Use these links to rapidly review the document
TABLE OF CONTENTS
Table of Contents
UNITED STATES
SECURITIES AND EXCHANGE COMMISSION
Washington, D.C. 20549
FORM 10-K
ANNUAL REPORT PURSUANT TO SECTION 13 OR 15(d) OF THE SECURITIES EXCHANGE ACT OF 1934
For the fiscal year ended September 30, 2013
Commission File Number: 001-34801
PEOPLES FEDERAL BANCSHARES, INC.
(Exact name of registrant as specified in its charter)
| | |
Maryland
(State or other jurisdiction of
incorporation or organization) | | 27-2814821
(I.R.S. Employer
Identification No.) |
435 Market Street, Brighton, Massachusetts
(Address of principal executive offices) |
|
02135
(Zip Code) |
(617) 254-0707
(Registrant's telephone number, including area code)
Securities registered pursuant to Section 12(b) of the Act:
| | |
| Title of each class | | Name of each exchange on which registered |
|---|
| Common Stock, par value $0.01 per share | | NASDAQ Capital Market |
Securities registered pursuant to Section 12(g) of the Act:None
Indicate by check mark if the registrant is a well-known seasoned issuer, as defined in Rule 405 of the Securities Act. Yes o No ý
Indicate by check mark if the registrant is not required to file reports pursuant to Section 13 or Section 15(d) of the Act. Yes o No ý
Indicate by check mark whether the registrant (1) has filed all reports required to be filed by Section 13 or 15(d) of the Securities Exchange Act of 1934 during the preceding 12 months (or for such shorter period that the registrant was required to file such reports), and (2) has been subject to such filing requirements for the past 90 days. Yes ý No o
Indicate by check mark whether the registrant has submitted electronically and posted on its corporate Web site, if any, every Interactive Data File required to be submitted and posted pursuant to Rule 405 of Regulation S-T (§ 232.405 of this chapter) during the preceding 12 months (or for such shorter period that the registrant was required to submit and post such files). Yes ý No o
Indicate by check mark if disclosure of delinquent filers pursuant to Item 405 of Regulation S-K is not contained herein, and will not be contained, to the best of the registrant's knowledge, in definitive proxy or information statements incorporated by reference in Part III of this Form 10-K or any amendment to this Form 10-K. ý
Indicate by check mark whether the registrant is a large accelerated filer, an accelerated filer, a non-accelerated filer, or a smaller reporting company.
| | | | | | |
| Large accelerated filer o | | Accelerated filer ý | | Non-accelerated filer o
(Do not check if a
smaller reporting company) | | Smaller reporting company o |
Indicate by check mark whether the registrant is a shell company (as defined by Rule 12b-2 of the Act). Yes o No ý
The aggregate market value of the voting and non-voting common equity held by non-affiliates, computed by reference to the closing price of the Registrant's shares of common stock as of March 28, 2013, the last business day of the registrant's second fiscal quarter was approximately $92.3 million.
The number of shares outstanding of the registrant's common stock as of November 30, 2013 was 6,465,934.
DOCUMENTS INCORPORATED BY REFERENCE:
Portions of the Proxy Statement for the Registrant's 2014 Annual Meeting of Stockholders are incorporated by reference in Part III of this Form 10-K.
Table of Contents
TABLE OF CONTENTS
| | | | | | |
| |
| | Page | |
|---|
PART I | | | | | | |
| | Forward-Looking Statements | | |
1 | |
Item 1. | | Business | | | 3 | |
| | Available Information | | | 3 | |
| | Market Area | | | 4 | |
| | Competition | | | 4 | |
| | Lending Activities | | | 4 | |
| | Asset Quality | | | 13 | |
| | Investment Activities | | | 18 | |
| | Sources of Funds | | | 20 | |
| | Personnel | | | 23 | |
| | Subsidiary Activity | | | 23 | |
| | Regulation and Supervision | | | 23 | |
Item 1A. | | Risk Factors | | | 32 | |
Item 1B. | | Unresolved Staff Comments | | | 36 | |
Item 2. | | Properties | | | 36 | |
Item 3. | | Legal Proceedings | | | 37 | |
Item 4. | | Mine Safety Disclosures | | | 37 | |
Part II | | | | | | |
Item 5. | | Market for Registrant's Common Equity, Related Stockholder Matters and Issuer Purchases of Equity Securities | | |
38 | |
Item 6. | | Selected Financial Data | | | 41 | |
Item 7. | | Management's Discussion and Analysis of Financial Condition and Results of Operations | | | 43 | |
Item 7A. | | Quantitative and Qualitative Disclosures About Market Risk | | | 52 | |
Item 8. | | Financial Statements and Supplementary Data | | | 58 | |
Item 9. | | Changes in and Disagreements with Accountants on Accounting and Financial Disclosure | | | 115 | |
Item 9A. | | Controls and Procedures | | | 115 | |
Item 9B. | | Other Information | | | 115 | |
PART III | | | | | | |
Item 10. | | Director, Executive Officers and Corporate Governance | | |
116 | |
Item 11. | | Executive Compensation | | | 116 | |
Item 12 | | Security Ownership of Certain Beneficial Owners and Management and Related Stockholder Matters | | | 116 | |
Item 13. | | Certain Relationships and Related Transactions and Director Independence | | | 116 | |
Item 14 | | Principal Accounting Fees and Services | | | 116 | |
PART IV | | | | | | |
Item 15. | | Exhibits, Financial Statement Schedules | | |
117 | |
SIGNATURES | | |
120 | |
Table of Contents
FORWARD LOOKING STATEMENTS
This Annual Report contains forward-looking statements, which can be identified by the use of words such as "estimate," "project," "believe," "intend," "anticipate," "plan," "seek," "expect," "will," "may" and words of similar meaning. These forward-looking statements include, but are not limited to:
- •
- statements of our goals, intentions and expectations;
- •
- statements regarding our business plans, prospects, growth and operating strategies;
- •
- statements regarding the asset quality of our loan and investment portfolios; and
- •
- estimates of our risks and future costs and benefits.
These forward-looking statements are based on our current beliefs and expectations and are inherently subject to significant business, economic and competitive uncertainties and contingencies, many of which are beyond our control. In addition, these forward-looking statements are subject to assumptions with respect to future business strategies and decisions that are subject to change. We are under no duty to and do not take any obligation to update any forward-looking statements after the date of this Annual Report.
The following factors, among others, could cause actual results to differ materially from the anticipated results or other expectations expressed in the forward-looking statements:
- •
- general economic conditions, either nationally or in our market areas, that are worse than expected;
- •
- competition among depository and other financial institutions;
- •
- inflation and changes in the interest rate environment that reduce our margins or reduce the fair value of financial instruments;
- •
- adverse changes in the securities markets;
- •
- changes in the laws or government regulations or policies affecting financial institutions, including changes in regulatory fees and capital requirements, including the effects of the Dodd-Frank Act and Basel III;
- •
- our ability to enter new markets successfully and capitalize on growth opportunities;
- •
- our ability to successfully integrate acquired entities, if any;
- •
- changes in consumer spending, borrowing and savings habits;
- •
- changes in accounting policies and practices, as may be adopted by the bank regulatory agencies, the Financial Accounting Standards Board, the Securities and Exchange Commission and the Public Company Accounting Oversight Board;
- •
- changes in our organization, compensation and benefit plans;
- •
- the timing and amount of revenues that we may recognize;
- •
- the value and marketability of collateral underlying our loan portfolios;
- •
- the impact of current governmental efforts to restructure the U.S. financial and regulatory system;
- •
- the quality and composition of our investment portfolio;
- •
- changes in financial condition or results of operations that reduce capital available to pay dividends; and
1
Table of Contents
- •
- changes in the financial condition or future prospects of issuers of securities that we own.
Because of these and a wide variety of other uncertainties, our actual future results may be materially different from the results indicated by these forward-looking statements.
2
Table of Contents
Item 1. BUSINESS
Peoples Federal Bancshares, Inc.
Peoples Federal Bancshares, Inc. (the "Company") is a Maryland corporation that owns 100% of the common stock of Peoples Federal Savings Bank ("Peoples Federal" or the "Bank"). The Company was incorporated in March 2010 to become the holding company of the Bank in connection with Peoples Federal's mutual to stock conversion in July 2010. Other than holding the common stock of the Bank and the common stock of Peoples Funding Corporation, a Massachusetts corporation that was formed by the Company for the sole purpose of making a loan to Peoples Federal's Employee Stock Ownership Plan, the Company has not engaged in any business to date.
As a savings and loan holding company registered under the Home Owners' Loan Act, the Company is authorized to pursue any business activities permitted by applicable laws and regulations, which may include the acquisition of banking and financial services companies. See "Regulation and Supervision—Holding Company Regulation" for a discussion of the activities that are permitted for savings and loan holding companies. We may also borrow funds for reinvestment in Peoples Federal.
Our executive offices are located at 435 Market Street, Brighton, Massachusetts 02135. Our telephone number at this address is (617) 254-0707. Our website address is www.pfsb.com. Information on our website is not incorporated into this annual report and should not be considered part of this annual report.
Peoples Federal
Peoples Federal's business consists primarily of accepting deposits from the general public and investing those deposits, together with funds generated primarily from operations and borrowings, in one- to four-family residential mortgage loans, multi-family mortgage loans, commercial real estate loans, construction loans and investment securities. To a much lesser extent, we also originate consumer loans and commercial business loans. The Bank offers a variety of deposit accounts, including passbook and statement savings accounts, term certificates, money market accounts, commercial and regular checking accounts and IRAs.
The Bank offers extended hours at all of our branches, and we are dedicated to offering alternative banking delivery systems utilizing state-of-the-art technology, including ATMs, online banking, remote deposit capture and telephone banking delivery systems.
Our executive offices are located at 435 Market Street, Brighton, Massachusetts 02135. Our telephone number at this address is (617) 254-0707.
Available Information
The Company is a public company, and files interim, quarterly and annual reports with the Securities and Exchange Commission. These reports are on file and a matter of public record with the Securities and Exchange Commission and may be read and copied at the Securities and Exchange Commission's Public Reference Room at 450 Fifth Street, NW, Washington, DC 20549. The public may obtain information on the operation of the Public Reference Room by calling the Securities and Exchange Commission at 1-800-SEC-0330. The Securities and Exchange Commission maintains an Internet site that contains reports, proxy and information statements, and other information regarding issuers that file electronically with the SEC (http://www.sec.gov).
Our website address is www.pfsb.com. Information on our website is not incorporated into, and should not be considered a part of, this annual report.
3
Table of Contents
Market Area
The Bank's lending activities are concentrated primarily in the Boston metropolitan area and eastern Massachusetts. We conduct our operations from our seven full-service branch offices located in Brighton, Allston, West Roxbury and Jamaica Plain, in Suffolk County, Massachusetts, Brookline and Norwood, in Norfolk County, Massachusetts and West Newton in Middlesex County, Massachusetts. We also expect to open a branch office in Westwood, Massachusetts in our second fiscal quarter of 2014. The Bank considers Suffolk County, Norfolk County and portions of Middlesex County, Massachusetts as our primary market area for deposits and lending.
Competition
The Bank faces intense competition in our market area both in making loans and attracting deposits. We compete with commercial banks, savings institutions, mortgage brokerage firms, credit unions, finance companies, mutual funds, insurance companies and investment banking firms. Some of our competitors have greater name recognition and market presence that benefit them in attracting business, and offer certain services that we do not or cannot provide.
Our deposit sources are primarily concentrated in the communities surrounding our banking offices, located in Middlesex, Norfolk and Suffolk Counties, Massachusetts. As of June 30, 2013, the latest date for which information is publicly available from the Federal Deposit Insurance Corporation ("FDIC"), there were 53 banks and thrift institutions with offices in Middlesex County, Massachusetts, 48 banks and thrift institutions with offices in Norfolk County, Massachusetts and 43 banks and thrift institutions with offices in Suffolk County, Massachusetts. At June 30, 2013, we had less than a 1.0% market share in all of the communities in which we operate.
The Bank expects competition to increase in the future as a result of legislative, regulatory and technological changes and the continuing trend of consolidation in the financial services industry. Technological advances, for example, have lowered barriers to entry, allowed banks to expand their geographic reach by providing services over the Internet and made it possible for non-depository institutions to offer products and services that traditionally have been provided by banks. Changes in federal law permit affiliation among banks, securities firms and insurance companies, which promotes a competitive environment in the financial services industry. Competition for deposits and the origination of loans could limit our growth in the future.
Lending Activities
The Bank's primary lending activity is the origination of one- to four-family residential mortgage loans, multi-family mortgage loans, commercial real estate loans and construction loans. In addition, we purchase loans that are generally secured by one- to four-family, owner-occupied, residential mortgage properties. To a much lesser extent, we also originate consumer loans and commercial business loans.
4
Table of Contents
Loan Portfolio Composition. The following table sets forth the composition of our loan portfolio, excluding loans held-for-sale, by type of loan at the dates indicated:
| | | | | | | | | | | | | | | | | | | | | | | | | | | | | | | |
| | At September 30, | |
|---|
| | 2013 | | 2012 | | 2011 | | 2010 | | 2009 | |
|---|
| | Amount | | Percent | | Amount | | Percent | | Amount | | Percent | | Amount | | Percent | | Amount | | Percent | |
|---|
| | (Dollars in thousands)
| |
|---|
Mortgage loans: | | | | | | | | | | | | | | | | | | | | | | | | | | | | | | | |
Residential loans: | | | | | | | | | | | | | | | | | | | | | | | | | | | | | | | |
One-to four-family(1)(2) | | $ | 308,917 | | | 65.8 | % | $ | 297,412 | | | 65.5 | % | $ | 253,872 | | | 61.8 | % | $ | 239,257 | | | 62.8 | % | $ | 237,429 | | | 64.9 | % |
Multi-family | | | 68,021 | | | 14.5 | | | 66,651 | | | 14.7 | | | 61,881 | | | 15.1 | | | 47,880 | | | 12.6 | | | 40,966 | | | 11.2 | |
Commercial real estate | | | 60,467 | | | 12.9 | | | 64,431 | | | 14.2 | | | 71,668 | | | 17.4 | | | 67,901 | | | 17.8 | | | 63,861 | | | 17.4 | |
Construction | | | 17,148 | | | 3.7 | | | 11,174 | | | 2.4 | | | 14,297 | | | 3.5 | | | 19,384 | | | 5.1 | | | 16,536 | | | 4.5 | |
Consumer loans | | | 5,359 | | | 1.1 | | | 6,867 | | | 1.5 | | | 4,583 | | | 1.1 | | | 2,113 | | | 0.5 | | | 2,523 | | | 0.7 | |
Commercial loans | | | 9,419 | | | 2.0 | | | 7,823 | | | 1.7 | | | 4,448 | | | 1.1 | | | 4,452 | | | 1.2 | | | 4,830 | | | 1.3 | |
| | | | | | | | | | | | | | | | | | | | | | |
Total loans | | | 469,331 | | | 100.0 | % | | 454,358 | | | 100.0 | % | | 410,749 | | | 100.0 | % | | 380,987 | | | 100.0 | % | | 366,145 | | | 100.0 | % |
| | | | | | | | | | | | | | | | | | | | | | | | | | | |
Deferred loan costs (fees), net | | | 755 | | | | | | 567 | | | | | | 45 | | | | | | (120 | ) | | | | | (274 | ) | | | |
Allowance for loan losses | | | (4,037 | ) | | | | | (3,891 | ) | | | | | (3,371 | ) | | | | | (3,203 | ) | | | | | (3,204 | ) | | | |
| | | | | | | | | | | | | | | | | | | | | | | | | | | |
Total loans, net | | $ | 466,049 | | | | | $ | 451,034 | | | | | $ | 407,423 | | | | | $ | 377,664 | | | | | $ | 362,667 | | | | |
| | | | | | | | | | | | | | | | | | | | | | | | | | | |
- (1)
- Includes $11.2 million, $15.7 million, $16.4 million, $20.1 million and $19.8 million of home equity loans and lines of credit at September 30, 2013, 2012, 2011, 2010 and 2009, respectively.
- (2)
- Includes $130.9 million, $119.8 million, $131.2 million, $122.2 million and $108.2 million of loans collateralized by non-owner occupied properties, all of which were located in our market area, at September 30, 2013, 2012, 2011, 2010 and 2009, respectively.
Loan Portfolio Maturities and Yields. The following table summarizes the scheduled repayments of our loan portfolio at September 30, 2013. Demand loans, loans having no stated repayment schedule or maturity, and overdraft loans are reported as being due in one year or less.
| | | | | | | | | | | | | | | | | | | | | | | | | |
| | Residential Loans | |
| |
| |
| |
| |
|---|
| | Commercial Real
Estate | |
| |
| |
|---|
| | One-to Four-family | | Multi-family | | Construction Loans | |
|---|
| | Amount | | Weighted
Average
Rate | | Amount | | Weighted
Average
Rate | | Amount | | Weighted
Average
Rate | | Amount | | Weighted
Average
Rate | |
|---|
| | (Dollars in thousands)
| |
|---|
Due During the Years
Ending September 30, | | | | | | | | | | | | | | | | | | | | | | | | | |
2014 | | $ | 224 | | | 4.74 | % | $ | 31 | | | 4.98 | % | $ | 2,528 | | | 3.88 | % | $ | 16,383 | | | 4.87 | % |
2015 | | | 190 | | | 4.95 | | | — | | | — | | | 60 | | | 5.45 | | | 765 | | | 4.91 | |
2016 | | | 353 | | | 5.81 | | | 31 | | | 4.00 | | | 105 | | | 3.43 | | | — | | | — | |
2017 to 2018 | | | 2,922 | | | 5.28 | | | 1,768 | | | 3.38 | | | 3,176 | | | 4.16 | | | — | | | — | |
2019 to 2023 | | | 17,594 | | | 4.10 | | | 10,324 | | | 4.20 | | | 6,473 | | | 3.70 | | | — | | | — | |
2024 to 2028 | | | 84,331 | | | 3.62 | | | 7,299 | | | 3.58 | | | 11,097 | | | 4.17 | | | — | | | — | |
2029 and beyond | | | 203,303 | | | 3.99 | | | 48,568 | | | 3.90 | | | 37,028 | | | 4.27 | | | — | | | — | |
| | | | | | | | | | | | | | | | | | | | | | |
Total | | $ | 308,917 | | | 3.91 | % | $ | 68,021 | | | 3.90 | % | $ | 60,467 | | | 4.17 | % | $ | 17,148 | | | 4.87 | % |
| | | | | | | | | | | | | | | | | | | | | | |
5
Table of Contents
| | | | | | | | | | | | | | | | | | | |
| | Consumer Loans | | Commercial Loans | | Total | |
|---|
| | Amount | | Weighted
Average
Rate | | Amount | | Weighted
Average
Rate | | Amount | | Weighted
Average
Rate | |
|---|
| | (Dollars in thousands)
| |
|---|
Due During the Years Ending September 30, | | | | | | | | | | | | | | | | | | | |
2014 | | $ | 81 | | | 8.26 | % | $ | 1,851 | | | 4.53 | % | $ | 21,098 | | | 4.73 | % |
2015 | | | 284 | | | 6.25 | | | 223 | | | 5.15 | | | 1,522 | | | 5.22 | |
2016 | | | 359 | | | 5.79 | | | 291 | | | 4.51 | | | 1,139 | | | 5.20 | |
2017 to 2018 | | | 4,228 | | | 4.37 | | | 1,394 | | | 4.85 | | | 13,488 | | | 4.44 | |
2019 to 2023 | | | 112 | | | 5.58 | | | 936 | | | 6.00 | | | 35,439 | | | 4.11 | |
2024 to 2028 | | | 44 | | | 7.45 | | | 344 | | | 4.50 | | | 103,115 | | | 3.68 | |
2029 and beyond | | | 251 | | | 15.34 | | | 4,380 | | | 3.01 | | | 293,530 | | | 4.01 | |
| | | | | | | | | | | | | | | | | |
Total | | $ | 5,359 | | | 5.19 | % | $ | 9,419 | | | 4.03 | % | $ | 469,331 | | | 3.99 | % |
| | | | | | | | | | | | | | | | | |
The following table sets forth the scheduled repayments of fixed- and adjustable-rate loans at September 30, 2013 that are contractually due after September 30, 2014:
| | | | | | | | | | |
| | Due After September 30, 2014 | |
|---|
| | Fixed | | Adjustable | | Total | |
|---|
| | (In thousands)
| |
|---|
Mortgage loans: | | | | | | | | | | |
Residential loans: | | | | | | | | | | |
One-to four-family | | $ | 144,560 | | $ | 164,133 | | $ | 308,693 | |
Multi-family | | | 5,712 | | | 62,278 | | | 67,990 | |
Commercial real estate | | | 7,183 | | | 50,756 | | | 57,939 | |
Construction | | | — | | | 765 | | | 765 | |
Consumer loans | | | 4,964 | | | 314 | | | 5,278 | |
Commercial loans | | | 1,738 | | | 5,830 | | | 7,568 | |
| | | | | | | | |
Total loans | | $ | 164,157 | | $ | 284,076 | | $ | 448,233 | |
| | | | | | | | |
One- to Four-family Residential Mortgage Loans. At September 30, 2013, $308.9 million, or 65.8% of our total loan portfolio, consisted of one- to four-family residential mortgage loans. We offer fixed-rate and adjustable-rate residential mortgage loans with maturities of up to 30 years.
One- to four-family residential mortgage loans are generally underwritten according to Fannie Mae and Freddie Mac guidelines and loans that conform to such guidelines are referred to as "conforming loans." The Bank generally originates both fixed- and adjustable-rate mortgage loans in amounts up to the maximum conforming loan limits as established by the Federal Housing Finance Agency, which is generally $417,000, but is $523,750 for single-family homes located in the Boston metropolitan area. The Bank also originates loans above this amount, which are referred to as "jumbo loans." The Bank's maximum loan amount for these loans is generally $3.5 million. The Bank generally underwrites jumbo loans in a manner similar to conforming loans. Jumbo loans are common in our market area. In addition to single-family dwellings, much of the housing stock in our primary lending market area is comprised of two-, three- and four-unit properties, all of which are classified as one- to four-family residential mortgage loans. At September 30, 2013, our largest one- to four-family residential mortgage loan was $1.9 million and was performing in accordance with its repayment terms. At September 30, 2013, we had $2.5 million past due one- to four-family residential mortgages, of which $1.8 million was greater than 90 days delinquent and on non-accrual.
The Bank originates adjustable-rate one- to four-family residential mortgage loans with initial interest rate adjustment periods of one, three, five and seven years, based on changes in a designated
6
Table of Contents
market index. These loans are limited to a 2.00% increase on their interest rate annually, with a maximum upward adjustment of 5.00% over the life of the loan. The Bank determines whether a borrower qualifies for an adjustable-rate mortgage loan based on secondary market guidelines.
Generally, the Bank sells into the secondary market most of the conforming fixed-rate loans with maturities of 20 years or greater that we originate. We retain the servicing on all such loans that we sell to Fannie Mae or Freddie Mac and we release the servicing on all such loans that are sold to other mortgage investors.
The Bank does not offer "interest only" mortgage loans on one- to four-family residential properties nor does the Bank offer loans that provide for negative amortization of principal, such as "Option ARM" loans, where the borrower can pay less than the interest owed on their loan, resulting in an increased principal balance during the life of the loan. Additionally, the Bank generally does not offer "subprime loans" (loans that are made with low down-payments to borrowers with weakened credit histories typically characterized by payment delinquencies, previous charge-offs, judgments, bankruptcies, or borrowers with questionable repayment capacity as evidenced by low credit scores or high debt-burden ratios) or Alt-A loans (traditionally defined as loans having less than full documentation). Although the Bank participates in Fannie Mae's Expanded Approval program and Freddie Mac's A Minus program, which previously did not require income verification, our practice is to still verify income for these types of loans, as well as for all mortgage loans that we make.
Home Equity Loans and Lines of Credit. In addition to traditional one- to four-family residential mortgage loans, we offer home equity loans and home equity lines of credit that are secured by the borrower's primary residence, secondary residence or one- to four-family investment properties. Home equity lines of credit have a maximum term of 20 years and are originated with adjustable rates of interest that are based, generally, upon the Prime Rate. The borrower is permitted to draw against the line during the initial 10 years of the line. Our home equity loans are originated with fixed rates of interest with terms of up to 15 years.
Home equity loans and lines of credit are generally underwritten with the same criteria that we use to underwrite one- to four-family residential mortgage loans. For a borrower's primary residence, home equity loans may be originated with loan-to-value ratios of up to 75% when combined with the principal balance of the existing mortgage loan, while the maximum loan-to-value ratio on secondary residences and investment properties is 70%, when combined with the principal balance of the existing mortgage loan. We require appraisals on home equity loans and lines of credit when the aggregate loan amount exceeds 75% of the property's tax assessed value or when the home equity loan or line of credit is $250,000 or greater. At the time we close a home equity loan or line of credit, we record a mortgage to perfect our security interest in the underlying collateral. We generally impose a limitation of $250,000 on a home equity line of credit and may exceed such limitation on a case-by-case basis.
Multi-family Real Estate Loans. The Bank originates multi-family real estate loans with either fixed rates (up to 15 years) or adjustable rates (amortization up to 30 years) generally with initial principal balances of up to $4.0 million and with a maximum loan to value ratio of 75%. Additionally, in evaluating a proposed multi-family real estate loan, the Bank will emphasize the ratio of the property's projected net cash flow to the loan's debt service requirement (generally requiring a minimum ratio of 125%), computed after deduction for a vacancy factor and property expenses we deem appropriate. Personal guarantees are usually obtained from multi-family real estate borrowers. At September 30, 2013, $68.0 million, or 14.5% of our total loan portfolio, consisted of multi-family real estate loans.
Appraisals on properties securing multi-family real estate loans are performed by an outside independent appraiser designated by us or internal evaluations, where permitted by regulation. All appraisals on multi-family real estate loans are reviewed internally by our management. Our underwriting procedures include considering the borrower's expertise and require verification of the borrower's credit history, income and financial statements, banking relationships, references and income projections for the property. We generally obtain personal guarantees on these loans.
7
Table of Contents
The borrower's financial information on multi-family loans is monitored on an ongoing basis by requiring periodic financial statement updates, payment history reviews and periodic face-to-face meetings with the borrower. The Bank requires such borrowers to provide annually updated financial statements and federal tax returns. These requirements also apply to the principals of our corporate borrowers.
Multi-family real estate loans generally present a higher level of risk than loans secured by one- to four-family residences. This greater risk is due to several factors, including the concentration of principal in a limited number of loans and borrowers, the effects of general economic conditions on income-producing properties and the increased difficulty of evaluating and monitoring these types of loans. Furthermore, the repayment of loans secured by multi-family residential real estate is typically dependent upon the successful management and operation of the related real estate project. If the cash flow from the project is reduced (for example, if leases are not obtained, renewed or the condition of the collateral declines), the borrower's ability to repay the loan may be impaired.
At September 30, 2013, our largest multi-family real estate loan had a balance of $4.5 million and was secured by a 31-unit apartment building in our primary market area. At September 30, 2013, this loan was performing in accordance with its repayment terms. At September 30, 2013, we did not have any multi-family real estate loans that were delinquent.
Commercial Real Estate Loans. At September 30, 2013, $60.5 million, or 12.9% of our total loan portfolio, consisted of commercial real estate loans, which we define as loans that are secured by properties that are occupied primarily (50% or more) by commercial entities. Similar to our multi-family lending, we will originate commercial real estate loans with either fixed rates (up to 15 years) or adjustable rates (amortization up to 30 years), generally with initial principal balances of up to $4.0 million with a maximum loan to value ratio of 75%.
In the underwriting of commercial real estate loans, we generally lend up to the lesser of 75% of the property's appraised value or purchase price. We base our decision to lend primarily on the economic viability of the property and the creditworthiness of the borrower. In evaluating a proposed commercial real estate loan, we emphasize the ratio of the property's projected net cash flow to the loan's debt service requirement (generally requiring a minimum ratio of 125%), computed after deduction for a vacancy factor and property expenses we deem appropriate. Personal guarantees are usually obtained from commercial real estate borrowers. We require title insurance, fire and extended coverage casualty insurance, and, if appropriate, flood insurance, in order to protect our security interest in the underlying property.
Commercial real estate loans generally carry higher interest rates and have shorter terms than one- to four-family residential mortgage loans. Commercial real estate loans, however, entail greater credit risks compared to one- to four-family residential mortgage loans, as they typically involve larger loan balances concentrated with single borrowers or groups of related borrowers. In addition, the payment of loans secured by income-producing properties typically depends on the successful management and operation of the property, as repayment of the loan generally is dependent, in large part, on sufficient income from the property to cover operating expenses and debt service. Changes in economic conditions that are not in the control of the borrower or lender could affect the value of the collateral for the loan or the future cash flow of the property. Additionally, any decline in real estate values may be more pronounced for commercial real estate than residential properties.
Repayment of commercial real estate loans is normally expected from the property's eventual rental income, income from the borrower's operating entity, the personal resources of the guarantor or the sale of the subject property.
At September 30, 2013, our largest commercial real estate loan, in which we were the lead bank, had a balance of $3.6 million, which represented a 50% participation in a $7.2 million commercial real
8
Table of Contents
estate loan, and was secured by a 62-room hotel in our primary market area. At September 30, 2013, this loan was performing in accordance with its repayment terms. At September 30, 2013, we did not have any commercial real estate loans more than 30 days delinquent.
Construction Loans. The Bank also originates construction loans for one- to four-family residential properties, multi-family properties and commercial properties. As of September 30, 2013, $17.1 million, or 3.7% of our total loan portfolio, consisted of construction loans, all of which were secured by one-to four-family residential real estate.
The Bank grants construction loans for commercial properties, including commercial "mixed-use" buildings and residential homes built by developers on speculative undeveloped property. Advances on construction loans are made in accordance with a schedule reflecting the cost of construction, but are generally limited to 75% loan-to-completed-appraised-value ratio. Repayment of construction loans on residential properties is normally expected from the sale of the subject property, income from the borrower's operating entity, the property's eventual rental income, or the personal resources of the guarantor. In the case of income-producing property, repayment is usually expected from permanent financing upon completion of construction. The Bank typically provides the permanent mortgage financing on our construction loans on income-producing property.
Construction financing generally involves greater credit risk than long-term financing on improved, owner-occupied real estate. Risk of loss on a construction loan depends largely upon the accuracy of the initial estimate of the value of the property at completion of construction compared to the estimated cost (including interest) of construction and other assumptions. If the estimate of construction cost is inaccurate, we may be required to advance additional funds beyond the amount originally committed in order to protect the value of the property. Moreover, if the estimated value of the completed project is inaccurate, the borrower may hold a property with a value that is insufficient to assure full repayment of the construction loan upon the sale of the property. In the event the Bank makes a land acquisition loan on property that is not yet approved for the planned development, there is the risk that approvals will not be granted or will be delayed. Construction loans also expose the Bank to the risk that improvements will not be completed on time in accordance with specifications and projected costs. In addition, the ultimate sale or rental of the property may not occur as anticipated.
Consumer Loans. The Bank's consumer lending has been limited. At September 30, 2013, we had $5.4 million of consumer loans outstanding, representing 1.1% of the total loan portfolio. Consumer loans consist of loans secured by deposits, auto loans, overdraft lines of credit and various personal installment loans. The Bank offers a reduced interest rate on certain consumer loans for those customers who direct us to make automatic withdrawals from their Peoples Federal accounts for the monthly payments on their consumer loans.
Consumer loans may entail greater credit risk than residential mortgage loans, particularly in the case of consumer loans that are unsecured or are secured by rapidly depreciable assets, such as automobiles. In addition, consumer loan collections are dependent on the borrower's continuing financial stability, and thus are more likely to be affected by adverse personal circumstances. Furthermore, the application of various federal and state laws, including bankruptcy and insolvency laws, may limit the amount that can be recovered on such loans. At September 30, 2013, we had no consumer loans that were non-performing.
Commercial Loans. The Bank originates commercial term loans and variable lines of credit to small- and medium-sized companies in our primary market area. The Bank's commercial loans are generally used for working capital purposes or for acquiring equipment, inventory or furniture. These loans are secured by business assets other than real estate, such as business equipment and inventory or accounts receivable. The commercial business loans that are offered are floating-rate loans indexed to
9
Table of Contents
the prime rate as published in The Wall Street Journal and fixed-rate loans with terms ranging from one to seven years. The commercial loan portfolio consists primarily of secured loans. At September 30, 2013, we had $9.4 million of commercial loans outstanding, representing 2.0% of the total loan portfolio. At September 30, 2013, we did not have any non-performing commercial loans.
When making commercial loans, the Bank considers the financial statements of the borrower, the history of the borrower, the debt service capabilities of the borrower, the projected cash flows of the business and the value of the collateral, if any. Virtually all of our loans are guaranteed by the principals of the borrower.
Commercial loans generally have a greater credit risk than residential mortgage loans. Unlike residential mortgage loans, which generally are made on the basis of the borrower's ability to make repayment from his or her employment and other income, and which are secured by real property whose value tends to be more easily ascertainable, commercial business loans are of higher risk and typically are made on the basis of the borrower's ability to make repayment from the cash flow of the borrower's business. As a result, the availability of funds for the repayment of commercial business loans may be substantially dependent on the success of the business itself. Further, the collateral securing the loans may depreciate over time, may be difficult to appraise and may fluctuate in value based on the success of the business. We seek to minimize these risks through our underwriting standards.
At September 30, 2013, our largest commercial lending relationship was $4.3 million consisting of three commercial loans secured by marketable securities. At September 30, 2013, these loans were performing in accordance with their terms.
Loan Underwriting Risks
Adjustable-Rate Loans. While the Bank anticipates that adjustable-rate loans will better offset the adverse effects of an increase in interest rates as compared to fixed-rate loans, an increased monthly mortgage payment required of adjustable-rate loan borrowers in a rising interest rate environment could cause an increase in delinquencies and defaults. The marketability of the underlying property also could be adversely affected in a higher interest rate environment. In addition, although adjustable-rate mortgage loans make our asset base more responsive to changes in interest rates, the extent of this interest sensitivity is limited by the annual and lifetime interest rate adjustment limits.
Multi-family and Commercial Real Estate Loans. Loans secured by multi-family and commercial real estate generally have larger balances and involve a greater degree of risk than one-to-four family residential mortgage loans. Of primary concern in multi-family and commercial real estate lending is the cash flow potential of the project, feasibility of the project, creditworthiness of the borrower, managerial skills and financial strength of the loan sponsor. Payments on loans secured by income properties often depend on successful operation and management of the properties. As a result, repayment of such loans may be subject to a greater extent than residential real estate loans, to adverse conditions in the real estate market or the economy. To monitor cash flows on income properties, the Bank requires borrowers and loan guarantors, if any, to provide annual financial statements on multi-family and commercial real estate loans. In reaching a decision on whether to make a multi-family or commercial real estate loan, the Bank considers and reviews a global cash flow analysis of the borrower and considers the net operating income of the property, the borrower's expertise, credit history and profitability and the value of the underlying property. The Bank has generally required that the properties securing these real estate loans have debt service coverage ratios (the ratio of earnings before debt service to debt service) of at least 1.25. An environmental survey or environmental risk insurance is obtained when the possibility exists that hazardous materials may have existed on the site, or the site may have been impacted by adjoining properties that handled hazardous materials.
10
Table of Contents
Construction Loans. Construction financing is generally considered to involve a higher degree of risk of loss than long-term financing on improved, occupied real estate. Risk of loss on a construction loan depends largely upon the accuracy of the initial estimate of the property's value at completion of construction and the estimated cost of construction. During the construction phase, a number of factors could result in delays and/or cost overruns. If the estimate of construction costs proves to be inaccurate, the Bank may be required to advance funds beyond the amount originally committed to permit completion of the building. Also, the Bank may be confronted, at or before the maturity of the loan, with a building having a value that is insufficient to assure full repayment. If the Bank is forced to foreclose on such a building before or at completion due to a default, there can be no assurance that the Bank will be able to recover all of the unpaid balance of, and accrued interest on, the loan as well as related foreclosure and holding costs.
Consumer Loans. Consumer loans may entail greater risk than do residential mortgage loans, particularly in the case of consumer loans that are unsecured or secured by assets that depreciate rapidly, such as motor vehicles. In the latter case, repossessed collateral for a defaulted consumer loan may not provide an adequate source of repayment for the outstanding loan and a small remaining deficiency often does not warrant further substantial collection efforts against the borrower. Consumer loan collections depend on the borrower's continuing financial stability, and therefore are likely to be adversely affected by various factors, including job loss, divorce, illness or personal bankruptcy. Furthermore, the application of various federal and state laws, including federal and state bankruptcy and insolvency laws, may limit the amount that can be recovered on such loans.
Loan Originations, Purchases and Sales. Loan originations come from a number of sources. The primary source of loan originations is existing customers, walk-in traffic, advertising and referrals from customers. Occasionally, the Bank sells loans that it has originated. The decision to sell loans is based on prevailing market interest rate conditions and interest rate risk management.
We also purchase whole loans or participation loans to supplement our lending portfolio. Whole loans purchased totaled $86.5 million at September 30, 2013. We perform our underwriting analysis on each loan purchased using the same standards used for similar loans originated. The loans purchased are generally in our market area.
Loan participations that we purchased totaled $13.9 million at September 30, 2013. Loan participations are also subject to the same credit analysis and loan approvals as loans the Bank originates. The Bank is permitted to review all of the documentation relating to any loan in which the Bank participates. However, as with purchased loans, the Bank does not service purchased participation loans. Thus, with respect to purchased loans and participations, the Bank is subject to the policies and practices of the lead lender with regard to monitoring delinquencies, pursuing collections and instituting foreclosure proceedings.
The following table shows our loan originations, loan purchases and principal repayment activity for loans originated for our portfolio during the periods indicated. Loans are presented net of loans in
11
Table of Contents
process. The following table does not reflect loans that are originated for sale to the Federal Home Loan Mortgage Corporation.
| | | | | | | | | | | | | | | | |
| | Years Ended September 30, | |
|---|
| | 2013 | | 2012 | | 2011 | | 2010 | | 2009 | |
|---|
| | (In thousands)
| |
|---|
Total loans at beginning of period | | $ | 454,358 | | $ | 410,749 | | $ | 380,987 | | $ | 366,145 | | $ | 376,681 | |
Loans originated: | | | | | | | | | | | | | | | | |
Mortgage loans: | | | | | | | | | | | | | | | | |
Residential loans: | | | | | | | | | | | | | | | | |
One-to four-family | | | 53,088 | | | 73,044 | | | 80,079 | | | 40,302 | | | 42,045 | |
Multi-family | | | 16,571 | | | 14,124 | | | 20,776 | | | 2,664 | | | 4,411 | |
Commercial real estate | | | 13,654 | | | 6,032 | | | 12,777 | | | 11,960 | | | 14,522 | |
Construction | | | 23,863 | | | 14,203 | | | 11,862 | | | 16,389 | | | 11,785 | |
| | | | | | | | | | | | |
Total mortgage loans | | | 107,176 | | | 107,403 | | | 125,494 | | | 71,315 | | | 72,763 | |
Consumer loans | | | 3,149 | | | 1,576 | | | 1,321 | | | 1,084 | | | 1,417 | |
Commercial loans | | | 2,927 | | | 3,972 | | | 8,198 | | | 1,078 | | | 610 | |
| | | | | | | | | | | | |
Total loans originated | | | 113,252 | | | 112,951 | | | 135,013 | | | 73,477 | | | 74,790 | |
| | | | | | | | | | | | |
Loan purchased: | | | | | | | | | | | | | | | | |
Residential loans: | | | | | | | | | | | | | | | | |
One-to four-family | | | 31,151 | | | 40,268 | | | 31,071 | | | 35,716 | | | — | |
Consumer loans | | | — | | | 3,088 | | | 2,804 | | | — | | | — | |
| | | | | | | | | | | | |
Total loans purchased | | | 31,151 | | | 43,356 | | | 33,875 | | | 35,716 | | | — | |
| | | | | | | | | | | | |
Total loans originated and purchased | | | 144,403 | | | 156,307 | | | 168,888 | | | 109,193 | | | 74,790 | |
Deduct: | | | | | | | | | | | | | | | | |
Principal repayments | | | (129,430 | ) | | (112,698 | ) | | (139,126 | ) | | (94,351 | ) | | (85,326 | ) |
| | | | | | | | | | | | |
Net loan activity | | | 14,973 | | | 43,609 | | | 29,762 | | | 14,842 | | | (10,536 | ) |
| | | | | | | | | | | | |
Total loans at end of period | | $ | 469,331 | | $ | 454,358 | | $ | 410,749 | | $ | 380,987 | | $ | 366,145 | |
| | | | | | | | | | | | |
Loan Approval Procedures and Authority. The Bank's lending activities follow written, non-discriminatory underwriting standards and loan origination procedures established by our board of directors. The loan approval process is intended to assess the borrower's ability to repay the loan and the value of the property that will secure the loan. To assess the borrower's ability to repay, the Bank reviews the borrower's employment and credit history and information on the historical and projected income and expenses of the borrower. The Bank requires "full documentation" on all loan applications.
The Bank's policies and loan approval limits are established by the board of directors. Aggregate lending relationships in amounts up to $1.0 million can be approved by designated individual officers or officers acting together with specific lending approval authority. Relationships in excess of $1.0 million require the approval of the President and the Executive Vice President and are then ratified by the investment committee and the board of directors.
The Bank requires appraisals of all real property securing one- to four-family residential mortgage loans, multi-family loans and commercial real estate loans. In limited circumstances, the use of a detailed appraisal may be waived by the Executive Vice President/Chief Lending Officer or the President of the Bank for loans where new money borrowed is less than $250,000. All appraisers are independent, state-licensed or state-certified appraisers and are approved by the board of directors annually.
12
Table of Contents
Loans to One Borrower. The maximum amount the Bank may lend to one borrower and the borrower's related entities is limited, by regulation, to generally 15% of its unimpaired capital and surplus. At September 30, 2013, Peoples Federal's regulatory limit on loans to one borrower was $13.8 million. At that date, the Bank's largest lending relationship was $10.6 million and was secured by real property. This relationship consists of 33 real estate mortgage loans, each of which was performing in accordance with its original terms, at September 30, 2013.
Loan Commitments. The Bank issues commitments for fixed- and adjustable-rate mortgage loans conditioned upon the occurrence of certain events. Commitments to originate mortgage loans are legally binding agreements to lend to our customers. Generally, these loan commitments expire after 30 days.
Asset Quality
When a residential mortgage loan or home equity line of credit is 15 days past due, a late payment notice is generated and mailed to the borrower. For those borrowers who are seldom late in payment and for new customers of the Bank, we will attempt personal, direct contact with the borrower to determine when payment will be made. On the first day of the following month, we mail a letter reminding the borrower of the delinquency and will attempt to contact the borrower by telephone. If no contact is made, a property inspection is made to determine the condition of the property. Thereafter we will send an additional letter when a loan is 60 days or more past due and, thereafter, approximately every 30 days during such delinquency. By the 60th day of delinquency, unless the borrower has made arrangements to bring the loan current on its payments, we will refer the loan to legal counsel to commence foreclosure proceedings. Upon the recommendation of the Chief Lending Officer or the President, we may shorten these time frames. Upon board of director's approval, foreclosure activity is initiated by our counsel once a loan is 90 days delinquent. If necessary, subsequent late charges are issued and the account will be monitored on a regular basis thereafter.
Commercial business loans, commercial real estate loans and consumer loans are generally handled in the same manner as residential mortgage loans or home equity lines of credit. All commercial business loans that are 15 days past due are immediately referred to our senior lending officer. Because of the nature of the collateral securing consumer loans, we may commence collection procedures faster for consumer loans than for residential mortgage loans or home equity lines of credit.
Loans are placed on non-accrual status when payment of principal or interest is more than 90 days delinquent. Loans are also placed on non-accrual status if collection of principal or interest in full is in doubt. When loans are placed on a non-accrual status, unpaid accrued interest is fully reversed, and further income is recognized only to the extent received. The loan may be returned to accrual status if both principal and interest payments are brought current and full payment of principal and interest is expected.
Non-performing Assets. The table below sets forth the amounts and categories of our non-performing assets at the dates indicated. Non-performing loans include non-accrual loans, loans
13
Table of Contents
delinquent 90 days or greater and still accruing and non-performing troubled debt restructurings ("TDRs").
| | | | | | | | | | | | | | | | |
| | At September 30, | |
|---|
| | 2013 | | 2012 | | 2011 | | 2010 | | 2009 | |
|---|
| | (Dollars in thousands)
| |
|---|
Non-accrual loans: | | | | | | | | | | | | | | | | |
Mortgage loans: | | | | | | | | | | | | | | | | |
Residential loans: | | | | | | | | | | | | | | | | |
One-to four-family | | $ | 1,846 | | $ | 1,536 | | $ | 2,541 | | $ | 1,954 | | $ | 1,632 | |
Multi-family | | | — | | | — | | | — | | | — | | | 258 | |
Commercial real estate(1) | | | — | | | 1,868 | | | 671 | | | 225 | | | 1,911 | |
Construction | | | — | | | — | | | — | | | — | | | 1,540 | |
Consumer loans | | | — | | | — | | | 38 | | | 1 | | | — | |
Commercial loans | | | — | | | 13 | | | — | | | — | | | — | |
| | | | | | | | | | | | |
Total non-accrual loans | | | 1,846 | | | 3,417 | | | 3,250 | | | 2,180 | | | 5,341 | |
| | | | | | | | | | | | |
Total loans delinquent 90 days or greater and still accruing(2) | | | — | | | — | | | — | | | — | | | 384 | |
Troubled debt restructurings—accruing(3) | | | 303 | | | — | | | — | | | — | | | — | |
| | | | | | | | | | | | |
Total accruing non-performing loans | | | 303 | | | — | | | — | | | — | | | 384 | |
| | | | | | | | | | | | |
Total non-performing loans | | | 2,149 | | | 3,417 | | | 3,250 | | | 2,180 | | | 5,725 | |
| | | | | | | | | | | | |
Other real estate owned | | | — | | | — | | | — | | | 795 | | | — | |
| | | | | | | | | | | | |
Total non-performing assets(4) | | $ | 2,149 | | $ | 3,417 | | $ | 3,250 | | $ | 2,975 | | $ | 5,725 | |
| | | | | | | | | | | | |
Ratios: | | | | | | | | | | | | | | | | |
Non-performing loans to total loans | | | 0.46 | % | | 0.75 | % | | 0.79 | % | | 0.57 | % | | 1.56 | % |
Non-performing assets to total assets | | | 0.37 | % | | 0.60 | % | | 0.59 | % | | 0.54 | % | | 1.19 | % |
- (1)
- At September 30, 2012, amount consists of one non-performing TDR.
- (2)
- At September 30, 2009, amount consists of one 1-4 family residential mortgage loan.
- (3)
- At September 30, 2013, amount consists of one performing commercial real estate TDR.
- (4)
- At September 30, 2013, 2012, 2011, 2010 and 2009, loans totaling $2.1 million, $3.4 million, $3.3 million, $2.1 million and $5.3 million, respectively, were rated substandard. See—Classification of Assets.
For the fiscal year ended September 30, 2013, gross interest income that would have been recorded had our non-accruing loans been current in accordance with their original terms was $71,000. Interest income recognized on such loans for the fiscal year ended September 30, 2013 was $114,000.
Troubled Debt Restructurings. We periodically modify loans to extend the term or make other concessions to help a borrower stay current on its loan and to avoid foreclosure. TDRs that have been performing in accordance with their modified terms for a period of less than six months are classified as non-performing. At September 30, 2013, the Company had $303,000 of TDRs. During the third fiscal 2013 quarter, the Company restructured a performing commercial real estate loan collateralized by a commercial real estate property. The Company capitalized all past due interest and provided for interest only for four months. At September 30, 2013, management believes that the loan is more than adequately collateralized and it was accruing and performing in accordance with its modified terms.
14
Table of Contents
Delinquent Loans. The following table sets forth our loan delinquencies by type and by amount at the dates indicated.
| | | | | | | | | | | | | | | | | | | |
| | Loans Delinquent For | |
| |
| |
|---|
| | 30 - 89 Days | | 90 Days and Over | | Total | |
|---|
| | Number | | Amount | | Number | | Amount | | Number | | Amount | |
|---|
| | (Dollars in thousands)
| |
|---|
At September 30, 2013 | | | | | | | | | | | | | | | | | | | |
Mortgage loans: | | | | | | | | | | | | | | | | | | | |
Residential loans: | | | | | | | | | | | | | | | | | | | |
One-to four-family | | | 4 | | $ | 629 | | | 10 | | $ | 1,846 | | | 14 | | $ | 2,475 | |
Multi-family | | | — | | | — | | | — | | | — | | | — | | | — | |
Commercial real estate | | | — | | | — | | | — | | | — | | | — | | | — | |
Construction | | | — | | | — | | | — | | | — | | | — | | | — | |
Consumer loans | | | 6 | | | 31 | | | — | | | — | | | 6 | | | 31 | |
Commercial loans | | | 1 | | | 1 | | | — | | | — | | | 1 | | | 1 | |
| | | | | | | | | | | | | | |
Total loans | | | 11 | | $ | 661 | | | 10 | | $ | 1,846 | | | 21 | | $ | 2,507 | |
| | | | | | | | | | | | | | |
At September 30, 2012 | | | | | | | | | | | | | | | | | | | |
Mortgage loans: | | | | | | | | | | | | | | | | | | | |
Residential loans: | | | | | | | | | | | | | | | | | | | |
One-to four-family | | | 6 | | $ | 1,837 | | | 9 | | $ | 1,536 | | | 15 | | $ | 3,373 | |
Multi-family | | | — | | | — | | | — | | | — | | | — | | | — | |
Commercial real estate | | | 2 | | | 718 | | | 1 | | | 1,868 | | | 3 | | | 2,586 | |
Construction | | | — | | | — | | | — | | | — | | | — | | | — | |
Consumer loans | | | 8 | | | 54 | | | — | | | — | | | 8 | | | 54 | |
Commercial loans | | | 1 | | | 1 | | | 1 | | | 13 | | | 2 | | | 14 | |
| | | | | | | | | | | | | | |
Total loans | | | 17 | | $ | 2,610 | | | 11 | | $ | 3,417 | | | 28 | | $ | 6,027 | |
| | | | | | | | | | | | | | |
At September 30, 2011 | | | | | | | | | | | | | | | | | | | |
Mortgage loans: | | | | | | | | | | | | | | | | | | | |
Residential loans: | | | | | | | | | | | | | | | | | | | |
One-to four-family | | | 8 | | $ | 1,140 | | | 15 | | $ | 2,541 | | | 23 | | $ | 3,681 | |
Multi-family | | | 1 | | | 186 | | | — | | | — | | | 1 | | | 186 | |
Commercial real estate | | | 2 | | | 2,053 | | | 1 | | | 671 | | | 3 | | | 2,724 | |
Construction | | | — | | | — | | | — | | | — | | | — | | | — | |
Consumer loans | | | 6 | | | 16 | | | 2 | | | 38 | | | 8 | | | 54 | |
Commercial loans | | | — | | | — | | | — | | | — | | | — | | | — | |
| | | | | | | | | | | | | | |
Total loans | | | 17 | | $ | 3,395 | | | 18 | | $ | 3,250 | | | 35 | | $ | 6,645 | |
| | | | | | | | | | | | | | |
At September 30, 2010 | | | | | | | | | | | | | | | | | | | |
Mortgage loans: | | | | | | | | | | | | | | | | | | | |
Residential loans: | | | | | | | | | | | | | | | | | | | |
One-to four-family | | | 12 | | $ | 1,483 | | | 10 | | $ | 1,954 | | | 22 | | $ | 3,437 | |
Multi-family | | | 1 | | | 207 | | | — | | | — | | | 1 | | | 207 | |
Commercial real estate | | | 4 | | | 3,291 | | | 1 | | | 225 | | | 5 | | | 3,516 | |
Construction | | | — | | | — | | | — | | | — | | | — | | | — | |
Consumer loans | | | 9 | | | 34 | | | 1 | | | 1 | | | 10 | | | 35 | |
Commercial loans | | | 1 | | | 2 | | | — | | | — | | | 1 | | | 2 | |
| | | | | | | | | | | | | | |
Total loans | | | 27 | | $ | 5,017 | | | 12 | | $ | 2,180 | | | 39 | | $ | 7,197 | |
| | | | | | | | | | | | | | |
At September 30, 2009 | | | | | | | | | | | | | | | | | | | |
Mortgage loans: | | | | | | | | | | | | | | | | | | | |
Residential loans: | | | | | | | | | | | | | | | | | | | |
One-to four-family | | | 10 | | $ | 1,720 | | | 8 | | $ | 2,016 | | | 18 | | $ | 3,736 | |
Multi-family | | | 1 | | | 226 | | | 1 | | | 258 | | | 2 | | | 484 | |
Commercial real estate | | | 1 | | | 642 | | | 2 | | | 1,911 | | | 3 | | | 2,553 | |
Construction | | | — | | | — | | | 1 | | | 1,540 | | | 1 | | | 1,540 | |
Consumer loans | | | 6 | | | 31 | | | — | | | — | | | 6 | | | 31 | |
Commercial loans | | | 1 | | | 1 | | | — | | | — | | | 1 | | | 1 | |
| | | | | | | | | | | | | | |
Total loans | | | 19 | | $ | 2,620 | | | 12 | | $ | 5,725 | | | 31 | | $ | 8,345 | |
| | | | | | | | | | | | | | |
Other Real Estate Owned. Real estate acquired by us as a result of foreclosure or by deed in lieu of foreclosure is classified as other real estate owned. When property is acquired it is recorded at
15
Table of Contents
estimated fair market value at the date of foreclosure less the cost to sell, establishing a new cost basis. Estimated fair value generally represents the sales price a buyer would be willing to pay on the basis of current market conditions, including normal terms from other financial institutions. Holding costs and declines in estimated fair market value result in charges to expense after acquisition. As of September 30, 2013, 2012 and 2011, we had no other real estate owned. As of September 30, 2010, we had $795,000 in other real estate owned. As of September 30, 2009, we had no other real estate owned.
Classification of Assets. Our policies, consistent with regulatory guidelines, provide for the classification of loans and other assets that are considered to be of lesser quality as substandard, doubtful, or loss assets. An asset is considered substandard if it is inadequately protected by the current net worth and paying capacity of the obligor or of the collateral pledged, if any. Substandard assets include those assets characterized by the distinct possibility that we will sustain some loss if the deficiencies are not corrected. Assets classified as doubtful have all of the weaknesses inherent in those classified substandard with the added characteristic that the weaknesses present make collection or liquidation in full, on the basis of currently existing facts, conditions and values, highly questionable and improbable. Assets (or portions of assets) classified as loss are those considered uncollectible and of such little value that their continuance as assets is not warranted. Assets that do not expose us to risk sufficient to warrant classification in one of the aforementioned categories, but which possess potential weaknesses that deserve our close attention, are required to be designated as special mention.
We maintain an allowance for loan losses at an amount estimated to equal all credit losses incurred in our loan portfolio that are both probable and reasonable to estimate at a balance sheet date. Our determination as to the classification of our assets and the amount of our loss allowances is subject to review by the Bank's principal federal regulator, the Office of the Comptroller of the Currency ("OCC"), which can require that we establish additional loss allowances. We regularly review our asset portfolio to determine whether any assets require classification in accordance with applicable regulations.
The following table sets forth our amounts of classified assets, assets designated as special mention and criticized assets (classified assets and loans designated as special mention) at the dates indicated.
| | | | | | | | | | | | | | | | |
| | At September 30, | |
|---|
| | 2013 | | 2012 | | 2011 | | 2010 | | 2009 | |
|---|
| | (In thousands)
| |
|---|
Classified assets: | | | | | | | | | | | | | | | | |
Substandard | | $ | 4,100 | | $ | 9,620 | | $ | 12,569 | | $ | 6,678 | | $ | 6,223 | |
Doubtful | | | — | | | — | | | — | | | — | | | — | |
Loss | | | — | | | — | | | — | | | — | | | — | |
| | | | | | | | | | | | |
Total classified assets | | | 4,100 | | | 9,620 | | | 12,569 | | | 6,678 | | | 6,223 | |
Special mention | | | 2,357 | | | 10,546 | | | 4,036 | | | 4,452 | | | 4,754 | |
| | | | | | | | | | | | |
Total criticized assets | | $ | 6,457 | | $ | 20,166 | | $ | 16,605 | | $ | 11,130 | | $ | 10,977 | |
| | | | | | | | | | | | |
At September 30, 2013, we had $4.1 million of substandard assets, of which $1.2 million were commercial real estate loans, $2.9 million were one- to four-family residential mortgage loans and $9,000 were commercial loans. At September 30, 2013, we had assets designated special mention totaling $2.4 million of which $1.7 million were commercial real estate loans and $700,000 were commercial loans.
Allowance for Loan Losses. We provide for loan losses based upon the consistent application of our documented allowance for loan loss methodology. All loan losses are charged to the allowance for loan losses and all recoveries are credited to it. Additions to the allowance for loan losses are provided by charges to income based on various factors, which, in our judgment, deserve current recognition in
16
Table of Contents
estimating probable losses. We regularly review the loan portfolio, including a review of our classified assets, and make provisions for loan losses in order to maintain the allowance for loan losses in accordance with accounting principles generally accepted in the United States of America ("GAAP"). The allowance for loan losses consists primarily of two components:
- (1)
- Allocated component is established for impaired loans (as defined by GAAP). The amount of impairment provided for as a specific allowance is represented by the deficiency, if any, between the estimated fair value of the loan, or the loan's observable market price, if any, or the fair value of the underlying collateral, if the loan is collateral dependent, and the carrying value of the loan. Specific allowances are based on the present value of expected cash flows if the loan is not collateral dependent. Impaired loans for which the estimated fair value of the loan, or the loan's observable market price or the fair value of the underlying collateral if the loan is collateral dependent, exceeds the carrying value of the loan are not considered in establishing specific allowances for loan losses; and
- (2)
- General allowances established for loan losses on a portfolio basis for loans that do not meet the definition of impaired loans. The portfolio is grouped into similar risk characteristics, primarily loan type and regulatory classification. We apply an estimated loss rate to each loan group. The loss rates applied are based upon our loss experience adjusted, as appropriate, for the environmental factors discussed below. This evaluation is inherently subjective, as it requires material estimates that may be susceptible to significant revisions based upon changes in economic and real estate market conditions.
Actual loan losses may be significantly more than the allowance for loan losses we have established, which could have a material negative effect on our financial results.
The adjustments to historical loss experience are based on our evaluation of several qualitative and environmental factors, including:
- •
- changes in any concentration of credit (including, but not limited to, concentrations by geography, industry or collateral type);
- •
- changes in the number and amount of non-accrual loans, watch list loans and past due loans;
- •
- changes in national, state and local economic trends;
- •
- changes in the types of loans in the loan portfolio;
- •
- changes in the experience and ability of personnel and management in the mortgage loan origination and loan servicing departments;
- •
- changes in the value of underlying collateral for collateral dependent loans;
- •
- changes in lending strategies; and
- •
- changes in lending policies and procedures.
In addition, we may establish an unallocated allowance to provide for probable losses that have been incurred as of the reporting date but are not reflected in the allocated allowance.
Historically, we have experienced limited loan losses and, therefore, have relied on industry data and our assessed risks to determine loss factors for calculating our allowance for loan losses. More recently, as we have experienced manageable loan losses, we have utilized our own historical loss experience in determining applicable portions of the allowance for loan losses. During the fiscal year ended September 30, 2013, we have continued to use the same methodology in our calculation of the required allowance for loan losses. See "—Comparison of Operating Results for the Fiscal Years Ended September 30, 2013 and 2012—Provision for Loan Losses."
17
Table of Contents
We evaluate the allowance for loan losses based upon the combined total of the general, allocated and unallocated components. Generally when the loan portfolio increases, absent other factors, the allowance for loan loss methodology results in a higher dollar amount of estimated probable losses than would be the case without the increase. Generally when the loan portfolio decreases, absent other factors, the allowance for loan loss methodology results in a lower dollar amount of estimated probable losses than would be the case without the decrease.
The following table sets forth the Bank's amount of allowance by loan segment and the percent of the loans to total loans in each of the segments listed at the dates indicated. The allowance for loan losses allocated to each segment is not necessarily indicative of future losses in any particular segment and does not restrict the use of the allowance to absorb losses in other segments:
| | | | | | | | | | | | | | | | | | | | | | | | | | | | | | | |
| | September 30, | |
|---|
| | 2013 | | 2012 | | 2011 | | 2010 | | 2009 | |
|---|
| | Amount | | Percent | | Amount | | Percent | | Amount | | Percent | | Amount | | Percent | | Amount | | Percent | |
|---|
| | (Dollars in thousands)
| |
|---|
Mortgage loans: | | | | | | | | | | | | | | | | | | | | | | | | | | | | | | | |
Residential loans: | | | | | | | | | | | | | | | | | | | | | | | | | | | | | | | |
One-to four-family | | $ | 1,930 | | | 65.8 | % | $ | 1,847 | | | 65.5 | % | $ | 1,550 | | | 61.8 | % | $ | 1,481 | | | 62.8 | % | $ | 1,726 | | | 64.9 | % |
Multi-family | | | 728 | | | 14.5 | | | 759 | | | 14.7 | | | 601 | | | 15.1 | | | 502 | | | 12.6 | | | 357 | | | 11.2 | |
Commercial real estate | | | 719 | | | 12.9 | | | 768 | | | 14.2 | | | 670 | | | 17.4 | | | 684 | | | 17.8 | | | 438 | | | 17.4 | |
Construction | | | 249 | | | 3.7 | | | 134 | | | 2.4 | | | 292 | | | 3.5 | | | 340 | | | 5.1 | | | 219 | | | 4.5 | |
Consumer loans | | | 86 | | | 1.1 | | | 157 | | | 1.5 | | | 91 | | | 1.1 | | | 42 | | | 0.5 | | | 38 | | | 0.7 | |
Commercial loans | | | 135 | | | 2.0 | | | 93 | | | 1.7 | | | 40 | | | 1.1 | | | 40 | | | 1.2 | | | 127 | | | 1.3 | |
Unallocated | | | 190 | | | — | | | 133 | | | — | | | 127 | | | — | | | 114 | | | — | | | 299 | | | — | |
| | | | | | | | | | | | | | | | | | | | | | |
Total allowance | | $ | 4,037 | | | 100.0 | % | $ | 3,891 | | | 100.0 | % | $ | 3,371 | | | 100.0 | % | $ | 3,203 | | | 100.0 | % | $ | 3,204 | | | 100.0 | % |
| | | | | | | | | | | | | | | | | | | | | | |
During fiscal year ended September 30, 2013, management evaluated and modified some of the qualitative factors associated with the mortgage loan and consumer loan portfolios. In particular, management modified the qualitative factors associated with the one-to four-family residential, multi-family construction and commercial real estate segments based upon increased originations and changing economic factors.
Investment Activities
The Bank has legal authority to invest in various types of liquid assets, including U.S. Treasury obligations, securities of various Government-sponsored enterprises and of state and municipal governments, mortgage-backed securities and term certificates of federally insured institutions. Within certain regulatory limits, the Bank also may invest a portion of its assets in corporate securities and mutual funds. The Bank also is required to maintain an investment in Federal Home Loan Bank of Boston ("FHLB of Boston") stock.
Peoples Federal's investment objectives are to provide and maintain liquidity, to establish an acceptable level of interest rate and credit risk, to provide an alternate source of low-risk investments when demand for loans is weak and to generate a favorable return. The Bank's board of directors has the overall responsibility for the investment portfolio, including approval of the investment policy. The Chief Executive Officer and Chief Financial Officer are responsible for implementation of the investment policy and monitoring the Bank's investment performance. The board of directors of the Bank reviews the status of the investment portfolio on a quarterly basis, or more frequently if warranted.
Securities. At September 30, 2013, our securities portfolio consisted of U.S. Government corporations and agency securities and mortgage-backed securities issued by Fannie Mae, Freddie Mac
18
Table of Contents
or Ginnie Mae and had a fair value of $46.3 million, or 7.9% of assets, and an amortized cost of $46.3 million. At September 30, 2013, none of the underlying collateral consisted of subprime or Alt-A (traditionally defined as loans having less than full documentation) loans. At September 30, 2013, we held no common or preferred stock of Fannie Mae or Freddie Mac. See "Management's Discussion of Financial Condition and Results of Operations—Balance Sheet Analysis—Securities" for a discussion of the recent performance of our securities portfolio.
The following table sets forth the amortized cost and estimated fair value of our securities portfolios (excluding FHLB of Boston stock) at the dates indicated.
| | | | | | | | | | | | | | | | | | | |
| | At September 30, | |
|---|
| | 2013 | | 2012 | | 2011 | |
|---|
| | Amortized
Cost | | Fair Value | | Amortized
Cost | | Fair Value | | Amortized
Cost | | Fair Value | |
|---|
| | (In thousands)
| |
|---|
Securities available-for-sale: | | | | | | | | | | | | | | | | | | | |
Debt securities: | | | | | | | | | | | | | | | | | | | |
Debt securities issued by U.S. Government corporations and agencies | | $ | 8,000 | | $ | 7,987 | | $ | 17,000 | | $ | 17,057 | | $ | 27,999 | | $ | 28,055 | |
Mortgage-backed securities | | | 6,275 | | | 6,238 | | | 4,464 | | | 4,596 | | | 359 | | | 397 | |
| | | | | | | | | | | | | | |
Total securities available-for-sale | | $ | 14,275 | | $ | 14,225 | | $ | 21,464 | | $ | 21,653 | | $ | 28,358 | | $ | 28,452 | |
| | | | | | | | | | | | | | |
Securities held-to-maturity: | | | | | | | | | | | | | | | | | | | |
Debt securities: | | | | | | | | | | | | | | | | | | | |
Debt securities issued by U.S. Government corporations and agencies | | $ | 5,000 | | $ | 4,910 | | $ | — | | $ | — | | $ | — | | $ | — | |
Mortgage-backed securities | | | 27,054 | | | 27,195 | | | 25,921 | | | 26,746 | | | 19,713 | | | 19,925 | |
| | | | | | | | | | | | | | |
Total securities held-to-maturity | | $ | 32,054 | | $ | 32,105 | | $ | 25,921 | | $ | 26,746 | | $ | 19,713 | | $ | 19,925 | |
| | | | | | | | | | | | | | |
At September 30, 2013, we had no investments in a single company or entity that had an aggregate book value in excess of 10% of our consolidated equity.
19
Table of Contents
Portfolio Maturities and Yields. The composition and maturities of the investment securities portfolio at September 30, 2013 are summarized in the following table. Maturities are based on the final contractual payment dates, and do not reflect the impact of prepayments or early redemptions that may occur. No tax-equivalent adjustments have been made, as we did not hold any tax-free investment securities at September 30, 2013.
| | | | | | | | | | | | | | | | | | | | | | | | | | | | | | | | | | |
| | One Year or Less | | More Than One Year
Through Five Years | | More Than Five
Years
Through Ten Years | | More Than Ten
Years | | Total Securities | |
|---|
| | Amortized
Cost | | Weighted
Average
Yield | | Amortized
Cost | | Weighted
Average
Yield | | Amortized
Cost | | Weighted
Average
Yield | | Amortized
Cost | | Weighted
Average
Yield | | Amortized
Cost | | Fair Value | | Weighted
Average
Yield | |
|---|
| | (Dollars in thousands)
| |
|---|
Securities available-for-sale: | | | | | | | | | | | | | | | | | | | | | | | | | | | | | | | | | | |
Debt securities: | | | | | | | | | | | | | | | | | | | | | | | | | | | | | | | | | | |
Debt securities issued by U.S. Government corporations and agencies | | $ | — | | | — | % | $ | 8,000 | | | 0.69 | % | $ | — | | | — | % | $ | — | | | — | % | $ | 8,000 | | $ | 7,987 | | | 0.69 | % |
Mortgage-backed securities | | | — | | | — | | | — | | | — | | | 3,932 | | | 2.31 | | | 2,343 | | | 2.81 | | | 6,275 | | | 6,238 | | | 2.50 | |
| | | | | | | | | | | | | | | | | | | | | | | | | | | | | |
Total debt securities available-for-sale | | $ | — | | | — | % | $ | 8,000 | | | 0.69 | % | $ | 3,932 | | | 2.31 | % | $ | 2,343 | | | 2.81 | % | $ | 14,275 | | $ | 14,225 | | | 1.48 | % |
| | | | | | | | | | | | | | | | | | | | | | | | | | | | | |
Securities held-to-maturity: | | | | | | | | | | | | | | | | | | | | | | | | | | | | | | | | | | |
Debt securities: | | | | | | | | | | | | | | | | | | | | | | | | | | | | | | | | | | |
Debt securities issued by U.S. Government corporations and agencies | | $ | — | | | — | % | $ | 5,000 | | | 0.93 | % | $ | — | | | — | % | $ | — | | | — | % | $ | 5,000 | | $ | 4,910 | | | 0.93 | % |
Mortgage-backed securities | | | — | | | — | | | — | | | — | | | 6,305 | | | 2.38 | | | 20,749 | | | 3.08 | | | 27,054 | | | 27,195 | | | 2.92 | |
| | | | | | | | | | | | | | | | | | | | | | | | | | | | | |
Total debt securities held-to-maturity | | $ | — | | | — | % | $ | 5,000 | | | 0.93 | % | $ | 6,305 | | | 2.38 | % | $ | 20,749 | | | 3.08 | % | $ | 32,054 | | $ | 32,105 | | | 2.61 | % |
| | | | | | | | | | | | | | | | | | | | | | | | | | | | | |
Bank Owned Life Insurance. We invest in bank owned life insurance to provide us with a funding source for our benefit plan obligations. Bank owned life insurance also generally provides us non-interest income that is non-taxable. Federal regulations generally limit our investment in bank owned life insurance to 25% of our Tier 1 capital plus our allowance for loan losses. At September 30, 2013, this limit was $23.0 million, and we had invested $20.0 million in bank owned life insurance at that date.
Sources of Funds
General. Deposits traditionally have been our primary source of funds for our investment and lending activities. We also borrow from the FHLB of Boston to supplement cash flow needs, to lengthen the maturities of liabilities for interest rate risk management purposes and to manage our cost of funds. Our additional sources of funds are scheduled payments and prepayments of principal and interest on loans and investment securities and fee income and proceeds from the sales of loans and securities.
Deposits. We accept deposits primarily from the areas in which our offices are located. We rely on our competitive pricing and products, convenient locations and quality customer service to attract and retain deposits. We offer a variety of deposit accounts with a range of interest rates and terms. Our deposit accounts consist of passbook and statement savings accounts, term certificates, NOW accounts and regular checking accounts. Deposit rates and terms are based primarily on current operating strategies and market interest rates, liquidity requirements and our deposit growth goals. Historically, other than deposits that we have accepted through the Certificate of Deposit Account Registry Service ("CDARS") program, which are classified as brokered deposits for regulatory purposes, we have not accepted brokered deposits. At September 30, 2013, CDARS deposits totaled $4.0 million.
20
Table of Contents
The Bank continues to rely on its money-market accounts as a funding source, marketing the product using competitive pricing in a low interest rate environment and during a time when many customers do not want longer-term, fixed-rate certificate of deposit accounts. Money-market deposit account balances totaled $150.4 million, or 35.4% of deposits at September 30, 2013, versus $152.6 million, or, 36.6% of deposits at September 30, 2012. In addition to our retail funding sources, we have chosen to fund our operations utilizing FHLB advances as a funding source.
At September 30, 2013, we had a total of $120.8 million in term certificates, of which $88.4 million, or 73.1%, had remaining maturities of one year or less. Based on historical experience and our current pricing strategy, we believe we will retain a large portion of these accounts upon maturity.
The following table sets forth the distribution of our average total deposit accounts (including interest-bearing and non-interest bearing deposits), by account type, for the periods indicated.
| | | | | | | | | | | | | | | | | | | | | | | | | | | | |
| | For the Years Ended September 30, | |
|---|
| | 2013 | | 2012 | | 2011 | |
|---|
| | Average
Balance | | Percent | | Weighted
Average
Rate | | Average
Balance | | Percent | | Weighted
Average
Rate | | Average
Balance | | Percent | | Weighted
Average
Rate | |
|---|
| | (Dollars in thousands)
| |
|---|
Deposit type: | �� | | | | | | | | | | | | | | | | | | | | | | | | | | | |
Demand deposits | | $ | 52,293 | | | 12.4 | % | | — | % | $ | 41,816 | | | 10.2 | % | | — | % | $ | 35,837 | | | 9.2 | % | | — | % |
NOW deposits | | | 38,220 | | | 9.0 | | | 0.06 | | | 36,724 | | | 8.9 | | | 0.11 | | | 34,165 | | | 8.8 | | | 0.19 | |
Money market deposits | | | 152,967 | | | 36.1 | | | 0.50 | | | 153,789 | | | 37.4 | | | 0.69 | | | 145,228 | | | 37.4 | | | 0.89 | |
Savings | | | 53,727 | | | 12.7 | | | 0.13 | | | 48,675 | | | 11.8 | | | 0.18 | | | 46,944 | | | 12.1 | | | 0.45 | |
Term certificates | | | 126,255 | | | 29.8 | | | 1.01 | | | 130,326 | | | 31.7 | | | 1.20 | | | 126,111 | | | 32.5 | | | 1.49 | |
| | | | | | | | | | | | | | | | | | | | | | | |
Total deposits | | $ | 423,462 | | | 100.0 | % | | 0.49 | % | $ | 411,330 | | | 100.0 | % | | 0.67 | % | $ | 388,285 | | | 100.0 | % | | 0.89 | % |
| | | | | | | | | | | | | | | | | | | | | | | |
The following table sets forth term certificates classified by interest rate as of the dates indicated.
| | | | | | | | | | |
| | At September 30, | |
|---|
| | 2013 | | 2012 | | 2011 | |
|---|
| | (In thousands)
| |
|---|
Interest Rate: | | | | | | | | | | |
Less than 2.00% | | $ | 114,899 | | $ | 116,475 | | $ | 125,567 | |
2.00% through 2.99% | | | 5,929 | | | 9,759 | | | 11,607 | |
3.00% through 3.99% | | | — | | | 1,510 | | | 3,379 | |
4.00% through 4.99% | | | — | | | 3 | | | 72 | |
| | | | | | | | |
Total | | $ | 120,828 | | $ | 127,747 | | $ | 140,625 | |
| | | | | | | | |
21
Table of Contents
The following table sets forth, by interest rate ranges, information concerning our term certificates.
| | | | | | | | | | | | | | | | | | | | | | |
| | At September 30, 2013 | |
|---|
| | Period to Maturity | |
|---|
| | Less Than
or Equal to
One Year | | More Than
One Year to
Two Years | | More Than
Two Years to
Three Years | | More Than
Three Years
to Four
Years | | Thereafter | | Total | | Percent of
Total | |
|---|
| | (Dollars in thousands)
| |
|---|
Interest Rate: | | | | | | | | | | | | | | | | | | | | | | |
Less than 2.00% | | $ | 84,349 | | $ | 18,565 | | $ | 3,743 | | $ | 6,036 | | $ | 2,206 | | $ | 114,899 | | | 95.1 | % |
2.00% through 2.99% | | | 4,036 | | | 1,893 | | | — | | | — | | | — | | | 5,929 | | | 4.9 | % |
| | | | | | | | | | | | | | | | |
Total | | $ | 88,385 | | $ | 20,458 | | $ | 3,743 | | $ | 6,036 | | $ | 2,206 | | $ | 120,828 | | | 100.0 | % |
| | | | | | | | | | | | | | | | |
As of September 30, 2013, the aggregate amount of outstanding term certificates in amounts greater than or equal to $100,000 was approximately $57.8 million. The following table sets forth the maturity of those certificates as of September 30, 2013.
| | | | |
| | Amount | |
|---|
| | (In thousands)
| |
|---|
Three months or less | | $ | 11,514 | |
Over three months through six months | | | 8,468 | |
Over six months through one year | | | 21,335 | |
Over one year through three years | | | 11,940 | |
Over three years | | | 4,532 | |
| | | | |
| | $ | 57,789 | |
| | | | |
Borrowings. Our borrowings consist of advances from the FHLB of Boston. The Bank utilizes advances from the FHLB of Boston to supplement the Bank's investable funds. The FHLB functions as a central reserve bank providing credit for member financial institutions. As a member, the Bank is required to own capital stock in the FHLB and is authorized to apply for advances on the security of such stock and certain of the Bank's mortgage loans and other assets (principally securities which are obligations of, or guaranteed by, the United States), provided certain standards related to creditworthiness have been met. Advances are made under several different programs, each having its own interest rate and range of maturities. Depending on the program, limitations on the amount of advances are based either on a fixed percentage of an institution's net worth or on the FHLB's assessment of the institution's creditworthiness. At September 30, 2013, we had $44.0 million of FHLB advances and we had access to additional FHLB advances of up to $79.0 million. Advances from the FHLB of Boston are secured by our investment in the capital stock of the FHLB of Boston as well as by a blanket lien on qualified collateral.
During the fiscal year ended September 30, 2013, our borrowings increased $11.0 million, or 33.3%. The increase was the result of the Bank's strategy to include wholesale borrowing from the FHLB of Boston as a funding source in an effort to fund lending growth. FHLB advances continue to remain an important funding source of our ongoing asset/liability management strategy.
22
Table of Contents
The following table sets forth information concerning balances and interest rates on our FHLB advances at the dates and for the periods indicated:
| | | | | | | | | | |
| | At or For The Years Ended
September 30, | |
|---|
| | 2013 | | 2012 | | 2011 | |
|---|
| | (Dollars in thousands)
| |
|---|
Short-term borrowings: | | | | | | | | | | |
Balance at end of period: | | $ | 6,000 | | $ | 8,000 | | | N/A | |
Average balance during the period: | | $ | 6,411 | | $ | 1,235 | | | N/A | |
Maximum outstanding at any month-end period: | | $ | 8,000 | | $ | 8,000 | | | N/A | |
Weighted average interest rate at end of period: | | | 0.36 | % | | 0.34 | % | | N/A | |
Average interest rate during period: | | | 0.37 | % | | 0.32 | % | | N/A | |
Long-term debt: | | | | | | | | | | |
Balance at end of period: | | $ | 38,000 | | $ | 25,000 | | $ | 18,000 | |
Average balance during the period: | | $ | 27,107 | | $ | 21,481 | | $ | 24,016 | |
Maximum outstanding at any month-end period: | | $ | 38,000 | | $ | 27,000 | | $ | 33,000 | |
Weighted average interest rate at end of period: | | | 1.73 | % | | 2.34 | % | | 2.88 | % |
Average interest rate during period: | | | 2.15 | % | | 2.61 | % | | 3.10 | % |
Personnel
As of September 30, 2013, we had 72 full-time employees and 15 part-time employees. Our employees are not represented by any collective bargaining group. Management believes that we have a good working relationship with our employees.
Subsidiary Activity
The Bank is a wholly-owned subsidiary of the Company. Additionally, the Company formed Peoples Funding Corporation, which has the sole purpose of funding a loan to Peoples Federal's Employee Stock Ownership Plan.
People Federal Savings Bank has no subsidiaries.
Regulation and Supervision
General. The Bank is supervised and examined by the OCC and is subject to examination by the FDIC. This regulation and supervision establishes a comprehensive framework of activities in which an institution may engage and is intended primarily for the protection of the FDIC's deposit insurance fund and depositors, and not for the protection of security holders. Under this system of federal regulation, financial institutions are periodically examined to ensure that they satisfy applicable standards with respect to their capital adequacy, assets, management, earnings, liquidity and sensitivity to market interest rates. The Bank also is a member of and owns stock in the FHLB of Boston, which is one of the twelve regional banks in the Federal Home Loan Bank System. The Bank also is regulated to a lesser extent by the Board of Governors of the Federal Reserve System (the "Federal Reserve Board"), governing reserves to be maintained against deposits and other matters. The OCC examines the Bank and prepares reports for the consideration of its board of directors on any operating deficiencies. The Bank's relationship with its depositors and borrowers also is regulated to a great extent by federal law and, to a much lesser extent, state law, especially in matters concerning the ownership of deposit accounts and the form and content of the Bank's loan documents.
As a savings and loan holding company, the Company is required to file certain reports with, is subject to examination by, and otherwise must comply with the rules and regulations of the Federal
23
Table of Contents
Reserve Board. The Company is also subject to the rules and regulations of the Securities and Exchange Commission under the federal securities laws.
Any change in these laws or regulations, whether by the FDIC, the OCC, the Federal Reserve Board or Congress, could have a material adverse impact on the Company, the Bank and their operations.
Certain of the regulatory requirements that are applicable to the Bank and the Company are described below. This description of statutes and regulations is not intended to be a complete description of such statutes and regulations and their effects on the Bank and the Company.
Dodd-Frank Act. The Dodd-Frank Act has changed the bank regulatory structure and affected the lending, investment, trading and operating activities of financial institutions and their holding companies. The Dodd-Frank Act eliminated our former primary federal regulator, the Office of Thrift Supervision, and required the Bank to be regulated by the OCC (the primary federal regulator for national banks). The Dodd-Frank Act also authorizes the Federal Reserve Board to supervise and regulate all savings and loan holding companies like the Company, in addition to bank holding companies, which it regulates. As a result, the Federal Reserve Board's regulations applicable to bank holding companies, including holding company capital requirements, apply to savings and loan holding companies like the Company, unless an exemption exists. These capital requirements are substantially similar to the capital requirements currently applicable to the Bank, as described in "—Federal Banking Regulation—Capital Requirements." The Dodd-Frank Act also requires the Federal Reserve Board to set minimum capital levels for bank holding companies that are as stringent as those required for the insured depository subsidiaries, and the components of Tier 1 capital are restricted to capital instruments that are currently considered to be Tier 1 capital for insured depository institutions. Bank holding companies with assets of less than $500 million are exempt from these capital requirements. Under the Dodd-Frank Act, the proceeds of trust preferred securities are excluded from Tier 1 capital unless such securities were issued prior to May 19, 2010 by bank or savings and loan holding companies with less than $15 billion of assets. The legislation also establishes a floor for capital of insured depository institutions that cannot be lower than the standards in effect today, and directs the federal banking regulators to implement new leverage and capital requirements within 18 months that take into account off-balance sheet activities and other risks, including risks relating to securitized products and derivatives.
The Dodd-Frank Act also created the Consumer Financial Protection Bureau ("CFPB") with broad powers to supervise and enforce consumer protection laws. The CFPB has broad rule-making authority for a wide range of consumer protection laws that apply to all banks and savings institutions such as Peoples Federal, including the authority to prohibit "unfair, deceptive or abusive" acts and practices. The CFPB has examination and enforcement authority over all banks and savings institutions with more than $10 billion in assets. Banks and savings institutions with $10 billion or less in assets will be examined by their applicable bank regulators. The Dodd-Frank legislation also weakens the federal preemption available for national banks and federal savings associations, and gives state attorney generals the ability to enforce applicable federal consumer protection laws.
The legislation also broadens the base for FDIC insurance assessments. Assessments are now based on the average consolidated total assets less tangible equity capital of a financial institution. The Dodd-Frank Act also permanently increased the maximum amount of deposit insurance for banks, savings institutions and credit unions to $250,000 per depositor, retroactive to January 1, 2009, and non-interest bearing transaction accounts have unlimited deposit insurance through December 31, 2012. Lastly, the Dodd-Frank Act will increase stockholder influence over boards of directors by requiring companies to give stockholders a non-binding vote on executive compensation and so-called "golden parachute" payments, and authorizing the Securities and Exchange Commission to promulgate rules that would allow stockholders to nominate and solicit votes for their own candidates using a company's
24
Table of Contents
proxy materials. The legislation also directs the Federal Reserve Board to promulgate rules prohibiting excessive compensation paid to bank holding company executives, regardless of whether the company is publicly traded or not.
Federal Banking Regulation
Business Activities. A federal savings bank derives its lending and investment powers from the Home Owners' Loan Act, as amended, and the regulations of the OCC. Under these laws and regulations, the Bank may invest in mortgage loans secured by residential and commercial real estate, commercial business and consumer loans, certain types of debt securities and certain other assets, subject to applicable limits. The Bank also may establish subsidiaries that may engage in activities not otherwise permissible for the Bank, including real estate investment and securities and insurance brokerage.
Capital Requirements. OCC regulations require savings banks, such as the Bank, to meet three minimum capital standards: a 1.5% tangible capital ratio, a 4% leverage ratio (3% for savings banks receiving the highest rating on the CAMELS rating system) and an 8% risk-based capital ratio.
The risk-based capital standard for savings banks requires the maintenance of Tier 1 (core) and total capital (which is defined as core capital and supplementary capital) to risk-weighted assets of at least 4% and 8%, respectively. In determining the amount of risk-weighted assets, all assets, including certain off-balance sheet assets, are multiplied by a risk-weight factor of 0% to 100%, assigned by the OCC, based on the risks believed inherent in the type of asset. Core capital is defined as common stockholders' equity (including retained earnings), certain noncumulative perpetual preferred stock and related surplus and minority interests in equity accounts of consolidated subsidiaries, less intangibles other than certain mortgage servicing rights and credit card relationships. The components of supplementary capital include cumulative preferred stock, long-term perpetual preferred stock, mandatory convertible securities, subordinated debt and intermediate preferred stock, the allowance for loan and lease losses limited to a maximum of 1.25% of risk-weighted assets and up to 45% of net unrealized gains on available-for-sale equity securities with readily determinable fair market values. Overall, the amount of supplementary capital included as part of total capital cannot exceed 100% of core capital. Additionally, a savings bank that retains credit risk in connection with an asset sale may be required to maintain additional regulatory capital because of the purchaser's recourse against the savings bank. In assessing an institution's capital adequacy, the OCC takes into consideration not only these numeric factors but also qualitative factors as well, and has the authority to establish higher capital requirements for individual associations where necessary.
In July 2013, the OCC and the other federal bank regulatory agencies issued a final rule that will revise their leverage and risk-based capital requirements and the method for calculating risk-weighted assets to make them consistent with agreements that were reached by the Basel Committee on Banking Supervision and certain provisions of the Dodd-Frank Act. The final rule applies to all depository institutions, top-tier bank holding companies with total consolidated assets of $500 million or more and top-tier savings and loan holding companies. Among other things, the rule establishes a new common equity Tier 1 minimum capital requirement (4.5% of risk-weighted assets), increases the minimum Tier 1 capital to risk-based assets requirement (from 4% to 6% of risk-weighted assets) and assigns a higher risk weight (150%) to exposures that are more than 90 days past due or are on nonaccrual status and to certain commercial real estate facilities that finance the acquisition, development or construction of real property. The final rule also requires unrealized gains and losses on certain "available-for-sale" securities holdings to be included for purposes of calculating regulatory capital requirements unless a one-time opt-in or opt-out is exercised. The rule limits a banking organization's capital distributions and certain discretionary bonus payments if the banking organization does not hold a "capital conservation buffer" consisting of 2.5% of common equity Tier 1 capital to risk-weighted assets in addition to the amount necessary to meet its minimum risk-based capital requirements. The
25
Table of Contents
final rule becomes effective for the Bank on January 1, 2015. The capital conservation buffer requirement will be phased in beginning January 1, 2016 and ending January 1, 2019, when the full capital conservation buffer requirement will be effective.
At September 30, 2013, the Bank's capital exceeded all applicable requirements.
Loans-to-One Borrower. Generally, a federal savings bank may not make a loan or extend credit to a single or related group of borrowers in excess of 15% of unimpaired capital and surplus. An additional amount may be loaned, equal to 10% of unimpaired capital and surplus, if the loan is secured by readily marketable collateral, which generally does not include real estate. As of September 30, 2013, the Bank's largest lending relationship with a single or related group of borrowers totaled $10.6 million, which represented 12.0% of the Bank's unimpaired capital and surplus. Therefore, the Bank was in compliance with the loans-to-one borrower limitations.
Qualified Thrift Lender Test. As a federal savings bank, the Bank must satisfy the qualified thrift lender, or "QTL," test. Under the QTL test, the Bank must maintain at least 65% of its "portfolio assets" in "qualified thrift investments" (primarily residential mortgages and related investments, including mortgage-backed securities) in at least nine months of the most recent 12-month period. "Portfolio assets" generally means total assets of a savings bank, less the sum of specified liquid assets up to 20% of total assets, goodwill and other intangible assets, and the value of property used in the conduct of the savings bank's business.
The Bank also may satisfy the QTL test by qualifying as a "domestic building and loan association" as defined in the Internal Revenue Code.
A savings bank that fails the QTL test is subject to certain operating restrictions. In addition, the Dodd-Frank Act made noncompliance by a savings bank with the QTL test potentially subject to agency enforcement action for violation of laws. At September 30, 2013, the Bank maintained approximately 85.7% of its portfolio assets in qualified thrift investments and, therefore, satisfied the QTL test.
Capital Distributions. OCC regulations govern capital distributions by a federal savings bank, which include cash dividends, stock repurchases and other transactions charged to the savings bank's capital account. A savings bank must file an application for approval of a capital distribution if:
- •
- the total capital distributions for the applicable calendar year exceed the sum of the savings bank's net income for that year to date plus the savings bank's retained net income for the preceding two years;
- •
- the savings bank would not be at least adequately capitalized following the distribution;
- •
- the distribution would violate any applicable statute, regulation, agreement or OCC -imposed condition; or
- •
- the savings bank is not eligible for expedited treatment of its filings.
Even if an application is not otherwise required, every savings bank that is a subsidiary of a holding company must still file a notice with the OCC at least 30 days before the board of directors declares a dividend or approves a capital distribution.
The OCC may disapprove a notice or application if:
- •
- the savings bank would be undercapitalized following the distribution;
- •
- the proposed capital distribution raises safety and soundness concerns; or
- •
- the capital distribution would violate a prohibition contained in any statute, regulation or agreement.
26
Table of Contents
In addition, the Federal Deposit Insurance Act provides that an insured depository institution shall not make any capital distribution, if after making such distribution the institution would be undercapitalized. Also, a federal savings bank may not make a capital distribution that would reduce its regulatory capital below the amount required for the liquidation account that is established in the savings bank in connection with its conversion to stock form.
Liquidity. A federal savings bank is required to maintain a sufficient amount of liquid assets to ensure its safe and sound operation. The Bank's primary sources of liquidity to meet short-term and long-term fund needs are liquid assets, deposit generation and access to funding from the FHLB of Boston.
Community Reinvestment Act and Fair Lending Laws. All federal savings banks have a responsibility under the Community Reinvestment Act and related regulations of the OCC to help meet the credit needs of their communities, including low- and moderate-income borrowers. In connection with its examination of a federal savings bank, the OCC is required to assess the savings bank's record of compliance with the Community Reinvestment Act. In addition, the Equal Credit Opportunity Act and the Fair Housing Act prohibit lenders from discriminating in their lending practices on the basis of characteristics specified in those statutes. A savings bank's failure to comply with the provisions of the Community Reinvestment Act could, at a minimum, result in denial of certain corporate applications such as branches or mergers, or in restrictions on its activities. The failure to comply with the Equal Credit Opportunity Act and the Fair Housing Act could result in enforcement actions by the OCC, as well as other federal regulatory agencies and the Department of Justice. The Bank received a "satisfactory" Community Reinvestment Act rating in its most recent federal examination. The Community Reinvestment Act requires all Federal Deposit Insurance-insured institutions to publicly disclose their rating.
Transactions with Related Parties. A federal savings bank's authority to engage in transactions with its affiliates is limited by OCC regulations and by Sections 23A and 23B of the Federal Reserve Act and its implementing Regulation W promulgated by the Federal Reserve Board. An affiliate is generally a company that controls, is controlled by, or is under common control with an insured depository institution such as the Bank. The Company is an affiliate of the Bank. In general, transactions between an insured depository institution and its affiliates are subject to certain quantitative and collateral requirements. In addition, OCC regulations prohibit a federal savings bank from lending to any of its affiliates that are engaged in activities that are not permissible for bank holding companies and from purchasing the securities of any affiliate, other than a subsidiary. Finally, transactions with affiliates must be consistent with safe and sound banking practices, not involve low-quality assets and be on terms that are as favorable to the institution as comparable transactions with non-affiliates. The OCC requires federal savings banks to maintain detailed records of all transactions with affiliates.
The Bank's authority to extend credit to its directors, executive officers and 10% stockholders, as well as to entities controlled by such persons, is currently governed by the requirements of Sections 22(g) and 22(h) of the Federal Reserve Act and Regulation O of the Federal Reserve Board. Among other things, these provisions require that extensions of credit to insiders:
- (i)
- be made on terms that are substantially the same as, and follow credit underwriting procedures that are not less stringent than, those prevailing for comparable transactions with unaffiliated persons and that do not involve more than the normal risk of repayment or present other unfavorable features; and
- (ii)
- not exceed certain limitations on the amount of credit extended to such persons, individually and in the aggregate, which limits are based, in part, on the amount of the Bank's capital.
27
Table of Contents
In addition, extensions of credit in excess of certain limits must be approved by The Bank's board of directors.
Enforcement. The OCC has primary enforcement responsibility over federal savings banks and has the authority to bring enforcement action against all "institution-affiliated parties," including directors, officers, stockholders, and attorneys, appraisers and accountants who knowingly or recklessly participate in wrongful action likely to have an adverse effect on a federal savings bank. Formal enforcement action by the OCC may range from the issuance of a capital directive or cease and desist order to removal of officers and/or directors of the institution, and the appointment of a receiver or conservator. Civil penalties cover a wide range of violations and actions, and range from up to $25,000 per day, to circumstances involving a finding of reckless disregard, in which case penalties may be as high as $1 million per day.
Standards for Safety and Soundness. Federal law requires each federal banking agency to prescribe certain standards for all insured depository institutions. These standards relate to, among other things, internal controls, information systems and audit systems, loan documentation, credit underwriting, interest rate risk exposure, asset growth, compensation, and other operational and managerial standards, as the agency deems appropriate. Interagency guidelines set forth the safety and soundness standards that the federal banking agencies use to identify and address problems at insured depository institutions before capital becomes impaired. If the appropriate federal banking agency determines that an institution fails to meet any standard prescribed by the guidelines, the agency may require the institution to submit to the agency an acceptable plan to achieve compliance with the standard. If an institution fails to meet these standards, the appropriate federal banking agency may require the institution to implement an acceptable compliance plan. Failure to implement such a plan can result in further enforcement action, including the issuance of a cease and desist order or the imposition of civil money penalties.
Insurance of Deposit Accounts. The Deposit Insurance Fund ("DIF") of the FDIC insures deposits at FDIC-insured depository institutions, such as the Bank. Deposit accounts in the Bank are insured by the FDIC, generally up to a maximum of $250,000 per separately insured depositor and up to a maximum of $250,000 for self-directed retirement accounts.
The FDIC charges insured depository institutions premiums to maintain the DIF. Under the FDIC's risk-based assessment system, insured institutions are assigned to one of four risk categories based on supervisory evaluations, regulatory capital levels, and certain other risk factors. Rates are based on each institution's risk category and certain specified risk adjustments. Stronger institutions pay lower rates while riskier institutions pay higher rates. Assessment rates range from 2.5 to 45 basis points of an institution's total assets less tangible capital.
The Dodd-Frank Act increased the minimum target ratio for the DIF from 1.15% of estimated insured deposits to 1.35% of estimated insured deposits. The FDIC must seek to achieve the 1.35% ratio by September 30, 2020. Insured institutions with assets of $10 billion or more are supposed to fund the increase. The Dodd-Frank Act eliminated the 1.5% maximum fund ratio, instead leaving it to the discretion of the FDIC, and the FDIC has exercised that discretion by establishing a long-term fund ratio of 2%.
In addition to the FDIC assessments, the Financing Corporation ("FICO") is authorized to impose and collect, with the approval of the FDIC, assessments for anticipated payments, issuance costs, and custodial fees on bonds issued by the FICO in the 1980s to recapitalize the former Federal Savings and Loan Insurance Corporation. The bonds issued by the FICO are due to mature in 2017 through 2019. For the quarter ended September 30, 2013, the annualized FICO assessment was equal to 64 basis points of an institution's total assets less tangible capital.
28
Table of Contents
Insurance of deposits may be terminated by the FDIC upon a finding that an institution has engaged in unsafe or unsound practices, is in an unsafe or unsound condition to continue operations, or has violated any applicable law, regulation, rule, order, or condition imposed by the FDIC. The Bank does not know of any practice, condition, or violation that could lead to termination of its deposit insurance.
Prohibitions Against Tying Arrangements. Federal savings banks are prohibited, subject to some exceptions, from extending credit to or offering any other service, or fixing or varying the consideration for such extension of credit or service, on the condition that the customer obtain some additional service from the institution or its affiliates or not obtain services of a competitor of the institution.
Federal Home Loan Bank System. The Bank is a member of the Federal Home Loan Bank System, which consists of 12 regional Federal Home Loan Banks. The Federal Home Loan Bank System provides a central credit facility primarily for member institutions as well as other entities involved in home mortgage lending. As a member of the FHLB of Boston, the Bank is required to acquire and hold shares of capital stock in the FHLB of Boston. As of September 30, 2013, the Bank was in compliance with this requirement.
Other Regulations
Interest and other charges collected or contracted for by the Bank are subject to state usury laws and federal laws concerning interest rates. The Bank's operations are also subject to federal laws applicable to credit transactions, such as the:
- •
- Truth-In-Lending Act, governing disclosures of credit terms to consumer borrowers;
- •
- Home Mortgage Disclosure Act, requiring financial institutions to provide information to enable the public and public officials to determine whether a financial institution is fulfilling its obligation to help meet the housing needs of the community it serves;
- •
- Equal Credit Opportunity Act, prohibiting discrimination on the basis of race, creed or other prohibited factors in extending credit;
- •
- Fair Credit Reporting Act, governing the use and provision of information to credit reporting agencies;
- •
- Fair Debt Collection Act, governing the manner in which consumer debts may be collected by collection agencies;
- •
- Truth in Savings Act; and
- •
- Rules and regulations of the various federal agencies charged with the responsibility of implementing such federal laws.
The operations of the Bank also are subject to the:
- •
- Right to Financial Privacy Act, which imposes a duty to maintain confidentiality of consumer financial records and prescribes procedures for complying with administrative subpoenas of financial records;
- •
- Electronic Funds Transfer Act and Regulation E promulgated thereunder, which govern automatic deposits to and withdrawals from deposit accounts and customers' rights and liabilities arising from the use of automated teller machines and other electronic banking services;
- •
- Check Clearing for the 21st Century Act (also known as "Check 21"), which gives "substitute checks," such as digital check images and copies made from that image, the same legal standing as the original paper check;
29
Table of Contents
- •
- The USA PATRIOT Act, which requires savings banks to, among other things, establish broadened anti-money laundering compliance programs, and due diligence policies and controls to ensure the detection and reporting of money laundering. Such required compliance programs are intended to supplement and extend existing compliance requirements that also apply to financial institutions under the Bank Secrecy Act and the Office of Foreign Assets Control regulations; and
- •
- The Gramm-Leach-Bliley Act, which places limitations on the sharing of consumer financial information by financial institutions with unaffiliated third parties. Specifically, the Gramm-Leach-Bliley Act requires all financial institutions offering financial products or services to retail customers to provide such customers with the financial institution's privacy policy and provide such customers the opportunity to "opt out" of the sharing of certain personal financial information with unaffiliated third parties.
Holding Company Regulation
General. The Company is a non-diversified savings and loan holding company within the meaning of the Home Owners' Loan Act. As such, the Company is registered with the Federal Reserve Board ("FRB") and is subject to FRB regulations, examinations, supervision and reporting requirements. In addition, the FRB has enforcement authority over the Company and its non-depository subsidiaries. Among other things, this authority permits the FRB to restrict or prohibit activities that are determined to be a serious risk to the subsidiary savings institution.
Permissible Activities. Under present law, the business activities of the Company is generally limited to those activities permissible for financial holding companies under Section 4(k) of the Bank Holding Company Act of 1956, as amended, or for multiple savings and loan holding companies. A financial holding company may engage in activities that are financial in nature, including underwriting equity securities and insurance as well as activities that are incidental to financial activities or complementary to a financial activity. A multiple savings and loan holding company is generally limited to activities permissible for bank holding companies under Section 4(c)(8) of the Bank Holding Company Act, subject to the prior approval of the FRB, and certain additional activities authorized by FRB regulations.
Federal law prohibits a savings and loan holding company, including the Company, directly or indirectly, or through one or more subsidiaries, from acquiring more than 5% of another savings institution or holding company thereof, without prior written approval of the FRB. It also prohibits the acquisition or retention of, with certain exceptions, more than 5% of a non-subsidiary company engaged in activities that are not closely related to banking or financial in nature, or acquiring or retaining control of an institution that is not federally insured. In evaluating applications by holding companies to acquire savings institutions, the FRB must consider the financial and managerial resources, future prospects of the company and institution involved, the effect of the acquisition on the risk to the DIF, the convenience and needs of the community, and competitive factors.
The FRB is prohibited from approving any acquisition that would result in a multiple savings and loan holding company controlling savings institutions in more than one state, subject to two exceptions:
- (i)
- the approval of interstate supervisory acquisitions by savings and loan holding companies; and
- (ii)
- the acquisition of a savings institution in another state if the laws of the state of the target savings institution specifically permit such acquisition.
The states vary in the extent to which they permit interstate savings and loan holding company acquisitions.
30
Table of Contents
Capital. Savings and loan holding companies are not currently subject to specific regulatory capital requirements. The Dodd-Frank Act, however, requires the FRB to promulgate consolidated capital requirements for depository institution holding companies that are no less stringent, both quantitatively and in terms of components of capital, than those applicable to institutions themselves. Instruments such as cumulative preferred stock and trust preferred securities will no longer be includable as Tier 1 capital, which is currently permitted for bank holding companies. The final capital rule discussed above implements the consolidated capital requirements for savings and loan holding companies effective January 1, 2015, with the capital conservation buffer phased in between 2016 and 2019.
Source of Strength. The Dodd-Frank Act extended the "source of strength" doctrine to savings and loan holding companies. The regulatory agencies must issue regulations requiring that all bank and savings and loan holding companies serve as a source of strength to their subsidiary depository institutions by providing capital, liquidity and other support in times of financial stress.
Dividends and Repurchases. The FRB has issued a supervisory letter regarding the payment of dividends and the repurchase of shares of common stock by bank holding companies that it has made applicable to savings and loan holding companies as well. In general, the supervisory letter provides that dividends should be paid only out of current earnings and only if the prospective rate of earnings retention by the holding company appears consistent with the organization's capital needs, asset quality, and overall financial condition. Regulatory guidance provides for prior regulatory review of capital distributions in certain circumstances such as where the Company's net income for the past four quarters, net of dividends previously paid over that period, is insufficient to fully fund the dividend or the Company's overall rate of earnings retention is inconsistent with the Company's capital needs and overall financial condition. The ability of a holding company to pay dividends may be restricted if a subsidiary bank becomes undercapitalized. The supervisory letter also provides for regulatory review prior to a holding Company redeeming or repurchasing its stock in certain circumstances. These regulatory policies could affect the ability of the Company to pay dividends, repurchase shares of common stock, or otherwise engage in capital distributions.
Acquisition. Under the Federal Change in Control Act, a notice must be submitted to the FRB if any person (including a company), or group acting in concert, seeks to acquire direct or indirect control of a savings and loan holding company. Under certain circumstances, such as where the company involved has securities registered with the SEC under the Securities Exchange Act of 1934, a change of control may occur, and prior notice is required, upon the acquisition of 10% or more of the company's outstanding voting stock, unless the FRB has found that the acquisition will not result in control of the company. That rebuttable presumption applies to the Company. A change in control is defined under federal law to occur upon the acquisition of 25% or more of the company's outstanding voting stock. Under the Change in Control Act, the FRB generally has 60 days from the filing of a complete notice to act, taking into consideration certain factors, including the financial and managerial resources of the acquirer and the competitive effects of the acquisition.
Federal Securities Laws
The Company's common stock is registered with the Securities and Exchange Commission under the Securities Exchange Act of 1934. The Company is subject to the information, proxy solicitation, insider trading restrictions and other requirements under the Securities Exchange Act of 1934.
The Company common stock held by persons who are affiliates (generally officers, directors and principal shareholders) of the Company may not be resold without registration or unless sold in accordance with certain resale restrictions. If the Company meets specified current public information requirements, each affiliate of the Company is able to sell in the public market, without registration, a limited number of shares in any three-month period.
31
Table of Contents
Sarbanes-Oxley Act of 2002
The Sarbanes-Oxley Act of 2002 addresses, among other issues, corporate governance, auditing and accounting, executive compensation, and enhanced and timely disclosure of corporate information. As directed by the Sarbanes-Oxley Act, our Chief Executive Officer and Chief Financial Officer are required to certify that our quarterly and annual reports do not contain any untrue statement of a material fact. The rules adopted by the Securities and Exchange Commission under the Sarbanes-Oxley Act have several requirements, including having these officers certify that: they are responsible for establishing, maintaining and regularly evaluating the effectiveness of our internal control over financial reporting; they have made certain disclosures to our auditors and the audit committee of the board of directors about our internal control over financial reporting; and they have included information in our quarterly and annual reports about their evaluation and whether there have been changes in our internal control over financial reporting or in other factors that could materially affect internal control over financial reporting. We will be subject to further reporting and audit requirements during the fiscal year ending September 30, 2013 under the requirements of the Sarbanes-Oxley Act. We have prepared policies, procedures and systems designed to ensure compliance with these regulations.
Item 1A. RISK FACTORS
Because we intend to continue to emphasize our commercial real estate and multi-family loan originations, our credit risk will increase, and continued downturns in the local real estate market or economy could adversely affect our earnings.
We intend to continue originating commercial real estate and multi-family loans. At September 30, 2013, $68.0 million, or 14.5%, of our total loan portfolio consisted of multi-family loans and an additional $60.5 million, or 12.9% of our total loan portfolio, consisted of commercial real estate loans. Commercial real estate and multi-family loans generally have more risk than the one- to four-family residential real estate loans that we originate. Because the repayment of commercial real estate and multi-family loans depends on the successful management and operation of the borrower's properties or related businesses, repayment of such loans can be affected by adverse conditions in the local real estate market or economy. Commercial real estate and multi-family loans may also involve relatively large loan balances to individual borrowers or groups of related borrowers. A downturn in the real estate market or the local economy could adversely affect the value of properties securing the loan or the revenues from the borrower's business, thereby increasing the risk of non-performing loans. As our commercial real estate and multi-family loan portfolios increase, the corresponding risks and potential for losses from these loans may also increase.
A portion of our one-to four-family residential mortgage loans is comprised of non-owner occupied properties, which increases the credit risk on this portion of our loan portfolio.
Much of the housing stock in our primary lending market area is comprised of two-, three- and four-unit properties. At September 30, 2013, of the $308.9 million of one-to four-family residential mortgage loans in our portfolio, $130.9 million, or 42.4% of this amount, were comprised of non-owner occupied properties. We believe that there is a greater credit risk inherent in two-, three- and four-unit properties and especially in investor-owner and non-owner occupied properties, than in owner-occupied one-unit properties since, similar to commercial real estate and multi-family loans, the repayment of these loans may depend, in part, on the successful management of the property and/or the borrower's ability to lease the units of the property. A downturn in the real estate market or the local economy could adversely affect the value of properties securing these loans or the revenues derived from these properties, which could affect the borrower's ability to repay the loan.
32
Table of Contents
We make and hold in our portfolio construction loans, which are considered to have greater credit risk than other types of residential loans made by financial institutions.
We originate construction loans for one- to four-family residential properties, multi-family properties and commercial properties, including commercial "mixed-use" buildings and homes built by developers on speculative, undeveloped property. At September 30, 2013, $17.1 million, or 3.7% of our total loan portfolio, consisted of construction loans, all of which were secured by one- to four-family residential real estate. None of our construction loans were secured by commercial real estate at September 30, 2013. Construction loans are considered more risky than other types of residential mortgage loans. The primary credit risks associated with construction lending are underwriting, project risks and market risks. Project risks include cost overruns, borrower credit risk, project completion risk, general contractor credit risk, and environmental and other hazard risks. Market risks are risks associated with the sale of the completed residential units. They include affordability risk, which means the risk of affordability of financing by borrowers, product design risk, and risks posed by competing projects. While we believe we have established adequate reserves on our financial statements to cover the credit risk of our construction loan portfolio, there can be no assurance that losses will not exceed our reserves, which could adversely impact our future earnings.
If our allowance for loan losses is not sufficient to cover actual loan losses, our earnings will decrease.
We make various assumptions and judgments about the collectability of our loan portfolio, including the creditworthiness of our borrowers and the value of the real estate and other assets serving as collateral for the repayment of many of our loans. In determining the amount of the allowance for loan losses, we review our loans and our loss and delinquency experience, and we evaluate economic conditions. If our assumptions are incorrect, our allowance for loan losses may not be sufficient to cover probable incurred losses in our loan portfolio, resulting in additions to our allowance. Material additions to our allowance could materially decrease our net income.
In addition, bank regulators periodically review our allowance for loan losses and may require us to increase our allowance for loan losses or recognize further loan charge-offs. Any increase in our allowance for loan losses or loan charge-offs as required by these regulatory authorities might have a material adverse effect on our financial condition and results of operations.
Future changes in interest rates could reduce our profits.
Our ability to make a profit largely depends on our net interest income, which could be negatively affected by changes in interest rates. Net interest income is the difference between:
- •
- the interest income we earn on our interest-earning assets, such as loans and securities; and
- •
- the interest expense we pay on our interest-bearing liabilities, such as deposits and borrowings.
A significant portion of our loans are fixed-rate one- to four-family residential mortgage loans, and like many savings institutions, our focus on deposit accounts as a source of funds, which have no stated maturity date or shorter contractual maturities, results in our liabilities having a shorter duration than our assets. This imbalance can create significant earnings volatility, because market interest rates change over time. In a period of rising interest rates, the interest income earned on our assets, such as loans and investments, may not increase as rapidly as the interest paid on our liabilities, such as deposits. In a period of declining interest rates, the interest income earned on our assets may decrease more rapidly than the interest paid on our liabilities, as borrowers prepay mortgage loans, and mortgage-backed securities and callable investment securities are called or prepaid, thereby requiring us to reinvest these funds at lower interest rates. See "Management's Discussion and Analysis of Financial Condition and Results of Operations—Management of Market Risk."
33
Table of Contents
Changes in interest rates also create reinvestment risk, which is the risk that we may not be able to reinvest prepayments at rates that are comparable to the rates we earned on the prepaid loans or securities in a declining interest rate environment.
Additionally, increases in interest rates may decrease loan demand and/or make it more difficult for borrowers to repay adjustable-rate loans. At September 30, 2013, $164.3 million, or 53.2% of our $308.9 million one- to four-family residential mortgage loans at such date, had adjustable rates of interest. If interest rates increase, the rates on these loans will, in turn, increase, thereby increasing the risk that borrowers will not be able to repay these loans.
Changes in interest rates also affect the current fair value of our interest-earning securities portfolio. Generally, the value of debt securities moves inversely with changes in interest rates.
At September 30, 2013, our internal "rate shock" analysis indicated that our economic value of equity (the discounted present value of expected cash flows from interest-earning assets, interest-bearing liabilities and off-balance sheet contracts) would decrease by $14.7 million, or 13.2%, if there was an instantaneous 200 basis point increase in market interest rates. See "Management's Discussion and Analysis of Financial Condition and Results of Operations—Management of Market Risk."
Concentration of loans in our primary market area, which has recently experienced an economic downturn, may increase risk.
Our success depends primarily on general economic conditions in the Boston metropolitan area, as nearly all of our loans are to customers in this market. Accordingly, the local economic conditions in this market have a significant impact on the ability of borrowers to repay loans as well as our ability to originate new loans. As such, a continuation of the weakness in real estate values in this market would also lower the value of the collateral securing loans on properties in our market. In addition, a continued weakening in general economic conditions caused by inflation, recession, unemployment or other factors beyond our control could negatively affect our financial results.
Risks Related to Recent Economic Conditions and Governmental Response Efforts.
Our business has been and may continue to be adversely affected by current conditions in the financial markets and economic conditions generally. The United States and Massachusetts economies are experiencing reduced business activity and consumer spending as a result of, among other factors, disruptions in the capital and credit markets. Declines in the housing market, with falling home prices and increasing foreclosures and unemployment, have resulted in significant write-downs of asset values by financial institutions, including government-sponsored entities and major commercial and investment banks. A sustained weakness or weakening in business and economic conditions generally or specifically in the principal markets in which we do business could have one or more of the following adverse effects on our business:
- •
- a decrease in the demand for loans or other products and services offered by us;
- •
- a decrease in the value of our loans or other assets secured by residential or commercial real estate;
- •
- a decrease in deposit balances due to overall reductions in the accounts of customers;
- •
- an impairment of our investment securities; and/or
- •
- an increase in the number of borrowers who become delinquent, file for protection under bankruptcy laws or default on their loans or other obligations to us. An increase in the number of delinquencies, bankruptcies or defaults could result in a higher level of non-performing assets, net charge-offs and provision for credit losses, which would reduce our earnings.
34
Table of Contents
Government responses to economic conditions may adversely affect our operations, financial condition and earnings.
The Dodd-Frank Wall Street Reform and Consumer Protection Act has changed the bank regulatory framework, created an independent consumer protection bureau that has assumed the consumer protection responsibilities of the various federal banking agencies, and established more stringent capital standards for banks and bank holding companies. Bank regulatory agencies also have been responding aggressively to concerns and adverse trends identified in examinations. Ongoing uncertainty and adverse developments in the financial services industry and the domestic and international credit markets, and the effect of the Dodd-Frank Act and regulatory actions, may adversely affect the Company's operations by restricting its business activities, including the ability to originate or sell loans, modify loan terms, or foreclose on property securing loans. These risks could affect the performance and value of the Bank's loan and investment securities portfolios, which also would negatively affect financial performance. In addition, the Dodd-Frank Act and implementing regulations are likely to have a significant effect on the financial services industry, which are likely to increase operating costs and reduce profitability. Regulatory or legislative changes could make regulatory compliance more difficult or expensive, and could cause changes to or limits on some products and services, or the way business is operated.
If the Board of Governors of the Federal Reserve System increases the federal funds rate, overall interest rates will likely rise, which may negatively impact the housing markets and the U.S. economic recovery. In addition, deflationary pressures, while possibly lowering the Bank's operating costs, could have a significant negative effect on the Bank's borrowers, especially business borrowers, and the values of underlying collateral securing loans, which could negatively affect the Bank's financial performance.
Loss of key personnel could adversely impact results.
Our success has been and will continue to be greatly influenced by our ability to retain the services of our existing senior management. We have benefited from consistency within our senior management team, with our top four executives averaging over 30 years of service with the Bank. The Company has entered into employment contracts with each of these top management officials. Nevertheless, the unexpected loss of the services of any of the key management personnel, or the inability to recruit and retain qualified personnel in the future, could have an adverse impact on our business and financial results.
Future legislative or regulatory actions responding to perceived financial and market problems could impair our ability to collect our loans and foreclose on collateral.
There have been proposals made by members of Congress and others that would reduce the amount distressed borrowers are otherwise contractually obligated to pay under their mortgage loans and limit an institution's ability to foreclose on mortgage collateral. Were proposals such as these, or other proposals limiting our rights as a creditor, to be implemented, we could experience increased credit losses or increased expense in pursuing our remedies as a creditor. In addition, there have been legislative proposals to create a federal consumer protection agency that may, among other powers, have the ability to limit our rights as a creditor.
If our investment in the stock of the FHLB of Boston is classified as other-than-temporarily impaired or as permanently impaired, our earnings and stockholders' equity could decrease.
We own stock of the FHLB of Boston. We hold this stock to qualify for membership in the Federal Home Loan Bank System and to be eligible to borrow funds under the FHLB of Boston's advance program. The aggregate cost of our FHLB of Boston stock as of September 30, 2013 was
35
Table of Contents
$3.8 million. FHLB stock is not a marketable security and can only be redeemed by the FHLB. However, in recent years, the FHLB of Boston has not repurchased excess stock outstanding.
In addition, FHLBs may be subject to accounting rules and asset quality risks that could materially lower their regulatory capital. In an extreme situation, it is possible that the capitalization of FHLB, including the FHLB of Boston, could be substantially diminished or reduced to zero. Consequently, we believe that there is a risk that our investment in FHLB of Boston stock could be deemed impaired at some time in the future, and if this occurs, it would cause our earnings and stockholders' equity to decrease by the after-tax amount of the impairment charge.
Our earnings have been negatively affected by the low level of dividends paid by the FHLB of Boston on its stock during 2013.
We received $16,000 in total dividends from the FHLB of Boston during fiscal 2013. We received $19,000 in total dividends during fiscal 2012. Accordingly, the reduction of the FHLB of Boston dividend payments has reduced our earnings. In addition, the FHLB of Boston is an important source of liquidity for us, and any restrictions on their operations may hinder our ability to use it as a liquidity source.
Our branch network expansion strategy may negatively affect our financial performance.
We expanded our branch network by establishing a new branch office in West Newton, Massachusetts, which opened in the second calendar quarter of 2011 and expect to establish a new branch in Westwood, Massachusetts during our second fiscal 2014 quarter. This strategy may not generate earnings, or may not generate earnings within a reasonable period of time. Numerous factors contribute to the performance of a new branch, such as a suitable location, qualified personnel, and an effective marketing strategy. Additionally, it takes time for a new branch to originate sufficient loans and generate sufficient deposits to produce enough income to offset expenses, some of which, like salaries and occupancy expense, are relatively fixed costs. Any additional newly established branches could negatively impact earnings.
Strong competition within our market areas may limit our growth and profitability.
Competition in the banking and financial services industry is intense. In our market areas, we compete with commercial banks, savings institutions, mortgage brokerage firms, credit unions, finance companies, mutual funds, insurance companies, and brokerage and investment banking firms operating locally and elsewhere. Some of our competitors have greater name recognition and market presence that benefit them in attracting business, and offer certain services that we do not or cannot provide. In addition, larger competitors may be able to price loans and deposits more aggressively than we do, which could affect our ability to grow and remain profitable on a long-term basis. Our profitability depends upon our continued ability to successfully compete in our market areas. If we must raise interest rates paid on deposits or lower interest rates charged on our loans, our net interest margin and profitability could be adversely affected. For additional information see "Business—Competition."
ITEM 1B. UNRESOLVED STAFF COMMENTS
None.
ITEM 2. PROPERTIES
We operate from our main office and six full-service branches located in Brighton, Allston, West Roxbury, Jamaica Plain, Brookline, West Newton and Norwood, Massachusetts. During our second fiscal 2014 quarter, we expect to establish a new branch in Westwood, Massachusetts. The net book value of our premises, land and equipment was $3.5 million at September 30, 2013.
36
Table of Contents
The following table sets forth information with respect to our full-service banking offices, including the expiration date of leases with respect to leased facilities.
| | | | | | | | |
Location | | Leased or
Owned | | Original Year
Leased or
Acquired | | Date of Lease
Expiration | | Date of Lease
Options
Expiration |
|---|
Main Office: | | | | | | | | |
435 Market Street(1) | | Owned | | 1977 | | N/A | | N/A |
Brighton, Massachusetts 02135 | | | | | | | | |
Full Service Branches: | | | | | | | | |
Allston | | Owned | | 1996 | | N/A | | N/A |
229 North Harvard Street | | | | | | | | |
Allston, Massachusetts 02134 | | | | | | | | |
Brookline | | Owned | | 1955 | | N/A | | N/A |
264 Washington Street | | | | | | | | |
Brookline, Massachusetts 02445 | | | | | | | | |
Jamaica Plain | | Leased | | 2001 | | 02/29/16 | | N/A |
725 Centre Street | | | | | | | | |
Jamaica Plain, Massachusetts 02130 | | | | | | | | |
Norwood | | Owned | | 2005 | | N/A | | N/A |
61 Lenox Street | | | | | | | | |
Norwood, Massachusetts 02062 | | | | | | | | |
West Newton | | Leased | | 2010 | | 06/12/21 | | 06/12/31 |
989-1001 Watertown Street | | | | | | | | |
West Newton, Massachusetts 02465 | | | | | | | | |
West Roxbury | | Owned | | 1997 | | N/A | | N/A |
1905 Centre Street | | | | | | | | |
West Roxbury, Massachusetts 02132 | | | | | | | | |
Westwood | | Leased | | 2013 | | (2) | | (2) |
670 High Street(2) | | | | | | | | |
Westwood, MA 02090 | | | | | | | | |
- (1)
- Main office has a full service branch.
- (2)
- New branch expected to open in the second fiscal 2014 quarter. For additional information, see Note 9 of the Notes to the Consolidated Financial Statements included in Item 8 of this Report.
ITEM 3. LEGAL PROCEEDINGS
We are not involved in any pending legal proceedings as a plaintiff or a defendant other than routine legal proceedings occurring in the ordinary course of business. At September 30, 2013, we were not involved in any legal proceedings the outcome of which we believe would be material to our financial condition or results of operations.
ITEM 4. MINE SAFETY DISCLOSURES
Not applicable
37
Table of Contents
PART II
ITEM 5. MARKET FOR REGISTRANT'S COMMON EQUITY, RELATED STOCKHOLDER MATTERS AND ISSUER PURCHASES OF EQUITY SECURITIES
Market.
The Company's common stock trades on the NASDAQ Capital Market under the trading symbol "PEOP." The following table presents quarterly market information for the Company's common stock for each of the past two fiscal years. The following information with respect to trading prices was provided by the NASDAQ Capital Market.
| | | | | | | | | | |
Fiscal Year Ending September 30, | | High | | Low | | Dividends
Declared Per
Share | |
|---|
2013 | | | | | | | | | | |
First Quarter | | $ | 17.50 | | $ | 16.10 | | $ | 0.28 | (1) |
Second Quarter | | | 19.28 | | | 17.09 | | | 0.03 | |
Third Quarter | | | 19.21 | | | 17.62 | | | 0.04 | |
Fourth Quarter | | | 19.24 | | | 17.29 | | | 0.04 | |
2012 | | | | | | | | | | |
First Quarter | | $ | 14.25 | | $ | 12.74 | | $ | — | |
Second Quarter | | | 16.40 | | | 14.15 | | | — | |
Third Quarter | | | 16.70 | | | 15.75 | | | — | |
Fourth Quarter | | | 17.51 | | | 16.22 | | | 0.03 | |
- (1)
- Includes a special dividend of $0.25 per share that was paid on December 20, 2012.
Holders.
The approximate number of holders of record of the Company's common stock as of November 30, 2013 was 511. Certain shares of the Company, Inc. are held in "nominee" or "street" name and accordingly, the number of beneficial owners of such shares is not known or included in the foregoing number.
Dividends.
The Company began paying a quarterly dividend during the fourth quarter of fiscal 2012. We expect that, subject to regulatory requirements and our financial condition and results of operations, quarterly dividends will continue to be paid in the future. In addition, the board of directors may declare and pay periodic special cash dividends in addition to, or in lieu of, regular cash dividends. The Company cannot guarantee that it will pay dividends or that if paid, the Company will not reduce or eliminate dividends in the future. See Item 1 "Regulations and Supervision—Capital Distributions" for information relating to restrictions on dividends. If the Company issues preferred stock, the holders of the preferred stock may have dividend preferences over the holders of common stock.
Securities Authorized for Issuance under Equity Compensation Plans.
At a special meeting of stockholders, held on August 16, 2011, the Company's stockholders approved the Peoples Federal Bancshares, Inc. 2011 Equity Incentive Plan (the "Stock Plan"). Under the Stock Plan, the Company may grant options, restricted stock awards or restricted stock unit awards to its employees and directors for up to 999,810 shares of its common stock. On August 20, 2013, the Company granted the remaining available shares under the Stock Plan and granted 58,255 stock
38
Table of Contents
options and 75,375 restricted stock awards to its directors and certain employees of the Company. There are no further shares available for grant under the Stock Plan.
The following table provides information as of September 30, 2013, with respect to compensation plans (other than our employee stock ownership plan) under which equity securities of the Company are authorized for issuance:
| | | | | | | | | | |
Plan Category | | Number of
Securities to
be Issued Upon
Exercise of
Outstanding
Options (A) | | Weighted-
Average
Exercise Price
of Outstanding
Options (B) | | Number of
Securities
Remaining
Available for
Future Issuance
Under Equity
Compensation
Plans (Excluding
Securities
Reflected in
Column (A)) (C) | |
|---|
Equity compensation plans approved by security stockholders | | | 642,735 | | $ | 15.74 | | | — | |
Equity compensation plans not approved by security stockholders | | | — | | $ | — | | | — | |
| | | | | | | | | |
Total | | | 642,735 | | $ | 15.74 | | | — | |
| | | | | | | | |
Performance Graph.
The following graph compares the performance of the Company's common stock (assuming reinvestment of dividends) with the total return for companies with the Russell 2000 Index, SNL New England U.S. Bank Index and SNL New England U.S. Thrift Index. The calculation of total cumulative return assumes a $100 investment was made at market close on July 7, 2010, the date the Company's common stock began trading after the Company's initial public offering.
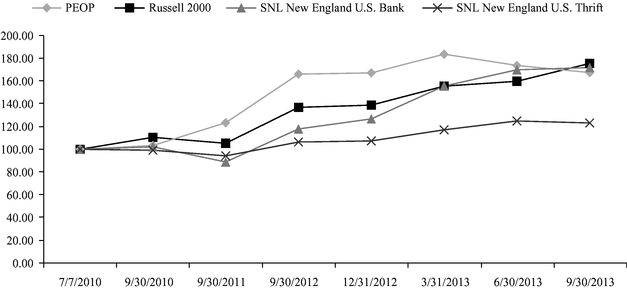
| | | | | | | | | | | | | | | | | | | | | | | | | |
| | 7/7/2010 | | 9/30/2010 | | 9/30/2011 | | 9/30/2012 | | 12/31/2012 | | 3/31/2013 | | 6/30/2013 | | 9/30/2013 | |
|---|
PEOP | | | 100.00 | | | 103.37 | | | 123.37 | | | 166.15 | | | 167.21 | | | 183.65 | | | 173.75 | | | 167.50 | |
Russell 2000 | | | 100.00 | | | 110.54 | | | 105.31 | | | 136.91 | | | 138.86 | | | 155.57 | | | 159.81 | | | 175.55 | |
SNL New England U.S. Bank | | | 100.00 | | | 102.20 | | | 88.87 | | | 117.91 | | | 126.75 | | | 155.64 | | | 169.92 | | | 171.92 | |
SNL New England U.S. Thrift | | | 100.00 | | | 99.21 | | | 94.25 | | | 106.39 | | | 107.38 | | | 117.15 | | | 124.93 | | | 123.17 | |
39
Table of Contents
Sales of Unregistered Securities.
The Company has not sold any of its securities within the past three years, which were not registered under the Securities Act of 1933.
Use of Proceeds.
Not applicable.
Repurchase of Equity Securities by the Issuer.
On October 31, 2012, the Company announced that its Board of Directors authorized an increase in the number of common shares that may be repurchased pursuant to the Company's stock repurchase plan that was previously announced on July 20, 2011 and expanded in January 2012. Under the expanded repurchase plan, the Company is authorized to repurchase up to an additional 5% of its issued and outstanding common shares, or up to an additional 336,345 common shares. The repurchase program permits shares to be repurchased in open market or private transactions, through block trades, and pursuant to any trading plan that may be adopted in accordance with Rule 10b5-1 of the Securities and Exchange Commission. The repurchase program may be suspended, terminated or modified at any time for any reason, including market conditions, the cost of repurchasing shares, the availability of alternative investment opportunities, liquidity, and other factors deemed appropriate.
At September 30, 2013, total repurchases under the repurchase program were 1,032,641 shares at an average price of $15.85. Included in the repurchases noted above, the Company purchased 82,445 shares, during the fourth fiscal quarter ended September 30, 2013, at an average price of $18.28 as follows:
| | | | | | | | | | | | | |
Period | | Total
Number
of Shares
Purchased | | Average
Price Paid
per Share | | Total Number of
Shares Purchased
as Part of Publicly
Announced Plans
or Programs | | Maximum Number of
Shares That May
Yet Be Purchased
Under the Plans
or Programs | |
|---|
July 1 - 31, 2013 | | | 23,000 | | $ | 18.41 | | | 23,000 | | | 59,445 | |
August 1 - 31, 2013 | | | 35,000 | | $ | 18.44 | | | 35,000 | | | 24,445 | |
September 1 - 30, 2013 | | | 24,445 | | $ | 17.92 | | | 24,445 | | | — | |
| | | | | | | | | | | | |
Total | | | 82,445 | | $ | 18.28 | | | 82,445 | | | | |
| | | | | | | | | | | |
On December 6, 2013, the Company announced that its Board of Directors authorized an increase in the number of common shares that may be repurchased pursuant to the Company's stock repurchase plan that was previously announced on July 20, 2011 and subsequently expanded in February 2012 and October 2012. Under the expanded repurchase plan, the Company is authorized to repurchase up to an additional 5% of its issued and outstanding common shares, or up to an additional 323,296 common shares. The repurchase program permits shares to be repurchased in open market or private transactions, through block trades, and pursuant to any trading plan that may be adopted in accordance with Rule 10b5-1 of the Securities and Exchange Commission. The repurchase program may be suspended, terminated or modified at any time for any reason, including market conditions, the cost of repurchasing shares, the availability of alternative investment opportunities, liquidity, and other factors deemed appropriate.
40
Table of Contents
ITEM 6. SELECTED FINANCIAL DATA
| | | | | | | | | | | | | | | | |
| | At or For the Years Ended September 30, | |
|---|
| | 2013 | | 2012 | | 2011 | | 2010 | | 2009 | |
|---|
| | (In thousands, except per share data)
| |
|---|
Selected Financial Condition Data: | | | | | | | | | | | | | | | | |
Total assets | | $ | 585,246 | | $ | 570,827 | | $ | 554,189 | | $ | 545,937 | | $ | 482,828 | |
Total cash and cash equivalents | | | 37,134 | | | 36,241 | | | 61,729 | | | 113,863 | | | 88,634 | |
Securities available-for-sale | | | 14,225 | | | 21,653 | | | 28,452 | | | 23,596 | | | 6,328 | |
Securities held-to-maturity | | | 32,054 | | | 25,921 | | | 19,713 | | | — | | | — | |
Loans, net | | | 466,049 | | | 451,034 | | | 407,423 | | | 377,664 | | | 362,667 | |
Loans held for sale | | | — | | | — | | | — | | | 260 | | | — | |
Other real estate owned | | | — | | | — | | | — | | | 795 | | | — | |
Cash surrender value of life insurance policies | | | 20,007 | | | 19,364 | | | 18,713 | | | 11,670 | | | 11,249 | |
Federal Home Loan Bank stock, at cost | | | 3,775 | | | 4,014 | | | 4,339 | | | 4,339 | | | 4,339 | |
Deposits | | | 425,093 | | | 416,748 | | | 416,645 | | | 390,839 | | | 366,464 | |
Federal Home Loan Bank advances | | | 44,000 | | | 33,000 | | | 18,000 | | | 33,000 | | | 58,000 | |
Total stockholders' equity | | | 106,352 | | | 110,538 | | | 115,702 | | | 114,360 | | | 50,943 | |
Selected Operating Data: | | | | | | | | | | | | | | | | |
Interest and dividend income | | | 19,393 | | | 20,329 | | | 20,590 | | | 21,086 | | | 22,614 | |
Interest expense | | | 2,745 | | | 3,319 | | | 4,190 | | | 6,234 | | | 8,687 | |
| | | | | | | | | | | | |
Net interest and dividend income | | | 16,648 | | | 17,010 | | | 16,400 | | | 14,852 | | | 13,927 | |
Provision for loan losses | | | 200 | | | 540 | | | 405 | | | 300 | | | 127 | |
| | | | | | | | | | | | |
Net interest and dividend income after provision for loan losses | | | 16,448 | | | 16,470 | | | 15,995 | | | 14,552 | | | 13,800 | |
| | | | | | | | | | | | |
Net gain on sales of mortgage loans | | | 189 | | | 169 | | | 178 | | | 277 | | | 307 | |
Net gain on sales of securities available-for-sale | | | — | | | — | | | — | | | 210 | | | 208 | |
Other non-interest income | | | 1,665 | | | 1,664 | | | 1,542 | | | 1,453 | | | 1,301 | |
| | | | | | | | | | | | |
Total non-interest income | | | 1,854 | | | 1,833 | | | 1,720 | | | 1,940 | | | 1,816 | |
| | | | | | | | | | | | |
Total non-interest expense | | | 14,346 | | | 14,126 | | | 12,787 | | | 17,055 | | | 11,263 | |
| | | | | | | | | | | | |
Income (loss) before income taxes | | | 3,956 | | | 4,177 | | | 4,928 | | | (563 | ) | | 4,353 | |
Provision (benefit) for income taxes | | | 1,671 | | | 2,520 | | | 1,857 | | | (399 | ) | | 1,681 | |
| | | | | | | | | | | | |
Net income (loss) | | $ | 2,285 | | $ | 1,657 | | $ | 3,071 | | $ | (164 | ) | $ | 2,672 | |
| | | | | | | | | | | | |
Earnings per share (basic)(1) | | $ | 0.37 | | $ | 0.26 | | $ | 0.47 | | | N/A | | | N/A | |
Earnings per share (diluted)(1) | | $ | 0.37 | | $ | 0.26 | | $ | 0.47 | | | N/A | | | N/A | |
Dividends paid per common share(1) | | $ | 0.39 | | $ | 0.03 | | $ | — | | | N/A | | | N/A | |
Dividend payout ratio(1) | | | 105.41 | % | | 11.54 | % | | — | % | | N/A | | | N/A | |
- (1)
- Not applicable for year ended September 30, 2010 and prior years, as the Company did not issue stock until July 2010.
41
Table of Contents
| | | | | | | | | | | | | | | | |
| | At or For the Years Ended September 30, | |
|---|
| | 2013 | | 2012 | | 2011 | | 2010 | | 2009 | |
|---|
Selected Financial Ratios and Other Data: | | | | | | | | | | | | | | | | |
Performance Ratios: | | | | | | | | | | | | | | | | |
Return (loss) on assets (net income to average total assets) | | | 0.40 | % | | 0.30 | % | | 0.57 | % | | (0.03 | )% | | 0.59 | % |
Return (loss) on equity (net income to average equity) | | | 2.11 | % | | 1.46 | % | | 2.64 | % | | (0.23 | )% | | 5.32 | % |
Net interest rate spread(1) | | | 2.92 | % | | 3.12 | % | | 3.05 | % | | 3.12 | % | | 2.97 | % |
Net interest margin(2) | | | 3.09 | % | | 3.32 | % | | 3.31 | % | | 3.30 | % | | 3.31 | % |
Efficiency ratio(3) | | | 77.54 | % | | 74.97 | % | | 70.57 | % | | 101.57 | % | | 71.54 | % |
Non-interest expense to average total assets | | | 2.50 | % | | 2.54 | % | | 2.38 | % | | 3.34 | % | | 2.50 | % |
Average interest-earning assets to interest-bearing liabilities | | | 1.33x | | | 1.31x | | | 1.32x | | | 1.13x | | | 1.16x | |
Average stockholders' equity to average total assets | | | 18.85 | % | | 20.37 | % | | 21.67 | % | | 13.85 | % | | 11.16 | % |
Asset Quality Ratios: | | | | | | | | | | | | | | | | |
Non-performing assets to total assets | | | 0.37 | % | | 0.60 | % | | 0.59 | % | | 0.54 | % | | 1.19 | % |
Non-performing loans to total loans | | | 0.46 | % | | 0.75 | % | | 0.79 | % | | 0.57 | % | | 1.56 | % |
Allowance for loan losses to non-performing loans | | | 187.85 | % | | 113.87 | % | | 103.72 | % | | 146.93 | % | | 55.97 | % |
Allowance for loan losses to total loans | | | 0.86 | % | | 0.86 | % | | 0.82 | % | | 0.84 | % | | 0.88 | % |
Net charge-offs to average loans outstanding | | | 0.01 | % | | 0.01 | % | | 0.06 | % | | 0.08 | % | | 0.04 | % |
Capital Ratios (Bank Only): | | | | | | | | | | | | | | | | |
Total capital (to risk-weighted assets) | | | 24.83 | % | | 24.12 | % | | 23.81 | % | | 24.43 | % | | 16.93 | % |
Tier 1 capital (to risk-weighted assets) | | | 23.74 | % | | 23.05 | % | | 22.86 | % | | 23.46 | % | | 15.95 | % |
Tier 1 capital (to adjusted total assets)(4) | | | 15.08 | % | | 14.71 | % | | 14.61 | % | | 14.11 | % | | 10.48 | % |
Other Data: | | | | | | | | | | | | | | | | |
Number of full service branches | | | 7 | | | 7 | | | 7 | | | 6 | | | 6 | |
Full time equivalent employees | | | 80 | | | 75 | | | 73 | | | 66 | | | 61 | |
- (1)
- The net interest rate spread represents the difference between the weighted-average yield on interest-earning assets and the weighted-average cost of interest-bearing liabilities for the period.
- (2)
- The net interest margin represents net interest income as a percent of average interest-earning assets for the period.
- (3)
- The efficiency ratio represents non-interest expense divided by the sum of net interest income (before the provision for loan losses) and non-interest income.
- (4)
- Prior to September 30, 2012, average total assets was used to calculate this ratio.
42
Table of Contents
ITEM 7. MANAGEMENT'S DISCUSSION AND ANALYSIS OF FINANCIAL CONDITION AND RESULTS OF OPERATIONS
Overview
We have historically operated as a traditional thrift institution. A significant majority of our assets consist of long-term, fixed-rate and adjustable-rate one- to four-family residential mortgage loans, which we have funded primarily with retail deposits and FHLB of Boston advances. Our results of operations depend primarily on our net interest income. Net interest income is the difference between the interest income we earn on our interest-earning assets, consisting primarily of loans, investment securities (including securities issued by U.S. government agencies and residential mortgage-backed securities issued by government-sponsored entities) and other interest-earning assets, primarily interest-earning deposits at other financial institutions, and the interest we pay on our interest-bearing liabilities, consisting primarily of money market accounts, savings accounts, term certificates, and FHLB of Boston advances. Our results of operations also are affected by our provision for loan losses, non-interest income and non-interest expense. Non-interest income currently consists primarily of service charges on deposit accounts, income derived from insurance policies we hold on certain of our executive officers, which serve as a funding source for our benefit obligations, loan servicing fees and other income and gains or losses on the sale of loans and on the sale of available-for-sale securities. Non-interest expense currently consists primarily of salaries and employee benefits, occupancy and equipment expenses, data processing, legal, accounting and exam fees, FDIC insurance premiums and other operating expenses. Our results of operations also may be affected significantly by general and local economic and competitive conditions, changes in market interest rates, governmental policies and actions of regulatory authorities.
All of our residential mortgage-backed securities have been issued or guaranteed by Freddie Mac, Fannie Mae or Ginnie Mae, all of which are U.S. government-sponsored entities. These agencies guarantee the payment of principal and interest on our residential mortgage-backed securities. We do not own any trust preferred securities or collateralized debt obligations ("CDOs").
Since September 30, 2009, we have increased our total assets by 21.2% from $482.8 million at September 30, 2009 to $585.2 million at September 30, 2013. During the fiscal years 2010, 2011, 2012 and 2013, we purchased approximately $138.2 million of one- to four-family residential mortgage loans, substantially all of which are higher-yielding, jumbo mortgage loans, collateralized by single-family properties in our market area.
Our operations in recent years have also been affected by our efforts to manage our interest rate risk position by reducing our exposure to long-term, fixed-rate assets and replacing a portion of these assets with adjustable-rate loans. Specifically, during the year ended September 30, 2013, we sold $5.8 million of 20- and 30-year fixed-rate, lower-yielding, conforming one- to four-family residential mortgage loans and we have used the net proceeds of these sales to repay short-term borrowings and to fund loan originations and purchases. We did not sell any available-for-sale or held-to-maturity securities during the fiscal year ended September 30, 2013.
The low-interest rate environment during fiscal 2013 and 2012 generated a substantial amount of loan pre-payments in our one-to four-family residential mortgage loan portfolio. In addition, loan origination activity and loan purchases resulted in loan growth of $15.0 million for the year ended September 30, 2013 and $43.6 million for the year ended September 30, 2012. Management made the determination to utilize both retail deposits and FHLB advances to fund this loan growth. Accordingly, our FHLB advances increased to $44.0 million at September 30, 2013 from $33.0 million at September 30, 2012. In addition, during the same time period, our deposits increased to $425.1 million at September 30, 2013 from $416.7 million at September 30, 2012.
43
Table of Contents
We have traditionally focused on the origination of one- to four-family residential mortgage loans, the origination or participation in multi-family mortgage loans and commercial real estate loans, and at September 30, 2013, 93.2% of our loan portfolio was comprised of these types of loans. We intend to continue to emphasize the origination of these types of loans in the future.
Our emphasis on conservative loan underwriting has resulted in relatively low levels of non-performing assets at a time when many financial institutions are experiencing significant asset quality issues. Our non-performing assets totaled $2.1 million, or 0.4% of total assets, at September 30, 2013, compared to $3.4 million, or 0.6%, of total assets at September 30, 2012. Total loan delinquencies were $2.5 million and $6.0 million, respectively, as of September 30, 2013 and 2012. Our non-performing loans and loss experience has enabled us to maintain a relatively low allowance for loan losses in relation to other peer institutions and correspondingly has resulted in low levels of provisions for loan losses. Our provision for loan losses was $200,000, $540,000 and $405,000 for the fiscal years ended September 30, 2013, 2012 and 2011, respectively.
We do not offer loans that provide for negative amortization of principal, such as "Option ARM" loans, where the borrower can pay less than the interest owed on his or her loan, resulting in an increased principal balance during the life of the loan. We generally do not offer "subprime loans" (loans that are made with low down-payments to borrowers with weakened credit histories typically characterized by payment delinquencies, previous charge-offs, judgments and bankruptcies, or borrowers with questionable repayment capacity as evidenced by low credit scores or high debt-burden ratios) or Alt-A loans (generally defined as loans having less than full documentation). We do offer "interest only" loans (where the borrower pays only interest for an initial period, after which the loan converts to a fully amortizing loan) for the construction of one- to four-family residential properties, multi-family properties (which we define as five or more units) and commercial properties. Although we participate in Fannie Mae's Expanded Approval Program and Freddie Mac's A Minus program, which previously did not require income verification, we still verified income for these, as well as all types of mortgage loans.
Critical Accounting Policies
We consider accounting policies that require management to exercise significant judgment or discretion or make significant assumptions that have, or could have, a material impact on the carrying value of certain assets or on income, to be critical accounting policies. We consider the following to be our critical accounting policies:
Allowance for Loan Losses. The allowance for loan losses is the amount estimated by management as necessary to cover losses inherent in the loan portfolio at the balance sheet date. The allowance is established through the provision for loan losses, which is charged to income. Determining the amount of the allowance for loan losses necessarily involves a high degree of judgment. Among the material estimates required to establish the allowance are the following: loss exposure at default; the amount and timing of future cash flows on impacted loans; value of collateral; and determination of loss factors to be applied to the various elements of the portfolio. All of these estimates are susceptible to significant change. Although we believe that we use the best information available to establish the allowance for loan losses, future adjustments to the allowance may be necessary if economic conditions differ substantially from the assumptions used in making the evaluation. In addition, the OCC, as an integral part of its examination process, periodically reviews our allowance for loan losses. The OCC may require us to recognize adjustments to the allowance based on its judgments about information available to it at the time of its examination. The allowance for loan losses is maintained at a level that management considers adequate to provide for estimated losses and impairment based upon an evaluation of known and inherent risk in the loan portfolio. Loan impairment is evaluated based on the fair value of collateral or estimated net realizable value. A provision for loan losses is charged to operations based on management's evaluation of the estimated losses that have been incurred in our
44
Table of Contents
loan portfolio. It is the policy of management to provide for losses on unidentified loans in its portfolio in addition to classified loans.
Management monitors its allowance for loan losses at least quarterly and makes adjustments to the allowance through the provision for loan losses as economic conditions and other pertinent factors indicate. The quarterly review and adjustment of the qualitative factors employed in the allowance methodology and the updating of historical loss experience allow for timely reaction to emerging conditions and trends. In this context, a series of qualitative factors are used in a methodology as a measurement of how current circumstances are affecting the loan portfolio. Included in these qualitative factors are:
- •
- Levels of past due, classified and non-accrual loans, troubled debt restructurings and modifications;
- •
- Nature and volume of loans;
- •
- Changes in lending policies and procedures, underwriting standards, collections and charge-offs and recoveries, and for commercial loans, the level of loans being approved with exceptions to policy;
- •
- National and local economic and business conditions, including various market segments;
- •
- Quality of our loan review system and degree of board of directors oversight;
- •
- Concentrations of credit by industry, geography and collateral type, with a specific emphasis on real estate, and changes in levels of such concentrations; and
- •
- Effect of external factors, including the deterioration of collateral values, on the level of estimated credit losses in the current portfolio.
In determining the allowance for loan losses, management has established both specific allowances and general pooled allowances. The general pooled allowances are determined by assigning certain qualitative factors and quantitative factors developed from historic loss experience which provide a dynamic basis for the calculation of reserve factors for both pass-rated loans (general pooled allowance) and those criticized and classified loans under ASC 310-10-35, "Receivables—Loans and Debt Securities Acquired with Deteriorated Credit Quality—Subsequent Measurement." The amount of the specific allowance is determined through a loan-by-loan analysis of certain large dollar loans. Loans not individually reviewed are evaluated as a group using reserve factor percentages based on historic loss experience and the qualitative factors described above. In determining the appropriate level of the general pooled allowance, management makes estimates based on internal risk ratings, which take into account such factors as debt service coverage, loan-to-value ratios, and external factors. Estimates are periodically measured against actual loss experience.
As changes in our operating environment occur and as recent loss experience fluctuates, the factors for each category of loan based on type and risk rating will change to reflect current circumstances and the quality of the loan portfolio. Given that the components of the allowance are based partially on historical losses and on risk rating changes in response to recent events, required reserves may trail the emergence of any unforeseen deterioration in credit quality.
Although we maintain our allowance for loan losses at levels considered adequate to provide for the inherent risk of loss in our loan portfolio, if economic conditions differ substantially from the assumptions used in making the evaluations there can be no assurance that future losses will not exceed estimated amounts or that additional provisions for loan losses will not be required in future periods. Accordingly, the current decline in the national economy and the local economies of the areas in which the loans are concentrated could result in an increase in loan delinquencies, foreclosures or repossessions resulting in increased charge-off amounts and the need for additional loan loss allowances
45
Table of Contents
in future periods. In addition, our determination as to the amount of our allowance for loan losses is subject to review by the OCC, our primary regulator, as part of its examination process, which may result in the establishment of an additional allowance based upon the judgment of the OCC after a review of the information available at the time of the OCC examination. A large loss could deplete the allowance and require increased provisions to replenish the allowance, which would negatively affect earnings.
Income Taxes. Management considers accounting for income taxes as a critical accounting policy due to the subjective nature of certain estimates that are involved in the calculation. We use the asset and liability method of accounting for income taxes. Under this method, deferred tax assets and liabilities are recognized for the future tax consequences attributable to differences between the financial statement carrying amounts of existing assets and liabilities and their respective tax bases. A valuation allowance related to deferred tax assets is established when, in the judgment of management, it is more likely than not that all or a portion of such deferred tax assets will not be realized. Periodically, the Company assesses the realizability of its deferred tax assets. Adjustments to increase or decrease the valuation allowance are generally charged or credited, respectively, to income tax expense.
Analysis of Net Interest Income
Net interest income represents the difference between income on interest-earning assets and the expense on interest-bearing liabilities. Net interest income depends upon the relative amounts of interest-earning assets and interest-bearing liabilities and the interest rates earned or paid on them. The following table sets forth average balance sheets, average yields and costs and certain other information for the periods indicated. All average balances are daily average balances. The yields set forth below include the effect of deferred fees, and discounts and premiums that are amortized or accreted to interest income or expense. Tax-exempt income and yields have not been adjusted to a tax-equivalent basis. The Company does not accrue interest on loans on non-accrual status, however, the balance of these loans is included in the total average balance, which has the effect of lowering average loan yields.
46
Table of Contents
The following table sets forth average balance sheets, average yields and costs and certain other information for the periods indicated:
| | | | | | | | | | | | | | | | | | | | | | | | | | | | |
| | Years Ended September 30, | |
|---|
| | 2013 | | 2012 | | 2011 | |
|---|
| | Average
Outstanding
Balance | | Interest
Earned/
Paid | | Average
Yield/
Rate(1) | | Average
Outstanding
Balance | | Interest
Earned/
Paid | | Average
Yield/
Rate(1) | | Average
Outstanding
Balance | | Interest
Earned/
Paid | | Average
Yield/
Rate(1) | |
|---|
| | (Dollars in thousands)
| |
|---|
Interest-earning assets: | | | | | | | | | | | | | | | | | | | | | | | | | | | | |
Loans(1) | | $ | 453,202 | | $ | 18,690 | | | 4.12 | % | $ | 422,198 | | $ | 19,323 | | | 4.58 | % | $ | 394,920 | | $ | 20,048 | | | 5.08 | % |
Taxable securities(2) | | | 40,283 | | | 600 | | | 1.49 | | | 56,856 | | | 914 | | | 1.61 | | | 30,175 | | | 400 | | | 1.33 | |
Other interest-earning assets | | | 41,484 | | | 87 | | | 0.21 | | | 28,864 | | | 73 | | | 0.25 | | | 65,629 | | | 132 | | | 0.20 | |
FHLB stock | | | 3,880 | | | 16 | | | 0.41 | | | 4,155 | | | 19 | | | 0.46 | | | 4,339 | | | 10 | | | 0.23 | |
| | | | | | | | | | | | | | | | | | | | | | | |
Total interest-earning assets | | | 538,849 | | | 19,393 | | | 3.60 | | | 512,073 | | | 20,329 | | | 3.97 | | | 495,063 | | | 20,590 | | | 4.16 | |
| | | | | | | | | | | | | | | | | | | | | | | | | | |
Non-interest-earning assets | | | 35,834 | | | | | | | | | 44,030 | | | | | | | | | 41,521 | | | | | | | |
| | | | | | | | | | | | | | | | | | | | | | | | | | |
Total assets | | $ | 574,683 | | | | | | | | $ | 556,103 | | | | | | | | $ | 536,584 | | | | | | | |
| | | | | | | | | | | | | | | | | | | | | | | | | | |
Interest-bearing liabilities: | | | | | | | | | | | | | | | | | | | | | | | | | | | | |
Deposits: | | | | | | | | | | | | | | | | | | | | | | | | | | | | |
Savings | | $ | 53,727 | | | 72 | | | 0.13 | | $ | 48,675 | | | 90 | | | 0.18 | | $ | 46,944 | | | 213 | | | 0.45 | |
Money market accounts | | | 152,967 | | | 767 | | | 0.50 | | | 153,789 | | | 1,066 | | | 0.69 | | | 145,228 | | | 1,292 | | | 0.89 | |
NOW accounts | | | 38,220 | | | 24 | | | 0.06 | | | 36,724 | | | 40 | | | 0.11 | | | 34,165 | | | 64 | | | 0.19 | |
Term certificates | | | 126,255 | | | 1,274 | | | 1.01 | | | 130,326 | | | 1,559 | | | 1.20 | | | 126,111 | | | 1,876 | | | 1.49 | |
| | | | | | | | | | | | | | | | | | | | | | | |
Total deposits | | | 371,169 | | | 2,137 | | | 0.58 | | | 369,514 | | | 2,755 | | | 0.75 | | | 352,448 | | | 3,445 | | | 0.98 | |
FHLB advances | | | 33,518 | | | 608 | | | 1.81 | | | 22,716 | | | 564 | | | 2.48 | | | 24,016 | | | 745 | | | 3.10 | |
| | | | | | | | | | | | | | | | | | | | | | | |
Total interest-bearing liabilities | | | 404,687 | | | 2,745 | | | 0.68 | | | 392,230 | | | 3,319 | | | 0.85 | | | 376,464 | | | 4,190 | | | 1.11 | |
| | | | | | | | | | | | | | | | | | | | | | | |
Demand deposits | | | 52,293 | | | | | | | | | 41,816 | | | | | | | | | 35,837 | | | | | | | |
Other non-interest-bearing liabilities | | | 9,380 | | | | | | | | | 8,762 | | | | | | | | | 8,003 | | | | | | | |
| | | | | | | | | | | | | | | | | | | | | | | | | | |
Total non-interest-bearing liabilities | | | 61,673 | | | | | | | | | 50,578 | | | | | | | | | 43,840 | | | | | | | |
| | | | | | | | | | | | | | | | | | | | | | | | | | |
Total liabilities | | | 466,360 | | | | | | | | | 442,808 | | | | | | | | | 420,304 | | | | | | | |
Stockholders' equity | | | 108,323 | | | | | | | | | 113,295 | | | | | | | | | 116,280 | | | | | | | |
| | | | | | | | | | | | | | | | | | | | | | | | | | |
Total liabilities and stockholders' equity | | $ | 574,683 | | | | | | | | $ | 556,103 | | | | | | | | $ | 536,584 | | | | | | | |
| | | | | | | | | | | | | | | | | | | | | | | | | | |
Net interest income | | | | | $ | 16,648 | | | | | | | | $ | 17,010 | | | | | | | | $ | 16,400 | | | | |
| | | | | | | | | | | | | | | | | | | | | | | | | | |
Net interest rate spread(3) | | | | | | | | | 2.92 | % | | | | | | | | 3.12 | % | | | | | | | | 3.05 | % |
| | | | | | | | | | | | | | | | | | | | | | | | | | |
Net interest-earning assets(4) | | $ | 134,162 | | | | | | | | $ | 119,843 | | | | | | | | $ | 118,599 | | | | | | | |
| | | | | | | | | | | | | | | | | | | | | | | | | | |
Net interest margin(5) | | | | | | | | | 3.09 | % | | | | | | | | 3.32 | % | | | | | | | | 3.31 | % |
| | | | | | | | | | | | | | | | | | | | | | | | | | |
Ratio of interest-earning assets to total interest-bearing liabilities | | | 1.33 | x | | | | | | | | 1.31 | x | | | | | | | | 1.32 | x | | | | | | |
| | | | | | | | | | | | | | | | | | | | | | | | | | |
- (1)
- Average loans include non-accrual loans and are net of average deferred loan fees/costs.
- (2)
- Average balances are presented at average amortized cost.
- (3)
- Net interest rate spread represents the difference between the yield on interest-earning assets and the cost of interest-bearing liabilities.
- (4)
- Net interest-earning assets represent total interest-earning assets less total interest-bearing liabilities.
- (5)
- Net interest margin represents net interest income divided by average total interest-earning assets.
The following table presents the effects of changing rates and volumes on our net interest income for the periods indicated. The rate column shows the effects attributable to changes in rate (change in rate multiplied by prior volume). The volume column shows the effects attributable to changes in
47
Table of Contents
volume (changes in volume multiplied by prior rate). The net column represents the sum of the prior columns. For purposes of this table, changes attributable to both rate and volume, which cannot be segregated, have been allocated proportionately, based on the changes due to rate and the changes due to volume.
| | | | | | | | | | | | | | | | | | | | | | | | | | | | |
| | Years Ended September 30,
2013 vs. 2012 | | Years Ended September 30,
2012 vs. 2011 | | Years Ended September 30,
2011 vs. 2010 | |
|---|
| | Increase
(Decrease)
Due to | |
| | Increase
(Decrease)
Due to | |
| | Increase
(Decrease)
Due to | |
| |
|---|
| | Total
Increase
(Decrease) | | Total
Increase
(Decrease) | | Total
Increase
(Decrease) | |
|---|
| | Volume | | Rate | | Volume | | Rate | | Volume | | Rate | |
|---|
| | (In thousands)
| |
|---|
Interest-earning assets: | | | | | | | | | | | | | | | | | | | | | | | | | | | | |
Loans(1) | | $ | 1,419 | | $ | (2,052 | ) | $ | (633 | ) | $ | 1,705 | | $ | (2,430 | ) | $ | (725 | ) | $ | 1,722 | | $ | (2,465 | ) | $ | (743 | ) |
Taxable securities(2) | | | (267 | ) | | (47 | ) | | (314 | ) | | 414 | | | 100 | | | 514 | | | 274 | | | (33 | ) | | 241 | |
Other interest-earning assets | | | 32 | | | (18 | ) | | 14 | | | (109 | ) | | 50 | | | (59 | ) | | (5 | ) | | 1 | | | (4 | ) |
FHLB stock | | | (1 | ) | | (2 | ) | | (3 | ) | | — | | | 9 | | | 9 | | | — | | | 10 | | | 10 | |
| | | | | | | | | | | | | | | | | | | | |
Total interest-earning assets | | | 1,183 | | | (2,119 | ) | | (936 | ) | | 2,010 | | | (2,271 | ) | | (261 | ) | | 1,991 | | | (2,487 | ) | | (496 | ) |
| | | | | | | | | | | | | | | | | | | | |
Interest-bearing liabilities: | | | | | | | | | | | | | | | | | | | | | | | | | | | | |
Deposits: | | | | | | | | | | | | | | | | | | | | | | | | | | | | |
Savings | | | 10 | | | (28 | ) | | (18 | ) | | 8 | | | (131 | ) | | (123 | ) | | 15 | | | (126 | ) | | (111 | ) |
Money market accounts | | | (6 | ) | | (293 | ) | | (299 | ) | | 82 | | | (308 | ) | | (226 | ) | | (160 | ) | | (620 | ) | | (780 | ) |
NOW accounts | | | 2 | | | (18 | ) | | (16 | ) | | 5 | | | (29 | ) | | (24 | ) | | 5 | | | 1 | | | 6 | |
Term certificates | | | (49 | ) | | (236 | ) | | (285 | ) | | 66 | | | (383 | ) | | (317 | ) | | 304 | | | (545 | ) | | (241 | ) |
| | | | | | | | | | | | | | | | | | | | |
Total deposits | | | (43 | ) | | (575 | ) | | (618 | ) | | 161 | | | (851 | ) | | (690 | ) | | 164 | | | (1,290 | ) | | (1,126 | ) |
FHLB advances | | | 268 | | | (224 | ) | | 44 | | | (39 | ) | | (142 | ) | | (181 | ) | | (795 | ) | | (123 | ) | | (918 | ) |
| | | | | | | | | | | | | | | | | | | | |
Total interest-bearing liabilities | | | 225 | | | (799 | ) | | (574 | ) | | 122 | | | (993 | ) | | (871 | ) | | (631 | ) | | (1,413 | ) | | (2,044 | ) |
| | | | | | | | | | | | | | | | | | | | |
Increase (decrease) in net interest income | | $ | 958 | | $ | (1,320 | ) | $ | (362 | ) | $ | 1,888 | | $ | (1,278 | ) | $ | 610 | | $ | 2,622 | | $ | (1,074 | ) | $ | 1,548 | |
| | | | | | | | | | | | | | | | | | | | |
- (1)
- Average loans include non-accrual loans and are net of average deferred loan fees/costs.
- (2)
- Average balances are presented at average amortized cost.
Comparison of Financial Condition at September 30, 2013 and September 30, 2012
Total assets increased $14.4 million, or 2.5%, to $585.2 million at September 30, 2013, from $570.8 million at September 30, 2012. Loans, net increased $15.0 million, or 3.3%, to $466.0 million at September 30, 2013 from $451.0 million at September 30, 2012 primarily from loan originations of $113.3 million, of which $53.1 million were one- to four- family residential mortgage loans collateralized by properties in our market area. Total cash and cash equivalents increased $900,000, or 2.5%, to $37.1 million at September 30, 2013 from $36.2 million at September 30, 2012 as funds from customer deposits, FHLB advances and maturing investment securities offset the funding of loan growth. Securities available-for-sale decreased $7.5 million, or 34.3%, to $14.2 million at September 30, 2013, from $21.7 million at September 30, 2012. Securities held-to-maturity increased to $32.1 million at September 30, 2013, from $25.9 million at September 30, 2012.
Deposits increased to $425.1 million at September 30, 2013 from $416.7 million at September 30, 2012. The increase resulted from an increase in demand deposits to $57.9 million at September 30, 2013 from $49.2 million at September 30, 2012, an increase in savings to $57.3 million at September 30, 2013 from $50.1 million at September 30, 2012 and an increase in NOW deposits to $38.6 million at September 30, 2013 from $37.1 million at September 30, 2012. These increases were offset by a decrease in term certificates to $120.8 million at September 30, 2013 from $127.7 million at September 30, 2012 and a decrease in money market deposits to $150.4 million at September 30, 2013 from $152.6 million at September 30, 2012.
48
Table of Contents
Borrowings, consisting of FHLB advances, increased $11.0 million to $44.0 million at September 30, 2013 from $33.0 million at September 30, 2012.
Total stockholders' equity decreased to $106.4 million at September 30, 2013 from $110.5 million at September 30, 2012. The decrease was primarily due to stock repurchases and retirements totaling $6.0 million and dividends paid of $2.3 million during the period, offset primarily by net income of $2.3 million, stock based compensation expense of $1.5 million and ESOP expense of $510,000 for the year ended September 30, 2013.
Comparison of Operating Results for the Years Ended September 30, 2013 and September 30, 2012
General. Net income for the year ended September 30, 2013 was $2.3 million as compared to net income of $1.7 million for the year ended September 30, 2012. Interest and dividend income for the year ended September 30, 2013 was $19.4 million, compared to $20.3 million for year ended September 30, 2012, a decrease of 4.6%. Interest expense decreased to $2.7 million for the year ended September 30, 2013 from $3.3 million for the year ended September 30, 2012. The decrease was due to the decrease in interest on deposits, offset by an increase in interest on FHLB advances. The provision for loan losses decreased $340,000 to $200,000 for the year ended September 30, 2013 from $540,000 during the year ended September 30, 2012. Non-interest income totaled $1.9 million for the year ended September 30, 2013 compared to $1.8 million for the year ended September 30, 2012. There were no significant increases or decreases in non-interest income. Non-interest expense increased $220,000, or 1.6%, to $14.3 million for the year ended September 30, 2013 from $14.1 million for the year ended September 30, 2012. The increase in non-interest expense resulted mainly from increases in salaries and employee benefits and professional fees, offset by decreases in advertising expense and other operating expense. The provision for income taxes decreased to $1.7 million for the year ended September 30, 2013 as compared to a provision for income taxes of $2.5 million for the year ended September 30, 2012.
Net Interest Income. Net interest and dividend income for the year ended September 30, 2013 was $16.6 million, compared to $17.0 million for year ended September 31, 2012, a decrease of $362,000, or 2.1%, as declining rates and margin compression continue to affect the Company. The decrease in net interest and dividend income was due to the decrease in the yield on our interest-earning assets and the increase in the average balance on interest-bearing liabilities. The yield on interest-earning assets decreased 37 basis points to 3.60% for the year ended September 30, 2013 from 3.97% for the year ended September 30, 2012. The most significant decrease was in the yield on loans, which decreased 46 basis points to 4.12% for the year ended September 30, 2013 from 4.58% for the year ended September 30, 2012. Rates on loans continue to decline due to the paydown on our higher yielding loans replaced by the origination and purchase of lower yielding loans due to market conditions and competition with financial institutions in our lending area. In addition, the average balance on interest-bearing liabilities increased $12.5 million to $404.7 million for the year ended September 30, 2013 from $392.2 million for the year ended September 30, 2012. The increase was due primarily to the increase in the average balance on FHLB advances. Management funded loan growth mainly with competitively priced FHLB advances resulting in the increase in the FHLB advances average balance to $33.5 million for the year ended September 30, 2013 from $22.7 million for the year ended September 30, 2012. Offsetting the decreases impacting net interest and dividend income noted above was the increase in the average balance on interest-earning assets and the decrease in cost of funds on interest-bearing liabilities. The average balance on interest-earning assets increased $26.7 million to $538.8 million for the year ended September 30, 2013 from $512.1 million for the year ended September 30, 2012. The increase was mainly due to the increase in average loan balances. We continue to competitively price our loan products to increase organic loan originations. In addition, the average rate on interest-bearing liabilities decreased 17 basis points to 0.68% for the year ended September 30, 2013 from 0.85% for the year ended September 30, 2012. The decrease was noted primarily in the decrease in
49
Table of Contents
cost of funds on FHLB advances as the average rate decreased 67 basis points to 1.81% for the year ended September 30, 2013 from 2.48% for the year ended September 30, 2012. The Company replaced maturing higher cost borrowings with lower rate FHLB advances during the year ended September 30, 2013.
Provision for Loan Losses. The loan loss provision for the years ended September 30, 2013 and September 30, 2012 was $200,000 and $540,000, respectively. The provision decreased primarily due to changes in the composition of the loan portfolio, including the increase in residential mortgage loans and the overall loan portfolio growth and decreases in non-accrual loans, classified loans and TDRs.
Non-interest Income. Non-interest income was $1.9 million and $1.8 million for the years ended September 30, 2013 and 2012, respectively, an increase of $21,000, or 1.1%. The increase in non-interest income was attributable primarily to a $41,000 increase in loan servicing fees, net and the increase in net gain on sales of mortgage loans of $20,000. These increases were offset by the decrease in other operating income of $19,000, the decrease in customer service fees of $13,000 and the decrease in the cash surrender value income of our bank-owned life insurance of $8,000.
Non-interest Expense. Non-interest expense increased $220,000, or 1.6%, to $14.3 million for the year ended September 30, 2013 from $14.1 million for the year ended September 30, 2012. During the year ended September 30, 2013, salaries and employee benefits expense increased to $9.8 million from $9.6 million for the year ended September 30, 2012, reflecting additional employees and normal annual salary increases, accruals under our benefit plans and the cost associated with the equity incentive plan. In addition, occupancy expense increased to $965,000 during fiscal year 2013 from $920,000 during fiscal year 2012, professional fees increased to $570,000 from $488,000, data processing increased to $853,000 from $811,000 and deposit insurance increased to $268,000 from $251,000. Partially offsetting these increases were decreases during the year ended September 2013, as equipment expense decreased to $390,000 from $437,000, advertising expense decreased to $497,000 from $558,000 and other operating expense decreased to $1.0 million from $1.1 million.
Income Taxes. The provision for income taxes was $1.7 million for the fiscal year ended September 30, 2013 as compared to the provision for income taxes of $2.5 million for the fiscal year ended September 30, 2012. The effective tax rates were 42.2% and 60.3% for the years ended September 30, 2013 and 2012, respectively. The decrease in the effective tax rate was attributed primarily to the decrease in the amount of the provision for the valuation allowance. During the years ended September 30, 2013 and 2012, the Company provided $30,000 and $991,000, respectively, for a valuation allowance against the deferred tax asset, relating to the charitable contribution made in conjunction with the establishment and funding of a charitable foundation in connection with our initial public offering in 2010. A valuation allowance is established against deferred tax assets when, based upon the available evidence, including historical and projected taxable income, management determines that it is more likely than not that some or all of the deferred tax asset will not be realized. The provision for the valuation allowance was based upon management's analysis of the deferred tax asset at September 30, 2013.
Comparison of Operating Results for the Years Ended September 30, 2012 and September 30, 2011
General. Net income for the year ended September 30, 2012 was $1.7 million as compared to net income of $3.1 million for the year ended September 30, 2011. Interest and dividend income for the year ended September 30, 2012 was $20.3 million, compared to $20.6 million for year ended September 30, 2011, a decrease of 1.3%. Non-interest income totaled $1.8 million for the fiscal year ended September 30, 2012 compared to $1.7 million for the fiscal year ended September 30, 2011. Non-interest expense increased $1.3 million, or 10.2%, to $14.1 million for the year ended September 30, 2012 from $12.8 million for the year ended September 30, 2011. The increase in non-interest expense resulted primarily from increases in employee salaries and benefits, partially offset
50
Table of Contents
by increases in net interest and dividend income as well as increased non-interest income. The provision for income taxes increased to $2.5 million for the year ended September 30, 2012 as compared to a provision of $1.9 million for the year earlier period.
Net Interest Income. Net interest and dividend income for the year ended September 30, 2012 was $17.0 million, compared to $16.4 million for year ended September 31, 2011, an increase of 3.7%. The increase was due to the increase in the average balance of interest-earning assets of $17.0 million, or 3.4%, offset by a decrease in the yield on interest-earning assets to 3.97% in fiscal 2012 from 4.16% in fiscal 2011, a decrease of 19 basis points while the cost of our interest-bearing liabilities decreased to 0.85% in fiscal 2012 from 1.11% in fiscal 2011, a decrease of 26 basis points. In addition, the average cost of interest-bearing deposits decreased by 23 basis points, as a result of the continued low interest rate environment in 2012. With decreases in short-term market interest rates, customers have increasingly shown a preference for lower costing core accounts and short-term time deposits, rather than the longer-term time deposit accounts. The total cost of borrowings decreased $181,000 to $564,000 for fiscal 2012 from $745,000 for fiscal 2011. Our average balance of borrowings decreased to $22.7 million in fiscal 2012 as we repaid advances at the maturity of the contracts and the average cost of the advances decreased 62 basis points to 2.48% for fiscal 2012 from 3.10% for 2011. The Company's interest rate spread increased seven basis points to 3.12% for the year ended September 30, 2012 from 3.05% for the year ended September 30, 2011.
Provision for Loan Losses. The loan loss provision for the years ended September 30, 2012 and September 30, 2011 was $540,000 and $405,000, respectively. The provision was increased primarily due to the changes in the composition of the loan portfolio, including the increase in residential real estate mortgages, and the overall loan portfolio growth.
Non-interest Income. Non-interest income was $1.8 million and $1.7 million for the fiscal years 2012 and 2011, respectively. The increase in non-interest income was attributable primarily to a $108,000 increase in the cash surrender value of our bank-owned life insurance to $651,000 from $543,000. In addition, customer service charges increased to $838,000 from $809,000 and other income increased to $173,000 from $150,000. These increases were partially offset by decreases in the net gain on the sale of mortgage loans to $169,000 from $178,000 and net loan servicing fees to $2,000 from $40,000.
Non-interest Expense. Non-interest expense increased $1.3 million, or 10.2%, to $14.1 million for the year ended September 30, 2012 from $12.8 million for the year ended September 30, 2011. During the year ended September 30, 2012, salaries and employee benefits expense increased to $9.6 million from $8.3 million for the year ended September 30, 2011, reflecting normal annual salary increases, accruals under our benefit plans and the cost associated with the equity incentive plan. In addition, occupancy expense increased to $920,000 in 2012 from $857,000 in fiscal 2011, equipment expense increased to $437,000 in fiscal 2012 from $436,000 in fiscal 2011, advertising expense increased to $558,000 from $240,000 and data processing increased to $811,000 from $749,000. Partially offsetting the increases were decreases during the year ended September 2012 as deposit insurance expense decreased to $251,000 from $400,000 and professional fees decreased to $488,000 from $574,000 and other expense decreased to $1.1 million in fiscal 2012 from $1.2 million in fiscal 2011.
Income Taxes. The income tax expense was $2.5 million for the fiscal year ended September 30, 2012 as compared to an income tax expense of $1.9 million for the fiscal year ended September 30, 2011. The effective tax rates were 60.3% and 37.7% in 2012 and 2011, respectively. The Company established a valuation allowance of $991,000 during the quarter ended September 30, 2012, against a deferred tax asset, which was created due to a charitable contribution made in conjunction with the establishment and funding of a charitable foundation in connection with our initial public offering in 2010. A valuation allowance is established against deferred tax assets when, based upon the available evidence, including historical and projected taxable income, management determines that it is more likely than not that some or all of the deferred tax asset will not be realized.
51
Table of Contents
Impact of Inflation and Changing Prices
Our consolidated financial statements and related notes have been prepared in accordance with GAAP. GAAP requires the measurement of financial position and operating results in terms of historical dollars without consideration of changes in the relative purchasing power of money over time due to inflation. The impact of inflation is reflected in the increased cost of our operations. Unlike industrial companies, our assets and liabilities are primarily monetary in nature. As a result, changes in market interest rates have a greater impact on performance than the effects of inflation.
Recent Accounting Pronouncements
Footnote 2 in the Notes to the Consolidated Financial Statements, which is included in Item 8 of this Report, discusses new accounting pronouncements adopted by the Company in fiscal year 2013 and the expected impact of accounting pronouncements recently issued but not yet required to be adopted.
Item 7A. QUANTITATIVE AND QUALITATIVE DISCLOSURES ABOUT MARKET RISK
Risk Management
General. Our most significant form of market risk is interest rate risk because, as a financial institution, the majority of our assets and liabilities are sensitive to changes in interest rates. Therefore, a principal part of our operations is to manage interest rate risk and limit the exposure of our net interest income to changes in market interest rates. Our board of directors has established an Asset/Liability Management Committee ("ALCO"), which is responsible for evaluating the interest rate risk inherent in our assets and liabilities, for determining the level of risk that is appropriate, given our business strategy, operating environment, capital, liquidity and performance objectives, and for managing this risk consistent with the guidelines approved by the board of directors.
Historically, we have operated as a traditional thrift institution. A significant portion of our assets consist of longer-term, fixed- and adjustable-rate residential mortgage loans and mortgage-backed securities, which we funded primarily with checking and savings accounts and short-term borrowings. In recent years, in an effort to improve our earnings and to decrease our exposure to interest rate risk, we generally have sold long-term (primarily 20- and 30-year), fixed-rate, conforming one- to four-family residential mortgage loans and we have shifted our focus to originating and purchasing more higher-yielding, fixed-rate jumbo loans and adjustable-rate jumbo loans (generally with rates that adjust after the initial 5 years) and more commercial real estate loans, which generally have shorter maturities than one- to four-family residential mortgage loans, and are usually originated with adjustable interest rates. Additionally, to increase our liquidity and further reduce our exposure to interest rate risk, in recent years we have sold a substantial amount of our short-term, mortgage-backed securities in the relatively low interest rate environment.
In addition to the above strategies with respect to our lending activities, we have used the following strategies to reduce our interest rate risk:
- •
- increasing our money market accounts, which are less rate-sensitive than term certificates and which provide us with a stable, low-cost source of funds;
- •
- managing our portfolio of long and short-term borrowings; and
- •
- maintaining relatively high levels of capital.
We have not conducted hedging activities, such as engaging in futures, options or swap transactions, or investing in high-risk mortgage derivatives, such as collateralized mortgage obligations, residual interests, real estate mortgage investment conduit residual interests or stripped mortgage backed securities.
52
Table of Contents
Management of Market Risk. Market risk is the risk of loss due to adverse changes in market prices and rates, and typically encompasses exposures such as sensitivity to changes in market interest rates, foreign currency exchange rates, and commodity prices. The Bank has no exposure to foreign currency exchange or commodity price movements. Because net interest income is the Bank's primary source of revenue, interest rate risk is a significant market risk to which the Bank is exposed.
Interest rate risk is the exposure of the Bank's net interest income in response to movements in interest rates. Net interest income is affected by changes in interest rates as well as by fluctuations in the level and duration of the Bank's assets and liabilities. Over and above the influence that interest rates have on net interest income, changes in rates may also affect the volume of lending activity, the ability of borrowers to repay variable rate loans, the volume of loan prepayments and refinancing, the availability, mix and cost of deposits and other funding alternatives, and the market value of the Bank's assets and liabilities.
Exposure to interest rate risk is managed by the Bank through periodic evaluations of the current interest rate risk inherent in its rate-sensitive assets and liabilities, primarily deposits, borrowings, loans and investment securities, coupled with determinations of the level of risk considered appropriate given the Bank's capital and liquidity requirements, business strategy and performance objectives. Through such management, the Bank seeks to manage the vulnerability of its net interest income to changes in interest rates.
The ALCO, comprised of several members of senior management and two members of the board of directors, is responsible for managing interest rate risk. On a quarterly basis, this committee reviews with the board of directors its analysis of our exposure to interest rate risk, the effect subsequent changes in interest rates could have on the Bank's future net interest income, key interest rate risk strategies and other activities, and the effect of those strategies on the Bank's operating results. This committee is also involved in the Bank's planning and budgeting process as well as in determining pricing strategies for deposits and loans. Management is aided in these efforts by the use of an independent third party that convenes with management on a quarterly basis for a complete asset/liability analysis and review.
The primary method that ALCO uses for measuring and evaluating interest rate risk is an income simulation analysis. This analysis considers the maturity and interest rate repricing characteristics of all of our interest-earning assets and interest-bearing liabilities, as well as the relative sensitivities of these balance sheet components over a range of interest rate scenarios. Interest rate scenarios tested generally include parallel and flattening/steepening rate ramps over a one-year period, and static, or flat, rates. The simulation analysis is used to measure the exposure of net interest income to changes in interest rates over a specified time horizon, usually a two-year period. The simulations also show the net interest income volatility for up to five years.
For September 30, 2013, we used a simulation model to project changes for four rate scenarios. This analysis calculates the difference between net interest income forecasts for these scenarios compared to the net interest income forecast using a flat rate scenario. In each of these instances, Federal Funds is used as the driving rate.
53
Table of Contents
The table below sets forth, as of September 30, 2013, the estimated changes in the Bank's economic value of equity and net interest income that would result from the designated immediate changes in the Federal Funds rate.
| | | | | | | | | | | | | | | | | | | |
| |
| | Economic Value of
Equity(2) | | Net Interest Income | |
|---|
| |
| | Estimated
Increase
(Decrease) | |
| | Estimated
Increase
(Decrease) | |
|---|
Change in
Interest Rates
(basis points)(1) | | Estimated
EVE(2) | | Estimated Net
Interest
Income | |
|---|
| | Amount | | Percent | | Amount | | Percent | |
|---|
| | (Dollars in thousands)
| |
|---|
+300bp | | $ | 84,029 | | $ | (27,396 | ) | | (24.6 | )% | $ | 16,065 | | $ | (1,226 | ) | | (7.1 | )% |
+200bp | | | 96,696 | | | (14,729 | ) | | (13.2 | )% | | 16,995 | | | (296 | ) | | (1.7 | )% |
+100bp | | | 106,095 | | | (5,330 | ) | | (4.8 | )% | | 17,355 | | | 64 | | | 0.4 | % |
0bp | | | 111,425 | | | — | | | — | % | | 17,291 | | | — | | | — | % |
-100bp | | | 116,464 | | | 5,039 | | | 4.5 | % | | 16,628 | | | (663 | ) | | (3.8 | )% |
- (1)
- Assumes an instantaneous uniform change in interest rates at all maturities.
- (2)
- EVE is the discounted present value of expected cash flows from interest-earning assets, interest-bearing bearing liabilities and off-balance sheet contracts.
The income simulation model includes various assumptions regarding the re-pricing relationships for each of our products. Many of our assets are floating rate loans tied to the Prime rate, which are assumed to re-price immediately and to the same extent as the change in market rates, according to their contracted index. Many of these credit relationships, however, now have interest rate "floors" at "above market" levels. Many of these loans may not re-price with the first couple of increases in short-term interest rates. Conversely, we have various transaction account products that would not increase or decrease in the same increments or at the same speed. Money market accounts, as an example, are assumed to increase sooner and in larger increments than savings and NOW accounts. These assumptions are based on our prior experience with the changes in rates paid on these non-maturity deposits coincident with changes in market interest rates. The model begins by disseminating data into appropriate repricing buckets. Assets and liabilities are then assigned a multiplier to simulate how much that particular balance sheet item will reprice when interest rates change. The final step is to simulate the timing effect of assets and liabilities with a month-by-month simulation to estimate the change in interest income and expense over the next 12 months.
This analysis indicates the impact of changes in net interest income for the given set of rate changes and assumptions. It does not incorporate any balance sheet growth, and it assumes that the structure and composition of the balance sheet will remain comparable to the structure at the start of the simulation. It does not account for other factors that might impact this analysis, including changes by management to mitigate the impact of interest rate changes or secondary impacts such as changes to our credit risk profile as interest rates change. Furthermore, loan prepayment rate estimates and spread relationships change regularly. Interest rate changes create changes in actual loan prepayment rates that differ from the market estimates incorporated in this analysis. Changes that vary significantly from the assumptions may have significant effects on our net interest income.
For the rising interest rate scenarios, the base market interest rate forecast was increased, on an instantaneous and sustained basis, by 100, 200 and 300 basis points. For the falling interest rate scenario, the base market interest rate forecast was decreased, on an instantaneous and sustained basis, by 100 basis points. At September 30, 2013, our net interest income exposure related to these hypothetical changes in market interest rates was within our established guidelines.
There are inherent shortcomings to income simulations, given the number and variety of assumptions that must be made in performing the analysis. The assumptions relied upon in making
54
Table of Contents
these calculations of interest rate sensitivity include the level of market interest rates, the shape of the yield curve, the degree to which certain assets and liabilities with similar attributes react to changes in market interest rates, and the degree to which non-maturity deposits, such as checking accounts, react to changes in market rates. Although the analysis shown above provides an indication of the Bank's sensitivity to interest rate changes at a point in time, these estimates are not intended to and do not provide a precise forecast of the effect of changes in market interest rates on the Bank's net interest income and may differ from actual results.
Liquidity and Capital Resources
Liquidity is the ability to meet current and future financial obligations. Our primary sources of funds consist of deposit inflows, loan repayments, advances from the FHLB of Boston, principal repayments and loan sales and the sale of available-for-sale securities. While maturities and scheduled amortization of loans and securities are predictable sources of funds, deposit flows and mortgage prepayments are greatly influenced by general interest rates, economic conditions and competition. Our Asset/Liability Management Committee, under the direction of our Chief Financial Officer, is responsible for establishing and monitoring our liquidity targets and strategies in order to ensure that sufficient liquidity exists for meeting the borrowing needs and deposit withdrawals of our customers as well as unanticipated contingencies. We believe that we have enough sources of liquidity to satisfy our short- and long-term liquidity needs as of September 30, 2013.
We regularly monitor and adjust our investments in liquid assets based upon our assessment of:
- (i)
- expected loan demand;
- (ii)
- expected deposit flows and borrowing maturities;
- (iii)
- yields available on interest-earning deposits and securities; and
- (iv)
- the objectives of our asset/liability management program.
Excess liquid assets are invested generally in interest-earning deposits and short-term securities and are also used to pay off short-term borrowings.
Our most liquid assets are cash and cash equivalents. The level of these assets is dependent on our operating, financing, lending and investing activities during any given period. At September 30, 2013, cash and cash equivalents totaled $37.1 million.
Our cash flows are derived from operating activities, investing activities and financing activities as reported in our Consolidated Statements of Cash Flows included in our Consolidated Financial Statements.
At September 30, 2013, we had $7.3 million in loan commitments outstanding, $4.8 million of which were for fixed-rate loans and $2.5 million of which were for adjustable-rate loans. In addition to commitments to originate loans, we had $34.0 million in unused lines of credit to borrowers and $66,000 in standby letters of credit. Term certificates due within one year of September 30, 2013 totaled $88.4 million, or 73.1% of our term certificates. If these deposits do not remain with us, we may be required to seek other sources of funds, including loan sales, brokered deposits, repurchase agreements and FHLB advances. Depending on market conditions, we may be required to pay higher rates on such deposits or other borrowings than we currently pay on the term certificates, or on our money market accounts. We believe, however, based on historical experience and current market interest rates that we will retain upon maturity a large portion of our term certificates with maturities of one year or less as of September 30, 2013.
Our primary investing activity is originating loans. During the fiscal years ended September 30, 2013 and 2012, we originated $113.3 million and $113.0 million of loans, respectively. Additionally,
55
Table of Contents
during the fiscal years ended September 30, 2013 and 2012, we purchased $31.2 million and $43.4 million of loans, respectively.
Financing activities consist primarily of activity in deposit accounts and FHLB advances. We experienced a net increase in deposits of $8.3 million during the year ended September 30, 2013. Deposit flows are affected by the overall level of interest rates, the interest rates and products offered by us and our local competitors, and by other factors.
Liquidity management is both a daily and long-term function of business management. If we require funds beyond our ability to generate them internally, borrowing agreements exist with the FHLB of Boston, which provide an additional source of funds. We have historically relied on FHLB advances as a funding source and expect that we will continue to utilize these as a source of funding. FHLB advances increased $11.0 million to $44.0 million, at September 30, 2013, from $33.0 million at September 30, 2012. At September 30, 2013, we had the ability to borrow up to an additional $79.0 million from the FHLB of Boston.
Capital Resources. The Bank is subject to various regulatory capital requirements, including a risk-based capital measure. The risk-based capital guidelines include both a definition of capital and a framework for calculating risk-weighted assets by assigning balance sheet assets and off-balance sheet items to broad risk categories. At September 30, 2013, the Bank exceeded all regulatory capital requirements. The Bank is considered "well capitalized" under regulatory guidelines. See "Supervision and Regulation—Federal Banking Regulation—Capital Requirements" and Note 14 to the Consolidated Financial Statements.
Off-Balance Sheet Arrangements and Aggregate Contractual Obligations
Commitments. As a financial services provider, we routinely are a party to various financial instruments with off-balance-sheet risks, such as commitments to extend credit and unused lines of credit. While these contractual obligations represent our potential future cash requirements, a significant portion of commitments to extend credit may expire without being drawn upon. Such commitments are subject to the same credit policies and approval process accorded to loans we make. In addition, we enter into commitments to sell mortgage loans. For additional information, see Note 11 of the Notes to our Consolidated Financial Statements.
The following table presents information indicating various Company loan commitments outstanding and their respective maturity dates as of September 30, 2013:
| | | | | | | | | | | | | | | | |
| | September 30, 2013 | |
|---|
| | One Year
or Less | | More than
One Year
Through
Three Years | | More than
Three Years
Through
Five Years | | Over
Five Years | | Total | |
|---|
| | (In thousands)
| |
|---|
Commitments to originate loans | | $ | 7,253 | | $ | — | | $ | — | | $ | — | | $ | 7,253 | |
Unadvanced portions of loans: | | | | | | | | | | | | | | | | |
Construction loans | | | 5,821 | | | 898 | | | — | | | — | | | 6,719 | |
Commercial real estate lines of credit | | | — | | | — | | | — | | | 6,964 | | | 6,964 | |
Home equity lines of credit | | | 229 | | | 672 | | | 252 | | | 14,459 | | | 15,612 | |
Consumer | | | — | | | — | | | — | | | 638 | | | 638 | |
Commercial | | | 1,180 | | | 167 | | | — | | | 2,656 | | | 4,003 | |
Standby letters of credit | | | 66 | | | | | | | | | | | | 66 | |
| | | | | | | | | | | | |
Total | | $ | 14,549 | | $ | 1,737 | | $ | 252 | | $ | 24,717 | | $ | 41,255 | |
| | | | | | | | | | | | |
56
Table of Contents
Contractual Obligations. In the ordinary course of our operations, we enter into certain contractual obligations. Such obligations include operating leases for premises and equipment, agreements with respect to borrowed funds and deposit liabilities and agreements with respect to investments.
The following table presents information indicating various contractual obligations and commitments of the Company as of September 30, 2013 and their respective maturity dates:
| | | | | | | | | | | | | | | | |
| | September 30, 2013 | |
|---|
| | One Year
or Less | | More than
One Year
Through
Three Years | | More than
Three Years
Through
Five Years | | Over
Five Years | | Total | |
|---|
| | (In thousands)
| |
|---|
Federal Home Loan Bank advances | | $ | 18,000 | | $ | 16,000 | | $ | 10,000 | | $ | — | | $ | 44,000 | |
Operating leases | | | 145 | | | 249 | | | 151 | | | 215 | | | 760 | |
| | | | | | | | | | | | |
Total contractual obligations | | $ | 18,145 | | $ | 16,249 | | $ | 10,151 | | $ | 215 | | $ | 44,760 | |
| | | | | | | | | | | | |
In addition, the Company has also entered into a lease agreement as part of its branch expansion into Westwood, Massachusetts. The lease term is 10 years, with four renewal options. Each renewal option is five years. Under the lease agreement, the lease payments on the new Westwood branch do not commence until occupancy is established and are not included in the prior schedule of contractual obligations and commitments of the Company for operating leases. Once occupancy is established, the annual lease expense will be $55,200. The new branch is expected to open during the second quarter of the Company's 2014 fiscal year.
57
Table of Contents
ITEM 8. FINANCIAL STATEMENTS AND SUPPLEMENTARY DATA

The Board of Directors and Stockholders
Peoples Federal Bancshares, Inc.
Brighton, Massachusetts
REPORT OF INDEPENDENT REGISTERED PUBLIC ACCOUNTING FIRM
We have audited the accompanying consolidated balance sheets of Peoples Federal Bancshares, Inc. and Subsidiaries as of September 30, 2013 and 2012 and the related consolidated statements of income, comprehensive income, changes in stockholders' equity and cash flows for each of the three years in the period ended September 30, 2013. These consolidated financial statements are the responsibility of the Company's management. Our responsibility is to express an opinion on these consolidated financial statements based on our audits.
We conducted our audits in accordance with the standards of the Public Company Accounting Oversight Board (United States). Those standards require that we plan and perform the audit to obtain reasonable assurance about whether the consolidated financial statements are free from material misstatement. An audit includes examining, on a test basis, evidence supporting the amounts and disclosures in the consolidated financial statements. An audit also includes assessing the accounting principles used and significant estimates made by management, as well as evaluating the overall consolidated financial statement presentation. We believe that our audits provide a reasonable basis for our opinion.
In our opinion, the consolidated financial statements referred to above present fairly, in all material respects, the consolidated financial position of Peoples Federal Bancshares, Inc. and Subsidiaries as of September 30, 2013 and 2012, and the consolidated results of their operations and their cash flows for each of the three years in the period ended September 30, 2013, in conformity with accounting principles generally accepted in the United States of America.
We also have audited, in accordance with the standards of the Public Company Accounting Oversight Board (United States), Peoples Federal Bancshares, Inc. and Subsidiaries' internal controls over financial reporting as of September 30, 2013, based on criteria established in Internal Control—Integrated Framework issued by the Committee of Sponsoring Organizations of the Treadway Commission and our report dated December 10, 2013 expressed an unqualified opinion thereon.
| | |
| | |
 |
| | SHATSWELL, MacLEOD & COMPANY, P.C. |
West Peabody, Massachusetts
December 10, 2013

58
Table of Contents
The Board of Directors and Stockholders
Peoples Federal Bancshares, Inc.
Brighton, Massachusetts
REPORT OF INDEPENDENT REGISTERED PUBLIC ACCOUNTING FIRM
We have audited Peoples Federal Bancshares, Inc. and Subsidiaries' internal control over financial reporting as of September 30, 2013, based on criteria established inInternal Control—Integrated Framework issued by the Committee of Sponsoring Organizations of the Treadway Commission (the COSO criteria). Peoples Federal Bancshares, Inc. and Subsidiaries' management is responsible for maintaining effective internal control over financial reporting and for its assessment of the effectiveness of internal control over financial reporting, included in the accompanying Report of Management on Peoples Federal Bancshares, Inc.'s Internal Control over Financial Reporting. Our responsibility is to express an opinion on the company's internal control over financial reporting based on our audit.
We conducted our audit in accordance with the standards of the Public Company Accounting Oversight Board (United States). Those standards require that we plan and perform the audit to obtain reasonable assurance about whether the internal control over financial reporting was maintained in all material respects. Our audit included obtaining an understanding of internal control over financial reporting, assessing the risk that a material weakness exists, testing and evaluating the design and operating effectiveness of internal control based on the assessed risk and performing such other procedures as we consider necessary in the circumstances. We believe that our audit provides a reasonable basis for our opinion.
A company's internal control over financial reporting is a process designed to provide reasonable assurance regarding the reliability of financial reporting and the preparation of financial statements for external purposes in accordance with generally accepted accounting principles. A company's internal control over financial reporting includes those policies and procedures that (1) pertain to the maintenance of records that, in reasonable detail, accurately and fairly reflect the transactions and dispositions of the assets of the company; (2) provide reasonable assurance that transactions are recorded as necessary to permit preparation of financial statements in accordance with generally accepted accounting principles, and that receipts and expenditures of the company are being made only in accordance with authorizations of management and directors of the company; and (3) provide reasonable assurance regarding prevention or timely detection of unauthorized acquisition, use or disposition of the company's assets that could have a material effect on the financial statements.
Because of its inherent limitations, internal control over financial reporting may not prevent or detect misstatements. Also, projections of any evaluation of effectiveness to future periods are subject to the risk that controls may become inadequate because of changes in conditions, or that the degree of compliance with the policies or procedures may deteriorate.
In our opinion, Peoples Federal Bancshares, Inc. and Subsidiaries maintained, in all material respects, effective internal control over financial reporting as of September 30, 2013, based on the COSO criteria.
59
Table of Contents
We also have audited, in accordance with the standards of the Public Company Accounting Oversight Board (United States), the consolidated balance sheets of Peoples Federal Bancshares, Inc. and Subsidiaries as of September 30, 2013 and 2012, and the related consolidated statements of income, comprehensive income, changes in stockholders' equity and cash flows for each of the three years in the period ended September 30, 2013 of Peoples Federal Bancshares, Inc. and Subsidiaries and our report dated December 10, 2013 expressed on unqualified opinion thereon.
| | |
| | |
|
| | SHATSWELL, MacLEOD & COMPANY, P.C. |
West Peabody, Massachusetts
December 10, 2013
60
Table of Contents
PEOPLES FEDERAL BANCSHARES, INC. AND SUBSIDIARIES
CONSOLIDATED BALANCE SHEETS
| | | | | | | |
| | September 30, | |
|---|
| | 2013 | | 2012 | |
|---|
| | (In thousands, except
share data)
| |
|---|
ASSETS | | | | | | | |
Cash and due from banks | | $ | 4,047 | | $ | 6,713 | |
Interest-bearing demand deposits with other banks | | | 30,906 | | | 27,378 | |
Federal funds sold | | | 79 | | | 48 | |
Federal Home Loan Bank—overnight deposit | | | 2,102 | | | 2,102 | |
| | | | | | |
Total cash and cash equivalents | | | 37,134 | | | 36,241 | |
Securities available-for-sale | | | 14,225 | | | 21,653 | |
Securities held-to-maturity (fair values of $32,105 and $26,746) | | | 32,054 | | | 25,921 | |
Federal Home Loan Bank stock (at cost) | | | 3,775 | | | 4,014 | |
Loans | | | 470,086 | | | 454,925 | |
Allowance for loan losses | | | (4,037 | ) | | (3,891 | ) |
| | | | | | |
Loans, net | | | 466,049 | | | 451,034 | |
| | | | | | |
Premises and equipment, net | | | 3,465 | | | 3,577 | |
Cash surrender value of life insurance policies | | | 20,007 | | | 19,364 | |
Accrued interest receivable | | | 1,448 | | | 1,589 | |
Deferred income tax asset, net | | | 5,432 | | | 5,116 | |
Other assets | | | 1,657 | | | 2,318 | |
| | | | | | |
Total assets | | $ | 585,246 | | $ | 570,827 | |
| | | | | | |
LIABILITIES AND STOCKHOLDERS' EQUITY | | | | | | | |
Deposits: | | | | | | | |
Non-interest bearing | | $ | 57,891 | | $ | 49,165 | |
Interest-bearing | | | 367,202 | | | 367,583 | |
| | | | | | |
Total deposits | | | 425,093 | | | 416,748 | |
Short-term borrowings | | | 6,000 | | | 8,000 | |
Long-term debt | | | 38,000 | | | 25,000 | |
Accrued expenses and other liabilities | | | 9,801 | | | 10,541 | |
| | | | | | |
Total liabilities | | | 478,894 | | | 460,289 | |
| | | | | | |
Stockholders' equity: | | | | | | | |
Preferred stock, $0.01 par value; 50,000,000 shares authorized; none issued | | | — | | | — | |
Common stock, $0.01 par value; 100,000,000 shares authorized; 6,465,934 and 6,726,904 shares issued and outstanding at September 30, 2013 and 2012, respectively | | | 65 | | | 67 | |
Additional paid-in capital | | | 60,039 | | | 63,909 | |
Retained earnings | | | 55,103 | | | 55,153 | |
Accumulated other comprehensive (loss) income | | | (30 | ) | | 113 | |
Unearned restricted shares; 256,894 and 244,140 shares at September 30, 2013 and 2012, respectively | | | (4,183 | ) | | (3,777 | ) |
Unearned compensation—ESOP | | | (4,642 | ) | | (4,927 | ) |
| | | | | | |
Total stockholders' equity | | | 106,352 | | | 110,538 | |
| | | | | | |
Total liabilities and stockholders' equity | | $ | 585,246 | | $ | 570,827 | |
| | | | | | |
The accompanying notes are an integral part of these consolidated financial statements.
61
Table of Contents
PEOPLES FEDERAL BANCSHARES, INC. AND SUBSIDIARIES
CONSOLIDATED STATEMENTS OF INCOME
| | | | | | | | | | |
| | Years Ended September 30, | |
|---|
| | 2013 | | 2012 | | 2011 | |
|---|
| | (Dollars in thousands, except share data)
| |
|---|
Interest and dividend income: | | | | | | | | | | |
Interest and fees on loans | | $ | 18,690 | | $ | 19,323 | | $ | 20,048 | |
Interest on debt securities: | | | | | | | | | | |
Taxable | | | 600 | | | 914 | | | 400 | |
Other interest | | | 87 | | | 73 | | | 132 | |
Dividends on equity securities | | | 16 | | | 19 | | | 10 | |
| | | | | | | | |
Total interest and dividend income | | | 19,393 | | | 20,329 | | | 20,590 | |
| | | | | | | | |
Interest expense: | | | | | | | | | | |
Interest on deposits | | | 2,137 | | | 2,755 | | | 3,445 | |
Interest on Federal Home Loan Bank advances | | | 608 | | | 564 | | | 745 | |
| | | | | | | | |
Total interest expense | | | 2,745 | | | 3,319 | | | 4,190 | |
| | | | | | | | |
Net interest and dividend income | | | 16,648 | | | 17,010 | | | 16,400 | |
Provision for loan losses | | | 200 | | | 540 | | | 405 | |
| | | | | | | | |
Net interest and dividend income, after provision for loan losses | | | 16,448 | | | 16,470 | | | 15,995 | |
| | | | | | | | |
Non-interest income: | | | | | | | | | | |
Customer service fees | | | 825 | | | 838 | | | 809 | |
Loan servicing fees, net | | | 43 | | | 2 | | | 40 | |
Net gain on sales of mortgage loans | | | 189 | | | 169 | | | 178 | |
Increase in cash surrender value of life insurance | | | 643 | | | 651 | | | 543 | |
Other income | | | 154 | | | 173 | | | 150 | |
| | | | | | | | |
Total non-interest income | | | 1,854 | | | 1,833 | | | 1,720 | |
| | | | | | | | |
Non-interest expense: | | | | | | | | | | |
Salaries and employee benefits | | | 9,799 | | | 9,587 | | | 8,322 | |
Occupancy expense | | | 965 | | | 920 | | | 857 | |
Equipment expense | | | 390 | | | 437 | | | 436 | |
Professional fees | | | 570 | | | 488 | | | 574 | |
Advertising expense | | | 497 | | | 558 | | | 240 | |
Data processing expense | | | 853 | | | 811 | | | 749 | |
Deposit insurance expense | | | 268 | | | 251 | | | 400 | |
Other expense | | | 1,004 | | | 1,074 | | | 1,209 | |
| | | | | | | | |
Total non-interest expense | | | 14,346 | | | 14,126 | | | 12,787 | |
| | | | | | | | |
Income before income taxes | | | 3,956 | | | 4,177 | | | 4,928 | |
Provision for income taxes | | | 1,671 | | | 2,520 | | | 1,857 | |
| | | | | | | | |
Net income | | $ | 2,285 | | $ | 1,657 | | $ | 3,071 | |
| | | | | | | | |
Weighted-average shares outstanding: | | | | | | | | | | |
Basic | | | 5,875,741 | | | 6,175,042 | | | 6,579,784 | |
Diluted | | | 5,915,400 | | | 6,183,718 | | | 6,579,784 | |
Earnings per common share: | | | | | | | | | | |
Basic | | $ | 0.37 | | $ | 0.26 | | $ | 0.47 | |
Diluted | | $ | 0.37 | | $ | 0.26 | | $ | 0.47 | |
The accompanying notes are an integral part of these consolidated financial statements.
62
Table of Contents
PEOPLES FEDERAL BANCSHARES, INC. AND SUBSIDIARIES
CONSOLIDATED STATEMENTS OF COMPREHENSIVE INCOME
| | | | | | | | | | |
| | Years Ended September 30, | |
|---|
| | 2013 | | 2012 | | 2011 | |
|---|
| | (In thousands)
| |
|---|
Net income | | $ | 2,285 | | $ | 1,657 | | $ | 3,071 | |
| | | | | | | | |
Net unrealized (loss) gain on securities available-for-sale | | | (239 | ) | | 95 | | | (16 | ) |
Reclassification adjustment for net securities gains | | | — | | | — | | | — | |
| | | | | | | | |
Net unrealized (losses) gains | | | (239 | ) | | 95 | | | (16 | ) |
Income tax benefit (expense) | | | 96 | | | (38 | ) | | 7 | |
| | | | | | | | |
Other comprehensive (loss) income, net of tax | | | (143 | ) | | 57 | | | (9 | ) |
| | | | | | | | |
Total comprehensive income | | $ | 2,142 | | $ | 1,714 | | $ | 3,062 | |
| | | | | | | | |
The accompanying notes are an integral part of these consolidated financial statements.
63
Table of Contents
PEOPLES FEDERAL BANCSHARES, INC. AND SUBSIDIARIES
CONSOLIDATED STATEMENTS OF CHANGES IN STOCKHOLDERS' EQUITY
| | | | | | | | | | | | | | | | | | | | | | | | | | | | |
| | Common Stock | |
| |
| | Accumulated
Other
Comprehensive
Income (Loss) | |
| |
| |
| |
| |
|---|
| | Additional
Paid-In
Capital | | Retained
Earnings | | Unearned
Restricted
Shares | | Unearned
Compensation—
ESOP | | Treasury
Stock | | Total
Stockholders'
Equity | |
|---|
| | Shares | | Amount | |
|---|
| | (Dollars in thousands, except share amounts)
| |
|---|
Balance at September 30, 2010 | | | 7,141,500 | | $ | 71 | | $ | 69,331 | | $ | 50,606 | | $ | 65 | | $ | — | | $ | (5,713 | ) | $ | — | | $ | 114,360 | |
Net income | | | — | | | — | | | — | | | 3,071 | | | — | | | — | | | — | | | — | | | 3,071 | |
Other comprehensive loss | | | — | | | — | | | — | | | — | | | (9 | ) | | — | | | — | | | — | | | (9 | ) |
Purchase of shares for stock repurchase plan (168,300 shares) | | | — | | | — | | | — | | | — | | | — | | | — | | | — | | | (2,326 | ) | | (2,326 | ) |
Common stock released by ESOP (28,566 shares) | | | — | | | — | | | — | | | — | | | — | | | — | | | 286 | | | — | | | 286 | |
Common stock held by ESOP committed to be released (21,425 shares) | | | — | | | — | | | 106 | | | — | | | — | | | — | | | 214 | | | — | | | 320 | |
| | | | | | | | | | | | | | | | | | | | |
Balance at September 30, 2011 | | | 7,141,500 | | | 71 | | | 69,437 | | | 53,677 | | | 56 | | | — | | | (5,213 | ) | | (2,326 | ) | | 115,702 | |
Net income | | | — | | | — | | | — | | | 1,657 | | | — | | | — | | | — | | | — | | | 1,657 | |
Other comprehensive income | | | — | | | — | | | — | | | — | | | 57 | | | — | | | — | | | — | | | 57 | |
Purchase of shares for stock repurchase plan (527,996 shares) | | | — | | | — | | | — | | | — | | | — | | | — | | | — | | | (8,027 | ) | | (8,027 | ) |
Retirement of treasury stock | | | (414,596 | ) | | (4 | ) | | (6,437 | ) | | — | | | — | | | — | | | — | | | 6,441 | | | — | |
Restricted stock awards (281,700 shares) | | | — | | | — | | | 446 | | | — | | | — | | | (4,358 | ) | | — | | | 3,912 | | | — | |
Restricted stock awards earned (37,560 shares) | | | — | | | — | | | — | | | — | | | — | | | 581 | | | — | | | — | | | 581 | |
Stock option expense | | | — | | | — | | | 308 | | | — | | | — | | | — | | | — | | | — | | | 308 | |
Common stock released by ESOP (7,142 shares) | | | — | | | — | | | 24 | | | — | | | — | | | — | | | 71 | | | — | | | 95 | |
Common stock held by ESOP committed to be released (21,425 shares) | | | — | | | — | | | 131 | | | — | | | — | | | — | | | 215 | | | — | | | 346 | |
Dividends paid ($0.03 per share) | | | — | | | — | | | — | | | (181 | ) | | — | | | | | | — | | | — | | | (181 | ) |
| | | | | | | | | | | | | | | | | | | | |
Balance at September 30, 2012 | | | 6,726,904 | | | 67 | | | 63,909 | | | 55,153 | | | 113 | | | (3,777 | ) | | (4,927 | ) | | — | | | 110,538 | |
Net income | | | — | | | — | | | — | | | 2,285 | | | — | | | — | | | — | | | — | | | 2,285 | |
Other comprehensive loss | | | — | | | — | | | — | | | — | | | (143 | ) | | — | | | — | | | — | | | (143 | ) |
Purchase and retirement of shares for stock repurchase plan | | | (336,345 | ) | | (3 | ) | | (6,012 | ) | | — | | | — | | | — | | | — | | | — | | | (6,015 | ) |
Restricted stock awards | | | 75,375 | | | 1 | | | 1,393 | | | — | | | — | | | (1,394 | ) | | — | | | — | | | — | |
Restricted stock awards earned (62,621 shares) | | | — | | | — | | | — | | | — | | | — | | | 988 | | | — | | | — | | | 988 | |
Tax benefit of vested restricted stock awards (56,340 shares) | | | — | | | — | | | 51 | | | — | | | — | | | — | | | — | | | — | | | 51 | |
Stock option expense | | | — | | | — | | | 473 | | | — | | | — | | | — | | | — | | | — | | | 473 | |
Common stock released by ESOP (7,142 shares) | | | — | | | — | | | 50 | | | — | | | — | | | — | | | 71 | | | — | | | 121 | |
Common stock held by ESOP committed to be released (21,425 shares) | | | — | | | — | | | 175 | | | — | | | — | | | — | | | 214 | | | — | | | 389 | |
Dividends paid ($0.39 per share) | | | — | | | — | | | — | | | (2,335 | ) | | — | | | — | | | — | | | — | | | (2,335 | ) |
| | | | | | | | | | | | | | | | | | | | |
Balance at September 30, 2013 | | | 6,465,934 | | $ | 65 | | $ | 60,039 | | $ | 55,103 | | $ | (30 | ) | $ | (4,183 | ) | $ | (4,642 | ) | $ | — | | $ | 106,352 | |
| | | | | | | | | | | | | | | | | | | | |
The accompanying notes are an integral part of these consolidated financial statements.
64
Table of Contents
PEOPLES FEDERAL BANCSHARES, INC. AND SUBSIDIARIES
CONSOLIDATED STATEMENTS OF CASH FLOWS
| | | | | | | | | | |
| | Years Ended September 30, | |
|---|
| | 2013 | | 2012 | | 2011 | |
|---|
| | (In thousands)
| |
|---|
Cash flows from operating activities: | | | | | | | | | | |
Net income | | $ | 2,285 | | $ | 1,657 | | $ | 3,071 | |
Adjustments to reconcile net income to net cash provided by operating activities: | | | | | | | | | | |
Amortization (accretion) of securities, net | | | 269 | | | 291 | | | (4 | ) |
Provision for loan losses | | | 200 | | | 540 | | | 405 | |
Change in net deferred loan fees | | | (188 | ) | | (522 | ) | | (165 | ) |
Depreciation and amortization | | | 408 | | | 436 | | | 380 | |
Decrease in loans held for sale | | | — | | | — | | | 260 | |
Loss on sales of other real estate owned | | | — | | | — | | | 30 | |
Decrease (increase) in accrued interest receivable | | | 141 | | | (62 | ) | | 62 | |
Income on cash surrender value of life insurance | | | (643 | ) | | (651 | ) | | (543 | ) |
Decrease in other assets | | | 694 | | | 183 | | | 102 | |
(Decrease) increase in accrued expenses and other liabilities | | | (688 | ) | | 2,639 | | | 329 | |
Decrease in prepaid income taxes | | | 7 | | | 235 | | | 419 | |
(Decrease) increase in income taxes payable | | | (41 | ) | | 60 | | | — | |
Deferred income tax (benefit) expense | | | (220 | ) | | 585 | | | (85 | ) |
Stock based compensation expense | | | 1,461 | | | 889 | | | — | |
ESOP expense | | | 510 | | | 441 | | | 381 | |
| | | | | | | | |
Net cash provided by operating activities | | | 4,195 | | | 6,721 | | | 4,642 | |
| | | | | | | | |
Cash flows from investing activities: | | | | | | | | | | |
Activity in securities available-for-sale: | | | | | | | | | | |
Purchases | | | (4,063 | ) | | (22,413 | ) | | (39,999 | ) |
Maturities, prepayments and calls | | | 11,218 | | | 29,300 | | | 35,127 | |
Activity in securities held-to-maturity: | | | | | | | | | | |
Purchases | | | (14,818 | ) | | (14,537 | ) | | (19,954 | ) |
Maturities, prepayments and calls | | | 8,450 | | | 8,045 | | | 245 | |
Redemptions of Federal Home Loan Bank stock | | | 239 | | | 325 | | | — | |
Loan originations and principal collections, net | | | 16,103 | | | (315 | ) | | 3,864 | |
Purchased loans | | | (31,151 | ) | | (43,356 | ) | | (33,875 | ) |
Recovery of loans previously charged off | | | 21 | | | 42 | | | 19 | |
Investments in life insurance policies | | | — | | | — | | | (6,500 | ) |
Capital expenditures | | | (296 | ) | | (195 | ) | | (941 | ) |
Proceeds from sales of other real estate owned | | | — | | | — | | | 758 | |
| | | | | | | | |
Net cash used in investing activities | | | (14,297 | ) | | (43,104 | ) | | (61,256 | ) |
| | | | | | | | |
The accompanying notes are an integral part of these consolidated financial statements.
65
Table of Contents
PEOPLES FEDERAL BANCSHARES, INC. AND SUBSIDIARIES
CONSOLIDATED STATEMENTS OF CASH FLOWS (Concluded)
| | | | | | | | | | |
| | Years Ended September 30, | |
|---|
| | 2013 | | 2012 | | 2011 | |
|---|
| | (In thousands)
| |
|---|
Cash flows from financing activities: | | | | | | | | | | |
Net increase (decrease) in: | | | | | | | | | | |
Demand deposits, NOW and savings accounts | | | 15,264 | | | 16,981 | | | 5,218 | |
Term certificates | | | (6,919 | ) | | (12,878 | ) | | 16,588 | |
Short-term borrowings | | | (2,000 | ) | | 8,000 | | | — | |
Activity in long-term debt: | | | | | | | | | | |
Proceeds from advances | | | 16,000 | | | 10,000 | | | — | |
Payment of advances | | | (3,000 | ) | | (3,000 | ) | | (15,000 | ) |
Common stock repurchased | | | (6,015 | ) | | (8,027 | ) | | (2,326 | ) |
Dividends paid | | | (2,335 | ) | | (181 | ) | | — | |
| | | | | | | | |
Net cash provided by financing activities | | | 10,995 | | | 10,895 | | | 4,480 | |
| | | | | | | | |
Net increase (decrease) in cash and cash equivalents | | | 893 | | | (25,488 | ) | | (52,134 | ) |
Cash and cash equivalents at beginning of year | | | 36,241 | | | 61,729 | | | 113,863 | |
| | | | | | | | |
Cash and cash equivalents at end of year | | $ | 37,134 | | $ | 36,241 | | $ | 61,729 | |
| | | | | | | | |
Supplemental disclosures of cash flow information: | | | | | | | | | | |
Cash paid during the year for: | | | | | | | | | | |
Interest | | $ | 2,744 | | $ | 3,298 | | $ | 4,235 | |
Income taxes paid | | | 1,924 | | | 1,640 | | | 1,523 | |
Supplemental disclosures of non-cash financing and investing activities: | | | | | | | | | | |
Transfers from loans to other real estate owned | | | — | | | — | | | 164 | |
Loans originated from sales of other real estate owned | | | — | | | — | | | 171 | |
The accompanying notes are an integral part of these consolidated financial statements.
66
Table of Contents
PEOPLES FEDERAL BANCSHARES, INC. AND SUBSIDIARIES
NOTES TO THE CONSOLIDATED FINANCIAL STATEMENTS
NOTE 1—NATURE OF OPERATIONS
Peoples Federal Bancshares, Inc. (the "Company") is a Maryland corporation organized in 2010 for the purpose of becoming the stock holding company of Peoples Federal Savings Bank (the "Bank") in connection with the mutual to stock conversion of Peoples Federal MHC, the Bank's former holding company. The Company has two wholly-owned subsidiaries, the Bank and Peoples Funding Corporation ("PFC"). The Bank was organized in 1888, and in 2005 reorganized into a mutual holding company structure. The Bank is headquartered in Brighton, Massachusetts. The Bank operates its business from seven banking offices located in Brighton, Allston, West Roxbury, Jamaica Plain, Brookline, West Newton and Norwood. The Bank is engaged principally in the business of providing a variety of financial services to individuals and small businesses primarily in the form of various deposit products and residential and commercial mortgage lending products. PFC was formed for the purpose of making a loan to the Peoples Federal Savings Bank Employee Stock Ownership Plan (the "ESOP").
NOTE 2—ACCOUNTING POLICIES
The accounting and reporting policies of the Company and its subsidiaries conform to accounting principles generally accepted in the United States of America and predominant practices within the banking industry. The consolidated financial statements were prepared using the accrual basis of accounting. The significant accounting policies are summarized below to assist the reader in better understanding the consolidated financial statements and other data contained herein.
Use of Estimates
The preparation of financial statements in conformity with accounting principles generally accepted in the United States of America requires management to make estimates and assumptions that affect the reported amounts of assets and liabilities and disclosure of contingent assets and liabilities at the date of the financial statements and the reported amounts of revenues and expenses during the reporting period. Actual results could differ from those estimates.
Basis of Presentation
The consolidated financial statements include the accounts of Peoples Federal Bancshares, Inc. and its wholly-owned subsidiaries, Peoples Federal Savings Bank and Peoples Funding Corporation. All significant intercompany accounts and transactions have been eliminated in the consolidation.
Operating Segments
Management evaluates the Company's performance and allocates resources based on a single segment concept. Accordingly, there are no separately identified operating segments for which discrete financial information is available. The Company does not derive revenues from, or have assets located in, foreign countries, not does it derive revenues from any single customer that represents 10% or more of the Company's total revenues.
Reclassifications
Certain amounts have been reclassified in the 2012 and 2011 consolidated financial statements to conform to the 2013 presentation.
67
Table of Contents
PEOPLES FEDERAL BANCSHARES, INC. AND SUBSIDIARIES
NOTES TO THE CONSOLIDATED FINANCIAL STATEMENTS (Continued)
NOTE 2—ACCOUNTING POLICIES (Continued)
Cash and Cash Equivalents
For purposes of reporting cash flows, cash and cash equivalents include cash on hand, cash items, due from banks, interest-bearing demand deposits with other banks, federal funds sold and Federal Home Loan Bank—overnight deposit.
Cash and due from banks as of September 30, 2013 and 2012 includes $2,344,000 and $2,625,000, which is subject to withdrawals and usage restrictions to satisfy the reserve requirements of the Federal Reserve Bank.
As of September 30, 2013 and 2012, the Company had $4,277,000 and $2,408,000 on deposit with the Federal Home Loan Bank of Boston, representing approximately 4.0% and 2.2% of total stockholders' equity of the Company.
Fair Value Hierarchy
The Company groups its financial assets and financial liabilities measured at fair value in three levels, based on the markets in which the assets and liabilities are traded and the reliability of the assumptions used to determine fair value.
Level 1—Valuations for assets and liabilities traded in active exchange markets, such as the New York Stock Exchange. Valuations are obtained from readily available pricing sources for market transactions involving identical assets or liabilities.
Level 2—Valuations for assets and liabilities traded in less active dealer or broker markets. Valuations are obtained from third party pricing services for identical or comparable assets or liabilities.
Level 3—Valuations for assets and liabilities that are derived from other methodologies, including option pricing models, discounted cash flow models and similar techniques, and are not based on market exchange, dealer, or broker traded transactions. Level 3 valuations incorporate certain assumptions and projections in determining the fair value assigned to such assets and liabilities.
Transfers between levels are recognized at the actual date of the event that caused the transfer, if applicable.
Securities
Investments in debt securities are adjusted for amortization of premiums and accretion of discounts computed utilizing a method that approximates the interest method. Gains or losses on sales of investment securities are computed on a specific identification basis.
The Company classifies debt and equity securities into one of three categories: held-to-maturity, available-for-sale or trading. These security classifications may be modified after acquisition only under certain specified conditions. In general, securities may be classified as held-to-maturity only if the Company has the positive intent and ability to hold them to maturity. Trading securities are defined as those bought and held principally for the purpose of selling them in the near term. All other securities must be classified as available-for-sale.
68
Table of Contents
PEOPLES FEDERAL BANCSHARES, INC. AND SUBSIDIARIES
NOTES TO THE CONSOLIDATED FINANCIAL STATEMENTS (Continued)
NOTE 2—ACCOUNTING POLICIES (Continued)
Securities (Concluded)
Held-to-maturity securities are measured at amortized cost in the consolidated balance sheets. Unrealized holding gains and losses are not included in earnings or in a separate component of stockholders' equity. They are merely disclosed in the notes to the consolidated financial statements.
Available-for-sale securities are carried at fair value on the consolidated balance sheets. Unrealized holding gains and losses are not included in earnings, but are reported as a net amount (less expected tax) in a separate component of stockholders' equity until realized.
Trading securities are carried at fair value on the consolidated balance sheets. Unrealized holding gains and losses for trading securities are included in earnings.
Interest and dividends on securities are included in net interest and dividend income.
Each reporting period, the Company evaluates all debt securities with a decline in fair value below the amortized cost of the investment to determine whether or not the impairment is deemed to be other-than-temporary ("OTTI"). OTTI is required to be recognized if (1) the Company intends to sell the security or (2) it is "more likely than not" that the Company will be required to sell the security before recovery of its amortized cost basis. For impaired debt securities that the Company intends to sell, or more likely than not will be required to sell, the full amount of the impairment is recognized as OTTI through earnings. For all other impaired debt securities, credit-related OTTI is recognized through earnings and non-credit related OTTI is recognized in other comprehensive income, net of applicable taxes.
Declines in marketable equity securities below their cost that are deemed other than temporary are reflected in earnings as realized losses.
Federal Home Loan Bank of Boston stock, at cost
The Bank, as a member of the Federal Home Loan Bank ("FHLB") system, is required to maintain an investment in capital stock of the FHLB. Based on redemption provisions of the FHLB, the stock has no quoted market value and is carried at cost. At its discretion, the FHLB may declare dividends on the stock. The Bank reviews for impairment based on the ultimate recoverability of the cost basis in the FHLB stock. As of September 30, 2013, no impairment has been recognized.
Loans Held for Sale
Loans held-for-sale in the secondary market are carried at the lower of cost or estimated fair value in the aggregate. Net unrealized losses are provided for in a valuation allowance by charges to operations.
Loans
Loans receivable that management has the intent and ability to hold until maturity or payoff are reported at their outstanding principal balances adjusted for amounts due to borrowers on unadvanced loans, any charge-offs, the allowance for loan losses and any deferred fees or costs on originated loans, or unamortized premiums or discounts on purchased loans.
69
Table of Contents
PEOPLES FEDERAL BANCSHARES, INC. AND SUBSIDIARIES
NOTES TO THE CONSOLIDATED FINANCIAL STATEMENTS (Continued)
NOTE 2—ACCOUNTING POLICIES (Continued)
Loans (Concluded)
Interest on loans is recognized on a simple interest basis.
Loan origination and commitment fees and certain direct origination costs are deferred, and the net amount amortized as an adjustment of the related loan's yield. The Company is amortizing these amounts over the contractual life of the related loans.
Mortgage loans are generally placed on non-accrual when reaching 90 days past due or in the process of foreclosure. Secured consumer loans are written down to realizable value and unsecured consumer loans are charged off upon reaching 120 or 180 days past due depending on the type of loan. Commercial loans, which are 90 days or more past due are generally placed on non-accrual status, unless adequately secured and in the process of collection.
When a loan has been placed on non-accrual status, previously accrued and uncollected interest is reversed against interest on loans. A loan can be returned to accrual status when collectibility of all contractual principal and interest is reasonably assured and the loan has performed for a period of time, generally six months.
Cash receipts of interest income on impaired loans are credited to principal to the extent necessary to eliminate doubt as to the collectibility of the recorded investment of the loan. Some or all of the cash receipts of interest income on impaired loans is recognized as interest income if the remaining net carrying amount of the loan is deemed to be fully collectible. When recognition of interest income on an impaired loan on a cash basis is appropriate, the amount of income that is recognized is limited to that which would have been accrued on the net carrying amount of the loan at the contractual interest rate. Any cash interest payments received in excess of the limit and not applied to reduce the net carrying amount of the loan are recorded as recoveries of charge-offs until the charge-offs are fully recovered.
Allowance for Loan Losses
The allowance for loan losses is established as losses are estimated to have occurred through a provision for loan losses charged to earnings. Loan losses are charged against the allowance when management believes the uncollectibility of a loan balance is confirmed. Subsequent recoveries, if any, are credited to the allowance.
The allowance for loan losses is evaluated on a regular basis by management and is based upon management's periodic review of the collectibility of the loans in light of historical experience, the nature and volume of the loan portfolio, adverse situations that may affect the borrower's ability to repay, estimated value of any underlying collateral and prevailing economic conditions. This evaluation is inherently subjective, as it requires estimates that are susceptible to significant revision as more information becomes available.
General Component
The general component of the allowance for loan losses is based on historical loss experience adjusted for qualitative factors stratified by the following loan segments: residential loans, commercial real estate, construction, consumer and commercial.
70
Table of Contents
PEOPLES FEDERAL BANCSHARES, INC. AND SUBSIDIARIES
NOTES TO THE CONSOLIDATED FINANCIAL STATEMENTS (Continued)
NOTE 2—ACCOUNTING POLICIES (Continued)
Allowance for Loan Losses (Continued)
Management uses a rolling average of historical losses based on a time frame appropriate to capture relevant loss data for each loan segment. This historical loss factor is adjusted for the following qualitative factors: levels/trends in delinquencies; trends in volume and terms of loans; effects of changes in risk selection and underwriting standards and other changes in lending policies, procedures and practices; experience/ability/depth of lending management and staff; and national and local economic trends and conditions.
The qualitative factors are determined based on the various risk characteristics of each loan segment. Risk characteristics relevant to each portfolio segment are as follows:
Residential loans: The Company generally does not originate loans with a loan-to-value ratio greater than 80 percent. All loans in this segment are collateralized by residential real estate and repayment is dependent on the credit quality of the individual borrower. The overall health of the economy, including unemployment rates and housing prices, will have an effect on the credit quality in this segment.
Commercial real estate: Loans in this segment are primarily income-producing properties throughout Eastern Massachusetts. The underlying cash flows generated by the properties are adversely impacted by a downturn in the economy as evidenced by increased vacancy rates, which in turn, will have an effect on the credit quality in this segment. Management periodically obtains rent rolls and continually monitors the cash flows of these loans.
Construction loans: Loans in this segment primarily include speculative real estate development loans for which payment is derived from sale of the property. Credit risk is affected by cost overruns, time to sell at an adequate price and market conditions.
Consumer loans: Loans in this segment are generally unsecured and repayment is dependent on the credit quality of the individual borrower.
Commercial loans: Loans in this segment are made to businesses and are generally secured by assets of the business. Repayment is expected from the cash flows of the business. A weakened economy, and resultant decreased consumer spending, will have an effect on the credit quality in this segment.
Allocated Component
The allocated component relates to loans that are classified as impaired. Impairment is measured on a loan by loan basis for commercial, commercial real estate and construction loans by either the present value of expected future cash flows discounted at the loan's effective interest rate, except that as a practical expedient, based on the loan's observable market price or the fair value of the collateral if the loan is collateral dependent. An allowance is established when the discounted cash flows (observable market price or collateral value) of the impaired loan is lower than the recorded investment of that loan. Large groups of smaller balance homogeneous loans are collectively evaluated for impairment.
71
Table of Contents
PEOPLES FEDERAL BANCSHARES, INC. AND SUBSIDIARIES
NOTES TO THE CONSOLIDATED FINANCIAL STATEMENTS (Continued)
NOTE 2—ACCOUNTING POLICIES (Continued)
Allowance for Loan Losses (Concluded)
Accordingly, the Company does not separately identify individual consumer and residential loans for impairment evaluation, unless such loans are subject to a troubled debt restructuring agreement or have been identified as impaired as part of a larger customer relationship.
A loan is considered impaired when, based on current information and events, it is probable that the Company will be unable to collect the scheduled payments of principal or interest when due according to the contractual terms of the loan agreement. Factors considered by management in determining impairment include payment status, collateral value, and the probability of collecting scheduled principal and interest payments when due. Loans that experience insignificant payment delays and payment shortfalls generally are not classified as impaired.
Management determines the significance of payment delays and payment shortfalls on a case-by-case basis, taking into consideration all of the circumstances surrounding the loan and the borrower, including the length of the delay, the reasons for the delay, the borrower's prior payment record and the amount of the shortfall in relation to the principal and interest owed.
The Company periodically may agree to modify the contractual terms of loans. When a loan is modified and a concession is made to a borrower experiencing financial difficulty, the modification is considered a troubled debt restructuring ("TDR"). Such concessions typically include a reduction of an interest rate below market rate, taking into account the credit quality of the borrower, a significant reduction or deferral of payments and/or interest or an extension of the maturity date. All TDRs are initially classified as impaired.
Unallocated Component
An unallocated component is maintained to cover uncertainties that could affect management's estimate of probable losses. The unallocated component of the allowance reflects the margin of imprecision inherent in the underlying assumptions used in the methodologies for estimating allocated and general reserves in the portfolio.
Servicing
Servicing assets are recognized as separate assets when rights are acquired through purchase or through sale of financial assets. Generally, purchased servicing rights are capitalized at the cost to acquire the rights. For sales of mortgage loans, a portion of the cost of originating the loan is allocated to the servicing right based on relative fair value. Fair value is based on market prices for comparable mortgage servicing contracts, when available, or alternatively, is based on a valuation model that calculates the present value of estimated future net servicing income. The valuation model incorporates assumptions that market participants would use in estimating future net servicing income, such as the cost to service, the discount rate, the custodial earnings rate, an inflation rate, ancillary income, prepayment speeds and default rates and losses. Capitalized servicing rights are reported in other assets and are amortized into non-interest income in proportion to, and over the period of, the estimated future net servicing income of the underlying financial assets.
72
Table of Contents
PEOPLES FEDERAL BANCSHARES, INC. AND SUBSIDIARIES
NOTES TO THE CONSOLIDATED FINANCIAL STATEMENTS (Continued)
NOTE 2—ACCOUNTING POLICIES (Continued)
Servicing (Concluded)
Servicing assets are evaluated for impairment based upon the fair value of the rights as compared to amortized cost. Impairment is determined by stratifying rights into tranches based on predominant risk characteristics, such as interest rate, loan type and investor type. Impairment is recognized through a valuation allowance for an individual tranche, to the extent that fair value is less than the capitalized amount for the tranche. If the Company later determines that all or a portion of the impairment no longer exists for a particular tranche, a reduction of the allowance may be recorded as an increase to income.
Servicing fee income is recorded for fees earned for servicing loans. The fees are based on a contractual percentage of the outstanding principal, or a fixed amount per loan and are recorded as income when earned. The amortization of mortgage servicing rights is netted against loan servicing fee income.
Transfers of Financial Assets
A transfer of financial assets in which the transferor surrenders control over those assets is accounted for as a sale to the extent that consideration other than beneficial interests in the transferred assets is received in exchange. The transferor has surrendered control over transferred assets when (1) the transferred assets have been isolated from the transferor, (2) each transferee has the right to pledge or exchange the assets it received and no condition both constrains the transferee (or holder) from taking advantage of its right to pledge or exchange and provides more than a trivial benefit to the transferor and (3) the transferor does not maintain effective control over the transferred assets through either an agreement that both entitles and obligates the transferor to repurchase or redeem them before maturity or the ability to unilaterally cause the holder to return specific assets, other than through a cleanup call.
During the normal course of business, the Company may transfer a portion of a financial asset, for example, a participation loan or the government guaranteed portion of a loan. In order to be eligible for sales treatment, the transfer of the portion of the loan must meet the criteria of a participating interest. If it does not meet the criteria of a participating interest, the transfer must be accounted for as a secured borrowing. In order to meet the criteria for a participating interest, all cash flows from the loan must be divided proportionately, the rights of each loan holder must have the same priority, the loan holders must have no recourse to the transferor other than standard representations and warranties and no loan holder has the right to pledge or exchange the entire loan.
Other Real Estate Owned and In-substance Foreclosures
Other real estate owned includes properties acquired through foreclosure or in lieu of foreclosure. These properties are initially carried at estimated fair value of the asset less estimated costs to sell. Any write-down from cost to estimated fair value required at the time of foreclosure or classification as in-substance foreclosure is charged to the allowance for loan losses. Expenses incurred in connection with maintaining these assets, subsequent write-downs and gains or losses recognized upon sale are included in other expense.
73
Table of Contents
PEOPLES FEDERAL BANCSHARES, INC. AND SUBSIDIARIES
NOTES TO THE CONSOLIDATED FINANCIAL STATEMENTS (Continued)
NOTE 2—ACCOUNTING POLICIES (Continued)
Premises and Equipment
Land is stated at cost. Buildings and building improvements, furniture and equipment and leasehold improvements are stated at cost, less accumulated depreciation and amortization. Cost and related allowances for depreciation and amortization of premises and equipment retired or otherwise disposed of are removed from the respective accounts with any gain or loss included in income or expense. Depreciation and amortization are calculated principally on the straight-line method over the estimated useful lives of the asset.
Bank Owned Life Insurance
The Company invests in bank-owned life insurance to provide a funding source for benefit plan obligations. Bank-owned life insurance also generally provides noninterest income that is nontaxable. The Company is the owner and beneficiary of the life insurance policies, and as such, the investment is carried at the cash surrender value of the underlying policies. Income from the increase in cash surrender value of the policies is included in noninterest income in the statements of income.
Advertising
The Company directly expenses costs associated with advertising as they are incurred.
Share-based Compensation Plan
The Company accounts for the 2011 Equity Incentive Plan under ASC 718-10 "Compensation—Stock Compensation—Overall." Compensation cost relating to share-based payment transactions is based on the grant-date fair value of the equity instrument issued. Share-based compensation is recognized over the period the employee is required to provide services for the award. Reductions in compensation expense associated with forfeited options are estimated at the date of grant and this estimated forfeiture rate is adjusted, as necessary, based on actual forfeiture experience. The Company uses the Black-Scholes option-pricing method to determine the fair value of stock options granted.
Employee Stock Ownership Plan
The ESOP is accounted for in accordance with ASC 718-40, "Compensation—Stock Compensation—Employee Stock Ownership Plan." Under ASC 718-40, unearned ESOP shares are not considered outstanding and are therefore not taken into account when computing earnings per share. Unearned ESOP shares are presented as a reduction to stockholders' equity and represent shares to be allocated to ESOP participants in future periods for services provided to the Company. As shares are committed to be released, compensation expense is recognized for the fair market value of the stock and stockholders' equity is increased by a corresponding amount. The loan to the ESOP will be repaid principally from the Bank's contributions to the ESOP over a period of 20 years.
74
Table of Contents
PEOPLES FEDERAL BANCSHARES, INC. AND SUBSIDIARIES
NOTES TO THE CONSOLIDATED FINANCIAL STATEMENTS (Continued)
NOTE 2—ACCOUNTING POLICIES (Continued)
Income Taxes
The Company recognizes income taxes under the asset and liability method. Under this method, deferred tax assets and liabilities are established for the temporary differences between the accounting basis and the tax basis of the Company's assets and liabilities at enacted tax rates expected to be in effect when the amounts related to such temporary differences are realized or settled.
Earnings Per Share
The Company defines unvested share-based payment awards that contain nonforfeitable rights to dividends as participating securities that are included in computing Earnings Per Share ("EPS") using the two-class method.
The two-class method is an earnings allocation formula that determines earnings per share for each share of common stock and participating securities according to dividends declared and participation rights in undistributed earnings. Under this method, all earnings (distributed and undistributed) are allocated to common shares and participating securities based on their respective rights to receive dividends. Earnings per common share is calculated by dividing earnings allocated to common stockholders by the weighted-average number of common shares outstanding during the period.
Basic EPS excludes dilution and is computed by dividing income allocated to common stockholders by the weighted-average number of common shares outstanding for the period. Diluted EPS reflects the potential dilution that could occur if securities or other contracts to issue common stock were exercised or converted into common stock or resulted in the issuance of common stock that then shared in the earnings of the entity.
75
Table of Contents
PEOPLES FEDERAL BANCSHARES, INC. AND SUBSIDIARIES
NOTES TO THE CONSOLIDATED FINANCIAL STATEMENTS (Continued)
NOTE 2—ACCOUNTING POLICIES (Continued)
Earnings Per Share (Concluded)
The following table sets forth the computation of earnings per share (basic and diluted) for the periods indicated:
| | | | | | | | | | |
| | Years Ended September 30, | |
|---|
| | 2013 | | 2012 | | 2011 | |
|---|
| | (Dollars in thousands, except per
share data)
| |
|---|
Net income applicable to common stock | | $ | 2,285 | | $ | 1,657 | | $ | 3,071 | |
Less: Dividends and undistributed earnings allocated to participating securities | | | (85 | ) | | (34 | ) | | — | |
| | | | | | | | |
Net income allocated to common stock | | $ | 2,200 | | $ | 1,623 | | $ | 3,071 | |
| | | | | | | | |
Average number of common shares issued | | | 6,584,259 | | | 7,141,500 | | | 7,141,500 | |
Less: Average treasury shares | | | — | | | (295,353 | ) | | (17,280 | ) |
Less: Average unallocated ESOP shares | | | (481,963 | ) | | (510,539 | ) | | (544,436 | ) |
Less: Average unvested restricted stock awards | | | (226,555 | ) | | (160,566 | ) | | — | |
| | | | | | | | |
Average number of common shares outstanding used to calculate basic earnings per common share | | | 5,875,741 | | | 6,175,042 | | | 6,579,784 | |
Add: Dilutive effect of unvested restricted stock awards | | | 39,659 | | | 8,676 | | | — | |
| | | | | | | | |
Average number of common shares outstanding used to calculate diluted earnings per common share | | | 5,915,400 | | | 6,183,718 | | | 6,579,784 | |
| | | | | | | | |
Earnings per common share (basic) | | $ | 0.37 | | $ | 0.26 | | $ | 0.47 | |
| | | | | | | | |
Earnings per common share (diluted) | | $ | 0.37 | | $ | 0.26 | | $ | 0.47 | |
| | | | | | | | |
At September 30, 2013 and 2012, stock options to purchase 642,735 and 584,480 shares, respectively, were not included in the computation of diluted earnings per share because to do so would have been antidilutive. There is no dilutive effect at September 30, 2011 as stock options and restricted stock awards were not granted until February 21, 2012.
Recent Accounting Pronouncements
In June 2011, the Financial Accounting Standards Board ("FASB") issued Accounting Standards Update ("ASU") 2011-05, "Comprehensive Income (Topic 220)—Presentation of Comprehensive Income (Topic 220)." The objective of this ASU is to improve the comparability, consistency, and transparency of financial reporting and to increase the prominence of items reported in other comprehensive income. Under this ASU, an entity has the option to present the total of comprehensive income, the components of net income, and the components of other comprehensive income either in a single continuous statement of comprehensive income or in two separate but consecutive statements.
76
Table of Contents
PEOPLES FEDERAL BANCSHARES, INC. AND SUBSIDIARIES
NOTES TO THE CONSOLIDATED FINANCIAL STATEMENTS (Continued)
NOTE 2—ACCOUNTING POLICIES (Continued)
Recent Accounting Pronouncements (Continued)
An entity is required to present each component of net income along with total net income, each component of other comprehensive income along with a total for other comprehensive income, and a total amount for comprehensive income. An entity is required to present on the face of the financial statements reclassification adjustments for items that are reclassified from other comprehensive income to net income in the statement(s) where the components of net income and the components of other comprehensive income are presented.
In December 2011, the FASB issued ASU 2011-12, "Comprehensive Income (Topic 220)—Deferral of the Effective Date for Amendments to the Presentation of Reclassifications of Items Out of Accumulated Other Comprehensive Income in ASU 2011-05," which defers changes in ASU 2011-05 that relate to the presentation of reclassification adjustments. This ASU will allow the FASB to redeliberate whether to present on the face of the financial statements the effects of reclassifications out of accumulated other comprehensive income on the components of net income and other comprehensive income for all periods presented. All other requirements of ASU 2011-05 are not affected by this ASU.
The amendments in both ASU 2011-05 and 2011-12 should be applied retrospectively. The amendments are effective for fiscal years, and interim periods within those years, beginning after December 15, 2011. The required disclosures to the Company's financial statements have been reflected in the accompanying financial statements and footnotes.
In December 2011, the FASB issued ASU 2011-10, "Property, Plant, and Equipment (Topic 360)—Derecognition of in Substance Real Estate," an update to Topic 360, "Property, Plant and Equipment." The objective of the amendments in this ASU is to resolve the diversity in practice about whether the guidance in Subtopic 360-20, "Property, Plant, and Equipment—Real Estate Sales", applies to a parent that ceases to have a controlling financial interest (as described in Subtopic 810-10, "Consolidation—Overall") in a subsidiary that is in substance real estate as a result of default on the subsidiary's nonrecourse debt. This ASU does not address whether the guidance in Subtopic 360-20 would apply to other circumstances when a parent ceases to have a controlling financial interest in a subsidiary that is in substance real estate. Under the amendments of this ASU, when a parent (reporting entity) ceases to have a controlling financial interest (as described in Subtopic 810-10) in a subsidiary that is in substance real estate as a result of default on the subsidiary's nonrecourse debt, the reporting entity should apply the guidance in Subtopic 360-20 to determine whether it should derecognize the in substance real estate. Generally, a reporting entity would not satisfy the requirements to derecognize the in substance real estate before the legal transfer of the real estate to the lender and the extinguishment of the related nonrecourse indebtedness.
That is, even if the reporting entity ceases to have a controlling financial interest under Subtopic 810-10, the reporting entity would continue to include the real estate, debt and the results of the subsidiary's operations in its consolidated financial statements until legal title to the real estate is transferred to legally satisfy the debt. The amendments in this ASU are effective for fiscal years and interim periods beginning on or after June 15, 2012 and should be applied on a prospective basis to deconsolidating events occurring after the effective date. Early adoption is permitted. The adoption of this guidance did not have an impact on the Company's results of operations or financial position.
77
Table of Contents
PEOPLES FEDERAL BANCSHARES, INC. AND SUBSIDIARIES
NOTES TO THE CONSOLIDATED FINANCIAL STATEMENTS (Continued)
NOTE 2—ACCOUNTING POLICIES (Continued)
Recent Accounting Pronouncements (Continued)
In December 2011, the FASB issued ASU 2011-11, "Disclosures about Offsetting Assets and Liabilities," an update to Topic 210, "Balance Sheet." The amendments in this ASU require an entity to disclose information about offsetting and related arrangements to enable users of its financial statements to understand the effect of those arrangements on its financial position. The amendments in this ASU are effective for annual and interim periods beginning on or after January 1, 2013 and should be applied retrospectively for all comparable periods presented. The adoption of this guidance did not have an impact on the Company's results of operations or financial position.
In August 2012, the FASB issued ASU 2011-08, "Intangibles—Goodwill and Other (Topic 350)—Testing Goodwill for Impairment." The objective of the amendments in this ASU is to reduce the cost and complexity of performing an impairment test for indefinite-lived intangible assets by simplifying how an entity tests those assets for impairment and to improve consistency in impairment testing guidance among long-lived asset categories. The amendments permit an entity first to assess qualitative factors to determine whether it is more likely than not that an indefinite-lived intangible asset is impaired as a basis for determining whether it is necessary to perform the quantitative impairment test in accordance with Subtopic 350-30, "Intangibles—Goodwill and Other—General Intangibles Other than Goodwill." The more-likely-than-not threshold is defined as having a likelihood of more than 50 percent. The amendments in this ASU apply to all entities, both public and nonpublic, that have indefinite-lived intangible assets, other than goodwill, reported in their financial statements. The amendments are effective for annual and interim impairment tests performed for fiscal years beginning after September 15, 2012. Early adoption is permitted, including for annual and interim impairment tests performed as of a date before July 27, 2012, if a public entity's financial statements for the most recent annual or interim period have not yet been issued or, for nonpublic entities, have not yet been made available for issuance. The adoption of this guidance did not have an impact on the Company's results of operations or financial position.
In October 2012, the FASB issued ASU 2012-04, "Technical Corrections and Improvements." The amendments in this ASU represent changes to clarify the Codification, correct unintended application of guidance, or make minor improvements to the Codification that are not expected to have a significant effect on current accounting practice or create a significant administrative cost to most entities. Additionally, the amendments will make the Codification easier to understand and the fair value measurement guidance easier to apply by eliminating inconsistencies and providing needed clarifications. The amendments in this Update that will not have transition guidance will be effective upon issuance for both public entities and nonpublic entities. For public entities, the amendments that are subject to the transition guidance will be effective for fiscal periods beginning after December 15, 2012. The adoption of this guidance is not expected to have an impact on the Company's results of operations or financial position.
78
Table of Contents
PEOPLES FEDERAL BANCSHARES, INC. AND SUBSIDIARIES
NOTES TO THE CONSOLIDATED FINANCIAL STATEMENTS (Continued)
NOTE 2—ACCOUNTING POLICIES (Continued)
Recent Accounting Pronouncements (Continued)
In October 2012, the FASB issued ASU 2012-06, "Business Combinations (Topic 805)—Subsequent Accounting for an Indemnification Asset Recognized at the Acquisition Date as a Result of a Government-Assisted Acquisition of a Financial Institution." Accounting for a business combination requires that at each subsequent reporting date, an acquirer measure an indemnification asset on the same basis as the indemnified liability or asset, subject to any contractual limitations on its amount, and, for an indemnification asset that is not subsequently measured at its fair value, management's assessment of the collectibility of the indemnification asset.
The objective of this ASU is to address the diversity in practice about how to interpret the termson the same basis andcontractual limitations when subsequently measuring an indemnification asset recognized in a government-assisted (Federal Deposit Insurance Corporation or National Credit Union Administration) acquisition of a financial institution that includes a loss-sharing agreement (indemnification agreement) and affects all entities that recognize an indemnification asset as a result of a government-assisted acquisition of a financial institution. The amendments in this ASU are effective for fiscal years, and interim periods within those years, beginning on or after December 15, 2012. Early adoption is permitted. The amendments should be applied prospectively to any new indemnification assets acquired after the date of adoption and to indemnification assets existing as of the date of adoption arising from a government-assisted acquisition of a financial institution. The adoption of this guidance did not have an impact on the Company's results of operations or financial position.
In January 2013, the FASB issued ASU 2013-01, "Balance Sheet (Topic 210)—Clarifying the Scope of Disclosures about Offsetting Assets and Liabilities." The amendments in this ASU clarify that the scope of ASU 2011-11 applies to derivatives accounted for in accordance with Topic 815, "Derivatives and Hedging," including bifurcated embedded derivatives, repurchase agreements and reverse repurchase agreements and securities borrowing and securities lending transactions that are either offset in accordance with Section 210-20-45 or Section 815-10-45 or subject to an enforceable master netting arrangement or similar agreement. Entities with other types of financial assets and financial liabilities subject to a master netting arrangement or similar agreement are no longer subject to the disclosure requirements in ASU 2011-11. An entity is required to apply the amendments for fiscal years beginning on or after January 1, 2013 and interim periods within those annual periods. An entity should provide the required disclosures retrospectively for all comparative periods presented. The effective date is the same as the effective date of Update 2011-11. The adoption of this guidance did not have an impact on the Company's results of operations or financial position.
In February 2013, the FASB issued ASU 2013-02, "Other Comprehensive Income (Topic 220)—Reporting of Amounts Reclassified Out of Accumulated Other Comprehensive Income." The amendments in this ASU do not change the current requirements for reporting net income or other comprehensive income in financial statements. However, the amendments require an entity to provide information about the amounts reclassified out of accumulated other comprehensive income by component. In addition, an entity is required to present, either on the face of the statement where net income is presented or in the notes, significant amounts reclassified out of accumulated other comprehensive income by the respective line items of net income but only if the amount reclassified is required under U.S. GAAP to be reclassified to net income in its entirety in the same reporting period.
79
Table of Contents
PEOPLES FEDERAL BANCSHARES, INC. AND SUBSIDIARIES
NOTES TO THE CONSOLIDATED FINANCIAL STATEMENTS (Continued)
NOTE 2—ACCOUNTING POLICIES (Continued)
Recent Accounting Pronouncements (Continued)
For other amounts that are not required under U.S. GAAP to be reclassified in their entirety to net income, an entity is required to cross-reference to other disclosures required under U.S. GAAP that provide additional detail about those amounts. The amendments in this ASU apply to all entities that issue financial statements that are presented in conformity with U.S. GAAP and that report items of other comprehensive income. Public companies are required to comply with these amendments for all reporting periods presented, including interim periods. For public entities, the amendments are effective prospectively for reporting periods beginning after December 15, 2012. The adoption of this guidance did not have an impact the Company's results of operations or financial position.
In February 2013, the FASB issued ASU 2013-04, "Liabilities (Topic 405)—Obligations Resulting From Joint and Several Liability Arrangements for Which the Total Amount of the Obligation is Fixed at the Reporting Date." The amendments in this ASU provide guidance for the recognition, measurement and disclosure of obligations resulting from joint and several liability arrangements for which the total amount of the obligation within the scope of this guidance is fixed at the reporting date, except for obligations addressed within existing guidance in U.S. GAAP. The guidance improves financial reporting for users of financial statements by increasing comparability among the financial statements of entities with obligations within the scope of this ASU and reduces the complexity and cost for preparers of financial statements by providing a specific recognition and measurement model for those liabilities. The amendments are effective for fiscal years, and interim periods within those years, beginning after December 15, 2013. The amendments in this ASU should be applied retrospectively to all prior periods presented for those obligations resulting from joint and severable liability arrangements within the scope of this ASU that exist at the beginning of an entity's fiscal year of adoption. An entity may elect to use hindsight for the comparative periods (if it changed its accounting as a result of adopting the amendments in this ASU) and should disclose that fact. Early adoption is permitted. The adoption of this guidance did not have an impact on the Company's results of operations or financial position.
In March 2013, the FASB issued ASU 2013-05, "Foreign Currency Matters (Topic 830)—Parent's Accounting for the Cumulative Translation Adjustment upon Derecognition of Certain Subsidiaries or Groups of Assets within a Foreign Entity or of an Investment in a Foreign Entity." The amendments in this ASU clarify the applicable guidance for the release of the cumulative translation adjustment under current U.S. GAAP. The amendments resolve the diversity in practice about whether the guidance in Subtopic 830-30 applies to the release of the cumulative translation adjustment when an entity ceases to have a controlling financial interest in a subsidiary or group of assets that is a nonprofit activity or a business (other than a sale of in substance real estate or conveyance of oil and gas mineral rights)within a foreign entity. Likewise, the amendments resolve the diversity in practice about whether Subtopic 830-30 applies to the release of the cumulative translation adjustment when there is a loss of a controlling financial interestin a foreign entity or a step acquisition involving an equity method investment that is a foreign entity. The amendments improve current U.S. GAAP by emphasizing that the accounting for the release of the cumulative translation adjustment into net income for sales or transfers of a controlling financial interestwithin a foreign entity is the same irrespective of whether the sale or transfer is of a subsidiary or a group of assets (other than a sale of in substance real estate or conveyance of oil and gas mineral rights) that is a nonprofit activity or business. The amendments in this ASU are effective prospectively for fiscal years (and interim reporting periods within those years) beginning after December 15, 2013. The amendments should be applied prospectively to derecognition events occurring after the effective date. Prior periods should not be adjusted.
80
Table of Contents
PEOPLES FEDERAL BANCSHARES, INC. AND SUBSIDIARIES
NOTES TO THE CONSOLIDATED FINANCIAL STATEMENTS (Continued)
NOTE 2—ACCOUNTING POLICIES (Continued)
Recent Accounting Pronouncements (Continued)
Early adoption is permitted. If an entity elects to early adopt the amendments, it should apply them as of the beginning of the entity's fiscal year of adoption. The adoption of this guidance did not have an impact on the Company's results of operations or financial position.
In April 2013, the FASB issued ASU 2013-07, "Presentation of Financial Statements (Topic 205)—Liquidation Basis of Accounting." The amendments in this ASU clarify when an entity should apply the liquidation basis of accounting. In addition, the guidance provides principles for the recognition and measurement of assets and liabilities and requirements for financial statements prepared using the liquidation basis of accounting.
The amendments are effective for all entities that issue financial statements that are presented in conformity with U.S. GAAP except investment companies that are regulated under the Investment Company Act of 1940 (the 1940 Act) and are effective for entities that determine liquidation is imminent during annual reporting periods beginning after December 15, 2013, and interim reporting periods therein. Entities should apply the requirements prospectively from the day that liquidation becomes imminent. Early adoption is permitted. Entities that use the liquidation basis of accounting as of the effective date in accordance with other Topics (for example, terminating employee benefit plans) are not required to apply the amendments. Instead, those entities should continue to apply the guidance in those other Topics until they have completed liquidation. The adoption of this guidance did not have any impact on the Company's results of operations or financial position.
In July 2013, the FASB issued ASU 2013-10, "Derivatives and Hedging (Topic 815)—Inclusion of the Fed Funds Effective Swap Rate (or Overnight Index Swap Rate) as a Benchmark Interest Rate for Hedge Accounting Purposes." The amendments in this ASU permit the Fed Funds Effective Swap Rate (OIS) to be used as a U.S. benchmark interest rate for hedge accounting purposes under Topic 815, in addition to Treasury Obligations of the U.S. government (UST) and the London Interbank Offered Rate (LIBOR). The amendments also remove the restriction on using different benchmark rates for similar hedges. The amendments apply to all entities that elect to apply hedge accounting of the benchmark interest rate under Topic 815. The amendments are effective prospectively for qualifying new or redesignated hedging relationships entered into on or after July 17, 2013. The adoption of this ASU did not have an impact on the Company's results of operations or financial position.
In July 2013, the FASB issued ASU 2013-11, "Income Taxes (Topic 740)—Presentation of an Unrecognized Tax Benefit When a Net Operating Loss Carryforward, a Similar Tax Loss, or a Tax Credit Carryforward Exists." The amendments in this ASU provide guidance for the financial statement presentation of an unrecognized tax benefit when a net operating loss carryforward, a similar tax loss, or a tax credit carryforward exists. The amendments in this ASU are expected to reduce diversity in practice by providing guidance on the presentation of unrecognized tax benefits and will better reflect the manner in which an entity would settle at the reporting date any additional income taxes that would result from the disallowance of a tax position when net operating loss carryforwards, similar tax losses, or tax credit carryforwards exist.
81
Table of Contents
PEOPLES FEDERAL BANCSHARES, INC. AND SUBSIDIARIES
NOTES TO THE CONSOLIDATED FINANCIAL STATEMENTS (Continued)
NOTE 2—ACCOUNTING POLICIES (Concluded)
Recent Accounting Pronouncements (Concluded)
The amendments apply to all entities that have unrecognized tax benefits when a net operating loss carryforward, a similar tax loss, or a tax credit carryforward exists at the reporting date and are effective for fiscal years, and interim periods within those years, beginning after December 15, 2013. The adoption of this guidance is not expected to have an impact on the Company's results of operations or financial position.
NOTE 3—SECURITIES
Debt securities have been classified in the consolidated balance sheets according to management's intent. The amortized cost of investment securities and their approximate fair values are as follows:
| | | | | | | | | | | | | |
| | Amortized
Cost | | Gross
Unrealized
Gains | | Gross
Unrealized
Losses | | Fair Value | |
|---|
| | (In thousands)
| |
|---|
September 30, 2013: | | | | | | | | | | | | | |
Securities Available-for-Sale | | | | | | | | | | | | | |
Debt securities issued by U.S. Government corporations and agencies | | $ | 8,000 | | $ | 12 | | $ | 25 | | $ | 7,987 | |
Mortgage-backed securities | | | 6,275 | | | 40 | | | 77 | | | 6,238 | |
| | | | | | | | | | |
Total securities available-for-sale | | $ | 14,275 | | $ | 52 | | $ | 102 | | $ | 14,225 | |
| | | | | | | | | | |
Securities Held-to-Maturity | | | | | | | | | | | | | |
Debt securities issued by U.S. Government corporations and agencies | | $ | 5,000 | | $ | — | | $ | 90 | | $ | 4,910 | |
Mortgage-backed securities | | | 27,054 | | | 287 | | | 146 | | | 27,195 | |
| | | | | | | | | | |
Total securities held-to-maturity | | $ | 32,054 | | $ | 287 | | $ | 236 | | $ | 32,105 | |
| | | | | | | | | | |
| | | | | | | | | | | | | |
| | Amortized
Cost | | Gross
Unrealized
Gains | | Gross
Unrealized
Losses | | Fair Value | |
|---|
| | (In thousands)
| |
|---|
September 30, 2012: | | | | | | | | | | | | | |
Securities Available-for-Sale | | | | | | | | | | | | | |
Debt securities issued by U.S. Government corporations and agencies | | $ | 17,000 | | $ | 57 | | $ | — | | $ | 17,057 | |
Mortgage-backed securities | | | 4,464 | | | 132 | | | — | | | 4,596 | |
| | | | | | | | | | |
Total securities available-for-sale | | $ | 21,464 | | $ | 189 | | $ | — | | $ | 21,653 | |
| | | | | | | | | | |
Securities Held-to-Maturity | | | | | | | | | | | | | |
Mortgage-backed securities | | $ | 25,921 | | $ | 825 | | $ | — | | $ | 26,746 | |
| | | | | | | | | | |
Total securities held-to-maturity | | $ | 25,921 | | $ | 825 | | $ | — | | $ | 26,746 | |
| | | | | | | | | | |
82
Table of Contents
PEOPLES FEDERAL BANCSHARES, INC. AND SUBSIDIARIES
NOTES TO THE CONSOLIDATED FINANCIAL STATEMENTS (Continued)
NOTE 3—SECURITIES (Continued)
As of September 30, 2013 and 2012, all mortgage-backed securities held by the Company were issued by the FHLMC, GNMA or FNMA.
The scheduled maturities of debt securities were as follows as of September 30, 2013. Expected maturities may differ from contractual maturities because borrowers may have the right to call or prepay obligations with or without call or prepayment penalties.
| | | | | | | | | | | | | |
| | Available for Sale | | Held to Maturity | |
|---|
| | Amortized
Cost | | Fair
Value | | Amortized
Cost | | Fair
Value | |
|---|
| | (In thousands)
| |
|---|
Due after 1 year through 5 years | | $ | 8,000 | | $ | 7,987 | | $ | 5,000 | | $ | 4,910 | |
Mortgage-backed securities | | | 6,275 | | | 6,238 | | | 27,054 | | | 27,195 | |
| | | | | | | | | | |
| | $ | 14,275 | | $ | 14,225 | | $ | 32,054 | | $ | 32,105 | |
| | | | | | | | | | |
There were no sales of securities available for sale for the years ended September 30, 2013, 2012 and 2011.
There were no securities of issuers with an amortized cost basis or fair value which exceeded 10% of stockholders' equity as of September 30, 2013 and 2012.
As of September 30, 2013 and 2012, securities with carrying amounts totaling $14,225,000 and $35,393,000, respectively, were pledged to secure FHLB advances.
83
Table of Contents
PEOPLES FEDERAL BANCSHARES, INC. AND SUBSIDIARIES
NOTES TO THE CONSOLIDATED FINANCIAL STATEMENTS (Continued)
NOTE 3—SECURITIES (Concluded)
The aggregate fair value and unrealized losses of securities that have been in a continuous loss position for less than twelve months and for twelve months or longer, and are not other than temporarily impaired, are as follows:
| | | | | | | | | | | | | |
| | Less Than Twelve
Months | | Twelve Months or
Longer | |
|---|
| | Gross
Unrealized
Losses | | Fair
Value | | Gross
Unrealized
Losses | | Fair
Value | |
|---|
| | (In thousands)
| |
|---|
September 30, 2013: | | | | | | | | | | | | | |
Securities Available-for-Sale | | | | | | | | | | | | | |
Debt securities issued by U.S. Government corporations and agencies | | $ | 25 | | $ | 3,976 | | $ | — | | $ | — | |
Mortgage-backed securities | | | 77 | | | 4,929 | | | — | | | — | |
| | | | | | | | | | |
| | $ | 102 | | $ | 8,905 | | $ | — | | $ | — | |
| | | | | | | | | | |
Securities Held-to-Maturity | | | | | | | | | | | | | |
Debt securities issued by U.S. Government corporations and agencies | | $ | 90 | | $ | 4,910 | | $ | — | | $ | — | |
Mortgage-backed securities | | | 146 | | | 8,388 | | | — | | | — | |
| | | | | | | | | | |
| | $ | 236 | | $ | 13,298 | | $ | — | | $ | — | |
| | | | | | | | | | |
At September 30, 2012, there were no debt securities with unrealized losses.
At September 30, 2013, 18 debt securities had unrealized losses for less than twelve months with aggregate depreciation of 1.50% from the amortized cost of these securities.
At September 30, 2013, the unrealized losses on the Company's debt securities issued by U.S. Government corporations and agencies and mortgage-backed securities were attributable to changes in market interest rates. These securities are guaranteed or issued by government-sponsored enterprises with strong credit ratings. The Company does not anticipate selling any of these securities and it is more likely than not that the Company will not be required to sell the securities before recovery of their amortized cost basis or maturity. Based on the review of the investment portfolio, the Company did not consider these securities to be other-than-temporarily impaired at September 30, 2013.
84
Table of Contents
PEOPLES FEDERAL BANCSHARES, INC. AND SUBSIDIARIES
NOTES TO THE CONSOLIDATED FINANCIAL STATEMENTS (Continued)
NOTE 4—LOANS
The loan portfolio consists of the following:
| | | | | | | |
| | September 30, | |
|---|
| | 2013 | | 2012 | |
|---|
| | (In thousands)
| |
|---|
Mortgage loans: | | | | | | | |
Residential loans: | | | | | | | |
One-to four-family | | $ | 308,917 | | $ | 297,412 | |
Multi-family | | | 68,021 | | | 66,651 | |
Commercial real estate | | | 60,467 | | | 64,431 | |
Construction loans | | | 17,148 | | | 11,174 | |
| | | | | | |
Total mortgage loans | | | 454,553 | | | 439,668 | |
Consumer loans | | | 5,359 | | | 6,867 | |
Commercial loans | | | 9,419 | | | 7,823 | |
| | | | | | |
Total loans | | | 469,331 | | | 454,358 | |
Deferred loan origination costs, net | | | 755 | | | 567 | |
Allowance for loan losses | | | (4,037 | ) | | (3,891 | ) |
| | | | | | |
Loans, net | | $ | 466,049 | | $ | 451,034 | |
| | | | | | |
Certain directors and executive officers of the Company and companies in which they have significant ownership interest were customers of the Bank during the years ended September 30, 2013 and 2012.
Information pertaining to the activity of loans to directors and executive officers is as follows:
| | | | | | | |
| | September 30, | |
|---|
| | 2013 | | 2012 | |
|---|
| | (In thousands)
| |
|---|
Balance at beginning of year | | $ | 2,811 | | $ | 2,820 | |
Principal additions | | | 15 | | | 215 | |
Principal payments | | | (171 | ) | | (224 | ) |
| | | | | | |
Balance at end of year | | $ | 2,655 | | $ | 2,811 | |
| | | | | | |
85
Table of Contents
PEOPLES FEDERAL BANCSHARES, INC. AND SUBSIDIARIES
NOTES TO THE CONSOLIDATED FINANCIAL STATEMENTS (Continued)
NOTE 4—LOANS (Continued)
The following tables set forth information regarding the allowance for loan losses and principal of loans by portfolio segment:
| | | | | | | | | | | | | | | | | | | | | | | | | |
| | Year Ended September 30, 2013 | |
|---|
| | Mortgage Loans | | Other | |
| |
| |
|---|
| | Residential Loans | |
| |
| |
| |
| |
| |
| |
|---|
| | One-to Four-
family | | Multi-family | | Commercial
Real Estate | | Construction
Loans | | Consumer
Loans | | Commercial
Loans | | Unallocated | | Total | |
|---|
| | (In thousands)
| |
|---|
Allowance for loan losses: | | | | | | | | | | | | | | | | | | | | | | | | | |
Balance at beginning of period | | $ | 1,847 | | $ | 759 | | $ | 768 | | $ | 134 | | $ | 157 | | $ | 93 | | $ | 133 | | $ | 3,891 | |
Provision (benefit) for loan losses | | | 107 | | | (31 | ) | | (49 | ) | | 115 | | | (57 | ) | | 58 | | | 57 | | | 200 | |
Recoveries of loans previously charged-off | | | 1 | | | — | | | — | | | — | | | 8 | | | 12 | | | — | | | 21 | |
| | | | | | | | | | | | | | | | | | |
| | | 1,955 | | | 728 | | | 719 | | | 249 | | | 108 | | | 163 | | | 190 | | | 4,112 | |
Loans charged off | | | (25 | ) | | — | | | — | | | — | | | (22 | ) | | (28 | ) | | — | | | (75 | ) |
| | | | | | | | | | | | | | | | | | |
Balance at end of period | | $ | 1,930 | | $ | 728 | | $ | 719 | | $ | 249 | | $ | 86 | | $ | 135 | | $ | 190 | | $ | 4,037 | |
| | | | | | | | | | | | | | | | | | |
Individually evaluated for impairment | | $ | — | | $ | — | | $ | — | | $ | — | | $ | — | | $ | — | | $ | — | | $ | — | |
Collectively evaluated for impairment | | | 1,930 | | | 728 | | | 719 | | | 249 | | | 86 | | | 135 | | | 190 | | | 4,037 | |
| | | | | | | | | | | | | | | | | | |
| | $ | 1,930 | | $ | 728 | | $ | 719 | | $ | 249 | | $ | 86 | | $ | 135 | | $ | 190 | | $ | 4,037 | |
| | | | | | | | | | | | | | | | | | |
Loans ending balances: | | | | | | | | | | | | | | | | | | | | | | | | | |
Individually evaluated for impairment | | $ | — | | $ | — | | $ | 303 | | $ | — | | $ | — | | $ | 9 | | | | | $ | 312 | |
Collectively evaluated for impairment | | | 308,917 | | | 68,021 | | | 60,164 | | | 17,148 | | | 5,359 | | | 9,410 | | | | | | 469,019 | |
| | | | | | | | | | | | | | | | | | | |
| | $ | 308,917 | | $ | 68,021 | | $ | 60,467 | | $ | 17,148 | | $ | 5,359 | | $ | 9,419 | | | | | $ | 469,331 | |
| | | | | | | | | | | | | | | | | | | |
| | | | | | | | | | | | | | | | | | | | | | | | | |
| | Year Ended September 30, 2012 | |
|---|
| | Mortgage Loans | | Other | |
| |
| |
|---|
| | Residential Loans | |
| |
| |
| |
| |
| |
| |
|---|
| | One-to Four-
family | | Multi-family | | Commercial
Real Estate | | Construction
Loans | | Consumer
Loans | | Commercial
Loans | | Unallocated | | Total | |
|---|
| | (In thousands)
| |
|---|
Allowance for loan losses: | | | | | | | | | | | | | | | | | | | | | | | | | |
Balance at beginning of period | | $ | 1,550 | | $ | 601 | | $ | 670 | | $ | 292 | | $ | 91 | | $ | 40 | | $ | 127 | | $ | 3,371 | |
Provision (benefit) for loan losses | | | 297 | | | 158 | | | 98 | | | (158 | ) | | 67 | | | 72 | | | 6 | | | 540 | |
Recoveries of loans previously charged-off | | | — | | | — | | | — | | | — | | | 38 | | | 4 | | | — | | | 42 | |
| | | | | | | | | | | | | | | | | | |
| | | 1,847 | | | 759 | | | 768 | | | 134 | | | 196 | | | 116 | | | 133 | | | 3,953 | |
Loans charged off | | | — | | | — | | | — | | | — | | | (39 | ) | | (23 | ) | | — | | | (62 | ) |
| | | | | | | | | | | | | | | | | | |
Balance at end of period | | $ | 1,847 | | $ | 759 | | $ | 768 | | $ | 134 | | $ | 157 | | $ | 93 | | $ | 133 | | $ | 3,891 | |
| | | | | | | | | | | | | | | | | | |
Individually evaluated for impairment | | $ | — | | $ | — | | $ | — | | $ | — | | $ | — | | $ | — | | $ | — | | $ | — | |
Collectively evaluated for impairment | | | 1,847 | | | 759 | | | 768 | | | 134 | | | 157 | | | 93 | | | 133 | | | 3,891 | |
| | | | | | | | | | | | | | | | | | |
| | $ | 1,847 | | $ | 759 | | $ | 768 | | $ | 134 | | $ | 157 | | $ | 93 | | $ | 133 | | $ | 3,891 | |
| | | | | | | | | | | | | | | | | | |
Loans ending balances: | | | | | | | | | | | | | | | | | | | | | | | | | |
Individually evaluated for impairment | | $ | — | | $ | 1,968 | | $ | 1,868 | | $ | — | | $ | — | | $ | 13 | | | | | $ | 3,849 | |
Collectively evaluated for impairment | | | 297,412 | | | 64,683 | | | 62,563 | | | 11,174 | | | 6,867 | | | 7,810 | | | | | | 450,509 | |
| | | | | | | | | | | | | | | | | | | |
| | $ | 297,412 | | $ | 66,651 | | $ | 64,431 | | $ | 11,174 | | $ | 6,867 | | $ | 7,823 | | | | | $ | 454,358 | |
| | | | | | | | | | | | | | | | | | | |
86
Table of Contents
PEOPLES FEDERAL BANCSHARES, INC. AND SUBSIDIARIES
NOTES TO THE CONSOLIDATED FINANCIAL STATEMENTS (Continued)
NOTE 4—LOANS (Continued)
| | | | | | | | | | | | | | | | | | | | | | | | | |
| | Year Ended September 30, 2011 | |
|---|
| | Mortgage Loans | | Other | |
| |
| |
|---|
| | Residential Loans | |
| |
| |
| |
| |
| |
| |
|---|
| | One-to Four-
family | | Multi-family | | Commercial
Real Estate | | Construction
Loans | | Consumer
Loans | | Commercial
Loans | | Unallocated | | Total | |
|---|
| | (In thousands)
| |
|---|
Allowance for loan losses: | | | | | | | | | | | | | | | | | | | | | | | | | |
Balance at beginning of period | | $ | 1,481 | | $ | 502 | | $ | 684 | | $ | 340 | | $ | 42 | | $ | 40 | | $ | 114 | | $ | 3,203 | |
Provision (benefit) for loan losses | | | 215 | | | 99 | | | 29 | | | (48 | ) | | 85 | | | 12 | | | 13 | | | 405 | |
Recoveries of loans previously charged-off | | | — | | | — | | | 3 | | | — | | | 15 | | | 1 | | | — | | | 19 | |
| | | | | | | | | | | | | | | | | | |
| | | 1,696 | | | 601 | | | 716 | | | 292 | | | 142 | | | 53 | | | 127 | | | 3,627 | |
Loans charged off | | | (146 | ) | | — | | | (46 | ) | | — | | | (51 | ) | | (13 | ) | | — | | | (256 | ) |
| | | | | | | | | | | | | | | | | | |
Balance at end of period | | $ | 1,550 | | $ | 601 | | $ | 670 | | $ | 292 | | $ | 91 | | $ | 40 | | $ | 127 | | $ | 3,371 | |
| | | | | | | | | | | | | | | | | | |
Individually evaluated for impairment | | $ | — | | $ | — | | $ | — | | $ | — | | $ | — | | $ | — | | $ | — | | $ | — | |
Collectively evaluated for impairment | | | 1,550 | | | 601 | | | 670 | | | 292 | | | 91 | | | 40 | | | 127 | | | 3,371 | |
| | | | | | | | | | | | | | | | | | |
| | $ | 1,550 | | $ | 601 | | $ | 670 | | $ | 292 | | $ | 91 | | $ | 40 | | $ | 127 | | $ | 3,371 | |
| | | | | | | | | | | | | | | | | | |
Loans ending balances: | | | | | | | | | | | | | | | | | | | | | | | | | |
Individually evaluated for impairment | | $ | — | | $ | — | | $ | 2,590 | | $ | 1,866 | | $ | — | | $ | — | | | | | $ | 4,456 | |
Collectively evaluated for impairment | | | 253,872 | | | 61,881 | | | 69,078 | | | 12,431 | | | 4,583 | | | 4,448 | | | | | | 406,293 | |
| | | | | | | | | | | | | | | | | | | |
| | $ | 253,872 | | $ | 61,881 | | $ | 71,668 | | $ | 14,297 | | $ | 4,583 | | $ | 4,448 | | | | | $ | 410,749 | |
| | | | | | | | | | | | | | | | | | | |
The following tables set forth information regarding non-accrual loans and past-due loans:
| | | | | | | | | | | | | | | | | | | | | | |
| | Age Analysis of Past Due Loans | |
|---|
| | September 30, 2013 | |
|---|
| | 30 - 59 Days
Past Due | | 60 - 89 Days
Past Due | | 90 Days
or More
Past Due | | Total
Past Due | | Current | | Total
Loans | | Total
Non-Accrual
Loans | |
|---|
| | (In thousands)
| |
|---|
Mortgage loans: | | | | | | | | | | | | | | | | | | | | | | |
Residential loans: | | | | | | | | | | | | | | | | | | | | | | |
One-to four-family | | $ | — | | $ | 629 | | $ | 1,846 | | $ | 2,475 | | $ | 306,442 | | $ | 308,917 | | $ | 1,846 | |
Multi-family | | | — | | | — | | | — | | | — | | | 68,021 | | | 68,021 | | | — | |
Commercial real estate | | | — | | | — | | | — | | | — | | | 60,467 | | | 60,467 | | | — | |
Construction loans | | | — | | | — | | | — | | | — | | | 17,148 | | | 17,148 | | | — | |
| | | | | | | | | | | | | | | | |
Total mortgage loans | | | — | | | 629 | | | 1,846 | | | 2,475 | | | 452,078 | | | 454,553 | | | 1,846 | |
Consumer loans | | | 26 | | | 5 | | | — | | | 31 | | | 5,328 | | | 5,359 | | | — | |
Commercial loans | | | 1 | | | — | | | — | | | 1 | | | 9,418 | | | 9,419 | | | — | |
| | | | | | | | | | | | | | | | |
Total | | $ | 27 | | $ | 634 | | $ | 1,846 | | $ | 2,507 | | $ | 466,824 | | $ | 469,331 | | $ | 1,846 | |
| | | | | | | | | | | | | | | | |
87
Table of Contents
PEOPLES FEDERAL BANCSHARES, INC. AND SUBSIDIARIES
NOTES TO THE CONSOLIDATED FINANCIAL STATEMENTS (Continued)
NOTE 4—LOANS (Continued)
| | | | | | | | | | | | | | | | | | | | | | |
| | Age Analysis of Past Due Loans | |
|---|
| | September 30, 2012 | |
|---|
| | 30 - 59 Days
Past Due | | 60 - 89 Days
Past Due | | 90 Days
or More
Past Due | | Total
Past Due | | Current | | Total
Loans | | Total
Non-Accrual
Loans | |
|---|
| | (In thousands)
| |
|---|
Mortgage loans: | | | | | | | | | | | | | | | | | | | | | | |
Residential loans: | | | | | | | | | | | | | | | | | | | | | | |
One-to four-family | | $ | 1,311 | | $ | 526 | | $ | 1,536 | | $ | 3,373 | | $ | 294,039 | | $ | 297,412 | | $ | 1,536 | |
Multi-family | | | — | | | — | | | — | | | — | | | 66,651 | | | 66,651 | | | — | |
Commercial real estate | | | 718 | | | — | | | 1,868 | | | 2,586 | | | 61,845 | | | 64,431 | | | 1,868 | |
Construction loans | | | — | | | — | | | — | | | — | | | 11,174 | | | 11,174 | | | — | |
| | | | | | | | | | | | | | | | |
Total mortgage loans | | | 2,029 | | | 526 | | | 3,404 | | | 5,959 | | | 433,709 | | | 439,668 | | | 3,404 | |
Consumer loans | | | 52 | | | 2 | | | — | | | 54 | | | 6,813 | | | 6,867 | | | — | |
Commercial loans | | | 1 | | | — | | | 13 | | | 14 | | | 7,809 | | | 7,823 | | | 13 | |
| | | | | | | | | | | | | | | | |
Total | | $ | 2,082 | | $ | 528 | | $ | 3,417 | | $ | 6,027 | | $ | 448,331 | | $ | 454,358 | | $ | 3,417 | |
| | | | | | | | | | | | | | | | |
There were no loans 90 days or more past due and still accruing at September 30, 2013 and 2012.
Information about loans that meet the definition of an impaired loan in ASC 310-10-35 is as follows:
| | | | | | | | | | | | | | | | | | | |
| | Years Ended September 30, | |
|---|
| | 2013 | | 2012 | |
|---|
| | Recorded
Investment | | Unpaid
Principal
Balance | | Related
Valuation
Allowance | | Recorded
Investment | | Unpaid
Principal
Balance | | Related
Valuation
Allowance | |
|---|
| | (In thousands)
| |
|---|
Impaired loans without a valuation allowance: | | | | | | | | | | | | | | | | | | | |
Mortgage loans: | | | | | | | | | | | | | | | | | | | |
Residential loans: | | | | | | | | | | | | | | | | | | | |
One-to four-family | | $ | — | | $ | — | | $ | — | | $ | — | | $ | — | | $ | — | |
Multi-family | | | — | | | — | | | — | | | 1,968 | | | 1,968 | | | — | |
Commercial real estate | | | 303 | | | 303 | | | — | | | 1,868 | | | 1,868 | | | — | |
Construction loans | | | — | | | — | | | — | | | — | | | — | | | — | |
Consumer loans | | | — | | | — | | | — | | | — | | | — | | | — | |
Commercial loans | | | 9 | | | 9 | | | — | | | 13 | | | 13 | | | — | |
| | | | | | | | | | | | | | |
| | $ | 312 | | $ | 312 | | $ | — | | $ | 3,849 | | $ | 3,849 | | $ | — | |
| | | | | | | | | | | | | | |
88
Table of Contents
PEOPLES FEDERAL BANCSHARES, INC. AND SUBSIDIARIES
NOTES TO THE CONSOLIDATED FINANCIAL STATEMENTS (Continued)
NOTE 4—LOANS (Continued)
| | | | | | | | | | | | | | | | | | | | | | | | | | | | |
| | Years Ended September 30, | |
|---|
| | 2013 | | 2012 | | 2011 | |
|---|
| |
| | Interest Income
Recognized | |
| | Interest Income
Recognized | |
| | Interest Income
Recognized | |
|---|
| | Average
Recorded
Investment | | Total | | Cash Basis | | Average
Recorded
Investment | | Total | | Cash Basis | | Average
Recorded
Investment | | Total | | Cash Basis | |
|---|
| | (In thousands)
| |
|---|
Impaired loans without a valuation allowance: | | | | | | | | | | | | | | | | | | | | | | | | | | | | |
Mortgage loans: | | | | | | | | | | | | | | | | | | | | | | | | | | | | |
Residential loans: | | | | | | | | | | | | | | | | | | | | | | | | | | | | |
One-to four-family | | $ | — | | $ | — | | $ | — | | $ | — | | $ | — | | $ | — | | $ | 875 | | $ | 45 | | $ | — | |
Multi-family | | | 635 | | | 36 | | | — | | | 1,977 | | | 92 | | | — | | | — | | | — | | | — | |
Commercial real estate | | | 941 | | | 76 | | | 68 | | | 2,090 | | | 59 | | | 57 | | | 2,734 | | | 120 | | | 1 | |
Construction loans | | | 12 | | | 1 | | | — | | | — | | | — | | | — | | | 1,493 | | | 90 | | | — | |
Consumer loans | | | — | | | — | | | — | | | — | | | — | | | — | | | — | | | — | | | — | |
Commercial loans | | | 12 | | | 1 | | | — | | | 1 | | | — | | | — | | | — | | | — | | | — | |
| | | | | | | | | | | | | | | | | | | | |
| | $ | 1,600 | | $ | 114 | | $ | 68 | | $ | 4,068 | | $ | 151 | | $ | 57 | | $ | 5,102 | | $ | 255 | | $ | 1 | |
| | | | | | | | | | | | | | | | | | | | |
At September 30, 2013 and 2012, and during the years then ended, there were no impaired loans with a valuation allowance. No additional funds were committed to be advanced to borrowers with impaired loans as of September 30, 2013.
The following table sets forth information pertaining to troubled debt restructurings entered into during the period indicated:
| | | | | | | | | | | | | | | | | | | |
| | Years Ended September 30, | |
|---|
| | 2013 | | 2012 | |
|---|
| | Number of
Contracts | | Pre-
modification
Outstanding
Recorded
Investment | | Post-
modification
Outstanding
Recorded
Investment | | Number of
Contracts | | Pre-
modification
Outstanding
Recorded
Investment | | Post-
modification
Outstanding
Recorded
Investment | |
|---|
| | (Dollars in thousands)
| | (Dollars in thousands)
| |
|---|
Troubled Debt Restructurings: | | | | | | | | | | | | | | | | | | | |
Multi-family | | | 1 | | $ | 522 | | $ | — | | | 1 | | $ | 1,816 | | $ | 1,802 | |
Commercial real estate | | | 1 | | | 303 | | | 303 | | | — | | | — | | | — | |
Construction | | | 1 | | | 79 | | | — | | | — | | | — | | | — | |
| | | | | | | | | | | | | | |
| | | 3 | | $ | 904 | | $ | 303 | | | 1 | | $ | 1,816 | | $ | 1,802 | |
| | | | | | | | | | | | | | |
During the year ended September 30, 2013, the Company modified three loans as part of TDRs. The Company advanced $79,000 in additional funds to complete construction on three remaining units of an existing multi-family condominium loan with an outstanding balance of $522,000. During the quarter ended March 31, 2013, the multi-family and construction loans paid off and all delinquent principal and interest was recovered. In addition, the Company modified an existing accruing commercial real estate loan with an outstanding balance of $303,000. In this case, the Company capitalized all past due interest and provided for interest only for four months. At September 30, 2013, this loan was accruing and performing in accordance with its modified terms and conditions. There were no TDR agreements entered into during the year ended September 30, 2013 that subsequently defaulted. TDRs outstanding at September 30, 2012 paid off during the year ended September 30, 2013.
89
Table of Contents
PEOPLES FEDERAL BANCSHARES, INC. AND SUBSIDIARIES
NOTES TO THE CONSOLIDATED FINANCIAL STATEMENTS (Continued)
NOTE 4—LOANS (Continued)
During the year ended September 30, 2012, the Company extended and reclassified an accruing TDR construction loan in the amount of $1,816,000, to an accruing multi-family residential TDR mortgage loan, due to the completion of construction. At September 30, 2012, this loan was accruing and performing in accordance with its modified terms and conditions. There were no TDR agreements entered into during the year ended September 30, 2012, that subsequently defaulted.
There were no TDR agreements entered into during the year ended September 30, 2011.
At September 30, 2013, TDRs amounted to $303,000 and consisted of one commercial real estate loan, noted above, that was accruing and performing in accordance with its modified terms and conditions.
At September 30, 2012, TDRs amounted to $3,670,000 and consisted of one loan with a balance of $1,802,000, as described above, and one commercial real estate loan with a balance of $1,868,000 that was modified prior to September 30, 2011. In this case, the loan modification was due to an extension of maturity for a borrower experiencing financial difficulty. At September 30, 2012, this loan was not performing in accordance with the TDR agreement and was placed on non-accrual.
At September 30, 2013 and 2012, none of the allowance for loan losses was allocated to TDRs and the impact of the identification of these loans as TDRs did not have a material impact on the allowance.
There were no commitments to lend additional funds to borrowers with troubled debt restructured loans at September 30, 2013.
Credit Quality Indicators
The Company utilizes an eight grade internal loan risk rating system for loans as follows:
Loans rated 1 - 4: Loans in these categories are considered "pass" loans with low to average risk.
Loans rated 5: Loans in this category are considered "special mention." These loans are starting to show signs of potential weakness and are being closely monitored by management.
Loans rated 6: Loans in this category are considered "substandard." Generally, a loan is considered substandard if it is inadequately protected by the current net worth and paying capacity of the obligors and/or the collateral pledged. There is a distinct possibility that the Company will sustain some loss if the weakness is not corrected.
Loans rated 7: Loans in this category are considered "doubtful." Loans classified as doubtful have all the weaknesses inherent in those classified substandard with the added characteristic that the weaknesses make collection or liquidation in full, on the basis of currently existing facts, highly questionable and improbable.
Loans rated 8: Loans in this category are considered uncollectible "loss" and of such little value that their continuance as loans is not warranted.
On an annual basis, or more often if needed, the Company formally reviews the loan risk rating on all multi-family, commercial real estate, construction and commercial loans. At least annually, the Company engages an independent third-party to review a significant portion of loans within these loan segments. Management uses the results of the independent review as part of its annual review process.
90
Table of Contents
PEOPLES FEDERAL BANCSHARES, INC. AND SUBSIDIARIES
NOTES TO THE CONSOLIDATED FINANCIAL STATEMENTS (Continued)
NOTE 4—LOANS (Continued)
For all residential real estate and consumer loans, the Company initially assesses credit quality based upon the borrower's ability to service the debt and subsequently monitors these loans based upon the borrower's payment activity.
The following tables present the Company's loans by risk rating:
| | | | | | | | | | | | | | | | | | | | | | |
| | Credit Risk Profile by Credit Worthiness Category | |
|---|
| | September 30, 2013 | |
|---|
| | One-to Four-
family | | Multi-
Family | | Commercial
Real Estate | | Construction
Loans | | Consumer
Loans | | Commercial
Loans | | Total | |
|---|
| | (In thousands)
| |
|---|
Pass | | $ | 306,055 | | $ | 68,021 | | $ | 57,581 | | $ | 17,148 | | $ | 5,359 | | $ | 8,710 | | $ | 462,874 | |
Special Mention | | | — | | | — | | | 1,657 | | | — | | | — | | | 700 | | | 2,357 | |
Substandard | | | 2,862 | | | — | | | 1,229 | | | — | | | — | | | 9 | | | 4,100 | |
Doubtful | | | — | | | — | | | — | | | — | | | — | | | — | | | — | |
Loss | | | — | | | — | | | — | | | — | | | — | | | — | | | — | |
| | | | | | | | | | | | | | | | |
Total | | $ | 308,917 | | $ | 68,021 | | $ | 60,467 | | $ | 17,148 | | $ | 5,359 | | $ | 9,419 | | $ | 469,331 | |
| | | | | | | | | | | | | | | | |
| | | | | | | | | | | | | | | | | | | | | | |
| | Credit Risk Profile by Credit Worthiness Category | |
|---|
| | September 30, 2012 | |
|---|
| | One-to Four-
family | | Multi-Family | | Commercial Real Estate | | Construction
Loans | | Consumer
Loans | | Commercial
Loans | | Total | |
|---|
| | (In thousands)
| |
|---|
Pass | | $ | 294,917 | | $ | 61,943 | | $ | 53,609 | | $ | 9,646 | | $ | 6,867 | | $ | 7,210 | | $ | 434,192 | |
Special Mention | | | — | | | 1,969 | | | 6,449 | | | 1,528 | | | — | | | 600 | | | 10,546 | |
Substandard | | | 2,495 | | | 2,739 | | | 4,373 | | | — | | | — | | | 13 | | | 9,620 | |
Doubtful | | | — | | | — | | | — | | | — | | | — | | | — | | | — | |
Loss | | | — | | | — | | | — | | | — | | | — | | | — | | | — | |
| | | | | | | | | | | | | | | | |
Total | | $ | 297,412 | | $ | 66,651 | | $ | 64,431 | | $ | 11,174 | | $ | 6,867 | | $ | 7,823 | | $ | 454,358 | |
| | | | | | | | | | | | | | | | |
Mortgage loans serviced for others are not included in the accompanying consolidated balance sheets. The risks inherent in mortgage servicing assets relate primarily to changes in prepayments that result from shifts in mortgage interest rates. As of September 30, 2013 and 2012, the Company serviced loans for others with unpaid principal balances of $36,073,000 and $42,532,000, respectively.
91
Table of Contents
PEOPLES FEDERAL BANCSHARES, INC. AND SUBSIDIARIES
NOTES TO THE CONSOLIDATED FINANCIAL STATEMENTS (Continued)
NOTE 4—LOANS (Concluded)
The following summarizes mortgage servicing rights capitalized and amortized, along with the aggregate activity in the related valuation allowance:
| | | | | | | | | | |
| | Years Ended September 30, | |
|---|
| | 2013 | | 2012 | | 2011 | |
|---|
| | (In thousands)
| |
|---|
Mortgage servicing rights: | | | | | | | | | | |
Balance, beginning of period | | $ | 133 | | $ | 182 | | $ | 189 | |
Capitalized | | | 86 | | | 47 | | | 78 | |
Amortization | | | (78 | ) | | (96 | ) | | (85 | ) |
| | | | | | | | |
Balance, end of period | | | 141 | | | 133 | | | 182 | |
| | | | | | | | |
Valuation allowance: | | | | | | | | | | |
Balance, beginning of period | | $ | 20 | | $ | 23 | | $ | 31 | |
Additions | | | 3 | | | 30 | | | 22 | |
Reductions | | | (19 | ) | | (33 | ) | | (30 | ) |
| | | | | | | | |
Balance, end of period | | | 4 | | | 20 | | | 23 | |
| | | | | | | | |
Mortgage servicing rights, net | | $ | 137 | | $ | 113 | | $ | 159 | |
| | | | | | | | |
Fair value of mortgage servicing rights | | $ | 259 | | $ | 178 | | $ | 260 | |
| | | | | | | | |
NOTE 5—PREMISES AND EQUIPMENT
A summary of the cost and accumulated depreciation and amortization of premises and equipment is as follows:
| | | | | | | | |
| | September 30, | |
|
|---|
| | Estimated Useful Life |
|---|
| | 2013 | | 2012 |
|---|
| | (In thousands)
| |
|
|---|
Land | | $ | 566 | | $ | 566 | | N/A |
Building and building improvements | | | 6,088 | | | 6,026 | | 3 - 42 years |
Furniture and equipment | | | 2,844 | | | 2,764 | | 1 - 10 years |
Leasehold improvements | | | 967 | | | 965 | | 5 - 10 years |
Construction in progress | | | 170 | | | 18 | | N/A |
| | | | | | | |
| | | 10,635 | | | 10,339 | | |
Accumulated depreciation and amortization | | | (7,170 | ) | | (6,762 | ) | |
| | | | | | | |
| | $ | 3,465 | | $ | 3,577 | | |
| | | | | | | |
At September 30, 2013 and 2012, construction in progress represents costs incurred for the design and construction of a new branch in Westwood, Massachusetts. At September 30, 2013, outstanding commitments related to the construction amounted to $368,000.
92
Table of Contents
PEOPLES FEDERAL BANCSHARES, INC. AND SUBSIDIARIES
NOTES TO THE CONSOLIDATED FINANCIAL STATEMENTS (Continued)
NOTE 6—DEPOSITS
The aggregate amount of term certificates in denominations of $100,000 or more as of September 30, 2013 and 2012 was $57,789,000 and $58,490,000, respectively. Generally, deposits in excess of $250,000 are not federally insured.
Maturities of term certificates for each of the years ending after September 30 are as follows:
| | | | | | | | | | | | | |
| | September 30, | |
|---|
| | 2013 | | 2012 | |
|---|
| | Amount | | Weighted
Average
Rate | | Amount | | Weighted
Average
Rate | |
|---|
| | (Dollars in thousands)
| |
|---|
Within 1 year | | $ | 88,385 | | | 0.82 | % | $ | 91,976 | | | 0.94 | % |
Over 1 year to 2 years | | | 20,458 | | | 1.17 | | | 22,836 | | | 1.39 | |
Over 2 years to 3 years | | | 3,743 | | | 1.13 | | | 7,522 | | | 1.66 | |
Over 3 years to 4 years | | | 6,036 | | | 1.67 | | | 1,371 | | | 1.45 | |
Over 4 years to 5 years | | | 2,206 | | | 1.37 | | | 4,042 | | | 1.90 | |
| | | | | | | | | | | | |
| | $ | 120,828 | | | 0.94 | % | $ | 127,747 | | | 1.10 | % |
| | | | | | | | | | | | |
Deposits from related parties held by the Company as of September 30, 2013 and 2012 amounted to $5,204,000 and $5,335,000, respectively.
NOTE 7—SHORT-TERM BORROWINGS
Federal Home Loan Bank Advances
FHLB advances with original maturities of one year or less amounted to $6,000,000 and $8,000,000, respectively, at September 30, 2013 and 2012 with a weighted average interest rate of 0.36% and 0.34%, respectively.
The Company also has an available line of credit of $296,000 with the FHLB at an interest rate that adjusts daily. Borrowings under the line are limited to 2% of the Bank's total assets. At September 30, 2013 and 2012, there were no outstanding borrowings under this line of credit.
Bankers Bank Northeast
The Company has an available line of credit of $5,000,000 with Bankers Bank Northeast at an interest rate that adjusts daily. At September 30, 2013 and 2012, there were no outstanding borrowings under this line of credit.
93
Table of Contents
PEOPLES FEDERAL BANCSHARES, INC. AND SUBSIDIARIES
NOTES TO THE CONSOLIDATED FINANCIAL STATEMENTS (Continued)
NOTE 8—LONG-TERM DEBT
Long-term debt at September 30, 2013 and 2012 consists of the following fixed-rate FHLB advances with original maturities greater than one year:
| | | | | | | | | | | | | |
| | September 30, | |
|---|
| | 2013 | | 2012 | |
|---|
| | Amount | | Weighted
Average
Rate | | Amount | | Weighted
Average
Rate | |
|---|
| | (Dollars in thousands)
| |
|---|
Advances maturing: | | | | | | | | | | | | | |
2013 | | $ | — | | | — | % | $ | 3,000 | (a) | | 3.16 | % |
2014 | | | 12,000 | | | 2.77 | | | 12,000 | | | 2.77 | |
2015 | | | 4,000 | | | 0.84 | | | — | | | — | |
2016 | | | 12,000 | | | 1.19 | | | 4,000 | | | 1.04 | |
2017 | | | 7,000 | | | 1.30 | | | 3,000 | | | 1.96 | |
2018 | | | 3,000 | | | 1.93 | | | 3,000 | | | 1.93 | |
| | | | | | | | | | | | |
Total FHLB Advances | | $ | 38,000 | | | 1.73 | % | $ | 25,000 | | | 2.34 | % |
| | | | | | | | | | | | |
- (a)
- Includes a $1,000,000 advance, callable quarterly, with a rate of 5.49% that matured on August 19, 2013.
Advances from the FHLB are secured by a blanket lien on qualified collateral, defined principally as 75% of the carrying value of first mortgage loans on owner-occupied residential property and 95% of the market value of U.S. Government, government sponsored enterprises and mortgage-backed securities obligations, except for FHLMC and FNMA issued mortgage-backed securities which are at 90% of market value.
NOTE 9—LEASE COMMITMENTS
The Company is obligated under non-cancelable operating lease commitments for bank premises expiring in February 2016 and June 2021. The leases are reported under the straight-line method under the terms of the agreement. The leases contain renewal options. The cost of such renewals is not included below. Lease expense, excluding applicable real estate taxes and operating cost charges, was $147,000, $146,000, and $89,000 for the years ended September 30, 2013, 2012 and 2011, respectively.
The required future minimum lease payments under the terms of the lease agreements noted above are as follows at September 30, 2013:
| | | | |
Years Ending September 30, | | Amount | |
|---|
| | (In thousands)
| |
|---|
2014 | | $ | 145 | |
2015 | | | 145 | |
2016 | | | 104 | |
2017 | | | 75 | |
2018 | | | 76 | |
Thereafter | | | 215 | |
| | | | |
| | $ | 760 | |
| | | | |
94
Table of Contents
PEOPLES FEDERAL BANCSHARES, INC. AND SUBSIDIARIES
NOTES TO THE CONSOLIDATED FINANCIAL STATEMENTS (Continued)
NOTE 9—LEASE COMMITMENTS (Concluded)
The Company has also entered into a lease agreement as part of its branch expansion into Westwood, Massachusetts. The lease term is 10 years, with four renewal options. Each renewal option is five years. Under the lease agreement, the lease payments on the new Westwood branch do not commence until occupancy is established and are not included in the prior schedule of future minimum lease payments. Once occupancy is established, the annual lease expense will be $55,200. The new branch is expected to open during the second quarter of the Company's 2014 fiscal year.
NOTE 10—INCOME TAXES
The components of provision for income tax are as follows:
| | | | | | | | | | |
| | Years Ended September 30, | |
|---|
| | 2013 | | 2012 | | 2011 | |
|---|
| | (In thousands)
| |
|---|
Current: | | | | | | | | | | |
Federal | | $ | 1,480 | | $ | 1,460 | | $ | 1,459 | |
State | | | 411 | | | 475 | | | 483 | |
| | | | | | | | |
Total current provision | | | 1,891 | | | 1,935 | | | 1,942 | |
| | | | | | | | |
Deferred: | | | | | | | | | | |
Federal | | | (194 | ) | | (315 | ) | | (66 | ) |
State | | | (56 | ) | | (91 | ) | | (19 | ) |
Change in valuation allowance | | | 30 | | | 991 | | | — | |
| | | | | | | | |
Total deferred (benefit) provision | | | (220 | ) | | 585 | | | (85 | ) |
| | | | | | | | |
Total provision for income tax | | $ | 1,671 | | $ | 2,520 | | $ | 1,857 | |
| | | | | | | | |
The reasons for the differences between the statutory federal income tax rate and the effective tax rates are summarized as follows:
| | | | | | | | | | |
| | Years Ended
September 30, | |
|---|
| | 2013 | | 2012 | | 2011 | |
|---|
Federal income tax at statutory rate | | | 34.0 | % | | 34.0 | % | | 34.0 | % |
Increase (decrease) resulting from: | | | | | | | | | | |
State taxes, net of federal tax | | | 5.9 | | | 6.1 | | | 6.2 | |
Cash surrender value of bank owned life insurance | | | (5.5 | ) | | (5.3 | ) | | (3.7 | ) |
Change in valuation allowance | | | 0.8 | | | 23.7 | | | — | |
Stock-based compensation | | | 2.8 | | | 1.7 | | | — | |
ESOP | | | 1.9 | | | 1.3 | | | 0.7 | |
Other, net | | | 2.3 | | | (1.2 | ) | | 0.5 | |
| | | | | | | | |
Effective tax rate | | | 42.2 | % | | 60.3 | % | | 37.7 | % |
| | | | | | | | |
95
Table of Contents
PEOPLES FEDERAL BANCSHARES, INC. AND SUBSIDIARIES
NOTES TO THE CONSOLIDATED FINANCIAL STATEMENTS (Continued)
NOTE 10—INCOME TAXES (Continued)
The Company had gross deferred tax assets and gross deferred tax liabilities as follows as of September 30:
| | | | | | | |
| | 2013 | | 2012 | |
|---|
| | (In thousands)
| |
|---|
Deferred tax assets: | | | | | | | |
Depreciation | | $ | 495 | | $ | 421 | |
Allowance for loan losses | | | 1,613 | | | 1,554 | |
Contribution to Peoples Federal Savings Bank Charitable Foundation | | | 1,523 | | | 1,702 | |
ESOP | | | 139 | | | 111 | |
Restricted stock awards | | | 278 | | | 232 | |
Stock options | | | 96 | | | 38 | |
Net unrealized holding loss on securities available-for-sale | | | 20 | | | — | |
Director and executive retirement agreements and deferred compensation plans | | | 2,527 | | | 2,247 | |
Other | | | 179 | | | 186 | |
| | | | | | |
Gross deferred tax assets | | | 6,870 | | | 6,491 | |
Valuation allowance | | | (1,021 | ) | | (991 | ) |
| | | | | | |
Gross deferred tax assets, net of valuation allowance | | | 5,849 | | | 5,500 | |
| | | | | | |
Deferred tax liabilities: | | | | | | | |
Mortgage servicing rights | | | (55 | ) | | (45 | ) |
Deferred loan costs, net | | | (302 | ) | | (226 | ) |
Net unrealized holding gain on securities available-for-sale | | | — | | | (76 | ) |
Net unrealized holding gain on trading securities | | | (60 | ) | | (37 | ) |
| | | | | | |
Gross deferred tax liabilities | | | (417 | ) | | (384 | ) |
| | | | | | |
Net deferred tax asset | | $ | 5,432 | | $ | 5,116 | |
| | | | | | |
In connection with its initial public offering, the Company donated common stock in the amount of $5.3 million to the Peoples Federal Savings Bank Charitable Foundation, Inc. (the "Foundation"), which resulted in a tax benefit of $2.2 million.
As of September 30, 2013 and 2012, the Company established a valuation reserve of $1,021,000 and $991,000, respectively, against deferred tax assets related to the uncertain utilization of the charitable contribution carryforward created primarily by the donation to the Foundation. The judgment applied by management considers the likelihood that sufficient taxable income will be realized within the carryforward period in light of its tax planning strategies and changes in market conditions.
The charitable contribution carryforward of $3.8 million at September 30, 2013 expires in 2015 and the related tax benefit, net of the valuation allowance, included in net deferred tax assets is $502,000.
96
Table of Contents
PEOPLES FEDERAL BANCSHARES, INC. AND SUBSIDIARIES
NOTES TO THE CONSOLIDATED FINANCIAL STATEMENTS (Continued)
NOTE 10—INCOME TAXES (Concluded)
The federal income tax reserve for loan losses at the Company's base year is approximately $3,444,000. If any portion of the reserve is used for purposes other than to absorb loan losses, approximately 150% of the amount actually used, limited to the amount of the reserve, would be subject to taxation in the fiscal year in which used. As the Bank intends to use the reserve to absorb only loan losses, a deferred tax liability of approximately $1,376,000 has not been provided.
It is the Company's policy to provide for uncertain tax positions and the related interest and penalties based upon management's assessment of whether a tax benefit is more likely than not to be sustained upon examination by tax authorities. As of September 30, 2013 and 2012, there were no material uncertain tax positions related to federal and state income tax matters. The Company is currently open to audit under statute of limitations by the Internal Revenue Service and state taxing authorities for the years ended September 30, 2010 through September 30, 2013.
NOTE 11—OFF-BALANCE SHEET ACTIVITIES
Credit Related Financial Instruments
The Company is party to financial instruments with off-balance sheet risk in the normal course of business to meet the financing needs of its customers. These financial instruments include commitments to originate loans, unadvanced funds on loans and standby letters of credit. The instruments involve, to varying degrees, elements of credit risk in excess of the amount recognized in the consolidated balance sheets. The contract amounts of those instruments reflect the extent of involvement the Company has in particular classes of financial instruments.
The Company's exposure to credit loss in the event of nonperformance by the other party to the financial instrument for loan commitments is represented by the contractual amounts of those instruments. The Bank uses the same credit policies in making commitments and conditional obligations as it does for on-balance sheet instruments.
Commitments to originate loans are agreements to lend to a customer provided there is no violation of any condition established in the contract. Commitments generally have fixed expiration dates or other termination clauses and may require payment of a fee. Since many of the commitments are expected to expire without being drawn upon, the total commitment amounts do not necessarily represent future cash requirements. The Company evaluates each customer's creditworthiness on a case-by-case basis. The amount of collateral obtained, if deemed necessary by the Company upon extension of credit, is based on management's credit evaluation of the borrower. Collateral held varies, but may include secured interests in mortgages, accounts receivable, inventory, property, plant and equipment and income-producing properties. Standby letters of credit are contingent commitments issued by the Company to support the financial obligations of a customer to a third party. The credit risk involved in issuing letters of credit is the same as that involved in extending loans to customers. The Company's outstanding letters of credit have maturities that reflect the maturities of the underlying obligations. The Company holds various forms of collateral to support the letters of credit. In the event the customer does not perform their obligation, the Company may be called upon to fund the customer's letter of credit.
97
Table of Contents
PEOPLES FEDERAL BANCSHARES, INC. AND SUBSIDIARIES
NOTES TO THE CONSOLIDATED FINANCIAL STATEMENTS (Continued)
NOTE 11—OFF-BALANCE SHEET ACTIVITIES (Concluded)
Credit Related Financial Instruments (Concluded)
Notional amounts of financial instrument liabilities with off-balance sheet credit risk are as follows:
| | | | | | | |
| | September 30, | |
|---|
| | 2013 | | 2012 | |
|---|
| | (In thousands)
| |
|---|
Commitments to originate loans | | $ | 7,253 | | $ | 6,475 | |
Unadvanced portions of loans: | | | | | | | |
Construction loans | | | 6,719 | | | 2,828 | |
Commercial real estate lines of credit | | | 6,964 | | | 5,373 | |
Home equity lines of credit | | | 15,612 | | | 16,408 | |
Consumer loans | | | 638 | | | 632 | |
Commercial loans | | | 4,003 | | | 4,242 | |
Standby letters of credit | | | 66 | | | — | |
| | | | | | |
| | $ | 41,255 | | $ | 35,958 | |
| | | | | | |
There is no material difference between the notional amount and the estimated fair value of the off-balance sheet liabilities.
Employment Agreements
The Company and the Bank have each entered into employment agreements with three executive officers and the Company has entered into an additional employment agreement ("Agreements") with another executive officer. The Agreements with the executive officers each provide for three-year terms, subject to annual renewal by the Board of Directors for an additional year beyond the then-current expiration date, and with respect to the Agreements with the Company, subject to daily renewals, with annual review by the Board of Directors. The Agreements also provide for participation in incentive compensation programs and other employee benefits.
Upon termination of an executive's employment for cause, as defined in each of the Agreements, the executive will receive no further compensation or benefits under the agreement. If the executive terminates without cause or if the executive terminates voluntarily under specified circumstances that constitute good reason (as defined in the Agreements), the executive will be entitled to the base salary and incentive compensation and the value of all employee benefits that would have been provided for the remaining term of the Agreements had the executive's employment not terminated. Such amounts would be paid in a lump sum payment.
Under the terms of the Agreements, upon the occurrence of a change in control, as defined in the Agreements, followed by executive termination of employment, the Company shall pay the executive, as severance pay or liquidated damages, or both, the greater of (1) the executive's base salary and incentive compensation that would have been paid to executive for the remaining term of the Agreement plus the value of all employee benefits that would have been provided to executive for the remaining term of the Agreement, or (2) three times the executive's average annual compensation over the five most recently completed calendar years ending with the year immediately preceding the effective date of the change in control, payable in a lump sum, plus certain continued benefits for three years or payment equal to the cost of providing such benefits.
98
Table of Contents
PEOPLES FEDERAL BANCSHARES, INC. AND SUBSIDIARIES
NOTES TO THE CONSOLIDATED FINANCIAL STATEMENTS (Continued)
NOTE 12—FAIR VALUE MEASUREMENTS
Fair Value Hierarchy
ASC 820-10, "Fair Value Measurements and Disclosures," provides a framework for measuring fair value under generally accepted accounting principles. This guidance also allows an entity the irrevocable option to elect fair value for the initial and subsequent measurement for certain financial assets and liabilities on a contract-by-contract basis.
In accordance with ASC 820-10, the Company groups its financial assets and financial liabilities measured at fair value in three levels, based on the markets in which the assets and liabilities are traded and the reliability of the assumptions used to determine fair value.
A financial instrument's level within the fair value hierarchy is based on the lowest level of input that is significant to the fair value measurement.
A description of the valuation methodologies used for instruments measured at fair value, as well as the general classification of such instruments pursuant to the valuation hierarchy, is set forth below. These valuation methodologies were applied to all of the Company's financial assets and financial liabilities carried at fair value for September 30, 2013 and 2012.
The Company's cash instruments and trading securities are generally classified within level 1 or level 2 of the fair value hierarchy because they are valued using quoted market prices, broker or dealer quotations, or alternative pricing sources with reasonable levels of price transparency.
The Company's investment in securities available-for-sale is generally classified within level 2 of the fair value hierarchy. For these securities, the Company obtains fair value measurements from independent pricing services. The fair value measurements consider observable data that may include dealer quotes, market spreads, cash flows, the U.S. treasury yield curve, trading levels, market consensus prepayment speeds, credit information and the instrument's terms and conditions.
Level 3 is for positions that are not traded in active markets or are subject to transfer restrictions, valuations are adjusted to reflect illiquidity and/or non-transferability, and such adjustments are generally based on available market evidence. In the absence of such evidence, management's best estimate is used.
Subsequent to inception, management only changes level 3 inputs and assumptions when corroborated by evidence such as transactions in similar instruments, completed or pending third-party transactions in the underlying investment or comparable entities, subsequent rounds of financing, recapitalization and other transactions across the capital structure, offerings in the equity or debt markets, and changes in financial ratios or cash flows.
The Company's impaired loans are reported at the fair value of the underlying collateral if repayment is expected solely from the collateral. Collateral values are estimated using level 2 inputs based upon appraisals of similar properties obtained from a third party.
Other real estate owned values are estimated using level 2 inputs based upon appraisals of similar properties obtained from a third party. For level 3 inputs fair values are based on management's estimates.
99
Table of Contents
PEOPLES FEDERAL BANCSHARES, INC. AND SUBSIDIARIES
NOTES TO THE CONSOLIDATED FINANCIAL STATEMENTS (Continued)
NOTE 12—FAIR VALUE MEASUREMENTS (Continued)
Fair Value of Financial Instruments
ASC 825, "Financial Instruments," requires that the Company disclose estimated fair value for its financial instruments. Fair value methods and assumptions used by the Company in estimating its fair value disclosures are as follows:
Cash and cash equivalents: The carrying amounts reported in the balance sheet for cash and cash equivalents approximate fair value, as they do not present unanticipated valuation risk.
Securities (including mortgage-backed securities): Fair values for securities are based on quoted market prices, where available. If quoted market prices are not available, fair values are based on quoted market prices of comparable instruments.
Loans held-for-sale: Fair values for loans held-for-sale are estimated based on outstanding investor commitments, or in the absence of such commitments, are based on current investor yield requirements.
Loans receivable: For variable-rate loans that reprice frequently and with no significant change in credit risk, fair values are based on carrying values. The fair values for other loans are estimated using discounted cash flow analyses, using interest rates currently being offered for loans with similar terms to borrowers of similar credit quality.
Accrued interest receivable: The carrying amount approximates fair value.
Deposit liabilities: The fair values disclosed for demand deposits (e.g., interest and non-interest checking, passbook savings and money market accounts) are, by definition, equal to the amount payable on demand at the reporting date (i.e., their carrying amounts). Fair values for fixed-rate certificates of deposit are estimated using a discounted cash flow calculation that applies interest rates currently being offered on certificates to a schedule of aggregated expected monthly maturities on time deposits.
Short-term borrowings: The carrying amount of short-term borrowings approximates fair value because they mature within 1 year or less and do not present unanticipated valuation risk.
Long-term borrowings: The fair value of these borrowings are estimated using a discounted cash flow technique that applies interest rates currently being offered on advances to a schedule of aggregated expected monthly maturities on Federal Home Loan Bank of Boston advances.
Off-balance sheet instruments: The fair value of commitments to originate loans is estimated using the fees currently charged to enter similar agreements, taking into account the remaining terms of the agreements and the present creditworthiness of the counterparties. For fixed-rate loan commitments and the unadvanced portion of loans, fair value also considers the difference between current levels of interest rates and the committed rates. The fair value of letters of credit is based on fees currently charged for similar agreements or on the estimated cost to terminate them or otherwise settle the obligation with the counterparties at the reporting date.
100
Table of Contents
PEOPLES FEDERAL BANCSHARES, INC. AND SUBSIDIARIES
NOTES TO THE CONSOLIDATED FINANCIAL STATEMENTS (Continued)
NOTE 12—FAIR VALUE MEASUREMENTS (Continued)
Assets Measured at Fair Value on a Recurring Basis
The following summarizes assets measured at fair value on a recurring basis:
| | | | | | | | | | | | | |
| | September 30, 2013 | |
|---|
| | Level 1 | | Level 2 | | Level 3 | | Fair Value | |
|---|
| | (In thousands)
| |
|---|
Trading securities | | $ | 1,048 | | $ | — | | $ | — | | $ | 1,048 | |
Securities available-for-sale: | | | | | | | | | | | | | |
Debt securities issued by U.S. Government corporations and agencies | | | — | | | 7,987 | | | — | | | 7,987 | |
Mortgage-backed securities | | | — | | | 6,238 | | | — | | | 6,238 | |
| | | | | | | | | | |
Total assets | | $ | 1,048 | | $ | 14,225 | | $ | — | | $ | 15,273 | |
| | | | | | | | | | |
| | | | | | | | | | | | | |
| | September 30, 2012 | |
|---|
| | Level 1 | | Level 2 | | Level 3 | | Fair Value | |
|---|
| | (In thousands)
| |
|---|
Trading securities | | $ | 976 | | $ | — | | $ | — | | $ | 976 | |
Securities available-for-sale: | | | | | | | | | | | | | |
Debt securities issued by U.S. Government corporations and agencies | | | — | | | 17,057 | | | — | | | 17,057 | |
Mortgage-backed securities | | | — | | | 4,596 | | | — | | | 4,596 | |
| | | | | | | | | | |
Total assets | | $ | 976 | | $ | 21,653 | | $ | — | | $ | 22,629 | |
| | | | | | | | | | |
There were no transfers between Level 1 and Level 2 assets for the years ended September 30, 2013 and 2012.
Assets Measured at Fair Value on a Nonrecurring Basis
Under certain circumstances, the Company makes adjustments to fair value of its assets and liabilities, although they are not measured at fair value on an ongoing basis. There were no financial instruments carried on the consolidated balance sheet by caption and by level in the fair value hierarchy at September 30, 2013 and 2012, for which a nonrecurring change in fair value has been recorded.
There were no transfers in and out of Level 1 and 2 during the years ended September 30, 2013 and 2012.
101
Table of Contents
PEOPLES FEDERAL BANCSHARES, INC. AND SUBSIDIARIES
NOTES TO THE CONSOLIDATED FINANCIAL STATEMENTS (Continued)
NOTE 12—FAIR VALUE MEASUREMENTS (Concluded)
Summary of Fair Values of Financial Instruments
The estimated stated carrying amount and estimated fair value of the Company's financial instruments are as follows:
| | | | | | | | | | | | | | | | |
| | September 30, 2013 | |
|---|
| |
| | Fair Value | |
|---|
| | Carrying
Amount | |
|---|
| | Level 1 | | Level 2 | | Level 3 | | Total | |
|---|
| | (In thousands)
| |
|---|
Financial assets: | | | | | | | | | | | | | | | | |
Cash and cash equivalents | | $ | 37,134 | | $ | 37,134 | | $ | — | | $ | — | | $ | 37,134 | |
Trading securities | | | 1,048 | | | 1,048 | | | — | | | — | | | 1,048 | |
Securities available-for-sale | | | 14,225 | | | — | | | 14,225 | | | — | | | 14,225 | |
Securities held-to-maturity | | | 32,054 | | | — | | | 32,105 | | | — | | | 32,105 | |
Federal Home Loan Bank stock | | | 3,775 | | | — | | | — | | | 3,775 | | | 3,775 | |
Loans, net | | | 466,049 | | | — | | | — | | | 466,899 | | | 466,899 | |
Accrued interest receivable | | | 1,448 | | | — | | | — | | | 1,448 | | | 1,448 | |
Financial liabilities: | | | | | | | | | | | | | | | | |
Deposits | | | 425,093 | | | — | | | — | | | 425,536 | | | 425,536 | |
Short-term borrowings | | | 6,000 | | | — | | | — | | | 6,000 | | | 6,000 | |
Long-term debt | | | 38,000 | | | — | | | — | | | 38,168 | | | 38,168 | |
| | | | | | | | | | | | | | | | |
| | September 30, 2012 | |
|---|
| |
| | Fair Value | |
|---|
| | Carrying
Amount | |
|---|
| | Level 1 | | Level 2 | | Level 3 | | Total | |
|---|
| | (In thousands)
| |
|---|
Financial assets: | | | | | | | | | | | | | | | | |
Cash and cash equivalents | | $ | 36,241 | | $ | 36,241 | | $ | — | | $ | — | | $ | 36,241 | |
Trading securities | | | 976 | | | 976 | | | — | | | — | | | 976 | |
Securities available-for-sale | | | 21,653 | | | — | | | 21,653 | | | — | | | 21,653 | |
Securities held-to-maturity | | | 25,921 | | | — | | | 26,746 | | | — | | | 26,746 | |
Federal Home Loan Bank stock | | | 4,014 | | | — | | | — | | | 4,014 | | | 4,014 | |
Loans, net | | | 451,034 | | | — | | | — | | | 459,533 | | | 459,533 | |
Accrued interest receivable | | | 1,589 | | | — | | | — | | | 1,589 | | | 1,589 | |
Financial liabilities: | | | | | | | | | | | | | | | | |
Deposits | | | 416,748 | | | — | | | — | | | 417,254 | | | 417,254 | |
Short-term borrowings | | | 8,000 | | | — | | | — | | | 8,000 | | | 8,000 | |
Long-term debt | | | 25,000 | | | — | | | — | | | 25,693 | | | 25,693 | |
The carrying amounts of financial instruments shown in the previous table are included in the consolidated balance sheets under the indicated captions, except for trading securities, which are included in other assets.
NOTE 13—SIGNIFICANT GROUP CONCENTRATIONS OF CREDIT RISK
Most of the Company's business activity is with customers located within the Commonwealth of Massachusetts. There are no concentrations of credit to borrowers that have similar economic characteristics. The majority of the Bank's loan portfolio is comprised of loans collateralized by real estate located in the Commonwealth of Massachusetts.
102
Table of Contents
PEOPLES FEDERAL BANCSHARES, INC. AND SUBSIDIARIES
NOTES TO THE CONSOLIDATED FINANCIAL STATEMENTS (Continued)
NOTE 14—REGULATORY MATTERS
The Bank is subject to various regulatory capital requirements administered by the federal banking agencies. Failure to meet minimum capital requirements can initiate certain mandatory and possibly additional discretionary actions by regulators that, if undertaken, could have a direct material effect on the Company's and the Bank's financial statements. Under capital adequacy guidelines and the regulatory framework for prompt corrective action, the Bank must meet specific capital guidelines that involve quantitative measures of its assets, liabilities, and certain off-balance-sheet items as calculated under regulatory accounting practices. The Bank's capital amounts and classification are also subject to qualitative judgments by the regulators about components, risk weightings and other factors.
At September 30, 2013 and 2012, quantitative measures established by regulation to ensure capital adequacy require the Bank to maintain minimum amounts and ratios (set forth in the following table) of total and Tier 1 capital (as defined in the regulations) to risk-weighted assets (as defined), of Tier 1 leverage capital (as defined) to adjusted total assets (as defined).
As of September 30, 2013 and 2012, the most recent notification from the Office of the Comptroller of the Currency ("OCC") categorized the Bank as well capitalized under the regulatory framework for prompt corrective action. To be categorized as well capitalized the Bank must maintain minimum total risk-based, Tier 1 risk-based, Leverage and Core capital ratios as set forth in the table. There are no conditions or events since that notification that management believes have changed the Bank's category.
The Bank's actual capital amounts and ratios are also presented in the table.
| | | | | | | | | | | | | | | | | | | |
| | Actual | | For Capital
Adequacy
Purposes | | To Be Well
Capitalized Under
Prompt Corrective
Action Provisions | |
|---|
| | Amount | | Ratio | | Amount | | Ratio | | Amount | | Ratio | |
|---|
| | (Dollars in thousands)
| |
|---|
September 30, 2013: | | | | | | | | | | | | | | | | | | | |
Total Capital (to Risk Weighted Assets) | | $ | 92,122 | | | 24.83 | % | $ | 29,677 | | | 8.0 | % | $ | 37,097 | | | 10.0 | % |
Tier 1 Capital (to Risk Weighted Assets) | | | 88,085 | | | 23.74 | | | 14,839 | | | 4.0 | | | 22,258 | | | 6.0 | |
Tier 1 Leverage Capital (to Adjusted Total Assets) | | | 88,085 | | | 15.08 | | | 23,369 | | | 4.0 | | | 29,212 | | | 5.0 | |
September 30, 2012: | | | | | | | | | | | | | | | | | | | |
Total Capital (to Risk Weighted Assets) | | $ | 87,782 | | | 24.12 | % | $ | 29,110 | | | 8.0 | % | $ | 36,388 | | | 10.0 | % |
Tier 1 Capital (to Risk Weighted Assets) | | | 83,891 | | | 23.05 | | | 14,555 | | | 4.0 | | | 21,833 | | | 6.0 | |
Tier 1 Leverage Capital (to Adjusted Total Assets) | | | 83,891 | | | 14.71 | | | 22,805 | | | 4.0 | | | 28,507 | | | 5.0 | |
103
Table of Contents
PEOPLES FEDERAL BANCSHARES, INC. AND SUBSIDIARIES
NOTES TO THE CONSOLIDATED FINANCIAL STATEMENTS (Continued)
NOTE 14—REGULATORY MATTERS (Concluded)
The Bank's capital under generally accepted accounting principles is reconciled as follows:
| | | | | | | |
| | September 30, | |
|---|
| | 2013 | | 2012 | |
|---|
| | (In thousands)
| |
|---|
Total capital per Bank | | $ | 88,055 | | $ | 84,015 | |
Adjustments to Tier 1 capital: | | | | | | | |
Unrealized losses (gains) on available-for-sale securities, net of tax | | | 30 | | | (113 | ) |
Mortgage servicing asset disallowed | | | — | | | (11 | ) |
| | | | | | |
Total Tier 1 capital | | | 88,085 | | | 83,891 | |
| | | | | | |
Adjustments to total risk-based capital: | | | | | | | |
Allowance for loan losses | | | 4,037 | | | 3,891 | |
| | | | | | |
Total risk-based capital per regulatory reporting | | $ | 92,122 | | $ | 87,782 | |
| | | | | | |
NOTE 15—RESTRICTIONS ON DIVIDENDS
Federal banking regulations place certain restrictions on dividends paid and loans or advances made by the Bank to the Company. The total amount of dividends, which may be paid in any calendar year, cannot exceed the Bank's net income for the current year, plus the Bank's net income retained for the previous two years, without regulatory approval.
At September 30, 2013 and 2012, the Bank's retained earnings available for the payment of dividends was $10,043,000 and $6,300,000, respectively. Accordingly, $78,012,000 and $77,715,000, respectively, of the Company's equity in the net assets of the Bank was restricted at September 30, 2013 and 2012.
In addition, dividends paid by the Bank to the Company would be prohibited if the effect thereof would cause the Bank's capital to be reduced below applicable minimum capital requirements.
NOTE 16—EMPLOYEE BENEFIT PLANS
Defined Benefit Plan
The Company provides pension benefits for its employees through participation in the Pentegra Defined Benefit Plan for Financial Institutions (the "Plan"), a tax-qualified defined benefit plan. The Plan's Employer Identification Number is 13-5645888 and the Plan Number is 333. The Plan operates as a multi-employer plan for accounting purposes and as a multiple-employer plan under the Employee Retirement Income Security Act of 1974 and the Internal Revenue Code. There are no collective bargaining agreements in place that require contributions to the Plan. The Plan is a single plan under Internal Revenue Code Section 413(c) and, as a result, all of the assets stand behind all of the liabilities. Accordingly, under the Plan contributions made by a participating employer may be used to provide benefits to participants of other participating employers. The Plan covers all salaried employees who are at least twenty-one years of age with at least one year of employment with the Company. The Plan is funded by contributions based on actuarial calculations. As is the case with multi-employer plans, separate actuarial valuations are not made with respect to each employer. No employees hired on or after July 1, 2010 are eligible to participate in the Plan.
104
Table of Contents
PEOPLES FEDERAL BANCSHARES, INC. AND SUBSIDIARIES
NOTES TO THE CONSOLIDATED FINANCIAL STATEMENTS (Continued)
NOTE 16—EMPLOYEE BENEFIT PLANS (Continued)
Defined Benefit Plan (Concluded)
The funded status (market value of plan assets divided by the funding target) was 93.19% and 101.72%, respectively, as of July 1, 2013 and 2012.
Total contributions made to the Plan by participating institutions, as reported on Form 5500, were $196,473,000 and $299,729,000, respectively, for the Plan years ended June 30, 2012 and 2011. Although the Form 5500 has not been filed for the Plan year ended June 30, 2013, the actuary and management feel the Company's contributions to the Plan will not be more than 5% of the total contributions made to the Plan by participating institutions.
The Company made the following contributions to the Plan for the years ended September 30, 2013, 2012 and 2011:
| | | | | | | | | | | | | | |
| Years Ended September 30, | |
|---|
| 2013 | | 2012 | | 2011 | |
|---|
Date Paid | | Amount | | Date Paid | | Amount | | Date Paid | | Amount | |
|---|
(Dollars in thousands)
| |
|---|
10/16/12 | | $ | 43 | | 10/18/11 | | $ | 190 | | 12/31/10 | | $ | 788 | |
12/21/12 | | | 154 | | 12/20/11 | | | 859 | | 09/27/11 | | | 65 | |
| | | | | | | | | | | | |
| | $ | 197 | | | | $ | 1,049 | | | | $ | 853 | |
| | | | | | | | | | | | |
Defined Contribution Plan
Substantially all of the Company's employees are eligible to participate in the Peoples Federal Savings Bank 401(k) plan, a single employer plan. Each employee reaching the age of 21 and having completed at least 1,000 hours of service in a 12 month period beginning with such employee's date of employment, or anniversary thereof, becomes eligible to be a participant in the plan. Under this plan, participants can elect to invest their account balances in Company stock. The plan permits an employee to contribute a percentage of his or her wages to the plan on a tax-deferred basis subject to federal limitations. The Company matches the employee's contribution at an amount equal to 50% of the contribution for the first 6% of the employee's compensation.
The Company's cost under the 401(k) plan was $95,000, $94,000 and $85,000 for the years ended September 30, 2013, 2012 and 2011, respectively.
Deferred Compensation Plan
The Company provides a nonqualified deferred compensation plan to a select group of management and directors providing an opportunity to defer a specified amount of their cash compensation. The Company's obligations under this plan are non-funded for tax purposes and for purposes of Title I of ERISA, and they are unsecured general obligations of the Company to pay in the future the value of the deferred compensation adjusted to reflect the performance, whether positive or negative, of selected investment options chosen by each participant during the deferral period.
The Company has an investment in a Rabbi Trust in connection with the nonqualified deferred compensation plan. The assets in the Rabbi Trust have been included in the Company's consolidated balance sheets in other assets as of September 30, 2013 and 2012 and are available to the general creditors of the Company in the event of the Company's insolvency. The assets of the Rabbi Trust are
105
Table of Contents
PEOPLES FEDERAL BANCSHARES, INC. AND SUBSIDIARIES
NOTES TO THE CONSOLIDATED FINANCIAL STATEMENTS (Continued)
NOTE 16—EMPLOYEE BENEFIT PLANS (Continued)
Deferred Compensation Plan (Concluded)
mutual funds and common stocks classified as trading securities, and totaled $1,048,000 and $976,000 as of September 30, 2013 and 2012, respectively. The Company contributed $44,000, $71,000 and $33,000 to the Rabbi Trust for the years ended September 30, 2013, 2012 and 2011, respectively.
Retirement and Salary Continuation Agreements
The Company entered into Director Retirement Agreements and Salary Continuation Agreements with certain directors and senior executives. The agreements require the payment of specified benefits upon retirement over periods of ten or twenty years as described in each agreement. The total liability for the Director Retirement Agreements and the Salary Continuation Agreements included in other liabilities was $4,672,000 and $4,014,000 at September 30, 2013 and September 30, 2012, respectively, and expenses under these agreements were $658,000, $544,000 and $461,000 for the years ended September 30, 2013, 2012 and 2011, respectively. There were no benefit payments made to beneficiaries under these agreements during the years ended September 30, 2013 and 2012.
The Company has a supplemental retirement plan with a former executive whereby the amounts paid under this plan commenced upon the executive's retirement and continue for his lifetime. The Company has purchased life insurance contracts in connection with this agreement. The charge to employee benefits expense in connection with this plan amounted to $33,000, $35,000 and $37,000 for the years ended September 30, 2013, 2012 and 2011, respectively. The liability for this supplemental retirement plan was $607,000 and $638,000 at September 30, 2013 and 2012, respectively. Benefit payments made to the former executive amounted to $64,000 for each of the years ended September 30, 2013 and 2012.
Supplemental Retirement Agreements
The Company provides postretirement medical benefits for executives, one retired, under separate individual agreements. The obligation included in other liabilities was $224,000 and $200,000 at September 30, 2013 and 2012, respectively. The related expense for the years ending September 30, 2013, 2012 and 2011 amounted to $24,000, $27,000 and $28,000, respectively.
Endorsement Split-Dollar Life Insurance Plans
The Bank is the sole owner of endorsement split-dollar life insurance plans for the benefit of certain bank executives. Effective March 1, 2011, the plans were amended to increase the amount of the death proceeds payable under the plans. The split-dollar plans divide the death proceeds payable under certain life insurance policies owned by the Bank that insure the lives of the participating executives between the Bank and the designated beneficiary of each insured participating executive. The death benefit is payable to the beneficiaries provided that such benefit cannot exceed the net death proceeds under the applicable policy (i.e., the total death proceeds reduced by the greater of (i) the cash surrender value or (ii) the aggregate premiums paid by the Bank). A participant's rights under the split dollar plan will automatically cease upon the participant's termination for cause. In the event the Bank decides to maintain the policy after the participant's termination of participation in the plan, the Bank will be the direct beneficiary of the entire death proceeds of the policy.
106
Table of Contents
PEOPLES FEDERAL BANCSHARES, INC. AND SUBSIDIARIES
NOTES TO THE CONSOLIDATED FINANCIAL STATEMENTS (Continued)
NOTE 16—EMPLOYEE BENEFIT PLANS (Continued)
Endorsement Split-Dollar Life Insurance Plans (Concluded)
The Bank's future postretirement benefit obligation for the arrangements included in other liabilities was $399,000 and $361,000 at September 30, 2013 and 2012, respectively. The expense under this arrangement was $38,000, $26,000 and $93,000 for the years ending September 30, 2013, 2012 and 2011, respectively.
Employee Stock Ownership Plan
The Bank established an ESOP to provide eligible employees the opportunity to own Company stock. As part of the Bank's mutual to stock conversion, the Company invested in a subsidiary, PFC. PFC used the proceeds from the investment to fund a loan to the Peoples Federal Savings Bank Employee Stock Ownership Plan Trust (the "Trust") in the amount of $5,713,000, which was used to purchase 571,320 shares of the Company's common stock at a price of $10.00 per share. The loan bears an interest rate equal to the Wall Street Journal Prime Rate, adjusted annually, and provides for annual payments of interest and principal over the 20 year term of the loan. The interest rate is 3.25%.
At September 30, 2013, the remaining principal balance on the ESOP debt is payable as follows:
| | | | |
Years Ending September 30, | | Amount | |
|---|
| | (In thousands)
| |
|---|
2014 | | $ | 224 | |
2015 | | | 232 | |
2016 | | | 239 | |
2017 | | | 247 | |
2018 | | | 255 | |
Thereafter | | | 3,792 | |
| | | | |
| | $ | 4,989 | |
| | | | |
The Bank has committed to make contributions to the ESOP sufficient to support the debt service of the loan. The loan is secured by the shares purchased, which are held in a suspense account until released for allocation to the participants, as principal and interest payments are made by the ESOP to the Company.
Shares released are allocated to each eligible participant based on the ratio of each such participant's compensation, as defined in the ESOP, to the total compensation of all eligible plan participants. Forfeited shares shall be reallocated among other participants in the Plan. Cash dividends paid on allocated shares will be distributed, at the direction of the Bank, to participants' accounts or used to repay the principal and interest on the ESOP loan used to acquire Company stock on which dividends were paid. Cash dividends on unallocated shares will be used to repay the outstanding debt of the ESOP.
107
Table of Contents
PEOPLES FEDERAL BANCSHARES, INC. AND SUBSIDIARIES
NOTES TO THE CONSOLIDATED FINANCIAL STATEMENTS (Continued)
NOTE 16—EMPLOYEE BENEFIT PLANS (Continued)
Employee Stock Ownership Plan (Concluded)
Shares held by the ESOP include the following:
| | | | | | | |
| | September 30, | |
|---|
| | 2013 | | 2012 | |
|---|
Allocated | | | 83,321 | | | 56,242 | |
Committed to be released | | | 21,425 | | | 21,425 | |
Unallocated | | | 464,197 | | | 492,763 | |
| | | | | | |
| | | 568,943 | | | 570,430 | |
| | | | | | |
At September 30, 2013 and 2012, the fair value of unallocated ESOP shares was $8,460,000 and $8,885,000, respectively. As ESOP shares are earned by the participants, the Company recognizes compensation expense equal to the fair value of the earned ESOP shares during the periods in which they become committed to be released.
Total compensation expense recognized in connection with the ESOP was $510,000, $441,000 and $381,000 for the years ending September 30, 2013 and 2012 and 2011, respectively.
Stock Options
Under the Company's 2011 Equity Incentive Plan (the "Stock Plan"), the Company may grant stock options to its directors and employees for up to 999,810 shares of its common stock, reduced by the number of restricted stock awards and restricted stock unit awards granted. Both incentive stock options and non-qualified stock options may be granted under the Stock Plan. The exercise price of each stock option shall not be less than the fair market value of the Company's common stock on the date of the grant and the maximum term of each option is ten years (or five years with respect to incentive stock options granted to an employee who is a 10% stockholder). There are no further shares available for grant under the Stock Plan.
On August 20, 2013, in accordance with the Stock Plan, the Company granted 58,255 stock options to its directors and certain employees of the Company. The fair value of the stock options granted on August 20, 2013 was $2.37 per share. The stock options vest 50% per year from the date of grant over a two-year period.
On February 21, 2012, in accordance with the Stock Plan, the Company granted 584,480 stock options to its directors and certain employees of the Company. The fair value of the stock options granted on February 21, 2012 was $3.95 per share. The stock options vest 20% per year from the date of grant over a five-year period.
108
Table of Contents
PEOPLES FEDERAL BANCSHARES, INC. AND SUBSIDIARIES
NOTES TO THE CONSOLIDATED FINANCIAL STATEMENTS (Continued)
NOTE 16—EMPLOYEE BENEFIT PLANS (Continued)
Stock Options (Concluded)
The fair value of each stock option granted was estimated on the date of grant using the Black-Scholes option-pricing model with the following weighted-average assumptions:
| | | | | | | |
| | August 20,
2013 | | February 21,
2012 | |
|---|
Expected dividends | | | 0.90 | % | | — | % |
Expected term | | | 5.75 years | | | 10 years | |
Expected volatility | | | 11.51 | % | | 13.01 | % |
Risk-free interest rate | | | 1.84 | % | | 1.99 | % |
Forfeiture rate | | | — | % | | — | % |
The dividend yield assumption is based upon the Company's history of dividend payouts. The expected term is based upon the expected life or the contractual term of the stock option. The expected volatility is based upon historic volatility. The risk-free interest rate is estimated using the U.S. Treasury yield curve in effect at the time of the grant based upon the expected option term.
A summary of stock option activity under the Stock Plan as of September 30, 2013, and changes during the year then ended, is presented below:
| | | | | | | | | | | | | |
Stock Options | | Shares | | Weighted
Average
Exercise
Price | | Weighted
Average
Remaining
Contractual
Term
(In Years) | | Aggregate
Intrinsic
Value | |
|---|
| |
| |
| |
| | (In thousands)
| |
|---|
Outstanding at beginning of year | | | 584,480 | | $ | 15.47 | | | 9.4 | | $ | 2,309 | |
Granted | | | 58,255 | | | 18.49 | | | | | | | |
Exercised | | | — | | | — | | | | | | | |
Forfeited | | | — | | | — | | | | | | | |
Expired | | | — | | | — | | | | | | | |
| | | | | | | | | | | | | |
Outstanding at end of year | | | 642,735 | | $ | 15.74 | | | 8.5 | | $ | 2,213 | |
| | | | | | | | | | |
Exercisable at end of year | | | 116,896 | | $ | 15.47 | | | 8.4 | | $ | 228 | |
| | | | | | | | | | |
The weighted average grant date fair value of the stock options granted during the years ended September 30, 2013 and 2012 was $2.37 and $3.95, respectively. There were no options exercised during the years ended September 30, 2013 and 2012.
For the years ended September 30, 2013 and 2012, the share-based compensation expense applicable to the stock options was $473,000 and $308,000, respectively, and the recognized tax benefit related to this expense was $81,000 and $123,000, respectively.
As of September 30, 2013 and 2012, the unrecognized share-based compensation expense related to the non-vested stock options was $1.7 million and $2.0 million, respectively. As of September 30, 2013, this amount is expected to be recognized over a weighted-average period of 3.3 years.
109
Table of Contents
PEOPLES FEDERAL BANCSHARES, INC. AND SUBSIDIARIES
NOTES TO THE CONSOLIDATED FINANCIAL STATEMENTS (Continued)
NOTE 16—EMPLOYEE BENEFIT PLANS (Concluded)
Restricted Stock Awards and Restricted Stock Unit Awards
Under the Company's Stock Plan, the Company may issue shares of its common stock as restricted stock awards or restricted stock unit awards to its directors and employees. The maximum number of shares that may be issued under the Stock Plan as restricted stock awards or restricted stock unit awards is 357,075 shares. A restricted stock award is a grant of shares of Company common stock for no consideration, subject to a vesting schedule or the satisfaction of market conditions or performance conditions. A restricted stock unit award is similar, except no shares are actually granted on the grant date. The Company may issue the shares or purchase the shares of its common stock through open market transactions or negotiated block transactions. Shares issued upon vesting may be either authorized but unissued or reacquired shares held by the Company. Any shares not issued because vesting requirements are not met will again be available for issuance under Stock Plan. The fair market value of shares awarded is based on market price at the date of grant and is recorded as unearned compensation and amortized over the applicable vesting period. There are no further shares available for grant under the Stock Plan.
Restricted Stock Awards
On August 20, 2013 and February 21, 2012, in accordance with the Stock Plan, the Company granted 75,375 and 281,700 restricted stock awards, respectively, to its directors and certain employees. The shares awarded in August 2013 vest 50% per year over a two-year period and the shares awarded in February 2012 vest 20% per year over a five-year period. The fair value of the restricted stock awards granted on August 20, 2013 and February 21, 2012 was $18.49 and $15.47 per share, respectively.
The following table presents the status of non-vested restricted stock awards under the Stock Plan as of September 30, 2013, and changes during the year then ended:
| | | | | | | |
| | Number
of Shares | | Weighted
Average
Grant-date
Fair Value | |
|---|
Non-vested restricted stock awards at beginning of year | | | 281,700 | | $ | 15.47 | |
Restricted shares granted | | | 75,375 | | | 18.49 | |
Shares vested | | | (56,340 | ) | | 15.47 | |
Forfeited | | | — | | | — | |
| | | | | | | |
Non-vested restricted stock awards at end of year | | | 300,735 | | $ | 16.23 | |
| | | | | | |
For the years ended September 30, 2013 and 2012, the share-based compensation expense applicable to the restricted stock awards was $988,000 and $581,000, respectively, and the recognized tax benefit related to this expense was $395,000 and $232,000, respectively.
As of September 30, 2013 and 2012, the unrecognized share-based compensation expense related to the non-vested restricted stock awards was $4.2 million and $3.8 million, respectively. As of September 30, 2013, this amount is expected to be recognized over a weighted-average period of 3.3 years.
Restricted Stock Unit Awards
As of September 30, 2013, there were no restricted stock unit awards granted under the Stock Plan.
110
Table of Contents
PEOPLES FEDERAL BANCSHARES, INC. AND SUBSIDIARIES
NOTES TO THE CONSOLIDATED FINANCIAL STATEMENTS (Continued)
NOTE 17—CONDENSED FINANCIAL STATEMENTS OF PARENT COMPANY
The following financial information pertains to the Peoples Federal Bancshares, Inc., (Parent Company Only), and should be read in conjunction with the consolidated financial statements of the Company.
Condensed Balance Sheets
| | | | | | | |
| | September 30, | |
|---|
| | 2013 | | 2012 | |
|---|
| | (In thousands)
| |
|---|
ASSETS | | | | | | | |
Cash on deposit with Peoples Federal Savings Bank | |
$ |
13,223 | |
$ |
21,485 | |
Investment in subsidiary, Peoples Federal Savings Bank | | | 88,055 | | | 84,015 | |
Investment in subsidiary, Peoples Funding Corporation | | | 5,111 | | | 5,333 | |
Deferred tax asset | | | 767 | | | 645 | |
Other assets | | | 269 | | | 160 | |
| | | | | | |
Total assets | | $ | 107,425 | | $ | 111,638 | |
| | | | | | |
LIABILITIES AND STOCKHOLDERS' EQUITY | | | | | | | |
Other liabilities | |
$ |
1,073 | |
$ |
1,100 | |
Stockholders' equity | | | 106,352 | | | 110,538 | |
| | | | | | |
Total liabilities and stockholders' equity | | $ | 107,425 | | $ | 111,638 | |
| | | | | | |
Condensed Statements of Income
| | | | | | | | | | |
| | Years Ended September 30, | |
|---|
| | 2013 | | 2012 | | 2011 | |
|---|
| | (In thousands)
| |
|---|
Non-interest expense: | | | | | | | | | | |
Salaries and employee benefits | | $ | 2,159 | | $ | 1,518 | | $ | 627 | |
Other operating expense | | | 342 | | | 347 | | | 193 | |
| | | | | | | | |
Total non-interest expense | | | 2,501 | | | 1,865 | | | 820 | |
| | | | | | | | |
Loss before income taxes and equity in undistributed earnings of subsidiaries | | | (2,501 | ) | | (1,865 | ) | | (820 | ) |
Income tax benefit | | | (724 | ) | | (657 | ) | | (263 | ) |
| | | | | | | | |
Loss before undistributed earnings of subsidiaries | | | (1,777 | ) | | (1,208 | ) | | (557 | ) |
Equity in undistributed earnings of subsidiary, Peoples Federal Savings Bank | | | 3,898 | | | 2,694 | | | 3,451 | |
Equity in undistributed earnings of subsidiary, Peoples Funding Corporation | | | 164 | | | 171 | | | 177 | |
| | | | | | | | |
Net income | | $ | 2,285 | | $ | 1,657 | | $ | 3,071 | |
| | | | | | | | |
111
Table of Contents
PEOPLES FEDERAL BANCSHARES, INC. AND SUBSIDIARIES
NOTES TO THE CONSOLIDATED FINANCIAL STATEMENTS (Continued)
NOTE 17—CONDENSED FINANCIAL STATEMENTS OF PARENT COMPANY (Concluded)
Condensed Statements of Cash Flows
| | | | | | | | | | |
| | Years Ended September 30, | |
|---|
| | 2013 | | 2012 | | 2011 | |
|---|
| | (In thousands)
| |
|---|
Cash flows from operating activities: | | | | | | | | | | |
Net income | | $ | 2,285 | | $ | 1,657 | | $ | 3,071 | |
Adjustments to reconcile net income to net cash used in operating activities: | | | | | | | | | | |
Equity in undistributed earnings of subsidiary, Peoples Federal Savings Bank | | | (3,898 | ) | | (2,694 | ) | | (3,451 | ) |
Equity in undistributed earnings of subsidiary, Peoples Funding Corporation | | | (164 | ) | | (171 | ) | | (177 | ) |
Deferred income tax benefit | | | (122 | ) | | (292 | ) | | (14 | ) |
(Increase) decrease in prepaid income taxes | | | (143 | ) | | 15 | | | 40 | |
(Decrease) increase in income taxes payable | | | (162 | ) | | 162 | | | (10 | ) |
Decrease (increase) in due from subsidiary, Peoples Federal Savings Bank | | | 131 | | | (37 | ) | | (98 | ) |
(Increase) decrease in other assets | | | (46 | ) | | 1 | | | (25 | ) |
Increase in other liabilities | | | 135 | | | 40 | | | 48 | |
Amortization of stock-based compensation and ESOP expense | | | 1,686 | | | 1,044 | | | 106 | |
| | | | | | | | |
Net cash used in operating activities | | | (298 | ) | | (275 | ) | | (510 | ) |
| | | | | | | | |
Cash flows from investing activities: | | | | | | | | | | |
Return on investment in subsidiary, Peoples Funding Corporation | | | 386 | | | 387 | | | 386 | |
| | | | | | | | |
Net cash provided by investing activities | | | 386 | | | 387 | | | 386 | |
| | | | | | | | |
Cash flows from financing activities: | | | | | | | | | | |
Dividends paid | | | (2,335 | ) | | (181 | ) | | — | |
Common stock repurchased | | | (6,015 | ) | | (8,027 | ) | | (2,326 | ) |
| | | | | | | | |
Net cash used in financing activities | | | (8,350 | ) | | (8,208 | ) | | (2,326 | ) |
| | | | | | | | |
Net decrease in cash and cash equivalents | | | (8,262 | ) | | (8,096 | ) | | (2,450 | ) |
Cash and cash equivalents at beginning of year | | | 21,485 | | | 29,581 | | | 32,031 | |
| | | | | | | | |
Cash and cash equivalents at end of year | | $ | 13,223 | | $ | 21,485 | | $ | 29,581 | |
| | | | | | | | |
The Parent Company Only Statements of Changes in Stockholders' Equity are identical to the Consolidated Statements of Changes in Stockholders' Equity for the years ended September 30, 2013, 2012 and 2011, and therefore are not reprinted here.
112
Table of Contents
PEOPLES FEDERAL BANCSHARES, INC. AND SUBSIDIARIES
NOTES TO THE CONSOLIDATED FINANCIAL STATEMENTS (Continued)
NOTE 18—QUARTERLY DATA (UNAUDITED)
| | | | | | | | | | | | | | | | | | | | | | | | | |
| | Years Ended September 30, | |
|---|
| | 2013 | | 2012 | |
|---|
| | Fourth
Quarter | | Third
Quarter | | Second
Quarter | | First
Quarter | | Fourth
Quarter | | Third
Quarter | | Second
Quarter | | First
Quarter | |
|---|
| | (In thousands, except share data)
| |
|---|
Interest and dividend income | | $ | 4,778 | | $ | 4,820 | | $ | 4,769 | | $ | 5,026 | | $ | 5,067 | | $ | 5,026 | | $ | 5,071 | | $ | 5,165 | |
Interest expense | | | 625 | | | 653 | | | 705 | | | 762 | | | 782 | | | 820 | | | 826 | | | 891 | |
| | | | | | | | | | | | | | | | | | |
Net interest income | | | 4,153 | | | 4,167 | | | 4,064 | | | 4,264 | | | 4,285 | | | 4,206 | | | 4,245 | | | 4,274 | |
Provision for loan losses | | | — | | | — | | | 80 | | | 120 | | | 165 | | | 125 | | | 125 | | | 125 | |
| | | | | | | | | | | | | | | | | | |
Net interest income, after provision for loan losses | | | 4,153 | | | 4,167 | | | 3,984 | | | 4,144 | | | 4,120 | | | 4,081 | | | 4,120 | | | 4,149 | |
Total non-interest income | | | 402 | | | 472 | | | 488 | | | 492 | | | 562 | | | 443 | | | 375 | | | 453 | |
Total non-interest expense | | | 3,767 | | | 3,571 | | | 3,567 | | | 3,441 | | | 3,675 | | | 3,592 | | | 3,580 | | | 3,279 | |
| | | | | | | | | | | | | | | | | | |
Income before income taxes | | | 788 | | | 1,068 | | | 905 | | | 1,195 | | | 1,007 | | | 932 | | | 915 | | | 1,323 | |
Provision for income taxes | | | 327 | | | 470 | | | 360 | | | 514 | | | 1,330 | | | 365 | | | 327 | | | 498 | |
| | | | | | | | | | | | | | | | | | |
Net income (loss) | | $ | 461 | | $ | 598 | | $ | 545 | | $ | 681 | | $ | (323 | ) | $ | 567 | | $ | 588 | | $ | 825 | |
| | | | | | | | | | | | | | | | | | |
Weighted-average shares outstanding: | | | | | | | | | | | | | | | | | | | | | | | | | |
Basic | | | 5,763,952 | | | 5,869,813 | | | 5,894,114 | | | 5,975,422 | | | 5,982,123 | | | 6,114,060 | | | 6,231,753 | | | 6,372,181 | |
Diluted | | | 5,811,421 | | | 5,905,052 | | | 5,914,177 | | | 6,031,289 | | | 5,982,123 | | | 6,144,309 | | | 6,236,209 | | | 6,372,181 | |
Earnings (loss) per common share: | | | | | | | | | | | | | | | | | | | | | | | | | |
Basic | | $ | 0.07 | | $ | 0.10 | | $ | 0.09 | | $ | 0.11 | | $ | (0.05 | ) | $ | 0.09 | | $ | 0.09 | | $ | 0.13 | |
Diluted | | $ | 0.07 | | $ | 0.10 | | $ | 0.09 | | $ | 0.11 | | $ | (0.05 | ) | $ | 0.09 | | $ | 0.09 | | $ | 0.13 | |
NOTE 19—SUBSEQUENT EVENTS
Dividend Declared and Paid
On October 16, 2013, the Company announced that its Board of Directors declared a quarterly cash dividend of $0.04 per share on the Company's common stock. The dividend was paid to stockholders of record as of November 1, 2013 on November 15, 2013.
Special Dividend Declared
On November 20, 2013, the Company announced that its Board of Directors declared a special cash dividend of $0.25 per share on the Company's common stock. The dividend is payable to stockholders of record as of December 3, 2013 and is expected to be paid on December 20, 2013.
Stock Repurchase Plan
On December 6, 2013, the Company announced that its Board of Directors authorized an increase in the number of common shares that may be repurchased pursuant to the Company's stock repurchase plan that was previously announced on July 20, 2011 and subsequently expanded in February 2012 and
113
Table of Contents
PEOPLES FEDERAL BANCSHARES, INC. AND SUBSIDIARIES
NOTES TO THE CONSOLIDATED FINANCIAL STATEMENTS (Concluded)
NOTE 19—SUBSEQUENT EVENTS (Concluded)
Stock Repurchase Plan (Concluded)
October 2012. Under the expanded repurchase plan, the Company is authorized to repurchase up to an additional 5% of its issued and outstanding common shares, or up to an additional 323,296 common shares. The repurchase program permits shares to be repurchased in open market or private transactions, through block trades, and pursuant to any trading plan that may be adopted in accordance with Rule 10b5-1 of the Securities and Exchange Commission. The repurchase program may be suspended, terminated or modified at any time for any reason, including market conditions, the cost of repurchasing shares, the availability of alternative investment opportunities, liquidity, and other factors deemed appropriate.
114
Table of Contents
ITEM 9. CHANGES IN AND DISAGREEMENTS WITH ACCOUNTANTS ON ACCOUNTING AND FINANCIAL DISCLOSURE
None.
ITEM 9A. CONTROLS AND PROCEDURES
Evaluation of Disclosure Controls and Procedures.
The Company's President, its Chief Executive Officer, its Chief Financial Officer and other members of its senior management team have evaluated the effectiveness of the Company's disclosure controls and procedures (as defined in Exchange Act Rules 13a-15(e) or 15d-15(e)), as of September 30, 2013. Based on such evaluation, the Chief Executive Officer, the President and Chief Financial Officer have concluded that the Company's disclosure controls and procedures, as of the end of the period covered by this report, were adequate and effective to provide reasonable assurance that information required to be disclosed by the Company, including the Bank, in reports that are filed or submitted under the Exchange Act, is recorded, processed, summarized and reported, within the time periods specified in the Commission's rules and forms.
Management's Report on Internal Control Over Financial Reporting.
Our management is responsible for establishing and maintaining adequate internal control over financial reporting, as such term is defined in Exchange Act Rules 13a-15(f) and 15d-15(f). Under supervision and with the participation of our management, including our Chief Executive Officer, Chief Financial Officer and other members of its senior management team, we conducted an evaluation of the effectiveness of our internal control over financial reporting as of September 30, 2013 based on the framework in Internal Control-Integrated Framework issued by the Committee of Sponsoring Organizations of the Treadway Commission, commonly referred to as the "COSO" criteria. Based on that evaluation, our management concluded that our internal control over financial reporting was effective as of September 30, 2013. Additionally, based upon management's assessment there were no material weaknesses in internal control over financial reporting as of September 30, 2013.
Changes in Internal Controls Over Financial Reporting.
There have been no changes in the Company's internal control over financial reporting during the year ended September 30, 2013 that have materially affected, or are reasonably likely to materially affect, the Company's internal control over financial reporting.
ITEM 9B. OTHER INFORMATION
Not applicable.
115
Table of Contents
PART III
ITEM 10. DIRECTORS, EXECUTIVE OFFICERS AND CORPORATE GOVERNANCE
The Company has adopted a Code of Ethics that applies to the Company's principal executive officer, principal financial officer and all other employees and directors. The Code of Ethics is available on our website at www.pfsb.com.
Information concerning directors and executive officers of the Company is incorporated herein by reference from the Proxy Statement, specifically the section captioned "Proposal I—Election of Directors."
ITEM 11. EXECUTIVE COMPENSATION
Information concerning executive compensation is incorporated herein by reference from the Proxy Statement, specifically the section captioned "Executive Compensation."
ITEM 12. SECURITY OWNERSHIP OF CERTAIN BENEFICIAL OWNERS AND MANAGEMENT AND RELATED STOCKHOLDER MATTERS
Information concerning security ownership of certain owners and management is incorporated herein by reference from the Proxy Statement, specifically the section captioned "Voting Securities and Principal Holder Thereof."
ITEM 13. CERTAIN RELATIONSHIPS AND RELATED TRANSACTIONS, AND DIRECTOR INDEPENDENCE
Information concerning relationships, transactions and director independence is incorporated herein by reference from the Proxy Statement, specifically the section captioned "Transactions with Certain Related Persons" and "Board Independence."
ITEM 14. PRINCIPAL ACCOUNTING FEES AND SERVICES
Information concerning principal accountant fees and services is incorporated herein by reference from the Proxy Statement, specifically the section captioned "Proposal II-Ratification of Independent Registered Public Accounting Firm."
116
Table of Contents
PART IV
ITEM 15. EXHIBITS
| | | |
| Exhibit No. | | Description |
|---|
| | 3.1 | | Articles of Incorporation of Peoples Federal Bancshares, Inc., as amended (incorporated by reference to Exhibit 3.1 of the Registration Statement No. 333-165525 on Form S-1 filed with the SEC on March 17, 2010.) |
| | | | |
| | 3.2 | | Amended and Restated Bylaws (incorporated by reference to Exhibit 3.1 of the Current Report on Form 8-K filed with the SEC on September 27, 2010.) |
| | | | |
| | 4 | | Form of Common Stock Certificate of Peoples Federal Bancshares, Inc. (incorporated by reference to Exhibit 4 of the Registration Statement No. 333-165525 on Form S-1 filed with the SEC on March 17, 2010.) |
| | | | |
| | 10.1 | + | Amended and Restated Employment Agreements with Maurice H. Sullivan, Jr. (incorporated by reference to Exhibit 10.1 of the Registration Statement No. 333-165525 on Form S-1 filed with the SEC on March 17, 2010.) |
| | | | |
| | 10.2 | + | Employment Agreement with Mr. Sullivan, Jr. dated September 21, 2010 (incorporated by reference to Exhibit 10.1 of the Current Report on Form 8-K filed with the SEC on September 24, 2010.) |
| | | | |
| | 10.3 | + | Amended and Restated Employment Agreements with Thomas J. Leetch, Jr. (incorporated by reference to Exhibit 10.2 of the Registration Statement No. 333-165525 on Form S-1 filed with the SEC on March 17, 2010.) |
| | | | |
| | 10.4 | + | Employment Agreement with Mr. Leetch, Jr. dated September 21, 2010 (incorporated by reference to Exhibit 10.2 of the Current Report on Form 8-K filed with the SEC on September 24, 2010.) |
| | | | |
| | 10.5 | + | Amended and Restated Employment Agreements with James J. Gavin (incorporated by reference to Exhibit 10.3 of the Registration Statement No. 333-165525 on Form S-1 filed with the SEC on March 17, 2010.) |
| | | | |
| | 10.6 | + | Employment Agreement with Mr. Gavin dated September 21, 2010 (incorporated by reference to Exhibit 10.3 of the Current Report on Form 8-K filed with the SEC on September 24, 2010.) |
| | | | |
| | 10.7 | + | Employment Agreement with Mr. Lake dated September 21, 2010 (incorporated by reference to Exhibit 10.4 of the Current Report on Form 8-K filed with the SEC on September 21, 2010.) |
| | | | |
| | 10.8 | + | Form of Amendment One to Employment Agreement between Peoples Federal Savings Bank and each Executive (incorporated by reference to Exhibit 10.1 of the Current Report on Form 8-K filed with the SEC on January 18, 2013.) |
| | | | |
| | 10.9 | + | Salary Continuation Agreement for Maurice H. Sullivan, Jr., as amended (incorporated by reference to Exhibit 10.5 of the Registration Statement No. 333-165525 on Form S-1 filed with the SEC on March 17, 2010.) |
| | | | |
| | 10.10 | + | Second Amendment to Salary Continuation Agreement between the Bank and Maurice H. Sullivan, Jr. (incorporated by reference to Exhibit 10.4 of the Current Report on Form 8-K filed with the SEC on April 18, 2011.) |
| |
| | |
117
Table of Contents
| | | |
| Exhibit No. | | Description |
|---|
| | 10.11 | + | Salary Continuation Agreement for Thomas J. Leetch, Jr., as amended (incorporated by reference to Exhibit 10.6 of the Registration Statement No. 333-165525 on Form S-1 filed with the SEC on March 17, 2010.) |
| | | | |
| | 10.12 | + | Second Amendment to Salary Continuation Agreement between the Bank and Thomas J. Leetch, Jr. (incorporated by reference to Exhibit 10.1 of the Current Report on Form 8-K filed with the SEC on April 18, 2011.) |
| | | | |
| | 10.13 | + | Salary Continuation Agreement for James J. Gavin, as amended (incorporated by reference to Exhibit 10.7 of the Registration Statement No. 333-165525 on Form S-1 filed with the SEC on March 17, 2010.) |
| | | | |
| | 10.14 | + | Second Amendment to Salary Continuation Agreement between the Bank and James J. Gavin (incorporated by reference to Exhibit 10.3 of the Current Report on Form 8-K filed with the SEC on April 18, 2011.) |
| | | | |
| | 10.15 | + | Salary Continuation Agreement for Christopher Lake, as amended* |
| | | | |
| | 10.16 | + | Second Amendment to Salary Continuation Agreement between the Bank and Christopher Lake (incorporated by reference to Exhibit 10.2 of the Current Report on Form 8-K filed with the SEC on April 18, 2011.) |
| | | | |
| | 10.17 | + | Voluntary Deferred Compensation Plan for Executives, as amended (incorporated by reference to Exhibit 10.8 of the Registration Statement No. 333-165525 on Form S-1 filed with the SEC on March 17, 2010.) |
| | | | |
| | 10.18 | + | Proposed Amended and Restated Voluntary Deferred Compensation and Supplemental Employment Stock Ownership Plan for Executives (incorporated by reference to Exhibit 10.9 of the Registration Statement No. 333-165525 on Form S-1 filed with the SEC on March 17, 2010.) |
| | | | |
| | 10.19 | + | Peoples Federal Bancshares, Inc. and Peoples Federal Savings Bank Amended and Restated Voluntary Deferred Compensation and Supplemental Employee Stock Ownership Plan for Executives (incorporated by reference to Exhibit 10.5 of the Current Report on Form 8-K filed with the SEC on September 24, 2010.) |
| | | | |
| | 10.20 | + | Voluntary Deferred Compensation Plan for Directors, as amended (incorporated by reference to Exhibit 10.10 of the Registration Statement No. 333-165525 on Form S-1 filed with the SEC on March 17, 2010.) |
| | | | |
| | 10.21 | + | Director Retirement Agreement for Maurice H. Sullivan, Jr., as amended (incorporated by reference to Exhibit 10.11 of the Registration Statement No. 333-165525 on Form S-1 filed with the SEC on March 17, 2010.) |
| | | | |
| | 10.22 | + | Second Amendment to Director Retirement Agreement between the Bank and Maurice H. Sullivan, Jr. (incorporated by reference to Exhibit 10.5 of the Current Report on Form 8-K filed with the SEC on April 18, 2011.) |
| | | | |
| | 10.23 | + | Director Retirement Agreement for Vincent Mannering, as amended (incorporated by reference to Exhibit 10.12 of the Registration Statement No. 333-165525 on Form S-1 filed with the SEC on March 17, 2010.) |
| | | | |
| | 10.24 | + | Director Retirement Agreement for John Reen, as amended (incorporated by reference to Exhibit 10.13 of the Registration Statement No. 333-165525 on Form S-1 filed with the SEC on March 17, 2010.) |
| |
| | |
118
Table of Contents
| | | |
| Exhibit No. | | Description |
|---|
| | 10.25 | + | Director Retirement Agreement for Maurice H. Sullivan III, as amended (incorporated by reference to Exhibit 10.14 of the Registration Statement No. 333-165525 on Form S-1 filed with the SEC on March 17, 2010.) |
| | | | |
| | 10.26 | + | Split Dollar Insurance Agreement, as amended (incorporated by reference to Exhibit 10.15 of the Registration Statement No. 333-165525 on Form S-1 filed with the SEC on March 17, 2010.) |
| | | | |
| | 10.27 | + | Split Dollar Plan for Maurice H. Sullivan, Jr. (incorporated by reference to Exhibit 10.8 of the Current Report on Form 8-K filed with the SEC on April 18, 2011.) |
| | | | |
| | 10.28 | + | Split Dollar Plan for Thomas J. Leetch (incorporated by reference to Exhibit 10.7 of the Current Report on Form 8-K filed with the SEC on April 18, 2011.) |
| | | | |
| | 10.29 | + | Split Dollar Plan for James J. Gavin and Christopher Lake (incorporated by reference to Exhibit 10.6 of the Current Report on Form 8-K filed with the SEC on April 18, 2011.) |
| | | | |
| | 10.30 | + | Peoples Federal Bancshares, Inc. 2011 Equity Incentive Plan (incorporated by reference to Appendix A to the proxy statement for the Special Meeting of Stockholders of Peoples Federal Bancshares, Inc. (File No. 001-34801, filed by Peoples Federal Bancshares, Inc. under the Securities Exchange Act of 1934 on July 8, 2011.) |
| | | | |
| | 14 | | Code of Ethics*** |
| | | | |
| | 21 | | Subsidiaries of Registrant (incorporated by reference to Exhibit 21 of the Registration Statement No. 333-165525 on Form S-1 filed with the SEC on March 17, 2010.) |
| | | | |
| | 23 | | Consent of Independent Registered Public Accounting Firm* |
| | | | |
| | 31.1 | | Certification of Chief Executive Officer pursuant to Section 302 of the Sarbanes-Oxley Act of 2002* |
| | | | |
| | 31.2 | | Certification of Chief Financial Officer pursuant to Section 302 of the Sarbanes-Oxley Act of 2002* |
| | | | |
| | 32 | | Certification of the Chief Executive Officer and Chief Financial Officer pursuant to Section 906 of the Sarbanes-Oxley Act of 2002** |
| | | | |
| | 101.INS | | XBRL Instance Document** |
| | | | |
| | 101.SCH | | XBRL Taxonomy Extension Schema** |
| | | | |
| | 101.CAL | | XBRL Extension Calculation Linkbase** |
| | | | |
| | 101.DEF | | XBRL Extension Definition Linkbase** |
| | | | |
| | 101.LAB | | XBRL Extension Labels Linkbase** |
| | | | |
| | 101.PRE | | XBRL Extension Presentation Linkbase** |
- +
- Represents management contract or compensatory plan or agreement.
- *
- Filed herewith.
- **
- Furnished herewith.
- ***
- Available on our website at www.pfsb.com
119
Table of Contents
SIGNATURES
Pursuant to the requirements of Section 13 or 15(d) of the Securities Exchange Act of 1934, the registrant has duly caused this report to be signed on its behalf by the undersigned, thereunto duly authorized.
| | | | |
| | | PEOPLES FEDERAL BANCSHARES, INC. |
|
|
By: |
|
/s/ MAURICE H. SULLIVAN, JR.
Maurice H. Sullivan, Jr.
Chairman and Chief Executive Officer
(Duly Authorized Representative) |
Pursuant to the requirements of Section 13 or 15(d) of the Securities Exchange Act of 1934, this report has been signed by the following persons on behalf of the registrant and in the capacities and on the dates indicated.
| | | | |
Signatures | | Title | | Date |
|---|
|
|
|
|
|
/s/ MAURICE H. SULLIVAN, JR.
Maurice H. Sullivan, Jr. | | Chairman and Chief Executive Officer (Principal Executive Officer) | | December 13, 2013 |
/s/ CHRISTOPHER LAKE
Christopher Lake |
|
Senior Vice President and Chief Financial Officer (Principal Financial and Accounting Officer) |
|
December 13, 2013 |
/s/ THOMAS J. LEETCH, JR.
Thomas J. Leetch, Jr. |
|
President and Director |
|
December 13, 2013 |
/s/ LEE ANN COTÉ
Lee Ann Coté |
|
Director |
|
December 13, 2013 |
/s/ D. RANDOLPH BERRY
D. Randolph Berry |
|
Director |
|
December 13, 2013 |
/s/ MYRON FOX
Myron Fox |
|
Director |
|
December 13, 2013 |
/s/ HUGH GALLAGHER
Hugh Gallagher |
|
Director |
|
December 13, 2013 |
120
Table of Contents
| | | | |
Signatures | | Title | | Date |
|---|
|
|
|
|
|
/s/ WILLIAM GIUDICE
William Giudice | | Director | | December 13, 2013 |
/s/ VINCENT MANNERING
Vincent Mannering |
|
Director |
|
December 13, 2013 |
/s/ NORMAN POSNER
Norman Posner |
|
Director |
|
December 13, 2013 |
/s/ JOHN F. REEN, JR.
John F. Reen, Jr. |
|
Director |
|
December 13, 2013 |
/s/ FREDERICK TAW
Frederick Taw |
|
Director |
|
December 13, 2013 |
/s/ MAURICE H. SULLIVAN, III
Maurice H. Sullivan, III |
|
Director |
|
December 13, 2013 |
121