| UNITED STATES |
| SECURITIES AND EXCHANGE COMMISSION |
| Washington, D.C. 20549 |
| |
FORM N-CSR |
| |
CERTIFIED SHAREHOLDER REPORT OF REGISTERED |
MANAGEMENT INVESTMENT COMPANIES |
| |
| |
| |
| Investment Company Act File Number: 811-22410 |
|
| |
| T. Rowe Price Real Assets Fund, Inc. |
|
| (Exact name of registrant as specified in charter) |
| |
| 100 East Pratt Street, Baltimore, MD 21202 |
|
| (Address of principal executive offices) |
| |
| David Oestreicher |
| 100 East Pratt Street, Baltimore, MD 21202 |
|
| (Name and address of agent for service) |
| |
| |
| Registrant’s telephone number, including area code: (410) 345-2000 |
| |
| |
| Date of fiscal year end: December 31 |
| |
| |
| Date of reporting period: June 30, 2011 |
Item 1: Report to Shareholders| Real Assets Fund | June 30, 2011 |

The views and opinions in this report were current as of June 30, 2011. They are not guarantees of performance or investment results and should not be taken as investment advice. Investment decisions reflect a variety of factors, and the managers reserve the right to change their views about individual stocks, sectors, and the markets at any time. As a result, the views expressed should not be relied upon as a forecast of the fund’s future investment intent. The report is certified under the Sarbanes-Oxley Act, which requires mutual funds and other public companies to affirm that, to the best of their knowledge, the information in their financial reports is fairly and accurately stated in all material respects.
REPORTS ON THE WEB
Sign up for our E-mail Program, and you can begin to receive updated fund reports and prospectuses online rather than through the mail. Log in to your account at troweprice.com for more information.
Manager’s Letter
Dear Investor:
Real assets stocks posted modest overall gains during the first six months of 2011 as strength in real estate and infrastructure stocks helped to offset pronounced weakness among metals stocks. Other commodity-focused investments, particularly oil and gas, surged in the first quarter, only to surrender much of these gains in the latter half of the period as investor sentiment was sapped by fiscal challenges and sagging recoveries in developed nations and inflation concerns and tighter monetary policies in developing markets. The Real Assets Fund managed a moderate gain in this environment but lagged its benchmark index.
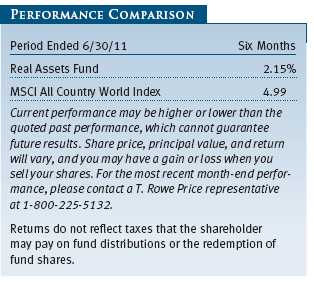
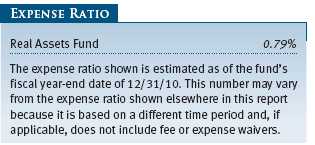
As shown in the accompanying Performance Comparison table, the Real Assets Fund rose 2.15% in the six-month period ended June 30, 2011, but trailed the 4.99% return of the MSCI All Country World Index. Performance among the fund’s underlying asset classes varied widely. Our U.S. and global real estate portfolios posted strong absolute gains and outpaced the broader equity markets, as did our global infrastructure and utilities holdings. Our natural resources stocks managed more modest gains, but our industrial and precious metals shares declined sharply. Security selection in the underlying portfolio and sector allocations detracted from returns relative to the benchmark MSCI index.
SUMMARY OF THE FUND’S INVESTMENT APPROACH
The Real Assets Fund invests in assets that typically provide some protection against the impact of inflation over time. In selecting investments, the fund’s management team searches for U.S. and international stocks that typically have a low correlation with the broader global equity market in order to outperform the market during periods of high or rising inflation. The fund is not a “fund of funds,” but your management team pays close attention to the analysis and judgment of the firm’s specialized mutual fund managers.
The fund normally invests at least 80% of its assets in real assets and securities of companies that derive at least 50% of their profits or revenues from real assets. Real assets include any investments that have physical properties, such as energy and natural resources, real estate, basic materials, equipment, utilities and infrastructure, and commodities. The fund may invest in securities issued by companies of any market capitalization. It may also invest in real estate investment trusts (REITs), which are pooled investment vehicles that typically invest directly in real estate and mortgages and loans backed by real estate. We generally favor companies that benefit from leading industry positions, compelling business models, strong managements, and reasonable valuations.
Please note that the Real Assets Fund currently is available only within the underlying investment lineups of certain T. Rowe Price asset allocation portfolios. Investors cannot directly purchase the Real Assets Fund at this time.
MARKET ENVIRONMENT
U.S. stocks produced solid overall gains in a volatile first half of 2011, as strong returns through April were trimmed by weakness in the last two months of the period. Extensive monetary and fiscal stimulus provided some positive momentum early in the period and contributed to improved business and consumer activity. Investor sentiment weakened, however, as economic growth in the U.S. and other developed markets failed to meet expectations in the first quarter of 2011. The long-running European debt crisis, geopolitical tensions in the Middle East and North Africa, and a devastating earthquake and tsunami in Japan also undermined investor optimism. Stocks proved resilient, however, and reached new highs in April before soft U.S. economic data, renewed concerns over Greek sovereign debt, and slowing growth in key emerging markets sparked a sharp sell-off in May and June. Aided by a weakening U.S. dollar, non-U.S. developed market stocks produced good returns and outpaced the U.S. market. Emerging market equity returns differed between countries and regions but managed a slim overall gain.
Natural resource stocks underperformed the broader market in the first half of 2011, weighed down by fiscal challenges and sagging recoveries in developed markets and slower growth in developing countries due to inflationary pressures and tighter monetary policies. U.S. real estate provided rewarding returns, as stocks advanced despite ongoing hesitancy in the nation’s economic recovery. Global real estate securities overcame widespread geopolitical uncertainties and posted gains, although returns varied from region to region, and the relative strength of select foreign currencies aided portfolio performance to some extent. Global infrastructure and utilities stocks recorded solid gains and modestly outpaced the broader global equity markets.
PORTFOLIO REVIEW
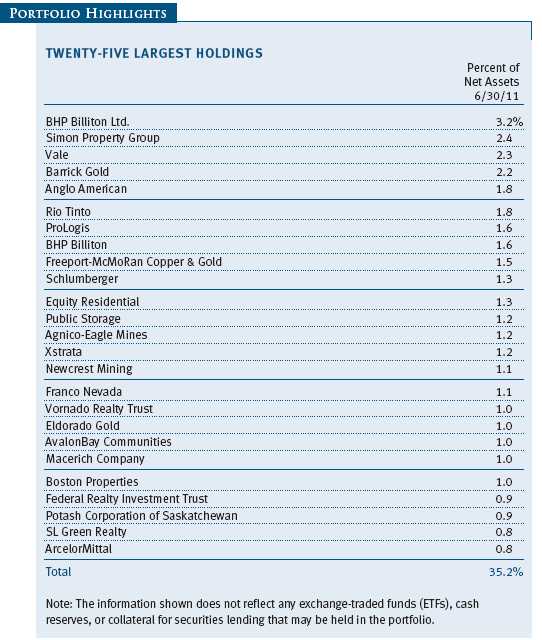
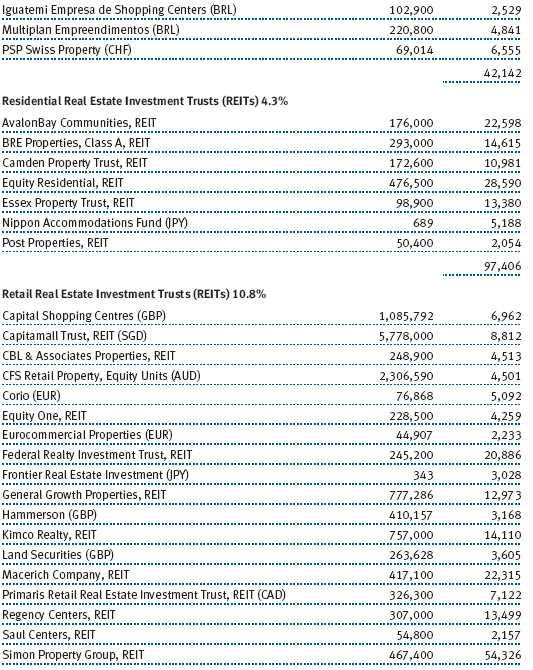
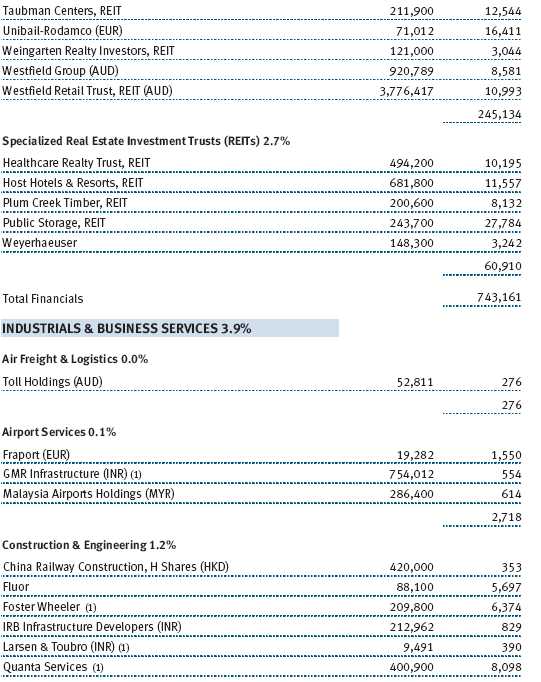
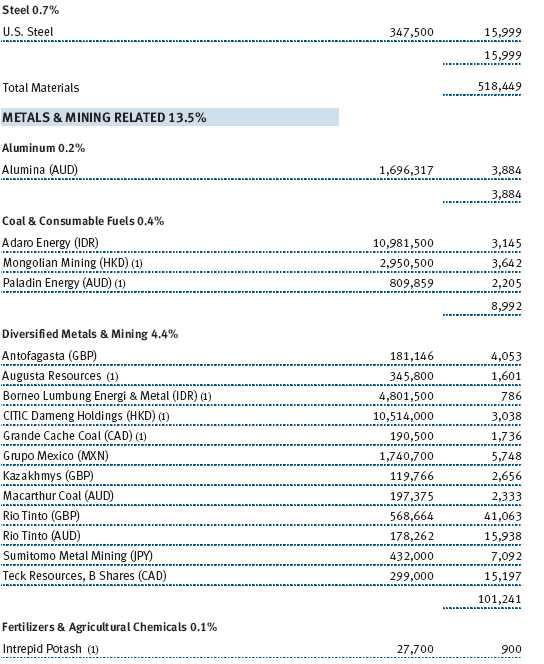
Our U.S. real estate investments generated the portfolio’s biggest gains. Apartments continued to shine during the period as falling homeownership rates have translated into increased rental demand. Not unexpectedly, areas where affordability remains challenging saw resilient demand for rental properties, and Essex Property Trust and BRE Properties were bolstered by their concentrations along the West Coast. Infill office markets on both coasts drew heightened investor demand, thus propelling SL Green Realty, with its Manhattan exposure, and Douglas Emmett, on the west coast of the U.S. The lodging subsector lagged notably amid anemic economic growth and higher travel costs. However, the business environment should improve, and we added to shares of Starwood Hotels & Resorts Worldwide and Marriott on weakness. Wealthier consumers seemed to fare better during the period, benefiting high-end mall owner Simon Property Group. Two of our larger industrial holdings, Prologis and AMB Property, combined during the period. We expect projected synergies to be exceeded by the new entity and believe it offers attractive global potential. (Please refer to our portfolio of investments for a complete list of holdings and the amount each represents in the portfolio.)
Global real estate returns varied by country but provided a strong overall boost to portfolio performance. Although performance was closer to neutral in local currencies, the continued weakness of the U.S. dollar translated into positive returns for many of our securities denominated in non-U.S. currencies. Westfield Retail Trust was spun out from Westfield Group late last year, creating a focused play on Australian regional malls that was one of our top performers. Prime European properties continued to attract investors in a flight to quality during the ongoing European debt crisis, benefiting Great Portland Estates in London’s West End and PSP Swiss Property. Our Japanese real estate holdings largely avoided direct damage from the earthquake and tsunami. Nevertheless, Mitsui Fudosan and other stocks were hit hard by the country’s broad market correction and weighed on returns.
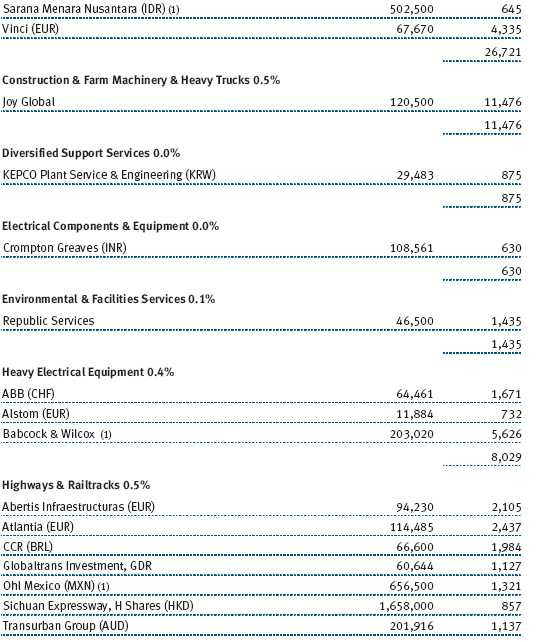
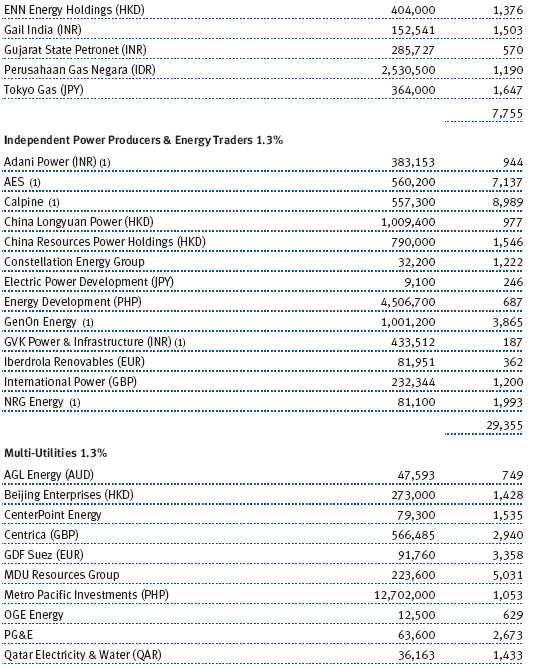
Our global infrastructure and utilities holdings also posted good gains and outperformed the broader global equity market. The electric utilities industry led absolute returns, with Enel and CEMIG among the top performers. Our lack of significant exposure to the hard-hit Japanese electric utilities industry provided a substantial boost to the portfolio’s performance versus its benchmark. Our industrials and business services shares were positive overall, but stock selection, particularly in the transportation infrastructure segment, detracted from returns. Shares of Sichuan Expressway, a toll road operator in China’s Sichuan province, declined due to a violation of bond market rules by a sister company. However, this violation is purely related to the sister company and has no direct impact on Sichuan Expressway itself.
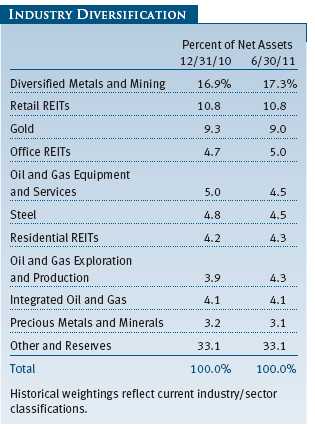
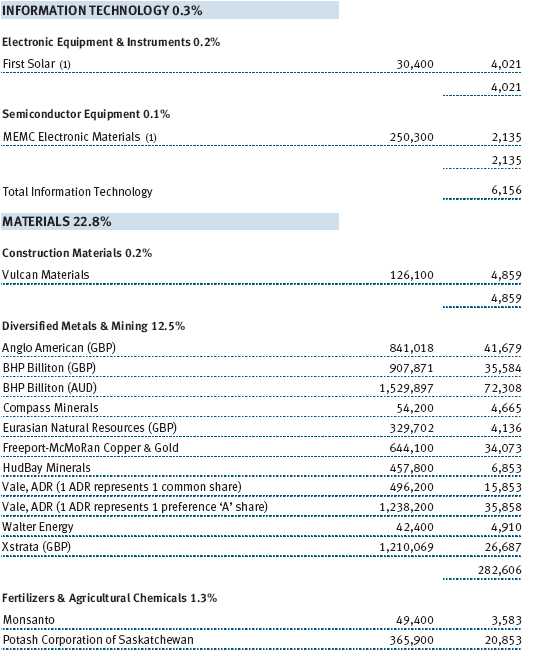
Natural resource stocks generated modest overall gains for the portfolio. Our industrial gas producers were among the stronger performers for the first half of the year. Fund holdings in this industry include Praxair and Air Products, two members of the global oligopoly in the industrial gas business. Shares of Potash Corporation of Saskatchewan, the world’s largest fertilizer company, and Chile’s Sociedad Quimica y Minera, also a major producer of potassium nitrate fertilizers, climbed as global potash prices ticked higher amid rising crop prices. Coal producers were among our performance leaders in 2010 but lagged sharply in the first half of 2011. Arch Coal stands out for its poor performance as investors were disappointed by the company’s decision to buy International Coal Group.
After an exceptional run in the latter half of 2010, industrial and precious metals stocks declined sharply through the first six months of 2011. Gold producers Barrick Gold, Eldorado Gold, and Agnico-Eagle Mines lagged significantly, even as the price of gold remained strong, as investors chose to avoid gold miners, betting that gold prices would fall. Our platinum miners, including Aquarius Platinum, Anglo American, and Eastern Platinum, continued to have operational issues as mining in South Africa is proving to be almost impossible to do in a cost-effective manner.
OUTLOOK
The global economy continues to recover at a modest, if uneven, pace. Corporations are in much better financial shape than they have been in some time and should do well as the global economy continues to improve. Although recent economic data have been decidedly mixed, we believe the U.S. and other developed markets remain on a path toward moderate economic growth. Key emerging markets largely have been able to promote growth and contain inflation and should continue to benefit from increasing industrialization and expanding consumer wealth.
However, significant challenges remain. Public debt in the developed world is still at high levels and continues to grow at a significant rate. Although emerging markets generally enjoy healthier fiscal positions, policymakers in these countries face their own challenges as they try to tame mounting inflationary pressures without undermining economic growth. In an uneven economic environment, the identification of attractive long-term investment opportunities will depend on strong fundamental research, a disciplined security selection and asset allocation process, and careful attention to risk. These attributes have always formed the core of our investment approach, and we believe they will continue to add value for shareholders over the long term.
In closing, we would like to inform our investors that Ned Notzon will be retiring at the end of 2011 after more than two decades with T. Rowe Price. Wyatt Lee has assumed duties as portfolio manager and chairman of the fund’s Investment Advisory Committee. Wyatt has helped manage the fund since its inception and will continue to work closely with Ned over the coming months to ensure a thoughtful and seamless transition. We are grateful to our investors for the trust you have placed in us, and we will work hard to maintain your trust in the future.
Respectfully submitted,

Wyatt A. Lee
Portfolio manager and chairman of the fund’s Investment Advisory Committee

Edmund M. Notzon III
Member of the fund’s Investment Advisory Committee
July 25, 2011
The committee chairman has day-to-day responsibility for managing the portfolio and works with committee members in developing and executing its investment program.
RISKS OF STOCK INVESTING
The fund’s share price can fall because of weakness in the stock markets, a particular industry, or specific holdings. Stock markets can decline for many reasons, including adverse political or economic developments, changes in investor psychology, or heavy institutional selling. The prospects for an industry or company may deteriorate because of a variety of factors, including disappointing earnings or changes in the competitive environment. In addition, the investment manager’s assessment of companies held in a fund may prove incorrect, resulting in losses or poor performance even in rising markets. Funds that invest only in specific industries will experience greater volatility than funds investing in a broad range of industries. The rate of earnings growth of natural resources companies may be irregular since these companies are strongly affected by natural forces, global economic cycles, and international politics. For example, stock prices of energy companies can fall sharply when oil prices fall.
GLOSSARY
MSCI All Country World Index: A capitalization-weighted index of stocks from developed and emerging markets worldwide.

Performance and Expenses
As a mutual fund shareholder, you may incur two types of costs: (1) transaction costs, such as redemption fees or sales loads, and (2) ongoing costs, including management fees, distribution and service (12b-1) fees, and other fund expenses. The following example is intended to help you understand your ongoing costs (in dollars) of investing in the fund and to compare these costs with the ongoing costs of investing in other mutual funds. The example is based on an investment of $1,000 invested at the beginning of the most recent six-month period and held for the entire period.
Actual Expenses
The first line of the following table (“Actual”) provides information about actual account values and expenses based on the fund’s actual returns. You may use the information on this line, together with your account balance, to estimate the expenses that you paid over the period. Simply divide your account value by $1,000 (for example, an $8,600 account value divided by $1,000 = 8.6), then multiply the result by the number on the first line under the heading “Expenses Paid During Period” to estimate the expenses you paid on your account during this period.
Hypothetical Example for Comparison Purposes
The information on the second line of the table (“Hypothetical”) is based on hypothetical account values and expenses derived from the fund’s actual expense ratio and an assumed 5% per year rate of return before expenses (not the fund’s actual return). You may compare the ongoing costs of investing in the fund with other funds by contrasting this 5% hypothetical example and the 5% hypothetical examples that appear in the shareholder reports of the other funds. The hypothetical account values and expenses may not be used to estimate the actual ending account balance or expenses you paid for the period.
Note: T. Rowe Price charges an annual account service fee of $20, generally for accounts with less than $10,000 ($1,000 for UGMA/UTMA). The fee is waived for any investor whose T. Rowe Price mutual fund accounts total $50,000 or more; accounts employing automatic investing; accounts electing to receive electronic delivery of account statements, transaction confirmations, prospectuses, and shareholder reports; accounts of an investor who is a T. Rowe Price Preferred Services, Personal Services, or Enhanced Personal Services client (enrollment in these programs generally requires T. Rowe Price assets of at least $100,000); and IRAs and other retirement plan accounts that utilize a prototype plan sponsored by T. Rowe Price (although a separate custodial or administrative fee may apply to such accounts). This fee is not included in the accompanying table. If you are subject to the fee, keep it in mind when you are estimating the ongoing expenses of investing in the fund and when comparing the expenses of this fund with other funds.
You should also be aware that the expenses shown in the table highlight only your ongoing costs and do not reflect any transaction costs, such as redemption fees or sales loads. Therefore, the second line of the table is useful in comparing ongoing costs only and will not help you determine the relative total costs of owning different funds. To the extent a fund charges transaction costs, however, the total cost of owning that fund is higher.


Unaudited
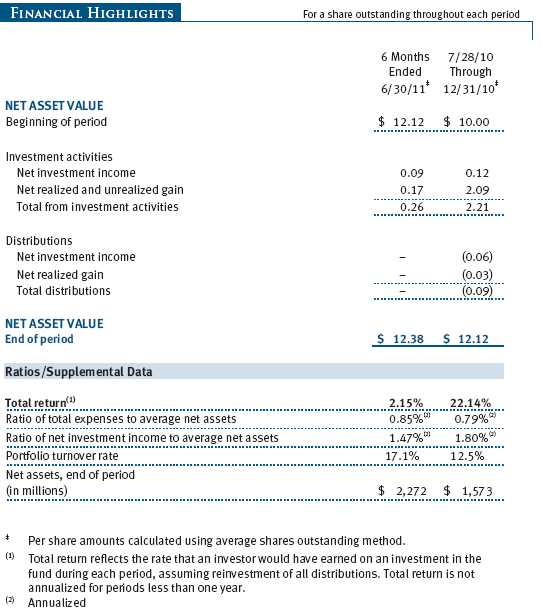
The accompanying notes are an integral part of these financial statements.
Unaudited
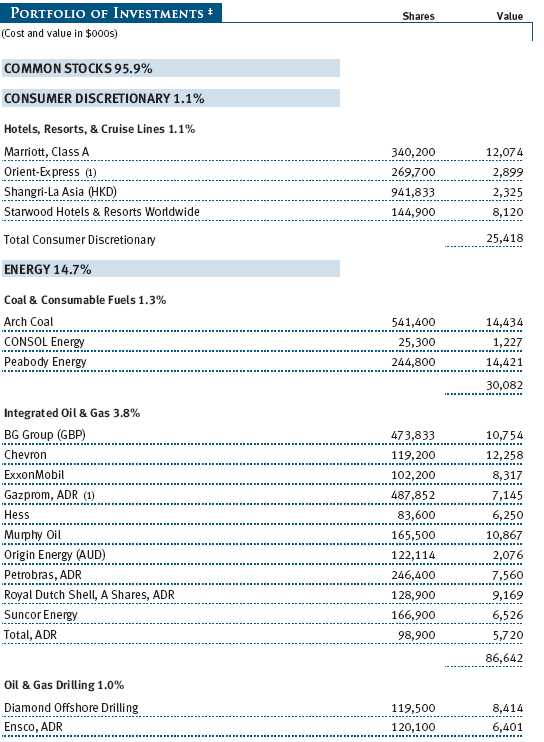
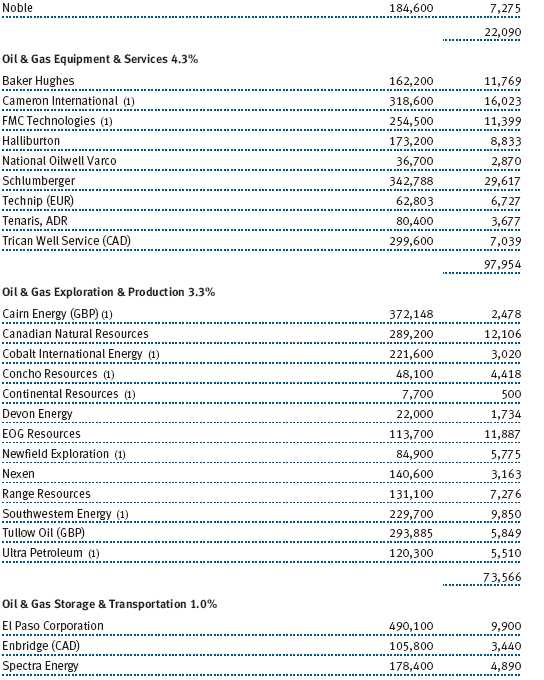
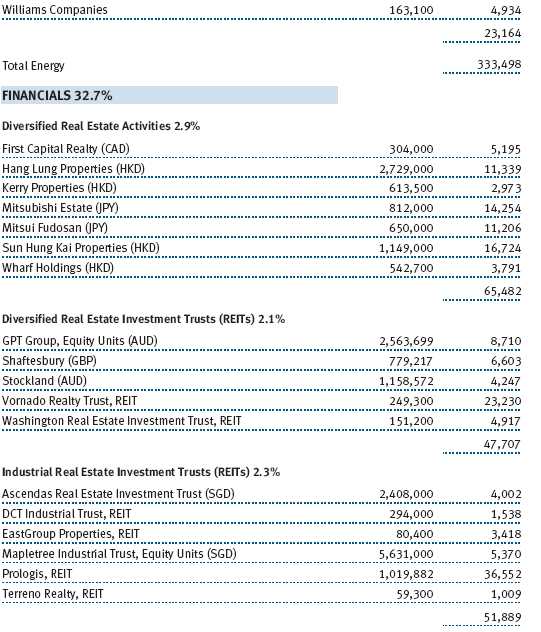







The accompanying notes are an integral part of these financial statements.
Unaudited

The accompanying notes are an integral part of these financial statements.
Unaudited

The accompanying notes are an integral part of these financial statements.
Unaudited

The accompanying notes are an integral part of these financial statements.
Unaudited
| NOTES TO FINANCIAL STATEMENTS |
T. Rowe Price Real Assets Fund, Inc. (the fund), is registered under the Investment Company Act of 1940 (the 1940 Act), as a diversified, open-end management investment company. The fund commenced operations on July 28, 2010. The fund is available for investment only by mutual funds plans managed by T. Rowe Price Associates, Inc., and/or its affiliates, and is not available for direct purchase by members of the public. The fund seeks to provide long-term growth of capital.
NOTE 1 - SIGNIFICANT ACCOUNTING POLICIES
Basis of Preparation The accompanying financial statements were prepared in accordance with accounting principles generally accepted in the United States of America (GAAP), which require the use of estimates made by management. Management believes that estimates and valuations are appropriate; however, actual results may differ from those estimates, and the valuations reflected in the accompanying financial statements may differ from the value ultimately realized upon sale or maturity.
Investment Transactions, Investment Income, and Distributions Income and expenses are recorded on the accrual basis. Dividends received from mutual fund investments are reflected as dividend income; capital gain distributions are reflected as realized gain/loss. Dividend income and capital gain distributions are recorded on the ex-dividend date. Income tax-related interest and penalties, if incurred, would be recorded as income tax expense. Investment transactions are accounted for on the trade date. Realized gains and losses are reported on the identified cost basis. Distributions to shareholders are recorded on the ex-dividend date. Income distributions are declared and paid annually. Capital gain distributions, if any, are generally declared and paid by the fund annually.
Currency Translation Assets, including investments, and liabilities denominated in foreign currencies are translated into U.S. dollar values each day at the prevailing exchange rate, using the mean of the bid and asked prices of such currencies against U.S. dollars as quoted by a major bank. Purchases and sales of securities, income, and expenses are translated into U.S. dollars at the prevailing exchange rate on the date of the transaction. The effect of changes in foreign currency exchange rates on realized and unrealized security gains and losses is reflected as a component of security gains and losses.
Rebates and Credits Subject to best execution, the fund may direct certain security trades to brokers who have agreed to rebate a portion of the related brokerage commission to the fund in cash. Commission rebates are reflected as realized gain on securities in the accompanying financial statements and totaled $5,000 for the six months ended June 30, 2011. Additionally, the fund earns credits on temporarily uninvested cash balances held at the custodian, which reduce the fund’s custody charges. Custody expense in the accompanying financial statements is presented before reduction for credits.
NOTE 2 - VALUATION
The fund’s financial instruments are reported at fair value as defined by GAAP. The fund determines the values of its assets and liabilities and computes its net asset value per share at the close of the New York Stock Exchange (NYSE), normally 4 p.m. ET, each day that the NYSE is open for business.
Valuation Methods Equity securities listed or regularly traded on a securities exchange or in the over-the-counter (OTC) market are valued at the last quoted sale price or, for certain markets, the official closing price at the time the valuations are made, except for OTC Bulletin Board securities, which are valued at the mean of the latest bid and asked prices. A security that is listed or traded on more than one exchange is valued at the quotation on the exchange determined to be the primary market for such security. Listed securities not traded on a particular day are valued at the mean of the latest bid and asked prices for domestic securities and the last quoted sale price for international securities.
Investments in mutual funds are valued at the mutual fund’s closing net asset value per share on the day of valuation.
Other investments, including restricted securities, and those financial instruments for which the above valuation procedures are inappropriate or are deemed not to reflect fair value are stated at fair value as determined in good faith by the T. Rowe Price Valuation Committee, established by the fund’s Board of Directors.
For valuation purposes, the last quoted prices of non-U.S. equity securities may be adjusted under the circumstances described below. If the fund determines that developments between the close of a foreign market and the close of the NYSE will, in its judgment, materially affect the value of some or all of its portfolio securities, the fund will adjust the previous closing prices to reflect what it believes to be the fair value of the securities as of the close of the NYSE. In deciding whether it is necessary to adjust closing prices to reflect fair value, the fund reviews a variety of factors, including developments in foreign markets, the performance of U.S. securities markets, and the performance of instruments trading in U.S. markets that represent foreign securities and baskets of foreign securities. A fund may also fair value securities in other situations, such as when a particular foreign market is closed but the fund is open. The fund uses outside pricing services to provide it with closing prices and information to evaluate and/or adjust those prices. The fund cannot predict how often it will use closing prices and how often it will determine it necessary to adjust those prices to reflect fair value. As a means of evaluating its security valuation process, the fund routinely compares closing prices, the next day’s opening prices in the same markets, and adjusted prices.
Valuation Inputs Various inputs are used to determine the value of the fund’s financial instruments. These inputs are summarized in the three broad levels listed below:
Level 1 – quoted prices in active markets for identical financial instruments
Level 2 – observable inputs other than Level 1 quoted prices (including, but not limited to, quoted prices for similar financial instruments, interest rates, prepayment speeds, and credit risk)
Level 3 – unobservable inputs
Observable inputs are those based on market data obtained from sources independent of the fund, and unobservable inputs reflect the fund’s own assumptions based on the best information available. The input levels are not necessarily an indication of the risk or liquidity associated with financial instruments at that level. For example, non-U.S. equity securities actively traded in foreign markets generally are reflected in Level 2 despite the availability of closing prices because the fund evaluates and determines whether those closing prices reflect fair value at the close of the NYSE or require adjustment, as described above. The following table summarizes the fund’s financial instruments, based on the inputs used to determine their values on June 30, 2011:

NOTE 3 - OTHER INVESTMENT TRANSACTIONS
Consistent with its investment objective, the fund engages in the following practices to manage exposure to certain risks and/or to enhance performance. The investment objective, policies, program, and risk factors of the fund are described more fully in the fund’s prospectus and Statement of Additional Information.
Emerging Markets At June 30, 2011, approximately 11% of the fund’s net assets were invested, either directly or through investments in T. Rowe Price institutional funds, in securities of companies located in emerging markets, securities issued by governments of emerging market countries, and/or securities denominated in or linked to the currencies of emerging market countries. Emerging market securities are often subject to greater price volatility, less liquidity, and higher rates of inflation than U.S. securities. In addition, emerging markets may be subject to greater political, economic and social uncertainty, and differing regulatory environments that may potentially impact the fund’s ability to buy or sell certain securities or repatriate proceeds to U.S. dollars.
American and Global Depository Receipts The fund may invest in American Depository Receipts (ADRs) and/or Global Depository Receipts (GDRs), certificates issued by U.S. and international banks that represent ownership of foreign securities held by the issuing bank. ADRs and GDRs are transferable, trade on established markets, and entitle the holder to all dividends and capital gains paid by the underlying foreign security. Issuing banks generally charge a security administration fee. Such fees are included in custody and accounting expense in the accompanying Statement of Operations and totaled $60,000 for the six months ended June 30, 2011.
Other Purchases and sales of portfolio securities other than short-term securities aggregated $1,004,003,000 and $349,535,000, respectively, for the six months ended June 30, 2011.
NOTE 4 - FEDERAL INCOME TAXES
No provision for federal income taxes is required since the fund intends to continue to qualify as a regulated investment company under Subchapter M of the Internal Revenue Code and distribute to shareholders all of its taxable income and gains. Distributions determined in accordance with federal income tax regulations may differ in amount or character from net investment income and realized gains for financial reporting purposes. Financial reporting records are adjusted for permanent book/tax differences to reflect tax character but are not adjusted for temporary differences. The amount and character of tax-basis distributions and composition of net assets are finalized at fiscal year-end; accordingly, tax-basis balances have not been determined as of the date of this report.
In accordance with federal tax regulations, the fund recognized ordinary income and capital losses in the current period for tax purposes that had been recognized in the prior fiscal year for financial reporting purposes. Such deferrals relate to REIT dividends and net capital losses realized between November 1, 2010 and December 31, 2010, and totaled $664,000.
At June 30, 2011, the cost of investments for federal income tax purposes was $2,109,926,000. Net unrealized gain aggregated $175,598,000 at period-end, of which $220,540,000 related to appreciated investments and $44,942,000 related to depreciated investments.
NOTE 5 - RELATED PARTY TRANSACTIONS
The fund is managed by T. Rowe Price Associates, Inc. (Price Associates), a wholly owned subsidiary of T. Rowe Price Group, Inc. (Price Group). The investment management agreement between the fund and Price Associates provides for an annual investment management fee, which is computed daily and paid monthly. The fee consists of an individual fund fee, equal to 0.30% of the fund’s average daily net assets, and a group fee. The group fee rate is calculated based on the combined net assets of certain mutual funds sponsored by Price Associates (the group) applied to a graduated fee schedule, with rates ranging from 0.48% for the first $1 billion of assets to 0.28% for assets in excess of $300 billion. The fund’s group fee is determined by applying the group fee rate to the fund’s average daily net assets. At June 30, 2011, the effective annual group fee rate was 0.30%.
The fund is also subject to a contractual expense limitation through April 30, 2013. During the limitation period, Price Associates is required to waive its management fee and reimburse the fund for any expenses, excluding interest, taxes, brokerage commissions, and extraordinary expenses, that would otherwise cause the fund’s ratio of annualized total expenses to average net assets (expense ratio) to exceed its expense limitation of 1.10%. For a period of three years after the date of any reimbursement or waiver, the fund is required to repay Price Associates for expenses previously reimbursed and management fees waived to the extent its net assets have grown or expenses have declined sufficiently to allow repayment without causing the fund’s expense ratio to exceed its expense limitation. For the six months ended June 30, 2011, the fund operated below its expense limitation.
In addition, the fund has entered into service agreements with Price Associates and a wholly owned subsidiary of Price Associates (collectively, Price). Price Associates computes the daily share price and provides certain other administrative services to the fund. T. Rowe Price Services, Inc., provides shareholder and administrative services in its capacity as the fund’s transfer and dividend disbursing agent. For the six months ended June 30, 2011, expenses incurred pursuant to these service agreements were $94,000 for Price Associates and less than $1,000 for T. Rowe Price Services, Inc. The total amount payable at period-end pursuant to these service agreements is reflected as Due to Affiliates in the accompanying financial statements.
The fund is also one of several mutual funds sponsored by Price Associates (underlying Price funds) in which the T. Rowe Price Retirement Funds (Retirement Funds) may invest. The Retirement Funds do not invest in the underlying Price funds for the purpose of exercising management or control. Pursuant to a special servicing agreement, expenses associated with the operation of the Retirement Funds are borne by each underlying Price fund to the extent of estimated savings to it and in proportion to the average daily value of its shares owned by the Retirement Funds. Expenses allocated under this agreement are reflected as shareholder servicing expense in the accompanying financial statements. For the six months ended June 30, 2011, the fund was allocated $2,153,000 of Retirement Funds’ expenses, of which $1,255,000 related to services provided by Price. The amount payable at period-end pursuant to this agreement is reflected as Due to Affiliates in the accompanying financial statements. At June 30, 2011, approximately 97% of the outstanding shares of the fund were held by the Retirement Funds.
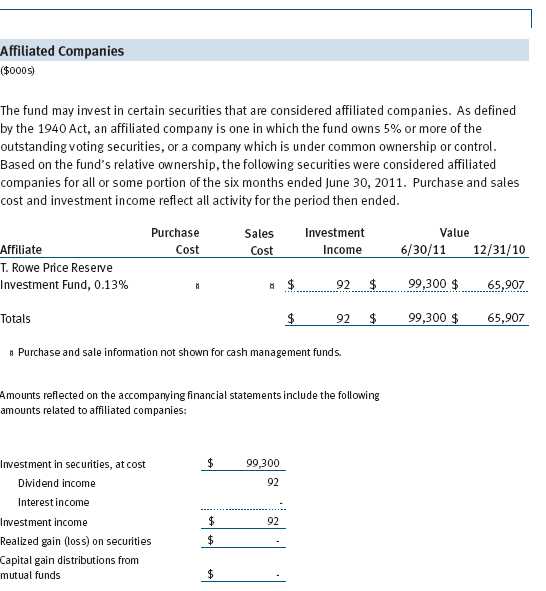
The fund may invest in the T. Rowe Price Reserve Investment Fund and the T. Rowe Price Government Reserve Investment Fund (collectively, the T. Rowe Price Reserve Investment Funds), open-end management investment companies managed by Price Associates and considered affiliates of the fund. The T. Rowe Price Reserve Investment Funds are offered as cash management options to mutual funds, trusts, and other accounts managed by Price Associates and/or its affiliates and are not available for direct purchase by members of the public. The T. Rowe Price Reserve Investment Funds pay no investment management fees.
Mutual funds and other accounts managed by T. Rowe Price and its affiliates (collectively, T. Rowe Price funds) may invest in the fund; however, no T. Rowe Price fund may invest for the purpose of exercising management or control over the fund. At June 30, 2011, approximately 3% of the fund’s outstanding shares were held by T. Rowe Price funds.
| INFORMATION ON PROXY VOTING POLICIES, PROCEDURES, AND RECORDS |
A description of the policies and procedures used by T. Rowe Price funds and portfolios to determine how to vote proxies relating to portfolio securities is available in each fund’s Statement of Additional Information, which you may request by calling 1-800-225-5132 or by accessing the SEC’s website, sec.gov. The description of our proxy voting policies and procedures is also available on our website, troweprice.com. To access it, click on the words “Our Company” at the top of our corporate homepage. Then, when the next page appears, click on the words “Proxy Voting Policies” on the left side of the page.
Each fund’s most recent annual proxy voting record is available on our website and through the SEC’s website. To access it through our website, follow the directions above, then click on the words “Proxy Voting Records” on the right side of the Proxy Voting Policies page.
| HOW TO OBTAIN QUARTERLY PORTFOLIO HOLDINGS |
The fund files a complete schedule of portfolio holdings with the Securities and Exchange Commission for the first and third quarters of each fiscal year on Form N-Q. The fund’s Form N-Q is available electronically on the SEC’s website (sec.gov); hard copies may be reviewed and copied at the SEC’s Public Reference Room, 450 Fifth St. N.W., Washington, DC 20549. For more information on the Public Reference Room, call 1-800-SEC-0330.
Item 2. Code of Ethics.
A code of ethics, as defined in Item 2 of Form N-CSR, applicable to its principal executive officer, principal financial officer, principal accounting officer or controller, or persons performing similar functions is filed as an exhibit to the registrant’s annual Form N-CSR. No substantive amendments were approved or waivers were granted to this code of ethics during the registrant’s most recent fiscal half-year.
Item 3. Audit Committee Financial Expert.
Disclosure required in registrant’s annual Form N-CSR.
Item 4. Principal Accountant Fees and Services.
Disclosure required in registrant’s annual Form N-CSR.
Item 5. Audit Committee of Listed Registrants.
Not applicable.
Item 6. Investments.
(a) Not applicable. The complete schedule of investments is included in Item 1 of this Form N-CSR.
(b) Not applicable.
Item 7. Disclosure of Proxy Voting Policies and Procedures for Closed-End Management Investment Companies.
Not applicable.
Item 8. Portfolio Managers of Closed-End Management Investment Companies.
Not applicable.
Item 9. Purchases of Equity Securities by Closed-End Management Investment Company and Affiliated Purchasers.
Not applicable.
Item 10. Submission of Matters to a Vote of Security Holders.
Not applicable.
Item 11. Controls and Procedures.
(a) The registrant’s principal executive officer and principal financial officer have evaluated the registrant’s disclosure controls and procedures within 90 days of this filing and have concluded that the registrant’s disclosure controls and procedures were effective, as of that date, in ensuring that information required to be disclosed by the registrant in this Form N-CSR was recorded, processed, summarized, and reported timely.
(b) The registrant’s principal executive officer and principal financial officer are aware of no change in the registrant’s internal control over financial reporting that occurred during the registrant’s second fiscal quarter covered by this report that has materially affected, or is reasonably likely to materially affect, the registrant’s internal control over financial reporting.
Item 12. Exhibits.
(a)(1) The registrant’s code of ethics pursuant to Item 2 of Form N-CSR is filed with the registrant’s annual Form N-CSR.
(2) Separate certifications by the registrant's principal executive officer and principal financial officer, pursuant to Section 302 of the Sarbanes-Oxley Act of 2002 and required by Rule 30a-2(a) under the Investment Company Act of 1940, are attached.
(3) Written solicitation to repurchase securities issued by closed-end companies: not applicable.
(b) A certification by the registrant's principal executive officer and principal financial officer, pursuant to Section 906 of the Sarbanes-Oxley Act of 2002 and required by Rule 30a-2(b) under the Investment Company Act of 1940, is attached.
| | |
SIGNATURES |
| |
| | Pursuant to the requirements of the Securities Exchange Act of 1934 and the Investment |
| Company Act of 1940, the registrant has duly caused this report to be signed on its behalf by the |
| undersigned, thereunto duly authorized. |
| |
| T. Rowe Price Real Assets Fund, Inc. |
| |
| |
| |
| By | /s/ Edward C. Bernard |
| | Edward C. Bernard |
| | Principal Executive Officer |
| |
| Date | August 17, 2011 |
| |
| |
| |
| | Pursuant to the requirements of the Securities Exchange Act of 1934 and the Investment |
| Company Act of 1940, this report has been signed below by the following persons on behalf of |
| the registrant and in the capacities and on the dates indicated. |
| |
| |
| By | /s/ Edward C. Bernard |
| | Edward C. Bernard |
| | Principal Executive Officer |
| |
| Date | August 17, 2011 |
| |
| |
| |
| By | /s/ Gregory K. Hinkle |
| | Gregory K. Hinkle |
| | Principal Financial Officer |
| |
| Date | August 17, 2011 |


