As filed with the Securities and Exchange Commission on March 2, 2011
UNITED STATES
SECURITIES AND EXCHANGE COMMISSION
WASHINGTON, D.C. 20549
FORM N-CSR
CERTIFIED SHAREHOLDER REPORT OF REGISTERED MANAGEMENT
INVESTMENT COMPANIES
Investment Company Act file number 811-22394
CHOU AMERICA MUTUAL FUNDS
Three Canal Plaza, Suite 600
Portland, Maine 04101
Michael J. McKeen, Principal Financial Officer
Three Canal Plaza, Suite 600
Portland, Maine 04101
207-347-2000
Date of fiscal year end: December 31
Date of reporting period: July 1, 2010 – December 31, 2010
ITEM 1. REPORT TO STOCKHOLDERS.
CHOU AMERICA MUTUAL FUNDS
Annual Report
December 31, 2010
Fund Adviser:
Chou America Management Inc.
110 Sheppard Ave. East
Suite 301, Box 18
Toronto, Ontario, Canada M2N 6Y8
Toll Free: (877)-755-5188
Financial Highlights.......................................................................................14
Dear Shareholder,
In its first six months of operation -- from its launch date of July 1, 2010 through December 31, 2010 -- the Chou Equity Opportunity Fund (the “Fund”) generated a total return of 22.00%. During this same period, the S&P 500 generated a return of 23.66%. (Performance data quoted represents past performance and is no guarantee of future results. Current performance may be lower or higher than the performance data quoted. Investment return and principal value will fluctuate so that an investor’s shares, when redeemed, may be worth more or less than original cost. For the most recent month-end performance, please call 877-682-6352. As stated in the current prospectus, the Fund’s annual operating expense ratio (gross) is 5.22%.� 60; However, the Adviser has contractually agreed to waive a portion of its fees and reimburse certain expenses through July 1, 2011, to limit Total Annual Fund Operating Expenses to 1.75%. Shares held less than 120 days will be subject to a 2.00% redemption fee.)
The performance of the Fund was aided by its position in King Pharmaceuticals. On October 12, 2010, Pfizer announced that it was going to purchase King for $14.25 per share. On the day of the announcement, the Fund had approximately 17.0% of its assets in King. This large holding had a meaningful impact on the performance of the Fund.
Other major positive contributors to the performance of the Fund were:
| · | Sears Holdings – which benefited from increased consumer confidence and an improvement in U.S. consumer spending. |
| · | Sandridge Energy – which benefited from strong energy prices and the continuation of an economic recovery in the United States. |
| · | Mannkind Corporation – which benefited from investor optimism surrounding the company’s diabetes drug, Afrezza. |
We are pleased to report that the Fund achieved a total return of 22.00% for its first six months of operation even though its average daily cash balance was approximately 46%. In a rising stock market, large cash balances are a drag on performance and this was the case for the Fund during the last six months of 2010.
Market Commentary
During the last six months of 2010 the stock market experienced very strong gains on the heels of an accelerating economic recovery in the United States, a resolution of the European debt crisis and strong corporate earnings. In addition, the capital markets were accessible and companies were able to issue debt at very favorable rates. Despite all of the positives, several areas of concern remain, such as large local, state and federal budget deficits in the United States, inflationary pressures (particularly in emerging markets) and sovereign debt issues in both Europe and Japan. These issues may increase market volatility and may provide us with attractive investment opportunities.
Our Philosophy
We are value investors. The investment principle we follow is to purchase securities at a price that is far less than what they are worth, measured by sustainable earning power and/or hard assets that are not depreciating in value. This approach seeks to achieve an adequate "Margin of Safety" when purchasing securities. This concept, while unappreciated and ignored by many, is what distinguishes investment from speculation.
In applying these value investment principles we are subject to the following guidelines, which may shape our investment options:
| · | The Fund is "Non-diversified," |
| · | the Fund can invest up to a maximum of 25% of the Fund's assets in any one industry with a total limit of 50% of the Fund’s assets in any two industries, |
| · | in accordance with the U.S. Tax Code, the Fund cannot invest more than 50% of its assets in securities where each security comprises more than 5% of the Fund's assets, and |
| · | the Fund may invest up to 15% of its assets in “illiquid securities.” |
Because of these guidelines, the Fund’s performance on a day-to-day basis may be more volatile.
Miscellaneous
After managing mutual funds in Canada for many years, we are very excited about managing the Chou Equity Opportunity Fund and will continue to apply the same value principles as we have done in Canada.
| CHOU EQUITY OPPORTUNITY FUND |
| A MESSAGE TO OUR SHAREHOLDERS |
| DECEMBER 31, 2010 |
Investors can buy the Fund directly by going to our website, www.chouamerica.com. In addition, we are now available on several brokerage platforms, including Charles Schwab.
Yours truly,
Francis Chou
Portfolio Manager and CEO
Chou America Management Inc.
The views in this report were those of the Fund managers as of December 31, 2010, and may not reflect their views on the date this report is first published or anytime thereafter. These views are intended to assist the shareholders of the Fund in understanding their investments in the Fund and do not constitute investment advice. This letter may contain discussions about certain investments held and not held in the portfolio. All current and future holdings are subject to risk and to change. There can be no guarantee of success with any technique, strategy or investment.
The S&P 500 Index is an unmanaged index representing the average performance of 500 widely held, publicly traded, large capitalization stocks. One cannot invest directly in an index.
| CHOU INCOME OPPORTUNITY FUND |
| A MESSAGE TO OUR SHAREHOLDERS |
| DECEMBER 31, 2010 |
Dear Shareholder,
In its first six months of operation -- from its launch date of July 1, 2010 through December 31, 2010 -- the Chou Income Opportunity Fund (the “Fund”) generated a total return of 18.54%. During this same period, the Barclay's U.S. High Yield Index generated a return of 10.23%. (Performance data quoted represents past performance and is no guarantee of future results. Current performance may be lower or higher than the performance data quoted. Investment return and principal value will fluctuate so that an investor’s shares, when redeemed, may be worth more or less than original cost. For the most recent month-end performance, please call 877-682-6352. As stated in the current prospectus, the Fund’s annual operating expense ratio (gross) is 5.22%. However, the Adviser has contractually agreed to waive a portion of its fees and reimburse certain expenses through July 1, 2011, to limit Total Annual Fund Operating Expenses to 1.50%. Shares held less than 120 days will be subject to a 2.00% redemption fee.)
Major positive contributors to the performance of the Fund were the debt securities of CompuCredit Holdings Corp., Abitibi-Consolidated, Inc. and Catalyst Paper Corp. During the third week of December, 2010, Abitibi-Consolidated, Inc. emerged from bankruptcy and the majority of the bonds that we were holding were converted into AbitibiBowater common shares on the initial distribution date. Supplemental interim distributions of the shares held in reserve will be distributed pending settlements with disputed claims.
We are pleased to report that the Fund achieved a total return of 18.54% in the first six months even though its average daily cash balance was approximately 55%. In a rising market, large cash balances are a drag on performance and this was the case for the Fund during the last six months of 2010.
Market Commentary
During the last six months of 2010, corporate bond markets were strong as investors grew more confident in the sustainability of an economic recovery in the United States. Corporate profits were strong and companies took advantage of favorable market conditions to issue debt at very attractive rates. In general, corporate balance sheets have become stronger.
Lately, we have focused on debt securities that have defaulted or are distressed. The down side to investing in defaulted or distressed securities is that even if we perform all the due diligence we want we could still end up financially distressed. The reason being that there are too many imponderables to consider - factors which cannot be measured, evaluated or foreseen - and these unknowns leave us vulnerable. Distressed securities involve companies that have one or more serious deficiencies including weak economics, stretched balance sheets, liquidity problems, incompetent management, accounting frauds, potentially mutant cockroaches - you name it.
Therefore, one must proceed with eyes wide open and accept that there is a good chance that at some point, one or more of the investments in distressed securities may not work out well. The up side is that because of the uncertainties and the stigma associated with distressed securities, the debt securities of these companies are often selling at deep discounts to their potential “recovery” values. As a result, we believe that we have a fair chance to earn equity-like returns but it comes with a price - the returns can be volatile.
Our Philosophy
We are value investors. The investment principle we follow is to purchase securities at a price that is far less than what they are worth, measured by their intrinsic or ultimate recovery value in a bankruptcy/restructuring scenario. This approach seeks to achieve an adequate “Margin of Safety” when purchasing securities. This concept, while unappreciated and ignored by many, is what distinguishes investment from speculation.
In applying these value investment principles we are subject to the following guidelines, which may shape our investment options:
| · | The Fund is "Non-diversified," |
| · | the Fund can invest up to a maximum of 25% of the Fund's assets in any one industry with a total limit of 50% of the Fund’s assets in any two industries, |
| · | in accordance with the U.S. Tax Code, the Fund cannot invest more than 50% of its assets in securities where each security comprises more than 5% of the Fund's assets, and |
| · | the Fund may invest up to 15% of its assets in “illiquid securities.” |
| CHOU INCOME OPPORTUNITY FUND |
| A MESSAGE TO OUR SHAREHOLDERS |
| DECEMBER 31, 2010 |
Because of these guidelines, the Fund’s performance on a day-to-day basis may be more volatile.
Miscellaneous
After managing mutual funds in Canada for many years, we are very excited about managing the Chou Income Opportunity Fund and will continue to apply the same value principles as we have done in Canada.
Investors can buy the Fund directly by going to our website, www.chouamerica.com. In addition, we are now available on several brokerage platforms, including Charles Schwab.
Yours truly,
Francis Chou
Portfolio Manager and CEO
Chou America Management Inc.
The views in this report were those of the Fund managers as of December 31, 2010, and may not reflect their views on the date this report is first published or anytime thereafter. These views are intended to assist the shareholders of the Fund in understanding their investments in the Fund and do not constitute investment advice. This letter may contain discussions about certain investments held and not held in the portfolio. All current and future holdings are subject to risk and to change. There can be no guarantee of success with any technique, strategy or investment.
The Barclays Capital U.S. Corporate High Yield Index is comprised of issues that meet the following criteria: at least $150 million par value outstanding, maximum credit rating of Ba1 (including defaulted issues) and at least one year to maturity. One cannot invest directly in an index.
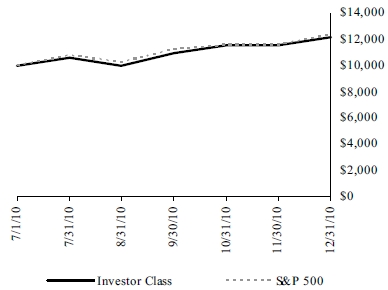
The following chart reflects the change in the value of a hypothetical $10,000 investment, including reinvested dividends and distributions, in the Chou Equity Opportunity Fund (the “Fund”) compared with the performance of the benchmark Standard & Poor's 500 Index ("S&P 500"), since inception. The S&P 500 is a market-value weighted index representing the performance of 500 widely held, publicly traded stocks. The total return of the S&P 500 includes reinvestment of dividends and income. The total return of the Fund includes operating expenses that reduce returns, while the total return of the S&P 500 does not include expenses. The Fund is professionally managed while the S&P 500 is unmanaged and is not available for investment.
Performance data quoted represents past performance and is no guarantee of future results. Current performance may be lower or higher than the performance data quoted. Investment return and principal value will fluctuate so that shares, when redeemed, may be worth more or less than original cost. For the most recent month-end performance please call (877) 682-6352. Shares redeemed or exchanged within 120 days of purchase will be charged a 2.00% redemption fee. As stated in the Fund's prospectus, the annual operating expense ratio (gross) is 5.22%. However, the Fund's adviser has agreed to contractually waive a portion of its fees and to reimburse expenses such that total operating expenses do not exceed 1.75%, which is in effect until July 1, 2011. D uring the period, certain fees were waived and/or expenses reimbursed; otherwise, returns would have been lower. The performance table and graph do not reflect the deduction of taxes that a shareholder would pay on Fund distributions or the redemption of Fund shares.
| Total Return as of 12/31/10 | Since Inception 07/01/10 |
| Chou Equity Opportunity Fund | 22.00% |
| S&P 500 | 23.66% |
| | |
| | |
| Investment Value as of 12/31/10 | |
| Chou Equity Opportunity Fund | $12,200 |
| S&P 500 | $12,366 |
| | |
| | |
| CHOU INCOME OPPORTUNITY FUND |
| PERFORMANCE CHART AND ANALYSIS |
| DECEMBER 31, 2010 |
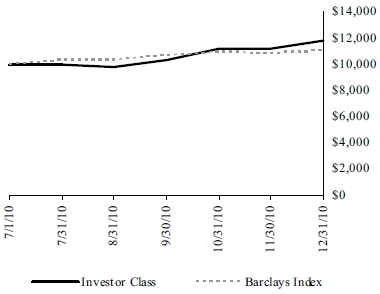
The following chart reflects the change in the value of a hypothetical $10,000 investment, including reinvested dividends and distributions, in the Chou Income Opportunity Fund (the “Fund”) compared with the performance of the benchmark Barclays Capital U.S. Corporate High Yield Index ("Barclays Index"), since inception. The Barclays Index is comprised of issues that meet the following criteria: at least $150 million par value outstanding, maximum credit rating of Ba1 (including defaulted issues) and at least one year to maturity.The total return of the Barclays Index includes reinvestment of dividends and income. The total return of the Fund includes operating expenses that reduce returns, while the total return of the Barclays Index does not include expenses. The Fund is professionally managed while the Barclays Index is unmanaged and is not available for investment.
Performance data quoted represents past performance and is no guarantee of future results. Current performance may be lower or higher than the performance data quoted. Investment return and principal value will fluctuate so that shares, when redeemed, may be worth more or less than original cost. For the most recent month-end performance please call (877) 682-6352. Shares redeemed or exchanged within 120 days of purchase will be charged a 2.00% redemption fee. As stated in the Fund's prospectus, the annual operating expense ratio (gross) is 5.22%. However, the Fund's adviser has agreed to contractually waive a portion of its fees and to reimburse expenses such that total operating expenses do not exceed 1.50%, which is in effect until July 1, 2011. D uring the period, certain fees were waived and/or expenses reimbursed; otherwise, returns would have been lower. The performance table and graph do not reflect the deduction of taxes that a shareholder would pay on Fund distributions or the redemption of Fund shares.
| Total Return as of 12/31/10 | Since Inception 07/01/10 |
| Chou Income Opportunity Fund | 18.54% |
| Barclays Capital U.S. Corporate High Yield Index | 10.23% |
| | |
| | |
| Investment Value as of 12/31/10 | |
| Chou Income Opportunity Fund | $11,854 |
| Barclays Capital U.S. Corporate High Yield Index | $11,023 |
| | |
| | |
| Shares | | Security Description | | Value | |
| Common Stock - 72.0% |
| Communications - 24.4% |
| | 20,900 | | Sprint Nextel Corp. (a) | $ | 88,407 | |
| | 80,000 | | UTStarcom, Inc. (a) | | 164,800 | |
| | | 253,207 | |
| Consumer Discretionary - 28.3% |
| | 4,800 | | Office Depot, Inc. (a) | | 25,920 | |
| | 1,500 | | Ryanair Holdings PLC, ADR (a) | | 46,140 | |
| | 3,000 | | Sears Holdings Corp. (a) | | 221,250 | |
| | | 293,310 | |
| Consumer Staples - 5.0% |
| | 4,310 | | Alliance One International, Inc. (a) | | 18,274 | |
| | 4,200 | | MannKind Corp. (a)(b) | | 33,852 | |
| | | 52,126 | |
| Energy - 2.8% |
| | 4,000 | | SandRidge Energy, Inc. (a) | | 29,280 | |
| | | | |
| Financials - 4.1% |
| | 5,200 | | Asta Funding, Inc. | | 42,120 | |
| | | | |
| Information Technology - 7.4% |
| | 5,700 | | Dell, Inc. (a) | | 77,235 | |
| | | | |
| Total Common Stock (Cost $686,418) | | 747,278 | |
| Warrants - 11.1% |
| | 6,000 | | Bank of America Corp. (a) | | 42,840 | |
| | 3,100 | | JPMorgan Chase & Co. (a) | | 44,795 | |
| | 2,500 | | Wells Fargo & Co. (a) | | 27,775 | |
| | | | |
| Total Warrants (Cost $102,865) | | 115,410 | |
| Total Investments - 83.1% (Cost $789,283)* | $ | 862,688 | |
| Contracts | | Security Description | | | Strike Price | | Exp. Date | | Value |
| Call Options Written - (0.5)% |
| (42) | | MannKind Corp. | | | $ 10.00 | | 02/11 | | (4,662 | ) |
Total Call Options Written – (0.5)% (Premiums Received $(4,873)) | $ | (4,662 | ) |
| Other Assets & Liabilities, Net – 17.4% | | 180,569 | |
| Net Assets – 100.0% | $ | 1,038,595 | |
| ADR | American Depository Receipt |
| PLC | Public Limited Company |
| (a) | Non-income producing security. |
| (b) | Subject to call option written by the Fund. |
| | * Cost of investments for federal income tax purposes is $784,410 and net unrealized appreciation on investments consists of: |
| Gross Unrealized Appreciation | | $ | 77,010 | |
| Gross Unrealized Depreciation | | | (3,394 | ) |
| Net Unrealized Appreciation | | $ | 73,616 | |
The inputs or methodology used for valuing securities are not necessarily an indication of the risk associated with investing in those securities. For more information on valuation inputs, and their aggregation into the levels used in the tables below, please refer to Note 2- Security Valuation section in the accompanying Notes to Financial Statements.
The following is a summary of the inputs used to value the Fund’s investments as of December 31, 2010.
| | Level 1 | | Level 2 | | Level 3 | | Total |
| Investments At Value: | | | | | | | | | | | | | | | |
| Investments in Securities | $ | 862,688 | | | $ | - | | | $ | - | | | $ | 862,688 | |
| Other Financial Instruments** | | (4,662 | ) | | | - | | | | - | | | | (4,662 | ) |
| Total Investments at Value | $ | 858,026 | | | $ | - | | | $ | - | | | $ | 858,026 | |
The Level 1 inputs displayed in this table are Common Stock, Warrants and Call Options Written. Refer to the Schedule of Investments for a further breakout of each security type.
| | ** Other Financial Instruments are derivative instruments not reflected in the Total Investments in Securities, such as written options, which are valued at their market value at period end date. |
| See Notes to Financial Statements. | 7 | |
| CHOU EQUITY OPPORTUNITY FUND |
| SCHEDULE OF INVESTMENTS |
| DECEMBER 31, 2010 |
| PORTFOLIO HOLDINGS | | |
| % of Total Investments | | |
| Communications | 29.4 | % |
| Consumer Discretionary | 34.0 | % |
| Consumer Staples | 6.0 | % |
| Energy | 3.4 | % |
| Financials | 4.9 | % |
| Information Technology | 8.9 | % |
| Warrants | 13.4 | % |
| | 100.0 | % |
| See Notes to Financial Statements. | 8 | |
| CHOU INCOME OPPORTUNITY FUND |
| SCHEDULE OF INVESTMENTS |
| DECEMBER 31, 2010 |
| | Shares | | Security Description | | Value | |
| Equity Securities - 10.6% |
| Common Stock - 10.6% |
| Materials - 10.6% |
| | 3,429 | | AbitibiBowater, Inc. (a) | $ | 81,164 | |
| | | | |
| Total Common Stock (Cost $54,140) | | 81,164 | |
| Total Equity Securities (Cost $54,140) | | 81,164 | |
| | Principal | | Security Description | | Rate | | Maturity | | Value | |
| Fixed Income Securities - 85.2% | |
| Corporate Convertible Bonds - 29.2% | |
| Communications - 4.2% | |
| $ | 30,000 | | Level 3 Communications, Inc. | | 6.50 | % | 10/01/16 | | | 32,513 | |
| Consumer Staples - 3.2% |
| | 37,000 | | MannKind Corp. | | 3.75 | | 12/15/13 | | 24,235 | |
| Financials - 21.8% |
| | 300,000 | | CompuCredit Holdings Corp. | | 5.88 | | 11/30/35 | | 166,875 | |
| Total Corporate Convertible Bonds (Cost $176,257) | | 223,623 | |
| Corporate Non-Convertible Bonds - 16.8% |
| Communications - 3.6% |
| | 40,000 | | Dex One Corp. | | 12.00 | | 01/29/17 | | 27,500 | |
| | | |
| Materials - 13.2% |
| |
| | 267,000 | | Abitibi Consolidated, Inc. (Escrow Shares) (b) | | 0.00 | | 12/23/49 | | 4,005 | |
| | 170,000 | | Abitibi Consolidated, Inc. (Escrow Shares) (b) | | 0.00 | | 12/23/49 | | 2,550 | |
| | 100,000 | | Catalyst Paper Corp. (c) | | 11.00 | | 12/15/16 | | 94,750 | |
| | 101,305 | |
Total Corporate Non-Convertible Bonds (Cost $108,359) | | 128,805 | |
| U.S. Government & Agency Obligations - 39.2% |
| U.S. Treasury Securities - 39.2% |
| | 300,000 | | U.S. Treasury Bill (d) | | 0.00 | | 01/20/11 | | 299,991 | |
| | | | |
Total U.S. Government & Agency Obligations (Cost $299,991) | | 299,991 | |
| Total Fixed Income Securities (Cost $584,607) | | 652,419 | |
| Total Investments - 95.8% (Cost $638,747)* | $ | 733,583 | |
| Other Assets & Liabilities, Net – 4.2% | | 32,428 | |
| Net Assets – 100.0% | $ | 766,011 | |
| (a) | Non-income producing security. Shares received as a result of company bankruptcy. |
| (b) | Security fair valued in accordance with procedures adopted by the Board of Trustees. At the period end, the value of these securities amounted to $6,555 or 0.8% of net assets. |
| (c) | Security exempt from registration under Rule 144A under the Securities Act of 1933. At the period end, the value of this security amounted to $94,750 or 12.4% of net assets. |
| (d) | Rate presented is yield to maturity. |
| | * Cost of investments for federal income tax purposes is $644,851 and net unrealized appreciation on investments consists of: |
| Gross Unrealized Appreciation | | $ | 92,326 | |
| Gross Unrealized Depreciation | | | (3,594 | ) |
| Net Unrealized Appreciation | | $ | 88,732 | |
The inputs or methodology used for valuing securities are not necessarily an indication of the risk associated with investing in those securities. For more information on valuation inputs, and their aggregation into the levels used in the tables below, please refer to Note 2- Security Valuation section in the accompanying Notes to Financial Statements.
The following is a summary of the inputs used to value the Fund’s investments as of December 31, 2010.
| | Level 1 | | Level 2 | | Level 3 | | Total |
| Common Stock | $ | 81,164 | | | $ | - | | | $ | - | | | $ | 81,164 | |
| Corporate Convertible Bonds | | - | | | | 223,623 | | | | - | | | | 223,623 | |
| Corporate Non-Convertible Bonds | | - | | | | 122,250 | | | | 6,555 | | | | 128,805 | |
| U.S. Treasury Bill | | - | | | | 299,991 | | | | - | | | | 299,991 | |
| TOTAL | $ | 81,164 | | | $ | 645,864 | | | $ | 6,555 | | | $ | 733,583 | |
| See Notes to Financial Statements. | 9 | |
| CHOU INCOME OPPORTUNITY FUND |
| SCHEDULE OF INVESTMENTS |
| DECEMBER 31, 2010 |
The following is a reconciliation of Level 3 assets (at either the beginning or ending of the period) for which significant unobservable inputs were used to determine fair value.
| | | Corporate Non-Convertible Bonds | |
| | | | | |
| Balance as of 07/01/10 | | $ | - | |
| Transfers into Level 3 | | | 6,555 | |
| Balance as of 12/31/10 | | $ | 6,555 | |
| PORTFOLIO HOLDINGS | | |
| % of Total Investments | | |
| Common Stock | 11.1 | % |
| Corporate Convertible Bonds | 30.4 | % |
| Corporate Non-Convertible Bonds | 17.6 | % |
| U.S. Treasury Securities | 40.9 | % |
| | 100.0 | % |
| See Notes to Financial Statements. | 10 | |
| | | | | | CHOU EQUITY OPPORTUNITY FUND | | | | CHOU INCOME OPPORTUNITY FUND | |
| ASSETS | | | | | | | | |
| | Total investments, at value (Cost $789,283 and $638,747, respectively) | $ | 862,688 | | | $ | 733,583 | |
| | Cash | | | 186,357 | | | | 29,469 | |
| | Receivables: | | | | | | | | |
| | | Dividends and interest | | | 182 | | | | 9,816 | |
| | | From investment adviser | | | 6,921 | | | | 6,936 | |
| | Prepaid expenses | | | 12,499 | | | | 10,844 | |
| Total Assets | | | 1,068,647 | | | | 790,648 | |
| | | | | | | | | | | |
| LIABILITIES | | | | | | | | |
| | Payables: | | | | | | | | |
| | | Call options written, at value (Premiums received $4,873 and $0, respectively) | | | 4,662 | | | | - | |
| | Accrued Liabilities: | | | | | | | | |
| | | Fund service fees | | | 5,944 | | | | 5,637 | |
| | | Compliance services fees | | | 1,050 | | | | 950 | |
| | | Other expenses | | | 18,396 | | | | 18,050 | |
| Total Liabilities | | | 30,052 | | | | 24,637 | |
| | | | | | | | | | | |
| NET ASSETS | | $ | 1,038,595 | | | $ | 766,011 | |
| | | | | | | | | | | |
| COMPONENTS OF NET ASSETS | | | | | | | | |
| | Paid-in capital | | $ | 903,830 | | | $ | 676,165 | |
| | Distributions in excess of net investment income | | | - | | | | (4,990 | ) |
| | Accumulated net realized gain | | | 61,149 | | | | - | |
| | Net unrealized appreciation | | | 73,616 | | | | 94,836 | |
| NET ASSETS | | $ | 1,038,595 | | | $ | 766,011 | |
| SHARES OF BENEFICIAL INTEREST AT NO PAR VALUE (UNLIMITED SHARES AUTHORIZED) | | | 85,149 | | | | 66,031 | |
| NET ASSET VALUE, OFFERING AND REDEMPTION PRICE* PER SHARE | | $ | 12.20 | | | $ | 11.60 | |
| | | | | | | | | | | |
| * | | Shares redeemed or exchanged within 120 days of purchase are charged a 2.00% redemption fee. | | | | | |
| See Notes to Financial Statements. | 11 | |
| | | | | | CHOU EQUITY OPPORTUNITY FUND | | | | CHOU INCOME OPPORTUNITY FUND | |
| INVESTMENT INCOME | | | | | | | | |
| | Dividend | | $ | 104 | | | $ | - | |
| | Interest income | | | 407 | | | | 15,568 | |
| Total Investment Income | | | 511 | | | | 15,568 | |
| | | | | | | | | |
| EXPENSES | | | | | | | | |
| | Investment adviser fees | | | 3,472 | | | | 2,929 | |
| | Fund service fees | | | 38,696 | | | | 38,097 | |
| | Distribution fees: | | | | | | | | |
| | Investor Class | | | 868 | | | | 732 | |
| | Custodian fees | | | 5,000 | | | | 5,000 | |
| | Registration fees | | | 515 | | | | 483 | |
| | Audit fees | | | 14,800 | | | | 14,800 | |
| | Legal fees | | | 21,556 | | | | 21,556 | |
| | Trustees' fees and expenses | | | 2,765 | | | | 2,691 | |
| | Compliance services fees | | | 6,144 | | | | 5,856 | |
| | Miscellaneous expenses | | | 5,399 | | | | 5,611 | |
| Total Expenses | | | 99,215 | | | | 97,755 | |
| | Fees waived and expenses reimbursed | | | (93,139 | ) | | | (93,362 | ) |
| Net Expenses | | | 6,076 | | | | 4,393 | |
| | | | | | | | | | | |
| NET INVESTMENT INCOME (LOSS) | | | (5,565 | ) | | | 11,175 | |
| | | | | | | | | | | |
| NET REALIZED AND UNREALIZED GAIN (LOSS) | | | | | | | | |
| | Net realized gain (loss) on: | | | | | | | | |
| | Investments | | | 68,049 | | | | - | |
| | Written options | | | (1,590 | ) | | | - | |
| | Net realized gain | | | 66,459 | | | | - | |
| | Net change in unrealized appreciation on: | | | | | | | | |
| | Investments | | | 73,405 | | | | 94,836 | |
| | Written options | | | 211 | | | | - | |
| | Net change in unrealized appreciation | | | 73,616 | | | | 94,836 | |
| NET REALIZED AND UNREALIZED GAIN | | | 140,075 | | | | 94,836 | |
| INCREASE IN NET ASSETS FROM OPERATIONS | | $ | 134,510 | | | $ | 106,011 | |
| | | | | | | | | | | |
** Commenced operations on July 1, 2010.
| See Notes to Financial Statements. | 12 | |
| | | | | CHOU EQUITY OPPORTUNITY FUND | | CHOU INCOME OPPORTUNITY FUND |
| | | | | | | | | | | | | | | | | | | |
| | | | | | | | | | Shares | | | | | | | | Shares | |
| | | | | | | | | | | | | | | | | | | |
| BEGINNING NET ASSETS JULY 1, 2010 | | $ | 500,001 | | | | | | | $ | 500,001 | | | | | |
| | | | | | | | | | | | | | | | | | | |
| OPERATIONS | | | | | | | | | | | | | | | | |
| | Net investment income (loss) | | | (5,565 | ) | | | | | | | 11,175 | | | | | |
| | Net realized gain | | | 66,459 | | | | | | | | - | | | | | |
| | Net change in unrealized appreciation | | | 73,616 | | | | | | | | 94,836 | | | | | |
| Increase in Net Assets Resulting from Operations | | | 134,510 | | | | | | | | 106,011 | | | | | |
| | | | | | | | | | | | | | | | | | | |
| DISTRIBUTIONS TO SHAREHOLDERS FROM | | | | | | | | | | | | | | | | |
| | Net investment income | | | - | | | | | | | | (16,420 | ) | | | | |
| | | | | | | | | | | | | | | | | | | |
| CAPITAL SHARE TRANSACTIONS | | | | | | | | | | | | | | | | |
| | Sale of shares | | | 404,099 | | | | 35,150 | | | | 159,999 | | | | 14,615 | |
| | Reinvestment of distributions | | | - | | | | - | | | | 16,420 | | | | 1,416 | |
| | Redemption of shares | | | (15 | ) | | | (1 | ) | | | - | | | | - | |
| Increase in Net Assets from Capital Share Transactions | | | 404,084 | | | | 35,149 | | | | 176,419 | | | | 16,031 | |
| Increase in Net Assets | | | 538,594 | | | | | | | | 266,010 | | | | | |
| | | December 31, 2010 | | | | | | | | | | | | | | | | |
| NET ASSETS DECEMBER 31, 2010 (including line (a)) | | $ | 1,038,595 | | | | | | | $ | 766,011 | | | | | |
| | | | | | | | | | | | | | | | | | | |
| | | | | | | | | | | | | | | | | | | |
(a) | Distributions in excess of net investment income at December 31, 2010 | | $ | - | | | | | | | $ | (4,990 | ) | | | | |
| See Notes to Financial Statements. | 13 | |
These financial highlights reflect selected data for a share outstanding throughout the period.
| |
| | | July 1, 2010 (a) through December 31, 2010 |
| INVESTOR CLASS | | | | |
| NET ASSET VALUE, Beginning of Period | $ | 10.00 | | |
| INVESTMENT OPERATIONS | | | | |
| Net investment loss (b) | | (0.09 | ) | |
| Net realized and unrealized gain | | 2.29 | | |
| Total from Investment Operations | | 2.20 | | |
| NET ASSET VALUE, End of Period | $ | 12.20 | | |
| TOTAL RETURN | | 22.00 | %(c) |
| RATIOS/SUPPLEMENTARY DATA | | | | |
| Net Assets at End of Period (000’s omitted) | | $1,039 | | |
| Ratios to Average Net Assets: | | | | |
| Net investment loss | | (1.60 | )%(d) |
| Net expense | | 1.75 | %(d) |
| Gross Expense | | 28.58 | %(d) |
| PORTFOLIO TURNOVER RATE | | 33 | %(c) |
| | | | | | |
| (a) | Commencement of operations. |
| (b) | Calculated based on average shares outstanding during the period. |
| (c) | Not annualized. |
| (d) | Annualized. |
| See Notes to Financial Statements. | 14 | |
| CHOU INCOME OPPORTUNITY FUND |
| FINANCIAL HIGHLIGHTS |
| |
These financial highlights reflect selected data for a share outstanding throughout the period.
| |
| | | July 1, 2010 (a) through December 31, 2010 |
| INVESTOR CLASS | | | |
| NET ASSET VALUE, Beginning of Period | $ | 10.00 | |
| INVESTMENT OPERATIONS | | | |
| Net investment income (b) | | 0.20 | |
| Net realized and unrealized gain | | 1.65 | |
| Total from Investment Operations | | 1.85 | |
| DISTRIBUTIONS TO SHAREHOLDERS FROM | | | |
| Net investment income | | (0.25 | ) |
| NET ASSET VALUE, End of Period | $ | 11.60 | |
| TOTAL RETURN | | 18.54 | %(c) |
| RATIOS/SUPPLEMENTARY DATA | | | |
| Net Assets at End of Period (000’s omitted) | | $766 | |
| Ratios to Average Net Assets: | | | |
| Net investment income | | 3.82 | %(d) |
| Net expense | | 1.50 | %(d) |
| Gross Expense | | 33.37 | %(d) |
| PORTFOLIO TURNOVER RATE | | 0 | %(c) |
| | | | | | | |
| (a) | Commencement of operations. | |
| (b) | Calculated based on average shares outstanding during the period. | |
| (c) | Not annualized. | |
| (d) | Annualized. | |
| See Notes to Financial Statements. | 15 | |
Note 1. Organization
The Chou Equity Opportunity Fund and Chou Income Opportunity Fund (individually, a “Fund” and, collectively the “Funds”) are non-diversified portfolios of Chou America Mutual Funds (the “Trust”). The Trust is a Delaware statutory trust that is registered as an open-end, management investment company under the Investment Company Act of 1940 (the “Act”), as amended. Under its Trust Instrument, the Trust is authorized to issue an unlimited number of each Fund’s shares of beneficial interest without par value. Chou Equity Opportunity Fund’s investment objective is to seek long-term growth of capital. Chou Income Opportunity Fund’s investment objective is to provide capital appreciation and income production with capital preservation as a secondary objective. The F unds commenced operations on July 1, 2010, with the sale of 50,000 shares of each Fund at $10 per share to Chou Associates Management Inc.
Note 2. Summary of Significant Accounting Policies
These financial statements are prepared in accordance with accounting principles generally accepted in the United States of America (“GAAP”), which requires management to make estimates and assumptions that affect the reported amounts of assets and liabilities, the disclosure of contingent liabilities at the date of the financial statements, and the reported amounts of increase and decrease in net assets from operations during the fiscal period. Actual amounts could differ from those estimates. The following summarizes the significant accounting policies of each Fund:
Security Valuation – Exchange-traded securities and over-the-counter securities are valued using the last quoted sale or official closing price, provided by independent pricing services as of the close of trading on the market or exchange for which they are primarily traded, on each Fund business day. In the absence of a sale, such securities are valued at the mean of the last bid and ask price provided by independent pricing services. Non-exchange traded securities for which quotations are available are valued using the last quoted sales price, or in the absence of a sale at the mean of the last bid and ask prices provided by independent pricing services. Debt securities may be valued at prices supplied by a fund’s pricing agent based on broker or dealer supplied valu ations or matrix pricing, a method of valuing securities by reference to the value of other securities with similar characteristics such as rating, interest rate and maturity. Exchange-traded options for which there were no sales reported that day are generally valued at the mean of the last bid and asked prices. Options not traded on an exchange are generally valued at broker-dealer bid quotation. Short-term investments that mature in sixty days or less may be valued at amortized cost.
Each Fund values its investments at fair value pursuant to procedures adopted by the Trust's Board of Trustees (the "Board") if (1) market quotations are insufficient or not readily available or (2) the adviser believes that the values available are unreliable. Fair valuation is based on subjective factors and, as a result, the fair value price of an investment may differ from the security’s market price and may not be the price at which the asset may be sold. Fair valuation could result in a different NAV than a NAV determined by using market quotes.
Each Fund has a three-tier fair value hierarchy. The basis of the tiers is dependent upon the various “inputs” used to determine the value of each Fund’s investments. These inputs are summarized in the three broad levels listed below:
Level 1 — quoted prices in active markets for identical assets
Level 2 — other significant observable inputs (including quoted prices of similar securities, interest rates, prepayment speeds, credit risk, etc.)
Level 3 — significant unobservable inputs (including each Fund’s own assumptions in determining the fair value of investments)
The aggregate value by input level, as of December 31, 2010, for each Fund’s investments is included at the end of each Fund’s Schedule of Investments.
Security Transactions, Investment Income and Realized Gain and Loss – Investment transactions are accounted for on trade date. Dividend income is recorded on the ex-dividend date. Foreign dividend income is recorded on the ex-dividend date or as soon as possible after a fund determines the existence of a dividend declaration after exercising reasonable due diligence. Income and capital gains on some foreign securities may be subject to foreign withholding taxes, which are accrued as applicable. Interest income is recorded on an accrual basis. Premium and discount is amortized and accreted in accordance with GAAP. Identified cost of investments sold is used to determine the gain and loss for both financial statement and federal income tax purposes.
| CHOU AMERICA MUTUAL FUNDS |
| NOTES TO FINANCIAL STATEMENTS |
| DECEMBER 31, 2010 |
Written Options – When a fund writes an option, an amount equal to the premium received by the fund is recorded as a liability and is subsequently adjusted to the current value of the option written. Premiums received from writing options that expire unexercised are treated by the fund on the expiration date as realized gain from written options. The difference between the premium and the amount paid on effecting a closing purchase transaction, including brokerage commissions, is also treated as a realized gain, or if the premium is less than the amount paid for the closing purchase transaction, as a realized loss. If a call option is exercised, the premium is added to the proceeds from the sale of the underlying security or currency in determining whether the fund has reali zed a gain or loss. If a put option is exercised, the premium reduces the cost basis of the securities purchased by the fund. The fund, as writer of an option, bears the market risk of an unfavorable change in the price of the security underlying the written option. Written options are non-income producing securities.
The values of each individual written option outstanding as of December 31, 2010, are disclosed in the Chou Equity Opportunity Fund’s Schedule of Investments. The volume of open positions may vary on a daily basis as the Fund transacts written options in order to achieve the exposure desired by the adviser. The Fund entered into a total value of $12,339 on written options for the year ended December 31, 2010.
Transactions in options written during the year ended December 31, 2010, for Chou Equity Opportunity Fund were as follows:
| | | Calls |
| | | Number of Contracts | | Premiums |
| Options Outstanding, July 1, 2010 | | - | | $ | - | |
| Options written | | 84 | | | 12,339 | |
| Options terminated in closing transactions | | (42 | ) | | (7,466 | ) |
| Options exercised | | - | | | - | |
| Options expired | | - | | | - | |
| Options Outstanding, December 31, 2010 | | 42 | | $ | 4,873 | |
Derivatives Transactions - The Chou Equity Opportunity Fund’s use of derivatives during the period ended December 31, 2010, was limited to written options. Following is a summary of how the derivatives are treated in the financial statements and their impact on the Chou Equity Opportunity Fund.
The location on the Statement of Assets and Liabilities of the Chou Equity Opportunity Fund’s derivative positions by type of exposure, all of which are not accounted for as hedging instruments, is as follows:
Contract Type/ Primary Risk Exposure | | | Location on Statement of Assets and Liabilities | | Liability Derivatives | |
| Equity Contracts | | | Call options written, at value | | $(4,662 | ) |
| | | | | | | |
Realized and unrealized gains and losses on derivatives contracts entered into during the period ended December 31, 2010, by the Chou Equity Opportunity Fund are recorded in the following locations in the Statement of Operations:
| Contract Type/Primary Risk Exposure | | Location of Gain or (Loss) on Derivatives | | Realized Gain (Loss) on Derivatives | | Change in Unrealized Appreciation on Derivatives | |
| | | | | | | | | | |
| Equity Contracts | | Realized gain (loss) – Written Options and Change in unrealized appreciation – Written Options | | | $(1,590 | ) | | $211 | |
| | | | | | | | | | |
| CHOU AMERICA MUTUAL FUNDS |
| NOTES TO FINANCIAL STATEMENTS |
| DECEMBER 31, 2010 |
Distributions to Shareholders – Distributions to shareholders of net investment income, if any, are declared and paid at least semi-annually. Distributions to shareholders of net capital gains, if any, are declared and paid annually. Distributions are based on amounts calculated in accordance with applicable federal income tax regulations, which may differ from GAAP. These differences are due primarily to differing treatments of income and gain on various investment securities held by each Fund, timing differences and differing characterizations of distributions made by each Fund.
Federal Taxes – Each Fund intends to qualify each year as a regulated investment company under Subchapter M of the Internal Revenue Code and distribute all of their taxable income to shareholders. In addition, by distributing in each calendar year substantially all their net investment income and capital gains, if any, the Funds will not be subject to a Federal excise tax. Therefore, no Federal income or excise tax provision is required.
As of December 31, 2010, there are no uncertain tax positions that would require financial statement recognition, de-recognition, or disclosure. Each Fund’s federal tax returns filed in the period ended December 31, 2010, remain subject to examination by the Internal Revenue Service.
Income and Expense Allocation – The Trust accounts separately for the assets, liabilities and operations of each of its investment portfolios. Expenses that are directly attributable to more than one investment portfolio are allocated among the respective investment portfolios in an equitable manner.
Redemption Fees – A shareholder who redeems or exchanges shares within 120 days of purchase will incur a redemption fee of 2.00% of the current net asset value of shares redeemed or exchanged, subject to certain limitations. The fee is charged for the benefit of the remaining shareholders and will be paid to each Fund to help offset transaction costs. The fee is accounted for as an addition to paid-in capital. Each Fund reserves the right to modify the terms of or terminate the fee at any time. There are limited exceptions to the imposition of the redemption fee.
Commitments and Contingencies – In the normal course of business, each Fund enters into contracts that provide general indemnifications by each Fund to the counterparty to the contract. Each Fund’s maximum exposure under these arrangements is dependent on future claims that may be made against each Fund and, therefore, cannot be estimated; however, based on experience, the risk of loss from such claims is considered remote.
Note 3. Advisory Fees, Servicing Fees and Other Transactions
Investment Adviser – Chou America Management Inc. (the “Adviser”), is the investment adviser to each Fund. Pursuant to an investment advisory agreement, the Adviser receives an advisory fee from each Fund at an annual rate of 1.00% of each Fund’s average daily net assets.
Distribution – Rafferty Capital Markets, LLC serves as each Fund’s distributor (the “Distributor”). The Funds have adopted a Distribution Plan (the “Plan”) in accordance with Rule 12b-1 of the Act. Under the Plan, the Funds pay the Distributor and/or any other entity as authorized by the Board a fee of up to 0.25% of the average daily net assets of each Fund. The Distributor is not affiliated with the Adviser or with Atlantic Fund Administration, LLC (d/b/a Atlantic Fund Services) (“Atlantic”) or their affiliates.
Other Service Providers – Atlantic provides fund accounting, fund administration, and transfer agency services to each Fund. Atlantic also provides certain shareholder report production, and EDGAR conversion and filing services. Pursuant to an Atlantic services agreement, each Fund pays Atlantic customary fees for its services. Atlantic provides a Principal Financial Officer, a Chief Compliance Officer, and an Anti-Money Laundering Officer to each Fund, as well as certain additional compliance support functions.
Trustees and Officers – The Trust pays each Trustee an annual retainer fee of $5,000 for service to the Trust. Each Trustee is also reimbursed for all reasonable out-of-pocket expenses incurred in connection with their duties as a Trustee, including travel and related expenses incurred in attending Board meetings. No officers of the Funds are compensated by the Funds, but officers are reimbursed for travel and related expenses incurred in attending Board meetings.
| CHOU AMERICA MUTUAL FUNDS |
| NOTES TO FINANCIAL STATEMENTS |
| DECEMBER 31, 2010 |
Note 4. Expense Reimbursements and Fees Waived
The Adviser has contractually agreed to waive a portion of its fee and reimburse certain expenses to limit total annual operating expenses to 1.75% and 1.50% of the average daily net assets of the Chou Equity Opportunity Fund and Chou Income Opportunity Fund, respectively, through July 1, 2011 (excluding other expenses, taxes, leverage interest, acquire fund fees and expenses, dividends or interest on short positions, other interest expenses, brokerage commissions, and extraordinary expenses such as litigation). For the period ended December 31, 2010, fees waived and reimbursed were as follows:
| | | Investment Adviser Fees Waived | | Expenses Reimbursed by Investment Adviser | | Total Fees Waived and Reimbursed | |
| Chou Equity Opportunity Fund | $ | 3,472 | $ | 89,667 | $ | 93,139 | |
| Chou Income Opportunity Fund | | 2,929 | | 90,433 | | 93,362 | |
Note 5. Security Transactions
The cost of purchases and proceeds from sales of investment securities (including maturities), other than short-term investments for the period ended December 31, 2010, were as follows:
| | | Purchases | | Sales |
| Chou Equity Opportunity Fund | | $ | 862,733 | | $ | 141,498 |
| Chou Income Opportunity Fund | | | 336,715 | | | - |
Note 6. Federal Income Tax and Investment Transactions
Distributions during the fiscal years ended as noted were characterized for tax purposes as follows:
| | | Ordinary Income | |
| Chou Income Opportunity Fund | | | | |
| 2010 | | $ | 16,420 | |
As of December 31, 2010, distributable earnings (accumulated losses) on a tax basis were as follows:
| | Undistributed Ordinary Income | | Unrealized Appreciation | | Total | | | |
| Chou Equity Opportunity Fund | $ | 61,149 | | $ | 73,616 | | $ | 134,765 | |
| Chou Income Opportunity Fund | | 1,114 | | | 88,732 | | | 89,846 | |
The difference between components of distributable earnings on a tax basis and the amounts reflected in the Statements of Assets and Liabilities are primarily due to non-deductible offering costs, accrued income on contingent payment debt instruments, net operating losses and the treatment of undistributed short-term gains as undistributed ordinary income for tax purposes.
| CHOU AMERICA MUTUAL FUNDS |
| NOTES TO FINANCIAL STATEMENTS |
| DECEMBER 31, 2010 |
On the Statement of Assets and Liabilities, as a result of permanent book to tax differences, certain amounts have been reclassified for the year ended December 31, 2010. The following reclassification was the result of non-deductible offering costs and net operating losses and has no impact on the net assets of each Fund.
| | Accumulated Net Investment Income (Loss) | | Undistributed Net Realized Gain (Loss) | | Paid-in-Capital |
| Chou Equity Opportunity Fund | $ | 5,565 | | $ | (5,310) | | $ | (255) |
| Chou Income Opportunity Fund | | 255 | | | - | | | (255) |
Note 7. Recent Accounting Pronouncements
In January 2010, the Financial Accounting Standards Board issued Accounting Standards Update (“ASU”) No. 2010-06 “Improving Disclosures about Fair Value Measurements.” ASU No. 2010-06 clarifies existing disclosure and requires additional disclosures regarding fair value measurements. Effective for fiscal years beginning after December 15, 2010, and for interim periods within those fiscal years, entities will need to disclose information about purchases, sales, issuances and settlements of Level 3 securities on a gross basis, rather than as a net number as currently required. Management is currently evaluating the impact ASU No. 2010-06 will have on financial statement disclosures.
Note 8. Subsequent Events
Effective May 1, 2011, the Adviser agrees to waive its investment advisory fee and/or reimburse expenses as necessary to ensure that total annual operating expenses (excluding other expenses, taxes, leverage interest, acquired fund fees and expenses, dividends on interest on short positions, other interest expenses, brokerage commissions and extraordinary expenses such as litigation) for the Chou Equity Opportunity Fund do not exceed 1.50% through May 1, 2012.
Management has evaluated whether any other subsequent events occurring after the date of this report through the date these financial statements were issued and has determined that there were no such events.
To the Shareholders of Chou Equity Opportunity Fund and Chou Income Opportunity Fund
and Board of Trustees of Chou America Mutual Funds
We have audited the accompanying statements of assets and liabilities, including the schedules of investments, of Chou Equity Opportunity Fund and Chou Income Opportunity Fund, each a series of shares of beneficial interest of Chou America Mutual Funds (the "Funds"), as of December 31, 2010, and the related statements of operations, the statements of changes in net assets, and the financial highlights for the period July 1, 2010 (commencement of operations) through December 31, 2010. These financial statements and financial highlights are the responsibility of the Funds’ management. Our responsibility is to express an opinion on these financial statements and financial highlights based on our audits.
We conducted our audits in accordance with the standards of the Public Company Accounting Oversight Board (United States). Those standards require that we plan and perform the audits to obtain reasonable assurance about whether the financial statements and financial highlights are free of material misstatement. An audit includes examining, on a test basis, evidence supporting the amounts and disclosures in the financial statements. Our procedures included confirmation of securities owned as of December 31, 2010 by correspondence with the custodian and brokers. An audit also includes assessing the accounting principles used and significant estimates made by management, as well as evaluating the overall financial statement presentation. We believe that our audits provide a reasonable ba sis for our opinion.
In our opinion, the financial statements and financial highlights referred to above present fairly, in all material respects, the financial position of Chou Equity Opportunity Fund and Chou Income Opportunity Fund as of December 31, 2010, the results of their operations, the changes in their net assets, and their financial highlights for period July 1, 2010 through December 31, 2010, in conformity with accounting principles generally accepted in the United States of America.
BBD, LLP
Philadelphia, Pennsylvania
February 24, 2011
Investment Advisory Agreement Approval
Provided below is a summary of certain of the factors the Board considered at its May 26, 2010 Board meeting in approving the Advisory Agreement between the Adviser and the Trust, on behalf of the Funds. The Board did not identify any particular information that was most relevant to its consideration to approve the Advisory Agreement and each Trustee may have afforded different weight to the various factors. The Board noted that the Funds had not yet commenced operations. Accordingly, the Board considered primarily the services to be provided by the Adviser, the management fee rates to be paid to the Adviser and the Funds’ estimated expenses.
Nature, Extent and Quality of Services Provided.
The Board considered the nature, extent and quality of the services to be provided under the Advisory Agreement by the Adviser. The Board also noted that the Adviser does not have any clients other than the Funds. However, the Board also noted that Francis Chou, the Funds’ portfolio manager, manages Canadian mutual funds with investment strategies similar to those of the Funds through a Canadian adviser. In this connection, the Board considered that the Funds were the first U.S. registered mutual funds managed by Mr. Chou. The Board considered the Adviser’s representation that it has the financial resources and appropriate staffing to manage the Funds and to meet its expense reimbursement obligations. Based on these and other considerations, the Board determined that, in the exercise of its business judgment, the nature, ex tent and quality of the services to be provided by the Adviser to the Funds under the Advisory Agreement were fair and reasonable.
Costs of Services Provided to the Funds and Profits Realized.
The Board considered the fees to be paid to the Adviser on an annual basis, including contractual fee waivers. The Board noted that the advisory fees that will be paid by each Fund are higher than the advisory fees paid by the mutual funds in each Fund’s peer group. The Board considered that the Adviser agreed to limit the total expenses for the 2010 fiscal year for the Funds via contractual fee waivers and/or expense limitations. Because the Funds had not commenced operations as of May 26, 2010, they did not have any prior performance history. However, the Board considered the performance history of the Canadian mutual funds advised by Mr. Chou. The Board also considered the pro forma financial information reflecting the Adviser’s projected profitability. Based on these considerations, the Board determined that, in the exe rcise of its business judgment, the costs of the services to be provided and the profits to be realized under the Advisory Agreement were fair and reasonable.
Other Benefits.
The Board considered the Adviser’s representation that it did not believe that its relationship with the Funds would provide any other benefits. Based on these and other considerations, the Board determined that, in the exercise of its business judgment, any benefits to the Adviser would be fair and reasonable.
Conclusion.
Based on, but not limited to, the above considerations and determinations, the Board determined that the Advisory Agreement for the Funds was fair and reasonable in light of the services to be performed, fees, expenses and such other matters as the Board considered relevant in the exercise of its business judgment. On this basis, the Board unanimously voted in favor of the approval of the Advisory Agreement.
Proxy Voting Information
A description of the policies and procedures that each Fund uses to determine how to vote proxies relating to securities held in each Fund’s portfolio, is available, without charge and upon request, by calling (877) 682-6352 and on the SEC’s website at www.sec.gov. Each Fund’s proxy voting record for the period of July 1, 2010 (commencement of operations) through June 30, 2011, will be available, without charge and upon request, by calling (877) 682-6352 and on the SEC’s website at www.sec.gov.
Availability of Quarterly Portfolio Schedules
Each Fund files its complete schedule of portfolio holdings with the SEC for the first and third quarters of each fiscal year on Form N-Q. Each Fund’s Forms N-Q are available, without charge and upon request on the SEC’s website at www.sec.gov or may be reviewed and copied at the SEC’s Public Reference Room in Washington, DC. Information on the operation of the Public
| CHOU AMERICA MUTUAL FUNDS |
| ADDITIONAL INFORMATION (Unaudited) |
| DECEMBER 31, 2010 |
Reference Room may be obtained by calling 1-800-SEC-0330.
Shareholder Expense Example
As a shareholder of the Funds, you incur two types of costs: (1) transaction costs, including redemption fees, and (2) ongoing costs, including management fees, distribution (12b-1) fees and other Fund expenses. This example is intended to help you understand your ongoing costs (in dollars) of investing in the Funds, and to compare these costs with the ongoing costs of investing in other mutual funds.
The example is based on an investment of $1,000 invested at the beginning of the period and held for the entire period from July 1, 2010, through December 31, 2010.
Actual Expenses – The first line in the table below provides information about actual account values and actual expenses. You may use the information in this line, together with the amount you invested, to estimate the expenses that you paid over the period. Simply divide your account value by $1,000 (for example, an $8,600 account value divided by $1,000 = 8.6), then multiply the result by the number in the first line under the heading entitled “Expenses Paid During Period” to estimate the expenses you paid on your account during the period.
Hypothetical Example for Comparison Purposes – The second line of the table below provides information about hypothetical account values and hypothetical expenses based on each Fund’s actual expense ratio and an assumed rate of return of 5% per year before expenses, which is not each Fund’s actual return. The hypothetical account values and expenses may not be used to estimate the actual ending balance or expenses you paid for the period. You may use this information to compare the ongoing cost of investing in each Fund and other funds. To do so, compare this 5% hypothetical example with the 5% hypothetical examples that appear in the shareholder reports of other funds.
Please note that expenses shown in the table are meant to highlight your ongoing costs only and do not reflect any transactional costs, such as redemption fees. Therefore, the second line of the table is useful in comparing ongoing costs only, and will not help you determine the relative total costs of owning different funds. In addition, if these transactional costs had been included, your costs would have been higher.
| | Beginning Account Value July 1, 2010 | | Ending Account Value December 31, 2010 | | Expenses Paid During Period * | | Annualized Expense Ratio * |
| Chou Equity Opportunity Fund | | | | | | | | | | | |
| Actual | $ | 1,000.00 | | $ | 1,220.00 | | $ | 9.74 | | | 1.75% |
Hypothetical (5% return before expenses) | $ | 1,000.00 | | $ | 1,016.38 | | $ | 8.89 | | | 1.75% |
| Chou Income Opportunity Fund | | | | | | | | | | | |
| Actual | $ | 1,000.00 | | $ | 1,185.42 | | $ | 8.22 | | | 1.50% |
Hypothetical (5% return before expenses) | $ | 1,000.00 | | $ | 1,017.64 | | $ | 7.63 | | | 1.50% |
| | | | | | | | | | | | |
* Expenses are equal to each Fund’s annualized expense ratio as indicated above multiplied by the average account value over the period, multiplied by the number of days in the most recent fiscal half-year divided by 365 to reflect the half-year period.
Federal Tax Status of Dividends Declared during the Tax Year
For federal income tax purposes, dividends from short-term capital gains are classified as ordinary income.
The Chou Income Opportunity Fund designates 39.12% as qualified interest income exempt from US tax for foreign shareholders (QII).
| CHOU AMERICA MUTUAL FUNDS |
| ADDITIONAL INFORMATION (Unaudited) |
| DECEMBER 31, 2010 |
Trustees and Officers of the Trust
The Board is responsible for oversight of the management of the Trust’s business affairs and of the exercise of all the Trust’s powers except those reserved for the shareholders. The following table provides information about each Board member and certain officers of the Trust. Each Trustee and officer holds office until the person resigns, is removed, or is replaced. Unless otherwise noted, the persons have held their principal occupations for more than five years. The address for all Trustees and officers is Three Canal Plaza, Suite 600, Portland, Maine 04101, unless otherwise indicated. Each Trustee oversees two portfolios in the Trust. Each Fund’s Statement of Additional Information includes additional information about the Trustees and is available , without charge and upon request, by calling (877) 682-6352.
| Name and Year of Birth | Position with the Trust | Length of Time Served | Principal Occupation(s) During Past 5 Years |
| Independent Trustees | | | |
Lily Pinarello Born: 1953 | Trustee | Since 2010 | Retired since 1999. |
David McLean Born: 1966 | Trustee | Since 2010 | Managing Director, McLean Asset Management, Ltd. And MAMGMT Fund Services Ltd., since 1998. |
| Interested Trustee | | | |
Francis S.M. Chou Born: 1956 | Trustee | Since 2010 | Chief Executive Officer, Chou America Management Inc., since 2010; Chief Executive Officer, Chou Associates Management, Inc., since 1986; Senior Vice President, Fairfax Financial Holdings, 1996-2007. |
| Officers | | | |
Francis S.M. Chou Born: 1956 | President and Principal Executive Officer | Since 2010 | Chief Executive Officer, Chou America Management Inc., since 2010; Chief Executive Officer, Chou Associates Management, Inc., since 1986; Senior Vice President, Fairfax Financial Holdings, 1996-2007. |
Michael J. McKeen Born: 1971 | Treasurer and Principal Financial Officer | Since 2010 | Senior Manager, Atlantic since 2008; Vice President, Citigroup Fund Services, LLC (“Citigroup”) 2003-2008. |
Megan Hadley Koehler Born: 1978 | Secretary | Since 2010 | Associate Counsel, Atlantic, since 2008; Assistant Vice President, Citigroup, 2007-2008; Thurber & Associates (Title Service), 2006-2007; Student Attorney, Cumberland Legal Aid Clinic, 2006; Legal Intern, Maine Unemployment Insurance Commission, 2005-2006; Associate, LexisNexis, 2004-2005. |
David Faherty Born: 1970 | Vice President | Since 2010 | Senior Counsel, Atlantic since 2009; Vice President, Citi Fund Services Ohio, Inc. 2007-2009.; Associate Counsel, Investors Bank & Trust Co. 2006-2007. |
Joshua LaPan Born: 1973 | Vice President | Since 2010 | Manager, Atlantic since 2008; Vice President, Citigroup 2003-2008. |
Timothy Bowden Born: 1969 | Vice President | Since 2010 | Manager, Atlantic since 2008; Vice President, Citigroup 2005-2008. |
FOR MORE INFORMATION:
P.O. Box 588
Portland, ME 04112
(877)-682-6352
INVESTMENT ADVISER
Chou America Management Inc.
110 Sheppard Ave. East
Suite 301, Box 18
Toronto, Ontario, Canada M2N 6Y8
TRANSFER AGENT
Atlantic Fund Services
P.O. Box 588
Portland, ME 04112
DISTRIBUTOR
Rafferty Capital Markets, LLC
59 Hilton Avenue
Garden City, NY 11530
www.raffcap.com
This report is submitted for the general information of the shareholders of the Funds. It is not authorized for
distribution to prospective investors unless preceded or accompanied by an effective prospectus, which includes information regarding the Funds’ risks, objectives, fees and expenses, experience of its management, and other information.
243-ANR-1210
ITEM 2. CODE OF ETHICS.
| (a) | As of the end of the period covered by this report, Chou America Mutual Funds (the “Registrant”) has adopted a code of ethics, which applies to its Principal Executive Officer and Principal Financial Officer. |
| (c) | There have been no amendments to the Registrant’s code of ethics that apply to its Principal Executive Officer and Principal Financial Officer. |
| (d) | There have been no waivers to the Registrant’s code of ethics that apply to its Principal Executive Officer and Principal Financial Officer. |
| (f) | (1) A copy of the Code of Ethics is being filed under Item 12(a) hereto. |
ITEM 3. AUDIT COMMITTEE FINANCIAL EXPERT.
The Board of Trustees has not yet determined that it has at least one audit committee financial expert serving on its Audit Committee or that no member of the Audit Committee is an "audit committee financial expert" as that term is defined under applicable regulatory guidelines.
ITEM 4. PRINCIPAL ACCOUNTANT FEES AND SERVICES.
(a) Audit Fees - The aggregate fees billed for the period (the “Reporting Period”) for professional services rendered by the Registrant’s principal accountant for the audit of the Registrant’s annual financial statements, or services that are normally provided by the principal accountant in connection with the statutory and regulatory filings or engagements for the Reporting Period, were $24,800 in 2010.
(b) Audit-Related Fees – The aggregate fees billed in the Reporting Period for assurance and related services rendered by the principal accountant that were reasonably related to the performance of the audit of the Registrant’s financial statements and are not reported under paragraph (a) of this Item 4 were $0 in 2010.
(c) Tax Fees - The aggregate fees billed in the Reporting Period for professional services rendered by the principal accountant to the Registrant for tax compliance, tax advice and tax planning were $4,800 in 2010. These services consisted of review or preparation of U.S. federal, state, local and excise tax returns.
(d) All Other Fees - The aggregate fees billed in the Reporting Period for products and services provided by the principal accountant to the Registrant, other than the services reported in paragraphs (a) through (c) of this Item, were $0 in 2010.
(e) (1) The Audit Committee reviews and approves in advance all audit and “permissible non-audit services” (as that term is defined by the rules and regulations of the Securities and Exchange Commission) to be rendered to a series of the Registrant (each, a “Series”). In addition, the Audit Committee reviews and approves in advance all “permissible non-audit services” to be provided to an investment adviser (not including any sub-adviser) of a Series, or an affiliate of such investment adviser, that is controlling, controlled by or under common control with the investment adviser and provides on-going services to the Registrant (“Affiliate”), by the Series’ principal accountant if the engagement relates directly to the operations and financial reporting of the Series. & #160;The Audit Committee considers whether fees paid by a Series’ investment adviser or an Affiliate to the Series’ principal accountant for audit and permissible non-audit services are consistent with the principal accountant’s independence.
(e) (2) 0%
(f) Not applicable
(g) The aggregate non-audit fees billed by the principal accountant for services rendered to the Registrant for the Reporting Period were $0 in 2010. There were no fees billed in either of the Reporting Period for non-audit services rendered by the principal accountant to the Registrant’s investment adviser or any Affiliate.
(h) During the Reporting Period, the Registrant’s principal accountant provided no non-audit services to the investment adviser or any entity controlling, controlled by or under common control with the investment adviser to the series of the Registrant.
ITEM 5. AUDIT COMMITTEE OF LISTED REGISTRANTS.
Not applicable
ITEM 6. INVESTMENTS.
| (a) | Included as part of report to shareholders under Item 1. |
ITEM 7. DISCLOSURE OF PROXY VOTING POLICIES AND PROCEDURES FOR CLOSED-END
MANAGEMENT INVESTMENT COMPANIES.
Not applicable.
ITEM 8. PORTFOLIO MANAGERS OF CLOSED-END MANAGEMENT INVESTMENT COMPANIES.
Not applicable.
ITEM 9. PURCHASES OF EQUITY SECURITIES BY CLOSED-END MANAGEMENT INVESTMENT COMPANY AND AFFILIATED PURCHASERS.
Not applicable.
ITEM 10. SUBMISSION OF MATTERS TO A VOTE OF SECURITY HOLDERS
The Registrant does not accept nominees to the board of trustees from shareholders.
ITEM 11. CONTROLS AND PROCEDURES
(a) The Registrant’s Principal Executive Officer and Principal Financial Officer have concluded that the Registrant’s disclosure controls and procedures (as defined in Rule 30a-3(c) under the Investment Company Act of 1940 (the “Act”)) are effective, based on their evaluation of the controls and procedures required by Rule 30a-3(b) under the Act and Rules 13a-15(b) or 15d-15(b) under the Securities Exchange Act of 1934, as of a date within 90 days of the filing date of this report.
(b) There were no changes in the Registrant’s internal control over financial reporting (as defined in
Rule 30a-3(d) under the Act) that occurred during the second fiscal quarter of the period covered by this report that have materially affected, or are reasonably likely to materially affect, the Registrant’s internal control over financial reporting.
ITEM 12. EXHIBITS.
(a)(1) Code of Ethics (Exhibit filed herewith).
(a)(2) Certifications pursuant to Rule 30a-2(a) of the Act, and Section 302 of the Sarbanes-Oxley Act of 2002. (Exhibits filed herewith)
(a)(3) Not applicable.
(b) Certifications pursuant to Rule 30a-2(b) of the Act, and Section 906 of the Sarbanes-Oxley Act of 2002. (Exhibit filed herewith)
SIGNATURES
Pursuant to the requirements of the Securities Exchange Act of 1934 and the Investment Company Act of 1940, the Registrant has duly caused this report to be signed on its behalf by the undersigned, thereunto duly authorized.
Registrant Chou America Mutual Funds
| | | | |
| | By | /s/ Francis S.M. Chou | |
| | | Francis S.M. Chou, Principal Executive Officer | |
| | | | |
| | Date | February 24, 2011 | |
| | | | |
Pursuant to the requirements of the Securities Exchange Act of 1934 and the Investment Company Act of 1940, this report has been signed below by the following persons on behalf of the Registrant and in the capacities and on the dates indicated.
| | | | |
| | By | /s/ Francis S.M. Chou | |
| | | Francis S.M. Chou, Principal Executive Officer | |
| | | | |
| | Date | February 24, 2011 | |
| | | | |
| | | | |
| | By | /s/ Michael J. McKeen | |
| | | Michael J. McKeen, Principal Financial Officer | |
| | | | |
| | Date | February 24, 2011 | |
| | | | |