As filed with the Securities and Exchange Commission on February 29, 2012
UNITED STATES
SECURITIES AND EXCHANGE COMMISSION
WASHINGTON, D.C. 20549
FORM N-CSR
CERTIFIED SHAREHOLDER REPORT OF REGISTERED MANAGEMENT
INVESTMENT COMPANIES
Investment Company Act file number 811-22394
CHOU AMERICA MUTUAL FUNDS
Three Canal Plaza, Suite 600
Portland, Maine 04101
Michael J. McKeen, Principal Financial Officer
Three Canal Plaza, Suite 600
Portland, Maine 04101
207-347-2000
Date of fiscal year end: December 31
Date of reporting period: January 1, 2011 – December 31, 2011
ITEM 1. REPORT TO STOCKHOLDERS.
CHOU AMERICA MUTUAL FUNDS
Annual Report
December 31, 2011
Fund Adviser:
Chou America Management, Inc.
110 Sheppard Ave. East
Suite 301, Box 18
Toronto, Ontario, Canada M2N 6Y8
Toll Free: (877) 755-5188
| TABLE OF CONTENTS |
| A Message to our Shareholders | 1 |
| Performance Charts and Analysis (Unaudited) | 6 |
| Schedules of Investments | 8 |
| Statements of Assets and Liabilities | 11 |
| Statements of Operations | 12 |
| Statements of Changes in Net Assets | 13 |
| Financial Highlights | 14 |
| Notes to Financial Statements | 16 |
| Report of Independent Registered Public Accounting Firm | 21 |
| Additional Information (Unaudited) | 22 |
CHOU EQUITY OPPORTUNITY FUND A MESSAGE TO OUR SHAREHOLDERS DECEMBER 31, 2011 |
Dear Shareholder,
During the year 2011, the Chou Equity Opportunity Fund (the “Fund”) lost 17.78% of its value while the S&P 500 generated a return of 2.11% during the same time period. The majority of the losses incurred by the Fund were related to our investment in the retail and financial sectors. These sectors combined represented approximately 60% of the Fund’s assets as of December 31, 2011. We continue to believe our holdings in these sectors are deeply undervalued and that the losses we took in 2011 are temporary. 2011 was one of those years where macro events such as the Euro crisis made stocks that we believe are undervalued go down further. We are long term investors with an investment time horizon of at least five years. Experience has taught us that attractive prices often come with short term headline risks and negative investor sentiment. These factors can cause stock prices to fall far more than we believe is justified by the current value of their underlying businesses. During times such as these, our ability to remain patient and disciplined will be the key to our investment success.
Investing in financial institutions requires a leap of faith. Mind you, this leap of faith is no greater than those we make on any company's future prospects, its position in the industry and how well it will do in a future economy. We believe that the following factors indicate that Funds holdings in the financial sector continue to provide attractive investment opportunities:
| ● | It has been five years since the financial crisis began in 2007. As each year has gone by, the quality of earnings of the banks has gotten higher, the books have become cleaner, the risks have become lower, and bank management has become far more risk averse. It is too bad that we had to go through so much turmoil to get there. |
| ● | The U.S. government will not let major financial institutions fail. |
| ● | The financial institutions that survive will be the ultimate beneficiaries of any recovery in the economy. |
| ● | Interest rates will continue to be kept at artificially low levels for the foreseeable future. The spreads between what the banks are paying for deposits and borrowings in the market (like FDIC insured), and what they can lend at, is enormous. After being severely burned, they have tightened their lending criteria and have been extremely cautious with their lending practices. In general, the quality of loans now being made is quite high and for the first time in many years, banks are being paid handsomely according to the risks they are taking. |
| ● | Financial institutions in general are hoarding capital. This will provide them with ample cushion to absorb losses if a double dip recession were to occur. In addition, this positions them well to meet the upcoming Basel III requirements. |
| ● | The books of financial institutions were carefully examined by various U.S. government regulators, before the government allowed them to repay the U.S. Treasury under the Troubled Asset Relief Program (TARP). |
| ● | Stress Test Results conducted in 2009, 2010, 2011, and those that will be conducted in 2012, have given and continue to give the U.S. government the assurance it needed before allowing some banks to resume paying dividends and to buy back stock. |
| ● | U.S. banks are benefitting from concerns about European banks and financial institutions. As concerns continue about European banks’ and financial institutions’ exposure to bad credit, bank deposits and capital investments are leaving Europe and coming into large U.S. banks. |
| ● | Bank valuations that were below 10 times earnings six months ago have decreased even further, with many bank stocks selling below book and some selling at big discounts to tangible book value. |
| ● | Concerns over financial reform and its ultimate impact on the earning power of the banks may be somewhat exaggerated. We believe the banks will most likely be able to pass the majority of the costs to customers. For an economy to flourish we need sound financial institutions that can generate reasonable profits. |
We have invested in common stocks of financial institutions as well as in TARP warrants of financial institutions. These are stock warrants that were issued to the U.S. Treasury by the banks when they received funds under TARP. The stock warrants give the holder the right to buy the bank's stock at a specific price. When the banks repaid TARP funds to the U.S. Treasury, the U.S. Treasury either sold the stock warrants back to the banks or they auctioned them to the public.
| 1 |
CHOU EQUITY OPPORTUNITY FUND A MESSAGE TO OUR SHAREHOLDERS DECEMBER 31, 2011 |
So, what is so unique about these stock warrants? We have considered the following characteristics:
| ● | They are long dated, with most expiring in 2018 or 2019. This time frame of six-plus years allows banks to grow their intrinsic value to a high enough level to have an appreciable impact on the strike price of the stock warrant. |
| ● | The strike price is adjusted downward for any quarterly dividend that exceeds a set price. Normally, this is not seen in a stock warrant. This is a truly stringent condition. In this case, we should give the government credit for extracting a pound of flesh. An example: for Bank of America, class 'A' warrants, the strike price is adjusted downward for any quarterly dividend paid exceeding one cent a share. |
| ● | Many of the banks have excess capital on their balance sheet. When the economy settles down, we expect the banks to use this excess capital either for buybacks or a one-time special dividend that may reduce the strike price on the stock warrants if this provision applies. |
Even so, everything is not hunky dory for the financial sector. Banks and financial institutions continue to face many issues and challenges. We have listed a few here:
| 1) | We still do not fully understand or trust the numbers. |
| 2) | Financial regulatory reform may reduce earning power. |
| 3) | New Basel rules may require more capital and reduce profits. |
| 4) | There may be a double dip recession. |
| 5) | The unemployment rate may go higher and create more defaults. |
| 6) | Commercial real estate prices may fall dramatically. |
| 7) | Banks are still not marking loans on their books properly. |
| 8) | Residential real estate prices may fall further. |
| 9) | States and municipalities are in bad shape. |
| 10) | Litigation continues to be a serious risk. |
Our investing horizon is long-term - six years or more remain for these bank warrants. Over that period, we believe that the odds are it will work out to be decent investment, perhaps even more so for the better-capitalized banks. We view it as the glass being more than half full rather than half empty. The bank TARP warrants are complex, with terms and conditions that are unique to each bank, and we encourage you to research them for yourself and draw your own conclusions.
As we previously noted, we saw the majority of losses in retail. In our opinion, concerns about the sustainability of the economic recovery in the U.S., uncertainty in Europe, and growing concerns of a slowdown in China have created a buy opportunity in the space. We believe that the companies we own are trading at a large discount to their private market value and have enough balance sheet flexibility to endure any short-term hiccups in the domestic/global economy. In addition, these companies have either been actively buying back shares and/or management has a large ownership stake in the company. To date, our investment thesis in retail has not worked out and has caused losses in the portfolio. However, we remain confident in our long-term view of the sector.
Effective March 1, 2012, the Fund will change its name to the Chou Opportunity Fund. Concurrent with this change, the Fund will eliminate its investment policy to invest normally at least 80% of its net assets in equity securities and financial instruments that provide exposure to equity securities. The Fund will continue to invest primarily in equity securities. This change is intended to position the Fund to execute its investment strategies by purchasing the most compelling investments at specific price points and holding investments over a longer time horizon for long-term growth of capital.
Yours truly,

Francis Chou
Portfolio Manager and CEO
Chou America Management Inc.
| 2 |
CHOU EQUITY OPPORTUNITY FUND A MESSAGE TO OUR SHAREHOLDERS DECEMBER 31, 2011 |
The views in this report were those of the Fund manager as of December 31, 2011, and may not reflect his view on the date this report is first published or anytime thereafter. The views are intended to assist the shareholders of the fund in understanding their investments in the Fund and do not constitute investment advice. This letter may contain discussions about certain investments held and not held in the portfolio. All current and future holdings are subject to risk and to change. There can be no guarantee of success with any technique, strategy or investment.
The S&P 500 is an unmanaged index representing the average performance of 500 widely held, publicly traded, large capitalization stocks. One cannot invest directly in an index.
| 3 |
CHOU INCOME OPPORTUNITY FUND A MESSAGE TO OUR SHAREHOLDERS DECEMBER 31, 2011 |
Dear Shareholder,
During the year 2011, the Chou Income Opportunity Fund (the “Fund”) lost 13.83% of its value, while the Barclay's U.S. High Yield Index generated a return of 4.98% during the same time period. 2011 was one of those years where macro events such as the Euro crisis made securities that we believe are undervalued go down further. We are long term investors with an investment time horizon of at least five years. Experience has taught us that attractive prices often come with short-term headline risks and negative investor sentiment. These factors can cause securities prices to fall far more than justified by the current value of their underlying businesses. During times such as these, our ability to remain patient and disciplined will be the key to our investment success.
Portfolio Commentary
The debt securities of Level 3 Communications, Inc., MBIA and Bank of America contributed positively to the performance of the Fund during 2011.
These following holdings principally lowered the Fund’s performance during 2011:
| ● | The term loan of R.H. Donnelley, Inc. (“Donnelley”) fell as debt holders were concerned with its operations. At the Donnelley’s current price, we believe its term loan is well covered by its earning power and assets. In addition, it has covenants that are protective to debt holders. This term loan comes with a cash flow sweep, which means that any free cash flow left after all the costs of the operations are met can be used to buy back debt at par from its holders. The term loan has additional credit support from two other subsidiaries of the holding company, Dex One Corporation. For the year 2011, Donnelley bought back approximately 6.9% of its term loan at par. |
● | The debt security of MannKind Corp. (“MannKind”) dropped after U.S. regulators asked MannKind to do additional trials before approval can be granted to market its inhaled insulin drug, Afrezza. In the first week of February 2012, Mannkind announced the completion of an underwritten public offering of 35,937,500 units for $2.40 per unit (with each unit consisting of one share of its common stock and a warrant to purchase 0.6 of a share of its common stock). The gross proceeds from this offering were approximately $86.3 million. In addition, Mannkind has entered into a purchase agreement with The Mann Group for the sale of its common shares. The Mann Group has committed to purchase 31,250,000 restricted shares of MannKind's common stock and warrants, which was initially announced on January 31, 2012. The shares to be purchased by The Mann Group will be priced at $2.47 per share, resulting in an aggregate purchase price of approximately $77.2 million. This aggregate purchase price will be paid by cancellation of principal indebtedness under MannKind's existing revolving loan arrangement with The Mann Group. At December 31, 2011, the principal amount outstanding under the loan arrangement was $277.2 million, and MannKind had $45.0 million remaining of available borrowing under the arrangement. |
At the current price, we believe the debt security of Mannkind, at 3¾% maturing in December 2013, is attractively priced, although, how well the debt security performs is dependent on the approval of Afrezza by the FDA. However, the recent fund raising and the fact that Alfred E. Mann, CEO and principal shareholder, was willing to convert $77.2 million of his loan to the company to common stock, makes us feel more positive about the company and Afrezza.
| 4 |
CHOU INCOME OPPORTUNITY FUND A MESSAGE TO OUR SHAREHOLDERS DECEMBER 31, 2011 |
In summary, we are comfortable with the holdings we have in the portfolio. We believe they are attractively priced and undervalued and are optimistic about the future.
Effective March 1, 2012, the Fund will change its name to the Chou Income Fund. The Fund will continue to invest at least 80% of its net assets in fixed income securities and financial instruments that provide exposure to fixed income securities. In addition to changing its name, the Fund will expand the types of fixed income securities in which it may invest to include money market instruments, commercial paper, variable and floating rate securities, Rule 144A securities, pay-in-kind securities and loan participation.
Yours truly,
Francis Chou
Portfolio Manager and CEO
Chou America Management Inc.
The views in this report were those of the Fund manager as of December 31, 2011, and may not reflect his view on the date this report is first published or anytime thereafter. The views are intended to assist the shareholders of the fund in understanding their investments in the Fund and do not constitute investment advice. This letter may contain discussions about certain investments held and not held in the portfolio. All current and future holdings are subject to risk and to change. There can be no guarantee of success with any technique, strategy or investment.
The Barclays Capital U.S. Corporate High Yield Index is comprised of issues that meet the following criteria: at least $150 million par value outstanding, maximum credit rating of Ba1 (including defaulted issues) and at least one year to maturity. One cannot invest directly in an index.
| 5 |
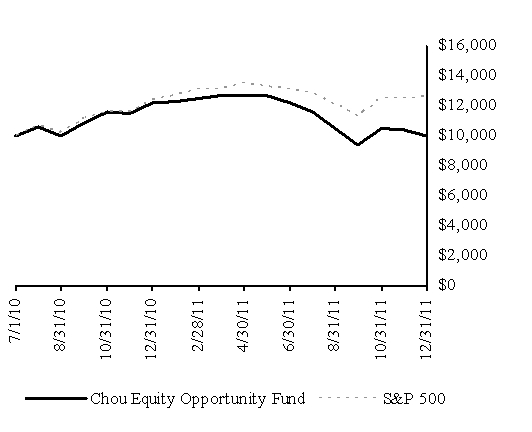
CHOU EQUITY OPPORTUNITY FUND PERFORMANCE CHART AND ANAYSIS (Unaudited) DECEMBER 31, 2011 |
The following chart reflects the change in the value of a hypothetical $10,000 investment, including reinvested dividends and distributions, in the Chou Equity Opportunity Fund (the “Fund”) compared with the performance of the benchmark, S&P 500 Index ("S&P 500"), since inception. The S&P 500 is a broad-based, unmanaged measurement of changes in stock market conditions based on the average of 500 widely held common stocks. The total return of the S&P 500 includes the reinvestment of dividends and income. The total return of the Fund includes operating expenses that reduce returns, while the total return of the S&P 500 does not include expenses. The Fund is professionally managed while the S&P 500 is unmanaged and is not available for investment.
Performance data quoted represents past performance and is no guarantee of future results. Current performance may be lower or higher than the performance data quoted. Investment return and principal value will fluctuate so that shares, when redeemed, may be worth more or less than original cost. For the most recent month-end performance, please call (877) 682-6352. Shares redeemed or exchanged within 120 days of purchase will be charged a 2.00% redemption fee. As stated in the Fund’s prospectus, the annual operating expense ratio (gross) is 2.37%. Effective May 1, 2011, the Fund’s adviser has contractually agreed to reduce a portion of its fees and reimburse expenses to limit total operating expenses to 1.50%, through May 1, 2012. During the period, certain fees were waived and/or expenses reimbursed; otherwise, returns would have been lower. The performance table and graph do not reflect the deduction of taxes that a shareholder would pay on Fund distributions or the redemption of Fund shares. Returns greater than one year are annualized.
| Total Return as of 12/31/11 | One Year | Since Inception 07/01/10 |
| Chou Equity Opportunity Fund | (17.78)% | 0.21% |
| S&P 500 Index | 2.11% | 16.81% |
Investment Value as of 12/31/11
| Chou Equity Opportunity Fund | $10,031 |
| S&P 500 Index | $12,627 |
| 6 |
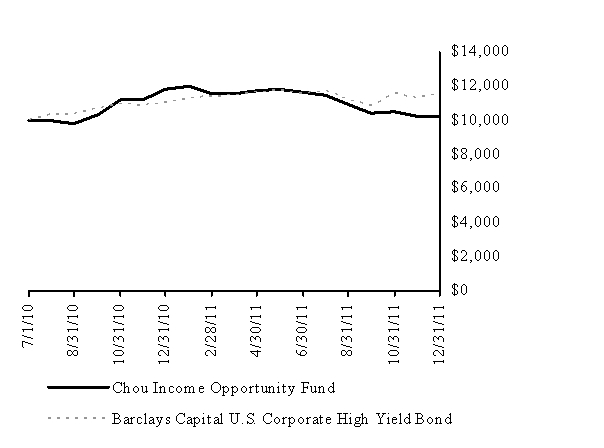
CHOU INCOME OPPORTUNITY FUND PERFORMANCE CHART AND ANAYSIS (Unaudited) DECEMBER 31, 2011 |
The following chart reflects the change in the value of a hypothetical $10,000 investment, including reinvested dividends and distributions, in the Chou Income Opportunity Fund (the “Fund”) compared with the performance of the benchmark, Barclays Capital U.S. Corporate High Yield Index ("Barclays Index"), since inception. The Barclays Index is comprised of issues that meet the following criteria: at least $150 million par value outstanding, maximum credit rating of Ba1 (including defaulted issues) and at least one year to maturity. The total return of the Barclays Index includes the reinvestment of dividends and income. The total return of the Fund includes operating expenses that reduce returns, while the total return of the Barclays Index does not include expenses. The Fund is professionally managed while the Barclays Index is unmanaged and is not available for investment.
Performance data quoted represents past performance and is no guarantee of future results. Current performance may be lower or higher than the performance data quoted. Investment return and principal value will fluctuate so that shares, when redeemed, may be worth more or less than original cost. For the most recent month-end performance, please call (877) 682-6352. Shares redeemed or exchanged within 120 days of purchase will be charged a 2.00% redemption fee. As stated in the Fund’s prospectus, the annual operating expense ratio (gross) is 3.62%. However, the Fund’s adviser has contractually agreed to reduce a portion of its fees and reimburse expenses to limit total operating expenses to 1.50%, through May 1, 2012. During the period, certain fees were waived and/or expenses reimbursed; otherwise, returns would have been lower. The performance table and graph do not reflect the deduction of taxes that a shareholder would pay on Fund distributions or the redemption of Fund shares. Returns greater than one year are annualized.
| Total Return as of 12/31/11 | One Year | Since Inception 07/01/10 |
| Chou Income Opportunity Fund | (13.83)% | 1.43% |
| Barclays Capital U.S. Corporate High Yield Bond Index | 4.98% | 10.21% |
Investment Value as of 12/31/11
| Chou Income Opportunity Fund | $10,215 |
| Barclays Capital U.S. Corporate High Yield Bond Index | $11,572 |
| 7 |
CHOU EQUITY OPPORTUNITY FUND SCHEDULE OF INVESTMENTS DECEMBER 31, 2011 |
| Shares | Security Description | Value |
| Common Stock - 68.0% | |||||||
| Communications - 19.8% | |||||||
| 860,960 | Overstock.com, Inc. (a) | $ | 6,749,927 | ||||
| 210,900 | Sprint Nextel Corp. (a) | 493,506 | |||||
| 2,880,000 | UTStarcom Holdings Corp. (a) | 3,974,400 | |||||
| 11,217,833 | |||||||
| Consumer Discretionary - 21.3% | |||||||
| 200,000 | Aeropostale, Inc. (a) | 3,050,000 | |||||
| 954,800 | Office Depot, Inc. (a) | 2,052,820 | |||||
| 2,190 | Orchard Supply Hardware Stores Corp., Series A (a)(b) | - | |||||
| 236,000 | RadioShack Corp. | 2,291,560 | |||||
| 36,112 | Ryanair Holdings PLC, ADR (a) | 1,006,080 | |||||
| 48,500 | Sears Holdings Corp. (a) | 1,541,330 | |||||
| 116,100 | The Gap, Inc. | 2,153,655 | |||||
| 12,095,445 | |||||||
| Consumer Staples - 1.0% | |||||||
| 209,310 | Alliance One International, Inc. (a) | 569,323 | |||||
| Financials - 22.6% | |||||||
| 120,200 | Asta Funding, Inc. | 959,196 | |||||
| 18 | Berkshire Hathaway, Inc., Class A (a) | 2,065,590 | |||||
| 100,000 | Citigroup, Inc. | 2,631,000 | |||||
| 80,300 | Flagstone Reinsurance Holdings SA | 665,687 | |||||
| 50,000 | Jefferies Group, Inc. | 687,500 | |||||
| 300,000 | MBIA, Inc. (a) | 3,477,000 | |||||
| 26,000 | The Goldman Sachs Group, Inc. | 2,351,180 | |||||
| 12,837,153 | |||||||
| Information Technology - 0.1% | |||||||
| 3,200 | Dell, Inc. (a) | 46,816 | |||||
| Materials - 3.2% | |||||||
| 124,000 | AbitibiBowater, Inc. (a) | 1,804,200 | |||||
| Total Common Stock (Cost $42,705,116) | 38,570,770 |
| Shares | Security Description | Rate | Value |
| Preferred Stock - 0.0% | ||||||||||
| Consumer Discretionary - 0.0% | ||||||||||
| 2,190 | Orchard Supply Hardware Stores Corp., Series A (a)(b)(c) (Cost $0) | 0.00 | % | - | ||||||
| Warrants - 6.5% | ||||||
| 659,430 | Bank of America Corp. (a) | 1,332,048 | ||||
| 195,386 | JPMorgan Chase & Co. (a) | 1,660,781 | ||||
| 77,400 | Wells Fargo & Co. (a) | 664,092 | ||||
| Total Warrants (Cost $4,960,116) | 3,656,921 |
| Principal | Security Description | Rate | Maturity | Value |
| Corporate Convertible Bonds - 7.5% | |||||||||||
| Consumer Staples - 7.5% | |||||||||||
| 8,100,000 | MannKind Corp. (Cost $4,548,151) | 3.75 | % | 12/15/13 | 4,262,625 | ||||||
| Total Investments - 82.0%(Cost $52,213,383)* | $ | 46,490,316 | ||
| Other Assets & Liabilities, Net – 18.0% | 10,234,151 | |||
| Net Assets – 100.0% | $ | 56,724,467 | ||
| ADR | American Depository Receipt |
| PLC | Public Limited Company |
| (a) | Non-income producing security. |
| (b) | Security fair valued in accordance with procedures adopted by the Board of Trustees. At the period end, the value of these securities amounted to $0 or 0.0% of net assets. |
| (c) | Zero coupon bond. Interest rate presented is yield to maturity. |
| * Cost for federal income tax purposes is $52,213,383 and net unrealized depreciation consists of: |
| Gross Unrealized Appreciation | $ | 3,870,945 | ||
| Gross Unrealized Depreciation | (9,594,012 | ) | ||
| Net Unrealized Depreciation | $ | (5,723,067 | ) |
The inputs or methodology used for valuing securities are not necessarily an indication of the risks associated with investing in those securities. For more information on valuation inputs, and their aggregation into the levels used in the tables below, please refer to the Security Valuation section in Note 2 of the accompanying Notes to Financial Statements.
The following is a summary of the inputs used to value the Fund’s investments as of December 31, 2011.
| Valuation Inputs | Investments in Securities |
| Level 1 - Quoted Prices | $ | 42,227,691 | ||
| Level 2 - Other Significant Observable Inputs | 4,262,625 | |||
| Level 3 - Significant Unobservable Inputs | - | |||
| Total | $ | 46,490,316 |
The Level 1 inputs displayed in this table are Common Stock and Warrants. The Level 2 inputs are Corporate Convertible Bonds. Refer to the Schedule of Investments for a further breakout of each security type.
| PORTFOLIO HOLDINGS | ||
| % of Total Investments | ||
| Communications | 24.1 | % |
| Consumer Discretionary | 26.0 | % |
| Consumer Staples | 10.4 | % |
| Financials | 27.6 | % |
| Information Technology | 0.1 | % |
| Materials | 3.9 | % |
| Warrants | 7.9 | % |
| 100.0 | % |
| See Notes to Financial Statements | 8 |
CHOU INCOME OPPORTUNITY FUND SCHEDULE OF INVESTMENTS DECEMBER 31, 2011 |
| Shares | Security Description | Value |
| Equity Securities - 1.9% | |||||||
| Common Stock - 1.9% | |||||||
| Energy - 1.9% | |||||||
| 22,365 | Compton Petroleum Corp. (a) | $ | 95,051 | ||||
| Materials - 0.0% | |||||||
| 49 | AbitibiBowater, Inc. (b) | 713 | |||||
| Total Common Stock (Cost $252,220) | 95,764 |
Total Equity Securities (Cost $252,220) | 95,764 |
| Principal | Security Description | Rate | Maturity | Value |
| Fixed Income Securities - 82.9% | |||||||||||
| Corporate Convertible Bonds - 35.1% | |||||||||||
| Communications - 0.7% | |||||||||||
| $ | 30,000 | Level 3 Communications, Inc. | 6.50 | % | 10/01/16 | 36,638 | |||||
| Consumer Staples - 22.3% | |||||||||||
| 2,137,000 | MannKind Corp. | 3.75 | 12/15/13 | 1,124,596 | |||||||
| Financials - 8.4% | |||||||||||
| 1,000,000 | CompuCredit Holdings Corp. | 5.88 | 11/30/35 | 426,250 | |||||||
| Materials - 3.7% | |||||||||||
| 400,000 | USEC, Inc. | 3.00 | 10/01/14 | 187,500 | |||||||
| Total Corporate Convertible Bonds (Cost $2,214,267) | 1,774,984 |
| Corporate Non-Convertible Bonds - 28.7% | |||||||||||
| Communications - 14.9% | |||||||||||
| 40,000 | Dex One Corp. | 12.00 | 01/29/17 | 9,100 | |||||||
| 220,000 | Level 3 Communications, Inc. (c) | 11.88 | 02/01/19 | 235,400 | |||||||
| 300,000 | Media General, Inc. | 11.75 | 02/15/17 | 288,000 | |||||||
| 260,317 | Morris Publishing Group, LLC | 10.00 | 09/01/14 | 222,571 | |||||||
| 755,071 | |||||||||||
| Financials - 12.7% | |||||||||||
| 500,000 | BAC Capital Trust XV (d) | 1.33 | 06/01/56 | 297,072 | |||||||
| 600,000 | MBIA Insurance Corp. (c)(d) | 14.00 | 01/15/33 | 342,000 | |||||||
| 639,072 | |||||||||||
| Materials - 1.1% | |||||||||||
| 100,000 | Catalyst Paper Corp. (c) | 11.00 | 12/15/16 | 53,500 | |||||||
| Total Corporate Non-Convertible Bonds (Cost $1,362,401) | 1,447,643 |
| Foreign Government Bonds - 2.6% | ||||||||||
| 600,000 | Hellenic Republic Government Bond (Cost $260,424) | 4.60 | 09/20/40 | 132,790 | ||||||
| Syndicated Loans - 16.5% | |||||||||||
| $ | 395,161 | Dex Media West, LLC (d) | 7.25 | % | 10/24/14 | 223,815 | |||||
| 1,675,697 | RH Donnelley, Inc. (d) | 9.00 | 10/24/14 | 609,535 | |||||||
Total Syndicated Loans (Cost $1,634,831) | 833,350 |
| Total Fixed Income Securities (Cost $5,471,923) | 4,188,767 |
Total Investments in Securities - 84.8% (Cost $5,724,143)* | $ | 4,284,531 |
| Other Assets & Liabilities, Net – 15.2% | 766,435 | ||
| Net Assets – 100.0% | $ | 5,050,966 |
| LLC | Limited Liability Company |
| (a) | Non-income producing security. |
| (b) | Non-income producing security. Shares received as a result of company bankruptcy. |
| (c) | Security exempt from registration under Rule 144A under the Securities Act of 1933. At the period end, the value of these securities amounted to $630,900 or 12.5% of net assets. |
| (d) | Variable rate security. Rate presented is as of December 31, 2011. |
| * Cost for federal income tax purposes is $5,773,636 and net unrealized depreciation consists of: |
| Gross Unrealized Appreciation | $ | 176,236 | ||
| Gross Unrealized Depreciation | (1,665,341 | ) | ||
| Net Unrealized Depreciation | $ | (1,489,105 | ) |
The inputs or methodology used for valuing securities are not necessarily an indication of the risks associated with investing in those securities. For more information on valuation inputs, and their aggregation into the levels used in the tables below, please refer to the Security Valuation section in Note 2 of the accompanying Notes to Financial Statements.
The following is a summary of the inputs used to value the Fund’s investments as of December 31, 2011.
| Level 1 | Level 2 | Level 3 | Total |
| Common Stock | $ | 95,764 | $ | - | $ | - | $ | 95,764 | ||||||||
| Corporate Convertible Bonds | - | 1,774,984 | - | 1,774,984 | ||||||||||||
| Corporate Non-Convertible Bonds | - | 1,447,643 | - | 1,447,643 | ||||||||||||
| Foreign Government Bonds | - | 132,790 | - | 132,790 | ||||||||||||
| Syndicated Loans | - | 833,350 | - | 833,350 |
| TOTAL | $ | 95,764 | $ | 4,188,767 | $ | - | $ | 4,284,531 |
| See Notes to Financial Statements | 9 |
CHOU INCOME OPPORTUNITY FUND SCHEDULE OF INVESTMENTS DECEMBER 31, 2011 |
The following is a reconciliation of Level 3 assets (at either the beginning or ending of the period) for which significant unobservable inputs were used to determine fair value.
| Corporate Non-Convertible Bonds | ||||
| Balance as of 12/31/10 | $ | 6,555 | ||
| Realized Gain/(Loss) | 2,458 | |||
| Change in Unrealized Appreciation/(Depreciation) | (6,555 | ) | ||
| Sales | (2,458 | ) | ||
| Balance as of 12/31/11 | $ | - | ||
| Net change in unrealized appreciation/(depreciation) from investments held as of 12/31/11 ** | $ | (6,555 | ) | |
| ** The change in unrealized appreciation/(depreciation) is included in net change in unrealized appreciation/(depreciation) of investments in the accompanying Statement of Operations. |
AFA
| PORTFOLIO HOLDINGS | ||
| % of Total Investments | ||
| Common Stock | 2.2 | % |
| Corporate Convertible Bonds | 41.4 | % |
| Corporate Non-Convertible Bonds | 33.8 | % |
| Foreign Government Bonds | 3.1 | % |
| Syndicated Loans | 19.5 | % |
| 100.0 | % |
| See Notes to Financial Statements | 10 |
CHOU AMERICA MUTUAL FUNDS STATEMENTS OF ASSETS AND LIABILITIES DECEMBER 31, 2011 |
| CHOU EQUITY OPPORTUNITY FUND | CHOU INCOME OPPORTUNITY FUND | |||||||||
| ASSETS | ||||||||||
| Total investments, at value (Cost $52,213,383 and $5,724,143, respectively) | $ | 46,490,316 | $ | 4,284,531 | ||||||
| Cash | 10,329,609 | 658,609 | ||||||||
| Receivables: | ||||||||||
| Dividends and interest | 30,764 | 116,135 | ||||||||
| From investment adviser | - | 19,620 | ||||||||
| Prepaid expenses | 20,089 | 12,521 | ||||||||
| Total Assets | 56,870,778 | 5,091,416 | ||||||||
| LIABILITIES | ||||||||||
| Payables: | ||||||||||
| Investment securities purchased | 42,988 | - | ||||||||
| Accrued Liabilities: | ||||||||||
| Investment adviser fees | 45,488 | - | ||||||||
| Trustees’ fees and expenses | 225 | 21 | ||||||||
| Fund services fees | 14,209 | 5,906 | ||||||||
| Compliance services fees | 1,281 | 722 | ||||||||
| Other expenses | 42,120 | 33,801 | ||||||||
| Total Liabilities | 146,311 | 40,450 | ||||||||
| NET ASSETS | $ | 56,724,467 | $ | 5,050,966 | ||||||
| COMPONENTS OF NET ASSETS | ||||||||||
| Paid-in capital | $ | 61,753,852 | $ | 6,528,637 | ||||||
| Distributions in excess of net investment income | (418 | ) | (40,268 | ) | ||||||
| Accumulated net realized gain | 694,100 | 2,630 | ||||||||
| Net unrealized depreciation | (5,723,067 | ) | (1,440,033 | ) | ||||||
| NET ASSETS | $ | 56,724,467 | $ | 5,050,966 | ||||||
| SHARES OF BENEFICIAL INTEREST AT NO PAR VALUE (UNLIMITED SHARES AUTHORIZED) | 5,672,358 | 577,594 | ||||||||
NET ASSET VALUE, OFFERING AND REDEMPTION PRICE PER SHARE* | $ | 10.00 | $ | 8.74 | ||||||
| * | Shares redeemed or exchanged within 120 days of purchase are charged a 2.00% redemption fee. | |||||||||
| See Notes to Financial Statements | 11 |
CHOU AMERICA MUTUAL FUNDS STATEMENTS OF OPERATIONS YEAR ENDED DECEMBER 31, 2011 |
| CHOU EQUITY OPPORTUNITY FUND | CHOU INCOME OPPORTUNITY FUND | ||||||||||
| INVESTMENT INCOME | |||||||||||
| Dividend income | $ | 134,525 | $ | - | |||||||
| Interest income | 325,512 | 710,737 | |||||||||
| Total Investment Income | 460,037 | 710,737 | |||||||||
| EXPENSES | |||||||||||
| Investment adviser fees | 274,572 | 51,731 | |||||||||
| Fund services fees | 108,677 | 70,863 | |||||||||
| Distribution fees: | |||||||||||
| Investor Class | 7,295 | 3,798 | |||||||||
| Custodian fees | 10,000 | 10,003 | |||||||||
| Registration fees | 22,125 | 15,304 | |||||||||
| Audit fees | 14,800 | 14,804 | |||||||||
| Legal fees | 44,784 | 44,791 | |||||||||
| Trustees' fees and expenses | 5,469 | 5,084 | |||||||||
| Compliance services fees | 14,795 | 9,867 | |||||||||
| Miscellaneous expenses | 26,764 | 17,438 | |||||||||
| Total Expenses | 529,281 | 243,683 | |||||||||
| Fees waived and expenses reimbursed | (110,128 | ) | (166,086 | ) | |||||||
| Net Expenses | 419,153 | 77,597 | |||||||||
| NET INVESTMENT INCOME | 40,884 | 633,140 | |||||||||
| NET REALIZED AND UNREALIZED GAIN (LOSS) | |||||||||||
| Net realized gain (loss) on: | |||||||||||
| Investments | 713,401 | 19,442 | |||||||||
| Foreign currency transactions | (533 | ) | (2,403 | ) | |||||||
| Written options | 54,215 | - | |||||||||
| Net realized gain | 767,083 | 17,039 | |||||||||
| Net change in unrealized appreciation (depreciation) on: | |||||||||||
| Investments | (5,796,472 | ) | (1,534,448 | ) | |||||||
| Foreign currency translations | - | (421 | ) | ||||||||
| Written options | (211 | ) | - | ||||||||
| Net change in unrealized appreciation (depreciation) | (5,796,683 | ) | (1,534,869 | ) | |||||||
| NET REALIZED AND UNREALIZED LOSS | (5,029,600 | ) | (1,517,830 | ) | |||||||
| DECREASE IN NET ASSETS FROM OPERATIONS | $ | (4,988,716 | ) | $ | (884,690 | ) | |||||
| See Notes to Financial Statements | 12 |
CHOU AMERICA MUTUAL FUNDS STATEMENTS OF CHANGES IN NET ASSETS |
| CHOU EQUITY OPPORTUNITY FUND | CHOU INCOME OPPORTUNITY FUND | ||||||||||||||||||
| Shares | Shares | ||||||||||||||||||
| BEGINNING NET ASSETS JULY 1, 2010 | $ | 500,001 | $ | 500,001 | |||||||||||||||
| OPERATIONS | |||||||||||||||||||
| Net investment income (loss) | (5,565 | ) | 11,175 | ||||||||||||||||
| Net realized gain | 66,459 | - | |||||||||||||||||
| Net change in unrealized appreciation (depreciation) | 73,616 | 94,836 | |||||||||||||||||
| Increase in Net Assets Resulting from Operations | 134,510 | 106,011 | |||||||||||||||||
| DISTRIBUTIONS TO SHAREHOLDERS FROM | |||||||||||||||||||
| Net investment income | - | (16,420 | ) | ||||||||||||||||
| CAPITAL SHARE TRANSACTIONS | |||||||||||||||||||
| Sale of shares | 404,099 | 35,150 | 159,999 | 14,615 | |||||||||||||||
| Reinvestment of distributions | - | - | 16,420 | 1,416 | |||||||||||||||
| Redemption of shares | (15 | ) | (1 | ) | - | - | |||||||||||||
| Increase in Net Assets from Capital Share Transactions | 404,084 | 35,149 | 176,419 | 16,031 | |||||||||||||||
| Increase in Net Assets | 538,594 | 266,010 | |||||||||||||||||
| December 31, 2010 | |||||||||||||||||||
| NET ASSETS DECEMBER 31, 2010 (Including line (a)) | $ | 1,038,595 | $ | 766,011 | |||||||||||||||
| OPERATIONS | |||||||||||||||||||
| Net investment income | 40,884 | 633,140 | |||||||||||||||||
| Net realized gain | 767,083 | 17,039 | |||||||||||||||||
| Net change in unrealized appreciation (depreciation) | (5,796,683 | ) | (1,534,869 | ) | |||||||||||||||
| Decrease in Net Assets Resulting from Operations | (4,988,716 | ) | (884,690 | ) | |||||||||||||||
| DISTRIBUTIONS TO SHAREHOLDERS FROM | |||||||||||||||||||
| Net investment income | (44,283 | ) | (666,015 | ) | |||||||||||||||
| Net realized gain | (131,151 | ) | (16,812 | ) | |||||||||||||||
| Total Distributions to Shareholders | (175,434 | ) | (682,827 | ) | |||||||||||||||
| CAPITAL SHARE TRANSACTIONS | |||||||||||||||||||
| Sale of shares | 61,117,822 | 5,610,354 | 5,269,798 | 448,794 | |||||||||||||||
| Reinvestment of distributions | 175,220 | 17,435 | 682,827 | 72,238 | |||||||||||||||
| Redemption of shares | (444,357 | ) | (40,580 | ) | (100,171 | ) | (9,469 | ) | |||||||||||
| Redemption fees | 1,337 | - | 18 | - | |||||||||||||||
| Increase in Net Assets from Capital Share Transactions | 60,850,022 | 5,587,209 | 5,852,472 | 511,563 | |||||||||||||||
| Increase in Net Assets | 55,685,872 | 4,284,955 | |||||||||||||||||
| December 31, 2011 | |||||||||||||||||||
| NET ASSETS DECEMBER 31, 2011 (Including line (b)) | $ | 56,724,467 | $ | 5,050,966 | |||||||||||||||
| (a) | Distributions in excess of net investment income December 31, 2010 | $ | - | $ | (4,990 | ) | |||||||||||||
| (b) | Distributions in excess of net investment income December 31, 2011 | $ | (418 | ) | $ | (40,268 | ) | ||||||||||||
| See Notes to Financial Statements | 13 |
CHOU EQUITY OPPORTUNITY FUND FINANCIAL HIGHLIGHTS |
| These financial highlights reflect selected data for a share outstanding throughout each period. | |||||||||
For the Year Ended December 31, 2011 | July 1, 2010 (a) through December 31, 2010 | ||||||||
| NET ASSET VALUE, Beginning of Period | $ | 12.20 | $ | 10.00 | |||||
| INVESTMENT OPERATIONS | |||||||||
| Net investment income (loss) (b) | 0.02 | (0.09 | ) | ||||||
| Net realized and unrealized gain (loss) | (2.19 | ) | 2.29 | ||||||
| Total from Investment Operations | (2.17 | ) | 2.20 | ||||||
| DISTRIBUTIONS TO SHAREHOLDERS FROM | |||||||||
| Net investment income | (0.01 | ) | — | ||||||
| Net realized gain | (0.02 | ) | — | ||||||
| Total Distributions to Shareholders | (0.03 | ) | — | ||||||
| REDEMPTION FEES (b) | — | (c) | — | ||||||
| NET ASSET VALUE, End of Period | $ | 10.00 | $ | 12.20 | |||||
| TOTAL RETURN | (17.78 | )% | 22.00 | %(d) | |||||
| RATIOS/SUPPLEMENTARY DATA | |||||||||
| Net Assets at End of Period (000's omitted) | $56,724 | $1,039 | |||||||
| Ratios to Average Net Assets: | |||||||||
| Net investment income (loss) | 0.15 | % | (1.60 | )%(e) | |||||
| Net expense | 1.53 | % | 1.75 | %(e) | |||||
| Gross expense (f) | 1.93 | % | 28.58 | %(e) | |||||
| PORTFOLIO TURNOVER RATE | 11 | % | 33 | %(d) | |||||
| (a) | Commencement of operations. | ||||||||
| (b) | Calculated based on average shares outstanding during the period. | ||||||||
| (c) | Less than $0.01 per share. | ||||||||
| (d) | Not annualized. | ||||||||
| (e) | Annualized. | ||||||||
| (f) | Reflects the expense ratio excluding any waivers and/or reimbursements. | ||||||||
| See Notes to Financial Statements | 14 |
CHOU INCOME OPPORTUNITY FUND FINANCIAL HIGHLIGHTS |
| These financial highlights reflect selected data for a share outstanding throughout each period. | |||||||||
For the Year Ended December 31, 2011 | July 1, 2010 (a) through December 31, 2010 | ||||||||
| NET ASSET VALUE, Beginning of Period | $ | 11.60 | $ | 10.00 | |||||
| INVESTMENT OPERATIONS | |||||||||
| Net investment income (b) | 1.30 | 0.20 | |||||||
| Net realized and unrealized gain (loss) | (2.86 | ) | 1.65 | ||||||
| Total from Investment Operations | (1.56 | ) | 1.85 | ||||||
| DISTRIBUTIONS TO SHAREHOLDERS FROM | |||||||||
| Net investment income | (1.27 | ) | (0.25 | ) | |||||
| Net realized gain | (0.03 | ) | — | ||||||
| Total Distributions to Shareholders | (1.30 | ) | (0.25 | ) | |||||
| REDEMPTION FEES (b) | — | (c) | — | ||||||
| NET ASSET VALUE, End of Period | $ | 8.74 | $ | 11.60 | |||||
| TOTAL RETURN | (13.83 | )% | 18.54 | %(d) | |||||
| RATIOS/SUPPLEMENTARY DATA | |||||||||
| Net Assets at End of Period (000's omitted) | $5,051 | $766 | |||||||
| Ratios to Average Net Assets: | |||||||||
| Net investment income | 12.24 | % | 3.82 | %(e) | |||||
| Net expense | 1.50 | % | 1.50 | %(e) | |||||
| Gross expense (f) | 4.71 | % | 33.37 | %(e) | |||||
| PORTFOLIO TURNOVER RATE | 17 | % | 0 | %(d) | |||||
| (a) | Commencement of operations. | ||||||||
| (b) | Calculated based on average shares outstanding during the period. | ||||||||
| (c) | Less than $0.01 per share. | ||||||||
| (d) | Not annualized. | ||||||||
| (e) | Annualized. | ||||||||
| (f) | Reflects the expense ratio excluding any waivers and/or reimbursements. | ||||||||
| See Notes to Financial Statements | 15 |
CHOU AMERICA MUTUAL FUNDS NOTES TO FINANCIAL STATEMENTS DECEMBER 31, 2011 |
Note 1. Organization
The Chou Equity Opportunity Fund and Chou Income Opportunity Fund (individually, a “Fund” and, collectively the “Funds”) are non-diversified portfolios of Chou America Mutual Funds (the “Trust”). The Trust is a Delaware statutory trust that is registered as an open-end, management investment company under the Investment Company Act of 1940 (the “Act”), as amended. Under its Trust Instrument, the Trust is authorized to issue an unlimited number of each Fund’s shares of beneficial interest without par value. Chou Equity Opportunity Fund’s investment objective is to seek long-term growth of capital. Chou Income Opportunity Fund’s investment objective is to provide capital appreciation and income production with capital preservation as a secondary consideration. The Funds commenced operations on July 1, 2010, with the sale of 50,000 shares of each Fund at $10 per share to Chou Associates Management Inc.
Note 2. Summary of Significant Accounting Policies
These financial statements are prepared in accordance with accounting principles generally accepted in the United States of America (“GAAP”), which require management to make estimates and assumptions that affect the reported amounts of assets and liabilities, the disclosure of contingent liabilities at the date of the financial statements, and the reported amounts of increase and decrease in net assets from operations during the fiscal period. Actual amounts could differ from those estimates. The following summarizes the significant accounting policies of each Fund:
Security Valuation – Exchange-traded securities and over-the-counter securities are valued using the last quoted sale or official closing price, provided by independent pricing services as of the close of trading on the market or exchange for which they are primarily traded, on each Fund business day. In the absence of a sale, such securities are valued at the mean of the last bid and ask price provided by independent pricing services. Non-exchange traded securities for which quotations are available are valued using the last quoted sales price, or in the absence of a sale at the mean of the last bid and ask prices provided by independent pricing services. Debt securities may be valued at prices supplied by a fund’s pricing agent based on broker or dealer supplied valuations or matrix pricing, a method of valuing securities by reference to the value of other securities with similar characteristics such as rating, interest rate and maturity. Exchange-traded options for which there were no sales reported that day are generally valued at the mean of the last bid and ask prices. Options not traded on an exchange are generally valued at broker-dealer bid quotation. Short-term investments that mature in 60 days or less may be valued at amortized cost.
Each Fund values its investments at fair value pursuant to procedures adopted by the Trust's Board of Trustees (the "Board") if (1) market quotations are insufficient or not readily available or (2) the adviser believes that the values available are unreliable. Fair valuation is based on subjective factors and, as a result, the fair value price of an investment may differ from the security’s market price and may not be the price at which the asset may be sold. Fair valuation could result in a different NAV than a NAV determined by using market quotes.
Each Fund has a three-tier fair value hierarchy. The basis of the tiers is dependent upon the various “inputs” used to determine the value of each Fund’s investments. These inputs are summarized in the three broad levels listed below:
Level 1 — quoted prices in active markets for identical assets
Level 2 — other significant observable inputs (including quoted prices of similar securities, interest rates, prepayment speeds, credit risk, etc.)
Level 3 — significant unobservable inputs (including each Fund’s own assumptions in determining the fair value of investments)
The aggregate value by input level, as of December 31, 2011, for each Fund’s investments is included at the end of each Fund’s Schedule of Investments.
Security Transactions, Investment Income and Realized Gain and Loss – Investment transactions are accounted for on the trade date. Dividend income is recorded on the ex-dividend date. Foreign dividend income is recorded on the ex-dividend date or as soon as possible after each Fund determines the existence of a dividend declaration after exercising reasonable due diligence. Income and capital gains on some foreign securities may be subject to foreign withholding taxes, which are accrued as applicable. Interest income is recorded on an accrual basis. Premium is amortized and discount is accreted using the effective interest method. Identified cost of investments sold is used to determine the gain and loss for both financial statement and federal income tax purposes.
| 16 |
CHOU AMERICA MUTUAL FUNDS NOTES TO FINANCIAL STATEMENTS DECEMBER 31, 2011 |
Written Options – When a fund writes an option, an amount equal to the premium received by the fund is recorded as a liability and is subsequently adjusted to the current value of the option written. Premiums received from writing options that expire unexercised are treated by the fund on the expiration date as realized gain from written options. The difference between the premium and the amount paid on effecting a closing purchase transaction, including brokerage commissions, is also treated as a realized gain, or if the premium is less than the amount paid for the closing purchase transaction, as a realized loss. If a call option is exercised, the premium is added to the proceeds from the sale of the underlying security in determining whether the fund has realized a gain or loss. If a put option is exercised, the premium reduces the cost basis of the securities purchased by the fund. The fund, as writer of an option, bears the market risk of an unfavorable change in the price of the security underlying the written option. Written options are non-income producing securities.
The volume of open positions may vary on a daily basis as the Fund transacts written options in order to achieve the exposure desired by the adviser. The Chou Equity Opportunity Fund Fund entered into written options with a total value of $49,342 during the period ended December 31, 2011.
Transactions in written options during the year ended December 31, 2011, were as follows:
| Calls | ||||||||
| Number of | ||||||||
| Contracts | Premiums | |||||||
| Options Outstanding, December 31, 2010 | (42) | $ | (4,873 | ) | ||||
| Options written | (500) | (49,342 | ) | |||||
| Options terminated in closing transactions | - | - | ||||||
| Options exercised | - | - | ||||||
| Options expired | 542 | 54,215 | ||||||
| Options Outstanding, December 31, 2011 | - | $ | - | |||||
Derivatives Transactions - The Chou Equity Opportunity Fund’s use of derivatives during the period ended December 31, 2011, was limited to written options. Following is a summary of how the derivatives are treated in the financial statements and their impact on the Chou Equity Opportunity Fund.
There were no open derivatives on December 31, 2011, and thus there was no disclosure on the Statement of Assets & Liabilities.
Realized and unrealized gains and losses on derivatives contracts entered into during the period ended December 31, 2011, by the Chou Equity Opportunity Fund are recorded in the following locations in the Statement of Operations:
| Contract Type/Primary Risk Exposure | Location of Gain or (Loss) on Derivatives | Realized Gain (Loss) on Derivatives | Change in Unrealized Appreciation (Depreciation) on Derivatives | ||||||
| Equity Contracts | Realized gain (loss) – Written Options and Change in unrealized appreciation (depreciation) – Written Options | $54,215 | $(211) | ||||||
Distributions to Shareholders – Distributions to shareholders of net investment income, if any, are declared and paid at least semi-annually. Distributions to shareholders of net capital gains, if any, are declared and paid annually. Distributions are based on amounts calculated in accordance with applicable federal income tax regulations, which may differ from GAAP. These differences are due primarily to differing treatments of income and gain on various investment securities held by each Fund, timing differences and differing characterizations of distributions made by each Fund.
Federal Taxes – Each Fund intends to qualify each year as a regulated investment company under Subchapter M of the Internal Revenue Code and to distribute all of their taxable income to shareholders. In addition, by distributing in each calendar year
| 17 |
CHOU AMERICA MUTUAL FUNDS NOTES TO FINANCIAL STATEMENTS DECEMBER 31, 2011 |
substantially all their net investment income and capital gains, if any, the Funds will not be subject to a federal excise tax. Therefore, no federal income or excise tax provision is required.
As of December 31, 2011, there are no uncertain tax positions that would require financial statement recognition, de-recognition, or disclosure. Each Fund’s federal tax return filed in the two-year period ended December 31, 2011, remains subject to examination by the Internal Revenue Service.
Income and Expense Allocation – The Trust accounts separately for the assets, liabilities and operations of each of its investment portfolios. Expenses that are directly attributable to more than one investment portfolio are allocated among the respective investment portfolios in an equitable manner.
Redemption Fees – A shareholder who redeems or exchanges shares within 120 days of purchase will incur a redemption fee of 2.00% of the current net asset value of shares redeemed or exchanged, subject to certain limitations. The fee is charged for the benefit of the remaining shareholders and will be paid to each Fund to help offset transaction costs. The fee is accounted for as an addition to paid-in capital. Each Fund reserves the right to modify the terms of or terminate the fee at any time. There are limited exceptions to the imposition of the redemption fee.
Commitments and Contingencies – In the normal course of business, each Fund enters into contracts that provide general indemnifications by each Fund to the counterparty to the contract. Each Fund’s maximum exposure under these arrangements is dependent on future claims that may be made against each Fund and, therefore, cannot be estimated; however, based on experience, the risk of loss from such claims is considered remote.
Note 3. Fees and Expenses
Investment Adviser – Chou America Management Inc. (the “Adviser”) is the investment adviser to each Fund. Pursuant to an investment advisory agreement, the Adviser receives an advisory fee from each Fund at an annual rate of 1.00% of each Fund’s average daily net assets.
Distribution – Rafferty Capital Markets, LLC serves as each Fund’s distributor (the “Distributor”). The Funds have adopted a Distribution Plan (the “Plan”) in accordance with Rule 12b-1 of the Act. Under the Plan, each Fund may pay the Distributor and/or any other entity as authorized by the Board a fee of up to 0.25% of each Fund’s average daily net assets for providing distribution and/or shareholder services to the Funds. Effective, May 1, 2011, the Board has not authorized the Funds to pay a Rule 12b-1 fee. Rule 12b-1 fees accrued from the commencement of the Funds’ operations on July 1, 2010 through April 30, 2011, have been returned to the Funds. The Distributor is not affiliated with the Adviser or Atlantic Fund Administration, LLC (d/b/a Atlantic Fund Services) (“Atlantic”) or their affiliates.
Other Service Providers – Atlantic provides fund accounting, fund administration, and transfer agency services to each Fund. Atlantic also provides certain shareholder report production, and EDGAR conversion and filing services. Pursuant to an Atlantic services agreement, each Fund pays Atlantic customary fees for its services. Atlantic provides a Principal Financial Officer, a Chief Compliance Officer, and an Anti-Money Laundering Officer to each Fund, as well as certain additional compliance support functions.
Trustees and Officers – The Trust pays each Trustee an annual retainer fee of $5,000 for service to the Trust. Each Trustee is also reimbursed for all reasonable out-of-pocket expenses incurred in connection with their duties as a Trustee, including travel and related expenses incurred in attending Board meetings. No officers of the Funds are compensated by the Funds, but officers are reimbursed for travel and related expenses incurred in attending Board meetings.
Note 4. Expense Reimbursements and Fees Waived
Effective May 1, 2011, the Adviser contractually agreed to waive a portion of its fee and reimburse certain expenses to limit total annual operating expenses to 1.50% of the average daily net assets of the Chou Equity Opportunity Fund and Chou Income Opportunity Fund, through May 1, 2012 (excluding other expenses, taxes, leverage interest, acquired fund fees and expenses, dividends or interest on short positions, other interest expenses, brokerage commissions, and extraordinary expenses such as litigation). For the period ended December 31, 2011, fees waived and reimbursed were as follows:
| 18 |
CHOU AMERICA MUTUAL FUNDS NOTES TO FINANCIAL STATEMENTS DECEMBER 31, 2011 |
| Investment Adviser Fees Waived | Investment Adviser Expenses Reimbursed | Total Fees Waived and Reimbursed | |||||
| Chou Equity Opportunity Fund | $ | 110,128 | $ | - | $ | 110,128 | |
| Chou Income Opportunity Fund | 51,731 | 114,355 | 166,086 |
The Funds may pay the Adviser for fees waived and expenses reimbursed pursuant to the expense cap if (1) such payment is made within three years of the fees waived or expense reimbursement, (2) such payment is approved by the Board and (3) and the overall expenses fall below the lesser of the Fund’s then current expense cap or the expense cap in effect at the time of such reimbursement. For the period July 1, 2010 (commencement of operations) through December 31, 2011, the Adviser waived and/or reimbursed fees as follows:
| Chou Equity Opportunity Fund | ||||||
| Amount of Fees Waived and/or Expenses Reimbursed | Expiration Date to Recoup Fees Waived and/or Expenses Reimbursed | Fees Recouped | ||||
| December 31, 2010 | $93,139 | December 31, 2013 | $0 | |||
| December 31, 2011 | $110,128 | December 31, 2014 | $0 | |||
| Chou Income Opportunity Fund | ||||||
| Amount of Fees Waived and/or Expenses Reimbursed | Expiration Date to Recoup Fees Waived and/or Expenses Reimbursed | Fees Recouped | ||||
| December 31, 2010 | $93,362 | December 31, 2013 | $0 | |||
| December 31, 2011 | $166,086 | December 31, 2014 | $0 | |||
Note 5. Security Transactions
The cost of purchases and proceeds from sales of investment securities (including maturities), other than short-term investments for the year ended December 31, 2011, were as follows:
| Purchases | Sales | |||||
| Chou Equity Opportunity Fund | $52,739,982 | $2,278,185 | ||||
| Chou Income Opportunity Fund | 5,597,970 | 564,957 | ||||
Note 6. Federal Income Tax and Investment Transactions
Distributions during the fiscal years ended as noted were characterized for tax purposes as follows:
| Ordinary Income |
| Chou Equity Opportunity Fund |
| 2011 | $ | 175,434 | ||||||||||||||
| 2010 | - | |||||||||||||||
| Chou Income Opportunity Fund | ||||||||||||||||
| 2011 | 682,827 | |||||||||||||||
| 2010 | 16,420 | |||||||||||||||
| 19 |
CHOU AMERICA MUTUAL FUNDS NOTES TO FINANCIAL STATEMENTS DECEMBER 31, 2011 |
As of December 31, 2011, distributable earnings (accumulated loss) on a tax basis were as follows:
| Undistributed Ordinary Income | Capital and Other Losses | Unrealized Depreciation | Total |
| Chou Equity Opportunity Fund | $ | 694,100 | $ | (418 | ) | $ | (5,723,067 | ) | $ | (5,029,385 | ) | ||||||
| Chou Income Opportunity Fund | 11,855 | - | (1,489,526 | ) | (1,477,671 | ) | |||||||||||
The difference between components of distributable earnings on a tax basis and the amounts reflected in the Statements of Assets and Liabilities are primarily due to late year ordinary loss deferral and contingent payment debt instruments.
For tax purposes, the current year post-October loss was $418 in the Chou Equity Opportunity Fund (realized during the period November 1, 2011 through December 31, 2011). This loss will be recognized for tax purposes on the first business day of each Fund’s next fiscal year, January 1, 2012.
On the Statements of Assets and Liabilities, as a result of permanent book to tax differences, certain amounts have been reclassified for the year ended December 31, 2011. The following reclassifications were the result of currency gain/loss and re-designation of distributions and has no impact on the net assets of each Fund.
| Accumulated Net Investment Income (Loss) | Undistributed Net Realized Gain (Loss) |
| Chou Equity Opportunity Fund | $ | 2,981 | $ | (2,981 | ) | |||||||
| Chou Income Opportunity Fund | (2,403 | ) | 2,403 |
Note 7. Recent Accounting Pronouncements
In May 2011, FASB issued ASU No. 2011-04 “Amendments to Achieve Common Fair Value Measurement and Disclosure Requirements in U.S. GAAP and IFRSs.” ASU No. 2011-04 establishes common requirements for measuring fair value and for disclosing information about fair value measurements in accordance with U.S. GAAP and International Financial Reporting Standards (“IFRSs”). ASU No. 2011-04 is effective for interim and annual periods beginning after December 15, 2011. Management is currently evaluating the impact ASU No. 2011-04 may have on financial statement disclosures.
Note 8. Subsequent Events
Subsequent events occurring after the date of this report through the date these financial statements were issued have been evaluated for potential impact and each Fund has had no such events.
| 20 |
REPORT OF INDEPENDENT REGISTERED PUBLIC ACCOUNTING FIRM |
To the Shareholders and Board of Trustees of Chou America Mutual Funds
We have audited the accompanying statements of assets and liabilities, including the schedules of investments, of the Chou Equity Opportunity Fund and the Chou Income Opportunity Fund, each a series of shares of beneficial interest of Chou America Mutual Funds, as of December 31, 2011, and the related statements of operations for the year then ended, and the statements of changes in net assets and financial highlights for the year then ended and the period July 1, 2010 (commencement of operations) through December 31, 2010. These financial statements and financial highlights are the responsibility of the Funds' management. Our responsibility is to express an opinion on these financial statements and financial highlights based on our audits.
We conducted our audits in accordance with the standards of the Public Company Accounting Oversight Board (United States). Those standards require that we plan and perform the audits to obtain reasonable assurance about whether the financial statements and financial highlights are free of material misstatement. An audit includes examining, on a test basis, evidence supporting the amounts and disclosures in the financial statements. Our procedures included confirmation of securities owned as of December 31, 2011 by correspondence with the custodian and brokers. An audit also includes assessing the accounting principles used and significant estimates made by management, as well as evaluating the overall financial statement presentation. We believe that our audits provide a reasonable basis for our opinion.
In our opinion, the financial statements and financial highlights referred to above present fairly, in all material respects, the financial position of the Chou Equity Opportunity Fund and the Chou Income Opportunity Fund as of December 31, 2011, the results of their operations for the year then ended, and the changes in their net assets, and their financial highlights for the year then ended and for the period July 1, 2010 through December 31, 2010, in conformity with accounting principles generally accepted in the United States of America.

BBD, LLP
Philadelphia, Pennsylvania
February 22, 2012
| 21 |
CHOU AMERICA MUTUAL FUNDS ADDITIONAL INFORMATION (Unaudited) DECEMBER 31, 2011 |
Proxy Voting Information
A description of the policies and procedures that each Fund uses to determine how to vote proxies relating to securities held in each Fund’s portfolio is available, without charge and upon request, by calling (877) 682-6352 and on the U.S. Securities and Exchange Commission’s (the “SEC”) website at www.sec.gov. Each Fund’s proxy voting record for the most recent twelve-month period ended June 30 is available, without charge and upon request, by calling (877) 682-6352 and on the SEC’s website at www.sec.gov.
Availability of Quarterly Portfolio Schedules
Each Fund files its complete schedule of portfolio holdings with the SEC for the first and third quarters of each fiscal year on Form N-Q. Each Fund’s Forms N-Q are available, without charge and upon request on the SEC’s website at www.sec.gov or may be reviewed and copied at the SEC’s Public Reference Room in Washington, DC. Information on the operation of the Public Reference Room may be obtained by calling (800) SEC-0330.
Shareholder Expense Example
As a shareholder of the Funds, you incur two types of costs: (1) transaction costs, including redemption fees, and (2) ongoing costs, including management fees, distribution (12b-1) fees and other Fund expenses. This example is intended to help you understand your ongoing costs (in dollars) of investing in the Funds, and to compare these costs with the ongoing costs of investing in other mutual funds.
The example is based on an investment of $1,000 invested at the beginning of the period and held for the entire period from July 1, 2011, through December 31, 2011.
Actual Expenses – The first line of the table below provides information about actual account values and actual expenses. You may use the information in this line, together with the amount you invested, to estimate the expenses that you paid over the period. Simply divide your account value by $1,000 (for example, an $8,600 account value divided by $1,000 = 8.6), then multiply the result by the number in the first line under the heading entitled “Expenses Paid During Period” to estimate the expenses you paid on your account during the period.
Hypothetical Example for Comparison Purposes – The second line of the table below provides information about hypothetical account values and hypothetical expenses based on each Fund’s actual expense ratio and an assumed rate of return of 5% per year before expenses, which is not each Fund’s actual return. The hypothetical account values and expenses may not be used to estimate the actual ending account balance or expenses you paid for the period. You may use this information to compare the ongoing costs of investing in each Fund and other funds. To do so, compare this 5% hypothetical example with the 5% hypothetical examples that appear in the shareholder reports of other funds.
Please note that the expenses shown in the table are meant to highlight your ongoing costs only and do not reflect any transactional costs, such as redemption fees. Therefore, the second line of the table is useful in comparing ongoing costs only, and will not help you determine the relative total costs of owning different funds. In addition, if these transactional costs were included, your costs would have been higher.
| Beginning | Ending | Expenses | Annualized | ||||||||
| Account Value | Account Value | Paid During | Expense | ||||||||
| July 1, 2011 | December 31, 2011 | Period* | Ratio* | ||||||||
| Chou Equity Opportunity Fund | |||||||||||
| Actual | $ | 1,000.00 | $ | 824.91 | $ | 6.90 | 1.50 | % | |||
| Hypothetical (5% return before taxes) | $ | 1,000.00 | $ | 1,017.64 | $ | 7.63 | 1.50 | % | |||
Chou Income Opportunity Fund | |||||||||||
| Actual | $ | 1,000.00 | $ | 877.49 | $ | 7.10 | 1.50 | % | |||
| Hypothetical (5% return before taxes) | $ | 1,000.00 | $ | 1,017.64 | $ | 7.63 | 1.50 | % | |||
| * | Expenses are equal to each Fund’s annualized expense ratio as indicated above multiplied by the average account value over the period, multiplied by the number of days in the most recent fiscal half-year divided by 365 to reflect the half-year period. |
| 22 |
CHOU AMERICA MUTUAL FUNDS ADDITIONAL INFORMATION (Unaudited) DECEMBER 31, 2011 |
Federal Tax Status of Dividends Declared during the Tax Year
For federal income tax purposes, dividends from short-term capital gains are classified as ordinary income. The Chou Equity Opportunity Fund designates 10.13% of its income dividend distributed as qualifying for the corporate dividends-received deduction (DRD) and 10.90% for the qualified dividend rate (QDI) as defined in Section 1(h)(11) of the Internal Revenue Code. The Chou Equity Opportunity Fund aso designates 23.24% as qualified interest income exempt from US tax for foreign shareholders (QII) and 76.76% as short-term capital gain dividends exempt from U.S. tax for foreign shareholders. (QSD). The Chou Income Opportunity Fund designates 82.04% as QII and 2.46% for QSD.
Trustees and Officers of the Trust
The Board is responsible for oversight of the management of the Trust’s business affairs and of the exercise of all the Trust’s powers except those reserved for the shareholders. The following table provides information about each Board member and certain officers of the Trust. Each Trustee and officer holds office until the person resigns, is removed, or is replaced. Unless otherwise noted, the persons have held their principal occupations for more than five years. The address for all Trustees and officers is Three Canal Plaza, Suite 600, Portland, Maine 04101. Each Trustee oversees two portfolios in the Trust. Each Fund’s Statement of Additional Information includes additional information about the Trustees and is available, without charge and upon request, by calling (877) 682-6352.
| Name and Year of Birth | Position with the Trust | Length of Time Served | Principal Occupation(s) During Past Five Years | Number of Series of Trust Overseen by Trustee | Other Directorships Held by Trustee |
| Independent Trustees | |||||
Lily Pinarello Born: 1953 | Trustee | Since 2010 | Retired since 1999. | 2 | 0 |
David McLean Born: 1966 | Trustee | Since 2010 | Managing Director, McLean Asset Management, Ltd. And MAMGMT Fund Services, Ltd., since 1998. | 2 | 0 |
| Interested Trustee | |||||
Francis S.M. Chou Born: 1956 | Trustee | Since 2010 | Chief Executive Officer, Chou America Management, Inc. since 2010; Chief Executive Officer, Chou Associates Management, Inc., since 1986; Senior Vice President, Fairfax Financial Holdings, 1996-2007. | 2 | 0 |
| Officers | |||||
Francis S.M. Chou Born: 1956 | President and Principal Executive Officer | Since 2010 | Chief Executive Officer, Chou America Management, Inc. since 2010; Chief Executive Officer, Chou Associates Management, Inc., since 1986; Senior Vice President, Fairfax Financial Holdings, 1996-2007. | N/A | N/A |
Michael J. McKeen Born: 1971 | Treasurer and Principal Financial Officer | Since 2010 | Senior Vice President, Atlantic since 2008; Vice President, Citigroup Fund Services, LLC ("Citigroup") 2003-2008. | N/A | N/A |
Megan Hadley Koehler Born: 1978 | Secretary | Since 2010 | Associate Counsel, Atlantic, since 2008; Assistant Vice President, Citigroup, 2007-2008; Thurber & Associates, 2006-2007; Student Attorney, Cumberland Legal Aid Clinic, 2006; Legal Intern, Maine Unemployment Insurance Commission, 2005-2006; Associate, LexisNexis, 2004-2005. | N/A | N/A |
David Faherty Born: 1970 | Vice President | Since 2010 | Senior Counsel, Atlantic since 2009; Vice President, Citi Fund Services Ohio, Inc. 2007-2009; Associate Counsel, Investors Bank & Trust Co. 2006-2007. | N/A | N/A |
Joshua LaPan Born: 1973 | Vice President | Since 2010 | Manager, Atlantic since 2008; Vice President, Citigroup 2003-2008. | N/A | N/A |
Timothy Bowden Born: 1969 | Vice President | Since 2010 | Manager, Atlantic since 2008; Vice President, Citigroup 2005-2008. | N/A | N/A |
| 23 |
FOR MORE INFORMATION:
P.O. Box 588
Portland, ME 04112
(877) 682-6352
INVESTMENT ADVISER
Chou America Management Inc.
110 Sheppard Ave. East
Suite 301, Box 18
Toronto, Ontario, Canada M2N 6Y8
TRANSFER AGENT
Atlantic Fund Services
P.O. Box 588
Portland, ME 04112
DISTRIBUTOR
Rafferty Capital Markets, LLC
59 Hilton Avenue
Garden City, NY 11530
www.raffcap.com
This report is submitted for the general information of the shareholders of the Funds. It is not authorized for
distribution to prospective investors unless preceded or accompanied by an effective prospectus, which includes information regarding the Funds’ risks, objectives, fees and expenses, experience of its management, and other information.
243-ANR-1211
ITEM 2. CODE OF ETHICS.
(a) | As of the end of the period covered by this report, Chou America Mutual Funds (the “Registrant”) has adopted a code of ethics, which applies to its Principal Executive Officer and Principal Financial Officer (the “Code of Ethics”). |
(c) | There have been no amendments to the Registrant’s Code of Ethics during the period covered by this report. |
| (d) | There have been no waivers to the Registrant’s Code of Ethics during the period covered by this report. |
| (e) | Not applicable. |
(f) (1) A copy of the Code of Ethics is being filed under Item 12(a) hereto.
ITEM 3. AUDIT COMMITTEE FINANCIAL EXPERT.
The Board of Trustees has not yet determined that it has at least one audit committee financial expert serving on its Audit Committee or that no member of the Audit Committee is an "audit committee financial expert" as that term is defined under applicable regulatory guidelines.
ITEM 4. PRINCIPAL ACCOUNTANT FEES AND SERVICES.
(a) Audit Fees - The aggregate fees billed for each of the last two fiscal years (the “Reporting Periods”) for professional services rendered by the Registrant’s principal accountant for the audit of the Registrant’s annual financial statements, or services that are normally provided by the principal accountant in connection with the statutory and regulatory filings or engagements for the Reporting Periods, were $24,800 in 2010 and $24,800 in 2011.
(b) Audit-Related Fees – The aggregate fees billed in the Reporting Periods for assurance and related services rendered by the principal accountant that were reasonably related to the performance of the audit of the Registrant’s financial statements and are not reported under paragraph (a) of this Item 4 were $0 in 2010 and $0 in 2011.
(c) Tax Fees - The aggregate fees billed in the Reporting Periods for professional services rendered by the principal accountant to the Registrant for tax compliance, tax advice and tax planning were $4,800 in 2010 and $4,800 in 2011. These services consisted of review or preparation of U.S. federal, state, local and excise tax returns.
(d) All Other Fees - The aggregate fees billed in the Reporting Periods for products and services provided by the principal accountant to the Registrant, other than the services reported in paragraphs (a) through (c) of this Item, were $0 in 2010 and $0 in 2011.
(e) (1) The Audit Committee reviews and approves in advance all audit and “permissible non-audit services” (as that term is defined by the rules and regulations of the Securities and Exchange Commission) to be rendered to a series of the Registrant (each, a “Series”). In addition, the Audit Committee reviews and approves in advance all “permissible non-audit services” to be provided to an investment adviser (not including any sub-adviser) of a Series, or an affiliate of such investment adviser, that is controlling, controlled by or under common control with the investment adviser and provides on-going services to the Registrant (“Affiliate”), by the Series’ principal accountant if the engagement relates directly to the operations and financial reporting of the Series. The Audit Committee considers whether fees paid by a Series’ investment adviser or an Affiliate to the Series’ principal accountant for audit and permissible non-audit services are consistent with the principal accountant’s independence.
(e) (2) No services included in (b) - (d) above were approved pursuant to paragraph (c)(7)(i)(C) of Rule 2-01 of Regulation S-X.
(f) Not applicable
(g) The aggregate non-audit fees billed by the principal accountant for services rendered to the Registrant for the Reporting Periods were $0 in 2010. There were no fees billed in either of the Reporting Periods for non-audit services rendered by the principal accountant to the Registrant’s investment adviser or any Affiliate.
(h) During the Reporting Periods, the Registrant’s principal accountant provided no non-audit services to the investment adviser or any entity controlling, controlled by or under common control with the investment adviser to the series of the Registrant.
ITEM 5. AUDIT COMMITTEE OF LISTED REGISTRANTS.
Not applicable
ITEM 6. INVESTMENTS.
| (a) | Included as part of report to shareholders under Item 1. |
| (b) | Not applicable. |
ITEM 7. DISCLOSURE OF PROXY VOTING POLICIES AND PROCEDURES FOR CLOSED-END
MANAGEMENT INVESTMENT COMPANIES.
Not applicable.
ITEM 8. PORTFOLIO MANAGERS OF CLOSED-END MANAGEMENT INVESTMENT COMPANIES.
Not applicable.
ITEM 9. PURCHASES OF EQUITY SECURITIES BY CLOSED-END MANAGEMENT INVESTMENT COMPANY AND AFFILIATED PURCHASERS.
Not applicable.
ITEM 10. SUBMISSION OF MATTERS TO A VOTE OF SECURITY HOLDERS
The Registrant does not accept nominees to the board of trustees from shareholders.
ITEM 11. CONTROLS AND PROCEDURES
(a) The Registrant’s Principal Executive Officer and Principal Financial Officer have concluded that the Registrant’s disclosure controls and procedures (as defined in Rule 30a-3(c) under the Investment Company Act of 1940 (the “Act”)) are effective, based on their evaluation of the controls and procedures required by Rule 30a-3(b) under the Act and Rules 13a-15(b) or 15d-15(b) under the Securities Exchange Act of 1934, as of a date within 90 days of the filing date of this report.
(b) There were no changes in the Registrant’s internal control over financial reporting (as defined in
Rule 30a-3(d) under the Act) that occurred during the second fiscal quarter of the period covered by this report that have materially affected, or are reasonably likely to materially affect, the Registrant’s internal control over financial reporting.
ITEM 12. EXHIBITS.
(a)(1) Code of Ethics (Exhibit filed herewith).
(a)(2) Certifications pursuant to Rule 30a-2(a) of the Act, and Section 302 of the Sarbanes-Oxley Act of 2002. (Exhibits filed herewith)
(a)(3) Not applicable.
(b) Certifications pursuant to Rule 30a-2(b) of the Act, and Section 906 of the Sarbanes-Oxley Act of 2002. (Exhibit filed herewith)
SIGNATURES
Pursuant to the requirements of the Securities Exchange Act of 1934 and the Investment Company Act of 1940, the Registrant has duly caused this report to be signed on its behalf by the undersigned, thereunto duly authorized.
Registrant�� Chou America Mutual Funds
By /s/ Francis S.M. Chou
Francis S.M. Chou, Principal Executive Officer
Date February 24, 2012
Pursuant to the requirements of the Securities Exchange Act of 1934 and the Investment Company Act of 1940, this report has been signed below by the following persons on behalf of the Registrant and in the capacities and on the dates indicated.
By /s/ Francis S.M. Chou
Francis S.M. Chou, Principal Executive Officer
Date February 24, 2012
By /s/ Michael J. McKeen
Michael J. McKeen, Principal Financial Officer
Date February 24, 2012