As filed with the Securities and Exchange Commission on March 3, 2015
UNITED STATES
SECURITIES AND EXCHANGE COMMISSION
WASHINGTON, D.C. 20549
FORM N-CSR
CERTIFIED SHAREHOLDER REPORT OF REGISTERED MANAGEMENT
INVESTMENT COMPANIES
Investment Company Act file number 811-22394
CHOU AMERICA MUTUAL FUNDS
Three Canal Plaza, Suite 600
Portland, Maine 04101
Michael J. McKeen, Principal Financial Officer
Three Canal Plaza, Suite 600
Portland, Maine 04101
207-347-2000
Date of fiscal year end: December 31
Date of reporting period: January 1, 2014 – December 31, 2014
ITEM 1. REPORT TO STOCKHOLDERS.
CHOU AMERICA MUTUAL FUNDS
Annual Report
December 31, 2014
Fund Adviser:
Chou America Management Inc.
110 Sheppard Ave. East
Suite 301, Box 18
Toronto, Ontario, Canada M2N 6Y8
Toll Free: (877) 755-5188
| A Message to our Shareholders (Unaudited) | 1 |
| Performance Charts and Analysis (Unaudited) | 10 |
| Schedules of Investments | 12 |
| Statements of Assets and Liabilities | 15 |
| Statements of Operations | 16 |
| Statements of Changes in Net Assets | 17 |
| Financial Highlights | 18 |
| Notes to Financial Statements | 20 |
| Report of Independent Registered Public Accounting Firm | 26 |
| Additional Information (Unaudited) | 27 |
CHOU OPPORTUNITY FUND A MESSAGE TO OUR SHAREHOLDERS (Unaudited) DECEMBER 31, 2014 |
Dear Shareholder,
During the 12 month-reporting period that ended on December 31, 2014, the Chou Opportunity Fund (the “Fund”) was up 4.88%, while the S&P 500 Total Return Index (the “S&P 500”) generated a return of 13.69% during the same period. The Fund's past performance is not necessarily an indication of how the Fund will perform in the future.
Portfolio Commentary
Our investments in the TARP warrants of Wells Fargo were up during the year increasing in value from $15.83 as of December 31, 2013 to $21.36 as of December 31, 2014. TARP warrants have several characteristics that make them appealing long-term investments. Specifically, they are long dated, with most expiring around 2018-2019. This time frame of four-plus years is intended to allow banks the potential to grow their intrinsic value to a high enough level to have an appreciable impact on the strike price of the stock warrant. In addition, we note that the terms of the warrants may require the strike price to be adjusted downward for any quarterly dividend that exceeds a set price. This is rarely seen in a stock warrant. An example: for Bank of America, class 'A' warrants, the strike price is adjusted downward for any quarterly dividend paid exceeding one cent per share.
We also hold TARP warrants of Bank of America and JPMorgan Chase, and as a group, we still consider them undervalued on a long term basis because the stocks underlying the TARP warrants are still cheap.
Our common stock investment in MBIA Inc. did not perform well because of concerns over its exposure to Puerto Rico's economic and financial situations, decreasing in value to $9.54 as of December 31, 2014 from $11.94 as of December 31, 2013. Although we believe that MBIA is cheap based on book value, it makes it harder to evaluate its intrinsic value when the main operating business has been mothballed for a while. Time is not on the side of investors in that type of business.
Our investments in the common stock of Resolute Forest Products were up during the year. They increased in value from $16.02 as of December 31, 2013 to $17.61 as of December 31, 2014.We sold 50,000 shares of Resolute Forest Products at $20 in order to decrease the Fund's holding in this stock as a percentage of its total assets.
The common stock of Sears Holdings dropped in value from $49.04 as of December 31, 2013 to $32.98 as of December 31, 2014. When viewed in isolation, this constitutes a loss. However, there is a small gain if you give consideration to the overall effect of the following transactions that Sears Holdings did in 2014:
1) It spun out Lands' End in April. We received 86,213 shares of Lands' End. When we sold it between the prices of $45.04 and $48.09, it amounted to approximately $13.81 per share of Sears Holdings.
2) In October, it distributed a rights offering whereby each right entitled the holder to purchase 0.375643 of a common share of Sears Canada for each share of Sears Holdings common stock owned as of the record date at a purchase price of U.S.$9.50 per share. When we sold the rights, it amounted to approximately 10 cents per share of Sears Holdings.
CHOU OPPORTUNITY FUND A MESSAGE TO OUR SHAREHOLDERS (Unaudited) DECEMBER 31, 2014 |
3) Also, in October, it distributed a rights offering whereby the holder received one right for every 85.1872 shares of the Company's common stock held as of the record on October 30, 2014. Each right entitles the holder thereof to purchase, at a subscription price of $500, one unit, consisting of (a) a 8% senior unsecured note due 2019 in the principal amount of $500 and (b) 17.5994 warrants, with each warrant entitling the holder thereof to purchase one share of the Company's common stock. The warrants will be exercisable upon issuance at an exercise price of $28.41. When we sold the rights, it amounted to approximately $2.83 per share of Sears Holdings.
In total, we received $16.74 per share of Sears Holdings through spin-offs and rights offerings.
On September 30 and October 1, we bought 261,548 shares of Sears Holdings when it was selling at a depressed price of just below $25. On October 24, we sold 200,000 shares at approximately $40.25 to bring the Sears Holdings to just below 15% of the Fund's assets. We feel more comfortable at this level of concentration.
As we have indicated before, we believe that Sears Holdings is a misunderstood story. There are many moving parts but we believe Sears Holdings’ intrinsic value lies in its real estate assets. It also has other valuable assets such as Kenmore, Craftsman and Diehard. Being a traditional department store has become a tough business during the last decade but, according to management, Sears is transitioning its historic focus on running a brick and mortar department store into a business that provides and delivers value by serving its members in the manner most convenient for them: whether in store, at home or through digital devices.
The value of its real estate allows Eddie Lampert, the controlling shareholder and CEO, the time and money to effect the changes. What Lampert is doing is the right thing to do, considering the possible outcomes – if it works, it’ll be a multi-bagger; if the transformation does not work out as expected, we believe the real estate values are high enough that we would not lose money in our investment at current prices after netting out all liabilities. If real estate was the only play from Lampert’s viewpoint, it seems that he would have liquidated the company a long time ago.
Other negative contributors to the Fund were securities of Overstock.com, Sears Canada and Sears Hometown and Outlet Stores Inc.
We initiated positions in common stock of Ascent Capital Group Inc., Chicago Bridge and Iron Company, and Class 'B' warrants of General Motors Company.
We are starting to look at credit default swaps (CDS)
One way of assessing investors' appetite for risk is to check the prices of credit default swaps (CDS). In CDS, one party sells credit protection and the other party buys credit protection. Put another way, one party is selling insurance and the counterparty is buying insurance against the default of a specific third party’s debt. If the protection buyer does not own debt issued by the third party, then CDS are more appropriately viewed as an investment transaction, rather than a hedging transaction, for the protection buyer notwithstanding the insurance-like features of a CDS. In most CDS, the protection buyer makes the premium payments over the life of the CDS, frequently on a quarterly basis.
CHOU OPPORTUNITY FUND A MESSAGE TO OUR SHAREHOLDERS (Unaudited) DECEMBER 31, 2014 |
We believe that CDS are starting to sell at prices that are becoming interesting. At recent prices, they appear to offer one of the potentially cheapest forms of insurance against market disruptions. We are continuing to monitor CDS prices and may potentially invest in CDS in the future. We are looking at who deals in such investments and we want to examine carefully what counterparty risk we may be exposed to. The mechanics of investing in CDS have changed somewhat from six years ago.
To make money in CDS, you don’t need a default of the third party’s debt. A dislocation in the economy or deterioriation in the credit profile of the issuer may cause the CDS price to rise from these low levels. The negative aspect is that, like insurance, the premium paid for the protection erodes over time and may expire worthless. There is no guarantee that the Manager will make money for the Fund on any particular CDS or correctly predict an increase of value in any particular CDS.
Debts at Negative Yields
I never thought that in my lifetime that we would ever see a situation in a developed economy when there is a negative yield on interest rates. A few weeks ago, Finland floated a five-year notes at a negative yield. It sold 1 billion euros of notes at an interest rate of negative 0.017%. In other words, noteholders or bondholders are willing to pay the government the privilege of holding its notes. And this is not an aberration. Countries like Germany, France, Sweden, Netherland, Belgium and Austria have seen their two-year sovereign debt trading at negative yields.
Not to be outdone, a corporate bond of Nestle 3/4% maturing in October of 2016 is trading at a negative yield. So, you have come to this ridiculous situation where you can borrow money for free.
The question is, how to capitalize on the situation? There are several possible ways of doing that but one way of seeking to take advantage of this type of situation is through an interest rate swap. An interest rate swap is a derivative contract between two counterparties whereby they agree to exchange one stream of interest payments for another, over a set period of time.
We are still considering the use of interest rate swaps and other similar derivatives. If we do use these contracts, we will do our best to quantify the risk of loss from these contracts and minimize losses if interest rates do not move in the manner that we anticipate. Of course, there is no guarantee that our use of these interest rate derivatves will work as intended or that we will accurately predict or analyze the direction of future interest rates.
Caution to the Investors
Investors should be advised that we run a highly focused portfolio, frequently just two or three securities may comprise close to 50% of the assets of the Fund. In addition, we have securities that are non-U.S. and could be subjected to geopolitical risks, which may trump or at least negatively influence the financial performance of the company. Also, we may enter into some derivative contracts with regard to CDS and interest rate swaps. Because of these factors, the net asset value of the Fund can be volatile. However, we are not bothered by this volatility because our focus has always been, and continues to be, on how inexpensive we believe the investments are relative to their intrinsic value.
Also, at year-end our cash position was approximately 41.3% of net assets. This large cash position may depress returns for a while as we hunt for undervalued investments. Obviously, if there is a severe
CHOU OPPORTUNITY FUND A MESSAGE TO OUR SHAREHOLDERS (Unaudited) DECEMBER 31, 2014 |
correction in the market in the near future, it will cushion the Fund against losses while providing us with the wherewithal to buy depressed investments - but for now it could be a drag on returns.
Yours truly,
Francis Chou
Portfolio Manager and CEO
Chou America Management Inc.
The views in this report were those of the Fund manager as of December 31, 2014, and may not reflect his view on the date this report is first published or anytime thereafter. The views are intended to assist the shareholders of the Fund in understanding their investments in the Fund and do not constitute investment advice. This letter may contain discussions about certain investments held and not held in the portfolio. All current and future holdings are subject to risk and to change. There can be no guarantee of success with any technique, strategy or investment.
The S&P 500 is an unmanaged index representing the average performance of 500 widely held, publicly traded, large capitalization stocks. One cannot invest directly in an index.
CHOU INCOME FUND A MESSAGE TO OUR SHAREHOLDERS (Unaudited) DECEMBER 31, 2014 |
Dear Shareholder,
During the 12 month-reporting period that ended on December 31, 2014, the Chou Income Fund (the “Fund”) was down -4.83%, while the Barclay's Capital U.S. Corporate High Yield Index (High Yield Index) generated a return of 2.45% during the same period. The Fund's performance is not necessarily indicative of how the Fund will perform in the future.
From the inception date of July 1, 2010 to December 31, 2014, which is 4.5 years, the return has been 11.1% compared to 9.0% return for the High Yield Index. However, we caution it is not possible to extrapolate the returns from inception into the future. As previously explained, the Fund's performance is not necessarily indicative of how the Fund will perform in the future. In fact, we expect that our since inception returns will be virtually impossible to duplicate due to current prices of non-investment grade securities. Also there are other constraints, such as the ability of any investment adviser to be able to recognize a mispriced bond when one comes along. In short, we feel that it is challenging to truly understand the value of most of the universe of debt securities.
Portfolio Commentary
Several of our debt securities were up for the year 2014. R.H. Donnelley's term loan rose from 61.20 cents on a dollar as of December 31, 2013 to 72.25 cents on a dollar as of December 31, 2014. Dex Media West's term loan rose from 78.60 cents on a dollar as of December 31, 2013 to 87.96 cents on a dollar as of December 31, 2014. At the time we bought into these two companies, we believed they were well covered by their earning power, assets, and covenants that are protective to debt holders. In addition, these term loans come with a cash-flow sweep, which means that any free cash flow remaining after all operational needs are met can be used to buy back debt at par from its holders. We continue to believe that at current prices, R.H Donnelley and Dex Media West are underpriced.
The debt security of JC Penny 7.95% 2017 was up from 87.75 cents on a dollar as of December 31, 2013 to 97.50 cents on a dollar as of December 31, 2014. In the first half, we sold half our position at close to par value, reducing our position to less than 5% of the portfolio. In the second half, the company tendered for this bond at 109 cents on a dollar, accepting 337,000 bonds out of the 1 million bonds tendered to the company. Several of our smaller positions were up too, such as Emerald Plantation Holdings 6% 2020 debt security which went up from 69 cents on a dollar as of December 31, 2013 to 87.10 cents on a dollar as of December 31, 2014.
Our main losses came from our purchases of debt securities of three Ukrainian companies, UkrLandFarming PLC, Avangardco Investments and Mriya Agro Holdings. UkrLandFarming PLC operates as an integrated agricultural producer and distributor. The company engages in crops farming, eggs and egg products production, sugar production, as well as cattle and meat production and distribution.
Avangardco Investments is one of the leading agroindustrial companies in Ukraine, focusing on the production of shell eggs and egg products. According to the Pro-Consulting Report, it has a market share of approximately 57% of all industrially produced shell eggs and 91% of all dry egg products produced in Ukraine in 2013.
CHOU INCOME FUND A MESSAGE TO OUR SHAREHOLDERS (Unaudited) DECEMBER 31, 2014 |
Mriya Agro Holdings, through its subsidiaries, cultivates agricultural commodities such as wheat, corn, rapeseed, sugar beets, buckwheat, potatoes, and other crops.
The bonds are down from their purchase price but that region of the world is highly volatile and is subject to serious geopolitical risk. Given that, we expect the prices of the bonds we purchased to be volatile and could be subjected to a permanent loss of capital. Strong balance sheet and decent financial operations count but we have to be cognizant of the fact that when investing in a civil war fueled by Putin, geopolitics can trump solid financials.
However, the flip side is that you won't find a decent bargain unless the company or the environment they are operating in, has perceived serious issues. Baron Rothschild, a member of the famous Rothschild banking family, made a killing in the panic that ensued after the Battle of Waterloo against Napoleon. He is quoted to have said, "Buy when there's blood in the streets, even if the blood is your own."
We believe that it is still too early to know whether our foray into Ukraine will continue to be unprofitable in the long term. So far, with the exception of Mriya, we think it is more likely to be a short-term quotational loss and not a permanent loss of capital.
On March 17, 2014, Rainmaker Entertainment, a Canadian animation company, completed a non-brokered private placement of unsecured subordinated convertible debentures in the aggregate principal amount of $7.5 million. Chou Income Fund purchased $3 million. The convertible debentures enjoy the same attributes as the debentures issued by Rainmaker in April and May 2013; they are unsecured and bear interest at a rate of 8% per annum, payable quarterly in arrears.
The debentures mature on March 31, 2016. The convertible debentures were listed on the TSX Venture Exchange and began trading on March 31, 2014 under the trading symbol RNK.DB.
The proceeds of the debentures will allow Rainmaker to aggressively pursue and secure new opportunities in several key segments of the animation industry. These include production service contracts in both the feature film and television markets.
The investment in the 8% convertible debenture gives us a decent return but what we are really excited about is the conversion feature to the common stock at 20 cents. At the time of purchase, we paid no premium to the conversion feature as the common stock was trading at 20 cents. On Dember 30, 2014, the common stock traded at 24 cents. With so many projects on the go, we feel the convertible debenture was attractively priced at the time of purchase.
Non-Investment (or High Yield) grade debt securities - they are not cheap
Prices for some non-investment grade bonds in North America do not seem to reflect the risks inherent in these securities. A company can float 10-year non-investment grade bonds with a coupon of 5.5% and investors will buy them at 100 cents on the dollar. Just a few years ago, a similar bond would be trading for 60 cents or less.
CHOU INCOME FUND A MESSAGE TO OUR SHAREHOLDERS (Unaudited) DECEMBER 31, 2014 |
In fact, we believe that there is a good chance that many of these debt securities may now be overvalued, and that the possibility of a large, permanent loss of capital is extremely high. Bargains are scarce and selections are quite meager in North America.
Changes to the Fund's Prospectus
During the 12-month reporting period, there were a few changes to the Fund’s prospectus that were intended to give the Manager more flexibility in managing the portfolio. On May 1, 2014, the prospectus was revised, so that under normal market conditions, the Fund will invest at least 80% of its net assets in fixed-income securities, financial instruments that provide exposure to fixed income securities, and preferred stocks (the "80% Policy"). Previously, the Fund treated its investments in preferred stock as equity securities, however, in seeking and evaluating investment opportunities for the Fund, we find that many forms of preferred stock have fixed income characteristics, are similar to bonds and other fixed income securities, and are more appropriately treated as fixed income securities. Therefore, we find these preferred stocks suitable for inclusion as fixed income investments under the Fund’s 80% Policy.
In addition, in October 2014, we supplemented the prospectus for three primary reasons:
| 1) | We clarified that the Manager can use derivatives to obtain exposure to one or more investments or markets, including the use of interest rate options for hedging purposes (other derivatives including CDS were already specifically included); |
| 2) | We removed a statement from the investment strategy of Chou Income Fund that relates to the fund having a “focus” on US/Can; |
| 3) | And we added a sentence to Chou Income Fund that said, "Portfolio holdings are typically concentrated without limits as to factors such as geography, the size of an issuer, the issuer’s earnings or the industry in which an issuer operates". |
Instead of feeling constrained, we hope that these changes will give me more flexibility and opportunity in hunting for bargains in fixed income securities. Please see the current prospectus for the complete disclosure relating to our permitted uses of derivatives and related risks - these statements are only a summary of the changes to the disclosure during the reporting period.
We are starting to look at credit default swaps (CDS)
One way of assessing investors' appetite for risk is to check the prices of credit default swap (CDS). In CDS, one party sells credit protection and the other party buys credit protection. Put another way, one party is selling insurance and the counterparty is buying insurance against the default of the third party’s debt. If the protection buyer does not own debt issued by the third party, then CDS may be viewed as more of an investment transaction by the protection buyer, than a hedging transaction, notwithstanding the insurance-like features of a CDS. In most CDS, the protection buyer makes the premium payments over the life of the CDS, frequently on a quarterly basis.
We believe that CDS are starting to sell at prices that are becoming interesting. At recent prices, they appear to offer one of the potentially cheapest forms of insurance against market disruptions. We are continuing to monitor CDS prices and may potentially invest in CDS in the future. We are looking at who deals in such investments and we want to examine carefully what counterparty risk we may be exposed to. The mechanics of investing in CDS have changed somewhat from six years ago.
CHOU INCOME FUND A MESSAGE TO OUR SHAREHOLDERS (Unaudited) DECEMBER 31, 2014 |
To make money in CDS, you don’t need a default of the third party’s debt. A dislocation in the economy or deterioriation in the credit profile of the issuer may cause may cause the CDS price to rise from these low levels. The negative aspect is that, like insurance, the premium paid for the protection erodes over time and may expire worthless. There is no guarantee that the Manager will make money on any particular CDS or correctly predict an increase of value in any particular CDS.
Debts at Negative Yields
I never thought that in my lifetime that we would ever see a situation in a developed economy when there is a negative yield on interest rates. A few weeks ago, Finland floated five-year notes at a negative yield. It sold 1 billion euros of notes at an interest rate of negative 0.017%. In other words, noteholders or bondholders are willing to pay the government the privilege of holding its notes. And this is not an aberration. Countries like Germany, France, Sweden, Netherlands, Belgium and Austria have seen their two-year sovereign debt trading at negative yields
Not to be outdone, a corporate bond of Nestle 3/4% maturing in October of 2016 is trading at a negative yield. So, you have come to this ridiculous situation where you can borrow money for free.
The question is how to capitalize on the situation? There are several possible ways of doing that but one way of taking advantage of this type of situation is through an interest rate swap. An interest rate swap is a derivative contract between two counterparties whereby they agree to exchange one stream of interest payments for another, over a set period of time.
In our case, we are looking to pay fixed-rate payments and in return, get floating-rate payments since we think that the negative spread will not last long-term.
If we do enter into these contracts, our job is to attempt to quantify the risk of loss from the contracts. In other words, in case we are wrong, we do not want to lose more money than what we may put into these type of securities.
Caution to the Investors
Investors should be advised that we run a highly focused portfolio, frequently just two or three securities may comprise close to 50% of the assets of the Fund. In addition, we have securities that are non-U.S. and could be subjected to geopolitical risks, which may trump or at least negatively impact (another word?) the financial performance of the company. Also, we may enter into some derivative contracts with regard to CDS and Interest Rate Swap. Because of these factors, the net asset value of the Fund can be more volatile than normal. However, we are not bothered by this volatility because our focus has always been, and continues to be, on how inexpensive we believe the securities are relative to their intrinsic value.
CHOU INCOME FUND A MESSAGE TO OUR SHAREHOLDERS (Unaudited) DECEMBER 31, 2014 |
At year-end our cash position was approximately 26.2% of net assets.
Yours truly,
Francis Chou
Portfolio Manager and CEO
Chou America Management Inc.
The views in this report were those of the Fund manager as of December 31, 2014, and may not reflect his view on the date this report is first published or anytime thereafter. The views are intended to assist the shareholders of the Fund in understanding their investments in the Fund and do not constitute investment advice. This letter may contain discussions about certain investments held and not held in the portfolio. All current and future holdings are subject to risk and to change. There can be no guarantee of success with any technique, strategy or investment.
The Barclays Capital U.S. Corporate High Yield Index is comprised of issues that meet the following criteria: at least $150 million par value outstanding, maximum credit rating of Ba1 (including defaulted issues) and at least one year to maturity. One cannot invest directly in an index.
CHOU OPPORTUNITY FUND PERFORMANCE CHART AND ANALYSIS (Unaudited) DECEMBER 31, 2014 |
The following chart reflects the change in the value of a hypothetical $10,000 investment, including reinvested dividends and distributions, in Chou Opportunity Fund (the “Fund”) compared with the performance of the benchmark, S&P 500 Index ("S&P 500"), since inception. The S&P 500 is a broad-based, unmanaged measurement of changes in stock market conditions based on the average of 500 widely held common stocks. The total return of the S&P 500 includes the reinvestment of dividends and income. The total return of the Fund includes operating expenses that reduce returns, while the total return of the S&P 500 does not include expenses. The Fund is professionally managed while the S&P 500 is unmanaged and is not available for investment.

Performance data quoted represents past performance and is no guarantee of future results. Current performance may be lower or higher than the performance data quoted. Investment return and principal value will fluctuate so that shares, when redeemed, may be worth more or less than original cost. For the most recent month-end performance, please call (877) 682-6352. Shares redeemed or exchanged within 120 days of purchase will be charged a 2.00% redemption fee. As stated in the Fund’s current prospectus, the annual operating expense ratio (gross) is 1.50%. The Fund’s adviser has contractually agreed to reduce a portion of its fees and reimburse expenses to limit total operating expenses to 1.50% (excluding other expenses, taxes, leverage interest, acquired fund fees and expenses, dividends or interest on short positions, other interest expenses, brokerage commissions, and extraordinary expenses such as litigation), through May 1, 2015. During the period, certain fees were waived and/or expenses reimbursed; otherwise, returns would have been lower. The performance table and graph do not reflect the deduction of taxes that a shareholder would pay on Fund distributions or the redemption of Fund shares. Returns greater than one year are annualized.
CHOU INCOME FUND PERFORMANCE CHART AND ANALYSIS (Unaudited) DECEMBER 31, 2014 |
The following chart reflects the change in the value of a hypothetical $10,000 investment, including reinvested dividends and distributions, in Chou Income Fund (the “Fund”) compared with the performance of the benchmark, Barclays Capital U.S. Corporate High Yield Index ("Barclays Index"), since inception. The Barclays Index is comprised of issues that meet the following criteria: at least $150 million par value outstanding, maximum credit rating of Ba1 (including defaulted issues) and at least one year to maturity. The total return of the Barclays Index includes the reinvestment of dividends and income. The total return of the Fund includes operating expenses that reduce returns, while the total return of the Barclays Index does not include expenses. The Fund is professionally managed while the Barclays Index is unmanaged and is not available for investment.
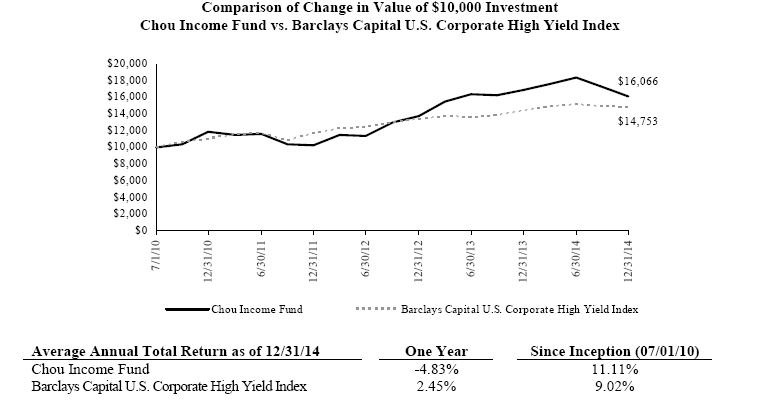
Performance data quoted represents past performance and is no guarantee of future results. Current performance may be lower or higher than the performance data quoted. Investment return and principal value will fluctuate so that shares, when redeemed, may be worth more or less than original cost. For the most recent month-end performance, please call (877) 682-6352. Shares redeemed or exchanged within 120 days of purchase will be charged a 2.00% redemption fee. As stated in the Fund’s current prospectus, the annual operating expense ratio (gross) is 3.41%. However, the Fund’s adviser has contractually agreed to reduce a portion of its fees and reimburse expenses to limit total operating expenses to 1.50% (excluding other expenses, taxes, leverage interest, acquired fund fees and expenses, dividends or interest on short positions, other interest expenses, brokerage commissions, and extraordinary expenses such as litigation), through May 1, 2015. During the period, certain fees were waived and/or expenses reimbursed; otherwise, returns would have been lower. The performance table and graph do not reflect the deduction of taxes that a shareholder would pay on Fund distributions or the redemption of Fund shares. Returns greater than one year are annualized.
CHOU OPPORTUNITY FUND SCHEDULE OF INVESTMENTS DECEMBER 31, 2014 |
| Shares | | Security Description | | Value | |
| Common Stock - 45.4% |
| Communications - 1.8% |
| | 15,000 | | Overstock.com, Inc. (a) | $ | 364,050 | |
| | 519,507 | | UTStarcom Holdings Corp. (a) | | 1,470,205 | |
| | | 1,834,255 | |
| Consumer Discretionary - 14.5% |
| | 37,904 | | Sears Canada, Inc. (a) | | 364,257 | |
| | 348,167 | | Sears Holdings Corp. (a) | | 11,482,548 | |
| | 197,013 | | Sears Hometown and Outlet Stores, Inc. (a) | | 2,590,721 | |
| | | 14,437,526 | |
| Consumer Staples - 2.5% |
| | 46,501 | | Ascent Capital Group, Inc., Class A (a) | | 2,461,298 | |
| | | | |
| Financials - 3.5% |
| | 157,480 | | Asta Funding, Inc. (a) | | 1,377,950 | |
| | 225,000 | | MBIA, Inc. (a) | | 2,146,500 | |
| | | 3,524,450 | |
| Industrials - 4.0% |
| | 95,000 | | Chicago Bridge & Iron Co. NV | | 3,988,100 | |
| Materials - 19.1% |
| | 1,081,940 | | Resolute Forest Products, Inc. (a) | | 19,052,963 | |
Total Common Stock (Cost $39,408,427) | | 45,298,592 | |
| Warrants - 13.4% | | Exer. Price | | Exp. Date | |
| | 377,430 | | Bank of America Corp. (a) | $ | 13.30 | | 1/19 | | 2,657,107 | |
| | 350,000 | | General Motors Co. (a) | | 18.33 | | 7/19 | | 5,995,500 | |
| | 150,000 | | JPMorgan Chase & Co. (a) | | 42.39 | | 10/18 | | 3,120,000 | |
| | 77,400 | | Wells Fargo & Co. (a) | | 34.01 | | 10/18 | | 1,653,264 | |
Total Warrants (Cost $7,917,546) | | 13,425,871 | |
Total Investments - 58.8% (Cost $47,325,973)* | $ | 58,724,463 | |
| Other Assets & Liabilities, Net – 41.2% | | 41,074,152 | |
| Net Assets – 100.0% | $ | 99,798,615 | |
| (a) | Non-income producing security. |
| | * Cost for federal income tax purposes is $47,456,453 and net unrealized appreciation consists of: |
| Gross Unrealized Appreciation | | $ | 13,385,532 | |
| Gross Unrealized Depreciation | | | (2,117,522 | ) |
| Net Unrealized Appreciation | | $ | 11,268,010 | |
The inputs or methodology used for valuing securities are not necessarily an indication of the risks associated with investing in those securities. For more information on valuation inputs, and their aggregation into the levels used in the table below, please refer to the Security Valuation section in Note 2 of the accompanying Notes to Financial Statements.
The following is a summary of the inputs used to value the Fund’s investments as of December 31, 2014.
| Valuation Inputs | | Investments in Securities | |
| Level 1 - Quoted Prices | | $ | 58,724,463 | | |
| Level 2 - Other Significant Observable Inputs | | | - | | |
| Level 3 - Significant Unobservable Inputs | | | - | | |
| Total | | $ | 58,724,463 | | |
The Level 1 value displayed in this table is Common Stock and Warrants. Refer to this Schedule of Investments for a further breakout of each security by type.
The Fund utilizes the end of period methodology when determining transfers. There were no transfers among Level 1, Level 2 and Level 3 for the year ended December 31, 2014.
| PORTFOLIO HOLDINGS | | |
| % of Total Investments | | |
| Communications | 3.1 | % |
| Consumer Discretionary | 24.6 | % |
| Consumer Staples | 4.2 | % |
| Financials | 6.0 | % |
| Industrials | 6.8 | % |
| Materials | 32.4 | % |
| Warrants | 22.9 | % |
| | 100.0 | % |
| See Notes to Financial Statements. | 12 | |
CHOU INCOME FUND SCHEDULE OF INVESTMENTS DECEMBER 31, 2014 |
| Shares | | Security Description | | Value | |
| Equity Securities - 6.0% |
| Common Stock - 4.9% |
| Materials - 4.9% |
| | 5,369 | | Centrus Energy Corp., Class A (a) | $ | 23,086 | |
| | 47,613 | | Resolute Forest Products, Inc. (a) | | 838,465 | |
Total Common Stock (Cost $251,821) | | 861,551 | |
| | 13,305 | | Sears Roebuck Acceptance Corp. | | 7.00 | % | | | 159,765 | |
| | 3,400 | | Sears Roebuck Acceptance Corp. | | 7.40 | | | | 41,731 | |
Total Preferred Stock (Cost $207,682) | | 201,496 | |
Total Equity Securities (Cost $459,503) | | 1,063,047 | |
| | Principal | | Security Description | | Rate | | Maturity | | Value | |
| Fixed Income Securities - 65.3% |
| Corporate Convertible Bonds - 33.2% |
| Communications - 16.2% |
| $ | 3,000,000 | | Rainmaker Entertainment, Inc. | | 8.00 | | 03/31/16 | $ | 2,840,420 | |
| Consumer Staples - 14.2% |
| | 3,000,000 | | Ascent Capital Group, Inc. | | 4.00 | | 07/15/20 | | 2,480,625 | |
| Financials - 2.0% |
| | 850,000 | | Atlanticus Holdings Corp. | | 5.88 | | 11/30/35 | | 355,938 | |
| Materials - 0.8% |
| | 283,000 | | Fortress Paper, Ltd. | | 6.50 | | 12/31/16 | | 132,755 | |
Total Corporate Convertible Bonds (Cost $5,839,000) | | 5,809,738 | |
| | Principal | | Security Description | | Rate | | Maturity | | Value | |
| Corporate Non-Convertible Bonds – 25.9% |
| | 49,169 | | Dex Media, Inc. (b) | | 12.00 | % | 01/29/17 | $ | 21,880 | |
| Consumer Discretionary - 3.7% |
| | 663,000 | | JC Penney Corp., Inc. | | 7.95 | | 04/01/17 | | 646,425 | |
| | 1,000,000 | | Avangardco Investments Public, Ltd. | | 10.00 | | 10/29/15 | | 640,000 | |
| | 1,000,000 | | Mriya Agro Holding PLC (c)(d) | | 9.45 | | 04/19/18 | | 125,000 | |
| | 4,700,000 | | Ukrlandfarming PLC (c) | | 10.88 | | 03/26/18 | | 2,256,000 | |
| | 212,000 | | Sears Roebuck Acceptance Corp. | | 7.00 | | 06/01/32 | | 119,250 | |
| | 1,150,943 | | Centrus Energy Corp. | | 8.00 | | 09/30/19 | | 604,245 | |
| | 135,179 | | Emerald Plantation Holdings, Ltd. (b) | | 6.00 | | 01/30/20 | | 117,741 | |
| | 225,000 | | Sino-Forest Corp. (d) | | 6.25 | | 10/21/17 | | 844 | |
| | 400,000 | | Sino-Forest Corp. (d) | | 6.25 | | 10/21/17 | | 1,500 | |
Total Corporate Non-Convertible Bonds (Cost $7,216,792) | | 4,532,885 | |
| | 237,933 | | Dex Media West, Inc. (e) | | 8.00 | | 12/31/16 | | 209,282 | |
| | 1,237,036 | | RH Donnelley, Inc. (e) | | 9.75 | | 12/31/16 | | 893,758 | |
Total Syndicated Loans (Cost $1,423,381) | | 1,103,040 | |
See Notes to Financial Statements. | 13 | |
CHOU INCOME FUND SCHEDULE OF INVESTMENTS DECEMBER 31, 2014 |
| | | | | Value | |
Total Fixed Income Securities (Cost $14,479,173) | $ | 11,445,663 | |
Total Investments - 71.4% (Cost $14,938,676)* | $ | 12,508,710 | |
| Other Assets & Liabilities, Net – 28.6% | | 5,016,969 | |
| Net Assets – 100.0% | $ | 17,525,679 | |
| LLC | Limited Liability Company |
| PLC | Public Limited Company |
| (a) | Non-income producing security. |
| (b) | Payment in-Kind Bond. Security that gives the issuer the option at each interest payment date of making interest payments in either cash or additional debt securities. |
| (c) | Security exempt from registration under Rule 144A under the Securities Act of 1933. At the period end, the value of these securities amounted to $2,381,000 or 13.6% of net assets. |
| (d) | Security is currently in default and is on scheduled interest or principal payment. |
| (e) | Variable rate security. Rate presented is as of December 31, 2014. |
| | * Cost for federal income tax purposes is $15,240,148 and net unrealized depreciation consists of: |
| Gross Unrealized Appreciation | | $ | 1,067,280 | |
| Gross Unrealized Depreciation | | | (3,798,718 | ) |
| Net Unrealized Depreciation | | $ | (2,731,438 | ) |
The inputs or methodology used for valuing securities are not necessarily an indication of the risks associated with investing in those securities. For more information on valuation inputs, and their aggregation into the levels used in the table below, please refer to the Security Valuation section in Note 2 of the accompanying Notes to Financial Statements.
The following is a summary of the inputs used to value the Fund’s investments as of December 31, 2014.
| | Level 1 | | Level 2 | | Level 3 | | Total |
| Investments At Value |
| Common Stock | | $ | 861,551 | | | $ | - | | | $ | - | | | $ | 861,551 | |
| Preferred Stock | | | - | | | | 201,496 | | | | - | | | | 201,496 | |
| Corporate Convertible Bonds | | | - | | | | 5,809,738 | | | | - | | | | 5,809,738 | |
| Corporate Non-Convertible Bonds | | | - | | | | 4,532,885 | | | | - | | | | 4,532,885 | |
| Syndicated Loans | | | - | | | | 1,103,040 | | | | - | | | | 1,103,040 | |
| Total Investments At Value | | $ | 861,551 | | | $ | 11,647,159 | | | $ | - | | | $ | 12,508,710 | |
The Fund utilizes the end of period methodology when determining transfers. There were no transfers among Level 1, Level 2 and Level 3 for the year ended December 31, 2014.
AFA
| PORTFOLIO HOLDINGS | | |
| % of Total Investments | | |
| Common Stock | 6.9 | % |
| Preferred Stock | 1.6 | % |
| Corporate Convertible Bonds | 46.4 | % |
| Corporate Non-Convertible Bonds | 36.3 | % |
| Syndicated Loans | 8.8 | % |
| | 100.0 | % |
See Notes to Financial Statements. | 14 | |
CHOU AMERICA MUTUAL FUNDS STATEMENTS OF ASSETS AND LIABILITIES DECEMBER 31, 2014 |
| | | | | CHOU OPPORTUNITY FUND | | CHOU INCOME FUND |
| ASSETS | | | | | | | | |
| | Total investments, at value (Cost $47,325,973 and $14,938,676, respectively) | $ | 58,724,463 | | | $ | 12,508,710 | |
| | Cash | | | 41,183,511 | | | | 4,594,421 | |
| | Foreign currency (Cost $0 and $140,138, respectively) | | | - | | | | 135,269 | |
| | Receivables: | | | | | | | | |
| | | Fund shares sold | | | - | | | | 5,000 | |
| | | Dividends and interest | | | 12,237 | | | | 353,306 | |
| | Prepaid expenses | | | 8,949 | | | | 8,044 | |
| Total Assets | | | 99,929,160 | | | | 17,604,750 | |
| | | | | | | | | | | |
| LIABILITIES | | | | | | | | |
| | Payables: | | | | | | | | |
| | | Fund shares redeemed | | | - | | | | 41,989 | |
| | Accrued Liabilities: | | | | | | | | |
| | Investment adviser fees | | | 83,469 | | | | 3,028 | |
| | | Trustees’ fees and expenses | | | 254 | | | | 46 | |
| | | Fund services fees | | | 17,282 | | | | 7,206 | |
| | | Other expenses | | | 29,540 | | | | 26,802 | |
| Total Liabilities | | | 130,545 | | | | 79,071 | |
| | | | | | | | | | | |
| NET ASSETS | | $ | 99,798,615 | | | $ | 17,525,679 | |
| | | | | | | | | | | |
| COMPONENTS OF NET ASSETS | | | | | | | | |
| | Paid-in capital | | $ | 87,555,124 | | | $ | 20,137,031 | |
| | Distributions in excess of net investment income | | | - | | | | (275,959 | ) |
| | Accumulated net realized gain | | | 845,001 | | | | 99,457 | |
| | Net unrealized appreciation (depreciation) | | | 11,398,490 | | | | (2,434,850 | ) |
| NET ASSETS | | $ | 99,798,615 | | | $ | 17,525,679 | |
| SHARES OF BENEFICIAL INTEREST AT NO PAR VALUE (UNLIMITED SHARES AUTHORIZED) | | | 7,277,598 | | | | 1,794,287 | |
NET ASSET VALUE, OFFERING AND REDEMPTION PRICE PER SHARE* | | $ | 13.71 | | | $ | 9.77 | |
| | | |
| * | Shares redeemed or exchanged wtihin 120 days of purchase are charged a 2.00% redemption fee. | |
See Notes to Financial Statements. | 15 | |
CHOU AMERICA MUTUAL FUNDS STATEMENTS OF OPERATIONS YEAR ENDED DECEMBER 31, 2014 |
| | | | | CHOU OPPORTUNITY FUND | | CHOU INCOME FUND | |
| INVESTMENT INCOME | | | | | | | | | |
| | Dividend income | | $ | 6,650 | | | $ | 31,895 | | |
| | Interest income | | | 43,582 | | | | 1,080,821 | | |
| Total Investment Income | | | 50,232 | | | | 1,112,716 | | |
| | | | | | | | | | |
| EXPENSES | | | | | | | | | |
| | Investment adviser fees | | | 783,263 | | | | 185,973 | | |
| | Fund services fees | | | 184,584 | | | | 88,265 | | |
| | Custodian fees | | | 10,263 | | | | 10,036 | | |
| | Registration fees | | | 26,346 | | | | 23,145 | | |
| | Audit fees | | | 17,000 | | | | 17,000 | | |
| | Legal fees | | | 18,510 | | | | 28,656 | | |
| | Trustees' fees and expenses | | | 8,545 | | | | 8,125 | | |
| | Miscellaneous expenses | | | 44,770 | | | | 30,838 | | |
| Total Expenses | | | 1,093,281 | | | | 392,038 | | |
| | Fees waived and expenses reimbursed | | | (13,734 | ) | | | (113,079 | ) | |
| Net Expenses | | | 1,079,547 | | | | 278,959 | | |
| | | | | | | | | | | | |
| NET INVESTMENT INCOME (LOSS) | | | (1,029,315 | ) | | | 833,757 | | |
| | | | | | | | | | | | |
| NET REALIZED AND UNREALIZED GAIN (LOSS) | | | | | | | | | |
| | Net realized gain (loss) on: | | | | | | | | | |
| | Investments | | | 3,814,264 | | | | 546,316 | | |
| | Foreign currency transactions | | | - | | | | (283 | ) | |
| | Written options | | | 386,629 | | | | - | | |
| | Net realized gain | | | 4,200,893 | | | | 546,033 | | |
| | Net change in unrealized appreciation (depreciation) on: | | | | | | | | | |
| | Investments | | | 1,935,968 | | | | (2,481,009 | ) | |
| | Foreign currency translations | | | - | | | | (4,938 | ) | |
| | Net change in unrealized appreciation (depreciation) | | | 1,935,968 | | | | (2,485,947 | ) | |
| NET REALIZED AND UNREALIZED GAIN (LOSS) | | | 6,136,861 | | | | (1,939,914 | ) | |
| INCREASE (DECREASE) IN NET ASSETS RESULTING FROM OPERATIONS | | $ | 5,107,546 | | | $ | (1,106,157 | ) | |
| | | | | | | | | | | | |
See Notes to Financial Statements. | 16 | |
CHOU AMERICA MUTUAL FUNDS STATEMENTS OF CHANGES IN NET ASSETS |
| | | | | CHOU OPPORTUNITY FUND | | CHOU INCOME FUND | |
| | | | | | | | | | Shares | | | | | | | | Shares | | |
| NET ASSETS DECEMBER 31, 2012 | | $ | 41,131,620 | | | | | | | $ | 6,727,951 | | | | | | |
| OPERATIONS | | | | | | | | | | | | | | | | | |
| | Net investment income | | | 205,434 | | | | | | | | 635,055 | | | | | | |
| | Net realized gain | | | 8,526,042 | | | | | | | | 33,138 | | | | | | |
| | Net change in unrealized appreciation (depreciation) | | | 5,755,830 | | | | | | | | 655,318 | | | | | | |
| Increase in Net Assets Resulting from Operations | | | 14,487,306 | | | | | | | | 1,323,511 | | | | | | |
| DISTRIBUTIONS TO SHAREHOLDERS FROM | | | | | | | | | | | | | | |
| | Net investment income | | | (839,533 | ) | | | | | | | (685,760 | ) | | | | | |
| | Net realized gain | | | (4,918,742 | ) | | | | | | | - | | | | | | |
| Total Distributions to Shareholders | | | (5,758,275 | ) | | | | | | | (685,760 | ) | | | | | |
| CAPITAL SHARE TRANSACTIONS | | | | | | | | | | | | | | | | | |
| | Sale of shares | | | 21,081,797 | | | | 1,693,658 | | | | 12,006,109 | | | | 1,077,027 | | |
| | Reinvestment of distributions | | | 5,704,186 | | | | 425,411 | | | | 669,365 | | | | 60,310 | | |
| | Redemption of shares | | | (10,356,772 | ) | | | (810,644 | ) | | | (5,319,510 | ) | | | (483,715 | ) | |
| | Redemption fees | | | 112,362 | | | | | | | | 15,191 | | | | | | |
| Increase in Net Assets from Capital Share Transactions | | | 16,541,573 | | | | 1,308,425 | | | | 7,371,155 | | | | 653,622 | | |
| Increase in Net Assets | | | 25,270,604 | | | | | | | | 8,008,906 | | | | | | |
| NET ASSETS DECEMBER 31, 2013 | | $ | 66,402,224 | | | | | | | $ | 14,736,857 | | | | | | |
| OPERATIONS | | | | | | | | | | | | | | | | | |
| | Net investment income (loss) | | | (1,029,315 | ) | | | | | | | 833,757 | | | | | | |
| | Net realized gain | | | 4,200,893 | | | | | | | | 546,033 | | | | | | |
| | Net change in unrealized appreciation (depreciation) | | | 1,935,968 | | | | | | | | (2,485,947 | ) | | | | | |
| Increase (Decrease) in Net Assets Resulting from Operations | | | 5,107,546 | | | | | | | | (1,106,157 | ) | | | | | |
| DISTRIBUTIONS TO SHAREHOLDERS FROM | | | | | | | | | | | | | | |
| | Net investment income | | | - | | | | | | | | (912,881 | ) | | | | | |
| | Net realized gain | | | (3,311,304 | ) | | | | | | | (421,424 | ) | | | | | |
| Total Distributions to Shareholders | | | (3,311,304 | ) | | | | | | | (1,334,305 | ) | | | | | |
| CAPITAL SHARE TRANSACTIONS | | | | | | | | | | | | | | | | | |
| | Sale of shares | | | 33,002,798 | | | | 2,471,099 | | | | 6,760,299 | | | | 586,420 | | |
| | Reinvestment of distributions | | | 3,285,259 | | | | 239,102 | | | | 1,313,807 | | | | 127,121 | | |
| | Redemption of shares | | | (4,688,450 | ) | | | (344,984 | ) | | | (2,851,655 | ) | | | (254,498 | ) | |
| | Redemption fees | | | 542 | | | | | | | | 6,833 | | | | | | |
| Increase in Net Assets from Capital Share Transactions | | | 31,600,149 | | | | 2,365,217 | | | | 5,229,284 | | | | 459,043 | | |
| Increase in Net Assets | | | 33,396,391 | | | | | | | | 2,788,822 | | | | | | |
| NET ASSETS DECEMBER 31, 2014 | | $ | 99,798,615 | | | | | | | $ | 17,525,679 | | | | | | |
| (a) | Distributions in excess of net investment income December 31, 2013 | | $ | - | | | | | | | $ | (196,542 | ) | | | | | |
| (a) | Distributions in excess of net investment income December 31, 2014 | | $ | - | | | | | | | $ | (275,959 | ) | | | | | |
See Notes to Financial Statements. | 17 | |
CHOU OPPORTUNITY FUND FINANCIAL HIGHLIGHTS |
| These financial highlights reflect selected data for a share outstanding throughout each period. | | | | | | |
| | | For the Years Ended December 31, | | July 1, 2010 (a) through | | |
| | | 2014 | | | | 2013 | | | | 2012 | | | | 2011 | | | December 31, 2010 | |
| NET ASSET VALUE, Beginning of Period | $ | 13.52 | | | $ | 11.41 | | | $ | 10.00 | | | $ | 12.20 | | | $ | 10.00 | | |
| INVESTMENT OPERATIONS | | | | | | | | | | | | | | | | | | | | |
| Net investment income (loss) (b) | | (0.18 | ) | | | 0.05 | | | | 0.32 | | | | 0.02 | | | | (0.09 | ) | |
| Net realized and unrealized gain (loss) | | 0.84 | | | | 3.31 | | | | 2.68 | | | | (2.19 | ) | | | 2.29 | | |
| Total from Investment Operations | | 0.66 | | | | 3.36 | | | | 3.00 | | | | (2.17 | ) | | | 2.20 | | |
| DISTRIBUTIONS TO SHAREHOLDERS FROM | | | | | | | | | | | | | | | |
| Net investment income | | — | | | | (0.19 | ) | | | (0.40 | ) | | | (0.01 | ) | | | — | | |
| Net realized gain | | (0.47 | ) | | | (1.09 | ) | | | (1.19 | ) | | | (0.02 | ) | | | — | | |
| Total Distributions to Shareholders | | (0.47 | ) | | | (1.28 | ) | | | (1.59 | ) | | | (0.03 | ) | | | — | | |
| REDEMPTION FEES (b) | | — | (c) | | 0.03 | | | | — | (c) | | — | (c) | | — | | |
| NET ASSET VALUE, End of Period | $ | 13.71 | | | $ | 13.52 | | | $ | 11.41 | | | $ | 10.00 | | | $ | 12.20 | | |
| TOTAL RETURN | | 4.88 | % | | 29.82 | % | | 30.81 | % | | (17.78 | )% | | 22.00 | %(d) | |
| RATIOS/SUPPLEMENTARY DATA | | | | | | | | | | | | | | | | | | | | | |
| Net Assets at End of Period (000's omitted) | $99,799 | | | $66,402 | | | $41,132 | | | $56,724 | | | $1,039 | | | |
| Ratios to Average Net Assets: | | | | | | | | | | | | | | | | | | | | | |
| Net investment income (loss) | | (1.31 | )% | | 0.34 | % | | 2.89 | % | | 0.15 | % | | (1.60 | )%(e) | |
| Net expenses | | 1.38 | % | | 1.48 | % | | 1.48 | % | | 1.53 | % | | 1.75 | %(e) | |
| Gross expenses (f) | | 1.40 | % | | 1.50 | % | | 1.55 | % | | 1.93 | % | | 28.58 | %(e) | |
| PORTFOLIO TURNOVER RATE | | 29 | % | | 56 | % | | 17 | % | | 11 | % | | 33 | %(d) | |
| | | | | | | | | | | | | | | | | | | | | | | |
| (a) | Commencement of operations. | |
| (b) | Calculated based on average shares outstanding during each period. | |
| (c) | Less than $0.01 per share. | |
| (d) | Not annualized. | |
| (e) | Annualized. | |
| (f) | Reflects the expense ratio excluding any waivers and/or reimbursements. | |
See Notes to Financial Statements. | 18 | |
CHOU INCOME FUND FINANCIAL HIGHLIGHTS |
| These financial highlights reflect selected data for a share outstanding throughout each period. | | | | | | |
| | | For the Years Ended December 31, | | July 1, 2010 (a) through | |
| | | 2014 | | | | 2013 | | | | 2012 | | | | 2011 | | | December 31, 2010 | |
| NET ASSET VALUE, Beginning of Period | $ | 11.04 | | | $ | 9.87 | | | $ | 8.74 | | | $ | 11.60 | | | $ | 10.00 | | |
| INVESTMENT OPERATIONS | | | | | | | | | | | | | | | | | | | | |
| Net investment income (b) | | 0.51 | | | | 0.94 | | | | 1.58 | | | | 1.30 | | | | 0.20 | | |
| Net realized and unrealized gain (loss) | | (1.01 | ) | | | 1.28 | | | | 1.27 | | | | (2.86 | ) | | | 1.65 | | |
| Total from Investment Operations | | (0.50 | ) | | | 2.22 | | | | 2.85 | | | | (1.56 | ) | | | 1.85 | | |
| DISTRIBUTIONS TO SHAREHOLDERS FROM | | | | | | | | | | | | | | | |
| Net investment income | | (0.52 | ) | | | (1.07 | ) | | | (1.72 | ) | | | (1.27 | ) | | | (0.25 | ) | |
| Net realized gain | | (0.25 | ) | | | — | | | | — | (c) | | (0.03 | ) | | | — | | |
| Total Distributions to Shareholders | | (0.77 | ) | | | (1.07 | ) | | | (1.72 | ) | | | (1.30 | ) | | | (0.25 | ) | |
| REDEMPTION FEES (b) | | — | (c) | | 0.02 | | | | — | | | | — | (c) | | — | | |
| NET ASSET VALUE, End of Period | $ | 9.77 | | | $ | 11.04 | | | $ | 9.87 | | | $ | 8.74 | | | $ | 11.60 | | |
| TOTAL RETURN | | (4.83 | )% | | 22.86 | % | | 34.69 | % | | (13.83 | )% | | 18.54 | %(d) |
| RATIOS/SUPPLEMENTARY DATA | | | | | | | | | | | | | | | | | | | | |
| Net Assets at End of Period (000's omitted) | $17,526 | | | $14,737 | | | $6,728 | | | $5,051 | | | $766 | | |
| Ratios to Average Net Assets | | | | | | | | | | | | | | | | | | | | |
| Net investment income | | 4.48 | % | | 8.39 | % | | 16.25 | % | | 12.24 | % | | 3.82 | %(e) |
| Net expenses | | 1.50 | % | | 1.50 | % | | 1.50 | % | | 1.50 | % | | 1.50 | %(e) |
| Gross expenses (f) | | 2.11 | % | | 3.41 | % | | 4.09 | % | | 4.71 | % | | 33.37 | %(e) |
| PORTFOLIO TURNOVER RATE | | 17 | % | | 40 | % | | 23 | % | | 17 | % | | 0 | %(d) |
| | | | | | | | | | | | | | | | | | | | | | |
| (a) | Commencement of operations. |
| (b) | Calculated based on average shares outstanding during each period. |
| (c) | Less than $0.01 per share. |
| (d) | Not annualized. |
| (e) | Annualized. |
| (f) | Reflects the expense ratio excluding any waivers and/or reimbursements. |
See Notes to Financial Statements. | 19 | |
CHOU AMERICA MUTUAL FUNDS NOTES TO FINANCIAL STATEMENTS DECEMBER 31, 2014 |
Note 1. Organization
The Chou Opportunity Fund and Chou Income Fund (individually, a “Fund” and, collectively the “Funds”) are non-diversified portfolios of Chou America Mutual Funds (the “Trust”). The Trust is a Delaware statutory trust that is registered as an open-end, management investment company under the Investment Company Act of 1940 (the “Act”), as amended. Under its Trust Instrument, the Trust is authorized to issue an unlimited number of each Fund’s shares of beneficial interest without par value. Chou Opportunity Fund’s investment objective is to seek long-term growth of capital. Chou Income Fund’s investment objective is to provide capital appreciation and income production with capital preservation as a secondary consideration. The Funds commenced operations on July 1, 2010, with the sale of 50,000 shares of each Fund at $10 per share to Chou Associates Management Inc.
Note 2. Summary of Significant Accounting Policies
These financial statements are prepared in accordance with accounting principles generally accepted in the United States of America (“GAAP”), which require management to make estimates and assumptions that affect the reported amounts of assets and liabilities, the disclosure of contingent liabilities at the date of the financial statements, and the reported amounts of increases and decreases in net assets from operations during the fiscal year. Actual amounts could differ from those estimates. The following summarizes the significant accounting policies of each Fund:
Security Valuation – Exchange-traded securities and over-the-counter securities are valued using the last quoted trade or official closing price, provided by independent pricing services as of the close of trading on the market or exchange for which they are primarily traded, on each Fund business day. In the absence of a sale, such securities are valued at the mean of the last bid and ask price provided by independent pricing services. Non-exchange traded securities for which quotations are available are valued using the last quoted sales price, or in the absence of a sale, at the mean of the last bid and ask prices provided by independent pricing services. Debt securities may be valued at prices supplied by a fund’s pricing agent based on broker or dealer supplied valuations or matrix pricing, a method of valuing securities by reference to the value of other securities with similar characteristics such as rating, interest rate and maturity. Exchange-traded options for which there were no sales reported that day are generally valued at the mean of the last bid and ask prices. Options not traded on an exchange are generally valued at broker-dealer bid quotations. Short-term investments that mature in 60 days or less may be valued at amortized cost.
Each Fund values its investments at fair value pursuant to procedures adopted by the Trust's Board of Trustees (the "Board") if (1) market quotations are insufficient or not readily available or (2) the adviser believes that the values available are unreliable. The Trust’s Valuation Committee, as defined in each Fund’s registration statement, performs certain functions as they relate to the administration and oversight of each Fund’s valuation procedures. Under these procedures, the Valuation Committee convenes on a regular and ad-hoc basis to review such investments and considers a number of factors, including valuation methodologies and significant unobservable inputs, when arriving at fair value.
The Valuation Committee may work with the adviser to provide valuation inputs. In determining fair valuations, inputs may include market-based analytics which may consider related or comparable assets or liabilities, recent transactions, market multiples, book values and other relevant investment information. Adviser inputs may include an income-based approach in which the anticipated future cash flows of the investment are discounted in determining fair value. Discounts may also be applied based on the nature or duration of any restrictions on the disposition of the investments. The Valuation Committee performs regular reviews of valuation methodologies, key inputs and assumptions, disposition analysis and market activity.
Fair valuation is based on subjective factors and, as a result, the fair value price of an investment may differ from the security’s market price and may not be the price at which the asset may be sold. Fair valuation could result in a
CHOU AMERICA MUTUAL FUNDS NOTES TO FINANCIAL STATEMENTS DECEMBER 31, 2014 |
different Net Asset Value ("NAV") than a NAV determined by using market quotes.
Each Fund has a three-tier fair value hierarchy. The basis of the tiers is dependent upon the various “inputs” used to determine the value of each Fund’s investments. These inputs are summarized in the three broad levels listed below:
Level 1 — quoted prices in active markets for identical assets and liabilities
Level 2 — other significant observable inputs (including quoted prices of similar securities, interest rates, prepayment speeds, credit risk, etc.)
Level 3 — significant unobservable inputs (including each Fund’s own assumptions in determining the fair value of investments)
The aggregate value by input level, as of December 31, 2014, for each Fund’s investments is included at the end of each Fund’s Schedule of Investments.
Security Transactions, Investment Income and Realized Gain and Loss – Investment transactions are accounted for on the trade date. Dividend income is recorded on the ex-dividend date. Foreign dividend income is recorded on the ex-dividend date or as soon as possible after each Fund determines the existence of a dividend declaration after exercising reasonable due diligence. Income and capital gains on some foreign securities may be subject to foreign withholding taxes, which are accrued as applicable. Interest income is recorded on an accrual basis. Premium is amortized and discount is accreted using the effective interest method. Identified cost of investments sold is used to determine the gain and loss for both financial statement and federal income tax purposes.
Foreign Currency Transactions – Each Fund may enter into transactions to purchase or sell foreign currency contracts and options on foreign currency. Forward currency contracts are agreements to exchange one currency for another at a future date and at a specified price. A fund may use forward currency contracts to facilitate transactions in foreign securities, to manage a fund’s foreign currency exposure and to protect the U.S. dollar value of its underlying portfolio securities against the effect of possible adverse movements in foreign exchange rates. These contracts are intrinsically valued daily based on forward rates, and a fund’s net equity therein, representing unrealized gain or loss on the contracts as measured by the difference between the forward foreign exchange rates at the dates of entry into the contracts and the forward rates at the reporting date, is recorded as a component of net asset value. These instruments involve market risk, credit risk, or both kinds of risks, in excess of the amount recognized in the Statement of Assets and Liabilities. Risks arise from the possible inability of counterparties to meet the terms of their contracts and from movement in currency and securities values and interest rates. Due to the risks associated with these transactions, a fund could incur losses up to the entire contract amount, which may exceed the net unrealized value included in its net asset value.
Written Options – When a fund writes an option, an amount equal to the premium received by the fund is recorded as a liability and is subsequently adjusted to the current value of the option written. Premiums received from writing options that expire unexercised are treated by the fund on the expiration date as realized gain from written options. The difference between the premium and the amount paid on effecting a closing purchase transaction, including brokerage commissions, is also treated as a realized gain, or if the premium is less than the amount paid for the closing purchase transaction, as a realized loss. If a call option is exercised, the premium is added to the proceeds from the sale of the underlying security in determining whether the fund has realized a gain or loss. If a put option is exercised, the premium reduces the cost basis of the securities purchased by the fund. The fund, as writer of an option, bears the market risk of an unfavorable change in the price of the security underlying the written option. Written options are non-income producing securities.
Transactions in written options during the period ended December 31, 2014, were as follows:
CHOU AMERICA MUTUAL FUNDS NOTES TO FINANCIAL STATEMENTS DECEMBER 31, 2014 |
| Chou Opportunity Fund | Calls |
| | Number of Contracts | | Premiums |
| Options Outstanding, December 31, 2013 | - | | $ | - |
| Options written | (3,250) | | | (386,629) |
| Options terminated in closing transactions | - | | | - |
| Options exercised | - | | | - |
| Options expired | 3,250 | | | 386,629 |
| Options Outstanding, December 31, 2014 | - | | | - |
Distributions to Shareholders – Distributions to shareholders of net investment income, if any, are declared and paid at least semi-annually. Distributions to shareholders of net capital gains, if any, are declared and paid annually. Distributions to shareholders are recorded on the ex-dividend date. Distributions are based on amounts calculated in accordance with applicable federal income tax regulations, which may differ from GAAP. These differences are due primarily to differing treatments of income and gain on various investment securities held by each Fund, timing differences and differing characterizations of distributions made by each Fund.
Federal Taxes – Each Fund intends to qualify each year as a regulated investment company under Subchapter M of the Internal Revenue Code and to distribute all of their taxable income to shareholders. In addition, by distributing in each calendar year substantially all of their net investment income and capital gains, if any, the Funds will not be subject to a federal excise tax. Therefore, no federal income or excise tax provision is required. Each Fund files a U.S. federal income and excise tax return as required. A fund’s federal income tax returns are subject to examination by the Internal Revenue Service for a period of three fiscal years after they are filed. As of December 31, 2014, there are no uncertain tax positions that would require financial statement recognition, de-recognition, or disclosure.
Income and Expense Allocation – The Trust accounts separately for the assets, liabilities and operations of each of its investment portfolios. Expenses that are directly attributable to more than one investment portfolio are allocated among the respective investment portfolios in an equitable manner.
Redemption Fees – A shareholder who redeems or exchanges shares within 120 days of purchase will incur a redemption fee of 2.00% of the current net asset value of shares redeemed or exchanged, subject to certain limitations. The fee is charged for the benefit of the remaining shareholders and will be paid to each Fund to help offset transaction costs. The fee is accounted for as an addition to paid-in capital. Each Fund reserves the right to modify the terms of or terminate the fee at any time. There are limited exceptions to the imposition of the redemption fee.
Commitments and Contingencies – In the normal course of business, each Fund enters into contracts that provide general indemnifications by each Fund to the counterparty to the contract. Each Fund’s maximum exposure under these arrangements is dependent on future claims that may be made against each Fund and, therefore, cannot be estimated; however, based on experience, the risk of loss from such claims is considered remote.
Note 3. Cash – Concentration in Uninsured Account
For cash management purposes each Fund may concentrate cash with each Fund’s custodian. This typically results in cash balances exceeding the Federal Deposit Insurance Corporation (“FDIC”) insurance limits. As of December 31, 2014, Chou Opportunity Fund and Chou Income Fund held $40,933,511 and $4,344,421 respectively as cash reserves at MUFG Union Bank, N.A. that exceeded the FDIC insurance limit.
CHOU AMERICA MUTUAL FUNDS NOTES TO FINANCIAL STATEMENTS DECEMBER 31, 2014 |
Note 4. Fees and Expenses
Investment Adviser – Chou America Management Inc. (the “Adviser”) is the investment adviser to each Fund. Pursuant to an investment advisory agreement, the Adviser receives an advisory fee from each Fund at an annual rate of 1.00% of each Fund’s average daily net assets.
Distribution – Rafferty Capital Markets, LLC serves as each Fund’s distributor (the “Distributor”). The Trust has adopted a Rule 12b-1 plan under which the Funds may pay an annual fee of up to 0.25% of the average daily net assets of the Funds for distribution services and/or the servicing of shareholder accounts. The Board has not authorized the Funds to pay a Rule 12b-1 fee at this time. The Distributor is not affiliated with the Adviser or Atlantic Fund Administration, LLC (d/b/a Atlantic Fund Services) (“Atlantic”) or their affiliates.
Other Service Providers – Atlantic provides fund accounting, fund administration, compliance and transfer agency services to each Fund. Atlantic also provides certain shareholder report production, and EDGAR conversion and filing services. Pursuant to an Atlantic services agreement, each Fund pays Atlantic customary fees for its services. Atlantic provides a Principal Financial Officer, a Chief Compliance Officer, and an Anti-Money Laundering Officer to each Fund, as well as certain additional compliance support functions.
Trustees and Officers – The Trust pays each Trustee an annual retainer fee of $8,000 for service to the Trust. Each Trustee is also reimbursed for all reasonable out-of-pocket expenses incurred in connection with their duties as a Trustee, including travel and related expenses incurred in attending Board meetings. No officers of the Funds are compensated by the Funds, but officers are reimbursed for travel and related expenses incurred in attending Board meetings.
Note 5. Expense Reimbursements and Fees Waived
The Adviser has contractually agreed to waive a portion of its fee and reimburse certain expenses to limit total annual operating expenses to 1.50% of the average daily net assets of the Chou Opportunity Fund and Chou Income Fund, through May 1, 2015 (excluding other expenses, taxes, leverage interest, acquired fund fees and expenses, dividends or interest on short positions, other interest expenses, brokerage commissions, and extraordinary expenses such as litigation). For the year ended December 31, 2014, fees waived and expenses reimbursed were as follows:
| | Investment Adviser Fees Waived |
| Chou Opportunity Fund | $ | 13,734 | |
| Chou Income Fund | | 113,079 | |
| | | | |
Note 6. Security Transactions
The cost of purchases and proceeds from sales of investment securities (including maturities), other than short-term investments during the year ended December 31, 2014, were as follows:
| | | Purchases | | Sales |
| Chou Opportunity Fund | | $ | 19,481,194 | | $ | 14,335,816 |
| Chou Income Fund | | | 11,324,538 | | | 1,636,687 |
| | | | | | | |
Note 7. Summary of Derivative Activity
The volume of open derivative positions may vary on a daily basis as the Chou Opportunity Fund transacts
CHOU AMERICA MUTUAL FUNDS NOTES TO FINANCIAL STATEMENTS DECEMBER 31, 2014 |
derivative contracts in order to achieve the exposure desired by the Adviser. The notional value of activity for the year ended December 31, 2014 for any derivative type that was held during the period is as follows:
| Written Options | | $ | (386,629) |
The Chou Opportunity Fund’s use of derivatives during the year ended December 31, 2014, was limited to written options.
Realized and unrealized gains and losses on derivatives contracts during the year ended December 31, 2014, by the Chou Opportunity Fund are recorded in the following locations on the Statement of Operations:
| Location | | Equity Contracts | |
| Net realized gain(loss) on: | | | | | |
| Written options | | $ | 386,629 | | |
Note 8. Federal Income Tax
Distributions paid during the fiscal years ended as noted were characterized for tax purposes as follows:
| | | Ordinary Income | | Long-Term Capital Gain | | Total |
| Chou Opportunity Fund | |
| 2014 | | $ | 150,277 | | | $ | 3,161,027 | | | $ | 3,311,304 | |
| 2013 | | | 332,710 | | | | 5,425,565 | | | | 5,758,275 | |
| Chou Income Fund | |
| 2014 | | | 1,216,228 | | | | 118,077 | | | | 1,334,305 | |
| 2013 | | | 685,760 | | | | - | | | | 685,760 | |
| | | | | | | | | | | | | |
As of December 31, 2014, distributable earnings (accumulated loss) on a tax basis were as follows:
| | | Undistributed Ordinary Income | | Undistributed Long-Term Gain | | | Unrealized Appreciation (Depreciation) | | Total |
| Chou Opportunity Fund | | $ | 444,668 | | | $ | 530,813 | | | $ | 11,268,010 | | | $ | 12,243,491 | |
| Chou Income Fund | | | 25,513 | | | | 99,457 | | | | (2,736,322 | ) | | | (2,611,352 | ) |
| | | | | | | | | | | | | | | | | |
The difference between components of distributable earnings on a tax basis and the amounts reflected in the Statement of Assets and Liabilities in Chou Opportunity Fund and Chou Income Fund are primarily due to wash sale and straddles for Chou Opportunity Fund and contingent payment debt instruments for Chou Income Fund.
On the Statements of Assets and Liabilities, as a result of permanent book to tax differences, certain amounts have been reclassified for the year ended December 31, 2014. The following reclassifications were the result of currency gain/loss, re-designation of distributions and net operating losses offsetting short term gains and have no impact on the net assets of each Fund.
CHOU AMERICA MUTUAL FUNDS NOTES TO FINANCIAL STATEMENTS DECEMBER 31, 2014 |
| | Undistributed Net Investment Income (Loss) | | Accumulated Net Realized Gain (Loss) |
| Chou Opportunity Fund | | $ | 1,029,315 | | | $ | (1,029,315 | ) |
| Chou Income Fund | | | (293 | ) | | | 293 | |
Note 9. Subsequent Events
Subsequent events occurring after the date of this report through the date these financial statements were issued have been evaluated for potential impact and each Fund has had no such events.
REPORT OF INDEPENDENT REGISTERED PUBLIC ACCOUNTING FIRM |
To the Board of Trustees of Chou America Mutual Funds and the Shareholders of Chou Income Fund and Chou Opportunity Fund
We have audited the accompanying statements of assets and liabilities, including the schedules of investments, of the Chou Opportunity Fund and the Chou Income Fund, each a series of shares of beneficial interest of Chou America Mutual Funds, as of December 31, 2014, and the related statements of operations for the year then ended, the statements of changes in net assets for each of the years in the two-year period then ended, and the financial highlights for each of the years in the four-year period then ended and for the period July 1, 2010 (commencement of operations) through December 31, 2010. These financial statements and financial highlights are the responsibility of the Funds' management. Our responsibility is to express an opinion on these financial statements and financial highlights based on our audits.
We conducted our audits in accordance with the standards of the Public Company Accounting Oversight Board (United States). Those standards require that we plan and perform the audits to obtain reasonable assurance about whether the financial statements and financial highlights are free of material misstatement. An audit includes examining, on a test basis, evidence supporting the amounts and disclosures in the financial statements. Our procedures included confirmation of securities owned as of December 31, 2014 by correspondence with the custodian. An audit also includes assessing the accounting principles used and significant estimates made by management, as well as evaluating the overall financial statement presentation. We believe that our audits provide a reasonable basis for our opinion.
In our opinion, the financial statements and financial highlights referred to above present fairly, in all material respects, the financial position of the Chou Opportunity Fund and the Chou Income Fund as of December 31, 2014, and the results of their operations for the year then ended, the changes in their net assets for each of the years in the two-year period then ended, and their financial highlights for each of the years in the four-year period then ended and for the period July 1, 2010 through December 31, 2010, in conformity with accounting principles generally accepted in the United States of America.

Philadelphia, Pennsylvania
February 26, 2015
CHOU AMERICA MUTUAL FUNDS ADDITIONAL INFORMATION (Unaudited) DECEMBER 31, 2014 |
Investment Advisory Agreement Approval
At a meeting held on December 4, 2014, the Board of Trustees of Chou America Mutual Funds, including all of the Independent Trustees (the "Board"), approved the renewal of the investment advisory agreement (the “Advisory Agreement”) between the Adviser and the Trust on behalf of the Funds.
In voting to approve the renewal of the Advisory Agreement, the Board considered the overall fairness of the Advisory Agreement and factors it deemed relevant with respect to each Fund including, but not limited to: (1) the nature, extent and quality of the services provided to each Fund; (2) the performance of each Fund as compared to the respective Fund’s benchmark index, peer group funds selected by Lipper, Inc. (“Lipper Peer Group”) and compiled by Atlantic Fund Services (“Atlantic”); (3) the level of the fees and the overall expenses of each Fund and how those compared to each Fund’s Lipper Peer Group; (4) the costs of services provided to the Funds and the profitability of Chou America; and (5) the effect of, as applicable, the growth or decline of fund assets on the advisory fee (i.e., economies of scale) and whether the fee levels reflect economies of scale for the benefit of investors. The Board did not identify any single factor or item of information as all-important or controlling.
In considering the approval of the Advisory Agreement, the Board considered a broad range of information provided by Chou America, including but not limited to, reports relating to each Fund’s performance and expenses. In addition, the Board considered a memorandum from its legal counsel regarding the Board’s fiduciary duties in considering the renewal of the Advisory Agreement. The Board also meets each quarter to review various aspects of the Funds and is provided additional material in connection with those meetings.
Nature, Extent and Quality of Services
The Board reviewed and considered the nature, extent and quality of the advisory services provided by Chou America to each Fund under the Advisory Agreement. The Board considered that Chou America does not have any clients other than the Funds. The Board noted that Chou America has provided high quality advisory services to the Funds. The Board also understood that Francis Chou, the Funds’ portfolio manager, manages Canadian mutual funds with investment strategies similar to those of the Funds through an affiliated Canadian adviser. The Board noted Chou America’s representation that it has the financial resources and appropriate staffing to manage the Funds and to meet its expense reimbursement obligations. The Board also reviewed and considered the qualifications of the portfolio manager to each Fund.
Performance
The Board considered the one-year and since-inception performance of each Fund as of October 31, 2014 as compared to its respective benchmark index. The Board considered that the Opportunity Fund underperformed its primary benchmark, the S&P 500 Index, for the since-inception and one-year periods ended December 31, 2013. Additionally, the Board considered that the Income Fund had outperformed its benchmark index, the Barclays Capital U.S. Corporate High Yield Index, for the since inception and one-year periods ended October 31, 2014. The Board also considered the performance of each Fund as compared to its respective Lipper Peer Group for the one-year and three-year period ended September 30, 2014. The Board considered that the Opportunity Fund had outperformed for the three-year period ended September 30, 2014 all of its Lipper Peer Group except for two funds that it underperformed. The Board also considered that the Opportunity Fund had underperformed its Lipper Peer Group for the one-year period ended September 30, 2014. The Board considered that the Income Fund had outperformed for the three-year period ended September 30, 2014 all of its Lipper Peer Group. The Board considered that the Income Fund’s performance for the one-year period ended September 30, 2014 was equivalent to the median for its Lipper Peer Group. Based on the foregoing, the Board determined that Chou America’s management of the Funds was satisfactory and could benefit the Funds and their shareholders.
CHOU AMERICA MUTUAL FUNDS ADDITIONAL INFORMATION (Unaudited) DECEMBER 31, 2014 |
Fees and Expenses
The Board considered the advisory fee rates charged to each Fund relative to the fee rates paid by the Fund’s Lipper Peer Group. The Board also considered the total expense ratios of each Fund relative to the Lipper Peer Group for the period ended September 30, 2014. The Board also considered that Chou America contractually agreed to continue its fee waivers and expense caps for each Fund’s 2015 fiscal year to the extent set forth in the Expense Limitation Agreement. The Board considered comparisons that excluded Rule 12b-1 fees, given that each Fund does not currently charge such fees. In reviewing the Lipper Peer Group expense information, the Board noted that the Lipper Peer Group contractual advisory fee information, which included advisory and administrative fees, did not include fee waivers and/or expense reimbursements. The Board noted that the actual advisory fee did reflect fee waivers and/or expense reimbursements and considered that Chou America waived its entire advisory fee for the Income Fund.
With respect to the Opportunity Fund, the Board considered that the Fund’s contractual and actual advisory fee rates were higher than the Lipper Peer Group average and its total expense ratio was higher than the Lipper Peer Group average. With respect to the Income Fund, the Board considered that the actual advisory fee rate was lower than the Lipper Peer Group average and the contractual advisory fee rate and total expense ratio were higher than the Lipper Peer Group average. The Board also considered that the Income Fund's total expense ratio reflected fees waived and/or expenses reimbursed.
Costs of Services and Profitability
The Board considered the costs to operate the Funds and the profitability of Chou America. The Board reviewed the fees paid by each Fund to Chou America for the fiscal year ended December 31, 2013. The Board also reviewed the profit and loss statement provided by Chou America on a fund-by-fund basis and considered Chou America’s methodology with respect to the profitability calculation. In this regard, the Board noted that Chou America was profitable with respect to services provided to the Opportunity Fund, but not the Income Fund.
Economies of Scale
With respect to economies of scale, the Board considered the current asset size of the Funds. In this regard, the Board also considered Chou America’s representation that while there is potential for economies of scale in connection with the services that Chou America provides to the Funds, Chou America does not believe that breakpoints in the fee schedules of the Funds would be appropriate in the absence of significant growth of Fund assets.
Other Benefits
The Board noted that Chou America did not identify any indirect "fall-out" benefits that accrue to Chou America or its affiliates (other than its direct compensation) from Chou America's relationship with the Funds. The Board also noted that Chou America represented that it does not use soft-dollars as permitted by Section 28(e) of the Securities and Exchange Act of 1934, as amended. Based on the foregoing representation, the Board concluded that other benefits received by Chou America from its relationship with the Funds were not a material factor to consider in approving the Advisory Agreement.
CHOU AMERICA MUTUAL FUNDS ADDITIONAL INFORMATION (Unaudited) DECEMBER 31, 2014 |
Conclusion
Based on its evaluation of these and other factors, the Board concluded with respect to each Fund that: (1) each Fund was reasonably likely to benefit from the nature, quality and extent of services provided by Chou America; (2) each Fund’s performance was satisfactory in light of all the factors considered by the Board; (3) the profits, as applicable, and fees payable to Chou America were reasonable in the context of all the factors considered by the Board; and (4) the economies of scale was not a material factor in its approval of the Advisory Agreement given the current size of the Funds. In light of these conclusions, the Board determined, in its business judgment, to renew the Advisory Agreement.
Proxy Voting Information
A description of the policies and procedures that each Fund uses to determine how to vote proxies relating to securities held in each Fund’s portfolio is available, without charge and upon request, by calling (877) 682-6352 and on the U.S. Securities and Exchange Commission’s (the “SEC”) website at www.sec.gov. Each Fund’s proxy voting record for the most recent twelve-month period ended June 30 is available, without charge and upon request, by calling (877) 682-6352 and on the SEC’s website at www.sec.gov.
Availability of Quarterly Portfolio Schedules
Each Fund files its complete schedule of portfolio holdings with the SEC for the first and third quarters of each fiscal year on Form N-Q. These filings are available, without charge and upon request on the SEC’s website at www.sec.gov or may be reviewed and copied at the SEC’s Public Reference Room in Washington, DC. Information on the operation of the Public Reference Room may be obtained by calling (800) SEC-0330.
Shareholder Expense Example
As a shareholder of the Funds, you incur two types of costs: (1) transaction costs, including redemption fees, and (2) ongoing costs, including management fees, distribution (12b-1) fees and other Fund expenses. This example is intended to help you understand your ongoing costs (in dollars) of investing in the Funds, and to compare these costs with the ongoing costs of investing in other mutual funds.
The example is based on an investment of $1,000 invested at the beginning of the period and held for the entire period from July 1, 2014, through December 31, 2014.
Actual Expenses – The first line of the table below provides information about actual account values and actual expenses. You may use the information in this line, together with the amount you invested, to estimate the expenses that you paid over the period. Simply divide your account value by $1,000 (for example, an $8,600 account value divided by $1,000 = 8.6), then multiply the result by the number in the first line under the heading entitled “Expenses Paid During Period” to estimate the expenses you paid on your account during the period.
Hypothetical Example for Comparison Purposes – The second line of the table below provides information about hypothetical account values and hypothetical expenses based on each Fund’s actual expense ratio and an assumed rate of return of 5% per year before expenses, which is not each Fund’s actual return. The hypothetical account values and expenses may not be used to estimate the actual ending account balance or expenses you paid for the period. You may use this information to compare the ongoing costs of investing in each Fund and other funds. To do so, compare this 5% hypothetical example with the 5% hypothetical examples that appear in the shareholder reports of other funds.
Please note that the expenses shown in the table are meant to highlight your ongoing costs only and do not reflect
CHOU AMERICA MUTUAL FUNDS ADDITIONAL INFORMATION (Unaudited) DECEMBER 31, 2014 |
any transactional costs, such as redemption fees. Therefore, the second line of the table is useful in comparing ongoing costs only, and will not help you determine the relative total costs of owning different funds. In addition, if these transactional costs were included, your costs would have been higher.
| | Beginning | | Ending | | Expenses | | Annualized |
| | Account Value | | Account Value | | Paid During | | Expense |
| | July 1, 2014 | | December 31, 2014 | | Period* | | Ratio* |
| Chou Opportunity Fund | | | | | | | | | | | |
| Actual | $ | 1,000.00 | | $ | 1,024.52 | | $ | 6.89 | | 1.35 | % |
| Hypothetical (5% return before taxes) | $ | 1,000.00 | | $ | 1,018.40 | | $ | 6.87 | | 1.35 | % |
| | | | | | | | | | | | |
| Chou Income Fund | | | | | | | | | | | |
| Actual | $ | 1,000.00 | | $ | 873.14 | | $ | 7.08 | | 1.50 | % |
| Hypothetical (5% return before taxes) | $ | 1,000.00 | | $ | 1,017.64 | | $ | 7.63 | | 1.50 | % |
| | | | | | | | | | | | |
| * | Expenses are equal to each Fund’s annualized expense ratio as indicated above multiplied by the average account value over the period, multiplied by the number of days in the most recent fiscal half-year divided by 365 to reflect the half-year period. |
Federal Tax Status of Dividends Declared during the Fiscal Year
For federal income tax purposes, dividends from short-term capital gains are classified as ordinary income. The Chou Opportunity Fund designates 10.27% of its income dividend distributed as qualifying for the corporate dividends-received deduction (DRD) and 47.04% for the qualified dividend rate (QDI) as defined in Section 1(h)(11) of the Internal Revenue Code. The Chou Opportunity Fund aso designates 100.00% as short-term capital gain dividends exempt from U.S. tax for foreign shareholders (QSD). The Chou Income Fund designates 2.61% as DRD, 2.61% as QDI and 24.94% for QSD. The Chou Income Fund also designates 27.52% as qualified interest income exempt from U.S. tax for foreign shareholders (QII).
Trustees and Officers of the Trust
The Board is responsible for oversight of the management of the Trust’s business affairs and of the exercise of all the Trust’s powers except those reserved for the shareholders. The following table provides information about each Board member and certain officers of the Trust. Each Trustee and officer holds office until the person resigns, is removed, or is replaced. Unless otherwise noted, the persons have held their principal occupations for more than five years. The address for all Trustees and officers is Three Canal Plaza, Suite 600, Portland, Maine 04101. Each Fund’s Statement of Additional Information includes additional information about the Trustees and is available, without charge and upon request, by calling (877) 682-6352.
CHOU AMERICA MUTUAL FUNDS ADDITIONAL INFORMATION (Unaudited) DECEMBER 31, 2014 |
| Name and Year of Birth | Position with the Trust | Length of Time Served | Principal Occupation(s) During Past Five Years | Number of Series of Trust Overseen by Trustee | Other Directorships Held by Trustee |
| Independent Trustees | | | | | |
Lily Pinarello Born: 1953 | Trustee | Since 2010 | Retired since 1999. | 2 | 0 |
Erroll Tyrone Tull Born: 1945 | Trustee | Since 2014 | Retired since 2010;Benefits Co-ordinator, Crown Metal Packaging, 1971-2010. | 2 | 0 |
| Interested Trustee | | | | | |
Francis S.M. Chou Born: 1956 | Trustee | Since 2010 | Chief Executive Officer, Chou America Management, Inc. since 2010; Chief Executive Officer, Chou Associates Management, Inc., since 1986. | 2 | 0 |
| Officers | | | | | |
Francis S.M. Chou Born: 1956 | President and Principal Executive Officer | Since 2010 | Chief Executive Officer, Chou America Management, Inc. since 2010; Chief Executive Officer, Chou Associates Management, Inc., since 1986. | N/A | N/A |
Michael J. McKeen Born: 1971 | Treasurer and Principal Financial Officer | Since 2010 | Senior Vice President, Atlantic since 2008. | N/A | N/A |
Dennis Mason Born: 1967 | Chief Compliance Officer | Since 2013 | Fund Compliance Officer, Atlantic, since 2013. Senior Specialist, Atlantic 2011-2013; Senior Analyst, Atlantic, 2008-2011. | N/A | N/A |
Vicki S. Horwitz Born: 1985 | Secretary | Since 2014 | Associate Counsel, Atlantic, Since 2014; Senior Associate, State Street Corp., 2011-2014; Student, Boston College Law School, 2008-2011. | N/A | N/A |
Zachary Tackett Born: 1988 | Vice President, and Anti-Money Laundering Compliance Officer | Since 2014 | Associate Counsel, Atlantic, Since 2014; Intern Associate, Coakley & Hyde, PLLC, 2010-2013. | N/A | N/A |
Timothy Bowden Born: 1969 | Vice President | Since 2010 | Manager, Atlantic since 2008. | N/A | N/A |
Geoffrey Ney Born: 1975 | Vice President | Since 2013 | Manager, Atlantic since 2013; Senior Fund Accountant, Atlantic, 2008-2013. | N/A | N/A |
Todd Proulx Born: 1978 | Vice President | Since 2013 | Manager, Atlantic since 2013; Senior Fund Accountant, Atlantic, 2008-2013. | N/A | N/A |
FOR MORE INFORMATION:
P.O. Box 588
Portland, ME 04112
(877) 682-6352
INVESTMENT ADVISER
Chou America Management Inc.
110 Sheppard Ave. East
Suite 301, Box 18
Toronto, Ontario, Canada M2N 6Y8
TRANSFER AGENT
Atlantic Fund Services
P.O. Box 588
Portland, ME 04112
www.atlanticfundservices.com
DISTRIBUTOR
Rafferty Capital Markets, LLC
1010 Franklin Avenue
Garden City, NY 11530
www.raffcap.com
This report is submitted for the general information of the shareholders of the Funds. It is not authorized for
distribution to prospective investors unless preceded or accompanied by an effective prospectus, which includes information regarding the Funds’ risks, objectives, fees and expenses, experience of its management, and other information.
243-ANR-1214
ITEM 2. CODE OF ETHICS.
| (a) | As of the end of the period covered by this report, Chou America Mutual Funds (the “Registrant”) has adopted a code of ethics, which applies to its Principal Executive Officer and Principal Financial Officer (the “Code of Ethics”). |
| (c) | There have been no amendments to the Registrant’s Code of Ethics during the period covered by this report. |
| (d) | There have been no waivers to the Registrant’s Code of Ethics during the period covered by this report. |
(f) (1) A copy of the Code of Ethics is being filed under Item 12(a) hereto.
ITEM 3. AUDIT COMMITTEE FINANCIAL EXPERT.
The Board of Trustees has not yet determined that it has at least one audit committee financial expert serving on its Audit Committee or that no member of the Audit Committee is an "audit committee financial expert" as that term is defined under applicable regulatory guidelines.
ITEM 4. PRINCIPAL ACCOUNTANT FEES AND SERVICES.
(a) Audit Fees - The aggregate fees billed for each of the last two fiscal years (the “Reporting Periods”) for professional services rendered by the Registrant’s principal accountant for the audit of the Registrant’s annual financial statements, or services that are normally provided by the principal accountant in connection with the statutory and regulatory filings or engagements for the Reporting Periods, were $28,000 in 2013 and $28,000 in 2014.
(b) Audit-Related Fees – The aggregate fees billed in the Reporting Periods for assurance and related services rendered by the principal accountant that were reasonably related to the performance of the audit of the Registrant’s financial statements and are not reported under paragraph (a) of this Item 4 were $0 in 2013 and $0 in 2014.
(c) Tax Fees - The aggregate fees billed in the Reporting Periods for professional services rendered by the principal accountant to the Registrant for tax compliance, tax advice and tax planning were $6,000 in 2013 and $6,000 in 2014. These services consisted of review or preparation of U.S. federal, state, local and excise tax returns.
(d) All Other Fees - The aggregate fees billed in the Reporting Periods for products and services provided by the principal accountant to the Registrant, other than the services reported in paragraphs (a) through (c) of this Item, were $0 in 2013 and $0 in 2014.
(e) (1) The Audit Committee reviews and approves in advance all audit and “permissible non-audit services” (as that term is defined by the rules and regulations of the Securities and Exchange Commission) to be rendered to a series of the Registrant (each, a “Series”). In addition, the Audit Committee reviews and approves in advance all “permissible non-audit services” to be provided to an investment adviser (not including any sub-adviser) of a Series, or an affiliate of such investment adviser, that is controlling, controlled by or under common control with the investment adviser and provides on-going services to the Registrant (“Affiliate”), by the Series’ principal accountant if the engagement relates directly to the operations and financial reporting of the Series. The Audit Committee considers whether fees paid by a Series’ investment adviser or an Affiliate to the Series’ principal accountant for audit and permissible non-audit services are consistent with the principal accountant’s independence.
(e) (2) No services included in (b) - (d) above were approved pursuant to paragraph (c)(7)(i)(C) of Rule 2-01 of Regulation S-X.
(f) Not applicable
(g) The aggregate non-audit fees billed by the principal accountant for services rendered to the Registrant for the Reporting Periods were $0 in 2013 and $0 in 2014. There were no fees billed in either of the Reporting Periods for non-audit services rendered by the principal accountant to the Registrant’s investment adviser or any Affiliate.
(h) During the Reporting Periods, the Registrant’s principal accountant provided no non-audit services to the investment adviser or any entity controlling, controlled by or under common control with the investment adviser to the series of the Registrant.
ITEM 5. AUDIT COMMITTEE OF LISTED REGISTRANTS.
Not applicable
ITEM 6. INVESTMENTS.
| (a) | Included as part of report to shareholders under Item 1. |
ITEM 7. DISCLOSURE OF PROXY VOTING POLICIES AND PROCEDURES FOR CLOSED-END
MANAGEMENT INVESTMENT COMPANIES.
Not applicable.
ITEM 8. PORTFOLIO MANAGERS OF CLOSED-END MANAGEMENT INVESTMENT COMPANIES.
Not applicable.
ITEM 9. PURCHASES OF EQUITY SECURITIES BY CLOSED-END MANAGEMENT INVESTMENT COMPANY AND AFFILIATED PURCHASERS.
Not applicable.
ITEM 10. SUBMISSION OF MATTERS TO A VOTE OF SECURITY HOLDERS
The Registrant does not accept nominees to the board of trustees from shareholders.
ITEM 11. CONTROLS AND PROCEDURES
(a) The Registrant’s Principal Executive Officer and Principal Financial Officer have concluded that the Registrant’s disclosure controls and procedures (as defined in Rule 30a-3(c) under the Investment Company Act of 1940 (the “Act”)) are effective, based on their evaluation of the controls and procedures required by Rule 30a-3(b) under the Act and Rules 13a-15(b) or 15d-15(b) under the Securities Exchange Act of 1934, as of a date within 90 days of the filing date of this report.
(b) There were no changes in the Registrant’s internal control over financial reporting (as defined in
Rule 30a-3(d) under the Act) that occurred during the second fiscal quarter of the period covered by this report that have materially affected, or are reasonably likely to materially affect, the Registrant’s internal control over financial reporting.
ITEM 12. EXHIBITS.
(a)(1) Code of Ethics (Exhibit filed herewith).
(a)(2) Certifications pursuant to Rule 30a-2(a) of the Act, and Section 302 of the Sarbanes-Oxley Act of 2002. (Exhibits filed herewith)
(a)(3) Not applicable.
(b) Certifications pursuant to Rule 30a-2(b) of the Act, and Section 906 of the Sarbanes-Oxley Act of 2002. (Exhibit filed herewith)
SIGNATURES
Pursuant to the requirements of the Securities Exchange Act of 1934 and the Investment Company Act of 1940, the Registrant has duly caused this report to be signed on its behalf by the undersigned, thereunto duly authorized.
Registrant Chou America Mutual Funds
| By: | /s/ Francis S. M. Chou |
| | Francis S.M. Chou, Principal Executive Officer |
| Date | February 25, 2015 |
Pursuant to the requirements of the Securities Exchange Act of 1934 and the Investment Company Act of 1940, this report has been signed below by the following persons on behalf of the Registrant and in the capacities and on the dates indicated.
| By: | /s/ Francis S. M. Chou |
| | Francis S.M. Chou, Principal Executive Officer |
| Date | February 25, 2015 |
| By: | /s/ Michael J. McKeen |
| | Michael J. McKeen, Principal Financial Officer |
| Date | February 25, 2015 |
