As filed with the Securities and Exchange Commission on March 2, 2017
UNITED STATES
SECURITIES AND EXCHANGE COMMISSION
WASHINGTON, D.C. 20549
FORM N-CSR
CERTIFIED SHAREHOLDER REPORT OF REGISTERED MANAGEMENT
INVESTMENT COMPANIES
Investment Company Act file number 811-22394
CHOU AMERICA MUTUAL FUNDS
Three Canal Plaza, Suite 600
Portland, Maine 04101
Michael J. McKeen, Principal Financial Officer
Three Canal Plaza, Suite 600
Portland, Maine 04101
207-347-2000
Date of fiscal year end: December 31
Date of reporting period: January 1, 2016 – December 31, 2016
ITEM 1. REPORT TO STOCKHOLDERS.
CHOU AMERICA MUTUAL FUNDS
Annual Report
December 31, 2016
Fund Adviser:
Chou America Management Inc.
110 Sheppard Ave. East
Suite 301, Box 18
Toronto, Ontario, Canada M2N 6Y8
Toll Free: (877) 755-5188
| A Message to our Shareholders (Unaudited) | 1 |
| Performance Charts and Analysis (Unaudited) | 9 |
| Schedules of Investments | 11 |
| Statements of Assets and Liabilities | 17 |
| Statements of Operations | 18 |
| Statements of Changes in Net Assets | 19 |
| Financial Highlights | 20 |
| Notes to Financial Statements | 22 |
| Report of Independent Registered Public Accounting Firm | 27 |
| Additional Information (Unaudited) | 28 |
CHOU OPPORTUNITY FUNDA MESSAGE TO OUR SHAREHOLDERS (Unaudited) DECEMBER 31, 2016
|
Dear Shareholder,
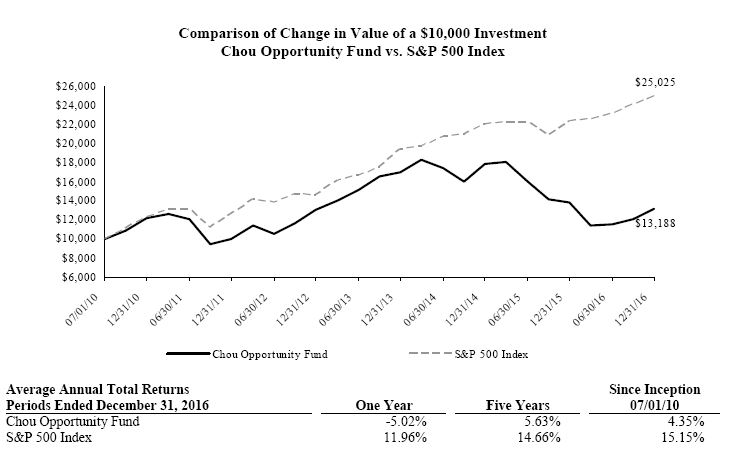
For the year of 2016, the Chou Opportunity Fund (the "Fund") was down 5.02%, while the S&P 500 Total Return Index generated a return of 11.96% during the same period. The Fund's prior performance is not necessarily indicative of how the Fund will perform in the future.
Portfolio Commentary
In 2016, the largest positive contributors to the Fund's performance included the EXCO Resources (NYSE: XCO) second lien term loan 12.5%, maturing in 2020, as well as the Bank of America and JP Morgan Chase TARP warrants.
Primary losses came from Fund investments in Valeant Pharmaceuticals, Sears Holdings and Resolute Forest Products.
The Fund initiated a position in Valeant Pharmaceuticals in the first half of 2016.
All shares of the equity holdings of Asta Funding Inc. were sold during the first half of 2016 for a minor gain.
U.S. Bank TARP Warrants
Overall, investments in the TARP warrants of Bank of America, Wells Fargo and JPMorgan Chase performed well in 2016, as reflected by the increases in prices of each position shown in the following table.
| Warrant | Price as of Dec 31'15 | Price as of Dec 31'16 | Percentage Change |
| Bank of America | $5.81 | $9.95 | 71.26% |
| Wells Fargo | $20.49 | $21.33 | 4.10% |
| JPMorgan Chase | $23.69 | $44.27 | 86.87% |
In the letter for the 2011 annual report, we outlined our thesis as to why we believed that these warrants were attractive long-term investments. We wrote:
"So, what is so unique about these stock warrants? We have considered the following characteristics:
| · | They are long dated, with most expiring in 2018 or 2019. This time frame of six-plus years allows banks to grow their intrinsic value to a high enough level to have an appreciable impact on the strike price of the stock warrant. |
| · | The strike price is adjusted downward for any quarterly dividend that exceeds a set price. Normally, this is not seen in a stock warrant. This is a truly stringent condition. In this case, we should give the government credit for extracting a pound of flesh. An example: for Bank of America, class 'A' warrants, the strike price is adjusted downward for any quarterly dividend paid exceeding one cent a share. |
| · | Many of the banks have excess capital on their balance sheet. When the economy settles down, we expect the banks to use this excess capital either for buybacks or a one-time special dividend that may reduce the strike price on the stock warrants if this provision applies." |
Since the price of the TARP warrants is contingent on the stock price of the bank, it was important that we held a view that the banks in general were undervalued. This is what we said about the banks in the 2011 annual report:
CHOU OPPORTUNITY FUNDA MESSAGE TO OUR SHAREHOLDERS (Unaudited) DECEMBER 31, 2016
|
| · | "It has been five years since the financial crisis began in 2007. As each year has gone by, the quality of earnings of the banks has gotten higher, the books have become cleaner, the risks have become lower, and bank management has become far more risk averse. It is too bad that we had to go through so much turmoil to get there. |
| · | The financial institutions that survive will be the ultimate beneficiaries of any recovery in the economy. |
| · | Interest rates will continue to be kept at artificially low levels for the foreseeable future. The spreads between what the banks are paying for deposits and borrowings in the market (like FDIC insured), and what they can lend at, is enormous. After being severely burned, they have tightened their lending criteria and have been extremely cautious with their lending practices. In general, the quality of loans now being made is quite high and for the first time in many years, banks are being paid handsomely according to the risks they are taking. |
| · | Bank valuations that were below 10 times earnings six months ago have decreased even further, with many bank stocks selling below book and some selling at big discounts to tangible book value. |
| · | Concerns over financial reform and its ultimate impact on the earning power of the banks may be somewhat exaggerated. We believe the banks will most likely be able to pass the majority of the costs to customers. For an economy to flourish we need sound financial institutions that can generate reasonable profits. |
Our investing horizon is long-term – six years or more remain for these bank warrants. Over that period, we believe that the odds are it will work out to be a decent investment, perhaps even more so for the better-capitalized banks. We view it as the glass being more than half full rather than half empty. The bank TARP warrants are complex, with terms and conditions that are unique to each bank, and we encourage you to research them for yourself and draw your own conclusions."
We are now in the year 2017 and the maturity date for the TARP warrants is less than 3 years from now. As the time element gets shorter, we believe that the warrant is likely to become more speculative by nature and therefore we expect to reduce or eliminate the positions in the various TARP warrants. If we believe that the banks in question may still be undervalued, then we would be more likely to invest in the common stock of the banks. Although, it is important to note that any future decision to sell the warrants or buy the common stock will be based upon our view of the markets as well as the issuers that exist at the time when we make any such investment decision.
EXCO Resources
In 2015, we initiated the position in EXCO Resources second-lien term loan 12.5%, maturing in 2020. This term loan did quite well in 2016, rising in price from 55.8 cents on a dollar at December 31, 2015 to 72.9 cents on a dollar at December 31, 2016, an increase of 30.7% excluding interests received.
EXCO Resources is an independent oil and natural gas company that engages in the acquisition, exploration, development and production of onshore oil and natural gas properties with a focus on shale resource plays in the United States.
We liked this security because it met our criteria for investing in the Oil & Gas sector. The criteria that we considered in analyzing this type of investment is that the security should be:
1. A first or second lien loan or note;
2. Issued by a company with a significantly limited ability to add senior or pari-passu debt to its capital structure; and
3. Of a type that if the company restructures or goes into bankruptcy, the recovery value of the bond is likely to be greater than the current price of the bond.
CHOU OPPORTUNITY FUNDA MESSAGE TO OUR SHAREHOLDERS (Unaudited) DECEMBER 31, 2016
|
As of December 31, 2016, the Fund owned about $19 million worth of EXCO's second-lien term loan ($26 million in par value). This is the largest position in the portfolio, comprising more than 20% of the assets of the Fund (at market value). In addition to the security being very senior in the capital structure, we also hold the view that management seems to be making good decisions with respect to the allocation of capital in a tough environment.
Valeant Pharmaceuticals
At the current price, Valeant stock is not a mouth-watering bargain at less than 3 times earnings or less than 2 times free cash flow because it carries around $30 billion of debt, but it is still relatively cheap. If Valeant can reduce its debt by as much as $8 billion as stated by management, through a combination of organic earnings and the sale of non-core assets, it will remove the feeling that the company is standing on the edge of a precipice.
A large debt means that any small misstep or missed guidance could result in bankruptcy. If the company's debt is reduced, it will then be valued based on the free cash flow generated from operations. In addition, Valeant is also undergoing criminal investigations over its ties with Philidor. However, we believe the impact of these litigations is likely to be rather limited given that it pertains to only 5% of its revenue. Although, we do emphasize that it is difficult to accurately predict the outcome or impact of any lawsuit.
In conclusion:
• Valeant could return to trading at the normal multiples if its debt is significantly reduced and the impact and costs of litigations are determined.
• The company appears to have good cash flow characteristics, resulting from solid portfolio pipelines.
• While we believe Valeant is cheap, the undervaluation is not as deep as it first appears. One must look at return on a fully capitalized basis to get the full picture. Based on the information we now have, the initial price we paid was on the high side but we believe that the intrinsic value is higher than the average cost we have paid for Valeant.
Sears Holdings
In July 2015, Sears Holdings Corporation (SHLD) announced that it closed its rights offering and sale leaseback transactions with Seritage Growth Properties ("Seritage"), a newly formed, independent, and publicly traded real estate investment trust ("REIT").
In the transaction, Sears sold 235 Sears- and Kmart-branded stores to Seritage, along with Sears' 50 percent interests in joint ventures with each of Simon Property Group, Inc., General Growth Properties, Inc. and The Macerich Company. The three entities combined hold an additional 31 Sears Holdings properties. Based on our rough estimate, this represented less than 25% of the company's real estate assets and Sears Holdings received aggregate gross proceeds from the transaction of $2.7 billion.
However, from our perspective, the most important thing that has happened is that Seritage is now a public company and when its stock trades daily, we have a more reliable way of assessing the real estate value in SHLD indirectly. We also know that pre-Seritage and post-Seritage, the profile and the quality of the properties that is held in Seritage and SHLD is roughly the same.
Considering SHLD's brand collections and what we believe to be the value of the SHLD real estate portfolio (based in part upon our analysis of the Seritage valuation over the reporting period), it may appear that at the year-end price of $9.29 for Sears (about $994 million in market capitalization), the company is severely underpriced. However, given the company's net debt of approximately $4 billion, pension deficit of about $2 billion, and the enormous losses it has taken to date to transform its business from a brick and mortar business to an asset-light business, we believe that the intrinsic value of SHLD may have been severely eroded (notwithstanding its real estate and brand portfolio). It is hard to evaluate what kind of value you can assign to company's "Shop Your Way" program
CHOU OPPORTUNITY FUNDA MESSAGE TO OUR SHAREHOLDERS (Unaudited) DECEMBER 31, 2016
|
even though management has poured billions of dollars into it. From management's perspective, they can argue that "Shop Your Way" could be worth more than the capital invested. However, unless it generates significant amounts of cash or cash earnings relative to the capital invested, it is doubtful if it could be worth anything. It is hard to foresee why investors will give a similar valuation of Amazon.com to "Shop Your Way" even though Sears' membership program has some characteristics similar to Amazon Prime. In conclusion, even if you take the best case scenario and "Shop Your Way" turns out to be profitable, it could be a Pyrrhic victory.
In hindsight, our initial assessment of Sears being worth more than $50 per share a few years ago was most likely too optimistic. This is taking into consideration that we received roughly $13 per share in distribution from various spin-offs and later receiving proceeds from selling them into the stock markets. Nevertheless, we believe that the stock may still be cheap at the current valuation, albeit not at the level that we initially anticipated.
Resolute Forest Products
Resolute Forest Products (RFP) is primarily involved in Newsprints, Specialty Papers, Wood Products and Market Pulp. As the downturn in global commodities intensified, RFP was not spared as all four of the company's business segments got hit. Management has concentrated on lowering the cost of every segment but these actions were not enough to compensate for the deterioration of prices in their respective markets.
At year-end 2016, the market price of RFP was at $5.35 per share. At $5.35 per share, the market capitalization of the company is roughly $480 million dollars. As we have explained in the past, the company continues to have consolidated sales of close to $3.6 billion and in each of its major business segments, it is a global leader. It continues to be the biggest volume producer of wood products east of the Rockies, the third largest in North America for Market Pulp, the number one producer of newsprint in the world and the largest producer in North America of uncoated mechanical paper and an emerging tissue producer. With the exception of the Wood Products segment, which continues to have revenues of approximately $500 million, the other three segments each continue to have revenues of approximately $1 billion. We believe that each of the 4 business segments could fetch at least $400 million in a normal market, and as a result, RFP may be undervalued.
Goodwill
For the 2015 annual report, this is what we wrote:
"We have not done as well as the market for a couple of years and we wanted to take this opportunity to address that:
1) We could explain that we have been managing money for than 30 years and explain that there will always be times where we are going to underperform for a period of time.
2) We could point that in 2004, we won the Morningstar Manager of the Decade award in Canada.
3) We could write a lengthy tome of more than 100 pages on each of our significant holdings with the goal of demonstrating convincingly why we believe that they are so cheap and why we believe that the market is so wrong.
4) We could write about why we believe that our sound investment principles and a commitment to integrity and being fair to our investors should translate into better results over the long term business cycle.
But at the end of the day, when all is said and done, the reality is that we have not done well in the recent past and, particularly, in the previous year. So, as a gesture of goodwill and what we believe to be the fairest way to behave, we made a voluntary capital contribution of $918,468 which approximates to the 2015 management fees that we were paid by Chou Opportunity Fund. We have also decided to voluntarily waive the fee going forward for the calendar year 2016."
CHOU OPPORTUNITY FUNDA MESSAGE TO OUR SHAREHOLDERS (Unaudited) DECEMBER 31, 2016
|
Since doing a good deed feels good, we have decided to waive the fee going forward for the calendar year 2017.
Caution to the Investors
Investors should be advised that we run a highly focused portfolio, frequently just two or three securities may comprise close to 50% of the assets of the Fund. In addition, the Fund has securities that are non-U.S. and could be subjected to geopolitical risks, which may trump or at least negatively influence the financial performance of the company. Also, we may enter into some derivative contracts, such as credit default swaps and interest rate swaps, when we feel that the market conditions are right to use those instruments. Because of any or all of these factors, the net asset value of the Fund can be from time to time more volatile than at other times. However, we are not bothered by this volatility because our focus has always been, and continues to be, on how inexpensive we believe the Fund's portfolio holdings are relative to what we believe to be their intrinsic value.
Also, the Fund's cash position was approximately 20% of net assets as at December 31, 2016. This large cash position may depress returns for a while as we hunt for undervalued securities. Obviously, if there is a severe correction in the market in the near future, it will cushion the Fund against losses while providing us with the wherewithal to find good investment opportunities. But for now it could be a drag on returns.
Yours truly,

Francis Chou
Portfolio Manager and CEO
Chou America Management Inc.
The investment and portfolio performance views in this report were those of Portfolio Manager as of December 31, 2016, and may not reflect his views on the date this report is first published or anytime thereafter. The views are intended to assist the shareholders of the Fund in understanding their investments in the Fund and do not constitute investment advice. This letter may contain discussions about certain investments held and not held in the portfolio. All current and future holdings are subject to risk and to change. There can be no guarantee of success with any technique, strategy or investment.
This letter contains discussions about voluntary fee waivers and voluntary capital contributions of Chou America Management Inc., the investment adviser to the Opportunity Fund (the "Adviser"), with respect to fund operations during or following the year ending December 31, 2016. Any such voluntary arrangement can be modified, terminated, or discontinued by the Adviser at any time; provided that the amount of any such waiver or capital contribution may not be recouped by the Adviser at a later date. The Adviser is under no obligation to make a voluntary fee waiver or voluntary capital contribution in the future for any reason. The Adviser made its decision to implement both the voluntary waiver in, and the voluntary capital contribution to, the Opportunity Fund subsequent to, and independent of, the decision of the Board of Trustees to the Trust to renew the Investment Advisory Agreement, as discussed in this report.
The S&P 500 is an unmanaged index representing the average performance of 500 widely held, publicly traded, large capitalization stocks. One cannot invest directly in an index.
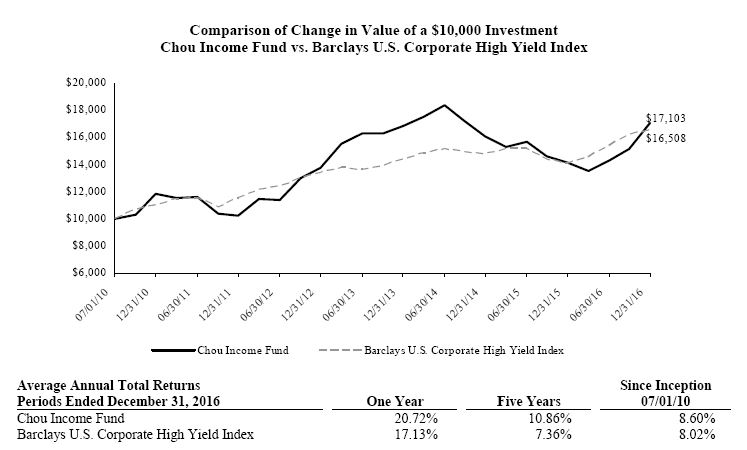
The following chart reflects the change in the value of a hypothetical $10,000 investment, including reinvested dividends and distributions, in Chou Income Fund (the "Fund") compared with the performance of the benchmark, Barclays U.S. Corporate High Yield Index ("Barclays Index"), since inception. The Barclays Index is comprised of issues that meet the following criteria: at least $150 million par value outstanding, maximum credit rating of Ba1 (including defaulted issues) and at least one year to maturity. The total return of the Barclays Index includes the reinvestment of dividends and income. The total return of the Fund includes operating expenses that reduce returns, while the total return of the Barclays Index does not include expenses. The Fund is professionally managed, while the Barclays Index is unmanaged and is not available for investment.
Performance data quoted represents past performance and is no guarantee of future results. Current performance may be lower or higher than the performance data quoted. Investment return and principal value will fluctuate so that shares, when redeemed, may be worth more or less than original cost. For the most recent month-end performance, please call (877) 682-6352. Shares redeemed or exchanged within 120 days of purchase will be charged a 2.00% redemption fee. As stated in the Fund's current prospectus, the annual operating expense ratio (gross) is 2.36%. However, the Fund's adviser has contractually agreed to reduce a portion of its fees and reimburse expenses to limit total operating expenses to 1.20% (excluding other expenses, taxes, leverage interest, acquired fund fees and expenses, dividends or interest on short positions, other interest expenses, brokerage commissions, and extraordinary expenses such as litigation)], through May 1, 2017. During the period, certain fees were waived and/or expenses reimbursed; otherwise, returns would have been lower. The performance table and graph do not reflect the deduction of taxes that a shareholder would pay on Fund distributions or the redemption of Fund shares. Returns greater than one year are annualized.
| Equity Securities - 55.4% |
| Shares | | Security Description | | Value | |
| Communications - 1.8% |
| | 15,000 | | Overstock.com, Inc. (a) | $ | 262,500 | |
| | 645,181 | | UTStarcom Holdings Corp. (a) | | 1,290,362 | |
| | | 1,552,862 | |
| Consumer Discretionary - 6.6% |
| | 37,904 | | Sears Canada, Inc. (a) | | 64,437 | |
| | 491,608 | | Sears Holdings Corp. (a) | | 4,567,038 | |
| | 197,013 | | Sears Hometown and Outlet Stores, Inc. (a) | | 925,961 | |
| | | 5,557,436 | |
| Consumer Staples - 11.7% |
| | 211,319 | | Ascent Capital Group, Inc., Class A (a) | | 3,436,047 | |
| | 441,000 | | Valeant Pharmaceuticals International, Inc. (a) | | 6,403,320 | |
| | | 9,839,367 | |
| Financials - 2.9% |
| | 225,000 | | MBIA, Inc. (a) | | 2,407,500 | |
| | | | |
| Industrials - 3.6% |
| | 95,000 | | Chicago Bridge & Iron Co. NV | | 3,016,250 | |
| | | | |
| Materials - 13.8% |
| | 2,179,359 | | Resolute Forest Products, Inc. (a) | | 11,659,571 | |
| | | | |
| Total Common Stock (Cost $67,748,257) | | 34,032,986 | |
| | Shares | | Security Description | | Exer. Price | | Exp. Date | | Value | |
| | 90,000 | | JPMorgan Chase & Co. (a) | | $42.25 | | 10/28/18 | | 3,984,300 | |
| | 77,400 | | Wells Fargo & Co. (a) | | 34.01 | | 10/28/18 | | 1,650,942 | |
| | 352,430 | | Bank of America Corp. (a) | | 12.94 | | 01/16/19 | | 3,506,678 | |
| | 205,000 | | General Motors Co. (a) | | 18.33 | | 07/10/19 | | 3,511,650 | |
| Total Warrants (Cost $5,110,741) | | 12,653,570 | |
| Communications - 0.0% | | Rate | | | |
| | 1,500 | | Overstock.com, Inc., Class B | | 1.00 | % | | 25,500 | |
| Total Preferred Stock (Cost $23,520) | | | | | 25,500 | |
| | | | |
| Total Equity Securities (Cost $72,882,518) | | 46,712,056 | |
See Notes to Financial Statements. | 11 | |
CHOU OPPORTUNITY FUNDSCHEDULE OF INVESTMENTS DECEMBER 31, 2016
|
| Fixed Income Securities - 22.5% |
| Syndicated Loan - 22.5% |
| | Principal | | Security Description | | Rate | | Maturity | | Value | | |
| $ | 26,000,000 | | Exco Resources | | 12.50 | % | 10/19/20 | $ | 18,947,500 | |
| Total Fixed Income Securities (Cost $15,379,755) | | 18,947,500 | |
| | | | | | | | | | | |
| | | | |
Total Investments - 77.9% (Cost $88,262,273)* | $ | 65,659,556 | |
| Other Assets & Liabilities, Net – 22.1% | | 18,666,038 | |
| Net Assets – 100.0% | $ | 84,325,594 | |
| (a) | Non-income producing security. |
| * Cost for federal income tax purposes is $88,392,753 and net unrealized depreciation consists of: |
| Gross Unrealized Appreciation | | $ | 12,547,500 | |
| Gross Unrealized Depreciation | | | (35,280,697 | ) |
| Net Unrealized Depreciation | | $ | (22,733,197 | ) |
The inputs or methodology used for valuing securities are not necessarily an indication of the risks associated with investing in those securities. For more information on valuation inputs, and their aggregation into the levels used in the table below, please refer to the Security Valuation section in Note 2 of the accompanying Notes to Financial Statements.
The following is a summary of the inputs used to value the Fund's investments as of December 31, 2016.
| Valuation Inputs | | Investments in Securities |
| Level 1 - Quoted Prices | | $ | 46,686,556 | |
| Level 2 - Other Significant Observable Inputs | | | 18,973,000 | |
| Level 3 - Significant Unobservable Inputs | | | - | |
| Total | | $ | 65,659,556 | |
The Level 1 value displayed in this table includes Common Stock and Warrants. The Level 2 value displayed in this table includes a Syndicated Loan and Preferred Stock. Refer to this Schedule of Investments for a further breakout of each security by type.
The Fund utilizes the end of period methodology when determining transfers. There were no transfers among Level 1, Level 2 and Level 3 for the year ended December 31, 2016.
See Notes to Financial Statements. | 12 | |
CHOU OPPORTUNITY FUNDSCHEDULE OF INVESTMENTS DECEMBER 31, 2016
|
| Equity Securities - 12.5% |
| Common Stock - 9.7% |
| Shares | | Security Description | | Value | |
| Consumer Discretionary - 6.4% |
| | 808,273 | | Wow Unlimited Media, Inc., Class A (a) | $ | 1,137,777 | |
| | | | |
| Energy - 1.9% |
| | 2,452 | | Contura Energy, Inc. (a) | | 174,092 | |
| | 7,164 | | SandRidge Energy, Inc. (a) | | 168,712 | |
| | | 342,804 | |
| Materials - 1.4% |
| | 47,613 | | Resolute Forest Products, Inc. (a) | | 254,729 | |
| | | | |
| Total Common Stock (Cost $1,576,859) | | 1,735,310 | |
| Preferred Stock - 2.8% |
| | | | | | Rate | | | | | |
| Financials - 2.8% |
| | 50,765 | | Sears Roebuck Acceptance Corp. | | 7.00% | | | 474,526 | | |
| | 3,400 | | Sears Roebuck Acceptance Corp. | | 7.40 | | | 30,279 | | |
| Total Preferred Stock (Cost $563,553) | | 504,805 | |
| Warrants - 0.0% |
| | Shares | | Security Description | | Exer. Price | | Exp. Date | | | |
| | 2,167 | | Dex Media, Inc.(a) | $ | 13.55 | | 08/15/23 | | 108 | |
| Total Warrants (Cost $0) | | 108 | |
| | | | |
| Total Equity Securities (Cost $2,140,412) | | 2,240,223 | |
| Fixed Income Securities - 62.7% |
| Corporate Convertible Bonds - 18.1% |
| | Principal | | Security Description | | Rate | | Maturity | | Value | |
| Consumer Staples - 12.7% |
| $ | 3,000,000 | | Ascent Capital Group, Inc. | | 4.00 | % | 07/15/20 | | 2,280,000 | |
| | | | |
| Energy - 3.2% |
| | 451,807 | | SandRidge Energy, Inc. (b) | | 0.00-1.19 | | 10/04/20 | | 565,041 | |
| | | | |
| Financials - 2.2% |
| | 850,000 | | Atlanticus Holdings Corp. | | 5.88 | | 11/30/35 | | 397,375 | |
| | | | |
| Total Corporate Convertible Bonds (Cost $3,533,984) | | 3,242,416 | |
See Notes to Financial Statements. | 14 | |
CHOU INCOME FUNDSCHEDULE OF INVESTMENTS DECEMBER 31, 2016
|
| Corporate Non-Convertible Bonds - 29.3% |
| | Principal | | Security Description | | Rate | | Maturity | | Value | |
| Consumer Staples - 14.6% |
| $ | 1,108,698 | | Avangardco Investments Public, Ltd. (c) | | 10.00 | % | 10/29/18 | $ | 321,522 | |
| | 1,000,000 | | Mriya Agro Holding PLC (d) | | 9.45 | | 04/19/18 | | 76,950 | | |
| | 5,101,866 | | UkrlandFarming PLC | | 10.88 | | 03/26/18 | | 1,617,062 | | |
| | 800,000 | | Valeant Pharmaceuticals International, Inc. (e) | | 6.13 | | 04/15/25 | | 604,000 | | |
| | | | | |
| | | 2,619,534 | | |
| Energy - 5.7% | |
| | 189,000 | | EXCO Resources, Inc. | | 8.50 | | 04/15/22 | | 94,500 | | |
| | 1,000,000 | | Westmore-land Coal Co. (e) | | 8.75 | | 01/01/22 | | 917,500 | | |
| | | | | |
| | | 1,012,000 | | |
| Financials - 0.7% | |
| | 212,000 | | Sears Roebuck Acceptance Corp. | | 7.00 | | 06/01/32 | | 113,420 | | |
| | | | | |
| Materials - 8.3% | |
| | 1,251,841 | | Centrus Energy Corp. (c) | | 8.00 | | 09/30/19 | | 574,282 | | |
| | 1,000,000 | | Resolute Forest Products, Inc. | | 5.88 | | 05/15/23 | | 905,000 | | |
| | 225,000 | | Sino-Forest Corp. (f) | | 6.25 | | 10/21/17 | | 563 | | |
| | 400,000 | | Sino-Forest Corp. (f) | | 6.25 | | 10/21/17 | | 1,000 | | |
| | | | |
| | | 1,480,845 | | |
| Total Corporate Non-Convertible Bonds (Cost $9,651,820) | | 5,225,799 | |
| Syndicated Loans - 15.3% |
| | Principal | | Security Description | | Rate | | Maturity | Value | |
| | 208,436 | | Contura Energy, Inc. | | 6.00 | | 07/26/20 | | 209,479 | |
| | 344,693 | | Dex Media, Inc. | | 11.00 | | 07/29/21 | | 345,985 | |
| | 3,000,000 | | Exco Resources | | 12.50 | | 10/19/20 | | 2,186,250 | |
| Total Syndicated Loans (Cost $2,366,546) | | 2,741,714 | |
| Total Fixed Income Securities (Cost $15,552,350) | | 11,209,929 | |
Total Investments - 75.2% (Cost $17,692,762)* | $ | 13,450,152 | |
| Other Assets & Liabilities, Net – 24.8% | | 4,434,795 | |
| Net Assets – 100.0% | $ | 17,884,947 | |
| PLC | Public Limited Company |
| (a) | Non-income producing security. |
| (b) | Zero coupon bond. Interest rate presented is yield to maturity. |
| (c) | Payment in-Kind Bond. Security that gives the issuer the option at each interest payment date of making interest payments in either cash or additional debt securities. |
(d) Security currently in default.
| (e) | Security exempt from registration under Rule 144A under the Securities Act of 1933. At the period end, the value of these securities amounted to $1,521,500 or 8.5% of net assets. |
(f) Security represents entitlement to potential distributions from a litigation trust.
* Cost for federal income tax purposes is $18,174,194 and net unrealized depreciation consists of:
| Gross Unrealized Appreciation | | $ | 1,863,117 | |
| Gross Unrealized Depreciation | | | (6,587,159 | ) |
| Net Unrealized Depreciation | | $ | (4,724,042 | ) |
| | | 120 | | CHOU OPPORTUNITY FUND | | | CHOU INCOME FUND | |
| ASSETS | | | | | | | | |
| . | Total investments, at value (Cost $88,262,273 and $17,692,762, respectively) | $ | 65,659,556 | | | $ | 13,450,152 | |
| | Cash | | | 16,528,254 | | | | 3,664,273 | |
| | Foreign currency (Cost $0 and $345,336, respectively) | | | - | | | | 345,079 | |
| | Receivables: | | | | | | | | |
| | | Fund shares sold | | | 500 | | | | - | |
| | | Investment securities sold | | | 2,167,500 | | | | 130,636 | |
| | | Dividends and interest | | | 28,847 | | | | 327,226 | |
| | Prepaid expenses | | | 8,672 | | | | 7,229 | |
| Total Assets | | | 84,393,329 | | | | 17,924,595 | |
| | | | | | | | | | | |
| LIABILITIES | | | | | | | | |
| | Payables: | | | | | | | | |
| | | Fund shares redeemed | | | 19,228 | | | | - | |
| | Accrued Liabilities: | | | | | | | | |
| | | Investment adviser fees | | | - | | | | 6,128 | |
| | | Trustees' fees and expenses | | | 302 | | | | 63 | |
| | | Fund services fees | | | 7,711 | | | | 7,243 | |
| | | Other expenses | | | 40,494 | | | | 26,214 | |
| Total Liabilities | | | 67,735 | | | | 39,648 | |
| | | | | | | | | | | |
| NET ASSETS | | $ | 84,325,594 | | | $ | 17,884,947 | |
| | | | | | | | | | | |
| COMPONENTS OF NET ASSETS | | | | | | | | |
| | Paid-in capital | | $ | 107,605,576 | | | $ | 23,453,159 | |
| | Undistributed (distributions in excess of) net investment income | | | 236,080 | | | | (532,346 | ) |
| | Accumulated net realized loss | | | (913,345 | ) | | | (792,999 | ) |
| | Net unrealized depreciation | | | (22,602,717 | ) | | | (4,242,867 | ) |
| NET ASSETS | | $ | 84,325,594 | | | $ | 17,884,947 | |
| SHARES OF BENEFICIAL INTEREST AT NO PAR VALUE (UNLIMITED SHARES AUTHORIZED) | | | 9,017,187 | | | | 2,231,583 | |
NET ASSET VALUE, OFFERING AND REDEMPTION PRICE PER SHARE* | | $ | 9.35 | | | $ | 8.01 | |
| | | |
| * | Shares redeemed or exchanged within 120 days of purchase are charged a 2.00% redemption fee. | |
See Notes to Financial Statements. | 17 | |
CHOU AMERICA MUTUAL FUNDSSTATEMENTS OF OPERATIONS YEAR ENDED DECEMBER 31, 2016
|
| | | | | CHOU OPPORTUNITY FUND | | | CHOU INCOME FUND | | |
| INVESTMENT INCOME | | | | | | | | | | |
| | Dividend income (Net of foreign withholding taxes of $3,990 and $0, respectively) | . | | $ | 22,611 | | | $ | 72,919 | | |
| | Interest income | | | 4,798,950 | | | | 2,151,664 | | |
| Total Investment Income | | | | 4,821,561 | | | | 2,224,583 | | |
| Adviser | | | | | | | | | | |
| EXPENSES | | | | | | | | | | |
| | Investment adviser fees | | | 820,428 | | | | 157,672 | | |
| | Fund services fees | | | 92,668 | | | | 86,936 | | |
| | Custodian fees | | | 10,035 | | | | 10,160 | | |
| | Registration fees | | | 22,961 | | | | 22,029 | | |
| | Audit fees | | | 17,500 | | | | 17,500 | | |
| | Legal fees | | | 47,810 | | | | 1,680 | | |
| | Trustees' fees and expenses | | | 16,952 | | | | 3,262 | | |
| | Miscellaneous expenses | | | 48,761 | | | | 31,676 | | |
| Total Expenses | | | | 1,077,115 | | | | 330,915 | | |
| | Fees waived and expenses reimbursed | | | (834,736 | ) | | | (141,709 | ) | |
| Net Expenses | | | | 242,379 | | | | 189,206 | | |
| | | | | | | | | | | | |
| NET INVESTMENT INCOME | | | | 4,579,182 | | | | 2,035,377 | | |
| | | | | | | | | | | | |
| NET REALIZED AND UNREALIZED GAIN (LOSS) | | | | | | | | | | |
| | Net realized gain (loss) on: | | | | | | | | | |
| | Investments | | | (782,865 | ) | | | (1,159,512 | ) | |
| | Foreign currency transactions | | | - | | | | 257,811 | | |
| | Net realized loss | | | (782,865 | ) | | | (901,701 | ) | |
| | Net change in unrealized appreciation (depreciation) on: | | | | | | | | | |
| | Investments | | | (9,322,201 | ) | | | 2,025,103 | | |
| | Foreign currency translations | | | - | | | | 41,068 | | |
| | Net change in unrealized appreciation (depreciation) | | | (9,322,201 | ) | | | 2,066,171 | | |
| NET REALIZED AND UNREALIZED GAIN (LOSS) | | | | (10,105,066 | ) | | | 1,164,470 | | |
| INCREASE (DECREASE) IN NET ASSETS RESULTING FROM OPERATIONS | | | $ | (5,525,884 | ) | | $ | 3,199,847 | | |
| | | | | | | | | | | | |
See Notes to Financial Statements. | 18 | |
CHOU AMERICA MUTUAL FUNDSSTATEMENTS OF CHANGES IN NET ASSETS
|
| | | | | CHOU OPPORTUNITY FUND | | CHOU INCOME FUND | |
| | | December 31, 2014 | | | | | | | Shares | | | | | | | | Shares | | |
| NET ASSETS DECEMBER 31, 2014 | | $ | 99,798,615 | | | | $99,798,615 | | | $ | 17,525,679 | | | | $17,525,679 | | |
| OPERATIONS | | | | | | | | | | | | | | | | | |
| | Net investment income (loss) | | | (1,106,985 | ) | | | | | | | 1,639,954 | | | | | | |
| | Net realized gain | | | 1,510,301 | | | | | | | | 163,433 | | | | | | |
| | Net change in unrealized appreciation (depreciation) | | | (24,679,006 | ) | | | | | | | (3,874,188 | ) | | | | | |
| Decrease in Net Assets Resulting from Operations | | | (24,275,690 | ) | | | | | | | (2,070,801 | ) | | | | | |
| DISTRIBUTIONS TO SHAREHOLDERS FROM | | | | | | | | | | | | | | |
| | Net investment income | | | - | | | | | | | | (1,718,275 | ) | | | | | |
| | Net realized gain | | | (1,331,988 | ) | | | | | | | (272,242 | ) | | | | | |
| Total Distributions to Shareholders | | | (1,331,988 | ) | | | | | | | (1,990,517 | ) | | | | | |
| CAPITAL SHARE TRANSACTIONS | | | | | | | | | | | | | | | | | |
| | Sale of shares | | | 23,081,184 | | | | 1,951,529 | | | | 646,342 | | | | 71,620 | | |
| | Reinvestment of distributions | | | 1,323,318 | | | | 125,077 | | | | 1,954,159 | | | | 240,674 | | |
| | Redemption of shares | | | (2,529,888 | ) | | | (212,213 | ) | | | (812,548 | ) | | | (88,723 | ) | |
| | Redemption fees | | | 369 | | | | - | | | | 509 | | | | - | | |
| Increase in Net Assets from Capital Share Transactions | | | 21,874,983 | | | | 1,864,393 | | | | 1,788,462 | | | | 223,571 | | |
| Decrease in Net Assets | | | (3,732,695 | ) | | | | | | | (2,272,856 | ) | | | | | |
| NET ASSETS DECEMBER 31, 2015 (Including line (a)) | | $ | 96,065,920 | | | | | | | $ | 15,252,823 | | | | | | |
| OPERATIONS | | | | | | | | | | | | | | | | | |
| | Net investment income | | | 4,579,182 | | | | | | | | 2,035,377 | | | | | | |
| | Net realized loss | | | (782,865 | ) | | | | | | | (901,701 | ) | | | | | |
| | Net change in unrealized appreciation (depreciation) | | | (9,322,201 | ) | | | | | | | 2,066,171 | | | | | | |
| Increase (Decrease) in Net Assets Resulting from Operations | | | (5,525,884 | ) | | | | | | | 3,199,847 | | | | | | |
| DISTRIBUTIONS TO SHAREHOLDERS FROM | | | | | | | | | | | | | | |
| | Net investment income | | | (5,261,532 | ) | | | | | | | (2,097,065 | ) | | | | | |
| | Net realized gain | | | (46,847 | ) | | | | | | | - | | | | | | |
| Total Distributions to Shareholders | | | (5,308,379 | ) | | | | | | | (2,097,065 | ) | | | | | |
| CAPITAL SHARE TRANSACTIONS | | | | | | | | | | | | | | | | | |
| | Sale of shares | | | 5,057,874 | | | | 586,768 | | | | 2,498,877 | | | | 341,359 | | |
| | Reinvestment of distributions | | | 5,282,278 | | | | 591,207 | | | | 2,068,336 | | | | 278,159 | | |
| | Redemption of shares | | | (12,165,674 | ) | | | (1,302,779 | ) | | | (3,037,871 | ) | | | (405,793 | ) | |
| | Redemption fees | | | 991 | | | | - | | | | - | | | | - | | |
| | Net contribution from affiliate (note 5) | | | 918,468 | | | | - | | | | - | | | | - | | |
| Increase (Decrease) in Net Assets from Capital Share Transactions | | (906,063 | ) | | | (124,804 | ) | | | 1,529,342 | | | | 213,725 | | |
| Increase (Decrease) in Net Assets | | | (11,740,326 | ) | | | | | | | 2,632,124 | | | | | | |
| NET ASSETS DECEMBER 31, 2016 (Including line (b)) | | $ | 84,325,594 | | | | | | | $ | 17,884,947 | | | | | | |
| (a) | Distributions in excess of net investment income December 31, 2015 | $ | - | | | | | | | $ | (363,632 | ) | | | | | |
| (b) | Undistributed (distributions in excess of) net investment income December 31, 2016 | $ | 236,080 | | | | | | | $ | (532,346 | ) | | | | | |
See Notes to Financial Statements. | 19 | |
CHOU OPORTUNITY FUNDFINANCIAL HIGHLIGHTS
|
| These financial highlights reflect selected data for a share outstanding throughout each year. | | | | | | |
| | | For the Year Ended December 31, |
| | | 2016 | | | | 2015 | | | | 2014 | | | | 2013 | | | | 2012 | | |
| NET ASSET VALUE, Beginning of Year | $ | 10.51 | | | $ | 13.71 | | | $ | 13.52 | | | $ | 11.41 | | | $ | 10.00 | | |
| INVESTMENT OPERATIONS | | | | | | | | | | | | | | | | | | | | |
| Net investment income (loss) (a) | | 0.51 | | | | (0.14 | ) | | | (0.18 | ) | | | 0.05 | | | | 0.32 | | |
| Net realized and unrealized gain (loss) | | (1.17 | ) | | | (2.91 | ) | | | 0.84 | | | | 3.31 | | | | 2.68 | | |
| Total from Investment Operations | | (0.66 | ) | | | (3.05 | ) | | | 0.66 | | | | 3.36 | | | | 3.00 | | |
| DISTRIBUTIONS TO SHAREHOLDERS FROM | | | | | | | | | | | | | | | | | | |
| Net investment income | | (0.59 | ) | | | — | | | | — | | | | (0.19 | ) | | | (0.40 | ) | |
| Net realized gain | | (0.01 | ) | | | (0.15 | ) | | | (0.47 | ) | | | (1.09 | ) | | | (1.19 | ) | |
| Total Distributions to Shareholders | | (0.60 | ) | | | (0.15 | ) | | | (0.47 | ) | | | (1.28 | ) | | | (1.59 | ) | |
| REDEMPTION FEES (a) | | — | (b) | | — | (b) | | — | (b) | | 0.03 | | | | — | (b) |
| NET CONTRIBUTION BY AFFILIATE (c) | | 0.10 | | | | - | | | | - | | | | - | | | | - | | |
| NET ASSET VALUE, End of Year | $ | 9.35 | | | $ | 10.51 | | | $ | 13.71 | | | $ | 13.52 | | | $ | 11.41 | | |
| TOTAL RETURN | | (5.02 | )%(d) | (22.27 | )% | | 4.88 | % | | 29.82 | % | | 30.81 | % |
| RATIOS/SUPPLEMENTARY DATA | | | | | | | | | | | | | | | | | | | | |
| Net Assets at End of Year (000's omitted) | $84,326 | | | $96,066 | | | $99,799 | | | $66,402 | | | $41,132 | | |
| Ratios to Average Net Assets: | | | | | | | | | | | | | | | | | | | | |
| Net investment income (loss) | | 5.58 | % | | (1.15 | )% | | (1.31 | )% | | 0.34 | % | | 2.89 | % |
| Net expenses | | 0.30 | % | | 1.24 | % | | 1.38 | % | | 1.48 | % | | 1.48 | % |
| Gross expenses (e) | | 1.31 | % | | 1.28 | % | | 1.40 | % | | 1.50 | % | | 1.55 | % |
| PORTFOLIO TURNOVER RATE | | 18 | % | | 4 | % | | 29 | % | | 56 | % | | 17 | % |
| | | | | | | | | | | | | | | | | | | | | | |
| | | | | | | | | | | | | | | | | | | | | | |
| (a) | Calculated based on average shares outstanding during each year. |
| (b) | Less than $0.01 per share. |
| (c) | Calculated based on shares outstanding on February 18, 2016, the date of the capital contribution. See note 5. |
| (d) | Calculation includes affiliate reimbursements and contribution of capital. Excluding the effect of the net reimbursements and contribution of capital from the Fund's ending net asset value per share, total return for the year ended December 31, 2016, would have been (6.04)%. |
| (e) | Reflects the expense ratio excluding any waivers and/or reimbursements. |
See Notes to Financial Statements. | 20 | |
CHOU INCOME FUNDFINANCIAL HIGHLIGHTS
|
| These financial highlights reflect selected data for a share outstanding throughout each year. | | | | | | |
| | | For the Year Ended December 31, | |
| | | 2016 | | | | 2015 | | | | 2014 | | | | 2013 | | | | 2012 | | |
| NET ASSET VALUE, Beginning of Year | $ | 7.56 | | | $ | 9.77 | | | $ | 11.04 | | | $ | 9.87 | | | $ | 8.74 | | |
| INVESTMENT OPERATIONS | | | | | | | | | | | | | | | | | | | | |
| Net investment income (a) | | 0.96 | | | | 0.90 | | | | 0.51 | | | | 0.94 | | | | 1.58 | | |
| Net realized and unrealized gain (loss) | | 0.49 | | | | (2.01 | ) | | | (1.01 | ) | | | 1.28 | | | | 1.27 | | |
| Total from Investment Operations | | 1.45 | | | | (1.11 | ) | | | (0.50 | ) | | | 2.22 | | | | 2.85 | | |
| | | | | | | | | | | | | | | | | | | | | |
| DISTRIBUTIONS TO SHAREHOLDERS FROM | | | | | | | | | | | | | | | | | | |
| Net investment income | | (1.00 | ) | | | (0.95 | ) | | | (0.52 | ) | | | (1.07 | ) | | | (1.72 | ) | |
| Net realized gain | | — | | | | (0.15 | ) | | | (0.25 | ) | | | — | | | | — | (b) |
| Total Distributions to Shareholders | | (1.00 | ) | | | (1.10 | ) | | | (0.77 | ) | | | (1.07 | ) | | | (1.72 | ) | |
| REDEMPTION FEES (a) | | — | | | | — | (b) | | — | (b) | | 0.02 | | | | — | | |
| NET ASSET VALUE, End of Year | $ | 8.01 | | | $ | 7.56 | | | $ | 9.77 | | | $ | 11.04 | | | $ | 9.87 | | |
| TOTAL RETURN | | 20.72 | % | | (11.92 | )% | | (4.83 | )% | | 22.86 | % | | 34.69 | % |
| RATIOS/SUPPLEMENTARY DATA | | | | | | | | | | | | | | | | | | | | |
| Net Assets at End of Year (000's omitted) | $17,885 | | | $15,253 | | | $17,526 | | | $14,737 | | | $6,728 | | |
| Ratios to Average Net Assets: | | | | | | | | | | | | | | | | | | | | |
| Net investment income | | 12.91 | % | | 9.94 | % | | 4.48 | % | | 8.39 | % | | 16.25 | % |
| Net expenses | | 1.20 | % | | 1.30 | % | | 1.50 | % | | 1.50 | % | | 1.50 | % |
| Gross expenses (c) | | 2.10 | % | | 2.36 | % | | 2.11 | % | | 3.41 | % | | 4.09 | % |
| PORTFOLIO TURNOVER RATE | | 22 | % | | 7 | % | | 17 | % | | 40 | % | | 23 | % |
| | | | | | | | | | | | | | | | | | | | | | |
| | | | | | | | | | | | | | | | | | | | | | |
| (a) | Calculated based on average shares outstanding during each year. |
| (b) | Less than $0.01 per share. |
| (c) | Reflects the expense ratio excluding any waivers and/or reimbursements. |
See Notes to Financial Statements. | 21 | |
CHOU AMERICA MUTUAL FUNDSNOTES TO FINANCIAL STATEMENTS DECEMBER 31, 2016
|
Note 1. Organization
The Chou Opportunity Fund and Chou Income Fund (individually, a "Fund" and, collectively the "Funds") are non-diversified portfolios of Chou America Mutual Funds (the "Trust"). The Trust is a Delaware statutory trust that is registered as an open-end, management investment company under the Investment Company Act of 1940 (the "Act"), as amended. Under its Trust Instrument, the Trust is authorized to issue an unlimited number of each Fund's shares of beneficial interest without par value. Chou Opportunity Fund's investment objective is long-term growth of capital. Chou Income Fund's investment objective is to provide capital appreciation and income production, with capital preservation as a secondary consideration. The Funds commenced operations on July 1, 2010, with the sale of 50,000 shares of each Fund at $10 per share to Chou Associates Management Inc.
Note 2. Summary of Significant Accounting Policies
The Funds are investment companies and follow accounting and reporting guidance under Financial Accounting Standards Board ("FASB") Accounting Standards Codification ("ASC") Topic 946, "Financial Services-Investment Companies". These financial statements are prepared in accordance with accounting principles generally accepted in the United States of America ("GAAP"), which require management to make estimates and assumptions that affect the reported amounts of assets and liabilities, the disclosure of contingent liabilities at the date of the financial statements, and the reported amounts of increases and decreases in net assets from operations during the fiscal year. Actual amounts could differ from those estimates. The following summarizes the significant accounting policies of each Fund:
Security Valuation – Securities are valued at market prices using the last quoted trade or official closing price from the principal exchange where the security is traded, as provided by independent pricing services on each Fund business day. In the absence of a last trade, securities are valued at the mean of the last bid and ask price provided by the pricing service. Debt securities may be valued at prices supplied by a fund's pricing agent based on broker or dealer supplied valuations or matrix pricing, a method of valuing securities by reference to the value of other securities with similar characteristics such as rating, interest rate and maturity. Short-term investments that mature in 60 days or less may be valued at amortized cost.
Each Fund values its investments at fair value pursuant to procedures adopted by the Trust's Board of Trustees (the "Board") if (1) market quotations are insufficient or not readily available or (2) the Fund believes that the values available are unreliable. The Trust's Valuation Committee, as defined in each Fund's registration statement, performs certain functions as they relate to the administration and oversight of each Fund's valuation procedures. Under these procedures, the Valuation Committee convenes on a regular and ad-hoc basis to review such investments and considers a number of factors, including valuation methodologies and significant unobservable inputs, when arriving at fair value.
The Valuation Committee may work with the Adviser, as defined in Note 4, to provide valuation inputs. In determining fair valuations, inputs may include market-based analytics which may consider related or comparable assets or liabilities, recent transactions, market multiples, book values and other relevant investment information. Adviser inputs may include an income-based approach in which the anticipated future cash flows of the investment are discounted in determining fair value. Discounts may also be applied based on the nature or duration of any restrictions on the disposition of the investments. The Valuation Committee performs regular reviews of valuation methodologies, key inputs and assumptions, disposition analysis and market activity.
Fair valuation is based on subjective factors and, as a result, the fair value price of an investment may differ from the security's market price and may not be the price at which the asset may be sold. Fair valuation could result in a different Net Asset Value ("NAV") than a NAV determined by using market quotes.
CHOU AMERICA MUTUAL FUNDSNOTES TO FINANCIAL STATEMENTS DECEMBER 31, 2016
|
Each Fund has a three-tier fair value hierarchy. The basis of the tiers is dependent upon the various "inputs" used to determine the value of each Fund's investments. These inputs are summarized in the three broad levels listed below:
Level 1 — quoted prices in active markets for identical assets and liabilities
Level 2 — other significant observable inputs (including quoted prices of similar securities, interest rates, prepayment speeds, credit risk, etc.)
Level 3 — significant unobservable inputs (including each Fund's own assumptions in determining the fair value of investments)
The aggregate value by input level, as of December 31, 2016, for each Fund's investments is included at the end of each Fund's Schedule of Investments.
Security Transactions, Investment Income and Realized Gain and Loss – Investment transactions are accounted for on the trade date. Dividend income is recorded on the ex-dividend date. Foreign dividend income is recorded on the ex-dividend date or as soon as possible after each Fund determines the existence of a dividend declaration after exercising reasonable due diligence. Income and capital gains on some foreign securities may be subject to foreign withholding taxes, which are accrued as applicable. Interest income is recorded on an accrual basis. Premium is amortized and discount is accreted using the effective interest method. Identified cost of investments sold is used to determine the gain and loss for both financial statement and federal income tax purposes.
Foreign Currency Transactions – Each Fund may enter into transactions to purchase or sell foreign currency contracts and options on foreign currency. Forward currency contracts are agreements to exchange one currency for another at a future date and at a specified price. A fund may use forward currency contracts to facilitate transactions in foreign securities, to manage a fund's foreign currency exposure and to protect the U.S. dollar value of its underlying portfolio securities against the effect of possible adverse movements in foreign exchange rates. These contracts are intrinsically valued daily based on forward rates, and a fund's net equity therein, representing unrealized gain or loss on the contracts as measured by the difference between the forward foreign exchange rates at the dates of entry into the contracts and the forward rates at the reporting date, is recorded as a component of NAV. These instruments involve market risk, credit risk, or both kinds of risks, in excess of the amount recognized in the Statement of Assets and Liabilities. Risks arise from the possible inability of counterparties to meet the terms of their contracts and from movement in currency and securities values and interest rates. Due to the risks associated with these transactions, a fund could incur losses up to the entire contract amount, which may exceed the net unrealized value included in its NAV.
Distributions to Shareholders – Distributions to shareholders of net investment income, if any, are declared and paid semi-annually. Distributions to shareholders of net capital gains, if any, are declared and paid at least annually. Distributions to shareholders are recorded on the ex-dividend date. Distributions are based on amounts calculated in accordance with applicable federal income tax regulations, which may differ from GAAP. These differences are due primarily to differing treatments of income and gain on various investment securities held by each Fund, timing differences and differing characterizations of distributions made by each Fund.
Federal Taxes – Each Fund intends to continue to qualify each year as a regulated investment company under Subchapter M of Chapter 1, Subtitle A, of the Internal Revenue Code of 1986, as amended ("Code"), and to distribute all of their taxable income to shareholders. In addition, by distributing in each calendar year substantially all of their net investment income and capital gains, if any, the Funds will not be subject to a federal excise tax. Therefore, no federal income or excise tax provision is required. Each Fund files a U.S. federal income and excise tax return as required. Each Fund's federal income tax returns are subject to examination by the Internal Revenue Service for a period of three fiscal years after they are filed. As of December 31, 2016, there are no uncertain tax
CHOU AMERICA MUTUAL FUNDSNOTES TO FINANCIAL STATEMENTS DECEMBER 31, 2016
|
positions that would require financial statement recognition, de-recognition or disclosure.
Income and Expense Allocation – The Trust accounts separately for the assets, liabilities and operations of each of its investment portfolios. Expenses that are directly attributable to more than one investment portfolio are allocated among the respective investment portfolios in an equitable manner.
Redemption Fees – A shareholder who redeems or exchanges shares within 120 days of purchase will incur a redemption fee of 2.00% of the current NAV of shares redeemed or exchanged, subject to certain limitations. The fee is charged for the benefit of the remaining shareholders and will be paid to each Fund to help offset transaction costs. The fee is accounted for as an addition to paid-in capital. Each Fund reserves the right to modify the terms of or terminate the fee at any time. There are limited exceptions to the imposition of the redemption fee. Redemption fees incurred for the Funds, if any, are reflected on the Statements of Changes in Net Assets.
Commitments and Contingencies – In the normal course of business, each Fund enters into contracts that provide general indemnifications by each Fund to the counterparty to the contract. Each Fund's maximum exposure under these arrangements is dependent on future claims that may be made against each Fund and, therefore, cannot be estimated; however, based on experience, the risk of loss from such claims is considered remote.
Note 3. Cash – Concentration in Uninsured Account
For cash management purposes each Fund may concentrate cash with each Fund's custodian. This typically results in cash balances exceeding the Federal Deposit Insurance Corporation ("FDIC") insurance limits. As of December 31, 2016, Chou Opportunity Fund and Chou Income Fund held $16,278,254 and $3,414,273, respectively, as cash reserves at MUFG Union Bank, N.A. that exceeded the FDIC insurance limit.
Note 4. Fees and Expenses
Investment Adviser – Chou America Management Inc. (the "Adviser") is the investment adviser to each Fund. Pursuant to an investment advisory agreement, the Adviser receives an advisory fee, payable monthly, from each Fund at an annual rate of 1.00% of each Fund's average daily net assets.
Distribution – Rafferty Capital Markets, LLC serves as each Fund's distributor (the "Distributor"). The Trust has adopted a Rule 12b-1 plan under which the Funds may pay an annual fee of up to 0.25% of the average daily net assets of the Funds for distribution services and/or the servicing of shareholder accounts. The Board has not authorized the Funds to pay a Rule 12b-1 fee at this time. The Distributor is not affiliated with the Adviser or Atlantic Fund Administration, LLC (d/b/a Atlantic Fund Services) ("Atlantic") or their affiliates.
Other Service Providers – Atlantic provides fund accounting, fund administration, compliance and transfer agency services to each Fund. The fees related to these services are included in Fund services fees within the Statement of Operations. Atlantic also provides certain shareholder report production and EDGAR conversion and filing services. Pursuant to an Atlantic services agreement, each Fund pays Atlantic customary fees for its services. Atlantic provides a Principal Financial Officer, a Chief Compliance Officer, and an Anti-Money Laundering Officer to each Fund, as well as certain additional compliance support functions.
Trustees and Officers – The Trust pays each Independent Trustee an annual retainer fee of $8,240 for service to the Trust and the Audit and Compliance Committee Chairperson receives an additional retainer fee of $3,000. Each Trustee is also reimbursed for all reasonable out-of-pocket expenses incurred in connection with their duties as a Trustee, including travel and related expenses incurred in attending Board meetings. No officers of the Funds are compensated by the Funds, but officers are reimbursed for travel and related expenses incurred in attending Board meetings.
CHOU AMERICA MUTUAL FUNDSNOTES TO FINANCIAL STATEMENTS DECEMBER 31, 2016
|
Note 5. Capital Contribution
On February 18, 2016, the Adviser made a voluntary capital contribution to the Chou Opportunity Fund in the amount of $918,468, which approximates the advisory fees retained by the Adviser with respect to the Chou Opportunity Fund during the fiscal year ended December 31, 2015. This voluntary contribution, included on the Statements of Changes, was a gesture of goodwill by the Adviser to the Chou Opportunity Fund in recognition of the Fund's underperformance in the prior year relative to its performance in earlier years. The Adviser is under no obligation to make a voluntary waiver, a voluntary fee reimbursement, or a voluntary capital contribution to either of the Funds in the future for any reason.
Note 6. Expense Reimbursements and Fees Waived
The Adviser has contractually agreed to waive a portion of its fee and/or reimburse certain expenses to limit total annual operating expenses to 1.20% of the average daily net assets of each Fund through at least May 1, 2017 (excluding other expenses, taxes, leverage interest, acquired fund fees and expenses, dividends or interest on short positions, other interest expenses, brokerage commissions, and extraordinary expenses such as litigation). The Adviser has voluntarily decided to waive its entire advisory fee on the Chou Opportunity Fund beginning on January 1, 2016. The Adviser can unilaterally decide to terminate this voluntary waiver at any time. For the year ended December 31, 2016, fees waived and expenses reimbursed were as follows:
| | | Investment Adviser Fees Waived | | Expenses Reimbursed | | Total Fees Waived and Expenses Reimbursed |
| Chou Opportunity Fund | | $ | 820,428 | | $ | 14,308 | | $ | 834,736 |
| Chou Income Fund | | | 139,022 | | | 2,687 | | | 141,709 |
| | | | | | | | | |
Note 7. Security Transactions
The cost of purchases and proceeds from sales of investment securities (including maturities), other than short-term investments during the year ended December 31, 2016, were as follows:
| | | Purchases | | Sales |
| Chou Opportunity Fund | | $ | 18,654,887 | | $ | 11,293,867 |
| Chou Income Fund | | | 4,005,990 | | | 2,569,498 |
Note 8. Federal Income Tax
Distributions during the fiscal years as noted were characterized for tax purposes as follows:
| | | Ordinary Income | | Long-Term Capital Gain | | Total | | | |
| Chou Opportunity Fund |
| 2016 | | $ | 5,261,570 | | | $ | 46,809 | | | $ | 5,308,379 | | | | |
| 2015 | | | 603,853 | | | | 728,135 | | | | 1,331,988 | | | | |
| |
Chou Income Fund
| 2016 | | | 2,097,065 | | | | - | | | | | 2,097,065 | | |
| 2015 | | | 1,718,288 | | | | 272,229 | | | | | 1,990,517 | | |
CHOU AMERICA MUTUAL FUNDSNOTES TO FINANCIAL STATEMENTS DECEMBER 31, 2016
|
As of December 31, 2016, distributable earnings (accumulated loss) on a tax basis were as follows:
| | | Undistributed Ordinary Income | | Capital and Other Losses | | Unrealized Depreciation | | Other Temporary Differences | | Total |
| Chou Opportunity Fund | | $ | 236,080 | | | $ | (782,865 | ) | | $ | (22,733,197 | ) | | $ | - | | | $ | (23,279,982 | ) |
| Chou Income Fund | | | - | | | | (821,703 | ) | | | (4,724,299 | ) | | | (22,210 | ) | | | (5,568,212 | ) |
The difference between components of distributable earnings on a tax basis and the amounts reflected in the Statement of Assets and Liabilities are primarily due to wash sales and straddles for Chou Opportunity Fund and contingent payment debt instruments for Chou Income Fund.
As of December 31, 2016, the Chou Opportunity Fund and Chou Income Fund had $782,865 and $792,999, respectively, of available long-term capital loss carryforwards that have no expiration date.
For tax purposes, the current late year ordinary loss was $28,704 (realized during the period November 1, 2016 through December 31, 2016) for Chou Income Fund. This loss was recognized for tax purposes on the first business day of the Fund's current fiscal year, January 1, 2017.
On the Statements of Assets and Liabilities, as a result of permanent book to tax differences, certain amounts have been reclassified for the year ended December 31, 2016. The following reclassifications were the result of currency gain/loss, re-designation of distributions and distributions in excess of income and have no impact on the net assets of each Fund.
| | Undistributed Net Investment Income (Loss) | | Accumulated Net Realized Gain (Loss) | | Paid-in-Capital |
| Chou Opportunity Fund | | $ | 918,430 | | | $ | 38 | | | $ | (918,468 | ) |
| Chou Income Fund | | | (107,026 | ) | | | 108,702 | | | | (1,676 | ) |
Note 9. Securities Lending Agreement
The Funds established a securities lending arrangement with The Bank of New York Mellon as securities lending agent in which the Funds lends portfolio securities to a broker in exchange for collateral consisting of cash in an amount at least equal to the market value of the securities on loan. Cash collateral may be invested in government securities. During the year ended December 31, 2016, the Funds did not have any securities on loan.
Note 10. Recent Accounting Pronouncements
In October 2016, the U.S. Securities and Exchange Commission ("SEC") issued a new rule, Investment Company Reporting Modernization, which, among other provisions, amends Regulation S-X to require standardized, enhanced disclosures, particularly related to derivatives, in investment company financial statements. Compliance with the amendments to Regulation S-X is required for financial statements filed with the SEC on or after August 1, 2017. Management is currently evaluating the impact that the amendments will have on the Funds' financial statements and related disclosures.
Note 11. Subsequent Events
Subsequent events occurring after the date of this report through the date these financial statements were issued have been evaluated for potential impact, and each Fund has had no such events.