As filed with the Securities and Exchange Commission on March 5, 2019
UNITED STATES
SECURITIES AND EXCHANGE COMMISSION
WASHINGTON, D.C. 20549
FORM N-CSR
CERTIFIED SHAREHOLDER REPORT OF REGISTERED MANAGEMENT
INVESTMENT COMPANIES
Investment Company Act file number 811-22394
CHOU AMERICA MUTUAL FUNDS
Three Canal Plaza, Suite 600
Portland, Maine 04101
Michael J. McKeen, Principal Financial Officer
Three Canal Plaza, Suite 600
Portland, Maine 04101
207-347-2000
Date of fiscal year end: December 31
Date of reporting period: January 1, 2018 – December 31, 2018
ITEM 1. REPORT TO STOCKHOLDERS.
CHOU AMERICA MUTUAL FUNDS
Annual Report
December 31, 2018
Fund Adviser:
Chou America Management Inc.
110 Sheppard Ave. East
Suite 301, Box 18
Toronto, Ontario, Canada M2N 6Y8
Toll Free: (877) 755-5188
TABLE OF CONTENTS
| A Message to our Shareholders (Unaudited) | 1 |
| Performance Charts and Analysis (Unaudited) | 9 |
| Schedules of Investments | 11 |
| Statements of Assets and Liabilities | 18 |
| Statements of Operations | 19 |
| Statements of Changes in Net Assets | 20 |
| Statements of Cash Flows | 21 |
| Financial Highlights | 22 |
| Notes to Financial Statements | 24 |
| Report of Independent Registered Public Accounting Firm | 31 |
| Additional Information (Unaudited) | 32 |
CHOU OPPORTUNITY FUND
A MESSAGE TO OUR SHAREHOLDERS (Unaudited)
DECEMBER 31, 2018
Dear Shareholder,
For the year ending December 31, 2018, the Chou Opportunity Fund (the “Fund”) was down 17.52%, while the S&P 500 Total Return Index declined 4.38% during the same period. The Fund’s prior performance is not necessarily indicative of how the Fund will perform in the future.
PORTFOLIO OVERVIEW
For the year, the main positive contributor to the Fund’s performance was MBIA Inc. Conversely, the equity holdings of Ascent Capital, Sears Holdings, and Teva Pharmaceutical, as well as the EXCO Resources 1.75 lien term loan contributed negatively to the Fund’s performance in 2018.
During the year, the Fund added three new companies to its equity portfolio: Allegiant Travel Co., DaVita Inc., and Spirit Airlines Inc. The Fund also wrote covered call options on the common shares of Resolute Forest Products, Endo International and Bausch Health.
The Fund reduced its equity holdings of MBIA Inc., Resolute Forest Products, Sears Holdings, and Ascent Capital Group in 2018.
In August 2018, the Fund elected to exercise all units of the J.P. Morgan Chase & Co., Bank of America, and Wells Fargo TARP warrants to common shares on a cashless basis.
Overall, the Fund was heavily affected by market conditions, dropping about 17% in the last quarter of the year. The Fund’s performance has since recovered 10% in January 2019.
COMMENTARIES
EXCO Resources
As of December 31, 2018, the Fund owned around $10 million worth of EXCO Resources’ (“EXCO”) 1.75 lien term loan (converted from the second-lien term loan held previously in Feb. 2017), with approximately $23 million in par value. This is the largest position in the portfolio, comprising approximately 27% of the assets of the Fund (at market value).
On January 15, 2018, EXCO filed voluntary petitions for a court-supervised reorganization under Chapter 11 of the U.S. Bankruptcy Code to facilitate a restructuring of its balance sheet. EXCO was saddled with very expensive transportation and other contracts. During a bankruptcy proceeding, contracts that have a present value of, for example $200 million, could potentially be renegotiated to as low as $20 million. On November 5, 2018, EXCO filed their restructuring plan and it stated that holders of the 1.75 lien term loan will receive 82% of the new common stock of the company, subject to dilution by the management incentive plan.
Based on the valuation analysis by EXCO’s investment banking firm, PJT Partners Inc. (“PJT”), EXCO’s total enterprise value range was estimated to be between $850.0 million as a low estimate, and $1,150 million as a high estimate. Taking into account the $565.0 million in net debt, this implies a total equity value of $285.0 to $585.0 million that has the potential to be allocated to holders of the 1.75 lien term loan and other lower priority claim holders under the restructuring plan.
CHOU OPPORTUNITY FUND
A MESSAGE TO OUR SHAREHOLDERS (Unaudited)
DECEMBER 31, 2018
| (US$in millions) | Low | Midpoint | High |
| Total Enterprise Value | $850 | $1,000 | $1.150 |
| Less: Net Debt | -565 | -565 | -565 |
| Total Equity Value | $285 | $435 | $585 |
| 82% for 1.75L term loan | $234 | $357 | $480 |
| Percentage Recovery | 31% | 48% | 65% |
| Source: Exhibit F - Valuation Analysis of Document 1233 for Case 18-30155. |
Based upon the reported mid-point valuation of $435.0 million, the 1.75 lien term loan holders are expected to achieve a 48% recovery under the restructuring plan (given the $742.2 total principal amounts outstanding for the 1.75 lien term loan). However, the expected recovery of 48 cents on the dollar under the current restructuring plan would vary should the overall valuation of EXCO change depending on the commodity prices (from the low of 31% to the high end of estimate at 65% recovery).
On average, we purchased the EXCO term loans at 56 cents on a dollar. During the year 2016, we received approximately $3.48 million in cash interest, equivalent to around 12 cents on a dollar. In addition, we also received payment-in-kind interest that was added to the term loan principal. If our current assumptions regarding this investment prove to be correct over the long term, then we think the value of the EXCO 1.75 lien term loan should be higher than the year end 2018 price of 44.36 cents on a dollar.
Pharmaceutical Companies
We believe pharmaceutical stocks as a group are selling at attractive valuations. The companies generate their earnings in cash, and at the time of our purchase were selling at less than 10 times earnings. Some companies were down more than 50% from their highs, which is what initially caught our attention. As discussed in past reports, we invested in more than two pharmaceutical companies (that is, we utilized a so-called “basket approach”) in order to reduce the potential risks from issues relating to Food and Drug Administration (“FDA”) approval and patent expiration that may be faced by a single company.
Sears Holdings
In October 2018, Sears Holdings (“Sears”) filed for voluntary Chapter 11 proceedings in Federal Bankruptcy Court in New York to cut its debts and reorganize its operations through further store closures. Instead of a liquidation procedure preferred by some creditors to close down all the stores and sell the remaining assets of the company, the CEO and majority shareholder, Edward Lampert, won the auction with a $5.3 billion bid and the promise to keep over 400 stores open. We significantly reduced our holdings in 2018 and sold the remaining shares of Sears in early 2019.
From 2010 to 2015, the Fund spent approximately $25.4 million on the purchase of Sears shares (weighted average purchase price of $30.67 per share). The shares were sold for a total of $11.8 million (weighted average sale price of $14.18 per share). Over the entire period, during which the Fund held a position in Sears (the “Investment Period”), the Fund received a total of about $5.0 million in distributions from dividends, various spin-offs and right offerings (which we later sold in the market). In 2017, we also initiated a stock lending program, as a result of which the Fund received a total investment return on the shares lent of about $2.1 million.
CHOU OPPORTUNITY FUND
A MESSAGE TO OUR SHAREHOLDERS (Unaudited)
DECEMBER 31, 2018
| Sears Holdings Investment | (in Millions) |
| Total Cost of Purchase | $25.4 |
| Proceeds From: | |
| (-) Total Sales | $11.8 |
| (-) Dividends | 0.2 |
| (-) Spin-Offs | 2.3 |
| (-) Rights Offerings | 2.5 |
| (-) Stock Lending Return | 2.1 |
| NET LOSS | $6.6 |
| % of Total Purchase | 26% |
As shown above, on a simple cash flow basis for the Investment Period, the Fund suffered a net loss of approximately $6.6 million on the investment in Sears, or 26% of the total purchase amount. In spite of the various distributions including dividends, spin-offs, rights offerings, and the stock lending revenue, it was still a poor investment overall. We were correct that the real estate plus the brand names would afford some cushion against losses. However, we were inaccurate that Eddie Lampert would maximize returns for shareholders based on the real estate assets, and the value of the retail company that Sears had at the time of purchase. Instead, he tried to re-invent the company, suffered huge losses along the way, and almost completely eroded the value of the considerable real estate assets that Sears held.
Resolute Forest Products
As of December 31, 2018, the market price of Resolute Forest Products (“RFP”) was at $7.93 per share, giving a market capitalization of roughly $720 million dollars. This was after $1.50 per share in special dividends we received in December 2018. As we have explained in the past, the company continues to have consolidated sales of close to $3.5 billion, and it is a global leader in each of its major business segments. It continues to be the biggest volume producer of wood products east of the Rockies, the third largest in North America for market pulp, the number one producer of newsprint in the world, and the largest North American producer of uncoated mechanical paper. The wood products segment continues to have revenues of approximately $800 million, while the other three segments each continue to have revenues of approximately $900 million. We believe that each of the four business segments could fetch at least $400 million in a normal market and, as a result, RFP may be undervalued. However, in spite of the stock price breaking $10 during most of 2018, we have been disappointed with management’s ability to make sound capital allocation decisions over the last five years.
With the appointment of Yves Laflamme as RFP’s new CEO in February 2018, there is more optimism on what the company can do with its four business segments. However, the stock continues to trade at less than 6 times earnings.
In 2017, we began to sell covered call options on RFP’s common shares. There are two factors to consider - the premiums we are going to receive and the strike price. The call options were sold at a strike price where if the shares are called away, we would be happy to sell it at that price. We have since received net premiums of $683,190 in 2017 and $935,346 in 2018, totaling over $1.6 million or about $1.15 per share. Combined with the $1.50 per share in special dividends, the premiums we’ve received on the covered call options have helped provide a cushion against unrealized losses on the Fund’s position as of the end of the annual reporting period.
CHOU OPPORTUNITY FUND
A MESSAGE TO OUR SHAREHOLDERS (Unaudited)
DECEMBER 31, 2018
U.S. Bank TARP Warrants
Overall, our investments in the TARP warrants of Bank of America, Wells Fargo and J.P. Morgan Chase & Co. have performed well since we bought them several years ago. We converted the warrants to their respective common shares in August 2018.
| Warrants | Average Cost Base (“ACB”) | Price on Warrant Exercise Date* | % Increase from ACB |
| Bank of America (Jan. 16, 2019) | $2.22 | $19.52 | 779% |
| Wells Fargo (Oct. 28, 2018) | $7.42 | $25.79 | 248% |
| J.P. Morgan Chase (Oct. 28, 2018) | $8.21 | $75.94 | 825% |
| * | The warrants were converted on August 28, 2018. |
The timing of the conversion also proved advantageous for the Fund as we received more shares than we would have at expiration. Here is a comparison of the number of common shares we received for Bank of America, Wells Fargo and J.P. Morgan Chase & Co. at the time of conversion in August 2018 vs. what we would have received upon expiration:
| Warrants | Shares Received from Exercise in August 2018 | Shares to be Received upon Expiration* | Percentage Increase |
| Bank of America (Jan. 16, 2019) | 52,960 | 45,617 | 16% |
| Wells Fargo (Oct. 28, 2018) | 33,717 | 25,916 | 30% |
| JPMorgan Chase (Oct. 28, 2018) | 19,633 | 18,543 | 6% |
| * | Expiration date of the last listing date two or three days prior. |
A unique characteristic of these warrants is the ability to convert them to common shares via a cashless transaction. Instead of paying for the exercise price of the warrants in cash at the time of conversion, these warrants are only payable by netting out the number of the common shares issued upon exercise of the warrants that in total equal the exercise price.
CAUTION TO THE INVESTORS
Investors should be advised that we run a highly focused portfolio, frequently just two or three securities may comprise close to 50% of the assets of the Fund. In addition, the Fund has securities that are non-U.S. and could be subjected to geopolitical risks, which may trump or at least negatively influence the financial performance of the company. Also, we may enter into some derivative contracts, such as credit default swaps and interest rate swaps, when we feel that the market conditions are right to use those instruments. Because of any or all of these factors, the net asset value of the Fund can be from time to time more volatile than at other times. However, we are not bothered by this volatility because our focus has always been, and continues to be, on how inexpensive we believe the Fund’s portfolio holdings are relative to what we believe to be their intrinsic value.
The Fund’s cash position was approximately 4% of net assets as at December 31, 2018.
CHOU OPPORTUNITY FUND
A MESSAGE TO OUR SHAREHOLDERS (Unaudited)
DECEMBER 31, 2018
Yours truly,
Francis Chou
Portfolio Manager and CEO
Chou America Management Inc.
The investment and portfolio performance views in this report were those of the Portfolio Manager as of December 31, 2018, and may not reflect his views on the date this report is first published or anytime thereafter. The views are intended to assist the shareholders of the Fund in understanding their investments in the Fund and do not constitute investment advice. This letter may contain discussions about certain investments held and not held in the portfolio. All current and future holdings are subject to risk and to change. There can be no guarantee of success with any technique, strategy or investment.
The S&P 500 is an unmanaged index representing the average performance of 500 widely held, publicly traded, large capitalization stocks. One cannot invest directly in an index.
CHOU INCOME FUND
A MESSAGE TO OUR SHAREHOLDERS (Unaudited)
DECEMBER 31, 2018
Dear Shareholder,
For the year ending December 31, 2018, the Chou Income Fund (the “Fund”) was down 13.23%, while the Barclay's Capital U.S. Corporate High Yield Index (High Yield Index) declined 2.08% during the same period. The Fund's performance is not necessarily indicative of how the Fund will perform in the future.
PORTFOLIO OVERVIEW
For the year, the main positive contributors to the Fund’s performance were the debt holdings of Atlanticus Holdings Corporation and Ukrlandfarming PLC. Conversely, the equity holdings of Sandridge Energy Inc., WOW Unlimited Media, as well as the debt holdings of EXCO Resources, Westmoreland Coal Company, Avangardco Investments, and Ascent Capital Group contributed negatively to the Fund’s performance in 2018.
During the year, the Fund added two new pharmaceutical corporate bonds: Mallinckrodt International Finance’s 5.625% unsecured bond, due on Oct-15-2023, and Endo Finance’s 6.00% unsecured bond, due on Jul-15-2023.
The Fund reduced debt holdings in Ascent Capital Group in 2018. The Fund also exited positions in the common shares of Contura Energy Inc., the corporate bond of Westmoreland Coal Company, and the preferred shares of Sears Roebuck Acceptance Corp.
COMMENTARIES
Ascent Capital Group
Ascent Capital Group (“Ascent”)’s 4% convertible bond due on Jul-15-2020 is currently the Fund’s largest holding at year-end 2018, comprising 14.5% of the assets of the Fund at market value. During the year, the bond price dropped 11.9%, from 79.44 cents on a dollar on December 31, 2017 to 70.00 cents on a dollar on December 31, 2018.
The bond price reached as low as 58.75 cents on a dollar as of June 30, 2018. This was mainly due the poor financial performance at the operating subsidiary, Monitronics International Inc. (“Monitronics”). At the holding company level, Ascent had over $100 million in cash and short-term securities, enough to cover the $96.8 million in principal of the 4% convertible bond which the Fund holds. To refinance Monitronics’ debt, the company had a series of proposed deals to divert cash from the holding company to Monitronics. This was done at the expense of the holding company’s creditors and would render Ascent unable to pay off the 4% convertible bond on the maturity date in July 2020.
In late 2018, some of Ascent’s creditors took the issue to the Delaware Chancery Court over the proposed transaction that would see Ascent contribute $75 million to Monitronics to refinance the subsidiary’s unsecured senior notes for new second-lien secured notes. The Fund was not part of the lawsuit filed by those creditors. The lawsuit was recently settled in February 2019 with the plaintiffs receiving a total of $70.67 million in cash. Excluding the $6.10 million in professional and other fees, this is equivalent to a payment of 85 cents on a dollar for the bond.
We are disappointed that Ascent did not extend similar treatment to all creditors. A recent cash proposal only offered 71.03 cents on a dollar to repurchase the 4% unsecured bond. We are exploring alternatives to obtain what we believe represents a reasonable amount of consideration for this investment.
Avangardco Investments and Ukrlandfarming PLC
Avangardco Investments’ 10% unsecured bond, due on Oct-29-2018, fell from 22.45 cents on a dollar on December 31, 2017 to 18.12 cents on December 31, 2018. Ukrlandfarming’s 10.875% unsecured bond, due on Mar-26-2018 increased slightly from 15.25 cents on a dollar on December 31, 2017 to 15.97 cents on December 31, 2018.
CHOU INCOME FUND
A MESSAGE TO OUR SHAREHOLDERS (Unaudited)
DECEMBER 31, 2018
As mentioned in previous reports, we believe that the bonds of those companies are down from their purchase price in large part because the Ukrainian region of the world is highly volatile and is subject to serious geopolitical risk. As a result, we expect the prices of the bonds we purchased to be volatile and could subject the Fund to a permanent loss of capital.
Both bonds have defaulted upon their maturity in 2018 and were unable to repay their principals. We are waiting for an updated restructuring plan from Avangardco and Urklandfarming PLC for the bondholders.
EXCO Resources
As of December 31, 2018, the Fund owned around $1.4 million worth of EXCO Resources’ (“EXCO”) 1.75 lien term loan (converted from the second lien term loan held previously in Feb. 2017), with approximately $3.1 million in par value. This is the largest position in the portfolio, comprising more than 14% of the assets of the Fund (at market value).
On January 15, 2018, EXCO filed voluntary petitions for a court-supervised reorganization under Chapter 11 of the U.S. Bankruptcy Code to facilitate a restructuring of its balance sheet. EXCO was saddled with very expensive transportation and other contracts. During a bankruptcy proceeding, contracts that have a present value of, for example $200 million, could potentially be renegotiated to as low as $20 million. On November 5, 2018, EXCO filed their restructuring plan and it stated that holders of the 1.75 lien term loan will receive 82% of the new common stock of the company, subject to dilution by the management incentive plan.
Based on the valuation analysis by EXCO’s investment banking firm, PJT Partners Inc. (“PJT”), EXCO’s total enterprise value range was estimated to be between $850.0 million as a low estimate, and $1,150 million as a high estimate. Taking into account the $565.0 million in net debt, this implies a total equity value of $285.0 to $585.0 million that has the potential to be allocated to holders of the 1.75 lien term loan and other lower priority claim holders under the restructuring plan.
| (US$ in millions) | Low | Midpoint | High |
| Total Enterprise Value | $850 | $1,000 | $1,150 |
| Less: Net Debt | -565 | -565 | -565 |
| Total Equity Value | $285 | $435 | $585 |
| 82% for 1.75L term loan | $234 | $357 | $480 |
| Percentage Recovery | 31% | 48% | 65% |
| Source: Exhibit F – Valuation Analysis of Document 1233 for Case 18-30155. |
Based upon the reported mid-point valuation of $435.0 million, the 1.75 lien term loan holders are expected to achieve a 48% recovery under the restructuring plan (given the $742.2 total principal amounts outstanding for the 1.75 lien term loan). However, the expected recovery of 48 cents on the dollar under the current restructuring plan would vary should the overall valuation of EXCO change depending on the commodity prices (from the low of 31% to the high end of estimate at 65% recovery).
On average, we purchased the EXCO term loans at 37 cents on a dollar. During the year 2016, we received approximately $330,200 in cash interest, equivalent to around 11 cents on a dollar. In addition, we also received payment-in-kind interest that was added to the term loan principal. If our current assumptions regarding this investment prove to be correct over the long term, then we think the value of the EXCO 1.75 lien term loan should be higher than the year end 2018 price of 44.36 cents on a dollar.
The Pharmaceutical Industry
We believe pharmaceutical bonds as a group are selling at attractive valuations, in comparison to the free cash flow and earnings the companies generate.
CHOU INCOME FUND
A MESSAGE TO OUR SHAREHOLDERS (Unaudited)
DECEMBER 31, 2018
In May 2018, we purchased two new pharmaceutical bonds in addition to Bausch Health Cos. (previously known as Valeant Pharmaceuticals): Mallinckrodt International Finance’s 5.625% unsecured bond, due on Oct-15-2023, and Endo Finance’s 6.00% unsecured bond, due on Jul-15-2023.
CAUTION TO THE INVESTORS
Investors should be advised that we run a highly focused portfolio, frequently only two or three securities may comprise close to 50% of the assets of the Fund. In addition, we have securities that are non-U.S. and could be subjected to geopolitical risks, which may trump or at least negatively impact the financial performance of the company. Also, we may enter into some derivative contracts such as credit default swaps and interest rate swaps, when we feel that the market conditions are right to use those instruments. Because of these factors, the net asset value of the Fund can from time to time be more volatile than at other times. However, we are not bothered by this volatility because our focus has always been, and continues to be, on how inexpensive we believe the securities are relative to their intrinsic value.
At December 31, 2018, our cash position was approximately 23% of net assets.
Yours truly,
Francis Chou
Portfolio Manager and CEO
Chou America Management Inc.
The views in this report were those of the Fund manager as of December 31, 2018, and may not reflect his view on the date this report is first published or anytime thereafter. The views are intended to assist the shareholders of the Fund in understanding their investments in the Fund and do not constitute investment advice. This letter may contain discussions about certain investments held and not held in the portfolio. All current and future holdings are subject to risk and to change. There can be no guarantee of success with any technique, strategy or investment.
The Barclays Capital U.S. Corporate High Yield Index is comprised of issues that meet the following criteria: at least $150 million par value outstanding, maximum credit rating of Ba1 (including defaulted issues) and at least one year to maturity. One cannot invest directly in an index.
CHOU OPPORTUNITY FUND
PERFORMANCE CHART AND ANALYSIS (Unaudited)
DECEMBER 31, 2018
The following chart reflects the change in the value of a hypothetical $10,000 investment, including reinvested dividends and distributions, in the Chou Opportunity Fund (the “Fund”) compared with the performance of the benchmark, S&P 500® Index (“S&P 500”), since inception. The S&P 500 is a broad-based measurement of the U.S. stock market based on the performance of 500 widely held large capitalization common stocks. The total return of the S&P 500 includes the reinvestment of dividends and income. The total return of the Fund includes operating expenses that reduce returns, while the total return of the S&P 500 does not include expenses. The Fund is professionally managed, while the S&P 500 is unmanaged and is not available for investment.
Comparison of Change in Value of a $10,000 Investment
Chou Opportunity Fund vs. S&P 500 Index

Average Annual Total Return Periods Ended December 31, 2018 | One Year | Five Year | Since Inception 07/01/10 |
| Chou Opportunity Fund | -17.52% | -5.94% | 2.70% |
| S&P 500® Index | -4.38% | 8.49% | 13.41% |
Performance data quoted represents past performance and is no guarantee of future results. Current performance may be lower or higher than the performance data quoted. Investment return and principal value will fluctuate so that shares, when redeemed, may be worth more or less than original cost. As stated in the Fund’s prospectus, the annual operating expense ratio (gross) is 1.32%. However, the Fund’s adviser has contractually agreed to waive its fee and/or reimburse Fund expenses to limit Total Annual Fund Operating Expenses After Fee Waiver and/or Expense Reimbursement (excluding other expenses, taxes, leverage interest, acquired fund fees and expenses, dividends or interest on short positions, other interest expenses, brokerage commissions, and extraordinary expenses such as litigation) to 1.20%, through at least May 1, 2020 (the “Expense Cap”). The Expense Cap may be raised or eliminated only with the consent of the Board of Trustees and the Adviser. During the period, certain fees were waived and/or expenses reimbursed; otherwise, returns would have been lower. Shares redeemed or exchanged within 120 days of purchase will be charged a 2.00% redemption fee. The performance table and graph do not reflect the deduction of taxes that a shareholder would pay on Fund distributions or the redemption of Fund shares. Returns greater than one year are annualized. For the most recent month-end performance, please call (877) 682-6352.
CHOU INCOME FUND
PERFORMANCE CHART AND ANALYSIS (Unaudited)
DECEMBER 31, 2018
The following chart reflects the change in the value of a hypothetical $10,000 investment, including reinvested dividends and distributions, in the Chou Income Fund (the “Fund”) compared with the performance of the benchmark, Barclays Capital U.S. Corporate High Yield Bond Index (“Barclays Index”), since inception. The Barclays Index is comprised of issues that meet the following criteria: at least $150 million par value outstanding, maximum credit rating of Ba1 (including defaulted issues) and at least one year to maturity.The total return of the Barclays Index includes the reinvestment of dividends and income. The total return of the Fund includes operating expenses that reduce returns, while the total return of the Barclays Index does not include expenses. The Fund is professionally managed, while the Barclays Index is unmanaged and is not available for investment.
Comparison of Change in Value of a $10,000 Investment
Chou Income Fund vs. Barclays Capital U.S. Corporate High Yield Bond Index
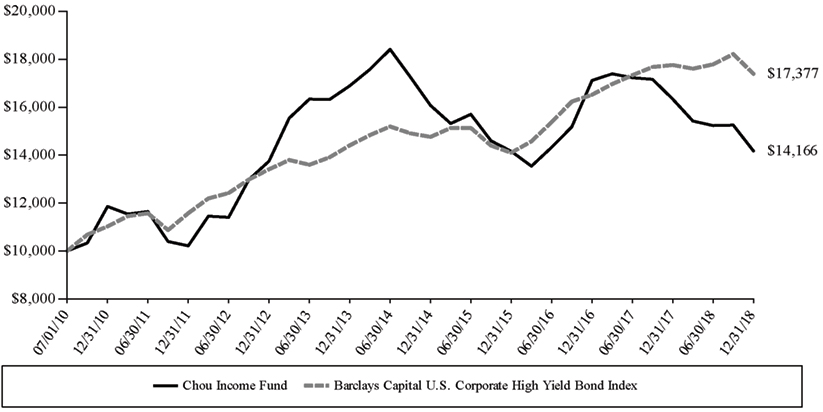
| Average Annual Total Return Periods Ended December 31, 2018 | One Year | Five Year | Since Inception 07/01/10 |
| Chou Income Fund | -13.23% | -3.45% | 4.18% |
| Barclays Capital U.S. Corporate High Yield Bond Index | -2.08% | 3.83% | 6.72% |
Performance data quoted represents past performance and is no guarantee of future results. Current performance may be lower or higher than the performance data quoted. Investment return and principal value will fluctuate so that shares, when redeemed, may be worth more or less than original cost. As stated in the Fund’s prospectus, the annual operating expense ratio (gross) is 2.02%. However, the Fund’s adviser has contractually agreed to waive its fee and/or reimburse Fund expenses to limit Total Annual Fund Operating Expenses After Fee Waiver and/or Expense Reimbursement (excluding other expenses, taxes, leverage interest, acquired fund fees and expenses, dividends or interest on short positions, other interest expenses, brokerage commissions and extraordinary expenses such as litigation) to 1.20%, through at least May 1, 2020 (the “Expense Cap”). The Expense Cap may be raised or eliminated only with the consent of the Board of Trustees and the Adviser. During the period, certain fees were waived and/or expenses reimbursed; otherwise, returns would have been lower. Shares redeemed or exchanged within 120 days days of purchase will be charged a 2.00% redemption fee. The performance table and graph do not reflect the deduction of taxes that a shareholder would pay on Fund distributions or the redemption of Fund shares. Returns greater than one year are annualized. For the most recent month-end performance, please call (877) 682-6352.
CHOU OPPORTUNITY FUND
SCHEDULE OF INVESTMENTS
DECEMBER 31, 2018
Equity Securities - 69.7%
Common Stock - 69.7%
| Shares | | Security Description | | Value | |
| Consumer Discretionary - 26.8% | | | | |
| 12,523 | | Allegiant Travel Co. | | $ | 1,255,055 | |
| 400,000 | | Bausch Health Cos., Inc. (a)(b) | | | 7,388,000 | |
| 91,603 | | Sears Holdings Corp. (a) | | | 24,691 | |
| 140,324 | | Sears Hometown and Outlet Stores, Inc. (a)(c) | | | 298,890 | |
| 21,492 | | Spirit Airlines, Inc. (a) | | | 1,244,817 | |
| | | | | | 10,211,453 | |
| Consumer Staples - 9.0% | | | | |
| 111,319 | | Ascent Capital Group, Inc., Class A (a) | | | 43,414 | |
| 15,601 | | DaVita, Inc. (a) | | | 802,828 | |
| 214,577 | | Endo International PLC (a)(b)(c) | | | 1,566,412 | |
| 65,000 | | Teva Pharmaceutical Industries, Ltd., ADR (a) | | | 1,002,300 | |
| | | | | | 3,414,954 | |
| Financial - 12.3% | | | | |
| 52,960 | | Bank of America Corp. | | | 1,304,934 | |
| 7,633 | | JPMorgan Chase & Co. | | | 745,134 | |
| 175,000 | | MBIA, Inc. (a)(c) | | | 1,561,000 | |
| 23,717 | | Wells Fargo & Co. | | | 1,092,879 | |
| | | | | | 4,703,947 | |
| Materials - 21.6% | | | | |
| 1,038,721 | | Resolute Forest Products, Inc. (b) | | | 8,237,058 | |
| | | | | | | |
| Total Common Stock (Cost $38,371,321) | | | 26,567,412 | |
Preferred Stock - 0.0%
| Shares | | Security Description | | Rate | | | Value | |
| Communications - 0.0% | | | | | | |
| 500 | | Overstock.com, Inc. (callable at 16 beginning 01/31/19) (d) | | | 0.16% | | | | 7,625 | |
| | | | | | | | | | | |
| Total Preferred Stock (Cost $7,840) | | | | | | | 7,625 | |
| | | | | | | | | |
| Total Equity Securities (Cost $38,379,161) | | | | | | | 26,575,037 | |
Fixed Income Securities - 27.1%
Syndicated Loan - 27.1%
| Principal | | Security Description | | Rate | | | Maturity | | | Value | |
| Energy - 27.1% | | | | | | | | | | | |
| $ | 23,296,667 | | EXCO Resources, Inc. (e)(f)(g)(h) | | | 12.50 | | | | 10/26/20 | | | | 10,334,401 | |
| | | | | | | | | | | | | | | | |
| Total Syndicated Loan (Cost $18,648,425) | | | | | | | | | | | 10,334,401 | |
| Total Fixed Income Securities (Cost $18,648,425) | | | | | | | | | | | 10,334,401 | |
Collateral Received for Securities Loaned - 4.4% (i)
| Principal | | | Security Description | | Rate | | | Maturity | | | Value | |
| | 172,084 | | | U.S. Treasury Bills | | | 0.00% | | | | 01/17/19-02/07/19 | | | | 171,841 | |
| | 60,265 | | | U.S. Treasury Bonds | | | 2.25-8.75 | | | | 05/15/20-08/15/46 | | | | 62,401 | |
| | 99,842 | | | U.S. Treasury Inflation Index Bonds | | | 0.75-3.38 | | | | 01/15/25-02/15/46 | | | | 101,558 | |
| | 28,929 | | | U.S. Treasury Inflation Index Notes | | | 0.13-1.38 | | | | 04/15/19-01/15/26 | | | | 33,138 | |
See Notes to Financial Statements.
CHOU OPPORTUNITY FUND
SCHEDULE OF INVESTMENTS
DECEMBER 31, 2018
| Principal | | | Security Description | | Rate | | | Maturity | | | Value | |
| | 1,364,878 | | | U.S. Treasury Notes | | | 0.88-3.63% | | | | 01/31/19-08/15/28 | | | $ | 1,337,298 | |
| Total Collateral Received for Securities Loaned (Cost $1,706,236) | | | | | | | | | | | 1,706,236 | |
Repurchase Agreements - 0.6% (j)
| Principal | | Security Description | | Rate | | | Maturity | | | Value | |
| | 223,463 | | RBC Dominion Securities, Inc., dated 12/31/18, repurchase price $223,519 collateralized by U.S. Government Agencies, ranging from 3.00%-7.00%, maturing 10/01/25-10/20/48; total market value $227,932 | | | 3.02 | | | | 01/02/19 | | | | 223,463 | |
| Total Repurchase Agreements (Cost $223,463) | | | | | | | | | | | 223,463 | |
| | | | | | | | | | | | | | | |
| Investments, at value - 101.8% (Cost $58,957,285) | | | | | | | | | | $ | 38,839,137 | |
Written Options - (0.5)%
Call Options Written - (0.5)%
| Contracts | | Security Description | | Strike Price | | | Exp. Date | | Notional Contract Value | | | Value | |
| Basic Materials - 0.0% | | | | | | | | | | | | | | |
| (2,163) | | Resolute Forest Products, Inc. | | | 11.00 | | | 01/18/19 | | $ | 1,715,259 | | | | (2,163 | ) |
| (2,000) | | Resolute Forest Products, Inc. | | | 13.50 | | | 04/18/19 | | | 1,586,000 | | | | (2,000 | ) |
| | | | | | | | | | | | | | | | (4,163 | ) |
| Consumer Discretionary - 0.0% | | | | | | | | | | | | | | |
| (4,000) | | Bausch Health Cos., Inc. | | | 27.50 | | | 01/18/19 | | | 7,388,000 | | | | (4,000 | ) |
| Consumer Staples - (0.5)% | | | | | | | | | | | | | | |
| (2,000) | | Endo International PLC | | | 12.00 | | | 01/17/20 | | | 1,460,000 | | | | (170,000 | ) |
| | | | | | | | | | | | | | | | | |
| Total Written Options (Premiums Received $(1,596,613)) | | | | | | | | | | (178,163 | ) |
| | | | | | | | | | | | |
| Other Assets & Liabilities, Net – (1.3)% | | | | | | | | | | (519,882 | ) |
| Net Assets - 100.0% | | | | | | | | | $ | 38,141,092 | |
| ADR | American Depositary Receipt |
| PLC | Public Limited Company |
| (a) | Non-income producing security. |
| (b) | Subject to call option written by the Fund. |
| (c) | This security or a portion of the security is out on loan as of December 31, 2018. Total loaned securities had a value of $1,904,015 as of December 31, 2018. |
| (d) | Perpetual maturity security. |
| (e) | Security fair valued in accordance with procedures adopted by the Board of Trustees. At the period end, the value of these securities amounted to $10,334,401 or 27.1% of net assets. |
| (f) | Payment in Kind Security. Security that gives the issuer the option as each interest payment date of making interest payments in either cash or additional debt securities. |
| (g) | Security is currently in default. |
| (i) | These securities represent the collateral received in connection with securities out on loan as of December 31, 2018. |
| (j) | This security represents the investment of the collateral received in connection with securities out on loan at December 31, 2018. |
The following is a summary of the inputs used to value the Fund's investments as of December 31, 2018.
The inputs or methodology used for valuing securities are not necessarily an indication of the risks associated with investing in those securities. For more information on valuation inputs, and their aggregation into the levels used in the table below, please refer to the Security Valuation section in Note 2 of the accompanying Notes to Financial Statements.
See Notes to Financial Statements.
CHOU OPPORTUNITY FUND
SCHEDULE OF INVESTMENTS
DECEMBER 31, 2018
| | | Level 1 | | | Level 2 | | | Level 3 | | | Total | |
| Assets | | | | | | | | | | | | |
| Investments at Value | | | | | | | | | | | | |
| Common Stock | | $ | 26,567,412 | | | $ | – | | | $ | – | | | $ | 26,567,412 | |
| Preferred Stock | | | 7,625 | | | | – | | | | – | | | | 7,625 | |
| Syndicated Loan | | | – | | | | – | | | | 10,334,401 | | | | 10,334,401 | |
| Collateral Received for Securities Loaned | | | – | | | | 1,706,236 | | | | – | | | | 1,706,236 | |
| Repurchase Agreement | | | – | | | | 223,463 | | | | – | | | | 223,463 | |
| Investments at Value | | $ | 26,575,037 | | | $ | 1,929,699 | | | $ | 10,334,401 | | | $ | 38,839,137 | |
| Total Assets | | $ | 26,575,037 | | | $ | 1,929,699 | | | $ | 10,334,401 | | | $ | 38,839,137 | |
| Liabilities | | | | | | | | | | | | | | | | |
| Other Financial Instruments* | | | | | | | | | | | | | | | | |
| Written Options | | | (174,000 | ) | | | (4,163 | ) | | | – | | | | (178,163 | ) |
| Total Liabilities | | $ | (174,000 | ) | | $ | (4,163 | ) | | $ | – | | | $ | (178,163 | ) |
| * | Other Financial Instruments are derivative instruments reflected in separate schedules such as written options, which appear in the Schedule of Call and Put Options Written and are valued at their market value at year end. |
Significant unobservable inputs developed by the Valuation Committee for Level 3 investments held at year-end are as follows:
| | | Fair Value at 12/31/2018 | | | Valuation Techniques | | Unobservable Input | | Range (Weighted Average) | |
| Investment in Syndicated Loan | | $ | 10,334,401 | | | Discounted cash flows and restructuring plan recovery approach | | Estimated Enterprise Value of Exco Resources, Inc. | | | 25.73%-62.99% | |
The valuation used by the Fund was provided by an unaffiliated independent third party. The Fund used the average of the low and high recovery value to arrive at the valuation at 12/31/18.
The following is a reconciliation of Level 3 investments for which significant unobservable inputs were used to determine fair value.
| | | Syndicated Loan | |
| Balance as of 12/31/17 | | $ | – | |
| Transfer In | | | 10,334,401 | |
| Balance as of 12/31/18 | | $ | 10,334,401 | |
| Net change in unrealized appreciation/(depreciation) from investments held as of 12/31/18** | | $ | (4,180,100 | ) |
| ** | The change in unrealized appreciation/(depreciation) is included in net change in unrealized appreciation/(depreciation) of investments in the accompanying Statement of Operations. |
The Fund utilizes the end of period methodology when determining transfers. There were no transfers between Level 1 and Level 2 for the year ended December 31, 2018. As of December 31, 2018, there was a $10,334,401 transfer from Level 2 into Level 3 as a result of a change in valuation approach. This was a result of a security transferring from an evaluated price to a fair value price.
See Notes to Financial Statements.
CHOU OPPORTUNITY FUND
SCHEDULE OF INVESTMENTS
DECEMBER 31, 2018
| PORTFOLIO HOLDINGS (Unaudited) | |
| % of Net Assets | |
| Communications | 0.0% |
| Consumer Discretionary | 26.8% |
| Consumer Staples | 8.5% |
| Energy | 27.1% |
| Financial | 12.3% |
| Materials | 21.6% |
| Collateral Received for Securities Loaned | 4.4% |
| Repurchase Agreement | 0.6% |
| Other Assets and Liabilities, Net (1) | (1.3)% |
| Total | 100.0% |
| (1) | "Other Assets & Liabilities, Net" consists of assets, other than derivatives and securities, less liabilities and includes un-invested cash which represented 3.5% of the Fund's total net assets at December 31, 2018. For more information, see the Fund's Statement of Assets and Liabilities. |
See Notes to Financial Statements.
CHOU INCOME FUND
SCHEDULE OF INVESTMENTS
DECEMBER 31, 2018
Equity Securities - 9.5%
Common Stock - 9.5%
| Shares | | | Security Description | | Value | |
| Consumer, Cyclical - 7.1% | | | |
| | 788,273 | | | Wow Unlimited Media, Inc. (a) | | $ | 692,886 | |
| Energy - 2.4% | | | | |
| | 31,249 | | | SandRidge Energy, Inc. (a) | | | 237,805 | |
| | | | | | | | | |
| Total Common Stock (Cost $1,855,432) | | | 930,691 | |
| | | | | |
| Total Equity Securities (Cost $1,855,432) | | | 930,691 | |
Fixed Income Securities - 63.0%
Corporate Convertible Bonds - 19.2%
| Principal | | | Security Description | | Rate | | Maturity | | Value | |
| Consumer Staples - 14.3% | | | | | | | | | | |
| $ | 2,000,000 | | | Ascent Capital Group, Inc. | | | 4.00 | % | | 07/15/20 | | | 1,400,000 | |
| Financials - 4.9% | | | | | | | | | | |
| 850,000 | | | Atlanticus Holdings Corp. | | | 5.88 | | | 11/30/35 | | | 471,667 | |
| | | | | | | | | | | | | | |
| Total Corporate Convertible Bonds (Cost $2,291,034) | | | | | | | | | 1,871,667 | |
Corporate Non-Convertible Bonds - 29.7%
| Principal | | | Security Description | | Rate | | Maturity | | Value | |
| Consumer Staples - 17.1% | | | | | | | | | | |
| | 851,006 | | | Avangardco Investments Public, Ltd. (b) | | | 10.00 | | | 10/29/18 | | | 154,174 | |
| | 5,101,866 | | | Ukrlandfarming PLC (b) | | | 10.88 | | | 03/26/18 | | | 814,513 | |
| | 800,000 | | | Bausch Health Cos., Inc. (c) | | | 6.13 | | | 04/15/25 | | | 700,000 | |
| | | | | | | | | | | | | | 1,668,687 | |
| Financials - 9.0% | | | | | | |
| | 500,000 | | | Endo Designated Activity Company (c) | | | 6.00 | | | 07/15/23 | | | 383,750 | |
| | 650,000 | | | Mallinckrodt International Finance SA (c)(d) | | | 5.63 | | | 10/15/23 | | | 497,250 | |
| | | | | | | | | | | | | | 881,000 | |
| Materials - 3.6% | | | | | | | |
| | 453,617 | | | Centrus Energy Corp. (c) | | | 8.25 | | | 02/28/27 | | | 352,687 | |
| | 400,000 | | | Sino-Forest Corp. (b)(e)(f) | | | 6.25 | | | 10/21/17 | | | 600 | |
| | 225,000 | | | Sino-Forest Corp. (b)(e)(f) | | | 6.25 | | | 10/21/17 | | | 337 | |
| | | | | | | | | | | | | 353,624 | |
| | | | | | | | | | | | | | |
| Total Corporate Non-Convertible Bonds (Cost $7,609,885) | | | | | | | | | 2,903,311 | |
Syndicated Loan - 14.1%
| Principal | | | Security Description | | Rate | | Maturity | | Value | |
| Energy - 14.1% | | | | | | | |
| | 3,115,000 | | | EXCO Resources, Inc. (b)(e)(g)(h) | | | 12.50 | | | 10/26/20 | | | 1,381,814 | |
| | | | | | | | | | | | | | | |
| Total Syndicated Loan (Cost $2,495,265) | | | | | | | | | 1,381,814 | |
| Total Fixed Income Securities (Cost $12,396,184) | | | | | | | | | 6,156,792 | |
See Notes to Financial Statements.
CHOU INCOME FUND
SCHEDULE OF INVESTMENTS
DECEMBER 31, 2018
Repurchase Agreements - 0.1% (i)
| Principal | | | Security Description | | | Rate | | | Maturity | | | Value | |
| | 7,445 | | | RBC Capital Markets LLC, dated 12/31/18, repurchase price $7,446 collateralized by U.S. Government Agencies, ranging from 2.21-6.50%, maturity 02/01/20-11/01/48; total market value $7,594 | | | 3.00 | % | | 01/02/19 | | $ | 7,445 | |
| Total Repurchase Agreements (Cost $7,445) | | | | | | | | | 7,445 | |
| | | | | | | | | | | | | | |
| Investments, at value - 72.6% (Cost $14,259,061) | | | | | | | | $ | 7,094,928 | |
| | | | | | | | | | | |
| Other Assets & Liabilities, Net - 27.4% | | | | | | | | | 2,681,946 | |
| Net Assets - 100.0% | | | | | | | | $ | 9,776,874 | |
| LLC | Limited Liability Company |
| PLC | Public Limited Company |
| (a) | Non-income producing security. |
| (b) | Security is currently in default. |
| (c) | Security exempt from registration under Rule 144A under the Securities Act of 1933. At the period end, the value of these securities amounted to $1,933,687 or 19.8% of net assets. |
| (d) | This security or a portion of the security is out on loan as of December 31, 2018. Total loaned securities had a value of $6,885 as of December 31, 2018. |
| (e) | Security fair valued in accordance with procedures adopted by the Board of Trustees. At the period end, the value of these securities amounted to $1,382,751 or 14.1% of net assets. |
| (f) | Security represents entitlement to potential distributions from a litigation trust. |
| (g) | Payment in Kind Security. Security that gives the issuer the option as each interest payment date of making interest payments in either cash or additional debt securities. |
| (i) | These securities represent the investment of the collateral received in connection with securities out on loan at December 31, 2018. |
The following is a summary of the inputs used to value the Fund's instruments as of December 31, 2018.
The inputs or methodology used for valuing securities are not necessarily an indication of the risks associated with investing in those securities. For more information on valuation inputs, and their aggregation into the levels used in the table below, please refer to the Security Valuation section in Note 2 of the accompanying Notes to Financial Statements.
| | | Level 1 | | | Level 2 | | | Level 3 | | | Total | |
| Assets | | | | | | | | | | | | |
| Investments at Value | | | | | | | | | | | | |
| Common Stock | | $ | 930,691 | | | $ | – | | | $ | – | | | $ | 930,691 | |
| Corporate Convertible Bonds | | | – | | | | 1,871,667 | | | | – | | | | 1,871,667 | |
| Corporate Non-Convertible Bonds | | | – | | | | 2,902,374 | | | | 937 | | | | 2,903,311 | |
| Syndicated Loan | | | – | | | | – | | | | 1,381,814 | | | | 1,381,814 | |
| Repurchase Agreement | | | – | | | | 7,445 | | | | – | | | | 7,445 | |
| Total Assets | | $ | 930,691 | | | $ | 4,781,486 | | | $ | 1,382,751 | | | $ | 7,094,928 | |
See Notes to Financial Statements.
CHOU INCOME FUND
SCHEDULE OF INVESTMENTS
DECEMBER 31, 2018
Significant unobservable inputs developed by the Valuation Committee for Level 3 investments held at year-end are as follows:
| | | Fair Value at
12/31/2018 | | | Valuation
Techniques | | Unobservable
Input | | Range
(Weighted Average) | |
| Investment in Syndicated Loan | | $ | 1,381,814 | | | Discounted cash flows and restructuring plan recovery approach | | Estimated Enterprise Value of Exco Resources, Inc. | | 25.73%-62.99% | |
The valuation used by the Fund was provided by an unaffiliated independent third party. The Fund used the average of the low and high recovery value to arrive at the valuation at 12/31/18.
The following is a reconciliation of Level 3 investments for which significant unobservable inputs were used to determine fair value.
| | | Corporate Non-
Convertible Bonds | | | Syndicated Loan | |
| Balance as of 12/31/17 | | $ | – | | | $ | – | |
| Transfers In | | | 937 | | | | 1,381,814 | |
| Balance as of 12/31/18 | | $ | 937 | | | $ | 1,381,814 | |
| Net change in unrealized appreciation/(depreciation) from investments held as of 12/31/18** | | $ | (625 | ) | | $ | (526,124 | ) |
** The change in unrealized appreciation/(depreciation) is included in net change in unrealized appreciation/(depreciation) of investments in the accompanying Statement of Operations.
The Fund utilizes the end of period methodology when determining transfers. There were no transfers between Level 1 and Level 2 for the year ended December 31, 2018. As of December 31, 2018, there was a $1,382,751 transfer from Level 2 into Level 3 as a result of a change in valuation approach. This was a result of a security transferring from an evaluated price to a fair value price.
| PORTFOLIO HOLDINGS (Unaudited) | | | |
| % of Net Assets | | | |
| Consumer Staples | | | 31.4 | % |
| Consumer, Cyclical | | | 7.1 | % |
| Energy | | | 16.5 | % |
| Financials | | | 13.9 | % |
| Materials | | | 3.6 | % |
| Repurchase Agreement | | | 0.1 | % |
| Other Assets and Liabilities, Net (1) | | | 27.4 | % |
| Total | | | 100.0 | % |
| (1) | "Other Assets & Liabilities, Net" consists of assets, other than derivatives and securities, less liabilities and includes un-invested cash which represented 22.6% of the Fund's total net assets at December 31, 2018. For more information, see the Fund's Statement of Assets and Liabilities. |
See Notes to Financial Statements.
CHOU AMERICA MUTUAL FUNDS
STATEMENTS OF ASSETS AND LIABILITIES
DECEMBER 31, 2018
| | | CHOU OPPORTUNITY FUND | | | CHOU INCOME FUND | |
| ASSETS | | | | | | |
| Investments, at value (Cost $58,957,285 and $14,259,061, respectively) | | $ | 38,839,137 | | | $ | 7,094,928 | |
| Cash | | | 1,350,839 | | | | 2,212,959 | |
| Foreign currency (Cost $0 and $346,058, respectively) | | | – | | | | 339,379 | |
| Receivables: | | | | | | | | |
| Investment securities sold | | | 102,666 | | | | – | |
| Dividends and interest | | | 706 | | | | 145,181 | |
| From investment advisor | | | – | | | | 14,384 | |
| Prepaid expenses | | | 11,484 | | | | 10,551 | |
| Total Assets | | | 40,304,832 | | | | 9,817,382 | |
| | | | | | | | | |
| LIABILITIES | | | | | | | | |
| Call options written, at value (Premiums received $1,596,613 and $0, respectively) | | | 178,163 | | | | – | |
| Payables: | | | | | | | | |
| Collateral received on securities lending | | | 1,929,699 | | | | 7,445 | |
| Accrued Liabilities: | | | | | | | | |
| Investment adviser fees | | | 15,910 | | | | – | |
| Fund services fees | | | 7,688 | | | | 7,279 | |
| Other expenses | | | 32,280 | | | | 25,784 | |
| Total Liabilities | | | 2,163,740 | | | | 40,508 | |
| | | | | | | | | |
| NET ASSETS | | $ | 38,141,092 | | | $ | 9,776,874 | |
| | | | | | | | | |
| COMPONENTS OF NET ASSETS | | | | | | | | |
| Paid-in capital | | $ | 68,746,383 | | | $ | 19,384,154 | |
| Accumulated Loss | | | (30,605,291 | ) | | | (9,607,280 | ) |
| NET ASSETS | | $ | 38,141,092 | | | $ | 9,776,874 | |
| SHARES OF BENEFICIAL INTEREST AT NO PAR VALUE (UNLIMITED SHARES AUTHORIZED) | | | 4,891,654 | | | | 1,642,218 | |
| NET ASSET VALUE, OFFERING AND REDEMPTION PRICE PER SHARE* | | $ | 7.80 | | | $ | 5.95 | |
| * | Shares redeemed or exchanged within 120 days of purchase are charged a 2.00% redemption fee. |
See Notes to Financial Statements.
CHOU AMERICA MUTUAL FUNDS
STATEMENTS OF OPERATIONS
YEAR ENDED DECEMBER 31, 2018
| | | CHOU OPPORTUNITY FUND | | | CHOU INCOME FUND | |
| INVESTMENT INCOME | | | | | | | | |
| Dividend income | | $ | 1,617,486 | | | $ | 27,347 | |
| Interest income | | | 276,902 | | | | 321,758 | |
| Securities lending | | | 224,265 | | | | 6,247 | |
| Total Investment Income | | | 2,118,653 | | | | 355,352 | |
| | | | | | | | | |
| EXPENSES | | | | | | | | |
| Investment adviser fees | | | 530,315 | | | | 121,252 | |
| Fund services fees | | | 92,397 | | | | 87,256 | |
| Custodian fees | | | 13,219 | | | | 10,000 | |
| Registration fees | | | 22,658 | | | | 22,308 | |
| Audit fees | | | 17,500 | | | | 17,500 | |
| Legal fees | | | 41,301 | | | | 9,654 | |
| Trustees' fees and expenses | | | 16,176 | | | | 3,736 | |
| Other expenses | | | 33,405 | | | | 24,256 | |
| Total Expenses | | | 766,971 | | | | 295,962 | |
| Fees waived and expenses reimbursed | | | (128,321 | ) | | | (150,460 | ) |
| Net Expenses | | | 638,650 | | | | 145,502 | |
| | | | | | | | | |
| NET INVESTMENT INCOME | | | 1,480,003 | | | | 209,850 | |
| | | | | | | | | |
| NET REALIZED AND UNREALIZED GAIN (LOSS) | | | | | | | | |
| Net realized gain (loss) on: | | | | | | | | |
| Investments | | | (8,805,112 | ) | | | (1,481,930 | ) |
| Written options | | | 405,020 | | | | – | |
| Net realized loss | | | (8,400,092 | ) | | | (1,481,930 | ) |
| Net change in unrealized appreciation (depreciation) on: | | | | | | | | |
| Investments | | | (3,588,437 | ) | | | (435,030 | ) |
| Foreign currency translations | | | – | | | | (29,213 | ) |
| Written options | | | 1,890,048 | | | | – | |
| Net change in unrealized appreciation (depreciation) | | | (1,698,389 | ) | | | (464,243 | ) |
| NET REALIZED AND UNREALIZED LOSS | | | (10,098,481 | ) | | | (1,946,173 | ) |
| DECREASE IN NET ASSETS RESULTING FROM OPERATIONS | | $ | (8,618,478 | ) | | $ | (1,736,323 | ) |
See Notes to Financial Statements.
CHOU AMERICA MUTUAL FUNDS
STATEMENTS OF CHANGES IN NET ASSETS
| | | CHOU OPPORTUNITY FUND | | | CHOU INCOME FUND | |
| | | | | | Shares | | | | | | Shares | |
| NET ASSETS December 31, 2016 | | $ | 84,325,594 | | | | | | | $ | 17,884,947 | | | | | |
| OPERATIONS | | | | | | | | | | | | | | | | |
| Net investment income | | | 5,937,352 | | | | | | | | 624,353 | | | | | |
| Net realized gain (loss) | | | (2,592,296 | ) | | | | | | | 1,048,901 | | | | | |
| Net change in unrealized appreciation (depreciation) | | | 5,601,409 | | | | | | | | (2,463,703 | ) | | | | |
| Increase (Decrease) in Net Assets Resulting from Operations | | | 8,946,465 | | | | | | | | (790,449 | ) | | | | |
| DISTRIBUTIONS TO SHAREHOLDERS* | | | (6,171,272 | ) | | | | | | | (1,055,060 | ) | | | | |
| CAPITAL SHARE TRANSACTIONS | | | | | | | | | | | | | | | | |
| Sale of shares | | | 2,561,995 | | | | 277,036 | | | | 135,164 | | | | 16,851 | |
| Reinvestment of distributions | | | 6,135,288 | | | | 662,832 | | | | 1,041,353 | | | | 146,315 | |
| Redemption of shares | | | (29,875,769 | ) | | | (3,269,621 | ) | | | (517,439 | ) | | | (65,662 | ) |
| Redemption fees | | | 164 | | | | – | | | | 699 | | | | – | |
| Increase (Decrease) in Net Assets from Capital Share Transactions | | | (21,178,322 | ) | | | (2,329,753 | ) | | | 659,777 | | | | 97,504 | |
| Decrease in Net Assets | | | (18,403,129 | ) | | | | | | | (1,185,732 | ) | | | | |
| NET ASSETS December 31, 2017** | | $ | 65,922,465 | | | | | | | $ | 16,699,215 | | | | | |
| OPERATIONS | | | | | | | | | | | | | | | | |
| Net investment income | | | 1,480,003 | | | | | | | | 209,850 | | | | | |
| Net realized loss | | | (8,400,092 | ) | | | | | | | (1,481,930 | ) | | | | |
| Net change in unrealized appreciation (depreciation) | | | (1,698,389 | ) | | | | | | | (464,243 | ) | | | | |
| Decrease in Net Assets Resulting from Operations | | | (8,618,478 | ) | | | | | | | (1,736,323 | ) | | | | |
| DISTRIBUTIONS TO SHAREHOLDERS | | | (1,482,024 | ) | | | | | | | (457,236 | ) | | | | |
| CAPITAL SHARE TRANSACTIONS | | | | | | | | | | | | | | | | |
| Sale of shares | | | 5,465,799 | | | | 634,874 | | | | 24,164 | | | | 3,614 | |
| Reinvestment of distributions | | | 1,475,939 | | | | 203,739 | | | | 436,053 | | | | 73,147 | |
| Redemption of shares | | | (24,625,001 | ) | | | (2,634,393 | ) | | | (5,188,999 | ) | | | (763,630 | ) |
| Redemption fees | | | 2,392 | | | | – | | | | – | | | | – | |
| Decrease in Net Assets from Capital Share Transactions | | | (17,680,871 | ) | | | (1,795,780 | ) | | | (4,728,782 | ) | | | (686,869 | ) |
| Decrease in Net Assets | | | (27,781,373 | ) | | | | | | | (6,922,341 | ) | | | | |
| NET ASSETS December 31, 2018 | | $ | 38,141,092 | | | | | | | $ | 9,776,874 | | | | | |
| * | Distribution was the result of net investment income for the year ending December 31, 2017. |
| | **
| Includes undistributed (distributions in excess of) net investment income of $2,160 and $(575,937) for Chou Opportunity Fund and Chou Income Fund, respectively, at December 31, 2017. The requirement to disclose the corresponding amount as of December 31, 2018 was eliminated.
|
See Notes to Financial Statements.
CHOU AMERICA MUTUAL FUNDS
STATEMENTS OF CASH FLOWS
YEAR ENDED DECEMBER 31, 2018
| | | CHOU OPPORTUNITY FUND | | | CHOU INCOME FUND | |
| CASH FLOWS FROM OPERATING ACTIVITIES | | | | | | | | |
| Decrease in net assets from operations | | $ | (8,618,478 | ) | | $ | (1,736,323 | ) |
| Adjustments to reconcile decrease in net assets resulting from operations to net cash provided by operating activities: | | | | | | | | |
| Purchase of investments | | | (8,030,699 | ) | | | (920,755 | ) |
| Proceeds from sale of investments | | | 14,774,306 | | | | 1,825,639 | |
| Amortization of premium (discount) on investments | | | (245,294 | ) | | | 92,380 | |
| Net realized loss from sale of investments | | | 8,805,112 | | | | 1,481,931 | |
| Net change in unrealized appreciation (depreciation) on investments | | | 3,588,437 | | | | 435,030 | |
| Premiums received for written call options | | | 1,317,341 | | | | – | |
| Premiums paid for written call options | | | (224,307 | ) | | | – | |
| Net realized gain from written call options | | | (405,020 | ) | | | – | |
| Net change in unrealized appreciation (depreciation) on written call options | | | (1,890,048 | ) | | | – | |
| Collateral received on securities lending | | | (1,944,384 | ) | | | (204,817 | ) |
| | | | | | | | | |
| Changes in operating assets and liabilities: | | | | | | | | |
| Fund shares sold | | | 5,000 | | | | – | |
| Investment securities sold | | | 575,320 | | | | 136,200 | |
| Dividends and interest | | | 90,271 | | | | 22,257 | |
| From investment advisor | | | – | | | | (14,384 | ) |
| Prepaid expenses | | | (1,178 | ) | | | (1,438 | ) |
| Fund shares redeemed | | | (19,698 | ) | | | (10,133 | ) |
| Investment adviser fees | | | 15,910 | | | | (2,508 | ) |
| Trustees’ fees and expenses | | | (302 | ) | | | (63 | ) |
| Fund services fees | | | 8 | | | | 11 | |
| Other expenses | | | 2,751 | | | | 123 | |
| NET CASH PROVIDED BY OPERATING ACTIVITIES | | | 7,795,048 | | | | 1,103,150 | |
| CASH FLOWS FROM FINANCING ACTIVITIES | | | | | | | | |
| Sale of shares | | | 5,465,799 | | | | 24,164 | |
| Payments for shareholder distributions | | | (6,085 | ) | | | (21,183 | ) |
| Redemption of shares | | | (24,622,609 | ) | | | (5,188,999 | ) |
| NET CASH USED IN FINANCING ACTIVITIES | | | (19,162,895 | ) | | | (5,186,018 | ) |
| NET DECREASE IN CASH | | | (11,367,847 | ) | | | (4,082,868 | ) |
| CASH – BEGINNING OF YEAR | | | 12,718,686 | | | | 6,635,206 | |
| CASH – END OF YEAR | | $ | 1,350,839 | | | $ | 2,552,338 | |
| SUPPLEMENTAL OF DISCLOSURE OF NON-CASH OPERATING ACTIVITIES: | | | | | | | | |
| Collateral received on securities lending | | $ | (1,944,384 | ) | | $ | (204,817 | ) |
| Reinvestment of shareholder distributions | | | 1,475,939 | | | | 436,053 | |
See Notes to Financial Statements.
CHOU OPPORTUNITY FUND
FINANCIAL HIGHLIGHTS
These financial highlights reflect selected data for a share outstanding throughout each year.
| | | For the Year Ended December 31, | |
| | | 2018 | | | 2017 | | | 2016 | | | 2015 | | | 2014 | |
| NET ASSET VALUE, Beginning of Year | | $ | 9.86 | | | $ | 9.35 | | | $ | 10.51 | | | $ | 13.71 | | | $ | 13.52 | |
| INVESTMENT OPERATIONS | | | | | | | | | | | | | | | | | | | | |
| Net investment income (loss) (a) | | | 0.25 | | | | 0.73 | | | | 0.51 | | | | (0.14 | ) | | | (0.18 | ) |
| Net realized and unrealized gain (loss) | | | (2.00 | ) | | | 0.63 | | | | (1.17 | ) | | | (2.91 | ) | | | 0.84 | |
| Total from Investment Operations | | | (1.75 | ) | | | 1.36 | | | | (0.66 | ) | | | (3.05 | ) | | | 0.66 | |
| DISTRIBUTIONS TO SHAREHOLDERS FROM | | | | | | | | | | | | | | | | | | | | |
| Net investment income | | | (0.31 | ) | | | (0.85 | ) | | | (0.59 | ) | | | – | | | | – | |
| Net realized gain | | | – | | | | – | | | | (0.01 | ) | | | (0.15 | ) | | | (0.47 | ) |
| Total Distributions to Shareholders | | | (0.31 | ) | | | (0.85 | ) | | | (0.60 | ) | | | (0.15 | ) | | | (0.47 | ) |
| REDEMPTION FEES (a) | | | – | (b) | | | – | (b) | | | – | (b) | | | – | (b) | | | – | (b) |
| NET CONTRIBUTION BY AFFILIATE (c) | | | – | | | | – | | | | 0.10 | | | | – | | | | – | |
| NET ASSET VALUE, End of Year | | $ | 7.80 | | | $ | 9.86 | | | $ | 9.35 | | | $ | 10.51 | | | $ | 13.71 | |
| TOTAL RETURN | | | (17.52 | )% | | | 15.28 | % | | | (5.02 | )%(d) | | | (22.27 | )% | | | 4.88 | % |
| | | | | | | | | | | | | | | | | | | | | |
| RATIOS/SUPPLEMENTARY DATA | | | | | | | | | | | | | | | | | | | | |
| Net Assets at End of Year (000s omitted) | | $ | 38,141 | | | $ | 65,922 | | | $ | 84,326 | | | $ | 96,066 | | | $ | 99,799 | |
| Ratios to Average Net Assets: | | | | | | | | | | | | | | | | | | | | |
| Net investment income (loss) | | | 2.79 | % | | | 7.99 | % | | | 5.58 | % | | | (1.15 | )% | | | (1.31 | )% |
| Net expenses | | | 1.20 | % | | | 0.30 | % | | | 0.30 | % | | | 1.24 | % | | | 1.38 | % |
| Gross expenses (e) | | | 1.45 | % | | | 1.32 | % | | | 1.31 | % | | | 1.28 | % | | | 1.40 | % |
| PORTFOLIO TURNOVER RATE | | | 13 | % | | | 14 | % | | | 18 | % | | | 4 | % | | | 29 | % |
| (a) | Calculated based on average shares outstanding during each year. |
| (b) | Less than $0.01 per share. |
| (c) | Calculated based on shares outstanding on February 18, 2016, the date of the capital contribution. See note 5. |
| (d) | Calculation includes affiliate reimbursements and contribution of capital. Excluding the effect of the net reimbursements and contribution of capital from the Fund's ending net asset value per share, total return for the year ended December 31, 2016, would have been (6.04)%. |
| (e) | Reflects the expense ratio excluding any waivers and/or reimbursements. |
See Notes to Financial Statements.
CHOU INCOME FUND
FINANCIAL HIGHLIGHTS
These financial highlights reflect selected data for a share outstanding throughout each year.
| | | For the Year Ended December 31, | |
| | | 2018 | | | 2017 | | | 2016 | | | 2015 | | | 2014 | |
| NET ASSET VALUE, Beginning of Year | | $ | 7.17 | | | $ | 8.01 | | | $ | 7.56 | | | $ | 9.77 | | | $ | 11.04 | |
| INVESTMENT OPERATIONS | | | | | | | | | | | | | | | | | | | | |
| Net investment income (a) | | | 0.11 | | | | 0.28 | | | | 0.96 | | | | 0.90 | | | | 0.51 | |
| Net realized and unrealized gain (loss) | | | (1.06 | ) | | | (0.64 | ) | | | 0.49 | | | | (2.01 | ) | | | (1.01 | ) |
| Total from Investment Operations | | | (0.95 | ) | | | (0.36 | ) | | | 1.45 | | | | (1.11 | ) | | | (0.50 | ) |
| DISTRIBUTIONS TO SHAREHOLDERS FROM | | | | | | | | | | | | | | | | | | | | |
| Net investment income | | | (0.27 | ) | | | (0.48 | ) | | | (1.00 | ) | | | (0.95 | ) | | | (0.52 | ) |
| Net realized gain | | | – | | | | – | | | | – | | | | (0.15 | ) | | | (0.25 | ) |
| Total Distributions to Shareholders | | | (0.27 | ) | | | (0.48 | ) | | | (1.00 | ) | | | (1.10 | ) | | | (0.77 | ) |
| REDEMPTION FEES(a) | | | – | | | | – | (b) | | | – | (b) | | | – | (b) | | | – | (b) |
| NET ASSET VALUE, End of Year | | $ | 5.95 | | | $ | 7.17 | | | $ | 8.01 | | | $ | 7.56 | | | $ | 9.77 | |
| TOTAL RETURN | | | (13.23 | )% | | | (4.43 | )% | | | 20.72 | % | | | (11.92 | )% | | | (4.83 | )% |
| | | | | | | | | | | | | | | | | | | | | |
| RATIOS/SUPPLEMENTARY DATA | | | | | | | | | | | | | | | | | | | | |
| Net Assets at End of Year (000s omitted) | | $ | 9,777 | | | $ | 16,699 | | | $ | 17,885 | | | $ | 15,253 | | | $ | 17,526 | |
| Ratios to Average Net Assets: | | | | | | | | | | | | | | | | | | | | |
| Net investment income | | | 1.73 | % | | | 3.53 | % | | | 12.91 | % | | | 9.94 | % | | | 4.48 | % |
| Net expenses | | | 1.20 | % | | | 1.20 | % | | | 1.20 | % | | | 1.30 | % | | | 1.50 | % |
| Gross expenses (c) | | | 2.44 | % | | | 2.02 | % | | | 2.10 | % | | | 2.36 | % | | | 2.11 | % |
| PORTFOLIO TURNOVER RATE | | | 11 | % | | | 3 | % | | | 22 | % | | | 7 | % | | | 17 | % |
| (a) | Calculated based on average shares outstanding during each year. |
| (b) | Less than $0.01 per share. |
| (c) | Reflects the expense ratio excluding any waivers and/or reimbursements. |
See Notes to Financial Statements.
CHOU AMERICA MUTUAL FUNDS
NOTES TO FINANCIAL STATEMENTS
DECEMBER 31, 2018
Note 1. Organization
The Chou Opportunity Fund and Chou Income Fund (individually, a “Fund” and, collectively the “Funds”) are non-diversified portfolios of Chou America Mutual Funds (the “Trust”). The Trust is a Delaware statutory trust that is registered as an open-end, management investment company under the Investment Company Act of 1940 (the “Act”), as amended. Under its Trust Instrument, the Trust is authorized to issue an unlimited number of each Fund’s shares of beneficial interest without par value. Chou Opportunity Fund’s investment objective is long-term growth of capital. Chou Income Fund’s investment objective is to provide capital appreciation and income production, with capital preservation as a secondary consideration. The Funds commenced operations on July 1, 2010, with the sale of 50,000 shares of each Fund at $10 per share to Chou Associates Management Inc.
Note 2. Summary of Significant Accounting Policies
The Funds are investment companies and follow accounting and reporting guidance under Financial Accounting Standards Board (“FASB”) Accounting Standards Codification (“ASC”) Topic 946, “Financial Services – Investment Companies.” These financial statements are prepared in accordance with accounting principles generally accepted in the United States of America (“GAAP”), which require management to make estimates and assumptions that affect the reported amounts of assets and liabilities, the disclosure of contingent liabilities at the date of the financial statements, and the reported amounts of increases and decreases in net assets from operations during the fiscal year. Actual amounts could differ from those estimates. The following summarizes the significant accounting policies of each Fund:
Security Valuation – Securities are valued at market prices using the last quoted trade or official closing price from the principal exchange where the security is traded, as provided by independent pricing services on each Fund business day. In the absence of a last trade, securities are valued at the mean of the last bid and ask price provided by the pricing service. Debt securities may be valued at prices supplied by a fund’s pricing agent based on broker or dealer supplied valuations or matrix pricing, a method of valuing securities by reference to the value of other securities with similar characteristics such as rating, interest rate and maturity. Short-term investments that mature in sixty days or less may be valued at amortized cost.
Each Fund values its investments at fair value pursuant to procedures adopted by the Trust’s Board of Trustees (the “Board”) if (1) market quotations are not readily available or (2) the Adviser, as defined in Note 4, believes that the values available are unreliable. The Trust’s Valuation Committee, as defined in each Fund’s registration statement, performs certain functions as they relate to the administration and oversight of each Fund’s valuation procedures. Under these procedures, the Valuation Committee convenes on a regular and ad hoc basis to review such investments and considers a number of factors, including valuation methodologies and significant unobservable inputs, when arriving at fair value.
The Valuation Committee may work with the Adviser to provide valuation inputs. In determining fair valuations, inputs may include market-based analytics that may consider related or comparable assets or liabilities, recent transactions, market multiples, book values and other relevant investment information. Adviser inputs may include an income-based approach in which the anticipated future cash flows of the investment are discounted in determining fair value. Discounts may also be applied based on the nature or duration of any restrictions on the disposition of the investments. The Valuation Committee performs regular reviews of valuation methodologies, key inputs and assumptions, disposition analysis and market activity.
Fair valuation is based on subjective factors and, as a result, the fair value price of an investment may differ from the security’s market price and may not be the price at which the asset may be sold. Fair valuation could result in a different Net Asset Value (“NAV”) than a NAV determined by using market quotes.
CHOU AMERICA MUTUAL FUNDS
NOTES TO FINANCIAL STATEMENTS
DECEMBER 31, 2018
GAAP has a three-tier fair value hierarchy. The basis of the tiers is dependent upon the various “inputs” used to determine the value of each Fund’s investments. These inputs are summarized in the three broad levels listed below:
Level 1 - Quoted prices in active markets for identical assets and liabilities.
Level 2 - Prices determined using significant other observable inputs (including quoted prices for similar securities, interest rates, prepayment speeds, credit risk, etc.). Short-term securities with maturities of sixty days or less are valued at amortized cost, which approximates market value, and are categorized as Level 2 in the hierarchy. Municipal securities, long-term U.S. government obligations and corporate debt securities are valued in accordance with the evaluated price supplied by the pricing service and generally categorized as Level 2 in the hierarchy. Other securities that are categorized as Level 2 in the hierarchy include, but are not limited to, warrants that do not trade on an exchange, securities valued at the mean between the last reported bid and ask quotation and international equity securities valued by an independent third party with adjustments for changes in value between the time of the securities’ respective local market closes and the close of the U.S. market.
Level 3 - Significant unobservable inputs (including each Fund’s own assumptions in determining the fair value of investments).
The aggregate value by input level, as of December 31, 2018, for each Fund’s investments is included at the end of each Fund’s Schedule of Investments.
Security Transactions, Investment Income and Realized Gain and Loss – Investment transactions are accounted for on the trade date. Dividend income is recorded on the ex-dividend date. Foreign dividend income is recorded on the ex-dividend date or as soon as possible after determining the existence of a dividend declaration after exercising reasonable due diligence. Income and capital gains on some foreign securities may be subject to foreign withholding taxes, which are accrued as applicable. Interest income is recorded on an accrual basis. Premium is amortized and discount is accreted using the effective interest method. Identified cost of investments sold is used to determine the gain and loss for both financial statement and federal income tax purposes.
Foreign Currency Transactions – Each Fund may enter into transactions to purchase or sell foreign currency contracts and options on foreign currency. Forward currency contracts are agreements to exchange one currency for another at a future date and at a specified price. A fund may use forward currency contracts to facilitate transactions in foreign securities, to manage a fund’s foreign currency exposure and to protect the U.S. dollar value of its underlying portfolio securities against the effect of possible adverse movements in foreign exchange rates. These contracts are intrinsically valued daily based on forward rates, and a fund’s net equity therein, representing unrealized gain or loss on the contracts as measured by the difference between the forward foreign exchange rates at the dates of entry into the contracts and the forward rates at the reporting date, is recorded as a component of NAV. These instruments involve market risk, credit risk, or both kinds of risks, in excess of the amount recognized in the Statements of Assets and Liabilities. Risks arise from the possible inability of counterparties to meet the terms of their contracts and from movement in currency and securities values and interest rates. Due to the risks associated with these transactions, a fund could incur losses up to the entire contract amount, which may exceed the net unrealized value included in its NAV.
Written Options – When a fund writes an option, an amount equal to the premium received by the fund is recorded as a liability and is subsequently adjusted to the current value of the option written. Premiums received from writing options that expire unexercised are treated by the fund on the expiration date as realized gain from written options. The difference between the premium and the amount paid on effecting a closing purchase transaction, including brokerage commissions, is also treated as a realized gain, or if the premium is less than the amount paid for the closing purchase transaction, as a realized loss. If a call option is exercised, the premium is added to the proceeds from the sale of the underlying security in determining whether the fund has realized a gain or loss. If a put option is exercised, the premium
CHOU AMERICA MUTUAL FUNDS
NOTES TO FINANCIAL STATEMENTS
DECEMBER 31, 2018
reduces the cost basis of the securities purchased by the fund. The fund, as writer of an option, bears the market risk of an unfavorable change in the price of the security underlying the written option. Written options are non-income producing securities.
The values of each individual written option outstanding as of December 31, 2018, for each Fund, if any, are disclosed in each Fund’s Schedule of Investments.
Distributions to Shareholders – Distributions to shareholders of net investment income, if any, are declared and paid semi-annually. Distributions to shareholders of net capital gains, if any, are declared and paid at least annually. Distributions to shareholders are recorded on the ex-dividend date. Distributions are based on amounts calculated in accordance with applicable federal income tax regulations, which may differ from GAAP. These differences are due primarily to differing treatments of income and gain on various investment securities held by each Fund, timing differences and differing characterizations of distributions made by each Fund.
Federal Taxes – Each Fund intends to continue to qualify each year as a regulated investment company under Subchapter M of Chapter 1, Subtitle A, of the Internal Revenue Code of 1986, as amended (“Code”), and to distribute all of their taxable income to shareholders. In addition, by distributing in each calendar year substantially all of their net investment income and capital gains, if any, the Funds will not be subject to a federal excise tax. Therefore, no federal income or excise tax provision is required. Each Fund files a U.S. federal income and excise tax return as required. Each Fund’s federal income tax returns are subject to examination by the Internal Revenue Service for a period of three fiscal years after they are filed. As of December 31, 2018, there are no uncertain tax positions that would require financial statement recognition, de-recognition or disclosure.
Income and Expense Allocation – The Trust accounts separately for the assets, liabilities and operations of each of its investment portfolios. Expenses that are directly attributable to more than one investment portfolio are allocated among the respective investment portfolios in an equitable manner.
Redemption Fees – A shareholder who redeems or exchanges shares within 120 days of purchase will incur a redemption fee of 2.00% of the current NAV of shares redeemed or exchanged, subject to certain limitations. The fee is charged for the benefit of the remaining shareholders and will be paid to each Fund to help offset transaction costs. The fee is accounted for as an addition to paid-in capital. Each Fund reserves the right to modify the terms of or terminate the fee at any time. There are limited exceptions to the imposition of the redemption fee. Redemption fees incurred for the Funds, if any, are reflected on the Statements of Changes in Net Assets.
Commitments and Contingencies – In the normal course of business, each Fund enters into contracts that provide general indemnifications by each Fund to the counterparty to the contract. Each Fund’s maximum exposure under these arrangements is dependent on future claims that may be made against each Fund and, therefore, cannot be estimated; however, based on experience, the risk of loss from such claims is considered remote. Each Fund has determined that none of these arrangements requires disclosure on each Fund’s balance sheet.
Note 3. Cash – Concentration in Uninsured Account
For cash management purposes, each Fund may concentrate cash with each Fund’s custodian. This typically results in cash balances exceeding the Federal Deposit Insurance Corporation (“FDIC”) insurance limits. As of December 31, 2018, Chou Opportunity Fund and Chou Income Fund had $1,100,839 and $1,962,959, respectively, at MUFG Union Bank, N.A. that exceeded the FDIC insurance limit.
CHOU AMERICA MUTUAL FUNDS
NOTES TO FINANCIAL STATEMENTS
DECEMBER 31, 2018
Note 4. Fees and Expenses
Investment Adviser – Chou America Management Inc. (the “Adviser”) is the investment adviser to each Fund. Pursuant to an investment advisory agreement, the Adviser receives an advisory fee, payable monthly, from each Fund at an annual rate of 1.00% of each Fund’s average daily net assets.
Distribution – Rafferty Capital Markets, LLC serves as each Fund’s distributor (the “Distributor”). The Trust has adopted a Rule 12b-1 plan under which the Funds may pay an annual fee of up to 0.25% of the average daily net assets of the Funds for distribution services and/or the servicing of shareholder accounts. The Board has not authorized the Funds to pay a Rule 12b-1 fee at this time. The Distributor is not affiliated with the adviser or Atlantic Fund Administration, LLC (d/b/a Atlantic Fund Services) (“Atlantic”) or their affiliates.
Other Service Providers – Atlantic provides fund accounting, fund administration, compliance and transfer agency services to each Fund. The fees related to these services are included in Fund services fees within the Statements of Operations. Atlantic also provides certain shareholder report production and EDGAR conversion and filing services. Pursuant to an Atlantic services agreement, each Fund pays Atlantic customary fees for its services. Atlantic provides a Principal Financial Officer, a Chief Compliance Officer, and an Anti-Money Laundering Officer to each Fund, as well as certain additional compliance support functions.
Trustees and Officers – The Trust pays each Independent Trustee an annual retainer fee of $8,240 for service to the Trust and the Audit and Compliance Committee Chairperson receives an additional retainer fee of $3,000. Each Trustee is also reimbursed for all reasonable out-of-pocket expenses incurred in connection with their duties as a Trustee, including travel and related expenses incurred in attending Board meetings. No officers of the Funds are compensated by the Funds, but officers are reimbursed for travel and related expenses incurred in attending Board meetings.
Note 5. Capital Contribution
On February 18, 2016, the Adviser made a voluntary capital contribution to the Chou Opportunity Fund in the amount of $918,468, which approximates the advisory fees retained by the Adviser with respect to the Chou Opportunity Fund during the fiscal year ended December 31, 2015. This voluntary contribution was a gesture of goodwill by the Adviser to the Chou Opportunity Fund in recognition of the Fund’s underperformance in the prior year relative to its performance in earlier years. The Adviser is under no obligation to make a voluntary waiver, a voluntary fee reimbursement, or a voluntary capital contribution to either of the Funds in the future for any reason.
Note 6. Expense Reimbursements and Fees Waived
The Adviser has contractually agreed to waive a portion of its fee and/or reimburse certain expenses to limit total annual operating expenses to 1.20% of the average daily net assets of each Fund through at least May 1, 2020 (excluding other expenses, taxes, leverage interest, acquired fund fees and expenses, dividends or interest on short positions, other interest expenses, brokerage commissions, and extraordinary expenses such as litigation). For the year ended December 31, 2018, fees waived and expenses reimbursed were as follows:
| | | | Investment Adviser Fees Waived | | | Expenses Reimbursed | |
| Chou Opportunity Fund | | | $ | 128,321 | | | $ | – | |
| Chou Income Fund | | | $ | 116,232 | | | $ | 34,228 | |
CHOU AMERICA MUTUAL FUNDS
NOTES TO FINANCIAL STATEMENTS
DECEMBER 31, 2018
Note 7. Summary of Derivative Activity
The volume of open derivative positions may vary on a daily basis as the Chou Opportunity Fund transacts derivative contracts in order to achieve the exposure desired by the Adviser. The total value of transactions in written options for the year ended December 31, 2018, were approximately as follows:
| Written Options | | $ | (1,317,341 | ) |
The Chou Opportunity Fund’s use of derivatives during the year ended December 31, 2018, was limited to written options.
Following is a summary of the effect of derivatives on the Chou Opportunity Fund’s Statement of Assets and Liabilities as of December 31, 2018:
| Location: | | Equity Contracts | |
| Liability derivatives: | | | | |
| Call options written, at value | | $ | (178,163 | ) |
Realized and unrealized gains and losses on derivatives contracts during the year ended December 31, 2018, by the Chou Opportunity Fund are recorded in the following locations on the Statement of Operations:
| Location: | | Equity Contracts | |
| Net realized gain (loss) on: | | | | |
| Written options | | $ | 405,020 | |
| Location: | | Equity Contracts | |
| Net change in unrealized appreciation (depreciation) on: | | | | |
| Written options | | $ | 1,890,048 | |
Note 8. Offsetting of Financial and Derivative Assets and Liabilities
The following table summarizes any derivatives and securities lending and related collateral, at the end of the reporting period, that are subject to an enforceable master netting agreement or similar agreement. For financial reporting purposes, the Funds do not offset financial assets and financial liabilities that are subject to the master netting agreements in the Statements of Assets and Liabilities.
| | | | Gross Asset (Liability) as Presented in the Statement of Assets and Liabilities | | | | Financial Instruments (Received) Pledged* | | | | Cash Collateral (Received) Pledged* | | | | Net Amount | |
| Chou Opportunity Fund | | | | | | | | | | | | | | | | |
| Assets: | | | | | | | | | | | | | | | | |
| Securities Lending | | $ | 1,904,015 | | | $ | – | | | $ | (1,904,015 | ) | | $ | – | |
| Liabilities: | | | | | | | | | | | | | | | | |
| Derivatives** | | | (178,163 | ) | | | 178,163 | | | | – | | | | – | |
| Chou Income Fund | | | | | | | | | | | | | | | | |
| Assets: | | | | | | | | | | | | | | | | |
| Securities Lending | | $ | 6,885 | | | $ | – | | | $ | (6,885 | ) | | $ | – | |
| * | The actual financial instruments and cash collateral (received) pledged may be in excess of the amounts shown in the table. The table only reflects collateral amounts up to the amount of the financial instrument disclosed on the Schedules of Investments. |
CHOU AMERICA MUTUAL FUNDS
NOTES TO FINANCIAL STATEMENTS
DECEMBER 31, 2018
| ** | Derivatives consist of options contracts. The amounts disclosed above represent the exposure to one or more counterparties. For further detail on individual derivative contracts and the corresponding unrealized appreciation (depreciation), see the Schedules of Investments. |
Note 9. Security Transactions
The cost of purchases and proceeds from sales of investment securities (including maturities), other than short-term investments during the year ended December 31, 2018, were as follows:
| | | | Purchases | | | Sales | |
| Chou Opportunity Fund | | | $ | 6,101,000 | | | $ | 10,900,223 | |
| Chou Income Fund | | | | 913,310 | | | | 1,573,189 | |
Note 10. Federal Income Tax
As of December 31, 2018, the cost of investments and the components of net unrealized appreciation (depreciation) were as follows:
| | | | Tax Cost of Investments | | | Gross Unrealized Appreciation | | | Gross Unrealized Depreciation | | | Net Unrealized Depreciation | |
| Chou Opportunity Fund | | | $ | 57,741,814 | | | $ | 5,917,127 | | | $ | (24,997,967 | ) | | $ | (19,080,840 | ) |
| Chou Income Fund | | | | 14,943,188 | | | | 97,698 | | | | (7,945,958 | ) | | | (7,848,260 | ) |
Distributions paid during the fiscal years ended as noted were characterized for tax purposes as follows:
| | | | Ordinary Income | |
| Chou Opportunity Fund | | | | |
| 2018 | | | $ | 1,482,024 | |
| 2017 | | | | 6,171,272 | |
| Chou Income Fund | | | | | |
| 2018 | | | | 457,236 | |
| 2017 | | | | 1,055,060 | |
As of December 31, 2018, distributable earnings (accumulated loss) on a tax basis were as follows:
| | | | Undistributed Ordinary Income | | | Capital and Other Losses | | | Unrealized Depreciation | | | Total | |
| Chou Opportunity Fund | | | $ | 139 | | | $ | (11,524,591 | ) | | $ | (19,080,839 | ) | | $ | (30,605,291 | ) |
| Chou Income Fund | | | | 98,067 | | | | (1,850,407 | ) | | | (7,854,940 | ) | | | (9,607,280 | ) |
The difference between components of distributable earnings on a tax basis and the amounts reflected in the Statement of Assets and Liabilities are primarily due to straddles and wash sales for Chou Opportunity Fund and contingent payment debt instruments for Chou Income Fund.
As of December 31, 2018, Chou Opportunity Fund and Chou Income Fund had $11,524,591 and $1,850,407, respectively, of available long-term capital loss carryforwards that have no expiration date.
Note 11. Securities Lending Agreement
The Funds may lend securities, through their agent, to qualified borrowers in order to earn additional income. The Funds lend portfolio securities to a broker in exchange for collateral consisting of cash or securities of a collateral requirement of at least 102% of the market value of the securities on loan. If the value of the collateral falls below the collateral requirement, the agent shall request additional collateral in order to comply with the collateral requirement. Should the borrower of the securities fail to return any loaned securities promptly, the bank has the right to use the collateral to repurchase the loaned securities. As of December 31, 2018, cash collateral was invested in repurchase agreements and U.S. Treasury Securities as noted on the Funds’ Schedules of Investments. Securities lending income is disclosed
CHOU AMERICA MUTUAL FUNDS
NOTES TO FINANCIAL STATEMENTS
DECEMBER 31, 2018
in the Funds’ Statements of Operations. As of December 31, 2018, the Chou Opportunity Fund received collateral of $1,929,699 and the value of securities loaned amounted to $1,904,015 and the Chou Income Fund received collateral of $7,445 and the value of securities on loan amounted to $6,885.
Note 12. Recent Accounting Pronouncements
In August 2018, the Financial Accounting Standards Board (“FASB”) issued Accounting Standards Update No. 2018-13 “Fair Value Measurement (Topic 820): Disclosure Framework – Changes to the Disclosure Requirements for Fair Value Measurement” (“ASU 2018-13”) which includes amendments intended to improve the effectiveness of disclosures in the notes to financial statements. For example, ASU 2018-13 includes additional disclosures regarding the range and weighted average of significant unobservable inputs used to develop Level 3 fair value measurements, and clarifications to the narrative description of measurement uncertainty disclosures. ASU 2018-13 is effective for interim and annual periods beginning after December 15, 2019. Early adoption is permitted and the Funds have adopted ASU 2018-13 within these financial statements.
In September 2018, the Securities and Exchange Commission released Final Rule 33-10532 captioned “Disclosure Update and Simplification,” which includes: (i) an amendment to require presentation of the total, rather than the components, of distributable earnings on the Statement of Assets and Liabilities; and (ii) an amendment to require presentation of the total, rather than the components, of distributions to shareholders, except for tax return of capital distributions, on the Statement of Changes in Net Assets. The amendments also removed the requirement for parenthetical disclosure of undistributed net investment income on the Statement of Changes in Net Assets. These changes were effective November 5, 2018. These amendments are reflected in the Funds' financial statements for the year ended December 31, 2018.
In March 2017, the FASB issued ASU No. 2017-08, Receivables—Nonrefundable Fees and Other Costs (Subtopic 310-20): Premium Amortization on Purchased Callable Debt Securities. The amendments in the ASU shorten the amortization period for certain callable debt securities, held at a premium, to be amortized to the earliest call date. The ASU does not require an accounting change for securities held at a discount; which continues to be amortized to maturity. The ASU is effective for fiscal years and interim periods within those fiscal years beginning after December 15, 2018. Management is currently evaluating the impact, if any, of applying this provision.
Note 13. Subsequent Events
Subsequent events occurring after the date of this report through the date these financial statements were issued have been evaluated for potential impact, and each Fund has had no such events.
REPORT OF INDEPENDENT REGISTERED PUBLIC ACCOUNTING FIRM
To the Board of Trustees of Chou America Mutual Funds and the Shareholders of Chou Opportunity Fund and Chou Income Fund
Opinion on the Financial Statements
We have audited the accompanying statements of assets and liabilities of Chou Opportunity Fund and Chou Income Fund, each a series of shares of beneficial interest in Chou America Mutual Funds (the “Funds”), including the schedules of investments, as of December 31, 2018, and the related statements of operations and cash flows for the year then ended, the statements of changes in net assets for each of the years in the two-year period then ended and the financial highlights for each of the years in the five-year period then ended, and the related notes (collectively referred to as the “financial statements”). In our opinion, the financial statements present fairly, in all material respects, the financial position of the Funds as of December 31, 2018, and the results of their operations and cash flows for the year then ended, the changes in their net assets for each of the years in the two-year period then ended and their financial highlights for each of the years in the five-year period then ended, in conformity with accounting principles generally accepted in the United States of America.
Basis for Opinion
These financial statements are the responsibility of the Funds’ management. Our responsibility is to express an opinion on the Funds’ financial statements based on our audits. We are a public accounting firm registered with the Public Company Accounting Oversight Board (United States) (“PCAOB”) and are required to be independent with respect to the Funds in accordance with the U.S. federal securities law and the applicable rules and regulations of the Securities and Exchange Commission and the PCAOB.
We conducted our audits in accordance with the standards of the PCAOB. Those standards require that we plan and perform the audits to obtain reasonable assurance about whether the financial statements are free of material misstatement, whether due to error or fraud. The Funds are not required to have, nor were we engaged to perform, an audit of their internal control over financial reporting. As part of our audits we are required to obtain an understanding of internal control over financial reporting but not for the purpose of expressing an opinion on the effectiveness of the Funds’ internal control over financial reporting. Accordingly, we express no such opinion.
The financial statements for Chou Opportunity Fund and Chou Income Fund include an investment valued at $10,334,401 (27% of net assets) and $1,381,814 (14% of net assets), respectively, whose fair values have been estimated under procedures established by the Board of Trustees in the absence of readily ascertainable fair values, as explained in Note 2.
Our audits included performing procedures to assess the risk of material misstatement of those financial statements, whether due to error or fraud, and performing procedures that respond to those risks. Such procedures included examining, on a test basis, evidence regarding the amounts and disclosures in the financial statements. Our procedures included confirmation of securities owned as of December 31, 2018 by correspondence with the custodian and brokers. Our audits also included evaluating the accounting principles used and significant estimates made by management, as well as evaluating the overall presentation of the financial statements. We believe that our audits provide a reasonable basis for our opinion.

BBD, LLP
We have served as the auditor of one or more of the Funds in the Chou America Mutual Funds since 2010.
Philadelphia, Pennsylvania
February 28, 2019
CHOU AMERICA MUTUAL FUNDS
ADDITIONAL INFORMATION (Unaudited)
DECEMBER 31, 2018
Investment Advisory Agreement Approval
At a meeting held on December 6, 2018, the Board of Trustees of Chou America Mutual Funds, including all of the Independent Trustees (the “Board”), approved the renewal of the investment advisory agreement (the “Advisory Agreement”) between the Adviser and Chou America Mutual Funds (the “Trust”), on behalf of the Funds.
In voting to approve the renewal of the Advisory Agreement, the Board considered the overall fairness of the Advisory Agreement and factors it deemed relevant with respect to each Fund including, but not limited to: (1) the nature, extent and quality of the services provided to each Fund; (2) the performance of each Fund as compared to the respective Fund’s benchmark index and a peer group of funds (“Broadridge Peer Group”) selected by Broadridge Financial Solutions, Inc. (“Broadridge”); (3) the level of the advisory fees and the overall expenses of each Fund and how those compared to each Fund’s Broadridge Peer Group; (4) the costs of services provided to the Funds and the profitability of the Adviser; and (5) the effect of, as applicable, the growth or decline of fund assets on the advisory fee (i.e., economies of scale) and whether the fee levels reflect economies of scale for the benefit of investors. The Board also considered whether or not any “fall-out” benefits accrued to the Adviser or its affiliates (other than its direct compensation) as a result of the Adviser’s relationship with the Funds. The Board did not identify any single factor or item of information as all-important or controlling.
In considering the approval of the Advisory Agreement, the Board considered a broad range of information provided by the Adviser, including but not limited to, reports relating to each Fund’s performance and expenses. In addition, the Board considered a memorandum from its legal counsel regarding the legal framework and the Board’s duties in considering the renewal of the Advisory Agreement. The Board also meets each quarter to review various aspects of the Funds and is provided additional material in connection with those meetings.
Nature, Extent and Quality of Services
The Board reviewed and considered the nature, extent and quality of the advisory services provided by the Adviser to each Fund under the Advisory Agreement. The Adviser has previously represented to the Board that the Adviser does not have any clients other than the Funds and that Francis Chou, the Funds’ portfolio manager, manages Canadian mutual funds with investment strategies similar to those of the Funds through an affiliated Canadian adviser. The Board also noted the Adviser’s representation that it has the financial resources and appropriate staffing to manage the Funds and to meet its expense reimbursement obligations. The Board also reviewed and considered the qualifications of Mr. Chou as the portfolio manager to each Fund.
Performance
The Board considered the performance of each Fund as of September 30, 2018 as compared to its particular benchmark index. The Board considered that the Opportunity Fund underperformed its benchmark index, the S&P 500 Index, for the since-inception and one-year, three-year and five-year periods ended September 30, 2018. Additionally, the Board considered that the Income Fund underperformed its benchmark index, the Barclays Capital U.S. Corporate High Yield Index, for the since inception and one-year, three-year and five-year periods ended September 30, 2018. The Board noted that the Opportunity Fund’s performance was above the median for its Broadridge Peer Group for the one-year period ended September 30, 2018, but below the median for each of the three-year and five-year periods ended September 30, 2018. Further, the performance of the Income Fund was below the median for its Broadridge Peer Group for the one-year, three-year and five-year periods ended September 30, 2018. While the Board concluded that the Adviser’s management of the Funds was satisfactory and could benefit the Funds and their shareholders, the Board discussed with Mr. Chou the reasons for the Funds’ underperformance. Particularly, the Board discussed the reasons for each Fund’s poor relative performance during periods, which was principally due to certain of the Funds’ portfolio security holdings underperforming the Adviser’s expectations. The Board considered the steps the Adviser was taking to improve Fund performance. The Independent Trustees also discussed how the Adviser was seeking to meet each Fund’s
CHOU AMERICA MUTUAL FUNDS
ADDITIONAL INFORMATION (Unaudited)
DECEMBER 31, 2018
investment objective and investment strategies being utilized by the Adviser.
Fees and Expenses
The Board considered the contractual and actual advisory fee rates for each Fund relative to the contractual and actual advisory fee rates for each Fund’s Broadridge Peer Group for the period ended September 30, 2018. The Board also considered the total operating expense ratios of each Fund relative to each Fund’s Broadridge Peer Group for the same period. The Board noted that the Adviser waived most of its advisory fee for the Income Fund in 2017, and is currently waiving all of its advisory fee and reimbursing expenses for the Income Fund monthly, and that the Adviser’s voluntary waiver of its entire advisory fee with respect to the Opportunity Fund during the fiscal year ended December 31, 2017 was discontinued on January 1, 2018. The Board further considered that the Adviser contractually agreed to continue its advisory fee waivers and expense caps for each Fund through May 1, 2020 to the extent set forth in the Expense Limitation Agreement, in order for the Funds’ total operating expenses to remain competitive.
With respect to the Opportunity Fund, the Board considered that the Fund’s contractual advisory fee rate was higher than the median of its Broadridge Peer Group and its total operating expense ratio and actual advisory fee rate, net of waivers, were lower than the median of its the Broadridge Peer Group. With respect to the Income Fund, the Board considered the actual advisory fee rate, net of waivers, was lower than the Broadridge Peer Group median advisory fee, and that the contractual advisory fee rate and total operating expense ratio were higher than the median of its Broadridge Peer Group. The Board also considered that each Fund’s total operating expense ratio reflected advisory fees waived and/or expenses reimbursed by the Adviser. Taking all of the foregoing into consideration, the Board concluded that each Fund’s contractual and actual advisory fee rates were reasonable.
The Independent Trustees considered that the advisory fees charged by Chou Associates Management, Inc. (“Chou Associates”), an affiliate of the Adviser, to certain Canadian funds advised by Chou Associates were higher than the contractual and actual advisory fees charged to the Funds by the Adviser.
Costs of Services and Profitability
The Board considered the costs to operate the Funds and the profitability of the Adviser. The Board reviewed the fees paid by each Fund to the Adviser for the fiscal year ended December 31, 2017. The Board also reviewed the profit and loss statement provided by the Adviser on a fund-by-fund basis and considered the Adviser’s methodology with respect to the profitability calculation. In this regard, the Board noted that the Adviser did not realize a profit with respect to services provided to the Opportunity Fund for the fiscal year ended December 31, 2017 after the effect of certain fee waivers and expense reimbursements, although the Adviser realized a small profit in 2017 with respect to the Income Fund. The Board also noted the existing Expense Limitation Agreement for each Fund is in place through May 1, 2020. After considering all of the information the Board concluded that it was satisfied with the profitability of the Adviser and believed the Adviser had the financial resources to continue to manage the Funds.
Economies of Scale
With respect to economies of scale, the Board considered the current asset size of the Funds. In this regard, the Board also considered the Adviser’s representation that while there is potential for economies of scale in connection with the services that the Adviser provides to the Funds, the Adviser does not believe that breakpoints in the fee schedules of the Funds would be appropriate in the absence of significant and continued growth of Fund assets. The Board concluded it would monitor the asset growth of the Funds and would consider breakpoints in the event of significant and sustained asset growth.
Other Benefits
The Board noted that the Adviser did not identify any material indirect "fall-out" benefits that accrue to the Adviser or its affiliates (other than its direct compensation) from the Adviser’s relationship with the Funds. The Board also noted that the Adviser represented that it does not use soft-dollars as permitted by Section 28(e) of the Securities Exchange
CHOU AMERICA MUTUAL FUNDS
ADDITIONAL INFORMATION (Unaudited)
DECEMBER 31, 2018
Act of 1934, as amended. Based on the foregoing representation, the Board concluded that other benefits received by the Adviser from its relationship with the Funds were not a material factor to consider in approving the Advisory Agreement.
Conclusion
Based on its evaluation of these and other factors, the Board, in the exercise of its business judgment, concluded with respect to each Fund that: (1) each Fund was reasonably likely to benefit from the nature, quality and extent of services provided by the Adviser; (2) each Fund’s performance was satisfactory in light of all the factors considered by the Board, and acknowledged the steps the Adviser was taking to improve performance, and; (3) the profits, as applicable, and fees payable to the Adviser were reasonable in the context of all the factors considered by the Board; (4) the economies of scale were not a material factor in its approval of the Advisory Agreement given the current size of the Funds; and (5) other benefits received by the Adviser from its relationship with the Funds were not a material factor to consider in approving the Advisory Agreement. In light of these conclusions, the Board determined, in its business judgment, to renew the Advisory Agreement.
Proxy Voting Information
A description of the policies and procedures that each Fund uses to determine how to vote proxies relating to securities held in each Fund’s portfolio is available, without charge and upon request, by calling (877) 682-6352 and on the U.S. Securities and Exchange Commission’s website at www.sec.gov. Each Fund’s proxy voting record for the most recent twelve-month period ended June 30 is available, without charge and upon request, by calling (877) 682-6352 and on the SEC’s website at www.sec.gov.
Availability of Quarterly Portfolio Schedules
Each Fund files its complete schedule of portfolio holdings with the SEC for the first and third quarters of each fiscal year on Form N-Q. These filings are available, without charge and upon request on the SEC’s website at www.sec.gov or may be reviewed and copied at the SEC’s Public Reference Room in Washington, DC. Information on the operation of the Public Reference Room may be obtained by calling (800) SEC-0330.
Shareholder Expense Example
As a shareholder of the Funds, you incur two types of costs: (1) transaction costs, including redemption fees, and (2) ongoing costs, including management fees, distribution (12b-1) fees and other Fund expenses. This example is intended to help you understand your ongoing costs (in dollars) of investing in the Funds, and to compare these costs with the ongoing costs of investing in other mutual funds.
The example is based on an investment of $1,000 invested at the beginning of the period and held for the entire period from July 1, 2018 through December 31, 2018.
Actual Expenses – The first line of the table below provides information about actual account values and actual expenses. You may use the information in this line, together with the amount you invested, to estimate the expenses that you paid over the period. Simply divide your account value by $1,000 (for example, an $8,600 account value divided by $1,000 = 8.6), then multiply the result by the number in the first line under the heading entitled “Expenses Paid During Period” to estimate the expenses you paid on your account during the period.
Hypothetical Example for Comparison Purposes – The second line of the table below provides information about hypothetical account values and hypothetical expenses based on each Fund’s actual expense ratio and an assumed rate
CHOU AMERICA MUTUAL FUNDS
ADDITIONAL INFORMATION (Unaudited)
DECEMBER 31, 2018
of return of 5% per year before expenses, which is not each Fund’s actual return. The hypothetical account values and expenses may not be used to estimate the actual ending account balance or expenses you paid for the period. You may use this information to compare the ongoing costs of investing in each Fund and other funds. To do so, compare this 5% hypothetical example with the 5% hypothetical examples that appear in the shareholder reports of other funds.
Please note that the expenses shown in the table are meant to highlight your ongoing costs only and do not reflect any transactional costs, such as redemption fees. Therefore, the second line of the table is useful in comparing ongoing costs only and will not help you determine the relative total costs of owning different funds. In addition, if these transactional costs were included, your costs would have been higher
| | Beginning Account Value July 1, 2018 | Ending Account Value December 31, 2018 | Expenses Paid During Period* | Annualized Expense Ratio* |
| Chou Opportunity Fund | | | | |
| Actual | $1,000.00 | $908.49 | $5.82 | 1.21% |
| Hypothetical (5% return before expenses) | $1,000.00 | $1,019.11 | $6.16 | 1.21% |
| Chou Income Fund | | | | |
| Actual | $1,000.00 | $930.72 | $5.84 | 1.20% |
| Hypothetical (5% return before expenses) | $1,000.00 | $1,019.16 | $6.11 | 1.20% |
| * | Expenses are equal to the Fund’s annualized expense ratio multiplied by the average account value over the period, multiplied by the number of days in the most recent fiscal half-year (184) divided by 365 to reflect the half-year period. |
Federal Tax Status of Dividends Declared during the Fiscal Year
For federal income tax purposes, dividends from short-term capital gains are classified as ordinary income. The Chou Opportunity Fund designates 16.23% as qualified interest income exempt from U.S. tax for foreign shareholders (QII). The Chou Opportunity Fund also designates 99.86% of its income dividend distributed as qualifying for the qualified dividend rate (QDI) and 99.85% of its income dividend distributed as qualifying for the corporate dividends-received deduction (DRD) as defined in Section 1(h)(11) of the Internal Revenue Code. The Chou Income Fund designates 5.04% of its income dividend distributed as DRD and 5.04% as QDI. The Chou Income Fund also designates 52.92% as QII.
Trustees and Officers of the Trust
The Board is responsible for oversight of the management of the Trust’s business affairs and of the exercise of all the Trust’s powers except those reserved for the shareholders. The following table provides information about each Board member and certain officers of the Trust. Each Trustee and officer holds office until the person resigns, is removed, or is replaced. Unless otherwise noted, the persons have held their principal occupations for more than five years. The address for all Trustees and officers is Three Canal Plaza, Suite 600, Portland, Maine 04101. each Fund’s Statement of Additional Information includes additional information about the Trustees and is available, without charge and upon request, by calling (877) 682-6352.
CHOU AMERICA MUTUAL FUNDS
ADDITIONAL INFORMATION (Unaudited)
DECEMBER 31, 2018
Name and Year of Birth | Position with the Trust | Length of Time Served | Principal Occupation(s) During Past Five Years | Number of Series of Trust Overseen by Trustee | Other Directorships Held by Trustee |
| Independent Trustees |
Lily Pinarello Born: 1953 | Trustee | Since 2010 | Retired since 1999. | 2 | 0 |
Erroll Tyrone Tull Born: 1945 | Trustee, Chairman Audit and Compliance Committee | Since 2014 | Retired since 2010; Benefits Co-ordinator, Crown Metal Packaging, 1971-2010. | 2 | 0 |
| Interested Trustee |
Francis S.M. Chou Born: 1956 | Trustee | Since 2010 | Chief Executive Officer, Chou America Management, Inc. since 2010; Chief Executive Officer, Chou Associates Management, Inc., since 1986. Chief Executive Officer, Wintaai Holdings, Ltd., since 2017. Chairman of the Board, Stonetrust Commercial Insurance Company, since 2018. | 2 | 0 |
| Officers |
Francis S.M. Chou Born: 1956 | President and Principal Executive Officer | Since 2010 | Chief Executive Officer, Chou America Management, Inc. since 2010; Chief Executive Officer, Chou Associates Management, Inc., since 1986. Chief Executive Officer, Wintaai Holdings, Ltd., since 2017. Chairman of the Board, Stonetrust Commercial Insurance Company, since 2018. | N/A | N/A |
Michael J. McKeen Born: 1971 | Treasurer and Principal Financial Officer | Since 2010 | Senior Vice President, Atlantic since 2008. | N/A | N/A |
Dennis Mason Born: 1967 | Chief Compliance Officer | Since 2013 | Fund Compliance Officer, Atlantic, since 2013. Senior Specialist, Atlantic 2011-2013; Senior Analyst, Atlantic, 2008-2011. | N/A | N/A |
Gino Malaspina Born: 1968 | Secretary | Since 2016 | Senior Counsel, Atlantic, since June 2014; Senior Counsel and Managing Director, Cipperman & Company/Cipperman Compliance Services LLC, 2010-2014; and Associate, Stradley Ronon Stevens & Young, LLP, 2009-2010. | N/A | N/A |
Zachary Tackett Born: 1988 | Vice President, and Anti-Money Laundering Compliance Officer | Since 2014 | Counsel, Atlantic, Since 2014; Intern Associate, Coakley & Hyde, PLLC, 2010-2013. | N/A | N/A |
Timothy Bowden Born: 1969 | Vice President | Since 2010 | Manager, Atlantic since 2008. | N/A | N/A |
Geoffrey Ney Born: 1975 | Vice President | Since 2013 | Manager, Atlantic since 2013; Senior Fund Accountant, Atlantic, 2008-2013. | N/A | N/A |
Todd Proulx Born: 1978 | Vice President | Since 2013 | Manager, Atlantic since 2013; Senior Fund Accountant, Atlantic, 2008-2013. | N/A | N/A |
FOR MORE INFORMATION:
P.O. Box 588
Portland, ME 04112
(877) 682-6352
INVESTMENT ADVISER
Chou America Management Inc.
110 Sheppard Ave. East
Suite 301, Box 18
Toronto, Ontario, Canada M2N 6Y8
TRANSFER AGENT
Atlantic Fund Services
P.O. Box 588
Portland, ME 04112
www.atlanticfundservices.com
DISTRIBUTOR
Rafferty Capital Markets, LLC
1010 Franklin Avenue
Garden City, NY 11530
www.raffcap.com
This report is submitted for the general information of the shareholders of the Funds. It is not authorized for distribution to prospective investors unless preceded or accompanied by an effective prospectus, which includes information regarding the Funds’ risks, objectives, fees and expenses, experience of its management, and other information.
243-ANR-1218
ITEM 2. CODE OF ETHICS.
| (a) | As of the end of the period covered by this report, Chou America Mutual Funds (the “Registrant”) has adopted a code of ethics, which applies to its Principal Executive Officer and Principal Financial Officer (the “Code of Ethics”). |
| (c) | There have been no amendments to the Registrant’s Code of Ethics during the period covered by this report. |
| (d) | There have been no waivers to the Registrant’s Code of Ethics during the period covered by this report. |
| (f) (1) | A copy of the Code of Ethics is being filed under Item 12(a) hereto. |
ITEM 3. AUDIT COMMITTEE FINANCIAL EXPERT.
The Board of Trustees has determined that no members of the Audit Committee are an "audit committee financial expert" as that term is defined under applicable regulatory guidelines.
ITEM 4. PRINCIPAL ACCOUNTANT FEES AND SERVICES.
(a) Audit Fees - The aggregate fees billed for each of the last two fiscal years (the “Reporting Periods”) for professional services rendered by the Registrant’s principal accountant for the audit of the Registrant’s annual financial statements, or services that are normally provided by the principal accountant in connection with the statutory and regulatory filings or engagements for the Reporting Periods, were $29,000 in 2017 and $29,000 in 2018.
(b) Audit-Related Fees – The aggregate fees billed in the Reporting Periods for assurance and related services rendered by the principal accountant that were reasonably related to the performance of the audit of the Registrant’s financial statements and are not reported under paragraph (a) of this Item 4 were $0 in 2017 and $0 in 2018.
(c) Tax Fees - The aggregate fees billed in the Reporting Periods for professional services rendered by the principal accountant to the Registrant for tax compliance, tax advice and tax planning were $6,000 in 2017 and $6,000 in 2018. These services consisted of review or preparation of U.S. federal, state, local and excise tax returns.
(d) All Other Fees - The aggregate fees billed in the Reporting Periods for products and services provided by the principal accountant to the Registrant, other than the services reported in paragraphs (a) through (c) of this Item, were $0 in 2017 and $0 in 2018.
(e) (1) The Audit Committee reviews and approves in advance all audit and “permissible non-audit services” (as that term is defined by the rules and regulations of the Securities and Exchange Commission) to be rendered to a series of the Registrant (each, a “Series”). In addition, the Audit Committee reviews and approves in advance all “permissible non-audit services” to be provided to an investment adviser (not including any sub-adviser) of a Series, or an affiliate of such investment adviser, that is controlling, controlled by or under common control with the investment adviser and provides on-going services to the Registrant (“Affiliate”), by the Series’ principal accountant if the engagement relates directly to the operations and financial reporting of the Series. The Audit Committee considers whether fees paid by a Series’ investment adviser or an Affiliate to the Series’ principal accountant for audit and permissible non-audit services are consistent with the principal accountant’s independence.
(e) (2) No services included in (b) - (d) above were approved pursuant to paragraph (c)(7)(i)(C) of Rule 2-01 of Regulation S-X.
(f) Not applicable
(g) The aggregate non-audit fees billed by the principal accountant for services rendered to the Registrant for the Reporting Periods were $0 in 2017 and $0 in 2018. There were no fees billed in either of the Reporting Periods for non-audit services rendered by the principal accountant to the Registrant’s investment adviser or any Affiliate.
(h) During the Reporting Periods, the Registrant’s principal accountant provided no non-audit services to the investment adviser or any entity controlling, controlled by or under common control with the investment adviser to the series of the Registrant.
ITEM 5. AUDIT COMMITTEE OF LISTED REGISTRANTS.
Not applicable
ITEM 6. INVESTMENTS.
| (a) | Included as part of report to shareholders under Item 1. |
ITEM 7. DISCLOSURE OF PROXY VOTING POLICIES AND PROCEDURES FOR CLOSED-END
MANAGEMENT INVESTMENT COMPANIES.
Not applicable.
ITEM 8. PORTFOLIO MANAGERS OF CLOSED-END MANAGEMENT INVESTMENT COMPANIES.
Not applicable.
ITEM 9. PURCHASES OF EQUITY SECURITIES BY CLOSED-END MANAGEMENT INVESTMENT COMPANY AND AFFILIATED PURCHASERS.
Not applicable.
ITEM 10. SUBMISSION OF MATTERS TO A VOTE OF SECURITY HOLDERS
The Registrant does not accept nominees to the board of trustees from shareholders.
ITEM 11. CONTROLS AND PROCEDURES
(a) The Registrant’s Principal Executive Officer and Principal Financial Officer have concluded that the Registrant’s disclosure controls and procedures (as defined in Rule 30a-3(c) under the Investment Company Act of 1940 (the “Act”)) are effective, based on their evaluation of the controls and procedures required by Rule 30a-3(b) under the Act and Rules 13a-15(b) or 15d-15(b) under the Securities Exchange Act of 1934, as of a date within 90 days of the filing date of this report.
(b) There were no changes in the Registrant’s internal control over financial reporting (as defined in
Rule 30a-3(d) under the Act) that occurred during the second fiscal quarter of the period covered by this report that have materially affected, or are reasonably likely to materially affect, the Registrant’s internal control over financial reporting.
ITEM 12. DISCLOSURE OF SECURITIES LENDING ACTIVITIES FOR CLOSED-END MANAGEMENT INVESTMENT COMPANIES
Not applicable.
ITEM 13. EXHIBITS.
(a)(1) Code of Ethics (Exhibit filed herewith).
(a)(2) Certifications pursuant to Rule 30a-2(a) of the Act, and Section 302 of the Sarbanes-Oxley Act of 2002. (Exhibits filed herewith)
(a)(3) Not applicable.
(b) Certifications pursuant to Rule 30a-2(b) of the Act, and Section 906 of the Sarbanes-Oxley Act of 2002. (Exhibit filed herewith)
| (b) | Certifications pursuant to Rule 30a-2(b) of the Act, and Section 906 of the Sarbanes-Oxley Act of 2002. (Exhibit filed herewith) |
SIGNATURES
Pursuant to the requirements of the Securities Exchange Act of 1934 and the Investment Company Act of 1940, the Registrant has duly caused this report to be signed on its behalf by the undersigned, thereunto duly authorized.
Registrant Chou America Mutual Funds
| By: | /s/ Francis S. M. Chou |
| | Francis S.M. Chou, Principal Executive Officer |
| Date | February 28, 2019 |
Pursuant to the requirements of the Securities Exchange Act of 1934 and the Investment Company Act of 1940, this report has been signed below by the following persons on behalf of the Registrant and in the capacities and on the dates indicated.
| By: | /s/ Francis S.M. Chou |
| | Francis S.M. Chou, Principal Executive Officer |
| Date | February 28, 2019 |
| By: | /s/ Michael J. McKeen |
| | Michael J. McKeen, Principal Financial Officer |
| Date | February 28, 2019 |