As filed with the Securities and Exchange Commission on August 26, 2011
UNITED STATES
SECURITIES AND EXCHANGE COMMISSION
WASHINGTON, D.C. 20549
FORM N-CSR
CERTIFIED SHAREHOLDER REPORT OF REGISTERED MANAGEMENT
INVESTMENT COMPANIES
Investment Company Act file number 811-22394
CHOU AMERICA MUTUAL FUNDS
Three Canal Plaza, Suite 600
Portland, Maine 04101
Michael J. McKeen, Principal Financial Officer
Three Canal Plaza, Suite 600
Portland, Maine 04101
207-347-2000
Date of fiscal year end: December 31
Date of reporting period: January 1, 2011 – June 30, 2011
ITEM 1. REPORT TO STOCKHOLDERS.
| CHOU AMERICA MUTUAL FUNDS |
Semi-Annual Report
June 30, 2011
(Unaudited)
Fund Adviser:
Chou America Management Inc.
110 Sheppard Ave. East
Suite 301, Box 18
Toronto, Ontario, Canada M2N 6Y8
Toll Free: (877) 755-5188
| A Message to our Shareholders | 1 |
| Performance Charts and Analysis | 5 |
| Schedules of Investments | 7 |
| Statements of Assets and Liabilities | 11 |
| Statements of Operations | 12 |
| Statements of Changes | 13 |
| Financial Highlights | 14 |
| Notes to Financial Statements | 16 |
| Additional Information | 21 |
| |
CHOU EQUITY OPPORTUNITY FUND A MESSAGE TO OUR SHAREHOLDERS JUNE 30, 2011 |
| |
Dear Shareholder,
During the first six months of 2011, the Chou Equity Opportunity Fund (the “Fund”) lost 0.33% of its value, while the S&P 500 Index (“S&P 500”) generated a return of 6.02% during the same time period.
Portfolio Commentary
Major contributors to the performance of the Fund were:
| · | Shares of Sprint Nextel Corp. rose as investors grew more confident in the company’s turnaround and its ability to grow net subscribers. |
| · | Shares of SandRidge Energy, Inc. increased in value as investors liked the company’s strategy of diversifying into additional oil assets from being an exclusive natural gas company. |
| · | Shares of Dell, Inc. rose when the company reported strong earnings and appeased investors’ concerns about its margins. |
The following holdings lowered the Fund’s performance during the first half of 2011:
| · | Bank Warrants fell as investors became increasingly concerned about mortgage losses, litigation and the prospect of slower economic growth. |
| · | Shares of MannKind Corp. dropped after U.S. regulators’ asked MannKind to do more trials before approval to market its inhaled insulin, Afrezza. |
| · | Shares of UTStarcom Holdings Corp. declined due to “tainting by association” when some Chinese companies listed in North America were suspected of fraud. |
| · | Shares of Office Depot, Inc. declined after it reported poor earnings that sparked investors’ concern about its future growth. |
During the first half of 2011, the average daily cash balance of the fund was 53%.
Market Commentary
The second quarter of 2011 ended with investors turning more cautious as sovereign debt problems in Europe resurfaced and an overheated Chinese economy threatened the global economy. The end of the second phase of quantitative easing on June 30, 2011, and the political stalemate over raising the U.S. debt ceiling, added to investor anxiety.
Our Outlook
Was S&P’s reduction of the United States’ credit rating from AAA to AA+ a blessing in disguise?
In our opinion, it was a blessing in disguise. While the ratings of rating agencies are important, how investors’ view and use these credit ratings is more important. We are diligent about doing our own homework on companies and countries and find that, while ratings may be useful to others, they are not that meaningful to us. In our opinion, the U.S. has not had triple-A credit for some time and the downgrade by S&P provided a much needed dose of reality. We believe that in the long run, the downgrade will not have a material effect on the economic prospects of the country, but in the short-run, the U.S. may have to pay slightly higher interest rates.
We think the stock market’s adverse reaction to the downgrade is extreme, and as long term investors, expect the recent turmoil in financial markets to give us some attractive investment opportunities. Because our investment horizon is five years or longer, we are willing to buy into situations where the short term looks cloudy but where the long term story is solid and valuations are attractive.
| |
CHOU EQUITY OPPORTUNITY FUND A MESSAGE TO OUR SHAREHOLDERS JUNE 30, 2011 |
| |
In summary, we are comfortable with the holdings we have in the portfolio. We believe they are attractively priced and undervalued and are optimistic about the future.
Yours truly,
Francis Chou
Portfolio Manager and CEO
Chou America Management Inc.
The views in this report were those of the Fund manager as of June 30, 2011, and may not reflect his view on the date this report is first published or anytime thereafter. The views are intended to assist the shareholders of the fund in understanding their investments in the Fund and do not constitute investment advice. This letter may contain discussions about certain investments held and not held in the portfolio. All current and future holdings are subject to risk and to change. There can be no guarantee of success with any technique, strategy or investment.
The S&P 500 is an unmanaged index representing the average performance of 500 widely held, publicly traded, large capitalization stocks. One cannot invest directly in an index.
| |
CHOU INCOME OPPORTUNITY FUND A MESSAGE TO OUR SHAREHOLDERS JUNE 30, 2011 |
| |
Dear Shareholder,
During the first six months of 2011, the Chou Income Opportunity Fund (the “Fund”) lost 1.79% of its value, while the Barclay's U.S. High Yield Index generated a return of 4.97% during the same time period.
Portfolio Commentary
The debt securities of Level 3 Communications, Inc. contributed positively to the performance of the Fund during the first half of 2011.
These holdings principally lowered the Fund’s performance during the first half of 2011:
| · | The term loan of R.H. Donnelley, Inc. fell as debt holders were concerned with its operations. For the price we paid for R.H. Donnelley, Inc., we believe its term loan is well covered by its earning power and assets. In addition, it has covenants that are protective to debt holders. This term loan comes with a cash flow sweep, which means that any free cash flow left after all the needs of the operations are met can be used to buy back debt at par from its holders and has additional credit support from two other subsidiaries of the holding company, Dex One Corporation. For the first six months of this year, R.H. Donnelley, Inc. bought back approximately 4.7% of its term loan at par. |
| · | The debt security of MannKind Corp. dropped after U.S. regulators’ asked MannKind to do more trials before approval to market its inhaled insulin, Afrezza. |
During the first half of 2011, the average daily cash position of the Fund, including U.S. Treasury Bills, was 47%.
Market Commentary
The second quarter of 2011 ended with investors turning more cautious as sovereign debt problems in Europe resurfaced and an overheated Chinese economy threatened the global economy. The end of the second phase of quantitative easing on June 30, 2011, and the political stalemate over raising the U.S. debt ceiling, added to investor anxiety.
Our Outlook
Was S&P’s reduction of the United States’ credit rating from AAA to AA+ a blessing in disguise?
In our opinion, it was a blessing in disguise. While the ratings of rating agencies are important, how investors’ view and use these credit ratings is more important. We are diligent about doing our own homework on companies and countries and find that, while ratings may be useful to others, they are not that meaningful to us. In our opinion, the U.S. has not had triple-A credit for some time and the downgrade by S&P provided a much needed dose of reality. We believe that in the long run, the downgrade will not have a material effect on the economic prospects of the country, but in the short-run, the U.S. may have to pay slightly higher interest rates.
We think the bond market’s adverse reaction to the downgrade is extreme, and as long term investors, expect the recent turmoil in financial markets to give us some attractive investment opportunities. Because our investment horizon is five years or longer, we are willing to buy into situations where the short term looks cloudy but where the long term story is solid and valuations are attractive.
In summary, we are comfortable with the holdings we have in the portfolio. We believe they are attractively priced and undervalued and are optimistic about the future.
Yours truly,
Francis Chou
Portfolio Manager and CEO
Chou America Management Inc.
| |
CHOU INCOME OPPORTUNITY FUND A MESSAGE TO OUR SHAREHOLDERS JUNE 30, 2011 |
| |
The views in this report were those of the Fund manager as of June 30, 2011, and may not reflect his view on the date this report is first published or anytime thereafter. The views are intended to assist the shareholders of the fund in understanding their investments in the Fund and do not constitute investment advice. This letter may contain discussions about certain investments held and not held in the portfolio. All current and future holdings are subject to risk and to change. There can be no guarantee of success with any technique, strategy or investment.
The Barclays Capital U.S. Corporate High Yield Index is comprised of issues that meet the following criteria: at least $150 million par value outstanding, maximum credit rating of Ba1 (including defaulted issues) and at least one year to maturity. One cannot invest directly in an index.
| |
CHOU EQUITY OPPORTUNITY FUND PERFORMANCE CHART AND ANALYSIS JUNE 30, 2011 |
| |
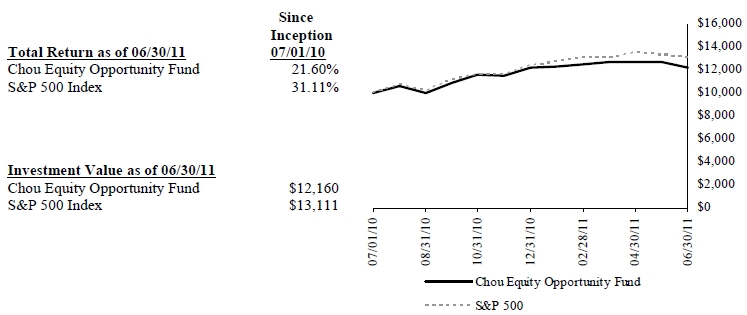
The following chart reflects the change in the value of a hypothetical $10,000 investment, including reinvested dividends and distributions, in the Chou Equity Opportunity Fund (the “Fund”) compared with the performance of the benchmark, S&P 500 Index ("S&P 500"), since inception. The S&P 500 is a broad-based, unmanaged measurement of changes in stock market conditions based on the average of 500 widely held common stocks. The total return of the S&P 500 includes reinvestment of dividends and income. The total return of the Fund includes operating expenses that reduce returns, while the total return of the S&P 500 does not include expenses. The Fund is professionally managed while the S&P 500 is unmanaged and is not available for investment.
Performance data quoted represents past performance and is no guarantee of future results. Current performance may be lower or higher than the performance data quoted. Investment return and principal value will fluctuate so that shares, when redeemed, may be worth more or less than original cost. For the most recent month-end performance, please call (877) 682-6352. Shares redeemed or exchanged within 120 days of purchase will be charged a 2.00% redemption fee. As stated in the Fund’s prospectus, the annual operating expense ratio (gross) is 2.37%. However, the Fund’s adviser has agreed to contractually waive a portion of its fees and to reimburse expenses such that total operating expenses do not exceed 1.50%, until May 1, 2012. During the period, certain fees were waived and/or expenses reimbursed; otherwise, returns would have been lower. The performance table and graph do not reflect the deduction of taxes that a shareholder would pay on Fund distributions or the redemption of Fund shares.
| |
CHOU INCOME OPPORTUNITY FUND PERFORMANCE CHART AND ANALYSIS JUNE 30, 2011 |
| |
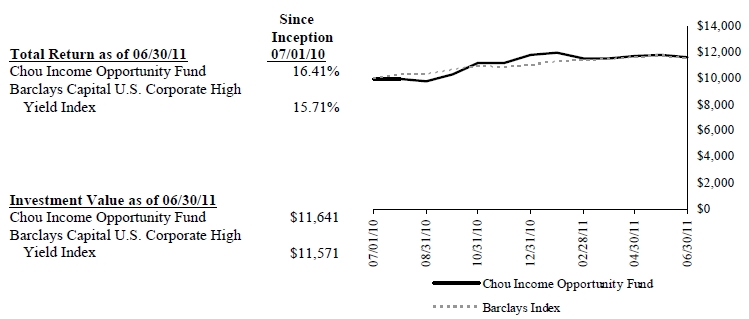
The following chart reflects the change in the value of a hypothetical $10,000 investment, including reinvested dividends and distributions, in the Chou Income Opportunity Fund (the “Fund”) compared with the performance of the benchmark, Barclays Capital U.S. Corporate High Yield Index ("Barclays Index"), since inception. The Barclays Index is comprised of issues that meet the following criteria: at least $150 million par value outstanding, maximum credit rating of Ba1 (including defaulted issues) and at least one year to maturity. The total return of the Barclays Index includes reinvestment of dividends and income. The total return of the Fund includes operating expenses that reduce returns, while the total return of the Barclays Index does not include expenses. The Fund is professionally managed while the Barclays Index is unmanaged and is not available for investment.
Performance data quoted represents past performance and is no guarantee of future results. Current performance may be lower or higher than the performance data quoted. Investment return and principal value will fluctuate so that shares, when redeemed, may be worth more or less than original cost. For the most recent month-end performance, please call (877) 682-6352. Shares redeemed or exchanged within 120 days of purchase will be charged a 2.00% redemption fee. As stated in the Fund’s prospectus, the annual operating expense ratio (gross) is 3.62%. However, the Fund’s adviser has agreed to contractually waive a portion of its fees and to reimburse expenses such that total operating expenses do not exceed 1.50%, until May 1, 2012. During the period, certain fees were waived and/or expenses reimbursed; otherwise, returns would have been lower. The performance table and graph do not reflect the deduction of taxes that a shareholder would pay on Fund distributions or the redemption of Fund shares.
| |
CHOU EQUITY OPPORTUNITY FUND SCHEDULE OF INVESTMENTS JUNE 30, 2011 |
| |
| | Shares | | Security Description | | Value | |
| Common Stock - 77.4% |
| Communications - 26.3% |
| | 171,700 | | Overstock.com, Inc. (a)(b) | | $ | 2,613,274 | |
| | 210,900 | | Sprint Nextel Corp. (a) | | | 1,136,751 | |
| | 880,000 | | UTStarcom Holdings Corp. (a) | | | 1,372,800 | |
| | | | 5,122,825 | |
| Consumer Discretionary – 24.7% |
| | 204,800 | | Office Depot, Inc. (a) | | | 864,256 | |
| | 66,000 | | RadioShack Corp. | | | 878,460 | |
| | 17,300 | | Ryanair Holdings PLC, ADR (a) | | | 507,582 | |
| | 23,000 | | Sears Holdings Corp. (a) | | | 1,643,120 | |
| | 50,000 | | The Gap, Inc. | | | 905,000 | |
| | | | 4,798,418 | |
| Consumer Staples – 3.7% |
| | 209,310 | | Alliance One International, Inc. (a) | | | 676,071 | |
| | 4,200 | | MannKind Corp. (a) | | | 15,960 | |
| | 20,000 | | Village Farms International, Inc. (a) | | | 26,544 | |
| | | | 718,575 | |
| Financials – 18.2% |
| | 120,200 | | Asta Funding, Inc. | | | 1,008,478 | |
| | 8 | | Berkshire Hathaway, Inc., Class A (a) | | | 928,840 | |
| | 80,000 | | Flagstone Reinsurance Holdings SA | | | 674,400 | |
| | 7,000 | | The Goldman Sachs Group, Inc. | | | 931,630 | |
| | | | 3,543,348 | |
| Information Technology – 0.3% |
| | 3,200 | | Dell, Inc. (a) | | | 53,344 | |
| | | | | |
| Materials – 4.2% |
| | 40,000 | | AbitibiBowater, Inc. (a) | | | 812,000 | |
| Total Common Stock (Cost $15,274,566) | | | 15,048,510 | |
| | Principal | | Security Description | | Rate | | Maturity | | Value | |
| Corporate Convertible Bonds - 0.3% |
| Consumer Staples - 0.3% |
| $ | 100,000 | | MannKind Corp. | | 3.75 | % | 12/15/13 | $ | 57,375 | |
Total Corporate Convertible Bonds (Cost $52,363) | | | 57,375 | |
| | Shares | | Security Description | | Value | |
| Warrants - 4.3% |
| | 86,000 | | Bank of America Corp. (a) | | | 476,440 | |
| | 25,386 | | JPMorgan Chase & Co. (a) | | | 341,949 | |
| | 2,500 | | Wells Fargo & Co. (a) | | | 23,275 | |
| Total Warrants (Cost $995,483) | | | 841,664 | |
Total Investments in Securities - 82.0% (Cost $16,322,412)* | | $ | 15,947,549 | |
| | Contracts | | Security Description | | | Strike Price | | Exp. Date | | Value | |
| Call Options Written - (0.0)% |
| (350) | | Overstock.com, Inc. (c) | | $ | 20.00 | | 09/11 | | | (350) |
Total Call Options Written – (0.0)% (Premiums Received $(38,844)) | | | (350) |
| Other Assets & Liabilities, Net – 18.0% | | | 3,498,200 | |
| Net Assets – 100.0% | | $ | 19,445,399 | |
| ADR | American Depository Receipt |
| PLC | Public Limited Company |
| (a) | Non-income producing security. |
| (b) | Subject to call option written by the Fund. |
| (c) | Security fair valued in accordance with procedures adopted by the Board of Trustees. At the period end, the value of these securities amounted to $(350) or (0.0)% of net assets. |
| | *Cost for Federal income tax purposes is substantially the same as for finanical statement purposes and net unrealized depreciation consists of: |
| Gross Unrealized Appreciation | | $ | 792,792 | |
| Gross Unrealized Depreciation | | | (1,129,161 | ) |
| Net Unrealized Depreciation | | $ | (336,369 | ) |
The inputs or methodology used for valuing securities are not necessarily an indication of the risks associated with investing in those securities. For more information on valuation inputs, and their aggregation into the levels used in the tables below, please refer to Note 2 - Security Valuation section in the accompanying Notes to Financial Statements.
The following is a summary of the inputs used to value the Fund’s investments and other financial instruments and liabilities as of June 30, 2011.
| Valuation Inputs | | Investments in Securities | | Other Financial Instruments** |
| Level 1 - Quoted Prices | | $ | 15,890,174 | | | $ | - | |
| Level 2 - Other Significant Observable Inputs | | | 57,375 | | | | - | |
| Level 3 - Significant Unobservable Inputs | | | - | | | | (350 | ) |
| Total | | $ | 15,947,549 | | | $ | (350 | ) |
The Level 1 inputs displayed in the Investments in Securities column are Common Stock and Warrants. The Level 2 input displayed is a Corporate Bond. Refer to the Schedule of Investments for a further breakout of each security type.
** Other Financial Instruments are derivative instruments not reflected in the Total Investments in Securities, such as written options, which are valued at their market value at period end.
| See Notes to Financial Statements. | 7 | |
| |
CHOU EQUITY OPPORTUNITY FUND SCHEDULE OF INVESTMENTS JUNE 30, 2011 |
| |
The following is a reconciliation of Level 3 assets (at either the beginning or ending of the period) for which significant unobservable inputs were used to determine fair value.
| | | Written Options |
| | | | | |
| Balance as of 12/31/10 | | $ | - | |
| Transfers In | | | (350 | ) |
| Balance as of 06/30/11 | | $ | (350 | ) |
| Net change in unrealized depreciation from investments held as of 06/30/11*** | | $ | (38,494 | ) |
| | *** The unrealized depreciation is included in net change in unrealized appreciation (depreciation) on investments in the accompanying Statement of Operations. |
| PORTFOLIO HOLDINGS | | |
| % of Total Investments | | |
| Communications | 32.1 | % |
| Consumer Discretionary | 30.1 | % |
| Consumer Staples | 4.9 | % |
| Financials | 22.2 | % |
| Information Technology | 0.3 | % |
| Materials | 5.1 | % |
| Warrants | 5.3 | % |
| | 100.0 | % |
| See Notes to Financial Statements. | 8 | |
| |
CHOU INCOME OPPORTUNITY FUND SCHEDULE OF INVESTMENTS JUNE 30, 2011 |
| |
| | Shares | | Security Description | | Value | |
| Equity Securities - 0.0% |
| Common Stock - 0.0% |
| Materials - 0.0% |
| | 49 | | AbitibiBowater, Inc. (a) | $ | 995 | |
| | | | |
| Total Common Stock (Cost $0) | | 995 | |
| Total Equity Securities (Cost $0) | | 995 | |
| | Principal | | Security Description | | Rate | | Maturity | | Value | |
| Fixed Income Securities - 87.5% |
| Corporate Convertible Bonds - 30.8% |
| Communications - 1.1% |
| $ | 30,000 | | Level 3 Communications, Inc. | | 6.50 | % | 10/01/16 | | 63,412 | |
| | | | |
| Consumer Staples - 22.0% |
| | 2,237,000 | | MannKind Corp. | | 3.75 | | 12/15/13 | | 1,283,479 | |
| | | | |
| Financials - 7.7% |
| | 1,000,000 | | CompuCredit Holdings Corp. | | 5.88 | | 11/30/35 | | 453,750 | |
Total Corporate Convertible Bonds (Cost $1,935,701) | | 1,800,641 | |
| Corporate Non-Convertible Bonds - 19.4% |
| Communications - 14.1% |
| | 40,000 | | Dex One Corp. | | 12.00 | | 01/29/17 | | 17,500 | |
| | 220,000 | | Level 3 Communications, Inc. (b) | | 11.88 | | 02/01/19 | | 237,875 | |
| | 300,000 | | Media General, Inc. | | 11.75 | | 02/15/17 | | 293,250 | |
| | 284,942 | | Morris Publishing Group, LLC | | 10.00 | | 09/01/14 | | 277,106 | |
| | | 825,731 | |
| Energy - 3.8% |
| | 300,000 | | Compton Petroleum Finance Corp. | | 10.00 | | 09/15/17 | | 219,000 | |
| Materials - 1.5% |
| | 267,000 | | Abitibi Consolidated, Inc. (Escrow Shares) (c) | | 0.00 | | 12/23/49 | | 2,003 | |
| | 170,000 | | Abitibi Consolidated, Inc. (Escrow Shares) (c) | | 0.00 | | 12/23/49 | | 1,275 | |
| | 100,000 | | Catalyst Paper Corp. (b) | | 11.00 | | 12/15/16 | | 86,000 | |
| | | 89,278 | |
Total Corporate Non-Convertible Bonds (Cost $1,139,374) | | 1,134,009 | |
| Syndicated Loans – 20.2% |
| | 1,715,251 | | RH Donnelley, Inc. (d) | | 8.74 | | 10/24/14 | | 1,179,235 | |
| | | | |
Total Syndicated Loans (Cost $1,405,179) | | 1,179,235 | |
| U.S. Government & Agency Obligations - 17.1% |
| U.S. Treasury Securities - 17.1% |
| | 1,000,000 | | U.S. Treasury Bill (e) | | 0.01 | | 08/04/11 | | 999,994 | |
| | | | |
Total U.S. Government & Agency Obligations (Cost $999,994) | | 999,994 | |
| Total Fixed Income Securities (Cost $5,480,248) | | 5,113,879 | |
Total Investments in Securities - 87.5% (Cost $5,480,248)* | $ | 5,114,874 | |
| Other Assets & Liabilities, Net – 12.5% | | 728,154 | |
| Net Assets – 100.0% | $ | 5,843,028 | |
| LLC | Limited Liability Company |
| (a) | Non-income producing security. Shares received as a result of company bankruptcy. |
| (b) | Security exempt from registration under Rule 144A under the Securities Act of 1933. At the period end, the value of these securities amounted to $323,875 or 5.5% of net assets. |
| (c) | Security fair valued in accordance with procedures adopted by the Board of Trustees. At the period end, the value of these securities amounted to $3,278 or 0.1% of net assets. |
| (d) | Variable rate security. Rate presented is as of June 30, 2011. |
| (e) | Rate presented is yield to maturity. |
| | *Cost for Federal income tax purposes is substantially the same as for finanical statement purposes and net unrealized depreciation consists of: |
| Gross Unrealized Appreciation | | $ | 74,212 | |
| Gross Unrealized Depreciation | | | (439,586 | ) |
| Net Unrealized Depreciation | | $ | (365,374 | ) |
The inputs or methodology used for valuing securities are not necessarily an indication of the risks associated with investing in those securities. For more information on valuation inputs, and their aggregation into the levels used in the tables below, please refer to Note 2 - Security Valuation section in the accompanying Notes to Financial Statements.
| See Notes to Financial Statements. | 9 | |
| |
CHOU INCOME OPPORTUNITY FUND SCHEDULE OF INVESTMENTS JUNE 30, 2011 |
| |
The following is a summary of the inputs used to value the Fund’s investments as of June 30, 2011.
| | Level 1 | | Level 2 | | Level 3 | | Total |
| Common Stock | | $ | 995 | | | $ | - | | | $ | - | | | $ | 995 | |
| Corporate Convertible Bonds | | | - | | | | 1,800,641 | | | | - | | | | 1,800,641 | |
| Corporate Non-Convertible Bonds | | | - | | | | 1,130,731 | | | | 3,278 | | | | 1,134,009 | |
| Syndicated Loans | | | - | | | | 1,179,235 | | | | - | | | | 1,179,235 | |
| U.S. Government & Agency Obligations | | | - | | | | 999,994 | | | | - | | | | 999,994 | |
| TOTAL | | $ | 995 | | | $ | 5,110,601 | | | $ | 3,278 | | | $ | 5,114,874 | |
The following is a reconciliation of Level 3 assets (at either the beginning or ending of the period) for which significant unobservable inputs were used to determine fair value.
| | | | | | | |
| | | | Corporate Non-Convertible Bonds | |
| | | | | | | |
| | Balance as of 12/31/10 | | $ | 6,555 | | |
| | Change in Unrealized Appreciation/ (Depreciation) | | | (3,277 | ) | |
| | Balance as of 06/30/11 | | $ | 3,278 | | |
| | Net change in unrealized appreciation/(depreciation) from investments held as of 06/30/11** | | $ | (3,277 | ) | |
| | | | | | | |
| | | | | | | |
| | ** The change in unrealized appreciation/(depreciation) is included in net change in unrealized appreciation/(depreciation) of investments in the accompanying Statement of Operations. |
| | | | | |
| | PORTFOLIO HOLDINGS | | | |
| | % of Total Investments | | | |
| | Common Stock | 0.0 | % | |
| | Corporate Convertible Bonds | 35.2 | % | |
| | Corporate Non-Convertible Bonds | 22.2 | % | |
| | Syndicated Loans | 23.1 | % | |
| | U.S. Government & Agency Obligations | 19.5 | % | |
| | | 100.0 | % | |
| | | | | |
| See Notes to Financial Statements. | 10 | |
| |
CHOU AMERICA MUTUAL FUNDS STATEMENTS OF ASSETS AND LIABILITIES JUNE 30, 2011 |
| |
| | | | | | CHOU EQUITY OPPORTUNITY FUND | | | | CHOU INCOME OPPORTUNITY FUND | |
| ASSETS | | | | | | | | |
| | Total investments, at value (Cost $16,322,412 and $5,480,248, respectively) | $ | 15,947,549 | | | $ | 5,114,874 | |
| | Cash | | | 3,506,720 | | | | 598,989 | |
| | Receivables: | | | | | | | | |
| | | Fund shares sold | | | 500 | | | | - | |
| | | Dividends and interest | | | 3,146 | | | | 104,469 | |
| | | From investment adviser | | | - | | | | 30,933 | |
| | Prepaid expenses | | | 10,695 | | | | 10,587 | |
| Total Assets | | | 19,468,610 | | | | 5,859,852 | |
| | | | | | | | | | | |
| LIABILITIES | | | | | | | | |
| | Payables: | | | | | | | | |
| | | Call options written, at value (Premiums received $38,844 and $0, respectively) | | | 350 | | | | - | |
| | Accrued Liabilities: | | | | | | | | |
| | Investment adviser fees | | | 3,003 | | | | - | |
| | | Trustees’ fees and expenses | | | 668 | | | | 386 | |
| | | Fund service fees | | | 7,780 | | | | 5,830 | |
| | | Compliance services fees | | | 1,170 | | | | 830 | |
| | | Other expenses | | | 10,240 | | | | 9,778 | |
| Total Liabilities | | | 23,211 | | | | 16,824 | |
| | | | | | | | | | | |
| NET ASSETS | | $ | 19,445,399 | | | $ | 5,843,028 | |
| | | | | | | | | | | |
| COMPONENTS OF NET ASSETS | | | | | | | | |
| | Paid-in capital | | $ | 19,757,369 | | | $ | 6,179,755 | |
| | Distributions in excess of net investment income | | | (74,984 | ) | | | (2,468 | ) |
| | Accumulated net realized gain | | | 99,383 | | | | 31,115 | |
| | Net unrealized depreciation | | | (336,369 | ) | | | (365,374 | ) |
| NET ASSETS | | $ | 19,445,399 | | | $ | 5,843,028 | |
| SHARES OF BENEFICIAL INTEREST AT NO PAR VALUE (UNLIMITED SHARES AUTHORIZED) | | | 1,599,426 | | | | 536,103 | |
NET ASSET VALUE, OFFERING AND REDEMPTION PRICE PER SHARE* | | $ | 12.16 | | | $ | 10.90 | |
| | Shares redeemed or exchanged within 120 days of purchase are charged a 2.00% redemption fee. | | | | | |
| * |
| | | | | | | | | | | | |
| See Notes to Financial Statements. | 11 | |
| |
CHOU AMERICA MUTUAL FUNDS STATEMENTS OF OPERATIONS SIX MONTHS ENDED JUNE 30, 2011 |
| |
| | | | | | | | | | | | |
| | | | | | CHOU EQUITY OPPORTUNITY FUND | | | | CHOU INCOME OPPORTUNITY FUND | | |
| | | | | | | | | |
| | Dividend income | | $ | 8,158 | | | $ | - | | |
| | Interest income | | | 11,801 | | | | 292,356 | | |
| Total Investment Income | | | 19,959 | | | | 292,356 | | |
| | | | | | | | | | |
| EXPENSES | | | | | | | | | |
| | Investment adviser fees | | | 58,432 | | | | 25,027 | | |
| | Fund service fees | | | 41,042 | | | | 35,520 | | |
| | Distribution fees | | | 7,295 | | | | 3,798 | | |
| | Custodian fees | | | 5,000 | | | | 5,000 | | |
| | Registration fees | | | 13,321 | | | | 12,113 | | |
| | Audit fees | | | 7,339 | | | | 7,339 | | |
| | Legal fees | | | 16,820 | | | | 16,820 | | |
| | Trustees' fees and expenses | | | 3,168 | | | | 2,886 | | |
| | Compliance services fees | | | 6,696 | | | | 5,304 | | |
| | Miscellaneous expenses | | | 15,790 | | | | 11,053 | | |
| Total Expenses | | | 174,903 | | | | 124,860 | | |
| | Fees waived and expenses reimbursed | | | (79,960 | ) | | | (87,319 | ) | |
| Net Expenses | | | 94,943 | | | | 37,541 | | |
| | | | | | | | | | | | |
| NET INVESTMENT INCOME (LOSS) | | | (74,984 | ) | | | 254,815 | | |
| | | | | | | | | | | | |
| NET REALIZED AND UNREALIZED GAIN (LOSS) | | | | | | | | | |
| | Net realized gain (loss) on: | | | | | | | | | |
| | Investments | | | 22,978 | | | | 31,115 | | |
| | Foreign currency transactions | | | (115 | ) | | | - | | |
| | Written options | | | 15,371 | | | | - | | |
| | Net realized gain | | | 38,234 | | | | 31,115 | | |
| | Net change in unrealized appreciation (depreciation) on: | | | | | | | | | |
| | Investments | | | (448,268 | ) | | | (460,210 | ) | |
| | Written options | | | 38,283 | | | | - | | |
| | Net change in unrealized appreciation (depreciation) | | | (409,985 | ) | | | (460,210 | ) | |
| NET REALIZED AND UNREALIZED LOSS | | | (371,751 | ) | | | (429,095 | ) | |
| DECREASE IN NET ASSETS FROM OPERATIONS | | $ | (446,735 | ) | | $ | (174,280 | ) | |
| | | | | | | | | | | | |
| See Notes to Financial Statements. | 12 | |
| |
CHOU AMERICA MUTUAL FUNDS STATEMENTS OF CHANGES IN NET ASSETS |
| |
| | | | | | | CHOU INCOME OPPORTUNITY FUND | |
| CHOU EQUITY OPPORTUNITY FUND |
| | | | | | | | | | | | | | | | | | | | |
| | | | | | | | | | Shares | | | | | | | | Shares | | |
| BEGINNING NET ASSETS JULY 1, 2010 | | $ | 500,001 | | | | | | | $ | 500,001 | | | | | | |
| | | | | | | | | | | | | | | | | | | | |
| OPERATIONS | | | | | | | | | | | | | | | | | |
| | Net investment income (loss) | | | (5,565 | ) | | | | | | | 11,175 | | | | | | |
| | Net realized gain | | | 66,459 | | | | | | | | - | | | | | | |
| | Net change in unrealized appreciation | | | 73,616 | | | | | | | | 94,836 | | | | | | |
| Increase in Net Assets Resulting from Operations | | | 134,510 | | | | | | | | 106,011 | | | | | | |
| | | | | | | | | | | | | | | | | | | | |
| DISTRIBUTIONS TO SHAREHOLDERS FROM | | | | | | | | | | | | | | | | | |
| | Net investment income | | | - | | | | | | | | (16,420 | ) | | | | | |
| | | | | | | | | | | | | | | | | | | | |
| CAPITAL SHARE TRANSACTIONS | | | | | | | | | | | | | | | | | |
| | Sale of shares | | | 404,099 | | | | 35,150 | | | | 159,999 | | | | 14,615 | | |
| | Reinvestment of distributions | | | - | | | | - | | | | 16,420 | | | | 1,416 | | |
| | Redemption of shares | | | (15 | ) | | | (1 | ) | | | - | | | | - | | |
| Increase in Net Assets from Capital Share Transactions | | | 404,084 | | | | 35,149 | | | | 176,419 | | | | 16,031 | | |
| Increase in Net Assets | | | 538,594 | | | | | | | | 266,010 | | | | | | |
| | | | | | | | | | | | | | | | | | | | |
| NET ASSETS DECEMBER 31, 2010 (including line (a)) | | $ | 1,038,595 | | | | | | | $ | 766,011 | | | | | | |
| | | | | | | | | | | | | | | | | | | | |
| OPERATIONS | | | | | | | | | | | | | | | | | |
| | Net investment income (loss) | | | (74,984 | ) | | | | | | | 254,815 | | | | | | |
| | Net realized gain | | | 38,234 | | | | | | | | 31,115 | | | | | | |
| | Net change in unrealized appreciation (depreciation) | | | (409,985 | ) | | | | | | | (460,210 | ) | | | | | |
| Decrease in Net Assets Resulting from Operations | | | (446,735 | ) | | | | | | | (174,280 | ) | | | | | |
| | | | | | | | | | | | | | | | | | | | |
| DISTRIBUTIONS TO SHAREHOLDERS FROM | | | | | | | | | | | | | | | | | |
| | Net investment income | | | - | | | | | | | | (252,293 | ) | | | | | |
| | | | | | | | | | | | | | | | | | | | |
| CAPITAL SHARE TRANSACTIONS | | | | | | | | | | | | | | | | | |
| | Sale of shares | | | 18,923,889 | | | | 1,520,288 | | | | 5,251,297 | | | | 446,926 | | |
| | Reinvestment of distributions | | | - | | | | - | | | | 252,293 | | | | 23,146 | | |
| | Redemption of shares | | | (71,687 | ) | | | (6,011 | ) | | | - | | | | - | | |
| | Redemption fees | | | 1,337 | | | | - | | | | - | | | | - | | |
| Increase in Net Assets from Capital Share Transactions | | | 18,853,539 | | | | 1,514,277 | | | | 5,503,590 | | | | 470,072 | | |
| Increase in Net Assets | | | 18,406,804 | | | | | | | | 5,077,017 | | | | | | |
| | | | | | | | | | | | | | | | | | | | |
| NET ASSETS JUNE 30, 2011 (Including line (b)) | | $ | 19,445,399 | | | | | | | $ | 5,843,028 | | | | | | |
| | | | | | | | | | | | | | | | | | | | |
| (a) | Distributions in excess of net investment income December 31, 2010 | | $ | - | | | | | | | $ | (4,990 | ) | | | | | |
| | | | | | | | | | | | | | | | | | | | |
| (b) | Distributions in excess of net investment income June 30, 2011 | | $ | (74,984 | ) | | | | | | $ | (2,468 | ) | | | | | |
| | | | | | | | | | | | | | | | | | | | |
| | | | | | | | | | | | | | | | | | | | |
| See Notes to Financial Statements. | 13 | |
| |
CHOU EQUITY OPPORTUNITY FUND FINANCIAL HIGHLIGHTS |
| |
These financial highlights reflect selected data for a share outstanding throughout each period. |
| | | For the Six Months | | July 1, 2010 (a) | |
| Ended June 30, 2011 | through December 31, 2010 |
| NET ASSET VALUE, Beginning of Period | $ | 12.20 | | | $ | 10.00 | | |
| INVESTMENT OPERATIONS | | | | | | | | |
| Net investment loss (b) | | (0.08 | ) | | | (0.09 | ) | |
| Net realized and unrealized gain (loss) | | 0.04 | (c) | | | 2.29 | | |
| Total from Investment Operations | | (0.04 | ) | | | 2.20 | | |
| REDEMPTION FEES (b) | | — | (d) | | | — | | |
| NET ASSET VALUE, End of Period | $ | 12.16 | | | $ | 12.20 | | |
| TOTAL RETURN | | (0.33 | )%(e) | | 22.00 | %(e) | |
| RATIOS/SUPPLEMENTARY DATA | | | | | | | | |
| Net Assets at End of Period (000's omitted) | $19,445 | | | $1,039 | | |
| Ratios to Average Net Assets: | | | | | | | | |
| Net investment loss | | (1.28 | )%(f) | (1.60 | )%(f) |
| Net expense | | 1.62 | %(f) | 1.75 | %(f) |
| Gross expense (g) | | 2.99 | %(f) | 28.58 | %(f) |
| PORTFOLIO TURNOVER RATE | | 1 | %(e) | 33 | %(e) |
| | | | | | | | | | |
| (a) | Commencement of operations. |
| (b) | Calculated based on average shares outstanding during the period. |
| (c) | Per share amount does not reflect the actual net realized and unrealized gain/loss for the period because of the timing of sales of the Fund shares and the amount of per share realized and unrealized gains and losses at such time. |
| (d) | Less than $0.01 per share. |
| (e) | Not annualized. |
| (f) | Annualized. |
| (g) | Reflects the expense ratio excluding any waivers and/or reimbursements. |
| See Notes to Financial Statements. | 14 | |
| |
CHOU INCOME OPPORTUNITY FUND FINANCIAL HIGHLIGHTS |
| |
These financial highlights reflect selected data for a share outstanding throughout each period. |
| | | For the Six Months | | July 1, 2010 (a) | |
| Ended June 30, 2011 | through December 31, 2010 |
| NET ASSET VALUE, Beginning of Period | $ | 11.60 | | | $ | 10.00 | | |
| INVESTMENT OPERATIONS | | | | | | | | |
| Net investment income (b) | | 0.57 | | | | 0.20 | | |
| Net realized and unrealized gain (loss) | | (0.78 | ) | | | 1.65 | | |
| Total from Investment Operations | | (0.21 | ) | | | 1.85 | | |
| DISTRIBUTION TO SHAREHOLDERS FROM | | | | | | | | |
| Net investment income | | (0.49 | ) | | | (0.25 | ) | |
| NET ASSET VALUE, End of Period | $ | 10.90 | | | $ | 11.60 | | |
| TOTAL RETURN | | (1.79 | )%(c) | 18.54 | %(c) |
| RATIOS/SUPPLEMENTARY DATA | | | | | | | | |
| Net Assets at End of Period (000's omitted) | $5,843 | | | $766 | | |
| Ratios to Average Net Assets: | | | | | | | | |
| Net investment income | | 10.18 | %(d) | 3.82 | %(d) |
| Net expense | | 1.50 | %(d) | 1.50 | %(d) |
| Gross expense (e) | | 4.99 | %(d) | 33.37 | %(d) |
| PORTFOLIO TURNOVER RATE | | 6 | %(c) | 0 | %(c) |
| | | | | | | | | | |
| (a) | Commencement of operations. |
| (b) | Calculated based on average shares outstanding during the period. |
| (c) | Not annualized. |
| (d) | Annualized. |
| (e) | Reflects the expense ratio excluding any waivers and/or reimbursements. |
| See Notes to Financial Statements. | 15 | |
| |
CHOU AMERICA MUTUAL FUNDS NOTES TO FINANCIAL STATEMENTS JUNE 30, 2011 |
| |
Note 1. Organization
The Chou Equity Opportunity Fund and Chou Income Opportunity Fund (individually, a “Fund” and, collectively the “Funds”) are non-diversified portfolios of Chou America Mutual Funds (the “Trust”). The Trust is a Delaware statutory trust that is registered as an open-end, management investment company under the Investment Company Act of 1940 (the “Act”), as amended. Under its Trust Instrument, the Trust is authorized to issue an unlimited number of each Fund’s shares of beneficial interest without par value. Chou Equity Opportunity Fund’s investment objective is to seek long-term growth of capital. Chou Income Opportunity Fund’s investment objective is to provide capital appreciation and income production with capital preservation as a secondary consideration. The Funds commenced operations on July 1, 2010, with the sale of 50,000 shares of each Fund at $10 per share to Chou Associates Management Inc.
Note 2. Summary of Significant Accounting Policies
These financial statements are prepared in accordance with generally accepted accounting principles in the United States of America (“GAAP”), which require management to make estimates and assumptions that affect the reported amounts of assets and liabilities, the disclosure of contingent liabilities at the date of the financial statements, and the reported amounts of increase and decrease in net assets from operations during the fiscal period. Actual amounts could differ from those estimates. The following summarizes the significant accounting policies of each Fund:
Security Valuation – Exchange-traded securities and over-the-counter securities are valued using the last quoted sale or official closing price, provided by independent pricing services as of the close of trading on the market or exchange for which they are primarily traded, on each Fund business day. In the absence of a sale, such securities are valued at the mean of the last bid and ask price provided by independent pricing services. Non-exchange traded securities for which quotations are available are valued using the last quoted sales price, or in the absence of a sale at the mean of the last bid and ask prices provided by independent pricing services. Debt securities may be valued at prices supplied by a fund’s pricing agent based on broker or dealer supplied valuations or matrix pricing, a method of valuing securities by reference to the value of other securities with similar characteristics such as rating, interest rate and maturity. Exchange-traded options for which there were no sales reported that day are generally valued at the mean of the last bid and asked prices. Options not traded on an exchange are generally valued at broker-dealer bid quotation. Short-term investments that mature in sixty days or less may be valued at amortized cost.
Each Fund values its investments at fair value pursuant to procedures adopted by the Trust's Board of Trustees (the "Board") if (1) market quotations are insufficient or not readily available or (2) the adviser believes that the values available are unreliable. Fair valuation is based on subjective factors and, as a result, the fair value price of an investment may differ from the security’s market price and may not be the price at which the asset may be sold. Fair valuation could result in a different NAV than a NAV determined by using market quotes.
Each Fund has a three-tier fair value hierarchy. The basis of the tiers is dependent upon the various “inputs” used to determine the value of each Fund’s investments. These inputs are summarized in the three broad levels listed below:
Level 1 — quoted prices in active markets for identical assets
Level 2 — other significant observable inputs (including quoted prices of similar securities, interest rates, prepayment speeds, credit risk, etc.)
Level 3 — significant unobservable inputs (including each Fund’s own assumptions in determining the fair value of investments)
The aggregate value by input level, as of June 30, 2011, for each Fund’s investments is included at the end of each Fund’s Schedule of Investments.
Security Transactions, Investment Income and Realized Gain and Loss – Investment transactions are accounted for on the trade date. Dividend income is recorded on the ex-dividend date. Foreign dividend income is recorded on the ex-dividend date or as soon as possible after each Fund determines the existence of a dividend declaration after exercising reasonable due diligence. Income and capital gains on some foreign securities may be subject to foreign withholding taxes, which are accrued as applicable. Interest income is recorded on an accrual basis. Premium is amortized and discount is accreted in accordance with GAAP. Identified cost of investments sold is used to determine the gain and loss for both financial statement and federal income tax purposes.
| |
CHOU AMERICA MUTUAL FUNDS NOTES TO FINANCIAL STATEMENTS JUNE 30, 2011 |
| |
Written Options – When a fund writes an option, an amount equal to the premium received by the fund is recorded as a liability and is subsequently adjusted to the current value of the option written. Premiums received from writing options that expire unexercised are treated by the fund on the expiration date as realized gain from written options. The difference between the premium and the amount paid on effecting a closing purchase transaction, including brokerage commissions, is also treated as a realized gain, or if the premium is less than the amount paid for the closing purchase transaction, as a realized loss. If a call option is exercised, the premium is added to the proceeds from the sale of the underlying security in determining whether the fund has realized a gain or loss. If a put option is exercised, the premium reduces the cost basis of the securities purchased by the fund. The fund, as writer of an option, bears the market risk of an unfavorable change in the price of the security underlying the written option. Written options are non-income producing securities.
The values of each individual written option outstanding as of June 30, 2011, are disclosed in the Chou Equity Opportunity Fund’s Schedule of Investments. The volume of open positions may vary on a daily basis as the Fund transacts written options in order to achieve the exposure desired by the adviser. The Fund entered into written options with a total value of $49,342 for the period ended June 30, 2011.
Transactions in written options during the period ended June 30, 2011, were as follows:
| | | Calls | |
| | | Number of | | | | | |
| | | Contracts | | | Premiums | |
| Options Outstanding, December 31, 2010 | | 42 | | | $ | 4,873 | | |
| Options written | | 500 | | | | 49,342 | | |
| Options terminated in closing transactions | | (192 | ) | | (15,371 | ) |
| Options exercised | | - | | | | - | | |
| Options expired | | - | | | | - | | |
| Options Outstanding, June 30, 2011 | | 350 | | | $ | 38,844 | | |
| | | | | | | | | |
Derivatives Transactions - The Chou Equity Opportunity Fund’s use of derivatives during the period ended June 30, 2011, was limited to written options. Following is a summary of how the derivatives are treated in the financial statements and their impact on the Chou Equity Opportunity Fund.
The location on the Statement of Assets and Liabilities of the Chou Equity Opportunity Fund’s derivative positions by type of exposure, all of which are not accounted for as hedging instruments, is as follows:
Contract Type/ Primary Risk Exposure | | | Location on Statement of Assets and Liabilities | | Liability Derivatives | |
| | | | | | | | |
| Equity Contracts | | | Call options written, at value | | | $(350 | ) |
| | | | | | | | |
| |
CHOU AMERICA MUTUAL FUNDS NOTES TO FINANCIAL STATEMENTS JUNE 30, 2011 |
Realized and unrealized gains and losses on derivatives contracts entered into during the period ended June 30, 2011, by the Chou Equity Opportunity Fund are recorded in the following locations in the Statement of Operations:
| Contract Type/Primary Risk Exposure | | Location of Gain or (Loss) on Derivatives | | Realized Gain (Loss) on Derivatives | | Change in Unrealized Appreciation (Depreciation) on Derivatives | |
| | | | | | | | | | |
| Equity Contracts | | Realized gain (loss) – Written Options and Change in unrealized appreciation (depreciation) – Written Options | | | $15,371 | | | $38,283 | |
Distributions to Shareholders – Distributions to shareholders of net investment income, if any, are declared and paid at least semi-annually. Distributions to shareholders of net capital gains, if any, are declared and paid annually. Distributions are based on amounts calculated in accordance with applicable federal income tax regulations, which may differ from GAAP. These differences are due primarily to differing treatments of income and gain on various investment securities held by each Fund, timing differences and differing characterizations of distributions made by each Fund.
Federal Taxes – Each Fund intends to qualify each year as a regulated investment company under Subchapter M of the Internal Revenue Code and distribute all of their taxable income to shareholders. In addition, by distributing in each calendar year substantially all their net investment income and capital gains, if any, the Funds will not be subject to a federal excise tax. Therefore, no federal income or excise tax provision is required.
As of June 30, 2011, there are no uncertain tax positions that would require financial statement recognition, de-recognition, or disclosure. Each Fund’s federal tax return filed in the one-year period ended December 31, 2010, remains subject to examination by the Internal Revenue Service.
Income and Expense Allocation – The Trust accounts separately for the assets, liabilities and operations of each of its investment portfolios. Expenses that are directly attributable to more than one investment portfolio are allocated among the respective investment portfolios in an equitable manner.
Redemption Fees – A shareholder who redeems or exchanges shares within 120 days of purchase will incur a redemption fee of 2.00% of the current net asset value of shares redeemed or exchanged, subject to certain limitations. The fee is charged for the benefit of the remaining shareholders and will be paid to each Fund to help offset transaction costs. The fee is accounted for as an addition to paid-in capital. Each Fund reserves the right to modify the terms of or terminate the fee at any time. There are limited exceptions to the imposition of the redemption fee.
Commitments and Contingencies – In the normal course of business, each Fund enters into contracts that provide general indemnifications by each Fund to the counterparty to the contract. Each Fund’s maximum exposure under these arrangements is dependent on future claims that may be made against each Fund and, therefore, cannot be estimated; however, based on experience, the risk of loss from such claims is considered remote.
Note 3. Advisory Fees, Servicing Fees and Other Transactions
Investment Adviser – Chou America Management Inc. (the “Adviser”) is the investment adviser to each Fund. Pursuant to an investment advisory agreement, the Adviser receives an advisory fee from each Fund at an annual rate of 1.00% of each Fund’s average daily net assets.
Distribution – Rafferty Capital Markets, LLC serves as each Fund’s distributor (the “Distributor”). The Funds have adopted a Distribution Plan (the “Plan”) in accordance with Rule 12b-1 of the Act. Under the Plan, each Fund may pay the Distributor and/or any other entity as authorized by the Board a fee of up to 0.25% of the Fund’s average daily net assets for providing distribution and/or shareholder services to the Fund. Effective, May 1, 2011, the Board has not authorized the Funds to pay a Rule 12b-1 fee. Rule 12b-1 fees accrued from the commencement of the Funds’ operations on July 1, 2010 through April 30, 2011, have been returned to the Funds. The Distributor is not affiliated with the Adviser or Atlantic Fund Administration, LLC (d/b/a Atlantic Fund Services) (“Atlantic”) or their affiliates.
| |
CHOU AMERICA MUTUAL FUNDS NOTES TO FINANCIAL STATEMENTS JUNE 30, 2011 |
Other Service Providers – Atlantic provides fund accounting, fund administration, and transfer agency services to each Fund. Atlantic also provides certain shareholder report production, and EDGAR conversion and filing services. Pursuant to an Atlantic services agreement, each Fund pays Atlantic customary fees for its services. Atlantic provides a Principal Financial Officer, a Chief Compliance Officer, and an Anti-Money Laundering Officer to each Fund, as well as certain additional compliance support functions.
Trustees and Officers – The Trust pays each Trustee an annual retainer fee of $5,000 for service to the Trust. Each Trustee is also reimbursed for all reasonable out-of-pocket expenses incurred in connection with their duties as a Trustee, including travel and related expenses incurred in attending Board meetings. No officers of the Funds are compensated by the Funds, but officers are reimbursed for travel and related expenses incurred in attending Board meetings.
Note 4. Expense Reimbursements and Fees Waived
Effective May 1, 2011, the Adviser contractually agreed to waive a portion of its fee and reimburse certain expenses to limit total annual operating expenses to 1.50% of the average daily net assets of the Chou Equity Opportunity Fund and Chou Income Opportunity Fund, through May 1, 2012 (excluding other expenses, taxes, leverage interest, acquired fund fees and expenses, dividends or interest on short positions, other interest expenses, brokerage commissions, and extraordinary expenses such as litigation). For the period ended June 30, 2011, fees waived and reimbursed were as follows:
| | | Investment Adviser Fees Waived | | Investment Adviser Expenses Reimbursed | | Total Fees Waived and Reimbursed | |
| Chou Equity Opportunity Fund | $ | 58,432 | $ | 21,528 | $ | 79,960 | |
| Chou Income Opportunity Fund | | 25,027 | | 62,292 | | 87,319 | |
The Funds may pay the Adviser for fees waived and expenses reimbursed pursuant to the expense cap if (1) such payment is made within three years of the fees waived or expense reimbursement, (2) such payment is approved by the Board and (3) and the overall expenses fall below the lesser of the Fund’s then current expense cap or the expense cap in effect at the time of such reimbursement. For the period July 1, 2010 (commencement of operations) through June 30, 2011, the Adviser waived and/or reimbursed fees as follows:
| Chou Equity Opportunity Fund | | | | |
| | | Amount of Fees Waived and/or Expenses Reimbursed | | Expiration Date to Recoup Fees Waived and/or Expenses Reimbursed | | Fees Recouped |
| December 31, 2010 | | $93,139 | | December 31, 2013 | | $0 |
| June 30, 2011 | | $79,960 | | December 31, 2014 | | $0 |
| | | | | | | |
| Chou Income Opportunity Fund | | | | |
| | | Amount of Fees Waived and/or Expenses Reimbursed | | Expiration Date to Recoup Fees Waived and/or Expenses Reimbursed | | Fees Recouped |
| December 31, 2010 | | $93,362 | | December 31, 2013 | | $0 |
| June 30, 2011 | | $87,319 | | December 31, 2014 | | $0 |
| | | | | | | |
| |
CHOU AMERICA MUTUAL FUNDS NOTES TO FINANCIAL STATEMENTS JUNE 30, 2011 |
Note 5. Security Transactions
| | | | | Purchases | | Sales |
| Chou Equity Opportunity Fund | | $15,583,205 | | $77,417 |
| Chou Income Opportunity Fund | | $4,152,270 | | $184,511 |
| | | | | |
Note 6. Federal Income Tax and Investment Transactions
As of December 31, 2010, distributable earnings (accumulated losses) on a tax basis were as follows:
| | Undistributed Ordinary Income | | Unrealized Appreciation | | Total | |
| Chou Equity Opportunity Fund | $ | 61,149 | | $ | 73,616 | | $ | 134,765 | | |
| Chou Income Opportunity Fund | | 1,114 | | | 88,732 | | | 89,846 | | |
The difference between components of distributable earnings on a tax basis and the amounts reflected in the Statements of Assets and Liabilities are primarily due to non-deductible offering costs, accrued income on contingent payment debt instruments, net operating losses and the treatment of undistributed short-term gains as undistributed ordinary income for tax purposes.
Note 7. Recent Accounting Pronouncements
In January 2010, the Financial Accounting Standards Board (“FASB”) issued Accounting Standards Update (“ASU”) No. 2010-06 “Improving Disclosures about Fair Value Measurements.” ASU No. 2010-06 clarifies existing disclosure and requires additional disclosures regarding fair value measurements. ASU No. 2010-06 is effective for fiscal years beginning after December 15, 2010, and for interim periods within those fiscal years. Management has evaluated ASU No. 2010-06 and has determined that it did not have a significant impact on the reporting of the Fund’s financial statement disclosures.
In May 2011, FASB issued ASU No. 2011-04 “Amendments to Achieve Common Fair Value Measurement and Disclosure Requirements in U.S. GAAP and IFRSs.” ASU No. 2011-04 establishes common requirements for measuring fair value and for disclosing information about fair value measurements in accordance with U.S. GAAP and International Financial Reporting Standards (“IFRSs”). ASU No. 2011-04 is effective for interim and annual periods beginning after December 15, 2011. Management is currently evaluating the impact ASU No. 2011-04 may have on financial statement disclosures.
Note 8. Subsequent Events
Subsequent events occurring after the date of this report through the date these financial statements were issued have been evaluated for potential impact and each Fund has had no such events.
| |
CHOU AMERICA MUTUAL FUNDS ADDITIONAL INFORMATION
JUNE 30, 2011 |
Proxy Voting Information
A description of the policies and procedures that each Fund uses to determine how to vote proxies relating to securities held in each Fund’s portfolio is available, without charge and upon request, by calling (877) 682-6352 and on the SEC’s website at www.sec.gov. Each Fund’s proxy voting record for the most recent twelve-month period ended June 30 is available, without charge and upon request, by calling (877) 682-6352 and on the SEC’s website at www.sec.gov.
Availability of Quarterly Portfolio Schedules
Each Fund files its complete schedule of portfolio holdings with the SEC for the first and third quarters of each fiscal year on Form N-Q. Each Fund’s Forms N-Q are available, without charge and upon request on the SEC’s website at www.sec.gov or may be reviewed and copied at the SEC’s Public Reference Room in Washington, DC. Information on the operation of the Public Reference Room may be obtained by calling (800) SEC-0330.
Shareholder Expense Example
As a shareholder of the Funds, you incur two types of costs: (1) transaction costs, including redemption fees, and (2) ongoing costs, including management fees, distribution (12b-1) fees and other Fund expenses. This example is intended to help you understand your ongoing costs (in dollars) of investing in the Funds, and to compare these costs with the ongoing costs of investing in other mutual funds.
The example is based on an investment of $1,000 invested at the beginning of the period and held for the entire period from January 1, 2011, through June 30, 2011.
Actual Expenses – The first line in the table below provides information about actual account values and actual expenses. You may use the information in this line, together with the amount you invested, to estimate the expenses that you paid over the period. Simply divide your account value by $1,000 (for example, an $8,600 account value divided by $1,000 = 8.6), then multiply the result by the number in the first line under the heading entitled “Expenses Paid During Period” to estimate the expenses you paid on your account during the period.
Hypothetical Example for Comparison Purposes – The second line of the table below provides information about hypothetical account values and hypothetical expenses based on each Fund’s actual expense ratio and an assumed rate of return of 5% per year before expenses, which is not each Fund’s actual return. The hypothetical account values and expenses may not be used to estimate the actual ending balance or expenses you paid for the period. You may use this information to compare the ongoing cost of investing in each Fund and other funds. To do so, compare this 5% hypothetical example with the 5% hypothetical examples that appear in the shareholder reports of other funds.
Please note that expenses shown in the table are meant to highlight your ongoing costs only and do not reflect any transactional costs, such as redemption fees. Therefore, the second line of the table is useful in comparing ongoing costs only, and will not help you determine the relative total costs of owning different funds. In addition, if these transactional costs had been included, your costs would have been higher.
| | Beginning | | Ending | | Expenses | | Annualized |
| | Account Value | | Account Value | | Paid During | | Expense |
| | January 1, 2011 | | June 30, 2011 | | Period* | | Ratio* |
| Chou Equity Opportunity Fund | | | | | | | | | | | |
| Actual | $ | 1,000.00 | | $ | 996.72 | | $ | 8.02 | | 1.62 | % |
| Hypothetical (5% return before taxes) | $ | 1,000.00 | | $ | 1,016.76 | | $ | 8.10 | | 1.62 | % |
| Chou Income Opportunity Fund | | | | | | | | | | | |
| Actual | $ | 1,000.00 | | $ | 982.06 | | $ | 7.37 | | 1.50 | % |
| Hypothetical (5% return before taxes) | $ | 1,000.00 | | $ | 1,017.36 | | $ | 7.50 | | 1.50 | % |
| | | | | | | | | | | | |
| * | Expenses are equal to the Fund’s annualized expense ratio as indicated above multiplied by the average account value over the period, multiplied by the number of days in the most recent fiscal half-year divided by 365 to reflect the half-year period. |
FOR MORE INFORMATION:
P.O. Box 588
Portland, ME 04112
(877) 682-6352
INVESTMENT ADVISER
Chou America Management Inc.
110 Sheppard Ave. East
Suite 301, Box 18
Toronto, Ontario, Canada M2N 6Y8
TRANSFER AGENT
Atlantic Fund Services
P.O. Box 588
Portland, ME 04112
DISTRIBUTOR
Rafferty Capital Markets, LLC
59 Hilton Avenue
Garden City, NY 11530
www.raffcap.com
This report is submitted for the general information of the shareholders of the Funds. It is not authorized for
distribution to prospective investors unless preceded or accompanied by an effective prospectus, which includes information regarding the Funds’ risks, objectives, fees and expenses, experience of its management, and other information.
243-SAR-0611
ITEM 2. CODE OF ETHICS.
Not applicable.
ITEM 3. AUDIT COMMITTEE FINANCIAL EXPERT.
Not applicable.
ITEM 4. PRINCIPAL ACCOUNTANT FEES AND SERVICES.
Not applicable.
ITEM 5. AUDIT COMMITTEE OF LISTED REGISTRANTS.
Not applicable
ITEM 6. INVESTMENTS.
| (a) | Included as part of report to shareholders under Item 1. |
ITEM 7. DISCLOSURE OF PROXY VOTING POLICIES AND PROCEDURES FOR CLOSED-END
MANAGEMENT INVESTMENT COMPANIES.
Not applicable.
ITEM 8. PORTFOLIO MANAGERS OF CLOSED-END MANAGEMENT INVESTMENT COMPANIES.
Not applicable.
ITEM 9. PURCHASES OF EQUITY SECURITIES BY CLOSED-END MANAGEMENT INVESTMENT COMPANY AND AFFILIATED PURCHASERS.
Not applicable.
ITEM 10. SUBMISSION OF MATTERS TO A VOTE OF SECURITY HOLDERS
The Registrant does not accept nominees to the board of trustees from shareholders.
ITEM 11. CONTROLS AND PROCEDURES
(a) The Registrant’s Principal Executive Officer and Principal Financial Officer have concluded that the Registrant’s disclosure controls and procedures (as defined in Rule 30a-3(c) under the Investment Company Act of 1940 (the “Act”)) are effective, based on their evaluation of the controls and procedures required by Rule 30a-3(b) under the Act and Rules 13a-15(b) or 15d-15(b) under the Securities Exchange Act of 1934, as of a date within 90 days of the filing date of this report.
(b) There were no changes in the Registrant’s internal control over financial reporting (as defined in
Rule 30a-3(d) under the Act) that occurred during the second fiscal quarter of the period covered by this report that have materially affected, or are reasonably likely to materially affect, the Registrant’s internal control over financial reporting.
ITEM 12. EXHIBITS.
(a)(1) Not applicable.
(a)(2) Certifications pursuant to Rule 30a-2(a) of the Act, and Section 302 of the Sarbanes-Oxley Act of 2002. (Exhibits filed herewith)
(a)(3) Not applicable.
(b) Certifications pursuant to Rule 30a-2(b) of the Act, and Section 906 of the Sarbanes-Oxley Act of 2002. (Exhibit filed herewith)
SIGNATURES
Pursuant to the requirements of the Securities Exchange Act of 1934 and the Investment Company Act of 1940, the Registrant has duly caused this report to be signed on its behalf by the undersigned, thereunto duly authorized.
Registrant Chou America Mutual Funds
| By | /s/ Francis S.M. Chou | |
| | Francis S.M. Chou, Principal Executive Officer | |
| | | |
| Date | August 23, 2011 | |
Pursuant to the requirements of the Securities Exchange Act of 1934 and the Investment Company Act of 1940, this report has been signed below by the following persons on behalf of the Registrant and in the capacities and on the dates indicated.
| By | /s/ Francis S.M. Chou | |
| | Francis S.M. Chou, Principal Executive Officer | |
| | | |
| Date | August 23, 2011 | |
| By | /s/ Michael J. McKeen | |
| | Michael J. McKeen, Principal Financial Officer | |
| | | |
| Date | August 25, 2011 | |