As filed with the Securities and Exchange Commission on August 28, 2012
UNITED STATES
SECURITIES AND EXCHANGE COMMISSION
WASHINGTON, D.C. 20549
FORM N-CSR
CERTIFIED SHAREHOLDER REPORT OF REGISTERED MANAGEMENT
INVESTMENT COMPANIES
Investment Company Act file number 811-22394
CHOU AMERICA MUTUAL FUNDS
Three Canal Plaza, Suite 600
Portland, Maine 04101
Michael J. McKeen, Principal Financial Officer
Three Canal Plaza, Suite 600
Portland, Maine 04101
207-347-2000
Date of fiscal year end: December 31
Date of reporting period: January 1, 2012 – June 30, 2012
ITEM 1. REPORT TO STOCKHOLDERS.
CHOU AMERICA MUTUAL FUNDS
Semi-Annual Report
June 30, 2012
(Unaudited)
Fund Adviser:
Chou America Management Inc.
110 Sheppard Ave. East
Suite 301, Box 18
Toronto, Ontario, Canada M2N 6Y8
Toll Free: (877) 755-5188
| A Message to our Shareholders | 1 |
| Performance Charts and Analysis | 4 |
| Schedules of Investments | 6 |
| Statements of Assets and Liabilities | 9 |
| Statements of Operations | 10 |
| Statements of Changes | 11 |
| Financial Highlights | 13 |
| Notes to Financial Statements | 14 |
| Additional Information | 18 |
CHOU OPPORTUNITY FUND A MESSAGE TO OUR SHAREHOLDERS JUNE 30, 2012 |
Dear Shareholder,
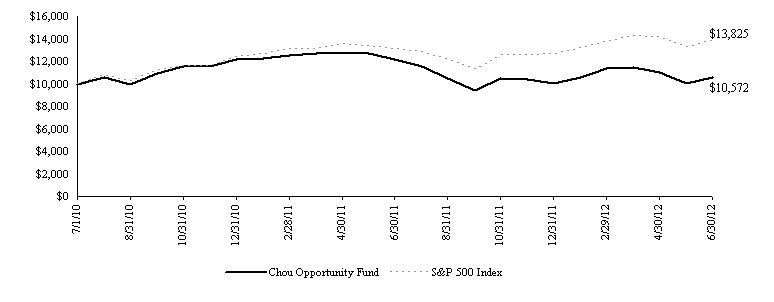
During the first six months of 2012, the Chou Opportunity Fund (the “Fund”) was up 5.40%, while the S&P 500 Index (S&P 500) generated a return of 9.49% during the same period.
Portfolio Commentary
Major positive contributors to the Fund’s performance were Sears Holdings Corporation, The Gap Inc. and Aeropostale Inc. Securities that declined most in the same period were Overstock.com Inc., RadioShack Corporation, UTStarcom Holdings Corporation and MBIA Inc.
About two years ago, we saw that weak consumer spending and an anemic recovery had made many stocks in the retail sector undervalued. This prompted us to buy a number of companies in the sector, including Sears Holdings, RadioShack, The Gap, Aeropostale, using a basket approach. During the first half of 2012, we sold The Gap and Aeropostale at an average price of $27.22 and $17.80 respectively, versus our average cost of $17.13 and $9.87 respectively. Radio Shack was one that did not work out as expected, largely because its decision to change its business model was taking longer than expected to implement. According to the current numbers, and new information we have on the company, we suspect RadioShack’s intrinsic value is now below what we paid for it, and we may have to take a permanent loss on this investment.
In general we are not concerned with short-term quotational loss. If we are correct about the value of a company, and can buy it at a discount of 40% or more, we believe the performance of the portfolio will be satisfactory in the long run. We have found that when an investment does not work out it’s usually because we misjudged the intrinsic value of the company.
Our portfolio is highly concentrated in a few names, such as Resolute Forest Products (formerly known as AbitibiBowater), Sears Holdings and Overstock.com. Because of the high concentration, the net asset value of the Fund can be volatile. This volatility does not bother us because our focus has always been on how cheap stocks are relative to their intrinsic value. In my view, they are trading at significant discounts to their intrinsic value.
For example, Resolute Forest Products is currently priced at $10, but it has a book value of approximately $35, low debt, huge tax loss carry forwards so it will not be paying taxes for years, and a highly capable management.
In the case of Sears Holdings, the value of its real estate assets exceeds its current stock price. It also has other valuable assets such as Lands' End, Kenmore, Craftsman and Diehards. Without going into too much detail, the best way to understand Sears is to separate out the 'Guarantor' and 'Non-Guarantor' businesses. In addition, Sears CEO and majority owner Eddie Lampert is highly motivated to maximize the value of the company and his interests are strongly aligned with the shareholders.
Overstock.com (OSTK) is harder to evaluate but recent transactions within its industry provide a sense of its worth. For example, in 2009 Amazon bought Zappos, a company that is similar but different in many ways, at close to one time revenue. At one time revenue, OSTK’s intrinsic value is more than $40 per share whereas its stock price closed on June 29 at $6.91 per share. One important caveat: This type of comparison is fraught with danger and should be viewed as just a frame of reference. At the end of the day, OSTK’s earning power or its future potential earnings based on its revenue growth (or lack of it) will determine its intrinsic value. So, be extremely cautious when using only revenue as a basis for estimating intrinsic value. It must be substantiated by earnings. If the earning power is not there, then a company’s value is strictly the value of its liquidated assets minus its liabilities. Under that scenario, OSTK would be worth almost nothing. On the other hand, OSTK is debt free after taking into account the cash on its balance sheet, management currently has been buying shares and the founder owns a huge chunk of the company. Since management has been quick to admit that they have made many missteps along the way, we believe they are now on the right path. We especially like OSTK’s fulfillment partner business, through which they sell merchandise of other retailers, cataloguers or manufacturers via their website, which accounts for approximately 80% of its revenue. At the June 29 closing price of $6.91, we think the stock is compellingly cheap.
Although we believe the three stocks mentioned are deeply undervalued, we cannot predict when these investments will work out. Patience is an important virtue in value investing.
Following up on a past letter, we continue to believe U.S. financial institutions are very cheap and TARP warrants associated with these companies are an attractive way to invest in them. Depending on the price, TARP warrants have several characteristics that make them appealing long-term investments. Specifically, they are long dated, with most expiring around 2018-2019. This time
CHOU OPPORTUNITY FUND A MESSAGE TO OUR SHAREHOLDERS JUNE 30, 2012 |
frame of six-plus years allows banks to grow their intrinsic value to a high enough level to have an appreciable impact on the strike price of the stock warrant. In addition, we believe the strike price will be adjusted downward for any quarterly dividend that exceeds a set price. This is rarely seen in a stock warrant. An example: for Bank of America, class 'A' warrants, the strike price is adjusted downward for any quarterly dividend paid exceeding one cent a share.
Bank TARP warrants are complex, with terms and conditions that are unique to each bank. Thus we encourage you to research them for yourself and draw your own conclusions. The legalese is quite intimidating but there is some help on the way. Some banks have started to pay dividends that exceed a set price, and we are starting to see how anti-dilution clauses that were added to protect TARP warrant holders apply with regard to:
a) the adjustment of the strike price.
b) the adjustment to the number of shares you can purchase for each warrant you hold.
In conclusion, we feel fairly comfortable with the holdings we have in the Fund.
Yours truly,
Francis Chou
Portfolio Manager and CEO
Chou America Management Inc.
The views in this report were those of the Fund manager as of June 30, 2012, and may not reflect his view on the date this report is first published or anytime thereafter. The views are intended to assist the shareholders of the fund in understanding their investments in the Fund and do not constitute investment advice. This letter may contain discussions about certain investments held and not held in the portfolio. All current and future holdings are subject to risk and to change. There can be no guarantee of success with any technique, strategy or investment.
The S&P 500 is an unmanaged index representing the average performance of 500 widely held, publicly traded, large capitalization stocks. One cannot invest directly in an index.
CHOU INCOME FUND A MESSAGE TO OUR SHAREHOLDERS JUNE 30, 2012 |
Dear Shareholder,
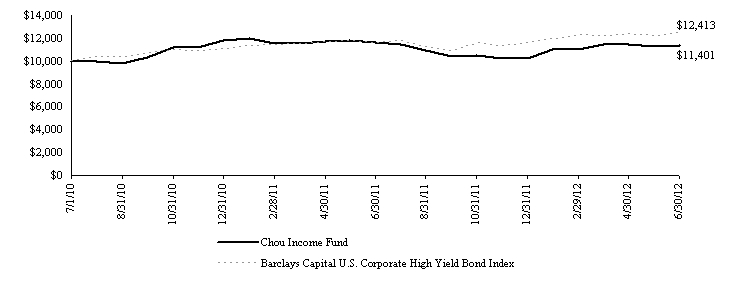
During the first six months of 2012, the Chou Income Fund (the “Fund”) was up 11.63%, while the Barclay's U.S. High Yield Index generated a return of 7.27% during the same period.
Portfolio Commentary
The debt securities of MannKind Corp, Inc., Media General and Bank of America were positive contributors to the Fund during the first half of 2012. The debt security of Bank of America performed especially well as we were able to sell the security back to the company at 80 cents on the dollar, a 32 cents gain over our purchase price of 48 cents on the dollar.
The debt security of Compton Petroleum was our biggest loss due to the unprecedented fall in the price of natural gas to $2 per million Btu. Historically, there has been a strong relationship between the price of oil and gas, usually in the realm of 8 to 1. Currently the ratio is 33 to 1, though a few months ago it went over 50 to 1. As a result, Compton Petroleum had to restructure its debt, and the common shares we received were nowhere close to the price we paid for the debt security.
We are highly concentrated in the following two securities:
• The term loan of R.H. Donnelley, Inc. At the current price, we believe R.H. Donnelley’s term loan is well covered by its earning power, assets, and covenants that are protective to debt holders. In addition, this term loan comes with a cash flow sweep, which means that any free cash flow remaining after all operational needs are met can be used to buy back debt at par from its holders. The company also has credit support from two subsidiaries of Dex One Corporation, the holding company. During the first six months of 2012, R.H. Donnelley, Inc. bought back approximately 7% of its term loan at par.
• The 3 3/4% debt security of MannKind Corp. In the first week of February 2012, MannKind announced the completion of an underwritten public offering of 35,937,500 units for $2.40 per unit, with each unit consisting of one share of common stock, plus a warrant to purchase 0.6 of a share of its common stock. The gross proceeds from this offering were approximately $86.3 million.
At the current price, we believe MannKind’s 3 3/4%, debt security maturing in December 2013, is attractively priced, even though, its performance depends on FDA approval of the drug Afrezza. That said, CEO and principal shareholder Alfred E. Mann’s decision to convert part of his $77.2 million loan to the company to common stock, makes us feel positive about the company and its drug Afrezza.
In summary, we are comfortable with the holdings in the portfolio and believe they are attractively priced and undervalued. We are optimistic about the future.
Yours truly,
Francis Chou
Portfolio Manager and CEO
Chou America Management Inc.
The views in this report were those of the Fund manager as of June 30, 2012, and may not reflect his view on the date this report is first published or anytime thereafter. The views are intended to assist the shareholders of the fund in understanding their investments in the Fund and do not constitute investment advice. This letter may contain discussions about certain investments held and not held in the portfolio. All current and future holdings are subject to risk and to change. There can be no guarantee of success with any technique, strategy or investment.
The Barclays Capital U.S. Corporate High Yield Index is comprised of issues that meet the following criteria: at least $150 million par value outstanding, maximum credit rating of Ba1 (including defaulted issues) and at least one year to maturity. One cannot invest directly in an index.
CHOU OPPORUNITY FUND PERFORMANCE CHART AND ANALYSIS JUNE 30, 2012 |
The following chart reflects the change in the value of a hypothetical $10,000 investment, including reinvested dividends and distributions, in the Chou Opportunity Fund (the “Fund”) compared with the performance of the benchmark, S&P 500 Index ("S&P 500"), since inception. The S&P 500 is a broad-based, unmanaged measurement of changes in stock market conditions based on the average of 500 widely held common stocks. The total return of the S&P 500 includes the reinvestment of dividends and income. The total return of the Fund includes operating expenses that reduce returns, while the total return of the S&P 500 does not include expenses. The Fund is professionally managed while the S&P 500 is unmanaged and is not available for investment.
Performance data quoted represents past performance and is no guarantee of future results. Current performance may be lower or higher than the performance data quoted. Investment return and principal value will fluctuate so that shares, when redeemed, may be worth more or less than original cost. For the most recent month-end performance, please call (877) 682-6352. Shares redeemed or exchanged within 120 days of purchase will be charged a 2.00% redemption fee. As stated in the Fund’s prospectus, the annual operating expense ratio (gross) is 1.90%. The Fund’s adviser has contractually agreed to reduce a portion of its fees and reimburse expenses to limit total operating expenses to 1.50%, through May 1, 2013. During the period, certain fees were waived and/or expenses reimbursed; otherwise, returns would have been lower. The performance table and graph do not reflect the deduction of taxes that a shareholder would pay on Fund distributions or the redemption of Fund shares. Returns greater than one year are annualized.
Comparison of change in value of a $10,000 Investment Chou Opportunity Fund vs. S&P 500 Index |
| Average Annual Total Return as of 06/30/12: | One Year | Since Inception |
| Chou Opportunity Fund | -13.06% | 2.83% |
| S&P 500 | 5.45% | 17.61% |
CHOU INCOME FUND PERFORMANCE CHART AND ANALYSIS JUNE 30, 2012 |
The following chart reflects the change in the value of a hypothetical $10,000 investment, including reinvested dividends and distributions, in the Chou Income Fund (the “Fund”) compared with the performance of the benchmark, Barclays Capital U.S. Corporate High Yield Index ("Barclays Index"), since inception. The Barclays Index is comprised of issues that meet the following criteria: at least $150 million par value outstanding, maximum credit rating of Ba1 (including defaulted issues) and at least one year to maturity. The total return of the Barclays Index includes the reinvestment of dividends and income. The total return of the Fund includes operating expenses that reduce returns, while the total return of the Barclays Index does not include expenses. The Fund is professionally managed while the Barclays Index is unmanaged and is not available for investment.
Performance data quoted represents past performance and is no guarantee of future results. Current performance may be lower or higher than the performance data quoted. Investment return and principal value will fluctuate so that shares, when redeemed, may be worth more or less than original cost. For the most recent month-end performance, please call (877) 682-6352. Shares redeemed or exchanged within 120 days of purchase will be charged a 2.00% redemption fee. As stated in the Fund’s prospectus, the annual operating expense ratio (gross) is 4.64%. However, the Fund’s adviser has contractually agreed to reduce a portion of its fees and reimburse expenses to limit total operating expenses to 1.50%, through May 1, 2013. During the period, certain fees were waived and/or expenses reimbursed; otherwise, returns would have been lower. The performance table and graph do not reflect the deduction of taxes that a shareholder would pay on Fund distributions or the redemption of Fund shares. Returns greater than one year are annualized.
Comparison of change in value of a $10,000 Investment Chou Income Fund vs. Barclays Capital U.S. Corporate High Yield Bond Index |
| Average Annual Total Return as of 06/30/12 | One Year | Since Inception |
| Chou Income Fund | -2.06% | 6.79% |
| Barclays Capital U.S. Corporate High Yield Index | 7.27% | 11.43% |
CHOU OPPORTUNITY FUND SCHEDULE OF INVESTMENTS JUNE 30, 2012 |
| Shares | | Security Description | | Value | |
| Common Stock - 77.7% |
| Communications - 23.5% |
| | 950,529 | | Overstock.com, Inc. (a) | $ | 6,568,155 | |
| | 2,880,000 | | UTStarcom Holdings Corp. (a) | | 3,427,200 | |
| | | 9,995,355 | |
| Consumer Discretionary - 14.6% |
| | 2,190 | | Orchard Supply Hardware Stores Corp. (a) | | 36,420 | |
| | 236,000 | | RadioShack Corp. | | 906,240 | |
| | 88,500 | | Sears Holdings Corp. (a) | | 5,283,450 | |
| | | 6,226,110 | |
| Consumer Staples - 1.7% |
| | 209,310 | | Alliance One International, Inc. (a) | | 724,212 | |
| Financials - 24.5% |
| | 157,480 | | Asta Funding, Inc. | | 1,475,588 | |
| | 80,000 | | Citigroup, Inc. | | 2,192,800 | |
| | 72,136 | | Flagstone Reinsurance Holdings SA | | 577,809 | |
| | 50,000 | | Jefferies Group, Inc. | | 649,500 | |
| | 300,000 | | MBIA, Inc. (a) | | 3,243,000 | |
| | 24,000 | | The Goldman Sachs Group, Inc. | | 2,300,640 | |
| | | 10,439,337 | |
| Information Technology - 0.1% |
| | 3,200 | | Dell, Inc. (a) | | 40,064 | |
| Materials - 13.3% |
| | 490,072 | | Resolute Forest Products (a) | | 5,675,034 | |
| | | | |
Total Common Stock (Cost $38,258,186) | | 33,100,112 | |
| | Shares | | Security Description | | Rate | | | Value | |
| Preferred Stock - 0.0% |
| Consumer Discretionary - 0.0% |
| | 2,190 | | Orchard Supply Hardware Stores Corp., Series A (a)(b) (Cost $4,413) | | 0.00 | % | �� | 4,271 | |
| Warrants - 11.5% |
| | 659,430 | | Bank of America Corp. (a) | | 2,327,788 | |
| | 195,386 | | JPMorgan Chase & Co. (a) | | 1,908,921 | |
| | 77,400 | | Wells Fargo & Co. (a) | | 681,894 | |
Total Warrants (Cost $4,960,116) | | 4,918,603 | |
| | Principal | | Security Description | | Rate | | Maturity | | Value | |
| Corporate Convertible Bonds - 10.3% |
| Consumer Staples - 10.3% |
| $ | 8,100,000 | | MannKind Corp. (Cost $5,243,774) | | 3.75 | % | 12/15/13 | | 4,374,000 | |
| | | | |
Total Investments - 99.5% (Cost $48,466,489)* | $ | 42,396,986 | |
| Other Assets & Liabilities, Net – 0.5% | | 214,808 | |
| Net Assets – 100.0% | $ | 42,611,794 | |
(a) Non-income producing security.
(b) Zero coupon bond. Interest rate presented is yield to maturity.
| | * Cost for federal income tax purposes is substantially the same as for financial statement purposes and net unrealized depreciation consists of: |
| Gross Unrealized Appreciation | | $ | 3,066,796 | |
| Gross Unrealized Depreciation | | | (9,136,299 | ) |
| Net Unrealized Depreciation | | $ | (6,069,503 | ) |
The inputs or methodology used for valuing securities are not necessarily an indication of the risks associated with investing in those securities. For more information on valuation inputs, and their aggregation into the levels used in the tables below, please refer to the Security Valuation section in Note 2 of the accompanying Notes to Financial Statements.
The following is a summary of the inputs used to value the Fund’s investments as of June 30, 2012.
| Valuation Inputs | | Investments in Securities |
| Level 1 - Quoted Prices | | $ | 38,022,986 | |
| Level 2 - Other Significant Observable Inputs | | | 4,374,000 | |
| Level 3 - Significant Unobservable Inputs | | | - | |
| Total | | $ | 42,396,986 | |
The Level 1 inputs displayed in this table are Common Stock, Preferred Stock and Warrants. The Level 2 inputs are Corporate Convertible Bonds. Refer to the Schedule of Investments for a further breakout of each security type.
There were no significant transfers between Level 1 and Level 2 for the period ended June 30, 2012.
AFA
| PORTFOLIO HOLDINGS | | |
| % of Total Investments | | |
| Communications | 23.6 | % |
| Consumer Discretionary | 14.7 | % |
| Consumer Staples | 12.0 | % |
| Financials | 24.6 | % |
| Information Technology | 0.1 | % |
| Materials | 13.4 | % |
| Warrants | 11.6 | % |
| | 100.0 | % |
AFA
| See Notes to Financial Statements. | 6 | |
CHOU INCOME FUND SCHEDULE OF INVESTMENTS JUNE 30, 2012 |
| Shares | | Security Description | | Value | |
| Equity Securities - 0.5% |
| Common Stock - 0.5% |
| Energy - 0.5% |
| | 22,365 | | Compton Petroleum Corp. (a) | $ | 27,459 | |
| Materials - 0.0% |
| | 49 | | Resolute Forest Products (a) | | 567 | |
| | | | |
Total Common Stock (Cost $252,220) | | 28,026 | |
Total Equity Securities (Cost $252,220) | | 28,026 | |
| | Principal | | Security Description | | Rate | | Maturity | | Value | |
| Fixed Income Securities - 90.4% |
| Corporate Convertible Bonds - 33.6% |
| Communications - 0.8% |
| $ | 30,000 | | Level 3 Communications, Inc. | | 6.50 | % | 10/01/16 | | 42,038 | |
| | | | |
| Consumer Staples - 21.4% |
| | 2,137,000 | | MannKind Corp. | | 3.75 | | 12/15/13 | | 1,153,980 | |
| | | | |
| Financials - 7.7% |
| | 1,000,000 | | CompuCredit Holdings Corp. | | 5.88 | | 11/30/35 | | 415,000 | |
| | | | |
| Materials - 3.7% |
| | 400,000 | | USEC, Inc. | | 3.00 | | 10/01/14 | | 196,000 | |
| | | | |
Total Corporate Convertible Bonds (Cost $2,381,132) | | 1,807,018 | |
| Corporate Non-Convertible Bonds - 20.3% |
| Communications - 10.3% |
| | 41,400 | | Dex One Corp. | | 14.00 | | 01/29/17 | | 10,143 | |
| | 300,000 | | Media General, Inc. | | 11.75 | | 02/15/17 | | 323,250 | |
| | 219,261 | | Morris Publishing Group, LLC | | 10.00 | | 09/01/14 | | 219,261 | |
| | | 552,654 | |
| Energy - 3.5% |
| | 400,000 | | ATP Oil & Gas Corp. | | 11.88 | | 05/01/15 | | 188,000 | |
| | | | |
| Financials - 5.6% |
| | 550,000 | | MBIA Insurance Corp. (b)(c) | | 14.00 | | 01/15/33 | | 302,500 | |
| | | | |
| Materials - 0.9% |
| | 100,000 | | Catalyst Paper Corp. (b)(d) | | 11.00 | | 12/15/16 | | 49,500 | |
Total Corporate Non-Convertible Bonds (Cost $1,071,489) | | 1,092,654 | |
| Foreign Government Bonds - 0.7% |
| | 9,000 | | Hellenic Republic Government Bond (e) | | 2.00 | | 02/24/23 | | 2,042 | |
| | 9,000 | | Hellenic Republic Government Bond (e) | | 2.00 | | 02/24/24 | | 1,957 | |
| | 9,000 | | Hellenic Republic Government Bond (e) | | 2.00 | | 02/24/25 | | 1,825 | |
| | 9,000 | | Hellenic Republic Government Bond (e) | | 2.00 | | 02/24/26 | | 1,774 | |
| | 9,000 | | Hellenic Republic Government Bond (e) | | 2.00 | | 02/24/27 | | 1,743 | |
| | Principal | | Security Description | | Rate | | Maturity | | Value | |
| | 9,600 | | Hellenic Republic Government Bond (e) | | 2.00 | | 02/24/28 | $ | 1,902 | |
| | 9,600 | | Hellenic Republic Government Bond (e) | | 2.00 | | 02/24/29 | | 1,791 | |
| | 9,600 | | Hellenic Republic Government Bond (e) | | 2.00 | | 02/24/30 | | 1,725 | |
| | 9,600 | | Hellenic Republic Government Bond (e) | | 2.00 | | 02/24/31 | | 1,755 | |
| | 9,600 | | Hellenic Republic Government Bond (e) | | 2.00 | | 02/24/32 | | 1,725 | |
| | 9,600 | | Hellenic Republic Government Bond (e) | | 2.00 | | 02/24/33 | | 1,723 | |
| | 9,600 | | Hellenic Republic Government Bond (e) | | 2.00 | | 02/24/34 | | 1,714 | |
| | 9,600 | | Hellenic Republic Government Bond (e) | | 2.00 | | 02/24/35 | | 1,709 | |
| | 9,600 | | Hellenic Republic Government Bond (e) | | 2.00 | | 02/24/36 | | 1,703 | |
| | 9,600 | | Hellenic Republic Government Bond (e) | | 2.00 | | 02/24/37 | | 1,701 | |
| | 9,600 | | Hellenic Republic Government Bond (e) | | 2.00 | | 02/24/38 | | 1,695 | |
| | 9,600 | | Hellenic Republic Government Bond (e) | | 2.00 | | 02/24/39 | | 1,691 | |
| | 9,600 | | Hellenic Republic Government Bond (e) | | 2.00 | | 02/24/40 | | 1,689 | |
| | 9,600 | | Hellenic Republic Government Bond (e) | | 2.00 | | 02/24/41 | | 1,678 | |
| | 9,600 | | Hellenic Republic Government Bond (e) | | 2.00 | | 02/24/42 | | 1,689 | |
| | 189,000 | | Hellenic Republic Government Bond (c) | | 0.00 | | 10/15/42 | | 837 | |
Total Foreign Government Bonds (Cost $62,875) | | 36,068 | |
| Foreign Treasury Bills - 0.3% |
| | 13,348 | | European Financial Stability Facility Treasury Bill (f) (Cost $17,573) | | 0.00 | | 09/12/12 | | 16,890 | |
| | | | |
| Syndicated Loans - 16.9% |
| | 355,430 | | Dex Media West, LLC (c) | | 7.25 | | 10/24/14 | | 219,478 | |
| | 1,555,720 | | RH Donnelley, Inc. (c) | | 9.00 | | 10/24/14 | | 692,295 | |
Total Syndicated Loans (Cost $1,567,116) | | 911,773 | |
| See Notes to Financial Statements. | 7 | |
CHOU INCOME FUND SCHEDULE OF INVESTMENTS JUNE 30, 2012 |
| | Principal | | Security Description | | Rate | | Maturity | | Value | |
| U.S. Treasury Securities - 18.6% |
| $ | 1,000,000 | | U.S. Treasury Bill (g) (Cost $999,998) | | 0.01 | % | 07/12/12 | $ | 999,984 | |
| Total Fixed Income Securities (Cost $6,100,183) | | 4,864,387 | |
| Total Investments- 90.9% (Cost $6,352,403)* | $ | 4,892,413 | |
| Other Assets & Liabilities, Net – 9.1% | | 491,380 | |
| Net Assets – 100.0% | $ | 5,383,793 | |
| LLC | Limited Liability Company |
| (a) | Non-income producing security. |
| (b) | Security exempt from registration under Rule 144A under the Securities Act of 1933. At the period end, the value of these securities amounted to $352,000 or 6.5% of net assets. |
| (c) | Variable rate security. Rate presented is as of June 30, 2012. |
| (d) | Security is currently in default and is on scheduled interest or principal payment. |
| (e) | Debt obligation initially issued at one coupon rate which converts to higher coupon rate at a specified date. Rate presented is as of June 30, 2012. |
| (f) | Zero coupon bond. Rate presented is yield to maturity. |
| (g) | Rate presented is yield to maturity. |
| | * Cost for federal income tax purposes is substantially the same as for financial statement purposes and net unrealized depreciation consists of: |
| Gross Unrealized Appreciation | | $ | 118,415 | |
| Gross Unrealized Depreciation | | | (1,578,405 | ) |
| Net Unrealized Depreciation | | $ | (1,459,990 | ) |
The inputs or methodology used for valuing securities are not necessarily an indication of the risks associated with investing in those securities. For more information on valuation inputs, and their aggregation into the levels used in the tables below, please refer to the Security Valuation section in Note 2 of the accompanying Notes to Financial Statements.
The following is a summary of the inputs used to value the Fund’s investments as of June 30, 2012.
| | Level 1 | | Level 2 | | Level 3 | | Total |
| Common Stock | | $ | 28,026 | | | | | | | | | | | $ | 28,026 | |
| Corporate Convertible Bonds | | | - | | | | 1,807,018 | | | | - | | | | 1,807,018 | |
| Corporate Non-Convertible Bonds | | | - | | | | 1,092,654 | | | | - | | | | 1,092,654 | |
| Foreign Government Bonds | | | - | | | | 36,068 | | | | - | | | | 36,068 | |
| Foreign Treasury Bills | | | - | | | | 16,890 | | | | - | | | | 16,890 | |
| Syndicated Loans | | | - | | | | 911,773 | | | | - | | | | 911,773 | |
| U.S. Treasury Securities | | | - | | | | 999,984 | | | | - | | | | 999,984 | |
| Total | | $ | 28,026 | | | $ | 4,864,387 | | | $ | - | | | $ | 4,892,413 | |
There were no significant transfers between Level 1 and Level 2 for the period ended June 30, 2012.
| PORTFOLIO HOLDINGS | | |
| % of Total Investments | | |
| Common Stock | 0.6 | % |
| Corporate Convertible Bonds | 36.9 | % |
| Corporate Non-Convertible Bonds | 22.3 | % |
| Foreign Government Bonds | 0.7 | % |
| Foreign Treasury Bills | 0.4 | % |
| Syndicated Loans | 18.6 | % |
| U.S. Treasury Securities | 20.5 | % |
| | 100.0 | % |
| | | |
| See Notes to Financial Statements. | 8 | |
CHOU AMERICA MUTUAL FUNDS STATEMENTS OF ASSETS AND LIABILITIES JUNE 30, 2012 |
| | | 120 | | | CHOU OPPORTUNITY FUND | | | | CHOU INCOME FUND | |
| ASSETS | | | | | | | | |
| | Total investments, at value (Cost $48,466,489 and $6,352,403, respectively) | $ | 42,396,986 | | | $ | 4,892,413 | |
| | Cash | | | - | | | | 402,871 | |
| | Receivables: | | | | | | | | |
| | | Investment securities sold | | | 1,019,811 | | | | - | |
| | | Dividends and interest | | | 16,455 | | | | 97,603 | |
| adviser | From investment adviser | | | - | | | | 6,979 | |
| | Prepaid expenses | | | 24,966 | | | | 18,243 | |
| Total Assets | | | 43,458,218 | | | | 5,418,109 | |
| | | | | | | | | | | |
| LIABILITIES | | | | | | | | |
| | Payables: | | | | | | | | |
| | | Due to custodian | | | 774,076 | | | | - | |
| | Accrued Liabilities: | | | | | | | | |
| adviser | Investment adviser fees | | | 35,061 | | | | - | |
| | | Trustees’ fees and expenses | | | 218 | | | | 41 | |
| | | Fund services fees | | | 8,648 | | | | 6,843 | |
| | | Other expenses | | | 28,421 | | | | 27,432 | |
| Total Liabilities | | | 846,424 | | | | 34,316 | |
| | | | | | | | | | | |
| NET ASSETS | | $ | 42,611,794 | | | $ | 5,383,793 | |
| | | | | | | | | | | |
| COMPONENTS OF NET ASSETS | | | | | | | | |
| | Paid-in capital | | $ | 45,138,764 | | | $ | 6,739,476 | |
| | Undistributed (distributions in excess of) net investment income | | | 6,501 | | | | (24,164 | ) |
| | Accumulated net realized gain | | | 3,536,032 | | | | 128,499 | |
| | Net unrealized depreciation | | | (6,069,503 | ) | | | (1,460,018 | ) |
| NET ASSETS | | $ | 42,611,794 | | | $ | 5,383,793 | |
| SHARES OF BENEFICIAL INTEREST AT NO PAR VALUE (UNLIMITED SHARES AUTHORIZED) | | | 4,098,889 | | | | 602,225 | |
NET ASSET VALUE, OFFERING AND REDEMPTION PRICE PER SHARE* | | $ | 10.40 | | | $ | 8.94 | |
| * | Shares redeemed or exchanged within 120 days of purchase are charged a 2.00% redemption fee. | | | | | |
| | | |
| See Notes to Financial Statements. | 9 | |
CHOU AMERICA MUTUAL FUNDS STATEMENTS OF OPERATIONS SIX MONTHS ENDING JUNE 30, 2012 |
| | | | | | CHOU OPPORTUNITY FUND | | | | CHOU INCOME FUND | | |
| INVESTMENT INCOME | | | | | | | | | |
| | Dividend income | | $ | 115,349 | | | $ | 181 | | |
| | Interest income | | | 851,449 | | | | 512,710 | | |
| Total Investment Income | | | 966,798 | | | | 512,891 | | |
| adviser | | | | | | | | | |
| EXPENSES | | | | | | | | | |
| | Investment adviser fees | | | 276,158 | | | | 26,540 | | |
| | Fund services fees | | | 81,449 | | | | 39,262 | | |
| | Custodian fees | | | 4,557 | | | | 5,037 | | |
| | Registration fees | | | 10,531 | | | | 11,311 | | |
| | Audit fees | | | 6,750 | | | | 7,455 | | |
| | Legal fees | | | 12,516 | | | | 13,947 | | |
| | Trustees' fees and expenses | | | 2,798 | | | | 2,547 | | |
| | Miscellaneous expenses | | | 12,039 | | | | 6,606 | | |
| Total Expenses | | | 406,798 | | | | 112,705 | | |
| | Fees waived and expenses reimbursed | | | - | | | | (72,895 | ) | |
| Net Expenses | | | 406,798 | | | | 39,810 | | |
| | | | | | | | | | | | |
| NET INVESTMENT INCOME | | | 560,000 | | | | 473,081 | | |
| | | | | | | | | | | | |
| NET REALIZED AND UNREALIZED GAIN (LOSS) | | | | | | | | | |
| | Net realized gain on: | | | | | | | | | |
| | Investments | | | 2,841,932 | | | | 124,715 | | |
| | Foreign currency transactions | | | - | | | | 1,154 | | |
| | Net realized gain | | | 2,841,932 | | | | 125,869 | | |
| | Net change in unrealized appreciation (depreciation) on: | | | | | | | | | |
| | Investments | | | (346,436 | ) | | | (20,378 | ) | |
| | Foreign currency translations | | | - | | | | 393 | | |
| | Net change in unrealized appreciation (depreciation) | | | (346,436 | ) | | | (19,985 | ) | |
| NET REALIZED AND UNREALIZED GAIN | | | 2,495,496 | | | | 105,884 | | |
| INCREASE IN NET ASSETS FROM OPERATIONS | | $ | 3,055,496 | | | $ | 578,965 | | |
| | | | | | | | | | | | |
| | | |
| See Notes to Financial Statements. | 10 | |
CHOU AMERICA MUTUAL FUNDS STATEMENTS OF CHANGES IN NET ASSETS |
| | | | | CHOU OPPORTUNITY FUND | | CHOU INCOME FUND | |
| | | | | | | | | | | | | | | | | | | | |
| | | December 31, 2010 | | | | | | | Shares | | | | | | | | Shares | | |
| NET ASSETS DECEMBER 31, 2010 | | $ | 1,038,595 | | | | $1,038,595 | | | $ | 766,011 | | | | $766,011 | | |
| | | | | | | | | | | | | | | | | | | | |
| OPERATIONS | | | | | | | | | | | | | | | | | |
| | Net investment income | | | 40,884 | | | | | | | | 633,140 | | | | | | |
| | Net realized gain | | | 767,083 | | | | | | | | 17,039 | | | | | | |
| | Net change in unrealized appreciation (depreciation) | | | (5,796,683 | ) | | | | | | | (1,534,869 | ) | | | | | |
| Decrease in Net Assets Resulting from Operations | | | (4,988,716 | ) | | | | | | | (884,690 | ) | | | | | |
| | | | | | | | | | | | | | | | | | | | |
| DISTRIBUTIONS TO SHAREHOLDERS FROM | | | | | | | | | | | | | | | | | |
| | Net investment income | | | (44,283 | ) | | | | | | | (666,015 | ) | | | | | |
| | Net realized gain | | | (131,151 | ) | | | | | | | (16,812 | ) | | | | | |
| Total Distributions to Shareholders | | | (175,434 | ) | | | | | | | (682,827 | ) | | | | | |
| | | | | | | | | | | | | | | | | | | | |
| CAPITAL SHARE TRANSACTIONS | | | | | | | | | | | | | | | | | |
| | Sale of shares | | | 61,117,822 | | | | 5,610,354 | | | | 5,269,798 | | | | 448,794 | | |
| | Reinvestment of distributions | | | 175,220 | | | | 17,435 | | | | 682,827 | | | | 72,238 | | |
| | Redemption of shares | | | (444,357 | ) | | | (40,580 | ) | | | (100,171 | ) | | | (9,469 | ) | |
| | Redemption fees | | | 1,337 | | | | - | | | | 18 | | | | - | | |
| Increase in Net Assets from Capital Share Transactions | | | 60,850,022 | | | | 5,587,209 | | | | 5,852,472 | | | | 511,563 | | |
| Increase in Net Assets | | | 55,685,872 | | | | | | | | 4,284,955 | | | | | | |
| | | December 31, 2011 | | | | | | | | | | | | | | | | | |
| NET ASSETS DECEMBER 31, 2011 (Including line (a)) | | $ | 56,724,467 | | | | | | | $ | 5,050,966 | | | | | | |
| | | | | | | | | | | | | | | | | | | | |
| OPERATIONS | | | | | | | | | | | | | | | | | |
| | Net investment income | | | 560,000 | | | | | | | | 473,081 | | | | | | |
| | Net realized gain | | | 2,841,932 | | | | | | | | 125,869 | | | | | | |
| | Net change in unrealized appreciation (depreciation) | | | (346,436 | ) | | | | | | | (19,985 | ) | | | �� | | |
| Increase in Net Assets Resulting from Operations | | | 3,055,496 | | | | | | | | 578,965 | | | | | | |
| | | | | | | | | | | | | | | | | | | | |
| DISTRIBUTIONS TO SHAREHOLDERS FROM | | | | | | | | | | | | | | | | | |
| | Net investment income | | | (553,081 | ) | | | | | | | (456,977 | ) | | | | | |
| | | | | | | | | | | | | | | | | | | | |
| CAPITAL SHARE TRANSACTIONS | | | | | | | | | | | | | | | | | |
| | Sale of shares | | | 246,619 | | | | 21,878 | | | | 7,001 | | | | 781 | | |
| | Reinvestment of distributions | | | 546,772 | | | | 53,869 | | | | 419,398 | | | | 47,176 | | |
| | Redemption of shares | | | (17,419,555 | ) | | | (1,649,216 | ) | | | (215,560 | ) | | | (23,326 | ) | |
| | Redemption fees | | | 11,076 | | | | - | | | | - | | | | - | | |
| Increase (Decrease) in Net Assets from Capital Share Transactions | | (16,615,088 | ) | | | (1,573,469 | ) | | | 210,839 | | | | 24,631 | | |
| Increase (Decrease) in Net Assets | | | (14,112,673 | ) | | | | | | | 332,827 | | | | | | |
| | | June 30, 2012 | | | | | | | | | | | | | | | | | |
| NET ASSETS JUNE 30, 2012 (Including line (b)) | | $ | 42,611,794 | | | | | | | $ | 5,383,793 | | | | | | |
| | | | | | | | | | | | | | | | | | | | |
| (a) | Distributions in excess of net investment income December 31, 2011 | | $ | (418 | ) | | | | | | $ | (40,268 | ) | | | | | |
| | | | | | | | | | | | | | | | | | | | |
| (b) | Undistributed (distributions in excess of) net investment income June 30, 2012 | | $ | 6,501 | | | | | | | $ | (24,164 | ) | | | | | |
| | | |
| See Notes to Financial Statements. | 11 | |
CHOU OPPORTUNITY FUND FINANCIAL HIGHLIGHTS |
| These financial highlights reflect selected data for a share outstanding throughout each period. |
| | | For the Six Months Ended June 30, 2012 | | For the Year Ended December 31, 2011 | | July 1, 2010 (a) through December 31, 2010 | |
| NET ASSET VALUE, Beginning of Period | $ | 10.00 | | | $ | 12.20 | | | $ | 10.00 | | |
| INVESTMENT OPERATIONS | | | | | | | | | | | | |
| Net investment income (loss) (b) | | 0.11 | | | | 0.02 | | | | (0.09 | ) | |
| Net realized and unrealized gain (loss) | | 0.43 | | | | (2.19 | | | | 2.29 | | |
| Total from Investment Operations | | 0.54 | | | | (2.17 | | | | 2.20 | | |
| DISTRIBUTIONS TO SHAREHOLDERS FROM | | | | | | | | | | | | |
| Net investment income | | (0.14 | ) | | | (0.01 | ) | | | — | | |
| Net realized gain | | — | | | | (0.02 | ) | | | — | | |
| Total Distributions to Shareholders | | (0.14 | ) | | | (0.03 | ) | | | — | | |
| REDEMPTION FEES (b) | | — | (c) | | — | (c) | | — | | |
| NET ASSET VALUE, End of Period | $ | 10.40 | | | $ | 10.00 | | | $ | 12.20 | | |
| TOTAL RETURN | | 5.40 | %(d) | (17.78 | )% | | 22.00 | %(d) |
| RATIOS/SUPPLEMENTARY DATA | | | | | | | | | | | | |
| Net Assets at End of Period (000's omitted) | $42,612 | | | $56,724 | | | $1,039 | | |
| Ratios to Average Net Assets: | | | | | | | | | | | | |
| Net investment income (loss) | | 2.03 | %(e) | 0.15 | % | | (1.60 | )%(e) |
| Net expense | | 1.47 | %(e) | 1.53 | % | | 1.75 | %(e) |
| Gross expense (f) | | 1.47 | %(e) | 1.93 | % | | 28.58 | %(e) |
| PORTFOLIO TURNOVER RATE | | 15 | %(d) | 11 | % | | 33 | %(d) |
| | | | | | | | | | | | | | |
| (a) | Commencement of operations. |
| (b) | Calculated based on average shares outstanding during each period. |
| (c) | Less than $0.01 per share. |
| (d) | Not annualized. |
| (e) | Annualized. |
| (f) | Reflects the expense ratio excluding any waivers and/or reimbursements. |
| See Notes to Financial Statements. | 12 | |
CHOU INCOME FUND FINANCIAL HIGHLIGHTS |
| These financial highlights reflect selected data for a share outstanding throughout each period. |
| | | For the Six Months Ended June 30, 2012 | | For the Year Ended December 31, 2011 | | July 1, 2010 (a) Through December 31, 2010 | |
| NET ASSET VALUE, Beginning of Period | $ | 8.74 | | | $ | 11.60 | | | $ | 10.00 | | |
| INVESTMENT OPERATIONS | | | | | | | | | | | | |
| Net investment income (b) | | 0.84 | | | | 1.30 | | | | 0.20 | | |
| Net realized and unrealized gain (loss) | | 0.18 | | | | (2.86 | ) | | | 1.65 | | |
| Total from Investment Operations | | 1.02 | | | | (1.56 | ) | | | 1.85 | | |
| DISTRIBUTIONS TO | | | | | | | | | | | | |
| SHAREHOLDERS FROM | | | | | | | | | | | | |
| Net investment income | | (0.82 | ) | | | (1.27 | ) | | | (0.25 | ) | |
| Net realized gain | | — | | | | (0.03 | ) | | | — | | |
| Total Distributions to Shareholders | | (0.82 | ) | | | (1.30 | ) | | | (0.25 | ) | |
| REDEMPTION FEES (b) | | — | | | | — | (c) | | — | | |
| NET ASSET VALUE, End of Period | $ | 8.94 | | | $ | 8.74 | | | $ | 11.60 | | |
| TOTAL RETURN | | 11.63 | %(d) | (13.83 | )% | | 18.54 | %(d) |
| RATIOS/SUPPLEMENTARY DATA | | | | | | | | | | | | |
| | | | | | | | | | | | | |
| Net Assets at End of Period (000's omitted) | $5,384 | | | $5,051 | | | $766 | | |
| Ratios to Average Net Assets: | | | | | | | | | | | | |
| Net investment income | | 17.83 | %(e) | 12.24 | % | | 3.82 | %(e) |
| Net expense | | 1.50 | %(e) | 1.50 | % | | 1.50 | %(e) |
| Gross expense (f) | | 4.25 | %(e) | 4.71 | % | | 33.37 | %(e) |
| PORTFOLIO TURNOVER RATE | | 8 | %(d) | 17 | % | | 0 | %(d) |
| | | | | | | | | | | | | | |
| (a) | Commencement of operations. |
| (b) | Calculated based on average shares outstanding during each period. |
| (c) | Less than $0.01 per share. |
| (d) | Not annualized. |
| (e) | Annualized. |
| (f) | Reflects the expense ratio excluding any waivers and/or reimbursements. |
| See Notes to Financial Statements. | 13 | |
CHOU AMERICA MUTUAL FUNDS NOTES TO FINANCIAL STATEMENTS JUNE 30, 2012 |
Note 1. Organization
The Chou Opportunity Fund and Chou Income Fund (individually, a “Fund” and, collectively the “Funds”) are non-diversified portfolios of Chou America Mutual Funds (the “Trust”). The Trust is a Delaware statutory trust that is registered as an open-end, management investment company under the Investment Company Act of 1940 (the “Act”), as amended. Under its Trust Instrument, the Trust is authorized to issue an unlimited number of each Fund’s shares of beneficial interest without par value. Chou Opportunity Fund’s investment objective is to seek long-term growth of capital. Chou Income Fund’s investment objective is to provide capital appreciation and income production with capital preservation as a secondary consideration. The Funds commenced operations on July 1, 2010, with the sale of 50,000 shares of each Fund at $10 per share to Chou Associates Management Inc. Effective March 1, 2012, the name of the Chou Equity Opportunity Fund changed to the Chou Opportunity Fund and the name of the Chou Income Opportunity Fund changed to the Chou Income Fund.
Note 2. Summary of Significant Accounting Policies
These financial statements are prepared in accordance with accounting principles generally accepted in the United States of America (“GAAP”), which require management to make estimates and assumptions that affect the reported amounts of assets and liabilities, the disclosure of contingent liabilities at the date of the financial statements, and the reported amounts of increase and decrease in net assets from operations during the fiscal period. Actual amounts could differ from those estimates. The following summarizes the significant accounting policies of each Fund:
Security Valuation – Exchange-traded securities and over-the-counter securities are valued using the last quoted sale or official closing price, provided by independent pricing services as of the close of trading on the market or exchange for which they are primarily traded, on each Fund business day. In the absence of a sale, such securities are valued at the mean of the last bid and ask price provided by independent pricing services. Non-exchange traded securities for which quotations are available are valued using the last quoted sales price, or in the absence of a sale at the mean of the last bid and ask prices provided by independent pricing services. Debt securities may be valued at prices supplied by a fund’s pricing agent based on broker or dealer supplied valuations or matrix pricing, a method of valuing securities by reference to the value of other securities with similar characteristics such as rating, interest rate and maturity. Exchange-traded options for which there were no sales reported that day are generally valued at the mean of the last bid and ask prices. Options not traded on an exchange are generally valued at broker-dealer bid quotations. Short-term investments that mature in 60 days or less may be valued at amortized cost.
Each Fund values its investments at fair value pursuant to procedures adopted by the Trust's Board of Trustees (the "Board") if (1) market quotations are insufficient or not readily available or (2) the adviser believes that the values available are unreliable. Fair valuation is based on subjective factors and, as a result, the fair value price of an investment may differ from the security’s market price and may not be the price at which the asset may be sold. Fair valuation could result in a different NAV than a NAV determined by using market quotes.
Each Fund has a three-tier fair value hierarchy. The basis of the tiers is dependent upon the various “inputs” used to determine the value of each Fund’s investments. These inputs are summarized in the three broad levels listed below:
Level 1 — quoted prices in active markets for identical assets
Level 2 — other significant observable inputs (including quoted prices of similar securities, interest rates, prepayment speeds, credit risk, etc.)
Level 3 — significant unobservable inputs (including each Fund’s own assumptions in determining the fair value of investments)
The aggregate value by input level, as of June 30, 2012, for each Fund’s investments is included at the end of each Fund’s Schedule of Investments.
Security Transactions, Investment Income and Realized Gain and Loss – Investment transactions are accounted for on the trade date. Dividend income is recorded on the ex-dividend date. Foreign dividend income is recorded on the ex-dividend date or as soon as possible after each Fund determines the existence of a dividend declaration after exercising reasonable due diligence. Income and capital gains on some foreign securities may be subject to foreign withholding taxes, which are accrued as applicable. Interest income is recorded on an accrual basis. Premium is amortized and discount is accreted using the effective interest method. Identified cost of investments sold is used to determine the gain and loss for both financial statement and federal income tax purposes.
CHOU AMERICA MUTUAL FUNDS NOTES TO FINANCIAL STATEMENTS JUNE 30, 2012 |
Foreign Currency Transactions – Each Fund may enter into transactions to purchase or sell foreign currency contracts and options on foreign currency. Forward currency contracts are agreements to exchange one currency for another at a future date and at a specified price. A fund may use forward currency contracts to facilitate transactions in foreign securities, to manage a fund’s foreign currency exposure and to protect the U.S. dollar value of its underlying portfolio securities against the effect of possible adverse movements in foreign exchange rates. These contracts are intrinsically valued daily based on forward rates, and a fund’s net equity therein, representing unrealized gain or loss on the contracts as measured by the difference between the forward foreign exchange rates at the dates of entry into the contracts and the forward rates at the reporting date, is recorded as a component of net asset value. These instruments involve market risk, credit risk, or both kinds of risks, in excess of the amount recognized in the Statement of Assets and Liabilities. Risks arise from the possible inability of counterparties to meet the terms of their contracts and from movement in currency and securities values and interest rates. Due to the risks associated with these transactions, a fund could incur losses up to the entire contract amount, which may exceed the net unrealized value included in its net asset value.
Distributions to Shareholders – Distributions to shareholders of net investment income, if any, are declared and paid at least semi-annually. Distributions to shareholders of net capital gains, if any, are declared and paid annually. Distributions are based on amounts calculated in accordance with applicable federal income tax regulations, which may differ from GAAP. These differences are due primarily to differing treatments of income and gain on various investment securities held by each Fund, timing differences and differing characterizations of distributions made by each Fund.
Federal Taxes – Each Fund intends to continue to qualify each year as a regulated investment company under Subchapter M of the Internal Revenue Code and to distribute all of their taxable income to shareholders. In addition, by distributing in each calendar year substantially all of their net investment income and capital gains, if any, the Funds will not be subject to a federal excise tax. Therefore, no federal income or excise tax provision is required. Each Fund files a U.S. federal income and excise tax return as required. A fund’s federal income tax returns are subject to examination by the Internal Revenue Service for a period of three fiscal years after they are filed. As of June 30, 2012, there are no uncertain tax positions that would require financial statement recognition, de-recognition, or disclosure.
Income and Expense Allocation – The Trust accounts separately for the assets, liabilities and operations of each of its investment portfolios. Expenses that are directly attributable to more than one investment portfolio are allocated among the respective investment portfolios in an equitable manner.
Redemption Fees – A shareholder who redeems or exchanges shares within 120 days of purchase will incur a redemption fee of 2.00% of the current net asset value of shares redeemed or exchanged, subject to certain limitations. The fee is charged for the benefit of the remaining shareholders and will be paid to each Fund to help offset transaction costs. The fee is accounted for as an addition to paid-in capital. Each Fund reserves the right to modify the terms of or terminate the fee at any time. There are limited exceptions to the imposition of the redemption fee.
Commitments and Contingencies – In the normal course of business, each Fund enters into contracts that provide general indemnifications by each Fund to the counterparty to the contract. Each Fund’s maximum exposure under these arrangements is dependent on future claims that may be made against each Fund and, therefore, cannot be estimated; however, based on experience, the risk of loss from such claims is considered remote.
Note 3. Fees and Expenses
Investment Adviser – Chou America Management Inc. (the “Adviser”) is the investment adviser to each Fund. Pursuant to an investment advisory agreement, the Adviser receives an advisory fee from each Fund at an annual rate of 1.00% of each Fund’s average daily net assets.
Distribution – Rafferty Capital Markets, LLC serves as each Fund’s distributor (the “Distributor”). The Funds have adopted a Distribution Plan (the “Plan”) in accordance with Rule 12b-1 of the Act. Under the Plan, each Fund may pay the Distributor and/or any other entity as authorized by the Board a fee of up to 0.25% of each Fund’s average daily net assets for providing distribution and/or shareholder services to the Funds. The Distributor is not affiliated with the Adviser or Atlantic Fund Administration, LLC (d/b/a Atlantic Fund Services) (“Atlantic”) or their affiliates.
Other Service Providers – Atlantic provides fund accounting, fund administration, compliance and transfer agency services to each Fund. Atlantic also provides certain shareholder report production, and EDGAR conversion and filing services. Pursuant to an Atlantic services agreement, each Fund pays Atlantic customary fees for its services. Atlantic provides a Principal Financial Officer,
CHOU AMERICA MUTUAL FUNDS NOTES TO FINANCIAL STATEMENTS JUNE 30, 2012 |
a Chief Compliance Officer, and an Anti-Money Laundering Officer to each Fund, as well as certain additional compliance support functions.
Trustees and Officers – The Trust pays each Trustee an annual retainer fee of $5,000 for service to the Trust. Each Trustee is also reimbursed for all reasonable out-of-pocket expenses incurred in connection with their duties as a Trustee, including travel and related expenses incurred in attending Board meetings. No officers of the Funds are compensated by the Funds, but officers are reimbursed for travel and related expenses incurred in attending Board meetings.
Note 4. Expense Reimbursements and Fees Waived
The Adviser has contractually agreed to waive a portion of its fee and reimburse certain expenses to limit total annual operating expenses to 1.50% of the average daily net assets of the Chou Opportunity Fund and Chou Income Fund, through May 1, 2013 (excluding other expenses, taxes, leverage interest, acquired fund fees and expenses, dividends or interest on short positions, other interest expenses, brokerage commissions, and extraordinary expenses such as litigation). For the period ended June 30, 2012, fees waived and reimbursed were as follows:
| | Investment Adviser Fees Waived | | Investment Adviser Expenses Reimbursed | | Total Fees Waived and Expenses Reimbursed |
| Chou Income Fund | $ 26,540 | | $ 46,355 | | $ 72,895 |
The Funds may pay the Adviser for fees waived and expenses reimbursed pursuant to the expense cap if (1) such payment is made within three years of the fees waived or expense reimbursement, (2) such payment is approved by the Board and (3) and the overall expenses fall below the lesser of the Fund’s then current expense cap or the expense cap in effect at the time of such reimbursement. For the period July 1, 2010 (commencement of operations) through June 30, 2012, the Adviser waived and/or reimbursed fees as follows:
| Chou Opportunity Fund | | | | | | |
| | | Amount of Fees Waived and/or Expenses Reimbursed | | Expiration Date to Recoup Fees Waived and/or Expenses Reimbursed | | Fees Recouped |
| December 31, 2010 | | $ | 93,139 | | December 31, 2013 | | $ | - |
| December 31, 2011 | | $ | 110,128 | | December 31, 2014 | | $ | - |
| Chou Income Fund | | | | | | |
| | | Amount of Fees Waived and/or Expenses Reimbursed | | Expiration Date to Recoup Fees Waived and/or Expenses Reimbursed | | Fees Recouped |
| December 31, 2010 | | $ | 93,362 | | December 31, 2013 | | $ | - |
| December 31, 2011 | | $ | 166,086 | | December 31, 2014 | | $ | - |
| June 30, 2012 | | $ | 72,895 | | December 31, 2015 | | $ | - |
Note 5. Security Transactions
The cost of purchases and proceeds from sales of investment securities (including maturities), other than short-term investments during the period ended June 30, 2012, were as follows:
| | | | | Purchases | | Sales |
| Chou Opportunity Fund | | $7,067,166 | | $14,351,615 |
| Chou Income Fund | | $337,242 | | $1,113,769 |
CHOU AMERICA MUTUAL FUNDS NOTES TO FINANCIAL STATEMENTS JUNE 30, 2012 |
Note 6. Federal Income Tax and Investment Transactions
As of December 31, 2011, distributable earnings (accumulated loss) on a tax basis were as follows:
| | | Undistributed Ordinary Income | | Undistributed Long-Term Gain | | Capital and Other Losses | | Unrealized Appreciation (Depreciation) | | Total |
| Chou Opportunity Fund | | $ | 694,100 | | | $ | - | | | $ | (418 | ) | | $ | (5,723,067 | ) | | $ | (5,029,385 | ) |
| Chou Income Fund | | | 11,855 | | | | - | | | | - | | | | (1,489,526 | ) | | | (1,477,671 | ) |
The difference between components of distributable earnings on a tax basis and the amounts reflected in the Statements of Assets and Liabilities are primarily due to late year ordinary loss deferral and contingent payment debt instruments.
Note 7. Recent Accounting Pronouncements
In May 2011, FASB issued ASU No. 2011-04 “Amendments to Achieve Common Fair Value Measurement and Disclosure Requirements in U.S. GAAP and IFRSs.” ASU No. 2011-04 establishes common requirements for measuring fair value and for disclosing information about fair value measurements in accordance with U.S. GAAP and International Financial Reporting Standards (“IFRSs”). ASU No. 2011-04 is effective for interim and annual periods beginning after December 15, 2011. Management has evaluated ASU No. 2011-04 and has determined that it did not have a significant impact on the reporting of the financial statement disclosures.
In December 2011, FASB issued ASU No. 2011-11 “Disclosures about Offsetting Assets and Liabilities” requiring disclosure of both gross and net information related to offsetting and related arrangements enabling users of its financial statements to understand the effect of those arrangements on the entity’s financial position. The objective of this disclosure is to facilitate comparison between those entities that prepare their financial statements on the basis of U.S. GAAP and those entities that prepare their financial statements on the basis of IFRSs. ASU No. 2011-11 is effective for interim and annual periods beginning on or after January 1, 2013. Management is evaluating any impact ASU No. 2011-11 may have on each Fund’s financial statements.
Note 8. Subsequent Events
Subsequent events occurring after the date of this report through the date these financial statements were issued have been evaluated for potential impact and each Fund has had no such events.
CHOU AMERICA MUTUAL FUNDS ADDITIONAL INFORMATION JUNE 30, 2012 |
Investment Advisory Agreement Approval
At a meeting held on March 1, 2012, the Board of Trustees of Chou America Mutual Funds, including the independent Trustees (the “Board”), approved the renewal of the Investment Advisory Agreement (the “Agreement”) between Chou America Management Inc. (the “Adviser”) and Chou America Mutual Funds (the “Trust”), on behalf of the Funds.
In voting to approve the renewal of the Agreement, the Board considered the overall fairness of the Agreement and factors it deemed relevant with respect to each Fund including, but not limited to: (1) the nature, extent and quality of the services provided to each Fund; (2) the performance of each Fund (and adviser) as compared to a relevant benchmark and other similar funds; (3) the level of the fees and the overall expenses of each Fund and how those compared to other similar funds and other accounts; (4) the costs of services provided to the Funds and the profitability of the Adviser; and (5) the effect of, as applicable, the growth or decline of fund assets on the advisory fee (i.e., economies of scale) and whether the fee levels reflect economies of scale for the benefit of investors. The Board did not identify any single factor or item of information as all-important or controlling.
In considering the approval of the Agreement, the Board considered a broad range of information provided by the Adviser, including but not limited to, reports relating to each Fund’s performance and expenses, information on related entities, certain portfolio compliance policies and the background and experience of the portfolio manager. In addition, the Board considered a memorandum from its legal counsel regarding the Board’s fiduciary duties in considering the renewal of the Agreement. The Board also meets each quarter to review various aspects of the Funds.
Nature, Extent and Quality of Services
The Board reviewed and considered the nature, extent and quality of the advisory services provided by the Adviser to each Fund under the Agreement. The Board considered that the Adviser does not have any clients other than the Funds. However, the Board noted that the Adviser has provided high quality advisory services to the Funds during the initial period of the Agreement. It also noted that Francis Chou, the Funds’ portfolio manager, manages Canadian mutual funds with investment strategies similar to those of the Funds through an affiliated Canadian adviser. The Board noted the Adviser’s representation that representation that it has the financial resources and appropriate staffing to manage the Funds and to meet its expense reimbursement obligations. The Board also reviewed and considered the qualifications of the portfolio manager to each Fund.
Performance
In connection with a presentation by the Adviser regarding its approach to managing the Funds, the Board considered the one-year performance of each Fund as of December 31, 2011 as compared to a benchmark index. The Board noted that the Chou Opportunity Fund and the Chou Income Fund each underperformed its primary benchmark, the S&P 500 Index and the Barclays Capital U.S. Corporate High Yield Index, respectively, for the period. Based on information provided by the Adviser, the Board noted that the Funds’ performance against their respective benchmarks during their first full calendar year were negatively impacted by: (1) the Funds’ principal investment strategies of investing in undervalued securities, with the potential for growth of capital realized generally over the long-term; and (2) macro events in the market. Based on the foregoing, the Board determined that the Adviser’s management of the Funds could benefit the Funds and their shareholders.
Fees and Expenses
The Board considered the advisory fee rates of each Fund and the total expense ratios of each Fund relative to similar funds and the other clients of the Adviser’s affiliated adviser. The Board also considered that the Adviser contractually agreed to continue its fee waivers and expense caps for each Fund’s 2012 fiscal year. The Board compared the contractual advisory fee rate and the total expense ratio (after fee waivers and/or expense reimbursements) of each Fund to a category of similar funds compiled by Lipper, Inc. (“Lipper Category”). The first quartile in the Lipper Category represents those funds with the lowest fees or expenses. The Board considered comparisons that excluded Rule 12b-1 fees given that each Fund no longer charges such fees. The Board further considered that the Adviser waived a substantial portion and all of its advisory fees for the Chou Opportunity Fund and the Chou Income Fund, respectively. As such, the Trustees gave less weight to the comparisons for the contractual advisory fee rate for each Fund and more weight to each Fund’s total expense ratio.
In this regard, the Board noted that the contractual advisory fee rate and the total expense ratio for the Chou Opportunity Fund were in the first and third quartiles of the Lipper Category. In this case, the advisory fee rate was lower than the average of the Lipper Category and the total expense ratio was higher than the average of the Lipper Category.
CHOU AMERICA MUTUAL FUNDS ADDITIONAL INFORMATION JUNE 30, 2012 |
The Board noted that the contractual advisory fee rate and the total expense ratio for the Chou Income Fund were in the first and third quartiles of the Lipper Category, respectively. In this case, the advisory fee rate was lower than the average of the Lipper Category and the total expense ratio was higher than the average of the Lipper Category.
The Board considered the advisory fee rates charged by the affiliated Canadian adviser to the Adviser to the mutual funds it advises. The Board noted that the fee rates charged by the Adviser’s affiliate are higher than those charged to the Funds and are not comparable primarily as a result of the different market and regulatory structures as well as compliance costs and other expenses incurred by the Adviser’s affiliate.
Costs of Services and Profitability
The Board considered the costs to operate the Funds and the profitability of the Adviser. The Board reviewed the fees paid by each Fund to the Adviser for the fiscal year ended December 31, 2011. The Board also reviewed the profit and loss statement provided by the Adviser on a fund-by-fund basis. In this regard, the Board noted that the Adviser made a profit on the Chou Opportunity Fund but it did not make a profit relating to the Chou Income Fund.
Economies of Scale
With respect to economies of scale, the Board considered the net subscriptions and assets in each Fund since inception. In this connection, the Board noted the the Adviser’s representation that while there is potential for economies of scale in connection with the Adviser’s services to the Funds, the Adviser does not believe that breakpoints in the fee schedules of the Funds would be appropriate in the absence of significant growth of Fund assets.
Other Benefits
The Board noted the Adviser’s representation that, aside from its contractual advisory fees, it does not benefit in a material way from its relationship with the Funds and does not use soft-dollars as set forth in Section 28(e) of the Securities and Exchange Act of 1934, as amended. Based on the foregoing representation, the Board concluded that other benefits received by the Adviser from its relationship with the Funds were not a material factor to consider in approving the Advisory Agreement.
Conclusion
Based on its evaluation of these and other factors, the Board concluded with respect to each Fund that (1) each Fund was reasonably likely to benefit from the nature, quality and extent of services provided by the Adviser; (2) each Fund’s performance was satisfactory in light of all the factors considered by the Board; (3) the profits, where applicable, and fees payable to the Adviser were reasonable in the context of all the factors considered by the Board; and (4) the current advisory fee rate structure provides Fund shareholders with reasonable benefits associated with economies of scale. In light of these conclusions, the Board determined, in its business judgment, to renew the Agreement.
Proxy Voting Information
A description of the policies and procedures that each Fund uses to determine how to vote proxies relating to securities held in each Fund’s portfolio is available, without charge and upon request, by calling (877) 682-6352 and on the U.S. Securities and Exchange Commission’s (the “SEC”) website at www.sec.gov. Each Fund’s proxy voting record for the most recent twelve-month period ended June 30 is available, without charge and upon request, by calling (877) 682-6352 and on the SEC’s website at www.sec.gov.
Availability of Quarterly Portfolio Schedules
Each Fund files its complete schedule of portfolio holdings with the SEC for the first and third quarters of each fiscal year on Form N-Q. These filings are available, without charge and upon request on the SEC’s website at www.sec.gov or may be reviewed and copied at the SEC’s Public Reference Room in Washington, DC. Information on the operation of the Public Reference Room may be obtained by calling (800) SEC-0330.
CHOU AMERICA MUTUAL FUNDS ADDITIONAL INFORMATION JUNE 30, 2012 |
Shareholder Expense Example
As a shareholder of the Funds, you incur two types of costs: (1) transaction costs, including redemption fees, and (2) ongoing costs, including management fees, distribution (12b-1) fees and other Fund expenses. This example is intended to help you understand your ongoing costs (in dollars) of investing in the Funds, and to compare these costs with the ongoing costs of investing in other mutual funds.
The example is based on an investment of $1,000 invested at the beginning of the period and held for the entire period from January 1, 2012, through June 30, 2012.
Actual Expenses – The first line of the table below provides information about actual account values and actual expenses. You may use the information in this line, together with the amount you invested, to estimate the expenses that you paid over the period. Simply divide your account value by $1,000 (for example, an $8,600 account value divided by $1,000 = 8.6), then multiply the result by the number in the first line under the heading entitled “Expenses Paid During Period” to estimate the expenses you paid on your account during the period.
Hypothetical Example for Comparison Purposes – The second line of the table below provides information about hypothetical account values and hypothetical expenses based on each Fund’s actual expense ratio and an assumed rate of return of 5% per year before expenses, which is not each Fund’s actual return. The hypothetical account values and expenses may not be used to estimate the actual ending account balance or expenses you paid for the period. You may use this information to compare the ongoing costs of investing in each Fund and other funds. To do so, compare this 5% hypothetical example with the 5% hypothetical examples that appear in the shareholder reports of other funds.
Please note that the expenses shown in the table are meant to highlight your ongoing costs only and do not reflect any transactional costs, such as redemption fees. Therefore, the second line of the table is useful in comparing ongoing costs only, and will not help you determine the relative total costs of owning different funds. In addition, if these transactional costs were included, your costs would have been higher.
| | Beginning | | Ending | | Expenses | | Annualized |
| | Account Value | | Account Value | | Paid During | | Expense |
| | January 1, 2012 | | June 30, 2012 | | Period* | | Ratio* |
| Chou Opportunity Fund | | | | | | | | | | | |
| Actual | $ | 1,000.00 | | $ | 1,053.99 | | $ | 7.51 | | 1.47 | % |
| Hypothetical (5% return before taxes) | $ | 1,000.00 | | $ | 1,017.55 | | $ | 7.37 | | 1.47 | % |
| | | | | | | | | | | | |
| Chou Income Fund | | | | | | | | | | | |
| Actual | $ | 1,000.00 | | $ | 1,116.34 | | $ | 7.89 | | 1.50 | % |
| Hypothetical (5% return before taxes) | $ | 1,000.00 | | $ | 1,017.40 | | $ | 7.52 | | 1.50 | % |
| * | Expenses are equal to each Fund’s annualized expense ratio as indicated above multiplied by the average account value over the period, multiplied by the number of days in the most recent fiscal half-year divided by 366 to reflect the half-year period. |
FOR MORE INFORMATION:
P.O. Box 588
Portland, ME 04112
(877) 682-6352
INVESTMENT ADVISER
Chou America Management Inc.
110 Sheppard Ave. East
Suite 301, Box 18
Toronto, Ontario, Canada M2N 6Y8
TRANSFER AGENT
Atlantic Fund Services
P.O. Box 588
Portland, ME 04112
DISTRIBUTOR
Rafferty Capital Markets, LLC
59 Hilton Avenue
Garden City, NY 11530
www.raffcap.com
This report is submitted for the general information of the shareholders of the Funds. It is not authorized for
distribution to prospective investors unless preceded or accompanied by an effective prospectus, which includes information regarding the Funds’ risks, objectives, fees and expenses, experience of its management, and other information.
243-SAR-0612
ITEM 2. CODE OF ETHICS.
Not applicable.
ITEM 3. AUDIT COMMITTEE FINANCIAL EXPERT.
Not applicable.
ITEM 4. PRINCIPAL ACCOUNTANT FEES AND SERVICES.
Not applicable.
ITEM 5. AUDIT COMMITTEE OF LISTED REGISTRANTS.
Not applicable
ITEM 6. INVESTMENTS.
| (a) | Included as part of report to shareholders under Item 1. |
ITEM 7. DISCLOSURE OF PROXY VOTING POLICIES AND PROCEDURES FOR CLOSED-END
MANAGEMENT INVESTMENT COMPANIES.
Not applicable.
ITEM 8. PORTFOLIO MANAGERS OF CLOSED-END MANAGEMENT INVESTMENT COMPANIES.
Not applicable.
ITEM 9. PURCHASES OF EQUITY SECURITIES BY CLOSED-END MANAGEMENT INVESTMENT COMPANY AND AFFILIATED PURCHASERS.
Not applicable.
ITEM 10. SUBMISSION OF MATTERS TO A VOTE OF SECURITY HOLDERS
The Registrant does not accept nominees to the board of trustees from shareholders.
ITEM 11. CONTROLS AND PROCEDURES
(a) The Registrant’s Principal Executive Officer and Principal Financial Officer have concluded that the Registrant’s disclosure controls and procedures (as defined in Rule 30a-3(c) under the Investment Company Act of 1940 (the “Act”)) are effective, based on their evaluation of the controls and procedures required by Rule 30a-3(b) under the Act and Rules 13a-15(b) or 15d-15(b) under the Securities Exchange Act of 1934, as of a date within 90 days of the filing date of this report.
(b) There were no changes in the Registrant’s internal control over financial reporting (as defined in
Rule 30a-3(d) under the Act) that occurred during the second fiscal quarter of the period covered by this report that have materially affected, or are reasonably likely to materially affect, the Registrant’s internal control over financial reporting.
ITEM 12. EXHIBITS.
(a)(1) Not applicable.
(a)(2) Certifications pursuant to Rule 30a-2(a) of the Act, and Section 302 of the Sarbanes-Oxley Act of 2002. (Exhibits filed herewith)
(a)(3) Not applicable.
(b) Certifications pursuant to Rule 30a-2(b) of the Act, and Section 906 of the Sarbanes-Oxley Act of 2002. (Exhibit filed herewith)
SIGNATURES
Pursuant to the requirements of the Securities Exchange Act of 1934 and the Investment Company Act of 1940, the Registrant has duly caused this report to be signed on its behalf by the undersigned, thereunto duly authorized.
Registrant Chou America Mutual Funds
By /s/ Francis S.M. Chou
Francis S.M. Chou, Principal Executive Officer
Date August 24, 2012
Pursuant to the requirements of the Securities Exchange Act of 1934 and the Investment Company Act of 1940, this report has been signed below by the following persons on behalf of the Registrant and in the capacities and on the dates indicated.
By /s/ Francis S.M. Chou
Francis S.M. Chou, Principal Executive Officer
Date August 24, 2012
By /s/ Michael J. Mckeen
Michael J. McKeen, Principal Financial Officer
Date August 24, 2012