Washington, D.C. 20549
Blackstone / GSO
| BSL | BGX | BGB |
Senior Floating
Rate Term Fund
(NYSE: BSL) | Long-Short Credit
Income Fund
(NYSE: BGX) | Strategic
Credit Fund
(NYSE: BGB) |
Semi-Annual Report
June 30, 2017
Table of Contents
| Manager Commentary | 1 |
| Fund Summary | |
| Blackstone / GSO Senior Floating Rate Term Fund | 3 |
| Blackstone / GSO Long-Short Credit Income Fund | 5 |
| Blackstone / GSO Strategic Credit Fund | 7 |
| Portfolio of Investments | |
| Blackstone / GSO Senior Floating Rate Term Fund | 9 |
| Blackstone / GSO Long-Short Credit Income Fund | 19 |
| Blackstone / GSO Strategic Credit Fund | 29 |
| Statements of Assets and Liabilities | 41 |
| Statements of Operations | 42 |
| Statements of Changes in Net Assets | 43 |
| Statements of Cash Flows | 44 |
| Financial Highlights | |
| Blackstone / GSO Senior Floating Rate Term Fund | 45 |
| Blackstone / GSO Long-Short Credit Income Fund | 47 |
| Blackstone / GSO Strategic Credit Fund | 49 |
| Notes to Financial Statements | 51 |
| Summary of Dividend Reinvestment Plan | 63 |
| Additional Information | 64 |
| Privacy Procedures | 65 |
| Approval of Investment Advisory Agreements | 67 |
| Trustees & Officers | 71 |
| Blackstone / GSO Funds | Manager Commentary |
June 30, 2017 (Unaudited)
To Our Shareholders:
The year began with the market’s attention shifting from monetary policy to the political picture, with a great focus on President Trump’s attempt to implement “Trumponomics” in a partisan and divided Washington, D.C. and the outcome of the major European elections throughout 2017. After we saw some softness throughout the market, the tides shifted to end the period in a spectacular reversal, as unexpected hawkish commentary from the Federal Open Market Committee (“FOMC”) and European Central Bank (“ECB”) left markets scrambling to unwind consensus trades. Treasury yields, which slid to year‐to‐date lows in June, bounced back to end the month +10bp month‐over‐month, and risk assets remained resilient thanks to an investor base hungry for better value and cash deployment opportunities. Flows returned to loans in response to a steepening curve and 3‐Month LIBOR rates boosting asset yields. Despite some deceleration in consumer confidence amid falling oil prices, inflation trends tracking lower, and decreasing odds of fiscal stimulus, we continue to expect relatively contained volatility in the third quarter, with few major macroeconomic catalysts on the horizon throughout the remainder of the summer. We believe that the global economic landscape remains relatively healthy despite some softening in economic data.
Returns for loans (+1.91%) and high yield (+4.93%) were volatile as Trump’s political struggles, heightened geopolitical tensions, and stagnant corporate profitability started to drive consumers into safe haven assets. In June, loans saw some softness as investors began to focus on the disproportionate benefit to fixed income peers from a steady decline in long‐end US Treasury yields; however, we are already seeing prices rise. While lower‐quality bonds and loans outperformed during the first quarter, in the second quarter we saw a reversal in performance across quality and industry: the lower quality loans in the market (CCC), energy, and shipping issuers underperformed while B‐rated and retail credits rebounded. Over the first half of 2017, loans B‐rated within the S&P/LSTA Leveraged Loan Index returned +2.09% versus loans rated BB and CCC, which returned +1.33% and +5.76%, respectively.
Risky asset classes outperformed over the period, with large cap equities (S&P 500) rallying +9.34% and emerging markets gaining +5.11%, with returns during the first quarter almost double those of the second. The relative performance of treasuries and investment grade bonds were the reverse, with the returns of the 10‐year Treasury (+2.08%) and US corporates (+3.80%) driven by the risk‐off mentality of the second quarter.
The loan market’s technical backdrop continues to support valuations, and demand for the asset class remains robust. While repricings continued to dominate new issues, the relentless pace of senior loan repricings did slow slightly towards the end of the second quarter as many issuers had already taken advantage of the borrower‐friendly environment, leaving fewer viable candidates. Near term we expect this more modest repricing trend to continue, but provided the majority of the loan market continues to trade above par, we anticipate the technicals of the secondary market to further strengthen and support the resurgence of repricings later in 2017.
Demand for the asset class continues to be robust as institutional and retail investors search for yield and try to limit duration risk, and CLO issuance accelerates. Weekly loan inflows have reached a magnitude that we have not seen since 2013. According to S&P/LCD, 25 of the first 28 weeks of the year saw positive retail loan flows. As rates rise, we believe that we will continue to see both institutional and retail investors continue to deploy capital and shift exposure to short duration and floating rate assets.
Loan and high yield default activity has been modest year‐to‐date, with 22 companies defaulting for a total of $18.0 billion – less than half of the amount of defaults over the same period in 2016 ($43.4 billion). According to JP Morgan, at the end of June, the last twelve month loan default rate (par‐weighted) was 1.42% (0.93% ex‐Energy), down from 1.49% at the start of the year. High yield par‐weighted defaults were down to 1.50% (0.92% ex‐Energy), from 3.57% at the beginning of the year. Unsurprisingly, energy has accounted for the largest number of defaults and second highest volume (20%) year‐to‐date with the technology, utility, and retail sectors representing 33%, 15%, and 12% of default volume, respectively. JP Morgan continues to expect 2017 high yield and loan default rates to remain below historical averages at 2.0% and 1.5%, respectively. We also believe that the fundamental backdrop is favorable for the asset class and expect defaults to remain low through the remainder of 2017.
Total Returns for the Six Months Ended June 30, 2017
| US Loans (S&P/LSTA Leveraged Loan Index) | 1.91% |
| US High Yield Bonds (Bloomberg Barclays U.S. High Yield Index) | 4.93% |
| 3‐month Treasury Bills (Bloomberg Barclays U.S. Treasury Bellweathers: 3 Month) | 0.31% |
| 10‐Year Treasuries (Bloomberg Barclays U.S. Treasury Bellweathers: 10 Year) | 2.08% |
| US Aggregate Bonds(Bloomberg Barclays U.S. Aggregate Index) | 2.27% |
| US Investment Grade Bonds (Bloomberg Barclays U.S. Corporate Investment Grade Index) | 3.80% |
| Emerging Markets (Bloomberg Barclays EM USD Aggregate Index) | 5.11% |
US Large Cap Equities (S&P 500® Index) | 9.34% |
Sources: Barclays, Bloomberg, S&P/LCD
Past performance is no guarantee of future results. Index performance is shown for illustrative purposes only. You cannot invest directly in an index.
| Semi-Annual Report | June 30, 2017 | 1 |
| Blackstone / GSO Funds | Manager Commentary |
June 30, 2017 (Unaudited)
We continue to believe that floating rate senior loans offer compelling risk‐reward, particularly given the uncertain backdrop for Treasury yields, and we prefer the security and floating rate coupons in senior loans. Senior loans provide collateral, offer a floating rate benefit as interest rates rise, and allow investors to pick up yield without adding material duration risk. We still anticipate more muted gains over the medium term and favor an up‐in‐quality allocation within the senior loan asset class.
At GSO / Blackstone, we value your continued investment and confidence in us and in our family of funds. Additional information about our funds is available on our website at www.blackstone‐gso.com.
Sincerely,
GSO / Blackstone Debt Funds Management LLC
| Blackstone / GSO Senior Floating Rate Term Fund | Fund Summary |
June 30, 2017 (Unaudited)
Fund Overview
Blackstone / GSO Senior Floating Rate Term Fund (“BSL” or herein, the “Fund”) is a closed‐end term fund that trades on the New York Stock Exchange under the symbol “BSL”. BSL’s primary investment objective is to seek high current income, with a secondary objective to seek preservation of capital, consistent with its primary goal of high current income. Under normal market conditions, the fund invests at least 80% of its total assets in senior, secured floating rate loans (“Senior Loans”). BSL may also invest in second‐lien loans and high yield bonds and employs financial leverage, which may increase risk to the fund. The Fund has a limited term, and absent shareholder approval to extend the life of the Fund, the Fund will dissolve on or about May 31, 2020. The Fund has a reinvestment period after which it will stop reinvesting principal proceeds generated by maturities, prepayments and sales of investments. In March 2017, the reinvestment period was extended to last until one year prior to the Fund’s scheduled dissolution date.
Portfolio Management Commentary
Fund Performance
BSL outperformed its key benchmark, the S&P/LSTA Leveraged Loan Index (“S&P LLI”), on a Net Asset Value (“NAV”) per share basis for the periods of six months, one year, three years, five years, and the life of the Fund since inception. On a share price basis, the Fund underperformed its benchmark for the six month period and outperformed its benchmark for the periods of one year, three years, five years, and since inception. The shares of the Fund traded at an average premium to NAV of 2.3% for the six months ended June 30, compared to its peer group average discount of 3.5% over the same time.1
NAV Performance Factors2
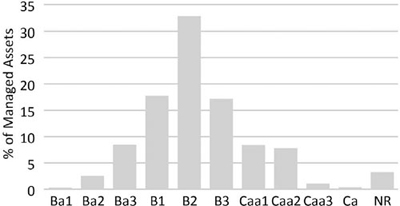
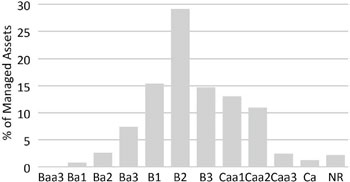
The Fund’s outperformance relative to its benchmark in the first half of 2017 was attributable to its under‐allocation to higher‐rated (BB‐ or above) assets (11.9% vs. 45.7% for the benchmark), which underperformed during the period. By sector, the Fund’s credit selection in IT, energy, healthcare, and utilities were the strongest contributors to outperformance. Additionally, the Fund’s modest allocation to bonds (4.9%) also contributed positively. By issuer, the largest contributors to performance relative to the benchmark were Nine West, Carestream Health, and Pinnacle Operating (Jimmy Sanders), which were partially offset by negative contributions from Spencer Gifts, ExGen Texas Power, and Sandy Creek Energy Associates.
Portfolio Activity and Positioning
Over the first six months of 2017, the Fund focused on taking advantage of new issuance while net reducing its allocation to certain higher beta/stressed loans as well as repriced, low coupon loans. On a sector basis, the Fund reduced its allocation to telecom, industrials, and utilities while increasing exposure to technology and healthcare. The Fund continues to seek to opportunistically take advantage of rallies to pare higher risk names where the portfolio managers believe inadequate levels of compensation are being offered relative to the credit risk. Given the outlook for repricing activity as well as modest expectations for new issue, we anticipate this dynamic to continue into the second half of 2017.
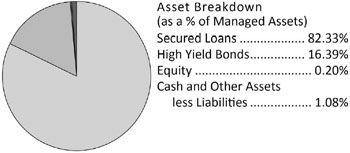
As of June 30, 2017, the Fund held 82.4% of its Managed Assets in Senior Loans, 12.2% in second lien loans, and 5.2% in high yield bonds. BSL’s investments represented the obligations of 227 companies, with an average position size representing 0.37% of Managed Assets of the Fund. Healthcare and pharmaceuticals, high tech industries, and business services represent the Fund’s top sector weightings.
1 | Average discount and peer group per Morningstar. |
2 | Industries per the Global Industry Classification Standard. |
| Semi-Annual Report | June 30, 2017 | 3 |
| Blackstone / GSO Senior Floating Rate Term Fund | Fund Summary |
| | June 30, 2017 (Unaudited) |
BSL’s Portfolio Composition
* | Less than 0.005% of Managed Assets |
BSL’s Moody’s Rating Distribution**
** | For more information on Moody's ratings and descriptions refer to www.moodys.com. |
| Portfolio Characteristics | |
| Weighted Average Loan Spread | 4.59% |
| Weighted Average Bond Coupon | 7.87% |
Current Dividend Yield† | 6.50% |
| Weighted Average Days to Reset | 49 |
Effective Duration* | 0.44 |
Average Position** | 0.37% |
Leverage** | 32.90% |
† | Using current dividend rate of $0.097/share and market price/share as of June 30, 2017. |
| * | Loan durations are treated as 3 months because of LIBOR resets, however, the effective rate for loans with LIBOR floors will not change if LIBOR is below the floor. |
** | As a percentage of Managed Assets. |
Top 10 Holdings* | |
| DTI Holdco Inc, Senior Secured First Lien Initial Term Loan | 1.33% |
| Aspect Software Inc, Senior Secured First Lien Exit Term Loan | 1.29% |
| Centurylink Inc, Senior Secured First Lien Term B Loan | 1.12% |
| Surgery Center Holdings Inc, Senior Secured First Lien Initial Term Loan | 1.09% |
| Endo Luxembourg Finance Company l SarI, Senior Secured First Lien Initial Term Loan | 1.09% |
| Onex Carestream Finance LP, Senior Secured Second Lien Term Loan | 1.07% |
| Crossmark Holdings Inc, Senior Secured First Lien Term Loan | 1.06% |
| LBM Borrower LLC, Senior Secured First Lien Initial Term Loan | 1.06% |
| Vertiv Group Corporation, Senior Secured First Lien Term B Loan | 1.04% |
| Windstream Services LLC, Senior Secured First Lien New Tranche B‐6 Term Loan | 0.98% |
| Top 10 Holdings | 11.13% |
Portfolio holdings and distributions are subject to change and are not recommendations to buy or sell any security.
Top 5 Industries*^ | |
| Healthcare and Pharmaceuticals | 16.90% |
| High Tech Industries | 14.92% |
| Services ‐ Business | 11.83% |
| Construction and Building | 7.99% |
| Banking, Finance, Insurance and Real Estate | 6.60% |
| Top 5 Industries | 58.24% |
| BSL Total Return | | | | |
| | 6 Month | 1 Year | 3 Year† | 5 Year† | Since Inception† |
| NAV | 3.17% | 13.29% | 4.34% | 5.35% | 5.85% |
| Market Price | 1.80% | 20.54% | 7.02% | 5.82% | 5.36% |
| S&P LLI | 1.91% | 7.42% | 3.35% | 4.58% | 4.97% |
* | As a percentage of Managed Assets. |
| Blackstone / GSO Long-Short Credit Income Fund | Fund Summary |
| | June 30, 2017 (Unaudited) |
Fund Overview
Blackstone / GSO Long Short Credit Income Fund (“BGX” or herein, the “Fund”) is a closed‐end fund that trades on the New York Stock Exchange under the symbol “BGX”. BGX’s primary investment objective is to provide current income, with a secondary objective of capital appreciation. BGX will take long positions in investments which we believe offer the potential for attractive returns under various economic and interest rate environments. BGX may also take short positions in investments which we believe will under‐perform due to a greater sensitivity to earnings growth of the issuer, default risk or the general level and direction of interest rates. BGX must hold no less than 70% of its Managed Assets in first‐and second‐lien secured floating rate loans (“Secured Loans”), but may also invest in unsecured loans and high yield bonds.
Portfolio Management Commentary
Fund Performance
BGX outperformed a composite weighting of the S&P LLI and the Barclays High Yield Index (“Barclays HYI”) (70% loans, 30% high yield bonds) on a NAV per share basis for the periods of six months, one year, three years, five years, and the life of the Fund since inception. On a share price basis, the Fund outperformed its benchmark for the periods of six months, one year, three years, and five years and underperformed its benchmark since inception. The shares of the Fund traded at an average discount to NAV of 5.4% for the six months ended June 30, compared to its peer group average discount of 6.5% over the same time.1
NAV Performance Factors2
The Fund’s outperformance relative to its benchmark in the first half of 2017 was attributable to its under‐allocation to higher‐rated (BB‐ or above) assets (12.9% vs. 47.4% for the benchmark), which underperformed during the period. By sector, the Fund’s credit selection in consumer discretionary and industrials were the strongest contributors to outperformance. Credit selection within bonds also contributed positively during the period, although this was partially offset by an underweight allocation to bonds (16.9% vs. 30.0%). By issuer, the largest contributors to performance relative to the benchmark were York Risk Services, Carestream Health, and PF Chang’s, which were partially offset by negative contributions from SandRidge Energy, Sandy Creek Energy, and Forterra.
Portfolio Activity and Positioning
Over the first six months of 2017, the Fund focused on taking advantage of new issuance while net reducing its allocation to certain higher beta/stressed loans as well as repriced, low coupon loans. On a sector basis, the Fund reduced its allocation to telecom, industrials, and utilities while increasing exposure to technology and healthcare. The Fund continues to seek to opportunistically take advantage of rallies to pare higher risk names where the portfolio managers believe inadequate levels of compensation are being offered relative to the credit risk. Given the outlook for repricing activity as well as modest expectations for new issue, we anticipate this dynamic to continue into the second half of 2017.
As of June 30, 2017, the Fund held 82.3% of its Managed Assets in Secured Loans and 16.4% in high yield bonds. BGX’s investments represented the obligations of 244 companies, with an average position size representing 0.36% of Managed Assets of the Fund. Healthcare and pharmaceuticals, high tech industries, and business services represent the Fund’s top sector weightings.
1 | Average discount and peer group per Morningstar. |
2 | Industries per the Global Industry Classification Standard. |
| Semi-Annual Report | June 30, 2017 | 5 |
| Blackstone / GSO Long-Short Credit Income Fund | Fund Summary |
| | June 30, 2017 (Unaudited) |
BGX’s Portfolio Composition
BGX’s Moody’s Rating Distribution**
| ** | For more information on Moody's ratings and descriptions refer to www.moodys.com. |
| Portfolio Characteristics | |
| Weighted Average Loan Spread | 4.66% |
| Weighted Average Bond Coupon | 8.21% |
Current Dividend Yield† | 7.66% |
| Weighted Average Days to Reset | 50 |
| Effective Duration* | 0.63 |
| Average Position** | 0.36% |
| Long Positions*** | 160.34% |
| Short Positions*** | 0.00% |
| Net Positions*** | 160.34% |
| Leverage** | 36.25% |
| † | Using current dividend rate of $0.103/share and market price/share as of June 30, 2017. |
| * | Loan durations are treated as 3 months because of LIBOR resets, however, the effective rate for loans with LIBOR floors will not change if LIBOR is below the floor. |
** | As a percentage of Managed Assets. |
*** | As a percentage of net assets. |
| Top 10 Holdings* | |
| Onex Carestream Finance LP, Senior Secured Second Lien Term Loan | 1.20% |
| Aspect Software Inc, Senior Secured First Lien Exit Term Loan | 1.17% |
| Centurylink Inc, Senior Secured First Lien Term B Loan | 1.15% |
| Avantor Performance Materials Holdings Inc, Senior Secured First Lien Initial Term Loan | 1.13% |
| LBM Borrower LLC, Senior Secured First Lien Initial Term Loan | 1.09% |
| PriSo Acq Corp / Bldng Pro, Senior Unsecured Bond | 1.06% |
| Windstream Services LLC, Senior Secured First Lien New Tranche B‐6 Term Loan | 1.02% |
| Endo Luxembourg Finance Company l SarI, Senior Secured First Lien Initial Term Loan | 1.02% |
| P F Chang's China Bistro Inc, Senior Unsecured Bond | 1.01% |
| Alvogen Pharma US Inc, Senior Secured First Lien Term Loan | 1.00% |
| Top 10 Holdings | 10.85% |
Portfolio holdings and distributions are subject to change and are not recommendations to buy or sell any security.
Top 5 Industries*^ | |
| Healthcare and Pharmaceuticals | 16.00% |
| High Tech Industries | 14.21% |
| Services ‐ Business | 11.61% |
| Construction and Building | 9.76% |
| Banking, Finance, Insurance and Real Estate | 8.71% |
| Top 5 Industries | 60.29% |
BGX Total Return
| | 6 Month | 1 Year | 3 Year† | 5 Year† | Since Inception† |
| NAV | 4.59% | 15.39% | 4.94% | 6.35% | 6.05% |
| Market Price | 4.61% | 22.36% | 5.25% | 5.47% | 4.28% |
| 70% S&P LLI / 30% Barclays HYI | 2.81% | 8.99% | 3.84% | 5.36% | 5.10% |
| * | As a percentage of Managed Assets. |
| Blackstone / GSO Strategic Credit Fund | Fund Summary |
| | June 30, 2017 (Unaudited) |
Fund Overview
Blackstone / GSO Strategic Credit Fund (“BGB” or herein, the “Fund”) is a closed‐end term fund that trades on the New York Stock Exchange under the symbol “BGB”. BGB’s primary investment objective is to seek high current income, with a secondary objective to seek preservation of capital, consistent with its primary goal of high current income. BGB invests primarily in a diversified portfolios or loans and other fixed income instruments of predominantly US Corporate issuers, including first‐ and second‐lien loans (“Senior Secured Loans”) and high yield corporate bonds of varying maturities. BGB must hold no less than 80% of its Managed Assets in credit investments comprised of corporate fixed income instruments and other investments (including derivatives) with similar economic characteristics. The Fund has a limited term and will dissolve on or about September 15, 2027, absent shareholder approval to extend such term.
Portfolio Management Commentary
Fund Performance
BGB outperformed a composite weighting of the S&P LLI and the Barclays HYI (75% loans, 25% high yield bonds) on a NAV per share basis for the periods of six months, one year, three years, and the life of the Fund since inception. On a share price basis, the Fund outperformed its benchmark for the periods of six months, one year, and three years and underperformed its benchmark since inception. The shares of the Fund traded at an average discount to NAV of 6.2% for the six months ended June 30, compared to its peer group average discount of 6.4% over the same time.1
NAV Performance Factors2
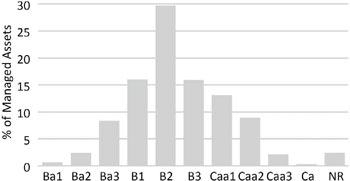
The Fund’s outperformance relative to its benchmark in the first half of 2017 was attributable to its under‐allocation to higher‐rated (BB‐ or above) assets (12.2% vs. 47.1% for the benchmark), which underperformed during the period. By sector, the Fund’s credit selection in consumer discretionary and industrials were the strongest contributors to outperformance. Credit selection within bonds also contributed positively during the period, although this was partially offset by an underweight allocation to bonds (19.5% vs. 25.0%). By issuer, the largest contributors to performance relative to the benchmark were York Risk Services, Pinnacle Operating (Jimmy Sanders), and Carestream Health, which were partially offset by negative contributions from ExGen Texas Power, SandRidge Energy, and Sandy Creek Energy.
Portfolio Activity and Positioning
Over the first six months of 2017, the Fund focused on taking advantage of new issuance while net reducing its allocation to certain higher beta/stressed loans as well as repriced, low coupon loans. On a sector basis, the Fund reduced its allocation to telecom, industrials, and utilities while increasing exposure to technology and healthcare. The Fund continues to seek to opportunistically take advantage of rallies to pare higher risk names where the portfolio managers believe inadequate levels of compensation are being offered relative to the credit risk. Given the outlook for repricing activity as well as modest expectations for new issue, we anticipate this dynamic to continue into the second half of 2017.
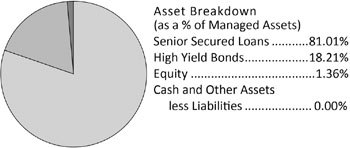
As of June 30, 2017, the Fund held 81.0% of its Managed Assets in Senior Secured Loans and 18.2% in high yield bonds. BGB’s investments represented the obligations of 271 companies, with an average position size representing 0.31% of Managed Assets of the Fund. Healthcare and pharmaceuticals, high tech industries, and business services represent the Fund’s top sector weightings.
| 1 | Average discount and peer group per Morningstar. |
| 2 | Industries per the Global Industry Classification Standard. |
| Semi-Annual Report | June 30, 2017 | 7 |
| Blackstone / GSO Strategic Credit Fund | Fund Summary |
| | June 30, 2017 (Unaudited) |
BGB’s Portfolio Composition
| † | The Fund’s Net Cash and Other Assets Less Liabilities includes amounts payable for investments purchased but not yet settled and amounts receivable for investments sold but not yet settled. At period end, the amounts payable for investments purchased but not yet settled exceeded the amount of cash on hand, and the Fund’s Net Cash and Other Assets Less Liabilities therefore equaled -0.59% of the Fund’s Managed Assets. The Fund uses funds from its leverage program to settle amounts payable for investments purchased, but such funds are not reflected in the Fund’s net cash. |
BGB’s Moody’s Rating Distribution**
| ** | For more information on Moody's ratings and descriptions refer to www.moodys.com. |
| Portfolio Characteristics | |
| Weighted Average Loan Spread | 4.79% |
| Weighted Average Bond Coupon | 7.99% |
Current Dividend Yield† | 7.91% |
| Weighted Average Days to Reset | 50 |
| Effective Duration* | 0.63 |
| Average Position** | 0.31% |
| Leverage** | 36.25% |
| † | Using current dividend rate of $0.105/share and market price/share as of June 30, 2017. |
| * | Loan durations are treated as 3 months because of LIBOR resets, however, the effective rate for loans with LIBOR floors will not change if LIBOR is below the floor. |
| ** | As a percentage of Managed Assets. |
| Top 10 Holdings* | |
| P F Chang's China Bistro Inc, Senior Unsecured Bond | 1.15% |
| PriSo Acq Corp / Bldng Pro, Senior Unsecured Bond | 1.14% |
| Centurylink Inc, Senior Secured First Lien Term B Loan | 1.13% |
| Onex Carestream Finance LP, Senior Secured Second Lien Term Loan | 1.10% |
| Endo Luxembourg Finance Company l SarI, Senior Secured First Lien Initial Term Loan | 1.09% |
| Aspect Software Inc, Senior Secured First Lien Exit Term Loan | 1.05% |
| Vertiv Group Corporation, Senior Secured First Lien Term B Loan | 1.04% |
| Onex York Acquisition Co, Senior Unsecured Bond | 0.99% |
| Windstream Services LLC, Senior Secured First Lien New Tranche B‐6 Term Loan | 0.99% |
| Avantor Performance Materials Holdings Inc, Senior Secured First Lien Initial Term Loan | 0.97% |
| Top 10 Holdings | 10.65% |
Portfolio holdings and distributions are subject to change and are not recommendations to buy or sell any security.
Top 5 Industries*^ | |
| Healthcare and Pharmaceuticals | 15.02% |
| High Tech Industries | 14.93% |
| Services ‐ Business | 10.72% |
| Construction and Building | 8.98% |
| Banking, Finance, Insurance and Real Estate | 8.90% |
| Top 5 Industries | 58.55% |
BGB Total Return
| | 6 Month | 1 Year | 3 Year† | Since Inception† |
| NAV | 4.89% | 15.12% | 4.57% | 5.69% |
| Market Price | 7.20% | 20.56% | 4.86% | 3.17% |
| 75% S&P LLI / 25% Barclays HYI | 2.66% | 8.73% | 3.76% | 4.71% |
| * | As a percentage of Managed Assets. |
| Blackstone / GSO Senior Floating Rate Term Fund | Portfolio of Investments |
June 30, 2017 (Unaudited)
| | | Principal Amount | | | Value | |
FLOATING RATE LOAN INTERESTS(a) ‐ 140.92% | | | | | | |
| Aerospace and Defense ‐ 1.90% | | | | | | |
| Engility Corporation, Senior Secured First Lien Term B‐2 Loan, 4.976%, 08/12/2023 | | $ | 688,181 | | | $ | 696,660 | |
| PRV Aerospace LLC, Senior Secured First Lien Term Loan, 8.750%, 05/09/2018 | | | 3,073,647 | | | | 2,994,255 | |
| WP CPP Holdings LLC, Senior Secured First Lien B‐3 Term Loan, 4.539%, 12/27/2019 | | | 1,469,152 | | | | 1,420,949 | |
| | | | | | | | 5,111,864 | |
| | | | | | | | | |
| Automotive ‐ 4.57% | | | | | | | | |
| American Tire Distributors Inc, Senior Secured First Lien Initial Term Loan, 5.476%, 09/01/2021 | | | 3,156,766 | | | | 3,177,490 | |
Bright Bidco BV, Senior Secured First Lien Term B Loan, L+4.50%, 03/15/2024(b) | | | 1,368,821 | | | | 1,390,209 | |
| CH Hold Corp, Senior Secured Second Lien Initial Term Loan, 8.476%, 02/03/2025 | | | 1,052,632 | | | | 1,082,237 | |
| Dealer Tire LLC, Senior Secured First Lien Initial Term Loan, 5.063%, 12/22/2021 | | | 920,923 | | | | 934,736 | |
Mitchell International Inc, Senior Secured First Lien Initial Term Loan, L+3.50%, 10/13/2020(b) | | | 540,541 | | | | 544,597 | |
| Mitchell International Inc, Senior Secured Second Lien Term Loan, 8.672%, 10/11/2021 | | | 2,895,978 | | | | 2,926,748 | |
| Superior Industries International Inc, Senior Secured First Lien Closing Date Term Loan, 5.787%, 03/22/2024 | | | 2,250,000 | | | | 2,244,375 | |
| | | | | | | | 12,300,392 | |
| | | | | | | | | |
| Banking, Finance, Insurance and Real Estate ‐ 9.57% | | | | | | | | |
| Acrisure LLC, Senior Secured First Lien Term B Loan, 6.296%, 11/22/2023 | | | 1,430,677 | | | | 1,447,066 | |
| Alliant Holdings Intermediate LLC, Senior Secured First Lien Initial Term Loan, 4.417%, 08/12/2022 | | | 1,313,955 | | | | 1,314,330 | |
| Almonde Inc, Senior Secured First Lien US Term Loan, 4.736%, 06/13/2024 | | | 2,716,981 | | | | 2,720,527 | |
| ASP MCS Acquisition Corp, Senior Secured First Lien Initial Term Loan, 5.959%, 05/18 /2024 | | | 2,016,807 | | | | 2,052,101 | |
| Asurion LLC, Senior Secured Second Lien Term Loan, 8.726%, 03/03/2021 | | | 1,925,532 | | | | 1,937,566 | |
| Broadstreet Partners Inc, Senior Secured First Lien Initial Term Loan, 5.476%, 11/08/2023 | | | 1,456,098 | | | | 1,478,849 | |
| Cunningham Lindsey US Inc, Senior Secured First Lien Initial Term Loan, 5.046%, 12/10/2019 | | | 3,760,697 | | | | 3,412,832 | |
| Cypress Merger Sub Inc, Senior Secured Second Lien Initial Term Loan, 7.976%, 04/28/2025 | | | 930,233 | | | | 955,814 | |
Focus Financial Partners LLC, Senior Secured First Lien Term Loan, L+3.25%, 05/19/2024(b) | | | 1,453,488 | | | | 1,466,512 | |
| MPH Acquisition Holdings LLC, Senior Secured First Lien Initial Term Loan, 4.296%, 06/07/2023 | | | 2,119,398 | | | | 2,122,376 | |
NFP Corp, Senior Secured First Lien Term B Term Loan, L+3.50%, 01/08/2024(b) | | | 1,004,604 | | | | 1,008,527 | |
| Opal Acquisition Inc, Senior Secured First Lien Term B Loan, 5.236%, 11/27/2020 | | | 498,708 | | | | 464,113 | |
| Resolute Investment Managers Inc, Senior Secured First Lien Initial Term Loan, 5.546%, 04/30/2022 | | | 1,127,827 | | | | 1,136,285 | |
| Victory Capital Operating LLC, Senior Secured First Lien Initial Term Loan, 8.796%, 10/29/2021 | | | 658,258 | | | | 668,954 | |
| York Risk Services Holding Corp (Onex York Finance LP), Senior Secured First Lien Initial Term Loan, 4.976%, 10/01/2021 | | | 3,653,978 | | | | 3,582,725 | |
| | | | | | | | 25,768,577 | |
| | | | | | | | | |
| Beverage, Food and Tobacco ‐ 5.30% | | | | | | | | |
| Americold Realty Operating Partnership LP, Senior Secured First Lien Initial Term Loan, 4.976%, 12/01/2022 | | | 661,179 | | | | 671,510 | |
| Candy Intermediate Holdings Inc, Senior Secured First Lien Initial Term Loan, 5.796%, 06/15/2023 | | | 1,583,665 | | | | 1,523,296 | |
| CEC Entertainment Inc, Senior Secured First Lien Term B Loan, 4.226%, 02/15/2021 | | | 1,665,376 | | | | 1,660,871 | |
| Chobani LLC, Senior Secured First Lien Closing Date Term Loan, 5.476%, 10/09/2023 | | | 2,846,354 | | | | 2,871,274 | |
| Constellation Brands Canada Inc, Senior Secured First Lien Initial Tranche B‐1 Term Loan, 5.000%, 12/15/2023 | | | 459,231 | | | | 463,249 | |
| CSM Bakery Solutions LLC, Senior Secured First Lien Term Loan, 5.150%, 07/03/2020 | | | 750,000 | | | | 714,844 | |
| NPC International Inc, Senior Secured First Lien Initial Term Loan, 4.716%, 04/19/2024 | | | 1,311,475 | | | | 1,323,777 | |
| NPC International Inc, Senior Secured Second Lien Initial Term Loan, 8.716%, 04/18/2025 | | | 1,084,746 | | | | 1,101,017 | |
| TKC Holdings Inc, Senior Secured First Lien Term Loan, 5.376%, 02/01/2023 | | | 1,436,644 | | | | 1,436,199 | |
| TKC Holdings Inc, Senior Secured Second Lien Initial Term Loan, 9.126%, 02/01/2024 | | | 417,910 | | | | 419,651 | |
| Semi-Annual Report | June 30, 2017 | 9 |
| Blackstone / GSO Senior Floating Rate Term Fund | Portfolio of Investments |
June 30, 2017 (Unaudited)
| | | Principal Amount | | | Value | |
| Beverage, Food and Tobacco (continued) | | | | | | |
| Weight Watchers International Inc, Senior Secured First Lien Initial Tranche B‐2 Term Loan, 4.470%, 04/02/2020 | | $ | 1,852,219 | | | $ | 1,787,863 | |
| Winebow Holdings Inc, Senior Secured First Lien Initial Term Loan, 4.750%, 07/01/2021 | | | 288,240 | | | | 284,097 | |
| | | | | | | | 14,257,648 | |
| | | | | | | | | |
| Capital Equipment ‐ 1.30% | | | | | | | | |
| Duke Finance LLC, Senior Secured First Lien Term B Loan, 6.296%, 02/21/2024 | | | 969,792 | | | | 983,732 | |
| LTI Holdings Inc, Senior Secured Second Lien Initial Term Loan, 9.922%, 05/16/2025 | | | 1,300,000 | | | | 1,277,250 | |
| Meter Readings Holding LLC, Senior Secured First Lien Initial Term Loan, 6.952%, 08/29/2023 | | | 1,235,000 | | | | 1,247,350 | |
| | | | | | | | 3,508,332 | |
| | | | | | | | | |
| Chemicals, Plastics and Rubber ‐ 2.88% | | | | | | | | |
| DuBois Chemicals Inc, Senior Secured First Lien Delayed Draw Term Loan, 5.000%, 03/15/2024 | | | 108,543 | | | | 109,358 | |
| DuBois Chemicals Inc, Senior Secured First Lien Initial Term Loan, 4.909%, 03/15/2024 | | | 434,171 | | | | 437,429 | |
| Emerald Performance Materials LLC, Senior Secured First Lien Initial Term Loan, 4.726%, 08/02/2021 | | | 2,970,044 | | | | 2,996,492 | |
| Pinnacle Operating Corporation, Senior Secured First Lien 2017 Extended Term Loan, 8.476%, 11/15/2021 | | | 2,643,065 | | | | 2,454,747 | |
| Tekni‐Plex Inc, Senior Secured Second Lien Initial Term Loan, 8.976%, 06/01/2023 | | | 713,942 | | | | 715,727 | |
Venator Materials LLC, Senior Secured First Lien Term B Loan, L+3.00%, 06/28/2024(b) | | | 1,041,667 | | | | 1,046,875 | |
| | | | | | | | 7,760,628 | |
| | | | | | | | | |
| Construction and Building ‐ 10.33% | | | | | | | | |
| American Bath Group LLC, Senior Secured First Lien Replacement Term Loan, 6.546%, 09/30/2023 | | | 2,799,533 | | | | 2,837,159 | |
| American Bath Group LLC, Senior Secured Second Lien Term Loan, 11.046%, 09/30/2024 | | | 250,000 | | | | 248,125 | |
| Dayton Superior Corporation, Senior Secured First Lien Term Loan, 9.296%, 11/03/2021 | | | 1,547,778 | | | | 1,555,517 | |
| Diversitech Holdings Inc, Senior Secured First Lien Term Loan, 4.702%, 06/01/2024 | | | 397,351 | | | | 398,346 | |
Forterra Finance LLC, Senior Secured First Lien Replacement Loan, L+3.00%, 10/25/2023(b) | | | 1,652,528 | | | | 1,563,118 | |
| GYP Holdings III Corp, Senior Secured First Lien 2017 Incremental First Lien Term Loan, 4.142%, 04/01/2023 | | | 311,688 | | | | 312,955 | |
| HNC Holdings Inc, Senior Secured First Lien Initial Term Loan, 5.726%, 10/05/2023 | | | 1,237,306 | | | | 1,257,028 | |
| Interior Logic Group Inc, Senior Secured First Lien Initial Term Loan, 7.210%, 02/28/2024 | | | 2,116,071 | | | | 2,110,781 | |
| IPS Structural Adhesive Holdings Inc, Senior Secured First Lien Initial Term Loan, 6.466%, 12/20/2023 | | | 2,288,188 | | | | 2,299,629 | |
| IPS Structural Adhesive Holdings Inc, Senior Secured Second Lien Initial Term Loan, 10.716%, 12/14/2024 | | | 1,000,000 | | | | 1,000,000 | |
| LBM Borrower LLC, Senior Secured First Lien Initial Term Loan, 6.452%, 08/20/2022 | | | 4,217,789 | | | | 4,249,422 | |
| Morsco Inc, Senior Secured First Lien Initial Term Loan, 8.226%, 10/31/2023 | | | 1,975,000 | | | | 1,998,453 | |
| New Arclin US Holding Corp, Senior Secured First Lien Term Loan, 5.670%, 02/14/2024 | | | 1,884,817 | | | | 1,907,199 | |
| Siteone Landscape Supply LLC, Senior Secured First Lien Term Loan, 4.760%, 04/29/2022 | | | 1,422,211 | | | | 1,434,214 | |
| SRS Distribution Inc, Senior Secured First Lien Tranche B‐4 Term Loan, 4.297%, 08/25/2022 | | | 2,098,864 | | | | 2,110,020 | |
| SRS Distribution Inc, Senior Secured Second Lien 06/16 Term Loan, 10.046%, 02/24/2023 | | | 1,142,751 | | | | 1,174,177 | |
| VC GB Holdings Inc, Senior Secured First Lien Term Loan, 4.976%, 02/28/2024 | | | 692,050 | | | | 692,483 | |
| Wilsonart LLC, Senior Secured First Lien Tranche C Term Loan, 4.800%, 12/19/2023 | | | 656,044 | | | | 658,996 | |
| | | | | | | | 27,807,622 | |
| | | | | | | | | |
| Consumer Goods Durable ‐ 2.29% | | | | | | | | |
| Apex Tool Group LLC, Senior Secured First Lien Term Loan, 4.500%, 01/31/2020 | | | 1,015,027 | | | | 991,767 | |
| Culligan Holding Inc, Senior Secured First Lien Tranche B‐1 Term Loan, 5.159%, 12/13/2023 | | | 1,043,137 | | | | 1,053,569 | |
| Hercules Achievement Inc, Senior Secured First Lien Initial Term Loan, 4.550%, 12/13/2021 | | | 1,828,125 | | | | 1,840,465 | |
| MND Holdings III Corp, Senior Secured First Lien Term Loan, 5.796%, 06/19/2024 | | | 208,333 | | | | 210,156 | |
Power Products LLC, Senior Secured First Lien Term B Loan, L+4.00%, 12/20/2022(b) | | | 833,923 | | | | 836,529 | |
| Blackstone / GSO Senior Floating Rate Term Fund | Portfolio of Investments |
June 30, 2017 (Unaudited)
| | | Principal Amount | | | Value | |
| Consumer Goods Durable (continued) | | | | | | |
| Zodiac Pool Solutions LLC (f/k/a Piscine US Acquisition LLC), Senior Secured Repriced First Lien Term Loan, 5.296%, 12/20/2023 | | $ | 1,234,021 | | | $ | 1,246,361 | |
| | | | | | | | 6,178,847 | |
| | | | | | | | | |
| Consumer Goods Non Durable ‐ 0.99% | | | | | | | | |
Acosta Inc, Senior Secured First Lien Tranche B‐1 Loan, L+3.25%, 09/26/2021(b) | | | 800,000 | | | | 720,800 | |
| Arctic Glacier USA Inc, Senior Secured First Lien Initial Term Loan, 5.476%, 03/20/2024 | | | 721,084 | | | | 730,098 | |
Sally Holdings LLC, Senior Secured First Lien Term B Loan, L+4.50%, 06/23/2024(b) | | | 1,200,000 | | | | 1,204,500 | |
| | | | | | | | 2,655,398 | |
| | | | | | | | | |
| Containers, Packaging and Glass ‐ 2.77% | | | | | | | | |
| Berlin Packaging LLC, Senior Secured Retired First Lien Term B Loan, 4.432%, 10/01/2021 | | | 2,985,791 | | | | 2,996,749 | |
| Caraustar Industries Inc, Senior Secured First Lien Refinancing Term Loan, 6.796%, 03/14/2022 | | | 699,182 | | | | 700,493 | |
| Charter Nex US Inc, Senior Secured First Lien Term B‐3 Loan, 4.476%, 05/16/2024 | | | 963,855 | | | | 965,513 | |
| Consolidated Container Company LLC, Senior Secured First Lien initial Term Loan, 4.726%, 05/22/2024 | | | 693,642 | | | | 698,123 | |
| IBC Capital Limited, Senior Secured Second Lien Term Loan, 8.228%, 09/09/2022 | | | 912,750 | | | | 851,139 | |
| Pregis Holding I Corporation, Senior Secured First Lien Initial Term Loan, 4.796%, 05/20/2021 | | | 824,742 | | | | 827,320 | |
| ProAmpac PG Borrower LLC, Senior Secured First Lien Initial Loan, 5.190%, 11/20/2023 | | | 423,529 | | | | 429,287 | |
| | | | | | | | 7,468,624 | |
| | | | | | | | | |
| Energy, Oil and Gas ‐ 3.51% | | | | | | | | |
| Ascent Resources ‐ Marcellus LLC, Senior Secured First Lien Term Loan, 5.250%, 08/04/2020 | | | 1,399,353 | | | | 901,414 | |
| Crestwood Holdings LLC, Senior Secured First Lien Tranche B‐1 Term Loan, 9.209%, 06/19/2019 | | | 2,324,907 | | | | 2,278,409 | |
| Jonah Energy Inc, Senior Secured Second Lien Initial Term Loan, 7.726%, 05/12/2021 | | | 2,000,000 | | | | 1,915,840 | |
| Sheridan Investment Partners I LLC, Senior Secured First Lien Tranche B‐2 Term Loan, 4.590%, 10/01/2019 | | | 2,832,142 | | | | 2,400,240 | |
Sheridan Production Partners I LLC, Senior Secured First Lien Deferred Principal Term Loan,: 0.000%, 01/01/2030 | | | 8,866 | | | | 6,698 | |
| 0.000%, 01/01/2030 | | | 109,547 | | | | 82,763 | |
| Sheridan Production Partners I LLC, Senior Secured First Lien Term Loan, 0.000%, 01/01/2030 | | | 14,516 | | | | 10,967 | |
| Sheridan Production Partners I‐A LP, Senior Secured First Lien Tranche B‐2 Term Loan, 4.730%, 10/01/2019 | | | 375,282 | | | | 318,051 | |
| Sheridan Production Partners I‐M LP, Senior Secured First Lien Tranche B‐2 Term Loan, 4.600%, 10/01/2019 | | | 229,224 | | | | 194,268 | |
| Utex Industries Inc, Senior Secured First Lien New Initial Term Loan, 5.000%, 05/24/2021 | | | 1,490,315 | | | | 1,337,714 | |
| | | | | | | | 9,446,364 | |
| | | | | | | | | |
| Environmental Industries ‐ 1.11% | | | | | | | | |
| EnergySolutions LLC, Senior Secured First Lien Advance Term Loan, 6.980%, 05/29/2020 | | | 1,734,545 | | | | 1,749,723 | |
| Infiltrator Water Technologies LLC, Senior Secured First Lien Term B‐1 Loan, 4.796%, 05/27/2022 | | | 1,241,928 | | | | 1,251,242 | |
| | | | | | | | 3,000,965 | |
| | | | | | | | | |
| Forest Products and Paper ‐ 0.07% | | | | | | | | |
| W/S Packaging Group Inc, Senior Secured First Lien Term Loan, 6.226%, 08/09/2019 | | | 209,957 | | | | 194,735 | |
| | | | | | | | | |
| Healthcare and Pharmaceuticals ‐ 24.23% | | | | | | | | |
| Albany Molecular Research Inc, Senior Secured First Lien Term Loan, 5.906%, 07/16/2021 | | | 2,307,970 | | | | 2,319,037 | |
| Alvogen Pharma US Inc, Senior Secured First Lien Term Loan, 6.230%, 04/01/2022 | | | 3,748,207 | | | | 3,696,669 | |
American Renal Holdings Inc, Senior Secured First Lien New Term Loan B, L+3.25%, 06/14/2024(b) | | | 2,445,652 | | | | 2,446,423 | |
| Semi-Annual Report | June 30, 2017 | 11 |
| Blackstone / GSO Senior Floating Rate Term Fund | Portfolio of Investments |
June 30, 2017 (Unaudited)
| | Principal Amount | | | Value | |
| Healthcare and Pharmaceuticals (continued) | | | | | | |
| Amneal Pharmaceuticals LLC, Senior Secured First Lien Term B Loan, 4.796%, 11/01/2019 | | $ | 332,606 | | | $ | 335,309 | |
| Arbor Pharmaceuticals LLC, Senior Secured First Lien Initial Term Loan, 6.296%, 07/05/2023 | | | 1,672,530 | | | | 1,692,040 | |
| Avantor Performance Materials Holdings Inc, Senior Secured First Lien Initial Term Loan, 5.230%, 03/11/2024 | | | 3,854,777 | | | | 3,867,633 | |
| Avantor Performance Materials Holdings Inc, Senior Secured Second Lien Initial Term Loan, 9.480%, 03/10/2025 | | | 923,077 | | | | 937,500 | |
| BioClinica‐Clinverse Holdings Corp, Senior Secured First Lien Initial Term Loan, 5.375%, 10/20/2023 | | | 1,427,609 | | | | 1,402,183 | |
| BioClinica‐Clinverse Holdings Corp, Senior Secured Second Lien Initial Term Loan, 9.375%, 10/04/2024 | | | 1,052,629 | | | | 1,031,576 | |
| CHG Healthcare Services Inc, Senior Secured First Lien Term B Loan, 4.422%, 06/07/2023 | | | 1,362,514 | | | | 1,377,277 | |
| Concordia Healthcare Corp, Senior Secured First Lien Dollar Term Loan, 5.501%, 10/21/2021 | | | 2,738,787 | | | | 2,054,090 | |
| CPI Holdco LLC, Senior Secured Closing Date Term Loan, 5.300%, 03/21/2024 | | | 566,627 | | | | 570,169 | |
| CT Technologies Intermediate Holdings Inc, Senior Secured First Lien Initial Term Loan, 5.476%, 12/01/2021 | | | 2,216,363 | | | | 2,213,593 | |
| Endo Luxembourg Finance Company l Sarl, Senior Secured First Lien Initial Term Loan, 5.500%, 04/29/2024 | | | 4,310,345 | | | | 4,357,500 | |
| Equian Buyer Corp (Fka Aeneas Buyer Corp), Senior Secured Delayed Draw Term Loan, 1.000%, 05/20/2024 | | | 715,180 | | | | 721,663 | |
| Equian Buyer Corp (Fka Aeneas Buyer Corp), Senior Secured First Lien Initial Term Loan, 4.928%, 05/20/2024 | | | 2,324,334 | | | | 2,345,404 | |
| Global Healthcare Exchange LLC, Senior Secured First Lien Initial Term Loan, 5.250%, 08/15/2022 | | | 1,875,526 | | | | 1,878,658 | |
| Greenway Health LLC, Senior Secured First Lien Term Loan, 6.050%, 02/16/2024 | | | 1,379,310 | | | | 1,386,207 | |
| Horizon Pharma Inc, Senior Secured First Lien Second Amendment Refinancing Term Loan, 4.875%, 03/29/2024 | | | 735,294 | | | | 739,154 | |
Inc Research Holdings Inc, Senior Secured First Lien Term B Loan, L+2.25%, 06/28/2024(b) | | | 1,437,126 | | | | 1,441,171 | |
| Lanai Holdings III Inc, Senior Secured First Lien Initial Term Loan, 5.976%, 08/29/2022 | | | 1,238,532 | | | | 1,213,761 | |
| Netsmart Technologies Inc, Senior Secured First Lien Term C‐1 Loan, 5.796%, 04/19/2023 | | | 2,133,621 | | | | 2,149,623 | |
| nThrive Inc, Senior Secured First Lien Term B‐2 Loan, 5.726%, 10/20/2022 | | | 3,597,096 | | | | 3,620,711 | |
| Onex Carestream Finance LP, Senior Secured First Lien Term Loan, 5.296%, 06/07/2019 | | | 450,711 | | | | 448,834 | |
| Onex Carestream Finance LP, Senior Secured Second Lien Term Loan, 9.796%, 12/09/2019 | | | 4,349,338 | | | | 4,273,225 | |
| Onex Schumacher Finance LP, Senior Secured First Lien Initial Term Loan, 5.226%, 07/29/2022 | | | 1,200,235 | | | | 1,202,732 | |
| Ortho Clinical Diagnostics Inc, Senior Secured First Lien Initial Term Loan, 5.046%, 06/30/2021 | | | 553,633 | | | | 551,455 | |
| Packaging Coordinators Midco Inc, Senior Secured First Lien Initial Term Loan, 5.150%, 06/30/2023 | | | 1,724,723 | | | | 1,724,723 | |
| Press Ganey Holdings Inc, Senior Secured Second Lien Initial Term Loan, 8.476%, 10/21/2024 | | | 909,091 | | | | 931,818 | |
| Project Ruby Ultimate Parent Corp, Senior Secured First Lien Closing Date Term Loan, 4.795%, 02/09/2024 | | | 517,611 | | | | 519,229 | |
Sterigenics‐Nordion Holdings LLC, Senior Secured First Lien New Term B Loan, 4.150%, 05/16/2022 | | | 335,174 | | | | 334,545 | |
Stratose Intermediate Holdings II LLC, Senior Secured First Lien Term Loan, L+5.00%, 01/26/2022(b) | | | 702,703 | | | | 708,412 | |
| Surgery Center Holdings Inc, Senior Secured First Lien Initial Term Loan, 4.830%, 11/03/2020 | | | 4,365,990 | | | | 4,391,924 | |
U.S. Anesthesia Partners Inc, Senior Secured First Lien Initial Term Loan, L+3.25%, 06/23/2024(b) | | | 1,834,862 | | | | 1,839,064 | |
| U.S. Renal Care Inc, Senior Secured First Lien Initial Term Loan, 5.546%, 12/30/2022 | | | 3,944,937 | | | | 3,825,347 | |
| Valeant Pharmaceuticals International Inc, Senior Secured First Lien Series F‐1 Tranche B Term Loan, 6.039%, 04/01/2022 | | | 681,241 | | | | 691,282 | |
| | | | | | | 65,239,941 | |
| | | | | | | | |
| High Tech Industries ‐ 21.51% | | | | | | | | |
Aerial Merger Sub Inc (Neustar), Senior Secured First Lien Term B2 Loan, L+3.75%, 03/01/2024(b) | | | 952,381 | | | | 961,014 | |
| Blackstone / GSO Senior Floating Rate Term Fund | Portfolio of Investments |
June 30, 2017 (Unaudited)
| | | Principal Amount | | | Value | |
| High Tech Industries (continued) | | | | | | |
| Aspect Software Inc, Senior Secured First Lien Exit Term Loan, 10.152%, 05/25/2020 | | $ | 5,195,336 | | | $ | 5,166,112 | |
| CompuCom Systems Inc, Senior Secured First Lien Term Loan, 4.480%, 05/11/2020 | | | 3,940,184 | | | | 3,113,573 | |
| Compuware Corporation, Senior Secured First Lien Tranche B‐3 Term Loan, 5.550%, 12/15/2021 | | | 907,215 | | | | 915,153 | |
| Compuware Corporation, Senior Secured Second Lien Term Loan, 9.550%, 12/15/2022 | | | 2,811,213 | | | | 2,839,325 | |
| CPI Acquisition Inc, Senior Secured First Lien Term Loan, 5.834%, 08/17/2022 | | | 2,002,537 | | | | 1,722,182 | |
| CPI International Inc, Senior Secured Second Lien Term Loan, 8.460%, 04/07/2022 | | | 750,000 | | | | 752,344 | |
Cypress Semiconductor Corp, Senior Secured First Lien 2016 Incremental Term Loan, 4.840%, 07/05/2021 | | | 1,626,761 | | | | 1,645,468 | |
| Epicor Software Corporation, Senior Secured First Lien Term B Loan, 4.980%, 06/01/2022 | | | 2,779,392 | | | | 2,782,435 | |
Hyland Software Inc, Senior Secured Second Lien Term Loan, L+7.00%, 05/31/2025(b) | | | 368,098 | | | | 374,770 | |
Hyland Software Inc, Senior Secured Term Loan 3, L+4.90%, 07/01/2022(b) | | | 506,024 | | | | 509,883 | |
Idera Inc, Senior Secured First Lien Delayed Draw Term Loan, L+5.00%, 06/27/2024(b) | | | 309,091 | | | | 309,091 | |
Idera Inc, Senior Secured First Lien Term B Loan, L+5.00%, 06/27/2024(b) | | | 1,690,909 | | | | 1,690,909 | |
| Informatica Corporation, Senior Secured First Lien Dollar Term Loan, 4.796%, 08/05/2022 | | | 2,389,957 | | | | 2,391,666 | |
LANDesk Group Inc, Senior Secured First Lien Term Loan, L+4.25%, 01/22/2024(b) | | | 2,116,430 | | | | 2,108,937 | |
| LANDesk Group Inc, Senior Secured Second Lien Term Loan, 10.230%, 01/20/2025 | | | 2,000,000 | | | | 2,004,160 | |
| P2 Upstream Acquisition Co, Senior Secured First Lien Term Loan, 5.180%, 10/30/2020 | | | 2,757,143 | | | | 2,711,181 | |
| Peak 10 Inc, Senior Secured First Lien Term Loan, 5.147%, 06/17/2021 | | | 2,645,455 | | | | 2,661,989 | |
| Peak 10 Inc, Senior Secured Second Lien Initial Term Loan, 8.406%, 06/17/2022 | | | 875,000 | | | | 873,906 | |
| Pomeroy Group LLC, Senior Secured First Lien Initial Term Loan, 7.588%, 11/12/2021 | | | 1,484,925 | | | | 1,418,103 | |
| Project Alpha Intermediate Holding Inc, Senior Secured First Lien Term Loan, 4.670%, 04/26/2024 | | | 3,409,469 | | | | 3,391,893 | |
Project Leopard Holdings Inc, Senior Secured First Lien Term Loan, L+5.50%, 06/21/2023(b) | | | 833,333 | | | | 836,458 | |
| Quest Software US Holdings Inc, Senior Secured First Lien Initial Term Loan, 7.226%, 10/31/2022 | | | 3,066,126 | | | | 3,118,250 | |
| Ramundsen Public Sector LLC, Senior Secured First Lien Term Loan, 5.546%, 02/01/2024 | | | 328,846 | | | | 331,313 | |
| Rocket Software Inc, Senior Secured First Lien Term Loan, 5.546%, 10/13/2023 | | | 2,076,615 | | | | 2,098,680 | |
| SMS Systems Maintenance Services Inc, Senior Secured First Lien Initial Term Loan, 6.226%, 10/30/2023 | | | 1,920,420 | | | | 1,919,229 | |
| SolarWinds Holdings Inc, Senior Secured First Lien 2017 Refinancing Term Loan 4.726%, 02/03/2023 | | | 2,227,944 | | | | 2,235,608 | |
| Sybil Software LLC, Senior Secured First Lien Initial Refinancing Dollar Term Loan, 4.546%, 09/30/2023 | | | 1,505,092 | | | | 1,522,378 | |
| Synchronoss Technologies Inc, Senior Secured Initial Term Loan, 4.082%, 01/19/2024 | | | 1,056,721 | | | | 1,040,078 | |
| TIBCO Software Inc, Senior Secured First Lien Term B Loan, 5.730%, 12/04/2020 | | | 287,049 | | | | 288,996 | |
| TTM Technologies Inc, Senior Secured First Lien Term B Loan, 5.476%, 05/31/2021 | | | 1,618,388 | | | | 1,634,572 | |
Verint Systems Inc, Senior Secured First Lien Initial Term Loan, L+2.25%, 06/21/2024(b) | | | 696,056 | | | | 698,666 | |
Veritas US Inc, Senior Secured First Lien Term Loan B Facility, L+4.50%, 01/27/2023(b) | | | 1,838,235 | | | | 1,843,980 | |
| | | | | | | | 57,912,302 | |
| | | | | | | | | |
| Hotels, Gaming and Leisure - 4.14% | | | | | | | | |
| Alpha Topco Limited ‐ Delta 2 (Lux) Sarl, Senior Secured Second Lien Term Loan, 8.004%, 07/29/2022 | | | 1,143,780 | | | | 1,153,891 | |
| AP Gaming I LLC, Senior Secured First Lien Term B Loan, 6.586%, 02/15/2024 | | | 3,048,387 | | | | 3,078,871 | |
| CWGS Group LLC, Senior Secured First Lien Term Loan, 4.839%, 11/08/2023 | | | 184,154 | | | | 185,363 | |
Intrawest Resorts Holdings Inc, Senior Secured First Lien Term B Loan, L+3.50%, 06/28/2024(b) | | | 493,275 | | | | 494,508 | |
Intrawest Resorts Holdings Inc, Senior Secured First Lien Term B2 Loan, L+3.25%, 06/28/2024(b) | | | 260,494 | | | | 261,145 | |
| Scientific Games International Inc, Senior Secured First Lien Term B-3 Loan, 5.226%, 10/01/2021 | | | 2,128,687 | | | | 2,152,198 | |
| SMG, Senior Secured First Lien 2014 Term Loan, 6.500%, 02/27/2020 | | | 1,614,111 | | | | 1,620,672 | |
| Semi-Annual Report | June 30, 2017 | 13 |
| Blackstone / GSO Senior Floating Rate Term Fund | Portfolio of Investments |
June 30, 2017 (Unaudited)
| | | Principal Amount | | | Value | |
| Hotels, Gaming and Leisure (continued) | | | | | | |
| TravelCLICK Inc, Senior Secured Repriced First Lien Term Loan, 5.185%, 05/12/2021 | | $ | 2,190,248 | | | $ | 2,203,937 | |
| | | | | | | | 11,150,585 | |
| | | | | | | | | |
| Media Advertising, Printing and Publishing - 0.19% | | | | | | | | |
| McGraw-Hill Global Education Holdings LLC, Senior Secured First Lien Term B Loan, 5.226%, 05/04/2022 | | | 515,007 | | | | 507,642 | |
| | | | | | | | | |
| Media Broadcasting and Subscription - 1.29% | | | | | | | | |
| Sable International Finance Limited (Cable and Wireless), Senior Secured First Lien Term B-3 Loan, 4.726%, 01/31/2025 | | | 3,462,164 | | | | 3,476,238 | |
| | | | | | | | | |
| Media Diversified and Production - 0.43% | | | | | | | | |
DHX Media Ltd, Senior Secured Term Loan, L+3.75%, 12/22/2023(b) | | | 1,147,541 | | | | 1,153,640 | |
| | | | | | | | | |
| Metals and Mining - 1.81% | | | | | | | | |
Canam Steel Corporation, Senior Secured First Lien Term B Loan, L+5.50%, 06/29/2024(b) | | | 2,500,000 | | | | 2,450,000 | |
| Fairmount Santrol Inc, Senior Secured First Lien Tranche B-2 Term Loan, 4.647%, 09/05/2019 | | | 1,548,865 | | | | 1,466,388 | |
| Murray Energy Corporation, Senior Secured First Lien Term B-2 Non-PIK Loan, 8.546%, 04/16/2020 | | | 988,162 | | | | 968,809 | |
| | | | | | | | 4,885,197 | |
| | | | | | | | | |
| Retail - 3.27% | | | | | | | | |
| Ascena Retail Group Inc, Senior Secured First Lien Tranche B Term Loan, 5.625%, 08/19/2022 | | | 1,273,484 | | | | 1,075,298 | |
| Fairway Group Acquisition Company, Senior Secured First Lien First Out Term Loan, 9.147%, 01/03/2020 | | | 255,529 | | | | 254,251 | |
| Fairway Group Acquisition Company, Senior Secured First Lien Last Out Non-PIK Term Loan, 10.000%, 01/03/2020 | | | 169,062 | | | | 71,851 | |
| Fairway Group Holdings Corp, Senior Secured First Lien Subordinated Non-PIK Term Loan, 11.000%, 10/04/2021 | | | 147,599 | | | | 62,730 | |
| Neiman Marcus Group Ltd LLC, Senior Secured First Lien Other Term Loan, 4.339%, 10/25/2020 | | | 1,258,615 | | | | 950,254 | |
| Nine West Holdings Inc, Senior Secured First Lien Initial Term Loan, 4.900%, 10/08/2019 | | | 1,067,002 | | | | 912,287 | |
| Petco Animal Supplies Inc, Senior Secured First Lien Second Amendment Term Loan, 4.172%, 01/26/2023 | | | 2,444,708 | | | | 2,214,905 | |
| Spencer Gifts LLC, Senior Secured First Lien Term B-1 Loan, 5.250%, 07/16/2021 | | | 3,810,612 | | | | 3,029,437 | |
| Sports Authority (The), Senior Secured First Lien Term B Loan, 7.500%, 11/16/2017 | | | 4,954,239 | | | | 238,423 | |
| | | | | | | | 8,809,436 | |
| Services - Business - 17.10% | | | | | | | | |
| Advantage Sales & Marketing Inc, Senior Secured First Lien Incremental Term B-2 Loan, 4.420%, 07/25/2021 | | | 975,000 | | | | 938,442 | |
| Advantage Sales & Marketing Inc, Senior Secured Second Lien Initial Term Loan, 7.796%, 07/25/2022 | | | 2,750,000 | | | | 2,646,875 | |
| AqGen Ascensus Inc (fka Ascensus Holdings Inc), Senior Secured First Lien Replacement Term Loan, 5.296%, 12/05/2022 | | | 230,191 | | | | 233,068 | |
| BarBri Inc (Gemini Holdings Inc), Senior Secured First Lien Term Loan, 4.530%, 07/17/2019 | | | 2,380,589 | | | | 2,377,613 | |
| BMC Software Finance Inc, Senior Secured First Lien Initial B-1 US Term Loan, 5.226%, 09/10/2022 | | | 2,461,981 | | | | 2,470,610 | |
| Crossmark Holdings Inc, Senior Secured First Lien Term Loan, Series 0000, 4.796%, 12/20/2019 | | | 6,025,003 | | | | 4,265,702 | |
| DTI Holdco Inc, Senior Secured First Lien Initial Term Loan, 6.422%, 10/02/2023 | | | 5,472,162 | | | | 5,355,879 | |
| Erie Acquisition Holdings Inc, Senior Secured First Lien Term Loan, 5.950%, 03/01/2023 | | | 3,301,571 | | | | 3,319,795 | |
| GlobalLogic Holdings Inc, Senior Secured First Lien Closing Date Term Loan, 5.796%, 06/20/2022 | | | 2,780,921 | | | | 2,805,254 | |
| Information Resources Inc, Senior Secured First Lien Initial Term Loan, 5.466%, 01/18/2024 | | | 2,475,186 | | | | 2,487,946 | |
| Blackstone / GSO Senior Floating Rate Term Fund | Portfolio of Investments |
June 30, 2017 (Unaudited)
| | | Principal Amount | | | Value | |
| Services - Business (continued) | | | | | | |
| Information Resources Inc, Senior Secured Second Lien Initial Term Loan, 9.466%, 01/20/2025 | | $ | 2,000,000 | | | $ | 1,998,750 | |
| Inmar Inc, Senior Secured First Lien Initial Term Loan, 4.670%, 05/01/2024 | | | 1,612,903 | | | | 1,618,194 | |
| Inmar Inc, Senior Secured Second Lien Initial Term Loan, 9.170%, 05/01/2025 | | | 1,183,432 | | | | 1,175,148 | |
| LD Intermediate Holdings Inc, Senior Secured First Lien Initial Term Loan, 7.055%, 12/09/2022 | | | 1,975,000 | | | | 1,878,719 | |
| Sedgwick Claims Management Services Inc, Senior Secured Second Lien Incremental Term Loan, 6.952%, 02/28/2022 | | | 2,075,472 | | | | 2,087,157 | |
| Sedgwick Claims Management Services Inc, Senior Secured Second Lien Initial Term Loan, 6.976%, 02/28/2022 | | | 1,845,960 | | | | 1,859,804 | |
| SurveyMonkey Inc, Senior Secured First Lien Term Loan, 5.800%, 04/13/2024 | | | 3,533,476 | | | | 3,566,602 | |
| Transaction Network Services, Senior Secured First Lien Initial Term Loan, 5.230%, 02/14/2020 | | | 1,018,037 | | | | 1,028,217 | |
| Transaction Network Services, Senior Secured Second Lien Initial Term Loan, 9.230%, 08/14/2020 | | | 479,902 | | | | 482,302 | |
| TravelCLICK Inc, Senior Secured Second Lien Initial Term Loan, 8.976%, 11/08/2021 | | | 1,666,667 | | | | 1,675,000 | |
TRC Companies Inc, Senior Secured First Lien Term Loan, L+4.00%, 05/24/2024(b) | | | 1,750,000 | | | | 1,762,399 | |
| | | | | | | | 46,033,476 | |
| | | | | | | | | |
| Services - Consumer - 5.11% | | | | | | | | |
| American Residential Services LLC, Senior Secured First Lien Term Loan, 5.293%, 06/30/2021 | | | 947,536 | | | | 951,094 | |
| Ascend Learning LLC, Senior Secured First Lien Term Loan, 5.726%, 07/31/2019 | | | 454,517 | | | | 455,597 | |
| Big Jack Holdings LP, Senior Secured First Lien Term Loan B, 5.480%, 03/20/2024 | | | 678,039 | | | | 681,429 | |
| KUEHG Corp, Senior Secured First Lien Term B‐2 Loan, 5.046%, 08/12/2022 | | | 1,416,592 | | | | 1,426,339 | |
| Learning Care Group (US) No. 2 Inc, Senior Secured First Lien Term Loan, 5.000%, 05/05/2021 | | | 1,417,593 | | | | 1,424,681 | |
| NVA Holdings Inc, Senior Secured First Lien Term B‐2 Loan, 4.647%, 08/14/2021 | | | 2,787,854 | | | | 2,807,020 | |
| NVA Holdings Inc, Senior Secured Second Lien Term Loan, 8.296%, 08/14/2022 | | | 1,908,876 | | | | 1,930,351 | |
| Red Lobster Management LLC, Senior Secured First Lien Initial Term Loan, 6.295%, 07/28/2021 | | | 849,977 | | | | 857,414 | |
| Renaissance Learning Inc, Senior Secured First Lien Initial Term Loan, 5.046%, 04/09/2021 | | | 1,352,239 | | | | 1,359,209 | |
Spin Holdco Inc, Senior Secured First Lien Revolver, L+3.75%, 05/14/2018(b) | | | 1,000,000 | | | | 950,000 | |
Spin Holdco Inc, Senior Secured First Lien Term B‐1 Loan, L+3.75%, 11/14/2022(b) | | | 914,634 | | | | 910,518 | |
| | | | | | | | 13,753,652 | |
| | | | | | | | | |
| Telecommunications - 7.74% | | | | | | | | |
| Alorica Inc, Senior Secured First Lien Term B Loan, 5.976%, 06/30/2022 | | | 902,847 | | | | 909,618 | |
| Centurylink Inc, Senior Secured First Lien Term B Loan, 1.375%, 01/31/2025 | | | 4,551,194 | | | | 4,506,001 | |
| Cologix Holdings Inc, Senior Secured Second Lien Initial Term Loan, 8.216%, 03/20/2025 | | | 1,797,743 | | | | 1,814,229 | |
| Digicel International Finance Limited, Senior Secured First Lien Term Loan, 4.940%, 05/27/2024 | | | 958,084 | | | | 965,720 | |
| Fairpoint Communications Inc, Senior Secured First Lien Term Loan, 7.500%, 02/14/2019 | | | 2,353,834 | | | | 2,358,742 | |
Greeneden US Holdings II LLC, Senior Secured 2017 Incremental First Lien Term Loan, L+3.75%, 12/01/2023(b) | | | 615,464 | | | | 618,387 | |
| GTT Communications Inc, Senior Secured First Lien Initial Term Loan, 5.250%, 01/09/2024 | | | 412,435 | | | | 414,757 | |
| Masergy Holdings Inc, Senior Secured First Lien 2017 Replacement Term Loan, 5.046%, 12/15/2023 | | | 617,054 | | | | 621,682 | |
| Masergy Holdings Inc, Senior Secured Second Lien Initial Term Loan, 9.796%, 12/16/2024 | | | 500,000 | | | | 506,250 | |
| Vertiv Group Corporation, Senior Secured First Lien Term B Loan, 5.226%, 11/30/2023 | | | 4,161,070 | | | | 4,184,476 | |
| Windstream Services LLC, Senior Secured First Lien New Tranche B-6 Term Loan, 5.210%, 03/29/2021 | | | 3,934,886 | | | | 3,933,234 | |
| | | | | | | | 20,833,096 | |
| Semi-Annual Report | June 30, 2017 | 15 |
| Blackstone / GSO Senior Floating Rate Term Fund | Portfolio of Investments |
June 30, 2017 (Unaudited)
| | | Principal Amount | | | Value | |
| Transportation Cargo ‐ 0.26% | | | | | | |
| REP WWEX Acquisition Parent LLC, Senior Secured First Lien Term Loan, 5.672%, 02/03/2025 | | $ | 686,803 | | | $ | 691,384 | |
| | | | | | | | | |
| Transportation Consumer ‐ 1.51% | | | | | | | | |
| Air Medical Group Holdings Inc, Senior Secured First Lien 2016 New Term Loan, 5.159%, 04/28/2022 | | | 479,032 | | | | 477,894 | |
| Lineage Logistics LLC, Senior Secured First Lien Term Loan, 4.726%, 04/07/2021 | | | 3,587,986 | | | | 3,596,974 | |
| | | | | | | | 4,074,868 | |
| | | | | | | | | |
| Utilities Electric ‐ 5.74% | | | | | | | | |
| Chief Power Finance LLC, Senior Secured First Lien Term B Advance Loan, 6.070%, 12/31/2020 | | | 1,609,958 | | | | 1,116,240 | |
| Eastern Power LLC, Senior Secured First Lien Term Loan, 5.226%, 10/02/2023 | | | 1,034,900 | | | | 1,031,795 | |
| Exgen Texas Power LLC, Senior Secured First Lien Term Loan Non-PIK, 6.046%, 09/20/2021 | | | 2,242,426 | | | | 1,360,670 | |
| Granite Acquisition Inc, Senior Secured Second Lien Term B Loan, 8.546%, 12/19/2022 | | | 1,826,276 | | | | 1,818,971 | |
| Green Energy Partners / Stonewall LLC, Senior Secured First Lien Term B-1 Conversion Advance Loan, 6.796%, 11/13/2021 | | | 500,000 | | | | 465,000 | |
| Helix Gen Funding LLC, Senior Secured First Lien Term Loan, 4.960%, 06/03/2024 | | | 594,750 | | | | 599,107 | |
| Panda Liberty LLC, Senior Secured First Lien Construction B-1 Facility Term Loan, 7.796%, 08/21/2020 | | | 3,423,648 | | | | 3,173,311 | |
| Panda Patriot LLC (fka Moxie Patriot LLC), Senior Secured First Lien Construction B-1 Facility Term Loan, 7.046%, 12/18/2020 | | | 1,442,864 | | | | 1,332,846 | |
| Pike Corporation, Senior Secured First Lien Initial Term Loan, 4.980%, 03/08/2024 | | | 528,477 | | | | 536,074 | |
| Sandy Creek Energy Associates LP, Senior Secured First Lien Term Loan, 5.296%, 11/09/2020 | | | 3,044,326 | | | | 2,319,411 | |
| Southeast PowerGen LLC, Senior Secured First Lien Advance Term B Loan, 4.500%, 12/02/2021 | | | 1,743,520 | | | | 1,689,759 | |
| | | | | | | | 15,443,184 | |
| | | | | | | | | |
| TOTAL FLOATING RATE LOAN INTERESTS(Cost $387,489,779) | | | | | | | 379,424,637 | |
| | | | | | | | | |
| CORPORATE BONDS ‐ 7.79% | | | | | | | | |
| Banking, Finance, Insurance and Real Estate ‐ 0.25% | | | | | | | | |
National Financial Partners Corp, Senior Unsecured Bond, 9.000%, 07/15/2021(c) | | | 650,000 | | | | 682,338 | |
| | | | | | | | | |
| Beverage, Food and Tobacco ‐ 0.38% | | | | | | | | |
PF Chang's China Bistro Inc, Senior Unsecured Bond, 10.250%, 06/30/2020(c) | | | 1,000,000 | | | | 1,022,500 | |
| | | | | | | | | |
| Construction and Building ‐ 1.57% | | | | | | | | |
FBM Finance Inc, Senior Secured Bond, 8.250%, 08/15/2021(c) | | | 1,950,000 | | | | 2,098,687 | |
Great Lakes Dredge & Dock, Senior Unsecured Bond, 8.000%, 05/15/2022(c) | | | 2,080,000 | | | | 2,124,200 | |
| | | | | | | | 4,222,887 | |
| | | | | | | | | |
| Containers, Packaging and Glass ‐ 0.67% | | | | | | | | |
ARD Finance SA, Senior Unsecured Bond, 7.125%, 09/15/2023(d) | | | 600,000 | | | | 641,940 | |
Coveris Holdings SA, Senior Unsecured Bond, 7.875%, 11/01/2019(c) | | | 955,000 | | | | 945,450 | |
Reynolds GRP ISS / Reynold, Senior Unsecured Bond, 7.000%, 07/15/2024(c) | | | 190,000 | | | | 204,172 | |
| | | | | | | | 1,791,562 | |
| | | | | | | | | |
| Energy, Oil and Gas ‐ 0.37% | | | | | | | | |
Comstock Resources Inc, Senior Unsecured Bond, 10.000%, 03/15/2020(d) | | | 1,000,000 | | | | 1,002,500 | |
| | | | | | | | | |
| Environmental Industries ‐ 0.18% | | | | | | | | |
GFL Environmental Inc, Senior Unsecured Bond, 9.875%, 02/01/2021(c) | | | 431,000 | | | | 470,868 | |
| Blackstone / GSO Senior Floating Rate Term Fund | Portfolio of Investments |
June 30, 2017 (Unaudited)
| | | Principal Amount | | | Value | |
| Healthcare and Pharmaceuticals ‐ 0.99% | | | | | | |
Endo Finance Co (Endo Luxembourg Finance Co. I S.a.r.l), Senior Unsecured Bond, 5.875%, 10/15/2024(c) | | $ | 254,000 | | | $ | 262,890 | |
InVentiv Group Holdings Inc, Senior Unsecured Bond, 7.500%, 10/01/2024(c) | | | 340,000 | | | | 370,600 | |
Tenet Healthcare Corp, Senior Unsecured Bond, 7.000%, 08/01/2025(c) | | | 1,143,000 | | | | 1,141,571 | |
| Valeant Pharmaceuticals International Inc, Senior Unsecured Bond,: | | | | | | | | |
6.500%, 03/15/2022(c) | | | 520,000 | | | | 546,650 | |
7.000%, 03/15/2024(c) | | | 323,000 | | | | 340,361 | |
| | | | | | | | 2,662,072 | |
| | | | | | | | | |
| High Tech Industries ‐ 0.69% | | | | | | | | |
| Infor US Inc, Senior Unsecured Bond, 6.500%, 05/15/2022 | | | 750,000 | | | | 780,000 | |
j2 Global Inc, Senior Unsecured Bond, 6.000%, 07/15/2025(c) | | | 625,000 | | | | 646,875 | |
Riverbed Technology Inc, Senior Unsecured Bond, 8.875%, 03/01/2023(c) | | | 430,000 | | | | 438,600 | |
| | | | | | | | 1,865,475 | |
| | | | | | | | | |
| Hotels, Gaming and Leisure ‐ 1.02% | | | | | | | | |
Scientific Games International Inc, Senior Secured Bond, 7.000%, 01/01/2022(c) | | | 2,580,000 | | | | 2,754,150 | |
| | | | | | | | | |
| Media Advertising, Printing and Publishing ‐ 0.10% | | | | | | | | |
McGraw‐Hill Global Education, Senior Unsecured Bond, 7.875%, 05/15/2024(c) | | | 270,000 | | | | 262,238 | |
| | | | | | | | | |
| Media Broadcasting and Subscription ‐ 0.09% | | | | | | | | |
Radiate Holdco LLC, Senior Unsecured Bond, 6.625%, 02/15/2025(c) | | | 250,000 | | | | 250,625 | |
| | | | | | | | | |
| Retail ‐ 0.17% | | | | | | | | |
Nine West Holdings Inc, Senior Unsecured Bond, 8.250%, 03/15/2019(c) | | | 1,800,000 | | | | 450,000 | |
| | | | | | | | | |
| Services ‐ Business ‐ 0.54% | | | | | | | | |
Infinity ACQ LLC / FI Corp, Senior Unsecured Bond, 7.250%, 08/01/2022(c) | | | 1,500,000 | | | | 1,451,250 | |
| | | | | | | | | |
| Telecommunications ‐ 0.77% | | | | | | | | |
Avaya Inc, Senior Secured Bond, 7.000%, 04/01/2019(c)(e) | | | 757,000 | | | | 611,277 | |
Fairpoint Communications Inc, Senior Secured Bond, 8.750%, 08/15/2019(c) | | | 1,430,000 | | | | 1,470,898 | |
| | | | | | | | 2,082,175 | |
| | | | | | | | | |
| TOTAL CORPORATE BONDS (Cost $21,260,260) | | | | | | | 20,970,640 | |
| | | Shares | | | | |
| COMMON STOCK - 0.13% | | | | | | |
| Energy, Oil and Gas - 0.13% | | | | | | |
TE Holdings LLC (Templar), Class A,(f) | | | 72,786 | | | $ | 347,554 | |
| | | | | | | | | |
| TOTAL COMMON STOCK (Cost $2,919,283) | | | | | | | 347,554 | |
| | | | | | | | | |
| PREFERRED STOCK - 0.18% | | | | | | | | |
| Energy, Oil and Gas - 0.18% | | | | | | | | |
TE Holdings LLC (Templar)(f) | | | 48,248 | | | | 470,421 | |
| | | | | | | | | |
| TOTAL PREFERRED STOCK (Cost $482,483) | | | | | | | 470,421 | |
| Semi-Annual Report | June 30, 2017 | 17 |
| Blackstone / GSO Senior Floating Rate Term Fund | Portfolio of Investments |
June 30, 2017 (Unaudited)
| | | Shares | | | Value | |
| RIGHTS AND WARRANTS - 0.01% | | | | | | |
| Energy, Oil and Gas - 0.01% | | | | | | |
Comstock Resources Inc, expires 9/2/2018 at $0.01(f) | | | 3,438 | | | $ | 24,272 | |
| | | | | | | | | |
| TOTAL RIGHTS AND WARRANTS (Cost $–) | | | | | | | 24,272 | |
| | | | | | | | | |
| Total Investments - 149.03% (Cost $412,151,805) | | | | | | | 401,237,524 | |
| | | | | | | | | |
Other Assets in Excess of Liabilities - 0.00%(g) | | | | | | | 4,060 | |
| | | | | | | | | |
| Leverage Facility - (49.03)% | | | | | | | (132,000,000 | ) |
| | | | | | | | | |
| Net Assets - 100.00% | | | | | | $ | 269,241,584 | |
Amounts above are shown as a percentage of net assets as of June 30, 2017.
| (a) | The interest rate shown represents the rate at period end. |
| (b) | All or a portion of this position has not settled as of June 30, 2017. The interest rate shown represents the stated spread over the London Interbank Offered Rate (“LIBOR” or “L”) or the applicable LIBOR floor; the Fund will not accrue interest until the settlement date, at which point LIBOR will be established. |
| (c) | Security exempt from registration under Rule 144A of the Securities Act of 1933. Total market value of Rule 144A securities amounts to $18,546,200, which represents approximately 6.89% of net assets as of June 30, 2017. Such securities may normally be sold to qualified institutional buyers in transactions exempt from registration. |
| (d) | Option to convert to pay-in-kind security. |
| (e) | Security is in default as of period end and is therefore non-income producing. |
| (f) | Non-income producing security. |
| (g) | Amount represents less than 0.005% of net assets. |
See Notes to Financial Statements.
| Blackstone / GSO Long-Short Credit Income Fund | Portfolio of Investments |
| | June 30, 2017 (Unaudited) |
| | | Principal Amount | | | Value |
FLOATING RATE LOAN INTERESTS(a) -128.85% | | | | | |
Aerospace and Defense ‐ 0.24% | | | | | |
Engility Corporation, Senior Secured First Lien Term B‐2 Loan, 4.976%, 08/12/2023 | | $ | 523,780 | | | $ | 530,233 |
| | | | | | | | |
Automotive ‐ 2.57% | | | | | | | |
| American Tire Distributors Inc, Senior Secured First Lien Initial Term Loan, 5.476%, 09/01/2021 | | | 393,484 | | | | 396,067 |
Bright Bidco BV, Senior Secured First Lien Term B Loan, L+4.50%, 03/15/2024(b) | | | 1,026,616 | | | | 1,042,657 |
| CH Hold Corp, Senior Secured Second Lien Initial Term Loan, 8.476%, 02/03/2025 | | | 789,474 | | | | 811,678 |
Mitchell International Inc, Senior Secured First Lien Initial Term Loan, L+3.50%, 10/13/2020(b) | | | 540,541 | | | | 544,597 |
| Mitchell International Inc, Senior Secured Second Lien Term Loan, 8.672%, 10/11/2021 | | | 1,294,266 | | | | 1,308,017 |
| Superior Industries International Inc, Senior Secured First Lien Closing Date Term Loan, 5.787%, 03/22/2024 | | | 1,500,000 | | | | 1,496,250 |
| | | | | | | | 5,599,266 |
| | | | | | | | |
Banking, Finance, Insurance and Real Estate ‐ 10.30% | | | | | | | |
| Acrisure LLC, Senior Secured First Lien Term B Loan, 6.296%, 11/22/2023 | | | 1,311,454 | | | | 1,326,477 |
| Alliant Holdings Intermediate LLC, Senior Secured First Lien Initial Term Loan, 4.417%, 08/12/2022 | | | 636,986 | | | | 637,167 |
| Almonde Inc, Senior Secured First Lien US Term Loan, 4.736%, 06/13/2024 | | | 2,490,566 | | | | 2,493,816 |
| ASP MCS Acquisition Corp, Senior Secured First Lien Initial Term Loan, 5.959%, 05/18/2024 | | | 1,848,740 | | | | 1,881,092 |
| Asurion LLC, Senior Secured Second Lien Term Loan, 8.726%, 03/03/2021 | | | 2,050,064 | | | | 2,062,877 |
| Broadstreet Partners Inc, Senior Secured First Lien Initial Term Loan, 5.476%, 11/08/2023 | | | 1,092,073 | | | | 1,109,137 |
| Cunningham Lindsey US Inc, Senior Secured First Lien Initial Term Loan, 5.046%, 12/10/2019 | | | 1,753,878 | | | | 1,591,645 |
| Cypress Merger Sub Inc, Senior Secured Second Lien Initial Term Loan, 7.976%, 04/28/2025 | | | 813,953 | | | | 836,337 |
| DTZ US Borrower LLC, Senior Secured Second Lien Initial Term Loan, 9.289%, 11/04/2022 | | | 166,512 | | | | 166,929 |
| EZE Software Group LLC, Senior Secured Second Lien Term Loan, 7.796%, 04/05/2021 | | | 470,905 | | | | 471,790 |
| First Eagle Holdings Inc, Senior Secured First Lien New Initial Term Loan, 4.796%, 12/01/2022 | | | 1,431,875 | | | | 1,447,805 |
Focus Financial Partners LLC, Senior Secured First Lien Term Loan, L+3.25%, 05/19/2024(b) | | | 872,093 | | | | 879,907 |
| MPH Acquisition Holdings LLC, Senior Secured First Lien Initial Term Loan, 4.296%, 06/07/2023 | | | 1,695,519 | | | | 1,697,901 |
NFP Corp, Senior Secured First Lien Term B Term Loan, L+3.50%, 01/08/2024(b) | | | 734,750 | | | | 737,619 |
| Opal Acquisition Inc, Senior Secured First Lien Term B Loan, 5.236%, 11/27/2020 | | | 398,966 | | | | 371,290 |
| Resolute Investment Managers Inc, Senior Secured First Lien Initial Term Loan, 5.546%, 04/30/2022 | | | 939,855 | | | | 946,904 |
| Solera LLC, Senior Secured First Lien Dollar Term Loan, 5.750%, 03/03/2023 | | | 2,557,199 | | | | 2,568,872 |
| Victory Capital Operating LLC, Senior Secured First Lien Initial Term Loan, 8.796%, 10/29/2021 | | | 494,018 | | | | 502,046 |
| York Risk Services Holding Corp (Onex York Finance LP), Senior Secured First Lien Initial Term Loan, 4.976%, 10/01/2021 | | | 745,093 | | | | 730,564 |
| | | | | | | | 22,460,175 |
| | | | | | | | |
Beverage, Food and Tobacco ‐ 5.93% | | | | | | | |
| Americold Realty Operating Partnership LP, Senior Secured First Lien Initial Term Loan, 4.976%, 12/01/2022 | | | 286,413 | | | | 290,888 |
| Candy Intermediate Holdings Inc, Senior Secured First Lien Initial Term Loan, 5.796%, 06/15/2023 | | | 1,781,777 | | | | 1,713,855 |
| CEC Entertainment Inc, Senior Secured First Lien Term B Loan, 4.226%, 02/15/2021 | | | 984,733 | | | | 982,069 |
| Chobani LLC, Senior Secured First Lien Closing Date Term Loan, 5.476%, 10/09/2023 | | | 2,400,044 | | | | 2,421,057 |
Constellation Brands Canada Inc, Senior Secured First Lien Initial Tranche B‐1 Term Loan, 5.000%, 12/15/2023 | | | 574,038 | | | | 579,061 |
| CSM Bakery Solutions LLC, Senior Secured First Lien Term Loan, 5.150%, 07/03/2020 | | | 750,000 | | | | 714,844 |
| NPC International Inc, Senior Secured First Lien Initial Term Loan, 4.716%, 04/19/2024 | | | 1,147,541 | | | | 1,158,305 |
| NPC International Inc, Senior Secured Second Lien Initial Term Loan, 8.716%, 04/18/2025 | | | 949,153 | | | | 963,390 |
| TKC Holdings Inc, Senior Secured First Lien Term Loan, 5.376%, 02/01/2023 | | | 1,216,182 | | | | 1,215,805 |
| TKC Holdings Inc, Senior Secured Second Lien Initial Term Loan, 9.126%, 02/01/2024 | | | 315,759 | | | | 317,074 |
| Semi-Annual Report | June 30, 2017 | 19 |
| Blackstone / GSO Long-Short Credit Income Fund | Portfolio of Investments |
June 30, 2017 (Unaudited)
| | | Principal Amount | | | Value |
| Beverage, Food and Tobacco (continued) | | | | | |
Weight Watchers International Inc, Senior Secured First Lien Initial Tranche B‐2 Term Loan, 4.470%, 04/02/2020 | | $ | 1,990,332 | | | $ | 1,921,178 |
| Winebow Holdings Inc, Senior Secured Second Lien Initial Term Loan, 8.726%, 01/03/2022 | | | 693,642 | | | | 648,555 |
| | | | | | | | 12,926,081 |
| | | | | | | | |
Capital Equipment ‐ 1.50% | | | | | | | |
| Duke Finance LLC, Senior Secured First Lien Term B Loan, 6.296%, 02/21/2024 | | | 692,708 | | | | 702,666 |
| LTI Holdings Inc, Senior Secured Second Lien Initial Term Loan, 9.922%, 05/16/2025 | | | 700,000 | | | | 687,750 |
| Meter Readings Holding LLC, Senior Secured First Lien Initial Term Loan, 6.952%, 08/29/2023 | | | 1,852,500 | | | | 1,871,025 |
| | | | | | | | 3,261,441 |
| | | | | | | | |
Chemicals, Plastics and Rubber ‐ 2.71% | | | | | | | |
| DuBois Chemicals Inc, Senior Secured First Lien Delayed Draw Term Loan, 5.000%, 03/15/2024 | | | 108,543 | | | | 109,357 |
| DuBois Chemicals Inc, Senior Secured First Lien Initial Term Loan, 4.909%, 03/15/2024 | | | 433,085 | | | | 436,336 |
| Emerald Performance Materials LLC, Senior Secured First Lien Initial Term Loan, 4.726%, 08/02/2021 | | | 698,834 | | | | 705,057 |
| Emerald Performance Materials LLC, Senior Secured Second Lien Initial Term Loan, 8.750%, 08/01/2022 | | | 1,500,000 | | | | 1,501,875 |
| Pinnacle Operating Corporation, Senior Secured First Lien 2017 Extended Term Loan, 8.476%, 11/15/2021 | | | 2,206,805 | | | | 2,049,570 |
Tekni‐Plex Inc, Senior Secured Second Lien Initial Term Loan, 8.976%, 06/01/2023 | | | 475,962 | | | | 477,152 |
Venator Materials LLC, Senior Secured First Lien Term B Loan, L+3.00%, 06/28/2024(b) | | | 625,000 | | | | 628,125 |
| | | | | | | | 5,907,472 |
| | | | | | | | |
Construction and Building ‐ 10.34% | | | | | | | |
| American Bath Group LLC, Senior Secured First Lien Replacement Term Loan, 6.546%, 09/30/2023 | | | 2,350,903 | | | | 2,382,499 |
| American Bath Group LLC, Senior Secured Second Lien Term Loan, 11.046%, 09/30/2024 | | | 150,000 | | | | 148,875 |
| Dayton Superior Corporation, Senior Secured First Lien Term Loan, 9.296%, 11/03/2021 | | | 1,160,833 | | | | 1,166,638 |
| Diversitech Holdings Inc, Senior Secured First Lien Term Loan, 4.702%, 06/01/2024 | | | 317,881 | | | | 318,677 |
Forterra Finance LLC, Senior Secured First Lien Replacement Loan, L+3.00%, 10/25/2023(b) | | | 1,766,837 | | | | 1,671,243 |
| GYP Holdings III Corp, Senior Secured First Lien 2017 Incremental First Lien Term Loan, 4.142%, 04/01/2023 | | | 311,688 | | | | 312,955 |
| HNC Holdings Inc, Senior Secured First Lien Initial Term Loan, 5.726%, 10/05/2023 | | | 618,653 | | | | 628,514 |
| Interior Logic Group Inc, Senior Secured First Lien Initial Term Loan, 7.210%, 02/28/2024 | | | 1,410,714 | | | | 1,407,188 |
| IPS Structural Adhesive Holdings Inc, Senior Secured First Lien Initial Term Loan, 6.466%, 12/20/2023 | | | 2,288,188 | | | | 2,299,629 |
| IPS Structural Adhesive Holdings Inc, Senior Secured Second Lien Initial Term Loan, 10.716%, 12/14/2024 | | | 750,000 | | | | 750,000 |
| LBM Borrower LLC, Senior Secured First Lien Initial Term Loan, 6.546%, 08/20/2022 | | | 3,686,477 | | | | 3,714,126 |
| Morsco Inc, Senior Secured First Lien Initial Term Loan, 8.226%, 10/31/2023 | | | 1,234,375 | | | | 1,249,033 |
| New Arclin US Holding Corp, Senior Secured First Lien Term Loan, 5.670%, 02/14/2024 | | | 1,570,681 | | | | 1,589,332 |
| Siteone Landscape Supply LLC, Senior Secured First Lien Term Loan, 4.760%, 04/29/2022 | | | 1,039,014 | | | | 1,047,783 |
SRS Distribution Inc, Senior Secured First Lien Tranche B‐4 Term Loan, 4.297%, 08/25/2022 | | | 1,796,469 | | | | 1,806,017 |
| SRS Distribution Inc, Senior Secured Second Lien 06/16 Term Loan, 10.046%, 02/24/2023 | | | 810,445 | | | | 832,732 |
| VC GB Holdings Inc, Senior Secured First Lien Term Loan, 4.976%, 02/28/2024 | | | 576,709 | | | | 577,069 |
| Wilsonart LLC, Senior Secured First Lien Tranche C Term Loan, 4.800%, 12/19/2023 | | | 656,044 | | | | 658,996 |
| | | | | | | | 22,561,306 |
| | | | | | | | |
Consumer Goods Durable ‐ 2.74% | | | | | | | |
| Apex Tool Group LLC, Senior Secured First Lien Term Loan, 4.500%, 01/31/2020 | | | 676,082 | | | | 660,589 |
Culligan Holding Inc, Senior Secured First Lien Tranche B‐1 Term Loan, 5.159%, 12/13/2023 | | | 2,301,422 | | | | 2,324,436 |
| Hercules Achievement Inc, Senior Secured First Lien Initial Term Loan, 4.726%, 12/13/2021 | | | 1,828,125 | | | | 1,840,465 |
| Hillman Group Inc (The), Senior Secured First Lien Initial Term Loan, 4.796%, 06/30/2021 | | | 493,639 | | | | 497,343 |
| Blackstone / GSO Long-Short Credit Income Fund | Portfolio of Investments |
| | June 30, 2017 (Unaudited) |
| | | Principal Amount | | | Value |
| Consumer Goods Durable (continued) | | | | | |
Power Products LLC, Senior Secured First Lien Term B Loan, L+4.00%, 12/20/2022(b) | | $ | 641,479 | | | $ | 643,484 |
| | | | | | | | 5,966,317 |
| | | | | | | | |
Consumer Goods Non Durable ‐ 0.89% | | | | | | | |
Acosta Inc, Senior Secured First Lien Tranche B‐1 Loan, L+3.25%, 09/26/2021(b) | | | 600,000 | | | | 540,600 |
| Arctic Glacier USA Inc, Senior Secured First Lien Initial Term Loan, 5.476%, 03/20/2024 | | | 600,904 | | | | 608,415 |
Sally Holdings LLC, Senior Secured First Lien Term B Loan, L+4.50%, 06/23/2024(b) | | | 800,000 | | | | 803,000 |
| | | | | | | | 1,952,015 |
| | | | | | | | |
Containers, Packaging and Glass ‐ 2.60% | | | | | | | |
| Berlin Packaging LLC, Senior Secured Retired First Lien Term B Loan, 4.432%, 10/01/2021 | | | 619,641 | | | | 621,915 |
| Caraustar Industries Inc, Senior Secured First Lien Refinancing Term Loan, 6.796%, 03/14/2022 | | | 699,182 | | | | 700,493 |
| Charter Nex US Inc, Senior Secured First Lien Term B-3 Loan, 4.476%, 05/16/2024 | | | 843,373 | | | | 844,824 |
| Consolidated Container Company LLC, Senior Secured First Lien initial Term Loan, 4.726%, 05/22/2024 | | | 606,936 | | | | 610,857 |
| IBC Capital Limited, Senior Secured Second Lien Term Loan, 8.228%, 09/09/2022 | | | 1,203,926 | | | | 1,122,662 |
| Plaze Inc, Senior Secured First Lien Term Loan, 4.761%, 07/31/2022 | | | 376,204 | | | | 379,026 |
| Pregis Holding I Corporation, Senior Secured First Lien Initial Term Loan, 4.796%, 05/20/2021 | | | 721,649 | | | | 723,905 |
| ProAmpac PG Borrower LLC, Senior Secured First Lien Initial Loan, 5.179%, 11/20/2023 | | | 352,057 | | | | 356,843 |
| Ranpak Corp, Senior Secured Second Lien Initial Term Loan, 8.250%, 10/03/2022 | | | 311,111 | | | | 310,333 |
| | | | | | | | 5,670,858 |
| | | | | | | | |
Energy, Oil and Gas ‐ 1.38% | | | | | | | |
| Chief Exploration & Development LLC, Senior Secured Second Lien Term Loan, 7.932%, 05/17/2021 | | | 752,941 | | | | 728,471 |
Sheridan Investment Partners I LLC, Senior Secured First Lien Tranche B‐2 Term Loan, 4.590%, 10/01/2019 | | | 879,143 | | | | 745,073 |
Sheridan Production Partners I LLC, Senior Secured First Lien Deferred Principal Term Loan,:
0.000%, 01/01/2030 | | | 2,752 | | | | 2,079 |
| 0.000%, 01/01/2030 | | | 34,005 | | | | 25,691 |
| Sheridan Production Partners I LLC, Senior Secured First Lien Term Loan, 0.000%, 01/01/2030 | | | 4,506 | | | | 3,404 |
Sheridan Production Partners I‐A LP, Senior Secured First Lien Tranche B‐2 Term Loan, 4.730%, 10/01/2019 | | | 116,494 | | | | 98,729 |
Sheridan Production Partners I‐M LP, Senior Secured First Lien Tranche B‐2 Term Loan , 4.600%, 10/01/2019 | | | 71,155 | | | | 60,304 |
| Utex Industries Inc, Senior Secured First Lien New Initial Term Loan, 5.000%, 05/24/2021 | | | 1,490,315 | | | | 1,337,714 |
| | | | | | | | 3,001,465 |
| | | | | | | | |
Environmental Industries ‐ 1.26% | | | | | | | |
| EnergySolutions LLC, Senior Secured First Lien Advance Term Loan, 6.980%, 05/29/2020 | | | 1,734,545 | | | | 1,749,723 |
Infiltrator Water Technologies LLC, Senior Secured First Lien Term B‐1 Loan, 4.796%, 05/27/2022 | | | 988,204 | | | | 995,615 |
| | | | | | | | 2,745,338 |
| | | | | | | | |
Forest Products and Paper ‐ 0.07% | | | | | | | |
| W/S Packaging Group Inc, Senior Secured First Lien Term Loan, 8.250%, 08/09/2019 | | | 157,042 | | | | 145,656 |
| | | | | | | | |
Healthcare and Pharmaceuticals ‐ 23.20% | | | | | | | |
| Albany Molecular Research Inc, Senior Secured First Lien Term Loan, 5.906%, 07/16/2021 | | | 814,305 | | | | 818,210 |
| Alvogen Pharma US Inc, Senior Secured First Lien Term Loan, 6.230%, 04/01/2022 | | | 3,478,857 | | | | 3,431,022 |
American Renal Holdings Inc, Senior Secured First Lien New Term Loan B, L+3.25%, 06/14/2024(b) | | | 1,467,391 | | | | 1,467,854 |
| Amneal Pharmaceuticals LLC, Senior Secured First Lien Term B Loan, 4.796%, 11/01/2019 | | | 1,477,130 | | | | 1,489,131 |
| Semi-Annual Report | June 30, 2017 | 21 |
| Blackstone / GSO Long-Short Credit Income Fund | Portfolio of Investments |
| | June 30, 2017 (Unaudited) |
| | | Principal Amount | | | Value |
| Healthcare and Pharmaceuticals (continued) | | | | | |
| Arbor Pharmaceuticals LLC, Senior Secured First Lien Initial Term Loan, 6.296%, 07/05/2023 | | $ | 1,254,400 | | | $ | 1,269,032 |
| Avantor Performance Materials Holdings Inc, Senior Secured First Lien Initial Term Loan, 5.230%, 03/11/2024 | | | 3,855,168 | | | | 3,868,025 |
| Avantor Performance Materials Holdings Inc, Senior Secured Second Lien Initial Term Loan, 9.480%, 03/10/2025 | | | 923,077 | | | | 937,500 |
BioClinica‐Clinverse Holdings Corp, Senior Secured First Lien Initial Term Loan, 5.375%, 10/20/2023 | | | 951,739 | | | | 934,789 |
BioClinica‐Clinverse Holdings Corp, Senior Secured Second Lien Initial Term Loan, 9.375%, 10/04/2024 | | | 789,474 | | | | 773,684 |
| CHG Healthcare Services Inc, Senior Secured First Lien Term B Loan, 4.422%, 06/07/2023 | | | 1,259,745 | | | | 1,273,394 |
| Concordia Healthcare Corp, Senior Secured First Lien Dollar Term Loan, 5.501%, 10/21/2021 | | | 1,324,650 | | | | 993,487 |
| CPI Holdco LLC, Senior Secured Closing Date Term Loan, 5.300%, 03/21/2024 | | | 497,041 | | | | 500,148 |
| CT Technologies Intermediate Holdings Inc, Senior Secured First Lien Initial Term Loan, 5.476%, 12/01/2021 | | | 783,849 | | | | 782,870 |
| Endo Luxembourg Finance Company l Sarl, Senior Secured First Lien Initial Term Loan, 5.500%, 04/29/2024 | | | 3,448,276 | | | | 3,486,000 |
| Equian Buyer Corp (Fka Aeneas Buyer Corp), Senior Secured Delayed Draw Term Loan, 1.000%, 05/20/2024 | | | 607,903 | | | | 613,413 |
| Equian Buyer Corp (Fka Aeneas Buyer Corp), Senior Secured First Lien Initial Term Loan, 4.928%, 05/20/2024 | | | 1,975,684 | | | | 1,993,593 |
| Greenway Health LLC, Senior Secured First Lien Term Loan, 6.050%, 02/16/2024 | | | 1,379,310 | | | | 1,386,207 |
| Horizon Pharma Inc, Senior Secured First Lien Second Amendment Refinancing Term Loan, 4.875%, 03/29/2024 | | | 597,426 | | | | 600,563 |
Inc Research Holdings Inc, Senior Secured First Lien Term B Loan, L+2.25%, 06/28/2024(b) | | | 958,084 | | | | 960,781 |
| Lanai Holdings III Inc, Senior Secured First Lien Initial Term Loan, 5.976%, 08/29/2022 | | | 1,134,826 | | | | 1,112,129 |
Netsmart Technologies Inc, Senior Secured First Lien Term C‐1 Loan, 5.796%, 04/19/2023 | | | 1,971,465 | | | | 1,986,251 |
nThrive Inc, Senior Secured First Lien Term B‐2 Loan, 5.726%, 10/20/2022 | | | 2,650,909 | | | | 2,668,312 |
| Onex Carestream Finance LP, Senior Secured First Lien Term Loan, 5.296%, 06/07/2019 | | | 346,462 | | | | 345,019 |
| Onex Carestream Finance LP, Senior Secured Second Lien Term Loan, 9.796%, 12/09/2019 | | | 4,190,287 | | | | 4,116,957 |
| Onex Schumacher Finance LP, Senior Secured First Lien Initial Term Loan, 5.226%, 07/29/2022 | | | 2,109,293 | | | | 2,113,681 |
| Ortho Clinical Diagnostics Inc, Senior Secured First Lien Initial Term Loan, 5.046%, 06/30/2021 | | | 484,429 | | | | 482,523 |
| Packaging Coordinators Midco Inc, Senior Secured First Lien Initial Term Loan, 5.150%, 06/30/2023 | | | 2,247,412 | | | | 2,247,412 |
| Press Ganey Holdings Inc, Senior Secured Second Lien Initial Term Loan, 8.476%, 10/21/2024 | | | 681,818 | | | | 698,864 |
| Project Ruby Ultimate Parent Corp, Senior Secured First Lien Closing Date Term Loan, 4.795%, 02/09/2024 | | | 423,500 | | | | 424,824 |
Sterigenics‐Nordion Holdings LLC, Senior Secured First Lien New Term B Loan, 4.150%, 05/16/2022 | | | 293,277 | | | | 292,727 |
Stratose Intermediate Holdings II LLC, Senior Secured First Lien Term Loan, L+5.00%, 01/26/2022(b) | | | 468,468 | | | | 472,275 |
| Surgery Center Holdings Inc, Senior Secured First Lien Initial Term Loan, 4.830%, 11/03/2020 | | | 1,433,045 | | | | 1,441,558 |
U.S. Anesthesia Partners Inc, Senior Secured First Lien Initial Term Loan, L+3.25%, 06/23/2024(b) | | | 1,467,890 | | | | 1,471,251 |
| U.S. Renal Care Inc, Senior Secured First Lien Initial Term Loan, 5.546%, 12/30/2022 | | | 2,522,214 | | | | 2,445,753 |
Valeant Pharmaceuticals International Inc, Senior Secured First Lien Series F‐1 Tranche B Term Loan, 6.039%, 04/01/2022 | | | 681,241 | | | | 691,282 |
| | | | | | | | 50,590,521 |
| | | | | | | | |
High Tech Industries ‐ 19.97% | | | | | | | |
Aerial Merger Sub Inc (Neustar), Senior Secured First Lien Term B2 Loan, L+3.75%, 03/01/2024(b) | | | 952,381 | | | | 961,014 |
Aerial Merger Sub Inc, Senior Secured First Lien Term B Loan, L+3.25%, 09/02/2019(b) | | | 571,429 | | | | 577,320 |
| Aspect Software Inc, Senior Secured First Lien Exit Term Loan, 11.278%, 05/25/2020 | | | 4,034,124 | | | | 4,011,432 |
| CompuCom Systems Inc, Senior Secured First Lien Term Loan, 4.480%, 05/11/2020 | | | 3,100,749 | | | | 2,450,243 |
| Blackstone / GSO Long-Short Credit Income Fund | Portfolio of Investments |
| | June 30, 2017 (Unaudited) |
| | | Principal Amount | | | Value | |
| High Tech Industries (continued) | | | | | | |
Compuware Corporation, Senior Secured First Lien Tranche B‐3 Term Loan, 5.550%, 12/15/2021 | | $ | 2,691,971 | | | $ | 2,715,526 | |
| CPI Acquisition Inc, Senior Secured First Lien Term Loan, 5.834%, 08/17/2022 | | | 1,947,370 | | | | 1,674,738 | |
| CPI International Inc, Senior Secured Second Lien Term Loan, 8.460%, 04/07/2022 | | | 750,000 | | | | 752,344 | |
| Cypress Semiconductor Corp, Senior Secured First Lien 2016 Incremental Term Loan, 4.840%, 07/05/2021 | | | 1,084,507 | | | | 1,096,979 | |
| Epicor Software Corporation, Senior Secured First Lien Term B Loan, 4.980%, 06/01/2022 | | | 975,762 | | | | 976,831 | |
| Flexera Software LLC, Senior Secured Second Lien Term Loan, 8.300%, 04/02/2021 | | | 200,000 | | | | 199,666 | |
Hyland Software Inc, Senior Secured Second Lien Term Loan, L+7.00%, 05/31/2025(b) | | | 322,086 | | | | 327,924 | |
Hyland Software Inc, Senior Secured Term Loan 3, L+4.90%, 07/01/2022(b) | | | 463,855 | | | | 467,392 | |
Idera Inc, Senior Secured First Lien Delayed Draw Term Loan, L+5.00%, 06/27/2024(b) | | | 231,818 | | | | 231,818 | |
Idera Inc, Senior Secured First Lien Term B Loan, L+5.00%, 06/27/2024(b) | | | 1,268,182 | | | | 1,268,182 | |
| Informatica Corporation, Senior Secured First Lien Dollar Term Loan, 4.796%, 08/05/2022 | | | 908,817 | | | | 909,467 | |
LANDesk Group Inc, Senior Secured First Lien Term Loan, L+4.25%, 01/22/2024(b) | | | 2,921,841 | | | | 2,911,497 | |
| LANDesk Group Inc, Senior Secured Second Lien Term Loan, 10.230%, 01/20/2025 | | | 2,000,000 | | | | 2,004,160 | |
| Peak 10 Inc, Senior Secured First Lien Term Loan, 5.147%, 06/17/2021 | | | 970,000 | | | | 976,062 | |
| Peak 10 Inc, Senior Secured Second Lien Initial Term Loan, 8.406%, 06/17/2022 | | | 1,875,000 | | | | 1,872,656 | |
| Pomeroy Group LLC, Senior Secured First Lien Initial Term Loan, 7.588%, 11/12/2021 | | | 989,950 | | | | 945,402 | |
| Project Alpha Intermediate Holding Inc, Senior Secured First Lien Term Loan, 4.670%, 04/26/2024 | | | 2,983,285 | | | | 2,967,906 | |
Project Leopard Holdings Inc, Senior Secured First Lien Term Loan, L+5.50%, 06/21/2023(b) | | | 555,556 | | | | 557,639 | |
| Ramundsen Public Sector LLC, Senior Secured First Lien Term Loan, 5.546%, 02/01/2024 | | | 548,077 | | | | 552,187 | |
| Rocket Software Inc, Senior Secured First Lien Term Loan, 5.546%, 10/13/2023 | | | 1,557,462 | | | | 1,574,010 | |
| SMS Systems Maintenance Services Inc, Senior Secured First Lien Initial Term Loan, 8.250%, 10/30/2023 | | | 1,764,808 | | | | 1,763,714 | |
| SolarWinds Holdings Inc, Senior Secured First Lien 2017 Refinancing Term Loan 4.726%, 02/03/2023 | | | 2,587,412 | | | | 2,596,312 | |
| Sophia LP, Senior Secured First Lien Term B Loan, 4.546%, 09/30/2022 | | | 1,047,412 | | | | 1,046,103 | |
| Sybil Software LLC, Senior Secured First Lien Initial Refinancing Dollar Term Loan, 4.546%, 09/30/2023 | | | 1,151,113 | | | | 1,164,333 | |
| Synchronoss Technologies Inc, Senior Secured Initial Term Loan, 4.082%, 01/19/2024 | | | 792,544 | | | | 780,061 | |
| TIBCO Software Inc, Senior Secured First Lien Term B Loan, 5.730%, 12/04/2020 | | | 251,167 | | | | 252,872 | |
| TTM Technologies Inc, Senior Secured First Lien Term B Loan, 5.476%, 05/31/2021 | | | 1,380,802 | | | | 1,394,611 | |
Verint Systems Inc, Senior Secured First Lien Initial Term Loan, L+2.25%, 06/21/2024(b) | | | 464,037 | | | | 465,777 | |
Veritas US Inc, Senior Secured First Lien Term Loan B Facility, L+4.50%, 01/27/2023(b) | | | 1,102,941 | | | | 1,106,388 | |
| | | | | | | | 43,552,566 | |
| | | | | | | | | |
Hotels, Gaming and Leisure ‐ 1.99% | | | | | | | | |
Alpha Topco Limited ‐ Delta 2 (Lux) Sarl, Senior Secured Second Lien Term Loan, 8.004%, 07/29/2022 | | | 815,220 | | | | 822,426 | |
| AP Gaming I LLC, Senior Secured First Lien Term B Loan, 6.586%, 02/15/2024 | | | 2,177,419 | | | | 2,199,194 | |
| CWGS Group LLC, Senior Secured First Lien Term Loan, 4.839%, 11/08/2023 | | | 168,385 | | | | 169,490 | |
Intrawest Resorts Holdings Inc, Senior Secured First Lien Term B Loan, L+3.50%, 06/28/2024(b) | | | 328,850 | | | | 329,672 | |
Intrawest Resorts Holdings Inc, Senior Secured First Lien Term B2 Loan, L+3.25%, 06/28/2024(b) | | | 173,662 | | | | 174,097 | |
Scientific Games International Inc, Senior Secured First Lien Term B‐3 Loan, 5.226%, 10/01/2021 | | | 639,808 | | | | 646,875 | |
| | | | | | | | 4,341,754 | |
| | | | | | | | | |
Media Advertising, Printing and Publishing ‐ 0.27% | | | | | | | | |
McGraw‐Hill Global Education Holdings LLC, Senior Secured First Lien Term B Loan, 5.226%, 05/04/2022 | | | 606,664 | | | | 597,988 | |
| Semi-Annual Report | June 30, 2017 | 23 |
| Blackstone / GSO Long-Short Credit Income Fund | Portfolio of Investments |
| | June 30, 2017 (Unaudited) |
| | | Principal Amount | | | Value | |
Media Broadcasting and Subscription ‐ 1.39% | | | | | | |
Sable International Finance Limited (Cable and Wireless), Senior Secured First Lien Term B‐3 Loan, 4.726%, 01/31/2025 | | $ | 3,029,393 | | | $ | 3,041,708 | |
| | | | | | | | | |
Media Diversified and Production ‐ 0.35% | | | | | | | | |
DHX Media Ltd, Senior Secured Term Loan, L+3.75%, 12/22/2023(b) | | | 765,027 | | | | 769,094 | |
| | | | | | | | | |
Metals and Mining ‐ 1.71% | | | | | | | | |
Canam Steel Corporation, Senior Secured First Lien Term B Loan, L+5.50%, 06/29/2024(b) | | | 1,666,667 | | | | 1,633,333 | |
Fairmount Santrol Inc, Senior Secured First Lien Tranche B‐2 Term Loan, 4.647%, 09/05/2019 | | | 1,450,925 | | | | 1,373,664 | |
Murray Energy Corporation, Senior Secured First Lien Term B‐2 Non‐PIK Loan, 8.546%, 04/16/2020 | | | 741,121 | | | | 726,606 | |
| | | | | | | | 3,733,603 | |
Retail ‐ 1.78% | | | | | | | | |
| Ascena Retail Group Inc, Senior Secured First Lien Tranche B Term Loan, 5.625%, 08/19/2022 | | | 291,084 | | | | 245,784 | |
| Jill Acquisition LLC, Senior Secured First Lien Initial Term Loan, 6.180%, 05/09/2022 | | | 443,530 | | | | 434,937 | |
| Nine West Holdings Inc, Senior Secured First Lien Initial Term Loan, 4.900%, 10/08/2019 | | | 388,001 | | | | 331,740 | |
| Petco Animal Supplies Inc, Senior Secured First Lien Second Amendment Term Loan, 4.172%, 01/26/2023 | | | 800,774 | | | | 725,502 | |
| Pier 1 Imports (US) Inc, Senior Secured First Lien Initial Term Loan, 4.796%, 04/30/2021 | | | 2,020,833 | | | | 1,950,104 | |
| Sports Authority (The), Senior Secured First Lien Term B Loan, 7.500%, 11/16/2017 | | | 3,907,779 | | | | 188,062 | |
| | | | | | | | 3,876,129 | |
Services ‐ Business ‐ 17.70% | | | | | | | | |
Advantage Sales & Marketing Inc, Senior Secured First Lien Incremental Term B‐2 Loan, 4.420%, 07/25/2021 | | | 758,333 | | | | 729,900 | |
| Advantage Sales & Marketing Inc, Senior Secured Second Lien Initial Term Loan, 7.796%, 07/25/2022 | | | 2,000,000 | | | | 1,925,000 | |
| Allied Universal Holdco LLC, Senior Secured First Lien Initial Term Loan, 5.046%, 07/28/2022 | | | 1,185,000 | | | | 1,190,184 | |
| AqGen Ascensus Inc (fka Ascensus Holdings Inc), Senior Secured First Lien Replacement Term Loan, 5.296%, 12/05/2022 | | | 184,153 | | | | 186,455 | |
BMC Software Finance Inc, Senior Secured First Lien Initial B‐1 US Term Loan, 5.226%, 09/10/2022 | | | 861,149 | | | | 864,167 | |
| Crossmark Holdings Inc, Senior Secured First Lien Term Loan, Series 0000, 4.796%, 12/20/2019 | | | 3,283,541 | | | | 2,324,747 | |
| Crossmark Holdings Inc, Senior Secured Second Lien Term Loan, 8.796%, 12/21/2020 | | | 1,500,000 | | | | 688,747 | |
| DTI Holdco Inc, Senior Secured First Lien Initial Term Loan, 6.422%, 10/02/2023 | | | 2,736,081 | | | | 2,677,939 | |
| Erie Acquisition Holdings Inc, Senior Secured First Lien Term Loan, 5.950%, 03/01/2023 | | | 2,476,178 | | | | 2,489,847 | |
| GlobalLogic Holdings Inc, Senior Secured First Lien Closing Date Term Loan, 5.796%, 06/20/2022 | | | 2,513,709 | | | | 2,535,704 | |
| Information Resources Inc, Senior Secured First Lien Initial Term Loan, 5.466%, 01/18/2024 | | | 2,165,788 | | | | 2,176,952 | |
| Information Resources Inc, Senior Secured Second Lien Initial Term Loan, 9.466%, 01/20/2025 | | | 2,000,000 | | | | 1,998,750 | |
| Inmar Inc, Senior Secured First Lien Initial Term Loan, 4.670%, 05/01/2024 | | | 1,290,323 | | | | 1,294,555 | |
| Inmar Inc, Senior Secured Second Lien Initial Term Loan, 9.170%, 05/01/2025 | | | 946,746 | | | | 940,118 | |
| LD Intermediate Holdings Inc, Senior Secured First Lien Initial Term Loan, 7.055%, 12/09/2022 | | | 1,975,000 | | | | 1,878,719 | |
| Neff Rental LLC, Senior Secured Second Lien Closing Date Term Loan, 7.664%, 06/09/2021 | | | 3,105,673 | | | | 3,115,378 | |
| Sedgwick Claims Management Services Inc, Senior Secured Second Lien Incremental Term Loan, 6.952%, 02/28/2022 | | | 3,160,377 | | | | 3,178,170 | |
| SurveyMonkey Inc, Senior Secured First Lien Term Loan, 5.800%, 04/13/2024 | | | 2,518,614 | | | | 2,542,226 | |
| Transaction Network Services, Senior Secured First Lien Initial Term Loan, 5.230%, 02/14/2020 | | | 678,691 | | | | 685,478 | |
| Transaction Network Services, Senior Secured Second Lien Initial Term Loan, 9.230%, 08/14/2020 | | | 1,823,628 | | | | 1,832,746 | |
| Blackstone / GSO Long-Short Credit Income Fund | Portfolio of Investments |
| | June 30, 2017 (Unaudited) |
| | | Principal Amount | | | Value | |
Services ‐ Business (continued) | | | | | | |
| TravelCLICK Inc, Senior Secured Second Lien Initial Term Loan, 8.976%, 11/08/2021 | | $ | 1,818,182 | | | $ | 1,827,273 | |
TRC Companies Inc, Senior Secured First Lien Term Loan, L+4.00%, 05/24/2024(b) | | | 1,500,000 | | | | 1,510,628 | |
| | | | | | | | 38,593,683 | |
| | | | | | | | | |
Services ‐ Consumer ‐ 3.79% | | | | | | | | |
| American Residential Services LLC, Senior Secured First Lien Term Loan, 5.293%, 06/30/2021 | | | 710,652 | | | | 713,321 | |
| Ascend Learning LLC, Senior Secured First Lien Term Loan, 5.726%, 07/31/2019 | | | 951,505 | | | | 953,764 | |
| Ascend Learning LLC, Senior Secured Second Lien Term Loan, 9.726%, 11/30/2020 | | | 1,000,000 | | | | 1,003,440 | |
| Big Jack Holdings LP, Senior Secured First Lien Term Loan B, 5.480%, 03/20/2024 | | | 593,284 | | | | 596,251 | |
KUEHG Corp, Senior Secured First Lien Term B‐2 Loan, 5.046%, 08/12/2022 | | | 1,180,494 | | | | 1,188,615 | |
| NVA Holdings Inc, Senior Secured Second Lien Term Loan, 8.296%, 08/14/2022 | | | 1,297,848 | | | | 1,312,448 | |
| Red Lobster Management LLC, Senior Secured First Lien Initial Term Loan, 6.295%, 07/28/2021 | | | 267,242 | | | | 269,581 | |
| Renaissance Learning Inc, Senior Secured First Lien Initial Term Loan, 5.046%, 04/09/2021 | | | 1,664,294 | | | | 1,672,873 | |
Spin Holdco Inc, Senior Secured First Lien Term B‐1 Loan, L+3.75%, 11/14/2022(b) | | | 548,780 | | | | 546,311 | |
| | | | | | | | 8,256,604 | |
| | | | | | | | | |
Telecommunications ‐ 8.19% | | | | | | | | |
| Alorica Inc, Senior Secured First Lien Term B Loan, 5.976%, 06/30/2022 | | | 722,278 | | | | 727,695 | |
| Centurylink Inc, Senior Secured First Lien Term B Loan, 1.375%, 01/31/2025 | | | 3,982,295 | | | | 3,942,750 | |
| Cologix Holdings Inc, Senior Secured Second Lien Initial Term Loan, 8.216%, 03/20/2025 | | | 1,523,309 | | | | 1,537,278 | |
| Digicel International Finance Limited, Senior Secured First Lien Term Loan, 4.940%, 05/27/2024 | | | 838,323 | | | | 845,005 | |
| Fairpoint Communications Inc, Senior Secured First Lien Term Loan, 7.500%, 02/14/2019 | | | 316,777 | | | | 317,437 | |
Greeneden US Holdings II LLC, Senior Secured 2017 Incremental First Lien Term Loan, L+3.75%, 12/01/2023(b) | | | 461,598 | | | | 463,791 | |
| GTT Communications Inc, Senior Secured First Lien Initial Term Loan, 5.250%, 01/09/2024 | | | 412,435 | | | | 414,757 | |
| Masergy Holdings Inc, Senior Secured First Lien 2017 Replacement Term Loan, 5.046%, 12/15/2023 | | | 617,054 | | | | 621,682 | |
| Masergy Holdings Inc, Senior Secured Second Lien Initial Term Loan, 9.796%, 12/16/2024 | | | 500,000 | | | | 506,250 | |
| Tierpoint LLC, Senior Secured First Lien Term Loan, 4.976%, 05/06/2024 | | | 1,818,400 | | | | 1,822,946 | |
| Vertiv Group Corporation, Senior Secured First Lien Term B Loan, 5.226%, 11/30/2023 | | | 3,147,355 | | | | 3,165,059 | |
Windstream Services LLC, Senior Secured First Lien New Tranche B‐6 Term Loan, 5.210%, 03/29/2021 | | | 3,505,870 | | | | 3,504,397 | |
| | | | | | | | 17,869,047 | |
| | | | | | | | | |
Transportation Cargo ‐ 0.26% | | | | | | | | |
| REP WWEX Acquisition Parent LLC, Senior Secured First Lien Term Loan, 5.672%, 02/03/2025 | | | 572,336 | | | | 576,154 | |
| | | | | | | | | |
Transportation Consumer ‐ 1.60% | | | | | | | | |
| Air Medical Group Holdings Inc, Senior Secured First Lien 2016 New Term Loan, 5.159%, 04/28/2022 | | | 479,032 | | | | 477,895 | |
| Lineage Logistics LLC, Senior Secured First Lien Term Loan, 4.726%, 04/07/2021 | | | 3,014,983 | | | | 3,022,536 | |
| | | | | | | | 3,500,431 | |
| | | | | | | | | |
Utilities Electric ‐ 4.12% | | | | | | | | |
| Eastern Power LLC, Senior Secured First Lien Term Loan, 5.226%, 10/02/2023 | | | 883,612 | | | | 880,961 | |
Exgen Texas Power LLC, Senior Secured First Lien Term Loan Non‐PIK, 6.046%, 09/20/2021 | | | 989,663 | | | | 600,513 | |
| Granite Acquisition Inc, Senior Secured Second Lien Term B Loan, 8.546%, 12/19/2022 | | | 2,421,507 | | | | 2,411,821 | |
Green Energy Partners / Stonewall LLC, Senior Secured First Lien Term B‐1 Conversion Advance Loan, 6.796%, 11/13/2021 | | | 500,000 | | | | 465,000 | |
| Helix Gen Funding LLC, Senior Secured First Lien Term Loan, 4.960%, 06/03/2024 | | | 594,750 | | | | 599,107 | |
Panda Liberty LLC, Senior Secured First Lien Construction B‐1 Facility Term Loan, 7.796%, 08/21/2020 | | | 1,450,698 | | | | 1,344,623 | |
| Semi-Annual Report | June 30, 2017 | 25 |
| Blackstone / GSO Long-Short Credit Income Fund | Portfolio of Investments |
| | June 30, 2017 (Unaudited) |
| | | Principal Amount | | | Value | |
| Utilities Electric (continued) | | | | | | |
| | | | | | | |
Panda Patriot LLC (fka Moxie Patriot LLC), Senior Secured First Lien Construction B‐1 Facility Term Loan, 7.046%, 12/18/2020 | | $ | 721,432 | | | $ | 666,423 | |
| Pike Corporation, Senior Secured First Lien Initial Term Loan, 4.980%, 03/08/2024 | | | 462,417 | | | | 469,064 | |
| Sandy Creek Energy Associates LP, Senior Secured First Lien Term Loan, 5.296%, 11/09/2020 | | | 2,025,794 | | | | 1,543,412 | |
| | | | | | | | 8,980,924 | |
| | | | | | | | | |
| TOTAL FLOATING RATE LOAN INTERESTS (Cost $284,255,409) | | | | | | | 281,007,829 | |
| | | | | | | | | |
CORPORATE BONDS ‐ 25.71% | | | | | | | | |
Automotive ‐ 0.26% | | | | | | | | |
Omega US Sub LLC, Senior Unsecured Bond, 8.750%, 07/15/2023(c) | | | 530,000 | | | | 563,125 | |
| | | | | | | | | |
Banking, Finance, Insurance and Real Estate ‐ 3.35% | | | | | | | | |
| Fly Leasing Limited, Senior Unsecured Bond, 6.750%, 12/15/2020 | | | 500,000 | | | | 525,625 | |
HUB International Ltd, Senior Unsecured Bond, 8.125%, 07/15/2019(c)(d) | | | 2,025,000 | | | | 2,032,594 | |
National Financial Partners Corp, Senior Unsecured Bond, 9.000%, 07/15/2021(c) | | | 1,300,000 | | | | 1,364,675 | |
Onex York Acquisition Co, Senior Unsecured Bond, 8.500%, 10/01/2022(c) | | | 3,500,000 | | | | 3,386,250 | |
| | | | | | | | 7,309,144 | |
| | | | | | | | | |
Beverage, Food and Tobacco ‐ 1.75% | | | | | | | | |
| CEC Entertainment Inc, Senior Unsecured Bond, 8.000%, 02/15/2022 | | | 345,000 | | | | 361,387 | |
PF Chang's China Bistro Inc, Senior Unsecured Bond, 10.250%, 06/30/2020(c) | | | 3,377,000 | | | | 3,452,983 | |
| | | | | | | | 3,814,370 | |
| | | | | | | | | |
Capital Equipment ‐ 1.03% | | | | | | | | |
| Diebold Inc, Senior Unsecured Bond, Series WI, 8.500%, 04/15/2024 | | | 500,000 | | | | 561,300 | |
Hardwoods Acquisition Inc, Senior Secured Bond, 7.500%, 08/01/2021(c) | | | 289,000 | | | | 259,377 | |
NWH Escrow Corp, Senior Secured Bond, 7.500%, 08/01/2021(c) | | | 1,600,000 | | | | 1,432,000 | |
| | | | | | | | 2,252,677 | |
| | | | | | | | | |
Construction and Building ‐ 4.98% | | | | | | | | |
Builders FirstSource Inc, Senior Unsecured Bond, 10.750%, 08/15/2023(c) | | | 2,020,000 | | | | 2,338,150 | |
FBM Finance Inc, Senior Secured Bond, 8.250%, 08/15/2021(c) | | | 1,590,000 | | | | 1,711,237 | |
Great Lakes Dredge & Dock, Senior Unsecured Bond, 8.000%, 05/15/2022(c) | | | 1,835,000 | | | | 1,873,994 | |
PriSo Acquisition Corp / Building Pro, Senior Unsecured Bond, 9.000%, 05/15/2023(c) | | | 3,477,000 | | | | 3,633,465 | |
Zachry Holdings Inc, Senior Unsecured Bond, 7.500%, 02/01/2020(c) | | | 1,250,000 | | | | 1,293,750 | |
| | | | | | | | 10,850,596 | |
| | | | | | | | | |
Containers, Packaging and Glass ‐ 1.01% | | | | | | | | |
ARD Finance SA, Senior Unsecured Bond, 7.125%, 09/15/2023(d) | | | 400,000 | | | | 427,960 | |
Coveris Holdings SA, Senior Unsecured Bond, 7.875%, 11/01/2019(c) | | | 331,000 | | | | 327,690 | |
Flex Acquisition Co Inc, Senior Unsecured Bond, 6.875%, 01/15/2025(c) | | | 1,250,000 | | | | 1,302,344 | |
Reynolds GRP ISS / Reynold, Senior Unsecured Bond, 7.000%, 07/15/2024(c) | | | 140,000 | | | | 150,442 | |
| | | | | | | | 2,208,436 | |
| | | | | | | | | |
Energy, Oil and Gas ‐ 1.73% | | | | | | | | |
| Calumet Specialty Prod, Senior Unsecured Bond, 7.750%, 04/15/2023 | | | 1,600,000 | | | | 1,400,000 | |
| Comstock Resources Inc, Senior Unsecured Bond,: | | | | | | | | |
10.000%, 03/15/2020(d) | | | 250,000 | | | | 250,625 | |
9.500%, 06/15/2020(d) | | | 2,149,731 | | | | 1,655,293 | |
| Blackstone / GSO Long-Short Credit Income Fund | Portfolio of Investments |
June 30, 2017 (Unaudited)
| | | Principal Amount | | | Value | |
| Energy, Oil and Gas (continued) | | | | | | |
| CSI Compressco LP / CSI Compressco Finance Inc, Senior Unsecured Bond, 7.250%, 08/15/2022 | | $ | 500,000 | | | $ | 462,500 | |
| | | | | | | | 3,768,418 | |
| | | | | | | | | |
Environmental Industries ‐ 0.22% | | | | | | | | |
GFL Environmental Inc, Senior Unsecured Bond, 9.875%, 02/01/2021(c) | | | 431,000 | | | | 470,868 | |
| | | | | | | | | |
Forest Products and Paper ‐ 0.37% | | | | | | | | |
Tembec Industries Inc, Senior Secured Bond, 9.000%, 12/15/2019(c) | | | 765,000 | | | | 796,174 | |
| | | | | | | | | |
Healthcare and Pharmaceuticals ‐ 1.90% | | | | | | | | |
Endo Finance Co (Endo Luxembourg Finance Co. I S.a.r.l), Senior Unsecured Bond, 5.875%, 10/15/2024(c) | | | 203,000 | | | | 210,105 | |
InVentiv Group Holdings Inc, Senior Unsecured Bond, 7.500%, 10/01/2024(c) | | | 250,000 | | | | 272,500 | |
Surgery Center Holdings Inc, Senior Unsecured Bond, 8.875%, 04/15/2021(c) | | | 1,500,000 | | | | 1,629,375 | |
Tenet Healthcare Corp, Senior Unsecured Bond, 7.000%, 08/01/2025(c) | | | 1,143,000 | | | | 1,141,571 | |
| Valeant Pharmaceuticals International Inc, Senior Unsecured Bond,: | | | | | | | | |
6.500%, 03/15/2022(c) | | | 520,000 | | | | 546,650 | |
7.000%, 03/15/2024(c) | | | 323,000 | | | | 340,361 | |
| | | | | | | | 4,140,562 | |
| | | | | | | | | |
High Tech Industries ‐ 2.26% | | | | | | | | |
| BMC Software Inc, Senior Unsecured Bond, 7.250%, 06/01/2018 | | | 456,000 | | | | 474,240 | |
Global A&T Electronics, Senior Unsecured Bond, 10.000%, 02/01/2019(c) | | | 1,500,000 | | | | 1,125,000 | |
| Infor US Inc, Senior Unsecured Bond, 6.500%, 05/15/2022 | | | 1,000,000 | | | | 1,040,000 | |
j2 Global Inc, Senior Unsecured Bond, 6.000%, 07/15/2025(c) | | | 625,000 | | | | 646,875 | |
Riverbed Technology Inc, Senior Unsecured Bond, 8.875%, 03/01/2023(c) | | | 1,604,000 | | | | 1,636,080 | |
| | | | | | | | 4,922,195 | |
| | | | | | | | | |
Hotels, Gaming and Leisure ‐ 1.36% | | | | | | | | |
Scientific Games International Inc, Senior Secured Bond, 7.000%, 01/01/2022(c) | | | 2,770,000 | | | | 2,956,975 | |
| | | | | | | | | |
Media Advertising, Printing and Publishing ‐ 0.10% | | | | | | | | |
McGraw‐Hill Global Education, Senior Unsecured Bond, 7.875%, 05/15/2024(c) | | | 230,000 | | | | 223,388 | |
| | | | | | | | | |
Media Broadcasting and Subscription ‐ 1.51% | | | | | | | | |
| Cablevision Systems Corp, Senior Unsecured Bond, 8.000%, 04/15/2020 | | | 1,400,000 | | | | 1,562,750 | |
Cequel Communications Holdings I, Senior Unsecured Bond, 5.125%, 12/15/2021(c) | | | 1,500,000 | | | | 1,535,145 | |
Radiate Holdco LLC, Senior Unsecured Bond, 6.625%, 02/15/2025(c) | | | 190,000 | | | | 190,475 | |
| | | | | | | | 3,288,370 | |
| | | | | | | | | |
Media Diversified and Production ‐ 0.33% | | | | | | | | |
Gray Television Inc, Senior Unsecured Bond, 5.125%, 10/15/2024(c) | | | 720,000 | | | | 729,000 | |
| | | | | | | | | |
Services ‐ Business ‐ 0.55% | | | | | | | | |
Infinity ACQ LLC / FI Corp, Senior Unsecured Bond, 7.250%, 08/01/2022(c) | | | 1,250,000 | | | | 1,209,375 | |
| | | | | | | | | |
Telecommunications ‐ 2.21% | | | | | | | | |
Avaya Inc, Senior Secured Bond, 7.000%, 04/01/2019(c)(e) | | | 316,000 | | | | 255,170 | |
Digicel Limited, Senior Unsecured Bond, 6.000%, 04/15/2021(c) | | | 750,000 | | | | 721,875 | |
Fairpoint Communications Inc, Senior Secured Bond, 8.750%, 08/15/2019(c) | | | 2,580,000 | | | | 2,653,788 | |
| Frontier Communications, Senior Unsecured Bond, 10.500%, 09/15/2022 | | | 1,250,000 | | | | 1,195,312 | |
| | | | | | | | 4,826,145 | |
| Semi-Annual Report | June 30, 2017 | 27 |
| Blackstone / GSO Long-Short Credit Income Fund | Portfolio of Investments |
June 30, 2017 (Unaudited)
| | | Principal Amount | | | Value | |
Transportation Consumer ‐ 0.79% | | | | | | |
Air Canada, Senior Unsecured Bond, 7.750%, 04/15/2021(c) | | $ | 1,500,000 | | | $ | 1,725,000 | |
| | | | | | | | | |
| TOTAL CORPORATE BONDS (Cost $54,833,286) | | | | | | | 56,054,818 | |
| | | | | | | | | |
| | | Shares | | | | | |
COMMON STOCK ‐ 0.30% | | | | | | | | |
Energy, Oil and Gas ‐ 0.30% | | | | | | | | |
SandRidge Energy Inc(f) | | | 37,842 | | | $ | 651,261 | |
| | | | | | | | | |
| TOTAL COMMON STOCK (Cost $1,750,000) | | | | | | | 651,261 | |
| | | | | | | | | |
RIGHTS AND WARRANTS ‐ 0.01% | | | | | | | | |
Energy, Oil and Gas ‐ 0.01% | | | | | | | | |
Comstock Resources Inc, expires 9/2/2018 at $0.01(f) | | | 3,438 | | | | 24,272 | |
| | | | | | | | | |
| TOTAL RIGHTS AND WARRANTS (Cost $–) | | | | | | | 24,272 | |
| | | | | | | | | |
Total Investments ‐ 154.87% (Cost $340,838,695) | | | | | | | 337,738,180 | |
| | | | | | | | | |
Other Assets in Excess of Liabilities ‐ 2.05% | | | | | | | 4,478,254 | |
| | | | | | | | | |
Mandatory Redeemable Preferred Shares ‐ (9.23)% | | | | | | | | |
| (liquidation preference plus distributions payable on term preferred shares) | | | | | | | (20,131,634 | ) |
| | | | | | | | | |
Leverage Facility ‐ (47.69)% | | | | | | | (104,000,000 | ) |
| | | | | | | | | |
Net Assets ‐ 100.00% | | | | | | $ | 218,084,800 | |
Amounts above are shown as a percentage of net assets as of June 30, 2017.
(a) | The interest rate shown represents the rate at period end. |
(b) | All or a portion of this position has not settled as of June 30, 2017. The interest rate shown represents the stated spread over the London Interbank Offered Rate (“LIBOR” or “L”) or the applicable LIBOR floor; the Fund will not accrue interest until the settlement date, at which point LIBOR will be established. |
(c) | Security exempt from registration under Rule 144A of the Securities Act of 1933. Total market value of Rule 144A securities amounts to $46,137,826, which represents approximately 21.16% of net assets as of June 30, 2017. Such securities may normally be sold to qualified institutional buyers in transactions exempt from registration. |
(d) | Option to convert to pay-in-kind security. |
(e) | Security is in default as of period end and is therefore non-income producing. |
(f) | Non-income producing security. |
See Notes to Financial Statements.
| Blackstone / GSO Strategic Credit Fund | Portfolio of Investments |
June 30, 2017 (Unaudited)
| | | Principal Amount | | | Value | |
FLOATING RATE LOAN INTERESTS(a) ‐ 127.09% | | | | | | |
Aerospace and Defense ‐ 0.27% | | | | | | |
Engility Corporation, Senior Secured First Lien Term B‐2 Loan, 4.976%, 08/12/2023 | | $ | 2,058,500 | | | $ | 2,083,861 | |
| | | | | | | | | |
Automotive ‐ 3.70% | | | | | | | | |
| American Tire Distributors Inc, Senior Secured First Lien Initial Term Loan, 5.476%, 09/01/2021 | | | 1,573,936 | | | | 1,584,269 | |
Bright Bidco BV, Senior Secured First Lien Term B Loan, L+4.50%, 03/15/2024(b) | | | 3,650,190 | | | | 3,707,224 | |
| CH Hold Corp, Senior Secured Second Lien Initial Term Loan, 8.476%, 02/03/2025 | | | 3,157,895 | | | | 3,246,711 | |
| Dealer Tire LLC, Senior Secured First Lien Initial Term Loan, 5.063%, 12/22/2021 | | | 4,381,744 | | | | 4,447,470 | |
Mitchell International Inc, Senior Secured First Lien Initial Term Loan, L+3.50%, 10/13/2020(b) | | | 1,081,081 | | | | 1,089,195 | |
| Mitchell International Inc, Senior Secured Second Lien Term Loan, 8.672%, 10/11/2021 | | | 6,559,757 | | | | 6,629,454 | |
| Superior Industries International Inc, Senior Secured First Lien Closing Date Term Loan, 5.787%, 03/22/2024 | | | 7,500,000 | | | | 7,481,250 | |
| | | | | | | | 28,185,573 | |
| | | | | | | | | |
Banking, Finance, Insurance and Real Estate ‐ 9.29% | | | | | | | | |
| Acrisure LLC, Senior Secured First Lien Term B Loan, 6.296%, 11/22/2023 | | | 4,292,032 | | | | 4,341,197 | |
| Alliant Holdings Intermediate LLC, Senior Secured First Lien Initial Term Loan, 4.417%, 08/12/2022 | | | 2,547,943 | | | | 2,548,669 | |
| Almonde Inc, Senior Secured First Lien US Term Loan, 4.736%, 06/13/2024 | | | 8,150,943 | | | | 8,161,580 | |
| AmWINS Group Inc, Second Lien Term Loan, 7.976%, 01/25/2025 | | | 406,780 | | | | 415,932 | |
| ASP MCS Acquisition Corp, Senior Secured First Lien Initial Term Loan, 5.959%, 05/18/2024 | | | 6,050,420 | | | | 6,156,303 | |
| Asurion LLC, Senior Secured Second Lien Term Loan, 8.726%, 03/03/2021 | | | 5,763,158 | | | | 5,799,178 | |
| Broadstreet Partners Inc, Senior Secured First Lien Initial Term Loan, 5.476%, 11/08/2023 | | | 4,368,293 | | | | 4,436,547 | |
| Cunningham Lindsey US Inc, Senior Secured First Lien Initial Term Loan, 5.046%, 12/10/2019 | | | 8,769,392 | | | | 7,958,223 | |
| Cypress Merger Sub Inc, Senior Secured Second Lien Initial Term Loan, 7.976%, 04/28/2025 | | | 2,790,698 | | | | 2,867,442 | |
| EZE Software Group LLC, Senior Secured Second Lien Term Loan, 7.796%, 04/05/2021 | | | 2,956,466 | | | | 2,962,024 | |
| First Eagle Holdings Inc, Senior Secured First Lien New Initial Term Loan, 4.796%, 12/01/2022 | | | 5,233,750 | | | | 5,291,976 | |
Focus Financial Partners LLC, Senior Secured First Lien Term Loan, L+3.25%, 05/19/2024(b) | | | 3,488,372 | | | | 3,519,628 | |
| MPH Acquisition Holdings LLC, Senior Secured First Lien Initial Term Loan, 4.296%, 06/07/2023 | | | 5,086,556 | | | | 5,093,703 | |
NFP Corp, Senior Secured First Lien Term B Term Loan, L+3.50%, 01/08/2024(b) | | | 2,693,651 | | | | 2,704,170 | |
| Opal Acquisition Inc, Senior Secured First Lien Term B Loan, 5.236%, 11/27/2020 | | | 2,399,523 | | | | 2,233,068 | |
| Resolute Investment Managers Inc, Senior Secured First Lien Initial Term Loan, 5.546%, 04/30/2022 | | | 3,007,537 | | | | 3,030,094 | |
| Victory Capital Operating LLC, Senior Secured First Lien Initial Term Loan, 8.796%, 10/29/2021 | | | 1,973,476 | | | | 2,005,545 | |
| York Risk Services Holding Corp (Onex York Finance LP), Senior Secured First Lien Initial Term Loan, 4.976%, 10/01/2021 | | | 1,266,658 | | | | 1,241,958 | |
| | | | | | | | 70,767,237 | |
| | | | | | | | | |
Beverage, Food and Tobacco ‐ 5.45% | | | | | | | | |
| Americold Realty Operating Partnership LP, Senior Secured First Lien Initial Term Loan, 4.976%, 12/01/2022 | | | 1,145,653 | | | | 1,163,554 | |
| Candy Intermediate Holdings Inc, Senior Secured First Lien Initial Term Loan, 5.796%, 06/15/2023 | | | 5,474,614 | | | | 5,265,922 | |
| CEC Entertainment Inc, Senior Secured First Lien Term B Loan, 4.226%, 02/15/2021 | | | 3,938,931 | | | | 3,928,276 | |
| Chobani LLC, Senior Secured First Lien Closing Date Term Loan, 5.476%, 10/09/2023 | | | 7,452,877 | | | | 7,518,127 | |
Constellation Brands Canada Inc, Senior Secured First Lien Initial Tranche B‐1 Term Loan, 5.000%, 12/15/2023 | | | 1,377,692 | | | | 1,389,747 | |
| CSM Bakery Solutions LLC, Senior Secured First Lien Term Loan, 5.150%, 07/03/2020 | | | 2,500,000 | | | | 2,382,812 | |
| NPC International Inc, Senior Secured First Lien Initial Term Loan, 4.716%, 04/19/2024 | | | 3,934,426 | | | | 3,971,331 | |
| NPC International Inc, Senior Secured Second Lien Initial Term Loan, 8.716%, 04/18/2025 | | | 3,254,237 | | | | 3,303,051 | |
| TKC Holdings Inc, Senior Secured First Lien Term Loan, 5.376%, 02/01/2023 | | | 3,869,009 | | | | 3,867,809 | |
| TKC Holdings Inc, Senior Secured Second Lien Initial Term Loan, 9.126%, 02/01/2024 | | | 1,838,854 | | | | 1,846,513 | |
| Semi-Annual Report | June 30, 2017 | 29 |
| Blackstone / GSO Strategic Credit Fund | Portfolio of Investments |
June 30, 2017 (Unaudited)
| | | Principal Amount | | | Value | |
| Beverage, Food and Tobacco (continued) | | | | | | |
Weight Watchers International Inc, Senior Secured First Lien Initial Tranche B‐2 Term Loan, 4.470%, 04/02/2020 | | $ | 4,796,081 | | | $ | 4,629,442 | |
| Winebow Holdings Inc, Senior Secured Second Lien Initial Term Loan, 8.726%, 01/03/2022 | | | 2,387,283 | | | | 2,232,110 | |
| | | | | | | | 41,498,694 | |
| | | | | | | | | |
Capital Equipment ‐ 1.49% | | | | | | | | |
| Duke Finance LLC, Senior Secured First Lien Term B Loan, 6.296%, 02/21/2024 | | | 2,770,833 | | | | 2,810,664 | |
| LTI Holdings Inc, Senior Secured Second Lien Initial Term Loan, 9.922%, 05/16/2025 | | | 3,000,000 | | | | 2,947,500 | |
| Meter Readings Holding LLC, Senior Secured First Lien Initial Term Loan, 6.952%, 08/29/2023 | | | 5,553,965 | | | | 5,609,504 | |
| | | | | | | | 11,367,668 | |
| | | | | | | | | |
Chemicals, Plastics and Rubber ‐ 2.03% | | | | | | | | |
| DuBois Chemicals Inc, Senior Secured First Lien Delayed Draw Term Loan, 5.000%, 03/15/2024 | | | 322,236 | | | | 324,655 | |
| DuBois Chemicals Inc, Senior Secured First Lien Initial Term Loan, 4.909%, 03/15/2024 | | | 1,299,256 | | | | 1,309,007 | |
| Emerald Performance Materials LLC, Senior Secured First Lien Initial Term Loan, 4.726%, 08/02/2021 | | | 1,747,085 | | | | 1,762,643 | |
| Pinnacle Operating Corporation, Senior Secured First Lien 2017 Extended Term Loan, 8.476%, 11/15/2021 | | | 7,941,857 | | | | 7,376,000 | |
Tekni‐Plex Inc, Senior Secured Second Lien Initial Term Loan, 8.976%, 06/01/2023 | | | 2,141,827 | | | | 2,147,181 | |
Venator Materials LLC, Senior Secured First Lien Term B Loan, L+3.00%, 06/28/2024(b) | | | 2,500,000 | | | | 2,512,500 | |
| | | | | | | | 15,431,986 | |
| | | | | | | | | |
Construction and Building ‐ 9.82% | | | | | | | | |
| American Bath Group LLC, Senior Secured First Lien Replacement Term Loan, 6.546%, 09/30/2023 | | | 8,849,735 | | | | 8,968,676 | |
| American Bath Group LLC, Senior Secured Second Lien Term Loan, 11.046%, 09/30/2024 | | | 600,000 | | | | 595,500 | |
| Dayton Superior Corporation, Senior Secured First Lien Term Loan, 9.296%, 11/03/2021 | | | 4,256,389 | | | | 4,277,671 | |
| Diversitech Holdings Inc, Senior Secured First Lien Term Loan, 4.702%, 06/01/2024 | | | 1,271,523 | | | | 1,274,708 | |
Forterra Finance LLC, Senior Secured First Lien Replacement Loan, L+3.00%, 10/25/2023(b) | | | 5,701,348 | | | | 5,392,877 | |
| GYP Holdings III Corp, Senior Secured First Lien 2017 Incremental First Lien Term Loan, 4.142%, 04/01/2023 | | | 935,065 | | | | 938,866 | |
| HNC Holdings Inc, Senior Secured First Lien Initial Term Loan, 5.726%, 10/05/2023 | | | 2,268,394 | | | | 2,304,552 | |
| Interior Logic Group Inc, Senior Secured First Lien Initial Term Loan, 7.210%, 02/28/2024 | | | 3,526,786 | | | | 3,517,969 | |
| IPS Structural Adhesive Holdings Inc, Senior Secured First Lien Initial Term Loan, 6.466%, 12/20/2023 | | | 6,407,093 | | | | 6,439,128 | |
| IPS Structural Adhesive Holdings Inc, Senior Secured Second Lien Initial Term Loan, 10.716%, 12/14/2024 | | | 2,250,000 | | | | 2,250,000 | |
| LBM Borrower LLC, Senior Secured First Lien Initial Term Loan, 6.546%, 08/20/2022 | | | 8,277,507 | | | | 8,339,588 | |
| LBM Borrower LLC, Senior Secured Second Lien Initial Term Loan, 10.485%, 08/20/2023 | | | 1,713,476 | | | | 1,710,272 | |
| Morsco Inc, Senior Secured First Lien Initial Term Loan, 8.226%, 10/31/2023 | | | 5,925,000 | | | | 5,995,359 | |
| New Arclin US Holding Corp, Senior Secured First Lien Term Loan, 5.670%, 02/14/2024 | | | 5,539,267 | | | | 5,605,046 | |
| Siteone Landscape Supply LLC, Senior Secured First Lien Term Loan, 4.760%, 04/29/2022 | | | 3,081,573 | | | | 3,107,582 | |
SRS Distribution Inc, Senior Secured First Lien Tranche B‐4 Term Loan, 4.297%, 08/25/2022 | | | 7,347,087 | | | | 7,386,136 | |
| SRS Distribution Inc, Senior Secured Second Lien 06/16 Term Loan, 10.046%, 02/24/2023 | | | 3,125,114 | | | | 3,211,055 | |
| VC GB Holdings Inc, Senior Secured First Lien Term Loan, 4.976%, 02/28/2024 | | | 1,845,468 | | | | 1,846,621 | |
| Wilsonart LLC, Senior Secured First Lien Tranche C Term Loan, 4.800%, 12/19/2023 | | | 1,640,110 | | | | 1,647,490 | |
| | | | | | | | 74,809,096 | |
| | | | | | | | | |
Consumer Goods Durable ‐ 2.21% | | | | | | | | |
| Apex Tool Group LLC, Senior Secured First Lien Term Loan, 4.500%, 01/31/2020 | | | 1,691,711 | | | | 1,652,946 | |
Culligan Holding Inc, Senior Secured First Lien Tranche B‐1 Term Loan, 5.159%, 12/13/2023 | | | 2,868,627 | | | | 2,897,314 | |
| Hercules Achievement Inc, Senior Secured First Lien Initial Term Loan, 4.726%, 12/13/2021 | | | 4,875,000 | | | | 4,907,906 | |
| Hillman Group Inc (The), Senior Secured First Lien Initial Term Loan, 4.796%, 06/30/2021 | | | 1,480,916 | | | | 1,492,030 | |
| MND Holdings III Corp, Senior Secured First Lien Term Loan, 5.796%, 06/19/2024 | | | 694,444 | | | | 700,521 | |
| Blackstone / GSO Strategic Credit Fund | Portfolio of Investments |
June 30, 2017 (Unaudited)
| | | Principal Amount | | | Value | |
| Consumer Goods Durable (continued) | | | | | | |
Power Products LLC, Senior Secured First Lien Term B Loan, L+4.00%, 12/20/2022(b) | | $ | 2,052,733 | | | $ | 2,059,148 | |
| Zodiac Pool Solutions LLC (f/k/a Piscine US Acquisition LLC), Senior Secured Repriced First Lien Term Loan, 5.296%, 12/20/2023 | | | 3,077,339 | | | | 3,108,112 | |
| | | | | | | | 16,817,977 | |
| | | | | | | | | |
| Consumer Goods Non Durable ‐ 1.00% | | | | | | | | |
Acosta Inc, Senior Secured First Lien Tranche B‐1 Loan, L+3.25%, 09/26/2021(b) | | | 1,600,000 | | | | 1,441,600 | |
| Arctic Glacier USA Inc, Senior Secured First Lien Initial Term Loan, 5.476%, 03/20/2024 | | | 2,163,253 | | | | 2,190,294 | |
Sally Holdings LLC, Senior Secured First Lien Term B Loan, L+4.50%, 06/23/2024(b) | | | 4,000,000 | | | | 4,015,000 | |
| | | | | | | | 7,646,894 | |
| | | | | | | | | |
| Containers, Packaging and Glass ‐ 2.21% | | | | | | | | |
| Berlin Packaging LLC, Senior Secured Retired First Lien Term B Loan, 4.432%, 10/01/2021 | | | 1,858,923 | | | | 1,865,745 | |
| Berlin Packaging LLC, Senior Secured Second Lien Initial Term Loan, 7.810%, 10/03/2022 | | | 428,571 | | | | 434,284 | |
| Caraustar Industries Inc, Senior Secured First Lien Refinancing Term Loan, 6.796%, 03/14/2022 | | | 2,097,547 | | | | 2,101,480 | |
| Charter Nex US Inc, Senior Secured First Lien Term B‐3 Loan, 4.476%, 05/16/2024 | | | 2,891,566 | | | | 2,896,540 | |
| Consolidated Container Company LLC, Senior Secured First Lien initial Term Loan, 4.726%, 05/22/2024 | | | 2,080,925 | | | | 2,094,368 | |
| IBC Capital Limited, Senior Secured Second Lien Term Loan, 8.228%, 09/09/2022 | | | 2,310,794 | | | | 2,154,816 | |
| Plaze Inc, Senior Secured First Lien Term Loan, 4.761%, 07/31/2022 | | | 1,484,937 | | | | 1,496,074 | |
| Pregis Holding I Corporation, Senior Secured First Lien Initial Term Loan, 4.796%, 05/20/2021 | | | 2,471,748 | | | | 2,479,472 | |
| ProAmpac PG Borrower LLC, Senior Secured First Lien Initial Loan, 5.179%, 11/20/2023 | | | 1,267,404 | | | | 1,284,634 | |
| | | | | | | | 16,807,413 | |
| | | | | | | | | |
| Energy, Oil and Gas ‐ 3.79% | | | | | | | | |
| Ascent Resources ‐ Marcellus LLC, Senior Secured First Lien Term Loan, 5.250%, 08/04/2020 | | | 6,996,764 | | | | 4,507,070 | |
| Brock Holdings III Inc, Senior Secured Second Lien Initial Term Loan, 11.500%, 03/16/2018 | | | 3,833,333 | | | | 3,780,624 | |
| Chief Exploration & Development LLC, Senior Secured Second Lien Term Loan, 7.932%, 05/17/2021 | | | 752,941 | | | | 728,471 | |
| Crestwood Holdings LLC, Senior Secured First Lien Tranche B‐1 Term Loan, 9.209%, 06/19/2019 | | | 4,981,943 | | | | 4,882,304 | |
| Jonah Energy Inc, Senior Secured Second Lien Initial Term Loan, 7.726%, 05/12/2021 | | | 7,246,575 | | | | 6,941,640 | |
| Sheridan Investment Partners I LLC, Senior Secured First Lien Tranche B‐2 Term Loan, 4.590%, 10/01/2019 | | | 3,108,639 | | | | 2,634,571 | |
| Sheridan Production Partners I LLC, Senior Secured First Lien Deferred Principal Term Loan,: | | | | | | | | |
| 0.000%, 01/01/2030 | | | 9,732 | | | | 7,352 | |
| 0.000%, 01/01/2030 | | | 120,242 | | | | 90,843 | |
| Sheridan Production Partners I LLC, Senior Secured First Lien Term Loan, 0.000%, 01/01/2030 | | | 15,933 | | | | 12,037 | |
| Sheridan Production Partners I‐A LP, Senior Secured First Lien Tranche B‐2 Term Loan, 4.730%, 10/01/2019 | | | 411,920 | | | | 349,102 | |
| Sheridan Production Partners I‐M LP, Senior Secured First Lien Tranche B‐2 Term Loan, 4.600%, 10/01/2019 | | | 251,603 | | | | 213,234 | |
| Talos Production LLC, Senior Secured First Lien Bridge Loan, 11.000%, 04/03/2022 | | | 2,000,000 | | | | 1,870,000 | |
| Utex Industries Inc, Senior Secured Second Lien New Term Loan, 8.476%, 05/23/2022 | | | 3,181,818 | | | | 2,830,832 | |
| | | | | | | | 28,848,080 | |
| | | | | | | | | |
| Environmental Industries ‐ 1.33% | | | | | | | | |
| EnergySolutions LLC, Senior Secured First Lien Advance Term Loan, 6.980%, 05/29/2020 | | | 6,312,727 | | | | 6,367,963 | |
| Infiltrator Water Technologies LLC, Senior Secured First Lien Term B‐1 Loan, 4.796%, 05/27/2022 | | | 3,725,784 | | | | 3,753,728 | |
| | | | | | | | 10,121,691 | |
| Semi-Annual Report | June 30, 2017 | 31 |
| Blackstone / GSO Strategic Credit Fund | Portfolio of Investments |
June 30, 2017 (Unaudited)
| | | Principal Amount | | | Value | |
| Forest Products and Paper ‐ 0.08% | | | | | | |
| W/S Packaging Group Inc, Senior Secured First Lien Term Loan, 8.250%, 08/09/2019 | | $ | 628,166 | | | $ | 582,623 | |
| | | | | | | | | |
| Healthcare and Pharmaceuticals ‐ 21.44% | | | | | | | | |
| Albany Molecular Research Inc, Senior Secured First Lien Term Loan, 5.906%, 07/16/2021 | | | 3,257,220 | | | | 3,272,838 | |
| Alvogen Pharma US Inc, Senior Secured First Lien Term Loan, 6.230%, 04/01/2022 | | | 9,721,450 | | | | 9,587,779 | |
| American Renal Holdings Inc, Senior Secured First Lien New Term Loan B, L+3.25%, | | | | | | | | |
06/14/2024(b) | | | 5,869,565 | | | | 5,871,414 | |
| Amneal Pharmaceuticals LLC, Senior Secured First Lien Term B Loan, 4.796%, 11/01/2019 | | | 1,108,687 | | | | 1,117,695 | |
| Arbor Pharmaceuticals LLC, Senior Secured First Lien Initial Term Loan, 6.296%, 07/05/2023 | | | 5,017,594 | | | | 5,076,125 | |
| Avantor Performance Materials Holdings Inc, Senior Secured First Lien Initial Term Loan, | | | | | | | | |
| 5.230%, 03/11/2024 | | | 11,565,503 | | | | 11,604,074 | |
| Avantor Performance Materials Holdings Inc, Senior Secured Second Lien Initial Term Loan, | | | | | | | | |
| 9.480%, 03/10/2025 | | | 2,460,367 | | | | 2,498,811 | |
| BioClinica‐Clinverse Holdings Corp, Senior Secured First Lien Initial Term Loan, 5.375%, | | | | | | | | |
| 10/20/2023 | | | 3,806,957 | | | | 3,739,155 | |
| BioClinica‐Clinverse Holdings Corp, Senior Secured Second Lien Initial Term Loan, 9.375%, | | | | | | | | |
| 10/04/2024 | | | 3,157,898 | | | | 3,094,740 | |
| CHG Healthcare Services Inc, Senior Secured First Lien Term B Loan, 4.422%, 06/07/2023 | | | 4,087,543 | | | | 4,131,832 | |
| Concordia Healthcare Corp, Senior Secured First Lien Dollar Term Loan, 5.501%, 10/21/2021 | | | 5,298,598 | | | | 3,973,949 | |
| CPI Holdco LLC, Senior Secured Closing Date Term Loan, 5.300%, 03/21/2024 | | | 1,704,142 | | | | 1,714,793 | |
| CT Technologies Intermediate Holdings Inc, Senior Secured First Lien Initial Term Loan, | | | | | | | | |
| 5.476%, 12/01/2021 | | | 2,971,055 | | | | 2,967,341 | |
| Endo Luxembourg Finance Company l Sarl, Senior Secured First Lien Initial Term Loan, | | | | | | | | |
| 5.500%, 04/29/2024 | | | 12,931,034 | | | | 13,072,500 | |
| Equian Buyer Corp (Fka Aeneas Buyer Corp), Senior Secured Delayed Draw Term Loan, | | | | | | | | |
| 1.000%, 05/20/2024 | | | 2,145,539 | | | | 2,164,988 | |
| Equian Buyer Corp (Fka Aeneas Buyer Corp), Senior Secured First Lien Initial Term Loan, | | | | | | | | |
| 4.928%, 05/20/2024 | | | 6,973,002 | | | | 7,036,212 | |
| Genoa a QoL Healthcare Company LLC, Senior Secured First Lien Initial Term Loan, 4.976%, | | | | | | | | |
| 10/30/2023 | | | 1,173,703 | | | | 1,180,452 | |
| Global Healthcare Exchange LLC, Senior Secured First Lien Initial Term Loan, 5.250%, | | | | | | | | |
| 08/15/2022 | | | 987,512 | | | | 989,161 | |
| Greenway Health LLC, Senior Secured First Lien Term Loan, 6.050%, 02/16/2024 | | | 3,103,448 | | | | 3,118,965 | |
| Horizon Pharma Inc, Senior Secured First Lien Second Amendment Refinancing Term Loan, | | | | | | | | |
| 4.875%, 03/29/2024 | | | 2,200,368 | | | | 2,211,919 | |
Immucor Inc, Senior Secured First Lien Term Loan, L+5.00%, 06/25/2021(b) | | | 346,154 | | | | 349,759 | |
Inc Research Holdings Inc, Senior Secured First Lien Term B Loan, L+2.25%, 06/28/2024(b) | | | 4,790,419 | | | | 4,803,904 | |
| Lanai Holdings III Inc, Senior Secured First Lien Initial Term Loan, 5.976%, 08/29/2022 | | | 5,356,969 | | | | 5,249,830 | |
| Netsmart Technologies Inc, Senior Secured First Lien Term C‐1 Loan, 5.796%, 04/19/2023 | | | 5,658,362 | | | | 5,700,800 | |
| nThrive Inc, Senior Secured First Lien Term B‐2 Loan, 5.726%, 10/20/2022 | | | 6,476,488 | | | | 6,519,006 | |
| Onex Carestream Finance LP, Senior Secured First Lien Term Loan, 5.296%, 06/07/2019 | | | 1,085,180 | | | | 1,080,660 | |
| Onex Carestream Finance LP, Senior Secured Second Lien Term Loan, 9.796%, 12/09/2019 | | | 13,360,375 | | | | 13,126,568 | |
| Onex Schumacher Finance LP, Senior Secured First Lien Initial Term Loan, 5.226%, | | | | | | | | |
| 07/29/2022 | | | 5,479,837 | | | | 5,491,235 | |
| Ortho Clinical Diagnostics Inc, Senior Secured First Lien Initial Term Loan, 5.046%, | | | | | | | | |
| 06/30/2021 | | | 1,660,900 | | | | 1,654,364 | |
| Packaging Coordinators Midco Inc, Senior Secured First Lien Initial Term Loan, 5.150%, | | | | | | | | |
| 06/30/2023 | | | 5,174,172 | | | | 5,174,172 | |
| Press Ganey Holdings Inc, Senior Secured Second Lien Initial Term Loan, 8.476%, 10/21/2024 | | | 2,500,000 | | | | 2,562,500 | |
| Project Ruby Ultimate Parent Corp, Senior Secured First Lien Closing Date Term Loan, | | | | | | | | |
| 4.795%, 02/09/2024 | | | 1,504,632 | | | | 1,509,334 | |
| Sterigenics‐Nordion Holdings LLC, Senior Secured First Lien New Term B Loan, 4.150%, | | | | | | | | |
| 05/16/2022 | | | 1,340,695 | | | | 1,338,181 | |
| Stratose Intermediate Holdings II LLC, Senior Secured First Lien Term Loan, L+5.00%, | | | | | | | | |
01/26/2022(b) | | | 2,342,342 | | | | 2,361,374 | |
| Surgery Center Holdings Inc, Senior Secured First Lien Initial Term Loan, 4.830%, 11/03/2020 | | | 5,037,705 | | | | 5,067,629 | |
| Blackstone / GSO Strategic Credit Fund | Portfolio of Investments |
June 30, 2017 (Unaudited)
| | | Principal Amount | | | Value | |
| Healthcare and Pharmaceuticals (continued) | | | | | | |
| U.S. Anesthesia Partners Inc, Senior Secured First Lien Initial Term Loan, L+3.25%, | | | | | | |
06/23/2024(b) | | $ | 5,871,560 | | | $ | 5,885,005 | |
| U.S. Renal Care Inc, Senior Secured First Lien Initial Term Loan, 5.546%, 12/30/2022 | | | 7,211,640 | | | | 6,993,019 | |
| | | | | | | | 163,292,083 | |
| | | | | | | | | |
| High Tech Industries ‐ 20.37% | | | | | | | | |
| Aerial Merger Sub Inc (Neustar), Senior Secured First Lien Term B2 Loan, L+3.75%, | | | | | | | | |
03/01/2024(b) | | | 2,857,143 | | | | 2,883,043 | |
Aerial Merger Sub Inc, Senior Secured First Lien Term B Loan, L+3.25%, 09/02/2019(b) | | | 1,714,286 | | | | 1,731,960 | |
| Aspect Software Inc, Senior Secured First Lien Exit Term Loan, 10.152%, 05/25/2020 | | | 12,561,225 | | | | 12,490,568 | |
| CompuCom Systems Inc, Senior Secured First Lien Term Loan, 4.480%, 05/11/2020 | | | 8,411,848 | | | | 6,647,126 | |
Compuware Corporation, Senior Secured First Lien Tranche B‐3 Term Loan, 5.550%, 12/15/2021 | | | 3,610,716 | | | | 3,642,310 | |
| Compuware Corporation, Senior Secured Second Lien Term Loan, 9.550%, 12/15/2022 | | | 3,212,815 | | | | 3,244,943 | |
| CPI Acquisition Inc, Senior Secured First Lien Term Loan, 5.834%, 08/17/2022 | | | 6,316,126 | | | | 5,431,869 | |
| CPI International Inc, Senior Secured Second Lien Term Loan, 8.460%, 04/07/2022 | | | 2,000,000 | | | | 2,006,250 | |
| Cypress Semiconductor Corp, Senior Secured First Lien 2016 Incremental Term Loan, | | | | | | | | |
| 4.840%, 07/05/2021 | | | 3,795,775 | | | | 3,839,426 | |
| Epicor Software Corporation, Senior Secured First Lien Term B Loan, 4.980%, 06 /01/2022 | | | 5,558,784 | | | | 5,564,871 | |
| Flexera Software LLC, Senior Secured Second Lien Term Loan, 8.300%, 04/02/2021 | | | 2,800,000 | | | | 2,795,324 | |
Hyland Software Inc, Senior Secured Second Lien Term Loan, L+7.00%, 05/31/2025(b) | | | 1,104,294 | | | | 1,124,310 | |
Hyland Software Inc, Senior Secured Term Loan 3, L+4.90%, 07/01/2022(b) | | | 1,349,398 | | | | 1,359,687 | |
Idera Inc, Senior Secured First Lien Delayed Draw Term Loan, L+5.00%, 06/27/2024(b) | | | 1,004,545 | | | | 1,004,545 | |
Idera Inc, Senior Secured First Lien Term B Loan, L+5.00%, 06/27/2024(b) | | | 5,495,455 | | | | 5,495,455 | |
| Informatica Corporation, Senior Secured First Lien Dollar Term Loan, 4.796%, 08/05/2022 | | | 3,635,269 | | | | 3,637,869 | |
LANDesk Group Inc, Senior Secured First Lien Term Loan, L+4.25%, 01/22/2024(b) | | | 6,038,872 | | | | 6,017,494 | |
| LANDesk Group Inc, Senior Secured Second Lien Term Loan, 10.230%, 01/20/2025 | | | 6,000,000 | | | | 6,012,480 | |
| P2 Upstream Acquisition Co, Senior Secured First Lien Term Loan, 5.180%, 10/30/2020 | | | 4,135,714 | | | | 4,066,772 | |
| Peak 10 Inc, Senior Secured First Lien Term Loan, 5.147%, 06/17/2021 | | | 2,078,967 | | | | 2,091,961 | |
| Peak 10 Inc, Senior Secured Second Lien Initial Term Loan, 8.406%, 06/17/2022 | | | 5,083,333 | | | | 5,076,979 | |
| Pomeroy Group LLC, Senior Secured First Lien Initial Term Loan, 7.588%, 11/12/2021 | | | 2,474,874 | | | | 2,363,505 | |
| Project Alpha Intermediate Holding Inc, Senior Secured First Lien Term Loan, 4.670%, | | | | | | | | |
| 04/26/2024 | | | 10,228,406 | | | | 10,175,679 | |
Project Leopard Holdings Inc, Senior Secured First Lien Term Loan, L+5.50%, 06/21/2023(b) | | | 2,777,778 | | | | 2,788,194 | |
| Quest Software US Holdings Inc, Senior Secured First Lien Initial Term Loan, 7.226%, | | | | | | | | |
| 10/31/2022 | | | 7,632,252 | | | | 7,762,001 | |
| Ramundsen Public Sector LLC, Senior Secured First Lien Term Loan, 5.546%, 02/01/2024 | | | 1,315,385 | | | | 1,325,250 | |
| Rocket Software Inc, Senior Secured First Lien Term Loan, 5.546%, 10/13/2023 | | | 6,229,846 | | | | 6,296,038 | |
| SMS Systems Maintenance Services Inc, Senior Secured First Lien Initial Term Loan, 6.226%, | | | | | | | | |
| 10/30/2023 | | | 5,761,259 | | | | 5,757,687 | |
| SolarWinds Holdings Inc, Senior Secured First Lien 2017 Refinancing Term Loan 4.726%, | | | | | | | | |
| 02/03/2023 | | | 7,673,857 | | | | 7,700,255 | |
| Sophia LP, Senior Secured First Lien Term B Loan, 4.546%, 09/30/2022 | | | 4,716,572 | | | | 4,710,676 | |
| Sybil Software LLC, Senior Secured First Lien Initial Refinancing Dollar Term Loan, 4.546%, | | | | | | | | |
| 09/30/2023 | | | 4,183,591 | | | | 4,231,639 | |
| Synchronoss Technologies Inc, Senior Secured Initial Term Loan, 4.082%, 01/19/2024 | | | 3,170,169 | | | | 3,120,239 | |
| TIBCO Software Inc, Senior Secured First Lien Term B Loan, 5.730%, 12/04/2020 | | | 861,146 | | | | 866,988 | |
| TTM Technologies Inc, Senior Secured First Lien Term B Loan, 5.476%, 05/31/2021 | | | 5,041,314 | | | | 5,091,728 | |
Verint Systems Inc, Senior Secured First Lien Initial Term Loan, L+2.25%, 06/21/2024(b) | | | 2,320,186 | | | | 2,328,886 | |
Veritas US Inc, Senior Secured First Lien Term Loan B Facility, L+4.50%, 01/27/2023(b) | | | 4,411,765 | | | | 4,425,551 | |
| | | | | | | | 155,109,558 | |
| | | | | | | | | |
| Hotels, Gaming and Leisure ‐ 2.22% | | | | | | | | |
| Alpha Topco Limited ‐ Delta 2 (Lux) Sarl, Senior Secured Second Lien Term Loan, 8.004%, | | | | | | | | |
| 07/29/2022 | | | 1,705,903 | | | | 1,720,983 | |
| Semi-Annual Report | June 30, 2017 | 33 |
| Blackstone / GSO Strategic Credit Fund | Portfolio of Investments |
June 30, 2017 (Unaudited)
| | | Principal Amount | | | Value | |
| Hotels, Gaming and Leisure (continued) | | | | | | |
| AP Gaming I LLC, Senior Secured First Lien Term B Loan, 6.586%, 02/15/2024 | | $ | 8,709,677 | | | $ | 8,796,774 | |
| CWGS Group LLC, Senior Secured First Lien Term Loan, 4.839%, 11/08/2023 | | | 489,846 | | | | 493,062 | |
Intrawest Resorts Holdings Inc, Senior Secured First Lien Term B Loan, L+3.50%, 06/28/2024(b) | | | 1,644,251 | | | | 1,648,361 | |
Intrawest Resorts Holdings Inc, Senior Secured First Lien Term B2 Loan, L+3.25%, 06/28/2024(b) | | | 868,312 | | | | 870,483 | |
| Scientific Games International Inc, Senior Secured First Lien Term B‐3 Loan, 5.226%, 10/01/2021 | | | 3,338,546 | | | | 3,375,421 | |
| | | | | | | | 16,905,084 | |
| | | | | | | | | |
| Media Advertising, Printing and Publishing ‐ 0.16% | | | | | | | | |
| McGraw‐Hill Global Education Holdings LLC, Senior Secured First Lien Term B Loan, 5.226%, 05/04/2022 | | | 1,219,613 | | | | 1,202,173 | |
| | | | | | | | | |
| Media Broadcasting and Subscription ‐ 1.37% | | | | | | | | |
| Sable International Finance Limited (Cable and Wireless), Senior Secured First Lien Term B‐3 Loan, 4.726%, 01/31/2025 | | | 10,386,492 | | | | 10,428,713 | |
| | | | | | | | | |
| Media Diversified and Production ‐ 0.50% | | | | | | | |
DHX Media Ltd, Senior Secured Term Loan, L+3.75%, 12/22/2023(b) | | | 3,825,137 | | | | 3,845,467 | |
| | | | | | | | | |
| Metals and Mining ‐ 2.18% | | | | | | | | |
Canam Steel Corporation, Senior Secured First Lien Term B Loan, L+5.50%, 06/29/2024(b) | | | 8,333,333 | | | | 8,166,666 | |
| Fairmount Santrol Inc, Senior Secured First Lien Tranche B‐2 Term Loan, 4.647%, 09/05/2019 | | | 5,822,835 | | | | 5,512,769 | |
| Murray Energy Corporation, Senior Secured First Lien Term B‐2 Non‐PIK Loan, 8.546%, 04/16/2020 | | | 2,964,494 | | | | 2,906,435 | |
| | | | | | | | 16,585,870 | |
| | | | | | | | | |
| Retail ‐ 2.24% | | | | | | | | |
| Ascena Retail Group Inc, Senior Secured First Lien Tranche B Term Loan, 5.625%, 08/19/2022 | | | 3,197,330 | | | | 2,699,745 | |
| Fairway Group Acquisition Company, Senior Secured First Lien First Out Term Loan, 9.147%, 01/03/2020 | | | 899,697 | | | | 895,199 | |
| Fairway Group Acquisition Company, Senior Secured First Lien Last Out Non‐PIK Term Loan, 10.000%, 01/03/2020 | | | 595,254 | | | | 252,983 | |
| Fairway Group Holdings Corp, Senior Secured First Lien Subordinated Non‐PIK Term Loan, 11.000%, 10/04/2021 | | | 519,684 | | | | 220,866 | |
| Jill Acquisition LLC, Senior Secured First Lien Initial Term Loan, 6.180%, 05/09/2022 | | | 479,376 | | | | 470,088 | |
| Neiman Marcus Group Ltd LLC, Senior Secured First Lien Other Term Loan, 4.339%, 10/25/2020 | | | 2,318,769 | | | | 1,750,671 | |
| Nine West Holdings Inc, Senior Secured First Lien Initial Term Loan, 4.900%, 10/08/2019 | | | 2,428,651 | | | | 2,076,496 | |
| Petco Animal Supplies Inc, Senior Secured First Lien Second Amendment Term Loan, 4.172%, 01/26/2023 | | | 7,327,081 | | | | 6,638,335 | |
| Pier 1 Imports (US) Inc, Senior Secured First Lien Initial Term Loan, 4.796%, 04/30/2021 | | | 2,020,833 | | | | 1,950,104 | |
| Sports Authority (The), Senior Secured First Lien Term B Loan, 7.500%, 11/16/2017 | | | 2,501,540 | | | | 120,387 | |
| | | | | | | | 17,074,874 | |
| | | | | | | | | |
| Services ‐ Business ‐ 16.43% | | | | | | | | |
| Advantage Sales & Marketing Inc, Senior Secured First Lien Incremental Term B‐2 Loan, 4.420%, 07/25/2021 | | | 2,600,000 | | | | 2,502,513 | |
| Advantage Sales & Marketing Inc, Senior Secured Second Lien Initial Term Loan, 7.796%, 07/25/2022 | | | 6,750,000 | | | | 6,496,875 | |
| Allied Universal Holdco LLC, Senior Secured First Lien Initial Term Loan, 5.046%, 07/28/2022 | | | 4,740,000 | | | | 4,760,737 | |
| AqGen Ascensus Inc (fka Ascensus Holdings Inc), Senior Secured First Lien Replacement Term Loan, 5.296%, 12/05/2022 | | | 736,611 | | | | 745,818 | |
| Blackstone / GSO Strategic Credit Fund | Portfolio of Investments |
June 30, 2017 (Unaudited)
| | | Principal Amount | | | Value | |
| Services ‐ Business (continued) | | | | | | |
| BMC Software Finance Inc, Senior Secured First Lien Initial B‐1 US Term Loan, 5.226%, | | | | | | |
| 09/10/2022 | | $ | 1,751,202 | | | $ | 1,757,340 | |
Clean Harbors Inc, Senior Secured First Lien Term B Loan, L+2.00%, 06/28/2024(b) | | | 259,740 | | | | 260,714 | |
| Crossmark Holdings Inc, Senior Secured First Lien Term Loan, Series 0000, 4.796%, | | | | | | | | |
| 12/20/2019 | | | 7,841,388 | | | | 5,551,703 | |
| Crossmark Holdings Inc, Senior Secured Second Lien Term Loan, 8.796%, 12/21/2020 | | | 4,000,000 | | | | 1,836,660 | |
| DTI Holdco Inc, Senior Secured First Lien Initial Term Loan, 6.422%, 10/02/2023 | | | 10,944,324 | | | | 10,711,757 | |
| Erie Acquisition Holdings Inc, Senior Secured First Lien Term Loan, 5.950%, 03/01/2023 | | | 9,904,713 | | | | 9,959,387 | |
| FHC Health Systems Inc, Senior Secured First Lien Initial Term Loan, 5.226%, 12/23/2021 | | | 179,876 | | | | 168,409 | |
| FR Dixie Acquisition Corp, Senior Secured First Lien Initial Term Loan, 5.952%, 12/18/2020 | | | 5,078,947 | | | | 3,529,868 | |
| GlobalLogic Holdings Inc, Senior Secured First Lien Closing Date Term Loan, 5.796%, | | | | | | | | |
| 06/20/2022 | | | 7,580,392 | | | | 7,646,721 | |
| Information Resources Inc, Senior Secured First Lien Initial Term Loan, 5.466%, 01/18/2024 | | | 6,806,762 | | | | 6,841,851 | |
| Information Resources Inc, Senior Secured Second Lien Initial Term Loan, 9.466%, | | | | | | | | |
| 01/20/2025 | | | 5,500,000 | | | | 5,496,563 | |
| Inmar Inc, Senior Secured First Lien Initial Term Loan, 4.670%, 05/01/2024 | | | 5,161,290 | | | | 5,178,219 | |
| Inmar Inc, Senior Secured Second Lien Initial Term Loan, 9.170%, 05/01/2025 | | | 3,786,982 | | | | 3,760,473 | |
| LD Intermediate Holdings Inc, Senior Secured First Lien Initial Term Loan, 7.055%, | | | | | | | | |
| 12/09/2022 | | | 5,925,000 | | | | 5,636,156 | |
| Neff Rental LLC, Senior Secured Second Lien Closing Date Term Loan, 7.664%, 06/09/2021 | | | 5,919,083 | | | | 5,937,580 | |
| Sedgwick Claims Management Services Inc, Senior Secured Second Lien Incremental Term | | | | | | | | |
| Loan, 6.952%, 02/28/2022 | | | 8,481,132 | | | | 8,528,881 | |
| Sedgwick Claims Management Services Inc, Senior Secured Second Lien Initial Term Loan, | | | | | | | | |
| 6.976%, 02/28/2022 | | | 1,267,677 | | | | 1,277,184 | |
| SurveyMonkey Inc, Senior Secured First Lien Term Loan, 5.800%, 04/13/2024 | | | 9,304,037 | | | | 9,391,262 | |
| Transaction Network Services, Senior Secured First Lien Initial Term Loan, 5.230%, | | | | | | | | |
| 02/14/2020 | | | 1,696,728 | | | | 1,713,695 | |
| Transaction Network Services, Senior Secured Second Lien Initial Term Loan, 9.230%, | | | | | | | | |
| 08/14/2020 | | | 4,980,931 | | | | 5,005,835 | |
| TravelCLICK Inc, Senior Secured Second Lien Initial Term Loan, 8.976%, 11/08/2021 | | | 5,530,303 | | | | 5,557,955 | |
TRC Companies Inc, Senior Secured First Lien Term Loan, L+4.00%, 05/24/2024(b) | | | 4,814,516 | | | | 4,848,627 | |
| | | | | | | | 125,102,783 | |
| | | | | | | | | |
| Services ‐ Consumer ‐ 3.47% | | | | | | | | |
| American Residential Services LLC, Senior Secured First Lien Term Loan, L+4.00%, | | | | | | | | |
06/30/2021(b) | | | 3,079,493 | | | | 3,091,056 | |
| Ascend Learning LLC, Senior Secured First Lien Term Loan, 5.726%, 07/31/2019 | | | 3,303,016 | | | | 3,310,861 | |
| Ascend Learning LLC, Senior Secured Second Lien Term Loan, 9.726%, 11/30/2020 | | | 1,000,000 | | | | 1,003,440 | |
| Big Jack Holdings LP, Senior Secured First Lien Term Loan B, 5.480%, 03/20/2024 | | | 2,034,118 | | | | 2,044,288 | |
| KUEHG Corp, Senior Secured First Lien Term B‐2 Loan, 5.046%, 08/12/2022 | | | 4,249,777 | | | | 4,279,016 | |
| NVA Holdings Inc, Senior Secured Second Lien Term Loan, 8.296%, 08/14/2022 | | | 5,250,811 | | | | 5,309,883 | |
| Red Lobster Management LLC, Senior Secured First Lien Initial Term Loan, 6.295%, | | | | | | | | |
| 07/28/2021 | | | 1,068,967 | | | | 1,078,320 | |
| Renaissance Learning Inc, Senior Secured First Lien Initial Term Loan, 5.046%, 04/09/2021 | | | 2,704,477 | | | | 2,718,419 | |
Spin Holdco Inc, Senior Secured First Lien Revolver, L+3.25%, 05/14/2018(b) | | | 1,500,000 | | | | 1,425,000 | |
Spin Holdco Inc, Senior Secured First Lien Term B‐1 Loan, L+3.75%, 11/14/2022(b) | | | 2,195,122 | | | | 2,185,244 | |
| | | | | | | | 26,445,527 | |
| | | | | | | | | |
| Telecommunications ‐ 8.24% | | | | | | | | |
| Alorica Inc, Senior Secured First Lien Term B Loan, 5.976%, 06/30/2022 | | | 2,889,111 | | | | 2,910,779 | |
| Centurylink Inc, Senior Secured First Lien Term B Loan, 1.375%, 01/31/2025 | | | 13,653,582 | | | | 13,518,002 | |
| Cologix Holdings Inc, Senior Secured Second Lien Initial Term Loan, 8.216%, 03/20/2025 | | | 5,421,805 | | | | 5,471,523 | |
| Digicel International Finance Limited, Senior Secured First Lien Term Loan, 4.940%, | | | | | | | | |
| 05/27/2024 | | | 2,874,252 | | | | 2,897,159 | |
| Fairpoint Communications Inc, Senior Secured First Lien Term Loan, 7.500%, 02/14/2019 | | | 775,419 | | | | 777,036 | |
| Semi-Annual Report | June 30, 2017 | 35 |
| Blackstone / GSO Strategic Credit Fund | Portfolio of Investments |
June 30, 2017 (Unaudited)
| | | Principal Amount | | | Value | |
| Telecommunications (continued) | | | | | | |
Greeneden US Holdings II LLC, Senior Secured 2017 Incremental First Lien Term Loan, L+3.75%, 12/01/2023(b) | | $ | 1,538,660 | | | $ | 1,545,968 | |
| GTT Communications Inc, Senior Secured First Lien Initial Term Loan, 5.250%, 01/09/2024 | | | 1,031,088 | | | | 1,036,893 | |
| Masergy Holdings Inc, Senior Secured First Lien 2017 Replacement Term Loan, 5.046%, 12/15/2023 | | | 1,542,636 | | | | 1,554,206 | |
| Masergy Holdings Inc, Senior Secured Second Lien Initial Term Loan, 9.796%, 12/16/2024 | | | 1,500,000 | | | | 1,518,750 | |
| Tierpoint LLC, Senior Secured First Lien Term Loan, 4.976%, 05/06 /2024 | | | 7,273,600 | | | | 7,291,784 | |
| Vertiv Group Corporation, Senior Secured First Lien Term B Loan, 5.226%, 11/30/2023 | | | 12,376,998 | | | | 12,446,619 | |
| Windstream Services LLC, Senior Secured First Lien New Tranche B‐6 Term Loan, 5.210%, 03/29/2021 | | | 11,777,244 | | | | 11,772,298 | |
| | | | | | | | 62,741,017 | |
| | | | | | | | | |
| Transportation Cargo ‐ 0.27% | | | | | | | | |
| REP WWEX Acquisition Parent LLC, Senior Secured First Lien Term Loan, 5.672%, 02/03/2025 | | | 2,060,410 | | | | 2,074,153 | |
| | | | | | | | | |
| Transportation Consumer ‐ 1.11% | | | | | | | | |
| Air Medical Group Holdings Inc, Senior Secured First Lien 2016 New Term Loan, 5.159%, 04/28/2022 | | | 1,916,129 | | | | 1,911,578 | |
| Lineage Logistics LLC, Senior Secured First Lien Term Loan, 4.726%, 04/07/2021 | | | 6,508,315 | | | | 6,524,619 | |
| | | | | | | | 8,436,197 | |
| | | | | | | | | |
| Utilities Electric ‐ 4.42% | | | | | | | | |
| Chief Power Finance LLC, Senior Secured First Lien Term B Advance Loan, 6.070%, 12/31/2020 | | | 4,817,521 | | | | 3,340,156 | |
| Eastern Power LLC, Senior Secured First Lien Term Loan, 5.226%, 10/02/2023 | | | 2,783,012 | | | | 2,774,663 | |
| Exgen Texas Power LLC, Senior Secured First Lien Term Loan Non‐PIK, 6.046%, 09/20/2021 | | | 6,286,893 | | | | 3,814,792 | |
| Granite Acquisition Inc, Senior Secured Second Lien Term B Loan, 8.546%, 12/19/2022 | | | 5,742,624 | | | | 5,719,654 | |
| Green Energy Partners / Stonewall LLC, Senior Secured First Lien Term B‐1 Conversion Advance Loan, 6.796%, 11/13/2021 | | | 1,601,000 | | | | 1,488,930 | |
| Helix Gen Funding LLC, Senior Secured First Lien Term Loan, 4.960%, 06/03/2024 | | | 1,784,251 | | | | 1,797,321 | |
| Panda Liberty LLC, Senior Secured First Lien Construction B‐1 Facility Term Loan, 7.796%, 08/21/2020 | | | 6,847,295 | | | | 6,346,621 | |
| Panda Patriot LLC (fka Moxie Patriot LLC), Senior Secured First Lien Construction B‐1 Facility Term Loan, 7.046%, 12/18/2020 | | | 450,895 | | | | 416,514 | |
| Pike Corporation, Senior Secured First Lien Initial Term Loan, 4.980%, 03/08/2024 | | | 1,585,430 | | | | 1,608,221 | |
| Pike Corporation, Senior Secured Second Lien Term Loan, 9.230%, 09/10/2024 | | | 237,624 | | | | 241,782 | |
| Sandy Creek Energy Associates LP, Senior Secured First Lien Term Loan, 5.296%, 11/09/2020 | | | 8,052,531 | | | | 6,135,063 | |
| | | | | | | | 33,683,717 | |
| | | | | | | | | |
| TOTAL FLOATING RATE LOAN INTERESTS (Cost $982,265,237) | | | | | | | 967,896,009 | |
| | | | | | | | | |
| CORPORATE BONDS ‐ 28.56% | | | | | | | | |
| Automotive ‐ 0.27% | | | | | | | | |
Omega US Sub LLC, Senior Unsecured Bond, 8.750%, 07/15/2023(c) | | | 1,920,000 | | | | 2,040,000 | |
| | | | | | | | | |
| Banking, Finance, Insurance and Real Estate ‐ 4.67% | | | | | | | | |
First Data Corp, Senior Unsecured Bond, 7.000%, 12/01/2023(c) | | | 2,000,000 | | | | 2,140,000 | |
| Fly Leasing Limited, Senior Unsecured Bond,: | | | | | | | | |
| 6.750%, 12/15/2020 | | | 500,000 | | | | 525,625 | |
| 6.375%, 10/15/2021 | | | 2,100,000 | | | | 2,212,875 | |
Hockey Merger Sub 2 Inc, Senior Unsecured Bond, 7.875%, 10/01/2021(c) | | | 4,000,000 | | | | 4,180,000 | |
HUB International Ltd, Senior Unsecured Bond, 8.125%, 07/15/2019(c)(d) | | | 7,500,000 | | | | 7,528,125 | |
| Blackstone / GSO Strategic Credit Fund | Portfolio of Investments |
June 30, 2017 (Unaudited)
| | | Principal Amount | | | Value | |
| Banking, Finance, Insurance and Real Estate (continued) | | | | | | |
National Financial Partners Corp, Senior Unsecured Bond, 9.000%, 07/15/2021(c) | | $ | 6,850,000 | | | $ | 7,190,788 | |
Onex York Acquisition Co, Senior Unsecured Bond, 8.500%, 10/01/2022(c) | | | 12,200,000 | | | | 11,803,500 | |
| | | | | | | | 35,580,913 | |
| | | | | | | | | |
| Beverage, Food and Tobacco ‐ 1.99% | | | | | | | | |
| CEC Entertainment Inc, Senior Unsecured Bond, 8.000%, 02/15/2022 | | | 1,369,000 | | | | 1,434,027 | |
PF Chang's China Bistro Inc, Senior Unsecured Bond, 10.250%, 06/30/2020(c) | | | 13,415,000 | | | | 13,716,838 | |
| | | | | | | | 15,150,865 | |
| | | | | | | | | |
| Capital Equipment ‐ 1.15% | | | | | | | | |
| Diebold Inc, Senior Unsecured Bond, Series WI, 8.500%, 04/15/2024 | | | 1,500,000 | | | | 1,683,900 | |
Hardwoods Acquisition Inc, Senior Secured Bond, 7.500%, 08/01/2021(c) | | | 3,211,000 | | | | 2,881,872 | |
NWH Escrow Corp, Senior Secured Bond, 7.500%, 08/01/2021(c) | | | 4,650,000 | | | | 4,161,750 | |
| | | | | | | | 8,727,522 | |
| | | | | | | | | |
| Chemicals, Plastics and Rubber ‐ 0.21% | | | | | | | | |
Pinnacle Operating Corporation, Senior Secured Bond, 9.000%, 11/15/2020(c) | | | 2,000,000 | | | | 1,610,000 | |
| | | | | | | | | |
| Construction and Building ‐ 4.27% | | | | | | | | |
Builders FirstSource Inc, Senior Unsecured Bond, 10.750%, 08/15/2023(c) | | | 4,697,000 | | | | 5,436,777 | |
FBM Finance Inc, Senior Secured Bond, 8.250%, 08/15/2021(c) | | | 4,320,000 | | | | 4,649,400 | |
Great Lakes Dredge & Dock, Senior Unsecured Bond, 8.000%, 05/15/2022(c) | | | 5,874,000 | | | | 5,998,823 | |
PriSo Acquisition Corp / Building Pro, Senior Unsecured Bond, 9.000%, 05/15/2023(c) | | | 13,060,000 | | | | 13,647,700 | |
Zachry Holdings Inc, Senior Unsecured Bond, 7.500%, 02/01/2020(c) | | | 2,700,000 | | | | 2,794,500 | |
| | | | | | | | 32,527,200 | |
| | | | | | | | | |
| Consumer Goods Durable ‐ 0.17% | | | | | | | | |
Hillman Group Inc (The), Senior Unsecured Bond, 6.375%, 07/15/2022(c) | | | 1,300,000 | | | | 1,254,500 | |
| | | | | | | | | |
| Containers, Packaging and Glass ‐ 1.21% | | | | | | | | |
ARD Finance SA, Senior Unsecured Bond, 7.125%, 09/15/2023(d) | | | 1,600,000 | | | | 1,711,840 | |
Coveris Holdings SA, Senior Unsecured Bond, 7.875%, 11/01/2019(c) | | | 6,454,000 | | | | 6,389,460 | |
Flex Acquisition Co Inc, Senior Unsecured Bond, 6.875%, 01/15/2025(c) | | | 524,000 | | | | 545,943 | |
Reynolds GRP ISS / Reynold, Senior Unsecured Bond, 7.000%, 07/15/2024(c) | | | 560,000 | | | | 601,770 | |
| | | | | | | | 9,249,013 | |
| | | | | | | | | |
| Energy, Oil and Gas ‐ 1.32% | | | | | | | | |
| Calumet Specialty Prod, Senior Unsecured Bond, 7.750%, 04/15/2023 | | | 6,600,000 | | | | 5,775,000 | |
Comstock Resources Inc, 7.750%, 04/01/2019(d) | | | 1,044,131 | | | | 814,422 | |
Comstock Resources Inc, Senior Unsecured Bond, 10.000%, 03/15/2020(d) | | | 2,250,000 | | | | 2,255,625 | |
| CSI Compressco LP / CSI Compressco Finance Inc, Senior Unsecured Bond, 7.250%, 08/15/2022 | | | 800,000 | | | | 740,000 | |
| Ridgeback Resources Inc, Senior Unsecured Bond, 12.000%, 12/21/2021 | | | 486,000 | | | | 486,000 | |
| | | | | | | | 10,071,047 | |
| | | | | | | | | |
| Environmental Industries ‐ 0.19% | | | | | | | | |
GFL Environmental Inc, Senior Unsecured Bond, 9.875%, 02/01/2021(c) | | | 1,292,000 | | | | 1,411,510 | |
| | | | | | | | | |
| Forest Products and Paper ‐ 0.43% | | | | | | | | |
Tembec Industries Inc, Senior Secured Bond, 9.000%, 12/15/2019(c) | | | 3,151,000 | | | | 3,279,403 | |
| | | | | | | | | |
| Healthcare and Pharmaceuticals ‐ 2.15% | | | | | | | | |
Endo Finance Co (Endo Luxembourg Finance Co. I S.a.r.l), Senior Unsecured Bond, 5.875%, 10/15/2024(c) | | | 763,000 | | | | 789,705 | |
| Semi-Annual Report | June 30, 2017 | 37 |
| Blackstone / GSO Strategic Credit Fund | Portfolio of Investments |
June 30, 2017 (Unaudited)
| | | Principal Amount | | | Value | |
| Healthcare and Pharmaceuticals (continued) | | | | | | |
InVentiv Group Holdings Inc, Senior Unsecured Bond, 7.500%, 10/01/2024(c) | | $ | 1,010,000 | | | $ | 1,100,900 | |
Surgery Center Holdings Inc, Senior Unsecured Bond, 8.875%, 04/15/2021(c) | | | 5,500,000 | | | | 5,974,375 | |
Tenet Healthcare Corp, Senior Unsecured Bond, 7.000%, 08/01/2025(c) | | | 5,714,000 | | | | 5,706,857 | |
| Valeant Pharmaceuticals International Inc, Senior Unsecured Bond,: | | | | | | | | |
6.500%, 03/15/2022(c) | | | 1,387,000 | | | | 1,458,084 | |
7.000%, 03/15/2024(c) | | | 1,293,000 | | | | 1,362,499 | |
| | | | | | | | 16,392,420 | |
| | | | | | | | | |
| High Tech Industries ‐ 3.15% | | | | | | | | |
| BMC Software Inc, Senior Unsecured Bond, 7.250%, 06/01/2018 | | | 3,578,000 | | | | 3,721,120 | |
Boxer Parent Co Inc, Senior Unsecured Bond, 9.000%, 10/15/2019(c)(d) | | | 3,000,000 | | | | 3,011,250 | |
Global A&T Electronics, Senior Unsecured Bond, 10.000%, 02/01/2019(c) | | | 6,000,000 | | | | 4,500,000 | |
| Infor US Inc, Senior Unsecured Bond, 6.500%, 05/15/2022 | | | 4,250,000 | | | | 4,420,000 | |
j2 Global Inc, Senior Unsecured Bond, 6.000%, 07/15/2025(c) | | | 3,125,000 | | | | 3,234,375 | |
Riverbed Technology Inc, Senior Unsecured Bond, 8.875%, 03/01/2023(c) | | | 4,966,000 | | | | 5,065,320 | |
| | | | | | | | 23,952,065 | |
| | | | | | | | | |
| Hotels, Gaming and Leisure ‐ 1.97% | | | | | | | | |
Mood Media Borrower LLC, Senior Unsecured Second Lien Notes, 14.000%, 06/28/2024(c)(e) | | | 4,925,000 | | | | 4,925,000 | |
Mood Media Corporation, Senior Unsecured Bond, 10.000%, 08/06/2023(c) | | | 1,480,000 | | | | 1,472,600 | |
Scientific Games International Inc, Senior Secured Bond, 7.000%, 01/01/2022(c) | | | 8,060,000 | | | | 8,604,050 | |
| | | | | | | | 15,001,650 | |
| | | | | | | | | |
| Media Advertising, Printing and Publishing ‐ 0.49% | | | | | | | | |
McGraw‐Hill Global Education, Senior Unsecured Bond, 7.875%, 05/15/2024(c) | | | 2,820,000 | | | | 2,738,925 | |
Southern Graphics Inc, Senior Unsecured Bond, 8.375%, 10/15/2020(c) | | | 1,000,000 | | | | 1,022,500 | |
| | | | | | | | 3,761,425 | |
| | | | | | | | | |
| Media Broadcasting and Subscription ‐ 1.68% | | | | | | | | |
| Cablevision Systems Corp, Senior Unsecured Bond, 8.000%, 04/15/2020 | | | 4,600,000 | | | | 5,134,750 | |
| Cequel Communications Holdings I, Senior Unsecured Bond,: | | | | | | | | |
6.375%, 09/15/2020(c) | | | 3,912,000 | | | | 4,000,020 | |
5.125%, 12/15/2021(c) | | | 500,000 | | | | 511,715 | |
Radiate Holdco LLC, Senior Unsecured Bond, 6.625%, 02/15/2025(c) | | | 760,000 | | | | 761,900 | |
SFR Group SA, Senior Secured Bond, 6.000%, 05/15/2022(c) | | | 2,250,000 | | | | 2,356,875 | |
| | | | | | | | 12,765,260 | |
| | | | | | | | | |
| Retail ‐ 0.18% | | | | | | | | |
Nine West Holdings Inc, Senior Unsecured Bond, 8.250%, 03/15/2019(c) | | | 5,600,000 | | | | 1,400,000 | |
| | | | | | | | | |
| Services ‐ Business ‐ 0.41% | | | | | | | | |
Infinity ACQ LLC / FI Corp, Senior Unsecured Bond, 7.250%, 08/01/2022(c) | | | 3,250,000 | | | | 3,144,375 | |
| | | | | | | | | |
| Telecommunications ‐ 2.39% | | | | | | | | |
Avaya Inc, Senior Secured Bond, 7.000%, 04/01/2019(c)(f) | | | 1,291,000 | | | | 1,042,482 | |
Digicel Limited, Senior Unsecured Bond, 6.000%, 04/15/2021(c) | | | 2,250,000 | | | | 2,165,625 | |
Fairpoint Communications Inc, Senior Secured Bond, 8.750%, 08/15/2019(c) | | | 10,600,000 | | | | 10,903,160 | |
| Frontier Communications, Senior Unsecured Bond,: | | | | | | | | |
| 10.500%, 09/15/2022 | | | 750,000 | | | | 717,188 | |
| 7.125%, 01/15/2023 | | | 4,000,000 | | | | 3,350,000 | |
| | | | | | | | 18,178,455 | |
| Blackstone / GSO Strategic Credit Fund | Portfolio of Investments |
June 30, 2017 (Unaudited)
| | | Principal Amount | | | Value | |
| Transportation Consumer ‐ 0.26% | | | | | | |
Air Canada, Senior Unsecured Bond, 7.750%, 04/15/2021(c) | | $ | 1,750,000 | | | $ | 2,012,500 | |
| | | | | | | | | |
| TOTAL CORPORATE BONDS (Cost $216,098,796) | | | | | | | 217,510,123 | |
| | | | | | | | | |
| | | Shares | | | | | |
| COMMON STOCK ‐ 1.95% | | | | | | | | |
| Energy, Oil and Gas ‐ 1.48% | | | | | | | | |
Ridgeback Resources Inc(g) | | | 1,201,345 | | | $ | 6,762,661 | |
SandRidge Energy Inc(g) | | | 135,154 | | | | 2,326,000 | |
TE Holdings LLC (Templar), Class A,(g) | | | 197,643 | | | | 943,743 | |
Titan Energy LLC,(g) | | | 29,318 | | | | 227,215 | |
Total Safety Holdings LLC,(g) | | | 2,951 | | | | 1,003,340 | |
| | | | | | | | 11,262,959 | |
| | | | | | | | | |
| Hotels, Gaming and Leisure ‐ 0.47% | | | | | | | | |
Mood Media Corporation(g) | | | 3,709,356 | | | | 3,598,075 | |
| | | | | | | | | |
| TOTAL COMMON STOCK (Cost $35,293,387) | | | | | | | 14,861,034 | |
| | | | | | | | | |
| PREFERRED STOCK ‐ 0.17% | | | | | | | | |
| Energy, Oil and Gas ‐ 0.17% | | | | | | | | |
TE Holdings LLC (Templar)(g) | | | 131,013 | | | | 1,277,373 | |
| | | | | �� | | | | |
| TOTAL PREFERRED STOCK (Cost $1,310,126) | | | | | | | 1,277,373 | |
| | | | | | | | | |
| RIGHTS AND WARRANTS ‐ 0.01% | | | | | | | | |
| Energy, Oil and Gas ‐ 0.01% | | | | | | | | |
Comstock Resources Inc, expires 9/2/2018 at $0.01(g) | | | 8,250 | | | | 58,245 | |
| | | | | | | | | |
TOTAL RIGHTS AND WARRANTS (Cost $–) | | | | | | | 58,245 | |
| | | | | | | | | |
Total Investments ‐ 157.78% (Cost $1,234,967,546) | | | | | | | 1,201,602,784 | |
| | | | | | | | | |
| Liabilities in Excess of Other Assets ‐ (0.88)% | | | | | | | (6,721,450 | ) |
| | | | | | | | | |
| Mandatory Redeemable Preferred Shares ‐ (5.95)% (liquidation preference plus distributions payable on term preferred shares) | | | | | | | (45,296,176 | ) |
| | | | | | | | | |
| Leverage Facility ‐ (50.95)% | | | | | | | (388,000,000 | ) |
| | | | | | | | | |
| Net Assets ‐ 100.00% | | | | | | $ | 761,585,158 | |
Amounts above are shown as a percentage of net assets as of June 30, 2017.
| (a) | The interest rate shown represents the rate at period end. |
| Semi-Annual Report | June 30, 2017 | 39 |
| Blackstone / GSO Strategic Credit Fund | Portfolio of Investments |
June 30, 2017 (Unaudited)
| (b) | All or a portion of this position has not settled as of June 30, 2017. The interest rate shown represents the stated spread over the London Interbank Offered Rate ("LIBOR" or "L") or the applicable LIBOR floor; the Fund will not accrue interest until the settlement date, at which point LIBOR will be established. |
| (c) | Security exempt from registration under Rule 144A of the Securities Act of 1933. Total market value of Rule 144A securities amounts to $182,527,751, which represents approximately 23.97% of net assets as of June 30, 2017. Such securities may normally be sold to qualified institutional buyers in transactions exempt from registration. |
| (d) | Option to convert to pay-in-kind security. |
| (e) | Floating or variable rate security. Interest rate disclosed is that which is in effect at June 30, 2017. |
| (f) | Security is in default as of period end and is therefore non-income producing. |
| (g) | Non-income producing security. |
See Notes to Financial Statements.
| Blackstone / GSO Funds | Statements of Assets and Liabilities |
June 30, 2017 (Unaudited)
| | | Senior Floating Rate Term Fund | | | Long-Short Credit Income Fund | | | Strategic Credit Fund | |
| ASSETS: | | | | | | | | | |
| Investments, at value (Cost $412,151,805, $340,838,695 and $1,234,967,546, respectively) | | $ | 401,237,524 | | | $ | 337,738,180 | | | $ | 1,201,602,784 | |
| Cash | | | 12,154,989 | | | | 11,363,009 | | | | 26,827,036 | |
| Receivable for investment securities sold | | | 26,633,524 | | | | 20,279,753 | | | | 76,489,978 | |
| Interest receivable | | | 2,179,600 | | | | 2,069,922 | | | | 8,322,481 | |
| Prepaid expenses and other assets | | | 117,424 | | | | 84,886 | | | | 322,193 | |
| Total Assets | | | 442,323,061 | | | | 371,535,750 | | | | 1,313,564,472 | |
| | | | | | | | | | | | | |
| LIABILITIES: | | | | | | | | | | | | |
| Payable for investment securities purchased | | | 40,405,048 | | | | 28,997,854 | | | | 117,390,478 | |
| Leverage facility (Note 8) | | | 132,000,000 | | | | 104,000,000 | | | | 388,000,000 | |
| Interest due on leverage facility (Note 8) | | | 159,733 | | | | 125,583 | | | | 515,519 | |
| Accrued investment advisory fee payable | | | 330,358 | | | | 215,704 | | | | 985,452 | |
| Accrued fund accounting and administration fees payable | | | 33,036 | | | | 21,570 | | | | 147,818 | |
| Accrued trustees' fees payable | | | 13,188 | | | | 18,003 | | | | 18,765 | |
| Other payables and accrued expenses | | | 140,114 | | | | 158,577 | | | | 115,551 | |
Mandatory redeemable preferred shares (net of deferred financing costs of: –, $(217,975) and $(490,445), respectively)(a) (Note 8) | | | – | | | | 19,782,025 | | | | 44,509,555 | |
| Distributions payable on mandatory redeemable preferred shares | | | – | | | | 131,634 | | | | 296,176 | |
| Total Liabilities | | | 173,081,477 | | | | 153,450,950 | | | | 551,979,314 | |
| Net Assets Attributable to Common Shareholders | | $ | 269,241,584 | | | $ | 218,084,800 | | | $ | 761,585,158 | |
| | | | | | | | | | | | | |
| COMPOSITION OF NET ASSETS ATTRIBUTABLE TO COMMON SHARES: | | | | | | | | | | | | |
| Paid‐in capital | | $ | 286,273,344 | | | $ | 236,962,777 | | | $ | 840,264,384 | |
| Undistributed net investment income | | | 4,904,764 | | | | 4,088,854 | | | | 13,673,006 | |
| Accumulated net realized loss | | | (11,022,243 | ) | | | (19,866,316 | ) | | | (58,987,470 | ) |
| Net unrealized depreciation | | | (10,914,281 | ) | | | (3,100,515 | ) | | | (33,364,762 | ) |
| Net Assets Attributable to Common Shareholders | | $ | 269,241,584 | | | $ | 218,084,800 | | | $ | 761,585,158 | |
| | | | | | | | | | | | | |
| Common shares outstanding (unlimited shares authorized, par value $0.001 per share) | | | 15,237,926 | | | | 12,702,160 | | | | 44,664,382 | |
| Net Asset Value per Common Share | | $ | 17.67 | | | $ | 17.17 | | | $ | 17.05 | |
(a) | $1,000 liquidation value per share. -, 20,000, and 45,000 shares issued and outstanding, respectively. |
See Notes to Financial Statements.
| Semi-Annual Report | June 30, 2017 | 41 |
| Blackstone / GSO Funds | Statements of Operations |
For the Six Months Ended June 30, 2017 (Unaudited)
| | | Senior Floating Rate Term Fund | | | Long-Short Credit Income Fund | | | Strategic Credit Fund | |
| INVESTMENT INCOME: | | | | | | | | | |
| Interest | | $ | 13,263,378 | | | $ | 11,132,900 | | | $ | 40,378,963 | |
| Facility and other fees | | | 550,972 | | | | 361,733 | | | | 1,438,424 | |
| Total Investment Income | | | 13,814,350 | | | | 11,494,633 | | | | 41,817,387 | |
| | | | | | | | | | | | | |
| EXPENSES: | | | | | | | | | | | | |
| Investment advisory fee | | | 1,997,083 | | | | 1,300,086 | | | | 5,927,511 | |
| Fund accounting and administration fees | | | 199,718 | | | | 130,019 | | | | 889,115 | |
| Insurance expense | | | 36,296 | | | | 30,319 | | | | 103,804 | |
| Legal and audit fees | | | 169,731 | | | | 206,268 | | | | 352,731 | |
| Custodian fees | | | 53,674 | | | | 24,280 | | | | 100,864 | |
| Trustees' fees and expenses | | | 77,488 | | | | 77,967 | | | | 80,049 | |
| Printing expense | | | 16,001 | | | | 13,699 | | | | 30,314 | |
| Transfer agent fees | | | 9,256 | | | | 15,258 | | | | 15,338 | |
| Interest on leverage facility | | | 1,146,004 | | | | 888,994 | | | | 3,668,275 | |
| Amortization of deferred financing costs (Note 8) | | | – | | | | 17,796 | | | | 40,041 | |
| Other expenses | | | 40,342 | | | | 62,862 | | | | 82,378 | |
| Distributions to mandatory redeemable preferred shares | | | – | | | | 369,305 | | | | 827,594 | |
| Total Expenses | | | 3,745,593 | | | | 3,136,853 | | | | 12,118,014 | |
| Net Investment Income | | | 10,068,757 | | | | 8,357,780 | | | | 29,699,373 | |
| | | | | | | | | | | | | |
| REALIZED AND UNREALIZED GAIN/(LOSS) ON INVESTMENTS: | | | | | | | | | | | | |
| Net realized loss on: | | | | | | | | | | | | |
| Investment securities | | | (106,097 | ) | | | (1,341,902 | ) | | | (2,776,799 | ) |
| Foreign currency transactions | | | – | | | | – | | | | (11,625 | ) |
| Net realized loss: | | | (106,097 | ) | | | (1,341,902 | ) | | | (2,788,424 | ) |
| Change in unrealized appreciation/(depreciation) on: | | | | | | | | | | | | |
| Investment securities | | | (1,708,185 | ) | | | 2,374,946 | | | | 8,243,771 | |
| Translation of assets and liabilities in foreign currency transactions | | | – | | | | – | | | | 11,625 | |
| Net unrealized gain/(loss): | | | (1,708,185 | ) | | | 2,374,946 | | | | 8,255,396 | |
| Net Realized and Unrealized Gain/(Loss) on Investments | | | (1,814,282 | ) | | | 1,033,044 | | | | 5,466,972 | |
| | | | | | | | | | | | | |
| Net Increase in Net Assets Attributable to Common Shares from Operations | | $ | 8,254,475 | | | $ | 9,390,824 | | | $ | 35,166,345 | |
See Notes to Financial Statements.
| Blackstone / GSO Funds | Statements of Changes in Net Assets |
| | | Senior Floating Rate Term Fund | | | Long-Short Credit Income Fund | | | Strategic Credit Fund | |
| | | For the Six Months Ended June 30, 2017 (Unaudited) | | | For the Year Ended December 31, 2016 | | | For the Six Months Ended June 30, 2017 (Unaudited) | | | For the Year Ended December 31, 2016 | | | For the Six Months Ended June 30, 2017 (Unaudited) | | | For the Year Ended December 31, 2016 | |
| FROM OPERATIONS: | | | | | | | | | | | | | | | | | | |
Net investment income(a) | | $ | 10,068,757 | | | $ | 18,904,522 | | | $ | 8,357,780 | | | $ | 17,797,555 | | | $ | 29,699,373 | | | $ | 62,137,550 | |
| Net realized loss | | | (106,097 | ) | | | (7,016,365 | ) | | | (1,341,902 | ) | | | (12,321,736 | ) | | | (2,788,424 | ) | | | (36,576,103 | ) |
| Change in unrealized appreciation/(depreciation) | | | (1,708,185 | ) | | | 30,870,797 | | | | 2,374,946 | | | | 32,770,485 | | | | 8,255,396 | | | | 105,305,722 | |
| Net Increase in Net Assets Attributable to Common Shares from Operations | | | 8,254,475 | | | | 42,758,954 | | | | 9,390,824 | | | | 38,246,304 | | | | 35,166,345 | | | | 130,867,169 | |
| | | | | | | | | | | | | | | | | | | | | | | | | |
| DISTRIBUTIONS TO COMMON SHAREHOLDERS: |
| From net investment income | | | (7,388,251 | ) | | | (17,608,045 | ) | | | (6,541,612 | ) | | | (18,214,897 | ) | | | (23,448,801 | ) | | | (60,028,929 | ) |
| Net Decrease in Net Assets from Distributions to Common Shareholders | | | (7,388,251 | ) | | | (17,608,045 | ) | | | (6,541,612 | ) | | | (18,214,897 | ) | | | (23,448,801 | ) | | | (60,028,929 | ) |
| | | | | | | | | | | | | | | | | | | | | | | | | |
| Net asset value of common shares issued to stockholders from reinvestment of dividends | | | 221,872 | | | | 128,713 | | | | – | | | | – | | | | – | | | | – | |
| Net Increase from Capital Share Transactions | | | 221,872 | | | | 128,713 | | | | – | | | | – | | | | – | | | | – | |
| Net Increase in Net Assets Attributable to Common Shares | | | 1,088,096 | | | | 25,279,622 | | | | 2,849,212 | | | | 20,031,407 | | | | 11,717,544 | | | | 70,838,240 | |
| | | | | | | | | | | | | | | | | | | | | | | | | |
| NET ASSETS ATTRIBUTABLE TO COMMON SHAREHOLDERS |
| Beginning of period | | | 268,153,488 | | | | 242,873,866 | | | | 215,235,588 | | | | 195,204,181 | | | | 749,867,614 | | | | 679,029,374 | |
End of period* | | $ | 269,241,584 | | | $ | 268,153,488 | | | $ | 218,084,800 | | | $ | 215,235,588 | | | $ | 761,585,158 | | | $ | 749,867,614 | |
* Including undistributed net investment income of: | | $ | 4,904,764 | | | $ | 2,224,258 | | | $ | 4,088,854 | | | $ | 2,272,686 | | | $ | 13,673,006 | | | $ | 7,422,434 | |
(a) | Includes distributions to preferred shareholders from net investment income. Distributions on the Fund's mandatory redeemable preferred stock ("MRPS") are treated as an operating expense under GAAP and are included in the calculation of net investment income. See Note 8 -Leverage. The Long-Short Credit Income Fund and the Strategic Credit Fund paid $369,305 and $827,597, respectively, to holders of MRPS for the period ended June 30, 2017 which were characterized as distributions. |
See Notes to Financial Statements.
| Semi-Annual Report | June 30, 2017 | 43 |
| Blackstone / GSO Funds | Statements of Cash Flows |
For the Six Months Ended June 30, 2017 (Unaudited)
| | | Senior Floating Rate Term Fund | | | Long-Short Credit Income Fund | | | Strategic Credit Fund | |
| | | | | | | | | | |
| CASH FLOWS FROM OPERATING ACTIVITIES: | | | | | | | | | |
| Net increase in net assets from operations | | $ | 8,254,475 | | | $ | 9,390,824 | | | $ | 35,166,345 | |
| Adjustments to reconcile net increase in net assets from operations to net cash provided by operating activities: | | | | | | | | | | | | |
| Purchases of investment securities | | | (289,761,486 | ) | | | (240,886,449 | ) | | | (831,591,626 | ) |
| Proceeds from disposition of investment securities | | | 293,968,179 | | | | 228,731,732 | | | | 833,987,782 | |
| Discounts accreted/premiums amortized | | | (1,239,999 | ) | | | (848,879 | ) | | | (2,817,754 | ) |
| Net realized loss on: | | | | | | | | | | | | |
| Investment securities | | | 106,097 | | | | 1,346,968 | | | | 2,776,799 | |
| Net change in unrealized appreciation on: | | | | | | | | | | | | |
| Investment securities | | | 1,708,185 | | | | (2,380,012 | ) | | | (8,243,771 | ) |
| Amortization of deferred financing costs | | | – | | | | 17,797 | | | | 40,041 | |
| (Increase)/Decrease in assets: | | | | | | | | | | | | |
| Interest receivable | | | (226 | ) | | | 437,314 | | | | 2,016,552 | |
| Prepaid expenses and other assets | | | (88,238 | ) | | | (47,947 | ) | | | (219,762 | ) |
| Increase/(Decrease) in liabilities: | | | | | | | | | | | | |
| Distributions payable on mandatory redeemable preferred shares | | | – | | | | 6,820 | | | | 15,345 | |
| Interest due on loan facility | | | 81,034 | | | | 113,726 | | | | 478,655 | |
| Accrued investment advisory fees payable | | | (7,791 | ) | | | (6,122 | ) | | | (9,201 | ) |
| Accrued fund accounting and administration expense | | | (33,283 | ) | | | (21,844 | ) | | | (144,692 | ) |
| Accrued trustees' fees payable | | | (5,605 | ) | | | (969 | ) | | | (406 | ) |
| Other payables and accrued expenses | | | (16,943 | ) | | | 14,707 | | | | (91,363 | ) |
| Net Cash Provided by Operating Activities | | | 12,964,399 | | | | (4,132,334 | ) | | | 31,362,944 | |
| | | | | | | | | | | | | |
| CASH FLOWS FROM FINANCING ACTIVITIES: | | | | | | | | | | | | |
| Proceeds from leverage facility | | | 3,000,000 | | | | 27,500,000 | | | | 32,000,000 | |
| Payments on leverage facility | | | (2,000,000 | ) | | | (16,500,000 | ) | | | (21,000,000 | ) |
| Distributions paid ‐ common shareholders ‐ net | | | (8,642,975 | ) | | | (11,063,581 | ) | | | (31,890,369 | ) |
| Net Cash Provided Used in Financing Activities | | | (7,642,975 | ) | | | (63,581 | ) | | | (20,890,369 | ) |
| | | | | | | | | | | | | |
| Net Increase/(Decrease) in Cash | | | 5,321,424 | | | | (4,195,915 | ) | | | 10,472, 575 | |
| Cash, beginning balance | | $ | 6,833,565 | | | $ | 15,558,924 | | | $ | 16,354,461 | |
| Cash, ending balance | | $ | 12,154,989 | | | $ | 11,363,009 | | | $ | 26,827,036 | |
| | | | | | | | | | | | | |
| Supplemental disclosure of cash flow information: | | | | | | | | | | | | |
| Cash paid on interest on leverage facility | | $ | 1,064,970 | | | $ | 775,268 | | | $ | 3,189,620 | |
| | | | | | | | | | | | | |
| Reinvestment of distributions | | $ | 221,872 | | | $ | – | | | $ | – | |
See Notes to Financial Statements.
| Blackstone / GSO Senior Floating Rate Term Fund | Financial Highlights |
| | For a Share Outstanding Throughout the Periods Indicated |
| | | For the Six Months Ended June 30, 2017 (Unaudited) | | | For the Year Ended December 31, 2016 | | | For the Year Ended December 31, 2015 | | | For the Year Ended December 31, 2014 | | | For the Year Ended December 31, 2013 | | | For the Year Ended December 31, 2012 | |
| PER COMMON SHARE OPERATING PERFORMANCE: | | | | | | | | | | | | |
| Net asset value ‐ beginning of period | | $ | 17.61 | | | $ | 15.96 | | | $ | 18.08 | | | $ | 19.27 | | | $ | 19.31 | | | $ | 18.81 | |
| INCOME/(LOSS) FROM INVESTMENT OPERATIONS: | | | | | | | | | | | | | |
Net investment income(a) | | | 0.66 | | | | 1.24 | | | | 1.22 | | | | 0.92 | | | | 1.17 | | | | 1.36 | |
| Net realized and unrealized gain/(loss)on investments | | | (0.11 | ) | | | 1.57 | | | | (2.17 | ) | | | (0.84 | ) | | | 0.08 | | | | 0.65 | |
| DISTRIBUTIONS TO PREFERRED SHAREHOLDERS: | | | | | | | | | | | | | | | | | | | |
From net investment income(a) | | | – | | | | – | | | | – | | | | (0.06 | ) | | | (0.08 | ) | | | (0.08 | ) |
| From net realized gains | | | – | | | | – | | | | – | | | | – | | | | – | | | | (0.01 | ) |
| Total Income/(Loss) from Investment Operations | | | 0.55 | | | | 2.81 | | | | (0.95 | ) | | | 0.02 | | | | 1.17 | | | | 1.92 | |
| DISTRIBUTIONS TO COMMON SHAREHOLDERS: | | | | | | | | | | | | | | | | | | | | | |
| From net investment income | | | (0.49 | ) | | | (1.16 | ) | | | (1.17 | ) | | | (0.86 | ) | | | (1.06 | ) | | | (1.23 | ) |
| From net realized gains | | | – | | | | – | | | | – | | | | (0.08 | ) | | | (0.15 | ) | | | (0.19 | ) |
| From tax return of capital | | | – | | | | – | | | | – | | | | (0.27 | ) | | | – | | | | – | |
| Total Distributions to Common Shareholders | | | (0.49 | ) | | | (1.16 | ) | | | (1.17 | ) | | | (1.21 | ) | | | (1.21 | ) | | | (1.42 | ) |
| Net asset value per common share ‐ end of period | | $ | 17.67 | | | $ | 17.61 | | | $ | 15.96 | | | $ | 18.08 | | | $ | 19.27 | | | $ | 19.31 | |
| Market price per common share ‐ end of period | | $ | 17.90 | | | $ | 18.08 | | | $ | 14.85 | | | $ | 16.74 | | | $ | 18.85 | | | $ | 20.33 | |
Total Investment Return ‐ Net Asset Value(b) | | | 3.17 | % | | | 18.44 | % | | | (5.19 | %) | | | 0.38 | % | | | 6.27 | % | | | 10.51 | % |
Total Investment Return ‐ Market Price(b) | | | 1.80 | % | | | 30.70 | % | | | (4.72 | %) | | | (4.99 | %) | | | (1.26 | %) | | | 19.20 | % |
| RATIOS AND SUPPLEMENTAL DATA: | | | | | | | | | | | | | | | | | | | | | | | | |
| Net assets attributable to common shares, end of period (000s) | | $ | 269,242 | | | $ | 268,153 | | | $ | 242,874 | | | $ | 275,201 | | | $ | 293,242 | | | $ | 293,459 | |
| Ratio of expenses to average net assets attributable to common shares | | | 2.80 | %(c) | | | 2.59 | % | | | 2.48 | % | | | 3.02 | %(d) | | | 2.73 | %(d) | | | 2.78 | %(d) |
| Ratio of net investment income to average net assets attributable to common shares | | | 7.52 | %(c) | | | 7.48 | % | | | 6.84 | % | | | 4.88 | %(d) | | | 6.02 | %(d) | | | 7.04 | %(d) |
Ratio of expenses to average managed assets(e) | | | 1.88 | %(c) | | | 1.74 | % | | | 1.67 | % | | | 2.02 | %(d) | | | 1.83 | %(d) | | | 1.87 | %(d) |
| Portfolio turnover rate | | | 75 | % | | | 99 | % | | | 65 | % | | | 66 | % | | | 85 | % | | | 73 | % |
| Semi-Annual Report | June 30, 2017 | 45 |
| Blackstone / GSO Senior Floating Rate Term Fund | Financial Highlights |
| | For a Share Outstanding Throughout the Periods Indicated |
| | | For the Six Months Ended June 30, 2017 (Unaudited) | | | For the Year Ended December 31, 2016 | | | For the Year Ended December 31, 2015 | | | For the Year Ended December 31, 2014 | | | For the Year Ended December 31, 2013 | | | For the Year Ended December 31, 2012 | |
| TERM PREFERRED SHARES: | | | | | | | | | | | | | | | | | | |
| Liquidation value, end of period, including dividends payable on Term Preferred Shares (000s) | | $ | N/A | | | $ | N/A | | | $ | N/A | | | $ | N/A | (f) | | $ | 48,100 | | | $ | 48,109 | |
| Total shares outstanding (000s) | | | – | | | | – | | | | – | | | | – | | | | 48 | | | | 48 | |
| Asset coverage per share | | $ | N/A | | | $ | N/A | | | $ | N/A | | | $ | N/A | (f) | | $ | 3,035 | (g) | | $ | 7,116 | (h) |
| Liquidation preference per share | | $ | N/A | | | $ | N/A | | | $ | N/A | | | $ | N/A | (f) | | $ | 1,000 | | | $ | 1,000 | |
| SENIOR SECURED NOTES: | | | | | | | | | | | | | | | | | | | | | | | | |
| Aggregate principal amount, end of period (000s) | | $ | N/A | | | $ | N/A | | | $ | N/A | | | $ | – | (i) | | $ | 96,000 | | | $ | 96,000 | |
| Average borrowings outstanding during the period (000s) | | $ | N/A | | | $ | N/A | | | $ | N/A | | | $ | 96,000 | (i) | | $ | 96,000 | | | $ | 96,000 | |
| Asset coverage, end of period per $1,000 | | | N/A | | | | N/A | | | | N/A | | | | N/A | (i) | | $ | 4,556 | (j) | | $ | 4,057 | (k) |
| LEVERAGE FACILITY: | | | | | | | | | | | | | | | | | | | | | | | | |
| Aggregate principal amount, end of period (000s) | | $ | 132,000 | | | $ | 131,000 | | | $ | 119,500 | | | $ | 133,000 | | | $ | N/A | | | $ | N/A | |
| Average borrowings outstanding during the period (000s) | | $ | 132,652 | | | $ | 122,782 | | | $ | 132,372 | | | $ | 137,412 | (l) | | $ | N/A | | | $ | N/A | |
| Asset coverage, end of period per $1,000 | | $ | 3,040 | | | $ | 3,047 | | | $ | 3,032 | | | $ | 3,069 | | | $ | N/A | | | $ | N/A | |
(a) | Calculated using average common shares outstanding. |
(b) | Total investment return is calculated assuming a purchase of common share at the opening on the first day and a sale at closing on the last day of each period reported. Dividends and distributions are assumed for purposes of this calculation to be reinvested at prices obtained under the Fund's dividend reinvestment plan. Total investment returns do not reflect brokerage commissions, if any, and are not annualized. |
(d) | Ratios do not reflect dividend payments to preferred shareholders. |
(e) | Average managed assets represent net assets applicable to common shares plus principal value of leverage. |
(f) | On October 8, 2014, BSL redeemed 100% of the term preferred shares at 100% of their liquidation preference. |
(g) | Calculated by subtracting the Fund's total liabilities (excluding Term Preferred Shares and Senior Secured Notes) from the Fund's total assets and dividing by the sum of the Term Preferred Shares and the Senior Secured Notes and then multiplying by $1,000. |
(h) | Calculated by subtracting the Fund's total liabilities (excluding Mandatory Redeemable Preferred Shares) from the Fund's total assets and dividing by the number of Mandatory Redeemable Preferred Shares outstanding. |
(i) | On October 8, 2014, BSL redeemed 100% of the senior secured notes at 100% of their principal amount and entered into a new 364-day revolving credit facility. Average borrowings are shown for the period January 1, 2014 through the redemption date. |
(j) | Calculated by subtracting the Fund's total liabilities (excluding Term Preferred Shares and Senior Secured Notes) from the Fund's total assets and dividing by the principal amount of Senior Secured Notes and then multiplying by $1,000. |
(k) | Calculated by subtracting the Fund's total liabilities (including Term Preferred Shares but excluding Senior Secured Notes) from the Fund's total assets and dividing by the principal amount of Senior Secured Notes and then multiplying by $1,000. |
(l) | Since first borrowing was made on October 8, 2014. |
See Notes to Financial Statements.
| Blackstone / GSO Long-Short Credit Income Fund | Financial Highlights |
For a Share Outstanding Throughout the Periods Indicated
| | | For the Six Months Ended June 30, 2017 (Unaudited) | | | For the Year Ended December 31, 2016 | | | For the Year Ended December 31, 2015 | | | For the Year Ended December 31, 2014 | | | For the Year Ended December 31, 2013 | | | For the Year Ended December 31, 2012 | |
| PER COMMON SHARE OPERATING PERFORMANCE: |
| Net asset value - beginning of period | | $ | 16.94 | | | $ | 15.37 | | | $ | 17.82 | | | $ | 19.11 | | | $ | 18.97 | | | $ | 18.10 | |
| INCOME/(LOSS) FROM INVESTMENT OPERATIONS: | | | | | | | | | | | | | | | |
Net investment income(a)(b) | | | 0.66 | | | | 1.40 | | | | 1.48 | | | | 0.94 | | | | 1.13 | | | | 1.22 | |
| Net realized and unrealized gain/(loss) on investments | | | 0.09 | | | | 1.60 | | | | (2.66 | ) | | | (1.03 | ) | | | 0.36 | | | | 0.95 | |
| Total Income/(Loss) from Investment Operations | | | 0.75 | | | | 3.00 | | | | (1.18 | ) | | | (0.09 | ) | | | 1.49 | | | | 2.17 | |
| |
| DISTRIBUTIONS TO COMMON SHAREHOLDERS: |
| From net investment income | | | (0.52 | ) | | | (1.43 | ) | | | (1.27 | ) | | | (0.96 | ) | | | (1.23 | ) | | | (1.30 | ) |
| From net realized gains | | | – | | | | – | | | | – | | | | (0.06 | ) | | | (0.12 | ) | | | – | |
| From tax return of capital | | | – | | | | – | | | | – | | | | (0.18 | ) | | | – | | | | – | |
| Total Distributions to Common Shareholders | | | (0.52 | ) | | | (1.43 | ) | | | (1.27 | ) | | | (1.20 | ) | | | (1.35 | ) | | | (1.30 | ) |
| | | | | | | | | | | | | | | | | | | | | | | | | |
| Net asset value per common share - end of period | | $ | 17.17 | | | $ | 16.94 | | | $ | 15.37 | | | $ | 17.82 | | | $ | 19.11 | | | $ | 18.97 | |
| Market price per common share - end of period | | $ | 16.14 | | | $ | 15.92 | | | $ | 13.48 | | | $ | 15.53 | | | $ | 17.87 | | | $ | 18.75 | |
Total Investment Return - Net Asset Value(c) | | | 4.59 | % | | | 21.21 | % | | | (6.04 | %) | | | (0.06 | %) | | | 8.34 | % | | | 12.45 | % |
Total Investment Return - Market Price(c) | | | 4.61 | % | | | 29.89 | % | | | (5.44 | %) | | | (6.86 | %) | | | 2.50 | % | | | 17.92 | % |
| | | | | | | | | | | | | | | | | | | | | | | | | |
| RATIOS AND SUPPLEMENTAL DATA: |
| Net assets attributable to common shares, end of period (000s) | | $ | 218,085 | | | $ | 215,236 | | | $ | 195,204 | | | $ | 226,316 | | | $ | 242,699 | | | $ | 240,978 | |
| Ratio of expenses to average net assets attributable to common shares | | | 2.90 | %(d) | | | 2.58 | % | | | 2.07 | % | | | 1.86 | % | | | 1.85 | % | | | 1.82 | % |
| Ratio of expenses to average net assets excluding interest expense on short sales attributable to common shares | | | 2.90 | %(d) | | | 2.58 | % | | | 2.07 | % | | | 1.85 | % | | | 1.83 | % | | | 1.82 | % |
| Ratio of net investment income to average net assets attributable to common shares | | | 7.71 | %(d) | | | 8.67 | % | | | 8.45 | % | | | 4.99 | % | | | 5.94 | % | | | 6.54 | % |
Ratio of expenses to average managed assets(e) | | | 1.85 | %(d) | | | 1.73 | % | | | 1.43 | % | | | 1.66 | % | | | N/A | | | | N/A | |
| Portfolio turnover rate | | | 67 | % | | | 103 | % | | | 72 | % | | | 66 | % | | | 80 | % | | | 77 | % |
| | | | | | | | | | | | | | | | | | | | | | | | | |
| MANDATORY REDEEMABLE PREFERRED SHARES: |
| Liquidation value, end of period, including dividends payable on Mandatory Redeemable Preferred Shares (000s) | | $ | 20,132 | | | $ | 20,125 | | | $ | N/A | | | $ | N/A | | | $ | N/A | | | $ | N/A | |
| Total shares outstanding (000s) | | | 20 | | | | 20 | | | | – | | | | – | | | | – | | | | – | |
| Asset coverage per share | | $ | 10,904 | (f) | | $ | 11,768 | (f) | | $ | N/A | | | $ | N/A | | | $ | N/A | | | $ | N/A | |
| Liquidation preference per share | | $ | 1,000 | | | $ | 1,000 | | | $ | N/A | | | $ | N/A | | | $ | N/A | | | $ | N/A | |
| | | | | | | | | | | | | | | | | | | | | | | | | |
| LEVERAGE FACILITY: | | | | | | | | | | | | | | | | | | | | |
| Aggregate principal amount, end of period (000s) | | $ | 104,000 | | | $ | 93,000 | | | $ | 96,000 | | | $ | 73,000 | | | $ | N/A | | | $ | N/A | |
| Average borrowings outstanding during the period (000s) | | $ | 103,670 | | | $ | 93,684 | | | $ | 100,261 | | | $ | 66,827 | (g) | | $ | N/A | | | $ | N/A | |
| Asset coverage, end of period per $1,000 | | $ | 3,289 | (h) | | $ | 3,314 | (i) | | $ | 3,033 | (i) | | $ | 4,100 | (i) | | $ | N/A | | | $ | N/A | |
| Semi-Annual Report | June 30, 2017 | 47 |
| Blackstone / GSO Long-Short Credit Income Fund | Financial Highlights |
| For a Share Outstanding Throughout the Periods Indicated |
| (a) | Calculated using average common shares outstanding. |
| (b) | Distributions on the Company's MRPS are treated as an operating expense under GAAP and are included in the calculation of net investment income. See Note 8 - Leverage. |
| (c) | Total investment return is calculated assuming a purchase of common share at the opening on the first day and a sale at closing on the last day of each period reported. Dividends and distributions are assumed for purposes of this calculation to be reinvested at prices obtained under the Fund's dividend reinvestment plan. Total investment returns do not reflect brokerage commissions, if any, and are not annualized. |
| (e) | Average managed assets represent net assets applicable to common shares plus principal value of leverage. |
(f) | Calculated by subtracting the Fund's total liabilities (excluding Mandatory Redeemable Preferred Shares) from the Fund's total assets and dividing by the number of Mandatory Redeemable Preferred Shares outstanding. |
| (g) | Since first borrowing was made on July 29, 2014. |
| (h) | Calculated by subtracting the Fund's total liabilities (excluding Mandatory Redeemable Preferred Shares and the principal amount of the Leverage Facility) from the Fund's total assets and dividing by the principal amount of the Leverage Facility and then multiplying by $1,000. |
| (i) | Calculated by subtracting the Fund's total liabilities (the principal amount of the Leverage Facility) from the Fund's total assets and dividing by the principal amount of the Leverage Facility and then multiplying by $1,000. |
See Notes to Financial Statements.
| Blackstone / GSO Strategic Credit Fund | Financial Highlights |
| | For a Share Outstanding Throughout the Periods Indicated |
| | | For the Six Months Ended June 30, 2017 (Unaudited) | | | For the Year Ended December 31, 2016 | | | For the Year Ended December 31, 2015 | | | For the Year Ended December 31, 2014 | | | For the Year Ended December 31, 2013 | | | For the Period September 26, 2012 (Commencement of Operations) to December 31, 2012 | |
| PER COMMON SHARE OPERATING PERFORMANCE: |
| Net asset value - beginning of period | | $ | 16.79 | | | $ | 15.20 | | | $ | 17.98 | | | $ | 19.12 | | | $ | 19.19 | | | $ | 19.10 | |
| INCOME/(LOSS) FROM INVESTMENT OPERATIONS: |
Net investment income(a)(b) | | | 0.66 | | | | 1.39 | | | | 1.48 | | | | 1.17 | | | | 1.21 | | | | 0.14 | |
| Net realized and unrealized gain/(loss) on investments | | | 0.13 | | | | 1.54 | | | | (2.89 | ) | | | (1.03 | ) | | | 0.12 | | | | 0.22 | |
| Total Income/(Loss) from Investment Operations | | | 0.79 | | | | 2.93 | | | | (1.41 | ) | | | 0.14 | | | | 1.33 | | | | 0.36 | |
| |
| DISTRIBUTIONS TO COMMON SHAREHOLDERS: |
| From net investment income | | | (0.53 | ) | | | (1.34 | ) | | | (1.37 | ) | | | (1.17 | ) | | | (1.21 | ) | | | (0.13 | ) |
| From net realized gains | | | – | | | | – | | | | – | | | | (0.01 | ) | | | (0.14 | ) | | | (0.01 | ) |
| From tax return of capital | | | – | | | | – | | | | – | | | | (0.10 | ) | | | (0.05 | ) | | | (0.09 | ) |
| Total Distributions to Common Shareholders | | | (0.53 | ) | | | (1.34 | ) | | | (1.37 | ) | | | (1.28 | ) | | | (1.40 | ) | | | (0.23 | ) |
| |
| CAPITAL SHARE TRANSACTIONS: |
| Common share offering costs charged to paid-in capital | | | – | | | | – | | | | – | | | | – | | | | – | | | | (0.04 | ) |
| Total Capital Share Transactions | | | – | | | | – | | | | – | | | | – | | | | – | | | | (0.04 | ) |
| | | | | | | | | | | | | | | | | | | | | | | | | |
| Net asset value per common share - end of period | | $ | 17.05 | | | $ | 16.79 | | | $ | 15.20 | | | $ | 17.98 | | | $ | 19.12 | | | $ | 19.19 | |
| Market price per common share - end of period | | $ | 15.92 | | | $ | 15.34 | | | $ | 13.37 | | | $ | 16.48 | | | $ | 17.80 | | | $ | 18.55 | |
Total Investment Return - Net Asset Value(c) | | | 4.89 | % | | | 21.02 | % | | | (7.42 | %) | | | 1.27 | % | | | 7.48 | % | | | 1.73 | % |
Total Investment Return - Market Price(c) | | | 7.20 | % | | | 25.71 | % | | | (11.15 | %) | | | (0.29 | %) | | | 3.51 | % | | | (6.09 | %) |
| |
| RATIOS AND SUPPLEMENTAL DATA: |
| Net assets attributable to common shares, end of period (000s) | | $ | 761,585 | | | $ | 749,868 | | | $ | 679,029 | | | $ | 803,029 | | | $ | 854,173 | | | $ | 856,376 | |
| Ratio of expenses to average net assets attributable to common shares | | | 3.20 | %(d) | | | 2.74 | % | | | 2.33 | % | | | 2.32 | % | | | 2.21 | % | | | 1.33 | %(d) |
| Ratio of net investment income to average net assets attributable to common shares | | | 7.85 | %(d) | | | 8.73 | % | | | 8.41 | % | | | 6.16 | % | | | 6.26 | % | | | 2.79 | %(d) |
Ratio of expenses to average managed assets(e) | | | 2.04 | %(d) | | | 1.82 | % | | | 1.57 | % | | | 1.57 | % | | | 1.57 | % | | | 1.32 | %(d) |
| Portfolio turnover rate | | | 73 | % | | | 93 | % | | | 74 | % | | | 76 | % | | | 73 | % | | | 11 | % |
| Semi-Annual Report | June 30, 2017 | 49 |
| Blackstone / GSO Strategic Credit Fund | Financial Highlights |
| | For a Share Outstanding Throughout the Periods Indicated |
| | | For the Six Months Ended June 30, 2017 (Unaudited) | | | For the Year Ended December 31, 2016 | | | For the Year Ended December 31, 2015 | | | For the Year Ended December 31, 2014 | | | For the Year Ended December 31, 2013 | | | For the Period September 26, 2012 (Commencement of Operations) to December 31, 2012 | |
| MANDATORY REDEEMABLE PREFERRED SHARES: |
| Liquidation value, end of period, including dividends payable on Mandatory Redeemable Preferred Shares (000s) | | $ | 45,296 | | | $ | 45,281 | | | $ | N/A | | | $ | N/A | | | $ | N/A | | | $ | N/A | |
| Total shares outstanding (000s) | | | 45 | | | | 45 | | | | – | | | | – | | | | – | | | | – | |
| Asset coverage per share | | $ | 16,924 | (f) | | $ | 17,670 | (f) | | $ | N/A | | | $ | N/A | | | $ | N/A | | | $ | N/A | |
| Liquidation preference per share | | $ | 1,000 | | | $ | 1,000 | | | $ | N/A | | | $ | N/A | | | $ | N/A | | | $ | N/A | |
| | | | | | | | | | | | | | | | | | | | | | | | | |
| LEVERAGE FACILITY: | | | | | | | | | | | | | | | | | | | | | | | | |
| Aggregate principal amount, end of period (000s) | | $ | 388,000 | | | $ | 377,000 | | | $ | 331,000 | | | $ | 389,500 | | | $ | 390,000 | | | $ | 125,000 | |
| Average borrowings outstanding during the period (000s) | | $ | 387,630 | | | $ | 342,331 | | | $ | 382,162 | | | $ | 403,727 | | | $ | 357,342 | | | $ | 125,000 | (g) |
| Asset coverage, end of period per $1,000 | | $ | 3,079 | (h) | | $ | 2,989 | (i) | | $ | 3,051 | (i) | | $ | 3,062 | (i) | | $ | 3,190 | (i) | | $ | 7,851 | (i) |
(a) | Calculated using average common shares outstanding. |
(b) | Distributions on the Company's MRPS are treated as an operating expense under GAAP and are included in the calculation of net investment income. See Note 8 - Leverage. |
(c) | Total investment return is calculated assuming a purchase of common share at the opening on the first day and a sale at closing on the last day of each period reported. Dividends and distributions are assumed for purposes of this calculation to be reinvested at prices obtained under the Fund's dividend reinvestment plan. Total investment returns do not reflect brokerage commissions, if any, and are not annualized. |
(e) | Average managed assets represent net assets applicable to common shares plus principal value of leverage. |
(f) | Calculated by subtracting the Fund's total liabilities (excluding Mandatory Redeemable Preferred Shares) from the Fund's total assets and dividing by the number of Mandatory Redeemable Preferred Shares outstanding. |
(g) | Since first borrowing was made on December 27, 2012. |
(h) | Calculated by subtracting the Fund's total liabilities (excluding Mandatory Redeemable Preferred Shares and the principal amount of the Leverage Facility) from the Fund's total assets and dividing by the principal amount of the Leverage Facility and then multiplying by $1,000. |
(i) | Calculated by subtracting the Fund's total liabilities (the principal amount of the Leverage Facility) from the Fund's total assets and dividing by the principal amount of the Leverage Facility and then multiplying by $1,000. |
See Notes to Financial Statements.
| Blackstone / GSO Funds | Notes to Financial Statements |
| | June 30, 2017 (Unaudited) |
NOTE 1. ORGANIZATION
Blackstone / GSO Senior Floating Rate Term Fund (“BSL”), is a diversified, closed-end management investment company. BSL was organized as a Delaware statutory trust on March 4, 2010. BSL was registered under the Investment Company Act of 1940, as amended (the “1940 Act”), on March 5, 2010. BSL commenced operations on May 26, 2010. Prior to that date, BSL had no operations other than matters relating to its organization and the sale and issuance of 5,236 common shares of beneficial interest in BSL to GSO / Blackstone Debt Funds Management LLC (the “Adviser”) at a price of $19.10 per share. The Adviser serves as BSL’s investment adviser. BSL’s common shares are listed on the New York Stock Exchange (the “Exchange”) and trade under the ticker symbol “BSL.”
Absent shareholder approval to extend the term of BSL, BSL will dissolve on or about May 31, 2020. Upon dissolution, BSL will distribute substantially all of its net assets to shareholders, after making appropriate provision for any liabilities. Pursuant to BSL’s Amended and Restated Agreement and Declaration of Trust (the “Declaration of Trust”), prior to the date of dissolution a majority of the Board of Trustees, with the approval of a majority of the shareholders entitled to vote (as defined in the 1940 Act), may extend the life of BSL. If approved, the dissolution date of BSL may be extended by a period of two years or such shorter time as may be determined. However, the dissolution date of BSL may be extended an unlimited number of times. BSL has a reinvestment period after which it will stop reinvesting principal proceeds generated by maturities, prepayments and sales of investments. In March 2017, the reinvestment period was extended to last until one year prior to BSL’s scheduled dissolution date.
Blackstone / GSO Long-Short Credit Income Fund (“BGX”) is a diversified, closed-end management investment company. BGX was organized as a Delaware statutory trust on October 22, 2010. BGX was registered under the 1940 Act on October 26, 2010. BGX commenced operations on January 27, 2011. Prior to that, BGX had no operations other than matters relating to its organization and the sale and issuance of 5,236 common shares of beneficial interest in BGX to the Adviser at a price of $19.10 per share. The Adviser serves as the investment adviser for BGX. BGX’s common shares are listed on the Exchange and trade under the ticker symbol “BGX.”
Blackstone / GSO Strategic Credit Fund (“BGB” and, collectively with BSL and BGX, the “Funds”) is a diversified, closed-end management investment company. BGB was organized as a Delaware statutory trust on March 28, 2012. BGB was registered under the 1940 Act on April 6, 2012. BGB commenced operations on September 26, 2012. Prior to that, BGB had no operations other than matters relating to its organization and the sale and issuance of 5,236 common shares of beneficial interest in BGB to the Adviser at a price of $19.10 per share. The Adviser serves as the investment adviser for BGB. BGB’s common shares are listed on the Exchange and trade under the ticker symbol “BGB.”
BGB will dissolve on or about September 15, 2027, absent shareholder approval to extend such term. Upon dissolution, BGB will distribute substantially all of its net assets to shareholders, after making appropriate provision for any liabilities of the Fund. Pursuant to BGB’s Agreement and Declaration of Trust, prior to the date of dissolution a majority of the Board of Trustees, with the approval of a majority of the outstanding voting securities entitled to vote (as defined in the 1940 Act), may extend the life of BGB. If approved, the dissolution date of the Fund may be extended by a period of two years or such shorter time as may be determined. However, the dissolution date of the Fund may be extended an unlimited number of times.
The Funds were previously classified as non-diversified investment companies for purposes of the 1940 Act. As a result of ongoing operations, BGX and BSL are now classified as diversified companies as of April 1, 2014 and BGB as of September 25, 2015. This means that with respect to 75% of each Fund’s total assets, no more than 5% of such Fund’s total assets may be invested in any one issuer, excepting cash and cash items, U.S. government securities, and securities of other investment companies. The Funds may not resume operating in a non-diversified manner without first obtaining shareholder approval in accordance with the 1940 Act.
BSL’s primary investment objective is to seek high current income, with a secondary objective to seek preservation of capital, consistent with its primary goal of high current income. Under normal market conditions, at least 80% of BSL’s assets will be invested in senior secured, floating rate loans (“Senior Loans”).
BGX’s primary investment objective is to provide current income, with a secondary objective of capital appreciation. BGX seeks to achieve its investment objectives by employing a dynamic long-short strategy in a diversified portfolio of loans and fixed-income instruments of predominantly U.S. corporate issuers, including first- and second-lien secured loans (“Secured Loans”) and high-yield corporate debt securities of varying maturities. BGX’s long positions in loans and fixed-income instruments will typically be rated below investment grade at the time of purchase. BGX’s long positions, either directly or through the use of derivatives, may total up to 150% of BGX’s net assets. BGX’s short positions, either directly or through the use of derivatives, may total up to 30% of such Fund’s net assets. Subject to the preceding restrictions, such Fund’s total long and short positions, either directly or through the use of derivatives, may total up to 160% of such Fund’s net assets.
On November 17, 2016, the Board of Trustees approved a change to BGX’s investment guidelines that took effect in January 2017. Under the new investment guidelines, BGX’s long positions are not limited. BGX’s short positions will continue to be limited to 30% of net assets.
| Semi-Annual Report | June 30, 2017 | 51 |
| Blackstone / GSO Funds | Notes to Financial Statements |
June 30, 2017 (Unaudited)
BGB’s primary investment objective is to seek high current income, with a secondary objective to seek preservation of capital, consistent with its primary goal of high current income. The Fund will seek to achieve its investment objectives by investing primarily in a diversified portfolio of loans and other fixed income instruments of predominantly U.S. corporate issuers, including first‐ and second‐lien secured loans (‘‘Senior Secured Loans’’) and high yield corporate bonds of varying maturities. Under normal market conditions, at least 80% of BGB’s assets will be invested in credit investments comprised of corporate fixed income instruments and other investments (including derivatives) with similar economic characteristics.
Senior Loans, Secured Loans and Senior Secured Loans are referred to collectively as “Loans” throughout the Notes to Financial Statements.
NOTE 2. SIGNIFICANT ACCOUNTING POLICIES
The following is a summary of significant accounting policies followed by the Funds in the preparation of their financial statements. The preparation of their financial statements is in accordance with accounting principles generally accepted in the United States of America (“GAAP”), which requires management to make estimates and assumptions that affect the reported amounts and disclosures in the financial statements. Actual results could differ from those estimates and these differences could be material. Each Fund is considered an investment company for financial reporting purposes under GAAP.
Portfolio Valuation: Each Fund’s net asset value (“NAV”) is determined daily on each day that the Exchange is open for business, as of the close of the regular trading session on the Exchange. Each Fund calculates NAV per share by subtracting liabilities (including accrued expenses or dividends) from the total assets of such Fund (the value of the securities plus cash or other assets, including interest accrued but not yet received) and dividing the result by the total number of outstanding common shares of such Fund.
Loans are primarily valued by using a composite loan price from a nationally recognized loan pricing service. The methodology used by the Funds’ nationally recognized loan pricing provider for composite loan prices is to value loans at the mean of the bid and ask prices from one or more brokers or dealers. Collateralized Loan Obligations (“CLOs”) are valued at the price provided by a nationally recognized pricing service. The prices provided by the nationally recognized pricing service are typically based on the evaluated mid‐price of each of the CLOs. Corporate bonds and convertible bonds, other than short‐term investments, are valued at the price provided by a nationally recognized pricing service. The prices provided by the nationally recognized pricing service are typically based on the mean of bid and ask prices for each corporate bond security. In determining the value of a particular investment, pricing services may use certain information with respect to transactions in such investments, quotations from dealers, pricing matrices, market transactions in comparable investments, various relationships observed in the market between investments and calculated yield measures based on valuation technology commonly employed in the market for such investments. Equity securities for which market quotations are available are generally valued at the last sale price or official closing price on the primary market or exchange on which they trade. Futures contracts are ordinarily valued at the last sales price on the securities or commodities exchange on which they are traded. Written and purchased options are ordinarily valued at the closing price on the securities or commodities exchange on which they are traded. Short‐term debt investments, if any, having a remaining maturity of 60 days or less when purchased would be valued at cost adjusted for amortization of premiums and accretion of discounts. Any investments and other assets for which such current market quotations are not readily available are valued at fair value (“Fair Valued Assets”) as determined in good faith by a committee of the Adviser (“Fair Valued Asset Committee”) under procedures established by, and under the general supervision and responsibility of, the Funds’ Boards of Trustees. A Fair Valued Asset Committee meeting may be called at any time by any member of the Fair Valued Asset Committee. The pricing of all Fair Valued Assets and determinations thereof shall be reported by the Fair Valued Asset Committee to the Board at each regularly scheduled quarterly meeting. The Funds have procedures to identify and investigate potentially stale prices for investments which are valued using a nationally recognized pricing service, exchange price or broker‐dealer quotations. After performing such procedures, any prices which are deemed to be stale are reviewed by the Fair Valued Asset Committee and an alternative pricing methodology is determined.
Various inputs are used to determine the value of the Funds’ investments. Observable inputs are inputs that reflect the assumptions market participants would use in pricing the asset or liability developed based on market data obtained from sources independent of the reporting entity. Unobservable inputs are inputs that reflect the reporting entity’s own assumptions about the assumptions market participants would use in pricing the asset or liability developed based on the best information available in the circumstances. The three‐tier hierarchy of inputs is summarized in the three broad Levels listed below.
Level 1— Unadjusted quoted prices in active markets for identical investments at the measurement date.
Level 2— Significant observable inputs (including quoted prices for similar investments, interest rates, prepayment speeds, credit risk, etc.).
Level 3— Significant unobservable inputs (including the Funds’ own assumptions in determining the fair value of investments).
The valuation techniques used by the Funds to measure fair value during the period ended June 30, 2017 maximized the use of observable inputs and minimized the use of unobservable inputs. The categorization of a value determined for investments and other financial instruments is based on the pricing transparency of the investment and other financial instrument and does not necessarily correspond to the Funds’ perceived risk of investing in those securities.
| Blackstone / GSO Funds | Notes to Financial Statements |
June 30, 2017 (Unaudited)
The following tables summarize valuation of the Funds’ investments under the fair value hierarchy levels as of June 30, 2017:
Blackstone / GSO Senior Floating Rate Term Fund
| Investments in Securities at Value* | | Level 1 - Quoted Prices | | | Level 2 - Significant Observable Inputs | | | Level 3 - Significant Unobservable Inputs | | | Total | |
| Floating Rate Loan Interests | | | | | | | | | | | | |
| Automotive | | $ | – | | | $ | 10,056,017 | | | $ | 2,244,375 | | | $ | 12,300,392 | |
| Banking, Finance, Insurance and Real Estate | | | – | | | | 23,716,476 | | | | 2,052,101 | | | | 25,768,577 | |
| Capital Equipment | | | – | | | | 2,260,982 | | | | 1,247,350 | | | | 3,508,332 | |
| Chemicals, Plastics and Rubber | | | – | | | | 5,998,026 | | | | 1,762,602 | | | | 7,760,628 | |
| Construction and Building | | | – | | | | 19,901,087 | | | | 7,906,535 | | | | 27,807,622 | |
| Consumer Goods Durable | | | – | | | | 4,078,593 | | | | 2,100,254 | | | | 6,178,847 | |
| Consumer Goods Non Durable | | | – | | | | 1,450,898 | | | | 1,204,500 | | | | 2,655,398 | |
| Energy, Oil and Gas | | | – | | | | 9,345,936 | | | | 100,428 | | | | 9,446,364 | |
| Healthcare and Pharmaceuticals | | | – | | | | 62,806,806 | | | | 2,433,135 | | | | 65,239,941 | |
| High Tech Industries | | | – | | | | 52,905,397 | | | | 5,006,905 | | | | 57,912,302 | |
| Hotels, Gaming and Leisure | | | – | | | | 10,394,932 | | | | 755,653 | | | | 11,150,585 | |
| Retail | | | – | | | | 8,420,604 | | | | 388,832 | | | | 8,809,436 | |
| Services ‐ Business | | | – | | | | 37,986,620 | | | | 8,046,856 | | | | 46,033,476 | |
| Services ‐ Consumer | | | – | | | | 10,790,128 | | | | 2,963,524 | | | | 13,753,652 | |
| Utilities Electric | | | – | | | | 14,978,184 | | | | 465,000 | | | | 15,443,184 | |
| Other | | | – | | | | 65,655,901 | | | | – | | | | 65,655,901 | |
| Corporate Bonds | | | – | | | | 20,970,640 | | | | – | | | | 20,970,640 | |
| Common Stock | | | | | | | | | | | | | | | | |
| Energy, Oil and Gas | | | – | | | | – | | | | 347,554 | | | | 347,554 | |
| Preferred Stocks | | | | | | | | | | | | | | | | |
| Energy, Oil and Gas | | | – | | | | – | | | | 470,421 | | | | 470,421 | |
| Rights and Warrants | | | – | | | | 24,272 | | | | – | | | | 24,272 | |
| Total | | $ | – | | | $ | 361,741,499 | | | $ | 39,496,025 | | | $ | 401,237,524 | |
Blackstone / GSO Long‐Short Credit Income Fund
| Investments in Securities at Value* | | Level 1 - Quoted Prices | | | Level 2 - Significant Observable Inputs | | | Level 3 - Significant Unobservable Inputs | | | Total | |
| Floating Rate Loan Interests | | | | | | | | | | | | |
| Automotive | | $ | – | | | $ | 4,103,016 | | | $ | 1,496,250 | | | $ | 5,599,266 | |
| Banking, Finance, Insurance and Real Estate | | | – | | | | 20,579,083 | | | | 1,881,092 | | | | 22,460,175 | |
| Beverage, Food and Tobacco | | | – | | | | 12,277,526 | | | | 648,555 | | | | 12,926,081 | |
| Capital Equipment | | | – | | | | 1,390,416 | | | | 1,871,025 | | | | 3,261,441 | |
| Chemicals, Plastics and Rubber | | | – | | | | 4,802,195 | | | | 1,105,277 | | | | 5,907,472 | |
| Construction and Building | | | – | | | | 16,211,907 | | | | 6,349,399 | | | | 22,561,306 | |
| Consumer Goods Durable | | | – | | | | 2,998,397 | | | | 2,967,920 | | | | 5,966,317 | |
| Consumer Goods Non Durable | | | – | | | | 1,149,015 | | | | 803,000 | | | | 1,952,015 | |
| Containers, Packaging and Glass | | | – | | | | 5,360,525 | | | | 310,333 | | | | 5,670,858 | |
| Energy, Oil and Gas | | | – | | | | 2,970,291 | | | | 31,174 | | | | 3,001,465 | |
| Healthcare and Pharmaceuticals | | | – | | | | 47,870,834 | | | | 2,719,687 | | | | 50,590,521 | |
| High Tech Industries | | | – | | | | 39,797,181 | | | | 3,755,385 | | | | 43,552,566 | |
| Hotels, Gaming and Leisure | | | – | | | | 3,837,985 | | | | 503,769 | | | | 4,341,754 | |
| Services ‐ Business | | | – | | | | 31,688,480 | | | | 6,905,203 | | | | 38,593,683 | |
| Services ‐ Consumer | | | – | | | | 7,390,772 | | | | 865,832 | | | | 8,256,604 | |
| Utilities Electric | | | – | | | | 8,515,924 | | | | 465,000 | | | | 8,980,924 | |
| Other | | | – | | | | 37,385,381 | | | | – | | | | 37,385,381 | |
| Corporate Bonds | | | – | | | | 56,054,818 | | | | – | | | | 56,054,818 | |
| Common Stock | | | 651,261 | | | | – | | | | – | | | | 651,261 | |
| Rights and Warrants | | | – | | | | 24,272 | | | | – | | | | 24,272 | |
| Total | | $ | 651,261 | | | $ | 304,408,018 | | | $ | 32,678,901 | | | $ | 337,738,180 | |
| Semi-Annual Report | June 30, 2017 | 53 |
| Blackstone / GSO Funds | Notes to Financial Statements |
June 30, 2017 (Unaudited)
Blackstone / GSO Strategic Credit Fund
| Investments in Securities at Value* | | Level 1 - Quoted Prices | | | Level 2 - Significant Observable Inputs | | | Level 3 - Significant Unobservable Inputs | | | Total | |
| Floating Rate Loan Interests | | | | | | | | | | | | |
| Automotive | | $ | – | | | $ | 20,704,323 | | | $ | 7,481,250 | | | $ | 28,185,573 | |
| Banking, Finance, Insurance and Real Estate | | | – | | | | 64,610,934 | | | | 6,156,303 | | | | 70,767,237 | |
| Beverage, Food and Tobacco | | | – | | | | 39,266,584 | | | | 2,232,110 | | | | 41,498,694 | |
| Capital Equipment | | | – | | | | 5,758,164 | | | | 5,609,504 | | | | 11,367,668 | |
| Chemicals, Plastics and Rubber | | | – | | | | 10,772,305 | | | | 4,659,681 | | | | 15,431,986 | |
| Construction and Building | | | – | | | | 55,882,207 | | | | 18,926,889 | | | | 74,809,096 | |
| Consumer Goods Durable | | | – | | | | 11,160,994 | | | | 5,656,983 | | | | 16,817,977 | |
| Consumer Goods Non Durable | | | – | | | | 3,631,894 | | | | 4,015,000 | | | | 7,646,894 | |
| Energy, Oil and Gas | | | – | | | | 23,087,224 | | | | 5,760,856 | | | | 28,848,080 | |
| Healthcare and Pharmaceuticals | | | – | | | | 155,756,537 | | | | 7,535,546 | | | | 163,292,083 | |
| High Tech Industries | | | – | | | | 141,451,609 | | | | 13,657,949 | | | | 155,109,558 | |
| Hotels, Gaming and Leisure | | | – | | | | 14,386,240 | | | | 2,518,844 | | | | 16,905,084 | |
| Retail | | | – | | | | 15,705,826 | | | | 1,369,048 | | | | 17,074,874 | |
| Services ‐ Business | | | – | | | | 102,506,845 | | | | 22,595,938 | | | | 125,102,783 | |
| Services ‐ Consumer | | | – | | | | 23,322,919 | | | | 3,122,608 | | | | 26,445,527 | |
| Utilities Electric | | | – | | | | 31,953,005 | | | | 1,730,712 | | | | 33,683,717 | |
| Other | | | – | | | | 134,909,178 | | | | – | | | | 134,909,178 | |
| Corporate Bonds | | | | | | | | | | | | | | | | |
| Energy, Oil and Gas | | | – | | | | 9,585,047 | | | | 486,000 | | | | 10,071,047 | |
| Hotel, Gaming and Leisure | | | – | | | | – | | | | 4,925,000 | | | | 4,925,000 | |
| Other | | | – | | | | 202,514,076 | | | | – | | | | 202,514,076 | |
| Common Stock | | | | | | | | | | | | | | | | |
| Energy, Oil and Gas | | | 2,553,215 | | | | 1,003,340 | | | | 7,706,404 | | | | 11,262,959 | |
| Hotel, Gaming and Leisure | | | – | | | | – | | | | 3,598,075 | | | | 3,598,075 | |
| Preferred Stocks | | | | | | | | | | | | | | | | |
| Energy, Oil and Gas | | | – | | | | – | | | | 1,277,373 | | | | 1,277,373 | |
| Rights and Warrants | | | – | | | | 58,245 | | | | – | | | | 58,245 | |
| Total | | $ | 2,553,215 | | | $ | 1,068,027,496 | | | $ | 131,022,073 | | | $ | 1,201,602,784 | |
| * | Refer to each Fund’s Portfolio of Investments for a listing of securities by type. |
The changes of the fair value of investments for which the Funds have used Level 3 inputs to determine the fair value are as follows:
| Blackstone / GSO Senior Floating Rate Term Fund | | Floating Rate Loan Interests | | | Common Stock | | | Preferred Stock | | | Total | |
| Balance as of December 31, 2016 | | $ | 34,293,394 | | | $ | – | | | $ | – | | | $ | 34,293,394 | |
| Accrued discount/ premium | | | 36,008 | | | | – | | | | – | | | | 36,008 | |
| Return of Capital | | | – | | | | – | | | | – | | | | – | |
| Realized Gain/(Loss) | | | 92,589 | | | | – | | | | – | | | | 92,589 | |
| Change in Unrealized Appreciation/(Depreciation) | | | (400,119 | ) | | | – | | | | – | | | | (400,119 | ) |
| Purchases | | | 20,533,069 | | | | – | | | | – | | | | 20,533,069 | |
| Sales Proceeds | | | (14,368,701 | ) | | | – | | | | – | | | | (14,368,701 | ) |
| Transfer into Level 3 | | | 11,168,846 | | | | 347,554 | | | | 470,421 | | | | 11,986,821 | |
| Transfer out of Level 3 | | | (12,677,036 | ) | | | – | | | | – | | | | (12,677,036 | ) |
| Balance as of June 30, 2017 | | $ | 38,678,050 | | | $ | 347,554 | | | $ | 470,421 | | | $ | 39,496,025 | |
| Net change in unrealized appreciation/(depreciation) included in the Statements of Operations attributable to Level 3 investments held at June 30, 2017 | | $ | (165,513 | ) | | $ | – | | | $ | – | | | $ | (165,513 | ) |
| Blackstone / GSO Funds | Notes to Financial Statements |
June 30, 2017 (Unaudited)
| Blackstone / GSO Long-Short Credit Income Fund | | Floating Rate Loan Interests | | | Total | |
| Balance as of December 31, 2016 | | $ | 19,304,681 | | | $ | 19,304,681 | |
| Accrued discount/ premium | | | 49,590 | | | | 49,590 | |
| Return of Capital | | | – | | | | – | |
| Realized Gain/(Loss) | | | 60,355 | | | | 60,355 | |
| Change in Unrealized Appreciation/(Depreciation) | | | 52,525 | | | | 52,525 | |
| Purchases | | | 15,094,367 | | | | 15,094,367 | |
| Sales Proceeds | | | (7,719,191 | ) | | | (7,719,191 | ) |
| Transfer into Level 3 | | | 10,390,885 | | | | 10,390,885 | |
| Transfer out of Level 3 | | | (4,554,311 | ) | | | (4,554,311 | ) |
| Balance as of June 30, 2017 | | $ | 32,678,901 | | | $ | 32,678,901 | |
| Net change in unrealized appreciation/(depreciation) included in the Statements of Operations attributable to Level 3 investments held at June 30, 2017 | | $ | (24,927 | ) | | $ | (24,927 | ) |
| Blackstone / GSO Strategic Credit Fund | | Floating Rate Loan Interests | | | Corporate Bonds | | | Common Stock | | | Preferred Stock | | | Total | |
| Balance as of December 31, 2016 | | $ | 75,568,228 | | | $ | 486,000 | | | $ | 8,171,108 | | | $ | – | | | $ | 84,225,336 | |
| Accrued discount/ premium | | | 121,723 | | | | 721 | | | | – | | | | – | | | | 122,444 | |
| Return of Capital | | | – | | | | – | | | | – | | | | – | | | | – | |
| Realized Gain/(Loss) | | | 218,082 | | | | – | | | | – | | | | – | | | | 218,082 | |
| Change in Unrealized | | | | | | | | | | | | | | | | | | | | |
| Appreciation/(Depreciation) | | | (397,703 | ) | | | 117,242 | | | | (3,564,215 | ) | | | – | | | | (3,844,676 | ) |
| Purchases | | | 60,832,079 | | | | 4,807,037 | | | | 5,981,058 | | | | – | | | | 71,620,174 | |
| Sales Proceeds | | | (31,199,123 | ) | | | – | | | | – | | | | – | | | | (31,199,123 | ) |
| Transfer into Level 3 | | | 29,438,199 | | | | – | | | | 943,743 | | | | 1,277,373 | | | | 31,659,315 | |
| Transfer out of Level 3 | | | (21,552,264 | ) | | | – | | | | (227,215 | ) | | | – | | | | (21,779,479 | ) |
| Balance as of June 30, 2017 | | $ | 113,029,221 | | | $ | 5,411,000 | | | $ | 11,304,479 | | | $ | 1,277,373 | | | $ | 131,022,073 | |
| Net change in unrealized appreciation/(depreciation) included in the Statements of Operations attributable to Level 3 investments held at June 30, 2017 | | $ | (11,726 | ) | | $ | 117,242 | | | $ | (10,091,112 | ) | | $ | (32,753 | ) | | $ | (10,018,349 | ) |
Information about Level 3 fair value measurements as of June 30, 2017:
| Blackstone / GSO Senior Floating Rate Term Fund | | Fair Value | | Valuation Technique(s) | Unobservable Input(s) | | Value/Range | |
| Assets | | | | | | | | |
| Floating Rate Loan Interests | | $ | 38,678,050 | | Third‐party vendor pricing service | Broker quotes | | | N/A | |
| Common Stock | | $ | 347,544 | | Third‐party vendor pricing service | Broker quotes | | | N/A | |
| Preferred Stock | | $ | 470,421 | | Third‐party vendor pricing service | Broker quotes | | | N/A | |
| Blackstone / GSO Long-Short Credit Income Fund | | Fair Value | | Valuation Technique(s) | Unobservable Input(s) | | Value/Range | |
| Assets | | | | | | | | |
| Floating Rate Loan Interests | | $ | 32,678,901 | | Third‐party vendor pricing service | Broker quotes | | | N/A | |
| Semi-Annual Report | June 30, 2017 | 55 |
| Blackstone / GSO Funds | Notes to Financial Statements |
June 30, 2017 (Unaudited)
| Blackstone / GSO Strategic Credit Fund | | Fair Value | | Valuation Technique(s) | Unobservable Input(s) | | Value/Range | |
| Assets | | | | | | | | |
| Floating Rate Loan Interests | | $ | 113,029,221 | | Third‐party vendor pricing service | Broker quotes | | | N/A | |
| | | | | | | | | | | |
| Corporate Bonds | | $ | 4,925,000 | | Discounted Cash Flow | Discount Rate(a) | | | 11.00% | |
| | | | | | Performance Multiple Methodology | EBITDA Multiple(a) | | | 6.5x | |
| | | $ | 486,000 | | Energy Market Multiples(a) | | | | | |
| | | | | | | Proved PV‐10 | | | 0.76x | |
| | | | | | | Proved & Probable PV‐10 | | | 0.50x | |
| | | | | | | LFQ Daily Production | | | 44,750 | |
| | | | | | | CFY Daily Production | | | 44,500 | |
| | | | | | | Proved Reserves | | | 11.75 | |
| | | | | | | Proved & Probable Reserves | | | 7.63 | |
| | | | | | | | | | | |
| Common Stock | | $ | 943,743 | | Third‐party vendor pricing service | Broker quote | | | N/A | |
| | | $ | 3,598,075 | | Discounted Cash Flow | Discount Rate(a) | | | 11.00% | |
| | | | | | Performance Multiple Methodology | EBITDA Multiple(a) | | | 6.5x | |
| | | $ | 6,762,661 | | Energy Market Multiples(a) | | | | | |
| | | | | | | Proved PV‐10 | | | 0.76x | |
| | | | | | | Proved & Probable PV‐10 | | | 0.50x | |
| | | | | | | LFQ Daily Production | | | 44,750 | |
| | | | | | | CFY Daily Production | | | 44,500 | |
| | | | | | | Proved Reserves | | | 11.75 | |
| | | | | | | Proved & Probable Reserves | | | 7.63 | |
| | | | | | | | | | | |
| Preferred Stock | | $ | 1,277,373 | | Third‐party vendor pricing service | Broker quote | | | N/A | |
(a) | A change to the unobservable input may result in a significant change to the value of the investment as follows: |
| Unobservable Input | Impact to Value if Input Increases | Impact to Value if Input Decreases |
| Discount Rate | Decrease | Increase |
| EBITDA Multiple | Increase | Decrease |
| Energy Market Multiples | Increase | Decrease |
The Funds evaluate transfers into or out of Level 1, 2 and 3 as of the end of the reporting period. There were no transfers between Level 1 and 2 during the period. Securities were transferred from Level 2 to Level 3 because of a lack of observable market data due to decrease in market activity and information for these securities. Other securities were moved from Level 3 to Level 2 as observable inputs were available for purposes of valuing those assets.
Securities Transactions and Investment Income: Securities transactions are recorded on trade date for financial reporting purposes and amounts payable or receivable for trades not settled at the time of period end are reflected as liabilities and assets, respectively. Interest income, including accretion of discount and amortization of premium, is recorded on the accrual basis. Realized gains and losses from securities transactions and foreign currency transactions, if any, are recorded on the basis of identified cost and stated separately in the Statement of Operations.
When the Funds sell a floating rate loan interest they may pay an agency fee. The Funds earn facility and other fees on floating rate loan interests, and facility fees are typically amortized to income over the term of the loan. Consent and amendment fees are also recorded to income as earned. All of these fees are shown on the Statement of Operations under “Facility and other fees.”
Federal Income Taxes: It is the policy of the Funds to continue to qualify as regulated investment companies by complying with the requirements of Subchapter M of the Internal Revenue Code of 1986, as amended, applicable to regulated investment companies, and to distribute substantially all of their earnings to their shareholders. While no federal income tax provision is required, in early 2016 BSL, BGX and BGB paid excise taxes of $15,132, $77,101, and $153,510, respectively.
| Blackstone / GSO Funds | Notes to Financial Statements |
June 30, 2017 (Unaudited)
Income distributions and capital gain distributions are determined in accordance with income tax regulations, which may differ from GAAP. These differences are primarily due to differing treatments of income and gains on various investment securities held by the Funds, timing differences and differing characterization of distributions made by the Funds as a whole.
As of and during the period ended June 30, 2017, the Funds did not have a liability for any unrecognized tax benefits. The Funds file U.S. federal, state, and local tax returns as required. The Funds’ tax returns are subject to examination by the relevant tax authorities until expiration of the applicable statute of limitations which is generally three years after the filing of the tax return for federal purposes and four years for most state returns. Tax returns for open years have incorporated no uncertain tax positions that require a provision for income taxes.
Distributions to Shareholders: The Funds make monthly cash distributions of all or a portion of their net investment income to common shareholders. The Funds will distribute to common shareholders at least annually all or substantially all of their net investment income after the payment of dividends and interest, if any, owed with respect to outstanding preferred shares and/or borrowings, if applicable. The Funds intend to pay any capital gains distributions at least annually.
NOTE 3. MANAGEMENT FEES, ADMINISTRATION FEES, AND OTHER AGREEMENTS
The Adviser, a wholly‐owned subsidiary of GSO Capital Partners LP (collectively with its affiliates, “GSO”), is a registered investment adviser and is responsible for the day‐to‐day management of, and providing administrative and compliance oversight services to, the Funds. GSO is an affiliate of The Blackstone Group L.P.
For BSL, the Adviser receives a monthly fee at the annual rate of 1.00% of the average daily value of BSL’s total assets (including any assets attributable to any leverage used) minus the sum of the BSL’s accrued liabilities (other than Fund liabilities incurred for any leverage) (“Managed Assets”). For BGX, the Adviser receives a monthly fee at the annual rate of 1.20% of the average daily value of BGX’s net assets (total assets of BGX minus liabilities, including accrued expenses or dividends). For BGB, the Adviser receives a monthly fee at the annual rate of 1.00% of the average daily value of BGB’s Managed Assets.
Each Fund pays every Trustee who is not a director, officer, employee, or affiliate of GSO or ALPS (as defined below), a fee of $23,333 per annum, plus $2,500 per regular in‐person joint meeting of the Board of Trustees. If such in‐person regular board meeting is not held jointly, the respective Fund will pay each Trustee $3,000 for each such meeting attended. For each in‐person special meeting of the Board of Trustees, each Fund will pay each Trustee $2,000 if held jointly, and $2,500 per applicable Fund if not held jointly. If a meeting is held telephonically the Funds will pay each Trustee $750 if held jointly, and $1,000 per applicable Fund if not held jointly. The Chairman of the Audit Committee and the Chairman of the Nominating and Governance Committee also each receive $3,333 per annum from each fund. The Lead Independent Trustee receives $4,667 from each Fund. In addition, for each joint meeting of a committee of the Board of Trustees that does not occur on a regular meeting or special meeting of the Funds, the Funds will each pay every committee member $750 for each such committee meeting attended. If such committee meeting is not held jointly, the respective Fund will pay each committee member $1,000 for each such meeting attended. The Funds will also reimburse independent Trustees for travel and out‐of‐pocket expenses incurred in connection with such meetings.
ALPS Fund Services, Inc. (“ALPS��) serves as administrator to the Funds. Under the administration agreement, ALPS is responsible for calculating the net asset value of the common shares and generally managing the administrative affairs of the Funds. For BSL and BGB, ALPS receives a monthly fee based on the average daily value of the Funds’ respective Managed Assets, plus out‐of‐pocket expenses. For BGX, ALPS receives a monthly fee based on the average daily value of the Fund’s net assets, plus out‐of‐pocket expenses. ALPS is not considered an affiliate of the Funds, as defined under the 1940 Act.
The Bank of New York Mellon serves as the Funds’ custodian. Computershare Shareowner Services, LLC, serves as the Funds’ transfer agent. The Bank of New York Mellon and Computershare Shareowner Services, LLC, are not considered affiliates of the Funds as defined under the 1940 Act.
NOTE 4. SECURITIES TRANSACTIONS
Investment transactions for the six months ended June 30, 2017, excluding temporary short‐term investments, were as follows:
| Fund | | Cost of Investments Purchased | | | Proceeds from Investments Sold | |
| Blackstone / GSO Senior Floating Rate Term Fund | | $ | 303,921,065 | | | $ | 306,101,761 | |
| Blackstone / GSO Long‐Short Credit Income Fund | | | 241,819,354 | | | | 230,155,669 | |
| Blackstone / GSO Strategic Credit Fund | | | 875,113,084 | | | | 871,522,475 | |
| Semi-Annual Report | June 30, 2017 | 57 |
| Blackstone / GSO Funds | Notes to Financial Statements |
June 30, 2017 (Unaudited)NOTE 5. RELATED PARTY TRANSACTIONS
During the period ended June 30, 2017, none of the Funds engaged in cross trades with an affiliate pursuant to Rule 17a‐7.
NOTE 6. CAPITAL
The Funds have authorized an unlimited number of $0.001 par value common shares.
Transactions in shares were as follows:
| Blackstone / GSO Senior Floating Rate Term Fund | | For the Six Months Ended June 30, 2017 (Unaudited) | | | For the Year Ended December 31, 2016 | |
| Common shares outstanding ‐ beginning of period | | | 15,225,178 | | | | 15,217,684 | |
| Common shares issued as reinvestment of dividends | | | 12,748 | | | | 7,494 | |
| Common shares outstanding ‐ end of period | | | 15,237,926 | | | | 15,225,178 | |
| | | | | | | | | |
| Blackstone / GSO Long-Short Credit Income Fund | | For the Six Months Ended June 30, 2017 (Unaudited) | | | For the Year Ended December 31, 2016 | |
| Common shares outstanding ‐ beginning of period | | | 12,702,160 | | | | 12,702,160 | |
| Common shares issued as reinvestment of dividends | | | – | | | | – | |
| Common shares outstanding ‐ end of period | | | 12,702,160 | | | | 12,702,160 | |
| | | | | | | | | |
| Blackstone / GSO Strategic Credit Fund | | For the Six Months Ended June 30, 2017 (Unaudited) | | | For the Year Ended December 31, 2016 | |
| Common shares outstanding ‐ beginning of period | | | 44,664,382 | | | | 44,664,382 | |
| Common shares issued as reinvestment of dividends | | | – | | | | – | |
| Common shares outstanding ‐ end of period | | | 44,664,382 | | | | 44,664,382 | |
NOTE 7. SENIOR AND SECURED FLOATING RATE LOANS
BSL defines “Senior Loans” as first lien senior secured, floating rate loans that are made to U.S. and, to a limited extent, non‐U.S. corporations, partnerships and other business entities (“Borrowers”), which operate in various industries and geographical regions. BGX includes first and second lien secured, floating rate loans in its definition of “Secured Loans.” Under normal market conditions, at least 80% of BSL’s Managed Assets will be invested in Senior Loans and 70% of BGX’s managed assets will be invested in Secured Loans. Under normal market conditions, at least 80% of BGB's Managed Assets will be invested in credit investments comprised of corporate fixed income instruments and other investments (including derivatives) with similar economic characteristics. BGX defines its managed assets as net assets plus effective leverage obtained through securities lending, swap contract arrangements, and short selling or other derivative transactions (“BGX Managed Assets”). At June 30, 2017, 82.40% of BSL’s Managed Assets were held in Senior Loans, 82.33% of BGX's Managed Assets were held in Secured Loans, and 99.22% of BGB’s Managed Assets were held in corporate fixed income instruments including Senior Secured Loans.
Loans hold a senior position in the capital structure of a business entity, are secured with specific collateral and have a claim on the assets and/or stock of the Borrower that is senior to that held by unsecured creditors, subordinated debt holders and stockholders of the Borrower.
Loans often require prepayments from Borrowers’ excess cash flows or permit the Borrowers to repay at their election. The degree to which Borrowers repay, whether as a contractual requirement or at their election, cannot be predicted with accuracy. As a result, the actual remaining maturity may be substantially less than the stated maturities shown. However, floating rate loans typically have an expected average life of two to four years. Floating rate loans typically have rates of interest which are re‐determined periodically, either daily, monthly, quarterly or semi‐annually by reference to a floating base lending rate, primarily the London Interbank Offered Rate (LIBOR), plus a premium or credit spread.
Loans are subject to the risk of payment defaults of scheduled interest or principal. Such non‐payment could result in a reduction of income, a reduction in the value of the investment and a potential decrease in the net asset value of any of the Funds. Risk of loss of income is generally higher for subordinated unsecured loans or debt, which are not backed by a security interest in any specific collateral. There can be no assurance that the liquidation of any collateral securing a Loan would satisfy the Borrower’s obligation to the applicable Fund in the event of non‐payment of scheduled interest or principal payments, or that such collateral could be readily liquidated.
| Blackstone / GSO Funds | Notes to Financial Statements |
June 30, 2017 (Unaudited)
Second lien loans generally are subject to similar risks as those associated with investments in first lien loans except that such loans are subordinated in payment and/or lower in lien priority to first lien holders. In the event of default on a second lien loan, the first priority lien holder has first claim to the underlying collateral of the loan. Second lien loans are subject to the additional risk that the cash flow of the Borrower and property securing the loan or debt, if any, may be insufficient to meet scheduled payments after giving effect to the senior obligations of the Borrower. At June 30, 2017, BSL, BGX and BGB had invested $51,726,701, $41,420,978, $147,402,433, respectively, in second lien secured loans. Second lien secured loans are considered Secured Loans for BGX and Senior Secured Loans for BGB, but are not considered Senior Loans for BSL.
Loans can be rated below investment grade or may also be unrated. As a result, the risks associated with Loans may be similar to the risks of other below investment grade securities, although they are senior and secured in contrast to other below investment grade securities, which are often subordinated or unsecured. The Funds typically invest in Loans rated below investment grade, which are considered speculative because of the credit risk of the Borrowers. Such companies are more likely than investment grade issuers to default on their payments of interest and principal owed to the Funds, and such defaults could reduce net asset value and income distributions. The amount of public information available with respect to below investment grade loans will generally be less extensive than that available for registered or exchange‐listed securities. In evaluating the creditworthiness of Borrowers, the Adviser will consider, and may rely in part on, analyses performed by others. The Adviser’s established best execution procedures and guidelines require trades to be placed for execution only with broker‐dealer counterparties approved by the Counterparty Committee of the Adviser. The factors considered by the Counterparty Committee when selecting and approving brokers and dealers include, but are not limited to: (i) quality, accuracy, and timeliness of execution, (ii) review of the reputation, financial strength and stability of the financial institution, (iii) willingness and ability of the counterparty to commit capital, (iv) ongoing reliability and (v) access to underwritten offerings and secondary markets. The Counterparty Committee regularly reviews each broker‐dealer counterparty based on the foregoing factors.
The Funds may acquire Loans through assignments or participations. The Funds typically acquire these Loans through assignment, and if a Fund acquires a Loan through participation, it will seek to elevate a participation interest into an assignment as soon as practicably possible. The purchaser of an assignment typically succeeds to all the rights and obligations of the assigning institution and becomes a lender under the credit agreement with respect to the debt obligation; however, the purchaser’s rights can be more restricted than those of the assigning institution, and the Funds may not be able to unilaterally enforce all rights and remedies under the Loan and with regard to any associated collateral. A participation typically results in a contractual relationship only with the institution participating out the interest, not with the Borrower. Sellers of participations typically include banks, broker‐dealers, other financial institutions and lending institutions. The Adviser has adopted best execution procedures and guidelines to mitigate credit and counterparty risk in the atypical situation when the Funds must acquire a Loan through a participation. None of the Funds had outstanding participations as of June 30, 2017.
NOTE 8. LEVERAGE
On August 13, 2010, BSL issued $96 million in aggregate principal amount of senior secured notes and 48,000 term preferred shares with an aggregate liquidation preference of $48 million, both rated “AAA” by Fitch Ratings. On October 8, 2014, BSL redeemed 100% of the senior secured notes and term preferred shares at 100% of their principal amount or liquidation preference, as applicable, and paid amounts representing the final accumulated interest or dividend amounts owed through the redemption date. BSL financed the prepayment of its senior secured notes and term preferred shares with borrowings under a new 364‐day revolving credit facility described below.
Through July 29, 2014, BGX employed leverage through securities lending arrangements and swap arrangements. All costs and expenses related to any form of leverage used by BGX are borne entirely by holders of common shares. BGX’s leverage consisted of (i) the amount of securities lending cash collateral held less proforma cash (which includes the net difference between receivables and payables for investments sold/purchased), (ii) the fair market value of the reference securities of total return swaps less cash pledged and (iii) the fair market value of securities sold short less any segregated cash or offsetting securities. BGX’s use of these forms of effective leverage did not exceed 30% of its net assets.
On July 27, 2016 BGX and BGB issued 7‐year Mandatory Redeemable Preferred Shares (“MRPS”). BGX issued 20,000 MRPS with a total liquidation value of $20,000,000 and BGB issued 45,000 MRPS with a total liquidation value of $45,000,000, rated “AA” by Fitch Ratings. BGB and BGX used the proceeds of the offerings to make additional investments for their portfolios. The final redemption date of the MRPS is July 27, 2023. BGB and BGX make quarterly dividend payments on the MRPS at an annual dividend rate of 3.61%. Due to the terms of the MRPS, face value approximates fair value at June 30, 2017. This fair value is based on Level 2 inputs under the three‐tier fair valuation hierarchy (see Note 2).
In connection with BGB and BGX’s issuance of MRPS, certain costs were incurred by BGB and BGX and have been recorded net against the outstanding liability. These costs are being amortized over the period beginning July 27, 2016 (day of issuance) through July 27, 2023, the final redemption date. The net deferred financing costs as of June 30, 2017 are shown on BGB and BGX’s Statement of Assets and Liabilities. The amount of expense amortized during the period ended June 30, 2017 is shown on BGB and BGX’s Statement of Operations under amortization of deferred financing costs.
| Semi-Annual Report | June 30, 2017 | 59 |
| Blackstone / GSO Funds | Notes to Financial Statements |
| | June 30, 2017 (Unaudited) |
Except for matters which do not require the vote of holders of MRPS under the 1940 Act and except as otherwise provided in the Declaration of Trust (as supplemented), or Bylaws, the Securities Purchase Agreement applicable to the MRPS or as otherwise required by applicable law, each Holder of MRPS shall be entitled to one vote for each MRPS held on each matter submitted to a vote of shareholders of the Fund, and the holders of Outstanding Preferred Shares and Common Shares shall vote together as a single class on all matters submitted to shareholders; provided, however, that the holders of Outstanding Preferred Shares shall be entitled, as a class, to the exclusion of the holders of shares of all other classes of beneficial interest of the Fund, to elect two Trustees of the Fund at all times.
Each Fund has entered into a separate Credit Agreement (each, an “Agreement”) with a bank to borrow money pursuant to a 364‐day revolving line of credit (“Leverage Facility”) for BSL and BGX and a 728‐day Leverage Facility for BGB. BSL entered into an agreement dated October 8, 2014, as amended on October 7, 2015 and October 5, 2016, to borrow up to a limit of $142 million. BGX entered into an agreement dated July 29, 2014, as amended on January 26, 2015, July 28, 2015, and July 26, 2016, to borrow up to a limit of $112 million. BGB entered into an agreement dated December 21, 2012, as amended at December 20, 2013, December 19, 2014, December 18, 2015, July 26, 2016, and December 16, 2016, to borrow up to a limit of $415 million. Borrowings under each Agreement are secured by the assets of each Fund. Interest is charged at a rate of 0.80% above LIBOR for BSL and BGX and 0.975% above LIBOR for BGB, with LIBOR measured for the period commencing on the date of the making of such LIBOR loan (or the last date upon which any other Loan was converted to, or continued as, such LIBOR loan) and ending on the numerically corresponding day in the calendar month that is one (1) week or one (1), two (2), three (3), six (6) or nine (9) months thereafter, as each Fund may elect, or such other period as the lender may agree in its sole and absolute discretion. Under the terms of the applicable Agreement, each Fund must pay a commitment fee on any undrawn amounts. The commitment fee payable in BSL and BGX is 0.20% on the undrawn amounts and in BGB is 0.15% on the undrawn amounts when drawn amounts exceed 75% of the borrowing limit and 0.25% on the undrawn amounts at any other time. Interest and fees are payable quarterly. Each Fund may elect to extend the applicable Agreement for a further period with the consent of the lending bank. At June 30, 2017, BSL, BGX, and BGB had borrowings outstanding under its respective Leverage Facility of $132 million, $104 million, and $388 million, at an interest rate of 1.89%, 1.89%, and 2.06%, respectively. Due to the short term nature of each Agreement, face value approximates fair value at June 30, 2017. This fair value is based on Level 2 inputs under the three‐tier fair valuation hierarchy (see Note 2). For the period of January 1, 2017 through June 30, 2017, the average borrowings under BSL’s, BGX’s and BGB’s Leverage Facility and the average interest rates were $132,651,934 and 1.70%, $103,670,330 and 1.70%, and $387,629,834 and 1.87%, respectively.
Under each Agreement and each governing document of the MRPS, each Fund has agreed to certain covenants and additional investment limitations while the leverage is outstanding. Each Fund agreed to maintain asset coverage of three times over borrowings and BGX and BGB have agreed to maintain 225% asset coverage over borrowings plus MRPS. Compliance with the investment restrictions and calculations are performed by the Funds’ custodian, The Bank of New York Mellon. As of June 30, 2017, each Fund was in compliance with all required investment limitations and asset coverage requirements related to its leverage.
The use of borrowings to leverage the common shares of the Funds can create risks. Changes in the value of the Funds’ portfolios, including securities bought with the proceeds of leverage, are borne entirely by the holders of common shares of the Funds. All costs and expenses related to any form of leverage used by the Funds are borne entirely by common shareholders. If there is a net decrease or increase in the value of the Funds’ investment portfolios, the leverage may decrease or increase, as the case may be, the net asset value per common share to a greater extent than if the Funds did not utilize leverage. During periods when BSL and BGB are using leverage, the fees paid to the Adviser for advisory services and to ALPS for administrative services are higher than if BSL and BGB did not use leverage because the fees paid are calculated on the basis of BSL and BGB’s Managed Assets, which include the assets purchased through leverage. As of June 30, 2017, BSL’s, BGX’s, and BGB’s leverage represented 32.90%, 36.25% and 36.25% of each Fund’s Managed Assets, respectively. The leverage amounts in BGX and BGB include 5.85% and 3.77% of Managed Assets attributable to the MRPS, respectively.
NOTE 9. TAX BASIS DISTRIBUTIONS
Ordinary income (inclusive of short‐term capital gains) and long‐term capital gains are allocated to common stockholders after payment of the available amounts on any outstanding term preferred shares. To the extent that the amount distributed to common stockholders exceeds the amount of available ordinary income and long‐term capital gains after allocation to any outstanding term preferred shares, these distributions are treated as a tax return of capital. Additionally, to the extent that the amount distributed on any outstanding term preferred shares exceeds the amount of available ordinary income and long‐term capital gains, these distributions are treated as a tax return of capital.
| Blackstone / GSO Funds | Notes to Financial Statements |
| | June 30, 2017 (Unaudited) |
As determined on December 31, 2016, certain permanent differences between financial and tax accounting were reclassified. These differences were primarily due to the differing tax treatment of certain investments. The amounts reclassified did not affect net assets. The reclassifications were as follows:
| Fund | | Decrease Paid-in capital | | | Increase/(Decrease)Accumulated net investment income | | | Increase Accumulated net realized loss on investments | |
| Blackstone / GSO Senior Floating Rate Term Fund | | $ | (106,272 | ) | | $ | 31,078 | | | $ | 75,194 | |
| Blackstone / GSO Long‐Short Credit Income Fund | | $ | (77,101 | ) | | $ | 77,101 | | | $ | – | |
| Blackstone / GSO Strategic Credit Fund | | $ | (153,510 | ) | | $ | 153,510 | | | $ | – | |
The tax character of distributions paid by the Funds during the fiscal years ended December 31, 2016 was as follows:
| 2016 | | Blackstone / GSO Senior Floating Rate Term Fund | | | Blackstone / GSO Long-Short Credit Income Fund | | | Blackstone / GSO Strategic Credit Fund | |
| Distributions Paid From: | | | | | | | | | |
| Ordinary Income | | $ | 17,608,045 | | | $ | 18,520,211 | (a) | | $ | 60,715,885 | (a) |
| Total | | $ | 17,608,045 | | | $ | 18,520,211 | | | $ | 60,715,885 | |
(a) | Distributions paid include common shares and mandatory redeemable preferred shares. |
At December 31, 2016, the Funds had available for federal tax purposes unused capital loss carryforwards, which are available to offset future realized gains. To the extent that these carryforwards are used to offset future gains, it is probable that the amount offset will not be distributed to shareholders. The carryforward losses are as follows:
| Fund | | Short Term | | | Long Term | |
| Blackstone / GSO Senior Floating Rate Term Fund | | $ | 398,079 | | | $ | 10,446,090 | |
| Blackstone / GSO Long‐Short Credit Income Fund | | $ | 5,167,997 | | | $ | 12,832,124 | |
| Blackstone / GSO Strategic Credit Fund | | $ | 14,067,689 | | | $ | 38,873,648 | |
The Funds elects to defer to the period ending December 31, 2017, capital losses recognized during the period November 1, 2016 to December 31, 2016 in the amount of:
| Fund | | Capital Losses | |
| Blackstone / GSO Senior Floating Rate Term Fund | | $ | 69,957 | |
| Blackstone / GSO Long‐Short Credit Income Fund | | $ | 515,906 | |
| Blackstone / GSO Strategic Credit Fund | | $ | 3,223,806 | |
The Blackstone/GSO Senior Floating Rate Term Fund utilized capital loss carryovers during the year ended December 31, 2016 of $573,663.
At December 31, 2016, the components of distributable earnings on a tax basis for the Funds were as follows:
| | | Blackstone / GSO Senior Floating Rate Term Fund | | | Blackstone / GSO Long-Short Credit Income Fund | | | Blackstone / GSO Strategic Credit Fund | |
| Undistributed ordinary income | | $ | 2,224,258 | | | $ | 2,397,500 | | | $ | 7,703,265 | |
| Accumulated capital losses | | | (10,914,126 | ) | | | (18,516,027 | ) | | | (56,165,143 | ) |
| Unrealized depreciation | | | (9,219,684 | ) | | | (5,483,848 | ) | | | (41,654,061 | ) |
| Other Cumulative effect of timing differences | | | 11,568 | | | | (124,814 | ) | | | (280,831 | ) |
| Total | | $ | (17,897,984 | ) | | $ | (21,727,189 | ) | | $ | (90,396,770 | ) |
| Semi-Annual Report | June 30, 2017 | 61 |
| Blackstone / GSO Funds | Notes to Financial Statements |
June 30, 2017 (Unaudited)
The amount of net unrealized appreciation/(depreciation) and the cost of investment securities for tax purposes, including short‐term securities at June 30, 2017, were as follows:
| | | Blackstone / GSO Senior Floating Rate Term Fund | | | Blackstone / GSO Long-Short Credit Income Fund | | | Blackstone / GSO Strategic Credit Fund | |
| Cost of investments for income tax purposes | | $ | 412,172,613 | | | $ | 340,848,875 | | | $ | 1,235,006,886 | |
| Gross appreciation (excess of value over tax cost) | | $ | 5,387,464 | | | $ | 5,816,191 | | | $ | 21,538,008 | |
| Gross depreciation (excess of tax cost over value) | | | (16,322,553 | ) | | | (8,926,886 | ) | | | (54,942,110 | ) |
| Net unrealized depreciation | | $ | (10,935,089 | ) | | $ | (3,110,695 | ) | | $ | (33,404,102 | ) |
NOTE 10. SUBSEQUENT EVENTS
Shareholder Distributions for BSL: On July 31, 2017 BSL paid the regularly scheduled distribution in the amount of $0.097 per share to shareholders of record as of July 24, 2017. On August 22, 2017, BSL went ex the regularly scheduled monthly distribution of $0.097 to stockholders of record as of August 24, 2017.
Shareholder Distributions for BGX: On July 31, 2017 BGX paid the regularly scheduled distribution of $0.103 per share to shareholders of record as of July 24, 2017. On August 22, 2017, BGX went ex the regularly scheduled monthly distribution of $0.103 to stockholders of record as of August 24, 2017.
Shareholder Distributions for BGB: On July 31, 2017 BGB paid the regularly scheduled distribution of $0.105 per share to shareholders of record as of July 24, 2017. On August 22, 2017, BGB went ex the regularly scheduled monthly distribution of $0.105 to stockholders of record as of August 24, 2017.
BGX Leverage: On July 25, 2017, BGX’s line of credit agreement, dated July 29, 2014, was amended to create a 728‐day Leverage Facility terminating July 25, 2019 and also to increase the borrowing rate to 1.00% above LIBOR.
| Blackstone / GSO Funds | Summary of Dividend Reinvestment Plan |
June 30, 2017 (Unaudited)
Pursuant to the Funds’ Dividend Reinvestment Plan (the “DRIP”), shareholders whose shares are registered in their own name may ‘‘opt‐in’’ to the plan and elect to reinvest all or a portion of their distributions in common shares by providing the required enrollment notice to Computershare, the DRIP administrator. Shareholders whose shares are held in the name of a broker or other nominee may have distributions reinvested only if such a service is provided by the broker or the nominee or if the broker or the nominee permits participation in the DRIP. Shareholders whose shares are held in the name of a broker or other nominee should contact the broker or nominee for details. A shareholder may terminate participation in the DRIP at any time by notifying the DRIP administrator before the record date of the next distribution through the Internet, by telephone or in writing. All distributions to shareholders who do not participate in the DRIP, or have elected to terminate their participation in the DRIP, will be paid by check mailed directly to the record holder by or under the direction of the DRIP administrator when the Funds’ Board of Trustees declares a distribution.
When the Funds declare a distribution, shareholders who are participants in the applicable DRIP receive the equivalent of the amount of the distribution in common shares. If you participate in the DRIP, the number of common shares of the Funds that you will receive will be determined as follows:
(1) If the market price of the common shares plus any brokerage commissions on the payable date (or, if the payable date is not a New York Stock Exchange trading day, the immediately preceding trading day) for determining shareholders eligible to receive the relevant distribution (the ‘‘determination date’’) is equal to or exceeds 98% of the net asset value per common share, the Fund will issue new common shares at a price equal to the greater of:
(a) 98% of the net asset value per share at the close of trading on the New York Stock Exchange on the determination date or
(b) 95% of the market price per common share on the determination date.
(2) If 98% of the net asset value per common share exceeds the market price of the common shares plus any brokerage commissions on the determination date, the DRIP administrator will receive the distribution in cash and will buy common shares in the open market, on the New York Stock Exchange or elsewhere, for your account as soon as practicable commencing on the trading day following the determination date and terminating no later than the earlier of (a) 30 days after the distribution payment date, or (b) the record date for the next succeeding distribution to be made to the shareholders; except when necessary to comply with applicable provisions of the federal securities laws. If during this period: (i) the market price plus any brokerage commissions rises so that it equals or exceeds 98% of the net asset value per common share at the close of trading on the New York Stock Exchange on the determination date before the DRIP administrator has completed the open market purchases or (ii) the DRIP administrator is unable to invest the full amount eligible to be reinvested in open market purchases, the DRIP administrator will cease purchasing common shares in the open market and the Fund will issue the remaining common shares at a price per share equal to the greater of (a) 98% of the net asset value per share at the close of trading on the New York Stock Exchange on the determination date or (b) 95% of the then current market price per share.
The DRIP administrator maintains all shareholder accounts in the dividend reinvestment plan and furnishes written confirmations of all transactions in the account, including information needed by shareholders for personal and tax records. Common shares in the account of each DRIP participant are held by the DRIP administrator in non‐certificated form in the name of the participant, and each shareholder’s proxy includes shares purchased pursuant to the DRIP.
There is no charge to participants for reinvesting regular distributions and capital gains distributions. The fees of the DRIP administrator for handling the reinvestment of regular distributions and capital gains distributions are included in the fee to be paid by us to our transfer agent. There are no brokerage charges with respect to shares issued directly by us as a result of regular distributions or capital gains distributions payable either in shares or in cash. However, each participant bears a pro rata share of brokerage commissions incurred with respect to the DRIP administrator’s open market purchases in connection with the reinvestment of such distributions. Shareholders that opt‐in to the DRIP will add to their investment through dollar cost averaging. Because all dividends and distributions paid to such shareholder will be automatically reinvested in additional common shares, the average cost of such shareholder’s common shares will decrease over time. Dollar cost averaging is a technique for lowering the average cost per share over time if the Fund’s net asset value declines. While dollar cost averaging has definite advantages, it cannot assure profit or protect against loss in declining markets.
The automatic reinvestment of such dividends or distributions does not relieve participants of any income tax that may be payable on such dividends or distributions.
You may obtain additional information by contacting the DRIP administrator at the following address: Computershare, Attn: Sales Dept., P.O. Box 358035, Pittsburgh, PA 15252.
| Semi-Annual Report | June 30, 2017 | 63 |
| Blackstone / GSO Funds | Additional Information |
June 30, 2017 (Unaudited)
Portfolio Information. The Funds file their complete schedules of portfolio holdings with the Securities and Exchange Commission (the “SEC”) for the first and third quarters of each fiscal year on Form N‐Q. The Funds’ Forms N‐Q will be available (1) on the Funds’ website located at http://www.blackstone‐gso.com; (2) on the SEC’s website at http://www.sec.gov; or (3) for review and copying at the SEC’s Public Reference Room (the “PRR”) in Washington, DC. Information regarding the operation of the PRR may be obtained by calling 1‐800‐SEC‐0330.
Proxy Information. The policies and procedures used to determine how to vote proxies relating to securities held by the Funds are available (1) without charge, upon request, by calling 1‐877‐876‐1121, (2) on the Funds’ website located at http://www.blackstone‐gso.com, and (3) on the SEC’s website at http://www.sec.gov. Information regarding how the Funds voted proxies relating to portfolio securities during the most recent twelve‐month period ended June 30 is available on Form N‐PX by August 31 of each year (1) without charge, upon request, by calling 1‐877‐876‐1121, (2) on the Funds’ website located at http://www.blacksone‐gso.com, and (3) on the SEC’s website at http://www.sec.gov.
Senior Officer Code of Ethics. The Funds file a copy of their code of ethics that applies to the Funds’ principal executive officer, principal financial officer or controller, or persons performing similar functions, with the SEC as an exhibit to each annual report on Form N‐CSR. This will be available on the SEC’s website at http://www.sec.gov.
BSL Meeting of Shareholders – Voting Results
On April 19, 2017, BSL held its Annual Meeting of Shareholders to consider the proposal set forth below. The following votes were recorded:
Proposal 1: The election of one (1) Trustee of BSL, to hold office for the term indicated and until his successor shall have been elected and qualified.
Election of Edward H. D’Alelio as Class III Trustee of BSL, term to expire at 2020 Annual Meeting
| | Number of Shares | % of Shares Voted |
| Affirmative | 13,470,531 | 98.73% |
| Withheld | 172,956 | 1.27% |
| Total | 13,643,487 | 100.00% |
BGX Meeting of Shareholders – Voting Results
On April 19, 2017, BGX held its Annual Meeting of Shareholders to consider the proposal set forth below. The following votes were recorded:
Proposal 1: The election of one (1) Trustee of BGX, to hold office for the term indicated and until his successor shall have been elected and qualified.
Election of Edward H. D’Alelio as Class II Trustee of BGX, term to expire at 2020 Annual Meeting
| | Number of Shares | % of Shares Voted |
| Affirmative | 11,671,385 | 99.14% |
| Withheld | 101,169 | 0.86% |
| Total | 11,772,554 | 100.00% |
BGB Meeting of Shareholders – Voting Results
On April 19, 2017, BGB held its Annual Meeting of Shareholders to consider the proposal set forth below. The following votes were recorded:
Proposal 1: The election of one (1) Trustee of BGB, to hold office for the term indicated and until his successor shall have been elected and qualified.
Election of Edward H. D’Alelio as Class I Trustee of BGB, term to expire at 2020 Annual Meeting
| | Number of Shares | % of Shares Voted |
| Affirmative | 38,571,749 | 98.75% |
| Withheld | 487,218 | 1.25% |
| Total | 39,058,967 | 100.00% |
| Blackstone / GSO Funds | Privacy Procedures |
June 30, 2017 (Unaudited)
| FACTS | WHAT DO BLACKSTONE REGISTERED FUNDS DO WITH YOUR PERSONAL INFORMATION? |
| Why? | Financial companies choose how they share your personal information. Federal law gives consumers the right to limit some but not all sharing. Federal law also requires us to tell you how we collect, share, and protect your personal information. Please read this notice carefully to understand what we do. |
| What? | The types of personal information we collect and share depend on the product or service you have with us. This information can include: |
| | | ● | Social Security number and income |
| | | ● | Assets and investment experience |
| | | ● | Risk tolerance and transaction history |
| How? | All financial companies need to share customers’ personal information to run their everyday business. In the section below, we list the reasons financial companies can share their customers’ personal information; the reasons Blackstone Registered Funds (as defined below) choose to share; and whether you can limit this sharing. |
| Reasons we can share your personal information | Do Blackstone Registered Funds share? | Can you limit this sharing? |
For our everyday business purposes – such as to process your transactions, maintain your account(s), respond to court orders and legal investigations, or report to credit bureaus | Yes | No |
For our marketing purposes – to offer our products and services to you | Yes | No |
| For joint marketing with other financial companies | No | We don't share |
For our affiliates' everyday business purposes – information about your transactions and experiences | No | We don't share |
For our affiliates' everyday business purposes – information about your creditworthiness | No | We don't share |
| For our affiliates to market to you | No | We don't share |
| For nonaffiliates to market to you | No | We don't share |
| Questions? | Email us at GLB.privacy@blackstone.com |
| Semi-Annual Report | June 30, 2017 | 65 |
| Blackstone / GSO Funds | Privacy Procedures |
June 30, 2017 (Unaudited)
| Who We Are | | | |
| Who is providing this notice? | Blackstone Registered Funds include Blackstone Alternative Alpha Fund, Blackstone Alternative Alpha Fund II, Blackstone Real Estate Income Fund, Blackstone Real Estate Income Fund II, Blackstone Alternative Investment Funds, on behalf of its series Blackstone Alternative Multi‐Manager Fund and Blackstone Alternative Multi‐Strategy Fund, Blackstone / GSO Senior Floating Rate Term Fund, Blackstone / GSO Long‐Short Credit Income Fund and Blackstone / GSO Strategic Income Fund |
| What We Do | | | |
| How do Blackstone Registered Funds protect my personal information? | To protect your personal information from unauthorized access and use, we use security measures that comply with federal law. These measures include computer safeguards and secured files and buildings. |
| How do Blackstone Registered Funds collect my personal information? | We collect your personal information, for example, when you: |
| | ● | open an account or give us your income information |
| | | ● | provide employment information or give us your contact information |
| | | ● | tell us about your investment or retirement portfolio |
| | We also collect your personal information from others, such as credit bureaus, affiliates, or other companies. |
| Why can't I limit all sharing? | Federal law gives you the right to limit only: |
| | | ● | sharing for affiliates’ everyday business purposes—information about your creditworthiness |
| | | ● | affiliates from using your information to market to you |
| | | ● | sharing for nonaffiliates to market to you |
| | State laws and individual companies may give you additional rights to limit sharing. See below for more on your rights under state law. |
| What happens when I limit sharing for an account I hold jointly with someone else? | Your choices will apply to everyone on your account—unless you tell us otherwise. |
| Definitions | | | |
| Affiliates | Companies related by common ownership or control. They can be financial and nonfinancial companies. |
| | | ● | Our affiliates include companies with a Blackstone name and financial companies such as GSO Capital Partners LP and Strategic Partners Fund Solutions. |
| Nonaffiliates | Companies not related by common ownership or control. They can be financial and nonfinancial companies. |
| | | ● | Blackstone Registered Funds do not share with nonaffiliates so they can market to you. |
| Joint marketing | A formal agreement between nonaffiliated financial companies that together market financial products or services to you. |
| | | ● | Our joint marketing partners include financial services companies. |
Other Important Information |
California Residents — In accordance with California law, we will not share information we collect about California residents with nonaffiliates except as permitted by law, such as with the consent of the customer or to service the customer’s accounts. We will also limit the sharing of information about you with our affiliates to the extent required by applicable California law.
Vermont Residents — In accordance with Vermont law, we will not share information we collect about Vermont residents with nonaffiliates except as permitted by law, such as with the consent of the customer or to service the customer’s accounts. We will not share creditworthiness information about Vermont residents among Blackstone Registered Funds’ affiliates except with the authorization or consent of the Vermont resident.
| Blackstone / GSO Funds | Approval of Investment Advisory Agreements |
June 30, 2017 (Unaudited)
The Investment Company Act of 1940, as amended (the “1940 Act”), requires that the Board of Trustees (collectively, the “Board”) of each of Blackstone / GSO Senior Floating Rate Term Fund (“BSL”), Blackstone / GSO Long‐Short Credit Income Fund (“BGX”), and Blackstone / GSO Strategic Credit Fund (“BGB,” and together with BSL and BGX, the “Funds” and each a “Fund”), including a majority of its members who are not considered to be “interested persons” under the 1940 Act (the “Independent Trustees”) voting separately, approve on an annual basis the continuation of the Fund’s investment advisory agreement (each an “Agreement” and, collectively, the “Agreements”) with the Fund’s investment adviser, GSO / Blackstone Debt Funds Management LLC (the “Adviser”). At a joint meeting (the “Contract Renewal Meeting”) held in person on May 18, 2017, the Board of each Fund, including the Independent Trustees, considered and approved the continuation of each Agreement for an additional one‐year term. To assist in its consideration of the renewal of each of the Agreements, the Board requested, received and considered a variety of information (together with the information provided at the Contract Renewal Meeting, the “Contract Renewal Information”) about the Adviser, as well as the advisory arrangements for the Funds, certain portions of which are discussed below. In preparation for the Contract Renewal Meeting, the Independent Trustees met in person in a private session (the “Review Session”) prior to the Contract Renewal Meeting with counsel to the Independent Trustees (“Independent Counsel”) to review Contract Renewal Information received to that time. No representatives of the Funds, the Adviser, or Fund management were present at the Review Session. In addition to the Contract Renewal Information, the Board received performance and other information since each Fund’s inception related to the services rendered by the Adviser to such Fund. The Board’s evaluation took into account the information received since each Fund’s inception and also reflected the knowledge and familiarity gained as members of the Board with respect to the investment advisory and other services provided to each Fund by the Adviser under the Fund’s Agreement.
Board Approval of the Continuation of the Agreements
In its deliberations regarding renewal of each Agreement, the Board, including the Independent Trustees, considered various factors, including those set forth below.
Nature, Extent and Quality of the Services Provided to the Funds under the Agreements
The Board received and considered Contract Renewal Information regarding the nature, extent and quality of services provided to the Funds by the Adviser under the Agreements. The Board also reviewed Contract Renewal Information regarding the Funds’ compliance policies and procedures established pursuant to the 1940 Act and considered each Fund’s compliance record during the previous year and since its inception.
The Board reviewed the qualifications, backgrounds and responsibilities of the Funds’ senior personnel and the portfolio management team primarily responsible for the day‐to‐day portfolio management of each Fund. The Board also considered, based on its knowledge of the Adviser and its affiliates, the Contract Renewal Information and the Board’s discussions with the Adviser at the Contract Renewal Meeting, the general reputation and investment performance records of the Adviser and its affiliates and the financial resources of the corporate parent of the Adviser, The Blackstone Group L.P., available to support the Adviser’s activities in respect of the Funds.
The Board considered the responsibilities of the Adviser under each Fund’s Agreement, including the Adviser’s coordination and oversight of the services provided to the Fund by other unaffiliated parties.
In reaching its determinations regarding continuation of each Fund’s Agreement, the Board took into account that such Fund’s shareholders, in pursuing their investment goals and objectives, likely considered the reputation and the investment style, philosophy and strategy of the Adviser, as well as the resources available to the Adviser, in purchasing their shares.
Fund Performance
Among other things, the Board received and considered information and analyses (the “Morningstar Performance Information”) comparing the performance of each Fund with a group of funds (the “Peer Group”) selected by Morningstar, Inc. (“Morningstar”), an independent provider of investment company data, primarily from its US Senior Loan Funds Leveraged CEF classification (the “Morningstar Senior Loan Leveraged Classification”), which consisted of 27 closed‐end funds for the 1‐year period ended March 31, 2017 (the “1‐year period”), 26 closed‐end funds for the 3‐year period ended March 31, 2017 (the “3‐year period”), and 22 closed‐end funds for the 5‐year period ended March 31, 2017 (the “5‐year period”). The Peer Group funds were selected primarily from the Morningstar Senior Loan Leveraged Classification to be more comparable to the Funds based upon Morningstar’s consideration of the constituent funds’ investment style, share class characterization, and assets. The Board was provided with a description of the methodology used by Morningstar to select each Fund’s Peer Group. On May 4, 2017, each of the members of the Board and Independent Counsel participated in a conference call and webinar with Morningstar regarding the Morningstar Performance Information, including its peer grouping methodology and reporting format. Representatives of the Adviser also participated on that conference call and webinar. The Board noted Morningstar’s advice that the relatively limited number of closed‐end funds compared to the open‐end fund universe poses particular challenges for peer grouping.
| Semi-Annual Report | June 30, 2017 | 67 |
| Blackstone / GSO Funds | Approval of Investment Advisory Agreements |
June 30, 2017 (Unaudited)
The Peer Group for BSL consisted of eleven funds for each of the 1‐ and 3‐year periods and ten funds for the 5‐year period, including BSL, with an emphasis on strategies that have historical net portfolio allocations to bank loans exceeding 75%. There was a single Peer Group for both BGX and BGB, which consisted of ten funds for the 1‐ and 3‐year periods and five funds for the 5‐year period, including BGX and BGB, when applicable. The Peer Group for BGX and BGB included funds with historical portfolio allocations to bank loans greater than 20% and allowances for high‐yield bonds. Most Peer Group funds, like BGX and BGB, had a majority of assets allocated to bank loans, while two Peer Group funds had less than 50% of assets in bank loans. In addition, four funds from outside the Morningstar Senior Loan Leveraged Classification with portfolio allocations to bank loans of at least 20% were included in the Peer Group for BGX and BGB. The Board noted that it had received and discussed with the Adviser information at periodic intervals since each Fund’s inception comparing such Fund’s performance against its benchmarks and its Peer Group funds. The Board considered the return volatility and Sharpe ratio (a measure of risk‐weighted return) of each Fund relative to its Peer Group funds. The performance discussion below focuses on the comparison of the Funds’ performance relative to the Peer Groups, rather than to the broader Morningstar Senior Loan Leveraged Classification.
BSL
The Morningstar Performance Information comparing BSL’s performance to that of the Peer Group based on net asset value (“NAV”) per share showed, among other things, that BSL’s returns, measured on a gross return basis, ranked first among its Peer Group funds for the 1‐year period; ranked fifth among its Peer Group funds for the 3‐year period; and ranked seventh among its Peer Group funds for the 5‐year period. In these performance rankings, first represents the fund with the best performance in the Peer Group, whether measured on a gross or net return basis. The Fund’s net performance was better than the Peer Group median performance in each of the 1‐ and 3‐year periods but worse than the Peer Group median performance for the 5‐year period. BSL’s returns, measured on a net return basis, ranked first among the Peer Group funds for the 1‐year period; ranked ninth among the Peer Group funds for the 3‐year period; and ranked tenth among the Peer Group funds for the 5‐year period. The Board also considered BSL’s performance relative to its benchmark and in absolute terms. The Adviser noted that, whether measured on a gross NAV or a net NAV return basis, the Fund outperformed its benchmark for each of the 1‐, 3‐, and 5‐year periods. The Morningstar Performance Information noted that BSL had higher volatility in its returns relative to other Peer Group funds as measured by standard deviation (a measure of return volatility) but also noted that BSL’s Sharpe ratio (a measure of risk‐weighted return) was ranked third among the Peer Group funds for the 1‐year period, representing a higher risk‐weighted return than the Peer Group median.
BGX
The Morningstar Performance Information comparing BGX’s performance to that of the Peer Group based on NAV per share showed, among other things, that BGX’s returns ranked seventh among the ten funds in its Peer Group for each of the 1‐ and 3‐year periods and fifth among the five funds in its Peer Group for the 5‐year period, whether measured on a gross or net return basis. The Fund’s gross performance and net performance were worse than the Peer Group median performance in each period. The Board also considered BGX’s performance relative to its benchmark and in absolute terms. The Adviser noted that BGX on a gross NAV return basis outperformed its benchmark for each of the 1‐, 3‐, and 5‐year periods. On a net NAV return basis, BGX outperformed its benchmark for each of the 1‐ and 5‐year periods but underperformed its benchmark for the 3‐year period. The Morningstar Performance Information noted that while BGX’s performance trailed the Peer Group median in the 1‐year period, BGX had the highest Sharpe ratio and, therefore, the highest risk‐weighted return profile among the Peer Group funds.
BGB
The Morningstar Performance Information comparing BGB’s performance to that of the Peer Group based on NAV per share showed, among other things, that both BGB’s gross return and net return ranked sixth among the funds in its Peer Group for the 1‐year period and ranked eighth among the funds in its Peer Group for the 3‐year period. The Fund’s gross performance and net performance were worse than the Peer Group median performance in each period. The Board also considered BGB’s performance relative to its benchmark and in absolute terms. The Adviser noted that BGB on a gross NAV return basis outperformed its benchmark for each of the 1‐ and 3‐year periods. On a net NAV return basis, BGB outperformed its benchmark for the 1‐year period but underperformed its benchmark for the 3‐year period. The Morningstar Performance Information noted that BGB’s Sharpe ratio was ranked fourth among the Peer Group funds for the 1‐year period, representing a higher risk‐weighted return than the Peer Group median.
In assessing Fund performance, the Adviser noted that the small number and varying investment strategies of funds in the Peer Groups for BSL, BGX and BGB made meaningful performance comparisons difficult. Morningstar itself noted that the relatively limited number of closed‐end funds compared to the open‐end funds poses particular challenges for peer grouping. The Adviser questioned whether the Morningstar Senior Loan Leveraged Classification provided relevant and appropriate performance comparisons in the case of BGX and BGB in light of their broader investment strategies. The Adviser also noted the particular limitations of the BGX and BGB Peer Groups, highlighting the wide range of investment strategies employed and returns achieved by funds in those Peer (relative to the BSL Peer Group). In addition to the Morningstar Performance Information, the Board considered and gave significant weight to information provided by the Adviser regarding the Funds and the Morningstar Senior Loan Leveraged Classification and their respective Peer Groups as to differences in each fund’s portfolio composition by asset class, credit rating, investment size, and other relevant metrics. The Board noted the Adviser’s efforts to maintain each Fund’s level of distributions to shareholders at a competitive level in light of the prevailing low interest rate environment and credit market conditions, although there can be no assurance that each Fund’s past levels of distribution will continue in light of the prevailing low interest rate environment.
| Blackstone / GSO Funds | Approval of Investment Advisory Agreements |
June 30, 2017 (Unaudited)
The Board also noted the comprehensive and rigorous credit review and other processes employed by the Adviser in managing the Funds’ investment portfolios as well as the Adviser’s arranging and management of the respective Funds’ leverage. Significantly, the Adviser noted that the leadership of the Funds’ portfolio management team changed in October 2015 and that the portfolio of each Fund had been repositioned to implement the strategies of the new team with a meaningful improvement in the Funds’ recent performance, particularly BSL. The Board gave significant weight to the changes made to the portfolio management team to address the Funds’ performance, to the Funds’ limited performance history under the new portfolio management team, and to the improvement of each Fund’s performance in recent periods under the new portfolio management team. Based on its review and considering other relevant factors, including those noted above, the Board concluded that, under the circumstances, continuation of each Fund’s Agreement for an additional period of one year would be consistent with the interests of the Fund’s shareholders.
Management Fees and Expenses
The Board reviewed and considered the investment advisory fee (the “Advisory Fee”) payable by each Fund to the Adviser under its Agreement in light of the nature, extent and overall quality of the investment advisory and other services provided by the Adviser to the Fund.
Additionally, the Board received and considered information and analyses (the “Morningstar Expense Information”) prepared by Morningstar, comparing, among other things, the Advisory Fee for each Fund and each Fund’s overall expenses with the Morningstar Senior Loan Leveraged Classification and the Fund’s Peer Group. The comparison was based upon the constituent funds’ latest fiscal years. The discussion below focuses on the Funds’ expenses relative to their respective Peer Groups, rather than to the broader Morningstar Senior Loan Leveraged Classification.
BSL
BSL’s eleven Peer Group funds had average common share net assets ranging from $111.28 million to $1.182 billion. Seven of the other funds in the Peer Group were larger than BSL and three were smaller. The Morningstar Expense Information, comparing BSL’s actual total expenses to the Peer Group, showed, among other things, that the Fund’s actual Advisory Fee (i.e., giving effect to any voluntary fee waivers implemented by the Adviser with respect to the Fund and by the managers of the other Peer Group funds) compared on the basis of common share net assets ranked ninth among the eleven funds in the Peer Group and was higher (i.e., worse) than the Peer Group median for that expense component. In these expense component rankings, first is best (i.e., lowest). The Fund’s actual total expenses compared on the basis of common share net assets ranked ninth among the funds in the Peer Group and were higher than the Peer Group median.
BGX
BGX’s ten Peer Group funds had average common share net assets ranging from $174.02 million to $1.07 billion. Seven of the other funds in the Peer Group were larger than BGX and two were smaller. The Morningstar Expense Information, comparing BGX’s actual total expenses to the Fund’s Peer Group, showed, among other things, that the Fund’s actual Advisory Fee compared on the basis of common share net assets ranked second among the funds in the Peer Group and was better (i.e., lower) than the Peer Group median for that expense component. The Fund’s actual total expenses compared on the basis of common share net assets ranked fourth among the funds in the Peer Group and were lower (i.e., better) than the Peer Group median.
BGB
BGB’s ten Peer Group funds had average common share net assets ranging from $174.02 million to $1.07 billion. Two of the other funds in the Peer Group were larger than BGB and seven were smaller. The Morningstar Expense Information, comparing BGB’s actual total expenses to the Fund’s Peer Group, showed, among other things, that the Fund’s actual Advisory Fee compared on the basis of common share net assets ranked sixth among the funds in the Peer Group and was higher (i.e., worse) than the Peer Group median for that expense component. The Fund’s actual total expenses compared on the basis of common share net assets ranked seventh among the funds in the Peer Group and were higher than the Peer Group median.
In its evaluation of the Advisory Fee and Morningstar Expense Information for each Fund, the Board took into account the complexity of such Fund’s investment program and the comprehensive and rigorous credit review and other processes employed by the Adviser in managing the Funds’ investment portfolios, including the Adviser’s prominence in the leveraged finance market and the strength of its investment management team and trading and middle office support. The Board further noted Morningstar’s advice that the relatively limited number of close ‐end funds compared to the open‐end fund universe poses particular challenges for peer grouping and that the small number and varying sizes of funds in the Funds’ Peer Groups made meaningful expense comparisons difficult. The Board considered the Adviser’s belief that smaller funds, such as BSL and BGX, may be disadvantaged in comparison with larger funds that have greater opportunities for economies of scale. The Board also considered the Adviser’s belief that other Peer Group funds that were launched prior to the financial crisis in 2008 and 2009 and that are parts of larger fund complexes than the Funds’ fund complex benefit from reduced cost‐sharing opportunities and opportunities owing to economies of scale that are not available to the Funds. The Adviser provided and the Board considered expense information provided by the Adviser in support of this belief.
| Semi-Annual Report | June 30, 2017 | 69 |
| Blackstone / GSO Funds | Approval of Investment Advisory Agreements |
June 30, 2017 (Unaudited)
The Board also considered Contract Renewal Information regarding fees (including sub‐advisory fees) charged by the Adviser to other U.S. clients investing primarily in an asset class similar to that of the Funds, including, where applicable, institutional commingled funds and exchange‐traded funds. The Board was advised that the base fees paid by such institutional and other clients generally are lower, and may be significantly lower, than the Advisory Fee. The Contract Renewal Information discussed the significant differences in scope of services provided to the Funds and to these other clients, noting that the Funds were subject to heightened regulatory requirements relative to institutional clients; that the Funds were provided with administrative services, office facilities and Fund officers (including each Fund’s chief executive, chief financial and chief compliance officers); and that the Adviser manages the leverage arrangements of the Funds and coordinates and oversees the provision of services to the Funds by other fund service providers. The Board considered the fee comparisons in light of the different services provided in managing these other types of clients and funds.
Taking all of the above into consideration, the Board determined that the Advisory Fee for each Fund was reasonable in light of the nature, extent and overall quality of the investment advisory and other services provided to such Fund under its Agreement.
Profitability
The Board, as part of the Contract Renewal Information, received an analysis of the profitability to the Adviser and its affiliates in providing services to each Fund for each of the past two fiscal years. In addition, the Board received Contract Renewal Information with respect to the Adviser’s revenue and cost allocation methodologies used in preparing such profitability data. The profitability analysis, among other things, indicated that the profitability to the Adviser in providing investment advisory and other services to each Fund was at a level which was not considered excessive by the Board in light of the nature, extent and overall quality of such services.
Economies of Scale
The Board received and discussed Contract Renewal Information concerning whether the Adviser would realize economies of scale if the Funds’ assets grow. The Board noted that because each Fund is a closed‐end fund with no current plans to seek additional assets beyond maintaining its dividend reinvestment plan, any significant growth in its assets generally will occur through appreciation in the value of each Fund’s investment portfolio, rather than sales of additional shares in the Fund. The Board determined that the Advisory Fee structure was appropriate under present circumstances.
Other Benefits to the Adviser
The Board considered other benefits received by the Adviser and its affiliates as a result of the Adviser’s relationship with each of the Funds and did not regard such benefits as excessive.
* * * * *
In light of all of the foregoing and other relevant factors, the Board determined that, under the circumstances, continuation of each Fund’s Agreement would be in the interests of the Fund and its shareholders and unanimously voted to continue the Agreement for a period of one additional year.
No single factor reviewed by the Board was identified by the Board as the principal factor in determining whether to approve continuation of each Agreement for the next year, and each Board member attributed different weights to the various factors. The Independent Trustees were advised by separate independent legal counsel throughout the process. Prior to the Review Session and the Contract Renewal Meeting, the Board received a memorandum prepared by counsel to the Funds discussing its responsibilities in connection with the proposed continuation of the Agreements as part of the Contract Renewal Information and the Independent Trustees separately received a memorandum as to their responsibilities in this regard from their independent counsel. Prior to voting, the Independent Trustees discussed the proposed continuation of the Agreements in a private session with their independent legal counsel at which no representatives of the Adviser or Fund management were present.
| Blackstone / GSO Funds | Trustees & Officers |
June 30, 2017 (Unaudited)
The oversight of the business and affairs of the Funds is vested in the Board of Trustees. The Board of Trustees is classified into three classes—Class I, Class II and Class III—as nearly equal in number as reasonably possible, with the Trustees in each class to hold office until their successors are elected and qualified. At each annual meeting of shareholders, the successors to the class of Trustees whose terms expire at that meeting shall be elected to hold office for terms expiring at the later of the annual meeting of shareholders held in the third year following the year of their election or the election and qualification of their successors. The Funds’ executive officers were appointed by the Board of Trustees to hold office until removed or replaced by the Board of Trustees or until their respective successors are duly elected and qualified.
Below is a list of the Trustees and officers of the Funds and their present positions and principal occupations during the past five years. The business address of the Funds, the Trustees, the Funds’ officers, and the Adviser is 345 Park Avenue, 30th Floor, New York, NY 10154, unless specified otherwise below.
| NON‐INTERESTED TRUSTEES | | | | |
Name, Address and Year of Birth(1) | Position(s) Held with the Funds | Term of Office and Length of Time Served | Principal Occupation(s) During Past 5 Years | Number of Portfolios in Fund Complex Overseen by Trustee(2) | Other Directorships Held by Trustee |
Edward H. D'Alelio Birth Year: 1952 | Lead Independent Trustee and member of Audit and Nominating and Governance Committees | Trustee Since: BSL: April 2010 BGX: November 2010 BGB: May 2012 Term Expires: BSL: 2020 BGX: 2020 BGB: 2020 | Mr D'Alelio was formerly a Managing Director and CIO for Fixed Income at Putnam Investments, Boston where be retired in 2002. He currently is an Executive in Residence with the School of Management, Univ. of Mass Boston. | 6 | Owl Rock Capital Corp.; Owl Rock Capital Corp. II. |
Michael Holland Birth Year: 1944 | Trustee and member of Audit and Nominating and Governance Committees | Trustee Since: BSL: April 2010 BGX: November 2010 BGB: May 2012 Term Expires: BSL: 2019 BGX: 2019 BGB: 2019 | Mr. Holland is the Chairman of Holland & Company, a private investment firm he founded in 1995. He is also President and Founder of the Holland Balanced Fund. | 6 | The China Fund, Inc.; State Street Master Funds; Reaves Utility Income Fund. |
Thomas W. Jasper Birth Year: 1948 | Trustee, Chairman of Audit Committee and member of Nominating and Governance Committee | Trustee Since: BSL: April 2010 BGX: November 2010 BGB: May 2012 Term Expires: BSL: 2018 BGX:2018 BGB: 2018 | Mr. Jasper is the Managing Partner of Manursing Partners LLC, a consulting firm. He was Chief Executive Officer of Primus Guaranty, Ltd. from 2001‐2010. | 6 | Ciner Resources LP. |
Gary S. Schpero Birth Year: 1953 | Trustee, Chairman of Nominating and Governance Committee and member of Audit Committee | Trustee Since: BSL: May 2012 BGX: May 2012 BGB: May 2012 Term Expires: BSL: 2018 BGX:2018 BGB: 2018 | Retired. Prior to January 2000, Mr. Schpero was a partner at the law firm of Simpson Thacher & Bartlett LLP where he served as managing partner of the Investment Management and Investment Company Practice Group. | 3 | EQ Advisors Trust; 1290 Funds; AXA Premier VIP Trust. |
| Semi-Annual Report | June 30, 2017 | 71 |
| Blackstone / GSO Funds | Trustees & Officers |
June 30, 2017 (Unaudited)
INTERESTED TRUSTEE(3) | | | | |
Name, Address and Year of Birth(1) | Position(s) Held with the Funds | Term of Office and Length of Time Served | Principal Occupation(s) During Past 5 Years | Number of Portfolios in Fund Complex Overseen by Trustee(2) | Other Directorships Held by Trustee |
Daniel H. Smith, Jr. Birth Year: 1963 | Chairman of the Board, President, Chief Executive Officer, Trustee | Trustee Since: BSL: April 2010 BGX: November 2010 BGB: May 2012 Term Expires: BSL: 2019 BGX: 2019 BGB: 2019 | Mr. Smith is a Senior Managing Director of GSO and is Head of GSO / Blackstone Debt Funds Management LLC. Mr. Smith joined GSO from the Royal Bank of Canada in July 2005 where he was a Managing Partner and Co‐head of RBC Capital Market's Alternative Investments Unit. | 3 | None |
| OFFICERS | | | |
Name, Address and Year of Birth(1) | Position(s) Held with the Funds | Term of Office and Length of Time Served | Principal Occupation During the Past Five Years |
Daniel H. Smith, Jr. Birth Year: 1963 | Trustee, Chairman of the Board, President, Chief Executive Officer | Officer Since: BSL: April 2010 BGX: November 2010 BGB: May 2012 Term of Office: Indefinite | Mr. Smith is a Senior Managing Director of GSO and is Head of GSO / Blackstone Debt Funds Management LLC. Mr. Smith joined GSO from the Royal Bank of Canada in July 2005 where he was a Managing Partner and Co‐head of RBC Capital Market's Alternative Investments Unit. |
Dohyun (Doris) Lee‐Silvestri Birth Year: 1977 | Chief Financial Officer and Treasurer | Officer Since: BSL: March 2016 BGX: March 2016 BGB: March 2016 Term of Office: Indefinite | Doris Lee‐Silvestri is a Managing Director and Chief Financial Officer of GSO. At GSO, Ms. Lee‐Silvestri was most recently the head of the fund accounting and financial reporting group. Before joining GSO in 2006, Ms. Lee‐Silvestri held a variety of positions at Merrill Lynch Investment Advisors and JP Morgan Partners within the respective finance and accounting teams. In addition, Ms. Lee‐Silvestri worked at McGladrey LLP, a global public accounting firm. |
Robert Zable Birth Year: 1972 | Executive Vice President and Assistant Secretary | Officer Since: BSL: September 2015 BGX: September 2015 BGB: September 2015 Term of Office: Indefinite | Mr. Zable is a Senior Managing Director of GSO. Before joining GSO, Mr. Zable was a Vice President at FriedbergMilstein LLC, where he was responsible for credit opportunity investments and junior capital origination and execution. Prior to that, Mr. Zable was a Principal with Abacus Advisors Group, a restructuring and distressed investment firm. Mr. Zable began his career at JP Morgan Securities Inc., where he focused on leveraged finance in New York and London. Mr. Zable received a BS from Cornell University, and an MBA in Finance from The Wharton School at the University of Pennsylvania. |
| Blackstone / GSO Funds | Trustees & Officers |
June 30, 2017 (Unaudited)
| OFFICERS (continued) | | | |
Name, Address and Year of Birth(1) | Position(s) Held with the Funds | Term of Office and Length of Time Served | Principal Occupation During the Past Five Years |
Marisa Beeney Birth Year: 1970 | Chief Compliance Officer, Chief Legal Counsel and Secretary | Officer Since: BSL: April 2010 BGX: November 2010 BGB: May 2012 Term of Office: Indefinite | Ms. Beeney is a Managing Director, Chief Legal Officer and Chief Compliance Officer of GSO. From March 2007 to December 2008, she served as Counsel and Director of GSO. Prior to that time she was with the finance group of DLA Piper since 2005. |
Jane Lee Birth Year: 1972 | Public Relations Officer | Officer Since: BSL: November 2010 BGX: November 2010 BGB: May 2012 Term of Office: Indefinite | Ms. Lee is a Managing Director of GSO and Head of GSO / Blackstone’s capital formation efforts. Ms. Lee joined GSO from Royal Bank of Canada in July 2005, where she was most recently a partner in the Debt Investments Group and was responsible for origination of new CLO transactions and investor relations. |
(1) | The address of each Trustee/Nominee and Officer, unless otherwise noted, is GSO Capital Partners LP, 345 Park Avenue, 30th Floor, New York, NY 10154. |
(2) | The “Fund Complex” consists of the Funds, Blackstone / GSO Senior Floating Rate Term Fund, Blackstone / GSO Long-Short Credit Income Fund and Blackstone / GSO Strategic Credit Fund, as well as the “Blackstone Real Estate Funds,” Blackstone Real Estate Income Fund, Blackstone Real Estate Income Fund II and Blackstone Real Estate Income Master Fund. |
(3) | "Interested person" of the Fund as defined in Section 2(a)(19) of the 1940 Act. Mr. Smith is an interested person due to his employment with the Adviser. |
| Semi-Annual Report | June 30, 2017 | 73 |
| Trustees | Fund Officers |
| Daniel H. Smith, Jr. | Daniel H. Smith, Jr. |
| Chairman of the Board of Trustees | President and Chief Executive Officer |
| Thomas W. Jasper | Doris Lee-Silvestri |
| Michael Holland | Chief Financial Officer and Treasurer |
| Edward H. D’Alelio | Robert Zable |
| Gary S. Schpero | Executive Vice President |
| | and Assistant Secretary |
| Investment Manager | Marisa Beeney |
| GSO / Blackstone Debt Funds | Chief Compliance Officer, |
| Management LLC | Chief Legal Officer and Secretary |
| 345 Park Avenue, 30th Floor | Jane Lee |
| New York, New York 10154 | Public Relations Officer |
| | |
| Administrator | DRIP Administrator |
| ALPS Fund Services, Inc. | Computershare |
| 1290 Broadway, 11th Floor | P.O. Box 358035 |
| Denver, Colorado 80203 | Pittsburgh, Pennsylvania 15252 |
| | |
| Custodian | Independent Registered Public |
| The Bank of New York Mellon, N.A. | Accounting Firm |
| 2 Hanson Place, 8th Floor | Deloitte & Touche LLP |
| Brooklyn, New York 11217 | 555 17th Street, Ste 3600 |
| | Denver, Colorado 80202 |
| Transfer Agent | |
| Computershare | Legal Counsel |
| 480 Washington Blvd. | Simpson Thacher & Bartlett LLP |
| Jersey City, New Jersey 07310 | 425 Lexington Avenue |
| | New York, New York 10017 |
| | |
| | |
This report, including the financial information herein, is transmitted to the shareholders of Blackstone / GSO Senior Floating Rate Income Fund, Blackstone / GSO Long-Short Credit Income Fund and Blackstone / GSO Strategic Credit Fund for their information. It is not a prospectus, circular or representation intended for use in the purchase of shares of the Fund or any securities mentioned in this report.
Notice is hereby given in accordance with Section 23(c) of the Investment Company Act of 1940, as amended, that from time to time the Funds may purchase their common shares in the open market.
Information on the Funds is available at www.blackstone-gso.com.
1.877.876.1121 | WWW.BLACKSTONE-GSO.COM
Not applicable to this Report.
Not applicable to this Report.
Not applicable to this Report.
Not applicable to this Report.
Not applicable to this Report.
None.
There have been no material changes to the procedures by which shareholders may recommend nominees to the Registrant’s Board of Trustees, where those changes were implemented after the Registrant last provided disclosure in response to the requirements of Item 407(c)(2) of Regulation S-K, or this Item.
(a)(3) Not applicable to Registrant.
Pursuant to the requirements of the Securities Exchange Act of 1934 and the Investment Company Act of 1940, the Registrant has duly caused this report to be signed on its behalf by the undersigned, thereunto duly authorized.
Pursuant to the requirements of the Securities Exchange Act of 1934 and the Investment Company Act of 1940, this report has been signed below by the following persons on behalf of the Registrant and in the capacities and on the dates indicated.