UNITED STATES
SECURITIES AND EXCHANGE COMMISSION
Washington, D.C. 20549
FORM N-CSR
CERTIFIED SHAREHOLDER REPORT OF REGISTERED
MANAGEMENT INVESTMENT COMPANIES
Investment Company Act file number: 811-22393
Blackstone / GSO Senior Floating Rate Term Fund
(exact name of Registrant as specified in charter)
345 Park Avenue, 31st Floor
New York, New York 10154
(Address of principal executive offices) (Zip code)
(Name and address of agent for service)
Marisa Beeney
345 Park Avenue, 31st Floor
New York, New York 10154
Registrant’s telephone number, including area code:(877) 876-1121
Date of fiscal year end: December 31
Date of reporting period:June 30, 2019
| Item 1. | Report to Stockholders. |
Beginning on January 1, 2021, as permitted by regulations adopted by the Securities and Exchange Commission, paper copies of the Funds’ shareholder reports will no longer be sent by mail, unless you specifically request paper copies of the reports from a Fund or from your financial intermediary, such as a broker-dealer or bank. Instead, the reports will be made available on each Fund’s website and you will be notified by mail each time a report is posted and provided with a website link to access the report.
If you already elected to receive shareholder reports electronically, you will not be affected by this change and you need not take any action. Shareholders who invest directly with a Fund may elect to receive shareholder reports and other communications from the Fund electronically by calling 1-800-522-6645 to make such arrangements. For shareholders who invest through a financial intermediary, please contact that financial intermediary directly for information on how to receive shareholder reports and other communications electronically.
You may elect to receive all future reports in paper free of charge. If you invest directly with a Fund, you can inform the Fund that you wish to continue receiving paper copies of your shareholder reports by calling 1-800-522-6645 to make such arrangements. For shareholders who invest through a financial intermediary, please contact that financial intermediary directly to inform them that you wish to continue receiving paper copies of your shareholder reports. If your common shares are held through a financial intermediary, your election to receive reports in paper will apply to all funds held with that financial intermediary.
Table of Contents
| Manager Commentary | 2 |
| Fund Summary | 4 |
| Portfolio of Investments | 10 |
| Statements of Assets and Liabilities | 48 |
| Statements of Operations | 49 |
| Statements of Changes in Net Assets | 50 |
| Statements of Cash Flows | 51 |
| Financial Highlights | 52 |
| Notes to Financial Statements | 58 |
| Summary of Dividend Reinvestment Plan | 71 |
| Additional Information | 72 |
| Privacy Procedures | 74 |
| Approval of Investment Advisory Agreement | 81 |
| Trustees & Officers | 85 |
| Blackstone / GSO Funds | Manager Commentary |
June 30, 2019 (Unaudited)
To Our Shareholders:
Central banks completed the transition from tightening to easing in the second quarter of 2019. The prospects of coordinated easing across major economies likely propelled risk assets to new highs in the first half of 2019, turning the relationship between markets and the Federal Reserve (the “Fed”) on its head – risk assets are supposed to rally after the Fed cuts, not before. Historically, equity returns have been flat in the six months prior to a Fed cut, but year-to-date through June, the stock market was up over 20%. Markets have a poor history of predicting the magnitude and timing of Fed actions, and we believe current conditions do not warrant as aggressive a rate path as markets are currently pricing in. Notably, the U.S. doesn’t have a growth problem, and inflation may not be as weak as investors believe. Meanwhile, investors have jumped headfirst into longer duration bonds in hopes of lower rates for longer periods. They appear to be ignoring the issues bubbling under the surface that we believe make risk assets unlikely to make much progress and credit spreads likely to widen from here. Policy may disappoint, corporate profits are slowing, and trade tensions may intensify. The mismatch between investor expectations and reality may be a source of volatility for the remainder of 2019. The end of the economic cycle is not expected soon, and pullbacks may create buying opportunities in the market.
Following a volatile end to 2018, the U.S. corporate credit markets rallied in the first half of 2019. The snapback in the second quarter of 2019 slowed for loans as rate cut expectations seemed to work against the otherwise bullish sentiment in the credit markets. Loans returned 1.68% in the second quarter of 2019, bringing year-to-date performance to 5.74% as of June 30, 2019. This represents the best first half-year performance in ten years, as lower levels of new issue loan supply offset the headwind of continued outflows from mutual funds and exchange-traded funds (“ETFs”). The Bloomberg Barclays U.S. Corporate High Yield Index returned 9.9% year-to-date as of June 30, 2019 as the light tone from the Fed and the European Central Bank, coupled with de-escalation of the U.S./China trade conflict, probably propelled relatively strong performance over the quarter. May represented the only negative returning month for high yield bonds in 2019, with a return of -1.2%, largely due to the broader risk-off sentiment as retail investors exited the asset class driving $6 billion of outflows. This sentiment quickly reversed in June following accommodative statements by Fed Chairman Powell, which seemed to drive high yield fund inflows totaling $3.7 billion and a monthly return of 2.3%, the second highest returning month in 2019.
Total Returns through June 30, 2019
| US Loans (S&P/LSTA Leveraged Loan Index) | 5.74% |
| US High Yield Bonds (Bloomberg Barclays U.S. High Yield Index) | 9.94% |
| 3-month Treasury Bills (Bloomberg Barclays U.S. Treasury Bellwethers: 3 Month) | 1.25% |
| 10-Year Treasuries (Bloomberg Barclays U.S. Treasury Bellwethers: 10 Year) | 7.44% |
| US Aggregate Bonds (Bloomberg Barclays U.S. Aggregate Index) | 6.11% |
| US Investment Grade Bonds (Bloomberg Barclays U.S. Corporate Investment Grade Index) | 9.85% |
| Emerging Markets (Bloomberg Barclays EM USD Aggregate Index) | 9.39% |
| US Large Cap Equities (S&P 500® Index) | 18.54% |
Sources: Bloomberg, Barclays, S&P/LCD
Past Performance is no guarantee of future results. Index performance is shown for illustrative purposes only. You cannot invest directly in an index.
Higher quality loans outperformed the lower quality segment of the market during the first half of 2019, with BB and B rated loans returning 6.0% and 5.2%, respectively, compared to CCC rated loans, which returned just 2.8%. In contrast, high yield bond returns during the first half of 2019 were relatively consistent across credit quality. BB rated high yield bonds returned 10.3%, B rated bonds returned 9.8%, and CCC rated bonds returned 10.0% year-to-date as of June 30, 2019.
Loan new issue supply has remained subdued year-to-date as bond-for-loan refinancings increased while loan repricings decreased. Total gross loan issuance in the first half of 2019 totaled $158 billion, a 69% decrease compared to the first half of 2018, which recorded gross issuance of over $500 billion (of which 67% was repricing and refinancing). Loan issuance net of refinancing and repricing activity has also slowed year-to-date with net loan issuance totaling just $103 billion for the first half, a 38% decrease year-over-year. In comparison, gross high yield bond issuance continued at an accelerated pace in the second quarter of 2019, totaling $71 billion and bringing year-to-date issuance to $141 billion as of June 30. Net high yield bond issuance, excluding refinancing, was also up year-over-year, totaling $47 billion, representing a 3% increase compared to the first half of 2018. Strong high yield bond issuance is expected to continue into the third quarter of 2019 with $20 billion of gross issuance in the current pipeline.
Loan mutual funds and ETFs have experienced a record 33 straight weeks of net outflows through June 30, 2019 as demand for loans from retail investors continues to be heavily predicated on expected movements in interest rates. From mid-July 2018 to October 2018, the asset class was flooded with almost $45 billion of net inflows into loan retail funds as interest rate increases were anticipated. However, as rate expectations shifted lower in October 2018, over 80% of the $45 billion has since exited the asset class. We expect outflows to continue at a moderate pace given the current rate outlook. Although high yield retail funds experienced a net monthly outflow during May 2019, year-to-date net flows remain positive at $12.2 billion as of June 30, 2019. This has helped to fuel the recent high yield issuance surge as retail investors adjust their rate expectations and shift into fixed rate, longer duration assets.
| Blackstone / GSO Funds | Manager Commentary |
June 30, 2019 (Unaudited)
U.S. Collateralized Loan Obligation (“CLO”) issuance lagged slightly year-over-year with $65 billion issued through June 30, 2019 compared to $67 billion over the same period last year. JP Morgan estimates that U.S. CLO issuance will total $115-$125 billion by year-end, which would represent a decline of approximately 8-12% year-over-year.
As of June 30, 2019, both loan and high yield bond default rates had decreased compared to year-end 2018 levels. Per JP Morgan, the par-weighted loan default rate for the last-twelve-month (“LTM”) period ending June 30, 2019 was 1.30%, which was down 42 basis points since the end of 2018 and down 69 basis points year-over-year. The par-weighted LTM high yield bond default rate per JP Morgan was 1.46% at June 30, 2019, down 37 basis points year-to-date and down 52 basis points year-over-year. JP Morgan continues to expect 2019 year-end default rates of just 1.5% and 2020 default rates of 2.0% for loans and high yield bonds, both of which are below the 20-year average. Lower default rate expectations are supported by robust interest coverage, expected continuance of U.S. GDP growth, and limited near-term U.S. loan and high yield bond maturities.
We continue to believe that floating rate senior loans offer a compelling risk-reward opportunity, especially given the low correlation of loans with other fixed income investments, as well as such loans’ senior secured nature.
At GSO / Blackstone, we value your continued investment and confidence in us and in our family of funds. Additional information about our funds is available on our website at www.blackstone-gso.com.
Sincerely,
GSO / Blackstone Debt Funds Management LLC

| Semi-Annual Report | June 30, 2019 | 3 |
| Blackstone / GSO Senior Floating Rate Term Fund | Fund Summary |
June 30, 2019 (Unaudited)
Blackstone / GSO Senior Floating Rate Term Fund
Fund Overview
Blackstone / GSO Senior Floating Rate Term Fund (“BSL” or herein, the “Fund”) is a closed-end term fund that trades on the New York Stock Exchange under the symbol “BSL”. BSL’s primary investment objective is to seek high current income, with a secondary objective to seek preservation of capital, consistent with its primary goal of high current income. Under normal market conditions, the Fund invests at least 80% of its Managed Assets in senior, secured floating rate loans (“Senior Loans”). BSL may also invest in second-lien loans and high yield bonds and employs financial leverage, which may increase risk to the Fund. The Fund has a limited term, and absent shareholder approval to extend the life of the Fund, the Fund will dissolve on or about May 31, 2022.
Portfolio Management Commentary
Fund Performance
BSL outperformed its key benchmark, the S&P/LSTA Leveraged Loan Index (“S&P LLI”), on a Net Asset Value (“NAV”) per share basis for the periods of three years, five years, and the life of the Fund since inception and underperformed its benchmark for the six month and one year periods. On a market share per price basis, the Fund outperformed its benchmark for the periods of six months, three years, five years, and since inception and underperformed its benchmark for the one year period. The shares of the Fund traded at an average discount to NAV of 1.3% for the six months ended June 30, 2019, compared to its peer group average discount of 7.9% over the same time.1
NAV Performance Factors
The Fund’s underperformance relative to its benchmark in the first half of 2019 was partially attributable to an underweight allocation to larger tranche loans, which rallied in January after underperforming in late 4Q 2018 due to heavy selling by loan mutual funds to meet historic redemptions. During the first half of 2019, loans in the benchmark with tranches of $1.0 billion or greater (approximately 28% of the Fund and 58% of the benchmark) returned +6.3% compared to a return of +4.9% for loans below $1.0 billion (approximately 68% of the Fund and 42% of the benchmark). Credit selection within single-B rated loans, which represented approximately 79% of the Fund during the period, also negatively impacted performance, as single-B loans held by the Fund returned approximately +5.1% compared to approximately +5.7% for single-B loans in the benchmark. By issuer, the largest positive contributors to performance relative to the benchmark were Beacon Health, GFL Environmental, and US LBM, while Sheridan Production Partners, MCS, and Southern Graphics were the most significant detractors.
Portfolio Activity and Positioning
Over the first six months of 2019, the Fund focused on taking advantage of new issuance while net reducing its allocation to certain higher beta/stressed loans. On a sector basis, the Fund reduced its allocation to basic materials and energy while increasing exposure to information technology.2 The Fund continues to seek to opportunistically take advantage of strong technicals to pare higher risk names where the portfolio managers believe inadequate levels of compensation are being offered relative to the credit risk.
As of June 30, 2019, the Fund held 83.6% of its Managed Assets in Senior Loans, 12.1% in second lien loans, and 2.9% in high yield bonds. BSL’s investments represented the obligations of 267 companies, with an average position size representing 0.32% of Managed Assets of the Fund. Electronics/electric, healthcare, and business equipment & services represented the Fund’s top sector weightings.3
| 1 | Average discount and peer group per Morningstar. |
| 2 | Industries per Bloomberg classifications. |
| 3 | Industries per S&P classifications. |
| Blackstone / GSO Senior Floating Rate Term Fund | Fund Summary |
June 30, 2019 (Unaudited)
BSL’s Portfolio Composition*

| * | Numbers may not sum to 100.00% due to rounding. The Fund’s Cash and Other represents net cash and other assets and liabilities, which includes amounts payable for investments purchased but not yet settled and amounts receivable for investments sold but not yet settled. At period end, the amounts payable for investments purchased but not yet settled exceeded the amount of cash on hand. The Fund uses sales proceeds or funds from its leverage program to settle amounts payable for investments purchased, but such amounts are not reflected in the Fund’s net cash. |
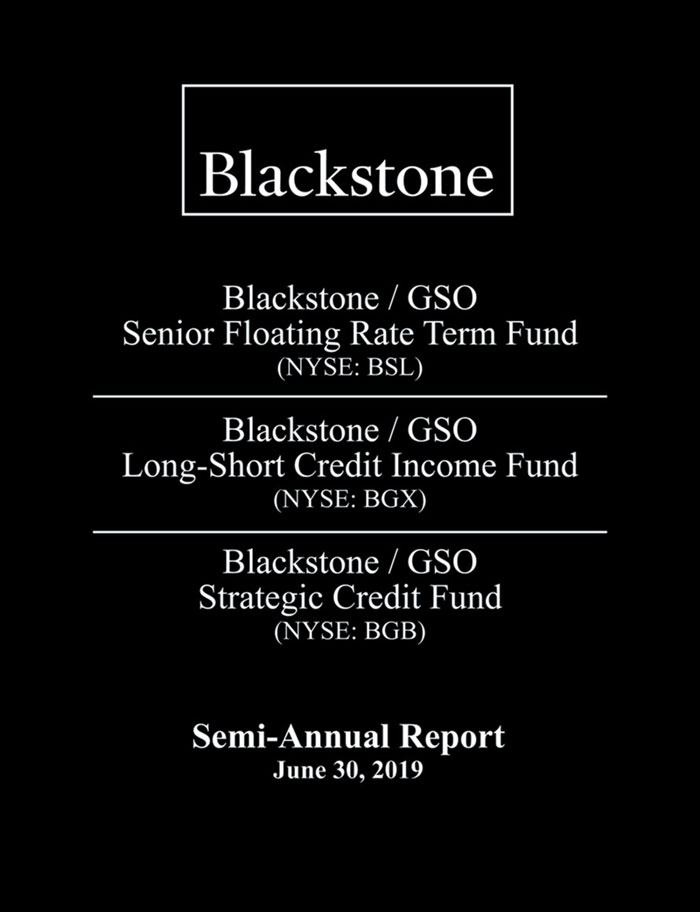
BSL’s Moody’s Rating*
| * | For more information on Moody's ratings and descriptions refer to www.moodys.com. |
Portfolio Characteristics
| Average All-In Rate | 7.02% |
| Current Dividend Yield^ | 7.89% |
| Effective Duration^^ | 0.22 yr |
| Average Position* | 0.32% |
| Leverage* | 33.19% |
| ^ | Using current dividend rate of $0.111/share and market price/share as of 6/30/2019. |
| ^^ | Loan durations are based on the actual remaining time until LIBOR is reset for each individual loan. |
| * | As a percentage of Managed Assets. |
Top 10 Issuers*
| Quest Software US Holdings, Inc. | 1.6% |
| EG Group, Ltd. | 1.3% |
| TKC Holdings, Inc. | 1.2% |
| Advantage Sales & Marketing, Inc. | 1.2% |
| LBM Borrower LLC | 1.1% |
| GI Revelation Acquisition LLC | 1.1% |
| Ivanti Software, Inc. | 1.1% |
| KUEHG Corp | 1.0% |
| PT Intermediate Holdings | 1.0% |
| Netsmart Technologies, Inc. | 1.0% |
| Top 10 Issuer | 11.5% |
| * | As a percentage of Managed Assets. |
Portfolio holdings and distributions are subject to change and are not recommendations to buy or sell any security.
Top 5 Industries*^
| Electronics/Electric | 19.5% |
| Healthcare | 16.3% |
| Business Equipment & Services | 15.4% |
| Building & Development | 6.0% |
| Industrial Equipment | 3.3% |
| Top 5 Industries | 60.5% |
| * | As a percentage of Managed Assets. |
| ^ | S&P Industry Classification Schema. |
BSL Total Return
| | 6 Month | 1 Year | 3 Year† | 5 Year† | Since Inception† |
| NAV* | 5.00%** | 3.70% | 7.83% | 4.67% | 5.70% |
| Market Price* | 13.83% | 2.30% | 9.90% | 6.18% | 5.26% |
| S&P LLI | 5.74% | 3.97% | 5.24% | 3.68% | 4.79% |
| * | Assumes distributions are reinvested pursuant to the Fund’s dividend reinvestment plan. Performance data quoted represents past performance and does not guarantee future results. |
| ** | Excludes adjustments in accordance with accounting principles generally accepted in the United States of America and as such, the net asset value and total return for shareholder transactions reported to the market at period ended June 30, 2019 may differ from the net asset value for financial reporting purposes. |
| Semi-Annual Report | June 30, 2019 | 5 |
| Blackstone / GSO Long-Short Credit Income Fund | Fund Summary |
June 30, 2019 (Unaudited)
Blackstone / GSO Long-Short Credit Income Fund
Fund Overview
Blackstone / GSO Long Short Credit Income Fund (“BGX” or herein, the “Fund”) is a closed-end fund that trades on the New York Stock Exchange under the symbol “BGX”. BGX’s primary investment objective is to provide current income, with a secondary objective of capital appreciation. BGX will take long positions in investments which we believe offer the potential for attractive returns under various economic and interest rate environments. BGX may also take short positions in investments which we believe will under-perform due to a greater sensitivity to earnings growth of the issuer, default risk or the general level and direction of interest rates. BGX must hold no less than 70% of its Managed Assets in first- and second-lien secured loans (“Secured Loans”) but may also invest in unsecured loans and high yield bonds.
Portfolio Management Commentary
Fund Performance
BGX outperformed a composite weighting of the S&P LLI and the Barclays U.S. High Yield Index (“Barclays HYI”) (70% loans, 30% high yield bonds) on a NAV per share basis for the periods of three years, five years, and the life of the Fund since inception and underperformed its benchmark for the six month and one year periods. On a market share per price basis, the Fund outperformed its benchmark for the periods of six months, one year, three years, five years, and since inception. The shares of the Fund traded at an average discount to NAV of 4.5% for the six months ended June 30, 2019, compared to its peer group average discount of 9.8% over the same time.1
NAV Performance Factors
The Fund’s underperformance relative to its benchmark in the first half of 2019 was partially attributable to an underweight allocation to larger tranche loans, which rallied in January after underperforming in late 4Q 2018 due to heavy selling by loan mutual funds to meet historic redemptions. During the first half of 2019, loans in the benchmark with tranches of $1.0 billion or greater (approximately 24% of the Fund and 41% of the benchmark) returned +6.3% compared to a return of +4.9% for loans below $1.0 billion (approximately 62% of the Fund and 29% of the benchmark). Credit selection within single-B rated loans, which represented approximately 69% of the Fund during the period, also negatively impacted performance, as single-B loans held by the Fund returned approximately +5.1% compared to approximately +5.7% for single-B loans in the benchmark. The Fund’s underweight allocation to high yield, and particularly longer duration high yield, also negatively impacted performance. By issuer, the largest positive contributors to performance relative to the benchmark were York Risk Services, Beacon Health, and Calumet Specialty Products Partners, while Pier 1, Southern Graphics, and MCS were the most significant detractors.
Portfolio Activity and Positioning
Over the first six months of 2019, the Fund focused on taking advantage of new issuance while net reducing its allocation to certain higher beta/stressed loans. On a sector basis, the Fund reduced its allocation to basic materials and consumer discretionary while increasing exposure to information technology and industrials.2 The Fund continues to seek to opportunistically take advantage of strong technicals to pare higher risk names where the portfolio managers believe inadequate levels of compensation are being offered relative to the credit risk.
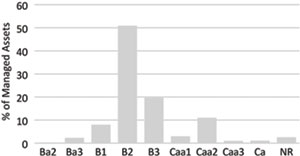
As of June 30, 2019, the Fund held 86.5% of its Managed Assets in Secured Loans and 12.1% in high yield bonds. BGX’s investments represented the obligations of 283 companies, with an average position size representing 0.30% of Managed Assets of the Fund. Electronics/electric, healthcare, and business equipment & services represented the Fund’s top sector weightings.3
| 1 | Average discount and peer group per Morningstar. |
| 2 | Industries per Bloomberg classifications. |
| 3 | Industries per S&P classifications. |
| Blackstone / GSO Long-Short Credit Income Fund | Fund Summary |
June 30, 2019 (Unaudited)
BGX’s Portfolio Composition*
| * | Numbers may not sum to 100.00% due to rounding. The Fund’s Cash and Other represents net cash and other assets and liabilities, which includes amounts payable for investments purchased but not yet settled and amounts receivable for investments sold but not yet settled. At period end, the amounts payable for investments purchased but not yet settled exceeded the amount of cash on hand. The Fund uses sales proceeds or funds from its leverage program to settle amounts payable for investments purchased, but such amounts are not reflected in the Fund’s net cash. |
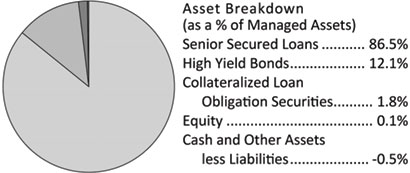
BGX’s Moody’s Rating Distribution*
| * | For more information on Moody's ratings and descriptions refer to www.moodys.com. |
Portfolio Characteristics
| Average All-In Rate | 7.28% |
| Current Dividend Yield^ | 9.33% |
| Effective Duration^^ | 0.48 yr |
| Average Position* | 0.30% |
| Leverage* | 39.14% |
| ^ | Using current dividend rate of $0.122/share and market price/share as of 6/30/2019. |
| ^^ | Loan durations are based on the actual remaining time until LIBOR is reset for each individual loan. |
| * | As a percentage of Managed Assets. |
Top 10 Issuers*
| Quest Software US Holdings, Inc. | 1.6% |
| Ivanti Software, Inc. | 1.5% |
| Advantage Sales & Marketing, Inc. | 1.2% |
| Avantor, Inc. | 1.1% |
| Allied Universal Holdco LLC | 1.1% |
| KUEHG Corp | 1.1% |
| York Risk Services Holding Corp. | 1.1% |
| Asurion LLC | 1.0% |
| Carestream Health, Inc. | 1.0% |
| GI Revelation Acquisition LLC | 1.0% |
| Top 10 Issuer | 11.7% |
| * | As a percentage of Managed Assets. |
Portfolio holdings and distributions are subject to change and are not recommendations to buy or sell any security.
Top 5 Industries*^
| Electronics/Electric | 17.6% |
| Healthcare | 16.1% |
| Business Equipment & Services | 14.5% |
| Building & Development | 6.6% |
| Telecommunications | 3.6% |
| Top 5 Industries | 58.4% |
| * | As a percentage of Managed Assets. |
| ^ | S&P Industry Classification Schema. |
BGX Total Return
| | 6 Month | 1 Year | 3 Year† | 5 Year† | Since Inception† |
| NAV* | 6.22%** | 3.88% | 8.90% | 5.28% | 5.99% |
| Market Price* | 18.56% | 6.27% | 12.68% | 6.39% | 5.18% |
| 70% S&P LLI / 30% Barclays HYI | 6.99% | 5.02% | 5.93% | 4.08% | 4.94% |
| * | Assumes distributions are reinvested pursuant to the Fund’s dividend reinvestment plan. Performance data quoted represents past performance and does not guarantee future results. |
| ** | Excludes adjustments in accordance with accounting principles generally accepted in the United States of America and as such, the net asset value and total return for shareholder transactions reported to the market at period ended June 30, 2019 may differ from the net asset value for financial reporting purposes. |
| Semi-Annual Report | June 30, 2019 | 7 |
| Blackstone / GSO Strategic Credit Fund | Fund Summary |
June 30, 2019 (Unaudited)
Blackstone / GSO Strategic Credit Fund
Fund Overview
Blackstone / GSO Strategic Credit Fund (“BGB” or herein, the “Fund”) is a closed-end term fund that trades on the New York Stock Exchange under the symbol “BGB”. BGB’s primary investment objective is to seek high current income, with a secondary objective to seek preservation of capital, consistent with its primary goal of high current income. BGB invests primarily in a diversified portfolio of loans and other fixed income instruments of predominantly U.S. corporate issuers, including first- and second-lien loans (“Senior Secured Loans”) and high yield corporate bonds of varying maturities. BGB must hold no less than 80% of its Managed Assets in credit investments comprising corporate fixed income instruments and other investments (including derivatives) with similar economic characteristics. The Fund has a limited term and will dissolve on or about September 15, 2027, absent shareholder approval to extend such term.
Portfolio Management Commentary
Fund Performance
BGB outperformed a composite weighting of the S&P LLI and the Barclays HYI (75% loans, 25% high yield bonds) on a NAV per share basis for the periods of three years, five years, and the life of the Fund since inception and underperformed its benchmark for the six month and one year periods. On a market share per price basis, the Fund outperformed its benchmark for the periods of six months, three years, and five years and underperformed its benchmark for the periods of one year and since inception. The shares of the Fund traded at an average discount to NAV of 8.1% for the six months ended June 30, 2019, compared to its peer group average discount of 9.4% over the same time.1
NAV Performance Factors
The Fund’s underperformance relative to its benchmark in the first half of 2019 was partially attributable to an underweight allocation to larger tranche loans, which rallied in January after underperforming in late 4Q 2018 due to heavy selling by loan mutual funds to meet historic redemptions. During the first half of 2019, loans in the benchmark with tranches of $1.0 billion or greater (approximately 24% of the Fund and 44% of the benchmark) returned +6.3% compared to a return of +4.9% for loans below $1.0 billion (approximately 62% of the Fund and 31% of the benchmark). Credit selection within single-B rated loans, which represented approximately 69% of the Fund during the period, also negatively impacted performance, as single-B loans held by the Fund returned approximately +5.1% compared to approximately +5.7% for single-B loans in the benchmark. The Fund’s underweight allocation to high yield, and particularly longer duration high yield, also negatively impacted performance. By issuer, the largest positive contributors to performance relative to the benchmark were York Risk Services, Calumet Specialty Products Partners, and Beacon Health, while Mood Media, Southern Graphics, and PrimeSource were the most significant detractors.
Portfolio Activity and Positioning
Over the first six months of 2019, the Fund focused on taking advantage of new issuance while net reducing its allocation to certain higher beta/stressed loans. On a sector basis, the Fund reduced its allocation to basic materials and consumer discretionary while increasing exposure to information technology.2 The Fund continues to seek to opportunistically take advantage of strong technicals to pare higher risk names where the portfolio managers believe inadequate levels of compensation are being offered relative to the credit risk.
As of June 30, 2019, the Fund held 86.3% of its Managed Assets in Senior Secured Loans and 13.0% in high yield bonds. BGB’s investments represented the obligations of 291 companies, with an average position size representing 0.29% of Managed Assets of the Fund. Electronics/electric, business equipment & services, and healthcare represented the Fund’s top sector weightings.3
| 1 | Average discount and peer group per Morningstar. |
| 2 | Industries per Bloomberg classifications. |
| 3 | Industries per S&P classifications. |
| Blackstone / GSO Strategic Credit Fund | Fund Summary |
June 30, 2019 (Unaudited)
BGB’s Portfolio Composition*
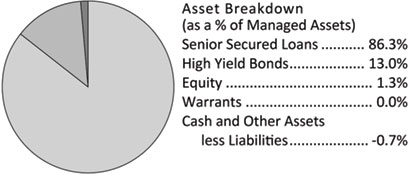
| * | Numbers may not sum to 100.00% due to rounding. The Fund’s Cash and Other represents net cash and other assets and liabilities, which includes amounts payable for investments purchased but not yet settled and amounts receivable for investments sold but not yet settled. At period end, the amounts payable for investments purchased but not yet settled exceeded the amount of cash on hand. The Fund uses sales proceeds or funds from its leverage program to settle amounts payable for investments purchased, but such amounts are not reflected in the Fund’s net cash. |
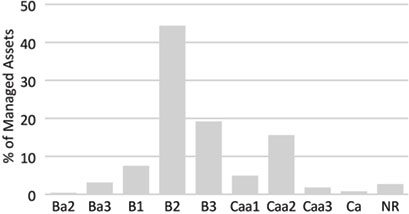
BGB’s Moody’s Rating Distribution*
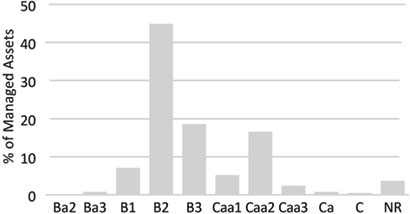
| * | For more information on Moody's ratings and descriptions refer to www.moodys.com. |
Portfolio Characteristics
| Average All-In Rate | 7.36% |
| Current Dividend Yield^ | 9.33% |
| Effective Duration^^ | 0.49 yr |
| Average Position* | 0.29% |
| Leverage* | 37.23% |
| ^ | Using current dividend rate of $0.114/share and market price/share as of 6/30/2019. |
| ^^ | Loan durations are based on the actual remaining time until LIBOR is reset for each individual loan. |
| * | As a percentage of Managed Assets. |
Top 10 Issuers*
| Quest Software US Holdings, Inc. | 1.6% |
| Advantage Sales & Marketing, Inc. | 1.3% |
| Allied Universal Holdco LLC | 1.2% |
| Priso Acquisition Corp | 1.1% |
| Ivanti Software, Inc. | 1.1% |
| GI Revelation Acquisition LLC | 1.0% |
| KUEHG Corp | 1.0% |
| York Risk Services Holding Corp. | 1.0% |
| Carestream Health, Inc. | 0.9% |
| American Bath Group LLC | 0.9% |
| Top 10 Issuer | 11.1% |
| * | As a percentage of Managed Assets. |
Portfolio holdings and distributions are subject to change and are not recommendations to buy or sell any security.
Top 5 Industries*^
| Electronics/Electric | 19.0% |
| Business Equipment & Services | 15.1% |
| Healthcare | 14.8% |
| Building & Development | 7.4% |
| Oil & Gas | 4.1% |
| Top 5 Industries | 60.4% |
| * | As a percentage of Managed Assets. |
| ^ | S&P Industry Classification Schema. |
BGB Total Return
| | 6 Month | 1 Year | 3 Year† | 5 Year† | Since Inception† |
| NAV* | 5.75%** | 2.79% | 8.10% | 4.64% | 5.41% |
| Market Price* | 13.10% | 2.90% | 10.06% | 4.98% | 3.76% |
| 75% S&P LLI / 25% Barclays HYI | 6.79% | 4.85% | 5.81% | 4.01% | 4.62% |
| * | Assumes distributions are reinvested pursuant to the Fund’s dividend reinvestment plan. Performance data quoted represents past performance and does not guarantee future results. |
| ** | Excludes adjustments in accordance with accounting principles generally accepted in the United States of America and as such, the net asset value and total return for shareholder transactions reported to the market at period ended June 30, 2019 may differ from the net asset value for financial reporting purposes. |
| Semi-Annual Report | June 30, 2019 | 9 |
| Blackstone / GSO Senior Floating Rate Term Fund | Portfolio of Investments |
June 30, 2019 (Unaudited)
| | | Principal
Amount | | | Value | |
| | | | | |
| FLOATING RATE LOAN INTERESTS(a) - 143.28% | | | | | | | | |
| Aerospace & Defense - 2.87% | | | | | | | | |
| Nordam Group LLC, First Lien Initial Term Loan, 3M US L + 5.50%, 04/09/2026(b) | | $ | 1,755,600 | | | $ | 1,757,794 | |
| Propulsion Acquisition LLC, First Lien Initial Term Loan, 1M US L + 6.00%, 07/13/2021(b) | | | 2,132,624 | | | | 2,111,298 | |
| Vectra Co., First Lien Initial Term Loan: | | | | | | | | |
| 1M US L + 3.25%, 03/10/2025 | | | 1,182,090 | | | | 1,140,350 | |
| 1M US L + 7.25%, 03/08/2026(b) | | | 1,000,000 | | | | 967,500 | |
| WP CPP Holdings LLC, First Lien Initial Term Loan, 3M US L + 3.75%, 04/30/2025 | | | 1,368,125 | | | | 1,368,125 | |
| | | | | | | | 7,345,067 | |
| | | | | | | | | |
| Air Transport - 0.73% | | | | | | | | |
| Air Medical Group Holdings, Inc., First Lien 2018 New Term Loan, 1M US L + 4.25%, 03/14/2025 | | | 1,970,000 | | | | 1,857,218 | |
| | | | | | | | | |
| Automotive - 1.36% | | | | | | | | |
| Bright Bidco B.V., First Lien 2018 Refinancing B Term Loan, 3M US L + 3.50%, 06/30/2024 | | | 79,886 | | | | 57,019 | |
| Midas Intermediate Holdco II LLC, First Lien 2017 Refinancing Term Loan, 3M US L + 2.75%, 08/18/2021 | | | 436,641 | | | | 424,634 | |
| Panther BF Aggregator 2 L P, First Lien Initial Dollar Term Loan, 1M US L + 3.50%, 04/30/2026 | | | 1,760,000 | | | | 1,749,554 | |
| Superior Industries International, Inc., First Lien Replacement Term Loan, 1M US L + 4.00%, 05/22/2024(b) | | | 1,313,970 | | | | 1,254,841 | |
| | | | | | | | 3,486,048 | |
| | | | | | | | | |
| Brokers, Dealers & Investment Houses - 0.90% | | | | | | | | |
| Deerfield Dakota Holding LLC, First Lien Initial Term Loan, 1M US L + 3.25%, 02/13/2025 | | | 875,567 | | | | 850,863 | |
| Edelman Financial Center LLC, Second Lien Initial Term Loan, 1M US L + 6.75%, 06/26/2026 | | | 676,923 | | | | 682,000 | |
| Newport Group Holdings II, Inc., First Lien Initial Term Loan, 3M US L + 3.75%, 09/12/2025 | | | 766,700 | | | | 760,470 | |
| | | | | | | | 2,293,333 | |
| | | | | | | | | |
| Building & Development - 8.71% | | | | | | | | |
| American Bath Group LLC, Second Lien Term Loan: | | | | | | | | |
| 3M US L + 4.25%, 09/30/2023 | | | 3,199,873 | | | | 3,181,874 | |
| 3M US L + 9.75%, 09/30/2024(b) | | | 250,000 | | | | 250,000 | |
| CPG International LLC, First Lien New Term Loan, 6M US L + 3.75%, 05/06/2024 | | | 289,630 | | | | 285,285 | |
| Dayton Superior Corp., First Lien Borrowing Term Loan, 3M US L + 8.00%, 11/03/2021 | | | 1,357,907 | | | | 1,127,063 | |
| Forterra Finance LLC, First Lien Replacement Term Loan, 1M US L + 3.00%, 10/25/2023 | | | 3,029,958 | | | | 2,804,817 | |
| Hillman Group, Inc., First Lien Initial Term Loan, 1M US L + 4.00%, 05/30/2025 | | | 3,269,729 | | | | 3,153,245 | |
| Interior Logic Group Holdings IV LLC, First Lien Initial Term Loan, 3M US L + 4.00%, 05/30/2025 | | | 2,382,000 | | | | 2,355,203 | |
| LBM Borrower LLC, First Lien Tranche C Term Loan, 1M US L + 3.75%, 08/20/2022 | | | 4,131,931 | | | | 4,132,364 | |
| Ply Gem Midco, Inc., First Lien Initial Term Loan, 3M US L + 3.75%, 04/12/2025 | | | 1,368,735 | | | | 1,333,949 | |
| SIWF Holdings, Inc., First Lien Initial Term Loan, 1M US L + 4.25%, 06/15/2025(b) | | | 871,200 | | | | 865,755 | |
| SRS Distribution, Inc., First Lien Initial Term Loan, 1M US L + 3.25%, 05/23/2025 | | | 2,886,000 | | | | 2,774,168 | |
| | | | | | | | 22,263,723 | |
| | | | | | | | | |
| Business Equipment & Services - 22.46% | | | | | | | | |
| Access CIG LLC, First Lien B Term Loan: | | | | | | | | |
| 3M US L + 3.75%, 02/27/2025 | | | 888,402 | | | | 885,351 | |
| 1M US L + 7.75%, 02/27/2026 | | | 119,565 | | | | 119,117 | |
| Advantage Sales & Marketing, Inc., First Lien Initial Term Loan: | | | | | | | | |
| 3M US L + 3.25%, 07/23/2021 | | | 955,500 | | | | 874,402 | |
| 3M US L + 3.25%, 07/23/2021 | | | 1,033,088 | | | | 948,117 | |
| 3M US L + 6.50%, 07/25/2022 | | | 3,248,461 | | | | 2,586,603 | |
| Blackstone / GSO Senior Floating Rate Term Fund | Portfolio of Investments |
June 30, 2019 (Unaudited)
| | | | | |
| | | Principal
Amount | | | Value | |
| | | | | |
| Business Equipment & Services (continued) | | | | | | | | |
| Allied Universal Holdco LLC, First Lien Incremental Term Loan: | | | | | | | | |
| 1M US L + 4.25%, 07/28/2022 | | $ | 1,397,234 | | | $ | 1,397,458 | |
| 3M US L + 4.25%, 06/26/2026(b) | | | 1,401,261 | | | | 1,397,758 | |
| 3M US L + 4.25%, 06/26/2026(b) | | | 138,739 | | | | 138,392 | |
| APFS Staffing Holdings, Inc., First Lien Initial Term Loan, 1M US L + 5.00%, 04/15/2026 | | | 2,000,000 | | | | 1,981,250 | |
| AqGen Ascensus, Inc., First Lien Replacement Term Loan, 6M US L + 4.00%, 12/05/2022 | | | 1,755,671 | | | | 1,761,166 | |
| BMC Acquisition, Inc., First Lien Initial Term Loan, 3M US L + 5.25%, 12/28/2024 | | | 861,875 | | | | 861,875 | |
| Capri Acquisitions BidCo, Ltd., First Lien Initial Dollar Term Loan, 3M US L + 3.25%, 11/01/2024 | | | 2,165,486 | | | | 2,128,673 | |
| Cast & Crew Payroll LLC, First Lien Initial Term Loan, 1M US L + 4.00%, 02/09/2026 | | | 400,010 | | | | 402,410 | |
| DG Investment Intermediate Holdings 2, Inc., First Lien Initial Term Loan: | | | | | | | | |
| 1M US L + 3.00%, 02/03/2025(b) | | | 335,259 | | | | 324,782 | |
| 1M US L + 6.75%, 02/02/2026(b) | | | 465,517 | | | | 453,880 | |
| Dun & Bradstreet Corp., First Lien Initial Borrowing Term Loan, 1M US L + 5.00%, 02/06/2026 | | | 1,506,306 | | | | 1,508,664 | |
| Epicor Software Corp., First Lien B Term Loan, 1M US L + 3.25%, 06/01/2022 | | | 997,802 | | | | 992,813 | |
| GI Revelation Acquisition LLC, First Lien Initial Term Loan: | | | | | | | | |
| 1M US L + 5.00%, 04/16/2025 | | | 2,020,382 | | | | 2,005,229 | |
| 1M US L + 9.00%, 04/16/2026 | | | 2,200,000 | | | | 2,117,500 | |
| Informatica LLC, First Lien Dollar B-1 Term Loan, 1M US L + 3.25%, 08/05/2022 | | | 203,306 | | | | 203,730 | |
| Inmar, Inc., First Lien Initial Term Loan: | | | | | | | | |
| 3M US L + 4.00%, 05/01/2024 | | | 392,766 | | | | 372,539 | |
| 3M US L + 8.00%, 05/01/2025 | | | 1,183,432 | | | | 1,112,426 | |
| KUEHG Corp., Second Lien Tranche B Term Loan: | | | | | | | | |
| 3M US L + 3.75%, 02/21/2025 | | | 1,633,302 | | | | 1,629,799 | |
| 3M US L + 8.25%, 08/15/2025 | | | 2,250,000 | | | | 2,247,187 | |
| LD Intermediate Holdings, Inc., First Lien Initial Term Loan, 3M US L + 5.875%, 12/09/2022 | | | 1,963,405 | | | | 1,953,597 | |
| LegalZoom.com, Inc., First Lien 2018 Term Loan, 1M US L + 4.50%, 11/21/2024 | | | 1,876,286 | | | | 1,889,194 | |
| Minotaur Acquisition, Inc., First Lien B Term Loan, 1M US L + 5.00%, 02/27/2026 | | | 1,688,077 | | | | 1,664,157 | |
| Mitchell International, Inc., First Lien Initial Term Loan: | | | | | | | | |
| 1M US L + 3.25%, 11/29/2024 | | | 2,076,935 | | | | 1,987,555 | |
| 1M US L + 7.25%, 12/01/2025 | | | 690,909 | | | | 671,045 | |
| National Intergovernmental Purchasing Alliance Co., First Lien Initial Term Loan: | | | | | | | | |
| 3M US L + 3.75%, 05/19/2025 | | | 2,032,549 | | | | 2,007,153 | |
| 3M US L + 7.50%, 05/22/2026(b) | | | 1,540,000 | | | | 1,509,200 | |
| PricewaterhouseCoopers Public Sector LLP, Second Lien Initial Term Loan, 1M US L + 7.50%, 05/01/2026(b) | | | 440,000 | | | | 437,800 | |
| Project Boost Purchaser LLC, First Lien B Term Loan, 3M US L + 3.50%, 06/01/2026 | | | 636,364 | | | | 634,505 | |
| PT Intermediate Holdings III LLC, First Lien B Term Loan, 3M US L + 4.00%, 12/04/2024 | | | 3,903,563 | | | | 3,783,216 | |
| RevSpring, Inc., First Lien Initial Term Loan, 1M US L + 4.25%, 10/11/2025 | | | 1,313,400 | | | | 1,312,172 | |
| Sedgwick Holdings, Inc., First Lien Initial Term Loan, 1M US L + 3.25%, 12/31/2025 | | | 1,452,608 | | | | 1,434,836 | |
| SurveyMonkey, Inc., First Lien Term Loan, 1W US L + 3.75%, 10/10/2025(b) | | | 2,571,782 | | | | 2,573,325 | |
| ThoughtWorks, Inc., First Lien Replacement Term Loan, 1M US L + 4.00%, 10/11/2024 | | | 1,937,641 | | | | 1,940,073 | |
| TRC Cos., Inc., First Lien Initial Term Loan, 1M US L + 3.50%, 06/21/2024 | | | 1,925,232 | | | | 1,921,622 | |
| Trugreen LP, First Lien Initial Refinancing Term Loan, 1M US L + 3.75%, 03/19/2026 | | | 85,938 | | | | 86,260 | |
| Weld North Education LLC, First Lien Initial Term Loan, 3M US L + 4.25%, 02/07/2025(b) | | | 3,160,000 | | | | 3,160,000 | |
| | | | | | | | 57,416,831 | |
| | | | | | | | | |
| Cable & Satellite Television - 0.29% | | | | | | | | |
| Radiate Holdco LLC, First Lien Amendment No. 2 Incremental Term Loan, 3M US L + 3.50%, 02/01/2024 | | | 735,000 | | | | 728,455 | |
| | | | | | | | | |
| Chemical & Plastics - 3.36% | | | | | | | | |
| Composite Resins Holding B.V., First Lien Initial Term Loan, 3M US L + 4.25%, 06/27/2025 | | | 2,613,600 | | | | 2,593,998 | |
| Semi-Annual Report | June 30, 2019 | 11 |
| Blackstone / GSO Senior Floating Rate Term Fund | Portfolio of Investments |
June 30, 2019 (Unaudited)
| | | Principal
Amount | | | Value | |
| | | | | |
| Chemical & Plastics (continued) | | | | | | | | |
| Emerald Performance Materials LLC, First Lien Initial Term Loan, 1M US L + 3.50%, 08/02/2021 | | $ | 1,935,543 | | | $ | 1,931,111 | |
| Spectrum Holdings III Corp., First Lien Closing Date Term Loan: | | | | | | | | |
| 1M US L + 3.25%, 01/31/2025 | | | 290,791 | | | | 275,524 | |
| 1M US L + 7.00%, 01/31/2026(b) | | | 600,000 | | | | 552,000 | |
| Starfruit Finco B.V., First Lien Initial Dollar Term Loan, 1M US L + 3.25%, 10/01/2025 | | | 1,843,149 | | | | 1,818,958 | |
| Vantage Specialty Chemicals, Inc., First Lien Closing Date Term Loan: | | | | | | | | |
| 1M US L + 3.50%, 10/20/2024 | | | 726,473 | | | | 718,300 | |
| 3M US L + 8.25%, 10/27/2025(b) | | | 725,111 | | | | 692,481 | |
| | | | | | | | 8,582,372 | |
| | | | | | | | | |
| Conglomerates - 0.64% | | | | | | | | |
| American Residential Services LLC, First Lien Term Loan, 1M US L + 4.00%, 06/30/2021 | | | 387,654 | | | | 383,453 | |
| Output Services Group, Inc., First Lien B Term Loan, 1M US L + 4.25%, 03/26/2024(b) | | | 525,076 | | | | 475,194 | |
| Spring Education Group, Inc., First Lien Initial Term Loan, 3M US L + 4.25%, 07/30/2025 | | | 779,961 | | | | 776,389 | |
| | | | | | | | 1,635,036 | |
| | | | | | | | | |
| Containers & Glass Products - 2.93% | | | | | | | | |
| Charter NEX US, Inc., First Lien Third Amendment Incremental Term Loan, 1M US L + 3.50%, 05/16/2024 | | | 237,500 | | | | 237,174 | |
| Flex Acquisition Co., Inc., First Lien Incremental B-2018 Term Loan, 3M US L + 3.25%, 06/29/2025 | | | 1,288,408 | | | | 1,226,056 | |
| Goodpack, Ltd., Second Lien Tranche B-1 Term Loan, 3M US L + 7.00%, 09/11/2024(b) | | | 620,110 | | | | 610,808 | |
| IBC Capital I, Ltd., First Lien Tranche B-1 Term Loan, 3M US L + 3.75%, 09/11/2023 | | | 1,086,250 | | | | 1,085,348 | |
| Loparex International BV, First Lien B Term Loan, 1M US L + 4.25%, 04/11/2025(b) | | | 612,063 | | | | 612,063 | |
| Pregis Holding I Corp., First Lien Term Loan, 3M US L + 3.50%, 05/20/2021 | | | 809,663 | | | | 810,505 | |
| ProAmpac PG Borrower LLC, First Lien Initial Term Loan: | | | | | | | | |
| 3M US L + 3.50%, 11/20/2023 | | | 584,750 | | | | 561,544 | |
| 3M US L + 8.50%, 11/18/2024 | | | 488,038 | | | | 466,686 | |
| Strategic Materials Holding Corp., First Lien Initial Term Loan: | | | | | | | | |
| 3M US L + 3.75%, 11/01/2024(b) | | | 545,538 | | | | 493,712 | |
| 3M US L + 7.75%, 10/27/2025(b) | | | 1,400,000 | | | | 1,022,000 | |
| Trident TPI Holdings, Inc., First Lien Tranche B-1 Term Loan, 1M US L + 3.25%, 10/04/2024 | | | 380,175 | | | | 360,931 | |
| | | | | | | | 7,486,827 | |
| | | | | | | | | |
| Diversified Insurance - 2.14% | | | | | | | | |
| Acrisure LLC, First Lien 2017-2 Refinancing Term Loan: | | | | | | | | |
| 3M US L + 4.25%, 11/22/2023 | | | 1,469,987 | | | | 1,466,011 | |
| 3M US L + 3.75%, 11/22/2023 | | | 611,798 | | | | 608,228 | |
| BroadStreet Partners, Inc., First Lien Tranche B-2 Term Loan, 1M US L + 3.25%, 11/08/2023 | | | 27,687 | | | | 27,657 | |
| CP VI Bella Midco LLC, First Lien Initial Term Loan: | | | | | | | | |
| 1M US L + 2.75%, 01/24/2025 | | | 415,547 | | | | 404,639 | |
| 1M US L + 6.75%, 12/28/2025 | | | 385,714 | | | | 378,964 | |
| Genworth Holdings, Inc., First Lien Initial Term Loan, 2M US L + 4.50%, 03/07/2023 | | | 378,783 | | | | 382,809 | |
| York Risk Services Holding Corp., First Lien Term Loan, 1M US L + 3.75%, 10/01/2021 | | | 2,322,763 | | | | 2,202,269 | |
| | | | | | | | 5,470,577 | |
| | | | | | | | | |
| Drugs - 1.84% | | | | | | | | |
| Albany Molecular Research, Inc., Second Lien Initial Term Loan, 1M US L + 7.00%, 08/28/2025 | | | 392,857 | | | | 393,594 | |
| Arbor Pharmaceuticals LLC, First Lien Initial Term Loan, 3M US L + 5.00%, 07/05/2023 | | | 1,555,346 | | | | 1,455,548 | |
| Avantor Funding, Inc., First Lien Initial B-2 Dollar Term Loan, 1M US L + 3.75%, 11/21/2024 | | | 964,509 | | | | 969,635 | |
| Blackstone / GSO Senior Floating Rate Term Fund | Portfolio of Investments |
June 30, 2019 (Unaudited)
| | | Principal
Amount | | | Value | |
| | | | | |
| Drugs (continued) | | | | | | | | |
| Packaging Coordinators Midco, Inc., First Lien Initial Term Loan, 1M US L + 4.00%, 06/30/2023 | | $ | 1,890,363 | | | $ | 1,896,866 | |
| | | | | | | | 4,715,643 | |
| | | | | | | | | |
| Ecological Services & Equipment - 0.89% | | | | | | | | |
| Emerald 3 Limited, 3M US L + 7.00%, 05/31/2022(b) | | | 636,109 | | | | 636,109 | |
| EnergySolutions LLC, First Lien Initial Term Loan, 3M US L + 3.75%, 05/09/2025 | | | 926,815 | | | | 889,742 | |
| ERM Emerald US, Inc., First Lien Term Loan, 3M US L + 3.75%, 06/26/2026(b) | | | 346,392 | | | | 347,258 | |
| Tunnel Hill Partners LP, First Lien Initial Term Loan, 1M US L + 3.50%, 02/06/2026 | | | 407,827 | | | | 407,572 | |
| | | | | | | | 2,280,681 | |
| | | | | | | | | |
| Electronics/Electrical - 28.80% | | | | | | | | |
| AppLovin Corp., First Lien Initial Term Loan, 1M US L + 3.50%, 08/15/2025 | | | 405,136 | | | | 405,138 | |
| Boxer Parent Co., Inc., First Lien Initial Dollar Term Loan, 3M US L + 4.25%, 10/02/2025 | | | 3,283,500 | | | | 3,115,221 | |
| Brave Parent Holdings, Inc., First Lien Initial Term Loan, 3M US L + 4.00%, 04/18/2025 | | | 873,383 | | | | 867,383 | |
| CommerceHub, Inc., First Lien Initial Term Loan, 1M US L + 3.75%, 05/21/2025(b) | | | 1,262,250 | | | | 1,249,628 | |
| Compuware Corp., First Lien Term Loan, 1M US L + 3.50%, 08/23/2025 | | | 354,930 | | | | 354,930 | |
| ConvergeOne Holdings, Corp., First Lien Initial Term Loan, 1M US L + 5.00%, 01/04/2026 | | | 2,194,500 | | | | 2,093,004 | |
| CPI International, Inc., Second Lien Initial Term Loan, 1M US L + 7.25%, 07/25/2025(b) | | | 313,725 | | | | 301,177 | |
| Curvature, Inc., First Lien Initial Term Loan, 1M US L + 5.00%, 10/30/2023 | | | 3,846,812 | | | | 2,681,766 | |
| DigiCert, Inc., First Lien Term Loan, 1M US L + 4.00%, 09/20/2024 | | | 2,540,989 | | | | 2,535,437 | |
| DiscoverOrg LLC, First Lien Initial Term Loan, 1M US L + 4.50%, 02/02/2026 | | | 1,828,750 | | | | 1,824,178 | |
| Dynatrace LLC, Second Lien Term Loan, 1M US L + 7.00%, 08/24/2026 | | | 558,159 | | | | 563,043 | |
| ECi Macola/MAX Holding LLC, First Lien Initial Term Loan, 3M US L + 4.25%, 09/27/2024 | | | 671,577 | | | | 671,577 | |
| Ellie Mae, Inc., First Lien Term Loan, 3M US L + 4.00%, 04/17/2026 | | | 3,520,000 | | | | 3,514,122 | |
| Flexera Software LLC, First Lien Initial Term Loan: | | | | | | | | |
| 1M US L + 3.50%, 01/24/2025 | | | 227,012 | | | | 226,658 | |
| 1M US L + 7.25%, 02/26/2026 | | | 773,145 | | | | 772,422 | |
| Gigamon, Inc., First Lien Initial Term Loan, 1M US L + 4.25%, 12/27/2024(b) | | | 1,884,203 | | | | 1,837,098 | |
| Help/Systems Holdings, Inc., First Lien Term Loan, 3M US L + 3.75%, 03/28/2025 | | | 1,169,291 | | | | 1,161,983 | |
| Hyland Software, Inc., Second Lien Initial Term Loan, 1M US L + 7.00%, 05/31/2025 | | | 573,341 | | | | 577,403 | |
| Idera, Inc., First Lien Initial Term Loan, 1M US L + 4.50%, 06/28/2024 | | | 1,897,253 | | | | 1,898,040 | |
| Imperva, Inc., First Lien Term Loan: | | | | | | | | |
| 1M US L + 4.00%, 01/12/2026 | | | 1,200,000 | | | | 1,195,878 | |
| 1M US L + 7.75%, 01/11/2027 | | | 1,035,294 | | | | 1,022,353 | |
| Ivanti Software, Inc., First Lien Term Loan: | | | | | | | | |
| 1M US L + 4.25%, 01/19/2024 | | | 2,072,824 | | | | 2,070,668 | |
| 1M US L + 9.00%, 01/20/2025 | | | 2,000,000 | | | | 1,981,000 | |
| MACOM Technology Solutions Holdings, Inc., First Lien Initial Term Loan, 1M US L + 2.25%, 05/17/2024 | | | 1,645,802 | | | | 1,478,136 | |
| McAfee LLC, First Lien B USD Term Loan, 1M US L + 3.75%, 09/30/2024 | | | 2,647,471 | | | | 2,647,881 | |
| MH Sub I LLC, First Lien Amendment No. 2 Initial Term Loan, 1M US L + 3.75%, 08/16/2024 | | | 937,975 | | | | 923,085 | |
| MLN US HoldCo LLC, First Lien B Term Loan, 1M US L + 4.50%, 11/30/2025 | | | 1,503,011 | | | | 1,440,388 | |
| MYOB US Borrower LLC, First Lien Initial U.S. Term Loan, 1M US L + 4.00%, 04/17/2026 | | | 977,778 | | | | 980,227 | |
| Navex Topco, Inc., First Lien Initial Term Loan: | | | | | | | | |
| 1M US L + 3.25%, 09/05/2025 | | | 245,337 | | | | 240,982 | |
| 1M US L + 7.00%, 09/04/2026 | | | 1,100,000 | | | | 1,091,750 | |
| P2 Upstream Acquisition Co., First Lien Term Loan, 3M US L + 4.00%, 10/30/2020 | | | 2,687,309 | | | | 2,667,719 | |
| Park Place Technologies LLC, First Lien Initial Term Loan, 1M US L + 4.00%, 03/29/2025 | | | 1,963,929 | | | | 1,954,110 | |
| Perforce Software, Inc., First Lien B Term Loan, 3M US L + 4.50%, 06/12/2026 | | | 423,387 | | | | 423,387 | |
| Ping Identity Corp., First Lien Term Loan, 1M US L + 3.75%, 01/24/2025 | | | 554,400 | | | | 553,707 | |
| Project Alpha Intermediate Holding, Inc., First Lien Term Loan, 3M US L + 3.50%, 04/26/2024 | | | 3,341,274 | | | | 3,249,389 | |
| Project Angel Parent LLC, First Lien Initial Term Loan, 1M US L + 4.00%, 05/30/2025(b) | | | 1,303,582 | | | | 1,290,546 | |
| Semi-Annual Report | June 30, 2019 | 13 |
| Blackstone / GSO Senior Floating Rate Term Fund | Portfolio of Investments |
June 30, 2019 (Unaudited)
| | | Principal
Amount | | | Value | |
| | | | | |
| Electronics/Electrical (continued) | | | | | | | | |
| Project Leopard Holdings, Inc., First Lien 2018 Repricing Term Loan: | | | | | | | | |
| 6M US L + 4.50%, 07/07/2023 | | $ | 322,578 | | | $ | 322,512 | |
| 6M US L + 4.25%, 07/07/2023 | | | 379,427 | | | | 379,664 | |
| Project Silverback Holdings Corp., First Lien New Term Loan, 1M US L + 3.50%, 08/21/2024 | | | 747,254 | | | | 668,792 | |
| Quest Software US Holdings, Inc., First Lien Initial Term Loan: | | | | | | | | |
| 3M US L + 4.25%, 05/16/2025 | | | 3,262,803 | | | | 3,218,755 | |
| 3M US L + 8.25%, 05/17/2026 | | | 2,994,017 | | | | 2,954,736 | |
| Riverbed Technology, Inc., First Lien First Amendment Term Loan, 1M US L + 3.25%, 04/24/2022 | | | 991,180 | | | | 858,887 | |
| Rocket Software, Inc., First Lien Initial Term Loan, 1M US L + 4.25%, 11/28/2025 | | | 2,063,471 | | | | 2,022,202 | |
| SciQuest, Inc., First Lien Term Loan, 1M US L + 4.00%, 12/28/2024(b) | | | 2,050,962 | | | | 2,035,579 | |
| SCS Holdings I, Inc., First Lien New Tranche B Term Loan, 1M US L + 4.25%, 10/30/2022 | | | 1,170,489 | | | | 1,178,536 | |
| SonicWall US Holdings, Inc., First Lien Initial Term Loan: | | | | | | | | |
| 3M US L + 3.50%, 05/16/2025 | | | 1,323,250 | | | | 1,237,239 | |
| 3M US L + 7.50%, 05/17/2026 | | | 1,760,000 | | | | 1,625,800 | |
| Triton Solar US Acquisition Co., First Lien Initial Term Loan, 3M US L + 6.00%, 10/29/2024 | | | 253,475 | | | | 238,583 | |
| Veritas US, Inc., First Lien New Dollar B Term Loan, 1M US L + 4.50%, 01/27/2023 | | | 1,796,887 | | | | 1,640,791 | |
| Vero Parent, Inc., First Lien 2018 Refinancing Term Loan, 1M US L + 4.50%, 08/16/2024 | | | 615,070 | | | | 613,917 | |
| Web.com Group, Inc., First Lien B Term Loan: | | | | | | | | |
| 1M US L + 3.75%, 10/10/2025 | | | 1,999,087 | | | | 1,974,518 | |
| 1M US L + 7.75%, 10/09/2026 | | | 804,990 | | | | 792,915 | |
| | | | | | | | 73,624,840 | |
| | | | | | | | | |
| Equipment Leasing - 0.24% | | | | | | | | |
| CSC SW Holdco, Inc., First Lien B-1 Term Loan, 3M US L + 3.25%, 11/14/2022 | | | 620,253 | | | | 609,011 | |
| | | | | | | | | |
| Financial Intermediaries - 2.01% | | | | | | | | |
| ASP MCS Acquisition Corp., First Lien Initial Term Loan, 1M US L + 4.75%, 05/20/2024 | | | 2,747,328 | | | | 1,730,817 | |
| NorthStar Financial Services Group LLC, First Lien Initial Term Loan: | | | | | | | | |
| 2M US L + 3.25%, 05/25/2025 | | | 1,683,142 | | | | 1,670,518 | |
| 2M US L + 7.50%, 05/25/2026(b) | | | 433,744 | | | | 429,406 | |
| Victory Capital Holdings, Inc., First Lien B Term Loan, 3M US L + 3.25%, 06/07/2026 | | | 1,312,500 | | | | 1,314,961 | |
| | | | | | | | 5,145,702 | |
| | | | | | | | | |
| Food Products - 2.58% | | | | | | | | |
| Alphabet Holding Co., Inc., First Lien Initial Term Loan, 1M US L + 3.50%, 09/26/2024 | | | 2,074,368 | | | | 1,962,871 | |
| TKC Holdings, Inc., First Lien Initial Term Loan: | | | | | | | | |
| 1M US L + 3.75%, 01/31/2023 | | | 3,610,497 | | | | 3,541,662 | |
| 1M US L + 8.00%, 01/31/2024 | | | 1,105,408 | | | | 1,090,800 | |
| | | | | | | | 6,595,333 | |
| | | | | | | | | |
| Food Service - 3.84% | | | | | | | | |
| CEC Entertainment, Inc., First Lien B Term Loan, 1M US L + 3.25%, 02/15/2021 | | | 1,630,949 | | | | 1,621,775 | |
| Flynn Restaurant Group LP, First Lien Initial Term Loan, 1M US L + 3.50%, 06/27/2025 | | | 2,792,356 | | | | 2,712,956 | |
| Fogo de Chao, Inc., First Lien 2018 Refinancing Term Loan, 1M US L + 4.25%, 04/07/2025 | | | 1,878,028 | | | | 1,880,376 | |
| Quidditch Acquisition, Inc., First Lien B Term Loan, 1M US L + 7.00%, 03/21/2025(b) | | | 1,261,806 | | | | 1,274,423 | |
| Red Lobster Management LLC, First Lien Initial Term Loan, 1M US L + 5.25%, 07/28/2021 | | | 1,349,316 | | | | 1,336,673 | |
| Tacala Investment Corp., Second Lien Initial Term Loan, 1M US L + 7.00%, 01/30/2026 | | | 993,103 | | | | 1,001,793 | |
| | | | | | | | 9,827,996 | |
| Blackstone / GSO Senior Floating Rate Term Fund | Portfolio of Investments |
June 30, 2019 (Unaudited)
| | | Principal
Amount | | | Value | |
| | | | | |
| Food/Drug Retailers - 1.97% | | | | | | | | |
| EG Group, Ltd., First Lien Facility B Term Loan: | | | | | | | | |
| 3M US L + 4.00%, 01/31/2025 | | $ | 205,729 | | | $ | 202,600 | |
| 3M US L + 4.00%, 02/07/2025 | | | 4,906,197 | | | | 4,831,573 | |
| | | | | | | | 5,034,173 | |
| | | | | | | | | |
| Health Insurance - 1.46% | | | | | | | | |
| Achilles Acquisition LLC, First Lien Closing Date Term Loan, 1M US L + 4.00%, 10/13/2025 | | | 842,688 | | | | 843,741 | |
| FHC Health Systems, Inc., First Lien Initial Term Loan, 1M US L + 4.00%, 12/23/2021 | | | 2,552,420 | | | | 2,554,551 | |
| MPH Acquisition Holdings LLC, First Lien Initial Term Loan, 3M US L + 2.75%, 06/07/2023 | | | 344,433 | | | | 330,225 | |
| | | | | | | | 3,728,517 | |
| | | | | | | | | |
| Healthcare - 23.52% | | | | | | | | |
| Alvogen Pharma US, Inc., First Lien 2018 Refinancing Term Loan, 1M US L + 4.75%, 04/01/2022 | | | 2,439,350 | | | | 2,250,301 | |
| ATI Holdings Acquisition, Inc., First Lien Initial Term Loan, 1M US L + 3.50%, 05/10/2023 | | | 585,926 | | | | 578,602 | |
| BioClinica Holding I LP, First Lien Initial Term Loan: | | | | | | | | |
| 3M US L + 4.25%, 10/20/2023 | | | 1,835,781 | | | | 1,743,992 | |
| 3M US L + 8.25%, 10/04/2024 | | | 1,052,629 | | | | 933,334 | |
| Carestream Health, Inc., First Lien Extended Term Loan: | | | | | | | | |
| 1M US L + 5.75%, 02/28/2021 | | | 205,876 | | | | 199,700 | |
| 1M US L + 9.50%, 06/07/2021 | | | 2,390,930 | | | | 2,301,270 | |
| Certara Holdco, Inc., First Lien Replacement Term Loan, 3M US L + 3.50%, 08/15/2024(b) | | | 220,385 | | | | 219,283 | |
| Covenant Surgical Partners, Inc., First Lien Term Loan: | | | | | | | | |
| 3M US L + 4.00%, 06/19/2026 | | | 262,500 | | | | 261,024 | |
| 3M US L + 4.00%, 06/19/2026 | | | 1,312,500 | | | | 1,305,117 | |
| CT Technologies Intermediate Holdings, Inc., First Lien New Facility Term Loan, 1M US L + 4.25%, 12/01/2021 | | | 2,171,131 | | | | 1,856,317 | |
| Dentalcorp Health Services ULC, First Lien Initial Term Loan, 1M US L + 3.75%, 06/06/2025 | | | 1,151,192 | | | | 1,139,323 | |
| Endo Luxembourg Finance Company I S.a r.l., First Lien Initial Term Loan, 1M US L + 4.25%, 04/12/2024 | | | 771,846 | | | | 726,824 | |
| Envision Healthcare Corp., First Lien Initial Term Loan, 1M US L + 3.75%, 10/10/2025 | | | 2,287,858 | | | | 2,027,614 | |
| Equian Buyer Corp., First Lien 2018 Incremental Term Loan, 1M US L + 3.25%, 05/20/2024 | | | 1,481,329 | | | | 1,481,885 | |
| Femur Buyer, Inc., First Lien Initial Term Loan, 3M US L + 4.25%, 03/05/2026 | | | 668,800 | | | | 671,726 | |
| Greenway Health LLC, First Lien Term Loan, 3M US L + 3.75%, 02/16/2024 | | | 1,351,724 | | | | 1,199,655 | |
| Heartland Dental LLC, First Lien Initial Term Loan: | | | | | | | | |
| 3M US L + 4.50%, 04/30/2025(b) | | | 492,188 | | | | 483,574 | |
| 1M US L + 3.75%, 04/30/2025 | | | 2,970,453 | | | | 2,821,945 | |
| Lanai Holdings II, Inc., First Lien Initial Term Loan, 3M US L + 4.75%, 08/29/2022 | | | 2,234,217 | | | | 2,144,848 | |
| LifeScan Global Corp., First Lien Initial Term Loan, 3M US L + 6.00%, 10/01/2024 | | | 3,184,500 | | | | 3,049,159 | |
| Maravai Intermediate Holdings LLC, First Lien Initial Term Loan, 1M US L + 4.25%, 08/02/2025(b) | | | 1,003,706 | | | | 1,003,706 | |
| Navicure, Inc., First Lien Initial Term Loan, 1M US L + 3.75%, 11/01/2024 | | | 2,044,518 | | | | 2,033,018 | |
| Netsmart Technologies, Inc., First Lien D-1 Term Loan, 1M US L + 3.75%, 04/19/2023 | | | 3,694,639 | | | | 3,664,620 | |
| NMSC Holdings, Inc., First Lien Initial Term Loan, 1M US L + 5.00%, 04/19/2023(b) | | | 237,362 | | | | 237,955 | |
| nThrive, Inc., First Lien Additional B-2 Term Loan, 1M US L + 4.50%, 10/20/2022 | | | 3,524,427 | | | | 3,343,800 | |
| NVA Holdings, Inc., First Lien B-3 Term Loan: | | | | | | | | |
| 1M US L + 2.75%, 02/02/2025 | | | 698,903 | | | | 698,610 | |
| 1M US L + 3.50%, 02/02/2025 | | | 660,000 | | | | 660,775 | |
| Onex TSG Holdings II Corp., First Lien Initial Term Loan, 1M US L + 4.00%, 07/29/2022 | | | 1,196,887 | | | | 1,195,391 | |
| PAREXEL International Corp., First Lien Initial Term Loan, 1M US L + 2.75%, 09/27/2024 | | | 1,040,487 | | | | 999,242 | |
| Pearl Intermediate Parent LLC, First Lien Initial Term Loan: | | | | | | | | |
| 1M US L + 2.75%, 01/31/2025(c) | | | 130,615 | | | | 126,452 | |
| 1M US L + 2.75%, 01/31/2025 | | | 579,823 | | | | 561,341 | |
| PetVet Care Centers LLC, First Lien 2018 Term Loan, 1M US L + 3.25%, 02/14/2025 | | | 656,692 | | | | 644,789 | |
| Phoenix Guarantor, Inc., First Lien Initial Term Loan, 1M US L + 4.50%, 03/05/2026 | | | 3,152,866 | | | | 3,143,802 | |
| Semi-Annual Report | June 30, 2019 | 15 |
| Blackstone / GSO Senior Floating Rate Term Fund | Portfolio of Investments |
June 30, 2019 (Unaudited)
| | | Principal
Amount | | | Value | |
| | | | | | | |
| Healthcare (continued) | | | | | | | | |
| Press Ganey Holdings, Inc., Second Lien Initial Term Loan, 1M US L + 6.50%, 10/21/2024 | | $ | 408,582 | | | $ | 410,453 | |
| Project Ruby Ultimate Parent Corp., First Lien New Term Loan, 1M US L + 3.50%, 02/09/2024 | | | 801,618 | | | | 797,943 | |
| Prospect Medical Holdings, Inc., First Lien B-1 Term Loan, 1M US L + 5.50%, 02/16/2024 | | | 2,566,500 | | | | 2,429,616 | |
| Regionalcare Hospital Partners Holdings, Inc., First Lien B Term Loan, 1M US L + 4.50%, 11/16/2025 | | | 1,962,665 | | | | 1,954,421 | |
| Surgery Center Holdings, Inc., First Lien Initial Term Loan, 1M US L + 3.25%, 09/02/2024 | | | 139,669 | | | | 135,246 | |
| Team Health Holdings, Inc., First Lien Initial Term Loan, 1M US L + 2.75%, 02/06/2024 | | | 992,386 | | | | 881,363 | |
| U.S. Anesthesia Partners, Inc., First Lien Initial Term Loan, 1M US L + 3.00%, 06/23/2024 | | | 274,909 | | | | 269,869 | |
| Verscend Holding Corp., First Lien B Term Loan, 1M US L + 4.50%, 08/27/2025 | | | 1,364,688 | | | | 1,368,318 | |
| Viant Medical Holdings, Inc., First Lien Initial Term Loan, 3M US L + 3.75%, 07/02/2025 | | | 412,298 | | | | 411,609 | |
| Vyaire Medical, Inc., First Lien Term Loan, 3M US L + 4.75%, 04/16/2025(b) | | | 3,267,000 | | | | 2,956,635 | |
| YI LLC, First Lien Initial Term Loan, 3M US L + 4.00%, 11/06/2024(b) | | | 1,398,527 | | | | 1,396,779 | |
| Zest Acquisition Corp., Second Lien Initial Term Loan, 1M US L + 7.50%, 03/06/2026(b) | | | 1,500,000 | | | | 1,413,750 | |
| | | | | | | | 60,134,996 | |
| | | | | | | | | |
| Home Furnishings - 1.19% | | | | | | | | |
| AI Aqua Merger Sub, Inc., First Lien Tranche B-1 Term Loan: | | | | | | | | |
| 1M US L + 3.25%, 12/13/2023 | | | 945,600 | | | | 914,868 | |
| 1M US L + 3.25%, 12/13/2023 | | | 1,299,921 | | | | 1,260,923 | |
| Hayward Industries, Inc., First Lien Initial Term Loan, 1M US L + 3.50%, 08/05/2024 | | | 111,614 | | | | 109,521 | |
| Serta Simmons Bedding LLC, Second Lien Initial Term Loan, 1M US L + 8.00%, 11/08/2024 | | | 1,645,600 | | | | 747,102 | |
| | | | | | | | 3,032,414 | |
| | | | | | | | | |
| Industrial Equipment - 4.97% | | | | | | | | |
| AI Alpine AT BidCo GmbH, First Lien Facility B Term Loan, 1M US L + 3.25%, 10/31/2025(b) | | | 295,595 | | | | 291,531 | |
| Apex Tool Group LLC, First Lien Second Amendment Term Loan, 1M US L + 3.75%, 02/01/2022 | | | 2,138,705 | | | | 2,062,075 | |
| Engineered Machinery Holdings, Inc., First Lien Initial Term Loan, 3M US L + 3.25%, 07/19/2024(b) | | | 1,479,470 | | | | 1,442,483 | |
| Helix Acquisition Holdings, Inc., First Lien 2018 New Term Loan, 3M US L + 3.75%, 09/30/2024 | | | 1,414,722 | | | | 1,388,196 | |
| Justrite Safety Group: | | | | | | | | |
| 3M US L + 4.50%, 06/26/2026(b) | | | 115,652 | | | | 115,508 | |
| 3M US L + 4.50%, 06/26/2026(b) | | | 948,348 | | | | 947,162 | |
| LTI Holdings, Inc., First Lien Initial Term Loan: | | | | | | | | |
| 1M US L + 3.50%, 09/06/2025 | | | 721,818 | | | | 684,150 | |
| 1M US L + 6.75%, 09/07/2026 | | | 468,085 | | | | 436,021 | |
| Robertshaw US Holding Corp., First Lien Initial Term Loan, 1M US L + 3.50%, 02/28/2025(b) | | | 1,387,397 | | | | 1,283,343 | |
| Tailwind Smith Cooper Intermediate Corp., First Lien Initial Term Loan, 3M US L + 5.00%, 05/28/2026 | | | 1,540,000 | | | | 1,512,088 | |
| Titan Acquisition, Ltd., First Lien Initial Term Loan, 1M US L + 3.00%, 03/28/2025 | | | 2,651,713 | | | | 2,538,644 | |
| | | | | | | | 12,701,201 | |
| | | | | | | | | |
| Insurance - 1.07% | | | | | | | | |
| APCO Holdings LLC, First Lien Initial Term Loan, 1M US L + 5.50%, 06/06/2025 | | | 1,605,852 | | | | 1,609,867 | |
| HIG Finance 2, Ltd., First Lien Initial Dollar Term Loan, 1M US L + 3.50%, 12/13/2024 | | | 236,323 | | | | 236,257 | |
| Outcomes Group Holdings, Inc., Second Lien Term Loan: | | | | | | | | |
| 3M US L + 3.50%, 10/24/2025 | | | 477,600 | | | | 472,227 | |
| 3M US L + 7.50%, 10/26/2026 | | | 423,077 | | | | 420,962 | |
| | | | | | | | 2,739,313 | |
| | | | | | | | | |
| Leisure Goods/Activities/Movies - 2.61% | | | | | | | | |
| Recess Holdings, Inc., First Lien Initial Term Loan, 3M US L + 3.75%, 09/30/2024 | | | 1,963,819 | | | | 1,931,298 | |
| Travel Leaders Group LLC, First Lien 2018 Refinancing Term Loan, 1M US L + 4.00%, 01/25/2024 | | | 578,611 | | | | 580,538 | |
| Blackstone / GSO Senior Floating Rate Term Fund | Portfolio of Investments |
June 30, 2019 (Unaudited)
| | | Principal
Amount | | | Value | |
| | | | | | | |
| Leisure Goods/Activities/Movies (continued) | | | | | | | | |
| Travelport Finance S.à r.l., First Lien Initial Term Loan, 3M US L + 5.00%, 05/29/2026 | | $ | 2,640,000 | | | $ | 2,490,668 | |
| UFC Holdings LLC, First Lien 2019 Term Loan, 1M US L + 3.25%, 04/29/2026 | | | 411,832 | | | | 411,574 | |
| United PF Holdings LLC, First Lien Term Loan: | | | | | | | | |
| 1M US L + 4.50%, 06/10/2026 | | | 1,068,273 | | | | 1,070,944 | |
| 1M US L + 8.50%, 06/10/2027(b) | | | 198,649 | | | | 197,159 | |
| | | | | | | | 6,682,181 | |
| | | | | | | | | |
| Lodging & Casinos - 0.66% | | | | | | | | |
| Casablanca US Holdings, Inc., First Lien Amendment No. 2 Initial Term Loan, 3M US L + 4.00%, 03/29/2024(b) | | | 1,738,000 | | | | 1,694,550 | |
| | | | | | | | | |
| Nonferrous Metals/Minerals - 1.32% | | | | | | | | |
| Aleris International, Inc., First Lien Initial Term Loan, 1M US L + 4.75%, 02/27/2023 | | | 1,752,414 | | | | 1,756,795 | |
| American Rock Salt Co. LLC, First Lien Initial Term Loan, 1M US L + 3.75%, 03/21/2025 | | | 972,454 | | | | 972,454 | |
| Murray Energy Corp., First Lien Superpriority B-2 Term Loan, 3M US L + 7.25%, 10/17/2022 | | | 967,856 | | | | 654,111 | |
| | | | | | | | 3,383,360 | |
| | | | | | | | | |
| Oil & Gas - 3.92% | | | | | | | | |
| Ascent Resources - Marcellus LLC, First Lien Initial Term Loan, 1M US L + 6.50%, 03/30/2023(b) | | | 246,914 | | | | 244,444 | |
| Equitrans Midstream Corp., First Lien Holdco B Facility Term Loan, 1M US L + 4.50%, 01/31/2024 | | | 739,527 | | | | 745,691 | |
| Keane Group Holdings LLC, First Lien Initial Term Loan, 1M US L + 3.75%, 05/26/2025 | | | 1,306,800 | | | | 1,292,641 | |
| Lower Cadence Holdings LLC, First Lien Initial Term Loan, 1M US L + 4.00%, 05/22/2026 | | | 1,346,939 | | | | 1,342,171 | |
| Lucid Energy Group II Borrower LLC, First Lien Initial Term Loan, 1M US L + 3.00%, 01/31/2025 | | | 400,594 | | | | 383,571 | |
| Petroleum GEO-Services ASA, First Lien Extended Term Loan, 3M US L + 2.50%, 03/19/2021 | | | 1,638,530 | | | | 1,580,010 | |
| Sheridan Investment Partners I LLC, First Lien Tranche B-2 Term Loan, 3M US L + 3.50%, 10/01/2019 | | | 2,772,674 | | | | 1,982,462 | |
| Sheridan Production Partners I LLC, First Lien Deferred Principal Term Loan: | | | | | | | | |
| 3M US L + 0.00%, 10/01/2019(b) | | | 14,516 | | | | 10,282 | |
| 3M US L + 0.00%, 10/01/2019(b) | | | 109,547 | | | | 77,592 | |
| 3M US L + 0.00%, 10/01/2019(b) | | | 8,866 | | | | 6,280 | |
| Sheridan Production Partners I-A LP, First Lien Tranche B-2 Term Loan, 3M US L + 3.50%, 10/01/2019 | | | 367,402 | | | | 262,692 | |
| Sheridan Production Partners I-M LP, First Lien Tranche B-2 Term Loan, 3M US L + 3.50%, 10/01/2019 | | | 224,411 | | | | 160,454 | |
| UTEX Industries, Inc., First Lien Initial Term Loan, 1M US L + 4.00%, 05/21/2021 | | | 2,047,216 | | | | 1,924,383 | |
| | | | | | | | 10,012,673 | |
| | | | | | | | | |
| Property & Casualty Insurance - 1.48% | | | | | | | | |
| Applied Systems, Inc., First Lien Closing Date Term Loan, 3M US L + 3.00%, 09/19/2024 | | | 171,108 | | | | 169,931 | |
| Asurion LLC, Second Lien Replacement B-2 Term Loan, 1M US L + 6.50%, 08/04/2025 | | | 1,910,526 | | | | 1,941,381 | |
| Confie Seguros Holding II Co., First Lien B Term Loan, 3M US L + 4.75%, 04/19/2022 | | | 1,687,293 | | | | 1,664,793 | |
| | | | | | | | 3,776,105 | |
| | | | | | | | | |
| Publishing - 1.57% | | | | | | | | |
| Champ Acquisition Corp., First Lien Initial Term Loan, 3M US L + 5.50%, 12/19/2025 | | | 1,633,582 | | | | 1,617,246 | |
| Recorded Books, Inc., First Lien Initial Term Loan, 3M US L + 4.50%, 08/29/2025 | | | 957,675 | | | | 960,673 | |
| Southern Graphics, Inc., Second Lien Initial Term Loan: | | | | | | | | |
| 2M US L + 3.25%, 12/31/2022 | | | 406,509 | | | | 341,216 | |
| 2M US L + 7.50%, 12/31/2023(b) | | | 1,500,000 | | | | 1,095,000 | |
| | | | | | | | 4,014,135 | |
| Semi-Annual Report | June 30, 2019 | 17 |
| Blackstone / GSO Senior Floating Rate Term Fund | Portfolio of Investments |
June 30, 2019 (Unaudited)
| | | Principal
Amount | | | Value | |
| | | | | | | |
| Radio & Television - 1.12% | | | | | | | | |
| iHeartCommunications, Inc., First Lien Initial Term Loan, 3M US L + 4.00%, 05/01/2026 | | $ | 2,500,000 | | | $ | 2,506,062 | |
| William Morris Endeavor Entertainment LLC, First Lien B-1 Term Loan, 1M US L + 2.75%, 05/18/2025 | | | 355,272 | | | | 344,318 | |
| | | | | | | | 2,850,380 | |
| | | | | | | | | |
| Retailers (except food & drug) - 1.96% | | | | | | | | |
| Academy, Ltd., First Lien Initial Term Loan, 1M US L + 4.00%, 07/01/2022 | | | 657,704 | | | | 472,231 | |
| Apro LLC, First Lien Initial Term Loan, 1M US L + 4.00%, 08/08/2024 | | | 784,407 | | | | 787,839 | |
| Ascena Retail Group, Inc., First Lien Tranche B Term Loan, 1M US L + 4.50%, 08/19/2022 | | | 1,094,008 | | | | 719,764 | |
| FBB Holdings III, Inc., First Lien Initial Term Loan: | | | | | | | | |
| 3M US L + 9.00%, 02/07/2024(b) | | | 185,648 | | | | 176,366 | |
| 3M US L + 7.00%, 01/31/2025(b) | | | 63,008 | | | | 43,476 | |
| Neiman Marcus Group, Ltd. LLC, First Lien Cash Pay/PIK Extended Term Loan, 1M US L + 6.50%, 10/25/2023 | | | 989,450 | | | | 868,242 | |
| Petco Animal Supplies, Inc., First Lien Term Loan, 3M US L + 3.25%, 01/26/2023 | | | 647,325 | | | | 504,105 | |
| Spencer Spirit Holding/Gift, First Lien Initial Term Loan, 3M US L + 6.00%, 06/19/2026 | | | 1,470,000 | | | | 1,441,217 | |
| Sports Authority, Inc., First Lien B Term Loan, 3M US L + 6.00%, 11/16/2017(b)(d) | | | 4,296,916 | | | | 8,594 | |
| | | | | | | | 5,021,834 | |
| | | | | | | | | |
| Steel - 0.84% | | | | | | | | |
| Can Am Construction, Inc., First Lien Closing Date Term Loan, 1M US L + 5.00%, 07/01/2024(b) | | | 1,858,138 | | | | 1,802,394 | |
| Phoenix Services International LLC, First Lien B Term Loan, 1M US L + 3.75%, 03/01/2025 | | | 359,370 | | | | 356,225 | |
| | | | | | | | 2,158,619 | |
| | | | | | | | | |
| Surface Transport - 1.17% | | | | | | | | |
| Drive Chassis Holdco LLC, Second Lien B Term Loan, 3M US L + 8.25%, 04/10/2026 | | | 2,200,000 | | | | 2,120,250 | |
| SMB Shipping Logistics LLC, First Lien Term Loan, 3M US L + 4.00%, 02/05/2024 | | | 867,883 | | | | 863,544 | |
| | | | | | | | 2,983,794 | |
| | | | | | | | | |
| Telecommunications - 3.37% | | | | | | | | |
| Alorica, Inc., First Lien New B Term Loan, 1M US L + 3.75%, 06/30/2022 | | | 842,907 | | | | 815,513 | |
| Avaya, Inc., First Lien Tranche B Term Loan, 1M US L + 4.25%, 12/15/2024 | | | 992,443 | | | | 951,505 | |
| Cyxtera DC Holdings, Inc., Second Lien Initial Term Loan, 1M US L + 7.25%, 05/01/2025 | | | 300,751 | | | | 263,481 | |
| Ensono LP, First Lien Term Loan, 1M US L + 5.25%, 06/27/2025 | | | 1,235,324 | | | | 1,234,169 | |
| Masergy Holdings, Inc., Second Lien Initial Term Loan: | | | | | | | | |
| 3M US L + 3.25%, 12/15/2023 | | | 717,695 | | | | 707,826 | |
| 3M US L + 7.50%, 12/16/2024 | | | 588,972 | | | | 580,138 | |
| Peak 10 Holding Corp., First Lien Initial Term Loan: | | | | | | | | |
| 3M US L + 3.50%, 08/01/2024 | | | 1,071,818 | | | | 987,418 | |
| 3M US L + 7.25%, 08/01/2025 | | | 1,157,143 | | | | 975,616 | |
| Securus Technologies Holdings, Inc., First Lien Initial Term Loan, 3M US L + 4.50%, 11/01/2024 | | | 167,870 | | | | 156,679 | |
| Vertiv Group Corp., First Lien B Term Loan, 3M US L + 4.00%, 11/30/2023 | | | 2,040,638 | | | | 1,943,707 | |
| | | | | | | | 8,616,052 | |
| | | | | | | | | |
| Utilities - 2.49% | | | | | | | | |
| Brookfield WEC Holdings, Inc., Second Lien Initial Term Loan: | | | | | | | | |
| 3M US L + 3.50%, 08/01/2025(b) | | | 675,234 | | | | 675,234 | |
| 1M US L + 6.75%, 08/03/2026 | | | 274,143 | | | | 278,128 | |
| Eastern Power LLC, First Lien Term Loan, 1M US L + 3.75%, 10/02/2023 | | | 572,205 | | | | 572,442 | |
| Granite Acquisition, Inc., First Lien C Term Loan, 3M US L + 3.50%, 12/20/2021 | | | 62,857 | | | | 62,987 | |
| Green Energy Partners/Stonewall LLC, First Lien B-1 Conversion Advances Term Loan, 3M US L + 5.50%, 11/13/2021 | | | 491,250 | | | | 481,425 | |
| Blackstone / GSO Senior Floating Rate Term Fund | Portfolio of Investments |
June 30, 2019 (Unaudited)
| | | Principal
Amount | | | Value | |
| | | | | | | |
| Utilities (continued) | | | | | | | | |
| Moxie Liberty LLC, First Lien Construction B-1 Advance Term Loan, 3M US L + 6.50%, 08/21/2020 | | $ | 2,369,712 | | | $ | 2,142,622 | |
| Moxie Patriot LLC, First Lien Construction B-1 Advances Term Loan, 3M US L + 5.75%, 12/19/2020 | | | 1,369,580 | | | | 1,316,508 | |
| Southeast PowerGen LLC, First Lien B Advance Term Loan, 1M US L + 3.50%, 12/02/2021 | | | 862,830 | | | | 836,945 | |
| | | | | | | | 6,366,291 | |
| | | | | | | | | |
| TOTAL FLOATING RATE LOAN INTERESTS | | | | | | | | |
| (Cost $380,341,426) | | | | | | | 366,295,281 | |
| | | | | | | | | |
| COLLATERALIZED LOAN OBLIGATION SECURITIES(a)- 1.52% | | | | | | | | |
| Structured Finance Obligations - 1.52% | | | | | | | | |
| Babson CLO, Ltd. 2015-I 3M US L + 5.50%, 01/20/2031(b)(e) | | | 875,000 | | | | 776,726 | |
| Carlyle Global Market Strategies CLO 2016-2, Ltd. 3M US L + 5.17%, 07/15/2027(b)(e) | | | 1,000,000 | | | | 979,294 | |
| Dryden 40 Senior Loan Fund 3M US L + 5.75%, 08/15/2031(b)(e) | | | 800,000 | | | | 760,150 | |
| Highbridge Loan Management 6-2015, Ltd. 3M US L + 5.10%, 02/05/2031(b)(e) | | | 834,000 | | | | 764,827 | |
| Neuberger Berman Loan Advisers CLO 27, Ltd. 3M US L + 5.20%, 01/15/2030(b)(e) | | | 667,000 | | | | 609,339 | |
| | | | | | | | 3,890,336 | |
| | | | | | | | | |
| TOTAL COLLATERALIZED LOAN OBLIGATION SECURITIES | | | | | | | | |
| (Cost $4,152,939) | | | | | | | 3,890,336 | |
| | | | | | | | | |
| CORPORATE BONDS - 4.32% | | | | | | | | |
| Automotive - 0.28% | | | | | | | | |
| IAA, Inc. 5.500%, 06/15/2027(e) | | | 181,000 | | | | 188,693 | |
| Midas Intermediate Holdco II LLC / Midas Intermediate Holdco II Finance, Inc. 7.875%, 10/01/2022(e) | | | 550,000 | | | | 525,250 | |
| | | | | | | | 713,943 | |
| | | | | | | | | |
| Building & Development - 0.30% | | | | | | | | |
| Builders FirstSource, Inc. 6.750%, 06/01/2027(e) | | | 157,000 | | | | 166,420 | |
| NWH Escrow Corp. 7.500%, 08/01/2021(e) | | | 1,000,000 | | | | 610,000 | |
| | | | | | | | 776,420 | |
| | | | | | | | | |
| Business Equipment & Services - 0.55% | | | | | | | | |
| Allied Universal Holdco LLC 6.625%, 07/15/2026(e) | | | 1,370,000 | | | | 1,395,687 | |
| | | | | | | | | |
| Chemical & Plastics - 0.24% | | | | | | | | |
| Starfruit Finco BV / Starfruit US Holdco LLC 8.000%, 10/01/2026(e) | | | 595,000 | | | | 614,338 | |
| | | | | | | | | |
| Containers & Glass Products - 0.13% | | | | | | | | |
| ARD Securities Finance SARL 8.750%, 01/31/2023(e)(f) | | | 327,432 | | | | 331,525 | |
| | | | | | | | | |
| Ecological Services & Equipment - 0.87% | | | | | | | | |
| GFL Environmental, Inc.: | | | | | | | | |
| 5.375%, 03/01/2023(e) | | | 1,325,000 | | | | 1,318,375 | |
| 8.500%, 05/01/2027(e) | | | 843,000 | | | | 909,386 | |
| | | | | | | | 2,227,761 | |
| | | | | | | | | |
| Electronics/Electrical - 0.36% | | | | | | | | |
| Riverbed Technology, Inc. 8.875%, 03/01/2023(e) | | | 1,385,000 | | | | 931,413 | |
| | | | | | | | | |
| Healthcare - 0.93% | | | | | | | | |
| Envision Healthcare Corp. 8.750%, 10/15/2026(e) | | | 2,292,000 | | | | 1,598,670 | |
| Semi-Annual Report | June 30, 2019 | 19 |
| Blackstone / GSO Senior Floating Rate Term Fund | Portfolio of Investments |
June 30, 2019 (Unaudited)
| | | Principal
Amount | | | Value | |
| | | | | | | |
| Healthcare (continued) | | | | | | | | |
| Team Health Holdings, Inc. 6.375%, 02/01/2025(e) | | $ | 1,000,000 | | | $ | 770,000 | |
| | | | | | | | 2,368,670 | |
| | | | | | | | | |
| Property & Casualty Insurance - 0.14% | | | | | | | | |
| GTCR AP Finance, Inc. 8.000%, 05/15/2027(e) | | | 350,000 | | | | 352,625 | |
| | | | | | | | | |
| Publishing - 0.15% | | | | | | | | |
| McGraw-Hill Global Education Holdings LLC / McGraw-Hill Global Education Finance 7.875%, 05/15/2024(e) | | | 420,000 | | | | 390,600 | |
| | | | | | | | | |
| Radio & Television - 0.17% | | | | | | | | |
| Entercom Media Corp. 6.500%, 05/01/2027(e) | | | 123,000 | | | | 128,227 | |
| Univision Communications, Inc. 5.125%, 05/15/2023(e) | | | 300,000 | | | | 294,750 | |
| | | | | | | | 422,977 | |
| | | | | | | | | |
| Telecommunications - 0.20% | | | | | | | | |
| Sprint Communications, Inc. 6.000%, 11/15/2022 | | | 500,000 | | | | 522,500 | |
| | | | | | | | | |
| TOTAL CORPORATE BONDS | | | | | | | | |
| (Cost $12,418,785) | | | | | | | 11,048,459 | |
| | | Shares | | | | |
| COMMON STOCK - 0.18% | | | | | | | | |
| Oil & Gas - 0.18% | | | | | | | | |
| Ascent Resources - Equity(b)(g) | | | 177,384 | | | | 465,633 | |
| Templar Energy LLC(b)(g) | | | 72,786 | | | | – | |
| | | | | | | | 465,633 | |
| | | | | | | | | |
| TOTAL COMMON STOCK | | | | | | | | |
| (Cost $3,533,965) | | | | | | | 465,633 | |
| | | | | | | | | |
| PREFERRED STOCK - 0.00% | | | | | | | | |
| Oil & Gas - 0.00% | | | | | | | | |
| Templar Energy LLC(b)(g) | | | 48,248 | | | | – | |
| | | | | | | | | |
| TOTAL PREFERRED STOCK | | | | | | | | |
| (Cost $482,483) | | | | | | | – | |
| | | | | | | | | |
| WARRANTS - 0.00%(h) | | | | | | | | |
| Oil & Gas - 0.00% | | | | | | | | |
| Ascent Resources Marcellus LLC expires 3/30/2023 at $6.15(b)(g) | | | 45,926 | | | | 1,378 | |
| | | | | | | | | |
| TOTAL WARRANTS | | | | | | | | |
| (Cost $5,013) | | | | | | | 1,378 | |
| Blackstone / GSO Senior Floating Rate Term Fund | Portfolio of Investments |
June 30, 2019 (Unaudited)
| | | Value | |
| Total Investments - 149.31% | | | | |
| (Cost $400,934,611) | | $ | 381,701,087 | |
| | | | | |
| Other Assets in Excess of Liabilities - 0.37% | | | 947,481 | |
| | | | | |
| Leverage Facility - (49.68)% | | | (127,000,000 | ) |
| | | | | |
| Net Assets - 100.00% | | $ | 255,648,568 | |
Amounts above are shown as a percentage of net assets as of June 30, 2019.
Investment Abbreviations:
LIBOR - London Interbank Offered Rate
PIK - Payment In Kind
Libor Rates:
1W US L - 1 Week LIBOR as of June 30, 2019 was 2.37%
1M US L - 1 Month LIBOR as of June 30, 2019 was 2.40%
2M US L - 2 Month LIBOR as of June 30, 2019 was 2.33%
3M US L - 3 Month LIBOR as of June 30, 2019 was 2.32%
6M US L - 6 Month LIBOR as of June 30, 2019 was 2.20%
| (a) | Floating or variable rate security. The reference rate is described above. The rate in effect as of June 30, 2019 is based on the reference rate plus the displayed spread as of the security's last reset date. |
| (b) | Level 3 assets valued using significant unobservable inputs as a result of unavailable quoted prices from an active market or the unavailability of other significant observable inputs. |
| (c) | A portion of this position was not funded as of June 30, 2019. The Portfolio of Investments records only the funded portion of each position. As of June 30, 2019, the Fund has unfunded delayed draw loans in the amount of $336,063. Fair value of these unfunded delayed draw loans was $323,976. |
| (d) | Security is in default as of period end and is therefore non-income producing. |
| (e) | Security exempt from registration under Rule 144A of the Securities Act of 1933. Total market value of Rule 144A securities amounts to $14,416,295, which represented approximately 5.64% of net assets as of June 30, 2019. Such securities may normally be sold to qualified institutional buyers in transactions exempt from registration. |
| (f) | Option to convert to pay-in-kind security. |
| (g) | Non-income producing security. |
| (h) | Amount represents less than 0.005% of net assets. |
See Notes to Financial Statements.
| Semi-Annual Report | June 30, 2019 | 21 |
| Blackstone / GSO Long-Short Credit Income Fund | Portfolio of Investments |
June 30, 2019 (Unaudited)
| | | Principal Amount | | | Value | |
| FLOATING RATE LOAN INTERESTS(a) - 142.18% | | | | | | | | |
| Aerospace & Defense - 2.91% | | | | | | | | |
| Nordam Group LLC, First Lien Initial Term Loan, 3M US L + 5.50%, 04/09/2026(b) | | $ | 1,436,400 | | | $ | 1,438,196 | |
| Propulsion Acquisition LLC, First Lien Initial Term Loan, 1M US L + 6.00%, 07/13/2021(b) | | | 1,865,762 | | | | 1,847,104 | |
| Vectra Co., First Lien Initial Term Loan: | | | | | | | | |
| 1M US L + 3.25%, 03/10/2025 | | | 886,567 | | | | 855,262 | |
| 1M US L + 7.25%, 03/08/2026(b) | | | 666,667 | | | | 645,000 | |
| WP CPP Holdings LLC, First Lien Initial Term Loan, 3M US L + 3.75%, 04/30/2025 | | | 1,116,563 | | | | 1,116,563 | |
| | | | | | | | 5,902,125 | |
| | | | | | | | | |
| Air Transport - 1.13% | | | | | | | | |
| Air Medical Group Holdings, Inc., First Lien 2018 New Term Loan: | | | | | | | | |
| 1M US L + 3.25%, 04/28/2022 | | | 469,469 | | | | 443,481 | |
| 1M US L + 4.25%, 03/14/2025 | | | 1,970,000 | | | | 1,857,218 | |
| | | | | | | | 2,300,699 | |
| | | | | | | | | |
| Automotive - 0.58% | | | | | | | | |
| Midas Intermediate Holdco II LLC, First Lien 2017 Refinancing Term Loan, 3M US L + 2.75%, 08/18/2021 | | | 357,252 | | | | 347,428 | |
| Superior Industries International, Inc., First Lien Replacement Term Loan, 1M US L + 4.00%, 05/22/2024(b) | | | 875,980 | | | | 836,561 | |
| | | | | | | | 1,183,989 | |
| | | | | | | | | |
| Beverage & Tobacco - 0.23% | | | | | | | | |
| Winebow Holdings, Inc., Second Lien Term Loan, 1M US L + 7.50%, 01/02/2022(b) | | | 693,642 | | | | 464,740 | |
| | | | | | | | | |
| Brokers, Dealers & Investment Houses - 0.92% | | | | | | | | |
| Deerfield Dakota Holding LLC, First Lien Initial Term Loan, 1M US L + 3.25%, 02/13/2025 | | | 716,373 | | | | 696,161 | |
| Edelman Financial Center LLC, Second Lien Initial Term Loan, 1M US L + 6.75%, 06/26/2026 | | | 553,846 | | | | 558,000 | |
| Newport Group Holdings II, Inc., First Lien Initial Term Loan, 3M US L + 3.75%, 09/12/2025 | | | 626,622 | | | | 621,530 | |
| | | | | | | | 1,875,691 | |
| | | | | | | | | |
| Building & Development - 8.62% | | | | | | | | |
| American Bath Group LLC, Second Lien Term Loan: | | | | | | | | |
| 3M US L + 4.25%, 09/30/2023 | | | 2,674,792 | | | | 2,659,747 | |
| 3M US L + 9.75%, 09/30/2024(b) | | | 150,000 | | | | 150,000 | |
| CPG International LLC, First Lien New Term Loan, 6M US L + 3.75%, 05/06/2024 | | | 236,970 | | | | 233,415 | |
| Dayton Superior Corp., First Lien Borrowing Term Loan, 3M US L + 8.00%, 11/03/2021 | | | 1,018,430 | | | | 845,297 | |
| Forest City Enterprises LP, First Lien Initial Term Loan, 1M US L + 4.00%, 12/08/2025 | | | 470,040 | | | | 472,586 | |
| Forterra Finance LLC, First Lien Replacement Term Loan, 1M US L + 3.00%, 10/25/2023 | | | 2,646,611 | | | | 2,449,955 | |
| Hillman Group, Inc., First Lien Initial Term Loan, 1M US L + 4.00%, 05/30/2025 | | | 2,675,233 | | | | 2,579,928 | |
| Interior Logic Group Holdings IV LLC, First Lien Initial Term Loan, 3M US L + 4.00%, 05/30/2025 | | | 1,948,909 | | | | 1,926,984 | |
| LBM Borrower LLC, First Lien Tranche C Term Loan, 1M US L + 3.75%, 08/20/2022 | | | 2,078,386 | | | | 2,078,604 | |
| Ply Gem Midco, Inc., First Lien Initial Term Loan, 3M US L + 3.75%, 04/12/2025 | | | 1,119,874 | | | | 1,091,413 | |
| SIWF Holdings, Inc., First Lien Initial Term Loan, 1M US L + 4.25%, 06/15/2025(b) | | | 712,800 | | | | 708,345 | |
| SRS Distribution, Inc., First Lien Initial Term Loan, 1M US L + 3.25%, 05/23/2025 | | | 2,376,269 | | | | 2,284,188 | |
| | | | | | | | 17,480,462 | |
| | | | | | | | | |
| Business Equipment & Services - 23.05% | | | | | | | | |
| Access CIG LLC, First Lien B Term Loan: | | | | | | | | |
| 3M US L + 3.75%, 02/27/2025 | | | 726,875 | | | | 724,378 | |
| 1M US L + 7.75%, 02/27/2026 | | | 97,826 | | | | 97,459 | |
| Blackstone / GSO Long-Short Credit Income Fund | Portfolio of Investments |
June 30, 2019 (Unaudited)
| | | Principal Amount | | | Value | |
| Business Equipment & Services (continued) | | | | | | | | |
| Advantage Sales & Marketing, Inc., First Lien Initial Term Loan: | | | | | | | | |
| 3M US L + 3.25%, 07/23/2021 | | $ | 743,167 | | | $ | 680,090 | |
| 3M US L + 3.25%, 07/23/2021 | | | 774,819 | | | | 711,090 | |
| 3M US L + 6.50%, 07/25/2022 | | | 3,123,849 | | | | 2,487,381 | |
| Allied Universal Holdco LLC, First Lien Initial Term Loan: | | | | | | | | |
| 1M US L + 4.25%, 07/28/2022 | | | 1,143,191 | | | | 1,143,375 | |
| 1M US L + 3.75%, 07/28/2022 | | | 1,161,000 | | | | 1,160,518 | |
| 3M US L + 4.25%, 06/26/2026(b) | | | 1,201,081 | | | | 1,198,078 | |
| 3M US L + 4.25%, 06/26/2026(b) | | | 118,919 | | | | 118,622 | |
| APFS Staffing Holdings, Inc., First Lien Initial Term Loan, 1M US L + 5.00%, 04/15/2026 | | | 1,636,364 | | | | 1,621,023 | |
| AqGen Ascensus, Inc., First Lien Replacement Term Loan, 6M US L + 4.00%, 12/05/2022 | | | 1,285,982 | | | | 1,290,007 | |
| BMC Acquisition, Inc., First Lien Initial Term Loan, 3M US L + 5.25%, 12/28/2024 | | | 646,406 | | | | 646,406 | |
| Capri Acquisitions BidCo, Ltd., First Lien Initial Dollar Term Loan, 3M US L + 3.25%, 11/01/2024 | | | 1,771,762 | | | | 1,741,642 | |
| Cast & Crew Payroll LLC, First Lien Initial Term Loan, 1M US L + 4.00%, 02/09/2026 | | | 327,281 | | | | 329,245 | |
| DG Investment Intermediate Holdings 2, Inc., First Lien Initial Term Loan: | | | | | | | | |
| 1M US L + 3.00%, 02/03/2025(b) | | | 306,609 | | | | 297,027 | |
| 1M US L + 6.75%, 02/02/2026(b) | | | 439,655 | | | | 428,664 | |
| Dun & Bradstreet Corp., First Lien Initial Borrowing Term Loan, 1M US L + 5.00%, 02/06/2026 | | | 1,232,432 | | | | 1,234,361 | |
| Epicor Software Corp., First Lien B Term Loan, 1M US L + 3.25%, 06/01/2022 | | | 565,979 | | | | 563,149 | |
| GI Revelation Acquisition LLC, First Lien Initial Term Loan: | | | | | | | | |
| 1M US L + 5.00%, 04/16/2025 | | | 1,571,474 | | | | 1,559,688 | |
| 1M US L + 9.00%, 04/16/2026 | | | 1,800,000 | | | | 1,732,500 | |
| IG Investments Holdings LLC, First Lien Refinancing Term Loan, 1M US L + 4.00%, 05/23/2025 | | | 231,195 | | | | 229,635 | |
| Informatica LLC, First Lien Dollar B-1 Term Loan, 1M US L + 3.25%, 08/05/2022 | | | 166,341 | | | | 166,688 | |
| Inmar, Inc., First Lien Initial Term Loan: | | | | | | | | |
| 3M US L + 4.00%, 05/01/2024 | | | 314,213 | | | | 298,031 | |
| 3M US L + 8.00%, 05/01/2025 | | | 946,746 | | | | 889,941 | |
| KUEHG Corp., Second Lien Tranche B Term Loan: | | | | | | | | |
| 3M US L + 3.75%, 02/21/2025 | | | 1,401,920 | | | | 1,398,913 | |
| 3M US L + 8.25%, 08/15/2025 | | | 2,198,220 | | | | 2,195,472 | |
| LD Intermediate Holdings, Inc., First Lien Initial Term Loan, 3M US L + 5.875%, 12/09/2022 | | | 1,935,054 | | | | 1,925,388 | |
| LegalZoom.com, Inc., First Lien 2018 Term Loan, 1M US L + 4.50%, 11/21/2024 | | | 1,535,143 | | | | 1,545,705 | |
| Minotaur Acquisition, Inc., First Lien B Term Loan, 1M US L + 5.00%, 02/27/2026 | | | 1,381,154 | | | | 1,361,583 | |
| Mitchell International, Inc., First Lien Initial Term Loan: | | | | | | | | |
| 1M US L + 3.25%, 11/29/2024 | | | 1,458,067 | | | | 1,395,319 | |
| 1M US L + 7.25%, 12/01/2025 | | | 460,606 | | | | 447,363 | |
| National Intergovernmental Purchasing Alliance Co., First Lien Initial Term Loan: | | | | | | | | |
| 3M US L + 3.75%, 05/19/2025 | | | 1,667,187 | | | | 1,646,355 | |
| 3M US L + 7.50%, 05/22/2026(b) | | | 1,260,000 | | | | 1,234,800 | |
| PricewaterhouseCoopers Public Sector LLP, Second Lien Initial Term Loan, 1M US L + 7.50%, 05/01/2026(b) | | | 360,000 | | | | 358,200 | |
| Project Boost Purchaser LLC, First Lien B Term Loan, 3M US L + 3.50%, 06/01/2026 | | | 520,661 | | | | 519,141 | |
| PT Intermediate Holdings III LLC, First Lien B Term Loan: | | | | | | | | |
| 3M US L + 4.00%, 12/04/2024 | | | 1,421,230 | | | | 1,377,413 | |
| 3M US L + 8.00%, 12/08/2025(b) | | | 1,260,000 | | | | 1,222,200 | |
| RevSpring, Inc., First Lien Initial Term Loan, 1M US L + 4.25%, 10/11/2025 | | | 1,074,600 | | | | 1,073,595 | |
| Sedgwick Holdings, Inc., First Lien Initial Term Loan, 1M US L + 3.25%, 12/31/2025 | | | 1,188,498 | | | | 1,173,956 | |
| SurveyMonkey, Inc., First Lien Term Loan, 1W US L + 3.75%, 10/10/2025(b) | | | 1,833,131 | | | | 1,834,231 | |
| ThoughtWorks, Inc., First Lien Replacement Term Loan, 1M US L + 4.00%, 10/11/2024 | | | 1,105,062 | | | | 1,106,449 | |
| TRC Cos., Inc., First Lien Initial Term Loan, 1M US L + 3.50%, 06/21/2024 | | | 1,173,138 | | | | 1,170,938 | |
| Trugreen LP, First Lien Initial Refinancing Term Loan, 1M US L + 3.75%, 03/19/2026 | | | 70,313 | | | | 70,576 | |
| Weld North Education LLC, First Lien Initial Term Loan, 3M US L + 4.25%, 02/07/2025(b) | | | 2,370,000 | | | | 2,370,000 | |
| | | | | | | | 46,776,595 | |
| Semi-Annual Report | June 30, 2019 | 23 |
| Blackstone / GSO Long-Short Credit Income Fund | Portfolio of Investments |
June 30, 2019 (Unaudited)
| | | Principal Amount | | | Value | |
| Cable & Satellite Television - 0.31% | | | | | | | | |
| Radiate Holdco LLC, First Lien Amendment No. 2 Incremental Term Loan, 3M US L + 3.50%, 02/01/2024 | | $ | 630,000 | | | $ | 624,390 | |
| | | | | | | | | |
| Chemical & Plastics - 3.41% | | | | | | | | |
| Composite Resins Holding B.V., First Lien Initial Term Loan, 3M US L + 4.25%, 06/27/2025 | | | 2,138,400 | | | | 2,122,362 | |
| Emerald Performance Materials LLC, Second Lien Initial Term Loan, 1M US L + 7.75%, 08/01/2022 | | | 1,500,000 | | | | 1,475,002 | |
| Spectrum Holdings III Corp., First Lien Closing Date Term Loan: | | | | | | | | |
| 1M US L + 3.25%, 01/31/2025 | | | 274,636 | | | | 260,218 | |
| 1M US L + 7.00%, 01/31/2026(b) | | | 566,667 | | | | 521,333 | |
| Starfruit Finco B.V., First Lien Initial Dollar Term Loan, 1M US L + 3.25%, 10/01/2025 | | | 1,507,416 | | | | 1,487,631 | |
| Vantage Specialty Chemicals, Inc., First Lien Closing Date Term Loan: | | | | | | | | |
| 1M US L + 3.50%, 10/20/2024 | | | 492,049 | | | | 486,514 | |
| 3M US L + 8.25%, 10/27/2025(b) | | | 588,834 | | | | 562,336 | |
| | | | | | | | 6,915,396 | |
| | | | | | | | | |
| Clothing & Textiles - 0.24% | | | | | | | | |
| Hercules Achievement, Inc., First Lien Initial Term Loan, 1M US L + 3.50%, 12/16/2024 | | | 503,776 | | | | 495,116 | |
| | | | | | | | | |
| Conglomerates - 0.64% | | | | | | | | |
| American Residential Services LLC, First Lien Term Loan, 1M US L + 4.00%, 06/30/2021 | | | 290,740 | | | | 287,590 | |
| Output Services Group, Inc., First Lien B Term Loan, 1M US L + 4.25%, 03/26/2024(b) | | | 405,884 | | | | 367,325 | |
| Spring Education Group, Inc., First Lien Initial Term Loan, 3M US L + 4.25%, 07/30/2025 | | | 638,150 | | | | 635,227 | |
| | | | | | | | 1,290,142 | |
| | | | | | | | | |
| Containers & Glass Products - 3.43% | | | | | | | | |
| Charter NEX US, Inc., First Lien Third Amendment Incremental Term Loan, 1M US L + 3.50%, 05/16/2024 | | | 194,318 | | | | 194,051 | |
| Flex Acquisition Co., Inc., First Lien Incremental B-2018 Term Loan, 3M US L + 3.25%, 06/29/2025 | | | 1,054,152 | | | | 1,003,137 | |
| Goodpack, Ltd., Second Lien Tranche B-1 Term Loan, 3M US L + 7.00%, 09/11/2024(b) | | | 507,363 | | | | 499,752 | |
| IBC Capital I, Ltd., First Lien Tranche B-1 Term Loan, 3M US L + 3.75%, 09/11/2023 | | | 888,750 | | | | 888,012 | |
| Loparex International BV, First Lien B Term Loan, 1M US L + 4.25%, 04/11/2025(b) | | | 1,573,875 | | | | 1,573,875 | |
| Pregis Holding I Corp., First Lien Term Loan, 3M US L + 3.50%, 05/20/2021 | | | 708,455 | | | | 709,192 | |
| ProAmpac PG Borrower LLC, First Lien Initial Term Loan: | | | | | | | | |
| 3M US L + 3.50%, 11/20/2023 | | | 479,447 | | | | 460,420 | |
| 3M US L + 8.50%, 11/18/2024 | | | 366,029 | | | | 350,016 | |
| Strategic Materials Holding Corp., First Lien Initial Term Loan: | | | | | | | | |
| 3M US L + 3.75%, 11/01/2024(b) | | | 328,333 | | | | 297,142 | |
| 3M US L + 7.75%, 10/27/2025(b) | | | 933,333 | | | | 681,333 | |
| Trident TPI Holdings, Inc., First Lien Tranche B-1 Term Loan, 1M US L + 3.25%, 10/04/2024 | | | 311,053 | | | | 295,307 | |
| | | | | | | | 6,952,237 | |
| | | | | | | | | |
| Diversified Insurance - 1.35% | | | | | | | | |
| Acrisure LLC, First Lien 2017-2 Refinancing Term Loan: | | | | | | | | |
| 3M US L + 4.25%, 11/22/2023 | | | 536,548 | | | | 535,097 | |
| 3M US L + 3.75%, 11/22/2023 | | | 500,562 | | | | 497,641 | |
| BroadStreet Partners, Inc., First Lien Tranche B-2 Term Loan, 1M US L + 3.25%, 11/08/2023 | | | 22,653 | | | | 22,628 | |
| CP VI Bella Midco LLC, First Lien Initial Term Loan: | | | | | | | | |
| 1M US L + 2.75%, 01/24/2025 | | | 392,461 | | | | 382,159 | |
| 1M US L + 6.75%, 12/28/2025 | | | 364,286 | | | | 357,911 | |
| Genworth Holdings, Inc., First Lien Initial Term Loan, 2M US L + 4.50%, 03/07/2023 | | | 309,913 | | | | 313,207 | |
| York Risk Services Holding Corp., First Lien Term Loan, 1M US L + 3.75%, 10/01/2021 | | | 662,129 | | | | 627,781 | |
| | | | | | | | 2,736,424 | |
| Blackstone / GSO Long-Short Credit Income Fund | Portfolio of Investments |
June 30, 2019 (Unaudited)
| | | Principal Amount | | | Value | |
| Drugs - 2.02% | | | | | | | | |
| Albany Molecular Research, Inc., Second Lien Initial Term Loan, 1M US L + 7.00%, 08/28/2025 | | $ | 294,643 | | | $ | 295,195 | |
| Arbor Pharmaceuticals LLC, First Lien Initial Term Loan, 3M US L + 5.00%, 07/05/2023 | | | 1,166,512 | | | | 1,091,662 | |
| Avantor Funding, Inc., First Lien Initial B-2 Dollar Term Loan, 1M US L + 3.75%, 11/21/2024 | | | 329,805 | | | | 331,558 | |
| Packaging Coordinators Midco, Inc., First Lien Initial Term Loan, 1M US L + 4.00%, 06/30/2023 | | | 2,366,041 | | | | 2,374,181 | |
| | | | | | | | 4,092,596 | |
| | | | | | | | | |
| Ecological Services & Equipment - 0.94% | | | | | | | | |
| Emerald 3 Limited, 3M US L + 7.00%, 05/31/2022(b) | | | 545,236 | | | | 545,236 | |
| EnergySolutions LLC, First Lien Initial Term Loan, 3M US L + 3.75%, 05/09/2025 | | | 758,303 | | | | 727,971 | |
| ERM Emerald US, Inc., First Lien Term Loan, 3M US L + 3.75%, 06/26/2026(b) | | | 296,907 | | | | 297,650 | |
| Tunnel Hill Partners LP, First Lien Initial Term Loan, 1M US L + 3.50%, 02/06/2026 | | | 333,677 | | | | 333,468 | |
| | | | | | | | 1,904,325 | |
| | | | | | | | | |
| Electronics/Electrical - 27.01% | | | | | | | | |
| AppLovin Corp., First Lien Initial Term Loan, 1M US L + 3.50%, 08/15/2025 | | | 331,475 | | | | 331,477 | |
| Boxer Parent Co., Inc., First Lien Initial Dollar Term Loan, 3M US L + 4.25%, 10/02/2025 | | | 2,686,500 | | | | 2,548,817 | |
| Brave Parent Holdings, Inc., First Lien Initial Term Loan, 3M US L + 4.00%, 04/18/2025 | | | 714,586 | | | | 709,677 | |
| CommerceHub, Inc., First Lien Initial Term Loan, 1M US L + 3.75%, 05/21/2025(b) | | | 965,250 | | | | 955,598 | |
| Compuware Corp., First Lien Term Loan, 1M US L + 3.50%, 08/23/2025 | | | 304,225 | | | | 304,225 | |
| ConvergeOne Holdings, Corp., First Lien Initial Term Loan, 1M US L + 5.00%, 01/04/2026 | | | 1,795,500 | | | | 1,712,458 | |
| CPI International, Inc., Second Lien Initial Term Loan, 1M US L + 7.25%, 07/25/2025(b) | | | 209,150 | | | | 200,784 | |
| Curvature, Inc., First Lien Initial Term Loan, 1M US L + 5.00%, 10/30/2023 | | | 3,206,952 | | | | 2,235,695 | |
| DigiCert, Inc., Second Lien Initial Term Loan, 1M US L + 8.00%, 09/19/2025 | | | 800,000 | | | | 796,000 | |
| DiscoverOrg LLC, First Lien Initial Term Loan, 1M US L + 4.50%, 02/02/2026 | | | 1,496,250 | | | | 1,492,509 | |
| Dynatrace LLC, Second Lien Term Loan, 1M US L + 7.00%, 08/24/2026 | | | 456,675 | | | | 460,671 | |
| ECi Macola/MAX Holding LLC, First Lien Initial Term Loan, 3M US L + 4.25%, 09/27/2024 | | | 514,876 | | | | 514,876 | |
| Ellie Mae, Inc., First Lien Term Loan, 3M US L + 4.00%, 04/17/2026 | | | 2,880,000 | | | | 2,875,190 | |
| Flexera Software LLC, Second Lien Initial Term Loan, 1M US L + 7.25%, 02/26/2026 | | | 705,887 | | | | 705,227 | |
| Gigamon, Inc., First Lien Initial Term Loan, 1M US L + 4.25%, 12/27/2024(b) | | | 2,175,536 | | | | 2,121,148 | |
| Help/Systems Holdings, Inc., First Lien Term Loan: | | | | | | | | |
| 3M US L + 3.75%, 03/28/2025 | | | 584,646 | | | | 580,991 | |
| 3M US L + 7.75%, 03/23/2026(b) | | | 775,862 | | | | 771,983 | |
| Hyland Software, Inc., Second Lien Initial Term Loan, 1M US L + 7.00%, 05/31/2025 | | | 497,917 | | | | 501,445 | |
| Idera, Inc., First Lien Initial Term Loan, 1M US L + 4.50%, 06/28/2024 | | | 696,890 | | | | 697,179 | |
| Imperva, Inc., First Lien Term Loan: | | | | | | | | |
| 1M US L + 4.00%, 01/12/2026 | | | 981,818 | | | | 978,446 | |
| 1M US L + 7.75%, 01/11/2027 | | | 847,059 | | | | 836,470 | |
| Ivanti Software, Inc., First Lien Term Loan: | | | | | | | | |
| 1M US L + 4.25%, 01/19/2024 | | | 2,867,155 | | | | 2,864,173 | |
| 1M US L + 9.00%, 01/20/2025 | | | 2,000,000 | | | | 1,981,000 | |
| MACOM Technology Solutions Holdings, Inc., First Lien Initial Term Loan, 1M US L + 2.25%, 05/17/2024 | | | 1,346,565 | | | | 1,209,384 | |
| McAfee LLC, First Lien B USD Term Loan, 1M US L + 3.75%, 09/30/2024 | | | 728,672 | | | | 728,786 | |
| MH Sub I LLC, First Lien Amendment No. 2 Initial Term Loan, 1M US L + 3.75%, 08/16/2024 | | | 1,406,963 | | | | 1,384,627 | |
| MLN US HoldCo LLC, First Lien B Term Loan, 1M US L + 4.50%, 11/30/2025 | | | 1,229,736 | | | | 1,178,499 | |
| MYOB US Borrower LLC, First Lien Initial U.S. Term Loan, 1M US L + 4.00%, 04/17/2026 | | | 800,000 | | | | 802,004 | |
| Navex Topco, Inc., First Lien Initial Term Loan: | | | | | | | | |
| 1M US L + 3.25%, 09/05/2025 | | | 201,236 | | | | 197,664 | |
| 1M US L + 7.00%, 09/04/2026 | | | 900,000 | | | | 893,250 | |
| Park Place Technologies LLC, First Lien Initial Term Loan, 1M US L + 4.00%, 03/29/2025 | | | 1,112,544 | | | | 1,106,981 | |
| Perforce Software, Inc., First Lien B Term Loan, 3M US L + 4.50%, 06/12/2026 | | | 362,903 | | | | 362,903 | |
| Ping Identity Corp., First Lien Term Loan, 1M US L + 3.75%, 01/24/2025 | | | 369,600 | | | | 369,138 | |
| Semi-Annual Report | June 30, 2019 | 25 |
| Blackstone / GSO Long-Short Credit Income Fund | Portfolio of Investments |
June 30, 2019 (Unaudited)
| | | Principal Amount | | | Value | |
| Electronics/Electrical (continued) | | | | | | | | |
| Project Alpha Intermediate Holding, Inc., First Lien B Term Loan, 3M US L + 4.25%, 04/26/2024 | | $ | 1,818,182 | | | $ | 1,813,636 | |
| Project Angel Parent LLC, First Lien Initial Term Loan, 1M US L + 4.00%, 05/30/2025(b) | | | 1,066,567 | | | | 1,055,902 | |
| Project Leopard Holdings, Inc., First Lien 2018 Repricing Term Loan: | | | | | | | | |
| 6M US L + 4.50%, 07/07/2023 | | | 545,854 | | | | 545,742 | |
| 6M US L + 4.25%, 07/07/2023 | | | 310,440 | | | | 310,634 | |
| Project Silverback Holdings Corp., First Lien New Term Loan, 1M US L + 3.50%, 08/21/2024 | | | 498,169 | | | | 445,861 | |
| Quest Software US Holdings, Inc., First Lien Initial Term Loan: | | | | | | | | |
| 3M US L + 4.25%, 05/16/2025 | | | 2,757,570 | | | | 2,720,343 | |
| 3M US L + 8.25%, 05/17/2026 | | | 2,607,692 | | | | 2,573,479 | |
| Rocket Software, Inc., First Lien Initial Term Loan, 1M US L + 4.25%, 11/28/2025 | | | 1,539,317 | | | | 1,508,531 | |
| SciQuest, Inc., First Lien Term Loan, 1M US L + 4.00%, 12/28/2024(b) | | | 1,367,308 | | | | 1,357,053 | |
| SCS Holdings I, Inc., First Lien New Tranche B Term Loan, 1M US L + 4.25%, 10/30/2022 | | | 780,326 | | | | 785,691 | |
| SonicWall US Holdings, Inc., First Lien Initial Term Loan: | | | | | | | | |
| 3M US L + 3.50%, 05/16/2025 | | | 1,082,659 | | | | 1,012,286 | |
| 3M US L + 7.50%, 05/17/2026 | | | 1,440,000 | | | | 1,330,200 | |
| Triton Solar US Acquisition Co., First Lien Initial Term Loan, 3M US L + 6.00%, 10/29/2024 | | | 207,389 | | | | 195,204 | |
| Veritas US, Inc., First Lien New Dollar B Term Loan, 1M US L + 4.50%, 01/27/2023 | | | 1,078,139 | | | | 984,481 | |
| Vero Parent, Inc., First Lien 2018 Refinancing Term Loan, 1M US L + 4.50%, 08/16/2024 | | | 503,239 | | | | 502,296 | |
| Web.com Group, Inc., First Lien B Term Loan: | | | | | | | | |
| 1M US L + 3.75%, 10/10/2025 | | | 1,635,616 | | | | 1,615,515 | |
| 1M US L + 7.75%, 10/09/2026 | | | 658,628 | | | | 648,749 | |
| | | | | | | | 54,814,878 | |
| | | | | | | | | |
| Financial Intermediaries - 2.28% | | | | | | | | |
| ASP MCS Acquisition Corp., First Lien Initial Term Loan, 1M US L + 4.75%, 05/20/2024 | | | 2,128,850 | | | | 1,341,176 | |
| Misys, Ltd., First Lien Dollar Term Loan, 1M US L + 3.50%, 04/26/2024 | | | 457,966 | | | | 447,028 | |
| NorthStar Financial Services Group LLC, First Lien Initial Term Loan: | | | | | | | | |
| 2M US L + 3.25%, 05/25/2025 | | | 1,377,116 | | | | 1,366,788 | |
| 2M US L + 7.50%, 05/25/2026(b) | | | 354,881 | | | | 351,332 | |
| Victory Capital Holdings, Inc., First Lien B Term Loan, 3M US L + 3.25%, 06/07/2026 | | | 1,125,000 | | | | 1,127,109 | |
| | | | | | | | 4,633,433 | |
| | | | | | | | | |
| Food Products - 1.83% | | | | | | | | |
| Alphabet Holding Co., Inc., First Lien Initial Term Loan, 1M US L + 3.50%, 09/26/2024 | | | 1,626,665 | | | | 1,539,232 | |
| TKC Holdings, Inc., First Lien Initial Term Loan: | | | | | | | | |
| 1M US L + 3.75%, 01/31/2023 | | | 1,381,955 | | | | 1,355,608 | |
| 1M US L + 8.00%, 01/31/2024 | | | 831,382 | | | | 820,395 | |
| | | | | | | | 3,715,235 | |
| | | | | | | | | |
| Food Service - 3.45% | | | | | | | | |
| Agro Merchants North America Holdings, Inc., First Lien Effective Date Term Loan, 3M US L + 3.75%, 12/06/2024(b) | | | 796,296 | | | | 793,310 | |
| CEC Entertainment, Inc., First Lien B Term Loan, 1M US L + 3.25%, 02/15/2021 | | | 980,792 | | | | 975,275 | |
| Flynn Restaurant Group LP, First Lien Initial Term Loan, 1M US L + 3.50%, 06/27/2025 | | | 2,284,655 | | | | 2,219,691 | |
| Fogo de Chao, Inc., First Lien 2018 Refinancing Term Loan, 1M US L + 4.25%, 04/07/2025 | | | 593,162 | | | | 593,904 | |
| Quidditch Acquisition, Inc., First Lien B Term Loan, 1M US L + 7.00%, 03/21/2025(b) | | | 820,174 | | | | 828,375 | |
| Red Lobster Management LLC, First Lien Initial Term Loan, 1M US L + 5.25%, 07/28/2021 | | | 649,362 | | | | 643,277 | |
| Tacala Investment Corp., Second Lien Initial Term Loan, 1M US L + 7.00%, 01/30/2026 | | | 937,931 | | | | 946,138 | |
| | | | | | | | 6,999,970 | |
| Blackstone / GSO Long-Short Credit Income Fund | Portfolio of Investments |
June 30, 2019 (Unaudited)
| | | Principal Amount | | | Value | |
| Food/Drug Retailers - 0.91% | | | | | | | | |
| EG Group, Ltd., First Lien Facility B Term Loan: | | | | | | | | |
| 3M US L + 4.00%, 01/31/2025 | | $ | 137,153 | | | $ | 135,067 | |
| 3M US L + 4.00%, 02/07/2025 | | | 1,734,628 | | | | 1,708,244 | |
| | | | | | | | 1,843,311 | |
| | | | | | | | | |
| Health Insurance - 1.60% | | | | | | | | |
| Achilles Acquisition LLC, First Lien Closing Date Term Loan, 1M US L + 4.00%, 10/13/2025 | | | 689,472 | | | | 690,334 | |
| FHC Health Systems, Inc., First Lien Initial Term Loan, 1M US L + 4.00%, 12/23/2021 | | | 2,430,753 | | | | 2,432,782 | |
| MPH Acquisition Holdings LLC, First Lien Initial Term Loan, 3M US L + 2.75%, 06/07/2023 | | | 137,773 | | | | 132,090 | |
| | | | | | | | 3,255,206 | |
| | | | | | | | | |
| Healthcare - 23.99% | | | | | | | | |
| Alvogen Pharma US, Inc., First Lien 2018 Refinancing Term Loan, 1M US L + 4.75%, 04/01/2022 | | | 2,264,056 | | | | 2,088,591 | |
| BioClinica Holding I LP, First Lien Initial Term Loan: | | | | | | | | |
| 3M US L + 4.25%, 10/20/2023 | | | 617,522 | | | | 586,645 | |
| 3M US L + 8.25%, 10/04/2024 | | | 789,474 | | | | 700,003 | |
| Carestream Health, Inc., First Lien Extended Term Loan: | | | | | | | | |
| 1M US L + 5.75%, 02/28/2021 | | | 158,257 | | | | 153,509 | |
| 1M US L + 9.50%, 06/07/2021 | | | 3,276,562 | | | | 3,153,691 | |
| Certara Holdco, Inc., First Lien Replacement Term Loan, 3M US L + 3.50%, 08/15/2024(b) | | | 158,405 | | | | 157,613 | |
| Covenant Surgical Partners, Inc., First Lien Term Loan: | | | | | | | | |
| 3M US L + 4.00%, 06/19/2026 | | | 225,000 | | | | 223,734 | |
| 3M US L + 4.00%, 06/19/2026 | | | 1,125,000 | | | | 1,118,672 | |
| CT Technologies Intermediate Holdings, Inc., First Lien New Facility Term Loan, 1M US L + 4.25%, 12/01/2021 | | | 767,852 | | | | 656,514 | |
| Dentalcorp Health Services ULC, First Lien Initial Term Loan, 1M US L + 3.75%, 06/06/2025 | | | 941,884 | | | | 932,173 | |
| Endo Luxembourg Finance Company I S.a r.l., First Lien Initial Term Loan, 1M US L + 4.25%, 04/12/2024 | | | 1,906,854 | | | | 1,795,627 | |
| Envision Healthcare Corp., First Lien Initial Term Loan, 1M US L + 3.75%, 10/10/2025 | | | 1,871,884 | | | | 1,658,957 | |
| Equian Buyer Corp., First Lien 2018 Incremental Term Loan, 1M US L + 3.25%, 05/20/2024 | | | 598,258 | | | | 598,482 | |
| Femur Buyer, Inc., First Lien Initial Term Loan, 3M US L + 4.25%, 03/05/2026 | | | 547,200 | | | | 549,594 | |
| Greenway Health LLC, First Lien Term Loan, 3M US L + 3.75%, 02/16/2024 | | | 1,351,724 | | | | 1,199,655 | |
| Heartland Dental LLC, First Lien Initial Term Loan: | | | | | | | | |
| 3M US L + 4.50%, 04/30/2025(b) | | | 421,875 | | | | 414,492 | |
| 1M US L + 3.75%, 04/30/2025 | | | 1,492,232 | | | | 1,417,628 | |
| Lanai Holdings II, Inc., First Lien Initial Term Loan, 3M US L + 4.75%, 08/29/2022 | | | 1,624,346 | | | | 1,559,372 | |
| LifeScan Global Corp., First Lien Initial Term Loan, 3M US L + 6.00%, 10/01/2024 | | | 2,605,500 | | | | 2,494,766 | |
| Maravai Intermediate Holdings LLC, First Lien Initial Term Loan, 1M US L + 4.25%, 08/02/2025(b) | | | 821,214 | | | | 821,214 | |
| Midwest Physician Administrative Services LLC, Second Lien Initial Term Loan, 1M US L + 7.00%, 08/15/2025 | | | 640,000 | | | | 627,200 | |
| Navicure, Inc., First Lien Initial Term Loan, 1M US L + 3.75%, 11/01/2024 | | | 1,411,040 | | | | 1,403,102 | |
| Netsmart Technologies, Inc., First Lien D-1 Term Loan, 1M US L + 3.75%, 04/19/2023 | | | 3,244,101 | | | | 3,217,743 | |
| NMSC Holdings, Inc., First Lien Initial Term Loan, 1M US L + 5.00%, 04/19/2023(b) | | | 203,453 | | | | 203,962 | |
| nThrive, Inc., First Lien Additional B-2 Term Loan, 1M US L + 4.50%, 10/20/2022 | | | 2,597,355 | | | | 2,464,241 | |
| NVA Holdings, Inc., First Lien B-3 Term Loan: | | | | | | | | |
| 1M US L + 2.75%, 02/02/2025 | | | 179,098 | | | | 179,023 | |
| 1M US L + 3.50%, 02/02/2025 | | | 540,000 | | | | 540,634 | |
| Onex TSG Holdings II Corp., First Lien Initial Term Loan, 1M US L + 4.00%, 07/29/2022 | | | 2,361,755 | | | | 2,358,803 | |
| PAREXEL International Corp., First Lien Initial Term Loan, 1M US L + 2.75%, 09/27/2024 | | | 851,308 | | | | 817,562 | |
| Pearl Intermediate Parent LLC, First Lien Initial Term Loan: | | | | | | | | |
| 1M US L + 2.75%, 01/31/2025(c) | | | 76,092 | | | | 73,667 | |
| 1M US L + 2.75%, 01/31/2025 | | | 337,789 | | | | 327,021 | |
| PetVet Care Centers LLC, First Lien 2018 Term Loan, 1M US L + 3.25%, 02/14/2025 | | | 537,293 | | | | 527,555 | |
| Semi-Annual Report | June 30, 2019 | 27 |
| Blackstone / GSO Long-Short Credit Income Fund | Portfolio of Investments |
June 30, 2019 (Unaudited)
| | | Principal Amount | | | Value | |
| Healthcare (continued) | | | | | | | | |
| Phoenix Guarantor, Inc., First Lien Initial Term Loan, 1M US L + 4.50%, 03/05/2026 | | $ | 2,579,618 | | | $ | 2,572,201 | |
| Press Ganey Holdings, Inc., Second Lien Initial Term Loan, 1M US L + 6.50%, 10/21/2024 | | | 306,437 | | | | 307,840 | |
| Project Ruby Ultimate Parent Corp., First Lien New Term Loan, 1M US L + 3.50%, 02/09/2024 | | | 650,510 | | | | 647,528 | |
| Prospect Medical Holdings, Inc., First Lien B-1 Term Loan, 1M US L + 5.50%, 02/16/2024 | | | 1,295,345 | | | | 1,226,258 | |
| Regionalcare Hospital Partners Holdings, Inc., First Lien B Term Loan, 1M US L + 4.50%, 11/16/2025 | | | 1,457,213 | | | | 1,451,092 | |
| Surgery Center Holdings, Inc., First Lien Initial Term Loan, 1M US L + 3.25%, 09/02/2024 | | | 114,275 | | | | 110,656 | |
| Team Health Holdings, Inc., First Lien Initial Term Loan, 1M US L + 2.75%, 02/06/2024 | | | 248,096 | | | | 220,341 | |
| U.S. Anesthesia Partners, Inc., 1M US L + 3.00%, 06/23/2024 | | | 235,636 | | | | 231,316 | |
| Verscend Holding Corp., First Lien B Term Loan, 1M US L + 4.50%, 08/27/2025 | | | 1,116,562 | | | | 1,119,533 | |
| Viant Medical Holdings, Inc., First Lien Initial Term Loan, 3M US L + 3.75%, 07/02/2025 | | | 744,375 | | | | 743,132 | |
| Vyaire Medical, Inc., First Lien Term Loan, 3M US L + 4.75%, 04/16/2025(b) | | | 2,673,000 | | | | 2,419,065 | |
| YI LLC, First Lien Initial Term Loan, 3M US L + 4.00%, 11/06/2024(b) | | | 1,398,527 | | | | 1,396,779 | |
| Zest Acquisition Corp., Second Lien Initial Term Loan, 1M US L + 7.50%, 03/06/2026(b) | | | 1,285,714 | | | | 1,211,786 | |
| | | | | | | | 48,678,972 | |
| | | | | | | | | |
| Home Furnishings - 1.12% | | | | | | | | |
| AI Aqua Merger Sub, Inc., First Lien Tranche B-1 Term Loan: | | | | | | | | |
| 1M US L + 3.25%, 12/13/2023 | | | 630,400 | | | | 609,912 | |
| 1M US L + 3.25%, 12/13/2023 | | | 1,055,628 | | | | 1,023,959 | |
| Hayward Industries, Inc., First Lien Initial Term Loan, 1M US L + 3.50%, 08/05/2024 | | | 77,717 | | | | 76,260 | |
| Serta Simmons Bedding LLC, Second Lien Initial Term Loan, 1M US L + 8.00%, 11/08/2024 | | | 1,246,702 | | | | 566,003 | |
| | | | | | | | 2,276,134 | |
| | | | | | | | | |
| Industrial Equipment - 4.75% | | | | | | | | |
| AI Alpine AT BidCo GmbH, First Lien Facility B Term Loan, 1M US L + 3.25%, 10/31/2025(b) | | | 241,850 | | | | 238,525 | |
| Apex Tool Group LLC, First Lien Second Amendment Term Loan, 1M US L + 3.75%, 02/01/2022 | | | 1,137,834 | | | | 1,097,066 | |
| Engineered Machinery Holdings, Inc., First Lien Initial Term Loan, 3M US L + 3.25%, 07/19/2024(b) | | | 1,120,930 | | | | 1,092,907 | |
| Helix Acquisition Holdings, Inc., First Lien 2018 New Term Loan, 3M US L + 3.75%, 09/30/2024 | | | 985,734 | | | | 967,252 | |
| Justrite Safety Group: | | | | | | | | |
| 3M US L + 4.50%, 06/26/2026(b) | | | 99,130 | | | | 99,007 | |
| 3M US L + 4.50%, 06/26/2026(b) | | | 812,870 | | | | 811,853 | |
| LTI Holdings, Inc., First Lien Initial Term Loan: | | | | | | | | |
| 1M US L + 3.50%, 09/06/2025 | | | 590,579 | | | | 559,759 | |
| 1M US L + 6.75%, 09/07/2026 | | | 382,979 | | | | 356,745 | |
| Robertshaw US Holding Corp., First Lien Initial Term Loan, 1M US L + 3.50%, 02/28/2025(b) | | | 1,135,143 | | | | 1,050,007 | |
| Tailwind Smith Cooper Intermediate Corp., First Lien Initial Term Loan, 3M US L + 5.00%, 05/28/2026 | | | 1,260,000 | | | | 1,237,162 | |
| Titan Acquisition, Ltd., First Lien Initial Term Loan, 1M US L + 3.00%, 03/28/2025 | | | 2,227,289 | | | | 2,132,317 | |
| | | | | | | | 9,642,600 | |
| | | | | | | | | |
| Insurance - 1.51% | | | | | | | | |
| APCO Holdings LLC, First Lien Initial Term Loan, 1M US L + 5.50%, 06/06/2025 | | | 1,313,879 | | | | 1,317,164 | |
| Cypress Intermediate Holdings III, Inc., Second Lien Initial Term Loan, 1M US L + 6.75%, 03/31/2025 | | | 813,953 | | | | 822,093 | |
| HIG Finance 2, Ltd., First Lien Initial Dollar Term Loan, 1M US L + 3.50%, 12/13/2024 | | | 193,365 | | | | 193,311 | |
| Outcomes Group Holdings, Inc., Second Lien Term Loan: | | | | | | | | |
| 3M US L + 3.50%, 10/24/2025 | | | 390,764 | | | | 386,368 | |
| 3M US L + 7.50%, 10/26/2026 | | | 346,154 | | | | 344,423 | |
| | | | | | | | 3,063,359 | |
| Blackstone / GSO Long-Short Credit Income Fund | Portfolio of Investments |
June 30, 2019 (Unaudited)
| | | Principal
Amount | | | Value | |
| Leisure Goods/Activities/Movies - 2.32% | | | | | | | | |
| Recess Holdings, Inc., First Lien Initial Term Loan, 3M US L + 3.75%, 09/30/2024 | | $ | 1,121,334 | | | $ | 1,102,765 | |
| Travel Leaders Group LLC, First Lien 2018 Refinancing Term Loan, 1M US L + 4.00%, 01/25/2024 | | | 473,409 | | | | 474,985 | |
| Travelport Finance S.à r.l., First Lien Initial Term Loan, 3M US L + 5.00%, 05/29/2026 | | | 2,160,000 | | | | 2,037,820 | |
| United PF Holdings LLC, First Lien Term Loan: | | | | | | | | |
| 1M US L + 4.50%, 06/10/2026 | | | 915,663 | | | | 917,952 | |
| 1M US L + 8.50%, 06/10/2027(b) | | | 170,270 | | | | 168,993 | |
| | | | | | | | 4,702,515 | |
| | | | | | | | | |
| Lodging & Casinos - 1.28% | | | | | | | | |
| AP Gaming I LLC, First Lien Incremental B Term Loan, 1M US L + 3.50%, 02/15/2024 | | | 1,207,780 | | | | 1,207,025 | |
| Casablanca US Holdings, Inc., First Lien Amendment No. 2 Initial Term Loan, 3M US L + 4.00%, 03/29/2024(b) | | | 1,422,000 | | | | 1,386,450 | |
| | | | | | | | 2,593,475 | |
| | | | | | | | | |
| Nonferrous Metals/Minerals - 1.35% | | | | | | | | |
| Aleris International, Inc., First Lien Initial Term Loan, 1M US L + 4.75%, 02/27/2023 | | | 1,433,793 | | | | 1,437,378 | |
| American Rock Salt Co. LLC, First Lien Initial Term Loan, 1M US L + 3.75%, 03/21/2025 | | | 818,171 | | | | 818,170 | |
| Murray Energy Corp., First Lien Superpriority B-2 Term Loan, 3M US L + 7.25%, 10/17/2022 | | | 725,892 | | | | 490,583 | |
| | | | | | | | 2,746,131 | |
| | | | | | | | | |
| Oil & Gas - 3.23% | | | | | | | | |
| Equitrans Midstream Corp., First Lien Holdco B Facility Term Loan, 1M US L + 4.50%, 01/31/2024 | | | 605,068 | | | | 610,111 | |
| Keane Group Holdings LLC, First Lien Initial Term Loan, 1M US L + 3.75%, 05/26/2025 | | | 1,069,200 | | | | 1,057,615 | |
| Lower Cadence Holdings LLC, First Lien Initial Term Loan, 1M US L + 4.00%, 05/22/2026 | | | 1,102,041 | | | | 1,098,140 | |
| Lucid Energy Group II Borrower LLC, First Lien Initial Term Loan, 1M US L + 3.00%, 01/31/2025 | | | 267,063 | | | | 255,714 | |
| Petroleum GEO-Services ASA, First Lien Extended Term Loan, 3M US L + 2.50%, 03/19/2021 | | | 1,058,968 | | | | 1,021,147 | |
| Sheridan Investment Partners I LLC, First Lien Tranche B-2 Term Loan, 3M US L + 3.50%, 10/01/2019 | | | 860,683 | | | | 615,388 | |
| Sheridan Production Partners I LLC, First Lien Deferred Principal Term Loan: | | | | | | | | |
| 3M US L + 0.00%, 10/01/2019(b) | | | 4,506 | | | | 3,192 | |
| 3M US L + 0.00%, 10/01/2019(b) | | | 34,005 | | | | 24,086 | |
| 3M US L + 0.00%, 10/01/2019(b) | | | 2,752 | | | | 1,949 | |
| Sheridan Production Partners I-A LP, First Lien Tranche B-2 Term Loan, 3M US L + 3.50%, 10/01/2019 | | | 114,048 | | | | 81,544 | |
| Sheridan Production Partners I-M LP, First Lien Tranche B-2 Term Loan, 3M US L + 3.50%, 10/01/2019 | | | 69,661 | | | | 49,808 | |
| UTEX Industries, Inc., First Lien Initial Term Loan, 1M US L + 4.00%, 05/21/2021 | | | 1,851,339 | | | | 1,740,259 | |
| | | | | | | | 6,558,953 | |
| | | | | | | | | |
| Property & Casualty Insurance - 2.40% | | | | | | | | |
| Asurion LLC, Second Lien Replacement B-2 Term Loan, 1M US L + 6.50%, 08/04/2025 | | | 3,381,340 | | | | 3,435,949 | |
| Confie Seguros Holding II Co., First Lien B Term Loan, 3M US L + 4.75%, 04/19/2022 | | | 1,446,251 | | | | 1,426,965 | |
| | | | | | | | 4,862,914 | |
| | | | | | | | | |
| Publishing - 1.71% | | | | | | | | |
| Champ Acquisition Corp., First Lien Initial Term Loan, 3M US L + 5.50%, 12/19/2025 | | | 1,336,567 | | | | 1,323,201 | |
| Recorded Books, Inc., First Lien Initial Term Loan, 3M US L + 4.50%, 08/29/2025 | | | 783,553 | | | | 786,005 | |
| Southern Graphics, Inc., Second Lien Initial Term Loan: | | | | | | | | |
| 2M US L + 3.25%, 12/31/2022 | | | 304,882 | | | | 255,912 | |
| 2M US L + 7.50%, 12/31/2023(b) | | | 1,500,000 | | | | 1,095,000 | |
| | | | | | | | 3,460,118 | |
| Semi-Annual Report | June 30, 2019 | 29 |
| Blackstone / GSO Long-Short Credit Income Fund | Portfolio of Investments |
June 30, 2019 (Unaudited)
| | | Principal
Amount | | | Value | |
| Radio & Television - 0.63% | | | | | | | | |
| Gray Television, Inc., First Lien B-2 Term Loan, 1M US L + 2.25%, 02/07/2024 | | $ | 142,857 | | | $ | 142,464 | |
| iHeartCommunications, Inc., First Lien Initial Term Loan, 3M US L + 4.00%, 05/01/2026 | | | 1,000,000 | | | | 1,002,425 | |
| William Morris Endeavor Entertainment LLC, First Lien B-1 Term Loan, 1M US L + 2.75%, 05/18/2025 | | | 142,109 | | | | 137,727 | |
| | | | | | | | 1,282,616 | |
| | | | | | | | | |
| Retailers (except food & drug) - 1.54% | | | | | | | | |
| Academy, Ltd., First Lien Initial Term Loan, 1M US L + 4.00%, 07/01/2022 | | | 309,577 | | | | 222,276 | |
| Apro LLC, First Lien Initial Term Loan, 1M US L + 4.00%, 08/08/2024 | | | 589,831 | | | | 592,411 | |
| Ascena Retail Group, Inc., First Lien Tranche B Term Loan, 1M US L + 4.50%, 08/19/2022 | | | 250,061 | | | | 164,518 | |
| FBB Holdings III, Inc., First Lien Initial Term Loan: | | | | | | | | |
| 3M US L + 9.00%, 02/07/2024(b) | | | 139,237 | | | | 132,275 | |
| 3M US L + 7.00%, 01/31/2025(b) | | | 47,256 | | | | 32,607 | |
| Petco Animal Supplies, Inc., First Lien Term Loan, 3M US L + 3.25%, 01/26/2023 | | | 305,871 | | | | 238,197 | |
| Pier 1 Imports US, Inc., First Lien Initial Term Loan, 3M US L + 3.50%, 04/30/2021(b) | | | 1,979,167 | | | | 494,792 | |
| Spencer Spirit Holding/Gift, First Lien Initial Term Loan, 3M US L + 6.00%, 06/19/2026 | | | 1,260,000 | | | | 1,235,329 | |
| Sports Authority, Inc., First Lien B Term Loan, 3M US L + 6.00%, 11/16/2017(b)(d) | | | 3,389,299 | | | | 6,779 | |
| | | | | | | | 3,119,184 | |
| | | | | | | | | |
| Steel - 0.71% | | | | | | | | |
| Can Am Construction, Inc., First Lien Closing Date Term Loan, 1M US L + 5.00%, 07/01/2024(b) | | | 1,238,759 | | | | 1,201,596 | |
| Phoenix Services International LLC, First Lien B Term Loan, 1M US L + 3.75%, 03/01/2025 | | | 239,580 | | | | 237,483 | |
| | | | | | | | 1,439,079 | |
| | | | | | | | | |
| Surface Transport - 1.21% | | | | | | | | |
| Drive Chassis Holdco LLC, Second Lien B Term Loan, 3M US L + 8.25%, 04/10/2026 | | | 1,800,000 | | | | 1,734,750 | |
| SMB Shipping Logistics LLC, First Lien Term Loan, 3M US L + 4.00%, 02/05/2024 | | | 723,584 | | | | 719,966 | |
| | | | | | | | 2,454,716 | |
| | | | | | | | | |
| Telecommunications - 4.51% | | | | | | | | |
| Alorica, Inc., First Lien New B Term Loan, 1M US L + 3.75%, 06/30/2022 | | | 674,326 | | | | 652,410 | |
| Avaya, Inc., First Lien Tranche B Term Loan, 1M US L + 4.25%, 12/15/2024 | | | 2,169,634 | | | | 2,080,136 | |
| Cyxtera DC Holdings, Inc., Second Lien Initial Term Loan, 1M US L + 7.25%, 05/01/2025 | | | 225,564 | | | | 197,611 | |
| Ensono LP, First Lien Term Loan, 1M US L + 5.25%, 06/27/2025 | | | 1,010,720 | | | | 1,009,775 | |
| Masergy Holdings, Inc., Second Lien Initial Term Loan: | | | | | | | | |
| 3M US L + 3.25%, 12/15/2023 | | | 697,141 | | | | 687,556 | |
| 3M US L + 7.50%, 12/16/2024 | | | 548,872 | | | | 540,639 | |
| Peak 10 Holding Corp., First Lien Initial Term Loan: | | | | | | | | |
| 3M US L + 3.50%, 08/01/2024 | | | 714,545 | | | | 658,278 | |
| 3M US L + 7.25%, 08/01/2025 | | | 771,429 | | | | 650,411 | |
| Securus Technologies Holdings, Inc., First Lien Initial Term Loan, 3M US L + 4.50%, 11/01/2024 | | | 137,348 | | | | 128,192 | |
| TierPoint LLC, First Lien Initial Term Loan, 1M US L + 3.75%, 05/06/2024 | | | 1,389,050 | | | | 1,293,553 | |
| Vertiv Group Corp., First Lien B Term Loan, 3M US L + 4.00%, 11/30/2023 | | | 1,312,355 | | | | 1,250,018 | |
| | | | | | | | 9,148,579 | |
| | | | | | | | | |
| Utilities - 3.06% | | | | | | | | |
| Brookfield WEC Holdings, Inc., Second Lien Initial Term Loan: | | | | | | | | |
| 3M US L + 3.50%, 08/01/2025(b) | | | 633,032 | | | | 633,032 | |
| 1M US L + 6.75%, 08/03/2026 | | | 224,299 | | | | 227,559 | |
| Eastern Power LLC, First Lien Term Loan, 1M US L + 3.75%, 10/02/2023 | | | 488,556 | | | | 488,759 | |
| Granite Acquisition, Inc., Second Lien B Term Loan, 3M US L + 7.25%, 12/19/2022 | | | 2,421,507 | | | | 2,427,949 | |
| Green Energy Partners/Stonewall LLC, First Lien B-1 Conversion Advances Term Loan, 3M US L + 5.50%, 11/13/2021 | | | 491,250 | | | | 481,425 | |
| Blackstone / GSO Long-Short Credit Income Fund | Portfolio of Investments |
June 30, 2019 (Unaudited)
| | | Principal
Amount | | | Value | |
| Utilities (continued) | | | | | | | | |
| Moxie Liberty LLC, First Lien Construction B-1 Advance Term Loan, 3M US L + 6.50%, 08/21/2020 | | $ | 1,421,391 | | | $ | 1,285,179 | |
| Moxie Patriot LLC, First Lien Construction B-1 Advances Term Loan, 3M US L + 5.75%, 12/19/2020 | | | 684,790 | | | | 658,254 | |
| | | | | | | | 6,202,157 | |
| | | | | | | | | |
| TOTAL FLOATING RATE LOAN INTERESTS | | | | | | | | |
| (Cost $299,825,523) | | | | | | | 288,488,462 | |
| | | | | | | | | |
| COLLATERALIZED LOAN OBLIGATION SECURITIES(a)-3.01% | | | | | | | | |
| Structured Finance Obligations - 3.01% | | | | | | | | |
| Babson CLO, Ltd. 2015-I 3M US L + 5.50%, 01/20/2031(b)(e) | | | 875,000 | | | | 776,726 | |
| Carlyle Global Market Strategies CLO 2016-2, Ltd. 3M US L + 5.17%, 07/15/2027(b)(e) | | | 1,000,000 | | | | 979,294 | |
| Dryden 40 Senior Loan Fund 3M US L + 5.75%, 08/15/2031(b)(e) | | | 700,000 | | | | 665,131 | |
| Highbridge Loan Management 6-2015, Ltd. 3M US L + 5.10%, 02/05/2031(b)(e) | | | 833,000 | | | | 763,910 | |
| Neuberger Berman Loan Advisers CLO 27, Ltd. 3M US L + 5.20%, 01/15/2030(b)(e) | | | 667,000 | | | | 609,339 | |
| Tiaa Clo III, Ltd. 3M US L + 5.90%, 01/16/2031(b)(e) | | | 2,500,000 | | | | 2,318,323 | |
| | | | | | | | 6,112,723 | |
| | | | | | | | | |
| TOTAL COLLATERALIZED LOAN OBLIGATION SECURITIES | | | | | | | | |
| (Cost $6,554,819) | | | | | | | 6,112,723 | |
| | | | | | | | | |
| CORPORATE BONDS - 19.86% | | | | | | | | |
| Automotive - 0.29% | | | | | | | | |
| IAA, Inc. 5.500%, 06/15/2027(e) | | | 148,000 | | | | 154,290 | |
| Midas Intermediate Holdco II LLC / Midas Intermediate Holdco II Finance, Inc. 7.875%, 10/01/2022(e) | | | 450,000 | | | | 429,750 | |
| | | | | | | | 584,040 | |
| | | | | | | | | |
| Building & Development - 2.16% | | | | | | | | |
| Builders FirstSource, Inc. 6.750%, 06/01/2027(e) | | | 129,000 | | | | 136,740 | |
| Northwest Hardwoods, Inc. 7.500%, 08/01/2021(e) | | | 289,000 | | | | 177,735 | |
| NWH Escrow Corp. 7.500%, 08/01/2021(e) | | | 1,332,000 | | | | 812,520 | |
| PriSo Acquisition Corp. 9.000%, 05/15/2023(e) | | | 3,477,000 | | | | 3,264,034 | |
| | | | | | | | 4,391,029 | |
| | | | | | | | | |
| Business Equipment & Services - 0.83% | | | | | | | | |
| Allied Universal Holdco LLC 6.625%, 07/15/2026(e) | | | 1,174,000 | | | | 1,196,012 | |
| Clean Harbors, Inc.: | | | | | | | | |
| 4.875%, 07/15/2027(e) | | | 328,000 | | | | 334,183 | |
| 5.125%, 07/15/2029(e) | | | 162,000 | | | | 165,645 | |
| | | | | | | | 1,695,840 | |
| | | | | | | | | |
| Chemical & Plastics - 0.25% | | | | | | | | |
| Starfruit Finco BV / Starfruit US Holdco LLC 8.000%, 10/01/2026(e) | | | 487,000 | | | | 502,828 | |
| | | | | | | | | |
| Containers & Glass Products - 1.63% | | | | | | | | |
| ARD Securities Finance SARL 8.750%, 01/31/2023(e)(f) | | | 436,576 | | | | 442,033 | |
| Flex Acquisition Co., Inc. 6.875%, 01/15/2025(e) | | | 1,916,000 | | | | 1,743,560 | |
| Trident Merger Sub, Inc. 6.625%, 11/01/2025(e) | | | 1,200,000 | | | | 1,125,000 | |
| | | | | | | | 3,310,593 | |
| | | | | | | | | |
| Diversified Insurance - 1.62% | | | | | | | | |
| HUB International, Ltd. 7.000%, 05/01/2026(e) | | | 378,000 | | | | 384,143 | |
| Semi-Annual Report | June 30, 2019 | 31 |
| Blackstone / GSO Long-Short Credit Income Fund | Portfolio of Investments |
June 30, 2019 (Unaudited)
| | | Principal
Amount | | | Value | |
| Diversified Insurance (continued) | | | | | | | | |
| York Risk Services Holding Corp. 8.500%, 10/01/2022(e) | | $ | 3,500,000 | | | $ | 2,896,250 | |
| | | | | | | | 3,280,393 | |
| | | | | | | | | |
| Drugs - 1.87% | | | | | | | | |
| Avantor, Inc.: | | | | | | | | |
| 6.000%, 10/01/2024(e) | | | 833,000 | | | | 888,394 | |
| 9.000%, 10/01/2025(e) | | | 2,600,000 | | | | 2,905,500 | |
| | | | | | | | 3,793,894 | |
| | | | | | | | | |
| Ecological Services & Equipment - 0.81% | | | | | | | | |
| GFL Environmental, Inc.: | | | | | | | | |
| 5.375%, 03/01/2023(e) | | | 864,000 | | | | 859,680 | |
| 7.000%, 06/01/2026(e) | | | 37,000 | | | | 37,971 | |
| 8.500%, 05/01/2027(e) | | | 689,000 | | | | 743,259 | |
| | | | | | | | 1,640,910 | |
| | | | | | | | | |
| Electronics/Electrical - 1.85% | | | | | | | | |
| Banff Merger Sub, Inc. 9.750%, 09/01/2026(e) | | | 857,000 | | | | 747,732 | |
| Global A&T Electronics, Ltd. 8.500%, 01/12/2023 | | | 1,363,502 | | | | 1,279,897 | |
| Riverbed Technology, Inc. 8.875%, 03/01/2023(e) | | | 2,559,000 | | | | 1,720,928 | |
| | | | | | | | 3,748,557 | |
| | | | | | | | | |
| Food Service - 0.17% | | | | | | | | |
| CEC Entertainment, Inc. 8.000%, 02/15/2022 | | | 345,000 | | | | 348,881 | |
| | | | | | | | | |
| Food/Drug Retailers - 0.34% | | | | | | | | |
| eG Global Finance PLC 6.750%, 02/07/2025(e) | | | 704,000 | | | | 700,269 | |
| | | | | | | | | |
| Healthcare - 2.44% | | | | | | | | |
| Envision Healthcare Corp. 8.750%, 10/15/2026(e) | | | 1,875,000 | | | | 1,307,813 | |
| Team Health Holdings, Inc. 6.375%, 02/01/2025(e) | | | 1,500,000 | | | | 1,155,000 | |
| Tenet Healthcare Corp.: | | | | | | | | |
| 4.625%, 07/15/2024 | | | 667,000 | | | | 677,839 | |
| 5.125%, 05/01/2025 | | | 667,000 | | | | 672,002 | |
| 7.000%, 08/01/2025 | | | 1,143,000 | | | | 1,143,000 | |
| | | | | | | | 4,955,654 | |
| | | | | | | | | |
| Industrial Equipment - 0.11% | | | | | | | | |
| Titan Acquisition, Ltd. / Titan Co.-Borrower LLC 7.750%, 04/15/2026(e) | | | 250,000 | | | | 225,625 | |
| | | | | | | | | |
| Leisure Goods/Activities/Movies - 0.14% | | | | | | | | |
| Cedar Fair LP 5.250%, 07/15/2029(e) | | | 278,000 | | | | 284,255 | |
| | | | | | | | | |
| Oil & Gas - 0.98% | | | | | | | | |
| Calumet Specialty Products Partners LP / Calumet Finance Corp. 7.750%, 04/15/2023 | | | 1,600,000 | | | | 1,540,000 | |
| CSI Compressco LP / CSI Compressco Finance, Inc. 7.250%, 08/15/2022 | | | 500,000 | | | | 451,250 | |
| | | | | | | | 1,991,250 | |
| | | | | | | | | |
| Property & Casualty Insurance - 2.07% | | | | | | | | |
| AssuredPartners, Inc. 7.000%, 08/15/2025(e) | | | 1,136,000 | | | | 1,134,580 | |
| GTCR AP Finance, Inc. 8.000%, 05/15/2027(e) | | | 286,000 | | | | 288,145 | |
| Solera LLC / Solera Finance, Inc. 10.500%, 03/01/2024(e) | | | 2,550,000 | | | | 2,769,937 | |
| | | | | | | | 4,192,662 | |
| Blackstone / GSO Long-Short Credit Income Fund | Portfolio of Investments |
June 30, 2019 (Unaudited)
| | | Principal
Amount | | | Value | |
| Publishing - 0.27% | | | | | | | | |
| McGraw-Hill Global Education Holdings LLC / McGraw-Hill Global Education Finance 7.875%, 05/15/2024(e) | | $ | 580,000 | | | $ | 539,400 | |
| | | | | | | | | |
| Radio & Television - 0.36% | | | | | | | | |
| Entercom Media Corp. 6.500%, 05/01/2027(e) | | | 101,000 | | | | 105,293 | |
| Univision Communications, Inc. 5.125%, 05/15/2023(e) | | | 630,000 | | | | 618,975 | |
| | | | | | | | 724,268 | |
| | | | | | | | | |
| Telecommunications - 1.34% | | | | | | | | |
| Digicel, Ltd. 6.000%, 04/15/2021(e) | | | 750,000 | | | | 573,750 | |
| Frontier Communications Corp. 10.500%, 09/15/2022 | | | 1,250,000 | | | | 853,125 | |
| Sprint Communications, Inc. 6.000%, 11/15/2022 | | | 1,050,000 | | | | 1,097,250 | |
| Vertiv Group Corp. 9.250%, 10/15/2024(e) | | | 204,000 | | | | 196,350 | |
| | | | | | | | 2,720,475 | |
| | | | | | | | | |
| Utilities - 0.33% | | | | | | | | |
| Calpine Corp. 5.750%, 01/15/2025 | | | 667,000 | | | | 664,499 | |
| | | | | | | | | |
| TOTAL CORPORATE BONDS | | | | | | | | |
| (Cost $43,339,914) | | | | | | | 40,295,322 | |
| | | Shares | | | | |
| COMMON STOCK - 0.13% | | | | | | | | |
| Oil & Gas - 0.13% | | | | | | | | |
| SandRidge Energy, Inc.(g) | | | 37,842 | | | | 261,866 | |
| | | | | | | | | |
| TOTAL COMMON STOCK | | | | | | | | |
| (Cost $1,749,997) | | | | | | | 261,866 | |
| | | | | | | | | |
| Total Investments - 165.18% | | | | | | | | |
| (Cost $351,470,253) | | | | | | | 335,158,373 | |
| | | | | | | | | |
| Liabilities in Excess of Other Assets - (0.81)% | | | | | | | (1,630,101 | ) |
| | | | | | | | | |
| Mandatory Redeemable Preferred Shares - (9.92)% | | | | | | | | |
| (liquidation preference plus distributions payable on term preferred shares) | | | | | | | (20,118,997 | ) |
| | | | | | | | | |
| Leverage Facility - (54.46)% | | | | | | | (110,500,000 | ) |
| | | | | | | | | |
| Net Assets - 100.00% | | | | | | $ | 202,909,275 | |
Amounts above are shown as a percentage of net assets as of June 30, 2019.
| Semi-Annual Report | June 30, 2019 | 33 |
| Blackstone / GSO Long-Short Credit Income Fund | Portfolio of Investments |
June 30, 2019 (Unaudited)
Investment Abbreviations:
LIBOR - London Interbank Offered Rate
Libor Rates:
1W US L - 1 Week LIBOR as of June 30, 2019 was 2.37%
1M US L - 1 Month LIBOR as of June 30, 2019 was 2.40%
2M US L - 2 Month LIBOR as of June 30, 2019 was 2.33%
3M US L - 3 Month LIBOR as of June 30, 2019 was 2.32%
6M US L - 6 Month LIBOR as of June 30, 2019 was 2.20%
| (a) | Floating or variable rate security. The reference rate is described above. The rate in effect as of June 30, 2019 is based on the reference rate plus the displayed spread as of the security's last reset date. |
| (b) | Level 3 assets valued using significant unobservable inputs as a result of unavailable quoted prices from an active market or the unavailability of other significant observable inputs. |
| (c) | A portion of this position was not funded as of June 30, 2019. The Portfolio of Investments records only the funded portion of each position. As of June 30, 2019, the Fund has unfunded delayed draw loans in the amount of $249,956. Fair value of these unfunded delayed draw loans was $241,440. |
| (d) | Security is in default as of period end and is therefore non-income producing. |
| (e) | Security exempt from registration under Rule 144A of the Securities Act of 1933. Total market value of Rule 144A securities amounts to $37,680,302, which represented approximately 18.57% of net assets as of June 30, 2019. Such securities may normally be sold to qualified institutional buyers in transactions exempt from registration. |
| (f) | Option to convert to pay-in-kind security. |
| (g) | Non-income producing security. |
See Notes to Financial Statements.
| Blackstone / GSO Strategic Credit Fund | Portfolio of Investments |
June 30, 2019 (Unaudited)
| | | Principal Amount | | | Value | |
| FLOATING RATE LOAN INTERESTS(a) - 137.51% | | | | | | | | |
| Aerospace & Defense - 2.67% | | | | | | | | |
| Nordam Group LLC, First Lien Initial Term Loan, 3M US L + 5.50%, 04/09/2026(b) | | $ | 4,788,000 | | | $ | 4,793,985 | |
| Propulsion Acquisition LLC, First Lien Initial Term Loan, 1M US L + 6.00%, 07/13/2021(b) | | | 6,219,207 | | | | 6,157,014 | |
| Vectra Co., First Lien Initial Term Loan: | | | | | | | | |
| 1M US L + 3.25%, 03/10/2025 | | | 2,364,179 | | | | 2,280,700 | |
| 1M US L + 7.25%, 03/08/2026(b) | | | 1,666,667 | | | | 1,612,500 | |
| WP CPP Holdings LLC, First Lien Initial Term Loan, 3M US L + 3.75%, 04/30/2025 | | | 3,731,250 | | | | 3,731,250 | |
| | | | | | | | 18,575,449 | |
| | | | | | | | | |
| Air Transport - 0.80% | | | | | | | | |
| Air Medical Group Holdings, Inc., First Lien 2018 New Term Loan, 1M US L + 4.25%, 03/14/2025 | | | 5,910,000 | | | | 5,571,652 | |
| | | | | | | | | |
| Automotive - 0.78% | | | | | | | | |
| Bright Bidco B.V., First Lien 2018 Refinancing B Term Loan, 3M US L + 3.50%, 06/30/2024 | | | 134,175 | | | | 95,767 | |
| Midas Intermediate Holdco II LLC, First Lien 2017 Refinancing Term Loan, 3M US L + 2.75%, 08/18/2021 | | | 1,190,840 | | | | 1,158,092 | |
| Superior Industries International, Inc., First Lien Replacement Term Loan, 1M US L + 4.00%, 05/22/2024(b) | | | 4,379,898 | | | | 4,182,802 | |
| | | | | | | | 5,436,661 | |
| | | | | | | | | |
| Beverage & Tobacco - 0.23% | | | | | | | | |
| Winebow Holdings, Inc., Second Lien Term Loan, 1M US L + 7.50%, 01/02/2022(b) | | | 2,387,283 | | | | 1,599,480 | |
| | | | | | | | | |
| Brokers, Dealers & Investment Houses - 0.69% | | | | | | | | |
| Deerfield Dakota Holding LLC, First Lien Initial Term Loan, 1M US L + 3.25%, 02/13/2025 | | | 891,697 | | | | 866,538 | |
| Edelman Financial Center LLC, Second Lien Initial Term Loan, 1M US L + 6.75%, 06/26/2026 | | | 1,846,154 | | | | 1,860,000 | |
| Newport Group Holdings II, Inc., First Lien Initial Term Loan, 3M US L + 3.75%, 09/12/2025 | | | 2,088,739 | | | | 2,071,768 | |
| | | | | | | | 4,798,306 | |
| | | | | | | | | |
| Building & Development - 8.33% | | | | | | | | |
| American Bath Group LLC, Second Lien Term Loan: | | | | | | | | |
| 3M US L + 4.25%, 09/30/2023 | | | 9,917,325 | | | | 9,861,540 | |
| 3M US L + 9.75%, 09/30/2024(b) | | | 600,000 | | | | 600,000 | |
| CPG International LLC, First Lien New Term Loan, 6M US L + 3.75%, 05/06/2024 | | | 789,899 | | | | 778,050 | |
| Dayton Superior Corp., First Lien Borrowing Term Loan, 3M US L + 8.00%, 11/03/2021 | | | 3,734,245 | | | | 3,099,423 | |
| Forterra Finance LLC, First Lien Replacement Term Loan, 1M US L + 3.00%, 10/25/2023 | | | 9,385,206 | | | | 8,687,839 | |
| Hillman Group, Inc., First Lien Initial Term Loan, 1M US L + 4.00%, 05/30/2025 | | | 8,917,444 | | | | 8,599,760 | |
| Interior Logic Group Holdings IV LLC, First Lien Initial Term Loan, 3M US L + 4.00%, 05/30/2025 | | | 6,496,364 | | | | 6,423,279 | |
| LBM Borrower LLC, Second Lien Initial Term Loan: | | | | | | | | |
| 1M US L + 3.75%, 08/20/2022 | | | 4,666,747 | | | | 4,667,237 | |
| 1M US L + 9.25%, 08/20/2023 | | | 1,713,476 | | | | 1,679,206 | |
| Ply Gem Midco, Inc., First Lien Initial Term Loan, 3M US L + 3.75%, 04/12/2025 | | | 3,742,341 | | | | 3,647,229 | |
| SIWF Holdings, Inc., First Lien Initial Term Loan, 1M US L + 4.25%, 06/15/2025(b) | | | 2,376,000 | | | | 2,361,150 | |
| SRS Distribution, Inc., First Lien Initial Term Loan, 1M US L + 3.25%, 05/23/2025 | | | 7,939,225 | | | | 7,631,580 | |
| | | | | | | | 58,036,293 | |
| | | | | | | | | |
| Business Equipment & Services - 23.04% | | | | | | | | |
| Access CIG LLC, First Lien B Term Loan: | | | | | | | | |
| 3M US L + 3.75%, 02/27/2025 | | | 2,422,916 | | | | 2,414,593 | |
| 1M US L + 7.75%, 02/27/2026 | | | 326,087 | | | | 324,864 | |
| Semi-Annual Report | June 30, 2019 | 35 |
| Blackstone / GSO Strategic Credit Fund | Portfolio of Investments |
June 30, 2019 (Unaudited)
| | | Principal Amount | | | Value | |
| Business Equipment & Services (continued) | | | | | | | | |
| Advantage Sales & Marketing, Inc., First Lien Initial Term Loan: | | | | | | | | |
| 3M US L + 3.25%, 07/23/2021 | | $ | 2,548,000 | | | $ | 2,331,739 | |
| 3M US L + 3.25%, 07/23/2021 | | | 3,099,270 | | | | 2,844,355 | |
| 3M US L + 6.50%, 07/25/2022 | | | 11,245,389 | | | | 8,954,197 | |
| Allied Universal Holdco LLC, First Lien Initial Term Loan: | | | | | | | | |
| 1M US L + 4.25%, 07/28/2022 | | | 3,810,638 | | | | 3,811,248 | |
| 1M US L + 3.75%, 07/28/2022 | | | 4,644,000 | | | | 4,642,073 | |
| 3M US L + 4.25%, 06/26/2026(b) | | | 4,070,330 | | | | 4,060,155 | |
| 3M US L + 4.25%, 06/26/2026(b) | | | 403,003 | | | | 401,995 | |
| APFS Staffing Holdings, Inc., First Lien Initial Term Loan, 1M US L + 5.00%, 04/15/2026 | | | 5,454,545 | | | | 5,403,409 | |
| AqGen Ascensus, Inc., First Lien Replacement Term Loan, 6M US L + 4.00%, 12/05/2022 | | | 8,107,050 | | | | 8,132,425 | |
| BMC Acquisition, Inc., First Lien Initial Term Loan, 3M US L + 5.25%, 12/28/2024 | | | 2,801,094 | | | | 2,801,094 | |
| Capri Acquisitions BidCo, Ltd., First Lien Initial Dollar Term Loan, 3M US L + 3.25%, 11/01/2024 | | | 5,905,872 | | | | 5,805,472 | |
| Cast & Crew Payroll LLC, First Lien Initial Term Loan, 1M US L + 4.00%, 02/09/2026 | | | 1,090,937 | | | | 1,097,482 | |
| DG Investment Intermediate Holdings 2, Inc., First Lien Initial Term Loan: | | | | | | | | |
| 1M US L + 3.00%, 02/03/2025(b) | | | 998,338 | | | | 967,140 | |
| 1M US L + 6.75%, 02/02/2026(b) | | | 1,422,414 | | | | 1,386,854 | |
| Dun & Bradstreet Corp., First Lien Initial Borrowing Term Loan, 1M US L + 5.00%, 02/06/2026 | | | 4,108,108 | | | | 4,114,537 | |
| GI Revelation Acquisition LLC, First Lien Initial Term Loan: | | | | | | | | |
| 1M US L + 5.00%, 04/16/2025 | | | 5,139,040 | | | | 5,100,497 | |
| 1M US L + 9.00%, 04/16/2026 | | | 6,000,000 | | | | 5,775,000 | |
| IG Investments Holdings LLC, First Lien Refinancing Term Loan, 1M US L + 4.00%, 05/23/2025 | | | 759,809 | | | | 754,681 | |
| Informatica LLC, First Lien Dollar B-1 Term Loan, 1M US L + 3.25%, 08/05/2022 | | | 554,471 | | | | 555,627 | |
| Inmar, Inc., First Lien Initial Term Loan: | | | | | | | | |
| 3M US L + 4.00%, 05/01/2024 | | | 1,256,852 | | | | 1,192,125 | |
| 3M US L + 8.00%, 05/01/2025 | | | 3,786,982 | | | | 3,559,763 | |
| KUEHG Corp., Second Lien Tranche B Term Loan: | | | | | | | | |
| 3M US L + 3.75%, 02/21/2025 | | | 4,654,901 | | | | 4,644,916 | |
| 3M US L + 8.25%, 08/15/2025 | | | 6,161,780 | | | | 6,154,078 | |
| LD Intermediate Holdings, Inc., First Lien Initial Term Loan, 3M US L + 5.875%, 12/09/2022 | | | 5,890,213 | | | | 5,860,792 | |
| LegalZoom.com, Inc., First Lien 2018 Term Loan, 1M US L + 4.50%, 11/21/2024 | | | 5,117,143 | | | | 5,152,349 | |
| Minotaur Acquisition, Inc., First Lien B Term Loan, 1M US L + 5.00%, 02/27/2026 | | | 4,603,846 | | | | 4,538,610 | |
| Mitchell International, Inc., First Lien Initial Term Loan: | | | | | | | | |
| 1M US L + 3.25%, 11/29/2024 | | | 6,096,335 | | | | 5,833,979 | |
| 1M US L + 7.25%, 12/01/2025 | | | 2,303,030 | | | | 2,236,818 | |
| National Intergovernmental Purchasing Alliance Co., First Lien Initial Term Loan: | | | | | | | | |
| 3M US L + 3.75%, 05/19/2025 | | | 5,557,290 | | | | 5,487,851 | |
| 3M US L + 7.50%, 05/22/2026(b) | | | 4,200,000 | | | | 4,116,000 | |
| PricewaterhouseCoopers Public Sector LLP, Second Lien Initial Term Loan, 1M US L + 7.50%, 05/01/2026(b) | | | 1,200,000 | | | | 1,194,000 | |
| Project Boost Purchaser LLC, First Lien B Term Loan, 3M US L + 3.50%, 06/01/2026 | | | 1,735,537 | | | | 1,730,469 | |
| PT Intermediate Holdings III LLC, First Lien B Term Loan: | | | | | | | | |
| 3M US L + 4.00%, 12/04/2024 | | | 4,761,121 | | | | 4,614,336 | |
| 3M US L + 8.00%, 12/08/2025(b) | | | 4,200,000 | | | | 4,074,000 | |
| RevSpring, Inc., First Lien Initial Term Loan, 1M US L + 4.25%, 10/11/2025 | | | 3,582,000 | | | | 3,578,651 | |
| Sedgwick Holdings, Inc., First Lien Initial Term Loan, 1M US L + 3.25%, 12/31/2025 | | | 3,961,659 | | | | 3,913,188 | |
| SurveyMonkey, Inc., First Lien Term Loan, 1W US L + 3.75%, 10/10/2025(b) | | | 6,771,788 | | | | 6,775,851 | |
| ThoughtWorks, Inc., First Lien Replacement Term Loan, 1M US L + 4.00%, 10/11/2024 | | | 4,186,694 | | | | 4,191,948 | |
| TRC Cos., Inc., First Lien Initial Term Loan, 1M US L + 3.50%, 06/21/2024 | | | 1,292,202 | | | | 1,289,779 | |
| Trugreen LP, First Lien Initial Refinancing Term Loan, 1M US L + 3.75%, 03/19/2026 | | | 597,872 | | | | 600,117 | |
| Weld North Education LLC, First Lien Initial Term Loan, 3M US L + 4.25%, 02/07/2025(b) | | | 7,998,469 | | | | 7,998,468 | |
| | | | | | | | 160,417,525 | |
| Blackstone / GSO Strategic Credit Fund | Portfolio of Investments |
June 30, 2019 (Unaudited)
| | | Principal Amount | | | Value | |
| Cable & Satellite Television - 0.30% | | | | | | | | |
| Radiate Holdco LLC, First Lien Amendment No. 2 Incremental Term Loan, 3M US L + 3.50%, 02/01/2024 | | $ | 2,135,000 | | | $ | 2,115,988 | |
| | | | | | | | | |
| Chemical & Plastics - 2.71% | | | | | | | | |
| Composite Resins Holding B.V., First Lien Initial Term Loan, 3M US L + 4.25%, 06/27/2025 | | | 7,128,000 | | | | 7,074,540 | |
| Spectrum Holdings III Corp., First Lien Closing Date Term Loan: | | | | | | | | |
| 1M US L + 3.25%, 01/31/2025 | | | 888,528 | | | | 841,880 | |
| 1M US L + 7.00%, 01/31/2026(b) | | | 1,833,333 | | | | 1,686,667 | |
| Starfruit Finco B.V., First Lien Initial Dollar Term Loan, 1M US L + 3.25%, 10/01/2025 | | | 5,037,313 | | | | 4,971,199 | |
| Vantage Specialty Chemicals, Inc., First Lien Closing Date Term Loan: | | | | | | | | |
| 1M US L + 3.50%, 10/20/2024 | | | 2,390,640 | | | | 2,363,745 | |
| 3M US L + 8.25%, 10/27/2025(b) | | | 1,995,334 | | | | 1,905,544 | |
| | | | | | | | 18,843,575 | |
| | | | | | | | | |
| Conglomerates - 1.12% | | | | | | | | |
| American Residential Services LLC, First Lien Term Loan, 1M US L + 4.00%, 06/30/2021 | | | 1,259,875 | | | | 1,246,224 | |
| Genuine Financial Holdings LLC, First Lien Initial Term Loan, 1M US L + 3.75%, 07/11/2025 | | | 3,123,934 | | | | 3,088,790 | |
| Output Services Group, Inc., First Lien B Term Loan, 1M US L + 4.25%, 03/26/2024(b) | | | 1,526,920 | | | | 1,381,863 | |
| Spring Education Group, Inc., First Lien Initial Term Loan, 3M US L + 4.25%, 07/30/2025 | | | 2,127,167 | | | | 2,117,425 | |
| | | | | | | | 7,834,302 | |
| | | | | | | | | |
| Containers & Glass Products - 3.46% | | | | | | | | |
| Charter NEX US, Inc., First Lien Third Amendment Incremental Term Loan, 1M US L + 3.50%, 05/16/2024 | | | 647,727 | | | | 646,837 | |
| Flex Acquisition Co., Inc., First Lien Incremental B-2018 Term Loan, 3M US L + 3.25%, 06/29/2025 | | | 3,513,841 | | | | 3,343,788 | |
| Goodpack, Ltd., Second Lien Tranche B-1 Term Loan, 3M US L + 7.00%, 09/11/2024(b) | | | 1,691,209 | | | | 1,665,841 | |
| IBC Capital I, Ltd., First Lien Tranche B-1 Term Loan, 3M US L + 3.75%, 09/11/2023 | | | 2,962,500 | | | | 2,960,041 | |
| Loparex International BV, First Lien B Term Loan, 1M US L + 4.25%, 04/11/2025(b) | | | 5,246,250 | | | | 5,246,250 | |
| Pregis Holding I Corp., First Lien Term Loan, 3M US L + 3.50%, 05/20/2021 | | | 2,428,990 | | | | 2,431,516 | |
| ProAmpac PG Borrower LLC, First Lien Initial Term Loan: | | | | | | | | |
| 3M US L + 3.50%, 11/20/2023 | | | 1,717,784 | | | | 1,649,614 | |
| 3M US L + 8.50%, 11/18/2024 | | | 1,464,115 | | | | 1,400,060 | |
| Strategic Materials Holding Corp., Second Lien Initial Term Loan, 3M US L + 7.75%, 10/27/2025(b) | | | 4,666,667 | | | | 3,406,667 | |
| Trident TPI Holdings, Inc., First Lien Tranche B-1 Term Loan, 1M US L + 3.25%, 10/04/2024 | | | 1,411,041 | | | | 1,339,614 | |
| | | | | | | | 24,090,228 | |
| | | | | | | | | |
| Diversified Insurance - 0.81% | | | | | | | | |
| Acrisure LLC, First Lien 2018-1 Additional Term Loan, 3M US L + 3.75%, 11/22/2023 | | | 1,672,753 | | | | 1,662,992 | |
| BroadStreet Partners, Inc., First Lien Tranche B-2 Term Loan, 1M US L + 3.25%, 11/08/2023 | | | 75,510 | | | | 75,427 | |
| CP VI Bella Midco LLC, First Lien Initial Term Loan: | | | | | | | | |
| 1M US L + 2.75%, 01/24/2025 | | | 1,269,727 | | | | 1,236,396 | |
| 1M US L + 6.75%, 12/28/2025 | | | 1,178,571 | | | | 1,157,947 | |
| Genworth Holdings, Inc., First Lien Initial Term Loan, 2M US L + 4.50%, 03/07/2023 | | | 1,033,043 | | | | 1,044,025 | |
| York Risk Services Holding Corp., First Lien Term Loan, 1M US L + 3.75%, 10/01/2021 | | | 482,488 | | | | 457,459 | |
| | | | | | | | 5,634,246 | |
| | | | | | | | | |
| Drugs - 1.66% | | | | | | | | |
| Albany Molecular Research, Inc., Second Lien Initial Term Loan, 1M US L + 7.00%, 08/28/2025 | | | 1,473,214 | | | | 1,475,977 | |
| Arbor Pharmaceuticals LLC, First Lien Initial Term Loan, 3M US L + 5.00%, 07/05/2023 | | | 4,666,043 | | | | 4,366,646 | |
| Avantor Funding, Inc., First Lien Initial B-2 Dollar Term Loan, 1M US L + 3.75%, 11/21/2024 | | | 69,220 | | | | 69,588 | |
| Semi-Annual Report | June 30, 2019 | 37 |
| Blackstone / GSO Strategic Credit Fund | Portfolio of Investments |
June 30, 2019 (Unaudited)
| | | Principal Amount | | | Value | |
| Drugs (continued) | | | | | | | | |
| Packaging Coordinators Midco, Inc., First Lien Initial Term Loan, 1M US L + 4.00%, 06/30/2023 | | $ | 5,616,415 | | | $ | 5,635,736 | |
| | | | | | | | 11,547,947 | |
| | | | | | | | | |
| Ecological Services & Equipment - 0.92% | | | | | | | | |
| Emerald 3 Limited, 3M US L + 7.00%, 05/31/2022(b) | | | 1,847,745 | | | | 1,847,745 | |
| EnergySolutions LLC, First Lien Initial Term Loan, 3M US L + 3.75%, 05/09/2025 | | | 2,527,676 | | | | 2,426,569 | |
| ERM Emerald US, Inc., First Lien Term Loan, 3M US L + 3.75%, 06/26/2026(b) | | | 1,006,186 | | | | 1,008,701 | |
| Tunnel Hill Partners LP, First Lien Initial Term Loan, 1M US L + 3.50%, 02/06/2026 | | | 1,112,257 | | | | 1,111,562 | |
| | | | | | | | 6,394,577 | |
| | | | | | | | | |
| Electronics/Electrical - 28.48% | | | | | | | | |
| AppLovin Corp., First Lien Initial Term Loan, 1M US L + 3.50%, 08/15/2025 | | | 1,104,916 | | | | 1,104,922 | |
| Boxer Parent Co., Inc., First Lien Initial Dollar Term Loan, 3M US L + 4.25%, 10/02/2025 | | | 8,955,000 | | | | 8,496,056 | |
| Brave Parent Holdings, Inc., First Lien Initial Term Loan, 3M US L + 4.00%, 04/18/2025 | | | 2,381,955 | | | | 2,365,591 | |
| CommerceHub, Inc., First Lien Initial Term Loan, 1M US L + 3.75%, 05/21/2025(b) | | | 3,712,500 | | | | 3,675,375 | |
| Compuware Corp., First Lien Term Loan, 1M US L + 3.50%, 08/23/2025 | | | 1,030,986 | | | | 1,030,986 | |
| ConvergeOne Holdings, Corp., First Lien Initial Term Loan, 1M US L + 5.00%, 01/04/2026 | | | 5,985,000 | | | | 5,708,194 | |
| CPI International, Inc., Second Lien Initial Term Loan, 1M US L + 7.25%, 07/25/2025(b) | | | 1,045,752 | | | | 1,003,922 | |
| Curvature, Inc., First Lien Initial Term Loan, 1M US L + 5.00%, 10/30/2023 | | | 11,570,036 | | | | 8,065,935 | |
| DigiCert, Inc., Second Lien Initial Term Loan, 1M US L + 8.00%, 09/19/2025 | | | 4,000,000 | | | | 3,980,000 | |
| DiscoverOrg LLC, First Lien Initial Term Loan, 1M US L + 4.50%, 02/02/2026 | | | 4,987,500 | | | | 4,975,031 | |
| Dynatrace LLC, Second Lien Term Loan, 1M US L + 7.00%, 08/24/2026 | | | 1,522,251 | | | | 1,535,570 | |
| ECi Macola/MAX Holding LLC, First Lien Initial Term Loan, 3M US L + 4.25%, 09/27/2024 | | | 2,096,812 | | | | 2,096,812 | |
| Ellie Mae, Inc., First Lien Term Loan, 3M US L + 4.00%, 04/17/2026 | | | 9,600,000 | | | | 9,583,968 | |
| Flexera Software LLC, Second Lien Initial Term Loan, 1M US L + 7.25%, 02/26/2026 | | | 2,299,194 | | | | 2,297,044 | |
| Gigamon, Inc., First Lien Initial Term Loan, 1M US L + 4.25%, 12/27/2024(b) | | | 10,152,502 | | | | 9,898,689 | |
| Help/Systems Holdings, Inc., First Lien Term Loan: | | | | | | | | |
| 3M US L + 3.75%, 03/28/2025 | | | 2,143,701 | | | | 2,130,302 | |
| 3M US L + 7.75%, 03/23/2026(b) | | | 2,068,966 | | | | 2,058,621 | |
| Hyland Software, Inc., Second Lien Initial Term Loan, 1M US L + 7.00%, 05/31/2025 | | | 1,675,906 | | | | 1,687,779 | |
| Idera, Inc., First Lien Initial Term Loan, 1M US L + 4.50%, 06/28/2024 | | | 2,830,564 | | | | 2,831,738 | |
| Imperva, Inc., First Lien Term Loan: | | | | | | | | |
| 1M US L + 4.00%, 01/12/2026 | | | 3,272,727 | | | | 3,261,486 | |
| 1M US L + 7.75%, 01/11/2027 | | | 2,823,529 | | | | 2,788,235 | |
| Ivanti Software, Inc., First Lien Term Loan: | | | | | | | | |
| 1M US L + 4.25%, 01/19/2024 | | | 5,927,213 | | | | 5,921,049 | |
| 1M US L + 9.00%, 01/20/2025 | | | 6,000,000 | | | | 5,943,000 | |
| MACOM Technology Solutions Holdings, Inc., First Lien Initial Term Loan, 1M US L + 2.25%, 05/17/2024 | | | 4,488,550 | | | | 4,031,279 | |
| McAfee LLC, First Lien B USD Term Loan, 1M US L + 3.75%, 09/30/2024 | | | 7,651,223 | | | | 7,652,409 | |
| MH Sub I LLC, First Lien Amendment No. 2 Initial Term Loan, 1M US L + 3.75%, 08/16/2024 | | | 2,818,616 | | | | 2,773,870 | |
| MLN US HoldCo LLC, First Lien B Term Loan, 1M US L + 4.50%, 11/30/2025 | | | 4,099,120 | | | | 3,928,330 | |
| MYOB US Borrower LLC, First Lien Initial U.S. Term Loan, 1M US L + 4.00%, 04/17/2026 | | | 2,666,667 | | | | 2,673,347 | |
| Navex Topco, Inc., First Lien Initial Term Loan: | | | | | | | | |
| 1M US L + 3.25%, 09/05/2025 | | | 670,787 | | | | 658,880 | |
| 1M US L + 7.00%, 09/04/2026 | | | 3,000,000 | | | | 2,977,500 | |
| P2 Upstream Acquisition Co., First Lien Term Loan, 3M US L + 4.00%, 10/30/2020 | | | 4,030,964 | | | | 4,001,578 | |
| Park Place Technologies LLC, First Lien Initial Term Loan, 1M US L + 4.00%, 03/29/2025 | | | 3,967,402 | | | | 3,947,565 | |
| Perforce Software, Inc., First Lien B Term Loan, 3M US L + 4.50%, 06/12/2026 | | | 1,229,839 | | | | 1,229,839 | |
| Ping Identity Corp., First Lien Term Loan, 1M US L + 3.75%, 01/24/2025 | | | 1,848,000 | | | | 1,845,690 | |
| Project Alpha Intermediate Holding, Inc., First Lien Term Loan: | | | | | | | | |
| 3M US L + 3.50%, 04/26/2024 | | | 2,085,997 | | | | 2,028,632 | |
| 3M US L + 4.25%, 04/26/2024 | | | 3,636,364 | | | | 3,627,273 | |
| Project Angel Parent LLC, First Lien Initial Term Loan, 1M US L + 4.00%, 05/30/2025(b) | | | 3,555,224 | | | | 3,519,672 | |
| Blackstone / GSO Strategic Credit Fund | Portfolio of Investments |
June 30, 2019 (Unaudited)
| | | Principal Amount | | | Value | |
| Electronics/Electrical (continued) | | | | | | | | |
| Project Leopard Holdings, Inc., First Lien 2018 Repricing Term Loan: | | | | | | | | |
| 6M US L + 4.50%, 07/07/2023 | | $ | 2,729,271 | | | $ | 2,728,711 | |
| 6M US L + 4.25%, 07/07/2023 | | | 1,034,800 | | | | 1,035,447 | |
| Project Silverback Holdings Corp., First Lien New Term Loan, 1M US L + 3.50%, 08/21/2024 | | | 1,992,676 | | | | 1,783,445 | |
| Quest Software US Holdings, Inc., First Lien Initial Term Loan: | | | | | | | | |
| 3M US L + 4.25%, 05/16/2025 | | | 9,403,373 | | | | 9,276,428 | |
| 3M US L + 8.25%, 05/17/2026 | | | 8,885,470 | | | | 8,768,893 | |
| Rocket Software, Inc., First Lien Initial Term Loan, 1M US L + 4.25%, 11/28/2025 | | | 5,154,808 | | | | 5,051,712 | |
| SciQuest, Inc., First Lien Term Loan, 1M US L + 4.00%, 12/28/2024(b) | | | 6,836,538 | | | | 6,785,264 | |
| SCS Holdings I, Inc., First Lien New Tranche B Term Loan, 1M US L + 4.25%, 10/30/2022 | | | 3,901,630 | | | | 3,928,453 | |
| SonicWall US Holdings, Inc., First Lien Initial Term Loan: | | | | | | | | |
| 3M US L + 3.50%, 05/16/2025 | | | 3,608,863 | | | | 3,374,287 | |
| 3M US L + 7.50%, 05/17/2026 | | | 4,800,000 | | | | 4,434,000 | |
| Triton Solar US Acquisition Co., First Lien Initial Term Loan, 3M US L + 6.00%, 10/29/2024 | | | 691,295 | | | | 650,681 | |
| Veritas US, Inc., First Lien New Dollar B Term Loan, 1M US L + 4.50%, 01/27/2023 | | | 4,312,500 | | | | 3,937,873 | |
| Vero Parent, Inc., First Lien 2018 Refinancing Term Loan, 1M US L + 4.50%, 08/16/2024 | | | 1,677,465 | | | | 1,674,319 | |
| Web.com Group, Inc., First Lien B Term Loan: | | | | | | | | |
| 1M US L + 3.75%, 10/10/2025 | | | 5,452,055 | | | | 5,385,049 | |
| 1M US L + 7.75%, 10/09/2026 | | | 2,195,428 | | | | 2,162,496 | |
| | | | | | | | 198,313,227 | |
| | | | | | | | | |
| Financial Intermediaries - 2.75% | | | | | | | | |
| ASP MCS Acquisition Corp., First Lien Initial Term Loan, 1M US L + 4.75%, 05/20/2024 | | | 6,757,170 | | | | 4,257,017 | |
| ION Trading Technologies S.A.R.L., First Lien 2018 Initial Dollar Term Loan, 3M US L + 4.00%, 11/21/2024 | | | 5,468,947 | | | | 5,317,566 | |
| NorthStar Financial Services Group LLC, First Lien Initial Term Loan: | | | | | | | | |
| 2M US L + 3.25%, 05/25/2025 | | | 4,590,387 | | | | 4,555,959 | |
| 2M US L + 7.50%, 05/25/2026(b) | | | 1,182,937 | | | | 1,171,107 | |
| Victory Capital Holdings, Inc., First Lien B Term Loan, 3M US L + 3.25%, 06/07/2026 | | | 3,812,500 | | | | 3,819,649 | |
| | | | | | | | 19,121,298 | |
| | | | | | | | | |
| Food Products - 1.96% | | | | | | | | |
| Alphabet Holding Co., Inc., First Lien Initial Term Loan, 1M US L + 3.50%, 09/26/2024 | | | 5,422,218 | | | | 5,130,774 | |
| TKC Holdings, Inc., First Lien Initial Term Loan: | | | | | | | | |
| 1M US L + 3.75%, 01/31/2023 | | | 4,631,309 | | | | 4,543,013 | |
| 1M US L + 8.00%, 01/31/2024 | | | 4,051,201 | | | | 3,997,664 | |
| | | | | | | | 13,671,451 | |
| | | | | | | | | |
| Food Service - 3.72% | | | | | | | | |
| CEC Entertainment, Inc., First Lien B Term Loan, 1M US L + 3.25%, 02/15/2021 | | | 3,771,327 | | | | 3,750,113 | |
| Flynn Restaurant Group LP, First Lien Initial Term Loan, 1M US L + 3.50%, 06/27/2025 | | | 7,615,517 | | | | 7,398,970 | |
| Fogo de Chao, Inc., First Lien 2018 Refinancing Term Loan, 1M US L + 4.25%, 04/07/2025 | | | 2,307,748 | | | | 2,310,633 | |
| K-Mac Holdings Corp., Second Lien Initial Term Loan, 1M US L + 6.75%, 03/16/2026 | | | 1,744,186 | | | | 1,738,954 | |
| NPC International, Inc., Second Lien Initial Term Loan, 1M US L + 7.50%, 04/18/2025 | | | 3,424,278 | | | | 2,110,211 | |
| Quidditch Acquisition, Inc., First Lien B Term Loan, 1M US L + 7.00%, 03/21/2025(b) | | | 2,965,243 | | | | 2,994,896 | |
| Red Lobster Management LLC, First Lien Initial Term Loan, 1M US L + 5.25%, 07/28/2021 | | | 2,597,444 | | | | 2,573,106 | |
| Tacala Investment Corp., Second Lien Initial Term Loan, 1M US L + 7.00%, 01/30/2026 | | | 3,034,483 | | | | 3,061,034 | |
| | | | | | | | 25,937,917 | |
| | | | | | | | | |
| Food/Drug Retailers - 0.89% | | | | | | | | |
| EG Group, Ltd., First Lien Facility B Term Loan: | | | | | | | | |
| 3M US L + 4.00%, 01/31/2025 | | | 685,764 | | | | 675,333 | |
| 3M US L + 4.00%, 02/07/2025 | | | 5,594,918 | | | | 5,509,819 | |
| | | | | | | | 6,185,152 | |
| Semi-Annual Report | June 30, 2019 | 39 |
| Blackstone / GSO Strategic Credit Fund | Portfolio of Investments |
June 30, 2019 (Unaudited)
| | | Principal Amount | | | Value | |
| Health Insurance - 1.46% | | | | | | | | |
| Achilles Acquisition LLC, First Lien Closing Date Term Loan, 1M US L + 4.00%, 10/13/2025 | | $ | 2,298,240 | | | $ | 2,301,113 | |
| FHC Health Systems, Inc., First Lien Initial Term Loan, 1M US L + 4.00%, 12/23/2021 | | | 7,381,849 | | | | 7,388,012 | |
| MPH Acquisition Holdings LLC, First Lien Initial Term Loan, 3M US L + 2.75%, 06/07/2023 | | | 482,206 | | | | 462,316 | |
| | | | | | | | 10,151,441 | |
| | | | | | | | | |
| Healthcare - 21.75% | | | | | | | | |
| Alvogen Pharma US, Inc., First Lien 2018 Refinancing Term Loan, 1M US L + 4.75%, 04/01/2022 | | | 6,326,766 | | | | 5,836,441 | |
| Auris Luxembourg III S.a r.l., First Lien Facility B2 Term Loan, 1M US L + 3.75%, 02/27/2026 | | | 2,071,731 | | | | 2,078,464 | |
| BioClinica Holding I LP, First Lien Initial Term Loan: | | | | | | | | |
| 3M US L + 4.25%, 10/20/2023 | | | 2,445,497 | | | | 2,323,223 | |
| 3M US L + 8.25%, 10/04/2024 | | | 3,157,898 | | | | 2,800,013 | |
| Carestream Health, Inc., First Lien Extended Term Loan: | | | | | | | | |
| 1M US L + 5.75%, 02/28/2021 | | | 495,690 | | | | 480,819 | |
| 1M US L + 9.50%, 06/07/2021 | | | 10,447,039 | | | | 10,055,275 | |
| Certara Holdco, Inc., First Lien Replacement Term Loan, 3M US L + 3.50%, 08/15/2024(b) | | | 929,697 | | | | 925,048 | |
| Covenant Surgical Partners, Inc., First Lien Term Loan: | | | | | | | | |
| 3M US L + 4.00%, 06/19/2026 | | | 762,500 | | | | 758,211 | |
| 3M US L + 4.00%, 06/19/2026 | | | 3,812,500 | | | | 3,791,055 | |
| CT Technologies Intermediate Holdings, Inc., First Lien New Facility Term Loan, 1M US L + 4.25%, 12/01/2021 | | | 2,910,421 | | | | 2,488,410 | |
| Dentalcorp Health Services ULC, First Lien Initial Term Loan, 1M US L + 3.75%, 06/06/2025 | | | 3,139,614 | | | | 3,107,244 | |
| Envision Healthcare Corp., First Lien Initial Term Loan, 1M US L + 3.75%, 10/10/2025 | | | 6,239,613 | | | | 5,529,857 | |
| Equian Buyer Corp., First Lien 2018 Incremental Term Loan, 1M US L + 3.25%, 05/20/2024 | | | 1,341,582 | | | | 1,342,085 | |
| Femur Buyer, Inc., First Lien Initial Term Loan, 3M US L + 4.25%, 03/05/2026 | | | 1,824,000 | | | | 1,831,980 | |
| Greenway Health LLC, First Lien Term Loan, 3M US L + 3.75%, 02/16/2024 | | | 3,041,379 | | | | 2,699,224 | |
| Heartland Dental LLC, First Lien Initial Term Loan: | | | | | | | | |
| 3M US L + 4.50%, 04/30/2025(b) | | | 1,429,688 | | | | 1,404,668 | |
| 1M US L + 3.75%, 04/30/2025 | | | 4,997,277 | | | | 4,747,438 | |
| Immucor, Inc., First Lien B-3 Term Loan, 3M US L + 5.00%, 06/15/2021 | | | 339,231 | | | | 338,807 | |
| Lanai Holdings II, Inc., First Lien Initial Term Loan, 3M US L + 4.75%, 08/29/2022 | | | 6,286,171 | | | | 6,034,725 | |
| LifeScan Global Corp., First Lien Initial Term Loan, 3M US L + 6.00%, 10/01/2024 | | | 8,685,000 | | | | 8,315,887 | |
| Maravai Intermediate Holdings LLC, First Lien Initial Term Loan, 1M US L + 4.25%, 08/02/2025(b) | | | 2,737,379 | | | | 2,737,379 | |
| Midwest Physician Administrative Services LLC, Second Lien Initial Term Loan, 1M US L + 7.00%, 08/15/2025 | | | 2,560,000 | | | | 2,508,800 | |
| Navicure, Inc., First Lien Initial Term Loan, 1M US L + 3.75%, 11/01/2024 | | | 6,622,952 | | | | 6,585,698 | |
| Netsmart Technologies, Inc., First Lien D-1 Term Loan, 1M US L + 3.75%, 04/19/2023 | | | 9,918,929 | | | | 9,838,338 | |
| NMSC Holdings, Inc., First Lien Initial Term Loan, 1M US L + 5.00%, 04/19/2023(b) | | | 689,480 | | | | 691,203 | |
| nThrive, Inc., First Lien Additional B-2 Term Loan, 1M US L + 4.50%, 10/20/2022 | | | 6,362,004 | | | | 6,035,951 | |
| NVA Holdings, Inc., First Lien B-3 Term Loan: | | | | | | | | |
| 1M US L + 2.75%, 02/02/2025 | | | 596,992 | | | | 596,742 | |
| 1M US L + 3.50%, 02/02/2025 | | | 800,000 | | | | 800,940 | |
| Onex TSG Holdings II Corp., First Lien Initial Term Loan, 1M US L + 4.00%, 07/29/2022 | | | 4,966,836 | | | | 4,960,627 | |
| PAREXEL International Corp., First Lien Initial Term Loan, 1M US L + 2.75%, 09/27/2024 | | | 2,837,693 | | | | 2,725,206 | |
| Pearl Intermediate Parent LLC, First Lien Initial Term Loan: | | | | | | | | |
| 1M US L + 2.75%, 01/31/2025(c) | | | 355,748 | | | | 344,409 | |
| 1M US L + 2.75%, 01/31/2025 | | | 1,579,230 | | | | 1,528,892 | |
| PetVet Care Centers LLC, First Lien 2018 Term Loan, 1M US L + 3.25%, 02/14/2025 | | | 1,790,977 | | | | 1,758,516 | |
| Phoenix Guarantor, Inc., First Lien Initial Term Loan, 1M US L + 4.50%, 03/05/2026 | | | 8,598,726 | | | | 8,574,005 | |
| Press Ganey Holdings, Inc., Second Lien Initial Term Loan, 1M US L + 6.50%, 10/21/2024 | | | 1,123,601 | | | | 1,128,747 | |
| Project Ruby Ultimate Parent Corp., First Lien New Term Loan, 1M US L + 3.50%, 02/09/2024 | | | 2,594,568 | | | | 2,582,672 | |
| Prospect Medical Holdings, Inc., First Lien B-1 Term Loan, 1M US L + 5.50%, 02/16/2024 | | | 4,649,994 | | | | 4,401,987 | |
| Regionalcare Hospital Partners Holdings, Inc., First Lien B Term Loan, 1M US L + 4.50%, 11/16/2025 | | | 4,881,067 | | | | 4,860,567 | |
| Surgery Center Holdings, Inc., First Lien Initial Term Loan, 1M US L + 3.25%, 09/02/2024 | | | 380,916 | | | | 368,852 | |
| Blackstone / GSO Strategic Credit Fund | Portfolio of Investments |
June 30, 2019 (Unaudited)
| | | Principal
Amount | | | Value | |
| | | | | | | |
| Healthcare (continued) | | | | | | | | |
| Team Health Holdings, Inc., First Lien Initial Term Loan, 1M US L + 2.75%, 02/06/2024 | | $ | 992,386 | | | $ | 881,363 | |
| U.S. Anesthesia Partners, Inc., First Lien Initial Term Loan, 1M US L + 3.00%, 06/23/2024 | | | 798,545 | | | | 783,904 | |
| Verscend Holding Corp., First Lien B Term Loan, 1M US L + 4.50%, 08/27/2025 | | | 3,721,875 | | | | 3,731,775 | |
| Vyaire Medical, Inc., First Lien Term Loan, 3M US L + 4.75%, 04/16/2025(b) | | | 8,910,000 | | | | 8,063,550 | |
| YI LLC, First Lien Initial Term Loan, 3M US L + 4.00%, 11/06/2024(b) | | | 4,005,983 | | | | 4,000,976 | |
| Zest Acquisition Corp., Second Lien Initial Term Loan, 1M US L + 7.50%, 03/06/2026(b) | | | 4,357,143 | | | | 4,106,607 | |
| | | | | | | | 151,486,580 | |
| | | | | | | | | |
| Home Furnishings - 0.48% | | | | | | | | |
| AI Aqua Merger Sub, Inc., First Lien Tranche B-1 Term Loan: | | | | | | | | |
| 1M US L + 3.25%, 12/13/2023 | | | 182,151 | | | | 176,231 | |
| 1M US L + 3.25%, 12/13/2023 | | | 674,587 | | | | 654,350 | |
| Hayward Industries, Inc., First Lien Initial Term Loan, 1M US L + 3.50%, 08/05/2024 | | | 358,813 | | | | 352,085 | |
| Serta Simmons Bedding LLC, Second Lien Initial Term Loan, 1M US L + 8.00%, 11/08/2024 | | | 4,786,804 | | | | 2,173,209 | |
| | | | | | | | 3,355,875 | |
| | | | | | | | | |
| Industrial Equipment - 4.98% | | | | | | | | |
| AI Alpine AT BidCo GmbH, First Lien Facility B Term Loan, 1M US L + 3.25%, 10/31/2025(b) | | | 808,193 | | | | 797,081 | |
| Apex Tool Group LLC, First Lien Second Amendment Term Loan, 1M US L + 3.75%, 02/01/2022 | | | 5,183,511 | | | | 4,997,786 | |
| Engineered Machinery Holdings, Inc., First Lien Initial Term Loan, 3M US L + 3.25%, 07/19/2024(b) | | | 4,393,100 | | | | 4,283,272 | |
| Helix Acquisition Holdings, Inc., First Lien 2018 New Term Loan, 3M US L + 3.75%, 09/30/2024 | | | 3,789,626 | | | | 3,718,571 | |
| Justrite Safety Group: | | | | | | | | |
| 3M US L + 4.50%, 06/26/2026(b) | | | 335,942 | | | | 335,522 | |
| 3M US L + 4.50%, 06/26/2026(b) | | | 2,754,725 | | | | 2,751,281 | |
| LTI Holdings, Inc., First Lien Initial Term Loan: | | | | | | | | |
| 1M US L + 3.50%, 09/06/2025 | | | 1,968,595 | | | | 1,865,864 | |
| 1M US L + 6.75%, 09/07/2026 | | | 1,276,596 | | | | 1,189,149 | |
| Robertshaw US Holding Corp., First Lien Initial Term Loan, 1M US L + 3.50%, 02/28/2025(b) | | | 3,783,811 | | | | 3,500,025 | |
| Tailwind Smith Cooper Intermediate Corp., First Lien Initial Term Loan, 3M US L + 5.00%, 05/28/2026 | | | 4,200,000 | | | | 4,123,875 | |
| Titan Acquisition, Ltd., First Lien Initial Term Loan, 1M US L + 3.00%, 03/28/2025 | | | 7,437,033 | | | | 7,119,918 | |
| | | | | | | | 34,682,344 | |
| | | | | | | | | |
| Insurance - 1.48% | | | | | | | | |
| APCO Holdings LLC, First Lien Initial Term Loan, 1M US L + 5.50%, 06/06/2025 | | | 4,379,598 | | | | 4,390,547 | |
| Cypress Intermediate Holdings III, Inc., Second Lien Initial Term Loan, 1M US L + 6.75%, 03/31/2025 | | | 2,790,698 | | | | 2,818,605 | |
| HIG Finance 2, Ltd., First Lien Initial Dollar Term Loan, 1M US L + 3.50%, 12/13/2024 | | | 644,518 | | | | 644,337 | |
| Outcomes Group Holdings, Inc., Second Lien Term Loan: | | | | | | | | |
| 3M US L + 3.50%, 10/24/2025 | | | 1,302,545 | | | | 1,287,892 | |
| 3M US L + 7.50%, 10/26/2026 | | | 1,153,846 | | | | 1,148,077 | |
| | | | | | | | 10,289,458 | |
| | | | | | | | | |
| Leisure Goods/Activities/Movies - 1.73% | | | | | | | | |
| Travel Leaders Group LLC, First Lien 2018 Refinancing Term Loan, 1M US L + 4.00%, 01/25/2024 | | | 1,578,030 | | | | 1,583,285 | |
| Travelport Finance S.à r.l., First Lien Initial Term Loan, 3M US L + 5.00%, 05/29/2026 | | | 7,200,000 | | | | 6,792,732 | |
| United PF Holdings LLC, First Lien Term Loan: | | | | | | | | |
| 1M US L + 4.50%, 06/10/2026 | | | 3,103,079 | | | | 3,110,837 | |
| 1M US L + 8.50%, 06/10/2027(b) | | | 577,027 | | | | 572,699 | |
| | | | | | | | 12,059,553 | |
| Semi-Annual Report | June 30, 2019 | 41 |
| Blackstone / GSO Strategic Credit Fund | Portfolio of Investments |
June 30, 2019 (Unaudited)
| | | Principal
Amount | | | Value | |
| | | | | | | |
| Lodging & Casinos - 0.66% | | | | | | | | |
| Casablanca US Holdings, Inc., First Lien Amendment No. 2 Initial Term Loan, 3M US L + 4.00%, 03/29/2024(b) | | $ | 4,740,000 | | | $ | 4,621,500 | |
| | | | | | | | | |
| Nonferrous Metals/Minerals - 1.39% | | | | | | | | |
| Aleris International, Inc., First Lien Initial Term Loan, 1M US L + 4.75%, 02/27/2023 | | | 4,779,310 | | | | 4,791,259 | |
| American Rock Salt Co. LLC, First Lien Initial Term Loan, 1M US L + 3.75%, 03/21/2025 | | | 2,892,065 | | | | 2,892,065 | |
| Murray Energy Corp., First Lien Superpriority B-2 Term Loan, 3M US L + 7.25%, 10/17/2022 | | | 2,903,567 | | | | 1,962,332 | |
| | | | | | | | 9,645,656 | |
| | | | | | | | | |
| Oil & Gas - 3.66% | | | | | | | | |
| Ascent Resources - Marcellus LLC, First Lien Initial Term Loan, 1M US L + 6.50%, 03/30/2023(b) | | | 1,234,568 | | | | 1,222,222 | |
| Equitrans Midstream Corp., First Lien Holdco B Facility Term Loan, 1M US L + 4.50%, 01/31/2024 | | | 2,016,892 | | | | 2,033,703 | |
| Keane Group Holdings LLC, First Lien Initial Term Loan, 1M US L + 3.75%, 05/26/2025 | | | 3,564,000 | | | | 3,525,384 | |
| Lower Cadence Holdings LLC, First Lien Initial Term Loan, 1M US L + 4.00%, 05/22/2026 | | | 3,673,469 | | | | 3,660,465 | |
| Lucid Energy Group II Borrower LLC, First Lien Initial Term Loan, 1M US L + 3.00%, 01/31/2025 | | | 1,335,314 | | | | 1,278,570 | |
| Petroleum GEO-Services ASA, First Lien Extended Term Loan, 3M US L + 2.50%, 03/19/2021 | | | 3,382,368 | | | | 3,261,567 | |
| Sheridan Investment Partners I LLC, First Lien Tranche B-2 Term Loan, 3M US L + 3.50%, 10/01/2019 | | | 3,043,366 | | | | 2,176,006 | |
| Sheridan Production Partners I LLC, First Lien Deferred Principal Term Loan: | | | | | | | | |
| 3M US L + 0.00%, 10/01/2019(b) | | | 15,933 | | | | 11,286 | |
| 3M US L + 0.00%, 10/01/2019(b) | | | 120,242 | | | | 85,167 | |
| 3M US L + 0.00%, 10/01/2019(b) | | | 9,732 | | | | 6,893 | |
| Sheridan Production Partners I-A LP, First Lien Tranche B-2 Term Loan, 3M US L + 3.50%, 10/01/2019 | | | 403,271 | | | | 288,339 | |
| Sheridan Production Partners I-M LP, First Lien Tranche B-2 Term Loan, 3M US L + 3.50%, 10/01/2019 | | | 246,320 | | | | 176,119 | |
| Traverse Midstream Partners LLC, First Lien Advance Term Loan, 3M US L + 4.00%, 09/27/2024 | | | 4,868,320 | | | | 4,826,574 | |
| UTEX Industries, Inc., Second Lien Initial Term Loan, 1M US L + 7.25%, 05/20/2022 | | | 3,181,818 | | | | 2,908,707 | |
| | | | | | | | 25,461,002 | |
| | | | | | | | | |
| Property & Casualty Insurance - 1.61% | | | | | | | | |
| Applied Systems, Inc., Second Lien Initial Term Loan, 3M US L + 7.00%, 09/19/2025 | | | 303,030 | | | | 307,121 | |
| Asurion LLC, Second Lien Replacement B-2 Term Loan, 1M US L + 6.50%, 08/04/2025 | | | 9,089,314 | | | | 9,236,107 | |
| Confie Seguros Holding II Co., First Lien B Term Loan, 3M US L + 4.75%, 04/19/2022 | | | 1,687,293 | | | | 1,664,793 | |
| | | | | | | | 11,208,021 | |
| | | | | | | | | |
| Publishing - 1.63% | | | | | | | | |
| Champ Acquisition Corp., First Lien Initial Term Loan, 3M US L + 5.50%, 12/19/2025 | | | 4,455,224 | | | | 4,410,672 | |
| Recorded Books, Inc., First Lien Initial Term Loan, 3M US L + 4.50%, 08/29/2025 | | | 2,611,842 | | | | 2,620,017 | |
| Southern Graphics, Inc., Second Lien Initial Term Loan: | | | | | | | | |
| 2M US L + 3.25%, 12/31/2022 | | | 1,219,527 | | | | 1,023,647 | |
| 2M US L + 7.50%, 12/31/2023(b) | | | 4,500,000 | | | | 3,285,000 | |
| | | | | | | | 11,339,336 | |
| | | | | | | | | |
| Radio & Television - 0.21% | | | | | | | | |
| Gray Television, Inc., First Lien B-2 Term Loan, 1M US L + 2.25%, 02/07/2024 | | | 500,000 | | | | 498,625 | |
| iHeartCommunications, Inc., First Lien Initial Term Loan, 3M US L + 4.00%, 05/01/2026 | | | 500,000 | | | | 501,213 | |
| William Morris Endeavor Entertainment LLC, First Lien B-1 Term Loan, 1M US L + 2.75%, 05/18/2025 | | | 497,381 | | | | 482,044 | |
| | | | | | | | 1,481,882 | |
| Blackstone / GSO Strategic Credit Fund | Portfolio of Investments |
June 30, 2019 (Unaudited)
| | | Principal
Amount | | | Value | |
| | | | | | | |
| Retailers (except food & drug) - 1.97% | | | | | | | | |
| Academy, Ltd., First Lien Initial Term Loan, 1M US L + 4.00%, 07/01/2022 | | $ | 1,973,114 | | | $ | 1,416,696 | |
| Apro LLC, First Lien Initial Term Loan, 1M US L + 4.00%, 08/08/2024 | | | 2,359,322 | | | | 2,369,644 | |
| Ascena Retail Group, Inc., First Lien Tranche B Term Loan, 1M US L + 4.50%, 08/19/2022 | | | 2,746,719 | | | | 1,807,108 | |
| FBB Holdings III, Inc., First Lien Initial Term Loan: | | | | | | | | |
| 3M US L + 9.00%, 02/07/2024(b) | | | 556,946 | | | | 529,098 | |
| 3M US L + 7.00%, 01/31/2025(b) | | | 189,025 | | | | 130,428 | |
| Neiman Marcus Group, Ltd. LLC, First Lien Cash Pay/PIK Extended Term Loan, 1M US L + 6.50%, 10/25/2023 | | | 1,822,881 | | | | 1,599,578 | |
| Petco Animal Supplies, Inc., First Lien Term Loan, 3M US L + 3.25%, 01/26/2023 | | | 1,557,318 | | | | 1,212,761 | |
| Pier 1 Imports US, Inc., First Lien Initial Term Loan, 3M US L + 3.50%, 04/30/2021(b) | | | 1,979,167 | | | | 494,792 | |
| Spencer Spirit Holding/Gift, First Lien Initial Term Loan, 3M US L + 6.00%, 06/19/2026 | | | 4,270,000 | | | | 4,186,393 | |
| Sports Authority, Inc., First Lien B Term Loan, 3M US L + 6.00%, 11/16/2017(b)(d) | | | 2,169,639 | | | | 4,339 | |
| | | | | | | | 13,750,837 | |
| | | | | | | | | |
| Steel - 1.03% | | | | | | | | |
| Can Am Construction, Inc., First Lien Closing Date Term Loan, 1M US L + 5.00%, 07/01/2024(b) | | | 6,193,794 | | | | 6,007,979 | |
| Phoenix Services International LLC, First Lien B Term Loan, 1M US L + 3.75%, 03/01/2025 | | | 1,197,899 | | | | 1,187,418 | |
| | | | | | | | 7,195,397 | |
| | | | | | | | | |
| Surface Transport - 1.20% | | | | | | | | |
| Drive Chassis Holdco LLC, Second Lien B Term Loan, 3M US L + 8.25%, 04/10/2026 | | | 6,000,000 | | | | 5,782,500 | |
| SMB Shipping Logistics LLC, First Lien Term Loan, 3M US L + 4.00%, 02/05/2024 | | | 2,565,877 | | | | 2,553,048 | |
| | | | | | | | 8,335,548 | |
| | | | | | | | | |
| Telecommunications - 4.07% | | | | | | | | |
| Alorica, Inc., First Lien New B Term Loan, 1M US L + 3.75%, 06/30/2022 | | | 2,697,303 | | | | 2,609,640 | |
| Avaya, Inc., First Lien Tranche B Term Loan, 1M US L + 4.25%, 12/15/2024 | | | 7,351,014 | | | | 7,047,785 | |
| Cyxtera DC Holdings, Inc., Second Lien Initial Term Loan, 1M US L + 7.25%, 05/01/2025 | | | 902,256 | | | | 790,444 | |
| Ensono LP, First Lien Term Loan, 1M US L + 5.25%, 06/27/2025 | | | 3,377,574 | | | | 3,374,416 | |
| Masergy Holdings, Inc., Second Lien Initial Term Loan: | | | | | | | | |
| 3M US L + 3.25%, 12/15/2023 | | | 1,819,928 | | | | 1,794,904 | |
| 3M US L + 7.50%, 12/16/2024 | | | 1,766,917 | | | | 1,740,414 | |
| Peak 10 Holding Corp., First Lien Initial Term Loan: | | | | | | | | |
| 3M US L + 3.50%, 08/01/2024 | | | 3,572,727 | | | | 3,291,393 | |
| 3M US L + 7.25%, 08/01/2025 | | | 3,857,143 | | | | 3,252,053 | |
| Securus Technologies Holdings, Inc., First Lien Initial Term Loan, 3M US L + 4.50%, 11/01/2024 | | | 457,826 | | | | 427,305 | |
| Vertiv Group Corp., First Lien B Term Loan, 3M US L + 4.00%, 11/30/2023 | | | 4,201,217 | | | | 4,001,660 | |
| | | | | | | | 28,330,014 | |
| | | | | | | | | |
| Utilities - 2.88% | | | | | | | | |
| Brookfield WEC Holdings, Inc., First Lien Initial Term Loan: | | | | | | | | |
| 1M US L + 3.50%, 07/31/2025 | | | 5,492,138 | | | | 5,491,753 | |
| 1M US L + 6.75%, 08/03/2026 | | | 747,664 | | | | 758,531 | |
| Granite Acquisition, Inc., Second Lien B Term Loan, 3M US L + 7.25%, 12/19/2022 | | | 5,742,624 | | | | 5,757,900 | |
| Green Energy Partners/Stonewall LLC, First Lien B-1 Conversion Advances Term Loan, 3M US L + 5.50%, 11/13/2021 | | | 1,572,983 | | | | 1,541,523 | |
| Moxie Liberty LLC, First Lien Construction B-1 Advance Term Loan, 3M US L + 6.50%, 08/21/2020 | | | 6,708,966 | | | | 6,066,046 | |
| Semi-Annual Report | June 30, 2019 | 43 |
| Blackstone / GSO Strategic Credit Fund | Portfolio of Investments |
June 30, 2019 (Unaudited)
| | | Principal
Amount | | | Value | |
| | | | | | | |
| Utilities (continued) | | | | | | | | |
| Moxie Patriot LLC, First Lien Construction B-1 Advances Term Loan, 3M US L + 5.75%, 12/19/2020 | | $ | 427,994 | | | $ | 411,409 | |
| | | | | | | | 20,027,162 | |
| | | | | | | | | |
| TOTAL FLOATING RATE LOAN INTERESTS | | | | | | | | |
| (Cost $990,310,566) | | | | | | | 957,546,880 | |
| | | | | | | | | |
| CORPORATE BONDS - 20.78% | | | | | | | | |
| Automotive - 0.28% | | | | | | | | |
| IAA, Inc. 5.500%, 06/15/2027(e) | | | 494,000 | | | | 514,995 | |
| Midas Intermediate Holdco II LLC / Midas Intermediate Holdco II Finance, Inc. 7.875%, 10/01/2022(e) | | | 1,500,000 | | | | 1,432,500 | |
| | | | | | | | 1,947,495 | |
| | | | | | | | | |
| Building & Development - 3.45% | | | | | | | | |
| Builders FirstSource, Inc. 6.750%, 06/01/2027(e) | | | 429,000 | | | | 454,740 | |
| Great Lakes Dredge & Dock Corp. 8.000%, 05/15/2022 | | | 4,874,000 | | | | 5,172,533 | |
| Hillman Group, Inc. 6.375%, 07/15/2022(e) | | | 1,300,000 | | | | 1,157,000 | |
| Northwest Hardwoods, Inc. 7.500%, 08/01/2021(e) | | | 3,211,000 | | | | 1,974,765 | |
| NWH Escrow Corp. 7.500%, 08/01/2021(e) | | | 4,918,000 | | | | 2,999,980 | |
| PriSo Acquisition Corp. 9.000%, 05/15/2023(e) | | | 13,060,000 | | | | 12,260,075 | |
| | | | | | | | 24,019,093 | |
| | | | | | | | | |
| Business Equipment & Services - 0.82% | | | | | | | | |
| Allied Universal Holdco LLC 6.625%, 07/15/2026(e) | | | 3,978,000 | | | | 4,052,587 | |
| Clean Harbors, Inc.: | | | | | | | | |
| 4.875%, 07/15/2027(e) | | | 1,100,000 | | | | 1,120,735 | |
| 5.125%, 07/15/2029(e) | | | 544,000 | | | | 556,240 | |
| | | | | | | | 5,729,562 | |
| | | | | | | | | |
| Chemical & Plastics - 0.49% | | | | | | | | |
| Pinnacle Operating Corp. 9.000%, 11/15/2020(e) | | | 2,000,000 | | | | 1,720,000 | |
| Starfruit Finco BV / Starfruit US Holdco LLC 8.000%, 10/01/2026(e) | | | 1,621,000 | | | | 1,673,683 | |
| | | | | | | | 3,393,683 | |
| | | | | | | | | |
| Containers & Glass Products - 1.01% | | | | | | | | |
| ARD Securities Finance SARL 8.750%, 01/31/2023(e)(f) | | | 1,418,875 | | | | 1,436,611 | |
| Flex Acquisition Co., Inc. 6.875%, 01/15/2025(e) | | | 1,192,000 | | | | 1,084,720 | |
| Trident Merger Sub, Inc. 6.625%, 11/01/2025(e) | | | 4,800,000 | | | | 4,500,000 | |
| | | | | | | | 7,021,331 | |
| | | | | | | | | |
| Diversified Insurance - 2.36% | | | | | | | | |
| HUB International, Ltd. 7.000%, 05/01/2026(e) | | | 1,281,000 | | | | 1,301,816 | |
| NFP Corp. 6.875%, 07/15/2025(e) | | | 5,084,000 | | | | 5,050,700 | |
| York Risk Services Holding Corp. 8.500%, 10/01/2022(e) | | | 12,200,000 | | | | 10,095,500 | |
| | | | | | | | 16,448,016 | |
| | | | | | | | | |
| Drugs - 0.91% | | | | | | | | |
| Avantor, Inc. 9.000%, 10/01/2025(e) | | | 5,667,000 | | | | 6,332,872 | |
| Blackstone / GSO Strategic Credit Fund | Portfolio of Investments |
June 30, 2019 (Unaudited)
| | | Principal
Amount | | | Value | |
| | | | | | | |
| Ecological Services & Equipment - 0.80% | | | | | | | | |
| GFL Environmental, Inc.: | | | | | | | | |
| 5.375%, 03/01/2023(e) | | $ | 2,884,000 | | | $ | 2,869,580 | |
| 7.000%, 06/01/2026(e) | | | 186,000 | | | | 190,883 | |
| 8.500%, 05/01/2027(e) | | | 2,298,000 | | | | 2,478,967 | |
| | | | | | | | 5,539,430 | |
| | | | | | | | | |
| Electronics/Electrical - 1.83% | | | | | | | | |
| Banff Merger Sub, Inc. 9.750%, 09/01/2026(e) | | | 2,816,000 | | | | 2,456,960 | |
| Global A&T Electronics, Ltd. 8.500%, 01/12/2023 | | | 5,455,007 | | | | 5,120,526 | |
| Riverbed Technology, Inc. 8.875%, 03/01/2023(e) | | | 7,723,000 | | | | 5,193,718 | |
| | | | | | | | 12,771,204 | |
| | | | | | | | | |
| Equipment Leasing - 0.16% | | | | | | | | |
| Fly Leasing, Ltd. 6.375%, 10/15/2021 | | | 1,100,000 | | | | 1,128,875 | |
| | | | | | | | | |
| Food Service - 0.20% | | | | | | | | |
| CEC Entertainment, Inc. 8.000%, 02/15/2022 | | | 1,369,000 | | | | 1,384,401 | |
| | | | | | | | | |
| Food/Drug Retailers - 0.30% | | | | | | | | |
| eG Global Finance PLC 6.750%, 02/07/2025(e) | | | 2,113,000 | | | | 2,101,801 | |
| | | | | | | | | |
| Healthcare - 1.83% | | | | | | | | |
| Envision Healthcare Corp. 8.750%, 10/15/2026(e) | | | 6,250,000 | | | | 4,359,375 | |
| Team Health Holdings, Inc. 6.375%, 02/01/2025(e) | | | 3,500,000 | | | | 2,695,000 | |
| Tenet Healthcare Corp. 7.000%, 08/01/2025 | | | 5,714,000 | | | | 5,714,000 | |
| | | | | | | | 12,768,375 | |
| | | | | | | | | |
| Industrial Equipment - 0.16% | | | | | | | | |
| Titan Acquisition, Ltd. / Titan Co.-Borrower LLC 7.750%, 04/15/2026(e) | | | 1,250,000 | | | | 1,128,125 | |
| | | | | | | | | |
| Leisure Goods/Activities/Movies - 0.97% | | | | | | | | |
| Cedar Fair LP 5.250%, 07/15/2029(e) | | | 929,000 | | | | 949,902 | |
| Mood Media Borrower LLC / Mood Media Co.-Issuer, Inc. 6M US L + 6.00%, 8.00% PIK, 07/01/2024(a) | | | 6,573,214 | | | | 5,767,996 | |
| | | | | | | | 6,717,898 | |
| | | | | | | | | |
| Oil & Gas - 1.32% | | | | | | | | |
| Calumet Specialty Products Partners LP / Calumet Finance Corp. 7.750%, 04/15/2023 | | | 6,600,000 | | | | 6,352,500 | |
| CSI Compressco LP / CSI Compressco Finance, Inc. 7.250%, 08/15/2022 | | | 800,000 | | | | 722,000 | |
| Talos Production LLC / Talos Production Finance, Inc. 11.000%, 04/03/2022 | | | 2,000,000 | | | | 2,117,500 | |
| | | | | | | | 9,192,000 | |
| | | | | | | | | |
| Property & Casualty Insurance - 1.64% | | | | | | | | |
| AssuredPartners, Inc. 7.000%, 08/15/2025(e) | | | 4,545,000 | | | | 4,539,319 | |
| GTCR AP Finance, Inc. 8.000%, 05/15/2027(e) | | | 955,000 | | | | 962,162 | |
| Solera LLC / Solera Finance, Inc. 10.500%, 03/01/2024(e) | | | 5,450,000 | | | | 5,920,063 | |
| | | | | | | | 11,421,544 | |
| | | | | | | | | |
| Publishing - 0.58% | | | | | | | | |
| McGraw-Hill Global Education Holdings LLC / McGraw-Hill Global Education Finance 7.875%, 05/15/2024(e) | | | 4,320,000 | | | | 4,017,600 | |
| | | | | | | | | |
| Radio & Television - 0.34% | | | | | | | | |
| Entercom Media Corp. 6.500%, 05/01/2027(e) | | | 336,000 | | | | 350,280 | |
| Semi-Annual Report | June 30, 2019 | 45 |
| Blackstone / GSO Strategic Credit Fund | Portfolio of Investments |
June 30, 2019 (Unaudited)
| | | Principal
Amount | | | Value | |
| | | | | | | |
| Radio & Television (continued) | | | | | | | | |
| Univision Communications, Inc. 5.125%, 05/15/2023(e) | | $ | 2,070,000 | | | $ | 2,033,775 | |
| | | | | | | | 2,384,055 | |
| | | | | | | | | |
| Telecommunications - 1.33% | | | | | | | | |
| Digicel, Ltd. 6.000%, 04/15/2021(e) | | | 2,250,000 | | | | 1,721,250 | |
| Frontier Communications Corp.: | | | | | | | | |
| 10.500%, 09/15/2022 | | | 750,000 | | | | 511,875 | |
| 7.125%, 01/15/2023 | | | 4,000,000 | | | | 2,410,000 | |
| Sprint Communications, Inc. 6.000%, 11/15/2022 | | | 3,450,000 | | | | 3,605,250 | |
| Vertiv Group Corp. 9.250%, 10/15/2024(e) | | | 1,022,000 | | | | 983,675 | |
| | | | | | | | 9,232,050 | |
| | | | | | | | | |
| TOTAL CORPORATE BONDS | | | | | | | | |
| (Cost $156,984,608) | | | | | | | 144,679,410 | |
| | | Shares | | | | |
| COMMON STOCK - 2.06% | | | | | | | | |
| Building & Development - 0.00% | | | | | | | | |
| Baan Rock Garden PCL(b) | | | 164,832 | | | | – | |
| | | | | | | | | |
| Business Equipment & Services - 0.13% | | | | | | | | |
| Expanse Energy(b)(g) | | | 169,664 | | | | 933,152 | |
| | | | | | | | | |
| Leisure goods/activities/movies - 0.33% | | | | | | | | |
| Mood Media Corp.(b)(g) | | | 3,709,356 | | | | 2,262,707 | |
| | | | | | | | | |
| Oil & Gas - 1.60% | | | | | | | | |
| Ascent Resources - Equity(b)(g) | | | 886,921 | | | | 2,328,168 | |
| Ridgeback Resources Inc.(b)(g) | | | 1,201,345 | | | | 6,926,161 | |
| SandRidge Energy, Inc.(g) | | | 135,154 | | | | 935,266 | |
| Templar Energy LLC(b)(g) | | | 197,643 | | | | – | |
| Titan Energy LLC(g) | | | 29,318 | | | | 819 | |
| Total Safety Holdings, LLC(g) | | | 2,951 | | | | 973,830 | |
| | | | | | | | 11,164,244 | |
| | | | | | | | | |
| TOTAL COMMON STOCK | | | | | | | | |
| (Cost $42,341,121) | | | | | | | 14,360,103 | |
| | | | | | | | | |
| PREFERRED STOCK - 0.00% | | | | | | | | |
| Oil & Gas - 0.00% | | | | | | | | |
| Templar Energy LLC(b)(g) | | | 131,013 | | | | – | |
| | | | | | | | | |
| TOTAL PREFERRED STOCK | | | | | | | | |
| (Cost $1,310,126) | | | | | | | – | |
| | | | | | | | | |
| WARRANTS - 0.00%(h) | | | | | | | | |
| Oil & Gas - 0.00% | | | | | | | | |
| Ascent Resources Marcellus LLC expires 3/30/2023 at $6.15(b)(g) | | | 229,630 | | | | 6,889 | |
| | | | | | | | | |
| TOTAL WARRANTS | | | | | | | | |
| (Cost $25,062) | | | | | | | 6,889 | |
| Blackstone / GSO Strategic Credit Fund | Portfolio of Investments |
June 30, 2019 (Unaudited)
| | | Value | |
| Total Investments - 160.35% | | | | |
| (Cost $1,190,971,483) | | $ | 1,116,593,282 | |
| | | | | |
| Liabilities in Excess of Other Assets - (1.01)% | | | (6,988,673 | ) |
| | | | | |
| Mandatory Redeemable Preferred Shares - (6.50)% | | | | |
| (liquidation preference plus distributions payable on term preferred shares) | | | (45,267,743 | ) |
| | | | | |
| Leverage Facility - (52.85)% | | | (368,000,000 | ) |
| | | | | |
| Net Assets - 100.00% | | $ | 696,336,866 | |
Amounts above are shown as a percentage of net assets as of June 30, 2019.
Investment Abbreviations:
LIBOR - London Interbank Offered Rate
PIK - Payment In Kind
Libor Rates:
1W US L - 1 Week LIBOR as of June 30, 2019 was 2.37%
1M US L - 1 Month LIBOR as of June 30, 2019 was 2.40%
2M US L - 2 Month LIBOR as of June 30, 2019 was 2.33%
3M US L - 3 Month LIBOR as of June 30, 2019 was 2.32%
6M US L - 6 Month LIBOR as of June 30, 2019 was 2.20%
| (a) | Floating or variable rate security. The reference rate is described above. The rate in effect as of June 30, 2019 is based on the reference rate plus the displayed spread as of the security's last reset date. |
| (b) | Level 3 assets valued using significant unobservable inputs as a result of unavailable quoted prices from an active market or the unavailability of other significant observable inputs. |
| (c) | A portion of this position was not funded as of June 30, 2019. The Portfolio of Investments records only the funded portion of each position. As of June 30, 2019, the Fund has unfunded delayed draw loans in the amount of $872,694. Fair value of these unfunded delayed draw loans was $843,280. |
| (d) | Security is in default as of period end and is therefore non-income producing. |
| (e) | Security exempt from registration under Rule 144A of the Securities Act of 1933. Total market value of Rule 144A securities amounts to $104,671,954, which represented approximately 15.03% of net assets as of June 30, 2019. Such securities may normally be sold to qualified institutional buyers in transactions exempt from registration. |
| (f) | Option to convert to pay-in-kind security. |
| (g) | Non-income producing security. |
| (h) | Amount represents less than 0.005% of net assets. |
See Notes to Financial Statements.
| Semi-Annual Report | June 30, 2019 | 47 |
| Blackstone / GSO Funds | Statements of Assets and Liabilities |
June 30, 2019 (Unaudited)
| | | Senior Floating
Rate Term Fund | | | Long-Short
Credit Income Fund | | | Strategic
Credit Fund | |
| ASSETS: | | | | | | | | | |
| Investments, at fair value (Cost $400,934,611, $351,470,253 and $1,190,971,483, respectively) | | $ | 381,701,087 | | | $ | 335,158,373 | | | $ | 1,116,593,282 | |
| Cash | | | 12,071,226 | | | | 7,795,889 | | | | 22,457,890 | |
| Receivable for investment securities sold | | | 2,540,751 | | | | 2,057,541 | | | | 2,217,907 | |
| Interest receivable | | | 1,507,014 | | | | 1,956,045 | | | | 6,548,769 | |
| Receivable for dividend reinvest | | | 31,048 | | | | 11,432 | | | | – | |
| Prepaid expenses and other assets | | | 211,921 | | | | 77,861 | | | | 122,702 | |
| Total Assets | | | 398,063,047 | | | | 347,057,141 | | | | 1,147,940,550 | |
| | | | | | | | | | | | | |
| LIABILITIES: | | | | | | | | | | | | |
| Payable for investment securities purchased | | | 14,411,758 | | | | 12,853,465 | | | | 36,241,583 | |
| Leverage facility | | | 127,000,000 | | | | 110,500,000 | | | | 368,000,000 | |
| Interest due on leverage facility | | | 338,498 | | | | 218,042 | | | | 712,979 | |
| Accrued investment advisory fee payable | | | 284,160 | | | | 201,832 | | | | 915,419 | |
| Accrued fund accounting and administration fees payable | | | 89,936 | | | | 69,157 | | | | 210,392 | |
| Accrued trustees' fees payable | | | 20,608 | | | | 15,198 | | | | 62,484 | |
| Other payables and accrued expenses | | | 269,519 | | | | 317,377 | | | | 522,038 | |
| Mandatory redeemable preferred shares (net of deferred financing costs of: –, $(146,202) and $(328,954), respectively)(a) | | | – | | | | 19,853,798 | | | | 44,671,046 | |
| Distributions payable on mandatory redeemable preferred shares | | | – | | | | 118,997 | | | | 267,743 | |
| Total Liabilities | | | 142,414,479 | | | | 144,147,866 | | | | 451,603,684 | |
| Net Assets Attributable to Common Shareholders | | $ | 255,648,568 | | | $ | 202,909,275 | | | $ | 696,336,866 | |
| | | | | | | | | | | | | |
| COMPOSITION OF NET ASSETS ATTRIBUTABLE TO COMMON SHARES: | | | | | | | | | | | | |
| Paid-in capital | | $ | 286,764,190 | | | $ | 236,817,083 | | | $ | 839,760,850 | |
| Total distributable earnings | | | (31,115,622 | ) | | | (33,907,808 | ) | | | (143,423,984 | ) |
| Net Assets Attributable to Common Shareholders | | $ | 255,648,568 | | | $ | 202,909,275 | | | $ | 696,336,866 | |
| | | | | | | | | | | | | |
| Common shares outstanding (unlimited shares authorized, par value $0.001 per share) | | | 15,276,446 | | | | 12,702,890 | | | | 44,664,382 | |
| Net Asset Value per Common Share | | $ | 16.73 | | | $ | 15.97 | | | $ | 15.59 | |
| (a) | $1,000 liquidation value per share. -, 20,000, and 45,000 shares issued and outstanding, respectively. |
| See Notes to Financial Statements. |
| Blackstone / GSO Funds | Statements of Operations |
For the Six Months Ended June 30, 2019 (Unaudited)
| | | Senior Floating
Rate Term Fund | | | Long-Short
Credit Income Fund | | | Strategic
Credit Fund | |
| INVESTMENT INCOME: | | | | | | | | | | | | |
| Interest | | $ | 14,798,030 | | | $ | 13,195,730 | | | $ | 44,355,798 | |
| Facility and other fees | | | 174,217 | | | | 134,482 | | | | 368,250 | |
| Total Investment Income | | | 14,972,247 | | | | 13,330,212 | | | | 44,724,048 | |
| | | | | | | | | | | | | |
| EXPENSES: | | | | | | | | | | | | |
| Investment advisory fee | | | 1,717,093 | | | | 1,218,928 | | | | 5,536,073 | |
| Fund accounting and administration fees | | | 223,584 | | | | 169,027 | | | | 632,242 | |
| Insurance expense | | | 53,964 | | | | 61,857 | | | | 987 | |
| Legal and audit fees | | | 162,350 | | | | 137,496 | | | | 286,306 | |
| Custodian fees | | | 50,968 | | | | 30,335 | | | | 92,393 | |
| Trustees' fees and expenses | | | 46,612 | | | | 35,668 | | | | 127,233 | |
| Printing expense | | | 17,339 | | | | 13,681 | | | | 35,204 | |
| Transfer agent fees | | | 9,612 | | | | 15,714 | | | | 15,289 | |
| Interest on leverage facility | | | 2,319,589 | | | | 2,001,404 | | | | 6,521,650 | |
| Amortization of deferred financing costs | | | – | | | | 17,796 | | | | 40,041 | |
| Other expenses | | | 15,158 | | | | 32,635 | | | | 46,487 | |
| Distributions to mandatory redeemable preferred shares | | | – | | | | 358,439 | | | | 806,487 | |
| Total Expenses | | | 4,616,269 | | | | 4,092,980 | | | | 14,140,392 | |
| Net Investment Income | | | 10,355,978 | | | | 9,237,232 | | | | 30,583,656 | |
| | | | | | | | | | | | | |
| REALIZED AND UNREALIZED GAIN/(LOSS) ON INVESTMENTS: | | | | | | | | | | | | |
| Net realized gain/(loss) on: | | | | | | | | | | | | |
| Investment securities | | | (895,850 | ) | | | (353,529 | ) | | | (1,844,149 | ) |
| Net realized loss: | | | (895,850 | ) | | | (353,529 | ) | | | (1,844,149 | ) |
| Change in unrealized appreciation/(depreciation) on: | | | | | | | | | | | | |
| Investment securities | | | 2,836,969 | | | | 3,032,752 | | | | 8,629,644 | |
| Net unrealized gain: | | | 2,836,969 | | | | 3,032,752 | | | | 8,629,644 | |
| Net Realized and Unrealized Gain on Investments | | | 1,941,119 | | | | 2,679,223 | | | | 6,785,495 | |
| | | | | | | | | | | | | |
| Net Increase in Net Assets Attributable to Common Shares from Operations | | $ | 12,297,097 | | | $ | 11,916,455 | | | $ | 37,369,151 | |
| See Notes to Financial Statements. |
| Semi-Annual Report | June 30, 2019 | 49 |
| Blackstone / GSO Funds | Statements of Changes in Net Assets |
| | | Senior Floating Rate Term Fund | | | Long-Short Credit Income Fund | | | Strategic Credit Fund | |
| | | For the Six Months Ended June 30, 2019 (Unaudited) | | | For the Year Ended December 31, 2018 | | | For the Six Months Ended June 30, 2019 (Unaudited) | | | For the Year Ended December 31, 2018 | | | For the Six Months Ended June 30, 2019 (Unaudited) | | | For the Year Ended December 31, 2018 | |
| FROM OPERATIONS: | | | | | | | | | | | | | | | | | | | | | | | | |
| Net investment income(a) | | $ | 10,355,978 | | | $ | 20,209,373 | | | $ | 9,237,232 | | | $ | 18,571,028 | | | $ | 30,583,656 | | | $ | 61,697,251 | |
| Net realized loss | | | (895,850 | ) | | | (5,114,704 | ) | | | (353,529 | ) | | | (2,688,443 | ) | | | (1,844,149 | ) | | | (20,276,387 | ) |
| Change in unrealized appreciation/(depreciation) | | | 2,836,969 | | | | (10,111,102 | ) | | | 3,032,752 | | | | (14,061,219 | ) | | | 8,629,644 | | | | (45,020,486 | ) |
| Net Increase/(Decrease) in Net Assets Attributable to Common Shares from Operations | | | 12,297,097 | | | | 4,983,567 | | | | 11,916,455 | | | | 1,821,366 | | | | 37,369,151 | | | | (3,599,622 | ) |
| | | | | | | | | | | | | | | | | | | | | | | | | |
| DISTRIBUTIONS TO COMMON SHAREHOLDERS: | | | | | | | | | | | | | | | | | | | | | | | | |
| From distributable earnings | | | (8,414,695 | ) | | | (21,551,497 | ) | | | (7,418,061 | ) | | | (20,488,583 | ) | | | (24,610,074 | ) | | | (67,264,559 | ) |
| Net Decrease in Net Assets from Distributions to Common Shareholders | | | (8,414,695 | ) | | | (21,551,497 | ) | | | (7,418,061 | ) | | | (20,488,583 | ) | | | (24,610,074 | ) | | | (67,264,559 | ) |
| | | | | | | | | | | | | | | | | | | | | | | | | |
| Net asset value of common shares issued to shareholders from reinvestment of dividends | | | 121,608 | | | | 309,392 | | | | 11,433 | | | | – | | | | – | | | | – | |
| Net Increase from Capital Share Transactions | | | 121,608 | | | | 309,392 | | | | 11,433 | | | | – | | | | – | | | | – | |
| Net Increase/(Decrease) in Net Assets Attributable to Common Shares | | | 4,004,010 | | | | (16,258,538 | ) | | | 4,509,827 | | | | (18,667,217 | ) | | | 12,759,077 | | | | (70,864,181 | ) |
| | | | | | | | | | | | | | | | | | | | | | | | | |
| NET ASSETS ATTRIBUTABLE TO COMMON SHAREHOLDERS: | | | | | | | | | | | | | | | | | | | | | | | | |
| Beginning of period | | | 251,644,558 | | | | 267,903,096 | | | | 198,399,448 | | | | 217,066,665 | | | | 683,577,789 | | | | 754,441,970 | |
| End of period | | $ | 255,648,568 | | | $ | 251,644,558 | | | $ | 202,909,275 | | | $ | 198,399,448 | | | $ | 696,336,866 | | | $ | 683,577,789 | |
| (a) | Includes impact of distributions to preferred shareholders from net investment income. Distributions on the Fund's mandatory redeemable preferred stock (“MRPS”) are treated as an operating expense under GAAP and are included in the calculation of net investment income. See Note 9 - Leverage. The Long-Short Credit Income Fund and the Strategic Credit Fund recorded distributions of $358,439 and $806,487, respectively, to holders of MRPS for the six months ended June 30, 2019. For the fiscal year ended December 31, 2018, the Long-Short Credit Income Fund and the Strategic Credit Fund recorded distributions of $722,671 and $1,626,010, respectively, to holders of MRPS. See Note 10 for details on tax characterization of distributions. |
| See Notes to Financial Statements. |
| Blackstone / GSO Funds | Statements of Cash Flows |
For the Six Months Ended June 30, 2019 (Unaudited)
| | | Senior Floating
Rate Term Fund | | | Long-Short
Credit Income Fund | | | Strategic
Credit Fund | |
| CASH FLOWS FROM OPERATING ACTIVITIES: | | | | | | | | | | | | |
| Net increase in net assets from operations | | $ | 12,297,097 | | | $ | 11,916,455 | | | $ | 37,369,151 | |
| Adjustments to reconcile net increase/(decrease) in net assets from operations to net cash provided by (used in) operating activities: | | | | | | | | | | | | |
| Purchases of investment securities | | | (71,004,511 | ) | | | (59,370,560 | ) | | | (209,913,671 | ) |
| Proceeds from disposition of investment securities | | | 78,000,368 | | | | 62,367,372 | | | | 211,974,767 | |
| Discounts (accreted)/premiums amortized | | | (402,863 | ) | | | (248,625 | ) | | | (1,035,463 | ) |
| Net realized (gain)/loss on: | | | | | | | | | | | | |
| Investment securities | | | 895,850 | | | | 353,529 | | | | 1,844,149 | |
| Net change in unrealized (appreciation)/depreciation on: | | | | | | | | | | | | |
| Investment securities | | | (2,836,969 | ) | | | (3,032,752 | ) | | | (8,629,644 | ) |
| Amortization of deferred financing costs | | | – | | | | 17,796 | | | | 40,041 | |
| (Increase)/Decrease in assets: | | | | | | | | | | | | |
| Interest receivable | | | 46,101 | | | | 17,223 | | | | 66,468 | |
| Prepaid expenses and other assets | | | (45,918 | ) | | | (31,954 | ) | | | (122,571 | ) |
| Increase/(Decrease) in liabilities: | | | | | | | | | | | | |
| Distributions payable on mandatory redeemable preferred shares | | | – | | | | (2,561 | ) | | | (5,762 | ) |
| Interest due on loan facility | | | (31,444 | ) | | | 46,655 | | | | (59,981 | ) |
| Accrued investment advisory fees payable | | | (14,573 | ) | | | (10,561 | ) | | | (51,604 | ) |
| Accrued fund accounting and administration expense | | | 28,517 | | | | 24,773 | | | | 15,145 | |
| Accrued trustees' fees payable | | | 579 | | | | (842 | ) | | | (1,343 | ) |
| Other payables and accrued expenses | | | (17,878 | ) | | | (3,818 | ) | | | (42,403 | ) |
| Net Cash Provided by (Used in) Operating Activities | | | 16,914,356 | | | | 12,042,130 | | | | 31,447,279 | |
| | | | | | | | | | | | | |
| CASH FLOWS FROM FINANCING ACTIVITIES: | | | | | | | | | | | | |
| Proceeds from leverage facility | | | 4,000,000 | | | | 4,500,000 | | | | 15,500,000 | |
| Payments on leverage facility | | | (1,000,000 | ) | | | (1,500,000 | ) | | | (9,000,000 | ) |
| Distributions paid - common shareholders - net | | | (13,439,286 | ) | | | (13,337,266 | ) | | | (40,063,950 | ) |
| Net Cash Provided by (Used in) Financing Activities | | | (10,439,286 | ) | | | (10,337,266 | ) | | | (33,563,950 | ) |
| | | | | | | | | | | | | |
| Net Increase/(Decrease) in Cash | | | 6,475,070 | | | | 1,704,864 | | | | (2,116,671 | ) |
| Cash, beginning balance | | $ | 5,596,156 | | | $ | 6,091,025 | | | $ | 24,574,561 | |
| Cash, ending balance | | $ | 12,071,226 | | | $ | 7,795,889 | | | $ | 22,457,890 | |
| | | | | | | | | | | | | |
| Supplemental disclosure of cash flow information: | | | | | | | | | | | | |
| Cash paid on interest on leverage facility | | $ | 2,351,033 | | | $ | 1,954,749 | | | $ | 6,581,631 | |
| | | | | | | | | | | | | |
| Reinvestment of distributions | | $ | 121,608 | | | $ | 11,433 | | | | – | |
| See Notes to Financial Statements. |
| Semi-Annual Report | June 30, 2019 | 51 |
| Blackstone / GSO Senior Floating Rate Term Fund | Financial Highlights |
For a Share Outstanding Throughout the Periods Indicated
| | | For the Six Months Ended June 30, 2019 (Unaudited) | | | For the Year Ended December 31, 2018 | | | For the Year Ended December 31, 2017 | | | For the Year Ended December 31, 2016 | | | For the Year Ended December 31, 2015 | | | For the Year Ended December 31, 2014 | |
| PER COMMON SHARE OPERATING PERFORMANCE: | | | | | | | | | | | | | | | | | | |
| Net asset value - beginning of period | | $ | 16.48 | | | $ | 17.57 | | | $ | 17.61 | | | $ | 15.96 | | | $ | 18.08 | | | $ | 19.27 | |
| INCOME/(LOSS) FROM INVESTMENT OPERATIONS: | | | | | | | | | | | | | | | | | | | | | | | | |
| Net investment income(a) | | | 0.68 | | | | 1.32 | | | | 1.26 | | | | 1.24 | | | | 1.22 | | | | 0.92 | |
| Net realized and unrealized gain/(loss) on investments | | | 0.12 | | | | (1.00 | ) | | | (0.14 | ) | | | 1.57 | | | | (2.17 | ) | | | (0.84 | ) |
| DISTRIBUTIONS TO PREFERRED SHAREHOLDERS: | | | | | | | | | | | | | | | | | | | | | | | | |
| From net investment income(a) | | | – | | | | – | | | | – | | | | – | | | | – | | | | (0.06 | ) |
| From net realized gains | | | – | | | | – | | | | – | | | | – | | | | – | | | | – | |
| Total Income/(Loss) from Investment Operations | | | 0.80 | | | | 0.32 | | | | 1.12 | | | | 2.81 | | | | (0.95 | ) | | | 0.02 | |
| | | | | | | | | | | | | | | | | | | | | | | | | |
| DISTRIBUTIONS TO COMMON SHAREHOLDERS: | | | | | | | | | | | | | | | | | | | | | | | | |
| From net investment income | | | (0.55 | ) | | | (1.41 | ) | | | (1.16 | ) | | | (1.16 | ) | | | (1.17 | ) | | | (0.86 | ) |
| From net realized gains | | | – | | | | – | | | | – | | | | – | | | | – | | | | (0.08 | ) |
| From tax return of capital | | | – | | | | – | | | | – | | | | – | | | | – | | | | (0.27 | ) |
| Total Distributions to Common Shareholders | | | (0.55 | ) | | | (1.41 | ) | | | (1.16 | ) | | | (1.16 | ) | | | (1.17 | ) | | | (1.21 | ) |
| | | | | | | | | | | | | | | | | | | | | | | | | |
| Net asset value per common share - end of period | | $ | 16.73 | | | $ | 16.48 | | | $ | 17.57 | | | $ | 17.61 | | | $ | 15.96 | | | $ | 18.08 | |
| Market price per common share - end of period | | $ | 16.88 | | | $ | 15.33 | | | $ | 18.00 | | | $ | 18.08 | | | $ | 14.85 | | | $ | 16.74 | |
| | | | | | | | | | | | | | | | | | | | | | | | | |
| Total Investment Return - Net Asset Value(b) | | | 4.94 | % | | | 1.88 | % | | | 6.67 | % | | | 18.44 | % | | | (5.19 | %) | | | 0.38 | % |
| Total Investment Return - Market Price(b) | | | 13.83 | % | | | (7.49 | %) | | | 6.44 | % | | | 30.70 | % | | | (4.72 | %) | | | (4.99 | %) |
| | | | | | | | | | | | | | | | | | | | | | | | | |
| RATIOS AND SUPPLEMENTAL DATA: | | | | | | | | | | | | | | | | | | | | | | | | |
| Net assets attributable to common shares, end of period (000s) | | $ | 255,649 | | | $ | 251,645 | | | $ | 267,903 | | | $ | 268,153 | | | $ | 242,874 | | | $ | 275,201 | |
| Ratio of expenses to average net assets attributable to common shares | | | 3.61 | %(c) | | | 3.35 | % | | | 3.01 | % | | | 2.59 | % | | | 2.48 | % | | | 3.02 | %(d) |
| Ratio of net investment income to average net assets attributable to common shares | | | 8.10 | %(c) | | | 7.49 | % | | | 7.11 | % | | | 7.48 | % | | | 6.84 | % | | | 4.88 | %(d) |
| Ratio of expenses to average managed assets(e) | | | 2.42 | %(c) | | | 2.25 | % | | | 2.02 | % | | | 1.74 | % | | | 1.67 | % | | | 2.02 | %(d) |
| Portfolio turnover rate | | | 19 | %(f) | | | 88 | % | | | 135 | % | | | 99 | % | | | 65 | % | | | 66 | % |
| | | | | | | | | | | | | | | | | | | | | | | | | |
| TERM PREFERRED SHARES: | | | | | | | | | | | | | | | | | | | | | | | | |
| Liquidation value, end of period, including dividends payable on Term Preferred Shares (000s) | | $ | N/A | | | $ | N/A | | | $ | N/A | | | $ | N/A | | | $ | N/A | | | $ | N/A | (g) |
| Total shares outstanding (000s) | | | – | | | | – | | | | – | | | | – | | | | – | | | | – | |
| Asset coverage per share | | $ | N/A | | | $ | N/A | | | $ | N/A | | | $ | N/A | | | $ | N/A | | | $ | N/A | (g) |
| Liquidation preference per share | | $ | N/A | | | $ | N/A | | | $ | N/A | | | $ | N/A | | | $ | N/A | | | $ | N/A | (g) |
| | | | | | | | | | | | | | | | | | | | | | | | | |
| SENIOR SECURED NOTES: | | | | | | | | | | | | | | | | | | | | | | | | |
| Aggregate principal amount, end of period (000s) | | $ | N/A | | | $ | N/A | | | $ | N/A | | | $ | N/A | | | $ | N/A | | | $ | – | (h) |
| Average borrowings outstanding during the period (000s) | | $ | N/A | | | $ | N/A | | | $ | N/A | | | $ | N/A | | | $ | N/A | | | $ | 96,000 | (h) |
| Asset coverage, end of period per $1,000 | | | N/A | | | | N/A | | | | N/A | | | | N/A | | | | N/A | | | | N/A | (h) |
| | | | | | | | | | | | | | | | | | | | | | | | | |
| LEVERAGE FACILITY: | | | | | | | | | | | | | | | | | | | | | | | | |
| Aggregate principal amount, end of period (000s) | | $ | 127,000 | | | $ | 124,000 | | | $ | 132,000 | | | $ | 131,000 | | | $ | 119,500 | | | $ | 133,000 | |
| Average borrowings outstanding during the period (000s) | | $ | 126,801 | | | $ | 132,067 | | | $ | 132,323 | | | $ | 122,782 | | | $ | 132,372 | | | $ | 137,412 | (i) |
| Asset coverage, end of period per $1,000(j) | | $ | 3,013 | | | $ | 3,029 | | | $ | 3,030 | | | $ | 3,047 | | | $ | 3,032 | | | $ | 3,069 | |
| Blackstone / GSO Senior Floating Rate Term Fund | Financial Highlights |
For a Share Outstanding Throughout the Periods Indicated
| (a) | Calculated using average common shares outstanding. |
| (b) | Total investment return is calculated assuming a purchase of common share at the opening on the first day and a sale at closing on the last day of each period reported. Dividends and distributions are assumed for purposes of this calculation to be reinvested at prices obtained under the Fund's dividend reinvestment plan. Total investment returns do not reflect brokerage commissions, if any, and are not annualized. |
| (d) | Ratios do not reflect dividend payments to preferred shareholders. |
| (e) | Average managed assets represent net assets applicable to common shares plus principal value of leverage. |
| (f) | Percentage represents the results for the period and is not annualized. |
| (g) | On October 8, 2014, BSL redeemed 100% of the term preferred shares at 100% of their liquidation preference. |
| (h) | On October 8, 2014, BSL redeemed 100% of the senior secured notes at 100% of their principal amount and entered into a new 364-day revolving credit facility. Average borrowings are shown for the period January 1, 2014 through the redemption date. |
| (i) | Since first borrowing was made on October 8, 2014. |
| (j) | Calculated by subtracting the Fund's total liabilities (excluding the principal amount of the Leverage Facility) from the Fund's total assets and dividing by the principal amount of the Leverage Facility and then multiplying by $1,000. |
| See Notes to Financial Statements. |
| Semi-Annual Report | June 30, 2019 | 53 |
| Blackstone / GSO Long-Short Credit Income Fund | Financial Highlights |
For a Share Outstanding Throughout the Periods Indicated
| | | | | | | | | | | | | | | | | | | |
| | | For the Six
Months Ended
June 30, 2019
(Unaudited) | | | For the
Year Ended
December 31,
2018 | | | For the
Year Ended
December 31,
2017 | | | For the
Year Ended
December 31,
2016 | | | For the
Year Ended
December 31,
2015 | | | For the
Year Ended
December 31,
2014 | |
| PER COMMON SHARE OPERATING PERFORMANCE: | | | | | | | | | | | | | | | | | | |
| Net asset value - beginning of period | | $ | 15.62 | | | $ | 17.09 | | | $ | 16.94 | | | $ | 15.37 | | | $ | 17.82 | | | $ | 19.11 | |
| INCOME/(LOSS) FROM INVESTMENT OPERATIONS: | | | | | | | | | | | | | | | | | | | | | | | | |
| Net investment income(a)(b) | | | 0.73 | | | | 1.46 | | | | 1.34 | | | | 1.40 | | | | 1.48 | | | | 0.94 | |
| Net realized and unrealized gain/(loss) on investments | | | 0.20 | | | | (1.32 | ) | | | 0.05 | | | | 1.60 | | | | (2.66 | ) | | | (1.03 | ) |
| Total Income/(Loss) from Investment Operations | | | 0.93 | | | | 0.14 | | | | 1.39 | | | | 3.00 | | | | (1.18 | ) | | | (0.09 | ) |
| | | | | | | | | | | | | | | | | | | | | | | | | |
| DISTRIBUTIONS TO COMMON SHAREHOLDERS: | | | | | | | | | | | | | | | | | | | | | | | | |
| From net investment income | | | (0.58 | ) | | | (1.61 | ) | | | (1.24 | ) | | | (1.43 | ) | | | (1.27 | ) | | | (0.96 | ) |
| From net realized gains | | | – | | | | – | | | | – | | | | – | | | | – | | | | (0.06 | ) |
| From tax return of capital | | | – | | | | – | | | | – | | | | – | | | | – | | | | (0.18 | ) |
| Total Distributions to Common Shareholders | | | (0.58 | ) | | | (1.61 | ) | | | (1.24 | ) | | | (1.43 | ) | | | (1.27 | ) | | | (1.20 | ) |
| | | | | | | | | | | | | | | | | | | | | | | | | |
| Net asset value per common share - end of period | | $ | 15.97 | | | $ | 15.62 | | | $ | 17.09 | | | $ | 16.94 | | | $ | 15.37 | | | $ | 17.82 | |
| Market price per common share - end of period | | $ | 15.69 | | | $ | 13.74 | | | $ | 15.92 | | | $ | 15.92 | | | $ | 13.48 | | | $ | 15.53 | |
| | | | | | | | | | | | | | | | | | | | | | | | | |
| Total Investment Return - Net Asset Value(c) | | | 6.22 | % | | | 1.25 | % | | | 8.85 | % | | | 21.21 | % | | | (6.04 | %) | | | (0.06 | %) |
| Total Investment Return - Market Price(c) | | | 18.56 | % | | | (4.40 | %) | | | 7.90 | % | | | 29.89 | % | | | (5.44 | %) | | | (6.86 | %) |
| | | | | | | | | | | | | | | | | | | | | | | | | |
| RATIOS AND SUPPLEMENTAL DATA: | | | | | | | | | | | | | | | | | | | | | | | | |
| Net assets attributable to common shares, end of period (000s) | | $ | 202,909 | | | $ | 198,399 | | | $ | 217,067 | | | $ | 215,236 | | | $ | 195,204 | | | $ | 226,316 | |
| Ratio of expenses to average net assets attributable to common shares | | | 4.03 | %(d) | | | 3.73 | % | | | 3.03 | % | | | 2.58 | % | | | 2.07 | % | | | 1.86 | % |
| Ratio of expenses to average net assets excluding interest expense on short sales attributable to common shares | | | 4.03 | %(d) | | | 3.73 | % | | | 3.03 | % | | | 2.58 | % | | | 2.07 | % | | | 1.85 | % |
| Ratio of net investment income to average net assets attributable to common shares | | | 9.09 | %(d) | | | 8.52 | % | | | 7.82 | % | | | 8.67 | % | | | 8.45 | % | | | 4.99 | % |
| Ratio of expenses to average managed assets(e) | | | 2.46 | %(d) | | | 2.31 | % | | | 1.93 | % | | | 1.73 | % | | | 1.43 | % | | | 1.66 | % |
| Portfolio turnover rate | | | 18 | %(f) | | | 75 | % | | | 126 | % | | | 103 | % | | | 72 | % | | | 66 | % |
| | | | | | | | | | | | | | | | | | | | | | | | | |
| MANDATORY REDEEMABLE PREFERRED SHARES: | | | | | | | | | | | | | | | | | | | | | | | | |
| Liquidation value, end of period, including dividends payable on Mandatory Redeemable Preferred Shares (000s) | | $ | 20,119 | | | $ | 20,122 | | | $ | 20,121 | | | $ | 20,125 | | | $ | N/A | | | $ | N/A | |
| Total shares outstanding (000s) | | | 20 | | | | 20 | | | | 20 | | | | 20 | | | | – | | | | – | |
| Asset coverage , end of period per $1,000 | | $ | 2,555 | (g) | | $ | 2,556 | (g) | | $ | 2,644 | (g) | | $ | 2,905 | (g) | | $ | N/A | | | $ | N/A | |
| Liquidation preference per share | | $ | 1,000 | | | $ | 1,000 | | | $ | 1,000 | | | $ | 1,000 | | | $ | N/A | | | $ | N/A | |
| | | | | | | | | | | | | | | | | | | | | | | | | |
| LEVERAGE FACILITY: | | | | | | | | | | | | | | | | | | | | | | | | |
| Aggregate principal amount, end of period (000s) | | $ | 110,500 | | | $ | 107,500 | | | $ | 112,000 | | | $ | 93,000 | | | $ | 96,000 | | | $ | 73,000 | |
| Average borrowings outstanding during the period (000s) | | $ | 110,390 | | | $ | 115,392 | | | $ | 105,633 | | | $ | 93,684 | | | $ | 100,261 | | | $ | 66,827 | (h) |
| Asset coverage, end of period per $1,000(i) | | $ | 3,017 | | | $ | 3,032 | | | $ | 3,117 | | | $ | 3,314 | | | $ | 3,033 | | | $ | 4,100 | |
| (a) | Calculated using average common shares outstanding. |
| (b) | Distributions on the Company's MRPS are treated as an operating expense under GAAP and are included in the calculation of net investment income. See Note 9 - Leverage. |
| Blackstone / GSO Long-Short Credit Income Fund | Financial Highlights |
For a Share Outstanding Throughout the Periods Indicated
| (c) | Total investment return is calculated assuming a purchase of common share at the opening on the first day and a sale at closing on the last day of each period reported. Dividends and distributions are assumed for purposes of this calculation to be reinvested at prices obtained under the Fund's dividend reinvestment plan. Total investment returns do not reflect brokerage commissions, if any, and are not annualized. |
| (e) | Average managed assets represent net assets applicable to common shares plus principal value of leverage. |
| (f) | Percentage represents the results for the period and is not annualized. |
| (g) | Calculated by subtracting the Fund's total liabilities (excluding the liquidation value of the Mandatory Redeemable Preferred Shares and the principal amount of the Leverage Facility) from the Fund's total assets and dividing by the liquidation value of the Mandatory Redeemable Preferred Shares and the principal amount of the Leverage Facility and then multiplying by $1,000. |
| (h) | Since first borrowing was made on July 29, 2014. |
| (i) | Calculated by subtracting the Fund's total liabilities (excluding Mandatory Redeemable Preferred Shares at liquidation value, including dividends payable on mandatory redeemable preferred shares, and the principal amount of the Leverage Facility) from the Fund's total assets and dividing by the principal amount of the Leverage Facility and then multiplying by $1,000. |
See Notes to Financial Statements.
| Semi-Annual Report | June 30, 2019 | 55 |
| Blackstone / GSO Strategic Credit Fund | Financial Highlights |
For a Share Outstanding Throughout the Periods Indicated
| | | For the Six Months Ended June 30, 2019
(Unaudited) | | For the Year Ended
December 31, 2018 | | | For the Year Ended
December 31, 2017 | | | For the Year Ended
December 31, 2016 | | | For the Year Ended
December 31, 2015 | | | For the Year Ended
December 31, 2014 | |
| PER COMMON SHARE OPERATING PERFORMANCE: | | | | | | | | | | | | | | | | | |
| Net asset value - beginning of period | | $ | 15.30 | | $ | 16.89 | | | $ | 16.79 | | | $ | 15.20 | | | $ | 17.98 | | | $ | 19.12 | |
| INCOME/(LOSS) FROM INVESTMENT OPERATIONS: | | | | | | | | | | | | | | | | | | | | | | | |
| Net investment income(a)(b) | | | 0.68 | | | 1.38 | | | | 1.26 | | | | 1.39 | | | | 1.48 | | | | 1.17 | |
| Net realized and unrealized gain/(loss) on investments | | | 0.16 | | | (1.46 | ) | | | 0.10 | | | | 1.54 | | | | (2.89 | ) | | | (1.03 | ) |
| Total Income/(Loss) from Investment Operations | | | 0.84 | | | (0.08 | ) | | | 1.36 | | | | 2.93 | | | | (1.41 | ) | | | 0.14 | |
| | | | | | | | | | | | | | | | | | | | | | | | |
| DISTRIBUTIONS TO COMMON SHAREHOLDERS: | | | | | | | | | | | | | | | | | | | | | | | |
| From net investment income | | | (0.55 | ) | | (1.51 | ) | | | (1.26 | ) | | | (1.34 | ) | | | (1.37 | ) | | | (1.17 | ) |
| From net realized gains | | | – | | | – | | | | – | | | | – | | | | – | | | | (0.01 | ) |
| From tax return of capital | | | – | | | – | | | | – | | | | – | | | | – | | | | (0.10 | ) |
| Total Distributions to Common Shareholders | | | (0.55 | ) | | (1.51 | ) | | | (1.26 | ) | | | (1.34 | ) | | | (1.37 | ) | | | (1.28 | ) |
| | | | | | | | | | | | | | | | | | | | | | | | |
| Net asset value per common share - end of period | | $ | 15.59 | | $ | 15.30 | | | $ | 16.89 | | | $ | 16.79 | | | $ | 15.20 | | | $ | 17.98 | |
| Market price per common share - end of period | | $ | 14.67 | | $ | 13.47 | | | $ | 15.71 | | | $ | 15.34 | | | $ | 13.37 | | | $ | 16.48 | |
| | | | | | | | | | | | | | | | | | | | | | | | |
| Total Investment Return - Net Asset Value(c) | | | 5.82 | % | | (0.02 | %) | | | 8.79 | % | | | 21.02 | % | | | (7.42 | %) | | | 1.27 | % |
| Total Investment Return - Market Price(c) | | | 13.10 | % | | (5.37 | %) | | | 10.75 | % | | | 25.71 | % | | | (11.15 | %) | | | (0.29 | %) |
| | | | | | | | | | | | | | | | | | | | | | | | |
| RATIOS AND SUPPLEMENTAL DATA: | | | | | | | | | | | | | | | | | | | | | | | |
| Net assets attributable to common shares, end of period (000s) | | $ | 696,337 | | $ | 683,578 | | | $ | 754,442 | | | $ | 749,868 | | | $ | 679,029 | | | $ | 803,029 | |
| Ratio of expenses to average net assets attributable to common shares | | | 4.06 | %(d) | | 3.72 | % | | | 3.29 | % | | | 2.74 | % | | | 2.33 | % | | | 2.32 | % |
| Ratio of net investment income to average net assets attributable to common shares | | | 8.77 | %(d) | | 8.20 | % | | | 7.38 | % | | | 8.73 | % | | | 8.41 | % | | | 6.16 | % |
| Ratio of expenses to average managed assets(e) | | | 2.55 | %(d) | | 2.36 | % | | | 2.10 | % | | | 1.82 | % | | | 1.57 | % | | | 1.57 | % |
| Portfolio turnover rate | | | 17 | %(f) | | 76 | % | | | 136 | % | | | 93 | % | | | 74 | % | | | 76 | % |
| | | | | | | | | | | | | | | | | | | | | | | | |
| MANDATORY REDEEMABLE PREFERRED SHARES: | | | | | | | | | | | | | | | | | | | | | | | |
| Liquidation value, end of period, including dividends payable on Mandatory Redeemable Preferred Shares (000s) | | $ | 45,268 | | $ | 45,274 | | | $ | 45,272 | | | $ | 45,281 | | | $ | N/A | | | $ | N/A | |
| Total shares outstanding (000s) | | | 45 | | | 45 | | | | 45 | | | | 45 | | | | – | | | | – | |
| Asset coverage, end of period per $1,000 | | $ | 2,686 | (g) | $ | 2,682 | (g) | | $ | 2,796 | (g) | | $ | 2,777 | (g) | | $ | N/A | | | $ | N/A | |
| Liquidation preference per share | | $ | 1,000 | | $ | 1,000 | | | $ | 1,000 | | | $ | 1,000 | | | $ | N/A | | | $ | N/A | |
| | | | | | | | | | | | | | | | | | | | | | | | |
| LEVERAGE FACILITY: | | | | | | | | | | | | | | | | | | | | | | | |
| Aggregate principal amount, end of period (000s) | | $ | 368,000 | | $ | 361,500 | | | $ | 375,000 | | | $ | 377,000 | | | $ | 331,000 | | | $ | 389,500 | |
| Average borrowings outstanding during the period (000s) | | $ | 368,249 | | $ | 387,479 | | | $ | 384,195 | | | $ | 342,331 | | | $ | 382,162 | | | $ | 403,727 | |
| Asset coverage, end of period per $1,000(h) | | $ | 3,015 | | $ | 3,015 | | | $ | 3,132 | | | $ | 2,989 | | | $ | 3,051 | | | $ | 3,062 | |
| (a) | Calculated using average common shares outstanding. |
| (b) | Distributions on the Company's MRPS are treated as an operating expense under GAAP and are included in the calculation of net investment income. See Note 9 - Leverage. |
| Blackstone / GSO Strategic Credit Fund | Financial Highlights |
For a Share Outstanding Throughout the Periods Indicated
| (c) | Total investment return is calculated assuming a purchase of common share at the opening on the first day and a sale at closing on the last day of each period reported. Dividends and distributions are assumed for purposes of this calculation to be reinvested at prices obtained under the Fund's dividend reinvestment plan. Total investment returns do not reflect brokerage commissions, if any, and are not annualized. |
| (e) | Average managed assets represent net assets applicable to common shares plus principal value of leverage. |
| (f) | Percentage represents the results for the period and is not annualized. |
| (g) | Calculated by subtracting the Fund's total liabilities (excluding the liquidation value of the Mandatory Redeemable Preferred Shares and the principal amount of the Leverage Facility) from the Fund's total assets and dividing by the liquidation value of the Mandatory Redeemable Preferred Shares and the principal amount of the Leverage Facility and then multiplying by $1,000. |
| (h) | Calculated by subtracting the Fund's total liabilities (excluding Mandatory Redeemable Preferred Shares at liquidation value, including dividends payable on mandatory redeemable preferred shares, and the principal amount of the Leverage Facility) from the Fund's total assets and dividing by the principal amount of the Leverage Facility and then multiplying by $1,000. |
See Notes to Financial Statements.
| Semi-Annual Report | June 30, 2019 | 57 |
| Blackstone / GSO Funds | Notes to Financial Statements |
June 30, 2019 (Unaudited)
NOTE 1. ORGANIZATION
Blackstone / GSO Senior Floating Rate Term Fund (“BSL”), is a diversified, closed-end management investment company. BSL was organized as a Delaware statutory trust on March 4, 2010. BSL was registered under the Investment Company Act of 1940, as amended (the “1940 Act”), on March 5, 2010. BSL commenced operations on May 26, 2010. Prior to that date, BSL had no operations other than matters relating to its organization and the sale and issuance of 5,236 common shares of beneficial interest in BSL to GSO / Blackstone Debt Funds Management LLC (the “Adviser”) at a price of $19.10 per share. The Adviser serves as BSL’s investment adviser. BSL’s common shares are listed on the New York Stock Exchange (the “Exchange”) and trade under the ticker symbol “BSL.”
Absent shareholder approval to extend the term of BSL, BSL was initially scheduled to dissolve on or about May 31, 2020. On November 17, 2017, BSL’s shareholders approved extending the term of BSL by two years by changing BSL’s scheduled dissolution date from May 31, 2020 to May 31, 2022. Upon dissolution, BSL will distribute substantially all of its net assets to shareholders, after making appropriate provision for any liabilities. Pursuant to BSL’s Amended and Restated Agreement and Declaration of Trust, prior to the date of dissolution a majority of the Board of Trustees, with the approval of a majority of the shareholders entitled to vote (as defined in the 1940 Act), may extend the life of BSL by a period of two years or such shorter time as may be determined. The dissolution date of BSL may be extended an unlimited number of times. On March 31, 2017, BSL announced an extension of BSL’s reinvestment period. The extension will allow BSL to continue to reinvest proceeds generated by maturities, prepayments and sales of investments until one year prior to BSL’s scheduled dissolution date, which is currently May 31, 2022.
Blackstone / GSO Long-Short Credit Income Fund (“BGX”) is a diversified, closed-end management investment company. BGX was organized as a Delaware statutory trust on October 22, 2010. BGX was registered under the 1940 Act on October 26, 2010. BGX commenced operations on January 27, 2011. Prior to that, BGX had no operations other than matters relating to its organization and the sale and issuance of 5,236 common shares of beneficial interest in BGX to the Adviser at a price of $19.10 per share. The Adviser serves as the investment adviser for BGX. BGX’s common shares are listed on the Exchange and trade under the ticker symbol “BGX.”
Blackstone / GSO Strategic Credit Fund (“BGB” and, collectively with BSL and BGX, the “Funds”) is a diversified, closed-end management investment company. BGB was organized as a Delaware statutory trust on March 28, 2012. BGB was registered under the 1940 Act on April 6, 2012. BGB commenced operations on September 26, 2012. Prior to that, BGB had no operations other than matters relating to its organization and the sale and issuance of 5,236 common shares of beneficial interest in BGB to the Adviser at a price of $19.10 per share. The Adviser serves as the investment adviser for BGB. BGB’s common shares are listed on the Exchange and trade under the ticker symbol “BGB.”
BGB will dissolve on or about September 15, 2027, absent shareholder approval to extend such term. Upon dissolution, BGB will distribute substantially all of its net assets to shareholders, after making appropriate provision for any liabilities of BGB. Pursuant to BGB’s Amended and Restated Agreement and Declaration of Trust, prior to the date of dissolution a majority of the Board of Trustees, with the approval of a majority of the outstanding voting securities entitled to vote (as defined in the 1940 Act), may extend the life of BGB. If approved, the dissolution date of BGB may be extended by a period of two years or such shorter time as may be determined. The dissolution date of BGB may be extended an unlimited number of times.
The Funds were previously classified as non-diversified investment companies for purposes of the 1940 Act. As a result of ongoing operations, the Funds are now classified as diversified companies; BGX and BSL as of April 1, 2014 and BGB as of September 25, 2015. This means that with respect to 75% of each Fund’s total assets, no more than 5% of such Fund’s total assets may be invested in any one issuer, excepting cash and cash items, U.S. government securities, and securities of other investment companies. The Funds may not resume operating in a non-diversified manner without first obtaining shareholder approval in accordance with the 1940 Act.
BSL’s primary investment objective is to seek high current income, with a secondary objective to seek preservation of capital, consistent with its primary goal of high current income. Under normal market conditions, at least 80% of BSL’s Managed Assets (defined below) will be invested in senior secured, floating rate loans (“Senior Loans”).
BGX’s primary investment objective is to provide current income, with a secondary objective of capital appreciation. BGX seeks to achieve its investment objectives by employing a dynamic long-short strategy in a diversified portfolio of loans and fixed-income instruments of predominantly U.S. corporate issuers, including first- and second-lien secured loans (“Secured Loans”) and high-yield corporate debt securities of varying maturities. BGX’s short positions, either directly or through the use of derivatives, may total up to 30% of such Fund’s net assets.
BGB’s primary investment objective is to seek high current income, with a secondary objective to seek preservation of capital, consistent with its primary goal of high current income. The Fund will seek to achieve its investment objectives by investing primarily in a diversified portfolio of loans and other fixed income instruments of predominantly U.S. corporate issuers, including first- and second-lien secured loans (‘‘Senior Secured Loans’’) and high yield corporate bonds of varying maturities. Under normal market conditions, at least 80% of BGB’s Managed Assets (defined below) will be invested in credit investments comprised of corporate fixed income instruments and other investments (including derivatives) with similar economic characteristics.
| Blackstone / GSO Funds | Notes to Financial Statements |
June 30, 2019 (Unaudited)
Senior Loans, Secured Loans and Senior Secured Loans are referred to collectively as “Loans” throughout the Notes to Financial Statements.
NOTE 2. SIGNIFICANT ACCOUNTING POLICIES
The following is a summary of significant accounting policies followed by the Funds in the preparation of their financial statements. The preparation of their financial statements is in accordance with accounting principles generally accepted in the United States of America (“GAAP”), which requires management to make estimates and assumptions that affect the reported amounts and disclosures in the financial statements. Actual results could differ from those estimates and these differences could be material. Each Fund is considered an investment company for financial reporting purposes under GAAP.
Portfolio Valuation: Each Fund’s net asset value (“NAV”) is determined daily on each day that the Exchange is open for business, as of the close of the regular trading session on the Exchange. Each Fund calculates NAV per share by subtracting liabilities (including accrued expenses or dividends) from the total assets of such Fund (the value of the securities plus cash or other assets, including interest accrued but not yet received) and dividing the result by the total number of outstanding common shares of such Fund.
Loans are primarily valued by using a composite loan price from a nationally recognized loan pricing service. The methodology used by the Funds’ nationally recognized loan pricing provider for composite loan prices is to value loans at the mean of the bid and ask prices from one or more brokers or dealers. Collateralized Loan Obligation securities (“CLOs”) are valued at the price provided by a nationally recognized pricing service. The prices provided by the nationally recognized pricing service are typically based on the evaluated mid-price of each of the CLOs. Corporate bonds and convertible bonds, other than short-term investments, are valued at the price provided by a nationally recognized pricing service. The prices provided by the nationally recognized pricing service are typically based on the mean of bid and ask prices for each corporate bond security. In determining the value of a particular investment, pricing services may use certain information with respect to transactions in such investments, quotations from dealers, pricing matrices, market transactions in comparable investments, various relationships observed in the market between investments and calculated yield measures based on valuation technology commonly employed in the market for such investments. Equity securities for which market quotations are available are generally valued at the last sale price or official closing price on the primary market or exchange on which they trade. Futures contracts are ordinarily valued at the last sales price on the securities or commodities exchange on which they are traded. Written and purchased options are ordinarily valued at the closing price on the securities or commodities exchange on which they are traded. Short-term debt investments, if any, having a remaining maturity of 60 days or less when purchased would be valued at cost adjusted for amortization of premiums and accretion of discounts. Any investments and other assets for which such current market quotations are not readily available are valued at fair value (“Fair Valued Assets”) as determined in good faith by a committee of the Adviser (“Fair Valued Asset Committee”) under procedures established by, and under the general supervision and responsibility of, the Funds’ Boards of Trustees. Such methods may include, but are not limited to, the use of a market comparable and/or income approach methodologies. A Fair Valued Asset Committee meeting may be called at any time by any member of the Fair Valued Asset Committee. The pricing of all Fair Valued Assets and determinations thereof shall be reported by the Fair Valued Asset Committee to the Board at each regularly scheduled quarterly meeting. The Funds have procedures to identify and investigate potentially stale or missing prices for investments which are valued using a nationally recognized pricing service, exchange price or broker-dealer quotations. After performing such procedures, any prices which are deemed to be stale are reviewed by the Fair Valued Asset Committee and an alternative pricing source is determined.
Various inputs are used to determine the value of the Funds’ investments. Observable inputs are inputs that reflect the assumptions market participants would use in pricing the asset or liability developed based on market data obtained from sources independent of the reporting entity. Unobservable inputs are inputs that reflect the reporting entity’s own assumptions about the assumptions market participants would use in pricing the asset or liability developed based on the best information available in the circumstances. The three-tier hierarchy of inputs is summarized in the three broad Levels listed below.
Level 1— Unadjusted quoted prices in active markets for identical investments at the measurement date.
Level 2— Significant observable inputs (including quoted prices for similar investments, interest rates, prepayment speeds, credit risk, etc.).
Level 3— Significant unobservable inputs (including the Funds’ own assumptions in determining the fair value of investments).
The categorization of a value determined for investments and other financial instruments is based on the pricing transparency of the investment and other financial instrument and does not necessarily correspond to the Funds’ perceived risk of investing in those securities. Investments measured and reported at fair value are classified and disclosed in one of the following levels within the fair value hierarchy based on the lowest level of input that is significant to the fair value measurement.
| Semi-Annual Report | June 30, 2019 | 59 |
| Blackstone / GSO Funds | Notes to Financial Statements |
June 30, 2019 (Unaudited)
The following tables summarize valuation of the Funds’ investments under the fair value hierarchy levels as of June 30, 2019:
Blackstone / GSO Senior Floating Rate Term Fund
| Investments in Securities at Value* | | Level 1 - Quoted Prices | | | Level 2 - Significant Observable Inputs | | | Level 3 - Significant Unobservable Inputs | | | Total | |
| Floating Rate Loan Interests | | | | | | | | | | | | | | | | |
| Aerospace & Defense | | $ | – | | | $ | 2,508,475 | | | $ | 4,836,592 | | | $ | 7,345,067 | |
| Automotive | | | – | | | | 2,231,207 | | | | 1,254,841 | | | | 3,486,048 | |
| Building & Development | | | – | | | | 21,147,968 | | | | 1,115,755 | | | | 22,263,723 | |
| Business Equipment & Services | | | – | | | | 47,421,694 | | | | 9,995,137 | | | | 57,416,831 | |
| Chemical & Plastics | | | – | | | | 7,337,891 | | | | 1,244,481 | | | | 8,582,372 | |
| Conglomerates | | | – | | | | 1,159,842 | | | | 475,194 | | | | 1,635,036 | |
| Containers & Glass Products | | | – | | | | 4,748,244 | | | | 2,738,583 | | | | 7,486,827 | |
| Ecological Services & Equipment | | | – | | | | 1,297,314 | | | | 983,367 | | | | 2,280,681 | |
| Electronics/Electrical | | | – | | | | 66,910,812 | | | | 6,714,028 | | | | 73,624,840 | |
| Financial Intermediaries | | | – | | | | 4,716,296 | | | | 429,406 | | | | 5,145,702 | |
| Food Service | | | – | | | | 8,553,573 | | | | 1,274,423 | | | | 9,827,996 | |
| Healthcare | | | – | | | | 52,423,314 | | | | 7,711,682 | | | | 60,134,996 | |
| Industrial Equipment | | | – | | | | 8,621,174 | | | | 4,080,027 | | | | 12,701,201 | |
| Leisure Goods/Activities/Movies | | | – | | | | 6,485,022 | | | | 197,159 | | | | 6,682,181 | |
| Lodging & Casinos | | | – | | | | – | | | | 1,694,550 | | | | 1,694,550 | |
| Oil & Gas | | | – | | | | 9,674,075 | | | | 338,598 | | | | 10,012,673 | |
| Publishing | | | – | | | | 2,919,135 | | | | 1,095,000 | | | | 4,014,135 | |
| Retailers (except food & drug) | | | – | | | | 4,793,398 | | | | 228,436 | | | | 5,021,834 | |
| Steel | | | – | | | | 356,225 | | | | 1,802,394 | | | | 2,158,619 | |
| Utilities | | | – | | | | 5,691,057 | | | | 675,234 | | | | 6,366,291 | |
| Other | | | – | | | | 58,413,678 | | | | – | | | | 58,413,678 | |
| Collateralized Loan Obligation Securities | | | | | | | | | | | | | | | | |
| Structured Finance Obligations | | | – | | | | – | | | | 3,890,336 | | | | 3,890,336 | |
| Corporate Bonds | | | – | | | | 11,048,459 | | | | – | | | | 11,048,459 | |
| Common Stock | | | | | | | | | | | | | | | | |
| Oil & Gas | | | – | | | | – | | | | 465,633 | | | | 465,633 | |
| Warrants | | | | | | | | | | | | | | | | |
| Oil & Gas | | | – | | | | – | | | | 1,378 | | | | 1,378 | |
| Total | | | – | | | | 328,458,853 | | | | 53,242,234 | | | | 381,701,087 | |
Blackstone / GSO Long-Short Credit Income Fund
| Investments in Securities at Value* | | Level 1 - Quoted Prices | | | Level 2 - Significant Observable Inputs | | | Level 3 - Significant Unobservable Inputs | | | Total | |
| Floating Rate Loan Interests | | | | | | | | | | | | | | | | |
| Aerospace & Defense | | $ | – | | | $ | 1,971,825 | | | $ | 3,930,300 | | | $ | 5,902,125 | |
| Automotive | | | – | | | | 347,428 | | | | 836,561 | | | | 1,183,989 | |
| Beverage & Tobacco | | | – | | | | – | | | | 464,740 | | | | 464,740 | |
| Building & Development | | | – | | | | 16,622,117 | | | | 858,345 | | | | 17,480,462 | |
| Business Equipment & Services | | | – | | | | 37,714,773 | | | | 9,061,822 | | | | 46,776,595 | |
| Chemical & Plastics | | | – | | | | 5,831,727 | | | | 1,083,669 | | | | 6,915,396 | |
| Conglomerates | | | – | | | | 922,817 | | | | 367,325 | | | | 1,290,142 | |
| Containers & Glass Products | | | – | | | | 3,900,135 | | | | 3,052,102 | | | | 6,952,237 | |
| Ecological Services & Equipment | | | – | | | | 1,061,439 | | | | 842,886 | | | | 1,904,325 | |
| Electronics/Electrical | | | – | | | | 48,352,410 | | | | 6,462,468 | | | | 54,814,878 | |
| Financial Intermediaries | | | – | | | | 4,282,101 | | | | 351,332 | | | | 4,633,433 | |
| Food Service | | | – | | | | 5,378,285 | | | | 1,621,685 | | | | 6,999,970 | |
| Healthcare | | | – | | | | 42,054,061 | | | | 6,624,911 | | | | 48,678,972 | |
| Industrial Equipment | | | – | | | | 6,350,301 | | | | 3,292,299 | | | | 9,642,600 | |
| Leisure Goods/Activities/Movies | | | – | | | | 4,533,522 | | | | 168,993 | | | | 4,702,515 | |
| Lodging & Casinos | | | – | | | | 1,207,025 | | | | 1,386,450 | | | | 2,593,475 | |
| Oil & Gas | | | – | | | | 6,529,726 | | | | 29,227 | | | | 6,558,953 | |
| Publishing | | | – | | | | 2,365,118 | | | | 1,095,000 | | | | 3,460,118 | |
| Retailers (except food & drug) | | | – | | | | 2,452,731 | | | | 666,453 | | | | 3,119,184 | |
| Blackstone / GSO Funds | Notes to Financial Statements |
June 30, 2019 (Unaudited)
Blackstone / GSO Long-Short Credit Income Fund (continued)
| Investments in Securities at Value* | | Level 1 - Quoted Prices | | | Level 2 - Significant Observable Inputs | | | Level 3 - Significant Unobservable Inputs | | | Total | |
| Steel | | $ | – | | | $ | 237,483 | | | $ | 1,201,596 | | | $ | 1,439,079 | |
| Utilities | | | – | | | | 5,569,125 | | | | 633,032 | | | | 6,202,157 | |
| Other | | | – | | | | 46,773,117 | | | | – | | | | 46,773,117 | |
| Collateralized Loan Obligation Securities | | | | | | | | | | | | | | | | |
| Structured Finance Obligations | | | – | | | | – | | | | 6,112,723 | | | | 6,112,723 | |
| Corporate Bonds | | | – | | | | 40,295,322 | | | | – | | | | 40,295,322 | |
| Common Stock | | | 261,866 | | | | – | | | | – | | | | 261,866 | |
| Total | | | 261,866 | | | | 284,752,588 | | | | 50,143,919 | | | | 335,158,373 | |
Blackstone / GSO Strategic Credit Fund
| Investments in Securities at Value* | | Level 1 - Quoted Prices | | | Level 2 - Significant Observable Inputs | | | Level 3 - Significant Unobservable Inputs | | | Total | |
| Floating Rate Loan Interests | | | | | | | | | | | | | | | | |
| Aerospace & Defense | | $ | – | | | $ | 6,011,950 | | | $ | 12,563,499 | | | $ | 18,575,449 | |
| Automotive | | | – | | | | 1,253,859 | | | | 4,182,802 | | | | 5,436,661 | |
| Beverage & Tobacco | | | – | | | | – | | | | 1,599,480 | | | | 1,599,480 | |
| Building & Development | | | – | | | | 55,075,143 | | | | 2,961,150 | | | | 58,036,293 | |
| Business Equipment & Services | | | – | | | | 129,443,062 | | | | 30,974,463 | | | | 160,417,525 | |
| Chemical & Plastics | | | – | | | | 15,251,364 | | | | 3,592,211 | | | | 18,843,575 | |
| Conglomerates | | | – | | | | 6,452,439 | | | | 1,381,863 | | | | 7,834,302 | |
| Containers & Glass Products | | | – | | | | 13,771,470 | | | | 10,318,758 | | | | 24,090,228 | |
| Ecological Services & Equipment | | | – | | | | 3,538,131 | | | | 2,856,446 | | | | 6,394,577 | |
| Electronics/Electrical | | | – | | | | 171,371,684 | | | | 26,941,543 | | | | 198,313,227 | |
| Financial Intermediaries | | | – | | | | 17,950,191 | | | | 1,171,107 | | | | 19,121,298 | |
| Food Service | | | – | | | | 22,943,021 | | | | 2,994,896 | | | | 25,937,917 | |
| Healthcare | | | – | | | | 129,557,149 | | | | 21,929,431 | | | | 151,486,580 | |
| Industrial Equipment | | | – | | | | 23,015,163 | | | | 11,667,181 | | | | 34,682,344 | |
| Leisure Goods/Activities/Movies | | | – | | | | 11,486,854 | | | | 572,699 | | | | 12,059,553 | |
| Lodging & Casinos | | | – | | | | – | | | | 4,621,500 | | | | 4,621,500 | |
| Oil & Gas | | | – | | | | 24,135,434 | | | | 1,325,568 | | | | 25,461,002 | |
| Publishing | | | – | | | | 8,054,336 | | | | 3,285,000 | | | | 11,339,336 | |
| Retailers (except food & drug) | | | – | | | | 12,592,180 | | | | 1,158,657 | | | | 13,750,837 | |
| Steel | | | – | | | | 1,187,418 | | | | 6,007,979 | | | | 7,195,397 | |
| Other | | | – | | | | 152,349,799 | | | | – | | | | 152,349,799 | |
| Corporate Bonds | | | – | | | | 144,679,410 | | | | – | | | | 144,679,410 | |
| Common Stock | | | | | | | | | | | | | | | | |
| Business Equipment & Services | | | – | | | | – | | | | 933,152 | | | | 933,152 | |
| Leisure goods/activities/movies | | | – | | | | – | | | | 2,262,707 | | | | 2,262,707 | |
| Oil & Gas | | | 936,085 | | | | 973,830 | | | | 9,254,329 | | | | 11,164,244 | |
| Warrants | | | | | | | | | | | | | | | | |
| Oil & Gas | | | – | | | | – | | | | 6,889 | | | | 6,889 | |
| Total | | | 936,085 | | | | 951,093,887 | | | | 164,563,310 | | | | 1,116,593,282 | |
| * | Refer to each Fund's Portfolio of Investments for a listing of securities by type. |
| Semi-Annual Report | June 30, 2019 | 61 |
| Blackstone / GSO Funds | Notes to Financial Statements |
June 30, 2019 (Unaudited)
The changes of the fair value of investments for which the Funds have used significant unobservable (Level 3) inputs to determine the fair value are as follows:
| Blackstone/GSO Senior Floating Rate Term Fund | | Floating Rate Loan Interests | | | Collateralized Loan Obligation Securities | | | Common Stock | | | Preferred Stock | | | Warrants | | | Total | |
| Balance as of December 31, 2018 | | $ | 77,368,725 | | | $ | 5,338,520 | | | $ | 554,675 | | | $ | 144,745 | | | $ | 1,378 | | | $ | 83,408,043 | |
| Accrued discount/ premium | | | 63,772 | | | | 562 | | | | – | | | | – | | | | – | | | | 64,334 | |
| Realized Gain/(Loss) | | | 48,108 | | | | (109,497 | ) | | | – | | | | – | | | | – | | | | (61,389 | ) |
| Change in Unrealized Appreciation/(Depreciation) | | | 17,870 | | | | 266,508 | | | | (89,042 | ) | | | (144,745 | ) | | | – | | | | 50,591 | |
| Purchases | | | 7,696,387 | | | | – | | | | – | | | | – | | | | – | | | | 7,696,387 | |
| Sales Proceeds | | | (6,356,202 | ) | | | (1,605,757 | ) | | | – | | | | – | | | | – | | | | (7,961,959 | ) |
| Transfer into Level 3 | | | 7,638,457 | | | | – | | | | – | | | | – | | | | – | | | | 7,638,457 | |
| Transfer out of Level 3 | | | (37,592,230 | ) | | | – | | | | – | | | | – | | | | – | | | | (37,592,230 | ) |
| Balance as of June 30, 2019 | | $ | 48,884,887 | | | $ | 3,890,336 | | | $ | 465,633 | | | $ | – | | | $ | 1,378 | | | $ | 53,242,234 | |
| Net change in unrealized appreciation/ (depreciation) included in the Statements of Operations attributable to Level 3 investments held at June 30, 2019 | | $ | (519,672 | ) | | $ | 102,968 | | | $ | (89,042 | ) | | $ | (144,745 | ) | | $ | – | | | $ | (650,491 | ) |
| Blackstone/GSO Long-Short Credit Income Fund | | Floating Rate Loan Interests | | | Collateralized Loan Obligation Securities | | | Total | |
| Balance as of December 31, 2018 | | $ | 66,097,334 | | | $ | 6,630,969 | | | $ | 72,728,303 | |
| Accrued discount/ premium | | | 54,115 | | | | 461 | | | | 54,576 | |
| Realized Gain/(Loss) | | | 55,668 | | | | (64,344 | ) | | | (8,676 | ) |
| Change in Unrealized Appreciation/(Depreciation) | | | 45,765 | | | | 206,292 | | | | 252,057 | |
| Purchases | | | 6,394,177 | | | | – | | | | 6,394,177 | |
| Sales Proceeds | | | (6,117,214 | ) | | | (660,655 | ) | | | (6,777,869 | ) |
| Transfer into Level 3 | | | 6,218,595 | | | | – | | | | 6,218,595 | |
| Transfer out of Level 3 | | | (28,717,244 | ) | | | – | | | | (28,717,244 | ) |
| Balance as of June 30, 2019 | | $ | 44,031,196 | | | $ | 6,112,723 | | | $ | 50,143,919 | |
| Net change in unrealized appreciation/ (depreciation) included in the Statements of Operations attributable to Level 3 investments held at June 30, 2019 | | $ | (1,280,871 | ) | | $ | 107,797 | | | $ | (1,173,074 | ) |
| Blackstone/GSO Strategic Credit Fund | | Floating Rate Loan Interests | | | Common Stock | | | Preferred Stock | | | Warrants | | | Total | |
| Balance as of December 31, 2018 | | $ | 229,511,149 | | | $ | 13,989,703 | | | $ | 393,038 | | | $ | 6,889 | | | $ | 243,900,779 | |
| Accrued discount/ premium | | | 190,983 | | | | – | | | | – | | | | – | | | | 190,983 | |
| Realized Gain/(Loss) | | | 61,209 | | | | – | | | | – | | | | – | | | | 61,209 | |
| Change in Unrealized Appreciation/(Depreciation) | | | (142,065 | ) | | | (1,539,515 | ) | | | (393,038 | ) | | | – | | | | (2,074,618 | ) |
| Purchases | | | 21,183,468 | | | | – | | | | – | | | | – | | | | 21,183,468 | |
| Sales Proceeds | | | (19,673,913 | ) | | | – | | | | – | | | | – | | | | (19,673,913 | ) |
| Transfer into Level 3 | | | 20,085,552 | | | | – | | | | – | | | | – | | | | 20,085,552 | |
| Transfer out of Level 3 | | | (99,110,150 | ) | | | – | | | | – | | | | – | | | | (99,110,150 | ) |
| Balance as of June 30, 2019 | | $ | 152,106,233 | | | $ | 12,450,188 | | | $ | – | | | $ | 6,889 | | | $ | 164,563,310 | |
| Net change in unrealized appreciation/ (depreciation) included in the Statements of Operations attributable to Level 3 investments held at June 30, 2019 | | $ | (2,473,636 | ) | | $ | (164,921 | ) | | $ | (393,038 | ) | | $ | – | | | $ | (3,031,595 | ) |
| Blackstone / GSO Funds | Notes to Financial Statements |
June 30, 2019 (Unaudited)
| Blackstone / GSO Senior Floating Rate Term Fund | Fair Value | | Valuation Technique(s) | Unobservable Input(s) | Value/Range (Weighted Average) |
| Floating Rate Loan Interests | $ | 48,884,887 | | Third-party vendor pricing service | Broker quotes | N/A |
| Collateralized Loan Obligation Securities | | 3,890,336 | | Third-party vendor pricing service | Broker quotes | N/A |
| Common Stock | | 465,633 | | Third-party vendor pricing service | Broker quotes | N/A |
| Warrants | | 1,378 | | Third-party vendor pricing service | Broker quotes | N/A |
| Blackstone / GSO Long-Short Credit Income Fund | Fair Value | | Valuation Technique(s) | Unobservable Input(s) | Value/Range (Weighted Average) |
| Floating Rate Loan Interests | $ | 44,031,196 | | Third-party vendor pricing service | Broker quotes | N/A |
| Collateralized Loan Obligation Securities | | 6,112,723 | | Third-party vendor pricing service | Broker quotes | N/A |
| Blackstone / GSO Strategic Credit Fund | Fair Value | | Valuation Technique(s) | Unobservable Input(s) | Value/Range (Weighted Average) |
| Floating Rate Loan Interests | $ | 152,106,233 | | Third-party vendor pricing service | Broker quote | N/A |
| Common Stock | | 3,261,320 | | Third-party vendor pricing service | Broker quote | N/A |
| | 2,262,707 | | Performance Multiple Methodology | EBITDA Multiple(a) | 7.25x |
| | 6,926,161 | | Performance Multiple Methodology | EBITDA Multiple(a) | 4.25x |
| | | | | Proved & Probable PV-10(a) | 0.54x |
| | | | | Daily Production(a) | 40.8 |
| | | | | Proved & Probable Reserves(a) | 8.9 |
| Warrants | | 6,889 | | Third-party vendor pricing service | Broker quotes | N/A |
| (a) | A change to the unobservable input at the reporting date would result in a significant change to the value of the investment as follows: |
| Unobservable Input | Impact to Value if Input Increases | Impact to Value if Input Decreases |
| EBITDA Multiple | Increase | Decrease |
| Proved & Probable PV-10 | Increase | Decrease |
| Daily Production | Increase | Decrease |
| Proved & Probable Reserves | Increase | Decrease |
Securities Transactions and Investment Income: Securities transactions are recorded on trade date for financial reporting purposes and amounts payable or receivable for trades not settled at the time of period end are reflected as liabilities and assets, respectively. Interest income, including accretion of discount and amortization of premium, is recorded on the accrual basis. Realized gains and losses from securities transactions and foreign currency transactions, if any, are recorded on the basis of identified cost and stated separately in the Statement of Operations.
When the Funds sell a floating rate loan interest, they may pay an agency fee. The Funds earn facility and other fees on floating rate loan interests, and facility fees are typically amortized to income over the term of the loan. Consent and amendment fees are also recorded to income as earned. All of these fees are shown on the Statement of Operations under “Facility and other fees.”
Federal Income Taxes: It is the policy of the Funds to continue to qualify as regulated investment companies by complying with the requirements of Subchapter M of the Internal Revenue Code of 1986, as amended, applicable to regulated investment companies, and to distribute substantially all of their earnings to their shareholders. While no federal income tax provisions are required, in early 2019 BSL paid excise taxes of $2,982 for the excise tax year ended December 31, 2018. BGX and BGB did not incur an excise tax for this period.
Income distributions and capital gain distributions are determined in accordance with income tax regulations, which may differ from GAAP. These differences are primarily due to differing treatments of income and gains on various investment securities held by the Funds, timing differences and differing characterization of distributions made by the Funds as a whole.
As of and during the period ended June 30, 2019, the Funds did not have a liability for any unrecognized tax benefits. The Funds file U.S. federal, state, and local tax returns as required. The Funds’ tax returns are subject to examination by the relevant tax authorities until expiration of the applicable statute of limitations which is generally three years after the filing of the tax return for federal purposes and four years for most state returns. Tax returns for open years have incorporated no uncertain tax positions that require a provision for income taxes.
Semi-Annual Report | June 30, 2019 | 63 |
| Blackstone / GSO Funds | Notes to Financial Statements |
June 30, 2019 (Unaudited)
Distributions to Shareholders: The Funds make monthly cash distributions of all or a portion of their net investment income to common shareholders. The Funds will distribute to common shareholders at least annually all or substantially all of their net investment income after the payment of dividends and interest, if any, owed with respect to outstanding preferred shares and/or borrowings, if applicable. The Funds intend to pay any capital gains distributions at least annually. On November 20, 2018, the Adviser announced that the Funds were transitioning from a strategy that seeks to maintain Fund distributions at stable levels notwithstanding increases or decreases in net income earned to a distribution strategy that is more reflective of the net income earned by the Funds.
NOTE 3. MANAGEMENT FEES, ADMINISTRATION FEES, AND OTHER AGREEMENTS
The Adviser, a wholly-owned subsidiary of GSO Capital Partners LP (collectively with its affiliates, “GSO”), is a registered investment adviser and is responsible for the day-to-day management of, and providing administrative and compliance oversight services to, the Funds. GSO is an affiliate of The Blackstone Group Inc.
For BSL, the Adviser receives a monthly fee at the annual rate of 0.90% of the average daily value of BSL’s total assets (including any assets attributable to any leverage used) minus the sum of the BSL’s accrued liabilities (other than Fund liabilities incurred for any leverage) (“BSL Managed Assets”). Effective November 17, 2017, the Adviser agreed to reduce a portion of the previous management fee, which was at an annual rate equal to 1.00% of BSL’s Managed Assets, in connection with the extension of BSL’s term through May 31, 2022. If BSL’s term is extended again by shareholders beyond May 31, 2022, the management fee will return to an annual rate of 1.00% of BSL’s Managed Assets unless waived or otherwise modified. For BGX, the Adviser receives a monthly fee at the annual rate of 1.20% of the average daily value of BGX’s net assets (total assets of BGX minus liabilities, including accrued expenses or dividends). For BGB, the Adviser receives a monthly fee at the annual rate of 1.00% of the average daily value of BGB’s Managed Assets (defined below).
In 2018, the Funds and the Blackstone / GSO Floating Rate Enhanced Income Fund paid every Trustee who is not a director, officer, employee, or affiliate of GSO or ALPS, a retainer fee of $120,000 per annum. Effective January 1, 2019, the Funds will pay a retainer fee of $130,000 per annum. The Chairman of the Audit Committee and the Chairman of the Nominating and Governance Committee also will receive a retainer fee of $10,000 per annum. The Lead Independent Trustee will also receive a retainer fee of $14,000 per annum.
ALPS Fund Services, Inc. (“ALPS”) serves as administrator to the Funds. Under the administration agreement, ALPS is responsible for calculating the net asset value of the common shares and generally managing the administrative affairs of the Funds. For BSL and BGB, ALPS receives a monthly fee based on the average daily value of the Funds’ respective Managed Assets, plus out-of-pocket expenses. For BGX, ALPS receives a monthly fee based on the average daily value of the Fund’s net assets, plus out-of-pocket expenses. ALPS is not considered an affiliate of the Funds, as defined under the 1940 Act.
The Bank of New York Mellon serves as the Funds’ custodian. Computershare Shareowner Services, LLC, serves as the Funds’ transfer agent. The Bank of New York Mellon and Computershare Shareowner Services, LLC, are not considered affiliates of the Funds as defined under the 1940 Act.
NOTE 4. SECURITIES TRANSACTIONS
Investment transactions for the period ended June 30, 2019, excluding temporary short-term investments, were as follows:
| Fund | | Cost of Investments Purchased | | | Proceeds from Investments Sold | |
| Blackstone / GSO Senior Floating Rate Term Fund | | $ | 72,653,065 | | | $ | 75,598,186 | |
| Blackstone / GSO Long-Short Credit Income Fund | | | 60,016,156 | | | | 59,657,264 | |
| Blackstone / GSO Strategic Credit Fund | | | 197,445,843 | | | | 195,663,497 | |
NOTE 5. RELATED PARTY TRANSACTIONS
The Adviser is a related party. Fees payable to the related parties are disclosed in Note 3 and accrued amounts are disclosed in the Statement of Operations.
During the period ended June 30, 2019 none of the Funds engaged in cross trades with an affiliate pursuant to Rule 17a-7.
Blackstone Holdings Finance Co. L.L.C ("FINCO"), an affiliate of the investment adviser, pays expenses on behalf of the Funds from time to time. The Funds reimburse FINCO for such expenses paid on behalf of the Funds. FINCO does not charge any fees for providing such services. The amounts of $73,960, $76,158, and $164,807 for BSL, BGX, and BGB, respectively, as of the period ended June 30, 2019 is recorded as other payables and accrued expenses on the Funds' Statements of Assets and Liabilities.
| Blackstone / GSO Funds | Notes to Financial Statements |
June 30, 2019 (Unaudited)
NOTE 6. CAPITAL
The Funds have authorized an unlimited number of $0.001 par value common shares.
Transactions in shares were as follows:
| Blackstone / GSO Senior Floating Rate Term Fund | | For the Six Months Ended June 30, 2019 (Unaudited) | | | For the Year Ended December 31, 2018 | |
| Common shares outstanding - beginning of period | | | 15,269,106 | | | | 15,251,298 | |
| Common shares issued as reinvestment of dividends | | | 7,340 | | | | 17,808 | |
| Common shares outstanding - end of period | | | 15,276,446 | | | | 15,269,106 | |
| Blackstone / GSO Long-Short Credit Income Fund | | For the Six Months Ended June 30, 2019 (Unaudited) | | | For the Year Ended December 31, 2018 | |
| Common shares outstanding - beginning of period | | | 12,702,160 | | | | 12,702,160 | |
| Common shares issued as reinvestment of dividends | | | 730 | | | | – | |
| Common shares outstanding - end of period | | | 12,702,890 | | | | 12,702,160 | |
| Blackstone / GSO Strategic Credit Fund | | For the Six Months Ended June 30, 2019 (Unaudited) | | | For the Year Ended December 31, 2018 | |
| Common shares outstanding - beginning of period | | | 44,664,382 | | | | 44,664,382 | |
| Common shares issued as reinvestment of dividends | | | – | | | | – | |
| Common shares outstanding - end of period | | | 44,664,382 | | | | 44,664,382 | |
NOTE 7. LOANS AND OTHER INVESTMENTS
BSL defines “Senior Loans” as first lien senior secured, floating rate loans that are made to U.S. and, to a limited extent, non-U.S. corporations, partnerships and other business entities (“Borrowers”), which operate in various industries and geographical regions. BGX includes first and second lien secured, floating rate loans in its definition of “Secured Loans.” Under normal market conditions, at least 80% of BSL’s Managed Assets will be invested in Senior Loans and 70% of BGX’s Managed Assets (defined below) will be invested in Secured Loans. BGB defines its managed assets as net assets plus any borrowings for investment purposes, which includes effective leverage obtained through total return swaps, securities lending arrangements, credit default swaps or other derivative transactions ("BGB Managed Assets"). Under normal market conditions, at least 80% of BGB's Managed Assets will be invested in credit investments comprised of corporate fixed income instruments and other investments (including derivatives) with similar economic characteristics. BGX defines its managed assets as net assets plus any borrowings for investment purposes, which includes effective leverage obtained through securities lending, swap contract arrangements, and short selling or other derivative transactions (“BGX Managed Assets”). At June 30, 2019, 83.6% of BSL’s Managed Assets were held in Senior Loans, 86.5% of BGX's Managed Assets were held in Secured Loans, and 99.3% of BGB’s Managed Assets were held in corporate fixed income instruments including Senior Secured Loans.
Senior secured loans hold a senior position in the capital structure of a business entity, are secured with specific collateral and have a claim on the assets and/or stock of the Borrower that is senior to that held by unsecured creditors, subordinated debt holders and stockholders of the Borrower.
Loans often require prepayments from Borrowers’ excess cash flows or permit the Borrowers to repay at their election. The degree to which Borrowers repay, whether as a contractual requirement or at their election, cannot be predicted with accuracy. As a result, the actual remaining maturity may be substantially less than the stated maturities shown. However, floating rate loans typically have an expected average life of two to four years. Floating rate loans typically have rates of interest which are re-determined periodically, either daily, monthly, quarterly or semi-annually by reference to a floating base lending rate, primarily the London Interbank Offered Rate (LIBOR), plus a premium or credit spread.
Loans are subject to the risk of payment defaults of scheduled interest or principal. Such non-payment could result in a reduction of income, a reduction in the value of the investment and a potential decrease in the net asset value of any of the Funds. Risk of loss of income is generally higher for subordinated unsecured loans or debt, which are not backed by a security interest in any specific collateral. There can be no assurance that the liquidation of any collateral securing a Loan would satisfy the Borrower’s obligation to the applicable Fund in the event of non-payment of scheduled interest or principal payments, or that such collateral could be readily liquidated.
Semi-Annual Report | June 30, 2019 | 65 |
| Blackstone / GSO Funds | Notes to Financial Statements |
June 30, 2019 (Unaudited)
Second lien loans generally are subject to similar risks as those associated with investments in first lien loans except that such loans are subordinated in payment and/or lower in lien priority to first lien holders. In the event of default on a second lien loan, the first priority lien holder has first claim to the underlying collateral of the loan. Second lien loans are subject to the additional risk that the cash flow of the Borrower and property securing the loan or debt, if any, may be insufficient to meet scheduled payments after giving effect to the senior obligations of the Borrower. At June 30, 2019, BSL, BGX and BGB had invested $46,282,001, $50,629,337 and $173,877,334, respectively, in second lien secured loans. Second lien secured loans are considered Secured Loans for BGX and Senior Secured Loans for BGB, but are not considered Senior Loans for BSL.
Loans can be rated below investment grade or may also be unrated. As a result, the risks associated with Loans may be similar to the risks of other below investment grade securities, although they are senior and secured in contrast to other below investment grade securities, which are often subordinated or unsecured. The Funds typically invest in Loans rated below investment grade, which are considered speculative because of the credit risk of the Borrowers. Such companies are more likely than investment grade issuers to default on their payments of interest and principal owed to the Funds, and such defaults could reduce net asset value and income distributions. The amount of public information available with respect to below investment grade loans will generally be less extensive than that available for registered or exchange-listed securities. In evaluating the creditworthiness of Borrowers, the Adviser will consider, and may rely in part on, analyses performed by others. The Adviser’s established best execution procedures and guidelines require trades to be placed for execution only with broker-dealer counterparties approved by the Counterparty Committee of the Adviser. The factors considered by the Counterparty Committee when selecting and approving brokers and dealers include, but are not limited to: (i) quality, accuracy, and timeliness of execution, (ii) review of the reputation, financial strength and stability of the financial institution, (iii) willingness and ability of the counterparty to commit capital, (iv) ongoing reliability and (v) access to underwritten offerings and secondary markets. The Counterparty Committee regularly reviews each broker-dealer counterparty based on the foregoing factors.
The Funds may acquire Loans through assignments or participations. The Funds typically acquire these Loans through assignment, and if a Fund acquires a Loan through participation, it will seek to elevate a participation interest into an assignment as soon as practicably possible. The purchaser of an assignment typically succeeds to all the rights and obligations of the assigning institution and becomes a lender under the credit agreement with respect to the debt obligation. A participation typically results in a contractual relationship only with the institution participating out the interest, not with the Borrower. Sellers of participations typically include banks, broker-dealers, other financial institutions and lending institutions. The Adviser has adopted best execution procedures and guidelines which seek to mitigate credit and counterparty risk in the atypical situation when the Funds must acquire a Loan through a participation.
BSL and BGX have invested in Collateralized Loan Obligation securities (“CLOs”). A CLO is a financing company (generally called a Special Purpose Vehicle (“SPV”)), created to reapportion the risk and return characteristics of a pool of assets. While the assets underlying a CLO are typically Secured Loans, the assets may also include (i) unsecured loans, (ii) debt securities that are rated below investment grade, and (iii) equity securities incidental to investments in Secured Loans. When investing in CLOs, each fund will not invest in equity tranches, which are the lowest tranche. However, each fund may invest in lower tranches of CLO debt securities, which typically experience a lower recovery, greater risk of loss or deferral or non-payment of interest than more senior debt tranches of the CLO. In addition, each fund intends to invest in CLOs consisting primarily of individual Secured Loans of Borrowers and not repackaged CLO obligations from other high risk pools. The underlying Secured Loans purchased by CLOs are generally performing at the time of purchase but may become non-performing, distressed or defaulted. CLOs with underlying assets of non-performing, distressed or defaulted loans are not contemplated to comprise a significant portion of each fund’s investments in CLOs. The key feature of the CLO structure is the prioritization of the cash flows from a pool of debt securities among the several classes of the CLO. The SPV is a company founded solely for the purpose of securitizing payment claims arising out of this diversified asset pool. On this basis, marketable securities are issued by the SPV which, due to the diversification of the underlying risk, generally represent a lower level of risk than the original assets. The redemption of the securities issued by the SPV typically takes place on a date earlier than legal maturity from refinancing of the senior debt tranches.
NOTE 8. CREDIT DEFAULT SWAPS
BGX may enter into over-the-counter (“OTC”) and/or centrally cleared credit default swap contracts and may also use credit default swaps to express a negative credit view on a loan or other investment. If BGX purchases protection under a credit default swap and no credit event occurs on the reference obligation, BGX will have made a series of periodic payments and recover nothing of monetary value. However, if a credit event occurs on the reference obligation, BGX (if the buyer of protection) will receive the full notional value of the reference obligation through a cash payment in exchange for the reference obligation or alternatively, a cash payment representing the difference between the expected recovery rate and the full notional value.
| Blackstone / GSO Funds | Notes to Financial Statements |
June 30, 2019 (Unaudited)
The periodic swap payments received or made by BGX are recorded in the Statements of Operations as realized gains or losses, respectively. Any upfront fees paid are recorded as assets and any upfront fees received are recorded as liabilities and amortized over the term of the swap. Swaps are marked-to-market daily and changes in value, including the accrual of periodic amounts of interest, are recorded as unrealized appreciation (depreciation) and shown on BGX’s Statement of Operations. When the swap is terminated, BGX will record a realized gain or loss equal to the difference between the proceeds from (or cost of) the closing transaction and BGX’s basis in the contract, if any. Generally, the basis of the contracts is the unamortized premium received or paid.
International Swaps and Derivatives Association, Inc. Master Agreements (“ISDA Master Agreements”) govern OTC (“over the counter”) financial derivative transactions entered into by a Fund and those counterparties. The ISDA Master Agreements maintain provisions for general obligations, representations, agreements, collateral and events of default or termination. Events of termination include conditions that may entitle counterparties to elect to terminate early and cause settlement of all outstanding transactions under the applicable ISDA Master Agreement. Any election to terminate early could be material to the financial statements.
Swap transactions involve, to varying degrees, elements of interest rate, credit and market risk in excess of the amounts recognized in the Statements of Assets and Liabilities. Such risks involve the possibility that there will be no liquid market for these agreements, that the counterparty to the agreements may default on its obligation to perform or disagree as to the meaning of the contractual terms in the agreements, and that there may be unfavorable changes in interest rates and/or market values associated with these transactions. The Adviser selects only those counterparties that it believes are credit-worthy.
During the period ended June 30, 2019, BGX did not enter into any credit default swaps.
NOTE 9. LEVERAGE
On July 27, 2016 BGX and BGB issued 7-year Mandatory Redeemable Preferred Shares (“MRPS”). BGX issued 20,000 MRPS with a total liquidation value of $20,000,000 and BGB issued 45,000 MRPS with a total liquidation value of $45,000,000, rated “AA” by Fitch Ratings. BGB and BGX used the proceeds of the offerings to make additional investments for their portfolios. The final redemption date of the MRPS is July 27, 2023. BGB and BGX make quarterly dividend payments on the MRPS at an annual dividend rate of 3.61%. Due to the terms of the MRPS, face value approximates fair value at June 30, 2019. This fair value is based on Level 2 inputs under the three-tier fair valuation hierarchy (see Note 2).
In connection with BGB and BGX’s issuance of MRPS, certain costs were incurred by BGB and BGX and have been recorded net against the outstanding liability. These costs are being amortized over the period beginning July 27, 2016 (day of issuance) through July 27, 2023, the final redemption date. The net deferred financing costs as of June 30, 2019 are shown on BGB’s and BGX’s Statements of Assets and Liabilities. The amount of expense amortized during the period ended June 30, 2019 is shown on BGB’s and BGX’s Statements of Operations under amortization of deferred financing costs.
Except for matters which do not require the vote of Holders of MRPS under the 1940 Act and except as otherwise provided in BGB’s and BGX’s Declarations of Trust, Bylaws, or the applicable Securities Purchase Agreements or as otherwise required by applicable law, each holder of MRPS shall be entitled to one vote for each MRPS held on each matter submitted to a vote of shareholders of the Fund, and the holders of outstanding preferred shares and common shares shall vote together as a single class on all matters submitted to shareholders; provided, however, that the holders of outstanding preferred shares shall be entitled, as a class, to the exclusion of the holders of shares of all other classes of beneficial interest of the Fund, to elect two Trustees of the applicable Fund at all times.
Each Fund has entered into a separate Credit Agreement (each, an “Agreement”) with a bank to borrow money pursuant to a two-year revolving line of credit (“Leverage Facility”) for BSL, BGX and BGB. BSL entered into an agreement dated October 8, 2014, as amended on October 7, 2015, October 5, 2016, and October 4, 2017 and as further amended and restated on June 20, 2018, to borrow up to a limit of $142 million. BGX entered into an agreement dated July 29, 2014, as amended on January 26, 2015, July 28, 2015, July 26, 2016, July 25, 2017, and February 23, 2018 and as further amended and restated on June 20, 2018, and as further amended and restated on July 25, 2019 to borrow up to a limit of $122 million, with $41 million for tranche A loans (“BGX Tranche A Loans”) and $81 million for tranche B loans (“BGX Tranche B Loans”). BGB entered into an agreement dated December 21, 2012, as amended at December 20, 2013, December 19, 2014, December 18, 2015, July 26, 2016, December 16, 2016, December 20, 2017, as amended and restated on June 20, 2018, as amended on December 4, 2018 and as further amended and restated on January 11, 2019 to borrow up to a limit of $415 million, with $145 million for tranche A loans (“BGB Tranche A Loans” and collectively with BGX Tranche A Loans, the “Tranche A Loans”) and $270 million for tranche B loans (“BGB Tranche B Loans” and collectively with BGX Tranche B Loans, the “Tranche B Loans”). Borrowings under each Agreement are secured by the assets of each Fund.
Interest on BSL’s Leverage Facility is charged at a rate of 1.15% above LIBOR for short-term (one (1) month) LIBOR loans and 1.00% above LIBOR for long term (three (3) month, six (6) month or nine (9) month) LIBOR loans, with LIBOR measured for the period commencing on the date of the making of such LIBOR loan (or the last date upon which any other Loan was converted to, or continued as, such LIBOR loan) and ending on the numerically corresponding day in the calendar month that is one (1) week or one (1), two (2), three (3), six (6) or nine (9) months thereafter, as the Fund may elect, as applicable, or such other period as the lender may agree in its sole and absolute discretion. Interest on BGB’s and BGX’s Leverage Facilities is charged at a rate of 0.85% above LIBOR for Tranche A Loans, 1.15% above LIBOR for one (1) month interest period Tranche B Loans and 1.00% above LIBOR for three (3), six (6) and nine (9) months interest period Tranche B Loans, with LIBOR measured for the period commencing on the date of the making of such LIBOR Loan (or the last date upon which any other Loan was converted to, or continued as, such LIBOR Loan) and ending on the numerically corresponding day in the calendar month that is one (1) week or one (1), three (3), six (6) or nine (9) months thereafter, as the Fund may elect, or such other periods as the lender may agree in its sole and absolute discretion.
Semi-Annual Report | June 30, 2019 | 67 |
| Blackstone / GSO Funds | Notes to Financial Statements |
June 30, 2019 (Unaudited)
Under the terms of the applicable Agreement, each Fund must pay a commitment fee on any undrawn amounts. The commitment fee payable in BSL is 0.20% on the undrawn amounts and in BGB and BGX, for each of Tranche A and Tranche B Loans is 0.15% on the undrawn amounts when drawn amounts exceed 75% of the borrowing limit and 0.25% on the undrawn amounts at any other time. Interest and fees are payable quarterly. Each Fund may elect to extend the applicable Agreement for a further period with the consent of the lending bank. At June 30, 2019, BSL, BGX, and BGB had borrowings outstanding under its respective Leverage Facility of $127,000,000, $110,500,000, and $368,000,000, at an interest rate of 3.51%, 3.46%, and 3.39%, respectively. Due to the short term nature of each Agreement, face value approximates fair value at June 30, 2019. This fair value is based on Level 2 inputs under the three-tier fair valuation hierarchy (see Note 2). For the period ended June 30, 2019, the average borrowings under BSL’s, BGX’s and BGB’s Leverage Facility and the average interest rates were $126,801,105, and 3.61%, $110,389,503, and 3.59%, and $368,248,619, and 3.49%, respectively.
Under each Agreement and each governing document of the MRPS, each Fund has agreed to certain covenants and additional investment limitations while the leverage is outstanding. Each Fund agreed to maintain asset coverage of three times over borrowings and BGX and BGB have agreed to maintain 225% asset coverage over borrowings plus MRPS. Compliance with the investment restrictions and calculations are performed by the Funds’ custodian, The Bank of New York Mellon.
The use of borrowings to leverage the common shares of the Funds can create risks. Changes in the value of the Funds’ portfolios, including securities bought with the proceeds of leverage, are borne entirely by the holders of common shares of the Funds. All costs and expenses related to any form of leverage used by the Funds are borne entirely by common shareholders. If there is a net decrease or increase in the value of the Funds’ investment portfolios, the leverage may decrease or increase, as the case may be, the net asset value per common share to a greater extent than if the Funds did not utilize leverage. During periods when BSL and BGB are using leverage, the fees paid to the Adviser for advisory services and to ALPS for administrative services are higher than if BSL and BGB did not use leverage because the fees paid are calculated on the basis of BSL and BGB’s Managed Assets, which include the assets purchased through leverage. As of June 30, 2019, BSL’s, BGX’s, and BGB’s leverage represented 33.19%, 39.14% and 37.23% of each Fund’s Managed Assets, respectively. The leverage amounts in BGX and BGB include 6.00% and 4.06% of Managed Assets attributable to the MRPS, respectively.
NOTE 10. TAX BASIS DISTRIBUTIONS
Ordinary income including net short-term capital gains, if any, and net long-term capital gains are allocated to common stockholders after payment of the available amounts on any outstanding term preferred shares. To the extent that the amount distributed to common stockholders exceeds the amount of available ordinary income and long-term capital gains after allocation to any outstanding term preferred shares, these distributions are treated as a tax return of capital. Additionally, to the extent that the amount distributed on any outstanding term preferred shares exceeds the amount of available ordinary income and long-term capital gains, these distributions are treated as a tax return of capital.
As determined on December 31, 2018, certain permanent differences between financial and tax accounting were reclassified. These differences were primarily due to the differing tax treatment of certain investments. The amounts reclassified did not affect net assets. The reclassifications were as follows:
| Fund | | Decrease
Paid-in capital | | | Increase
Total Distributable Earnings | |
| Blackstone / GSO Senior Floating Rate Term Fund | | $ | (129,867 | ) | | $ | 129,867 | |
| Blackstone / GSO Long-Short Credit Income Fund | | $ | (88,152 | ) | | $ | 88,152 | |
| Blackstone / GSO Strategic Credit Fund | | $ | (245,787 | ) | | $ | 245,787 | |
| Blackstone / GSO Funds | Notes to Financial Statements |
June 30, 2019 (Unaudited)
The tax character of distributions paid by the Funds during the fiscal year ended December 31, 2018 was as follows:
| 2018 | | | | Blackstone / GSO Senior Floating Rate Term Fund | | | | Blackstone / GSO Long-Short Credit Income Fund | | | | Blackstone / GSO Strategic Credit Fund | |
| Distributions Paid From: Ordinary Income | | | $ | 21,551,497 | | | $ | 21,211,254 | (a) | | $ | 68,890,569 | (a) |
| Total | | | $ | 21,551,497 | | | $ | 21,211,254 | | | $ | 68,890,569 | |
| (a) | Distributions paid include common shares and mandatory redeemable preferred shares. |
Under the Regulated Investment Company Modernization Act of 2010 (the "RIC Mod Act"), net capital losses recognized by the Fund may get carried forward indefinitely, and retain their character as short-term and/or long-term losses. Any such losses will be deemed to arise on the first day of the next taxable year. The losses carried forward from December 31, 2018 were as follows:
| Fund | | Short Term | | | Long Term | |
| Blackstone / GSO Senior Floating Rate Term Fund | | $ | – | | | $ | 13,408,320 | |
| Blackstone / GSO Long-Short Credit Income Fund | | $ | 1,075,555 | | | $ | 18,473,239 | |
| Blackstone / GSO Strategic Credit Fund | | $ | 1,884,756 | | | $ | 67,764,612 | |
Capital losses arising in the post-October period of the current fiscal year may be deferred to the next fiscal year if the fund elects to defer the recognition of these losses. When this election is made any losses recognized during the period are treated as having occurred on the first day of the next fiscal year separate from and in addition to the application of normal capital loss carryovers as described above. At December 31, 2018, the Funds elected to defer the following post-October losses:
| Fund | | Capital Losses |
| Blackstone / GSO Senior Floating Rate Term Fund | | $ | 117,519 | |
| Blackstone / GSO Strategic Credit Fund | | | 4,288,118 | |
At December 31, 2018, the components of distributable earnings on a tax basis for the Funds were as follows:
| | | Blackstone / GSO
Senior Floating
Rate Term Fund | | Blackstone / GSO
Long-Short
Credit Income Fund | | Blackstone / GSO
Strategic
Credit Fund |
| Undistributed ordinary income | | $ | 617,538 | | | $ | 639,202 | | | $ | 1,122,033 | |
| Accumulated capital losses | | | (13,525,839 | ) | | | (19,548,794 | ) | | | (73,937,486 | ) |
| Unrealized depreciation | | | (22,089,723 | ) | | | (19,375,052 | ) | | | (83,094,103 | ) |
| Other Cumulative effect of timing differences | | | – | | | | (121,558 | ) | | | (273,505 | ) |
| Total | | $ | (34,998,024 | ) | | $ | (38,406,202 | ) | | $ | (156,183,061 | ) |
At June 30, 2019, the amount of net tax unrealized appreciation/(depreciation) and the tax cost of investment securities, including short-term securities, were as follows*:
| | | Blackstone / GSO
Senior Floating
Rate Term Fund | | Blackstone / GSO
Long-Short
Credit Income Fund | | Blackstone / GSO
Strategic
Credit Fund |
| Cost of investments for income tax purposes | | $ | 400,953,841 | | | $ | 351,500,673 | | | $ | 1,191,057,768 | |
| Gross appreciation (excess of value over tax cost) | | $ | 1,600,068 | | | $ | 1,972,618 | | | $ | 6,477,655 | |
| Gross depreciation (excess of tax cost over value) | | | (20,852,822 | ) | | | (18,314,918 | ) | | | (80,942,141 | ) |
| Net unrealized depreciation | | $ | (19,252,754 | ) | | $ | (16,342,300 | ) | | $ | (74,464,486 | ) |
| * | Amounts computed using book/tax differences as of December 31, 2018. |
| Semi-Annual Report | June 30, 2019 | 69 |
| Blackstone / GSO Funds | Notes to Financial Statements |
June 30, 2019 (Unaudited)
11. RECENT ACCOUNTING PRONOUNCEMENT
In March 2017, the FASB issued ASU 2017-08,Receivables – Nonrefundable Fees and Other Costs (Subtopic 310-20): Premium Amortization on Purchased Callable Debt Securities, which provides guidance related to the amortization period for certain purchased callable debt securities purchased at a premium. Specifically, it required the premium to be amortized to the earliest call date. The ASU is effective for annual periods beginning after December 15, 2018, and interim periods within those annual periods. The Funds have adopted and applied ASU 2017-08 on a modified retrospective basis through a cumulative-effect adjustment as of the beginning of the period of adoption. As a result of the adoption of ASU 2017-08, as of January 1, 2019, the amortized cost basis of investments was reduced by $36, $83,122 and $201,554 for BSL, BGX and BGB respectively, and unrealized appreciation of investments was increased by corresponding amounts. The adoption of ASU 2017-08 had no impact on beginning net assets, the current period results from operations, or any prior period information presented in the financial statements. Management has evaluated the impact of this ASU and has adopted the changes into these financial statements.
NOTE 12. SUBSEQUENT EVENTS
In preparing these financial statements, the Funds’ management has evaluated events and transactions for potential recognition or disclosure through the date the financial statements were issued.
Shareholder Distributions for BSL: On June 11, 2019, a monthly distribution of $0.111 per share was declared to common shareholders, payable on July 31, 2019 to common shareholders of record on July 24, 2019. On June 11, 2019, a monthly distribution of $0.111 per share was declared to common shareholders, payable August 30, 2019 to common shareholders of record on August 23, 2019.
Shareholder Distributions for BGX: On June 11, 2019, a monthly distribution of $0.122 per share was declared to common shareholders, payable on July 31, 2019 to common shareholders of record on July 24, 2019. On June 11, 2019, a monthly distribution of $0.122 per share was declared to common shareholders, payable August 30, 2019 to common shareholders of record on August 23, 2019.
Shareholder Distributions for BGB: On June 11, 2019, a monthly distribution of $0.114 per share was declared to common shareholders, payable on July 31, 2019 to common shareholders of record on July 24, 2019. On June 11, 2019, a monthly distribution of $0.114 per share was declared to common shareholders, payable August 30, 2019 to common shareholders of record on August 23, 2019.
| Blackstone / GSO Funds | Summary of Dividend Reinvestment Plan |
June 30, 2019 (Unaudited)
Pursuant to the Funds’ Dividend Reinvestment Plan (the “DRIP”), shareholders whose shares are registered in their own name may ‘‘opt-in’’ to the plan and elect to reinvest all or a portion of their distributions in common shares by providing the required enrollment notice to Computershare, the DRIP administrator. Shareholders whose shares are held in the name of a broker or other nominee may have distributions reinvested only if such a service is provided by the broker or the nominee or if the broker or the nominee permits participation in the DRIP. Shareholders whose shares are held in the name of a broker or other nominee should contact the broker or nominee for details. A shareholder may terminate participation in the DRIP at any time by notifying the DRIP administrator before the record date of the next distribution through the Internet, by telephone or in writing. All distributions to shareholders who do not participate in the DRIP, or have elected to terminate their participation in the DRIP, will be paid by check mailed directly to the record holder by or under the direction of the DRIP administrator when the Funds’ Board of Trustees declares a distribution.
When the Funds declare a distribution, shareholders who are participants in the applicable DRIP receive the equivalent of the amount of the distribution in common shares. If you participate in the DRIP, the number of common shares of the Funds that you will receive will be determined as follows:
(1) If the market price of the common shares plus any brokerage commissions on the payable date (or, if the payable date is not a New York Stock Exchange trading day, the immediately preceding trading day) for determining shareholders eligible to receive the relevant distribution (the ‘‘determination date’’) is equal to or exceeds 98% of the net asset value per common share, the Fund will issue new common shares at a price equal to the greater of:
(a) 98% of the net asset value per share at the close of trading on the New York Stock Exchange on the determination date or
(b) 95% of the market price per common share on the determination date.
(2) If 98% of the net asset value per common share exceeds the market price of the common shares plus any brokerage commissions on the determination date, the DRIP administrator will receive the distribution in cash and will buy common shares in the open market, on the New York Stock Exchange or elsewhere, for your account as soon as practicable commencing on the trading day following the determination date and terminating no later than the earlier of (a) 30 days after the distribution payment date, or (b) the record date for the next succeeding distribution to be made to the shareholders; except when necessary to comply with applicable provisions of the federal securities laws. If during this period: (i) the market price plus any brokerage commissions rises so that it equals or exceeds 98% of the net asset value per common share at the close of trading on the New York Stock Exchange on the determination date before the DRIP administrator has completed the open market purchases or (ii) the DRIP administrator is unable to invest the full amount eligible to be reinvested in open market purchases, the DRIP administrator will cease purchasing common shares in the open market and the Fund will issue the remaining common shares at a price per share equal to the greater of (a) 98% of the net asset value per share at the close of trading on the New York Stock Exchange on the determination date or (b) 95% of the then current market price per share.
The DRIP administrator maintains all shareholder accounts in the dividend reinvestment plan and furnishes written confirmations of all transactions in the account, including information needed by shareholders for personal and tax records. Common shares in the account of each DRIP participant are held by the DRIP administrator in non-certificated form in the name of the participant, and each shareholder’s proxy includes shares purchased pursuant to the DRIP.
There is no charge to participants for reinvesting regular distributions and capital gains distributions. The fees of the DRIP administrator for handling the reinvestment of regular distributions and capital gains distributions are included in the fee to be paid by us to our transfer agent. There are no brokerage charges with respect to shares issued directly by us as a result of regular distributions or capital gains distributions payable either in shares or in cash. However, each participant bears a pro rata share of brokerage commissions incurred with respect to the DRIP administrator’s open market purchases in connection with the reinvestment of such distributions. Shareholders that opt-in to the DRIP will add to their investment through dollar cost averaging. Because all dividends and distributions paid to such shareholder will be automatically reinvested in additional common shares, the average cost of such shareholder’s common shares will decrease over time. Dollar cost averaging is a technique for lowering the average cost per share over time if the Fund’s net asset value declines. While dollar cost averaging has definite advantages, it cannot assure profit or protect against loss in declining markets.
The automatic reinvestment of such dividends or distributions does not relieve participants of any income tax that may be payable on such dividends or distributions.
You may obtain additional information by contacting the DRIP administrator at the following address: Computershare, Attn: Sales Dept., P.O. Box 358035, Pittsburgh, PA 15252.
| Semi-Annual Report | June 30, 2019 | 71 |
| Blackstone / GSO Funds | Additional Information |
June 30, 2019 (Unaudited)
Portfolio Information.The Funds file their complete schedules of portfolio holdings with the Securities and Exchange Commission (the “SEC”) for the first and third quarters of each fiscal year on Form N-Q. Beginning April 30, 2019, the Funds will be required to use new Form N-PORT on a monthly basis to disclose portfolio holdings, with every third month made available to the public by the SEC 60 days after the end of the Funds’ fiscal quarter, and Form N-Q filings will no longer be required. The Funds’ Forms N-Q or Form N-PORT will be available (1) on the Funds’ website located at http://www.blackstone-gso.com or (2) on the SEC’s website at http://www.sec.gov.
Proxy Information.The policies and procedures used to determine how to vote proxies relating to securities held by the Funds are available (1) without charge, upon request, by calling 1-877-876-1121, (2) on the Funds’ website located at http://www.blackstone-gso.com, and (3) on the SEC’s website at http://www.sec.gov. Information regarding how the Funds voted proxies relating to portfolio securities during the most recent twelve-month period ended June 30 is available on Form N-PX by August 31 of each year (1) without charge, upon request, by calling 1-877-876-1121, (2) on the Funds’ website located at http://www.blacksone-gso.com, and (3) on the SEC’s website at http://www.sec.gov.
Senior Officer Code of Ethics.The Funds file a copy of their code of ethics that applies to the Funds’ principal executive officer, principal financial officer or controller, or persons performing similar functions, with the SEC as an exhibit to each annual report on Form N-CSR. This will be available on the SEC’s website athttp://www.sec.gov.
BSL Meeting of Shareholders – Voting Results
On April 17, 2019, BSL held its Annual Meeting of Shareholders to consider the proposal set forth below. The following votes were recorded:
Proposal 1: The election of two (2) Trustees of BSL, to hold office for the term indicated and until his successor shall have been elected and qualified.
Election of Michael F. Holland as Class II Trustee of BSL, term to expire at 2022 Annual Meeting.
| | Number of Shares | % of Shares Voted |
| Affirmative | 12,846,668 | 92.36% |
| Withheld | 1,062,520 | 7.64% |
| Total | 13,909,188 | 100.00% |
Election of Daniel H. Smith, Jr. as Class II Trustee of BSL, term to expire at 2022 Annual Meeting.
| | Number of Shares | % of Shares Voted |
| Affirmative | 13,155,430 | 94.58% |
| Withheld | 753,758 | 5.42% |
| Total | 13,909,188 | 100.00% |
BGX Meeting of Shareholders – Voting Results
On April 17, 2019, BGX held its Annual Meeting of Shareholders to consider the proposal set forth below. The following votes were recorded:
Proposal 1: The election of two (2) Trustees of BGX, to hold office for the term indicated and until his successor shall have been elected and qualified.
Election of Michael F. Holland as Class I Trustee of BGX, term to expire at 2022 Annual Meeting (only preferred shareholders vote).
| | Number of Shares | % of Shares Voted |
| Affirmative | 20,000 | 100.00% |
| Withheld | – | – |
| Total | 20,000 | 100.00% |
Election of Daniel H. Smith, Jr. as Class I Trustee of BSL, term to expire at 2022 Annual Meeting (common and preferred shareholders vote).
| | Number of Shares | % of Shares Voted |
| Affirmative | 10,454,709 | 88.96% |
| Withheld | 1,297,148 | 11.04% |
| Total | 11,751,857 | 100.00% |
| Blackstone / GSO Funds | Additional Information |
June 30, 2019 (Unaudited)
BGB Meeting of Shareholders – Voting Results
On April 17, 2019, BGB held its Annual Meeting of Shareholders to consider the proposal set forth below. The following votes were recorded:
Proposal 1: The election of two (2) Trustees of BGB, to hold office for the term indicated and until his successor shall have been elected and qualified.
Election of Michael F. Holland as Class III Trustee of BGB, term to expire at 2022 Annual Meeting (only preferred shareholders vote).
| | Number of Shares | % of Shares Voted |
| Affirmative | 45,000 | 100.00% |
| Withheld | – | – |
| Total | 45,000 | 100.00% |
Election of Daniel H. Smith, Jr. as Class III Trustee of BGB, term to expire at 2022 Annual Meeting (common and preferred shareholders vote).
| | Number of Shares | % of Shares Voted |
| Affirmative | 38,605,343.5 | 95.25% |
| Withheld | 1,924,511.0 | 4.75% |
| Total | 40,529,854.5 | 100.00% |
| Semi-Annual Report | June 30, 2019 | 73 |
| Blackstone / GSO Funds | Privacy Procedures |
June 30, 2019 (Unaudited)
This privacy policy sets forth the Investment Manager’s policies with respect to nonpublic personal information of individual investors, shareholders, prospective investors and former investors of investment funds managed by the Investment Manager. These policies apply to individuals only and are subject to change.
| FACTS | WHAT DO BLACKSTONE REGISTERED FUNDS DO WITH YOUR PERSONAL INFORMATION? |
| Why? | Financial companies choose how they share your personal information. Federal law gives consumers the right to limit some but not all sharing. Federal law also requires us to tell you how we collect, share, and protect your personal information. Please read this notice carefully to understand what we do. |
| What? | The types of personal information we collect and share depend on the product or service you have with us. This information can include: ● Social Security number and income ● Assets and investment experience ● Risk tolerance and transaction history |
| How? | All financial companies need to share customers’ personal information to run their everyday business. In the section below, we list the reasons financial companies can share their customers’ personal information; the reasons Blackstone Registered Funds (as defined below) choose to share; and whether you can limit this sharing. |
| Reasons we can share your personal information | Do Blackstone Registered
Funds share? | Can you limit this sharing? |
| For our everyday business purposes– such as to process your transactions, maintain your account(s), respond to court orders and legal investigations, or report to credit bureaus | Yes | No |
| For our marketing purposes– to offer our products and services to you | Yes | No |
| For joint marketing with other financial companies | No | We don't share |
| For our affiliates' everyday business purposes– information about your transactions and experiences | No | We don't share |
| For our affiliates' everyday business purposes– information about your creditworthiness | No | We don't share |
| For our affiliates to market to you | No | We don't share |
| For nonaffiliates to market to you | No | We don't share |
| Questions? | Email us at GLB.privacy@blackstone.com |
| Who We Are | |
| Who is providing this notice? | Blackstone Registered Funds include Blackstone Alternative Alpha Fund, Blackstone Alternative Alpha Fund II, Blackstone Real Estate Income Fund, Blackstone Real Estate Income Fund II, Blackstone Real Estate Income Trust, Inc., Blackstone Alternative Investment Funds, on behalf of its series Blackstone Alternative Multi-Strategy Fund, Blackstone Diversified Multi-Strategy Fund, a sub-fund of Blackstone Alternative Investment Funds plc, and the GSO Funds, consisting of Blackstone / GSO Senior Floating Rate Term Fund, Blackstone / GSO Long-Short Credit Income Fund, Blackstone / GSO Strategic Credit Fund, Blackstone / GSO Floating Rate Enhanced Income Fund and Blackstone / GSO Secured Lending Fund and Blackstone / GSO Floating Rate Enhanced Income Fund |
| What We Do | |
| How do Blackstone Registered Funds protect my personal information? | To protect your personal information from unauthorized access and use, we use security measures that comply with federal law. These measures include computer safeguards and secured files and buildings. |
| Blackstone / GSO Funds | Privacy Procedures |
June 30, 2019 (Unaudited)
| How do Blackstone Registered Funds collect my personal information? | We collect your personal information, for example, when you: ● open an account or give us your income information ● provide employment information or give us your contact information ● tell us about your investment or retirement portfolio We also collect your personal information from others, such as credit bureaus, affiliates, or other companies. |
| Why can't I limit all sharing? | Federal law gives you the right to limit only: ● sharing for affiliates’ everyday business purposes—information about your creditworthiness ● affiliates from using your information to market to you ● sharing for nonaffiliates to market to you State laws and individual companies may give you additional rights to limit sharing. See below for more on your rights under state law. |
| What happens when I limit sharing for an account I hold jointly with someone else? | Your choices will apply to everyone on your account—unless you tell us otherwise. |
| Definitions | |
| Affiliates | Companies related by common ownership or control. They can be financial and nonfinancial companies. ● Our affiliates include companies with a Blackstone name and financial companies such as GSO Capital Partners LP and Strategic Partners Fund Solutions. |
| Nonaffiliates | Companies not related by common ownership or control. They can be financial and nonfinancial companies. ● Blackstone Registered Funds do not share with nonaffiliates so they can market to you. |
| Joint marketing | A formal agreement between nonaffiliated financial companies that together market financial products or services to you. ● Our joint marketing partners include financial services companies. |
| Other Important Information | |
California Residents— In accordance with California law, we will not share information we collect about California residents with nonaffiliates except as permitted by law, such as with the consent of the customer or to service the customer’s accounts. We will also limit the sharing of information about you with our affiliates to the extent required by applicable California law.
Vermont Residents— In accordance with Vermont law, we will not share information we collect about Vermont residents with nonaffiliates except as permitted by law, such as with the consent of the customer or to service the customer’s accounts. We will not share creditworthiness information about Vermont residents among Blackstone Registered Funds’ affiliates except with the authorization or consent of the Vermont resident.
GDPR PRIVACY STATEMENT
DATA PRIVACY NOTICE FOR INVESTORS
Why are you seeing this notice?
| ● | This Data Privacy Notice applies to you to the extent that European Union (“EU”) data protection legislation applies to our processing of your Personal Data (defined below) or to the extent you are a resident of the EU or the European Economic Area (“EEA”). If this Data Privacy Notice applies to you, you have certain rights with respect to your Personal Data which are contained in this Data Privacy Notice. |
| ● | You may need to provide Personal Data to us as part of your investment into a Fund. |
| ● | We want you to understand how and why we use, store and otherwise process your Personal Data when you deal with us or our relevant affiliates. |
| Semi-Annual Report | June 30, 2019 | 75 |
| Blackstone / GSO Funds | Privacy Procedures |
June 30, 2019 (Unaudited)
| ● | “Personal Data” has the meaning given in the EU data protection legislation and includes any information relating to an identifiable individual (such as name, address, date of birth or economic information). |
Please read the information below carefully. It explains how and why Personal Data is processed by us.
Who is providing this notice?
The Fund is committed to protecting and respecting your privacy.
The Fund-related entities on whose behalf this privacy statement is made are: (i) the Fund, (ii) GSO / Blackstone Debt Funds Management LLC, (the “Investment Adviser”), (iii), their respective affiliates, and in each case such persons’ legal and other advisors and agents (together, the “Fund Parties”).
Where we use the terms “we”, “us” and “our” in this Data Privacy Notice, we are referring to the Fund and the Fund Parties.
When you provide us with your Personal Data, the Fund acts as a “data controller”. In simple terms, this means that:
| ● | we “control” the Personal Data that you provide – including making sure that it is kept secure |
| ● | we make certain decisions on how to use and protect your Personal Data – but only to the extent that we have informed you about the use or are otherwise permitted by law |
What Personal Data do we collect about you?
The types of Personal Data we collect and share depends on the product or service you have with us and the nature of your investment. This information can include or be related to:
| ● | name, date of birth, country(ies) of citizenship, mailing and permanent address, email address, and telephone number |
| ● | photo identification, including passports, driving license, and other government-issued IDs |
| ● | bank and brokerage account information, including routing and account numbers |
| ● | national insurance number and tax identification number |
| ● | source of wealth, employment information, education history, number of dependents and income |
| ● | investment strategy, experience, and activity |
| ● | risk tolerance and transaction history |
| ● | internet protocol address |
| ● | information about your third-party representatives |
The Personal Data collected about you will help us provide you with a better service and facilitate our business relationship.
| ● | We may combine Personal Data that you provide to us with Personal Data that we collect from, or about you, in some circumstances. |
| ● | This will include Personal Data collected in an online or offline context. |
| Blackstone / GSO Funds | Privacy Procedures |
June 30, 2019 (Unaudited)
Where do we obtain your Personal Data?
We collect, and have collected, Personal Data about you from a number of sources, including from you directly:
| WHAT | HOW |
Personal Data that you give us | ● from the forms and any associated documentation that you complete when subscribing for an investment, shares and/or opening an account with us. This will include information about your name, address, date of birth, passport details or other national identifier, driving licence, your national insurance or social security number and income, employment information and details about your investment or retirement portfolio(s) ● when you provide it to us in correspondence and conversations ● when you make transactions with respect to the Fund ● when you purchase shares from us and/or tell us where to send money |
Personal Data we obtain from others | ● publicly available and accessible directories and sources ● bankruptcy registers ● tax authorities, including those that are based outside the United Kingdom and the EEA if you are subject to tax in another jurisdiction ● governmental and competent regulatory authorities to whom we have regulatory obligations |
Why do we process your Personal Data?
We process your Personal Data for the following reasons:
| WHY | HOW |
| Contract | It isnecessary to perform our contractwith you to: ● administer, manage and set up your investor account(s) to allow you to purchase your holding (of shares) in our funds ● meet the resulting contractual obligations we have to you ● facilitate the continuation or termination of the contractual relationship between you and the Fund ● facilitate the transfer of funds, and administering and facilitating any other transaction, between you and the Fund |
| Compliance with law | It isnecessary for compliance with an applicable legal or regulatory obligationto which we are subject to: ● undertake our client and investor due diligence, and on-boarding checks ● carry out verification, know your client (KYC), terrorist financing and anti-money laundering checks ● verify the identity and addresses of our investors (and, if applicable their beneficial owners) ● comply with requests from regulatory, governmental, tax and law enforcement authorities ● surveillance and investigation ● carry out audit checks ● maintain statutory registers ● prevent and detect fraud ● comply with sanctions laws |
| Semi-Annual Report | June 30, 2019 | 77 |
| Blackstone / GSO Funds | Privacy Procedures |
June 30, 2019 (Unaudited)
| Our legitimate interests | For ourlegitimate interestsor those of a third party to: ● manage and administer your holding in any funds in which you are invested, and any related accounts on an ongoing basis ● assess and process any applications or requests made by you ● open, maintain or close accounts in connection with your investment in, or withdrawal from, the Fund ● send updates, information and notices or otherwise correspond with you in connection with your investment in the Fund ● address or investigate any complaints, claims, proceedings or disputes ● provide you with, and inform you about, our investment products and services ● monitor and improve our relationships with investors ● comply with applicable regulatory obligations ● manage our risk and operations ● comply with our accounting and tax reporting requirements ● comply with our audit requirements ● assist with internal compliance with our policies and process ● ensure appropriate group management and governance ● keep our internal records ● prepare reports on incidents / accidents ● protect our business against fraud, breach of confidence, theft of proprietary materials, and other financial or business crimes (to the extent that this is not required of us by law) ● analyse and manage commercial risks ● seek professional advice, including legal advice ● enable any actual or proposed, assignee or transferee, participant or sub-participant of the Fund's or ● Fund vehicles' rights or obligations to evaluate proposed transactions ● facilitate business asset transactions involving the ● Fund or Fund-related vehicles ● monitor communications to/from us using our systems ● protect the security and integrity of our IT systems We only rely on these interests where we have considered that, on balance, our legitimate interests are not overridden by your interests, fundamental rights or freedoms. |
Monitoring as described at (3) above
We monitor communications where the law requires us to do so. We will also monitor where we are required to do so to comply with our regulatory rules and practices and, where we are permitted to do so, to protect our business and the security of our systems.
Who we share your Personal Data with
We will share your Personal Data with the following persons for the following reasons:
| WHO | WHY |
| Fund associates | We share your Personal Data with our associates, related parties and members of our group. This is to: ● manage our relationship with you ● the purposes set out in this Data Privacy Notice |
| Fund Managers, Depositories, Administrators, Custodians, Investment Advisers | ● delivering the services you require ● managing your investment ● supporting and administering investment-related activities ● complying with applicable investment laws and regulations Fund and investment specific details of these third parties can be found in the relevant subscription documents you have been provided with |
| Blackstone / GSO Funds | Privacy Procedures |
June 30, 2019 (Unaudited)
| Tax Authorities | ● to comply with applicable laws and regulations ● where required by EEA tax authorities (who, in turn, may share your Personal Data with foreign tax authorities) ● where required by foreign tax authorities, including outside of the EEA |
| Service Providers | ● delivering and facilitating the services needed to support our business relationship with you ● supporting and administering investment-related activities |
| Our lawyers, auditors and other professional advisors | ● providing you with investment-related services ● to comply with applicable legal and regulatory requirements |
In exceptional circumstances, we will share your Personal Data with:
| ● | competent regulatory, prosecuting and other governmental agencies or litigation counterparties, in any country or territory |
| ● | organisations and agencies – where we are required to do so by law |
Do you have to provide us with this Personal Data?
Unless otherwise indicated, you should assume that we require the Personal Data for business and/or compliance purposes.
Where we collect Personal Data from you that is purely voluntary and there are no implications for you if you do not wish to provide us with it, we will indicate as such.
Some of the Personal Data we request is necessary for us to perform our contract with you and if you do not wish to provide us with this Personal Data, it will affect our ability to provide our services to you and manage your investment.
Sending your Personal Data internationally
We will transfer your Personal Data to our group members, shareholders of the Fund and related parties, and to third party service providers outside of the EEA, which do not have similarly strict data protection and privacy laws.
Where we transfer Personal Data to other members of our group, or our service providers, we have put in place data transfer agreements and safeguards using European Commission approved terms.
Please contact us if you would like to know more about these agreements or receive a copy of them. Please see below for our contact details.
Consent – and your right to withdraw it
We do not generally rely on obtaining your consent to process your Personal Data.
If we do, you have the right to withdraw this consent at any time.
Please contact us or send us an email at GDPRqueries@blackstone.com at any time if you wish to do so.
Retention and deletion of your Personal Data
We keep your Personal Data for as long as it is required by us for our legitimate business purposes, to perform our contractual obligations, or where longer, such longer period as is required by law or regulatory obligations which apply to us.
| ● | We will generally retain Personal Data about you throughout the life cycle of any investment you are involved in |
| ● | Some Personal Data will be retained after your relationship with us ends. As a general principle, we do not retain your Personal Data for longer than we need it. |
| Semi-Annual Report | June 30, 2019 | 79 |
| Blackstone / GSO Funds | Privacy Procedures |
June 30, 2019 (Unaudited)
We will usually delete your Personal Data (at the latest) after you cease to be an investor in any investment vehicle related to the Fund and there is no longer any legal or regulatory requirement or other legitimate business purpose for retaining your Personal Data.
Your rights
You have certain data protection rights, including:
| ● | the right to access your Personal Data |
| ● | the right to restrict the use of your Personal Data |
| ● | the right to have incomplete or inaccurate Personal Data corrected |
| ● | the right to ask us to stop processing your Personal Data |
| ● | the right to require us to delete your Personal Data in some limited circumstances |
From 25 May 2018, you also have the right in some circumstances to request for us to “port” your Personal Data in a portable, re-usable format to other organisations (where this is possible).
Concerns or queries
We take your concerns very seriously. We encourage you to bring it to our attention if you have any concerns about our processing your Personal Data.
This Data Privacy Notice was drafted with simplicity and clarity in mind. We are, of course, happy to provide any further information or explanation needed. Our contact details are below.
If you want to make a complaint, you can also contact the body regulating data protection in your country, where you live or work, or the location where the data protection issue arose. A list of the EU data protection authorities is available by clicking this link: http://ec.europa.eu/newsroom/article29/item-detail.cfm?item_id=612080.
Contact us
Please contact us if you have any questions about this Data Privacy Notice or the Personal Data we hold about you.
Contact us byemailat GDPRqueries@blackstone.com.
Contact us inwritingusing the address below:
| Address | The Blackstone Group Inc.
Attn: Legal and Compliance
345 Park Avenue
New York, NY 10154 |
Changes to this Data Privacy Notice
We keep this Data Privacy Notice under regular review.
This Data Privacy Notice was last updated on May 24, 2018.
| Blackstone / GSO Funds | Approval of Investment Advisory Agreement |
June 30, 2019 (Unaudited)
The Investment Company Act of 1940, as amended (the “1940 Act”), requires that the Board of Trustees (collectively, the “Board”) of each of Blackstone / GSO Senior Floating Rate Term Fund (“BSL”), Blackstone / GSO Long-Short Credit Income Fund (“BGX”), and Blackstone / GSO Strategic Credit Fund (“BGB,” and together with BSL and BGX, the “Funds” and each a “Fund”), including a majority of its members who are not considered to be “interested persons” under the 1940 Act (the “Independent Trustees”) voting separately, approve on an annual basis the continuation of the Fund’s investment advisory agreement (each an “Agreement” and, collectively, the “Agreements”) with the Fund’s investment adviser, GSO / Blackstone Debt Funds Management LLC (the “Adviser”). At a joint meeting (the “Contract Renewal Meeting”) held in person on May 30, 2019, the Board of each Fund, including the Independent Trustees, considered and approved the continuation of each Agreement for an additional one-year term. To assist in its consideration of the renewal of each of the Agreements, the Board requested, received and considered a variety of information (together with the information provided at the Contract Renewal Meeting, the “Contract Renewal Information”) about the Adviser, as well as the advisory arrangements for the Funds, certain portions of which are discussed below. In preparation for the Contract Renewal Meeting, the Independent Trustees met in person in a private session (the “Review Session”) prior to the Contract Renewal Meeting with counsel to the Independent Trustees (“Independent Counsel”) to review Contract Renewal Information received to that time. No representatives of the Funds, the Adviser, or Fund management were present at the Review Session. In addition to the Contract Renewal Information, the Board received performance and other information since each Fund’s inception related to the services rendered by the Adviser to such Fund. The Board’s evaluation took into account the information received since each Fund’s inception and also reflected the knowledge and familiarity gained as members of the Board with respect to the investment advisory and other services provided to each Fund by the Adviser under the Fund’s Agreement.
Board Approval of the Continuation of the Agreements
In its deliberations regarding renewal of each Agreement, the Board, including the Independent Trustees, considered various factors, including those set forth below.
Nature, Extent and Quality of the Services Provided to the Funds under the Agreements
The Board received and considered Contract Renewal Information regarding the nature, extent and quality of services provided to the Funds by the Adviser under the Agreements. The Board also reviewed Contract Renewal Information regarding the Funds’ compliance policies and procedures established pursuant to the 1940 Act and considered each Fund’s compliance record during the previous year and since its inception.
The Board reviewed the qualifications, backgrounds and responsibilities of the Funds’ senior personnel and the portfolio management team primarily responsible for the day-to-day portfolio management of each Fund. The Board also considered, based on its knowledge of the Adviser and its affiliates, the Contract Renewal Information and the Board’s discussions with the Adviser at the Contract Renewal Meeting, the general reputation and investment performance records of the Adviser and its affiliates and the financial resources of the corporate parent of the Adviser, The Blackstone Group Inc., available to support the Adviser’s activities in respect of the Funds.
The Board considered the responsibilities of the Adviser under each Fund’s Agreement, including the Adviser’s coordination and oversight of the services provided to the Fund by other unaffiliated parties.
In reaching its determinations regarding continuation of each Fund’s Agreement, the Board took into account that such Fund’s shareholders, in pursuing their investment goals and objectives, likely considered the reputation and the investment style, philosophy and strategy of the Adviser, as well as the resources available to the Adviser, in purchasing their shares.
Fund Performance
Among other things, the Board received and considered information and analyses (the “Broadridge Performance Information”) comparing the performance of each Fund with a group of funds (the “Peer Group”) selected by Broadridge Financial Solutions (“Broadridge”), an independent provider of investment company data, primarily from the Morningstar CEF Classification of US Senior Loan Funds Leveraged classification (the “Morningstar Senior Loan Leveraged Classification”), which consisted of 31 closed-end funds. The Peer Group funds were selected primarily from the Morningstar Senior Loan Leveraged Classification to be more comparable to the Funds based upon Broadridge’s consideration of the constituent funds’ investment style, share class characterization, and assets. The Board was provided with a description of the methodology used by Broadridge to select each Fund’s Peer Group. On May 23, 2019, each of the members of the Board and Independent Counsel participated in a conference call with Broadridge regarding the Broadridge Performance Information, including its peer grouping methodology and reporting format. Representatives of the Adviser also participated on that conference call. The Board noted Broadridge’s advice that the relatively limited number of closed-end funds compared to the open-end fund universe poses particular challenges for peer grouping.
The Peer Group for BSL consisted of eleven funds, including BSL, for each of the 1-, 3- and 5-year periods ended March 31, 2019 (such periods being hereinafter called the “1-year period”, the “3-year period” and the “5-year period”, respectively) with an emphasis on strategies that have high historical net portfolio allocations to bank loans. There was a single Peer Group for BGX and BGB, which consisted of ten funds, including both BGX and BGB, for each of the 1-, 3- and 5-year periods. The Peer Group for BGX and BGB included funds with historical portfolio allocations to bank loans greater than 20% and allowances for high-yield bonds. Most Peer Group funds, like BGX and BGB, had a majority of assets allocated to bank loans, while two Peer Group funds had less than 50% of assets in bank loans. Funds from outside the Morningstar Senior Loan Leveraged Classification with portfolio allocations to bank loans higher than 20% were included in the Peer Group for BGX and BGB. The Board noted that it had received and discussed with the Adviser information at periodic intervals since each Fund’s inception comparing such Fund’s performance against its benchmarks and its Peer Group funds. The Board considered the return volatility and Sharpe ratio (a measure of risk-weighted return) of each Fund relative to its Peer Group funds. The performance discussion below focuses on the comparison of the Funds’ performance relative to the Peer Groups, rather than to the broader Morningstar Senior Loan Leveraged Classification.
| Semi-Annual Report | June 30, 2019 | 81 |
| Blackstone / GSO Funds | Approval of Investment Advisory Agreement |
June 30, 2019 (Unaudited)
BSL
The Broadridge Performance Information comparing BSL’s performance to that of the Peer Group based on net asset value (“NAV”) per share showed, among other things, that BSL’s returns, measured on a gross return basis, ranked third among its Peer Group funds for the 1-year period; ranked first among its Peer Group funds for the 3-year period; and ranked fourth among its Peer Group funds for the 5-year period. In these performance rankings, first represents the fund with the best returns in the Peer Group, whether measured on a gross or net return basis. BSL’s returns, measured on a net return basis, ranked fourth among its Peer Group funds for the 1-year period; ranked first among its Peer Group funds for the 3-year period; and ranked third among its Peer Group funds for the 5-year period. Whether measured on a gross or net return basis, BSL’s returns were better than the Peer Group median performance for each of the 1-, 3- and 5-year periods. The Board also considered BSL’s performance relative to its benchmark and in absolute terms. The Broadridge Performance Information showed that, measured on a gross return basis, BSL outperformed its benchmark for each of the 1-, 3-, and 5-year periods. Measured on a net return basis, BSL underperformed its benchmark for the 1-year period but outperformed its benchmark for each of the 3- and 5-year periods. The Broadridge Performance Information noted that BSL’s Sharpe ratio (a measure of risk-weighted return) compared favorably relative to the Peer Group indicating that BSL performed well relative to the Peer Group on a risk-adjusted basis too. On a gross return basis, BSL’s Sharpe ratio ranked first (i.e. best), first and eighth among its Peer Group funds, respectively, for the 1-, 3- and 5-year periods. On a net return basis, BSL’s Share ratio ranked fourth, first and eighth, respectively, among its Peer Group funds for the 1-, 3- and 5-year periods.
BGX
The Broadridge Performance Information comparing BGX’s performance to that of the Peer Group based on NAV per share showed, among other things, that BGX’s returns, measured on a gross return basis, ranked third among its Peer Group funds for the 1-year period; ranked fifth among its Peer Group funds for the 3-year period; and ranked sixth among its Peer Group funds for the 5-year period. BGX’s returns, measured on a net return basis, ranked fifth among its Peer Group funds for each of the 1- and 3-year periods and ranked seventh among its Peer Group funds for the 5-year period. The Fund’s gross and net returns were better than the Peer Group median return in each of the 1- and 3-year periods and slightly below, but in line with, the Peer Group median for the 5-year period. The Board also considered BGX’s performance relative to its benchmark and in absolute terms. The Adviser noted that BGX on a gross return basis outperformed its benchmark for each of the 1-, 3-, and 5-year periods. On a net return basis, BGX underperformed its benchmark for the 1-year period but outperformed its benchmark for each of the 3- and 5-year periods. The Adviser noted, and the Broadridge Performance Information showed, that BGX’s Sharpe ratio on a gross or net return basis compared favorably to the other Peer Group funds for the 1- and 3-year periods, and was in line with the median Peer Group Sharpe ratio for the 5-year period.
BGB
The Broadridge Performance Information comparing BGB’s performance to that of the Peer Group based on NAV per share showed, among other things, that BGB’s returns, measured on a gross return basis, ranked eighth among its Peer Group funds for the 1-year period and ranked seventh among its Peer Group funds for each of the 3- and 5-year periods. BGB’s returns, measured on a net return basis, ranked ninth among its Peer Group funds for the 1-year period; ranked seventh among its Peer Group funds for the 3-year period; and ranked tenth among its Peer Group funds for the 5-year period. The Fund’s returns on both a gross and net return basis were worse than the Peer Group median performance for each of the 1-, 3- and 5-year periods. The Board also considered BGB’s performance relative to its benchmark and in absolute terms. The Adviser noted that BGB on a gross basis outperformed its benchmark for each of the 1-, 3- and 5-year periods. On a net return basis, BGB underperformed its benchmark for the 1-year period, outperformed its benchmark for the 3-year period and, while slightly worse, was in line with its benchmark indices for the 5-year period. The Broadridge Performance Information showed that BGB’s Sharpe ratio, on a gross return basis, was ranked seventh among its Peer Group funds for the 1-year period; fourth among the Peer Group funds for the 3-year period; and ninth among the Peer Group funds for the 5-year period. BGB’s Sharpe ratio on a net return basis was ranked ninth for the 1-year period; fifth for the 3-year period; and ninth for the five year period.
In assessing Fund performance, the Adviser noted that the small number and varying investment strategies of funds in the Peer Groups for BSL, BGX and BGB made meaningful performance comparisons difficult. Broadridge itself noted that the relatively limited number of closed-end funds compared to the open-end funds poses particular challenges for peer grouping. The Adviser questioned whether the Morningstar Senior Loan Leveraged Classification provided relevant and appropriate performance comparisons in the case of BGX and BGB in light of their broader investment strategies. The Adviser also noted the particular limitations of the BGX and BGB Peer Groups, highlighting the wide range of investment strategies employed and returns achieved by funds in those Peer Groups (relative to the BSL Peer Group). In addition to the Broadridge Performance Information, the Board considered and gave significant weight to information provided by the Adviser regarding the Funds and the Morningstar Senior Loan Leveraged Classification and their respective Peer Groups as to differences in each fund’s portfolio composition by asset class, credit rating, investment size, and other relevant metrics.
| Blackstone / GSO Funds | Approval of Investment Advisory Agreement |
June 30, 2019 (Unaudited)
The Board also noted the comprehensive and rigorous credit review and other processes employed by the Adviser in managing the Funds’ investment portfolios as well as the Adviser’s arranging and management of the respective Funds’ leverage. Significantly, the Adviser noted that the leadership of the Funds’ portfolio management team changed in October 2015 and that the portfolio of each Fund had been repositioned to implement the strategies of the new team with a meaningful improvement in the Funds’ recent performance, particularly BSL. The Board gave significant weight to the changes made to the portfolio management team to address the Funds’ performance and to the Funds’ performance history under the new portfolio management team. Based on its review and considering other relevant factors, including those noted above, the Board concluded that, under the circumstances, continuation of each Fund’s Agreement for an additional period of one year would be consistent with the interests of the Fund’s shareholders.
Management Fees and Expenses
The Board reviewed and considered the investment advisory fee (the “Advisory Fee”) payable by each Fund to the Adviser under its Agreement in light of the nature, extent and overall quality of the investment advisory and other services provided by the Adviser to the Fund.
Additionally, the Board received and considered information and analyses (the “Broadridge Expense Information”) prepared by Broadridge, comparing, among other things, the Advisory Fee for each Fund and each Fund’s overall expenses with the Morningstar Senior Loan Leveraged Classification and the Fund’s Peer Group. The comparison was based upon the constituent funds’ latest fiscal years. The discussion below focuses on the Funds’ expenses relative to their respective Peer Groups, rather than to the broader Morningstar Senior Loan Leveraged Classification.
BSL
The eleven funds in BSL’s Peer Group had average common share net assets ranging from $112.80 million to $879.60 million. Seven of the other funds in the Peer Group were larger than BSL and three were smaller. The Broadridge Expense Information, comparing BSL’s actual total expenses to the Peer Group, showed, among other things, that the Fund’s actual Advisory Fee (i.e., giving effect to any voluntary fee waivers implemented by the Adviser with respect to the Fund and by the managers of the other Peer Group funds) compared on the basis of common share net assets ranked ninth among the eleven funds in the Peer Group and was higher (i.e., worse) than the Peer Group median for that expense component. In these expense component rankings, first is best (i.e., lowest). The Fund’s actual total expenses compared on the basis of common share net assets ranked tenth among the funds in the Peer Group and were higher than the Peer Group median for that expense component. The Adviser noted that BSL’s term was extended effective November 17, 2017 and that BSL’s Advisory Fee was reduced in connection with its term extension.
BGX
The ten funds in BGX’s Peer Group (which was the same as BGB’s Peer Group and included both BGX and BGB) had average common share net assets ranging from $162.40 million to $968.50 million. Seven of the other funds in the Peer Group were larger than BGX and two were smaller. The Broadridge Expense Information, comparing BGX’s actual total expenses to the Fund’s Peer Group, showed, among other things, that the Fund’s actual Advisory Fee compared on the basis of common share net assets ranked second among the funds in the Peer Group and was better (i.e., lower) than the Peer Group median for that expense component. The Fund’s actual total expenses compared on the basis of common share net assets ranked ninth among the funds in the Peer Group and were higher than the Peer Group median for that expense component.
BGB
The ten funds in BGB’s Peer Group (which was the same as BGX’s Peer Group and included both BGB and BGX) had average common share net assets ranging from $162.40 million to $968.50 million. Two of the other funds in the Peer Group were larger than BGB and seven were smaller. The Broadridge Expense Information, comparing BGB’s actual total expenses to the Fund’s Peer Group, showed, among other things, that the Fund’s actual Advisory Fee compared on the basis of common share net assets ranked ninth among the funds in the Peer Group and was higher than the Peer Group median for that expense component. The Fund’s actual total expenses compared on the basis of common share net assets ranked eighth among the funds in the Peer Group and were higher than the Peer Group median for that expense component.
The Broadridge Expense Information noted that the gross expense ratios of BSL, BGX and BGB increased significantly in the past year due to increases in their leverage interest expense as applicable borrowing rates generally rose.
In its evaluation of the Advisory Fee and Broadridge Expense Information for each Fund, the Board took into account the complexity of such Fund’s investment program and the comprehensive and rigorous credit review and other processes employed by the Adviser in managing the Funds’ investment portfolios, including the Adviser’s prominence in the leveraged finance market and the strength of its investment management team and trading and middle office support. The Board further noted Broadridge’s advice that the relatively limited number of closed-end funds compared to the open-end fund universe poses particular challenges for peer grouping and that the small number and varying sizes of funds in the Funds’ Peer Groups made meaningful expense comparisons difficult. The Board considered the Adviser’s belief that smaller funds, such as BSL and BGX, may be disadvantaged in comparison with larger funds that have greater opportunities for economies of scale. The Board also considered the Adviser’s belief that other Peer Group funds that were launched prior to the financial crisis in 2008 and 2009 and that are parts of larger fund complexes than the Funds’ fund complex benefit from reduced cost-sharing opportunities and opportunities owing to economies of scale that are not available to the Funds. The Adviser provided and the Board considered expense information provided by the Adviser in support of this belief.
| Semi-Annual Report | June 30, 2019 | 83 |
| Blackstone / GSO Funds | Approval of Investment Advisory Agreement |
June 30, 2019 (Unaudited)
The Board also considered Contract Renewal Information regarding fees (including sub-advisory fees) charged by the Adviser to other U.S. clients investing primarily in an asset class similar to that of the Funds, including, where applicable, institutional commingled funds and exchange-traded funds. The Board was advised that the base fees paid by such institutional and other clients generally are lower, and may be significantly lower, than the Advisory Fee. The Contract Renewal Information discussed the significant differences in scope of services provided to the Funds and to these other clients, noting that the Funds were subject to heightened regulatory requirements relative to institutional clients; that the Funds were provided with administrative services, office facilities and Fund officers (including each Fund’s chief executive, chief financial and chief compliance officers); and that the Adviser manages the leverage arrangements of the Funds and coordinates and oversees the provision of services to the Funds by other fund service providers. The Board considered the fee comparisons in light of the different services provided in managing these other types of clients and funds.
Taking all of the above into consideration, the Board determined that the Advisory Fee for each Fund was reasonable in light of the nature, extent and overall quality of the investment advisory and other services provided to such Fund under its Agreement.
Profitability
The Board, as part of the Contract Renewal Information, received an analysis of the profitability to the Adviser and its affiliates in providing services to each Fund for each of the past two fiscal years. In addition, the Board received Contract Renewal Information with respect to the Adviser’s revenue and cost allocation methodologies used in preparing such profitability data. The profitability analysis, among other things, indicated that the profitability to the Adviser in providing investment advisory and other services to each Fund was at a level which was not considered excessive by the Board in light of the nature, extent and overall quality of such services.
Economies of Scale
The Board received and discussed Contract Renewal Information concerning whether the Adviser would realize economies of scale if the Funds’ assets grow. The Board noted that because each Fund is a closed-end fund with no current plans to seek additional assets beyond maintaining its dividend reinvestment plan, any significant growth in its assets generally will occur through appreciation in the value of each Fund’s investment portfolio, rather than sales of additional shares in the Fund. The Board determined that the Advisory Fee structure was appropriate under present circumstances.
Other Benefits to the Adviser
The Board considered other benefits received by the Adviser and its affiliates as a result of the Adviser’s relationship with each of the Funds and did not regard such benefits as excessive.
* * * * *
In light of all of the foregoing and other relevant factors, the Board determined that, under the circumstances, continuation of each Fund’s Agreement would be in the interests of the Fund and its shareholders and unanimously voted to continue the Agreement for a period of one additional year.
No single factor reviewed by the Board was identified by the Board as the principal factor in determining whether to approve continuation of each Agreement for the next year, and each Board member attributed different weights to the various factors. The Independent Trustees were advised by separate independent legal counsel throughout the process. Prior to the Review Session and the Contract Renewal Meeting, the Board received a memorandum prepared by counsel to the Funds discussing its responsibilities in connection with the proposed continuation of the Agreements as part of the Contract Renewal Information and the Independent Trustees separately received a memorandum as to their responsibilities in this regard from their independent counsel. Prior to voting, the Independent Trustees discussed the proposed continuation of the Agreements in a private session with their independent legal counsel at which no representatives of the Adviser or Fund management were present.
| Blackstone / GSO Funds | Trustees & Officers |
June 30, 2019 (Unaudited)
The oversight of the business and affairs of the Funds is vested in the Board of Trustees. The Board of Trustees is classified into three classes—Class I, Class II and Class III—as nearly equal in number as reasonably possible, with the Trustees in each class to hold office until their successors are elected and qualified. At each annual meeting of shareholders, the successors to the class of Trustees whose terms expire at that meeting shall be elected to hold office for terms expiring at the later of the annual meeting of shareholders held in the third year following the year of their election or the election and qualification of their successors. The Funds’ executive officers were appointed by the Board of Trustees to hold office until removed or replaced by the Board of Trustees or until their respective successors are duly elected and qualified.
Below is a list of the Trustees and officers of the Funds and their present positions and principal occupations during the past five years. The business address of the Funds, the Trustees, the Funds’ officers, and the Adviser is 345 Park Avenue, 31st Floor, New York, NY 10154, unless specified otherwise below.
| NON-INTERESTED TRUSTEES |
Name, Address and Year of Birth(1) | Position(s) Held
with the Funds | Term of Office and Length of Time Served | Principal Occupation(s) During Past 5 Years | Number of Portfolios in Fund
Complex Overseen by Trustee(2) | Other Directorships Held by Trustee |
Edward H. D'Alelio Birth Year: 1952 | Lead IndependentTrustee and memberof Audit andNominating andGovernanceCommittees | Trustee Since: BSL: April 2010 BGX: November 2010
BGB: May 2012 Term Expires: BSL: 2020 BGX: 2020 BGB: 2020 | Mr D'Alelio was formerly a ManagingDirector and CIO for Fixed Income atPutnam Investments, Boston wherehe retired in 2002. He currently is anExecutive in Residence with theSchool of Management, Univ. ofMass Boston. | 7 | Owl Rock CapitalCorp. businessdevelopmentcompanies (3portfolios overseen inFund Complex). |
Michael F. Holland Birth Year: 1944 | Trustee and memberof Audit andNominating andGovernanceCommittees | Trustee Since: BSL: April 2010 BGX: November 2010
BGB: May 2012 Term Expires: BSL: 2022 BGX: 2022 BGB: 2022 | Mr. Holland is the Chairman ofHolland & Company, a privateinvestment firm he founded in 1995.He is also President and Founder ofthe Holland Balanced Fund. | 7 | State Street MasterFunds; Reaves UtilityIncome Fund; TheChina Fund, Inc. (until2019); The TaiwanFund, Inc.(until 2017). |
Thomas W. Jasper Birth Year: 1948 | Trustee, Chairman ofAudit Committee andmember ofNominating andGovernanceCommittee | Trustee Since: BSL: April 2010 BGX: November 2010
BGB: May 2012 Term Expires: BSL: 2021 BGX:2021 BGB: 2021 | Mr. Jasper is the Managing Partnerof Manursing Partners LLC, aconsulting firm. He was ChiefExecutive Officer of PrimusGuaranty, Ltd. from 2001-2010. | 7 | Ciner Resources LP(master limitedpartnership). |
Gary S. Schpero Birth Year: 1953 | Trustee, Chairman ofNominating andGovernanceCommittee andmember of AuditCommittee | Trustee Since: BSL: May 2012 BGX: May 2012 BGB: May 2012 Term Expires: BSL: 2021 BGX:2021 BGB: 2021 | Mr. Schpero is retired. Prior toJanuary 2000, he was a partner atthe law firm of Simpson Thacher &Bartlett LLP where he served asmanaging partner of the InvestmentManagement and InvestmentCompany Practice Group. | 4 | AXA Premier VIPTrust; EQ AdvisorsTrust; 1290 Funds. |
| Semi-Annual Report | June 30, 2019 | 85 |
| Blackstone / GSO Funds | Trustees & Officers |
June 30, 2019 (Unaudited)
| INTERESTED TRUSTEE(3) |
Name, Address and Year of Birth(1) | Position(s) Held with the Funds | Term of Office and Length of Time Served | Principal Occupation(s) During Past 5 Years | Number of Portfolios in Fund Complex Overseen by Trustee(2) | Other Directorships Held by Trustee |
Daniel H. Smith, Jr. Birth Year: 1963 | Chairman of theBoard, President,Chief ExecutiveOfficer, Trustee | Trustee Since: BSL: April 2010
BGX: November 2010 BGB: May 2012 Term Expires: BSL: 2022 BGX: 2022 BGB: 2022 | Mr. Smith is a Senior Managing Director of The Blackstone Group Inc. and is Head of GSO / Blackstone Debt Funds Management LLC. Mr. Smith joined GSO from the Royal Bank of Canada in July 2005 where he was a Managing Partner and Co-head of RBC Capital Market's Alternative Investments Unit. | 5 | None. |
| OFFICERS | | | | | |
Name, Address and Year of Birth(1) | Position(s) Held with the Funds | Term of Office
and Length of
Time Served | Principal Occupation During the Past Five Years |
Daniel H. Smith, Jr. Birth Year: 1963 | Trustee, Chairmanof the Board,President, ChiefExecutive Officer | Officer Since: BSL: April 2010 BGX: November 2010 BGB: May 2012 Term of Office: Indefinite | Mr. Smith is a Senior Managing Director of TheBlackstone Group Inc.and is Head of GSO / Blackstone Debt Funds Management LLC.Mr. Smith joined GSO from theRoyal Bank of Canada in July 2005where he was a Managing Partner and Co-head of RBC CapitalMarket's Alternative Investments Unit. |
Robert W. Busch Birth Year: 1982 | Chief FinancialOfficer andTreasurer | Officer Since: BSL: March 2019 BGX: March 2019 BGB: March 2019 Term of Office: Indefinite | Robert W. Busch is a Senior Vice President of The Blackstone GroupInc. Before joining GSO, Mr. Busch worked previously at Fifth StreetAsset Management from 2012to 2018, where he was Senior VicePresident of Finance and served as Controller ofthe firm’s twopublicly traded business development companies and publicly tradedalternative asset manager. Prior to that, Mr. Busch worked at Deloitte& Touche LLP, a global public accounting firm. |
Robert Zable Birth Year: 1972 | Executive VicePresident andAssistant Secretary | Officer Since: BSL: September 2015 BGX: September 2015 BGB: September 2015 Term of Office: Indefinite | Mr. Zable is a Senior ManagingDirector of The Blackstone Group Inc.Before joining GSO, Mr. Zablewas a Vice President atFriedbergMilstein LLC, where he was responsible for creditopportunity investments and junior capital origination and execution.Prior to that, Mr. Zable was a Principal with Abacus Advisors Group, arestructuring and distressed investment firm. Mr. Zable began hiscareer at JP Morgan SecuritiesInc., where he focused on leveragedfinance in New York and London. |
| Blackstone / GSO Funds | Trustees & Officers |
June 30, 2019 (Unaudited)
| OFFICERS (continued) |
Name, Address and Year of Birth(1) | Position(s) Held with the Funds | Term of Office
and Length of
Time Served | Principal Occupation During the Past Five Years |
Marisa Beeney
Birth Year: 1970 | Chief ComplianceOfficer, Chief LegalOfficer andSecretary | Officer Since: BSL: April 2010 BGX: November 2010
BGB: May 2012 Term of Office:Indefinite | Ms. Beeney is a Senior Managing Director of The Blackstone GroupInc. and General Counsel of GSO. Before joining GSO, she was withthe finance group of DLA Piper. Ms. Beeney began her career at Latham& Watkins LLP working primarily on project finance and developmenttransactions, as well as other structured credit products. |
Jane Lee
Birth Year: 1972 | Public RelationsOfficer | Officer Since: BSL: November 2010
BGX: November 2010
BGB: May 2012 Term of Office:Indefinite | Ms. Lee is a Senior Managing Director of The Blackstone Group Inc.and Head of GSO’s capital formation efforts. Ms. Lee joined GSO fromRoyal Bank of Canada in July 2005, where she was most recently apartner in the Debt Investments Group and was responsible fororigination of new CLO transactions and investor relations. |
| (1) | The address of each Trustee/Nominee and Officer, unless otherwise noted, is GSO Capital Partners LP, 345 Park Avenue, 31st Floor, New York, NY 10154. |
| (2) | The “Fund Complex” consists of the Funds, Blackstone / GSO Senior Floating Rate Term Fund, Blackstone / GSO Long-Short Credit Income Fund, Blackstone / GSO Strategic Credit Fund and Blackstone / GSO Floating Rate Enhanced Income Fund, as well as the “Blackstone Real Estate Funds,” (Blackstone Real Estate Income Fund, Blackstone Real Estate Income Fund II and Blackstone Real Estate Income Master Fund), the “Blackstone Alternative Alpha Funds” (Blackstone Alternative Alpha Fund, Blackstone Alternative Alpha Fund II and Blackstone Alternative Alpha Master Fund), Blackstone / GSO Secured Lending Fund, and the “Blackstone Alternative Investment Funds” (Blackstone Alternative Multi-Manager Fund and Blackstone Alternative Multi-Strategy Fund). |
| (3) | "Interested person" of the Fund as defined in Section 2(a)(19) of the 1940 Act. Mr. Smith is an interested person due to his employment with the Adviser. |
| Semi-Annual Report | June 30, 2019 | 87 |

Not applicable to this Report.
| Item 3. | Audit Committee Financial Expert. |
Not applicable to this Report.
| Item 4. | Principal Accountant Fees and Services. |
Not applicable to this Report.
| Item 5. | Audit Committee of Listed Registrants. |
Not applicable to this Report.
| (a) | Schedule of Investments in securities of unaffiliated issuers as of the close of the reporting period is included as part of the Report to Stockholders filed under Item 1 of this Form N-CSR. |
| Item 7. | Disclosure of Proxy Voting Policies and Procedures for Closed-End Management Investment Companies. |
Not applicable to this Report.
| Item 8. | Portfolio Managers of Closed-End Management Investment Companies. |
| (a) | Not applicable to this Report. |
| (b) | As of the date of this filing, there have been no changes in any of the portfolio managers identified in the most recent annual report on Form N-CSR. |
| Item 9. | Purchases of Equity Securities by Closed-End Management Investment Company and Affiliated Purchasers. |
None.
| Item 10. | Submission of Matters to a Vote of Security Holders. |
There have been no material changes to the procedures by which shareholders may recommend nominees to the Registrant’s Board of Trustees, where those changes were implemented after the Registrant last provided disclosure in response to the requirements of Item 407(c)(2)(iv) of Regulation S-K, or this Item.
| Item 11. | Controls and Procedures. |
| (a) | The Registrant’s principal executive officer and principal financial officer have concluded that the Registrant’s disclosure controls and procedures (as defined in Rule 30a-3(c) under the Investment Company Act of 1940, as amended (the “1940 Act”)) are effective as of a date within 90 days of the filing date of this Report. |
| (b) | There was no change in the Registrant's internal control over financial reporting (as defined in Rule 30a-3(d) under the 1940 Act) that occurred during the period covered by this Report that has materially affected, or is reasonably likely to materially affect, the Registrant's internal control over financial reporting. |
| Item 12. | Disclosure of Securities Lending Activities for Closed-End Management Investment Companies. |
Not applicable.
| (a)(1) | Not applicable to this Report. |
| (a)(2) | The certifications required by Rule 30a-2(a) under the 1940 Act are attached hereto as Exhibit 99.302Cert. |
| (a)(3) | Not applicable to Registrant. |
| (b) | The certifications by the Registrant’s principal executive officer and principal financial officer, as required by Rule 30a-2(b) under the 1940 Act, are attached hereto as Exhibit 99.906Cert. |
SIGNATURES
Pursuant to the requirements of the Securities Exchange Act of 1934 and the Investment Company Act of 1940, the Registrant has duly caused this report to be signed on its behalf by the undersigned, thereunto duly authorized.
Blackstone / GSO Senior Floating Rate Term Fund
| By: | /s/ Daniel H. Smith, Jr. | |
| | Daniel H. Smith, Jr. (Principal Executive Officer) | |
| | President and Chief Executive Officer | |
| | | |
| Date: | September 4, 2019 | |
| By: | /s/ Robert W. Busch | |
| | Robert W. Busch (Principal Financial Officer) | |
| | Treasurer and Chief Financial Officer | |
| | | |
| Date: | September 4, 2019 | |
Pursuant to the requirements of the Securities Exchange Act of 1934 and the Investment Company Act of 1940, this report has been signed below by the following persons on behalf of the Registrant and in the capacities and on the dates indicated.
Blackstone / GSO Senior Floating Rate Term Fund
| By: | /s/ Daniel H. Smith, Jr. | |
| | Daniel H. Smith, Jr. (Principal Executive Officer) | |
| | President and Chief Executive Officer | |
| | | |
| Date: | September 4, 2019 | |
| By: | /s/ Robert W. Busch | |
| | Robert W. Busch (Principal Financial Officer) | |
| | Treasurer and Chief Financial Officer | |
| | | |
| Date: | September 4, 2019 | |