Neuberger Berman High Yield Strategies Fund (NHS)
Filed: 13 Sep 19, 5:17pm
| Filed by the Registrant [X] | ||
| Filed by a Party other than the Registrant [ ] | ||
| Check the appropriate box: | ||
| [ ] | Preliminary Proxy Statement | |
| [ ] | Confidential, for Use of the Commission Only (as permitted by Rule 14a-6(e)(2)) | |
| [ ] | Definitive Proxy Statement | |
| [X] | Definitive Additional Materials | |
| [ ] | Soliciting Material Pursuant to §240.14a-12 | |
| Neuberger Berman High Yield Strategies Fund Inc. | ||
| (Name of Registrant as Specified In Its Charter) | ||
| (Name of Person(s) Filing Proxy Statement, if other than the Registrant) |
| Payment of Filing Fee (Check the appropriate box): | ||||
| [X] | No fee required. | |||
| [ ] | Fee computed on table below per Exchange Act Rules 14a-6(i)(1) and 0-11. | |||
| 1) | Title of each class of securities to which transaction applies: | |||
| 2) | Aggregate number of securities to which transaction applies: | |||
| 3) | Per unit price or other underlying value of transaction computed pursuant to Exchange Act Rule 0-11 (set forth the amount on which the filing fee is calculated and state how it was determined): | |||
| 4) | Proposed maximum aggregate value of transaction: | |||
| 5) | Total fee paid: | |||
| [ ] | Fee paid previously with preliminary materials. | |||
| [ ] | Check box if any part of the fee is offset as provided by Exchange Act Rule 0-11(a)(2) and identify the filing for which the offsetting fee was paid previously. Identify the previous filing by registration statement number, or the Form or Schedule and the date of its filing. | |||
| 1) | Amount Previously Paid: | |||
| 2) | Form, Schedule or Registration Statement No.: | |||
| 3) | Filing Party: | |||
| 4) | Date Filed: | |||
Neuberger Berman High Yield Strategies Fund Inc. (NYSE American: NHS) |
| Table of Contents |
| I. | Fund Overview |
| II. | Fund Performance |
| III. | Closed-end Fund Discounts |
| IV. | Information on Incumbent Nominees |
| V. | Saba’s Dissident Nominees |
| VI. | Saba’s Stockholder Proposals |
| VII. | Conclusion |
| VIII. | Appendix A: Neuberger Berman High Yield Strategies Fund Inc. – Fact Sheet as of 6/30/19 |
 | | 2 |
| Fund Overview |
| | 3 |
| A Strong History of Outperformance |
| Total Return (%) Based on Market Value – As of June 30, 2019 |
| 1 Year | 3 Year | 5 Year | 10 Year | |
| NHS | 16.46 | 10.32 | 4.80 | 11.68 |
Morningstar U.S. Closed-end High Yield Funds Average | 9.78 | 8.09 | 4.77 | 10.47 |
| NHS Excess Return | 6.68 | 2.23 | 0.03 | 1.21 |
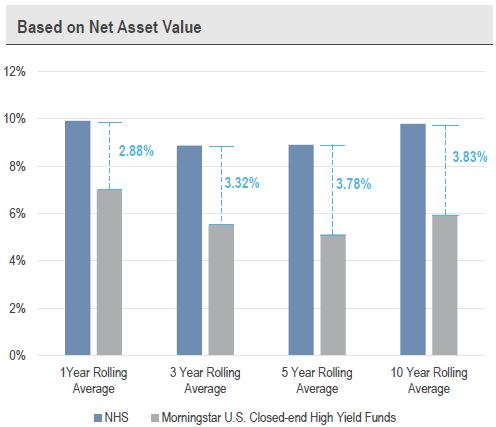
Total Return (%) Based on Net Asset Value – As of June 30, 2019 |
| 1 Year | 3 Year | 5 Year | 10 Year | |
| NHS | 7.45 | 7.91 | 3.78 | 10.91 |
Morningstar U.S. Closed-end High Yield Funds Average | 6.98 | 7.74 | 4.22 | 10.00 |
| NHS Excess Return | 0.47 | 0.17 | - 0.44 | 0.91 |
| | 4 |
| A Strong History of Outperformance (Continued) |

| 1 Represents average total return based on month-end returns since the Fund’s inception on July 28, 2003. |
| Source: Morningstar |
| | 5 |
| A Strong History of Outperformance (Continued) |
| Based on Net Asset Value | |||
| Rolling Period | # of Periods Measured | Top 2 Quartiles | Bottom 2 Quartiles |
| 1 Year Rolling | 180 | 61% | 39% |
| 3 Year Rolling | 155 | 67% | 33% |
| 5 Year Rolling | 132 | 70% | 30% |
| 10 Year Rolling | 72 | 100% | 0% |
| Based on Market Value | |||
| Rolling Period | # of Periods Measured | Top 2 Quartiles | Bottom 2 Quartiles |
| 1 Year Rolling | 180 | 53% | 47% |
| 3 Year Rolling | 155 | 52% | 48% |
| 5 Year Rolling | 132 | 64% | 36% |
| 10 Year Rolling | 72 | 99% | 1% |
| | 6 |
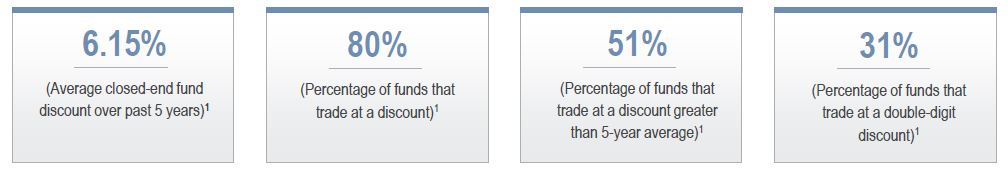
| The Truth About Closed-End Funds’ Discounts |
| • | Neuberger Berman believes that discounts in the closed-end fund market are caused by numerous factors, are often driven by broad market sentiment, and may fluctuate significantly over time. |
| | 7 |
| The Truth About Closed-End Funds’ Discounts (Continued) |

| | 8 |
| The Fund’s Three Independent and Highly Experienced Incumbent Nominees |
 | Tom D. Seip (Director of NHS since 2006 and Independent Chair and/or Lead Independent Director of the Board since 2008): Mr. Seip has experience in senior management and as chief executive officer and director of Charles Schwab Investment Management, Inc. He has experience in management of a private investment partnership. |
 | Michael J. Cosgrove (Director of NHS since 2015): Mr. Cosgrove is President of Carragh Consulting USA, an asset management consulting firm. He has experience as President, Chief Executive Officer and Chief Financial Officer of the asset management division of General Electric Company. He also has experience as a President of institutional sales and marketing for the asset management division of the same corporation, where he was responsible for all distribution, marketing and development of mutual fund products. He also has served as a member of the boards of various not-for-profit organizations. |
 | Deborah C. McLean (Director of NHS since 2015): Ms. McLean has broad experience in the financial services industry, having previously served as Managing Director at Morgan Stanley. She is currently involved with a high net worth private wealth management membership practice and an angel investing group, where she is active in investment screening and deal leadership and execution. For many years she has been engaged in numerous roles with a variety of not-for-profit and private company boards, and has taught corporate finance at the graduate and undergraduate levels. She commenced her professional training at a major financial services corporation, where she was employed for multiple years. |
| | 9 |
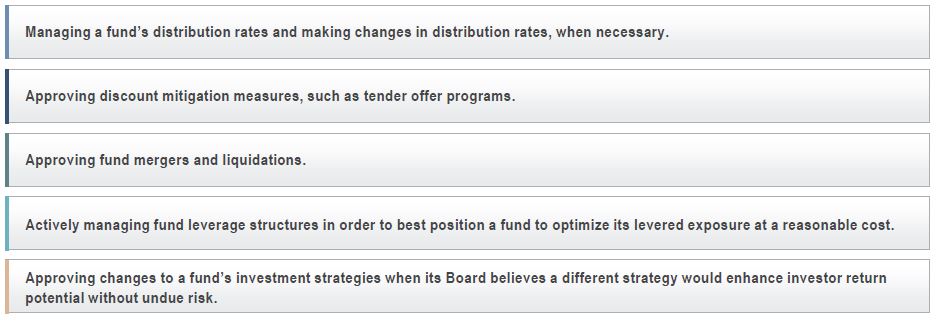
| NHS Board: Demonstrated History of Acting in the Long-Term Interest of Stockholders |
| | 10 |
| Recent Proactive Measure to Enhance Stockholder Value |
| | 11 |
| Saba’s Slate of Inexperienced, Paid Dissident Nominees Would Only Serve Saba and May Harm the Long-term Viability of the Fund |
| • | Based on the information Saba included in its proxy statement, two of Saba’s nominees have no experience overseeing closed-end funds while the other’s experience is limited to his own closed-end fund arbitrage campaigns, and the Fund’s Board does not believe they have any relevant experience that would add value to the Board’s consideration of important issues facing closed-end fund investors: |
| | 12 |
| Saba’s Slate of Inexperienced, Paid Dissident Nominees Would Only Serve Saba and May Harm the Long-term Viability of the Fund (Continued) |
| • | Each of Saba’s nominees are paid directly by Saba and two have been nominated by Saba during the same time period for numerous other closed-end funds for which Saba has initiated an activist campaign. Saba could not have selected these two nominees thinking they would be especially appropriate for NHS as Saba also nominated them for very different funds at numerous fund complexes this year, despite the fact that in each such instance stockholders have not elected Saba’s nominees. |
| • | Despite their numerous recent nominations, we do not believe Saba truly desires for its nominees to serve on closed-end fund boards and their nominations are merely designed to exert pressure on funds and their boards to agree to concessions that will benefit Saba. |
| • | We believe Saba’s nominees would only act to further Saba’s own agenda and not the long-term interests of the Fund’s stockholders. |
| | 13 |
| Saba’s Stockholder Proposal to Terminate the Fund’s Management Agreement |
| • | Saba cites the Fund’s discount to NAV and “years of underperformance,” despite the Fund’s actual history of delivering strong returns, as reasons why stockholders should vote to terminate the Management Agreement, but fails to acknowledge the serious harm that doing so would cause, including: |
| | 14 |
| Saba’s Stockholder Proposal to Terminate the Fund’s Management Agreement (Continued) |
| • | What Saba fails to mention is that 96% of all closed-end funds were trading at a discount at that point in time, a level not exhibited in the closed-end fund market since the depths of the credit crisis in 2008, as illustrated on page 8. |
| • | From December 21, 2018 through August 31, 2019, the Fund’s discount improved by 1,284 bps, while the Morningstar Category average discount improved by 730 bps. |
| • | Contrary to Saba’s assertion, under Neuberger Berman’s and the Board’s stewardship, the Fund has enjoyed strong performance over various periods of time compared to the Morningstar Category, outperforming the Morningstar Category over the rolling 1-, 3-, 5- and 10-year periods. |
| | 15 |
Saba’s Stockholder Proposal Requesting the Board Consider a Self-Tender for All Outstanding Common Stock of the Fund |
| | 16 |
| Conclusion: Separating Fact from Fiction |
| Saba’s Allegations | In Reality | |
Saba’s slate of nominees would better protect stockholder value | > | Saba’s inexperienced, paid dissident nominees would only serve Saba’s interests and the incumbent Directors have a history of being devoted to safeguarding stockholders’ investments. |
Neuberger Berman has not managed the Fund properly and its performance has lagged | > | Neuberger Berman has a history of generating strong returns for the Fund. NHS has meaningfully outperformed the Morningstar Category average total return (market price & NAV) for the rolling 1-, 3-, 5- and 10-year periods, since inception. |
NHS’ discount has been persistently high and the Board has been ineffective in addressing it | > | The Fund’s Board has taken a variety of actions to enhance investor value and address the Fund’s discount without jeopardizing the Fund’s long-term viability. The Fund’s discount has improved 8.95% year-to-date as of August 31, 2019, outperforming the Morningstar Category, and has continued to improve since the Board approved an increase in the Fund’s distribution rate. |
Neuberger Berman extracts high advisory fees because the definition of “managed assets” in the advisory agreement includes leverage amounts and this incentivizes Neuberger to run a high level of leverage | > | Neuberger Berman follows standard industry practice by including leverage amounts in “managed assets” when calculating its advisory fee. In managing the Fund, Neuberger Berman opportunistically utilizes leverage to generate greater returns and income for stockholders, all in accordance with its stated objective and strategy, 1940 Act regulations and rating agency guidelines. The Fund’s leverage is currently and has been historically accretive to its common stockholders. |
| | 17 |
| Conclusion: Saba Seeks Change Only to Further Its Self-Serving Agenda |
| • | In 2019 alone, Saba has also waged closed-end fund campaigns against Blackrock, Legg Mason/Western, Nuveen, Ivy, Invesco, MFS and Eaton Vance. |
| • | Following its standard playbook, Saba acquired a large majority of its shares during a period of market dislocation when closed-end funds’ discounts tend to be more substantial, then submitted its proposals to change the Fund’s Board and threaten the Fund’s existence, in hopes of extracting concessions from the Fund for its own gain. |
| • | Saba is simply looking to generate a short-term profit at the expense of stockholders who invest in the Fund for long-term returns. |
| • | As demonstrated below, Saba typically completely exits or significantly reduces its holdings in many of the closed-end funds it targets, often after pressuring a fund’s board to implement its self-serving proposals. |
| Fund | Saba Ownership Prior to annual Meeting or Date of Standstill Agreement (% of Outstanding Shares) | Saba Ownership as of Latest SEC Filing (% of Outstanding Shares)3 |
| Delaware Enhanced Global Dividend & Income Fund (DEX) | 12.1%1 | 0.0% |
| Aberdeen Total Dynamic Dividend Fund (AOD) | 5.6%1 | 0.0% |
| Clough Global Equity Fund (GLQ) | 14.4%2 | 0.0% |
| Clough Global Opportunities Fund (GLO) | 14.3%2 | 0.0% |
| Clough Global Dividend & Income Fund (GLV) | 17.5%2 | 0.0% |
| BlackRock Debt Strategies Fund, Inc. (DSU) | 13.6%1 | 1.9% |
| Franklin Limited Duration Income Trust (FTF) | 15.0%1 | 0.0% |
| First Trust Strategic High Income Fund II (FHY) | 10.0%2 | n/a4 |
| First Trust High Income Long/Short Fund (FSD) | 13.1%2 | 9.6%4 |
| Wells Fargo Multi-Sector Income Fund (ERC) | 15.0%2 | 0.0% |
| | 18 |
Appendix A Neuberger Berman High Yield Strategies Fund Inc. - Fact Sheet as of 6/30/19 |
| CLOSEDEND FUND QUARTERLY |  |
| Neuberger Berman High Yield Strategies Fund Inc. |
| AS OF 6/30/19 | TICKER: NHS |
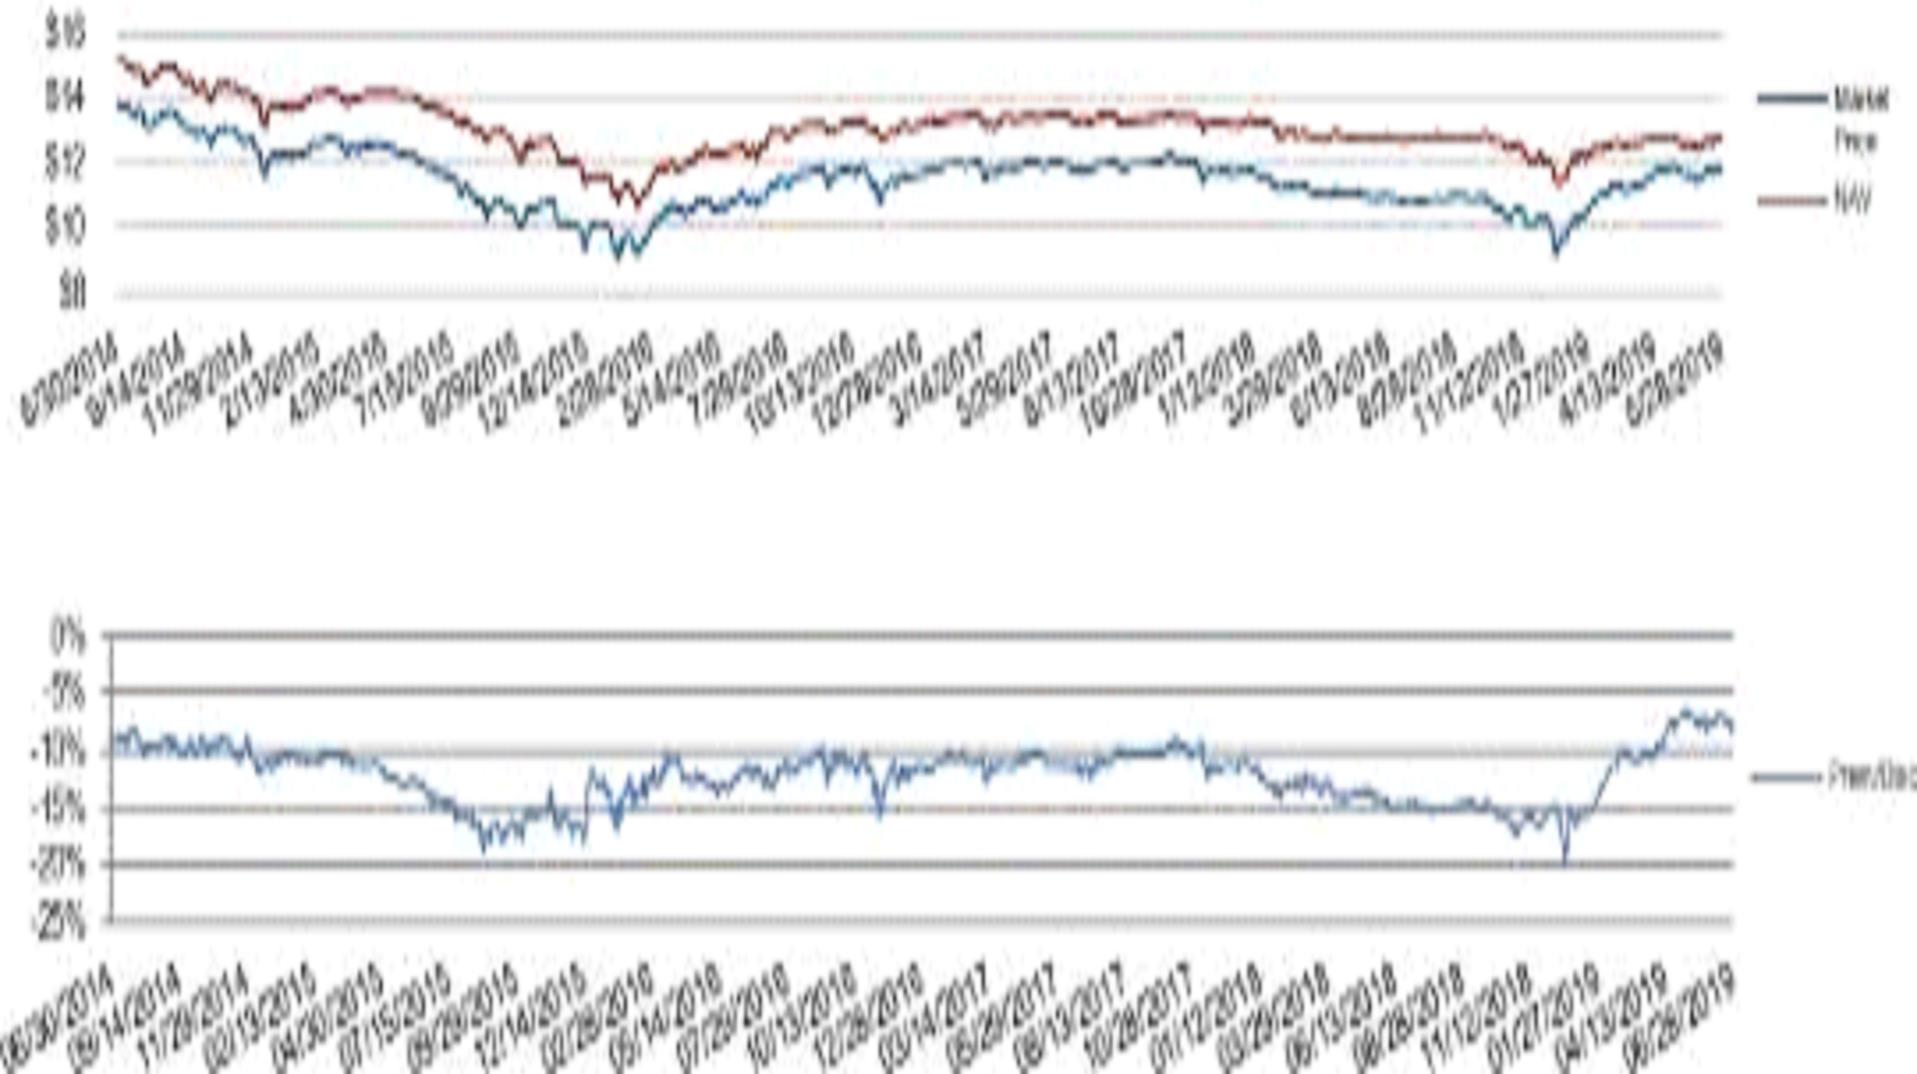
| NHS: PRICE AND VALUATION TRENDS (Last 5 Years) |
| ♦ | Neuberger Berman High Yield Strategies Fund Inc. (NHS or the Fund) is a diversified, closed-end management investment company investing in the high yield debt securities market. |
| ♦ | The Fund utilizes leverage through the issuance of privately placed notes and preferred stock. |
| ♦ | The Fund’s investment objective is to seek high total return (income plus capital appreciation). |
| ♦ | The Fund will pursue its investment objective by investing its assets primarily in high yield debt securities. |
| ♦ | At least 80% of the Fund will be invested in below investment grade (high yield) debt securities (including corporate loans) of US and foreign issuers. |
| ♦ | The Fund may invest up to 20% of it’s managed assets in other securities. |
| MARKET DATA | CAPITAL STRUCTURE | |||||||
| Market Price | Total Assets | $374.658 million | ||||||
| Current | $ | 11.70 | Common Assets | $249.658 million | ||||
| Last 12 Month Range | $ | 11.97 - $ 9.19 | Leverage ($amt) | $125.000 million | ||||
| Net Asset Value | Leverage (% of total assets) | 33.4% | ||||||
| Current | $ | 12.78 | LEVERAGE STRUCTURE | |||||
| Last 12 Month Range | $ | 12.92 - $ 11.38 | Leverage | |||||
| Premium / (Discount) | Debt - Floating Rate | |||||||
| Current | (8.45%) | Senior Notes | $90.0 million | |||||
| Last 12 Month Range | (6.48%) - (19.9)%) | |||||||
Distribution Rate1 | Mandatory Redeemable Preferred Shares | |||||||
| On Market Price | 9.28% | Maturity Date | Annual Interest Rate | Amount | ||||
| On NAV | 8.50% | September 18, 2023 | Floating Rate | $35.0 million | ||||
While the use of leverage can result in greater returns in a rising market as well as increased income generation, its use can also generate greater losses in a declining market as well as pressure income levels in an environment of higher borrowing costs. | ||||||||
| CUSIP Number | 64128C106 | INTEREST RATE SWAPS2 | ||||||
| Inception Date | 7/28/2003 | Clearinghouse | Termination Date | Rate | Amount | |||
| Listed Exchange | NYSE American | CME Group, Inc. | June 29, 2021 | 0.9940% | $20.0 million | |||
| CME Group, Inc. | June 17, 2021 | 1.1380% | $25.0 million | |||||
| 1. | Distribution Rate is annualized and based on monthly distributions. The Fund has adopted a policy to pay common shareholders a stable monthly distribution. In an effort to maintain a stable monthly distribution, the Fund may pay distributions consisting of net investment income, net realized gains and return of capital. There is no assurance that the Fund will always be able to pay distributions of a particular size, or that distributions will consist solely of net investment income and net realized capital gains. In connection with each monthly distribution the Fund issues a notice that includes estimates of the source of the monthly distribution payment. This notice is not for tax reporting purposes and is being provided only for informational purpose in order to comply with the requirements of Section 19 of the Investment Company Act of 1940, as amended. The actual composition of the Fund’s distributions for a calendar year can only be determined after year end and will be reported to Fund shareholders on IRS Form 1099-DIV. The notices for the current calendar year are also available on Neuberger Berman’s website at www.nb.com. For the Fund’s most recent distribution payment, which was paid on July 31, 2019, the distribution was estimated to consist of $0.0639 net investment income and $0.0266 return of capital. This estimate was based on earnings and portfolio activity as of the record date for the distribution. |
| Please see footnotes on last page. |
| Neuberger Berman High Yield Strategies Fund Inc. |
| MANAGER COMMENTARY | |
PORTFOLIO MANAGERS Thomas P. O’Reilly 30 years investment experience Russ Covode 30 years investment experience Dan Doyle 34 years investment experience Joseph Lind 20 years investment experience Chris Kocinski 14 years investment experience Increase in Monthly Distribution Post the market close on Thursday, April 11, 2019, NHS announced an increase in its monthly distribution rate per share of common stock. Effective with the distribution payable on May 31, 2019, NHS’s monthly distribution increased approximately 38% (to $0.0905 from $0.0658 per share). The $0.0905 per share monthlydistribution represents anannualized distribution of $1.086 per share. Neuberger Berman and the Fund’s Board of Directors continue to be focused on delivering value to shareholders of the Fund. The increased distribution rate is an effort to enhance the Fund’s competitiveness in the secondary market and increase demand for the Fund’s common stock in the secondary market, in order to narrow the discount between the market price of the Fund’s common stock and its net asset value per share. | HIGH YIELD MARKET Despite a setback in May, the U.S. high yield market generated positive results during the second quarter. In June, the ICE Bank of America Merrill Lynch U.S. High Yield Constrained Index (the “Index”) gained 2.45%, boosting its second quarter return to 2.57%. Year-to-date, the Index has risen 10.16%. While global trade tensions continued, concerns were largely offset by indications from the Fed and several other central banks that they would pursue more accommodative monetary policies, perhaps including rate cuts during the second half of the year. Such actions could help prolong the lengthy economic expansion. Meanwhile, the market’s credit quality remains stable as fundamental trends continue to be constructive. While revenue growth is expected to slow, interest coverage remains strong and leverage continues to decline. High yield new-issue activity in June was $28.5 billion. Year-to-date gross new issue volume of $140.5 billion was11% higher year-over-year. Lower-quality securities underperformed their higher-quality counterparts in June, as CCC & lower rated bonds returned 1.38%, compared to the 2.80% return for BB rated issues. For the second quarter, CCC & lower rated bonds gained 0.65%, versus the 3.16% return for BB rated issues. Option-adjusted high yield spreads narrowed 52 basis points (bps) in June and ended the quarter at 407 bps. According to JPMorgan, the LTM par-weighted U.S. high yield default rate in June was 1.46%, versus 1.44% the prior month. However, June’s print was 37 bps lower year-to-date and 52 bps lower than June 2018. FUND PERFORMANCE & POSITIONING The Neuberger Berman High Yield Strategies Fund (NHS) generated net asset value (NAV) and Market Price based total returns of 3.09% and 5.83%, respectively, during the second quarter. Accordingly, the Fund outperformed its benchmark, the Index, based on both measures. From a sector perspective, the largest contributors to performance were security selection within support-services, an overweight to media-cable, and security selection within telecommunications. Conversely, security selection within gas distribution, security selection within super retail, and security selection within energy detracted the most from performance. The Fund’s use of leverage also contributed to NAV outperformance for the quarter. Investors need to be aware that the Fund’s use of a leveraged capital structure can magnify the directional movement of the Fund’s common share NAV. It may result in greater returns in a rising market but may also generate greater losses in a declining market. In addition, the use of leverage can increase the amount of income generation and cash flow per common share, but in an environment of rising interest rates, which is likely to result in higher borrowing costs for the Fund, income levels and cash flow per common share can come under pressure and possibly be reduced. At quarter-end, the Fund’s largest sector over weights were media-cable, utilities and gaming, lodging & leisure. The largest sector underweights were banking & insurance, automotive & auto parts, and energy. The allocation to senior floating rate Loans was 4.94%, an increase versus the prior quarter–end level of 3.78%. OUTLOOK The ongoing business cycle has led to stability for issuer’s fundamentals. However, a re-escalation of trade wars with China and possible trade wars with Mexico has resulted in increased market volatility. First quarter 2019 GDP growth was 3.1%--versus 2.2% and 3.4% for the fourth quarter and third quarter of 2018, respectively. While soft landings historically have proven to be quite difficult to engineer, we believe the soft-landing thesis is intact and strengthening. For example, consumer spending, which accounts for about two-thirds of the country’s economic activity, should, in our view, be able to withstand a mild economic deceleration given the financial health of American consumers. Perhaps most important, clear signs of strain in the markets and the economy have encouraged the Fed to pause interest rate hikes in 2019, with the idea that the Fed may ultimately cut rates in the future. Not only could this policy help stabilize U.S. economic growth rates at more modest levels, it could help extend the business cycle further still. We continue to believe fundamentals and valuations are compensating investors for a benign default environment. Operating performance of underlying issuers has been stable, revenue growth remains in positive territory, and while leverage levels have risen modestly, interest coverage remains strong and refinancing activity has significantly reduced the amount of bonds maturing in the near term. While economic growth is expected to slow, the Fed continues to push a more dovish narrative, thus leading to an expectation for even fewer recessionary pressures in the U.S. All told, we believe spreads could continue to tighten over the near term. That being said, risks continue to exist, including uncertainty around global growth expectations, trade policy, government disruptions, and the overall regulatory environment, which could lead to periods of spread volatility. We believe the Fund’s portfolio is positioned to provide downside protection as market volatility rises as well as take advantage of future opportunities within lower quality securities. Given this environment, we maintain our overall up in quality positioning – underweight CCC credits, but yet selectively allocating to B and CCC securities where we see attractive relative value. |
Please see footnotes on last page. |
| Neuberger Berman High Yield Strategies Fund Inc. |
| PORTFOLIO CHARACTERISTICS | FINANCIAL HIGHLIGHTS | |||
| FUND METRICS | (as of Semi Annual Shareholder Report – April 2019) | |||
| Common Shares (06/30/19) | 19,540,585 | Portfolio Turnover (not annualized) | 29.00% | |
Number of Holdings (06/30/19) | 365 | Total Expense Ratio ^* (annualized) | 3.41% | |
Average Daily Volume (Trailing 12 months) | 88,868 | ^ Includes interest expense. Annualized ratio of interest expense to average net assets applicable to common shareholders was 1.45%. * Does not include the effect of distribution payments to preferred shareholders. | ||
| INTEREST RATE SENSITIVITY | ||||
Weighted Average Maturity | 6.8 years | |||
Average Duration to Worst | 3.70 | |||
Average Duration to Worst (Leverage Adjusted) | 5.55 | |||
| INCOME METRICS | | |||
Average Yield to Maturity | 6.09% | |||
Average Coupon | 6.16% | |||
| | | |||
Weighted Average Maturity (WAM) is the weighted average length of timeuntil the average security in a portfolio will mature or be redeemed. It indicates a portfolios sensitivity to interest rate changes. A portfolio with a longer WAM implies greater volatility in a changing interest rate environment. Duration to Worst is derived by utilizing the redemption date which would provide the lowest yield (for callable bonds) or highest yield (for putable bonds). For holdings without calls or puts, Duration to Worst is equal to modified duration. Yield to Maturity (YTM) is the rate of return anticipated on a bond if it is held until the maturity date. It is calculated by dividing the bond's coupon payments by the current price of the bond. Coupon is the interest rate that is to be paid over the life of a debt security, it is usually expressed as a percentage of face value. Issuers typically make payments to bondholders semiannually. | ||||
| PORTFOLIO COMPOSITION | CREDIT QUALITY BREAKDOWN | |
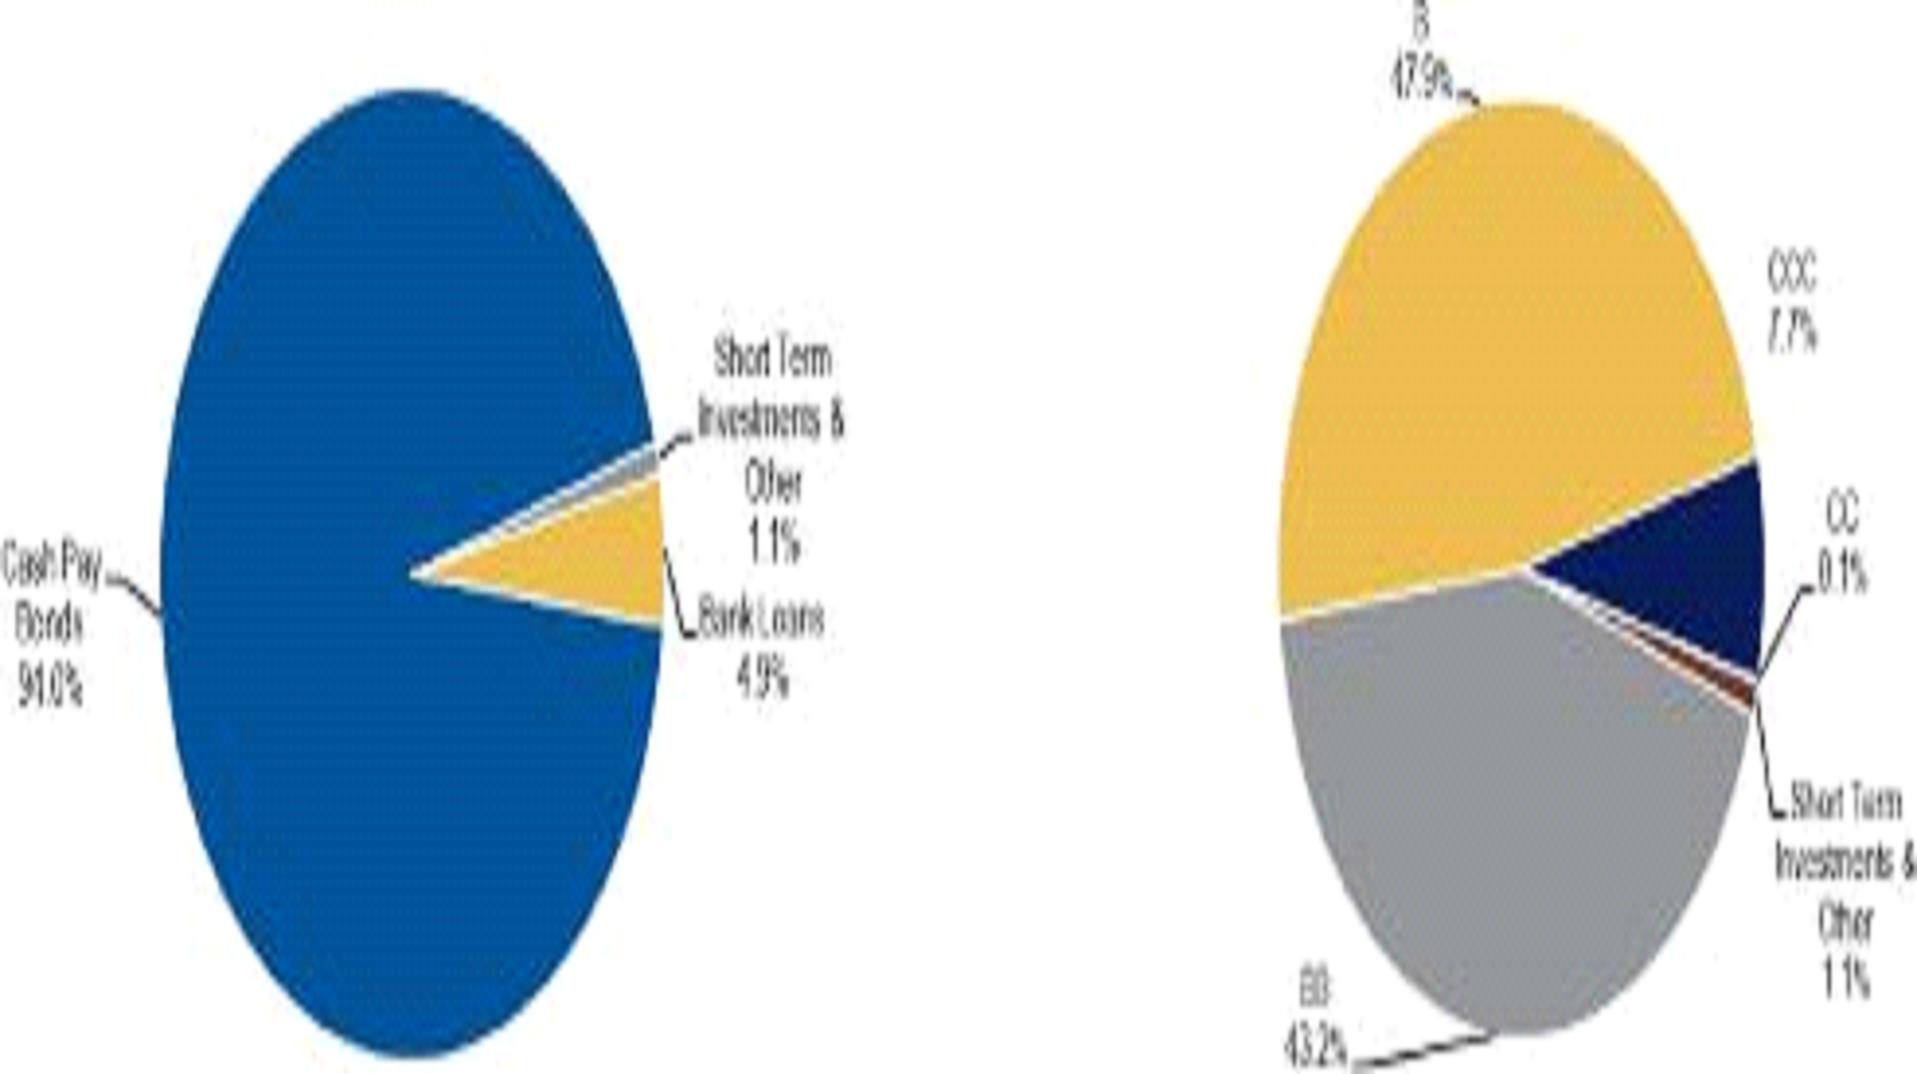 | ||
| DURATION BREAKDOWN | Represents the ratings of the securities held by the Fund as of 6/30/19. Ratings categories shown in the above chart are those of the S&P. Please see footnotes for additional disclosures regarding ratings methodology.3 | |
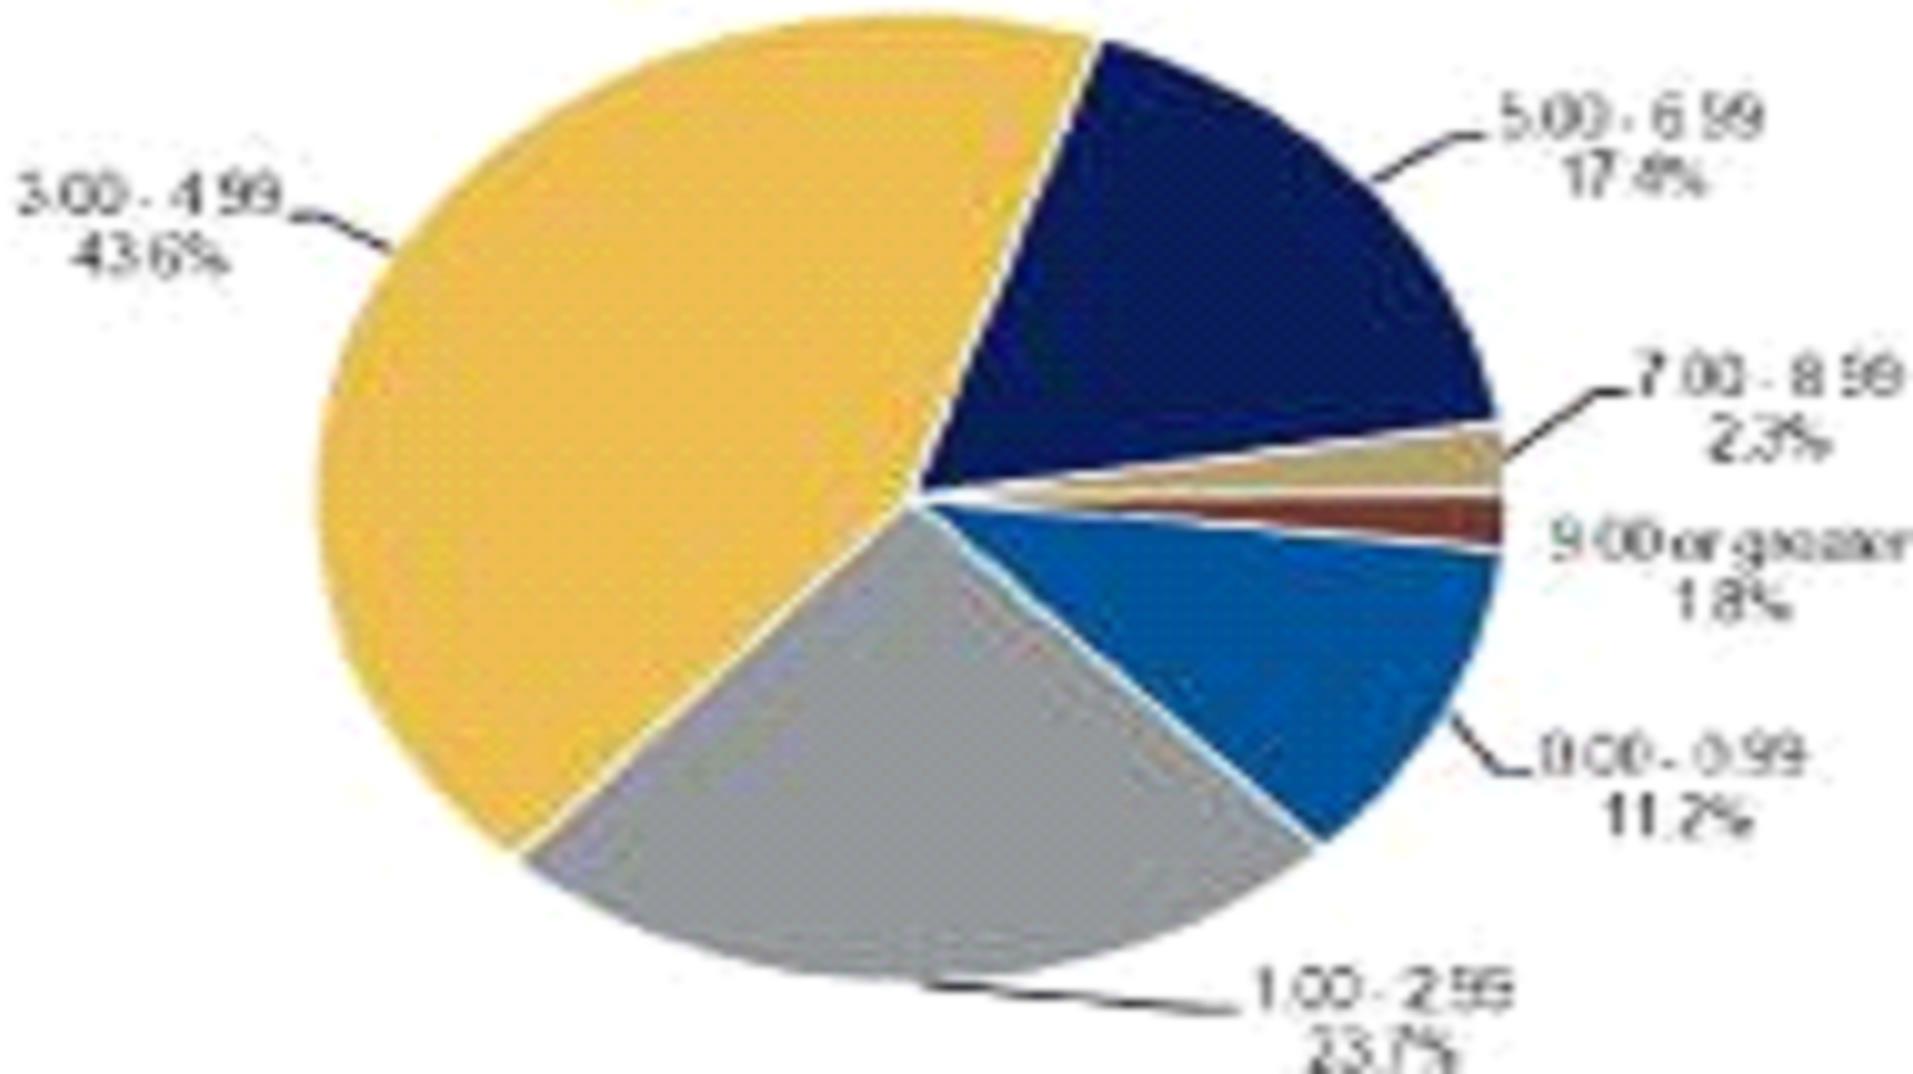
| Duration is the measure of a bond's price sensitivity to interest rates. |
Please see footnotes on last page |
Neuberger Berman High Yield Strategies Fund Inc. |
| NHS: Performance- Common Shares (as of 06/30/19) | Total Return (%) | |||||||||
| Monthly | Quarterly | Six Months | One Year | Three Year | Five Year | From Inception 7/28/2003 | ||||
| Cum | Annual | Cum | Annual | Cum | Annual | |||||
| NAV | 3.93 | 3.08 | 15.29 | 8.64 | 29.20 | 8.91 | 26.40 | 4.80 | 317.99 | 9.40 |
| Market Price | 3.41 | 5.82 | 25.74 | 16.65 | 34.27 | 10.32 | 26.33 | 4.78 | 265.45 | 8.48 |
| TOP TEN INDUSTRIES | % OF TNA | DISTRIBUTION HISTORY4 | ||||||
| Media - Cable | 9.3% | Ex-Date | Record Date | Payable Date | $/Share | |||
| Healthcare | 9.3% | 06/19 | 06/14/2019 | 06/17/2019 | 06/28/2019 | 0.0905 | ||
| Telecommunications | 8.9% | 05/19 | 05/14/2019 | 05/15/2019 | 05/31/2019 | 0.0905 | ||
| Energy | 8.3% | 04/19 | 04/12/2019 | 04/15/2019 | 04/30/2019 | 0.0658 | ||
| Consumer Products / Services | 7.8% | 03/19 | 03/14/2019 | 03/15/2019 | 03/29/2019 | 0.0658 | ||
| Gaming / Lodging / Leisure | 7.1% | 02/19 | 02/14/2019 | 02/15/2019 | 02/28/2019 | 0.0658 | ||
| Gas Distribution | 6.6% | 01/19 | 01/14/2019 | 01/15/2019 | 01/31/2019 | 0.0658 | ||
| Media - Broadcasting / Diversified | 6.3% | 12/18 | 12/14/2018 | 12/17/2018 | 12/31/2018 | 0.0658 | ||
| Real Estate / Homebuilders | 5.9% | 11/18 | 11/14/2018 | 11/15/2018 | 11/30/2018 | 0.0658 | ||
| Utilities | 4.7% | 10/18 | 10/12/2018 | 10/15/2018 | 10/31/2018 | 0.0658 | ||
| TOP FIVE INDUSTRY OVERWEIGHTS | 09/18 | 09/14/2018 | 09/17/2018 | 09/28/2018 | 0.0658 | |||
| Industry | NHS | +/- vs Benchmark | 08/18 | 08/14/2018 | 08/15/2018 | 08/31/2018 | 0.0658 | |
| Media - Cable | 9.3% | 3.0% | 07/18 | 07/13/2018 | 07/16/2018 | 07/31/2018 | 0.0658 | |
| Utilities | 4.7% | 2.3% | 06/18 | 06/14/2018 | 06/15/2018 | 06/29/2018 | 0.0658 | |
| Gaming / Lodging / Leisure | 7.1% | 2.1% | TOP TEN HOLDINGS5 | % OF TNA | ||||
| Media - Broadcasting / Diversified | 6.3% | 1.8% | Intelsat SA | 1/3% | ||||
| Gas Distribution | 6.6% | 1.8% | Sprint Corp | 1/3% | ||||
| TOP FIVE INDUSTRY UNDERWEIGHTS | LPL Financial Holdings Inc. | 1.2% | ||||||
| Industry | NHS | +/- vs Benchmark | Bausch Health Companies Inc. | 1.1% | ||||
| Banking / Insurance | 0.2% | -2.9% | Numericable Group | 1.0% | ||||
| Automotive / Auto Parts | 0.2% | -1.7% | Ardagh Group SA | 1.0% | ||||
| Energy | 8.3% | -1.1% | NRG Energy Inc. | 0.9% | ||||
| Technology / Electronics | 4.6% | -1.1% | Charter Communications | 0.9% | ||||
| Food / Beverage / Tobacco | 0.6% | -1.0% | Rackspace Hosting Inc. | 0.8% | ||||
| Avis Budget Group Inc. | 0.8% | |||||||
| 2. | The Fund may, from time to time, enter into interest rate swaps in an attempt to reduce the risk that an increase in short-term interest rates could reduce common share net earnings as a result of the Fund’s use of floating rate leverage. In such an instance, the Fund may agree with a counterparty to pay a fixed rate (multiplied by a notional amount) and the counterparty to pay a floating rate multiplied by the same notional amount. If long-term interest rates rise, the Fund would receive payments under the swap that could offset a portion of its increased leverage costs; if interest rates fall, the Fund would likely lose money on the swap transaction as the amount it receives may be less than the fixed rate it has agreed to pay. |
| 3. | Ratings categories shown in the above charts are those of S&P. In looking at the rating of a particular security, the Fund considers the ratings of S&P, Moody’s and Fitch (each, an “NRSRO”). In the event that a particular security is rated differently by one of the three NRSROs, the highest rating is used. Chart represents the ratings of the securities held by the Fund and does not imply any credit rating of the Fund itself. |
| 4. | Past distributions are not indicative of future distributions. |
| 5. | Holdings are as of 6/30/19 and are subject to change without notice. This list does not constitute a recommendation to buy, sell or hold a security. |
| | |
| Neuberger Berman BD LLC, member FINRA | © 2019 Neuberger Berman Investment Advisers LLC Investment adviser and administrator. All rights reserved. |