ameresco.com © 2023 Ameresco, Inc. All rights reserved. Q1 2023 Supplemental Information May 1, 2023

2 Safe Harbor Forward Looking Statements Any statements in this presentation about future expectations, plans and prospects for Ameresco, Inc., including statements about market conditions, pipeline, visibility and backlog, as well as estimated future revenues, net income, adjusted EBITDA, Non-GAAP EPS, gross margin, capital investments, other financial guidance and longer term outlook, statements about our agreement with SCE including the impact of any delays, and the impact of the IRA and macroeconomic conditions on our business, longer term outlook, and other statements containing the words “projects,” “believes,” “anticipates,” “plans,” “expects,” “will” and similar expressions, constitute forward-looking statements within the meaning of The Private Securities Litigation Reform Act of 1995. Actual results may differ materially from those indicated by such forward looking statements as a result of various important factors, including the timing of, and ability to, enter into contracts for awarded projects on the terms proposed or at all; the timing of work we do on projects where we recognize revenue on a percentage of completion basis, including the ability to perform under signed contracts without delay and in accordance with their terms; demand for our energy efficiency and renewable energy solutions; our ability to complete and operate our projects on a profitable basis and as committed to our customers; our ability to arrange financing to fund our operations and projects and to comply with covenants in our existing debt agreements; changes in federal, state and local government policies and programs related to energy efficiency and renewable energy and the fiscal health of the government; the ability of customers to cancel or defer contracts included in our backlog; the output and performance of our energy plants and energy projects; the effects of our acquisitions and joint ventures; seasonality in construction and in demand for our products and services; a customer’s decision to delay our work on, or other risks involved with, a particular project; availability and cost of labor and equipment particularly given global supply chain challenges and global trade conflicts; our reliance on third parties for our construction and installation work; the addition of new customers or the loss of existing customers; the impact of macroeconomic challenges, weather related events and climate change on our business; global supply chain challenges, component shortages and inflationary pressures; market price of the Company's stock prevailing from time to time; the nature of other investment opportunities presented to the Company from time to time; the Company's cash flows from operations; cybersecurity incidents and breaches; regulatory and other risks inherent to constructing and operating energy assets; risks related to our international operation and international growth strategy; and other factors discussed in our most recent Annual Report on Form 10-K and Quarterly Report on Form 10-Q. The forward-looking statements included in this presentation represent our views as of the date of this presentation. We anticipate that subsequent events and developments will cause our views to change. However, while we may elect to update these forward-looking statements at some point in the future, we specifically disclaim any obligation to do so. These forward-looking statements should not be relied upon as representing our views as of any date subsequent to the date of this presentation. Use of Non-GAAP Financial Measures This presentation and the accompanying tables include references to adjusted EBITDA, Non-GAAP EPS, Non-GAAP net income and adjusted cash from operations, which are Non-GAAP financial measures. For a description of these Non-GAAP financial measures, including the reasons management uses these measures, please see the section in the back of this presentation titled “Non-GAAP Financial Measures”. For a reconciliation of these Non-GAAP financial measures to the most directly comparable financial measures prepared in accordance with GAAP, please see the table at the end of this presentation titled “GAAP to Non-GAAP Reconciliation.”

Sources of Revenue – Q1 2023 3 Projects Energy efficiency and renewable energy projects Recurring Energy & incentive revenue from owned energy assets; plus recurring O&M from projects Other Services, software and integrated PV $183.2M $63.1M $24.8M

Projects 15% Assets 73% O&M 5% Other 7% $27M Adjusted EBITDA* 78% of Adjusted EBITDA Came From Recurring Lines of Business 4 Projects 68% Assets 15% O&M 8% Other 9%23% Recurring $271M Revenue * Adjusted EBITDA percentages allocate corporate expenses according to revenue shareQ1 2023 78% Recurring
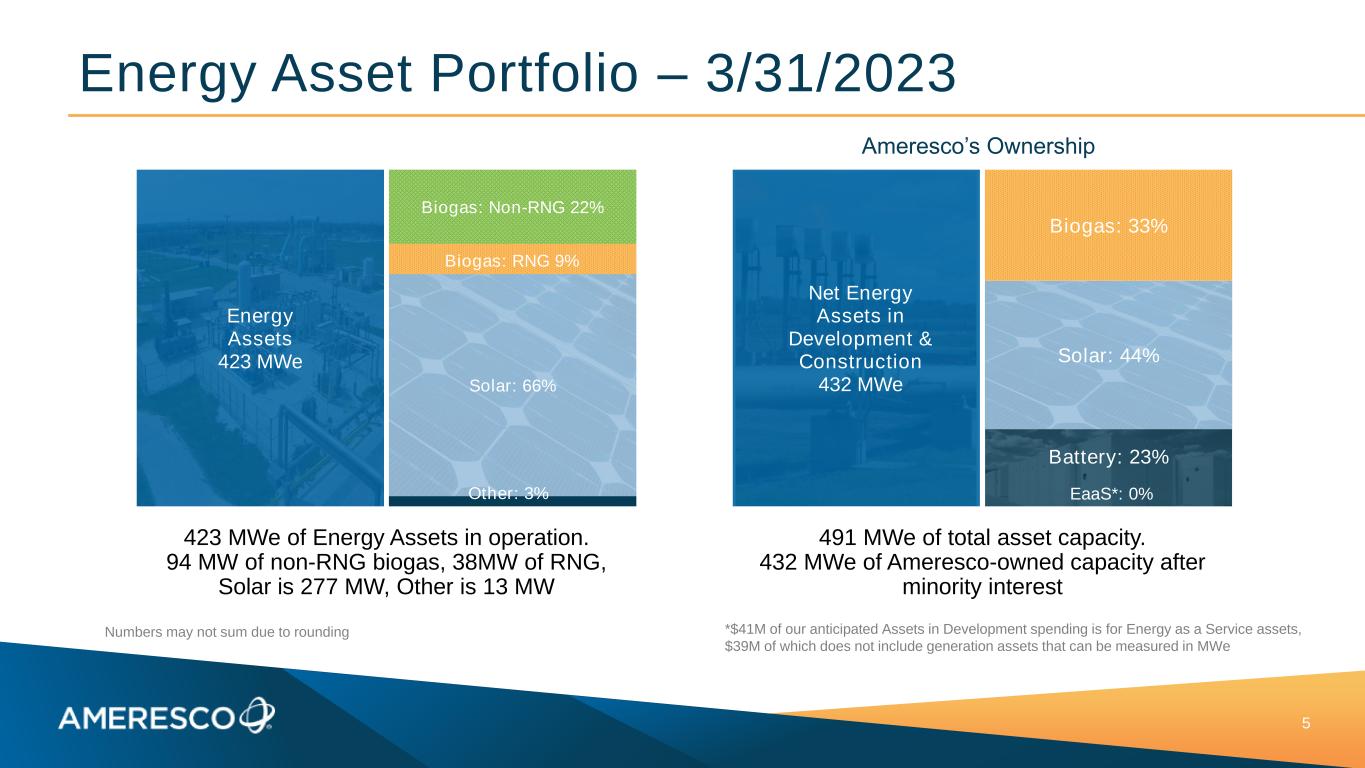
Energy Asset Portfolio – 3/31/2023 5 423 MWe of Energy Assets in operation. 94 MW of non-RNG biogas, 38MW of RNG, Solar is 277 MW, Other is 13 MW 491 MWe of total asset capacity. 432 MWe of Ameresco-owned capacity after minority interest Energy Assets 423 MWe Other: 3% Solar: 66% Biogas: RNG 9% Biogas: Non-RNG 22% Net Energy Assets in Development & Construction 432 MWe EaaS*: 0% Battery: 23% Solar: 44% Biogas: 33% Numbers may not sum due to rounding *$41M of our anticipated Assets in Development spending is for Energy as a Service assets, $39M of which does not include generation assets that can be measured in MWe Ameresco’s Ownership
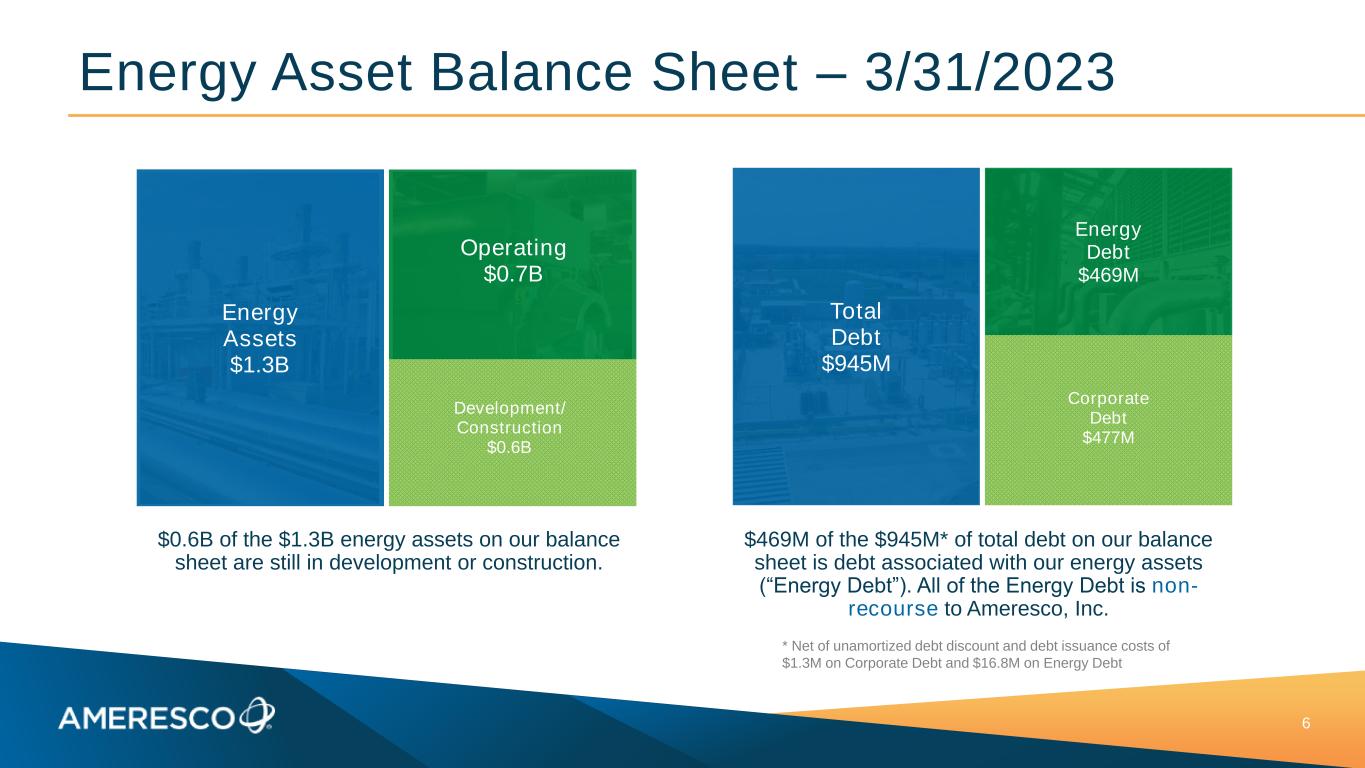
Energy Asset Balance Sheet – 3/31/2023 6 * Net of unamortized debt discount and debt issuance costs of $1.3M on Corporate Debt and $16.8M on Energy Debt $0.6B of the $1.3B energy assets on our balance sheet are still in development or construction. $469M of the $945M* of total debt on our balance sheet is debt associated with our energy assets (“Energy Debt”). All of the Energy Debt is non- recourse to Ameresco, Inc. Total Debt $945M Corporate Debt $477M Energy Debt $469M Energy Assets $1.3B Development/ Construction $0.6B Operating $0.7B
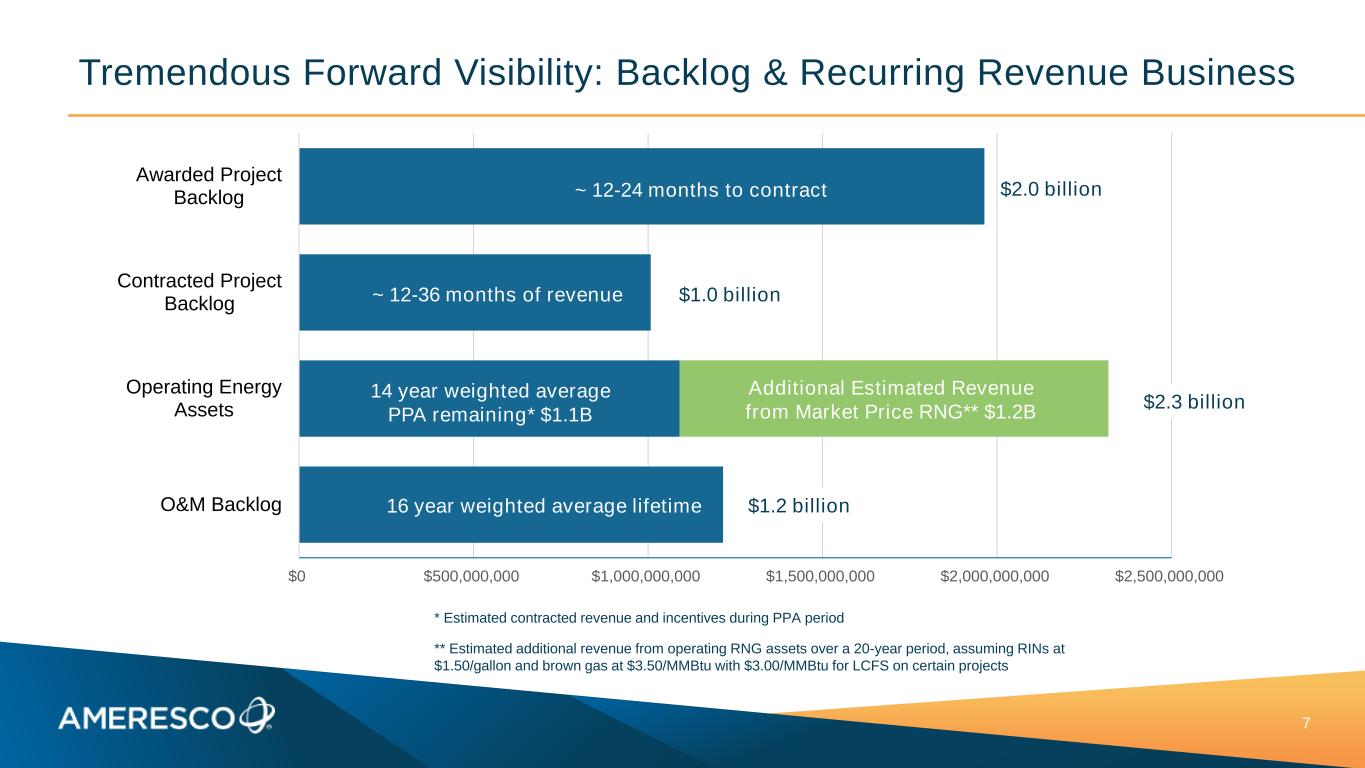
$0 $500,000,000 $1,000,000,000 $1,500,000,000 $2,000,000,000 $2,500,000,000 Awarded Project Backlog Contracted Project Backlog Operating Energy Assets O&M Backlog Additional Estimated Revenue from Market Price RNG** $1.2B Tremendous Forward Visibility: Backlog & Recurring Revenue Business 7 ~ 12-24 months to contract ~ 12-36 months of revenue 14 year weighted average PPA remaining* $1.1B 16 year weighted average lifetime * Estimated contracted revenue and incentives during PPA period ** Estimated additional revenue from operating RNG assets over a 20-year period, assuming RINs at $1.50/gallon and brown gas at $3.50/MMBtu with $3.00/MMBtu for LCFS on certain projects $2.0 billion $1.0 billion $2.3 billion $1.2 billion

Sustainable & Profitable Business Model 8 Revenue ($M) $787 $867 $1,032 $1,216 $1,824 $1,450 2018 2019 2020 2021 2022 2023 Guidance $1,550 $91 $91 $118 $153 $205 $210 $300 2018 2019 2020 2021 2022 2023 Guidance 2024 Target Adjusted EBITDA ($M) $220 2023 Guidance • High-End 19.3% CAGR • Low-End 18.2% CAGR Expected to Expand Earnings at a Faster Rate than Revenue by Growing Higher Margin Recurring Lines of Business FY 2023 guidance, as reaffirmed May 1, 2023 5 YEAR CAGR 27% 2023 Guidance • High-End 14.7% CAGR • Low-End 13.2% CAGR
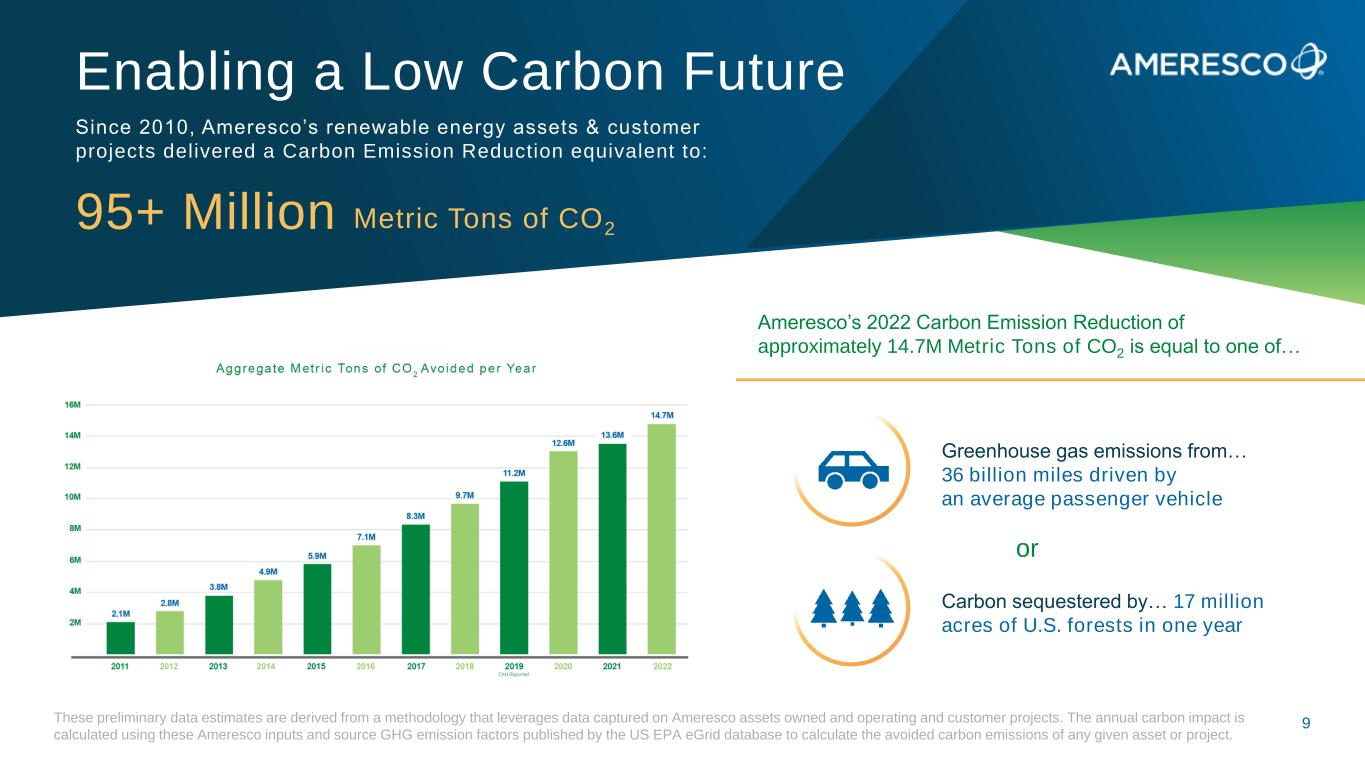
Enabling a Low Carbon Future Since 2010, Ameresco’s renewable energy assets & customer projects delivered a Carbon Emission Reduction equivalent to: Greenhouse gas emissions from… 36 billion miles driven by an average passenger vehicle Carbon sequestered by… 17 million acres of U.S. forests in one year or These preliminary data estimates are derived from a methodology that leverages data captured on Ameresco assets owned and operating and customer projects. The annual carbon impact is calculated using these Ameresco inputs and source GHG emission factors published by the US EPA eGrid database to calculate the avoided carbon emissions of any given asset or project. 95+ Million Metric Tons of CO2 Ameresco’s 2022 Carbon Emission Reduction of approximately 14.7M Metric Tons of CO2 is equal to one of… 9

ameresco.com © 2023 Ameresco, Inc. All rights reserved. to Our Customers, Employees, and Shareholders Thank You
11 Non-GAAP Financial Measures We use the Non-GAAP financial measures defined and discussed below to provide investors and others with useful supplemental information to our financial results prepared in accordance with GAAP. These Non-GAAP financial measures should not be considered as an alternative to any measure of financial performance calculated and presented in accordance with GAAP. For a reconciliation of these Non-GAAP measures to the most directly comparable financial measures prepared in accordance with GAAP, please see the table at the end of this presentation titled “GAAP to Non-GAAP Reconciliation.” We understand that, although measures similar to these Non- GAAP financial measures are frequently used by investors and securities analysts in their evaluation of companies, they have limitations as analytical tools, and investors should not consider them in isolation or as a substitute for the most directly comparable GAAP financial measures or an analysis of our results of operations as reported under GAAP. To properly and prudently evaluate our business, we encourage investors to review our GAAP financial statements and not to rely on any single financial measure to evaluate our business. Adjusted EBITDA and Adjusted EBITDA Margin We define adjusted EBITDA as net income attributable to common shareholders, including impact from redeemable non-controlling interests, before income tax (benefit) provision, other expenses net, depreciation, amortization of intangible assets, accretion of asset retirement obligations, contingent consideration expense, stock-based compensation expense, energy asset impairment, restructuring and other charges, gain or loss on sale of equity investment, and gain or loss upon deconsolidation of a variable interest entity. We believe adjusted EBITDA is useful to investors in evaluating our operating performance for the following reasons: adjusted EBITDA and similar Non-GAAP measures are widely used by investors to measure a company's operating performance without regard to items that can vary substantially from company to company depending upon financing and accounting methods, book values of assets, capital structures and the methods by which assets were acquired; securities analysts often use adjusted EBITDA and similar Non-GAAP measures as supplemental measures to evaluate the overall operating performance of companies; and by comparing our adjusted EBITDA in different historical periods, investors can evaluate our operating results without the additional variations of depreciation and amortization expense, accretion of asset retirement obligations, contingent consideration expense, stock-based compensation expense, impact from redeemable non-controlling interests, restructuring and asset impairment charges. We define adjusted EBITDA margin as adjusted EBITDA stated as a percentage of revenue. Our management uses adjusted EBITDA and adjusted EBITDA margin as measures of operating performance, because they do not include the impact of items that we do not consider indicative of our core operating performance; for planning purposes, including the preparation of our annual operating budget; to allocate resources to enhance the financial performance of the business; to evaluate the effectiveness of our business strategies; and in communications with the board of directors and investors concerning our financial performance. Non-GAAP Net Income and EPS We define Non-GAAP net income and earnings per share (EPS) to exclude certain discrete items that management does not consider representative of our ongoing operations, including energy asset impairment, restructuring and other charges, impact from redeemable non-controlling interest, gain or loss on sale of equity investment, and gain or loss upon deconsolidation of a variable interest entity. We consider Non-GAAP net income and Non- GAAP EPS to be important indicators of our operational strength and performance of our business because they eliminate the effects of events that are not part of the Company's core operations. Adjusted Cash from Operations We define adjusted cash from operations as cash flows from operating activities plus proceeds from Federal ESPC projects. Cash received in payment of Federal ESPC projects is treated as a financing cash flow under GAAP due to the unusual financing structure for these projects. These cash flows, however, correspond to the revenue generated by these projects. Thus we believe that adjusting operating cash flow to include the cash generated by our Federal ESPC projects provides investors with a useful measure for evaluating the cash generating ability of our core operating business. Our management uses adjusted cash from operations as a measure of liquidity because it captures all sources of cash associated with our revenue generated by operations.

GAAP to Non-GAAP Reconciliation 12 (Unaudited) (Unaudited) Adjusted EBITDA: Net income attributable to common shareholders 1,102$ 17,384$ Impact from redeemable non-controlling interests 32 1,914 (Less) plus: Income tax provision (benefit) (503) 2,307 Plus: Other expenses, net 8,043 7,081 Plus: Depreciation and amortization 14,287 13,118 Plus: Stock-based compensation 4,037 3,531 Plus: Contingent consideration, restructuring and other charges 371 (209) Adjusted EBITDA 27,369$ 45,126$ Adjusted EBITDA margin 10.1% 9.5% Revenue 271,042 473,948 Non-GAAP net income and EPS: Net income attributable to common shareholders 1,102$ 17,384$ Adjustment for accretion of tax equity financing fees (27) (28) Impact of redeemable non-controlling interests 32 1,914 Plus: Contingent consideration, restructuring and other charges 371 (209) (Less) plus: Income Tax effect of Non-GAAP adjustments (96) 54 Non-GAAP net income 1,382$ 19,115$ Earnings per share: Diluted net income per common share 0.02$ 0.32$ Effect of adjustments to net income 0.01 0.04 Non-GAAP EPS 0.03$ 0.36$ Adjusted cash from operations Cash flows from operating activities 58,772$ (276,122)$ Plus: proceeds from Federal ESPC projects 42,309 64,788 Adjusted cash from operations 101,081$ (211,334)$ 2023 2022 Three Months Ended March 31,

GAAP to Non-GAAP Reconciliation (continued) 13 * Adjusted EBITDA by Line of Business includes corporate expenses allocated according to revenue share $000 USD Projects Operating Assets O&M Other Consolidated Adjusted EBITDA: Net (loss) income attributable to common shareholders (1,300)$ 1,149$ 532$ 721$ 1,102$ Impact from redeemable non-controlling interests - 32 - - 32 (Less) plus: Income tax provision (benefit) (884) 72 127 182 (503) Plus: Other expenses, net 2,490 4,905 236 412 8,043 Plus: Depreciation and amortization 660 13,122 304 201 14,287 Plus: Stock-based compensation 2,729 607 332 369 4,037 Plus: Restructuring and other charges 337 20 7 7 371 Adjusted EBITDA 4,032 19,907 1,538 1,892 27,369 Adjusted EBITDA margin 2.2% 48.8% 6.9% 7.6% 10.1% Three Months Ended March 31, 2023