UNITED STATES
SECURITIES AND EXCHANGE COMMISSION
Washington, D.C. 20549
FORM N-CSR
CERTIFIED SHAREHOLDER REPORT OF REGISTERED
MANAGEMENT INVESTMENT COMPANIES
Investment Company Act file number: 811-22555
FlexShares Trust
(Exact name of registrant as specified in charter)
50 South LaSalle Street
Chicago, Illinois 60603
(Address of principal executive offices) (Zip code)
Diana E. McCarthy, Esq.
Drinker Biddle & Reath LLP
One Logan Square, Ste. 2000
Philadelphia, Pennsylvania 19103-6996
(Name and Address of Agent for Service)
with a copy to:
Jeff Beeson
Jose Del Real, Esq.
Northern Trust Investments, Inc.
50 South LaSalle Street
Chicago, Illinois 60603
(Name and Address of Agent for Service)
Registrant’s telephone number, including area code: 855-353-9383
Date of fiscal year end: October 31
Date of reporting period: October 31, 2018
Item 1. Reports To Stockholders.
The following is a copy of the report transmitted to shareholders pursuant to Rule 30e-1 under the Investment Company Act of 1940 (17 CFR 270.30e-1).

FlexShares® Trust
Annual Report
October 31, 2018
FlexShares® Morningstar US Market Factor Tilt Index Fund
FlexShares® Morningstar Developed Markets ex-US Factor Tilt Index Fund
FlexShares® Morningstar Emerging Markets Factor Tilt Index Fund
FlexShares® Currency Hedged Morningstar DM ex-US Factor Tilt Index Fund
FlexShares® Currency Hedged Morningstar EM Factor Tilt Index Fund
FlexShares® US Quality Large Cap Index Fund
FlexShares® STOXX® US ESG Impact Index Fund
FlexShares® STOXX® Global ESG Impact Index Fund
FlexShares® Morningstar Global Upstream Natural Resources Index Fund
FlexShares® STOXX® Global Broad Infrastructure Index Fund
FlexShares® Global Quality Real Estate Index Fund
FlexShares® Real Assets Allocation Index Fund
FlexShares® Quality Dividend Index Fund
FlexShares® Quality Dividend Defensive Index Fund
FlexShares® Quality Dividend Dynamic Index Fund
FlexShares® International Quality Dividend Index Fund
FlexShares® International Quality Dividend Defensive Index Fund
FlexShares® International Quality Dividend Dynamic Index Fund
FlexShares® iBoxx 3-Year Target Duration TIPS Index Fund
FlexShares® iBoxx 5-Year Target Duration TIPS Index Fund
FlexShares® Disciplined Duration MBS Index Fund
FlexShares® Credit-Scored US Corporate Bond Index Fund
FlexShares® Credit-Scored US Long Corporate Bond Index Fund
FlexShares® High Yield Value-Scored Bond Index Fund
FlexShares® Ready Access Variable Income Fund
FlexShares® Core Select Bond Fund

Table of Contents

Letter to Shareholders
Dear Shareholder:
We are pleased to present the FlexShares Annual Report. Enclosed you will find details such as fund characteristics, performance results and investment commentaries for the fiscal year ended October 31, 2018. From a stewardship perspective, the past 12-months were marked by both continuity and change. Our approach to developing distinctive exchange-traded fund (“ETF”) products remains steadfast: we continue to pair our insights on evolving investor needs with expertise in index design and portfolio management. Likewise, our differentiated ETFs still aim to help investors achieve their real-world goals. One change is worth noting, however: there is a new captain steering the ship. In the first quarter of 2018, I was honored to succeed Shundrawn Thomas as Head of the Funds and Managed Accounts business within Northern Trust Asset Management, including overall responsibilities for FlexShares ETFs. Since then, my engagements with clients have helped me understand and appreciate how our ETFs are positioned and used in the marketplace. My goal is to maintain all the strengths of FlexShares ETFs while evolving and guiding the business through its next phase of growth.
The FlexShares suite of 26 ETFs are designed to serve four investor objectives: Capital Appreciation, Risk Management, Liquidity, and Income Generation. Over the past twelve months, FlexShares launched one new, passively-managed ETF:
| | | | | | |
| FlexShares ETF | | Ticker | | | Investor Objective |
|
| | |
High Yield Value-Scored Bond Index Fund | | | HYGV | | | Income |
This annual report includes management discussions of each Fund, other than the recently launched FlexShares® High Yield Value-Scored Bond Index Fund.
Investment Themes
The return of market volatility during the fiscal year ended October 31, 2018 heralded several important changes to the investment landscape. Shifting outlooks for global growth, inflation and monetary policy topped this list.
On the growth front, the synchronized global experience of 2017 proved temporary. The U.S. economy in 2018
continued to advance at a strong clip, outstripping overseas growth, which slowed appreciably into the fiscal year’s close. Aided by significant tax and spending stimuli, the domestic economy benefited from a constructive dynamic of strong job growth boosting household incomes, consumption and sentiment, which then fed back into more hiring. The tax stimulus also ramped up business investment during 2018’s first half. Growth overseas benefited little from U.S. stimulus programs and faced stiff headwinds following President Trump’s many trade and tariff directives. Evidence that offshore growth was slipping in both developed and emerging regions surfaced slowly but registered meaningfully as the year progressed. Fresh populist crosscurrents in various countries added to economic uncertainties. Few, if any, impacted countries signaled an appetite to pursue pro-growth policies to counter the slowing impulse. The increasingly divergent global growth backdrop laid a foundation of uncertainty under many investor outlooks.
Inflation in the U.S. firmed modestly during the fiscal year amid a tight labor market and solid expansion. At the end of October 2018, the Core Consumer Price Index (CPI) (2.5% annual rate) fell back from a July high (2.9%). Weakening price growth in the U.S. for health care and property rents along with lower crude prices suggested a potential inflation pullback was possible. In comparison to the modest uptick seen in the U.S., measures of inflation in other developed economies stayed subdued. The low inflation backdrop seen in recent years remained well anchored. We believe that a growing contingent of investors are questioning whether steady, subdued price trends are sufficient to quell the increasingly hawkish sentiments of central bankers.
The differences in regional growth and inflation behaviors have elicited divergent monetary policy responses. Using the policy phases of quantitative easing (i.e. implementation, maintenance, exit) to calibrate its progress, the U.S. Federal Reserve (the “Fed”), among global central banks, remains the furthest down the road of rate normalization and well-into “exit mode.” In fact, the term “quantitative tightening” was coined this year to describe the Fed’s dual pursuit of rate hikes and balance sheet reduction. In contrast, other global central banks remain ensconced in the “maintenance” policy phase – although with less firmness than in prior years;
| | |
| 2 | | FLEXSHARES ANNUAL REPORT |
Letter to Shareholders (cont.)
several have resolved to end quantitative easing in the near future despite rising economic risks and all but non-existent inflation. Following numerous years of low and stable rates, over the past 12 months investors have grown more worried about the path of future interest rates. This was reflected in higher market volatility and significant equity sell-offs in February and October of 2018.
Financial Market Highlights
Divergences in growth outlooks and central bank policy behaviors were the key inputs to market performance during the fiscal year ended October 31, 2018. The period’s blend of organic and policy induced growth, incorporating both fiscal and monetary inputs, generated a wide dispersion of market outcomes. These outcomes contrasted sharply with the predominately positive investment results of the prior year.
| · | | For much of the year, the largest technology companies drove the stock market to record highs before experiencing a sharp sell-off in September and October of 2018. The correction was broad based and coincided with signs of economic slowing, primarily overseas. More specific concerns focused on whether earnings for the cycle had peaked, how benefits from tax cuts in the U.S. might fade in 2019 and the likelihood of unfavorable U.S. midterm election outcomes. Although the domestic economy continued to outperform other regions, increased worries about a global slowdown weighed on equity markets. Year-to-date performance, according to Bloomberg, as of October 31, 2018, the S&P 500 gained 3.4%, the MSCI U.S. Equities IMI Index gained 3.2%, the MSCI World ex-U.S. IMI Index was down -8% and the MSCI Emerging Market Equities Index was also down -12.6%. |
| · | | Year-to-date, according to Bloomberg, as of October 31, 2018, overall Treasury securities rates, 2-year maturity and longer, moved higher as investors both anticipated and responded to the Fed’s rate normalization program. The Fed, led by chair Jerome Powell, tightened policy three times in 2018. Additionally, the Fed has been shrinking the size of its balance sheet by $50 billion per month. Year-to-date, according to Bloomberg, as of October 31, 2018, the Treasury yield curve took on a flatter shape with T-bill yields rising by 120 basis points (bps)1, 10-year rates by 75 bps and 30-year rates by |
| | | about 50 bps. Throughout the year, there appeared to be a significant disconnect between the Fed’s and investors’ outlooks regarding the timing and degree of future interest rate increases. Year-to-date, according to Bloomberg, as of October 31, 2018, bond index returns as exhibited by the Bloomberg Barclays Aggregate Index fell -2.7%. Year-to-date, according to Bloomberg, high yield, as measured by the Bloomberg Barclays High Yield 2% Capped Index, as of October 31, 2018, was a positive exception, gaining 1.1% year-to-date, while emerging market bonds, as measured by the JP Morgan GBI-EM Global Diversified Index, as of October 31, 2018, according to Bloomberg, lost 8.6% year-to-date. |
| · | | Prices of natural resource commodities experienced considerable volatility amid a shifting mix of monetary, regulatory, geo-political and fundamental factors, including the diverging growth outlooks in the U.S., Eurozone and China. Oil prices fell sharply in the late months of the fiscal year. Real assets, year-to-date as of October 31, 2018, according to Bloomberg, measured by S&P Global Natural Resources Index, FTSE EPRA/NAREIT Global Index and S&P Global Infrastructure Index all had negative performance of -2.8%, -4.9% and -7.9%, respectively. |
Please review our Annual Report to learn more about FlexShares ETFs, and visit our website at www.flexshares.com for additional information about our products.
We look forward to continuing to serve your investment needs and appreciate your interest in FlexShares.
Sincerely,
Darek Wojnar, CFA
Head of Funds and Managed Accounts, Northern Trust Asset Management
The views in this letter were as of October 31, 2018 and may not necessarily reflect the same views on the date this letter is first published or any time thereafter. These views are intended to help shareholders in understanding the Funds’ investment methodology and do not constitute investment advice.
| 1 | A unit that is equal to 1/100th of 1% and is used to denote the change in a financial instrument. |
| | | | |
| FLEXSHARES ANNUAL REPORT | | | 3 | |
Letter to Shareholders (cont.)
This report is submitted for the general information of the shareholders of the Funds. It is not authorized for distribution to prospective investors unless preceded or accompanied by an effective prospectus, which includes information regarding the Funds’ risks, objectives, fees and expenses, experience of its management, and other information.
An investment in the Funds’ is subject to numerous risks, including possible loss of principal. Fund returns may not match the return of the respective indexes. Some of the risks include, but are not limited to, the following: asset class; commodity; concentration; counterparty; currency; derivatives; dividend; emerging markets; equity securities; fluctuation of yield; foreign securities; geographic; income; industry concentration; inflation-protected securities; infrastructure-related companies; interest rate / maturity risk; issuer; large cap; management; market; market trading; mid cap stock; MLP; momentum; natural resources; new funds; non-diversification; passive investment; privatization; small cap stock; tracking error; value investing; and volatility risk. A full description of risks is in each Fund’s prospectus.
Foreside Fund Services, LLC, distributor.
| | |
| 4 | | FLEXSHARES ANNUAL REPORT |
| | |
| FlexShares® Morningstar | | MANAGEMENT’S DISCUSSION OF FUND PERFORMANCE |
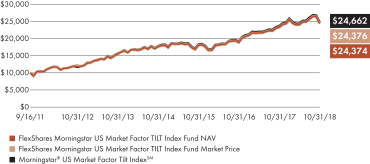
US Market Factor Tilt Index Fund Ticker: TILT
CUMULATIVE PERFORMANCE
Through October 31, 2018
AVERAGE ANNUAL TOTAL RETURN
For the period ended October 31, 2018
| | | | | | | | | | | | | | | | |
| | | 1 Year | | | 3 Year | | | 5 Year | | | Fund
Inception
9/16/2011 | |
| | | | |
| | | | |
FlexShares Morningstar US Market Factor TILT Index Fund (Based on Net Asset Value) | | | 4.22 | % | | | 10.53 | % | | | 9.45 | % | | | 13.32 | % |
| | | | |
FlexShares Morningstar US Market Factor TILT Index Fund (Based on Market Price) | | | 4.19 | % | | | 10.54 | % | | | 9.42 | % | | | 13.32 | % |
| | | | |
Morningstar® U.S. Market Factor Tilt IndexSM | | | 4.26 | % | | | 10.60 | % | | | 9.61 | % | | | 13.50 | % |
All data as of 10/31/18. Total returns based on market price do not include brokerage commissions that may be payable on secondary market transactions. If brokerage commissions were included, these returns would be lower. Total returns based on market price and net asset value (“NAV”) assumes that dividends and capital gain distributions have been reinvested in the Fund at market price and NAV, respectively. NAV is a fund’s net asset value per share, which is calculated by dividing the total value of all the securities in the fund’s portfolio plus cash, interest and receivables less any liabilities by the number of fund shares outstanding. Market price is determined by the midpoint of the bid/ask spread at 4:00 p.m. Eastern Time from the primary listing exchange. Market price returns may vary from net asset value returns.
Performance quoted represents past performance and does not guarantee future results. The graph and table do not reflect the deduction of taxes that a shareholder would pay on Fund distributions or the redemption or sale of Fund shares. Unlike the Index, the Fund’s total returns are reduced by operating expenses, such as transaction costs and management fees. An investor cannot invest directly in an index.
Performance reflects contractual reimbursements in effect until March 1, 2019. In the absence of such reimbursements, performance would be reduced. The gross expense ratio of the Fund is 0.26% and the net expense ratio is 0.25%. The gross and net expense ratios disclosed are as reported in the Fund’s prospectus, which may differ from the gross and net expense ratios presented in the Fund’s financial reports. Current performance may be higher or lower than performance shown. Investment return and the principal value of an investment will fluctuate. Shares may be worth more or less than original cost when redeemed or sold in the market.
FlexShares ETFs’ performance data current to the most recent month-end is available at www.flexshares.com.
PORTFOLIO ANALYSIS
The Fund seeks to provide investment results that, before fees and expenses, correspond generally to the price and yield performance of the Morningstar® U.S. Market Factor Tilt IndexSM (the “Underlying Index”). The Underlying Index reflects the performance of a selection of U.S. equity securities that is designed to provide a broad exposure to the overall U.S. equities market, with increased exposure (or a “tilt”) to small-capitalization stocks and value stocks. As of October 31, 2018, there were 2,511 issues in the Underlying Index. Northern Trust Investments, Inc. (“NTI”) uses a “passive” or indexing approach to try to achieve the Fund’s investment objective. NTI uses a representative sampling strategy to manage the Fund. This means the Fund may or may not hold all of the issues that are included in the Underlying Index.
During the 12 months ended October 31, 2018, prices on domestic investments generally traded higher. Through Q4 of 2017, U.S. equity markets advanced on positive macroeconomic data and the passing of a tax reform bill by Congress that was viewed positively by markets. Volatility increased in Q1 of 2018 with markets potentially responding to the impact of stronger-than-expected inflation, the U.S. Federal Reserve Bank’s (“Fed”) pace of rate hikes and U.S.-China trade war concerns versus positive macroeconomic data. Gross Domestic Product (“GDP”) growth results for Q4 of 2017 (reported in Q1 of 2018) were revised higher, corporate earnings and revenue beat expectations and business confidence hit a new high due to tax reform. U.S. equities were up in Q2 and Q3 of 2018 as strong corporate earnings and positive macroeconomic data supported domestic investments. Macroeconomic data continued to be robust, unemployment hit an 18-year low and wages grew at the fastest pace since 2009. Trade tensions with Mexico and Canada eased as the North American Free Trade Agreement (“NAFTA”) was replaced by the United States-Mexico-Canada Agreement (“USMCA”). U.S. markets sold off in October of 2018 as concerns surrounding the sustainability of continued earnings growth, the cadence of future Fed rate hikes and escalating trade tensions between the U.S. and China weighed on domestic equities.
| | | | |
| FLEXSHARES ANNUAL REPORT | | | 5 | |
| | |
| FlexShares® Morningstar | | MANAGEMENT’S DISCUSSION OF FUND PERFORMANCE |
US Market Factor Tilt Index Fund (cont.)
PORTFOLIO ANALYSIS (cont.)
Size exposure was a negative driver of performance for the 12 months ended October 31, 2018, as the sell-off in small cap stocks in September and October was enough to offset the positive performance small caps experienced over the first ten months of the period. In addition, value exposure was a negative driver of performance over the twelve months as value stocks underperformed growth stocks. Overall, the negative performance derived from the size and value exposures was the primary source of the Underlying Index’s underperformance to the Russell 3000 Index by 2.34%. Tracking difference between the Fund’s NAV and the Underlying Index’s total return for the 12-month period was -4 basis points (“bps”)1, which is reflective of the management fee (-25 bps), stock selection/futures (+14 bps) and securities lending (+7 bps).
| 1 | A unit that is equal to 1/100th of 1% and is used to denote the change in a financial instrument. |
| | |
| 6 | | FLEXSHARES ANNUAL REPORT |
| | |
| FlexShares® Morningstar | | MANAGEMENT’S DISCUSSION OF FUND PERFORMANCE |
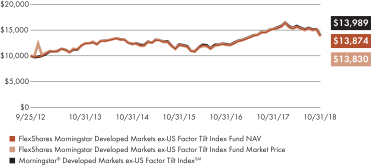
Developed Markets ex-US Factor Tilt Index Fund Ticker: TLTD
CUMULATIVE PERFORMANCE
Through October 31, 2018
AVERAGE ANNUAL TOTAL RETURN
For the period ended October 31, 2018
| | | | | | | | | | | | | | | | |
| | | 1 Year | | | 3 Year | | | 5 Year | | | Fund
Inception
9/25/2012 | |
| | | | |
| | | | |
FlexShares Morningstar Developed Markets ex-US Factor Tilt Index Fund (Based on Net Asset Value) | | | (8.61 | )% | | | 4.49 | % | | | 2.24 | % | | | 5.51 | % |
| | | | |
FlexShares Morningstar Developed Markets ex-US Factor Tilt Index Fund (Based on Market Price) | | | (9.48 | )% | | | 4.59 | % | | | 2.08 | % | | | 5.46 | % |
| | | | |
Morningstar® Developed Markets ex-US Factor Tilt IndexSM | | | (8.60 | )% | | | 4.56 | % | | | 2.36 | % | | | 5.66 | % |
All data as of 10/31/18. Total returns based on market price do not include brokerage commissions that may be payable on secondary market transactions. If brokerage commissions were included, these returns would be lower. Total returns based on market price and net asset value (“NAV”) assume that dividends and capital gain distributions have been reinvested in the Fund at market price and NAV, respectively. NAV is a fund’s net asset value per share, which is calculated by dividing the total value of all the securities in the fund’s portfolio plus cash, interest and receivables less any liabilities by the number of fund shares outstanding. Market price is determined by the midpoint of the bid/ask spread at 4:00 p.m. Eastern Time from the primary listing exchange. Market price returns may vary from net asset value returns.
Performance quoted represents past performance and does not guarantee future results. The graph and table do not reflect the deduction of taxes that a shareholder would pay on Fund distributions or the redemption or sale of Fund shares. Unlike the Index, the Fund’s total returns are reduced by operating expenses, such as transaction costs and management fees. An investor cannot invest directly in an index.
Performance reflects contractual reimbursements in effect until March 1, 2019. In the absence of such reimbursements, performance would be reduced. The gross expense ratio of the Fund is 0.40% and the net expense ratio is 0.39%. The gross and net expense ratios disclosed are as reported in the Fund’s prospectus, which may differ from the gross and net expense ratios presented in the Fund’s financial reports. Current performance may be higher or lower than performance shown. Investment return and the principal value of an investment will fluctuate. Shares may be worth more or less than original cost when redeemed or sold in the market.
FlexShares ETFs’ performance data current to the most recent month-end is available at www.flexshares.com.
PORTFOLIO ANALYSIS
The Fund seeks to provide investment results that, before fees and expenses, correspond generally to the price and yield performance of the Morningstar® Developed Markets ex-U.S. Factor Tilt IndexSM (the “Underlying Index”). The Underlying Index reflects the performance of a selection of equity securities designed to provide a broad exposure to the global developed equities market excluding the U.S., with increased exposure (or a “tilt”) to small-capitalization stocks and value stocks. As of October 31, 2018, there were 3,401 issues in the Underlying Index. Northern Trust Investments, Inc. (“NTI”) uses a “passive” or indexing approach to try to achieve the Fund’s investment objective. NTI uses a representative sampling strategy to manage the Fund. This means the Fund may or may not hold all of the issues that are included in the Underlying Index.
During the 12 months ended October 31, 2018, prices on developed international investments generally traded lower. Over the course of the 12-month period, the U.S. dollar (“USD”) was volatile, but ultimately strengthened and negatively impacted U.S. investors as returns in local currencies generally were diminished by the rising value of the USD. Through Q4 of 2017, developed international markets moved higher on strengthening economic data, led by strong performance in the Asia Pacific region; for U.S. investors, positive returns were amplified as European and British currencies strengthened versus the USD. Developed international markets moved lower in Q1 of 2018 as increased global trade tensions impacted investments. Markets continued lower in Q2 as European economic data disappointed and concerns of slowing global growth weighed on equities. Eurozone Gross Domestic Product growth slowed and the Bank of England reduced its growth forecast for the United Kingdom. Q3 of 2018 was volatile, but ultimately ended positively as investors balanced positive macroeconomic data in Europe and positive election results in Japan versus fears of emerging market contagion affecting European banks and concerns over Italy’s budget negotiations with the European Union. Markets moved lower in October 2018 as investors feared that
| | | | |
| FLEXSHARES ANNUAL REPORT | | | 7 | |
| | |
| FlexShares® Morningstar | | MANAGEMENT’S DISCUSSION OF FUND PERFORMANCE |
Developed Markets ex-US Factor Tilt Index Fund (cont.)
PORTFOLIO ANALYSIS (cont.)
weaker corporate earnings and increased trade tensions would lead to slowing global growth. The USD strengthened from Q2 through October 31, 2018, negatively impacting the returns experienced by U.S. investors.
Increased market volatility and concerns of slowing global growth dampened investor appetites for small cap stocks in developed international markets, which helped cause small cap stocks to underperform large cap stocks during the year ended October 31, 2018. In addition, value exposure was a negative driver of Underlying Index and Fund performance over the 12 months, as value stocks in developed markets underperformed growth stocks. Overall, the negative performance derived from the size and value exposures was the primary source of the Underlying Index’s underperformance against the MSCI World ex-USA IMI Index of 1.69%. Tracking difference between the Fund’s NAV and the Underlying Index’s total return for the 12-month period was -1 basis point (“bp”)1, which is reflective of the Fund’s management fee (-39 bps), stock selection/futures (+7 bps), securities lending (+10 bps), dividend tax differential (+19 bps) and performance calculation differences between the Underlying Index and the Fund (+2 bps).
| 1 | A unit that is equal to 1/100th of 1% and is used to denote the change in a financial instrument. |
| | |
| 8 | | FLEXSHARES ANNUAL REPORT |
| | |
| FlexShares® Morningstar | | MANAGEMENT’S DISCUSSION OF FUND PERFORMANCE |
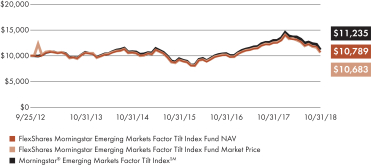
Emerging Markets Factor Tilt Index Fund Ticker: TLTE
CUMULATIVE PERFORMANCE
Through October 31, 2018
AVERAGE ANNUAL TOTAL RETURN
For the period ended October 31, 2018
| | | | | | | | | | | | | | | | |
| | | 1 Year | | | 3 Year | | | 5 Year | | | Fund
Inception
9/25/2012 | |
| | | | |
| | | | |
FlexShares Morningstar Emerging Markets Factor Tilt Index Fund (Based on Net Asset Value) | | | (13.99 | )%* | | | 5.13 | % | | | 0.34 | % | | | 1.23 | % |
| | | | |
FlexShares Morningstar Emerging Markets Factor Tilt Index Fund (Based on Market Price) | | | (15.22 | )% | | | 5.02 | % | | | 0.16 | % | | | 1.09 | % |
| | | | |
Morningstar® Emerging Markets Factor Tilt IndexSM | | | (13.62 | )% | | | 5.84 | % | | | 0.96 | % | | | 1.92 | % |
All data as of 10/31/18. Total returns based on market price do not include brokerage commissions that may be payable on secondary market transactions. If brokerage commissions were included, these returns would be lower. Total returns based on market price and net asset value (“NAV”) assume that dividends and capital gain distributions have been reinvested in the Fund at market price and NAV, respectively. NAV is a fund’s net asset value per share, which is calculated by dividing the total value of all the securities in the fund’s portfolio plus cash, interest and receivables less any liabilities by the number of fund shares outstanding. Market price is determined by the midpoint of the bid/ask spread at 4:00 p.m. Eastern Time from the primary listing exchange. Market price returns may vary from net asset value returns.
Performance quoted represents past performance and does not guarantee future results. The graph and table do not reflect the deduction of taxes that a shareholder would pay on Fund distributions or the redemption or sale of Fund shares. Unlike the Index, the Fund’s total returns are reduced by operating expenses, such as transaction costs and management fees. An investor cannot invest directly in an index.
Performance reflects contractual reimbursements in effect until March 1, 2019. In the absence of such reimbursements, performance would be reduced. The gross expense ratio of the Fund is 0.60% and the net expense ratio is 0.59%. The gross and net expense ratios disclosed are as reported in the Fund’s prospectus, which may differ from the gross and net expense ratios presented in the Fund’s financial reports. Current performance may be higher or lower than performance shown. Investment return and the principal value of an investment will fluctuate. Shares may be worth more or less than original cost when redeemed or sold in the market.
FlexShares ETFs’ performance data current to the most recent month-end is available at www.flexshares.com.
PORTFOLIO ANALYSIS
The Fund seeks to provide investment results that, before fees and expenses, correspond generally to the price and yield performance of the Morningstar® Emerging Markets Factor Tilt IndexSM (the “Underlying Index”). The Underlying Index reflects the performance of a selection of equity securities designed to provide broad exposure to the global emerging equities markets, with increased exposure (or a “tilt”) to small-capitalization stocks and value stocks. As of October 31, 2018, there were 2,608 issues in the Underlying Index. Northern Trust Investments, Inc. (“NTI”) uses a “passive” or indexing approach to try to achieve the Fund’s investment objective. NTI uses a representative sampling strategy to manage the Fund. This means the Fund may or may not hold all of the securities that are included in the Underlying Index.
During the 12 months ended October 31, 2018, prices on emerging market equities generally traded lower. Over the course of the 12-month period, the U.S. dollar (“USD”) was volatile, but ultimately strengthened and negatively impacted U.S. investors as returns in local currencies generally were diminished by the rising value of the USD. Through Q4 of 2017, emerging markets moved higher on improved global growth prospects, election results in South Africa that investors viewed as positive for markets and easing of concerns surrounding India’s banking system after the country announced a significant recapitalization plan for state-controlled banks. Emerging market equities continued to advance in Q1 of 2018 as China reported better than expected Gross Domestic Product growth for 2017 and S&P Global Ratings upgraded Russia’s debt rating to investment grade. Latin America was the best performing region during the period, led by Brazilian equities, as investors viewed positive election news in Brazil as favorable to its markets. Emerging markets traded lower in Q2 of 2018 as USD strength and concerns over decelerating global growth weighed on emerging market stocks. Markets continued lower in Q3 on China’s macroeconomic data weakness, the escalation of trade tensions between the U.S. and China and continued USD strength. Emerging market equities declined
| | | | |
| FLEXSHARES ANNUAL REPORT | | | 9 | |
| | |
| FlexShares® Morningstar | | MANAGEMENT’S DISCUSSION OF FUND PERFORMANCE |
Emerging Markets Factor Tilt Index Fund (cont.)
| * | The return shown is based on net asset value calculated for shareholder transactions and may differ from the return shown in the financial highlights, which reflects adjustments made to the net asset value in accordance with accounting principles generally accepted in the United States of America. The net asset value was $47.91 as of October 31, 2018. |
PORTFOLIO ANALYSIS (cont.)
in October of 2018 as concerns over slowing growth in China, increased tariffs in the U.S.-China trade war and anxiety over the U.S. Federal Reserve Bank’s continued pace of future rate hikes weighed on investments in developing markets.
Increased market volatility and concerns of slowing global growth dampened investor appetites for small cap stocks in emerging economies, which helped cause small cap stocks to underperform large cap stocks during the year ended October 31, 2018. Value exposure was a positive driver of performance over the 12 months as attractively-priced equities outperformed growth stocks in emerging economies. Overall, the positive performance derived from the Underlying Index’s value exposure was not enough to offset the negative contribution from the size exposure, leading to Underlying Index’s underperformance compared to the MSCI EM IMI Net Index of 0.59%. Tracking difference between the Fund’s NAV and the Underlying Index’s total return for the 12-month period was -37 basis points (“bps”)1, which is reflective of the Fund’s management fee (-59 bps), stock selection/futures (+7 bps), securities lending (+4 bps), dividend tax differential (+1 bps) and performance calculation differences between the Underlying Index and the Fund (+10 bps).
| 1 | A unit that is equal to 1/100th of 1% and is used to denote the change in a financial instrument. |
| | |
| 10 | | FLEXSHARES ANNUAL REPORT |
| | |
| FlexShares® Currency | | MANAGEMENT’S DISCUSSION OF FUND PERFORMANCE |
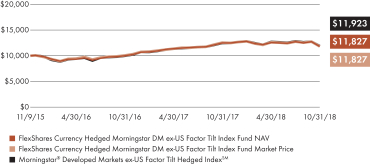
Hedged Morningstar DM ex-US Factor Tilt Index Fund Ticker: TLDH
CUMULATIVE PERFORMANCE
Through October 31, 2018
AVERAGE ANNUAL TOTAL RETURN
For the period ended October 31, 2018
| | | | | | | | |
| | | 1 Year | | | Fund
Inception
11/9/2015 | |
| | | | |
| | |
FlexShares Currency Hedged Morningstar DM ex-US Factor Tilt Index Fund (Based on Net Asset Value) | | | (5.73 | )% | | | 5.80 | % |
| | |
FlexShares Currency Hedged Morningstar DM ex-US Factor Tilt Index Fund (Based on Market Price) | | | (6.19 | )% | | | 5.79 | % |
| | |
Morningstar® Developed Markets ex-US Factor Tilt Hedged IndexSM | | | (4.60 | )% | | | 6.09 | % |
All data as of 10/31/18. Total returns based on market price do not include brokerage commissions that may be payable on secondary market transactions. If brokerage commissions were included, these returns would be lower. Total returns based on market price and net asset value (“NAV”) assume that dividends and capital gain distributions have been reinvested in the Fund at market price and NAV, respectively. NAV is a fund’s net asset value per share, which is calculated by dividing the total value of all the securities in the fund’s portfolio plus cash, interest and receivables less any liabilities by the number of fund shares outstanding. Market price is determined by the midpoint of the bid/ask spread at 4:00 p.m. Eastern Time from the primary listing exchange. Market price returns may vary from net asset value returns.
Performance quoted represents past performance and does not guarantee future results. The graph and table do not reflect the deduction of taxes that a shareholder would pay on Fund distributions or the redemption or sale of Fund shares. Unlike the Index, the Fund’s total returns are reduced by operating expenses, such as transaction costs and management fees. An investor cannot invest directly in an index.
Performance reflects contractual reimbursements in effect until March 1, 2019. In the absence of such reimbursements, performance would be reduced. The gross expense ratio of the Fund is 0.85% and the net expense ratio is 0.44%. The gross and net expense ratios disclosed are as reported in the Fund’s prospectus, which may differ from the gross and net expense ratios presented in the Fund’s financial reports. Current performance may be higher or lower than performance shown. Investment return and the principal value of an investment will fluctuate. Shares may be worth more or less than original cost when redeemed or sold in the market.
FlexShares ETFs’ performance data current to the most recent month-end is available at www.flexshares.com.
PORTFOLIO ANALYSIS
The Fund seeks to provide investment results that, before fees and expenses, correspond generally to the price and yield performance of the Morningstar® Developed Markets ex-U.S. Factor Tilt Hedged IndexSM (the “Underlying Index”). The Underlying Index reflects the performance of a selection of equity securities designed to provide broad exposure to the global developed equities markets, excluding the U.S., with (i) increased exposure (or a “tilt”) to small-capitalization stocks and value stocks and (ii) currency risk of the securities included in the Index hedged against the U.S. dollar on a monthly basis. As of October 31, 2018, there were 3,401 issues in the Underlying Index. Currently, the Fund seeks to achieve its investment objective by investing a substantial portion of its assets in the FlexShares Morningstar® Developed Markets ex-US Factor Tilt Index Fund (an “Underlying Fund”). In order to replicate the “hedging” component of the Underlying Index, the Fund enters into foreign currency forward contracts designed to offset the Fund’s exposure to the component currencies. Northern Trust Investments, Inc. (“NTI”) uses a “passive” or indexing approach to try to achieve the Fund’s investment objective. NTI uses a representative sampling strategy to manage the Fund. This means the Fund may or may not hold all of the issues that are included in the Underlying Index.
During the 12 months ended October 31, 2018, prices on developed international investments generally traded lower. Over the course of the 12-month period the U.S. dollar (“USD”) was volatile, but ultimately strengthened and negatively impacted U.S. investors as returns in local currencies generally were diminished by the rising value of the USD. Through Q4 of 2017, developed international markets moved higher on strengthening economic data, led by strong performance in the Asia Pacific region; for U.S. investors, positive returns were amplified as European and British currencies strengthened versus the USD. Developed international markets moved lower in Q1 of 2018 as increased global trade tensions impacted investments. Markets continued lower in Q2 as European economic data
| | | | |
| FLEXSHARES ANNUAL REPORT | | | 11 | |
| | |
| FlexShares® Currency | | MANAGEMENT’S DISCUSSION OF FUND PERFORMANCE |
Hedged Morningstar DM ex-US Factor Tilt Index Fund (cont.)
PORTFOLIO ANALYSIS (cont.)
disappointed and concerns of slowing global growth weighed on equities. Eurozone Gross Domestic Product growth slowed and the Bank of England reduced its growth forecast for the United Kingdom during Q2 of 2018. Q3 of 2018 was volatile, but ultimately ended positively as investors balanced positive macroeconomic data in Europe and positive election results in Japan versus fears of emerging market contagion affecting European banks and concerns over Italy’s budget negotiation with the European Union. Global markets moved lower in October of 2018 as investors feared that weaker corporate earnings and increased trade tensions would lead to slowing global growth. The USD strengthened from Q2 through October 31, 2018, negatively impacting the returns experienced by U.S. investors.
Increased market volatility and concerns of slowing global growth dampened investor appetites for small cap stocks in developed international markets, which helped cause small cap stocks to underperform large cap stocks during the year ended October 31, 2018. In addition, value exposure was a negative driver of Underlying Index and Fund performance over the 12 months, as value stocks in developed markets underperformed growth stocks. As the USD appreciated versus most developed market currencies over the 12 months, hedging the underlying foreign currency exposure was a positive driver of the Underlying Index’s performance. Overall, the positive impact of the currency hedge of the Underling Index offset the negative performance derived from the size and value exposures and the Underlying Index outperformed the MSCI World ex-USA IMI Index by 2.31%. Tracking difference between the Fund’s NAV and the Underlying Index’s total return for the 12-month period was -1.13%, which is reflective of the Fund’s management fee of -44 basis points (“bps”)1, implementation of the currency hedge (-4 bps), tracking error of the Underlying Fund against its underlying index (+41 bps) and performance calculation differences between the Underlying Index and the Fund (-1.06%).
| 1 | A unit that is equal to 1/100th of 1% and is used to denote the change in a financial instrument. |
| | |
| 12 | | FLEXSHARES ANNUAL REPORT |
| | |
| FlexShares® Currency | | MANAGEMENT’S DISCUSSION OF FUND PERFORMANCE |
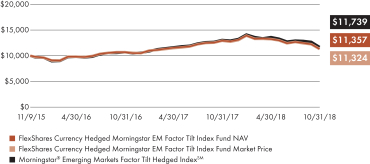
Hedged Morningstar EM Factor Tilt Index Fund Ticker: TLEH
CUMULATIVE PERFORMANCE
Through October 31, 2018
AVERAGE ANNUAL TOTAL RETURN
For the period ended October 31, 2018
| | | | | | | | |
| | | 1 Year | | | Fund
Inception
11/9/2015 | |
| | | | |
| | |
FlexShares Currency Hedged Morningstar EM Factor Tilt Index Fund (Based on Net Asset Value) | | | (12.40 | )% | | | 4.38 | % |
| | |
FlexShares Currency Hedged Morningstar EM Factor Tilt Index Fund (Based on Market Price) | | | (12.44 | )% | | | 4.27 | % |
| | |
Morningstar® Emerging Markets Factor Tilt Hedged IndexSM | | | (10.27 | )% | | | 5.54 | % |
All data as of 10/31/18. Total returns based on market price do not include brokerage commissions that may be payable on secondary market transactions. If brokerage commissions were included, these returns would be lower. Total returns based on market price and net asset value (“NAV”) assume that dividends and capital gain distributions have been reinvested in the Fund at market price and NAV, respectively. NAV is a fund’s net asset value per share, which is calculated by dividing the total value of all the securities in the fund’s portfolio plus cash, interest and receivables less any liabilities by the number of fund shares outstanding. Market price is determined by the midpoint of the bid/ask spread at 4:00 p.m. Eastern Time from the primary listing exchange. Market price returns may vary from net asset value returns.
Performance quoted represents past performance and does not guarantee future results. The graph and table do not reflect the deduction of taxes that a shareholder would pay on Fund distributions or the redemption or sale of Fund shares. Unlike the Index, the Fund’s total returns are reduced by operating expenses, such as transaction costs and management fees. An investor cannot invest directly in an index.
Performance reflects contractual reimbursements in effect until March 1, 2019. In the absence of such reimbursements, performance would be reduced. The gross expense ratio of the Fund is 1.24% and the net expense ratio is 0.64%. The gross and net expense ratios disclosed are as reported in the Fund’s prospectus, which may differ from the gross and net expense ratios presented in the Fund’s financial reports. Current performance may be higher or lower than performance shown. Investment return and the principal value of an investment will fluctuate. Shares may be worth more or less than original cost when redeemed or sold in the market.
FlexShares ETFs’ performance data current to the most recent month-end is available at www.flexshares.com.
PORTFOLIO ANALYSIS
The Fund seeks to provide investment results that, before fees and expenses, correspond generally to the price and yield performance of the Morningstar® Emerging Markets Factor Tilt Hedged IndexSM (the “Underlying Index”). The Underlying Index reflects the performance of a selection of equity securities designed to provide broad exposure to the global emerging equities markets, with (i) increased exposure (or a “tilt”) to small-capitalization stocks and value stocks and (ii) currency risk of the securities included in the Index hedged against the U.S. dollar on a monthly basis. As of October 31, 2018, there were 2,608 issues in the Underlying Index. Currently, the Fund seeks to achieve its investment objective by investing a substantial portion of its assets in the FlexShares Morningstar® Emerging Markets Factor Tilt Index Fund (an “Underlying Fund”). In order to replicate the “hedging” component of the Underlying Index, the Fund intends to enter into foreign currency forward contracts designed to offset the Fund’s exposure to the component currencies. Northern Trust Investments, Inc. (“NTI”) uses a “passive” or indexing approach to try to achieve the Fund’s investment objective. NTI uses a representative sampling strategy to manage the Fund. This means the Fund may or may not hold all of the issues that are included in the Underlying Index.
During the 12 months ended October 31, 2018, prices of emerging market equities generally traded lower. Over the course of the 12-month period, the U.S. dollar (“USD”) was volatile, but ultimately strengthened and negatively impacted U.S. investors as returns in local currencies generally were diminished by the rising value of the USD. Through Q4 of 2017, emerging markets moved higher on improved global growth prospects, election results in South Africa that investors viewed as positive for markets and easing of concerns surrounding India’s banking system after the country announced a significant recapitalization plan for state-controlled banks. Emerging market equities continued to advance in Q1 of 2018 as China reported better than expected Gross Domestic Product growth for 2017 and S&P Global Ratings upgraded Russia’s debt rating to investment
| | | | |
| FLEXSHARES ANNUAL REPORT | | | 13 | |
| | |
| FlexShares® Currency | | MANAGEMENT’S DISCUSSION OF FUND PERFORMANCE |
Hedged Morningstar EM Factor Tilt Index Fund (cont.)
PORTFOLIO ANALYSIS (cont.)
grade. Latin America was the best performing region, led by Brazilian equities, which rose in value as investors viewed positive election news as favorable to markets. Emerging markets traded lower in Q2 of 2018 as USD strength and concerns over decelerating global growth weighed on emerging market stocks. Emerging markets continued lower in Q3 on China’s macroeconomic data weakness, the escalation of trade tensions between the U.S. and China and continued USD strength. Emerging market equities declined in October as concerns over slowing growth in China, increased tariffs in the US-China trade war and anxiety over the U.S. Federal Reserve Bank’s continued pace of future rate hikes weighed on investments in developing markets.
Increased market volatility and concerns of slowing global growth dampened investor appetites for small cap stocks in emerging economies which helped cause small caps to underperform large cap stocks during the year ended October 31, 2018. Value exposure was a positive driver of performance over the twelve months as attractive priced equities in emerging economies outperformed growth stocks. As the USD appreciated versus most emerging market currencies over the 12 months, hedging the underlying foreign currency exposure was a positive driver of the Fund’s performance. Overall, the positive performance from the value exposure as well as the positive impact of the currency hedge offset the negative performance derived from the size exposure and the Underlying Index outperformed the MSCI EM IMI Net Index by 2.76%. Tracking difference between the Fund’s NAV and the Underlying Index’s total return for the 12-month period was -2.13%, which is reflective of the Fund’s management fee of -64 basis points (“bps”)1, implementation of the currency hedge (-38 bps), tracking error of the of the Underlying Fund against its underlying index (+27 bps) and performance calculation differences between the Underlying Index and the Fund (-1.39%).
| 1 | A unit that is equal to 1/100th of 1% and is used to denote the change in a financial instrument. |
| | |
| 14 | | FLEXSHARES ANNUAL REPORT |
| | |
| FlexShares® | | MANAGEMENT’S DISCUSSION OF FUND PERFORMANCE |
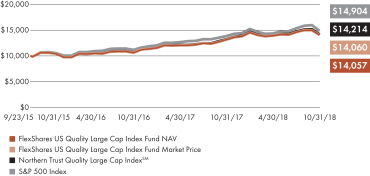
US Quality Large Cap Index Fund Ticker: QLC
CUMULATIVE PERFORMANCE
Through October 31, 2018
AVERAGE ANNUAL TOTAL RETURN
For the period ended October 31, 2018
| | | | | | | | | | | | |
| | | 1 Year | | | 3 Year | | | Fund
Inception
9/23/2015 | |
| | | | |
| | | |
FlexShares US Quality Large Cap Index Fund (Based on Net Asset Value) | | | 6.63 | % | | | 9.70 | % | | | 11.59 | % |
| | | |
FlexShares US Quality Large Cap Index Fund (Based on Market Price) | | | 6.30 | % | | | 9.71 | % | | | 11.60 | % |
| | | |
Northern Trust Quality Large Cap IndexSM | | | 6.92 | % | | | 10.08 | % | | | 11.99 | % |
| | | |
S&P 500 Index | | | 7.35 | % | | | 11.51 | % | | | 13.71 | % |
All data as of 10/31/18. Total returns based on market price do not include brokerage commissions that may be payable on secondary market transactions. If brokerage commissions were included, these returns would be lower. Total returns based on market price and net asset value (“NAV”) assume that dividends and capital gain distributions have been reinvested in the Fund at market price and NAV, respectively. NAV is a fund’s net asset value per share, which is calculated by dividing the total value of all the securities in the fund’s portfolio plus cash, interest and receivables less any liabilities by the number of fund shares outstanding. Market price is determined by the midpoint of the bid/ask spread at 4:00 p.m. Eastern Time from the primary listing exchange. Market price returns may vary from net asset value returns.
Performance quoted represents past performance and does not guarantee future results. The graph and table do not reflect the deduction of taxes that a shareholder would pay on Fund distributions or the redemption or sale of Fund shares. Unlike the Index, the Fund’s total returns are reduced by operating expenses, such as transaction costs and management fees. An investor cannot invest directly in an index.
Performance reflects contractual reimbursements in effect until March 1, 2019. In the absence of such reimbursements, performance would be reduced. The gross expense ratio of the Fund is 0.34% and the net expense ratio is 0.32%. The gross and net expense ratios disclosed are as reported in the Fund’s prospectus, which may differ from the gross and net expense ratios presented in the Fund’s financial reports. Current performance may be higher or lower than performance shown. Investment return and the principal value of an investment will fluctuate. Shares may be worth more or less than original cost when redeemed or sold in the market.
FlexShares ETFs’ performance data current to the most recent month-end is available at www.flexshares.com.
PORTFOLIO ANALYSIS
The Fund seeks to provide investment results that, before fees and expenses, correspond generally to the price and yield performance of the Northern Trust Quality Large Cap IndexSM (the “Underlying Index”). The Underlying Index is designed to measure the performance of companies that exhibit certain quality, valuation and momentum characteristics, within a universe of publicly-traded U.S. large capitalization equity securities. As of October 31, 2018, there were 131 issues in the Underlying Index. Northern Trust Investments, Inc. (“NTI”) uses a “passive” or indexing approach to try to achieve the Fund’s investment objective. NTI uses a representative sampling strategy to manage the Fund. This means the Fund may or may not hold all of the issues that are included in the Underlying Index.
During the 12 months ended October 31, 2018, prices on domestic investments generally traded higher. Through Q4 of 2017, U.S. equity markets advanced on positive macroeconomic data and the passing of a tax reform bill by Congress that was viewed positively by markets. Volatility increased in Q1 of 2018 with markets potentially responding to the impact of stronger-than-expected inflation, the U.S. Federal Reserve Bank’s (“Fed”) pace of rate hikes and U.S.-China trade war concerns versus positive macroeconomic data. Gross Domestic Product (“GDP”) growth results for Q4 of 2017 (reported in Q1 of 2018) were revised higher, corporate earnings and revenue beat expectations and business confidence hit a new high due to tax reform. U.S. equities were up in Q2 and Q3 of 2018 as strong corporate earnings and positive macroeconomic data supported domestic investments. Macroeconomic data continued to be robust, unemployment hit an 18-year low and wages grew at the fastest pace since 2009. Trade tensions with Mexico and Canada eased as the North American Free Trade Agreement (“NAFTA”) was replaced by the United States-Mexico-Canada Agreement (“USMCA”). U.S. markets sold off in October of 2018 as concerns surrounding the sustainability of continued earnings growth, the cadence of future Fed rate hikes and escalating trade tensions between the U.S. and China weighed on domestic equities.
| | | | |
| FLEXSHARES ANNUAL REPORT | | | 15 | |
| | |
| FlexShares® | | MANAGEMENT’S DISCUSSION OF FUND PERFORMANCE |
US Quality Large Cap Index Fund (cont.)
PORTFOLIO ANALYSIS (cont.)
Both the size and value exposure were negative drivers of Underlying Index and Fund performance during the 12 months ended October 31, 2018 as attractively priced equities underperformed growth stocks in the U.S. The quality and momentum exposures of the Underlying Index were positive drivers of performance. Overall, the positive exposures to quality and momentum were not enough to offset the headwinds from the negative performance derived from the value and size exposure and the Underlying Index underperformed the S&P 500 Index by 0.43%. Tracking difference between the Fund’s NAV and the Underlying Index’s total return for the 12-month period was -29 basis points (“bps”)1, which is reflective of the management fee (-32 bps), stock selection/futures (+1 bps) and performance calculation differences between the Underlying Index and the Fund (+2 bps).
| 1 | A unit that is equal to 1/100th of 1% and is used to denote the change in a financial instrument. |
| | |
| 16 | | FLEXSHARES ANNUAL REPORT |
| | |
| FlexShares® STOXX® | | MANAGEMENT’S DISCUSSION OF FUND PERFORMANCE |
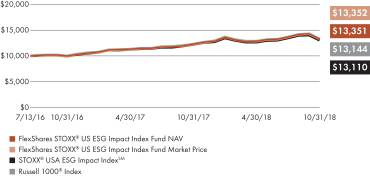
US ESG Impact Index Fund Ticker: ESG
CUMULATIVE PERFORMANCE
Through October 31, 2018
AVERAGE ANNUAL TOTAL RETURN
For the period ended October 31, 2018
| | | | | | | | |
| | | 1 Year | | | Fund
Inception
7/13/2016 | |
| | | | �� |
| | |
FlexShares STOXX® US ESG Impact Index Fund (Based on Net Asset Value) | | | 8.13 | % | | | 13.39 | % |
| | |
FlexShares STOXX® US ESG Impact Index Fund (Based on Market Price) | | | 7.97 | % | | | 13.38 | % |
| | |
STOXX® USA ESG Impact IndexSM | | | 6.78 | % | | | 12.49 | % |
| | |
Russell 1000® Index | | | 6.98 | % | | | 12.62 | % |
All data as of 10/31/18. Total returns based on market price do not include brokerage commissions that may be payable on secondary market transactions. If brokerage commissions were included, these returns would be lower. Total returns based on market price and net asset value (“NAV”) assume that dividends and capital gain distributions have been reinvested in the Fund at market price and NAV, respectively. NAV is a fund’s net asset value per share, which is calculated by dividing the total value of all the securities in the fund’s portfolio plus cash, interest and receivables less any liabilities by the number of fund shares outstanding. Market price is determined by the midpoint of the bid/ask spread at 4:00 p.m. Eastern Time from the primary listing exchange. Market price returns may vary from net asset value returns.
Performance quoted represents past performance and does not guarantee future results. The graph and table do not reflect the deduction of taxes that a shareholder would pay on Fund distributions or the redemption or sale of Fund shares. Unlike the Index, the Fund’s total returns are reduced by operating expenses, such as transaction costs and management fees. An investor cannot invest directly in an index.
Performance reflects contractual reimbursements in effect until March 1, 2019. In the absence of such reimbursements, performance would be reduced. The gross expense ratio of the Fund is 0.35% and the net expense ratio is 0.32%. The gross and net expense ratios disclosed are as reported in the Fund’s prospectus, which may differ from the gross and net expense ratios presented in the Fund’s financial reports. Current performance may be higher or lower than performance shown. Investment return and the principal value of an investment will fluctuate. Shares may be worth more or less than original cost when redeemed or sold in the market.
FlexShares ETFs’ performance data current to the most recent month-end is available at www.flexshares.com.
PORTFOLIO ANALYSIS
The Fund seeks investment results that correspond generally to the price and yield performance, before fees and expenses, of the STOXX® USA ESG Impact IndexSM (“Underlying Index”). The Underlying Index is an optimized index designed to provide broad market exposure that is tilted toward U.S. companies that score better with respect to a small set of environmental, social and governance (“ESG”) characteristics and to provide the potential for attractive risk-adjusted performance relative to the STOXX® USA 900 Index, as determined by STOXX Ltd., the index provider, in accordance with its methodology and analytical findings. As of October 31, 2018, there were 268 issues in the Underlying Index.
Northern Trust Investments, Inc. (“NTI”) uses a “passive” or indexing approach to try to achieve the Fund’s investment objective. NTI uses a representative sampling strategy to manage the Fund. The Fund may or may not hold all of the securities that are included in the Underlying Index.
During the 12 months ended October 31, 2018, prices on domestic investments generally traded higher. Through Q4 of 2017, U.S. equity markets advanced on positive macroeconomic data and the passing of a tax reform bill by Congress that was viewed positively by markets. Volatility increased in Q1 of 2018 with markets potentially responding to the impact of stronger-than-expected inflation, the U.S. Federal Reserve Bank’s (“Fed”) pace of rate hikes and U.S.-China trade war concerns versus positive macroeconomic data. Gross Domestic Product (“GDP”) growth results for Q4 of 2017 (reported in Q1 of 2018) were revised higher, corporate earnings and revenue beat expectations and business confidence hit a new high due to tax reform. U.S. equities were up in Q2 and Q3 of 2018 as strong corporate earnings and positive macroeconomic data supported domestic investments. Macroeconomic data continued to be robust, unemployment hit an 18-year low and wages grew at the fastest pace since 2009. Trade tensions with Mexico and Canada eased as the North American Free Trade Agreement (“NAFTA”) was replaced by the United States-Mexico-Canada Agreement
| | | | |
| FLEXSHARES ANNUAL REPORT | | | 17 | |
| | |
| FlexShares® STOXX® | | MANAGEMENT’S DISCUSSION OF FUND PERFORMANCE |
US ESG Impact Index Fund (cont.)
PORTFOLIO ANALYSIS (cont.)
(“USMCA”). U.S. markets sold off in October of 2018 as concerns surrounding the sustainability of continued earnings growth, the cadence of future Fed rate hikes and escalating trade tensions between the U.S. and China weighed on domestic equities.
The Underlying Index had a positive total return during the 12 months ended October 31, 2018 but underperformed the domestic equity markets, as defined by the Russell 1000 Index, by 0.19%. The Underlying Index’s ESG tilted approach resulted in a slightly greater allocation to consumer staples/discretionary, energy, information technology and financials sectors and an underweight position in the industrials, materials, utilities, real estate and health care sectors. All sectors were positive contributors to performance during the period except telecommunication services, energy and industrials. Relative to the Russell 1000 Index, sector overweight positions in information technology and consumer staples/discretionary and an underweight in the health care sector contributed to the Underlying Index’s relative and absolute performance positively during the fiscal year. Furthermore, overweights to telecommunication services and energy sectors and an underweight to the industrials sector detracted from performance of the Underlying Index.
Tracking difference for the period between the Fund’s NAV and the Underlying Index was +135 basis points (“bps”)1, which is reflective of the Fund’s management fee (-32 bps), stock selection (+106 bps), futures (+1 bps), foreign dividend tax differential treatment (+60 bps), and transaction cost (-1 bps).
| 1 | A unit that is equal to 1/100th of 1% and is used to denote the change in a financial instrument. |
| | |
| 18 | | FLEXSHARES ANNUAL REPORT |
| | |
| FlexShares® STOXX® | | MANAGEMENT’S DISCUSSION OF FUND PERFORMANCE |
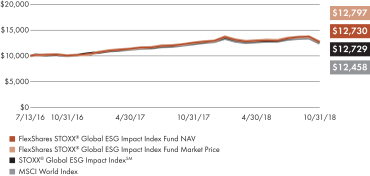
Global ESG Impact Index Fund Ticker: ESGG
CUMULATIVE PERFORMANCE
Through October 31, 2018
AVERAGE ANNUAL TOTAL RETURN
For the period ended October 31, 2018
| | | | | | | | |
| | | 1 Year | | | Fund
Inception
7/13/2016 | |
| | | | |
| | |
FlexShares STOXX® Global ESG Impact Index Fund (Based on Net Asset Value) | | | 1.36 | %* | | | 11.07 | % |
| | |
FlexShares STOXX® Global ESG Impact Index Fund (Based on Market Price) | | | 1.71 | % | | | 11.32 | % |
| | |
STOXX® Global ESG Impact IndexSM | | | 1.51 | % | | | 11.06 | % |
| | |
MSCI World Index | | | 1.16 | % | | | 10.02 | % |
All data as of 10/31/18. Total returns based on market price do not include brokerage commissions that may be payable on secondary market transactions. If brokerage commissions were included, these returns would be lower. Total returns based on market price and net asset value (“NAV”) assume that dividends and capital gain distributions have been reinvested in the Fund at market price and NAV, respectively. NAV is a fund’s net asset value per share, which is calculated by dividing the total value of all the securities in the fund’s portfolio plus cash, interest and receivables less any liabilities by the number of fund shares outstanding. Market price is determined by the midpoint of the bid/ask spread at 4:00 p.m. Eastern Time from the primary listing exchange. Market price returns may vary from net asset value returns.
Performance quoted represents past performance and does not guarantee future results. The graph and table do not reflect the deduction of taxes that a shareholder would pay on Fund distributions or the redemption or sale of Fund shares. Unlike the Index, the Fund’s total returns are reduced by operating expenses, such as transaction costs and management fees. An investor cannot invest directly in an index.
Performance reflects contractual reimbursements in effect until March 1, 2019. In the absence of such reimbursements, performance would be reduced. The gross expense ratio of the Fund is 0.45% and the net expense ratio is 0.42%. The gross and net expense ratios disclosed are as reported in the Fund’s prospectus, which may differ from the gross and net expense ratios presented in the Fund’s financial reports. Current performance may be higher or lower than performance shown. Investment return and the principal value of an investment will fluctuate. Shares may be worth more or less than original cost when redeemed or sold in the market.
FlexShares ETFs’ performance data current to the most recent month-end is available at www.flexshares.com.
PORTFOLIO ANALYSIS
The Fund seeks investment results that correspond generally to the price and yield performance, before fees and expenses, of the STOXX® Global ESG Impact IndexSM (“Underlying Index”). The Underlying Index is an optimized index designed to provide broad market exposure that is tilted toward global companies that score better with respect to a small set of environmental, social and governance (“ESG”) characteristics and to provide the potential for attractive risk-adjusted performance relative to the STOXX® Global 1800 Index, as determined by STOXX Ltd., the index provider, in accordance with its methodology and analytical findings. As of October 31, 2018, there were 879 issues in the Underlying Index.
Northern Trust Investments, Inc. (“NTI”) uses a “passive” or indexing approach to try to achieve the Fund’s investment objective. NTI uses a representative sampling strategy to manage the Fund. The Fund may or may not hold all of the securities that are included in the Underlying Index.
During the 12 months ended October 31, 2018, prices on global investments generally traded lower. Through Q4 of 2017, global equity markets moved higher on improved global growth prospects, strengthening economic data and U.S. pro-business tax reform. Global markets moved lower in Q1 of 2018 as increased global trade tensions and concerns over the pace of U.S. Federal Reserve Bank (“Fed”) rate hikes impacted investments. Global equities were up in Q2 and Q3 as strong corporate earnings and positive macroeconomic data out of the U.S. offset weakness in international equities. Global markets moved lower in October of 2018 as concerns over slowing growth in China, increased tariffs in the US-China trade war, the sustainability of continued earnings growth in the U.S. and anxiety over the Fed’s continued pace of future rate hikes weighed on investments.
The Underlying Index had a positive total return during the 12 months ended October 31, 2018 but underperformed the global equity markets, as defined by the MSCI World Index, by (-0.22%). The
| | | | |
| FLEXSHARES ANNUAL REPORT | | | 19 | |
| | |
| FlexShares® STOXX® | | MANAGEMENT’S DISCUSSION OF FUND PERFORMANCE |
Global ESG Impact Index Fund (cont.)
| * | The return shown is based on net asset value calculated for shareholder transactions and may differ from the return shown in the financial highlights, which reflects adjustments made to the net asset value in accordance with accounting principles generally accepted in the United States of America. The net asset value was $91.60 as of October 31, 2018. |
PORTFOLIO ANALYSIS (cont.)
Underlying Index’s ESG tilted approach resulted in a slightly greater allocation to the consumer staples/discretionary, information technology, communication services and financials sectors and underweight positions in the industrials, energy, materials, utilities, real estate and health care sectors. Only the energy and consumer staples/discretionary sectors were positive contributors to performance and the remaining sectors detracted from performance during the period. Relative to the MSCI World Index, a sector overweight in consumer staples/discretionary helped relative and absolute performance, while an underweight in energy contributed positively to relative and absolute performance. Overweights to information technology detracted from performance.
Tracking difference for the period between the Fund’s NAV and the Underlying Index was -15 basis points (“bps”),1 which is reflective of the Fund’s management fee (-42 bps), stock selection (-8 bps), foreign dividend tax differential treatment (+38 bps), and transaction cost (-3 bps).
| 1 | A unit that is equal to 1/100th of 1% and is used to denote the change in a financial instrument. |
| | |
| 20 | | FLEXSHARES ANNUAL REPORT |
| | |
| FlexShares® Morningstar | | MANAGEMENT’S DISCUSSION OF FUND PERFORMANCE |
Global Upstream Natural Resources Index Fund Ticker: GUNR
CUMULATIVE PERFORMANCE
Through October 31, 2018
AVERAGE ANNUAL TOTAL RETURN
For the period ended October 31, 2018
| | | | | | | | | | | | | | | | |
| | | 1 Year | | | 3 Year | | | 5 Year | | | Fund
Inception
9/16/2011 | |
| | | | |
| | | | |
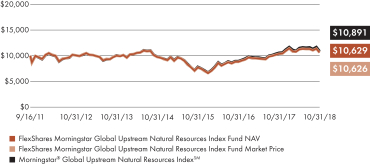
FlexShares Morningstar Global Upstream Natural Resources Index Fund (Based on Net Asset Value) | | | 2.33 | % | | | 11.13 | % | | | 1.14 | % | | | 0.86 | % |
| | | | |
FlexShares Morningstar Global Upstream Natural Resources Index Fund (Based on Market Price) | | | 2.01 | % | | | 11.13 | % | | | 1.12 | % | | | 0.86 | % |
| | | | |
Morningstar® Global Upstream Natural Resources IndexSM | | | 2.85 | % | | | 11.67 | % | | | 1.59 | % | | | 1.21 | % |
All data as of 10/31/18. Total returns based on market price do not include brokerage commissions that may be payable on secondary market transactions. If brokerage commissions were included, these returns would be lower. Total returns based on market price and net asset value (“NAV”) assume that dividends and capital gain distributions have been reinvested in the Fund at market price and NAV, respectively. NAV is a fund’s net asset value per share, which is calculated by dividing the total value of all the securities in the fund’s portfolio plus cash, interest and receivables less any liabilities by the number of fund shares outstanding. Market price is determined by the midpoint of the bid/ask spread at 4:00 p.m. Eastern Time from the primary listing exchange. Market price returns may vary from net asset value returns.
Performance quoted represents past performance and does not guarantee future results. The graph and table do not reflect the deduction of taxes that a shareholder would pay on Fund distributions or the redemption or sale of Fund shares. Unlike the Index, the Fund’s total returns are reduced by operating expenses, such as transaction costs and management fees. An investor cannot invest directly in an index.
Performance reflects contractual reimbursements in effect until March 1, 2019. In the absence of such reimbursements, performance would be reduced. The gross expense ratio of the Fund is 0.47% and the net expense ratio is 0.46%. The gross and net expense ratios disclosed are as reported in the Fund’s prospectus, which may differ from the gross and net expense ratios presented in the Fund’s financial reports. Current performance may be higher or lower than performance shown. Investment return and the principal value of an investment will fluctuate. Shares may be worth more or less than original cost when redeemed or sold in the market.
FlexShares ETFs’ performance data current to the most recent month-end is available at www.flexshares.com.
PORTFOLIO ANALYSIS
The Fund seeks to provide investment results that, before fees and expenses, correspond generally to the performance of the Morningstar® Global Upstream Natural Resources IndexTM (the “Underlying Index”). The Underlying Index reflects the performance of a selection of equity securities that are traded in or are issued by companies domiciled in global developed or emerging market countries, including the U.S., as determined by Morningstar, Inc., (the “Index Provider”) pursuant to its index methodology. The companies included in the Underlying Index have significant business operations in the ownership, management and/or production of natural resources in energy, agriculture, precious or industrial metals, timber and water resources sectors, as determined by the Index Provider, pursuant to its index methodology. As of October 31, 2018, there were 120 issues in the Underlying Index. Northern Trust Investments, Inc. (“NTI”) uses a “passive” or indexing approach to try to achieve the Fund’s investment objective and a representative sampling strategy to manage the Fund. This means the Fund may or may not hold all of the issues that are included in the Underlying Index.
During the first quarter of the fiscal year 2018, higher commodity and natural resources prices in many sectors were driven by improving global economic growth; however, growing concerns about a U.S. and China trade war coupled with weaker expectations concerning emerging market growth we believe resulted in a decline of commodities price returns during Q2 and Q3 of 2018. Commodities prices remained volatile throughout the fiscal year.
A strengthening U.S. Dollar reduced demand for emerging markets equities. During the fiscal year, the U.S. Dollar (DXY Index) fell 5.09% through March, then recovered to be up 2.65% at fiscal year-end on expectations for a December 2018 U.S. Federal Reserve Bank increase of overnight borrowing rates.
Positive price momentum in industrial metals decelerated in March, after several months of positive to neutral performance. Industrial metals experienced a momentary recovery in April 2018; however, the reduction of stimulus efforts by emerging market economies resulted in falling prices in copper, aluminum, zinc and nickel, which continued to decline through October 2018. Following price gains in 2017 and through the first three months of the 2018 fiscal year, iron ore prices were weaker on excess supply and reduced demand,
| | | | |
| FLEXSHARES ANNUAL REPORT | | | 21 | |
| | |
| FlexShares® Morningstar | | MANAGEMENT’S DISCUSSION OF FUND PERFORMANCE |
Global Upstream Natural Resources Index Fund (cont.)
PORTFOLIO ANALYSIS (cont.)
mostly from China. Iron ore demand remained subdued since March of 2018, with a modest pick-up late in the year. Similar to fiscal year 2017, precious metals prices were mixed as gold and silver prices were lower for the fiscal year due to higher interest rates reducing precious metals investments while industrial applications for palladium drove prices higher.
Grains remained mostly flat on the year. Protein prices (cattle and hogs) were flat for the first five months of the fiscal year; however, increasing trade tension between the U.S. and China weakened demand for cattle and hogs in the second half of the year. In 2017, U.S. lumber prices posted strong price gains on housing demand and supply restrictions due to an ongoing Canada/U.S. trade dispute. After Canada escalated the dispute to the World Trade Organization (“WTO”) in March of 2018, housing demand fell as a result of increasing short-term rates and lumber prices declined. Production cutbacks by Organization of Petroleum Exporting Countries (“OPEC”) producers in the first eight months of the fiscal year aided in reducing excess global inventories of crude oil, while demand dipped slightly lower. To meet increasing demand OPEC production increased from July to October of 2018 to levels similar to December 2016.
For the 12-month period, the Underlying Index outperformed the global natural resource equity markets, as defined by the S&P Global Natural Resources Index, 2.85% versus 1.50%, respectively. Due to the Underlying Index’s focus on the upstream section of the natural resource supply chain, there was limited to no exposure to underperforming downstream natural resource sectors. Three of the five natural resource sectors (agriculture, timber and metals) generated positive returns for the year. The remaining sectors (energy and water) detracted slightly from performance. Tracking difference for the period between the Fund’s NAV and the Underlying Index was -52 basis points (“bps”),1 which is reflective of the Fund’s management fee (-46 bps), stock selection (-5 bps), futures (-11 bps), foreign dividend tax differential treatment (+7 bps), securities lending (+5 bps) and transaction cost (-3 bps).
| 1 | A unit that is equal to 1/100th of 1% and is used to denote the change in a financial instrument. |
| | |
| 22 | | FLEXSHARES ANNUAL REPORT |
| | |
| FlexShares® STOXX® | | MANAGEMENT’S DISCUSSION OF FUND PERFORMANCE |
Global Broad Infrastructure Index Fund Ticker: NFRA
CUMULATIVE PERFORMANCE
Through October 31, 2018
AVERAGE ANNUAL TOTAL RETURN
For the period ended October 31, 2018
| | | | | | | | | | | | | | | | |
| | | 1 Year | | | 3 Year | | | 5 Year | | | Fund
Inception
10/8/2013 | |
| | | | |
| | | | |
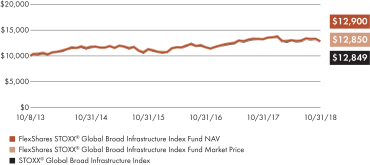
FlexShares STOXX Global Broad Infrastructure Index Fund (Based on Net Asset Value) | | | (2.90 | )% | | | 4.33 | % | | | 4.39 | % | | | 5.16 | % |
| | | | |
FlexShares STOXX Global Broad Infrastructure Index Fund (Based on Market Price) | | | (3.25 | )% | | | 4.20 | % | | | 4.29 | % | | | 5.08 | % |
| | | | |
STOXX® Global Broad Infrastructure Index | | | (3.04 | )% | | | 4.21 | % | | | 4.31 | % | | | 5.08 | % |
All data as of 10/31/18. Total returns based on market price do not include brokerage commissions that may be payable on secondary market transactions. If brokerage commissions were included, these returns would be lower. Total returns based on market price and net asset value (“NAV”) assume that dividends and capital gain distributions have been reinvested in the Fund at market price and NAV, respectively. NAV is a fund’s net asset value per share, which is calculated by dividing the total value of all the securities in the fund’s portfolio plus cash, interest and receivables less any liabilities by the number of fund shares outstanding. Market price is determined by the midpoint of the bid/ask spread at 4:00 p.m. Eastern Time from the primary listing exchange. Market price returns may vary from net asset value returns.
Performance quoted represents past performance and does not guarantee future results. The graph and table do not reflect the deduction of taxes that a shareholder would pay on Fund distributions or the redemption or sale of Fund shares. Unlike the Index, the Fund’s total returns are reduced by operating expenses, such as transaction costs and management fees. An investor cannot invest directly in an index.
Performance reflects contractual reimbursements in effect until March 1, 2019. In the absence of such reimbursements, performance would be reduced. The gross expense ratio of the Fund is 0.48% and the net expense ratio is 0.47%. The gross and net expense ratios disclosed are as reported in the Fund’s prospectus, which may differ from the gross and net expense ratios presented in the Fund’s financial reports. Current performance may be higher or lower than performance shown. Investment return and the principal value of an investment will fluctuate. Shares may be worth more or less than original cost when redeemed or sold in the market.
FlexShares ETFs’ performance data current to the most recent month-end is available at www.flexshares.com.
PORTFOLIO ANALYSIS
The Fund seeks to provide investment results that, before fees and expenses, correspond generally to the price and yield performance of the STOXX® Global Broad Infrastructure Index (the “Underlying Index”). The Underlying Index reflects the performance of a selection of equity securities of infrastructure-related companies that are domiciled or traded in developed and emerging markets around the world (including the U.S.). The companies included in the Underlying Index derive at least 50% of their revenues from the ownership, development, construction, financing or operation of infrastructure assets, as determined by STOXX, the index provider, pursuant to its index methodology. As of October 31, 2018, there were 151 issues in the Underlying Index. Northern Trust Investments, Inc. (“NTI”) uses a “passive” or indexing approach to try to achieve the Fund’s investment objective. NTI uses a representative sampling strategy to manage the Fund. This means the Fund may or may not hold all of the issues that are included in the Underlying Index.
During the 12 months ended October 31, 2018, prices on global investments generally traded lower. Through Q4 of 2017, global equity markets moved higher on improved global growth prospects, strengthening economic data and U.S. pro-business tax reform. Global markets moved lower in Q1of 2018 as increased global trade tensions and concerns over the pace of U.S. Federal Reserve Bank (“Fed”) rate hikes impacted global investments. Global equities were up in Q2 and Q3 as strong corporate earnings and positive macroeconomic data out of the U.S. offset weakness in international equities. Global markets moved lower in October of 2018 as concerns over slowing growth in China, increased tariffs in the U.S.-China trade war, the sustainability of continued earnings growth in the U.S. and anxiety over the Fed’s continued pace of future rate hikes weighed on investments.
The global infrastructure asset class, as referenced by the S&P Global Infrastructure Index, underperformed the broad global equity market, as defined by the MSCI ACWI Index, during the 12 months ended
| | | | |
| FLEXSHARES ANNUAL REPORT | | | 23 | |
| | |
| FlexShares® STOXX® | | MANAGEMENT’S DISCUSSION OF FUND PERFORMANCE |
Global Broad Infrastructure Index Fund (cont.)
PORTFOLIO ANALYSIS (cont.)
October 31, 2018 by 7.58%. The broader definition of infrastructure incorporated in the Fund’s Underlying Index as compared to the S&P Global Infrastructure Index positively impacted the Underlying Index’s performance as it outperformed the S&P Global Infrastructure Index by 5.42%. The Underlying Index’s exposures to the transportation, communication and utilities sectors positively impacted its performance while exposures to energy and social infrastructure detracted from Underlying Index performance. The tracking difference between the Fund’s NAV and the Underlying Index’s total return for the 12-month period was +14 basis points (“bps”)1, which is reflective of the Fund’s management fee (-47 bps), stock selection/futures (+4 bps), securities lending (+3 bps), dividend tax differential (+53 bps) and performance calculation differences between the Underlying Index and the Fund (+1 bps).
| 1 | A unit that is equal to 1/100th of 1% and is used to denote the change in a financial instrument. |
| | |
| 24 | | FLEXSHARES ANNUAL REPORT |
| | |
| FlexShares® | | MANAGEMENT’S DISCUSSION OF FUND PERFORMANCE |
Global Quality Real Estate Index Fund Ticker: GQRE
CUMULATIVE PERFORMANCE
Through October 31, 2018
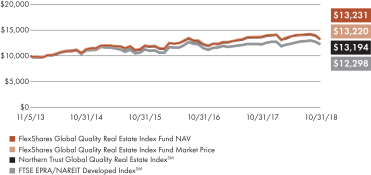
AVERAGE ANNUAL TOTAL RETURN
For the period ended October 31, 2018
| | | | | | | | | | | | |
| | | 1 Year | | | 3 Year | | | Fund
Inception
11/5/2013 | |
| | | | |
| | | |
FlexShares Global Quality Real Estate Index Fund (Based on Net Asset Value) | | | (3.69 | )% | | | 3.24 | % | | | 5.78 | % |
| | | |
FlexShares Global Quality Real Estate Index Fund (Based on Market Price) | | | (3.95 | )% | | | 3.21 | % | | | 5.75 | % |
| | | |
Northern Trust Global Quality Real Estate IndexSM | | | (3.71 | )% | | | 3.22 | % | | | 5.71 | % |
| | | |
FTSE EPRA/NAREIT Developed IndexSM | | | 0.30 | % | | | 2.94 | % | | | 4.23 | % |
All data as of 10/31/18. Total returns based on market price do not include brokerage commissions that may be payable on secondary market transactions. If brokerage commissions were included, these returns would be lower. Total returns based on market price and net asset value (“NAV”) assume that dividends and capital gain distributions have been reinvested in the Fund at market price and NAV, respectively. NAV is a fund’s net asset value per share, which is calculated by dividing the total value of all the securities in the fund’s portfolio plus cash, interest and receivables less any liabilities by the number of fund shares outstanding. Market price is determined by the midpoint of the bid/ask spread at 4:00 p.m. Eastern Time from the primary listing exchange. Market price returns may vary from net asset value returns.
Performance quoted represents past performance and does not guarantee future results. The graph and table do not reflect the deduction of taxes that a shareholder would pay on Fund distributions or the redemption or sale of Fund shares. Unlike the Index, the Fund’s total returns are reduced by operating expenses, such as transaction costs and management fees. An investor cannot invest directly in an index.
Performance reflects contractual reimbursements in effect until March 1, 2019. In the absence of such reimbursements, performance would be reduced. The gross expense ratio of the Fund is 0.46% and the net expense ratio is 0.45%. The gross and net expense ratios disclosed are as reported in the Fund’s prospectus, which may differ from the gross and net expense ratios presented in the Fund’s financial reports. Current performance may be higher or lower than performance shown. Investment return and the principal value of an investment will fluctuate. Shares may be worth more or less than original cost when redeemed or sold in the market.
FlexShares ETFs’ performance data current to the most recent month-end is available at www.flexshares.com.
PORTFOLIO ANALYSIS
The Fund seeks to provide investment results that, before fees and expenses, correspond generally to the price and yield performance of the Northern Trust Global Quality Real Estate IndexTM (the “Underlying Index”). The Underlying Index is designed to measure the performance of companies that exhibit certain quality, valuation and momentum characteristics within a universe of publicly-traded equity securities of U.S. and non-U.S. real estate investment trusts (“REITs”) and real estate companies. As of October 31, 2018, there were 150 issues in the Underlying Index. Northern Trust Investments, Inc. (“NTI”) uses a “passive” or indexing approach to try to achieve the Fund’s investment objective. NTI uses a representative sampling strategy to manage the Fund. This means the Fund may or may not hold all of the issues that are included in the Underlying Index.
During the 12 months ended October 31, 2018, prices on global investments generally traded lower. Through Q4 of 2017 global equity markets moved higher on improved global growth prospects, strengthening economic data and U.S. pro-business tax reform. Global markets moved lower in Q1 as increased global trade tensions and concerns over the pace of U.S. Federal Reserve Bank (“Fed”) rate hikes impacted investments. Global equities were up in Q2 and Q3 as strong corporate earnings and positive macroeconomic data out of the U.S. offset weakness in international equities. Global markets moved lower in October of 2018 as concerns over slowing growth in China, increased tariffs in the U.S.-China trade war, the sustainability of continued earnings growth in the U.S. and anxiety over the Fed’s continued pace of future rate hikes weighed on investments.
The global real estate asset class, as measured by the FTSE EPRA/NAREIT Developed Net Index, outperformed the broad global equity market, as measured by the MSCI ACWI Index, during the 12 months ended October 31, 2018 by 0.29%. The value and momentum exposures of the Underlying Index were negative drivers of performance while the quality exposure was a positive
| | | | |
| FLEXSHARES ANNUAL REPORT | | | 25 | |
| | |
| FlexShares® | | MANAGEMENT’S DISCUSSION OF FUND PERFORMANCE |
Global Quality Real Estate Index Fund (cont.)
PORTFOLIO ANALYSIS (cont.)
driver. Overall, the positive exposure to quality was not enough to offset the headwinds from the negative performance derived from the value and momentum exposures and the Underlying Index underperformed the FTSE EPRA/NAREIT Developed Net Index by 4.01%. Tracking difference between the Fund’s NAV and the Underlying Index’s total return for the period was +2 basis point (“bps”)1, which is reflective of the Fund’s management fee (-45 bps), stock selection/futures (+9 bps), securities lending (+2 bps), dividend tax differential (+35 bps) and performance calculation differences between the Underlying Index and the Fund (+1 bps).
| 1 | A unit that is equal to 1/100th of 1% and is used to denote the change in a financial instrument. |
| | |
| 26 | | FLEXSHARES ANNUAL REPORT |
| | |
| FlexShares® | | MANAGEMENT’S DISCUSSION OF FUND PERFORMANCE |
Real Assets Allocation Index Fund Ticker: ASET
CUMULATIVE PERFORMANCE
Through October 31, 2018
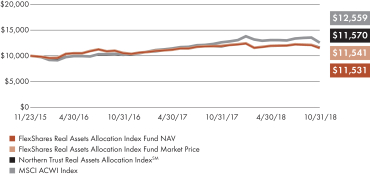
AVERAGE ANNUAL TOTAL RETURN
For the period ended October 31, 2018
| | | | | | | | |
| | | 1 Year | | | Fund
Inception
11/23/2015 | |
| | | | |
| | |
FlexShares Real Assets Allocation Index Fund (Based on Net Asset Value) | | | (3.09 | )% | | | 4.97 | % |
| | |
FlexShares Real Assets Allocation Index Fund (Based on Market Price) | | | (3.32 | )% | | | 5.00 | % |
| | |
Northern Trust Real Assets Allocation IndexSM | | | (2.97 | )% | | | 5.09 | % |
| | |
MSCI ACWI Index | | | (0.52 | )% | | | 8.06 | % |
All data as of 10/31/17. Total returns based on market price do not include brokerage commissions that may be payable on secondary market transactions. If brokerage commissions were included, these returns would be lower. Total returns based on market price and net asset value (“NAV”) assume that dividends and capital gain distributions have been reinvested in the Fund at market price and NAV, respectively. NAV is a fund’s net asset value per share, which is calculated by dividing the total value of all the securities in the fund’s portfolio plus cash, interest and receivables less any liabilities by the number of fund shares outstanding. Market price is determined by the midpoint of the bid/ask spread at 4:00 p.m. Eastern Time from the primary listing exchange. Market price returns may vary from net asset value returns.
Performance quoted represents past performance and does not guarantee future results. The graph and table do not reflect the deduction of taxes that a shareholder would pay on Fund distributions or the redemption or sale of Fund shares. Unlike the Index, the Fund’s total returns are reduced by operating expenses, such as transaction costs and management fees. An investor cannot invest directly in an index.
Performance reflects contractual reimbursements in effect until March 1, 2019. In the absence of such reimbursements, performance would be reduced. The gross expense ratio of the Fund is 1.12% and the net expense ratio is 0.57%. The gross and net expense ratios disclosed are as reported in the Fund’s prospectus, which may differ from the gross and net expense ratios presented in the Fund’s financial reports. Current performance may be higher or lower than performance shown. Investment return and the principal value of an investment will fluctuate. Shares may be worth more or less than original cost when redeemed or sold in the market.
FlexShares ETFs’ performance data current to the most recent month-end is available at www.flexshares.com.
PORTFOLIO ANALYSIS
The Fund seeks to provide investment results that, before fees and expenses, correspond generally to the performance of the Northern Trust Real Assets Allocation IndexSM (the “Underlying Index”). The Underlying Index measures the performance of an optimized allocation to other FlexShares ETFs (“Underlying Funds”) that is intended to provide exposures to certain real assets and minimize overall volatility of investment in the Underlying Funds. The Underlying Funds invest primarily in separate sets of securities representing or providing exposures to global “real assets.” Examples of real assets include but are not limited to commodities, precious metals, oil, and real estate. As of October 31, 2018, there were three Underlying Funds in the Underlying Index. Northern Trust Investments, Inc. (“NTI”) uses a “passive” or indexing approach to try to achieve the Fund’s investment objective and to manage the Fund.
During the 12 months ended October 31, 2018, prices on global investments generally traded lower. Through Q4 of 2017, global equity markets moved higher on improved global growth prospects, strengthening economic data and U.S. pro-business tax reform. Global markets moved lower in Q1 of 2018 as increased global trade tensions and concerns over the pace of U.S. Federal Reserve Bank (“Fed”) rate hikes impacted investments. Global equities were up in Q2 and Q3 as strong corporate earnings and positive macroeconomic data out of the U.S. offset weakness in international equities. Global markets moved lower in October of 2018 as concerns over slowing growth in China, increased tariffs in the US-China trade war, the sustainability of continued earnings growth in the U.S. and anxiety over the Fed’s continued pace of future rate hikes weighed on investments.
For the 12 months ended October 31, 2018, real assets as an asset class exhibited overall negative returns. Traditional yield-attractive assets, like infrastructure and real estate, experienced pressure due to rising short-term yields as the Fed continued its tightening cycle. Natural resources and commodities, however, exhibited positive performance due to supply constraints.
| | | | |
| FLEXSHARES ANNUAL REPORT | | | 27 | |
| | |
| FlexShares® | | MANAGEMENT’S DISCUSSION OF FUND PERFORMANCE |
Real Assets Allocation Index Fund (cont.)
PORTFOLIO ANALYSIS (cont.)
The Underlying Index had a negative total return during the 12 months ended October 31, 2018; underperforming the global equity markets, as defined by the MSCI All Country World Index (ACWI) by (-2.98%). The Underlying Index’s approach resulted in a greater allocation to real estate and infrastructure relative to its natural resource allocation. The tracking difference of the fund NAV and the Underlying index for the period was -12 basis points (“bps”)1, which is largely reflective of the Fund’s management fee (-57 bps) and a reimbursement amount equal to the Acquired Fund Fees and Expenses attributable to the Fund’s investments in the Underlying Fund (+47 bps) and transaction cost (-1 bps).
| 1 | A unit that is equal to 1/100th of 1% and is used to denote the change in a financial instrument. |
| | |
| 28 | | FLEXSHARES ANNUAL REPORT |
| | |
| FlexShares® | | MANAGEMENT’S DISCUSSION OF FUND PERFORMANCE |
Quality Dividend Index Fund Ticker: QDF
CUMULATIVE PERFORMANCE
Through October 31, 2018
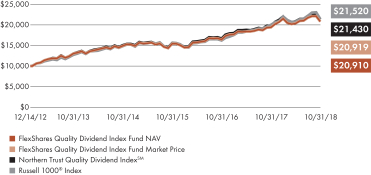
AVERAGE ANNUAL TOTAL RETURN
For the period ended October 31, 2018
| | | | | | | | | | | | | | | | |
| | | 1 Year | | | 3 Year | | | 5 Year | | | Fund
Inception
12/14/2012 | |
| | | | |
| | | | |
FlexShares Quality Dividend Index Fund
(Based on Net Asset Value) | | | 7.42 | % | | | 10.52 | % | | | 9.86 | % | | | 13.37 | % |
| | | | |
FlexShares Quality Dividend Index Fund
(Based on Market Price) | | | 7.40 | % | | | 10.50 | % | | | 9.84 | % | | | 13.37 | % |
| | | | |
Northern Trust Quality Dividend IndexSM | | | 7.63 | % | | | 10.97 | % | | | 10.32 | % | | | 13.84 | % |
| | | | |
Russell 1000® Index | | | 6.98 | % | | | 11.30 | % | | | 11.05 | % | | | 13.93 | % |
All data as of 10/31/18. Total returns based on market price do not include brokerage commissions that may be payable on secondary market transactions. If brokerage commissions were included, these returns would be lower. Total returns based on market price and net asset value (“NAV”) assume that dividends and capital gain distributions have been reinvested in the Fund at market price and NAV, respectively. NAV is a fund’s net asset value per share, which is calculated by dividing the total value of all the securities in the fund’s portfolio plus cash, interest and receivables less any liabilities by the number of fund shares outstanding. Market price is determined by the midpoint of the bid/ask spread at 4:00 p.m. Eastern Time from the primary listing exchange. Market price returns may vary from net asset value returns.
Performance quoted represents past performance and does not guarantee future results. The graph and table do not reflect the deduction of taxes that a shareholder would pay on Fund distributions or the redemption or sale of Fund shares. Unlike the Index, the Fund’s total returns are reduced by operating expenses, such as transaction costs and management fees. An investor cannot invest directly in an index.
Performance reflects contractual reimbursements in effect until March 1, 2019. In the absence of such reimbursements, performance would be reduced. The gross expense ratio of the Fund is 0.38% and the net expense ratio is 0.37%. The gross and net expense ratios disclosed are as reported in the Fund’s prospectus, which may differ from the gross and net expense ratios presented in the Fund’s financial reports. Current performance may be higher or lower than performance shown. Investment return and the principal value of an investment will fluctuate. Shares may be worth more or less than original cost when redeemed or sold in the market.
FlexShares ETFs’ performance data current to the most recent month-end is available at www.flexshares.com.
PORTFOLIO ANALYSIS
The Fund seeks to provide investment results that, before fees and expenses, correspond generally to the price and yield performance of the Northern Trust Quality Dividend IndexTM (the “Underlying Index”). The Underlying Index is designed to provide exposure to a high quality, income-oriented portfolio of U.S. equity securities, with an emphasis on long-term capital growth and targeted overall volatility similar to that of the Northern Trust 1250 IndexSM (the “Parent Index”).1 Companies included in the Underlying Index are a subset of the Parent Index, and are selected based on expected dividend payments and fundamental factors such as profitability, management expertise and cash flow, as determined by Northern Trust Investments, Inc. (“NTI”) in its capacity as the index provider (the “Index Provider”) pursuant to its index methodology. The Underlying Index begins with the Parent Index, and then follows a rules-based methodology to calculate optimal weights for securities in the Underlying Index based upon a targeted overall beta2 similar to the Parent Index, dividend yield, quality factors and lower total risk. As of October 31, 2018, there were 150 issues in the Underlying Index. NTI uses a “passive” or indexing approach to try to achieve the Fund’s investment objective. NTI uses a representative sampling strategy to manage the Fund. This means the Fund may or may not hold all of the issues that are included in the Underlying Index.
During the 12 months ended October 31, 2018, prices on domestic investments generally traded higher. Through Q4 of 2017, U.S. equity markets advanced on positive
| 1 | Northern Trust 1250 IndexSM is a float-adjusted market-capitalization weighted index comprised of the 1250 largest U.S. domiciled companies by market capitalization. |
| 2 | A statistical measure of the volatility, or sensitivity, of rates of return on a portfolio or security compared to a market index. The beta for an ETF measures the expected change in return of the ETF relative to the return of a designated index. By definition, the beta of the Standard & Poor’s (“S&P”) 500 Index is 1.00. Accordingly, a fund with a 1.10 beta is expected to perform 10% better than the S&P 500 Index in rising markets and 10% worse in falling markets. |
| | | | |
| FLEXSHARES ANNUAL REPORT | | | 29 | |
| | |
| FlexShares® | | MANAGEMENT’S DISCUSSION OF FUND PERFORMANCE |
Quality Dividend Index Fund (cont.)
PORTFOLIO ANALYSIS (cont.)
macroeconomic data and the passing of a tax reform bill by Congress that was viewed positively by markets. Volatility increased in Q1 of 2018, with markets moving modestly lower as investors assessed the impact of stronger-than-expected inflation on the U.S Federal Reserve Bank’s (“Fed”) pace of rate hikes and U.S.-China trade war concerns versus positive macroeconomic data. Q4 of 2017 Gross Domestic Product (“GDP”) growth results (reported in Q1 of 2018) were revised higher, corporate earnings and revenue beat expectations and business confidence hit a new high due to tax reform. U.S. equities were up in Q2 and Q3 as strong corporate earnings and positive macroeconomic data supported domestic investments. Macroeconomic data continued to be robust, unemployment hit an 18-year low and wages grew at the fastest pace since 2009. Trade tensions with Mexico and Canada eased as the North American Free Trade Agreement was replaced by the United States-Mexico-Canada Agreement (“USMCA”). U.S. markets sold off in October of 2018 as concerns surrounding the sustainability of continued earnings growth, the cadence of future Fed rate hikes and escalating trade tensions between the U.S. and China weighed on domestic equities.
The quality focus of the Fund’s Underlying Index was a positive driver of performance during the 12 months ended October 31, 2018. The companies deemed higher quality outperformed those domestic companies deemed to be lower quality. The yield exposure of the Underlying Index was a negative driver compared to the broad large cap universe as the top dividend yielding stocks underperformed non-dividend paying stocks for the 12-month period. Overall, the positive performance derived from the quality exposure offset the negative performance derived from the yield exposure and the Underlying Index outperformed the Russell 1000 Index by 0.65%. Tracking difference between the Fund’s NAV and the Underlying Index’s total return for the twelve month period was -21 basis points (“bps”)3, which is reflective of the management fee (-37 bps), stock selection/futures (+13 bps) and securities lending (+3 bps).
| 3 | A unit that is equal to 1/100th of 1% and is used to denote the change in a financial instrument. |
| | |
| 30 | | FLEXSHARES ANNUAL REPORT |
| | |
| FlexShares® | | MANAGEMENT’S DISCUSSION OF FUND PERFORMANCE |
Quality Dividend Defensive Index Fund Ticker: QDEF
CUMULATIVE PERFORMANCE
Through October 31, 2018
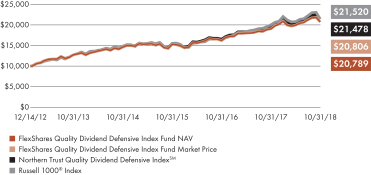
AVERAGE ANNUAL TOTAL RETURN
For the period ended October 31, 2018
| | | | | | | | | | | | | | | | |
| | | 1 Year | | | 3 Year | | | 5 Year | | | Fund
Inception
12/14/2012 | |
| | | | |
| | | | |
FlexShares Quality Dividend Defensive Index Fund (Based on Net Asset Value) | | | 8.69 | % | | | 10.59 | % | | | 10.28 | % | | | 13.26 | % |
| | | | |
FlexShares Quality Dividend Defensive Index Fund (Based on Market Price) | | | 8.74 | % | | | 10.60 | % | | | 10.24 | % | | | 13.27 | % |
| | | | |
Northern Trust Quality Dividend Defensive IndexSM | | | 9.76 | % | | | 11.25 | % | | | 10.93 | % | | | 13.89 | % |
| | | | |
Russell 1000® Index | | | 6.98 | % | | | 11.30 | % | | | 11.05 | % | | | 13.93 | % |
All data as of 10/31/18. Total returns based on market price do not include brokerage commissions that may be payable on secondary market transactions. If brokerage commissions were included, these returns would be lower. Total returns based on market price and net asset value (“NAV”) assume that dividends and capital gain distributions have been reinvested in the Fund at market price and NAV, respectively. NAV is a fund’s net asset value per share, which is calculated by dividing the total value of all the securities in the fund’s portfolio plus cash, interest and receivables less any liabilities by the number of fund shares outstanding. Market price is determined by the midpoint of the bid/ask spread at 4:00 p.m. Eastern Time from the primary listing exchange. Market price returns may vary from net asset value returns.
Performance quoted represents past performance and does not guarantee future results. The graph and table do not reflect the deduction of taxes that a shareholder would pay on Fund distributions or the redemption or sale of Fund shares. Unlike the Index, the Fund’s total returns are reduced by operating expenses, such as transaction costs and management fees. An investor cannot invest directly in an index.
Performance reflects contractual reimbursements in effect until March 1, 2019. In the absence of such reimbursements, performance would be reduced. The gross expense ratio of the Fund is 0.38% and the net expense ratio is 0.37%. The gross and net expense ratios disclosed are as reported in the Fund’s prospectus, which may differ from the gross and net expense ratios presented in the Fund’s financial reports. Current performance may be higher or lower than performance shown. Investment return and the principal value of an investment will fluctuate. Shares may be worth more or less than original cost when redeemed or sold in the market.
FlexShares ETFs’ performance data current to the most recent month-end is available at www.flexshares.com.
PORTFOLIO ANALYSIS
The Fund seeks to provide investment results that correspond generally to the price and yield performance, before fees and expenses, of the Northern Trust Quality Dividend Defensive IndexSM (the “Underlying Index”). The Underlying Index is designed to provide exposure to a high-quality, income-oriented portfolio of U.S. equity securities, with an emphasis on long-term capital growth and a targeted overall volatility that is lower than that of the Northern Trust 1250 IndexSM (the “Parent Index”)1. Companies included in the Underlying Index are a subset of the Parent Index, and are selected based on expected dividend payment and fundamental factors such as profitability, management expertise and cash flow, as determined by Northern Trust Investments, Inc. (“NTI”) in its capacity as the index provider (the “Index Provider”), pursuant to its index methodology. The Underlying Index begins with the Parent Index, and then follows a rules-based methodology to calculate optimal weights for securities in the Underlying Index based upon a targeted overall beta2 generally between 0.5 and 1.0 times that of the Parent Index, dividend yield, quality factors and lower total risk. As of October 31, 2018, there were 181 issues in the Underlying Index. NTI uses a “passive” or indexing approach to try to achieve the Fund’s investment objective. NTI uses a representative sampling strategy to manage the Fund. This means the Fund may or may not hold all of the securities that are included in the Underlying Index.
During the 12 months ended October 31, 2018, prices on domestic investments generally traded higher. Through Q4 of 2017, U.S. equity markets advanced on positive macroeconomic data and the passing of a tax reform bill by Congress that was viewed positively by markets. Volatility increased in Q1
| 1 | Northern Trust 1250 IndexSM is a float-adjusted market-capitalization weighted index comprised of the 1250 largest U.S. domiciled companies by market capitalization. |
| 2 | A statistical measure of the volatility, or sensitivity, of rates of return on a portfolio or security compared to a market index. The beta for an ETF measures the expected change in return of the ETF relative to the return of a designated index. By definition, the beta of the Standard & Poor’s (S&P) 500 Index is 1.00. Accordingly, a fund with a 1.10 beta is expected to perform 10% better than the S&P 500 Index in rising markets and 10% worse in falling markets. |
| | | | |
| FLEXSHARES ANNUAL REPORT | | | 31 | |
| | |
| FlexShares® | | MANAGEMENT’S DISCUSSION OF FUND PERFORMANCE |
Quality Dividend Defensive Index Fund (cont.)
PORTFOLIO ANALYSIS (cont.)
of 2018 with markets potentially responding to the impact of stronger-than-expected inflation, the U.S. Federal Reserve Bank’s (“Fed”) pace of rate hikes and U.S.-China trade war concerns versus positive macroeconomic data. Gross Domestic Product (“GDP”) growth results for Q4 of 2017 (reported in Q1 of 2018) were revised higher, corporate earnings and revenue beat expectations and business confidence hit a new high due to tax reform. U.S. equities were up in Q2 and Q3 of 2018 as strong corporate earnings and positive macroeconomic data supported domestic investments. Macroeconomic data continued to be robust, unemployment hit an 18-year low and wages grew at the fastest pace since 2009. Trade tensions with Mexico and Canada eased as the North American Free Trade Agreement (“NAFTA”) was replaced by the United States-Mexico-Canada Agreement (“USMCA”). U.S. markets sold off in October of 2018 as concerns surrounding the sustainability of continued earnings growth, the cadence of future Fed rate hikes and escalating trade tensions between the U.S. and China weighed on domestic equities.
The quality focus of the Fund’s Underlying Index was a positive driver of performance during the 12 months ended October 31, 2018. The companies deemed higher quality outperformed those domestic companies deemed to be lower quality. The yield exposure of the Underlying Index was a negative driver compared to the broad large cap universe as the top dividend yielding stocks underperformed non-dividend paying stocks for the 12-month period. The Underlying Index’s lower beta exposure was a positive driver as lower volatility stocks outperformed stocks with market-like volatility. Overall, the positive performance derived from the quality and low beta exposures offset the negative performance derived from the yield exposure, and the Underlying Index outperformed the Russell 1000 Index by 2.78%. Tracking difference between the Fund’s NAV and the Underlying Index’s total return for the 12- month period was -1.07%, which is reflective of the management fee of -37 basis points (bps)3, stock selection/futures (-73 bps) and securities lending (+2 bps) and performance calculation differences between the Underlying Index and the Fund (+1 bps).
| 3 | A unit that is equal to 1/100th of 1% and is used to denote the change in a financial instrument. |
| | |
| 32 | | FLEXSHARES ANNUAL REPORT |
| | |
| FlexShares® | | MANAGEMENT’S DISCUSSION OF FUND PERFORMANCE |
Quality Dividend Dynamic Index Fund Ticker: QDYN
CUMULATIVE PERFORMANCE
Through October 31, 2018
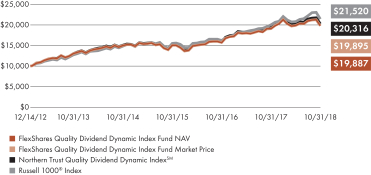
AVERAGE ANNUAL TOTAL RETURN
For the period ended October 31, 2018
| | | | | | | | | | | | | | | | |
| | | 1 Year | | | 3 Year | | | 5 Year | | | Fund
Inception
12/14/2012 | |
| | | | |
| | | | |
FlexShares Quality Dividend Dynamic Index Fund
(Based on Net Asset Value) | | | 3.59 | % | | | 9.54 | % | | | 8.77 | % | | | 12.41 | % |
| | | | |
FlexShares Quality Dividend Dynamic Index Fund
(Based on Market Price) | | | 3.67 | % | | | 9.60 | % | | | 8.76 | % | | | 12.41 | % |
| | | | |
Northern Trust Quality Dividend Dynamic IndexSM | | | 3.93 | % | | | 9.90 | % | | | 9.17 | % | | | 12.81 | % |
| | | | |
Russell 1000® Index | | | 6.98 | % | | | 11.30 | % | | | 11.05 | % | | | 13.93 | % |
All data as of 10/31/18. Total returns based on market price do not include brokerage commissions that may be payable on secondary market transactions. If brokerage commissions were included, these returns would be lower. Total returns based on market price and net asset value (“NAV”) assume that dividends and capital gain distributions have been reinvested in the Fund at market price and NAV, respectively. NAV is a fund’s net asset value per share, which is calculated by dividing the total value of all the securities in the fund’s portfolio plus cash, interest and receivables less any liabilities by the number of fund shares outstanding. Market price is determined by the midpoint of the bid/ask spread at 4:00 p.m. Eastern Time from the primary listing exchange. Market price returns may vary from net asset value returns.
Performance quoted represents past performance and does not guarantee future results. The graph and table do not reflect the deduction of taxes that a shareholder would pay on Fund distributions or the redemption or sale of Fund shares. Unlike the Index, the Fund’s total returns are reduced by operating expenses, such as transaction costs and management fees. An investor cannot invest directly in an index.
Performance reflects contractual reimbursements in effect until March 1, 2019. In the absence of such reimbursements, performance would be reduced. The gross expense ratio of the Fund is 0.38% and the net expense ratio is 0.37%. The gross and net expense ratios disclosed are as reported in the Fund’s prospectus, which may differ from the gross and net expense ratios presented in the Fund’s financial reports. Current performance may be higher or lower than performance shown. Investment return and the principal value of an investment will fluctuate. Shares may be worth more or less than original cost when redeemed or sold in the market.
FlexShares ETFs’ performance data current to the most recent month-end is available at www.flexshares.com.
PORTFOLIO ANALYSIS
The Fund seeks to provide investment results that correspond generally to the price and yield performance, before fees and expenses, of the Northern Trust Quality Dividend Dynamic IndexSM (the “Underlying Index”). The Underlying Index is designed to provide exposure to a high-quality, income-oriented portfolio of U.S. equity securities, with an emphasis on long-term capital growth and a targeted overall volatility that is greater than that of the Northern Trust 1250 IndexSM (the “Parent Index”)1. Companies included in the Underlying Index are a subset of the Parent Index, and are selected based on expected dividend payment and fundamental factors such as profitability, management expertise and cash flow, as determined by Northern Trust Investments, Inc. (“NTI”) in its capacity as the index provider (the “Index Provider”), pursuant to its index methodology. The Underlying Index begins with the Parent Index, and then follows a rules-based methodology to calculate optimal weights for securities in the Underlying Index based upon a targeted overall beta2 generally between 1.0 and 1.5 times that of the Parent Index, dividend yield, quality factors and lower total risk. As of October 31, 2018, there were 145 issues in the Underlying Index. NTI uses a “passive” or indexing approach to try to achieve the Fund’s investment objective. NTI uses a representative sampling strategy to manage the Fund. This means the Fund may or may not hold all of the securities that are included in the Underlying Index.
During the 12 months ended October 31, 2018, prices on domestic investments generally traded higher. Through Q4 of 2017, U.S. equity markets advanced on positive macroeconomic data and the passing of a tax reform bill by Congress that was viewed
| 1 | Northern Trust 1250 IndexSM is a float-adjusted market-capitalization weighted index comprised of the 1250 largest U.S. domiciled companies by market capitalization. |
| 2 | A statistical measure of the volatility, or sensitivity, of rates of return on a portfolio or security compared to a market index. The beta for an ETF measures the expected change in return of the ETF relative to the return of a designated index. By definition, the beta of the Standard & Poor’s (S&P) 500 Index is 1.00. Accordingly, a fund with a 1.10 beta is expected to perform 10% better than the S&P 500 Index in rising markets and 10% worse in falling markets. |
| | | | |
| FLEXSHARES ANNUAL REPORT | | | 33 | |
| | |
| FlexShares® | | MANAGEMENT’S DISCUSSION OF FUND PERFORMANCE |
Quality Dividend Dynamic Index Fund (cont.)
PORTFOLIO ANALYSIS (cont.)
positively by markets. Volatility increased in Q1 of 2018 with markets potentially responding to the impact of stronger-than-expected inflation, the U.S. Federal Reserve Bank’s (“Fed”) pace of rate hikes and U.S.-China trade war concerns versus positive macroeconomic data. Gross Domestic Product (“GDP”) growth results for Q4 of 2017 (reported in Q1 of 2018) were revised higher, corporate earnings and revenue beat expectations and business confidence hit a new high due to tax reform. U.S. equities were up in Q2 and Q3 of 2018 as strong corporate earnings and positive macroeconomic data supported domestic investments. Macroeconomic data continued to be robust, unemployment hit an 18-year low and wages grew at the fastest pace since 2009. Trade tensions with Mexico and Canada eased as the North American Free Trade Agreement (“NAFTA”) was replaced by the United States-Mexico-Canada Agreement (“USMCA”). U.S. markets sold off in October of 2018 as concerns surrounding the sustainability of continued earnings growth, the cadence of future Fed rate hikes and escalating trade tensions between the U.S. and China weighed on domestic equities.
The quality focus of the Fund’s Underlying Index was a positive driver of performance during the 12 months ended October 31, 2018. The companies deemed higher quality outperformed those domestic companies deemed to be lower quality. The yield exposure of the Underlying Index was a negative driver compared to the broad large cap universe as the top dividend yielding stocks underperformed non-dividend paying stocks for the 12-month period. The Underlying Index’s higher beta exposure was a negative driver as higher volatility stocks underperformed stocks with market-like volatility. Overall, the positive exposure to quality was not enough to offset the headwinds from the negative performance derived from the yield and higher beta exposures as the Underlying Index underperformed the Russell 1000 Index by 3.05%. Tracking difference between the Fund’s NAV and the Underlying Index’s total return for the 12- month period was -34 basis points (bps)3, which is reflective of the management fee (-37 bps), stock selection/futures (+2 bps) and securities lending (+1 bps).
| 3 | A unit that is equal to 1/100th of 1% and is used to denote the change in a financial instrument. |
| | |
| 34 | | FLEXSHARES ANNUAL REPORT |
| | |
| FlexShares® | | MANAGEMENT’S DISCUSSION OF FUND PERFORMANCE |
International Quality Dividend Index Fund Ticker: IQDF
CUMULATIVE PERFORMANCE
Through October 31, 2018
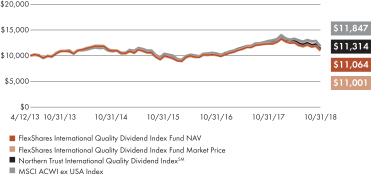
AVERAGE ANNUAL TOTAL RETURN
For the period ended October 31, 2018
| | | | | | | | | | | | | | | | |
| | | 1 Year | | | 3 Year | | | 5 Year | | | Fund
Inception
4/12/2013 | |
| | | | |
| | | | |
FlexShares International Quality Dividend Index Fund (Based on Net Asset Value) | | | (10.48 | )% | | | 3.24 | % | | | 0.25 | % | | | 1.83 | % |
| | | | |
FlexShares International Quality Dividend Index Fund (Based on Market Price) | | | (11.30 | )% | | | 3.31 | % | | | 0.08 | % | | | 1.73 | % |
| | | | |
Northern Trust International Quality Dividend IndexSM | | | (10.53 | )% | | | 3.53 | % | | | 0.65 | % | | | 2.24 | % |
| | | | |
MSCI ACWI ex USA Index | | | (8.24 | )% | | | 4.37 | % | | | 1.63 | % | | | 3.10 | % |
All data as of 10/31/18. Total returns based on market price do not include brokerage commissions that may be payable on secondary market transactions. If brokerage commissions were included, these returns would be lower. Total returns based on market price and net asset value (“NAV”) assume that dividends and capital gain distributions have been reinvested in the Fund at market price and NAV, respectively. NAV is a fund’s net asset value per share, which is calculated by dividing the total value of all the securities in the fund’s portfolio plus cash, interest and receivables less any liabilities by the number of fund shares outstanding. Market price is determined by the midpoint of the bid/ask spread at 4:00 p.m. Eastern Time from the primary listing exchange. Market price returns may vary from net asset value returns.
Performance quoted represents past performance and does not guarantee future results. The graph and table do not reflect the deduction of taxes that a shareholder would pay on Fund distributions or the redemption or sale of Fund shares. Unlike the Index, the Fund’s total returns are reduced by operating expenses, such as transaction costs and management fees. An investor cannot invest directly in an index.
Performance reflects contractual reimbursements in effect until March 1, 2019. In the absence of such reimbursements, performance would be reduced. The gross expense ratio of the Fund is 0.48% and the net expense ratio is 0.47%. The gross and net expense ratios disclosed are as reported in the Fund’s prospectus, which may differ from the gross and net expense ratios presented in the Fund’s financial reports. Current performance may be higher or lower than performance shown. Investment return and the principal value of an investment will fluctuate. Shares may be worth more or less than original cost when redeemed or sold in the market.
FlexShares ETFs’ performance data current to the most recent month-end is available at www.flexshares.com.
PORTFOLIO ANALYSIS
The Fund seeks to provide investment results that correspond generally to the price and yield performance, before fees and expenses, of the Northern Trust International Quality Dividend IndexSM (the “Underlying Index”). The Underlying Index is designed to provide exposure to a high-quality, income-oriented portfolio of international equity securities issued by non-U.S.-based companies, with an emphasis on long-term capital growth and a targeted overall volatility similar to that of the Northern Trust International Large Cap IndexSM (the “Parent Index”)1. Companies included in the Underlying Index are a subset of the Parent Index, and are selected based on expected dividend payment and fundamental factors such as profitability, management expertise and cash flow, as determined by Northern Trust Investments, Inc. (“NTI”) in its capacity as the index provider (the “Index Provider”), pursuant to its index methodology. The Underlying Index begins with the Parent Index, and then follows a rules-based methodology to calculate optimal weights for securities in the Underlying Index based upon a targeted overall beta2 similar to the Parent Index, dividend yield, quality factors and lower total risk.
As of October 31, 2018, there were 192 issues in the Underlying Index. NTI uses a “passive” or indexing approach to try to achieve the Fund’s investment objective. NTI uses a representative sampling strategy to manage the Fund. This means the Fund may or may not hold all of the securities that are included in the Underlying Index.
| 1 | The Northern Trust International Large Cap IndexSM is a float-adjusted market capitalization weighted index comprised of eligible large capitalization securities of developed or emerging market countries as determined by the Index Provider. |
| 2 | A statistical measure of the volatility, or sensitivity, of rates of return on a portfolio or security compared to a market index. The beta for an ETF measures the expected change in return of the ETF relative to the return of a designated index. By definition, the beta of the Standard & Poor’s (S&P) 500 Index is 1.00. Accordingly, a fund with a 1.10 beta is expected to perform 10% better than the S&P 500 Index in rising markets and 10% worse in falling markets. |
| | | | |
| FLEXSHARES ANNUAL REPORT | | | 35 | |
| | |
| FlexShares® | | MANAGEMENT’S DISCUSSION OF FUND PERFORMANCE |
International Quality Dividend Index Fund (cont.)
PORTFOLIO ANALYSIS (cont.)
During the 12 months ended October 31, 2018, prices on international risk assets generally traded lower. Over the course of the 12-month period, the U.S. dollar (“USD”) was volatile, but ultimately strengthened and negatively impacted U.S. investors as returns in local currencies generally were diminished by the rising value of the USD. Through Q4 of 2017, developed international markets moved higher on improved global growth prospects and strengthening economic data. International markets moved lower in Q1 of 2018 as increased global trade tensions impacted risk assets. Markets continued to move lower in Q2 of 2018 as European economic data disappointed, the USD strengthened and concerns of slowing global growth weighed on equities. Q3 of 2018 was volatile, but ultimately ended modestly positive as investors balanced constructive macroeconomic data in Europe and positive election results in Japan versus China’s weak macroeconomic data, the escalation of trade tensions between the U.S. and China and a budget standoff between Italy and the European Union. Global markets moved lower in October of 2018 as investors feared that weaker corporate earnings and increased trade tensions would lead to slowing global growth.
The focus on dividend paying stocks was a negative driver of performance during the 12 months ended October 31, 2018 as non-dividend paying stocks outperformed high yielding equities. The impact of quality exposure on international equity markets was a positive driver of performance during the 12-month period. The companies deemed higher quality outperformed those international companies deemed to be lower quality. Overall, the positive exposure to quality was not enough to offset the headwinds from the negative performance derived from the yield exposure as the Underlying Index underperformed the MSCI ACWI ex USA Index by 2.29%. Tracking difference between the Fund’s NAV and the Underlying Index’s total return for the 12- month period was +5 basis points (bps)3, which is reflective of the Fund’s management fee (-47 bps), stock selection/futures (+43 bps), securities lending (+8 bps) and dividend tax differential (+1 bps).
| 3 | A unit that is equal to 1/100th of 1% and is used to denote the change in a financial instrument. |
| | |
| 36 | | FLEXSHARES ANNUAL REPORT |
| | |
| FlexShares® | | MANAGEMENT’S DISCUSSION OF FUND PERFORMANCE |
International Quality Dividend Defensive Index Fund Ticker: IQDE
CUMULATIVE PERFORMANCE
Through October 31, 2018
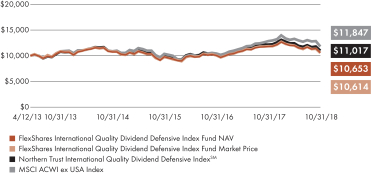
AVERAGE ANNUAL TOTAL RETURN
For the period ended October 31, 2018
| | | | | | | | | | | | | | | | |
| | | 1 Year | | | 3 Year | | | 5 Year | | | Fund
Inception
4/12/2013 | |
| | | | |
| | | | |
FlexShares International Quality Dividend Defensive Index Fund (Based on Net Asset Value) | | | (10.03 | )% | | | 2.61 | % | | | (0.30 | )% | | | 1.15 | % |
| | | | |
FlexShares International Quality Dividend Defensive Index Fund (Based on Market Price) | | | (10.91 | )% | | | 2.73 | % | | | (0.52 | )% | | | 1.07 | % |
| | | | |
Northern Trust International Quality Dividend Defensive IndexSM | | | (9.92 | )% | | | 2.94 | % | | | 0.36 | % | | | 1.76 | % |
| | | | |
MSCI ACWI ex USA Index | | | (8.24 | )% | | | 4.37 | % | | | 1.63 | % | | | 3.10 | % |
All data as of 10/31/18. Total returns based on market price do not include brokerage commissions that may be payable on secondary market transactions. If brokerage commissions were included, these returns would be lower. Total returns based on market price and net asset value (“NAV”) assume that dividends and capital gain distributions have been reinvested in the Fund at market price and NAV, respectively. NAV is a fund’s net asset value per share, which is calculated by dividing the total value of all the securities in the fund’s portfolio plus cash, interest and receivables less any liabilities by the number of fund shares outstanding. Market price is determined by the midpoint of the bid/ask spread at 4:00 p.m. Eastern Time from the primary listing exchange. Market price returns may vary from net asset value returns.
Performance quoted represents past performance and does not guarantee future results. The graph and table do not reflect the deduction of taxes that a shareholder would pay on Fund distributions or the redemption or sale of Fund shares. Unlike the Index, the Fund’s total returns are reduced by operating expenses, such as transaction costs and management fees. An investor cannot invest directly in an index.
Performance reflects contractual reimbursements in effect until March 1, 2019. In the absence of such reimbursements, performance would be reduced. The gross expense ratio of the Fund is 0.48% and the net expense ratio is 0.47%. The gross and net expense ratios disclosed are as reported in the Fund’s prospectus, which may differ from the gross and net expense ratios presented in the Fund’s financial reports. Current performance may be higher or lower than performance shown. Investment return and the principal value of an investment will fluctuate. Shares may be worth more or less than original cost when redeemed or sold in the market.
FlexShares ETFs’ performance data current to the most recent month-end is available at www.flexshares.com.
PORTFOLIO ANALYSIS
The Fund seeks to provide investment results that correspond generally to the price and yield performance, before fees and expenses, of the Northern Trust International Quality Dividend Defensive IndexSM (the “Underlying Index”). The Underlying Index is designed to provide exposure to a high-quality, income-oriented portfolio of international equity securities issued by non-U.S.-based companies, with an emphasis on long-term capital growth and a targeted overall volatility that is lower than that of the Northern Trust International Large Cap IndexSM (the “Parent Index”)1. Companies included in the Underlying Index are a subset of the Parent Index, and are selected based on expected dividend payment and fundamental factors such as profitability, management expertise and cash flow, as determined by Northern Trust Investments, Inc. (“NTI”) in its capacity as the index provider (the “Index Provider”), pursuant to its index methodology.
The Underlying Index begins with the Parent Index, and then follows a rules-based methodology to calculate optimal weights for securities in the Underlying Index based upon a targeted overall beta2 generally between 0.5 and 1.0 times that of the Parent Index, dividend yield, quality factors and lower total risk. As of October 31, 2018, there were 197 issues in the Underlying Index. NTI uses a “passive” or indexing approach to try to achieve the Fund’s investment objective. NTI uses a representative sampling strategy to manage the Fund. This means the Fund may or may not hold all of the securities that are included in the Underlying Index.
During the 12 months ended October 31, 2018, prices on international risk assets generally traded lower. Over the course of the
| 1 | The Northern Trust International Large Cap IndexSM is a float-adjusted market capitalization weighted index comprised of eligible large capitalization securities of developed or emerging market countries as determined by the Index Provider. |
| 2 | A statistical measure of the volatility, or sensitivity, of rates of return on a portfolio or security compared to a market index. The beta for an ETF measures the expected change in return of the ETF relative to the return of a designated index. By definition, the beta of the Standard & Poor’s (S&P) 500 Index is 1.00. Accordingly, a fund with a 1.10 beta is expected to perform 10% better than the S&P 500 Index in rising markets and 10% worse in falling markets. |
| | | | |
| FLEXSHARES ANNUAL REPORT | | | 37 | |
| | |
| FlexShares® | | MANAGEMENT’S DISCUSSION OF FUND PERFORMANCE |
International Quality Dividend Defensive Index Fund (cont.)
PORTFOLIO ANALYSIS (cont.)
12-month period, the U.S. dollar (“USD”) was volatile, but ultimately strengthened and negatively impacted U.S. investors as returns in local currencies generally were diminished by the rising value of the USD. Through Q4 of 2017, developed international markets moved higher on improved global growth prospects and strengthening economic data. International markets moved lower in Q1 of 2018 as increased global trade tensions impacted risk assets. Markets continued lower in Q2 of 2018 as European economic data disappointed, the USD strengthened against other major currencies and concerns of slowing global growth weighed on equities. Q3 of 2018 was volatile, but ultimately ended modestly positive as investors balanced constructive macroeconomic data in Europe and positive election results in Japan versus China’s weak macroeconomic data, the escalation of trade tensions between the U.S. and China and a budget standoff between Italy and the European Union. Global markets moved lower in October of 2018 as investors feared that weaker corporate earnings and increased trade tensions would lead to slowing global growth.
The focus on dividend paying stocks was a negative driver of performance during the 12 months ended October 31, 2018 as non-dividend paying stocks outperformed high yielding equities. The impact of quality exposure on international equity markets was a positive driver of performance during the 12-month period. The companies deemed higher quality outperformed those international companies deemed to be lower quality. The Underlying Index’s lower beta exposure was a positive driver as lower volatility stocks outperformed stocks with market-like volatility. Overall, the positive exposures to quality and lower beta were not enough to offset the headwinds from the negative performance derived from the yield exposure as the Underlying Index underperformed the MSCI ACWI ex USA Index by 1.68%. Tracking difference between the Fund’s NAV and the Underlying Index’s total return for the 12-month period was -11 basis points (bps)3, which is reflective of the Fund’s management fee (-47 bps), stock selection/futures (+26 bps), securities lending (+9 bps) and dividend tax differential (+1 bps).
| 3 | A unit that is equal to 1/100th of 1% and is used to denote the change in a financial instrument. |
| | |
| 38 | | FLEXSHARES ANNUAL REPORT |
| | |
| FlexShares® | | MANAGEMENT’S DISCUSSION OF FUND PERFORMANCE |
International Quality Dividend Dynamic Index Fund Ticker: IQDY
CUMULATIVE PERFORMANCE
Through October 31, 2018
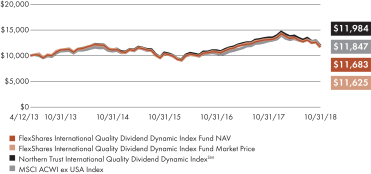
AVERAGE ANNUAL TOTAL RETURN
For the period ended October 31, 2018
| | | | | | | | | | | | | | | | |
| | | 1 Year | | | 3 Year | | | 5 Year | | | Fund
Inception
4/12/2013 | |
| | | | |
| | | | |
FlexShares International Quality Dividend Dynamic Index Fund (Based on Net Asset Value) | | | (11.34 | )% | | | 3.83 | % | | | 0.93 | % | | | 2.84 | % |
| | | | |
FlexShares International Quality Dividend Dynamic Index Fund (Based on Market Price) | | | (12.11 | )% | | | 3.94 | % | | | 0.81 | % | | | 2.75 | % |
| | | | |
Northern Trust International Quality Dividend Dynamic IndexSM | | | (11.33 | )% | | | 4.14 | % | | | 1.42 | % | | | 3.31 | % |
| | | | |
MSCI ACWI ex USA Index | | | (8.24 | )% | | | 4.37 | % | | | 1.63 | % | | | 3.10 | % |
All data as of 10/31/18. Total returns based on market price do not include brokerage commissions that may be payable on secondary market transactions. If brokerage commissions were included, these returns would be lower. Total returns based on market price and net asset value (“NAV”) assume that dividends and capital gain distributions have been reinvested in the Fund at market price and NAV, respectively. NAV is a fund’s net asset value per share, which is calculated by dividing the total value of all the securities in the fund’s portfolio plus cash, interest and receivables less any liabilities by the number of fund shares outstanding. Market price is determined by the midpoint of the bid/ask spread at 4:00 p.m. Eastern Time from the primary listing exchange. Market price returns may vary from net asset value returns.
Performance quoted represents past performance and does not guarantee future results. The graph and table do not reflect the deduction of taxes that a shareholder would pay on Fund distributions or the redemption or sale of Fund shares. Unlike the Index, the Fund’s total returns are reduced by operating expenses, such as transaction costs and management fees. An investor cannot invest directly in an index.
Performance reflects contractual reimbursements in effect until March 1, 2019. In the absence of such reimbursements, performance would be reduced. The gross expense ratio of the Fund is 0.48% and the net expense ratio is 0.47%. The gross and net expense ratios disclosed are as reported in the Fund’s prospectus, which may differ from the gross and net expense ratios presented in the Fund’s financial reports. Current performance may be higher or lower than performance shown. Investment return and the principal value of an investment will fluctuate. Shares may be worth more or less than original cost when redeemed or sold in the market.
FlexShares ETFs’ performance data current to the most recent month-end is available at www.flexshares.com.
PORTFOLIO ANALYSIS
The Fund seeks to provide investment results that correspond generally to the price and yield performance, before fees and expenses, of the Northern Trust International Quality Dividend Dynamic IndexSM (the “Underlying Index”). The Underlying Index is designed to provide exposure to a high-quality, income-oriented portfolio of international equity securities issued by non-U.S.-based companies, with an emphasis on long-term capital growth and a targeted overall volatility that is greater than that of the Northern Trust International Large Cap IndexSM (the “Parent Index”)1. Companies included in the Underlying Index are a subset of the Parent Index and are selected based on expected dividend payment and fundamental factors such as profitability, management expertise and cash flow, as determined by Northern Trust Investments, Inc. (“NTI”) in its capacity as the index provider (the “Index Provider”) pursuant to its index methodology.
The Underlying Index begins with the Parent Index, and then follows a rules-based methodology to calculate optimal weights for securities in the Underlying Index based upon a targeted overall beta2 generally between 1.0 and 1.5 times that of the Parent Index, dividend yield, quality factors and lower total risk. As of October 31, 2018, there were 173 issues in the Underlying Index. NTI uses a “passive” or indexing approach to try to achieve the Fund’s investment objective. NTI uses a representative sampling strategy to manage the Fund. This means the Fund may or may not hold all of the securities that are included in the Underlying Index.
During the 12 months ended October 31, 2018, prices on international risk assets
| 1 | The Northern Trust International Large Cap IndexSM is a float-adjusted market capitalization weighted index comprised of eligible large capitalization securities of developed or emerging market countries as determined by the Index Provider. |
| 2 | A statistical measure of the volatility, or sensitivity, of rates of return on a portfolio or security compared to a market index. The beta for an ETF measures the expected change in return of the ETF relative to the return of a designated index. By definition, the beta of the Standard & Poor’s (S&P) 500 Index is 1.00. Accordingly, a fund with a 1.10 beta is expected to perform 10% better than the S&P 500 Index in rising markets and 10% worse in falling markets. |
| | | | |
| FLEXSHARES ANNUAL REPORT | | | 39 | |
| | |
| FlexShares® | | MANAGEMENT’S DISCUSSION OF FUND PERFORMANCE |
International Quality Dividend Dynamic Index Fund (cont.)
PORTFOLIO ANALYSIS (cont.)
generally traded lower. Over the course of the 12-month period the U.S. dollar (“USD”) was volatile, but ultimately strengthened and negatively impacted U.S. investors as returns in local currencies generally were diminished by the rising value of the USD. Through Q4 of 2017 developed international markets moved higher on improved global growth prospects and strengthening economic data. International markets moved lower in Q1 of 2018 as increased global trade tensions impacted risk assets. Markets continued lower in Q2 of 2018 as European economic data disappointed, the USD strengthened against other major currencies and concerns of slowing global growth weighed on equities. Q3 of 2018 was volatile, but ultimately ended modestly positive as investors balanced constructive macroeconomic data in Europe and positive election results in Japan versus China’s weak macroeconomic data, the escalation of trade tensions between the U.S. and China and a budget standoff between Italy and the European Union. Global markets moved lower in October of 2018 as investors feared that weaker corporate earnings and increased trade tensions would lead to slowing global growth.
The focus on dividend paying stocks was a negative driver of performance during the 12 months ended October 31, 2018 as non-dividend paying stocks outperformed high yielding equities. The impact of quality exposure on international equity markets was a positive driver of performance during the 12-month period. The companies deemed higher quality outperformed those international companies deemed to be lower quality. The Underlying Index’s higher beta exposure was a negative driver as higher volatility stocks underperformed stocks with market-like volatility. Overall, the positive exposure to quality was not enough to offset the headwinds from the negative performance derived from the yield and higher beta exposures as the Underlying Index underperformed the MSCI ACWI ex USA Index by 3.09%. Tracking difference between the Fund’s NAV and the Underlying Index’s total return for the 12-month period was -1 basis point (bps)3, which is reflective of the Fund’s management fee (-47 bps), stock selection/futures (+35 bps), securities lending (+7 bps) and dividend tax differential (+4 bps).
| 3 | A unit that is equal to 1/100th of 1% and is used to denote the change in a financial instrument. |
| | |
| 40 | | FLEXSHARES ANNUAL REPORT |
| | |
| FlexShares® iBoxx | | MANAGEMENT’S DISCUSSION OF FUND PERFORMANCE |
3-Year Target Duration TIPS Index Fund Ticker: TDTT
CUMULATIVE PERFORMANCE
Through October 31, 2018
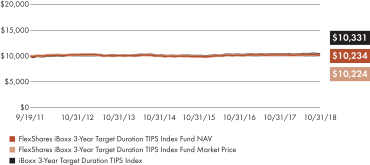
AVERAGE ANNUAL TOTAL RETURN
For the period ended October 31, 2018
| | | | | | | | | | | | | | | | |
| | | 1 Year | | | 3 Year | | | 5 Year | | | Fund
Inception
9/19/2011 | |
| | | | |
| | | | |
FlexShares iBoxx 3-Year Target Duration TIPS Index Fund (Based on Net Asset Value) | | | (0.41 | )% | | | 0.85 | % | | | 0.19 | % | | | 0.32 | % |
| | | | |
FlexShares iBoxx 3-Year Target Duration TIPS Index Fund (Based on Market Price) | | | (0.49 | )% | | | 0.83 | % | | | 0.18 | % | | | 0.31 | % |
| | | | |
iBoxx 3-Year Target Duration TIPS Index | | | (0.32 | )% | | | 0.97 | % | | | 0.35 | % | | | 0.46 | % |
All data as of 10/31/18. Total returns based on market price do not include brokerage commissions that may be payable on secondary market transactions. If brokerage commissions were included, these returns would be lower. Total returns based on market price and net asset values (“NAV”) assume that dividends and capital gain distributions have been reinvested in the Fund at market price and NAV, respectively. NAV is a fund’s net asset value per share, which is calculated by dividing the total value of all the securities in the fund’s portfolio plus cash, interest and receivables less any liabilities by the number of fund shares outstanding. Market price is determined by the midpoint of the bid/ask spread at 4:00 p.m. Eastern Time from the primary listing exchange. Market price returns may vary from net asset value returns.
Performance quoted represents past performance and does not guarantee future results. The graph and table do not reflect the deduction of taxes that a shareholder would pay on Fund distributions or the redemption or sale of Fund shares. Unlike the Index, the Fund’s total returns are reduced by operating expenses, such as transaction costs and management fees. An investor cannot invest directly in an index.
Performance reflects contractual reimbursements in effect until March 1, 2019. In the absence of such reimbursements, performance would be reduced. The gross expense ratio of the Fund is 0.19% and the net expense ratio is 0.18%. The gross and net expense ratios disclosed are as reported in the Fund’s prospectus, which may differ from the gross and net expense ratios presented in the Fund’s financial reports. Current performance may be higher or lower than performance shown. Investment return and the principal value of an investment will fluctuate. Shares may be worth more or less than original cost when redeemed or sold in the market.
FlexShares ETFs’ performance data current to the most recent month-end is available at www.flexshares.com.
PORTFOLIO ANALYSIS
The Fund seeks to provide investment results that, before fees and expenses, correspond generally to the performance of the iBoxx 3-Year Target Duration TIPS Index (the “Underlying Index”). The Underlying Index reflects the performance of a selection of inflation protected debt obligations of the U.S. Treasury, commonly known as “TIPS,” with a targeted average modified adjusted duration1 of approximately three years. The Underlying Index includes publicly issued TIPS that have maturity dates of at least one year but not more than ten years from an index rebalancing date. Under normal circumstances, the Fund will invest at least 80% of its total assets (exclusive of collateral from securities lending) in the securities of the Underlying Index. As of October 31, 2018, there were 19 issues in the Underlying Index. Northern Trust Investments, Inc. (“NTI”) uses a “passive” or indexing approach to achieve the Fund’s investment objective. NTI uses replication to manage the Fund, but may use representative sampling in certain circumstances. This means the Fund may or may not hold all of the securities that are included in the Underlying Index.
U.S. interest rates rose during fiscal year 2018. The yield curve flattened as short-term rates responded throughout the year to four increases in the Federal funds rate of 25 basis points (bps)2 each (in December of 2017 and March, June and September of 2018) by the Federal Open Market Committee (FOMC). Short-term treasury maturities ended the fiscal year higher by approximately 120 bps. Intermediate and long-term rates also rose during the year albeit taking an indirect path. Rates rose during Q1 of 2018 responding to higher growth and inflation expectations following a positive U.S. employment report. Mounting concerns surrounding geopolitical risks, trade tensions and prospects for slowing global growth during Q2 and Q3 of 2018 dampened the upward pressure. October 2018 closed out the fiscal year with a volatile month. Rates moved sharply higher early in
| 1 | The duration calculated from the real modified duration of a TIPS security, adjusted for the market’s estimated beta for a TIPS security versus a nominal Treasury security due to the actual and expected changes in inflation. |
| 2 | A unit that is equal to 1/100th of 1% and is used to denote the change in a financial instrument. |
| | | | |
| FLEXSHARES ANNUAL REPORT | | | 41 | |
| | |
| FlexShares® iBoxx | | MANAGEMENT’S DISCUSSION OF FUND PERFORMANCE |
3-Year Target Duration TIPS Index Fund (cont.)
PORTFOLIO ANALYSIS (cont.)
the month responding to various concerns including an increasingly hawkish Federal Reserve, a slowdown in U.S. earnings, a trade war and heightened geopolitical risks. During the fiscal year, the U.S. 10-year and 30-year Treasuries rose roughly 76 bps and 51 bps, respectively. The yield differential between the 2-year and 10-year Treasuries declined approximately 50 bps during the year.
For the fiscal year ended October 31, 2018, higher commodity prices, especially in energy, upward pressure in owner’s equivalent rent and actual rents, along with modest increases in transportation services and food prices drove annual Consumer Price Index (“CPI”) higher to 2.5% from 2.0% in fiscal year 2017. Inflation expectations, as represented by TIPS breakeven spreads, ended the fiscal year flat to slightly higher during that same time span. Short-term inflation expectations moderated during the year following a volatile environment for energy prices. Longer-term inflation breakeven spreads trended slightly higher on firm economic growth.
During the fiscal year ended October 31, 2018, real yields3 were higher with the rise in nominal Treasury yields offsetting higher TIPS breakeven spreads for maturity periods 3-years and longer. 1-year real yields increased +202 bps while 5-, 10- and 30-year real yields were +90 bps, +59 bps, +38 bps higher, respectively. As of October 31, 2018, real yields were positive across the curve.
Despite the rise in real interest rates, the combination of the Fund’s short duration positioning and higher annual inflation resulted in a decline in fixed income investments including TIPS with both the Fund and the Underlying Index having negative total return performance for the 12- month period. During the same period, the Underlying Index outperformed the Bloomberg Barclays U.S. TIPS 1-10 Year Index by 0.32%, due mostly to lower duration positioning against the backdrop of higher real interest rates and greater exposure to short-term TIPS breakeven spreads. Tracking difference between the Fund’s NAV and the Underlying Index for the 12- month period was -9 bps, reflective of the Fund’s management fee (-18 bps), intra-day trading and fees ( -0.7 bps), pricing differences (+6.3 bps) and other factors (+2.4 bps).
| 3 | Nominal yield adjusted for the effects of expected inflation. |
| | |
| 42 | | FLEXSHARES ANNUAL REPORT |
| | |
| FlexShares® iBoxx | | MANAGEMENT’S DISCUSSION OF FUND PERFORMANCE |
5-Year Target Duration TIPS Index Fund Ticker: TDTF
CUMULATIVE PERFORMANCE
Through October 31, 2018
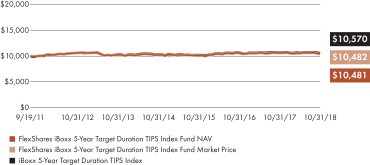
AVERAGE ANNUAL TOTAL RETURN
For the period ended October 31, 2018
| | | | | | | | | | | | | | | | |
| | | 1 Year | | | 3 Year | | | 5 Year | | | Fund
Inception
9/19/2011 | |
| | | | |
| | | | |
FlexShares iBoxx 5-Year Target Duration TIPS Index Fund (Based on Net Asset Value) | | | (1.51 | )% | | | 1.09 | % | | | 0.35 | % | | | 0.66 | % |
| | | | |
FlexShares iBoxx 5-Year Target Duration TIPS Index Fund (Based on Market Price) | | | (1.51 | )% | | | 1.04 | % | | | 0.36 | % | | | 0.66 | % |
| | | | |
iBoxx 5-Year Target Duration TIPS Index | | | (1.41 | )% | | | 1.15 | % | | | 0.44 | % | | | 0.78 | % |
All data as of 10/31/18. Total returns based on market price do not include brokerage commissions that may be payable on secondary market transactions. If brokerage commissions were included, these returns would be lower. Total returns based on market price and net asset values (“NAV”) assume that dividends and capital gain distributions have been reinvested in the Fund at market price and NAV, respectively. NAV is a fund’s net asset value per share, which is calculated by dividing the total value of all the securities in the fund’s portfolio plus cash, interest and receivables less any liabilities by the number of fund shares outstanding. Market price is determined by the midpoint of the bid/ask spread at 4:00 p.m. Eastern Time from the primary listing exchange. Market price returns may vary from net asset value returns.
Performance quoted represents past performance and does not guarantee future results. The graph and table do not reflect the deduction of taxes that a shareholder would pay on Fund distributions or the redemption or sale of Fund shares. Unlike the Index, the Fund’s total returns are reduced by operating expenses, such as transaction costs and management fees. An investor cannot invest directly in an index.
Performance reflects contractual reimbursements in effect until March 1, 2019. In the absence of such reimbursements, performance would be reduced. The gross expense ratio of the Fund is 0.19% and the net expense ratio is 0.18%. The gross and net expense ratios disclosed are as reported in the Fund’s prospectus, which may differ from the gross and net expense ratios presented in the Fund’s financial reports. Current performance may be higher or lower than performance shown. Investment return and the principal value of an investment will fluctuate. Shares may be worth more or less than original cost when redeemed or sold in the market.
FlexShares ETFs’ performance data current to the most recent month-end is available at www.flexshares.com.
PORTFOLIO ANALYSIS
The Fund seeks to provide investment results that, before fees and expenses, correspond generally to the price and yield performance of the iBoxx 5-Year Target Duration TIPS Index (the “Underlying Index”). The Underlying Index reflects the performance of a selection of inflation protected debt obligations of the U.S. Treasury, commonly known as “TIPS,” with a targeted average modified adjusted duration1 of approximately five years. The Underlying Index includes publicly issued TIPS that have maturity dates of at least three years but not more than twenty years from an index rebalancing date. Under normal circumstances, the Fund will invest at least 80% of its total assets (exclusive of collateral from securities lending) in the securities of the Underlying Index. As of October 31, 2018, there were 21 issues in the Underlying Index. Northern Trust Investments, Inc. (“NTI”) uses a “passive” or indexing approach to try to achieve the Fund’s investment objective. NTI uses replication to manage the Fund, but may use representative sampling in certain circumstances. This means the Fund may or may not hold all of the securities that are included in the Underlying Index.
U.S. interest rates rose during fiscal year 2018. The yield curve flattened as short-term rates responded throughout the year to four increases in the Federal funds rate of 25 basis points (bps)2 each (in December of 2017 and March, June and September of 2018) by the Federal Open Market Committee (“FOMC”). Short-term treasury maturities ended the fiscal year higher by approximately 120 bps. Intermediate and long-term rates also rose during the year albeit taking an indirect path. Rates rose during Q1 of 2018 responding to higher growth and inflation expectations following a positive U.S. employment report. Mounting concerns surrounding geopolitical risks, trade tensions and prospects for slowing global growth during Q2 and Q3 of 2018 dampened the upward pressure. October 2018 closed out the fiscal year with a volatile month. Rates spiked early in the month
| 1 | The duration calculated from the real modified duration of a TIPS security, adjusted for the market’s estimated beta for a TIPS security versus a nominal Treasury security due to the actual and expected changes in inflation. |
| 2 | A unit that is equal to 1/100th of 1% and is used to denote the change in a financial instrument. |
| | | | |
| FLEXSHARES ANNUAL REPORT | | | 43 | |
| | |
| FlexShares® iBoxx | | MANAGEMENT’S DISCUSSION OF FUND PERFORMANCE |
5-Year Target Duration TIPS Index Fund (cont.)
PORTFOLIO ANALYSIS (cont.)
responding to various concerns including an increasingly hawkish Federal Reserve, a slowdown in U.S. earnings, and growing geopolitical risks. During the fiscal year, the U.S. 10-year and 30-year Treasuries rose roughly 76 bps and 51 bps respectively. The yield differential between the 2-year and 10-year Treasuries declined approximately 50 bps during the year.
For the fiscal year ended October 31, 2018, higher commodity prices, especially in energy, upward pressure in owner’s equivalent rent and actual rents, along with modest increases in transportation services and food prices drove annual Consumer Price Index (“CPI”) higher to 2.5% from 2.0% in fiscal year 2017. Inflation expectations, as represented by TIPS breakeven spreads, ended the fiscal year flat to slightly higher during that same time span. Short-term inflation expectations moderated during the year following a volatile environment for energy prices. Longer-term inflation breakeven spreads trended slightly higher on firm economic growth.
During the fiscal year ended October 31, 2018, real yields3 were higher with the rise in nominal Treasury yields offsetting higher TIPS breakeven spreads for maturity periods 3 years and longer. 1-year real yields increased +202 bps while 5-, 10- and 30-year real yields were +90 bps, +59 bps, +38 bps higher, respectively. As of October 31, 2018, real yields were positive across the curve.
Despite the rise in real interest rates, the combination of the Fund’s short duration positioning and higher annual inflation resulted in a decline in performance of fixed income investments, including TIPS, resulting in both the Fund and the Underlying Index having negative total return performance for the 12- month period. During the same period, the Underlying Index underperformed the Bloomberg Barclays U.S. TIPS Index by 0.16%; due mostly to lower duration exposure and lower breakeven spreads in shorter maturity TIPS. Tracking difference between the Fund’s NAV and the Underlying Index for the 12- month period was -10 bps, reflective of the Fund’s management fee (-18 bps), intra-day trading and fees (+.3 bps), pricing differences (+5.5 bps) and other factors (-1.1 bps).
| 3 | Nominal yield adjusted for the effects of expected inflation. |
| | |
| 44 | | FLEXSHARES ANNUAL REPORT |
| | |
| FlexShares® | | MANAGEMENT’S DISCUSSION OF FUND PERFORMANCE |
Disciplined Duration MBS Index Fund Ticker: MBSD
CUMULATIVE PERFORMANCE
Through October 31, 2018
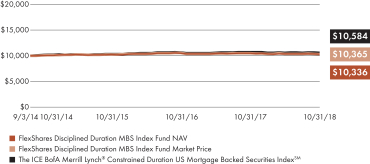
AVERAGE ANNUAL TOTAL RETURN
For the period ended October 31, 2018
| | | | | | | | | | | | |
| | | 1 Year | | | 3 Year | | | Fund
Inception
9/3/2014 | |
| | | | |
| | | |
FlexShares Disciplined Duration MBS Index Fund (Based on Net Asset Value) | | | (1.65 | )% | | | 0.29 | % | | | 0.80 | % |
| | | |
FlexShares Disciplined Duration MBS Index Fund (Based on Market Price) | | | (1.31 | )% | | | 0.27 | % | | | 0.86 | % |
| | | |
ICE BofA Merrill Lynch® Constrained Duration US Mortgage Backed Securities IndexSM | | | (1.10 | )% | | | 0.70 | % | | | 1.23 | % |
All data as of 10/31/18. Total returns based on market price do not include brokerage commissions that may be payable on secondary market transactions. If brokerage commissions were included, these returns would be lower. Total returns based on market price and net asset value (“NAV”) assume that dividends and capital gain distributions have been reinvested in the Fund at market price and NAV, respectively. NAV is a fund’s net asset value per share, which is calculated by dividing the total value of all the securities in the fund’s portfolio plus cash, interest and receivables less any liabilities by the number of fund shares outstanding. Market price is determined by the midpoint of the bid/ask spread at 4:00 p.m. Eastern Time from the primary listing exchange. Market price returns may vary from net asset value returns.
Performance quoted represents past performance and does not guarantee future results. The graph and table do not reflect the deduction of taxes that a shareholder would pay on Fund distributions or the redemption or sale of Fund shares. Unlike the Index, the Fund’s total returns are reduced by operating expenses, such as transaction costs and management fees. An investor cannot invest directly in an index.
Performance reflects contractual reimbursements in effect until March 1, 2019. In the absence of such reimbursements, performance would be reduced. The gross expense ratio of the Fund is 0.21% and the net expense ratio is 0.20%. The gross and net expense ratios disclosed are as reported in the Fund’s prospectus, which may differ from the gross and net expense ratios presented in the Fund’s financial reports. Current performance may be higher or lower than performance shown. Investment return and the principal value of an investment will fluctuate. Shares may be worth more or less than original cost when redeemed or sold in the market.
FlexShares ETFs’ performance data current to the most recent month-end is available at www.flexshares.com.
PORTFOLIO ANALYSIS
The Fund seeks investment results that correspond generally to the price and yield performance, before fees and expenses, of the ICE BofA Merrill Lynch® Constrained Duration US Mortgage Backed Securities IndexSM (the “Underlying Index”). The Underlying Index reflects the performance of a selection of investment-grade US agency residential mortgage-backed pass-through securities (“MBS”). Pursuant to the Underlying Index’s methodology, the average effective duration of the portfolio of MBS represented in the Underlying Index generally will range between 3.25 and 4.25 years. As of October 31, 2018, there were 183 securities in the Underlying Index. Northern Trust Investments, Inc. (“NTI”) uses a “passive” or indexing approach to try to achieve the Fund’s investment objective. NTI uses a representative sampling strategy to manage the Fund. This means the Fund may or may not hold all of the securities that are included in the Underlying Index.
U.S. interest rates rose during fiscal year 2018. The yield curve flattened as short-term rates responded throughout the year in conjunction with four increases in the Federal funds rate of 25 basis points (bps)1 each (in December of 2017 and March, June and September of 2018) by the Federal Open Market Committee (“FOMC”). Short-term treasury maturities ended the fiscal year higher by approximately 120 bps. Intermediate and long-term rates also rose during the year albeit taking an indirect path. Rates rose during Q1 of 2018 responding to higher growth and inflation expectations following a positive U.S. Employment report. Mounting concerns surrounding geopolitical risks, trade tensions and prospects for slowing global growth during Q2 and Q3 of 2018 dampened the upward pressure. October 2018 closed out the fiscal year with a volatile month. Rates moved sharply higher early in the month responding to various concerns including an increasingly hawkish Federal Reserve, a slowdown in U.S. earnings, trade war and heightened geopolitical risks. During the fiscal year, the U.S. 10-year and 30-year Treasury rose roughly 76 bps and 51 bps,
| 1 | A unit that is equal to 1/100th of 1% and is used to denote the change in a financial instrument |
| | | | |
| FLEXSHARES ANNUAL REPORT | | | 45 | |
| | |
| FlexShares® | | MANAGEMENT’S DISCUSSION OF FUND PERFORMANCE |
Disciplined Duration MBS Index Fund (cont.)
PORTFOLIO ANALYSIS (cont.)
respectively. The yield differential between the 2-year and 10-year Treasury declined approximately 50 bps during the same time span. Higher U.S. mortgage rates (Federal Home Loan Mortgage Corporation (Freddie Mac) average 30-Year mortgage rate 4.83% versus 3.94% during the fiscal year acted as a headwind for the U.S. housing market. Both existing and new home sales were lower year-over-year. Refinancing activity moderated as mortgage applications fell on lower home sales and higher home prices.
During the fiscal year ended October 31, 2018, the Fund’s positive income from portfolio yield was offset by higher Treasury yields and widening mortgage credit spreads. For the 12- month period, the Underlying Index outperformed the market-weighted MBS market, as defined by the Bloomberg Barclays Capital U.S. MBS Index by 0.41% due primarily to security selection and curve positioning of the Underlying Index. Tracking difference between the Fund’s NAV and the Underlying Index’s total return for the 12-month period was -55 bps, reflective of the Fund’s management fee (-20 bps), trading costs and fees (-45 bps), pricing differences (-56 bps), yield curve positioning (-4 bps), sector allocation (-1 bp), security selection (+73 bps) and other factors (-2 bps).
| | |
| 46 | | FLEXSHARES ANNUAL REPORT |
| | |
| FlexShares® Credit-Scored | | MANAGEMENT’S DISCUSSION OF FUND PERFORMANCE |
US Corporate Bond Index Fund Ticker: SKOR
CUMULATIVE PERFORMANCE
Through October 31, 2018
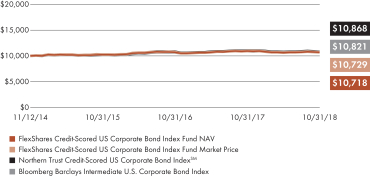
AVERAGE ANNUAL TOTAL RETURN
For the period ended October 31, 2018
| | | | | | | | | | | | |
| | | 1 Year | | | 3 Year | | | Fund
Inception
11/12/2014 | |
| | | | |
| | | |
FlexShares Credit-Scored US Corporate Bond Index Fund (Based on Net Asset Value) | | | (2.05 | )% | | | 1.47 | % | | | 1.77 | % |
| | | |
FlexShares Credit-Scored US Corporate Bond Index Fund (Based on Market Price) | | | (2.23 | )% | | | 1.45 | % | | | 1.79 | % |
| | | |
Northern Trust Credit-Scored US Corporate Bond IndexSM | | | (1.61 | )% | | | 1.83 | % | | | 2.12 | % |
| | | |
Bloomberg Barclays Intermediate U.S. Corporate Index | | | (1.30 | )% | | | 1.98 | % | | | 2.01 | % |
All data as of 10/31/18. Total returns based on market price do not include brokerage commissions that may be payable on secondary market transactions. If brokerage commissions were included, these returns would be lower. Total returns based on market price and net asset values (“NAV”) assume that dividends and capital gain distributions have been reinvested in the Fund at market price and NAV, respectively. NAV is a fund’s net asset value per share, which is calculated by dividing the total value of all the securities in the fund’s portfolio plus cash, interest and receivables less any liabilities by the number of fund shares outstanding. Market price is determined by the midpoint of the bid/ask spread at 4:00 p.m. Eastern Time from the primary listing exchange. Market price returns may vary from net asset value returns.
Performance quoted represents past performance and does not guarantee future results. The graph and table do not reflect the deduction of taxes that a shareholder would pay on Fund distributions or the redemption or sale of Fund shares. Unlike the Index, the Fund’s total returns are reduced by operating expenses, such as transaction costs and management fees. An investor cannot invest directly in an index.
Performance reflects contractual reimbursements in effect until March 1, 2019. In the absence of such reimbursements, performance would be reduced. The gross expense ratio of the Fund is 0.23% and the net expense ratio is 0.22%. The gross and net expense ratios disclosed are as reported in the Fund’s prospectus, which may differ from the gross and net expense ratios presented in the Fund’s financial reports. Current performance may be higher or lower than performance shown. Investment return and the principal value of an investment will fluctuate. Shares may be worth more or less than original cost when redeemed or sold in the market.
FlexShares ETFs’ performance data current to the most recent month-end is available at www.flexshares.com.
PORTFOLIO ANALYSIS
The Fund seeks investment results that correspond generally to the price and yield performance, before fees and expenses, of the Northern Trust Credit-Scored US Corporate Bond IndexSM (the “Underlying Index”)1. The Underlying Index reflects the performance of a broad universe of US-dollar denominated bonds of companies that are considered by the index provider to have higher credit quality, lower risk of default and the potential for higher yield, price appreciation and liquidity relative to the universe of securities comprising the Northern Trust US Investment-Grade Corporate Bond IndexSM (the “Parent Index”)2. The Underlying Index begins with the Parent Index and then follows a rules-based methodology to select and calculate optimal weights for securities in the Underlying Index based on liquidity and security issuers’ fundamental factors, as determined by Northern Trust Investments, Inc. (“NTI”), in its capacity as index provider (the “Index Provider”). As of October 31, 2018, there were 1,455 issues in the Underlying Index. NTI uses a “passive” or indexing approach to try to achieve the Fund’s investment objective. NTI uses a representative sampling strategy to manage the Fund. This means the Fund may or may not hold all of the securities that are included in the Underlying Index.
U.S. interest rates rose during fiscal year 2018. The yield curve flattened as short-term rates responded throughout the year in conjunction with four increases in the Federal funds rate of 25 basis points (bps)3 each (in December of 2017 and March, June and September of 2018) by the Federal Open Market Committee (“FOMC”). Short-term treasury maturities ended the fiscal year higher by approximately 120 bps. Intermediate and long-term rates also rose during the year albeit taking an indirect path. Rates rose during Q1 of 2018 responding to higher growth and inflation expectations following a positive U.S. Employment report. Mounting concerns surrounding geopolitical risks, trade tensions and prospects for slowing
| 1 | Index Provider—Northern Trust Investments, Inc. |
| 2 | The Northern Trust US Investment Grade Corporate Bond Index is designed to measure the performance of a diversified universe of intermediate maturity, U.S.-dollar denominated bonds of companies with investment grade-like characteristics, and enhanced short-term and long-term solvency. |
| 3 | A unit that is equal to 1/100th of 1% and is used to denote the change in a financial instrument. |
| | | | |
| FLEXSHARES ANNUAL REPORT | | | 47 | |
| | |
| FlexShares® Credit-Scored | | MANAGEMENT’S DISCUSSION OF FUND PERFORMANCE |
US Corporate Bond Index Fund (cont.)
PORTFOLIO ANALYSIS (cont.)
global growth during Q2 and Q3 of 2018 dampened the upward pressure. October 2018 closed out the fiscal year with a volatile month. Rates moved sharply higher early in the month responding to various concerns including an increasingly hawkish Federal Reserve, a slowdown in U.S. earnings, a trade war and heightened geopolitical risks. During the fiscal year, the U.S. 10-year and 30-year Treasury rose roughly 76 bps and 51 bps, respectively, resulting in the yield differential declining 25 bps during the fiscal year. U.S. long-term credit spreads widened during the fiscal year. Credit markets underperformed early in the fiscal year as demand waned following corporate tax reform. Growing fears that positive economic growth and inflationary pressures would cause the Federal Reserve to increase its pace of rate hikes combined with a strengthening U.S. dollar and geopolitical risks contributed to spread widening though Q1 and Q2 of 2018. Strong corporate earnings prompted an uptick in demand for fixed income securities that caused spread tightening into Q3 of 2018 before reversing course in October 2018. In late October 2018, interest rate markets reverted to the earlier downward trend leading to significant spread widening to close out the fiscal year. On a comparative and relative basis, longer maturity issues with lower credit quality had their yields diverge less versus higher credit quality issues during the fiscal year.
During the fiscal year ended October 31, 2018, the Underlying Index underperformed the Bloomberg Barclays Capital Intermediate US Corporate Bond Index by 0.31%, due to the Underlying Index’s longer duration4 positioning. The Underlying Index’s longer duration and curve positioning resulted in a greater negative price performance contribution with the increase in interest rates, while overweight allocations to the U.S. financial sector benefited performance. Relative underweights and security selection in the technology and health care sectors detracted from the Underlying Index performance. The tracking difference between the Fund’s NAV and the Underlying Index’s total return for the period was -44 bps, which is reflective of the Fund’s management fee (-22 bps), trading costs and fees (-8 bps), pricing differences (-2.1 bps), sector and security selection (-11.7 bps), yield curve positioning (1 bps) and other factors (-1.2 bps).
| 4 | Duration is how sensitive a fixed income investment is to a change in interest rates and is expressed as a number of years—the higher the number the more volatile would be the expected change. |
| | |
| 48 | | FLEXSHARES ANNUAL REPORT |
| | |
| FlexShares® Credit-Scored | | MANAGEMENT’S DISCUSSION OF FUND PERFORMANCE |
US Long Corporate Bond Index Fund Ticker: LKOR
CUMULATIVE PERFORMANCE
Through October 31, 2018
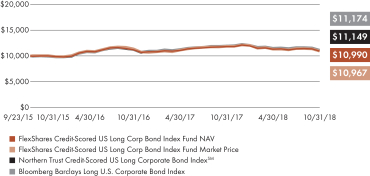
AVERAGE ANNUAL TOTAL RETURN
For the period ended October 31, 2018
| | | | | | | | | | | | |
| | | 1 Year | | | 3 Year | | | Fund
Inception
9/23/2015 | |
| | | | |
| | | |
FlexShares Credit-Scored US Long Corp Bond Index Fund (Based on Net Asset Value) | | | (7.24 | )% | | | 3.03 | % | | | 3.11 | % |
| | | |
FlexShares Credit-Scored US Long Corp Bond Index Fund (Based on Market Price) | | | (7.86 | )% | | | 2.69 | % | | | 2.98 | % |
| | | |
Northern Trust Credit-Scored US Long Corporate Bond IndexSM | | | (6.68 | )% | | | 3.55 | % | | | 3.62 | % |
| | | |
Bloomberg Barclays Long U.S. Corporate Index | | | (6.68 | )% | | | 3.61 | % | | | 3.64 | % |
All data as of 10/31/18. Total returns based on market price do not include brokerage commissions that may be payable on secondary market transactions. If brokerage commissions were included, these returns would be lower. Total returns based on market price and net asset values (“NAV”) assume that dividends and capital gain distributions have been reinvested in the Fund at market price and NAV, respectively. NAV is a fund’s net asset value per share, which is calculated by dividing the total value of all the securities in the fund’s portfolio plus cash, interest and receivables less any liabilities by the number of fund shares outstanding. Market price is determined by the midpoint of the bid/ask spread at 4:00 p.m. Eastern Time from the primary listing exchange. Market price returns may vary from net asset value returns.
Performance quoted represents past performance and does not guarantee future results. The graph and table do not reflect the deduction of taxes that a shareholder would pay on Fund distributions or the redemption or sale of Fund shares. Unlike the Index, the Fund’s total returns are reduced by operating expenses, such as transaction costs and management fees. An investor cannot invest directly in an index.
Performance reflects contractual reimbursements in effect until March 1, 2019. In the absence of such reimbursements, performance would be reduced. The gross expense ratio of the Fund is 0.24% and the net expense ratio is 0.22%. The gross and net expense ratios disclosed are as reported in the Fund’s prospectus, which may differ from the gross and net expense ratios presented in the Fund’s financial reports. Current performance may be higher or lower than performance shown. Investment return and the principal value of an investment will fluctuate. Shares may be worth more or less than original cost when redeemed or sold in the market.
FlexShares ETFs’ performance data current to the most recent month-end is available at www.flexshares.com.
PORTFOLIO ANALYSIS
The Fund seeks investment results that correspond generally to the price and yield performance, before fees and expenses, of the Northern Trust Credit-Scored US Long Corporate Bond IndexSM (the “Underlying Index”). The Underlying Index reflects the performance of a broad universe of US-dollar denominated bonds of companies that are considered by the index provider1 to have higher credit quality, lower risk of default and the potential for higher yield, price appreciation and liquidity relative to the universe of securities comprising the Northern Trust Investment-Grade US Long Corporate Bond IndexSM (the “Parent Index”)2. The Underlying Index begins with the Parent Index and then follows a rules-based methodology to select and calculate optimal weights for securities in the Underlying Index based on liquidity and security issuers’ fundamental factors, as determined by Northern Trust Investments, Inc. (“NTI”) in its capacity as index provider (the “Index Provider”). As of October 31, 2018, there were 800 issues in the Underlying Index. NTI uses a “passive” or indexing approach to try to achieve the Fund’s investment objective. NTI uses a representative sampling strategy to manage the Fund. This means the Fund may or may not hold all of the securities that are included in the Underlying Index.
U.S. interest rates rose during fiscal year 2018. The yield curve flattened as short-term rates responded throughout the year in conjunction with four increases in the Federal funds rate of 25 basis points (bps)3 each (in December of 2017 and March, June and September of 2018) by the Federal Open Market Committee (“FOMC”). Short-term treasury maturities ended the fiscal year higher by approximately 120 bps. Intermediate and long-term rates also rose during the year albeit taking an indirect path. Rates
| 1 | Index Provider—Northern Trust Investments, Inc. |
| 2 | The Northern Trust Investment-Grade US Long Corporate Bond IndexSM is designed to measure the performance of a diversified universe of intermediate maturity, U.S.-dollar denominated bonds of companies with investment grade-like characteristics, and enhanced short-term and long-term solvency. |
| 3 | A unit that is equal to 1/100th of 1% and is used to denote the change in a financial instrument. |
| | | | |
| FLEXSHARES ANNUAL REPORT | | | 49 | |
| | |
| FlexShares® Credit-Scored | | MANAGEMENT’S DISCUSSION OF FUND PERFORMANCE |
US Long Corporate Bond Index Fund (cont.)
PORTFOLIO ANALYSIS (cont.)
rose during Q1 of 2018 responding to higher growth and inflation expectations following a positive U.S. Employment report. Mounting concerns surrounding geopolitical risks, trade tensions and prospects for slowing global growth during Q2 and Q3 of 2018 dampened the upward pressure. October 2018 closed out the fiscal year with a volatile month. Rates moved sharply higher early in the month responding to various concerns including an increasingly hawkish Federal Reserve, a slowdown in U.S. earnings, trade war and heightened geopolitical risks. During the fiscal year, the U.S. 10-year and 30-year Treasury rose roughly 76 bps and 51 bps, respectively, resulting in the yield differential declining 25 bps during the fiscal year. U.S. long-term credit spreads widened during the fiscal year. Credit markets underperformed early in the fiscal year as demand weaned following corporate tax reform. Growing fears that positive economic growth and inflationary pressures would cause the Federal Reserve to increase its pace of rate hikes combined with a strengthening U.S. dollar and geopolitical risks contributed to spread widening though Q1 and Q2 of 2018. Strong corporate earnings prompted an uptick in demand for fixed income securities that caused spread tightening into Q3 of 2018 before reversing course in October 2018. In late October 2018, interest rate markets reverted to the earlier downward trend leading to significant spread widening to close out the fiscal year. On a comparative and relative basis, longer maturity issues with lower credit quality had their yields diverge less versus higher credit quality issues during the fiscal year.
During the fiscal year ended October 31, 2018, the Underlying Index performed in line with the Bloomberg Barclays Capital U.S. Long Corporate Bond Index. The tracking difference between the Fund’s NAV and the Underlying Index for the period was -56 bps, which is reflective of the Fund’s management fee (-22 bps), trading costs and fees (-29.8 bps), pricing differences (-7.3 bps), sector and security selection (+3.9 bps), yield curve positioning (-3.3 bps) and other factors (+2.5 bps).
| | |
| 50 | | FLEXSHARES ANNUAL REPORT |
| | |
| FlexShares® | | MANAGEMENT’S DISCUSSION OF FUND PERFORMANCE |
Ready Access Variable Income Fund Ticker: RAVI
CUMULATIVE PERFORMANCE
Through October 31, 2018
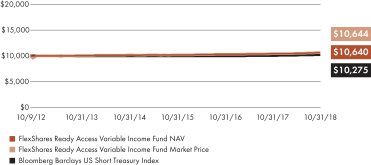
AVERAGE ANNUAL TOTAL RETURN
For the period ended October 31, 2018
| | | | | | | | | | | | | | | | |
| | | 1 Year | | | 3 Year | | | 5 Year | | | Fund
Inception
10/9/2012 | |
| | | | |
| | | | |
FlexShares Ready Access Variable Income Fund
(Based on Net Asset Value) | | | 1.80 | % | | | 1.39 | % | | | 1.09 | % | | | 1.03 | % |
| | | | |
FlexShares Ready Access Variable Income Fund
(Based on Market Price) | | | 1.91 | % | | | 1.38 | % | | | 1.09 | % | | | 1.04 | % |
| | | | |
Bloomberg Barclays US Short Treasury Index | | | 1.62 | % | | | 0.84 | % | | | 0.51 | % | | | 0.44 | % |
All data as of 10/31/18. Total returns based on market price do not include brokerage commissions that may be payable on secondary market transactions. If brokerage commissions were included, these returns would be lower. Total returns based on market price and net asset values (“NAV”) assume that dividends and capital gain distributions have been reinvested in the Fund at market price and NAV, respectively. NAV is a fund’s net asset value per share, which is calculated by dividing the total value of all the securities in the fund’s portfolio plus cash, interest and receivables less any liabilities by the number of fund shares outstanding. Market price is determined by the midpoint of the bid/ask spread at 4:00 p.m. Eastern Time from the primary listing exchange. Market price returns may vary from net asset value returns.
Performance quoted represents past performance and does not guarantee future results. The graph and table do not reflect the deduction of taxes that a shareholder would pay on Fund distributions or the redemption or sale of Fund shares. Unlike the Index, the Fund’s total returns are reduced by operating expenses, such as transaction costs and management fees. An investor cannot invest directly in an index.
Performance reflects contractual reimbursements in effect until March 1, 2019. In the absence of such reimbursements, performance would be reduced. The gross expense ratio of the Fund is 0.26% and the net expense ratio is 0.25%. The gross and net expense ratios disclosed are as reported in the Fund’s prospectus, which may differ from the gross and net expense ratios presented in the Fund’s financial reports. Current performance may be higher or lower than performance shown. Investment return and the principal value of an investment will fluctuate. Shares may be worth more or less than original cost when redeemed or sold in the market.
FlexShares ETFs’ performance data current to the most recent month-end is available at www.flexshares.com.
PORTFOLIO ANALYSIS
The Fund seeks maximum current income consistent with the preservation of capital and liquidity. The Fund attempts to achieve its investment objective by investing under normal circumstances at least 80% of its total assets in a non-diversified portfolio of fixed-income instruments, including bonds, debt securities and other similar instruments issued by U.S. and non-U.S. public and private sector entities. Such issuers include, without limitation, U.S. and non-U.S. governments and their agencies, instrumentalities or sponsored enterprises, U.S. state and local governments and U.S. and non-U.S. private-sector entities, such as corporations and banks. The average portfolio duration1 of the Fund will vary based on the Northern Trust Company Investment Policy Committee’s forecast for interest rates and will normally not exceed one year. The dollar-weighted average portfolio maturity of the Fund is normally not expected to exceed two years.
U.S. Treasury yields were higher during the fiscal year ended October 31, 2018 driven by improving U.S. and global economic growth and monetary tightening by U.S. Federal Reserve (“Fed”). The yield curve flattened as short-term rates responded throughout the year in conjunction with four increases in the Federal funds rate of 25 basis points (bps)2 each (in December of 2017 and March, June and September of 2018) by the Federal Open Market Committee (“FOMC”). By fiscal-year end, the U.S. yield curve was higher and flatter as 1-5 year Treasury yields were higher by 90-125 bps while 7-year and longer yields were higher by 50-83 bps. The effective Federal funds rate increased 100 bps to 2.18% during the fiscal year. Three-month London Interbank Offer Rate (“LIBOR”) moved steadily higher ending the fiscal year +118 bps at 2.56%.
| 1 | Duration is how sensitive a fixed income investment is to a change in interest rates and is expressed as a number of years—the higher the number the more volatile would be the expected change. |
| 2 | A unit that is equal to 1/100th of 1% and is used to denote the change in a financial instrument. |
| | | | |
| FLEXSHARES ANNUAL REPORT | | | 51 | |
| | |
| FlexShares® | | MANAGEMENT’S DISCUSSION OF FUND PERFORMANCE |
Ready Access Variable Income Fund (cont.)
PORTFOLIO ANALYSIS (cont.)
Global Central Banks (“GCBs”) maintained accommodative monetary policy as geopolitical risks weighed on markets. Notably, the Bank of England and the Bank of Canada both raised rates by 50 bps and 75 bps, respectively. United Kingdom short-term sovereign yields moved 30-40 bps higher in tandem with rate rises, while intermediate yields moved 10-25 bps higher as markets weighed the outcome of Brexit negotiations. The German and Japan sovereign curves were both slightly flatter by fiscal year end. Through the year, global investors sought out havens and higher relative yields in the U.S. as uncertainties around global growth weighed on global economies.
The Fund’s NAV outperformed its market benchmark, the Bloomberg Barclays US Short Treasury Index. Despite higher short-term rates, the positive contributions from the credit allocation decisions more than offset the adverse impact of a higher duration in the Fund’s portfolio than the benchmark. The Fund’s effective duration was generally managed in anticipation of higher potential interest rates balanced against other potentially attractive opportunities in short-term corporate securities. The Fund’s positioning in floating rate corporate securities benefitted performance as coupons reset on higher LIBOR rates. Positioning in term fixed-rate credit hurt performance as option adjusted spreads widened between October 2017 and October 2018.
| | |
| 52 | | FLEXSHARES ANNUAL REPORT |
| | |
| FlexShares® | | MANAGEMENT’S DISCUSSION OF FUND PERFORMANCE |
Core Select Bond Fund Ticker: BNDC
CUMULATIVE PERFORMANCE
Through October 31, 2018
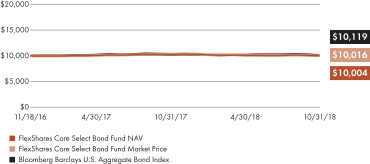
AVERAGE ANNUAL TOTAL RETURN
For the period ended October 31, 2018
| | | | | | | | |
| | | 1 Year | | | Fund
Inception
11/18/2016 | |
| | | | |
| | |
FlexShares Core Select Bond Fund Index Fund (Based on Net Asset Value) | | | (2.73 | )% | | | 0.03 | % |
| | |
FlexShares Core Select Bond Fund Index Fund (Based on Market Price) | | | (2.92 | )% | | | 0.09 | % |
| | |
Bloomberg Barclays U.S. Aggregate Bond Index | | | (2.05 | )% | | | 0.61 | % |
All data as of 10/31/18. Total returns based on market price do not include brokerage commissions that may be payable on secondary market transactions. If brokerage commissions were included, these returns would be lower. Total returns based on market price and net asset value (“NAV”) assume that dividends and capital gain distributions have been reinvested in the Fund at market price and NAV, respectively. NAV is a fund’s net asset value per share, which is calculated by dividing the total value of all the securities in the fund’s portfolio plus cash, interest and receivables less any liabilities by the number of fund shares outstanding. Market price is determined by the midpoint of the bid/ask spread at 4:00 p.m. Eastern Time from the primary listing exchange. Market price returns may vary from net asset value returns.
Performance quoted represents past performance and does not guarantee future results. The graph and table do not reflect the deduction of taxes that a shareholder would pay on Fund distributions or the redemption or sale of Fund shares. Unlike the Index, the Fund’s total returns are reduced by operating expenses, such as transaction costs and management fees. An investor cannot invest directly in an index.
Performance reflects contractual reimbursements in effect until March 1, 2019. In the absence of such reimbursements, performance would be reduced. The gross expense ratio of the Fund is 0.67% and the net expense ratio is 0.35%. The gross and net expense ratios disclosed are as reported in the Fund’s prospectus, which may differ from the gross and net expense ratios presented in the Fund’s financial reports. Current performance may be higher or lower than performance shown. Investment return and the principal value of an investment will fluctuate. Shares may be worth more or less than original cost when redeemed or sold in the market.
FlexShares ETFs’ performance data current to the most recent month-end is available at www.flexshares.com.
PORTFOLIO ANALYSIS
The Fund seeks total return and preservation of capital. The Fund seeks to achieve its investment objective by investing, under normal circumstances, at least 80% of its net assets in U.S. dollar-denominated investment-grade fixed-income securities either directly or indirectly through exchange-traded funds (“ETFs”) and other registered investment companies (together with ETFs, “Underlying Funds”). The Fund primarily invests in fixed-rate securities of varying maturities, including bonds, debt securities and other similar instruments issued by U.S. public and U.S and non-U.S. private sector entities. Such issuers include, without limitation, U.S. governments and their agencies, instrumentalities or sponsored enterprises, and U.S. and non-U.S. private-sector entities, such as corporations and banks. The Fund may invest in fixed income securities of any maturity.
The Fund seeks to provide attractive risk-adjusted performance by investing in a portfolio of fixed-income securities that is designed to achieve optimal potential for total return after taking into account various sources of investment risk. The Fund adjusts its allocations to securities based on Northern Trust Investment Inc.’s assessment of potential changes in interest rate levels, the shape of the yield curve and credit spread relationships. The Fund also seeks to balance the potential for return and risk while emphasizing liquidity and diversification across a spectrum of U.S. dollar-denominated investment-grade fixed income securities including those of both affiliated and unaffiliated funds.
U.S. interest rates rose during fiscal year 2018. The yield curve flattened as short-term rates responded throughout the year to four increases in the Federal funds rate of 25 basis points (bps)1 each (in December of 2017 and March, June and September of 2018) by the Federal Open Market Committee (“FOMC”). Short-term treasury maturities ended the fiscal year higher by approximately 120 bps. Intermediate and long-term rates also rose
| 1 | A unit that is equal to 1/100th of 1% and is used to denote the change in a financial instrument. |
| | | | |
| FLEXSHARES ANNUAL REPORT | | | 53 | |
| | |
| FlexShares® | | MANAGEMENT’S DISCUSSION OF FUND PERFORMANCE |
Core Select Bond Fund (cont.)
PORTFOLIO ANALYSIS (cont.)
during the year albeit taking an indirect path. Rates rose during Q1 of 2018 responding to higher growth and inflation expectations following a positive U.S. employment report. Mounting concerns surrounding geopolitical risks, trade tensions and prospects for slowing global growth during Q2 and Q3 of 2018 dampened the upward pressure. October 2018 closed out the fiscal year with a volatile month. Rates moved sharply higher early in the month responding to various concerns including an increasingly hawkish Federal Reserve, a slowdown in U.S. earnings, and heightened geopolitical risks. During the fiscal year, the U.S. 10-year and 30-year Treasuries rose roughly 76 bps and 51 bps, respectively.
The Fund was positioned with an overweight in corporate credit on expectations for improving economic growth and corporate earnings. An overweight to mortgage-backed securities (“MBS”) during the year was based on valuations and interest rate expectations. The Fund reduced allocations to Treasury Inflation Protected Securities (“TIPS”) during the year as expectations for inflation weakened. Duration2 positioning was generally short during the fiscal year, with the exception of a few periods when duration was neutralized when investor sentiment weakened and Treasury yields rallied on geopolitical and restrictive FOMC monetary policy concerns. Both U.S. investment grade-corporate credit spreads and MBS spreads widened from October 2017 levels.
The Fund underperformed its benchmark, the Bloomberg Barclays U.S. Aggregate Bond Index during the fiscal year. Overweight allocations of its underlying funds to corporate credit and MBS added to performance, while security selection of its underlying funds in corporates detracted from performance. Duration and yield curve positioning in its underlying funds contributed modestly to performance.
| 2 | Duration is how sensitive a fixed income investment is to a change in interest rates and is expressed as a number of years—the higher the number the more volatile would be the expected change. |
| | |
| 54 | | FLEXSHARES ANNUAL REPORT |
FlexShares® Trust
Statements of Assets and Liabilities October 31, 2018 (Unaudited)
| | | | | | | | | | | | | | | | |
| | | FlexShares®
Morningstar US
Market Factor Tilt
Index Fund | | | FlexShares®
Morningstar
Developed
Markets ex-US
Factor Tilt
Index Fund | | | FlexShares®
Morningstar
Emerging
Markets
Factor Tilt
Index Fund | | | FlexShares®
Currency Hedged
Morningstar DM
ex-US Factor Tilt
Index Fund | |
| | | | |
ASSETS | | | | | | | | | | | | | | | | |
Securities, at cost | | $ | 998,482,329 | | | $ | 906,507,390 | | | $ | 492,949,525 | | | $ | — | |
Affiliate securities, at cost | | | 579,351 | | | | — | | | | — | | | | 8,590,055 | |
Securities Lending Reinvestments, at cost | | | 130,653,865 | | | | 14,811,881 | | | | 714,117 | | | | — | |
| | | | |
Securities, at value | | | 1,370,326,592 | | | | 948,590,030 | | | | 486,230,559 | | | | — | |
Affiliate securities, at value | | | 809,190 | | | | — | | | | — | | | | 7,846,364 | |
Securities Lending Reinvestments, at value | | | 130,655,170 | | | | 14,811,881 | | | | 714,117 | | | | — | |
Cash | | | 14,663,226 | | | | 8,724,915 | | | | 1,391,402 | | | | 1,291 | |
Cash segregated at broker* | | | 2,330,609 | | | | 2,144,417 | | | | 363,330 | | | | 3 | |
Foreign cash† | | | — | | | | 4,475,216 | | | | 808,248 | | | | — | |
Restricted cash** | | | — | | | | — | | | | — | | | | — | |
Due from Custodian | | | — | | | | 97,829 | | | | — | | | | — | |
Unrealized appreciation on forward foreign currency contracts | | | — | | | | 31,267 | | | | 13,145 | | | | 85,584 | |
Receivables: | | | — | | | | — | | | | — | | | | — | |
Dividends and interest | | | 979,582 | | | | 4,220,573 | | | | 438,809 | | | | — | |
Securities lending income | | | 53,751 | | | | 94,648 | | | | 26,203 | | | | — | |
Capital shares issued | | | — | | | | — | | | | — | | | | — | |
Investment adviser | | | 77,279 | | | | 56,737 | | | | 29,586 | | | | 967 | |
Securities sold | | | — | | | | 823,975 | | | | 168,511 | | | | — | |
| | | | |
Total Assets | | | 1,519,895,399 | | | | 984,071,488 | | | | 490,183,910 | | | | 7,934,209 | |
| | | | |
| | | | |
LIABILITIES | | | | | | | | | | | | | | | | |
Cash overdraft | | | — | | | | — | | | | — | | | | — | |
Unrealized depreciation on forward foreign currency contracts | | | — | | | | 179,231 | | | | 46,527 | | | | 40 | |
Payables: | | | | | | | | | | | | | | | | |
Cash collateral received from securities loaned | | | 130,654,828 | | | | 14,811,881 | | | | 714,117 | | | | — | |
Deferred compensation (Note 7) | | | 68,555 | | | | 50,372 | | | | 25,700 | | | | 506 | |
Investment advisory fees (Note 4) | | | 282,268 | | | | 328,575 | | | | 260,244 | | | | 130 | |
Trustee fees (Note 7) | | | 8,724 | | | | 6,365 | | | | 3,886 | | | | 461 | |
Securities purchased | | | — | | | | — | | | | 60 | | | | — | |
Due to Authorized Participant | | | — | | | | — | | | | 97,212 | | | | — | |
Variation margin on futures contracts | | | 1,204,342 | | | | 579,346 | | | | 150,119 | | | | — | |
Capital shares redeemed | | | — | | | | — | | | | — | | | | — | |
Other | | | 12,000 | | | | 20,000 | | | | 150,000 | | | | — | |
| | | | |
Total Liabilities | | | 132,230,717 | | | | 15,975,770 | | | | 1,447,865 | | | | 1,137 | |
| | | | |
Net Assets | | $ | 1,387,664,682 | | | $ | 968,095,718 | | | $ | 488,736,045 | | | $ | 7,933,072 | |
| | | | |
| | | | |
NET ASSETS CONSIST OF: | | | | | | | | | | | | | | | | |
Paid-in capital | | $ | 1,029,790,493 | | | $ | 993,123,881 | | | $ | 531,606,759 | | | $ | 9,636,961 | |
Distributable earnings (loss) (Note 13) | | | 357,874,189 | | | | (25,028,163 | ) | | | (42,870,714 | ) | | | (1,703,889 | ) |
| | | | |
Net Assets | | $ | 1,387,664,682 | | | $ | 968,095,718 | | | $ | 488,736,045 | | | $ | 7,933,072 | |
| | | | |
| | | | |
Shares Outstanding (unlimited number of shares authorized $0.0001 par value) | | | 12,600,001 | | | | 16,200,001 | | | | 10,200,001 | | | | 300,001 | |
Net Asset Value | | $ | 110.13 | | | $ | 59.76 | | | $ | 47.92 | | | $ | 26.44 | |
| | | | |
† Cost of foreign cash | | $ | — | | | $ | 4,526,282 | | | $ | 811,399 | | | $ | — | |
| * | Includes cash pledged by the Fund to cover margin requirements for open futures contracts as of 10/31. |
| ** | Includes cash pledged by an Authorized Participant for missing deposit securities required to secure Creation Units. |
See Accompanying Notes to the Financial Statements.
| | | | |
| FLEXSHARES ANNUAL REPORT | | | 55 | |
Statements of Assets and Liabilities (cont.)
| | | | | | | | | | | | | | | | |
| | | FlexShares®
Currency Hedged
Morningstar EM
Factor Tilt
Index Fund | | | FlexShares®
US Quality
Large Cap
Index Fund | | | FlexShares®
STOXX® US
ESG Impact
Index Fund | | | FlexShares®
STOXX®
Global ESG
Impact
Index Fund | |
| | | | |
ASSETS | | | | | | | | | | | | | | | | |
Securities, at cost | | $ | — | | | $ | 58,930,813 | | | $ | 26,065,711 | | | $ | 71,070,288 | |
Affiliate securities, at cost | | | 5,229,977 | | | | — | | | | — | | | | — | |
Securities Lending Reinvestments, at cost | | | — | | | | — | | | | — | | | | — | |
| | | | |
Securities, at value | | | — | | | | 61,687,611 | | | | 28,337,902 | | | | 72,219,825 | |
Affiliate securities, at value | | | 4,467,575 | | | | — | | | | — | | | | — | |
Securities Lending Reinvestments, at value | | | — | | | | — | | | | — | | | | — | |
Cash | | | 41,776 | | | | 112,480 | | | | 500,043 | | | | 484,967 | |
Cash segregated at broker* | | | 15,895 | | | | 45,084 | | | | 93,648 | | | | 146,161 | |
Foreign cash† | | | — | | | | — | | | | — | | | | 377,038 | |
Restricted cash** | | | — | | | | — | | | | — | | | | — | |
Due from Custodian | | | — | | | | — | | | | — | | | | 3,276 | |
Unrealized appreciation on forward foreign currency contracts | | | 46,245 | | | | — | | | | — | | | | — | |
Receivables: | | | — | | | | — | | | | — | | | | — | |
Dividends and interest | | | — | | | | 55,883 | | | | 27,703 | | | | 146,889 | |
Securities lending income | | | — | | | | — | | | | — | | | | — | |
Capital shares issued | | | — | | | | — | | | | — | | | | — | |
Investment adviser | | | 1,736 | | | | 1,638 | | | | 927 | | | | 1,794 | |
Securities sold | | | — | | | | 1,646,378 | | | | 3,027,268 | | | | — | |
| | | | |
Total Assets | | | 4,573,227 | | | | 63,549,074 | | | | 31,987,491 | | | | 73,379,950 | |
| | | | |
| | | | |
LIABILITIES | | | | | | | | | | | | | | | | |
Cash overdraft | | | — | | | | — | | | | — | | | | — | |
Unrealized depreciation on forward foreign currency contracts | | | 9,041 | | | | — | | | | — | | | | — | |
Payables: | | | | | | | | | | | | | | | | |
Cash collateral received from securities loaned | | | — | | | | — | | | | — | | | | — | |
Deferred compensation (Note 7) | | | 1,360 | | | | 934 | | | | 419 | | | | 983 | |
Investment advisory fees (Note 4) | | | — | | | | 17,631 | | | | 7,700 | | | | 26,823 | |
Trustee fees (Note 7) | | | 360 | | | | 704 | | | | 508 | | | | 811 | |
Securities purchased | | | — | | | | — | | | | 3,004,894 | | | | — | |
Due to Authorized Participant | | | — | | | | — | | | | — | | | | — | |
Variation margin on futures contracts | | | 5,037 | | | | 11,170 | | | | 26,889 | | | | 67,226 | |
Capital shares redeemed | | | — | | | | 1,657,398 | | | | — | | | | — | |
Other | | | — | | | | 2,500 | | | | 700 | | | | — | |
| | | | |
Total Liabilities | | | 15,798 | | | | 1,690,337 | | | | 3,041,110 | | | | 95,843 | |
| | | | |
Net Assets | | $ | 4,557,429 | | | $ | 61,858,737 | | | $ | 28,946,381 | | | $ | 73,284,107 | |
| | | | |
| | | | |
NET ASSETS CONSIST OF: | | | | | | | | | | | | | | | | |
Paid-in capital | | $ | 7,079,503 | | | $ | 59,813,666 | | | $ | 26,770,362 | | | $ | 72,978,036 | |
Distributable earnings (loss) (Note 13) | | | (2,522,074 | ) | | | 2,045,071 | | | | 2,176,019 | | | | 306,071 | |
| | | | |
Net Assets | | $ | 4,557,429 | | | $ | 61,858,737 | | | $ | 28,946,381 | | | $ | 73,284,107 | |
| | | | |
| | | | |
Shares Outstanding (unlimited number of shares authorized $0.0001 par value) | | | 175,001 | | | | 1,850,001 | | | | 450,001 | | | | 800,001 | |
Net Asset Value | | $ | 26.04 | | | $ | 33.44 | | | $ | 64.33 | | | $ | 91.61 | |
| | | | |
† Cost of foreign cash | | $ | — | | | $ | — | | | $ | — | | | $ | 386,292 | |
| * | Includes cash pledged by the Fund to cover margin requirements for open futures contracts as of 10/31. |
| ** | Includes cash pledged by an Authorized Participant for missing deposit securities required to secure Creation Units. |
See Accompanying Notes to the Financial Statements.
| | |
| 56 | | FLEXSHARES ANNUAL REPORT |
Statements of Assets and Liabilities (cont.)
| | | | | | | | | | | | | | | | |
| | | FlexShares®
Morningstar Global
Upstream Natural
Resources
Index Fund | | | FlexShares®
STOXX®
Global Broad
Infrastructure
Index Fund | | | FlexShares®
Global Quality
Real Estate
Index Fund | | | FlexShares®
Real Assets
Allocation
Index Fund | |
| | | | |
ASSETS | | | | | | | | | | | | | | | | |
Securities, at cost | | $ | 5,014,610,067 | | | $ | 740,569,657 | | | $ | 258,074,535 | | | $ | — | |
Affiliate securities, at cost | | | — | | | | — | | | | — | | | | 14,429,243 | |
Securities Lending Reinvestments, at cost | | | 138,790,533 | | | | 37,964,782 | | | | 7,435,740 | | | | — | |
| | | | |
Securities, at value | | | 5,407,931,120 | | | | 767,738,370 | | | | 267,743,073 | | | | — | |
Affiliate securities, at value | | | — | | | | — | | | | — | | | | 13,881,869 | |
Securities Lending Reinvestments, at value | | | 138,792,036 | | | | 37,965,474 | | | | 7,435,740 | | | | — | |
Cash | | | 17,450,581 | | | | 1,725,369 | | | | 2,945,909 | | | | 6,070 | |
Cash segregated at broker* | | | 3,932,242 | | | | 704,461 | | | | 1,007,556 | | | | — | |
Foreign cash† | | | 5,252,543 | | | | 1,769,399 | | | | 3,639,953 | | | | — | |
Restricted cash** | | | 90,063 | | | | 138,033 | | | | — | | | | — | |
Due from Custodian | | | — | | | | — | | | | — | | | | — | |
Unrealized appreciation on forward foreign currency contracts | | | 386,287 | | | | 7,237 | | | | 18,770 | | | | — | |
Receivables: | | | — | | | | — | | | | — | | | | — | |
Dividends and interest | | | 5,160,045 | | | | 1,992,700 | | | | 521,883 | | | | — | |
Securities lending income | | | 218,255 | | | | 41,057 | | | | 8,613 | | | | — | |
Capital shares issued | | | 10,900,652 | | | | — | | | | — | | | | — | |
Investment adviser | | | 304,656 | | | | 43,611 | | | | 13,164 | | | | 645 | |
Securities sold | | | — | | | | 7,306 | | | | — | | | | — | |
| | | | |
Total Assets | | | 5,590,418,480 | | | | 812,133,017 | | | | 283,334,661 | | | | 13,888,584 | |
| | | | |
| | | | |
LIABILITIES | | | | | | | | | | | | | | | | |
Cash overdraft | | | — | | | | — | | | | — | | | | — | |
Unrealized depreciation on forward foreign currency contracts | | | 617,805 | | | | 21,556 | | | | 6,809 | | | | — | |
Payables: | | | | | | | | | | | | | | | | |
Cash collateral received from securities loaned | | | 138,793,426 | | | | 37,964,782 | | | | 7,435,740 | | | | — | |
Deferred compensation (Note 7) | | | 272,101 | | | | 38,642 | | | | 11,048 | | | | 206 | |
Investment advisory fees (Note 4) | | | 2,183,603 | | | | 309,566 | | | | 106,448 | | | | 926 | |
Trustee fees (Note 7) | | | 32,555 | | | | 4,969 | | | | 2,116 | | | | 439 | |
Securities purchased | | | 10,814,039 | | | | — | | | | — | | | | — | |
Due to Authorized Participant | | | 90,063 | | | | 138,033 | | | | — | | | | — | |
Variation margin on futures contracts | | | 1,822,828 | | | | 278,714 | | | | 438,768 | | | | — | |
Capital shares redeemed | | | — | | | | — | | | | — | | | | — | |
Other | | | 9,000 | | | | 14,000 | | | | 2,000 | | | | — | |
| | | | |
Total Liabilities | | | 154,635,420 | | | | 38,770,262 | | | | 8,002,929 | | | | 1,571 | |
| | | | |
Net Assets | | $ | 5,435,783,060 | | | $ | 773,362,755 | | | $ | 275,331,732 | | | $ | 13,887,013 | |
| | | | |
| | | | |
NET ASSETS CONSIST OF: | | | | | | | | | | | | | | | | |
Paid-in capital | | $ | 5,666,651,338 | | | $ | 780,671,062 | | | $ | 269,108,423 | | | $ | 14,456,708 | |
Distributable earnings (loss) (Note 13) | | | (230,868,278 | ) | | | (7,308,307 | ) | | | 6,223,309 | | | | (569,695 | ) |
| | | | |
Net Assets | | $ | 5,435,783,060 | | | $ | 773,362,755 | | | $ | 275,331,732 | | | $ | 13,887,013 | |
| | | | |
| | | | |
Shares Outstanding (unlimited number of shares authorized $0.0001 par value) | | | 172,500,001 | | | | 17,150,001 | | | | 4,750,001 | | | | 525,001 | |
Net Asset Value | | $ | 31.51 | | | $ | 45.09 | | | $ | 57.96 | | | $ | 26.45 | |
| | | | |
† Cost of foreign cash | | $ | 5,269,767 | | | $ | 1,783,380 | | | $ | 3,676,081 | | | $ | — | |
| * | Includes cash pledged by the Fund to cover margin requirements for open futures contracts as of 10/31. |
| ** | Includes cash pledged by an Authorized Participant for missing deposit securities required to secure Creation Units. |
See Accompanying Notes to the Financial Statements.
| | | | |
| FLEXSHARES ANNUAL REPORT | | | 57 | |
Statements of Assets and Liabilities (cont.)
| | | | | | | | | | | | | | | | |
| | | FlexShares®
Quality
Dividend
Index Fund | | | FlexShares®
Quality Dividend
Defensive
Index Fund | | | FlexShares®
Quality Dividend
Dynamic Index
Fund | | | FlexShares®
International
Quality Dividend
Index Fund | |
| | | | |
ASSETS | | | | | | | | | | | | | | | | |
Securities, at cost | | $ | 1,466,713,370 | | | $ | 270,084,688 | | | $ | 39,059,319 | | | $ | 812,480,108 | |
Affiliate securities, at cost | | | — | | | | — | | | | — | | | | — | |
Securities Lending Reinvestments, at cost | | | 267,327,726 | | | | 41,878,173 | | | | 4,414,438 | | | | 26,811,607 | |
| | | | |
Securities, at value | | | 1,745,076,088 | | | | 317,704,572 | | | | 43,725,021 | | | | 758,484,526 | |
Affiliate securities, at value | | | — | | | | — | | | | — | | | | — | |
Securities Lending Reinvestments, at value | | | 267,329,351 | | | | 41,878,171 | | | | 4,414,438 | | | | 26,811,607 | |
Cash | | | 12,519,029 | | | | 1,750,663 | | | | 483,987 | | | | 1,454,057 | |
Cash segregated at broker* | | | 1,950,016 | | | | 501,396 | | | | 69,437 | | | | 937,614 | |
Foreign cash† | | | — | | | | — | | | | — | | | | 1,695,039 | |
Restricted cash** | | | — | | | | — | | | | — | | | | — | |
Due from Custodian | | | — | | | | — | | | | — | | | | — | |
Unrealized appreciation on forward foreign currency contracts | | | — | | | | — | | | | — | | | | 269,684 | |
Receivables: | | | — | | | | — | | | | — | | | | — | |
Dividends and interest | | | 1,884,919 | | | | 349,741 | | | | 73,453 | | | | 3,243,365 | |
Securities lending income | | | 155,511 | | | | 4,902 | | | | 233 | | | | 89,916 | |
Capital shares issued | | | — | | | | 2,222,854 | | | | — | | | | — | |
Investment adviser | | | 94,802 | | | | 17,711 | | | | 5,300 | | | | 41,841 | |
Securities sold | | | 76,954,582 | | | | — | | | | — | | | | 304,342 | |
| | | | |
Total Assets | | | 2,105,964,298 | | | | 364,430,010 | | | | 48,771,869 | | | | 793,331,991 | |
| | | | |
| | | | |
LIABILITIES | | | | | | | | | | | | | | | | |
Cash overdraft | | | — | | | | — | | | | — | | | | — | |
Unrealized depreciation on forward foreign currency contracts | | | — | | | | — | | | | — | | | | 286,539 | |
Payables: | | | | | | | | | | | | | | | | |
Cash collateral received from securities loaned | | | 267,451,902 | | | | 41,878,173 | | | | 4,414,438 | | | | 26,811,607 | |
Deferred compensation (Note 7) | | | 83,085 | | | | 15,220 | | | | 4,521 | | | | 36,527 | |
Investment advisory fees (Note 4) | | | 564,138 | | | | 101,577 | | | | 14,290 | | | | 318,543 | |
Trustee fees (Note 7) | | | 11,717 | | | | 2,491 | | | | 779 | | | | 5,314 | |
Securities purchased | | | 73,345,250 | | | | 2,184,109 | | | | — | | | | 18 | |
Due to Authorized Participant | | | — | | | | — | | | | — | | | | 261,031 | |
Variation margin on futures contracts | | | 937,299 | | | | 154,465 | | | | 31,672 | | | | 385,673 | |
Capital shares redeemed | | | 4,453,433 | | | | — | | | | — | | | | — | |
Other | | | 9,750 | | | | 3,000 | | | | 750 | | | | 60,000 | |
| | | | |
Total Liabilities | | | 346,856,574 | | | | 44,339,035 | | | | 4,466,450 | | | | 28,165,252 | |
| | | | |
Net Assets | | $ | 1,759,107,724 | | | $ | 320,090,975 | | | $ | 44,305,419 | | | $ | 765,166,739 | |
| | | | |
| | | | |
NET ASSETS CONSIST OF: | | | | | | | | | | | | | | | | |
Paid-in capital | | $ | 1,456,479,444 | | | $ | 259,300,141 | | | $ | 39,807,613 | | | $ | 888,794,948 | |
Distributable earnings (loss) (Note 13) | | | 302,628,280 | | | | 60,790,834 | | | | 4,497,806 | | | | (123,628,209 | ) |
| | | | |
Net Assets | | $ | 1,759,107,724 | | | $ | 320,090,975 | | | $ | 44,305,419 | | | $ | 765,166,739 | |
| | | | |
| | | | |
Shares Outstanding (unlimited number of shares authorized $0.0001 par value) | | | 39,500,001 | | | | 7,200,001 | | | | 1,050,001 | | | | 34,200,001 | |
Net Asset Value | | $ | 44.53 | | | $ | 44.46 | | | $ | 42.20 | | | $ | 22.37 | |
| | | | |
† Cost of foreign cash | | $ | — | | | $ | — | | | $ | — | | | $ | 1,707,736 | |
| * | Includes cash pledged by the Fund to cover margin requirements for open futures contracts as of 10/31. |
| ** | Includes cash pledged by an Authorized Participant for missing deposit securities required to secure Creation Units. |
See Accompanying Notes to the Financial Statements.
| | |
| 58 | | FLEXSHARES ANNUAL REPORT |
Statements of Assets and Liabilities (cont.)
| | | | | | | | | | | | | | | | |
| | | FlexShares®
International
Quality Dividend
Defensive Index
Fund | | | FlexShares®
International
Quality Dividend
Dynamic Index
Fund | | | FlexShares®
iBoxx 3-Year Target
Duration TIPS
Index Fund | | | FlexShares®
iBoxx 5-Year Target
Duration TIPS
Index Fund | |
| | | | |
ASSETS | | | | | | | | | | | | | | | | |
Securities, at cost | | $ | 92,311,458 | | | $ | 67,610,884 | | | $ | 1,677,650,199 | | | $ | 934,122,755 | |
Affiliate securities, at cost | | | — | | | | — | | | | — | | | | — | |
Securities Lending Reinvestments, at cost | | | 55,421 | | | | 454,933 | | | | — | | | | — | |
| | | | |
Securities, at value | | | 86,461,789 | | | | 62,937,200 | | | | 1,639,405,709 | | | | 902,085,685 | |
Affiliate securities, at value | | | — | | | | — | | | | — | | | | — | |
Securities Lending Reinvestments, at value | | | 55,421 | | | | 454,933 | | | | — | | | | — | |
Cash | | | 205,533 | | | | 131,343 | | | | 345,646 | | | | — | |
Cash segregated at broker* | | | 198,762 | | | | 88,765 | | | | — | | | | — | |
Foreign cash† | | | 617,349 | | | | 79,986 | | | | — | | | | — | |
Restricted cash** | | | — | | | | — | | | | — | | | | — | |
Due from Custodian | | | — | | | | — | | | | — | | | | — | |
Unrealized appreciation on forward foreign currency contracts | | | 1,426 | | | | — | | | | — | | | | — | |
Receivables: | | | — | | | | — | | | | — | | | | — | |
Dividends and interest | | | 328,811 | | | | 310,525 | | | | 2,108,338 | | | | 1,910,576 | |
Securities lending income | | | 12,391 | | | | 6,759 | | | | — | | | | — | |
Capital shares issued | | | — | | | | — | | | | — | | | | — | |
Investment adviser | | | 6,176 | | | | 4,041 | | | | 181,996 | | | | 62,424 | |
Securities sold | | | — | | | | 2,116 | | | | 9,530,023 | | | | 3,812,396 | |
| | | | |
Total Assets | | | 87,887,658 | | | | 64,015,668 | | | | 1,651,571,712 | | | | 907,871,081 | |
| | | | |
| | | | |
LIABILITIES | | | | | | | | | | | | | | | | |
Cash overdraft | | | — | | | | — | | | | — | | | | 3,642,265 | |
Unrealized depreciation on forward foreign currency contracts | | | 2,909 | | | | — | | | | — | | | | — | |
Payables: | | | | | | | | | | | | | | | | |
Cash collateral received from securities loaned | | | 55,421 | | | | 454,933 | | | | — | | | | — | |
Deferred compensation (Note 7) | | | 5,292 | | | | 3,252 | | | | 171,722 | | | | 56,532 | |
Investment advisory fees (Note 4) | | | 35,681 | | | | 27,230 | | | | 256,197 | | | | 139,169 | |
Trustee fees (Note 7) | | | 884 | | | | 789 | | | | 10,274 | | | | 5,892 | |
Securities purchased | | | 261 | | | | 2,116 | | | | — | | | | — | |
Due to Authorized Participant | | | — | | | | — | | | | — | | | �� | — | |
Variation margin on futures contracts | | | 84,529 | | | | 41,619 | | | | — | | | | — | |
Capital shares redeemed | | | — | | | | — | | | | 9,523,481 | | | | — | |
Other | | | — | | | | 5,000 | | | | — | | | | — | |
| | | | |
Total Liabilities | | | 184,977 | | | | 534,939 | | | | 9,961,674 | | | | 3,843,858 | |
| | | | |
Net Assets | | $ | 87,702,681 | | | $ | 63,480,729 | | | $ | 1,641,610,038 | | | $ | 904,027,223 | |
| | | | |
| | | | |
NET ASSETS CONSIST OF: | | | | | | | | | | | | | | | | |
Paid-in capital | | $ | 108,705,227 | | | $ | 77,602,597 | | | $ | 1,740,254,889 | | | $ | 951,823,829 | |
Distributable earnings (loss) (Note 13) | | | (21,002,546 | ) | | | (14,121,868 | ) | | | (98,644,851 | ) | | | (47,796,606 | ) |
| | | | |
Net Assets | | $ | 87,702,681 | | | $ | 63,480,729 | | | $ | 1,641,610,038 | | | $ | 904,027,223 | |
| | | | |
| | | | |
Shares Outstanding (unlimited number of shares authorized $0.0001 par value) | | | 4,100,001 | | | | 2,700,001 | | | | 68,954,000 | | | | 37,750,001 | |
Net Asset Value | | $ | 21.39 | | | $ | 23.51 | | | $ | 23.81 | | | $ | 23.95 | |
| | | | |
† Cost of foreign cash | | $ | 624,003 | | | $ | 80,306 | | | $ | — | | | $ | — | |
| * | Includes cash pledged by the Fund to cover margin requirements for open futures contracts as of 10/31. |
| ** | Includes cash pledged by an Authorized Participant for missing deposit securities required to secure Creation Units. |
See Accompanying Notes to the Financial Statements.
| | | | |
| FLEXSHARES ANNUAL REPORT | | | 59 | |
Statements of Assets and Liabilities (cont.)
| | | | | | | | | | | | | | | | |
| | | FlexShares®
Disciplined
Duration MBS
Index Fund | | | FlexShares®
Credit-Scored
US Corporate
Bond Index
Fund | | | FlexShares®
Credit-Scored
US Long
Corporate Bond
Index Fund | | | FlexShares®
High Yield
Value-Scored
Bond Index
Fund | |
| | | | |
ASSETS | | | | | | | | | | | | | | | | |
Securities, at cost | | $ | 73,256,197 | | | $ | 61,821,711 | | | $ | 27,753,672 | | | $ | 49,507,707 | |
Affiliate securities, at cost | | | — | | | | — | | | | — | | | | — | |
Securities Lending Reinvestments, at cost | | | — | | | | — | | | | — | | | | — | |
| | | | |
Securities, at value | | | 71,184,920 | | | | 60,097,304 | | | | 25,960,236 | | | | 47,942,467 | |
Affiliate securities, at value | | | — | | | | — | | | | — | | | | — | |
Securities Lending Reinvestments, at value | | | — | | | | — | | | | — | | | | — | |
Cash | | | 2,763,033 | | | | 213,281 | | | | 94,417 | | | | 101,335 | |
Cash segregated at broker* | | | — | | | | — | | | | — | | | | — | |
Foreign cash† | | | — | | | | — | | | | — | | | | — | |
Restricted cash** | | | — | | | | — | | | | — | | | | — | |
Due from Custodian | | | — | | | | — | | | | — | | | | — | |
Unrealized appreciation on forward foreign currency contracts | | | — | | | | — | | | | — | | | | — | |
Receivables: | | | — | | | | — | | | | — | | | | — | |
Dividends and interest | | | 238,358 | | | | 530,974 | | | | 353,931 | | | | 943,004 | |
Securities lending income | | | — | | | | — | | | | — | | | | — | |
Capital shares issued | | | — | | | | — | | | | — | | | | — | |
Investment adviser | | | 2,672 | | | | 2,571 | | | | 1,193 | | | | 835 | |
Securities sold | | | 1,030,667 | | | | 3,989,289 | | | | 1,533,565 | | | | 1,629,767 | |
| | | | |
Total Assets | | | 75,219,650 | | | | 64,833,419 | | | | 27,943,342 | | | | 50,617,408 | |
| | | | |
| | | | |
LIABILITIES | | | | | | | | | | | | | | | | |
Cash overdraft | | | — | | | | — | | | | — | | | | — | |
Unrealized depreciation on forward foreign currency contracts | | | — | | | | — | | | | — | | | | — | |
Payables: | | | | | | | | | | | | | | | | |
Cash collateral received from securities loaned | | | — | | | | — | | | | — | | | | — | |
Deferred compensation (Note 7) | | | 1,888 | | | | 1,863 | | | | 683 | | | | 165 | |
Investment advisory fees (Note 4) | | | 12,061 | | | | 11,361 | | | | 5,011 | | | | 15,484 | |
Trustee fees (Note 7) | | | 784 | | | | 708 | | | | 510 | | | | 322 | |
Securities purchased | | | 3,576,133 | | | | 4,083,217 | | | | 1,513,166 | | | | 1,756,451 | |
Due to Authorized Participant | | | — | | | | — | | | | — | | | | — | |
Variation margin on futures contracts | | | — | | | | — | | | | — | | | | — | |
Capital shares redeemed | | | — | | | | — | | | | — | | | | — | |
Other | | | 1,200 | | | | 500 | | | | — | | | | — | |
| | | | |
Total Liabilities | | | 3,592,066 | | | | 4,097,649 | | | | 1,519,370 | | | | 1,772,422 | |
| | | | |
Net Assets | | $ | 71,627,584 | | | $ | 60,735,770 | | | $ | 26,423,972 | | | $ | 48,844,986 | |
| | | | |
| | | | |
NET ASSETS CONSIST OF: | | | | | | | | | | | | | | | | |
Paid-in capital | | $ | 75,677,992 | | | $ | 63,032,687 | | | $ | 28,788,651 | | | $ | 50,000,050 | |
Distributable earnings (loss) (Note 13) | | | (4,050,408 | ) | | | (2,296,917 | ) | | | (2,364,679 | ) | | | (1,155,064 | ) |
| | | | |
Net Assets | | $ | 71,627,584 | | | $ | 60,735,770 | | | $ | 26,423,972 | | | $ | 48,844,986 | |
| | | | |
| | | | |
Shares Outstanding (unlimited number of shares authorized $0.0001 par value) | | | 3,150,001 | | | | 1,250,001 | | | | 550,001 | | | | 1,000,001 | |
Net Asset Value | | $ | 22.74 | | | $ | 48.59 | | | $ | 48.04 | | | $ | 48.84 | |
| | | | |
† Cost of foreign cash | | $ | — | | | $ | — | | | $ | — | | | $ | — | |
| * | Includes cash pledged by the Fund to cover margin requirements for open futures contracts as of 10/31. |
| ** | Includes cash pledged by an Authorized Participant for missing deposit securities required to secure Creation Units. |
See Accompanying Notes to the Financial Statements.
| | |
| 60 | | FLEXSHARES ANNUAL REPORT |
Statements of Assets and Liabilities (cont.)
| | | | | | | | |
| | | FlexShares®
Ready Access
Variable
Income Fund | | | FlexShares®
Core Select
Bond Fund | |
| | |
ASSETS | | | | | | | | |
Securities, at cost | | $ | 222,725,165 | | | $ | 7,255,758 | |
Affiliate securities, at cost | | | — | | | | 32,067,506 | |
Securities Lending Reinvestments, at cost | | | — | | | | — | |
| | | | |
Securities, at value | | | 222,596,732 | | | | 7,209,594 | |
Affiliate securities, at value | | | — | | | | 31,200,291 | |
Securities Lending Reinvestments, at value | | | — | | | | — | |
Cash | | | 1,610,853 | | | | 177,680 | |
Cash segregated at broker* | | | — | | | | — | |
Foreign cash† | | | — | | | | — | |
Restricted cash** | | | — | | | | — | |
Due from Custodian | | | — | | | | — | |
Unrealized appreciation on forward foreign currency contracts | | | — | | | | — | |
Receivables: | | | — | | | | — | |
Dividends and interest | | | 1,024,015 | | | | — | |
Securities lending income | | | — | | | | — | |
Capital shares issued | | | — | | | | — | |
Investment adviser | | | 9,808 | | | | 861 | |
Securities sold | | | — | | | | — | |
| | | | |
Total Assets | | | 225,241,408 | | | | 38,588,426 | |
| | | | |
| | |
LIABILITIES | | | | | | | | |
Cash overdraft | | | — | | | | — | |
Unrealized depreciation on forward foreign currency contracts | | | — | | | | — | |
Payables: | | | | | | | | |
Cash collateral received from securities loaned | | | — | | | | — | |
Deferred compensation (Note 7) | | | 8,194 | | | | 309 | |
Investment advisory fees (Note 4) | | | 42,292 | | | | 4,666 | |
Trustee fees (Note 7) | | | 1,614 | | | | 552 | |
Securities purchased | | | 13,837,527 | | | | — | |
Due to Authorized Participant | | | — | | | | — | |
Variation margin on futures contracts | | | — | | | | — | |
Capital shares redeemed | | | — | | | | — | |
Other | | | 2,100 | | | | — | |
| | | | |
Total Liabilities | | | 13,891,727 | | | | 5,527 | |
| | | | |
Net Assets | | $ | 211,349,681 | | | $ | 38,582,899 | |
| | | | |
| | |
NET ASSETS CONSIST OF: | | | | | | | | |
Paid-in capital | | $ | 211,059,436 | | | $ | 39,691,847 | |
Distributable earnings (loss) (Note 13) | | | 290,245 | | | | (1,108,948 | ) |
| | | | |
Net Assets | | $ | 211,349,681 | | | $ | 38,582,899 | |
| | | | |
| | |
Shares Outstanding (unlimited number of shares authorized $0.0001 par value) | | | 2,800,001 | | | | 1,625,001 | |
Net Asset Value | | $ | 75.48 | | | $ | 23.74 | |
| | |
† Cost of foreign cash | | $ | — | | | $ | — | |
| * | Includes cash pledged by the Fund to cover margin requirements for open futures contracts as of 10/31. |
| ** | Includes cash pledged by an Authorized Participant for missing deposit securities required to secure Creation Units. |
See Accompanying Notes to the Financial Statements.
| | | | |
| FLEXSHARES ANNUAL REPORT | | | 61 | |
FlexShares® Trust
Statements of Operations
For the year or period ended October 31, 2018
| | | | | | | | | | | | | | | | |
| | | FlexShares®
Morningstar US
Market Factor Tilt
Index Fund | | | FlexShares®
Morningstar
Developed
Markets ex-US
Factor Tilt
Index Fund | | | FlexShares®
Morningstar
Emerging
Markets
Factor Tilt
Index Fund | | | FlexShares®
Currency Hedged
Morningstar DM
ex-US Factor Tilt
Index Fund | |
| | | | |
INVESTMENT INCOME | | | | | | | | | | | | | | | | |
Dividend income | | $ | 24,569,612 | | | $ | 34,283,834 | | | $ | 22,157,000 | | | $ | — | |
Dividend income received from affiliate | | | 13,646 | | | | — | | | | — | | | | 447,732 | |
Interest income | | | — | | | | — | | | | 746 | | | | — | |
Securities lending income (net of fees) (Note 2) | | | 851,800 | | | | 1,037,086 | | | | 259,348 | | | | — | |
Foreign withholding tax on dividends | | | (4,050 | ) | | | (3,066,707 | ) | | | (2,188,753 | ) | | | — | |
Foreign withholding tax on interest | | | — | | | | — | | | | (12 | ) | | | — | |
| | | | |
Total Investment Income | | | 25,431,008 | | | | 32,254,213 | | | | 20,228,329 | | | | 447,732 | |
| | | | |
| | | | |
EXPENSES | | | | | | | | | | | | | | | | |
Deferred compensation (Note 7) | | | 3,650 | | | | 3,137 | | | | 1,811 | | | | 64 | |
Investment advisory fees | | | 3,140,692 | | | | 4,136,301 | | | | 3,785,424 | | | | 59,742 | |
Trustee fees (Note 7) | | | 57,157 | | | | 47,595 | | | | 29,618 | | | | 1,983 | |
| | | | |
Total Gross Expenses Before Fees Reimbursed | | | 3,201,499 | | | | 4,187,033 | | | | 3,816,853 | | | | 61,789 | |
| | | | |
| | | | |
Less: | | | | | | | | | | | | | | | | |
Deferred compensation reimbursed (Note 7) | | | (3,650 | ) | | | (3,137 | ) | | | (1,811 | ) | | | (64 | ) |
Investment advisory fees reimbursed (Note 4) | | | — | | | | — | | | | — | | | | (53,048 | ) |
Trustee fees reimbursed (Note 7) | | | (57,157 | ) | | | (47,595 | ) | | | (29,618 | ) | | | (1,983 | ) |
| | | | |
Total Net Expenses | | | 3,140,692 | | | | 4,136,301 | | | | 3,785,424 | | | | 6,694 | |
| | | | |
Net Investment Income (Loss) | | | 22,290,316 | | | | 28,117,912 | | | | 16,442,905 | | | | 441,038 | |
| | | | |
| | | | |
NET REALIZED GAIN (LOSS) FROM: | | | | | | | | | | | | | | | | |
Transactions in investment securities of affiliated issuers | | | — | | | | — | | | | — | | | | 17,863 | |
Transactions in investment securities | | | 2,568,604 | | | | (14,792,800 | ) | | | (6,169,555 | )(1) | | | — | |
In-kind redemptions on investments in affiliated securities | | | 6,755 | | | | — | | | | — | | | | 2,168,758 | |
In-kind redemptions on investments in securities | | | 12,264,581 | | | | 2,875,308 | | | | 2,656,916 | | | | — | |
Expiration or closing of futures contracts | | | 2,336,303 | | | | 1,392,367 | | | | (564,062 | ) | | | (1,196 | ) |
Settlement of forward foreign currency contracts | | | — | | | | (379,309 | ) | | | 169,646 | | | | 120,969 | |
Foreign currency transactions | | | — | | | | (410,496 | ) | | | (742,411 | ) | | | (152,520 | ) |
| | | | |
Net Realized Gain (Loss) | | | 17,176,243 | | | | (11,314,930 | ) | | | (4,649,466 | ) | | | 2,153,874 | |
| | | | |
| | | | |
NET CHANGE IN UNREALIZED APPRECIATION (DEPRECIATION) ON: | | | | | | | | | | | | | | | | |
Investments in securities | | | 5,726,569 | (2) | | | (108,644,385 | ) | | | (106,045,359 | )(3) | | | (3,254,309 | )(4) |
Securities lending | | | (2,174 | ) | | | — | | | | — | | | | — | |
Futures contracts | | | (1,557,640 | ) | | | (1,334,315 | ) | | | (241,123 | ) | | | — | |
Forward foreign currency contracts | | | — | | | | 33,228 | | | | (45,681 | ) | | | (54,606 | ) |
Translation of other assets and liabilities denominated in foreign currencies | | | — | | | | (100,313 | ) | | | 41,158 | | | | — | |
| | | | |
Net Change in Unrealized Appreciation (Depreciation) | | | 4,166,755 | | | | (110,045,785 | ) | | | (106,291,005 | ) | | | (3,308,915 | ) |
| | | | |
Net Realized and Unrealized Gain (Loss) | | | 21,342,998 | | | | (121,360,715 | ) | | | (110,940,471 | ) | | | (1,155,041 | ) |
| | | | |
Net Increase (Decrease) in Net Assets Resulting from Operations | | $ | 43,633,314 | | | $ | (93,242,803 | ) | | $ | (94,497,566 | ) | | $ | (714,003 | ) |
| | | | |
| (1) | Net of non-US capital gains tax of $(209,278). |
| (2) | Includes $(5,793) change in unrealized depreciation on investments in affiliates. |
| (3) | Net of deferred non-US capital gains tax of $297,634. |
| (4) | Includes $(3,254,309) change in unrealized depreciation on investments in affiliates. |
See Accompanying Notes to the Financial Statements.
| | |
| 62 | | FLEXSHARES ANNUAL REPORT |
Statements of Operations (cont.)
| | | | | | | | | | | | | | | | |
| | | FlexShares®
Currency Hedged
Morningstar EM
Factor Tilt
Index Fund | | | FlexShares®
US Quality
Large Cap
Index Fund | | | FlexShares®
STOXX® US
ESG Impact
Index Fund | | | FlexShares®
STOXX®
Global ESG
Impact
Index Fund | |
| | | | |
INVESTMENT INCOME | | | | | | | | | | | | | | | | |
Dividend income | | $ | — | | | $ | 866,920 | | | $ | 440,539 | | | $ | 1,697,712 | |
Dividend income received from affiliate | | | 657,918 | | | | — | | | | — | | | | — | |
Interest income | | | — | | | | — | | | | — | | | | — | |
Securities lending income (net of fees) (Note 2) | | | — | | | | — | | | | — | | | | — | |
Foreign withholding tax on dividends | | | — | | | | — | | | | — | | | | (89,108 | ) |
Foreign withholding tax on interest | | | — | | | | — | | | | — | | | | — | |
| | | | |
Total Investment Income | | | 657,918 | | | | 866,920 | | | | 440,539 | | | | 1,608,604 | |
| | | | |
| | | | |
EXPENSES | | | | | | | | | | | | | | | | |
Deferred compensation (Note 7) | | | 119 | | | | 108 | | | | 48 | | | | 138 | |
Investment advisory fees | | | 200,191 | | | | 146,955 | | | | 70,771 | | | | 274,617 | |
Trustee fees (Note 7) | | | 2,532 | | | | 3,516 | | | | 2,416 | | | | 4,598 | |
| | | | |
Total Gross Expenses Before Fees Reimbursed | | | 202,842 | | | | 150,579 | | | | 73,235 | | | | 279,353 | |
| | | | |
| | | | |
Less: | | | | | | | | | | | | | | | | |
Deferred compensation reimbursed (Note 7) | | | (119 | ) | | | (108 | ) | | | (48 | ) | | | (138 | ) |
Investment advisory fees reimbursed (Note 4) | | | (183,878 | ) | | | — | | | | — | | | | — | |
Trustee fees reimbursed (Note 7) | | | (2,532 | ) | | | (3,516 | ) | | | (2,416 | ) | | | (4,598 | ) |
| | | | |
Total Net Expenses | | | 16,313 | | | | 146,955 | | | | 70,771 | | | | 274,617 | |
| | | | |
Net Investment Income (Loss) | | | 641,605 | | | | 719,965 | | | | 369,768 | | | | 1,333,987 | |
| | | | |
| | | | |
NET REALIZED GAIN (LOSS) FROM: | | | | | | | | | | | | | | | | |
Transactions in investment securities of affiliated issuers | | | 68,668 | | | | — | | | | — | | | | — | |
Transactions in investment securities | | | — | | | | (520,573 | ) | | | (82,007 | ) | | | (864,558 | ) |
In-kind redemptions on investments in affiliated securities | | | 6,296,747 | | | | — | | | | — | | | | — | |
In-kind redemptions on investments in securities | | | — | | | | 594,442 | | | | 379,179 | | | | — | |
Expiration or closing of futures contracts | | | (34,901 | ) | | | 27,755 | | | | 28,334 | | | | 47,466 | |
Settlement of forward foreign currency contracts | | | 755,229 | | | | — | | | | — | | | | — | |
Foreign currency transactions | | | 74,176 | | | | — | | | | — | | | | (19,577 | ) |
| | | | |
Net Realized Gain (Loss) | | | 7,159,919 | | | | 101,624 | | | | 325,506 | | | | (836,669 | ) |
| | | | |
| | | | |
NET CHANGE IN UNREALIZED APPRECIATION (DEPRECIATION) ON: | | | | | | | | | | | | | | | | |
Investments in securities | | | (10,006,917 | )(1) | | | 291,989 | | | | 751,280 | | | | (1,051,902 | ) |
Securities lending | | | — | | | | — | | | | — | | | | — | |
Futures contracts | | | (2,781 | ) | | | (11,172 | ) | | | (27,543 | ) | | | (74,839 | ) |
Forward foreign currency contracts | | | (59,720 | ) | | | — | | | | — | | | | — | |
Translation of other assets and liabilities denominated in foreign currencies | | | 8 | | | | — | | | | — | | | | (9,201 | ) |
| | | | |
Net Change in Unrealized Appreciation (Depreciation) | | | (10,069,410 | ) | | | 280,817 | | | | 723,737 | | | | (1,135,942 | ) |
| | | | |
Net Realized and Unrealized Gain (Loss) | | | (2,909,491 | ) | | | 382,441 | | | | 1,049,243 | | | | (1,972,611 | ) |
| | | | |
Net Increase (Decrease) in Net Assets Resulting from Operations | | $ | (2,267,886 | ) | | $ | 1,102,406 | | | $ | 1,419,011 | | | $ | (638,624 | ) |
| | | | |
| (1) | Includes $(10,006,917) change in unrealized depreciation on investments in affiliates. |
See Accompanying Notes to the Financial Statements.
| | | | |
| FLEXSHARES ANNUAL REPORT | | | 63 | |
Statements of Operations (cont.)
| | | | | | | | | | | | | | | | |
| | | FlexShares®
Morningstar Global
Upstream Natural
Resources
Index Fund | | | FlexShares®
STOXX®
Global Broad
Infrastructure
Index Fund | | | FlexShares®
Global Quality
Real Estate
Index Fund | | | FlexShares®
Real Assets
Allocation
Index Fund | |
| | | | |
INVESTMENT INCOME | | | | | | | | | | | | | | | | |
Dividend income | | $ | 179,502,382 | | | $ | 29,448,188 | | | $ | 9,458,889 | | | $ | — | |
Dividend income received from affiliate | | | — | | | | — | | | | — | | | | 341,615 | |
Interest income | | | — | | | | — | | | | — | | | | — | |
Securities lending income (net of fees) (Note 2) | | | 2,890,900 | | | | 253,762 | | | | 54,865 | | | | — | |
Foreign withholding tax on dividends | | | (8,304,581 | ) | | | (1,589,134 | ) | | | (372,423 | ) | | | — | |
Foreign withholding tax on interest | | | — | | | | — | | | | — | | | | — | |
| | | | |
Total Investment Income | | | 174,088,701 | | | | 28,112,816 | | | | 9,141,331 | | | | 341,615 | |
| | | | |
| | | | |
EXPENSES | | | | | | | | | | | | | | | | |
Deferred compensation (Note 7) | | | 15,649 | | | | 2,637 | | | | 805 | | | | 27 | |
Investment advisory fees | | | 25,178,142 | | | | 3,936,524 | | | | 1,220,458 | | | | 65,358 | |
Trustee fees (Note 7) | | | 238,681 | | | | 36,564 | | | | 13,259 | | | | 1,936 | |
| | | | |
Total Gross Expenses Before Fees Reimbursed | | | 25,432,472 | | | | 3,975,725 | | | | 1,234,522 | | | | 67,321 | |
| | | | |
| | | | |
Less: | | | | | | | | | | | | | | | | |
Deferred compensation reimbursed (Note 7) | | | (15,649 | ) | | | (2,637 | ) | | | (805 | ) | | | (27 | ) |
Investment advisory fees reimbursed (Note 4) | | | — | | | | — | | | | — | | | | (52,763 | ) |
Trustee fees reimbursed (Note 7) | | | (238,681 | ) | | | (36,564 | ) | | | (13,259 | ) | | | (1,936 | ) |
| | | | |
Total Net Expenses | | | 25,178,142 | | | | 3,936,524 | | | | 1,220,458 | | | | 12,595 | |
| | | | |
Net Investment Income (Loss) | | | 148,910,559 | | | | 24,176,292 | | | | 7,920,873 | | | | 329,020 | |
| | | | |
| | | | |
NET REALIZED GAIN (LOSS) FROM: | | | | | | | | | | | | | | | | |
Transactions in investment securities of affiliated issuers | | | — | | | | — | | | | — | | | | (21,526 | ) |
Transactions in investment securities | | | (104,231,768 | )(1) | | | (8,246,963 | )(2) | | | (1,497,386 | ) | | | — | |
In-kind redemptions on investments in affiliated securities | | | — | | | | — | | | | — | | | | — | |
In-kind redemptions on investments in securities | | | — | | | | 21,674,040 | | | | — | | | | — | |
Expiration or closing of futures contracts | | | 4,447,203 | | | | 782,656 | | | | 852,119 | | | | — | |
Settlement of forward foreign currency contracts | | | (337,780 | ) | | | (32,688 | ) | | | (440 | ) | | | — | |
Foreign currency transactions | | | (804,461 | ) | | | (305,002 | ) | | | (91,486 | ) | | | — | |
| | | | |
Net Realized Gain (Loss) | | | (100,926,806 | ) | | | 13,872,043 | | | | (737,193 | ) | | | (21,526 | ) |
| | | | |
| | | | |
NET CHANGE IN UNREALIZED APPRECIATION (DEPRECIATION) ON: | | | | | | | | | | | | | | | | |
Investments in securities | | | 43,903,426 | (3) | | | (59,403,954 | ) | | | (17,735,517 | ) | | | (839,345 | )(4) |
Securities lending | | | (1,290 | ) | | | 251 | | | | — | | | | — | |
Futures contracts | | | (3,517,850 | ) | | | (568,768 | ) | | | (660,133 | ) | | | — | |
Forward foreign currency contracts | | | (190,105 | ) | | | 19,229 | | | | 9,047 | | | | — | |
Translation of other assets and liabilities denominated in foreign currencies | | | 57,494 | | | | (9,468 | ) | | | (20,137 | ) | | | — | |
| | | | |
Net Change in Unrealized Appreciation (Depreciation) | | | 40,251,675 | | | | (59,962,710 | ) | | | (18,406,740 | ) | | | (839,345 | ) |
| | | | |
Net Realized and Unrealized Gain (Loss) | | | (60,675,131 | ) | | | (46,090,667 | ) | | | (19,143,933 | ) | | | (860,871 | ) |
| | | | |
Net Increase (Decrease) in Net Assets Resulting from Operations | | $ | 88,235,428 | | | $ | (21,914,375 | ) | | $ | (11,223,060 | ) | | $ | (531,851 | ) |
| | | | |
| (1) | Net of non-US capital gains tax of $(12,043). |
| (2) | Net of non-US capital gains tax of $(27,307). |
| (3) | Net of deferred non-US capital gains tax of $412,574. |
| (4) | Includes $(839,345) change in unrealized depreciation on investments in affiliates. |
See Accompanying Notes to the Financial Statements.
| | |
| 64 | | FLEXSHARES ANNUAL REPORT |
Statements of Operations (cont.)
| | | | | | | | | | | | | | | | |
| | | FlexShares®
Quality
Dividend
Index Fund | | | FlexShares®
Quality Dividend
Defensive
Index Fund | | | FlexShares®
Quality Dividend
Dynamic Index
Fund | | | FlexShares®
International
Quality Dividend
Index Fund | |
| | | | |
INVESTMENT INCOME | | | | | | | | | | | | | | | | |
Dividend income | | $ | 55,723,890 | | | $ | 9,760,827 | | | $ | 1,561,207 | | | $ | 57,156,022 | |
Dividend income received from affiliate | | | — | | | | — | | | | — | | | | — | |
Interest income | | | — | | | | — | | | | — | | | | — | |
Securities lending income (net of fees) (Note 2) | | | 512,382 | | | | 56,910 | | | | 4,640 | | | | 795,476 | |
Foreign withholding tax on dividends | | | — | | | | (549 | ) | | | — | | | | (5,571,435 | ) |
Foreign withholding tax on interest | | | — | | | | — | | | | — | | | | — | |
| | | | |
Total Investment Income | | | 56,236,272 | | | | 9,817,188 | | | | 1,565,847 | | | | 52,380,063 | |
| | | | |
| | | | |
EXPENSES | | | | | | | | | | | | | | | | |
Deferred compensation (Note 7) | | | 5,715 | | | | 969 | | | | 176 | | | | 3,054 | |
Investment advisory fees | | | 6,909,085 | | | | 1,180,847 | | | | 193,751 | | | | 4,691,660 | |
Trustee fees (Note 7) | | | 82,307 | | | | 15,791 | | | | 4,180 | | | | 43,435 | |
| | | | |
Total Gross Expenses Before Fees Reimbursed | | | 6,997,107 | | | | 1,197,607 | | | | 198,107 | | | | 4,738,149 | |
| | | | |
| | | | |
Less: | | | | | | | | | | | | | | | | |
Deferred compensation reimbursed (Note 7) | | | (5,715 | ) | | | (969 | ) | | | (176 | ) | | | (3,054 | ) |
Investment advisory fees reimbursed (Note 4) | | | — | | | | — | | | | — | | | | — | |
Trustee fees reimbursed (Note 7) | | | (82,307 | ) | | | (15,791 | ) | | | (4,180 | ) | | | (43,435 | ) |
| | | | |
Total Net Expenses | | | 6,909,085 | | | | 1,180,847 | | | | 193,751 | | | | 4,691,660 | |
| | | | |
Net Investment Income (Loss) | | | 49,327,187 | | | | 8,636,341 | | | | 1,372,096 | | | | 47,688,403 | |
| | | | |
| | | | |
NET REALIZED GAIN (LOSS) FROM: | | | | | | | | | | | | | | | | |
Transactions in investment securities of affiliated issuers | | | — | | | | — | | | | — | | | | — | |
Transactions in investment securities | | | 36,037,297 | | | | 14,271,169 | | | | 1,054,620 | | | | (26,259,310 | )(1) |
In-kind redemptions on investments in affiliated securities | | | — | | | | — | | | | — | | | | — | |
In-kind redemptions on investments in securities | | | 71,242,802 | | | | 5,405,472 | | | | 3,659,718 | | | | 13,395,212 | |
Expiration or closing of futures contracts | | | 3,737,327 | | | | 417,901 | | | | 96,880 | | | | 278,050 | |
Settlement of forward foreign currency contracts | | | — | | | | — | | | | — | | | | (117,158 | ) |
Foreign currency transactions | | | — | | | | — | | | | — | | | | (838,135 | ) |
| | | | |
Net Realized Gain (Loss) | | | 111,017,426 | | | | 20,094,542 | | | | 4,811,218 | | | | (13,541,341 | ) |
| | | | |
| | | | |
NET CHANGE IN UNREALIZED APPRECIATION (DEPRECIATION) ON: | | | | | | | | | | | | | | | | |
Investments in securities | | | (21,987,412 | ) | | | (2,292,464 | ) | | | (3,532,854 | ) | | | (135,233,875 | ) |
Securities lending | | | (1,882 | ) | | | (155 | ) | | | — | | | | (57 | ) |
Futures contracts | | | (1,818,947 | ) | | | (209,584 | ) | | | (48,373 | ) | | | (686,015 | ) |
Forward foreign currency contracts | | | — | | | | — | | | | — | | | | (13,634 | ) |
Translation of other assets and liabilities denominated in foreign currencies | | | — | | | | — | | | | — | | | | (7,988 | ) |
| | | | |
Net Change in Unrealized Appreciation (Depreciation) | | | (23,808,241 | ) | | | (2,502,203 | ) | | | (3,581,227 | ) | | | (135,941,569 | ) |
| | | | |
Net Realized and Unrealized Gain (Loss) | | | 87,209,185 | | | | 17,592,339 | | | | 1,229,991 | | | | (149,482,910 | ) |
| | | | |
Net Increase (Decrease) in Net Assets Resulting from Operations | | $ | 136,536,372 | | | $ | 26,228,680 | | | $ | 2,602,087 | | | $ | (101,794,507 | ) |
| | | | |
| (1) | Net of non-US capital gains tax of $(230,135). |
See Accompanying Notes to the Financial Statements.
| | | | |
| FLEXSHARES ANNUAL REPORT | | | 65 | |
Statements of Operations (cont.)
| | | | | | | | | | | | | | | | |
| | | FlexShares®
International
Quality Dividend
Defensive Index
Fund | | | FlexShares®
International
Quality Dividend
Dynamic Index
Fund | | | FlexShares®
iBoxx 3-Year Target
Duration TIPS
Index Fund | | | FlexShares®
iBoxx 5-Year Target
Duration TIPS
Index Fund | |
| | | | |
INVESTMENT INCOME | | | | | | | | | | | | | | | | |
Dividend income | | $ | 5,469,531 | | | $ | 4,827,723 | | | $ | — | | | $ | — | |
Dividend income received from affiliate | | | — | | | | — | | | | — | | | | — | |
Interest income | | | — | | | | — | | | | 59,777,984 | | | | 28,145,501 | |
Securities lending income (net of fees) (Note 2) | | | 83,758 | | | | 57,848 | | | | — | | | | — | |
Foreign withholding tax on dividends | | | (531,546 | ) | | | (489,903 | ) | | | — | | | | — | |
Foreign withholding tax on interest | | | — | | | | — | | | | — | | | | — | |
| | | | |
Total Investment Income | | | 5,021,743 | | | | 4,395,668 | | | | 59,777,984 | | | | 28,145,501 | |
| | | | |
| | | | |
EXPENSES | | | | | | | | | | | | | | | | |
Deferred compensation (Note 7) | | | 286 | | | | 257 | | | | 5,902 | | | | 2,520 | |
Investment advisory fees | | | 457,995 | | | | 390,114 | | | | 3,612,754 | | | | 1,653,034 | |
Trustee fees (Note 7) | | | 5,551 | | | | 4,864 | | | | 86,761 | | | | 41,922 | |
| | | | |
Total Gross Expenses Before Fees Reimbursed | | | 463,832 | | | | 395,235 | | | | 3,705,417 | | | | 1,697,476 | |
| | | | |
| | | | |
Less: | | | | | | | | | | | | | | | | |
Deferred compensation reimbursed (Note 7) | | | (286 | ) | | | (257 | ) | | | (5,902 | ) | | | (2,520 | ) |
Investment advisory fees reimbursed (Note 4) | | | — | | | | — | | | | — | | | | — | |
Trustee fees reimbursed (Note 7) | | | (5,551 | ) | | | (4,864 | ) | | | (86,761 | ) | | | (41,922 | ) |
| | | | |
Total Net Expenses | | | 457,995 | | | | 390,114 | | | | 3,612,754 | | | | 1,653,034 | |
| | | | |
Net Investment Income (Loss) | | | 4,563,748 | | | | 4,005,554 | | | | 56,165,230 | | | | 26,492,467 | |
| | | | |
| | | | |
NET REALIZED GAIN (LOSS) FROM: | | | | | | | | | | | | | | | | |
Transactions in investment securities of affiliated issuers | | | — | | | | — | | | | — | | | | — | |
Transactions in investment securities | | | (1,401,632 | )(1) | | | (3,089,956 | )(2) | | | (21,125,533 | ) | | | (8,505,701 | ) |
In-kind redemptions on investments in affiliated securities | | | — | | | | — | | | | — | | | | — | |
In-kind redemptions on investments in securities | | | — | | | | 1,647,481 | | | | (4,382,219 | ) | | | (279,788 | ) |
Expiration or closing of futures contracts | | | (107,878 | ) | | | (45,528 | ) | | | — | | | | — | |
Settlement of forward foreign currency contracts | | | 14,411 | | | | — | | | | — | | | | — | |
Foreign currency transactions | | | (146,024 | ) | | | (74,751 | ) | | | — | | | | — | |
| | | | |
Net Realized Gain (Loss) | | | (1,641,123 | ) | | | (1,562,754 | ) | | | (25,507,752 | ) | | | (8,785,489 | ) |
| | | | |
| | | | |
NET CHANGE IN UNREALIZED APPRECIATION (DEPRECIATION) ON: | | | | | | | | | | | | | | | | |
Investments in securities | | | (12,811,718 | ) | | | (11,782,730 | ) | | | (35,763,699 | ) | | | (31,104,417 | ) |
Securities lending | | | — | | | | — | | | | — | | | | — | |
Futures contracts | | | (109,958 | ) | | | (52,077 | ) | | | — | | | | — | |
Forward foreign currency contracts | | | (5,644 | ) | | | — | | | | — | | | | — | |
Translation of other assets and liabilities denominated in foreign currencies | | | (17,410 | ) | | | 1,710 | | | | — | | | | — | |
| | | | |
Net Change in Unrealized Appreciation (Depreciation) | | | (12,944,730 | ) | | | (11,833,097 | ) | | | (35,763,699 | ) | | | (31,104,417 | ) |
| | | | |
Net Realized and Unrealized Gain (Loss) | | | (14,585,853 | ) | | | (13,395,851 | ) | | | (61,271,451 | ) | | | (39,889,906 | ) |
| | | | |
Net Increase (Decrease) in Net Assets Resulting from Operations | | $ | (10,022,105 | ) | | $ | (9,390,297 | ) | | $ | (5,106,221 | ) | | $ | (13,397,439 | ) |
| | | | |
| (1) | Net of non-US capital gains tax of $(3,010). |
| (2) | Net of non-US capital gains tax of $(11,974). |
See Accompanying Notes to the Financial Statements.
| | |
| 66 | | FLEXSHARES ANNUAL REPORT |
Statements of Operations (cont.)
| | | | | | | | | | | | | | | | |
| | | FlexShares®
Disciplined
Duration MBS
Index Fund | | | FlexShares®
Credit-Scored
US Corporate
Bond Index
Fund | | | FlexShares®
Credit-Scored
US Long
Corporate Bond
Index Fund | | | FlexShares®
High Yield
Value-Scored
Bond Index
Fund | |
| | | | | | | | | | | | July 17,
2018*
through
October 31,
2018 | |
| | | | |
INVESTMENT INCOME | | | | | | | | | | | | | | | | |
Dividend income | | $ | — | | | $ | — | | | $ | — | | | $ | — | |
Dividend income received from affiliate | | | — | | | | — | | | | — | | | | — | |
Interest income | | | 1,143,221 | | | | 1,722,774 | | | | 1,030,346 | | | | 1,730,236 | |
Securities lending income (net of fees) (Note 2) | | | — | | | | — | | | | — | | | | — | |
Foreign withholding tax on dividends | | | — | | | | — | | | | — | | | | — | |
Foreign withholding tax on interest | | | — | | | | — | | | | — | | | | — | |
| | | | |
Total Investment Income | | | 1,143,221 | | | | 1,722,774 | | | | 1,030,346 | | | | 1,730,236 | |
| | | | |
| | | | |
EXPENSES | | | | | | | | | | | | | | | | |
Deferred compensation (Note 7) | | | 144 | | | | 165 | | | | 68 | | | | 46 | |
Investment advisory fees | | | 99,481 | | | | 123,978 | | | | 52,915 | | | | 53,627 | |
Trustee fees (Note 7) | | | 3,680 | | | | 3,882 | | | | 2,481 | | | | 788 | |
| | | | |
Total Gross Expenses Before Fees Reimbursed | | | 103,305 | | | | 128,025 | | | | 55,464 | | | | 54,461 | |
| | | | |
| | | | |
Less: | | | | | | | | | | | | | | | | |
Deferred compensation reimbursed (Note 7) | | | (144 | ) | | | (165 | ) | | | (68 | ) | | | (46 | ) |
Investment advisory fees reimbursed (Note 4) | | | — | | | | — | | | | — | | | | — | |
Trustee fees reimbursed (Note 7) | | | (3,680 | ) | | | (3,882 | ) | | | (2,481 | ) | | | (788 | ) |
| | | | |
Total Net Expenses | | | 99,481 | | | | 123,978 | | | | 52,915 | | | | 53,627 | |
| | | | |
Net Investment Income (Loss) | | | 1,043,740 | | | | 1,598,796 | | | | 977,431 | | | | 1,676,609 | |
| | | | |
| | | | |
NET REALIZED GAIN (LOSS) FROM: | | | | | | | | | | | | | | | | |
Transactions in investment securities of affiliated issuers | | | — | | | | — | | | | — | | | | — | |
Transactions in investment securities | | | (186,319 | ) | | | (709,479 | ) | | | (624,604 | ) | | | (22,286 | ) |
In-kind redemptions on investments in affiliated securities | | | — | | | | — | | | | — | | | | — | |
In-kind redemptions on investments in securities | | | — | | | | — | | | | — | | | | — | |
Expiration or closing of futures contracts | | | — | | | | — | | | | — | | | | — | |
Settlement of forward foreign currency contracts | | | — | | | | — | | | | — | | | | — | |
Foreign currency transactions | | | — | | | | — | | | | — | | | | — | |
| | | | |
Net Realized Gain (Loss) | | | (186,319 | ) | | | (709,479 | ) | | | (624,604 | ) | | | (22,286 | ) |
| | | | |
| | | | |
NET CHANGE IN UNREALIZED APPRECIATION (DEPRECIATION) ON: | | | | | | | | | | | | | | | | |
Investments in securities | | | (1,657,657 | ) | | | (1,967,302 | ) | | | (2,315,008 | ) | | | (1,565,240 | ) |
Securities lending | | | — | | | | — | | | | — | | | | — | |
Futures contracts | | | — | | | | — | | | | — | | | | — | |
Forward foreign currency contracts | | | — | | | | — | | | | — | | | | — | |
Translation of other assets and liabilities denominated in foreign currencies | | | — | | | | — | | | | — | | | | — | |
| | | | |
Net Change in Unrealized Appreciation (Depreciation) | | | (1,657,657 | ) | | | (1,967,302 | ) | | | (2,315,008 | ) | | | (1,565,240 | ) |
| | | | |
Net Realized and Unrealized Gain (Loss) | | | (1,843,976 | ) | | | (2,676,781 | ) | | | (2,939,612 | ) | | | (1,587,526 | ) |
| | | | |
Net Increase (Decrease) in Net Assets Resulting from Operations | | $ | (800,236 | ) | | $ | (1,077,985 | ) | | $ | (1,962,181 | ) | | $ | 89,083 | |
| | | | |
| * | Commencement of investment operations. |
See Accompanying Notes to the Financial Statements.
| | | | |
| FLEXSHARES ANNUAL REPORT | | | 67 | |
Statements of Operations (cont.)
| | | | | | | | |
| | | FlexShares®
Ready Access
Variable
Income Fund | | | FlexShares®
Core Select
Bond Fund | |
| | |
INVESTMENT INCOME | | | | | | | | |
Dividend income | | $ | — | | | $ | 62,823 | |
Dividend income received from affiliate | | | — | | | | 554,420 | |
Interest income | | | 3,767,365 | | | | 1,655 | |
Securities lending income (net of fees) (Note 2) | | | — | | | | — | |
Foreign withholding tax on dividends | | | — | | | | — | |
Foreign withholding tax on interest | | | — | | | | — | |
| | | | |
Total Investment Income | | | 3,767,365 | | | | 618,898 | |
| | | | |
| | |
EXPENSES | | | | | | | | |
Deferred compensation (Note 7) | | | 486 | | | | 41 | |
Investment advisory fees | | | 401,334 | | | | 78,283 | |
Trustee fees (Note 7) | | | 8,865 | | | | 2,492 | |
| | | | |
Total Gross Expenses Before Fees Reimbursed | | | 410,685 | | | | 80,816 | |
| | | | |
| | |
Less: | | | | | | | | |
Deferred compensation reimbursed (Note 7) | | | (486 | ) | | | (41 | ) |
Investment advisory fees reimbursed (Note 4) | | | — | | | | (42,336 | ) |
Trustee fees reimbursed (Note 7) | | | (8,865 | ) | | | (2,492 | ) |
| | | | |
Total Net Expenses | | | 401,334 | | | | 35,947 | |
| | | | |
Net Investment Income (Loss) | | | 3,366,031 | | | | 582,951 | |
| | | | |
| | |
NET REALIZED GAIN (LOSS) FROM: | | | | | | | | |
Transactions in investment securities of affiliated issuers | | | — | | | | (142,035 | ) |
Transactions in investment securities | | | (6,133 | ) | | | (57,116 | ) |
In-kind redemptions on investments in affiliated securities | | | — | | | | 206 | |
In-kind redemptions on investments in securities | | | 16,179 | | | | 248 | |
Expiration or closing of futures contracts | | | — | | | | 19,159 | |
Settlement of forward foreign currency contracts | | | — | | | | — | |
Foreign currency transactions | | | — | | | | — | |
| | | | |
Net Realized Gain (Loss) | | | 10,046 | | | | (179,538 | ) |
| | | | |
| | |
NET CHANGE IN UNREALIZED APPRECIATION (DEPRECIATION) ON: | | | | | | | | |
Investments in securities | | | (425,090 | ) | | | (929,296 | )(1) |
Securities lending | | | — | | | | — | |
Futures contracts | | | — | | | | (4,571 | ) |
Forward foreign currency contracts | | | — | | | | — | |
Translation of other assets and liabilities denominated in foreign currencies | | | — | | | | — | |
| | | | |
Net Change in Unrealized Appreciation (Depreciation) | | | (425,090 | ) | | | (933,867 | ) |
| | | | |
Net Realized and Unrealized Gain (Loss) | | | (415,044 | ) | | | (1,113,405 | ) |
| | | | |
Net Increase (Decrease) in Net Assets Resulting from Operations | | $ | 2,950,987 | | | $ | (530,454 | ) |
| | | | |
| (1) | Includes $(882,127) change in unrealized depreciation on investments in affiliates. |
See Accompanying Notes to the Financial Statements.
| | |
| 68 | | FLEXSHARES ANNUAL REPORT |
FlexShares® Trust
Statements of Changes in Net Assets
| | | | | | | | | | | | | | | | |
| | | FlexShares® Morningstar US
Market Factor Tilt Index Fund | | | FlexShares® Morningstar
Developed Markets ex-US
Factor Tilt Index Fund | |
| | | Year Ended
October 31,
2018 | | | Year Ended
October 31,
2017 | | | Year Ended
October 31,
2018 | | | Year Ended
October 31,
2017 | |
| | | | |
OPERATIONS | | | | | | | | | | | | | | | | |
Net investment income (loss) | | $ | 22,290,316 | | | $ | 17,763,815 | | | $ | 28,117,912 | | | $ | 20,623,457 | |
Net realized gain (loss) | | | 17,176,243 | | | | 3,998,619 | | | | (11,314,930 | ) | | | (5,182,583 | ) |
Net increase from payments by affiliates | | | — | | | | — | | | | — | | | | 10,248 | |
Net change in unrealized appreciation (depreciation) | | | 4,166,755 | | | | 186,736,480 | | | | (110,045,785 | ) | | | 162,246,210 | |
| | | | |
| | | | |
Net Increase (Decrease) in Net Assets | | | | | | | | | | | | | | | | |
Resulting from Operations | | | 43,633,314 | | | | 208,498,914 | | | | (93,242,803 | ) | | | 177,697,332 | |
| | | | |
| | | | |
DISTRIBUTIONS TO SHAREHOLDERS (Note 13) | | | | | | | | | | | | | | | | |
Net investment income | | | | | | | (17,203,496 | ) | | | | | | | (20,692,030 | ) |
Net realized gain | | | | | | | — | | | | | | | | — | |
Distributable earnings | | | (21,895,299 | ) | | | | | | | (33,761,589 | ) | | | | |
Tax return of capital | | | — | | | | — | | | | — | | | | — | |
| | | | |
Total distributions | | | (21,895,299 | ) | | | (17,203,496 | ) | | | (33,761,589 | ) | | | (20,692,030 | ) |
| | | | |
| | | | |
CAPITAL TRANSACTIONS(1) | | | | | | | | | | | | | | | | |
Proceeds from shares issued | | | 244,086,962 | | | | 138,394,830 | | | | 122,745,608 | | | | 205,703,755 | |
Cost of shares redeemed | | | (28,359,353 | ) | | | (9,743,868 | ) | | | (13,253,045 | ) | | | — | |
| | | | |
Net Increase (Decrease) from Capital Transactions | | | 215,727,609 | | | | 128,650,962 | | | | 109,492,563 | | | | 205,703,755 | |
| | | | |
Total Increase (Decrease) in Net Assets | | | 237,465,624 | | | | 319,946,380 | | | | (17,511,829 | ) | | | 362,709,057 | |
| | | | |
| | | | |
NET ASSETS | | | | | | | | | | | | | | | | |
Beginning of Period | | $ | 1,150,199,058 | | | $ | 830,252,678 | | | $ | 985,607,547 | | | $ | 622,898,490 | |
| | | | |
End of Period | | $ | 1,387,664,682 | | | $ | 1,150,199,058 | | | $ | 968,095,718 | | | $ | 985,607,547 | |
| | | | |
Undistributed (accumulated) net investment income (loss) included in end of period net assets (Note 13) | | | | | | $ | 2,245,513 | | | | | | | $ | 2,070,859 | |
| | | | | | | | | | | | | | | | |
| | | | |
SHARE TRANSACTIONS | | | | | | | | | | | | | | | | |
Beginning of period | | | 10,700,001 | | | | 9,400,001 | | | | 14,600,001 | | | | 11,200,001 | |
Shares issued | | | — | | | | — | | | | — | | | | — | |
Shares issued in-kind | | | 2,150,000 | | | | 1,400,000 | | | | 1,800,000 | | | | 3,400,000 | |
Shares redeemed | | | — | | | | — | | | | — | | | | — | |
Shares redeemed in-kind | | | (250,000 | ) | | | (100,000 | ) | | | (200,000 | ) | | | — | |
| | | | |
Shares Outstanding, End of Period | | | 12,600,001 | | | | 10,700,001 | | | | 16,200,001 | | | | 14,600,001 | |
| | | | |
| (1) | Capital transactions may include transaction fees associated with creation and redemption transactions which occurred during the period. See Note 9 to the Financial Statements. |
See Accompanying Notes to the Financial Statements.
| | | | |
| FLEXSHARES ANNUAL REPORT | | | 69 | |
Statements of Changes in Net Assets (cont.)
| | | | | | | | | | | | | | | | |
| | | FlexShares® Morningstar Emerging
Markets Factor Tilt Index Fund | | | FlexShares® Currency Hedged
Morningstar DM ex-US Factor
Tilt Index Fund | |
| | | Year Ended
October 31,
2018 | | | Year Ended
October 31,
2017 | | | Year Ended
October 31,
2018 | | | Year Ended
October 31,
2017 | |
| | | | |
OPERATIONS | | | | | | | | | | | | | | | | |
Net investment income (loss) | | $ | 16,442,905 | | | $ | 10,444,529 | | | $ | 441,038 | | | $ | 385,670 | |
Net realized gain (loss) | | | (4,649,466 | ) | | | 2,685,437 | | | | 2,153,874 | | | | 210,970 | |
Net increase from payments by affiliates | | | — | | | | — | | | | — | | | | — | |
Net change in unrealized appreciation (depreciation) | | | (106,291,005 | ) | | | 79,744,981 | | | | (3,308,915 | ) | | | 2,666,671 | |
| | | | |
| | | | |
Net Increase (Decrease) in Net Assets | | | | | | | | | | | | | | | | |
Resulting from Operations | | | (94,497,566 | ) | | | 92,874,947 | | | | (714,003 | ) | | | 3,263,311 | |
| | | | |
| | | | |
DISTRIBUTIONS TO SHAREHOLDERS (Note 13) | | | | | | | | | | | | | | | | |
Net investment income | | | | | | | (10,564,341 | ) | | | | | | | (386,878 | ) |
Net realized gain | | | | | | | — | | | | | | | | — | |
Distributable earnings | | | (17,566,133 | ) | | | | | | | (413,050 | ) | | | | |
Tax return of capital | | | — | | | | — | | | | (152,741 | ) | | | — | |
| | | | |
Total distributions | | | (17,566,133 | ) | | | (10,564,341 | ) | | | (565,791 | ) | | | (386,878 | ) |
| | | | |
| | | | |
CAPITAL TRANSACTIONS(1) | | | | | | | | | | | | | | | | |
Proceeds from shares issued | | | 143,643,883 | | | | 186,409,055 | | | | 8,486,631 | | | | 26,565,920 | |
Cost of shares redeemed | | | (110,914,729 | ) | | | — | | | | (18,214,928 | ) | | | (14,096,084 | ) |
| | | | |
Net Increase (Decrease) from Capital Transactions | | | 32,729,154 | | | | 186,409,055 | | | | (9,728,297 | ) | | | 12,469,836 | |
| | | | |
Total Increase (Decrease) in Net Assets | | | (79,334,545 | ) | | | 268,719,661 | | | | (11,008,091 | ) | | | 15,346,269 | |
| | | | |
| | | | |
NET ASSETS | | | | | | | | | | | | | | | | |
Beginning of Period | | $ | 568,070,590 | | | $ | 299,350,929 | | | $ | 18,941,163 | | | $ | 3,594,894 | |
| | | | |
End of Period | | $ | 488,736,045 | | | $ | 568,070,590 | | | $ | 7,933,072 | | | $ | 18,941,163 | |
| | | | |
Undistributed (accumulated) net investment income (loss) included in end of period net assets (Note 13) | | | | | | $ | 466,682 | | | | | | | $ | 124,187 | |
| | | | | | | | | | | | | | | | |
| | | | |
SHARE TRANSACTIONS | | | | | | | | | | | | | | | | |
Beginning of period | | | 9,900,001 | | | | 6,300,001 | | | | 650,001 | | | | 150,001 | |
Shares issued | | | — | | | | — | | | | — | | | | — | |
Shares issued in-kind | | | 2,400,000 | | | | 3,600,000 | | | | 300,000 | | | | 1,025,000 | |
Shares redeemed | | | — | | | | — | | | | — | | | | — | |
Shares redeemed in-kind | | | (2,100,000 | ) | | | — | | | | (650,000 | ) | | | (525,000 | ) |
| | | | |
Shares Outstanding, End of Period | | | 10,200,001 | | | | 9,900,001 | | | | 300,001 | | | | 650,001 | |
| | | | |
| (1) | Capital transactions may include transaction fees associated with creation and redemption transactions which occurred during the period. See Note 9 to the Financial Statements. |
See Accompanying Notes to the Financial Statements.
| | |
| 70 | | FLEXSHARES ANNUAL REPORT |
Statements of Changes in Net Assets (cont.)
| | | | | | | | | | | | | | | | |
| | | FlexShares® Currency Hedged
Morningstar EM Factor Tilt
Index Fund | | | FlexShares® US Quality
Large Cap Index Fund | |
| | | Year Ended
October 31,
2018 | | | Year Ended
October 31,
2017 | | | Year Ended
October 31,
2018 | | | Year Ended
October 31,
2017 | |
| | | | |
OPERATIONS | | | | | | | | | | | | | | | | |
Net investment income (loss) | | $ | 641,605 | | | $ | 887,210 | | | $ | 719,965 | | | $ | 307,144 | |
Net realized gain (loss) | | | 7,159,919 | | | | 2,452,108 | | | | 101,624 | | | | 417,880 | |
Net increase from payments by affiliates | | | — | | | | — | | | | — | | | | — | |
Net change in unrealized appreciation (depreciation) | | | (10,069,410 | ) | | | 4,304,175 | | | | 280,817 | | | | 2,368,515 | |
| | | | |
| | | | |
Net Increase (Decrease) in Net Assets | | | | | | | | | | | | | | | | |
Resulting from Operations | | | (2,267,886 | ) | | | 7,643,493 | | | | 1,102,406 | | | | 3,093,539 | |
| | | | |
| | | | |
DISTRIBUTIONS TO SHAREHOLDERS (Note 13) | | | | | | | | | | | | | | | | |
Net investment income | | | | | | | (889,287 | ) | | | | | | | (281,734 | ) |
Net realized gain | | | | | | | — | | | | | | | | — | |
Distributable earnings | | | (616,733 | ) | | | | | | | (695,332 | ) | | | | |
Tax return of capital | | | (32,884 | ) | | | — | | | | — | | | | — | |
| | | | |
Total distributions | | | (649,617 | ) | | | (889,287 | ) | | | (695,332 | ) | | | (281,734 | ) |
| | | | |
| | | | |
CAPITAL TRANSACTIONS(1) | | | | | | | | | | | | | | | | |
Proceeds from shares issued | | | — | | | | 11,741,649 | | | | 37,735,567 | | | | 23,378,847 | |
Cost of shares redeemed | | | (33,809,843 | ) | | | (10,778,254 | ) | | | (3,339,109 | ) | | | (5,673,272 | ) |
| | | | |
Net Increase (Decrease) from Capital Transactions | | | (33,809,843 | ) | | | 963,395 | | | | 34,396,458 | | | | 17,705,575 | |
| | | | |
Total Increase (Decrease) in Net Assets | | | (36,727,346 | ) | | | 7,717,601 | | | | 34,803,532 | | | | 20,517,380 | |
| | | | |
| | | | |
NET ASSETS | | | | | | | | | | | | | | | | |
Beginning of Period | | $ | 41,284,775 | | | $ | 33,567,174 | | | $ | 27,055,205 | | | $ | 6,537,825 | |
| | | | |
End of Period | | $ | 4,557,429 | | | $ | 41,284,775 | | | $ | 61,858,737 | | | $ | 27,055,205 | |
| | | | |
Undistributed (accumulated) net investment income (loss) included in end of period net assets (Note 13) | | | | | | $ | 7,681 | | | | | | | $ | 36,229 | |
| | | | | | | | | | | | | | | | |
| | | | |
SHARE TRANSACTIONS | | | | | | | | | | | | | | | | |
Beginning of period | | | 1,350,001 | | | | 1,300,001 | | | | 850,001 | | | | 250,001 | |
Shares issued | | | — | | | | — | | | | — | | | | — | |
Shares issued in-kind | | | — | | | | 425,000 | | | | 1,100,000 | | | | 800,000 | |
Shares redeemed | | | — | | | | — | | | | — | | | | — | |
Shares redeemed in-kind | | | (1,175,000 | ) | | | (375,000 | ) | | | (100,000 | ) | | | (200,000 | ) |
| | | | |
Shares Outstanding, End of Period | | | 175,001 | | | | 1,350,001 | | | | 1,850,001 | | | | 850,001 | |
| | | | |
| (1) | Capital transactions may include transaction fees associated with creation and redemption transactions which occurred during the period. See Note 9 to the Financial Statements. |
See Accompanying Notes to the Financial Statements.
| | | | |
| FLEXSHARES ANNUAL REPORT | | | 71 | |
Statements of Changes in Net Assets (cont.)
| | | | | | | | | | | | | | | | |
| | | FlexShares® STOXX® US ESG
Impact Index Fund | | | FlexShares® STOXX® Global
ESG Impact Index Fund | |
| | | Year Ended
October 31,
2018 | | | Year Ended
October 31,
2017 | | | Year Ended
October 31,
2018 | | | Year Ended
October 31,
2017 | |
| | | | |
OPERATIONS | | | | | | | | | | | | | | | | |
Net investment income (loss) | | $ | 369,768 | | | $ | 162,683 | | | $ | 1,333,987 | | | $ | 184,459 | |
Net realized gain (loss) | | | 325,506 | | | | 4,886 | | | | (836,669 | ) | | | 19,480 | |
Net increase from payments by affiliates | | | — | | | | — | | | | — | | | | 69 | |
Net change in unrealized appreciation (depreciation) | | | 723,737 | | | | 1,507,838 | | | | (1,135,942 | ) | | | 2,120,227 | |
| | | | |
| | | | |
Net Increase (Decrease) in Net Assets | | | | | | | | | | | | | | | | |
Resulting from Operations | | | 1,419,011 | | | | 1,675,407 | | | | (638,624 | ) | | | 2,324,235 | |
| | | | |
| | | | |
DISTRIBUTIONS TO SHAREHOLDERS (Note 13) | | | | | | | | | | | | | | | | |
Net investment income | | | | | | | (147,860 | ) | | | | | | | (177,721 | ) |
Net realized gain | | | | | | | — | | | | | | | | — | |
Distributable earnings | | | (364,337 | ) | | | | | | | (1,253,536 | ) | | | | |
Tax return of capital | | | — | | | | — | | | | — | | | | — | |
| | | | |
Total distributions | | | (364,337 | ) | | | (147,860 | ) | | | (1,253,536 | ) | | | (177,721 | ) |
| | | | |
| | | | |
CAPITAL TRANSACTIONS(1) | | | | | | | | | | | | | | | | |
Proceeds from shares issued | | | 15,899,635 | | | | 7,085,865 | | | | 42,987,562 | | | | 22,490,287 | |
Cost of shares redeemed | | | (1,617,494 | ) | | | — | | | | — | | | | — | |
| | | | |
Net Increase (Decrease) from Capital Transactions | | | 14,282,141 | | | | 7,085,865 | | | | 42,987,562 | | | | 22,490,287 | |
| | | | |
Total Increase (Decrease) in Net Assets | | | 15,336,815 | | | | 8,613,412 | | | | 41,095,402 | | | | 24,636,801 | |
| | | | |
| | | | |
NET ASSETS | | | | | | | | | | | | | | | | |
Beginning of Period | | $ | 13,609,566 | | | $ | 4,996,154 | | | $ | 32,188,705 | | | $ | 7,551,904 | |
| | | | |
End of Period | | $ | 28,946,381 | | | $ | 13,609,566 | | | $ | 73,284,107 | | | $ | 32,188,705 | |
| | | | |
Undistributed (accumulated) net investment income (loss) included in end of period net assets (Note 13) | | | | | | $ | 25,960 | | | | | | | $ | 35,924 | |
| | | | | | | | | | | | | | | | |
| | | | |
SHARE TRANSACTIONS | | | | | | | | | | | | | | | | |
Beginning of period | | | 225,001 | | | | 100,001 | | | | 350,001 | | | | 100,001 | |
Shares issued | | | — | | | | — | | | | — | | | | — | |
Shares issued in-kind | | | 250,000 | | | | 125,000 | | | | 450,000 | | | | 250,000 | |
Shares redeemed | | | — | | | | — | | | | — | | | | — | |
Shares redeemed in-kind | | | (25,000 | ) | | | — | | | | — | | | | — | |
| | | | |
Shares Outstanding, End of Period | | | 450,001 | | | | 225,001 | | | | 800,001 | | | | 350,001 | |
| | | | |
| (1) | Capital transactions may include transaction fees associated with creation and redemption transactions which occurred during the period. See Note 9 to the Financial Statements. |
See Accompanying Notes to the Financial Statements.
| | |
| 72 | | FLEXSHARES ANNUAL REPORT |
Statements of Changes in Net Assets (cont.)
| | | | | | | | | | | | | | | | |
| | | FlexShares® Morningstar
Global Upstream Natural
Resources Index Fund | | | FlexShares® STOXX®
Global Broad Infrastructure
Index Fund | |
| | | Year Ended
October 31,
2018 | | | Year Ended
October 31,
2017 | | | Year Ended
October 31,
2018 | | | Year Ended
October 31,
2017 | |
| | | | |
OPERATIONS | | | | | | | | | | | | | | | | |
Net investment income (loss) | | $ | 148,910,559 | | | $ | 97,268,299 | | | $ | 24,176,292 | | | $ | 24,452,934 | |
Net realized gain (loss) | | | (100,926,806 | ) | | | (153,969,129 | ) | | | 13,872,043 | | | | 8,061,112 | |
Net increase from payments by affiliates | | | — | | | | 2,597,250 | | | | — | | | | — | |
Net change in unrealized appreciation (depreciation) | | | 40,251,675 | | | | 688,415,180 | | | | (59,962,710 | ) | | | 72,100,845 | |
| | | | |
| | | | |
Net Increase (Decrease) in Net Assets | | | | | | | | | | | | | | | | |
Resulting from Operations | | | 88,235,428 | | | | 634,311,600 | | | | (21,914,375 | ) | | | 104,614,891 | |
| | | | |
| | | | |
DISTRIBUTIONS TO SHAREHOLDERS (Note 13) | | | | | | | | | | | | | | | | |
Net investment income | | | | | | | (91,591,308 | ) | | | | | | | (25,424,557 | ) |
Net realized gain | | | | | | | — | | | | | | | | — | |
Distributable earnings | | | (142,689,396 | ) | | | | | | | (25,040,675 | ) | | | | |
Tax return of capital | | | — | | | | — | | | | — | | | | — | |
| | | | |
Total distributions | | | (142,689,396 | ) | | | (91,591,308 | ) | | | (25,040,675 | ) | | | (25,424,557 | ) |
| | | | |
| | | | |
CAPITAL TRANSACTIONS(1) | | | | | | | | | | | | | | | | |
Proceeds from shares issued | | | 729,840,347 | | | | 1,612,772,251 | | | | 44,339,305 | | | | 212,697,031 | |
Cost of shares redeemed | | | — | | | | (217,108,283 | ) | | | (99,649,945 | ) | | | (85,934,569 | ) |
| | | | |
Net Increase (Decrease) from Capital Transactions | | | 729,840,347 | | | | 1,395,663,968 | | | | (55,310,640 | ) | | | 126,762,462 | |
| | | | |
Total Increase (Decrease) in Net Assets | | | 675,386,379 | | | | 1,938,384,260 | | | | (102,265,690 | ) | | | 205,952,796 | |
| | | | |
| | | | |
NET ASSETS | | | | | | | | | | | | | | | | |
Beginning of Period | | $ | 4,760,396,681 | | | $ | 2,822,012,421 | | | $ | 875,628,445 | | | $ | 669,675,649 | |
| | | | |
End of Period | | $ | 5,435,783,060 | | | $ | 4,760,396,681 | | | $ | 773,362,755 | | | $ | 875,628,445 | |
| | | | |
Undistributed (accumulated) net investment income (loss) included in end of period net assets (Note 13) | | | | | | $ | (2,774,385 | ) | | | | | | $ | 3,015,777 | |
| | | | | | | | | | | | | | | | |
| | | | |
SHARE TRANSACTIONS | | | | | | | | | | | | | | | | |
Beginning of period | | | 150,700,001 | | | | 103,000,001 | | | | 18,300,001 | | | | 15,400,001 | |
Shares issued | | | — | | | | — | | | | — | | | | — | |
Shares issued in-kind | | | 21,800,000 | | | | 55,300,000 | | | | 950,000 | | | | 4,700,000 | |
Shares redeemed | | | — | | | | — | | | | — | | | | — | |
Shares redeemed in-kind | | | — | | | | (7,600,000 | ) | | | (2,100,000 | ) | | | (1,800,000 | ) |
| | | | |
Shares Outstanding, End of Period | | | 172,500,001 | | | | 150,700,001 | | | | 17,150,001 | | | | 18,300,001 | |
| | | | |
| (1) | Capital transactions may include transaction fees associated with creation and redemption transactions which occurred during the period. See Note 9 to the Financial Statements. |
See Accompanying Notes to the Financial Statements.
| | | | |
| FLEXSHARES ANNUAL REPORT | | | 73 | |
Statements of Changes in Net Assets (cont.)
| | | | | | | | | | | | | | | | |
| | | FlexShares® Global Quality
Real Estate Index Fund | | | FlexShares® Real Assets
Allocation Index Fund | |
| | | Year Ended
October 31,
2018 | | | Year Ended
October 31,
2017 | | | Year Ended
October 31,
2018 | | | Year Ended
October 31,
2017 | |
| | | | |
OPERATIONS | | | | | | | | | | | | | | | | |
Net investment income (loss) | | $ | 7,920,873 | | | $ | 3,550,182 | | | $ | 329,020 | | | $ | 70,988 | |
Net realized gain (loss) | | | (737,193 | ) | | | (86,200 | ) | | | (21,526 | ) | | | 846 | |
Net increase from payments by affiliates | | | — | | | | — | | | | — | | | | — | |
Net change in unrealized appreciation (depreciation) | | | (18,406,740 | ) | | | 19,986,486 | | | | (839,345 | ) | | | 266,100 | |
| | | | |
| | | | |
Net Increase (Decrease) in Net Assets | | | | | | | | | | | | | | | | |
Resulting from Operations | | | (11,223,060 | ) | | | 23,450,468 | | | | (531,851 | ) | | | 337,934 | |
| | | | |
| | | | |
DISTRIBUTIONS TO SHAREHOLDERS (Note 13) | | | | | | | | | | | | | | | | |
Net investment income | | | | | | | (5,694,447 | ) | | | | | | | (71,705 | ) |
Net realized gain | | | | | | | — | | | | | | | | — | |
Distributable earnings | | | (8,103,123 | ) | | | | | | | (331,490 | ) | | | | |
Tax return of capital | | | — | | | | — | | | | — | | | | — | |
| | | | |
Total distributions | | | (8,103,123 | ) | | | (5,694,447 | ) | | | (331,490 | ) | | | (71,705 | ) |
| | | | |
| | | | |
CAPITAL TRANSACTIONS(1) | | | | | | | | | | | | | | | | |
Proceeds from shares issued | | | 49,688,173 | | | | 30,164,949 | | | | 8,432,070 | | | | 4,770,437 | |
Cost of shares redeemed | | | — | | | | — | | | | — | | | | — | |
| | | | |
Net Increase (Decrease) from Capital Transactions | | | 49,688,173 | | | | 30,164,949 | | | | 8,432,070 | | | | 4,770,437 | |
| | | | |
Total Increase (Decrease) in Net Assets | | | 30,361,990 | | | | 47,920,970 | | | | 7,568,729 | | | | 5,036,666 | |
| | | | |
| | | | |
NET ASSETS | | | | | | | | | | | | | | | | |
Beginning of Period | | $ | 244,969,742 | | | $ | 197,048,772 | | | $ | 6,318,284 | | | $ | 1,281,618 | |
| | | | |
End of Period | | $ | 275,331,732 | | | $ | 244,969,742 | | | $ | 13,887,013 | | | $ | 6,318,284 | |
| | | | |
Undistributed (accumulated) net investment income (loss) included in end of period net assets (Note 13) | | | | | | $ | 122,968 | | | | | | | $ | — | |
| | | | | | | | | | | | | | | | |
| | | | |
SHARE TRANSACTIONS | | | | | | | | | | | | | | | | |
Beginning of period | | | 3,950,001 | | | | 3,450,001 | | | | 225,001 | | | | 50,001 | |
Shares issued | | | — | | | | — | | | | — | | | | — | |
Shares issued in-kind | | | 800,000 | | | | 500,000 | | | | 300,000 | | | | 175,000 | |
Shares redeemed | | | — | | | | — | | | | — | | | | — | |
Shares redeemed in-kind | | | — | | | | — | | | | — | | | | — | |
| | | | |
Shares Outstanding, End of Period | | | 4,750,001 | | | | 3,950,001 | | | | 525,001 | | | | 225,001 | |
| | | | |
| (1) | Capital transactions may include transaction fees associated with creation and redemption transactions which occurred during the period. See Note 9 to the Financial Statements. |
See Accompanying Notes to the Financial Statements.
| | |
| 74 | | FLEXSHARES ANNUAL REPORT |
Statements of Changes in Net Assets (cont.)
| | | | | | | | | | | | | | | | |
| | | FlexShares® Quality Dividend
Index Fund | | | FlexShares® Quality Dividend
Defensive Index Fund | |
| | | Year Ended
October 31,
2018 | | | Year Ended
October 31,
2017 | | | Year Ended
October 31,
2018 | | | Year Ended
October 31,
2017 | |
| | | | |
OPERATIONS | | | | | | | | | | | | | | | | |
Net investment income (loss) | | $ | 49,327,187 | | | $ | 50,724,829 | | | $ | 8,636,341 | | | $ | 8,784,830 | |
Net realized gain (loss) | | | 111,017,426 | | | | 44,573,416 | | | | 20,094,542 | | | | 5,158,732 | |
Net increase from payments by affiliates | | | — | | | | — | | | | — | | | | — | |
Net change in unrealized appreciation (depreciation) | | | (23,808,241 | ) | | | 174,511,525 | | | | (2,502,203 | ) | | | 32,703,597 | |
| | | | |
| | | | |
Net Increase (Decrease) in Net Assets | | | | | | | | | | | | | | | | |
Resulting from Operations | | | 136,536,372 | | | | 269,809,770 | | | | 26,228,680 | | | | 46,647,159 | |
| | | | |
| | | | |
DISTRIBUTIONS TO SHAREHOLDERS (Note 13) | | | | | | | | | | | | | | | | |
Net investment income | | | | | | | (49,628,114 | ) | | | | | | | (8,458,570 | ) |
Net realized gain | | | | | | | — | | | | | | | | — | |
Distributable earnings | | | (50,127,940 | ) | | | | | | | (8,856,044 | ) | | | | |
Tax return of capital | | | — | | | | — | | | | — | | | | — | |
| | | | |
Total distributions | | | (50,127,940 | ) | | | (49,628,114 | ) | | | (8,856,044 | ) | | | (8,458,570 | ) |
| | | | |
| | | | |
CAPITAL TRANSACTIONS(1) | | | | | | | | | | | | | | | | |
Proceeds from shares issued | | | 139,288,073 | | | | 343,462,008 | | | | 11,354,790 | | | | 41,242,639 | |
Cost of shares redeemed | | | (282,253,367 | ) | | | (186,128,276 | ) | | | (21,803,484 | ) | | | (18,487,149 | ) |
| | | | |
Net Increase (Decrease) from Capital Transactions | | | (142,965,294 | ) | | | 157,333,732 | | | | (10,448,694 | ) | | | 22,755,490 | |
| | | | |
Total Increase (Decrease) in Net Assets | | | (56,556,862 | ) | | | 377,515,388 | | | | 6,923,942 | | | | 60,944,079 | |
| | | | |
| | | | |
NET ASSETS | | | | | | | | | | | | | | | | |
Beginning of Period | | $ | 1,815,664,586 | | | $ | 1,438,149,198 | | | $ | 313,167,033 | | | $ | 252,222,954 | |
| | | | |
End of Period | | $ | 1,759,107,724 | | | $ | 1,815,664,586 | | | $ | 320,090,975 | | | $ | 313,167,033 | |
| | | | |
Undistributed (accumulated) net investment income (loss) included in end of period net assets (Note 13) | | | | | | $ | 5,100,255 | | | | | | | $ | 975,534 | |
| | | | | | | | | | | | | | | | |
| | | | |
SHARE TRANSACTIONS | | | | | | | | | | | | | | | | |
Beginning of period | | | 42,650,001 | | | | 38,750,001 | | | | 7,450,001 | | | | 6,850,001 | |
Shares issued | | | — | | | | — | | | | — | | | | — | |
Shares issued in-kind | | | 3,100,000 | | | | 8,500,000 | | | | 250,000 | | | | 1,050,000 | |
Shares redeemed | | | — | | | | — | | | | — | | | | — | |
Shares redeemed in-kind | | | (6,250,000 | ) | | | (4,600,000 | ) | | | (500,000 | ) | | | (450,000 | ) |
| | | | |
Shares Outstanding, End of Period | | | 39,500,001 | | | | 42,650,001 | | | | 7,200,001 | | | | 7,450,001 | |
| | | | |
| (1) | Capital transactions may include transaction fees associated with creation and redemption transactions which occurred during the period. See Note 9 to the Financial Statements. |
See Accompanying Notes to the Financial Statements.
| | | | |
| FLEXSHARES ANNUAL REPORT | | | 75 | |
Statements of Changes in Net Assets (cont.)
| | | | | | | | | | | | | | | | |
| | | FlexShares® Quality
Dividend Dynamic Index Fund | | | FlexShares® International
Quality Dividend Index Fund | |
| | | Year Ended
October 31,
2018 | | | Year Ended
October 31,
2017 | | | Year Ended
October 31,
2018 | | | Year Ended
October 31,
2017 | |
| | | | |
OPERATIONS | | | | | | | | | | | | | | | | |
Net investment income (loss) | | $ | 1,372,096 | | | $ | 1,935,005 | | | $ | 47,688,403 | | | $ | 30,676,471 | |
Net realized gain (loss) | | | 4,811,218 | | | | 5,356,840 | | | | (13,541,341 | ) | | | 21,660,610 | |
Net increase from payments by affiliates | | | — | | | | — | | | | — | | | | — | |
Net change in unrealized appreciation (depreciation) | | | (3,581,227 | ) | | | 5,065,870 | | | | (135,941,569 | ) | | | 83,475,075 | |
| | | | |
| | | | |
Net Increase (Decrease) in Net Assets | | | | | | | | | | | | | | | | |
Resulting from Operations | | | 2,602,087 | | | | 12,357,715 | | | | (101,794,507 | ) | | | 135,812,156 | |
| | | | |
| | | | |
DISTRIBUTIONS TO SHAREHOLDERS (Note 13) | | | | | | | | | | | | | | | | |
Net investment income | | | | | | | (1,825,259 | ) | | | | | | | (28,328,453 | ) |
Net realized gain | | | | | | | — | | | | | | | | — | |
Distributable earnings | | | (1,451,340 | ) | | | | | | | (48,549,571 | ) | | | | |
Tax return of capital | | | — | | | | — | | | | — | | | | — | |
| | | | |
Total distributions | | | (1,451,340 | ) | | | (1,825,259 | ) | | | (48,549,571 | ) | | | (28,328,453 | ) |
| | | | |
| | | | |
CAPITAL TRANSACTIONS(1) | | | | | | | | | | | | | | | | |
Proceeds from shares issued | | | 2,093,800 | | | | 9,329,699 | | | | 127,597,477 | | | | 376,167,377 | |
Cost of shares redeemed | | | (17,509,790 | ) | | | (14,270,382 | ) | | | (191,787,732 | ) | | | — | |
| | | | |
Net Increase (Decrease) from Capital Transactions | | | (15,415,990 | ) | | | (4,940,683 | ) | | | (64,190,255 | ) | | | 376,167,377 | |
| | | | |
Total Increase (Decrease) in Net Assets | | | (14,265,243 | ) | | | 5,591,773 | | | | (214,534,333 | ) | | | 483,651,080 | |
| | | | |
| | | | |
NET ASSETS | | | | | | | | | | | | | | | | |
Beginning of Period | | $ | 58,570,662 | | | $ | 52,978,889 | | | $ | 979,701,072 | | | $ | 496,049,992 | |
| | | | |
End of Period | | $ | 44,305,419 | | | $ | 58,570,662 | | | $ | 765,166,739 | | | $ | 979,701,072 | |
| | | | |
Undistributed (accumulated) net investment income (loss) included in end of period net assets (Note 13) | | | | | | $ | 220,847 | | | | | | | $ | 3,523,168 | |
| | | | | | | | | | | | | | | | |
| | | | |
SHARE TRANSACTIONS | | | | | | | | | | | | | | | | |
Beginning of period | | | 1,400,001 | | | | 1,500,001 | | | | 37,300,001 | | | | 22,100,001 | |
Shares issued | | | — | | | | — | | | | — | | | | — | |
Shares issued in-kind | | | 50,000 | | | | 250,000 | | | | 4,800,000 | | | | 15,200,000 | |
Shares redeemed | | | — | | | | — | | | | — | | | | — | |
Shares redeemed in-kind | | | (400,000 | ) | | | (350,000 | ) | | | (7,900,000 | ) | | | — | |
| | | | |
Shares Outstanding, End of Period | | | 1,050,001 | | | | 1,400,001 | | | | 34,200,001 | | | | 37,300,001 | |
| | | | |
| (1) | Capital transactions may include transaction fees associated with creation and redemption transactions which occurred during the period. See Note 9 to the Financial Statements. |
See Accompanying Notes to the Financial Statements.
| | |
| 76 | | FLEXSHARES ANNUAL REPORT |
Statements of Changes in Net Assets (cont.)
| | | | | | | | | | | | | | | | |
| | | FlexShares® International Quality
Dividend Defensive Index Fund | | | FlexShares® International Quality
Dividend Dynamic Index Fund | |
| | | Year Ended
October 31,
2018 | | | Year Ended
October 31,
2017 | | | Year Ended
October 31,
2018 | | | Year Ended
October 31,
2017 | |
| | | | |
OPERATIONS | | | | | | | | | | | | | | | | |
Net investment income (loss) | | $ | 4,563,748 | | | $ | 3,424,671 | | | $ | 4,005,554 | | | $ | 2,449,832 | |
Net realized gain (loss) | | | (1,641,123 | ) | | | 1,426,337 | | | | (1,562,754 | ) | | | 1,476,605 | |
Net increase from payments by affiliates | | | — | | | | — | | | | — | | | | — | |
Net change in unrealized appreciation (depreciation) | | | (12,944,730 | ) | | | 8,052,058 | | | | (11,833,097 | ) | | | 7,362,594 | |
| | | | |
| | | | |
Net Increase (Decrease) in Net Assets | | | | | | | | | | | | | | | | |
Resulting from Operations | | | (10,022,105 | ) | | | 12,903,066 | | | | (9,390,297 | ) | | | 11,289,031 | |
| | | | |
| | | | |
DISTRIBUTIONS TO SHAREHOLDERS (Note 13) | | | | | | | | | | | | | | | | |
Net investment income | | | | | | | (3,119,837 | ) | | | | | | | (2,117,337 | ) |
Net realized gain | | | | | | | — | | | | | | | | — | |
Distributable earnings | | | (5,084,444 | ) | | | | | | | (3,934,883 | ) | | | | |
Tax return of capital | | | — | | | | — | | | | — | | | | — | |
| | | | |
Total distributions | | | (5,084,444 | ) | | | (3,119,837 | ) | | | (3,934,883 | ) | | | (2,117,337 | ) |
| | | | |
| | | | |
CAPITAL TRANSACTIONS(1) | | | | | | | | | | | | | | | | |
Proceeds from shares issued | | | 7,592,082 | | | | 14,435,332 | | | | 5,669,259 | | | | 63,846,996 | |
Cost of shares redeemed | | | — | | | | (6,562,120 | ) | | | (20,658,934 | ) | | | — | |
| | | | |
Net Increase (Decrease) from Capital Transactions | | | 7,592,082 | | | | 7,873,212 | | | | (14,989,675 | ) | | | 63,846,996 | |
| | | | |
Total Increase (Decrease) in Net Assets | | | (7,514,467 | ) | | | 17,656,441 | | | | (28,314,855 | ) | | | 73,018,690 | |
| | | | |
| | | | |
NET ASSETS | | | | | | | | | | | | | | | | |
Beginning of Period | | $ | 95,217,148 | | | $ | 77,560,707 | | | $ | 91,795,584 | | | $ | 18,776,894 | |
| | | | |
End of Period | | $ | 87,702,681 | | | $ | 95,217,148 | | | $ | 63,480,729 | | | $ | 91,795,584 | |
| | | | |
Undistributed (accumulated) net investment income (loss) included in end of period net assets (Note 13) | | | | | | $ | 733,112 | | | | | | | $ | 277,672 | |
| | | | | | | | | | | | | | | | |
| | | | |
SHARE TRANSACTIONS | | | | | | | | | | | | | | | | |
Beginning of period | | | 3,800,001 | | | | 3,500,001 | | | | 3,300,001 | | | | 800,001 | |
Shares issued | | | — | | | | — | | | | — | | | | — | |
Shares issued in-kind | | | 300,000 | | | | 600,000 | | | | 200,000 | | | | 2,500,000 | |
Shares redeemed | | | — | | | | — | | | | — | | | | — | |
Shares redeemed in-kind | | | — | | | | (300,000 | ) | | | (800,000 | ) | | | — | |
| | | | |
Shares Outstanding, End of Period | | | 4,100,001 | | | | 3,800,001 | | | | 2,700,001 | | | | 3,300,001 | |
| | | | |
| (1) | Capital transactions may include transaction fees associated with creation and redemption transactions which occurred during the period. See Note 9 to the Financial Statements. |
See Accompanying Notes to the Financial Statements.
| | | | |
| FLEXSHARES ANNUAL REPORT | | | 77 | |
Statements of Changes in Net Assets (cont.)
| | | | | | | | | | | | | | | | |
| | | FlexShares® iBoxx 3-Year Target
Duration TIPS Index Fund | | | FlexShares® iBoxx 5-Year Target
Duration TIPS Index Fund | |
| | | Year Ended
October 31,
2018 | | | Year Ended
October 31,
2017 | | | Year Ended
October 31,
2018 | | | Year Ended
October 31,
2017 | |
| | | | |
OPERATIONS | | | | | | | | | | | | | | | | |
Net investment income (loss) | | $ | 56,165,230 | | | $ | 29,898,387 | | | $ | 26,492,467 | | | $ | 13,971,379 | |
Net realized gain (loss) | | | (25,507,752 | ) | | | (7,368,691 | ) | | | (8,785,489 | ) | | | (151,278 | ) |
Net increase from payments by affiliates | | | — | | | | — | | | | — | | | | — | |
Net change in unrealized appreciation (depreciation) | | | (35,763,699 | ) | | | (14,275,862 | ) | | | (31,104,417 | ) | | | (12,381,777 | ) |
| | | | |
| | | | |
Net Increase (Decrease) in Net Assets | | | | | | | | | | | | | | | | |
Resulting from Operations | | | (5,106,221 | ) | | | 8,253,834 | | | | (13,397,439 | ) | | | 1,438,324 | |
| | | | |
| | | | |
DISTRIBUTIONS TO SHAREHOLDERS (Note 13) | | | | | | | | | | | | | | | | |
Net investment income | | | | | | | (26,104,812 | ) | | | | | | | (12,089,212 | ) |
Net realized gain | | | | | | | — | | | | | | | | — | |
Distributable earnings | | | (58,646,589 | ) | | | | | | | (27,570,542 | ) | | | | |
Tax return of capital | | | — | | | | — | | | | — | | | | — | |
| | | | |
Total distributions | | | (58,646,589 | ) | | | (26,104,812 | ) | | | (27,570,542 | ) | | | (12,089,212 | ) |
| | | | |
| | | | |
CAPITAL TRANSACTIONS(1) | | | | | | | | | | | | | | | | |
Proceeds from shares issued | | | 204,979,683 | | | | 305,158,033 | | | | 218,359,896 | | | | 189,689,043 | |
Cost of shares redeemed | | | (612,747,018 | ) | | | (16,078,914 | ) | | | (92,736,712 | ) | | | (11,271,501 | ) |
| | | | |
Net Increase (Decrease) from Capital Transactions | | | (407,767,335 | ) | | | 289,079,119 | | | | 125,623,184 | | | | 178,417,542 | |
| | | | |
Total Increase (Decrease) in Net Assets | | | (471,520,145 | ) | | | 271,228,141 | | | | 84,655,203 | | | | 167,766,654 | |
| | | | |
| | | | |
NET ASSETS | | | | | | | | | | | | | | | | |
Beginning of Period | | $ | 2,113,130,183 | | | $ | 1,841,902,042 | | | $ | 819,372,020 | | | $ | 651,605,366 | |
| | | | |
End of Period | | $ | 1,641,610,038 | | | $ | 2,113,130,183 | | | $ | 904,027,223 | | | $ | 819,372,020 | |
| | | | |
Undistributed (accumulated) net investment income (loss) included in end of period net assets (Note 13) | | | | | | $ | 3,734,274 | | | | | | | $ | 1,882,167 | |
| | | | | | | | | | | | | | | | |
| | | | |
SHARE TRANSACTIONS | | | | | | | | | | | | | | | | |
Beginning of period | | | 85,904,000 | | | | 74,204,000 | | | | 32,700,001 | | | | 25,600,001 | |
Shares issued | | | — | | | | — | | | | — | | | | — | |
Shares issued in-kind | | | 8,450,000 | | | | 12,350,000 | | | | 8,850,000 | | | | 7,550,000 | |
Shares redeemed | | | — | | | | — | | | | — | | | | — | |
Shares redeemed in-kind | | | (25,400,000 | ) | | | (650,000 | ) | | | (3,800,000 | ) | | | (450,000 | ) |
| | | | |
Shares Outstanding, End of Period | | | 68,954,000 | | | | 85,904,000 | | | | 37,750,001 | | | | 32,700,001 | |
| | | | |
| (1) | Capital transactions may include transaction fees associated with creation and redemption transactions which occurred during the period. See Note 9 to the Financial Statements. |
See Accompanying Notes to the Financial Statements.
| | |
| 78 | | FLEXSHARES ANNUAL REPORT |
Statements of Changes in Net Assets (cont.)
| | | | | | | | | | | | | | | | |
| | | FlexShares® Disciplined Duration
MBS Index Fund | | | FlexShares® Credit-Scored US
Corporate Bond Index Fund | |
| | | Year Ended
October 31,
2018 | | | Year Ended
October 31,
2017 | | | Year Ended
October 31,
2018 | | | Year Ended
October 31,
2017 | |
| | | | |
OPERATIONS | | | | | | | | | | | | | | | | |
Net investment income (loss) | | $ | 1,043,740 | | | $ | 587,968 | | | $ | 1,598,796 | | | $ | 1,028,664 | |
Net realized gain (loss) | | | (186,319 | ) | | | (204,134 | ) | | | (709,479 | ) | | | (24,129 | ) |
Net increase from payments by affiliates | | | — | | | | — | | | | — | | | | — | |
Net change in unrealized appreciation (depreciation) | | | (1,657,657 | ) | | | (635,676 | ) | | | (1,967,302 | ) | | | (169,676 | ) |
| | | | |
| | | | |
Net Increase (Decrease) in Net Assets | | | | | | | | | | | | | | | | |
Resulting from Operations | | | (800,236 | ) | | | (251,842 | ) | | | (1,077,985 | ) | | | 834,859 | |
| | | | |
| | | | |
DISTRIBUTIONS TO SHAREHOLDERS (Note 13) | | | | | | | | | | | | | | | | |
Net investment income | | | | | | | (1,159,790 | ) | | | | | | | (991,097 | ) |
Net realized gain | | | | | | | — | | | | | | | | (138,136 | ) |
Distributable earnings | | | (1,511,413 | ) | | | | | | | (1,546,217 | ) | | | | |
Tax return of capital | | | — | | | | — | | | | — | | | | — | |
| | | | |
Total distributions | | | (1,511,413 | ) | | | (1,159,790 | ) | | | (1,546,217 | ) | | | (1,129,233 | ) |
| | | | |
| | | | |
CAPITAL TRANSACTIONS(1) | | | | | | | | | | | | | | | | |
Proceeds from shares issued | | | 39,295,437 | | | | 7,207,654 | | | | 12,378,133 | | | | 15,235,609 | |
Cost of shares redeemed | | | (3,539,176 | ) | | | (9,676,454 | ) | | | — | | | | — | |
| | | | |
Net Increase (Decrease) from Capital Transactions | | | 35,756,261 | | | | (2,468,800 | ) | | | 12,378,133 | | | | 15,235,609 | |
| | | | |
Total Increase (Decrease) in Net Assets | | | 33,444,612 | | | | (3,880,432 | ) | | | 9,753,931 | | | | 14,941,235 | |
| | | | |
| | | | |
NET ASSETS | | | | | | | | | | | | | | | | |
Beginning of Period | | $ | 38,182,972 | | | $ | 42,063,404 | | | $ | 50,981,839 | | | $ | 36,040,604 | |
| | | | |
End of Period | | $ | 71,627,584 | | | $ | 38,182,972 | | | $ | 60,735,770 | | | $ | 50,981,839 | |
| | | | |
Undistributed (accumulated) net investment income (loss) included in end of period net assets (Note 13) | | | | | | $ | 105,130 | | | | | | | $ | 108,616 | |
| | | | | | | | | | | | | | | | |
| | | | |
SHARE TRANSACTIONS | | | | | | | | | | | | | | | | |
Beginning of period | | | 1,600,001 | | | | 1,700,001 | | | | 1,000,001 | | | | 700,001 | |
Shares issued | | | 1,700,000 | | | | 300,000 | | | | 250,000 | | | | 300,000 | |
Shares issued in-kind | | | — | | | | — | | | | — | | | | — | |
Shares redeemed | | | (150,000 | ) | | | (400,000 | ) | | | — | | | | — | |
Shares redeemed in-kind | | | — | | | | — | | | | — | | | | — | |
| | | | |
Shares Outstanding, End of Period | | | 3,150,001 | | | | 1,600,001 | | | | 1,250,001 | | | | 1,000,001 | |
| | | | |
| (1) | Capital transactions may include transaction fees associated with creation and redemption transactions which occurred during the period. See Note 9 to the Financial Statements. |
See Accompanying Notes to the Financial Statements.
| | | | |
| FLEXSHARES ANNUAL REPORT | | | 79 | |
Statements of Changes in Net Assets (cont.)
| | | | | | | | | | | | |
| | | FlexShares® Credit-Scored US
Long Corporate Bond
Index Fund | | | FlexShares®
High Yield
Value-Scored
Bond Index
Fund | |
| | | Year Ended
October 31,
2018 | | | Year Ended
October 31,
2017 | | | July 17,
2018*
through
October 31,
2018 | |
| | | |
OPERATIONS | | | | | | | | | | | | |
Net investment income (loss) | | $ | 977,431 | | | $ | 538,175 | | | $ | 1,676,609 | |
Net realized gain (loss) | | | (624,604 | ) | | | (44,026 | ) | | | (22,286 | ) |
Net increase from payments by affiliates | | | — | | | | — | | | | — | |
Net change in unrealized appreciation (depreciation) | | | (2,315,008 | ) | | | 196,617 | | | | (1,565,240 | ) |
| | | | |
| | | |
Net Increase (Decrease) in Net Assets | | | | | | | | | | | | |
Resulting from Operations | | | (1,962,181 | ) | | | 690,766 | | | | 89,083 | |
| | | | |
| | | |
DISTRIBUTIONS TO SHAREHOLDERS (Note 13) | | | | | | | | | | | | |
Net investment income | | | | | | | (520,832 | ) | | | | |
Net realized gain | | | | | | | (170,620 | ) | | | | |
Distributable earnings | | | (940,216 | ) | | | | | | | (1,244,147 | ) |
Tax return of capital | | | — | | | | — | | | | — | |
| | | | |
Total distributions | | | (940,216 | ) | | | (691,452 | ) | | | (1,244,147 | ) |
| | | | |
| | | |
CAPITAL TRANSACTIONS(1) | | | | | | | | | | | | |
Proceeds from shares issued | | | 10,468,015 | | | | 7,948,258 | | | | — | |
Cost of shares redeemed | | | — | | | | (2,546,276 | ) | | | — | |
| | | | |
Net Increase (Decrease) from Capital Transactions | | | 10,468,015 | | | | 5,401,982 | | | | — | |
| | | | |
Total Increase (Decrease) in Net Assets | | | 7,565,618 | | | | 5,401,296 | | | | (1,155,064 | ) |
| | | | |
| | | |
NET ASSETS | | | | | | | | | | | | |
Beginning of Period | | $ | 18,858,354 | | | $ | 13,457,058 | | | $ | 50,000,050 | (2) |
| | | | |
End of Period | | $ | 26,423,972 | | | $ | 18,858,354 | | | $ | 48,844,986 | |
| | | | |
Undistributed (accumulated) net investment income (loss) included in end of period net assets (Note 13) | | | | | | $ | 61,335 | | | | | |
| | | | | | | | | | | | |
| | | |
SHARE TRANSACTIONS | | | | | | | | | | | | |
Beginning of period | | | 350,001 | | | | 250,001 | | | | 1,000,001 | (2) |
Shares issued | | | 150,000 | | | | 100,000 | | | | — | |
Shares issued in-kind | | | 50,000 | | | | 50,000 | | | | — | |
Shares redeemed | | | — | | | | (50,000 | ) | | | — | |
Shares redeemed in-kind | | | — | | | | — | | | | — | |
| | | | |
Shares Outstanding, End of Period | | | 550,001 | | | | 350,001 | | | | 1,000,001 | |
| | | | |
| * | Commencement of investment operations. |
| (1) | Capital transactions may include transaction fees associated with creation and redemption transactions which occurred during the period. See Note 9 to the Financial Statements. |
| (2) | Amount includes the initial subscription. |
See Accompanying Notes to the Financial Statements.
| | |
| 80 | | FLEXSHARES ANNUAL REPORT |
Statements of Changes in Net Assets (cont.)
| | | | | | | | | | | | | | | | |
| | | FlexShares® Ready Access
Variable Income Fund | | | FlexShares®
Core Select Bond Fund | |
| | | Year Ended
October 31,
2018 | | | Year Ended
October 31,
2017 | | | Year Ended
October 31,
2018 | | | November 18,
2016*
through
October 31,
2017 | |
| | | | |
OPERATIONS | | | | | | | | | | | | | | | | |
Net investment income (loss) | | $ | 3,366,031 | | | $ | 1,830,697 | | | $ | 582,951 | | | $ | 63,998 | |
Net realized gain (loss) | | | 10,046 | | | | 36,095 | | | | (179,538 | ) | | | (6,208 | ) |
Net increase from payments by affiliates | | | — | | | | — | | | | — | | | | — | |
Net change in unrealized appreciation (depreciation) | | | (425,090 | ) | | | 76,962 | | | | (933,867 | ) | | | 20,488 | |
| | | | |
| | | | |
Net Increase (Decrease) in Net Assets | | | | | | | | | | | | | | | | |
Resulting from Operations | | | 2,950,987 | | | | 1,943,754 | | | | (530,454 | ) | | | 78,278 | |
| | | | |
| | | | |
DISTRIBUTIONS TO SHAREHOLDERS (Note 13) | | | | | | | | | | | | | | | | |
Net investment income | | | | | | | (1,720,304 | ) | | | | | | | (72,451 | ) |
Net realized gain | | | | | | | — | | | | | | | | — | |
Distributable earnings | | | (3,138,154 | ) | | | | | | | (583,175 | ) | | | | |
Tax return of capital | | | — | | | | — | | | | — | | | | — | |
| | | | |
Total distributions | | | (3,138,154 | ) | | | (1,720,304 | ) | | | (583,175 | ) | | | (72,451 | ) |
| | | | |
| | | | |
CAPITAL TRANSACTIONS(1) | | | | | | | | | | | | | | | | |
Proceeds from shares issued | | | 94,240,235 | | | | 64,102,037 | | | | 36,542,513 | | | | 1,876,187 | |
Cost of shares redeemed | | | (45,260,520 | ) | | | (11,331,858 | ) | | | (608,373 | ) | | | (619,651 | ) |
| | | | |
Net Increase (Decrease) from Capital Transactions | | | 48,979,715 | | | | 52,770,179 | | | | 35,934,140 | | | | 1,256,536 | |
| | | | |
Total Increase (Decrease) in Net Assets | | | 48,792,548 | | | | 52,993,629 | | | | 34,820,511 | | | | 1,262,363 | |
| | | | |
| | | | |
NET ASSETS | | | | | | | | | | | | | | | | |
Beginning of Period | | $ | 162,557,133 | | | $ | 109,563,504 | | | $ | 3,762,388 | | | $ | 2,500,025 | (2) |
| | | | |
End of Period | | $ | 211,349,681 | | | $ | 162,557,133 | | | $ | 38,582,899 | | | $ | 3,762,388 | |
| | | | |
Undistributed (accumulated) net investment income (loss) included in end of period net assets (Note 13) | | | | | | $ | 197,903 | | | | | | | $ | — | |
| | | | | | | | | | | | | | | | |
| | | | |
SHARE TRANSACTIONS | | | | | | | | | | | | | | | | |
Beginning of period | | | 2,150,001 | | | | 1,450,001 | | | | 150,001 | | | | 100,001 | (2) |
Shares issued | | | 1,250,000 | | | | 850,000 | | | | — | | | | — | |
Shares issued in-kind | | | — | | | | — | | | | 1,500,000 | | | | 75,000 | |
Shares redeemed | | | — | | | | — | | | | — | | | | — | |
Shares redeemed in-kind | | | (600,000 | ) | | | (150,000 | ) | | | (25,000 | ) | | | (25,000 | ) |
| | | | |
Shares Outstanding, End of Period | | | 2,800,001 | | | | 2,150,001 | | | | 1,625,001 | | | | 150,001 | |
| | | | |
| * | Commencement of investment operations. |
| (1) | Capital transactions may include transaction fees associated with creation and redemption transactions which occurred during the period. See Note 9 to the Financial Statements. |
| (2) | Amount includes the initial subscription. |
See Accompanying Notes to the Financial Statements.
| | | | |
| FLEXSHARES ANNUAL REPORT | | | 81 | |
FlexShares® Trust
Financial Highlights
| | | | | | | | | | | | | | | | | | | | | | | | | | | | | | | | |
| | | | | | PER SHARE | |
| | | | | | Investment Operations | | | Distributions | |
| | | Net asset
value,
beginning of
period | | | Net
Investment
Income (loss) | | | Net Realized
and
Unrealized
Gain (Loss) | | | Total from
Operations(b)(c) | | | Net
Investment
Income | | | From Net
Realized
Gains | | | Tax return of
capital | | | Total | |
| | | | | | | | |
FlexShares® Morningstar US Market Factor Tilt Index Fund | | | | | | | | | | | | | | | | | | | | | | | | | | | | | | | | |
Year ended October 31, 2018 | | $ | 107.50 | | | $ | 2.02 | (a) | | $ | 2.59 | | | $ | 4.61 | | | $ | (1.98 | ) | | $ | — | | | $ | — | | | $ | (1.98 | ) |
Year ended October 31, 2017 | | | 88.32 | | | | 1.74 | (a) | | | 19.13 | | | | 20.87 | | | | (1.69 | ) | | | — | | | | — | | | | (1.69 | ) |
Year ended October 31, 2016 | | | 87.02 | | | | 1.65 | (a) | | | 2.33 | | | | 3.98 | | | | (2.68 | ) | | | — | | | | — | | | | (2.68 | ) |
Year ended October 31, 2015 | | | 86.19 | | | | 1.58 | (a) | | | 0.42 | | | | 2.00 | | | | (1.17 | ) | | | — | | | | — | | | | (1.17 | ) |
Year ended October 31, 2014 | | | 76.56 | | | | 1.16 | (a) | | | 9.26 | | | | 10.42 | | | | (0.79 | ) | | | — | | | | — | | | | (0.79 | ) |
| | | | | | | | |
FlexShares® Morningstar Developed Markets ex-US Factor Tilt Index Fund | | | | | | | | | | | | | | | | | | | | | | | | | | | | | | | | |
Year ended October 31, 2018 | | | 67.51 | | | | 1.78 | (a) | | | (7.39 | ) | | | (5.61 | ) | | | (2.14 | ) | | | — | | | | — | | | | (2.14 | ) |
Year ended October 31, 2017 | | | 55.62 | | | | 1.58 | (a) | | | 11.91 | (k) | | | 13.49 | | | | (1.60 | ) | | | — | | | | — | | | | (1.60 | ) |
Year ended October 31, 2016 | | | 58.18 | | | | 1.59 | (a) | | | (1.55 | ) | | | 0.04 | | | | (2.60 | ) | | | — | | | | — | | | | (2.60 | ) |
Year ended October 31, 2015 | | | 60.74 | | | | 1.51 | (a) | | | (2.27 | ) | | | (0.76 | ) | | | (1.80 | ) | | | — | | | | — | | | | (1.80 | ) |
Year ended October 31, 2014 | | | 61.95 | | | | 1.80 | (a) | | | (2.29 | ) | | | (0.49 | ) | | | (0.72 | ) | | | — | | | | — | | | | (0.72 | ) |
| | | | | | | | |
FlexShares® Morningstar Emerging Markets Factor Tilt Index Fund | | | | | | | | | | | | | | | | | | | | | | | | | | | | | | | | |
Year ended October 31, 2018 | | | 57.38 | | | | 1.46 | (a) | | | (9.34 | ) | | | (7.88 | ) | | | (1.58 | ) | | | — | | | | — | | | | (1.58 | ) |
Year ended October 31, 2017 | | | 47.52 | | | | 1.28 | (a) | | | 9.80 | | | | 11.08 | | | | (1.22 | ) | | | — | | | | — | | | | (1.22 | ) |
Year ended October 31, 2016 | | | 45.02 | | | | 0.97 | (a) | | | 3.10 | | | | 4.07 | | | | (1.57 | ) | | | — | | | | — | | | | (1.57 | ) |
Year ended October 31, 2015 | | | 52.75 | | | | 0.92 | (a) | | | (7.65 | ) | | | (6.73 | ) | | | (1.00 | ) | | | — | | | | — | | | | (1.00 | ) |
Year ended October 31, 2014 | | | 52.92 | | | | 1.03 | (a) | | | (0.77 | ) | | | 0.26 | | | | (0.43 | ) | | | — | | | | — | | | | (0.43 | ) |
| * | Commencement of investment operations. |
| (a) | Net investment income per share is based on average shares outstanding. |
| (b) | Not annualized for periods less than one year. |
| (c) | Annualized for periods less than one year. |
| (d) | Net asset value total return is calculated assuming an initial investment made at the net asset value at the beginning of the period, reinvestment of all dividends and distributions at net asset value during the period and redemption on the last day of the period at adjusted net asset value. |
| (e) | Market value total return is calculated assuming an initial investment made at the market value at the beginning of the period, reinvestment of all dividends and distributions at net asset value during the period and redemption on the last day of the period at market value. Market value is determined by the mid point of the bid/ask spread at 4:00 p.m. Eastern Time from the primary listing exchange. Market value returns may vary from net asset value returns. |
| (f) | In-kind transactions are not included in portfolio turnover calculations. |
| (g) | The amount shown for a share outstanding throughout the period is directionally inconsistent with aggregate net realized and unrealized for the period as presented in the financial statements. |
| (h) | Per share amount is less than $0.005. |
| (i) | The Fund indirectly bears its proportionate share of fees and expenses incurred by the Underlying Fund(s) in which the Fund is invested. This ratio does not include these indirect fees and expenses. |
| (j) | The Expenses net of reimbursements and Net investment Income (Loss) net of reimbursement ratios include a voluntary reimbursement of advisory fees made by JPMorgan Chase Bank, N.A. Absent this additional reimbursement, Expenses net of reimbursements would have increased by 0.20% and the Net investment Income (Loss) net of reimbursement would have decreased by 0.20%. |
| (k) | Northern Trust Investments, Inc. reimbursed the Funds for losses incurred related to an error. The impact was an increase of $0.02 to the net realized and unrealized gain (loss) on investments per share and an increase of 0.06% to the total return of the FlexShares Morningstar Global Upstream Natural Resources Index Fund. For the FlexShares Morningstar Developed Markets ex-US Factor Tilt Index Fund and FlexShares STOXX Global ESG Impact Index Fund, the impact to the net realized and unrealized gain (loss) on investments per share amount is less than $0.005 and the total returns are less than 0.005%. Had these reimbursements not been made, the total returns would have been lower. |
See Accompanying Notes to the Financial Statements.
| | |
| 82 | | FLEXSHARES ANNUAL REPORT |
| | | | | | | | | | | | | | | | | | | | | | | | | | | | | | | | | | |
| | | RATIOS/SUPPLEMENTAL DATA | |
| | | | Total Return(b) | | | Ratios to Average Net Assets(c) | | | Supplemental Data | |
Net Asset
Value,
end of
period | | | Net Asset
Value(d) | | | Market Value
(Unaudited)(e) | | | Expenses | | | Expenses net of
reimbursements | | | Net investment
income (loss)
before
reimbursements | | | Net investment
Income (Loss)
net of
reimbursements | | | Portfolio
Turnover
Rate(b)(f) | | | Net assets, end
of period
(thousands) | |
| | | | | | | | |
| | | | | | | | | | | | | | | | | | | | | | | | | | | | | | | | | | |
| $ | 110.13 | | | | 4.22 | % | | | 4.19 | % | | | 0.25 | % | | | 0.25 | % | | | 1.77 | % | | | 1.77 | % | | | 15 | % | | $ | 1,387,665 | |
| | 107.50 | | | | 23.77 | | | | 23.72 | | | | 0.26 | | | | 0.25 | | | | 1.73 | | | | 1.74 | | | | 22 | | | | 1,150,199 | |
| | 88.32 | | | | 4.70 | | | | 4.77 | | | | 0.28 | | | | 0.27 | | | | 1.92 | | | | 1.93 | | | | 26 | | | | 830,253 | |
| | 87.02 | | | | 2.30 | | | | 2.30 | | | | 0.28 | | | | 0.27 | | | | 1.81 | | | | 1.81 | | | | 51 | | | | 761,457 | |
| | 86.19 | | | | 13.69 | | | | 13.54 | | | | 0.28 | | | | 0.27 | | | | 1.41 | | | | 1.41 | | | | 25 | | | | 741,260 | |
| | | | | | | | |
| | | | | | | | | | | | | | | | | | | | | | | | | | | | | | | | | | |
| | 59.76 | | | | (8.61 | ) | | | (9.48 | ) | | | 0.39 | | | | 0.39 | | | | 2.65 | | | | 2.65 | | | | 34 | | | | 968,096 | |
| | 67.51 | | | | 24.58 | (k) | | | 25.38 | | | | 0.40 | | | | 0.39 | | | | 2.57 | | | | 2.57 | | | | 22 | | | | 985,608 | |
| | 55.62 | | | | 0.20 | | | | 0.80 | | | | 0.43 | | | | 0.42 | | | | 2.91 | | | | 2.92 | | | | 35 | | | | 622,898 | |
| | 58.18 | | | | (1.26 | ) | | | (2.34 | ) | | | 0.43 | | | | 0.42 | | | | 2.52 | | | | 2.53 | | | | 26 | | | | 570,188 | |
| | 60.74 | | | | (0.81 | ) | | | (0.80 | ) | | | 0.43 | | | | 0.42 | | | | 2.84 | | | | 2.85 | | | | 16 | | | | 643,893 | |
| | | | | | | | |
| | | | | | | | | | | | | | | | | | | | | | | | | | | | | | | | | | |
| | 47.92 | | | | (14.05 | ) | | | (15.22 | ) | | | 0.59 | | | | 0.59 | | | | 2.56 | | | | 2.56 | | | | 49 | | | | 488,736 | |
| | 57.38 | | | | 23.56 | | | | 23.47 | | | | 0.60 | | | | 0.59 | | | | 2.44 | | | | 2.44 | | | | 34 | | | | 568,071 | |
| | 47.52 | | | | 9.41 | | | | 10.65 | | | | 0.66 | | | | 0.65 | | | | 2.23 | | | | 2.23 | | | | 34 | | | | 299,351 | |
| | 45.02 | | | | (12.91 | ) | | | (13.43 | ) | | | 0.66 | | | | 0.65 | | | | 1.86 | | | | 1.87 | | | | 30 | | | | 198,073 | |
| | 52.75 | | | | 0.52 | | | | 0.52 | | | | 0.66 | | | | 0.65 | | | | 1.96 | | | | 1.97 | | | | 19 | | | | 258,481 | |
See Accompanying Notes to the Financial Statements.
| | | | |
| FLEXSHARES ANNUAL REPORT | | | 83 | |
Financial Highlights (cont.)
| | | | | | | | | | | | | | | | | | | | | | | | | | | | | | | | |
| | | | | | PER SHARE | |
| | | | | | Investment Operations | | | Distributions | |
| | | Net asset
value,
beginning of
period | | | Net
Investment
Income (loss) | | | Net Realized
and
Unrealized
Gain (Loss) | | | Total from
Operations(b)(c) | | | Net
Investment
Income | | | From Net
Realized
Gains | | | Tax return of
capital | | | Total | |
| | | | | | | | |
FlexShares® Currency Hedged Morningstar DM ex-US Factor Tilt Index Fund | | | | | | | | | | | | | | | | | | | | | | | | | | | | | | | | |
Year ended October 31, 2018 | | $ | 29.14 | | | $ | 0.93 | (a) | | $ | (2.53 | ) | | $ | (1.60 | ) | | $ | (0.78 | ) | | $ | — | | | $ | (0.32 | ) | | $ | (1.10 | ) |
Year ended October 31, 2017 | | | 23.97 | | | | 0.59 | (a) | | | 5.27 | | | | 5.86 | | | | (0.69 | ) | | | — | | | | — | | | | (0.69 | ) |
For the period 11/09/15* through 10/31/16 | | | 25.00 | | | | 1.04 | (a) | | | (0.96 | ) | | | 0.08 | | | | (0.98 | ) | | | — | | | | (0.13 | ) | | | (1.11 | ) |
| | | | | | | | |
FlexShares® Currency Hedged Morningstar EM Factor Tilt Index Fund | | | | | | | | | | | | | | | | | | | | | | | | | | | | | | | | |
Year ended October 31, 2018 | | | 30.58 | | | | 0.63 | (a) | | | (4.35 | ) | | | (3.72 | ) | | | (0.79 | ) | | | — | | | | (0.03 | ) | | | (0.82 | ) |
Year ended October 31, 2017 | | | 25.82 | | | | 0.63 | (a) | | | 4.77 | | | | 5.40 | | | | (0.64 | ) | | | — | | | | — | | | | (0.64 | ) |
For the period 11/09/15* through 10/31/16 | | | 25.00 | | | | 0.59 | (a) | | | 1.10 | | | | 1.69 | | | | (0.87 | ) | | | — | | | | — | | | | (0.87 | ) |
| | | | | | | | |
FlexShares® US Quality Large Cap Index Fund | | | | | | | | | | | | | | | | | | | | | | | | | | | | | | | | |
Year ended October 31, 2018 | | | 31.83 | | | | 0.54 | (a) | | | 1.58 | | | | 2.12 | | | | (0.51 | ) | | | — | | | | — | | | | (0.51 | ) |
Year ended October 31, 2017 | | | 26.15 | | | | 0.49 | (a) | | | 5.65 | | | | 6.14 | | | | (0.46 | ) | | | — | | | | — | | | | (0.46 | ) |
Year ended October 31, 2016 | | | 26.62 | | | | 0.50 | (a) | | | (0.47 | ) | | | 0.03 | | | | (0.50 | ) | | | — | | | | — | | | | (0.50 | ) |
For the period 09/23/15* through 10/31/15 | | | 25.00 | | | | 0.03 | (a) | | | 1.59 | | | | 1.62 | | | | — | | | | — | | | | — | | | | — | |
| * | Commencement of investment operations. |
| (a) | Net investment income per share is based on average shares outstanding. |
| (b) | Not annualized for periods less than one year. |
| (c) | Annualized for periods less than one year. |
| (d) | Net asset value total return is calculated assuming an initial investment made at the net asset value at the beginning of the period, reinvestment of all dividends and distributions at net asset value during the period and redemption on the last day of the period at adjusted net asset value. |
| (e) | Market value total return is calculated assuming an initial investment made at the market value at the beginning of the period, reinvestment of all dividends and distributions at net asset value during the period and redemption on the last day of the period at market value. Market value is determined by the mid point of the bid/ask spread at 4:00 p.m. Eastern Time from the primary listing exchange. Market value returns may vary from net asset value returns. |
| (f) | In-kind transactions are not included in portfolio turnover calculations. |
| (g) | The amount shown for a share outstanding throughout the period is directionally inconsistent with aggregate net realized and unrealized for the period as presented in the financial statements. |
| (h) | Per share amount is less than $0.005. |
| (i) | The Fund indirectly bears its proportionate share of fees and expenses incurred by the Underlying Fund(s) in which the Fund is invested. This ratio does not include these indirect fees and expenses. |
| (j) | The Expenses net of reimbursements and Net investment Income (Loss) net of reimbursement ratios include a voluntary reimbursement of advisory fees made by JPMorgan Chase Bank, N.A. Absent this additional reimbursement, Expenses net of reimbursements would have increased by 0.20% and the Net investment Income (Loss) net of reimbursement would have decreased by 0.20%. |
| (k) | Northern Trust Investments, Inc. reimbursed the Funds for losses incurred related to an error. The impact was an increase of $0.02 to the net realized and unrealized gain (loss) on investments per share and an increase of 0.06% to the total return of the FlexShares Morningstar Global Upstream Natural Resources Index Fund. For the FlexShares Morningstar Developed Markets ex-US Factor Tilt Index Fund and FlexShares STOXX Global ESG Impact Index Fund, the impact to the net realized and unrealized gain (loss) on investments per share amount is less than $0.005 and the total returns are less than 0.005%. Had these reimbursements not been made, the total returns would have been lower. |
See Accompanying Notes to the Financial Statements.
| | |
| 84 | | FLEXSHARES ANNUAL REPORT |
| | | | | | | | | | | | | | | | | | | | | | | | | | | | | | | | | | |
| | | RATIOS/SUPPLEMENTAL DATA | |
| | | | Total Return(b) | | | Ratios to Average Net Assets(c) | | | Supplemental Data | |
Net Asset
Value,
end of
period | | | Net Asset
Value(d) | | | Market Value
(Unaudited)(e) | | | Expenses | | | Expenses net of
reimbursements | | | Net investment
income (loss)
before
reimbursements | | | Net investment
Income (Loss)
net of
reimbursements | | | Portfolio
Turnover
Rate(b)(f) | | | Net assets, end
of period
(thousands) | |
| | | | | | | | |
| | | | | | | | | | | | | | | | | | | | | | | | | | | | | | | | | | |
| $ | 26.44 | | | | (5.73 | ) % | | | (6.19 | ) % | | | 0.46 | % (i) | | | 0.05 | % (i) | | | 2.84 | % | | | 3.25 | % | | | 9 | % | | $ | 7,933 | |
| | 29.14 | | | | 24.75 | | | | 24.84 | | | | 0.46 | (i) | | | 0.05 | (i) | | | 1.78 | | | | 2.18 | | | | 6 | | | | 18,941 | |
| 23.97 | | | | 0.59 | | | | 0.97 | | | | 0.55 | (i) | | | 0.05 | (i) | | | 4.12 | | | | 4.62 | | | | 11 | | | | 3,595 | |
| | | | | | | | |
|
|
| | | | | | | | | | | | | | | | | | | | | | | | | | | | | | | | |
| | 26.04 | | | | (12.40 | ) | | | (12.44 | ) | | | 0.65 | (i) | | | 0.05 | (i) | | | 1.45 | | | | 2.05 | | | | 6 | | | | 4,557 | |
| | 30.58 | | | | 21.16 | | | | 20.75 | | | | 0.65 | (i) | | | 0.05 | (i) | | | 1.67 | | | | 2.27 | | | | 4 | | | | 41,285 | |
| 25.82 | | | | 7.04 | | | | 7.12 | | | | 0.72 | (i) | | | 0.05 | (i) | | | 1.81 | | | | 2.47 | | | | 4 | | | | 33,567 | |
| | | | | | | | |
| | | | | | | | | | | | | | | | | | | | | | | | | | | | | | | | | | |
| | 33.44 | | | | 6.63 | | | | 6.30 | | | | 0.33 | | | | 0.32 | | | | 1.56 | | | | 1.57 | | | | 94 | | | | 61,859 | |
| | 31.83 | | | | 23.65 | | | | 24.08 | | | | 0.34 | | | | 0.32 | | | | 1.65 | | | | 1.67 | | | | 64 | | | | 27,055 | |
| | 26.15 | | | | 0.12 | | | | 0.12 | | | | 0.38 | | | | 0.32 | | | | 1.87 | | | | 1.93 | | | | 59 | | | | 6,538 | |
| 26.62 | | | | 6.48 | | | | 6.48 | | | | 0.42 | | | | 0.32 | | | | 1.10 | | | | 1.20 | | | | 3 | | | | 2,662 | |
See Accompanying Notes to the Financial Statements.
| | | | |
| FLEXSHARES ANNUAL REPORT | | | 85 | |
Financial Highlights (cont.)
| | | | | | | | | | | | | | | | | | | | | | | | | | | | | | | | |
| | | | | | PER SHARE | |
| | | | | | Investment Operations | | | Distributions | |
| | | Net asset
value,
beginning of
period | | | Net
Investment
Income (loss) | | | Net Realized
and
Unrealized
Gain (Loss) | | | Total from
Operations(b)(c) | | | Net
Investment
Income | | | From Net
Realized
Gains | | | Tax return of
capital | | | Total | |
| | | | | | | | |
FlexShares® STOXX® US ESG Impact Index Fund | | | | | | | | | | | | | | | | | | | | | | | | | | | | | | | | |
Year ended October 31, 2018 | | $ | 60.49 | | | $ | 1.09 | (a) | | $ | 3.84 | | | $ | 4.93 | | | $ | (1.09 | ) | | $ | — | | | $ | — | | | $ | (1.09 | ) |
Year ended October 31, 2017 | | | 49.96 | | | | 1.05 | (a) | | | 10.45 | | | | 11.50 | | | | (0.97 | ) | | | — | | | | — | | | | (0.97 | ) |
For the period 07/13/16* through 10/31/16 | | | 50.00 | | | | 0.27 | (a) | | | (0.15 | ) | | | 0.12 | | | | (0.16 | ) | | | — | | | | — | | | | (0.16 | ) |
| | | | | | | | |
FlexShares® STOXX® Global ESG Impact Index Fund | | | | | | | | | | | | | | | | | | | | | | | | | | | | | | | | |
Year ended October 31, 2018 | | | 91.97 | | | | 1.95 | (a) | | | (0.61 | ) | | | 1.34 | | | | (1.70 | ) | | | — | | | | — | | | | (1.70 | ) |
Year ended October 31, 2017 | | | 75.52 | | | | 1.56 | (a) | | | 16.67 | (k) | | | 18.23 | | | | (1.78 | ) | | | — | | | | — | | | | (1.78 | ) |
For the period 07/13/16* through 10/31/16 | | | 75.00 | | | | 0.41 | (a) | | | 0.34 | | | | 0.75 | | | | (0.23 | ) | | | — | | | | — | | | | (0.23 | ) |
| | | | | | | | |
FlexShares® Morningstar Global Upstream Natural Resources Index Fund | | | | | | | | | | | | | | | | | | | | | | | | | | | | | | | | |
Year ended October 31, 2018 | | | 31.59 | | | | 0.91 | (a) | | | (0.13 | ) | | | 0.78 | | | | (0.86 | ) | | | — | | | | — | | | | (0.86 | ) |
Year ended October 31, 2017 | | | 27.40 | | | | 0.70 | (a) | | | 4.13 | (k) | | | 4.83 | | | | (0.64 | ) | | | — | | | | — | | | | (0.64 | ) |
Year ended October 31, 2016 | | | 25.52 | | | | 0.55 | (a) | | | 2.73 | | | | 3.28 | | | | (1.40 | ) | | | — | | | | — | | | | (1.40 | ) |
Year ended October 31, 2015 | | | 33.18 | | | | 0.94 | (a) | | | (7.74 | ) | | | (6.80 | ) | | | (0.86 | ) | | | — | | | | — | | | | (0.86 | ) |
Year ended October 31, 2014 | | | 34.71 | | | | 0.80 | (a) | | | (1.63 | ) | | | (0.83 | ) | | | (0.70 | ) | | | — | | | | — | | | | (0.70 | ) |
| * | Commencement of investment operations. |
| (a) | Net investment income per share is based on average shares outstanding. |
| (b) | Not annualized for periods less than one year. |
| (c) | Annualized for periods less than one year. |
| (d) | Net asset value total return is calculated assuming an initial investment made at the net asset value at the beginning of the period, reinvestment of all dividends and distributions at net asset value during the period and redemption on the last day of the period at adjusted net asset value. |
| (e) | Market value total return is calculated assuming an initial investment made at the market value at the beginning of the period, reinvestment of all dividends and distributions at net asset value during the period and redemption on the last day of the period at market value. Market value is determined by the mid point of the bid/ask spread at 4:00 p.m. Eastern Time from the primary listing exchange. Market value returns may vary from net asset value returns. |
| (f) | In-kind transactions are not included in portfolio turnover calculations. |
| (g) | The amount shown for a share outstanding throughout the period is directionally inconsistent with aggregate net realized and unrealized for the period as presented in the financial statements. |
| (h) | Per share amount is less than $0.005. |
| (i) | The Fund indirectly bears its proportionate share of fees and expenses incurred by the Underlying Fund(s) in which the Fund is invested. This ratio does not include these indirect fees and expenses. |
| (j) | The Expenses net of reimbursements and Net investment Income (Loss) net of reimbursement ratios include a voluntary reimbursement of advisory fees made by JPMorgan Chase Bank, N.A. Absent this additional reimbursement, Expenses net of reimbursements would have increased by 0.20% and the Net investment Income (Loss) net of reimbursement would have decreased by 0.20%. |
| (k) | Northern Trust Investments, Inc. reimbursed the Funds for losses incurred related to an error. The impact was an increase of $0.02 to the net realized and unrealized gain (loss) on investments per share and an increase of 0.06% to the total return of the FlexShares Morningstar Global Upstream Natural Resources Index Fund. For the FlexShares Morningstar Developed Markets ex-US Factor Tilt Index Fund and FlexShares STOXX Global ESG Impact Index Fund, the impact to the net realized and unrealized gain (loss) on investments per share amount is less than $0.005 and the total returns are less than 0.005%. Had these reimbursements not been made, the total returns would have been lower. |
See Accompanying Notes to the Financial Statements.
| | |
| 86 | | FLEXSHARES ANNUAL REPORT |
| | | | | | | | | | | | | | | | | | | | | | | | | | | | | | | | | | |
| | | RATIOS/SUPPLEMENTAL DATA | |
| | | | Total Return(b) | | | Ratios to Average Net Assets(c) | | | Supplemental Data | |
Net Asset
Value,
end of
period | | | Net Asset
Value(d) | | | Market Value
(Unaudited)(e) | | | Expenses | | | Expenses net of
reimbursements | | | Net investment
income (loss)
before
reimbursements | | | Net investment
Income (Loss)
net of
reimbursements | | | Portfolio
Turnover
Rate(b)(f) | | | Net assets, end
of period
(thousands) | |
| | | | | | | | |
| | | | | | | | | | | | | | | | | | | | | | | | | | | | | | | | | | |
| $ | 64.33 | | | | 8.13 | % | | | 7.97 | % | | | 0.33 | % | | | 0.32 | % | | | 1.66 | % | | | 1.67 | % | | | 110 | % | | $ | 28,946 | |
| | 60.49 | | | | 23.19 | | | | 23.30 | | | | 0.35 | | | | 0.32 | | | | 1.82 | | | | 1.85 | | | | 67 | | | | 13,610 | |
| 49.96 | | | | 0.24 | | | | 0.28 | | | | 0.37 | | | | 0.32 | | | | 1.75 | | | | 1.80 | | | | 20 | | | | 4,996 | |
| | | | | | | | |
| | | | | | | | | | | | | | | | | | | | | | | | | | | | | | | | | | |
| | 91.61 | | | | 1.38 | | | | 1.71 | | | | 0.43 | | | | 0.42 | | | | 2.03 | | | | 2.04 | | | | 78 | | | | 73,284 | |
| | 91.97 | | | | 24.37 | (k) | | | 24.55 | | | | 0.45 | | | | 0.42 | | | | 1.81 | | | | 1.83 | | | | 64 | | | | 32,189 | |
| 75.52 | | | | 1.00 | | | | 1.03 | | | | 0.45 | | | | 0.42 | | | | 1.74 | | | | 1.77 | | | | 22 | | | | 7,552 | |
| | | | | | | | |
| | | | | | | | | | | | | | | | | | | | | | | | | | | | | | | | | | |
| | 31.51 | | | | 2.33 | | | | 2.01 | | | | 0.46 | | | | 0.46 | | | | 2.72 | | | | 2.72 | | | | 30 | | | | 5,435,783 | |
| | 31.59 | | | | 17.81 | (k) | | | 17.97 | | | | 0.47 | | | | 0.46 | | | | 2.36 | | | | 2.36 | | | | 18 | | | | 4,760,397 | |
| | 27.40 | | | | 13.84 | | | | 14.05 | | | | 0.49 | | | | 0.48 | | | | 2.20 | | | | 2.20 | | | | 18 | | | | 2,822,012 | |
| | 25.52 | | | | (20.97 | ) | | | (21.05 | ) | | | 0.49 | | | | 0.48 | | | | 3.17 | | | | 3.17 | | | | 13 | | | | 2,004,234 | |
| | 33.18 | | | | (2.44 | ) | | | (2.44 | ) | | | 0.49 | | | | 0.48 | | | | 2.27 | | | | 2.27 | | | | 11 | | | | 2,874,838 | |
See Accompanying Notes to the Financial Statements.
| | | | |
| FLEXSHARES ANNUAL REPORT | | | 87 | |
Financial Highlights (cont.)
| | | | | | | | | | | | | | | | | | | | | | | | | | | | | | | | |
| | | | | | PER SHARE | |
| | | | | | Investment Operations | | | Distributions | |
| | | Net asset
value,
beginning of
period | | | Net
Investment
Income (loss) | | | Net Realized
and
Unrealized
Gain (Loss) | | | Total from
Operations(b)(c) | | | Net
Investment
Income | | | From Net
Realized
Gains | | | Tax return of
capital | | | Total | |
| | | | | | | | |
FlexShares® STOXX® Global Broad Infrastructure Index Fund | | | | | | | | | | | | | | | | | | | | | | | | | | | | | | | | |
Year ended October 31, 2018 | | $ | 47.85 | | | $ | 1.36 | (a) | | $ | (2.71 | ) | | $ | (1.35 | ) | | $ | (1.41 | ) | | $ | — | | | $ | — | | | $ | (1.41 | ) |
Year ended October 31, 2017 | | | 43.49 | | | | 1.37 | (a) | | | 4.40 | | | | 5.77 | | | | (1.41 | ) | | | — | | | | — | | | | (1.41 | ) |
Year ended October 31, 2016 | | | 43.30 | | | | 1.34 | (a) | | | (0.02 | )(g) | | | 1.32 | | | | (1.13 | ) | | | — | | | | — | | | | (1.13 | ) |
Year ended October 31, 2015 | | | 45.84 | | | | 1.13 | (a) | | | (2.67 | ) | | | (1.54 | ) | | | (1.00 | ) | | | — | | | | — | | | | (1.00 | ) |
Year ended October 31, 2014 | | | 41.62 | | | | 1.73 | (a) | | | 3.65 | | | | 5.38 | | | | (1.16 | ) | | | — | | | | — | | | | (1.16 | ) |
| | | | | | | | |
FlexShares® Global Quality Real Estate Index Fund | | | | | | | | | | | | | | | | | | | | | | | | | | | | | | | | |
Year ended October 31, 2018 | | | 62.02 | | | | 1.80 | (a) | | | (3.99 | ) | | | (2.19 | ) | | | (1.87 | ) | | | — | | | | — | | | | (1.87 | ) |
Year ended October 31, 2017 | | | 57.12 | | | | 0.99 | (a) | | | 5.54 | | | | 6.53 | | | | (1.63 | ) | | | — | | | | — | | | | (1.63 | ) |
Year ended October 31, 2016 | | | 57.47 | | | | 1.90 | (a) | | | (0.58 | ) | | | 1.32 | | | | (1.67 | ) | | | — | | | | — | | | | (1.67 | ) |
Year ended October 31, 2015 | | | 55.24 | | | | 1.36 | (a) | | | 2.25 | | | | 3.61 | | | | (1.38 | ) | | | — | | | | — | | | | (1.38 | ) |
For the period 11/05/13* through 10/31/14 | | | 50.00 | | | | 1.65 | (a) | | | 4.67 | | | | 6.32 | | | | (1.08 | ) | | | — | | | | — | | | | (1.08 | ) |
| | | | | | | | |
FlexShares® Real Assets Allocation Index Fund | | | | | | | | | | | | | | | | | | | | | | | | | | | | | | | | |
Year ended October 31, 2018 | | | 28.08 | | | | 0.80 | (a) | | | (1.64 | ) | | | (0.84 | ) | | | (0.79 | ) | | | 0.00 | (h) | | | — | | | | (0.79 | ) |
Year ended October 31, 2017 | | | 25.63 | | | | 0.66 | (a) | | | 2.54 | | | | 3.20 | | | | (0.75 | ) | | | — | | | | — | | | | (0.75 | ) |
For the period 11/23/15* through 10/31/16 | | | 25.00 | | | | 0.86 | (a) | | | 0.51 | (g) | | | 1.37 | | | | (0.74 | ) | | | — | | | | — | | | | (0.74 | ) |
| * | Commencement of investment operations. |
| (a) | Net investment income per share is based on average shares outstanding. |
| (b) | Not annualized for periods less than one year. |
| (c) | Annualized for periods less than one year. |
| (d) | Net asset value total return is calculated assuming an initial investment made at the net asset value at the beginning of the period, reinvestment of all dividends and distributions at net asset value during the period and redemption on the last day of the period at adjusted net asset value. |
| (e) | Market value total return is calculated assuming an initial investment made at the market value at the beginning of the period, reinvestment of all dividends and distributions at net asset value during the period and redemption on the last day of the period at market value. Market value is determined by the mid point of the bid/ask spread at 4:00 p.m. Eastern Time from the primary listing exchange. Market value returns may vary from net asset value returns. |
| (f) | In-kind transactions are not included in portfolio turnover calculations. |
| (g) | The amount shown for a share outstanding throughout the period is directionally inconsistent with aggregate net realized and unrealized for the period as presented in the financial statements. |
| (h) | Per share amount is less than $0.005. |
| (i) | The Fund indirectly bears its proportionate share of fees and expenses incurred by the Underlying Fund(s) in which the Fund is invested. This ratio does not include these indirect fees and expenses. |
| (j) | The Expenses net of reimbursements and Net investment Income (Loss) net of reimbursement ratios include a voluntary reimbursement of advisory fees made by JPMorgan Chase Bank, N.A. Absent this additional reimbursement, Expenses net of reimbursements would have increased by 0.20% and the Net investment Income (Loss) net of reimbursement would have decreased by 0.20%. |
| (k) | Northern Trust Investments, Inc. reimbursed the Funds for losses incurred related to an error. The impact was an increase of $0.02 to the net realized and unrealized gain (loss) on investments per share and an increase of 0.06% to the total return of the FlexShares Morningstar Global Upstream Natural Resources Index Fund. For the FlexShares Morningstar Developed Markets ex-US Factor Tilt Index Fund and FlexShares STOXX Global ESG Impact Index Fund, the impact to the net realized and unrealized gain (loss) on investments per share amount is less than $0.005 and the total returns are less than 0.005%. Had these reimbursements not been made, the total returns would have been lower. |
See Accompanying Notes to the Financial Statements.
| | |
| 88 | | FLEXSHARES ANNUAL REPORT |
| | | | | | | | | | | | | | | | | | | | | | | | | | | | | | | | | | |
| | | RATIOS/SUPPLEMENTAL DATA | |
| | | | Total Return(b) | | | Ratios to Average Net Assets(c) | | | Supplemental Data | |
Net Asset
Value,
end of
period | | | Net Asset
Value(d) | | | Market Value
(Unaudited)(e) | | | Expenses | | | Expenses net of
reimbursements | | | Net investment
income (loss)
before
reimbursements | | | Net investment
Income (Loss)
net of
reimbursements | | | Portfolio
Turnover
Rate(b)(f) | | | Net assets, end
of period
(thousands) | |
| | | | | | | | |
| | | | | | | | | | | | | | | | | | | | | | | | | | | | | | | | | | |
| $ | 45.09 | | | | (2.90 | ) % | | | (3.25 | ) % | | | 0.47 | % | | | 0.47 | % | | | 2.88 | % | | | 2.89 | % | | | 13 | % | | $ | 773,363 | |
| | 47.85 | | | | 13.44 | | | | 13.23 | | | | 0.48 | | | | 0.47 | | | | 2.97 | | | | 2.98 | | | | 12 | | | | 875,628 | |
| | 43.49 | | | | 3.09 | | | | 3.26 | | | | 0.48 | | | | 0.47 | | | | 3.09 | | | | 3.10 | | | | 14 | | | | 669,676 | |
| | 43.30 | | | | (3.40 | ) | | | (4.03 | ) | | | 0.48 | | | | 0.47 | | | | 2.52 | | | | 2.53 | | | | 15 | | | | 467,681 | |
| | 45.84 | | | | 13.02 | | | | 13.62 | | | | 0.48 | | | | 0.47 | | | | 3.87 | | | | 3.88 | | | | 17 | | | | 240,664 | |
| | | | | | | | |
| | | | | | | | | | | | | | | | | | | | | | | | | | | | | | | | | | |
| | 57.96 | | | | (3.69 | ) | | | (3.95 | ) | | | 0.46 | | | | 0.45 | | | | 2.92 | | | | 2.92 | | | | 61 | | | | 275,332 | |
| | 62.02 | | | | 11.71 | | | | 11.71 | | | | 0.46 | | | | 0.45 | | | | 1.67 | | | | 1.67 | | | | 64 | | | | 244,970 | |
| | 57.12 | | | | 2.28 | | | | 2.44 | | | | 0.46 | | | | 0.45 | | | | 3.26 | | | | 3.27 | | | | 57 | | | | 197,049 | |
| | 57.47 | | | | 6.60 | | | | 5.93 | | | | 0.46 | | | | 0.45 | | | | 2.39 | | | | 2.40 | | | | 81 | | | | 132,184 | |
| 55.24 | | | | 12.79 | | | | 13.51 | | | | 0.47 | | | | 0.45 | | | | 3.16 | | | | 3.18 | | | | 44 | | | | 58,003 | |
| | | | | | | | |
|
|
| | | | | | | | | | | | | | | | | | | | | | | | | | | | | | | | |
| | 26.45 | | | | (3.09 | ) | | | (3.32 | ) | | | 0.59 | (i) | | | 0.11 | (i) | | | 2.39 | | | | 2.87 | | | | 5 | | | | 13,887 | |
| | 28.08 | | | | 12.73 | | | | 13.05 | | | | 0.65 | (i) | | | 0.11 | (i) | | | 1.88 | | | | 2.42 | | | | 11 | | | | 6,318 | |
| 25.63 | | | | 5.56 | | | | 5.60 | | | | 0.72 | (i) | | | 0.11 | (i) | | | 3.03 | | | | 3.64 | | | | 11 | | | | 1,282 | |
See Accompanying Notes to the Financial Statements.
| | | | |
| FLEXSHARES ANNUAL REPORT | | | 89 | |
Financial Highlights (cont.)
| | | | | | | | | | | | | | | | | | | | | | | | | | | | | | | | |
| | | | | | PER SHARE | |
| | | | | | Investment Operations | | | Distributions | |
| | | Net asset
value,
beginning of
period | | | Net
Investment
Income (loss) | | | Net Realized
and
Unrealized
Gain (Loss) | | | Total from
Operations(b)(c) | | | Net
Investment
Income | | | From Net
Realized
Gains | | | Tax return of
capital | | | Total | |
| | | | | | | | |
FlexShares® Quality Dividend Index Fund | | | | | | | | | | | | | | | | | | | | | | | | | | | | | | | | |
Year ended October 31, 2018 | | $ | 42.57 | | | $ | 1.20 | (a) | | $ | 1.98 | | | $ | 3.18 | | | $ | (1.22 | ) | | $ | — | | | $ | — | | | $ | (1.22 | ) |
Year ended October 31, 2017 | | | 37.11 | | | | 1.23 | (a) | | | 5.43 | | | | 6.66 | | | | (1.20 | ) | | | — | | | | — | | | | (1.20 | ) |
Year ended October 31, 2016 | | | 35.99 | | | | 1.23 | (a) | | | 1.03 | | | | 2.26 | | | | (1.14 | ) | | | — | | | | — | | | | (1.14 | ) |
Year ended October 31, 2015 | | | 35.77 | | | | 1.08 | (a) | | | 0.14 | | | | 1.22 | | | | (1.00 | ) | | | — | | | | — | | | | (1.00 | ) |
Year ended October 31, 2014 | | | 32.15 | | | | 1.02 | (a) | | | 3.62 | | | | 4.64 | | | | (1.02 | ) | | | — | | | | — | | | | (1.02 | ) |
| | | | | | | | |
FlexShares® Quality Dividend Defensive Index Fund | | | | | | | | | | | | | | | | | | | | | | | | | | | | | | | | |
Year ended October 31, 2018 | | | 42.04 | | | | 1.21 | (a) | | | 2.45 | | | | 3.66 | | | | (1.24 | ) | | | — | | | | — | | | | (1.24 | ) |
Year ended October 31, 2017 | | | 36.82 | | | | 1.18 | (a) | | | 5.18 | | | | 6.36 | | | | (1.14 | ) | | | — | | | | — | | | | (1.14 | ) |
Year ended October 31, 2016 | | | 35.81 | | | | 1.11 | (a) | | | 0.99 | | | | 2.10 | | | | (1.09 | ) | | | — | | | | — | | | | (1.09 | ) |
Year ended October 31, 2015 | | | 34.99 | | | | 1.03 | (a) | | | 0.72 | | | | 1.75 | | | | (0.93 | ) | | | — | | | | — | | | | (0.93 | ) |
Year ended October 31, 2014 | | | 31.42 | | | | 0.96 | (a) | | | 3.62 | | | | 4.58 | | | | (1.01 | ) | | | — | | | | — | | | | (1.01 | ) |
| | | | | | | | |
FlexShares® Quality Dividend Dynamic Index Fund | | | | | | | | | | | | | | | | | | | | | | | | | | | | | | | | |
Year ended October 31, 2018 | | | 41.84 | | | | 1.15 | (a) | | | 0.40 | | | | 1.55 | | | | (1.19 | ) | | | — | | | | — | | | | (1.19 | ) |
Year ended October 31, 2017 | | | 35.32 | | | | 1.19 | (a) | | | 6.45 | | | | 7.64 | | | | (1.12 | ) | | | — | | | | — | | | | (1.12 | ) |
Year ended October 31, 2016 | | | 35.14 | | | | 1.11 | (a) | | | 0.31 | (g) | | | 1.42 | | | | (1.24 | ) | | | — | | | | — | | | | (1.24 | ) |
Year ended October 31, 2015 | | | 35.83 | | | | 1.14 | (a) | | | (0.82 | ) | | | 0.32 | | | | (1.01 | ) | | | — | | | | — | | | | (1.01 | ) |
Year ended October 31, 2014 | | | 32.06 | | | | 0.98 | (a) | | | 3.72 | | | | 4.70 | | | | (0.93 | ) | | | — | | | | — | | | | (0.93 | ) |
| * | Commencement of investment operations. |
| (a) | Net investment income per share is based on average shares outstanding. |
| (b) | Not annualized for periods less than one year. |
| (c) | Annualized for periods less than one year. |
| (d) | Net asset value total return is calculated assuming an initial investment made at the net asset value at the beginning of the period, reinvestment of all dividends and distributions at net asset value during the period and redemption on the last day of the period at adjusted net asset value. |
| (e) | Market value total return is calculated assuming an initial investment made at the market value at the beginning of the period, reinvestment of all dividends and distributions at net asset value during the period and redemption on the last day of the period at market value. Market value is determined by the mid point of the bid/ask spread at 4:00 p.m. Eastern Time from the primary listing exchange. Market value returns may vary from net asset value returns. |
| (f) | In-kind transactions are not included in portfolio turnover calculations. |
| (g) | The amount shown for a share outstanding throughout the period is directionally inconsistent with aggregate net realized and unrealized for the period as presented in the financial statements. |
| (h) | Per share amount is less than $0.005. |
| (i) | The Fund indirectly bears its proportionate share of fees and expenses incurred by the Underlying Fund(s) in which the Fund is invested. This ratio does not include these indirect fees and expenses. |
| (j) | The Expenses net of reimbursements and Net investment Income (Loss) net of reimbursement ratios include a voluntary reimbursement of advisory fees made by JPMorgan Chase Bank, N.A. Absent this additional reimbursement, Expenses net of reimbursements would have increased by 0.20% and the Net investment Income (Loss) net of reimbursement would have decreased by 0.20%. |
| (k) | Northern Trust Investments, Inc. reimbursed the Funds for losses incurred related to an error. The impact was an increase of $0.02 to the net realized and unrealized gain (loss) on investments per share and an increase of 0.06% to the total return of the FlexShares Morningstar Global Upstream Natural Resources Index Fund. For the FlexShares Morningstar Developed Markets ex-US Factor Tilt Index Fund and FlexShares STOXX Global ESG Impact Index Fund, the impact to the net realized and unrealized gain (loss) on investments per share amount is less than $0.005 and the total returns are less than 0.005%. Had these reimbursements not been made, the total returns would have been lower. |
See Accompanying Notes to the Financial Statements.
| | |
| 90 | | FLEXSHARES ANNUAL REPORT |
| | | | | | | | | | | | | | | | | | | | | | | | | | | | | | | | | | |
| | | RATIOS/SUPPLEMENTAL DATA | |
| | | | Total Return(b) | | | Ratios to Average Net Assets(c) | | | Supplemental Data | |
Net Asset
Value,
end of
period | | | Net Asset
Value(d) | | | Market Value
(Unaudited)(e) | | | Expenses | | | Expenses net of
reimbursements | | | Net investment
income (loss)
before
reimbursements | | | Net investment
Income (Loss)
net of
reimbursements | | | Portfolio
Turnover
Rate(b)(f) | | | Net assets, end
of period
(thousands) | |
| | | | | | | | |
| | | | | | | | | | | | | | | | | | | | | | | | | | | | | | | | | | |
| $ | 44.53 | | | | 7.42 | % | | | 7.40 | % | | | 0.37 | % | | | 0.37 | % | | | 2.64 | % | | | 2.64 | % | | | 76 | % | | $ | 1,759,108 | |
| | 42.57 | | | | 18.10 | | | | 18.03 | | | | 0.38 | | | | 0.37 | | | | 3.00 | | | | 3.00 | | | | 89 | | | | 1,815,665 | |
| | 37.11 | | | | 6.41 | | | | 6.43 | | | | 0.38 | | | | 0.37 | | | | 3.38 | | | | 3.38 | | | | 85 | | | | 1,438,149 | |
| | 35.99 | | | | 3.43 | | | | 3.52 | | | | 0.38 | | | | 0.37 | | | | 2.99 | | | | 2.99 | | | | 86 | | | | 703,615 | |
| | 35.77 | | | | 14.61 | | | | 14.47 | | | | 0.38 | | | | 0.37 | | | | 2.99 | | | | 3.00 | | | | 67 | | | | 586,667 | |
| | | | | | | | |
| | | | | | | | | | | | | | | | | | | | | | | | | | | | | | | | | | |
| | 44.46 | | | | 8.69 | | | | 8.74 | | | | 0.38 | | | | 0.37 | | | | 2.70 | | | | 2.71 | | | | 94 | | | | 320,091 | |
| | 42.04 | | | | 17.44 | | | | 17.41 | | | | 0.38 | | | | 0.37 | | | | 2.94 | | | | 2.95 | | | | 74 | | | | 313,167 | |
| | 36.82 | | | | 5.96 | | | | 5.96 | | | | 0.38 | | | | 0.37 | | | | 3.09 | | | | 3.10 | | | | 72 | | | | 252,223 | |
| | 35.81 | | | | 5.04 | | | | 5.13 | | | | 0.38 | | | | 0.37 | | | | 2.87 | | | | 2.88 | | | | 92 | | | | 191,606 | |
| | 34.99 | | | | 14.79 | | | | 14.47 | | | | 0.38 | | | | 0.37 | | | | 2.88 | | | | 2.89 | | | | 73 | | | | 122,462 | |
| | | | | | | | |
| | | | | | | | | | | | | | | | | | | | | | | | | | | | | | | | | | |
| | 42.20 | | | | 3.59 | | | | 3.67 | | | | 0.38 | | | | 0.37 | | | | 2.61 | | | | 2.62 | | | | 77 | | | | 44,305 | |
| | 41.84 | | | | 21.81 | | | | 21.59 | | | | 0.38 | | | | 0.37 | | | | 2.99 | | | | 3.00 | | | | 63 | | | | 58,571 | |
| | 35.32 | | | | 4.16 | | | | 4.43 | | | | 0.38 | | | | 0.37 | | | | 3.23 | | | | 3.25 | | | | 69 | | | | 52,979 | |
| | 35.14 | | | | 0.89 | | | | 0.78 | | | | 0.38 | | | | 0.37 | | | | 3.15 | | | | 3.16 | | | | 87 | | | | 73,804 | |
| | 35.83 | | | | 14.78 | | | | 14.68 | | | | 0.38 | | | | 0.37 | | | | 2.82 | | | | 2.84 | | | | 75 | | | | 93,151 | |
See Accompanying Notes to the Financial Statements.
| | | | |
| FLEXSHARES ANNUAL REPORT | | | 91 | |
Financial Highlights (cont.)
| | | | | | | | | | | | | | | | | | | | | | | | | | | | | | | | |
| | | | | | PER SHARE | |
| | | | | | Investment Operations | | | Distributions | |
| | | Net asset
value,
beginning of
period | | | Net
Investment
Income (loss) | | | Net Realized
and
Unrealized
Gain (Loss) | | | Total from
Operations(b)(c) | | | Net
Investment
Income | | | From Net
Realized
Gains | | | Tax return of
capital | | | Total | |
| | | | | | | | |
FlexShares® International Quality Dividend Index Fund | | | | | | | | | | | | | | | | | | | | | | | | | | | | | | | | |
Year ended October 31, 2018 | | $ | 26.27 | | | $ | 1.22 | (a) | | $ | (3.86 | ) | | $ | (2.64 | ) | | $ | (1.26 | ) | | $ | — | | | $ | — | | | $ | (1.26 | ) |
Year ended October 31, 2017 | | | 22.45 | | | | 1.06 | (a) | | | 3.69 | | | | 4.75 | | | | (0.93 | ) | | | — | | | | — | | | | (0.93 | ) |
Year ended October 31, 2016 | | | 23.03 | | | | 0.92 | (a) | | | (0.68 | ) | | | 0.24 | | | | (0.82 | ) | | | — | | | | — | | | | (0.82 | ) |
Year ended October 31, 2015 | | | 26.15 | | | | 1.01 | (a) | | | (3.18 | ) | | | (2.17 | ) | | | (0.95 | ) | | | — | | | | — | | | | (0.95 | ) |
Year ended October 31, 2014 | | | 27.00 | | | | 1.25 | (a) | | | (1.06 | ) | | | 0.19 | | | | (1.04 | ) | | | — | | | | — | | | | (1.04 | ) |
| | | | | | | | |
FlexShares® International Quality Dividend Defensive Index Fund | | | | | | | | | | | | | | | | | | | | | | | | | | | | | | | | |
Year ended October 31, 2018 | | | 25.06 | | | | 1.14 | (a) | | | (3.54 | ) | | | (2.40 | ) | | | (1.27 | ) | | | — | | | | — | | | | (1.27 | ) |
Year ended October 31, 2017 | | | 22.16 | | | | 0.99 | (a) | | | 2.81 | | | | 3.80 | | | | (0.90 | ) | | | — | | | | — | | | | (0.90 | ) |
Year ended October 31, 2016 | | | 22.54 | | | | 0.83 | (a) | | | (0.35 | ) | | | 0.48 | | | | (0.86 | ) | | | — | | | | — | | | | (0.86 | ) |
Year ended October 31, 2015 | | | 25.55 | | | | 0.94 | (a) | | | (3.04 | ) | | | (2.10 | ) | | | (0.91 | ) | | | — | | | | — | | | | (0.91 | ) |
Year ended October 31, 2014 | | | 26.66 | | | | 1.23 | (a) | | | (1.32 | ) | | | (0.09 | ) | | | (1.02 | ) | | | — | | | | — | | | | (1.02 | ) |
| | | | | | | | |
FlexShares® International Quality Dividend Dynamic Index Fund | | | | | | | | | | | | | | | | | | | | | | | | | | | | | | | | |
Year ended October 31, 2018 | | | 27.82 | | | | 1.32 | (a) | | | (4.34 | ) | | | (3.02 | ) | | | (1.29 | ) | | | — | | | | — | | | | (1.29 | ) |
Year ended October 31, 2017 | | | 23.47 | | | | 1.11 | (a) | | | 4.08 | | | | 5.19 | | | | (0.84 | ) | | | — | | | | — | | | | (0.84 | ) |
Year ended October 31, 2016 | | | 23.82 | | | | 0.83 | (a) | | | (0.13 | ) | | | 0.70 | | | | (0.98 | ) | | | — | | | | (0.07 | ) | | | (1.05 | ) |
Year ended October 31, 2015 | | | 26.50 | | | | 0.88 | (a) | | | (2.50 | ) | | | (1.62 | ) | | | (1.06 | ) | | | — | | | | — | | | | (1.06 | ) |
Year ended October 31, 2014 | | | 27.34 | | | | 0.99 | (a) | | | (1.00 | ) | | | (0.01 | ) | | | (0.83 | ) | | | — | | | | — | | | | (0.83 | ) |
| * | Commencement of investment operations. |
| (a) | Net investment income per share is based on average shares outstanding. |
| (b) | Not annualized for periods less than one year. |
| (c) | Annualized for periods less than one year. |
| (d) | Net asset value total return is calculated assuming an initial investment made at the net asset value at the beginning of the period, reinvestment of all dividends and distributions at net asset value during the period and redemption on the last day of the period at adjusted net asset value. |
| (e) | Market value total return is calculated assuming an initial investment made at the market value at the beginning of the period, reinvestment of all dividends and distributions at net asset value during the period and redemption on the last day of the period at market value. Market value is determined by the mid point of the bid/ask spread at 4:00 p.m. Eastern Time from the primary listing exchange. Market value returns may vary from net asset value returns. |
| (f) | In-kind transactions are not included in portfolio turnover calculations. |
| (g) | The amount shown for a share outstanding throughout the period is directionally inconsistent with aggregate net realized and unrealized for the period as presented in the financial statements. |
| (h) | Per share amount is less than $0.005. |
| (i) | The Fund indirectly bears its proportionate share of fees and expenses incurred by the Underlying Fund(s) in which the Fund is invested. This ratio does not include these indirect fees and expenses. |
| (j) | The Expenses net of reimbursements and Net investment Income (Loss) net of reimbursement ratios include a voluntary reimbursement of advisory fees made by JPMorgan Chase Bank, N.A. Absent this additional reimbursement, Expenses net of reimbursements would have increased by 0.20% and the Net investment Income (Loss) net of reimbursement would have decreased by 0.20%. |
| (k) | Northern Trust Investments, Inc. reimbursed the Funds for losses incurred related to an error. The impact was an increase of $0.02 to the net realized and unrealized gain (loss) on investments per share and an increase of 0.06% to the total return of the FlexShares Morningstar Global Upstream Natural Resources Index Fund. For the FlexShares Morningstar Developed Markets ex-US Factor Tilt Index Fund and FlexShares STOXX Global ESG Impact Index Fund, the impact to the net realized and unrealized gain (loss) on investments per share amount is less than $0.005 and the total returns are less than 0.005%. Had these reimbursements not been made, the total returns would have been lower. |
See Accompanying Notes to the Financial Statements.
| | |
| 92 | | FLEXSHARES ANNUAL REPORT |
| | | | | | | | | | | | | | | | | | | | | | | | | | | | | | | | | | |
| | | RATIOS/SUPPLEMENTAL DATA | |
| | | | Total Return(b) | | | Ratios to Average Net Assets(c) | | | Supplemental Data | |
Net Asset
Value,
end of
period | | | Net Asset
Value(d) | | | Market Value
(Unaudited)(e) | | | Expenses | | | Expenses net of
reimbursements | | | Net investment
income (loss)
before
reimbursements | | | Net investment
Income (Loss)
net of
reimbursements | | | Portfolio
Turnover
Rate(b)(f) | | | Net assets, end
of period
(thousands) | |
| | | | | | | | |
| | | | | | | | | | | | | | | | | | | | | | | | | | | | | | | | | | |
| $ | 22.37 | | | | (10.48 | ) % | | | (11.30 | ) % | | | 0.47 | % | | | 0.47 | % | | | 4.77 | % | | | 4.78 | % | | | 71 | % | | $ | 765,167 | |
| | 26.27 | | | | 21.50 | | | | 21.80 | | | | 0.48 | | | | 0.47 | | | | 4.27 | | | | 4.28 | | | | 69 | | | | 979,701 | |
| | 22.45 | | | | 1.16 | | | | 2.05 | | | | 0.48 | | | | 0.47 | | | | 4.17 | | | | 4.18 | | | | 68 | | | | 496,050 | |
| | 23.03 | | | | (8.45 | ) | | | (9.95 | ) | | | 0.48 | | | | 0.47 | | | | 4.08 | | | | 4.09 | | | | 77 | | | | 430,590 | |
| | 26.15 | | | | 0.53 | | | | 1.11 | | | | 0.48 | | | | 0.47 | | | | 4.56 | | | | 4.57 | | | | 61 | | | | 329,485 | |
| | | | | | | | |
| | | | | | | | | | | | | | | | | | | | | | | | | | | | | | | | | | |
| | 21.39 | | | | (10.03 | ) | | | (10.91 | ) | | | 0.48 | | | | 0.47 | | | | 4.68 | | | | 4.68 | | | | 69 | | | | 87,703 | |
| | 25.06 | | | | 17.45 | | | | 17.69 | | | | 0.48 | | | | 0.47 | | | | 4.18 | | | | 4.19 | | | | 72 | | | | 95,217 | |
| | 22.16 | | | | 2.24 | | | | 3.39 | | | | 0.48 | | | | 0.47 | | | | 3.78 | | | | 3.79 | | | | 73 | | | | 77,561 | |
| | 22.54 | | | | (8.37 | ) | | | (9.81 | ) | | | 0.48 | | | | 0.47 | | | | 3.86 | | | | 3.87 | | | | 77 | | | | 87,893 | |
| | 25.55 | | | | (0.51 | ) | | | (0.33 | ) | | | 0.48 | | | | 0.47 | | | | 4.58 | | | | 4.59 | | | | 69 | | | | 66,441 | |
| | | | | | | | |
| | | | | | | | | | | | | | | | | | | | | | | | | | | | | | | | | | |
| | 23.51 | | | | (11.34 | ) | | | (12.11 | ) | | | 0.48 | | | | 0.47 | | | | 4.83 | | | | 4.83 | | | | 75 | | | | 63,481 | |
| | 27.82 | | | | 22.37 | | | | 22.91 | | | | 0.48 | | | | 0.47 | | | | 4.19 | | | | 4.20 | | | | 76 | | | | 91,796 | |
| | 23.47 | | | | 3.17 | | | | 3.96 | | | | 0.49 | | | | 0.47 | | | | 3.70 | | | | 3.72 | | | | 75 | | | | 18,777 | |
| | 23.82 | | | | (6.28 | ) | | | (8.00 | ) | | | 0.48 | | | | 0.47 | | | | 3.43 | | | | 3.43 | | | | 89 | | | | 35,726 | |
| | 26.50 | | | | (0.18 | ) | | | 0.80 | | | | 0.49 | | | | 0.47 | | | | 3.55 | | | | 3.58 | | | | 45 | | | | 113,945 | |
See Accompanying Notes to the Financial Statements.
| | | | |
| FLEXSHARES ANNUAL REPORT | | | 93 | |
Financial Highlights (cont.)
| | | | | | | | | | | | | | | | | | | | | | | | | | | | | | | | |
| | | | | | PER SHARE | |
| | | | | | Investment Operations | | | Distributions | |
| | | Net asset
value,
beginning of
period | | | Net
Investment
Income (loss) | | | Net Realized
and
Unrealized
Gain (Loss) | | | Total from
Operations(b)(c) | | | Net
Investment
Income | | | From Net
Realized
Gains | | | Tax return of
capital | | | Total | |
| | | | | | | | |
FlexShares® iBoxx 3-Year Target Duration TIPS Index Fund | | | | | | | | | | | | | | | | | | | | | | | | | | | | | | | | |
Year ended October 31, 2018 | | $ | 24.60 | | | $ | 0.68 | (a) | | $ | (0.78 | ) | | $ | (0.10 | ) | | $ | (0.69 | ) | | $ | — | | | $ | — | | | $ | (0.69 | ) |
Year ended October 31, 2017 | | | 24.82 | | | | 0.37 | (a) | | | (0.27 | ) | | | 0.10 | | | | (0.32 | ) | | | — | | | | — | | | | (0.32 | ) |
Year ended October 31, 2016 | | | 24.38 | | | | 0.15 | (a) | | | 0.47 | | | | 0.62 | | | | (0.16 | ) | | | — | | | | (0.02 | ) | | | (0.18 | ) |
Year ended October 31, 2015 | | | 24.73 | | | | (0.10 | )(a) | | | (0.23 | ) | | | (0.33 | ) | | | — | | | | — | | | | (0.02 | ) | | | (0.02 | ) |
Year ended October 31, 2014 | | | 24.97 | | | | 0.10 | (a) | | | (0.15 | ) | | | (0.05 | ) | | | (0.10 | ) | | | — | | | | (0.09 | ) | | | (0.19 | ) |
| | | | | | | | |
FlexShares® iBoxx 5-Year Target Duration TIPS Index Fund | | | | | | | | | | | | | | | | | | | | | | | | | | | | | | | | |
Year ended October 31, 2018 | | | 25.06 | | | | 0.71 | (a) | | | (1.08 | ) | | | (0.37 | ) | | | (0.74 | ) | | | — | | | | — | | | | (0.74 | ) |
Year ended October 31, 2017 | | | 25.45 | | | | 0.47 | (a) | | | (0.45 | ) | | | 0.02 | | | | (0.41 | ) | | | — | | | | — | | | | (0.41 | ) |
Year ended October 31, 2016 | | | 24.56 | | | | 0.30 | (a) | | | 0.88 | | | | 1.18 | | | | (0.27 | ) | | | — | | | | (0.02 | ) | | | (0.29 | ) |
Year ended October 31, 2015 | | | 24.87 | | | | 0.05 | (a) | | | (0.30 | ) | | | (0.25 | ) | | | (0.05 | ) | | | — | | | | (0.01 | ) | | | (0.06 | ) |
Year ended October 31, 2014 | | | 25.29 | | | | 0.21 | (a) | | | (0.32 | ) | | | (0.11 | ) | | | (0.24 | ) | | | — | | | | (0.07 | ) | | | (0.31 | ) |
| | | | | | | | |
FlexShares® Disciplined Duration MBS Index Fund | | | | | | | | | | | | | | | | | | | | | | | | | | | | | | | | |
Year ended October 31, 2018 | | | 23.86 | | | | 0.49 | (a) | | | (0.88 | ) | | | (0.39 | ) | | | (0.73 | ) | | | — | | | | — | | | | (0.73 | ) |
Year ended October 31, 2017 | | | 24.74 | | | | 0.39 | (a) | | | (0.50 | ) | | | (0.11 | ) | | | (0.77 | ) | | | — | | | | — | | | | (0.77 | ) |
Year ended October 31, 2016 | | | 24.87 | | | | 0.45 | (a) | | | 0.29 | | | | 0.74 | | | | (0.87 | ) | | | — | | | | — | | | | (0.87 | ) |
Year ended October 31, 2015 | | | 25.12 | | | | 0.37 | (a) | | | 0.06 | (g) | | | 0.43 | | | | (0.68 | ) | | | 0.00 | (h) | | | — | | | | (0.68 | ) |
For the period 09/03/14* through 10/31/14 | | | 25.00 | | | | 0.09 | (a) | | | 0.09 | | | | 0.18 | | | | (0.06 | ) | | | — | | | | — | | | | (0.06 | ) |
| * | Commencement of investment operations. |
| (a) | Net investment income per share is based on average shares outstanding. |
| (b) | Not annualized for periods less than one year. |
| (c) | Annualized for periods less than one year. |
| (d) | Net asset value total return is calculated assuming an initial investment made at the net asset value at the beginning of the period, reinvestment of all dividends and distributions at net asset value during the period and redemption on the last day of the period at adjusted net asset value. |
| (e) | Market value total return is calculated assuming an initial investment made at the market value at the beginning of the period, reinvestment of all dividends and distributions at net asset value during the period and redemption on the last day of the period at market value. Market value is determined by the mid point of the bid/ask spread at 4:00 p.m. Eastern Time from the primary listing exchange. Market value returns may vary from net asset value returns. |
| (f) | In-kind transactions are not included in portfolio turnover calculations. |
| (g) | The amount shown for a share outstanding throughout the period is directionally inconsistent with aggregate net realized and unrealized for the period as presented in the financial statements. |
| (h) | Per share amount is less than $0.005. |
| (i) | The Fund indirectly bears its proportionate share of fees and expenses incurred by the Underlying Fund(s) in which the Fund is invested. This ratio does not include these indirect fees and expenses. |
| (j) | The Expenses net of reimbursements and Net investment Income (Loss) net of reimbursement ratios include a voluntary reimbursement of advisory fees made by JPMorgan Chase Bank, N.A. Absent this additional reimbursement, Expenses net of reimbursements would have increased by 0.20% and the Net investment Income (Loss) net of reimbursement would have decreased by 0.20%. |
| (k) | Northern Trust Investments, Inc. reimbursed the Funds for losses incurred related to an error. The impact was an increase of $0.02 to the net realized and unrealized gain (loss) on investments per share and an increase of 0.06% to the total return of the FlexShares Morningstar Global Upstream Natural Resources Index Fund. For the FlexShares Morningstar Developed Markets ex-US Factor Tilt Index Fund and FlexShares STOXX Global ESG Impact Index Fund, the impact to the net realized and unrealized gain (loss) on investments per share amount is less than $0.005 and the total returns are less than 0.005%. Had these reimbursements not been made, the total returns would have been lower. |
See Accompanying Notes to the Financial Statements.
| | |
| 94 | | FLEXSHARES ANNUAL REPORT |
| | | | | | | | | | | | | | | | | | | | | | | | | | | | | | | | | | |
| | | RATIOS/SUPPLEMENTAL DATA | |
| | | | Total Return(b) | | | Ratios to Average Net Assets(c) | | | Supplemental Data | |
Net Asset
Value,
end of
period | | | Net Asset
Value(d) | | | Market Value
(Unaudited)(e) | | | Expenses | | | Expenses net of
reimbursements | | | Net investment
income (loss)
before
reimbursements | | | Net investment
Income (Loss)
net of
reimbursements | | | Portfolio
Turnover
Rate(b)(f) | | | Net assets, end
of period
(thousands) | |
| | | | | | | | |
| | | | | | | | | | | | | | | | | | | | | | | | | | | | | | | | | | |
| $ | 23.81 | | | | (0.41 | ) % | | | (0.49 | ) % | | | 0.18 | % | | | 0.18 | % | | | 2.79 | % | | | 2.80 | % | | | 85 | % | | $ | 1,641,610 | |
| | 24.60 | | | | 0.42 | | | | 0.46 | | | | 0.21 | | | | 0.20 | | | | 1.49 | | | | 1.50 | | | | 134 | | | | 2,113,130 | |
| | 24.82 | | | | 2.55 | | | | 2.55 | | | | 0.21 | | | | 0.20 | | | | 0.62 | | | | 0.63 | | | | 105 | | | | 1,841,902 | |
| | 24.38 | | | | (1.34 | ) | | | (1.46 | ) | | | 0.21 | | | | 0.20 | | | | (0.40 | ) | | | (0.39 | ) | | | 83 | | | | 1,978,311 | |
| | 24.73 | | | | (0.22 | ) | | | (0.10 | ) | | | 0.21 | | | | 0.20 | | | | 0.40 | | | | 0.41 | | | | 179 | | | | 2,246,873 | |
| | | | | | | | |
| | | | | | | | | | | | | | | | | | | | | | | | | | | | | | | | | | |
| | 23.95 | | | | (1.51 | ) | | | (1.51 | ) | | | 0.18 | | | | 0.18 | | | | 2.88 | | | | 2.88 | | | | 65 | | | | 904,027 | |
| | 25.06 | | | | 0.08 | | | | 0.08 | | | | 0.21 | | | | 0.20 | | | | 1.86 | | | | 1.87 | | | | 87 | | | | 819,372 | |
| | 25.45 | | | | 4.81 | | | | 4.64 | | | | 0.21 | | | | 0.20 | | | | 1.18 | | | | 1.19 | | | | 72 | | | | 651,605 | |
| | 24.56 | | | | (1.00 | ) | | | (1.04 | ) | | | 0.21 | | | | 0.20 | | | | 0.19 | | | | 0.20 | | | | 113 | | | | 432,210 | |
| | 24.87 | | | | (0.49 | ) | | | (0.25 | ) | | | 0.21 | | | | 0.20 | | | | 0.82 | | | | 0.83 | | | | 150 | | | | 308,335 | |
| | | | | | | | |
| | | | | | | | | | | | | | | | | | | | | | | | | | | | | | | | | | |
| | 22.74 | | | | (1.65 | ) | | | (1.31 | ) | | | 0.21 | | | | 0.20 | | | | 2.09 | | | | 2.10 | | | | 160 | | | | 71,628 | |
| | 23.86 | | | | (0.44 | ) | | | (0.53 | ) | | | 0.21 | | | | 0.20 | | | | 1.61 | | | | 1.62 | | | | 61 | | | | 38,183 | |
| | 24.74 | | | | 3.02 | | | | 2.69 | | | | 0.21 | | | | — | (j) | | | 1.62 | | | | 1.83 | (j) | | | 89 | | | | 42,063 | |
| | 24.87 | | | | 1.74 | | | | 2.02 | | | | 0.22 | | | | 0.20 | | | | 1.44 | | | | 1.46 | | | | 179 | | | | 23,627 | |
|
25.12 |
| | | 0.72 | | | | 0.76 | | | | 0.27 | | | | 0.20 | | | | 2.18 | | | | 2.26 | | | | 23 | | | | 5,025 | |
See Accompanying Notes to the Financial Statements.
| | | | |
| FLEXSHARES ANNUAL REPORT | | | 95 | |
Financial Highlights (cont.)
| | | | | | | | | | | | | | | | | | | | | | | | | | | | | | | | |
| | | | | | PER SHARE | |
| | | | | | Investment Operations | | | Distributions | |
| | | Net asset
value,
beginning of
period | | | Net
Investment
Income (loss) | | | Net Realized
and
Unrealized
Gain (Loss) | | | Total from
Operations(b)(c) | | | Net
Investment
Income | | | From Net
Realized
Gains | | | Tax return of
capital | | | Total | |
| | | | | | | | |
FlexShares® Credit-Scored US Corporate Bond Index Fund | | | | | | | | | | | | | | | | | | | | | | | | | | | | | | | | |
Year ended October 31, 2018 | | $ | 50.98 | | | $ | 1.40 | (a) | | $ | (2.43 | ) | | $ | (1.03 | ) | | $ | (1.36 | ) | | $ | — | | | $ | — | | | $ | (1.36 | ) |
Year ended October 31, 2017 | | | 51.49 | | | | 1.26 | (a) | | | (0.34 | ) | | | 0.92 | | | | (1.23 | ) | | | (0.20 | ) | | | — | | | | (1.43 | ) |
Year ended October 31, 2016 | | | 50.32 | | | | 1.21 | (a) | | | 1.13 | | | | 2.34 | | | | (1.17 | ) | | | — | | | | — | | | | (1.17 | ) |
For the period 11/12/14* through 10/31/15 | | | 50.00 | | | | 1.12 | (a) | | | 0.18 | | | | 1.30 | | | | (0.98 | ) | | | — | | | | — | | | | (0.98 | ) |
| | | | | | | | |
FlexShares® Credit-Scored US Long Corporate Bond Index Fund | | | | | | | | | | | | | | | | | | | | | | | | | | | | | | | | |
Year ended October 31, 2018 | | | 53.88 | | | | 2.07 | (a) | | | (5.87 | ) | | | (3.80 | ) | | | (2.04 | ) | | | — | | | | — | | | | (2.04 | ) |
Year ended October 31, 2017 | | | 53.83 | | | | 2.06 | (a) | | | 0.74 | | | | 2.80 | | | | (2.07 | ) | | | (0.68 | ) | | | — | | | | (2.75 | ) |
Year ended October 31, 2016 | | | 50.29 | | | | 2.14 | (a) | | | 3.56 | | | | 5.70 | | | | (2.16 | ) | | | — | | | | — | | | | (2.16 | ) |
For the period 09/23/15* through 10/31/15 | | | 50.00 | | | | 0.23 | (a) | | | 0.06 | | | | 0.29 | | | | — | | | | — | | | | — | | | | — | |
| | | | | | | | |
FlexShares® High Yield Value-Scored Bond Index Fund | | | | | | | | | | | | | | | | | | | | | | | | | | | | | | | | |
For the period 07/17/18* through 10/31/18 | | | 50.00 | | | | 1.68 | (a) | | | (1.60 | ) | | | 0.08 | | | | (1.24 | ) | | | — | | | | — | | | | (1.24 | ) |
| * | Commencement of investment operations. |
| (a) | Net investment income per share is based on average shares outstanding. |
| (b) | Not annualized for periods less than one year. |
| (c) | Annualized for periods less than one year. |
| (d) | Net asset value total return is calculated assuming an initial investment made at the net asset value at the beginning of the period, reinvestment of all dividends and distributions at net asset value during the period and redemption on the last day of the period at adjusted net asset value. |
| (e) | Market value total return is calculated assuming an initial investment made at the market value at the beginning of the period, reinvestment of all dividends and distributions at net asset value during the period and redemption on the last day of the period at market value. Market value is determined by the mid point of the bid/ask spread at 4:00 p.m. Eastern Time from the primary listing exchange. Market value returns may vary from net asset value returns. |
| (f) | In-kind transactions are not included in portfolio turnover calculations. |
| (g) | The amount shown for a share outstanding throughout the period is directionally inconsistent with aggregate net realized and unrealized for the period as presented in the financial statements. |
| (h) | Per share amount is less than $0.005. |
| (i) | The Fund indirectly bears its proportionate share of fees and expenses incurred by the Underlying Fund(s) in which the Fund is invested. This ratio does not include these indirect fees and expenses. |
| (j) | The Expenses net of reimbursements and Net investment Income (Loss) net of reimbursement ratios include a voluntary reimbursement of advisory fees made by JPMorgan Chase Bank, N.A. Absent this additional reimbursement, Expenses net of reimbursements would have increased by 0.20% and the Net investment Income (Loss) net of reimbursement would have decreased by 0.20%. |
| (k) | Northern Trust Investments, Inc. reimbursed the Funds for losses incurred related to an error. The impact was an increase of $0.02 to the net realized and unrealized gain (loss) on investments per share and an increase of 0.06% to the total return of the FlexShares Morningstar Global Upstream Natural Resources Index Fund. For the FlexShares Morningstar Developed Markets ex-US Factor Tilt Index Fund and FlexShares STOXX Global ESG Impact Index Fund, the impact to the net realized and unrealized gain (loss) on investments per share amount is less than $0.005 and the total returns are less than 0.005%. Had these reimbursements not been made, the total returns would have been lower. |
See Accompanying Notes to the Financial Statements.
| | |
| 96 | | FLEXSHARES ANNUAL REPORT |
| | | | | | | | | | | | | | | | | | | | | | | | | | | | | | | | | | |
| | | RATIOS/SUPPLEMENTAL DATA | |
| | | | Total Return(b) | | | Ratios to Average Net Assets(c) | | | Supplemental Data | |
Net Asset
Value,
end of
period | | | Net Asset
Value(d) | | | Market Value
(Unaudited)(e) | | | Expenses | | | Expenses net of
reimbursements | | | Net investment
income (loss)
before
reimbursements | | | Net investment
Income (Loss)
net of
reimbursements | | | Portfolio
Turnover
Rate(b)(f) | | | Net assets, end
of period
(thousands) | |
| | | | | | | | |
| | | | | | | | | | | | | | | | | | | | | | | | | | | | | | | | | | |
| $ | 48.59 | | | | (2.05 | ) % | | | (2.23 | ) % | | | 0.23 | % | | | 0.22 | % | | | 2.83 | % | | | 2.84 | % | | | 76 | % | | $ | 60,736 | |
| | 50.98 | | | | 1.85 | | | | 1.99 | | | | 0.23 | | | | 0.22 | | | | 2.48 | | | | 2.49 | | | | 65 | | | | 50,982 | |
| | 51.49 | | | | 4.71 | | | | 4.70 | | | | 0.24 | | | | 0.22 | | | | 2.34 | | | | 2.36 | | | | 59 | | | | 36,041 | |
|
50.32 |
| | | 2.61 | | | | 2.78 | | | | 0.26 | | | | 0.22 | | | | 2.26 | | | | 2.30 | | | | 69 | | | | 12,581 | |
| | | | | | | | |
| | | | | | | | | | | | | | | | | | | | | | | | | | | | | | | | | | |
| | 48.04 | | | | (7.24 | ) | | | (7.86 | ) | | | 0.23 | | | | 0.22 | | | | 4.05 | | | | 4.06 | | | | 93 | | | | 26,424 | |
| | 53.88 | | | | 5.58 | | | | 4.25 | | | | 0.24 | | | | 0.22 | | | | 3.92 | | | | 3.94 | | | | 91 | | | | 18,858 | |
| | 53.83 | | | | 11.60 | | | | 12.75 | | | | 0.25 | | | | 0.22 | | | | 4.01 | | | | 4.04 | | | | 80 | | | | 13,457 | |
|
50.29 |
| | | 0.56 | | | | 1.16 | | | | 0.27 | | | | 0.22 | | | | 4.38 | | | | 4.43 | | | | — | | | | 5,029 | |
| | | | | | | | |
| | | | | | | | | | | | | | | | | | | | | | | | | | | | | | | | | | |
|
48.84 |
| | | 0.13 | | | | 0.13 | | | | 0.38 | | | | 0.37 | | | | 11.56 | | | | 11.57 | | | | 18 | | | | 48,845 | |
See Accompanying Notes to the Financial Statements.
| | | | |
| FLEXSHARES ANNUAL REPORT | | | 97 | |
Financial Highlights (cont.)
| | | | | | | | | | | | | | | | | | | | | | | | | | | | | | | | |
| | | | | | PER SHARE | |
| | | | | | Investment Operations | | | Distributions | |
| | | Net asset
value,
beginning of
period | | | Net
Investment
Income (loss) | | | Net Realized
and
Unrealized
Gain (Loss) | | | Total from
Operations(b)(c) | | | Net
Investment
Income | | | From Net
Realized
Gains | | | Tax return of
capital | | | Total | |
| | | | | | | | |
FlexShares® Ready Access Variable Income Fund | | | | | | | | | | | | | | | | | | | | | | | | | | | | | | | | |
Year ended October 31, 2018 | | $ | 75.61 | | | $ | 1.58 | (a) | | $ | (0.24 | ) | | $ | 1.34 | | | $ | (1.47 | ) | | $ | — | | | $ | — | | | $ | (1.47 | ) |
Year ended October 31, 2017 | | | 75.56 | | | | 0.89 | (a) | | | 0.00 | (h) | | | 0.89 | | | | (0.84 | ) | | | — | | | | — | | | | (0.84 | ) |
Year ended October 31, 2016 | | | 75.36 | | | | 0.65 | (a) | | | 0.23 | | | | 0.88 | | | | (0.63 | ) | | | (0.05 | ) | | | — | | | | (0.68 | ) |
Year ended October 31, 2015 | | | 75.61 | | | | 0.43 | (a) | | | (0.15 | ) | | | 0.28 | | | | (0.42 | ) | | | (0.11 | ) | | | — | | | | (0.53 | ) |
Year ended October 31, 2014 | | | 75.32 | | | | 0.39 | (a) | | | 0.29 | | | | 0.68 | | | | (0.39 | ) | | | — | | | | — | | | | (0.39 | ) |
| | | | | | | | |
FlexShares® Core Select Bond Fund | | | | | | | | | | | | | | | | | | | | | | | | | | | | | | | | |
Year ended October 31, 2018 | | | 25.08 | | | | 0.63 | (a) | | | (1.31 | ) | | | (0.68 | ) | | | (0.66 | ) | | | — | | | | — | | | | (0.66 | ) |
For the period 11/18/16* through 10/31/17 | | | 25.00 | | | | 0.55 | (a) | | | 0.15 | | | | 0.70 | | | | (0.62 | ) | | | — | | | | — | | | | (0.62 | ) |
| * | Commencement of investment operations. |
| (a) | Net investment income per share is based on average shares outstanding. |
| (b) | Not annualized for periods less than one year. |
| (c) | Annualized for periods less than one year. |
| (d) | Net asset value total return is calculated assuming an initial investment made at the net asset value at the beginning of the period, reinvestment of all dividends and distributions at net asset value during the period and redemption on the last day of the period at adjusted net asset value. |
| (e) | Market value total return is calculated assuming an initial investment made at the market value at the beginning of the period, reinvestment of all dividends and distributions at net asset value during the period and redemption on the last day of the period at market value. Market value is determined by the mid point of the bid/ask spread at 4:00 p.m. Eastern Time from the primary listing exchange. Market value returns may vary from net asset value returns. |
| (f) | In-kind transactions are not included in portfolio turnover calculations. |
| (g) | The amount shown for a share outstanding throughout the period is directionally inconsistent with aggregate net realized and unrealized for the period as presented in the financial statements. |
| (h) | Per share amount is less than $0.005. |
| (i) | The Fund indirectly bears its proportionate share of fees and expenses incurred by the Underlying Fund(s) in which the Fund is invested. This ratio does not include these indirect fees and expenses. |
| (j) | The Expenses net of reimbursements and Net investment Income (Loss) net of reimbursement ratios include a voluntary reimbursement of advisory fees made by JPMorgan Chase Bank, N.A. Absent this additional reimbursement, Expenses net of reimbursements would have increased by 0.20% and the Net investment Income (Loss) net of reimbursement would have decreased by 0.20%. |
| (k) | Northern Trust Investments, Inc. reimbursed the Funds for losses incurred related to an error. The impact was an increase of $0.02 to the net realized and unrealized gain (loss) on investments per share and an increase of 0.06% to the total return of the FlexShares Morningstar Global Upstream Natural Resources Index Fund. For the FlexShares Morningstar Developed Markets ex-US Factor Tilt Index Fund and FlexShares STOXX Global ESG Impact Index Fund, the impact to the net realized and unrealized gain (loss) on investments per share amount is less than $0.005 and the total returns are less than 0.005%. Had these reimbursements not been made, the total returns would have been lower. |
See Accompanying Notes to the Financial Statements.
| | |
| 98 | | FLEXSHARES ANNUAL REPORT |
| | | | | | | | | | | | | | | | | | | | | | | | | | | | | | | | | | |
| | | RATIOS/SUPPLEMENTAL DATA | |
| | | | Total Return(b) | | | Ratios to Average Net Assets(c) | | | Supplemental Data | |
Net Asset
Value,
end of
period | | | Net Asset
Value(d) | | | Market Value
(Unaudited)(e) | | | Expenses | | | Expenses net of
reimbursements | | | Net investment
income (loss)
before
reimbursements | | | Net investment
Income (Loss)
net of
reimbursements | | | Portfolio
Turnover
Rate(b)(f) | | | Net assets, end
of period
(thousands) | |
| | | | | | | | |
| | | | | | | | | | | | | | | | | | | | | | | | | | | | | | | | | | |
| $ | 75.48 | | | | 1.80 | % | | | 1.91 | % | | | 0.26 | % | | | 0.25 | % | | | 2.09 | % | | | 2.10 | % | | | 131 | % | | $ | 211,350 | |
| | 75.61 | | | | 1.18 | | | | 1.06 | | | | 0.26 | | | | 0.25 | | | | 1.17 | | | | 1.18 | | | | 71 | | | | 162,557 | |
| | 75.56 | | | | 1.19 | | | | 1.18 | | | | 0.26 | | | | 0.25 | | | | 0.86 | | | | 0.87 | | | | 59 | | | | 109,564 | |
| | 75.36 | | | | 0.36 | | | | 0.28 | | | | 0.26 | | | | 0.25 | | | | 0.56 | | | | 0.57 | | | | 38 | | | | 97,962 | |
| | 75.61 | | | | 0.90 | | | | 1.04 | | | | 0.26 | | | | 0.25 | | | | 0.51 | | | | 0.52 | | | | 135 | | | | 75,611 | |
| | | | | | | | |
| | | | | | | | | | | | | | | | | | | | | | | | | | | | | | | | | | |
| | 23.74 | | | | (2.73 | ) | | | (2.92 | ) | | | 0.36 | (i) | | | 0.16 | (i) | | | 2.41 | | | | 2.61 | | | | 53 | | | | 38,583 | |
|
25.08 |
| | | 2.86 | | | | 3.19 | | | | 0.43 | (i) | | | 0.16 | (i) | | | 2.08 | | | | 2.35 | | | | 99 | | | | 3,762 | |
See Accompanying Notes to the Financial Statements.
| | | | |
| FLEXSHARES ANNUAL REPORT | | | 99 | |
Schedule of Investments
FlexShares® Morningstar US Market Factor Tilt Index Fund
October 31, 2018
| | | | | | | | |
| Investments | | Shares | | | Value | |
| COMMON STOCKS – 98.8% | |
| Aerospace & Defense – 1.9% | |
AAR Corp. | | | 8,064 | | | $ | 383,685 | |
Aerojet Rocketdyne Holdings, Inc.* (a) | | | 12,852 | | | | 453,933 | |
Aerovironment, Inc.* (a) | | | 1,764 | | | | 158,707 | |
Arconic, Inc. | | | 10,080 | | | | 204,926 | |
Astronics Corp.* | | | 1,008 | | | | 29,393 | |
Astronics Corp., Class B* | | | 136 | | | | 3,958 | |
Axon Enterprise, Inc.* | | | 5,292 | | | | 326,622 | |
Boeing Co. (The) | | | 17,892 | | | | 6,349,155 | |
BWX Technologies, Inc.(a) | | | 2,016 | | | | 117,855 | |
Curtiss-Wright Corp.(a) | | | 3,276 | | | | 358,591 | |
Esterline Technologies Corp.* | | | 5,040 | | | | 591,494 | |
General Dynamics Corp. | | | 7,812 | | | | 1,348,195 | |
Harris Corp. | | | 4,284 | | | | 637,074 | |
HEICO Corp.(a) | | | 8,241 | | | | 690,843 | |
Hexcel Corp. | | | 7,056 | | | | 412,917 | |
Huntington Ingalls Industries, Inc. | | | 3,276 | | | | 715,741 | |
Kratos Defense & Security Solutions, Inc.* (a) | | | 12,852 | | | | 161,036 | |
L3 Technologies, Inc. | | | 3,276 | | | | 620,704 | |
Lockheed Martin Corp. | | | 8,064 | | | | 2,369,606 | |
Mercury Systems, Inc.* | | | 3,780 | | | | 177,131 | |
Moog, Inc., Class A | | | 6,048 | | | | 432,734 | |
National Presto Industries, Inc.(a) | | | 504 | | | | 62,834 | |
Northrop Grumman Corp. | | | 5,796 | | | | 1,518,262 | |
Raytheon Co. | | | 10,584 | | | | 1,852,623 | |
Rockwell Collins, Inc. | | | 3,780 | | | | 483,916 | |
Spirit AeroSystems Holdings, Inc., Class A | | | 9,324 | | | | 783,309 | |
Teledyne Technologies, Inc.* (a) | | | 2,772 | | | | 613,388 | |
Textron, Inc. | | | 11,844 | | | | 635,194 | |
TransDigm Group, Inc.* | | | 1,008 | | | | 332,892 | |
Triumph Group, Inc.(a) | | | 756 | | | | 13,797 | |
United Technologies Corp. | | | 25,704 | | | | 3,192,694 | |
Wesco Aircraft Holdings, Inc.* (a) | | | 11,592 | | | | 118,007 | |
| | | | | | | | 26,151,216 | |
| | | | | | | | |
| Investments | | Shares | | | Value | |
| Air Freight & Logistics – 0.5% | |
Air Transport Services Group, Inc.* | | | 18,144 | | | $ | 355,622 | |
Atlas Air Worldwide Holdings, Inc.* (a) | | | 12,600 | | | | 650,412 | |
CH Robinson Worldwide, Inc. | | | 4,284 | | | | 381,405 | |
Echo Global Logistics, Inc.* | | | 1,260 | | | | 32,395 | |
Expeditors International of Washington, Inc. | | | 4,788 | | | | 321,658 | |
FedEx Corp. | | | 8,568 | | | | 1,887,873 | |
Forward Air Corp.(a) | | | 3,276 | | | | 196,527 | |
Hub Group, Inc., Class A* | | | 2,520 | | | | 115,466 | |
United Parcel Service, Inc., Class B | | | 17,388 | | | | 1,852,517 | |
XPO Logistics, Inc.* (a) | | | 8,820 | | | | 788,332 | |
| | | | | | | | 6,582,207 | |
| Airlines – 0.7% | |
Alaska Air Group, Inc.(a) | | | 5,544 | | | | 340,513 | |
Allegiant Travel Co.(a) | | | 2,772 | | | | 316,396 | |
American Airlines Group, Inc.(a) | | | 30,240 | | | | 1,060,819 | |
Delta Air Lines, Inc. | | | 41,076 | | | | 2,248,090 | |
Hawaiian Holdings, Inc.(a) | | | 13,356 | | | | 462,251 | |
JetBlue Airways Corp.* | | | 24,444 | | | | 408,948 | |
SkyWest, Inc. | | | 23,436 | | | | 1,342,648 | |
Southwest Airlines Co. | | | 29,988 | | | | 1,472,411 | |
Spirit Airlines, Inc.* (a) | | | 19,656 | | | | 1,020,146 | |
United Continental Holdings, Inc.* | | | 18,396 | | | | 1,573,042 | |
| | | | | | | | 10,245,264 | |
| Auto Components – 0.6% | |
Adient plc(a) | | | 9,072 | | | | 275,970 | |
American Axle & Manufacturing Holdings, Inc.* (a) | | | 33,768 | | | | 512,260 | |
Aptiv plc | | | 14,076 | | | | 1,081,037 | |
Autoliv, Inc.(a) | | | 5,040 | | | | 420,034 | |
BorgWarner, Inc. | | | 13,356 | | | | 526,360 | |
Cooper Tire & Rubber Co.(a) | | | 15,876 | | | | 490,410 | |
Cooper-Standard Holdings, Inc.* | | | 5,040 | | | | 466,956 | |
See Accompanying Notes to the Financial Statements.
| | |
| 100 | | FLEXSHARES ANNUAL REPORT |
FlexShares® Morningstar US Market Factor Tilt Index Fund (cont.)
| | | | | | | | |
| Investments | | Shares | | | Value | |
| COMMON STOCKS – (continued) | |
| Auto Components – (continued) | |
Dana, Inc. | | | 56,700 | | | $ | 882,819 | |
Delphi Technologies plc | | | 34,695 | | | | 743,861 | |
Dorman Products, Inc.* (a) | | | 2,016 | | | | 159,284 | |
Gentex Corp. | | | 10,080 | | | | 212,184 | |
Gentherm, Inc.* (a) | | | 3,780 | | | | 164,959 | |
Goodyear Tire & Rubber Co. (The) | | | 4,032 | | | | 84,914 | |
LCI Industries(a) | | | 9,828 | | | | 681,572 | |
Lear Corp. | | | 2,520 | | | | 334,908 | |
Modine Manufacturing Co.* | | | 13,356 | | | | 173,761 | |
Motorcar Parts of America, Inc.* (a) | | | 3,528 | | | | 74,723 | |
Standard Motor Products, Inc.(a) | | | 3,780 | | | | 204,536 | |
Superior Industries International, Inc. | | | 252 | | | | 2,477 | |
Tenneco, Inc., Class A | | | 18,648 | | | | 642,051 | |
Visteon Corp.* (a) | | | 4,536 | | | | 358,525 | |
| | | | | | | | 8,493,601 | |
| Automobiles – 0.4% | |
Ford Motor Co. | | | 49,644 | | | | 474,100 | |
General Motors Co. | | | 64,512 | | | | 2,360,494 | |
Harley-Davidson, Inc. | | | 10,080 | | | | 385,258 | |
Tesla, Inc.* (a) | | | 4,788 | | | | 1,615,088 | |
Thor Industries, Inc. | | | 5,292 | | | | 368,535 | |
Winnebago Industries, Inc. | | | 11,592 | | | | 319,475 | |
| | | | | | | | 5,522,950 | |
| Banks – 8.0% | |
1st Source Corp. | | | 4,032 | | | | 187,851 | |
Ameris Bancorp | | | 5,040 | | | | 216,166 | |
Associated Banc-Corp.(a) | | | 52,164 | | | | 1,209,161 | |
Banc of California, Inc. | | | 1,008 | | | | 16,078 | |
BancFirst Corp. | | | 3,528 | | | | 202,437 | |
BancorpSouth Bank(a) | | | 9,072 | | | | 260,366 | |
Bank of America Corp. | | | 499,464 | | | | 13,735,260 | |
Bank of Hawaii Corp.(a) | | | 3,528 | | | | 276,736 | |
Bank OZK(a) | | | 6,048 | | | | 165,473 | |
BankUnited, Inc. | | | 34,020 | | | | 1,126,062 | |
Banner Corp. | | | 3,780 | | | | 218,560 | |
BB&T Corp.(a) | | | 41,328 | | | | 2,031,684 | |
| | | | | | | | |
| Investments | | Shares | | | Value | |
| Banks – (continued) | |
Berkshire Hills Bancorp, Inc.(a) | | | 5,796 | | | $ | 193,412 | |
BOK Financial Corp. | | | 252 | | | | 21,604 | |
Boston Private Financial Holdings, Inc. | | | 7,056 | | | | 95,256 | |
Brookline Bancorp, Inc. | | | 14,112 | | | | 218,736 | |
Bryn Mawr Bank Corp. | | | 2,520 | | | | 100,649 | |
Cathay General Bancorp(a) | | | 28,476 | | | | 1,072,691 | |
Central Pacific Financial Corp.(a) | | | 4,032 | | | | 109,025 | |
Chemical Financial Corp. | | | 28,728 | | | | 1,346,194 | |
CIT Group, Inc.(a) | | | 13,860 | | | | 656,687 | |
Citigroup, Inc. | | | 140,112 | | | | 9,171,731 | |
Citizens Financial Group, Inc. | | | 29,232 | | | | 1,091,815 | |
City Holding Co.(a) | | | 3,024 | | | | 223,111 | |
Columbia Banking System, Inc. | | | 8,820 | | | | 327,134 | |
Comerica, Inc. | | | 5,544 | | | | 452,169 | |
Commerce Bancshares, Inc. | | | 1,838 | | | | 116,897 | |
Community Bank System, Inc.(a) | | | 5,544 | | | | 323,714 | |
Community Trust Bancorp, Inc. | | | 2,268 | | | | 103,217 | |
Cullen/Frost Bankers, Inc. | | | 504 | | | | 49,352 | |
Customers Bancorp, Inc.* | | | 15,624 | | | | 320,136 | |
CVB Financial Corp.(a) | | | 15,120 | | | | 330,372 | |
Eagle Bancorp, Inc.* | | | 2,772 | | | | 136,299 | |
East West Bancorp, Inc. | | | 3,276 | | | | 171,793 | |
Fifth Third Bancorp | | | 39,816 | | | | 1,074,634 | |
First BanCorp* | | | 38,556 | | | | 355,872 | |
First Citizens BancShares, Inc., Class A | | | 2,268 | | | | 967,597 | |
First Commonwealth Financial Corp.(a) | | | 13,860 | | | | 187,110 | |
First Financial Bancorp | | | 14,364 | | | | 375,906 | |
First Financial Bankshares, Inc.(a) | | | 4,284 | | | | 252,713 | |
First Hawaiian, Inc. | | | 9,576 | | | | 237,293 | |
First Horizon National Corp. | | | 18,280 | | | | 295,039 | |
First Interstate BancSystem, Inc., Class A | | | 4,536 | | | | 188,063 | |
First Merchants Corp. | | | 8,820 | | | | 367,000 | |
First Midwest Bancorp, Inc. | | | 8,568 | | | | 196,721 | |
See Accompanying Notes to the Financial Statements.
| | | | |
| FLEXSHARES ANNUAL REPORT | | | 101 | |
FlexShares® Morningstar US Market Factor Tilt Index Fund (cont.)
| | | | | | | | |
| Investments | | Shares | | | Value | |
| COMMON STOCKS – (continued) | |
| Banks – (continued) | |
First of Long Island Corp. (The) | | | 4,032 | | | $ | 81,487 | |
First Republic Bank(a) | | | 4,032 | | | | 366,872 | |
Flushing Financial Corp. | | | 7,308 | | | | 165,818 | |
FNB Corp.(a) | | | 104,832 | | | | 1,240,163 | |
Fulton Financial Corp. | | | 54,432 | | | | 871,456 | |
Glacier Bancorp, Inc.(a) | | | 6,552 | | | | 277,805 | |
Great Western Bancorp, Inc.(a) | | | 11,592 | | | | 424,847 | |
Hancock Whitney Corp.(a) | | | 26,712 | | | | 1,120,835 | |
Hanmi Financial Corp. | | | 11,088 | | | | 232,626 | |
Heartland Financial USA, Inc.(a) | | | 1,260 | | | | 66,956 | |
Hilltop Holdings, Inc. | | | 33,516 | | | | 666,968 | |
Home BancShares, Inc.(a) | | | 10,332 | | | | 196,721 | |
Hope Bancorp, Inc.(a) | | | 37,548 | | | | 543,695 | |
Huntington Bancshares, Inc.(a) | | | 83,664 | | | | 1,198,905 | |
IBERIABANK Corp. | | | 19,404 | | | | 1,445,404 | |
Independent Bank Corp. | | | 5,544 | | | | 434,927 | |
International Bancshares Corp. | | | 11,340 | | | | 438,858 | |
Investors Bancorp, Inc. | | | 15,876 | | | | 177,494 | |
JPMorgan Chase & Co. | | | 180,684 | | | | 19,698,170 | |
KeyCorp | | | 72,576 | | | | 1,317,980 | |
Lakeland Financial Corp. | | | 6,048 | | | | 260,245 | |
LegacyTexas Financial Group, Inc.(a) | | | 10,584 | | | | 407,801 | |
M&T Bank Corp. | | | 7,056 | | | | 1,167,133 | |
MB Financial, Inc. | | | 6,804 | | | | 302,030 | |
NBT Bancorp, Inc.(a) | | | 7,812 | | | | 285,060 | |
OFG Bancorp | | | 30,744 | | | | 525,415 | |
Old National Bancorp | | | 36,036 | | | | 643,243 | |
PacWest Bancorp(a) | | | 6,300 | | | | 255,906 | |
Park National Corp.(a) | | | 2,772 | | | | 253,361 | |
Peoples Bancorp, Inc. | | | 1,260 | | | | 43,130 | |
People’s United Financial, Inc.(a) | | | 8,064 | | | | 126,282 | |
Pinnacle Financial Partners, Inc.(a) | | | 4,032 | | | | 210,874 | |
PNC Financial Services Group, Inc. (The) | | | 23,940 | | | | 3,076,051 | |
| | | | | | | | |
| Investments | | Shares | | | Value | |
| Banks – (continued) | |
Popular, Inc. | | | 33,516 | | | $ | 1,743,167 | |
Prosperity Bancshares, Inc.(a) | | | 9,324 | | | | 606,340 | |
Regions Financial Corp. | | | 49,644 | | | | 842,459 | |
Renasant Corp. | | | 5,544 | | | | 193,375 | |
S&T Bancorp, Inc.(a) | | | 8,064 | | | | 323,447 | |
Sandy Spring Bancorp, Inc. | | | 5,796 | | | | 206,048 | |
Signature Bank | | | 1,512 | | | | 166,169 | |
Simmons First National Corp., Class A | | | 22,322 | | | | 597,783 | |
South State Corp. | | | 2,772 | | | | 187,581 | |
Southside Bancshares, Inc.(a) | | | 4,536 | | | | 143,700 | |
State Bank Financial Corp. | | | 3,780 | | | | 96,655 | |
Sterling Bancorp(a) | | | 23,940 | | | | 430,441 | |
Stock Yards Bancorp, Inc. | | | 4,536 | | | | 143,837 | |
SunTrust Banks, Inc. | | | 20,916 | | | | 1,310,597 | |
SVB Financial Group* | | | 2,268 | | | | 538,038 | |
Synovus Financial Corp. | | | 10,836 | | | | 407,000 | |
TCF Financial Corp. | | | 48,636 | | | | 1,015,520 | |
Texas Capital Bancshares, Inc.* (a) | | | 3,276 | | | | 213,693 | |
Tompkins Financial Corp.(a) | | | 3,024 | | | | 221,145 | |
TriCo Bancshares | | | 1,764 | | | | 63,539 | |
Trustmark Corp. | | | 17,136 | | | | 527,789 | |
UMB Financial Corp.(a) | | | 3,276 | | | | 209,173 | |
Umpqua Holdings Corp. | | | 59,976 | | | | 1,151,539 | |
Union Bankshares Corp.(a) | | | 10,332 | | | | 352,734 | |
United Bankshares, Inc.(a) | | | 30,240 | | | | 1,003,061 | |
United Community Banks, Inc. | | | 5,292 | | | | 131,612 | |
Univest Corp. of Pennsylvania | | | 1,512 | | | | 37,739 | |
US Bancorp | | | 81,396 | | | | 4,254,569 | |
Valley National Bancorp(a) | | | 105,084 | | | | 1,048,738 | |
Washington Trust Bancorp, Inc. | | | 3,780 | | | | 194,103 | |
Webster Financial Corp. | | | 7,308 | | | | 430,003 | |
Wells Fargo & Co. | | | 212,940 | | | | 11,334,796 | |
WesBanco, Inc. | | | 8,064 | | | | 323,366 | |
Westamerica Bancorp(a) | | | 252 | | | | 14,669 | |
Western Alliance Bancorp* | | | 8,064 | | | | 389,007 | |
Wintrust Financial Corp. | | | 5,292 | | | | 402,933 | |
Zions Bancorp NA(a) | | | 5,544 | | | | 260,845 | |
| | | | | | | | 110,817,504 | |
See Accompanying Notes to the Financial Statements.
| | |
| 102 | | FLEXSHARES ANNUAL REPORT |
FlexShares® Morningstar US Market Factor Tilt Index Fund (cont.)
| | | | | | | | |
| Investments | | Shares | | | Value | |
| COMMON STOCKS – (continued) | |
| Beverages – 1.0% | |
Boston Beer Co., Inc. (The), Class A* | | | 504 | | | $ | 154,874 | |
Brown-Forman Corp., Class B(a) | | | 12,151 | | | | 563,077 | |
Coca-Cola Bottling Co. Consolidated(a) | | | 756 | | | | 130,508 | |
Coca-Cola Co.(The) | | | 119,700 | | | | 5,731,236 | |
Constellation Brands, Inc., Class A | | | 5,544 | | | | 1,104,531 | |
Keurig Dr Pepper, Inc. | | | 7,812 | | | | 203,112 | |
Molson Coors Brewing Co., Class B | | | 10,332 | | | | 661,248 | |
Monster Beverage Corp.* | | | 13,104 | | | | 692,547 | |
PepsiCo, Inc. | | | 46,872 | | | | 5,267,476 | |
| | | | | | | | 14,508,609 | |
| Biotechnology – 2.3% | |
AbbVie, Inc. | | | 55,692 | | | | 4,335,622 | |
ACADIA Pharmaceuticals, Inc.* (a) | | | 5,796 | | | | 112,906 | |
Achaogen, Inc.* (a) | | | 5,544 | | | | 21,344 | |
Achillion Pharmaceuticals, Inc.* | | | 77,112 | | | | 220,540 | |
Acorda Therapeutics, Inc.* (a) | | | 14,364 | | | | 274,496 | |
Agios Pharmaceuticals, Inc.* (a) | | | 1,512 | | | | 95,347 | |
Alder Biopharmaceuticals, Inc.* (a) | | | 5,544 | | | | 70,409 | |
Alexion Pharmaceuticals, Inc.* | | | 6,552 | | | | 734,283 | |
Alnylam Pharmaceuticals, Inc.* (a) | | | 3,276 | | | | 263,489 | |
AMAG Pharmaceuticals, Inc.* (a) | | | 12,096 | | | | 260,064 | |
Amgen, Inc. | | | 38,808 | | | | 7,481,794 | |
Amicus Therapeutics, Inc.* (a) | | | 14,112 | | | | 157,772 | |
Aquinox Pharmaceuticals, Inc.* | | | 5,292 | | | | 13,653 | |
Arena Pharmaceuticals, Inc.* (a) | | | 2,520 | | | | 89,863 | |
Array BioPharma, Inc.* (a) | | | 252 | | | | 4,082 | |
| | | | | | | | |
| Investments | | Shares | | | Value | |
| Biotechnology – (continued) | |
Atara Biotherapeutics, Inc.* (a) | | | 8,316 | | | $ | 284,158 | |
Biogen, Inc.* | | | 10,836 | | | | 3,297,070 | |
BioMarin Pharmaceutical, Inc.* | | | 4,032 | | | | 371,629 | |
Bluebird Bio, Inc.* (a) | | | 1,008 | | | | 115,618 | |
Blueprint Medicines Corp.* (a) | | | 2,268 | | | | 137,826 | |
Celgene Corp.* | | | 31,752 | | | | 2,273,443 | |
Clovis Oncology, Inc.* (a) | | | 6,048 | | | | 70,338 | |
Coherus Biosciences, Inc.* | | | 10,332 | | | | 120,781 | |
Concert Pharmaceuticals, Inc.* | | | 2,772 | | | | 41,358 | |
Curis, Inc.* | | | 1 | | | | 2 | |
Eagle Pharmaceuticals, Inc.* (a) | | | 1,764 | | | | 86,859 | |
Emergent BioSolutions, Inc.* | | | 2,520 | | | | 154,199 | |
Epizyme, Inc.* | | | 3,024 | | | | 24,343 | |
Esperion Therapeutics, Inc.* (a) | | | 5,796 | | | | 263,312 | |
Exact Sciences Corp.* (a) | | | 3,024 | | | | 214,855 | |
Exelixis, Inc.* | | | 7,308 | | | | 101,362 | |
Geron Corp.* | | | 252 | | | | 386 | |
Gilead Sciences, Inc. | | | 47,880 | | | | 3,264,458 | |
Halozyme Therapeutics, Inc.* | | | 4,536 | | | | 70,444 | |
Heron Therapeutics, Inc.* | | | 252 | | | | 6,996 | |
ImmunoGen, Inc.* | | | 8,568 | | | | 46,524 | |
Incyte Corp.* | | | 5,544 | | | | 359,362 | |
Insmed, Inc.* (a) | | | 3,276 | | | | 47,830 | |
Intrexon Corp.* (a) | | | 2,772 | | | | 32,044 | |
Ionis Pharmaceuticals, Inc.* | | | 5,292 | | | | 262,219 | |
Iovance Biotherapeutics, Inc.* (a) | | | 18,396 | | | | 167,036 | |
Ironwood Pharmaceuticals, Inc.* (a) | | | 1,260 | | | | 16,506 | |
Keryx Biopharmaceuticals, Inc.* (a) | | | 14,616 | | | | 40,633 | |
La Jolla Pharmaceutical Co.* (a) | | | 2,268 | | | | 36,968 | |
Ligand Pharmaceuticals, Inc.* (a) | | | 2,016 | | | | 332,257 | |
MacroGenics, Inc.* | | | 1,764 | | | | 29,036 | |
MiMedx Group, Inc.* (a) | | | 504 | | | | 2,933 | |
See Accompanying Notes to the Financial Statements.
| | | | |
| FLEXSHARES ANNUAL REPORT | | | 103 | |
FlexShares® Morningstar US Market Factor Tilt Index Fund (cont.)
| | | | | | | | |
| Investments | | Shares | | | Value | |
| COMMON STOCKS – (continued) | |
| Biotechnology – (continued) | |
Minerva Neurosciences, Inc.* | | | 16,884 | | | $ | 185,218 | |
Momenta Pharmaceuticals, Inc.* | | | 3,024 | | | | 37,830 | |
Myriad Genetics, Inc.* | | | 2,016 | | | | 90,781 | |
Neurocrine Biosciences, Inc.* (a) | | | 4,788 | | | | 513,034 | |
Novavax, Inc.* (a) | | | 44,604 | | | | 78,503 | |
OPKO Health, Inc.* (a) | | | 135,158 | | | | 456,834 | |
PDL BioPharma, Inc.* (a) | | | 73,584 | | | | 183,224 | |
Portola Pharmaceuticals, Inc.* (a) | | | 2,772 | | | | 54,581 | |
Progenics Pharmaceuticals, Inc.* | | | 2,772 | | | | 13,888 | |
Puma Biotechnology, Inc.* (a) | | | 1,260 | | | | 46,683 | |
Regeneron Pharmaceuticals, Inc.* | | | 3,024 | | | | 1,025,862 | |
Repligen Corp.* (a) | | | 2,268 | | | | 122,971 | |
Retrophin, Inc.* | | | 3,276 | | | | 84,062 | |
Rigel Pharmaceuticals, Inc.* | | | 252 | | | | 723 | |
Sangamo Therapeutics, Inc.* (a) | | | 17,136 | | | | 217,113 | |
Sarepta Therapeutics, Inc.* (a) | | | 4,788 | | | | 640,443 | |
Seattle Genetics, Inc.* (a) | | | 3,780 | | | | 212,171 | |
Sorrento Therapeutics, Inc.* (a) | | | 8,820 | | | | 28,136 | |
Syros Pharmaceuticals, Inc.* | | | 6,048 | | | | 39,796 | |
TESARO, Inc.* (a) | | | 1,008 | | | | 29,111 | |
TG Therapeutics, Inc.* (a) | | | 2,772 | | | | 12,613 | |
Ultragenyx Pharmaceutical, Inc.* (a) | | | 1,512 | | | | 73,256 | |
United Therapeutics Corp.* | | | 2,268 | | | | 251,431 | |
Vertex Pharmaceuticals, Inc.* | | | 9,072 | | | | 1,537,341 | |
| | | | | | | | 32,344,054 | |
| Building Products – 0.4% | |
AAON, Inc.(a) | | | 5,040 | | | | 173,830 | |
American Woodmark Corp.* (a) | | | 1,512 | | | | 91,385 | |
AO Smith Corp. | | | 10,080 | | | | 458,942 | |
Apogee Enterprises, Inc.(a) | | | 5,544 | | | | 200,138 | |
| | | | | | | | |
| Investments | | Shares | | | Value | |
| Building Products – (continued) | |
Armstrong Flooring, Inc.* | | | 4,032 | | | $ | 62,698 | |
Armstrong World Industries, Inc.* | | | 252 | | | | 15,561 | |
Builders FirstSource, Inc.* | | | 32,760 | | | | 405,569 | |
Fortune Brands Home & Security, Inc. | | | 3,276 | | | | 146,863 | |
Gibraltar Industries, Inc.* (a) | | | 2,520 | | | | 89,813 | |
Griffon Corp. | | | 7,308 | | | | 88,573 | |
Insteel Industries, Inc. | | | 756 | | | | 19,747 | |
JELD-WEN Holding, Inc.* (a) | | | 22,680 | | | | 368,777 | |
Johnson Controls International plc | | | 33,012 | | | | 1,055,394 | |
Lennox International, Inc.(a) | | | 2,772 | | | | 584,587 | |
Masco Corp. | | | 6,048 | | | | 181,440 | |
Masonite International Corp.* | | | 3,276 | | | | 181,458 | |
NCI Building Systems, Inc.* | | | 756 | | | | 9,261 | |
Owens Corning | | | 5,544 | | | | 262,065 | |
Patrick Industries, Inc.* (a) | | | 5,651 | | | | 245,875 | |
Quanex Building Products Corp.(a) | | | 504 | | | | 7,469 | |
Simpson Manufacturing Co., Inc. | | | 2,016 | | | | 115,073 | |
Trex Co., Inc.* | | | 6,048 | | | | 370,742 | |
Universal Forest Products, Inc. | | | 5,292 | | | | 149,605 | |
USG Corp.(a) | | | 13,860 | | | | 585,169 | |
| | | | | | | | 5,870,034 | |
| Capital Markets – 2.6% | |
Affiliated Managers Group, Inc. | | | 1,764 | | | | 200,496 | |
Ameriprise Financial, Inc. | | | 6,048 | | | | 769,548 | |
Artisan Partners Asset Management, Inc., Class A(a) | | | 10,584 | | | | 290,107 | |
Bank of New York Mellon Corp. (The) | | | 40,824 | | | | 1,932,200 | |
BGC Partners, Inc., Class A(a) | | | 60,480 | | | | 640,483 | |
BlackRock, Inc. | | | 4,032 | | | | 1,658,845 | |
Blucora, Inc.* | | | 16,884 | | | | 488,285 | |
BrightSphere Investment Group plc | | | 23,940 | | | | 272,916 | |
Cboe Global Markets, Inc. | | | 5,292 | | | | 597,202 | |
See Accompanying Notes to the Financial Statements.
| | |
| 104 | | FLEXSHARES ANNUAL REPORT |
FlexShares® Morningstar US Market Factor Tilt Index Fund (cont.)
| | | | | | | | |
| Investments | | Shares | | | Value | |
| COMMON STOCKS – (continued) | |
| Capital Markets – (continued) | |
Charles Schwab Corp. (The) | | | 32,508 | | | $ | 1,503,170 | |
CME Group, Inc. | | | 10,332 | | | | 1,893,236 | |
Cohen & Steers, Inc. | | | 1,008 | | | | 38,697 | |
Cowen, Inc.* (a) | | | 21,168 | | | | 313,286 | |
Donnelley Financial Solutions, Inc.* | | | 9,576 | | | | 148,907 | |
E*TRADE Financial Corp. | | | 16,632 | | | | 821,953 | |
Eaton Vance Corp. | | | 1,260 | | | | 56,763 | |
Evercore, Inc., Class A | | | 2,520 | | | | 205,859 | |
FactSet Research Systems, Inc.(a) | | | 756 | | | | 169,163 | |
Federated Investors, Inc., Class B(a) | | | 36,036 | | | | 889,008 | |
Franklin Resources, Inc.(a) | | | 10,584 | | | | 322,812 | |
Goldman Sachs Group, Inc. (The) | | | 18,648 | | | | 4,202,700 | |
Interactive Brokers Group, Inc., Class A | | | 7,308 | | | | 361,088 | |
Intercontinental Exchange, Inc. | | | 17,640 | | | | 1,359,023 | |
INTL. FCStone, Inc.* | | | 9,828 | | | | 445,012 | |
Invesco Ltd. | | | 756 | | | | 16,413 | |
Investment Technology Group, Inc. | | | 7,056 | | | | 193,899 | |
Janus Henderson Group plc(a) | | | 20,664 | | | | 507,715 | |
Jefferies Financial Services, Inc. | | | 20,160 | | | | 432,835 | |
Legg Mason, Inc.(a) | | | 35,784 | | | | 1,009,825 | |
LPL Financial Holdings, Inc. | | | 11,088 | | | | 683,021 | |
MarketAxess Holdings, Inc.(a) | | | 2,268 | | | | 475,532 | |
Moody’s Corp. | | | 5,292 | | | | 769,880 | |
Morgan Stanley | | | 76,860 | | | | 3,509,428 | |
Morningstar, Inc. | | | 252 | | | | 31,450 | |
MSCI, Inc. | | | 3,024 | | | | 454,749 | |
Nasdaq, Inc.(a) | | | 2,268 | | | | 196,658 | |
Northern Trust Corp.(b) | | | 8,602 | | | | 809,190 | |
Piper Jaffray Cos. | | | 3,528 | | | | 244,773 | |
Raymond James Financial, Inc. | | | 2,520 | | | | 193,259 | |
S&P Global, Inc. | | | 6,804 | | | | 1,240,505 | |
| | | | | | | | |
| Investments | | Shares | | | Value | |
| Capital Markets – (continued) | |
SEI Investments Co. | | | 4,536 | | | $ | 242,449 | |
State Street Corp. | | | 17,136 | | | | 1,178,100 | |
Stifel Financial Corp.(a) | | | 28,224 | | | | 1,290,402 | |
T. Rowe Price Group, Inc. | | | 10,080 | | | | 977,659 | |
TD Ameritrade Holding Corp. | | | 4,788 | | | | 247,635 | |
Virtu Financial, Inc., Class A(a) | | | 22,932 | | | | 543,947 | |
Virtus Investment Partners, Inc. | | | 504 | | | | 50,067 | |
Waddell & Reed Financial, Inc., Class A(a) | | | 28,476 | | | | 543,037 | |
| | | | | | | | 35,423,187 | |
| Chemicals – 1.7% | |
AdvanSix, Inc.* | | | 10,080 | | | | 279,619 | |
Air Products & Chemicals, Inc. | | | 5,796 | | | | 894,613 | |
Albemarle Corp.(a) | | | 5,292 | | | | 525,072 | |
American Vanguard Corp. | | | 252 | | | | 4,057 | |
Ashland Global Holdings, Inc. | | | 2,520 | | | | 186,430 | |
Balchem Corp.(a) | | | 2,772 | | | | 259,598 | |
Cabot Corp. | | | 16,128 | | | | 785,111 | |
Celanese Corp. | | | 6,048 | | | | 586,293 | |
CF Industries Holdings, Inc. | | | 4,284 | | | | 205,761 | |
Chemours Co. (The) | | | 14,364 | | | | 474,156 | |
DowDuPont, Inc. | | | 82,656 | | | | 4,456,811 | |
Eastman Chemical Co. | | | 8,820 | | | | 691,047 | |
Ecolab, Inc. | | | 7,560 | | | | 1,157,814 | |
Ferro Corp.* | | | 14,364 | | | | 243,326 | |
FMC Corp. | | | 9,072 | | | | 708,342 | |
FutureFuel Corp. | | | 252 | | | | 4,133 | |
GCP Applied Technologies, Inc.* (a) | | | 15,876 | | | | 412,300 | |
Hawkins, Inc. | | | 1,512 | | | | 50,894 | |
HB Fuller Co.(a) | | | 2,772 | | | | 123,243 | |
Huntsman Corp.(a) | | | 23,688 | | | | 518,293 | |
Innophos Holdings, Inc.(a) | | | 5,544 | | | | 162,439 | |
Innospec, Inc. | | | 4,788 | | | | 320,413 | |
International Flavors & Fragrances, Inc.(a) | | | 2,520 | | | | 364,543 | |
Koppers Holdings, Inc.* | | | 7,812 | | | | 208,971 | |
Kraton Corp.* (a) | | | 9,072 | | | | 249,843 | |
See Accompanying Notes to the Financial Statements.
| | | | |
| FLEXSHARES ANNUAL REPORT | | | 105 | |
FlexShares® Morningstar US Market Factor Tilt Index Fund (cont.)
| | | | | | | | |
| Investments | | Shares | | | Value | |
| COMMON STOCKS – (continued) | |
| Chemicals – (continued) | |
Kronos Worldwide, Inc.(a) | | | 14,364 | | | $ | 201,527 | |
Linde plc | | | 7,308 | | | | 1,209,255 | |
LyondellBasell Industries NV, Class A | | | 13,104 | | | | 1,169,794 | |
Minerals Technologies, Inc. | | | 7,308 | | | | 400,113 | |
Mosaic Co. (The) | | | 7,308 | | | | 226,110 | |
NewMarket Corp.(a) | | | 252 | | | | 97,262 | |
Olin Corp. | | | 13,860 | | | | 279,972 | |
OMNOVA Solutions, Inc.* | | | 1,764 | | | | 13,036 | |
Platform Specialty Products Corp.* (a) | | | 76,356 | | | | 826,172 | |
PolyOne Corp. | | | 12,348 | | | | 398,964 | |
PPG Industries, Inc. | | | 6,552 | | | | 688,550 | |
PQ Group Holdings, Inc.* | | | 2,268 | | | | 36,401 | |
Quaker Chemical Corp.(a) | | | 2,268 | | | | 408,013 | |
Rayonier Advanced Materials, Inc. | | | 13,356 | | | | 165,347 | |
RPM International, Inc. | | | 3,024 | | | | 184,978 | |
Scotts Miracle-Gro Co. (The)(a) | | | 3,276 | | | | 218,640 | |
Sensient Technologies Corp. | | | 4,032 | | | | 261,516 | |
Sherwin-Williams Co. (The) | | | 2,520 | | | | 991,544 | |
Stepan Co. | | | 5,544 | | | | 457,879 | |
Tredegar Corp. | | | 2,016 | | | | 37,498 | |
Trinseo SA | | | 21,672 | | | | 1,167,687 | |
Tronox Ltd., Class A(a) | | | 19,404 | | | | 222,176 | |
Valvoline, Inc.(a) | | | 5,040 | | | | 100,397 | |
Venator Materials plc* | | | 34,020 | | | | 229,975 | |
Westlake Chemical Corp. | | | 504 | | | | 35,935 | |
WR Grace & Co. | | | 1,008 | | | | 65,308 | |
| | | | | | | | 23,967,171 | |
| Commercial Services & Supplies – 0.8% | |
ABM Industries, Inc.(a) | | | 17,892 | | | | 550,179 | |
ACCO Brands Corp. | | | 22,428 | | | | 180,994 | |
Brady Corp., Class A | | | 6,552 | | | | 263,980 | |
Brink’s Co. (The)(a) | | | 6,804 | | | | 451,241 | |
Cimpress NV* | | | 3,024 | | | | 377,970 | |
Cintas Corp. | | | 3,276 | | | | 595,806 | |
Copart, Inc.* | | | 3,528 | | | | 172,554 | |
Covanta Holding Corp.(a) | | | 48,888 | | | | 718,165 | |
Deluxe Corp.(a) | | | 4,032 | | | | 190,351 | |
| | | | | | | | |
| Investments | | Shares | | | Value | |
| Commercial Services & Supplies – (continued) | |
Ennis, Inc.(a) | | | 8,568 | | | $ | 165,876 | |
Essendant, Inc.(a) | | | 14,364 | | | | 182,997 | |
Healthcare Services Group, Inc.(a) | | | 7,560 | | | | 306,860 | |
Herman Miller, Inc. | | | 12,096 | | | | 398,563 | |
HNI Corp. | | | 9,576 | | | | 362,835 | |
Interface, Inc. | | | 3,024 | | | | 49,261 | |
KAR Auction Services, Inc. | | | 7,812 | | | | 444,815 | |
Kimball International, Inc., Class B | | | 9,072 | | | | 149,325 | |
Knoll, Inc. | | | 4,788 | | | | 95,042 | |
LSC Communications, Inc.(a) | | | 10,836 | | | | 102,183 | |
Matthews International Corp., Class A | | | 5,292 | | | | 220,253 | |
McGrath RentCorp | | | 756 | | | | 40,363 | |
Mobile Mini, Inc.(a) | | | 2,772 | | | | 113,985 | |
MSA Safety, Inc. | | | 1,764 | | | | 184,232 | |
Multi-Color Corp.(a) | | | 2,772 | | | | 147,359 | |
Pitney Bowes, Inc.(a) | | | 62,244 | | | | 412,055 | |
Quad/Graphics, Inc. | | | 19,656 | | | | 303,292 | |
Republic Services, Inc. | | | 9,324 | | | | 677,668 | |
Rollins, Inc.(a) | | | 3,528 | | | | 208,858 | |
RR Donnelley & Sons Co.(a) | | | 16,632 | | | | 97,630 | |
SP Plus Corp.* | | | 504 | | | | 16,108 | |
Steelcase, Inc., Class A | | | 16,632 | | | | 276,091 | |
Team, Inc.* (a) | | | 9,828 | | | | 195,577 | |
Tetra Tech, Inc. | | | 8,064 | | | | 532,547 | |
UniFirst Corp. | | | 2,016 | | | | 300,989 | |
US Ecology, Inc. | | | 2,520 | | | | 176,224 | |
Viad Corp. | | | 1,512 | | | | 72,410 | |
VSE Corp. | | | 252 | | | | 7,903 | |
Waste Management, Inc. | | | 14,112 | | | | 1,262,601 | |
| | | | | | | | 11,005,142 | |
| Communications Equipment – 1.3% | |
ADTRAN, Inc. | | | 10,584 | | | | 142,249 | |
Applied Optoelectronics, Inc.* (a) | | | 7,308 | | | | 143,456 | |
Arista Networks, Inc.* (a) | | | 1,512 | | | | 348,289 | |
ARRIS International plc* | | | 7,308 | | | | 181,750 | |
CalAmp Corp.* (a) | | | 1,260 | | | | 25,124 | |
Calix, Inc.* | | | 504 | | | | 3,679 | |
Ciena Corp.* (a) | | | 47,376 | | | | 1,480,974 | |
See Accompanying Notes to the Financial Statements.
| | |
| 106 | | FLEXSHARES ANNUAL REPORT |
FlexShares® Morningstar US Market Factor Tilt Index Fund (cont.)
| | | | | | | | |
| Investments | | Shares | | | Value | |
| COMMON STOCKS – (continued) | |
| Communications Equipment – (continued) | |
Cisco Systems, Inc. | | | 189,756 | | | $ | 8,681,337 | |
EchoStar Corp., Class A* (a) | | | 2,520 | | | | 102,186 | |
Extreme Networks, Inc.* | | | 8,064 | | | | 44,755 | |
F5 Networks, Inc.* | | | 1,512 | | | | 265,023 | |
Finisar Corp.* (a) | | | 38,304 | | | | 639,294 | |
Harmonic, Inc.* (a) | | | 34,776 | | | | 191,616 | |
Infinera Corp.* | | | 8,064 | | | | 44,675 | |
InterDigital, Inc. | | | 3,780 | | | | 268,191 | |
Juniper Networks, Inc. | | | 13,860 | | | | 405,682 | |
Lumentum Holdings, Inc.* (a) | | | 20,664 | | | | 1,129,288 | |
Motorola Solutions, Inc. | | | 4,032 | | | | 494,162 | |
NETGEAR, Inc.* (a) | | | 5,040 | | | | 279,619 | |
NetScout Systems, Inc.* (a) | | | 26,208 | | | | 662,014 | |
Oclaro, Inc.* | | | 3,276 | | | | 26,929 | |
Palo Alto Networks, Inc.* | | | 3,024 | | | | 553,513 | |
Plantronics, Inc.(a) | | | 2,520 | | | | 148,604 | |
Ubiquiti Networks, Inc.(a) | | | 1,008 | | | | 93,835 | |
ViaSat, Inc.* (a) | | | 16,884 | | | | 1,076,524 | |
Viavi Solutions, Inc.* | | | 47,376 | | | | 546,245 | |
| | | | | | | | 17,979,013 | |
| Construction & Engineering – 0.3% | |
AECOM* (a) | | | 9,072 | | | | 264,358 | |
Aegion Corp.* | | | 6,048 | | | | 117,089 | |
Argan, Inc.(a) | | | 4,284 | | | | 188,582 | |
Comfort Systems USA, Inc. | | | 4,788 | | | | 256,062 | |
Dycom Industries, Inc.* (a) | | | 5,040 | | | | 342,115 | |
EMCOR Group, Inc. | | | 4,788 | | | | 339,852 | |
Fluor Corp. | | | 7,812 | | | | 342,634 | |
Granite Construction, Inc.(a) | | | 2,268 | | | | 103,693 | |
Jacobs Engineering Group, Inc. | | | 1,260 | | | | 94,614 | |
KBR, Inc.(a) | | | 41,076 | | | | 812,483 | |
MasTec, Inc.* (a) | | | 20,160 | | | | 877,162 | |
MYR Group, Inc.* | | | 756 | | | | 25,243 | |
Primoris Services Corp. | | | 3,528 | | | | 74,688 | |
Tutor Perini Corp.* (a) | | | 10,584 | | | | 164,052 | |
Valmont Industries, Inc.(a) | | | 504 | | | | 62,652 | |
| | | | | | | | 4,065,279 | |
| Construction Materials – 0.1% | |
Eagle Materials, Inc. | | | 2,268 | | | | 167,469 | |
| | | | | | | | |
| Investments | | Shares | | | Value | |
| Construction Materials – (continued) | |
Martin Marietta Materials, Inc.(a) | | | 2,268 | | | $ | 388,463 | |
Summit Materials, Inc., Class A* (a) | | | 282 | | | | 3,807 | |
US Concrete, Inc.* (a) | | | 7,308 | | | | 238,533 | |
Vulcan Materials Co.(a) | | | 4,032 | | | | 407,797 | |
| | | | | | | | 1,206,069 | |
| Consumer Finance – 1.1% | |
Ally Financial, Inc. | | | 26,460 | | | | 672,349 | |
American Express Co. | | | 29,232 | | | | 3,003,003 | |
Capital One Financial Corp. | | | 23,688 | | | | 2,115,339 | |
Credit Acceptance Corp.* | | | 1,764 | | | | 748,677 | |
Discover Financial Services | | | 21,168 | | | | 1,474,775 | |
Encore Capital Group, Inc.* (a) | | | 12,096 | | | | 307,359 | |
Enova International, Inc.* | | | 10,584 | | | | 250,312 | |
EZCORP, Inc., Class A* (a) | | | 16,380 | | | | 162,817 | |
FirstCash, Inc.(a) | | | 6,048 | | | | 486,259 | |
Green Dot Corp., Class A* | | | 3,528 | | | | 267,211 | |
LendingClub Corp.* (a) | | | 174,132 | | | | 562,446 | |
Navient Corp. | | | 86,184 | | | | 998,011 | |
Nelnet, Inc., Class A(a) | | | 9,828 | | | | 553,218 | |
OneMain Holdings, Inc.* | | | 20,160 | | | | 574,963 | |
PRA Group, Inc.* (a) | | | 10,080 | | | | 310,867 | |
Santander Consumer USA Holdings, Inc. | | | 14,364 | | | | 269,325 | |
SLM Corp.* (a) | | | 53,928 | | | | 546,830 | |
Synchrony Financial | | | 46,368 | | | | 1,339,108 | |
World Acceptance Corp.* | | | 1,260 | | | | 127,877 | |
| | | | | | | | 14,770,746 | |
| Containers & Packaging – 0.5% | |
AptarGroup, Inc. | | | 1,260 | | | | 128,470 | |
Avery Dennison Corp. | | | 2,268 | | | | 205,753 | |
Ball Corp.(a) | | | 12,852 | | | | 575,770 | |
Bemis Co., Inc. | | | 29,988 | | | | 1,372,551 | |
Berry Global Group, Inc.* (a) | | | 11,844 | | | | 516,635 | |
Crown Holdings, Inc.* (a) | | | 9,072 | | | | 383,655 | |
Graphic Packaging Holding Co.(a) | | | 24,696 | | | | 271,903 | |
International Paper Co. | | | 22,680 | | | | 1,028,765 | |
Myers Industries, Inc.(a) | | | 504 | | | | 7,993 | |
See Accompanying Notes to the Financial Statements.
| | | | |
| FLEXSHARES ANNUAL REPORT | | | 107 | |
FlexShares® Morningstar US Market Factor Tilt Index Fund (cont.)
| | | | | | | | |
| Investments | | Shares | | | Value | |
| COMMON STOCKS – (continued) | |
| Containers & Packaging – (continued) | |
Owens-Illinois, Inc.* (a) | | | 67,284 | | | $ | 1,054,340 | |
Packaging Corp. of America | | | 2,016 | | | | 185,089 | |
Sealed Air Corp.(a) | | | 4,536 | | | | 146,785 | |
Silgan Holdings, Inc.(a) | | | 25,704 | | | | 617,667 | |
Sonoco Products Co.(a) | | | 2,268 | | | | 123,787 | |
WestRock Co. | | | 15,120 | | | | 649,706 | |
| | | | | | | | 7,268,869 | |
| Distributors – 0.1% | |
Core-Mark Holding Co., Inc. | | | 6,048 | | | | 232,304 | |
Genuine Parts Co. | | | 2,772 | | | | 271,434 | |
LKQ Corp.* | | | 10,584 | | | | 288,626 | |
Pool Corp.(a) | | | 3,276 | | | | 477,477 | |
| | | | | | | | 1,269,841 | |
| Diversified Consumer Services – 0.3% | |
Adtalem Global Education, Inc.* (a) | | | 21,168 | | | | 1,071,736 | |
Bright Horizons Family Solutions, Inc.* | | | 3,780 | | | | 434,360 | |
Career Education Corp.* | | | 18,900 | | | | 271,782 | |
Carriage Services, Inc.(a) | | | 4,032 | | | | 76,850 | |
Graham Holdings Co., Class B | | | 504 | | | | 292,849 | |
Grand Canyon Education, Inc.* (a) | | | 5,040 | | | | 628,488 | |
H&R Block, Inc.(a) | | | 6,804 | | | | 180,578 | |
Houghton Mifflin Harcourt Co.* | | | 27,972 | | | | 187,412 | |
Service Corp. International(a) | | | 12,096 | | | | 501,621 | |
Strayer Education, Inc. | | | 3,780 | | | | 475,600 | |
Weight Watchers International, Inc.* (a) | | | 10,080 | | | | 666,288 | |
| | | | | | | | 4,787,564 | |
| Diversified Financial Services – 1.6% | |
Berkshire Hathaway, Inc., Class B* | | | 101,808 | | | | 20,899,146 | |
Cannae Holdings, Inc.* | | | 8,820 | | | | 162,906 | |
Voya Financial, Inc. | | | 16,128 | | | | 705,761 | |
| | | | | | | | 21,767,813 | |
| | | | | | | | |
| Investments | | Shares | | | Value | |
| Diversified Telecommunication Services – 2.0% | |
AT&T, Inc. | | | 385,002 | | | $ | 11,811,861 | |
ATN International, Inc. | | | 2,016 | | | | 170,332 | |
CenturyLink, Inc. | | | 53,172 | | | | 1,097,470 | |
Cincinnati Bell, Inc.* (a) | | | 20,160 | | | | 286,070 | |
Cogent Communications Holdings, Inc. | | | 3,780 | | | | 196,484 | |
Consolidated Communications Holdings, Inc.(a) | | | 32,256 | | | | 403,845 | |
Frontier Communications Corp.(a) | | | 34,776 | | | | 167,273 | |
Globalstar, Inc.* | | | 152,712 | | | | 53,098 | |
Iridium Communications, Inc.* | | | 31,248 | | | | 619,023 | |
ORBCOMM, Inc.* (a) | | | 3,024 | | | | 28,819 | |
Verizon Communications, Inc. | | | 211,680 | | | | 12,084,811 | |
Vonage Holdings Corp.* | | | 33,768 | | | | 447,764 | |
Windstream Holdings, Inc.* (a) | | | 15,963 | | | | 65,768 | |
Zayo Group Holdings, Inc.* | | | 7,056 | | | | 210,833 | |
| | | | | | | | 27,643,451 | |
| Electric Utilities – 1.5% | |
ALLETE, Inc.(a) | | | 7,056 | | | | 522,144 | |
Alliant Energy Corp. | | | 5,040 | | | | 216,619 | |
American Electric Power Co., Inc. | | | 19,152 | | | | 1,404,991 | |
Duke Energy Corp. | | | 34,272 | | | | 2,831,895 | |
Edison International | | | 15,120 | | | | 1,049,177 | |
El Paso Electric Co. | | | 6,300 | | | | 359,415 | |
Entergy Corp. | | | 10,332 | | | | 867,371 | |
Evergy, Inc. | | | 14,918 | | | | 835,259 | |
Eversource Energy | | | 12,852 | | | | 813,017 | |
Exelon Corp. | | | 47,376 | | | | 2,075,543 | |
FirstEnergy Corp.(a) | | | 23,688 | | | | 883,089 | |
Hawaiian Electric Industries, Inc. | | | 15,624 | | | | 582,775 | |
IDACORP, Inc.(a) | | | 4,032 | | | | 376,024 | |
MGE Energy, Inc.(a) | | | 2,772 | | | | 173,195 | |
NextEra Energy, Inc. | | | 13,356 | | | | 2,303,910 | |
OGE Energy Corp.(a) | | | 3,024 | | | | 109,318 | |
Otter Tail Corp. | | | 1,764 | | | | 79,503 | |
PG&E Corp.* | | | 14,616 | | | | 684,175 | |
See Accompanying Notes to the Financial Statements.
| | |
| 108 | | FLEXSHARES ANNUAL REPORT |
FlexShares® Morningstar US Market Factor Tilt Index Fund (cont.)
| | | | | | | | |
| Investments | | Shares | | | Value | |
| COMMON STOCKS – (continued) | |
| Electric Utilities – (continued) | |
Pinnacle West Capital Corp. | | | 2,268 | | | $ | 186,543 | |
PNM Resources, Inc.(a) | | | 10,080 | | | | 387,173 | |
Portland General Electric Co. | | | 11,844 | | | | 533,927 | |
PPL Corp. | | | 19,152 | | | | 582,221 | |
Southern Co. (The) | | | 49,140 | | | | 2,212,774 | |
Xcel Energy, Inc. | | | 26,208 | | | | 1,284,454 | |
| | | | | | | | 21,354,512 | |
| Electrical Equipment – 0.6% | |
Acuity Brands, Inc.(a) | | | 1,764 | | | | 221,629 | |
AMETEK, Inc. | | | 4,284 | | | | 287,371 | |
Atkore International Group, Inc.* | | | 4,788 | | | | 92,217 | |
AZZ, Inc. | | | 1,512 | | | | 67,057 | |
Eaton Corp. plc | | | 27,720 | | | | 1,986,692 | |
Emerson Electric Co. | | | 24,444 | | | | 1,659,259 | |
Encore Wire Corp.(a) | | | 1,512 | | | | 66,830 | |
EnerSys | | | 11,340 | | | | 902,324 | |
Generac Holdings, Inc.* (a) | | | 11,088 | | | | 562,494 | |
Hubbell, Inc.(a) | | | 756 | | | | 76,885 | |
Regal Beloit Corp. | | | 16,380 | | | | 1,174,446 | |
Rockwell Automation, Inc. | | | 2,520 | | | | 415,120 | |
Sensata Technologies Holding plc* | | | 2,016 | | | | 94,550 | |
Sunrun, Inc.* (a) | | | 21,924 | | | | 268,788 | |
Vivint Solar, Inc.* (a) | | | 1,008 | | | | 5,232 | |
| | | | | | | | 7,880,894 | |
| Electronic Equipment, Instruments & Components – 1.3% | |
Amphenol Corp., Class A | | | 9,324 | | | | 834,498 | |
Anixter International, Inc.* | | | 8,568 | | | | 562,832 | |
Arrow Electronics, Inc.* | | | 2,520 | | | | 170,629 | |
Avnet, Inc. | | | 2,520 | | | | 100,976 | |
AVX Corp.(a) | | | 8,820 | | | | 147,118 | |
Badger Meter, Inc.(a) | | | 3,024 | | | | 148,509 | |
Belden, Inc.(a) | | | 14,616 | | | | 789,995 | |
Benchmark Electronics, Inc. | | | 11,844 | | | | 258,554 | |
CDW Corp. | | | 3,528 | | | | 317,555 | |
Cognex Corp.(a) | | | 11,592 | | | | 496,601 | |
Coherent, Inc.* (a) | | | 1,512 | | | | 186,188 | |
Corning, Inc. | | | 57,960 | | | | 1,851,822 | |
CTS Corp. | | | 7,812 | | | | 208,502 | |
| | | | | | | | |
| Investments | | Shares | | | Value | |
Electronic Equipment, Instruments & Components –
(continued) | |
Dolby Laboratories, Inc., Class A | | | 1,008 | | | $ | 69,360 | |
Electro Scientific Industries, Inc.* (a) | | | 6,048 | | | | 175,392 | |
ePlus, Inc.* (a) | | | 5,040 | | | | 427,795 | |
Fabrinet* (a) | | | 12,600 | | | | 545,832 | |
Fitbit, Inc., Class A* (a) | | | 504 | | | | 2,384 | |
Flex Ltd.* | | | 10,332 | | | | 81,210 | |
FLIR Systems, Inc. | | | 4,032 | | | | 186,722 | |
II-VI, Inc.* (a) | | | 1,260 | | | | 46,910 | |
Insight Enterprises, Inc.* | | | 13,356 | | | | 690,372 | |
IPG Photonics Corp.* (a) | | | 3,276 | | | | 437,510 | |
Jabil, Inc. | | | 22,176 | | | | 548,412 | |
KEMET Corp.* | | | 12,852 | | | | 279,917 | |
Keysight Technologies, Inc.* | | | 1,764 | | | | 100,689 | |
Knowles Corp.* (a) | | | 1,512 | | | | 24,464 | |
Littelfuse, Inc.(a) | | | 2,326 | | | | 421,378 | |
Mesa Laboratories, Inc. | | | 252 | | | | 46,038 | |
Methode Electronics, Inc. | | | 3,780 | | | | 111,888 | |
National Instruments Corp. | | | 252 | | | | 12,340 | |
Novanta, Inc.* | | | 3,780 | | | | 220,034 | |
PC Connection, Inc. | | | 4,536 | | | | 150,323 | |
Plexus Corp.* (a) | | | 7,812 | | | | 456,221 | |
Resideo Technologies, Inc.* | | | 4,032 | | | | 84,874 | |
Rogers Corp.* | | | 1,512 | | | | 186,067 | |
Sanmina Corp.* | | | 25,704 | | | | 650,311 | |
ScanSource, Inc.* | | | 5,796 | | | | 225,348 | |
SYNNEX Corp. | | | 13,056 | | | | 1,013,276 | |
TE Connectivity Ltd. | | | 8,316 | | | | 627,193 | |
Tech Data Corp.* (a) | | | 13,104 | | | | 925,929 | |
Trimble, Inc.* | | | 6,048 | | | | 226,074 | |
TTM Technologies, Inc.* (a) | | | 25,200 | | | | 294,840 | |
Vishay Intertechnology, Inc.(a) | | | 53,676 | | | | 982,271 | |
Zebra Technologies Corp., Class A* | | | 5,796 | | | | 963,875 | |
| | | | | | | | 17,289,028 | |
| Energy Equipment & Services – 1.0% | |
Archrock, Inc. | | | 40,320 | | | | 413,683 | |
Baker Hughes a GE Co.(a) | | | 14,364 | | | | 383,375 | |
Basic Energy Services, Inc.* | | | 9,576 | | | | 74,406 | |
See Accompanying Notes to the Financial Statements.
| | | | |
| FLEXSHARES ANNUAL REPORT | | | 109 | |
FlexShares® Morningstar US Market Factor Tilt Index Fund (cont.)
| | | | | | | | |
| Investments | | Shares | | | Value | |
| COMMON STOCKS – (continued) | |
| Energy Equipment & Services – (continued) | |
C&J Energy Services, Inc.* | | | 18,396 | | | $ | 345,477 | |
Core Laboratories NV(a) | | | 1,008 | | | | 85,922 | |
Covia Holdings Corp.* | | | 11,844 | | | | 68,458 | |
Diamond Offshore Drilling, Inc.* (a) | | | 48,384 | | | | 686,085 | |
Ensco plc, Class A(a) | | | 17,388 | | | | 124,150 | |
Exterran Corp.* | | | 14,868 | | | | 310,593 | |
Frank’s International NV* | | | 21,420 | | | | 152,082 | |
FTS International, Inc.* | | | 16,884 | | | | 216,284 | |
Halliburton Co. | | | 17,640 | | | | 611,755 | |
Helix Energy Solutions Group, Inc.* (a) | | | 35,532 | | | | 302,733 | |
Helmerich & Payne, Inc. | | | 7,560 | | | | 470,912 | |
Keane Group, Inc.* (a) | | | 10,080 | | | | 126,706 | |
Matrix Service Co.* | | | 12,852 | | | | 261,281 | |
McDermott International, Inc.* | | | 67,814 | | | | 524,202 | |
Nabors Industries Ltd.(a) | | | 156,744 | | | | 779,018 | |
National Oilwell Varco, Inc.(a) | | | 14,112 | | | | 519,322 | |
Newpark Resources, Inc.* (a) | | | 5,796 | | | | 47,585 | |
Noble Corp. plc* (a) | | | 181,692 | | | | 912,094 | |
Oceaneering International, Inc.* (a) | | | 37,800 | | | | 715,932 | |
Oil States International, Inc.* (a) | | | 3,276 | | | | 72,957 | |
Patterson-UTI Energy, Inc.(a) | | | 67,032 | | | | 1,115,412 | |
ProPetro Holding Corp.* (a) | | | 14,112 | | | | 249,077 | |
RPC, Inc.(a) | | | 7,056 | | | | 104,993 | |
Schlumberger Ltd. | | | 23,436 | | | | 1,202,501 | |
SEACOR Holdings, Inc.* | | | 4,032 | | | | 193,496 | |
Superior Energy Services, Inc.* (a) | | | 73,080 | | | | 572,216 | |
TETRA Technologies, Inc.* | | | 50,904 | | | | 151,185 | |
Transocean Ltd.* (a) | | | 116,928 | | | | 1,287,377 | |
Unit Corp.* (a) | | | 22,680 | | | | 524,588 | |
US Silica Holdings, Inc.(a) | | | 22,680 | | | | 317,520 | |
Weatherford International plc* (a) | | | 362,880 | | | | 489,888 | |
| | | | | | | | 14,413,265 | |
| | | | | | | | |
| Investments | | Shares | | | Value | |
| Entertainment – 1.7% | |
Activision Blizzard, Inc. | | | 23,436 | | | $ | 1,618,256 | |
AMC Entertainment Holdings, Inc., Class A(a) | | | 22,680 | | | | 436,817 | |
Cinemark Holdings, Inc.(a) | | | 27,720 | | | | 1,152,320 | |
Electronic Arts, Inc.* | | | 8,568 | | | | 779,517 | |
Glu Mobile, Inc.* | | | 40,824 | | | | 287,809 | |
IMAX Corp.* | | | 252 | | | | 4,879 | |
Liberty Media Corp-Liberty Braves, Class C* (a) | | | 6,300 | | | | 163,170 | |
Liberty Media Corp-Liberty Formula One, Class A* (a) | | | 15,624 | | | | 495,124 | |
Lions Gate Entertainment Corp., Class A | | | 2,520 | | | | 48,283 | |
Lions Gate Entertainment Corp., Class B | | | 2,520 | | | | 44,831 | |
Live Nation Entertainment, Inc.* (a) | | | 11,592 | | | | 606,262 | |
Marcus Corp. (The) | | | 4,788 | | | | 186,828 | |
Netflix, Inc.* | | | 16,128 | | | | 4,867,108 | |
Pandora Media, Inc.* | | | 16,884 | | | | 143,514 | |
Take-Two Interactive Software, Inc.* | | | 6,804 | | | | 876,831 | |
Twenty-First Century Fox, Inc., Class A | | | 56,448 | | | | 2,569,513 | |
Twenty-First Century Fox, Inc., Class B | | | 16,128 | | | | 728,663 | |
Viacom, Inc., Class B | | | 12,096 | | | | 386,830 | |
Walt Disney Co. (The) | | | 73,836 | | | | 8,478,588 | |
World Wrestling Entertainment, Inc., Class A | | | 4,032 | | | | 292,683 | |
| | | | | | | | 24,167,826 | |
| Equity Real Estate Investment Trusts (REITs) – 3.5% | |
Acadia Realty Trust(a) | | | 1,260 | | | | 35,078 | |
Agree Realty Corp. | | | 1,260 | | | | 72,160 | |
Alexander & Baldwin, Inc.(a) | | | 7,308 | | | | 142,798 | |
Alexander’s, Inc. | | | 252 | | | | 79,383 | |
Alexandria Real Estate Equities, Inc. | | | 3,276 | | | | 400,425 | |
American Assets Trust, Inc.(a) | | | 3,276 | | | | 125,667 | |
American Campus Communities, Inc. | | | 6,804 | | | | 268,826 | |
See Accompanying Notes to the Financial Statements.
| | |
| 110 | | FLEXSHARES ANNUAL REPORT |
FlexShares® Morningstar US Market Factor Tilt Index Fund (cont.)
| | | | | | | | |
| Investments | | Shares | | | Value | |
| COMMON STOCKS – (continued) | |
| Equity Real Estate Investment Trusts (REITs) – (continued) | |
American Homes 4 Rent, Class A | | | 8,820 | | | $ | 185,837 | |
American Tower Corp. | | | 14,364 | | | | 2,238,055 | |
Apartment Investment & Management Co., Class A | | | 5,040 | | | | 216,922 | |
Apple Hospitality REIT, Inc. | | | 57,456 | | | | 929,064 | |
Ashford Hospitality Trust, Inc. | | | 25,956 | | | | 133,673 | |
AvalonBay Communities, Inc. | | | 6,048 | | | | 1,060,698 | |
Boston Properties, Inc. | | | 4,284 | | | | 517,336 | |
Braemar Hotels & Resorts, Inc. | | | 756 | | | | 8,044 | |
Brandywine Realty Trust | | | 15,372 | | | | 216,130 | |
Brixmor Property Group, Inc. | | | 21,924 | | | | 355,169 | |
Camden Property Trust | | | 2,772 | | | | 250,228 | |
CBL & Associates Properties, Inc.(a) | | | 1,512 | | | | 4,990 | |
Chatham Lodging Trust | | | 1,260 | | | | 24,570 | |
Chesapeake Lodging Trust(a) | | | 8,316 | | | | 244,407 | |
Colony Capital, Inc.(a) | | | 286,272 | | | | 1,680,417 | |
CoreCivic, Inc. | | | 49,644 | | | | 1,115,004 | |
CorEnergy Infrastructure Trust, Inc.(a) | | | 1,260 | | | | 45,524 | |
CoreSite Realty Corp.(a) | | | 3,024 | | | | 283,833 | |
Corporate Office Properties Trust(a) | | | 10,584 | | | | 273,491 | |
Cousins Properties, Inc. | | | 10,584 | | | | 87,953 | |
Crown Castle International Corp. | | | 13,860 | | | | 1,507,136 | |
CubeSmart | | | 14,616 | | | | 423,572 | |
CyrusOne, Inc. | | | 3,276 | | | | 174,381 | |
DiamondRock Hospitality Co. | | | 43,596 | | | | 455,578 | |
Digital Realty Trust, Inc. | | | 6,804 | | | | 702,581 | |
Douglas Emmett, Inc. | | | 2,772 | | | | 100,319 | |
Duke Realty Corp. | | | 12,852 | | | | 354,330 | |
EastGroup Properties, Inc. | | | 1,260 | | | | 120,695 | |
Empire State Realty Trust, Inc., Class A(a) | | | 8,064 | | | | 127,895 | |
EPR Properties | | | 4,032 | | | | 277,160 | |
Equinix, Inc. | | | 2,772 | | | | 1,049,867 | |
Equity Commonwealth | | | 18,900 | | | | 562,842 | |
Equity LifeStyle Properties, Inc. | | | 1,764 | | | | 167,033 | |
| | | | | | | | |
| Investments | | Shares | | | Value | |
| Equity Real Estate Investment Trusts (REITs) – (continued) | |
Equity Residential | | | 7,812 | | | $ | 507,468 | |
Essex Property Trust, Inc. | | | 2,268 | | | | 568,769 | |
Extra Space Storage, Inc. | | | 5,796 | | | | 521,988 | |
Federal Realty Investment Trust | | | 2,016 | | | | 250,085 | |
First Industrial Realty Trust, Inc. | | | 10,836 | | | | 332,665 | |
Forest City Realty Trust, Inc., Class A | | | 8,064 | | | | 202,890 | |
Franklin Street Properties Corp. | | | 504 | | | | 3,508 | |
Front Yard Residential Corp. | | | 32,004 | | | | 296,677 | |
Gaming and Leisure Properties, Inc. | | | 4,536 | | | | 152,818 | |
GEO Group, Inc. (The) | | | 41,580 | | | | 919,334 | |
Getty Realty Corp.(a) | | | 1,008 | | | | 27,045 | |
Global Net Lease, Inc.(a) | | | 6,804 | | | | 137,781 | |
Government Properties Income Trust(a) | | | 37,548 | | | | 331,549 | |
HCP, Inc. | | | 26,208 | | | | 722,030 | |
Healthcare Realty Trust, Inc.(a) | | | 6,552 | | | | 182,539 | |
Healthcare Trust of America, Inc., Class A | | | 5,796 | | | | 152,203 | |
Hersha Hospitality Trust | | | 7,308 | | | | 128,328 | |
Highwoods Properties, Inc. | | | 4,284 | | | | 182,670 | |
Hospitality Properties Trust | | | 11,088 | | | | 284,075 | |
Host Hotels & Resorts, Inc. | | | 29,232 | | | | 558,624 | |
Hudson Pacific Properties, Inc. | | | 6,552 | | | | 198,526 | |
InfraREIT, Inc. | | | 6,804 | | | | 143,020 | |
Investors Real Estate Trust | | | 23,688 | | | | 128,626 | |
Invitation Homes, Inc. | | | 15,022 | | | | 328,681 | |
Iron Mountain, Inc. | | | 6,048 | | | | 185,129 | |
iStar, Inc. | | | 30,996 | | | | 325,458 | |
Kilroy Realty Corp. | | | 1,764 | | | | 121,504 | |
Kimco Realty Corp. | | | 32,760 | | | | 527,108 | |
Kite Realty Group Trust(a) | | | 7,308 | | | | 115,759 | |
Lamar Advertising Co., Class A | | | 3,276 | | | | 240,196 | |
LaSalle Hotel Properties | | | 37,800 | | | | 1,247,778 | |
Lexington Realty Trust | | | 16,128 | | | | 125,315 | |
Liberty Property Trust | | | 504 | | | | 21,102 | |
Life Storage, Inc. | | | 5,292 | | | | 498,295 | |
See Accompanying Notes to the Financial Statements.
| | | | |
| FLEXSHARES ANNUAL REPORT | | | 111 | |
FlexShares® Morningstar US Market Factor Tilt Index Fund (cont.)
| | | | | | | | |
| Investments | | Shares | | | Value | |
| COMMON STOCKS – (continued) | |
| Equity Real Estate Investment Trusts (REITs) – (continued) | |
LTC Properties, Inc. | | | 3,528 | | | $ | 150,893 | |
Macerich Co. (The) | | | 252 | | | | 13,008 | |
Mack-Cali Realty Corp. | | | 32,508 | | | | 659,912 | |
MedEquities Realty Trust, Inc. | | | 5,292 | | | | 43,765 | |
Medical Properties Trust, Inc. | | | 49,140 | | | | 730,220 | |
Mid-America Apartment Communities, Inc. | | | 4,536 | | | | 443,213 | |
National Health Investors, Inc. | | | 3,024 | | | | 222,143 | |
National Retail Properties, Inc. | | | 3,528 | | | | 164,934 | |
New Senior Investment Group, Inc. | | | 45,612 | | | | 260,901 | |
NorthStar Realty Europe Corp. | | | 1,764 | | | | 23,673 | |
Omega Healthcare Investors, Inc.(a) | | | 11,592 | | | | 386,593 | |
Outfront Media, Inc. | | | 8,568 | | | | 151,825 | |
Paramount Group, Inc. | | | 5,796 | | | | 82,825 | |
Pebblebrook Hotel Trust(a) | | | 2,772 | | | | 93,444 | |
Pennsylvania REIT(a) | | | 252 | | | | 2,255 | |
Physicians Realty Trust(a) | | | 11,340 | | | | 188,017 | |
Piedmont Office Realty Trust, Inc., Class A | | | 6,804 | | | | 122,608 | |
PotlatchDeltic Corp. | | | 1,260 | | | | 45,675 | |
Preferred Apartment Communities, Inc., Class A | | | 12,600 | | | | 212,310 | |
Prologis, Inc. | | | 22,290 | | | | 1,437,036 | |
PS Business Parks, Inc. | | | 1,008 | | | | 131,645 | |
Public Storage | | | 4,032 | | | | 828,455 | |
QTS Realty Trust, Inc., Class A(a) | | | 1,260 | | | | 48,283 | |
Ramco-Gershenson Properties Trust | | | 756 | | | | 10,040 | |
Rayonier, Inc. | | | 5,040 | | | | 152,208 | |
Realty Income Corp. | | | 13,356 | | | | 804,975 | |
Regency Centers Corp. | | | 5,796 | | | | 367,235 | |
Retail Opportunity Investments Corp.(a) | | | 6,048 | | | | 106,384 | |
RLJ Lodging Trust | | | 5,292 | | | | 102,876 | |
Ryman Hospitality Properties, Inc. | | | 6,300 | | | | 488,817 | |
| | | | | | | | |
| Investments | | Shares | | | Value | |
| Equity Real Estate Investment Trusts (REITs) – (continued) | |
Sabra Health Care REIT, Inc.(a) | | | 74,592 | | | $ | 1,614,917 | |
Saul Centers, Inc. | | | 756 | | | | 36,107 | |
SBA Communications Corp.* | | | 3,024 | | | | 490,402 | |
Select Income REIT | | | 32,508 | | | | 614,726 | |
Senior Housing Properties Trust | | | 12,348 | | | | 198,432 | |
Simon Property Group, Inc. | | | 7,056 | | | | 1,294,917 | |
SL Green Realty Corp. | | | 1,512 | | | | 137,985 | |
Spirit Realty Capital, Inc. | | | 252 | | | | 1,971 | |
STAG Industrial, Inc. | | | 4,032 | | | | 106,687 | |
STORE Capital Corp. | | | 13,104 | | | | 380,409 | |
Summit Hotel Properties, Inc.(a) | | | 11,088 | | | | 127,734 | |
Sun Communities, Inc. | | | 4,536 | | | | 455,732 | |
Sunstone Hotel Investors, Inc. | | | 8,820 | | | | 127,625 | |
Taubman Centers, Inc. | | | 3,276 | | | | 180,213 | |
Terreno Realty Corp. | | | 252 | | | | 9,432 | |
Tier REIT, Inc. | | | 4,536 | | | | 98,295 | |
UDR, Inc. | | | 8,568 | | | | 335,780 | |
Uniti Group, Inc. | | | 19,404 | | | | 371,393 | |
Universal Health Realty Income Trust | | | 3,024 | | | | 193,838 | |
Urban Edge Properties | | | 6,300 | | | | 129,087 | |
Urstadt Biddle Properties, Inc., Class A | | | 252 | | | | 5,017 | |
Ventas, Inc. | | | 17,640 | | | | 1,023,826 | |
VEREIT, Inc. | | | 36,792 | | | | 269,685 | |
Vornado Realty Trust | | | 7,560 | | | | 514,685 | |
Washington Prime Group, Inc.(a) | | | 69,552 | | | | 445,133 | |
Washington REIT | | | 4,284 | | | | 119,395 | |
Weingarten Realty Investors | | | 1,260 | | | | 35,431 | |
Welltower, Inc. | | | 18,900 | | | | 1,248,723 | |
Weyerhaeuser Co. | | | 26,964 | | | | 718,051 | |
Xenia Hotels & Resorts, Inc. | | | 23,436 | | | | 481,610 | |
| | | | | | | | 47,932,020 | |
| Food & Staples Retailing – 1.6% | |
Andersons, Inc. (The) | | | 9,324 | | | | 335,664 | |
Casey’s General Stores, Inc.(a) | | | 11,844 | | | | 1,493,647 | |
Costco Wholesale Corp. | | | 16,884 | | | | 3,860,189 | |
See Accompanying Notes to the Financial Statements.
| | |
| 112 | | FLEXSHARES ANNUAL REPORT |
FlexShares® Morningstar US Market Factor Tilt Index Fund (cont.)
| | | | | | | | |
| Investments | | Shares | | | Value | |
| COMMON STOCKS – (continued) | |
| Food & Staples Retailing – (continued) | |
Ingles Markets, Inc., Class A(a) | | | 4,788 | | | $ | 157,717 | |
Kroger Co. (The) | | | 52,668 | | | | 1,567,400 | |
Performance Food Group Co.* | | | 34,272 | | | | 1,004,855 | |
PriceSmart, Inc.(a) | | | 756 | | | | 53,033 | |
Rite Aid Corp.* (a) | | | 47,376 | | | | 56,851 | |
Smart & Final Stores, Inc.* | | | 11,592 | | | | 58,540 | |
SpartanNash Co. | | | 14,364 | | | | 256,397 | |
Sprouts Farmers Market, Inc.* (a) | | | 36,036 | | | | 969,008 | |
Sysco Corp. | | | 15,624 | | | | 1,114,460 | |
United Natural Foods, Inc.* | | | 756 | | | | 16,428 | |
Walgreens Boots Alliance, Inc. | | | 43,596 | | | | 3,477,653 | |
Walmart, Inc. | | | 77,364 | | | | 7,758,062 | |
Weis Markets, Inc.(a) | | | 4,788 | | | | 220,966 | |
| | | | | | | | 22,400,870 | |
| Food Products – 1.2% | |
Archer-Daniels-Midland Co. | | | 22,176 | | | | 1,047,816 | |
B&G Foods, Inc.(a) | | | 25,956 | | | | 675,894 | |
Bunge Ltd. | | | 2,520 | | | | 155,736 | |
Calavo Growers, Inc.(a) | | | 1,512 | | | | 146,664 | |
Cal-Maine Foods, Inc. | | | 9,576 | | | | 466,064 | |
Campbell Soup Co.(a) | | | 8,820 | | | | 329,956 | |
Conagra Brands, Inc. | | | 18,707 | | | | 665,969 | |
Darling Ingredients, Inc.* | | | 37,044 | | | | 765,329 | |
Dean Foods Co.(a) | | | 37,800 | | | | 302,022 | |
Flowers Foods, Inc.(a) | | | 1,008 | | | | 19,464 | |
Fresh Del Monte Produce, Inc. | | | 10,836 | | | | 357,913 | |
Freshpet, Inc.* | | | 1,008 | | | | 38,405 | |
General Mills, Inc. | | | 31,500 | | | | 1,379,700 | |
Hain Celestial Group, Inc. (The)* | | | 5,292 | | | | 131,665 | |
Hershey Co. (The) | | | 3,780 | | | | 405,027 | |
Hormel Foods Corp. | | | 7,308 | | | | 318,921 | |
Ingredion, Inc. | | | 3,528 | | | | 356,963 | |
J&J Snack Foods Corp. | | | 1,764 | | | | 275,466 | |
JM Smucker Co. (The)(a) | | | 4,536 | | | | 491,340 | |
Kellogg Co.(a) | | | 7,812 | | | | 511,530 | |
| | | | | | | | |
| Investments | | Shares | | | Value | |
| Food Products – (continued) | |
Kraft Heinz Co. (The) | | | 37,800 | | | $ | 2,077,866 | |
Lancaster Colony Corp.(a) | | | 1,512 | | | | 259,127 | |
McCormick & Co., Inc. (Non-Voting)(a) | | | 3,276 | | | | 471,744 | |
Mondelez International, Inc., Class A | | | 43,596 | | | | 1,830,160 | |
Pilgrim’s Pride Corp.* | | | 14,868 | | | | 262,569 | |
Post Holdings, Inc.* (a) | | | 5,292 | | | | 467,919 | |
Sanderson Farms, Inc.(a) | | | 8,064 | | | | 793,417 | |
Seaboard Corp. | | | 24 | | | | 92,760 | |
Tootsie Roll Industries, Inc.(a) | | | 2,327 | | | | 73,463 | |
TreeHouse Foods, Inc.* (a) | | | 18,900 | | | | 861,084 | |
Tyson Foods, Inc., Class A | | | 14,868 | | | | 890,891 | |
| | | | | | | | 16,922,844 | |
| Gas Utilities – 0.2% | |
Atmos Energy Corp. | | | 1,764 | | | | 164,193 | |
Chesapeake Utilities Corp. | | | 3,528 | | | | 280,300 | |
New Jersey Resources Corp.(a) | | | 9,576 | | | | 431,878 | |
Northwest Natural Holding Co. | | | 252 | | | | 16,327 | |
ONE Gas, Inc.(a) | | | 4,788 | | | | 377,821 | |
South Jersey Industries, Inc.(a) | | | 9,828 | | | | 290,319 | |
Southwest Gas Holdings, Inc.(a) | | | 3,780 | | | | 292,080 | |
Spire, Inc. | | | 13,860 | | | | 1,005,959 | |
UGI Corp. | | | 4,536 | | | | 240,680 | |
| | | | | | | | 3,099,557 | |
| Health Care Equipment & Supplies – 2.4% | |
Abbott Laboratories | | | 67,536 | | | | 4,655,932 | |
ABIOMED, Inc.* | | | 3,276 | | | | 1,117,771 | |
Align Technology, Inc.* | | | 4,284 | | | | 947,621 | |
AngioDynamics, Inc.* (a) | | | 1,764 | | | | 36,039 | |
Anika Therapeutics, Inc.* (a) | | | 1,260 | | | | 45,058 | |
AtriCure, Inc.* (a) | | | 1,260 | | | | 40,081 | |
Avanos Medical, Inc.* (a) | | | 10,080 | | | | 570,528 | |
Baxter International, Inc. | | | 23,688 | | | | 1,480,737 | |
Becton Dickinson and Co. | | | 8,332 | | | | 1,920,526 | |
Boston Scientific Corp.* | | | 35,784 | | | | 1,293,234 | |
Cantel Medical Corp.(a) | | | 3,276 | | | | 259,295 | |
See Accompanying Notes to the Financial Statements.
| | | | |
| FLEXSHARES ANNUAL REPORT | | | 113 | |
FlexShares® Morningstar US Market Factor Tilt Index Fund (cont.)
| | | | | | | | |
| Investments | | Shares | | | Value | |
| COMMON STOCKS – (continued) | |
| Health Care Equipment & Supplies – (continued) | |
Cardiovascular Systems, Inc.* | | | 1,008 | | | $ | 28,274 | |
Cerus Corp.* | | | 3,276 | | | | 21,949 | |
CONMED Corp. | | | 6,048 | | | | 407,817 | |
Cooper Cos., Inc. (The) | | | 1,008 | | | | 260,377 | |
Danaher Corp. | | | 19,656 | | | | 1,953,806 | |
DENTSPLY SIRONA, Inc. | | | 2,268 | | | | 78,541 | |
DexCom, Inc.* | | | 4,536 | | | | 602,245 | |
Edwards Lifesciences Corp.* | | | 6,552 | | | | 967,075 | |
Globus Medical, Inc., Class A* | | | 6,552 | | | | 346,273 | |
Hill-Rom Holdings, Inc. | | | 5,040 | | | | 423,763 | |
Hologic, Inc.* | | | 9,072 | | | | 353,717 | |
ICU Medical, Inc.* | | | 1,260 | | | | 320,960 | |
IDEXX Laboratories, Inc.* | | | 3,024 | | | | 641,451 | |
Insulet Corp.* (a) | | | 2,520 | | | | 222,289 | |
Integer Holdings Corp.* | | | 12,348 | | | | 919,556 | |
Integra LifeSciences Holdings Corp.* (a) | | | 6,552 | | | | 350,991 | |
Intuitive Surgical, Inc.* | | | 3,024 | | | | 1,576,048 | |
Invacare Corp.(a) | | | 8,064 | | | | 104,187 | |
Lantheus Holdings, Inc.* | | | 6,300 | | | | 88,011 | |
Masimo Corp.* | | | 5,544 | | | | 640,886 | |
Medtronic plc | | | 39,312 | | | | 3,531,004 | |
Merit Medical Systems, Inc.* (a) | | | 5,292 | | | | 302,279 | |
Natus Medical, Inc.* (a) | | | 3,276 | | | | 97,887 | |
Neogen Corp.* (a) | | | 4,356 | | | | 264,496 | |
NuVasive, Inc.* (a) | | | 4,536 | | | | 254,787 | |
NxStage Medical, Inc.* | | | 3,780 | | | | 107,276 | |
OraSure Technologies, Inc.* | | | 1,008 | | | | 14,011 | |
Orthofix Medical, Inc.* | | | 5,544 | | | | 337,186 | |
Quidel Corp.* | | | 252 | | | | 16,219 | |
ResMed, Inc. | | | 3,276 | | | | 346,994 | |
Stryker Corp. | | | 13,608 | | | | 2,207,490 | |
Surmodics, Inc.* | | | 504 | | | | 31,969 | |
Teleflex, Inc. | | | 2,772 | | | | 667,331 | |
Varian Medical Systems, Inc.* | | | 1,764 | | | | 210,569 | |
West Pharmaceutical Services, Inc. | | | 5,544 | | | | 587,220 | |
| | | | | | | | |
| Investments | | Shares | | | Value | |
| Health Care Equipment & Supplies – (continued) | |
Wright Medical Group NV* (a) | | | 2,772 | | | $ | 74,789 | |
Zimmer Biomet Holdings, Inc. | | | 8,316 | | | | 944,614 | |
| | | | | | | | 32,671,159 | |
| Health Care Providers & Services – 3.3% | |
Acadia Healthcare Co., Inc.* (a) | | | 35,280 | | | | 1,464,120 | |
Aetna, Inc. | | | 13,608 | | | | 2,699,827 | |
Amedisys, Inc.* (a) | | | 5,544 | | | | 609,840 | |
American Renal Associates Holdings, Inc.* | | | 3,276 | | | | 63,194 | |
AmerisourceBergen Corp. | | | 8,568 | | | | 753,984 | |
AMN Healthcare Services, Inc.* (a) | | | 22,932 | | | | 1,160,818 | |
Anthem, Inc. | | | 13,860 | | | | 3,819,400 | |
BioTelemetry, Inc.* (a) | | | 252 | | | | 14,641 | |
Brookdale Senior Living, Inc.* (a) | | | 15,120 | | | | 135,022 | |
Capital Senior Living Corp.* (a) | | | 252 | | | | 2,268 | |
Cardinal Health, Inc. | | | 5,292 | | | | 267,775 | |
Centene Corp.* | | | 10,836 | | | | 1,412,148 | |
Chemed Corp. | | | 2,016 | | | | 613,529 | |
Cigna Corp.(a) | | | 8,316 | | | | 1,778,044 | |
Community Health Systems, Inc.* (a) | | | 1,512 | | | | 4,778 | |
CorVel Corp.* | | | 756 | | | | 43,818 | |
CVS Health Corp. | | | 37,044 | | | | 2,681,615 | |
DaVita, Inc.* | | | 4,788 | | | | 322,424 | |
Diplomat Pharmacy, Inc.* | | | 15,624 | | | | 309,980 | |
Encompass Health Corp.(a) | | | 13,608 | | | | 915,818 | |
Ensign Group, Inc. (The)(a) | | | 15,120 | | | | 560,045 | |
Express Scripts Holding Co.* | | | 27,468 | | | | 2,663,572 | |
HCA Healthcare, Inc. | | | 15,372 | | | | 2,052,623 | |
Henry Schein, Inc.* (a) | | | 3,276 | | | | 271,908 | |
Humana, Inc. | | | 4,788 | | | | 1,534,123 | |
Laboratory Corp. of America Holdings* | | | 5,544 | | | | 890,089 | |
LHC Group, Inc.* (a) | | | 4,839 | | | | 442,430 | |
LifePoint Health, Inc.* | | | 14,112 | | | | 915,304 | |
Magellan Health, Inc.* | | | 9,324 | | | | 606,619 | |
McKesson Corp. | | | 3,780 | | | | 471,593 | |
MEDNAX, Inc.* | | | 4,536 | | | | 187,291 | |
See Accompanying Notes to the Financial Statements.
| | |
| 114 | | FLEXSHARES ANNUAL REPORT |
FlexShares® Morningstar US Market Factor Tilt Index Fund (cont.)
| | | | | | | | |
| Investments | | Shares | | | Value | |
| COMMON STOCKS – (continued) | |
| Health Care Providers & Services – (continued) | |
Molina Healthcare, Inc.* | | | 12,852 | | | $ | 1,629,248 | |
Owens & Minor, Inc.(a) | | | 252 | | | | 1,991 | |
Patterson Cos., Inc.(a) | | | 35,532 | | | | 802,313 | |
Premier, Inc., Class A* (a) | | | 14,616 | | | | 657,720 | |
Providence Service Corp. (The)* | | | 2,772 | | | | 183,202 | |
Quest Diagnostics, Inc. | | | 5,292 | | | | 498,030 | |
R1 RCM, Inc.* (a) | | | 12,096 | | | | 102,453 | |
Select Medical Holdings Corp.* | | | 29,232 | | | | 484,667 | |
Surgery Partners, Inc.* (a) | | | 2,520 | | | | 34,247 | |
Tenet Healthcare Corp.* | | | 30,744 | | | | 791,043 | |
Tivity Health, Inc.* (a) | | | 3,024 | | | | 104,056 | |
Triple-S Management Corp., Class B* | | | 7,308 | | | | 125,405 | |
UnitedHealth Group, Inc. | | | 35,028 | | | | 9,154,568 | |
Universal Health Services, Inc., Class B | | | 6,552 | | | | 796,461 | |
US Physical Therapy, Inc.(a) | | | 1,512 | | | | 162,570 | |
WellCare Health Plans, Inc.* | | | 3,528 | | | | 973,693 | |
| | | | | | | | 46,170,307 | |
| Health Care Technology – 0.2% | |
Allscripts Healthcare Solutions, Inc.* | | | 71,820 | | | | 855,376 | |
athenahealth, Inc.* | | | 1,260 | | | | 160,700 | |
Cerner Corp.* | | | 9,828 | | | | 562,948 | |
Computer Programs & Systems, Inc.(a) | | | 252 | | | | 6,300 | |
HealthStream, Inc. | | | 504 | | | | 13,260 | |
Medidata Solutions, Inc.* (a) | | | 4,032 | | | | 283,450 | |
Omnicell, Inc.* | | | 4,032 | | | | 285,062 | |
Vocera Communications, Inc.* (a) | | | 4,788 | | | | 166,192 | |
| | | | | | | | 2,333,288 | |
| Hotels, Restaurants & Leisure – 1.8% | |
Aramark | | | 2,520 | | | | 90,518 | |
Belmond Ltd., Class A* (a) | | | 2,520 | | | | 43,142 | |
BJ’s Restaurants, Inc.(a) | | | 2,268 | | | | 138,756 | |
Bloomin’ Brands, Inc. | | | 41,580 | | | | 829,521 | |
Boyd Gaming Corp. | | | 16,380 | | | | 435,053 | |
| | | | | | | | |
| Investments | | Shares | | | Value | |
| Hotels, Restaurants & Leisure – (continued) | |
Brinker International, Inc.(a) | | | 12,852 | | | $ | 557,134 | |
Caesars Entertainment Corp.* (a) | | | 19,908 | | | | 171,010 | |
Carnival Corp. | | | 25,956 | | | | 1,454,574 | |
Cheesecake Factory, Inc. (The)(a) | | | 10,836 | | | | 523,812 | |
Chipotle Mexican Grill, Inc.* | | | 756 | | | | 348,010 | |
Choice Hotels International, Inc.(a) | | | 2,268 | | | | 166,471 | |
Churchill Downs, Inc. | | | 1,260 | | | | 314,509 | |
Cracker Barrel Old Country Store, Inc.(a) | | | 2,016 | | | | 319,899 | |
Darden Restaurants, Inc. | | | 4,536 | | | | 483,311 | |
Denny’s Corp.* | | | 14,364 | | | | 249,215 | |
Dine Brands Global, Inc.(a) | | | 5,292 | | | | 428,864 | |
Domino’s Pizza, Inc.(a) | | | 3,276 | | | | 880,556 | |
Dunkin’ Brands Group, Inc.(a) | | | 2,268 | | | | 164,566 | |
Eldorado Resorts, Inc.* (a) | | | 3,276 | | | | 119,574 | |
Fiesta Restaurant Group, Inc.* | | | 4,788 | | | | 123,578 | |
Hilton Worldwide Holdings, Inc. | | | 4,536 | | | | 322,827 | |
Hyatt Hotels Corp., Class A | | | 3,528 | | | | 244,138 | |
International Speedway Corp., Class A(a) | | | 2,016 | | | | 75,620 | |
Jack in the Box, Inc.(a) | | | 3,024 | | | | 238,684 | |
Las Vegas Sands Corp. | | | 8,820 | | | | 450,085 | |
Marriott International, Inc., Class A | | | 10,332 | | | | 1,207,708 | |
Marriott Vacations Worldwide Corp. | | | 6,564 | | | | 580,848 | |
McDonald’s Corp. | | | 28,224 | | | | 4,992,826 | |
MGM Resorts International | | | 12,600 | | | | 336,168 | |
Norwegian Cruise Line Holdings Ltd.* | | | 7,812 | | | | 344,275 | |
Papa John’s International, Inc.(a) | | | 3,528 | | | | 192,417 | |
Penn National Gaming, Inc.* (a) | | | 34,830 | | | | 845,672 | |
Red Robin Gourmet Burgers, Inc.* (a) | | | 756 | | | | 22,831 | |
Red Rock Resorts, Inc., Class A(a) | | | 5,796 | | | | 134,119 | |
See Accompanying Notes to the Financial Statements.
| | | | |
| FLEXSHARES ANNUAL REPORT | | | 115 | |
FlexShares® Morningstar US Market Factor Tilt Index Fund (cont.)
| | | | | | | | |
| Investments | | Shares | | | Value | |
| COMMON STOCKS – (continued) | |
| Hotels, Restaurants & Leisure – (continued) | |
Royal Caribbean Cruises Ltd. | | | 8,568 | | | $ | 897,327 | |
Ruth’s Hospitality Group, Inc. | | | 3,528 | | | | 95,362 | |
Scientific Games Corp.* (a) | | | 21,924 | | | | 488,028 | |
SeaWorld Entertainment, Inc.* | | | 21,672 | | | | 566,073 | |
Six Flags Entertainment Corp.(a) | | | 3,780 | | | | 203,591 | |
Sonic Corp. | | | 5,796 | | | | 250,851 | |
Starbucks Corp.(a) | | | 37,044 | | | | 2,158,554 | |
Texas Roadhouse, Inc.(a) | | | 4,788 | | | | 289,482 | |
Vail Resorts, Inc. | | | 2,772 | | | | 696,659 | |
Wendy’s Co. (The)(a) | | | 23,184 | | | | 399,692 | |
Wyndham Destinations, Inc. | | | 2,520 | | | | 90,418 | |
Wynn Resorts Ltd. | | | 2,016 | | | | 202,810 | |
Yum! Brands, Inc. | | | 11,340 | | | | 1,025,249 | |
Zoe’s Kitchen, Inc.* | | | 2,268 | | | | 28,849 | |
| | | | | | | | 25,223,236 | |
| Household Durables – 0.7% | |
Beazer Homes USA, Inc.* | | | 33,516 | | | | 295,276 | |
Cavco Industries, Inc.* | | | 756 | | | | 151,661 | |
DR Horton, Inc. | | | 20,916 | | | | 752,139 | |
Ethan Allen Interiors, Inc. | | | 756 | | | | 14,470 | |
Garmin Ltd. | | | 1,008 | | | | 66,689 | |
Hamilton Beach Brands Holding Co.* | | | 56 | | | | 1,300 | |
Helen of Troy Ltd.* | | | 9,324 | | | | 1,157,295 | |
Hooker Furniture Corp. | | | 4,284 | | | | 125,393 | |
Hovnanian Enterprises, Inc., Class A* (a) | | | 14,112 | | | | 20,604 | |
iRobot Corp.* (a) | | | 1,764 | | | | 155,532 | |
KB Home | | | 44,856 | | | | 895,774 | |
La-Z-Boy, Inc. | | | 9,576 | | | | 266,213 | |
Leggett & Platt, Inc.(a) | | | 2,772 | | | | 100,651 | |
Lennar Corp., Class A(a) | | | 22,598 | | | | 971,262 | |
Lennar Corp., Class B | | | 429 | | | | 15,345 | |
LGI Homes, Inc.* (a) | | | 5,544 | | | | 237,228 | |
M/I Homes, Inc.* (a) | | | 3,528 | | | | 85,272 | |
MDC Holdings, Inc.(a) | | | 10,034 | | | | 281,955 | |
Meritage Homes Corp.* (a) | | | 11,592 | | | | 431,802 | |
Mohawk Industries, Inc.* | | | 2,268 | | | | 282,888 | |
Newell Brands, Inc.(a) | | | 1,260 | | | | 20,009 | |
| | | | | | | | |
| Investments | | Shares | | | Value | |
| Household Durables – (continued) | |
NVR, Inc.* | | | 201 | | | $ | 450,045 | |
PulteGroup, Inc.(a) | | | 19,152 | | | | 470,565 | |
Taylor Morrison Home Corp., Class A* (a) | | | 27,468 | | | | 454,321 | |
Tempur Sealy International, Inc.* (a) | | | 8,820 | | | | 407,572 | |
Toll Brothers, Inc. | | | 5,796 | | | | 195,093 | |
TRI Pointe Group, Inc.* (a) | | | 75,096 | | | | 893,642 | |
Tupperware Brands Corp.(a) | | | 17,640 | | | | 619,164 | |
Universal Electronics, Inc.* (a) | | | 3,276 | | | | 102,441 | |
Whirlpool Corp. | | | 504 | | | | 55,319 | |
William Lyon Homes, Class A* | | | 12,348 | | | | 167,439 | |
| | | | | | | | 10,144,359 | |
| Household Products – 0.9% | |
Central Garden & Pet Co., Class A* | | | 14,616 | | | | 433,364 | |
Church & Dwight Co., Inc. | | | 7,560 | | | | 448,837 | |
Clorox Co. (The)(a) | | | 3,780 | | | | 561,141 | |
Colgate-Palmolive Co. | | | 27,972 | | | | 1,665,733 | |
Energizer Holdings, Inc.(a) | | | 3,780 | | | | 222,151 | |
Kimberly-Clark Corp. | | | 10,836 | | | | 1,130,195 | |
Procter & Gamble Co. (The) | | | 83,412 | | | | 7,396,976 | |
Spectrum Brands Holdings, Inc. | | | 5,095 | | | | 330,920 | |
WD-40 Co.(a) | | | 1,764 | | | | 294,729 | |
| | | | | | | | 12,484,046 | |
Independent Power and Renewable Electricity
Producers – 0.3% | |
AES Corp.(a) | | | 22,680 | | | | 330,674 | |
Clearway Energy, Inc., Class A | | | 756 | | | | 14,681 | |
Clearway Energy, Inc., Class C | | | 30,744 | | | | 602,890 | |
NRG Energy, Inc. | | | 24,948 | | | | 902,868 | |
Ormat Technologies, Inc.(a) | | | 3,780 | | | | 193,423 | |
TerraForm Power, Inc., Class A(a) | | | 30,240 | | | | 340,805 | |
Vistra Energy Corp.* | | | 55,202 | | | | 1,249,221 | |
| | | | | | | | 3,634,562 | |
See Accompanying Notes to the Financial Statements.
| | |
| 116 | | FLEXSHARES ANNUAL REPORT |
FlexShares® Morningstar US Market Factor Tilt Index Fund (cont.)
| | | | | | | | |
| Investments | | Shares | | | Value | |
| COMMON STOCKS – (continued) | |
| Industrial Conglomerates – 0.9% | |
3M Co. | | | 18,900 | | | $ | 3,595,914 | |
Carlisle Cos., Inc. | | | 1,764 | | | | 170,385 | |
General Electric Co. | | | 447,300 | | | | 4,517,730 | |
Honeywell International, Inc. | | | 24,192 | | | | 3,503,486 | |
Roper Technologies, Inc. | | | 3,276 | | | | 926,780 | |
| | | | | | | | 12,714,295 | |
| Insurance – 3.3% | |
Aflac, Inc. | | | 50,148 | | | | 2,159,874 | |
Alleghany Corp. | | | 504 | | | | 302,743 | |
Allstate Corp. (The) | | | 18,144 | | | | 1,736,744 | |
Ambac Financial Group, Inc.* | | | 6,048 | | | | 124,468 | |
American Equity Investment Life Holding Co. | | | 27,216 | | | | 849,683 | |
American Financial Group, Inc. | | | 1,764 | | | | 176,453 | |
American International Group, Inc. | | | 47,880 | | | | 1,976,965 | |
American National Insurance Co. | | | 3,276 | | | | 403,734 | |
AMERISAFE, Inc. | | | 1,764 | | | | 114,819 | |
AmTrust Financial Services, Inc. | | | 19,404 | | | | 278,253 | |
Aon plc | | | 9,072 | | | | 1,416,865 | |
Arch Capital Group Ltd.* | | | 15,120 | | | | 428,954 | |
Argo Group International Holdings Ltd. | | | 9,247 | | | | 569,708 | |
Arthur J Gallagher & Co. | | | 9,072 | | | | 671,419 | |
Aspen Insurance Holdings Ltd. | | | 16,884 | | | | 707,102 | |
Assurant, Inc. | | | 3,276 | | | | 318,460 | |
Assured Guaranty Ltd.(a) | | | 34,272 | | | | 1,370,194 | |
Athene Holding Ltd., Class A* | | | 11,844 | | | | 541,508 | |
Axis Capital Holdings Ltd.(a) | | | 3,276 | | | | 182,768 | |
Brighthouse Financial, Inc.* | | | 13,356 | | | | 529,298 | |
Brown & Brown, Inc. | | | 9,576 | | | | 269,852 | |
Chubb Ltd. | | | 23,940 | | | | 2,990,345 | |
Cincinnati Financial Corp.(a) | | | 5,544 | | | | 435,980 | |
CNO Financial Group, Inc. | | | 64,260 | | | | 1,214,514 | |
Employers Holdings, Inc. | | | 3,528 | | | | 162,147 | |
| | | | | | | | |
| Investments | | Shares | | | Value | |
| Insurance – (continued) | |
Enstar Group Ltd.* | | | 2,268 | | | $ | 411,869 | |
Erie Indemnity Co., Class A | | | 252 | | | | 32,682 | |
Everest Re Group Ltd. | | | 1,260 | | | | 274,504 | |
FBL Financial Group, Inc., Class A | | | 3,276 | | | | 225,978 | |
First American Financial Corp. | | | 10,080 | | | | 446,846 | |
Genworth Financial, Inc., Class A* | | | 193,032 | | | | 826,177 | |
Greenlight Capital Re Ltd., Class A* (a) | | | 24,948 | | | | 289,147 | |
Hanover Insurance Group, Inc. (The) | | | 7,812 | | | | 870,101 | |
Hartford Financial Services Group, Inc. (The) | | | 14,616 | | | | 663,859 | |
HCI Group, Inc. | | | 1,260 | | | | 55,024 | |
Health Insurance Innovations, Inc., Class A* (a) | | | 2,520 | | | | 123,228 | |
Heritage Insurance Holdings, Inc. | | | 2,520 | | | | 35,179 | |
Horace Mann Educators Corp. | | | 11,088 | | | | 435,537 | |
James River Group Holdings Ltd. | | | 3,780 | | | | 145,530 | |
Kemper Corp. | | | 11,685 | | | | 878,595 | |
Lincoln National Corp. | | | 15,624 | | | | 940,409 | |
Loews Corp. | | | 17,892 | | | | 833,051 | |
Maiden Holdings Ltd. | | | 36,792 | | | | 129,140 | |
Markel Corp.* | | | 504 | | | | 550,993 | |
Marsh & McLennan Cos., Inc. | | | 16,632 | | | | 1,409,562 | |
MBIA, Inc.* (a) | | | 30,996 | | | | 306,860 | |
Mercury General Corp.(a) | | | 7,812 | | | | 463,330 | |
MetLife, Inc. | | | 52,164 | | | | 2,148,635 | |
National General Holdings Corp. | | | 15,624 | | | | 435,285 | |
National Western Life Group, Inc., Class A | | | 504 | | | | 135,717 | |
Navigators Group, Inc. (The) | | | 7,056 | | | | 487,922 | |
Old Republic International Corp. | | | 18,900 | | | | 416,745 | |
Primerica, Inc. | | | 5,796 | | | | 636,053 | |
Principal Financial Group, Inc. | | | 12,348 | | | | 581,220 | |
See Accompanying Notes to the Financial Statements.
| | | | |
| FLEXSHARES ANNUAL REPORT | | | 117 | |
FlexShares® Morningstar US Market Factor Tilt Index Fund (cont.)
| | | | | | | | |
| Investments | | Shares | | | Value | |
| COMMON STOCKS – (continued) | |
| Insurance – (continued) | |
ProAssurance Corp.(a) | | | 3,780 | | | $ | 166,018 | |
Progressive Corp. (The) | | | 24,948 | | | | 1,738,876 | |
Prudential Financial, Inc. | | | 20,664 | | | | 1,937,870 | |
Reinsurance Group of America, Inc. | | | 1,512 | | | | 215,263 | |
RenaissanceRe Holdings Ltd.(a) | | | 2,268 | | | | 277,059 | |
RLI Corp.(a) | | | 3,276 | | | | 242,195 | |
Safety Insurance Group, Inc. | | | 2,520 | | | | 209,866 | |
Selective Insurance Group, Inc.(a) | | | 9,324 | | | | 604,661 | |
Stewart Information Services Corp. | | | 3,528 | | | | 145,636 | |
Third Point Reinsurance Ltd.* | | | 31,752 | | | | 351,177 | |
Torchmark Corp. | | | 5,544 | | | | 469,355 | |
Travelers Cos., Inc. (The) | | | 16,128 | | | | 2,018,097 | |
United Fire Group, Inc. | | | 6,048 | | | | 325,564 | |
Universal Insurance Holdings, Inc.(a) | | | 8,064 | | | | 338,527 | |
Unum Group | | | 10,080 | | | | 365,501 | |
White Mountains Insurance Group Ltd. | | | 252 | | | | 223,441 | |
Willis Towers Watson plc | | | 2,268 | | | | 324,687 | |
WR Berkley Corp. | | | 3,528 | | | | 267,775 | |
| | | | | | | | 45,343,596 | |
| Interactive Media & Services – 2.7% | |
Alphabet, Inc., Class A* | | | 8,316 | | | | 9,069,263 | |
Alphabet, Inc., Class C* | | | 11,844 | | | | 12,753,264 | |
Care.com, Inc.* | | | 2,268 | | | | 39,917 | |
Facebook, Inc., Class A* | | | 83,412 | | | | 12,661,107 | |
IAC/InterActiveCorp* | | | 1,260 | | | | 247,703 | |
Liberty TripAdvisor Holdings, Inc., Class A* | | | 24,696 | | | | 356,116 | |
Snap, Inc., Class A* (a) | | | 24,444 | | | | 161,575 | |
TripAdvisor, Inc.* | | | 8,568 | | | | 446,736 | |
Twitter, Inc.* | | | 18,396 | | | | 639,261 | |
XO Group, Inc.* | | | 2,772 | | | | 95,939 | |
Yelp, Inc.* | | | 2,268 | | | | 97,116 | |
Zillow Group, Inc., Class A* (a) | | | 7,560 | | | | 305,197 | |
| | | | | | | | |
| Investments | | Shares | | | Value | |
| Interactive Media & Services – (continued) | |
Zillow Group, Inc., Class C* (a) | | | 3,276 | | | $ | 131,892 | |
| | | | | | | | 37,005,086 | |
| Internet & Direct Marketing Retail – 2.1% | |
Amazon.com, Inc.* | | | 13,608 | | | | 21,745,720 | |
Booking Holdings, Inc.* | | | 1,512 | | | | 2,834,365 | |
eBay, Inc.* | | | 35,784 | | | | 1,038,809 | |
Etsy, Inc.* | | | 3,528 | | | | 150,011 | |
Expedia Group, Inc. | | | 4,032 | | | | 505,734 | |
Groupon, Inc.* (a) | | | 33,768 | | | | 110,421 | |
GrubHub, Inc.* | | | 4,032 | | | | 373,928 | |
Liberty Expedia Holdings, Inc., Class A* (a) | | | 9,828 | | | | 426,732 | |
MercadoLibre, Inc.(a) | | | 1,260 | | | | 408,870 | |
Nutrisystem, Inc.(a) | | | 4,536 | | | | 161,300 | |
PetMed Express, Inc.(a) | | | 1,008 | | | | 28,163 | |
Quotient Technology, Inc.* (a) | | | 2,772 | | | | 35,676 | |
Qurate Retail, Inc.* | | | 45,512 | | | | 998,533 | |
Shutterfly, Inc.* | | | 2,016 | | | | 100,800 | |
Stamps.com, Inc.* | | | 1,512 | | | | 305,681 | |
Wayfair, Inc., Class A* (a) | | | 2,520 | | | | 277,931 | |
| | | | | | | | 29,502,674 | |
| IT Services – 3.6% | |
Accenture plc, Class A | | | 22,932 | | | | 3,614,542 | |
Akamai Technologies, Inc.* | | | 6,300 | | | | 455,175 | |
Alliance Data Systems Corp. | | | 2,772 | | | | 571,531 | |
Automatic Data Processing, Inc. | | | 15,120 | | | | 2,178,490 | |
Black Knight, Inc.* | | | 2,610 | | | | 127,290 | |
Booz Allen Hamilton Holding Corp. | | | 10,836 | | | | 536,816 | |
Broadridge Financial Solutions, Inc. | | | 3,276 | | | | 383,096 | |
CACI International, Inc., Class A* | | | 8,568 | | | | 1,529,045 | |
Cardtronics plc, Class A* (a) | | | 16,380 | | | | 444,881 | |
Cass Information Systems, Inc. | | | 546 | | | | 36,091 | |
Cognizant Technology Solutions Corp., Class A | | | 20,412 | | | | 1,409,040 | |
Conduent, Inc.* (a) | | | 64,764 | | | | 1,236,992 | |
See Accompanying Notes to the Financial Statements.
| | |
| 118 | | FLEXSHARES ANNUAL REPORT |
FlexShares® Morningstar US Market Factor Tilt Index Fund (cont.)
| | | | | | | | |
| Investments | | Shares | | | Value | |
| COMMON STOCKS – (continued) | |
| IT Services – (continued) | |
CoreLogic, Inc.* (a) | | | 7,308 | | | $ | 296,851 | |
CSG Systems International, Inc. | | | 6,552 | | | | 229,975 | |
DXC Technology Co. | | | 11,088 | | | | 807,539 | |
Endurance International Group Holdings, Inc.* | | | 25,956 | | | | 256,186 | |
EPAM Systems, Inc.* | | | 2,268 | | | | 270,958 | |
Euronet Worldwide, Inc.* (a) | | | 4,284 | | | | 476,295 | |
Everi Holdings, Inc.* | | | 15,624 | | | | 112,493 | |
EVERTEC, Inc. | | | 15,876 | | | | 414,046 | |
ExlService Holdings, Inc.* | | | 1,512 | | | | 96,919 | |
Fidelity National Information Services, Inc. | | | 7,812 | | | | 813,229 | |
First Data Corp., Class A* | | | 38,556 | | | | 722,540 | |
Fiserv, Inc.* | | | 17,136 | | | | 1,358,885 | |
FleetCor Technologies, Inc.* | | | 3,024 | | | | 604,891 | |
Gartner, Inc.* (a) | | | 3,276 | | | | 483,276 | |
Genpact Ltd. | | | 8,064 | | | | 221,034 | |
Global Payments, Inc. | | | 5,040 | | | | 575,719 | |
Internap Corp.* | | | 8,568 | | | | 73,428 | |
International Business Machines Corp. | | | 37,800 | | | | 4,363,254 | |
Jack Henry & Associates, Inc. | | | 2,268 | | | | 339,815 | |
Leidos Holdings, Inc.(a) | | | 6,300 | | | | 408,114 | |
LiveRamp Holdings, Inc.* | | | 3,024 | | | | 138,136 | |
ManTech International Corp., Class A | | | 5,544 | | | | 317,560 | |
Mastercard, Inc., Class A | | | 29,988 | | | | 5,927,728 | |
MAXIMUS, Inc. | | | 5,292 | | | | 343,821 | |
MoneyGram International, Inc.* | | | 16,380 | | | | 69,451 | |
Net 1 UEPS Technologies, Inc.* | | | 18,900 | | | | 127,953 | |
NIC, Inc. | | | 2,772 | | | | 36,895 | |
Paychex, Inc. | | | 10,080 | | | | 660,139 | |
PayPal Holdings, Inc.* | | | 34,020 | | | | 2,864,144 | |
Perficient, Inc.* | | | 15,120 | | | | 378,302 | |
Presidio, Inc. | | | 7,308 | | | | 97,927 | |
Sabre Corp. | | | 6,048 | | | | 149,083 | |
Science Applications International Corp. | | | 3,780 | | | | 262,748 | |
Square, Inc., Class A* (a) | | | 3,780 | | | | 277,641 | |
| | | | | | | | |
| Investments | | Shares | | | Value | |
| IT Services – (continued) | |
Sykes Enterprises, Inc.* | | | 12,096 | | | $ | 370,984 | |
Teradata Corp.* (a) | | | 15,876 | | | | 577,886 | |
Total System Services, Inc. | | | 6,048 | | | | 551,275 | |
Travelport Worldwide Ltd. | | | 45,864 | | | | 686,125 | |
TTEC Holdings, Inc. | | | 5,292 | | | | 131,877 | |
Twilio, Inc., Class A* | | | 2,520 | | | | 189,554 | |
Unisys Corp.* (a) | | | 9,072 | | | | 167,016 | |
VeriSign, Inc.* | | | 3,276 | | | | 466,961 | |
Virtusa Corp.* (a) | | | 9,072 | | | | 449,881 | |
Visa, Inc., Class A | | | 60,732 | | | | 8,371,906 | |
Western Union Co. (The) | | | 16,128 | | | | 290,949 | |
WEX, Inc.* | | | 2,016 | | | | 354,735 | |
Worldpay, Inc.* | | | 9,576 | | | | 879,460 | |
| | | | | | | | 50,588,573 | |
| Leisure Products – 0.2% | |
Acushnet Holdings Corp. | | | 6,804 | | | | 166,222 | |
American Outdoor Brands Corp.* | | | 26,964 | | | | 368,867 | |
Brunswick Corp. | | | 6,552 | | | | 340,638 | |
Callaway Golf Co. | | | 6,804 | | | | 145,606 | |
Hasbro, Inc.(a) | | | 3,528 | | | | 323,553 | |
Mattel, Inc.* (a) | | | 12,348 | | | | 167,686 | |
MCBC Holdings, Inc.* | | | 3,780 | | | | 112,190 | |
Nautilus, Inc.* (a) | | | 7,056 | | | | 86,295 | |
Polaris Industries, Inc. | | | 3,024 | | | | 269,076 | |
Sturm Ruger & Co., Inc.(a) | | | 5,544 | | | | 329,258 | |
Vista Outdoor, Inc.* (a) | | | 12,852 | | | | 160,650 | |
| | | | | | | | 2,470,041 | |
| Life Sciences Tools & Services – 0.6% | |
Agilent Technologies, Inc. | | | 6,804 | | | | 440,831 | |
Bio-Rad Laboratories, Inc., Class A* | | | 252 | | | | 68,758 | |
Bio-Techne Corp. | | | 2,772 | | | | 464,920 | |
Bruker Corp. | | | 6,048 | | | | 189,484 | |
Cambrex Corp.* (a) | | | 5,040 | | | | 268,582 | |
Charles River Laboratories International, Inc.* (a) | | | 3,780 | | | | 460,480 | |
Illumina, Inc.* | | | 4,536 | | | | 1,411,376 | |
IQVIA Holdings, Inc.* | | | 6,048 | | | | 743,481 | |
Mettler-Toledo International, Inc.* | | | 1,008 | | | | 551,194 | |
See Accompanying Notes to the Financial Statements.
| | | | |
| FLEXSHARES ANNUAL REPORT | | | 119 | |
FlexShares® Morningstar US Market Factor Tilt Index Fund (cont.)
| | | | | | | | |
| Investments | | Shares | | | Value | |
| COMMON STOCKS – (continued) | |
| Life Sciences Tools & Services – (continued) | |
NeoGenomics, Inc.* (a) | | | 5,292 | | | $ | 97,584 | |
PerkinElmer, Inc. | | | 2,268 | | | | 196,137 | |
Thermo Fisher Scientific, Inc. | | | 13,356 | | | | 3,120,629 | |
Waters Corp.* | | | 1,764 | | | | 334,613 | |
| | | | | | | | 8,348,069 | |
| Machinery – 2.0% | |
Actuant Corp., Class A(a) | | | 1,260 | | | | 30,051 | |
AGCO Corp. | | | 3,780 | | | | 211,831 | |
Alamo Group, Inc. | | | 1,008 | | | | 86,406 | |
Albany International Corp., Class A | | | 4,536 | | | | 317,429 | |
Altra Industrial Motion Corp. | | | 1,512 | | | | 48,792 | |
American Railcar Industries, Inc. | | | 1,512 | | | | 105,704 | |
Astec Industries, Inc. | | | 2,016 | | | | 75,822 | |
Barnes Group, Inc. | | | 8,064 | | | | 456,422 | |
Briggs & Stratton Corp.(a) | | | 3,528 | | | | 51,262 | |
Caterpillar, Inc.(a) | | | 22,680 | | | | 2,751,538 | |
Chart Industries, Inc.* | | | 8,820 | | | | 600,201 | |
CIRCOR International, Inc.(a) | | | 2,772 | | | | 90,118 | |
Colfax Corp.* (a) | | | 12,852 | | | | 360,242 | |
Columbus McKinnon Corp.(a) | | | 1,008 | | | | 37,024 | |
Crane Co. | | | 6,300 | | | | 548,352 | |
Cummins, Inc. | | | 8,820 | | | | 1,205,606 | |
Deere & Co. | | | 12,348 | | | | 1,672,413 | |
Douglas Dynamics, Inc.(a) | | | 2,520 | | | | 109,343 | |
Dover Corp. | | | 6,552 | | | | 542,768 | |
Energy Recovery, Inc.* (a) | | | 5,544 | | | | 41,580 | |
EnPro Industries, Inc. | | | 1,260 | | | | 78,372 | |
ESCO Technologies, Inc.(a) | | | 756 | | | | 46,282 | |
Federal Signal Corp. | | | 5,796 | | | | 127,454 | |
Flowserve Corp.(a) | | | 756 | | | | 34,700 | |
Fortive Corp. | | | 8,064 | | | | 598,752 | |
Franklin Electric Co., Inc.(a) | | | 1,764 | | | | 74,829 | |
Global Brass & Copper Holdings, Inc. | | | 7,056 | | | | 223,111 | |
Gorman-Rupp Co. (The) | | | 1,260 | | | | 43,470 | |
Graco, Inc.(a) | | | 3,024 | | | | 122,865 | |
Greenbrier Cos., Inc. (The) | | | 9,576 | | | | 454,381 | |
Hillenbrand, Inc. | | | 12,096 | | | | 579,398 | |
| | | | | | | | |
| Investments | | Shares | | | Value | |
| Machinery – (continued) | |
IDEX Corp. | | | 1,764 | | | $ | 223,711 | |
Illinois Tool Works, Inc. | | | 11,592 | | | | 1,478,791 | |
Ingersoll-Rand plc | | | 7,308 | | | | 701,130 | |
ITT, Inc. | | | 7,056 | | | | 356,328 | |
John Bean Technologies Corp.(a) | | | 4,284 | | | | 445,407 | |
Kadant, Inc. | | | 3,780 | | | | 373,086 | |
Kennametal, Inc.(a) | | | 12,600 | | | | 446,670 | |
Lincoln Electric Holdings, Inc. | | | 1,764 | | | | 142,725 | |
Lindsay Corp. | | | 252 | | | | 24,096 | |
Lydall, Inc.* | | | 4,788 | | | | 143,018 | |
Manitowoc Co., Inc. (The)* (a) | | | 2,123 | | | | 38,808 | |
Meritor, Inc.* | | | 24,948 | | | | 423,867 | |
Middleby Corp. (The)* (a) | | | 3,528 | | | | 396,194 | |
Mueller Industries, Inc. | | | 5,544 | | | | 134,996 | |
Mueller Water Products, Inc., Class A | | | 14,112 | | | | 144,789 | |
Navistar International Corp.* (a) | | | 12,600 | | | | 421,974 | |
NN, Inc.(a) | | | 2,772 | | | | 32,155 | |
Nordson Corp. | | | 1,008 | | | | 123,651 | |
Oshkosh Corp. | | | 5,040 | | | | 282,946 | |
PACCAR, Inc. | | | 16,632 | | | | 951,517 | |
Parker-Hannifin Corp. | | | 5,796 | | | | 878,848 | |
Park-Ohio Holdings Corp. | | | 1,260 | | | | 41,681 | |
Pentair plc | | | 3,024 | | | | 121,414 | |
Proto Labs, Inc.* | | | 504 | | | | 60,203 | |
RBC Bearings, Inc.* | | | 2,016 | | | | 297,723 | |
REV Group, Inc.(a) | | | 4,284 | | | | 46,738 | |
Rexnord Corp.* (a) | | | 41,832 | | | | 1,121,516 | |
Snap-on, Inc.(a) | | | 1,512 | | | | 232,757 | |
SPX Corp.* | | | 24,696 | | | | 724,087 | |
SPX FLOW, Inc.* | | | 10,836 | | | | 370,916 | |
Standex International Corp. | | | 2,268 | | | | 183,980 | |
Stanley Black & Decker, Inc. | | | 5,292 | | | | 616,624 | |
Sun Hydraulics Corp.(a) | | | 1,008 | | | | 46,771 | |
Tennant Co.(a) | | | 1,260 | | | | 77,011 | |
Terex Corp.(a) | | | 12,096 | | | | 403,885 | |
Timken Co. (The) | | | 11,088 | | | | 438,530 | |
Titan International, Inc. | | | 8,064 | | | | 56,932 | |
Toro Co. (The)(a) | | | 9,072 | | | | 511,026 | |
TriMas Corp.* | | | 11,340 | | | | 333,963 | |
See Accompanying Notes to the Financial Statements.
| | |
| 120 | | FLEXSHARES ANNUAL REPORT |
FlexShares® Morningstar US Market Factor Tilt Index Fund (cont.)
| | | | | | | | |
| Investments | | Shares | | | Value | |
| COMMON STOCKS – (continued) | |
| Machinery – (continued) | |
Trinity Industries, Inc.(a) | | | 19,152 | | | $ | 546,790 | |
Wabash National Corp. | | | 20,412 | | | | 308,221 | |
WABCO Holdings, Inc.* (a) | | | 1,764 | | | | 189,542 | |
Wabtec Corp. | | | 2,016 | | | | 165,352 | |
Watts Water Technologies, Inc., Class A | | | 2,520 | | | | 176,526 | |
Woodward, Inc. | | | 5,040 | | | | 371,146 | |
Xylem, Inc. | | | 3,780 | | | | 247,892 | |
| | | | | | | | 27,582,451 | |
| Marine – 0.0%(c) | |
Kirby Corp.* (a) | | | 504 | | | | 36,258 | |
Matson, Inc. | | | 13,356 | | | | 468,528 | |
| | | | | | | | 504,786 | |
| Media – 1.7% | |
Altice USA, Inc., Class A(a) | | | 2,772 | | | | 45,211 | |
AMC Networks, Inc., Class A* (a) | | | 23,436 | | | | 1,372,881 | |
CBS Corp. (Non-Voting), Class B | | | 18,396 | | | | 1,055,011 | |
Central European Media Enterprises Ltd., Class A* | | | 14,364 | | | | 48,550 | |
Charter Communications, Inc., Class A* (a) | | | 7,812 | | | | 2,502,730 | |
Comcast Corp., Class A | | | 244,944 | | | | 9,342,164 | |
Discovery, Inc., Class A* | | | 252 | | | | 8,162 | |
Discovery, Inc., Class C* | | | 25,034 | | | | 733,747 | |
DISH Network Corp., Class A* | | | 5,292 | | | | 162,676 | |
Entercom Communications Corp., Class A(a) | | | 48,888 | | | | 317,283 | |
Entravision Communications Corp., Class A | | | 20,160 | | | | 99,590 | |
EW Scripps Co. (The), Class A(a) | | | 4,536 | | | | 76,296 | |
Gannett Co., Inc. | | | 21,672 | | | | 210,218 | |
GCI Liberty, Inc., Class A* (a) | | | 1,260 | | | | 59,636 | |
Gray Television, Inc.* (a) | | | 25,200 | | | | 436,212 | |
Interpublic Group of Cos., Inc. (The) | | | 8,568 | | | | 198,435 | |
| | | | | | | | |
| Investments | | Shares | | | Value | |
| Media – (continued) | |
John Wiley & Sons, Inc., Class A(a) | | | 5,292 | | | $ | 287,038 | |
Liberty Broadband Corp., Class A* | | | 252 | | | | 20,863 | |
Liberty Broadband Corp., Class C* (a) | | | 2,772 | | | | 229,882 | |
Liberty Media Corp-Liberty SiriusXM, Class A* | | | 2,772 | | | | 114,317 | |
Liberty Media Corp-Liberty SiriusXM, Class C* | | | 6,048 | | | | 249,601 | |
MDC Partners, Inc., Class A* | | | 24,710 | | | | 61,034 | |
Meredith Corp.(a) | | | 8,064 | | | | 415,780 | |
MSG Networks, Inc., Class A* (a) | | | 16,632 | | | | 424,948 | |
National CineMedia, Inc. | | | 22,176 | | | | 198,475 | |
New Media Investment Group, Inc.(a) | | | 19,656 | | | | 276,167 | |
New York Times Co. (The), Class A | | | 14,868 | | | | 392,515 | |
News Corp., Class B | | | 1,512 | | | | 20,170 | |
Nexstar Media Group, Inc., Class A(a) | | | 15,876 | | | | 1,188,954 | |
Omnicom Group, Inc.(a) | | | 3,780 | | | | 280,930 | |
Scholastic Corp. | | | 4,788 | | | | 207,703 | |
Sinclair Broadcast Group, Inc., Class A | | | 32,508 | | | | 931,029 | |
Sirius XM Holdings, Inc.(a) | | | 66,024 | | | | 397,465 | |
TEGNA, Inc.(a) | | | 4,536 | | | | 52,345 | |
Tribune Media Co., Class A | | | 12,852 | | | | 488,505 | |
WideOpenWest, Inc.* | | | 14,616 | | | | 142,360 | |
| | | | | | | | 23,048,883 | |
| Metals & Mining – 0.7% | |
AK Steel Holding Corp.* (a) | | | 73,332 | | | | 271,328 | |
Alcoa Corp.* | | | 8,316 | | | | 290,977 | |
Allegheny Technologies, Inc.* | | | 21,672 | | | | 561,088 | |
Carpenter Technology Corp.(a) | | | 8,820 | | | | 384,640 | |
Century Aluminum Co.* | | | 21,672 | | | | 172,076 | |
Cleveland-Cliffs, Inc.* (a) | | | 111,384 | | | | 1,198,492 | |
Coeur Mining, Inc.* | | | 22,932 | | | | 109,615 | |
Commercial Metals Co.(a) | | | 37,044 | | | | 706,059 | |
Freeport-McMoRan, Inc. | | | 66,528 | | | | 775,051 | |
See Accompanying Notes to the Financial Statements.
| | | | |
| FLEXSHARES ANNUAL REPORT | | | 121 | |
FlexShares® Morningstar US Market Factor Tilt Index Fund (cont.)
| | | | | | | | |
| Investments | | Shares | | | Value | |
| COMMON STOCKS – (continued) | |
| Metals & Mining – (continued) | |
Hecla Mining Co. | | | 50,904 | | | $ | 122,169 | |
Kaiser Aluminum Corp. | | | 3,780 | | | | 360,499 | |
Materion Corp. | | | 1,512 | | | | 85,927 | |
McEwen Mining, Inc.(a) | | | 18,144 | | | | 35,562 | |
Newmont Mining Corp. | | | 19,152 | | | | 592,180 | |
Nucor Corp. | | | 11,592 | | | | 685,319 | |
Reliance Steel & Aluminum Co. | | | 504 | | | | 39,776 | |
Royal Gold, Inc. | | | 2,268 | | | | 173,797 | |
Ryerson Holding Corp.* | | | 8,316 | | | | 76,341 | |
Schnitzer Steel Industries, Inc., Class A | | | 10,836 | | | | 291,488 | |
Steel Dynamics, Inc. | | | 3,528 | | | | 139,709 | |
SunCoke Energy, Inc.* | | | 37,296 | | | | 417,715 | |
TimkenSteel Corp.* (a) | | | 29,232 | | | | 339,968 | |
United States Steel Corp. | | | 40,320 | | | | 1,069,690 | |
Worthington Industries, Inc. | | | 16,632 | | | | 696,548 | |
| | | | | | | | 9,596,014 | |
| Mortgage Real Estate Investment Trusts (REITs) – 0.8% | |
AG Mortgage Investment Trust, Inc.(a) | | | 17,640 | | | | 305,172 | |
AGNC Investment Corp.(a) | | | 37,548 | | | | 669,856 | |
Annaly Capital Management, Inc. | | | 93,251 | | | | 920,387 | |
Anworth Mortgage Asset Corp.(a) | | | 59,472 | | | | 259,298 | |
Apollo Commercial Real Estate Finance, Inc.(a) | | | 20,160 | | | | 377,194 | |
ARMOUR Residential REIT, Inc. | | | 18,396 | | | | 400,665 | |
Blackstone Mortgage Trust, Inc., Class A(a) | | | 38,808 | | | | 1,309,382 | |
Capstead Mortgage Corp.(a) | | | 43,344 | | | | 297,340 | |
Chimera Investment Corp. | | | 77,364 | | | | 1,438,970 | |
Exantas Capital Corp. | | | 7,308 | | | | 82,873 | |
Hannon Armstrong Sustainable Infrastructure Capital, Inc.(a) | | | 1,764 | | | | 36,603 | |
Invesco Mortgage Capital, Inc. | | | 47,628 | | | | 718,230 | |
| | | | | | | | |
| Investments | | Shares | | | Value | |
| Mortgage Real Estate Investment Trusts (REITs) – (continued) | |
Ladder Capital Corp. | | | 24,696 | | | $ | 415,881 | |
MFA Financial, Inc. | | | 154,980 | | | | 1,074,011 | |
New Residential Investment Corp. | | | 36,792 | | | | 657,841 | |
New York Mortgage Trust, Inc.(a) | | | 49,644 | | | | 304,814 | |
Orchid Island Capital, Inc.(a) | | | 21,924 | | | | 143,383 | |
PennyMac Mortgage Investment Trust | | | 24,444 | | | | 472,014 | |
Redwood Trust, Inc.(a) | | | 20,160 | | | | 331,027 | |
Starwood Property Trust, Inc. | | | 1,008 | | | | 21,894 | |
Two Harbors Investment Corp. | | | 83,664 | | | | 1,229,024 | |
Western Asset Mortgage Capital Corp. | | | 6,300 | | | | 62,811 | |
| | | | | | | | 11,528,670 | |
| Multiline Retail – 0.6% | |
Big Lots, Inc.(a) | | | 9,324 | | | | 387,133 | |
Dillard’s, Inc., Class A(a) | | | 5,544 | | | | 390,409 | |
Dollar General Corp. | | | 12,348 | | | | 1,375,320 | |
Dollar Tree, Inc.* | | | 16,380 | | | | 1,380,834 | |
JC Penney Co., Inc.* (a) | | | 126,000 | | | | 185,220 | |
Kohl’s Corp.(a) | | | 7,560 | | | | 572,519 | |
Macy’s, Inc.(a) | | | 10,332 | | | | 354,284 | |
Nordstrom, Inc.(a) | | | 6,804 | | | | 447,499 | |
Target Corp. | | | 32,256 | | | | 2,697,569 | |
| | | | | | | | 7,790,787 | |
| Multi-Utilities – 0.9% | |
Ameren Corp. | | | 9,828 | | | | 634,692 | |
Avista Corp.(a) | | | 10,836 | | | | 557,187 | |
Black Hills Corp.(a) | | | 19,908 | | | | 1,184,526 | |
CenterPoint Energy, Inc. | | | 19,908 | | | | 537,715 | |
CMS Energy Corp. | | | 7,308 | | | | 361,892 | |
Consolidated Edison, Inc. | | | 12,852 | | | | 976,752 | |
Dominion Energy, Inc.(a) | | | 33,768 | | | | 2,411,711 | |
DTE Energy Co. | | | 8,064 | | | | 906,394 | |
MDU Resources Group, Inc. | | | 252 | | | | 6,290 | |
NiSource, Inc. | | | 6,552 | | | | 166,159 | |
NorthWestern Corp. | | | 12,348 | | | | 725,568 | |
Public Service Enterprise Group, Inc. | | | 25,704 | | | | 1,373,365 | |
SCANA Corp. | | | 13,356 | | | | 534,908 | |
See Accompanying Notes to the Financial Statements.
| | |
| 122 | | FLEXSHARES ANNUAL REPORT |
FlexShares® Morningstar US Market Factor Tilt Index Fund (cont.)
| | | | | | | | |
| Investments | | Shares | | | Value | |
| COMMON STOCKS – (continued) | |
| Multi-Utilities – (continued) | |
Sempra Energy(a) | | | 8,820 | | | $ | 971,258 | |
Unitil Corp. | | | 3,024 | | | | 143,670 | |
Vectren Corp. | | | 8,064 | | | | 576,818 | |
WEC Energy Group, Inc. | | | 13,356 | | | | 913,550 | |
| | | | | | | | 12,982,455 | |
| Oil, Gas & Consumable Fuels – 5.2% | |
Anadarko Petroleum Corp. | | | 18,396 | | | | 978,667 | |
Antero Resources Corp.* | | | 252 | | | | 4,004 | |
Apache Corp.(a) | | | 11,592 | | | | 438,525 | |
Arch Coal, Inc., Class A(a) | | | 9,576 | | | | 918,338 | |
Bonanza Creek Energy, Inc.* | | | 4,284 | | | | 110,313 | |
California Resources Corp.* | | | 15,876 | | | | 497,554 | |
Callon Petroleum Co.* (a) | | | 78,876 | | | | 786,394 | |
Carrizo Oil & Gas, Inc.* (a) | | | 25,956 | | | | 472,659 | |
Cheniere Energy, Inc.* | | | 8,316 | | | | 502,370 | |
Chesapeake Energy Corp.* (a) | | | 346,500 | | | | 1,216,215 | |
Chevron Corp. | | | 95,508 | | | | 10,663,468 | |
Cimarex Energy Co.(a) | | | 2,772 | | | | 220,291 | |
Clean Energy Fuels Corp.* | | | 90,468 | | | | 199,934 | |
CNX Resources Corp.* | | | 16,128 | | | | 252,403 | |
Concho Resources, Inc.* (a) | | | 5,990 | | | | 833,149 | |
ConocoPhillips | | | 40,320 | | | | 2,818,368 | |
CONSOL Energy, Inc.* | | | 5,846 | | | | 232,905 | |
Continental Resources, Inc.* (a) | | | 4,788 | | | | 252,232 | |
CVR Energy, Inc.(a) | | | 4,536 | | | | 195,048 | |
Delek US Holdings, Inc.(a) | | | 15,624 | | | | 573,713 | |
Denbury Resources, Inc.* (a) | | | 129,780 | | | | 447,741 | |
Devon Energy Corp. | | | 15,876 | | | | 514,382 | |
Diamondback Energy, Inc. | | | 3,276 | | | | 368,091 | |
Dorian LPG Ltd.* | | | 765 | | | | 6,082 | |
Eclipse Resources Corp.* (a) | | | 32,760 | | | | 37,346 | |
Energen Corp.* | | | 1,008 | | | | 72,546 | |
EOG Resources, Inc. | | | 23,436 | | | | 2,468,748 | |
EP Energy Corp., Class A* (a) | | | 12,600 | | | | 22,680 | |
EQT Corp.(a) | | | 9,576 | | | | 325,297 | |
Extraction Oil & Gas, Inc.* (a) | | | 7,560 | | | | 60,404 | |
| | | | | | | | |
| Investments | | Shares | | | Value | |
| Oil, Gas & Consumable Fuels – (continued) | |
Exxon Mobil Corp. | | | 204,372 | | | $ | 16,284,361 | |
Gran Tierra Energy, Inc.* | | | 151,704 | | | | 462,697 | |
Green Plains, Inc.(a) | | | 3,780 | | | | 64,411 | |
Gulfport Energy Corp.* (a) | | | 55,692 | | | | 507,354 | |
Halcon Resources Corp.* (a) | | | 15,372 | | | | 51,035 | |
Hess Corp. | | | 8,064 | | | | 462,874 | |
HighPoint Resources Corp.* (a) | | | 30,744 | | | | 114,368 | |
HollyFrontier Corp. | | | 17,892 | | | | 1,206,637 | |
International Seaways, Inc.* | | | 11,340 | | | | 243,923 | |
Kinder Morgan, Inc. | | | 69,804 | | | | 1,188,064 | |
Kosmos Energy Ltd.* (a) | | | 4,788 | | | | 31,074 | |
Laredo Petroleum, Inc.* | | | 66,024 | | | | 345,966 | |
Marathon Oil Corp. | | | 62,496 | | | | 1,186,799 | |
Marathon Petroleum Corp. | | | 47,435 | | | | 3,341,796 | |
Matador Resources Co.* (a) | | | 6,048 | | | | 174,424 | |
Midstates Petroleum Co., Inc.* (a) | | | 10,584 | | | | 76,311 | |
Murphy Oil Corp.(a) | | | 1,008 | | | | 32,115 | |
Newfield Exploration Co.* | | | 5,040 | | | | 101,808 | |
Noble Energy, Inc.(a) | | | 16,380 | | | | 407,043 | |
Oasis Petroleum, Inc.* (a) | | | 98,280 | | | | 988,697 | |
Occidental Petroleum Corp. | | | 15,876 | | | | 1,064,803 | |
ONEOK, Inc. | | | 5,544 | | | | 363,686 | |
Par Pacific Holdings, Inc.* | | | 4,536 | | | | 80,197 | |
Parsley Energy, Inc., Class A* | | | 7,812 | | | | 182,957 | |
PBF Energy, Inc., Class A | | | 52,668 | | | | 2,204,156 | |
PDC Energy, Inc.* (a) | | | 1,512 | | | | 64,184 | |
Peabody Energy Corp.(a) | | | 37,548 | | | | 1,331,077 | |
Penn Virginia Corp.* (a) | | | 2,772 | | | | 190,658 | |
Phillips 66 | | | 19,152 | | | | 1,969,209 | |
Pioneer Natural Resources Co. | | | 5,292 | | | | 779,353 | |
QEP Resources, Inc.* | | | 100,296 | | | | 893,637 | |
Range Resources Corp. | | | 75,852 | | | | 1,202,254 | |
Renewable Energy Group, Inc.* (a) | | | 2,268 | | | | 70,490 | |
Resolute Energy Corp.* (a) | | | 4,788 | | | | 133,250 | |
REX American Resources Corp.* | | | 1,512 | | | | 112,145 | |
Sanchez Energy Corp.* (a) | | | 40,320 | | | | 66,931 | |
SandRidge Energy, Inc.* | | | 12,852 | | | | 115,025 | |
See Accompanying Notes to the Financial Statements.
| | | | |
| FLEXSHARES ANNUAL REPORT | | | 123 | |
FlexShares® Morningstar US Market Factor Tilt Index Fund (cont.)
| | | | | | | | |
| Investments | | Shares | | | Value | |
| COMMON STOCKS – (continued) | |
| Oil, Gas & Consumable Fuels – (continued) | |
SemGroup Corp., Class A(a) | | | 3,780 | | | $ | 69,892 | |
SM Energy Co.(a) | | | 8,064 | | | | 196,278 | |
Southwestern Energy Co.* (a) | | | 237,888 | | | | 1,270,322 | |
SRC Energy, Inc.* (a) | | | 85,932 | | | | 608,399 | |
Targa Resources Corp.(a) | | | 10,836 | | | | 559,896 | |
Ultra Petroleum Corp.* (a) | | | 87,696 | | | | 105,235 | |
Valero Energy Corp. | | | 22,176 | | | | 2,020,012 | |
W&T Offshore, Inc.* (a) | | | 19,404 | | | | 130,783 | |
Whiting Petroleum Corp.* (a) | | | 25,956 | | | | 968,159 | |
WildHorse Resource Development Corp.* | | | 5,544 | | | | 117,588 | |
Williams Cos., Inc. (The) | | | 29,232 | | | | 711,215 | |
World Fuel Services Corp.(a) | | | 24,696 | | | | 790,272 | |
WPX Energy, Inc.* | | | 40,572 | | | | 650,775 | |
| | | | | | | | 72,784,462 | |
| Paper & Forest Products – 0.3% | |
Boise Cascade Co. | | | 6,300 | | | | 193,977 | |
Clearwater Paper Corp.* (a) | | | 4,788 | | | | 115,582 | |
Domtar Corp. | | | 23,436 | | | | 1,085,321 | |
KapStone Paper and Packaging Corp. | | | 29,988 | | | | 1,049,580 | |
Louisiana-Pacific Corp.(a) | | | 43,596 | | | | 949,085 | |
Mercer International, Inc. | | | 20,916 | | | | 318,133 | |
Neenah, Inc. | | | 3,024 | | | | 243,311 | |
PH Glatfelter Co.(a) | | | 11,340 | | | | 202,986 | |
Resolute Forest Products, Inc.* | | | 12,852 | | | | 144,842 | |
Schweitzer-Mauduit International, Inc. | | | 6,048 | | | | 193,052 | |
Verso Corp., Class A* (a) | | | 5,292 | | | | 148,758 | |
| | | | | | | | 4,644,627 | |
| Personal Products – 0.3% | |
Avon Products, Inc.* | | | 174,384 | | | | 341,793 | |
Coty, Inc., Class A(a) | | | 14,868 | | | | 156,857 | |
Edgewell Personal Care Co.* (a) | | | 20,664 | | | | 991,459 | |
Estee Lauder Cos., Inc. (The), Class A | | | 6,804 | | | | 935,142 | |
| | | | | | | | |
| Investments | | Shares | | | Value | |
| Personal Products – (continued) | |
Herbalife Nutrition Ltd.* | | | 13,104 | | | $ | 697,919 | |
Inter Parfums, Inc. | | | 2,772 | | | | 163,520 | |
Medifast, Inc. | | | 1,512 | | | | 320,060 | |
Nu Skin Enterprises, Inc., Class A | | | 7,560 | | | | 530,863 | |
Revlon, Inc., Class A* (a) | | | 2,772 | | | | 58,212 | |
USANA Health Sciences, Inc.* | | | 1,764 | | | | 206,423 | |
| | | | | | | | 4,402,248 | |
| Pharmaceuticals – 3.7% | |
Aerie Pharmaceuticals, Inc.* (a) | | | 1,260 | | | | 67,007 | |
Akorn, Inc.* | | | 2,268 | | | | 15,128 | |
Allergan plc | | | 17,640 | | | | 2,787,296 | |
Amneal Pharmaceuticals, Inc.* (a) | | | 3,276 | | | | 60,442 | |
Assertio Therapeutics, Inc.* | | | 756 | | | | 3,670 | |
Bristol-Myers Squibb Co. | | | 59,220 | | | | 2,992,979 | |
Collegium Pharmaceutical, Inc.* | | | 7,560 | | | | 121,338 | |
Eli Lilly & Co. | | | 28,224 | | | | 3,060,611 | |
Endo International plc* (a) | | | 72,576 | | | | 1,229,437 | |
Horizon Pharma plc* | | | 46,872 | | | | 853,539 | |
Innoviva, Inc.* (a) | | | 25,452 | | | | 355,310 | |
Jazz Pharmaceuticals plc* | | | 3,024 | | | | 480,272 | |
Johnson & Johnson | | | 88,200 | | | | 12,347,118 | |
Lannett Co., Inc.* (a) | | | 11,844 | | | | 43,349 | |
Mallinckrodt plc* (a) | | | 36,792 | | | | 922,008 | |
Medicines Co. (The)* (a) | | | 3,780 | | | | 87,923 | |
Merck & Co., Inc.(a) | | | 112,140 | | | | 8,254,625 | |
Mylan NV* | | | 16,380 | | | | 511,875 | |
Nektar Therapeutics* (a) | | | 6,804 | | | | 263,179 | |
Omeros Corp.* (a) | | | 1,260 | | | | 19,240 | |
Pacira Pharmaceuticals, Inc.* | | | 1,260 | | | | 61,601 | |
Perrigo Co. plc(a) | | | 7,056 | | | | 496,037 | |
Pfizer, Inc. | | | 319,032 | | | | 13,737,518 | |
Prestige Consumer Healthcare, Inc.* (a) | | | 18,144 | | | | 656,087 | |
Supernus Pharmaceuticals, Inc.* (a) | | | 504 | | | | 23,970 | |
Zoetis, Inc. | | | 14,112 | | | | 1,272,197 | |
| | | | | | | | 50,723,756 | |
See Accompanying Notes to the Financial Statements.
| | |
| 124 | | FLEXSHARES ANNUAL REPORT |
FlexShares® Morningstar US Market Factor Tilt Index Fund (cont.)
| | | | | | | | |
| Investments | | Shares | | | Value | |
| COMMON STOCKS – (continued) | |
| Professional Services – 0.5% | |
ASGN, Inc.* | | | 8,568 | | | $ | 574,741 | |
CBIZ, Inc.* | | | 11,844 | | | | 262,700 | |
CoStar Group, Inc.* | | | 1,764 | | | | 637,545 | |
Dun & Bradstreet Corp. (The) | | | 756 | | | | 107,564 | |
Equifax, Inc. | | | 3,276 | | | | 332,317 | |
Exponent, Inc. | | | 6,048 | | | | 305,182 | |
Forrester Research, Inc. | | | 504 | | | | 20,301 | |
FTI Consulting, Inc.* | | | 8,568 | | | | 592,134 | |
GP Strategies Corp.* | | | 1,260 | | | | 18,409 | |
Heidrick & Struggles International, Inc. | | | 1,764 | | | | 60,876 | |
Huron Consulting Group, Inc.* | | | 4,788 | | | | 260,898 | |
ICF International, Inc. | | | 4,284 | | | | 315,474 | |
IHS Markit Ltd.* | | | 4,788 | | | | 251,514 | |
Insperity, Inc.(a) | | | 5,040 | | | | 553,644 | |
Kelly Services, Inc., Class A | | | 3,276 | | | | 76,953 | |
Kforce, Inc. | | | 3,780 | | | | 116,500 | |
Korn/Ferry International | | | 13,104 | | | | 591,514 | |
ManpowerGroup, Inc. | | | 1,512 | | | | 115,350 | |
Mistras Group, Inc.* | | | 252 | | | | 5,015 | |
Navigant Consulting, Inc.(a) | | | 18,648 | | | | 402,797 | |
Nielsen Holdings plc | | | 15,372 | | | | 399,365 | |
Resources Connection, Inc. | | | 3,528 | | | | 57,577 | |
Robert Half International, Inc. | | | 2,772 | | | | 167,789 | |
TriNet Group, Inc.* | | | 2,520 | | | | 118,415 | |
TrueBlue, Inc.* | | | 18,648 | | | | 435,058 | |
Verisk Analytics, Inc.* | | | 4,284 | | | | 513,394 | |
WageWorks, Inc.* (a) | | | 2,016 | | | | 80,257 | |
| | | | | | | | 7,373,283 | |
| Real Estate Management & Development – 0.2% | |
CBRE Group, Inc., Class A* | | | 6,552 | | | | 263,980 | |
HFF, Inc., Class A | | | 3,528 | | | | 129,654 | |
Howard Hughes Corp. (The)* (a) | | | 1,008 | | | | 112,412 | |
Jones Lang LaSalle, Inc. | | | 2,520 | | | | 333,295 | |
Kennedy-Wilson Holdings, Inc.(a) | | | 42,588 | | | | 808,321 | |
Newmark Group, Inc., Class A | | | 10,584 | | | | 103,088 | |
Realogy Holdings Corp.(a) | | | 53,424 | | | | 1,018,796 | |
| | | | | | | | |
| Investments | | Shares | | | Value | |
| Real Estate Management & Development – (continued) | |
St Joe Co. (The)* (a) | | | 8,316 | | | $ | 126,320 | |
| | | | | | | | 2,895,866 | |
| Road & Rail – 0.9% | |
AMERCO | | | 504 | | | | 164,546 | |
ArcBest Corp.(a) | | | 8,568 | | | | 318,044 | |
Avis Budget Group, Inc.* (a) | | | 9,072 | | | | 255,105 | |
CSX Corp. | | | 37,548 | | | | 2,585,555 | |
Genesee & Wyoming, Inc., Class A* (a) | | | 504 | | | | 39,932 | |
Heartland Express, Inc.(a) | | | 3,528 | | | | 68,690 | |
Hertz Global Holdings, Inc.* (a) | | | 19,152 | | | | 263,340 | |
JB Hunt Transport Services, Inc. | | | 1,764 | | | | 195,116 | |
Kansas City Southern | | | 1,512 | | | | 154,164 | |
Knight-Swift Transportation Holdings, Inc.(a) | | | 13,608 | | | | 435,456 | |
Landstar System, Inc.(a) | | | 3,276 | | | | 327,895 | |
Marten Transport Ltd. | | | 8,568 | | | | 165,020 | |
Norfolk Southern Corp. | | | 12,600 | | | | 2,114,658 | |
Old Dominion Freight Line, Inc. | | | 4,032 | | | | 525,853 | |
Ryder System, Inc. | | | 15,372 | | | | 850,225 | |
Saia, Inc.* | | | 7,056 | | | | 443,540 | |
Union Pacific Corp. | | | 24,444 | | | | 3,574,202 | |
Werner Enterprises, Inc.(a) | | | 1,260 | | | | 40,559 | |
| | | | | | | | 12,521,900 | |
| Semiconductors & Semiconductor Equipment – 3.2% | |
Advanced Energy Industries, Inc.* (a) | | | 6,300 | | | | 271,089 | |
Advanced Micro Devices, Inc.* (a) | | | 60,228 | | | | 1,096,752 | |
Ambarella, Inc.* | | | 504 | | | | 17,529 | |
Amkor Technology, Inc.* | | | 31,248 | | | | 223,423 | |
Analog Devices, Inc. | | | 8,820 | | | | 738,322 | |
Applied Materials, Inc. | | | 37,296 | | | | 1,226,292 | |
Axcelis Technologies, Inc.* | | | 5,544 | | | | 95,689 | |
Broadcom, Inc. | | | 21,924 | | | | 4,899,795 | |
Brooks Automation, Inc.(a) | | | 5,292 | | | | 164,211 | |
Cabot Microelectronics Corp. | | | 2,268 | | | | 221,402 | |
CEVA, Inc.* (a) | | | 252 | | | | 6,209 | |
See Accompanying Notes to the Financial Statements.
| | | | |
| FLEXSHARES ANNUAL REPORT | | | 125 | |
FlexShares® Morningstar US Market Factor Tilt Index Fund (cont.)
| | | | | | | | |
| Investments | | Shares | | | Value | |
| COMMON STOCKS – (continued) | |
| Semiconductors & Semiconductor Equipment – (continued) | |
Cirrus Logic, Inc.* (a) | | | 16,632 | | | $ | 622,702 | |
Cohu, Inc. | | | 264 | | | | 5,491 | |
Cypress Semiconductor Corp.(a) | | | 41,580 | | | | 538,045 | |
Diodes, Inc.* | | | 1,008 | | | | 30,432 | |
Entegris, Inc. | | | 17,892 | | | | 474,854 | |
First Solar, Inc.* (a) | | | 3,780 | | | | 158,004 | |
FormFactor, Inc.* (a) | | | 18,144 | | | | 222,083 | |
Ichor Holdings Ltd.* (a) | | | 6,804 | | | | 120,771 | |
Inphi Corp.* | | | 2,520 | | | | 80,640 | |
Integrated Device Technology, Inc.* | | | 13,608 | | | | 636,990 | |
Intel Corp. | | | 236,628 | | | | 11,093,121 | |
KLA-Tencor Corp. | | | 2,268 | | | | 207,613 | |
Kulicke & Soffa Industries, Inc. | | | 9,072 | | | | 184,434 | |
Lam Research Corp. | | | 6,804 | | | | 964,331 | |
Lattice Semiconductor Corp.* | | | 8,064 | | | | 48,465 | |
Marvell Technology Group Ltd.(a) | | | 16,823 | | | | 276,065 | |
Maxim Integrated Products, Inc. | | | 8,568 | | | | 428,571 | |
MaxLinear, Inc.* (a) | | | 2,016 | | | | 39,131 | |
Microchip Technology, Inc.(a) | | | 4,284 | | | | 281,802 | |
Micron Technology, Inc.* | | | 58,212 | | | | 2,195,757 | |
MKS Instruments, Inc. | | | 5,544 | | | | 408,537 | |
Monolithic Power Systems, Inc.(a) | | | 3,780 | | | | 446,494 | |
Nanometrics, Inc.* | | | 252 | | | | 8,079 | |
NVIDIA Corp. | | | 19,908 | | | | 4,197,204 | |
ON Semiconductor Corp.* | | | 13,104 | | | | 222,768 | |
PDF Solutions, Inc.* | | | 1,008 | | | | 8,064 | |
Photronics, Inc.* (a) | | | 10,332 | | | | 100,634 | |
Power Integrations, Inc. | | | 1,764 | | | | 99,348 | |
Qorvo, Inc.* | | | 10,332 | | | | 759,505 | |
QUALCOMM, Inc. | | | 81,648 | | | | 5,134,843 | |
Rambus, Inc.* | | | 12,096 | | | | 105,356 | |
Rudolph Technologies, Inc.* | | | 1,764 | | | | 36,674 | |
Silicon Laboratories, Inc.* | | | 2,772 | | | | 226,001 | |
Skyworks Solutions, Inc. | | | 4,788 | | | | 415,407 | |
| | | | | | | | |
| Investments | | Shares | | | Value | |
| Semiconductors & Semiconductor Equipment – (continued) | |
SolarEdge Technologies, Inc.* (a) | | | 7,560 | | | $ | 292,799 | |
SunPower Corp.* (a) | | | 5,040 | | | | 30,290 | |
Synaptics, Inc.* (a) | | | 10,332 | | | | 387,863 | |
Teradyne, Inc.(a) | | | 7,812 | | | | 269,123 | |
Texas Instruments, Inc. | | | 32,004 | | | | 2,970,931 | |
Ultra Clean Holdings, Inc.* (a) | | | 12,600 | | | | 132,552 | |
Universal Display Corp.(a) | | | 1,512 | | | | 185,991 | |
Xilinx, Inc. | | | 6,300 | | | | 537,831 | |
Xperi Corp.(a) | | | 5,292 | | | | 68,796 | |
| | | | | | | | 44,615,105 | |
| Software – 4.4% | |
8x8, Inc.* | | | 7,812 | | | | 134,288 | |
ACI Worldwide, Inc.* (a) | | | 11,844 | | | | 297,166 | |
Adobe, Inc.* | | | 15,372 | | | | 3,777,823 | |
ANSYS, Inc.* | | | 3,024 | | | | 452,239 | |
Aspen Technology, Inc.* | | | 6,552 | | | | 556,199 | |
Autodesk, Inc.* | | | 6,552 | | | | 846,846 | |
Avaya Holdings Corp.* | | | 19,908 | | | | 326,889 | |
Blackbaud, Inc.(a) | | | 4,284 | | | | 307,248 | |
Bottomline Technologies DE, Inc.* | | | 504 | | | | 33,587 | |
CA, Inc. | | | 24,192 | | | | 1,073,157 | |
Cadence Design Systems, Inc.* | | | 6,300 | | | | 280,791 | |
CDK Global, Inc. | | | 4,536 | | | | 259,641 | |
Citrix Systems, Inc.* | | | 5,040 | | | | 516,449 | |
Cornerstone OnDemand, Inc.* | | | 2,016 | | | | 99,288 | |
Dell Technologies, Inc., Class V* | | | 9,324 | | | | 842,796 | |
Digimarc Corp.* (a) | | | 756 | | | | 18,998 | |
Ebix, Inc.(a) | | | 4,536 | | | | 259,958 | |
Ellie Mae, Inc.* (a) | | | 3,024 | | | | 200,431 | |
Envestnet, Inc.* | | | 2,016 | | | | 104,872 | |
Fair Isaac Corp.* (a) | | | 2,268 | | | | 437,066 | |
FireEye, Inc.* (a) | | | 6,300 | | | | 116,487 | |
Fortinet, Inc.* | | | 10,080 | | | | 828,374 | |
Guidewire Software, Inc.* (a) | | | 2,520 | | | | 224,204 | |
Imperva, Inc.* | | | 2,016 | | | | 111,586 | |
See Accompanying Notes to the Financial Statements.
| | |
| 126 | | FLEXSHARES ANNUAL REPORT |
FlexShares® Morningstar US Market Factor Tilt Index Fund (cont.)
| | | | | | | | |
| Investments | | Shares | | | Value | |
| COMMON STOCKS – (continued) | |
| Software – (continued) | |
Intuit, Inc. | | | 8,820 | | | $ | 1,861,020 | |
j2 Global, Inc.(a) | | | 15,372 | | | | 1,119,696 | |
LogMeIn, Inc. | | | 2,520 | | | | 217,022 | |
Manhattan Associates, Inc.* (a) | | | 4,032 | | | | 192,488 | |
Microsoft Corp. | | | 266,112 | | | | 28,423,423 | |
MicroStrategy, Inc., Class A* | | | 1,008 | | | | 126,978 | |
Monotype Imaging Holdings, Inc. | | | 2,016 | | | | 35,340 | |
Nuance Communications, Inc.* | | | 8,820 | | | | 153,380 | |
Nutanix, Inc., Class A* | | | 3,276 | | | | 135,987 | |
OneSpan, Inc.* | | | 3,276 | | | | 48,075 | |
Oracle Corp. | | | 101,556 | | | | 4,959,995 | |
Pegasystems, Inc. | | | 3,276 | | | | 175,332 | |
Progress Software Corp. | | | 3,780 | | | | 121,489 | |
Proofpoint, Inc.* | | | 3,024 | | | | 275,033 | |
PTC, Inc.* (a) | | | 9,072 | | | | 747,624 | |
Qualys, Inc.* (a) | | | 1,512 | | | | 107,715 | |
RealPage, Inc.* | | | 252 | | | | 13,356 | |
Red Hat, Inc.* | | | 4,788 | | | | 821,812 | |
salesforce.com, Inc.* | | | 26,208 | | | | 3,596,786 | |
ServiceNow, Inc.* | | | 3,276 | | | | 593,087 | |
Splunk, Inc.* | | | 4,284 | | | | 427,715 | |
SPS Commerce, Inc.* | | | 756 | | | | 70,376 | |
SS&C Technologies Holdings, Inc. | | | 8,568 | | | | 438,339 | |
Symantec Corp. | | | 17,640 | | | | 320,166 | |
Synopsys, Inc.* | | | 4,536 | | | | 406,108 | |
Tableau Software, Inc., Class A* (a) | | | 3,024 | | | | 322,600 | |
TiVo Corp.(a) | | | 45,108 | | | | 496,188 | |
Trade Desk, Inc. (The), Class A* (a) | | | 756 | | | | 93,404 | |
Tyler Technologies, Inc.* | | | 2,016 | | | | 426,707 | |
Ultimate Software Group, Inc. (The)* | | | 1,764 | | | | 470,335 | |
Verint Systems, Inc.* | | | 20,664 | | | | 943,725 | |
VMware, Inc., Class A* | | | 1,512 | | | | 213,782 | |
Workday, Inc., Class A* (a) | | | 3,528 | | | | 469,295 | |
Zendesk, Inc.* | | | 3,024 | | | | 166,229 | |
| | | | | | | | 61,096,990 | |
| | | | | | | | |
| Investments | | Shares | | | Value | |
| Specialty Retail – 3.0% | |
Aaron’s, Inc.(a) | | | 23,688 | | | $ | 1,116,415 | |
Abercrombie & Fitch Co., Class A(a) | | | 25,452 | | | | 501,404 | |
Advance Auto Parts, Inc. | | | 3,024 | | | | 483,114 | |
American Eagle Outfitters, Inc. | | | 83,664 | | | | 1,929,292 | |
Asbury Automotive Group, Inc.* | | | 9,576 | | | | 623,398 | |
Ascena Retail Group, Inc.* (a) | | | 85,176 | | | | 327,928 | |
AutoNation, Inc.* (a) | | | 22,176 | | | | 897,684 | |
AutoZone, Inc.* | | | 1,008 | | | | 739,338 | |
Barnes & Noble Education, Inc.* | | | 7,056 | | | | 40,290 | |
Barnes & Noble, Inc.(a) | | | 11,088 | | | | 70,187 | |
Bed Bath & Beyond, Inc.(a) | | | 504 | | | | 6,925 | |
Best Buy Co., Inc. | | | 12,852 | | | | 901,696 | |
Buckle, Inc. (The)(a) | | | 3,276 | | | | 66,830 | |
Burlington Stores, Inc.* | | | 5,292 | | | | 907,525 | |
Caleres, Inc. | | | 14,616 | | | | 499,867 | |
Camping World Holdings, Inc., Class A(a) | | | 8,568 | | | | 146,941 | |
CarMax, Inc.* (a) | | | 12,348 | | | | 838,553 | |
Cato Corp. (The), Class A | | | 4,032 | | | | 77,737 | |
Chico’s FAS, Inc. | | | 504 | | | | 3,866 | |
Children’s Place, Inc. (The) | | | 2,016 | | | | 301,190 | |
Citi Trends, Inc. | | | 2,520 | | | | 63,832 | |
Conn’s, Inc.* | | | 8,316 | | | | 231,018 | |
Dick’s Sporting Goods, Inc.(a) | | | 22,680 | | | | 802,192 | |
DSW, Inc., Class A(a) | | | 17,388 | | | | 461,651 | |
Express, Inc.* (a) | | | 24,696 | | | | 217,572 | |
Five Below, Inc.* (a) | | | 1,764 | | | | 200,778 | |
Foot Locker, Inc.(a) | | | 26,460 | | | | 1,247,324 | |
GameStop Corp., Class A(a) | | | 35,028 | | | | 511,409 | |
Gap, Inc. (The)(a) | | | 10,332 | | | | 282,064 | |
Genesco, Inc.* (a) | | | 7,056 | | | | 301,926 | |
GNC Holdings, Inc., Class A* (a) | | | 32,004 | | | | 117,775 | |
Group 1 Automotive, Inc.(a) | | | 7,560 | | | | 436,514 | |
Haverty Furniture Cos., Inc.(a) | | | 1,008 | | | | 20,442 | |
Hibbett Sports, Inc.* (a) | | | 252 | | | | 4,402 | |
See Accompanying Notes to the Financial Statements.
| | | | |
| FLEXSHARES ANNUAL REPORT | | | 127 | |
FlexShares® Morningstar US Market Factor Tilt Index Fund (cont.)
| | | | | | | | |
| Investments | | Shares | | | Value | |
| COMMON STOCKS – (continued) | |
| Specialty Retail – (continued) | |
Home Depot, Inc. (The) | | | 39,312 | | | $ | 6,914,195 | |
L Brands, Inc. | | | 252 | | | | 8,170 | |
Lithia Motors, Inc., Class A(a) | | | 8,316 | | | | 740,789 | |
Lowe’s Cos., Inc. | | | 30,744 | | | | 2,927,444 | |
Lumber Liquidators Holdings, Inc.* (a) | | | 8,316 | | | | 99,459 | |
MarineMax, Inc.* (a) | | | 3,024 | | | | 68,826 | |
Michaels Cos., Inc. (The)* (a) | | | 33,516 | | | | 531,229 | |
Monro, Inc. | | | 2,268 | | | | 168,739 | |
Murphy USA, Inc.* | | | 7,812 | | | | 629,882 | |
Office Depot, Inc. | | | 189,756 | | | | 485,775 | |
O’Reilly Automotive, Inc.* | | | 2,772 | | | | 889,119 | |
Party City Holdco, Inc.* (a) | | | 16,380 | | | | 171,499 | |
Penske Automotive Group, Inc.(a) | | | 11,844 | | | | 525,637 | |
RH* (a) | | | 6,300 | | | | 728,973 | |
Ross Stores, Inc. | | | 12,348 | | | | 1,222,452 | |
Sally Beauty Holdings, Inc.* (a) | | | 22,428 | | | | 399,443 | |
Shoe Carnival, Inc.(a) | | | 504 | | | | 20,528 | |
Signet Jewelers Ltd.(a) | | | 21,420 | | | | 1,200,591 | |
Sleep Number Corp.* (a) | | | 4,536 | | | | 164,974 | |
Sonic Automotive, Inc., Class A(a) | | | 18,648 | | | | 337,902 | |
Tailored Brands, Inc.(a) | | | 15,372 | | | | 322,966 | |
Tiffany & Co. | | | 2,016 | | | | 224,381 | |
TJX Cos., Inc. (The) | | | 25,200 | | | | 2,768,976 | |
Tractor Supply Co. | | | 7,812 | | | | 717,845 | |
Ulta Beauty, Inc.* | | | 1,512 | | | | 415,074 | |
Urban Outfitters, Inc.* (a) | | | 27,972 | | | | 1,103,775 | |
Williams-Sonoma, Inc.(a) | | | 27,720 | | | | 1,646,014 | |
Zumiez, Inc.* (a) | | | 6,300 | | | | 146,538 | |
| | | | | | | | 40,960,274 | |
| Technology Hardware, Storage & Peripherals – 3.2% | |
3D Systems Corp.* (a) | | | 18,144 | | | | 219,180 | |
Apple, Inc. | | | 166,068 | | | | 36,345,643 | |
Cray, Inc.* (a) | | | 2,520 | | | | 57,179 | |
Diebold Nixdorf, Inc.(a) | | | 27,216 | | | | 106,142 | |
Electronics For Imaging, Inc.* (a) | | | 6,804 | | | | 207,182 | |
| | | | | | | | |
| Investments | | Shares | | | Value | |
| Technology Hardware, Storage & Peripherals – (continued) | |
Hewlett Packard Enterprise Co. | | | 92,484 | | | $ | 1,410,381 | |
HP, Inc. | | | 79,632 | | | | 1,922,317 | |
NCR Corp.* (a) | | | 40,824 | | | | 1,096,124 | |
NetApp, Inc. | | | 14,616 | | | | 1,147,210 | |
Pure Storage, Inc., Class A* (a) | | | 20,412 | | | | 411,914 | |
Seagate Technology plc(a) | | | 12,600 | | | | 506,898 | |
Western Digital Corp. | | | 10,080 | | | | 434,146 | |
Xerox Corp. | | | 3,276 | | | | 91,302 | |
| | | | | | | | 43,955,618 | |
| Textiles, Apparel & Luxury Goods – 1.0% | |
Carter’s, Inc.(a) | | | 4,284 | | | | 411,178 | |
Columbia Sportswear Co. | | | 3,024 | | | | 273,007 | |
Crocs, Inc.* | | | 10,332 | | | | 212,219 | |
Deckers Outdoor Corp.* | | | 12,600 | | | | 1,602,342 | |
Fossil Group, Inc.* (a) | | | 11,592 | | | | 251,662 | |
G-III Apparel Group Ltd.* (a) | | | 10,332 | | | | 411,834 | |
Hanesbrands, Inc.(a) | | | 5,544 | | | | 95,135 | |
Lululemon Athletica, Inc.* | | | 3,024 | | | | 425,568 | |
Michael Kors Holdings Ltd.* | | | 13,104 | | | | 726,093 | |
Movado Group, Inc.(a) | | | 4,032 | | | | 155,272 | |
NIKE, Inc., Class B | | | 48,132 | | | | 3,611,825 | |
Oxford Industries, Inc.(a) | | | 4,536 | | | | 403,613 | |
PVH Corp. | | | 6,552 | | | | 791,416 | |
Skechers U.S.A., Inc., Class A* (a) | | | 50,148 | | | | 1,432,729 | |
Steven Madden Ltd. | | | 6,414 | | | | 200,566 | |
Tapestry, Inc. | | | 8,316 | | | | 351,850 | |
Under Armour, Inc., Class A* (a) | | | 7,812 | | | | 172,723 | |
Under Armour, Inc., Class C* (a) | | | 2,016 | | | | 39,977 | |
Unifi, Inc.* | | | 1,008 | | | | 23,073 | |
Vera Bradley, Inc.* (a) | | | 14,112 | | | | 186,137 | |
VF Corp. | | | 16,380 | | | | 1,357,575 | |
Wolverine World Wide, Inc.(a) | | | 36,540 | | | | 1,285,112 | |
| | | | | | | | 14,420,906 | |
| Thrifts & Mortgage Finance – 0.6% | |
Axos Financial, Inc.* (a) | | | 20,412 | | | | 619,708 | |
Beneficial Bancorp, Inc. | | | 5,544 | | | | 86,653 | |
See Accompanying Notes to the Financial Statements.
| | |
| 128 | | FLEXSHARES ANNUAL REPORT |
FlexShares® Morningstar US Market Factor Tilt Index Fund (cont.)
| | | | | | | | |
| Investments | | Shares | | | Value | |
| COMMON STOCKS – (continued) | |
| Thrifts & Mortgage Finance – (continued) | |
Capitol Federal Financial, Inc.(a) | | | 1,260 | | | $ | 15,637 | |
Dime Community Bancshares, Inc. | | | 17,388 | | | | 280,294 | |
Essent Group Ltd.* | | | 33,012 | | | | 1,301,333 | |
Federal Agricultural Mortgage Corp., Class C | | | 5,040 | | | | 351,994 | |
Flagstar Bancorp, Inc.* | | | 9,324 | | | | 287,086 | |
HomeStreet, Inc.* | | | 6,552 | | | | 170,221 | |
LendingTree, Inc.* (a) | | | 504 | | | | 101,652 | |
MGIC Investment Corp.* (a) | | | 124,236 | | | | 1,516,922 | |
New York Community Bancorp, Inc.(a) | | | 24,696 | | | | 236,588 | |
NMI Holdings, Inc., Class A* | | | 10,080 | | | | 213,091 | |
Northfield Bancorp, Inc. | | | 5,040 | | | | 66,377 | |
Northwest Bancshares, Inc.(a) | | | 15,876 | | | | 256,239 | |
Ocwen Financial Corp.* (a) | | | 32,760 | | | | 114,660 | |
Oritani Financial Corp.(a) | | | 1,008 | | | | 14,727 | |
PennyMac Financial Services, Inc., Class A | | | 4,788 | | | | 95,712 | |
Provident Financial Services, Inc. | | | 13,860 | | | | 338,184 | |
Radian Group, Inc. | | | 79,632 | | | | 1,528,138 | |
TFS Financial Corp.(a) | | | 2,772 | | | | 40,776 | |
TrustCo Bank Corp.(a) | | | 19,152 | | | | 143,448 | |
United Financial Bancorp, Inc. | | | 2,772 | | | | 42,827 | |
Walker & Dunlop, Inc. | | | 11,088 | | | | 465,252 | |
Washington Federal, Inc. | | | 14,112 | | | | 397,394 | |
WSFS Financial Corp. | | | 5,292 | | | | 225,069 | |
| | | | | | | | 8,909,982 | |
| Tobacco – 0.7% | |
Altria Group, Inc. | | | 67,788 | | | | 4,408,931 | |
Philip Morris International, Inc. | | | 54,180 | | | | 4,771,633 | |
Universal Corp. | | | 7,812 | | | | 530,122 | |
Vector Group Ltd. | | | 12,482 | | | | 168,757 | |
| | | | | | | | 9,879,443 | |
| | | | | | | | |
| Investments | | Shares | | | Value | |
| Trading Companies & Distributors – 0.7% | |
Air Lease Corp.(a) | | | 34,776 | | | $ | 1,324,966 | |
Applied Industrial Technologies, Inc. | | | 5,544 | | | | 364,407 | |
Beacon Roofing Supply, Inc.* (a) | | | 5,040 | | | | 140,666 | |
BMC Stock Holdings, Inc.* | | | 6,804 | | | | 113,899 | |
CAI International, Inc.* | | | 4,032 | | | | 100,437 | |
DXP Enterprises, Inc.* | | | 4,032 | | | | 128,137 | |
Fastenal Co. | | | 2,772 | | | | 142,509 | |
GATX Corp.(a) | | | 19,404 | | | | 1,453,942 | |
GMS, Inc.* | | | 7,560 | | | | 124,286 | |
H&E Equipment Services, Inc. | | | 5,292 | | | | 127,484 | |
HD Supply Holdings, Inc.* | | | 2,016 | | | | 75,741 | |
Herc Holdings, Inc.* | | | 1,764 | | | | 56,554 | |
Kaman Corp. | | | 6,300 | | | | 400,176 | |
MRC Global, Inc.* (a) | | | 26,460 | | | | 418,862 | |
MSC Industrial Direct Co., Inc., Class A(a) | | | 3,528 | | | | 285,980 | |
NOW, Inc.* (a) | | | 38,808 | | | | 498,295 | |
Rush Enterprises, Inc., Class A | | | 12,600 | | | | 445,914 | |
Triton International Ltd.(a) | | | 15,120 | | | | 486,410 | |
United Rentals, Inc.* | | | 4,536 | | | | 544,637 | |
Univar, Inc.* | | | 17,892 | | | | 440,501 | |
Veritiv Corp.* (a) | | | 3,780 | | | | 126,025 | |
Watsco, Inc. | | | 2,268 | | | | 336,072 | |
WESCO International, Inc.* | | | 12,348 | | | | 619,623 | |
WW Grainger, Inc. | | | 1,512 | | | | 429,363 | |
| | | | | | | | 9,184,886 | |
| Transportation Infrastructure – 0.1% | |
Macquarie Infrastructure Corp.(a) | | | 21,924 | | | | 810,092 | |
| Water Utilities – 0.1% | |
American States Water Co. | | | 4,788 | | | | 293,121 | |
American Water Works Co., Inc. | | | 4,032 | | | | 356,953 | |
Aqua America, Inc. | | | 2,268 | | | | 73,778 | |
California Water Service Group | | | 4,788 | | | | 201,096 | |
Connecticut Water Service, Inc. | | | 504 | | | | 34,837 | |
SJW Group | | | 756 | | | | 45,912 | |
| | | | | | | | 1,005,697 | |
See Accompanying Notes to the Financial Statements.
| | | | |
| FLEXSHARES ANNUAL REPORT | | | 129 | |
FlexShares® Morningstar US Market Factor Tilt Index Fund (cont.)
| | | | | | | | |
| Investments | | Shares | | | Value | |
| COMMON STOCKS – (continued) | |
| Wireless Telecommunication Services – 0.2% | |
Boingo Wireless, Inc.* | | | 4,788 | | | $ | 150,008 | |
Gogo, Inc.* (a) | | | 1,260 | | | | 7,207 | |
NII Holdings, Inc.* (a) | | | 21,420 | | | | 133,232 | |
Shenandoah Telecommunications Co. | | | 8,316 | | | | 316,174 | |
Spok Holdings, Inc. | | | 2,772 | | | | 38,863 | |
Sprint Corp.* | | | 44,604 | | | | 272,977 | |
Telephone & Data Systems, Inc. | | | 10,332 | | | | 318,536 | |
T-Mobile US, Inc.* | | | 12,096 | | | | 829,181 | |
United States Cellular Corp.* | | | 1,008 | | | | 48,152 | |
| | | | | | | | 2,114,330 | |
Total Common Stocks
(Cost $999,061,680) | | | | 1,371,117,202 | |
| | | Number of
Rights | | | | |
| RIGHTS – 0.0%(c) | |
| Chemicals – 0.0%(c) | |
A Schulman, Inc., CVR* ‡ (d) | | | 8,177 | | | | 16,354 | |
| Media – 0.0%(c) | |
Media General, Inc., CVR* ‡ (d) | | | 22,261 | | | | 2,226 | |
Total Rights
(Cost $–) | | | | 18,580 | |
| | | Principal
Amount | | | | |
| SECURITIES LENDING REINVESTMENTS(e) – 9.4% | |
| BANK NOTES – 0.1% | |
Bank of America NA, Charlotte
(ICE LIBOR USD 1 Month + 0.22%), 2.50%, 1/15/2019(f) (Cost $2,000,000) | | $ | 2,000,000 | | | | 2,000,000 | |
| | | | | | | | |
| Investments | | Principal
Amount | | | Value | |
| CERTIFICATES OF DEPOSIT – 3.9% | |
China Construction Bank Corp., New York | | | | | | | | |
2.55%, 1/2/2019 | | $ | 3,000,000 | | | $ | 2,999,145 | |
Cooperatieve Rabobank UA, London
(ICE LIBOR USD 3 Month + 0.17%), 2.64%, 4/18/2019(f) | | | 2,000,000 | | | | 2,000,000 | |
Industrial & Commercial Bank of China Ltd., New York Branch | | | | | | | | |
2.53%, 12/24/2018 | | | 3,000,000 | | | | 3,000,000 | |
KBC Bank NV, Brussels | | | | | |
2.40%, 12/27/2018 | | | 3,000,000 | | | | 3,000,000 | |
Mitsubishi UFJ Trust & Banking Corp., New York
(ICE LIBOR USD 1 Month + 0.20%), 2.48%, 4/15/2019(f) | | | 3,500,000 | | | | 3,499,958 | |
Mizuho Bank Ltd., New York
(ICE LIBOR USD 1 Month + 0.25%), 2.53%, 12/10/2018(f) | | | 3,000,000 | | | | 3,000,000 | |
Oversea-Chinese Banking Corp. Ltd., New York (ICE LIBOR USD 1 Month + 0.19%), 2.48%, 4/17/2019(f) | | | 4,000,000 | | | | 3,999,960 | |
Royal Bank of Canada, New York
(ICE LIBOR USD 1 Month + 0.21%), 2.50%, 9/17/2019(f) | | | 3,000,000 | | | | 3,000,234 | |
Societe Generale, New York
(ICE LIBOR USD 1 Month + 0.27%), 2.47%, 12/3/2018(f) | | | 2,500,000 | | | | 2,500,201 | |
Standard Chartered, New York | | | | | | | | |
2.41%, 11/9/2018 | | | 3,000,000 | | | | 3,000,000 | |
The Chiba Bank Ltd., New York Branch | | | | | | | | |
2.40%, 11/30/2018 | | | 4,000,000 | | | | 4,000,000 | |
See Accompanying Notes to the Financial Statements.
| | |
| 130 | | FLEXSHARES ANNUAL REPORT |
FlexShares® Morningstar US Market Factor Tilt Index Fund (cont.)
| | | | | | | | |
| Investments | | Principal
Amount | | | Value | |
| SECURITIES LENDING REINVESTMENTS(e) – (continued) | |
| CERTIFICATES OF DEPOSIT – (continued) | |
The Norinchukin Bank, London | | | | | | | | |
2.45%, 1/14/2019 | | $ | 4,000,000 | | | $ | 3,979,280 | |
The Norinchukin Bank, New York | | | | | | | | |
2.32%, 11/14/2018 | | | 1,500,000 | | | | 1,499,963 | |
The Sumitomo Bank Ltd., New York | | | | | | | | |
2.35%, 11/1/2018 | | | 1,000,000 | | | | 1,000,000 | |
(ICE LIBOR USD 1 Month + 0.21%), 2.50%, 5/17/2019(f) | | | 3,000,000 | | | | 2,999,970 | |
Toronto-Dominion Bank, New York | | | | | | | | |
2.40%, 11/16/2018 | | | 2,000,000 | | | | 2,000,000 | |
(ICE LIBOR USD 1 Month + 0.21%), 2.50%, 9/17/2019(f) | | | 2,000,000 | | | | 1,999,980 | |
Wells Fargo Bank (San Francisco) NA
(ICE LIBOR USD 3 Month + 0.21%), 2.73%, 10/25/2019(f) | | | 3,500,000 | | | | 3,500,000 | |
Westpac Banking Corp., New York
(US Federal Funds Effective Rate (continuous series) + 0.45%), 2.65%, 2/15/2019(f) | | | 2,000,000 | | | | 1,999,994 | |
Total Certificates of Deposit
(Cost $52,980,148) | | | | 52,978,685 | |
| | |
| | | | | | | | |
| COMMERCIAL PAPER – 0.3% | |
Union Bank of Switzerland (ICE LIBOR USD 1 Month + 0.43%), 2.69%, 2/1/2019(f) (g) (Cost $4,000,000) | | | 4,000,000 | | | | 4,002,768 | |
| | | | | | | | |
| Investments | | Principal
Amount | | | Value | |
| FUNDING AGREEMENTS – 0.2% | |
United of Omaha Life Insurance
(ICE LIBOR USD 3 Month + 0.12%), 2.45%, 11/30/2018(f) (Cost $3,000,000) | | $ | 3,000,000 | | | $ | 3,000,000 | |
| REPURCHASE AGREEMENTS – 4.9% | |
Citadel Clearing LLC, 2.80%, dated 10/31/2018, due 1/31/2019, repurchase price $5,035,778, collateralized by various Common Stocks; total market value $5,461,073 | | | 5,000,000 | | | | 5,000,000 | |
Citigroup Global Markets, Inc., 2.46%, dated 10/31/2018, due 11/7/2018, repurchase price $5,002,392, collateralized by various U.S. Treasury Securities, ranging from 1.00% – 2.75%, maturing 11/15/2042 – 2/15/2046; total market value $5,038,611 | | | 5,000,000 | | | | 5,000,000 | |
Citigroup Global Markets, Inc., 2.20%, dated 10/31/2018, due 11/1/2018, repurchase price $4,573,996, collateralized by various U.S. Treasury Securities, ranging from 1.13% – 4.63%, maturing 7/15/2020 – 8/15/2040; total market value $4,612,468 | | | 4,573,717 | | | | 4,573,717 | |
See Accompanying Notes to the Financial Statements.
| | | | |
| FLEXSHARES ANNUAL REPORT | | | 131 | |
FlexShares® Morningstar US Market Factor Tilt Index Fund (cont.)
| | | | | | | | |
| Investments | | Principal
Amount | | | Value | |
| SECURITIES LENDING REINVESTMENTS(e) – (continued) | |
| REPURCHASE AGREEMENTS – (continued) | |
Citigroup Global Markets, Ltd., 2.20%, dated 10/31/2018, due 11/1/2018, repurchase price $5,000,306, collateralized by various U.S. Treasury Securities, ranging from 0.75% – 4.50%, maturing 3/31/2019 – 5/15/2048; total market value $5,054,905 | | $ | 5,000,000 | | | $ | 5,000,000 | |
Mizuho Securities USA, Inc., 2.19%, dated 10/31/2018, due 11/1/2018, repurchase price $25,001,521, collateralized by various U.S. Treasury Securities, ranging from 0.00% – 2.88%, maturing 1/10/2019 – 2/15/2046; total market value $25,353,745 | | | 25,000,000 | | | | 25,000,000 | |
ML Pierce Fenner & Smith, Inc., 2.74%, dated 10/31/2018, due 1/31/2019, repurchase price $6,042,013, collateralized by various Common Stocks; total market value $6,673,847 | | | 6,000,000 | | | | 6,000,000 | |
NBC Global Finance Ltd., 2.36%, dated 10/31/2018, due 11/1/2018, repurchase price $8,100,531, collateralized by various Common Stocks; total market value $9,067,741 | | | 8,100,000 | | | | 8,100,000 | |
| | | | | | | | |
| Investments | | Principal
Amount | | | Value | |
| REPURCHASE AGREEMENTS – (continued) | |
Nomura Securities Co., Ltd., 2.19%, dated 10/31/2018, due 11/1/2018, repurchase price $10,000,608, collateralized by various U.S. Treasury Securities, ranging from 0.00% – 3.00%, maturing 11/15/2018 – 8/15/2047; total market value $10,152,325 | | $ | 10,000,000 | | | $ | 10,000,000 | |
Total Repurchase Agreements
(Cost $68,673,717) | | | | 68,673,717 | |
Total Securities Lending Reinvestments
(Cost $130,653,865) | | | | 130,655,170 | |
Total Investments – 108.2%
(Cost $1,129,715,545) | | | | 1,501,790,952 | |
Liabilities in excess of other assets – (8.2%) | | | | (114,126,270 | ) |
| NET ASSETS – 100.0% | | | $ | 1,387,664,682 | |
| * | Non-income producing security. |
| ‡ | Value determined using significant unobservable inputs. |
| (a) | The security or a portion of this security is on loan at October 31, 2018. The total value of securities on loan at October 31, 2018 was $186,274,310, collateralized in the form of cash with a value of $130,654,828 that was reinvested in the securities shown in the Securities Lending Reinvestment section of the Schedule of Investments; $42,889,498 of collateral in the form of U.S. Government Treasury Securities, interest rates ranging from 0.00% – 8.75%, and maturity dates ranging from November 15, 2018 – February 15, 2048 and $17,835,433 of collateral in the form of Foreign Government Fixed Income Securities, interest rates ranging from 0.00% – 8.50%, and maturity dates ranging from January 15, 2019 – July 22, 2068; a total value of $191,379,759. |
| (b) | Investment in affiliated company. Northern Trust Investments, Inc., the Investment Adviser of the Fund, is a subsidiary of Northern Trust Corporation. |
| (c) | Represents less than 0.05% of net assets. |
| (d) | Security fair valued as of October 31, 2018 in accordance with procedures approved by the Board of Trustees. Total value of all such securities at October 31, 2018 amounted to $18,580, which represents approximately 0.00% of net assets of the Fund. |
See Accompanying Notes to the Financial Statements.
| | |
| 132 | | FLEXSHARES ANNUAL REPORT |
FlexShares® Morningstar US Market Factor Tilt Index Fund (cont.)
| (e) | The security was purchased with cash collateral held from securities on loan at October 31, 2018. The total value of securities purchased was $130,655,170. |
| (f) | Variable or floating rate security, linked to the referenced benchmark. The interest rate shown is the rate in effect as of October 31, 2018. |
| (g) | Security exempt from registration under Section 4(2) of the Securities Act of 1933. Such securities may be sold in transactions exempt from registration normally to qualified institutional buyers. |
Percentages shown are based on Net Assets.
Abbreviations
CVR – Contingent Value Rights
ICE – Intercontinental Exchange
LIBOR – London Interbank Offered Rate
USD – US Dollar
As of October 31, 2018, the gross unrealized appreciation (depreciation) of investments based on the aggregate cost of investments (including derivative instruments, if applicable) for federal income tax purposes was as follows:
| | | | |
| | |
Aggregate gross unrealized appreciation | | $ | 398,579,793 | |
Aggregate gross unrealized depreciation | | | (26,251,039 | ) |
Net unrealized appreciation | | $ | 372,328,754 | |
Federal income tax cost | | $ | 1,128,298,591 | |
Investment in a company which was affiliated for the period ended October 31, 2018, was as follows:
| | | | | | | | | | | | | | | | | | | | | | | | | | | | | | | | |
| Security | | Value
October 31,
2017 | | | Purchases
at Cost | | | Sales
Proceeds | | | Shares
October 31,
2018 | | | Value
October 31,
2018 | | | Change in
Unrealized
Appreciation
(Depreciation) | | | Dividend
Income | | | Realized
Gain | |
Northern Trust Corp. | | $ | 686,811 | | | $ | 135,525 | | | $ | 14,108 | | | | 8,602 | | | $ | 809,190 | | | $ | (5,793 | ) | | $ | 13,646 | | | $ | 6,755 | |
Futures Contracts
FlexShares® Morningstar US Market Factor Tilt Index Fund had the following open futures contracts as of October 31, 2018:
| | | | | | | | | | | | | | | | | | | | |
| | | Number of
Contracts | | | Expiration
Date | | | Trading
Currency | | | Notional
Amount | | | Value and
Unrealized
Depreciation* | |
Long Contracts | | | | | |
Russell 2000 E-Mini Index | | | 39 | | | | 12/21/2018 | | | | USD | | | $ | 2,948,205 | | | $ | (305,969 | ) |
S&P 500 E-Mini Index | | | 74 | | | | 12/21/2018 | | | | USD | | | | 10,031,070 | | | | (560,857 | ) |
S&P Midcap 400 E-Mini Index | | | 19 | | | | 12/21/2018 | | | | USD | | | | 3,467,120 | | | | (296,781 | ) |
| | | | | | | | | | | | | | | | | | | $ | (1,163,607 | ) |
| * | This amount represents the cumulative appreciation/depreciation on futures contracts. Current day’s variation margin is reported within the Statement of Assets and Liabilities for futures contracts. |
Abbreviations:
USD – US Dollar
See Accompanying Notes to the Financial Statements.
| | | | |
| FLEXSHARES ANNUAL REPORT | | | 133 | |
Schedule of Investments
FlexShares® Morningstar Developed Markets ex-US Factor Tilt Index Fund
October 31, 2018
| | | | | | | | |
| Investments | | Shares | | | Value | |
| COMMON STOCKS – 97.9% | |
| Aerospace & Defense – 0.8% | |
Airbus SE | | | 18,711 | | | $ | 2,071,501 | |
BAE Systems plc | | | 98,577 | | | | 662,281 | |
Bombardier, Inc., Class B* | | | 48,735 | | | | 118,382 | |
CAE, Inc. | | | 7,384 | | | | 130,559 | |
Cobham plc* | | | 74,453 | | | | 102,410 | |
Dassault Aviation SA | | | 55 | | | | 91,295 | |
Elbit Systems Ltd. | | | 412 | | | | 49,256 | |
Leonardo SpA | | | 32,960 | | | | 358,142 | |
LISI | | | 3,196 | | | | 93,247 | |
Maxar Technologies Ltd.(a) | | | 3,111 | | | | 46,620 | |
Meggitt plc | | | 37,665 | | | | 254,974 | |
MTU Aero Engines AG | | | 1,458 | | | | 310,243 | |
QinetiQ Group plc | | | 30,657 | | | | 108,781 | |
Rolls-Royce Holdings plc* | | | 73,143 | | | | 784,116 | |
Rolls-Royce Holdings plc (Preference)* (b) | | | 3,364,578 | | | | 4,299 | |
Saab AB, Class B | | | 1,995 | | | | 78,275 | |
Safran SA | | | 10,368 | | | | 1,339,798 | |
Senior plc | | | 78,003 | | | | 272,094 | |
Singapore Technologies Engineering Ltd. | | | 17,900 | | | | 45,887 | |
Thales SA | | | 3,726 | | | | 477,057 | |
Ultra Electronics Holdings plc | | | 6,262 | | | | 115,058 | |
| | | | | | | | 7,514,275 | |
| Air Freight & Logistics – 0.4% | |
Bollore SA | | | 63,865 | | | | 270,780 | |
Cia de Distribucion Integral Logista Holdings SA | | | 2,159 | | | | 52,154 | |
Deutsche Post AG (Registered) | | | 23,976 | | | | 759,290 | |
Freightways Ltd. | | | 12,987 | | | | 62,586 | |
ID Logistics Group* | | | 81 | | | | 13,675 | |
Kerry Logistics Network Ltd. | | | 40,500 | | | | 64,164 | |
Kintetsu World Express, Inc. | | | 14,000 | | | | 217,465 | |
Konoike Transport Co. Ltd. | | | 30,400 | | | | 460,626 | |
Mainfreight Ltd. | | | 3,192 | | | | 59,196 | |
Oesterreichische Post AG | | | 1,673 | | | | 68,014 | |
Panalpina Welttransport Holding AG (Registered) | | | 680 | | | | 83,149 | |
PostNL NV(a) | | | 317,749 | | | | 941,827 | |
| | | | | | | | |
| Investments | | Shares | | | Value | |
| Air Freight & Logistics – (continued) | |
Royal Mail plc | | | 43,335 | | | $ | 198,783 | |
Singapore Post Ltd. | | | 83,600 | | | | 62,785 | |
Yamato Holdings Co. Ltd. | | | 12,600 | | | | 344,991 | |
| | | | | | | | 3,659,485 | |
| Airlines – 0.5% | |
Air Canada* | | | 21,303 | | | | 405,215 | |
Air France-KLM* (a) | | | 30,537 | | | | 296,176 | |
Air New Zealand Ltd. | | | 30,617 | | | | 55,980 | |
ANA Holdings, Inc. | | | 4,500 | | | | 151,323 | |
Cathay Pacific Airways Ltd.(a) | | | 81,000 | | | | 102,911 | |
Chorus Aviation, Inc.(a) | | | 92,988 | | | | 489,280 | |
Dart Group plc | | | 77,760 | | | | 844,542 | |
Deutsche Lufthansa AG (Registered) | | | 12,069 | | | | 242,864 | |
easyJet plc | | | 16,686 | | | | 255,846 | |
Exchange Income Corp.(a) | | | 15,714 | | | | 361,605 | |
Finnair OYJ(a) | | | 45,522 | | | | 342,225 | |
International Consolidated Airlines Group SA, DI | | | 42,606 | | | | 328,490 | |
Japan Airlines Co. Ltd. | | | 8,600 | | | | 306,111 | |
Norwegian Air Shuttle ASA* | | | 7,290 | | | | 186,479 | |
Qantas Airways Ltd. | | | 54,082 | | | | 209,668 | |
SAS AB* (a) | | | 88,913 | | | | 201,180 | |
Singapore Airlines Ltd. | | | 12,000 | | | | 82,149 | |
WestJet Airlines Ltd.(a) | | | 5,913 | | | | 86,359 | |
Wizz Air Holdings plc* (c) | | | 2,172 | | | | 71,352 | |
| | | | | | | | 5,019,755 | |
| Auto Components – 2.2% | |
Aisan Industry Co. Ltd. | | | 29,308 | | | | 220,222 | |
Aisin Seiki Co. Ltd. | | | 9,400 | | | | 369,403 | |
ARB Corp. Ltd.(a) | | | 997 | | | | 12,232 | |
Autoneum Holding AG(a) | | | 1,539 | | | | 298,345 | |
Brembo SpA(a) | | | 9,407 | | | | 104,241 | |
Bridgestone Corp. | | | 26,700 | | | | 1,032,228 | |
Burelle SA | | | 77 | | | | 82,010 | |
CIE Automotive SA | | | 3,217 | | | | 85,294 | |
Cie Generale des Etablissements Michelin SCA | | | 8,667 | | | | 891,080 | |
Cie Plastic Omnium SA | | | 5,832 | | | | 162,556 | |
Continental AG | | | 3,854 | | | | 637,331 | |
See Accompanying Notes to the Financial Statements.
| | |
| 134 | | FLEXSHARES ANNUAL REPORT |
FlexShares® Morningstar Developed Markets ex-US Factor Tilt Index Fund (cont.)
| | | | | | | | |
| Investments | | Shares | | | Value | |
| COMMON STOCKS – (continued) | |
| Auto Components – (continued) | |
Daikyonishikawa Corp. | | | 34,004 | | | $ | 325,412 | |
Denso Corp. | | | 20,600 | | | | 921,802 | |
Dometic Group AB(a) (d) | | | 11,110 | | | | 77,797 | |
Eagle Industry Co. Ltd. | | | 12,600 | | | | 146,817 | |
ElringKlinger AG | | | 12,393 | | | | 105,174 | |
Exedy Corp. | | | 2,800 | | | | 69,122 | |
Faurecia SA | | | 4,293 | | | | 208,722 | |
FCC Co. Ltd. | | | 5,300 | | | | 131,214 | |
Futaba Industrial Co. Ltd. | | | 22,500 | | | | 123,211 | |
Gestamp Automocion SA(c) | | | 12,716 | | | | 80,684 | |
G-Tekt Corp. | | | 9,900 | | | | 139,743 | |
GUD Holdings Ltd.(a) | | | 10,212 | | | | 89,314 | |
Hella GmbH & Co. KGaA | | | 1,806 | | | | 84,716 | |
HI-LEX Corp. | | | 11,264 | | | | 236,548 | |
Ichikoh Industries Ltd. | | | 17,400 | | | | 120,723 | |
Kasai Kogyo Co. Ltd. | | | 32,400 | | | | 298,865 | |
Keihin Corp. | | | 12,300 | | | | 242,937 | |
Koito Manufacturing Co. Ltd. | | | 3,200 | | | | 152,550 | |
KYB Corp.(a) | | | 19,500 | | | | 467,737 | |
Leoni AG | | | 24,202 | | | | 885,185 | |
Linamar Corp. | | | 5,348 | | | | 221,983 | |
Magna International, Inc. | | | 18,792 | | | | 927,401 | |
Martinrea International, Inc. | | | 54,756 | | | | 474,906 | |
Mitsuba Corp. | | | 18,200 | | | | 143,691 | |
Musashi Seimitsu Industry Co. Ltd. | | | 37,400 | | | | 545,814 | |
NGK Spark Plug Co. Ltd. | | | 7,400 | | | | 150,288 | |
NHK Spring Co. Ltd. | | | 17,000 | | | | 146,117 | |
Nifco, Inc.(a) | | | 2,400 | | | | 54,675 | |
Nippon Seiki Co. Ltd. | | | 48,300 | | | | 849,118 | |
Nissin Kogyo Co. Ltd. | | | 13,700 | | | | 199,452 | |
Nokian Renkaat OYJ | | | 2,182 | | | | 69,423 | |
Pacific Industrial Co. Ltd. | | | 50,900 | | | | 744,636 | |
Piolax, Inc. | | | 24,300 | | | | 530,119 | |
Pirelli & C SpA* (c) | | | 18,630 | | | | 137,080 | |
Press Kogyo Co. Ltd. | | | 97,200 | | | | 444,422 | |
SAF-Holland SA(a) | | | 26,649 | | | | 388,907 | |
Showa Corp. | | | 41,400 | | | | 573,375 | |
Stanley Electric Co. Ltd. | | | 3,800 | | | | 112,631 | |
Sumitomo Electric Industries Ltd. | | | 56,700 | | | | 774,723 | |
Sumitomo Riko Co. Ltd. | | | 36,900 | | | | 305,061 | |
| | | | | | | | |
| Investments | | Shares | | | Value | |
| Auto Components – (continued) | |
Sumitomo Rubber Industries Ltd. | | | 17,600 | | | $ | 253,423 | |
Tachi-S Co. Ltd. | | | 36,300 | | | | 512,069 | |
TI Fluid Systems plc(c) | | | 171,558 | | | | 453,761 | |
Tokai Rika Co. Ltd. | | | 2,600 | | | | 47,505 | |
Topre Corp. | | | 6,000 | | | | 124,939 | |
Toyo Tire & Rubber Co. Ltd.(a) | | | 12,600 | | | | 211,014 | |
Toyoda Gosei Co. Ltd. | | | 7,800 | | | | 168,296 | |
Toyota Boshoku Corp. | | | 10,700 | | | | 178,910 | |
Toyota Industries Corp. | | | 9,500 | | | | 467,192 | |
TPR Co. Ltd. | | | 17,100 | | | | 416,837 | |
TS Tech Co. Ltd. | | | 9,200 | | | | 264,942 | |
Unipres Corp. | | | 42,100 | | | | 755,043 | |
Valeo SA | | | 9,595 | | | | 310,385 | |
Yokohama Rubber Co. Ltd. (The)(a) | | | 8,000 | | | | 155,385 | |
| | | | | | | | 20,916,738 | |
| Automobiles – 2.6% | |
Bayerische Motoren Werke AG | | | 15,714 | | | | 1,357,256 | |
Bayerische Motoren Werke AG (Preference) | | | 7,452 | | | | 563,181 | |
Daimler AG (Registered) | | | 50,301 | | | | 2,984,182 | |
Ferrari NV | | | 3,726 | | | | 436,950 | |
Fiat Chrysler Automobiles NV* | | | 52,812 | | | | 804,830 | |
Honda Motor Co. Ltd. | | | 91,400 | | | | 2,624,849 | |
Isuzu Motors Ltd. | | | 35,800 | | | | 470,122 | |
Mazda Motor Corp. | | | 16,600 | | | | 180,040 | |
Mitsubishi Motors Corp.(a) | | | 25,300 | | | | 159,393 | |
Nissan Motor Co. Ltd. | | | 105,300 | | | | 958,715 | |
Peugeot SA | | | 36,045 | | | | 858,882 | |
Piaggio & C SpA | | | 30,294 | | | | 64,908 | |
Porsche Automobil Holding SE (Preference) | | | 5,265 | | | | 335,739 | |
Renault SA | | | 13,365 | | | | 1,000,512 | |
Subaru Corp. | | | 30,400 | | | | 822,393 | |
Suzuki Motor Corp. | | | 16,900 | | | | 846,086 | |
Toyota Motor Corp. | | | 139,000 | | | | 8,147,490 | |
Volkswagen AG | | | 3,321 | | | | 548,625 | |
Volkswagen AG (Preference) | | | 7,047 | | | | 1,187,789 | |
Yamaha Motor Co. Ltd. | | | 18,500 | | | | 439,489 | |
| | | | | | | | 24,791,431 | |
See Accompanying Notes to the Financial Statements.
| | | | |
| FLEXSHARES ANNUAL REPORT | | | 135 | |
FlexShares® Morningstar Developed Markets ex-US Factor Tilt Index Fund (cont.)
| | | | | | | | |
| Investments | | Shares | | | Value | |
| COMMON STOCKS – (continued) | |
| Banks – 10.9% | |
77 Bank Ltd. (The) | | | 10,300 | | | $ | 213,292 | |
ABN AMRO Group NV, CVA(c) | | | 14,256 | | | | 350,515 | |
Aichi Bank Ltd. (The) | | | 8,500 | | | | 324,997 | |
Akita Bank Ltd. (The) | | | 16,200 | | | | 376,380 | |
Aozora Bank Ltd. | | | 4,300 | | | | 148,407 | |
Australia & New Zealand Banking Group Ltd. | | | 144,261 | | | | 2,651,212 | |
Awa Bank Ltd. (The)(a) | | | 2,800 | | | | 76,293 | |
Banca Monte dei Paschi di Siena SpA* (a) | | | 60,183 | | | | 99,046 | |
Banca Popolare di Sondrio SCPA | | | 49,067 | | | | 155,000 | |
Banco Bilbao Vizcaya Argentaria SA | | | 327,402 | | | | 1,812,153 | |
Banco BPM SpA* (a) | | | 16,020 | | | | 30,150 | |
Banco Comercial Portugues SA, Class R* (a) | | | 822,393 | | | | 221,958 | |
Banco de Sabadell SA | | | 178,848 | | | | 236,080 | |
Banco Espirito Santo SA (Registered)* ‡ (b) | | | 48,647 | | | | — | |
Banco Santander SA | | | 820,854 | | | | 3,901,638 | |
Bank Hapoalim BM | | | 75,654 | | | | 512,192 | |
Bank Leumi Le-Israel BM | | | 73,062 | | | | 455,779 | |
Bank of East Asia Ltd. (The) | | | 52,589 | | | | 170,391 | |
Bank of Georgia Group plc | | | 25,191 | | | | 501,937 | |
Bank of Ireland Group plc | | | 43,659 | | | | 309,916 | |
Bank of Iwate Ltd. (The) | | | 13,800 | | | | 526,419 | |
Bank of Kyoto Ltd. (The) | | | 2,600 | | | | 117,266 | |
Bank of Montreal | | | 31,914 | | | | 2,392,001 | |
Bank of Nova Scotia (The) | | | 69,012 | | | | 3,712,696 | |
Bank of Okinawa Ltd. (The) | | | 4,240 | | | | 141,828 | |
Bank of Queensland Ltd.(a) | | | 798 | | | | 5,458 | |
Bank of the Ryukyus Ltd. | | | 40,561 | | | | 462,558 | |
Bankia SA | | | 84,879 | | | | 267,262 | |
Bankinter SA | | | 28,156 | | | | 231,099 | |
Banque Cantonale de Geneve | | | 1,296 | | | | 250,593 | |
Banque Cantonale Vaudoise (Registered) | | | 186 | | | | 139,236 | |
Barclays plc | | | 772,821 | | | | 1,703,389 | |
BAWAG Group AG(c) | | | 4,860 | | | | 210,023 | |
Bendigo & Adelaide Bank Ltd. | | | 3,078 | | | | 22,317 | |
| | | | | | | | |
| Investments | | Shares | | | Value | |
| Banks – (continued) | |
Berner Kantonalbank AG (Registered)(a) | | | 3,645 | | | $ | 768,208 | |
BNP Paribas SA | | | 57,915 | | | | 3,027,078 | |
BPER Banca(a) | | | 63,261 | | | | 240,694 | |
Caisse Regionale de Credit Agricole Mutuel de Paris et d’Ile-de-France | | | 7,695 | | | | 750,690 | |
CaixaBank SA | | | 162,648 | | | | 659,936 | |
Canadian Imperial Bank of Commerce | | | 22,923 | | | | 1,984,304 | |
Canadian Western Bank | | | 1,531 | | | | 35,697 | |
Chiba Bank Ltd. (The) | | | 34,000 | | | | 215,710 | |
Chugoku Bank Ltd. (The) | | | 30,800 | | | | 277,829 | |
Collector AB* (a) | | | 16,848 | | | | 98,621 | |
comdirect bank AG | | | 7,483 | | | | 88,686 | |
Commerzbank AG* | | | 29,322 | | | | 277,049 | |
Commonwealth Bank of Australia | | | 50,301 | | | | 2,468,107 | |
Concordia Financial Group Ltd. | | | 51,821 | | | | 237,856 | |
Credit Agricole SA | | | 50,301 | | | | 645,623 | |
Credito Emiliano SpA(a) | | | 31,418 | | | | 187,602 | |
Credito Valtellinese SpA* (a) | | | 6,334,281 | | | | 663,160 | |
CYBG plc | | | 75,903 | | | | 260,696 | |
Dah Sing Banking Group Ltd. | | | 24,640 | | | | 46,832 | |
Dah Sing Financial Holdings Ltd. | | | 5,340 | | | | 28,643 | |
Daishi Hokuetsu Financial Group, Inc. | | | 14,300 | | | | 514,448 | |
Danske Bank A/S | | | 33,372 | | | | 640,356 | |
DBS Group Holdings Ltd. | | | 62,229 | | | | 1,054,226 | |
DNB ASA | | | 55,485 | | | | 1,007,054 | |
Erste Group Bank AG* | | | 13,932 | | | | 568,283 | |
FIBI Holdings Ltd. | | | 9,123 | | | | 243,087 | |
FinecoBank Banca Fineco SpA | | | 6,110 | | | | 64,009 | |
Fukui Bank Ltd. (The) | | | 8,100 | | | | 153,524 | |
Fukuoka Financial Group, Inc. | | | 6,000 | | | | 147,907 | |
Graubuendner Kantonalbank | | | 81 | | | | 115,956 | |
Gunma Bank Ltd. (The) | | | 14,900 | | | | 67,598 | |
Hang Seng Bank Ltd. | | | 24,300 | | | | 569,110 | |
Heartland Bank Ltd.(b) | | | 208,585 | | | | 209,757 | |
Hokkoku Bank Ltd. (The)(a) | | | 26,000 | | | | 956,094 | |
HSBC Holdings plc | | | 596,808 | | | | 4,917,823 | |
Hyakugo Bank Ltd. (The) | | | 67,200 | | | | 247,709 | |
Hyakujushi Bank Ltd. (The) | | | 24,300 | | | | 621,846 | |
See Accompanying Notes to the Financial Statements.
| | |
| 136 | | FLEXSHARES ANNUAL REPORT |
FlexShares® Morningstar Developed Markets ex-US Factor Tilt Index Fund (cont.)
| | | | | | | | |
| Investments | | Shares | | | Value | |
| COMMON STOCKS – (continued) | |
| Banks – (continued) | |
ING Groep NV | | | 192,375 | | | $ | 2,284,331 | |
Intesa Sanpaolo SpA | | | 895,005 | | | | 1,980,509 | |
Israel Discount Bank Ltd., Class A | | | 72,098 | | | | 235,730 | |
Iyo Bank Ltd. (The) | | | 29,000 | | | | 172,425 | |
Juroku Bank Ltd. (The) | | | 34,300 | | | | 776,237 | |
Jyske Bank A/S (Registered) | | | 7,047 | | | | 288,207 | |
KBC Group NV | | | 10,287 | | | | 709,831 | |
Keiyo Bank Ltd. (The) | | | 43,000 | | | | 314,341 | |
Kiyo Bank Ltd. (The) | | | 59,000 | | | | 877,772 | |
Kyushu Financial Group, Inc.(a) | | | 64,800 | | | | 286,520 | |
Laurentian Bank of Canada(a) | | | 28,917 | | | | 915,127 | |
Liberbank SA* | | | 1,951,938 | | | | 916,063 | |
Liechtensteinische Landesbank AG | | | 9,639 | | | | 622,860 | |
Lloyds Banking Group plc | | | 3,564,567 | | | | 2,606,157 | |
Luzerner Kantonalbank AG (Registered)(a) | | | 259 | | | | 130,028 | |
Mebuki Financial Group, Inc. | | | 48,610 | | | | 148,602 | |
Mediobanca Banca di Credito Finanziario SpA | | | 52,083 | | | | 457,466 | |
Metro Bank plc* (a) | | | 5,084 | | | | 144,473 | |
Mitsubishi UFJ Financial Group, Inc. | | | 708,100 | | | | 4,296,725 | |
Miyazaki Bank Ltd. (The) | | | 16,200 | | | | 423,177 | |
Mizrahi Tefahot Bank Ltd. | | | 12,033 | | | | 202,630 | |
Mizuho Financial Group, Inc. | | | 1,239,300 | | | | 2,130,381 | |
Musashino Bank Ltd. (The) | | | 35,600 | | | | 965,274 | |
Nanto Bank Ltd. (The) | | | 34,746 | | | | 795,874 | |
National Australia Bank Ltd. | | | 73,224 | | | | 1,308,336 | |
National Bank of Canada | | | 20,898 | | | | 950,972 | |
Nishi-Nippon Financial Holdings, Inc. | | | 7,600 | | | | 72,461 | |
Nordea Bank Abp | | | 148,797 | | | | 1,295,749 | |
North Pacific Bank Ltd. | | | 38,600 | | | | 115,949 | |
Norwegian Finans Holding ASA* | | | 2,660 | | | | 23,847 | |
Ogaki Kyoritsu Bank Ltd. (The) | | | 27,100 | | | | 601,529 | |
Oita Bank Ltd. (The) | | | 16,800 | | | | 558,238 | |
Oversea-Chinese Banking Corp. Ltd.(a) | | | 145,073 | | | | 1,125,133 | |
Raiffeisen Bank International AG | | | 2,465 | | | | 67,311 | |
Resona Holdings, Inc. | | | 137,700 | | | | 725,989 | |
| | | | | | | | |
| Investments | | Shares | | | Value | |
| Banks – (continued) | |
Ringkjoebing Landbobank A/S | | | 1,100 | | | $ | 55,963 | |
Royal Bank of Canada | | | 41,715 | | | | 3,046,871 | |
Royal Bank of Scotland Group plc | | | 304,398 | | | | 919,465 | |
San-In Godo Bank Ltd. (The) | | | 24,800 | | | | 188,546 | |
Sbanken ASA(c) | | | 65,913 | | | | 658,742 | |
Senshu Ikeda Holdings, Inc. | | | 173,200 | | | | 532,545 | |
Seven Bank Ltd.(a) | | | 48,600 | | | | 152,016 | |
Shiga Bank Ltd. (The) | | | 1,000 | | | | 23,287 | |
Shikoku Bank Ltd. (The) | | | 41,900 | | | | 472,259 | |
Shizuoka Bank Ltd. (The) | | | 19,100 | | | | 167,721 | |
Skandinaviska Enskilda Banken AB, Class A | | | 64,314 | | | | 666,805 | |
Skandinaviska Enskilda Banken AB, Class C | | | 7,040 | | | | 72,405 | |
Societe Generale SA | | | 35,640 | | | | 1,311,604 | |
Spar Nord Bank A/S | | | 79,380 | | | | 658,215 | |
SpareBank 1 Nord Norge | | | 65,367 | | | | 524,183 | |
Sparebank 1 Oestlandet | | | 16,416 | | | | 171,095 | |
SpareBank 1 SMN | | | 105,381 | | | | 1,078,265 | |
SpareBank 1 SR-Bank ASA | | | 8,041 | | | | 89,738 | |
St Galler Kantonalbank AG (Registered) | | | 110 | | | | 54,240 | |
Standard Chartered plc | | | 63,261 | | | | 444,170 | |
Sumitomo Mitsui Financial Group, Inc. | | | 74,900 | | | | 2,929,499 | |
Sumitomo Mitsui Trust Holdings, Inc. | | | 22,600 | | | | 899,955 | |
Suruga Bank Ltd.(a) | | | 8,000 | | | | 37,783 | |
Svenska Handelsbanken AB, Class A | | | 32,686 | | | | 355,982 | |
Svenska Handelsbanken AB, Class B(a) | | | 31,940 | | | | 354,357 | |
Swedbank AB, Class A | | | 41,796 | | | | 942,499 | |
Sydbank A/S | | | 4,698 | | | | 108,662 | |
TBC Bank Group plc | | | 28,917 | | | | 624,433 | |
Toho Bank Ltd. (The) | | | 22,732 | | | | 80,772 | |
Tokyo Kiraboshi Financial Group, Inc. | | | 16,200 | | | | 262,260 | |
TOMONY Holdings, Inc. | | | 107,400 | | | | 417,780 | |
Toronto-Dominion Bank (The) | | | 55,647 | | | | 3,094,537 | |
Unicaja Banco SA(c) | | | 143,613 | | | | 184,037 | |
UniCredit SpA | | | 100,432 | | | | 1,287,698 | |
See Accompanying Notes to the Financial Statements.
| | | | |
| FLEXSHARES ANNUAL REPORT | | | 137 | |
FlexShares® Morningstar Developed Markets ex-US Factor Tilt Index Fund (cont.)
| | | | | | | | |
| Investments | | Shares | | | Value | |
| COMMON STOCKS – (continued) | |
| Banks – (continued) | |
Unione di Banche Italiane SpA(a) | | | 38,394 | | | $ | 117,456 | |
United Overseas Bank Ltd. | | | 50,826 | | | | 894,814 | |
Valiant Holding AG (Registered) | | | 11,421 | | | | 1,292,086 | |
Van Lanschot Kempen NV, CVA | | | 27,378 | | | | 671,597 | |
Walliser Kantonalbank (Registered) | | | 2,106 | | | | 236,582 | |
Westpac Banking Corp. | | | 95,499 | | | | 1,817,340 | |
Yamagata Bank Ltd. (The) | | | 2,200 | | | | 44,641 | |
Yamaguchi Financial Group, Inc. | | | 19,200 | | | | 202,965 | |
Yamanashi Chuo Bank Ltd. (The) | | | 16,200 | | | | 231,972 | |
| | | | | | | | 105,695,385 | |
| Beverages – 1.3% | |
AG Barr plc | | | 4,785 | | | | 46,711 | |
Anheuser-Busch InBev SA/NV | | | 28,629 | | | | 2,113,017 | |
Asahi Group Holdings Ltd. | | | 17,000 | | | | 748,359 | |
Britvic plc | | | 16,720 | | | | 168,989 | |
C&C Group plc | | | 257,022 | | | | 955,198 | |
Carlsberg A/S, Class B | | | 3,159 | | | | 348,585 | |
Coca-Cola Amatil Ltd. | | | 36,612 | | | | 257,152 | |
Coca-Cola Bottlers Japan Holdings, Inc. | | | 3,354 | | | | 87,821 | |
Coca-Cola European Partners plc | | | 8,100 | | | | 368,469 | |
Coca-Cola HBC AG, DI* | | | 7,791 | | | | 229,959 | |
Cott Corp.(a) | | | 6,871 | | | | 103,699 | |
Davide Campari-Milano SpA | | | 13,794 | | | | 106,201 | |
Diageo plc | | | 78,570 | | | | 2,719,139 | |
Fevertree Drinks plc | | | 3,795 | | | | 134,853 | |
Goldin Financial Holdings Ltd.* | | | 60,000 | | | | 21,430 | |
Heineken Holding NV | | | 4,698 | | | | 407,215 | |
Heineken NV | | | 8,748 | | | | 788,989 | |
Ito En Ltd.(a) | | | 800 | | | | 34,097 | |
Kirin Holdings Co. Ltd. | | | 29,038 | | | | 694,334 | |
Molson Coors Canada, Inc., Class B | | | 11,651 | | | | 765,644 | |
Pernod Ricard SA | | | 6,723 | | | | 1,026,838 | |
Remy Cointreau SA | | | 580 | | | | 68,937 | |
Royal Unibrew A/S | | | 1,210 | | | | 85,963 | |
Sapporo Holdings Ltd.(a) | | | 1,800 | | | | 33,510 | |
Suntory Beverage & Food Ltd. | | | 3,000 | | | | 122,414 | |
| | | | | | | | |
| Investments | | Shares | | | Value | |
| Beverages – (continued) | |
Takara Holdings, Inc. | | | 8,600 | | | $ | 120,783 | |
Treasury Wine Estates Ltd. | | | 22,356 | | | | 239,574 | |
| | | | | | | | 12,797,880 | |
| Biotechnology – 0.7% | |
Abcam plc | | | 10,049 | | | | 154,081 | |
Bavarian Nordic A/S* | | | 3,807 | | | | 88,140 | |
BioGaia AB, Class B | | | 1,134 | | | | 45,969 | |
Biotest AG (Preference) | | | 972 | | | | 25,826 | |
Cellectis SA* | | | 2,498 | | | | 62,551 | |
CSL Ltd. | | | 13,932 | | | | 1,856,369 | |
Galapagos NV* (a) | | | 1,680 | | | | 172,650 | |
Genmab A/S* | | | 1,134 | | | | 155,409 | |
Genus plc | | | 6,007 | | | | 169,934 | |
Grifols SA | | | 10,206 | | | | 291,295 | |
Grifols SA (Preference), Class B | | | 10,046 | | | | 206,481 | |
HEALIOS KK* (a) | | | 1,100 | | | | 15,547 | |
Idorsia Ltd.* | | | 1,863 | | | | 36,134 | |
Knight Therapeutics, Inc.* | | | 11,684 | | | | 69,931 | |
Mesoblast Ltd.* | | | 67,149 | | | | 94,708 | |
PeptiDream, Inc.* (a) | | | 2,500 | | | | 82,074 | |
SanBio Co. Ltd.* | | | 2,200 | | | | 71,738 | |
Shire plc | | | 44,955 | | | | 2,688,538 | |
Swedish Orphan Biovitrum AB* | | | 6,345 | | | | 129,681 | |
Vitrolife AB | | | 4,445 | | | | 65,977 | |
| | | | | | | | 6,483,033 | |
| Building Products – 1.1% | |
AGC, Inc. | | | 13,300 | | | | 437,225 | |
Aica Kogyo Co. Ltd. | | | 1,500 | | | | 44,659 | |
Arbonia AG* (a) | | | 3,800 | | | | 47,750 | |
Assa Abloy AB, Class B | | | 32,319 | | | | 645,340 | |
Belimo Holding AG (Registered) | | | 21 | | | | 94,050 | |
Bunka Shutter Co. Ltd.(a) | | | 58,500 | | | | 410,026 | |
Central Glass Co. Ltd.(a) | | | 32,600 | | | | 704,834 | |
Cie de Saint-Gobain | | | 34,101 | | | | 1,284,332 | |
Daikin Industries Ltd. | | | 8,700 | | | | 1,011,807 | |
dormakaba Holding AG* (a) | | | 212 | | | | 153,220 | |
Geberit AG (Registered) | | | 1,296 | | | | 508,016 | |
GWA Group Ltd. | | | 99,387 | | | | 193,712 | |
Inwido AB(a) | | | 22,194 | | | | 148,248 | |
James Halstead plc | | | 23,166 | | | | 114,257 | |
Kingspan Group plc | | | 4,835 | | | | 210,367 | |
See Accompanying Notes to the Financial Statements.
| | |
| 138 | | FLEXSHARES ANNUAL REPORT |
FlexShares® Morningstar Developed Markets ex-US Factor Tilt Index Fund (cont.)
| | | | | | | | |
| Investments | | Shares | | | Value | |
| COMMON STOCKS – (continued) | |
| Building Products – (continued) | |
Lindab International AB | | | 78,165 | | | $ | 547,344 | |
LIXIL Group Corp. | | | 5,200 | | | | 82,017 | |
Nibe Industrier AB, Class B | | | 9,994 | | | | 104,514 | |
Nichias Corp. | | | 6,500 | | | | 141,917 | |
Nichiha Corp. | | | 8,100 | | | | 178,644 | |
Nippon Sheet Glass Co. Ltd.(a) | | | 83,700 | | | | 708,285 | |
Nitto Boseki Co. Ltd. | | | 34,200 | | | | 678,212 | |
Noritz Corp. | | | 4,400 | | | | 63,902 | |
Okabe Co. Ltd. | | | 37,300 | | | | 331,504 | |
Polypipe Group plc | | | 29,851 | | | | 141,507 | |
Reliance Worldwide Corp. Ltd.(a) | | | 52,795 | | | | 187,467 | |
Rockwool International A/S, Class A | | | 220 | | | | 62,979 | |
Rockwool International A/S, Class B | | | 82 | | | | 28,044 | |
Sanwa Holdings Corp. | | | 9,800 | | | | 115,059 | |
Schweiter Technologies AG(a) | | | 136 | | | | 154,672 | |
Sekisui Jushi Corp. | | | 11,200 | | | | 203,149 | |
Takara Standard Co. Ltd. | | | 41,876 | | | | 647,871 | |
Takasago Thermal Engineering Co. Ltd. | | | 17,400 | | | | 297,568 | |
Tarkett SA | | | 5,258 | | | | 115,934 | |
TOTO Ltd. | | | 3,900 | | | | 139,958 | |
Uponor OYJ | | | 4,466 | | | | 48,451 | |
| | | | | | | | 10,986,841 | |
| Capital Markets – 2.3% | |
3i Group plc | | | 50,787 | | | | 569,891 | |
Amundi SA(c) | | | 3,219 | | | | 191,774 | |
Anima Holding SpA(c) | | | 27,311 | | | | 114,495 | |
Arko Holdings Ltd.* | | | 62,127 | | | | 31,963 | |
Ashmore Group plc | | | 23,895 | | | | 107,533 | |
ASX Ltd. | | | 2,924 | | | | 122,623 | |
Avanza Bank Holding AB | | | 1,367 | | | | 73,198 | |
Azimut Holding SpA(a) | | | 1,350 | | | | 16,650 | |
Banca Generali SpA | | | 7,557 | | | | 145,819 | |
Bolsas y Mercados Espanoles SHMSF SA | | | 1,925 | | | | 57,014 | |
Brederode SA* | | | 9,636 | | | | 583,025 | |
Brewin Dolphin Holdings plc | | | 14,682 | | | | 61,758 | |
| | | | | | | | |
| Investments | | Shares | | | Value | |
| Capital Markets – (continued) | |
Brookfield Asset Management, Inc., Class A | | | 31,590 | | | $ | 1,292,225 | |
Bure Equity AB | | | 36,000 | | | | 469,512 | |
Burford Capital Ltd. | | | 9,671 | | | | 204,881 | |
China LNG Group Ltd.* (a) | | | 324,000 | | | | 44,636 | |
China Smarter Energy Group Holdings Ltd.* | | | 162,000 | | | | 15,499 | |
CI Financial Corp. | | | 3,159 | | | | 46,835 | |
Close Brothers Group plc(a) | | | 16,196 | | | | 304,622 | |
CMBC Capital Holdings Ltd.* (a) | | | 680,000 | | | | 24,288 | |
Credit Suisse Group AG (Registered)* | | | 61,479 | | | | 807,985 | |
Daiwa Securities Group, Inc. | | | 52,500 | | | | 300,937 | |
Deutsche Bank AG (Registered) | | | 83,268 | | | | 816,194 | |
Deutsche Boerse AG | | | 6,077 | | | | 770,148 | |
DWS Group GmbH & Co. KGaA* (c) | | | 7,452 | | | | 208,301 | |
EFG International AG* | | | 61,155 | | | | 432,262 | |
Euronext NV(c) | | | 1,650 | | | | 101,796 | |
Fairfax India Holdings Corp.* (c) | | | 9,963 | | | | 126,430 | |
Fiera Capital Corp. | | | 50,537 | | | | 476,797 | |
Flow Traders(a) (c) | | | 3,572 | | | | 113,809 | |
GAM Holding AG* (a) | | | 22,437 | | | | 130,487 | |
Gimv NV | | | 15,671 | | | | 837,197 | |
GMO Financial Holdings, Inc. | | | 13,600 | | | | 87,851 | |
Haitong International Securities Group Ltd.(a) | | | 253,301 | | | | 82,717 | |
Hargreaves Lansdown plc | | | 5,061 | | | | 120,798 | |
Hong Kong Exchanges & Clearing Ltd. | | | 36,637 | | | | 972,076 | |
IG Group Holdings plc | | | 8,113 | | | | 62,665 | |
IGM Financial, Inc. | | | 158 | | | | 3,890 | |
Intermediate Capital Group plc | | | 18,306 | | | | 222,677 | |
Investec plc | | | 40,014 | | | | 247,459 | |
IP Group plc* | | | 18,946 | | | | 25,903 | |
Jafco Co. Ltd. | | | 300 | | | | 11,590 | |
Japan Exchange Group, Inc. | | | 19,200 | | | | 344,683 | |
Julius Baer Group Ltd.* | | | 5,994 | | | | 274,345 | |
Jupiter Fund Management plc | | | 39,320 | | | | 169,313 | |
Kingston Financial Group Ltd. | | | 260,000 | | | | 60,030 | |
Leonteq AG* | | | 920 | | | | 43,499 | |
London Stock Exchange Group plc | | | 10,044 | | | | 553,775 | |
See Accompanying Notes to the Financial Statements.
| | | | |
| FLEXSHARES ANNUAL REPORT | | | 139 | |
FlexShares® Morningstar Developed Markets ex-US Factor Tilt Index Fund (cont.)
| | | | | | | | |
| Investments | | Shares | | | Value | |
| COMMON STOCKS – (continued) | |
| Capital Markets – (continued) | |
Macquarie Group Ltd. | | | 11,988 | | | $ | 995,789 | |
Magellan Financial Group Ltd.(a) | | | 14,742 | | | | 278,345 | |
Man Group plc | | | 103,437 | | | | 205,453 | |
Marusan Securities Co. Ltd. | | | 3,500 | | | | 26,950 | |
Mason Group Holdings Ltd.* | | | 2,078,905 | | | | 37,657 | |
Monex Group, Inc.(a) | | | 15,400 | | | | 60,724 | |
Natixis SA | | | 75,249 | | | | 440,458 | |
NEX Group plc | | | 9,118 | | | | 132,350 | |
Nomura Holdings, Inc. | | | 141,500 | | | | 686,467 | |
Okasan Securities Group, Inc. | | | 144,700 | | | | 693,657 | |
Partners Group Holding AG | | | 567 | | | | 404,436 | |
Pendal Group Ltd.(a) | | | 25,924 | | | | 149,378 | |
Rathbone Brothers plc | | | 1,140 | | | | 33,532 | |
Ratos AB, Class B | | | 38,880 | | | | 105,158 | |
Rothschild & Co. | | | 6,804 | | | | 271,752 | |
Sanne Group plc | | | 13,604 | | | | 97,342 | |
SBI Holdings, Inc. | | | 11,200 | | | | 293,857 | |
Schroders plc | | | 6,275 | | | | 214,879 | |
Schroders plc (Non-Voting) | | | 4,377 | | | | 124,997 | |
St James’s Place plc | | | 29,727 | | | | 384,965 | |
Thomson Reuters Corp.(a) | | | 12,312 | | | | 574,419 | |
TMX Group Ltd. | | | 1,545 | | | | 97,400 | |
Tokai Tokyo Financial Holdings, Inc. | | | 13,200 | | | | 68,190 | |
TP ICAP plc | | | 37,017 | | | | 137,166 | |
UBS Group AG (Registered)* | | | 191,484 | | | | 2,682,185 | |
Value Partners Group Ltd.(a) | | | 8,000 | | | | 5,939 | |
Vontobel Holding AG (Registered) | | | 339 | | | | 21,063 | |
Vostok New Ventures Ltd., SDR* | | | 8,501 | | | | 64,736 | |
VZ Holding AG | | | 217 | | | | 61,590 | |
Yunfeng Financial Group Ltd.* | | | 136,000 | | | | 66,791 | |
| | | | | | | | 22,301,480 | |
| Chemicals – 2.8% | |
ADEKA Corp. | | | 4,200 | | | | 62,411 | |
Air Liquide SA | | | 12,202 | | | | 1,479,326 | |
Air Water, Inc. | | | 6,000 | | | | 97,346 | |
Akzo Nobel NV | | | 7,569 | | | | 637,029 | |
Arkema SA | | | 3,726 | | | | 391,693 | |
Asahi Kasei Corp. | | | 60,300 | | | | 725,064 | |
| | | | | | | | |
| Investments | | Shares | | | Value | |
| Chemicals – (continued) | |
BASF SE | | | 26,325 | | | $ | 2,029,168 | |
Borregaard ASA(a) | | | 6,375 | | | | 57,645 | |
C Uyemura & Co. Ltd. | | | 4,300 | | | | 274,715 | |
Chr Hansen Holding A/S | | | 2,916 | | | | 294,846 | |
Chugoku Marine Paints Ltd.(a) | | | 26,100 | | | | 209,762 | |
CI Takiron Corp. | | | 63,800 | | | | 327,324 | |
Clariant AG (Registered)* | | | 12,583 | | | | 271,575 | |
Corbion NV | | | 3,198 | | | | 97,255 | |
Covestro AG(c) | | | 12,555 | | | | 812,557 | |
Croda International plc | | | 4,779 | | | | 294,327 | |
Daicel Corp. | | | 15,700 | | | | 166,244 | |
Dainichiseika Color & Chemicals Manufacturing Co. Ltd. | | | 16,200 | | | | 479,447 | |
Denka Co. Ltd. | | | 2,600 | | | | 84,781 | |
DIC Corp. | | | 2,899 | | | | 85,669 | |
DuluxGroup Ltd. | | | 12,466 | | | | 65,381 | |
Elementis plc | | | 47,373 | | | | 124,088 | |
EMS-Chemie Holding AG (Registered) | | | 114 | | | | 62,899 | |
Essentra plc | | | 27,894 | | | | 136,151 | |
Evonik Industries AG | | | 8,586 | | | | 266,557 | |
FUCHS PETROLUB SE | | | 216 | | | | 9,373 | |
FUCHS PETROLUB SE (Preference) | | | 2,151 | | | | 99,779 | |
Fujimori Kogyo Co. Ltd. | | | 3,600 | | | | 104,630 | |
Fuso Chemical Co. Ltd.(a) | | | 1,100 | | | | 21,989 | |
Givaudan SA (Registered) | | | 243 | | | | 590,409 | |
Hexpol AB | | | 8,424 | | | | 78,067 | |
Hitachi Chemical Co. Ltd.(a) | | | 10,300 | | | | 162,548 | |
Incitec Pivot Ltd. | | | 54,091 | | | | 149,514 | |
Ishihara Sangyo Kaisha Ltd.* | | | 22,900 | | | | 273,936 | |
Israel Chemicals Ltd. | | | 29,862 | | | | 172,167 | |
Israel Corp. Ltd. (The) | | | 243 | | | | 71,094 | |
Johnson Matthey plc | | | 10,854 | | | | 412,316 | |
JSP Corp. | | | 10,300 | | | | 202,979 | |
JSR Corp. | | | 8,300 | | | | 123,998 | |
K+S AG (Registered) | | | 5,994 | | | | 111,856 | |
Kaneka Corp. | | | 4,400 | | | | 184,024 | |
Kansai Paint Co. Ltd.(a) | | | 6,100 | | | | 90,320 | |
Kanto Denka Kogyo Co. Ltd. | | | 34,800 | | | | 316,686 | |
Kemira OYJ | | | 4,535 | | | | 55,649 | |
KH Neochem Co. Ltd.(a) | | | 9,900 | | | | 280,714 | |
Koninklijke DSM NV | | | 5,715 | | | | 501,065 | |
See Accompanying Notes to the Financial Statements.
| | |
| 140 | | FLEXSHARES ANNUAL REPORT |
FlexShares® Morningstar Developed Markets ex-US Factor Tilt Index Fund (cont.)
| | | | | | | | |
| Investments | | Shares | | | Value | |
| COMMON STOCKS – (continued) | |
| Chemicals – (continued) | |
Konishi Co. Ltd.(a) | | | 16,200 | | | $ | 227,235 | |
Kumiai Chemical Industry Co. Ltd.(a) | | | 29,948 | | | | 186,288 | |
Kuraray Co. Ltd. | | | 9,500 | | | | 130,898 | |
Kureha Corp. | | | 3,800 | | | | 244,792 | |
LANXESS AG | | | 2,603 | | | | 161,505 | |
Lenzing AG(a) | | | 2,085 | | | | 189,347 | |
Lintec Corp. | | | 1,800 | | | | 42,618 | |
Methanex Corp. | | | 5,265 | | | | 341,779 | |
Mitsubishi Chemical Holdings Corp. | | | 73,400 | | | | 573,060 | |
Mitsubishi Gas Chemical Co., Inc. | | | 9,000 | | | | 151,602 | |
Mitsui Chemicals, Inc. | | | 8,400 | | | | 188,685 | |
Nihon Parkerizing Co. Ltd. | | | 7,600 | | | | 91,789 | |
Nippon Kayaku Co. Ltd.(a) | | | 15,100 | | | | 180,362 | |
Nippon Paint Holdings Co. Ltd.(a) | | | 5,200 | | | | 162,882 | |
Nippon Shokubai Co. Ltd. | | | 400 | | | | 25,803 | |
Nippon Soda Co. Ltd. | | | 11,239 | | | | 293,187 | |
Nissan Chemical Corp. | | | 3,800 | | | | 179,806 | |
Nitto Denko Corp. | | | 3,300 | | | | 206,968 | |
NOF Corp. | | | 2,000 | | | | 56,799 | |
Novozymes A/S, Class B | | | 7,047 | | | | 348,353 | |
Nufarm Ltd. | | | 18,010 | | | | 72,758 | |
Nutrien Ltd. | | | 19,452 | | | | 1,032,256 | |
OCI NV* | | | 2,358 | | | | 67,167 | |
Okamoto Industries, Inc. | | | 600 | | | | 27,008 | |
Orica Ltd. | | | 4,722 | | | | 57,430 | |
Osaka Soda Co. Ltd. | | | 17,000 | | | | 400,239 | |
Sakata INX Corp. | | | 32,800 | | | | 325,806 | |
Sanyo Chemical Industries Ltd. | | | 11,500 | | | | 527,845 | |
Sekisui Plastics Co. Ltd. | | | 8,100 | | | | 63,017 | |
Shikoku Chemicals Corp. | | | 10,000 | | | | 102,432 | |
Shin-Etsu Chemical Co. Ltd. | | | 10,600 | | | | 889,384 | |
Shin-Etsu Polymer Co. Ltd. | | | 23,200 | | | | 169,804 | |
Showa Denko KK | | | 9,800 | | | | 428,107 | |
Sika AG (Registered) | | | 4,860 | | | | 624,229 | |
Sirius Minerals plc* (a) | | | 374,953 | | | | 110,384 | |
SOL SpA | | | 3,009 | | | | 36,275 | |
Solvay SA | | | 4,860 | | | | 554,242 | |
Sumitomo Bakelite Co. Ltd. | | | 3,000 | | | | 108,591 | |
| | | | | | | | |
| Investments | | Shares | | | Value | |
| Chemicals – (continued) | |
Sumitomo Chemical Co. Ltd. | | | 75,000 | | | $ | 376,146 | |
Sumitomo Seika Chemicals Co. Ltd. | | | 8,100 | | | | 404,803 | |
Symrise AG | | | 3,645 | | | | 306,278 | |
Synthomer plc | | | 12,732 | | | | 72,231 | |
T Hasegawa Co. Ltd. | | | 900 | | | | 16,013 | |
Taiyo Holdings Co. Ltd. | | | 900 | | | | 32,178 | |
Taiyo Nippon Sanso Corp.(a) | | | 7,200 | | | | 115,922 | |
Takasago International Corp. | | | 16,200 | | | | 516,052 | |
Teijin Ltd. | | | 8,200 | | | | 142,413 | |
Tenma Corp. | | | 8,100 | | | | 141,035 | |
Tessenderlo Group SA* | | | 779 | | | | 27,450 | |
Toagosei Co. Ltd. | | | 6,900 | | | | 70,923 | |
Tokai Carbon Co. Ltd.(a) | | | 11,000 | | | | 172,132 | |
Tokuyama Corp. | | | 2,500 | | | | 56,134 | |
Tokyo Ohka Kogyo Co. Ltd. | | | 700 | | | | 18,794 | |
Toray Industries, Inc. | | | 35,400 | | | | 251,537 | |
Tosoh Corp. | | | 22,100 | | | | 292,369 | |
Toyo Ink SC Holdings Co. Ltd. | | | 1,600 | | | | 37,273 | |
Ube Industries Ltd. | | | 9,500 | | | | 207,753 | |
Umicore SA | | | 6,237 | | | | 293,910 | |
Victrex plc | | | 3,740 | | | | 126,733 | |
Wacker Chemie AG | | | 884 | | | | 79,188 | |
Yara International ASA | | | 6,318 | | | | 272,642 | |
Zeon Corp. | | | 8,000 | | | | 77,480 | |
| | | | | | | | 27,234,494 | |
| Commercial Services & Supplies – 1.0% | |
Babcock International Group plc | | | 24,138 | | | | 188,508 | |
Bell System24 Holdings, Inc.(a) | | | 5,600 | | | | 74,035 | |
Bilfinger SE | | | 2,914 | | | | 127,182 | |
Bingo Industries Ltd.(a) (c) | | | 9,500 | | | | 16,092 | |
Boyd Group Income Fund | | | 300 | | | | 27,484 | |
Brambles Ltd. | | | 65,020 | | | | 489,401 | |
Bravida Holding AB(c) | | | 12,702 | | | | 93,461 | |
Caverion OYJ* (a) | | | 9,768 | | | | 61,149 | |
CITIC Envirotech Ltd. | | | 534,600 | | | | 154,419 | |
Cleanaway Waste Management Ltd. | | | 120,181 | | | | 153,321 | |
Coor Service Management Holding AB(c) | | | 51,790 | | | | 365,488 | |
Dai Nippon Printing Co. Ltd. | | | 3,900 | | | | 87,604 | |
Daiseki Co. Ltd. | | | 2,500 | | | | 59,235 | |
See Accompanying Notes to the Financial Statements.
| | | | |
| FLEXSHARES ANNUAL REPORT | | | 141 | |
FlexShares® Morningstar Developed Markets ex-US Factor Tilt Index Fund (cont.)
| | | | | | | | |
| Investments | | Shares | | | Value | |
| COMMON STOCKS – (continued) | |
| Commercial Services & Supplies – (continued) | |
Derichebourg SA | | | 18,063 | | | $ | 87,186 | |
Downer EDI Ltd. | | | 45,846 | | | | 224,854 | |
Duskin Co. Ltd. | | | 5,700 | | | | 129,703 | |
Edenred | | | 5,681 | | | | 215,828 | |
Elis SA(a) | | | 7,711 | | | | 155,780 | |
Elis SA – XLON | | | 4,520 | | | | 91,289 | |
G4S plc(a) | | | 26,320 | | | | 72,305 | |
HomeServe plc | | | 11,489 | | | | 139,681 | |
Intrum AB(a) | | | 9,448 | | | | 241,273 | |
ISS A/S | | | 12,330 | | | | 405,588 | |
IWG plc | | | 39,525 | | | | 116,157 | |
Kokuyo Co. Ltd. | | | 5,600 | | | | 88,524 | |
Lassila & Tikanoja OYJ | | | 28,642 | | | | 516,000 | |
Loomis AB, Class B | | | 3,071 | | | | 95,090 | |
Mitie Group plc(a) | | | 227,755 | | | | 422,843 | |
Mitsubishi Pencil Co. Ltd. | | | 1,800 | | | | 31,389 | |
Nippon Kanzai Co. Ltd. | | | 1,300 | | | | 23,718 | |
Okamura Corp. | | | 17,200 | | | | 234,099 | |
Park24 Co. Ltd.(a) | | | 2,200 | | | | 57,917 | |
PayPoint plc | | | 3,648 | | | | 36,870 | |
Pilot Corp.(a) | | | 500 | | | | 27,646 | |
Prestige International, Inc. | | | 2,000 | | | | 22,755 | |
Prosegur Cash SA(c) | | | 25,272 | | | | 50,110 | |
Prosegur Cia de Seguridad SA | | | 11,866 | | | | 65,987 | |
Realord Group Holdings Ltd.* | | | 32,000 | | | | 18,573 | |
Relia, Inc. | | | 2,100 | | | | 23,241 | |
Renewi plc | | | 417,150 | | | | 273,436 | |
Rentokil Initial plc | | | 59,292 | | | | 239,554 | |
Restore plc | | | 5,184 | | | | 29,476 | |
Ritchie Bros Auctioneers, Inc. | | | 4,230 | | | | 142,627 | |
Sato Holdings Corp. | | | 1,100 | | | | 32,555 | |
Secom Co. Ltd. | | | 5,400 | | | | 442,651 | |
Securitas AB, Class B | | | 7,047 | | | | 121,013 | |
Serco Group plc* | | | 57,046 | | | | 70,048 | |
SG Fleet Group Ltd. | | | 19,475 | | | | 46,102 | |
SmartGroup Corp. Ltd. | | | 918 | | | | 6,487 | |
Societe BIC SA | | | 1,944 | | | | 186,344 | |
Sohgo Security Services Co. Ltd. | | | 2,900 | | | | 129,254 | |
SPIE SA(a) | | | 2,168 | | | | 34,071 | |
Tomra Systems ASA | | | 2,590 | | | | 64,404 | |
Toppan Forms Co. Ltd. | | | 21,400 | | | | 194,933 | |
| | | | | | | | |
| Investments | | Shares | | | Value | |
| Commercial Services & Supplies – (continued) | |
Toppan Printing Co. Ltd. | | | 23,000 | | | $ | 325,878 | |
Transcontinental, Inc., Class A | | | 61,155 | | | | 1,009,122 | |
Waste Connections, Inc. | | | 9,315 | | | | 713,849 | |
| | | | | | | | 9,553,589 | |
| Communications Equipment – 0.2% | |
Nokia OYJ | | | 203,715 | | | | 1,154,096 | |
Sierra Wireless, Inc.* (a) | | | 7,371 | | | | 133,192 | |
Telefonaktiebolaget LM Ericsson, Class A | | | 28,338 | | | | 251,764 | |
Telefonaktiebolaget LM Ericsson, Class B | | | 73,883 | | | | 644,921 | |
| | | | | | | | 2,183,973 | |
| Construction & Engineering – 2.6% | |
ACS Actividades de Construccion y Servicios SA | | | 17,331 | | | | 650,177 | |
Aecon Group, Inc. | | | 294 | | | | 4,238 | |
AF Gruppen ASA | | | 2,860 | | | | 43,385 | |
Arcadis NV(a) | | | 65,006 | | | | 880,178 | |
Badger Daylighting Ltd.(a) | | | 2,812 | | | | 56,957 | |
Balfour Beatty plc | | | 48,322 | | | | 162,447 | |
Boskalis Westminster | | | 218 | | | | 6,289 | |
Bouygues SA | | | 15,390 | | | | 562,190 | |
Chiyoda Corp. | | | 4,000 | | | | 19,919 | |
Cie d’Entreprises CFE | | | 842 | | | | 89,392 | |
CIMIC Group Ltd. | | | 5,661 | | | | 189,739 | |
COMSYS Holdings Corp. | | | 4,300 | | | | 119,831 | |
Dai-Dan Co. Ltd. | | | 16,200 | | | | 381,404 | |
Daiho Corp.(a) | | | 16,200 | | | | 446,431 | |
Eiffage SA | | | 3,078 | | | | 301,392 | |
Elecnor SA | | | 16,848 | | | | 213,804 | |
Electra Ltd. | | | 972 | | | | 235,414 | |
Ferrovial SA | | | 22,975 | | | | 460,763 | |
FLSmidth & Co. A/S(a) | | | 2,798 | | | | 146,981 | |
Fomento de Construcciones y Contratas SA* | | | 3,420 | | | | 45,570 | |
Fukuda Corp. | | | 6,000 | | | | 246,688 | |
Galliford Try plc | | | 76,909 | | | | 858,884 | |
Gold-Finance Holdings Ltd.* (c) | | | 89,827 | | | | 20,052 | |
Hazama Ando Corp.(a) | | | 32,400 | | | | 223,359 | |
Hibiya Engineering Ltd. | | | 17,800 | | | | 293,683 | |
HOCHTIEF AG | | | 602 | | | | 89,355 | |
See Accompanying Notes to the Financial Statements.
| | |
| 142 | | FLEXSHARES ANNUAL REPORT |
FlexShares® Morningstar Developed Markets ex-US Factor Tilt Index Fund (cont.)
| | | | | | | | |
| Investments | | Shares | | | Value | |
| COMMON STOCKS – (continued) | |
| Construction & Engineering – (continued) | |
Hong Kong International Construction Investment Management Group Co. Ltd. | | | 162,000 | | | $ | 45,463 | |
Implenia AG (Registered)(a) | | | 11,206 | | | | 623,855 | |
JGC Corp. | | | 13,400 | | | | 260,152 | |
John Laing Group plc(a) (c) | | | 408,645 | | | | 1,630,140 | |
Kajima Corp. | | | 35,500 | | | | 458,004 | |
Kandenko Co. Ltd. | | | 3,000 | | | | 30,623 | |
Keller Group plc | | | 65,286 | | | | 540,556 | |
Kier Group plc(a) | | | 66,096 | | | | 740,241 | |
Kinden Corp. | | | 7,500 | | | | 120,287 | |
Koninklijke BAM Groep NV(a) | | | 148,622 | | | | 512,093 | |
Koninklijke Volkerwessels NV | | | 14,337 | | | | 255,039 | |
Kumagai Gumi Co. Ltd. | | | 6,500 | | | | 169,678 | |
Kyowa Exeo Corp. | | | 3,900 | | | | 105,055 | |
Kyudenko Corp. | | | 2,100 | | | | 76,572 | |
Lehto Group OYJ(a) | | | 8,640 | | | | 45,032 | |
Maeda Corp. | | | 16,100 | | | | 182,035 | |
Maeda Road Construction Co. Ltd. | | | 3,000 | | | | 54,734 | |
Maire Tecnimont SpA | | | 81,567 | | | | 357,479 | |
Mirait Holdings Corp.(a) | | | 13,700 | | | | 221,181 | |
Monadelphous Group Ltd.(a) | | | 9,080 | | | | 92,606 | |
Mota-Engil SGPS SA* | | | 16,605 | | | | 33,076 | |
NCC AB, Class B | | | 246 | | | | 3,674 | |
Nippo Corp. | | | 2,000 | | | | 32,927 | |
Nippon Densetsu Kogyo Co. Ltd. | | | 1,700 | | | | 34,466 | |
Nippon Koei Co. Ltd. | | | 8,100 | | | | 182,305 | |
Nippon Road Co. Ltd. (The)(a) | | | 8,100 | | | | 447,149 | |
Nishimatsu Construction Co. Ltd. | | | 2,600 | | | | 60,522 | |
Obayashi Corp. | | | 57,100 | | | | 504,441 | |
Obrascon Huarte Lain SA(a) | | | 209,823 | | | | 240,117 | |
Okumura Corp. | | | 3,000 | | | | 94,502 | |
Peab AB | | | 3,999 | | | | 35,266 | |
Penta-Ocean Construction Co. Ltd. | | | 17,100 | | | | 102,429 | |
Porr Ag(a) | | | 8,181 | | | | 221,541 | |
Raito Kogyo Co. Ltd. | | | 32,400 | | | | 437,818 | |
RCR Tomlinson Ltd.(a) | | | 28,512 | | | | 18,288 | |
Sacyr SA | | | 316,231 | | | | 764,982 | |
Salini Impregilo SpA | | | 51,840 | | | | 114,420 | |
Sanki Engineering Co. Ltd. | | | 34,000 | | | | 332,604 | |
| | | | | | | | |
| Investments | | Shares | | | Value | |
| Construction & Engineering – (continued) | |
Shapir Engineering and Industry Ltd. | | | 18,954 | | | $ | 68,948 | |
Shikun & Binui Ltd.* | | | 237,414 | | | | 452,159 | |
Shimizu Corp. | | | 30,900 | | | | 250,803 | |
Shinnihon Corp. | | | 16,200 | | | | 153,595 | |
SHO-BOND Holdings Co. Ltd. | | | 600 | | | | 42,745 | |
Skanska AB, Class B | | | 591 | | | | 9,315 | |
SNC-Lavalin Group, Inc.(a) | | | 10,773 | | | | 385,556 | |
Strabag SE | | | 2,511 | | | | 88,340 | |
Sumitomo Mitsui Construction Co. Ltd. | | | 139,340 | | | | 875,389 | |
Sweco AB, Class B | | | 3,381 | | | | 76,352 | |
Taikisha Ltd. | | | 4,500 | | | | 127,199 | |
Taisei Corp. | | | 11,600 | | | | 496,974 | |
Takamatsu Construction Group Co. Ltd. | | | 13,500 | | | | 344,633 | |
Toa Corp.(a) | | | 16,200 | | | | 272,883 | |
Toda Corp. | | | 9,000 | | | | 60,689 | |
Toenec Corp. | | | 8,100 | | | | 233,982 | |
Tokyu Construction Co. Ltd. | | | 65,600 | | | | 594,065 | |
Toshiba Plant Systems & Services Corp. | | | 3,800 | | | | 77,714 | |
Totetsu Kogyo Co. Ltd. | | | 1,800 | | | | 44,452 | |
Veidekke ASA(a) | | | 14,056 | | | | 147,167 | |
Vinci SA(a) | | | 17,577 | | | | 1,570,944 | |
WSP Global, Inc. | | | 1,210 | | | | 60,553 | |
YIT OYJ(a) | | | 192,861 | | | | 1,099,161 | |
Yokogawa Bridge Holdings Corp. | | | 35,500 | | | | 576,279 | |
Yurtec Corp. | | | 32,200 | | | | 243,094 | |
| | | | | | | | 25,282,865 | |
| Construction Materials – 0.4% | |
Adelaide Brighton Ltd. | | | 26,716 | | | | 107,361 | |
Boral Ltd. | | | 64,628 | | | | 256,967 | |
Breedon Group plc* | | | 96,947 | | | | 88,694 | |
Brickworks Ltd. | | | 21,546 | | | | 257,312 | |
Buzzi Unicem SpA(a) | | | 5,653 | | | | 108,727 | |
Buzzi Unicem SpA (Retirement Savings Plan) | | | 1,925 | | | | 21,637 | |
Cementir Holding SpA | | | 22,032 | | | | 135,551 | |
CRH plc | | | 19,440 | | | | 583,479 | |
CSR Ltd.(a) | | | 54,796 | | | | 137,093 | |
See Accompanying Notes to the Financial Statements.
| | | | |
| FLEXSHARES ANNUAL REPORT | | | 143 | |
FlexShares® Morningstar Developed Markets ex-US Factor Tilt Index Fund (cont.)
| | | | | | | | |
| Investments | | Shares | | | Value | |
| COMMON STOCKS – (continued) | |
| Construction Materials – (continued) | |
Fletcher Building Ltd.* (a) | | | 45,569 | | | $ | 179,730 | |
Forterra plc(c) | | | 226,638 | | | | 638,539 | |
HeidelbergCement AG | | | 4,860 | | | | 330,397 | |
Ibstock plc(c) | | | 82,187 | | | | 235,652 | |
Imerys SA | | | 1,473 | | | | 90,960 | |
James Hardie Industries plc, CHDI | | | 14,275 | | | | 190,106 | |
LafargeHolcim Ltd. (Registered)* | | | 10,692 | | | | 495,856 | |
Sumitomo Osaka Cement Co. Ltd.(a) | | | 1,700 | | | | 63,267 | |
Vicat SA | | | 2,147 | | | | 115,551 | |
Wienerberger AG | | | 4,646 | | | | 106,967 | |
| | | | | | | | 4,143,846 | |
| Consumer Finance – 0.6% | |
Acom Co. Ltd.(a) | | | 56,700 | | | | 209,507 | |
AEON Financial Service Co. Ltd.(a) | | | 4,800 | | | | 94,252 | |
Aiful Corp.* (a) | | | 2,100 | | | | 5,545 | |
Allied Properties HK Ltd. | | | 1,698,000 | | | | 363,885 | |
Arrow Global Group plc | | | 119,720 | | | | 292,483 | |
B2Holding ASA | | | 12,936 | | | | 21,886 | |
Cembra Money Bank AG | | | 3,159 | | | | 265,370 | |
Credit Corp. Group Ltd.(a) | | | 6,029 | | | | 81,402 | |
Eclipx Group Ltd.(a) | | | 200,940 | | | | 344,647 | |
Hitachi Capital Corp. | | | 9,700 | | | | 238,256 | |
Hoist Finance AB(a) (c) | | | 82,242 | | | | 660,477 | |
Hong Leong Finance Ltd. | | | 202,500 | | | | 369,963 | |
J Trust Co. Ltd.(a) | | | 52,900 | | | | 270,465 | |
Jaccs Co. Ltd. | | | 22,600 | | | | 424,144 | |
Provident Financial plc* (a) | | | 187,861 | | | | 1,225,161 | |
Resurs Holding AB(a) (c) | | | 75,992 | | | | 504,274 | |
Sun Hung Kai & Co. Ltd. | | | 185,996 | | | | 83,752 | |
| | | | | | | | 5,455,469 | |
| Containers & Packaging – 0.3% | |
Amcor Ltd.(a) | | | 25,029 | | | | 235,933 | |
BillerudKorsnas AB(a) | | | 4,325 | | | | 51,343 | |
Cascades, Inc. | | | 43,071 | | | | 335,844 | |
CCL Industries, Inc., Class B | | | 5,211 | | | | 219,749 | |
DS Smith plc | | | 65,874 | | | | 330,706 | |
FP Corp.(a) | | | 600 | | | | 30,783 | |
| | | | | | | | |
| Investments | | Shares | | | Value | |
| Containers & Packaging – (continued) | |
Fuji Seal International, Inc. | | | 2,000 | | | $ | 60,697 | |
Huhtamaki OYJ(a) | | | 2,051 | | | | 57,609 | |
Intertape Polymer Group, Inc.(a) | | | 32,157 | | | | 425,821 | |
Mayr Melnhof Karton AG | | | 275 | | | | 34,836 | |
Orora Ltd. | | | 44,370 | | | | 105,663 | |
Pack Corp. (The) | | | 1,200 | | | | 34,398 | |
Pact Group Holdings Ltd.(a) | | | 24,422 | | | | 60,409 | |
Papeles y Cartones de Europa SA | | | 14,337 | | | | 271,284 | |
Rengo Co. Ltd.(a) | | | 16,800 | | | | 146,333 | |
RPC Group plc | | | 8,667 | | | | 84,452 | |
Smurfit Kappa Group plc | | | 12,231 | | | | 398,843 | |
Toyo Seikan Group Holdings Ltd. | | | 5,600 | | | | 114,674 | |
Vidrala SA | | | 1,180 | | | | 98,002 | |
Winpak Ltd. | | | 4,494 | | | | 156,285 | |
| | | | | | | | 3,253,664 | |
| Distributors – 0.2% | |
Arata Corp. | | | 11,600 | | | | 526,268 | |
Bapcor Ltd.(a) | | | 25,156 | | | | 121,774 | |
Canon Marketing Japan, Inc. | | | 3,700 | | | | 70,128 | |
Doshisha Co. Ltd. | | | 1,800 | | | | 37,083 | |
Inchcape plc | | | 43,335 | | | | 299,559 | |
Jardine Cycle & Carriage Ltd. | | | 10,322 | | | | 225,626 | |
PALTAC Corp. | | | 800 | | | | 40,831 | |
Uni-Select, Inc. | | | 22,356 | | | | 368,898 | |
| | | | | | | | 1,690,167 | |
| Diversified Consumer Services – 0.2% | |
AA plc | | | 444,913 | | | | 569,056 | |
AcadeMedia AB* (a) (c) | | | 106,726 | | | | 489,858 | |
Benesse Holdings, Inc. | | | 1,600 | | | | 44,588 | |
G8 Education Ltd.(a) | | | 264,192 | | | | 383,854 | |
IDP Education Ltd. | | | 6,853 | | | | 44,734 | |
InvoCare Ltd.(a) | | | 11,624 | | | | 99,933 | |
| | | | | | | | 1,632,023 | |
| Diversified Financial Services – 1.2% | |
Ackermans & van Haaren NV | | | 784 | | | | 123,564 | |
Aker ASA, Class A | | | 760 | | | | 57,961 | |
AMP Ltd. | | | 78,246 | | | | 136,978 | |
Banca Farmafactoring SpA(c) | | | 100,377 | | | | 517,481 | |
Banca IFIS SpA(a) | | | 22,272 | | | | 392,156 | |
See Accompanying Notes to the Financial Statements.
| | |
| 144 | | FLEXSHARES ANNUAL REPORT |
FlexShares® Morningstar Developed Markets ex-US Factor Tilt Index Fund (cont.)
| | | | | | | | |
| Investments | | Shares | | | Value | |
| COMMON STOCKS – (continued) | |
| Diversified Financial Services – (continued) | |
Banca Mediolanum SpA | | | 2,063 | | | $ | 11,980 | |
Banque Nationale de Belgique | | | 121 | | | | 353,716 | |
Challenger Ltd. | | | 30,244 | | | | 219,928 | |
ClearView Wealth Ltd. | | | 71,280 | | | | 41,931 | |
Corp. Financiera Alba SA | | | 2,511 | | | | 120,774 | |
doBank SpA(c) | | | 34,506 | | | | 381,001 | |
Element Fleet Management Corp. | | | 356,400 | | | | 2,103,255 | |
Eurazeo SE | | | 4,131 | | | | 302,135 | |
EXOR NV | | | 5,589 | | | | 316,884 | |
FFP | | | 330 | | | | 38,811 | |
Fuyo General Lease Co. Ltd. | | | 700 | | | | 38,891 | |
GRENKE AG | | | 495 | | | | 47,561 | |
Groupe Bruxelles Lambert SA | | | 2,754 | | | | 256,436 | |
HAL Trust(a) | | | 1,760 | | | | 283,172 | |
IBJ Leasing Co. Ltd. | | | 29,938 | | | | 752,330 | |
Industrivarden AB, Class A | | | 10,218 | | | | 218,453 | |
Industrivarden AB, Class C | | | 250 | | | | 5,203 | |
Investor AB, Class A | | | 2,092 | | | | 91,374 | |
Investor AB, Class B | | | 20,493 | | | | 889,479 | |
Japan Securities Finance Co. Ltd. | | | 40,500 | | | | 227,522 | |
KBC Ancora | | | 1,377 | | | | 63,719 | |
Kinnevik AB, Class B | | | 3,760 | | | | 104,452 | |
L E Lundbergforetagen AB, Class B | | | 1,348 | | | | 41,651 | |
Mitsubishi UFJ Lease & Finance Co. Ltd. | | | 46,300 | | | | 238,362 | |
Onex Corp. | | | 5,525 | | | | 364,126 | |
ORIX Corp. | | | 82,700 | | | | 1,349,082 | |
Pargesa Holding SA | | | 1,265 | | | | 92,998 | |
Ricoh Leasing Co. Ltd. | | | 19,200 | | | | 630,331 | |
Sofina SA | | | 330 | | | | 63,190 | |
SRH NV* ‡ (b) | | | 2,857 | | | | — | |
Standard Life Aberdeen* (b) | | | 206,550 | | | | 89,706 | |
Standard Life Aberdeen plc | | | 180,731 | | | | 624,663 | |
Tokyo Century Corp. | | | 600 | | | | 32,165 | |
Wendel SA | | | 1,377 | | | | 178,800 | |
Zenkoku Hosho Co. Ltd. | | | 1,600 | | | | 57,986 | |
| | | | | | | | 11,860,207 | |
| | | | | | | | |
| Investments | | Shares | | | Value | |
| Diversified Telecommunication Services – 1.7% | |
BCE, Inc. | | | 4,050 | | | $ | 157,127 | |
Bezeq The Israeli Telecommunication Corp. Ltd. | | | 3,283 | | | | 3,773 | |
BT Group plc | | | 534,438 | | | | 1,642,663 | |
Cellnex Telecom SA(a) (c) | | | 8,326 | | | | 207,637 | |
Chorus Ltd.(a) | | | 38,130 | | | | 118,270 | |
Com Hem Holding AB | | | 5,606 | | | | 87,589 | |
Deutsche Telekom AG (Registered) | | | 86,589 | | | | 1,422,100 | |
Elisa OYJ | | | 5,304 | | | | 211,241 | |
Euskaltel SA(c) | | | 23,652 | | | | 198,312 | |
Gamma Communications plc | | | 1,701 | | | | 17,388 | |
HKBN Ltd. | | | 51,500 | | | | 77,256 | |
HKT Trust & HKT Ltd. | | | 168,400 | | | | 231,997 | |
Infrastrutture Wireless Italiane SpA(c) | | | 5,179 | | | | 36,089 | |
Inmarsat plc | | | 397,502 | | | | 2,316,569 | |
Internet Initiative Japan, Inc. | | | 2,300 | | | | 44,449 | |
Koninklijke KPN NV | | | 53,946 | | | | 142,785 | |
Nippon Telegraph & Telephone Corp. | | | 36,700 | | | | 1,544,681 | |
Orange SA | | | 101,088 | | | | 1,582,912 | |
PCCW Ltd. | | | 206,035 | | | | 113,013 | |
Proximus SADP | | | 122 | | | | 3,117 | |
Singapore Telecommunications Ltd. | | | 153,900 | | | | 351,187 | |
Spark New Zealand Ltd. | | | 74,170 | | | | 191,310 | |
SpeedCast International Ltd.(a) | | | 65,934 | | | | 168,231 | |
Sunrise Communications Group AG* (c) | | | 2,795 | | | | 246,462 | |
Swisscom AG (Registered) | | | 324 | | | | 148,617 | |
TalkTalk Telecom Group plc | | | 121,905 | | | | 186,917 | |
Telecom Italia SpA* | | | 315,806 | | | | 185,782 | |
Telecom Italia SpA (Retirement Savings Plan) | | | 363,054 | | | | 183,795 | |
Telefonica Deutschland Holding AG | | | 14,053 | | | | 54,695 | |
Telefonica SA | | | 220,644 | | | | 1,809,505 | |
Telekom Austria AG* | | | 1,426 | | | | 10,599 | |
Telenor ASA | | | 23,085 | | | | 424,761 | |
Telia Co. AB | | | 91,611 | | | | 413,566 | |
Telstra Corp. Ltd. | | | 120,042 | | | | 262,046 | |
TELUS Corp. | | | 11,664 | | | | 400,391 | |
See Accompanying Notes to the Financial Statements.
| | | | |
| FLEXSHARES ANNUAL REPORT | | | 145 | |
FlexShares® Morningstar Developed Markets ex-US Factor Tilt Index Fund (cont.)
| | | | | | | | |
| Investments | | Shares | | | Value | |
| COMMON STOCKS – (continued) | |
| Diversified Telecommunication Services – (continued) | |
United Internet AG (Registered) | | | 3,122 | | | $ | 129,397 | |
Vocus Group Ltd.* (a) | | | 528,120 | | | | 1,283,866 | |
| | | | | | | | 16,610,095 | |
| Electric Utilities – 1.2% | |
Acciona SA | | | 1,497 | | | | 126,501 | |
Alpiq Holding AG (Registered)* | | | 1,052 | | | | 88,895 | |
AusNet Services | | | 147,818 | | | | 179,150 | |
BKW AG | | | 1,400 | | | | 88,935 | |
Chubu Electric Power Co., Inc. | | | 31,700 | | | | 457,432 | |
Chugoku Electric Power Co., Inc. (The)(a) | | | 4,206 | | | | 54,115 | |
CK Infrastructure Holdings Ltd. | | | 24,000 | | | | 175,422 | |
CLP Holdings Ltd. | | | 69,500 | | | | 779,275 | |
Contact Energy Ltd. | | | 20,140 | | | | 73,516 | |
EDP – Energias de Portugal SA | | | 137,619 | | | | 484,004 | |
Electricite de France SA | | | 14,335 | | | | 238,436 | |
Elia System Operator SA/NV | | | 1,089 | | | | 68,111 | |
Emera, Inc.(a) | | | 5,346 | | | | 165,356 | |
Endesa SA | | | 14,418 | | | | 301,895 | |
Enel SpA | | | 374,706 | | | | 1,840,046 | |
EVN AG | | | 2,240 | | | | 39,187 | |
Fortis, Inc. | | | 7,501 | | | | 248,463 | |
Fortum OYJ | | | 11,259 | | | | 237,217 | |
Genesis Energy Ltd. | | | 13,435 | | | | 20,529 | |
HK Electric Investments & HK Electric Investments Ltd.(a) (c) | | | 111,500 | | | | 106,104 | |
Hokkaido Electric Power Co., Inc.(a) | | | 10,100 | | | | 59,067 | |
Hokuriku Electric Power Co.* (a) | | | 15,000 | | | | 139,825 | |
Hydro One Ltd.(c) | | | 23,571 | | | | 343,716 | |
Iberdrola SA | | | 171,352 | | | | 1,214,605 | |
Infratil Ltd. | | | 37,798 | | | | 84,413 | |
Kansai Electric Power Co., Inc. (The) | | | 44,600 | | | | 683,889 | |
Kyushu Electric Power Co., Inc.(a) | | | 32,400 | | | | 377,242 | |
Mercury NZ Ltd. | | | 17,270 | | | | 38,343 | |
Okinawa Electric Power Co., Inc. (The) | | | 11,215 | | | | 209,384 | |
Orsted A/S(c) | | | 5,670 | | | | 360,365 | |
Red Electrica Corp. SA | | | 10,125 | | | | 209,940 | |
| | | | | | | | |
| Investments | | Shares | | | Value | |
| Electric Utilities – (continued) | |
Romande Energie Holding SA (Registered) | | | 76 | | | $ | 90,665 | |
Shikoku Electric Power Co., Inc. | | | 8,600 | | | | 108,210 | |
Spark Infrastructure Group | | | 1,230 | | | | 2,005 | |
SSE plc | | | 42,768 | | | | 623,793 | |
Terna Rete Elettrica Nazionale SpA(a) | | | 72,252 | | | | 373,714 | |
Tohoku Electric Power Co., Inc. | | | 12,700 | | | | 160,698 | |
Tokyo Electric Power Co. Holdings, Inc.* | | | 83,715 | | | | 428,756 | |
Trustpower Ltd. | | | 25,928 | | | | 103,448 | |
Verbund AG(a) | | | 3,625 | | | | 146,220 | |
| | | | | | | | 11,530,887 | |
| Electrical Equipment – 0.9% | |
ABB Ltd. (Registered) | | | 50,301 | | | | 1,015,121 | |
Daihen Corp. | | | 16,400 | | | | 383,933 | |
Fagerhult AB(a) | | | 8,445 | | | | 74,289 | |
Fuji Electric Co. Ltd. | | | 4,800 | | | | 147,162 | |
Fujikura Ltd. | | | 28,700 | | | | 123,848 | |
Furukawa Electric Co. Ltd. | | | 2,900 | | | | 78,503 | |
Futaba Corp. | | | 3,400 | | | | 53,084 | |
Huber + Suhner AG (Registered) | | | 867 | | | | 59,472 | |
Legrand SA | | | 7,614 | | | | 498,125 | |
Mabuchi Motor Co. Ltd. | | | 2,000 | | | | 71,242 | |
Melrose Industries plc | | | 213,678 | | | | 460,460 | |
Mitsubishi Electric Corp. | | | 50,200 | | | | 637,647 | |
Nidec Corp. | | | 8,255 | | | | 1,059,899 | |
Nissin Electric Co. Ltd.(a) | | | 39,600 | | | | 323,874 | |
Nitto Kogyo Corp. | | | 16,500 | | | | 286,855 | |
NKT A/S* (a) | | | 14,925 | | | | 281,061 | |
Nordex SE* | | | 21,222 | | | | 198,136 | |
OSRAM Licht AG | | | 1,782 | | | | 72,324 | |
Prysmian SpA | | | 9,545 | | | | 185,585 | |
Sanyo Denki Co. Ltd. | | | 3,100 | | | | 127,044 | |
Schneider Electric SE | | | 14,418 | | | | 1,044,871 | |
Senvion SA* (a) | | | 8,586 | | | | 48,836 | |
SGL Carbon SE* | | | 1,825 | | | | 18,331 | |
Siemens Gamesa Renewable Energy SA* | | | 8,096 | | | | 89,824 | |
Signify NV(a) (c) | | | 6,399 | | | | 158,058 | |
Sinfonia Technology Co. Ltd. | | | 32,400 | | | | 424,038 | |
Somfy SA | | | 275 | | | | 21,282 | |
See Accompanying Notes to the Financial Statements.
| | |
| 146 | | FLEXSHARES ANNUAL REPORT |
FlexShares® Morningstar Developed Markets ex-US Factor Tilt Index Fund (cont.)
| | | | | | | | |
| Investments | | Shares | | | Value | |
| COMMON STOCKS – (continued) | |
| Electrical Equipment – (continued) | |
TKH Group NV, CVA | | | 2,194 | | | $ | 111,021 | |
Ushio, Inc. | | | 5,900 | | | | 71,466 | |
Vestas Wind Systems A/S | | | 7,533 | | | | 472,593 | |
VPower Group International Holdings Ltd.(c) | | | 81,000 | | | | 31,721 | |
| | | | | | | | 8,629,705 | |
| Electronic Equipment, Instruments & Components – 1.9% | |
Alps Electric Co. Ltd. | | | 17,600 | | | | 417,952 | |
ALSO Holding AG (Registered)* | | | 4,455 | | | | 505,777 | |
Amano Corp. | | | 2,600 | | | | 55,292 | |
Anritsu Corp.(a) | | | 6,200 | | | | 94,053 | |
AT&S Austria Technologie & Systemtechnik AG(a) | | | 20,169 | | | | 478,760 | |
Azbil Corp. | | | 3,000 | | | | 55,877 | |
Barco NV(a) | | | 440 | | | | 50,153 | |
Canon Electronics, Inc. | | | 13,200 | | | | 242,116 | |
Celestica, Inc.* | | | 109,745 | | | | 1,141,532 | |
CMK Corp.(a) | | | 56,700 | | | | 364,753 | |
CONEXIO Corp. | | | 10,200 | | | | 147,141 | |
Daiwabo Holdings Co. Ltd. | | | 16,200 | | | | 957,459 | |
Datalogic SpA | | | 535 | | | | 15,730 | |
Dexerials Corp. | | | 54,200 | | | | 466,335 | |
Electrocomponents plc | | | 24,459 | | | | 193,703 | |
Evertz Technologies Ltd. | | | 1,712 | | | | 21,132 | |
FIH Mobile Ltd.* (a) | | | 2,309,000 | | | | 215,013 | |
Halma plc | | | 17,253 | | | | 292,758 | |
Hamamatsu Photonics KK | | | 3,400 | | | | 113,881 | |
Hexagon AB, Class B | | | 7,614 | | | | 373,715 | |
Hi-P International Ltd.(a) | | | 64,800 | | | | 35,563 | |
Hirose Electric Co. Ltd. | | | 782 | | | | 74,351 | |
Hitachi High-Technologies Corp. | | | 1,700 | | | | 64,096 | |
Hitachi Ltd. | | | 46,100 | | | | 1,414,188 | |
Hochiki Corp. | | | 900 | | | | 11,029 | |
Horiba Ltd. | | | 800 | | | | 37,570 | |
Hosiden Corp. | | | 59,400 | | | | 545,814 | |
Ibiden Co. Ltd. | | | 8,100 | | | | 100,052 | |
Inficon Holding AG (Registered)* | | | 110 | | | | 52,840 | |
Ingenico Group SA | | | 1,000 | | | | 70,974 | |
Iriso Electronics Co. Ltd. | | | 1,200 | | | | 50,773 | |
Isra Vision AG | | | 567 | | | | 24,381 | |
| | | | | | | | |
| Investments | | Shares | | | Value | |
| Electronic Equipment, Instruments & Components – (continued) | |
Japan Aviation Electronics Industry Ltd. | | | 2,044 | | | $ | 27,186 | |
Japan Display, Inc.* (a) | | | 594,300 | | | | 573,999 | |
Jenoptik AG | | | 2,585 | | | | 78,027 | |
Kaga Electronics Co. Ltd. | | | 18,600 | | | | 418,131 | |
Keyence Corp. | | | 2,700 | | | | 1,323,025 | |
Kyocera Corp. | | | 11,700 | | | | 636,344 | |
Lagercrantz Group AB, Class B | | | 1,944 | | | | 19,164 | |
LEM Holding SA (Registered) | | | 27 | | | | 30,922 | |
Macnica Fuji Electronics Holdings, Inc.(a) | | | 48,600 | | | | 702,806 | |
Murata Manufacturing Co. Ltd. | | | 6,800 | | | | 1,034,265 | |
Mycronic AB(a) | | | 3,001 | | | | 37,662 | |
Nichicon Corp. | | | 5,100 | | | | 42,344 | |
Nippon Ceramic Co. Ltd. | | | 900 | | | | 22,130 | |
Nippon Electric Glass Co. Ltd. | | | 10,700 | | | | 270,119 | |
Nippon Signal Co. Ltd.(a) | | | 42,000 | | | | 384,440 | |
Nissha Co. Ltd.(a) | | | 42,300 | | | | 688,914 | |
Nohmi Bosai Ltd. | | | 10,100 | | | | 212,194 | |
Oki Electric Industry Co. Ltd.(a) | | | 66,800 | | | | 916,277 | |
Omron Corp. | | | 8,400 | | | | 340,898 | |
Optex Group Co. Ltd. | | | 1,000 | | | | 18,245 | |
Renishaw plc | | | 1,617 | | | | 87,066 | |
Ryosan Co. Ltd. | | | 1,400 | | | | 40,379 | |
Sanshin Electronics Co. Ltd.(a) | | | 8,100 | | | | 136,226 | |
Shimadzu Corp. | | | 7,000 | | | | 176,962 | |
Siix Corp.(a) | | | 2,028 | | | | 27,512 | |
Spectris plc | | | 5,986 | | | | 163,986 | |
Taiyo Yuden Co. Ltd.(a) | | | 2,500 | | | | 50,485 | |
TDK Corp. | | | 4,300 | | | | 371,494 | |
Topcon Corp.(a) | | | 2,200 | | | | 32,009 | |
Truly International Holdings Ltd.* | | | 1,036,000 | | | | 150,654 | |
V Technology Co. Ltd.(a) | | | 300 | | | | 38,758 | |
Venture Corp. Ltd. | | | 18,300 | | | | 202,452 | |
VSTECS Holdings Ltd. | | | 324,000 | | | | 153,333 | |
Yaskawa Electric Corp. | | | 6,400 | | | | 185,158 | |
Yokogawa Electric Corp. | | | 8,000 | | | | 157,441 | |
| | | | | | | | 18,435,770 | |
| Energy Equipment & Services – 0.7% | |
Aker Solutions ASA* (c) | | | 7,535 | | | | 49,845 | |
BW Offshore Ltd.* | | | 89,829 | | | | 578,201 | |
CES Energy Solutions Corp.(a) | | | 31,144 | | | | 82,766 | |
See Accompanying Notes to the Financial Statements.
| | | | |
| FLEXSHARES ANNUAL REPORT | | | 147 | |
FlexShares® Morningstar Developed Markets ex-US Factor Tilt Index Fund (cont.)
| | | | | | | | |
| Investments | | Shares | | | Value | |
| COMMON STOCKS – (continued) | |
| Energy Equipment & Services – (continued) | |
CGG SA* | | | 600,210 | | | $ | 1,459,426 | |
Enerflex Ltd. | | | 76,367 | | | | 923,440 | |
Ensign Energy Services, Inc. | | | 60,550 | | | | 236,529 | |
Fugro NV, CVA* (a) | | | 6,156 | | | | 79,516 | |
Hunting plc | | | 21,556 | | | | 185,916 | |
John Wood Group plc | | | 32,481 | | | | 296,412 | |
Modec, Inc. | | | 8,100 | | | | 244,030 | |
Ocean Yield ASA(a) | | | 7,224 | | | | 55,008 | |
Odfjell Drilling Ltd.* (a) | | | 40,528 | | | | 148,997 | |
Pason Systems, Inc.(a) | | | 2,356 | | | | 35,647 | |
Petrofac Ltd. | | | 41,796 | | | | 308,787 | |
Petroleum Geo-Services ASA* | | | 62,775 | | | | 196,729 | |
Precision Drilling Corp.* (a) | | | 46,916 | | | | 113,606 | |
Saipem SpA* | | | 22,351 | �� | | | 122,445 | |
SBM Offshore NV | | | 9,020 | | | | 156,163 | |
Schoeller-Bleckmann Oilfield Equipment AG(a) | | | 202 | | | | 18,127 | |
Secure Energy Services, Inc. | | | 18,144 | | | | 118,542 | |
ShawCor Ltd. | | | 4,484 | | | | 81,537 | |
Subsea 7 SA | | | 10,602 | | | | 134,276 | |
TechnipFMC plc | | | 16,848 | | | | 443,102 | |
Tecnicas Reunidas SA(a) | | | 8,748 | | | | 235,408 | |
Tenaris SA | | | 11,856 | | | | 176,448 | |
TGS NOPEC Geophysical Co. ASA | | | 1,140 | | | | 38,371 | |
Vallourec SA* | | | 23,467 | | | | 111,489 | |
WorleyParsons Ltd.(a) | | | 26,291 | | | | 271,866 | |
| | | | | | | | 6,902,629 | |
| Entertainment – 0.5% | |
Avex, Inc. | | | 32,400 | | | | 436,096 | |
Capcom Co. Ltd. | | | 2,600 | | | | 54,002 | |
Cineworld Group plc | | | 75,796 | | | | 285,315 | |
CTS Eventim AG & Co. KGaA | | | 1,375 | | | | 51,662 | |
Daiichikosho Co. Ltd. | | | 1,100 | | | | 50,685 | |
DeNA Co. Ltd. | | | 4,000 | | | | 66,776 | |
Entertainment One Ltd. | | | 65,205 | | | | 340,761 | |
EVENT Hospitality and Entertainment Ltd. | | | 2,282 | | | | 21,705 | |
IGG, Inc. | | | 804,000 | | | | 847,136 | |
Kinepolis Group NV | | | 1,030 | | | | 55,376 | |
Koei Tecmo Holdings Co. Ltd. | | | 1,728 | | | | 27,393 | |
| | | | | | | | |
| Investments | | Shares | | | Value | |
| Entertainment – (continued) | |
Konami Holdings Corp. | | | 2,200 | | | $ | 84,019 | |
Nexon Co. Ltd.* | | | 9,800 | | | | 111,673 | |
Nintendo Co. Ltd. | | | 3,300 | | | | 1,028,116 | |
Paradox Interactive AB(a) | | | 952 | | | | 13,770 | |
Shochiku Co. Ltd.(a) | | | 300 | | | | 29,268 | |
Square Enix Holdings Co. Ltd. | | | 1,800 | | | | 64,516 | |
Toei Animation Co. Ltd. | | | 900 | | | | 30,304 | |
Toei Co. Ltd. | | | 2,000 | | | | 218,688 | |
Toho Co. Ltd. | | | 4,100 | | | | 133,875 | |
Ubisoft Entertainment SA* | | | 2,091 | | | | 188,352 | |
Vivendi SA | | | 28,431 | | | | 687,441 | |
| | | | | | | | 4,826,929 | |
| Equity Real Estate Investment Trusts (REITs) – 2.7% | |
Abacus Property Group | | | 215,055 | | | | 499,938 | |
Activia Properties, Inc. | | | 15 | | | | 62,204 | |
Advance Residence Investment Corp. | | | 41 | | | | 104,702 | |
Aedifica SA | | | 1,145 | | | | 95,874 | |
AEON REIT Investment Corp.(a) | | | 29 | | | | 31,992 | |
ALE Property Group(a) | | | 9,405 | | | | 35,995 | |
Allied Properties REIT | | | 6,211 | | | | 200,057 | |
alstria office REIT-AG | | | 6,756 | | | | 97,370 | |
Altarea SCA | | | 280 | | | | 61,611 | |
Argosy Property Ltd. | | | 64,665 | | | | 45,182 | |
Artis REIT(a) | | | 42,239 | | | | 360,234 | |
Ascendas REIT | | | 121,500 | | | | 221,100 | |
Ascott Residence Trust | | | 55,364 | | | | 41,979 | |
Assura plc | | | 340,345 | | | | 227,875 | |
Aventus Retail Property Fund Ltd. | | | 298,349 | | | | 425,024 | |
Befimmo SA | | | 1,377 | | | | 75,592 | |
Beni Stabili SpA SIIQ | | | 174,762 | | | | 149,600 | |
Big Yellow Group plc | | | 17,823 | | | | 196,420 | |
Boardwalk REIT | | | 5,589 | | | | 208,579 | |
British Land Co. plc (The) | | | 23,328 | | | | 176,459 | |
BWP Trust(a) | | | 52,734 | | | | 129,318 | |
Canadian Apartment Properties REIT | | | 5,068 | | | | 180,646 | |
CapitaLand Mall Trust | | | 10,900 | | | | 16,608 | |
CapitaLand Retail China Trust | | | 95,662 | | | | 94,640 | |
CDL Hospitality Trusts | | | 36,800 | | | | 38,533 | |
Champion REIT | | | 132,000 | | | | 88,905 | |
Charter Hall Group | | | 16,271 | | | | 79,571 | |
See Accompanying Notes to the Financial Statements.
| | |
| 148 | | FLEXSHARES ANNUAL REPORT |
FlexShares® Morningstar Developed Markets ex-US Factor Tilt Index Fund (cont.)
| | | | | | | | |
| Investments | | Shares | | | Value | |
| COMMON STOCKS – (continued) | |
| Equity Real Estate Investment Trusts (REITs) – (continued) | |
Charter Hall Long Wale REIT(a) | | | 75,897 | | | $ | 221,623 | |
Charter Hall Retail REIT(a) | | | 210,033 | | | | 632,659 | |
Choice Properties REIT | | | 134,784 | | | | 1,225,449 | |
Cofinimmo SA | | | 491 | | | | 58,804 | |
Comforia Residential REIT, Inc. | | | 34 | | | | 81,373 | |
Covivio | | | 3,070 | | | | 308,714 | |
Covivio Hotels SACA | | | 3,726 | | | | 104,277 | |
Cromwell Property Group(a) | | | 1,076,815 | | | | 786,088 | |
Daiwa House REIT Investment Corp.(a) | | | 42 | | | | 91,923 | |
Derwent London plc | | | 7,535 | | | | 282,000 | |
Dexus | | | 57,267 | | | | 413,997 | |
Dream Global REIT | | | 25,272 | | | | 258,253 | |
Dream Office REIT | | | 7,025 | | | | 124,639 | |
Eurocommercial Properties NV, CVA | | | 7,319 | | | | 271,174 | |
Far East Hospitality Trust | | | 53,300 | | | | 22,901 | |
First REIT | | | 26,713 | | | | 23,148 | |
Folkestone Education Trust(a) | | | 52,383 | | | | 105,810 | |
Frasers Centrepoint Trust | | | 25,000 | | | | 38,995 | |
Frasers Commercial Trust | | | 23,000 | | | | 22,754 | |
Frasers Hospitality Trust | | | 39,200 | | | | 19,957 | |
Frasers Logistics & Industrial Trust(c) | | | 125,180 | | | | 92,204 | |
GDI Property Group(a) | | | 211,653 | | | | 193,512 | |
Gecina SA | | | 2,665 | | | | 391,639 | |
Global One Real Estate Investment Corp. | | | 48 | | | | 48,402 | |
GLP J-Reit | | | 63 | | | | 62,355 | |
Goodman Group | | | 55,323 | | | | 407,002 | |
Goodman Property Trust | | | 19,085 | | | | 18,694 | |
GPT Group (The) | | | 103,842 | | | | 379,766 | |
Granite REIT | | | 5,994 | | | | 248,113 | |
Great Portland Estates plc | | | 10,614 | | | | 94,620 | |
Growthpoint Properties Australia Ltd.(a) | | | 18,673 | | | | 48,041 | |
Hamborner REIT AG | | | 6,058 | | | | 61,090 | |
Hammerson plc | | | 29,079 | | | | 162,928 | |
Hankyu Hanshin REIT, Inc. | | | 26 | | | | 32,346 | |
Hansteen Holdings plc | | | 22,562 | | | | 27,733 | |
Heiwa Real Estate REIT, Inc. | | | 73 | | | | 71,606 | |
Hibernia REIT plc | | | 139,563 | | | | 219,803 | |
| | | | | | | | |
| Investments | | Shares | | | Value | |
| Equity Real Estate Investment Trusts (REITs) – (continued) | |
Hulic Reit, Inc. | | | 23 | | | $ | 33,444 | |
ICADE | | | 2,437 | | | | 206,817 | |
Ichigo Office REIT Investment | | | 350 | | | | 287,183 | |
Immobiliare Grande Distribuzione SIIQ SpA | | | 15,018 | | | | 106,062 | |
Inmobiliaria Colonial Socimi SA(a) | | | 12,081 | | | | 121,484 | |
InterRent REIT | | | 1,944 | | | | 18,681 | |
Invesco Office J-Reit, Inc.(a) | | | 5,670 | | | | 801,351 | |
Investa Office Fund | | | 27,070 | | | | 106,482 | |
Invincible Investment Corp. | | | 121 | | | | 50,070 | |
Japan Hotel REIT Investment Corp. | | | 77 | | | | 54,788 | |
Japan Logistics Fund, Inc. | | | 19 | | | | 37,914 | |
Japan Prime Realty Investment Corp. | | | 25 | | | | 89,274 | |
Japan Rental Housing Investments, Inc. | | | 26 | | | | 20,389 | |
Japan Retail Fund Investment Corp. | | | 52 | | | | 96,024 | |
Kenedix Office Investment Corp. | | | 9 | | | | 55,744 | |
Kenedix Residential Next Investment Corp. | | | 34 | | | | 51,939 | |
Keppel DC REIT(a) | | | 139,440 | | | | 133,922 | |
Keppel REIT | | | 80,733 | | | | 65,878 | |
Killam Apartment REIT | | | 42,039 | | | | 517,625 | |
Kiwi Property Group Ltd. | | | 3,973 | | | | 3,412 | |
Klepierre SA | | | 11,907 | | | | 404,737 | |
Land Securities Group plc | | | 6,075 | | | | 66,228 | |
LaSalle Logiport REIT | | | 868 | | | | 799,125 | |
Link REIT | | | 60,301 | | | | 534,597 | |
Lippo Malls Indonesia Retail Trust | | | 383,400 | | | | 66,447 | |
LondonMetric Property plc | | | 96,348 | | | | 221,965 | |
Manulife US REIT(c) | | | 18,544 | | | | 13,166 | |
Mapletree Commercial Trust | | | 32,090 | | | | 37,309 | |
Mapletree Industrial Trust | | | 32,742 | | | | 43,741 | |
Mapletree Logistics Trust | | | 72,123 | | | | 63,019 | |
Mapletree North Asia Commercial Trust(c) | | | 49,500 | | | | 40,392 | |
MCUBS MidCity Investment Corp. | | | 100 | | | | 76,736 | |
Merlin Properties Socimi SA | | | 23,814 | | | | 298,966 | |
Mirvac Group | | | 145,557 | | | | 223,865 | |
See Accompanying Notes to the Financial Statements.
| | | | |
| FLEXSHARES ANNUAL REPORT | | | 149 | |
FlexShares® Morningstar Developed Markets ex-US Factor Tilt Index Fund (cont.)
| | | | | | | | |
| Investments | | Shares | | | Value | |
| COMMON STOCKS – (continued) | |
| Equity Real Estate Investment Trusts (REITs) – (continued) | |
Mori Trust Hotel Reit, Inc. | | | 324 | | | $ | 391,309 | |
National Storage REIT(a) | | | 70,798 | | | | 85,554 | |
NewRiver REIT plc(a) | | | 202,172 | | | | 653,563 | |
Nippon Accommodations Fund, Inc. | | | 8 | | | | 36,649 | |
Nippon Building Fund, Inc. | | | 40 | | | | 228,612 | |
Nippon Prologis REIT, Inc. | | | 41 | | | | 82,687 | |
NIPPON REIT Investment Corp. | | | 33 | | | | 107,315 | |
Nomura Real Estate Master Fund, Inc. | | | 159 | | | | 206,120 | |
Northview Apartment REIT | | | 22,356 | | | | 430,863 | |
NorthWest Healthcare Properties REIT | | | 38,961 | | | | 314,773 | |
Orix JREIT, Inc. | | | 134 | | | | 204,939 | |
OUE Hospitality Trust | | | 60,500 | | | | 29,708 | |
Parkway Life REIT | | | 12,500 | | | | 23,469 | |
Precinct Properties New Zealand Ltd. | | | 22,735 | | | | 20,933 | |
Premier Investment Corp.(a) | | | 90 | | | | 93,066 | |
Primary Health Properties plc | | | 109,786 | | | | 153,746 | |
Property for Industry Ltd. | | | 51,499 | | | | 57,842 | |
RDI REIT plc | | | 682,263 | | | | 288,117 | |
Regal REIT(a) | | | 681,000 | | | | 187,637 | |
Reit 1 Ltd. | | | 134,541 | | | | 525,918 | |
Retail Estates NV | | | 666 | | | | 53,200 | |
Safestore Holdings plc | | | 12,195 | | | | 83,209 | |
Scentre Group | | | 94,770 | | | | 267,330 | |
Secure Income REIT plc | | | 14,030 | | | | 67,763 | |
Segro plc | | | 46,870 | | | | 368,072 | |
Sekisui House Reit, Inc. | | | 55 | | | | 34,358 | |
Shaftesbury plc | | | 24,070 | | | | 275,876 | |
Shopping Centres Australasia Property Group | | | 100,734 | | | | 183,486 | |
Societe Fonciere Lyonnaise SA | | | 972 | | | | 69,383 | |
SPH REIT | | | 44,800 | | | | 31,866 | |
Starhill Global REIT(a) | | | 72,900 | | | | 35,271 | |
Stockland | | | 61,560 | | | | 157,507 | |
Sunlight REIT | | | 55,000 | | | | 33,115 | |
Suntec REIT | | | 148,800 | | | | 190,191 | |
Terreis | | | 968 | | | | 41,788 | |
Tokyu REIT, Inc. | | | 40 | | | | 56,320 | |
Tritax Big Box REIT plc | | | 105,902 | | | | 193,367 | |
| | | | | | | | |
| Investments | | Shares | | | Value | |
| Equity Real Estate Investment Trusts (REITs) – (continued) | |
Unibail-Rodamco-Westfield | | | 3,321 | | | $ | 603,111 | |
Unibail-Rodamco-Westfield, CHDI* | | | 5 | | | | 45 | |
UNITE Group plc (The) | | | 9,133 | | | | 99,484 | |
United Urban Investment Corp. | | | 84 | | | | 127,948 | |
Vicinity Centres | | | 4,212 | | | | 7,911 | |
Vital Healthcare Property Trust | | | 43,976 | | | | 59,586 | |
Viva Energy REIT(a) | | | 393,903 | | | | 608,610 | |
Warehouses De Pauw CVA, CVA | | | 851 | | | | 110,500 | |
Wereldhave NV | | | 28,376 | | | | 977,082 | |
Workspace Group plc | | | 10,154 | | | | 124,683 | |
| | | | | | | | 26,333,058 | |
| Food & Staples Retailing – 1.3% | |
Aeon Co. Ltd. | | | 33,813 | | | | 776,002 | |
Ain Holdings, Inc. | | | 800 | | | | 62,664 | |
Alimentation Couche-Tard, Inc., Class B | | | 9,315 | | | | 445,943 | |
Arcs Co. Ltd.(a) | | | 11,018 | | | | 267,310 | |
Axfood AB | | | 3,184 | | | | 56,871 | |
Axial Retailing, Inc. | | | 1,100 | | | | 36,064 | |
Belc Co. Ltd. | | | 800 | | | | 40,831 | |
Carrefour SA | | | 6,158 | | | | 119,661 | |
Cawachi Ltd. | | | 800 | | | | 14,851 | |
cocokara fine, Inc.(a) | | | 3,500 | | | | 192,592 | |
Colruyt SA | | | 1,990 | | | | 115,715 | |
Cosmos Pharmaceutical Corp. | | | 100 | | | | 20,442 | |
Create SD Holdings Co. Ltd. | | | 2,000 | | | | 50,738 | |
Daikokutenbussan Co. Ltd. | | | 400 | | | | 14,957 | |
Dairy Farm International Holdings Ltd. | | | 7,600 | | | | 68,628 | |
Empire Co. Ltd., Class A | | | 1,666 | | | | 30,383 | |
FamilyMart UNY Holdings Co. Ltd.(a) | | | 2,737 | | | | 318,191 | |
Genky DrugStores Co. Ltd. | | | 7,600 | | | | 245,802 | |
George Weston Ltd. | | | 4,165 | | | | 303,673 | |
Heiwado Co. Ltd. | | | 1,200 | | | | 30,793 | |
ICA Gruppen AB(a) | | | 4,604 | | | | 163,160 | |
Inageya Co. Ltd. | | | 2,398 | | | | 30,237 | |
Itochu-Shokuhin Co. Ltd. | | | 400 | | | | 18,643 | |
J Sainsbury plc | | | 107,163 | | | | 426,118 | |
Jeronimo Martins SGPS SA | | | 15,324 | | | | 188,561 | |
See Accompanying Notes to the Financial Statements.
| | |
| 150 | | FLEXSHARES ANNUAL REPORT |
FlexShares® Morningstar Developed Markets ex-US Factor Tilt Index Fund (cont.)
| | | | | | | | |
| Investments | | Shares | | | Value | |
| COMMON STOCKS – (continued) | |
| Food & Staples Retailing – (continued) | |
Kato Sangyo Co. Ltd. | | | 9,600 | | | $ | 295,601 | |
Kesko OYJ, Class A | | | 562 | | | | 31,584 | |
Kesko OYJ, Class B | | | 2,318 | | | | 135,575 | |
Kobe Bussan Co. Ltd. | | | 800 | | | | 20,331 | |
Koninklijke Ahold Delhaize NV | | | 71,523 | | | | 1,639,422 | |
Kusuri no Aoki Holdings Co. Ltd. | | | 600 | | | | 43,064 | |
Loblaw Cos. Ltd. | | | 9,477 | | | | 475,131 | |
MARR SpA | | | 1,155 | | | | 27,979 | |
Matsumotokiyoshi Holdings Co. Ltd. | | | 3,600 | | | | 129,830 | |
Metcash Ltd.(a) | | | 122,391 | | | | 238,548 | |
Metro, Inc.(a) | | | 10,836 | | | | 340,861 | |
Ministop Co. Ltd. | | | 1,000 | | | | 18,457 | |
North West Co., Inc. (The) | | | 95 | | | | 2,076 | |
Olam International Ltd. | | | 35,100 | | | | 45,624 | |
Qol Holdings Co. Ltd. | | | 1,500 | | | | 31,620 | |
Rallye SA(a) | | | 7,405 | | | | 82,350 | |
Rami Levy Chain Stores Hashikma Marketing 2006 Ltd. | | | 243 | | | | 12,391 | |
Seven & i Holdings Co. Ltd. | | | 24,600 | | | | 1,066,570 | |
Sheng Siong Group Ltd. | | | 51,500 | | | | 40,165 | |
Shufersal Ltd. | | | 3,578 | | | | 22,724 | |
Sligro Food Group NV(a) | | | 1,155 | | | | 51,235 | |
Sogo Medical Holdings Co. Ltd. | | | 2,000 | | | | 42,975 | |
Sonae SGPS SA | | | 76,391 | | | | 76,558 | |
Sugi Holdings Co. Ltd. | | | 800 | | | | 36,649 | |
Sundrug Co. Ltd. | | | 1,600 | | | | 58,128 | |
Tesco plc | | | 300,183 | | | | 818,131 | |
Tsuruha Holdings, Inc. | | | 900 | | | | 93,784 | |
United Super Markets Holdings, Inc. | | | 2,000 | | | | 21,940 | |
Valor Holdings Co. Ltd. | | | 10,400 | | | | 223,473 | |
Welcia Holdings Co. Ltd.(a) | | | 1,800 | | | | 91,870 | |
Wesfarmers Ltd. | | | 28,917 | | | | 955,473 | |
Wm Morrison Supermarkets plc | | | 159,813 | | | | 506,623 | |
Woolworths Group Ltd. | | | 30,699 | | | | 618,578 | |
Yaoko Co. Ltd. | | | 1,800 | | | | 98,250 | |
Yokohama Reito Co. Ltd. | | | 27,100 | | | | 215,157 | |
| | | | | | | | 12,647,557 | |
| | | | | | | | |
| Investments | | Shares | | | Value | |
| Food Products – 3.0% | |
a2 Milk Co. Ltd.* | | | 45,810 | | | $ | 311,703 | |
AAK AB | | | 5,004 | | | | 75,555 | |
Agrana Beteiligungs AG | | | 2,268 | | | | 45,228 | |
Ajinomoto Co., Inc. | | | 22,300 | | | | 360,914 | |
Ariake Japan Co. Ltd.(a) | | | 800 | | | | 70,887 | |
Aryzta AG* (a) | | | 75,730 | | | | 706,482 | |
Associated British Foods plc | | | 5,184 | | | | 158,045 | |
Austevoll Seafood ASA | | | 8,913 | | | | 143,797 | |
Australian Agricultural Co. Ltd.* (a) | | | 146,610 | | | | 137,161 | |
Bakkafrost P/F | | | 2,188 | | | | 123,237 | |
Bakkavor Group plc(c) | | | 143,208 | | | | 273,744 | |
Barry Callebaut AG (Registered) | | | 38 | | | | 74,383 | |
Bega Cheese Ltd.(a) | | | 7,095 | | | | 30,021 | |
Bell Food Group AG (Registered)(a) | | | 1,134 | | | | 356,242 | |
Bellamy’s Australia Ltd.* (a) | | | 1,296 | | | | 6,641 | |
Bonduelle SCA | | | 11,595 | | | | 411,867 | |
Bourbon Corp. | | | 8,100 | | | | 145,628 | |
Calbee, Inc.(a) | | | 3,200 | | | | 106,331 | |
Chocoladefabriken Lindt & Spruengli AG | | | 43 | | | | 297,097 | |
Chocoladefabriken Lindt & Spruengli AG (Registered) | | | 6 | | | | 479,571 | |
Costa Group Holdings Ltd. | | | 13,860 | | | | 59,922 | |
Cranswick plc | | | 2,274 | | | | 83,972 | |
Dairy Crest Group plc(a) | | | 39,310 | | | | 240,192 | |
Danone SA | | | 17,336 | | | | 1,229,231 | |
DyDo Group Holdings, Inc. | | | 500 | | | | 25,387 | |
Ebro Foods SA | | | 4,297 | | | | 84,423 | |
Elders Ltd.(a) | | | 83,025 | | | | 428,972 | |
Emmi AG (Registered)* | | | 41 | | | | 29,836 | |
First Resources Ltd. | | | 24,300 | | | | 27,725 | |
ForFarmers NV | | | 16,966 | | | | 191,657 | |
Fraser and Neave Ltd. | | | 89,100 | | | | 112,597 | |
Freedom Foods Group Ltd. | | | 4,139 | | | | 14,844 | |
Fuji Oil Holdings, Inc. | | | 3,400 | | | | 98,064 | |
Fujicco Co. Ltd. | | | 2,000 | | | | 45,864 | |
Fujiya Co. Ltd. | | | 400 | | | | 8,655 | |
Glanbia plc | | | 5,838 | | | | 103,322 | |
GrainCorp Ltd., Class A(a) | | | 10,837 | | | | 63,289 | |
Greencore Group plc | | | 506,331 | | | | 1,224,057 | |
Greenyard NV(a) | | | 7,938 | | | | 72,493 | |
See Accompanying Notes to the Financial Statements.
| | | | |
| FLEXSHARES ANNUAL REPORT | | | 151 | |
FlexShares® Morningstar Developed Markets ex-US Factor Tilt Index Fund (cont.)
| | | | | | | | |
| Investments | | Shares | | | Value | |
| COMMON STOCKS – (continued) | |
| Food Products – (continued) | |
Grieg Seafood ASA | | | 51,840 | | | $ | 758,022 | |
House Foods Group, Inc.(a) | | | 2,400 | | | | 69,115 | |
Inghams Group Ltd.(a) | | | 93,555 | | | | 258,598 | |
Itoham Yonekyu Holdings, Inc. | | | 6,500 | | | | 40,893 | |
Japfa Ltd.(a) | | | 182,200 | | | | 87,495 | |
Kagome Co. Ltd. | | | 900 | | | | 24,004 | |
Kameda Seika Co. Ltd. | | | 900 | | | | 42,665 | |
Kerry Group plc, Class A | | | 5,022 | | | | 514,961 | |
Kikkoman Corp. | | | 4,000 | | | | 220,105 | |
Kotobuki Spirits Co. Ltd. | | | 1,000 | | | | 38,279 | |
KWS Saat SE | | | 141 | | | | 47,928 | |
LDC SA(a) | | | 1,458 | | | | 183,371 | |
Leroy Seafood Group ASA | | | 18,318 | | | | 169,298 | |
Lotus Bakeries | | | 13 | | | | 33,584 | |
Maple Leaf Foods, Inc. | | | 8,026 | | | | 182,980 | |
Marine Harvest ASA | | | 19,343 | | | | 469,482 | |
Marudai Food Co. Ltd. | | | 6,200 | | | | 100,866 | |
Maruha Nichiro Corp. | | | 4,400 | | | | 159,461 | |
MEIJI Holdings Co. Ltd. | | | 3,800 | | | | 252,536 | |
Mitsui Sugar Co. Ltd. | | | 11,900 | | | | 320,553 | |
Morinaga & Co. Ltd. | | | 1,100 | | | | 44,203 | |
Morinaga Milk Industry Co. Ltd. | | | 1,200 | | | | 32,006 | |
Nestle SA (Registered) | | | 93,312 | | | | 7,896,130 | |
Nichirei Corp. | | | 3,500 | | | | 84,511 | |
Nippon Flour Mills Co. Ltd.(a) | | | 64,400 | | | | 1,065,392 | |
Nippon Suisan Kaisha Ltd. | | | 44,000 | | | | 281,104 | |
Nisshin Oillio Group Ltd. (The) | | | 25,700 | | | | 770,852 | |
Nisshin Seifun Group, Inc. | | | 7,090 | | | | 141,417 | |
Nissin Foods Holdings Co. Ltd. | | | 1,500 | | | | 96,894 | |
Norway Royal Salmon ASA | | | 12,751 | | | | 376,236 | |
Origin Enterprises plc | | | 107,892 | | | | 693,141 | |
Orkla ASA | | | 25,379 | | | | 219,641 | |
Premium Brands Holdings Corp. | | | 1,100 | | | | 74,154 | |
Prima Meat Packers Ltd. | | | 5,600 | | | | 105,643 | |
Riken Vitamin Co. Ltd. | | | 8,900 | | | | 274,441 | |
S Foods, Inc. | | | 4,500 | | | | 181,627 | |
Sakata Seed Corp. | | | 2,800 | | | | 88,574 | |
Salmar ASA | | | 3,732 | | | | 197,591 | |
Saputo, Inc. | | | 4,455 | | | | 136,067 | |
Savencia SA | | | 4,536 | | | | 333,041 | |
Schouw & Co. A/S | | | 1,480 | | | | 121,035 | |
| | | | | | | | |
| Investments | | Shares | | | Value | |
| Food Products – (continued) | |
Showa Sangyo Co. Ltd. | | | 23,200 | | | $ | 580,540 | |
Sipef NV | | | 5,751 | | | | 335,583 | |
Starzen Co. Ltd. | | | 1,100 | | | | 44,593 | |
Strauss Group Ltd. | | | 952 | | | | 20,878 | |
Suedzucker AG | | | 1,602 | | | | 24,777 | |
Synlait Milk Ltd.* | | | 26,973 | | | | 152,708 | |
Tassal Group Ltd. | | | 125,409 | | | | 367,089 | |
Tate & Lyle plc | | | 1,134 | | | | 9,754 | |
Toyo Suisan Kaisha Ltd. | | | 2,800 | | | | 96,513 | |
Vilmorin & Cie SA(a) | | | 3,888 | | | | 231,719 | |
Viscofan SA | | | 825 | | | | 49,356 | |
Vitasoy International Holdings Ltd. | | | 16,000 | | | | 50,922 | |
Wessanen | | | 3,410 | | | | 35,759 | |
WH Group Ltd.(c) | | | 333,500 | | | | 233,553 | |
Wilmar International Ltd. | | | 234,900 | | | | 536,023 | |
Yakult Honsha Co. Ltd. | | | 4,300 | | | | 305,197 | |
Yamazaki Baking Co. Ltd. | | | 2,900 | | | | 52,318 | |
| | | | | | | | 28,774,214 | |
| Gas Utilities – 0.3% | | | | | | |
AltaGas Ltd.(a) | | | 9,963 | | | | 125,557 | |
APA Group | | | 59,250 | | | | 403,137 | |
Hong Kong & China Gas Co. Ltd. | | | 251,317 | | | | 479,591 | |
Italgas SpA | | | 28,609 | | | | 147,879 | |
Naturgy Energy Group SA | | | 20,088 | | | | 494,363 | |
Nippon Gas Co. Ltd.(a) | | | 2,000 | | | | 60,520 | |
Osaka Gas Co. Ltd. | | | 11,700 | | | | 214,707 | |
Rubis SCA | | | 4,087 | | | | 211,626 | |
Saibu Gas Co. Ltd. | | | 3,300 | | | | 73,687 | |
Shizuoka Gas Co. Ltd. | | | 67,000 | | | | 579,434 | |
Superior Plus Corp. | | | 18,859 | | | | 169,885 | |
Toho Gas Co. Ltd. | | | 2,000 | | | | 69,115 | |
Tokyo Gas Co. Ltd. | | | 7,700 | | | | 189,745 | |
| | | | | | | | 3,219,246 | |
| Health Care Equipment & Supplies – 0.9% | |
Ambu A/S, Class B(a) | | | 8,875 | | | | 185,056 | |
Ansell Ltd. | | | 6,098 | | | | 100,183 | |
Arjo AB, Class B | | | 4,131 | | | | 14,057 | |
Asahi Intecc Co. Ltd. | | | 5,600 | | | | 229,002 | |
BioMerieux | | | 825 | | | | 63,003 | |
See Accompanying Notes to the Financial Statements.
| | |
| 152 | | FLEXSHARES ANNUAL REPORT |
FlexShares® Morningstar Developed Markets ex-US Factor Tilt Index Fund (cont.)
| | | | | | | | |
| Investments | | Shares | | | Value | |
| COMMON STOCKS – (continued) | |
| Health Care Equipment & Supplies – (continued) | |
Carl Zeiss Meditec AG | | | 715 | | | $ | 58,694 | |
Cochlear Ltd. | | | 1,232 | | | | 155,059 | |
Coloplast A/S, Class B | | | 3,969 | | | | 370,698 | |
ConvaTec Group plc(c) | | | 50,058 | | | | 103,618 | |
DiaSorin SpA | | | 869 | | | | 82,511 | |
Draegerwerk AG & Co. KGaA | | | 11,066 | | | | 540,402 | |
Draegerwerk AG & Co. KGaA (Preference) | | | 2,482 | | | | 133,468 | |
Eiken Chemical Co. Ltd. | | | 1,600 | | | | 35,784 | |
Elekta AB, Class B | | | 6,069 | | | | 77,060 | |
EssilorLuxottica SA | | | 6,075 | | | | 831,156 | |
Fisher & Paykel Healthcare Corp. Ltd. | | | 12,815 | | | | 113,807 | |
Fukuda Denshi Co. Ltd. | | | 3,563 | | | | 224,789 | |
GN Store Nord A/S | | | 3,824 | | | | 162,433 | |
Hogy Medical Co. Ltd. | | | 1,200 | | | | 35,408 | |
Hoya Corp. | | | 10,900 | | | | 619,491 | |
Koninklijke Philips NV | | | 30,978 | | | | 1,155,480 | |
Mani, Inc. | | | 1,300 | | | | 59,785 | |
Mazor Robotics Ltd.* | | | 2,094 | | | | 60,870 | |
Menicon Co. Ltd. | | | 1,600 | | | | 35,302 | |
Nagaileben Co. Ltd. | | | 1,500 | | | | 33,680 | |
Nakanishi, Inc. | | | 5,100 | | | | 119,439 | |
Nanosonics Ltd.* (a) | | | 26,752 | | | | 56,881 | |
Nihon Kohden Corp. | | | 2,300 | | | | 68,681 | |
Nikkiso Co. Ltd. | | | 25,400 | | | | 295,064 | |
Nipro Corp.(a) | | | 5,200 | | | | 66,259 | |
Olympus Corp. | | | 9,200 | | | | 307,332 | |
Paramount Bed Holdings Co. Ltd. | | | 800 | | | | 33,707 | |
Sartorius AG (Preference) | | | 1,400 | | | | 203,043 | |
Sectra AB, Class B* (a) | | | 1,654 | | | | 43,179 | |
Siemens Healthineers AG* (c) | | | 3,645 | | | | 151,116 | |
Smith & Nephew plc | | | 28,431 | | | | 462,633 | |
Sonova Holding AG (Registered) | | | 1,539 | | | | 251,757 | |
Straumann Holding AG (Registered) | | | 219 | | | | 149,679 | |
Sysmex Corp. | | | 4,200 | | | | 294,899 | |
Terumo Corp. | | | 9,600 | | | | 518,045 | |
William Demant Holding A/S* | | | 2,796 | | | | 92,058 | |
Ypsomed Holding AG (Registered)* | | | 81 | | | | 10,887 | |
| | | | | | | | 8,605,455 | |
| | | | | | | | |
| Investments | | Shares | | | Value | |
| Health Care Providers & Services – 0.6% | |
Alfresa Holdings Corp. | | | 12,300 | | | $ | 328,603 | |
Ambea AB(c) | | | 43,152 | | | | 401,317 | |
Amplifon SpA | | | 3,837 | | | | 68,082 | |
As One Corp. | | | 700 | | | | 49,745 | |
Australian Pharmaceutical Industries Ltd.(a) | | | 356,629 | | | | 386,724 | |
BML, Inc. | | | 3,300 | | | | 90,794 | |
Chartwell Retirement Residences | | | 14,947 | | | | 160,823 | |
EBOS Group Ltd. | | | 1,980 | | | | 26,945 | |
Estia Health Ltd. | | | 4,374 | | | | 6,324 | |
Fagron | | | 8,568 | | | | 139,601 | |
Fresenius Medical Care AG & Co. KGaA | | | 6,480 | | | | 508,959 | |
Fresenius SE & Co. KGaA | | | 12,717 | | | | 810,938 | |
Healthscope Ltd. | | | 71,257 | | | | 106,562 | |
Japan Lifeline Co. Ltd.(a) | | | 3,000 | | | | 43,569 | |
Korian SA(a) | | | 4,471 | | | | 176,495 | |
Medipal Holdings Corp. | | | 7,100 | | | | 152,437 | |
Metlifecare Ltd. | | | 61,236 | | | | 232,725 | |
NichiiGakkan Co. Ltd.(a) | | | 9,200 | | | | 85,923 | |
NMC Health plc | | | 1,466 | | | | 66,161 | |
Orpea | | | 1,278 | | | | 157,619 | |
Primary Health Care Ltd. | | | 122,227 | | | | 229,565 | |
Raffles Medical Group Ltd.(a) | | | 4,037 | | | | 3,061 | |
Ramsay Health Care Ltd. | | | 8,991 | | | | 358,255 | |
RHOEN-KLINIKUM AG | | | 2,259 | | | | 57,129 | |
Ryman Healthcare Ltd.(a) | | | 13,156 | | | | 103,949 | |
Ship Healthcare Holdings, Inc. | | | 3,300 | | | | 119,450 | |
Sienna Senior Living, Inc. | | | 2,835 | | | | 35,836 | |
Sigma Healthcare Ltd.(a) | | | 543,996 | | | | 200,490 | |
Sonic Healthcare Ltd. | | | 17,422 | | | | 278,444 | |
Spire Healthcare Group plc(a) (c) | | | 57,943 | | | | 86,919 | |
Summerset Group Holdings Ltd.(a) | | | 11,425 | | | | 49,687 | |
Suzuken Co. Ltd. | | | 3,380 | | | | 171,314 | |
Terveystalo OYJ* (c) | | | 2,916 | | | | 24,928 | |
Toho Holdings Co. Ltd.(a) | | | 4,200 | | | | 110,382 | |
Town Health International Medical Group Ltd.* (b) | | | 398,000 | | | | 35,031 | |
UDG Healthcare plc | | | 17,005 | | | | 137,322 | |
| | | | | | | | 6,002,108 | |
See Accompanying Notes to the Financial Statements.
| | | | |
| FLEXSHARES ANNUAL REPORT | | | 153 | |
FlexShares® Morningstar Developed Markets ex-US Factor Tilt Index Fund (cont.)
| | | | | | | | |
| Investments | | Shares | | | Value | |
| COMMON STOCKS – (continued) | |
| Health Care Technology – 0.0%(e) | |
CompuGroup Medical SE | | | 624 | | | $ | 35,351 | |
M3, Inc. | | | 10,000 | | | | 161,092 | |
| | | | | | | | 196,443 | |
| Hotels, Restaurants & Leisure – 1.6% | |
888 Holdings plc | | | 12,393 | | | | 29,343 | |
Accor SA | | | 7,695 | | | | 352,415 | |
Aeon Fantasy Co. Ltd. | | | 500 | | | | 15,595 | |
Arcland Service Holdings Co. Ltd. | | | 1,400 | | | | 28,656 | |
Ardent Leisure Group(a) | | | 43,861 | | | | 49,738 | |
Aristocrat Leisure Ltd. | | | 18,792 | | | | 352,949 | |
Atom Corp. | | | 5,800 | | | | 51,445 | |
Autogrill SpA | | | 6,257 | | | | 61,643 | |
Basic-Fit NV* (c) | | | 3,008 | | | | 86,739 | |
bet-at-home.com AG | | | 1,296 | | | | 75,477 | |
Carnival plc | | | 5,589 | | | | 304,435 | |
Cherry AB, Class B* | | | 5,700 | | | | 44,778 | |
Cie des Alpes | | | 10,044 | | | | 307,270 | |
Colowide Co. Ltd.(a) | | | 3,500 | | | | 85,255 | |
Compass Group plc | | | 44,955 | | | | 884,595 | |
Corporate Travel Management Ltd.(a) | | | 3,366 | | | | 47,832 | |
Create Restaurants Holdings, Inc. | | | 2,200 | | | | 23,276 | |
Crown Resorts Ltd. | | | 17,574 | | | | 155,819 | |
Dalata Hotel Group plc | | | 16,255 | | | | 100,745 | |
Domino’s Pizza Enterprises Ltd.(a) | | | 1,940 | | | | 74,262 | |
Domino’s Pizza Group plc | | | 41,025 | | | | 148,505 | |
Doutor Nichires Holdings Co. Ltd. | | | 2,700 | | | | 48,016 | |
EI Group plc* | | | 427,356 | | | | 907,542 | |
Elior Group SA(c) | | | 11,178 | | | | 161,228 | |
Evolution Gaming Group AB(a) (c) | | | 1,265 | | | | 95,293 | |
Flight Centre Travel Group Ltd. | | | 3,119 | | | | 102,571 | |
Fuji Kyuko Co. Ltd. | | | 1,000 | | | | 29,197 | |
Galaxy Entertainment Group Ltd. | | | 67,000 | | | | 362,375 | |
Genting Singapore Ltd. | | | 144,000 | | | | 91,508 | |
GL Ltd.* | | | 310,200 | | | | 163,522 | |
Great Canadian Gaming Corp.* | | | 2,860 | | | | 92,339 | |
| | | | | | | | |
| Investments | | Shares | | | Value | |
| Hotels, Restaurants & Leisure – (continued) | |
Greene King plc | | | 254,178 | | | $ | 1,567,369 | |
Greggs plc | | | 8,343 | | | | 123,766 | |
GVC Holdings plc | | | 28,316 | | | | 339,014 | |
Hiday Hidaka Corp. | | | 1,992 | | | | 38,797 | |
HIS Co. Ltd.(a) | | | 800 | | | | 24,279 | |
Ichibanya Co. Ltd. | | | 1,000 | | | | 38,102 | |
InterContinental Hotels Group plc | | | 7,635 | | | | 400,956 | |
J D Wetherspoon plc | | | 3,795 | | | | 59,886 | |
Kindred Group plc, SDR | | | 4,675 | | | | 49,933 | |
Kisoji Co. Ltd. | | | 1,700 | | | | 39,120 | |
KOMEDA Holdings Co. Ltd. | | | 1,200 | | | | 23,616 | |
Kyoritsu Maintenance Co. Ltd. | | | 1,600 | | | | 71,029 | |
Macau Legend Development Ltd.(a) | | | 456,000 | | | | 79,690 | |
Mandarin Oriental International Ltd. | | | 8,000 | | | | 15,120 | |
Marston’s plc(a) | | | 391,450 | | | | 497,174 | |
McDonald’s Holdings Co. Japan Ltd. | | | 1,100 | | | | 48,443 | |
Melco International Development Ltd. | | | 21,000 | | | | 35,896 | |
Melia Hotels International SA | | | 8,344 | | | | 85,844 | |
Merlin Entertainments plc(c) | | | 44,469 | | | | 183,643 | |
Miramar Hotel & Investment | | | 162,000 | | | | 280,215 | |
Mitchells & Butlers plc(a) | | | 120,565 | | | | 400,535 | |
MOS Food Services, Inc. | | | 2,100 | | | | 55,638 | |
NagaCorp Ltd. | | | 244,000 | | | | 222,854 | |
NetEnt AB* | | | 4,549 | | | | 23,393 | |
Ohsho Food Service Corp. | | | 1,504 | | | | 103,683 | |
Oriental Land Co. Ltd. | | | 8,100 | | | | 761,876 | |
Paddy Power Betfair plc – SGMX | | | 2,706 | | | | 232,350 | |
Paddy Power Betfair plc – XDUB | | | 1,701 | | | | 146,862 | |
Pandox AB | | | 6,600 | | | | 112,940 | |
Parques Reunidos Servicios Centrales SAU(c) | | | 7,480 | | | | 93,058 | |
Playtech plc | | | 160 | | | | 979 | |
Plenus Co. Ltd.(a) | | | 1,000 | | | | 15,994 | |
Radisson Hospitality AB* | | | 48,502 | | | | 187,593 | |
Rank Group plc | | | 58,239 | | | | 119,064 | |
Restaurant Brands International, Inc. | | | 3,994 | | | | 219,339 | |
See Accompanying Notes to the Financial Statements.
| | |
| 154 | | FLEXSHARES ANNUAL REPORT |
FlexShares® Morningstar Developed Markets ex-US Factor Tilt Index Fund (cont.)
| | | | | | | | |
| Investments | | Shares | | | Value | |
| COMMON STOCKS – (continued) | |
| Hotels, Restaurants & Leisure – (continued) | |
Restaurant Brands International, Inc.* | | | 3,458 | | | $ | 189,904 | |
Restaurant Brands New Zealand Ltd. | | | 6,220 | | | | 34,849 | |
Ringer Hut Co. Ltd. | | | 1,700 | | | | 34,104 | |
Round One Corp. | | | 2,700 | | | | 31,963 | |
Royal Holdings Co. Ltd. | | | 1,600 | | | | 39,598 | |
Saizeriya Co. Ltd.(a) | | | 1,300 | | | | 24,628 | |
Sands China Ltd. | | | 70,000 | | | | 275,914 | |
Scandic Hotels Group AB(c) | | | 38,270 | | | | 350,262 | |
Shangri-La Asia Ltd. | | | 32,000 | | | | 43,677 | |
SJM Holdings Ltd. | | | 76,000 | | | | 61,367 | |
SkiStar AB | | | 1,414 | | | | 36,898 | |
Skylark Holdings Co. Ltd. | | | 3,700 | | | | 57,637 | |
Sodexo SA | | | 567 | | | | 57,897 | |
SSP Group plc | | | 26,424 | | | | 225,404 | |
St Marc Holdings Co. Ltd. | | | 1,400 | | | | 33,271 | |
Star Entertainment Grp Ltd. (The) | | | 38,963 | | | | 130,895 | |
Stars Group, Inc. (The)* | | | 6,337 | | | | 132,120 | |
Tabcorp Holdings Ltd.(a) | | | 39,123 | | | | 128,105 | |
Thomas Cook Group plc | | | 523,017 | | | | 301,530 | |
Tokyo Dome Corp. | | | 7,000 | | | | 61,654 | |
Toridoll Holdings Corp.(a) | | | 1,600 | | | | 27,093 | |
Tosho Co. Ltd. | | | 800 | | | | 31,084 | |
TUI AG, DI | | | 23,190 | | | | 384,907 | |
Whitbread plc | | | 5,022 | | | | 282,342 | |
William Hill plc | | | 16,330 | | | | 43,860 | |
Wynn Macau Ltd. | | | 18,000 | | | | 37,151 | |
Yoshinoya Holdings Co. Ltd.(a) | | | 4,900 | | | | 80,498 | |
Zensho Holdings Co. Ltd.(a) | | | 3,600 | | | | 69,796 | |
| | | | | | | | 15,240,821 | |
| Household Durables – 1.7% | |
Alpine Electronics, Inc.(a) | | | 3,600 | | | | 61,279 | |
Bang & Olufsen A/S* | | | 1,701 | | | | 35,391 | |
Barratt Developments plc | | | 35,154 | | | | 230,879 | |
Bellway plc | | | 9,072 | | | | 332,799 | |
Berkeley Group Holdings plc | | | 7,128 | | | | 318,864 | |
Bonava AB, Class B | | | 83,106 | | | | 940,202 | |
Bovis Homes Group plc | | | 107,913 | | | | 1,336,114 | |
Breville Group Ltd. | | | 4,514 | | | | 39,319 | |
Cairn Homes plc* | | | 33,544 | | | | 53,894 | |
| | | | | | | | |
| Investments | | Shares | | | Value | |
| Household Durables – (continued) | |
Casio Computer Co. Ltd. | | | 10,000 | | | $ | 151,079 | |
Clarion Co. Ltd.(a) | | | 2,600 | | | | 56,882 | |
Countryside Properties plc(c) | | | 326,430 | | | | 1,249,619 | |
Crest Nicholson Holdings plc(a) | | | 178,051 | | | | 775,336 | |
De’ Longhi SpA | | | 4,522 | | | | 119,893 | |
Duni AB | | | 3,648 | | | | 40,951 | |
Electrolux AB, Series B | | | 3,797 | | | | 79,017 | |
ES-Con Japan Ltd. | | | 32,400 | | | | 191,779 | |
Fiskars OYJ Abp | | | 6,414 | | | | 118,458 | |
Forbo Holding AG (Registered) | | | 81 | | | | 119,096 | |
Foster Electric Co. Ltd.(a) | | | 11,437 | | | | 166,506 | |
Fujitsu General Ltd.(a) | | | 10,100 | | | | 150,800 | |
Glenveagh Properties plc* (c) | | | 14,904 | | | | 14,117 | |
Haseko Corp. | | | 18,900 | | | | 239,652 | |
Husqvarna AB, Class B | | | 22,273 | | | | 168,442 | |
Iida Group Holdings Co. Ltd. | | | 15,400 | | | | 280,285 | |
JM AB | | | 1,842 | | | | 35,058 | |
Kaufman & Broad SA | | | 14,794 | | | | 607,802 | |
Man Wah Holdings Ltd.(a) | | | 94,400 | | | | 43,471 | |
McCarthy & Stone plc(a) (c) | | | 330,885 | | | | 570,764 | |
Metall Zug AG (Registered) | | | 81 | | | | 239,562 | |
Nagawa Co. Ltd. | | | 500 | | | | 24,057 | |
Nikon Corp. | | | 16,600 | | | | 289,329 | |
Nobia AB(a) | | | 128,466 | | | | 818,752 | |
Panasonic Corp. | | | 73,100 | | | | 809,343 | |
Persimmon plc | | | 16,362 | | | | 479,596 | |
Pressance Corp. | | | 21,200 | | | | 241,202 | |
Q Technology Group Co. Ltd.(c) | | | 81,000 | | | | 38,333 | |
Redrow plc | | | 24,592 | | | | 166,067 | |
Rinnai Corp. | | | 1,000 | | | | 72,837 | |
Sangetsu Corp. | | | 2,256 | | | | 43,379 | |
SEB SA | | | 1,554 | | | | 223,088 | |
Sekisui Chemical Co. Ltd. | | | 20,300 | | | | 318,922 | |
Sekisui House Ltd. | | | 27,700 | | | | 407,934 | |
Sony Corp. | | | 40,500 | | | | 2,203,447 | |
Starts Corp., Inc. | | | 5,200 | | | | 108,096 | |
Sumitomo Forestry Co. Ltd.(a) | | | 24,300 | | | | 361,523 | |
Tamron Co. Ltd. | | | 6,800 | | | | 121,473 | |
Taylor Wimpey plc | | | 243,162 | | | | 501,781 | |
Techtronic Industries Co. Ltd. | | | 92,000 | | | | 430,696 | |
Token Corp.(a) | | | 1,710 | | | | 110,611 | |
TomTom NV* (a) | | | 19,325 | | | | 161,944 | |
Zojirushi Corp.(a) | | | 14,600 | | | | 159,125 | |
| | | | | | | | 16,858,845 | |
See Accompanying Notes to the Financial Statements.
| | | | |
| FLEXSHARES ANNUAL REPORT | | | 155 | |
FlexShares® Morningstar Developed Markets ex-US Factor Tilt Index Fund (cont.)
| | | | | | | | |
| Investments | | Shares | | | Value | |
| COMMON STOCKS – (continued) | |
| Household Products – 0.4% | |
Earth Corp.(a) | | | 600 | | | $ | 27,274 | |
Essity AB, Class A | | | 7,533 | | | | 171,435 | |
Essity AB, Class B | | | 3,840 | | | | 87,768 | |
Henkel AG & Co. KGaA | | | 3,159 | | | | 309,968 | |
Henkel AG & Co. KGaA (Preference) | | | 4,050 | | | | 443,191 | |
Lion Corp. | | | 7,900 | | | | 148,403 | |
Pigeon Corp. | | | 2,400 | | | | 101,865 | |
Reckitt Benckiser Group plc | | | 24,948 | | | | 2,018,790 | |
Unicharm Corp. | | | 17,000 | | | | 462,753 | |
| | | | | | | | 3,771,447 | |
Independent Power and Renewable Electricity
Producers – 0.2% | |
Boralex, Inc., Class A | | | 5,761 | | | | 74,576 | |
ContourGlobal plc(c) | | | 37,746 | | | | 89,708 | |
Drax Group plc | | | 46,730 | | | | 239,792 | |
EDP Renovaveis SA | | | 6,490 | | | | 58,387 | |
Electric Power Development Co. Ltd. | | | 200 | | | | 5,450 | |
Encavis AG | | | 3,696 | | | | 25,043 | |
ERG SpA | | | 2,090 | | | | 39,050 | |
Infigen Energy* | | | 127,984 | | | | 44,447 | |
Innergex Renewable Energy, Inc. | | | 559 | | | | 5,197 | |
Meridian Energy Ltd. | | | 28,875 | | | | 59,112 | |
Northland Power, Inc. | | | 2,116 | | | | 32,628 | |
Renewables Infrastructure Group Ltd. (The)(a) | | | 772,740 | | | | 1,125,600 | |
Scatec Solar ASA(c) | | | 988 | | | | 6,747 | |
TransAlta Renewables, Inc. | | | 4,536 | | | | 37,476 | |
Uniper SE | | | 10,773 | | | | 311,384 | |
| | | | | | | | 2,154,597 | |
| Industrial Conglomerates – 1.0% | |
CIR-Compagnie Industriali Riunite SpA | | | 326,754 | | | | 348,015 | |
CK Hutchison Holdings Ltd. | | | 141,856 | | | | 1,428,621 | |
DCC plc | | | 4,779 | | | | 410,043 | |
Discount Investment Corp. Ltd. (Registered)* | | | 94,932 | | | | 262,184 | |
Guoco Group Ltd. | | | 4,000 | | | | 67,352 | |
Hopewell Holdings Ltd. | | | 8,000 | | | | 24,696 | |
| | | | | | | | |
| Investments | | Shares | | | Value | |
| Industrial Conglomerates – (continued) | |
Indus Holding AG | | | 2,853 | | | $ | 155,973 | |
Investment AB Latour, Class B(a) | | | 15,323 | | | | 185,760 | |
Italmobiliare SpA | | | 4,005 | | | | 88,488 | |
Jardine Matheson Holdings Ltd. | | | 16,300 | | | | 940,673 | |
Jardine Strategic Holdings Ltd. | | | 9,000 | | | | 301,500 | |
Keppel Corp. Ltd. | | | 30,500 | | | | 136,554 | |
Lifco AB, Class B | | | 2,000 | | | | 85,123 | |
Nisshinbo Holdings, Inc. | | | 11,200 | | | | 123,755 | |
Nolato AB, Class B | | | 710 | | | | 32,743 | |
NWS Holdings Ltd. | | | 53,401 | | | | 105,720 | |
Rheinmetall AG | | | 1,708 | | | | 148,124 | |
Sembcorp Industries Ltd. | | | 17,200 | | | | 35,026 | |
Shun Tak Holdings Ltd. | | | 1,242,000 | | | | 396,076 | |
Siemens AG (Registered) | | | 24,705 | | | | 2,847,346 | |
Smiths Group plc | | | 16,929 | | | | 302,294 | |
TOKAI Holdings Corp. | | | 21,395 | | | | 178,774 | |
Toshiba Corp.* | | | 24,300 | | | | 727,783 | |
| | | | | | | | 9,332,623 | |
| Insurance – 5.3% | |
Admiral Group plc | | | 14,020 | | | | 360,610 | |
Aegon NV | | | 70,552 | | | | 433,909 | |
Ageas | | | 10,206 | | | | 511,240 | |
AIA Group Ltd. | | | 391,400 | | | | 2,963,185 | |
Allianz SE (Registered) | | | 22,518 | | | | 4,705,806 | |
ASR Nederland NV | | | 8,755 | | | | 398,381 | |
Assicurazioni Generali SpA | | | 59,940 | | | | 969,826 | |
AUB Group Ltd. | | | 2,255 | | | | 21,528 | |
Aviva plc | | | 185,085 | | | | 1,013,370 | |
AXA SA | | | 95,580 | | | | 2,397,694 | |
Baloise Holding AG (Registered) | | | 3,888 | | | | 557,361 | |
Beazley plc | | | 42,363 | | | | 285,532 | |
CBL Corp. Ltd.* (b) | | | 102,937 | | | | 213,081 | |
Clal Insurance Enterprises Holdings Ltd.* | | | 24,766 | | | | 411,192 | |
CNP Assurances | | | 17,731 | | | | 395,775 | |
Coface SA | | | 58,666 | | | | 587,608 | |
Dai-ichi Life Holdings, Inc. | | | 59,100 | | | | 1,118,582 | |
Direct Insurance Financial Investments Ltd. | | | 3,564 | | | | 40,167 | |
Direct Line Insurance Group plc | | | 35,073 | | | | 147,664 | |
E-L Financial Corp. Ltd. | | | 405 | | | | 250,479 | |
esure Group plc | | | 297,189 | | | | 1,058,696 | |
See Accompanying Notes to the Financial Statements.
| | |
| 156 | | FLEXSHARES ANNUAL REPORT |
FlexShares® Morningstar Developed Markets ex-US Factor Tilt Index Fund (cont.)
| | | | | | | | |
| Investments | | Shares | | | Value | |
| COMMON STOCKS – (continued) | |
| Insurance – (continued) | |
Fairfax Financial Holdings Ltd. | | | 1,215 | | | $ | 591,841 | |
Gjensidige Forsikring ASA | | | 945 | | | | 14,684 | |
Great Eastern Holdings Ltd. | | | 6,800 | | | | 125,560 | |
Great-West Lifeco, Inc. | | | 6,399 | | | | 147,203 | |
Grupo Catalana Occidente SA | | | 2,102 | | | | 86,931 | |
Hannover Rueck SE | | | 2,997 | | | | 404,434 | |
Harel Insurance Investments & Financial Services Ltd. | | | 19,063 | | | | 139,662 | |
Hastings Group Holdings plc(c) | | | 50,133 | | | | 118,570 | |
Helvetia Holding AG (Registered) | | | 253 | | | | 155,185 | |
Hiscox Ltd. | | | 14,904 | | | | 310,030 | |
IDI Insurance Co. Ltd. | | | 4,421 | | | | 248,237 | |
Industrial Alliance Insurance & Financial Services, Inc. | | | 2,430 | | | | 86,116 | |
Insurance Australia Group Ltd. | | | 62,454 | | | | 302,326 | |
Intact Financial Corp. | | | 6,642 | | | | 526,049 | |
Japan Post Holdings Co. Ltd. | | | 59,500 | | | �� | 706,482 | |
Japan Post Insurance Co. Ltd. | | | 7,600 | | | | 181,220 | |
Jardine Lloyd Thompson Group plc | | | 6,537 | | | | 157,531 | |
Just Group plc | | | 1,001,808 | | | | 1,136,053 | |
Lancashire Holdings Ltd. | | | 2,106 | | | | 15,917 | |
Legal & General Group plc | | | 257,175 | | | | 826,443 | |
Manulife Financial Corp. | | | 94,851 | | | | 1,497,248 | |
Mapfre SA | | | 122,153 | | | | 365,944 | |
Medibank Pvt Ltd. | | | 78,651 | | | | 155,526 | |
Menora Mivtachim Holdings Ltd. | | | 24,209 | | | | 268,873 | |
Migdal Insurance & Financial Holding Ltd. | | | 387,268 | | | | 428,968 | |
MS&AD Insurance Group Holdings, Inc. | | | 21,400 | | | | 645,859 | |
Muenchener Rueckversicherungs-Gesellschaft AG in Muenchen (Registered) | | | 6,966 | | | | 1,499,242 | |
nib holdings Ltd. | | | 28,964 | | | | 113,726 | |
NN Group NV | | | 20,817 | | | | 896,295 | |
Old Mutual Ltd. | | | 189,702 | | | | 286,022 | |
Phoenix Group Holdings(a) | | | 53,222 | | | | 409,727 | |
Phoenix Holdings Ltd. (The) | | | 21,712 | | | | 120,220 | |
Poste Italiane SpA(c) | | | 18,839 | | | | 135,544 | |
Power Corp. of Canada | | | 10,368 | | | | 214,584 | |
| | | | | | | | |
| Investments | | Shares | | | Value | |
| Insurance – (continued) | |
Power Financial Corp. | | | 6,237 | | | $ | 134,642 | |
Protector Forsikring ASA* (a) | | | 7,614 | | | | 35,330 | |
Prudential plc | | | 134,703 | | | | 2,703,094 | |
QBE Insurance Group Ltd. | | | 42,525 | | | | 341,180 | |
RSA Insurance Group plc | | | 69,579 | | | | 501,777 | |
Sabre Insurance Group plc(c) | | | 166,050 | | | | 560,130 | |
Saga plc | | | 1,054,458 | | | | 1,604,674 | |
Sampo OYJ, Class A | | | 11,586 | | | | 533,765 | |
SCOR SE | | | 12,960 | | | | 600,149 | |
Societa Cattolica di Assicurazioni SC | | | 116,640 | | | | 944,276 | |
Sompo Holdings, Inc. | | | 20,000 | | | | 829,383 | |
Sony Financial Holdings, Inc. | | | 8,500 | | | | 197,710 | |
Steadfast Group Ltd.(a) | | | 52,828 | | | | 111,202 | |
Storebrand ASA | | | 17,930 | | | | 149,670 | |
Sun Life Financial, Inc. | | | 32,724 | | | | 1,201,313 | |
Suncorp Group Ltd. | | | 20,574 | | | | 204,291 | |
Swiss Life Holding AG (Registered)* | | | 2,349 | | | | 887,852 | |
Swiss Re AG | | | 14,823 | | | | 1,340,392 | |
T&D Holdings, Inc. | | | 32,500 | | | | 523,836 | |
Talanx AG | | | 3,690 | | | | 132,202 | |
Tokio Marine Holdings, Inc. | | | 42,200 | | | | 1,999,036 | |
Topdanmark A/S | | | 1,650 | | | | 78,682 | |
Tryg A/S | | | 2,365 | | | | 57,179 | |
Unipol Gruppo SpA | | | 67,392 | | | | 271,684 | |
UnipolSai Assicurazioni SpA(a) | | | 27,841 | | | | 60,914 | |
UNIQA Insurance Group AG | | | 4,884 | | | | 45,654 | |
Vienna Insurance Group AG Wiener Versicherung Gruppe | | | 3,645 | | | | 97,054 | |
Wuestenrot & Wuerttembergische AG | | | 17,415 | | | | 352,809 | |
Zurich Insurance Group AG* | | | 7,371 | | | | 2,295,056 | |
| | | | | | | | 50,954,874 | |
| Interactive Media & Services – 0.1% | |
Auto Trader Group plc(c) | | | 28,947 | | | | 151,499 | |
carsales.com Ltd. | | | 634 | | | | 5,482 | |
Dip Corp. | | | 1,400 | | | | 30,492 | |
Domain Holdings Australia Ltd.(a) | | | 12,474 | | | | 21,926 | |
Gree, Inc. | | | 8,100 | | | | 33,949 | |
Gurunavi, Inc. | | | 1,800 | | | | 13,749 | |
See Accompanying Notes to the Financial Statements.
| | | | |
| FLEXSHARES ANNUAL REPORT | | | 157 | |
FlexShares® Morningstar Developed Markets ex-US Factor Tilt Index Fund (cont.)
| | | | | | | | |
| Investments | | Shares | | | Value | |
| COMMON STOCKS – (continued) | |
| Interactive Media & Services – (continued) | |
Kakaku.com, Inc. | | | 1,600 | | | $ | 29,021 | |
LINE Corp.* (a) | | | 900 | | | | 28,550 | |
REA Group Ltd. | | | 2,748 | | | | 139,490 | |
Rightmove plc | | | 32,130 | | | | 185,626 | |
Scout24 AG(c) | | | 2,584 | | | | 107,333 | |
XING SE | | | 165 | | | | 49,636 | |
| | | | | | | | 796,753 | |
| Internet & Direct Marketing Retail – 0.2% | |
ASKUL Corp.(a) | | | 500 | | | | 13,779 | |
ASOS plc* | | | 1,589 | | | | 110,776 | |
Belluna Co. Ltd. | | | 16,300 | | | | 161,910 | |
boohoo Group plc* | | | 34,236 | | | | 93,133 | |
Delivery Hero SE* (c) | | | 608 | | | | 24,552 | |
Dustin Group AB(a) (c) | | | 26,163 | | | | 210,112 | |
HelloFresh SE* | | | 1,701 | | | | 20,314 | |
Just Eat plc* | | | 13,319 | | | | 103,403 | |
Moneysupermarket.com Group plc | | | 30,328 | | | | 113,658 | |
N Brown Group plc(a) | | | 67,309 | | | | 116,536 | |
Ocado Group plc* (a) | | | 32,505 | | | | 355,192 | |
On the Beach Group plc(c) | | | 3,564 | | | | 19,513 | |
Rocket Internet SE* (c) | | | 1,646 | | | | 47,595 | |
Takeaway.com NV* (c) | | | 1,022 | | | | 60,215 | |
Takkt AG | | | 17,415 | | | | 295,981 | |
Trade Me Group Ltd. | | | 9,564 | | | | 30,290 | |
Webjet Ltd.(a) | | | 6,292 | | | | 58,196 | |
Zalando SE* (c) | | | 2,863 | | | | 110,942 | |
zooplus AG* | | | 527 | | | | 87,299 | |
ZOZO, Inc. | | | 4,000 | | | | 96,371 | |
| | | | | | | | 2,129,767 | |
| IT Services – 0.9% | |
Afterpay Touch Group Ltd.* | | | 2,660 | | | | 23,547 | |
Alten SA | | | 1,130 | | | | 109,021 | |
Altran Technologies SA(a) | | | 6,101 | | | | 60,625 | |
Amadeus IT Group SA | | | 13,689 | | | | 1,104,025 | |
Atea ASA | | | 10,346 | | | | 136,881 | |
Atos SE | | | 3,050 | | | | 261,881 | |
Bechtle AG | | | 1,192 | | | | 106,022 | |
Cancom SE | | | 2,336 | | | | 95,497 | |
Capgemini SE | | | 5,184 | | | | 634,363 | |
| | | | | | | | |
| Investments | | Shares | | | Value | |
| IT Services – (continued) | |
CGI Group, Inc., Class A* | | | 8,748 | | | $ | 541,567 | |
Computacenter plc | | | 9,339 | | | | 131,023 | |
Computershare Ltd. | | | 17,864 | | | | 250,310 | |
Digital Garage, Inc. | | | 1,300 | | | | 35,537 | |
DTS Corp. | | | 2,000 | | | | 69,470 | |
Econocom Group SA/NV(a) | | | 92,908 | | | | 290,965 | |
Equiniti Group plc(c) | | | 16,869 | | | | 46,450 | |
Evry A/S(c) | | | 116,235 | | | | 428,710 | |
FDM Group Holdings plc | | | 3,850 | | | | 42,257 | |
Formula Systems 1985 Ltd. | | | 4,749 | | | | 184,617 | |
Fujitsu Ltd. | | | 10,400 | | | | 632,358 | |
Global Dominion Access SA* (c) | | | 2,113 | | | | 11,300 | |
GMO internet, Inc. | | | 1,200 | | | | 17,141 | |
Indra Sistemas SA* | | | 15,067 | | | | 149,121 | |
Infocom Corp. | | | 800 | | | | 29,985 | |
Itochu Techno-Solutions Corp. | | | 2,400 | | | | 45,510 | |
Keywords Studios plc | | | 1,064 | | | | 18,625 | |
Link Administration Holdings Ltd. | | | 6,763 | | | | 35,950 | |
Matrix IT Ltd. | | | 2,464 | | | | 28,657 | |
NEC Networks & System Integration Corp. | | | 20,700 | | | | 451,583 | |
NET One Systems Co. Ltd. | | | 8,100 | | | | 169,529 | |
NEXTDC Ltd.* (a) | | | 16,647 | | | | 69,257 | |
Nihon Unisys Ltd. | | | 2,600 | | | | 56,974 | |
Nomura Research Institute Ltd. | | | 4,215 | | | | 186,744 | |
NS Solutions Corp. | | | 800 | | | | 23,924 | |
NSD Co. Ltd. | | | 2,580 | | | | 54,730 | |
NTT Data Corp. | | | 33,700 | | | | 434,781 | |
Obic Co. Ltd. | | | 1,500 | | | | 136,635 | |
Otsuka Corp. | | | 3,400 | | | | 112,977 | |
Reply SpA | | | 880 | | | | 48,817 | |
SCSK Corp. | | | 900 | | | | 38,160 | |
Shopify, Inc., Class A* | | | 2,867 | | | | 397,046 | |
Softcat plc | | | 12,119 | | | | 99,879 | |
Sopra Steria Group | | | 663 | | | | 73,619 | |
SUNeVision Holdings Ltd. | | | 134,000 | | | | 72,133 | |
Tieto OYJ | | | 1,598 | | | | 51,530 | |
TIS, Inc. | | | 2,300 | | | | 103,123 | |
Transcosmos, Inc. | | | 2,100 | | | | 47,580 | |
Wirecard AG | | | 2,754 | | | | 516,117 | |
Worldline SA* (c) | | | 1,045 | | | | 55,058 | |
| | | | | | | | 8,721,611 | |
See Accompanying Notes to the Financial Statements.
| | |
| 158 | | FLEXSHARES ANNUAL REPORT |
FlexShares® Morningstar Developed Markets ex-US Factor Tilt Index Fund (cont.)
| | | | | | | | |
| Investments | | Shares | | | Value | |
| COMMON STOCKS – (continued) | |
| Leisure Products – 0.3% | |
Amer Sports OYJ* | | | 5,748 | | | $ | 213,814 | |
Bandai Namco Holdings, Inc. | | | 9,300 | | | | 330,863 | |
Beneteau SA | | | 2,358 | | | | 39,221 | |
BRP, Inc. | | | 3,584 | | | | 144,534 | |
Heiwa Corp. | | | 8,850 | | | | 202,557 | |
Sega Sammy Holdings, Inc. | | | 5,300 | | | | 68,237 | |
Shimano, Inc. | | | 2,800 | | | | 383,076 | |
Spin Master Corp.* (c) | | | 2,688 | | | | 95,874 | |
Technogym SpA(c) | | | 4,905 | | | | 53,687 | |
Thule Group AB(c) | | | 2,805 | | | | 55,641 | |
Tomy Co. Ltd. | | | 76,600 | | | | 893,910 | |
Trigano SA | | | 414 | | | | 42,100 | |
Universal Entertainment Corp.* (a) | | | 300 | | | | 9,091 | |
Yamaha Corp. | | | 4,600 | | | | 202,782 | |
Yonex Co. Ltd.(a) | | | 10,000 | | | | 57,773 | |
| | | | | | | | 2,793,160 | |
| Life Sciences Tools & Services – 0.2% | |
Clinigen Group plc | | | 5,270 | | | | 61,075 | |
EPS Holdings, Inc. | | | 1,900 | | | | 37,089 | |
Eurofins Scientific SE(a) | | | 121 | | | | 61,201 | |
Evotec AG* | | | 8,740 | | | | 172,805 | |
Genfit* (a) | | | 3,645 | | | | 85,160 | |
Gerresheimer AG | | | 755 | | | | 53,252 | |
Lonza Group AG (Registered)* | | | 2,187 | | | | 688,560 | |
MorphoSys AG* | | | 1,667 | | | | 154,503 | |
QIAGEN NV* | | | 6,975 | | | | 253,193 | |
Sartorius Stedim Biotech | | | 770 | | | | 95,620 | |
Siegfried Holding AG (Registered)* | | | 165 | | | | 66,269 | |
Tecan Group AG (Registered) | | | 779 | | | | 175,951 | |
| | | | | | | | 1,904,678 | |
| Machinery – 2.8% | |
Aalberts Industries NV | | | 1,980 | | | | 72,800 | |
Ag Growth International, Inc. | | | 912 | | | | 40,813 | |
Aida Engineering Ltd. | | | 19,300 | | | | 159,045 | |
Alfa Laval AB | | | 6,238 | | | | 159,504 | |
Alimak Group AB(c) | | | 2,416 | | | | 34,047 | |
Alstom SA* | | | 3,962 | | | | 173,505 | |
Amada Holdings Co. Ltd. | | | 10,600 | | | | 99,937 | |
| | | | | | | | |
| Investments | | Shares | | | Value | |
| Machinery – (continued) | |
ANDRITZ AG | | | 20 | | | $ | 1,037 | |
Asahi Diamond Industrial Co. Ltd. | | | 8,100 | | | | 51,174 | |
Atlas Copco AB, Class A* | | | 15,228 | | | | 377,547 | |
Atlas Copco AB, Class B* | | | 12,636 | | | | 289,988 | |
ATS Automation Tooling Systems, Inc.* | | | 1,400 | | | | 20,639 | |
Aumann AG(c) | | | 385 | | | | 19,019 | |
Beijer Alma AB | | | 2,304 | | | | 34,793 | |
Bobst Group SA (Registered) | | | 200 | | | | 15,151 | |
Bodycote plc | | | 16,467 | | | | 167,379 | |
Bucher Industries AG (Registered) | | | 275 | | | | 76,002 | |
Burckhardt Compression Holding AG | | | 76 | | | | 25,235 | |
Cargotec OYJ, Class B | | | 3,484 | | | | 144,875 | |
CKD Corp.(a) | | | 14,100 | | | | 162,421 | |
CNH Industrial NV | | | 40,095 | | | | 417,317 | |
Concentric AB | | | 914 | | | | 12,280 | |
Construcciones y Auxiliar de Ferrocarriles SA | | | 5,589 | | | | 210,243 | |
Conzzeta AG (Registered) | | | 55 | | | | 49,264 | |
Daetwyler Holding AG | | | 334 | | | | 50,802 | |
Daifuku Co. Ltd. | | | 4,800 | | | | 206,708 | |
Daiwa Industries Ltd. | | | 1,600 | | | | 16,885 | |
Danieli & C Officine Meccaniche SpA | | | 3,209 | | | | 59,993 | |
Danieli & C Officine Meccaniche SpA (Retirement Savings Plan) | | | 3,477 | | | | 51,294 | |
Deutz AG | | | 11,766 | | | | 87,721 | |
DMG Mori AG | | | 1,007 | | | | 48,777 | |
DMG Mori Co. Ltd.(a) | | | 10,100 | | | | 146,325 | |
Duerr AG | | | 2,992 | | | | 106,855 | |
Ebara Corp. | | | 4,100 | | | | 119,888 | |
FANUC Corp. | | | 6,200 | | | | 1,084,197 | |
Fluidra SA* | | | 912 | | | | 11,036 | |
Fuji Corp.(a) | | | 4,900 | | | | 68,601 | |
Fujitec Co. Ltd. | | | 59,700 | | | | 650,667 | |
Furukawa Co. Ltd.(a) | | | 19,200 | | | | 238,182 | |
Georg Fischer AG (Registered) | | | 121 | | | | 112,772 | |
Harmonic Drive Systems, Inc.(a) | | | 1,500 | | | | 45,656 | |
Heidelberger Druckmaschinen AG* | | | 13,984 | | | | 32,513 | |
See Accompanying Notes to the Financial Statements.
| | | | |
| FLEXSHARES ANNUAL REPORT | | | 159 | |
FlexShares® Morningstar Developed Markets ex-US Factor Tilt Index Fund (cont.)
| | | | | | | | |
| Investments | | Shares | | | Value | |
| COMMON STOCKS – (continued) | |
| Machinery – (continued) | |
Hirata Corp.(a) | | | 1,700 | | | $ | 104,993 | |
Hitachi Construction Machinery Co. Ltd. | | | 5,100 | | | | 136,024 | |
Hitachi Zosen Corp. | | | 102,200 | | | | 388,497 | |
Hoshizaki Corp. | | | 1,900 | | | | 153,374 | |
IHI Corp. | | | 2,500 | | | | 91,489 | |
IMA Industria Macchine Automatiche SpA(a) | | | 495 | | | | 29,754 | |
IMI plc | | | 17,717 | | | | 225,134 | |
Interpump Group SpA | | | 3,884 | | | | 112,220 | |
Interroll Holding AG (Registered) | | | 34 | | | | 63,004 | |
Japan Steel Works Ltd. (The) | | | 8,700 | | | | 184,631 | |
JTEKT Corp. | | | 18,700 | | | | 233,470 | |
Jungheinrich AG (Preference) | | | 4,524 | | | | 150,189 | |
Kawasaki Heavy Industries Ltd. | | | 16,200 | | | | 384,562 | |
KION Group AG | | | 2,754 | | | | 161,326 | |
Kitz Corp. | | | 85,300 | | | | 679,498 | |
Koenig & Bauer AG | | | 388 | | | | 18,992 | |
Komatsu Ltd. | | | 28,000 | | | | 730,548 | |
Komax Holding AG (Registered)* | | | 165 | | | | 45,273 | |
Komori Corp. | | | 4,400 | | | | 47,760 | |
Kone OYJ, Class B | | | 11,664 | | | | 568,548 | |
Konecranes OYJ | | | 4,673 | | | | 167,632 | |
Krones AG | | | 330 | | | | 29,557 | |
KSB SE & Co. KGaA (Preference) | | | 162 | | | | 54,332 | |
Kubota Corp. | | | 27,987 | | | | 441,920 | |
Kurita Water Industries Ltd. | | | 3,400 | | | | 83,844 | |
Kyokuto Kaihatsu Kogyo Co. Ltd. | | | 24,300 | | | | 347,312 | |
Makino Milling Machine Co. Ltd.(a) | | | 16,200 | | | | 618,688 | |
Makita Corp. | | | 6,600 | | | | 228,373 | |
Max Co. Ltd. | | | 26,300 | | | | 354,457 | |
Meidensha Corp. | | | 36,000 | | | | 508,794 | |
Metso OYJ | | | 4,427 | | | | 139,997 | |
MINEBEA MITSUMI, Inc. | | | 16,211 | | | | 248,074 | |
MISUMI Group, Inc. | | | 8,600 | | | | 172,678 | |
Mitsubishi Heavy Industries Ltd. | | | 5,811 | | | | 205,397 | |
Mitsuboshi Belting Ltd.(a) | | | 21,500 | | | | 527,903 | |
Miura Co. Ltd. | | | 3,300 | | | | 80,852 | |
Morgan Advanced Materials plc | | | 39,032 | | | | 137,650 | |
| | | | | | | | |
| Investments | | Shares | | | Value | |
| Machinery – (continued) | |
Morita Holdings Corp. | | | 9,000 | | | $ | 171,539 | |
Nabtesco Corp. | | | 2,300 | | | | 50,706 | |
Nachi-Fujikoshi Corp.(a) | | | 3,300 | | | | 134,655 | |
NFI Group, Inc. | | | 4,543 | | | | 153,630 | |
NGK Insulators Ltd. | | | 8,700 | | | | 122,342 | |
Nilfisk Holding A/S* | | | 1,053 | | | | 41,418 | |
Nitta Corp. | | | 3,400 | | | | 123,672 | |
Noritake Co. Ltd. | | | 8,100 | | | | 404,803 | |
Norma Group SE | | | 1,114 | | | | 60,233 | |
NSK Ltd. | | | 9,100 | | | | 90,149 | |
NTN Corp.(a) | | | 43,800 | | | | 160,677 | |
Obara Group, Inc. | | | 600 | | | | 23,632 | |
OC Oerlikon Corp. AG (Registered)* | | | 4,758 | | | | 56,714 | |
Oiles Corp. | | | 8,620 | | | | 158,491 | |
OKUMA Corp.(a) | | | 1,000 | | | | 50,064 | |
OSG Corp. | | | 1,500 | | | | 31,022 | |
Outotec OYJ* | | | 6,765 | | | | 26,215 | |
Palfinger AG | | | 2,657 | | | | 81,133 | |
Pfeiffer Vacuum Technology AG | | | 302 | | | | 37,640 | |
Picanol | | | 324 | | | | 29,148 | |
Rational AG | | | 55 | | | | 31,907 | |
Rotork plc | | | 23,256 | | | | 89,087 | |
Ryobi Ltd. | | | 26,000 | | | | 759,116 | |
Sandvik AB | | | 35,721 | | | | 566,318 | |
Schindler Holding AG | | | 1,541 | | | | 325,389 | |
Schindler Holding AG (Registered) | | | 602 | | | | 125,200 | |
Shima Seiki Manufacturing Ltd. | | | 1,300 | | | | 35,134 | |
Shinmaywa Industries Ltd. | | | 77,100 | | | | 948,250 | |
Sintokogio Ltd. | | | 2,200 | | | | 18,968 | |
SKF AB, Class A | | | 2,427 | | | | 38,876 | |
SKF AB, Class B | | | 19,923 | | | | 320,435 | |
SMC Corp. | | | 2,000 | | | | 640,645 | |
Sodick Co. Ltd. | | | 47,600 | | | | 358,513 | |
Spirax-Sarco Engineering plc | | | 2,783 | | | | 230,072 | |
Stabilus SA | | | 1,549 | | | | 103,989 | |
Star Micronics Co. Ltd. | | | 5,900 | | | | 84,013 | |
Sulzer AG (Registered) | | | 566 | | | | 56,943 | |
Sumitomo Heavy Industries Ltd. | | | 5,200 | | | | 164,264 | |
Tadano Ltd. | | | 6,500 | | | | 70,152 | |
Takeuchi Manufacturing Co. Ltd. | | | 11,800 | | | | 244,354 | |
Takuma Co. Ltd. | | | 16,200 | | | | 205,846 | |
See Accompanying Notes to the Financial Statements.
| | |
| 160 | | FLEXSHARES ANNUAL REPORT |
FlexShares® Morningstar Developed Markets ex-US Factor Tilt Index Fund (cont.)
| | | | | | | | |
| Investments | | Shares | | | Value | |
| COMMON STOCKS – (continued) | |
| Machinery – (continued) | |
THK Co. Ltd. | | | 2,500 | | | $ | 55,403 | |
Toshiba Machine Co. Ltd.(a) | | | 19,849 | | | | 376,736 | |
Trelleborg AB, Class B | | | 14,198 | | | | 256,784 | |
Tsubaki Nakashima Co. Ltd.(a) | | | 5,600 | | | | 103,212 | |
Tsubakimoto Chain Co. | | | 2,200 | | | | 84,799 | |
Union Tool Co. | | | 500 | | | | 17,234 | |
Valmet OYJ | | | 5,005 | | | | 114,099 | |
VAT Group AG* (a) (c) | | | 357 | | | | 35,916 | |
Vesuvius plc | | | 180,144 | | | | 1,252,174 | |
Volvo AB, Class A | | | 14,337 | | | | 215,219 | |
Volvo AB, Class B | | | 83,265 | | | | 1,246,283 | |
Vossloh AG | | | 1,458 | | | | 67,484 | |
Wacker Neuson SE | | | 5,236 | | | | 116,517 | |
Wartsila OYJ Abp | | | 15,552 | | | | 265,287 | |
Weir Group plc (The) | | | 9,242 | | | | 187,290 | |
YAMABIKO Corp. | | | 32,400 | | | | 349,106 | |
Yangzijiang Shipbuilding Holdings Ltd. | | | 22,600 | | | | 20,237 | |
| | | | | | | | 26,998,767 | |
| Marine – 0.3% | |
AP Moller – Maersk A/S, Class B | | | 162 | | | | 205,775 | |
Clarkson plc | | | 2,422 | | | | 73,654 | |
Dfds A/S | | | 2,869 | | | | 122,869 | |
Golden Ocean Group Ltd. | | | 3,321 | | | | 24,992 | |
Hapag-Lloyd AG(c) | | | 836 | | | | 30,955 | |
Iino Kaiun Kaisha Ltd. | | | 12,400 | | | | 54,498 | |
Irish Continental Group plc(a) | | | 11,810 | | | | 69,583 | |
Kuehne + Nagel International AG (Registered) | | | 2,430 | | | | 338,446 | |
Mitsui OSK Lines Ltd. | | | 16,200 | | | | 395,329 | |
Nippon Yusen KK | | | 8,100 | | | | 130,987 | |
Orient Overseas International Ltd.* | | | 7,000 | | | | 41,075 | |
Pacific Basin Shipping Ltd.(a) | | | 3,321,000 | | | | 724,406 | |
SITC International Holdings Co. Ltd. | | | 182,000 | | | | 133,725 | |
Stolt-Nielsen Ltd. | | | 21,846 | | | | 294,747 | |
Wallenius Wilhelmsen ASA* | | | 19,252 | | | | 66,197 | |
Wilh Wilhelmsen Holding ASA, Class A | | | 2,416 | | | | 48,866 | |
| | | | | | | | |
| Investments | | Shares | | | Value | |
| Marine – (continued) | |
Wilh Wilhelmsen Holding ASA, Class B | | | 2,216 | | | $ | 44,162 | |
| | | | | | | | 2,800,266 | |
| Media – 1.3% | |
Altice Europe NV* | | | 11,083 | | | | 26,459 | |
Altice Europe NV, Class B* | | | 23,845 | | | | 57,007 | |
Altice USA, Inc., Class A | | | 3,073 | | | | 50,121 | |
APG SGA SA | | | 324 | | | | 114,345 | |
Ascential plc | | | 19,337 | | | | 93,099 | |
Atresmedia Corp. de Medios de Comunicacion SA | | | 52,245 | | | | 294,915 | |
Axel Springer SE | | | 2,916 | | | | 193,943 | |
Cogeco Communications, Inc. | | | 5,498 | | | | 270,242 | |
Cogeco, Inc. | | | 2,835 | | | | 133,412 | |
Corus Entertainment, Inc., Class B(a) | | | 75,220 | | | | 284,098 | |
CyberAgent, Inc. | | | 2,200 | | | | 93,376 | |
Daily Mail & General Trust plc, Class A | | | 15,425 | | | | 137,867 | |
Dentsu, Inc. | | | 10,200 | | | | 473,599 | |
Euromoney Institutional Investor plc | | | 3,918 | | | | 63,579 | |
Evergrande Health Industry Group Ltd.* | | | 125,000 | | | | 171,888 | |
Fairfax Media Ltd. | | | 2,098,587 | | | | 951,919 | |
Hakuhodo DY Holdings, Inc. | | | 7,400 | | | | 123,667 | |
Informa plc | | | 24,786 | | | | 225,999 | |
IPSOS | | | 36,369 | | | | 970,034 | |
ITV plc | | | 146,610 | | | | 279,029 | |
JCDecaux SA | | | 7,960 | | | | 262,094 | |
Lagardere SCA | | | 151 | | | | 4,139 | |
Macromill, Inc. | | | 8,100 | | | | 160,773 | |
Mediaset Espana Comunicacion SA | | | 31,914 | | | | 217,395 | |
Mediaset SpA* | | | 56,848 | | | | 171,399 | |
Metropole Television SA | | | 8,095 | | | | 156,934 | |
Modern Times Group MTG AB, Class B(a) | | | 1,546 | | | | 57,207 | |
Nine Entertainment Co. Holdings Ltd.(a) | | | 625,635 | | | | 749,378 | |
Nippon Television Holdings, Inc. | | | 8,100 | | | | 129,336 | |
NOS SGPS SA | | | 1,360 | | | | 7,643 | |
NRJ Group | | | 13,770 | | | | 121,696 | |
See Accompanying Notes to the Financial Statements.
| | | | |
| FLEXSHARES ANNUAL REPORT | | | 161 | |
FlexShares® Morningstar Developed Markets ex-US Factor Tilt Index Fund (cont.)
| | | | | | | | |
| Investments | | Shares | | | Value | |
| COMMON STOCKS – (continued) | |
| Media – (continued) | |
oOh!media Ltd. | | | 6,533 | | | $ | 21,901 | |
Pearson plc(a) | | | 41,391 | | | | 475,246 | |
Promotora de Informaciones SA, Class A* (a) | | | 158,274 | | | | 287,649 | |
ProSiebenSat.1 Media SE | | | 4,941 | | | | 114,319 | |
Publicis Groupe SA | | | 3,673 | | | | 213,245 | |
Quebecor, Inc., Class B | | | 8,092 | | | | 159,098 | |
RAI Way SpA(c) | | | 8,120 | | | | 42,092 | |
RTL Group SA | | | 243 | | | | 15,611 | |
Sanoma OYJ | | | 65,379 | | | | 737,443 | |
Schibsted ASA, Class A | | | 2,349 | | | | 81,636 | |
Schibsted ASA, Class B | | | 3,483 | | | | 110,644 | |
SES SA, FDR | | | 15,471 | | | | 332,621 | |
Seven West Media Ltd.* (a) | | | 788,610 | | | | 435,963 | |
Shaw Communications, Inc., Class B | | | 5,869 | | | | 109,537 | |
Singapore Press Holdings Ltd.(a) | | | 116,700 | | | | 223,321 | |
SKY Network Television Ltd. | | | 199,503 | | | | 291,817 | |
SKY Perfect JSAT Holdings, Inc.(a) | | | 15,200 | | | | 67,612 | |
Southern Cross Media Group Ltd. | | | 448,324 | | | | 362,235 | |
Stroeer SE & Co. KGaA | | | 1,820 | | | | 95,230 | |
Tamedia AG (Registered) | | | 2,559 | | | | 301,463 | |
Telenet Group Holding NV | | | 4,779 | | | | 232,189 | |
Vector, Inc. | | | 1,500 | | | | 25,706 | |
Wowow, Inc. | | | 3,630 | | | | 105,341 | |
WPP AUNZ Ltd.(a) | | | 17,974 | | | | 7,134 | |
WPP plc | | | 57,996 | | | | 658,492 | |
Zenrin Co. Ltd. | | | 2,400 | | | | 59,694 | |
| | | | | | | | 12,613,831 | |
| Metals & Mining – 4.2% | |
Acacia Mining plc* | | | 84,990 | | | | 166,532 | |
Acerinox SA | | | 13,671 | | | | 152,855 | |
Agnico Eagle Mines Ltd. | | | 4,270 | | | | 151,194 | |
Aichi Steel Corp. | | | 18,000 | | | | 636,392 | |
Alumina Ltd. | | | 94,737 | | | | 171,219 | |
AMG Advanced Metallurgical Group NV | | | 557 | | | | 26,683 | |
Anglo American plc(a) | | | 77,274 | | | | 1,654,040 | |
Antofagasta plc | | | 8,683 | | | | 87,071 | |
| | | | | | | | |
| Investments | | Shares | | | Value | |
| Metals & Mining – (continued) | |
APERAM SA | | | 4,224 | | | $ | 144,059 | |
ArcelorMittal | | | 27,297 | | | | 681,672 | |
Asahi Holdings, Inc.(a) | | | 33,200 | | | | 710,451 | |
Aurubis AG | | | 2,452 | | | | 149,136 | |
Ausdrill Ltd.(a) | | | 67,540 | | | | 82,095 | |
B2Gold Corp.* | | | 52,817 | | | | 130,710 | |
Barrick Gold Corp. | | | 19,756 | | | | 248,069 | |
Bekaert SA | | | 1,102 | | | | 23,799 | |
BHP Billiton Ltd. | | | 91,368 | | | | 2,085,825 | |
BHP Billiton plc | | | 121,257 | | | | 2,420,722 | |
BlueScope Steel Ltd. | | | 30,942 | | | | 315,136 | |
Boliden AB* | | | 14,661 | | | | 335,498 | |
Centamin plc | | | 132,669 | | | | 168,670 | |
Centerra Gold, Inc.* | | | 152,963 | | | | 598,690 | |
Detour Gold Corp.* | | | 155,796 | | | | 1,151,935 | |
Dowa Holdings Co. Ltd.(a) | | | 2,200 | | | | 64,233 | |
Eldorado Gold Corp.* | | | 12,700 | | | | 8,510 | |
Endeavour Mining Corp.* | | | 5,941 | | | | 91,337 | |
Eramet | | | 818 | | | | 75,491 | |
Evolution Mining Ltd. | | | 42,290 | | | | 89,320 | |
Evraz plc | | | 12,821 | | | | 88,954 | |
Ferrexpo plc | | | 224,757 | | | | 599,926 | |
First Majestic Silver Corp.* (a) | | | 7,212 | | | | 40,144 | |
First Quantum Minerals Ltd. | | | 22,680 | | | | 226,930 | |
Fortescue Metals Group Ltd.(a) | | | 30,592 | | | | 86,728 | |
Fortuna Silver Mines, Inc.* | | | 16,264 | | | | 61,923 | |
Franco-Nevada Corp. | | | 4,617 | | | | 289,061 | |
Galaxy Resources Ltd.* (a) | | | 98,577 | | | | 153,008 | |
Glencore plc* | | | 592,677 | | | | 2,414,629 | |
Goldcorp, Inc. | | | 7,186 | | | | 65,061 | |
Granges AB | | | 70,308 | | | | 744,643 | |
Hill & Smith Holdings plc | | | 4,063 | | | | 51,422 | |
Hitachi Metals Ltd. | | | 4,740 | | | | 55,945 | |
Hochschild Mining plc | | | 46,419 | | | | 93,476 | |
Hudbay Minerals, Inc.(a) | | | 187,322 | | | | 737,449 | |
IAMGOLD Corp.* | | | 26,072 | | | | 89,736 | |
Iluka Resources Ltd. | | | 2,673 | | | | 15,270 | |
Independence Group NL | | | 36,717 | | | | 105,134 | |
Ivanhoe Mines Ltd., Class A* (a) | | | 53,330 | | | | 100,711 | |
JFE Holdings, Inc. | | | 21,500 | | | | 405,977 | |
KAZ Minerals plc | | | 17,892 | | | | 118,605 | |
Kinross Gold Corp.* | | | 58,977 | | | | 153,589 | |
Kirkland Lake Gold Ltd. | | | 21,465 | | | | 422,190 | |
See Accompanying Notes to the Financial Statements.
| | |
| 162 | | FLEXSHARES ANNUAL REPORT |
FlexShares® Morningstar Developed Markets ex-US Factor Tilt Index Fund (cont.)
| | | | | | | | |
| Investments | | Shares | | | Value | |
| COMMON STOCKS – (continued) | |
| Metals & Mining – (continued) | |
Kobe Steel Ltd. | | | 16,200 | | | $ | 130,341 | |
Kyoei Steel Ltd.(a) | | | 14,300 | | | | 259,505 | |
Labrador Iron Ore Royalty Corp. | | | 58,351 | | | | 1,270,770 | |
Lundin Gold, Inc.* (a) | | | 17,172 | | | | 61,195 | |
Lundin Mining Corp. | | | 25,589 | | | | 105,415 | |
Mineral Resources Ltd.(a) | | | 22,599 | | | | 228,243 | |
Mitsui Mining & Smelting Co. Ltd. | | | 3,000 | | | | 84,932 | |
Nevsun Resources Ltd. | | | 25,643 | | | | 114,229 | |
New Gold, Inc.* | | | 42,600 | | | | 34,061 | |
Newcrest Mining Ltd. | | | 27,702 | | | | 404,652 | |
Nippon Denko Co. Ltd.(a) | | | 24,300 | | | | 57,706 | |
Nippon Light Metal Holdings Co. Ltd.(a) | | | 66,500 | | | | 140,242 | |
Nippon Steel & Sumitomo Metal Corp. | | | 38,610 | | | | 714,005 | |
Nisshin Steel Co. Ltd.(a) | | | 5,500 | | | | 71,933 | |
Nittetsu Mining Co. Ltd. | | | 8,100 | | | | 344,872 | |
Norsk Hydro ASA | | | 67,230 | | | | 350,030 | |
Northern Star Resources Ltd. | | | 33,407 | | | | 207,886 | |
Novagold Resources, Inc.* | | | 18,010 | | | | 73,507 | |
OceanaGold Corp. | | | 492,103 | | | | 1,420,194 | |
OM Holdings Ltd. | | | 245,835 | | | | 236,089 | |
Orocobre Ltd.* (a) | | | 10,611 | | | | 25,043 | |
Osaka Steel Co. Ltd. | | | 1,000 | | | | 17,740 | |
Outokumpu OYJ(a) | | | 8,217 | | | | 34,541 | |
OZ Minerals Ltd. | | | 13,621 | | | | 87,175 | |
Pan American Silver Corp. | | | 7,565 | | | | 111,696 | |
Polymetal International plc | | | 20,121 | | | | 186,189 | |
Pretium Resources, Inc.* (a) | | | 145,029 | | | | 1,166,195 | |
Randgold Resources Ltd. | | | 160 | | | | 12,573 | |
Regis Resources Ltd.(a) | | | 74,115 | | | | 221,672 | |
Resolute Mining Ltd.(a) | | | 637,158 | | | | 469,649 | |
Rio Tinto Ltd. | | | 16,038 | | | | 868,434 | |
Rio Tinto plc | | | 61,479 | | | | 2,987,831 | |
Salzgitter AG | | | 6,182 | | | | 247,820 | |
Sandfire Resources NL(a) | | | 147,420 | | | | 694,818 | |
Sandstorm Gold Ltd.* (a) | | | 16,268 | | | | 60,328 | |
Sanyo Special Steel Co. Ltd. | | | 14,300 | | | | 328,816 | |
Saracen Mineral Holdings Ltd.* (a) | | | 180,063 | | | | 312,668 | |
SEMAFO, Inc.* (a) | | | 22,315 | | | | 48,938 | |
| | | | | | | | |
| Investments | | Shares | | | Value | |
| Metals & Mining – (continued) | |
Sims Metal Management Ltd. | | | 5,940 | | | $ | 47,489 | |
South32 Ltd. | | | 278,316 | | | | 714,068 | |
SSAB AB, Class A | | | 13,394 | | | | 53,563 | |
SSAB AB, Class B | | | 21,454 | | | | 69,693 | |
SSR Mining, Inc.* | | | 9,309 | | | | 91,442 | |
St Barbara Ltd. | | | 93,312 | | | | 275,121 | |
Sumitomo Metal Mining Co. Ltd. | | | 17,000 | | | | 536,263 | |
Tahoe Resources, Inc.* (a) | | | 249,179 | | | | 590,098 | |
Teck Resources Ltd., Class B | | | 27,459 | | | | 568,939 | |
thyssenkrupp AG | | | 15,552 | | | | 327,314 | |
Toho Titanium Co. Ltd. | | | 200 | | | | 2,040 | |
Toho Zinc Co. Ltd. | | | 19,500 | | | | 623,765 | |
Tokyo Steel Manufacturing Co. Ltd.(a) | | | 77,400 | | | | 609,708 | |
Topy Industries Ltd.(a) | | | 16,300 | | | | 439,077 | |
Torex Gold Resources, Inc.* (a) | | | 11,202 | | | | 102,274 | |
Trevali Mining Corp.* (a) | | | 434,940 | | | | 162,285 | |
UACJ Corp.(a) | | | 25,500 | | | | 558,783 | |
voestalpine AG(a) | | | 5,346 | | | | 190,138 | |
Wheaton Precious Metals Corp. | | | 1,120 | | | | 18,456 | |
Yamana Gold, Inc. | | | 59,028 | | | | 134,395 | |
Yodogawa Steel Works Ltd. | | | 19,000 | | | | 413,486 | |
| | | | | | | | 40,462,185 | |
| Multiline Retail – 0.4% | |
B&M European Value Retail SA | | | 23,899 | | | | 127,278 | |
Canadian Tire Corp. Ltd., Class A(a) | | | 2,462 | | | | 277,724 | |
Dollarama, Inc. | | | 9,300 | | | | 257,843 | |
Don Quijote Holdings Co. Ltd.(a) | | | 3,400 | | | | 203,660 | |
Europris ASA* (c) | | | 71,442 | | | | 190,825 | |
Fuji Co. Ltd. | | | 8,100 | | | | 151,945 | |
H2O Retailing Corp. | | | 11,315 | | | | 175,758 | |
Harvey Norman Holdings Ltd.(a) | | | 5,610 | | | | 12,684 | |
Hudson’s Bay Co.(a) | | | 89,573 | | | | 577,714 | |
Isetan Mitsukoshi Holdings Ltd. | | | 14,400 | | | | 168,556 | |
Izumi Co. Ltd.(a) | | | 1,300 | | | | 70,728 | |
J Front Retailing Co. Ltd. | | | 10,700 | | | | 140,416 | |
Marks & Spencer Group plc | | | 32,562 | | | | 123,154 | |
Marui Group Co. Ltd.(a) | | | 5,500 | | | | 118,426 | |
Next plc | | | 7,032 | | | | 467,587 | |
Parco Co. Ltd.(a) | | | 17,600 | | | | 186,675 | |
Ryohin Keikaku Co. Ltd. | | | 600 | | | | 158,487 | |
See Accompanying Notes to the Financial Statements.
| | | | |
| FLEXSHARES ANNUAL REPORT | | | 163 | |
FlexShares® Morningstar Developed Markets ex-US Factor Tilt Index Fund (cont.)
| | | | | | | | |
| Investments | | Shares | | | Value | |
| COMMON STOCKS – (continued) | |
| Multiline Retail – (continued) | |
Seria Co. Ltd.(a) | | | 1,000 | | | $ | 33,716 | |
Takashimaya Co. Ltd. | | | 1,000 | | | | 15,772 | |
| | | | | | | | 3,458,948 | |
| Multi-Utilities – 0.8% | |
A2A SpA | | | 175,798 | | | | 283,743 | |
ACEA SpA | | | 6,912 | | | | 90,925 | |
AGL Energy Ltd. | | | 33,372 | | | | 425,743 | |
Algonquin Power & Utilities Corp. | | | 26,557 | | | | 265,722 | |
Centrica plc | | | 189,910 | | | | 357,192 | |
E.ON SE | | | 53,561 | | | | 519,241 | |
Engie SA | | | 111,699 | | | | 1,490,251 | |
Hera SpA | | | 68,753 | | | | 190,077 | |
Innogy SE* | | | 7,840 | | | | 327,076 | |
Iren SpA | | | 59,110 | | | | 128,122 | |
Just Energy Group, Inc.(a) | | | 22,842 | | | | 74,270 | |
Keppel Infrastructure Trust | | | 106,600 | | | | 35,410 | |
National Grid plc | | | 175,689 | | | | 1,861,443 | |
REN – Redes Energeticas Nacionais SGPS SA | | | 279,693 | | | | 745,997 | |
RWE AG | | | 25,056 | | | | 488,871 | |
RWE AG (Preference) (Non-Voting) | | | 6,955 | | | | 115,841 | |
Suez | | | 6,723 | | | | 97,390 | |
Telecom Plus plc | | | 7,522 | | | | 117,257 | |
Veolia Environnement SA | | | 27,540 | | | | 549,818 | |
| | | | | | | | 8,164,389 | |
| Oil, Gas & Consumable Fuels – 5.6% | |
Aker BP ASA | | | 4,404 | | | | 145,666 | |
Beach Energy Ltd.(a) | | | 203,553 | | | | 253,912 | |
Birchcliff Energy Ltd. | | | 34,070 | | | | 107,665 | |
BP plc | | | 608,393 | | | | 4,410,043 | |
Brightoil Petroleum Holdings Ltd.* (b) | | | 50,147 | | | | 9,595 | |
BW LPG Ltd.* (c) | | | 70,718 | | | | 335,629 | |
Cairn Energy plc* | | | 66,766 | | | | 168,488 | |
Caltex Australia Ltd. | | | 15,309 | | | | 306,628 | |
Cameco Corp. | | | 13,932 | | | | 149,584 | |
Canadian Natural Resources Ltd. | | | 43,821 | | | | 1,205,265 | |
Cenovus Energy, Inc. | | | 56,943 | | | | 483,034 | |
| | | | | | | | |
| Investments | | Shares | | | Value | |
| Oil, Gas & Consumable Fuels – (continued) | |
China Aviation Oil Singapore Corp. Ltd.(a) | | | 194,400 | | | $ | 193,726 | |
Cosmo Energy Holdings Co. Ltd. | | | 7,000 | | | | 260,201 | |
Crescent Point Energy Corp. | | | 30,051 | | | | 142,332 | |
Delek Group Ltd. | | | 543 | | | | 91,161 | |
DNO ASA | | | 149,931 | | | | 289,518 | |
Enagas SA | | | 4,779 | | | | 126,924 | |
Enbridge Income Fund Holdings, Inc.(a) | | | 9,882 | | | | 229,282 | |
Enbridge, Inc. | | | 46,668 | | | | 1,457,698 | |
Encana Corp.(a) | | | 32,238 | | | | 329,929 | |
Enerplus Corp. | | | 16,456 | | | | 153,502 | |
Eni SpA | | | 68,688 | | | | 1,222,350 | |
Equinor ASA | | | 25,786 | | | | 672,802 | |
Euronav NV | | | 8,816 | | | | 82,159 | |
Freehold Royalties Ltd. | | | 11,172 | | | | 82,264 | |
Frontera Energy Corp.* (a) | | | 21,870 | | | | 286,104 | |
Galp Energia SGPS SA | | | 7,324 | | | | 127,755 | |
Gaztransport Et Technigaz SA | | | 4,050 | | | | 300,111 | |
Gibson Energy, Inc. | | | 7,625 | | | | 121,001 | |
Husky Energy, Inc.(a) | | | 11,656 | | | | 165,177 | |
Idemitsu Kosan Co. Ltd. | | | 5,800 | | | | 264,676 | |
Imperial Oil Ltd. | | | 7,695 | | | | 240,943 | |
Inpex Corp. | | | 18,000 | | | | 207,266 | |
Inter Pipeline Ltd. | | | 824 | | | | 13,396 | |
Itochu Enex Co. Ltd. | | | 48,700 | | | | 458,713 | |
Jerusalem Oil Exploration* | | | 8,100 | | | | 466,345 | |
JXTG Holdings, Inc. | | | 158,650 | | | | 1,081,331 | |
Kelt Exploration Ltd.* | | | 5,548 | | | | 25,686 | |
Keyera Corp. | | | 10,530 | | | | 262,999 | |
Koninklijke Vopak NV | | | 2,356 | | | | 106,779 | |
Lundin Petroleum AB | | | 4,170 | | | | 127,477 | |
MEG Energy Corp.* | | | 205,011 | | | | 1,643,835 | |
Naphtha Israel Petroleum Corp. Ltd.* | | | 27,742 | | | | 174,030 | |
Neste OYJ | | | 5,346 | | | | 440,728 | |
New Hope Corp. Ltd. | | | 228,744 | | | | 536,625 | |
New Zealand Refining Co. Ltd. (The) | | | 67,959 | | | | 104,286 | |
NexGen Energy Ltd.* (a) | | | 34,998 | | | | 71,955 | |
NuVista Energy Ltd.* | | | 7,121 | | | | 28,739 | |
Oil Refineries Ltd. | | | 182,503 | | | | 86,687 | |
OMV AG | | | 7,047 | | | | 392,284 | |
See Accompanying Notes to the Financial Statements.
| | |
| 164 | | FLEXSHARES ANNUAL REPORT |
FlexShares® Morningstar Developed Markets ex-US Factor Tilt Index Fund (cont.)
| | | | | | | | |
| Investments | | Shares | | | Value | |
| COMMON STOCKS – (continued) | |
| Oil, Gas & Consumable Fuels – (continued) | |
Origin Energy Ltd.* | | | 79,380 | | | $ | 410,140 | |
Paramount Resources Ltd., Class A* (a) | | | 6,095 | | | | 44,648 | |
Parex Resources, Inc.* | | | 6,710 | | | | 97,948 | |
Parkland Fuel Corp. | | | 2,333 | | | | 78,539 | |
Pembina Pipeline Corp. | | | 9,315 | | | | 302,024 | |
Peyto Exploration & Development Corp.(a) | | | 154,872 | | | | 1,266,572 | |
PrairieSky Royalty Ltd.(a) | | | 486 | | | | 7,401 | |
Premier Oil plc* | | | 625,077 | | | | 862,587 | |
Repsol SA | | | 70,104 | | | | 1,257,001 | |
Royal Dutch Shell plc, Class A | | | 242,109 | | | | 7,735,416 | |
Royal Dutch Shell plc, Class B | | | 195,291 | | | | 6,400,523 | |
San-Ai Oil Co. Ltd.(a) | | | 20,100 | | | | 217,110 | |
Santos Ltd. | | | 84,078 | | | | 395,679 | |
Saras SpA | | | 342,555 | | | | 668,751 | |
Showa Shell Sekiyu KK | | | 10,200 | | | | 196,670 | |
Snam SpA | | | 20,007 | | | | 82,832 | |
Stobart Group Ltd. | | | 33,858 | | | | 91,716 | |
Suncor Energy, Inc. | | | 50,949 | | | | 1,713,236 | |
TORC Oil & Gas Ltd. | | | 28,276 | | | | 116,484 | |
TOTAL SA(a) | | | 139,321 | | | | 8,202,284 | |
Tourmaline Oil Corp. | | | 13,044 | | | | 190,706 | |
TransCanada Corp. | | | 22,422 | | | | 847,537 | |
Tullow Oil plc* | | | 37,552 | | | | 108,344 | |
United Energy Group Ltd. | | | 7,128,000 | | | | 1,391,157 | |
Vermilion Energy, Inc.(a) | | | 5,227 | | | | 138,949 | |
Washington H Soul Pattinson & Co. Ltd.(a) | | | 8,285 | | | | 169,583 | |
Whitecap Resources, Inc. | | | 30,035 | | | | 147,288 | |
Whitehaven Coal Ltd.(a) | | | 24,365 | | | | 83,753 | |
Woodside Petroleum Ltd. | | | 25,974 | | | | 641,556 | |
| | | | | | | | 54,510,719 | |
| Paper & Forest Products – 0.7% | |
Ahlstrom-Munksjo OYJ | | | 7,185 | | | | 112,020 | |
Altri SGPS SA | | | 87,804 | | | | 771,019 | |
Canfor Corp.* | | | 7,392 | | | | 106,440 | |
Canfor Pulp Products, Inc. | | | 28,026 | | | | 469,928 | |
Daiken Corp. | | | 12,500 | | | | 228,612 | |
Daio Paper Corp.(a) | | | 3,745 | | | | 48,615 | |
Ence Energia y Celulosa SA(a) | | | 98,172 | | | | 825,911 | |
| | | | | | | | |
| Investments | | Shares | | | Value | |
| Paper & Forest Products – (continued) | |
Hokuetsu Corp. | | | 21,100 | | | $ | 100,774 | |
Holmen AB, Class B | | | 4,070 | | | | 93,381 | |
Interfor Corp.* | | | 56,781 | | | | 629,531 | |
Metsa Board OYJ | | | 6,595 | | | | 57,800 | |
Mondi plc | | | 19,764 | | | | 465,800 | |
Navigator Co. SA (The) | | | 6,520 | | | | 32,505 | |
Nippon Paper Industries Co. Ltd.(a) | | | 8,100 | | | | 147,064 | |
Norbord, Inc. | | | 3,136 | | | | 80,164 | |
Oji Holdings Corp. | | | 44,000 | | | | 313,464 | |
Semapa-Sociedade de Investimento e Gestao | | | 25,151 | | | | 481,035 | |
Stella-Jones, Inc. | | | 1,045 | | | | 33,548 | |
Stora Enso OYJ, Class R | | | 28,836 | | | | 434,709 | |
Svenska Cellulosa AB SCA, Class A | | | 3,160 | | | | 30,633 | |
Svenska Cellulosa AB SCA, Class B | | | 14,939 | | | | 141,582 | |
Tokushu Tokai Paper Co. Ltd. | | | 8,100 | | | | 312,574 | |
UPM-Kymmene OYJ | | | 19,926 | | | | 641,417 | |
West Fraser Timber Co. Ltd. | | | 2,213 | | | | 111,455 | |
Western Forest Products, Inc. | | | 301,806 | | | | 404,476 | |
| | | | | | | | 7,074,457 | |
| Personal Products – 1.1% | |
Asaleo Care Ltd.(a) | | | 214,824 | | | | 106,580 | |
Beiersdorf AG | | | 2,754 | | | | 285,206 | |
Blackmores Ltd.(a) | | | 798 | | | | 68,645 | |
BWX Ltd.(a) | | | 10,773 | | | | 19,394 | |
Ci:z Holdings Co. Ltd. | | | 1,800 | | | | 93,465 | |
Fancl Corp. | | | 2,500 | | | | 110,540 | |
Interparfums SA | | | 541 | | | | 22,404 | |
Kao Corp. | | | 14,600 | | | | 974,282 | |
Kobayashi Pharmaceutical Co. Ltd. | | | 1,400 | | | | 91,799 | |
Kose Corp. | | | 700 | | | | 104,639 | |
L’Oreal SA | | | 7,785 | | | | 1,754,456 | |
Mandom Corp. | | | 2,600 | | | | 72,341 | |
Milbon Co. Ltd. | | | 1,000 | | | | 35,887 | |
Noevir Holdings Co. Ltd. | | | 1,900 | | | | 80,980 | |
Ontex Group NV(a) | | | 62,585 | | | | 1,201,248 | |
Oriflame Holding AG | | | 2,061 | | | | 48,753 | |
Pola Orbis Holdings, Inc. | | | 2,000 | | | | 53,520 | |
See Accompanying Notes to the Financial Statements.
| | | | |
| FLEXSHARES ANNUAL REPORT | | | 165 | |
FlexShares® Morningstar Developed Markets ex-US Factor Tilt Index Fund (cont.)
| | | | | | | | |
| Investments | | Shares | | | Value | |
| COMMON STOCKS – (continued) | |
| Personal Products – (continued) | |
Shiseido Co. Ltd. | | | 15,000 | | | $ | 948,607 | |
Unilever NV, CVA(a) | | | 49,167 | | | | 2,647,554 | |
Unilever plc | | | 36,612 | | | | 1,939,773 | |
YA-MAN Ltd.(a) | | | 800 | | | | 12,909 | |
| | | | | | | | 10,672,982 | |
| Pharmaceuticals – 3.9% | |
ALK-Abello A/S* | | | 532 | | | | 85,318 | |
Almirall SA | | | 4,648 | | | | 84,315 | |
Aphria, Inc.* | | | 7,900 | | | | 94,445 | |
ASKA Pharmaceutical Co. Ltd. | | | 24,300 | | | | 320,397 | |
Astellas Pharma, Inc. | | | 62,700 | | | | 970,599 | |
AstraZeneca plc | | | 41,634 | | | | 3,186,551 | |
Aurora Cannabis, Inc.* (a) (b) | | | 597 | | | | 1 | |
Aurora Cannabis, Inc.* (a) | | | 20,320 | | | | 138,329 | |
Bausch Health Cos., Inc.* | | | 20,785 | | | | 476,714 | |
Bayer AG (Registered) | | | 26,244 | | | | 2,015,490 | |
Boiron SA | | | 370 | | | | 22,177 | |
BTG plc* | | | 27,344 | | | | 192,862 | |
Canopy Growth Corp.* (a) | | | 9,882 | | | | 364,428 | |
Chugai Pharmaceutical Co. Ltd. | | | 8,600 | | | | 505,232 | |
Daiichi Sankyo Co. Ltd. | | | 18,900 | | | | 722,472 | |
Dechra Pharmaceuticals plc | | | 5,318 | | | | 155,335 | |
Eisai Co. Ltd. | | | 9,200 | | | | 767,190 | |
Faes Farma SA | | | 26,904 | | | | 113,247 | |
Financiere de Tubize SA(a) | | | 1,549 | | | | 107,412 | |
Galenica AG* (c) | | | 3,128 | | | | 167,921 | |
GlaxoSmithKline plc | | | 140,417 | | | | 2,711,362 | |
GW Pharmaceuticals plc* (b) | | | 1 | | | | 9 | |
H Lundbeck A/S | | | 1,852 | | | | 86,515 | |
Haw Par Corp. Ltd. | | | 3,200 | | | | 29,694 | |
Hikma Pharmaceuticals plc | | | 7,104 | | | | 172,602 | |
Hisamitsu Pharmaceutical Co., Inc. | | | 1,900 | | | | 107,244 | |
Hutchison China MediTech Ltd.* | | | 715 | | | | 44,401 | |
Indivior plc* | | | 25,760 | | | | 61,995 | |
Ipsen SA | | | 770 | | | | 106,962 | |
JCR Pharmaceuticals Co. Ltd. | | | 600 | | | | 25,493 | |
Kaken Pharmaceutical Co. Ltd. | | | 1,500 | | | | 75,229 | |
Kissei Pharmaceutical Co. Ltd. | | | 1,400 | | | | 40,379 | |
Kyowa Hakko Kirin Co. Ltd. | | | 5,000 | | | | 97,249 | |
Mayne Pharma Group Ltd.* | | | 148,797 | | | | 118,115 | |
| | | | | | | | |
| Investments | | Shares | | | Value | |
| Pharmaceuticals – (continued) | |
Merck KGaA | | | 2,835 | | | $ | 303,938 | |
Mitsubishi Tanabe Pharma Corp. | | | 12,700 | | | | 187,706 | |
Mochida Pharmaceutical Co. Ltd. | | | 1,600 | | | | 126,747 | |
Nippon Shinyaku Co. Ltd. | | | 2,000 | | | | 115,369 | |
Novartis AG (Registered) | | | 75,978 | | | | 6,664,975 | |
Novo Nordisk A/S, Class B | | | 49,572 | | | | 2,144,830 | |
Ono Pharmaceutical Co. Ltd. | | | 16,800 | | | | 382,877 | |
Orion OYJ, Class A | | | 1,474 | | | | 51,106 | |
Orion OYJ, Class B | | | 6,647 | | | | 228,954 | |
Otsuka Holdings Co. Ltd. | | | 17,500 | | | | 838,598 | |
Recipharm AB, Class B* | | | 3,741 | | | | 55,421 | |
Recordati SpA | | | 3,719 | | | | 126,077 | |
Roche Holding AG – BR | | | 892 | | | | 217,436 | |
Roche Holding AG – Genusschein | | | 20,736 | | | | 5,052,583 | |
Rohto Pharmaceutical Co. Ltd. | | | 2,000 | | | | 63,444 | |
Sanofi | | | 32,724 | | | | 2,923,224 | |
Santen Pharmaceutical Co. Ltd. | | | 16,300 | | | | 241,926 | |
Seikagaku Corp. | | | 1,800 | | | | 26,684 | |
Shionogi & Co. Ltd. | | | 9,400 | | | | 602,373 | |
STADA Arzneimittel AG | | | 2,195 | | | | 203,142 | |
Sumitomo Dainippon Pharma Co. Ltd. | | | 10,400 | | | | 217,667 | |
Taisho Pharmaceutical Holdings Co. Ltd. | | | 2,500 | | | | 266,714 | |
Takeda Pharmaceutical Co. Ltd.(a) | | | 21,900 | | | | 886,828 | |
Teva Pharmaceutical Industries Ltd. | | | 39,528 | | | | 788,606 | |
Torii Pharmaceutical Co. Ltd. | | | 700 | | | | 15,426 | |
Towa Pharmaceutical Co. Ltd. | | | 400 | | | | 30,907 | |
Tsumura & Co. | | | 900 | | | | 28,071 | |
UCB SA | | | 4,050 | | | | 340,401 | |
United Laboratories International Holdings Ltd. (The)(a) | | | 130,000 | | | | 90,377 | |
Vifor Pharma AG | | | 1,529 | | | | 221,241 | |
Virbac SA* | | | 532 | | | | 85,475 | |
ZERIA Pharmaceutical Co. Ltd. | | | 1,800 | | | | 33,670 | |
| | | | | | | | 37,730,477 | |
| Professional Services – 1.1% | |
Adecco Group AG (Registered) | | | 5,589 | | | | 274,144 | |
AF AB, Class B | | | 3,322 | | | | 71,349 | |
See Accompanying Notes to the Financial Statements.
| | |
| 166 | | FLEXSHARES ANNUAL REPORT |
FlexShares® Morningstar Developed Markets ex-US Factor Tilt Index Fund (cont.)
| | | | | | | | |
| Investments | | Shares | | | Value | |
| COMMON STOCKS – (continued) | |
| Professional Services – (continued) | |
ALS Ltd. | | | 13,503 | | | $ | 78,093 | |
Applus Services SA | | | 17,126 | | | | 233,243 | |
Benefit One, Inc. | | | 1,000 | | | | 25,741 | |
Bertrandt AG | | | 2,192 | | | | 181,555 | |
Brunel International NV | | | 2,003 | | | | 24,851 | |
Bureau Veritas SA | | | 3,536 | | | | 79,929 | |
Capita plc* | | | 1,340,534 | | | | 2,203,604 | |
Cerved Group SpA | | | 16,425 | | | | 131,110 | |
DKSH Holding AG | | | 660 | | | | 44,584 | |
en-japan, Inc. | | | 1,700 | | | | 67,937 | |
Experian plc | | | 29,808 | | | | 686,521 | |
Funai Soken Holdings, Inc. | | | 2,700 | | | | 57,251 | |
Groupe Crit | | | 2,511 | | | | 167,860 | |
Hays plc | | | 34,264 | | | | 71,932 | |
Intertek Group plc | | | 4,779 | | | | 286,267 | |
Intertrust NV(c) | | | 16,281 | | | | 262,872 | |
IPH Ltd. | | | 144,060 | | | | 551,354 | |
JAC Recruitment Co. Ltd. | | | 1,300 | | | | 23,499 | |
McMillan Shakespeare Ltd. | | | 17,577 | | | | 205,552 | |
Meitec Corp. | | | 2,400 | | | | 100,589 | |
Morneau Shepell, Inc.(a) | | | 2,428 | | | | 50,437 | |
Nihon M&A Center, Inc. | | | 2,400 | | | | 57,568 | |
Nomura Co. Ltd. | | | 3,000 | | | | 68,185 | |
Outsourcing, Inc. | | | 3,000 | | | | 38,013 | |
Pagegroup plc | | | 20,728 | | | | 132,956 | |
Persol Holdings Co. Ltd. | | | 5,700 | | | | 108,490 | |
Randstad NV | | | 6,156 | | | | 310,739 | |
Recruit Holdings Co. Ltd. | | | 55,200 | | | | 1,485,467 | |
RELX plc | | | 61,560 | | | | 1,219,203 | |
RWS Holdings plc | | | 3,113 | | | | 19,013 | |
SEEK Ltd. | | | 5,653 | | | | 71,557 | |
SGS SA (Registered) | | | 206 | | | | 489,862 | |
SMS Co. Ltd. | | | 3,200 | | | | 53,619 | |
Stantec, Inc. | | | 1,027 | | | | 26,792 | |
Synergie SA | | | 4,212 | | | | 128,855 | |
TechnoPro Holdings, Inc. | | | 1,900 | | | | 99,331 | |
Teleperformance | | | 1,701 | | | | 280,618 | |
Wolters Kluwer NV | | | 9,558 | | | | 543,217 | |
| | | | | | | | 11,013,759 | |
| | | | | | | | |
| Investments | | Shares | | | Value | |
| Real Estate Management & Development – 3.1% | |
ADLER Real Estate AG | | | 27,621 | | | $ | 447,532 | |
ADO Group Ltd.* | | | 8,847 | | | | 194,305 | |
ADO Properties SA(c) | | | 5,265 | | | | 311,101 | |
Aedas Homes SAU* (c) | | | 486 | | | | 12,577 | |
Aeon Mall Co. Ltd. | | | 7,690 | | | | 142,346 | |
Africa Israel Properties Ltd.* | | | 10,611 | | | | 275,666 | |
Airport City Ltd.* | | | 17,368 | | | | 202,274 | |
Allreal Holding AG (Registered)* | | | 1,474 | | | | 226,544 | |
Alrov Properties and Lodgings Ltd. | | | 7,938 | | | | 243,971 | |
Altus Group Ltd. | | | 4,352 | | | | 95,474 | |
Amot Investments Ltd. | | | 14,530 | | | | 72,178 | |
Aroundtown SA | | | 13,148 | | | | 109,197 | |
Atrium Ljungberg AB, Class B | | | 7,605 | | | | 129,139 | |
Aveo Group(a) | | | 243,162 | | | | 317,969 | |
Azrieli Group Ltd. | | | 2,518 | | | | 122,173 | |
Bayside Land Corp. | | | 144 | | | | 61,860 | |
Big Shopping Centers Ltd. | | | 3,240 | | | | 211,172 | |
Blue Square Real Estate Ltd. | | | 6,779 | | | | 240,403 | |
Bukit Sembawang Estates Ltd. | | | 97,200 | | | | 375,520 | |
CA Immobilien Anlagen AG | | | 1,760 | | | | 57,312 | |
Capital & Counties Properties plc | | | 51,118 | | | | 163,486 | |
CapitaLand Ltd. | | | 133,200 | | | | 302,028 | |
Carmila SA, REIT(a) | | | 6,697 | | | | 147,663 | |
Castellum AB | | | 17,739 | | | | 306,367 | |
Catena AB | | | 11,907 | | | | 242,317 | |
City Developments Ltd. | | | 21,400 | | | | 122,237 | |
CK Asset Holdings Ltd. | | | 162,000 | | | | 1,051,841 | |
CLS Holdings plc | | | 27,443 | | | | 76,442 | |
Colliers International Group, Inc. | | | 1,940 | | | | 132,066 | |
Corestate Capital Holding SA | | | 10,368 | | | | 447,578 | |
Daejan Holdings plc | | | 4,779 | | | | 358,444 | |
Daibiru Corp. | | | 3,300 | | | | 33,335 | |
Daikyo, Inc.(a) | | | 3,300 | | | | 86,612 | |
Daito Trust Construction Co. Ltd. | | | 2,300 | | | | 303,664 | |
Daiwa House Industry Co. Ltd. | | | 35,400 | | | | 1,069,324 | |
Deutsche EuroShop AG | | | 36,855 | | | | 1,144,184 | |
Deutsche Wohnen SE | | | 10,530 | | | | 482,490 | |
Dios Fastigheter AB | | | 75,006 | | | | 452,595 | |
Emperor International Holdings Ltd. | | | 380,000 | | | | 93,068 | |
Fabege AB | | | 12,308 | | | | 157,424 | |
See Accompanying Notes to the Financial Statements.
| | | | |
| FLEXSHARES ANNUAL REPORT | | | 167 | |
FlexShares® Morningstar Developed Markets ex-US Factor Tilt Index Fund (cont.)
| | | | | | | | |
| Investments | | Shares | | | Value | |
| COMMON STOCKS – (continued) | |
| Real Estate Management & Development – (continued) | |
Far East Consortium International Ltd. | | | 893,019 | | | $ | 415,787 | |
Fastighets AB Balder, Class B* | | | 8,540 | | | | 214,722 | |
FastPartner AB | | | 6,642 | | | | 39,970 | |
First Capital Realty, Inc. | | | 16,688 | | | | 249,573 | |
FirstService Corp.(a) | | | 1,780 | | | | 130,906 | |
Gazit-Globe Ltd. | | | 3,498 | | | | 29,246 | |
Goldcrest Co. Ltd. | | | 9,100 | | | | 142,320 | |
Grainger plc | | | 22,537 | | | | 78,039 | |
Grand City Properties SA | | | 2,508 | | | | 60,755 | |
Great Eagle Holdings Ltd. | | | 8,646 | | | | 39,483 | |
GSH Corp. Ltd. | | | 603,500 | | | | 169,963 | |
Heiwa Real Estate Co. Ltd. | | | 11,700 | | | | 216,884 | |
Hembla AB* | | | 6,592 | | | | 112,803 | |
Hemfosa Fastigheter AB | | | 10,627 | | | | 131,505 | |
Henderson Land Development Co. Ltd. | | | 28,763 | | | | 133,920 | |
Hiag Immobilien Holding AG* | | | 355 | | | | 41,997 | |
HKR International Ltd. | | | 732,160 | | | | 349,297 | |
Ho Bee Land Ltd. | | | 132,700 | | | | 232,857 | |
Hufvudstaden AB, Class A | | | 2,610 | | | | 38,637 | |
Hulic Co. Ltd. | | | 20,900 | | | | 191,675 | |
Hysan Development Co. Ltd. | | | 19,000 | | | | 89,069 | |
Ichigo, Inc. | | | 14,300 | | | | 46,756 | |
IMMOFINANZ AG* | | | 4,089 | | | | 97,572 | |
Intershop Holding AG | | | 131 | | | | 64,465 | |
Japan Asset Marketing Co. Ltd.* (a) | | | 53,700 | | | | 58,527 | |
Jerusalem Economy Ltd.* | | | 1,782 | | | | 4,783 | |
Jeudan A/S | | | 112 | | | | 15,887 | |
K Wah International Holdings Ltd. | | | 1,176,089 | | | | 531,081 | |
Kabuki-Za Co. Ltd. | | | 1,000 | | | | 50,507 | |
Kenedix, Inc. | | | 13,500 | | | | 70,218 | |
Kerry Properties Ltd. | | | 39,000 | | | | 122,631 | |
Klovern AB, Class B | | | 374,544 | | | | 433,158 | |
Kowloon Development Co. Ltd. | | | 183,000 | | | | 188,383 | |
Kungsleden AB | | | 36,207 | | | | 253,735 | |
Lai Sun Development Co. Ltd. | | | 154,124 | | | | 223,733 | |
Landing International Development Ltd.* | | | 165,600 | | | | 34,432 | |
| | | | | | | | |
| Investments | | Shares | | | Value | |
| Real Estate Management & Development – (continued) | |
Langham Hospitality Investments and Langham Hospitality Investments Ltd. | | | 143,500 | | | $ | 51,071 | |
LEG Immobilien AG | | | 2,673 | | | | 292,749 | |
LendLease Group | | | 23,895 | | | | 298,066 | |
Leopalace21 Corp.(a) | | | 21,500 | | | | 89,730 | |
Melisron Ltd. | | | 3,992 | | | | 169,238 | |
Mitsubishi Estate Co. Ltd. | | | 27,000 | | | | 431,957 | |
Mitsui Fudosan Co. Ltd. | | | 20,400 | | | | 459,861 | |
Mobimo Holding AG (Registered) | | | 232 | | | | 51,778 | |
Morguard Corp. | | | 3,159 | | | | 428,320 | |
New World Development Co. Ltd. | | | 192,362 | | | | 243,906 | |
Nexity SA | | | 2,826 | | | | 135,509 | |
Nomura Real Estate Holdings, Inc. | | | 5,800 | | | | 108,903 | |
Norstar Holdings, Inc. | | | 18,086 | | | | 284,395 | |
Norwegian Property ASA | | | 16,948 | | | | 20,850 | |
NTT Urban Development Corp.(a) | | | 3,200 | | | | 47,608 | |
Open House Co. Ltd. | | | 2,000 | | | | 78,596 | |
Oxley Holdings Ltd. | | | 715,488 | | | | 155,002 | |
PATRIZIA Immobilien AG | | | 3,248 | | | | 55,865 | |
Peet Ltd. | | | 12,636 | | | | 9,896 | |
Perennial Real Estate Holdings Ltd. | | | 299,200 | | | | 150,162 | |
Platzer Fastigheter Holding AB, Class B | | | 5,103 | | | | 32,997 | |
Property & Building Corp. Ltd. | | | 3,224 | | | | 231,177 | |
PSP Swiss Property AG (Registered) | | | 1,501 | | | | 145,116 | |
Raysum Co. Ltd. | | | 8,100 | | | | 99,550 | |
Relo Group, Inc. | | | 2,270 | | | | 53,625 | |
S IMMO AG | | | 45,117 | | | | 771,909 | |
Sagax AB, Class B | | | 5,743 | | | | 80,178 | |
Savills plc(a) | | | 114,777 | | | | 1,063,258 | |
SEA Holdings Ltd. | | | 197,170 | | | | 228,876 | |
Shinoken Group Co. Ltd. | | | 13,100 | | | | 108,417 | |
Sino Land Co. Ltd. | | | 184,066 | | | | 288,799 | |
Sirius Real Estate Ltd. | | | 88,371 | | | | 63,007 | |
St Modwen Properties plc | | | 2,689 | | | | 12,857 | |
Sumitomo Realty & Development Co. Ltd. | | | 9,000 | | | | 309,663 | |
See Accompanying Notes to the Financial Statements.
| | |
| 168 | | FLEXSHARES ANNUAL REPORT |
FlexShares® Morningstar Developed Markets ex-US Factor Tilt Index Fund (cont.)
| | | | | | | | |
| Investments | | Shares | | | Value | |
| COMMON STOCKS – (continued) | |
| Real Estate Management & Development – (continued) | |
Summit Real Estate Holdings Ltd. | | | 41,958 | | | $ | 378,526 | |
Sun Frontier Fudousan Co. Ltd.(a) | | | 16,200 | | | | 165,510 | |
Sun Hung Kai Properties Ltd. | | | 84,435 | | | | 1,097,524 | |
Swire Pacific Ltd., Class B | | | 245,000 | | | | 394,405 | |
Swire Properties Ltd. | | | 47,600 | | | | 162,423 | |
Swiss Prime Site AG (Registered)* | | | 2,592 | | | | 210,782 | |
TAG Immobilien AG | | | 7,460 | | | | 170,572 | |
TAI Cheung Holdings Ltd. | | | 324,000 | | | | 301,707 | |
Takara Leben Co. Ltd.(a) | | | 8,936 | | | | 25,734 | |
Tateru, Inc.(a) | | | 2,500 | | | | 10,522 | |
TLG Immobilien AG | | | 2,046 | | | | 52,021 | |
Tokyu Fudosan Holdings Corp. | | | 28,000 | | | | 157,795 | |
Tosei Corp. | | | 16,200 | | | | 148,141 | |
Tricon Capital Group, Inc.(a) | | | 87,318 | | | | 695,485 | |
United Engineers Ltd. | | | 77,800 | | | | 147,757 | |
United Industrial Corp. Ltd. | | | 5,656 | | | | 11,436 | |
Unizo Holdings Co. Ltd.(a) | | | 22,400 | | | | 421,780 | |
UOL Group Ltd. | | | 26,999 | | | | 117,565 | |
Vonovia SE | | | 16,245 | | | | 743,987 | |
Wallenstam AB, Class B(a) | | | 20,754 | | | | 187,224 | |
Wharf Holdings Ltd. (The) | | | 57,000 | | | | 142,220 | |
Wharf Real Estate Investment Co. Ltd. | | | 38,000 | | | | 235,337 | |
Wheelock & Co. Ltd. | | | 24,000 | | | | 128,122 | |
Wihlborgs Fastigheter AB | | | 8,338 | | | | 94,367 | |
Wing Tai Holdings Ltd. | | | 59,200 | | | | 82,507 | |
Wing Tai Properties Ltd. | | | 324,000 | | | | 215,741 | |
Yanlord Land Group Ltd. | | | 81,000 | | | | 73,700 | |
| | | | | | | | 29,952,935 | |
| Road & Rail – 1.9% | |
ALD SA(c) | | | 6,073 | | | | 90,623 | |
Canadian National Railway Co. | | | 24,867 | | | | 2,130,997 | |
Canadian Pacific Railway Ltd. | | | 5,184 | | | | 1,065,695 | |
Central Japan Railway Co. | | | 11,200 | | | | 2,148,598 | |
ComfortDelGro Corp. Ltd. | | | 136,300 | | | | 221,458 | |
DSV A/S | | | 5,913 | | | | 475,576 | |
East Japan Railway Co. | | | 13,200 | | | | 1,155,022 | |
Europcar Mobility Group(a) (c) | | | 79,892 | | | | 758,571 | |
Firstgroup plc* | | | 864,798 | | | | 944,771 | |
Fukuyama Transporting Co. Ltd. | | | 1,000 | | | | 38,678 | |
| | | | | | | | |
| Investments | | Shares | | | Value | |
| Road & Rail – (continued) | |
Go-Ahead Group plc (The) | | | 26,665 | | | $ | 523,334 | |
Hamakyorex Co. Ltd. | | | 8,100 | | | | 262,332 | |
Hankyu Hanshin Holdings, Inc. | | | 5,400 | | | | 177,998 | |
Hitachi Transport System Ltd. | | | 2,700 | | | | 69,477 | |
Keikyu Corp.(a) | | | 6,000 | | | | 88,840 | |
Keio Corp.(a) | | | 2,800 | | | | 152,089 | |
Keisei Electric Railway Co. Ltd. | | | 5,100 | | | | 157,038 | |
Kintetsu Group Holdings Co. Ltd. | | | 8,700 | | | | 333,800 | |
Kyushu Railway Co. | | | 2,100 | | | | 64,384 | |
MTR Corp. Ltd. | | | 42,881 | | | | 207,857 | |
Nankai Electric Railway Co. Ltd. | | | 3,000 | | | | 73,395 | |
National Express Group plc | | | 399,411 | | | | 2,042,410 | |
Nikkon Holdings Co. Ltd. | | | 2,600 | | | | 62,895 | |
Nippon Express Co. Ltd. | | | 3,700 | | | | 234,416 | |
Nishi-Nippon Railroad Co. Ltd. | | | 1,000 | | | | 24,731 | |
Odakyu Electric Railway Co. Ltd. | | | 16,400 | | | | 346,732 | |
Sankyu, Inc. | | | 2,333 | | | | 110,391 | |
Seino Holdings Co. Ltd. | | | 7,500 | | | | 103,939 | |
Senko Group Holdings Co. Ltd. | | | 133,200 | | | | 1,032,741 | |
Sixt SE | | | 550 | | | | 56,086 | |
Sixt SE (Preference) | | | 238 | | | | 16,396 | |
Stagecoach Group plc(a) | | | 240,384 | | | | 469,326 | |
Stef SA | | | 2,916 | | | | 267,291 | |
TFI International, Inc. | | | 6,708 | | | | 223,779 | |
Tobu Railway Co. Ltd. | | | 4,000 | | | | 111,116 | |
Tokyu Corp. | | | 22,000 | | | | 363,174 | |
Tonami Holdings Co. Ltd. | | | 5,000 | | | | 276,904 | |
Trancom Co. Ltd. | | | 3,400 | | | | 194,320 | |
Transport International Holdings Ltd. | | | 159,231 | | | | 396,077 | |
VTG AG | | | 4,293 | | | | 257,315 | |
West Japan Railway Co. | | | 8,400 | | | | 563,970 | |
| | | | | | | | 18,294,542 | |
| Semiconductors & Semiconductor Equipment – 0.9% | |
Advantest Corp.(a) | | | 3,100 | | | | 57,163 | |
AIXTRON SE* | | | 2,085 | | | | 26,235 | |
ams AG* (a) | | | 3,402 | | | | 132,509 | |
ASM International NV* | | | 677 | | | | 29,141 | |
ASM Pacific Technology Ltd.(a) | | | 5,000 | | | | 43,179 | |
ASML Holding NV | | | 13,851 | | | | 2,368,520 | |
BE Semiconductor Industries NV(a) | | | 4,004 | | | | 85,880 | |
See Accompanying Notes to the Financial Statements.
| | | | |
| FLEXSHARES ANNUAL REPORT | | | 169 | |
FlexShares® Morningstar Developed Markets ex-US Factor Tilt Index Fund (cont.)
| | | | | | | | |
| Investments | | Shares | | | Value | |
| COMMON STOCKS – (continued) | |
| Semiconductors & Semiconductor Equipment – (continued) | |
Dialog Semiconductor plc* | | | 66,440 | | | $ | 1,754,020 | |
Disco Corp. | | | 800 | | | | 127,385 | |
Infineon Technologies AG | | | 34,425 | | | | 690,783 | |
Japan Material Co. Ltd.(a) | | | 3,900 | | | | 45,720 | |
Lasertec Corp. | | | 500 | | | | 14,355 | |
Melexis NV(a) | | | 495 | | | | 32,586 | |
Meyer Burger Technology AG* (a) | | | 51,597 | | | | 27,083 | |
Nordic Semiconductor ASA* (a) | | | 113,782 | | | | 487,350 | |
NuFlare Technology, Inc. | | | 3,300 | | | | 166,382 | |
Rohm Co. Ltd. | | | 2,200 | | | | 154,783 | |
Sanken Electric Co. Ltd. | | | 22,200 | | | | 492,175 | |
SCREEN Holdings Co. Ltd. | | | 1,800 | | | | 98,090 | |
Shindengen Electric Manufacturing Co. Ltd. | | | 8,100 | | | | 352,767 | |
Shinko Electric Industries Co. Ltd. | | | 5,800 | | | | 40,344 | |
Siltronic AG | | | 754 | | | | 69,268 | |
SMA Solar Technology AG | | | 992 | | | | 23,154 | |
SOITEC* | | | 816 | | | | 58,479 | |
STMicroelectronics NV | | | 26,082 | | | | 396,591 | |
SUMCO Corp.(a) | | | 4,100 | | | | 55,439 | |
Tokyo Electron Ltd. | | | 4,700 | | | | 653,223 | |
Tokyo Seimitsu Co. Ltd. | | | 1,400 | | | | 33,680 | |
Tower Semiconductor Ltd.* | | | 3,423 | | | | 53,043 | |
u-blox Holding AG* | | | 81 | | | | 10,162 | |
Ulvac, Inc. | | | 1,700 | | | | 55,509 | |
| | | | | | | | 8,634,998 | |
| Software – 0.8% | |
Alfa Financial Software Holdings plc* (c) | | | 11,745 | | | | 18,939 | |
Altium Ltd. | | | 5,461 | | | | 84,647 | |
AVEVA Group plc | | | 2,580 | | | | 86,305 | |
BlackBerry Ltd.* | | | 15,570 | | | | 144,051 | |
Blue Prism Group plc* | | | 912 | | | | 20,206 | |
Constellation Software, Inc. | | | 652 | | | | 449,814 | |
Dassault Systemes SE | | | 4,151 | | | | 521,360 | |
Descartes Systems Group, Inc. (The)* | | | 4,000 | | | | 122,688 | |
Enghouse Systems Ltd. | | | 1,672 | | | | 92,764 | |
Fuji Soft, Inc. | | | 1,600 | | | | 73,439 | |
GB Group plc | | | 4,779 | | | | 30,898 | |
| | | | | | | | |
| Investments | | Shares | | | Value | |
| Software – (continued) | |
Gemalto NV* | | | 5,670 | | | $ | 323,532 | |
Hilan Ltd. | | | 1,569 | | | | 36,905 | |
Infomart Corp.(a) | | | 5,500 | | | | 57,020 | |
IRESS Ltd.(a) | | | 8,665 | | | | 66,633 | |
Justsystems Corp. | | | 5,600 | | | | 114,625 | |
Kinaxis, Inc.* | | | 1,436 | | | | 97,188 | |
Lectra | | | 810 | | | | 17,181 | |
Micro Focus International plc | | | 11,549 | | | | 179,811 | |
Miroku Jyoho Service Co. Ltd. | | | 1,000 | | | | 18,874 | |
Nemetschek SE | | | 770 | | | | 101,291 | |
Nice Ltd.* | | | 2,136 | | | | 226,328 | |
Open Text Corp. | | | 11,421 | | | | 386,483 | |
Oracle Corp. Japan | | | 800 | | | | 54,300 | |
Sage Group plc (The) | | | 30,375 | | | | 211,291 | |
SAP SE | | | 31,752 | | | | 3,405,545 | |
SimCorp A/S | | | 2,552 | | | | 196,689 | |
Software AG | | | 1,320 | | | | 59,212 | |
Sophos Group plc(c) | | | 11,880 | | | | 66,457 | |
Systena Corp. | | | 5,200 | | | | 62,803 | |
Technology One Ltd.(a) | | | 33,615 | | | | 129,606 | |
Temenos AG (Registered)* | | | 1,377 | | | | 189,596 | |
Trend Micro, Inc. | | | 2,500 | | | | 144,433 | |
WiseTech Global Ltd.(a) | | | 4,953 | | | | 56,343 | |
| | | | | | | | 7,847,257 | |
| Specialty Retail – 2.1% | |
ABC-Mart, Inc. | | | 700 | | | | 40,938 | |
Accent Group Ltd.(a) | | | 257,418 | | | | 227,144 | |
Alpen Co. Ltd. | | | 10,600 | | | | 178,271 | |
AOKI Holdings, Inc. | | | 20,300 | | | | 268,016 | |
Aoyama Trading Co. Ltd. | | | 2,000 | | | | 60,609 | |
AP Eagers Ltd.(a) | | | 40,728 | | | | 212,165 | |
Arcland Sakamoto Co. Ltd. | | | 27,800 | | | | 365,806 | |
AT-Group Co. Ltd. | | | 16,200 | | | | 375,375 | |
Autobacs Seven Co. Ltd. | | | 2,100 | | | | 33,773 | |
Automotive Holdings Group Ltd.(a) | | | 120,798 | | | | 154,536 | |
BCA Marketplace plc(a) | | | 685,584 | | | | 1,765,150 | |
Bic Camera, Inc.(a) | | | 4,100 | | | | 54,240 | |
Bilia AB, Class A | | | 42,316 | | | | 397,015 | |
CECONOMY AG | | | 470 | | | | 2,406 | |
Chiyoda Co. Ltd. | | | 2,800 | | | | 54,038 | |
See Accompanying Notes to the Financial Statements.
| | |
| 170 | | FLEXSHARES ANNUAL REPORT |
FlexShares® Morningstar Developed Markets ex-US Factor Tilt Index Fund (cont.)
| | | | | | | | |
| Investments | | Shares | | | Value | |
| COMMON STOCKS – (continued) | |
| Specialty Retail – (continued) | |
Chow Sang Sang Holdings International Ltd. | | | 264,000 | | | $ | 427,686 | |
Chow Tai Fook Jewellery Group Ltd. | | | 16,200 | | | | 14,197 | |
Clas Ohlson AB, Class B(a) | | | 49,248 | | | | 415,173 | |
DCM Holdings Co. Ltd.(a) | | | 26,300 | | | | 255,414 | |
Delek Automotive Systems Ltd. | | | 405 | | | | 2,280 | |
Dixons Carphone plc | | | 55,277 | | | | 119,683 | |
Dufry AG (Registered)* (a) | | | 2,607 | | | | 294,289 | |
Dunelm Group plc | | | 324 | | | | 2,469 | |
EDION Corp.(a) | | | 60,800 | | | | 638,951 | |
Fast Retailing Co. Ltd. | | | 1,900 | | | | 960,817 | |
Fenix Outdoor International AG | | | 609 | | | | 60,436 | |
Fielmann AG | | | 927 | | | | 57,611 | |
Fnac Darty SA* | | | 13,854 | | | | 987,359 | |
Geo Holdings Corp. | | | 12,400 | | | | 189,535 | |
Giordano International Ltd. | | | 1,082,000 | | | | 480,312 | |
GrandVision NV(c) | | | 10,935 | | | | 276,790 | |
Halfords Group plc | | | 120,528 | | | | 474,950 | |
Hennes & Mauritz AB, Class B(a) | | | 15,544 | | | | 275,073 | |
Hikari Tsushin, Inc. | | | 600 | | | | 104,843 | |
Hornbach Baumarkt AG | | | 8,550 | | | | 227,658 | |
Hornbach Holding AG & Co. KGaA | | | 9,720 | | | | 643,174 | |
IDOM, Inc.(a) | | | 32,400 | | | | 109,383 | |
Industria de Diseno Textil SA | | | 28,269 | | | | 798,513 | |
JB Hi-Fi Ltd.(a) | | | 9,194 | | | | 149,874 | |
JD Sports Fashion plc | | | 25,787 | | | | 134,532 | |
JINS, Inc. | | | 900 | | | | 51,119 | |
Joshin Denki Co. Ltd. | | | 5,800 | | | | 148,270 | |
Joyful Honda Co. Ltd. | | | 8,400 | | | | 121,249 | |
Kathmandu Holdings Ltd. | | | 68,445 | | | | 119,781 | |
Kingfisher plc | | | 53,622 | | | | 174,509 | |
Kohnan Shoji Co. Ltd. | | | 24,300 | | | | 609,142 | |
Komeri Co. Ltd. | | | 1,000 | | | | 25,927 | |
K’s Holdings Corp. | | | 14,100 | | | | 178,163 | |
Leon’s Furniture Ltd. | | | 24,057 | | | | 317,279 | |
LIXIL VIVA Corp. | | | 16,200 | | | | 263,122 | |
L’Occitane International SA | | | 81,000 | | | | 151,887 | |
Luk Fook Holdings International Ltd. | | | 16,672 | | | | 54,975 | |
| | | | | | | | |
| Investments | | Shares | | | Value | |
| Specialty Retail – (continued) | |
Maisons du Monde SA(c) | | | 4,322 | | | $ | 108,421 | |
Mekonomen AB(a) | | | 45,925 | | | | 537,652 | |
Nishimatsuya Chain Co. Ltd. | | | 1,300 | | | | 11,588 | |
Nitori Holdings Co. Ltd. | | | 2,600 | | | | 339,471 | |
Nojima Corp. | | | 32,400 | | | | 765,106 | |
PAL GROUP Holdings Co. Ltd. | | | 9,800 | | | | 287,865 | |
Pets at Home Group plc(a) | | | 547,317 | | | | 769,268 | |
Premier Investments Ltd. | | | 6,508 | | | | 75,738 | |
Sa Sa International Holdings Ltd.(a) | | | 204,700 | | | | 78,596 | |
Shimachu Co. Ltd. | | | 9,500 | | | | 248,917 | |
Shimamura Co. Ltd. | | | 100 | | | | 8,409 | |
Sleep Country Canada Holdings, Inc.(c) | | | 5,192 | | | | 105,006 | |
SMCP SA* (c) | | | 3,969 | | | | 93,989 | |
Sports Direct International plc* | | | 25,620 | | | | 106,850 | |
Super Retail Group Ltd.(a) | | | 119,251 | | | | 610,228 | |
Superdry plc | | | 708 | | | | 7,310 | |
T-Gaia Corp. | | | 7,600 | | | | 172,398 | |
United Arrows Ltd. | | | 4,400 | | | | 165,699 | |
USS Co. Ltd. | | | 6,200 | | | | 111,908 | |
Valora Holding AG (Registered)* | | | 428 | | | | 107,223 | |
VT Holdings Co. Ltd.(a) | | | 31,300 | | | | 130,353 | |
WH Smith plc | | | 4,859 | | | | 120,757 | |
Xebio Holdings Co. Ltd. | | | 5,000 | | | | 69,381 | |
XXL ASA(a) (c) | | | 49,977 | | | | 258,062 | |
Yamada Denki Co. Ltd. | | | 27,000 | | | | 127,278 | |
Yellow Hat Ltd. | | | 16,300 | | | | 400,657 | |
| | | | | | | | 20,324,037 | |
| Technology Hardware, Storage & Peripherals – 0.6% | |
Brother Industries Ltd. | | | 16,500 | | | | 302,791 | |
Canon, Inc. | | | 25,600 | | | | 730,878 | |
China Goldjoy Group Ltd. | | | 8,532,000 | | | | 348,272 | |
Eizo Corp. | | | 1,400 | | | | 57,064 | |
Elecom Co. Ltd. | | | 5,700 | | | | 135,259 | |
FUJIFILM Holdings Corp. | | | 24,300 | | | | 1,053,563 | |
Konica Minolta, Inc. | | | 18,900 | | | | 187,736 | |
Logitech International SA (Registered) | | | 3,669 | | | | 135,942 | |
Maxell Holdings Ltd.(a) | | | 6,500 | | | | 82,708 | |
MCJ Co. Ltd. | | | 64,800 | | | | 516,195 | |
See Accompanying Notes to the Financial Statements.
| | | | |
| FLEXSHARES ANNUAL REPORT | | | 171 | |
FlexShares® Morningstar Developed Markets ex-US Factor Tilt Index Fund (cont.)
| | | | | | | | |
| Investments | | Shares | | | Value | |
| COMMON STOCKS – (continued) | |
| Technology Hardware, Storage & Peripherals – (continued) | |
Melco Holdings, Inc.(a) | | | 8,100 | | | $ | 270,227 | |
NEC Corp. | | | 11,700 | | | | 335,900 | |
Neopost SA | | | 20,979 | | | | 675,075 | |
Razer, Inc.* (c) | | | 324,000 | | | | 50,009 | |
Ricoh Co. Ltd. | | | 27,400 | | | | 274,109 | |
Riso Kagaku Corp. | | | 1,700 | | | | 35,927 | |
S&T AG* | | | 228 | | | | 5,678 | |
Seiko Epson Corp. | | | 8,300 | | | | 134,147 | |
Toshiba TEC Corp. | | | 3,800 | | | | 113,473 | |
| | | | | | | | 5,444,953 | |
| Textiles, Apparel & Luxury Goods – 1.3% | |
adidas AG | | | 5,589 | | | | 1,317,184 | |
Asics Corp. | | | 12,200 | | | | 177,289 | |
Brunello Cucinelli SpA | | | 1,556 | | | | 53,332 | |
Burberry Group plc | | | 14,175 | | | | 328,010 | |
Cie Financiere Richemont SA (Registered) | | | 13,851 | | | | 1,014,831 | |
Coats Group plc | | | 98,856 | | | | 101,682 | |
Delta-Galil Industries Ltd. | | | 7,452 | | | | 208,613 | |
Descente Ltd.(a) | | | 2,800 | | | | 73,340 | |
Gildan Activewear, Inc. | | | 13,122 | | | | 393,185 | |
Goldwin, Inc. | | | 1,200 | | | | 85,490 | |
Gunze Ltd. | | | 700 | | | | 31,075 | |
Hermes International | | | 956 | | | | 547,014 | |
HUGO BOSS AG | | | 1,391 | | | | 99,576 | |
Japan Wool Textile Co. Ltd. (The) | | | 60,500 | | | | 478,189 | |
Kering SA | | | 2,349 | | | | 1,047,580 | |
Kurabo Industries Ltd. | | | 18,600 | | | | 448,786 | |
Luxottica Group SpA | | | 5,589 | | | | 351,587 | |
LVMH Moet Hennessy Louis Vuitton SE | | | 8,343 | | | | 2,540,976 | |
Moncler SpA(a) | | | 3,061 | | | | 106,476 | |
Onward Holdings Co. Ltd. | | | 6,000 | | | | 36,153 | |
OVS SpA* (a) (c) | | | 219,348 | | | | 387,959 | |
Pacific Textiles Holdings Ltd. | | | 486,000 | | | | 490,377 | |
Pandora A/S | | | 2,511 | | | | 157,150 | |
Puma SE | | | 208 | | | | 106,996 | |
Regina Miracle International Holdings Ltd.(c) | | | 20,000 | | | | 10,001 | |
Salvatore Ferragamo SpA | | | 2,964 | | | | 70,223 | |
| | | | | | | | |
| Investments | | Shares | | | Value | |
| Textiles, Apparel & Luxury Goods – (continued) | |
Samsonite International SA* (c) | | | 60,600 | | | $ | 173,929 | |
Seiko Holdings Corp. | | | 8,300 | | | | 199,162 | |
Seiren Co. Ltd.(a) | | | 19,500 | | | | 278,016 | |
Stella International Holdings Ltd. | | | 272,000 | | | | 272,368 | |
Swatch Group AG (The) | | | 567 | | | | 192,100 | |
Swatch Group AG (The) (Registered) | | | 1,997 | | | | 133,511 | |
Ted Baker plc | | | 4,738 | | | | 110,909 | |
Texwinca Holdings Ltd.(a) | | | 50,000 | | | | 16,966 | |
Tod’s SpA(a) | | | 245 | | | | 15,004 | |
TSI Holdings Co. Ltd. | | | 4,800 | | | | 32,707 | |
Wacoal Holdings Corp. | | | 1,500 | | | | 41,336 | |
Yondoshi Holdings, Inc. | | | 1,400 | | | | 29,748 | |
| | | | | | | | 12,158,830 | |
| Thrifts & Mortgage Finance – 0.6% | |
Aareal Bank AG | | | 8,019 | | | | 299,018 | |
Charter Court Financial Services Group plc(c) | | | 85,779 | | | | 318,510 | |
Deutsche Pfandbriefbank AG(c) | | | 126,198 | | | | 1,680,116 | |
Equitable Group, Inc. | | | 10,019 | | | | 461,564 | |
First National Financial Corp. | | | 12,474 | | | | 255,891 | |
Genworth Mortgage Insurance Australia Ltd.(a) | | | 76,302 | | | | 121,678 | |
Home Capital Group, Inc.* (a) | | | 56,214 | | | | 558,609 | |
OneSavings Bank plc | | | 165,078 | | | | 787,185 | |
Paragon Banking Group plc(a) | | | 184,680 | | | | 1,004,309 | |
| | | | | | | | 5,486,880 | |
| Tobacco – 0.7% | |
British American Tobacco plc | | | 66,420 | | | | 2,880,001 | |
Imperial Brands plc | | | 45,360 | | | | 1,537,645 | |
Japan Tobacco, Inc. | | | 26,300 | | | | 677,338 | |
Scandinavian Tobacco Group A/S(c) | | | 64,314 | | | | 976,230 | |
Swedish Match AB | | | 6,318 | | | | 322,339 | |
| | | | | | | | 6,393,553 | |
| Trading Companies & Distributors – 2.4% | |
AddTech AB, Class B | | | 4,329 | | | | 88,572 | |
Advan Co. Ltd. | | | 6,400 | | | | 64,479 | |
Ahlsell AB(c) | | | 31,347 | | | | 158,867 | |
Ashtead Group plc | | | 15,876 | | | | 392,627 | |
See Accompanying Notes to the Financial Statements.
| | |
| 172 | | FLEXSHARES ANNUAL REPORT |
FlexShares® Morningstar Developed Markets ex-US Factor Tilt Index Fund (cont.)
| | | | | | | | |
| Investments | | Shares | | | Value | |
| COMMON STOCKS – (continued) | |
| Trading Companies & Distributors – (continued) | |
BayWa AG | | | 5,184 | | | $ | 151,249 | |
Beijer Ref AB | | | 3,795 | | | | 60,041 | |
Bossard Holding AG (Registered), Class A(a) | | | 579 | | | | 94,629 | |
Brenntag AG | | | 3,645 | | | | 190,681 | |
Bunzl plc | | | 16,929 | | | | 499,893 | |
Cramo OYJ | | | 26,268 | | | | 500,613 | |
Diploma plc | | | 6,602 | | | | 110,930 | |
Ferguson plc | | | 8,185 | | | | 552,516 | |
Finning International, Inc. | | | 4,307 | | | | 89,666 | |
Grafton Group plc | | | 188,973 | | | | 1,748,172 | |
Hanwa Co. Ltd. | | | 4,200 | | | | 137,885 | |
Howden Joinery Group plc | | | 34,204 | | | | 205,016 | |
IMCD NV | | | 2,440 | | | | 165,740 | |
Inaba Denki Sangyo Co. Ltd. | | | 17,200 | | | | 692,694 | |
Inabata & Co. Ltd. | | | 28,400 | | | | 379,992 | |
Indutrade AB | | | 2,198 | | | | 52,811 | |
ITOCHU Corp. | | | 90,300 | | | | 1,676,297 | |
Iwatani Corp.(a) | | | 2,197 | | | | 77,578 | |
Jacquet Metal Service SA | | | 10,044 | | | | 208,488 | |
Japan Pulp & Paper Co. Ltd. | | | 9,600 | | | | 353,019 | |
Kamei Corp. | | | 16,200 | | | | 187,185 | |
Kanamoto Co. Ltd.(a) | | | 33,523 | | | | 1,119,859 | |
Kanematsu Corp.(a) | | | 79,700 | | | | 1,024,719 | |
Kloeckner & Co. SE | | | 64,916 | | | | 547,235 | |
Marubeni Corp. | | | 100,200 | | | | 813,551 | |
Mitani Corp. | | | 5,200 | | | | 247,893 | |
Mitsubishi Corp. | | | 89,700 | | | | 2,527,544 | |
Mitsui & Co. Ltd. | | | 98,000 | | | | 1,637,313 | |
MonotaRO Co. Ltd. | | | 2,800 | | | | 61,803 | |
Nagase & Co. Ltd. | | | 4,900 | | | | 77,025 | |
Nippon Steel & Sumikin Bussan Corp. | | | 600 | | | | 26,211 | |
Nishio Rent All Co. Ltd. | | | 17,300 | | | | 556,457 | |
Okaya & Co. Ltd. | | | 2,000 | | | | 175,446 | |
Ramirent OYJ | | | 65,934 | | | | 481,857 | |
Reece Ltd. | | | 5,999 | | | | 44,176 | |
Rexel SA | | | 1,782 | | | | 22,755 | |
Richelieu Hardware Ltd. | | | 5,260 | | | | 101,175 | |
Russel Metals, Inc. | | | 42,201 | | | | 782,161 | |
Seven Group Holdings Ltd.(a) | | | 10,640 | | | | 133,855 | |
SIG plc | | | 382,806 | | | | 548,804 | |
| | | | | | | | |
| Investments | | Shares | | | Value | |
| Trading Companies & Distributors – (continued) | |
Sojitz Corp. | | | 66,500 | | | $ | 223,916 | |
Sumitomo Corp. | | | 67,100 | | | | 1,018,793 | |
Toromont Industries Ltd. | | | 3,554 | | | | 167,734 | |
Toyota Tsusho Corp. | | | 17,100 | | | | 618,967 | |
Travis Perkins plc | | | 4,131 | | | | 58,432 | |
Yamazen Corp. | | | 75,100 | | | | 823,169 | |
Yuasa Trading Co. Ltd. | | | 16,200 | | | | 531,842 | |
| | | | | | | | 23,212,332 | |
| Transportation Infrastructure – 0.5% | |
Aena SME SA(c) | | | 3,402 | | | | 544,082 | |
Aeroports de Paris | | | 1,493 | | | | 312,785 | |
Ansaldo STS SpA* | | | 2,145 | | | | 30,866 | |
ASTM SpA | | | 7,857 | | | | 155,970 | |
Atlantia SpA | | | 4,720 | | | | 94,980 | |
Atlas Arteria Ltd.(a) | | | 39,038 | | | | 188,974 | |
Auckland International Airport Ltd. | | | 22,540 | | | | 102,883 | |
BBA Aviation plc | | | 54,258 | | | | 166,526 | |
Enav SpA(c) | | | 12,657 | | | | 57,106 | |
Flughafen Zurich AG (Registered) | | | 1,595 | | | | 315,860 | |
Fraport AG Frankfurt Airport Services Worldwide | | | 1,690 | | | | 130,785 | |
Getlink | | | 16,112 | | | | 202,912 | |
Hamburger Hafen und Logistik AG | | | 1,220 | | | | 25,905 | |
Hong Kong Aircraft Engineering Co. Ltd. | | | 35,200 | | | | 321,269 | |
Hutchison Port Holdings Trust | | | 461,700 | | | | 113,117 | |
James Fisher & Sons plc | | | 3,402 | | | | 73,637 | |
Kamigumi Co. Ltd. | | | 6,500 | | | | 134,429 | |
Nissin Corp. | | | 8,100 | | | | 155,605 | |
Port of Tauranga Ltd. | | | 5,225 | | | | 17,298 | |
Qube Holdings Ltd.(a) | | | 109,704 | | | | 190,494 | |
SATS Ltd. | | | 19,000 | | | | 68,328 | |
Societa Iniziative Autostradali e Servizi SpA | | | 4,167 | | | | 58,829 | |
Sumitomo Warehouse Co. Ltd. (The)(a) | | | 61,700 | | | | 725,496 | |
Sydney Airport | | | 69,629 | | | | 317,811 | |
Transurban Group | | | 67,751 | | | | 544,530 | |
Westshore Terminals Investment Corp. | | | 5,020 | | | | 91,742 | |
| | | | | | | | 5,142,219 | |
See Accompanying Notes to the Financial Statements.
| | | | |
| FLEXSHARES ANNUAL REPORT | | | 173 | |
FlexShares® Morningstar Developed Markets ex-US Factor Tilt Index Fund (cont.)
| | | | | | | | |
| Investments | | Shares | | | Value | |
| COMMON STOCKS – (continued) | |
| Water Utilities – 0.0%(e) | |
Pennon Group plc | | | 16,200 | | | $ | 154,460 | |
United Utilities Group plc | | | 1,134 | | | | 10,528 | |
| | | | | | | | 164,988 | |
| Wireless Telecommunication Services – 0.9% | |
1&1 Drillisch AG | | | 979 | | | | 43,749 | |
Cellcom Israel Ltd.* | | | 21,851 | | | | 137,956 | |
Freenet AG | | | 3,078 | | | | 69,367 | |
Hutchison Telecommunications Hong Kong Holdings Ltd. | | | 554,000 | | | | 204,232 | |
KDDI Corp. | | | 99,100 | | | | 2,471,463 | |
M1 Ltd. | | | 121,500 | | | | 185,128 | |
Millicom International Cellular SA, SDR | | | 415 | | | | 23,475 | |
NTT DOCOMO, Inc. | | | 42,800 | | | | 1,078,770 | |
Okinawa Cellular Telephone Co. | | | 11,000 | | | | 404,989 | |
Rogers Communications, Inc., Class B | | | 14,985 | | | | 773,526 | |
SmarTone Telecommunications Holdings Ltd. | | | 4,740 | | | | 6,578 | |
SoftBank Group Corp. | | | 27,041 | | | | 2,167,976 | |
StarHub Ltd. | | | 137,700 | | | | 186,941 | |
Tele2 AB, Class B | | | 8,165 | | | | 92,909 | |
Vodafone Group plc | | | 733,860 | | | | 1,386,093 | |
| | | | | | | | 9,233,152 | |
Total Common Stocks
(Cost $905,622,724) | | | | | | | 947,621,328 | |
| | |
| | | | | | | | |
| CLOSED END FUNDS – 0.1% | | | | | | |
| Capital Markets – 0.0%(e) | |
HBM Healthcare Investments AG Class A* | | | 1,620 | | | | 267,343 | |
| Equity Real Estate Investment Trusts (REITs) – 0.1% | |
UK Commercial Property REIT Ltd.(a) | | | 589,518 | | | | 660,606 | |
Total Closed End Funds
(Cost $852,599) | | | | | | | 927,949 | |
| | | | | | | | |
| Investments | | Number of
Rights | | | Value | |
| RIGHTS – 0.0%(e) | | | | | | |
| Banks – 0.0%(e) | | | | | | |
Banco Santander SA, expiring 11/6/2018, price 0.04 EUR* | | | 820,854 | | | $ | 31,902 | |
| Containers & Packaging – 0.0%(e) | |
Vidrala SA, expiring 11/12/2018, price 1.02 EUR* | | | 1,180 | | | | 4,746 | |
| Equity Real Estate Investment Trusts (REITs) – 0.0%(e) | |
Beni Stabili SpA SIIQ, expiring 11/10/2018, price 0.73 EUR* (b) | | | 174,762 | | | | — | (f) |
| Hotels, Restaurants & Leisure – 0.0% | |
GVC Holdings plc, CVR* ‡ (b) | | | 96,369 | | | | — | |
| Internet & Direct Marketing Retail – 0.0%(e) | |
Dustin Group AB, expiring 11/7/2018, price 63.00 SEK* (a) | | | 26,163 | | | | 4,105 | |
Total Rights
(Cost $32,067) | | | | | | | 40,753 | |
| | | Number of
Warrants | | | | |
| WARRANTS – 0.0% | | | | | | |
| Capital Markets – 0.0% | | | | | | |
Australis Capital, Inc., expiring 8/23/2019, price 0.25 CAD* ‡ (b) (Cost $–) | | | 597 | | | | — | |
See Accompanying Notes to the Financial Statements.
| | |
| 174 | | FLEXSHARES ANNUAL REPORT |
FlexShares® Morningstar Developed Markets ex-US Factor Tilt Index Fund (cont.)
| | | | | | | | |
| Investments | | Principal
Amount | | | Value | |
| SECURITIES LENDING REINVESTMENTS(g) – 1.5% | |
| REPURCHASE AGREEMENTS – 1.5% | |
Citigroup Global Markets, Inc., 2.20%, dated 10/31/2018, due 11/1/2018, repurchase price $1,511,973, collateralized by various U.S. Treasury Securities, ranging from 1.13% – 4.63%, maturing 7/15/2020 – 8/15/2040; total market value $1,524,691 | | $ | 1,511,881 | | | $ | 1,511,881 | |
Citigroup Global Markets, Inc., 2.46%, dated 10/31/2018, due 11/7/2018, repurchase price $1,000,478, collateralized by various U.S. Treasury Securities, ranging from 1.00% – 2.75%, maturing 11/15/2042 – 2/15/2046; total market value $1,007,722 | | | 1,000,000 | | | | 1,000,000 | |
Mizuho Securities USA, Inc., 2.19%, dated 10/31/2018, due 11/1/2018, repurchase price $3,000,183, collateralized by various U.S. Treasury Securities, ranging from 0.00% – 2.88%, maturing 1/10/2019 – 2/15/2046; total market value $3,042,449 | | | 3,000,000 | | | | 3,000,000 | |
NBC Global Finance Ltd., 2.36%, dated 10/31/2018, due 11/1/2018, repurchase price $2,300,151, collateralized by various Common Stocks; total market value $2,574,791 | | | 2,300,000 | | | | 2,300,000 | |
| | | | | | | | |
| Investments | | Principal
Amount | | | Value | |
| REPURCHASE AGREEMENTS – (continued) | |
Nomura Securities Co., Ltd., 2.19%, dated 10/31/2018, due 11/1/2018, repurchase price $7,000,426, collateralized by various U.S. Treasury Securities, ranging from 0.00% – 3.00%, maturing 11/15/2018 – 8/15/2047; total market value $7,106,628 | | $ | 7,000,000 | | | $ | 7,000,000 | |
| | | | | | | | 14,811,881 | |
Total Securities Lending Reinvestments
(Cost $14,811,881) | | | | 14,811,881 | |
| | | | | | | | | |
Total Investments – 99.5%
(Cost $921,319,271) | | | | 963,401,911 | |
Other Assets Less Liabilities – 0.5% | | | | 4,693,807 | |
| NET ASSETS – 100.0% | | | $ | 968,095,718 | |
| * | Non-income producing security. |
| ‡ | Value determined using significant unobservable inputs. |
| (a) | The security or a portion of this security is on loan at October 31, 2018. The total value of securities on loan at October 31, 2018 was $68,747,832, collateralized in the form of cash with a value of $14,811,881 that was reinvested in the securities shown in the Securities Lending Reinvestment section of the Schedule of Investments; $12,259,880 of collateral in the form of U.S. Government Treasury Securities, interest rates ranging from 0.00% – 8.75%, and maturity dates ranging from November 1, 2018 – February 15, 2048 and $46,627,804 of collateral in the form of Foreign Government Fixed Income Securities, interest rates ranging from 0.00% – 8.50%, and maturity dates ranging from November 14, 2018 – November 2, 2086; a total value of $73,699,565. |
| (b) | Security fair valued as of October 31, 2018 in accordance with procedures approved by the Board of Trustees. Total value of all such securities at October 31, 2018 amounted to $561,479, which represents approximately 0.06% of net assets of the Fund. |
| (c) | Security exempt from registration pursuant to Regulation S under the Securities Act of 1933. Regulation S applies to securities offerings that are made outside of the United States and do not involve direct selling efforts in the United States and as such may have restrictions on resale. |
See Accompanying Notes to the Financial Statements.
| | | | |
| FLEXSHARES ANNUAL REPORT | | | 175 | |
FlexShares® Morningstar Developed Markets ex-US Factor Tilt Index Fund (cont.)
| (d) | Securities exempt from registration under Rule 144A of the Securities Act of 1933. These securities may be resold in transactions exempt from registration, normally to qualified institutional buyers. The value of these securities is determined by valuations supplied by a pricing service or brokers, or, if not available, in accordance with procedures established by the Board of Trustees. |
| (e) | Represents less than 0.05% of net assets. |
| (f) | Amount less than one dollar. |
| (g) | The security was purchased with cash collateral held from securities on loan at October 31, 2018. The total value of securities purchased was $14,811,881. |
Percentages shown are based on Net Assets.
Abbreviations
CAD – Canadian Dollar
CHDI – Clearing House Electronic Subregister System (CHESS) Depository Interest
CVA – Dutch Certification
CVR – Contingent Value Rights
DI – Depositary Interest
EUR – Euro
FDR – Fiduciary Depositary Receipt
OYJ – Public Limited Company
Preference – A special type of equity investment that shares in the earnings of the company, has limited voting rights, and may have a dividend preference. Preference shares may also have liquidation preference.
SCA – Limited partnership with share capital
SDR – Swedish Depositary Receipt
SEK – Swedish Krona
As of October 31, 2018, the gross unrealized appreciation (depreciation) of investments based on the aggregate cost of investments (including derivative instruments, if applicable) for federal income tax purposes was as follows:
| | | | |
| | | | |
Aggregate gross unrealized appreciation | | $ | 110,352,015 | |
Aggregate gross unrealized depreciation | | | (76,673,819 | ) |
Net unrealized appreciation | | $ | 33,678,196 | |
Federal income tax cost | | $ | 928,995,263 | |
Futures Contracts
FlexShares® Morningstar Developed Markets ex-US Factor Tilt Index Fund had the following open futures contracts as of October 31, 2018:
| | | | | | | | | | | | | | | | | | | | |
| | | Number of
Contracts | | | Expiration
Date | | | Trading
Currency | | | Notional
Amount | | | Value and
Unrealized
Depreciation* | |
Long Contracts | | | | | |
EURO STOXX 50 Index | | | 157 | | | | 12/21/2018 | | | | EUR | | | $ | 5,681,770 | | | $ | (209,423 | ) |
FTSE 100 Index | | | 39 | | | | 12/21/2018 | | | | GBP | | | | 3,543,571 | | | | (57,792 | ) |
Hang Seng Index | | | 3 | | | | 11/29/2018 | | | | HKD | | | | 476,650 | | | | (18,587 | ) |
Nikkei 225 Index | | | 52 | | | | 12/13/2018 | | | | JPY | | | | 5,030,437 | | | | (120,675 | ) |
S&P/TSX 60 Index | | | 15 | | | | 12/20/2018 | | | | CAD | | | | 2,042,719 | | | | (94,157 | ) |
SPI 200 Index | | | 16 | | | | 12/20/2018 | | | | AUD | | | | 1,643,733 | | | | (79,854 | ) |
| | | | | | | | | | | | | | | | | | | $ | (580,488 | ) |
| * | This amount represents the cumulative appreciation/depreciation on futures contracts. Current day’s variation margin is reported within the Statement of Assets and Liabilities for futures contracts. |
Forward Foreign Currency Contracts
FlexShares® Morningstar Developed Markets ex-US Factor Tilt Index Fund had the following outstanding contracts as of October 31, 2018:
| | | | | | | | | | | | | | | | | | | | |
| Contracts to Receive | | | Counterparty | | In Exchange For | | | Maturity
Date | | | Unrealized
Appreciation/
(Depreciation) | |
AUD | | | 282,747 | | | Toronto-Dominion Bank (The) | | USD | | | 200,000 | | | | 12/19/2018 | | | $ | 503 | |
JPY | | | 58,523,676 | | | Toronto-Dominion Bank (The) | | USD | | | 520,000 | | | | 12/19/2018 | | | | 747 | |
USD | | | 367,607 | | | Bank of New York | | DKK | | | 2,338,011 | | | | 12/19/2018 | | | | 10,901 | |
USD | | | 700,000 | | | Citibank NA | | GBP | | | 531,581 | | | | 12/19/2018 | | | | 19,095 | |
USD | | | 2,788 | | | Citibank NA | | SGD | | | 3,828 | | | | 12/19/2018 | | | | 21 | |
Total unrealized appreciation | | | | | | | | | | | | $ | 31,267 | |
See Accompanying Notes to the Financial Statements.
| | |
| 176 | | FLEXSHARES ANNUAL REPORT |
FlexShares® Morningstar Developed Markets ex-US Factor Tilt Index Fund (cont.)
Forward Foreign Currency Contracts (cont.)
| | | | | | | | | | | | | | | | | | | | |
| Contracts to Receive | | | Counterparty | | In Exchange For | | | Maturity
Date | | | Unrealized
Appreciation/
(Depreciation) | |
AUD | | | 127,519 | | | BNP Paribas SA | | USD | | | 92,152 | | | | 12/19/2018 | | | $ | (1,726 | ) |
AUD | | | 421,056 | | | Citibank NA | | USD | | | 300,000 | | | | 12/19/2018 | | | | (1,419 | ) |
CAD | | | 258,969 | | | Citibank NA | | USD | | | 200,000 | | | | 12/19/2018 | | | | (2,605 | ) |
CAD | | | 1,250,538 | | | Toronto-Dominion Bank (The) | | USD | | | 959,370 | | | | 12/19/2018 | | | | (6,167 | ) |
CHF | | | 96,073 | | | Citibank NA | | USD | | | 100,000 | | | | 12/19/2018 | | | | (4,017 | ) |
CHF | | | 15,008 | | | Goldman Sachs & Co. | | USD | | | 15,663 | | | | 12/19/2018 | | | | (669 | ) |
CHF | | | 258,358 | | | Toronto-Dominion Bank (The) | | USD | | | 260,000 | | | | 12/19/2018 | | | | (1,884 | ) |
DKK | | | 1,574,416 | | | Toronto-Dominion Bank (The) | | USD | | | 250,000 | | | | 12/19/2018 | | | | (9,794 | ) |
EUR | | | 642,258 | | | Citibank NA | | USD | | | 750,000 | | | | 12/19/2018 | | | | (19,121 | ) |
EUR | | | 1,144,454 | | | Goldman Sachs & Co. | | USD | | | 1,346,648 | | | | 12/19/2018 | | | | (44,277 | ) |
EUR | | | 492,630 | | | Toronto-Dominion Bank (The) | | USD | | | 570,000 | | | | 12/19/2018 | | | | (9,395 | ) |
GBP | | | 1,120,467 | | | BNP Paribas SA | | USD | | | 1,472,716 | | | | 12/19/2018 | | | | (37,505 | ) |
GBP | | | 75,568 | | | Citibank NA | | USD | | | 100,000 | | | | 12/19/2018 | | | | (3,205 | ) |
JPY | | | 204,564,025 | | | Goldman Sachs & Co. | | USD | | | 1,841,101 | | | | 12/19/2018 | | | | (20,877 | ) |
JPY | | | 122,509,680 | | | Toronto-Dominion Bank (The) | | USD | | | 1,100,000 | | | | 12/19/2018 | | | | (9,901 | ) |
SEK | | | 618,850 | | | Goldman Sachs & Co. | | USD | | | 69,379 | | | | 12/19/2018 | | | | (1,352 | ) |
SEK | | | 1,771,309 | | | Toronto-Dominion Bank (The) | | USD | | | 200,000 | | | | 12/19/2018 | | | | (5,291 | ) |
USD | | | 1,400,000 | | | Citibank NA | | JPY | | | 157,340,540 | | | | 12/19/2018 | | | | (26 | ) |
Total unrealized depreciation | | | | | | | | | | | | $ | (179,231 | ) |
Net unrealized depreciation | | | | | | | | | | | | $ | (147,964 | ) |
Abbreviations:
AUD – Australian Dollar
CAD – Canadian Dollar
CHF – Swiss Franc
DKK – Danish Krone
EUR – Euro
GBP – British Pound
HKD – Hong Kong Dollar
JPY – Japanese Yen
SEK – Swedish Krona
SGD – Singapore Dollar
USD – US Dollar
See Accompanying Notes to the Financial Statements.
| | | | |
| FLEXSHARES ANNUAL REPORT | | | 177 | |
FlexShares® Morningstar Developed Markets ex-US Factor Tilt Index Fund (cont.)
FlexShares® Morningstar Developed Markets ex-US Factor Tilt Index Fund invested, as a percentage of net assets, in companies domiciled in the following countries as of October 31, 2018:
| | | | |
Australia | | | 5.5 | % |
Austria | | | 0.4 | |
Belgium | | | 1.1 | |
Canada | | | 9.0 | |
Denmark | | | 1.1 | |
Finland | | | 1.1 | |
France | | | 7.2 | |
Germany | | | 6.1 | |
Hong Kong | | | 2.8 | |
Ireland | | | 0.5 | |
Israel | | | 1.1 | |
Italy | | | 2.3 | |
Japan | | | 27.0 | |
Netherlands | | | 2.5 | |
New Zealand | | | 0.4 | |
Norway | | | 1.3 | |
Portugal | | | 0.3 | |
Singapore | | | 1.2 | |
Spain | | | 2.5 | |
Sweden | | | 2.9 | |
Switzerland | | | 5.2 | |
United Kingdom | | | 16.5 | |
United States | | | 0.0 | † |
Other1 | | | 2.0 | |
| | | | 100.0 | % |
| † | Amount represents less than 0.05%. |
| 1 | Includes any non-equity securities, securities lending reinvestments and net other assets (liabilities). |
See Accompanying Notes to the Financial Statements.
| | |
| 178 | | FLEXSHARES ANNUAL REPORT |
Schedule of Investments
FlexShares® Morningstar Emerging Markets Factor Tilt Index Fund
October 31, 2018
| | | | | | | | |
| Investments | | Shares | | | Value | |
| COMMON STOCKS – 99.5% | |
| Aerospace & Defense – 0.2% | |
Aselsan Elektronik Sanayi ve Ticaret A/S | | | 16,029 | | | $ | 72,260 | |
AviChina Industry & Technology Co. Ltd., Class H(a) | | | 60,000 | | | | 39,952 | |
Bharat Electronics Ltd. | | | 17,280 | | | | 21,744 | |
Embraer SA | | | 35,800 | | | | 201,721 | |
Hanwha Aerospace Co. Ltd.* | | | 1,767 | | | | 44,115 | |
Korea Aerospace Industries Ltd.* | | | 3,108 | | | | 78,958 | |
LIG Nex1 Co. Ltd. | | | 430 | | | | 10,981 | |
United Aircraft Corp. PJSC* ^ | | | 25,155,036 | | | | 308,794 | |
| | | | | | | | 778,525 | |
| Air Freight & Logistics – 0.4% | |
Aramex PJSC | | | 24,595 | | | | 26,449 | |
Blue Dart Express Ltd. | | | 318 | | | | 12,046 | |
GD Express Carrier Bhd. | | | 51,838 | | | | 4,522 | |
Gulf Warehousing Co. | | | 42,840 | | | | 477,274 | |
Hyundai Glovis Co. Ltd. | | | 2,346 | | | | 234,693 | |
Kerry TJ Logistics Co. Ltd. | | | 14,000 | | | | 16,514 | |
Pos Malaysia Bhd. | | | 20,800 | | | | 14,713 | |
Sinotrans Ltd., Class H | | | 3,162,000 | | | | 1,101,138 | |
| | | | | | | | 1,887,349 | |
| Airlines – 0.6% | |
Aegean Airlines SA | | | 7,106 | | | | 53,784 | |
Aeroflot PJSC | | | 37,169 | | | | 54,985 | |
Air Arabia PJSC | | | 3,486,258 | | | | 968,115 | |
Air China Ltd., Class H | | | 204,000 | | | | 164,201 | |
AirAsia Group Bhd. | | | 171,800 | | | | 107,978 | |
Asiana Airlines, Inc.* | | | 18,639 | | | | 59,701 | |
Azul SA (Preference)* | | | 12,000 | | | | 98,824 | |
Bangkok Airways PCL, NVDR | | | 52,000 | | | | 18,353 | |
Cebu Air, Inc. | | | 287,640 | | | | 344,061 | |
China Airlines Ltd. | | | 240,000 | | | | 71,047 | |
China Eastern Airlines Corp. Ltd., Class H | | | 176,000 | | | | 97,211 | |
China Southern Airlines Co. Ltd., Class H | | | 204,000 | | | | 110,335 | |
Eva Airways Corp. | | | 63,200 | | | | 28,901 | |
| | | | | | | | |
| Investments | | Shares | | | Value | |
| Airlines – (continued) | |
Gol Linhas Aereas Inteligentes SA (Preference)* | | | 3,500 | | | $ | 17,337 | |
Grupo Aeromexico SAB de CV* | | | 10,400 | | | | 11,509 | |
Hanjin Kal Corp. | | | 4,692 | | | | 79,466 | |
InterGlobe Aviation Ltd.(b) | | | 4,578 | | | | 55,033 | |
Jeju Air Co. Ltd. | | | 172 | | | | 4,641 | |
Jet Airways India Ltd.* | | | 1,248 | | | | 3,745 | |
Korean Air Lines Co. Ltd. | | | 5,100 | | | | 122,851 | |
Latam Airlines Group SA | | | 16,524 | | | | 150,197 | |
SpiceJet Ltd.* | | | 7,072 | | | | 6,948 | |
Thai Airways International PCL, NVDR* | | | 31,200 | | | | 12,235 | |
Turk Hava Yollari AO* | | | 76,842 | | | | 192,678 | |
| | | | | | | | 2,834,136 | |
| Auto Components – 1.3% | |
Apollo Tyres Ltd. | | | 14,352 | | | | 42,467 | |
Asahi India Glass Ltd. | | | 3,952 | | | | 14,954 | |
Balkrishna Industries Ltd. | | | 4,692 | | | | 69,493 | |
Bharat Forge Ltd. | | | 9,894 | | | | 78,261 | |
Bosch Ltd. | | | 408 | | | | 108,954 | |
Cayman Engley Industrial Co. Ltd. | | | 61,796 | | | | 220,679 | |
Ceat Ltd. | | | 936 | | | | 14,518 | |
Cheng Shin Rubber Industry Co. Ltd. | | | 102,000 | | | | 143,557 | |
China First Capital Group Ltd.* | | | 158,000 | | | | 63,689 | |
Cub Elecparts, Inc. | | | 2,811 | | | | 16,942 | |
Depo Auto Parts Ind Co. Ltd. | | | 157,000 | | | | 340,455 | |
Endurance Technologies Ltd.(b) | | | 1,456 | | | | 23,820 | |
Exide Industries Ltd. | | | 15,469 | | | | 55,657 | |
Fuyao Glass Industry Group Co. Ltd., Class H(b) | | | 27,600 | | | | 81,504 | |
Global PMX Co. Ltd. | | | 1,000 | | | | 2,317 | |
Halla Holdings Corp. | | | 11,016 | | | | 395,379 | |
Hankook Tire Co. Ltd. | �� | | 7,752 | | | | 281,631 | |
Hanon Systems | | | 8,160 | | | | 78,410 | |
Hiroca Holdings Ltd. | | | 91,000 | | | | 209,980 | |
Hota Industrial Manufacturing Co. Ltd. | | | 9,826 | | | | 41,123 | |
See Accompanying Notes to the Financial Statements.
| | | | |
| FLEXSHARES ANNUAL REPORT | | | 179 | |
FlexShares® Morningstar Emerging Markets Factor Tilt Index Fund (cont.)
| | | | | | | | |
| Investments | | Shares | | | Value | |
| COMMON STOCKS – (continued) | |
| Auto Components – (continued) | |
Hu Lane Associate, Inc. | | | 3,000 | | | $ | 7,659 | |
Hyundai Mobis Co. Ltd. | | | 7,446 | | | | 1,241,490 | |
Hyundai Wia Corp. | | | 1,853 | | | | 48,132 | |
Kenda Rubber Industrial Co. Ltd. | | | 29,307 | | | | 28,035 | |
Kumho Tire Co., Inc.* | | | 3,552 | | | | 15,647 | |
Macauto Industrial Co. Ltd. | | | 6,000 | | | | 13,787 | |
Mahindra CIE Automotive Ltd.* | | | 6,379 | | | | 22,874 | |
Mando Corp. | | | 1,800 | | | | 48,256 | |
Minda Industries Ltd. | | | 5,154 | | | | 21,593 | |
Minth Group Ltd.(a) | | | 36,000 | | | | 116,642 | |
Motherson Sumi Systems Ltd.* (c) | | | 16,473 | | | | 15,728 | |
Motherson Sumi Systems Ltd. | | | 32,946 | | | | 72,735 | |
MRF Ltd. | | | 36 | | | | 31,401 | |
Nan Kang Rubber Tire Co. Ltd. | | | 20,000 | | | | 17,451 | |
Nemak SAB de CV(b) | | | 62,400 | | | | 45,573 | |
Nexen Corp. | | | 28,560 | | | | 129,573 | |
Nexen Tire Corp. | | | 3,532 | | | | 25,323 | |
Nexteer Automotive Group Ltd. | | | 44,000 | | | | 61,739 | |
S&T Motiv Co. Ltd. | | | 12,648 | | | | 291,907 | |
Sebang Global Battery Co. Ltd. | | | 9,894 | | | | 304,751 | |
SL Corp. | | | 19,482 | | | | 246,186 | |
Sri Trang Agro-Industry PCL, NVDR | | | 20,800 | | | | 11,231 | |
Sundaram Finance Holdings Ltd. | | | 1,310 | | | | 1,771 | |
Sundram Fasteners Ltd. | | | 3,224 | | | | 23,202 | |
Tianneng Power International Ltd. | | | 1,070,000 | | | | 855,792 | |
Tong Yang Industry Co. Ltd. | | | 27,400 | | | | 30,904 | |
Tung Thih Electronic Co. Ltd. | | | 3,000 | | | | 6,108 | |
Tupy SA | | | 3,600 | | | | 16,961 | |
TYC Brother Industrial Co. Ltd. | | | 273,000 | | | | 201,598 | |
WABCO India Ltd. | | | 172 | | | | 14,658 | |
Xinyi Glass Holdings Ltd. | | | 148,000 | | | | 146,501 | |
| | | | | | | | 6,398,998 | |
| | | | | | | | |
| Investments | | Shares | | | Value | |
| Automobiles – 1.7% | |
Astra International Tbk. PT | | | 1,020,000 | | | $ | 530,044 | |
BAIC Motor Corp. Ltd., Class H(b) | | | 204,000 | | | | 114,499 | |
Bajaj Auto Ltd. | | | 3,162 | | | | 110,910 | |
Brilliance China Automotive Holdings Ltd.(a) | | | 156,000 | | | | 136,112 | |
BYD Co. Ltd., Class H(a) | | | 32,000 | | | | 207,363 | |
China Motor Corp. | | | 61,000 | | | | 45,933 | |
Chongqing Changan Automobile Co. Ltd., Class B | | | 989,400 | | | | 666,382 | |
Dongfeng Motor Group Co. Ltd., Class H | | | 310,000 | | | | 305,278 | |
DRB-Hicom Bhd. | | | 84,000 | | | | 37,739 | |
Eicher Motors Ltd. | | | 684 | | | | 202,250 | |
Ford Otomotiv Sanayi A/S | | | 10,171 | | | | 108,911 | |
Geely Automobile Holdings Ltd. | | | 551,000 | | | | 1,054,290 | |
Great Wall Motor Co. Ltd., Class H(a) | | | 306,000 | | | | 181,116 | |
Guangzhou Automobile Group Co. Ltd., Class H | | | 288,400 | | | | 291,733 | |
Hero MotoCorp Ltd. | | | 5,100 | | | | 190,520 | |
Hyundai Motor Co. | | | 15,198 | | | | 1,420,374 | |
Hyundai Motor Co. (2nd Preference) | | | 3,876 | | | | 240,815 | |
Hyundai Motor Co. (3rd Preference) | | | 312 | | | | 17,358 | |
Hyundai Motor Co. (Preference) | | | 1,938 | | | | 113,265 | |
Kia Motors Corp. | | | 27,642 | | | | 688,897 | |
Mahindra & Mahindra Ltd. | | | 31,212 | | | | 323,306 | |
Maruti Suzuki India Ltd. | | | 6,120 | | | | 547,601 | |
Oriental Holdings Bhd. | | | 10,400 | | | | 14,987 | |
Ssangyong Motor Co.* | | | 59,772 | | | | 194,073 | |
Tata Motors Ltd.* | | | 42,228 | | | | 102,279 | |
Tata Motors Ltd., Class A* | | | 25,527 | | | | 33,728 | |
Tofas Turk Otomobil Fabrikasi A/S | | | 6,639 | | | | 25,000 | |
TVS Motor Co. Ltd. | | | 7,446 | | | | 54,844 | |
UMW Holdings Bhd. | | | 20,800 | | | | 23,611 | |
Yadea Group Holdings Ltd.(b) | | | 40,000 | | | | 12,450 | |
See Accompanying Notes to the Financial Statements.
| | |
| 180 | | FLEXSHARES ANNUAL REPORT |
FlexShares® Morningstar Emerging Markets Factor Tilt Index Fund (cont.)
| | | | | | | | |
| Investments | | Shares | | | Value | |
| COMMON STOCKS – (continued) | |
| Automobiles – (continued) | |
Yulon Motor Co. Ltd. | | | 102,000 | | | $ | 59,500 | |
| | | | | | | | 8,055,168 | |
| Banks – 17.6% | |
Absa Group Ltd. | | | 72,930 | | | | 736,449 | |
Abu Dhabi Commercial Bank PJSC | | | 216,524 | | | | 476,894 | |
AFFIN Bank Bhd. | | | 37,910 | | | | 20,475 | |
Agricultural Bank of China Ltd., Class H | | | 2,958,000 | | | | 1,297,997 | |
Akbank T.A.S. | | | 193,650 | | | | 228,442 | |
Akbank T.A.S., ADR | | | 20,016 | | | | 46,637 | |
Al Khalij Commercial Bank PQSC | | | 252,528 | | | | 794,015 | |
Alior Bank SA* | | | 1,526 | | | | 23,006 | |
Alliance Bank Malaysia Bhd. | | | 71,400 | | | | 67,569 | |
Alpha Bank AE* | | | 69,666 | | | | 105,378 | |
AMMB Holdings Bhd. | | | 153,000 | | | | 138,941 | |
AU Small Finance Bank Ltd.(b) | | | 2,288 | | | | 17,191 | |
Axis Bank Ltd.* | | | 90,817 | | | | 715,286 | |
Banco Bradesco SA* | | | 92,960 | | | | 757,044 | |
Banco Bradesco SA (Preference)* | | | 357,000 | | | | 3,296,568 | |
Banco Davivienda SA (Preference) | | | 154,428 | | | | 1,486,039 | |
Banco de Bogota SA | | | 6,120 | | | | 121,621 | |
Banco de Chile | | | 1,382,930 | | | | 191,460 | |
Banco de Credito e Inversiones SA | | | 2,397 | | | | 150,627 | |
Banco del Bajio SA(b) | | | 61,200 | | | | 120,671 | |
Banco do Brasil SA* | | | 122,400 | | | | 1,408,696 | |
Banco do Estado do Rio Grande do Sul SA (Preference), Class B | | | 285,600 | | | | 1,526,993 | |
Banco Santander Brasil SA | | | 20,400 | | | | 231,762 | |
Banco Santander Chile | | | 3,235,746 | | | | 237,346 | |
Banco Santander Mexico SA Institucion de Banca Multiple Grupo Financiero Santand, Class B | | | 81,600 | | | | 102,065 | |
Bancolombia SA | | | 29,478 | | | | 277,074 | |
| | | | | | | | |
| Investments | | Shares | | | Value | |
| Banks – (continued) | |
Bancolombia SA (Preference) | | | 48,450 | | | $ | 452,692 | |
Bangkok Bank PCL, NVDR | | | 51,000 | | | | 318,462 | |
Bank Al Habib Ltd. | | | 1,275,000 | | | | 739,620 | |
Bank Alfalah Ltd. | | | 140,000 | | | | 55,239 | |
Bank Central Asia Tbk. PT | | | 530,100 | | | | 824,658 | |
Bank Danamon Indonesia Tbk. PT | | | 135,200 | | | | 66,033 | |
Bank Handlowy w Warszawie SA | | | 2,012 | | | | 36,768 | |
Bank Mandiri Persero Tbk. PT | | | 948,600 | | | | 427,424 | |
Bank Millennium SA* | | | 25,240 | | | | 58,182 | |
Bank Negara Indonesia Persero Tbk. PT | | | 377,400 | | | | 181,842 | |
Bank of Ayudhya PCL, NVDR | | | 86,600 | | | | 105,148 | |
Bank of Baroda* | | | 71,298 | | | | 106,689 | |
Bank of China Ltd., Class H | | | 7,956,000 | | | | 3,389,678 | |
Bank of Chongqing Co. Ltd., Class H | | | 663,000 | | | | 383,115 | |
Bank of Communications Co. Ltd., Class H | | | 2,290,000 | | | | 1,717,631 | |
Bank of Gansu Co. Ltd., Class H* (b) | | | 2,040,000 | | | | 525,652 | |
Bank of the Philippine Islands | | | 96,553 | | | | 148,245 | |
Bank of Zhengzhou Co. Ltd., Class H* (b) | | | 1,428,000 | | | | 734,092 | |
Bank Pan Indonesia Tbk. PT* | | | 325,900 | | | | 23,259 | |
Bank Pembangunan Daerah Jawa Barat Dan Banten Tbk. PT | | | 249,600 | | | | 29,389 | |
Bank Pembangunan Daerah Jawa Timur Tbk. PT | | | 10,744,000 | | | | 431,103 | |
Bank Permata Tbk. PT* | | | 4,661,400 | | | | 141,045 | |
Bank Polska Kasa Opieki SA | | | 8,058 | | | | 220,248 | |
Bank Rakyat Indonesia Persero Tbk. PT | | | 2,682,600 | | | | 555,842 | |
Bank Tabungan Negara Persero Tbk. PT | | | 469,200 | | | | 65,430 | |
BDO Unibank, Inc. | | | 89,760 | | | | 205,338 | |
BIMB Holdings Bhd. | | | 14,180 | | | | 12,403 | |
BNK Financial Group, Inc. | | | 25,092 | | | | 167,126 | |
BOC Hong Kong Holdings Ltd. | | | 182,000 | | | | 680,231 | |
Canara Bank* | | | 22,848 | | | | 80,939 | |
Capitec Bank Holdings Ltd. | | | 3,162 | | | | 212,139 | |
See Accompanying Notes to the Financial Statements.
| | | | |
| FLEXSHARES ANNUAL REPORT | | | 181 | |
FlexShares® Morningstar Emerging Markets Factor Tilt Index Fund (cont.)
| | | | | | | | |
| Investments | | Shares | | | Value | |
| COMMON STOCKS – (continued) | |
| Banks – (continued) | |
Central Bank of India* | | | 39,520 | | | $ | 17,022 | |
Chang Hwa Commercial Bank Ltd. | | | 288,534 | | | | 163,648 | |
China Banking Corp. | | | 51,084 | | | | 26,733 | |
China CITIC Bank Corp. Ltd., Class H | | | 1,261,000 | | | | 780,143 | |
China Construction Bank Corp., Class H | | | 11,322,000 | | | | 8,983,193 | |
China Development Financial Holding Corp. | | | 1,530,000 | | | | 490,996 | |
China Everbright Bank Co. Ltd., Class H | | | 352,000 | | | | 156,706 | |
China Merchants Bank Co. Ltd., Class H | | | 408,000 | | | | 1,571,753 | |
China Minsheng Banking Corp. Ltd., Class H | | | 663,000 | | | | 488,831 | |
China Zheshang Bank Co. Ltd., Class H | | | 136,000 | | | | 75,812 | |
Chong Hing Bank Ltd.(a) | | | 265,000 | | | | 446,208 | |
Chongqing Rural Commercial Bank Co. Ltd., Class H | | | 273,000 | | | | 150,440 | |
CIMB Group Holdings Bhd. | | | 256,169 | | | | 350,170 | |
City Union Bank Ltd. | | | 9,675 | | | | 22,256 | |
Commercial Bank PQSC (The) | | | 12,750 | | | | 145,127 | |
Commercial International Bank Egypt SAE | | | 54,978 | | | | 246,121 | |
Credicorp Ltd. | | | 3,366 | | | | 757,350 | |
Credit Agricole Egypt SAE | | | 11,960 | | | | 26,741 | |
Credit Bank of Moscow PJSC* | | | 844,272 | | | | 64,573 | |
CTBC Financial Holding Co. Ltd. | | | 2,088,000 | | | | 1,393,440 | |
DCB Bank Ltd. | | | 1,720 | | | | 3,694 | |
DGB Financial Group, Inc. | | | 16,932 | | | | 139,670 | |
Doha Bank QPSC | | | 16,446 | | | | 99,221 | |
Dubai Islamic Bank PJSC | | | 174,624 | | | | 250,067 | |
E.Sun Financial Holding Co. Ltd. | | | 513,151 | | | | 339,967 | |
East West Banking Corp.* | | | 867,000 | | | | 183,430 | |
Eurobank Ergasias SA* | | | 117,198 | | | | 79,011 | |
Far Eastern International Bank | | | 321,838 | | | | 102,970 | |
Federal Bank Ltd. | | | 58,440 | | | | 65,399 | |
| | | | | | | | |
| Investments | | Shares | | | Value | |
| Banks – (continued) | |
First Abu Dhabi Bank PJSC | | | 294,626 | | | $ | 1,108,527 | |
First Financial Holding Co. Ltd. | | | 515,600 | | | | 325,760 | |
Grupo Aval Acciones y Valores SA (Preference) | | | 420,954 | | | | 147,658 | |
Grupo Elektra SAB de CV | | | 3,060 | | | | 129,913 | |
Grupo Financiero Banorte SAB de CV, Class O | | | 139,700 | | | | 770,968 | |
Grupo Financiero Inbursa SAB de CV, Class O | | | 91,800 | | | | 119,357 | |
Grupo Security SA | | | 129,688 | | | | 53,358 | |
Guangzhou Rural Commercial Bank Co. Ltd., Class H(b) | | | 1,122,000 | | | | 715,616 | |
Habib Bank Ltd. | | | 71,400 | | | | 78,560 | |
Habib Metropolitan Bank Ltd. | | | 765,000 | | | | 266,414 | |
Hana Financial Group, Inc. | | | 31,518 | | | | 1,059,312 | |
Harbin Bank Co. Ltd., Class H(b) | | | 4,386,000 | | | | 1,018,256 | |
Hong Leong Bank Bhd. | | | 30,600 | | | | 151,373 | |
Hong Leong Financial Group Bhd. | | | 12,600 | | | | 55,344 | |
Hua Nan Financial Holdings Co. Ltd. | | | 464,642 | | | | 262,030 | |
Huishang Bank Corp. Ltd., Class H | | | 94,600 | | | | 40,787 | |
ICICI Bank Ltd. | | | 149,532 | | | | 717,883 | |
IDBI Bank Ltd.* | | | 75,601 | | | | 60,526 | |
IDFC Bank Ltd. | | | 56,935 | | | | 26,641 | |
Indian Bank* | | | 9,984 | | | | 34,119 | |
IndusInd Bank Ltd. | | | 14,994 | | | | 288,971 | |
Industrial & Commercial Bank of China Ltd., Class H | | | 8,293,000 | | | | 5,606,666 | |
Industrial Bank of Korea | | | 28,866 | | | | 376,166 | |
ING Bank Slaski SA | | | 1,734 | | | | 73,786 | |
Intercorp Financial Services, Inc.(b) | | | 1,040 | | | | 38,792 | |
Itau CorpBanca | | | 11,049,150 | | | | 102,340 | |
Itau Unibanco Holding SA (Preference) | | | 153,000 | | | | 2,028,604 | |
Itausa – Investimentos Itau SA | | | 41,909 | | | | 132,683 | |
Itausa – Investimentos Itau SA (Preference) | | | 234,711 | | | | 710,231 | |
JB Financial Group Co. Ltd. | | | 236,746 | | | | 1,140,569 | |
See Accompanying Notes to the Financial Statements.
| | |
| 182 | | FLEXSHARES ANNUAL REPORT |
FlexShares® Morningstar Emerging Markets Factor Tilt Index Fund (cont.)
| | | | | | | | |
| Investments | | Shares | | | Value | |
| COMMON STOCKS – (continued) | |
| Banks – (continued) | |
Karur Vysya Bank Ltd. (The) | | | 13,613 | | | $ | 14,682 | |
Kasikornbank PCL, NVDR | | | 57,100 | | | | 343,633 | |
KB Financial Group, Inc. | | | 42,635 | | | | 1,773,423 | |
Kiatnakin Bank PCL, NVDR | | | 40,800 | | | | 87,692 | |
King’s Town Bank Co. Ltd. | | | 102,000 | | | | 97,408 | |
Komercni banka A/S | | | 3,774 | | | | 143,389 | |
Kotak Mahindra Bank Ltd. | | | 40,800 | | | | 617,504 | |
Krung Thai Bank PCL, NVDR | | | 377,400 | | | | 228,831 | |
LH Financial Group PCL, NVDR | | | 290,449 | | | | 13,142 | |
Malayan Banking Bhd. | | | 252,427 | | | | 572,478 | |
Masraf Al Rayan QSC | | | 18,666 | | | | 194,731 | |
mBank SA | | | 714 | | | | 69,712 | |
MCB Bank Ltd. | | | 51,000 | | | | 76,191 | |
Mega Financial Holding Co. Ltd. | | | 530,000 | | | | 447,904 | |
Metropolitan Bank & Trust Co. | | | 80,584 | | | | 98,725 | |
Moneta Money Bank A/S(b) | | | 17,472 | | | | 57,990 | |
National Bank of Greece SA* | | | 29,228 | | | | 50,669 | |
National Bank of Pakistan* | | | 52,000 | | | | 18,926 | |
Nedbank Group Ltd. | | | 40,596 | | | | 684,341 | |
Oriental Bank of Commerce* | | | 163,506 | | | | 177,669 | |
OTP Bank Nyrt | | | 10,608 | | | | 380,905 | |
Philippine National Bank* | | | 712,200 | | | | 527,112 | |
Piraeus Bank SA* | | | 38,377 | | | | 56,528 | |
Postal Savings Bank of China Co. Ltd., Class H(a) (b) | | | 816,000 | | | | 487,139 | |
Powszechna Kasa Oszczednosci Bank Polski SA | | | 40,290 | | | | 419,987 | |
Public Bank Bhd. | | | 125,800 | | | | 739,558 | |
Punjab National Bank* | | | 80,682 | | | | 80,360 | |
Qatar International Islamic Bank QSC | | | 2,042 | | | | 34,795 | |
Qatar Islamic Bank SAQ | | | 12,945 | | | | 543,885 | |
Qatar National Bank QPSC | | | 22,468 | | | | 1,203,131 | |
RBL Bank Ltd.(b) | | | 6,656 | | | | 47,212 | |
RHB Bank Bhd. | | | 181,867 | | | | 227,307 | |
Rizal Commercial Banking Corp. | | | 43,139 | | | | 23,382 | |
| | | | | | | | |
| Investments | | Shares | | | Value | |
| Banks – (continued) | |
Santander Bank Polska SA | | | 1,632 | | | $ | 145,027 | |
Sberbank of Russia PJSC | | | 1,122,102 | | | | 3,239,656 | |
Sberbank of Russia PJSC (Preference) | | | 107,304 | | | | 266,546 | |
Security Bank Corp. | | | 13,750 | | | | 37,109 | |
Shengjing Bank Co. Ltd., Class H(b) | | | 714,000 | | | | 314,220 | |
Shinhan Financial Group Co. Ltd. | | | 50,796 | | | | 1,896,687 | |
Siam Commercial Bank PCL (The), NVDR | | | 153,000 | | | | 634,615 | |
SinoPac Financial Holdings Co. Ltd. | | | 1,122,000 | | | | 380,732 | |
Sociedad Matriz del Banco de Chile SA, Class B | | | 253,164 | | | | 111,114 | |
South Indian Bank Ltd. (The) | | | 1,231,140 | | | | 243,914 | |
Standard Bank Group Ltd. | | | 135,845 | | | | 1,502,586 | |
State Bank of India* | | | 87,210 | | | | 331,880 | |
Taichung Commercial Bank Co. Ltd. | | | 208,689 | | | | 68,792 | |
Taishin Financial Holding Co. Ltd. | | | 918,000 | | | | 407,927 | |
Taiwan Business Bank | | | 261,440 | | | | 86,181 | |
Taiwan Cooperative Financial Holding Co. Ltd. | | | 432,934 | | | | 243,449 | |
Thanachart Capital PCL, NVDR | | | 61,200 | | | | 97,385 | |
Tisco Financial Group PCL, NVDR | | | 20,800 | | | | 49,412 | |
TMB Bank PCL, NVDR | | | 1,122,000 | | | | 77,169 | |
Turkiye Garanti Bankasi A/S | | | 208,488 | | | | 260,084 | |
Turkiye Halk Bankasi A/S | | | 55,440 | | | | 61,047 | |
Turkiye Is Bankasi A/S, Class C | | | 130,866 | | | | 93,187 | |
Turkiye Sinai Kalkinma Bankasi A/S | | | 1,941,366 | | | | 245,993 | |
Turkiye Vakiflar Bankasi TAO, Class D | | | 94,752 | | | | 57,832 | |
Union Bank of India* | | | 4,560 | | | | 4,727 | |
Union Bank of Taiwan | | | 224,296 | | | | 69,877 | |
Union Bank of the Philippines | | | 16,100 | | | | 20,116 | |
Union National Bank PJSC | | | 117,682 | | | | 152,505 | |
United Bank Ltd. | | | 54,500 | | | | 61,707 | |
Vijaya Bank | | | 351,798 | | | | 209,095 | |
See Accompanying Notes to the Financial Statements.
| | | | |
| FLEXSHARES ANNUAL REPORT | | | 183 | |
FlexShares® Morningstar Emerging Markets Factor Tilt Index Fund (cont.)
| | | | | | | | |
| Investments | | Shares | | | Value | |
| COMMON STOCKS – (continued) | |
| Banks – (continued) | |
VTB Bank PJSC | | | 498,805,398 | | | $ | 277,553 | |
Woori Bank | | | 51,204 | | | | 707,703 | |
Yapi ve Kredi Bankasi A/S* | | | 204,587 | | | | 59,149 | |
Yes Bank Ltd. | | | 86,088 | | | | 218,989 | |
| | | | | | | | 86,108,116 | |
| Beverages – 0.6% | |
Ambev SA | | | 214,200 | | | | 942,261 | |
Anadolu Efes Biracilik ve Malt Sanayii A/S | | | 10,922 | | | | 36,626 | |
Arca Continental SAB de CV | | | 21,400 | | | | 107,946 | |
Becle SAB de CV | | | 34,400 | | | | 42,382 | |
Carabao Group PCL, NVDR | | | 13,100 | | | | 17,881 | |
Carlsberg Brewery Malaysia Bhd. | | | 10,400 | | | | 44,239 | |
China Resources Beer Holdings Co. Ltd. | | | 73,107 | | | | 254,122 | |
Cia Cervecerias Unidas SA | | | 7,650 | | | | 95,047 | |
Coca-Cola Embonor SA (Preference), Class B | | | 4,368 | | | | 9,722 | |
Coca-Cola Femsa SAB de CV, Series L | | | 25,600 | | | | 146,463 | |
Coca-Cola Icecek A/S | | | 360 | | | | 1,771 | |
Embotelladora Andina SA (Preference), Class B | | | 9,513 | | | | 32,866 | |
Emperador, Inc. | | | 145,600 | | | | 18,940 | |
Fomento Economico Mexicano SAB de CV | | | 91,800 | | | | 782,823 | |
Fraser & Neave Holdings Bhd. | | | 3,700 | | | | 29,798 | |
Heineken Malaysia Bhd. | | | 7,700 | | | | 33,122 | |
Hey Song Corp. | | | 2,000 | | | | 1,797 | |
Hite Jinro Co. Ltd. | | | 1,790 | | | | 24,740 | |
Lotte Chilsung Beverage Co. Ltd. | | | 15 | | | | 18,007 | |
Muhak Co. Ltd. | | | 761 | | | | 7,780 | |
Tibet Water Resources Ltd.* | | | 52,000 | | | | 14,659 | |
Tsingtao Brewery Co. Ltd., Class H | | | 18,000 | | | | 71,064 | |
United Breweries Ltd. | | | 3,744 | | | | 61,766 | |
United Spirits Ltd.* | | | 14,280 | | | | 111,390 | |
Varun Beverages Ltd. | | | 774 | | | | 8,538 | |
| | | | | | | | |
| Investments | | Shares | | | Value | |
| Beverages – (continued) | |
Vina Concha y Toro SA | | | 19,880 | | | $ | 37,415 | |
| | | | | | | | 2,953,165 | |
| Biotechnology – 0.4% | |
3SBio, Inc.(b) | | | 33,480 | | | | 48,601 | |
Amicogen, Inc.* | | | 514 | | | | 14,163 | |
Biocon Ltd. | | | 4,765 | | | | 42,466 | |
Celltrion, Inc.* | | | 4,995 | | | | 953,370 | |
China Biologic Products Holdings, Inc.* (a) | | | 1,300 | | | | 86,372 | |
Genexine Co. Ltd.* | | | 650 | | | | 42,381 | |
Green Cross Cell Corp. | | | 258 | | | | 11,886 | |
Green Cross Corp. | | | 300 | | | | 31,460 | |
Green Cross Holdings Corp. | | | 1,787 | | | | 32,539 | |
Hugel, Inc.* | | | 104 | | | | 25,043 | |
iNtRON Biotechnology, Inc.* | | | 460 | | | | 14,249 | |
Medy-Tox, Inc. | | | 204 | | | | 83,494 | |
OBI Pharma, Inc.* | | | 9,000 | | | | 35,194 | |
PharmaEngine, Inc. | | | 4,172 | | | | 14,090 | |
PharmaEssentia Corp.* | | | 9,000 | | | | 47,991 | |
Pharmicell Co. Ltd.* | | | 3,360 | | | | 35,530 | |
Seegene, Inc.* | | | 999 | | | | 16,131 | |
SillaJen, Inc.* | | | 3,123 | | | | 188,824 | |
TaiMed Biologics, Inc.* | | | 8,000 | | | | 49,898 | |
Tanvex BioPharma, Inc.* | | | 9,000 | | | | 16,288 | |
ViroMed Co. Ltd.* | | | 667 | | | | 109,045 | |
| | | | | | | | 1,899,015 | |
| Building Products – 0.3% | |
Astral Poly Technik Ltd. | | | 1,823 | | | | 24,194 | |
China Lesso Group Holdings Ltd. | | | 102,000 | | | | 53,736 | |
Dynasty Ceramic PCL, NVDR | | | 104,000 | | | | 7,216 | |
Elementia SAB de CV* (b) | | | 10,400 | | | | 5,906 | |
IS Dongseo Co. Ltd. | | | 20,400 | | | | 554,061 | |
Kajaria Ceramics Ltd. | | | 2,608 | | | | 13,903 | |
KCC Corp. | | | 306 | | | | 66,326 | |
Kyung Dong Navien Co. Ltd. | | | 208 | | | | 6,708 | |
LG Hausys Ltd. | | | 8,364 | | | | 352,307 | |
National Central Cooling Co. PJSC(c) | | | 947,682 | | | | 438,610 | |
Taiwan Glass Industry Corp. | | | 56,000 | | | | 23,980 | |
See Accompanying Notes to the Financial Statements.
| | |
| 184 | | FLEXSHARES ANNUAL REPORT |
FlexShares® Morningstar Emerging Markets Factor Tilt Index Fund (cont.)
| | | | | | | | |
| Investments | | Shares | | | Value | |
| COMMON STOCKS – (continued) | |
| Building Products – (continued) | |
Trakya Cam Sanayii A/S | | | 47,628 | | | $ | 27,795 | |
| | | | | | | | 1,574,742 | |
| Capital Markets – 2.2% | |
B3 SA – Brasil Bolsa Balcao* | | | 102,000 | | | | 728,787 | |
Banco BTG Pactual SA* | | | 10,200 | | | | 54,288 | |
Bolsa Mexicana de Valores SAB de CV | | | 24,100 | | | | 36,428 | |
Brait SE* | | | 46,002 | | | | 115,237 | |
Bursa Malaysia Bhd. | | | 17,700 | | | | 30,963 | |
Capital Securities Corp. | | | 219,680 | | | | 65,599 | |
China Bills Finance Corp. | | | 71,000 | | | | 30,288 | |
China Cinda Asset Management Co. Ltd., Class H | | | 918,000 | | | | 224,834 | |
China Everbright Ltd. | | | 94,000 | | | | 166,191 | |
China Galaxy Securities Co. Ltd., Class H(a) | | | 357,000 | | | | 179,424 | |
China Huarong Asset Management Co. Ltd., Class H(b) | | | 1,122,000 | | | | 203,235 | |
China International Capital Corp. Ltd., Class H(a) (b) | | | 40,800 | | | | 67,034 | |
China investment Fund International Holdings Co. Ltd.* | | | 16,000 | | | | 54,290 | |
China Merchants Securities Co. Ltd., Class H(b) | | | 1,183,200 | | | | 1,341,767 | |
CITIC Securities Co. Ltd., Class H | | | 255,000 | | | | 448,886 | |
Coronation Fund Managers Ltd.(a) | | | 16,810 | | | | 55,930 | |
CSC Financial Co. Ltd., Class H*(a) (b) | | | 1,185,500 | | | | 671,432 | |
Daishin Securities Co. Ltd. | | | 4,440 | | | | 43,054 | |
Daishin Securities Co. Ltd. (Preference) | | | 5,554 | | | | 43,719 | |
Daou Technology, Inc. | | | 4,080 | | | | 71,607 | |
Dubai Financial Market PJSC | | | 67,052 | | | | 15,827 | |
Edelweiss Financial Services Ltd. | | | 22,568 | | | | 49,626 | |
Egypt Kuwait Holding Co. SAE | | | 57,159 | | | | 63,447 | |
| | | | | | | | |
| Investments | | Shares | | | Value | |
| Capital Markets – (continued) | |
Egyptian Financial Group-Hermes Holding Co.* | | | 26,913 | | | $ | 21,293 | |
Everbright Securities Co. Ltd., Class H(b) | | | 437,600 | | | | 383,488 | |
GF Securities Co. Ltd., Class H | | | 156,200 | | | | 202,039 | |
Guotai Junan International Holdings Ltd.(a) | | | 142,800 | | | | 25,866 | |
Guotai Junan Securities Co. Ltd., Class H(b) | | | 40,800 | | | | 85,978 | |
Haitong Securities Co. Ltd., Class H | | | 367,200 | | | | 369,570 | |
Hanwha Investment & Securities Co. Ltd.* | | | 195,330 | | | | 349,676 | |
Huarong International Financial Holdings Ltd. | | | 1,672,000 | | | | 147,164 | |
Huatai Securities Co. Ltd., Class H(b) | | | 81,600 | | | | 131,153 | |
IIFL Holdings Ltd. | | | 9,360 | | | | 58,227 | |
Indiabulls Ventures Ltd. | | | 9,748 | | | | 56,541 | |
Investec Ltd. | | | 18,462 | | | | 114,739 | |
Jih Sun Financial Holdings Co. Ltd. | | | 96,907 | | | | 28,092 | |
JM Financial Ltd. | | | 11,544 | | | | 11,834 | |
JSE Ltd. | | | 4,205 | | | | 46,700 | |
KIWOOM Securities Co. Ltd. | | | 816 | | | | 54,063 | |
Korea Investment Holdings Co. Ltd. | | | 2,346 | | | | 122,081 | |
Kresna Graha Investama Tbk. PT* | | | 187,300 | | | | 7,700 | |
Macquarie Korea Infrastructure Fund | | | 11,023 | | | | 87,638 | |
Meritz Securities Co. Ltd. | | | 29,988 | | | | 104,473 | |
Mirae Asset Daewoo Co. Ltd. | | | 19,686 | | | | 111,080 | |
Moscow Exchange MICEX-RTS PJSC* | | | 74,154 | | | | 99,150 | |
NH Investment & Securities Co. Ltd. | | | 7,446 | | | | 79,390 | |
NH Investment & Securities Co. Ltd. (Preference) | | | 1,352 | | | | 10,286 | |
Norte Grande SA | | | 1,317 | | | | 8 | |
Orient Securities Co. Ltd., Class H(a) (b) | | | 1,183,200 | | | | 777,289 | |
President Securities Corp. | | | 1,224,000 | | | | 494,458 | |
PSG Konsult Ltd. | | | 3,256 | | | | 2,337 | |
See Accompanying Notes to the Financial Statements.
| | | | |
| FLEXSHARES ANNUAL REPORT | | | 185 | |
FlexShares® Morningstar Emerging Markets Factor Tilt Index Fund (cont.)
| | | | | | | | |
| Investments | | Shares | | | Value | |
| COMMON STOCKS – (continued) | |
| Capital Markets – (continued) | |
Reinet Investments SCA | | | 3,815 | | | $ | 63,866 | |
RP-SG Business Process Services Ltd.* (c) | | | 832 | | | | 4,233 | |
Samsung Securities Co. Ltd. | | | 3,264 | | | | 76,620 | |
Shinyoung Securities Co. Ltd. | | | 6,528 | | | | 325,383 | |
Sociedad de Inversiones Oro Blanco SA | | | 1,595,152 | | | | 10,308 | |
Warsaw Stock Exchange | | | 1,040 | | | | 10,494 | |
Waterland Financial Holdings Co. Ltd. | | | 150,929 | | | | 49,020 | |
Yuanta Financial Holding Co. Ltd. | | | 1,271,929 | | | | 616,583 | |
Yuanta Securities Korea Co. Ltd.* | | | 129,336 | | | | 358,652 | |
Zeder Investments Ltd. | | | 1,423,206 | | | | 452,997 | |
| | | | | | | | 10,712,362 | |
| Chemicals – 3.0% | |
AECI Ltd. | | | 159,426 | | | | 1,020,283 | |
Aekyung Petrochemical Co. Ltd. | | | 22,236 | | | | 160,006 | |
AK Holdings, Inc. | | | 8,262 | | | | 323,360 | |
Akzo Nobel India Ltd. | | | 832 | | | | 17,227 | |
Alexandria Mineral Oils Co. | | | 34,684 | | | | 13,518 | |
Alpek SAB de CV* (a) | | | 41,600 | | | | 54,930 | |
Asia Polymer Corp. | | | 18,544 | | | | 8,150 | |
Asian Paints Ltd. | | | 14,688 | | | | 244,399 | |
Barito Pacific Tbk. PT | | | 213,400 | | | | 26,320 | |
BASF India Ltd. | | | 836 | | | | 18,818 | |
Batu Kawan Bhd. | | | 22,800 | | | | 91,974 | |
Bayer CropScience Ltd. | | | 562 | | | | 29,649 | |
Berger Paints India Ltd. | | | 10,816 | | | | 40,941 | |
Braskem SA (Preference), Class A | | | 10,200 | | | | 143,204 | |
Castrol India Ltd. | | | 9,090 | | | | 18,280 | |
Chambal Fertilizers and Chemicals Ltd. | | | 5,408 | | | | 10,517 | |
China General Plastics Corp. | | | 527,550 | | | | 311,998 | |
China Lumena New Materials Corp.* ‡ (c) | | | 888,000 | | | | — | |
China Man-Made Fiber Corp. | | | 1,847,760 | | | | 585,207 | |
China Petrochemical Development Corp.* | | | 198,700 | | | | 72,563 | |
| | | | | | | | |
| Investments | | Shares | | | Value | |
| Chemicals – (continued) | |
China Steel Chemical Corp. | | | 8,000 | | | $ | 32,447 | |
Ciech SA | | | 38,320 | | | | 424,561 | |
Coremax Corp. | | | 4,000 | | | | 12,384 | |
Coromandel International Ltd. | | | 1,898 | | | | 10,816 | |
D&L Industries, Inc. | | | 110,800 | | | | 23,608 | |
DCM Shriram Ltd. | | | 60,160 | | | | 335,072 | |
Dongjin Semichem Co. Ltd. | | | 1,144 | | | | 8,654 | |
Dongyue Group Ltd. | | | 102,000 | | | | 54,387 | |
Eastern Polymer Group PCL, NVDR | | | 52,200 | | | | 12,125 | |
Ecopro Co. Ltd.* | | | 624 | | | | 21,602 | |
EID Parry India Ltd. | | | 1,204 | | | | 3,639 | |
Engro Corp. Ltd. | | | 30,600 | | | | 77,381 | |
Engro Fertilizers Ltd. | | | 69,500 | | | | 42,532 | |
Eternal Materials Co. Ltd. | | | 46,010 | | | | 34,274 | |
Everlight Chemical Industrial Corp. | | | 54,000 | | | | 26,962 | |
Fauji Fertilizer Co. Ltd. | | | 41,500 | | | | 30,789 | |
Finolex Industries Ltd. | | | 3,922 | | | | 28,994 | |
Foosung Co. Ltd.* | | | 1,768 | | | | 13,544 | |
Formosa Chemicals & Fibre Corp. | | | 204,000 | | | | 738,390 | |
Formosa Plastics Corp. | | | 204,000 | | | | 665,869 | |
Fufeng Group Ltd.(a) | | | 1,632,000 | | | | 691,155 | |
Grand Pacific Petrochemical | | | 90,000 | | | | 60,644 | |
Grupa Azoty SA | | | 7,848 | | | | 53,064 | |
Gujarat Fluorochemicals Ltd. | | | 1,704 | | | | 20,398 | |
Gujarat Narmada Valley Fertilizers & Chemicals Ltd. | | | 59,364 | | | | 266,935 | |
Hansol Chemical Co. Ltd. | | | 528 | | | | 36,697 | |
Hanwha Chemical Corp. | | | 9,894 | | | | 140,220 | |
Himadri Speciality Chemical Ltd. | | | 7,638 | | | | 12,922 | |
Ho Tung Chemical Corp. | | | 120,000 | | | | 25,828 | |
Huabao International Holdings Ltd. | | | 47,000 | | | | 21,883 | |
Huchems Fine Chemical Corp. | | | 2,040 | | | | 39,026 | |
Indorama Ventures PCL, NVDR | | | 97,700 | | | | 159,886 | |
International CSRC Investment Holdings Co. | | | 53,031 | | | | 59,298 | |
Kansai Nerolac Paints Ltd. | | | 7,592 | | | | 39,035 | |
See Accompanying Notes to the Financial Statements.
| | |
| 186 | | FLEXSHARES ANNUAL REPORT |
FlexShares® Morningstar Emerging Markets Factor Tilt Index Fund (cont.)
| | | | | | | | |
| Investments | | Shares | | | Value | |
| COMMON STOCKS – (continued) | |
| Chemicals – (continued) | |
Kolon Industries, Inc. | | | 1,836 | | | $ | 80,880 | |
Korea Petrochemical Ind Co. Ltd. | | | 440 | | | | 60,234 | |
Kumho Petrochemical Co. Ltd. | | | 1,938 | | | | 146,428 | |
LCY Chemical Corp. | | | 58,000 | | | | 97,282 | |
LG Chem Ltd. | | | 2,385 | | | | 726,247 | |
LG Chem Ltd. (Preference) | | | 408 | | | | 71,428 | |
Lotte Chemical Corp. | | | 1,734 | | | | 399,434 | |
Lotte Chemical Titan Holding Bhd.(b) | | | 60,000 | | | | 61,656 | |
LOTTE Fine Chemical Co. Ltd. | | | 1,734 | | | | 62,007 | |
Mexichem SAB de CV | | | 51,000 | | | | 135,137 | |
Misr Fertilizers Production Co. SAE | | | 1,204 | | | | 5,731 | |
Namhae Chemical Corp. | | | 1,040 | | | | 9,172 | |
Nan Ya Plastics Corp. | | | 277,000 | | | | 688,404 | |
Nantex Industry Co. Ltd. | | | 409,230 | | | | 381,549 | |
OCI Co. Ltd. | | | 918 | | | | 68,636 | |
Omnia Holdings Ltd. | | | 2,184 | | | | 17,187 | |
Oriental Union Chemical Corp. | | | 34,000 | | | | 30,766 | |
Petkim Petrokimya Holding A/S | | | 56,628 | | | | 51,339 | |
Petronas Chemicals Group Bhd. | | | 102,000 | | | | 227,913 | |
PhosAgro PJSC | | | 1,080 | | | | 40,578 | |
PI Industries Ltd. | | | 3,911 | | | | 41,033 | |
Pidilite Industries Ltd. | | | 6,732 | | | | 87,294 | |
PTT Global Chemical PCL, NVDR | | | 173,400 | | | | 404,077 | |
Rain Industries Ltd. | | | 2,912 | | | | 7,264 | |
Sasol Ltd. | | | 26,724 | | | | 875,945 | |
Scientex Bhd. | | | 8,700 | | | | 17,859 | |
Shinkong Synthetic Fibers Corp. | | | 61,000 | | | | 20,601 | |
Sidi Kerir Petrochemicals Co. | | | 3,797 | | | | 4,679 | |
Sinofert Holdings Ltd.* (a) | | | 172,000 | | | | 19,308 | |
Sinopec Shanghai Petrochemical Co. Ltd., Class H | | | 380,000 | | | | 166,747 | |
SK Chemicals Co. Ltd.* | | | 600 | | | | 31,802 | |
SK Discovery Co. Ltd. | | | 17,136 | | | | 406,765 | |
| | | | | | | | |
| Investments | | Shares | | | Value | |
| Chemicals – (continued) | |
SK Materials Co. Ltd. | | | 312 | | | $ | 50,980 | |
SKC Co. Ltd. | | | 2,046 | | | | 59,519 | |
SKCKOLONPI, Inc. | | | 520 | | | | 15,264 | |
Sociedad Quimica y Minera de Chile SA (Preference), Class B | | | 4,794 | | | | 206,919 | |
Soda Sanayii A/S | | | 30,857 | | | | 37,337 | |
Solar Industries India Ltd. | | | 1,040 | | | | 14,102 | |
Songwon Industrial Co. Ltd. | | | 187 | | | | 2,831 | |
Soulbrain Co. Ltd. | | | 416 | | | | 19,202 | |
Supreme Industries Ltd. | | | 1,204 | | | | 16,037 | |
Taekwang Industrial Co. Ltd. | | | 52 | | | | 67,353 | |
Taiwan Fertilizer Co. Ltd.* | | | 37,000 | | | | 50,221 | |
Taiwan Styrene Monomer | | | 714,000 | | | | 530,718 | |
Tata Chemicals Ltd. | | | 6,720 | | | | 62,320 | |
TOA Paint Thailand PCL, NVDR | | | 12,000 | | | | 12,217 | |
TSRC Corp. | | | 34,000 | | | | 31,316 | |
UPC Technology Corp. | | | 53,136 | | | | 19,490 | |
UPL Ltd. | | | 19,042 | | | | 173,656 | |
USI Corp. | | | 1,220,527 | | | | 465,444 | |
| | | | | | | | 14,696,673 | |
| Commercial Services & Supplies – 0.2% | |
Blue Label Telecoms Ltd.* | | | 1,017,144 | | | | 357,503 | |
China Everbright International Ltd. | | | 191,444 | | | | 152,630 | |
Cleanaway Co. Ltd. | | | 3,000 | | | | 16,530 | |
Eastern Media International Corp.* | | | 408,000 | | | | 183,279 | |
ECOVE Environment Corp. | | | 1,000 | | | | 5,526 | |
Greentown Service Group Co. Ltd.(a) (b) | | | 68,000 | | | | 44,932 | |
KEPCO Plant Service & Engineering Co. Ltd. | | | 1,144 | | | | 27,607 | |
S-1 Corp. | | | 918 | | | | 77,739 | |
Sunny Friend Environmental Technology Co. Ltd. | | | 3,000 | | | | 21,620 | |
Taiwan Secom Co. Ltd. | | | 11,165 | | | | 31,753 | |
Taiwan Shin Kong Security Co. Ltd. | | | 8,240 | | | | 8,908 | |
| | | | | | | | 928,027 | |
See Accompanying Notes to the Financial Statements.
| | | | |
| FLEXSHARES ANNUAL REPORT | | | 187 | |
FlexShares® Morningstar Emerging Markets Factor Tilt Index Fund (cont.)
| | | | | | | | |
| Investments | | Shares | | | Value | |
| COMMON STOCKS – (continued) | |
| Communications Equipment – 0.2% | |
Accton Technology Corp. | | | 27,000 | | | $ | 74,343 | |
Advanced Ceramic X Corp. | | | 1,000 | | | | 6,270 | |
Arcadyan Technology Corp. | | | 215,000 | | | | 349,497 | |
BYD Electronic International Co. Ltd.(a) | | | 51,000 | | | | 59,786 | |
Sangsangin Co. Ltd.* | | | 753 | | | | 11,597 | |
Sercomm Corp. | | | 311,000 | | | | 495,501 | |
Sterlite Technologies Ltd. | | | 5,616 | | | | 28,955 | |
Wistron NeWeb Corp. | | | 30,093 | | | | 70,022 | |
Yangtze Optical Fibre and Cable Joint Stock Ltd. Co., Class H(b) | | | 6,000 | | | | 14,619 | |
ZTE Corp., Class H* | | | 40,800 | | | | 62,246 | |
| | | | | | | | 1,172,836 | |
| Construction & Engineering – 1.9% | |
BES Engineering Corp. | | | 55,000 | | | | 12,460 | |
Budimex SA | | | 460 | | | | 14,891 | |
CH Karnchang PCL, NVDR | | | 737 | | | | 567 | |
China Communications Construction Co. Ltd., Class H | | | 476,000 | | | | 435,355 | |
China Energy Engineering Corp. Ltd., Class H | | | 612,000 | | | | 59,331 | |
China Railway Construction Corp. Ltd., Class H | | | 204,000 | | | | 258,142 | |
China Railway Group Ltd., Class H | | | 408,000 | | | | 364,314 | |
China State Construction International Holdings Ltd. | | | 205,750 | | | | 146,713 | |
Continental Holdings Corp. | | | 669,000 | | | | 279,984 | |
Daelim Industrial Co. Ltd. | | | 2,786 | | | | 185,807 | |
Daewoo Engineering & Construction Co. Ltd.* | | | 21,828 | | | | 86,676 | |
Dilip Buildcon Ltd.(b) | | | 1,768 | | | | 10,110 | |
Engineers India Ltd. | | | 7,880 | | | | 12,330 | |
Gamuda Bhd. | | | 60,000 | | | | 34,269 | |
GEK Terna Holding Real Estate Construction SA* | | | 115,566 | | | | 612,154 | |
GMR Infrastructure Ltd.* | | | 102,144 | | | | 23,276 | |
GS Engineering & Construction Corp. | | | 6,426 | | | | 235,431 | |
HDC Holdings Co. Ltd. | | | 3,003 | | | | 44,272 | |
| | | | | | | | |
| Investments | | Shares | | | Value | |
| Construction & Engineering – (continued) | |
Hyundai Engineering & Construction Co. Ltd. | | | 7,752 | | | $ | 311,223 | |
IJM Corp. Bhd. | | | 147,900 | | | | 57,612 | |
IRB Infrastructure Developers Ltd. | | | 13,440 | | | | 25,373 | |
Kalpataru Power Transmission Ltd. | | | 4,716 | | | | 20,692 | |
KEC International Ltd. | | | 516 | | | | 1,983 | |
KEPCO Engineering & Construction Co., Inc. | | | 602 | | | | 9,694 | |
Kumho Industrial Co. Ltd. | | | 29,172 | | | | 249,852 | |
Larsen & Toubro Ltd. | | | 16,942 | | | | 297,269 | |
Larsen & Toubro Ltd., GDR(b) | | | 296 | | | | 5,198 | |
Malaysian Resources Corp. Bhd. | | | 83,200 | | | | 14,514 | |
Metallurgical Corp. of China Ltd., Class H | | | 4,182,000 | | | | 1,013,572 | |
NCC Ltd. | | | 15,600 | | | | 15,822 | |
PP Persero Tbk. PT | | | 3,835,200 | | | | 335,525 | |
Rich Development Co. Ltd. | | | 918,000 | | | | 259,590 | |
Sadbhav Engineering Ltd. | | | 3,224 | | | | 8,984 | |
Salfacorp SA | | | 10,456 | | | | 14,806 | |
Samsung Engineering Co. Ltd.* | | | 7,389 | | | | 118,335 | |
Sinopec Engineering Group Co. Ltd., Class H | | | 1,785,000 | | | | 1,659,904 | |
Sino-Thai Engineering & Construction PCL, NVDR* | | | 41,571 | | | | 31,100 | |
Sunway Construction Group Bhd. | | | 25,800 | | | | 8,940 | |
Taeyoung Engineering & Construction Co. Ltd. | | | 62,118 | | | | 516,764 | |
Tekfen Holding A/S | | | 16,369 | | | | 62,049 | |
United Integrated Services Co. Ltd. | | | 293,000 | | | | 523,637 | |
Voltas Ltd. | | | 5,928 | | | | 43,311 | |
Waskita Karya Persero Tbk. PT | | | 219,600 | | | | 20,801 | |
Wijaya Karya Persero Tbk. PT | | | 111,166 | | | | 8,044 | |
Wilson Bayly Holmes-Ovcon Ltd. | | | 77,765 | | | | 805,865 | |
| | | | | | | | 9,256,541 | |
See Accompanying Notes to the Financial Statements.
| | |
| 188 | | FLEXSHARES ANNUAL REPORT |
FlexShares® Morningstar Emerging Markets Factor Tilt Index Fund (cont.)
| | | | | | | | |
| Investments | | Shares | | | Value | |
| COMMON STOCKS – (continued) | |
| Construction Materials – 1.7% | |
ACC Ltd. | | | 1,926 | | | $ | 35,809 | |
Ambuja Cements Ltd. | | | 26,928 | | | | 71,795 | |
Anhui Conch Cement Co. Ltd., Class H | | | 60,500 | | | | 312,556 | |
Asia Cement China Holdings Corp. | | | 612,000 | | | | 525,392 | |
Asia Cement Co. Ltd. | | | 2,346 | | | | 228,516 | |
Asia Cement Corp. | | | 107,020 | | | | 113,270 | |
BBMG Corp., Class H(a) | | | 3,468,000 | | | | 955,542 | |
Cahya Mata Sarawak Bhd. | | | 32,900 | | | | 22,801 | |
Cementos Argos SA | | | 26,160 | | | | 57,006 | |
Cementos Argos SA (Preference) | | | 10,296 | | | | 18,537 | |
Cementos Pacasmayo SAA | | | 4,992 | | | | 10,157 | |
CEMEX Latam Holdings SA* | | | 7,998 | | | | 12,413 | |
Cemex SAB de CV* | | | 683,400 | | | | 342,189 | |
Century Textiles & Industries Ltd. | | | 1,872 | | | | 20,829 | |
Chia Hsin Cement Corp. | | | 714,000 | | | | 265,359 | |
China National Building Material Co. Ltd., Class H | | | 408,050 | | | | 291,487 | |
China Resources Cement Holdings Ltd. | | | 204,000 | | | | 179,815 | |
China Shanshui Cement Group Ltd.* | | | 541,000 | | | | 227,044 | |
Corp. Moctezuma SAB de CV | | | 15,900 | | | | 58,117 | |
Dalmia Bharat Ltd.* | | | 720 | | | | 20,454 | |
DG Khan Cement Co. Ltd. | | | 306,000 | | | | 244,037 | |
Eagle Cement Corp. | | | 62,400 | | | | 17,727 | |
Goldsun Building Materials Co. Ltd. | | | 1,734,000 | | | | 457,274 | |
Grasim Industries Ltd. | | | 15,478 | | | | 174,477 | |
Grupo Argos SA | | | 16,626 | | | | 77,414 | |
Grupo Argos SA (Preference) | | | 6,000 | | | | 24,212 | |
Grupo Cementos de Chihuahua SAB de CV | | | 11,300 | | | | 61,084 | |
Hanil Holdings Co. Ltd. | | | 216 | | | | 8,767 | |
Huaxin Cement Co. Ltd., Class B | | | 316,200 | | | | 644,099 | |
India Cements Ltd. (The) | | | 2,408 | | | | 2,924 | |
Indocement Tunggal Prakarsa Tbk. PT | | | 91,800 | | | | 104,466 | |
| | | | | | | | |
| Investments | | Shares | | | Value | |
| Construction Materials – (continued) | |
JK Lakshmi Cement Ltd. | | | 657 | | | $ | 2,374 | |
Lafarge Malaysia Bhd.* | | | 23,500 | | | | 12,074 | |
Lucky Cement Ltd. | | | 10,400 | | | | 39,043 | |
Magnesita Refratarios SA* | | | 38,800 | | | | 585,995 | |
Maple Leaf Cement Factory Ltd. | | | 306,000 | | | | 115,419 | |
POSCO Chemtech Co. Ltd. | | | 1,144 | | | | 65,354 | |
PPC Ltd.* | | | 54,720 | | | | 22,012 | |
Prism Johnson Ltd. | | | 10,157 | | | | 11,930 | |
Qatar National Cement Co. QSC | | | 360 | | | | 5,931 | |
Qatari Investors Group QSC | | | 1,720 | | | | 13,575 | |
Ramco Cements Ltd. (The) | | | 3,536 | | | | 28,675 | |
Semen Baturaja Persero Tbk. PT | | | 86,000 | | | | 9,956 | |
Semen Indonesia Persero Tbk. PT | | | 153,000 | | | | 90,577 | |
Shree Cement Ltd. | | | 408 | | | | 76,791 | |
Siam Cement PCL (The), NVDR | | | 30,600 | | | | 385,846 | |
Siam City Cement PCL, NVDR | | | 4,700 | | | | 34,027 | |
Ssangyong Cement Industrial Co. Ltd. | | | 6,660 | | | | 28,024 | |
Taiwan Cement Corp. | | | 205,200 | | | | 230,115 | |
Tipco Asphalt PCL, NVDR | | | 41,600 | | | | 18,322 | |
Titan Cement Co. SA* | | | 605 | | | | 13,326 | |
TPI Polene PCL, NVDR | | | 377,200 | | | | 20,481 | |
T’way Holdings, Inc.* | | | 50,592 | | | | 100,780 | |
UltraTech Cement Ltd. | | | 4,794 | | | | 226,873 | |
Union Andina de Cementos SAA | | | 32,705 | | | | 20,498 | |
Waskita Beton Precast Tbk. PT | | | 490,200 | | | | 10,254 | |
West China Cement Ltd. | | | 3,060,000 | | | | 452,790 | |
| | | | | | | | 8,206,611 | |
| Consumer Finance – 0.6% | |
AEON Credit Service M Bhd. | | | 4,400 | | | | 15,878 | |
AEON Thana Sinsap Thailand PCL, NVDR | | | 3,500 | | | | 20,588 | |
Bajaj Finance Ltd. | | | 8,262 | | | | 266,206 | |
Capital First Ltd. | | | 1,376 | | | | 8,675 | |
Cholamandalam Investment and Finance Co. Ltd. | | | 1,997 | | | | 34,312 | |
See Accompanying Notes to the Financial Statements.
| | | | |
| FLEXSHARES ANNUAL REPORT | | | 189 | |
FlexShares® Morningstar Emerging Markets Factor Tilt Index Fund (cont.)
| | | | | | | | |
| Investments | | Shares | | | Value | |
| COMMON STOCKS – (continued) | |
| Consumer Finance – (continued) | |
Chong Sing Holdings FinTech Gr* (a) | | | 872,000 | | | $ | 39,488 | |
Gentera SAB de CV(a) | | | 1,458,600 | | | | 1,185,549 | |
KRUK SA | | | 858 | | | | 41,348 | |
Krungthai Card PCL, NVDR | | | 36,800 | | | | 38,576 | |
Mahindra & Mahindra Financial Services Ltd. | | | 13,201 | | | | 73,017 | |
Manappuram Finance Ltd. | | | 18,492 | | | | 19,981 | |
Muangthai Capital PCL, NVDR | | | 39,400 | | | | 62,101 | |
Muthoot Finance Ltd. | | | 3,784 | | | | 20,948 | |
Safmar Financial Investment | | | 77,641 | | | | 713,107 | |
Samsung Card Co. Ltd. | | | 2,856 | | | | 84,336 | |
Shriram City Union Finance Ltd. | | | 1,537 | | | | 33,773 | |
Shriram Transport Finance Co. Ltd. | | | 7,548 | | | | 118,898 | |
Srisawad Corp. PCL, NVDR | | | 24,821 | | | | 33,319 | |
Sundaram Finance Ltd. | | | 1,310 | | | | 26,530 | |
Transaction Capital Ltd. | | | 17,028 | | | | 20,480 | |
Unifin Financiera SAB de CV SOFOM ENR | | | 4,600 | | | | 8,720 | |
Yixin Group Ltd.* (b) | | | 122,000 | | | | 31,747 | |
Yulon Finance Corp. | | | 11,000 | | | | 30,253 | |
| | | | | | | | 2,927,830 | |
| Containers & Packaging – 0.8% | |
Beijing Enterprises Clean Energy Group Ltd.* | | | 3,777,142 | | | | 47,700 | |
Cheng Loong Corp. | | | 1,531,000 | | | | 977,192 | |
CPMC Holdings Ltd.(a) | | | 918,000 | | | | 300,949 | |
Dongwon Systems Corp. | | | 344 | | | | 8,030 | |
Greatview Aseptic Packaging Co. Ltd. | | | 12,000 | | | | 7,960 | |
Klabin SA | | | 40,800 | | | | 205,071 | |
Lock&Lock Co. Ltd. | | | 728 | | | | 9,870 | |
Nampak Ltd.* | | | 925,956 | | | | 931,208 | |
Taiwan Hon Chuan Enterprise Co. Ltd. | | | 408,000 | | | | 628,950 | |
Ton Yi Industrial Corp. | | | 38,000 | | | | 16,210 | |
Vitro SAB de CV, Series A | | | 153,000 | | | | 368,466 | |
| | | | | | | | |
| Investments | | Shares | | | Value | |
| Containers & Packaging – (continued) | |
Youyuan International Holdings Ltd.* | | | 549,000 | | | $ | 181,380 | |
| | | | | | | | 3,682,986 | |
| Distributors – 0.1% | |
Dah Chong Hong Holdings Ltd. | | | 1,247,016 | | | | 421,537 | |
Imperial Holdings Ltd. | | | 11,118 | | | | 122,660 | |
Inter Cars SA | | | 402 | | | | 25,187 | |
| | | | | | | | 569,384 | |
| Diversified Consumer Services – 0.2% | |
Advtech Ltd. | | | 41,880 | | | | 40,558 | |
China Education Group Holdings Ltd.* (b) | | | 31,000 | | | | 37,092 | |
China Maple Leaf Educational Systems Ltd. | | | 56,000 | | | | 24,145 | |
China Yuhua Education Corp. Ltd.(b) | | | 66,000 | | | | 26,520 | |
Curro Holdings Ltd.* | | | 7,904 | | | | 12,852 | |
Daekyo Co. Ltd. | | | 1,248 | | | | 7,557 | |
Estacio Participacoes SA | | | 16,600 | | | | 103,367 | |
Fu Shou Yuan International Group Ltd. | | | 42,000 | | | | 32,199 | |
Kroton Educacional SA | | | 71,400 | | | | 219,515 | |
Lung Yen Life Service Corp. | | | 14,000 | | | | 26,332 | |
Ser Educacional SA(b) | | | 81,600 | | | | 342,481 | |
Virscend Education Co. Ltd.(b) | | | 67,000 | | | | 38,203 | |
Wisdom Education International Holdings Co. Ltd.(b) | | | 40,000 | | | | 17,909 | |
| | | | | | | | 928,730 | |
| Diversified Financial Services – 1.4% | |
Aditya Birla Capital Ltd.* | | | 14,160 | | | | 20,021 | |
Al Waha Capital PJSC | | | 1,351,806 | | | | 684,533 | |
Alexander Forbes Group Holdings Ltd. | | | 954,516 | | | | 336,137 | |
Amanat Holdings PJSC | | | 49,192 | | | | 15,669 | |
Ayala Corp. | | | 12,240 | | | | 210,463 | |
Bajaj Holdings & Investment Ltd. | | | 1,560 | | | | 59,271 | |
Bank of Greece | | | 22,770 | | | | 319,914 | |
Chailease Holding Co. Ltd. | | | 64,260 | | | | 183,167 | |
China Shandong Hi-Speed Financial Group Ltd.* | | | 474,000 | | | | 14,874 | |
See Accompanying Notes to the Financial Statements.
| | |
| 190 | | FLEXSHARES ANNUAL REPORT |
FlexShares® Morningstar Emerging Markets Factor Tilt Index Fund (cont.)
| | | | | | | | |
| Investments | | Shares | | | Value | |
| COMMON STOCKS – (continued) | |
| Diversified Financial Services – (continued) | |
Corp. Financiera Colombiana SA* | | | 4,814 | | | $ | 29,438 | |
Far East Horizon Ltd. | | | 102,000 | | | | 98,885 | |
FirstRand Ltd. | | | 171,233 | | | | 745,754 | |
Fubon Financial Holding Co. Ltd. | | | 778,000 | | | | 1,218,179 | |
Grupo de Inversiones Suramericana SA | | | 21,726 | | | | 211,764 | |
Grupo de Inversiones Suramericana SA (Preference) | | | 13,566 | | | | 123,806 | |
GT Capital Holdings, Inc. | | | 10,170 | | | | 144,458 | |
Haci Omer Sabanci Holding A/S | | | 126,888 | | | | 161,234 | |
Hankook Tire Worldwide Co. Ltd. | | | 2,460 | | | | 36,483 | |
IDFC Ltd. | | | 1,175,040 | | | | 584,779 | |
IGB Bhd. | | | 438,600 | | | | 265,183 | |
Inversiones La Construccion SA | | | 3,744 | | | | 56,329 | |
L&T Finance Holdings Ltd. | | | 25,376 | | | | 43,841 | |
Meritz Financial Group, Inc. | | | 4,139 | | | | 37,593 | |
Metro Pacific Investments Corp. | | | 755,000 | | | | 67,732 | |
NICE Holdings Co. Ltd. | | | 29,478 | | | | 443,638 | |
Power Finance Corp. Ltd. | | | 51,840 | | | | 66,951 | |
PSG Group Ltd. | | | 5,057 | | | | 75,340 | |
REC Ltd. | | | 56,712 | | | | 89,273 | |
Reliance Capital Ltd. | | | 14,170 | | | | 46,355 | |
Remgro Ltd. | | | 26,418 | | | | 340,247 | |
RMB Holdings Ltd. | | | 39,066 | | | | 196,993 | |
TI Financial Holdings Ltd. | | | 3,206 | | | | 21,121 | |
| | | | | | | | 6,949,425 | |
| Diversified Telecommunication Services – 2.1% | |
Asia Pacific Telecom Co. Ltd.* | | | 104,000 | | | | 19,998 | |
Bharti Infratel Ltd. | | | 28,356 | | | | 103,250 | |
China Communications Services Corp. Ltd., Class H | | | 3,524,000 | | | | 2,849,983 | |
China Telecom Corp. Ltd., Class H | | | 1,490,000 | | | | 703,243 | |
China Unicom Hong Kong Ltd. | | | 304,000 | | | | 315,657 | |
| | | | | | | | |
| Investments | | Shares | | | Value | |
| Diversified Telecommunication Services – (continued) | |
Chunghwa Telecom Co. Ltd. | | | 197,000 | | | $ | 697,137 | |
CITIC Telecom International Holdings Ltd. | | | 2,040,000 | | | | 640,151 | |
Emirates Telecommunications Group Co. PJSC | | | 86,394 | | | | 409,261 | |
Hellenic Telecommunications Organization SA | | | 15,509 | | | | 173,089 | |
Inscobee, Inc.* | | | 5,160 | | | | 27,667 | |
Jasmine International PCL, NVDR | | | 76,400 | | | | 11,869 | |
LG Uplus Corp. | | | 22,950 | | | | 325,253 | |
Link Net Tbk. PT | | | 31,200 | | | | 9,009 | |
Magyar Telekom Telecommunications plc | | | 47,839 | | | | 65,208 | |
O2 Czech Republic A/S | | | 3,092 | | | | 32,543 | |
Oi SA* | | | 2,988,600 | | | | 2,252,815 | |
Oi SA (Preference)* | | | 244,800 | | | | 158,828 | |
Ooredoo QPSC | | | 11,628 | | | | 219,944 | |
Orange Polska SA* | | | 33,592 | | | | 38,060 | |
Rostelecom PJSC | | | 99,042 | | | | 105,460 | |
Rostelecom PJSC (Preference) | | | 15,392 | | | | 13,922 | |
Tata Communications Ltd. | | | 5,003 | | | | 33,247 | |
Telecom Egypt Co. | | | 37,657 | | | | 22,151 | |
Telefonica Brasil SA (Preference) | | | 20,400 | | | | 237,364 | |
Telekom Malaysia Bhd. | | | 60,000 | | | | 34,126 | |
Telekomunikasi Indonesia Persero Tbk. PT | | | 2,418,700 | | | | 612,530 | |
Telesites SAB de CV* (a) | | | 60,200 | | | | 37,248 | |
Telkom SA SOC Ltd. | | | 33,558 | | | | 121,926 | |
TIME dotCom Bhd. | | | 18,200 | | | | 33,925 | |
Tower Bersama Infrastructure Tbk. PT | | | 81,300 | | | | 25,028 | |
True Corp. PCL, NVDR | | | 540,600 | | | | 96,215 | |
| | | | | | | | 10,426,107 | |
| Electric Utilities – 1.2% | |
Adani Transmission Ltd.* | | | 14,456 | | | | 32,540 | |
Alupar Investimento SA | | | 3,500 | | | | 16,489 | |
Celsia SA ESP | | | 11,648 | | | | 14,391 | |
Centrais Eletricas Brasileiras SA* | | | 18,900 | | | | 119,572 | |
Centrais Eletricas Brasileiras SA (Preference), Class B* | | | 12,000 | | | | 85,933 | |
See Accompanying Notes to the Financial Statements.
| | | | |
| FLEXSHARES ANNUAL REPORT | | | 191 | |
FlexShares® Morningstar Emerging Markets Factor Tilt Index Fund (cont.)
| | | | | | | | |
| Investments | | Shares | | | Value | |
| COMMON STOCKS – (continued) | |
| Electric Utilities – (continued) | |
CESC Ltd. | | | 4,160 | | | $ | 39,097 | |
CEZ A/S | | | 7,956 | | | | 189,359 | |
Cia de Transmissao de Energia Eletrica Paulista (Preference) | | | 4,900 | | | | 86,207 | |
Cia Energetica de Minas Gerais (Preference) | | | 91,800 | | | | 272,595 | |
Cia Paranaense de Energia | | | 6,600 | | | | 46,215 | |
Cia Paranaense de Energia (Preference) | | | 8,600 | | | | 60,729 | |
EDP – Energias do Brasil SA | | | 30,600 | | | | 115,332 | |
Enea SA* | | | 28,560 | | | | 59,945 | |
Enel Americas SA | | | 3,033,852 | | | | 477,879 | |
Enel Chile SA | | | 2,456,364 | | | | 213,687 | |
ENEL RUSSIA PJSC | | | 9,331,980 | | | | 150,186 | |
Energa SA* | | | 25,680 | | | | 52,291 | |
Energisa SA | | | 12,300 | | | | 114,241 | |
Engie Energia Chile SA | | | 15,830 | | | | 26,319 | |
Equatorial Energia SA | | | 8,500 | | | | 155,584 | |
Federal Grid Co. Unified Energy System PJSC | | | 29,237,280 | | | | 68,023 | |
First Philippine Holdings Corp. | | | 340,680 | | | | 405,594 | |
Holding Co. ADMIE IPTO SA | | | 20,180 | | | | 36,904 | |
Inter RAO UES PJSC | | | 3,816,942 | | | | 231,200 | |
Interconexion Electrica SA ESP | | | 44,778 | | | | 166,241 | |
Korea District Heating Corp. | | | 4,284 | | | | 213,909 | |
Korea Electric Power Corp. | | | 27,336 | | | | 650,086 | |
Light SA | | | 98,300 | | | | 441,152 | |
Manila Electric Co. | | | 13,260 | | | | 91,151 | |
Mosenergo PJSC | | | 880,464 | | | | 25,829 | |
PGE Polska Grupa Energetyczna SA* | | | 75,684 | | | | 207,657 | |
Power Grid Corp. of India Ltd. | | | 74,460 | | | | 187,245 | |
Public Power Corp. SA* | | | 22,308 | | | | 33,516 | |
Reliance Infrastructure Ltd. | | | 14,280 | | | | 69,261 | |
ROSSETI PJSC | | | 2,682,436 | | | | 27,502 | |
RusHydro PJSC | | | 14,996,346 | | | | 125,418 | |
Tata Power Co. Ltd. (The) | | | 50,856 | | | | 52,648 | |
Tauron Polska Energia SA* | | | 78,960 | | | | 36,692 | |
Tenaga Nasional Bhd. | | | 122,400 | | | | 429,987 | |
TGC-1 PJSC | | | 901,664,496 | | | | 117,749 | |
| | | | | | | | |
| Investments | | Shares | | | Value | |
| Electric Utilities – (continued) | |
Torrent Power Ltd. | | | 5,978 | | | $ | 20,837 | |
Transmissora Alianca de Energia Eletrica SA | | | 17,600 | | | | 105,472 | |
| | | | | | | | 6,072,664 | |
| Electrical Equipment – 0.4% | |
ABB India Ltd. | | | 2,058 | | | | 35,601 | |
AcBel Polytech, Inc. | | | 612,000 | | | | 351,065 | |
Amara Raja Batteries Ltd. | | | 2,733 | | | | 27,526 | |
Bharat Heavy Electricals Ltd. | | | 37,473 | | | | 34,840 | |
Bizlink Holding, Inc. | | | 5,103 | | | | 27,211 | |
CG Power and Industrial Solutions Ltd.* | | | 12,473 | | | | 5,980 | |
China High Speed Transmission Equipment Group Co. Ltd.(c) | | | 20,000 | | | | 18,650 | |
Doosan Heavy Industries & Construction Co. Ltd.* | | | 6,834 | | | | 65,668 | |
ElSewedy Electric Co. | | | 78,484 | | | | 66,384 | |
Finolex Cables Ltd. | | | 2,600 | | | | 17,577 | |
Fullshare Holdings Ltd.* (a) (c) | | | 357,500 | | | | 139,089 | |
GE T&D India Ltd. | | | 3,640 | | | | 11,361 | |
Graphite India Ltd. | | | 2,600 | | | | 33,461 | |
Gunkul Engineering PCL, NVDR | | | 120,400 | | | | 11,259 | |
Havells India Ltd. | | | 12,852 | | | | 112,243 | |
HEG Ltd. | | | 201 | | | | 11,612 | |
Honbridge Holdings Ltd.* | | | 208,000 | | | | 22,022 | |
Korea Electric Terminal Co. Ltd. | | | 8,568 | | | | 281,202 | |
Kung Long Batteries Industrial Co. Ltd. | | | 5,000 | | | | 23,188 | |
LS Corp. | | | 3,060 | | | | 135,606 | |
LS Industrial Systems Co. Ltd. | | | 608 | | | | 26,224 | |
Shanghai Electric Group Co. Ltd., Class H | | | 54,000 | | | | 17,565 | |
Shihlin Electric & Engineering Corp. | | | 26,000 | | | | 33,610 | |
Taihan Electric Wire Co. Ltd.* | | | 7,800 | | | | 7,085 | |
Teco Electric and Machinery Co. Ltd. | | | 102,000 | | | | 58,511 | |
V-Guard Industries Ltd. | | | 1,032 | | | | 2,620 | |
See Accompanying Notes to the Financial Statements.
| | |
| 192 | | FLEXSHARES ANNUAL REPORT |
FlexShares® Morningstar Emerging Markets Factor Tilt Index Fund (cont.)
| | | | | | | | |
| Investments | | Shares | | | Value | |
| COMMON STOCKS – (continued) | |
| Electrical Equipment – (continued) | |
Voltronic Power Technology Corp. | | | 3,323 | | | $ | 53,642 | |
Walsin Lihwa Corp. | | | 276,000 | | | | 136,916 | |
Xinjiang Goldwind Science & Technology Co. Ltd., Class H | | | 24,000 | | | | 17,879 | |
Zhuzhou CRRC Times Electric Co. Ltd., Class H | | | 28,300 | | | | 151,258 | |
| | | | | | | | 1,936,855 | |
| Electronic Equipment, Instruments & Components – 3.2% | |
AAC Technologies Holdings, Inc.(a) | | | 36,000 | | | | 273,924 | |
Asia Optical Co., Inc. | | | 13,000 | | | | 23,275 | |
AU Optronics Corp. | | | 968,000 | | | | 381,657 | |
Aurora Corp. | | | 4,900 | | | | 14,885 | |
BH Co. Ltd.* | | | 35,700 | | | | 499,684 | |
Career Technology MFG. Co. Ltd. | | | 11,000 | | | | 15,197 | |
Chang Wah Electromaterials, Inc. | | | 41,000 | | | | 168,940 | |
Cheng Uei Precision Industry Co. Ltd. | | | 510,000 | | | | 351,065 | |
Chilisin Electronics Corp.* | | | 7,824 | | | | 18,837 | |
China Railway Signal & Communication Corp. Ltd., Class H(b) | | | 81,008 | | | | 54,354 | |
China Youzan Ltd.* | | | 232,000 | | | | 16,277 | |
Chin-Poon Industrial Co. Ltd. | | | 408,000 | | | | 454,901 | |
Chroma ATE, Inc. | | | 20,000 | | | | 70,129 | |
Chunghwa Precision Test Tech Co. Ltd. | | | 1,000 | | | | 13,476 | |
Compeq Manufacturing Co. Ltd. | | | 119,000 | | | | 76,146 | |
Concraft Holding Co. Ltd. | | | 3,355 | | | | 12,686 | |
Coretronic Corp. | | | 602,000 | | | | 826,843 | |
Co-Tech Development Corp. | | | 306,000 | | | | 251,679 | |
Daeduck Electronics Co. | | | 50,388 | | | | 366,121 | |
Delta Electronics Thailand PCL, NVDR | | | 25,200 | | | | 52,452 | |
Delta Electronics, Inc. | | | 102,000 | | | | 428,530 | |
E Ink Holdings, Inc. | | | 48,000 | | | | 37,850 | |
Egis Technology, Inc. | | | 2,000 | | | | 6,283 | |
| | | | | | | | |
| Investments | | Shares | | | Value | |
Electronic Equipment, Instruments & Components –
(continued) | |
Elite Material Co. Ltd. | | | 30,000 | | | $ | 60,014 | |
FLEXium Interconnect, Inc. | | | 27,138 | | | | 68,145 | |
Flytech Technology Co. Ltd. | | | 235 | | | | 527 | |
Foxconn Technology Co. Ltd. | | | 102,000 | | | | 216,243 | |
General Interface Solution Holding Ltd. | | | 24,000 | | | | 79,501 | |
Genius Electronic Optical Co. Ltd. | | | 3,000 | | | | 19,391 | |
G-treeBNT Co. Ltd.* | | | 525 | | | | 10,205 | |
Hana Microelectronics PCL, NVDR | | | 22,400 | | | | 24,495 | |
HannStar Display Corp. | | | 306,000 | | | | 67,246 | |
Hollysys Automation Technologies Ltd. | | | 700 | | | | 13,454 | |
Holy Stone Enterprise Co. Ltd. | | | 4,000 | | | | 12,526 | |
Hon Hai Precision Industry Co. Ltd.* | | | 1,371,920 | | | | 3,493,756 | |
Honeywell Automation India Ltd. | | | 104 | | | | 27,880 | |
Iljin Materials Co. Ltd. | | | 936 | | | | 37,332 | |
Inari Amertron Bhd. | | | 78,000 | | | | 36,535 | |
Innolux Corp. | | | 918,000 | | | | 277,984 | |
Interflex Co. Ltd.* | | | 16,524 | | | | 153,705 | |
KCE Electronics PCL, NVDR | | | 27,600 | | | | 31,014 | |
Kingboard Holdings Ltd. | | | 65,500 | | �� | | 175,460 | |
Kingboard Laminates Holdings Ltd. | | | 105,500 | | | | 80,746 | |
Kingpak Technology, Inc. | | | 2,000 | | | | 7,950 | |
L&F Co. Ltd. | | | 574 | | | | 17,907 | |
Largan Precision Co. Ltd. | | | 5,000 | | | | 541,318 | |
LG Display Co. Ltd. | | | 9,588 | | | | 138,828 | |
LG Innotek Co. Ltd. | | | 781 | | | | 84,984 | |
Lotes Co. Ltd. | | | 3,000 | | | | 16,773 | |
Merry Electronics Co. Ltd. | | | 10,000 | | | | 43,144 | |
Pan-International Industrial Corp. | | | 578,000 | | | | 330,627 | |
Partron Co. Ltd. | | | 1,768 | | | | 13,482 | |
Posiflex Technology, Inc. | | | 8,000 | | | | 24,354 | |
Redington India Ltd. | | | 394,944 | | | | 442,773 | |
Samsung Electro-Mechanics Co. Ltd. | | | 2,856 | | | | 295,738 | |
Samsung SDI Co. Ltd. | | | 2,754 | | | | 569,143 | |
SFA Engineering Corp. | | | 2,244 | | | | 76,602 | |
See Accompanying Notes to the Financial Statements.
| | | | |
| FLEXSHARES ANNUAL REPORT | | | 193 | |
FlexShares® Morningstar Emerging Markets Factor Tilt Index Fund (cont.)
| | | | | | | | |
| Investments | | Shares | | | Value | |
| COMMON STOCKS – (continued) | |
Electronic Equipment, Instruments & Components –
(continued) | |
Simplo Technology Co. Ltd. | | | 15,200 | | | $ | 88,175 | |
Sinbon Electronics Co. Ltd. | | | 3,253 | | | | 8,957 | |
Sunny Optical Technology Group Co. Ltd. | | | 32,400 | | | | 281,042 | |
Supreme Electronics Co. Ltd. | | | 521,000 | | | | 437,773 | |
Synnex Technology International Corp. | | | 151,000 | | | | 162,502 | |
Taiwan Union Technology Corp. | | | 7,000 | | | | 19,229 | |
Telcon RF Pharmaceutical, Inc.* | | | 4,800 | | | | 42,543 | |
Thinking Electronic Industrial Co. Ltd. | | | 5,000 | | | | 9,986 | |
Tong Hsing Electronic Industries Ltd. | | | 6,000 | | | | 17,839 | |
Tongda Group Holdings Ltd.(a) | | | 6,000,000 | | | | 773,018 | |
TPK Holding Co. Ltd. | | | 45,000 | | | | 69,806 | |
Tripod Technology Corp. | | | 24,000 | | | | 57,939 | |
Unimicron Technology Corp. | | | 75,000 | | | | 36,478 | |
Unitech Printed Circuit Board Corp. | | | 833,920 | | | | 349,005 | |
VS Industry Bhd. | | | 1,601,400 | | | | 612,317 | |
Wah Lee Industrial Corp. | | | 243,000 | | | | 380,092 | |
Walsin Technology Corp. | | | 14,378 | | | | 60,638 | |
Wintek Corp.* ‡ (c) | | | 64,000 | | | | — | |
WPG Holdings Ltd.* | | | 164,440 | | | | 195,300 | |
WT Microelectronics Co. Ltd. | | | 56,182 | | | | 72,354 | |
Yageo Corp. | | | 13,575 | | | | 138,413 | |
Zhen Ding Technology Holding Ltd. | | | 50,150 | | | | 114,585 | |
| | | | | | | | 15,832,964 | |
| Energy Equipment & Services – 0.4% | |
Bumi Armada Bhd.* | | | 145,600 | | | | 14,092 | |
China Oilfield Services Ltd., Class H | | | 96,000 | | | | 90,007 | |
Dialog Group Bhd. | | | 224,400 | | | | 181,794 | |
Gulf International Services QSC* | | | 4,696 | | | | 23,147 | |
Sapura Energy Bhd.* | | | 5,885,400 | | | | 478,202 | |
Serba Dinamik Holdings Bhd. | | | 25,800 | | | | 24,909 | |
| | | | | | | | |
| Investments | | Shares | | | Value | |
| Energy Equipment & Services – (continued) | |
Sinopec Oilfield Service Corp., Class H* | | | 3,060,000 | | | $ | 339,592 | |
TMK PJSC | | | 479,910 | | | | 446,037 | |
Wison Engineering Services Co. Ltd. | | | 1,224,000 | | | | 162,380 | |
Yinson Holdings Bhd. | | | 34,400 | | | | 36,583 | |
| | | | | | | | 1,796,743 | |
| Entertainment – 0.2% | |
Alibaba Pictures Group Ltd.* (a) | | | 680,000 | | | | 93,681 | |
CD Projekt SA* | | | 3,468 | | | | 143,317 | |
CJ CGV Co. Ltd. | | | 670 | | | | 23,724 | |
Com2uSCorp | | | 520 | | | | 58,455 | |
Gamania Digital Entertainment Co. Ltd.* | | | 6,000 | | | | 11,033 | |
IMAX China Holding, Inc.(b) | | | 1,900 | | | | 4,430 | |
International Games System Co. Ltd. | | | 3,000 | | | | 13,331 | |
Jcontentree Corp.* | | | 2,396 | | | | 9,567 | |
Major Cineplex Group PCL, NVDR | | | 25,300 | | | | 18,011 | |
Nan Hai Corp. Ltd. | | | 2,300,000 | | | | 53,397 | |
NCSoft Corp. | | | 881 | | | | 332,052 | |
NetDragon Websoft Holdings Ltd. | | | 12,000 | | | | 21,216 | |
Netmarble Corp.(b) | | | 1,734 | | | | 170,425 | |
NHN Entertainment Corp.* | | | 624 | | | | 25,107 | |
Pearl Abyss Corp.* | | | 312 | | | | 56,292 | |
PVR Ltd. | | | 1,040 | | | | 19,161 | |
RS PCL, NVDR | | | 22,500 | | | | 10,996 | |
SM Entertainment Co. Ltd.* | | | 831 | | | | 32,013 | |
SMI Holdings Group Ltd.* (c) | | | 72,000 | | | | 21,491 | |
Soft-World International Corp. | | | 5,000 | | | | 10,681 | |
Studio Dragon Corp.* | | | 480 | | | | 38,752 | |
Webzen, Inc.* | | | 474 | | | | 6,177 | |
WeMade Entertainment Co. Ltd. | | | 723 | | | | 14,973 | |
| | | | | | | | 1,188,282 | |
| Equity Real Estate Investment Trusts (REITs) – 0.8% | |
Arrowhead Properties Ltd. | | | 1,497,972 | | | | 543,749 | |
Concentradora Fibra Danhos SA de CV | | | 41,600 | | | | 54,950 | |
See Accompanying Notes to the Financial Statements.
| | |
| 194 | | FLEXSHARES ANNUAL REPORT |
FlexShares® Morningstar Emerging Markets Factor Tilt Index Fund (cont.)
| | | | | | | | |
| Investments | | Shares | | | Value | |
| COMMON STOCKS – (continued) | |
| Equity Real Estate Investment Trusts (REITs) – (continued) | |
Emlak Konut Gayrimenkul Yatirim Ortakligi A/S | | | 164,160 | | | $ | 48,926 | |
Fibra Uno Administracion SA de CV | | | 142,800 | | | | 153,934 | |
Fortress REIT Ltd., Class A | | | 111,282 | | | | 127,438 | |
Fortress REIT Ltd., Class B(a) | | | 109,752 | | | | 106,956 | |
Grivalia Properties REIC AE | | | 2,704 | | | | 23,254 | |
Growthpoint Properties Ltd. | | | 140,495 | | | | 215,506 | |
Hyprop Investments Ltd. | | | 12,240 | | | | 74,826 | |
IGB REIT | | | 68,800 | | | | 27,622 | |
Investec Property Fund Ltd. | | | 696,762 | | | | 697,883 | |
KLCCP Stapled Group | | | 18,100 | | | | 33,090 | |
Korea Asset In Trust Co. Ltd. | | | 65,688 | | | | 250,462 | |
Pavilion REIT | | | 46,200 | | | | 17,555 | |
PLA Administradora Industrial S de RL de CV* | | | 25,800 | | | | 31,468 | |
Prologis Property Mexico SA de CV | | | 10,400 | | | | 18,390 | |
Redefine Properties Ltd. | | | 263,874 | | | | 171,374 | |
Resilient REIT Ltd. | | | 41,814 | | | | 169,394 | |
SA Corporate Real Estate Ltd. | | | 3,715,444 | | | | 998,921 | |
Sunway REIT | | | 39,400 | | | | 15,913 | |
Vukile Property Fund Ltd. | | | 32,833 | | | | 45,137 | |
YTL Hospitality REIT | | | 43,000 | | | | 12,331 | |
Yuexiu REIT | | | 94,000 | | | | 57,076 | |
| | | | | | | | 3,896,155 | |
| Food & Staples Retailing – 1.0% | |
Al Meera Consumer Goods Co. QSC | | | 199 | | | | 7,978 | |
Almacenes Exito SA | | | 21,114 | | | | 91,102 | |
Atacadao Distribuicao Comercio e Industria Ltda* | | | 15,300 | | | | 62,774 | |
Avenue Supermarts Ltd.* (b) | | | 3,272 | | | | 59,203 | |
Berli Jucker PCL | | | 500 | | | | 841 | |
Berli Jucker PCL, NVDR | | | 60,700 | | | | 102,082 | |
BGF retail Co. Ltd. | | | 510 | | | | 75,411 | |
Bid Corp. Ltd. | | | 16,932 | | | | 317,272 | |
BIM Birlesik Magazalar A/S | | | 9,384 | | | | 132,973 | |
Cencosud SA | | | 66,606 | | | | 138,563 | |
Cia Brasileira de Distribuicao (Preference)* | | | 8,700 | | | | 183,205 | |
| | | | | | | | |
| Investments | | Shares | | | Value | |
| Food & Staples Retailing – (continued) | |
Clicks Group Ltd. | | | 11,424 | | | $ | 145,447 | |
Cosco Capital, Inc. | | | 4,120,800 | | | | 521,406 | |
CP ALL PCL, NVDR | | | 224,400 | | | | 455,231 | |
Dino Polska SA* (b) | | | 1,806 | | | | 39,839 | |
Dis-Chem Pharmacies Ltd.(a) (b) | | | 17,784 | | | | 34,818 | |
Dongsuh Cos., Inc. | | | 2,427 | | | | 39,721 | |
E-MART, Inc. | | | 1,020 | | | | 183,046 | |
Eurocash SA | | | 4,433 | | | | 23,655 | |
Grupo Comercial Chedraui SA de CV | | | 10,400 | | | | 18,442 | |
GS Retail Co. Ltd. | | | 1,264 | | | | 39,821 | |
Hyundai Greenfood Co. Ltd. | | | 2,808 | | | | 30,432 | |
InRetail Peru Corp.* (b) | | | 1,980 | | | | 51,084 | |
Magnit PJSC | | | 7,075 | | | | 386,359 | |
Massmart Holdings Ltd. | | | 5,304 | | | | 34,497 | |
Philippine Seven Corp. | | | 12,771 | | | | 25,062 | |
Pick n Pay Stores Ltd. | | | 18,054 | | | | 83,299 | |
President Chain Store Corp. | | | 30,000 | | | | 338,364 | |
Puregold Price Club, Inc. | | | 86,860 | | | | 65,829 | |
Raia Drogasil SA* | | | 10,200 | | | | 172,503 | |
Robinsons Retail Holdings, Inc. | | | 25,190 | | | | 35,686 | |
RP-SG Retail Ltd.* (c) | | | 2,496 | | | | 6,513 | |
Shoprite Holdings Ltd. | | | 22,950 | | | | 280,226 | |
SMU SA* | | | 125,632 | | | | 33,053 | |
SPAR Group Ltd. (The) | | | 9,588 | | | | 114,170 | |
Sun Art Retail Group Ltd. | | | 112,000 | | | | 122,438 | |
Taiwan FamilyMart Co. Ltd. | | | 3,000 | | | | 20,360 | |
Taiwan TEA Corp.* | | | 8,000 | | | | 4,046 | |
Wal-Mart de Mexico SAB de CV | | | 224,400 | | | | 574,879 | |
| | | | | | | | 5,051,630 | |
| Food Products – 2.4% | |
Alicorp SAA | | | 22,845 | | | | 66,163 | |
Astra Agro Lestari Tbk. PT | | | 20,800 | | | | 16,418 | |
Avanti Feeds Ltd. | | | 2,250 | | | | 12,129 | |
AVI Ltd. | | | 14,994 | | | | 101,542 | |
Binggrae Co. Ltd. | | | 321 | | | | 19,944 | |
Boustead Plantations Bhd. | | | 60,200 | | | | 13,595 | |
BRF SA* | | | 31,200 | | | | 183,949 | |
Britannia Industries Ltd. | | | 1,632 | | | | 124,568 | |
See Accompanying Notes to the Financial Statements.
| | | | |
| FLEXSHARES ANNUAL REPORT | | | 195 | |
FlexShares® Morningstar Emerging Markets Factor Tilt Index Fund (cont.)
| | | | | | | | |
| Investments | | Shares | | | Value | |
| COMMON STOCKS – (continued) | |
| Food Products – (continued) | |
Camil Alimentos SA* | | | 204,000 | | | $ | 451,442 | |
Century Pacific Food, Inc. | | | 17,700 | | | | 4,420 | |
Charoen Pokphand Enterprise | | | 270,000 | | | | 365,608 | |
Charoen Pokphand Foods PCL, NVDR | | | 175,700 | | | | 133,829 | |
Charoen Pokphand Indonesia Tbk. PT | | | 314,400 | | | | 113,744 | |
China Agri-Industries Holdings Ltd. | | | 204,000 | | | | 68,179 | |
China Foods Ltd. | | | 46,789 | | | | 21,904 | |
China Huishan Dairy Holdings Co. Ltd.* ‡ (c) | | | 158,000 | | | | — | |
China Huiyuan Juice Group Ltd.* (c) | | | 24,000 | | | | 6,184 | |
China Mengniu Dairy Co. Ltd.* | | | 138,000 | | | | 406,638 | |
China Modern Dairy Holdings Ltd.* | | | 185,000 | | | | 23,127 | |
China Shengmu Organic Milk Ltd.* (a) (b) | | | 5,916,000 | | | | 237,715 | |
CJ CheilJedang Corp. | | | 816 | | | | 232,007 | |
CJ CheilJedang Corp. (Preference) | | | 104 | | | | 10,815 | |
CP Pokphand Co. Ltd. | | | 720,000 | | | | 62,454 | |
Daesang Corp. | | | 29,376 | | | | 581,307 | |
Dali Foods Group Co. Ltd.(b) | | | 102,000 | | | | 72,863 | |
Dongwon F&B Co. Ltd. | | | 79 | | | | 18,302 | |
Dongwon Industries Co. Ltd. | | | 240 | | | | 50,862 | |
Dutch Lady Milk Industries Bhd. | | | 700 | | | | 10,703 | |
Easy Bio, Inc. | | | 59,160 | | | | 301,108 | |
Edita Food Industries SAE | | | 18,643 | | | | 14,345 | |
Farmsco | | | 688 | | | | 5,458 | |
FGV Holdings Bhd. | | | 106,100 | | | | 35,498 | |
Genting Plantations Bhd. | | | 10,400 | | | | 23,984 | |
GlaxoSmithKline Consumer Healthcare Ltd. | | | 442 | | | | 41,854 | |
Great Wall Enterprise Co. Ltd. | | | 77,896 | | | | 75,774 | |
Gruma SAB de CV, Class B | | | 9,690 | | | | 101,441 | |
Grupo Bimbo SAB de CV, Series A | | | 91,800 | | | | 172,485 | |
Grupo Nutresa SA | | | 13,668 | | | | 94,613 | |
| | | | | | | | |
| Investments | | Shares | | | Value | |
| Food Products – (continued) | |
Haitai Confectionery & Foods Co. Ltd. | | | 946 | | | $ | 7,795 | |
Harim Holdings Co. Ltd. | | | 3,240 | | | | 30,707 | |
Hatsun Agro Products Ltd. | | | 2,184 | | | | 18,240 | |
Health & Happiness H&H International Holdings Ltd.* | | | 10,000 | | | | 56,892 | |
Indofood CBP Sukses Makmur Tbk. PT | | | 111,600 | | | | 65,517 | |
Indofood Sukses Makmur Tbk. PT | | | 214,200 | | | | 84,186 | |
Industrias Bachoco SAB de CV, Series B | | | 7,300 | | | | 26,859 | |
IOI Corp. Bhd. | | | 142,800 | | | | 153,567 | |
Japfa Comfeed Indonesia Tbk. PT | | | 6,306,200 | | | | 842,071 | |
JBS SA | | | 102,000 | | | | 281,464 | |
Kernel Holding SA | | | 5,304 | | | | 67,987 | |
KRBL Ltd. | | | 2,726 | | | | 12,693 | |
Kuala Lumpur Kepong Bhd. | | | 16,500 | | | | 98,263 | |
Lien Hwa Industrial Corp. | | | 56,826 | | | | 55,921 | |
Lotte Food Co. Ltd. | | | 16 | | | | 9,211 | |
M Dias Branco SA* | | | 6,500 | | | | 77,818 | |
Marfrig Global Foods SA* | | | 14,400 | | | | 24,850 | |
Mayora Indah Tbk. PT | | | 83,900 | | | | 14,073 | |
Multiexport Foods SA | | | 756,008 | | | | 391,914 | |
Namchow Holdings Co. Ltd. | | | 6,000 | | | | 8,474 | |
Namyang Dairy Products Co. Ltd. | | | 35 | | | | 18,459 | |
Naturecell Co. Ltd.* | | | 2,520 | | | | 31,844 | |
Nestle India Ltd. | | | 1,122 | | | | 153,978 | |
Nestle Malaysia Bhd. | | | 2,300 | | | | 79,039 | |
Nong Shim Holdings Co. Ltd. | | | 134 | | | | 7,761 | |
NongShim Co. Ltd. | | | 208 | | | | 39,791 | |
Oceana Group Ltd. | | | 3,395 | | | | 20,003 | |
Orion Corp. | | | 1,224 | | | | 102,148 | |
Orion Holdings Corp. | | | 4,033 | | | | 55,387 | |
Ottogi Corp. | | | 94 | | | | 54,360 | |
Perusahaan Perkebunan London Sumatra Indonesia Tbk. PT | | | 122,600 | | | | 10,403 | |
Pioneer Foods Group Ltd. | | | 6,240 | | | | 34,221 | |
PPB Group Bhd. | | | 25,080 | | | | 100,452 | |
Pulmuone Co. Ltd. | | | 2,550 | | | | 212,808 | |
See Accompanying Notes to the Financial Statements.
| | |
| 196 | | FLEXSHARES ANNUAL REPORT |
FlexShares® Morningstar Emerging Markets Factor Tilt Index Fund (cont.)
| | | | | | | | |
| Investments | | Shares | | | Value | |
| COMMON STOCKS – (continued) | |
| Food Products – (continued) | |
QL Resources Bhd. | | | 49,530 | | | $ | 83,448 | |
RCL Foods Ltd. | | | 400,357 | | | | 454,142 | |
Salim Ivomas Pratama Tbk. PT | | | 5,151,000 | | | | 155,860 | |
Samyang Corp. | | | 5,100 | | | | 271,660 | |
Samyang Foods Co. Ltd. | | | 86 | | | | 4,581 | |
Samyang Holdings Corp. | | | 9,078 | | | | 687,492 | |
San Miguel Food and Beverage, Inc. | | | 9,690 | | | | 15,394 | |
Sao Martinho SA | | | 7,300 | | | | 38,126 | |
Sarawak Oil Palms Bhd. | | | 265,200 | | | | 164,779 | |
Sawit Sumbermas Sarana Tbk. PT | | | 135,700 | | | | 11,247 | |
Sime Darby Plantation Bhd. | | | 153,000 | | | | 192,324 | |
SLC Agricola SA | | | 2,400 | | | | 36,880 | |
SPC Samlip Co. Ltd. | | | 191 | | | | 21,035 | |
Standard Foods Corp. | | | 17,652 | | | | 26,498 | |
Taokaenoi Food & Marketing PCL, Class R, NVDR | | | 48,800 | | | | 18,990 | |
Tata Global Beverages Ltd. | | | 12,584 | | | | 37,074 | |
Thai Union Group PCL, NVDR | | | 114,400 | | | | 57,286 | |
Thai Vegetable Oil PCL, NVDR | | | 15,570 | | | | 13,268 | |
Tiger Brands Ltd. | | | 7,752 | | | | 138,374 | |
Tingyi Cayman Islands Holding Corp. | | | 110,000 | | | | 162,767 | |
Tongaat Hulett Ltd. | | | 157,284 | | | | 602,986 | |
Ulker Biskuvi Sanayi A/S* | | | 9,138 | | | | 24,104 | |
Uni-President China Holdings Ltd. | | | 69,000 | | | | 66,981 | |
Uni-President Enterprises Corp. | | | 250,000 | | | | 605,145 | |
United Plantations Bhd. | | | 3,700 | | | | 23,679 | |
Universal Robina Corp. | | | 44,880 | | | | 109,044 | |
Want Want China Holdings Ltd. | | | 326,000 | | | | 232,875 | |
Yashili International Holdings Ltd.* | | | 34,000 | | | | 5,855 | |
Yihai International Holding Ltd. | | | 9,000 | | | | 19,769 | |
Zhou Hei Ya International Holdings Co. Ltd.(b) | | | 43,000 | | | | 22,105 | |
| | | | | | | | 11,829,895 | |
| | | | | | | | |
| Investments | | Shares | | | Value | |
| Gas Utilities – 0.6% | |
Adani Gas Ltd.* (c) | | | 15,288 | | | $ | 12,601 | |
Aygaz A/S | | | 132,996 | | | | 288,621 | |
Beijing Enterprises Holdings Ltd. | | | 53,000 | | | | 286,655 | |
China Gas Holdings Ltd. | | | 115,640 | | | | 365,828 | |
China Resources Gas Group Ltd. | | | 42,000 | | | | 160,727 | |
China Tian Lun Gas Holdings Ltd. | | | 523,500 | | | | 373,957 | |
Cia de Gas de Sao Paulo – COMGAS (Preference), Class A | | | 7 | | | | 102 | |
ENN Energy Holdings Ltd. | | | 40,000 | | | | 340,077 | |
GAIL India Ltd. | | | 28,026 | | | | 141,845 | |
Grupo Energia Bogota SA ESP | | | 98,072 | | | | 56,472 | |
Gujarat Gas Ltd. | | | 774 | | | | 6,570 | |
Gujarat State Petronet Ltd. | | | 8,528 | | | | 20,644 | |
Indraprastha Gas Ltd. | | | 19,430 | | | | 70,237 | |
Infraestructura Energetica Nova SAB de CV | | | 25,600 | | | | 100,663 | |
Korea Gas Corp.* | | | 3,264 | | | | 149,229 | |
Mahanagar Gas Ltd.(b) | | | 1,456 | | | | 16,486 | |
Perusahaan Gas Negara Persero Tbk. | | | 744,600 | | | | 108,733 | |
Petronas Gas Bhd. | | | 23,100 | | | | 100,912 | |
SUI Northern Gas Pipeline | | | 533,900 | | | | 370,816 | |
Towngas China Co. Ltd.* | | | 58,339 | | | | 42,418 | |
Zhongyu Gas Holdings Ltd. | | | 52,000 | | | | 35,156 | |
| | | | | | | | 3,048,749 | |
| Health Care Equipment & Supplies – 0.1% | |
Dentium Co. Ltd. | | | 344 | | | | 21,826 | |
DIO Corp.* | | | 520 | | | | 11,864 | |
Ginko International Co. Ltd. | | | 3,000 | | | | 17,064 | |
Hartalega Holdings Bhd. | | | 81,600 | | | | 122,073 | |
Kossan Rubber Industries | | | 34,400 | | | | 34,034 | |
Lifetech Scientific Corp.* | | | 82,000 | | | | 17,782 | |
Microport Scientific Corp. | | | 11,035 | | | | 13,175 | |
Osstem Implant Co. Ltd.* | | | 612 | | | | 22,932 | |
Pihsiang Machinery Manufacturing Co. Ltd.* (c) | | | 5,000 | | | | 2,795 | |
See Accompanying Notes to the Financial Statements.
| | | | |
| FLEXSHARES ANNUAL REPORT | | | 197 | |
FlexShares® Morningstar Emerging Markets Factor Tilt Index Fund (cont.)
| | | | | | | | |
| Investments | | Shares | | | Value | |
| COMMON STOCKS – (continued) | |
| Health Care Equipment & Supplies – (continued) | |
Shandong Weigao Group Medical Polymer Co. Ltd., Class H | | | 48,000 | | | $ | 42,922 | |
St Shine Optical Co. Ltd. | | | 3,000 | | | | 53,324 | |
Top Glove Corp. Bhd. | | | 73,000 | | | | 103,625 | |
Value Added Technology Co. Ltd. | | | 510 | | | | 10,115 | |
Yestar Healthcare Holdings Co. Ltd. | | | 75,000 | | | | 19,517 | |
| | | | | | | | 493,048 | |
| Health Care Providers & Services – 0.4% | |
Apollo Hospitals Enterprise Ltd. | | | 5,170 | | | | 79,779 | |
Bangkok Chain Hospital PCL, NVDR | | | 72,800 | | | | 42,823 | |
Bangkok Dusit Medical Services PCL, NVDR | | | 214,200 | | | | 158,308 | |
Bumrungrad Hospital PCL, NVDR | | | 18,800 | | | | 109,454 | |
Celltrion Healthcare Co. Ltd.* | | | 2,289 | | | | 127,953 | |
Chabiotech Co. Ltd.* | | | 1,560 | | | | 25,120 | |
China Resources Medical Holdings Co. Ltd. | | | 30,000 | | | | 20,627 | |
Chularat Hospital PCL, NVDR | | | 183,100 | | | | 14,029 | |
Dr Lal PathLabs Ltd.(b) | | | 430 | | | | 5,115 | |
Fleury SA | | | 7,200 | | | | 40,415 | |
Fortis Healthcare Ltd.* | | | 9,651 | | | | 18,318 | |
Genertec Universal Medical Group Co. Ltd.(b) | | | 88,500 | | | | 68,751 | |
Global Cord Blood Corp. | | | 2,900 | | | | 17,719 | |
IHH Healthcare Bhd. | | | 122,400 | | | | 146,254 | |
Instituto Hermes Pardini SA | | | 1,800 | | | | 7,380 | |
KPJ Healthcare Bhd. | | | 145,424 | | | | 36,143 | |
Life Healthcare Group Holdings Ltd. | | | 66,547 | | | | 110,414 | |
Medipost Co. Ltd.* | | | 223 | | | | 15,303 | |
Mitra Keluarga Karyasehat Tbk. PT* (b) | | | 312,000 | | | | 29,348 | |
Narayana Hrudayalaya Ltd.* (b) | | | 946 | | | | 2,909 | |
Netcare Ltd. | | | 67,381 | | | | 113,304 | |
Odontoprev SA | | | 12,000 | | | | 42,708 | |
| | | | | | | | |
| Investments | | Shares | | | Value | |
| Health Care Providers & Services – (continued) | |
Qualicorp Consultoria e Corretora de Seguros SA | | | 12,000 | | | $ | 46,520 | |
Shanghai Pharmaceuticals Holding Co. Ltd., Class H | | | 99,100 | | | | 218,947 | |
Siloam International Hospitals Tbk. PT* | | | 32,500 | | | | 4,917 | |
Sinopharm Group Co. Ltd., Class H | | | 60,400 | | | | 291,237 | |
Vibhavadi Medical Center PCL, NVDR | | | 382,700 | | | | 26,090 | |
| | | | | | | | 1,819,885 | |
| Health Care Technology – 0.0%(d) | |
Alibaba Health Information Technology Ltd.* | | | 160,000 | | | | 129,398 | |
| Hotels, Restaurants & Leisure – 0.7% | |
Alsea SAB de CV | | | 22,900 | | | | 58,734 | |
AmRest Holdings SE* | | | 4,110 | | | | 42,596 | |
Berjaya Sports Toto Bhd. | | | 1,254,600 | | | | 629,624 | |
Bloomberry Resorts Corp. | | | 239,200 | | | | 37,553 | |
Central Plaza Hotel PCL | | | 1,600 | | | | 1,943 | |
Central Plaza Hotel PCL, NVDR | | | 31,200 | | | | 37,882 | |
China Travel International Investment Hong Kong Ltd. | | | 120,200 | | | | 32,199 | |
Coffee Day Enterprises Ltd.* (b) | | | 1,720 | | | | 6,049 | |
CVC Brasil Operadora e Agencia de Viagens SA | | | 7,800 | | | | 118,853 | |
Delta Corp. Ltd. | | | 1,376 | | | | 4,396 | |
DoubleUGames Co. Ltd. | | | 312 | | | | 17,851 | |
EIH Ltd. | | | 3,182 | | | | 6,967 | |
Famous Brands Ltd.* | | | 4,669 | | | | 33,058 | |
Formosa International Hotels Corp. | | | 2,311 | | | | 9,971 | |
Genting Bhd. | | | 102,000 | | | | 178,917 | |
Genting Malaysia Bhd. | | | 163,200 | | | | 175,115 | |
Gourmet Master Co. Ltd. | | | 4,868 | | | | 29,498 | |
Grand Korea Leisure Co. Ltd. | | | 1,040 | | | | 20,306 | |
Haichang Ocean Park Holdings Ltd.* (b) | | | 49,000 | | | | 8,001 | |
Hana Tour Service, Inc. | | | 403 | | | | 21,007 | |
Huayi Tencent Entertainment Co. Ltd.* | | | 400,000 | | | | 9,542 | |
See Accompanying Notes to the Financial Statements.
| | |
| 198 | | FLEXSHARES ANNUAL REPORT |
FlexShares® Morningstar Emerging Markets Factor Tilt Index Fund (cont.)
| | | | | | | | |
| Investments | | Shares | | | Value | |
| COMMON STOCKS – (continued) | |
| Hotels, Restaurants & Leisure – (continued) | |
Indian Hotels Co. Ltd. (The) | | | 22,940 | | | $ | 39,958 | |
Jollibee Foods Corp. | | | 22,440 | | | | 115,754 | |
Jubilant Foodworks Ltd. | | | 2,947 | | | | 43,182 | |
Kangwon Land, Inc. | | | 5,916 | | | | 148,997 | |
Magnum Bhd. | | | 1,244,400 | | | | 538,264 | |
Melco Resorts And Entertainment Philippines Corp.* | | | 17,200 | | | | 2,298 | |
Minor International PCL, NVDR | | | 122,400 | | | | 134,769 | |
MK Restaurants Group PCL, NVDR | | | 10,400 | | | | 21,098 | |
Modetour Network, Inc. | | | 520 | | | | 10,724 | |
OPAP SA | | | 11,220 | | | | 105,516 | |
Orbis SA | | | 832 | | | | 14,639 | |
Paradise Co. Ltd. | | | 2,112 | | | | 33,175 | |
Thomas Cook India Ltd. | | | 2,244 | | | | 6,341 | |
Tsogo Sun Holdings Ltd. | | | 52,428 | | | | 71,721 | |
Wowprime Corp. | | | 7,000 | | | | 18,482 | |
Xiabuxiabu Catering Management China Holdings Co. Ltd.(b) | | | 11,500 | | | | 14,391 | |
Yum China Holdings, Inc. | | | 19,100 | | | | 689,128 | |
| | | | | | | | 3,488,499 | |
| Household Durables – 0.9% | |
AmTRAN Technology Co. Ltd.* | | | 1,122,000 | | | | 427,871 | |
Arcelik A/S | | | 6,720 | | | | 18,625 | |
Coway Co. Ltd. | | | 2,652 | | | | 163,605 | |
Crompton Greaves Consumer Electricals Ltd. | | | 22,236 | | | | 64,126 | |
Cyrela Brazil Realty SA Empreendimentos e Participacoes | | | 11,400 | | | | 44,808 | |
Dom Development SA | | | 11,619 | | | | 205,654 | |
Ez Tec Empreendimentos e Participacoes SA | | | 2,900 | | | | 18,722 | |
Haier Electronics Group Co. Ltd.* | | | 74,000 | | | | 154,619 | |
Hanssem Co. Ltd. | | | 650 | | | | 27,864 | |
Hyundai Livart Furniture Co. Ltd. | | | 18,564 | | | | 353,507 | |
| | | | | | | | |
| Investments | | Shares | | | Value | |
| Household Durables – (continued) | |
Kinpo Electronics | | | 1,734,000 | | | $ | 518,356 | |
LG Electronics, Inc. | | | 11,118 | | | | 617,585 | |
LG Electronics, Inc. (Preference) | | | 2,280 | | | | 51,520 | |
MRV Engenharia e Participacoes SA | | | 24,000 | | | | 81,669 | |
Nien Made Enterprise Co. Ltd. | | | 8,000 | | | | 49,381 | |
PIK Group PJSC | | | 9,732 | | | | 52,154 | |
Skyworth Digital Holdings Ltd. | | | 2,764,000 | | | | 638,166 | |
Socovesa SA | | | 23,620 | | | | 12,313 | |
Symphony Ltd. | | | 1,272 | | | | 15,514 | |
Tatung Co. Ltd.* | | | 98,000 | | | | 114,016 | |
TCL Electronics Holdings Ltd. | | | 918,000 | | | | 373,552 | |
TTK Prestige Ltd. | | | 202 | | | | 18,137 | |
Vestel Elektronik Sanayi ve Ticaret A/S* | | | 124,338 | | | | 147,786 | |
Whirlpool of India Ltd. | | | 1,664 | | | | 31,431 | |
Wuxi Little Swan Co. Ltd., Class B | | | 5,200 | | | | 24,609 | |
| | | | | | | | 4,225,590 | |
| Household Products – 0.2% | |
Hindustan Unilever Ltd. | | | 35,674 | | | | 782,372 | |
Jyothy Laboratories Ltd. | | | 3,300 | | | | 8,448 | |
Kimberly-Clark de Mexico SAB de CV, Class A | | | 54,500 | | | | 78,799 | |
Unilever Indonesia Tbk. PT | | | 61,200 | | | | 174,009 | |
Vinda International Holdings Ltd. | | | 20,000 | | | | 28,523 | |
| | | | | | | | 1,072,151 | |
Independent Power and Renewable Electricity
Producers – 1.5% | |
Aboitiz Power Corp. | | | 93,600 | | | | 58,954 | |
Adani Power Ltd.* | | | 43,621 | | | | 27,195 | |
AES Gener SA | | | 216,720 | | | | 60,671 | |
AES Tiete Energia SA | | | 2 | | | | 1 | |
AES Tiete Energia SA – UNIT | | | 5,573 | | | | 15,453 | |
AES Tiete Energia SA (Preference) | | | 30 | | | | 17 | |
B Grimm Power PCL, NVDR | | | 41,600 | | | | 35,137 | |
Banpu Power PCL, NVDR | | | 41,600 | | | | 29,992 | |
BCPG PCL, NVDR | | | 41,600 | | | | 23,467 | |
See Accompanying Notes to the Financial Statements.
| | | | |
| FLEXSHARES ANNUAL REPORT | | | 199 | |
FlexShares® Morningstar Emerging Markets Factor Tilt Index Fund (cont.)
| | | | | | | | |
| Investments | | Shares | | | Value | |
| COMMON STOCKS – (continued) | |
Independent Power and Renewable Electricity
Producers – (continued) | |
CGN Power Co. Ltd., Class H(b) | | | 1,122,000 | | | $ | 257,622 | |
China Everbright Greentech
Ltd.(b) | | | 34,000 | | | | 24,461 | |
China Longyuan Power Group Corp. Ltd., Class H | | | 336,000 | | | | 255,448 | |
China Power Clean Energy Development Co. Ltd. | | | 612,000 | | | | 175,651 | |
China Power International Development Ltd. | | | 472,332 | | | | 93,389 | |
China Resources Power Holdings Co. Ltd. | | | 204,000 | | | | 358,589 | |
Cia Energetica de Sao Paulo (Preference), Class B | | | 8,600 | | | | 45,958 | |
Cikarang Listrindo Tbk. PT(b) | | | 189,200 | | | | 11,139 | |
Colbun SA | | | 371,994 | | | | 69,754 | |
CPFL Energias Renovaveis SA | | | 10,400 | | | | 46,869 | |
Datang International Power Generation Co. Ltd., Class H | | | 240,000 | | | | 53,575 | |
Electricity Generating PCL, NVDR | | | 11,900 | | | | 82,923 | |
Eneva SA* | | | 316,200 | | | | 1,174,737 | |
Engie Brasil Energia SA | | | 10,200 | | | | 109,291 | |
First Gen Corp. | | | 1,744,200 | | | | 509,194 | |
GCL New Energy Holdings
Ltd.* (a) | | | 11,220,000 | | | | 372,120 | |
Global Power Synergy PCL, NVDR | | | 17,200 | | | | 29,964 | |
Glow Energy PCL, NVDR | | | 24,800 | | | | 62,655 | |
Gulf Energy Development PCL, NVDR | | | 33,900 | | | | 79,765 | |
Huadian Fuxin Energy Corp. Ltd., Class H | | | 2,856,000 | | | | 513,682 | |
Huadian Power International Corp. Ltd., Class H(a) | | | 2,448,000 | | | | 927,438 | |
Huaneng Power International, Inc., Class H | | | 452,000 | | | | 251,963 | |
Huaneng Renewables Corp. Ltd., Class H | | | 468,000 | | | | 119,994 | |
Hub Power Co. Ltd. (The) | | | 31,200 | | | | 21,811 | |
JSW Energy Ltd.* | | | 22,880 | | | | 20,097 | |
| | | | | | | | |
| Investments | | Shares | | | Value | |
Independent Power and Renewable Electricity
Producers – (continued) | |
Kot Addu Power Co. Ltd. | | | 357,000 | | | $ | 144,957 | |
Malakoff Corp. Bhd. | | | 188,100 | | | | 38,658 | |
NHPC Ltd. | | | 248,574 | | | | 81,855 | |
NTPC Ltd. | | | 100,572 | | | | 217,139 | |
OGK-2 PJSC | | | 39,678,510 | | | | 209,740 | |
Panda Green Energy Group Ltd.* | | | 172,000 | | | | 6,472 | |
Reliance Power Ltd.* | | | 1,053,354 | | | | 430,202 | |
SPCG PCL, NVDR | | | 622,200 | | | | 379,138 | |
Super Energy Corp. PCL, NVDR* | | | 638,800 | | | | 13,489 | |
Taiwan Cogeneration Corp. | | | 18,000 | | | | 15,183 | |
Terna Energy SA* | | | 3,821 | | | | 26,539 | |
TPI Polene Power PCL, NVDR | | | 156,000 | | | | 28,235 | |
Unipro PJSC | | | 1,105,000 | | | | 45,518 | |
Zorlu Enerji Elektrik Uretim A/S* | | | 30,788 | | | | 6,099 | |
| | | | | | | | 7,562,200 | |
| Industrial Conglomerates – 2.2% | |
3M India Ltd.* | | | 131 | | | | 35,153 | |
Aamal Co. | | | 9,622 | | | | 24,811 | |
Aboitiz Equity Ventures, Inc. | | | 119,900 | | | | 105,323 | |
AG Anadolu Grubu Holding A/S | | | 20,274 | | | | 41,248 | |
Alfa SAB de CV, Class A | | | 285,600 | | | | 301,945 | |
Alliance Global Group, Inc.* | | | 469,200 | | | | 99,619 | |
AntarChile SA | | | 11,968 | | | | 178,392 | |
BGF Co. Ltd. | | | 5,520 | | | | 36,039 | |
Bidvest Group Ltd. (The) | | | 16,932 | | | | 210,723 | |
Boustead Holdings Bhd. | | | 31,200 | | | | 11,706 | |
CITIC Ltd. | | | 687,000 | | | | 1,030,579 | |
CJ Corp. | | | 1,734 | | | | 165,860 | |
CJ Corp. (Preference) | | | 208 | | | | 9,099 | |
DMCI Holdings, Inc. | | | 485,400 | | | | 116,485 | |
Dogan Sirketler Grubu Holding A/S* | | | 1,675,758 | | | | 325,982 | |
Doosan Corp. | | | 1,353 | | | | 141,884 | |
Doosan Corp. (Preference) | | | 416 | | | | 27,525 | |
Dubai Investments PJSC | | | 133,722 | | | | 58,977 | |
Enka Insaat ve Sanayi A/S | | | 191,148 | | | | 159,310 | |
Far Eastern New Century Corp. | | | 408,000 | | | | 409,411 | |
See Accompanying Notes to the Financial Statements.
| | |
| 200 | | FLEXSHARES ANNUAL REPORT |
FlexShares® Morningstar Emerging Markets Factor Tilt Index Fund (cont.)
| | | | | | | | |
| Investments | | Shares | | | Value | |
| COMMON STOCKS – (continued) | |
| Industrial Conglomerates – (continued) | |
Fosun International Ltd. | | | 255,000 | | | $ | 372,120 | |
Godrej Industries Ltd. | | | 3,377 | | | | 21,346 | |
Grupo Carso SAB de CV, Series A1 | | | 29,200 | | | | 86,197 | |
Hanwha Corp. | | | 4,080 | | | | 100,608 | |
Hanwha Corp. (Preference) | | | 1,425 | | | | 16,694 | |
HAP Seng Consolidated Bhd. | | | 30,000 | | | | 70,618 | |
Hong Leong Industries Bhd. | | | 8,600 | | | | 21,703 | |
Hosken Consolidated Investments Ltd. | | | 74,970 | | | | 645,251 | |
Hyosung Corp. | | | 989 | | | | 44,523 | |
Industries Qatar QSC | | | 9,588 | | | | 368,586 | |
Jaiprakash Associates Ltd.* | | | 41,807 | | | | 3,618 | |
JG Summit Holdings, Inc. | | | 142,800 | | | | 126,239 | |
KAP Industrial Holdings Ltd. | | | 63,408 | | | | 33,494 | |
KOC Holding A/S | | | 107,406 | | | | 298,643 | |
Kolon Corp. | | | 10,098 | | | | 271,159 | |
LG Corp. | | | 14,178 | | | | 824,888 | |
Lotte Corp.* | | | 3,978 | | | | 165,990 | |
LT Group, Inc. | | | 131,600 | | | | 35,664 | |
MMC Corp. Bhd. | | | 57,500 | | | | 14,703 | |
Mytilineos Holdings SA | | | 11,220 | | | | 99,287 | |
Quinenco SA | | | 12,939 | | | | 33,763 | |
Reunert Ltd. | | | 227,868 | | | | 1,230,676 | |
Samsung C&T Corp. | | | 4,692 | | | | 446,740 | |
San Miguel Corp. | | | 46,920 | | | | 149,955 | |
Shanghai Industrial Holdings Ltd. | | | 51,000 | | | | 107,212 | |
Siemens Ltd. | | | 2,760 | | | | 34,776 | |
Sigdo Koppers SA | | | 16,555 | | | | 25,604 | |
Sime Darby Bhd. | | | 140,900 | | | | 74,078 | |
SK Holdings Co. Ltd. | | | 3,672 | | | | 842,638 | |
SM Investments Corp. | | | 24,480 | | | | 411,775 | |
Turkiye Sise ve Cam Fabrikalari A/S | | | 73,440 | | | | 61,994 | |
| | | | | | | | 10,530,613 | |
| Insurance – 3.3% | |
Anadolu Anonim Turk Sigorta Sirketi | | | 261,528 | | | | 208,166 | |
Bajaj Finserv Ltd. | | | 1,734 | | | | 126,738 | |
| | | | | | | | |
| Investments | | Shares | | | Value | |
| Insurance – (continued) | |
Bangkok Life Assurance PCL, NVDR | | | 22,140 | | | $ | 21,205 | |
BB Seguridade Participacoes SA | | | 33,900 | | | | 241,667 | |
Cathay Financial Holding Co. Ltd. | | | 903,000 | | | | 1,429,952 | |
China Life Insurance Co. Ltd. | | | 204,000 | | | | 193,827 | |
China Life Insurance Co. Ltd., Class H | | | 377,000 | | | | 751,172 | |
China Pacific Insurance Group Co. Ltd., Class H | | | 122,400 | | | | 455,912 | |
China Reinsurance Group Corp., Class H | | | 8,976,000 | | | | 1,717,478 | |
China Taiping Insurance Holdings Co. Ltd. | | | 73,400 | | | | 245,310 | |
DB Insurance Co. Ltd. | | | 5,406 | | | | 340,618 | |
Discovery Ltd. | | | 23,358 | | | | 249,822 | |
General Insurance Corp. of India(b) | | | 17,544 | | | | 75,483 | |
Hanwha General Insurance Co. Ltd. | | | 75,072 | | | | 390,660 | |
Hanwha Life Insurance Co. Ltd. | | | 22,032 | | | | 86,713 | |
HDFC Standard Life Insurance Co. Ltd.(b) | | | 16,116 | | | | 81,141 | |
Hyundai Marine & Fire Insurance Co. Ltd. | | | 6,426 | | | | 235,713 | |
ICICI Lombard General Insurance Co. Ltd.(b) | | | 3,640 | | | | 39,649 | |
ICICI Prudential Life Insurance Co. Ltd.(b) | | | 10,400 | | | | 46,800 | |
IRB Brasil Resseguros S/A | | | 6,100 | | | | 118,995 | |
Korean Reinsurance Co. | | | 12,036 | | | | 102,346 | |
Liberty Holdings Ltd. | | | 13,260 | | | | 96,974 | |
Lotte Non-Life Insurance Co. Ltd. | | | 87,618 | | | | 190,298 | |
LPI Capital Bhd. | | | 9,127 | | | | 35,727 | |
Max Financial Services Ltd.* | | | 5,068 | | | | 25,852 | |
Mercuries & Associates Holding Ltd. | | | 665,760 | | | | 428,162 | |
Mercuries Life Insurance Co. Ltd.* | | | 117,328 | | | | 51,378 | |
Meritz Fire & Marine Insurance Co. Ltd. | | | 5,304 | | | | 84,711 | |
See Accompanying Notes to the Financial Statements.
| | | | |
| FLEXSHARES ANNUAL REPORT | | | 201 | |
FlexShares® Morningstar Emerging Markets Factor Tilt Index Fund (cont.)
| | | | | | | | |
| Investments | | Shares | | | Value | |
| COMMON STOCKS – (continued) | |
| Insurance – (continued) | |
Mirae Asset Life Insurance Co. Ltd. | | | 103,020 | | | $ | 411,791 | |
MMI Holdings Ltd.* | | | 70,992 | | | | 85,818 | |
New China Life Insurance Co. Ltd., Class H | | | 37,000 | | | | 172,979 | |
Orange Life Insurance Ltd.(b) | | | 3,978 | | | | 106,995 | |
People’s Insurance Co. Group of China Ltd. (The), Class H | | | 755,000 | | | | 308,187 | |
PICC Property & Casualty Co. Ltd., Class H | | | 744,000 | | | | 721,280 | |
Ping An Insurance Group Co. of China Ltd., Class H(a) | | | 255,000 | | | | 2,402,193 | |
Porto Seguro SA* | | | 7,300 | | | | 106,872 | |
Powszechny Zaklad Ubezpieczen SA | | | 28,866 | | | | 295,250 | |
Qatar Insurance Co. SAQ | | | 13,974 | | | | 140,832 | |
Qualitas Controladora SAB de CV, Class I(a) | | | 276,700 | | | | 559,248 | |
Rand Merchant Investment Holdings Ltd. | | | 42,738 | | | | 99,390 | |
Samsung Fire & Marine Insurance Co. Ltd. | | | 3,445 | | | | 841,940 | |
Samsung Fire & Marine Insurance Co. Ltd. (Preference) | | | 194 | | | | 30,303 | |
Samsung Life Insurance Co. Ltd. | | | 4,386 | | | | 354,098 | |
Sanlam Ltd. | | | 85,782 | | | | 431,401 | |
Santam Ltd. | | | 2,471 | | | | 51,961 | |
Shin Kong Financial Holding Co. Ltd. | | | 1,114,233 | | | | 365,494 | |
Shinkong Insurance Co. Ltd. | | | 306,000 | | | | 354,526 | |
Sul America SA | | | 12,000 | | | | 80,118 | |
ZhongAn Online P&C Insurance Co. Ltd., Class H* (a) (b) | | | 8,100 | | | | 26,916 | |
| | | | | | | | 16,020,061 | |
| Interactive Media & Services – 2.1% | |
Info Edge India Ltd. | | | 2,280 | | | | 48,685 | |
Kakao Corp. | | | 2,755 | | | | 221,454 | |
NAVER Corp. | | | 7,140 | | | | 717,415 | |
| | | | | | | | |
| Investments | | Shares | | | Value | |
| Interactive Media & Services – (continued) | |
SINA Corp.* | | | 3,400 | | | $ | 215,254 | |
Tencent Holdings Ltd. | | | 271,000 | | | | 9,229,915 | |
Tian Ge Interactive Holdings Ltd.(b) | | | 25,000 | | | | 13,171 | |
| | | | | | | | 10,445,894 | |
| Internet & Direct Marketing Retail – 0.2% | |
B2W Cia Digital* | | | 10,247 | | | | 95,174 | |
CJ ENM Co. Ltd. | | | 1,272 | | | | 252,268 | |
Cogobuy Group* (b) | | | 816,000 | | | | 277,919 | |
GS Home Shopping, Inc. | | | 452 | | | | 76,870 | |
Hyundai Home Shopping Network Corp. | | | 293 | | | | 25,095 | |
Infibeam Incorporation Ltd. | | | 2,580 | | | | 1,122 | |
momo.com, Inc. | | | 1,000 | | | | 6,027 | |
NS Shopping Co. Ltd. | | | 26,622 | | | | 252,308 | |
PChome Online, Inc.* | | | 2,763 | | | | 12,590 | |
| | | | | | | | 999,373 | |
| IT Services – 1.0% | |
AGTech Holdings Ltd.* | | | 84,000 | | | | 4,340 | |
Cafe24 Corp.* | | | 360 | | | | 34,909 | |
Chinasoft International Ltd.* | | | 102,000 | | | | 59,852 | |
Cielo SA | | | 51,000 | | | | 181,236 | |
Digital China Holdings Ltd.* | | | 58,000 | | | | 27,818 | |
eClerx Services Ltd. | | | 728 | | | | 10,475 | |
HCL Technologies Ltd. | | | 27,642 | | | | 394,603 | |
Hexaware Technologies Ltd. | | | 3,640 | | | | 16,510 | |
Infosys Ltd. | | | 190,333 | | | | 1,766,780 | |
Larsen & Toubro Infotech Ltd.(b) | | | 638 | | | | 15,241 | |
Mindtree Ltd. | | | 4,608 | | | | 53,022 | |
Mphasis Ltd. | | | 3,418 | | | | 45,620 | |
My EG Services Bhd. | | | 130,600 | | | | 37,452 | |
Persistent Systems Ltd. | | | 900 | | | | 6,894 | |
Posco ICT Co. Ltd. | | | 2,080 | | | | 10,057 | |
Samsung SDS Co. Ltd. | | | 2,040 | | | | 344,610 | |
SONDA SA | | | 24,083 | | | | 34,289 | |
Systex Corp. | | | 9,000 | | | | 18,004 | |
Tata Consultancy Services Ltd. | | | 45,652 | | | | 1,196,571 | |
Tech Mahindra Ltd. | | | 23,970 | | | | 241,142 | |
TravelSky Technology Ltd., Class H | | | 49,000 | | | | 118,759 | |
See Accompanying Notes to the Financial Statements.
| | |
| 202 | | FLEXSHARES ANNUAL REPORT |
FlexShares® Morningstar Emerging Markets Factor Tilt Index Fund (cont.)
| | | | | | | | |
| Investments | | Shares | | | Value | |
| COMMON STOCKS – (continued) | |
| IT Services – (continued) | |
Wipro Ltd. | | | 56,916 | | | $ | 254,927 | |
| | | | | | | | 4,873,111 | |
| Leisure Products – 0.0%(d) | |
Giant Manufacturing Co. Ltd. | | | 13,000 | | | | 49,575 | |
Goodbaby International Holdings Ltd. | | | 59,000 | | | | 18,289 | |
HLB, Inc.* | | | 1,530 | | | | 116,272 | |
KMC Kuei Meng International, Inc. | | | 3,315 | | | | 10,242 | |
Merida Industry Co. Ltd. | | | 9,350 | | | | 32,785 | |
| | | | | | | | 227,163 | |
| Life Sciences Tools & Services – 0.1% | |
Divi’s Laboratories Ltd. | | | 3,881 | | | | 77,914 | |
Genscript Biotech Corp.* (a) | | | 46,000 | | | | 70,179 | |
Samsung Biologics Co. Ltd.* (b) | | | 816 | | | | 277,478 | |
ST Pharm Co. Ltd. | | | 344 | | | | 6,339 | |
Syngene International Ltd.(b) | | | 860 | | | | 6,735 | |
Wuxi Biologics Cayman, Inc.* (b) | | | 19,500 | | | | 138,923 | |
| | | | | | | | 577,568 | |
| Machinery – 0.6% | |
AIA Engineering Ltd. | | | 1,599 | | | | 37,040 | |
Airtac International Group | | | 6,784 | | | | 58,428 | |
Ashok Leyland Ltd. | | | 61,914 | | | | 96,038 | |
BEML Ltd. | | | 768 | | | | 6,099 | |
China Conch Venture Holdings Ltd. | | | 93,000 | | | | 260,989 | |
China International Marine Containers Group Co. Ltd., Class H(a) | | | 65,400 | | | | 57,730 | |
CIMC Enric Holdings Ltd. | | | 36,000 | | | | 27,645 | |
CRRC Corp. Ltd., Class H | | | 204,000 | | | | 179,034 | |
CSSC Offshore and Marine Engineering Group Co. Ltd., Class H* | | | 386,000 | | | | 262,441 | |
Cummins India Ltd. | | | 2,280 | | | | 23,028 | |
Daewoo Shipbuilding & Marine Engineering Co. Ltd.* | | | 2,472 | | | | 63,451 | |
| | | | | | | | |
| Investments | | Shares | | | Value | |
| Machinery – (continued) | |
Doosan Bobcat, Inc.* | | | 1,462 | | | $ | 45,160 | |
Doosan Infracore Co. Ltd.* | | | 14,586 | | | | 98,558 | |
Escorts Ltd. | | | 1,997 | | | | 16,933 | |
Famur SA | | | 1,118 | | | | 1,629 | |
Grupo Rotoplas SAB de CV* | | | 8,600 | | | | 8,345 | |
Haitian International Holdings Ltd. | | | 30,000 | | | | 58,550 | |
Hiwin Technologies Corp. | | | 12,629 | | | | 81,628 | |
Hyundai Construction Equipment Co. Ltd.* | | | 312 | | | | 20,370 | |
Hyundai Elevator Co. Ltd. | | | 633 | | | | 44,272 | |
Hyundai Heavy Industries Co. Ltd.* | | | 1,938 | | | | 211,734 | |
Hyundai Heavy Industries Holdings Co. Ltd.* | | | 510 | | | | 159,550 | |
Hyundai Mipo Dockyard Co. Ltd.* | | | 624 | | | | 51,473 | |
Hyundai Rotem Co. Ltd.* | | | 1,341 | | | | 25,713 | |
Jain Irrigation Systems Ltd. | | | 7,396 | | | | 7,111 | |
King Slide Works Co. Ltd. | | | 3,000 | | | | 31,170 | |
Kinik Co. | | | 7,000 | | | | 11,967 | |
Lakshmi Machine Works Ltd. | | | 148 | | | | 11,531 | |
Lonking Holdings Ltd. | | | 104,000 | | | | 23,349 | |
Marcopolo SA (Preference) | | | 31,900 | | | | 33,751 | |
Mirle Automation Corp. | | | 241,000 | | | | 299,079 | |
Otokar Otomotiv ve Savunma Sanayi AS | | | 18 | | | | 229 | |
Rechi Precision Co. Ltd. | | | 21,969 | | | | 16,152 | |
Samsung Heavy Industries Co. Ltd.* | | | 22,815 | | | | 139,347 | |
Shanghai Zhenhua Heavy Industries Co. Ltd., Class B | | | 37,440 | | | | 12,954 | |
Shin Zu Shing Co. Ltd. | | | 4,000 | | | | 9,773 | |
Sinotruk Hong Kong Ltd.(a) | | | 65,500 | | | | 94,080 | |
SKF India Ltd. | | | 624 | | | | 15,057 | |
Sunonwealth Electric Machine Industry Co. Ltd. | | | 8,000 | | | | 8,661 | |
Thermax Ltd. | | | 2,214 | | | | 29,929 | |
WEG SA | | | 30,600 | | | | 148,284 | |
Weichai Power Co. Ltd., Class H | | | 214,000 | | | | 211,560 | |
Yungtay Engineering Co. Ltd. | | | 19,000 | | | | 34,631 | |
| | | | | | | | 3,034,453 | |
See Accompanying Notes to the Financial Statements.
| | | | |
| FLEXSHARES ANNUAL REPORT | | | 203 | |
FlexShares® Morningstar Emerging Markets Factor Tilt Index Fund (cont.)
| | | | | | | | |
| Investments | | Shares | | | Value | |
| COMMON STOCKS – (continued) | |
| Marine – 1.0% | |
Cia Sud Americana de Vapores SA* | | | 797,784 | | | $ | 23,898 | |
COSCO SHIPPING Development Co. Ltd., Class H* | | | 5,610,000 | | | | 572,493 | |
COSCO SHIPPING Energy Transportation Co. Ltd., Class H | | | 1,632,000 | | | | 893,089 | |
COSCO SHIPPING Holdings Co. Ltd., Class H* (a) | | | 3,672,000 | | | | 1,311,529 | |
Evergreen Marine Corp. Taiwan Ltd. | | | 109,200 | | | | 40,231 | |
Hyundai Merchant Marine Co. Ltd.* | | | 10,455 | | | | 34,680 | |
Korea Line Corp.* | | | 21,420 | | | | 403,193 | |
MISC Bhd. | | | 61,200 | | | | 89,215 | |
Pan Ocean Co. Ltd.* | | | 13,007 | | | | 54,446 | |
Qatar Navigation QSC | | | 6,070 | | | | 118,431 | |
Sinotrans Shipping Ltd. | | | 1,944,500 | | | | 647,389 | |
U-Ming Marine Transport Corp. | | | 25,000 | | | | 26,096 | |
Wan Hai Lines Ltd. | | | 61,000 | | | | 29,768 | |
Wisdom Marine Lines Co. Ltd.* | | | 510,000 | | | | 486,217 | |
Yang Ming Marine Transport Corp.* | | | 53,000 | | | | 14,628 | |
| | | | | | | | 4,745,303 | |
| Media – 1.1% | |
Astro Malaysia Holdings Bhd. | | | 133,000 | | | | 42,908 | |
BEC World PCL, NVDR* | | | 37,000 | | | | 6,808 | |
Cheil Worldwide, Inc. | | | 3,237 | | | | 64,481 | |
China Literature Ltd.* (a) (b) | | | 16,800 | | | | 90,757 | |
CJ Hello Co. Ltd. | | | 625 | | | | 4,986 | |
Cyfrowy Polsat SA* | | | 12,240 | | | | 70,618 | |
DB Corp. Ltd. | | | 1,806 | | | | 4,023 | |
Dish TV India Ltd.* | | | 17,517 | | | | 10,293 | |
Global Mediacom Tbk. PT | | | 10,353,000 | | | | 223,370 | |
Grupo Televisa SAB, Series CPO | | | 102,000 | | | | 294,954 | |
Innocean Worldwide, Inc. | | | 520 | | | | 26,467 | |
KT Skylife Co. Ltd. | | | 31,722 | | | | 345,183 | |
| | | | | | | | |
| Investments | | Shares | | | Value | |
| Media – (continued) | |
Media Nusantara Citra Tbk. PT | | | 312,000 | | | $ | 16,008 | |
Megacable Holdings SAB de CV | | | 10,200 | | | | 45,366 | |
Multiplus SA | | | 3,500 | | | | 23,782 | |
Nasmedia Co. Ltd. | | | 172 | | | | 4,898 | |
Naspers Ltd., Class N | | | 21,215 | | | | 3,724,961 | |
Plan B Media PCL, NVDR | | | 72,800 | | | | 14,275 | |
SBS Media Holdings Co. Ltd.* | | | 4,200 | | | | 8,293 | |
Smiles Fidelidade SA* | | | 3,400 | | | | 34,096 | |
Sun TV Network Ltd. | | | 4,576 | | | | 40,271 | |
Surya Citra Media Tbk. PT | | | 342,700 | | | | 35,391 | |
TV18 Broadcast Ltd.* | | | 16,016 | | | | 8,101 | |
VGI Global Media PCL, NVDR | | | 114,400 | | | | 26,055 | |
Zee Entertainment Enterprises Ltd. | | | 27,948 | | | | 170,496 | |
| | | | | | | | 5,336,841 | |
| Metals & Mining – 4.7% | |
African Rainbow Minerals Ltd. | | | 10,527 | | | | 89,035 | |
Alrosa PJSC | | | 267,546 | | | | 406,569 | |
Aluminum Corp. of China Ltd., Class H* | | | 204,000 | | | | 73,904 | |
Aneka Tambang Tbk. | | | 522,310 | | | | 23,363 | |
Angang Steel Co. Ltd., Class H(a) | | | 1,606,000 | | | | 1,366,434 | |
Anglo American Platinum Ltd. | | | 2,514 | | | | 82,050 | |
AngloGold Ashanti Ltd. | | | 44,565 | | | | 431,005 | |
Assore Ltd. | | | 4,386 | | | | 91,526 | |
Boryszew SA* | | | 117,650 | | | | 147,118 | |
Bradespar SA | | | 3,600 | | | | 29,947 | |
Bradespar SA (Preference) | | | 10,200 | | | | 94,902 | |
CAP SA | | | 8,160 | | | | 79,366 | |
China Metal Recycling Holdings Ltd.* ‡ (c) | | | 51,000 | | | | — | |
China Molybdenum Co. Ltd., Class H(a) | | | 172,200 | | | | 63,921 | |
China Oriental Group Co. Ltd. | | | 110,000 | | | | 86,996 | |
China Steel Corp. | | | 630,000 | | | | 496,784 | |
China Zhongwang Holdings Ltd.(a) | | | 163,200 | | | | 72,446 | |
See Accompanying Notes to the Financial Statements.
| | |
| 204 | | FLEXSHARES ANNUAL REPORT |
FlexShares® Morningstar Emerging Markets Factor Tilt Index Fund (cont.)
| | | | | | | | |
| Investments | | Shares | | | Value | |
| COMMON STOCKS – (continued) | |
| Metals & Mining – (continued) | |
Chung Hung Steel Corp.* | | | 1,236,000 | | | $ | 469,347 | |
Cia Siderurgica Nacional SA* | | | 38,200 | | | | 98,418 | |
Dongkuk Steel Mill Co. Ltd. | | | 83,334 | | | | 517,021 | |
Eregli Demir ve Celik Fabrikalari TAS | | | 184,416 | | | | 298,183 | |
Feng Hsin Steel Co. Ltd. | | | 26,000 | | | | 49,239 | |
Gerdau SA | | | 9,000 | | | | 31,425 | |
Gerdau SA (Preference) | | | 45,182 | | | | 197,781 | |
Gloria Material Technology Corp. | | | 18,000 | | | | 9,715 | |
Gold Fields Ltd. | | | 89,760 | | | | 238,225 | |
Grupa Kety SA | | | 331 | | | | 29,466 | |
Grupo Mexico SAB de CV, Series B | | | 179,500 | | | | 415,444 | |
Grupo Simec SAB de CV, Series B* | | | 10,400 | | | | 28,323 | |
Harmony Gold Mining Co. Ltd.* (a) | | | 628,218 | | | | 1,188,259 | |
Hindalco Industries Ltd. | | | 46,818 | | | | 139,545 | |
Hyundai Steel Co. | | | 9,180 | | | | 336,330 | |
Industrias CH SAB de CV, Series B* | | | 6,600 | | | | 23,746 | |
Industrias Penoles SAB de CV | | | 6,120 | | | | 86,522 | |
Jastrzebska Spolka Weglowa SA* | | | 6,732 | | | | 130,051 | |
Jenax, Inc.* | | | 705 | | | | 12,064 | |
Jiangxi Copper Co. Ltd., Class H | | | 102,000 | | | | 112,417 | |
Jindal Steel & Power Ltd.* | | | 20,072 | | | | 46,512 | |
JSW Steel Ltd. | | | 51,306 | | | | 235,489 | |
Kardemir Karabuk Demir Celik Sanayi ve Ticaret A/S, Class D* | | | 17,887 | | | | 9,768 | |
KGHM Polska Miedz SA* | | | 14,722 | | | | 333,907 | |
KISWIRE Ltd. | | | 720 | | | | 13,647 | |
Korea Zinc Co. Ltd. | | | 612 | | | | 203,544 | |
Koza Altin Isletmeleri A/S* | | | 3,880 | | | | 31,174 | |
Koza Anadolu Metal Madencilik Isletmeleri A/S* | | | 293,862 | | | | 264,320 | |
Krakatau Steel Persero Tbk. PT* | | | 5,946,600 | | | | 144,729 | |
| | | | | | | | |
| Investments | | Shares | | | Value | |
| Metals & Mining – (continued) | |
Kumba Iron Ore Ltd.(a) | | | 3,360 | | | $ | 65,761 | |
Maanshan Iron & Steel Co. Ltd., Class H | | | 2,534,000 | | | | 1,357,604 | |
Magnitogorsk Iron & Steel Works PJSC | | | 171,564 | | | | 125,124 | |
Mechel PJSC* | | | 254,388 | | | | 356,391 | |
Mechel PJSC (Preference) | | | 143,718 | | | | 214,462 | |
Metalurgica Gerdau SA (Preference) | | | 70,800 | | | | 151,340 | |
Minera Frisco SAB de CV, Class A1* | | | 662,000 | | | | 200,388 | |
MMC Norilsk Nickel PJSC | | | 2,721 | | | | 455,294 | |
MMG Ltd.* (a) | | | 132,000 | | | | 49,504 | |
MOIL Ltd. | | | 2,808 | | | | 6,786 | |
National Aluminium Co. Ltd. | | | 27,956 | | | | 25,784 | |
Nexa Resources Peru SAA* | | | 11,024 | | | | 11,821 | |
Nickel Asia Corp. | | | 6,060,800 | | | | 287,720 | |
NMDC Ltd. | | | 44,249 | | | | 65,316 | |
Northam Platinum Ltd.* | | | 24,591 | | | | 64,732 | |
Novolipetsk Steel PJSC | | | 103,632 | | | | 252,885 | |
Polyus PJSC | | | 2,311 | | | | 145,958 | |
Poongsan Corp. | | | 2,180 | | | | 46,200 | |
POSCO | | | 8,568 | | | | 1,939,839 | |
Press Metal Aluminium Holdings Bhd. | | | 112,200 | | | | 129,776 | |
Raspadskaya OJSC* | | | 191,046 | | | | 348,672 | |
Seah Besteel Corp. | | | 16,014 | | | | 227,657 | |
SeAH Steel Holdings Corp. | | | 3,135 | | | | 135,078 | |
Severstal PJSC | | | 18,972 | | | | 297,249 | |
Shougang Fushan Resources Group Ltd. | | | 4,692,000 | | | | 945,654 | |
Sibanye Gold Ltd.* | | | 151,572 | | | | 105,111 | |
Stalprodukt SA | | | 2,244 | | | | 216,166 | |
Steel Authority of India Ltd.* | | | 52,312 | | | | 45,595 | |
TA Chen Stainless Pipe | | | 103,962 | | | | 145,815 | |
Tata Steel Ltd. | | | 32,232 | | | | 241,419 | |
Tung Ho Steel Enterprise Corp. | | | 32,000 | | | | 21,666 | |
Usinas Siderurgicas de Minas Gerais SA (Preference), Class A | | | 23,300 | | | | 64,484 | |
Vale Indonesia Tbk. PT* | | | 134,900 | | | | 25,911 | |
Vale SA | | | 153,000 | | | | 2,335,881 | |
See Accompanying Notes to the Financial Statements.
| | | | |
| FLEXSHARES ANNUAL REPORT | | | 205 | |
FlexShares® Morningstar Emerging Markets Factor Tilt Index Fund (cont.)
| | | | | | | | |
| Investments | | Shares | | | Value | |
| COMMON STOCKS – (continued) | |
| Metals & Mining – (continued) | |
Vedanta Ltd. | | | 186,762 | | | $ | 533,299 | |
Volcan Cia Minera SAA, Class B | | | 3,551,965 | | | | 654,157 | |
YC INOX Co. Ltd. | | | 408,000 | | | | 325,683 | |
Yieh Phui Enterprise Co. Ltd. | | | 2,001,840 | | | | 620,420 | |
Young Poong Corp. | | | 102 | | | | 58,807 | |
Zhaojin Mining Industry Co. Ltd., Class H | | | 36,000 | | | | 31,778 | |
Zijin Mining Group Co. Ltd., Class H | | | 612,000 | | | | 227,176 | |
| | | | | | | | 22,890,340 | |
| Multiline Retail – 0.4% | |
Aeon Co. M Bhd. | | | 28,000 | | | | 11,308 | |
El Puerto de Liverpool SAB de CV, Class C1 | | | 10,200 | | | | 64,839 | |
Far Eastern Department Stores Ltd. | | | 143,012 | | | | 71,407 | |
Future Retail Ltd.* | | | 7,735 | | | | 51,168 | |
Golden Eagle Retail Group Ltd. | | | 27,000 | | | | 27,966 | |
Grupo Sanborns SAB de CV | | | 25,800 | | | | 23,531 | |
Hyundai Department Store Co. Ltd. | | | 1,734 | | | | 131,927 | |
Lojas Americanas SA* | | | 5,250 | | | | 19,787 | |
Lojas Americanas SA (Preference)* | | | 38,700 | | | | 195,870 | |
Lojas Renner SA* | | | 36,620 | | | | 370,686 | |
Lotte Shopping Co. Ltd. | | | 752 | | | | 127,693 | |
Magazine Luiza SA | | | 3,100 | | | | 140,875 | |
Matahari Department Store Tbk. PT | | | 265,200 | | | | 84,606 | |
Mitra Adiperkasa Tbk. PT | | | 258,000 | | | | 13,577 | |
Poya International Co. Ltd. | | | 4,161 | | | | 36,241 | |
Rimo International Lestari Tbk. PT* | | | 1,049,100 | | | | 10,834 | |
Ripley Corp. SA | | | 50,856 | | | | 43,187 | |
Robinson PCL, NVDR | | | 24,900 | | | | 49,011 | |
SACI Falabella | | | 25,296 | | | | 190,711 | |
Shinsegae, Inc. | | | 408 | | | | 92,552 | |
Woolworths Holdings Ltd. | | | 42,024 | | | | 144,944 | |
| | | | | | | | 1,902,720 | |
| | | | | | | | |
| Investments | | Shares | | | Value | |
| Multi-Utilities – 0.1% | |
Qatar Electricity & Water Co. QSC | | | 1,365 | | | $ | 70,425 | |
YTL Corp. Bhd. | | | 301,426 | | | | 76,356 | |
YTL Power International Bhd. | | | 459,000 | | | | 104,206 | |
| | | | | | | | 250,987 | |
| Oil, Gas & Consumable Fuels – 7.3% | |
Adaro Energy Tbk. PT | | | 816,000 | | | | 88,564 | |
Aegis Logistics Ltd. | | | 1,720 | | | | 5,050 | |
Bangchak Corp. PCL, NVDR | | | 41,600 | | | | 41,412 | |
Banpu PCL, NVDR | | | 251,400 | | | | 131,957 | |
Bashneft PJSC | | | 720 | | | | 21,083 | |
Bashneft PJSC (Preference) | | | 1,163 | | | | 32,109 | |
Bharat Petroleum Corp. Ltd. | | | 85,884 | | | | 319,517 | |
Bukit Asam Tbk. PT | | | 308,300 | | | | 86,188 | |
Bumi Resources Tbk. PT* | | | 1,552,600 | | | | 17,260 | |
Chennai Petroleum Corp. Ltd. | | | 46,614 | | | | 161,442 | |
China Coal Energy Co. Ltd., Class H | | | 204,000 | | | | 91,339 | |
China Petroleum & Chemical Corp., Class H | | | 2,738,000 | | | | 2,221,303 | |
China Shenhua Energy Co. Ltd., Class H | | | 365,500 | | | | 828,033 | |
CNOOC Ltd. | | | 1,632,000 | | | | 2,802,092 | |
Coal India Ltd. | | | 66,096 | | | | 237,899 | |
Cosan SA | | | 10,200 | | | | 88,558 | |
Dana Gas PJSC | | | 111,280 | | | | 34,840 | |
Ecopetrol SA | | | 252,858 | | | | 293,556 | |
Empresas COPEC SA | | | 18,054 | | | | 252,926 | |
Energy Absolute PCL, NVDR | | | 71,400 | | | | 106,615 | |
Esso Thailand PCL, NVDR | | | 135,200 | | | | 59,137 | |
Exxaro Resources Ltd. | | | 26,826 | | | | 274,142 | |
Formosa Petrochemical Corp. | | | 94,000 | | | | 370,617 | |
Gazprom PJSC | | | 566,574 | | | | 1,339,904 | |
Gazprom PJSC, ADR | | | 10,779 | | | | 51,071 | |
Great Eastern Shipping Co. Ltd. (The) | | | 67,524 | | | | 286,049 | |
Grupa Lotos SA | | | 8,976 | | | | 162,342 | |
GS Holdings Corp. | | | 5,304 | | | | 225,742 | |
Hellenic Petroleum SA | | | 6,163 | | | | 49,021 | |
Hengyuan Refining Co. Bhd. | | | 193,800 | | | | 271,862 | |
Hindustan Petroleum Corp. Ltd. | | | 58,752 | | | | 178,095 | |
See Accompanying Notes to the Financial Statements.
| | |
| 206 | | FLEXSHARES ANNUAL REPORT |
FlexShares® Morningstar Emerging Markets Factor Tilt Index Fund (cont.)
| | | | | | | | |
| Investments | | Shares | | | Value | |
| COMMON STOCKS – (continued) | |
| Oil, Gas & Consumable Fuels – (continued) | |
Indian Oil Corp. Ltd. | | | 206,346 | | | $ | 386,349 | |
Indika Energy Tbk. PT | | | 65,000 | | | | 9,577 | |
Indo Tambangraya Megah Tbk. PT | | | 41,600 | | | | 68,136 | |
Inner Mongolia Yitai Coal Co. Ltd., Class B | | | 112,200 | | | | 133,294 | |
Inner Mongolia Yitai Coal Co. Ltd., Class H | | | 20,800 | | | | 17,777 | |
IRPC PCL, NVDR | | | 928,200 | | | | 170,800 | |
Kunlun Energy Co. Ltd.(a) | | | 360,000 | | | | 408,705 | |
Lubelski Wegiel Bogdanka SA* | | | 17,792 | | | | 249,888 | |
LUKOIL PJSC | | | 21,420 | | | | 1,611,225 | |
Mangalore Refinery & Petrochemicals Ltd. | | | 15,060 | | | | 16,639 | |
Mari Petroleum Co. Ltd. | | | 1,804 | | | | 20,101 | |
Medco Energi Internasional Tbk. PT* | | | 6,619,800 | | | | 357,062 | |
MOL Hungarian Oil & Gas plc | | | 47,736 | | | | 500,243 | |
Motor Oil Hellas Corinth Refineries SA | | | 7,242 | | | | 171,496 | |
Novatek PJSC | | | 44,064 | | | | 703,657 | |
Oil & Gas Development Co. Ltd. | | | 71,400 | | | | 85,729 | |
Oil & Natural Gas Corp. Ltd. | | | 303,756 | | | | 629,530 | |
Oil India Ltd. | | | 30,149 | | | | 80,566 | |
Pakistan Oilfields Ltd. | | | 6,240 | | | | 25,666 | |
Pakistan Petroleum Ltd. | | | 59,025 | | | | 83,288 | |
Pakistan State Oil Co. Ltd. | | | 32,554 | | | | 68,937 | |
PetroChina Co. Ltd., Class H | | | 1,056,000 | | | | 773,202 | |
Petroleo Brasileiro SA* | | | 316,200 | | | | 2,581,016 | |
Petroleo Brasileiro SA (Preference)* | | | 449,000 | | | | 3,338,640 | |
Petron Corp. | | | 226,600 | | | | 34,304 | |
Petron Malaysia Refining & Marketing Bhd. | | | 91,800 | | | | 158,613 | |
Petronas Dagangan Bhd. | | | 15,200 | | | | 94,444 | |
Petronet LNG Ltd. | | | 31,518 | | | | 96,201 | |
Pilipinas Shell Petroleum Corp. | | | 24,960 | | | | 22,648 | |
Polski Koncern Naftowy ORLEN SA | | | 29,274 | | | | 704,921 | |
| | | | | | | | |
| Investments | | Shares | | | Value | |
| Oil, Gas & Consumable Fuels – (continued) | |
Polskie Gornictwo Naftowe i Gazownictwo SA | | | 167,484 | | | $ | 273,707 | |
PTT Exploration & Production PCL | | | 469 | | | | 1,974 | |
PTT Exploration & Production PCL, NVDR | | | 71,400 | | | | 300,462 | |
PTT PCL, NVDR | | | 900,600 | | | | 1,385,538 | |
Qatar Fuel QSC | | | 1,938 | | | | 92,122 | |
Qatar Gas Transport Co. Ltd. | | | 29,137 | | | | 139,622 | |
Reliance Industries Ltd. | | | 154,836 | | | | 2,222,188 | |
Rosneft Oil Co. PJSC | | | 54,100 | | | | 378,922 | |
Rosneft Oil Co. PJSC, GDR(b) | | | 6,040 | | | | 42,461 | |
RussNeft PJSC* | | | 4,992 | | | | 42,539 | |
Semirara Mining & Power Corp. | | | 193,800 | | | | 101,237 | |
Siamgas & Petrochemicals PCL, NVDR | | | 948,600 | | | | 303,323 | |
Sinopec Kantons Holdings Ltd. | | | 1,428,000 | | | | 581,080 | |
SK Gas Ltd. | | | 6,182 | | | | 396,564 | |
SK Innovation Co. Ltd. | | | 6,630 | | | | 1,242,161 | |
S-Oil Corp. | | | 4,590 | | | | 499,460 | |
S-Oil Corp. (Preference) | | | 208 | | | | 16,263 | |
Star Petroleum Refining PCL, NVDR | | | 131,100 | | | | 55,762 | |
Surgutneftegas PJSC | | | 410,578 | | | | 165,942 | |
Surgutneftegas PJSC, ADR | | | 3,506 | | | | 13,954 | |
Surgutneftegas PJSC, ADR, OTC | | | 12,172 | | | | 69,563 | |
Surgutneftegas PJSC (Preference) | | | 236,334 | | | | 137,095 | |
Tatneft PJSC | | | 42,018 | | | | 501,353 | |
Tatneft PJSC, ADR | | | 5,424 | | | | 382,175 | |
Tatneft PJSC (Preference) | | | 7,007 | | | | 56,065 | |
Thai Oil PCL, NVDR | | | 91,800 | | | | 234,692 | |
Transneft PJSC (Preference) | | | 87 | | | | 226,168 | |
Tupras Turkiye Petrol Rafinerileri A/S | | | 12,852 | | | | 302,073 | |
Ultrapar Participacoes SA | | | 20,400 | | | | 243,021 | |
United Tractors Tbk. PT | | | 71,400 | | | | 157,336 | |
Yanzhou Coal Mining Co. Ltd., Class H | | | 204,000 | | | | 192,826 | |
| | | | | | | | 35,490,027 | |
See Accompanying Notes to the Financial Statements.
| | | | |
| FLEXSHARES ANNUAL REPORT | | | 207 | |
FlexShares® Morningstar Emerging Markets Factor Tilt Index Fund (cont.)
| | | | | | | | |
| Investments | | Shares | | | Value | |
| COMMON STOCKS – (continued) | |
| Paper & Forest Products – 0.9% | |
Chung Hwa Pulp Corp. | | | 532,000 | | | $ | 156,111 | |
Duratex SA* | | | 16,474 | | | | 50,959 | |
Empresas CMPC SA | | | 55,456 | | | | 189,747 | |
Fibria Celulose SA | | | 11,600 | | | | 224,380 | |
Indah Kiat Pulp & Paper Corp. Tbk. PT | | | 115,400 | | | | 96,594 | |
Lee & Man Paper Manufacturing Ltd. | | | 154,000 | | | | 131,814 | |
Long Chen Paper Co. Ltd. | | | 34,522 | | | | 17,572 | |
Mondi Ltd. | | | 6,671 | | | | 159,422 | |
Nine Dragons Paper Holdings Ltd. | | | 183,000 | �� | | | 174,610 | |
Pabrik Kertas Tjiwi Kimia Tbk. PT | | | 1,812,400 | | | | 1,227,937 | |
Packages Ltd. | | | 73,450 | | | | 218,905 | |
Pfleiderer Group SA | | | 36,414 | | | | 269,976 | |
Sappi Ltd. | | | 27,948 | | | | 156,980 | |
Shandong Chenming Paper Holdings Ltd., Class B | | | 771,900 | | | | 448,012 | |
Shandong Chenming Paper Holdings Ltd., Class H(a) | | | 331,500 | | | | 186,060 | |
Suzano Papel e Celulose SA | | | 20,400 | | | | 207,872 | |
YFY, Inc. | | | 1,805,000 | | | | 653,330 | |
| | | | | | | | 4,570,281 | |
| Personal Products – 0.4% | |
Amorepacific Corp. | | | 1,597 | | | | 214,419 | |
Amorepacific Corp. (Preference) | | | 545 | | | | 43,043 | |
AMOREPACIFIC Group | | | 1,326 | | | | 72,261 | |
AMOREPACIFIC Group (Preference) | | | 312 | | | | 8,214 | |
Chlitina Holding Ltd. | | | 2,000 | | | | 13,282 | |
Colgate-Palmolive India Ltd. | | | 2,518 | | | | 38,053 | |
Cosmax, Inc. | | | 322 | | | | 32,495 | |
Dabur India Ltd. | | | 28,254 | | | | 147,011 | |
EIS Eczacibasi Ilac ve Sinai ve Finansal Yatirimlar Sanayi ve Ticaret A/S | | | 4,128 | | | | 2,188 | |
Emami Ltd. | | | 4,766 | | | | 25,463 | |
Gillette India Ltd. | | | 48 | | | | 4,243 | |
Godrej Consumer Products Ltd. | | | 19,278 | | | | 188,974 | |
| | | | | | | | |
| Investments | | Shares | | | Value | |
| Personal Products – (continued) | |
Grape King Bio Ltd. | | | 5,000 | | | $ | 31,510 | |
Hengan International Group Co. Ltd. | | | 39,500 | | | | 312,900 | |
It’s Hanbul Co. Ltd. | | | 501 | | | | 10,793 | |
Jayjun Cosmetic Co. Ltd.* | | | 756 | | | | 7,530 | |
Kolmar BNH Co. Ltd. | | | 688 | | | | 13,554 | |
Kolmar Korea Co. Ltd. | | | 643 | | | | 30,583 | |
LG Household & Health Care Ltd. | | | 510 | | | | 467,237 | |
LG Household & Health Care Ltd. (Preference) | | | 102 | | | | 65,521 | |
Marico Ltd. | | | 24,684 | | | | 107,255 | |
Natura Cosmeticos SA | | | 10,200 | | | | 89,492 | |
NUTRIBIOTECH Co. Ltd.* | | | 1,540 | | | | 20,474 | |
Procter & Gamble Hygiene & Health Care Ltd. | | | 344 | | | | 43,585 | |
TCI Co. Ltd. | | | 2,644 | | | | 36,956 | |
| | | | | | | | 2,027,036 | |
| Pharmaceuticals – 1.1% | |
Abbott India Ltd. | | | 166 | | | | 16,991 | |
Adcock Ingram Holdings Ltd. | | | 5,074 | | | | 19,710 | |
Ajanta Pharma Ltd.* | | | 1,415 | | | | 20,252 | |
Alembic Pharmaceuticals Ltd. | | | 2,150 | | | | 17,355 | |
Alkem Laboratories Ltd. | | | 1,560 | | | | 40,228 | |
Aspen Pharmacare Holdings Ltd. | | | 20,808 | | | | 219,829 | |
Aurobindo Pharma Ltd. | | | 14,076 | | | | 150,678 | |
Beijing Tong Ren Tang Chinese Medicine Co. Ltd. | | | 10,000 | | | | 16,838 | |
Bukwang Pharmaceutical Co. Ltd. | | | 1,516 | | | | 29,667 | |
Cadila Healthcare Ltd. | | | 13,825 | | | | 67,316 | |
Caregen Co. Ltd. | | | 258 | | | | 16,075 | |
Celltrion Pharm, Inc.* | | | 697 | | | | 32,723 | |
Center Laboratories, Inc.* | | | 3,541 | | | | 6,546 | |
China Grand Pharmaceutical and Healthcare Holdings Ltd.* | | | 32,000 | | | | 15,511 | |
China Medical System Holdings Ltd. | | | 72,000 | | | | 85,690 | |
China Resources Pharmaceutical Group Ltd.(b) | | | 82,000 | | | | 120,290 | |
See Accompanying Notes to the Financial Statements.
| | |
| 208 | | FLEXSHARES ANNUAL REPORT |
FlexShares® Morningstar Emerging Markets Factor Tilt Index Fund (cont.)
| | | | | | | | |
| Investments | | Shares | | | Value | |
| COMMON STOCKS – (continued) | |
| Pharmaceuticals – (continued) | |
China Traditional Chinese Medicine Holdings Co. Ltd. | | | 114,000 | | | $ | 72,564 | |
Chong Kun Dang Pharmaceutical Corp. | | | 257 | | | | 19,553 | |
Cipla Ltd. | | | 16,014 | | | | 136,274 | |
Consun Pharmaceutical Group Ltd. | | | 16,000 | | | | 11,082 | |
CSPC Pharmaceutical Group Ltd. | | | 226,000 | | | | 476,827 | |
Daewoong Co. Ltd. | | | 3,840 | | | | 46,840 | |
Daewoong Pharmaceutical Co. Ltd. | | | 266 | | | | 32,913 | |
Dong-A Socio Holdings Co. Ltd. | | | 104 | | | | 8,113 | |
Dong-A ST Co. Ltd. | | | 299 | | | | 21,883 | |
DongKook Pharmaceutical Co. Ltd. | | | 450 | | | | 21,917 | |
Dr Reddy’s Laboratories Ltd. | | | 4,182 | | | | 143,790 | |
Genomma Lab Internacional SAB de CV, Class B* | | | 12,000 | | | | 7,733 | |
Glenmark Pharmaceuticals Ltd. | | | 7,280 | | | | 61,188 | |
Guangzhou Baiyunshan Pharmaceutical Holdings Co. Ltd., Class H | | | 6,000 | | | | 21,851 | |
Hanall Biopharma Co. Ltd.* | | | 1,501 | | | | 31,217 | |
Hanmi Pharm Co. Ltd. | | | 312 | | | | 106,642 | |
Hanmi Science Co. Ltd. | | | 1,236 | | | | 72,345 | |
Hua Han Health Industry Holdings Ltd.* (c) | | | 3,780,000 | | | | 255,555 | |
Hypera SA* | | | 17,800 | | | | 142,707 | |
Il Dong Pharmaceutical Co. Ltd. | | | 457 | | | | 7,660 | |
Ilyang Pharmaceutical Co. Ltd.* | | | 756 | | | | 16,984 | |
Ipca Laboratories Ltd. | | | 1,664 | | | | 15,344 | |
Jubilant Life Sciences Ltd. | | | 4,445 | | | | 39,887 | |
JW Holdings Corp. | | | 54,876 | | | | 281,712 | |
JW Pharmaceutical Corp. | | | 16,626 | | | | 483,658 | |
Kalbe Farma Tbk. PT | | | 1,050,600 | | | | 94,677 | |
Kolon Life Science, Inc.* | | | 291 | | | | 15,730 | |
Komipharm International Co. Ltd.* | | | 2,616 | | | | 48,897 | |
| | | | | | | | |
| Investments | | Shares | | | Value | |
| Pharmaceuticals – (continued) | |
Kwang Dong Pharmaceutical Co. Ltd. | | | 73 | | | $ | 359 | |
Laurus Labs Ltd.(b) | | | 602 | | | | 2,775 | |
Livzon Pharmaceutical Group, Inc., Class H | | | 5,408 | | | | 15,694 | |
Lupin Ltd. | | | 8,568 | | | | 102,597 | |
Luye Pharma Group Ltd.(a) (b) | | | 75,000 | | | | 57,881 | |
Mega Lifesciences PCL, NVDR | | | 23,000 | | | | 26,018 | |
Natco Pharma Ltd. | | | 5,750 | | | | 58,643 | |
Pfizer Ltd. | | | 341 | | | | 13,457 | |
Pharmally International Holding Co. Ltd. | | | 2,000 | | | | 15,028 | |
Piramal Enterprises Ltd. | | | 3,978 | | | | 116,890 | |
Richter Gedeon Nyrt | | | 4,998 | | | | 92,869 | |
Samjin Pharmaceutical Co. Ltd. | | | 344 | | | | 11,169 | |
Sanofi India Ltd. | | | 6 | | | | 470 | |
ScinoPharm Taiwan Ltd. | | | 22,000 | | | | 16,210 | |
Searle Co. Ltd. (The)* | | | 5,200 | | | | 11,547 | |
Shanghai Fosun Pharmaceutical Group Co. Ltd., Class H | | | 20,000 | | | | 59,954 | |
Sihuan Pharmaceutical Holdings Group Ltd.(a) | | | 248,000 | | | | 50,300 | |
Sino Biopharmaceutical Ltd. | | | 318,000 | | | | 285,167 | |
SSY Group Ltd. | | | 80,165 | | | | 67,389 | |
Sun Pharma Advanced Research Co. Ltd.* | | | 4,836 | | | | 19,371 | |
Sun Pharmaceutical Industries Ltd. | | | 49,980 | | | | 392,195 | |
Tong Ren Tang Technologies Co. Ltd., Class H | | | 17,000 | | | | 24,331 | |
Torrent Pharmaceuticals Ltd. | | | 2,009 | | | | 45,307 | |
TTY Biopharm Co. Ltd. | | | 2,686 | | | | 7,014 | |
Wockhardt Ltd.* | | | 175 | | | | 1,170 | |
YiChang HEC ChangJiang Pharmaceutical Co. Ltd., Class H(b) | | | 800 | | | | 2,740 | |
Yuhan Corp. | | | 428 | | | | 62,911 | |
Yungjin Pharmaceutical Co. Ltd.* | | | 5,316 | | | | 25,751 | |
See Accompanying Notes to the Financial Statements.
| | | | |
| FLEXSHARES ANNUAL REPORT | | | 209 | |
FlexShares® Morningstar Emerging Markets Factor Tilt Index Fund (cont.)
| | | | | | | | |
| Investments | | Shares | | | Value | |
| COMMON STOCKS – (continued) | |
| Pharmaceuticals – (continued) | |
YungShin Global Holding Corp. | | | 11,000 | | | $ | 14,060 | |
| | | | | | | | 5,170,509 | |
| Professional Services – 0.0%(d) | |
Benefit Systems SA* | | | 98 | | | | 22,360 | |
Quess Corp. Ltd.* (b) | | | 1,560 | | | | 15,299 | |
Sporton International, Inc. | | | 2,386 | | | | 8,868 | |
| | | | | | | | 46,527 | |
| Real Estate Management & Development – 5.0% | |
Agile Group Holdings Ltd.(a) | | | 182,000 | | | | 207,552 | |
Aldar Properties PJSC | | | 333,642 | | | | 157,143 | |
Aliansce Shopping Centers SA | | | 3,500 | | | | 16,508 | |
Amata Corp. PCL | | | 44,900 | | | | 32,642 | |
AP Thailand PCL, NVDR | | | 1,417,800 | | | | 350,708 | |
Attacq Ltd. | | | 22,672 | | | | 22,447 | |
Ayala Land, Inc. | | | 295,800 | | | | 219,203 | |
Bangkok Land PCL, NVDR | | | 100 | | | | 5 | |
Barwa Real Estate Co. | | | 23,474 | | | | 241,022 | |
Belle Corp. | | | 6,222,000 | | | | 274,440 | |
BR Malls Participacoes SA* | | | 40,800 | | | | 139,497 | |
BR Properties SA | | | 4,577 | | | | 9,623 | |
Bumi Serpong Damai Tbk. PT* | | | 499,200 | | | | 36,120 | |
C C Land Holdings Ltd. | | | 151,000 | | | | 35,827 | |
C&D International Investment Group Ltd. | | | 306,000 | | | | 265,428 | |
Carnival Group International Holdings Ltd.* | | | 440,000 | | | | 7,970 | |
Cathay Real Estate Development Co. Ltd. | | | 33,100 | | | | 19,683 | |
Central China Real Estate Ltd. | | | 990,016 | | | | 361,181 | |
Central Pattana PCL, NVDR | | | 71,400 | | | | 170,154 | |
China Aoyuan Property Group Ltd. | | | 126,000 | | | | 73,613 | |
China Evergrande Group(a) | | | 306,000 | | | | 729,928 | |
China Jinmao Holdings Group Ltd. | | | 488,000 | | | | 204,801 | |
China Logistics Property Holdings Co. Ltd.* (b) | | | 59,000 | | | | 19,568 | |
| | | | | | | | |
| Investments | | Shares | | | Value | |
| Real Estate Management & Development – (continued) | |
China Merchants Land Ltd.* | | | 2,040,000 | | | $ | 262,826 | |
China Oceanwide Holdings Ltd.* | | | 202,000 | | | | 9,792 | |
China Overseas Grand Oceans Group Ltd. | | | 1,938,000 | | | | 598,255 | |
China Overseas Land & Investment Ltd. | | | 408,000 | | | | 1,277,700 | |
China Resources Land Ltd. | | | 281,777 | | | | 956,102 | |
China SCE Group Holdings Ltd. | | | 204,000 | | | | 69,480 | |
China South City Holdings Ltd. | | | 348,000 | | | | 51,050 | |
China Vanke Co. Ltd., Class H | | | 132,600 | | | | 408,487 | |
China Vast Industrial Urban Development Co. Ltd.(b) | | | 510,000 | | | | 197,770 | |
Chong Hong Construction Co. Ltd. | | | 24,000 | | | | 54,526 | |
CIFI Holdings Group Co. Ltd. | | | 381,149 | | | | 159,472 | |
Ciputra Development Tbk. PT | | | 597,049 | | | | 32,204 | |
Corp. Inmobiliaria Vesta SAB de CV | | | 802,500 | | | | 982,766 | |
Country Garden Holdings Co. Ltd. | | | 346,000 | | | | 370,301 | |
DAMAC Properties Dubai Co. PJSC | | | 104,520 | | | | 57,480 | |
DLF Ltd. | | | 19,408 | | | | 43,241 | |
Dongwon Development Co. Ltd. | | | 60,894 | | | | 189,167 | |
DoubleDragon Properties Corp.* | | | 42,720 | | | | 15,330 | |
Echo Investment SA | | | 233,070 | | | | 243,989 | |
Eco World International Bhd.* | | | 68,800 | | | | 14,715 | |
Emaar Development PJSC | | | 98,328 | | | | 132,510 | |
Emaar Malls PJSC | | | 96,296 | | | | 47,976 | |
Emaar Properties PJSC | | | 392,088 | | | | 544,404 | |
Ezdan Holding Group QSC* | | | 13,748 | | | | 41,302 | |
Fantasia Holdings Group Co. Ltd. | | | 2,142,000 | | | | 213,123 | |
Farglory Land Development Co. Ltd. | | | 29,000 | | | | 33,083 | |
Filinvest Land, Inc. | | | 13,464,000 | | | | 352,296 | |
Future Land Development Holdings Ltd. | | | 204,000 | | | | 117,101 | |
See Accompanying Notes to the Financial Statements.
| | |
| 210 | | FLEXSHARES ANNUAL REPORT |
FlexShares® Morningstar Emerging Markets Factor Tilt Index Fund (cont.)
| | | | | | | | |
| Investments | | Shares | | | Value | |
| COMMON STOCKS – (continued) | |
| Real Estate Management & Development – (continued) | |
Gemdale Properties & Investment Corp. Ltd. | | | 720,000 | | | $ | 66,127 | |
Globe Trade Centre SA | | | 11,472 | | | | 24,169 | |
Glorious Property Holdings Ltd.* | | | 86,000 | | | | 4,169 | |
Godrej Properties Ltd.* | | | 3,326 | | | | 26,952 | |
Greenland Hong Kong Holdings Ltd. | | | 1,224,000 | | | | 281,042 | |
Greentown China Holdings Ltd. | | | 80,000 | | | | 55,514 | |
Ground International Development Ltd.* | | | 150,000 | | | | 15,307 | |
Guangzhou R&F Properties Co. Ltd., Class H | | | 113,600 | | | | 178,238 | |
Guorui Properties Ltd.(b) | | | 1,122,000 | | | | 269,072 | |
Hanson International Tbk. PT* | | | 2,409,275 | | | | 19,176 | |
Highwealth Construction Corp. | | | 102,000 | | | | 149,491 | |
Hongkong Land Holdings Ltd. | | | 61,200 | | | | 362,304 | |
Hung Sheng Construction Ltd. | | | 788,400 | | | | 667,553 | |
Iguatemi Empresa de Shopping Centers SA | | | 4,800 | | | | 50,216 | |
Indiabulls Real Estate Ltd.* | | | 15,184 | | | | 15,390 | |
IOI Properties Group Bhd. | | | 87,200 | | | | 27,299 | |
Jiayuan International Group Ltd. | | | 40,430 | | | | 70,964 | |
Jingrui Holdings Ltd. | | | 612,000 | | | | 157,696 | |
Joy City Property Ltd. | | | 480,000 | | | | 50,820 | |
Kaisa Group Holdings Ltd. | | | 256,000 | | | | 62,372 | |
Kindom Construction Corp. | | | 541,000 | | | | 297,224 | |
Korea Real Estate Investment & Trust Co. Ltd. | | | 236,334 | | | | 486,335 | |
KWG Group Holdings Ltd. | | | 153,918 | | | | 117,607 | |
Land & Houses PCL, NVDR | | | 155,700 | | | | 48,377 | |
Lippo Karawaci Tbk. PT | | | 810,600 | | | | 14,930 | |
Logan Property Holdings Co. Ltd. | | | 162,000 | | | | 149,613 | |
Longfor Group Holdings Ltd. | | | 153,000 | | | | 371,600 | |
LSR Group PJSC | | | 57,426 | | | | 549,888 | |
LVGEM China Real Estate Investment Co. Ltd. | | | 84,000 | | | | 23,573 | |
Mah Sing Group Bhd. | | | 1,734,000 | | | | 397,811 | |
| | | | | | | | |
| Investments | | Shares | | | Value | |
| Real Estate Management & Development – (continued) | |
MAS Real Estate, Inc. | | | 13,905 | | | $ | 19,879 | |
MBK PCL, NVDR | | | 29,800 | | | | 21,934 | |
Medinet Nasr Housing* | | | 20,044 | | | | 7,924 | |
Megaworld Corp. | | | 585,000 | | | | 48,217 | |
Metropolitan Kentjana Tbk. PT | | | 4,100 | | | | 5,903 | |
Mingfa Group International Co. Ltd.* (c) | | | 36,000 | | | | 8,679 | |
NEPI Rockcastle plc | | | 18,768 | | | | 161,914 | |
Oberoi Realty Ltd. | | | 8,116 | | | | 46,466 | |
Origin Property PCL | | | 78,900 | | | | 21,897 | |
OSK Holdings Bhd. | | | 1,530,000 | | | | 332,728 | |
Pakuwon Jati Tbk. PT | | | 1,268,300 | | | | 39,878 | |
Palm Hills Developments SAE* | | | 1,071,816 | | | | 140,439 | |
Parque Arauco SA | | | 33,966 | | | | 77,012 | |
Phoenix Mills Ltd. (The) | | | 1,462 | | | | 10,942 | |
Poly Property Group Co. Ltd. | | | 204,000 | | | | 60,892 | |
Powerlong Real Estate Holdings Ltd. | | | 138,000 | | | | 47,177 | |
Prestige Estates Projects Ltd. | | | 6,656 | | | | 17,543 | |
Prince Housing & Development Corp. | | | 120,000 | | | | 39,169 | |
Pruksa Holding PCL, NVDR | | | 62,400 | | | | 38,024 | |
Quality Houses PCL, NVDR | | | 6,313,800 | | | | 598,049 | |
Red Star Macalline Group Corp. Ltd., Class H(b) | | | 999,679 | | | | 882,437 | |
Redco Group(b) | | | 52,000 | | | | 23,548 | |
Renhe Commercial Holdings Co. Ltd.* | | | 550,000 | | | | 18,592 | |
Road King Infrastructure Ltd. | | | 373,000 | | | | 575,720 | |
Robinsons Land Corp. | | | 103,906 | | | | 40,685 | |
Ronshine China Holdings Ltd.* (b) | | | 54,500 | | | | 61,387 | |
Ruentex Development Co. Ltd.* | | | 65,400 | | | | 90,461 | |
Sansiri PCL, NVDR | | | 8,670,000 | | | | 410,615 | |
Shanghai Industrial Urban Development Group Ltd. | | | 2,040,000 | | | | 304,462 | |
Shanghai Lujiazui Finance & Trade Zone Development Co. Ltd., Class B | | | 31,200 | | | | 39,624 | |
Shenzhen Investment Ltd. | | | 362,793 | | | | 104,126 | |
Shimao Property Holdings Ltd. | | | 117,500 | | | | 229,922 | |
See Accompanying Notes to the Financial Statements.
| | | | |
| FLEXSHARES ANNUAL REPORT | | | 211 | |
FlexShares® Morningstar Emerging Markets Factor Tilt Index Fund (cont.)
| | | | | | | | |
| Investments | | Shares | | | Value | |
| COMMON STOCKS – (continued) | |
| Real Estate Management & Development – (continued) | |
Shining Building Business Co. Ltd.* | | | 13,650 | | | $ | 4,323 | |
Shui On Land Ltd. | | | 408,000 | | | | 82,231 | |
Sime Darby Property Bhd. | | | 228,000 | | | | 53,125 | |
Singha Estate PCL, NVDR* | | | 77,400 | | | | 7,331 | |
Sino-Ocean Group Holding Ltd. | | | 309,267 | | | | 121,113 | |
Sinyi Realty, Inc. | | | 22,738 | | | | 21,641 | |
SK D&D Co. Ltd. | | | 258 | | | | 6,928 | |
Skyfame Realty Holdings Ltd. | | | 96,000 | | | | 16,532 | |
SM Prime Holdings, Inc. | | | 591,600 | | | | 373,724 | |
Sobha Ltd. | | | 1,548 | | | | 9,370 | |
SOHO China Ltd. | | | 104,000 | | | | 35,288 | |
SP Setia Bhd. Group | | | 52,000 | | | | 26,096 | |
Summarecon Agung Tbk. PT | | | 433,400 | | | | 17,105 | |
Sunac China Holdings Ltd. | | | 238,000 | | | | 646,657 | |
Sunshine 100 China Holdings Ltd.* (b) | | | 1,156,000 | | | | 560,349 | |
Sunway Bhd. | | | 100,235 | | | | 32,817 | |
Supalai PCL, NVDR | | | 48,600 | | | | 32,107 | |
Talaat Moustafa Group | | | 51,370 | | | | 26,580 | |
Tian An China Investment Co. Ltd. | | | 612,000 | | | | 326,321 | |
Times China Holdings Ltd. | | | 66,000 | | | | 57,502 | |
Tomson Group Ltd. | | | 1,428,000 | | | | 398,923 | |
UEM Sunrise Bhd. | | | 71,900 | | | | 11,770 | |
United Development Co. QSC | | | 12,360 | | | | 47,518 | |
UOA Development Bhd. | | | 17,600 | | | | 8,202 | |
Vista Land & Lifescapes, Inc. | | | 5,814,000 | | | | 573,739 | |
WHA Corp. PCL, NVDR | | | 394,090 | | | | 48,979 | |
Yuexiu Property Co. Ltd. | | | 612,000 | | | | 96,803 | |
Yuzhou Properties Co. Ltd. | | | 181,000 | | | | 64,648 | |
Zall Smart Commerce Group Ltd. | | | 156,000 | | | | 111,437 | |
Zhenro Properties Group Ltd.(b) | | | 120,000 | | | | 72,557 | |
| | | | | | | | 24,500,301 | |
| Road & Rail – 0.2% | |
Blue Bird Tbk. PT | | | 30,900 | | | | 5,793 | |
BTS Group Holdings PCL, NVDR | | | 220,640 | | | | 60,901 | |
| | | | | | | | |
| Investments | | Shares | | | Value | |
| Road & Rail – (continued) | |
CAR, Inc.* (a) | | | 42,000 | | | $ | 33,324 | |
CJ Logistics Corp.* | | | 416 | | | | 57,861 | |
Container Corp. of India Ltd. | | | 8,976 | | | | 76,929 | |
Cosan Logistica SA* | | | 4,018 | | | | 13,781 | |
GMexico Transportes SAB de CV(b) | | | 44,100 | | | | 60,561 | |
Guangshen Railway Co. Ltd., Class H | | | 30,000 | | | | 11,213 | |
Localiza Rent a Car SA* | | | 25,260 | | | | 195,511 | |
PKP Cargo SA* | | | 44,064 | | | | 462,433 | |
Rumo SA* | | | 51,000 | | | | 228,604 | |
| | | | | | | | 1,206,911 | |
| Semiconductors & Semiconductor Equipment – 3.7% | |
A-DATA Technology Co. Ltd. | | | 306,000 | | | | 372,821 | |
Advanced Wireless Semiconductor Co. | | | 10,000 | | | | 12,410 | |
Ardentec Corp. | | | 615,720 | | | | 534,275 | |
ASE Technology Holding Co. Ltd.* | | | 162,420 | | | | 327,538 | |
ASMedia Technology, Inc. | | | 1,104 | | | | 15,253 | |
ASPEED Technology, Inc. | | | 1,000 | | | | 14,753 | |
Chang Wah Technology Co. Ltd. | | | 23,000 | | | | 173,933 | |
Chipbond Technology Corp. | | | 35,000 | | | | 64,247 | |
ChipMOS Techinologies, Inc.* | | | 17,848 | | | | 12,315 | |
Darwin Precisions Corp. | | | 11,000 | | | | 5,439 | |
DB HiTek Co. Ltd. | | | 54,672 | | | | 544,537 | |
Elan Microelectronics Corp.* | | | 8,400 | | | | 15,609 | |
Elite Advanced Laser Corp. | | | 3,960 | | | | 6,898 | |
Elite Semiconductor Memory Technology, Inc. | | | 12,000 | | | | 11,479 | |
eMemory Technology, Inc. | | | 3,000 | | | | 22,202 | |
Eo Technics Co. Ltd. | | | 390 | | | | 16,718 | |
Epistar Corp. | | | 58,000 | | | | 52,390 | |
Eugene Technology Co. Ltd. | | | 344 | | | | 3,879 | |
Faraday Technology Corp. | | | 6,000 | | | | 6,205 | |
Formosa Advanced Technologies Co. Ltd. | | | 204,000 | | | | 202,398 | |
Foxsemicon Integrated Technology, Inc. | | | 1,102 | | | | 3,829 | |
GCL-Poly Energy Holdings Ltd.* (a) | | | 1,020,000 | | | | 60,502 | |
See Accompanying Notes to the Financial Statements.
| | |
| 212 | | FLEXSHARES ANNUAL REPORT |
FlexShares® Morningstar Emerging Markets Factor Tilt Index Fund (cont.)
| | | | | | | | |
| Investments | | Shares | | | Value | |
| COMMON STOCKS – (continued) | |
| Semiconductors & Semiconductor Equipment – (continued) | |
Gigasolar Materials Corp.* | | | 1,380 | | | $ | 3,777 | |
Global Unichip Corp. | | | 5,000 | | | | 33,933 | |
Globalwafers Co. Ltd. | | | 12,000 | | | | 95,207 | |
Greatek Electronics, Inc. | | | 6,000 | | | | 7,465 | |
Hanmi Semiconductor Co. Ltd. | | | 1,248 | | | | 10,065 | |
Holtek Semiconductor, Inc. | | | 1,000 | | | | 1,887 | |
Hua Hong Semiconductor Ltd.(b) | | | 20,000 | | | | 34,799 | |
Innox Advanced Materials Co. Ltd.* | | | 520 | | | | 18,116 | |
Jusung Engineering Co. Ltd. | | | 774 | | | | 4,653 | |
King Yuan Electronics Co. Ltd. | | | 132,000 | | | | 77,000 | |
Kinsus Interconnect Technology Corp. | | | 32,000 | | | | 41,832 | |
Koh Young Technology, Inc. | | | 416 | | | | 32,928 | |
LandMark Optoelectronics Corp. | | | 2,000 | | | | 13,282 | |
LEENO Industrial, Inc. | | | 416 | | | | 21,867 | |
Lextar Electronics Corp.* | | | 12,000 | | | | 6,399 | |
Macronix International | | | 90,780 | | | | 50,314 | |
MediaTek, Inc. | | | 83,000 | | | | 610,235 | |
Nanya Technology Corp. | | | 37,000 | | | | 61,461 | |
Novatek Microelectronics Corp. | | | 31,000 | | | | 136,751 | |
On-Bright Electronics, Inc. | | | 2,000 | | | | 11,085 | |
OptoTech Corp. | | | 23,000 | | | | 11,670 | |
Parade Technologies Ltd. | | | 3,400 | | | | 45,051 | |
Phison Electronics Corp. | | | 10,000 | | | | 65,605 | |
Pixart Imaging, Inc. | | | 5,000 | | | | 13,169 | |
Powertech Technology, Inc. | | | 91,000 | | | | 198,804 | |
PSK, Inc. | | | 20,296 | | | | 234,209 | |
Radiant Opto-Electronics Corp. | | | 48,330 | | | | 126,358 | |
Realtek Semiconductor Corp. | | | 26,070 | | | | 104,472 | |
SDI Corp. | | | 7,000 | | | | 15,157 | |
Semiconductor Manufacturing International Corp.* (a) | | | 167,000 | | | | 137,828 | |
Seoul Semiconductor Co. Ltd. | | | 1,370 | | | | 24,586 | |
Sigurd Microelectronics Corp. | | | 510,000 | | | | 456,549 | |
Silergy Corp. | | | 4,000 | | | | 50,932 | |
| | | | | | | | |
| Investments | | Shares | | | Value | |
| Semiconductors & Semiconductor Equipment – (continued) | |
Silicon Works Co. Ltd. | | | 416 | | | $ | 14,401 | |
Sino-American Silicon Products, Inc.* | | | 31,000 | | | | 57,706 | |
Sitronix Technology Corp. | | | 163,000 | | | | 421,420 | |
SK Hynix, Inc. | | | 61,912 | | | | 3,705,321 | |
Taiwan Semiconductor Co. Ltd. | | | 9,000 | | | | 13,467 | |
Taiwan Semiconductor Manufacturing Co. Ltd. | | | 918,000 | | | | 6,942,184 | |
TES Co. Ltd. | | | 430 | | | | 5,660 | |
Tokai Carbon Korea Co. Ltd. | | | 86 | | | | 4,241 | |
Topco Scientific Co. Ltd. | | | 204,000 | | | | 421,937 | |
Toptec Co. Ltd.* | | | 29,784 | | | | 346,310 | |
United Microelectronics Corp. | | | 612,000 | | | | 233,384 | |
United Renewable Energy Co. Ltd.* | | | 42,000 | | | | 9,325 | |
Vanguard International Semiconductor Corp. | | | 35,000 | | | | 64,473 | |
Visual Photonics Epitaxy Co. Ltd. | | | 6,000 | | | | 10,762 | |
Wafer Works Corp. | | | 16,798 | | | | 17,046 | |
Win Semiconductors Corp. | | | 20,961 | | | | 64,354 | |
Winbond Electronics Corp. | | | 306,000 | | | | 132,515 | |
Wonik Holdings Co. Ltd.* | | | 52,734 | | | | 185,105 | |
WONIK IPS Co. Ltd. | | | 946 | | | | 15,773 | |
XinTec, Inc.* | | | 6,000 | | | | 6,399 | |
| | | | | | | | 17,908,859 | |
| Software – 0.3% | |
Ahnlab, Inc. | | | 190 | | | | 6,769 | |
Asseco Poland SA | | | 108,222 | | | | 1,364,588 | |
Cyient Ltd. | | | 764 | | | | 6,419 | |
Douzone Bizon Co. Ltd. | | | 669 | | | | 25,450 | |
Kingdee International Software Group Co. Ltd. | | | 100,000 | | | | 81,639 | |
Kingsoft Corp. Ltd. | | | 54,000 | | | | 76,460 | |
Linx SA | | | 6,200 | | | | 42,797 | |
Oracle Financial Services Software Ltd. | | | 883 | | | | 43,272 | |
Tata Elxsi Ltd. | | | 516 | | | | 7,222 | |
XPEC Entertainment, Inc.* ‡ (c) | | | 14,800 | | | | — | |
| | | | | | | | 1,654,616 | |
See Accompanying Notes to the Financial Statements.
| | | | |
| FLEXSHARES ANNUAL REPORT | | | 213 | |
FlexShares® Morningstar Emerging Markets Factor Tilt Index Fund (cont.)
| | | | | | | | |
| Investments | | Shares | | | Value | |
| COMMON STOCKS – (continued) | |
| Specialty Retail – 1.0% | |
Ace Hardware Indonesia Tbk. PT | | | 163,200 | | | $ | 14,707 | |
Beauty Community PCL, NVDR | | | 114,400 | | | | 34,510 | |
Bermaz Auto Bhd. | | | 20,800 | | | | 9,444 | |
Cashbuild Ltd. | | | 1,168 | | | | 21,333 | |
China Harmony New Energy Auto Holding Ltd.(a) | | | 1,071,000 | | | | 424,881 | |
China Yongda Automobiles Services Holdings Ltd.(a) | | | 85,500 | | | | 45,698 | |
China ZhengTong Auto Services Holdings Ltd.(a) | | | 131,000 | | | | 62,497 | |
Cia Hering | | | 4,800 | | | | 29,269 | |
Detsky Mir PJSC(b) | | | 357,510 | | | | 486,723 | |
FF Group* (c) | | | 3,536 | | | | 19,231 | |
Foschini Group Ltd. (The) | | | 11,220 | | | | 122,502 | |
GOME Retail Holdings Ltd.* (a) | | | 623,447 | | | | 62,031 | |
Grand Baoxin Auto Group Ltd. | | | 816,000 | | | | 176,952 | |
Home Product Center PCL, NVDR | | | 214,200 | | | | 96,277 | |
Hotai Motor Co. Ltd. | | | 21,000 | | | | 144,895 | |
Hotel Shilla Co. Ltd. | | | 1,460 | | | | 91,350 | |
Italtile Ltd. | | | 43,920 | | | | 38,458 | |
JUMBO SA | | | 5,202 | | | | 75,916 | |
LOTTE Himart Co. Ltd. | | | 936 | | | | 46,079 | |
M.Video PJSC* | | | 2,600 | | | | 15,761 | |
Mr Price Group Ltd. | | | 13,158 | | | | 205,814 | |
Padini Holdings Bhd. | | | 17,200 | | | | 23,101 | |
PC Jeweller Ltd. | | | 180,642 | | | | 142,911 | |
Pou Sheng International Holdings Ltd.(a) | | | 3,028,000 | | | | 575,519 | |
PTG Energy PCL, NVDR | | | 26,300 | | | | 8,330 | |
Seobu T&D* | | | 475 | | | | 3,656 | |
Siam Global House PCL, NVDR | | | 58,364 | | | | 32,923 | |
Super Group Ltd.* | | | 539,784 | | | | 1,462,210 | |
Truworths International Ltd. | | | 22,236 | | | | 121,855 | |
Via Varejo SA | | | 5,700 | | | | 25,888 | |
Zhongsheng Group Holdings
Ltd.(a) | | | 56,500 | | | | 103,063 | |
| | | | | | | | 4,723,784 | |
| | | | | | | | |
| Investments | | Shares | | | Value | |
| Technology Hardware, Storage & Peripherals – 3.7% | |
Acer, Inc.* | | | 159,858 | | | $ | 112,107 | |
Adlink Technology, Inc. | | | 6,223 | | | | 7,059 | |
Advantech Co. Ltd. | | | 20,220 | | | | 139,187 | |
Asia Vital Components Co. Ltd. | | | 434,000 | | | | 297,347 | |
Asustek Computer, Inc. | | | 79,000 | | | | 584,656 | |
Casetek Holdings Ltd. | | | 17,875 | | | | 25,158 | |
Catcher Technology Co. Ltd. | | | 86,000 | | | | 865,753 | |
Chicony Electronics Co. Ltd. | | | 67,992 | | | | 136,015 | |
CMC Magnetics Corp.* | | | 44,000 | | | | 7,835 | |
Compal Electronics, Inc. | | | 453,000 | | | | 249,609 | |
Coolpad Group Ltd.* (c) | | | 326,000 | | | | 29,941 | |
Elitegroup Computer Systems Co. Ltd.* | | | 5,000 | | | | 2,052 | |
Ennoconn Corp. | | | 2,000 | | | | 13,250 | |
Getac Technology Corp. | | | 44,000 | | | | 51,760 | |
Gigabyte Technology Co. Ltd. | | | 29,000 | | | | 37,910 | |
HTC Corp.* | | | 88,000 | | | | 95,556 | |
Inventec Corp. | | | 315,000 | | | | 253,991 | |
Legend Holdings Corp.,
Class H(a) (b) | | | 798,900 | | | | 2,170,647 | |
Lenovo Group Ltd. | | | 612,000 | | | | 389,555 | |
Lite-On Technology Corp. | | | 230,000 | | | | 263,872 | |
Meitu, Inc.* (b) | | | 82,500 | | | | 43,042 | |
Micro-Star International Co. Ltd. | | | 40,000 | | | | 88,291 | |
Mitac Holdings Corp. | | | 82,409 | | | | 66,848 | |
Pegatron Corp. | | | 234,000 | | | | 425,757 | |
Primax Electronics Ltd. | | | 23,000 | | | | 30,921 | |
Qisda Corp. | | | 181,000 | | | | 102,658 | |
Quanta Computer, Inc. | | | 306,000 | | | | 483,085 | |
Ritek Corp.* | | | 32,590 | | | | 10,427 | |
Samsung Electronics Co. Ltd. | | | 265,608 | | | | 9,882,655 | |
Samsung Electronics Co. Ltd. (Preference) | | | 39,270 | | | | 1,231,980 | |
Sindoh Co. Ltd. | | | 16 | | | | 611 | |
Transcend Information, Inc. | | | 7,000 | | | | 14,614 | |
Wistron Corp. | | | 316,573 | | | | 193,363 | |
| | | | | | | | 18,307,512 | |
| Textiles, Apparel & Luxury Goods – 2.1% | |
361 Degrees International Ltd.(a) | | | 918,000 | | | | 213,123 | |
See Accompanying Notes to the Financial Statements.
| | |
| 214 | | FLEXSHARES ANNUAL REPORT |
FlexShares® Morningstar Emerging Markets Factor Tilt Index Fund (cont.)
| | | | | | | | |
| Investments | | Shares | | | Value | |
| COMMON STOCKS – (continued) | |
| Textiles, Apparel & Luxury Goods – (continued) | |
Aditya Birla Fashion and Retail Ltd.* | | | 6,536 | | | $ | 15,919 | |
Aksa Akrilik Kimya Sanayii A/S | | | 103,224 | | | | 166,719 | |
Alpargatas SA (Preference) | | | 5,900 | | | | 24,127 | |
ANTA Sports Products Ltd. | | | 42,000 | | | | 172,513 | |
Arezzo Industria e Comercio SA | | | 1,600 | | | | 20,417 | |
Arvind Ltd. | | | 7,361 | | | | 34,140 | |
Bata India Ltd. | | | 2,024 | | | | 26,674 | |
Bosideng International Holdings Ltd. | | | 5,304,000 | | | | 744,241 | |
CCC SA | | | 1,530 | | | | 66,703 | |
China Dongxiang Group Co. Ltd. | | | 5,202,000 | | | | 802,921 | |
China Lilang Ltd. | | | 22,000 | | | | 18,129 | |
Citychamp Watch & Jewellery Group Ltd. | | | 1,836,000 | | | | 377,065 | |
De Licacy Industrial Co. Ltd.* | | | 13,339 | | | | 8,471 | |
Eclat Textile Co. Ltd. | | | 9,698 | | | | 115,180 | |
F&F Co. Ltd. | | | 12,036 | | | | 551,340 | |
Feng TAY Enterprise Co. Ltd. | | | 21,122 | | | | 126,965 | |
Fila Korea Ltd. | | | 2,366 | | | | 87,307 | |
Formosa Taffeta Co. Ltd. | | | 33,000 | | | | 35,887 | |
Fuguiniao Co. Ltd., Class H* (c) | | | 334,800 | | | | 165,705 | |
Fulgent Sun International Holding Co. Ltd. | | | 133,000 | | | | 193,420 | |
Grendene SA | | | 18,822 | | | | 36,940 | |
Guararapes Confeccoes SA | | | 300 | | | | 10,742 | |
Handsome Co. Ltd. | | | 20,910 | | | | 667,916 | |
Hansae Co. Ltd. | | | 1,034 | | | | 16,832 | |
HengTen Networks Group Ltd.* (a) | | | 1,032,000 | | | | 36,860 | |
HS Industries Co. Ltd. | | | 57,426 | | | | 309,920 | |
Huvis Corp. | | | 22,746 | | | | 147,109 | |
Hwaseung Enterprise Co. Ltd. | | | 2,772 | | | | 26,636 | |
JNBY Design Ltd.(b) | | | 264,500 | | | | 404,878 | |
Lao Feng Xiang Co. Ltd., Class B | | | 295,800 | | | | 922,009 | |
LF Corp. | | | 27,540 | | | | 529,267 | |
Li Ning Co. Ltd.* | | | 77,000 | | | | 72,095 | |
| | | | | | | | |
| Investments | | Shares | | | Value | |
| Textiles, Apparel & Luxury Goods – (continued) | |
LPP SA | | | 78 | | | $ | 159,847 | |
Makalot Industrial Co. Ltd. | | | 7,650 | | | | 41,040 | |
Nan Liu Enterprise Co. Ltd. | | | 2,000 | | | | 10,148 | |
Nishat Mills Ltd. | | | 265,200 | | | | 293,939 | |
Page Industries Ltd. | | | 306 | | | | 121,885 | |
Pou Chen Corp. | | | 273,000 | | | | 276,591 | |
Quang Viet Enterprise Co. Ltd. | | | 4,000 | | | | 13,509 | |
Rajesh Exports Ltd. | | | 4,080 | | | | 31,409 | |
Raymond Ltd. | | | 2,176 | | | | 22,145 | |
Roo Hsing Co. Ltd.* | | | 640,000 | | | | 281,291 | |
Ruentex Industries Ltd.* | | | 37,800 | | | | 94,674 | |
Shenzhou International Group Holdings Ltd. | | | 35,000 | | | | 386,637 | |
SRF Ltd. | | | 774 | | | | 20,212 | |
Tainan Spinning Co. Ltd. | | | 48,555 | | | | 19,065 | |
Taiwan Paiho Ltd. | | | 11,000 | | | | 16,246 | |
Texhong Textile Group Ltd. | | | 364,000 | | | | 437,855 | |
Titan Co. Ltd. | | | 16,014 | | | | 182,912 | |
Vardhman Textiles Ltd. | | | 21,420 | | | | 292,745 | |
Welspun India Ltd. | | | 11,024 | | | | 8,788 | |
Xtep International Holdings Ltd. | | | 12,000 | | | | 6,582 | |
Youngone Corp. | | | 2,448 | | | | 76,799 | |
Youngone Holdings Co. Ltd. | | | 8,058 | | | | 434,172 | |
| | | | | | | | 10,376,661 | |
| Thrifts & Mortgage Finance – 0.5% | |
Dewan Housing Finance Corp. Ltd. | | | 9,048 | | | | 27,543 | |
GRUH Finance Ltd. | | | 12,740 | | | | 49,818 | |
Housing Development Finance Corp. Ltd. | | | 83,947 | | | | 2,008,564 | |
Indiabulls Housing Finance Ltd. | | | 16,422 | | | | 185,351 | |
LIC Housing Finance Ltd. | | | 12,954 | | | | 72,018 | |
Malaysia Building Society Bhd. | | | 94,322 | | | | 21,188 | |
PNB Housing Finance Ltd.(b) | | | 860 | | | | 9,308 | |
| | | | | | | | 2,373,790 | |
| Tobacco – 0.3% | |
British American Tobacco Malaysia Bhd. | | | 5,900 | | | | 43,850 | |
Eastern Tobacco | | | 49,140 | | | | 44,085 | |
See Accompanying Notes to the Financial Statements.
| | | | |
| FLEXSHARES ANNUAL REPORT | | | 215 | |
FlexShares® Morningstar Emerging Markets Factor Tilt Index Fund (cont.)
| | | | | | | | |
| Investments | | Shares | | | Value | |
| COMMON STOCKS – (continued) | |
| Tobacco – (continued) | |
Gudang Garam Tbk. PT | | | 21,600 | | | $ | 102,725 | |
ITC Ltd. | | | 138,108 | | | | 523,146 | |
KT&G Corp. | | | 6,426 | | | | 572,366 | |
| | | | | | | | 1,286,172 | |
| Trading Companies & Distributors – 0.4% | |
Adani Enterprises Ltd. | | | 15,288 | | | | 35,147 | |
AKR Corporindo Tbk. PT | | | 71,700 | | | | 16,319 | |
Barloworld Ltd. | | | 13,464 | | | | 109,417 | |
BOC Aviation Ltd.(b) | | | 22,500 | | | | 160,870 | |
China Aircraft Leasing Group Holdings Ltd.(b) | | | 420,000 | | | | 425,925 | |
CITIC Resources Holdings Ltd. | | | 126,000 | | | | 10,287 | |
Ferreycorp SAA | | | 1,408,416 | | | | 882,744 | |
HC Group, Inc.* | | | 50,000 | | | | 32,464 | |
LG International Corp. | | | 2,400 | | | | 32,960 | |
Posco Daewoo Corp. | | | 5,610 | | | | 87,629 | |
SK Networks Co. Ltd. | | | 19,380 | | | | 72,364 | |
| | | | | | | | 1,866,126 | |
| Transportation Infrastructure – 1.6% | |
Adani Ports & Special Economic Zone Ltd. | | | 40,698 | | | | 175,489 | |
Airports of Thailand PCL | | | 54,000 | | | | 103,439 | |
Airports of Thailand PCL, NVDR | | | 160,200 | | | | 309,285 | |
Bangkok Aviation Fuel Services PCL, NVDR | | | 18,800 | | | | 18,857 | |
Bangkok Expressway & Metro PCL, NVDR | | | 387,600 | | | | 99,385 | |
Beijing Capital International Airport Co. Ltd., Class H | | | 74,000 | | | | 80,141 | |
CCR SA | | | 51,000 | | | | 150,618 | |
China Merchants Port Holdings Co. Ltd. | | | 123,393 | | | | 209,973 | |
COSCO SHIPPING Ports Ltd.(a) | | | 89,384 | | | | 91,215 | |
DP World Ltd. | | | 8,874 | | | | 159,643 | |
Grindrod Ltd.* (a) | | | 14,604 | | | | 6,547 | |
Grupo Aeroportuario del Centro Norte SAB de CV | | | 16,500 | | | | 86,602 | |
| | | | | | | | |
| Investments | | Shares | | | Value | |
| Transportation Infrastructure – (continued) | |
Grupo Aeroportuario del Pacifico SAB de CV, Class B | | | 18,800 | | | $ | 156,009 | |
Grupo Aeroportuario del Sureste SAB de CV, Class B | | | 8,160 | | | | 136,050 | |
International Container Terminal Services, Inc. | | | 39,920 | | | | 67,522 | |
Jasa Marga Persero Tbk. PT | | | 88,423 | | | | 24,138 | |
Jiangsu Expressway Co. Ltd., Class H | | | 62,000 | | | | 83,200 | |
Lingkaran Trans Kota Holdings Bhd. | | | 17,200 | | | | 16,113 | |
Malaysia Airports Holdings Bhd. | | | 31,200 | | | | 61,885 | |
Novorossiysk Commercial Sea Port PJSC | | | 289,596 | | | | 27,026 | |
OHL Mexico SAB de CV(a) | | | 26,500 | | | | 36,549 | |
Promotora y Operadora de Infraestructura SAB de CV | | | 10,200 | | | | 93,110 | |
Promotora y Operadora de Infraestructura SAB de CV, Class L | | | 2,300 | | | | 15,844 | |
Qingdao Port International Co. Ltd., Class H* (b) | | | 1,632,000 | | | | 957,624 | |
Shenzhen Expressway Co. Ltd., Class H | | | 1,020,000 | | | | 938,107 | |
Shenzhen International Holdings Ltd. | | | 51,000 | | | | 97,584 | |
Sociedad Matriz SAAM SA | | | 6,648,462 | | | | 571,880 | |
Taiwan High Speed Rail Corp. | | | 116,000 | | | | 115,089 | |
TAV Havalimanlari Holding A/S | | | 18,156 | | | | 75,368 | |
Tianjin Port Development Holdings Ltd. | | | 2,448,000 | | | | 249,815 | |
Westports Holdings Bhd. | | | 61,600 | | | | 50,199 | |
Yuexiu Transport Infrastructure Ltd. | | | 1,020,000 | | | | 818,404 | |
Zhejiang Expressway Co. Ltd., Class H | | | 1,972,000 | | | | 1,652,683 | |
| | | | | | | | 7,735,393 | |
See Accompanying Notes to the Financial Statements.
| | |
| 216 | | FLEXSHARES ANNUAL REPORT |
FlexShares® Morningstar Emerging Markets Factor Tilt Index Fund (cont.)
| | | | | | | | |
| Investments | | Shares | | | Value | |
| COMMON STOCKS – (continued) | |
| Water Utilities – 0.3% | |
Aguas Andinas SA, Class A | | | 140,454 | | | $ | 73,015 | |
Beijing Enterprises Water Group Ltd. | | | 612,000 | | | | 311,488 | |
China Everbright Water Ltd. | | | 42,900 | | | | 10,843 | |
Cia de Saneamento Basico do Estado de Sao Paulo* | | | 36,700 | | | | 276,152 | |
Cia de Saneamento de Minas Gerais-COPASA | | | 8,600 | | | | 118,772 | |
Cia de Saneamento do Parana (Preference) | | | 24,000 | | | | 65,128 | |
CT Environmental Group Ltd. | | | 192,000 | | | | 8,694 | |
Guangdong Investment Ltd. | | | 156,000 | | | | 278,593 | |
Inversiones Aguas Metropolitanas SA | | | 11,208 | | | | 15,450 | |
Manila Water Co., Inc. | | | 33,800 | | | | 15,793 | |
SIIC Environment Holdings Ltd. | | | 89,300 | | | | 17,411 | |
TTW PCL, NVDR | | | 68,000 | | | | 25,231 | |
| | | | | | | | 1,216,570 | |
| Wireless Telecommunication Services – 2.4% | |
Advanced Info Service PCL, NVDR | | | 55,300 | | | | 326,962 | |
Almendral SA | | | 11,595,007 | | | | 649,204 | |
America Movil SAB de CV, Series L | | | 1,146,100 | | | | 832,509 | |
Axiata Group Bhd. | | | 159,782 | | | | 130,208 | |
Bharti Airtel Ltd. | | | 57,324 | | | | 226,637 | |
China Mobile Ltd. | | | 588,617 | | | | 5,503,690 | |
DiGi.Com Bhd. | | | 122,400 | | | | 126,071 | |
Empresa Nacional de Telecomunicaciones SA | | | 5,699 | | | | 41,387 | |
Far EasTone Telecommunications Co. Ltd. | | | 82,000 | | | | 195,308 | |
Global Telecom Holding SAE* | | | 353,160 | | | | 54,741 | |
Globe Telecom, Inc. | | | 1,560 | | | | 60,936 | |
Indosat Tbk. PT | | | 68,800 | | | | 10,907 | |
Intouch Holdings PCL, NVDR | | | 81,600 | | | | 130,462 | |
Maxis Bhd. | | | 71,400 | | | | 89,239 | |
Mobile TeleSystems PJSC | | | 102,306 | | | | 400,883 | |
MTN Group Ltd. | | | 74,154 | | | | 429,369 | |
| | | | | | | | |
| Investments | | Shares | | | Value | |
| Wireless Telecommunication Services – (continued) | |
PLAY Communications SA(b) | | | 10,800 | | | $ | 46,521 | |
PLDT, Inc. | | | 3,390 | | | | 88,068 | |
Sarana Menara Nusantara Tbk. PT | | | 1,853,000 | | | | 58,994 | |
SK Telecom Co. Ltd. | | | 4,284 | | | | 1,007,513 | |
Taiwan Mobile Co. Ltd. | | | 88,000 | | | | 314,255 | |
TIM Participacoes SA* | | | 40,800 | | | | 127,304 | |
Total Access Communication PCL, NVDR | | | 41,600 | | | | 59,608 | |
Turkcell Iletisim Hizmetleri A/S | | | 109,956 | | | | 222,726 | |
Vodacom Group Ltd. | | | 25,908 | | | | 218,265 | |
Vodafone Idea Ltd.* | | | 194,924 | | | | 101,884 | |
Vodafone Qatar QSC* | | | 20,384 | | | | 45,956 | |
XL Axiata Tbk. PT* | | | 149,675 | | | | 25,795 | |
| | | | | | | | 11,525,402 | |
Total Common Stocks
(Cost $492,949,525) | | | | | | | 486,212,338 | |
| | | Principal
Amount | | | | |
| CORPORATE BONDS – 0.0%(d) | |
Independent Power and Renewable Electricity
Producers – 0.0%(d) | |
NTPC Ltd. | | | | | |
Series 54, 8.49%, 3/25/2025
(Cost $–) | | | INR 49,126 | | | | 9,446 | |
| | | Number of
Rights | | | | |
| RIGHTS – 0.0%(d) | |
| Banks – 0.0%(d) | |
Banco de Credito e Inversiones SA, expiring 11/29/2018, price 41,500.00 CLP* (c) | | | 183 | | | | 594 | |
Taichung Commercial Bank Co., Ltd., expiring 11/26/2018, price 10.20 TWD* ‡ (c) | | | 7,288 | | | | — | |
Taishin Financial Holding Co. Ltd., expiring 11/22/2018, price 50.00 TWD* (c) | | | 19,426 | | | | 1,883 | |
| | | | | | | | 2,477 | |
See Accompanying Notes to the Financial Statements.
| | | | |
| FLEXSHARES ANNUAL REPORT | | | 217 | |
FlexShares® Morningstar Emerging Markets Factor Tilt Index Fund (cont.)
| | | | | | | | |
| Investments | | Number of
Rights | | | Value | |
| RIGHTS – (continued) | |
| Electric Utilities – 0.0% | |
RusHydro PJSC, expiring 6/28/2019, price 1.00 RUB* ‡ (c) | | | 565,935 | | | $ | — | |
| Marine – 0.0%(d) | |
Evergreen Marine Corp. Taiwan Ltd., expiring 11/21/2018, price 10.70 TWD* (c) | | | 6,220 | | | | 141 | |
| Multiline Retail – 0.0%(d) | |
SACI Falabella, expiring 11/17/2018, price 5,250.00 CLP* | | | 919 | | | | 92 | |
| Real Estate Management & Development – 0.0%(d) | |
Palm Hills Developments SAE, expiring 11/15/2018, price 2.03 EGP* | | | 374,785 | | | | 5,789 | |
Total Rights
(Cost $–) | | | | | | | 8,499 | |
| | | Number of
Warrants | | | | |
| WARRANTS – 0.0%(d) | |
| Media – 0.0%(d) | |
VGI Global Media PCL, expiring 9/10/2022, price 10.00 THB* | | | 22,880 | | | | 276 | |
| Road & Rail – 0.0% | |
BTS Group Holdings PCL, expiring 12/31/2019, price 10.50 THB* ‡ (c) | | | 24,515 | | | | — | |
Total Warrants
(Cost $–) | | | | | | | 276 | |
| | | | | | | | |
| Investments | | Principal Amount | | | Value | |
| SECURITIES LENDING REINVESTMENTS(e) – 0.1% | |
| REPURCHASE AGREEMENTS – 0.1% | |
Citigroup Global Markets, Inc., 2.20%, dated 10/31/2018, due 11/1/2018, repurchase price $429,536, collateralized by various U.S. Treasury Securities, ranging from 1.13% – 4.63%, maturing 7/15/2020 – 8/15/2040; total market value $433,149 | | $ | 429,510 | | | $ | 429,510 | |
Citigroup Global Markets, Inc., 2.46%, dated 10/31/2018, due 11/7/2018, repurchase price $200,096, collateralized by various U.S. Treasury Securities, ranging from 1.00% – 2.75%, maturing 11/15/2042 – 2/15/2046; total market value $201,544 | | | 200,000 | | | | 200,000 | |
NBC Global Finance Ltd., 2.36%, dated 10/31/2018, due 11/1/2018, repurchase price $84,612, collateralized by various Common Stocks; total market value $94,715 | | | 84,607 | | | | 84,607 | |
| | | | | | | | 714,117 | |
Total Securities Lending Reinvestments
(Cost $714,117) | | | | 714,117 | |
Total Investments – 99.6%
(Cost $493,663,642) | | | | 486,944,676 | |
Other Assets Less Liabilities – 0.4% | | | | 1,791,369 | |
| NET ASSETS – 100.0% | | | $ | 488,736,045 | |
| * | Non-income producing security. |
| ^ | Security subject to restrictions on resale. |
See Accompanying Notes to the Financial Statements.
| | |
| 218 | | FLEXSHARES ANNUAL REPORT |
FlexShares® Morningstar Emerging Markets Factor Tilt Index Fund (cont.)
| ‡ | Value determined using significant unobservable inputs. |
| (a) | The security or a portion of this security is on loan at October 31, 2018. The total value of securities on loan at October 31, 2018 was $11,852,772, collateralized in the form of cash with a value of $714,117 that was reinvested in the securities shown in the Securities Lending Reinvestment section of the Schedule of Investments; $2,261,820 of collateral in the form of U.S. Government Treasury Securities, interest rates ranging from 0.00% – 7.63%, and maturity dates ranging from November 1, 2018 – February 15, 2048 and $10,091,792 of collateral in the form of Foreign Government Fixed Income Securities, interest rates ranging from 0.00% – 8.50%, and maturity dates ranging from November 14, 2018 – November 2, 2086; a total value of $13,067,729. |
| (b) | Security exempt from registration pursuant to Regulation S under the Securities Act of 1933. Regulation S applies to securities offerings that are made outside of the United States and do not involve direct selling efforts in the United States and as such may have restrictions on resale. |
| (c) | Security fair valued as of October 31, 2018 in accordance with procedures approved by the Board of Trustees. Total value of all such securities at October 31, 2018 amounted to $1,147,623, which represents approximately 0.23% of net assets of the Fund. |
| (d) | Represents less than 0.05% of net assets. |
| (e) | The security was purchased with cash collateral held from securities on loan at October 31, 2018. The total value of securities purchased was $714,117. |
Percentages shown are based on Net Assets.
Abbreviations
ADR – American Depositary Receipt
CLP – Chilean Peso
EGP – Egyptian Pound
GDR – Global Depositary Receipt
INR – Indian Rupee
NVDR – Non-Voting Depositary Receipt
OJSC – Open Joint Stock Company
PJSC – Public Joint Stock Company
Preference – A special type of equity investment that shares in the earnings of the company, has limited voting rights, and may have a dividend preference. Preference shares may also have liquidation preference.
RUB – Russian Ruble
SCA – Limited partnership with share capital
THB – Thai Baht
TWD – Taiwan Dollar
As of October 31, 2018, the gross unrealized appreciation (depreciation) of investments based on the aggregate cost of investments (including derivative instruments, if applicable) for federal income tax purposes was as follows:
| | | | |
| | | | |
Aggregate gross unrealized appreciation | | $ | 56,459,332 | |
Aggregate gross unrealized depreciation | | | (70,681,481 | ) |
Net unrealized depreciation | | $ | (14,222,149 | ) |
Federal income tax cost | | $ | 501,007,167 | |
Futures Contracts
FlexShares® Morningstar Emerging Markets Factor Tilt Index Fund had the following open futures contracts as of October 31, 2018:
| | | | | | | | | | | | | | | | | | | | |
| | | Number of
Contracts | | | Expiration
Date | | | Trading
Currency | | | Notional
Amount | | | Value and
Unrealized
Depreciation* | |
Long Contracts | | | | | | | | | | | | | |
MSCI Emerging Markets E-Mini Index | | | 53 | | | | 12/21/2018 | | | | USD | | | $ | 2,535,255 | | | $ | (126,276 | ) |
| * | This amount represents the cumulative appreciation/depreciation on futures contracts. Current day’s variation margin is reported within the Statement of Assets and Liabilities for futures contracts. |
Forward Foreign Currency Contracts
FlexShares® Morningstar Emerging Markets Factor Tilt Index Fund had the following outstanding contracts as of October 31, 2018:
| | | | | | | | | | | | | | | | | | | | | | |
| Contracts to Receive | | | | | Counterparty | | In Exchange For | | | Maturity Date | | | Unrealized
Appreciation/
(Depreciation) | |
BRL* | | | 939,850 | | | | | Citibank NA | | USD | | | 250,000 | | | | 12/19/2018 | | | $ | 1,961 | |
HKD | | | 5,286,663 | | | | | Goldman Sachs & Co. | | USD | | | 675,000 | | | | 12/19/2018 | | | | 306 | |
KRW* | | | 341,787,000 | | | | | Citibank NA | | USD | | | 300,000 | | | | 12/19/2018 | | | | 363 | |
TWD* | | | 4,632,285 | | | | | Morgan Stanley | | USD | | | 150,000 | | | | 12/19/2018 | | | | 244 | |
USD | | | 87,874 | | | | | Toronto-Dominion Bank (The) | | INR* | | | 6,426,458 | | | | 12/19/2018 | | | | 1,463 | |
See Accompanying Notes to the Financial Statements.
| | | | |
| FLEXSHARES ANNUAL REPORT | | | 219 | |
FlexShares® Morningstar Emerging Markets Factor Tilt Index Fund (cont.)
| | | | | | | | | | | | | | | | | | | | | | |
| Contracts to Receive | | | | | Counterparty | | In Exchange For | | | Maturity Date | | | Unrealized
Appreciation/
(Depreciation) | |
USD | | | 17,308 | | | | | Goldman Sachs & Co. | | KRW* | | | 19,476,890 | | | | 12/19/2018 | | | $ | 192 | |
USD | | | 1,203,942 | | | | | Goldman Sachs & Co. | | TWD* | | | 36,853,868 | | | | 12/19/2018 | | | | 8,616 | |
Total unrealized appreciation | | | | | | | | | | | | $ | 13,145 | |
BRL* | | | 515,761 | | | | | BNP Paribas SA | | USD | | | 140,000 | | | | 12/19/2018 | | | $ | (1,732 | ) |
INR* | | | 16,212,020 | | | | | Goldman Sachs & Co. | | USD | | | 220,000 | | | | 12/19/2018 | | | | (2,012 | ) |
TWD* | | | 32,263,350 | | | | | Goldman Sachs & Co. | | USD | | | 1,050,000 | | | | 12/19/2018 | | | | (3,563 | ) |
USD | | | 328,533 | | | | | Goldman Sachs & Co. | | BRL* | | | 1,366,534 | | | | 12/19/2018 | | | | (37,815 | ) |
USD | | | 145,211 | | | | | Morgan Stanley | | HKD | | | 1,137,880 | | | | 12/19/2018 | | | | (139 | ) |
USD | | | 23,364 | | | | | Morgan Stanley | | RUB* | | | 1,628,891 | | | | 12/19/2018 | | | | (1,266 | ) |
Total unrealized depreciation | | | | | | | | | | | | $ | (46,527 | ) |
Net unrealized depreciation | | | | | | | | | | | | $ | (33,382 | ) |
| * | Non-deliverable forward. See Note 2 in the Notes to Financial Statements. |
Abbreviations:
BRL – Brazilian Real
HKD – Hong Kong Dollar
INR – Indian Rupee
KRW – Korean Won
RUB – Russian Ruble
TWD – Taiwan Dollar
USD – US Dollar
FlexShares® Morningstar Emerging Markets Factor Tilt Index Fund invested, as a percentage of net assets, in companies domiciled in the following countries as of October 31, 2018:
| | | | |
Brazil | | | 7.1 | % |
Chile | | | 1.1 | |
China | | | 29.0 | |
Colombia | | | 0.8 | |
Czech Republic | | | 0.1 | |
Egypt | | | 0.2 | |
Greece | | | 0.4 | |
Hungary | | | 0.2 | |
India | | | 6.7 | |
Indonesia | | | 1.9 | |
Malaysia | | | 2.3 | |
Mexico | | | 2.2 | |
Pakistan | | | 0.7 | |
Peru | | | 0.5 | |
Philippines | | | 1.6 | |
Poland | | | 1.6 | |
Qatar | | | 1.0 | |
Russia | | | 3.5 | |
South Africa | | | 5.9 | |
South Korea | | | 15.3 | |
Taiwan | | | 12.8 | |
Thailand | | | 2.4 | |
See Accompanying Notes to the Financial Statements.
| | |
| 220 | | FLEXSHARES ANNUAL REPORT |
FlexShares® Morningstar Emerging Markets Factor Tilt Index Fund (cont.)
| | | | |
Turkey | | | 1.0 | % |
United Arab Emirates | | | 1.2 | |
Other1 | | | 0.5 | |
| | | | 100.0 | % |
| 1 | Includes any non-equity securities, securities lending reinvestments and net other assets (liabilities). |
See Accompanying Notes to the Financial Statements.
| | | | |
| FLEXSHARES ANNUAL REPORT | | | 221 | |
Schedule of Investments
FlexShares® Currency Hedged Morningstar DM ex-US Factor Tilt Index Fund
October 31, 2018
| | | | | | | | |
| Investments | | Shares | | | Value | |
| EXCHANGE TRADED FUNDS – 98.9% | |
FlexShares® Morningstar Developed Markets ex-US Factor Tilt Index Fund(a)
(Cost $8,590,055) | | | 131,916 | | | | 7,846,364 | |
| | | | | | | | | |
Total Investments – 98.9%
(Cost $8,590,055) | | | | 7,846,364 | |
Other Assets Less Liabilities – 1.1% | | | | 86,708 | |
| NET ASSETS – 100.0% | | | $ | 7,933,072 | |
| (a) | Investment in affiliated Fund. Northern Trust Investments, Inc. is the Investment Adviser to both the Fund and the Underlying Fund. |
Percentages shown are based on Net Assets.
As of October 31, 2018, the gross unrealized appreciation (depreciation) of investments based on the aggregate cost of investments (including derivative instruments, if applicable) for federal income tax purposes was as follows:
| | | | |
| | | | |
Aggregate gross unrealized appreciation | | $ | 75,667 | |
Aggregate gross unrealized depreciation | | | (829,915 | ) |
Net unrealized depreciation | | $ | (754,248 | ) |
Federal income tax cost | | $ | 8,686,156 | |
The FlexShares® Currency Hedged Morningstar DM ex-US Factor Tilt Index Fund currently seeks its investment objective by investing a substantial portion of its assets in an affiliated FlexShares Fund. The Schedule of Investments of the affiliated FlexShares Fund is located elsewhere in this Report.
Investment in a company which was affiliated for the period ended October 31, 2018, was as follows:
| | | | | | | | | | | | | | | | | | | | | | | | | | | | | | | | |
| Security | | Value
October 31, 2017 | | | Purchases
at Cost | | | Sales
Proceeds | | | Shares
October 31, 2018 | | | Value
October 31, 2018 | | | Change in
Unrealized
Appreciation
(Depreciation) | | | Dividend
Income | | | Realized
Gain | |
FlexShares® Morningstar Developed Markets ex-US Factor Tilt Index Fund | | $ | 18,799,687 | | | $ | 9,617,583 | | | $ | 19,503,218 | | | | 131,916 | | | $ | 7,846,364 | | | $ | (3,254,309 | ) | | $ | 447,732 | | | $ | 2,186,621 | |
Forward Foreign Currency Contracts
FlexShares® Currency Hedged Morningstar DM ex-US Factor Tilt Index Fund had the following outstanding contracts as of October 31, 2018:
| | | | | | | | | | | | | | | | | | | | | | |
| Contracts to Receive | | | | | Counterparty | | In Exchange For | | | Maturity
Date | | | Unrealized
Appreciation/
(Depreciation) | |
USD | | | 445,949 | | | | | Toronto-Dominion Bank (The) | | AUD | | | 625,000 | | | | 11/20/2018 | | | $ | 2,893 | |
USD | | | 736,636 | | | | | Toronto-Dominion Bank (The) | | CAD | | | 965,000 | | | | 11/20/2018 | | | | 1,586 | |
USD | | | 417,489 | | | | | Toronto-Dominion Bank (The) | | CHF | | | 415,000 | | | | 11/20/2018 | | | | 4,257 | |
USD | | | 88,651 | | | | | Toronto-Dominion Bank (The) | | DKK | | | 574,000 | | | | 11/20/2018 | | | | 1,348 | |
USD | | | 1,982,731 | | | | | Toronto-Dominion Bank (The) | | EUR | | | 1,721,000 | | | | 11/20/2018 | | | | 29,987 | |
USD | | | 1,356,938 | | | | | Toronto-Dominion Bank (The) | | GBP | | | 1,039,000 | | | | 11/20/2018 | | | | 28,318 | |
USD | | | 87,139 | | | | | Toronto-Dominion Bank (The) | | ILS | | | 318,000 | | | | 11/20/2018 | | | | 1,577 | |
USD | | | 2,234,600 | | | | | Toronto-Dominion Bank (The) | | JPY | | | 250,869,000 | | | | 11/20/2018 | | | | 8,779 | |
USD | | | 104,592 | | | | | Toronto-Dominion Bank (The) | | NOK | | | 859,000 | | | | 11/20/2018 | | | | 2,314 | |
See Accompanying Notes to the Financial Statements.
| | |
| 222 | | FLEXSHARES ANNUAL REPORT |
FlexShares® Currency Hedged Morningstar DM ex-US Factor Tilt Index Fund (cont.)
Forward Foreign Currency Contracts (cont.)
| | | | | | | | | | | | | | | | | | | | | | |
| Contracts to Receive | | | | | Counterparty | | In Exchange For | | | Maturity Date | | | Unrealized
Appreciation/
(Depreciation) | |
USD | | | 27,041 | | | | | Toronto-Dominion Bank (The) | | NZD | | | 41,000 | | | | 11/20/2018 | | | $ | 263 | |
USD | | | 238,776 | | | | | Toronto-Dominion Bank (The) | | SEK | | | 2,145,000 | | | | 11/20/2018 | | | | 3,742 | |
USD | | | 88,654 | | | | | Toronto-Dominion Bank (The) | | SGD | | | 122,000 | | | | 11/20/2018 | | | | 520 | |
Total unrealized appreciation | | | | | | | $ | 85,584 | |
USD | | | 238,278 | | | | | Toronto-Dominion Bank (The) | | HKD | | | 1,867,000 | | | | 11/20/2018 | | | $ | (40 | ) |
Total unrealized depreciation | | | | | | | $ | (40 | ) |
Net unrealized appreciation | | | | | | | $ | 85,544 | |
Abbreviations:
AUD – Australian Dollar
CAD – Canadian Dollar
CHF – Swiss Franc
DKK – Danish Krone
EUR – Euro
GBP – British Pound
HKD – Hong Kong Dollar
ILS – Israeli Shekel
JPY – Japanese Yen
NOK – Norwegian Krone
NZD – New Zealand Dollar
SEK – Swedish Krona
SGD – Singapore Dollar
USD – US Dollar
See Accompanying Notes to the Financial Statements.
| | | | |
| FLEXSHARES ANNUAL REPORT | | | 223 | |
Schedule of Investments
FlexShares® Currency Hedged Morningstar EM Factor Tilt Index Fund
October 31, 2018
| | | | | | | | |
| Investments | | Shares | | | Value | |
| EXCHANGE TRADED FUNDS – 98.0% | |
FlexShares® Morningstar Emerging Markets Factor Tilt Index Fund(a)
(Cost $5,229,977) | | | 93,982 | | | $ | 4,467,575 | |
| | | | | | | | | |
Total Investments – 98.0%
(Cost $5,229,977) | | | | 4,467,575 | |
Other Assets Less Liabilities – 2.0% | | | | 89,854 | |
| NET ASSETS – 100.0% | | | $ | 4,557,429 | |
| (a) | Investment in affiliated Fund. Northern Trust Investments, Inc. is the Investment Adviser to both the Fund and the Underlying Fund. |
Percentages shown are based on Net Assets.
As of October 31, 2018, the gross unrealized appreciation (depreciation) of investments based on the aggregate cost of investments (including derivative instruments, if applicable) for federal income tax purposes was as follows:
| | | | |
| | | | |
Aggregate gross unrealized appreciation | | $ | 41,517 | |
Aggregate gross unrealized depreciation | | | (853,376 | ) |
Net unrealized depreciation | | $ | (811,859 | ) |
Federal income tax cost | | $ | 5,313,857 | |
The FlexShares® Currency Hedged Morningstar EM Factor Tilt Index Fund currently seeks its investment objective by investing a substantial portion of its assets in an affiliated FlexShares Fund. The Schedule of Investments of the affiliated FlexShares Fund is located elsewhere in this Report.
Investment in a company which was affiliated for the period ended October 31, 2018, was as follows:
| | | | | | | | | | | | | | | | | | | | | | | | | | | | | | | | |
| Security | | Value
October 31, 2017 | | | Purchases
at Cost | | | Sales
Proceeds | | | Shares
October 31, 2018 | | | Value
October 31, 2018 | | | Change in
Unrealized
Appreciation
(Depreciation) | | | Dividend
Income | | | Realized
Gain | |
FlexShares® Morningstar Emerging Markets Factor Tilt Index Fund | | $ | 41,185,996 | | | $ | 2,156,050 | | | $ | 35,232,969 | | | | 93,982 | | | $ | 4,467,575 | | | $ | (10,006,917 | ) | | $ | 657,918 | | | $ | 6,365,415 | |
Futures Contracts
FlexShares® Currency Hedged Morningstar EM Factor Tilt Index Fund had the following open futures contract as of October 31, 2018:
| | | | | | | | | | | | | | | | | | | | |
| | | Number of
Contracts | | | Expiration
Date | | | Trading
Currency | | | Notional Amount | | | Value and
Unrealized
Depreciation* | |
Long Contracts | | | | | |
MSCI Emerging Markets E-Mini Index | | | 1 | | | | 12/21/2018 | | | | USD | | | $ | 47,835 | | | $ | (2,781 | ) |
| * | This amount represents the cumulative appreciation/depreciation on futures contracts. Current day’s variation margin is reported within the Statement of Assets and Liabilities for futures contracts. |
See Accompanying Notes to the Financial Statements.
| | |
| 224 | | FLEXSHARES ANNUAL REPORT |
FlexShares® Currency Hedged Morningstar EM Factor Tilt Index Fund (cont.)
Forward Foreign Currency Contracts
FlexShares® Currency Hedged Morningstar EM Factor Tilt Index Fund had the following outstanding contracts as of October 31, 2018:
| | | | | | | | | | | | | | | | | | | | | | |
| Contracts to Receive | | | | | Counterparty | | In Exchange For | | | Maturity Date | | | Unrealized
Appreciation/
(Depreciation) | |
BRL* | | | 630,000 | | | | | Goldman Sachs & Co. | | USD | | | 168,126 | | | | 11/21/2018 | | | $ | 1,137 | |
HKD | | | 5,580,000 | | | | | Goldman Sachs & Co. | | USD | | | 712,166 | | | | 11/21/2018 | | | | 133 | |
PHP* | | | 2,130,000 | | | | | JPMorgan Chase Bank | | USD | | | 39,560 | | | | 11/21/2018 | | | | 203 | |
TRY | | | 160,000 | | | | | Citibank NA | | USD | | | 27,581 | | | | 11/21/2018 | | | | 632 | |
TWD* | | | 10,070,000 | | | | | Goldman Sachs & Co. | | USD | | | 325,490 | | | | 11/21/2018 | | | | 373 | |
USD | | | 478,533 | | | | | Goldman Sachs & Co. | | BRL* | | | 1,780,000 | | | | 11/21/2018 | | | | 300 | |
USD | | | 74,754 | | | | | BNP Paribas SA | | CLP* | | | 50,630,000 | | | | 11/21/2018 | | | | 2,035 | |
USD | | | 34,565 | | | | | Toronto-Dominion Bank (The) | | EUR | | | 30,000 | | | | 11/21/2018 | | | | 523 | |
USD | | | 1,158,450 | | | | | JPMorgan Chase Bank | | KRW* | | | 1,308,400,000 | | | | 11/21/2018 | | | | 9,702 | |
USD | | | 178,164 | | | | | Toronto-Dominion Bank (The) | | MXN | | | 3,430,000 | | | | 11/21/2018 | | | | 9,336 | |
USD | | | 117,818 | | | | | Toronto-Dominion Bank (The) | | PLN | | | 440,000 | | | | 11/21/2018 | | | | 2,907 | |
USD | | | 250,850 | | | | | JPMorgan Chase Bank | | RUB* | | | 16,500,000 | | | | 11/21/2018 | | | | 474 | |
USD | | | 170,761 | | | | | BNP Paribas SA | | THB | | | 5,560,000 | | | | 11/21/2018 | | | | 2,967 | |
USD | | | 918,172 | | | | | JPMorgan Chase Bank | | TWD* | | | 28,310,000 | | | | 11/21/2018 | | | | 2,067 | |
USD | | | 434,141 | | | | | Toronto-Dominion Bank (The) | | ZAR | | | 6,280,000 | | | | 11/21/2018 | | | | 9,851 | |
USD | | | 165,900 | | | | | Goldman Sachs & Co. | | MYR* | | | 690,000 | | | | 11/23/2018 | | | | 1,091 | |
USD | | | 468,489 | | | | | JPMorgan Chase Bank | | INR* | | | 34,560,000 | | | | 11/26/2018 | | | | 2,514 | |
Total unrealized appreciation | | | | | | | $ | 46,245 | |
CLP* | | | 18,020,000 | | | | | Citibank NA | | USD | | | 26,191 | | | | 11/21/2018 | | | $ | (309 | ) |
EUR | | | 10,000 | | | | | Goldman Sachs & Co. | | USD | | | 11,421 | | | | 11/21/2018 | | | | (73 | ) |
KRW* | | | 465,640,000 | | | | | JPMorgan Chase Bank | | USD | | | 409,023 | | | | 11/21/2018 | | | | (201 | ) |
MXN | | | 1,220,000 | | | | | Toronto-Dominion Bank (The) | | USD | | | 61,984 | | | | 11/21/2018 | | | | (1,934 | ) |
PLN | | | 160,000 | | | | | Bank of Montreal | | USD | | | 42,293 | | | | 11/21/2018 | | | | (508 | ) |
RUB* | | | 5,870,000 | | | | | BNP Paribas SA | | USD | | | 89,208 | | | | 11/21/2018 | | | | (135 | ) |
THB | | | 1,980,000 | | | | | Citibank NA | | USD | | | 60,138 | | | | 11/21/2018 | | | | (384 | ) |
USD | | | 1,999,944 | | | | | Toronto-Dominion Bank (The) | | HKD | | | 15,670,000 | | | | 11/21/2018 | | | | (365 | ) |
USD | | | 111,353 | | | | | BNP Paribas SA | | PHP* | | | 5,990,000 | | | | 11/21/2018 | | | | (469 | ) |
USD | | | 76,196 | | | | | BNP Paribas SA | | TRY | | | 440,000 | | | | 11/21/2018 | | | | (1,390 | ) |
ZAR | | | 2,240,000 | | | | | Bank of New York | | USD | | | 153,002 | | | | 11/21/2018 | | | | (1,663 | ) |
IDR* | | | 757,210,000 | | | | | Toronto-Dominion Bank (The) | | USD | | | 49,688 | | | | 11/23/2018 | | | | (11 | ) |
MYR* | | | 240,000 | | | | | Goldman Sachs & Co. | | USD | | | 57,679 | | | | 11/23/2018 | | | | (354 | ) |
USD | | | 139,442 | | | | | BNP Paribas SA | | IDR* | | | 2,127,680,000 | | | | 11/23/2018 | | | | (144 | ) |
INR* | | | 12,300,000 | | | | | Morgan Stanley | | USD | | | 166,943 | | | | 11/26/2018 | | | | (1,101 | ) |
Total unrealized depreciation | | | | | | | $ | (9,041 | ) |
Net unrealized appreciation | | | | | | | $ | 37,204 | |
| * | Non-deliverable forward. See Note 2 in the Notes to Financial Statements. |
See Accompanying Notes to the Financial Statements.
| | | | |
| FLEXSHARES ANNUAL REPORT | | | 225 | |
FlexShares® Currency Hedged Morningstar EM Factor Tilt Index Fund (cont.)
Abbreviations:
BRL – Brazilian Real
CLP – Chilean Peso
EUR – Euro
HKD – Hong Kong Dollar
IDR – Indonesian Rupiah
INR – Indian Rupee
KRW – Korean Won
MXN – Mexican Peso
MYR – Malaysian Ringgit
PHP – Philippine Peso
PLN – Polish Zloty
RUB – Russian Ruble
THB – Thai Baht
TRY – Turkish Lira
TWD – Taiwan Dollar
USD – US Dollar
ZAR – South African Rand
See Accompanying Notes to the Financial Statements.
| | |
| 226 | | FLEXSHARES ANNUAL REPORT |
Schedule of Investments
FlexShares® US Quality Large Cap Index Fund
October 31, 2018
| | | | | | | | |
| Investments | | Shares | | | Value | |
| COMMON STOCKS – 99.7% | |
| Aerospace & Defense – 4.3% | |
Boeing Co. (The) | | | 3,922 | | | $ | 1,391,761 | |
Lockheed Martin Corp. | | | 2,960 | | | | 869,796 | |
Spirit AeroSystems Holdings, Inc., Class A | | | 2,146 | | | | 180,286 | |
Textron, Inc. | | | 4,218 | | | | 226,211 | |
| | | | | | | | 2,668,054 | |
| Air Freight & Logistics – 0.6% | |
Expeditors International of Washington, Inc. | | | 5,846 | | | | 392,734 | |
| Airlines – 0.6% | |
United Continental Holdings, Inc.* | | | 4,366 | | | | 373,337 | |
| Auto Components – 0.3% | |
Lear Corp. | | | 1,480 | | | | 196,692 | |
| Banks – 6.0% | |
Bank of America Corp. | | | 50,986 | | | | 1,402,115 | |
Citigroup, Inc. | | | 18,056 | | | | 1,181,946 | |
Citizens Financial Group, Inc. | | | 7,104 | | | | 265,334 | |
Fifth Third Bancorp | | | 12,580 | | | | 339,534 | |
JPMorgan Chase & Co. | | | 2,294 | | | | 250,092 | |
Regions Financial Corp. | | | 15,244 | | | | 258,691 | |
| | | | | | | | 3,697,712 | |
| Biotechnology – 2.4% | |
AbbVie, Inc. | | | 4,958 | | | | 385,980 | |
Amgen, Inc. | | | 5,624 | | | | 1,084,251 | |
| | | | | | | | 1,470,231 | |
| Capital Markets – 3.0% | |
Goldman Sachs Group, Inc. (The) | | | 4,514 | | | | 1,017,320 | |
Morgan Stanley | | | 18,722 | | | | 854,847 | |
| | | | | | | | 1,872,167 | |
| Chemicals – 2.0% | |
CF Industries Holdings, Inc. | | | 5,846 | | | | 280,783 | |
LyondellBasell Industries NV, Class A | | | 3,478 | | | | 310,481 | |
Mosaic Co. (The) | | | 11,914 | | | | 368,619 | |
Westlake Chemical Corp. | | | 3,478 | | | | 247,982 | |
| | | | | | | | 1,207,865 | |
| | | | | | | | |
| Investments | | Shares | | | Value | |
| Communications Equipment – 2.4% | |
Cisco Systems, Inc. | | | 28,194 | | | $ | 1,289,876 | |
F5 Networks, Inc.* | | | 1,036 | | | | 181,590 | |
| | | | | | | | 1,471,466 | |
| Consumer Finance – 1.8% | |
Ally Financial, Inc. | | | 14,948 | | | | 379,829 | |
Capital One Financial Corp. | | | 5,328 | | | | 475,790 | |
Discover Financial Services | | | 3,996 | | | | 278,401 | |
| | | | | | | | 1,134,020 | |
| Diversified Financial Services – 0.5% | |
Berkshire Hathaway, Inc., Class B* | | | 1,406 | | | | 288,624 | |
| Diversified Telecommunication Services – 2.2% | |
Verizon Communications, Inc. | | | 23,976 | | | | 1,368,790 | |
| Electric Utilities – 1.9% | |
Exelon Corp. | | | 10,952 | | | | 479,807 | |
FirstEnergy Corp. | | | 10,878 | | | | 405,532 | |
PG&E Corp.* | | | 6,734 | | | | 315,218 | |
| | | | | | | | 1,200,557 | |
| Electrical Equipment – 0.6% | |
Eaton Corp. plc | | | 5,032 | | | | 360,643 | |
| Entertainment – 0.7% | |
Spotify Technology SA* | | | 666 | | | | 99,694 | |
Viacom, Inc., Class B | | | 10,878 | | | | 347,878 | |
| | | | | | | | 447,572 | |
| Equity Real Estate Investment Trusts (REITs) – 3.5% | |
Duke Realty Corp. | | | 13,912 | | | | 383,554 | |
Host Hotels & Resorts, Inc. | | | 19,462 | | | | 371,919 | |
Prologis, Inc. | | | 6,882 | | | | 443,682 | |
Public Storage | | | 2,146 | | | | 440,939 | |
SL Green Realty Corp. | | | 2,516 | | | | 229,610 | |
Weyerhaeuser Co. | | | 11,766 | | | | 313,329 | |
| | | | | | | | 2,183,033 | |
| Food & Staples Retailing – 3.9% | |
Kroger Co. (The) | | | 12,950 | | | | 385,392 | |
Walgreens Boots Alliance, Inc. | | | 11,026 | | | | 879,544 | |
Walmart, Inc. | | | 11,470 | | | | 1,150,212 | |
| | | | | | | | 2,415,148 | |
See Accompanying Notes to the Financial Statements.
| | | | |
| FLEXSHARES ANNUAL REPORT | | | 227 | |
FlexShares® US Quality Large Cap Index Fund (cont.)
| | | | | | | | |
| Investments | | Shares | | | Value | |
| COMMON STOCKS – (continued) | |
| Food Products – 2.2% | |
Archer-Daniels-Midland Co. | | | 8,510 | | | $ | 402,097 | |
Bunge Ltd. | | | 4,366 | | | | 269,819 | |
Conagra Brands, Inc. | | | 9,028 | | | | 321,397 | |
JM Smucker Co. (The) | | | 3,404 | | | | 368,721 | |
| | | | | | | | 1,362,034 | |
| Gas Utilities – 0.2% | |
UGI Corp. | | | 1,850 | | | | 98,161 | |
| Health Care Equipment & Supplies – 2.2% | |
Baxter International, Inc. | | | 7,326 | | | | 457,948 | |
Danaher Corp. | | | 8,732 | | | | 867,961 | |
ResMed, Inc. | | | 222 | | | | 23,514 | |
| | | | | | | | 1,349,423 | |
| Health Care Providers & Services – 5.7% | |
Anthem, Inc. | | | 3,552 | | | | 978,825 | |
Cigna Corp. | | | 2,738 | | | | 585,412 | |
CVS Health Corp. | | | 3,922 | | | | 283,914 | |
Express Scripts Holding Co.* | | | 7,696 | | | | 746,281 | |
Humana, Inc. | | | 1,628 | | | | 521,627 | |
UnitedHealth Group, Inc. | | | 1,480 | | | | 386,798 | |
| | | | | | | | 3,502,857 | |
| Hotels, Restaurants & Leisure – 0.7% | |
Yum! Brands, Inc. | | | 4,958 | | | | 448,253 | |
| Household Durables – 0.3% | |
DR Horton, Inc. | | | 5,180 | | | | 186,273 | |
Independent Power and Renewable Electricity
Producers – 1.3% | |
AES Corp. | | | 26,788 | | | | 390,569 | |
NRG Energy, Inc. | | | 10,952 | | | | 396,353 | |
| | | | | | | | 786,922 | |
| Insurance – 1.3% | |
Alleghany Corp. | | | 41 | | | | 24,628 | |
Allstate Corp. (The) | | | 3,626 | | | | 347,081 | |
Loews Corp. | | | 2,220 | | | | 103,363 | |
Progressive Corp. (The) | | | 2,072 | | | | 144,418 | |
Reinsurance Group of America, Inc. | | | 518 | | | | 73,748 | |
Torchmark Corp. | | | 1,110 | | | | 93,972 | |
| | | | | | | | 787,210 | |
| | | | | | | | |
| Investments | | Shares | | | Value | |
| Interactive Media & Services – 1.6% | |
Alphabet, Inc., Class A* | | | 183 | | | $ | 199,576 | |
Alphabet, Inc., Class C* | | | 145 | | | | 156,132 | |
Facebook, Inc., Class A* | | | 1,998 | | | | 303,276 | |
IAC/InterActiveCorp* | | | 1,554 | | | | 305,501 | |
| | | | | | | | 964,485 | |
| Internet & Direct Marketing Retail – 2.0% | |
Amazon.com, Inc.* | | | 589 | | | | 941,228 | |
eBay, Inc.* | | | 10,434 | | | | 302,899 | |
| | | | | | | | 1,244,127 | |
| IT Services – 3.9% | |
Akamai Technologies, Inc.* | | | 5,994 | | | | 433,067 | |
Amdocs Ltd. | | | 1,554 | | | | 98,322 | |
Cognizant Technology Solutions Corp., Class A | | | 8,436 | | | | 582,337 | |
International Business Machines Corp. | | | 740 | | | | 85,418 | |
Mastercard, Inc., Class A | | | 2,738 | | | | 541,220 | |
Total System Services, Inc. | | | 3,256 | | | | 296,784 | |
VeriSign, Inc.* | | | 2,442 | | | | 348,083 | |
| | | | | | | | 2,385,231 | |
| Machinery – 2.5% | |
Caterpillar, Inc. | | | 7,252 | | | | 879,813 | |
Cummins, Inc. | | | 2,812 | | | | 384,372 | |
PACCAR, Inc. | | | 5,180 | | | | 296,348 | |
| | | | | | | | 1,560,533 | |
| Metals & Mining – 1.3% | |
Freeport-McMoRan, Inc. | | | 22,866 | | | | 266,389 | |
Newmont Mining Corp. | | | 4,218 | | | | 130,421 | |
Nucor Corp. | | | 7,178 | | | | 424,363 | |
| | | | | | | | 821,173 | |
| Multiline Retail – 2.3% | |
Kohl’s Corp. | | | 3,404 | | | | 257,785 | |
Macy’s, Inc. | | | 6,956 | | | | 238,521 | |
Nordstrom, Inc. | | | 6,882 | | | | 452,629 | |
Target Corp. | | | 5,698 | | | | 476,524 | |
| | | | | | | | 1,425,459 | |
See Accompanying Notes to the Financial Statements.
| | |
| 228 | | FLEXSHARES ANNUAL REPORT |
FlexShares® US Quality Large Cap Index Fund (cont.)
| | | | | | | | |
| Investments | | Shares | | | Value | |
| COMMON STOCKS – (continued) | |
| Multi-Utilities – 1.1% | |
CenterPoint Energy, Inc. | | | 10,878 | | | $ | 293,815 | |
DTE Energy Co. | | | 3,626 | | | | 407,562 | |
| | | | | | | | 701,377 | |
| Oil, Gas & Consumable Fuels – 7.0% | |
Chevron Corp. | | | 11,544 | | | | 1,288,888 | |
ConocoPhillips | | | 14,134 | | | | 987,966 | |
Exxon Mobil Corp. | | | 3,330 | | | | 265,334 | |
HollyFrontier Corp. | | | 3,848 | | | | 259,509 | |
Marathon Petroleum Corp. | | | 7,400 | | | | 521,330 | |
Phillips 66 | | | 5,846 | | | | 601,086 | |
Valero Energy Corp. | | | 4,810 | | | | 438,143 | |
| | | | | | | | 4,362,256 | |
| Pharmaceuticals – 3.8% | |
Allergan plc | | | 3,922 | | | | 619,715 | |
Johnson & Johnson | | | 10,952 | | | | 1,533,170 | |
Mylan NV* | | | 7,178 | | | | 224,313 | |
| | | | | | | | 2,377,198 | |
| Professional Services – 0.6% | |
Robert Half International, Inc. | | | 5,698 | | | | 344,900 | |
| Road & Rail – 0.5% | |
Norfolk Southern Corp. | | | 1,998 | | | | 335,324 | |
| Semiconductors & Semiconductor Equipment – 5.3% | |
Analog Devices, Inc. | | | 3,182 | | | | 266,365 | |
Applied Materials, Inc. | | | 2,516 | | | | 82,726 | |
Intel Corp. | | | 27,232 | | | | 1,276,636 | |
KLA-Tencor Corp. | | | 2,442 | | | | 223,541 | |
Lam Research Corp. | | | 2,812 | | | | 398,545 | |
Micron Technology, Inc.* | | | 13,024 | | | | 491,265 | |
Qorvo, Inc.* | | | 3,256 | | | | 239,348 | |
Texas Instruments, Inc. | | | 2,960 | | | | 274,777 | |
| | | | | | | | 3,253,203 | |
| Software – 4.6% | |
Adobe, Inc.* | | | 1,406 | | | | 345,538 | |
CA, Inc. | | | 8,510 | | | | 377,504 | |
Citrix Systems, Inc.* | | | 3,996 | | | | 409,470 | |
Intuit, Inc. | | | 2,738 | | | | 577,718 | |
Microsoft Corp. | | | 10,360 | | | | 1,106,552 | |
| | | | | | | | 2,816,782 | |
| | | | | | | | |
| Investments | | Shares | | | Value | |
| Specialty Retail – 3.4% | |
Advance Auto Parts, Inc. | | | 740 | | | $ | 118,222 | |
Best Buy Co., Inc. | | | 3,552 | | | | 249,208 | |
Gap, Inc. (The) | | | 10,952 | | | | 298,990 | |
Home Depot, Inc. (The) | | | 7,326 | | | | 1,288,497 | |
O’Reilly Automotive, Inc.* | | | 518 | | | | 166,149 | |
| | | | | | | | 2,121,066 | |
| Technology Hardware, Storage & Peripherals – 5.8% | |
Apple, Inc. | | | 12,432 | | | | 2,720,867 | |
NetApp, Inc. | | | 3,996 | | | | 313,646 | |
Seagate Technology plc | | | 8,140 | | | | 327,472 | |
Western Digital Corp. | | | 4,736 | | | | 203,980 | |
| | | | | | | | 3,565,965 | |
| Textiles, Apparel & Luxury Goods – 0.9% | |
PVH Corp. | | | 2,886 | | | | 348,600 | |
Ralph Lauren Corp. | | | 1,850 | | | | 239,778 | |
| | | | | | | | 588,378 | |
| Tobacco – 2.0% | |
Altria Group, Inc. | | | 19,314 | | | | 1,256,183 | |
| Trading Companies & Distributors – 0.5% | |
WW Grainger, Inc. | | | 1,036 | | | | 294,193 | |
Total Common Stocks
(Cost $58,930,813) | | | | 61,687,611 | |
| | | | | | | | | |
Total Investments – 99.7%
(Cost $58,930,813) | | | | 61,687,611 | |
Other Assets Less Liabilities – 0.3% | | | | 171,126 | |
| NET ASSETS – 100.0% | | | $ | 61,858,737 | |
| * | Non-income producing security. |
Percentages shown are based on Net Assets.
As of October 31, 2018, the gross unrealized appreciation (depreciation) of investments based on the aggregate cost of investments (including derivative instruments, if applicable) for federal income tax purposes was as follows:
| | | | |
| | | | |
Aggregate gross unrealized appreciation | | $ | 4,664,999 | |
Aggregate gross unrealized depreciation | | | (1,908,201 | ) |
Net unrealized appreciation | | $ | 2,756,798 | |
Federal income tax cost | | $ | 58,919,641 | |
See Accompanying Notes to the Financial Statements.
| | | | |
| FLEXSHARES ANNUAL REPORT | | | 229 | |
FlexShares® US Quality Large Cap Index Fund (cont.)
Futures Contracts
FlexShares® US Quality Large Cap Index Fund had the following open futures contract as of October 31, 2018:
| | | | | | | | | | | | | | | | | | | | |
| | | Number of
Contracts | | | Expiration
Date | | | Trading
Currency | | | Notional
Amount | | | Value and
Unrealized
Depreciation* | |
Long Contracts | | | | | |
S&P 500 E-Mini Index | | | 1 | | | | 12/21/2018 | | | | USD | | | $ | 135,555 | | | $ | (11,172 | ) |
| * | This amount represents the cumulative appreciation/depreciation on futures contracts. Current day’s variation margin is reported within the Statement of Assets and Liabilities for futures contracts |
Abbreviations:
USD – US Dollar
See Accompanying Notes to the Financial Statements.
| | |
| 230 | | FLEXSHARES ANNUAL REPORT |
Schedule of Investments
FlexShares® STOXX® US ESG Impact Index Fund
October 31, 2018
| | | | | | | | |
| Investments | | Shares | | | Value | |
| COMMON STOCKS – 97.9% | |
| Aerospace & Defense – 1.0% | |
United Technologies Corp. | | | 2,232 | | | $ | 277,237 | |
| Air Freight & Logistics – 0.9% | |
Expeditors International of Washington, Inc. | | | 504 | | | | 33,859 | |
FedEx Corp. | | | 828 | | | | 182,442 | |
United Parcel Service, Inc., Class B | | | 162 | | | | 17,259 | |
XPO Logistics, Inc.* | | | 432 | | | | 38,612 | |
| | | | | | | | 272,172 | |
| Airlines – 0.2% | |
Alaska Air Group, Inc. | | | 540 | | | | 33,167 | |
United Continental Holdings, Inc.* | | | 378 | | | | 32,323 | |
| | | | | | | | 65,490 | |
| Auto Components – 0.0%(a) | |
Autoliv, Inc. | | | 54 | | | | 4,500 | |
| Automobiles – 0.9% | |
General Motors Co. | | | 4,014 | | | | 146,872 | |
Tesla, Inc.* | | | 360 | | | | 121,435 | |
| | | | | | | | 268,307 | |
| Banks – 5.9% | |
Bank of America Corp. | | | 18,180 | | | | 499,950 | |
Citigroup, Inc. | | | 4,356 | | | | 285,144 | |
JPMorgan Chase & Co. | | | 5,868 | | | | 639,729 | |
KeyCorp | | | 5,994 | | | | 108,851 | |
PNC Financial Services Group, Inc. (The) | | | 1,404 | | | | 180,400 | |
| | | | | | | | 1,714,074 | |
| Beverages – 2.4% | |
Brown-Forman Corp., Class B | | | 468 | | | | 21,687 | |
Coca-Cola Co. (The) | | | 7,236 | | | | 346,460 | |
Coca-Cola European Partners plc | | | 288 | | | | 13,101 | |
Constellation Brands, Inc., Class A | | | 216 | | | | 43,034 | |
PepsiCo, Inc. | | | 2,340 | | | | 262,969 | |
| | | | | | | | 687,251 | |
| | | | | | | | |
| Investments | | Shares | | | Value | |
| Biotechnology – 3.1% | |
AbbVie, Inc. | | | 1,656 | | | $ | 128,920 | |
Alkermes plc* | | | 80 | | | | 3,266 | |
Amgen, Inc. | | | 2,088 | | | | 402,545 | |
Biogen, Inc.* | | | 504 | | | | 153,352 | |
Gilead Sciences, Inc. | | | 1,332 | | | | 90,816 | |
Vertex Pharmaceuticals, Inc.* | | | 630 | | | | 106,760 | |
| | | | | | | | 885,659 | |
| Building Products – 0.2% | |
Johnson Controls International plc | | | 2,088 | | | | 66,753 | |
| Capital Markets – 2.7% | |
BlackRock, Inc. | | | 522 | | | | 214,761 | |
Goldman Sachs Group, Inc. (The) | | | 324 | | | | 73,020 | |
Intercontinental Exchange, Inc. | | | 144 | | | | 11,094 | |
Invesco Ltd. | | | 2,052 | | | | 44,549 | |
Morgan Stanley | | | 234 | | | | 10,684 | |
MSCI, Inc. | | | 648 | | | | 97,446 | |
Nasdaq, Inc. | | | 774 | | | | 67,114 | |
S&P Global, Inc. | | | 1,062 | | | | 193,624 | |
SEI Investments Co. | | | 1,296 | | | | 69,271 | |
| | | | | | | | 781,563 | |
| Chemicals – 1.4% | |
Air Products & Chemicals, Inc. | | | 90 | | | | 13,891 | |
Celanese Corp. | | | 72 | | | | 6,980 | |
Ecolab, Inc. | | | 900 | | | | 137,835 | |
International Flavors & Fragrances, Inc. | | | 198 | | | | 28,643 | |
LyondellBasell Industries NV, Class A | | | 1,116 | | | | 99,625 | |
PPG Industries, Inc. | | | 702 | | | | 73,773 | |
Sherwin-Williams Co. (The) | | | 108 | | | | 42,495 | |
| | | | | | | | 403,242 | |
| Commercial Services & Supplies – 0.7% | |
Cintas Corp. | | | 126 | | | | 22,916 | |
Republic Services, Inc. | | | 1,008 | | | | 73,261 | |
Waste Management, Inc. | | | 1,206 | | | | 107,901 | |
| | | | | | | | 204,078 | |
| Communications Equipment – 0.9% | |
Cisco Systems, Inc. | | | 5,526 | | | | 252,815 | |
See Accompanying Notes to the Financial Statements.
| | | | |
| FLEXSHARES ANNUAL REPORT | | | 231 | |
FlexShares® STOXX® US ESG Impact Index Fund (cont.)
| | | | | | | | |
| Investments | | Shares | | | Value | |
| COMMON STOCKS – (continued) | |
| Consumer Finance – 0.6% | |
Ally Financial, Inc. | | | 216 | | | $ | 5,489 | |
American Express Co. | | | 990 | | | | 101,703 | |
Synchrony Financial | | | 2,646 | | | | 76,416 | |
| | | | | | | | 183,608 | |
| Containers & Packaging – 0.3% | |
Ball Corp. | | | 666 | | | | 29,837 | |
International Paper Co. | | | 936 | | | | 42,457 | |
| | | | | | | | 72,294 | |
| Diversified Financial Services – 1.9% | |
Berkshire Hathaway, Inc., Class B* | | | 2,250 | | | | 461,880 | |
Voya Financial, Inc. | | | 1,692 | | | | 74,042 | |
| | | | | | | | 535,922 | |
| Diversified Telecommunication Services – 3.6% | |
AT&T, Inc. | | | 10,080 | | | | 309,254 | |
CenturyLink, Inc. | | | 5,976 | | | | 123,345 | |
Verizon Communications, Inc. | | | 10,530 | | | | 601,158 | |
| | | | | | | | 1,033,757 | |
| Electric Utilities – 1.5% | |
American Electric Power Co., Inc. | | | 1,278 | | | | 93,754 | |
Duke Energy Corp. | | | 1,170 | | | | 96,677 | |
Eversource Energy | | | 1,278 | | | | 80,846 | |
Exelon Corp. | | | 2,322 | | | | 101,727 | |
PG&E Corp.* | | | 1,080 | | | | 50,555 | |
| | | | | | | | 423,559 | |
| Electrical Equipment – 0.8% | |
Eaton Corp. plc | | | 2,088 | | | | 149,647 | |
Rockwell Automation, Inc. | | | 450 | | | | 74,128 | |
| | | | | | | | 223,775 | |
| Electronic Equipment, Instruments & Components – 0.2% | |
CDW Corp. | | | 504 | | | | 45,365 | |
| Energy Equipment & Services – 1.1% | |
Halliburton Co. | | | 108 | | | | 3,746 | |
Schlumberger Ltd. | | | 5,994 | | | | 307,552 | |
| | | | | | | | 311,298 | |
| | | | | | | | |
| Investments | | Shares | | | Value | |
| Entertainment – 2.3% | |
Netflix, Inc.* | | | 720 | | | $ | 217,282 | |
Twenty-First Century Fox, Inc., Class A | | | 1,566 | | | | 71,284 | |
Viacom, Inc., Class B | | | 1,080 | | | | 34,539 | |
Walt Disney Co. (The) | | | 2,898 | | | | 332,777 | |
| | | | | | | | 655,882 | |
| Equity Real Estate Investment Trusts (REITs) – 0.6% | |
AvalonBay Communities, Inc. | | | 540 | | | | 94,705 | |
HCP, Inc. | | | 684 | | | | 18,844 | |
Host Hotels & Resorts, Inc. | | | 487 | | | | 9,307 | |
Prologis, Inc. | | | 846 | | | | 54,542 | |
Vornado Realty Trust | | | 18 | | | | 1,225 | |
| | | | | | | | 178,623 | |
| Food & Staples Retailing – 1.7% | |
Costco Wholesale Corp. | | | 738 | | | | 168,729 | |
Kroger Co. (The) | | | 1,656 | | | | 49,282 | |
Sysco Corp. | | | 1,890 | | | | 134,814 | |
Walgreens Boots Alliance, Inc. | | | 1,926 | | | | 153,637 | |
| | | | | | | | 506,462 | |
| Food Products – 1.0% | |
Archer-Daniels-Midland Co. | | | 1,908 | | | | 90,153 | |
Conagra Brands, Inc. | | | 432 | | | | 15,379 | |
General Mills, Inc. | | | 72 | | | | 3,154 | |
Hershey Co. (The) | | | 702 | | | | 75,219 | |
Ingredion, Inc. | | | 90 | | | | 9,106 | |
Kellogg Co. | | | 216 | | | | 14,144 | |
McCormick & Co., Inc. (Non-Voting) | | | 54 | | | | 7,776 | |
Mondelez International, Inc., Class A | | | 1,890 | | | | 79,342 | |
| | | | | | | | 294,273 | |
| Health Care Equipment & Supplies – 3.2% | |
Abbott Laboratories | | | 5,364 | | | | 369,794 | |
Baxter International, Inc. | | | 126 | | | | 7,876 | |
Becton Dickinson and Co. | | | 648 | | | | 149,364 | |
Edwards Lifesciences Corp.* | | | 594 | | | | 87,675 | |
Hologic, Inc.* | | | 648 | | | | 25,266 | |
IDEXX Laboratories, Inc.* | | | 58 | | | | 12,303 | |
Medtronic plc | | | 2,304 | | | | 206,945 | |
Varian Medical Systems, Inc.* | | | 198 | | | | 23,635 | |
Zimmer Biomet Holdings, Inc. | | | 378 | | | | 42,937 | |
| | | | | | | | 925,795 | |
See Accompanying Notes to the Financial Statements.
| | |
| 232 | | FLEXSHARES ANNUAL REPORT |
FlexShares® STOXX® US ESG Impact Index Fund (cont.)
| | | | | | | | |
| Investments | | Shares | | | Value | |
| COMMON STOCKS – (continued) | |
| Health Care Providers & Services – 1.7% | |
Anthem, Inc. | | | 612 | | | $ | 168,649 | |
Cigna Corp. | | | 306 | | | | 65,426 | |
CVS Health Corp. | | | 2,484 | | | | 179,816 | |
Humana, Inc. | | | 180 | | | | 57,674 | |
Laboratory Corp. of America Holdings* | | | 180 | | | | 28,899 | |
| | | | | | | | 500,464 | |
| Hotels, Restaurants & Leisure – 2.2% | |
Carnival Corp. | | | 1,584 | | | | 88,767 | |
Darden Restaurants, Inc. | | | 90 | | | | 9,589 | |
Hilton Worldwide Holdings, Inc. | | | 1,188 | | | | 84,550 | |
Marriott International, Inc., Class A | | | 1,152 | | | | 134,657 | |
McDonald’s Corp. | | | 1,062 | | | | 187,868 | |
Starbucks Corp. | | | 1,332 | | | | 77,616 | |
Yum! Brands, Inc. | | | 468 | | | | 42,312 | |
| | | | | | | | 625,359 | |
| Household Products – 2.1% | |
Church & Dwight Co., Inc. | | | 1,800 | | | | 106,866 | |
Clorox Co. (The) | | | 360 | | | | 53,442 | |
Colgate-Palmolive Co. | | | 1,440 | | | | 85,752 | |
Procter & Gamble Co. (The) | | | 4,122 | | | | 365,539 | |
| | | | | | | | 611,599 | |
Independent Power and Renewable Electricity
Producers – 0.2% | |
AES Corp. | | | 2,250 | | | | 32,805 | |
NRG Energy, Inc. | | | 738 | | | | 26,708 | |
| | | | | | | | 59,513 | |
| Industrial Conglomerates – 2.2% | |
3M Co. | | | 1,908 | | | | 363,016 | |
General Electric Co. | | | 23,364 | | | | 235,976 | |
Roper Technologies, Inc. | | | 126 | | | | 35,646 | |
| | | | | | | | 634,638 | |
| Insurance – 1.9% | |
Aflac, Inc. | | | 810 | | | | 34,887 | |
Allstate Corp. (The) | | | 342 | | | | 32,736 | |
Aon plc | | | 792 | | | | 123,695 | |
Hartford Financial Services Group, Inc. (The) | | | 2,232 | | | | 101,377 | |
| | | | | | | | |
| Investments | | Shares | | | Value | |
| Insurance – (continued) | |
MetLife, Inc. | | | 226 | | | $ | 9,309 | |
Principal Financial Group, Inc. | | | 1,620 | | | | 76,253 | |
Progressive Corp. (The) | | | 160 | | | | 11,152 | |
Reinsurance Group of America, Inc. | | | 450 | | | | 64,067 | |
Unum Group | | | 1,170 | | | | 42,424 | |
Willis Towers Watson plc | | | 288 | | | | 41,230 | |
| | | | | | | | 537,130 | |
| Interactive Media & Services – 5.8% | |
Alphabet, Inc., Class C* | | | 652 | | | | 702,054 | |
Facebook, Inc., Class A* | | | 6,408 | | | | 972,670 | |
| | | | | | | | 1,674,724 | |
| Internet & Direct Marketing Retail – 3.8% | |
Amazon.com, Inc.* | | | 680 | | | | 1,086,647 | |
| IT Services – 2.7% | |
Accenture plc, Class A | | | 1,188 | | | | 187,252 | |
Amdocs Ltd. | | | 36 | | | | 2,278 | |
Cognizant Technology Solutions Corp., Class A | | | 1,404 | | | | 96,918 | |
International Business Machines Corp. | | | 1,242 | | | | 143,364 | |
Jack Henry & Associates, Inc. | | | 432 | | | | 64,727 | |
Leidos Holdings, Inc. | | | 18 | | | | 1,166 | |
Mastercard, Inc., Class A | | | 1,242 | | | | 245,506 | |
Square, Inc., Class A* | | | 666 | | | | 48,918 | |
VeriSign, Inc.* | | | 18 | | | | 2,566 | |
| | | | | | | | 792,695 | |
| Leisure Products – 0.1% | |
Hasbro, Inc. | | | 450 | | | | 41,270 | |
| Life Sciences Tools & Services – 1.2% | |
Agilent Technologies, Inc. | | | 1,296 | | | | 83,968 | |
Thermo Fisher Scientific, Inc. | | | 990 | | | | 231,314 | |
Waters Corp.* | | | 234 | | | | 44,387 | |
| | | | | | | | 359,669 | |
| Machinery – 1.6% | |
Cummins, Inc. | | | 882 | | | | 120,560 | |
Deere & Co. | | | 810 | | | | 109,706 | |
Dover Corp. | | | 594 | | | | 49,207 | |
Ingersoll-Rand plc | | | 756 | | | | 72,531 | |
Pentair plc | | | 72 | | | | 2,891 | |
See Accompanying Notes to the Financial Statements.
| | | | |
| FLEXSHARES ANNUAL REPORT | | | 233 | |
FlexShares® STOXX® US ESG Impact Index Fund (cont.)
| | | | | | | | |
| Investments | | Shares | | | Value | |
| COMMON STOCKS – (continued) | |
| Machinery – (continued) | |
Stanley Black & Decker, Inc. | | | 810 | | | $ | 94,381 | |
Xylem, Inc. | | | 108 | | | | 7,083 | |
| | | | | | | | 456,359 | |
| Media – 0.1% | |
Interpublic Group of Cos., Inc. (The) | | | 630 | | | | 14,591 | |
| Metals & Mining – 0.0%(a) | |
Newmont Mining Corp. | | | 108 | | | | 3,339 | |
| Mortgage Real Estate Investment Trusts (REITs) – 0.0%(a) | |
Annaly Capital Management, Inc. | | | 1,098 | | | | 10,837 | |
| Multiline Retail – 0.6% | |
Dollar General Corp. | | | 270 | | | | 30,073 | |
Dollar Tree, Inc.* | | | 180 | | | | 15,174 | |
Kohl’s Corp. | | | 306 | | | | 23,173 | |
Target Corp. | | | 1,422 | | | | 118,922 | |
| | | | | | | | 187,342 | |
| Multi-Utilities – 0.9% | |
Ameren Corp. | | | 792 | | | | 51,147 | |
DTE Energy Co. | | | 576 | | | | 64,742 | |
NiSource, Inc. | | | 1,656 | | | | 41,996 | |
Sempra Energy | | | 846 | | | | 93,162 | |
| | | | | | | | 251,047 | |
| Oil, Gas & Consumable Fuels – 5.8% | |
Cabot Oil & Gas Corp. | | | 108 | | | | 2,617 | |
Chevron Corp. | | | 5,814 | | | | 649,133 | |
ConocoPhillips | | | 3,168 | | | | 221,443 | |
Devon Energy Corp. | | | 252 | | | | 8,165 | |
Exxon Mobil Corp. | | | 8,874 | | | | 707,080 | |
Hess Corp. | | | 1,098 | | | | 63,025 | |
Valero Energy Corp. | | | 306 | | | | 27,874 | |
| | | | | | | | 1,679,337 | |
| Personal Products – 0.1% | |
Estee Lauder Cos., Inc. (The), Class A | | | 252 | | | | 34,635 | |
| Pharmaceuticals – 4.2% | |
Allergan plc | | | 90 | | | | 14,221 | |
Eli Lilly & Co. | | | 2,538 | | | | 275,221 | |
Merck & Co., Inc. | | | 3,870 | | | | 284,871 | |
| | | | | | | | |
| Investments | | Shares | | | Value | |
| Pharmaceuticals – (continued) | |
Mylan NV* | | | 1,530 | | | $ | 47,812 | |
Pfizer, Inc. | | | 14,112 | | | | 607,663 | |
| | | | | | | | 1,229,788 | |
| Professional Services – 0.2% | |
Verisk Analytics, Inc.* | | | 468 | | | | 56,085 | |
| Real Estate Management & Development – 0.2% | |
CBRE Group, Inc., Class A* | | | 1,746 | | | | 70,346 | |
| Semiconductors & Semiconductor Equipment – 3.9% | |
Advanced Micro Devices, Inc.* | | | 2,088 | | | | 38,023 | |
Intel Corp. | | | 12,636 | | | | 592,376 | |
Lam Research Corp. | | | 378 | | | | 53,574 | |
Maxim Integrated Products, Inc. | | | 1,512 | | | | 75,630 | |
Microchip Technology, Inc. | | | 936 | | | | 61,570 | |
Micron Technology, Inc.* | | | 2,394 | | | | 90,302 | |
ON Semiconductor Corp.* | | | 3,474 | | | | 59,058 | |
QUALCOMM, Inc. | | | 342 | | | | 21,508 | |
Texas Instruments, Inc. | | | 1,134 | | | | 105,269 | |
Xilinx, Inc. | | | 468 | | | | 39,953 | |
| | | | | | | | 1,137,263 | |
| Software – 8.0% | |
Adobe, Inc.* | | | 1,278 | | | | 314,081 | |
Autodesk, Inc.* | | | 342 | | | | 44,203 | |
CA, Inc. | | | 96 | | | | 4,259 | |
Dell Technologies, Inc., Class V* | | | 612 | | | | 55,319 | |
Intuit, Inc. | | | 1,080 | | | | 227,880 | |
Microsoft Corp. | | | 12,798 | | | | 1,366,954 | |
Oracle Corp. | | | 1,926 | | | | 94,066 | |
Red Hat, Inc.* | | | 450 | | | | 77,238 | |
salesforce.com, Inc.* | | | 558 | | | | 76,580 | |
Splunk, Inc.* | | | 540 | | | | 53,914 | |
| | | | | | | | 2,314,494 | |
| Specialty Retail – 2.1% | |
AutoZone, Inc.* | | | 54 | | | | 39,607 | |
Best Buy Co., Inc. | | | 342 | | | | 23,995 | |
Home Depot, Inc. (The) | | | 1,206 | | | | 212,111 | |
Lowe’s Cos., Inc. | | | 954 | | | | 90,840 | |
TJX Cos., Inc. (The) | | | 1,872 | | | | 205,695 | |
Ulta Beauty, Inc.* | | | 180 | | | | 49,414 | |
| | | | | | | | 621,662 | |
See Accompanying Notes to the Financial Statements.
| | |
| 234 | | FLEXSHARES ANNUAL REPORT |
FlexShares® STOXX® US ESG Impact Index Fund (cont.)
| | | | | | | | |
| Investments | | Shares | | | Value | |
| COMMON STOCKS – (continued) | |
| Technology Hardware, Storage & Peripherals – 5.8% | |
Apple, Inc. | | | 6,372 | | | $ | 1,394,576 | |
Hewlett Packard Enterprise Co. | | | 5,544 | | | | 84,546 | |
HP, Inc. | | | 6,588 | | | | 159,034 | |
Western Digital Corp. | | | 810 | | | | 34,887 | |
| | | | | | | | 1,673,043 | |
| Textiles, Apparel & Luxury Goods – 0.4% | |
Michael Kors Holdings Ltd.* | | | 468 | | | | 25,932 | |
NIKE, Inc., Class B | | | 480 | | | | 36,019 | |
Tapestry, Inc. | | | 234 | | | | 9,900 | |
VF Corp. | | | 594 | | | | 49,231 | |
| | | | | | | | 121,082 | |
| Tobacco – 0.7% | |
Altria Group, Inc. | | | 3,204 | | | | 208,388 | |
| Trading Companies & Distributors – 0.2% | |
Fastenal Co. | | | 900 | | | | 46,269 | |
HD Supply Holdings, Inc.* | | | 144 | | | | 5,410 | |
| | | | | | | | 51,679 | |
| | | | | | | | |
| Investments | | Shares | | | Value | |
| Water Utilities – 0.1% | |
American Water Works Co., Inc. | | | 216 | | | $ | 19,123 | |
| | | | | | | | | |
Total Common Stocks
(Cost $26,065,711) | | | | 28,337,902 | |
Total Investments – 97.9%
(Cost $26,065,711) | | | | 28,337,902 | |
Other Assets Less Liabilities – 2.1% | | | | 608,479 | |
| NET ASSETS – 100.0% | | | $ | 28,946,381 | |
| * | Non-income producing security. |
| (a) | Represents less than 0.05% of net assets. |
Percentages shown are based on Net Assets.
As of October 31, 2018, the gross unrealized appreciation (depreciation) of investments based on the aggregate cost of investments (including derivative instruments, if applicable) for federal income tax purposes was as follows:
| | | | |
| | | | |
Aggregate gross unrealized appreciation | | $ | 2,801,966 | |
Aggregate gross unrealized depreciation | | | (655,860 | ) |
Net unrealized appreciation | | $ | 2,146,106 | |
Federal income tax cost | | $ | 26,164,898 | |
Futures Contracts
FlexShares® STOXX® US ESG Impact Index Fund had the following open futures contracts as of October 31, 2018:
| | | | | | | | | | | | | | | | | | | | |
| | | Number of
Contracts | | | Expiration
Date | | | Trading
Currency | | | Notional
Amount | | | Value and
Unrealized
Depreciation* | |
Long Contracts | | | | | | | | | | | | | | | | | | | | |
S&P 500 E-Mini Index | | | 4 | | | | 12/21/2018 | | | | USD | | | $ | 542,220 | | | $ | (26,898 | ) |
| * | This amount represents the cumulative appreciation/depreciation on futures contracts. Current day’s variation margin is reported within the Statement of Assets and Liabilities for futures contracts. |
Abbreviations:
USD – US Dollar
See Accompanying Notes to the Financial Statements.
| | | | |
| FLEXSHARES ANNUAL REPORT | | | 235 | |
Schedule of Investments
FlexShares® STOXX® Global ESG Impact Index Fund
October 31, 2018
| | | | | | | | |
| Investments | | Shares | | | Value | |
| COMMON STOCKS – 98.5% | | | | | | |
| Aerospace & Defense – 0.2% | | | | | | |
Cobham plc* | | | 2,480 | | | $ | 3,411 | |
Meggitt plc | | | 96 | | | | 650 | |
United Technologies Corp. | | | 1,344 | | | | 166,938 | |
| | | | | | | | 170,999 | |
| Air Freight & Logistics – 0.8% | | | | | | |
Deutsche Post AG (Registered) | | | 3,184 | | | | 100,833 | |
Expeditors International of Washington, Inc. | | | 448 | | | | 30,097 | |
FedEx Corp. | | | 912 | | | | 200,950 | |
Royal Mail plc | | | 240 | | | | 1,101 | |
United Parcel Service, Inc., Class B | | | 1,760 | | | | 187,510 | |
Yamato Holdings Co. Ltd. | | | 3,000 | | | | 82,141 | |
| | | | | | | | 602,632 | |
| Airlines – 0.3% | | | | | | |
Air France-KLM* | | | 112 | | | | 1,086 | |
Alaska Air Group, Inc. | | | 656 | | | | 40,292 | |
Deutsche Lufthansa AG (Registered) | | | 464 | | | | 9,337 | |
easyJet plc | | | 1,232 | | | | 18,890 | |
International Consolidated Airlines Group SA, DI | | | 3,184 | | | | 24,548 | |
Qantas Airways Ltd. | | | 2,016 | | | | 7,816 | |
Southwest Airlines Co. | | | 528 | | | | 25,925 | |
United Continental Holdings, Inc.* | | | 1,072 | | | | 91,667 | |
| | | | | | | | 219,561 | |
| Auto Components – 0.6% | | | | | | |
Autoliv, Inc. | | | 224 | | | | 18,668 | |
Bridgestone Corp. | | | 8,500 | | | | 328,612 | |
Cie Generale des Etablissements Michelin SCA | | | 64 | | | | 6,580 | |
Cie Plastic Omnium SA | | | 2,208 | | | | 61,544 | |
Nokian Renkaat OYJ | | | 144 | | | | 4,582 | |
Valeo SA | | | 64 | | | | 2,070 | |
| | | | | | | | 422,056 | |
| Automobiles – 1.6% | | | | | | |
Bayerische Motoren Werke AG | | | 1,520 | | | | 131,286 | |
Daimler AG (Registered) | | | 688 | | | | 40,817 | |
Ferrari NV | | | 320 | | | | 37,526 | |
| | | | | | | | |
| Investments | | Shares | | | Value | |
| Automobiles – (continued) | | | | | | |
Fiat Chrysler Automobiles NV* | | | 2,032 | | | $ | 30,967 | |
Ford Motor Co. | | | 14,336 | | | | 136,909 | |
General Motors Co. | | | 2,800 | | | | 102,452 | |
Honda Motor Co. Ltd. | | | 19,800 | | | | 568,622 | |
Peugeot SA | | | 1,968 | | | | 46,893 | |
Porsche Automobil Holding SE (Preference) | | | 176 | | | | 11,223 | |
Renault SA | | | 80 | | | | 5,989 | |
Tesla, Inc.* | | | 144 | | | | 48,574 | |
| | | | | | | | 1,161,258 | |
| Banks – 11.0% | | | | | | |
ABN AMRO Group NV, CVA(a) | | | 496 | | | | 12,195 | |
AIB Group plc | | | 1,744 | | | | 8,442 | |
Australia & New Zealand Banking Group Ltd. | | | 6,704 | | | | 123,205 | |
Banco Bilbao Vizcaya Argentaria SA | | | 1,584 | | | | 8,767 | |
Banco BPM SpA* | | | 3,104 | | | | 5,842 | |
Banco Comercial Portugues SA, Class R* | | | 18,128 | | | | 4,893 | |
Banco Santander SA | | | 58,224 | | | | 276,747 | |
Bank of America Corp. | | | 47,088 | | | | 1,294,920 | |
Bank of Montreal | | | 2,352 | | | | 176,286 | |
Bank of Nova Scotia (The) | | | 2,416 | | | | 129,976 | |
Bank Polska Kasa Opieki SA | | | 336 | | | | 9,184 | |
Bankinter SA | | | 1,072 | | | | 8,799 | |
Barclays plc | | | 11,200 | | | | 24,686 | |
BNP Paribas SA | | | 4,640 | | | | 242,522 | |
CaixaBank SA | | | 9,488 | | | | 38,497 | |
Citigroup, Inc. | | | 11,328 | | | | 741,531 | |
Commerzbank AG* | | | 592 | | | | 5,594 | |
Commonwealth Bank of Australia | | | 8,960 | | | | 439,638 | |
Danske Bank A/S | | | 208 | | | | 3,991 | |
DBS Group Holdings Ltd. | | | 8,000 | | | | 135,529 | |
DNB ASA | | | 1,040 | | | | 18,876 | |
Erste Group Bank AG* | | | 176 | | | | 7,179 | |
Hang Seng Bank Ltd. | | | 1,200 | | | | 28,104 | |
HSBC Holdings plc | | | 77,168 | | | | 635,880 | |
ING Groep NV | | | 2,112 | | | | 25,079 | |
Intesa Sanpaolo SpA | | | 13,248 | | | | 29,316 | |
JPMorgan Chase & Co. | | | 11,648 | | | | 1,269,865 | |
See Accompanying Notes to the Financial Statements.
| | |
| 236 | | FLEXSHARES ANNUAL REPORT |
FlexShares® STOXX® Global ESG Impact Index Fund (cont.)
| | | | | | | | |
| Investments | | Shares | | | Value | |
| COMMON STOCKS – (continued) | |
| Banks – (continued) | | | | | | |
KBC Group NV | | | 1,712 | | | $ | 118,133 | |
KeyCorp | | | 4,656 | | | | 84,553 | |
Lloyds Banking Group plc | | | 131,360 | | | | 96,041 | |
Mediobanca Banca di Credito Finanziario SpA | | | 8,880 | | | | 77,997 | |
Mitsubishi UFJ Financial Group, Inc. | | | 94,400 | | | | 572,816 | |
Mizuho Financial Group, Inc. | | | 364,800 | | | | 627,098 | |
National Australia Bank Ltd. | | | 1,584 | | | | 28,302 | |
Nordea Bank Abp | | | 6,800 | | | | 59,215 | |
Powszechna Kasa Oszczednosci Bank Polski SA | | | 1,184 | | | | 12,342 | |
Raiffeisen Bank International AG | | | 96 | | | | 2,621 | |
Royal Bank of Canada | | | 3,904 | | | | 285,149 | |
Royal Bank of Scotland Group plc | | | 2,688 | | | | 8,119 | |
Skandinaviska Enskilda Banken AB, Class A | | | 1,024 | | | | 10,617 | |
Societe Generale SA | | | 416 | | | | 15,309 | |
Standard Chartered plc | | | 1,040 | | | | 7,302 | |
Svenska Handelsbanken AB, Class A | | | 848 | | | | 9,235 | |
Swedbank AB, Class A | | | 464 | | | | 10,463 | |
Toronto-Dominion Bank (The) | | | 3,888 | | | | 216,212 | |
UniCredit SpA | | | 960 | | | | 12,309 | |
Unione di Banche Italiane SpA | | | 608 | | | | 1,860 | |
United Overseas Bank Ltd. | | | 1,600 | | | | 28,169 | |
Westpac Banking Corp. | | | 5,280 | | | | 100,478 | |
| | | | | | | | 8,089,883 | |
| Beverages – 2.5% | | | | | | |
Anheuser-Busch InBev SA/NV | | | 656 | | | | 48,417 | |
Carlsberg A/S, Class B | | | 192 | | | | 21,187 | |
Coca-Cola Amatil Ltd. | | | 1,904 | | | | 13,373 | |
Coca-Cola Co. (The) | | | 8,832 | | | | 422,876 | |
Coca-Cola European Partners plc | | | 608 | | | | 27,658 | |
Coca-Cola HBC AG, DI* | | | 272 | | | | 8,028 | |
Diageo plc | | | 7,760 | | | | 268,557 | |
Heineken Holding NV | | | 224 | | | | 19,416 | |
Heineken NV | | | 720 | | | | 64,937 | |
Kirin Holdings Co. Ltd. | | | 6,900 | | | | 164,988 | |
PepsiCo, Inc. | | | 5,072 | | | | 569,991 | |
Pernod Ricard SA | | | 656 | | | | 100,194 | |
Suntory Beverage & Food Ltd. | | | 400 | | | | 16,322 | |
| | | | | | | | |
| Investments | | Shares | | | Value | |
| Beverages – (continued) | | | | | | |
Treasury Wine Estates Ltd. | | | 5,760 | | | $ | 61,726 | |
| | | | | | | | 1,807,670 | |
| Biotechnology – 2.4% | | | | | | |
AbbVie, Inc. | | | 4,016 | | | | 312,645 | |
Amgen, Inc. | | | 1,968 | | | | 379,411 | |
Biogen, Inc.* | | | 768 | | | | 233,679 | |
Celgene Corp.* | | | 816 | | | | 58,426 | |
CSL Ltd. | | | 1,392 | | | | 185,477 | |
Gilead Sciences, Inc. | | | 4,448 | | | | 303,265 | |
Shire plc | | | 2,656 | | | | 158,842 | |
Vertex Pharmaceuticals, Inc.* | | | 848 | | | | 143,702 | |
| | | | | | | | 1,775,447 | |
| Building Products – 0.9% | | | | | | |
AGC, Inc. | | | 1,600 | | | | 52,599 | |
Assa Abloy AB, Class B | | | 2,688 | | | | 53,674 | |
Cie de Saint-Gobain | | | 2,880 | | | | 108,468 | |
Daikin Industries Ltd. | | | 2,900 | | | | 337,269 | |
Geberit AG (Registered) | | | 128 | | | | 50,174 | |
LIXIL Group Corp. | | | 1,600 | | | | 25,236 | |
| | | | | | | | 627,420 | |
| Capital Markets – 2.6% | | | | | | |
3i Group plc | | | 4,640 | | | | 52,066 | |
Amundi SA(a) | | | 128 | | | | 7,626 | |
Bank of New York Mellon Corp. (The) | | | 3,776 | | | | 178,718 | |
BlackRock, Inc. | | | 736 | | | | 302,805 | |
Credit Suisse Group AG (Registered)* | | | 7,008 | | | | 92,102 | |
Deutsche Bank AG (Registered) | | | 6,160 | | | | 60,381 | |
Deutsche Boerse AG | | | 672 | | | | 85,164 | |
Euronext NV(a) | | | 96 | | | | 5,923 | |
Goldman Sachs Group, Inc. (The) | | | 1,168 | | | | 263,232 | |
Hargreaves Lansdown plc | | | 448 | | | | 10,693 | |
Hong Kong Exchanges & Clearing Ltd. | | | 2,400 | | | | 63,678 | |
Investec plc | | | 176 | | | | 1,089 | |
Julius Baer Group Ltd.* | | | 80 | | | | 3,662 | |
Jupiter Fund Management plc | | | 15,392 | | | | 66,278 | |
Macquarie Group Ltd. | | | 992 | | | | 82,401 | |
Morgan Stanley | | | 3,456 | | | | 157,801 | |
MSCI, Inc. | | | 80 | | | | 12,030 | |
See Accompanying Notes to the Financial Statements.
| | | | |
| FLEXSHARES ANNUAL REPORT | | | 237 | |
FlexShares® STOXX® Global ESG Impact Index Fund (cont.)
| | | | | | | | |
| Investments | | Shares | | | Value | |
| COMMON STOCKS – (continued) | |
| Capital Markets – (continued) | | | | | | |
Natixis SA | | | 336 | | | $ | 1,967 | |
S&P Global, Inc. | | | 768 | | | | 140,022 | |
Schroders plc | | | 208 | | | | 7,123 | |
SEI Investments Co. | | | 432 | | | | 23,090 | |
St James’s Place plc | | | 1,360 | | | | 17,612 | |
State Street Corp. | | | 176 | | | | 12,100 | |
Thomson Reuters Corp. | | | 144 | | | | 6,718 | |
UBS Group AG (Registered)* | | | 19,056 | | | | 266,924 | |
| | | | | | | | 1,921,205 | |
| Chemicals – 1.8% | | | | | | |
Air Liquide SA | | | 1,440 | | | | 174,580 | |
Air Products & Chemicals, Inc. | | | 592 | | | | 91,375 | |
Akzo Nobel NV | | | 1,033 | | | | 86,940 | |
Arkema SA | | | 224 | | | | 23,548 | |
BASF SE | | | 1,184 | | | | 91,264 | |
Celanese Corp. | | | 320 | | | | 31,021 | |
Chr Hansen Holding A/S | | | 48 | | | | 4,854 | |
Covestro AG(a) | | | 128 | | | | 8,284 | |
Ecolab, Inc. | | | 768 | | | | 117,619 | |
EMS-Chemie Holding AG (Registered) | | | 32 | | | | 17,656 | |
Evonik Industries AG | | | 976 | | | | 30,301 | |
FMC Corp. | | | 288 | | | | 22,487 | |
Givaudan SA (Registered) | | | 16 | | | | 38,875 | |
Hexpol AB | | | 240 | | | | 2,224 | |
Incitec Pivot Ltd. | | | 4,384 | | | | 12,118 | |
International Flavors & Fragrances, Inc. | | | 32 | | | | 4,629 | |
Johnson Matthey plc | | | 832 | | | | 31,606 | |
K+S AG (Registered) | | | 208 | | | | 3,882 | |
Koninklijke DSM NV | | | 849 | | | | 74,437 | |
Linde plc | | | 567 | | | | 93,011 | |
LyondellBasell Industries NV, Class A | | | 880 | | | | 78,558 | |
Novozymes A/S, Class B | | | 432 | | | | 21,355 | |
Orica Ltd. | | | 224 | | | | 2,724 | |
PPG Industries, Inc. | | | 1,104 | | | | 116,019 | |
Sherwin-Williams Co. (The) | | | 224 | | | | 88,137 | |
Sika AG (Registered) | | | 240 | | | | 30,826 | |
Solvay SA | | | 112 | | | | 12,773 | |
Umicore SA | | | 400 | | | | 18,849 | |
| | | | | | | | |
| Investments | | Shares | | | Value | |
| Chemicals – (continued) | | | | | | |
Yara International ASA | | | 368 | | | $ | 15,880 | |
| | | | | | | | 1,345,832 | |
| Commercial Services & Supplies – 0.3% | |
Brambles Ltd. | | | 2,560 | | | | 19,269 | |
Cintas Corp. | | | 288 | | | | 52,379 | |
Edenred | | | 82 | | | | 3,115 | |
ISS A/S | | | 656 | | | | 21,579 | |
Rentokil Initial plc | | | 24,624 | | | | 99,487 | |
Securitas AB, Class B | | | 3,232 | | | | 55,501 | |
| | | | | | | | 251,330 | |
| Communications Equipment – 0.7% | |
Cisco Systems, Inc. | | | 9,152 | | | | 418,704 | |
Nokia OYJ | | | 9,200 | | | | 52,120 | |
Telefonaktiebolaget LM Ericsson, Class B | | | 8,400 | | | | 73,323 | |
| | | | | | | | 544,147 | |
| Construction & Engineering – 0.2% | |
Balfour Beatty plc | | | 592 | | | | 1,990 | |
Bouygues SA | | | 96 | | | | 3,507 | |
Eiffage SA | | | 256 | | | | 25,067 | |
Ferrovial SA | | | 617 | | | | 12,374 | |
HOCHTIEF AG | | | 16 | | | | 2,375 | |
Skanska AB, Class B | | | 1,760 | | | | 27,739 | |
Vinci SA | | | 960 | | | | 85,800 | |
| | | | | | | | 158,852 | |
| Construction Materials – 0.2% | | | | | | |
CRH plc | | | 1,232 | | | | 36,894 | |
HeidelbergCement AG | | | 1,264 | | | | 85,931 | |
Imerys SA | | | 48 | | | | 2,964 | |
| | | | | | | | 125,789 | |
| Consumer Finance – 0.1% | | | | | | |
Synchrony Financial | | | 3,472 | | | | 100,271 | |
| Containers & Packaging – 0.2% | | | | | | |
Amcor Ltd. | | | 2,544 | | | | 23,981 | |
Ball Corp. | | | 1,136 | | | | 50,893 | |
DS Smith plc | | | 936 | | | | 4,699 | |
Huhtamaki OYJ | | | 272 | | | | 7,640 | |
International Paper Co. | | | 432 | | | | 19,596 | |
See Accompanying Notes to the Financial Statements.
| | |
| 238 | | FLEXSHARES ANNUAL REPORT |
FlexShares® STOXX® Global ESG Impact Index Fund (cont.)
| | | | | | | | |
| Investments | | Shares | | | Value | |
| COMMON STOCKS – (continued) | |
| Containers & Packaging – (continued) | |
RPC Group plc | | | 128 | | | $ | 1,247 | |
Smurfit Kappa Group plc | | | 288 | | | | 9,391 | |
| | | | | | | | 117,447 | |
| Distributors – 0.0%(b) | | | | | | |
Inchcape plc | | | 2,976 | | | | 20,572 | |
| Diversified Financial Services – 0.2% | |
Eurazeo SE | | | 83 | | | | 6,071 | |
EXOR NV | | | 1,392 | | | | 78,923 | |
Kinnevik AB, Class B | | | 384 | | | | 10,668 | |
Standard Life Aberdeen* (c) | | | 576 | | | | 250 | |
Standard Life Aberdeen plc | | | 504 | | | | 1,742 | |
Voya Financial, Inc. | | | 896 | | | | 39,209 | |
Wendel SA | | | 32 | | | | 4,155 | |
| | | | | | | | 141,018 | |
| Diversified Telecommunication Services – 2.8% | |
AT&T, Inc. | | | 18,496 | | | | 567,457 | |
BT Group plc | | | 16,096 | | | | 49,473 | |
CenturyLink, Inc. | | | 2,848 | | | | 58,783 | |
Deutsche Telekom AG (Registered) | | | 13,424 | | | | 220,470 | |
Elisa OYJ | | | 256 | | | | 10,196 | |
Iliad SA | | | 16 | | | | 1,854 | |
Koninklijke KPN NV | | | 3,712 | | | | 9,825 | |
Orange SA | | | 4,944 | | | | 77,417 | |
PCCW Ltd. | | | 48,000 | | | | 26,329 | |
Proximus SADP | | | 464 | | | | 11,855 | |
Singapore Telecommunications Ltd. | | | 3,200 | | | | 7,302 | |
Swisscom AG (Registered) | | | 96 | | | | 44,035 | |
Telecom Italia SpA* | | | 3,616 | | | | 2,127 | |
Telefonica SA | | | 14,016 | | | | 114,945 | |
Telenor ASA | | | 1,024 | | | | 18,841 | |
Telia Co. AB | | | 6,864 | | | | 30,987 | |
Telstra Corp. Ltd. | | | 49,744 | | | | 108,589 | |
Verizon Communications, Inc. | | | 12,304 | | | | 702,435 | |
| | | | | | | | 2,062,920 | |
| Electric Utilities – 0.7% | | | | | | |
Alliant Energy Corp. | | | 288 | | | | 12,378 | |
Contact Energy Ltd. | | | 752 | | | | 2,745 | |
Duke Energy Corp. | | | 1,696 | | | | 140,141 | |
| | | | | | | | |
| Investments | | Shares | | | Value | |
| Electric Utilities – (continued) | | | | | | |
EDP – Energias de Portugal SA | | | 3,200 | | | $ | 11,254 | |
Electricite de France SA | | | 1,283 | | | | 21,340 | |
Endesa SA | | | 240 | | | | 5,025 | |
Enel SpA | | | 4,768 | | | | 23,414 | |
Eversource Energy | | | 1,200 | | | | 75,912 | |
Fortum OYJ | | | 2,608 | | | | 54,948 | |
Iberdrola SA | | | 20,077 | | | | 142,313 | |
Orsted A/S(a) | | | 240 | | | | 15,254 | |
| | | | | | | | 504,724 | |
| Electrical Equipment – 0.7% | | | | | | |
ABB Ltd. (Registered) | | | 6,736 | | | | 135,939 | |
Eaton Corp. plc | | | 1,920 | | | | 137,606 | |
Legrand SA | | | 672 | | | | 43,964 | |
Rockwell Automation, Inc. | | | 400 | | | | 65,892 | |
Schneider Electric SE | | | 1,072 | | | | 77,688 | |
Signify NV(a) | | | 176 | | | | 4,347 | |
Vestas Wind Systems A/S | | | 528 | | | | 33,125 | |
| | | | | | | | 498,561 | |
| Electronic Equipment, Instruments & Components – 0.6% | |
CDW Corp. | | | 480 | | | | 43,205 | |
Electrocomponents plc | | | 3,888 | | | | 30,791 | |
Halma plc | | | 1,024 | | | | 17,376 | |
Hexagon AB, Class B | | | 1,696 | | | | 83,244 | |
Hitachi Ltd. | | | 7,600 | | | | 233,141 | |
Ingenico Group SA | | | 3 | | | | 213 | |
Spectris plc | | | 800 | | | | 21,916 | |
| | | | | | | | 429,886 | |
| Energy Equipment & Services – 0.4% | |
Halliburton Co. | | | 336 | | | | 11,653 | |
Saipem SpA* | | | 3,024 | | | | 16,566 | |
SBM Offshore NV | | | 1,328 | | | | 22,992 | |
Schlumberger Ltd. | | | 4,288 | | | | 220,017 | |
WorleyParsons Ltd. | | | 1,479 | | | | 15,294 | |
| | | | | | | | 286,522 | |
| Entertainment – 1.5% | | | | | | |
CD Projekt SA* | | | 64 | | | | 2,645 | |
Netflix, Inc.* | | | 752 | | | | 226,939 | |
Ubisoft Entertainment SA* | | | 432 | | | | 38,913 | |
Viacom, Inc., Class B | | | 1,024 | | | | 32,748 | |
See Accompanying Notes to the Financial Statements.
| | | | |
| FLEXSHARES ANNUAL REPORT | | | 239 | |
FlexShares® STOXX® Global ESG Impact Index Fund (cont.)
| | | | | | | | |
| Investments | | Shares | | | Value | |
| COMMON STOCKS – (continued) | |
| Entertainment – (continued) | | | | | | |
Vivendi SA | | | 2,192 | | | $ | 53,001 | |
Walt Disney Co. (The) | | | 6,240 | | | | 716,539 | |
| | | | | | | | 1,070,785 | |
| Equity Real Estate Investment Trusts (REITs) – 1.0% | |
AvalonBay Communities, Inc. | | | 752 | | | | 131,886 | |
British Land Co. plc (The) | | | 1,664 | | | | 12,587 | |
Dexus | | | 1,824 | | | | 13,186 | |
Gecina SA | | | 228 | | | | 33,506 | |
GPT Group (The) | | | 768 | | | | 2,809 | |
Great Portland Estates plc | | | — | (d) | | | 4 | |
Hammerson plc | | | 6,544 | | | | 36,666 | |
HCP, Inc. | | | 272 | | | | 7,493 | |
Host Hotels & Resorts, Inc. | | | 4,032 | | | | 77,051 | |
ICADE | | | 144 | | | | 12,221 | |
Iron Mountain, Inc. | | | 1,232 | | | | 37,711 | |
Klepierre SA | | | 400 | | | | 13,597 | |
Land Securities Group plc | | | 8,960 | | | | 97,680 | |
Link REIT | | | 4,500 | | | | 39,895 | |
Merlin Properties Socimi SA | | | 2,320 | | | | 29,126 | |
Mirvac Group | | | 9,360 | | | | 14,395 | |
Public Storage | | | 752 | | | | 154,513 | |
Stockland | | | 3,760 | | | | 9,620 | |
Vicinity Centres | | | 1,488 | | | | 2,795 | |
| | | | | | | | 726,741 | |
| Food & Staples Retailing – 1.3% | | | | | | |
Carrefour SA | | | 2,893 | | | | 56,216 | |
ICA Gruppen AB | | | 144 | | | | 5,103 | |
J Sainsbury plc | | | 7,136 | | | | 28,375 | |
Kesko OYJ, Class B | | | 176 | | | | 10,294 | |
Koninklijke Ahold Delhaize NV | | | 4,640 | | | | 106,356 | |
Kroger Co. (The) | | | 4,384 | | | | 130,468 | |
Lawson, Inc. | | | 100 | | | | 6,327 | |
Loblaw Cos. Ltd. | | | 752 | | | | 37,702 | |
Metcash Ltd. | | | 928 | | | | 1,809 | |
Metro, Inc. | | | 272 | | | | 8,556 | |
Sysco Corp. | | | 1,936 | | | | 138,095 | |
Walgreens Boots Alliance, Inc. | | | 1,920 | | | | 153,158 | |
Wesfarmers Ltd. | | | 5,088 | | | | 168,117 | |
Woolworths Group Ltd. | | | 4,032 | | | | 81,244 | |
| | | | | | | | 931,820 | |
| | | | | | | | |
| Investments | | Shares | | | Value | |
| Food Products – 2.1% | | | | | | |
Archer-Daniels-Midland Co. | | | 1,312 | | | $ | 61,992 | |
Associated British Foods plc | | | 112 | | | | 3,415 | |
Barry Callebaut AG (Registered) | | | 16 | | | | 31,319 | |
Bunge Ltd. | | | 64 | | | | 3,955 | |
Conagra Brands, Inc. | | | 848 | | | | 30,189 | |
Danone SA | | | 1,968 | | | | 139,543 | |
General Mills, Inc. | | | 304 | | | | 13,315 | |
Hershey Co. (The) | | | 224 | | | | 24,002 | |
JM Smucker Co. (The) | | | 288 | | | | 31,196 | |
Kellogg Co. | | | 176 | | | | 11,524 | |
Kerry Group plc, Class A | | | 96 | | | | 9,844 | |
Mondelez International, Inc., Class A | | | 3,392 | | | | 142,396 | |
Nestle SA (Registered) | | | 11,808 | | | | 999,202 | |
Nichirei Corp. | | | 1,600 | | | | 38,634 | |
Orkla ASA | | | 704 | | | | 6,093 | |
| | | | | | | | 1,546,619 | |
| Gas Utilities – 0.1% | | | | | | |
Hong Kong & China Gas Co. Ltd. | | | 17,820 | | | | 34,006 | |
Italgas SpA | | | 336 | | | | 1,737 | |
Naturgy Energy Group SA | | | 2,016 | | | | 49,613 | |
Rubis SCA | | | 197 | | | | 10,201 | |
| | | | | | | | 95,557 | |
| Health Care Equipment & Supplies – 2.1% | |
Abbott Laboratories | | | 6,720 | | | | 463,277 | |
Ansell Ltd. | | | 1,072 | | | | 17,612 | |
Baxter International, Inc. | | | 1,712 | | | | 107,017 | |
Becton Dickinson and Co. | | | 1,136 | | | | 261,848 | |
Coloplast A/S, Class B | | | 272 | | | | 25,405 | |
Edwards Lifesciences Corp.* | | | 608 | | | | 89,741 | |
EssilorLuxottica SA | | | 304 | | | | 41,592 | |
Fisher & Paykel Healthcare Corp. Ltd. | | | 1,088 | | | | 9,662 | |
Hologic, Inc.* | | | 448 | | | | 17,468 | |
Koninklijke Philips NV | | | 3,824 | | | | 142,635 | |
Medtronic plc | | | 2,928 | | | | 262,993 | |
Sartorius AG (Preference) | | | 176 | | | | 25,525 | |
Smith & Nephew plc | | | 2,544 | | | | 41,396 | |
Sonova Holding AG (Registered) | | | 48 | | | | 7,852 | |
Varian Medical Systems, Inc.* | | | 208 | | | | 24,829 | |
| | | | | | | | 1,538,852 | |
See Accompanying Notes to the Financial Statements.
| | |
| 240 | | FLEXSHARES ANNUAL REPORT |
FlexShares® STOXX® Global ESG Impact Index Fund (cont.)
| | | | | | | | |
| Investments | | Shares | | | Value | |
| COMMON STOCKS – (continued) | |
| Health Care Providers & Services – 1.1% | |
Anthem, Inc. | | | 1,104 | | | $ | 304,229 | |
CVS Health Corp. | | | 3,648 | | | | 264,079 | |
Fresenius Medical Care AG & Co. KGaA | | | 544 | | | | 42,727 | |
Humana, Inc. | | | 320 | | | | 102,531 | |
Laboratory Corp. of America Holdings* | | | 416 | | | | 66,789 | |
Orpea | | | 80 | | | | 9,867 | |
Ramsay Health Care Ltd. | | | 240 | | | | 9,563 | |
Ryman Healthcare Ltd. | | | 320 | | | | 2,528 | |
Sonic Healthcare Ltd. | | | 2,096 | | | | 33,499 | |
| | | | | | | | 835,812 | |
| Hotels, Restaurants & Leisure – 1.7% | |
Accor SA | | | 48 | | | | 2,198 | |
Aristocrat Leisure Ltd. | | | 1,088 | | | | 20,435 | |
Carnival Corp. | | | 912 | | | | 51,108 | |
Carnival plc | | | 880 | | | | 47,934 | |
Compass Group plc | | | 5,792 | | | | 113,971 | |
Hilton Worldwide Holdings, Inc. | | | 832 | | | | 59,213 | |
InterContinental Hotels Group plc | | | 512 | | | | 26,888 | |
Marriott International, Inc., Class A | | | 1,376 | | | | 160,841 | |
McDonald’s Corp. | | | 1,472 | | | | 260,397 | |
Merlin Entertainments plc(a) | | | 4,272 | | | | 17,642 | |
Sands China Ltd. | | | 6,400 | | | | 25,226 | |
Sodexo SA | | | 48 | | | | 4,901 | |
Star Entertainment Grp Ltd. (The) | | | 1,248 | | | | 4,193 | |
Starbucks Corp. | | | 5,984 | | | | 348,688 | |
Tabcorp Holdings Ltd. | | | 1,952 | | | | 6,392 | |
TUI AG, DI | | | 1,376 | | | | 22,839 | |
Whitbread plc | | | 784 | | | | 44,077 | |
William Hill plc | | | 3,488 | | | | 9,368 | |
| | | | | | | | 1,226,311 | |
| Household Durables – 1.2% | | | | | | |
Barratt Developments plc | | | 448 | | | | 2,942 | |
Berkeley Group Holdings plc | | | 256 | | | | 11,452 | |
Electrolux AB, Series B | | | 80 | | | | 1,665 | |
Husqvarna AB, Class B | | | 560 | | | | 4,235 | |
Panasonic Corp. | | | 8,000 | | | | 88,574 | |
Persimmon plc | | | 3,168 | | | | 92,859 | |
SEB SA | | | 96 | | | | 13,781 | |
| | | | | | | | |
| Investments | | Shares | | | Value | |
| Household Durables – (continued) | |
Sekisui House Ltd. | | | 8,000 | | | $ | 117,815 | |
Sony Corp. | | | 9,300 | | | | 505,977 | |
Taylor Wimpey plc | | | 720 | | | | 1,486 | |
Techtronic Industries Co. Ltd. | | | 2,000 | | | | 9,363 | |
| | | | | | | | 850,149 | |
| Household Products – 1.6% | | | | | | |
Clorox Co. (The) | | | 496 | | | | 73,631 | |
Colgate-Palmolive Co. | | | 1,456 | | | | 86,705 | |
Kimberly-Clark Corp. | | | 1,216 | | | | 126,829 | |
Procter & Gamble Co. (The) | | | 6,928 | | | | 614,375 | |
Reckitt Benckiser Group plc | | | 2,944 | | | | 238,228 | |
| | | | | | | | 1,139,768 | |
| Industrial Conglomerates – 1.8% | | | | | | |
3M Co. | | | 3,056 | | | | 581,435 | |
CK Hutchison Holdings Ltd. | | | 6,000 | | | | 60,425 | |
General Electric Co. | | | 37,600 | | | | 379,760 | |
Siemens AG (Registered) | | | 2,128 | | | | 245,260 | |
Smiths Group plc | | | 1,792 | | | | 31,999 | |
| | | | | | | | 1,298,879 | |
| Insurance – 2.5% | | | | | | |
Admiral Group plc | | | 464 | | | | 11,935 | |
Aegon NV | | | 3,914 | | | | 24,072 | |
Aflac, Inc. | | | 3,808 | | | | 164,011 | |
Ageas | | | 480 | | | | 24,044 | |
AIA Group Ltd. | | | 28,800 | | | | 218,037 | |
Alleghany Corp. | | | 48 | | | | 28,833 | |
Aon plc | | | 976 | | | | 152,432 | |
Assicurazioni Generali SpA | | | 4,240 | | | | 68,603 | |
Aviva plc | | | 784 | | | | 4,293 | |
AXA SA | | | 3,104 | | | | 77,866 | |
CNP Assurances | | | 1,712 | | | | 38,214 | |
Direct Line Insurance Group plc | | | 1,456 | | | | 6,130 | |
Hannover Rueck SE | | | 80 | | | | 10,796 | |
Insurance Australia Group Ltd. | | | 7,777 | | | | 37,646 | |
Legal & General Group plc | | | 43,408 | | | | 139,493 | |
Mapfre SA | | | 496 | | | | 1,486 | |
Medibank Pvt Ltd. | | | 48,464 | | | | 95,833 | |
Muenchener Rueckversicherungs-Gesellschaft AG in Muenchen (Registered) | | | 560 | | | | 120,525 | |
NN Group NV | | | 1,671 | | | | 71,946 | |
See Accompanying Notes to the Financial Statements.
| | | | |
| FLEXSHARES ANNUAL REPORT | | | 241 | |
FlexShares® STOXX® Global ESG Impact Index Fund (cont.)
| | | | | | | | |
| Investments | | Shares | | | Value | |
| COMMON STOCKS – (continued) | |
| Insurance – (continued) | | | | | | |
Old Mutual Ltd. | | | 6,368 | | | $ | 9,601 | |
Phoenix Group Holdings | | | 1,392 | | | | 10,716 | |
Poste Italiane SpA(a) | | | 2,016 | | | | 14,505 | |
Power Corp. of Canada | | | 112 | | | | 2,318 | |
Powszechny Zaklad Ubezpieczen SA | | | 1,520 | | | | 15,547 | |
Principal Financial Group, Inc. | | | 944 | | | | 44,434 | |
Prudential plc | | | 3,376 | | | | 67,746 | |
RSA Insurance Group plc | | | 2,080 | | | | 15,000 | |
Sampo OYJ, Class A | | | 800 | | | | 36,856 | |
Storebrand ASA | | | 3,696 | | | | 30,852 | |
Swiss Life Holding AG (Registered)* | | | 32 | | | | 12,095 | |
Swiss Re AG | | | 1,152 | | | | 104,171 | |
Tryg A/S | | | 272 | | | | 6,576 | |
Zurich Insurance Group AG* | | | 512 | | | | 159,418 | |
| | | | | | | | 1,826,030 | |
| Interactive Media & Services – 3.9% | |
Alphabet, Inc., Class C* | | | 1,312 | | | | 1,412,722 | |
Auto Trader Group plc(a) | | | 4,544 | | | | 23,782 | |
carsales.com Ltd. | | | 704 | | | | 6,088 | |
Facebook, Inc., Class A* | | | 9,056 | | | | 1,374,610 | |
REA Group Ltd. | | | 96 | | | | 4,873 | |
| | | | | | | | 2,822,075 | |
| Internet & Direct Marketing Retail – 4.5% | |
Amazon.com, Inc.* | | | 1,936 | | | | 3,093,747 | |
Booking Holdings, Inc.* | | | 96 | | | | 179,960 | |
Zalando SE* (a) | | | 240 | | | | 9,300 | |
| | | | | | | | 3,283,007 | |
| IT Services – 2.6% | | | | | | |
Accenture plc, Class A | | | 3,152 | | | | 496,818 | |
Akamai Technologies, Inc.* | | | 624 | | | | 45,084 | |
Amadeus IT Group SA | | | 928 | | | | 74,844 | |
Amdocs Ltd. | | | 384 | | | | 24,296 | |
Atos SE | | | 48 | | | | 4,121 | |
Capgemini SE | | | 528 | | | | 64,611 | |
Fujitsu Ltd. | | | 1,700 | | | | 103,366 | |
International Business Machines Corp. | | | 4,448 | | | | 513,433 | |
Link Administration Holdings Ltd. | | | 416 | | | | 2,211 | |
| | | | | | | | |
| Investments | | Shares | | | Value | |
| IT Services – (continued) | | | | | | |
Mastercard, Inc., Class A | | | 2,912 | | | $ | 575,615 | |
Wirecard AG | | | 128 | | | | 23,988 | |
| | | | | | | | 1,928,387 | |
| Leisure Products – 0.1% | | | | | | |
Hasbro, Inc. | | | 544 | | | | 49,890 | |
| Life Sciences Tools & Services – 0.4% | |
Lonza Group AG (Registered)* | | | 80 | | | | 25,187 | |
Thermo Fisher Scientific, Inc. | | | 1,136 | | | | 265,427 | |
| | | | | | | | 290,614 | |
| Machinery – 1.0% | | | | | | |
Alstom SA* | | | 48 | | | | 2,102 | |
Atlas Copco AB, Class A* | | | 224 | | | | 5,554 | |
CNH Industrial NV | | | 2,192 | | | | 22,815 | |
Cummins, Inc. | | | 96 | | | | 13,122 | |
Deere & Co. | | | 640 | | | | 86,681 | |
Dover Corp. | | | 336 | | | | 27,834 | |
Georg Fischer AG (Registered) | | | 16 | | | | 14,912 | |
IHI Corp. | | | 800 | | | | 29,276 | |
IMI plc | | | 5,968 | | | | 75,837 | |
KION Group AG | | | 16 | | | | 937 | |
Komatsu Ltd. | | | 3,100 | | | | 80,882 | |
Kone OYJ, Class B | | | 1,840 | | | | 89,689 | |
Metso OYJ | | | 80 | | | | 2,530 | |
PACCAR, Inc. | | | 176 | | | | 10,069 | |
Rotork plc | | | 3,392 | | | | 12,994 | |
Sandvik AB | | | 6,656 | | | | 105,524 | |
SKF AB, Class B | | | 80 | | | | 1,287 | |
Spirax-Sarco Engineering plc | | | 96 | | | | 7,936 | |
Stanley Black & Decker, Inc. | | | 432 | | | | 50,337 | |
Volvo AB, Class B | | | 6,624 | | | | 99,146 | |
Wartsila OYJ Abp | | | 96 | | | | 1,637 | |
| | | | | | | | 741,101 | |
| Media – 0.3% | | | | | | |
Dentsu, Inc. | | | 600 | | | | 27,859 | |
Eutelsat Communications SA | | | 544 | | | | 11,039 | |
JCDecaux SA | | | 400 | | | | 13,171 | |
Lagardere SCA | | | 624 | | | | 17,103 | |
Pearson plc | | | 3,696 | | | | 42,437 | |
Publicis Groupe SA | | | 400 | | | | 23,223 | |
Schibsted ASA, Class A | | | 96 | | | | 3,336 | |
See Accompanying Notes to the Financial Statements.
| | |
| 242 | | FLEXSHARES ANNUAL REPORT |
FlexShares® STOXX® Global ESG Impact Index Fund (cont.)
| | | | | | | | |
| Investments | | Shares | | | Value | |
| COMMON STOCKS – (continued) | |
| Media – (continued) | | | | | | |
SES SA, FDR | | | 1,280 | | | $ | 27,520 | |
Singapore Press Holdings Ltd. | | | 14,400 | | | | 27,556 | |
Telenet Group Holding NV | | | 48 | | | | 2,332 | |
WPP plc | | | 2,080 | | | | 23,616 | |
| | | | | | | | 219,192 | |
| Metals & Mining – 1.3% | | | | | | |
Agnico Eagle Mines Ltd. | | | 33 | | | | 1,168 | |
Alumina Ltd. | | | 3,776 | | | | 6,824 | |
Anglo American plc | | | 1,664 | | | | 35,618 | |
ArcelorMittal | | | 1,152 | | | | 28,768 | |
BHP Billiton Ltd. | | | 10,912 | | | | 249,108 | |
BHP Billiton plc | | | 7,808 | | | | 155,876 | |
BlueScope Steel Ltd. | | | 3,056 | | | | 31,125 | |
Boliden AB* | | | 3,456 | | | | 79,086 | |
Glencore plc* | | | 6,208 | | | | 25,292 | |
Newmont Mining Corp. | | | 256 | | | | 7,916 | |
Norsk Hydro ASA | | | 2,960 | | | | 15,411 | |
OZ Minerals Ltd. | | | 13,120 | | | | 83,968 | |
Randgold Resources Ltd. | | | 48 | | | | 3,772 | |
Rio Tinto Ltd. | | | 1,312 | | | | 71,043 | |
Rio Tinto plc | | | 1,568 | | | | 76,204 | |
South32 Ltd. | | | 21,488 | | | | 55,131 | |
Teck Resources Ltd., Class B | | | 656 | | | | 13,592 | |
voestalpine AG | | | 48 | | | | 1,707 | |
| | | | | | | | 941,609 | |
| Multiline Retail – 0.6% | | | | | | |
Canadian Tire Corp. Ltd., Class A | | | 208 | | | | 23,463 | |
Dollar General Corp. | | | 512 | | | | 57,026 | |
Dollar Tree, Inc.* | | | 176 | | | | 14,837 | |
Kohl’s Corp. | | | 416 | | | | 31,504 | |
Marui Group Co. Ltd. | | | 3,200 | | | | 68,903 | |
Next plc | | | 480 | | | | 31,917 | |
Target Corp. | | | 2,336 | | | | 195,360 | |
| | | | | | | | 423,010 | |
| Multi-Utilities – 0.4% | | | | | | |
AGL Energy Ltd. | | | 336 | | | | 4,287 | |
E.ON SE | | | 4,544 | | | | 44,051 | |
Engie SA | | | 464 | | | | 6,191 | |
National Grid plc | | | 13,120 | | | | 139,008 | |
| | | | | | | | |
| Investments | | Shares | | | Value | |
| Multi-Utilities – (continued) | | | | | | |
RWE AG | | | 1,120 | | | $ | 21,852 | |
Sempra Energy | | | 752 | | | | 82,810 | |
Suez | | | 1,072 | | | | 15,529 | |
Veolia Environnement SA | | | 256 | | | | 5,111 | |
| | | | | | | | 318,839 | |
| Oil, Gas & Consumable Fuels – 4.4% | |
Aker BP ASA | | | 80 | | | | 2,646 | |
BP plc | | | 25,296 | | | | 183,363 | |
Caltex Australia Ltd. | | | 624 | | | | 12,498 | |
Canadian Natural Resources Ltd. | | | 3,600 | | | | 99,016 | |
Chevron Corp. | | | 5,056 | | | | 564,503 | |
Enagas SA | | | 1,264 | | | | 33,570 | |
Eni SpA | | | 6,672 | | | | 118,733 | |
Equinor ASA | | | 4,441 | | | | 115,874 | |
Exxon Mobil Corp. | | | 7,696 | | | | 613,217 | |
Galp Energia SGPS SA | | | 3,280 | | | | 57,214 | |
Koninklijke Vopak NV | | | 304 | | | | 13,778 | |
Neste OYJ | | | 416 | | | | 34,295 | |
Oil Search Ltd. | | | 10,608 | | | | 58,418 | |
OMV AG | | | 96 | | | | 5,344 | |
Polski Koncern Naftowy ORLEN SA | | | 688 | | | | 16,567 | |
Royal Dutch Shell plc, Class A | | | 14,896 | | | | 475,282 | |
Snam SpA | | | 12,288 | | | | 50,874 | |
Suncor Energy, Inc. | | | 4,880 | | | | 164,097 | |
TOTAL SA | | | 8,145 | | | | 479,523 | |
Woodside Petroleum Ltd. | | | 4,912 | | | | 121,326 | |
| | | | | | | | 3,220,138 | |
| Paper & Forest Products – 0.2% | | | | | | |
Mondi plc | | | 1,072 | | | | 25,265 | |
Stora Enso OYJ, Class R | | | 1,504 | | | | 22,673 | |
Svenska Cellulosa AB SCA, Class B | | | 4,400 | | | | 41,700 | |
UPM-Kymmene OYJ | | | 1,120 | | | | 36,053 | |
| | | | | | | | 125,691 | |
| Personal Products – 1.6% | | | | | | |
Beiersdorf AG | | | 560 | | | | 57,994 | |
Estee Lauder Cos., Inc. (The), Class A | | | 880 | | | | 120,947 | |
L’Oreal SA | | | 1,040 | | | | 234,378 | |
Shiseido Co. Ltd. | | | 4,500 | | | | 284,582 | |
Unilever NV, CVA | | | 4,752 | | | | 255,887 | |
Unilever plc | | | 4,368 | | | | 231,425 | |
| | | | | | | | 1,185,213 | |
See Accompanying Notes to the Financial Statements.
| | | | |
| FLEXSHARES ANNUAL REPORT | | | 243 | |
FlexShares® STOXX® Global ESG Impact Index Fund (cont.)
| | | | | | | | |
| Investments | | Shares | | | Value | |
| COMMON STOCKS – (continued) | |
| Pharmaceuticals – 5.2% | | | | | | |
Allergan plc | | | 416 | | | $ | 65,732 | |
Astellas Pharma, Inc. | | | 17,600 | | | | 272,449 | |
AstraZeneca plc | | | 5,216 | | | | 399,218 | |
Bayer AG (Registered) | | | 688 | | | | 52,837 | |
Eli Lilly & Co. | | | 3,824 | | | | 414,675 | |
GlaxoSmithKline plc | | | 8,288 | | | | 160,036 | |
H Lundbeck A/S | | | 224 | | | | 10,464 | |
Ipsen SA | | | 48 | | | | 6,668 | |
Merck & Co., Inc. | | | 5,408 | | | | 398,083 | |
Merck KGaA | | | 928 | | | | 99,490 | |
Mylan NV* | | | 544 | | | | 17,000 | |
Novo Nordisk A/S, Class B | | | 5,584 | | | | 241,603 | |
Orion OYJ, Class B | | | 432 | | | | 14,880 | |
Pfizer, Inc. | | | 17,440 | | | | 750,966 | |
Roche Holding AG | | | 2,592 | | | | 631,573 | |
Sanofi | | | 2,592 | | | | 231,542 | |
UCB SA | | | 336 | | | | 28,241 | |
Vifor Pharma AG | | | 208 | | | | 30,097 | |
| | | | | | | | 3,825,554 | |
| Professional Services – 0.4% | | | | | | |
Adecco Group AG (Registered) | | | 368 | | | | 18,051 | |
Bureau Veritas SA | | | 1,136 | | | | 25,678 | |
Experian plc | | | 3,024 | | | | 69,647 | |
Randstad NV | | | 320 | | | | 16,153 | |
RELX plc | | | 5,552 | | | | 109,958 | |
SGS SA (Registered) | | | 16 | | | | 38,047 | |
Teleperformance | | | 32 | | | | 5,279 | |
Wolters Kluwer NV | | | 544 | | | | 30,918 | |
| | | | | | | | 313,731 | |
| Real Estate Management & Development – 0.3% | |
CapitaLand Ltd. | | | 8,000 | | | | 18,140 | |
Castellum AB | | | 896 | | | | 15,475 | |
CBRE Group, Inc., Class A* | | | 1,536 | | | | 61,886 | |
City Developments Ltd. | | | 1,600 | | | | 9,139 | |
CK Asset Holdings Ltd. | | | 4,000 | | | | 25,971 | |
Fabege AB | | | 5,856 | | | | 74,900 | |
Sun Hung Kai Properties Ltd. | | | 3,000 | | | | 38,995 | |
| | | | | | | | 244,506 | |
| | | | | | | | |
| Investments | | Shares | | | Value | |
| Road & Rail – 0.3% | | | | | | |
Aurizon Holdings Ltd. | | | 6,112 | | | $ | 18,194 | |
Canadian National Railway Co. | | | 2,064 | | | | 176,876 | |
DSV A/S | | | 528 | | | | 42,466 | |
| | | | | | | | 237,536 | |
| Semiconductors & Semiconductor Equipment – 2.6% | |
Advanced Micro Devices, Inc.* | | | 2,544 | | | | 46,326 | |
ASM International NV* | | | 16 | | | | 689 | |
ASML Holding NV | | | 512 | | | | 87,552 | |
Infineon Technologies AG | | | 1,472 | | | | 29,538 | |
Intel Corp. | | | 16,768 | | | | 786,084 | |
KLA-Tencor Corp. | | | 304 | | | | 27,828 | |
Lam Research Corp. | | | 560 | | | | 79,369 | |
Maxim Integrated Products, Inc. | | | 672 | | | | 33,613 | |
Microchip Technology, Inc. | | | 1,184 | | | | 77,883 | |
Micron Technology, Inc.* | | | 3,248 | | | | 122,515 | |
ON Semiconductor Corp.* | | | 1,360 | | | | 23,120 | |
QUALCOMM, Inc. | | | 3,856 | | | | 242,504 | |
STMicroelectronics NV | | | 1,440 | | | | 21,863 | |
Texas Instruments, Inc. | | | 3,088 | | | | 286,659 | |
Xilinx, Inc. | | | 176 | | | | 15,025 | |
| | | | | | | | 1,880,568 | |
| Software – 7.2% | | | | | | |
Adobe, Inc.* | | | 1,264 | | | | 310,640 | |
Autodesk, Inc.* | | | 688 | | | | 88,924 | |
Dassault Systemes SE | | | 418 | | | | 52,500 | |
Dell Technologies, Inc., Class V* | | | 64 | | | | 5,785 | |
Gemalto NV* | | | 210 | | | | 11,983 | |
Intuit, Inc. | | | 832 | | | | 175,552 | |
Microsoft Corp. | | | 34,912 | | | | 3,728,951 | |
Oracle Corp. | | | 5,712 | | | | 278,974 | |
salesforce.com, Inc.* | | | 2,464 | | | | 338,159 | |
SAP SE | | | 2,224 | | | | 238,534 | |
SimCorp A/S | | | 384 | | | | 29,596 | |
Symantec Corp. | | | 272 | | | | 4,937 | |
Temenos AG (Registered)* | | | 96 | | | �� | 13,218 | |
| | | | | | | | 5,277,753 | |
| Specialty Retail – 1.2% | | | | | | |
AutoZone, Inc.* | | | 80 | | | | 58,678 | |
Best Buy Co., Inc. | | | 672 | | | | 47,147 | |
Dufry AG (Registered)* | | | 16 | | | | 1,806 | |
See Accompanying Notes to the Financial Statements.
| | |
| 244 | | FLEXSHARES ANNUAL REPORT |
FlexShares® STOXX® Global ESG Impact Index Fund (cont.)
| | | | | | | | |
| Investments | | Shares | | | Value | |
| COMMON STOCKS – (continued) | |
| Specialty Retail – (continued) | | | | | | |
Fast Retailing Co. Ltd. | | | 400 | | | $ | 202,277 | |
Hennes & Mauritz AB, Class B | | | 2,416 | | | | 42,755 | |
JB Hi-Fi Ltd. | | | 736 | | | | 11,998 | |
Kingfisher plc | | | 1,600 | | | | 5,207 | |
Lowe’s Cos., Inc. | | | 3,072 | | | | 292,516 | |
TJX Cos., Inc. (The) | | | 2,208 | | | | 242,615 | |
| | | | | | | | 904,999 | |
| Technology Hardware, Storage & Peripherals – 5.8% | |
Apple, Inc. | | | 17,424 | | | | 3,813,416 | |
Hewlett Packard Enterprise Co. | | | 7,728 | | | | 117,852 | |
HP, Inc. | | | 4,736 | | | | 114,327 | |
NEC Corp. | | | 1,900 | | | | 54,548 | |
NetApp, Inc. | | | 384 | | | | 30,140 | |
Seiko Epson Corp. | | | 3,800 | | | | 61,417 | |
Xiaomi Corp., Class B* (a) | | | 28,800 | | | | 44,746 | |
| | | | | | | | 4,236,446 | |
| Textiles, Apparel & Luxury Goods – 0.8% | |
adidas AG | | | 528 | | | | 124,436 | |
Burberry Group plc | | | 512 | | | | 11,848 | |
Cie Financiere Richemont SA (Registered) | | | 1,088 | | | | 79,715 | |
Hermes International | | | 48 | | | | 27,465 | |
HUGO BOSS AG | | | 80 | | | | 5,727 | |
Kering SA | | | 240 | | | | 107,032 | |
Luxottica Group SpA | | | 576 | | | | 36,234 | |
LVMH Moet Hennessy Louis Vuitton SE | | | 576 | | | | 175,429 | |
Shenzhou International Group Holdings Ltd. | | | 1,000 | | | | 11,047 | |
Tapestry, Inc. | | | 832 | | | | 35,202 | |
| | | | | | | | 614,135 | |
| Tobacco – 0.9% | | | | | | |
Altria Group, Inc. | | | 4,384 | | | | 285,135 | |
British American Tobacco plc | | | 4,208 | | | | 182,461 | |
Imperial Brands plc | | | 416 | | | | 14,102 | |
Japan Tobacco, Inc. | | | 7,700 | | | | 198,308 | |
| | | | | | | | 680,006 | |
| | | | | | | | |
| Investments | | Shares | | | Value | |
| Trading Companies & Distributors – 1.0% | |
Brenntag AG | | | 224 | | | $ | 11,718 | |
Bunzl plc | | | 1,472 | | | | 43,466 | |
Fastenal Co. | | | 832 | | | | 42,773 | |
Ferguson plc | | | 757 | | | | 51,100 | |
HD Supply Holdings, Inc.* | | | 80 | | | | 3,006 | |
ITOCHU Corp. | | | 16,000 | | | | 297,018 | |
Marubeni Corp. | | | 16,000 | | | | 129,908 | |
Rexel SA | | | 704 | | | | 8,990 | |
Sojitz Corp. | | | 11,200 | | | | 37,712 | |
Toyota Tsusho Corp. | | | 3,200 | | | | 115,830 | |
WW Grainger, Inc. | | | 48 | | | | 13,631 | |
| | | | | | | | 755,152 | |
| Transportation Infrastructure – 0.2% | |
Aeroports de Paris | | | 176 | | | | 36,872 | |
Auckland International Airport Ltd. | | | 4,192 | | | | 19,134 | |
Fraport AG Frankfurt Airport Services Worldwide | | | 48 | | | | 3,715 | |
Getlink | | | 1,616 | | | | 20,352 | |
Sydney Airport | | | 1,312 | | | | 5,988 | |
Transurban Group | | | 8,400 | | | | 67,513 | |
| | | | | | | | 153,574 | |
| Water Utilities – 0.1% | | | | | | |
American Water Works Co., Inc. | | | 432 | | | | 38,245 | |
Severn Trent plc | | | 1,088 | | | | 25,899 | |
| | | | | | | | 64,144 | |
| Wireless Telecommunication Services – 1.4% | |
Freenet AG | | | 640 | | | | 14,423 | |
KDDI Corp. | | | 18,600 | | | | 463,867 | |
SoftBank Group Corp. | | | 5,700 | | | | 456,990 | |
Tele2 AB, Class B | | | 256 | | | | 2,913 | |
Vodafone Group plc | | | 36,624 | | | | 69,174 | |
| | | | | | | | 1,007,367 | |
Total Common Stocks
(Cost $71,068,014) | | | | | | | 72,217,562 | |
See Accompanying Notes to the Financial Statements.
| | | | |
| FLEXSHARES ANNUAL REPORT | | | 245 | |
FlexShares® STOXX® Global ESG Impact Index Fund (cont.)
| | | | | | | | |
| Investments | | Number of
Rights | | | Value ($) | |
| RIGHTS – 0.0%(b) | | | | | | |
| Banks – 0.0%(b) | | | | | | |
Banco Santander SA, expiring 11/6/2018, price 0.04 EUR*
(Cost $2,274) | | | 58,224 | | | $ | 2,263 | |
Total Investments – 98.5%
(Cost $71,070,288) | | | | | | | 72,219,825 | |
Other Assets Less Liabilities – 1.5% | | | | | | | 1,064,282 | |
| NET ASSETS – 100.0% | | | | | | $ | 73,284,107 | |
| * | Non-income producing security. |
| (a) | Security exempt from registration pursuant to Regulation S under the Securities Act of 1933. Regulation S applies to securities offerings that are made outside of the United States and do not involve direct selling efforts in the United States and as such may have restrictions on resale. |
| (b) | Represents less than 0.05% of net assets. |
| (c) | Security fair valued as of October 31, 2018 in accordance with procedures approved by the Board of Trustees. Total value of all such securities at October 31, 2018 amounted to $250, which represents approximately 0.00% of net assets of the Fund. |
| (d) | Amount represents less than one share. |
Percentages shown are based on Net Assets.
Abbreviations
CVA – Dutch Certification
DI – Depositary Interest
EUR – Euro
FDR – Fiduciary Depositary Receipt
OYJ – Public Limited Company
Preference – A special type of equity investment that shares in the earnings of the company, has limited voting rights, and may have a dividend preference. Preference shares may also have liquidation preference.
SCA – Limited partnership with share capital
As of October 31, 2018, the gross unrealized appreciation (depreciation) of investments based on the aggregate cost of investments (including derivative instruments, if applicable) for federal income tax purposes was as follows:
| | | | |
| | | | |
Aggregate gross unrealized appreciation | | $ | 5,019,607 | |
Aggregate gross unrealized depreciation | | | (3,876,102 | ) |
Net unrealized appreciation | | $ | 1,143,505 | |
Federal income tax cost | | $ | 71,010,146 | |
Futures Contracts
FlexShares® STOXX® Global ESG Impact Index Fund had the following open futures contracts as of October 31, 2018:
| | | | | | | | | | | | | | | | | | | | |
| | | Number of
Contracts | | | Expiration
Date | | | Trading
Currency | | | Notional
Amount | | | Value and
Unrealized
Depreciation* | |
Long Contracts | | | | | | | | | | | | | | | | | | | | |
MSCI EAFE E-Mini Index | | | 4 | | | | 12/21/2018 | | | | USD | | | $ | 362,500 | | | $ | (19,949 | ) |
S&P 500 E-Mini Index | | | 5 | | | | 12/21/2018 | | | | USD | | | | 677,775 | | | | (46,225 | ) |
| | | | | | | | | | | | | | | | | | | $ | (66,174 | ) |
| * | This amount represents the cumulative appreciation/depreciation on futures contracts. Current day’s variation margin is reported within the Statement of Assets and Liabilities for futures contracts. |
Abbreviations:
USD – US Dollar
See Accompanying Notes to the Financial Statements.
| | |
| 246 | | FLEXSHARES ANNUAL REPORT |
FlexShares® STOXX® Global ESG Impact Index Fund (cont.)
FlexShares® STOXX® Global ESG Impact Index Fund invested, as a percentage of net assets, in companies domiciled in the following countries as of October 31, 2018:
| | | | |
Australia | | | 3.5 | % |
Austria | | | 0.0 | † |
Belgium | | | 0.4 | |
Canada | | | 1.8 | |
Denmark | | | 0.6 | |
Finland | | | 0.5 | |
France | | | 4.5 | |
Germany | | | 2.9 | |
Hong Kong | | | 0.8 | |
Ireland | | | 0.1 | |
Italy | | | 0.9 | |
Japan | | | 9.1 | |
Luxembourg | | | 0.1 | |
Netherlands | | | 1.5 | |
New Zealand | | | 0.0 | † |
Norway | | | 0.3 | |
Poland | | | 0.1 | |
Portugal | | | 0.1 | |
Singapore | | | 0.3 | |
Spain | | | 1.1 | |
Sweden | | | 1.2 | |
Switzerland | | | 3.9 | |
United Kingdom | | | 7.6 | |
United States | | | 57.2 | |
Other1 | | | 1.5 | |
| | | | 100.0 | % |
| † | Amount represents less than 0.05%. |
| 1 | Includes any non-equity securities and net other assets (liabilities). |
See Accompanying Notes to the Financial Statements.
| | | | |
| FLEXSHARES ANNUAL REPORT | | | 247 | |
Schedule of Investments
FlexShares® Morningstar Global Upstream Natural Resources Index Fund
October 31, 2018
| | | | | | | | |
| Investments | | Shares | | | Value | |
| COMMON STOCKS – 99.5% | |
| Building Products – 0.1% | |
Universal Forest Products, Inc. | | | 162,150 | | | $ | 4,583,981 | |
| Chemicals – 12.7% | |
CF Industries Holdings, Inc.(a) | | | 1,628,400 | | | | 78,212,052 | |
FMC Corp. | | | 931,500 | | | | 72,731,520 | |
Incitec Pivot Ltd.(a) | | | 13,996,650 | | | | 38,688,489 | |
Israel Chemicals Ltd. | | | 3,743,250 | | | | 21,581,362 | |
K+S AG (Registered) | | | 1,749,150 | | | | 32,641,471 | |
Mosaic Co. (The)(a) | | | 2,511,600 | | | | 77,708,904 | |
Nufarm Ltd.(a) | | | 1,929,251 | | | | 7,793,932 | |
Nutrien Ltd. | | | 4,229,700 | | | | 224,456,724 | |
Sasol Ltd. | | | 538,200 | | | | 17,640,823 | |
Scotts Miracle-Gro Co. (The)(a) | | | 286,350 | | | | 19,110,999 | |
Sirius Minerals plc* (a) | | | 42,486,750 | | | | 12,507,827 | |
UPL Ltd. | | | 3,063,600 | | | | 27,938,855 | |
Yara International ASA | | | 1,383,450 | | | | 59,700,214 | |
| | | | | | | | 690,713,172 | |
| Diversified Financial Services – 0.1% | |
Metro Pacific Investments Corp. | | | 46,903,200 | | | | 4,207,744 | |
| Equity Real Estate Investment Trusts (REITs) – 1.3% | |
Rayonier, Inc.(a) | | | 379,500 | | | | 11,460,900 | |
Weyerhaeuser Co. | | | 2,283,900 | | | | 60,820,257 | |
| | | | | | | | 72,281,157 | |
| Food Products – 15.0% | |
a2 Milk Co. Ltd.* (a) | | | 6,644,700 | | | | 45,212,262 | |
Archer-Daniels-Midland Co. | | | 4,426,350 | | | | 209,145,037 | |
Bunge Ltd. | | | 1,138,500 | | | | 70,359,300 | |
Charoen Pokphand Foods PCL, NVDR | | | 25,530,000 | | | | 19,445,928 | |
Charoen Pokphand Indonesia Tbk. PT | | | 48,990,000 | | | | 17,723,730 | |
CJ CheilJedang Corp. | | | 79,350 | | | | 22,561,011 | |
Costa Group Holdings Ltd.(a) | | | 2,539,200 | | | | 10,977,913 | |
Fresh Del Monte Produce, Inc.(a) | | | 272,550 | | | | 9,002,326 | |
| | | | | | | | |
| Investments | | Shares | | | Value | |
| Food Products – (continued) | |
Golden Agri-Resources Ltd.(a) | | | 66,240,000 | | | $ | 12,197,574 | |
IOI Corp. Bhd. | | | 22,770,000 | | | | 24,486,797 | |
Kuala Lumpur Kepong Bhd. | | | 3,105,000 | | | | 18,491,241 | |
Marine Harvest ASA | | | 3,349,950 | | | | 81,308,015 | |
PPB Group Bhd. | | | 4,485,000 | | | | 17,963,580 | |
Salmar ASA | | | 462,300 | | | | 24,476,469 | |
Sime Darby Plantation Bhd. | | | 22,080,000 | | | | 27,755,001 | |
Tyson Foods, Inc., Class A | | | 2,325,300 | | | | 139,331,976 | |
Wilmar International Ltd.(a) | | | 28,290,000 | | | | 64,555,459 | |
| | | | | | | | 814,993,619 | |
| Metals & Mining – 31.6% | |
Agnico Eagle Mines Ltd.(a) | | | 837,341 | | | | 29,648,862 | |
Alcoa Corp.* (a) | | | 700,350 | | | | 24,505,246 | |
Alumina Ltd. | | | 9,111,450 | | | | 16,467,237 | |
Anglo American plc(a) | | | 4,968,000 | | | | 106,339,381 | |
Antofagasta plc(a) | | | 1,193,700 | | | | 11,970,163 | |
Barrick Gold Corp. | | | 4,600,993 | | | | 57,772,987 | |
BHP Billiton Ltd. | | | 11,819,700 | | | | 269,830,000 | |
Boliden AB* | | | 1,024,650 | | | | 23,447,766 | |
First Quantum Minerals Ltd. | | | 2,239,050 | | | | 22,403,287 | |
Fortescue Metals Group Ltd.(a) | | | 6,603,300 | | | | 18,720,355 | |
Franco-Nevada Corp. | | | 702,743 | | | | 43,997,357 | |
Freeport-McMoRan, Inc.(a) | | | 4,333,200 | | | | 50,481,780 | |
Glencore plc* | | | 42,993,900 | | | | 175,161,696 | |
Goldcorp, Inc.(a) | | | 3,199,959 | | | | 28,972,026 | |
Grupo Mexico SAB de CV, Series B | | | 16,560,000 | | | | 38,327,352 | |
Kinross Gold Corp.* | | | 5,323,350 | | | | 13,863,207 | |
Korea Zinc Co. Ltd. | | | 51,750 | | | | 17,211,399 | |
MMC Norilsk Nickel PJSC | | | 35,523 | | | | 5,943,915 | |
MMC Norilsk Nickel PJSC, ADR | | | 1,987,320 | | | | 32,949,766 | |
Newcrest Mining Ltd. | | | 2,873,850 | | | | 41,979,295 | |
Newmont Mining Corp.(a) | | | 2,087,250 | | | | 64,537,770 | |
Norsk Hydro ASA | | | 4,843,800 | | | | 25,219,030 | |
Randgold Resources Ltd. | | | 379,500 | | | | 29,821,726 | |
Rio Tinto plc | | | 4,064,100 | | | | 197,512,090 | |
Royal Gold, Inc.(a) | | | 244,950 | | | | 18,770,518 | |
South32 Ltd.(a) | | | 17,940,000 | | | | 46,028,208 | |
See Accompanying Notes to the Financial Statements.
| | |
| 248 | | FLEXSHARES ANNUAL REPORT |
FlexShares® Morningstar Global Upstream Natural Resources Index Fund (cont.)
| | | | | | | | |
| Investments | | Shares | | | Value | |
| COMMON STOCKS – (continued) | |
| Metals & Mining – (continued) | |
Sumitomo Metal Mining Co. Ltd.(a) | | | 1,099,300 | | | $ | 34,677,312 | |
Teck Resources Ltd., Class B | | | 1,576,650 | | | | 32,667,540 | |
Vale SA | | | 12,420,000 | | | | 189,618,576 | |
Vedanta Ltd. | | | 7,924,650 | | | | 22,628,844 | |
Wheaton Precious Metals Corp. | | | 1,669,856 | | | | 27,516,226 | |
| | | | | | | | 1,718,990,917 | |
| Multi-Utilities – 1.2% | |
Suez(a) | | | 1,624,950 | | | | 23,539,097 | |
Veolia Environnement SA | | | 2,170,050 | | | | 43,323,618 | |
| | | | | | | | 66,862,715 | |
| Oil, Gas & Consumable Fuels – 28.5% | |
Anadarko Petroleum Corp. | | | 479,550 | | | | 25,512,060 | |
Apache Corp.(a) | | | 348,450 | | | | 13,181,863 | |
BP plc | | | 17,284,500 | | | | 125,289,733 | |
Canadian Natural Resources Ltd. | | | 1,166,100 | | | | 32,072,745 | |
Chevron Corp. | | | 1,831,950 | | | | 204,537,218 | |
China Petroleum & Chemical Corp., Class H | | | 25,390,000 | | | | 20,598,566 | |
CNOOC Ltd. | | | 13,800,000 | | | | 23,694,160 | |
Concho Resources, Inc.* (a) | | | 165,600 | | | | 23,033,304 | |
ConocoPhillips | | | 1,076,400 | | | | 75,240,360 | |
Devon Energy Corp. | | | 427,800 | | | | 13,860,720 | |
Eni SpA | | | 2,515,050 | | | | 44,757,033 | |
EOG Resources, Inc. | | | 552,000 | | | | 58,147,680 | |
Equinor ASA | | | 966,000 | | | | 25,204,647 | |
Exxon Mobil Corp. | | | 3,308,550 | | | | 263,625,264 | |
Gazprom PJSC | | | 2,329,013 | | | | 5,507,935 | |
Gazprom PJSC, ADR | | | 4,034,883 | | | | 19,117,276 | |
Gazprom PJSC, ADR, OTC | | | 155,011 | | | | 728,552 | |
LUKOIL PJSC | | | 28,420 | | | | 2,137,768 | |
LUKOIL PJSC, ADR | | | 416,630 | | | | 31,122,261 | |
Marathon Oil Corp. | | | 738,300 | | | | 14,020,317 | |
Noble Energy, Inc.(a) | | | 445,050 | | | | 11,059,492 | |
Occidental Petroleum Corp. | | | 665,850 | | | | 44,658,560 | |
PetroChina Co. Ltd., Class H | | | 17,092,157 | | | | 12,514,858 | |
Petroleo Brasileiro SA (Preference)* | | | 6,210,000 | | | | 46,175,851 | |
| | | | | | | | |
| Investments | | Shares | | | Value | |
| Oil, Gas & Consumable Fuels – (continued) | |
Pioneer Natural Resources Co. | | | 169,050 | | | $ | 24,895,994 | |
Repsol SA | | | 1,090,200 | | | | 19,547,848 | |
Royal Dutch Shell plc, Class A | | | 4,312,500 | | | | 137,784,970 | |
Suncor Energy, Inc. | | | 1,580,100 | | | | 53,133,231 | |
Tatneft PJSC | | | 1,462,773 | | | | 17,453,592 | |
TOTAL SA(a) | | | 2,389,037 | | | | 140,650,437 | |
Woodside Petroleum Ltd. | | | 838,350 | | | | 20,707,192 | |
| | | | | | | | 1,549,971,487 | |
| Paper & Forest Products – 2.8% | |
Boise Cascade Co.(a) | | | 93,150 | | | | 2,868,088 | |
Canfor Corp.* | | | 186,300 | | | | 2,682,606 | |
Corticeira Amorim SGPS SA(a) | | | 65,550 | | | | 720,433 | |
Duratex SA* | | | 1,380,000 | | | | 4,268,731 | |
Interfor Corp.* | | | 162,150 | | | | 1,797,757 | |
Mondi plc | | | 1,183,350 | | | | 27,889,309 | |
Stella-Jones, Inc. | | | 120,750 | | | | 3,876,505 | |
Stora Enso OYJ, Class R | | | 1,745,700 | | | | 26,316,829 | |
Svenska Cellulosa AB SCA, Class B | | | 1,900,950 | | | | 18,015,940 | |
UPM-Kymmene OYJ | | | 1,611,150 | | | | 51,862,838 | |
West Fraser Timber Co. Ltd. | | | 169,050 | | | | 8,513,967 | |
Western Forest Products, Inc.(a) | | | 1,404,150 | | | | 1,881,823 | |
| | | | | | | | 150,694,826 | |
| Trading Companies & Distributors – 2.4% | |
Marubeni Corp. | | | 12,606,900 | | | | 102,358,801 | |
Mitsui & Co. Ltd. | | | 1,725,000 | | | | 28,820,057 | |
| | | | | | | | 131,178,858 | |
| Water Utilities – 3.8% | |
Aguas Andinas SA, Class A | | | 10,722,600 | | | | 5,574,135 | |
American States Water Co.(a) | | | 141,450 | | | | 8,659,569 | |
American Water Works Co., Inc. | | | 703,800 | | | | 62,307,414 | |
Aqua America, Inc.(a) | | | 672,750 | | | | 21,884,557 | |
California Water Service Group(a) | | | 179,400 | | | | 7,534,800 | |
See Accompanying Notes to the Financial Statements.
| | | | |
| FLEXSHARES ANNUAL REPORT | | | 249 | |
FlexShares® Morningstar Global Upstream Natural Resources Index Fund (cont.)
| | | | | | | | |
| Investments | | Shares | | | Value | |
| COMMON STOCKS – (continued) | |
| Water Utilities – (continued) | |
Cia de Saneamento Basico do Estado de Sao Paulo* | | | 1,725,000 | | | $ | 12,979,876 | |
Cia de Saneamento de Minas Gerais-COPASA | | | 345,000 | | | | 4,764,706 | |
Cia de Saneamento do Parana (Preference) | | | 1,035,000 | | | | 2,808,669 | |
Guangdong Investment Ltd. | | | 10,277,576 | | | | 18,354,219 | |
Pennon Group plc(a) | | | 1,442,100 | | | | 13,749,804 | |
Severn Trent plc | | | 903,900 | | | | 21,516,871 | |
United Utilities Group plc | | | 2,511,600 | | | | 23,318,024 | |
| | | | | | | | 203,452,644 | |
Total Common Stocks
(Cost $5,014,610,067) | | | | 5,407,931,120 | |
| | | Principal
Amount | | | | |
| SECURITIES LENDING REINVESTMENTS(b) – 2.5% | |
| BANK NOTES – 0.1% | |
Bank of America NA, Charlotte (ICE LIBOR USD 1 Month + 0.22%), 2.50%, 1/15/2019(c) (Cost $3,000,000) | | $ | 3,000,000 | | | | 3,000,000 | |
| | |
| | | | | | | | |
| CERTIFICATES OF DEPOSIT – 1.0% | |
China Construction Bank Corp., New York | | | | | | | | |
2.55%, 1/2/2019 | | | 2,500,000 | | | | 2,499,288 | |
Industrial & Commercial Bank of China Ltd., New York Branch | | | | | | | | |
2.53%, 12/24/2018 | | | 3,000,000 | | | | 3,000,000 | |
KBC Bank NV, Brussels | | | | | |
2.40%, 12/27/2018 | | | 5,000,000 | | | | 5,000,000 | |
Mitsubishi UFJ Trust & Banking Corp., New York (ICE LIBOR USD 1 Month + 0.20%), 2.48%, 4/15/2019(c) | | | 3,500,000 | | | | 3,499,958 | |
| | | | | | | | |
| Investments | | Principal
Amount | | | Value | |
| CERTIFICATES OF DEPOSIT – (continued) | |
Mizuho Bank Ltd., New York (ICE LIBOR USD 1 Month + 0.25%), 2.53%, 12/10/2018(c) | | $ | 3,000,000 | | | $ | 3,000,000 | |
Oversea-Chinese Banking Corp. Ltd., New York (ICE LIBOR USD 1 Month + 0.19%), 2.48%, 4/17/2019(c) | | | 4,000,000 | | | | 3,999,960 | |
Royal Bank of Canada, New York (ICE LIBOR USD 1 Month + 0.21%), 2.50%, 9/17/2019(c) | | | 4,000,000 | | | | 4,000,312 | |
Societe Generale, New York (ICE LIBOR USD 1 Month + 0.27%), 2.47%, 12/3/2018(c) | | | 2,500,000 | | | | 2,500,201 | |
Standard Chartered, New York | | | | | | | | |
2.41%, 11/9/2018 | | | 5,500,000 | | | | 5,500,000 | |
The Chiba Bank Ltd., New York Branch | | | | | | | | |
2.40%, 11/30/2018 | | | 4,000,000 | | | | 4,000,000 | |
The Norinchukin Bank, London | | | | | | | | |
2.45%, 1/14/2019 | | | 4,000,000 | | | | 3,979,280 | |
The Norinchukin Bank, New York | | | | | | | | |
2.32%, 11/14/2018 | | | 2,000,000 | | | | 1,999,950 | |
The Sumitomo Bank Ltd., New York | | | | | | | | |
2.35%, 11/1/2018 | | | 1,000,000 | | | | 1,000,000 | |
(ICE LIBOR USD 1 Month + 0.21%), 2.50%, 5/17/2019(c) | | | 3,000,000 | | | | 2,999,970 | |
Toronto-Dominion Bank, New York | | | | | | | | |
2.40%, 11/16/2018 | | | 2,000,000 | | | | 2,000,000 | |
(ICE LIBOR USD 1 Month + 0.21%), 2.50%, 9/17/2019(c) | | | 4,000,000 | | | | 3,999,960 | |
See Accompanying Notes to the Financial Statements.
| | |
| 250 | | FLEXSHARES ANNUAL REPORT |
FlexShares® Morningstar Global Upstream Natural Resources Index Fund (cont.)
| | | | | | | | |
| Investments | | Principal
Amount | | | Value | |
| SECURITIES LENDING REINVESTMENTS(b) – (continued) | |
| CERTIFICATES OF DEPOSIT – (continued) | |
Wells Fargo Bank (San Francisco) NA (ICE LIBOR USD 3 Month + 0.21%), 2.73%, 10/25/2019(c) | | $ | 3,500,000 | | | $ | 3,500,000 | |
Westpac Banking Corp., New York (US Federal Funds Effective Rate (continuous series) + 0.45%), 2.65%, 2/15/2019(c) | | | 3,000,000 | | | | 2,999,991 | |
Total Certificates of Deposit
(Cost $59,480,135) | | | | 59,478,870 | |
| | |
| | | | | | | | |
| COMMERCIAL PAPER – 0.0%(d) | |
Union Bank of Switzerland (ICE LIBOR USD 1 Month + 0.43%), 2.69%, 2/1/2019(c)(e) (Cost $4,000,000) | | | 4,000,000 | | | | 4,002,768 | |
| FUNDING AGREEMENTS – 0.1% | |
United of Omaha Life Insurance (ICE LIBOR USD 3 Month + 0.12%), 2.45%, 11/30/2018(c) (Cost $3,000,000) | | | 3,000,000 | | | | 3,000,000 | |
| REPURCHASE AGREEMENTS – 1.3% | |
Citadel Clearing LLC, 2.80%, dated 10/31/2018, due 1/31/2019, repurchase price $5,035,778, collateralized by various Common Stocks; total market value $5,461,073 | | | 5,000,000 | | | | 5,000,000 | |
| | | | | | | | |
| Investments | | Principal
Amount | | | Value | |
| REPURCHASE AGREEMENTS – (continued) | |
Citigroup Global Markets, Inc., 2.46%, dated 10/31/2018, due 11/7/2018, repurchase price $5,002,392, collateralized by various U.S. Treasury Securities, ranging from 1.00% – 2.75%, maturing 11/15/2042 – 2/15/2046; total market value $5,038,611 | | $ | 5,000,000 | | | $ | 5,000,000 | |
Citigroup Global Markets, Inc., 2.20%, dated 10/31/2018, due 11/1/2018, repurchase price $6,500,795, collateralized by various U.S. Treasury Securities, ranging from 1.13% – 4.63%, maturing 7/15/2020 – 8/15/2040; total market value $6,555,473 | | | 6,500,398 | | | | 6,500,398 | |
Citigroup Global Markets, Ltd., 2.20%, dated 10/31/2018, due 11/1/2018, repurchase price $5,000,306, collateralized by various U.S. Treasury Securities, ranging from 0.75% – 4.50%, maturing 3/31/2019 – 5/15/2048; total market value $5,054,905 | | | 5,000,000 | | | | 5,000,000 | |
See Accompanying Notes to the Financial Statements.
| | | | |
| FLEXSHARES ANNUAL REPORT | | | 251 | |
FlexShares® Morningstar Global Upstream Natural Resources Index Fund (cont.)
| | | | | | | | |
| Investments | | Principal
Amount | | | Value | |
| SECURITIES LENDING REINVESTMENTS(b) – (continued) | |
| REPURCHASE AGREEMENTS – (continued) | |
Mizuho Securities USA, Inc., 2.19%, dated 10/31/2018, due 11/1/2018, repurchase price $7,010,426, collateralized by various U.S. Treasury Securities, ranging from 0.00% – 2.88%, maturing 1/10/2019 – 2/15/2046; total market value $7,109,190 | | $ | 7,010,000 | | | $ | 7,010,000 | |
ML Pierce Fenner & Smith, Inc., 2.74%, dated 10/31/2018, due 1/31/2019, repurchase price $8,056,018, collateralized by various Common Stocks; total market value $8,898,463 | | | 8,000,000 | | | | 8,000,000 | |
NBC Global Finance Ltd., 2.36%, dated 10/31/2018, due 11/1/2018, repurchase price $7,800,511, collateralized by various Common Stocks; total market value $8,731,899 | | | 7,800,000 | | | | 7,800,000 | |
| | | | | | | | |
| Investments | | Principal
Amount | | | Value | |
| REPURCHASE AGREEMENTS – (continued) | |
Nomura Securities Co., Ltd., 2.19%, dated 10/31/2018, due 11/1/2018, repurchase price $25,001,521, collateralized by various U.S. Treasury Securities, ranging from 0.00% – 3.00%, maturing 11/15/2018 – 8/15/2047; total market value $25,380,813 | | $ | 25,000,000 | | | $ | 25,000,000 | |
Total Repurchase Agreements
(Cost $69,310,398) | | | | 69,310,398 | |
Total Securities Lending Reinvestments
(Cost $138,790,533) | | | | 138,792,036 | |
Total Investments – 102.0%
(Cost $5,153,400,600) | | | | 5,546,723,156 | |
Liabilities in excess of other assets – (2.0%) | | | | (110,940,096 | ) |
| NET ASSETS – 100.0% | | | $ | 5,435,783,060 | |
| * | Non-income producing security. |
| (a) | The security or a portion of this security is on loan at October 31, 2018. The total value of securities on loan at October 31, 2018 was $317,900,808, collateralized in the form of cash with a value of $138,793,426 that was reinvested in the securities shown in the Securities Lending Reinvestment section of the Schedule of Investments; $22,449,819 of collateral in the form of U.S. Government Treasury Securities, interest rates ranging from 0.00% – 8.75%, and maturity dates ranging from November 15, 2018 – August 15, 2047 and $165,887,457 of collateral in the form of Foreign Government Fixed Income Securities, interest rates ranging from 0.00% – 8.50%, and maturity dates ranging from November 14, 2018 – November 2, 2086; a total value of $327,130,702. |
| (b) | The security was purchased with cash collateral held from securities on loan at October 31, 2018. The total value of securities purchased was $138,792,036. |
| (c) | Variable or floating rate security, linked to the referenced benchmark. The interest rate shown is the rate in effect as of October 31, 2018. |
| (d) | Represents less than 0.05% of net assets. |
| (e) | Security exempt from registration under Section 4(2) of the Securities Act of 1933. Such securities may be sold in transactions exempt from registration normally to qualified institutional buyers. |
Percentages shown are based on Net Assets.
See Accompanying Notes to the Financial Statements.
| | |
| 252 | | FLEXSHARES ANNUAL REPORT |
FlexShares® Morningstar Global Upstream Natural Resources Index Fund (cont.)
Abbreviations
ADR – American Depositary Receipt
ICE – Intercontinental Exchange
LIBOR – London Interbank Offered Rate
NVDR – Non-Voting Depositary Receipt
OYJ – Public Limited Company
PJSC – Public Joint Stock Company
Preference – A special type of equity investment that shares in the earnings of the company, has limited voting rights, and may have a dividend preference. Preference shares may also have liquidation preference.
SCA – Limited partnership with share capital
USD – US Dollar
As of October 31, 2018, the gross unrealized appreciation (depreciation) of investments based on the aggregate cost of investments (including derivative instruments, if applicable) for federal income tax purposes was as follows:
| | | | |
| | | | |
Aggregate gross unrealized appreciation | | $ | 632,031,827 | |
Aggregate gross unrealized depreciation | | | (264,146,468 | ) |
Net unrealized appreciation | | $ | 367,885,359 | |
Federal income tax cost | | $ | 5,176,785,658 | |
Futures Contracts
FlexShares® Morningstar Global Upstream Natural Resources Index Fund had the following open futures contracts as of October 31, 2018:
| | | | | | | | | | | | | | | | | | | | |
| | | Number of
Contracts | | | Expiration
Date | | | Trading
Currency | | | Notional
Amount | | | Value and
Unrealized
Depreciation* | |
Long Contracts | | | | | |
DAX Index | | | 2 | | | | 12/21/2018 | | | | EUR | | | $ | 649,096 | | | $ | (49,072 | ) |
EURO STOXX 50 Index | | | 3 | | | | 12/21/2018 | | | | EUR | | | | 108,569 | | | | (5,145 | ) |
FTSE 100 Index | | | 80 | | | | 12/21/2018 | | | | GBP | | | | 7,268,864 | | | | (210,022 | ) |
FTSE/JSE Top 40 Index | | | 21 | | | | 12/20/2018 | | | | ZAR | | | | 659,783 | | | | (64,633 | ) |
Hang Seng Index | | | 6 | | | | 11/29/2018 | | | | HKD | | | | 953,300 | | | | (37,175 | ) |
MSCI Emerging Markets E-Mini Index | | | 20 | | | | 12/21/2018 | | | | USD | | | | 956,700 | | | | (88,371 | ) |
S&P Midcap 400 E-Mini Index | | | 28 | | | | 12/21/2018 | | | | USD | | | | 5,109,440 | | | | (561,761 | ) |
S&P/TSX 60 Index | | | 61 | | | | 12/20/2018 | | | | CAD | | | | 8,307,055 | | | | (538,037 | ) |
SPI 200 Index | | | 39 | | | | 12/20/2018 | | | | AUD | | | | 4,006,599 | | | | (236,848 | ) |
TOPIX Index | | | 2 | | | | 12/13/2018 | | | | JPY | | | | 290,816 | | | | (29,557 | ) |
| | | | | | | | | | | | | | | | | | | $ | (1,820,621 | ) |
| * | This amount represents the cumulative appreciation/depreciation on futures contracts. Current day’s variation margin is reported within the Statement of Assets and Liabilities for futures contracts. |
Forward Foreign Currency Contracts
FlexShares® Morningstar Global Upstream Natural Resources Index Fund had the following outstanding contracts as of October 31, 2018:
| | | | | | | | | | | | | | | | | | | | | | |
| Contracts to Receive | | | | | Counterparty | | In Exchange For | | | Maturity Date | | | Unrealized
Appreciation/
(Depreciation) | |
BRL* | | | 12,413,326 | | | | | BNP Paribas SA | | USD | | | 3,300,000 | | | | 12/19/2018 | | | $ | 27,835 | |
RUB* | | | 43,433,812 | | | | | Morgan Stanley | | USD | | | 623,004 | | | | 12/19/2018 | | | | 33,752 | |
USD | | | 2,500,000 | | | | | Toronto-Dominion Bank (The) | | AUD | | | 3,429,073 | | | | 12/19/2018 | | | | 68,363 | |
USD | | | 3,900,000 | | | | | Toronto-Dominion Bank (The) | | CAD | | | 5,028,878 | | | | 12/19/2018 | | | | 66,817 | |
USD | | | 1,003,471 | | | | | Goldman Sachs & Co. | | CHF | | | 961,534 | | | | 12/19/2018 | | | | 42,839 | |
USD | | | 1,470,000 | | | | | Bank of Montreal | | EUR | | | 1,243,131 | | | | 12/19/2018 | | | | 55,335 | |
USD | | | 800,000 | | | | | Toronto-Dominion Bank (The) | | EUR | | | 675,769 | | | | 12/19/2018 | | | | 30,985 | |
USD | | | 850,000 | | | | | Morgan Stanley | | GBP | | | 643,467 | | | | 12/19/2018 | | | | 25,780 | |
USD | | | 2,340,000 | | | | | Bank of Montreal | | JPY | | | 262,675,296 | | | | 12/19/2018 | | | | 2,698 | |
USD | | | 51,105 | | | | | Goldman Sachs & Co. | | KRW* | | | 57,507,731 | | | | 12/19/2018 | | | | 567 | |
USD | | | 600,000 | | | | | Toronto-Dominion Bank (The) | | NOK | | | 4,868,972 | | | | 12/19/2018 | | | | 19,399 | |
See Accompanying Notes to the Financial Statements.
| | | | |
| FLEXSHARES ANNUAL REPORT | | | 253 | |
FlexShares® Morningstar Global Upstream Natural Resources Index Fund (cont.)
| | | | | | | | | | | | | | | | | | | | | | |
| Forward Foreign Currency Contracts (cont.) | |
|
| | |
| Contracts to Receive | | | | | Counterparty | | In Exchange For | | | Maturity Date | | | Unrealized
Appreciation/
(Depreciation) | |
USD | | | 440,000 | | | | | JPMorgan Chase Bank | | NZD | | | 660,329 | | | | 12/19/2018 | | | $ | 8,591 | |
USD | | | 343,350 | | | | | Goldman Sachs & Co. | | RUB* | | | 22,622,371 | | | | 12/19/2018 | | | | 1,280 | |
USD | | | 272,964 | | | | | Citibank NA | | SGD | | | 374,784 | | | | 12/19/2018 | | | | 2,046 | |
Total unrealized appreciation | | | | | | | $ | 386,287 | |
AUD | | | 2,970,230 | | | | | BNP Paribas SA | | USD | | | 2,146,453 | | | | 12/19/2018 | | | $ | (40,193 | ) |
AUD | | | 836,292 | | | | | Citibank NA | | USD | | | 600,000 | | | | 12/19/2018 | | | | (6,966 | ) |
AUD | | | 1,995,296 | | | | | Goldman Sachs & Co. | | USD | | | 1,430,000 | | | | 12/19/2018 | | | | (15,088 | ) |
CAD | | | 2,269,936 | | | | | Citibank NA | | USD | | | 1,750,000 | | | | 12/19/2018 | | | | (19,778 | ) |
CAD | | | 907,258 | | | | | Goldman Sachs & Co. | | USD | | | 700,000 | | | | 12/19/2018 | | | | (8,457 | ) |
CAD | | | 4,744,131 | | | | | Toronto-Dominion Bank (The) | | USD | | | 3,650,640 | | | | 12/19/2018 | | | | (34,501 | ) |
EUR | | | 1,588,764 | | | | | Goldman Sachs & Co. | | USD | | | 1,869,455 | | | | 12/19/2018 | | | | (61,466 | ) |
GBP | | | 533,360 | | | | | Bank of Montreal | | USD | | | 700,000 | | | | 12/19/2018 | | | | (16,816 | ) |
GBP | | | 1,552,007 | | | | | BNP Paribas SA | | USD | | | 2,039,922 | | | | 12/19/2018 | | | | (51,949 | ) |
GBP | | | 532,855 | | | | | Citibank NA | | USD | | | 704,000 | | | | 12/19/2018 | | | | (21,464 | ) |
GBP | | | 953,076 | | | | | Goldman Sachs & Co. | | USD | | | 1,250,000 | | | | 12/19/2018 | | | | (29,201 | ) |
INR* | | | 14,832,540 | | | | | Toronto-Dominion Bank (The) | | USD | | | 202,817 | | | | 12/19/2018 | | | | (3,377 | ) |
JPY | | | 27,794,844 | | | | | Goldman Sachs & Co. | | USD | | | 250,157 | | | | 12/19/2018 | | | | (2,837 | ) |
NOK | | | 9,936,829 | | | | | Bank of New York | | USD | | | 1,208,539 | | | | 12/19/2018 | | | | (23,620 | ) |
NOK | | | 3,026,372 | | | | | Goldman Sachs & Co. | | USD | | | 370,000 | | | | 12/19/2018 | | | | (9,120 | ) |
NZD | | | 773,909 | | | | | Citibank NA | | USD | | | 509,464 | | | | 12/19/2018 | | | | (3,850 | ) |
SEK | | | 2,899,134 | | | | | Goldman Sachs & Co. | | USD | | | 325,020 | | | | 12/19/2018 | | | | (6,336 | ) |
USD | | | 2,259,921 | | | | | Goldman Sachs & Co. | | BRL* | | | 9,400,143 | | | | 12/19/2018 | | | | (260,122 | ) |
USD | | | 1,020,501 | | | | | Morgan Stanley | | HKD | | | 7,996,691 | | | | 12/19/2018 | | | | (978 | ) |
USD | | | 313,000 | | | | | Goldman Sachs & Co. | | RUB* | | | 20,811,441 | | | | 12/19/2018 | | | | (1,686 | ) |
Total unrealized depreciation | | | | | | | $ | (617,805 | ) |
Net unrealized depreciation | | | | | | | $ | (231,518 | ) |
| * | Non-deliverable forward. See Note 2 in the Notes to Financial Statements. |
Abbreviations:
AUD – Australian Dollar
BRL – Brazilian Real
CAD – Canadian Dollar
CHF – Swiss Franc
EUR – Euro
GBP – British Pound
HKD – Hong Kong Dollar
INR – Indian Rupee
JPY – Japanese Yen
KRW – Korean Won
NOK – Norwegian Krone
NZD – New Zealand Dollar
RUB – Russian Ruble
SEK – Swedish Krona
SGD – Singapore Dollar
USD – US Dollar
ZAR – South African Rand
See Accompanying Notes to the Financial Statements.
| | |
| 254 | | FLEXSHARES ANNUAL REPORT |
FlexShares® Morningstar Global Upstream Natural Resources Index Fund (cont.)
FlexShares® Morningstar Global Upstream Natural Resources Index Fund invested, as a percentage of net assets, in companies domiciled in the following countries as of October 31, 2018:
| | | | |
Australia | | | 8.7 | % |
Brazil | | | 4.8 | |
Canada | | | 10.8 | |
Chile | | | 0.1 | |
China | | | 1.4 | |
Finland | | | 1.4 | |
France | | | 3.8 | |
Germany | | | 0.6 | |
India | | | 0.9 | |
Indonesia | | | 0.3 | |
Israel | | | 0.4 | |
Italy | | | 0.8 | |
Japan | | | 3.0 | |
Malaysia | | | 1.6 | |
Mexico | | | 0.7 | |
New Zealand | | | 0.8 | |
Norway | | | 4.0 | |
Philippines | | | 0.1 | |
Portugal | | | 0.0 | † |
Russia | | | 2.1 | |
Singapore | | | 1.4 | |
South Africa | | | 0.3 | |
South Korea | | | 0.7 | |
Spain | | | 0.4 | |
Sweden | | | 0.8 | |
Thailand | | | 0.4 | |
United Kingdom | | | 16.3 | |
United States | | | 32.9 | |
Other1 | | | 0.5 | |
| | | | 100.0 | % |
| † | Amount represents less than 0.05%. |
| 1 | Includes any non-equity securities, securities lending reinvestments and net other assets (liabilities). |
See Accompanying Notes to the Financial Statements.
| | | | |
| FLEXSHARES ANNUAL REPORT | | | 255 | |
Schedule of Investments
FlexShares® STOXX® Global Broad Infrastructure Index Fund
October 31, 2018
| | | | | | | | |
| Investments | | Shares | | | Value | |
| COMMON STOCKS – 99.3% | |
| Air Freight & Logistics – 2.8% | |
bpost SA(a) | | | 54,537 | | | $ | 828,646 | |
CTT-Correios de Portugal SA(a) | | | 76,832 | | | | 295,115 | |
Deutsche Post AG (Registered) | | | 522,389 | | | | 16,543,405 | |
Oesterreichische Post AG(a) | | | 16,464 | | | | 669,325 | |
PostNL NV(a) | | | 236,327 | | | | 700,487 | |
Royal Mail plc | | | 533,708 | | | | 2,448,184 | |
Singapore Post Ltd.(a) | | | 686,000 | | | | 515,193 | |
| | | | | | | | 22,000,355 | |
| Commercial Services & Supplies – 3.4% | |
Bingo Industries Ltd.(a) (b) | | | 272,342 | | | | 461,324 | |
China Everbright International Ltd.(a) | | | 2,133,185 | | | | 1,700,692 | |
Clean Harbors, Inc.* (a) | | | 9,604 | | | | 653,456 | |
Cleanaway Co. Ltd. | | | 46,000 | | | | 253,466 | |
Cleanaway Waste Management Ltd. | | | 1,086,624 | | | | 1,386,261 | |
Covanta Holding Corp.(a) | | | 22,638 | | | | 332,552 | |
Daiseki Co. Ltd. | | | 23,200 | | | | 549,704 | |
Insun ENT Co. Ltd.* | | | 2,034 | | | | 10,120 | |
Republic Services, Inc. | | | 37,044 | | | | 2,692,358 | |
Shanghai Youngsun Investment Co. Ltd., Class B* ^ (c) | | | 57,800 | | | | 168,892 | |
Stericycle, Inc.* | | | 12,691 | | | | 634,169 | |
Waste Connections, Inc. | | | 139,258 | | | | 10,671,940 | |
Waste Management, Inc. | | | 72,030 | | | | 6,444,524 | |
| | | | | | | | 25,959,458 | |
| Diversified Financial Services – 0.1% | |
Metro Pacific Investments Corp. | | | 5,246,700 | | | | 470,688 | |
| Diversified Telecommunication Services – 15.6% | |
AT&T, Inc. | | | 1,187,123 | | | | 36,420,934 | |
BCE, Inc. | | | 148,176 | | | | 5,748,766 | |
BT Group plc | | | 1,439,914 | | | | 4,425,759 | |
Cellnex Telecom SA(a) (b) | | | 29,155 | | | | 727,080 | |
CenturyLink, Inc.(a) | | | 154,007 | | | | 3,178,705 | |
Chunghwa Telecom Co. Ltd. | | | 751,000 | | | | 2,657,612 | |
Deutsche Telekom AG (Registered) | | | 537,481 | | | | 8,827,351 | |
| | | | | | | | |
| Investments | | Shares | | | Value | |
| Diversified Telecommunication Services – (continued) | |
Infrastrutture Wireless Italiane SpA(b) | | | 42,875 | | | $ | 298,764 | |
Nippon Telegraph & Telephone Corp. | | | 210,800 | | | | 8,872,447 | |
Telefonica SA | | | 770,035 | | | | 6,315,069 | |
Telstra Corp. Ltd. | | | 1,955,443 | | | | 4,268,634 | |
Verizon Communications, Inc. | | | 681,884 | | | | 38,928,758 | |
| | | | | | | | 120,669,879 | |
| Electric Utilities – 12.3% | |
American Electric Power Co., Inc. | | | 82,320 | | | | 6,038,995 | |
Duke Energy Corp. | | | 114,562 | | | | 9,466,258 | |
Edison International(a) | | | 52,479 | | | | 3,641,518 | |
Enel SpA | | | 3,563,084 | | | | 17,497,018 | |
Exelon Corp. | | | 160,867 | | | | 7,047,583 | |
Iberdrola SA | | | 2,691,864 | | | | 19,080,903 | |
NextEra Energy, Inc.(a) | | | 78,204 | | | | 13,490,190 | |
PG&E Corp.* | | | 83,349 | | | | 3,901,567 | |
PPL Corp. | | | 112,504 | | | | 3,420,122 | |
Southern Co. (The) | | | 164,983 | | | | 7,429,184 | |
Xcel Energy, Inc. | | | 85,407 | | | | 4,185,797 | |
| | | | | | | | 95,199,135 | |
| Equity Real Estate Investment Trusts (REITs) – 4.2% | |
American Tower Corp.(a) | | | 73,402 | | | | 11,436,766 | |
CoreCivic, Inc. | | | 16,464 | | | | 369,781 | |
Crown Castle International Corp. | | | 68,943 | | | | 7,496,862 | |
CyrusOne, Inc. | | | 16,807 | | | | 894,637 | |
Digital Realty Trust, Inc.(a) | | | 34,643 | | | | 3,577,236 | |
Equinix, Inc. | | | 13,034 | | | | 4,936,497 | |
GEO Group, Inc. (The)(a) | | | 21,609 | | | | 477,775 | |
Keppel DC REIT(a) | | | 171,500 | | | | 164,713 | |
SBA Communications Corp.* (a) | | | 19,551 | | | | 3,170,586 | |
| | | | | | | | 32,524,853 | |
| Gas Utilities – 0.7% | |
APA Group | | | 455,504 | | | | 3,099,249 | |
Beijing Enterprises Holdings Ltd. | | | 234,500 | | | | 1,268,311 | |
See Accompanying Notes to the Financial Statements.
| | |
| 256 | | FLEXSHARES ANNUAL REPORT |
FlexShares® STOXX® Global Broad Infrastructure Index Fund (cont.)
| | | | | | | | |
| Investments | | Shares | | | Value | |
| COMMON STOCKS – (continued) | |
| Gas Utilities – (continued) | |
Infraestructura Energetica Nova SAB de CV | | | 34,300 | | | $ | 134,873 | |
Petronas Gas Bhd. | | | 240,100 | | | | 1,048,878 | |
| | | | | | | | 5,551,311 | |
| Health Care Providers & Services – 3.2% | |
Acadia Healthcare Co., Inc.* (a) | | | 12,348 | | | | 512,442 | |
Bangkok Dusit Medical Services PCL, NVDR | | | 5,762,400 | | | | 4,258,787 | |
Bumrungrad Hospital PCL, NVDR | | | 240,100 | | | | 1,397,867 | |
Encompass Health Corp.(a) | | | 17,150 | | | | 1,154,195 | |
HCA Healthcare, Inc.(a) | | | 47,334 | | | | 6,320,509 | |
Healthscope Ltd.(a) | | | 924,042 | | | | 1,381,870 | |
IHH Healthcare Bhd. | | | 1,131,900 | | | | 1,352,491 | |
Life Healthcare Group Holdings Ltd. | | | 701,778 | | | | 1,164,382 | |
LifePoint Health, Inc.* | | | 7,546 | | | | 489,434 | |
Netcare Ltd. | | | 685,314 | | | | 1,152,381 | |
Ramsay Health Care Ltd.(a) | | | 73,402 | | | | 2,924,770 | |
Spire Healthcare Group plc(a) (b) | | | 114,219 | | | | 171,338 | |
Tenet Healthcare Corp.* | | | 14,063 | | | | 361,841 | |
Universal Health Services, Inc., Class B | | | 15,092 | | | | 1,834,584 | |
| | | | | | | | 24,476,891 | |
| IT Services – 0.0%(d) | |
NEXTDC Ltd.* (a) | | | 39,102 | | | | 162,679 | |
| Media – 5.4% | |
Charter Communications, Inc., Class A* | | | 26,411 | | | | 8,461,292 | |
Comcast Corp., Class A | | | 753,914 | | | | 28,754,280 | |
DISH Network Corp., Class A* (a) | | | 35,672 | | | | 1,096,557 | |
Liberty Global plc, Class C* | | | 92,267 | | | | 2,310,366 | |
Sirius XM Holdings, Inc.(a) | | | 229,124 | | | | 1,379,326 | |
| | | | | | | | 42,001,821 | |
| Multi-Utilities – 7.9% | |
Consolidated Edison, Inc. | | | 52,136 | | | | 3,962,336 | |
| | | | | | | | |
| Investments | | Shares | | | Value | |
| Multi-Utilities – (continued) | |
Dominion Energy, Inc.(a) | | | 106,330 | | | $ | 7,594,088 | |
Engie SA | | | 850,640 | | | | 11,348,953 | |
National Grid plc | | | 1,564,423 | | | | 16,575,222 | |
Public Service Enterprise Group, Inc. | | | 84,721 | | | | 4,526,643 | |
Sempra Energy(a) | | | 44,247 | | | | 4,872,480 | |
Suez | | | 204,428 | | | | 2,961,353 | |
Veolia Environnement SA | | | 298,410 | | | | 5,957,559 | |
WEC Energy Group, Inc. | | | 53,165 | | | | 3,636,486 | |
| | | | | | | | 61,435,120 | |
| Oil, Gas & Consumable Fuels – 10.0% | |
Enagas SA | | | 107,016 | | | | 2,842,205 | |
Enbridge Income Fund Holdings, Inc.(a) | | | 64,141 | | | | 1,488,198 | |
Enbridge, Inc. | | | 785,470 | | | | 24,534,536 | |
Inter Pipeline Ltd. | | | 178,360 | | | | 2,899,666 | |
Keyera Corp. | | | 96,383 | | | | 2,407,281 | |
Kinder Morgan, Inc.(a) | | | 318,304 | | | | 5,417,534 | |
Koninklijke Vopak NV | | | 28,812 | | | | 1,305,817 | |
ONEOK, Inc.(a) | | | 68,943 | | | | 4,522,661 | |
Pembina Pipeline Corp. | | | 232,554 | | | | 7,540,186 | |
Plains GP Holdings LP, Class A* | | | 24,353 | | | | 520,424 | |
Polskie Gornictwo Naftowe i Gazownictwo SA | | | 697,319 | | | | 1,139,580 | |
Snam SpA | | | 1,032,430 | | | | 4,274,430 | |
TransCanada Corp.(a) | | | 408,856 | | | | 15,454,492 | |
Williams Cos., Inc. (The) | | | 133,427 | | | | 3,246,279 | |
| | | | | | | | 77,593,289 | |
| Road & Rail – 19.2% | |
Aurizon Holdings Ltd. | | | 1,053,010 | | | | 3,134,547 | |
Canadian National Railway Co. | | | 339,570 | | | | 29,099,720 | |
Canadian Pacific Railway Ltd. | | | 76,489 | | | | 15,724,147 | |
Central Japan Railway Co. | | | 109,500 | | | | 21,006,380 | |
CSX Corp. | | | 145,089 | | | | 9,990,829 | |
East Japan Railway Co. | | | 205,800 | | | | 18,007,842 | |
Hankyu Hanshin Holdings, Inc. | | | 137,200 | | | | 4,522,476 | |
Kansas City Southern(a) | | | 17,493 | | | | 1,783,586 | |
Keikyu Corp.(a) | | | 146,400 | | | | 2,167,688 | |
Keisei Electric Railway Co. Ltd. | | | 90,500 | | | | 2,786,651 | |
MTR Corp. Ltd. | | | 886,132 | | | | 4,295,356 | |
See Accompanying Notes to the Financial Statements.
| | | | |
| FLEXSHARES ANNUAL REPORT | | | 257 | |
FlexShares® STOXX® Global Broad Infrastructure Index Fund (cont.)
| | | | | | | | |
| Investments | | Shares | | | Value | |
| COMMON STOCKS – (continued) | |
| Road & Rail – (continued) | |
Norfolk Southern Corp. | | | 46,991 | | | $ | 7,886,500 | |
Tobu Railway Co. Ltd. | | | 111,500 | | | | 3,097,359 | |
Union Pacific Corp. | | | 122,451 | | | | 17,904,785 | |
West Japan Railway Co. | | | 102,900 | | | | 6,908,629 | |
| | | | | | | | 148,316,495 | |
| Transportation Infrastructure – 7.3% | |
Aena SME SA(a) (b) | | | 39,445 | | | | 6,308,439 | |
Aeroports de Paris | | | 14,749 | | | | 3,089,929 | |
Airports of Thailand PCL, NVDR | | | 2,298,100 | | | | 4,436,754 | |
Atlantia SpA(a) | | | 250,390 | | | | 5,038,590 | |
Atlas Arteria Ltd.(a) | | | 364,266 | | | | 1,763,325 | |
Auckland International Airport Ltd. | | | 501,809 | | | | 2,290,492 | |
Bangkok Expressway & Metro PCL, NVDR | | | 4,630,500 | | | | 1,187,308 | |
CCR SA | | | 686,000 | | | | 2,025,958 | |
China Merchants Port Holdings Co. Ltd. | | | 686,000 | | | | 1,167,339 | |
COSCO SHIPPING Ports Ltd.(a) | | | 933,676 | | | | 952,804 | |
Flughafen Zurich AG (Registered) | | | 9,947 | | | | 1,969,820 | |
Getlink | | | 247,989 | | | | 3,123,136 | |
Grupo Aeroportuario del Pacifico SAB de CV, Class B | | | 205,800 | | | | 1,707,802 | |
International Container Terminal Services, Inc. | | | 946,680 | | | | 1,601,244 | |
Novorossiysk Commercial Sea Port PJSC | | | 1,176,147 | | | | 109,761 | |
Promotora y Operadora de Infraestructura SAB de CV | | | 116,620 | | | | 1,064,558 | |
Qube Holdings Ltd.(a) | | | 771,407 | | | | 1,339,500 | |
Sydney Airport | | | 1,204,959 | | | | 5,499,854 | |
Transurban Group | | | 1,394,981 | | | | 11,211,776 | |
Westshore Terminals Investment Corp. | | | 24,010 | | | | 438,789 | |
| | | | | | | | 56,327,178 | |
| Water Utilities – 2.5% | |
Aguas Andinas SA, Class A | | | 1,311,632 | | | | 681,851 | |
American Water Works Co., Inc. | | | 30,184 | | | | 2,672,190 | |
| | | | | | | | |
| Investments | | Shares | | | Value | |
| Water Utilities – (continued) | |
Aqua America, Inc.(a) | | | 31,556 | | | $ | 1,026,517 | |
Beijing Enterprises Water Group Ltd. | | | 2,744,000 | | | | 1,396,607 | |
Cia de Saneamento Basico do Estado de Sao Paulo* | | | 171,500 | | | | 1,290,463 | |
Cia de Saneamento do Parana (Preference) | | | 137,200 | | | | 372,318 | |
Eastern Water Resources Development and Management PCL, NVDR | | | 135,600 | | | | 45,404 | |
Guangdong Investment Ltd. | | | 1,534,000 | | | | 2,739,495 | |
Pennon Group plc | | | 225,694 | | | | 2,151,895 | |
Severn Trent plc | | | 129,654 | | | | 3,086,346 | |
United Utilities Group plc | | | 366,324 | | | | 3,401,000 | |
WHA Utilities and Power PCL, NVDR | | | 686,000 | | | | 125,198 | |
| | | | | | | | 18,989,284 | |
| Wireless Telecommunication Services – 4.7% | |
China Mobile Ltd. | | | 925,500 | | | | 8,653,615 | |
KDDI Corp. | | | 293,200 | | | | 7,312,139 | |
SoftBank Group Corp. | | | 146,200 | | | | 11,721,391 | |
Vodafone Group plc | | | 4,432,932 | | | | 8,372,789 | |
| | | | | | | | 36,059,934 | |
Total Common Stocks
(Cost $740,569,657) | | | | 767,738,370 | |
| | | Principal
Amount | | | | |
| SECURITIES LENDING REINVESTMENTS(e) – 4.9% | |
| COMMERCIAL PAPER – 0.1% | |
Union Bank of Switzerland (ICE LIBOR USD 1 Month + 0.43%), 2.69%, 2/1/2019(f) (g) (Cost $1,000,000) | | $ | 1,000,000 | | | | 1,000,692 | |
See Accompanying Notes to the Financial Statements.
| | |
| 258 | | FLEXSHARES ANNUAL REPORT |
FlexShares® STOXX® Global Broad Infrastructure Index Fund (cont.)
| | | | | | | | |
| Investments | | Principal
Amount | | | Value | |
| SECURITIES LENDING REINVESTMENTS(e) – (continued) | |
| REPURCHASE AGREEMENTS – 4.8% | |
Citigroup Global Markets, Inc., 2.20%, dated 10/31/2018, due 11/1/2018, repurchase price $3,665,006, collateralized by various U.S. Treasury Securities, ranging from 1.13% – 4.63%, maturing 7/15/2020 – 8/15/2040; total market value $3,695,832 | | $ | 3,664,782 | | | $ | 3,664,782 | |
Citigroup Global Markets, Ltd., 2.20%, dated 10/31/2018, due 11/1/2018, repurchase price $3,000,183, collateralized by various U.S. Treasury Securities, ranging from 0.75% – 4.50%, maturing 3/31/2019 – 5/15/2048; total market value $3,032,943 | | | 3,000,000 | | | | 3,000,000 | |
Mizuho Securities USA, Inc., 2.19%, dated 10/31/2018, due 11/1/2018, repurchase price $17,001,034, collateralized by various U.S. Treasury Securities, ranging from 0.00% – 2.88%, maturing 1/10/2019 – 2/15/2046; total market value $17,240,548 | | | 17,000,000 | | | | 17,000,000 | |
ML Pierce Fenner & Smith, Inc., 2.74%, dated 10/31/2018, due 1/31/2019, repurchase price $2,014,004, collateralized by various Common Stocks; total market value $2,224,616 | | | 2,000,000 | | | | 2,000,000 | |
| | | | | | | | |
| Investments | | Principal
Amount | | | Value | |
| REPURCHASE AGREEMENTS – (continued) | |
NBC Global Finance Ltd., 2.36%, dated 10/31/2018, due 11/1/2018, repurchase price $5,300,348, collateralized by various Common Stocks; total market value $5,933,213 | | $ | 5,300,000 | | | $ | 5,300,000 | |
Nomura Securities Co., Ltd., 2.19%, dated 10/31/2018, due 11/1/2018, repurchase price $6,000,365, collateralized by various U.S. Treasury Securities, ranging from 0.00% – 3.00%, maturing 11/15/2018 – 8/15/2047; total market value $6,091,395 | | | 6,000,000 | | | | 6,000,000 | |
Total Repurchase Agreements
(Cost $36,964,782) | | | | 36,964,782 | |
Total Securities Lending Reinvestments
(Cost $37,964,782) | | | | 37,965,474 | |
Total Investments – 104.2%
(Cost $778,534,439) | | | | 805,703,844 | |
Liabilities in excess of other assets – (4.2%) | | | | (32,341,089 | ) |
| NET ASSETS – 100.0% | | | $ | 773,362,755 | |
| * | Non-income producing security. |
| ^ | Security subject to restrictions on resale. |
| (a) | The security or a portion of this security is on loan at October 31, 2018. The total value of securities on loan at October 31, 2018 was $54,553,663, collateralized in the form of cash with a value of $37,964,782 that was reinvested in the securities shown in the Securities Lending Reinvestment section of the Schedule of Investments; $2,240,522 of collateral in the form of U.S. Government Treasury Securities, interest rates ranging from 0.00% – 8.75%, and maturity dates ranging from November 15, 2018 – February 15, 2048 and $16,620,092 of collateral in the form of Foreign Government Fixed Income Securities, interest rates ranging from 0.00% – 8.50%, and maturity dates ranging from November 14, 2018 – November 2, 2086; a total value of $56,825,396. |
| (b) | Security exempt from registration pursuant to Regulation S under the Securities Act of 1933. Regulation S applies to securities offerings that are made outside of the United States and do not |
See Accompanying Notes to the Financial Statements.
| | | | |
| FLEXSHARES ANNUAL REPORT | | | 259 | |
FlexShares® STOXX® Global Broad Infrastructure Index Fund (cont.)
| | involve direct selling efforts in the United States and as such may have restrictions on resale. |
| (c) | Security fair valued as of October 31, 2018 in accordance with procedures approved by the Board of Trustees. Total value of all such securities at October 31, 2018 amounted to $168,892, which represents approximately 0.02% of net assets of the Fund. |
| (d) | Represents less than 0.05% of net assets. |
| (e) | The security was purchased with cash collateral held from securities on loan at October 31, 2018. The total value of securities purchased was $37,965,474. |
| (f) | Variable or floating rate security, linked to the referenced benchmark. The interest rate shown is the rate in effect as of October 31, 2018. |
| (g) | Security exempt from registration under Section 4(2) of the Securities Act of 1933. Such securities may be sold in transactions exempt from registration normally to qualified institutional buyers. |
Percentages shown are based on Net Assets.
Abbreviations
ICE – Intercontinental Exchange
LIBOR – London Interbank Offered Rate
NVDR – Non-Voting Depositary Receipt
PJSC – Public Joint Stock Company
Preference – A special type of equity investment that shares in the earnings of the company, has limited voting rights, and may have a dividend preference. Preference shares may also have liquidation preference.
USD – US Dollar
As of October 31, 2018, the gross unrealized appreciation (depreciation) of investments based on the aggregate cost of investments (including derivative instruments, if applicable) for federal income tax purposes was as follows:
| | | | |
| | | | |
Aggregate gross unrealized appreciation | | $ | 88,404,799 | |
Aggregate gross unrealized depreciation | | | (63,405,916 | ) |
Net unrealized appreciation | | $ | 24,998,883 | |
Federal income tax cost | | $ | 780,420,549 | |
Futures Contracts
FlexShares® STOXX® Global Broad Infrastructure Index Fund had the following open futures contracts as of October 31, 2018:
| | | | | | | | | | | | | | | | | | | | |
| | | Number of
Contracts | | | Expiration
Date | | | Trading
Currency | | | Notional
Amount | | | Value and
Unrealized
Depreciation* | |
Long Contracts | | | | | |
EURO STOXX 50 Index | | | 14 | | | | 12/21/2018 | | | | EUR | | | $ | 506,655 | | | $ | (21,807 | ) |
FTSE 100 Index | | | 7 | | | | 12/21/2018 | | | | GBP | | | | 636,025 | | | | (13,924 | ) |
S&P 500 E-Mini Index | | | 14 | | | | 12/21/2018 | | | | USD | | | | 1,897,770 | | | | (109,414 | ) |
S&P/TSX 60 Index | | | 10 | | | | 12/20/2018 | | | | CAD | | | | 1,361,812 | | | | (82,138 | ) |
SPI 200 Index | | | 3 | | | | 12/20/2018 | | | | AUD | | | | 308,200 | | | | (13,355 | ) |
TOPIX Index | | | 6 | | | | 12/13/2018 | | | | JPY | | | | 872,447 | | | | (29,455 | ) |
| | | | | | | | | | | | | | | | | | | $ | (270,093 | ) |
| * | This amount represents the cumulative appreciation/depreciation on futures contracts. Current day’s variation margin is reported within the Statement of Assets and Liabilities for futures contracts. |
Forward Foreign Currency Contracts
FlexShares® STOXX® Global Broad Infrastructure Index Fund had the following outstanding contracts as of October 31, 2018:
| | | | | | | | | | | | | | | | | | | | | | |
| Contracts to Receive | | | | | Counterparty | | In Exchange
For | | | Maturity Date | | | Unrealized
Appreciation/
(Depreciation) | |
USD | | | 162,315 | | | | | BNP Paribas SA | | AUD | | | 224,609 | | | | 12/19/2018 | | | $ | 3,039 | |
USD | | | 245,000 | | | | | Toronto-Dominion Bank (The) | | CAD | | | 315,917 | | | | 12/19/2018 | | | | 4,198 | |
Total unrealized appreciation | | | | | | | $ | 7,237 | |
CAD | | | 357,290 | | | | | Citibank NA | | USD | | | 274,000 | | | | 12/19/2018 | | | $ | (1,661 | ) |
CAD | | | 234,733 | | | | | Goldman Sachs & Co. | | USD | | | 180,000 | | | | 12/19/2018 | | | | (1,078 | ) |
CAD | | | 142,407 | | | | | Toronto-Dominion Bank (The) | | USD | | | 109,583 | | | | 12/19/2018 | | | | (1,036 | ) |
EUR | | | 152,212 | | | | | Citibank NA | | USD | | | 180,000 | | | | 12/19/2018 | | | | (6,785 | ) |
See Accompanying Notes to the Financial Statements.
| | |
| 260 | | FLEXSHARES ANNUAL REPORT |
FlexShares® STOXX® Global Broad Infrastructure Index Fund (cont.)
Forward Foreign Currency Contracts (cont.)
| | | | | | | | | | | | | | | | | | | | | | |
| Contracts to Receive | | | | | Counterparty | | In Exchange For | | | Maturity Date | | | Unrealized
Appreciation/
(Depreciation) | |
EUR | | | 157,228 | | | | | Goldman Sachs & Co. | | USD | | | 185,006 | | | | 12/19/2018 | | | $ | (6,083 | ) |
JPY | | | 18,985,104 | | | | | Citibank NA | | USD | | | 170,000 | | | | 12/19/2018 | | | | (1,069 | ) |
JPY | | | 37,563,413 | | | | | Goldman Sachs & Co. | | USD | | | 338,075 | | | | 12/19/2018 | | | | (3,834 | ) |
USD | | | 510,000 | | | | | Citibank NA | | JPY | | | 57,316,911 | | | | 12/19/2018 | | | | (10 | ) |
Total unrealized depreciation | | | | | | | $ | (21,556 | ) |
Net unrealized depreciation | | | | | | | $ | (14,319 | ) |
Abbreviations:
AUD – Australian Dollar
CAD – Canadian Dollar
EUR – Euro
GBP – British Pound
JPY – Japanese Yen
USD – US Dollar
FlexShares® STOXX® Global Broad Infrastructure Index Fund invested, as a percentage of net assets, in companies domiciled in the following countries as of October 31, 2018:
| | | | |
Australia | | | 4.7 | % |
Austria | | | 0.1 | |
Belgium | | | 0.1 | |
Brazil | | | 0.5 | |
Canada | | | 15.0 | |
Chile | | | 0.1 | |
China | | | 2.3 | |
France | | | 3.4 | |
Germany | | | 3.3 | |
Hong Kong | | | 0.6 | |
Italy | | | 3.5 | |
Japan | | | 11.2 | |
Malaysia | | | 0.3 | |
Mexico | | | 0.4 | |
Netherlands | | | 0.3 | |
New Zealand | | | 0.3 | |
Philippines | | | 0.3 | |
Poland | | | 0.1 | |
Portugal | | | 0.0 | † |
Russia | | | 0.0 | † |
Singapore | | | 0.1 | |
South Africa | | | 0.3 | |
South Korea | | | 0.0 | † |
Spain | | | 4.6 | |
Switzerland | | | 0.3 | |
Taiwan | | | 0.4 | |
Thailand | | | 1.5 | |
United Kingdom | | | 5.2 | |
United States | | | 40.4 | |
Other1 | | | 0.7 | |
| | | | 100.0 | % |
| † | Amount represents less than 0.05%. |
| 1 | Includes any non-equity securities, securities lending reinvestments and net other assets (liabilities). |
See Accompanying Notes to the Financial Statements.
| | | | |
| FLEXSHARES ANNUAL REPORT | | | 261 | |
Schedule of Investments
FlexShares® Global Quality Real Estate Index Fund
October 31, 2018
| | | | | | | | |
| Investments | | Shares | | | Value | |
| COMMON STOCKS – 97.2% | |
| Diversified Financial Services – 0.3% | |
Corp. Financiera Alba SA | | | 19,380 | | | $ | 932,139 | |
| Equity Real Estate Investment Trusts (REITs) – 76.9% | |
AEON REIT Investment Corp.(a) | | | 950 | | | | 1,048,026 | |
Agree Realty Corp.(a) | | | 17,670 | | | | 1,011,961 | |
alstria office REIT-AG | | | 68,590 | | | | 988,546 | |
American Homes 4 Rent, Class A | | | 100,225 | | | | 2,111,741 | |
Apple Hospitality REIT, Inc. | | | 88,825 | | | | 1,436,300 | |
Argosy Property Ltd. | | | 19,000 | | | | 13,276 | |
AvalonBay Communities, Inc. | | | 18,050 | | | | 3,165,609 | |
Big Yellow Group plc | | | 79,610 | | | | 877,349 | |
Boardwalk REIT(a) | | | 9,975 | | | | 372,263 | |
British Land Co. plc (The) | | | 336,015 | | | | 2,541,712 | |
BWP Trust(a) | | | 260,205 | | | | 638,094 | |
Camden Property Trust | | | 51,110 | | | | 4,613,700 | |
Canadian Apartment Properties REIT | | | 39,805 | | | | 1,418,825 | |
Champion REIT | | | 1,330,000 | | | | 895,783 | |
Charter Hall Group | | | 140,790 | | | | 688,516 | |
Chesapeake Lodging Trust(a) | | | 35,055 | | | | 1,030,266 | |
Columbia Property Trust, Inc. | | | 70,870 | | | | 1,591,032 | |
CoreSite Realty Corp.(a) | | | 17,290 | | | | 1,622,839 | |
Cousins Properties, Inc. | | | 191,045 | | | | 1,587,584 | |
Covivio | | | 17,005 | | | | 1,709,992 | |
Derwent London plc | | | 43,700 | | | | 1,635,485 | |
Dexus | | | 545,490 | | | | 3,943,483 | |
DiamondRock Hospitality Co. | | | 101,365 | | | | 1,059,264 | |
Dream Global REIT | | | 110,580 | | | | 1,130,008 | |
Dream Office REIT | | | 11,685 | | | | 207,318 | |
Duke Realty Corp. | | | 175,370 | | | | 4,834,951 | |
EastGroup Properties, Inc. | | | 20,330 | | | | 1,947,411 | |
Equinix, Inc. | | | 855 | | | | 323,823 | |
Equity Commonwealth | | | 71,535 | | | | 2,130,312 | |
Equity LifeStyle Properties, Inc. | | | 45,315 | | | | 4,290,877 | |
Equity Residential | | | 185,725 | | | | 12,064,696 | |
Eurocommercial Properties NV, CVA | | | 23,750 | | | | 879,955 | |
First Industrial Realty Trust, Inc. | | | 59,850 | | | | 1,837,395 | |
Four Corners Property Trust, Inc. | | | 36,670 | | | | 956,354 | |
Frasers Centrepoint Trust | | | 589,000 | | | | 918,718 | |
| | | | | | | | |
| Investments | | Shares | | | Value | |
| Equity Real Estate Investment Trusts (REITs) – (continued) | |
Frontier Real Estate Investment Corp. | | | 285 | | | $ | 1,092,220 | |
Fukuoka REIT Corp. | | | 190 | | | | 287,050 | |
Gecina SA | | | 25,460 | | | | 3,741,515 | |
Getty Realty Corp. | | | 29,545 | | | | 792,692 | |
Goodman Property Trust | | | 584,440 | | | | 572,459 | |
Granite REIT | | | 22,610 | | | | 935,907 | |
Green REIT plc | | | 417,525 | | | | 689,746 | |
Grivalia Properties REIC AE | | | 35,625 | | | | 306,370 | |
Growthpoint Properties Australia Ltd.(a) | | | 273,030 | | | | 702,441 | |
H&R REIT(a) | | | 47,975 | | | | 727,342 | |
Hansteen Holdings plc | | | 25,745 | | | | 31,646 | |
Hersha Hospitality Trust(a) | | | 38,000 | | | | 667,280 | |
Highwoods Properties, Inc. | | | 44,935 | | | | 1,916,028 | |
Host Hotels & Resorts, Inc. | | | 382,090 | | | | 7,301,740 | |
Inmobiliaria Colonial Socimi SA(a) | | | 157,700 | | | | 1,585,803 | |
Investa Office Fund | | | 281,675 | | | | 1,107,986 | |
Japan Excellent, Inc. | | | 760 | | | | 985,902 | |
Japan Rental Housing Investments, Inc.(a) | | | 1,235 | | | | 968,477 | |
Killam Apartment REIT | | | 70,585 | | | | 869,111 | |
Kilroy Realty Corp.(a) | | | 15,675 | | | | 1,079,694 | |
LaSalle Hotel Properties | | | 61,370 | | | | 2,025,824 | |
Liberty Property Trust | | | 73,245 | | | | 3,066,768 | |
Life Storage, Inc. | | | 26,600 | | | | 2,504,656 | |
Link REIT | | | 1,166,500 | | | | 10,341,576 | |
LondonMetric Property plc(a) | | | 470,250 | | | | 1,083,354 | |
Mapletree North Asia Commercial Trust(b) | | | 1,358,500 | | | | 1,108,539 | |
Merlin Properties Socimi SA | | | 179,835 | | | | 2,257,683 | |
MGM Growth Properties LLC, Class A | | | 37,240 | | | | 1,053,520 | |
Mori Trust Sogo Reit, Inc. | | | 760 | | | | 1,077,489 | |
National Health Investors, Inc.(a) | | | 24,985 | | | | 1,835,398 | |
National Retail Properties, Inc. | | | 87,590 | | | | 4,094,833 | |
Nippon Accommodations Fund, Inc.(a) | | | 285 | | | | 1,305,613 | |
Park Hotels & Resorts, Inc. | | | 110,200 | | | | 3,203,514 | |
Parkway Life REIT | | | 104,500 | | | | 196,202 | |
Pebblebrook Hotel Trust(a) | | | 34,200 | | | | 1,152,882 | |
See Accompanying Notes to the Financial Statements.
| | |
| 262 | | FLEXSHARES ANNUAL REPORT |
FlexShares® Global Quality Real Estate Index Fund (cont.)
| | | | | | | | |
| Investments | | Shares | | | Value | |
| COMMON STOCKS – (continued) | |
| Equity Real Estate Investment Trusts (REITs) – (continued) | |
Piedmont Office Realty Trust, Inc., Class A | | | 75,050 | | | $ | 1,352,401 | |
PotlatchDeltic Corp. | | | 12,635 | | | | 458,019 | |
Precinct Properties New Zealand Ltd. | | | 856,235 | | | | 788,361 | |
Premier Investment Corp.(a) | | | 1,045 | | | | 1,080,603 | |
Prologis, Inc. | | | 271,985 | | | | 17,534,873 | |
PS Business Parks, Inc.(a) | | | 10,450 | | | | 1,364,770 | |
Public Storage | | | 2,660 | | | | 546,550 | |
Ramco-Gershenson Properties Trust(a) | | | 67,260 | | | | 893,213 | |
Rayonier, Inc. | | | 66,120 | | | | 1,996,824 | |
Retail Properties of America, Inc., Class A | | | 79,040 | | | | 969,821 | |
RioCan REIT(a) | | | 78,185 | | | | 1,428,852 | |
Sabra Health Care REIT, Inc.(a) | | | 98,705 | | | | 2,136,963 | |
Scentre Group | | | 2,823,590 | | | | 7,964,853 | |
Segro plc | | | 496,185 | | | | 3,896,566 | |
Senior Housing Properties Trust(a) | | | 132,620 | | | | 2,131,203 | |
Shaftesbury plc | | | 49,970 | | | | 572,727 | |
Simon Property Group, Inc. | | | 28,690 | | | | 5,265,189 | |
SL Green Realty Corp. | | | 49,305 | | | | 4,499,574 | |
SmartCentres REIT | | | 48,070 | | | | 1,101,044 | |
Societe Fonciere Lyonnaise SA | | | 1,615 | | | | 115,282 | |
Spirit Realty Capital, Inc. | | | 170,240 | | | | 1,331,277 | |
Summit Hotel Properties, Inc.(a) | | | 24,700 | | | | 284,544 | |
Sunlight REIT | | | 475,000 | | | | 285,991 | |
Sunstone Hotel Investors, Inc. | | | 105,640 | | | | 1,528,611 | |
Terreno Realty Corp. | | | 32,585 | | | | 1,219,657 | |
Tritax Big Box REIT plc(a) | | | 535,040 | | | | 976,932 | |
UNITE Group plc (The) | | | 152,855 | | | | 1,665,022 | |
Urstadt Biddle Properties, Inc., Class A | | | 34,865 | | | | 694,162 | |
Vastned Retail NV | | | 4,655 | | | | 184,602 | |
VICI Properties, Inc. | | | 159,505 | | | | 3,443,713 | |
Weingarten Realty Investors | | | 69,540 | | | | 1,955,465 | |
Weyerhaeuser Co. | | | 364,800 | | | | 9,714,624 | |
Workspace Group plc | | | 80,845 | | | | 992,710 | |
Xenia Hotels & Resorts, Inc. | | | 53,960 | | | | 1,108,878 | |
| | | | | | | | 211,676,600 | |
| | | | | | | | |
| Investments | | Shares | | | Value | |
| Household Durables – 0.4% | |
Iida Group Holdings Co. Ltd.(a) | | | 57,000 | | | $ | 1,037,420 | |
| Real Estate Management & Development – 19.6% | |
ADO Properties SA(b) | | | 16,720 | | | | 987,961 | |
Aeon Mall Co. Ltd. | | | 47,500 | | | | 879,248 | |
City Developments Ltd. | | | 161,500 | | | | 922,491 | |
CK Asset Holdings Ltd. | | | 660,000 | | | | 4,285,277 | |
CLS Holdings plc | | | 101,270 | | | | 282,087 | |
Daejan Holdings plc | | | 475 | | | | 35,627 | |
Daibiru Corp. | | | 104,500 | | | | 1,055,602 | |
Daikyo, Inc.(a) | | | 9,500 | | | | 249,338 | |
Entra ASA(b) | | | 72,485 | | | | 984,870 | |
Fabege AB | | | 133,475 | | | | 1,707,192 | |
First Capital Realty, Inc. | | | 58,425 | | | | 873,761 | |
Forestar Group, Inc.* (a) | | | 28,595 | | | | 514,710 | |
Goldcrest Co. Ltd. | | | 9,500 | | | | 148,576 | |
GuocoLand Ltd.(a) | | | 503,500 | | | | 607,196 | |
Heiwa Real Estate Co. Ltd. | | | 47,500 | | | | 880,510 | |
Helical plc | | | 23,085 | | | | 91,735 | |
Henderson Land Development Co. Ltd. | | | 604,530 | | | | 2,814,673 | |
HKR International Ltd.(a) | | | 836,000 | | | | 398,837 | |
Hongkong Land Holdings Ltd. | | | 541,500 | | | | 3,205,680 | |
Hysan Development Co. Ltd. | | | 95,000 | | | | 445,347 | |
Kenedix, Inc.(a) | | | 161,500 | | | | 840,020 | |
Kungsleden AB | | | 138,415 | | | | 969,997 | |
LendLease Group | | | 315,780 | | | | 3,939,040 | |
Leopalace21 Corp.(a) | | | 66,500 | | | | 277,537 | |
Nomura Real Estate Holdings, Inc. | | | 52,300 | | | | 982,001 | |
NTT Urban Development Corp.(a) | | | 104,500 | | | | 1,554,698 | |
Olav Thon Eiendomsselskap ASA | | | 11,780 | | | | 204,907 | |
Relo Group, Inc.(a) | | | 47,500 | | | | 1,122,104 | |
St Joe Co. (The)* (a) | | | 24,605 | | | | 373,750 | |
St Modwen Properties plc | | | 227,145 | | | | 1,086,057 | |
Sumitomo Realty & Development Co. Ltd. | | | 173,000 | | | | 5,952,408 | |
Swire Pacific Ltd., Class A | | | 232,500 | | | | 2,412,669 | |
Swire Pacific Ltd., Class B | | | 475,000 | | | | 764,663 | |
Swire Properties Ltd. | | | 665,000 | | | | 2,269,147 | |
TAG Immobilien AG | | | 69,730 | | | | 1,594,373 | |
Tejon Ranch Co.* (a) | | | 41,990 | | | | 797,810 | |
See Accompanying Notes to the Financial Statements.
| | | | |
| FLEXSHARES ANNUAL REPORT | | | 263 | |
FlexShares® Global Quality Real Estate Index Fund (cont.)
| | | | | | | | |
| Investments | | Shares | | | Value | |
| COMMON STOCKS – (continued) | |
| Real Estate Management & Development – (continued) | |
Tokyo Tatemono Co. Ltd. | | | 43,700 | | | $ | 471,250 | |
Tokyu Fudosan Holdings Corp. | | | 237,500 | | | | 1,338,443 | |
Vonovia SE | | | 53,580 | | | | 2,453,850 | |
Wharf Real Estate Investment Co. Ltd. | | | 344,000 | | | | 2,130,418 | |
Wihlborgs Fastigheter AB | | | 75,810 | | | | 857,992 | |
Wing Tai Holdings Ltd. | | | 9,500 | | | | 13,240 | |
Yanlord Land Group Ltd. | | | 351,500 | | | | 319,822 | |
| | | | | | | | 54,096,914 | |
Total Common Stocks
(Cost $258,074,535) | | | | 267,743,073 | |
| | | Principal
Amount | | | | |
| SECURITIES LENDING REINVESTMENTS(c) – 2.7% | |
| REPURCHASE AGREEMENTS – 2.7% | |
Citigroup Global Markets, Inc., 2.20%, dated 10/31/2018, due 11/1/2018, repurchase price $2,035,864, collateralized by various U.S. Treasury Securities, ranging from 1.13% – 4.63%, maturing 7/15/2020 – 8/15/2040; total market value $2,052,988 | | $ | 2,035,740 | | | | 2,035,740 | |
Citigroup Global Markets, Inc., 2.46%, dated 10/31/2018, due 11/7/2018, repurchase price $300,144, collateralized by various U.S. Treasury Securities, ranging from 1.00% – 2.75%, maturing 11/15/2042 – 2/15/2046; total market value $302,317 | | | 300,000 | | | | 300,000 | |
| | | | | | | | |
| Investments | | Principal
Amount | | | Value | |
| REPURCHASE AGREEMENTS – (continued) | |
Citigroup Global Markets, Ltd., 2.20%, dated 10/31/2018, due 11/1/2018, repurchase price $3,000,183, collateralized by various U.S. Treasury Securities, ranging from 0.75% – 4.50%, maturing 3/31/2019 – 5/15/2048; total market value $3,032,943 | | $ | 3,000,000 | | | $ | 3,000,000 | |
Mizuho Securities USA, Inc., 2.19%, dated 10/31/2018, due 11/1/2018, repurchase price $1,000,061, collateralized by various U.S. Treasury Securities, ranging from 0.00% – 2.88%, maturing 1/10/2019 – 2/15/2046; total market value $1,014,150 | | | 1,000,000 | | | | 1,000,000 | |
NBC Global Finance Ltd., 2.36%, dated 10/31/2018, due 11/1/2018, repurchase price $1,100,072, collateralized by various Common Stocks; total market value $1,231,422 | | | 1,100,000 | | | | 1,100,000 | |
| | | | | 7,435,740 | |
Total Securities Lending Reinvestments
(Cost $7,435,740) | | | | 7,435,740 | |
Total Investments – 99.9%
(Cost $265,510,275) | | | | 275,178,813 | |
Other Assets Less Liabilities – 0.1% | | | | 152,919 | |
| NET ASSETS – 100.0% | | | $ | 275,331,732 | |
| * | Non-income producing security. |
| (a) | The security or a portion of this security is on loan at October 31, 2018. The total value of securities on loan at October 31, 2018 was $21,241,872, collateralized in the form of cash with a value of $7,435,740 that was reinvested in the securities shown in the |
See Accompanying Notes to the Financial Statements.
| | |
| 264 | | FLEXSHARES ANNUAL REPORT |
FlexShares® Global Quality Real Estate Index Fund (cont.)
| | Securities Lending Reinvestment section of the Schedule of Investments; $7,128,540 of collateral in the form of U.S. Government Treasury Securities, interest rates ranging from 0.00% – 8.75%, and maturity dates ranging from November 15, 2018 – August 15, 2047 and $7,772,454 of collateral in the form of Foreign Government Fixed Income Securities, interest rates ranging from 0.00% – 8.50%, and maturity dates ranging from November 14, 2018 – November 2, 2086; a total value of $22,336,734. |
| (b) | Security exempt from registration pursuant to Regulation S under the Securities Act of 1933. Regulation S applies to securities offerings that are made outside of the United States and do not involve direct selling efforts in the United States and as such may have restrictions on resale. |
| (c) | The security was purchased with cash collateral held from securities on loan at October 31, 2018. The total value of securities purchased was $7,435,740. |
Percentages shown are based on Net Assets.
Abbreviations
CVA – Dutch Certification
As of October 31, 2018, the gross unrealized appreciation (depreciation) of investments based on the aggregate cost of investments (including derivative instruments, if applicable) for federal income tax purposes was as follows:
| | | | |
| | | | |
Aggregate gross unrealized appreciation | | $ | 21,091,586 | |
Aggregate gross unrealized depreciation | | | (12,770,872 | ) |
Net unrealized appreciation | | $ | 8,320,714 | |
Federal income tax cost | | $ | 266,449,671 | |
Futures Contracts
FlexShares® Global Quality Real Estate Index Fund had the following open futures contracts as of October 31, 2018:
| | | | | | | | | | | | | | | | | | | | |
| | | Number of
Contracts | | | Expiration
Date | | | Trading
Currency | | | Notional
Amount | | | Value and
Unrealized
Depreciation* | |
Long Contracts | | | | | |
EURO STOXX 50 Index | | | 2 | | | | 12/21/2018 | | | | EUR | | | $ | 72,379 | | | $ | (1,968 | ) |
FTSE 100 Index | | | 4 | | | | 12/21/2018 | | | | GBP | | | | 363,443 | | | | (11,499 | ) |
Hang Seng Index | | | 2 | | | | 11/29/2018 | | | | HKD | | | | 317,767 | | | | (12,392 | ) |
Nikkei 225 Index | | | 6 | | | | 12/13/2018 | | | | JPY | | | | 580,435 | | | | (7,425 | ) |
S&P 500 E-Mini Index | | | 30 | | | | 12/21/2018 | | | | USD | | | | 4,066,650 | | | | (273,483 | ) |
S&P/TSX 60 Index | | | 3 | | | | 12/20/2018 | | | | CAD | | | | 408,544 | | | | (25,754 | ) |
SPI 200 Index | | | 17 | | | | 12/20/2018 | | | | AUD | | | | 1,746,466 | | | | (87,868 | ) |
| | | | | | | | | | | | | | | | | | | $ | (420,389 | ) |
| * | This amount represents the cumulative appreciation/depreciation on futures contracts. Current day’s variation margin is reported within the Statement of Assets and Liabilities for futures contracts. |
Forward Foreign Currency Contracts
FlexShares® Global Quality Real Estate Index Fund had the following outstanding contracts as of October 31, 2018:
| | | | | | | | | | | | | | | | | | | | | | |
| Contracts to Receive | | Counterparty | | In Exchange For | | | Maturity Date | | | Unrealized
Appreciation/
(Depreciation) | |
HKD | | | 3,136,373 | | | | | Morgan Stanley | | USD | | | 400,249 | | | | 12/19/2018 | | | $ | 383 | |
USD | | | 159,568 | | | | | Toronto-Dominion Bank (The) | | CAD | | | 207,364 | | | | 12/19/2018 | | | | 1,508 | |
USD | | | 47,565 | | | | | Goldman Sachs & Co. | | EUR | | | 40,423 | | | | 12/19/2018 | | | | 1,564 | |
USD | | | 400,000 | | | | | Toronto-Dominion Bank (The) | | EUR | | | 343,547 | | | | 12/19/2018 | | | | 9,049 | |
USD | | | 720,000 | | | | | Toronto-Dominion Bank (The) | | SGD | | | 987,370 | | | | 12/19/2018 | | | | 6,266 | |
Total unrealized appreciation | | | | | | | | | | | | | | $ | 18,770 | |
GBP | | | 187,683 | | | | | BNP Paribas SA | | USD | | | 246,687 | | | | 12/19/2018 | | | $ | (6,282 | ) |
SGD | | | 96,492 | | | | | Citibank NA | | USD | | | 70,277 | | | | 12/19/2018 | | | | (527 | ) |
Total unrealized depreciation | | | | | | | $ | (6,809 | ) |
Net unrealized appreciation | | | | | | | $ | 11,961 | |
See Accompanying Notes to the Financial Statements.
| | | | |
| FLEXSHARES ANNUAL REPORT | | | 265 | |
FlexShares® Global Quality Real Estate Index Fund (cont.)
Abbreviations:
AUD – Australian Dollar
CAD – Canadian Dollar
EUR – Euro
GBP – British Pound
HKD – Hong Kong Dollar
JPY – Japanese Yen
SGD – Singapore Dollar
USD – US Dollar
FlexShares® Global Quality Real Estate Index Fund invested, as a percentage of net assets, in companies domiciled in the following countries as of October 31, 2018:
| | | | |
Australia | | | 6.9 | % |
Canada | | | 3.3 | |
France | | | 2.0 | |
Germany | | | 2.2 | |
Greece | | | 0.1 | |
Hong Kong | | | 9.8 | |
Ireland | | | 0.3 | |
Japan | | | 8.9 | |
Netherlands | | | 0.4 | |
New Zealand | | | 0.5 | |
Norway | | | 0.4 | |
Singapore | | | 2.7 | |
Spain | | | 1.7 | |
Sweden | | | 1.3 | |
United Kingdom | | | 5.7 | |
United States | | | 51.0 | |
Other1 | | | 2.8 | |
| | | | 100.0 | % |
| 1 | Includes any non-equity securities, securities lending reinvestments and net other assets (liabilities). |
See Accompanying Notes to the Financial Statements.
| | |
| 266 | | FLEXSHARES ANNUAL REPORT |
Schedule of Investments
FlexShares® Real Assets Allocation Index Fund
October 31, 2018
| | | | | | | | |
| Investments | | Shares | | | Value | |
| EXCHANGE TRADED FUNDS – 100.0% | |
FlexShares® Global Quality Real Estate Index Fund(a) | | | 95,256 | | | $ | 5,511,512 | |
FlexShares® Global Upstream Natural Resources Index Fund(a) | | | 43,239 | | | | 1,361,164 | |
FlexShares® STOXX® Global Broad Infrastructure Index Fund(a) | | | 156,072 | | | | 7,009,193 | |
Total Exchange Traded Funds
(Cost $14,429,243) | | | | 13,881,869 | |
| | | | | | | | | |
Total Investments – 100.0%
(Cost $14,429,243) | | | | 13,881,869 | |
Other Assets Less Liabilities – 0.0%(b) | | | | 5,144 | |
| NET ASSETS – 100.0% | | | $ | 13,887,013 | |
| (a) | Investment in affiliated Fund. Northern Trust Investments, Inc. is the Investment Adviser to both the Fund and the Underlying Funds. |
| (b) | Represents less than 0.05% of net assets. |
Percentages shown are based on Net Assets.
As of October 31, 2018, the gross unrealized appreciation (depreciation) of investments based on the aggregate cost of investments (including derivative instruments, if applicable) for federal income tax purposes was as follows:
| | | | |
| | | | |
Aggregate gross unrealized appreciation | | $ | 23,124 | |
Aggregate gross unrealized depreciation | | | (586,517 | ) |
Net unrealized depreciation | | $ | (563,393 | ) |
Federal income tax cost | | $ | 14,445,262 | |
The underlying index of the FlexShares® Real Assets Allocation Index Fund is comprised of securities of affiliated FlexShares Funds. The Schedules of Investments of the affiliated FlexShares Funds are located elsewhere in this Report.
Investment in a company which was affiliated for the period ended October 31, 2018, was as follows:
| | | | | | | | | | | | | | | | | | | | | | | | | | | | | | | | |
| Security | | Value
October 31,
2017 | | | Purchases
at Cost | | | Sales
Proceeds | | | Shares
October 31,
2018 | | | Value
October 31,
2018 | | | Change in
Unrealized
Appreciation
(Depreciation) | | | Dividend
Income | | | Realized
Gain/(Loss) | |
FlexShares® Global Quality Real Estate Index Fund | | $ | 2,485,751 | | | $ | 3,565,430 | | | $ | 137,403 | | | | 95,256 | | | $ | 5,511,512 | | | $ | (397,953 | ) | | $ | 134,232 | | | $ | (4,313 | ) |
FlexShares® Global Upstream Natural Resources Index Fund | | | 680,722 | | | | 946,317 | | | | 224,758 | | | | 43,239 | | | | 1,361,164 | | | | (34,567 | ) | | | 32,690 | | | | (6,550 | ) |
FlexShares® STOXX® Global Broad Infrastructure Index Fund | | | 3,151,901 | | | | 4,444,343 | | | | 169,563 | | | | 156,072 | | | | 7,009,193 | | | | (406,825 | ) | | | 174,693 | | | | (10,663 | ) |
| | | $ | 6,318,374 | | | $ | 8,956,090 | | | $ | 531,724 | | | | 294,567 | | | $ | 13,881,869 | | | $ | (839,345 | ) | | $ | 341,615 | | | $ | (21,526 | ) |
See Accompanying Notes to the Financial Statements.
| | | | |
| FLEXSHARES ANNUAL REPORT | | | 267 | |
Schedule of Investments
FlexShares® Quality Dividend Index Fund
October 31, 2018
| | | | | | | | |
| Investments | | Shares | | | Value | |
| COMMON STOCKS – 99.2% | |
| Aerospace & Defense – 3.0% | |
Boeing Co. (The) | | | 80,580 | | | $ | 28,594,619 | |
Lockheed Martin Corp. | | | 82,160 | | | | 24,142,716 | |
| | | | | | | | 52,737,335 | |
| Banks – 3.9% | |
Bank of America Corp. | | | 352,340 | | | | 9,689,350 | |
Citigroup, Inc. | | | 77,420 | | | | 5,067,913 | |
JPMorgan Chase & Co. | | | 187,230 | | | | 20,411,815 | |
Wells Fargo & Co. | | | 625,680 | | | | 33,304,946 | |
| | | | | | | | 68,474,024 | |
| Beverages – 0.6% | |
Coca-Cola Co. (The) | | | 116,920 | | | | 5,598,130 | |
Keurig Dr Pepper, Inc. | | | 62,410 | | | | 1,622,660 | |
PepsiCo, Inc. | | | 33,180 | | | | 3,728,768 | |
| | | | | | | | 10,949,558 | |
| Biotechnology – 1.7% | |
AbbVie, Inc.(a) | | | 383,150 | | | | 29,828,227 | |
| Capital Markets – 3.6% | |
Ameriprise Financial, Inc. | | | 67,150 | | | | 8,544,166 | |
Eaton Vance Corp.(a) | | | 255,960 | | | | 11,530,998 | |
Invesco Ltd.(a) | | | 656,490 | | | | 14,252,398 | |
Lazard Ltd., Class A | | | 120,870 | | | | 4,803,374 | |
LPL Financial Holdings, Inc. | | | 186,440 | | | | 11,484,704 | |
T. Rowe Price Group, Inc. | | | 129,560 | | | | 12,566,024 | |
| | | | | | | | 63,181,664 | |
| Chemicals – 0.6% | |
LyondellBasell Industries NV, Class A | | | 122,450 | | | | 10,931,112 | |
| Communications Equipment – 2.5% | |
Cisco Systems, Inc. | | | 554,580 | | | | 25,372,035 | |
InterDigital, Inc.(a) | | | 123,240 | | | | 8,743,878 | |
Juniper Networks, Inc. | | | 341,280 | | | | 9,989,266 | |
| | | | | | | | 44,105,179 | |
| Consumer Finance – 0.3% | |
Navient Corp. | | | 430,550 | | | | 4,985,769 | |
| | | | | | | | |
| Investments | | Shares | | | Value | |
| Consumer Finance – (continued) | |
Santander Consumer USA Holdings, Inc. | | | 45,820 | | | $ | 859,125 | |
| | | | | | | | 5,844,894 | |
| Containers & Packaging – 0.0%(b) | |
Packaging Corp. of America | | | 5,563 | | | | 510,739 | |
| Diversified Consumer Services – 0.6% | |
H&R Block, Inc.(a) | | | 369,720 | | | | 9,812,369 | |
| Diversified Telecommunication Services – 2.5% | |
AT&T, Inc. | | | 831,870 | | | | 25,521,771 | |
Verizon Communications, Inc. | | | 307,310 | | | | 17,544,328 | |
| | | | | | | | 43,066,099 | |
| Electric Utilities – 2.9% | |
Edison International | | | 178,540 | | | | 12,388,891 | |
Entergy Corp.(a) | | | 12,640 | | | | 1,061,128 | |
Exelon Corp. | | | 240,950 | | | | 10,556,019 | |
FirstEnergy Corp.(a) | | | 206,190 | | | | 7,686,763 | |
Portland General Electric Co. | | | 160,370 | | | | 7,229,480 | |
PPL Corp. | | | 385,520 | | | | 11,719,808 | |
| | | | | | | | 50,642,089 | |
| Electronic Equipment, Instruments & Components – 0.6% | |
CDW Corp. | | | 112,970 | | | | 10,168,430 | |
| Energy Equipment & Services – 0.4% | |
RPC, Inc.(a) | | | 508,760 | | | | 7,570,349 | |
| Entertainment – 0.4% | |
Activision Blizzard, Inc.(a) | | | 66,895 | | | | 4,619,100 | |
Walt Disney Co. (The)(a) | | | 14,220 | | | | 1,632,882 | |
| | | | | | | | 6,251,982 | |
| Equity Real Estate Investment Trusts (REITs) – 5.5% | |
Apple Hospitality REIT, Inc. | | | 333,380 | | | | 5,390,755 | |
CoreCivic, Inc. | | | 398,950 | | | | 8,960,417 | |
Gaming and Leisure Properties, Inc. | | | 364,190 | | | | 12,269,561 | |
Host Hotels & Resorts, Inc.(a) | | | 637,530 | | | | 12,183,198 | |
Kimco Realty Corp.(a) | | | 655,700 | | | | 10,550,213 | |
See Accompanying Notes to the Financial Statements.
| | |
| 268 | | FLEXSHARES ANNUAL REPORT |
FlexShares® Quality Dividend Index Fund (cont.)
| | | | | | | | |
| Investments | | Shares | | | Value | |
| COMMON STOCKS – (continued) | |
| Equity Real Estate Investment Trusts (REITs) – (continued) | |
Lamar Advertising Co., Class A(a) | | | 132,720 | | | $ | 9,731,030 | |
LaSalle Hotel Properties | | | 244,110 | | | | 8,058,071 | |
Park Hotels & Resorts, Inc. | | | 51,350 | | | | 1,492,745 | |
Retail Properties of America, Inc., Class A | | | 241,740 | | | | 2,966,150 | |
Senior Housing Properties Trust | | | 56,090 | | | | 901,366 | |
Simon Property Group, Inc. | | | 55,300 | | | | 10,148,656 | |
Spirit Realty Capital, Inc.(a) | | | 251,220 | | | | 1,964,540 | |
Uniti Group, Inc. | | | 168,270 | | | | 3,220,688 | |
WP Carey, Inc.(a) | | | 126,400 | | | | 8,343,664 | |
| | | | | | | | 96,181,054 | |
| Food & Staples Retailing – 2.8% | |
Walgreens Boots Alliance, Inc.(a) | | | 18,170 | | | | 1,449,421 | |
Walmart, Inc. | | | 481,110 | | | | 48,245,711 | |
| | | | | | | | 49,695,132 | |
| Gas Utilities – 0.4% | |
National Fuel Gas Co.(a) | | | 127,980 | | | | 6,948,034 | |
| Health Care Providers & Services – 2.0% | |
Anthem, Inc. | | | 38,563 | | | | 10,626,806 | |
Cardinal Health, Inc. | | | 55,300 | | | | 2,798,180 | |
McKesson Corp. | | | 91,640 | | | | 11,433,006 | |
UnitedHealth Group, Inc. | | | 41,080 | | | | 10,736,258 | |
| | | | | | | | 35,594,250 | |
| Hotels, Restaurants & Leisure – 0.0%(b) | |
Darden Restaurants, Inc.(a) | | | 7,612 | | | | 811,059 | |
| Household Products – 1.0% | |
Clorox Co. (The)(a) | | | 37,130 | | | | 5,511,948 | |
Kimberly-Clark Corp.(a) | | | 119,290 | | | | 12,441,947 | |
| | | | | | | | 17,953,895 | |
| Industrial Conglomerates – 2.6% | |
3M Co. | | | 173,010 | | | | 32,916,883 | |
General Electric Co. | | | 1,299,550 | | | | 13,125,455 | |
| | | | | | | | 46,042,338 | |
| | | | | | | | |
| Investments | | Shares | | | Value | |
| Insurance – 4.2% | |
Aflac, Inc. | | | 258,330 | | | $ | 11,126,273 | |
Allstate Corp. (The) | | | 97,960 | | | | 9,376,731 | |
Arthur J Gallagher & Co.(a) | | | 82,160 | | | | 6,080,662 | |
First American Financial Corp. | | | 6,823 | | | | 302,463 | |
Principal Financial Group, Inc. | | | 152,470 | | | | 7,176,763 | |
Prudential Financial, Inc. | | | 46,610 | | | | 4,371,086 | |
Travelers Cos., Inc. (The) | | | 158,790 | | | | 19,869,393 | |
Unum Group(a) | | | 442,400 | | | | 16,041,424 | |
| | | | | | | | 74,344,795 | |
| IT Services – 6.0% | |
Accenture plc, Class A | | | 197,500 | | | | 31,129,950 | |
Broadridge Financial Solutions, Inc.(a) | | | 82,160 | | | | 9,607,790 | |
Fidelity National Information Services, Inc.(a) | | | 93,220 | | | | 9,704,202 | |
International Business Machines Corp. | | | 84,530 | | | | 9,757,298 | |
Jack Henry & Associates, Inc.(a) | | | 94,010 | | | | 14,085,518 | |
Mastercard, Inc., Class A | | | 30,020 | | | | 5,934,054 | |
Science Applications International Corp.(a) | | | 75,050 | | | | 5,216,726 | |
Total System Services, Inc. | | | 123,240 | | | | 11,233,326 | |
Visa, Inc., Class A(a) | | | 42,660 | | | | 5,880,681 | |
Western Union Co. (The)(a) | | | 139,830 | | | | 2,522,533 | |
| | | | | | | | 105,072,078 | |
| Machinery – 0.9% | |
Cummins, Inc.(a) | | | 120,080 | | | | 16,413,735 | |
| Media – 0.5% | |
Comcast Corp., Class A | | | 140,620 | | | | 5,363,247 | |
Omnicom Group, Inc.(a) | | | 44,240 | | | | 3,287,917 | |
| | | | | | | | 8,651,164 | |
| Metals & Mining – 1.2% | |
Nucor Corp. | | | 210,930 | | | | 12,470,182 | |
Steel Dynamics, Inc. | | | 199,870 | | | | 7,914,852 | |
| | | | | | | | 20,385,034 | |
See Accompanying Notes to the Financial Statements.
| | | | |
| FLEXSHARES ANNUAL REPORT | | | 269 | |
FlexShares® Quality Dividend Index Fund (cont.)
| | | | | | | | |
| Investments | | Shares | | | Value | |
| COMMON STOCKS – (continued) | |
| Mortgage Real Estate Investment Trusts (REITs) – 1.2% | |
MFA Financial, Inc. | | | 138,250 | | | $ | 958,072 | |
New Residential Investment Corp. | | | 576,700 | | | | 10,311,396 | |
Starwood Property Trust, Inc.(a) | | | 435,290 | | | | 9,454,499 | |
Two Harbors Investment Corp. | | | 2,370 | | | | 34,815 | |
| | | | | | | | 20,758,782 | |
| Multiline Retail – 2.7% | |
Kohl’s Corp.(a) | | | 218,040 | | | | 16,512,169 | |
Macy’s, Inc.(a) | | | 389,470 | | | | 13,354,926 | |
Nordstrom, Inc.(a) | | | 146,150 | | | | 9,612,286 | |
Target Corp.(a) | | | 105,860 | | | | 8,853,072 | |
| | | | | | | | 48,332,453 | |
| Multi-Utilities – 2.3% | |
Black Hills Corp.(a) | | | 136,670 | | | | 8,131,865 | |
CenterPoint Energy, Inc. | | | 328,640 | | | | 8,876,566 | |
NorthWestern Corp.(a) | | | 251,220 | | | | 14,761,687 | |
Vectren Corp. | | | 127,190 | | | | 9,097,901 | |
| | | | | | | | 40,868,019 | |
| Oil, Gas & Consumable Fuels – 8.3% | |
Chevron Corp. | | | 212,510 | | | | 23,726,742 | |
CVR Energy, Inc.(a) | | | 199,870 | | | | 8,594,410 | |
Delek US Holdings, Inc.(a) | | | 32,600 | | | | 1,197,072 | |
Exxon Mobil Corp. | | | 616,990 | | | | 49,161,763 | |
HollyFrontier Corp.(a) | | | 220,410 | | | | 14,864,450 | |
Occidental Petroleum Corp. | | | 48,190 | | | | 3,232,103 | |
ONEOK, Inc. | | | 26,807 | | | | 1,758,539 | |
PBF Energy, Inc., Class A(a) | | | 349,180 | | | | 14,613,183 | |
Phillips 66 | | | 140,620 | | | | 14,458,549 | |
Valero Energy Corp. | | | 150,890 | | | | 13,744,570 | |
| | | | | | | | 145,351,381 | |
| Paper & Forest Products – 0.5% | |
Domtar Corp. | | | 180,910 | | | | 8,377,942 | |
| Pharmaceuticals – 7.8% | |
Johnson & Johnson | | | 488,220 | | | | 68,345,918 | |
Merck & Co., Inc.(a) | | | 443,190 | | | | 32,623,216 | |
| | | | | | | | |
| Investments | | Shares | | | Value | |
| Pharmaceuticals – (continued) | |
Pfizer, Inc. | | | 824,760 | | | $ | 35,514,165 | |
| | | | | | | | 136,483,299 | |
| Professional Services – 0.2% | |
Nielsen Holdings plc(a) | | | 108,230 | | | | 2,811,815 | |
| Road & Rail –1.3% | |
Union Pacific Corp. | | | 155,630 | | | | 22,756,219 | |
| Semiconductors & Semiconductor Equipment – 2.8% | |
Intel Corp. | | | 253,590 | | | | 11,888,299 | |
KLA-Tencor Corp.(a) | | | 90,060 | | | | 8,244,093 | |
Maxim Integrated Products, Inc. | | | 3,508 | | | | 175,470 | |
MKS Instruments, Inc. | | | 5,530 | | | | 407,506 | |
Texas Instruments, Inc.(a) | | | 302,570 | | | | 28,087,573 | |
| | | | | | | | 48,802,941 | |
| Software – 5.6% | |
Intuit, Inc. | | | 58,460 | | | | 12,335,060 | |
j2 Global, Inc.(a) | | | 71,890 | | | | 5,236,468 | |
Microsoft Corp. | | | 658,860 | | | | 70,372,837 | |
Oracle Corp. | | | 48,980 | | | | 2,392,183 | |
SS&C Technologies Holdings, Inc. | | | 173,800 | | | | 8,891,608 | |
| | | | | | | | 99,228,156 | |
| Specialty Retail – 5.2% | |
Best Buy Co., Inc. | | | 218,040 | | | | 15,297,686 | |
Foot Locker, Inc.(a) | | | 176,170 | | | | 8,304,654 | |
Gap, Inc. (The)(a) | | | 402,110 | | | | 10,977,603 | |
Home Depot, Inc. (The) | | | 231,470 | | | | 40,710,944 | |
L Brands, Inc.(a) | | | 203,030 | | | | 6,582,232 | |
Office Depot, Inc. | | | 399,009 | | | | 1,021,463 | |
Williams-Sonoma, Inc.(a) | | | 153,260 | | | | 9,100,579 | |
| | | | | | | | 91,995,161 | |
| Technology Hardware, Storage & Peripherals – 5.5% | |
Apple, Inc. | | | 285,190 | | | | 62,416,684 | |
HP, Inc.(a) | | | 643,850 | | | | 15,542,539 | |
NetApp, Inc.(a) | | | 120,411 | | | | 9,451,059 | |
Seagate Technology plc(a) | | | 229,100 | | | | 9,216,693 | |
| | | | | | | | 96,626,975 | |
See Accompanying Notes to the Financial Statements.
| | |
| 270 | | FLEXSHARES ANNUAL REPORT |
FlexShares® Quality Dividend Index Fund (cont.)
| | | | | | | | |
| Investments | | Shares | | | Value | |
| COMMON STOCKS – (continued) | |
| Textiles, Apparel & Luxury Goods – 0.4% | |
Carter’s, Inc.(a) | | | 25,280 | | | $ | 2,426,374 | |
VF Corp. | | | 54,510 | | | | 4,517,789 | |
| | | | | | | | 6,944,163 | |
| Tobacco – 4.0% | |
Altria Group, Inc. | | | 452,670 | | | | 29,441,657 | |
Philip Morris International, Inc. | | | 466,890 | | | | 41,119,002 | |
| | | | | | | | 70,560,659 | |
| Trading Companies & Distributors – 0.7% | |
WW Grainger, Inc. | | | 45,820 | | | | 13,011,505 | |
Total Common Stocks
(Cost $1,466,713,370) | | | | 1,745,076,088 | |
| | | Principal
Amount | | | | |
| SECURITIES LENDING REINVESTMENTS(c) – 15.2% | |
| BANK NOTES – 0.1% | |
Bank of America NA, Charlotte (ICE LIBOR USD 1 Month + 0.22%), 2.50%, 1/15/2019(d) (Cost $2,000,000) | | $ | 2,000,000 | | | | 2,000,000 | |
| CERTIFICATES OF DEPOSIT – 2.9% | |
China Construction Bank Corp., New York 2.55%, 1/2/2019 | | | 2,500,000 | | | | 2,499,288 | |
Cooperatieve Rabobank UA, London (ICE LIBOR USD 3 Month + 0.17%), 2.64%, 4/18/2019(d) | | | 2,000,000 | | | | 2,000,000 | |
Industrial & Commercial Bank of China Ltd., New York Branch 2.53%, 12/24/2018 | | | 2,000,000 | | | | 2,000,000 | |
KBC Bank NV, Brussels 2.40%, 12/27/2018 | | | 3,000,000 | | | | 3,000,000 | |
Mitsubishi UFJ Trust & Banking Corp., New York (ICE LIBOR USD 1 Month + 0.20%), 2.48%, 4/15/2019(d) | | | 1,500,000 | | | | 1,499,982 | |
| | | | | | | | |
| Investments | | Principal
Amount | | | Value | |
| CERTIFICATES OF DEPOSIT – (continued) | |
Mizuho Bank Ltd., New York (ICE LIBOR USD 1 Month + 0.25%), 2.53%, 12/10/2018(d) | | $ | 3,000,000 | | | $ | 3,000,000 | |
Oversea-Chinese Banking Corp. Ltd., New York (ICE LIBOR USD 1 Month + 0.19%), 2.48%, 4/17/2019(d) | | | 4,000,000 | | | | 3,999,960 | |
Royal Bank of Canada, New York (ICE LIBOR USD 1 Month + 0.21%), 2.50%, 9/17/2019(d) | | | 3,000,000 | | | | 3,000,234 | |
Societe Generale, New York (ICE LIBOR USD 1 Month + 0.27%), 2.47%, 12/3/2018(d) | | | 1,000,000 | | | | 1,000,080 | |
Standard Chartered, New York 2.41%, 11/9/2018 | | | 5,000,000 | | | | 5,000,000 | |
The Chiba Bank Ltd., New York Branch 2.40%, 11/30/2018 | | | 4,000,000 | | | | 4,000,000 | |
The Norinchukin Bank, London 2.45%, 1/14/2019 | | | 3,000,000 | | | | 2,984,460 | |
The Norinchukin Bank, New York 2.32%, 11/14/2018 | | | 1,500,000 | | | | 1,499,963 | |
The Sumitomo Bank Ltd., New York 2.35%, 11/1/2018 | | | 2,000,000 | | | | 2,000,000 | |
(ICE LIBOR USD 1 Month + 0.21%), 2.50%, 5/17/2019(d) | | | 4,000,000 | | | | 3,999,960 | |
Toronto-Dominion Bank, New York (ICE LIBOR USD 1 Month + 0.21%), 2.50%, 9/17/2019(d) | | | 3,000,000 | | | | 2,999,970 | |
Wells Fargo Bank (San Francisco) NA (ICE LIBOR USD 3 Month + 0.21%), 2.73%, 10/25/2019(d) | | | 3,000,000 | | | | 3,000,000 | |
See Accompanying Notes to the Financial Statements.
| | | | |
| FLEXSHARES ANNUAL REPORT | | | 271 | |
FlexShares® Quality Dividend Index Fund (cont.)
| | | | | | | | |
| Investments | | Principal
Amount | | | Value | |
| SECURITIES LENDING REINVESTMENTS(c) – (continued) | |
| CERTIFICATES OF DEPOSIT – (continued) | |
Westpac Banking Corp., New York (US Federal Funds Effective Rate (continuous series) + 0.45%), 2.65%, 2/15/2019(d) | | $ | 3,000,000 | | | $ | 2,999,991 | |
Total Certificates of Deposit
(Cost $50,485,031) | | | | 50,483,888 | |
| | |
| | | | | | | | |
| COMMERCIAL PAPER – 0.2% | |
Union Bank of Switzerland (ICE LIBOR USD 1 Month + 0.43%), 2.69%, 2/1/2019(d) (e) (Cost $4,000,000) | | | 4,000,000 | | | | 4,002,768 | |
| FUNDING AGREEMENTS – 0.2% | |
United of Omaha Life Insurance (ICE LIBOR USD 3 Month + 0.12%), 2.45%, 11/30/2018(d) (Cost $4,000,000) | | | 4,000,000 | | | | 4,000,000 | |
| REPURCHASE AGREEMENTS – 11.8% | |
Citadel Clearing LLC, 2.80%, dated 10/31/2018, due 1/31/2019, repurchase price $5,035,778, collateralized by various Common Stocks; total market value $5,461,073 | | | 5,000,000 | | | | 5,000,000 | |
Citigroup Global Markets, Inc., 2.20%, dated 10/31/2018, due 11/1/2018, repurchase price $10,546,301, collateralized by various U.S. Treasury Securities, ranging from 1.13% – 4.63%, maturing 7/15/2020 – 8/15/2040; total market value $10,635,004 | | | 10,545,656 | | | | 10,545,656 | |
| | | | | | | | |
| Investments | | Principal
Amount | | | Value | |
| REPURCHASE AGREEMENTS – (continued) | |
Citigroup Global Markets, Inc., 2.46%, dated 10/31/2018, due 11/7/2018, repurchase price $5,152,463, collateralized by various U.S. Treasury Securities, ranging from 1.00% – 2.75%, maturing 11/15/2042 – 2/15/2046; total market value $5,189,769 | | $ | 5,150,000 | | | $ | 5,150,000 | |
Citigroup Global Markets, Ltd., 2.20%, dated 10/31/2018, due 11/1/2018, repurchase price $60,003,667, collateralized by various U.S. Treasury Securities, ranging from 0.75% – 4.50%, maturing 3/31/2019 – 5/15/2048; total market value $60,658,859 | | | 60,000,000 | | | | 60,000,000 | |
Mizuho Securities USA, Inc., 2.19%, dated 10/31/2018, due 11/1/2018, repurchase price $34,002,068, collateralized by various U.S. Treasury Securities, ranging from 0.00% – 2.88%, maturing 1/10/2019 – 2/15/2046; total market value $34,481,096 | | | 34,000,000 | | | | 34,000,000 | |
See Accompanying Notes to the Financial Statements.
| | |
| 272 | | FLEXSHARES ANNUAL REPORT |
FlexShares® Quality Dividend Index Fund (cont.)
| | | | | | | | |
| Investments | | Principal
Amount | | | Value | |
| SECURITIES LENDING REINVESTMENTS(c) – (continued) | |
| REPURCHASE AGREEMENTS – (continued) | |
ML Pierce Fenner & Smith, Inc., 2.74%, dated 10/31/2018, due 1/31/2019, repurchase price $8,056,018, collateralized by various Common Stocks; total market value $8,898,463 | | $ | 8,000,000 | | | $ | 8,000,000 | |
NBC Global Finance Ltd., 2.36%, dated 10/31/2018, due 11/1/2018, repurchase price $19,148,294, collateralized by various Common Stocks; total market value $21,434,616 | | | 19,147,039 | | | | 19,147,039 | |
Nomura Securities Co., Ltd., 2.19%, dated 10/31/2018, due 11/1/2018, repurchase price $65,003,954, collateralized by various U.S. Treasury Securities, ranging from 0.00% – 3.00%, maturing 11/15/2018 – 8/15/2047; total market value $65,990,114 | | | 65,000,000 | | | | 65,000,000 | |
Total Repurchase Agreements
(Cost $206,842,695) | | | | 206,842,695 | |
Total Securities Lending Reinvestments
(Cost $267,327,726) | | | | 267,329,351 | |
Total Investments – 114.4%
(Cost $1,734,041,096) | | | | 2,012,405,439 | |
Liabilities in excess of other assets – (14.4%) | | | | (253,297,715 | ) |
| NET ASSETS – 100.0% | | | $ | 1,759,107,724 | |
| (a) | The security or a portion of this security is on loan at October 31, 2018. The total value of securities on loan at October 31, 2018 was $290,518,614, collateralized in the form of cash with a value of $267,451,902 that was reinvested in the securities shown in the Securities Lending Reinvestment section of the Schedule of Investments; $18,627,846 of collateral in the form of U.S. Government Treasury Securities, interest rates ranging from 0.00% – 8.75%, and maturity dates ranging from November 23, 2018 – February 15, 2048 and $12,217,476 of collateral in the form of Foreign Government Fixed Income Securities, interest rates ranging from 0.00% – 8.25%, and maturity dates ranging from January 15, 2019 – July 22, 2068; a total value of $298,297,224. |
| (b) | Represents less than 0.05% of net assets. |
| (c) | The security was purchased with cash collateral held from securities on loan at October 31, 2018. The total value of securities purchased was $267,329,351. |
| (d) | Variable or floating rate security, linked to the referenced benchmark. The interest rate shown is the rate in effect as of October 31, 2018. |
| (e) | Security exempt from registration under Section 4(2) of the Securities Act of 1933. Such securities may be sold in transactions exempt from registration normally to qualified institutional buyers. |
Percentages shown are based on Net Assets.
Abbreviations
ICE – Intercontinental Exchange
LIBOR – London Interbank Offered Rate
USD – US Dollar
As of October 31, 2018, the gross unrealized appreciation (depreciation) of investments based on the aggregate cost of investments (including derivative instruments, if applicable) for federal income tax purposes was as follows:
| | | | |
| | | | |
Aggregate gross unrealized appreciation | | $ | 297,639,016 | |
Aggregate gross unrealized depreciation | | | (19,034,194 | ) |
Net unrealized appreciation | | $ | 278,604,822 | |
Federal income tax cost | | $ | 1,732,918,688 | |
See Accompanying Notes to the Financial Statements.
| | | | |
| FLEXSHARES ANNUAL REPORT | | | 273 | |
FlexShares® Quality Dividend Index Fund (cont.)
Futures Contracts
FlexShares® Quality Dividend Index Fund had the following open futures contracts as of October 31, 2018:
| | | | | | | | | | | | | | | | | | | | |
| | | Number of
Contracts | | | Expiration
Date | | | Trading
Currency | | | Notional Amount | | | Value and
Unrealized
Depreciation* | |
Long Contracts | | | | | |
S&P 500 E-Mini Index | | | 104 | | | | 12/21/2018 | | | | USD | | | $ | 14,097,720 | | | $ | (881,929 | ) |
| * | This amount represents the cumulative appreciation/depreciation on futures contracts. Current day’s variation margin is reported within the Statement of Assets and Liabilities for futures contracts. |
Abbreviations:
USD – US Dollar
See Accompanying Notes to the Financial Statements.
| | |
| 274 | | FLEXSHARES ANNUAL REPORT |
Schedule of Investments
FlexShares® Quality Dividend Defensive Index Fund
October 31, 2018
| | | | | | | | |
| Investments | | Shares | | | Value | |
| COMMON STOCKS – 99.2% | |
| Aerospace & Defense – 3.1% | |
Boeing Co. (The) | | | 13,680 | | | $ | 4,854,485 | |
BWX Technologies, Inc.(a) | | | 5,040 | | | | 294,638 | |
Lockheed Martin Corp. | | | 16,560 | | | | 4,866,156 | |
| | | | | | | | 10,015,279 | |
| Air Freight & Logistics – 1.0% | |
CH Robinson Worldwide, Inc. | | | 12,528 | | | | 1,115,368 | |
Expeditors International of Washington, Inc.(a) | | | 1,872 | | | | 125,761 | |
United Parcel Service, Inc., Class B | | | 16,848 | | | | 1,794,986 | |
| | | | | | | | 3,036,115 | |
| Automobiles – 0.5% | |
Ford Motor Co. | | | 158,976 | | | | 1,518,221 | |
| Banks – 4.0% | |
Bank of America Corp. | | | 75,168 | | | | 2,067,120 | |
Bank of NT Butterfield & Son Ltd. (The) | | | 2,880 | | | | 116,035 | |
Citigroup, Inc. | | | 19,296 | | | | 1,263,116 | |
JPMorgan Chase & Co. | | | 30,672 | | | | 3,343,862 | |
Wells Fargo & Co. | | | 110,736 | | | | 5,894,477 | |
| | | | | | | | 12,684,610 | |
| Beverages – 0.9% | |
Coca-Cola Co. (The) | | | 10,944 | | | | 523,999 | |
Keurig Dr Pepper, Inc. | | | 10,656 | | | | 277,056 | |
PepsiCo, Inc. | | | 19,872 | | | | 2,233,215 | |
| | | | | | | | 3,034,270 | |
| Biotechnology – 2.0% | |
AbbVie, Inc. | | | 84,096 | | | | 6,546,873 | |
| Capital Markets – 1.2% | |
Intercontinental Exchange, Inc. | | | 7,056 | | | | 543,594 | |
MarketAxess Holdings, Inc.(a) | | | 1,008 | | | | 211,347 | |
MSCI, Inc. | | | 10,368 | | | | 1,559,140 | |
Nasdaq, Inc.(a) | | | 6,336 | | | | 549,395 | |
T. Rowe Price Group, Inc. | | | 1,008 | | | | 97,766 | |
Thomson Reuters Corp.(a) | | | 7,200 | | | | 335,520 | |
| | | | | | | | |
| Investments | | Shares | | | Value | |
| Capital Markets – (continued) | |
Virtu Financial, Inc., Class A(a) | | | 17,568 | | | $ | 416,713 | |
| | | | | | | | 3,713,475 | |
| Chemicals – 0.6% | |
LyondellBasell Industries NV, Class A | | | 23,040 | | | | 2,056,781 | |
| Commercial Services & Supplies – 0.5% | |
Rollins, Inc.(a) | | | 28,224 | | | | 1,670,861 | |
| Communications Equipment – 4.4% | |
Cisco Systems, Inc. | | | 202,464 | | | | 9,262,728 | |
InterDigital, Inc.(a) | | | 19,584 | | | | 1,389,485 | |
Juniper Networks, Inc. | | | 59,616 | | | | 1,744,960 | |
Motorola Solutions, Inc. | | | 13,392 | | | | 1,641,324 | |
| | | | | | | | 14,038,497 | |
| Consumer Finance – 0.2% | |
Navient Corp. | | | 21,456 | | | | 248,460 | |
Synchrony Financial | | | 11,520 | | | | 332,698 | |
| | | | | | | | 581,158 | |
| Diversified Consumer Services – 0.6% | |
H&R Block, Inc.(a) | | | 72,576 | | | | 1,926,167 | |
| Diversified Telecommunication Services – 2.6% | |
AT&T, Inc. | | | 137,808 | | | | 4,227,949 | |
Verizon Communications, Inc. | | | 68,976 | | | | 3,937,840 | |
| | | | | | | | 8,165,789 | |
| Electric Utilities – 4.2% | |
Duke Energy Corp. | | | 15,696 | | | | 1,296,961 | |
Edison International | | | 28,080 | | | | 1,948,471 | |
Exelon Corp. | | | 61,056 | | | | 2,674,863 | |
FirstEnergy Corp.(a) | | | 42,624 | | | | 1,589,023 | |
Portland General Electric Co.(a) | | | 36,144 | | | | 1,629,372 | |
PPL Corp. | | | 67,824 | | | | 2,061,850 | |
Southern Co. (The) | | | 27,216 | | | | 1,225,536 | |
Xcel Energy, Inc. | | | 23,328 | | | | 1,143,305 | |
| | | | | | | | 13,569,381 | |
See Accompanying Notes to the Financial Statements.
| | | | |
| FLEXSHARES ANNUAL REPORT | | | 275 | |
FlexShares® Quality Dividend Defensive Index Fund (cont.)
| | | | | | | | |
| Investments | | Shares | | | Value | |
| COMMON STOCKS – (continued) | |
| Electronic Equipment, Instruments & Components – 1.1% | |
CDW Corp. | | | 21,888 | | | $ | 1,970,139 | |
Jabil, Inc. | | | 66,384 | | | | 1,641,676 | |
| | | | | | | | 3,611,815 | |
| Energy Equipment & Services – 0.6% | |
RPC, Inc. | | | 123,408 | | | | 1,836,311 | |
| Entertainment – 0.3% | |
Activision Blizzard, Inc.(a) | | | 2,130 | | | | 147,076 | |
Walt Disney Co. (The)(a) | | | 6,912 | | | | 793,705 | |
| | | | | | | | 940,781 | |
| Equity Real Estate Investment Trusts (REITs) – 4.3% | |
Apple Hospitality REIT, Inc. | | | 187,344 | | | | 3,029,352 | |
Brixmor Property Group, Inc. | | | 22,176 | | | | 359,251 | |
CoreCivic, Inc. | | | 67,968 | | | | 1,526,561 | |
EPR Properties(a) | | | 4,320 | | | | 296,957 | |
HCP, Inc. | | | 16,560 | | | | 456,228 | |
Kimco Realty Corp.(a) | | | 156,240 | | | | 2,513,902 | |
Medical Properties Trust, Inc. | | | 125,280 | | | | 1,861,661 | |
National Health Investors, Inc. | | | 1,136 | | | | 83,450 | |
Omega Healthcare Investors, Inc.(a) | | | 40,608 | | | | 1,354,277 | |
Park Hotels & Resorts, Inc. | | | 10,512 | | | | 305,584 | |
Retail Properties of America, Inc., Class A | | | 3,888 | | | | 47,706 | |
Sabra Health Care REIT, Inc.(a) | | | 5,616 | | | | 121,586 | |
Senior Housing Properties Trust | | | 9,504 | | | | 152,729 | |
Simon Property Group, Inc. | | | 2,880 | | | | 528,538 | |
Spirit Realty Capital, Inc.(a) | | | 28,080 | | | | 219,586 | |
Uniti Group, Inc. | | | 144 | | | | 2,756 | |
Ventas, Inc. | | | 4,464 | | | | 259,090 | |
Welltower, Inc.(a) | | | 10,224 | | | | 675,500 | |
| | | | | | | | 13,794,714 | |
| Food & Staples Retailing – 2.8% | |
Walmart, Inc. | | | 90,288 | | | | 9,054,081 | |
| Food Products – 0.6% | |
Conagra Brands, Inc.(a) | | | 23,472 | | | | 835,603 | |
Flowers Foods, Inc. | | | 20,016 | | | | 386,509 | |
Hershey Co. (The) | | | 5,040 | | | | 540,036 | |
| | | | | | | | 1,762,148 | |
| | | | | | | | |
| Investments | | Shares | | | Value | |
| Gas Utilities – 0.1% | |
New Jersey Resources Corp.(a) | | | 9,504 | | | $ | 428,630 | |
| Health Care Providers & Services – 2.9% | |
Aetna, Inc. | | | 13,536 | | | | 2,685,542 | |
Anthem, Inc. | | | 5,254 | | | | 1,447,845 | |
Cardinal Health, Inc. | | | 5,904 | | | | 298,742 | |
UnitedHealth Group, Inc. | | | 18,288 | | | | 4,779,569 | |
| | | | | | | | 9,211,698 | |
| Hotels, Restaurants & Leisure – 3.0% | |
Cracker Barrel Old Country Store, Inc.(a) | | | 1,152 | | | | 182,799 | |
Darden Restaurants, Inc.(a) | | | 3,456 | | | | 368,237 | |
Domino’s Pizza, Inc.(a) | | | 7,200 | | | | 1,935,288 | |
Dunkin’ Brands Group, Inc.(a) | | | 20,304 | | | | 1,473,258 | |
McDonald’s Corp. | | | 8,064 | | | | 1,426,522 | |
Starbucks Corp. | | | 73,008 | | | | 4,254,176 | |
| | | | | | | | 9,640,280 | |
| Household Products – 2.0% | |
Clorox Co. (The)(a) | | | 7,488 | | | | 1,111,594 | |
Colgate-Palmolive Co. | | | 51,264 | | | | 3,052,771 | |
Kimberly-Clark Corp.(a) | | | 20,880 | | | | 2,177,784 | |
| | | | | | | | 6,342,149 | |
| Industrial Conglomerates – 0.0%(b) | |
3M Co. | | | 720 | | | | 136,987 | |
| Insurance – 2.7% | |
Aflac, Inc. | | | 47,232 | | | | 2,034,282 | |
Fidelity National Financial, Inc. | | | 29,952 | | | | 1,001,895 | |
Principal Financial Group, Inc. | | | 27,360 | | | | 1,287,835 | |
Progressive Corp. (The)(a) | | | 30,240 | | | | 2,107,728 | |
Reinsurance Group of America, Inc. | | | 13,536 | | | | 1,927,120 | |
White Mountains Insurance Group Ltd. | | | 144 | | | | 127,681 | |
| | | | | | | | 8,486,541 | |
| IT Services – 5.2% | |
Accenture plc, Class A | | | 6,480 | | | | 1,021,377 | |
Amdocs Ltd. | | | 14,832 | | | | 938,421 | |
Broadridge Financial Solutions, Inc.(a) | | | 15,120 | | | | 1,768,133 | |
See Accompanying Notes to the Financial Statements.
| | |
| 276 | | FLEXSHARES ANNUAL REPORT |
FlexShares® Quality Dividend Defensive Index Fund (cont.)
| | | | | | | | |
| Investments | | Shares | | | Value | |
| COMMON STOCKS – (continued) | |
| IT Services – (continued) | |
Fidelity National Information Services, Inc. | | | 18,000 | | | $ | 1,873,800 | |
International Business Machines Corp. | | | 43,344 | | | | 5,003,198 | |
Jack Henry & Associates, Inc. | | | 13,824 | | | | 2,071,250 | |
Mastercard, Inc., Class A | | | 432 | | | | 85,393 | |
Paychex, Inc.(a) | | | 14,688 | | | | 961,917 | |
Sabre Corp. | | | 2,448 | | | | 60,343 | |
Visa, Inc., Class A(a) | | | 6,048 | | | | 833,717 | |
Western Union Co. (The)(a) | | | 109,872 | | | | 1,982,091 | |
| | | | | | | | 16,599,640 | |
| Machinery – 0.1% | |
Cummins, Inc. | | | 2,880 | | | | 393,667 | |
Toro Co. (The) | | | 432 | | | | 24,335 | |
| | | | | | | | 418,002 | |
| Metals & Mining – 0.2% | |
Newmont Mining Corp. | | | 144 | | | | 4,452 | |
Southern Copper Corp. | | | 12,528 | | | | 480,324 | |
| | | | | | | | 484,776 | |
| Mortgage Real Estate Investment Trusts (REITs) – 1.2% | |
MFA Financial, Inc. | | | 160,416 | | | | 1,111,683 | |
New Residential Investment Corp. | | | 72,288 | | | | 1,292,510 | |
Starwood Property Trust, Inc.(a) | | | 60,192 | | | | 1,307,370 | |
Two Harbors Investment Corp. | | | 3,744 | | | | 54,999 | |
| | | | | | | | 3,766,562 | |
| Multiline Retail – 3.0% | |
Kohl’s Corp. | | | 38,592 | | | | 2,922,572 | |
Macy’s, Inc.(a) | | | 72,000 | | | | 2,468,880 | |
Nordstrom, Inc.(a) | | | 25,920 | | | | 1,704,759 | |
Target Corp. | | | 29,808 | | | | 2,492,843 | |
| | | | | | | | 9,589,054 | |
| Multi-Utilities – 2.0% | |
CenterPoint Energy, Inc. | | | 44,784 | | | | 1,209,616 | |
CMS Energy Corp. | | | 15,840 | | | | 784,397 | |
Consolidated Edison, Inc. | | | 5,040 | | | | 383,040 | |
DTE Energy Co.(a) | | | 10,800 | | | | 1,213,920 | |
| | | | | | | | |
| Investments | | Shares | | | Value | |
| Multi-Utilities – (continued) | |
NorthWestern Corp.(a) | | | 43,776 | | | $ | 2,572,277 | |
WEC Energy Group, Inc. | | | 5,472 | | | | 374,285 | |
| | | | | | | | 6,537,535 | |
| Oil, Gas & Consumable Fuels – 8.1% | |
Chevron Corp. | | | 26,640 | | | | 2,974,356 | |
CVR Energy, Inc.(a) | | | 42,768 | | | | 1,839,024 | |
Exxon Mobil Corp. | | | 139,536 | | | | 11,118,229 | |
HollyFrontier Corp.(a) | | | 36,000 | | | | 2,427,840 | |
Kinder Morgan, Inc.(a) | | | 51,696 | | | | 879,866 | |
Occidental Petroleum Corp. | | | 22,320 | | | | 1,497,002 | |
PBF Energy, Inc., Class A(a) | | | 46,080 | | | | 1,928,448 | |
Phillips 66 | | | 3,456 | | | | 355,346 | |
Valero Energy Corp. | | | 32,112 | | | | 2,925,082 | |
| | | | | | | | 25,945,193 | |
| Pharmaceuticals – 7.8% | |
Eli Lilly & Co. | | | 20,016 | | | | 2,170,535 | |
Johnson & Johnson | | | 86,976 | | | | 12,175,769 | |
Merck & Co., Inc. | | | 61,776 | | | | 4,547,331 | |
Pfizer, Inc. | | | 141,408 | | | | 6,089,029 | |
| | | | | | | | 24,982,664 | |
| Professional Services – 0.2% | |
Nielsen Holdings plc | | | 20,304 | | | | 527,498 | |
| Road & Rail – 1.2% | |
Union Pacific Corp. | | | 26,208 | | | | 3,832,134 | |
| Semiconductors & Semiconductor Equipment – 3.7% | |
Broadcom, Inc. | | | 8,928 | | | | 1,995,319 | |
Intel Corp. | | | 29,808 | | | | 1,397,399 | |
KLA-Tencor Corp. | | | 8,640 | | | | 790,906 | |
Lam Research Corp.(a) | | | 12,528 | | | | 1,775,593 | |
NVIDIA Corp. | | | 1,296 | | | | 273,236 | |
Skyworks Solutions, Inc. | | | 2,016 | | | | 174,908 | |
Texas Instruments, Inc.(a) | | | 59,040 | | | | 5,480,683 | |
| | | | | | | | 11,888,044 | |
| Software – 4.3% | |
CA, Inc. | | | 30,672 | | | | 1,360,610 | |
Intuit, Inc. | | | 12,672 | | | | 2,673,792 | |
j2 Global, Inc.(a) | | | 8,784 | | | | 639,826 | |
Microsoft Corp. | | | 84,960 | | | | 9,074,578 | |
See Accompanying Notes to the Financial Statements.
| | | | |
| FLEXSHARES ANNUAL REPORT | | | 277 | |
FlexShares® Quality Dividend Defensive Index Fund (cont.)
| | | | | | | | |
| Investments | | Shares | | | Value | |
| COMMON STOCKS – (continued) | |
| Software – (continued) | |
Oracle Corp. | | | 432 | | | $ | 21,099 | |
| | | | | | | | 13,769,905 | |
| Specialty Retail – 4.8% | |
Aaron’s, Inc. | | | 30,672 | | | | 1,445,571 | |
Foot Locker, Inc.(a) | | | 45,792 | | | | 2,158,635 | |
Gap, Inc. (The)(a) | | | 68,256 | | | | 1,863,389 | |
Home Depot, Inc. (The) | | | 40,320 | | | | 7,091,482 | |
L Brands, Inc.(a) | | | 55,296 | | | | 1,792,696 | |
Williams-Sonoma, Inc.(a) | | | 16,992 | | | | 1,008,985 | |
| | | | | | | | 15,360,758 | |
| Technology Hardware, Storage & Peripherals – 4.5% | |
Apple, Inc. | | | 48,672 | | | | 10,652,354 | |
HP, Inc. | | | 62,741 | | | | 1,514,568 | |
Seagate Technology plc(a) | | | 46,368 | | | | 1,865,384 | |
Western Digital Corp.(a) | | | 10,368 | | | | 446,550 | |
| | | | | | | | 14,478,856 | |
| Textiles, Apparel & Luxury Goods – 1.0% | |
Carter’s, Inc.(a) | | | 16,848 | | | | 1,617,071 | |
NIKE, Inc., Class B | | | 22,176 | | | | 1,664,087 | |
| | | | | | | | 3,281,158 | |
| Thrifts & Mortgage Finance – 0.2% | |
New York Community Bancorp, Inc.(a) | | | 68,688 | | | | 658,031 | |
| Tobacco – 3.7% | |
Altria Group, Inc. | | | 118,224 | | | | 7,689,289 | |
Philip Morris International, Inc. | | | 48,384 | | | | 4,261,179 | |
| | | | | | | | 11,950,468 | |
| Trading Companies & Distributors – 1.3% | |
MSC Industrial Direct Co., Inc., Class A(a) | | | 21,312 | | | | 1,727,551 | |
WW Grainger, Inc. | | | 8,352 | | | | 2,371,717 | |
| | | | | | | | 4,099,268 | |
| Wireless Telecommunication Services – 0.5% | |
Telephone & Data Systems, Inc.(a) | | | 56,160 | | | | 1,731,414 | |
Total Common Stocks
(Cost $270,084,688) | | | | 317,704,572 | |
| | | | | | | | |
| Investments | | Principal
Amount | | | Value | |
| SECURITIES LENDING REINVESTMENTS(c) – 13.1% | |
| CERTIFICATES OF DEPOSIT – 0.2% | |
Westpac Banking Corp., New York (US Federal Funds Effective Rate (continuous series) + 0.45%), 2.65%, 2/15/2019(d) (Cost $500,000) | | $ | 500,000 | | | $ | 499,998 | |
| REPURCHASE AGREEMENTS – 12.9% | |
Citigroup Global Markets, Inc., 2.20%, dated 10/31/2018, due 11/1/2018, repurchase price $2,628,334, collateralized by various U.S. Treasury Securities, ranging from 1.13% – 4.63%, maturing 7/15/2020 – 8/15/2040; total market value $2,650,441 | | | 2,628,173 | | | | 2,628,173 | |
Citigroup Global Markets, Inc., 2.46%, dated 10/31/2018, due 11/7/2018, repurchase price $2,050,980, collateralized by various U.S. Treasury Securities, ranging from 1.00% – 2.75%, maturing 11/15/2042 – 2/15/2046; total market value $2,065,830 | | | 2,050,000 | | | | 2,050,000 | |
Citigroup Global Markets, Ltd., 2.20%, dated 10/31/2018, due 11/1/2018, repurchase price $4,000,244, collateralized by various U.S. Treasury Securities, ranging from 0.75% – 4.50%, maturing 3/31/2019 – 5/15/2048; total market value $4,043,924 | | | 4,000,000 | | | | 4,000,000 | |
See Accompanying Notes to the Financial Statements.
| | |
| 278 | | FLEXSHARES ANNUAL REPORT |
FlexShares® Quality Dividend Defensive Index Fund (cont.)
| | | | | | | | |
| Investments | | Principal
Amount | | | Value | |
| SECURITIES LENDING REINVESTMENTS(c) – (continued) | |
| REPURCHASE AGREEMENTS – (continued) | |
Mizuho Securities USA, Inc., 2.19%, dated 10/31/2018, due 11/1/2018, repurchase price $5,000,304, collateralized by various U.S. Treasury Securities, ranging from 0.00% – 2.88%, maturing 1/10/2019 – 2/15/2046; total market value $5,070,749 | | $ | 5,000,000 | | | $ | 5,000,000 | |
ML Pierce Fenner & Smith, Inc., 2.74%, dated 10/31/2018, due 1/31/2019, repurchase price $1,007,002, collateralized by various Common Stocks; total market value $1,112,308 | | | 1,000,000 | | | | 1,000,000 | |
NBC Global Finance Ltd., 2.36%, dated 10/31/2018, due 11/1/2018, repurchase price $1,700,111, collateralized by various Common Stocks; total market value $1,903,106 | | | 1,700,000 | | | | 1,700,000 | |
| | | | | | | | |
| Investments | | Principal
Amount | | | Value | |
| REPURCHASE AGREEMENTS – (continued) | |
Nomura Securities Co., Ltd., 2.19%, dated 10/31/2018, due 11/1/2018, repurchase price $25,001,521, collateralized by various U.S. Treasury Securities, ranging from 0.00% – 3.00%, maturing 11/15/2018 – 8/15/2047; total market value $25,380,813 | | $ | 25,000,000 | | | $ | 25,000,000 | |
Total Repurchase Agreements
(Cost $41,378,173) | | | | 41,378,173 | |
Total Securities Lending Reinvestments
(Cost $41,878,173) | | | | 41,878,171 | |
Total Investments – 112.3%
(Cost $311,962,861) | | | | 359,582,743 | |
Liabilities in excess of other assets – (12.3%) | | | | (39,491,768 | ) |
| NET ASSETS – 100.0% | | | $ | 320,090,975 | |
| (a) | The security or a portion of this security is on loan at October 31, 2018. The total value of securities on loan at October 31, 2018 was $49,462,663, collateralized in the form of cash with a value of $41,878,173 that was reinvested in the securities shown in the Securities Lending Reinvestment section of the Schedule of Investments; $4,583,171 of collateral in the form of U.S. Government Treasury Securities, interest rates ranging from 0.00% – 8.75%, and maturity dates ranging from November 15, 2018 – February 15, 2048 and $4,608,252 of collateral in the form of Foreign Government Fixed Income Securities, interest rates ranging from 0.00% – 8.50%, and maturity dates ranging from February 25, 2019 – July 22, 2068; a total value of $51,069,596. |
| (b) | Represents less than 0.05% of net assets. |
| (c) | The security was purchased with cash collateral held from securities on loan at October 31, 2018. The total value of securities purchased was $41,878,171. |
| (d) | Variable or floating rate security, linked to the referenced benchmark. The interest rate shown is the rate in effect as of October 31, 2018. |
Percentages shown are based on Net Assets.
See Accompanying Notes to the Financial Statements.
| | | | |
| FLEXSHARES ANNUAL REPORT | | | 279 | |
FlexShares® Quality Dividend Defensive Index Fund (cont.)
As of October 31, 2018, the gross unrealized appreciation (depreciation) of investments based on the aggregate cost of investments (including derivative instruments, if applicable) for federal income tax purposes was as follows:
| | | | |
| | | | |
Aggregate gross unrealized appreciation | | $ | 52,909,572 | |
Aggregate gross unrealized depreciation | | | (5,286,569 | ) |
Net unrealized appreciation | | $ | 47,623,003 | |
Federal income tax cost | | $ | 311,813,195 | |
Futures Contracts
FlexShares® Quality Dividend Defensive Index Fund had the following open futures contracts as of October 31, 2018:
| | | | | | | | | | | | | | | | | | | | |
| | | Number of
Contracts | | | Expiration
Date | | | Trading
Currency | | | Notional Amount | | | Value and
Unrealized
Depreciation* | |
Long Contracts | | | | | |
S&P 500 E-Mini Index | | | 17 | | | | 12/21/2018 | | | | USD | | | $ | 2,304,435 | | | $ | (146,545 | ) |
| * | This amount represents the cumulative appreciation/depreciation on futures contracts. Current day’s variation margin is reported within the Statement of Assets and Liabilities for futures contracts. |
Abbreviations:
USD – US Dollar
See Accompanying Notes to the Financial Statements.
| | |
| 280 | | FLEXSHARES ANNUAL REPORT |
Schedule of Investments
FlexShares® Quality Dividend Dynamic Index Fund
October 31, 2018
| | | | | | | | |
| Investments | | Shares | | | Value | |
| COMMON STOCKS – 98.7% | |
| Aerospace & Defense – 3.1% | |
Boeing Co. (The) | | | 3,507 | | | $ | 1,244,494 | |
Harris Corp. | | | 966 | | | | 143,654 | |
| | | | | | | | 1,388,148 | |
| Airlines – 0.5% | |
Copa Holdings SA, Class A | | | 2,982 | | | | 215,986 | |
| Auto Components – 0.5% | |
Dana, Inc. | | | 7,833 | | | | 121,960 | |
Lear Corp.(a) | | | 630 | | | | 83,727 | |
| | | | | | | | 205,687 | |
| Automobiles – 0.4% | |
Ford Motor Co. | | | 18,774 | | | | 179,292 | |
| Banks – 6.9% | |
Bank of America Corp. | | | 10,794 | | | | 296,835 | |
Citigroup, Inc. | | | 4,704 | | | | 307,924 | |
JPMorgan Chase & Co. | | | 16,380 | | | | 1,785,748 | |
PacWest Bancorp | | | 1,806 | | | | 73,360 | |
Wells Fargo & Co. | | | 11,277 | | | | 600,275 | |
| | | | | | | | 3,064,142 | |
| Beverages – 0.6% | |
Coca-Cola Co. (The) | | | 2,772 | | | | 132,723 | |
Keurig Dr Pepper, Inc.(a) | | | 2,415 | | | | 62,790 | |
PepsiCo, Inc. | | | 609 | | | | 68,440 | |
| | | | | | | | 263,953 | |
| Biotechnology – 4.7% | |
AbbVie, Inc. | | | 12,495 | | | | 972,736 | |
Amgen, Inc. | | | 5,733 | | | | 1,105,265 | |
| | | | | | | | 2,078,001 | |
| Capital Markets – 5.0% | |
Ameriprise Financial, Inc. | | | 2,247 | | | | 285,908 | |
BlackRock, Inc.(a) | | | 1,113 | | | | 457,910 | |
Eaton Vance Corp.(a) | | | 4,452 | | | | 200,563 | |
Evercore, Inc., Class A | | | 1,470 | | | | 120,084 | |
Franklin Resources, Inc.(a) | | | 5,313 | | | | 162,047 | |
Invesco Ltd. | | | 6,930 | | | | 150,450 | |
| | | | | | | | |
| Investments | | Shares | | | Value | |
| Capital Markets – (continued) | |
Lazard Ltd., Class A | | | 4,431 | | | $ | 176,088 | |
Morgan Stanley(a) | | | 8,778 | | | | 400,803 | |
T. Rowe Price Group, Inc. | | | 2,730 | | | | 264,783 | |
| | | | | | | | 2,218,636 | |
| Chemicals – 1.4% | |
Chemours Co. (The) | | | 3,759 | | | | 124,085 | |
Huntsman Corp.(a) | | | 4,830 | | | | 105,680 | |
LyondellBasell Industries NV, Class A | | | 2,562 | | | | 228,710 | |
Trinseo SA | | | 3,150 | | | | 169,722 | |
| | | | | | | | 628,197 | |
| Communications Equipment – 3.4% | |
Cisco Systems, Inc. | | | 32,928 | | | | 1,506,456 | |
| Consumer Finance – 0.7% | |
Navient Corp. | | | 12,495 | | | | 144,692 | |
Santander Consumer USA Holdings, Inc.(a) | | | 7,602 | | | | 142,538 | |
| | | | | | | | 287,230 | |
| Diversified Consumer Services – 0.5% | |
H&R Block, Inc. | | | 8,757 | | | | 232,411 | |
| Diversified Telecommunication Services – 2.8% | |
AT&T, Inc. | | | 18,228 | | | | 559,235 | |
Verizon Communications, Inc. | | | 12,096 | | | | 690,561 | |
| | | | | | | | 1,249,796 | |
| Electric Utilities – 0.6% | |
Entergy Corp.(a) | | | 1,701 | | | | 142,799 | |
PPL Corp. | | | 4,221 | | | | 128,318 | |
| | | | | | | | 271,117 | |
| Electrical Equipment – 0.9% | |
Eaton Corp. plc | | | 2,478 | | | | 177,598 | |
Emerson Electric Co. | | | 3,297 | | | | 223,801 | |
| | | | | | | | 401,399 | |
| Electronic Equipment, Instruments & Components – 0.7% | |
CDW Corp. | | | 3,360 | | | | 302,434 | |
See Accompanying Notes to the Financial Statements.
| | | | |
| FLEXSHARES ANNUAL REPORT | | | 281 | |
FlexShares® Quality Dividend Dynamic Index Fund (cont.)
| | | | | | | | |
| Investments | | Shares | | | Value | |
| COMMON STOCKS – (continued) | |
| Energy Equipment & Services – 0.1% | |
Helmerich & Payne, Inc. | | | 819 | | | $ | 51,015 | |
| Entertainment – 0.3% | |
Walt Disney Co. (The)(a) | | | 1,155 | | | | 132,629 | |
| Equity Real Estate Investment Trusts (REITs) – 6.2% | |
Apple Hospitality REIT, Inc. | | | 14,742 | | | | 238,378 | |
CoreCivic, Inc. | | | 9,471 | | | | 212,719 | |
Gaming and Leisure Properties, Inc. | | | 2,226 | | | | 74,994 | |
GEO Group, Inc. (The)(a) | | | 6,720 | | | | 148,579 | |
Host Hotels & Resorts, Inc. | | | 9,702 | | | | 185,405 | |
Kimco Realty Corp.(a) | | | 7,308 | | | | 117,586 | |
Lamar Advertising Co., Class A | | | 3,192 | | | | 234,037 | |
LaSalle Hotel Properties | | | 3,612 | | | | 119,232 | |
Omega Healthcare Investors, Inc.(a) | | | 2,226 | | | | 74,237 | |
Outfront Media, Inc. | | | 3,276 | | | | 58,051 | |
Park Hotels & Resorts, Inc. | | | 8,967 | | | | 260,671 | |
Ryman Hospitality Properties, Inc. | | | 3,570 | | | | 276,996 | |
Senior Housing Properties Trust | | | 8,736 | | | | 140,388 | |
Simon Property Group, Inc.(a) | | | 2,541 | | | | 466,324 | |
Spirit Realty Capital, Inc. | | | 19,929 | | | | 155,845 | |
| | | | | | | | 2,763,442 | |
| Food & Staples Retailing – 1.3% | |
Walgreens Boots Alliance, Inc.(a) | | | 6,594 | | | | 526,003 | |
Walmart, Inc. | | | 504 | | | | 50,541 | |
| | | | | | | | 576,544 | |
| Health Care Equipment & Supplies – 0.5% | |
Abbott Laboratories | | | 3,360 | | | | 231,638 | |
| Health Care Providers & Services – 1.0% | |
AmerisourceBergen Corp. | | | 21 | | | | 1,848 | |
Cardinal Health, Inc. | | | 4,872 | | | | 246,523 | |
UnitedHealth Group, Inc. | | | 735 | | | | 192,092 | |
| | | | | | | | 440,463 | |
| Hotels, Restaurants & Leisure – 0.6% | |
Las Vegas Sands Corp. | | | 168 | | | | 8,573 | |
Six Flags Entertainment Corp. | | | 882 | | | | 47,505 | |
Wyndham Destinations, Inc. | | | 5,880 | | | | 210,974 | |
| | | | | | | | 267,052 | |
| | | | | | | | |
| Investments | | Shares | | | Value | |
| Household Products – 0.9% | |
Kimberly-Clark Corp. | | | 2,667 | | | $ | 278,168 | |
Procter & Gamble Co. (The) | | | 1,470 | | | | 130,360 | |
| | | | | | | | 408,528 | |
Independent Power and Renewable Electricity
Producers – 0.7% | |
AES Corp. | | | 21,084 | | | | 307,405 | |
| Industrial Conglomerates – 1.9% | |
3M Co. | | | 4,452 | | | | 847,037 | |
| Insurance – 2.6% | |
American Equity Investment Life Holding Co. | | | 4,452 | | | | 138,991 | |
Lincoln National Corp. | | | 2,058 | | | | 123,871 | |
Principal Financial Group, Inc. | | | 4,977 | | | | 234,267 | |
Prudential Financial, Inc. | | | 4,116 | | | | 385,999 | |
Unum Group | | | 7,266 | | | | 263,465 | |
| | | | | | | | 1,146,593 | |
| IT Services – 6.1% | |
Accenture plc, Class A | | | 5,628 | | | | 887,085 | |
Broadridge Financial Solutions, Inc. | | | 1,911 | | | | 223,472 | |
International Business Machines Corp. | | | 2,835 | | | | 327,244 | |
Jack Henry & Associates, Inc. | | | 1,953 | | | | 292,618 | |
Mastercard, Inc., Class A | | | 273 | | | | 53,964 | |
Paychex, Inc. | | | 2,142 | | | | 140,280 | |
Science Applications International Corp. | | | 1,722 | | | | 119,696 | |
Total System Services, Inc. | | | 2,856 | | | | 260,325 | |
Visa, Inc., Class A(a) | | | 1,239 | | | | 170,796 | |
Western Union Co. (The)(a) | | | 11,781 | | | | 212,529 | |
| | | | | | | | 2,688,009 | |
| Machinery – 2.8% | |
Caterpillar, Inc. | | | 5,124 | | | | 621,644 | |
Cummins, Inc. | | | 2,037 | | | | 278,437 | |
Illinois Tool Works, Inc. | | | 2,646 | | | | 337,550 | |
| | | | | | | | 1,237,631 | |
| Media – 0.2% | |
Omnicom Group, Inc. | | | 987 | | | | 73,354 | |
See Accompanying Notes to the Financial Statements.
| | |
| 282 | | FLEXSHARES ANNUAL REPORT |
FlexShares® Quality Dividend Dynamic Index Fund (cont.)
| | | | | | | | |
| Investments | | Shares | | | Value | |
| COMMON STOCKS – (continued) | |
| Metals & Mining – 1.2% | |
Freeport-McMoRan, Inc. | | | 13,356 | | | $ | 155,597 | |
Nucor Corp.(a) | | | 4,431 | | | | 261,961 | |
United States Steel Corp.(a) | | | 3,465 | | | | 91,927 | |
| | | | | | | | 509,485 | |
| Mortgage Real Estate Investment Trusts (REITs) – 0.9% | |
Annaly Capital Management, Inc. | | | 12,327 | | | | 121,667 | |
MFA Financial, Inc. | | | 2,415 | | | | 16,736 | |
Starwood Property Trust, Inc. | | | 5,019 | | | | 109,013 | |
Two Harbors Investment Corp. | | | 10,731 | | | | 157,638 | |
| | | | | | | | 405,054 | |
| Multiline Retail – 2.2% | |
Kohl’s Corp.(a) | | | 4,158 | | | | 314,885 | |
Macy’s, Inc. | | | 4,578 | | | | 156,980 | |
Nordstrom, Inc.(a) | | | 4,515 | | | | 296,952 | |
Target Corp. | | | 2,562 | | | | 214,260 | |
| | | | | | | | 983,077 | |
| Multi-Utilities – 0.4% | |
CenterPoint Energy, Inc. | | | 6,804 | | | | 183,776 | |
| Oil, Gas & Consumable Fuels – 8.1% | |
Chevron Corp. | | | 10,542 | | | | 1,177,014 | |
CVR Energy, Inc. | | | 6,342 | | | | 272,706 | |
Exxon Mobil Corp. | | | 12,327 | | | | 982,215 | |
Murphy Oil Corp.(a) | | | 3,675 | | | | 117,086 | |
PBF Energy, Inc., Class A | | | 6,489 | | | | 271,565 | |
Phillips 66 | | | 4,095 | | | | 421,048 | |
Valero Energy Corp. | | | 3,822 | | | | 348,146 | |
| | | | | | | | 3,589,780 | |
| Paper & Forest Products – 0.3% | |
Domtar Corp. | | | 2,457 | | | | 113,784 | |
| Pharmaceuticals – 4.9% | |
Allergan plc | | | 2,457 | | | | 388,231 | |
Johnson & Johnson | | | 3,255 | | | | 455,667 | |
Merck & Co., Inc. | | | 8,421 | | | | 619,870 | |
Pfizer, Inc. | | | 16,842 | | | | 725,216 | |
| | | | | | | | 2,188,984 | |
| | | | | | | | |
| Investments | | Shares | | | Value | |
| Road & Rail – 0.3% | |
Norfolk Southern Corp. | | | 756 | | | $ | 126,879 | |
| Semiconductors & Semiconductor Equipment – 4.1% | |
Applied Materials, Inc. | | | 6,426 | | | | 211,287 | |
Intel Corp. | | | 4,473 | | | | 209,694 | |
KLA-Tencor Corp. | | | 2,625 | | | | 240,293 | |
Lam Research Corp. | | | 1,113 | | | | 157,746 | |
Maxim Integrated Products, Inc. | | | 2,919 | | | | 146,008 | |
NVIDIA Corp. | | | 168 | | | | 35,419 | |
Texas Instruments, Inc.(a) | | | 8,778 | | | | 814,862 | |
| | | | | | | | 1,815,309 | |
| Software – 4.2% | |
Intuit, Inc. | | | 1,932 | | | | 407,652 | |
j2 Global, Inc.(a) | | | 2,961 | | | | 215,679 | |
Microsoft Corp. | | | 10,563 | | | | 1,128,234 | |
Oracle Corp. | | | 525 | | | | 25,641 | |
SS&C Technologies Holdings, Inc. | | | 1,197 | | | | 61,239 | |
| | | | | | | | 1,838,445 | |
| Specialty Retail – 5.0% | |
Best Buy Co., Inc. | | | 4,263 | | | | 299,092 | |
Gap, Inc. (The) | | | 9,009 | | | | 245,946 | |
Home Depot, Inc. (The) | | | 8,127 | | | | 1,429,377 | |
L Brands, Inc.(a) | | | 5,229 | | | | 169,524 | |
Lowe’s Cos., Inc. | | | 966 | | | | 91,982 | |
| | | | | | | | 2,235,921 | |
| Technology Hardware, Storage & Peripherals – 4.7% | |
Apple, Inc. | | | 6,636 | | | | 1,452,355 | |
HP, Inc.(a) | | | 15,876 | | | | 383,247 | |
Seagate Technology plc(a) | | | 5,733 | | | | 230,638 | |
| | | | | | | | 2,066,240 | |
| Tobacco – 4.2% | |
Altria Group, Inc. | | | 15,456 | | | | 1,005,258 | |
Philip Morris International, Inc. | | | 9,870 | | | | 869,251 | |
| | | | | | | | 1,874,509 | |
| Trading Companies & Distributors – 0.3% | |
Fastenal Co. | | | 2,520 | | | | 129,553 | |
Total Common Stocks
(Cost $39,059,319) | | | | 43,725,021 | |
See Accompanying Notes to the Financial Statements.
| | | | |
| FLEXSHARES ANNUAL REPORT | | | 283 | |
FlexShares® Quality Dividend Dynamic Index Fund (cont.)
| | | | | | | | |
| Investments | | Principal
Amount | | | Value | |
| SECURITIES LENDING REINVESTMENTS(b) – 10.0% | |
| REPURCHASE AGREEMENTS – 10.0% | |
Citigroup Global Markets, Inc., 2.20%, dated 10/31/2018, due 11/1/2018, repurchase price $2,072,339, collateralized by various U.S. Treasury Securities, ranging from 1.13% – 4.63%, maturing 7/15/2020 – 8/15/2040; total market value $2,089,769 | | $ | 2,072,212 | | | $ | 2,072,212 | |
Citigroup Global Markets, Inc., 2.46%, dated 10/31/2018, due 11/7/2018, repurchase price $250,119, collateralized by various U.S. Treasury Securities, ranging from 1.00% – 2.75%, maturing 11/15/2042 – 2/15/2046; total market value $251,931 | | | 250,000 | | | | 250,000 | |
NBC Global Finance Ltd., 2.36%, dated 10/31/2018, due 11/1/2018, repurchase price $92,232, collateralized by various Common Stocks; total market value $103,245 | | | 92,226 | | | | 92,226 | |
| | | | | | | | |
| Investments | | Principal
Amount | | | Value | |
| REPURCHASE AGREEMENTS – (continued) | |
Nomura Securities Co., Ltd., 2.19%, dated 10/31/2018, due 11/1/2018, repurchase price $2,000,122, collateralized by various U.S. Treasury Securities, ranging from 0.00% – 3.00%, maturing 11/15/2018 – 8/15/2047; total market value $2,030,465 | | $ | 2,000,000 | | | $ | 2,000,000 | |
| | | | | 4,414,438 | |
Total Securities Lending Reinvestments
(Cost $4,414,438) | | | | 4,414,438 | |
Total Investments – 108.7%
(Cost $43,473,757) | | | | 48,139,459 | |
Liabilities in excess of other assets – (8.7%) | | | | (3,834,040 | ) |
| NET ASSETS – 100.0% | | | $ | 44,305,419 | |
| (a) | The security or a portion of this security is on loan at October 31, 2018. The total value of securities on loan at October 31, 2018 was $5,496,606, collateralized in the form of cash with a value of $4,414,438 that was reinvested in the securities shown in the Securities Lending Reinvestment section of the Schedule of Investments; $1,137,736 of collateral in the form of U.S. Government Treasury Securities, interest rates ranging from 0.00% – 8.75%, and maturity dates ranging from November 15, 2018 – February 15, 2048 and $49,454 of collateral in the form of Foreign Government Fixed Income Securities, interest rates ranging from 0.00% – 8.25%, and maturity dates ranging from February 25, 2019 – July 22, 2068; a total value of $5,601,628. |
| (b) | The security was purchased with cash collateral held from securities on loan at October 31, 2018. The total value of securities purchased was $4,414,438. |
Percentages shown are based on Net Assets.
As of October 31, 2018, the gross unrealized appreciation (depreciation) of investments based on the aggregate cost of investments (including derivative instruments, if applicable) for federal income tax purposes was as follows:
| | | | |
| | | | |
Aggregate gross unrealized appreciation | | $ | 5,948,779 | |
Aggregate gross unrealized depreciation | | | (1,273,491 | ) |
Net unrealized appreciation | | $ | 4,675,288 | |
Federal income tax cost | | $ | 43,433,824 | |
See Accompanying Notes to the Financial Statements.
| | |
| 284 | | FLEXSHARES ANNUAL REPORT |
FlexShares® Quality Dividend Dynamic Index Fund (cont.)
Futures Contracts
FlexShares® Quality Dividend Dynamic Index Fund had the following open futures contracts as of October 31, 2018:
| | | | | | | | | | | | | | | | | | | | |
| | | Number of
Contracts | | | Expiration
Date | | | Trading
Currency | | | Notional
Amount | | | Value and
Unrealized
Depreciation* | |
Long Contracts | | | | | |
S&P 500 E-Mini Index | | | 4 | | | | 12/21/2018 | | | | USD | | | $ | 542,220 | | | $ | (30,347 | ) |
| * | This amount represents the cumulative appreciation/depreciation on futures contracts. Current day’s variation margin is reported within the Statement of Assets and Liabilities for futures contracts. |
Abbreviations:
USD – US Dollar
See Accompanying Notes to the Financial Statements.
| | | | |
| FLEXSHARES ANNUAL REPORT | | | 285 | |
Schedule of Investments
FlexShares® International Quality Dividend Index Fund
October 31, 2018
| | | | | | | | |
| Investments | | Shares | | | Value | |
| COMMON STOCKS – 99.1% | |
| Air Freight & Logistics – 0.5% | |
bpost SA | | | 97,128 | | | $ | 1,475,782 | |
Deutsche Post AG (Registered) | | | 80,712 | | | | 2,556,048 | |
| | | | | | | | 4,031,830 | |
| Airlines – 0.7% | |
Aeroflot PJSC | | | 3,748,662 | | | | 5,545,442 | |
| Auto Components – 1.0% | |
Bridgestone Corp. | | | 189,900 | | | | 7,341,577 | |
| Automobiles – 1.9% | |
Ford Otomotiv Sanayi A/S | | | 683,658 | | | | 7,320,593 | |
Subaru Corp. | | | 228,100 | | | | 6,170,655 | |
Toyota Motor Corp. | | | 23,500 | | | | 1,377,454 | |
| | | | | | | | 14,868,702 | |
| Banks – 9.9% | |
ABN AMRO Group NV, CVA(a) | | | 245,898 | | | | 6,045,939 | |
Absa Group Ltd. | | | 171,342 | | | | 1,730,216 | |
Agricultural Bank of China Ltd., Class H | | | 9,234,000 | | | | 4,051,963 | |
Aozora Bank Ltd. | | | 52,200 | | | | 1,801,595 | |
Australia & New Zealand Banking Group Ltd. | | | 273,942 | | | | 5,034,475 | |
Bank of China Ltd., Class H | | | 7,182,000 | | | | 3,059,913 | |
Bank of Communications Co. Ltd., Class H | | | 2,394,000 | | | | 1,795,637 | |
Bank Polska Kasa Opieki SA | | | 55,062 | | | | 1,505,004 | |
Commonwealth Bank of Australia | | | 167,922 | | | | 8,239,389 | |
Danske Bank A/S | | | 81,396 | | | | 1,561,861 | |
HSBC Holdings plc | | | 1,425,798 | | | | 11,748,874 | |
National Australia Bank Ltd. | | | 259,236 | | | | 4,631,922 | |
National Bank of Canada | | | 72,846 | | | | 3,314,888 | |
Nordea Bank Abp | | | 284,886 | | | | 2,480,834 | |
Resona Holdings, Inc. | | | 957,600 | | | | 5,048,709 | |
Royal Bank of Canada | | | 5,130 | | | | 374,696 | |
Skandinaviska Enskilda Banken AB, Class A | | | 626,886 | | | | 6,499,526 | |
Swedbank AB, Class A | | | 297,540 | | | | 6,709,519 | |
| | | | | | | | |
| Investments | | Shares | | | Value | |
| Banks – (continued) | |
Toronto-Dominion Bank (The) | | | 5,130 | | | $ | 285,280 | |
| | | | | | | | 75,920,240 | |
| Capital Markets – 3.7% | |
Banca Generali SpA(b) | | | 23,598 | | | | 455,343 | |
China Huarong Asset Management Co. Ltd., Class H(a) | | | 26,676,000 | | | | 4,831,992 | |
CI Financial Corp. | | | 350,550 | | | | 5,197,189 | |
Coronation Fund Managers Ltd.(b) | | | 353,628 | | | | 1,176,585 | |
IG Group Holdings plc | | | 286,254 | | | | 2,211,026 | |
Macquarie Group Ltd. | | | 79,344 | | | | 6,590,749 | |
Natixis SA | | | 240,084 | | | | 1,405,292 | |
SBI Holdings, Inc. | | | 251,400 | | | | 6,596,034 | |
| | | | | | | | 28,464,210 | |
| Chemicals – 0.7% | |
BASF SE | | | 2,394 | | | | 184,533 | |
Mitsubishi Gas Chemical Co., Inc. | | | 68,400 | | | | 1,152,172 | |
Mitsui Chemicals, Inc. | | | 68,400 | | | | 1,536,432 | |
Sinopec Shanghai Petrochemical Co. Ltd., Class H | | | 6,156,000 | | | | 2,701,309 | |
| | | | | | | | 5,574,446 | |
| Commercial Services & Supplies – 0.5% | |
Edenred | | | 104,652 | | | | 3,975,851 | |
| Diversified Financial Services – 1.9% | |
AMP Ltd.(b) | | | 2,526,012 | | | | 4,422,068 | |
Banca Mediolanum SpA(b) | | | 779,760 | | | | 4,527,973 | |
REC Ltd. | | | 3,743,874 | | | | 5,893,393 | |
| | | | | | | | 14,843,434 | |
| Diversified Telecommunication Services – 3.9% | |
O2 Czech Republic A/S | | | 523,260 | | | | 5,507,194 | |
Proximus SADP | | | 149,454 | | | | 3,818,591 | |
Spark New Zealand Ltd. | | | 2,368,692 | | | | 6,109,685 | |
Telenor ASA | | | 336,528 | | | | 6,192,072 | |
Telia Co. AB | | | 441,180 | | | | 1,991,651 | |
See Accompanying Notes to the Financial Statements.
| | |
| 286 | | FLEXSHARES ANNUAL REPORT |
FlexShares® International Quality Dividend Index Fund (cont.)
| | | | | | | | |
| Investments | | Shares | | | Value | |
| COMMON STOCKS – (continued) | |
| Diversified Telecommunication Services – (continued) | |
Telstra Corp. Ltd. | | | 2,738,394 | | | $ | 5,977,777 | |
| | | | | | | | 29,596,970 | |
| Electric Utilities – 2.0% | |
EDP – Energias de Portugal SA | | | 518,130 | | | | 1,822,257 | |
Endesa SA | | | 278,730 | | | | 5,836,262 | |
Federal Grid Co. Unified Energy System PJSC | | | 2,658,705,264 | | | | 6,185,716 | |
Red Electrica Corp. SA | | | 76,266 | | | | 1,581,361 | |
| | | | | | | | 15,425,596 | |
| Electrical Equipment – 0.5% | |
Mitsubishi Electric Corp. | | | 273,600 | | | | 3,475,305 | |
| Electronic Equipment, Instruments & Components – 1.5% | |
AU Optronics Corp. | | | 14,364,000 | | | | 5,663,342 | |
Innolux Corp. | | | 4,446,000 | | | | 1,346,315 | |
Kingboard Laminates Holdings Ltd. | | | 1,539,000 | | | | 1,177,896 | |
Omron Corp. | | | 45,800 | | | | 1,858,704 | |
Yaskawa Electric Corp.(b) | | | 49,900 | | | | 1,443,653 | |
| | | | | | | | 11,489,910 | |
| Equity Real Estate Investment Trusts (REITs) – 1.7% | |
Covivio | | | 17,100 | | | | 1,719,545 | |
Growthpoint Properties Ltd. | | | 3,519,864 | | | | 5,399,131 | |
H&R REIT(b) | | | 124,830 | | | | 1,892,530 | |
RioCan REIT(b) | | | 219,906 | | | | 4,018,842 | |
Stockland | | | 32,490 | | | | 83,129 | |
| | | | | | | | 13,113,177 | |
| Food & Staples Retailing – 1.4% | |
President Chain Store Corp. | | | 629,000 | | | | 7,094,367 | |
Wesfarmers Ltd. | | | 118,674 | | | | 3,921,217 | |
| | | | | | | | 11,015,584 | |
| Food Products – 1.9% | |
Marine Harvest ASA | | | 303,012 | | | | 7,354,529 | |
Nestle SA (Registered) | | | 74,898 | | | | 6,337,924 | |
Uni-President Enterprises Corp. | | | 342,000 | | | | 827,838 | |
| | | | | | | | 14,520,291 | |
| | | | | | | | |
| Investments | | Shares | | | Value | |
| Gas Utilities – 0.4% | |
AltaGas Ltd.(b) | | | 89,262 | | | $ | 1,124,909 | |
Naturgy Energy Group SA | | | 76,608 | | | | 1,885,311 | |
| | | | | | | | 3,010,220 | |
| Hotels, Restaurants & Leisure – 1.4% | |
Crown Resorts Ltd. | | | 609,444 | | | | 5,403,612 | |
Sands China Ltd. | | | 1,368,000 | | | | 5,392,148 | |
| | | | | | | | 10,795,760 | |
| Household Durables – 1.1% | |
Panasonic Corp. | | | 205,200 | | | | 2,271,919 | |
Persimmon plc | | | 207,252 | | | | 6,074,884 | |
| | | | | | | | 8,346,803 | |
Independent Power and Renewable Electricity
Producers – 0.9% | |
Engie Brasil Energia SA | | | 649,800 | | | | 6,962,455 | |
| Industrial Conglomerates – 0.7% | |
Sime Darby Bhd. | | | 9,678,600 | | | | 5,088,522 | |
| Insurance – 7.8% | |
Admiral Group plc | | | 79,002 | | | | 2,032,019 | |
Aegon NV | | | 1,078,326 | | | | 6,631,916 | |
Allianz SE (Registered) | | | 49,932 | | | | 10,434,776 | |
Assicurazioni Generali SpA | | | 140,220 | | | | 2,268,753 | |
BB Seguridade Participacoes SA | | | 684,000 | | | | 4,876,113 | |
Gjensidige Forsikring ASA | | | 291,042 | | | | 4,522,345 | |
Legal & General Group plc | | | 2,088,936 | | | | 6,712,882 | |
Orange Life Insurance Ltd.(a) | | | 5,130 | | | | 137,979 | |
Poste Italiane SpA(a) | | | 256,842 | | | | 1,847,944 | |
Power Corp. of Canada | | | 70,794 | | | | 1,465,205 | |
Power Financial Corp. | | | 10,944 | | | | 236,255 | |
Sampo OYJ, Class A | | | 137,826 | | | | 6,349,618 | |
Sompo Holdings, Inc. | | | 68,400 | | | | 2,836,489 | |
Tokio Marine Holdings, Inc. | | | 97,300 | | | | 4,609,152 | |
Zurich Insurance Group AG* | | | 14,706 | | | | 4,578,904 | |
| | | | | | | | 59,540,350 | |
| Interactive Media & Services – 0.7% | |
Tencent Holdings Ltd. | | | 146,700 | | | | 4,996,416 | |
| IT Services – 0.2% | |
Nomura Research Institute Ltd. | | | 29,700 | | | | 1,315,848 | |
See Accompanying Notes to the Financial Statements.
| | | | |
| FLEXSHARES ANNUAL REPORT | | | 287 | |
FlexShares® International Quality Dividend Index Fund (cont.)
| | | | | | | | |
| Investments | | Shares | | | Value | |
| COMMON STOCKS – (continued) | |
| Machinery – 2.1% | |
Atlas Copco AB, Class A* | | | 23,256 | | | $ | 576,584 | |
Atlas Copco AB, Class B* | | | 15,390 | | | | 353,190 | |
FANUC Corp. | | | 38,300 | | | | 6,697,537 | |
Kone OYJ, Class B | | | 49,248 | | | | 2,400,535 | |
Sinotruk Hong Kong Ltd.(b) | | | 4,275,000 | | | | 6,140,330 | |
| | | | | | | | 16,168,176 | |
| Marine – 0.7% | |
Kuehne + Nagel International AG (Registered)(b) | | | 36,936 | | | | 5,144,382 | |
| Media – 2.1% | |
Eutelsat Communications SA | | | 265,734 | | | | 5,392,520 | |
ITV plc | | | 2,968,902 | | | | 5,650,440 | |
ProSiebenSat.1 Media SE | | | 233,244 | | | | 5,396,538 | |
| | | | | | | | 16,439,498 | |
| Metals & Mining – 6.5% | |
Alrosa PJSC | | | 2,026,350 | | | | 3,079,288 | |
Assore Ltd. | | | 61,902 | | | | 1,291,762 | |
BHP Billiton plc | | | 137,826 | | | | 2,751,498 | |
Cia Siderurgica Nacional SA* | | | 68,400 | | | | 176,225 | |
Eregli Demir ve Celik Fabrikalari TAS | | | 3,333,474 | | | | 5,389,908 | |
Evraz plc | | | 973,674 | | | | 6,755,528 | |
Fortescue Metals Group Ltd.(b) | | | 550,278 | | | | 1,560,038 | |
Kumba Iron Ore Ltd.(b) | | | 329,688 | | | | 6,452,541 | |
MMC Norilsk Nickel PJSC | | | 12,312 | | | | 2,060,116 | |
Novolipetsk Steel PJSC | | | 2,623,482 | | | | 6,401,871 | |
Rio Tinto plc | | | 127,566 | | | | 6,199,608 | |
Severstal PJSC | | | 403,560 | | | | 6,322,890 | |
Vedanta Ltd. | | | 535,230 | | | | 1,528,350 | |
| | | | | | | | 49,969,623 | |
| Multiline Retail – 0.2% | |
Marks & Spencer Group plc | | | 427,842 | | | | 1,618,158 | |
| Multi-Utilities – 0.6% | |
Centrica plc | | | 1,104,318 | | | | 2,077,054 | |
Engie SA | | | 196,992 | | | | 2,628,201 | |
| | | | | | | | 4,705,255 | |
| | | | | | | | |
| Investments | | Shares | | | Value | |
| Oil, Gas & Consumable Fuels – 9.6% | |
BP plc | | | 2,102,620 | | | $ | 15,241,210 | |
Bukit Asam Tbk. PT | | | 12,141,000 | | | | 3,394,129 | |
China Petroleum & Chemical Corp., Class H | | | 2,736,000 | | | | 2,219,680 | |
Enagas SA | | | 69,426 | | | | 1,843,864 | |
Eni SpA | | | 248,976 | | | | 4,430,698 | |
Exxaro Resources Ltd. | | | 160,056 | | | | 1,635,652 | |
Formosa Petrochemical Corp. | | | 920,000 | | | | 3,627,315 | |
Inter Pipeline Ltd. | | | 331,398 | | | | 5,387,662 | |
Pilipinas Shell Petroleum Corp. | | | 1,836,540 | | | | 1,666,462 | |
Royal Dutch Shell plc, Class A | | | 67,716 | | | | 2,163,536 | |
Royal Dutch Shell plc, Class B | | | 32,832 | | | | 1,076,045 | |
Snam SpA | | | 482,904 | | | | 1,999,302 | |
TOTAL SA(b) | | | 230,166 | | | | 13,550,627 | |
TransCanada Corp.(b) | | | 167,922 | | | | 6,347,343 | |
Tupras Turkiye Petrol Rafinerileri A/S | | | 299,592 | | | | 7,041,612 | |
Vermilion Energy, Inc.(b) | | | 55,404 | | | | 1,472,799 | |
| | | | | | | | 73,097,936 | |
| Paper & Forest Products – 0.4% | |
UPM-Kymmene OYJ | | | 92,682 | | | | 2,983,429 | |
| Personal Products – 2.7% | |
L’Oreal SA | | | 2,052 | | | | 462,446 | |
Pola Orbis Holdings, Inc. | | | 183,700 | | | | 4,915,812 | |
Unilever NV, CVA(b) | | | 278,388 | | | | 14,990,693 | |
| | | | | | | | 20,368,951 | |
| Pharmaceuticals – 7.3% | |
AstraZeneca plc | | | 133,380 | | | | 10,208,535 | |
GlaxoSmithKline plc | | | 951,786 | | | | 18,378,376 | |
Livzon Pharmaceutical Group, Inc., Class H | | | 171,000 | | | | 496,243 | |
Novartis AG (Registered) | | | 72,162 | | | | 6,330,227 | |
Orion OYJ, Class B | | | 176,472 | | | | 6,078,529 | |
Roche Holding AG | | | 37,962 | | | | 9,249,912 | |
Sanofi | | | 56,772 | | | | 5,071,423 | |
| | | | | | | | 55,813,245 | |
| Professional Services – 0.7% | |
Adecco Group AG (Registered) | | | 109,098 | | | | 5,351,323 | |
See Accompanying Notes to the Financial Statements.
| | |
| 288 | | FLEXSHARES ANNUAL REPORT |
FlexShares® International Quality Dividend Index Fund (cont.)
| | | | | | | | |
| Investments | | Shares | | | Value | |
| COMMON STOCKS – (continued) | |
| Real Estate Management & Development – 2.9% | |
Daito Trust Construction Co. Ltd. | | | 6,100 | | | $ | 805,370 | |
Land & Houses PCL, NVDR | | | 17,647,200 | | | | 5,483,142 | |
Logan Property Holdings Co. Ltd. | | | 4,104,000 | | | | 3,790,208 | |
Sino-Ocean Group Holding Ltd. | | | 2,052,000 | | | | 803,587 | |
SOHO China Ltd.(b) | | | 15,048,000 | | | | 5,105,962 | |
Wharf Holdings Ltd. (The) | | | 2,173,000 | | | | 5,421,828 | |
Yuzhou Properties Co. Ltd. | | | 3,078,000 | | | | 1,099,370 | |
| | | | | | | | 22,509,467 | |
| Road & Rail – 0.8% | |
Aurizon Holdings Ltd. | | | 1,986,678 | | | | 5,913,844 | |
| Semiconductors & Semiconductor Equipment – 3.0% | |
Disco Corp. | | | 34,200 | | | | 5,445,696 | |
Novatek Microelectronics Corp. | | | 1,276,000 | | | | 5,628,866 | |
Taiwan Semiconductor Manufacturing Co. Ltd. | | | 504,222 | | | | 3,813,074 | |
Tokyo Electron Ltd. | | | 42,500 | | | | 5,906,805 | |
Vanguard International Semiconductor Corp. | | | 1,368,000 | | | | 2,519,988 | |
| | | | | | | | 23,314,429 | |
| Software – 1.0% | |
Oracle Corp. Japan | | | 10,800 | | | | 733,047 | |
SAP SE | | | 3,078 | | | | 330,129 | |
Trend Micro, Inc. | | | 109,500 | | | | 6,326,171 | |
| | | | | | | | 7,389,347 | |
| Specialty Retail – 1.3% | |
CECONOMY AG | | | 496,584 | | | | 2,542,073 | |
Hennes & Mauritz AB, Class B(b) | | | 408,006 | | | | 7,220,247 | |
| | | | | | | | 9,762,320 | |
| Technology Hardware, Storage & Peripherals – 2.8% | |
Asustek Computer, Inc. | | | 236,000 | | | | 1,746,566 | |
Brother Industries Ltd. | | | 136,800 | | | | 2,510,414 | |
Canon, Inc. | | | 68,400 | | | | 1,952,814 | |
Chicony Electronics Co. Ltd. | | | 684,000 | | | | 1,368,310 | |
Compal Electronics, Inc. | | | 2,736,000 | | | | 1,507,572 | |
| | | | | | | | |
| Investments | | Shares | | | Value | |
| Technology Hardware, Storage & Peripherals – (continued) | |
Inventec Corp. | | | 2,052,000 | | | $ | 1,654,571 | |
Konica Minolta, Inc. | | | 34,200 | | | | 339,712 | |
Lite-On Technology Corp. | | | 1,368,000 | | | | 1,569,466 | |
Pegatron Corp. | | | 828,000 | | | | 1,506,525 | |
Quanta Computer, Inc. | | | 1,026,000 | | | | 1,619,756 | |
Samsung Electronics Co. Ltd. | | | 102,600 | | | | 3,817,507 | |
Samsung Electronics Co. Ltd. (Preference) | | | 50,274 | | | | 1,577,198 | |
| | | | | | | | 21,170,411 | |
| Textiles, Apparel & Luxury Goods – 0.7% | |
HUGO BOSS AG | | | 75,924 | | | | 5,435,103 | |
| Tobacco – 1.8% | |
British American Tobacco plc | | | 10,260 | | | | 444,878 | |
Imperial Brands plc | | | 196,308 | | | | 6,654,587 | |
Japan Tobacco, Inc. | | | 260,100 | | | | 6,698,690 | |
| | | | | | | | 13,798,155 | |
| Trading Companies & Distributors – 2.0% | |
ITOCHU Corp. | | | 143,900 | | | | 2,671,308 | |
Marubeni Corp. | | | 820,800 | | | | 6,664,295 | |
Mitsubishi Corp. | | | 134,000 | | | | 3,775,819 | |
Sumitomo Corp. | | | 136,800 | | | | 2,077,062 | |
| | | | | | | | 15,188,484 | |
| Transportation Infrastructure – 1.1% | |
Aena SME SA(a) (b) | | | 25,308 | | | | 4,047,508 | |
Atlantia SpA(b) | | | 72,846 | | | | 1,465,878 | |
Sydney Airport | | | 715,806 | | | | 3,267,189 | |
| | | | | | | | 8,780,575 | |
| Wireless Telecommunication Services – 1.9% | |
Freenet AG | | | 227,772 | | | | 5,133,153 | |
Intouch Holdings PCL, NVDR | | | 1,368,000 | | | | 2,187,149 | |
Mobile TeleSystems PJSC | | | 488,376 | | | | 1,913,685 | |
Vodafone Group plc | | | 2,684,016 | | | | 5,069,489 | |
| | | | | | | | 14,303,476 | |
Total Common Stocks
(Cost $812,480,108) | | | | 758,484,526 | |
See Accompanying Notes to the Financial Statements.
| | | | |
| FLEXSHARES ANNUAL REPORT | | | 289 | |
FlexShares® International Quality Dividend Index Fund (cont.)
| | | | | | | | |
| Investments | | Principal
Amount | | | Value | |
| SECURITIES LENDING REINVESTMENTS(c) – 3.5% | |
| REPURCHASE AGREEMENTS – 3.5% | |
Citigroup Global Markets, Inc., 2.20%, dated 10/31/2018, due 11/1/2018, repurchase price $4,511,883, collateralized by various U.S. Treasury Securities, ranging from 1.13% – 4.63%, maturing 7/15/2020 – 8/15/2040; total market value $4,549,831 | | $ | 4,511,607 | | | $ | 4,511,607 | |
Citigroup Global Markets, Ltd., 2.20%, dated 10/31/2018, due 11/1/2018, repurchase price $5,000,306, collateralized by various U.S. Treasury Securities, ranging from 0.75% – 4.50%, maturing 3/31/2019 – 5/15/2048; total market value $5,054,905 | | | 5,000,000 | | | | 5,000,000 | |
Mizuho Securities USA, Inc., 2.19%, dated 10/31/2018, due 11/1/2018, repurchase price $3,000,182, collateralized by various U.S. Treasury Securities, ranging from 0.00% – 2.88%, maturing 1/10/2019 – 2/15/2046; total market value $3,042,449 | | | 3,000,000 | | | | 3,000,000 | |
| | | | | | | | |
| Investments | | Principal
Amount | | | Value | |
| REPURCHASE AGREEMENTS – (continued) | |
NBC Global Finance Ltd., 2.36%, dated 10/31/2018, due 11/1/2018, repurchase price $4,300,282, collateralized by various Common Stocks; total market value $4,813,739 | | $ | 4,300,000 | | | $ | 4,300,000 | |
Nomura Securities Co., Ltd., 2.19%, dated 10/31/2018, due 11/1/2018, repurchase price $10,000,608, collateralized by various U.S. Treasury Securities, ranging from 0.00% - 3.00%, maturing 11/15/2018 - 8/15/2047; total market value $10,152,325 | | | 10,000,000 | | | | 10,000,000 | |
| | | | | 26,811,607 | |
Total Securities Lending Reinvestments
(Cost $26,811,607) | | | | 26,811,607 | |
Total Investments – 102.6%
(Cost $839,291,715) | | | | 785,296,133 | |
Liabilities in excess of other assets – (2.6%) | | | | (20,129,394 | ) |
| NET ASSETS – 100.0% | | | $ | 765,166,739 | |
| * | Non-income producing security. |
| (a) | Security exempt from registration pursuant to Regulation S under the Securities Act of 1933. Regulation S applies to securities offerings that are made outside of the United States and do not involve direct selling efforts in the United States and as such may have restrictions on resale. |
| (b) | The security or a portion of this security is on loan at October 31, 2018. The total value of securities on loan at October 31, 2018 was $46,064,578, collateralized in the form of cash with a value of $26,811,607 that was reinvested in the securities shown in the Securities Lending Reinvestment section of the Schedule of Investments; $3,895,302 of collateral in the form of U.S. Government Treasury Securities, interest rates ranging from 0.00% – 2.88%, and maturity dates ranging from December 6, 2018 – February 15, 2047 and $17,764,010 of collateral in the form of Foreign Government Fixed Income Securities, interest rates ranging from 0.00% – 8.50%, and maturity dates ranging from November 14, 2018 – November 2, 2086; a total value of $48,470,919. |
See Accompanying Notes to the Financial Statements.
| | |
| 290 | | FLEXSHARES ANNUAL REPORT |
FlexShares® International Quality Dividend Index Fund (cont.)
| (c) | The security was purchased with cash collateral held from securities on loan at October 31, 2018. The total value of securities purchased was $26,811,607. |
Percentages shown are based on Net Assets.
Abbreviations
CVA – Dutch Certification
NVDR – Non-Voting Depositary Receipt
OYJ – Public Limited Company
PJSC – Public Joint Stock Company
Preference – A special type of equity investment that shares in the earnings of the company, has limited voting rights, and may have a dividend preference. Preference shares may also have liquidation preference.
As of October 31, 2018, the gross unrealized appreciation (depreciation) of investments based on the aggregate cost of investments (including derivative instruments, if applicable) for federal income tax purposes was as follows:
| | | | |
| | | | |
Aggregate gross unrealized appreciation | | $ | 30,853,132 | |
Aggregate gross unrealized depreciation | | | (88,724,013 | ) |
Net unrealized depreciation | | $ | (57,870,881 | ) |
Federal income tax cost | | $ | 842,824,414 | |
Futures Contracts
FlexShares® International Quality Dividend Index Fund had the following open futures contracts as of October 31, 2018:
| | | | | | | | | | | | | | | | | | | | |
| | | Number of
Contracts | | | Expiration
Date | | | Trading
Currency | | | Notional Amount | | | Value and
Unrealized
Depreciation* | |
Long Contracts | | | | | |
EURO STOXX 50 Index | | | 52 | | | | 12/21/2018 | | | | EUR | | | $ | 1,881,860 | | | $ | (85,934 | ) |
FTSE 100 Index | | | 14 | | | | 12/21/2018 | | | | GBP | | | | 1,272,051 | | | | (35,930 | ) |
Hang Seng Index | | | 1 | | | | 11/29/2018 | | | | HKD | | | | 158,883 | | | | (6,196 | ) |
MSCI Emerging Markets E-Mini Index | | | 30 | | | | 12/21/2018 | | | | USD | | | | 1,435,050 | | | | (107,477 | ) |
S&P/TSX 60 Index | | | 2 | | | | 12/20/2018 | | | | CAD | | | | 272,363 | | | | (19,187 | ) |
SPI 200 Index | | | 6 | | | | 12/20/2018 | | | | AUD | | | | 616,400 | | | | (25,075 | ) |
TOPIX Index | | | 7 | | | | 12/13/2018 | | | | JPY | | | | 1,017,855 | | | | (45,946 | ) |
| | | | | | | | | | | | | | | | | | | $ | (325,745 | ) |
| * | This amount represents the cumulative appreciation/depreciation on futures contracts. Current day’s variation margin is reported within the Statement of Assets and Liabilities for futures contracts. |
Forward Foreign Currency Contracts
FlexShares® International Quality Dividend Index Fund had the following outstanding contracts as of October 31, 2018:
| | | | | | | | | | | | | | | | | | | | | | |
| Contracts to Receive | | | | | Counterparty | | In Exchange For | | | Maturity Date | | | Unrealized
Appreciation/
(Depreciation) | |
RUB* | | | 8,380,303 | | | | | Morgan Stanley | | USD | | | 120,205 | | | | 12/19/2018 | | | $ | 6,512 | |
USD | | | 1,200,000 | | | | | Toronto-Dominion Bank (The) | | AUD | | | 1,645,955 | | | | 12/19/2018 | | | | 32,814 | |
USD | | | 573,000 | | | | | Toronto-Dominion Bank (The) | | CAD | | | 738,858 | | | | 12/19/2018 | | | | 9,817 | |
USD | | | 688,000 | | | | | Toronto-Dominion Bank (The) | | CHF | | | 654,112 | | | | 12/19/2018 | | | | 34,502 | |
USD | | | 2,513,000 | | | | | Toronto-Dominion Bank (The) | | EUR | | | 2,122,758 | | | | 12/19/2018 | | | | 97,333 | |
USD | | | 1,546,000 | | | | | Toronto-Dominion Bank (The) | | GBP | | | 1,175,904 | | | | 12/19/2018 | | | | 39,779 | |
USD | | | 100,375 | | | | | Toronto-Dominion Bank (The) | | INR* | | | 7,340,681 | | | | 12/19/2018 | | | | 1,671 | |
USD | | | 786,000 | | | | | Bank of Montreal | | JPY | | | 88,231,958 | | | | 12/19/2018 | | | | 906 | |
USD | | | 1,424,000 | | | | | Toronto-Dominion Bank (The) | | JPY | | | 159,293,856 | | | | 12/19/2018 | | | | 6,593 | |
USD | | | 275,000 | | | | | BNP Paribas SA | | KRW* | | | 306,954,335 | | | | 12/19/2018 | | | | 5,248 | |
USD | | | 686,321 | | | | | Goldman Sachs & Co. | | KRW* | | | 772,308,085 | | | | 12/19/2018 | | | | 7,616 | |
USD | | | 160,000 | | | | | Toronto-Dominion Bank (The) | | NOK | | | 1,298,393 | | | | 12/19/2018 | | | | 5,173 | |
USD | | | 275,000 | | | | | Goldman Sachs & Co. | | RUB* | | | 18,116,788 | | | | 12/19/2018 | | | | 1,059 | |
See Accompanying Notes to the Financial Statements.
| | | | |
| FLEXSHARES ANNUAL REPORT | | | 291 | |
FlexShares® International Quality Dividend Index Fund (cont.)
Forward Foreign Currency Contracts (cont.)
| | | | | | | | | | | | | | | | | | | | | | |
| Contracts to Receive | | | | | Counterparty | | In Exchange For | | | Maturity Date | | | Unrealized
Appreciation/
(Depreciation) | |
USD | | | 430,000 | | | | | Toronto-Dominion Bank (The) | | SEK | | | 3,751,801 | | | | 12/19/2018 | | | $ | 17,589 | |
USD | | | 429,290 | | | | | Goldman Sachs & Co. | | TWD* | | | 13,140,993 | | | | 12/19/2018 | | | | 3,072 | |
Total unrealized appreciation | | | | | | | $ | 269,684 | |
AUD | | | 250,028 | | | | | BNP Paribas SA | | USD | | | 180,684 | | | | 12/19/2018 | | | $ | (3,383 | ) |
AUD | | | 565,061 | | | | | Citibank NA | | USD | | | 410,000 | | | | 12/19/2018 | | | | (9,301 | ) |
AUD | | | 1,139,542 | | | | | Goldman Sachs & Co. | | USD | | | 822,000 | | | | 12/19/2018 | | | | (13,924 | ) |
CAD | | | 649,796 | | | | | Toronto-Dominion Bank (The) | | USD | | | 500,022 | | | | 12/19/2018 | | | | (4,725 | ) |
CHF | | | 181,791 | | | | | Citibank NA | | USD | | | 190,000 | | | | 12/19/2018 | | | | (8,380 | ) |
CHF | | | 220,718 | | | | | Goldman Sachs & Co. | | USD | | | 230,345 | | | | 12/19/2018 | | | | (9,833 | ) |
CZK | | | 1,820,806 | | | | | Goldman Sachs & Co. | | USD | | | 83,066 | | | | 12/19/2018 | | | | (3,182 | ) |
EUR | | | 320,364 | | | | | Citibank NA | | USD | | | 380,000 | | | | 12/19/2018 | | | | (15,430 | ) |
EUR | | | 1,984,026 | | | | | Goldman Sachs & Co. | | USD | | | 2,334,549 | | | | 12/19/2018 | | | | (76,758 | ) |
EUR | | | 423,072 | | | | | JPMorgan Chase Bank | | USD | | | 490,000 | | | | 12/19/2018 | | | | (8,551 | ) |
GBP | | | 907,713 | | | | | BNP Paribas SA | | USD | | | 1,193,077 | | | | 12/19/2018 | | | | (30,384 | ) |
GBP | | | 485,762 | | | | | Citibank NA | | USD | | | 640,000 | | | | 12/19/2018 | | | | (17,785 | ) |
GBP | | | 122,802 | | | | | Goldman Sachs & Co. | | USD | | | 160,000 | | | | 12/19/2018 | | | | (2,702 | ) |
JPY | | | 26,923,944 | | | | | Citibank NA | | USD | | | 240,000 | | | | 12/19/2018 | | | | (429 | ) |
JPY | | | 174,681,742 | | | | | Goldman Sachs & Co. | | USD | | | 1,572,157 | | | | 12/19/2018 | | | | (17,828 | ) |
KRW* | | | 781,183,025 | | | | | Goldman Sachs & Co. | | USD | | | 700,000 | | | | 12/19/2018 | | | | (13,495 | ) |
NOK | | | 1,340,609 | | | | | Bank of New York | | USD | | | 163,048 | | | | 12/19/2018 | | | | (3,187 | ) |
SEK | | | 4,531,820 | | | | | Goldman Sachs & Co. | | USD | | | 508,059 | | | | 12/19/2018 | | | | (9,905 | ) |
SGD | | | 17,194 | | | | | Citibank NA | | USD | | | 12,523 | | | | 12/19/2018 | | | | (94 | ) |
TWD* | | | 21,026,255 | | | | | BNP Paribas SA | | USD | | | 690,000 | | | | 12/19/2018 | | | | (8,030 | ) |
USD | | | 253,201 | | | | | Goldman Sachs & Co. | | BRL* | | | 1,052,956 | | | | 12/19/2018 | | | | (29,081 | ) |
USD | | | 20,598 | | | | | Morgan Stanley | | HKD | | | 161,405 | | | | 12/19/2018 | | | | (20 | ) |
USD | | | 130,000 | | | | | JPMorgan Chase Bank | | TWD* | | | 4,012,190 | | | | 12/19/2018 | | | | (132 | ) |
Total unrealized depreciation | | | | | | | $ | (286,539 | ) |
Net unrealized depreciation | | | | | | | $ | (16,855 | ) |
| * | Non-deliverable forward. See Note 2 in the Notes to Financial Statements. |
Abbreviations:
AUD – Australian Dollar
BRL – Brazilian Real
CAD – Canadian Dollar
CHF – Swiss Franc
CZK – Czech Koruna
EUR – Euro
GBP – British Pound
HKD – Hong Kong Dollar
INR – Indian Rupee
JPY – Japanese Yen
KRW – Korean Won
NOK – Norwegian Krone
RUB – Russian Ruble
SEK – Swedish Krona
SGD – Singapore Dollar
TWD – Taiwan Dollar
USD – US Dollar
See Accompanying Notes to the Financial Statements.
| | |
| 292 | | FLEXSHARES ANNUAL REPORT |
FlexShares® International Quality Dividend Index Fund (cont.)
FlexShares® International Quality Dividend Index Fund invested, as a percentage of net assets, in companies domiciled in the following countries as of October 31, 2018:
| | | | |
Australia | | | 7.2 | % |
Belgium | | | 0.7 | |
Brazil | | | 1.6 | |
Canada | | | 4.1 | |
China | | | 5.5 | |
Czech Republic | | | 0.7 | |
Denmark | | | 0.2 | |
Finland | | | 2.3 | |
France | | | 4.5 | |
Germany | | | 4.2 | |
Hong Kong | | | 1.4 | |
India | | | 1.0 | |
Indonesia | | | 0.4 | |
Italy | | | 2.2 | |
Japan | | | 13.9 | |
Malaysia | | | 0.7 | |
Netherlands | | | 3.6 | |
New Zealand | | | 0.8 | |
Norway | | | 2.4 | |
Philippines | | | 0.2 | |
Poland | | | 0.2 | |
Portugal | | | 0.2 | |
Russia | | | 4.1 | |
South Africa | | | 2.3 | |
South Korea | | | 0.7 | |
Spain | | | 2.0 | |
Sweden | | | 3.4 | |
Switzerland | | | 4.8 | |
Taiwan | | | 5.4 | |
Thailand | | | 1.0 | |
Turkey | | | 2.6 | |
United Kingdom | | | 14.8 | |
Other1 | | | 0.9 | |
| | | | 100.0 | % |
| 1 | Includes any non-equity securities, securities lending reinvestments and net other assets (liabilities). |
See Accompanying Notes to the Financial Statements.
| | | | |
| FLEXSHARES ANNUAL REPORT | | | 293 | |
Schedule of Investments
FlexShares® International Quality Dividend Defensive Index Fund
October 31, 2018
| | | | | | | | |
| Investments | | Shares | | | Value | |
| COMMON STOCKS – 98.5% | |
| Air Freight & Logistics – 0.8% | |
bpost SA | | | 11,480 | | | $ | 174,429 | |
Deutsche Post AG (Registered) | | | 7,626 | | | | 241,506 | |
Royal Mail plc | | | 57,564 | | | | 264,053 | |
| | | | | | | | 679,988 | |
| Airlines – 1.5% | |
Aeroflot PJSC | | | 436,486 | | | | 645,699 | |
Japan Airlines Co. Ltd. | | | 19,300 | | | | 686,971 | |
| | | | | | | | 1,332,670 | |
| Auto Components – 0.4% | |
Bridgestone Corp. | | | 6,300 | | | | 243,559 | |
Nokian Renkaat OYJ | | | 3,444 | | | | 109,575 | |
| | | | | | | | 353,134 | |
| Automobiles – 4.6% | |
Ford Otomotiv Sanayi A/S | | | 77,818 | | | | 833,273 | |
Nissan Motor Co. Ltd. | | | 28,700 | | | | 261,302 | |
Subaru Corp. | | | 25,800 | | | | 697,952 | |
Tofas Turk Otomobil Fabrikasi A/S | | | 201,843 | | | | 760,068 | |
Toyota Motor Corp. | | | 24,600 | | | | 1,441,930 | |
| | | | | | | | 3,994,525 | |
| Banks – 11.0% | |
ABN AMRO Group NV, CVA(a) | | | 27,839 | | | | 684,483 | |
Absa Group Ltd. | | | 19,024 | | | | 192,105 | |
Agricultural Bank of China Ltd., Class H | | | 1,535,000 | | | | 673,572 | |
Aozora Bank Ltd. | | | 5,400 | | | | 186,372 | |
Australia & New Zealand Banking Group Ltd. | | | 31,242 | | | | 574,162 | |
Bank Polska Kasa Opieki SA | | | 6,232 | | | | 170,339 | |
Commonwealth Bank of Australia | | | 19,147 | | | | 939,481 | |
CTBC Financial Holding Co. Ltd. | | | 192,000 | | | | 128,132 | |
Danske Bank A/S | | | 27,552 | | | | 528,679 | |
DNB ASA | | | 13,735 | | | | 249,291 | |
HSBC Holdings plc | | | 159,367 | | | | 1,313,217 | |
| | | | | | | | |
| Investments | | Shares | | | Value | |
| Banks – (continued) | |
Industrial & Commercial Bank of China Ltd., Class H | | | 246,000 | | | $ | 166,314 | |
Mizuho Financial Group, Inc. | | | 82,000 | | | | 140,960 | |
National Australia Bank Ltd. | | | 29,561 | | | | 528,184 | |
National Bank of Canada | | | 10,332 | | | | 470,162 | |
Nordea Bank Abp | | | 32,472 | | | | 282,772 | |
Royal Bank of Canada | | | 9,471 | | | | 691,763 | |
Sberbank of Russia PJSC | | | 50,225 | | | | 145,006 | |
Skandinaviska Enskilda Banken AB, Class A | | | 71,504 | | | | 741,350 | |
Swedbank AB, Class A | | | 33,907 | | | | 764,602 | |
Toronto-Dominion Bank (The) | | | 738 | | | | 41,040 | |
| | | | | | | | 9,611,986 | |
| Beverages – 0.1% | |
Coca-Cola Amatil Ltd. | | | 6,478 | | | | 45,500 | |
| Capital Markets – 1.6% | |
China Huarong Asset Management Co. Ltd., Class H(a) | | | 3,034,000 | | | | 549,568 | |
CI Financial Corp. | | | 12,669 | | | | 187,828 | |
IG Group Holdings plc | | | 61,869 | | | | 477,876 | |
Natixis SA | | | 28,905 | | | | 169,191 | |
| | | | | | | | 1,384,463 | |
| Chemicals – 0.7% | |
BASF SE | | | 451 | | | | 34,764 | |
Formosa Chemicals & Fibre Corp. | | | 151,000 | | | | 546,553 | |
Israel Chemicals Ltd. | | | 4,961 | | | | 28,602 | |
| | | | | | | | 609,919 | |
| Commercial Services & Supplies – 0.1% | |
Edenred | | | 779 | | | | 29,595 | |
Societe BIC SA | | | 697 | | | | 66,812 | |
| | | | | | | | 96,407 | |
| Construction & Engineering – 0.0%(b) | |
Kajima Corp. | | | 1,500 | | | | 19,352 | |
See Accompanying Notes to the Financial Statements.
| | |
| 294 | | FLEXSHARES ANNUAL REPORT |
FlexShares® International Quality Dividend Defensive Index Fund (cont.)
| | | | | | | | |
| Investments | | Shares | | | Value | |
| COMMON STOCKS – (continued) | |
| Diversified Financial Services – 1.3% | |
AMP Ltd.(c) | | | 288,107 | | | $ | 504,364 | |
REC Ltd. | | | 427,056 | | | | 672,247 | |
| | | | | | | | 1,176,611 | |
| Diversified Telecommunication Services – 4.0% | |
BCE, Inc. | | | 5,002 | | | | 194,062 | |
BT Group plc | | | 40,959 | | | | 125,893 | |
HKT Trust & HKT Ltd. | | | 151,000 | | | | 208,026 | |
Maroc Telecom | | | 13,981 | | | | 202,104 | |
O2 Czech Republic A/S | | | 28,618 | | | | 301,198 | |
Proximus SADP | | | 6,396 | | | | 163,420 | |
Spark New Zealand Ltd. | | | 265,557 | | | | 684,964 | |
Telenor ASA | | | 36,244 | | | | 666,885 | |
Telia Co. AB | | | 53,710 | | | | 242,467 | |
Telstra Corp. Ltd. | | | 323,736 | | | | 706,699 | |
| | | | | | | | 3,495,718 | |
| Electric Utilities – 3.0% | |
CEZ A/S | | | 8,201 | | | | 195,191 | |
EDP – Energias de Portugal SA | | | 59,983 | | | | 210,959 | |
Emera, Inc.(c) | | | 5,781 | | | | 178,812 | |
Endesa SA | | | 31,652 | | | | 662,754 | |
Enel SpA | | | 87,494 | | | | 429,651 | |
Federal Grid Co. Unified Energy System PJSC | | | 263,107,783 | | | | 612,144 | |
Fortum OYJ | | | 7,052 | | | | 148,579 | |
SSE plc | | | 15,334 | | | | 223,654 | |
| | | | | | | | 2,661,744 | |
| Electrical Equipment – 0.8% | |
Signify NV(a) (c) | | | 2,091 | | | | 51,649 | |
Vestas Wind Systems A/S | | | 10,537 | | | | 661,053 | |
| | | | | | | | 712,702 | |
| Electronic Equipment, Instruments & Components – 1.2% | |
AU Optronics Corp. | | | 1,640,000 | | | | 646,608 | |
Kingboard Laminates Holdings Ltd. | | | 143,500 | | | | 109,830 | |
WPG Holdings Ltd.* | | | 130,640 | | | | 155,157 | |
Yaskawa Electric Corp.(c) | | | 5,900 | | | | 170,692 | |
| | | | | | | | 1,082,287 | |
| | | | | | | | |
| Investments | | Shares | | | Value | |
| Equity Real Estate Investment Trusts (REITs) – 2.2% | |
Gecina SA | | | 919 | | | $ | 135,053 | |
Growthpoint Properties Ltd. | | | 319,472 | | | | 490,039 | |
H&R REIT(c) | | | 12,792 | | | | 193,938 | |
Hui Xian REIT | | | 246,000 | | | | 106,878 | |
Japan Retail Fund Investment Corp. | | | 25 | | | | 46,165 | |
Nomura Real Estate Master Fund, Inc. | | | 155 | | | | 200,935 | |
RioCan REIT | | | 35,383 | | | | 646,634 | |
Stockland | | | 60,311 | | | | 154,311 | |
| | | | | | | | 1,973,953 | |
| Food & Staples Retailing – 2.5% | |
Lawson, Inc.(c) | | | 3,100 | | | | 196,128 | |
METRO AG | | | 53,013 | | | | 798,883 | |
President Chain Store Corp. | | | 70,000 | | | | 789,516 | |
Wesfarmers Ltd. | | | 13,653 | | | | 451,121 | |
| | | | | | | | 2,235,648 | |
| Food Products – 3.9% | |
Marine Harvest ASA | | | 34,358 | | | | 833,917 | |
Nestle SA (Registered) | | | 19,434 | | | | 1,644,520 | |
Orkla ASA | | | 23,821 | | | | 206,157 | |
Uni-President Enterprises Corp. | | | 302,000 | | | | 731,015 | |
| | | | | | | | 3,415,609 | |
| Gas Utilities – 0.1% | |
AltaGas Ltd.(c) | | | 10,250 | | | | 129,174 | |
| Hotels, Restaurants & Leisure – 1.2% | |
Crown Resorts Ltd. | | | 49,200 | | | | 436,230 | |
Sands China Ltd. | | | 158,400 | | | | 624,354 | |
| | | | | | | | 1,060,584 | |
| Household Durables – 0.8% | |
Persimmon plc | | | 23,616 | | | | 692,222 | |
Independent Power and Renewable Electricity
Producers – 0.6% | |
Engie Brasil Energia SA | | | 45,100 | | | | 483,236 | |
| Industrial Conglomerates – 0.7% | |
Sime Darby Bhd. | | | 1,090,600 | | | | 573,383 | |
See Accompanying Notes to the Financial Statements.
| | | | |
| FLEXSHARES ANNUAL REPORT | | | 295 | |
FlexShares® International Quality Dividend Defensive Index Fund (cont.)
| | | | | | | | |
| Investments | | Shares | | | Value | |
| COMMON STOCKS – (continued) | |
| Insurance – 6.1% | |
Admiral Group plc | | | 8,856 | | | $ | 227,786 | |
Aegon NV | | | 55,350 | | | | 340,413 | |
Ageas | | | 8,692 | | | | 435,401 | |
AIA Group Ltd. | | | 1,200 | | | | 9,085 | |
Allianz SE (Registered) | | | 82 | | | | 17,136 | |
Assicurazioni Generali SpA | | | 15,703 | | | | 254,074 | |
AXA SA | | | 11,849 | | | | 297,241 | |
Direct Line Insurance Group plc | | | 46,453 | | | | 195,576 | |
Gjensidige Forsikring ASA | | | 42,763 | | | | 664,471 | |
Legal & General Group plc | | | 239,399 | | | | 769,319 | |
NN Group NV | | | 2,747 | | | | 118,275 | |
Orange Life Insurance Ltd.(a) | | | 3,321 | | | | 89,323 | |
Poste Italiane SpA(a) | | | 89,462 | | | | 643,667 | |
Sampo OYJ, Class A | | | 15,744 | | | | 725,323 | |
Zurich Insurance Group AG* | | | 1,681 | | | | 523,401 | |
| | | | | | | | 5,310,491 | |
| Interactive Media & Services – 1.1% | |
Kakaku.com, Inc. | | | 24,700 | | | | 448,016 | |
Tencent Holdings Ltd. | | | 16,100 | | | | 548,346 | |
| | | | | | | | 996,362 | |
| IT Services – 1.5% | |
Larsen & Toubro Infotech Ltd.(a) | | | 25,625 | | | | 612,148 | |
Otsuka Corp. | | | 20,700 | | | | 687,829 | |
| | | | | | | | 1,299,977 | |
| Machinery – 2.2% | |
FANUC Corp. | | | 4,400 | | | | 769,430 | |
Kone OYJ, Class B | | | 10,537 | | | | 513,613 | |
Sinotruk Hong Kong Ltd.(c) | | | 451,000 | | | | 647,787 | |
| | | | | | | | 1,930,830 | |
| Media – 2.9% | |
Eutelsat Communications SA | | | 30,176 | | | | 612,359 | |
ITV plc | | | 338,455 | | | | 644,150 | |
Lagardere SCA(c) | | | 6,478 | | | | 177,552 | |
ProSiebenSat.1 Media SE | | | 27,060 | | | | 626,084 | |
Shaw Communications, Inc., Class B | | | 10,501 | | | | 195,987 | |
Smiles Fidelidade SA* | | | 25,600 | | | | 256,724 | |
| | | | | | | | 2,512,856 | |
| | | | | | | | |
| Investments | | Shares | | | Value | |
| Metals & Mining – 6.0% | |
Alrosa PJSC | | | 497,494 | | | $ | 756,003 | |
Eregli Demir ve Celik Fabrikalari TAS | | | 302,949 | | | | 489,840 | |
Evraz plc | | | 112,545 | | | | 780,858 | |
Fortescue Metals Group Ltd.(c) | | | 63,755 | | | | 180,745 | |
Kumba Iron Ore Ltd.(c) | | | 37,597 | | | | 735,836 | |
Novolipetsk Steel PJSC | | | 296,717 | | | | 724,054 | |
Rio Tinto plc | | | 14,514 | | | | 705,369 | |
Severstal PJSC | | | 16,612 | | | | 260,273 | |
Severstal PJSC, GDR(a) | | | 28,857 | | | | 447,572 | |
Vedanta Ltd. | | | 61,787 | | | | 176,433 | |
| | | | | | | | 5,256,983 | |
| Multiline Retail – 0.2% | |
Marks & Spencer Group plc | | | 52,603 | | | | 198,952 | |
| Multi-Utilities – 1.3% | |
AGL Energy Ltd. | | | 32,021 | | | | 408,508 | |
Centrica plc | | | 126,526 | | | | 237,976 | |
Engie SA | | | 22,222 | | | | 296,478 | |
Innogy SE* | | | 4,879 | | | | 203,547 | |
| | | | | | | | 1,146,509 | |
| Oil, Gas & Consumable Fuels – 9.5% | |
BP plc | | | 240,261 | | | | 1,741,574 | |
Bukit Asam Tbk. PT | | | 533,000 | | | | 149,005 | |
China Petroleum & Chemical Corp., Class H | | | 108,000 | | | | 87,619 | |
Enagas SA | | | 8,077 | | | | 214,514 | |
Eni SpA | | | 28,208 | | | | 501,981 | |
Equinor ASA | | | 15,047 | | | | 392,603 | |
Hindustan Petroleum Corp. Ltd. | | | 113,775 | | | | 344,887 | |
Inter Pipeline Ltd. | | | 37,638 | | | | 611,895 | |
Neste OYJ | | | 8,815 | | | | 726,715 | |
Pilipinas Shell Petroleum Corp. | | | 651,490 | | | | 591,157 | |
Royal Dutch Shell plc, Class A | | | 7,913 | | | | 252,821 | |
Royal Dutch Shell plc, Class B | | | 2,747 | | | | 90,031 | |
Snam SpA | | | 50,553 | | | | 209,298 | |
TOTAL SA(c) | | | 26,432 | | | | 1,556,138 | |
Tupras Turkiye Petrol Rafinerileri A/S | | | 34,645 | | | | 814,296 | |
Vermilion Energy, Inc.(c) | | | 1,763 | | | | 46,866 | |
| | | | | | | | 8,331,400 | |
See Accompanying Notes to the Financial Statements.
| | |
| 296 | | FLEXSHARES ANNUAL REPORT |
FlexShares® International Quality Dividend Defensive Index Fund (cont.)
| | | | | | | | |
| Investments | | Shares | | | Value | |
| COMMON STOCKS – (continued) | |
| Personal Products – 0.5% | |
L’Oreal SA | | | 1,722 | | | $ | 388,076 | |
Unilever NV, CVA | | | 984 | | | | 52,987 | |
| | | | | | | | 441,063 | |
| Pharmaceuticals – 6.5% | |
Astellas Pharma, Inc. | | | 49,200 | | | | 761,618 | |
AstraZeneca plc | | | 3,116 | | | | 238,490 | |
GlaxoSmithKline plc | | | 108,158 | | | | 2,088,462 | |
H Lundbeck A/S | | | 5,371 | | | | 250,903 | |
Novartis AG (Registered) | | | 8,692 | | | | 762,483 | |
Orion OYJ, Class B | | | 12,669 | | | | 436,380 | |
Roche Holding AG | | | 4,141 | | | | 1,009,006 | |
Sanofi | | | 1,804 | | | | 161,151 | |
| | | | | | | | 5,708,493 | |
| Professional Services – 0.9% | |
Recruit Holdings Co. Ltd. | | | 28,700 | | | | 772,335 | |
| Real Estate Management & Development – 2.5% | |
Daito Trust Construction Co. Ltd. | | | 4,700 | | | | 620,531 | |
Land & Houses PCL, NVDR | | | 2,000,800 | | | | 621,666 | |
Logan Property Holdings Co. Ltd. | | | 246,000 | | | | 227,191 | |
SOHO China Ltd.(c) | | | 1,722,000 | | | | 584,295 | |
Wharf Holdings Ltd. (The) | | | 60,000 | | | | 149,705 | |
| | | | | | | | 2,203,388 | |
| Road & Rail – 0.8% | |
Aurizon Holdings Ltd. | | | 224,926 | | | | 669,548 | |
| Semiconductors & Semiconductor Equipment – 2.0% | |
Novatek Microelectronics Corp. | | | 144,000 | | | | 635,233 | |
Taiwan Semiconductor Manufacturing Co. Ltd. | | | 56,000 | | | | 423,488 | |
Tokyo Electron Ltd. | | | 4,900 | | | | 681,020 | |
| | | | | | | | 1,739,741 | |
| Software – 0.6% | |
SAP SE | | | 410 | | | | 43,974 | |
Trend Micro, Inc. | | | 8,200 | | | | 473,741 | |
| | | | | | | | 517,715 | |
| | | | | | | | |
| Investments | | Shares | | | Value | |
| Specialty Retail – 1.4% | |
CECONOMY AG | | | 58,015 | | | $ | 296,986 | |
Hennes & Mauritz AB, Class B(c) | | | 53,423 | | | | 945,396 | |
| | | | | | | | 1,242,382 | |
| Technology Hardware, Storage & Peripherals – 2.7% | |
Asustek Computer, Inc. | | | 25,000 | | | | 185,018 | |
Canon, Inc. | | | 26,400 | | | | 753,718 | |
Compal Electronics, Inc. | | | 287,000 | | | | 158,141 | |
Inventec Corp. | | | 246,000 | | | | 198,355 | |
Lite-On Technology Corp. | | | 160,000 | | | | 183,563 | |
Pegatron Corp. | | | 99,000 | | | | 180,128 | |
Quanta Computer, Inc. | | | 112,000 | | | | 176,815 | |
Samsung Electronics Co. Ltd. | | | 13,612 | | | | 506,471 | |
| | | | | | | | 2,342,209 | |
| Textiles, Apparel & Luxury Goods – 1.2% | |
HUGO BOSS AG | | | 4,141 | | | | 296,438 | |
Pandora A/S | | | 6,970 | | | | 436,214 | |
Yue Yuen Industrial Holdings Ltd. | | | 133,000 | | | | 363,912 | |
| | | | | | | | 1,096,564 | |
| Tobacco – 2.1% | |
British American Tobacco Malaysia Bhd. | | | 41,000 | | | | 304,720 | |
British American Tobacco plc | | | 1,189 | | | | 51,556 | |
Imperial Brands plc | | | 22,386 | | | | 758,856 | |
Japan Tobacco, Inc. | | | 29,600 | | | | 762,327 | |
| | | | | | | | 1,877,459 | |
| Trading Companies & Distributors – 0.6% | |
ITOCHU Corp. | | | 17,300 | | | | 321,151 | |
Sumitomo Corp. | | | 16,400 | | | | 249,005 | |
| | | | | | | | 570,156 | |
| Transportation Infrastructure – 1.1% | |
Atlantia SpA(c) | | | 17,097 | | | | 344,042 | |
Sydney Airport | | | 133,824 | | | | 610,820 | |
| | | | | | | | 954,862 | |
| Wireless Telecommunication Services – 1.7% | |
Freenet AG | | | 19,680 | | | | 443,515 | |
NTT DOCOMO, Inc. | | | 14,200 | | | | 357,910 | |
See Accompanying Notes to the Financial Statements.
| | | | |
| FLEXSHARES ANNUAL REPORT | | | 297 | |
FlexShares® International Quality Dividend Defensive Index Fund (cont.)
| | | | | | | | |
| Investments | | Shares | | | Value | |
| COMMON STOCKS – (continued) | |
| Wireless Telecommunication Services – (continued) | |
Turkcell Iletisim Hizmetleri A/S | | | 57,277 | | | $ | 116,020 | |
Vodafone Group plc | | | 319,390 | | | | 603,254 | |
| | | | | | | | 1,520,699 | |
Total Common Stocks
(Cost $92,311,458) | | | | 86,461,789 | |
| | | Principal
Amount | | | | |
| SECURITIES LENDING REINVESTMENTS(d) – 0.1% | |
| REPURCHASE AGREEMENTS – 0.1% | |
Citigroup Global Markets, Inc., 2.20%, dated 10/31/2018, due 11/1/2018, repurchase price $53,584, collateralized by various U.S. Treasury Securities, ranging from 1.13% – 4.63%, maturing 7/15/2020 – 8/15/2040; total market value $54,035 | | $ | 53,581 | | | | 53,581 | |
NBC Global Finance Ltd., 2.36%, dated 10/31/2018, due 11/1/2018, repurchase price $1,840, collateralized by various Common Stocks; total market value $2,060 | | | 1,840 | | | | 1,840 | |
| | | | | 55,421 | |
Total Securities Lending Reinvestments
(Cost $55,421) | | | | 55,421 | |
Total Investments – 98.6%
(Cost $92,366,879) | | | | 86,517,210 | |
Other Assets Less Liabilities – 1.4% | | | | 1,185,471 | |
| NET ASSETS – 100.0% | | | $ | 87,702,681 | |
| * | Non-income producing security. |
| (a) | Security exempt from registration pursuant to Regulation S under the Securities Act of 1933. Regulation S applies to securities offerings that are made outside of the United States and do not involve direct selling efforts in the United States and as such may have restrictions on resale. |
| (b) | Represents less than 0.05% of net assets. |
| (c) | The security or a portion of this security is on loan at October 31, 2018. The total value of securities on loan at October 31, 2018 was $3,361,647, collateralized in the form of cash with a value of $55,421 that was reinvested in the securities shown in the Securities Lending Reinvestment section of the Schedule of Investments; $246,158 of collateral in the form of U.S. Government Treasury Securities, interest rates ranging from 0.00% – 2.88%, and maturity dates ranging from December 6, 2018 – February 15, 2047 and $3,229,028 of collateral in the form of Foreign Government Fixed Income Securities, interest rates ranging from 0.00% – 8.50%, and maturity dates ranging from November 14, 2018 – November 2, 2086; a total value of $3,530,607. |
| (d) | The security was purchased with cash collateral held from securities on loan at October 31, 2018. The total value of securities purchased was $55,421. |
Percentages shown are based on Net Assets.
Abbreviations
CVA – Dutch Certification
GDR – Global Depositary Receipt
NVDR – Non-Voting Depositary Receipt
OYJ – Public Limited Company
PJSC – Public Joint Stock Company
SCA – Limited partnership with share capital
As of October 31, 2018, the gross unrealized appreciation (depreciation) of investments based on the aggregate cost of investments (including derivative instruments, if applicable) for federal income tax purposes was as follows:
| | | | |
| | | | |
Aggregate gross unrealized appreciation | | $ | 3,970,929 | |
Aggregate gross unrealized depreciation | | | (9,973,102 | ) |
Net unrealized depreciation | | $ | (6,002,173 | ) |
Federal income tax cost | | $ | 92,441,890 | |
See Accompanying Notes to the Financial Statements.
| | |
| 298 | | FLEXSHARES ANNUAL REPORT |
FlexShares® International Quality Dividend Defensive Index Fund (cont.)
Futures Contracts
FlexShares® International Quality Dividend Defensive Index Fund had the following open futures contracts as of October 31, 2018:
| | | | | | | | | | | | | | | | | | | | |
| | | Number of
Contracts | | | Expiration
Date | | | Trading
Currency | | | Notional Amount | | | Value and Unrealized Depreciation* | |
Long Contracts | | | | | |
MSCI EAFE E-Mini Index | | | 11 | | | | 12/21/2018 | | | | USD | | | $ | 996,875 | | | $ | (59,654 | ) |
MSCI Emerging Markets E-Mini Index | | | 5 | | | | 12/21/2018 | | | | USD | | | | 239,175 | | | | (16,356 | ) |
| | | | | | | | | | | | | | | | | | | $ | (76,010 | ) |
| * | This amount represents the cumulative appreciation/depreciation on futures contracts. Current day’s variation margin is reported within the Statement of Assets and Liabilities for futures contracts. |
Forward Foreign Currency Contracts
FlexShares® International Quality Dividend Defensive Index Fund had the following outstanding contracts as of October 31, 2018:
| | | | | | | | | | | | | | | | | | | | | | |
| Contracts to Receive | | | | | Counterparty | | In Exchange For | | | Maturity Date | | | Unrealized
Appreciation/
(Depreciation) | |
USD | | | 76,142 | | | | | BNP Paribas SA | | AUD | | | 105,364 | | | | 12/19/2018 | | | $ | 1,426 | |
Total unrealized appreciation | | | | | | | $ | 1,426 | |
NOK | | | 59,477 | | | | | Bank of New York | | USD | | | 7,234 | | | | 12/19/2018 | | | $ | (142 | ) |
USD | | | 24,041 | | | | | Goldman Sachs & Co. | | BRL* | | | 100,000 | | | | 12/19/2018 | | | | (2,767 | ) |
Total unrealized depreciation | | | | | | | $ | (2,909 | ) |
Net unrealized depreciation | | | | | | | $ | (1,483 | ) |
| * | Non-deliverable forward. See Note 2 in the Notes to Financial Statements. |
Abbreviations:
AUD – Australian Dollar
BRL – Brazilian Real
NOK – Norwegian Krone
USD – US Dollar
FlexShares® International Quality Dividend Defensive Index Fund invested, as a percentage of net assets, in companies domiciled in the following countries as of October 31, 2018:
| | | | |
Australia | | | 7.1 | % |
Belgium | | | 0.9 | |
Brazil | | | 0.8 | |
Canada | | | 4.1 | |
China | | | 4.2 | |
Czech Republic | | | 0.6 | |
Denmark | | | 2.1 | |
Finland | | | 3.0 | |
France | | | 4.4 | |
Germany | | | 3.4 | |
Hong Kong | | | 1.6 | |
India | | | 2.1 | |
Indonesia | | | 0.2 | |
Israel | | | 0.0 | † |
Italy | | | 2.7 | |
See Accompanying Notes to the Financial Statements.
| | | | |
| FLEXSHARES ANNUAL REPORT | | | 299 | |
FlexShares® International Quality Dividend Defensive Index Fund (cont.)
| | | | |
Japan | | | 13.6 | % |
Malaysia | | | 1.0 | |
Morocco | | | 0.2 | |
Netherlands | | | 1.4 | |
New Zealand | | | 0.8 | |
Norway | | | 3.4 | |
Philippines | | | 0.7 | |
Poland | | | 0.2 | |
Portugal | | | 0.2 | |
Russia | | | 4.1 | |
South Africa | | | 1.6 | |
South Korea | | | 0.7 | |
Spain | | | 1.0 | |
Sweden | | | 3.4 | |
Switzerland | | | 4.5 | |
Taiwan | | | 5.9 | |
Thailand | | | 0.7 | |
Turkey | | | 3.4 | |
United Kingdom | | | 14.5 | |
Other1 | | | 1.5 | |
| | | | 100.0 | % |
| † | Amount represents less than 0.05%. |
| 1 | Includes any non-equity securities, securities lending reinvestments and net other assets (liabilities). |
See Accompanying Notes to the Financial Statements.
| | |
| 300 | | FLEXSHARES ANNUAL REPORT |
Schedule of Investments
FlexShares® International Quality Dividend Dynamic Index Fund
October 31, 2018
| | | | | | | | |
| Investments | | Shares | | | Value | |
| COMMON STOCKS – 99.2% | |
| Air Freight & Logistics – 0.2% | |
bpost SA | | | 8,964 | | | $ | 136,201 | |
| Auto Components – 2.1% | |
Faurecia SA | | | 11,367 | | | | 552,654 | |
Magna International, Inc. | | | 13,716 | | | | 676,896 | |
Nokian Renkaat OYJ | | | 3,834 | | | | 121,983 | |
| | | | | | | | 1,351,533 | |
| Automobiles – 1.9% | |
Honda Motor Co. Ltd. | | | 5,400 | | | | 155,079 | |
Subaru Corp. | | | 24,300 | | | | 657,374 | |
Toyota Motor Corp. | | | 5,400 | | | | 316,521 | |
Yamaha Motor Co. Ltd. | | | 2,700 | | | | 64,141 | |
| | | | | | | | 1,193,115 | |
| Banks – 10.1% | |
Absa Group Ltd. | | | 15,984 | | | | 161,407 | |
Agricultural Bank of China Ltd., Class H | | | 1,539,000 | | | | 675,327 | |
Aozora Bank Ltd. | | | 4,700 | | | | 162,213 | |
Australia & New Zealand Banking Group Ltd. | | | 22,113 | | | | 406,390 | |
Bank of China Ltd., Class H | | | 594,000 | | | | 253,075 | |
Bank of Communications Co. Ltd., Class H | | | 189,000 | | | | 141,761 | |
Bank Polska Kasa Opieki SA | | | 5,022 | | | | 137,266 | |
China Construction Bank Corp., Class H | | | 351,000 | | | | 278,493 | |
China Merchants Bank Co. Ltd., Class H | | | 202,500 | | | | 780,098 | |
HSBC Holdings plc | | | 137,106 | | | | 1,129,782 | |
Industrial & Commercial Bank of China Ltd., Class H | | | 189,000 | | | | 127,778 | |
ING Groep NV | | | 24,651 | | | | 292,715 | |
Intesa Sanpaolo SpA | | | 123,444 | | | | 273,163 | |
National Australia Bank Ltd. | | | 19,845 | | | | 354,582 | |
Nordea Bank Abp | | | 26,217 | | | | 228,302 | |
Royal Bank of Canada | | | 999 | | | | 72,967 | |
Sumitomo Mitsui Financial Group, Inc. | | | 5,400 | | | | 211,206 | |
Swedbank AB, Class A | | | 31,482 | | | | 709,918 | |
| | | | | | | | |
| Investments | | Shares | | | Value | |
| Banks – (continued) | |
Toronto-Dominion Bank (The) | | | 702 | | | $ | 39,038 | |
| | | | | | | | 6,435,481 | |
| Building Products – 0.5% | |
Cie de Saint-Gobain | | | 4,050 | | | | 152,534 | |
TOTO Ltd.(a) | | | 4,300 | | | | 154,313 | |
| | | | | | | | 306,847 | |
| Capital Markets – 3.2% | |
CI Financial Corp. | | | 6,399 | | | | 94,870 | |
Coronation Fund Managers Ltd. | | | 24,192 | | | | 80,491 | |
Hong Kong Exchanges & Clearing Ltd. | | | 16,200 | | | | 429,829 | |
Macquarie Group Ltd. | | | 8,613 | | | | 715,443 | |
Natixis SA | | | 19,764 | | | | 115,685 | |
Nomura Holdings, Inc. | | | 35,100 | | | | 170,283 | |
SBI Holdings, Inc. | | | 13,500 | | | | 354,202 | |
St James’s Place plc | | | 5,265 | | | | 68,182 | |
| | | | | | | | 2,028,985 | |
| Chemicals – 2.6% | |
BASF SE | | | 7,911 | | | | 609,791 | |
Nutrien Ltd. | | | 4,185 | | | | 222,085 | |
Showa Denko KK | | | 16,200 | | | | 707,687 | |
Taiyo Nippon Sanso Corp.(a) | | | 8,100 | | | | 130,412 | |
| | | | | | | | 1,669,975 | |
| Construction & Engineering – 1.1% | |
ACS Actividades de Construccion y Servicios SA | | | 17,982 | | | | 674,600 | |
| Construction Materials – 0.9% | |
Buzzi Unicem SpA(a) | | | 30,429 | | | | 585,257 | |
| Diversified Financial Services – 3.2% | |
Banca Mediolanum SpA | | | 16,065 | | | | 93,288 | |
EXOR NV | | | 11,178 | | | | 633,768 | |
Mitsubishi UFJ Lease & Finance Co. Ltd. | | | 126,900 | | | | 653,306 | |
REC Ltd. | | | 426,573 | | | | 671,487 | |
| | | | | | | | 2,051,849 | |
See Accompanying Notes to the Financial Statements.
| | | | |
| FLEXSHARES ANNUAL REPORT | | | 301 | |
FlexShares® International Quality Dividend Dynamic Index Fund (cont.)
| | | | | | | | |
| Investments | | Shares | | | Value | |
| COMMON STOCKS – (continued) | |
| Diversified Telecommunication Services – 4.0% | |
Elisa OYJ | | | 4,077 | | | $ | 162,374 | |
O2 Czech Republic A/S | | | 56,403 | | | | 593,629 | |
Telefonica SA | | | 39,069 | | | | 320,405 | |
Telenor ASA | | | 35,910 | | | | 660,739 | |
Telia Co. AB | | | 33,750 | | | | 152,360 | |
Telstra Corp. Ltd. | | | 306,126 | | | | 668,258 | |
| | | | | | | | 2,557,765 | |
| Electric Utilities – 2.2% | |
EDP – Energias de Portugal SA | | | 48,330 | | | | 169,976 | |
Endesa SA | | | 30,132 | | | | 630,927 | |
Enel SpA | | | 51,732 | | | | 254,037 | |
Federal Grid Co. Unified Energy System PJSC | | | 131,673,141 | | | | 306,349 | |
| | | | | | | | 1,361,289 | |
| Electrical Equipment – 2.1% | |
ABB Ltd. (Registered) | | | 31,698 | | | | 639,695 | |
Mitsubishi Electric Corp. | | | 54,000 | | | | 685,916 | |
| | | | | | | | 1,325,611 | |
| Electronic Equipment, Instruments & Components – 2.1% | |
AU Optronics Corp. | | | 1,566,000 | | | | 617,432 | |
General Interface Solution Holding Ltd. | | | 27,000 | | | | 89,439 | |
Hitachi Ltd. | | | 5,400 | | | | 165,653 | |
Kingboard Laminates Holdings Ltd. | | | 108,000 | | | | 82,660 | |
Omron Corp. | | | 3,400 | | | | 137,982 | |
WPG Holdings Ltd.* | | | 102,080 | | | | 121,237 | |
Yaskawa Electric Corp.(a) | | | 3,600 | | | | 104,151 | |
| | | | | | | | 1,318,554 | |
| Equity Real Estate Investment Trusts (REITs) – 0.3% | |
Unibail-Rodamco-Westfield | | | 1,107 | | | | 201,037 | |
| Food & Staples Retailing – 1.1% | |
Cia Brasileira de Distribuicao (Preference)* | | | 5,400 | | | | 113,713 | |
Seven & i Holdings Co. Ltd. | | | 5,400 | | | | 234,125 | |
Wesfarmers Ltd. | | | 10,584 | | | | 349,716 | |
| | | | | | | | 697,554 | |
| | | | | | | | |
| Investments | | Shares | | | Value | |
| Food Products – 2.8% | |
China Agri-Industries Holdings Ltd. | | | 1,107,000 | | | $ | 369,970 | |
China Mengniu Dairy Co. Ltd.* | | | 54,000 | | | | 159,119 | |
Marine Harvest ASA | | | 33,669 | | | | 817,194 | |
Nestle SA (Registered) | | | 4,860 | | | | 411,257 | |
| | | | | | | | 1,757,540 | |
| Gas Utilities – 0.4% | |
AltaGas Ltd.(a) | | | 8,775 | | | | 110,585 | |
Naturgy Energy Group SA | | | 6,885 | | | | 169,439 | |
| | | | | | | | 280,024 | |
| Health Care Equipment & Supplies – 0.5% | |
Hoya Corp. | | | 5,900 | | | | 335,321 | |
| Hotels, Restaurants & Leisure – 0.7% | |
Sands China Ltd. | | | 118,800 | | | | 468,265 | |
| Household Durables – 0.8% | |
Persimmon plc | | | 16,092 | | | | 471,682 | |
Independent Power and Renewable Electricity
Producers – 1.2% | |
Engie Brasil Energia SA | | | 70,200 | | | | 752,177 | |
| Industrial Conglomerates – 1.1% | |
Fosun International Ltd. | | | 94,500 | | | | 137,904 | |
Sime Darby Bhd. | | | 1,036,800 | | | | 545,097 | |
| | | | | | | | 683,001 | |
| Insurance – 7.5% | |
Aegon NV | | | 118,168 | | | | 726,756 | |
Allianz SE (Registered) | | | 4,212 | | | | 880,223 | |
Assicurazioni Generali SpA | | | 10,611 | | | | 171,685 | |
AXA SA | | | 17,982 | | | | 451,091 | |
BB Seguridade Participacoes SA | | | 72,900 | | | | 519,691 | |
China Taiping Insurance Holdings Co. Ltd. | | | 48,600 | | | | 162,426 | |
Legal & General Group plc | | | 213,624 | | | | 686,489 | |
Mapfre SA | | | 40,878 | | | | 122,462 | |
Poste Italiane SpA(b) | | | 17,901 | | | | 128,795 | |
Power Corp. of Canada | | | 6,183 | | | | 127,968 | |
Power Financial Corp. | | | 5,103 | | | | 110,162 | |
Tokio Marine Holdings, Inc. | | | 5,400 | | | | 255,801 | |
Zurich Insurance Group AG* | | | 1,269 | | | | 395,120 | |
| | | | | | | | 4,738,669 | |
See Accompanying Notes to the Financial Statements.
| | |
| 302 | | FLEXSHARES ANNUAL REPORT |
FlexShares® International Quality Dividend Dynamic Index Fund (cont.)
| | | | | | | | |
| Investments | | Shares | | | Value | |
| COMMON STOCKS – (continued) | |
| Interactive Media & Services – 0.4% | |
Tencent Holdings Ltd. | | | 8,100 | | | $ | 275,876 | |
| Machinery – 3.2% | |
JTEKT Corp. | | | 8,100 | | | | 101,129 | |
MINEBEA MITSUMI, Inc. | | | 8,100 | | | | 123,953 | |
Mitsubishi Heavy Industries Ltd. | | | 2,700 | | | | 95,435 | |
NGK Insulators Ltd. | | | 8,100 | | | | 113,905 | |
NSK Ltd. | | | 64,800 | | | | 641,942 | |
OC Oerlikon Corp. AG (Registered)* | | | 10,557 | | | | 125,836 | |
SMC Corp. | | | 2,500 | | | | 800,806 | |
| | | | | | | | 2,003,006 | |
| Media – 2.3% | |
Eutelsat Communications SA | | | 19,953 | | | | 404,905 | |
ITV plc | | | 319,680 | | | | 608,418 | |
Naspers Ltd., Class N | | | 1,836 | | | | 322,367 | |
ProSiebenSat.1 Media SE | | | 4,779 | | | | 110,571 | |
| | | | | | | | 1,446,261 | |
| Metals & Mining – 6.6% | |
BHP Billiton plc | | | 11,772 | | | | 235,011 | |
Cia Siderurgica Nacional SA* | | | 221,400 | | | | 570,413 | |
Eregli Demir ve Celik Fabrikalari TAS | | | 217,809 | | | | 352,176 | |
Evraz plc | | | 105,651 | | | | 733,026 | |
Fortescue Metals Group Ltd.(a) | | | 41,823 | | | | 118,568 | |
Kumba Iron Ore Ltd.(a) | | | 33,048 | | | | 646,804 | |
Novolipetsk Steel PJSC | | | 84,915 | | | | 207,211 | |
Rio Tinto plc | | | 10,260 | | | | 498,628 | |
Severstal PJSC | | | 45,225 | | | | 708,576 | |
Vedanta Ltd. | | | 40,770 | | | | 116,419 | |
| | | | | | | | 4,186,832 | |
| Multi-Utilities – 0.3% | |
Engie SA | | | 13,959 | | | | 186,236 | |
| Oil, Gas & Consumable Fuels – 7.7% | |
BP plc | | | 178,336 | | | | 1,292,700 | |
China Petroleum & Chemical Corp., Class H | | | 216,000 | | | | 175,238 | |
Crescent Point Energy Corp.(a) | | | 23,274 | | | | 110,233 | |
Enagas SA | | | 5,373 | | | | 142,700 | |
| | | | | | | | |
| Investments | | Shares | | | Value | |
| Oil, Gas & Consumable Fuels – (continued) | |
Eni SpA | | | 21,411 | | | $ | 381,023 | |
Equinor ASA | | | 11,826 | | | | 308,561 | |
Inter Pipeline Ltd. | | | 35,694 | | | | 580,291 | |
Repsol SA | | | 12,258 | | | | 219,792 | |
TOTAL SA(a) | | | 19,413 | | | | 1,142,907 | |
TransCanada Corp.(a) | | | 8,883 | | | | 335,772 | |
Vermilion Energy, Inc.(a) | | | 4,158 | | | | 110,532 | |
Yanzhou Coal Mining Co. Ltd., Class H | | | 108,000 | | | | 102,084 | |
| | | | | | | | 4,901,833 | |
| Paper & Forest Products – 0.4% | |
UPM-Kymmene OYJ | | | 8,370 | | | | 269,430 | |
| Personal Products – 1.0% | |
Kose Corp.(a) | | | 4,100 | | | | 612,884 | |
| Pharmaceuticals – 6.5% | |
AstraZeneca plc | | | 11,475 | | | | 878,265 | |
Bayer AG (Registered) | | | 648 | | | | 49,765 | |
GlaxoSmithKline plc | | | 78,408 | | | | 1,514,008 | |
Novartis AG (Registered) | | | 7,749 | | | | 679,761 | |
Roche Holding AG | | | 1,485 | | | | 361,839 | |
Roche Holding AG – BR | | | 756 | | | | 184,284 | |
Sanofi | | | 5,265 | | | | 470,321 | |
| | | | | | | | 4,138,243 | |
| Real Estate Management & Development – 3.7% | |
China Evergrande Group(a) | | | 189,000 | | | | 450,838 | |
Future Land Development Holdings Ltd. | | | 864,000 | | | | 495,957 | |
KWG Group Holdings Ltd. | | | 121,500 | | | | 92,837 | |
Shimao Property Holdings Ltd. | | | 243,000 | | | | 475,498 | |
SOHO China Ltd.(a) | | | 1,471,500 | | | | 499,297 | |
Wharf Holdings Ltd. (The) | | | 81,000 | | | | 202,102 | |
Yuzhou Properties Co. Ltd. | | | 405,000 | | | | 144,654 | |
| | | | | | | | 2,361,183 | |
| Semiconductors & Semiconductor Equipment – 3.4% | |
Novatek Microelectronics Corp. | | | 135,000 | | | | 595,530 | |
Rohm Co. Ltd. | | | 2,700 | | | | 189,961 | |
Taiwan Semiconductor Manufacturing Co. Ltd. | | | 21,000 | | | | 158,808 | |
Tokyo Electron Ltd. | | | 4,900 | | | | 681,020 | |
See Accompanying Notes to the Financial Statements.
| | | | |
| FLEXSHARES ANNUAL REPORT | | | 303 | |
FlexShares® International Quality Dividend Dynamic Index Fund (cont.)
| | | | | | | | |
| Investments | | Shares | | | Value | |
| COMMON STOCKS – (continued) | |
| Semiconductors & Semiconductor Equipment – (continued) | |
Vanguard International Semiconductor Corp. | | | 270,000 | | | $ | 497,366 | |
| | | | | | | | 2,122,685 | |
| Software – 1.1% | |
Trend Micro, Inc. | | | 12,200 | | | | 704,834 | |
| Specialty Retail – 1.4% | |
CECONOMY AG | | | 9,099 | | | | 46,579 | |
Hennes & Mauritz AB, Class B(a) | | | 47,898 | | | | 847,623 | |
| | | | | | | | 894,202 | |
| Technology Hardware, Storage & Peripherals – 2.0% | |
Catcher Technology Co. Ltd. | | | 20,000 | | | | 201,338 | |
Compal Electronics, Inc. | | | 189,000 | | | | 104,141 | |
Inventec Corp. | | | 189,000 | | | | 152,395 | |
Lite-On Technology Corp. | | | 108,000 | | | | 123,905 | |
Logitech International SA (Registered) | | | 459 | | | | 17,007 | |
Pegatron Corp. | | | 81,000 | | | | 147,377 | |
Quanta Computer, Inc. | | | 81,000 | | | | 127,875 | |
Samsung Electronics Co. Ltd. | | | 5,724 | | | | 212,977 | |
Samsung Electronics Co. Ltd. (Preference) | | | 5,238 | | | | 164,327 | |
| | | | | | | | 1,251,342 | |
| Textiles, Apparel & Luxury Goods – 0.8% | |
HUGO BOSS AG | | | 6,804 | | | | 487,072 | |
| Tobacco – 2.9% | |
British American Tobacco plc | | | 12,393 | | | | 537,366 | |
Imperial Brands plc | | | 20,385 | | | | 691,025 | |
Japan Tobacco, Inc. | | | 24,300 | | | | 625,829 | |
| | | | | | | | 1,854,220 | |
| Trading Companies & Distributors – 2.0% | |
ITOCHU Corp. | | | 13,500 | | | | 250,609 | |
Mitsubishi Corp. | | | 10,800 | | | | 304,320 | |
Toyota Tsusho Corp. | | | 18,900 | | | | 684,121 | |
| | | | | | | | 1,239,050 | |
| | | | | | | | |
| Investments | | Shares | | | Value | |
| Transportation Infrastructure – 0.5% | |
Atlantia SpA | | | 16,848 | | | $ | 339,032 | |
| Wireless Telecommunication Services – 0.4% | |
Freenet AG | | | 8,478 | | | | 191,063 | |
Turkcell Iletisim Hizmetleri A/S | | | 44,226 | | | | 89,584 | |
| | | | | | | | 280,647 | |
Total Common Stocks
(Cost $67,610,884) | | | | 62,937,200 | |
| | | Principal
Amount | | | | |
| SECURITIES LENDING REINVESTMENTS(c) – 0.7% | |
| REPURCHASE AGREEMENTS – 0.7% | |
Citigroup Global Markets, Inc., 2.20%, dated 10/31/2018, due 11/1/2018, repurchase price $380,668, collateralized by various U.S. Treasury Securities, ranging from 1.13% – 4.63%, maturing 7/15/2020 – 8/15/2040; total market value $383,870 | | $ | 380,645 | | | | 380,645 | |
NBC Global Finance Ltd., 2.36%, dated 10/31/2018, due 11/1/2018, repurchase price $74,293, collateralized by various Common Stocks; total market value $83,163 | | | 74,288 | | | | 74,288 | |
| | | | | 454,933 | |
Total Securities Lending Reinvestments
(Cost $454,933) | | | | 454,933 | |
Total Investments – 99.9%
(Cost $68,065,817) | | | | 63,392,133 | |
Other Assets Less Liabilities – 0.1% | | | | 88,596 | |
| NET ASSETS – 100.0% | | | $ | 63,480,729 | |
| * | Non-income producing security. |
| (a) | The security or a portion of this security is on loan at October 31, 2018. The total value of securities on loan at October 31, 2018 was $3,611,317, collateralized in the form of cash with a value of $454,933 that was reinvested in the securities shown in the Securities Lending Reinvestment section of the Schedule of Investments; $901,138 of collateral in the form of U.S. Government Treasury |
See Accompanying Notes to the Financial Statements.
| | |
| 304 | | FLEXSHARES ANNUAL REPORT |
FlexShares® International Quality Dividend Dynamic Index Fund (cont.)
| | Securities, interest rates ranging from 0.00% – 5.25%, and maturity dates ranging from November 15, 2018 – February 15, 2047 and $2,474,530 of collateral in the form of Foreign Government Fixed Income Securities, interest rates ranging from 0.00% – 8.50%, and maturity dates ranging from November 14, 2018 – November 2, 2086; a total value of $3,830,601. |
| (b) | Security exempt from registration pursuant to Regulation S under the Securities Act of 1933. Regulation S applies to securities offerings that are made outside of the United States and do not involve direct selling efforts in the United States and as such may have restrictions on resale. |
| (c) | The security was purchased with cash collateral held from securities on loan at October 31, 2018. The total value of securities purchased was $454,933. |
Percentages shown are based on Net Assets.
Abbreviations
OYJ – Public Limited Company
PJSC – Public Joint Stock Company
Preference – A special type of equity investment that shares in the earnings of the company, has limited voting rights, and may have a dividend preference. Preference shares may also have liquidation preference.
As of October 31, 2018, the gross unrealized appreciation (depreciation) of investments based on the aggregate cost of investments (including derivative instruments, if applicable) for federal income tax purposes was as follows:
| | | | |
| | | | |
Aggregate gross unrealized appreciation | | $ | 2,640,015 | |
Aggregate gross unrealized depreciation | | | (7,393,838 | ) |
Net unrealized depreciation | | $ | (4,753,823 | ) |
Federal income tax cost | | $ | 68,116,442 | |
Futures Contracts
FlexShares® International Quality Dividend Dynamic Index Fund had the following open futures contracts as of October 31, 2018:
| | | | | | | | | | | | | | | | | | | | |
| | | Number of
Contracts | | | Expiration
Date | | | Trading
Currency | | | Notional Amount | | | Value and
Unrealized
Depreciation* | |
Long Contracts | | | | | |
MSCI EAFE E-Mini Index | | | 4 | | | | 12/21/2018 | | | | USD | | | $ | 362,500 | | | $ | (22,564 | ) |
MSCI Emerging Markets E-Mini Index | | | 3 | | | | 12/21/2018 | | | | USD | | | | 143,505 | | | | (6,950 | ) |
| | | | | | | | | | | | | | | | | | | $ | (29,514 | ) |
| * | This amount represents the cumulative appreciation/depreciation on futures contracts. Current day’s variation margin is reported within the Statement of Assets and Liabilities for futures contracts. |
Abbreviations:
USD – US Dollar
FlexShares® International Quality Dividend Dynamic Index Fund invested, as a percentage of net assets, in companies domiciled in the following countries as of October 31, 2018:
| | | | |
Australia | | | 4.1 | % |
Belgium | | | 0.2 | |
Brazil | | | 3.1 | |
Canada | | | 4.1 | |
China | | | 9.3 | |
Czech Republic | | | 0.9 | |
Finland | | | 0.9 | |
France | | | 5.5 | |
Germany | | | 3.8 | |
Hong Kong | | | 1.7 | |
India | | | 1.2 | |
Italy | | | 4.5 | |
Japan | | | 18.3 | |
Malaysia | | | 0.9 | |
Netherlands | | | 1.9 | |
See Accompanying Notes to the Financial Statements.
| | | | |
| FLEXSHARES ANNUAL REPORT | | | 305 | |
FlexShares® International Quality Dividend Dynamic Index Fund (cont.)
| | | | |
Norway | | | 2.8 | % |
Poland | | | 0.2 | |
Portugal | | | 0.3 | |
Russia | | | 1.9 | |
South Africa | | | 1.9 | |
South Korea | | | 0.6 | |
Spain | | | 3.6 | |
Sweden | | | 3.1 | |
Switzerland | | | 4.4 | |
Taiwan | | | 4.6 | |
Turkey | | | 0.7 | |
United Kingdom | | | 14.7 | |
Other1 | | | 0.8 | |
| | | | 100.0 | % |
| 1 | Includes any non-equity securities, securities lending reinvestments and net other assets (liabilities). |
See Accompanying Notes to the Financial Statements.
| | |
| 306 | | FLEXSHARES ANNUAL REPORT |
Schedule of Investments
FlexShares® iBoxx 3-Year Target Duration TIPS Index Fund
October 31, 2018
| | | | | | | | |
| Investments | | Principal
Amount | | | Value | |
| U.S. TREASURY OBLIGATIONS – 99.9% | |
U.S. Treasury Inflation Linked Bonds | | | | | | | | |
2.38%, 1/15/2025 | | $ | 60,215,215 | | | $ | 64,926,206 | |
2.00%, 1/15/2026 | | | 40,830,656 | | | | 43,378,659 | |
U.S. Treasury Inflation Linked Notes | | | | | | | | |
1.38%, 1/15/2020 | | | 35,507,337 | | | | 35,605,814 | |
0.13%, 4/15/2020 | | | 86,645,812 | | | | 85,189,304 | |
1.25%, 7/15/2020 | | | 60,159,514 | | | | 60,497,995 | |
1.13%, 1/15/2021 | | | 67,945,260 | | | | 68,011,740 | |
0.13%, 4/15/2021 | | | 76,975,974 | | | | 75,041,802 | |
0.63%, 7/15/2021 | | | 64,433,830 | | | | 63,908,007 | |
0.13%, 1/15/2022 | | | 161,535,800 | | | | 156,834,965 | |
0.13%, 4/15/2022 | | | 161,808,192 | | | | 156,434,600 | |
0.13%, 7/15/2022 | | | 157,890,240 | | | | 153,277,486 | |
0.13%, 1/15/2023 | | | 157,302,720 | | | | 151,475,902 | |
0.63%, 4/15/2023 | | | 117,733,618 | | | | 115,523,813 | |
0.38%, 7/15/2023 | | | 71,119,627 | | | | 69,307,752 | |
0.63%, 1/15/2024 | | | 70,933,210 | | | | 69,461,403 | |
0.13%, 7/15/2024 | | | 69,979,869 | | | | 66,695,950 | |
0.25%, 1/15/2025 | | | 70,149,181 | | | | 66,707,514 | |
0.38%, 7/15/2025 | | | 70,063,518 | | | | 67,141,011 | |
0.63%, 1/15/2026 | | | 72,371,794 | | | | 69,985,786 | |
Total U.S. Treasury Obligations
(Cost $1,677,650,199) | | | | 1,639,405,709 | |
| | | | | | |
Total Investments – 99.9%
(Cost $1,677,650,199) | | | | 1,639,405,709 | |
Other Assets Less Liabilities – 0.1% | | | | 2,204,329 | |
| NET ASSETS – 100.0% | | | $ | 1,641,610,038 | |
Percentages shown are based on Net Assets.
As of October 31, 2018, the gross unrealized appreciation (depreciation) of investments based on the aggregate cost of investments (including derivative instruments, if applicable) for federal income tax purposes was as follows:
| | | | |
| | | | |
Aggregate gross unrealized appreciation | | $ | — | |
Aggregate gross unrealized depreciation | | | (39,298,076 | ) |
Net unrealized depreciation | | $ | (39,298,076 | ) |
Federal income tax cost | | $ | 1,678,703,785 | |
See Accompanying Notes to the Financial Statements.
| | | | |
| FLEXSHARES ANNUAL REPORT | | | 307 | |
Schedule of Investments
FlexShares® iBoxx 5-Year Target Duration TIPS Index Fund
October 31, 2018
| | | | | | | | |
| Investments | | Principal
Amount | | | Value | |
| U.S. TREASURY OBLIGATIONS – 99.8% | |
U.S. Treasury Inflation Linked Bonds | | | | | | | | |
2.38%, 1/15/2025 | | $ | 40,089,970 | | | $ | 43,226,444 | |
2.00%, 1/15/2026 | | | 48,254,874 | | | | 51,266,179 | |
2.38%, 1/15/2027 | | | 39,141,268 | | | | 42,983,051 | |
1.75%, 1/15/2028 | | | 20,172,001 | | | | 21,268,328 | |
3.63%, 4/15/2028 | | | 28,022,306 | | | | 34,244,863 | |
2.50%, 1/15/2029 | | | 17,792,312 | | | | 20,110,061 | |
3.88%, 4/15/2029 | | | 32,340,173 | | | | 40,949,692 | |
3.38%, 4/15/2032 | | | 7,635,403 | | | | 9,716,547 | |
U.S. Treasury Inflation Linked Notes | | | | | | | | |
0.13%, 1/15/2023 | | | 47,953,297 | | | | 46,177,008 | |
0.63%, 4/15/2023 | | | 35,904,794 | | | | 35,230,878 | |
0.38%, 7/15/2023 | | | 47,538,768 | | | | 46,327,649 | |
0.63%, 1/15/2024 | | | 47,397,951 | | | | 46,414,482 | |
0.13%, 7/15/2024 | | | 46,596,611 | | | | 44,409,989 | |
0.25%, 1/15/2025 | | | 46,693,731 | | | | 44,402,838 | |
0.38%, 7/15/2025 | | | 82,800,309 | | | | 79,346,523 | |
0.63%, 1/15/2026 | | | 85,509,079 | | | | 82,689,950 | |
0.13%, 7/15/2026 | | | 73,608,102 | | | | 68,558,567 | |
0.38%, 1/15/2027 | | | 42,984,919 | | | | 40,491,179 | |
0.38%, 7/15/2027 | | | 40,741,184 | | | | 38,365,941 | |
0.50%, 1/15/2028 | | | 42,488,574 | | | | 40,172,726 | |
0.75%, 7/15/2028 | | | 26,553,958 | | | | 25,732,790 | |
Total U.S. Treasury Obligations
(Cost $934,122,755) | | | | 902,085,685 | |
| | | | | | |
Total Investments – 99.8%
(Cost $934,122,755) | | | | 902,085,685 | |
Other Assets Less Liabilities – 0.2% | | | | 1,941,538 | |
| NET ASSETS – 100.0% | | | $ | 904,027,223 | |
Percentages shown are based on Net Assets.
As of October 31, 2018, the gross unrealized appreciation (depreciation) of investments based on the aggregate cost of investments (including derivative instruments, if applicable) for federal income tax purposes was as follows:
| | | | |
| | | | |
Aggregate gross unrealized appreciation | | $ | — | |
Aggregate gross unrealized depreciation | | | (34,236,364 | ) |
Net unrealized depreciation | | $ | (34,236,364 | ) |
Federal income tax cost | | $ | 936,322,049 | |
See Accompanying Notes to the Financial Statements.
| | |
| 308 | | FLEXSHARES ANNUAL REPORT |
Schedule of Investments
FlexShares® Disciplined Duration MBS Index Fund
October 31, 2018
| | | | | | | | |
| Investments | | Principal
Amount | | | Value | |
| MORTGAGE-BACKED SECURITIES – 99.4% | |
FHLMC | |
3.50%, 1/1/2021 | | $ | 212,084 | | | $ | 212,147 | |
3.50%, 2/1/2021 | | | 93,285 | | | | 93,312 | |
4.00%, 7/1/2024 | | | 590,778 | | | | 602,265 | |
4.00%, 9/1/2024 | | | 172,781 | | | | 176,143 | |
4.00%, 4/1/2025 | | | 100,726 | | | | 102,391 | |
4.00%, 6/1/2025 | | | 207,849 | | | | 211,887 | |
3.50%, 10/1/2025 | | | 292,508 | | | | 292,666 | |
4.00%, 10/1/2025 | | | 144,306 | | | | 147,131 | |
3.50%, 2/1/2026 | | | 92,712 | | | | 92,866 | |
4.00%, 3/1/2026 | | | 172,930 | | | | 176,305 | |
4.00%, 4/1/2026 | | | 519,808 | | | | 530,000 | |
3.50%, 6/1/2026 | | | 445,899 | | | | 446,199 | |
3.00%, 9/1/2026 | | | 697,467 | | | | 688,433 | |
3.50%, 10/1/2026 | | | 121,024 | | | | 121,221 | |
3.00%, 12/1/2026 | | | 163,323 | | | | 161,204 | |
3.50%, 12/1/2026 | | | 186,847 | | | | 187,050 | |
3.00%, 1/1/2027 | | | 193,050 | | | | 190,547 | |
2.50%, 4/1/2027 | | | 228,949 | | | | 222,110 | |
3.00%, 5/1/2027 | | | 238,760 | | | | 235,663 | |
4.00%, 5/1/2027 | | | 178,027 | | | | 181,125 | |
3.50%, 8/1/2027 | | | 201,990 | | | | 202,100 | |
2.50%, 10/1/2027 | | | 114,841 | | | | 111,403 | |
2.50%, 2/1/2028 | | | 54,329 | | | | 52,703 | |
2.50%, 4/1/2028 | | | 121,570 | | | | 117,931 | |
2.50%, 11/1/2028 | | | 22,307 | | | | 21,639 | |
3.00%, 11/1/2028 | | | 269,701 | | | | 265,680 | |
3.00%, 6/1/2029 | | | 84,402 | | | | 83,110 | |
6.50%, 12/1/2029 | | | 120,222 | | | | 132,460 | |
2.00%, 10/1/2031 | | | 398,173 | | | | 370,905 | |
2.00%, 11/1/2031 | | | 271,031 | | | | 252,468 | |
2.00%, 3/1/2032 | | | 168,366 | | | | 156,826 | |
5.50%, 10/1/2032 | | | 118,950 | | | | 128,002 | |
3.00%, 4/1/2033 | | | 278,316 | | | | 271,285 | |
6.00%, 4/1/2034 | | | 67,765 | | | | 73,874 | |
5.00%, 5/1/2034 | | | 502,333 | | | | 531,759 | |
6.50%, 7/1/2034 | | | 100,555 | | | | 110,797 | |
6.50%, 11/1/2034 | | | 46,509 | | | | 51,247 | |
3.00%, 5/1/2035 | | | 311,434 | | | | 301,329 | |
5.50%, 5/1/2035 | | | 295,888 | | | | 318,484 | |
6.00%, 5/1/2035 | | | 245,553 | | | | 269,820 | |
5.50%, 6/1/2035 | | | 60,305 | | | | 64,301 | |
5.00%, 7/1/2035 | | | 70,699 | | | | 74,869 | |
5.50%, 10/1/2035 | | | 38,257 | | | | 41,156 | |
| | | | | | | | |
| Investments | | Principal
Amount | | | Value | |
3.00%, 11/1/2035 | | $ | 254,220 | | | $ | 245,161 | |
6.00%, 12/1/2035 | | | 131,875 | | | | 145,157 | |
5.50%, 1/1/2036 | | | 167,309 | | | | 179,929 | |
6.00%, 5/1/2036 | | | 282,433 | | | | 310,561 | |
5.50%, 12/1/2036 | | | 170,004 | | | | 182,754 | |
5.50%, 2/1/2037 | | | 51,380 | | | | 55,294 | |
6.00%, 4/1/2037 | | | 67,194 | | | | 73,631 | |
6.50%, 4/1/2037 | | | 171,459 | | | | 188,933 | |
5.50%, 7/1/2037 | | | 116,495 | | | | 125,362 | |
5.50%, 9/1/2037 | | | 56,152 | | | | 60,408 | |
6.00%, 9/1/2037 | | | 222,842 | | | | 245,050 | |
5.50%, 12/1/2037 | | | 343,926 | | | | 368,641 | |
6.50%, 12/1/2037 | | | 56,733 | | | | 62,515 | |
5.50%, 1/1/2038 | | | 28,309 | | | | 30,448 | |
5.00%, 7/1/2038 | | | 77,185 | | | | 81,475 | |
5.50%, 7/1/2038 | | | 6,202 | | | | 6,653 | |
5.50%, 8/1/2038 | | | 259,419 | | | | 277,530 | |
5.00%, 10/1/2038 | | | 55,853 | | | | 58,956 | |
5.50%, 12/1/2038 | | | 20,104 | | | | 21,460 | |
6.50%, 12/1/2038 | | | 92,916 | | | | 102,395 | |
5.00%, 2/1/2039 | | | 802,908 | | | | 846,629 | |
5.50%, 3/1/2039 | | | 160,137 | | | | 171,845 | |
6.50%, 4/1/2039 | | | 49,262 | | | | 55,054 | |
5.00%, 5/1/2039 | | | 124,227 | | | | 132,041 | |
5.00%, 8/1/2039 | | | 10,705 | | | | 11,306 | |
5.00%, 9/1/2039 | | | 12,512 | | | | 13,208 | |
6.50%, 9/1/2039 | | | 238,783 | | | | 270,958 | |
4.50%, 10/1/2039 | | | 24,586 | | | | 25,462 | |
5.50%, 1/1/2040 | | | 98,661 | | | | 105,572 | |
4.00%, 2/1/2040 | | | 15,018 | | | | 15,160 | |
4.50%, 4/1/2040 | | | 350,486 | | | | 363,287 | |
5.50%, 4/1/2040 | | | 221,490 | | | | 234,691 | |
6.00%, 4/1/2040 | | | 103,537 | | | | 113,158 | |
6.00%, 5/1/2040 | | | 224,904 | | | | 246,697 | |
5.50%, 6/1/2040 | | | 69,313 | | | | 73,507 | |
6.00%, 7/1/2040 | | | 1,774,653 | | | | 1,952,252 | |
3.50%, 12/1/2040 | | | 164,891 | | | | 162,030 | |
4.00%, 1/1/2041 | | | 123,747 | | | | 124,915 | |
4.50%, 3/1/2041 | | | 163,078 | | | | 169,047 | |
5.50%, 4/1/2041 | | | 29,627 | | | | 31,521 | |
5.50%, 6/1/2041 | | | 678,092 | | | | 728,617 | |
4.50%, 8/1/2041 | | | 155,074 | | | | 160,750 | |
3.50%, 11/1/2041 | | | 226,361 | | | | 222,437 | |
3.50%, 2/1/2042 | | | 237,185 | | | | 233,070 | |
5.00%, 2/1/2042 | | | 146,864 | | | | 155,164 | |
See Accompanying Notes to the Financial Statements.
| | | | |
| FLEXSHARES ANNUAL REPORT | | | 309 | |
FlexShares® Disciplined Duration MBS Index Fund (cont.)
| | | | | | | | |
| Investments | | Principal
Amount | | | Value | |
| MORTGAGE-BACKED SECURITIES – (continued) | |
4.00%, 4/1/2042 | | $ | 112,567 | | | $ | 113,633 | |
3.00%, 3/1/2043 | | | 36,941 | | | | 35,267 | |
3.00%, 4/1/2043 | | | 126,516 | | | | 120,782 | |
3.00%, 6/1/2043 | | | 189,724 | | | | 181,041 | |
4.50%, 3/1/2044 | | | 107,664 | | | | 110,816 | |
4.00%, 6/1/2044 | | | 17,442 | | | | 17,505 | |
4.50%, 7/1/2044 | | | 181,114 | | | | 186,215 | |
4.00%, 8/1/2044 | | | 51,356 | | | | 51,540 | |
5.00%, 8/1/2044 | | | 453,773 | | | | 478,746 | |
4.50%, 9/1/2044 | | | 78,843 | | | | 81,334 | |
4.50%, 12/1/2044 | | | 40,774 | | | | 41,837 | |
3.00%, 7/1/2045 | | | 109,096 | | | | 103,597 | |
4.00%, 7/1/2045 | | | 124,963 | | | | 125,296 | |
4.50%, 9/1/2045 | | | 81,197 | | | | 83,230 | |
4.00%, 10/1/2045 | | | 189,747 | | | | 190,232 | |
4.50%, 12/1/2045 | | | 401,571 | | | | 412,065 | |
3.00%, 4/1/2046 | | | 270,906 | | | | 256,735 | |
4.00%, 4/1/2046 | | | 94,872 | | | | 95,095 | |
3.50%, 5/1/2046 | | | 202,581 | | | | 197,947 | |
4.00%, 5/1/2046 | | | 107,092 | | | | 107,238 | |
4.50%, 5/1/2046 | | | 192,111 | | | | 196,941 | |
4.50%, 6/1/2046 | | | 313,181 | | | | 322,905 | |
4.00%, 10/1/2046 | | | 307,849 | | | | 308,574 | |
4.50%, 3/1/2047 | | | 349,461 | | | | 358,470 | |
3.00%, 9/1/2047 | | | 279,342 | | | | 264,874 | |
TBA 3.50%, 11/15/2048 | | | 175,000 | | | | 170,352 | |
TBA 4.00%, 11/15/2048 | | | 100,000 | | | | 100,021 | |
FNMA | |
4.00%, 12/1/2018 | | | 55 | | | | 55 | |
4.00%, 7/1/2019 | | | 2 | | | | 2 | |
4.50%, 1/1/2020 | | | 14,061 | | | | 14,269 | |
4.50%, 4/1/2020 | | | 9,710 | | | | 9,853 | |
4.50%, 11/1/2020 | | | 44,424 | | | | 45,080 | |
4.00%, 5/1/2024 | | | 124,737 | | | | 126,916 | |
4.00%, 1/1/2025 | | | 214,367 | | | | 218,108 | |
3.50%, 9/1/2025 | | | 121,396 | | | | 121,390 | |
4.00%, 9/1/2025 | | | 306,710 | | | | 311,986 | |
3.00%, 11/1/2025 | | | 355,787 | | | | 351,429 | |
3.50%, 11/1/2025 | | | 222,686 | | | | 222,674 | |
3.00%, 12/1/2025 | | | 165,465 | | | | 163,433 | |
3.50%, 12/1/2025 | | | 157,891 | | | | 157,883 | |
4.00%, 12/1/2025 | | | 193,930 | | | | 197,620 | |
3.00%, 1/1/2026 | | | 398,269 | | | | 393,394 | |
3.50%, 2/1/2026 | | | 273,637 | | | | 273,623 | |
4.00%, 4/1/2026 | | | 335,190 | | | | 341,610 | |
| | | | | | | | |
| Investments | | Principal
Amount | | | Value | |
4.00%, 5/1/2026 | | $ | 293,676 | | | $ | 299,008 | |
3.00%, 8/1/2026 | | | 292,949 | | | | 289,355 | |
3.00%, 10/1/2026 | | | 140,774 | | | | 139,041 | |
2.50%, 11/1/2026 | | | 63,082 | | | | 60,445 | |
3.50%, 12/1/2026 | | | 178,067 | | | | 178,058 | |
2.50%, 6/1/2027 | | | 23,278 | | | | 22,475 | |
3.50%, 6/1/2027 | | | 455,914 | | | | 455,891 | |
2.50%, 10/1/2027 | | | 487,282 | | | | 470,463 | |
2.50%, 12/1/2027 | | | 133,525 | | | | 128,919 | |
3.50%, 1/1/2028 | | | 829,136 | | | | 830,873 | |
3.00%, 3/1/2028 | | | 46,287 | | | | 45,584 | |
3.00%, 6/1/2028 | | | 920,104 | | | | 908,664 | |
3.00%, 7/1/2028 | | | 42,605 | | | | 41,978 | |
2.50%, 8/1/2028 | | | 75,349 | | | | 72,702 | |
2.50%, 9/1/2028 | | | 294,603 | | | | 284,258 | |
3.00%, 11/1/2028 | | | 41,313 | | | | 40,704 | |
4.00%, 7/1/2029 | | | 347,949 | | | | 354,205 | |
4.00%, 11/1/2029 | | | 152,594 | | | | 155,250 | |
3.00%, 9/1/2030 | | | 96,994 | | | | 95,388 | |
3.50%, 10/1/2030 | | | 141,353 | | | | 138,594 | |
3.50%, 11/1/2030 | | | 32,282 | | | | 31,652 | |
2.00%, 9/1/2031 | | | 312,778 | | | | 291,747 | |
2.00%, 11/1/2031 | | | 242,817 | | | | 226,486 | |
6.00%, 12/1/2032 | | | 26,703 | | | | 29,176 | |
3.00%, 3/1/2033 | | | 209,422 | | | | 203,620 | |
3.00%, 7/1/2033 | | | 35,121 | | | | 34,149 | |
3.00%, 10/1/2033 | | | 196,804 | | | | 191,351 | |
5.00%, 6/1/2034 | | | 198,158 | | | | 209,617 | |
6.00%, 8/1/2034 | | | 94,363 | | | | 102,657 | |
6.50%, 9/1/2034 | | | 234,061 | | | | 261,864 | |
5.00%, 12/1/2034 | | | 46,705 | | | | 49,422 | |
5.00%, 1/1/2035 | | | 60,495 | | | | 64,008 | |
5.00%, 6/1/2035 | | | 315,127 | | | | 333,423 | |
5.00%, 7/1/2035 | | | 118,198 | | | | 124,995 | |
5.00%, 10/1/2035 | | | 235,241 | | | | 248,938 | |
5.00%, 11/1/2035 | | | 114,890 | | | | 121,579 | |
6.00%, 11/1/2035 | | | 44,282 | | | | 48,358 | |
5.00%, 2/1/2036 | | | 122,868 | | | | 130,027 | |
5.00%, 8/1/2036 | | | 203,397 | | | | 215,288 | |
5.50%, 12/1/2036 | | | 124,366 | | | | 133,067 | |
6.50%, 12/1/2036 | | | 212,108 | | | | 232,775 | |
5.50%, 1/1/2037 | | | 37,469 | | | | 40,142 | |
5.50%, 2/1/2037 | | | 11,514 | | | | 12,391 | |
6.00%, 8/1/2037 | | | 83,333 | | | | 90,994 | |
6.00%, 9/1/2037 | | | 327,892 | | | | 360,393 | |
6.00%, 12/1/2037 | | | 541,649 | | | | 590,572 | |
5.00%, 3/1/2038 | | | 241,371 | | | | 252,919 | |
See Accompanying Notes to the Financial Statements.
| | |
| 310 | | FLEXSHARES ANNUAL REPORT |
FlexShares® Disciplined Duration MBS Index Fund (cont.)
| | | | | | | | |
| Investments | | Principal
Amount | | | Value | |
| MORTGAGE-BACKED SECURITIES – (continued) | |
5.00%, 5/1/2038 | | $ | 106,023 | | | $ | 112,206 | |
5.50%, 6/1/2038 | | | 320,112 | | | | 342,968 | |
5.50%, 7/1/2038 | | | 241,249 | | | | 259,156 | |
5.50%, 9/1/2038 | | | 38,629 | | | | 41,366 | |
6.00%, 9/1/2038 | | | 66,653 | | | | 72,802 | |
5.50%, 11/1/2038 | | | 194,005 | | | | 208,134 | |
5.00%, 1/1/2039 | | | 12,900 | | | | 13,613 | |
5.50%, 3/1/2039 | | | 204,360 | | | | 219,740 | |
4.50%, 4/1/2039 | | | 128,399 | | | | 133,017 | |
5.50%, 4/1/2039 | | | 411,922 | | | | 441,279 | |
5.50%, 8/1/2039 | | | 214,606 | | | | 229,809 | |
5.50%, 1/1/2040 | | | 38,849 | | | | 41,341 | |
4.50%, 4/1/2040 | | | 22,503 | | | | 23,321 | |
5.50%, 4/1/2040 | | | 41,882 | | | | 45,050 | |
6.00%, 6/1/2040 | | | 497,356 | | | | 543,305 | |
4.50%, 7/1/2040 | | | 229,862 | | | | 238,241 | |
4.00%, 9/1/2040 | | | 94,400 | | | | 95,161 | |
3.50%, 1/1/2041 | | | 41,757 | | | | 41,030 | |
3.50%, 2/1/2041 | | | 78,109 | | | | 76,750 | |
4.00%, 2/1/2041 | | | 165,725 | | | | 167,058 | |
4.50%, 2/1/2041 | | | 40,507 | | | | 41,977 | |
4.50%, 4/1/2041 | | | 110,288 | | | | 114,302 | |
5.50%, 4/1/2041 | | | 13,312 | | | | 14,185 | |
6.00%, 5/1/2041 | | | 213,963 | | | | 233,646 | |
4.50%, 6/1/2041 | | | 37,502 | | | | 38,869 | |
5.50%, 7/1/2041 | | | 92,805 | | | | 99,250 | |
6.00%, 7/1/2041 | | | 282,301 | | | | 308,282 | |
4.50%, 8/1/2041 | | | 48,372 | | | | 50,204 | |
5.00%, 8/1/2041 | | | 247,106 | | | | 259,169 | |
5.50%, 8/1/2041 | | | 161,368 | | | | 172,356 | |
5.50%, 9/1/2041 | | | 182,371 | | | | 195,237 | |
4.00%, 12/1/2041 | | | 170,792 | | | | 172,170 | |
3.50%, 1/1/2042 | | | 142,882 | | | | 140,393 | |
4.00%, 1/1/2042 | | | 89,452 | | | | 90,174 | |
4.50%, 1/1/2042 | | | 51,302 | | | | 53,172 | |
6.00%, 1/1/2042 | | | 268,211 | | | | 292,093 | |
3.00%, 4/1/2042 | | | 156,140 | | | | 149,212 | |
3.50%, 5/1/2042 | | | 209,604 | | | | 205,958 | |
3.50%, 8/1/2042 | | | 153,803 | | | | 151,125 | |
3.50%, 1/1/2043 | | | 105,862 | | | | 104,024 | |
3.00%, 2/1/2043 | | | 204,681 | | | | 195,539 | |
3.50%, 3/1/2043 | | | 198,351 | | | | 194,906 | |
3.00%, 5/1/2043 | | | 13,910 | | | | 13,294 | |
3.50%, 5/1/2043 | | | 251,649 | | | | 247,071 | |
3.00%, 6/1/2043 | | | 115,926 | | | | 110,646 | |
| | | | | | | | |
| Investments | | Principal
Amount | | | Value | |
3.50%, 7/1/2043 | | $ | 52,138 | | | $ | 51,230 | |
3.50%, 8/1/2043 | | | 101,951 | | | | 99,982 | |
4.00%, 8/1/2043 | | | 31,393 | | | | 31,568 | |
5.00%, 8/1/2043 | | | 300,269 | | | | 315,459 | |
3.00%, 9/1/2043 | | | 160,985 | | | | 153,748 | |
4.00%, 9/1/2043 | | | 178,761 | | | | 180,195 | |
4.50%, 9/1/2043 | | | 62,212 | | | | 64,085 | |
4.00%, 11/1/2043 | | | 142,742 | | | | 143,397 | |
4.50%, 12/1/2043 | | | 245,471 | | | | 252,872 | |
5.00%, 1/1/2044 | | | 273,455 | | | | 286,831 | |
5.00%, 3/1/2044 | | | 110,057 | | | | 116,884 | |
5.00%, 5/1/2044 | | | 125,667 | | | | 131,786 | |
5.50%, 5/1/2044 | | | 633,002 | | | | 678,073 | |
5.00%, 6/1/2044 | | | 36,537 | | | | 38,216 | |
4.50%, 10/1/2044 | | | 178,464 | | | | 183,847 | |
3.00%, 12/1/2044 | | | 425,051 | | | | 404,865 | |
3.00%, 2/1/2045 | | | 119,352 | | | | 113,631 | |
4.00%, 2/1/2045 | | | 94,776 | | | | 95,008 | |
3.00%, 4/1/2045 | | | 127,285 | | | | 121,184 | |
4.00%, 4/1/2045 | | | 59,166 | | | | 59,636 | |
3.00%, 5/1/2045 | | | 189,538 | | | | 180,178 | |
4.00%, 11/1/2045 | | | 134,052 | | | | 134,924 | |
4.00%, 3/1/2046 | | | 235,229 | | | | 236,053 | |
4.50%, 3/1/2046 | | | 178,526 | | | | 183,053 | |
3.50%, 5/1/2046 | | | 134,086 | | | | 131,058 | |
4.00%, 5/1/2046 | | | 229,221 | | | | 229,580 | |
4.50%, 7/1/2046 | | | 169,820 | | | | 174,126 | |
3.50%, 2/1/2047 | | | 90,836 | | | | 88,681 | |
4.50%, 2/1/2047 | | | 472,715 | | | | 487,848 | |
4.50%, 5/1/2047 | | | 248,334 | | | | 254,829 | |
TBA 3.50%, 11/25/2048 | | | 100,000 | | | | 97,340 | |
TBA 4.00%, 11/25/2048 | | | 100,000 | | | | 100,004 | |
GNMA | |
3.00%, 2/20/2027 | | | 858,734 | | | | 849,553 | |
2.50%, 4/20/2027 | | | 136,272 | | | | 131,987 | |
2.50%, 11/20/2027 | | | 148,185 | | | | 142,872 | |
2.50%, 1/20/2028 | | | 74,913 | | | | 72,557 | |
3.00%, 3/20/2028 | | | 153,643 | | | | 151,994 | |
3.00%, 7/20/2028 | | | 496,956 | | | | 491,618 | |
2.50%, 11/20/2028 | | | 152,374 | | | | 147,570 | |
2.50%, 12/20/2028 | | | 31,981 | | | | 30,973 | |
2.50%, 3/20/2031 | | | 224,941 | | | | 216,728 | |
2.50%, 10/20/2031 | | | 112,255 | | | | 108,155 | |
6.00%, 3/20/2032 | | | 143,818 | | | | 155,500 | |
6.00%, 11/15/2032 | | | 253,420 | | | | 278,322 | |
6.00%, 3/15/2033 | | | 245,396 | | | | 266,592 | |
5.50%, 6/15/2033 | | | 359,034 | | | | 386,916 | |
See Accompanying Notes to the Financial Statements.
| | | | |
| FLEXSHARES ANNUAL REPORT | | | 311 | |
FlexShares® Disciplined Duration MBS Index Fund (cont.)
| | | | | | | | |
| Investments | | Principal
Amount | | | Value | |
| MORTGAGE-BACKED SECURITIES – (continued) | |
5.50%, 8/20/2033 | | $ | 48,268 | | | $ | 51,612 | |
5.50%, 11/20/2033 | | | 67,961 | | | | 72,687 | |
6.00%, 12/15/2033 | | | 196,096 | | | | 216,375 | |
5.50%, 2/15/2034 | | | 429,885 | | | | 467,163 | |
5.50%, 3/20/2034 | | | 78,497 | | | | 83,947 | |
5.50%, 7/20/2034 | | | 52,275 | | | | 55,900 | |
5.50%, 3/15/2035 | | | 288,105 | | | | 310,392 | |
5.50%, 3/20/2036 | | | 257,583 | | | | 274,658 | |
5.50%, 3/20/2038 | | | 107,394 | | | | 114,389 | |
5.50%, 9/20/2038 | | | 106,606 | | | | 112,321 | |
6.00%, 12/20/2038 | | | 407,268 | | | | 441,420 | |
5.50%, 2/15/2039 | | | 236,639 | | | | 252,298 | |
5.50%, 2/20/2039 | | | 129,567 | | | | 137,982 | |
5.50%, 3/20/2039 | | | 98,330 | | | | 103,525 | |
4.50%, 5/15/2039 | | | 134,716 | | | | 139,635 | |
5.00%, 5/15/2039 | | | 98,336 | | | | 104,175 | |
5.50%, 5/15/2039 | | | 60,174 | | | | 64,110 | |
5.00%, 9/15/2039 | | | 203,946 | | | | 215,977 | |
5.50%, 9/15/2039 | | | 27,085 | | | | 28,873 | |
4.00%, 9/20/2039 | | | 41,772 | | | | 42,567 | |
4.50%, 10/15/2039 | | | 449,013 | | | | 465,353 | |
4.50%, 12/15/2039 | | | 213,603 | | | | 221,183 | |
5.50%, 12/15/2039 | | | 75,522 | | | | 80,518 | |
5.00%, 1/20/2040 | | | 344,471 | | | | 366,804 | |
5.50%, 3/15/2040 | | | 162,581 | | | | 173,298 | |
4.50%, 4/15/2040 | | | 535,030 | | | | 554,389 | |
5.00%, 4/15/2040 | | | 228,621 | | | | 243,018 | |
4.50%, 6/15/2040 | | | 637,653 | | | | 660,498 | |
4.00%, 8/15/2040 | | | 23,466 | | | | 23,885 | |
4.00%, 10/15/2040 | | | 15,469 | | | | 15,629 | |
3.50%, 11/15/2040 | | | 185,393 | | | | 183,184 | |
5.50%, 1/20/2041 | | | 41,528 | | | | 44,236 | |
4.00%, 3/15/2041 | | | 6,044 | | | | 6,126 | |
4.00%, 6/15/2041 | | | 184,949 | | | | 187,429 | |
4.00%, 8/15/2041 | | | 224,340 | | | | 227,338 | |
3.50%, 9/15/2041 | | | 123,495 | | | | 122,024 | |
5.50%, 9/20/2041 | | | 163,544 | | | | 174,272 | |
3.50%, 11/20/2041 | | | 101,375 | | | | 100,284 | |
3.50%, 1/15/2042 | | | 29,725 | | | | 29,371 | |
5.50%, 2/20/2042 | | | 39,208 | | | | 42,040 | |
3.50%, 4/20/2042 | | | 306,277 | | | | 302,665 | |
3.00%, 5/15/2042 | | | 88,866 | | | | 85,115 | |
3.50%, 6/15/2042 | | | 202,343 | | | | 199,928 | |
3.50%, 8/20/2042 | | | 53,107 | | | | 52,481 | |
3.00%, 9/15/2042 | | | 222,329 | | | | 213,632 | |
| | | | | | | | |
| Investments | | Principal
Amount | | | Value | |
3.00%, 10/15/2042 | | $ | 221,700 | | | $ | 213,008 | |
3.00%, 12/20/2042 | | | 127,157 | | | | 122,477 | |
3.50%, 12/20/2042 | | | 21,893 | | | | 21,522 | |
5.00%, 12/20/2042 | | | 194,625 | | | | 205,417 | |
6.00%, 1/20/2043 | | | 394,575 | | | | 422,500 | |
3.00%, 2/20/2043 | | | 88,674 | | | | 85,070 | |
5.50%, 2/20/2043 | | | 23,982 | | | | 25,593 | |
2.50%, 3/20/2043 | | | 103,874 | | | | 97,418 | |
3.00%, 3/20/2043 | | | 277,606 | | | | 266,322 | |
3.00%, 4/15/2043 | | | 90,376 | | | | 87,148 | |
3.00%, 5/15/2043 | | | 249,992 | | | | 241,062 | |
2.50%, 5/20/2043 | | | 149,384 | | | | 140,096 | |
3.50%, 5/20/2043 | | | 114,969 | | | | 112,991 | |
3.50%, 6/15/2043 | | | 284,691 | | | | 281,305 | |
3.00%, 9/20/2043 | | | 142,165 | | | | 137,221 | |
3.50%, 10/20/2043 | | | 282,565 | | | | 279,232 | |
5.00%, 12/20/2043 | | | 110,106 | | | | 116,190 | |
5.00%, 1/20/2044 | | | 8,057 | | | | 8,505 | |
5.50%, 4/20/2044 | | | 453,943 | | | | 489,222 | |
4.00%, 7/15/2044 | | | 251,257 | | | | 254,769 | |
3.50%, 8/20/2044 | | | 116,450 | | | | 114,867 | |
3.50%, 9/15/2044 | | | 216,107 | | | | 212,480 | |
4.00%, 9/15/2044 | | | 46,298 | | | | 46,633 | |
3.50%, 10/15/2044 | | | 94,573 | | | | 93,207 | |
3.50%, 10/20/2044 | | | 19,545 | | | | 19,270 | |
2.50%, 11/20/2044 | | | 115,658 | | | | 107,617 | |
4.00%, 12/15/2044 | | | 75,106 | | | | 75,650 | |
3.00%, 12/20/2044 | | | 61,155 | | | | 58,908 | |
3.50%, 12/20/2044 | | | 60,431 | | | | 59,548 | |
3.50%, 1/15/2045 | | | 260,202 | | | | 256,058 | |
3.00%, 1/20/2045 | | | 121,137 | | | | 116,386 | |
3.50%, 2/20/2045 | | | 80,725 | | | | 79,524 | |
3.00%, 3/15/2045 | | | 185,782 | | | | 178,536 | |
3.00%, 3/20/2045 | | | 94,808 | | | | 91,070 | |
3.50%, 5/15/2045 | | | 93,421 | | | | 91,851 | |
3.00%, 7/15/2045 | | | 507,283 | | | | 485,940 | |
3.00%, 12/20/2045 | | | 146,194 | | | | 140,294 | |
3.50%, 12/20/2045 | | | 277,664 | | | | 273,532 | |
3.00%, 1/20/2046 | | | 202,346 | | | | 194,399 | |
4.00%, 3/15/2046 | | | 195,797 | | | | 197,335 | |
4.00%, 3/20/2046 | | | 241,801 | | | | 244,818 | |
3.50%, 4/20/2046 | | | 784,463 | | | | 772,305 | |
4.00%, 5/20/2046 | | | 1,016,595 | | | | 1,029,906 | |
4.00%, 7/15/2046 | | | 252,990 | | | | 256,375 | |
3.00%, 9/20/2046 | | | 160,498 | | | | 153,895 | |
2.50%, 12/20/2046 | | | 287,386 | | | | 266,574 | |
3.00%, 12/20/2046 | | | 166,485 | | | | 159,457 | |
See Accompanying Notes to the Financial Statements.
| | |
| 312 | | FLEXSHARES ANNUAL REPORT |
FlexShares® Disciplined Duration MBS Index Fund (cont.)
| | | | | | | | |
| Investments | | Principal
Amount | | | Value | |
| MORTGAGE-BACKED SECURITIES – (continued) | |
5.50%, 5/20/2047 | | $ | 214,697 | | | $ | 226,632 | |
4.50%, 11/15/2047 | | | 729,645 | | | | 756,777 | |
5.00%, 2/20/2048 | | | 444,738 | | | | 463,276 | |
5.00%, 4/20/2048 | | | 216,453 | | | | 225,335 | |
Total Mortgage-Backed Securities
(Cost $73,256,197) | | | | 71,184,920 | |
| | | | | | |
Total Investments – 99.4%
(Cost $73,256,197) | | | | 71,184,920 | |
Other Assets Less Liabilities – 0.6% | | | | 442,664 | |
| NET ASSETS – 100.0% | | | $ | 71,627,584 | |
Percentages shown are based on Net Assets.
Abbreviations
FHLMC – Federal Home Loan Mortgage Corp.
FNMA – Federal National Mortgage Association
GNMA – Government National Mortgage Association
TBA – To Be Announced; Security is subject to delayed delivery.
As of October 31, 2018, the gross unrealized appreciation (depreciation) of investments based on the aggregate cost of investments (including derivative instruments, if applicable) for federal income tax purposes was as follows:
| | | | |
| | | | |
Aggregate gross unrealized appreciation | | $ | 54 | |
Aggregate gross unrealized depreciation | | | (2,077,393 | ) |
Net unrealized depreciation | | $ | (2,077,339 | ) |
Federal income tax cost | | $ | 73,262,259 | |
See Accompanying Notes to the Financial Statements.
| | | | |
| FLEXSHARES ANNUAL REPORT | | | 313 | |
Schedule of Investments
FlexShares® Credit-Scored US Corporate Bond Index Fund
October 31, 2018
| | | | | | | | |
| Investments | | Principal
Amount | | | Value | |
| CORPORATE BONDS – 98.9% | |
| Aerospace & Defense – 2.3% | |
General Dynamics Corp. | | | | | |
3.75%, 5/15/2028 | | $ | 200,000 | | | $ | 198,027 | |
L3 Technologies, Inc. | | | | | |
4.95%, 2/15/2021 | | | 150,000 | | | | 153,881 | |
Lockheed Martin Corp. | | | | | |
3.35%, 9/15/2021 | | | 155,000 | | | | 155,000 | |
3.55%, 1/15/2026 | | | 70,000 | | | | 68,443 | |
Northrop Grumman Corp. | | | | | |
2.93%, 1/15/2025 | | | 200,000 | | | | 188,735 | |
Rockwell Collins, Inc. | | | | | |
3.50%, 3/15/2027 | | | 100,000 | | | | 94,146 | |
United Technologies Corp. | | | | | |
3.10%, 6/1/2022 | | | 400,000 | | | | 392,524 | |
3.13%, 5/4/2027 | | | 150,000 | | | | 138,196 | |
| | | | | | | | 1,388,952 | |
| Air Freight & Logistics – 0.3% | |
FedEx Corp. | | | | | |
3.20%, 2/1/2025 | | | 130,000 | | | | 124,376 | |
United Parcel Service, Inc. | | | | | |
2.45%, 10/1/2022 | | | 80,000 | | | | 77,081 | |
| | | | | | | | 201,457 | |
| Banks – 33.4% | |
Australia & New Zealand Banking Group Ltd. | | | | | | | | |
2.30%, 6/1/2021 | | | 250,000 | | | | 242,364 | |
Banco Santander SA | | | | | |
3.13%, 2/23/2023 | | | 200,000 | | | | 188,895 | |
Bank of America Corp. | | | | | |
2.50%, 10/21/2022 | | | 700,000 | | | | 665,362 | |
3.30%, 1/11/2023 | | | 400,000 | | | | 391,274 | |
3.12%, 1/20/2023(a) | | | 250,000 | | | | 244,402 | |
4.20%, 8/26/2024 | | | 320,000 | | | | 317,706 | |
4.00%, 1/22/2025 | | | 255,000 | | | | 248,532 | |
3.88%, 8/1/2025 | | | 250,000 | | | | 246,189 | |
3.50%, 4/19/2026 | | | 150,000 | | | | 142,821 | |
3.82%, 1/20/2028(a) | | | 450,000 | | | | 430,953 | |
3.42%, 12/20/2028(a) | | | 200,000 | | | | 184,513 | |
4.27%, 7/23/2029(a) | | | 100,000 | | | | 98,701 | |
| | | | | | | | |
| Investments | | Principal
Amount | | | Value | |
| Banks – (continued) | |
Bank of Montreal | | | | | |
1.90%, 8/27/2021 | | $ | 150,000 | | | $ | 143,843 | |
Bank of Nova Scotia (The) | | | | | |
2.45%, 3/22/2021 | | | 150,000 | | | | 146,731 | |
4.50%, 12/16/2025 | | | 100,000 | | | | 99,013 | |
Barclays plc | | | | | |
3.20%, 8/10/2021 | | | 200,000 | | | | 195,728 | |
3.65%, 3/16/2025 | | | 200,000 | | | | 186,209 | |
4.38%, 1/12/2026 | | | 200,000 | | | | 192,157 | |
BB&T Corp. | | | | | |
2.85%, 10/26/2024 | | | 150,000 | | | | 141,993 | |
BNP Paribas SA | | | | | |
5.00%, 1/15/2021 | | | 95,000 | | | | 98,052 | |
Citibank NA | | | | | |
3.40%, 7/23/2021 | | | 250,000 | | | | 249,024 | |
Citigroup, Inc. | | | | | |
2.70%, 3/30/2021 | | | 425,000 | | | | 416,355 | |
4.50%, 1/14/2022 | | | 150,000 | | | | 153,323 | |
3.50%, 5/15/2023 | | | 250,000 | | | | 244,957 | |
3.30%, 4/27/2025 | | | 200,000 | | | | 190,147 | |
4.40%, 6/10/2025 | | | 175,000 | | | | 173,466 | |
3.40%, 5/1/2026 | | | 150,000 | | | | 141,017 | |
3.20%, 10/21/2026 | | | 200,000 | | | | 183,786 | |
4.45%, 9/29/2027 | | | 150,000 | | | | 146,130 | |
3.89%, 1/10/2028(a) | | | 200,000 | | | | 191,457 | |
3.67%, 7/24/2028(a) | | | 155,000 | | | | 145,442 | |
4.13%, 7/25/2028 | | | 200,000 | | | | 189,857 | |
3.52%, 10/27/2028(a) | | | 200,000 | | | | 185,643 | |
Citizens Financial Group, Inc. | | | | | |
4.30%, 12/3/2025 | | | 60,000 | | | | 58,857 | |
Credit Suisse Group Funding Guernsey Ltd. | | | | | | | | |
3.45%, 4/16/2021 | | | 250,000 | | | | 248,318 | |
3.80%, 9/15/2022 | | | 250,000 | | | | 247,553 | |
3.75%, 3/26/2025 | | | 250,000 | | | | 239,625 | |
Discover Bank | | | | | |
3.20%, 8/9/2021 | | | 250,000 | | | | 246,031 | |
Fifth Third Bancorp | | | | | |
3.50%, 3/15/2022 | | | 295,000 | | | | 292,746 | |
HSBC Holdings plc | | | | | |
4.00%, 3/30/2022 | | | 510,000 | | | | 514,828 | |
3.90%, 5/25/2026 | | | 200,000 | | | | 192,343 | |
4.04%, 3/13/2028(a) | | | 200,000 | | | | 191,610 | |
See Accompanying Notes to the Financial Statements.
| | |
| 314 | | FLEXSHARES ANNUAL REPORT |
FlexShares® Credit-Scored US Corporate Bond Index Fund (cont.)
| | | | | | | | |
| Investments | | Principal
Amount | | | Value | |
| CORPORATE BONDS – (continued) | |
| Banks – (continued) | |
Huntington Bancshares, Inc. | | | | | |
3.15%, 3/14/2021 | | $ | 100,000 | | | $ | 98,921 | |
ING Groep NV | | | | | |
4.55%, 10/2/2028 | | | 200,000 | | | | 196,867 | |
JPMorgan Chase & Co. | | | | | |
2.55%, 3/1/2021 | | | 475,000 | | | | 465,765 | |
3.38%, 5/1/2023 | | | 520,000 | | | | 507,330 | |
3.13%, 1/23/2025 | | | 230,000 | | | | 218,242 | |
3.90%, 7/15/2025 | | | 250,000 | | | | 246,536 | |
3.30%, 4/1/2026 | | | 220,000 | | | | 207,966 | |
2.95%, 10/1/2026 | | | 250,000 | | | | 229,324 | |
4.13%, 12/15/2026 | | | 125,000 | | | | 122,660 | |
4.25%, 10/1/2027 | | | 125,000 | | | | 123,029 | |
3.78%, 2/1/2028(a) | | | 875,000 | | | | 842,607 | |
KeyCorp | | | | | |
5.10%, 3/24/2021 | | | 145,000 | | | | 150,164 | |
Lloyds Bank plc | | | | | |
6.38%, 1/21/2021 | | | 115,000 | | | | 121,825 | |
Lloyds Banking Group plc | | | | | |
3.10%, 7/6/2021 | | | 200,000 | | | | 196,406 | |
4.38%, 3/22/2028 | | | 200,000 | | | | 191,474 | |
Mitsubishi UFJ Financial Group, Inc. | | | | | | | | |
2.95%, 3/1/2021 | | | 200,000 | | | | 197,329 | |
2.67%, 7/25/2022 | | | 300,000 | | | | 289,461 | |
3.85%, 3/1/2026 | | | 200,000 | | | | 195,618 | |
3.68%, 2/22/2027 | | | 350,000 | | | | 337,907 | |
Mizuho Financial Group, Inc. | | | | | | | | |
2.95%, 2/28/2022 | | | 200,000 | | | | 194,725 | |
4.02%, 3/5/2028 | | | 400,000 | | | | 394,084 | |
National Australia Bank Ltd. | | | | | |
1.88%, 7/12/2021 | | | 250,000 | | | | 239,167 | |
2.80%, 1/10/2022 | | | 250,000 | | | | 243,610 | |
PNC Financial Services Group, Inc. (The) | | | | | | | | |
3.30%, 3/8/2022 | | | 380,000 | | | | 376,418 | |
3.90%, 4/29/2024 | | | 50,000 | | | | 49,657 | |
3.15%, 5/19/2027 | | | 250,000 | | | | 234,605 | |
Royal Bank of Canada | | | | | |
2.75%, 2/1/2022 | | | 100,000 | | | | 97,759 | |
Santander UK Group Holdings plc | | | | | |
3.82%, 11/3/2028(a) | | | 200,000 | | | | 180,426 | |
| | | | | | | | |
| Investments | | Principal
Amount | | | Value | |
| Banks – (continued) | |
Sumitomo Mitsui Financial Group, Inc. | | | | | |
2.06%, 7/14/2021 | | $ | 400,000 | | | $ | 384,250 | |
2.78%, 7/12/2022 | | | 200,000 | | | | 193,424 | |
3.78%, 3/9/2026 | | | 250,000 | | | | 243,670 | |
3.36%, 7/12/2027 | | | 350,000 | | | | 328,675 | |
SunTrust Banks, Inc. | | | | | |
2.90%, 3/3/2021 | | | 200,000 | | | | 197,051 | |
Svenska Handelsbanken AB | | | | | |
2.45%, 3/30/2021 | | | 250,000 | | | | 243,840 | |
Toronto-Dominion Bank (The) | | | | | |
2.50%, 12/14/2020 | | | 200,000 | | | | 196,997 | |
US Bancorp | | | | | |
Series X, 3.15%, 4/27/2027 | | | 150,000 | | | | 141,543 | |
Wells Fargo & Co. | | | | | |
3.50%, 3/8/2022 | | | 400,000 | | | | 396,383 | |
3.07%, 1/24/2023 | | | 250,000 | | | | 242,373 | |
4.48%, 1/16/2024 | | | 225,000 | | | | 228,923 | |
3.55%, 9/29/2025 | | | 200,000 | | | | 191,951 | |
3.58%, 5/22/2028(a) | | | 250,000 | | | | 238,183 | |
Westpac Banking Corp. | | | | | |
2.60%, 11/23/2020 | | | 300,000 | | | | 295,768 | |
2.85%, 5/13/2026 | | | 150,000 | | | | 137,958 | |
3.40%, 1/25/2028 | | | 150,000 | | | | 142,058 | |
4.32%, 11/23/2031(a) | | | 100,000 | | | | 95,364 | |
| | | | | | | | 20,296,246 | |
| Beverages – 1.8% | |
Anheuser-Busch InBev Finance, Inc. | | | | | | | | |
2.65%, 2/1/2021 | | | 200,000 | | | | 196,178 | |
Anheuser-Busch InBev Worldwide, Inc. | | | | | | | | |
3.75%, 1/15/2022 | | | 345,000 | | | | 345,586 | |
Coca-Cola Co. (The) | | | | | |
3.20%, 11/1/2023 | | | 200,000 | | | | 197,792 | |
Constellation Brands, Inc. | | | | | |
4.25%, 5/1/2023 | | | 150,000 | | | | 151,551 | |
PepsiCo, Inc. | | | | | |
3.10%, 7/17/2022 | | | 200,000 | | | | 198,668 | |
| | | | | | | | 1,089,775 | |
| Biotechnology – 3.5% | |
AbbVie, Inc. | | | | | |
2.90%, 11/6/2022 | | | 250,000 | | | | 242,229 | |
3.20%, 11/6/2022 | | | 240,000 | | | | 234,659 | |
See Accompanying Notes to the Financial Statements.
| | | | |
| FLEXSHARES ANNUAL REPORT | | | 315 | |
FlexShares® Credit-Scored US Corporate Bond Index Fund (cont.)
| | | | | | | | |
| Investments | | Principal
Amount | | | Value | |
| CORPORATE BONDS – (continued) | |
| Biotechnology – (continued) | |
3.60%, 5/14/2025 | | $ | 150,000 | | | $ | 143,480 | |
3.20%, 5/14/2026 | | | 100,000 | | | | 91,673 | |
Amgen, Inc. | | | | | |
3.88%, 11/15/2021 | | | 250,000 | | | | 252,590 | |
2.70%, 5/1/2022 | | | 170,000 | | | | 164,916 | |
3.63%, 5/22/2024 | | | 100,000 | | | | 98,635 | |
Celgene Corp. | | | | | |
2.25%, 8/15/2021 | | | 150,000 | | | | 144,868 | |
3.63%, 5/15/2024 | | | 100,000 | | | | 97,234 | |
3.90%, 2/20/2028 | | | 200,000 | | | | 188,129 | |
Gilead Sciences, Inc. | | | | | |
3.70%, 4/1/2024 | | | 150,000 | | | | 148,741 | |
3.50%, 2/1/2025 | | | 225,000 | | | | 218,649 | |
2.95%, 3/1/2027 | | | 100,000 | | | | 91,521 | |
| | | | | | | | 2,117,324 | |
| Capital Markets – 9.1% | |
Bank of New York Mellon Corp. (The) | | | | | | | | |
2.50%, 4/15/2021 | | | 300,000 | | | | 294,093 | |
Series 0012,
3.65%, 2/4/2024 | | | 300,000 | | | | 298,481 | |
3.40%, 1/29/2028 | | | 150,000 | | | | 144,111 | |
BlackRock, Inc. | | | | | |
3.20%, 3/15/2027 | | | 100,000 | | | | 95,340 | |
Charles Schwab Corp. (The) | | | | | |
3.25%, 5/21/2021 | | | 100,000 | | | | 99,703 | |
Deutsche Bank AG | | | | | |
3.70%, 5/30/2024 | | | 145,000 | | | | 135,509 | |
Goldman Sachs Group, Inc. (The) | | | | | |
2.35%, 11/15/2021 | | | 250,000 | | | | 240,737 | |
5.75%, 1/24/2022 | | | 210,000 | | | | 222,001 | |
3.00%, 4/26/2022 | | | 400,000 | | | | 389,538 | |
3.63%, 1/22/2023 | | | 300,000 | | | | 296,612 | |
4.00%, 3/3/2024 | | | 210,000 | | | | 208,747 | |
3.50%, 1/23/2025 | | | 255,000 | | | | 244,291 | |
3.27%, 9/29/2025(a) | | | 300,000 | | | | 284,632 | |
3.85%, 1/26/2027 | | | 100,000 | | | | 95,920 | |
4.22%, 5/1/2029(a) | | | 150,000 | | | | 145,717 | |
Intercontinental Exchange, Inc. | | | | | |
2.75%, 12/1/2020 | | | 150,000 | | | | 148,360 | |
Morgan Stanley | | | | | |
5.75%, 1/25/2021 | | | 400,000 | | | | 418,295 | |
| | | | | | | | |
| Investments | | Principal
Amount | | | Value | |
| Capital Markets – (continued) | |
2.63%, 11/17/2021 | | $ | 400,000 | | | $ | 388,105 | |
2.75%, 5/19/2022 | | | 600,000 | | | | 580,274 | |
3.75%, 2/25/2023 | | | 200,000 | | | | 198,644 | |
4.00%, 7/23/2025 | | | 100,000 | | | | 98,272 | |
3.88%, 1/27/2026 | | | 200,000 | | | | 193,551 | |
State Street Corp. | | | | | |
3.10%, 5/15/2023 | | | 200,000 | | | | 194,461 | |
3.55%, 8/18/2025 | | | 100,000 | | | | 97,761 | |
| | | | | | | | 5,513,155 | |
| Chemicals – 0.9% | |
Dow Chemical Co. (The) | | | | | |
4.13%, 11/15/2021 | | | 100,000 | | | | 101,577 | |
3.00%, 11/15/2022 | | | 200,000 | | | | 194,401 | |
LYB International Finance BV | | | | | |
4.00%, 7/15/2023 | | | 130,000 | | | | 130,093 | |
Sherwin-Williams Co. (The) | | | | | |
2.75%, 6/1/2022 | | | 150,000 | | | | 144,470 | |
| | | | | | | | 570,541 | |
| Commercial Services & Supplies – 0.5% | |
Republic Services, Inc. | | | | | |
3.55%, 6/1/2022 | | | 100,000 | | | | 99,748 | |
3.95%, 5/15/2028 | | | 100,000 | | | | 97,997 | |
Waste Management, Inc. | | | | | |
3.13%, 3/1/2025 | | | 105,000 | | | | 100,747 | |
| | | | | | | | 298,492 | |
| Communications Equipment – 0.3% | |
Cisco Systems, Inc. | | | | | |
2.95%, 2/28/2026 | | | 100,000 | | | | 94,991 | |
Motorola Solutions, Inc. | | | | | |
3.75%, 5/15/2022 | | | 100,000 | | | | 98,499 | |
| | | | | | | | 193,490 | |
| Consumer Finance – 4.5% | |
AerCap Ireland Capital DAC | | | | | |
5.00%, 10/1/2021 | | | 150,000 | | | | 153,991 | |
3.88%, 1/23/2028 | | | 200,000 | | | | 182,568 | |
American Express Co. | | | | | |
2.50%, 8/1/2022 | | | 200,000 | | | | 191,689 | |
3.00%, 10/30/2024 | | | 200,000 | | | | 189,298 | |
3.63%, 12/5/2024 | | | 140,000 | | | | 136,820 | |
See Accompanying Notes to the Financial Statements.
| | |
| 316 | | FLEXSHARES ANNUAL REPORT |
FlexShares® Credit-Scored US Corporate Bond Index Fund (cont.)
| | | | | | | | |
| Investments | | Principal
Amount | | | Value | |
| CORPORATE BONDS – (continued) | |
| Consumer Finance – (continued) | |
American Honda Finance Corp. | | | | | |
1.70%, 9/9/2021 | | $ | 155,000 | | | $ | 148,441 | |
Capital One Financial Corp. | | | | | |
3.50%, 6/15/2023 | | | 200,000 | | | | 195,765 | |
4.20%, 10/29/2025 | | | 300,000 | | | | 289,937 | |
3.75%, 7/28/2026 | | | 150,000 | | | | 137,814 | |
3.75%, 3/9/2027 | | | 100,000 | | | | 92,716 | |
Discover Financial Services | | | | | |
4.10%, 2/9/2027 | | | 150,000 | | | | 141,637 | |
General Motors Financial Co., Inc. | | | | | | | | |
3.20%, 7/6/2021 | | | 150,000 | | | | 146,941 | |
4.38%, 9/25/2021 | | | 300,000 | | | | 302,869 | |
Synchrony Financial | | | | | |
4.25%, 8/15/2024 | | | 150,000 | | | | 142,638 | |
Toyota Motor Credit Corp. | | | | | |
1.90%, 4/8/2021 | | | 200,000 | | | | 193,386 | |
3.05%, 1/11/2028 | | | 100,000 | | | | 93,029 | |
| | | | | | | | 2,739,539 | |
| Diversified Financial Services – 1.8% | |
Berkshire Hathaway, Inc. | | | | | |
2.20%, 3/15/2021 | | | 165,000 | | | | 161,658 | |
3.13%, 3/15/2026 | | | 130,000 | | | | 123,879 | |
GE Capital International Funding Co. Unlimited Co. | | | | | | | | |
2.34%, 11/15/2020 | | | 200,000 | | | | 194,138 | |
Shell International Finance BV | | | | | |
1.88%, 5/10/2021 | | | 200,000 | | | | 193,482 | |
2.88%, 5/10/2026 | | | 175,000 | | | | 163,725 | |
Synchrony Bank | | | | | |
3.65%, 5/24/2021 | | | 250,000 | | | | 247,880 | |
| | | | | | | | 1,084,762 | |
| Diversified Telecommunication Services – 1.9% | |
AT&T, Inc. | | | | | |
3.00%, 2/15/2022 | | | 200,000 | | | | 195,418 | |
3.20%, 3/1/2022 | | | 50,000 | | | | 49,164 | |
Verizon Communications, Inc. | | | | | |
5.15%, 9/15/2023 | | | 550,000 | | | | 584,217 | |
4.13%, 3/16/2027 | | | 300,000 | | | | 297,434 | |
| | | | | | | | 1,126,233 | |
| | | | | | | | |
| Investments | | Principal
Amount | | | Value | |
| Electric Utilities – 1.5% | |
Commonwealth Edison Co. | | | | | |
2.55%, 6/15/2026 | | $ | 50,000 | | | $ | 45,624 | |
Duke Energy Corp. | | | | | |
3.15%, 8/15/2027 | | | 200,000 | | | | 183,732 | |
Eversource Energy | | | | | |
Series K, 2.75%, 3/15/2022 | | | 150,000 | | | | 146,724 | |
Exelon Corp. | | | | | |
3.50%, 6/1/2022(b) | | | 200,000 | | | | 195,211 | |
NextEra Energy Capital Holdings, Inc. | | | | | | | | |
3.55%, 5/1/2027 | | | 130,000 | | | | 123,823 | |
Virginia Electric & Power Co. | | | | | |
Series A, 3.15%, 1/15/2026 | | | 50,000 | | | | 48,145 | |
Series A, 3.50%, 3/15/2027 | | | 100,000 | | | | 97,162 | |
Xcel Energy, Inc. | | | | | |
4.00%, 6/15/2028 | | | 100,000 | | | | 99,524 | |
| | | | | | | | 939,945 | |
| Energy Equipment & Services – 0.1% | |
Halliburton Co. | | | | | |
3.80%, 11/15/2025 | | | 75,000 | | | | 73,072 | |
| Entertainment – 1.0% | |
21st Century Fox America, Inc. | | | | | |
3.70%, 10/15/2025 | | | 100,000 | | | | 98,743 | |
Viacom, Inc. | | | | | |
4.25%, 9/1/2023 | | | 100,000 | | | | 99,951 | |
Walt Disney Co. (The) | | | | | |
3.00%, 2/13/2026 | | | 160,000 | | | | 152,373 | |
1.85%, 7/30/2026 | | | 100,000 | | | | 87,020 | |
Warner Media LLC | | | | | |
4.70%, 1/15/2021 | | | 80,000 | | | | 81,918 | |
3.40%, 6/15/2022 | | | 100,000 | | | | 98,662 | |
| | | | | | | | 618,667 | |
| Equity Real Estate Investment Trusts (REITs) – 3.6% | |
American Tower Corp. | | | | | |
3.45%, 9/15/2021 | | | 145,000 | | | | 144,062 | |
3.50%, 1/31/2023 | | | 250,000 | | | | 245,025 | |
3.60%, 1/15/2028 | | | 50,000 | | | | 46,086 | |
Boston Properties LP | | | | | |
5.63%, 11/15/2020 | | | 120,000 | | | | 124,609 | |
3.65%, 2/1/2026 | | | 205,000 | | | | 197,249 | |
Crown Castle International Corp. | | | | | |
4.88%, 4/15/2022 | | | 250,000 | | | | 257,736 | |
See Accompanying Notes to the Financial Statements.
| | | | |
| FLEXSHARES ANNUAL REPORT | | | 317 | |
FlexShares® Credit-Scored US Corporate Bond Index Fund (cont.)
| | | | | | | | |
| Investments | | Principal
Amount | | | Value | |
| CORPORATE BONDS – (continued) | |
| Equity Real Estate Investment Trusts (REITs) – (continued) | |
Digital Realty Trust LP | | | | | |
3.95%, 7/1/2022 | | $ | 74,000 | | | $ | 74,519 | |
HCP, Inc. | | | | | |
4.25%, 11/15/2023 | | | 150,000 | | | | 149,258 | |
Omega Healthcare Investors, Inc. | | | | | |
4.38%, 8/1/2023 | | | 250,000 | | | | 247,496 | |
Realty Income Corp. | | | | | |
3.65%, 1/15/2028 | | | 100,000 | | | | 95,546 | |
Simon Property Group LP | | | | | |
4.38%, 3/1/2021 | | | 142,000 | | | | 144,849 | |
3.75%, 2/1/2024 | | | 120,000 | | | | 119,588 | |
3.38%, 10/1/2024 | | | 200,000 | | | | 194,402 | |
Ventas Realty LP | | | | | |
3.50%, 2/1/2025 | | | 50,000 | | | | 47,566 | |
Welltower, Inc. | | | | | |
3.75%, 3/15/2023 | | | 30,000 | | | | 29,692 | |
4.25%, 4/1/2026 | | | 100,000 | | | | 99,003 | |
| | | | | | | | 2,216,686 | |
| Food & Staples Retailing – 1.0% | |
Costco Wholesale Corp. | | | | | |
3.00%, 5/18/2027 | | | 75,000 | | | | 70,530 | |
Sysco Corp. | | | | | |
3.75%, 10/1/2025 | | | 200,000 | | | | 195,482 | |
Walgreens Boots Alliance, Inc. | | | | | |
3.30%, 11/18/2021 | | | 105,000 | | | | 103,841 | |
Walmart, Inc. | | | | | |
3.70%, 6/26/2028 | | | 250,000 | | | | 246,505 | |
| | | | | | | | 616,358 | |
| Food Products – 0.7% | |
Tyson Foods, Inc. | | | | | |
4.50%, 6/15/2022 | | | 124,000 | | | | 126,889 | |
3.55%, 6/2/2027 | | | 100,000 | | | | 93,371 | |
Unilever Capital Corp. | | | | | |
2.90%, 5/5/2027 | | | 100,000 | | | | 92,573 | |
3.50%, 3/22/2028 | | | 100,000 | | | | 96,572 | |
| | | | | | | | 409,405 | |
| Health Care Equipment & Supplies – 0.8% | |
Medtronic, Inc. | | | | | |
3.50%, 3/15/2025 | | | 350,000 | | | | 342,914 | |
| | | | | | | | |
| Investments | | Principal
Amount | | | Value | |
| Health Care Equipment & Supplies – (continued) | |
Stryker Corp. | | | | | |
3.65%, 3/7/2028 | | $ | 150,000 | | | $ | 143,139 | |
| | | | | | | | 486,053 | |
| Health Care Providers & Services – 2.2% | |
Aetna, Inc. | | | | | |
2.80%, 6/15/2023 | | | 195,000 | | | | 186,192 | |
Anthem, Inc. | | | | | |
3.30%, 1/15/2023 | | | 100,000 | | | | 97,918 | |
CVS Health Corp. | | | | | |
3.35%, 3/9/2021 | | | 250,000 | | | | 248,944 | |
Express Scripts Holding Co. | | | | | |
3.90%, 2/15/2022 | | | 150,000 | | | | 150,711 | |
3.50%, 6/15/2024 | | | 150,000 | | | | 145,833 | |
Laboratory Corp. of America Holdings | | | | | | | | |
3.20%, 2/1/2022 | | | 100,000 | | | | 98,577 | |
UnitedHealth Group, Inc. | | | | | |
3.75%, 7/15/2025 | | | 75,000 | | | | 74,324 | |
3.10%, 3/15/2026 | | | 350,000 | | | | 331,846 | |
| | | | | | | | 1,334,345 | |
| Hotels, Restaurants & Leisure – 1.0% | |
Marriott International, Inc. | | | | | |
2.30%, 1/15/2022 | | | 80,000 | | | | 76,528 | |
McDonald’s Corp. | | | | | |
2.75%, 12/9/2020 | | | 30,000 | | | | 29,704 | |
2.63%, 1/15/2022 | | | 150,000 | | | | 145,993 | |
3.38%, 5/26/2025 | | | 125,000 | | | | 120,588 | |
3.80%, 4/1/2028 | | | 150,000 | | | | 146,016 | |
Starbucks Corp. | | | | | |
3.50%, 3/1/2028 | | | 100,000 | | | | 94,432 | |
| | | | | | | | 613,261 | |
| Household Products – 0.1% | |
Procter & Gamble Co. (The) | | | | | |
3.10%, 8/15/2023 | | | 50,000 | | | | 49,583 | |
| Industrial Conglomerates – 0.5% | |
3M Co. | | | | | |
2.25%, 9/19/2026 | | | 100,000 | | | | 90,200 | |
Honeywell International, Inc. | | | | | |
1.85%, 11/1/2021 | | | 80,000 | | | | 76,760 | |
See Accompanying Notes to the Financial Statements.
| | |
| 318 | | FLEXSHARES ANNUAL REPORT |
FlexShares® Credit-Scored US Corporate Bond Index Fund (cont.)
| | | | | | | | |
| Investments | | Principal
Amount | | | Value | |
| CORPORATE BONDS – (continued) | |
| Industrial Conglomerates – (continued) | |
Roper Technologies, Inc. | | | | | |
3.80%, 12/15/2026 | | $ | 150,000 | | | $ | 144,251 | |
| | | | | | | | 311,211 | |
| Insurance – 1.3% | |
American International Group, Inc. | | | | | |
3.30%, 3/1/2021 | | | 300,000 | | | | 297,119 | |
3.90%, 4/1/2026 | | | 100,000 | | | | 95,701 | |
Chubb INA Holdings, Inc. | | | | | |
3.15%, 3/15/2025 | | | 170,000 | | | | 163,458 | |
Marsh & McLennan Cos., Inc. | | | | | |
3.50%, 3/10/2025 | | | 75,000 | | | | 72,432 | |
MetLife, Inc. | | | | | |
3.60%, 4/10/2024 | | | 80,000 | | | | 79,531 | |
Prudential Financial, Inc. | | | | | |
3.50%, 5/15/2024 | | | 100,000 | | | | 99,485 | |
5.20%, 3/15/2044(a) | | | 10,000 | | | | 9,762 | |
| | | | | | | | 817,488 | |
| Interactive Media & Services – 0.5% | |
Alphabet, Inc. | | | | | |
3.38%, 2/25/2024 | | | 100,000 | | | | 99,846 | |
Baidu, Inc. | | | | | |
4.13%, 6/30/2025 | | | 200,000 | | | | 195,440 | |
| | | | | | | | 295,286 | |
| Internet & Direct Marketing Retail – 0.5% | |
Alibaba Group Holding Ltd. | | | | | |
3.13%, 11/28/2021 | | | 200,000 | | | | 197,485 | |
eBay, Inc. | | | | | |
3.45%, 8/1/2024 | | | 120,000 | | | | 115,851 | |
| | | | | | | | 313,336 | |
| IT Services – 1.7% | |
Fidelity National Information Services, Inc. | | | | | | | | |
3.50%, 4/15/2023 | | | 100,000 | | | | 98,849 | |
Fiserv, Inc. | | | | | |
3.80%, 10/1/2023 | | | 250,000 | | | | 249,789 | |
International Business Machines Corp. | | | | | | | | |
3.45%, 2/19/2026 | | | 100,000 | | | | 96,620 | |
3.30%, 1/27/2027 | | | 150,000 | | | | 142,607 | |
| | | | | | | | |
| Investments | | Principal
Amount | | | Value | |
| IT Services – (continued) | |
Visa, Inc. | | | | | |
2.80%, 12/14/2022 | | $ | 350,000 | | | $ | 341,247 | |
2.75%, 9/15/2027 | | | 100,000 | | | | 92,213 | |
| | | | | | | | 1,021,325 | |
| Life Sciences Tools & Services – 0.4% | |
Thermo Fisher Scientific, Inc. | | | | | |
3.00%, 4/15/2023 | | | 250,000 | | | | 241,193 | |
| Media – 2.1% | |
CBS Corp. | | | | | |
2.90%, 1/15/2027 | | | 100,000 | | | | 87,855 | |
Comcast Corp. | | | | | |
3.95%, 10/15/2025 | | | 600,000 | | | | 599,550 | |
3.15%, 3/1/2026 | | | 395,000 | | | | 369,738 | |
3.15%, 2/15/2028 | | | 150,000 | | | | 137,971 | |
Omnicom Group, Inc. | | | | | |
3.60%, 4/15/2026 | | | 100,000 | | | | 94,020 | |
| | | | | | | | 1,289,134 | |
| Metals & Mining – 0.3% | |
Vale Overseas Ltd. | | | | | |
4.38%, 1/11/2022 | | | 200,000 | | | | 201,698 | |
| Multi-Utilities – 0.6% | |
Berkshire Hathaway Energy Co. | | | | | |
3.25%, 4/15/2028 | | | 100,000 | | | | 94,099 | |
Dominion Energy, Inc. | | | | | |
4.45%, 3/15/2021 | | | 150,000 | | | | 152,467 | |
DTE Energy Co. | | | | | |
3.80%, 3/15/2027 | | | 100,000 | | | | 96,787 | |
| | | | | | | | 343,353 | |
| Oil, Gas & Consumable Fuels – 6.6% | |
BP Capital Markets plc | | | | | |
3.22%, 11/28/2023 | | | 350,000 | | | | 341,237 | |
3.12%, 5/4/2026 | | | 300,000 | | | | 282,582 | |
3.02%, 1/16/2027 | | | 150,000 | | | | 139,137 | |
3.28%, 9/19/2027 | | | 50,000 | | | | 47,157 | |
Canadian Natural Resources Ltd. | | | | | |
3.80%, 4/15/2024 | | | 200,000 | | | | 196,802 | |
Chevron Corp. | | | | | |
2.95%, 5/16/2026 | | | 300,000 | | | | 282,711 | |
Energy Transfer Operating LP | | | | | |
4.65%, 6/1/2021 | | | 200,000 | | | | 203,687 | |
See Accompanying Notes to the Financial Statements.
| | | | |
| FLEXSHARES ANNUAL REPORT | | | 319 | |
FlexShares® Credit-Scored US Corporate Bond Index Fund (cont.)
| | | | | | | | |
| Investments | | Principal
Amount | | | Value | |
| CORPORATE BONDS – (continued) | |
| Oil, Gas & Consumable Fuels – (continued) | |
Enterprise Products Operating LLC | | | | | | | | |
3.35%, 3/15/2023 | | $ | 180,000 | | | $ | 176,428 | |
3.75%, 2/15/2025 | | | 200,000 | | | | 196,260 | |
4.15%, 10/16/2028 | | | 100,000 | | | | 98,374 | |
EOG Resources, Inc. | | | | | |
4.15%, 1/15/2026 | | | 100,000 | | | | 100,997 | |
Exxon Mobil Corp. | | | | | |
2.22%, 3/1/2021 | | | 100,000 | | | | 97,735 | |
2.73%, 3/1/2023 | | | 160,000 | | | | 155,544 | |
Kinder Morgan, Inc. | | | | | |
4.30%, 6/1/2025 | | | 100,000 | | | | 99,606 | |
MPLX LP | | | | | |
4.13%, 3/1/2027 | | | 350,000 | | | | 334,497 | |
Occidental Petroleum Corp. | | | | | |
2.70%, 2/15/2023 | | | 80,000 | | | | 76,951 | |
3.40%, 4/15/2026 | | | 100,000 | | | | 96,902 | |
ONEOK Partners LP | | | | | |
4.90%, 3/15/2025 | | | 150,000 | | | | 153,805 | |
Plains All American Pipeline LP | | | | | |
4.65%, 10/15/2025 | | | 50,000 | | | | 49,390 | |
Sabine Pass Liquefaction LLC | | | | | |
5.63%, 2/1/2021(b) | | | 150,000 | | | | 155,282 | |
Total Capital International SA | | | | | |
3.75%, 4/10/2024 | | | 180,000 | | | | 180,861 | |
Transcontinental Gas Pipe Line Co. LLC | | | | | | | | |
7.85%, 2/1/2026 | | | 150,000 | | | | 180,303 | |
Williams Cos., Inc. (The) | | | | | |
4.13%, 11/15/2020 | | | 100,000 | | | | 100,959 | |
3.75%, 6/15/2027 | | | 250,000 | | | | 233,205 | |
| | | | | | | | 3,980,412 | |
| Pharmaceuticals – 2.2% | |
AstraZeneca plc | | | | | |
3.38%, 11/16/2025 | | | 50,000 | | | | 47,582 | |
3.13%, 6/12/2027 | | | 100,000 | | | | 91,612 | |
GlaxoSmithKline Capital, Inc. | | | | | |
3.38%, 5/15/2023 | | | 400,000 | | | | 396,276 | |
Merck & Co., Inc. | | | | | |
2.75%, 2/10/2025 | | | 115,000 | | | | 109,081 | |
Novartis Capital Corp. | | | | | |
3.10%, 5/17/2027 | | | 100,000 | | | | 94,881 | |
| | | | | | | | |
| Investments | | Principal
Amount | | | Value | |
| Pharmaceuticals – (continued) | |
Pfizer, Inc. | | | | | |
1.95%, 6/3/2021 | | $ | 150,000 | | | $ | 145,659 | |
3.00%, 12/15/2026 | | | 100,000 | | | | 94,799 | |
Shire Acquisitions Investments Ireland DAC | | | | | | | | |
2.88%, 9/23/2023 | | | 200,000 | | | | 188,884 | |
Zoetis, Inc. | | | | | |
3.25%, 2/1/2023 | | | 150,000 | | | | 147,069 | |
| | | | | | | | 1,315,843 | |
| Road & Rail – 0.6% | |
CSX Corp. | | | | | |
2.60%, 11/1/2026 | | | 100,000 | | | | 89,676 | |
Union Pacific Corp. | | | | | |
4.16%, 7/15/2022 | | | 100,000 | | | | 102,324 | |
3.95%, 9/10/2028 | | | 150,000 | | | | 147,677 | |
| | | | | | | | 339,677 | |
| Semiconductors & Semiconductor Equipment – 1.6% | |
Analog Devices, Inc. | | | | | |
3.50%, 12/5/2026 | | | 150,000 | | | | 141,736 | |
Broadcom Corp. | | | | | |
2.20%, 1/15/2021 | | | 100,000 | | | | 96,694 | |
3.00%, 1/15/2022 | | | 200,000 | | | | 193,757 | |
Intel Corp. | | | | | |
2.70%, 12/15/2022 | | | 200,000 | | | | 194,491 | |
QUALCOMM, Inc. | | | | | |
3.00%, 5/20/2022 | | | 200,000 | | | | 196,096 | |
3.25%, 5/20/2027 | | | 150,000 | | | | 138,872 | |
| | | | | | | | 961,646 | |
| Software – 2.1% | |
Microsoft Corp. | | | | | |
2.70%, 2/12/2025 | | | 140,000 | | | | 132,911 | |
3.13%, 11/3/2025 | | | 150,000 | | | | 145,354 | |
2.40%, 8/8/2026 | | | 100,000 | | | | 91,294 | |
Oracle Corp. | | | | | |
2.50%, 5/15/2022 | | | 560,000 | | | | 542,300 | |
2.65%, 7/15/2026 | | | 200,000 | | | | 183,092 | |
3.25%, 11/15/2027 | | | 200,000 | | | | 189,348 | |
| | | | | | | | 1,284,299 | |
See Accompanying Notes to the Financial Statements.
| | |
| 320 | | FLEXSHARES ANNUAL REPORT |
FlexShares® Credit-Scored US Corporate Bond Index Fund (cont.)
| | | | | | | | |
| Investments | | Principal
Amount | | | Value | |
| CORPORATE BONDS – (continued) | |
| Specialty Retail – 1.1% | |
AutoZone, Inc. | | | | | |
3.70%, 4/15/2022 | | $ | 145,000 | | | $ | 145,346 | |
Home Depot, Inc. (The) | | | | | |
2.63%, 6/1/2022 | | | 200,000 | | | | 195,356 | |
3.00%, 4/1/2026 | | | 130,000 | | | | 123,292 | |
Lowe’s Cos., Inc. | | | | | |
3.38%, 9/15/2025 | | | 100,000 | | | | 96,819 | |
3.10%, 5/3/2027 | | | 100,000 | | | | 93,988 | |
| | | | | | | | 654,801 | |
| Technology Hardware, Storage & Peripherals – 2.7% | |
Apple, Inc. | | | | | |
2.50%, 2/9/2022 | | | 150,000 | | | | 146,093 | |
3.00%, 2/9/2024 | | | 225,000 | | | | 218,744 | |
3.45%, 5/6/2024 | | | 450,000 | | | | 445,530 | |
3.00%, 6/20/2027 | | | 600,000 | | | | 561,949 | |
Hewlett Packard Enterprise Co. | | | | | |
4.40%, 10/15/2022(b) | | | 200,000 | | | | 204,060 | |
Seagate HDD Cayman | | | | | |
4.88%, 6/1/2027 | | | 100,000 | | | | 88,533 | |
| | | | | | | | 1,664,909 | |
| Tobacco – 1.4% | |
Altria Group, Inc. | | | | | |
2.85%, 8/9/2022 | | | 160,000 | | | | 155,569 | |
4.00%, 1/31/2024 | | | 100,000 | | | | 100,220 | |
2.63%, 9/16/2026 | | | 160,000 | | | | 143,948 | |
Philip Morris International, Inc. | | | | | |
2.50%, 11/2/2022 | | | 200,000 | | | | 191,902 | |
2.75%, 2/25/2026 | | | 100,000 | | | | 92,301 | |
Reynolds American, Inc. | | | | | |
4.00%, 6/12/2022 | | | 150,000 | | | | 150,417 | |
| | | | | | | | 834,357 | |
| | | | | | | | |
| Investments | | Principal
Amount | | | Value | |
| Trading Companies & Distributors – 0.4% | |
Air Lease Corp. | | | | | |
3.38%, 6/1/2021 | | $ | 105,000 | | | $ | 103,848 | |
3.00%, 9/15/2023 | | | 155,000 | | | | 146,147 | |
| | | | | | | | 249,995 | |
Total Corporate Bonds
(Cost $61,821,711) | | | | 60,097,304 | |
| | | | | | |
Total Investments – 98.9%
(Cost $61,821,711) | | | | 60,097,304 | |
Other Assets Less Liabilities – 1.1% | | | | 638,466 | |
| NET ASSETS – 100.0% | | | $ | 60,735,770 | |
| (a) | Security issued at a fixed coupon rate, which converts to a variable rate at a future date. Rate shown is the rate in effect as of period end. |
| (b) | Step bond. Interest rate is a fixed rate for an initial period that either resets at a specific date or may reset in the future at a contingent upon predetermined trigger. The interest rate shown was the current rate as of October 31, 2018. |
Percentages shown are based on Net Assets.
As of October 31, 2018, the gross unrealized appreciation (depreciation) of investments based on the aggregate cost of investments (including derivative instruments, if applicable) for federal income tax purposes was as follows:
| | | | |
| | | | |
Aggregate gross unrealized appreciation | | $ | 1,865 | |
Aggregate gross unrealized depreciation | | | (1,731,469 | ) |
Net unrealized depreciation | | $ | (1,729,604 | ) |
Federal income tax cost | | $ | 61,826,908 | |
See Accompanying Notes to the Financial Statements.
| | | | |
| FLEXSHARES ANNUAL REPORT | | | 321 | |
Schedule of Investments
FlexShares® Credit-Scored US Long Corporate Bond Index Fund
October 31, 2018
| | | | | | | | |
| Investments | | Principal
Amount | | | Value | |
| CORPORATE BONDS – 98.2% | |
| Aerospace & Defense – 3.0% | |
Harris Corp. | | | | | | | | |
5.05%, 4/27/2045 | | $ | 25,000 | | | $ | 25,837 | |
Lockheed Martin Corp. | | | | | | | | |
4.70%, 5/15/2046 | | | 150,000 | | | | 152,631 | |
Northrop Grumman Corp. | | | | | | | | |
4.75%, 6/1/2043 | | | 125,000 | | | | 125,149 | |
Raytheon Co. | | | | | | | | |
4.88%, 10/15/2040 | | | 20,000 | | | | 21,527 | |
Rockwell Collins, Inc. | | | | | | | | |
4.35%, 4/15/2047 | | | 35,000 | | | | 32,538 | |
United Technologies Corp. | | | | | | | | |
5.70%, 4/15/2040 | | | 140,000 | | | | 153,535 | |
4.50%, 6/1/2042 | | | 205,000 | | | | 194,818 | |
4.05%, 5/4/2047 | | | 115,000 | | | | 101,098 | |
| | | | | | | | 807,133 | |
| Air Freight & Logistics – 1.2% | |
FedEx Corp. | | | | | | | | |
3.90%, 2/1/2035 | | | 100,000 | | | | 90,977 | |
5.10%, 1/15/2044 | | | 65,000 | | | | 64,394 | |
4.75%, 11/15/2045 | | | 120,000 | | | | 114,383 | |
United Parcel Service, Inc. | | | | | | | | |
3.75%, 11/15/2047 | | | 50,000 | | | | 43,982 | |
| | | | | | | | 313,736 | |
| Automobiles – 0.4% | |
Daimler Finance North America LLC | | | | | | | | |
8.50%, 1/18/2031 | | | 75,000 | | | | 102,383 | |
| Banks – 10.9% | |
Bank of America Corp. | | | | | | | | |
4.24%, 4/24/2038(a) | | | 300,000 | | | | 284,013 | |
5.00%, 1/21/2044 | | | 95,000 | | | | 97,341 | |
Series L, 4.75%, 4/21/2045 | | | 140,000 | | | | 138,132 | |
4.44%, 1/20/2048(a) | | | 105,000 | | | | 100,240 | |
Citigroup, Inc. | | | | | | | | |
6.63%, 6/15/2032 | | | 250,000 | | | | 291,156 | |
8.13%, 7/15/2039 | | | 27,000 | | | | 37,808 | |
5.88%, 1/30/2042 | | | 40,000 | | | | 45,334 | |
5.30%, 5/6/2044 | | | 145,000 | | | | 146,606 | |
4.65%, 7/30/2045 | | | 105,000 | | | | 100,789 | |
| | | | | | | | |
| Investments | | Principal
Amount | | | Value | |
| Banks – (continued) | |
4.75%, 5/18/2046 | | $ | 40,000 | | | $ | 37,441 | |
4.28%, 4/24/2048(a) | | | 70,000 | | | | 64,429 | |
4.65%, 7/23/2048 | | | 50,000 | | | | 48,477 | |
Fifth Third Bancorp | | | | | | | | |
8.25%, 3/1/2038 | | | 30,000 | | | | 40,194 | |
HSBC Holdings plc | | | | | | | | |
6.10%, 1/14/2042 | | | 175,000 | | | | 203,937 | |
JPMorgan Chase & Co. | | | | | | | | |
6.40%, 5/15/2038 | | | 205,000 | | | | 246,936 | |
4.95%, 6/1/2045 | | | 265,000 | | | | 268,410 | |
4.26%, 2/22/2048(a) | | | 150,000 | | | | 138,453 | |
3.90%, 1/23/2049(a) | | | 320,000 | | | | 277,291 | |
Wells Fargo & Co. | | | | | | | | |
5.38%, 11/2/2043 | | | 175,000 | | | | 180,539 | |
5.61%, 1/15/2044 | | | 135,000 | | | | 144,020 | |
| | | | | | | | 2,891,546 | |
| Beverages – 0.7% | |
Diageo Capital plc | | | | | | | | |
5.88%, 9/30/2036 | | | 50,000 | | | | 58,283 | |
PepsiCo, Inc. | | | | | | | | |
3.45%, 10/6/2046 | | | 135,000 | | | | 115,678 | |
| | | | | | | | 173,961 | |
| Biotechnology – 5.2% | |
AbbVie, Inc. | | | | | | | | |
4.50%, 5/14/2035 | | | 200,000 | | | | 184,980 | |
4.40%, 11/6/2042 | | | 170,000 | | | | 149,856 | |
4.70%, 5/14/2045 | | | 200,000 | | | | 180,957 | |
Amgen, Inc. | | | | | | | | |
6.38%, 6/1/2037 | | | 20,000 | | | | 23,252 | |
5.15%, 11/15/2041 | | | 65,000 | | | | 67,082 | |
4.40%, 5/1/2045 | | | 150,000 | | | | 136,983 | |
4.66%, 6/15/2051 | | | 80,000 | | | | 74,369 | |
Biogen, Inc. | | | | | | | | |
5.20%, 9/15/2045 | | | 95,000 | | | | 95,516 | |
Celgene Corp. | | | | | | | | |
5.00%, 8/15/2045 | | | 200,000 | | | | 187,684 | |
Gilead Sciences, Inc. | | | | | | | | |
4.75%, 3/1/2046 | | | 150,000 | | | | 145,344 | |
4.15%, 3/1/2047 | | | 160,000 | | | | 142,258 | |
| | | | | | | | 1,388,281 | |
See Accompanying Notes to the Financial Statements.
| | |
| 322 | | FLEXSHARES ANNUAL REPORT |
FlexShares® Credit-Scored US Long Corporate Bond Index Fund (cont.)
| | | | | | | | |
| Investments | | Principal
Amount | | | Value | |
| CORPORATE BONDS – (continued) | |
| Building Products – 0.4% | |
Johnson Controls International plc | | | | | | | | |
5.13%, 9/14/2045 | | $ | 100,000 | | | $ | 99,541 | |
| Capital Markets – 4.1% | |
CME Group, Inc. | | | | | | | | |
5.30%, 9/15/2043 | | | 30,000 | | | | 33,679 | |
Credit Suisse USA, Inc. | | | | | | | | |
7.13%, 7/15/2032 | | | 75,000 | | | | 94,182 | |
Goldman Sachs Group, Inc. (The) | | | | | | | | |
6.75%, 10/1/2037 | | | 195,000 | | | | 228,003 | |
4.02%, 10/31/2038(a) | | | 150,000 | | | | 133,921 | |
6.25%, 2/1/2041 | | | 220,000 | | | | 255,873 | |
4.75%, 10/21/2045 | | | 115,000 | | | | 112,146 | |
Morgan Stanley | | | | | | | | |
6.38%, 7/24/2042 | | | 90,000 | | | | 109,140 | |
4.30%, 1/27/2045 | | | 70,000 | | | | 64,552 | |
Raymond James Financial, Inc. | | | | | | | | |
4.95%, 7/15/2046 | | | 50,000 | | | | 48,308 | |
| | | | | | | | 1,079,804 | |
| Chemicals – 1.9% | |
Dow Chemical Co. (The) | | | | | | | | |
4.25%, 10/1/2034 | | | 100,000 | | | | 91,567 | |
4.38%, 11/15/2042 | | | 150,000 | | | | 132,737 | |
Eastman Chemical Co. | | | | | | | | |
4.80%, 9/1/2042 | | | 50,000 | | | | 46,391 | |
EI du Pont de Nemours & Co. | | | | | | | | |
4.15%, 2/15/2043 | | | 50,000 | | | | 44,963 | |
International Flavors & Fragrances, Inc. | | | | | | | | |
4.38%, 6/1/2047 | | | 50,000 | | | | 44,186 | |
LYB International Finance BV | | | | | | | | |
4.88%, 3/15/2044 | | | 100,000 | | | | 91,766 | |
Praxair, Inc. | | | | | | | | |
3.55%, 11/7/2042 | | | 10,000 | | | | 8,971 | |
Sherwin-Williams Co. (The) | | | | | | | | |
4.50%, 6/1/2047 | | | 50,000 | | | | 45,055 | |
| | | | | | | | 505,636 | |
| Communications Equipment – 0.5% | |
Cisco Systems, Inc. | | | | | | | | |
5.90%, 2/15/2039 | | | 100,000 | | | | 121,151 | |
| | | | | | | | |
| Investments | | Principal
Amount | | | Value | |
| Consumer Finance – 0.1% | |
American Express Co. | | | | | | | | |
4.05%, 12/3/2042 | | $ | 30,000 | | | $ | 28,166 | |
| Diversified Financial Services – 1.1% | |
Shell International Finance BV | | | | | | | | |
6.38%, 12/15/2038 | | | 100,000 | | | | 126,375 | |
4.38%, 5/11/2045 | | | 155,000 | | | | 152,972 | |
| | | | | | | | 279,347 | |
| Diversified Telecommunication Services – 7.7% | |
AT&T, Inc. | | | | | | | | |
4.50%, 5/15/2035 | | | 50,000 | | | | 45,237 | |
5.35%, 9/1/2040 | | | 100,000 | | | | 95,657 | |
Bell Canada, Inc. | | | | | | | | |
4.46%, 4/1/2048 | | | 50,000 | | | | 47,972 | |
British Telecommunications plc | | | | | | | | |
9.63%, 12/15/2030(b) | | | 95,000 | | | | 132,552 | |
Deutsche Telekom International Finance BV | | | | | | | | |
8.75%, 6/15/2030(b) | | | 180,000 | | | | 239,604 | |
Orange SA | | | | | | | | |
9.00%, 3/1/2031(b) | | | 90,000 | | | | 124,059 | |
Verizon Communications, Inc. | | | | | | | | |
4.27%, 1/15/2036 | | | 175,000 | | | | 160,695 | |
5.25%, 3/16/2037 | | | 230,000 | | | | 237,163 | |
4.75%, 11/1/2041 | | | 230,000 | | | | 216,228 | |
4.86%, 8/21/2046 | | | 135,000 | | | | 128,917 | |
5.50%, 3/16/2047 | | | 270,000 | | | | 282,360 | |
5.01%, 8/21/2054 | | | 350,000 | | | | 336,707 | |
| | | | | | | | 2,047,151 | |
| Electric Utilities – 4.1% | |
Alabama Power Co. | | | | | | | | |
Series A, 4.30%, 7/15/2048 | | | 150,000 | | | | 144,877 | |
Appalachian Power Co. | | | | | | | | |
7.00%, 4/1/2038 | | | 35,000 | | | | 44,104 | |
Commonwealth Edison Co. | | | | | | | | |
5.90%, 3/15/2036 | | | 125,000 | | | | 143,786 | |
Duke Energy Carolinas LLC | | | | | | | | |
3.95%, 3/15/2048 | | | 50,000 | | | | 45,836 | |
Exelon Corp. | | | | | | | | |
5.10%, 6/15/2045 | | | 100,000 | | | | 102,574 | |
FirstEnergy Corp. | | | | | | | | |
Series C, 7.38%, 11/15/2031 | | | 60,000 | | | | 75,974 | |
See Accompanying Notes to the Financial Statements.
| | | | |
| FLEXSHARES ANNUAL REPORT | | | 323 | |
FlexShares® Credit-Scored US Long Corporate Bond Index Fund (cont.)
| | | | | | | | |
| Investments | | Principal
Amount | | | Value | |
| CORPORATE BONDS – (continued) | |
| Electric Utilities – (continued) | |
Florida Power & Light Co. | | | | | | | | |
4.13%, 2/1/2042 | | $ | 85,000 | | | $ | 82,980 | |
Pacific Gas & Electric Co. | | | | | | | | |
6.05%, 3/1/2034 | | | 150,000 | | | | 161,020 | |
5.40%, 1/15/2040 | | | 50,000 | | | | 50,099 | |
Public Service Electric & Gas Co. | | | | | | | | |
3.80%, 3/1/2046 | | | 50,000 | | | | 46,087 | |
Southern California Edison Co. | | | | | | | | |
Series C, 4.13%, 3/1/2048 | | | 200,000 | | | | 185,883 | |
| | | | | | | | 1,083,220 | |
| Electrical Equipment – 0.1% | |
Eaton Corp. | | | | | | | | |
4.15%, 11/2/2042 | | | 35,000 | | | | 32,199 | |
| Electronic Equipment, Instruments & Components – 0.2% | |
Corning, Inc. | | | | | | | | |
4.75%, 3/15/2042 | | | 50,000 | | | | 47,056 | |
| Energy Equipment & Services – 1.0% | |
Halliburton Co. | | | | | | | | |
4.85%, 11/15/2035 | | | 260,000 | | | | 261,916 | |
| Entertainment – 2.9% | |
21st Century Fox America, Inc. | | | | | | | | |
6.20%, 12/15/2034 | | | 75,000 | | | | 89,784 | |
4.75%, 9/15/2044 | | | 275,000 | | | | 284,513 | |
NBCUniversal Media LLC | | | | | | | | |
5.95%, 4/1/2041 | | | 115,000 | | | | 128,467 | |
4.45%, 1/15/2043 | | | 165,000 | | | | 153,789 | |
Viacom, Inc. | | | | | | | | |
4.38%, 3/15/2043 | | | 150,000 | | | | 123,178 | |
| | | | | | | | 779,731 | |
| Equity Real Estate Investment Trusts (REITs) – 0.7% | |
ERP Operating LP | | | | | | | | |
4.50%, 7/1/2044 | | | 25,000 | | | | 24,509 | |
Federal Realty Investment Trust | | | | | | | | |
4.50%, 12/1/2044 | | | 30,000 | | | | 28,930 | |
Simon Property Group LP | | | | | | | | |
4.75%, 3/15/2042 | | | 85,000 | | | | 86,066 | |
Weyerhaeuser Co. | | | | | | | | |
7.38%, 3/15/2032 | | | 40,000 | | | | 49,191 | |
| | | | | | | | 188,696 | |
| | | | | | | | |
| Investments | | Principal
Amount | | | Value | |
| Food & Staples Retailing – 1.4% | |
Sysco Corp. | | | | | | | | |
4.85%, 10/1/2045 | | $ | 40,000 | | | $ | 39,544 | |
Walgreen Co. | | | | | | | | |
4.40%, 9/15/2042 | | | 105,000 | | | | 92,984 | |
Walmart, Inc. | | | | | | | | |
6.50%, 8/15/2037 | | | 100,000 | | | | 127,310 | |
4.05%, 6/29/2048 | | | 125,000 | | | | 119,181 | |
| | | | | | | | 379,019 | |
| Food Products – 1.2% | |
Archer-Daniels-Midland Co. | | | | | | | | |
4.02%, 4/16/2043 | | | 100,000 | | | | 93,315 | |
Kellogg Co. | | | | | | | | |
Series B, 7.45%, 4/1/2031 | | | 50,000 | | | | 62,168 | |
Mead Johnson Nutrition Co. | | | | | | | | |
4.60%, 6/1/2044 | | | 35,000 | | | | 35,675 | |
Tyson Foods, Inc. | | | | | | | | |
4.88%, 8/15/2034 | | | 100,000 | | | | 98,329 | |
Unilever Capital Corp. | | | | | | | | |
5.90%, 11/15/2032 | | | 25,000 | | | | 30,128 | |
| | | | | | | | 319,615 | |
| Gas Utilities – 0.4% | |
Atmos Energy Corp. | | | | | | | | |
4.13%, 10/15/2044 | | | 50,000 | | | | 47,672 | |
Dominion Energy Gas Holdings LLC | | | | | | | | |
4.60%, 12/15/2044 | | | 50,000 | | | | 48,279 | |
| | | | | | | | 95,951 | |
| Health Care Equipment & Supplies – 1.6% | |
Abbott Laboratories | | | | | | | | |
5.30%, 5/27/2040 | | | 50,000 | | | | 53,362 | |
4.90%, 11/30/2046 | | | 150,000 | | | | 155,149 | |
Koninklijke Philips NV | | | | | | | | |
5.00%, 3/15/2042 | | | 40,000 | | | | 41,968 | |
Medtronic, Inc. | | | | | | | | |
4.38%, 3/15/2035 | | | 145,000 | | | | 144,667 | |
Stryker Corp. | | | | | | | | |
4.63%, 3/15/2046 | | | 40,000 | | | | 38,999 | |
| | | | | | | | 434,145 | |
See Accompanying Notes to the Financial Statements.
| | |
| 324 | | FLEXSHARES ANNUAL REPORT |
FlexShares® Credit-Scored US Long Corporate Bond Index Fund (cont.)
| | | | | | | | |
| Investments | | Principal
Amount | | | Value | |
| CORPORATE BONDS – (continued) | |
| Health Care Providers & Services – 2.4% | |
Aetna, Inc. | | | | | | | | |
6.63%, 6/15/2036 | | $ | 100,000 | | | $ | 117,550 | |
6.75%, 12/15/2037 | | | 35,000 | | | | 41,814 | |
Anthem, Inc. | | | | | | | | |
4.65%, 1/15/2043 | | | 175,000 | | | | 165,863 | |
Cigna Corp. | | | | | | | | |
3.88%, 10/15/2047 | | | 50,000 | | | | 40,659 | |
CVS Health Corp. | | | | | | | | |
4.78%, 3/25/2038 | | | 25,000 | | | | 24,130 | |
Express Scripts Holding Co. | | | | | | | | |
4.80%, 7/15/2046 | | | 60,000 | | | | 56,597 | |
Humana, Inc. | | | | | | | | |
4.95%, 10/1/2044 | | | 15,000 | | | | 15,132 | |
UnitedHealth Group, Inc. | | | | | | | | |
4.63%, 7/15/2035 | | | 170,000 | | | | 175,152 | |
| | | | | | | | 636,897 | |
| Hotels, Restaurants & Leisure – 1.3% | |
McDonald’s Corp. | | | | | | | | |
6.30%, 3/1/2038 | | | 110,000 | | | | 129,656 | |
4.88%, 12/9/2045 | | | 150,000 | | | | 150,608 | |
Starbucks Corp. | | | | | | | | |
3.75%, 12/1/2047 | | | 75,000 | | | | 62,094 | |
| | | | | | | | 342,358 | |
| Household Products – 0.2% | |
Kimberly-Clark Corp. | | | | | | | | |
6.63%, 8/1/2037 | | | 50,000 | | | | 63,609 | |
| Industrial Conglomerates – 0.3% | |
3M Co. | | | | | | | | |
3.63%, 10/15/2047 | | | 50,000 | | | | 44,568 | |
Ingersoll-Rand Global Holding Co. Ltd. | | | | | | | | |
5.75%, 6/15/2043 | | | 25,000 | | | | 27,867 | |
| | | | | | | | 72,435 | |
| Insurance – 3.0% | |
Allstate Corp. (The) | | | | | | | | |
6.50%, 5/15/2057(a) | | | 15,000 | | | | 16,238 | |
American International Group, Inc. | | | | | | | | |
3.88%, 1/15/2035 | | | 130,000 | | | | 111,811 | |
4.50%, 7/16/2044 | | | 40,000 | | | | 35,575 | |
| | | | | | | | |
| Investments | | Principal
Amount | | | Value | |
| Insurance – (continued) | |
Aon plc | | | | | | | | |
4.75%, 5/15/2045 | | $ | 65,000 | | | $ | 62,827 | |
Berkshire Hathaway Finance Corp. | | | | | | | | |
5.75%, 1/15/2040 | | | 75,000 | | | | 86,736 | |
Chubb Corp. (The) | | | | | | | | |
6.00%, 5/11/2037 | | | 65,000 | | | | 76,995 | |
Manulife Financial Corp. | | | | | | | | |
5.38%, 3/4/2046 | | | 35,000 | | | | 37,562 | |
Marsh & McLennan Cos., Inc. | | | | | | | | |
4.35%, 1/30/2047 | | | 75,000 | | | | 70,018 | |
MetLife, Inc. | | | | | | | | |
6.40%, 12/15/2036 | | | 70,000 | | | | 72,765 | |
4.60%, 5/13/2046 | | | 55,000 | | | | 53,783 | |
Principal Financial Group, Inc. | | | | | | | | |
6.05%, 10/15/2036 | | | 30,000 | | | | 34,482 | |
Prudential Financial, Inc. | | | | | | | | |
3.94%, 12/7/2049 | | | 50,000 | | | | 43,491 | |
Travelers Cos., Inc. (The) | | | | | | | | |
4.05%, 3/7/2048 | | | 100,000 | | | | 93,538 | |
| | | | | | | | 795,821 | |
| Internet & Direct Marketing Retail – 1.3% | |
Alibaba Group Holding Ltd. | | | | | | | | |
4.00%, 12/6/2037 | | | 200,000 | | | | 176,345 | |
Amazon.com, Inc. | | | | | | | | |
4.25%, 8/22/2057 | | | 150,000 | | | | 141,023 | |
eBay, Inc. | | | | | | | | |
4.00%, 7/15/2042 | | | 40,000 | | | | 31,072 | |
| | | | | | | | 348,440 | |
| IT Services – 0.7% | |
Fidelity National Information Services, Inc. | | | | | | | | |
4.75%, 5/15/2048 | | | 50,000 | | | | 47,916 | |
International Business Machines Corp. | | | | | | | | |
5.88%, 11/29/2032 | | | 50,000 | | | | 57,933 | |
Visa, Inc. | | | | | | | | |
4.30%, 12/14/2045 | | | 80,000 | | | | 79,303 | |
| | | | | | | | 185,152 | |
| Life Sciences Tools & Services – 0.2% | |
Thermo Fisher Scientific, Inc. | | | | | | | | |
4.10%, 8/15/2047 | | | 50,000 | | | | 45,089 | |
See Accompanying Notes to the Financial Statements.
| | | | |
| FLEXSHARES ANNUAL REPORT | | | 325 | |
FlexShares® Credit-Scored US Long Corporate Bond Index Fund (cont.)
| | | | | | | | |
| Investments | | Principal
Amount | | | Value | |
| CORPORATE BONDS – (continued) | |
| Machinery – 0.2% | |
Fortive Corp. | | | | | | | | |
4.30%, 6/15/2046 | | $ | 30,000 | | | $ | 27,635 | |
Illinois Tool Works, Inc. | | | | | | | | |
3.90%, 9/1/2042 | | | 30,000 | | | | 28,449 | |
| | | | | | | | 56,084 | |
| Media – 4.5% | |
CBS Corp. | | | | | | | | |
4.60%, 1/15/2045 | | | 100,000 | | | | 90,432 | |
Comcast Corp. | | | | | | | | |
6.50%, 11/15/2035 | | | 255,000 | | | | 301,491 | |
4.60%, 10/15/2038 | | | 500,000 | | | | 490,177 | |
3.40%, 7/15/2046 | | | 165,000 | | | | 130,445 | |
4.00%, 11/1/2049 | | | 200,000 | | | | 171,673 | |
| | | | | | | | 1,184,218 | |
| Metals & Mining – 0.8% | |
BHP Billiton Finance USA Ltd. | | | | | | | | |
5.00%, 9/30/2043 | | | 50,000 | | | | 53,953 | |
Nucor Corp. | | | | | | | | |
4.40%, 5/1/2048 | | | 75,000 | | | | 70,420 | |
Rio Tinto Finance USA Ltd. | | | | | | | | |
5.20%, 11/2/2040 | | | 75,000 | | | | 80,995 | |
| | | | | | | | 205,368 | |
| Multiline Retail – 0.2% | |
Target Corp. | | | | | | | | |
3.63%, 4/15/2046 | | | 50,000 | | | | 43,357 | |
| Multi-Utilities – 2.6% | |
Berkshire Hathaway Energy Co. | | | | | | | | |
5.15%, 11/15/2043 | | | 130,000 | | | | 137,755 | |
4.50%, 2/1/2045 | | | 110,000 | | | | 106,869 | |
Consolidated Edison Co. of New York, Inc. | | | | | | | | |
4.63%, 12/1/2054 | | | 131,000 | | | | 127,970 | |
Dominion Energy, Inc. | | | | | | | | |
Series B, 5.95%, 6/15/2035 | | | 155,000 | | | | 172,283 | |
Sempra Energy | | | | | | | | |
4.00%, 2/1/2048 | | | 100,000 | | | | 87,328 | |
Southern Co. Gas Capital Corp. | | | | | | | | |
3.95%, 10/1/2046 | | | 50,000 | | | | 42,881 | |
| | | | | | | | 675,086 | |
| | | | | | | | |
| Investments | | Principal
Amount | | | Value | |
| Oil, Gas & Consumable Fuels – 10.3% | |
Anadarko Petroleum Corp. | | | | | |
4.50%, 7/15/2044 | | $ | 100,000 | | | $ | 87,721 | |
Apache Corp. | | | | | | | | |
6.00%, 1/15/2037 | | | 70,000 | | | | 74,298 | |
4.75%, 4/15/2043 | | | 100,000 | | | | 89,111 | |
Canadian Natural Resources Ltd. | | | | | | | | |
6.25%, 3/15/2038 | | | 100,000 | | | | 112,995 | |
Cenovus Energy, Inc. | | | | | |
5.25%, 6/15/2037 | | | 150,000 | | | | 141,361 | |
Concho Resources, Inc. | | | | | |
4.88%, 10/1/2047 | | | 50,000 | | | | 47,438 | |
ConocoPhillips | | | | | |
5.90%, 10/15/2032 | | | 240,000 | | | | 280,132 | |
Enterprise Products Operating LLC | | | | | | | | |
5.95%, 2/1/2041 | | | 125,000 | | | | 137,103 | |
4.85%, 3/15/2044 | | | 150,000 | | | | 144,738 | |
5.10%, 2/15/2045 | | | 85,000 | | | | 84,768 | |
4.25%, 2/15/2048 | | | 100,000 | | | | 88,837 | |
Exxon Mobil Corp. | | | | | |
4.11%, 3/1/2046 | | | 75,000 | | | | 72,554 | |
Magellan Midstream Partners LP | | | | | | | | |
5.15%, 10/15/2043 | | | 20,000 | | | | 20,142 | |
4.20%, 10/3/2047 | | | 80,000 | | | | 70,658 | |
Marathon Petroleum Corp. | | | | | |
6.50%, 3/1/2041 | | | 80,000 | | | | 90,064 | |
MPLX LP | | | | | |
4.50%, 4/15/2038 | | | 200,000 | | | | 178,762 | |
Occidental Petroleum Corp. | | | | | |
4.63%, 6/15/2045 | | | 105,000 | | | | 105,402 | |
ONEOK Partners LP | | | | | |
6.13%, 2/1/2041 | | | 60,000 | | | | 62,924 | |
ONEOK, Inc. | | | | | |
4.95%, 7/13/2047 | | | 50,000 | | | | 47,441 | |
Petro-Canada | | | | | |
5.95%, 5/15/2035 | | | 120,000 | | | | 134,252 | |
Phillips 66 | | | | | |
5.88%, 5/1/2042 | | | 155,000 | | | | 169,572 | |
Phillips 66 Partners LP | | | | | |
4.90%, 10/1/2046 | | | 30,000 | | | | 27,806 | |
Suncor Energy, Inc. | | | | | |
4.00%, 11/15/2047 | | | 135,000 | | | | 121,630 | |
TransCanada PipeLines Ltd. | | | | | |
4.63%, 3/1/2034 | | | 50,000 | | | | 47,932 | |
See Accompanying Notes to the Financial Statements.
| | |
| 326 | | FLEXSHARES ANNUAL REPORT |
FlexShares® Credit-Scored US Long Corporate Bond Index Fund (cont.)
| | | | | | | | |
| Investments | | Principal
Amount | | | Value | |
| CORPORATE BONDS – (continued) | |
| Oil, Gas & Consumable Fuels – (continued) | |
Valero Energy Corp. | | | | | |
6.63%, 6/15/2037 | | $ | 105,000 | | | $ | 120,569 | |
Williams Cos., Inc. (The) | | | | | | | | |
6.30%, 4/15/2040 | | | 150,000 | | | | 159,829 | |
| | | | | | | | 2,718,039 | |
| Pharmaceuticals – 3.6% | |
AstraZeneca plc | | | | | |
6.45%, 9/15/2037 | | | 50,000 | | | | 59,001 | |
4.38%, 11/16/2045 | | | 135,000 | | | | 124,512 | |
Eli Lilly & Co. | | | | | |
3.70%, 3/1/2045 | | | 30,000 | | | | 27,347 | |
GlaxoSmithKline Capital, Inc. | | | | | | | | |
5.38%, 4/15/2034 | | | 35,000 | | | | 39,102 | |
6.38%, 5/15/2038 | | | 50,000 | | | | 62,456 | |
Johnson & Johnson | | | | | |
3.63%, 3/3/2037 | | | 100,000 | | | | 92,837 | |
3.70%, 3/1/2046 | | | 120,000 | | | | 109,179 | |
Merck & Co., Inc. | | | | | |
3.70%, 2/10/2045 | | | 55,000 | | | | 50,067 | |
Novartis Capital Corp. | | | | | |
4.40%, 5/6/2044 | | | 75,000 | | | | 76,347 | |
Wyeth LLC | | | | | |
6.50%, 2/1/2034 | | | 190,000 | | | | 232,334 | |
Zoetis, Inc. | | | | | |
4.70%, 2/1/2043 | | | 90,000 | | | | 88,316 | |
| | | | | | | | 961,498 | |
| Road & Rail – 3.3% | |
Burlington Northern Santa Fe LLC | | | | | | | | |
5.15%, 9/1/2043 | | | 175,000 | | | | 188,953 | |
Canadian National Railway Co. | | | | | | | | |
3.20%, 8/2/2046 | | | 50,000 | | | | 41,291 | |
CSX Corp. | | | | | |
6.15%, 5/1/2037 | | | 160,000 | | | | 185,923 | |
4.10%, 3/15/2044 | | | 115,000 | | | | 103,890 | |
Norfolk Southern Corp. | | | | | |
4.84%, 10/1/2041 | | | 165,000 | | | | 167,535 | |
Union Pacific Corp. | | | | | |
4.05%, 3/1/2046 | | | 160,000 | | | | 144,505 | |
4.50%, 9/10/2048 | | | 50,000 | | | | 48,634 | |
| | | | | | | | 880,731 | |
| | | | | | | | |
| Investments | | Principal
Amount | | | Value | |
| Semiconductors & Semiconductor Equipment – 1.3% | |
Applied Materials, Inc. | | | | | |
5.85%, 6/15/2041 | | $ | 25,000 | | | $ | 28,804 | |
4.35%, 4/1/2047 | | | 80,000 | | | | 75,505 | |
Intel Corp. | | | | | |
3.73%, 12/8/2047 | | | 100,000 | | | | 89,379 | |
QUALCOMM, Inc. | | | | | |
4.65%, 5/20/2035 | | | 55,000 | | | | 54,163 | |
4.80%, 5/20/2045 | | | 45,000 | | | | 43,608 | |
4.30%, 5/20/2047 | | | 55,000 | | | | 49,420 | |
| | | | | | | | 340,879 | |
| Software – 4.3% | |
Microsoft Corp. | | | | | |
3.50%, 2/12/2035 | | | 235,000 | | | | 219,911 | |
3.95%, 8/8/2056 | | | 205,000 | | | | 191,273 | |
4.50%, 2/6/2057 | | | 130,000 | | | | 134,389 | |
Oracle Corp. | | | | | |
5.38%, 7/15/2040 | | | 295,000 | | | | 326,225 | |
4.38%, 5/15/2055 | | | 295,000 | | | | 277,315 | |
| | | | | | | | 1,149,113 | |
| Specialty Retail – 1.4% | |
Home Depot, Inc. (The) | | | | | |
5.88%, 12/16/2036 | | | 195,000 | | | | 228,546 | |
3.50%, 9/15/2056 | | | 55,000 | | | | 44,640 | |
Lowe’s Cos., Inc. | | | | | |
4.05%, 5/3/2047 | | | 95,000 | | | | 85,978 | |
| | | | | | | | 359,164 | |
| Technology Hardware, Storage & Peripherals – 1.9% | |
Apple, Inc. | | | | | |
4.65%, 2/23/2046 | | | 345,000 | | | | 356,712 | |
Hewlett Packard Enterprise Co. | | | | | | | | |
6.35%, 10/15/2045(b) | | | 100,000 | | | | 98,127 | |
HP, Inc. | | | | | |
6.00%, 9/15/2041 | | | 40,000 | | | | 39,559 | |
| | | | | | | | 494,398 | |
| Textiles, Apparel & Luxury Goods – 0.2% | |
NIKE, Inc. | | | | | |
3.63%, 5/1/2043 | | | 50,000 | | | | 44,510 | |
See Accompanying Notes to the Financial Statements.
| | | | |
| FLEXSHARES ANNUAL REPORT | | | 327 | |
FlexShares® Credit-Scored US Long Corporate Bond Index Fund (cont.)
| | | | | | | | |
| Investments | | Principal
Amount | | | Value | |
| CORPORATE BONDS – (continued) | |
| Tobacco – 2.3% | |
Altria Group, Inc. | | | | | |
4.25%, 8/9/2042 | | $ | 105,000 | | | $ | 92,567 | |
5.38%, 1/31/2044 | | | 95,000 | | | | 96,935 | |
Philip Morris International, Inc. | | | | | |
6.38%, 5/16/2038 | | | 130,000 | | | | 150,407 | |
4.13%, 3/4/2043 | | | 95,000 | | | | 84,196 | |
4.25%, 11/10/2044 | | | 100,000 | | | | 90,231 | |
Reynolds American, Inc. | | | | | | | | |
5.70%, 8/15/2035 | | | 90,000 | | | | 92,216 | |
| | | | | | | | 606,552 | |
| Water Utilities – 0.3% | |
American Water Capital Corp. | | | | | | | | |
4.20%, 9/1/2048 | | | 80,000 | | | | 75,456 | |
| Wireless Telecommunication Services – 0.8% | |
Rogers Communications, Inc. | | | | | |
5.00%, 3/15/2044 | | | 115,000 | | | | 116,512 | |
Telefonica Europe BV | | | | | |
8.25%, 9/15/2030 | | | 50,000 | | | | 63,241 | |
Vodafone Group plc | | | | | |
7.88%, 2/15/2030 | | | 30,000 | | | | 36,845 | |
| | | | | | | | 216,598 | |
Total Corporate Bonds
(Cost $27,753,672) | | | | 25,960,236 | |
| | | | | | |
Total Investments – 98.2%
(Cost $27,753,672) | | | | 25,960,236 | |
Other Assets Less Liabilities – 1.8% | | | | 463,736 | |
| NET ASSETS – 100.0% | | | $ | 26,423,972 | |
| (a) | Security issued at a fixed coupon rate, which converts to a variable rate at a future date. Rate shown is the rate in effect as of period end. |
| (b) | Step bond. Interest rate is a fixed rate for an initial period that either resets at a specific date or may reset in the future at a contingent upon predetermined trigger. The interest rate shown was the current rate as of October 31, 2018. |
Percentages shown are based on Net Assets.
As of October 31, 2018, the gross unrealized appreciation (depreciation) of investments based on the aggregate cost of investments (including derivative instruments, if applicable) for federal income tax purposes was as follows:
| | | | |
| | | | |
Aggregate gross unrealized appreciation | | $ | 6,388 | |
Aggregate gross unrealized depreciation | | | (1,820,208 | ) |
Net unrealized depreciation | | $ | (1,813,820 | ) |
Federal income tax cost | | $ | 27,774,056 | |
See Accompanying Notes to the Financial Statements.
| | |
| 328 | | FLEXSHARES ANNUAL REPORT |
Schedule of Investments
FlexShares® High Yield Value-Scored Bond Index Fund
October 31, 2018
| | | | | | | | |
| Investments | | Principal
Amount | | | Value | |
| CORPORATE BONDS – 98.2% | |
| Aerospace & Defense – 1.9% | |
Pioneer Holdings LLC | | | | | |
9.00%, 11/1/2022(a) | | $ | 250,000 | | | $ | 256,250 | |
TransDigm UK Holdings plc | | | | | |
6.88%, 5/15/2026(a) | | | 245,000 | | | | 245,000 | |
TransDigm, Inc. | | | | | |
6.38%, 6/15/2026 | | | 300,000 | | | | 294,750 | |
Triumph Group, Inc. | | | | | |
7.75%, 8/15/2025 | | | 120,000 | | | | 113,100 | |
| | | | | | | | 909,100 | |
| Auto Components – 1.7% | |
American Axle & Manufacturing, Inc. | | | | | | | | |
6.25%, 4/1/2025 | | | 100,000 | | | | 94,750 | |
Cooper-Standard Automotive, Inc. | | | | | | | | |
5.63%, 11/15/2026(a) | | | 100,000 | | | | 95,000 | |
Dana Financing Luxembourg Sarl | | | | | |
6.50%, 6/1/2026(a) | | | 150,000 | | | | 148,875 | |
Goodyear Tire & Rubber Co. (The) | | | | | | | | |
5.13%, 11/15/2023 | | | 125,000 | | | | 122,937 | |
Icahn Enterprises LP | | | | | |
6.38%, 12/15/2025 | | | 250,000 | | | | 249,063 | |
JB Poindexter & Co., Inc. | | | | | |
7.13%, 4/15/2026(a) | | | 100,000 | | | | 103,500 | |
| | | | | | | | 814,125 | |
| Banks – 1.7% | |
Intesa Sanpaolo SpA | | | | | |
5.02%, 6/26/2024(a) | | | 450,000 | | | | 397,194 | |
Societe Generale SA | | | | | |
7.38%, 9/13/2021(a) (b) (c) | | | 200,000 | | | | 203,250 | |
8.00%, 9/29/2025(a) (b) (c) | | | 235,000 | | | | 239,113 | |
| | | | | | | | 839,557 | |
| Building Products – 0.8% | |
Griffon Corp. | | | | | |
5.25%, 3/1/2022 | | | 200,000 | | | | 188,250 | |
PGT Escrow Issuer, Inc. | | | | | |
6.75%, 8/1/2026(a) | | | 100,000 | | | | 103,250 | |
Standard Industries, Inc. | | | | | |
4.75%, 1/15/2028(a) | | | 100,000 | | | | 89,750 | |
| | | | | | | | 381,250 | |
| | | | | | | | |
| Investments | | Principal
Amount | | | Value | |
| Capital Markets – 1.4% | |
Credit Suisse Group AG | | | | | |
7.50%, 7/17/2023(a) (b) (c) | | $ | 350,000 | | | $ | 357,000 | |
Donnelley Financial Solutions, Inc. | | | | | | | | |
8.25%, 10/15/2024 | | | 100,000 | | | | 103,500 | |
LPL Holdings, Inc. | | | | | |
5.75%, 9/15/2025(a) | | | 50,000 | | | | 48,688 | |
MSCI, Inc. | | | | | |
5.25%, 11/15/2024(a) | | | 200,000 | | | | 202,500 | |
| | | | | | | | 711,688 | |
| Chemicals – 2.8% | |
CF Industries, Inc. | | | | | |
5.15%, 3/15/2034 | | | 100,000 | | | | 91,500 | |
Cornerstone Chemical Co. | | | | | |
6.75%, 8/15/2024(a) | | | 400,000 | | | | 389,000 | |
FXI Holdings, Inc. | | | | | |
7.88%, 11/1/2024(a) | | | 200,000 | | | | 187,000 | |
Hexion, Inc. | | | | | |
6.63%, 4/15/2020 | | | 340,000 | | | | 301,750 | |
SPCM SA | | | | | |
4.88%, 9/15/2025(a) | | | 200,000 | | | | 185,500 | |
TPC Group, Inc. | | | | | |
8.75%, 12/15/2020(a) | | | 200,000 | | | | 197,000 | |
| | | | | | | | 1,351,750 | |
| Commercial Services & Supplies – 4.9% | |
Algeco Global Finance plc | | | | | |
8.00%, 2/15/2023(a) | | | 200,000 | | | | 202,000 | |
APX Group, Inc. | | | | | |
7.88%, 12/1/2022 | | | 300,000 | | | | 302,250 | |
Covanta Holding Corp. | | | | | |
5.88%, 7/1/2025 | | | 200,000 | | | | 194,500 | |
Garda World Security Corp. | | | | | |
8.75%, 5/15/2025(a) | | | 200,000 | | | | 189,000 | |
GFL Environmental, Inc. | | | | | |
5.38%, 3/1/2023(a) | | | 200,000 | | | | 184,000 | |
Harland Clarke Holdings Corp. | | | | | |
9.25%, 3/1/2021(a) | | | 100,000 | | | | 88,750 | |
KAR Auction Services, Inc. | | | | | |
5.13%, 6/1/2025(a) | | | 150,000 | | | | 141,375 | |
Nielsen Finance LLC | | | | | |
5.00%, 4/15/2022(a) | | | 250,000 | | | | 244,062 | |
See Accompanying Notes to the Financial Statements.
| | | | |
| FLEXSHARES ANNUAL REPORT | | | 329 | |
FlexShares® High Yield Value-Scored Bond Index Fund (cont.)
| | | | | | | | |
| Investments | | Principal
Amount | | | Value | |
| CORPORATE BONDS – (continued) | |
| Commercial Services & Supplies – (continued) | |
Pitney Bowes, Inc. | | | | | |
3.87%, 10/1/2021(d) | | $ | 250,000 | | | $ | 238,750 | |
Prime Security Services Borrower LLC | | | | | | | | |
9.25%, 5/15/2023(a) | | | 400,000 | | | | 423,680 | |
West Corp. | | | | | |
8.50%, 10/15/2025(a) | | | 200,000 | | | | 181,500 | |
| | | | | | | | 2,389,867 | |
| Communications Equipment – 0.7% | |
CommScope, Inc. | | | | | |
5.50%, 6/15/2024(a) | | | 200,000 | | | | 194,000 | |
Riverbed Technology, Inc. | | | | | |
8.88%, 3/1/2023(a) | | | 150,000 | | | | 138,188 | |
| | | | | | | | 332,188 | |
| Construction & Engineering – 1.0% | |
Brand Industrial Services, Inc. | | | | | |
8.50%, 7/15/2025(a) | | | 300,000 | | | | 296,625 | |
Pisces Midco, Inc. | | | | | |
8.00%, 4/15/2026(a) | | | 200,000 | | | | 195,000 | |
| | | | | | | | 491,625 | |
| Consumer Finance – 1.4% | |
Ally Financial, Inc. | | | | | |
8.00%, 11/1/2031 | | | 85,000 | | | | 102,638 | |
Intrepid Aviation Group Holdings LLC | | | | | | | | |
8.50%, 8/15/2021(a) | | | 150,000 | | | | 151,125 | |
Navient Corp. | | | | | |
5.50%, 1/25/2023 | | | 325,000 | | | | 320,359 | |
TMX Finance LLC | | | | | |
11.13%, 4/1/2023(a) | | | 100,000 | | | | 94,250 | |
| | | | | | | | 668,372 | |
| Containers & Packaging – 2.4% | |
Berry Global, Inc. | | | | | |
5.13%, 7/15/2023 | | | 50,000 | | | | 49,938 | |
4.50%, 2/15/2026(a) | | | 55,000 | | | | 51,562 | |
BWAY Holding Co. | | | | | |
7.25%, 4/15/2025(a) | | | 380,000 | | | | 361,950 | |
Crown Cork & Seal Co., Inc. | | | | | |
7.38%, 12/15/2026 | | | 90,000 | | | | 96,750 | |
| | | | | | | | |
| Investments | | Principal
Amount | | | Value | |
| Containers & Packaging – (continued) | |
Flex Acquisition Co., Inc. | | | | | |
6.88%, 1/15/2025(a) | | $ | 150,000 | | | $ | 141,000 | |
Owens-Brockway Glass Container, Inc. | | | | | | | | |
5.88%, 8/15/2023(a) | | | 95,000 | | | | 95,000 | |
Pactiv LLC | | | | | |
8.38%, 4/15/2027 | | | 65,000 | | | | 67,925 | |
Plastipak Holdings, Inc. | | | | | |
6.25%, 10/15/2025(a) | | | 105,000 | | | | 96,600 | |
Reynolds Group Issuer, Inc. | | | | | |
5.13%, 7/15/2023(a) | | | 125,000 | | | | 122,344 | |
7.00%, 7/15/2024(a) | | | 70,000 | | | | 70,175 | |
| | | | | | | | 1,153,244 | |
| Distributors – 0.3% | |
Core & Main LP | | | | | |
6.13%, 8/15/2025(a) | | | 150,000 | | | | 141,375 | |
| Diversified Consumer Services – 1.1% | |
Laureate Education, Inc. | | | | | |
8.25%, 5/1/2025(a) | | | 200,000 | | | | 214,500 | |
Midas Intermediate Holdco II LLC | | | | | | | | |
7.88%, 10/1/2022(a) | | | 100,000 | | | | 88,750 | |
ServiceMaster Co. LLC (The) | | | | | |
5.13%, 11/15/2024(a) | | | 250,000 | | | | 241,250 | |
| | | | | | | | 544,500 | |
| Diversified Financial Services – 1.4% | |
ACE Cash Express, Inc. | | | | | |
12.00%, 12/15/2022(a) | | | 100,000 | | | | 104,000 | |
Jefferies Finance LLC | | | | | |
7.25%, 8/15/2024(a) | | | 200,000 | | | | 196,500 | |
Tempo Acquisition LLC | | | | | |
6.75%, 6/1/2025(a) | | | 250,000 | | | | 238,675 | |
Verscend Escrow Corp. | | | | | |
9.75%, 8/15/2026(a) | | | 150,000 | | | | 150,937 | |
| | | | | | | | 690,112 | |
| Diversified Telecommunication Services – 6.1% | |
CCO Holdings LLC | | | | | |
5.75%, 1/15/2024 | | | 120,000 | | | | 121,500 | |
5.88%, 4/1/2024(a) | | | 125,000 | | | | 126,406 | |
5.75%, 2/15/2026(a) | | | 125,000 | | | | 124,062 | |
5.13%, 5/1/2027(a) | | | 130,000 | | | | 122,688 | |
5.00%, 2/1/2028(a) | | | 200,000 | | | | 186,875 | |
See Accompanying Notes to the Financial Statements.
| | |
| 330 | | FLEXSHARES ANNUAL REPORT |
FlexShares® High Yield Value-Scored Bond Index Fund (cont.)
| | | | | | | | |
| Investments | | Principal
Amount | | | Value | |
| CORPORATE BONDS – (continued) | |
| Diversified Telecommunication Services – (continued) | |
CenturyLink, Inc. | | | | | |
Series T, 5.80%, 3/15/2022 | | $ | 325,000 | | | $ | 325,423 | |
Series Y, 7.50%, 4/1/2024 | | | 240,000 | | | | 252,600 | |
DKT Finance ApS | | | | | |
9.38%, 6/17/2023(a) | | | 200,000 | | | | 210,750 | |
Embarq Corp. | | | | | |
8.00%, 6/1/2036 | | | 130,000 | | | | 124,475 | |
Iridium Communications, Inc. | | | | | |
10.25%, 4/15/2023(a) | | | 250,000 | | | | 273,125 | |
Sable International Finance Ltd. | | | | | |
6.88%, 8/1/2022(a) | | | 200,000 | | | | 209,250 | |
Sprint Capital Corp. | | | | | |
6.88%, 11/15/2028 | | | 400,000 | | | | 394,500 | |
8.75%, 3/15/2032 | | | 200,000 | | | | 219,000 | |
Telecom Italia Capital SA | | | | | |
6.38%, 11/15/2033 | | | 125,000 | | | | 115,000 | |
Virgin Media Finance plc | | | | | |
6.00%, 10/15/2024(a) | | | 200,000 | | | | 196,310 | |
| | | | | | | | 3,001,964 | |
| Electrical Equipment – 0.2% | |
International Wire Group, Inc. | | | | | |
10.75%, 8/1/2021(a) | | | 100,000 | | | | 92,250 | |
| Energy Equipment & Services – 3.4% | |
Diamond Offshore Drilling, Inc. | | | | | |
7.88%, 8/15/2025 | | | 200,000 | | | | 197,500 | |
KCA Deutag UK Finance plc | | | | | |
9.63%, 4/1/2023(a) | | | 200,000 | | | | 189,000 | |
McDermott Technology Americas, Inc. | | | | | | | | |
10.63%, 5/1/2024(a) | | | 200,000 | | | | 182,000 | |
Noble Holding International Ltd. | | | | | |
7.88%, 2/1/2026(a) | | | 200,000 | | | | 199,250 | |
Rowan Cos., Inc. | | | | | |
7.38%, 6/15/2025 | | | 200,000 | | | | 191,000 | |
SESI LLC | | | | | |
7.75%, 9/15/2024 | | | 100,000 | | | | 98,625 | |
Transocean, Inc. | | | | | |
9.00%, 7/15/2023(a) | | | 250,000 | | | | 262,812 | |
USA Compression Partners LP | | | | | |
6.88%, 4/1/2026(a) | | | 200,000 | | | | 202,750 | |
| | | | | | | | |
| Investments | | Principal
Amount | | | Value | |
| Energy Equipment & Services – (continued) | |
Weatherford International Ltd. | | | | | |
4.50%, 4/15/2022 | | $ | 200,000 | | | $ | 150,000 | |
| | | | | | | | 1,672,937 | |
| Entertainment – 0.6% | |
Netflix, Inc. | | | | | |
5.88%, 11/15/2028(a) | | | 300,000 | | | | 296,250 | |
| Equity Real Estate Investment Trusts (REITs) – 2.8% | |
CBL & Associates LP | | | | | |
5.25%, 12/1/2023 | | | 200,000 | | | | 168,500 | |
Equinix, Inc. | | | | | |
5.75%, 1/1/2025 | | | 100,000 | | | | 102,375 | |
ESH Hospitality, Inc. | | | | | |
5.25%, 5/1/2025(a) | | | 200,000 | | | | 189,750 | |
GEO Group, Inc. (The) | | | | | |
5.88%, 10/15/2024 | | | 150,000 | | | | 139,845 | |
Iron Mountain, Inc. | | | | | |
5.75%, 8/15/2024 | | | 200,000 | | | | 196,750 | |
iStar, Inc. | | | | | |
6.00%, 4/1/2022 | | | 195,000 | | | | 195,488 | |
SBA Communications Corp. | | | | | |
4.00%, 10/1/2022 | | | 130,000 | | | | 125,125 | |
Uniti Group LP | | | | | |
8.25%, 10/15/2023 | | | 255,000 | | | | 241,612 | |
| | | | | | | | 1,359,445 | |
| Food & Staples Retailing – 0.7% | |
Beverages & More, Inc. | | | | | |
11.50%, 6/15/2022(a) | | | 100,000 | | | | 79,250 | |
Fresh Market, Inc. (The) | | | | | |
9.75%, 5/1/2023(a) | | | 150,000 | | | | 110,250 | |
Rite Aid Corp. | | | | | |
7.70%, 2/15/2027 | | | 200,000 | | | | 141,000 | |
| | | | | | | | 330,500 | |
| Food Products – 1.8% | |
Chobani LLC | | | | | |
7.50%, 4/15/2025(a) | | | 100,000 | | | | 85,875 | |
Dean Foods Co. | | | | | |
6.50%, 3/15/2023(a) | | | 200,000 | | | | 184,750 | |
Dole Food Co., Inc. | | | | | |
7.25%, 6/15/2025(a) | | | 100,000 | | | | 96,500 | |
See Accompanying Notes to the Financial Statements.
| | | | |
| FLEXSHARES ANNUAL REPORT | | | 331 | |
FlexShares® High Yield Value-Scored Bond Index Fund (cont.)
| | | | | | | | |
| Investments | | Principal
Amount | | | Value | |
| CORPORATE BONDS – (continued) | |
| Food Products – (continued) | |
Pilgrim’s Pride Corp. | | | | | |
5.88%, 9/30/2027(a) | | $ | 100,000 | | | $ | 91,000 | |
Post Holdings, Inc. | | | | | |
5.50%, 3/1/2025(a) | | | 100,000 | | | | 97,125 | |
Sigma Holdco BV | | | | | |
7.88%, 5/15/2026(a) | | | 200,000 | | | | 185,000 | |
Simmons Foods, Inc. | | | | | |
5.75%, 11/1/2024(a) | | | 200,000 | | | | 148,000 | |
| | | | | | | | 888,250 | |
| Gas Utilities – 1.0% | |
AmeriGas Partners LP | | | | | |
5.50%, 5/20/2025 | | | 250,000 | | | | 235,000 | |
Suburban Propane Partners LP | | | | | |
5.50%, 6/1/2024 | | | 200,000 | | | | 191,000 | |
Superior Plus LP | | | | | |
7.00%, 7/15/2026(a) | | | 50,000 | | | | 50,062 | |
| | | | | | | | 476,062 | |
| Health Care Equipment & Supplies – 1.6% | |
Avantor, Inc. | | | | | |
9.00%, 10/1/2025(a) | | | 250,000 | | | | 252,720 | |
Immucor, Inc. | | | | | |
11.13%, 2/15/2022(a) | | | 100,000 | | | | 103,125 | |
Mallinckrodt International Finance SA | | | | | | | | |
5.63%, 10/15/2023(a) | | | 500,000 | | | | 431,250 | |
| | | | | | | | 787,095 | |
| Health Care Providers & Services – 5.1% | |
AHP Health Partners, Inc. | | | | | |
9.75%, 7/15/2026(a) | | | 100,000 | | | | 102,250 | |
Encompass Health Corp. | | | | | |
5.75%, 11/1/2024 | | | 200,000 | | | | 200,250 | |
HCA, Inc. | | | | | |
7.69%, 6/15/2025 | | | 500,000 | | | | 548,750 | |
MPH Acquisition Holdings LLC | | | | | |
7.13%, 6/1/2024(a) | | | 300,000 | | | | 305,496 | |
One Call Corp. | | | | | |
10.00%, 10/1/2024(a) | | | 200,000 | | | | 161,000 | |
RegionalCare Hospital Partners Holdings, Inc. | | | | | | | | |
8.25%, 5/1/2023(a) | | | 200,000 | | | | 212,250 | |
| | | | | | | | |
| Investments | | Principal
Amount | | | Value | |
| Health Care Providers & Services – (continued) | |
Team Health Holdings, Inc. | | | | | |
6.38%, 2/1/2025(a) | | $ | 300,000 | | | $ | 260,250 | |
Tenet Healthcare Corp. | | | | | |
8.13%, 4/1/2022 | | | 500,000 | | | | 522,500 | |
West Street Merger Sub, Inc. | | | | | |
6.38%, 9/1/2025(a) | | | 200,000 | | | | 188,500 | |
| | | | | | | | 2,501,246 | |
| Hotels, Restaurants & Leisure – 4.1% | |
1011778 BC ULC | | | | | |
5.00%, 10/15/2025(a) | | | 200,000 | | | | 188,000 | |
24 Hour Fitness Worldwide, Inc. | | | | | |
8.00%, 6/1/2022(a) | | | 100,000 | | | | 98,750 | |
Diamond Resorts International, Inc. | | | | | | | | |
10.75%, 9/1/2024(a) | | | 200,000 | | | | 196,500 | |
Downstream Development Authority of the Quapaw Tribe of Oklahoma | | | | | | | | |
10.50%, 2/15/2023(a) | | | 100,000 | | | | 102,250 | |
Enterprise Development Authority (The) | | | | | | | | |
12.00%, 7/15/2024(a) | | | 100,000 | | | | 95,750 | |
Golden Nugget, Inc. | | | | | |
6.75%, 10/15/2024(a) | | | 300,000 | | | | 300,000 | |
Hilton Domestic Operating Co., Inc. | | | | | | | | |
5.13%, 5/1/2026(a) | | | 200,000 | | | | 196,000 | |
IRB Holding Corp. | | | | | |
6.75%, 2/15/2026(a) | | | 100,000 | | | | 96,000 | |
KFC Holding Co. | | | | | |
5.25%, 6/1/2026(a) | | | 100,000 | | | | 98,500 | |
LHMC Finco Sarl | | | | | |
7.88%, 12/20/2023(a) | | | 200,000 | | | | 202,100 | |
Mohegan Gaming & Entertainment | | | | | | | | |
7.88%, 10/15/2024(a) | | | 105,000 | | | | 102,244 | |
Viking Cruises Ltd. | | | | | |
6.25%, 5/15/2025(a) | | | 200,000 | | | | 201,440 | |
Wynn Las Vegas LLC | | | | | |
5.50%, 3/1/2025(a) | | | 150,000 | | | | 143,062 | |
| | | | | | | | 2,020,596 | |
| Household Durables – 2.8% | |
American Greetings Corp. | | | | | |
8.75%, 4/15/2025(a) | | | 200,000 | | | | 188,500 | |
See Accompanying Notes to the Financial Statements.
| | |
| 332 | | FLEXSHARES ANNUAL REPORT |
FlexShares® High Yield Value-Scored Bond Index Fund (cont.)
| | | | | | | | |
| Investments | | Principal
Amount | | | Value | |
| CORPORATE BONDS – (continued) | |
| Household Durables – (continued) | |
Brookfield Residential Properties, Inc. | | | | | | | | |
6.38%, 5/15/2025(a) | | $ | 200,000 | | | $ | 189,250 | |
Lennar Corp. | | | | | |
4.75%, 11/15/2022(d) | | | 400,000 | | | | 397,080 | |
Mattamy Group Corp. | | | | | |
6.50%, 10/1/2025(a) | | | 200,000 | | | | 189,000 | |
PulteGroup, Inc. | | | | | |
5.50%, 3/1/2026 | | | 200,000 | | | | 196,750 | |
TRI Pointe Group, Inc. | | | | | |
5.88%, 6/15/2024 | | | 200,000 | | | | 187,500 | |
| | | | | | | | 1,348,080 | |
| Household Products – 0.4% | |
Kronos Acquisition Holdings, Inc. | | | | | |
9.00%, 8/15/2023(a) | | | 200,000 | | | | 175,500 | |
Independent Power and Renewable Electricity
Producers – 1.9% | |
Calpine Corp. | | | | | |
5.75%, 1/15/2025 | | | 500,000 | | | | 448,650 | |
NRG Energy, Inc. | | | | | |
7.25%, 5/15/2026 | | | 200,000 | | | | 213,500 | |
Talen Energy Supply LLC | | | | | |
10.50%, 1/15/2026(a) | | | 300,000 | | | | 264,375 | |
| | | | | | | | 926,525 | |
| Insurance – 1.9% | |
Acrisure LLC | | | | | |
7.00%, 11/15/2025(a) | | | 190,000 | | | | 170,525 | |
Ardonagh Midco 3 plc | | | | | |
8.63%, 7/15/2023(a) | | | 200,000 | | | | 187,000 | |
Fidelity & Guaranty Life Holdings, Inc. | | | | | | | | |
5.50%, 5/1/2025(a) | | | 50,000 | | | | 49,812 | |
Genworth Holdings, Inc. | | | | | |
7.70%, 6/15/2020 | | | 200,000 | | | | 206,560 | |
HUB International Ltd. | | | | | |
7.00%, 5/1/2026(a) | | | 100,000 | | | | 97,850 | |
NFP Corp. | | | | | |
6.88%, 7/15/2025(a) | | | 150,000 | | | | 146,250 | |
| | | | | | | | |
| Investments | | Principal
Amount | | | Value | |
| Insurance – (continued) | |
USIS Merger Sub, Inc. | | | | | |
6.88%, 5/1/2025(a) | | $ | 100,000 | | | $ | 98,250 | |
| | | | | | | | 956,247 | |
| Interactive Media & Services – 1.0% | |
Rackspace Hosting, Inc. | | | | | |
8.63%, 11/15/2024(a) | | | 500,000 | | | | 471,250 | |
| IT Services – 1.1% | |
Banff Merger Sub, Inc. | | | | | |
9.75%, 9/1/2026(a) | | | 300,000 | | | | 288,750 | |
Zayo Group LLC | | | | | |
6.00%, 4/1/2023 | | | 120,000 | | | | 123,000 | |
6.38%, 5/15/2025 | | | 120,000 | | | | 123,150 | |
| | | | | | | | 534,900 | |
| Machinery – 1.6% | |
Apex Tool Group LLC | | | | | |
9.00%, 2/15/2023(a) | | | 100,000 | | | | 92,000 | |
BlueLine Rental Finance Corp. | | | | | |
9.25%, 3/15/2024(a) | | | 144,000 | | | | 150,480 | |
Cloud Crane LLC | | | | | |
10.13%, 8/1/2024(a) | | | 200,000 | | | | 216,000 | |
Novelis Corp. | | | | | |
6.25%, 8/15/2024(a) | | | 200,000 | | | | 198,500 | |
Titan Acquisition Ltd. | | | | | |
7.75%, 4/15/2026(a) | | | 150,000 | | | | 125,250 | |
| | | | | | | | 782,230 | |
| Marine – 0.4% | |
Stena AB | | | | | |
7.00%, 2/1/2024(a) | | | 200,000 | | | | 189,800 | |
| Media – 5.8% | |
CBS Radio, Inc. | | | | | |
7.25%, 11/1/2024(a) | | | 105,000 | | | | 99,356 | |
DISH DBS Corp. | | | | | |
6.75%, 6/1/2021 | | | 250,000 | | | | 253,125 | |
5.88%, 7/15/2022 | | | 260,000 | | | | 246,675 | |
5.00%, 3/15/2023 | | | 285,000 | | | | 250,444 | |
Lamar Media Corp. | | | | | |
5.00%, 5/1/2023 | | | 200,000 | | | | 200,624 | |
McGraw-Hill Global Education Holdings LLC | | | | | | | | |
7.88%, 5/15/2024(a) | | | 55,000 | | | | 47,094 | |
See Accompanying Notes to the Financial Statements.
| | | | |
| FLEXSHARES ANNUAL REPORT | | | 333 | |
FlexShares® High Yield Value-Scored Bond Index Fund (cont.)
| | | | | | | | |
| Investments | | Principal
Amount | | | Value | |
| CORPORATE BONDS – (continued) | |
| Media – (continued) | |
MDC Partners, Inc. | | | | | |
6.50%, 5/1/2024(a) | | $ | 200,000 | | | $ | 165,000 | |
Meredith Corp. | | | | | |
6.88%, 2/1/2026(a) | | | 270,000 | | | | 270,675 | |
Nexstar Broadcasting, Inc. | | | | | |
5.63%, 8/1/2024(a) | | | 125,000 | | | | 119,688 | |
Radiate Holdco LLC | | | | | |
6.63%, 2/15/2025(a) | | | 200,000 | | | | 187,500 | |
Sirius XM Radio, Inc. | | | | | |
6.00%, 7/15/2024(a) | | | 200,000 | | | | 204,960 | |
Tribune Media Co. | | | | | |
5.88%, 7/15/2022 | | | 200,000 | | | | 203,500 | |
Univision Communications, Inc. | | | | | |
5.13%, 5/15/2023(a) | | | 105,000 | | | | 99,172 | |
5.13%, 2/15/2025(a) | | | 160,000 | | | | 146,640 | |
UPC Holding BV | | | | | |
5.50%, 1/15/2028(a) | | | 200,000 | | | | 185,500 | |
Ziggo BV | | | | | |
5.50%, 1/15/2027(a) | | | 150,000 | | | | 138,000 | |
| | | | | | | | 2,817,953 | |
| Metals & Mining – 2.2% | |
Allegheny Technologies, Inc. | | | | | |
5.95%, 1/15/2021 | | | 200,000 | | | | 201,500 | |
Commercial Metals Co. | | | | | |
5.75%, 4/15/2026(a) | | | 50,000 | | | | 48,125 | |
FMG Resources August 2006 Pty. Ltd. | | | | | | | | |
4.75%, 5/15/2022(a) | | | 100,000 | | | | 96,375 | |
Freeport-McMoRan, Inc. | | | | | |
5.45%, 3/15/2043 | | | 85,000 | | | | 72,463 | |
Northwest Acquisitions ULC | | | | | |
7.13%, 11/1/2022(a) | | | 75,000 | | | | 75,701 | |
SunCoke Energy Partners LP | | | | | |
7.50%, 6/15/2025(a) | | | 200,000 | | | | 204,000 | |
Teck Resources Ltd. | | | | | |
6.00%, 8/15/2040 | | | 50,000 | | | | 49,125 | |
6.25%, 7/15/2041 | | | 50,000 | | | | 50,125 | |
United States Steel Corp. | | | | | |
6.88%, 8/15/2025 | | | 95,000 | | | | 93,575 | |
Warrior Met Coal, Inc. | | | | | |
8.00%, 11/1/2024(a) | | | 200,000 | | | | 206,000 | |
| | | | | | | | 1,096,989 | |
| | | | | | | | |
| Investments | | Principal
Amount | | | Value | |
| Multiline Retail – 0.2% | |
Neiman Marcus Group Ltd. LLC | | | | | | | | |
8.00%, 10/15/2021(a) | | $ | 200,000 | | | $ | 121,000 | |
| Oil, Gas & Consumable Fuels – 9.8% | |
Alliance Resource Operating Partners LP | | | | | | | | |
7.50%, 5/1/2025(a) | | | 70,000 | | | | 72,888 | |
American Midstream Partners LP | | | | | |
9.50%, 12/15/2021(a) (d) | | | 150,000 | | | | 147,750 | |
Ascent Resources Utica Holdings LLC | | | | | | | | |
10.00%, 4/1/2022(a) | | | 129,000 | | | | 142,706 | |
Berry Petroleum Co. LLC | | | | | |
7.00%, 2/15/2026(a) | | | 100,000 | | | | 99,620 | |
Calumet Specialty Products Partners LP | | | | | | | | |
7.63%, 1/15/2022 | | | 100,000 | | | | 96,500 | |
Chesapeake Energy Corp. | | | | | |
8.00%, 1/15/2025 | | | 300,000 | | | | 304,500 | |
CNX Midstream Partners LP | | | | | |
6.50%, 3/15/2026(a) | | | 200,000 | | | | 195,500 | |
Covey Park Energy LLC | | | | | |
7.50%, 5/15/2025(a) | | | 150,000 | | | | 148,125 | |
Eclipse Resources Corp. | | | | | |
8.88%, 7/15/2023 | | | 200,000 | | | | 200,000 | |
Energy Transfer Operating LP | | | | | |
Series A, 6.25%, 2/15/2023(b) (c) | | | 200,000 | | | | 187,375 | |
Energy Ventures Gom LLC | | | | | |
11.00%, 2/15/2023(a) | | | 100,000 | | | | 111,250 | |
Foresight Energy LLC | | | | | |
11.50%, 4/1/2023(a) | | | 100,000 | | | | 89,250 | |
Genesis Energy LP | | | | | |
6.75%, 8/1/2022 | | | 350,000 | | | | 353,500 | |
Gulfport Energy Corp. | | | | | |
6.38%, 1/15/2026 | | | 200,000 | | | | 187,000 | |
Indigo Natural Resources LLC | | | | | |
6.88%, 2/15/2026(a) | | | 250,000 | | | | 237,500 | |
Jonah Energy LLC | | | | | |
7.25%, 10/15/2025(a) | | | 200,000 | | | | 160,000 | |
MEG Energy Corp. | | | | | |
7.00%, 3/31/2024(a) | | | 400,000 | | | | 394,000 | |
Murray Energy Corp. | | | | | |
11.25%, 4/15/2021(a) | | | 100,000 | | | | 64,000 | |
See Accompanying Notes to the Financial Statements.
| | |
| 334 | | FLEXSHARES ANNUAL REPORT |
FlexShares® High Yield Value-Scored Bond Index Fund (cont.)
| | | | | | | | |
| Investments | | Principal
Amount | | | Value | |
| CORPORATE BONDS – (continued) | |
| Oil, Gas & Consumable Fuels – (continued) | |
NGL Energy Partners LP | | | | | |
7.50%, 11/1/2023 | | $ | 100,000 | | | $ | 98,625 | |
Parkland Fuel Corp. | | | | | |
6.00%, 4/1/2026(a) | | | 100,000 | | | | 98,000 | |
PBF Holding Co. LLC | | | | | |
7.25%, 6/15/2025 | | | 200,000 | | | | 206,500 | |
PBF Logistics LP | | | | | |
6.88%, 5/15/2023 | | | 200,000 | | | | 204,500 | |
Peabody Energy Corp. | | | | | |
6.38%, 3/31/2025(a) | | | 95,000 | | | | 95,356 | |
Sable Permian Resources Land LLC | | | | | | | | |
7.38%, 11/1/2021(a) | | | 200,000 | | | | 120,000 | |
Sanchez Energy Corp. | | | | | |
7.75%, 6/15/2021 | | | 200,000 | | | | 101,000 | |
SemGroup Corp. | | | | | |
5.63%, 11/15/2023 | | | 200,000 | | | | 190,000 | |
Southwestern Energy Co. | | | | | |
6.20%, 1/23/2025(d) | | | 200,000 | | | | 195,250 | |
Sunoco LP | | | | | |
4.88%, 1/15/2023(a) | | | 200,000 | | | | 193,250 | |
Ultra Resources, Inc. | | | | | |
7.13%, 4/15/2025(a) | | | 200,000 | | | | 89,000 | |
| | | | | | | | 4,782,945 | |
| Paper & Forest Products – 0.2% | |
Clearwater Paper Corp. | | | | | |
5.38%, 2/1/2025(a) | | | 100,000 | | | | 92,250 | |
| Personal Products – 0.7% | |
Avon Products, Inc. | | | | | |
7.00%, 3/15/2023(d) | | | 200,000 | | | | 175,750 | |
Revlon Consumer Products Corp. | | | | | |
5.75%, 2/15/2021(d) | | | 200,000 | | | | 158,000 | |
| | | | | | | | 333,750 | |
| Pharmaceuticals – 1.9% | |
Bausch Health Cos., Inc. | | | | | |
5.88%, 5/15/2023(a) | | | 500,000 | | | | 478,750 | |
6.13%, 4/15/2025(a) | | | 500,000 | | | | 461,100 | |
| | | | | | | | 939,850 | |
| Professional Services – 0.5% | |
Jaguar Holding Co. II | | | | | |
6.38%, 8/1/2023(a) | | | 250,000 | | | | 250,550 | |
| | | | | | | | |
| Investments | | Principal
Amount | | | Value | |
| Real Estate Management & Development – 1.8% | |
Five Point Operating Co. LP | | | | | |
7.88%, 11/15/2025(a) | | $ | 200,000 | | | $ | 198,640 | |
Howard Hughes Corp. (The) | | | | | |
5.38%, 3/15/2025(a) | | | 200,000 | | | | 193,000 | |
Hunt Cos., Inc. | | | | | |
6.25%, 2/15/2026(a) | | | 100,000 | | | | 92,500 | |
Kennedy-Wilson, Inc. | | | | | |
5.88%, 4/1/2024 | | | 250,000 | | | | 241,250 | |
Realogy Group LLC | | | | | |
4.88%, 6/1/2023(a) | | | 200,000 | | | | 182,000 | |
| | | | | | | | 907,390 | |
| Road & Rail – 0.4% | |
Neovia Logistics Services LLC | | | | | |
8.88%, 8/1/2020(a) | | | 100,000 | | | | 90,000 | |
Watco Cos. LLC | | | | | |
6.38%, 4/1/2023(a) | | | 100,000 | | | | 101,750 | |
| | | | | | | | 191,750 | |
| Semiconductors & Semiconductor Equipment – 1.0% | |
NXP BV | | | | | |
3.88%, 9/1/2022(a) | | | 300,000 | | | | 290,625 | |
Sensata Technologies UK Financing Co. plc | | | | | | | | |
6.25%, 2/15/2026(a) | | | 200,000 | | | | 204,500 | |
| | | | | | | | 495,125 | |
| Software – 1.3% | |
Change Healthcare Holdings LLC | | | | | |
5.75%, 3/1/2025(a) | | | 100,000 | | | | 98,125 | |
Infor US, Inc. | | | | | |
6.50%, 5/15/2022 | | | 200,000 | | | | 200,500 | |
j2 Cloud Services LLC | | | | | |
6.00%, 7/15/2025(a) | | | 150,000 | | | | 149,062 | |
Veritas US, Inc. | | | | | |
10.50%, 2/1/2024(a) | | | 250,000 | | | | 216,250 | |
| | | | | | | | 663,937 | |
| Specialty Retail – 2.8% | |
Guitar Center Escrow Issuer, Inc. | | | | | |
9.50%, 10/15/2021(a) | | | 200,000 | | | | 195,000 | |
J. Crew Brand LLC | | | | | |
13.00%, 9/15/2021(a) | | | 100,000 | | | | 118,000 | |
KGA Escrow LLC | | | | | |
7.50%, 8/15/2023(a) | | | 75,000 | | | | 77,250 | |
See Accompanying Notes to the Financial Statements.
| | | | |
| FLEXSHARES ANNUAL REPORT | | | 335 | |
FlexShares® High Yield Value-Scored Bond Index Fund (cont.)
| | | | | | | | |
| Investments | | Principal
Amount | | | Value | |
| CORPORATE BONDS – (continued) | |
| Specialty Retail – (continued) | |
L Brands, Inc. | | | | | |
5.63%, 2/15/2022 | | $ | 250,000 | | | $ | 253,437 | |
Penske Automotive Group, Inc. | | | | | |
5.50%, 5/15/2026 | | | 200,000 | | | | 191,000 | |
PetSmart, Inc. | | | | | |
8.88%, 6/1/2025(a) | | | 500,000 | | | | 348,750 | |
Staples, Inc. | | | | | |
8.50%, 9/15/2025(a) | | | 200,000 | | | | 182,000 | |
| | | | | | | | 1,365,437 | |
| Technology Hardware, Storage & Peripherals – 0.6% | |
NCR Corp. | | | | | |
5.00%, 7/15/2022 | | | 200,000 | | | | 193,000 | |
Western Digital Corp. | | | | | |
4.75%, 2/15/2026 | | | 100,000 | | | | 92,500 | |
| | | | | | | | 285,500 | |
| Thrifts & Mortgage Finance – 1.4% | |
Ladder Capital Finance Holdings LLLP | | | | | | | | |
5.25%, 10/1/2025(a) | | | 185,000 | | | | 171,588 | |
Nationstar Mortgage Holdings, Inc. | | | | | | | | |
9.13%, 7/15/2026(a) | | | 250,000 | | | | 254,375 | |
Provident Funding Associates LP | | | | | |
6.38%, 6/15/2025(a) | | | 50,000 | | | | 49,500 | |
Quicken Loans, Inc. | | | | | |
5.75%, 5/1/2025(a) | | | 200,000 | | | | 193,750 | |
| | | | | | | | 669,213 | |
| Tobacco – 0.4% | |
Vector Group Ltd. | | | | | |
6.13%, 2/1/2025(a) | | | 200,000 | | | | 183,000 | |
| Trading Companies & Distributors – 1.4% | |
Ahern Rentals, Inc. | | | | | |
7.38%, 5/15/2023(a) | | | 150,000 | | | | 139,500 | |
Fortress Transportation & Infrastructure Investors LLC | | | | | | | | |
6.75%, 3/15/2022(a) | | | 120,000 | | | | 123,150 | |
United Rentals North America, Inc. | | | | | |
6.50%, 12/15/2026 | | | 400,000 | | | | 405,396 | |
| | | | | | | | 668,046 | |
| | | | | | | | |
| Investments | | Principal
Amount | | | Value | |
| Wireless Telecommunication Services – 3.8% | |
Hughes Satellite Systems Corp. | | | | | |
6.63%, 8/1/2026 | | $ | 260,000 | | | $ | 248,300 | |
Intelsat Connect Finance SA | | | | | |
9.50%, 2/15/2023(a) | | | 900,000 | | | | 865,125 | |
T-Mobile USA, Inc. | | | | | |
6.50%, 1/15/2026 | | | 400,000 | | | | 422,000 | |
Wind Tre SpA | | | | | |
5.00%, 1/20/2026(a) | | | 365,000 | | | | 312,477 | |
| | | | | | | | 1,847,902 | |
Total Corporate Bonds
(Cost $49,507,707) | | | | 47,942,467 | |
| | | | | | |
Total Investments – 98.2%
(Cost $49,507,707) | | | | 47,942,467 | |
Other Assets Less Liabilities – 1.8% | | | | 902,519 | |
| NET ASSETS – 100.0% | | | $ | 48,844,986 | |
| (a) | Securities exempt from registration under Rule 144A of the Securities Act of 1933. These securities may be resold in transactions exempt from registration, normally to qualified institutional buyers. The value of these securities is determined by valuations supplied by a pricing service or brokers, or, if not available, in accordance with procedures established by the Board of Trustees. |
| (b) | Perpetual security. The rate reflected was the rate in effect on October 31, 2018. The maturity date reflects the next call date. |
| (c) | Security issued at a fixed coupon rate, which converts to a variable rate at a future date. Rate shown is the rate in effect as of period end. |
| (d) | Step bond. Interest rate is a fixed rate for an initial period that either resets at a specific date or may reset in the future at a contingent upon predetermined trigger. The interest rate shown was the current rate as of October 31, 2018. |
Percentages shown are based on Net Assets
As of October 31, 2018, the gross unrealized appreciation (depreciation) of investments based on the aggregate cost of investments (including derivative instruments, if applicable) for federal income tax purposes was as follows:
| | | | |
| | | | |
Aggregate gross unrealized appreciation | | $ | 94,189 | |
Aggregate gross unrealized depreciation | | | (1,661,724 | ) |
Net unrealized depreciation | | $ | (1,567,535 | ) |
Federal income tax cost | | $ | 49,510,002 | |
See Accompanying Notes to the Financial Statements.
| | |
| 336 | | FLEXSHARES ANNUAL REPORT |
Schedule of Investments
FlexShares® Ready Access Variable Income Fund
October 31, 2018
| | | | | | | | |
| Investments | | Principal
Amount | | | Value | |
| CORPORATE BONDS – 86.8% | |
| Aerospace & Defense – 2.0% | |
General Dynamics Corp.
(ICE LIBOR USD 3 Month + 0.29%), 2.63%, 5/11/2020(a) | | $ | 1,760,000 | | | $ | 1,764,838 | |
Rockwell Collins, Inc. | | | | | | | | |
1.95%, 7/15/2019 | | | 1,000,000 | | | | 992,639 | |
Spirit AeroSystems, Inc.
(ICE LIBOR USD 3 Month + 0.80%), 3.13%, 6/15/2021(a) | | | 921,000 | | | | 922,289 | |
United Technologies Corp.
(ICE LIBOR USD 3 Month + 0.35%), 2.69%, 11/1/2019(a) | | | 606,000 | | | | 607,232 | |
| | | | | | | | 4,286,998 | |
| Air Freight & Logistics – 1.2% | |
FedEx Corp. | | | | | | | | |
8.00%, 1/15/2019 | | | 440,000 | | | | 444,497 | |
2.30%, 2/1/2020 | | | 1,144,000 | | | | 1,131,500 | |
United Parcel Service, Inc. | | | | | |
5.13%, 4/1/2019 | | | 440,000 | | | | 444,273 | |
(ICE LIBOR USD 3 Month + 0.38%), 2.70%, 5/16/2022(a) | | | 552,000 | | | | 556,067 | |
| | | | | | | | 2,576,337 | |
| Automobiles – 2.2% | |
Daimler Finance North America LLC | | | | | | | | |
(ICE LIBOR USD 3 Month + 0.39%), 2.73%, 5/4/2020(a) (b) | | | 1,500,000 | | | | 1,499,010 | |
(ICE LIBOR USD 3 Month + 0.53%), 2.87%, 5/5/2020(a) (b) | | | 106,000 | | | | 106,246 | |
(ICE LIBOR USD 3 Month + 0.67%), 0.00%, 11/5/2021(a) (b) (c) | | | 2,100,000 | | | | 2,100,567 | |
| | | | | | | | |
| Investments | | Principal
Amount | | | Value | |
| Automobiles – (continued) | |
Nissan Motor Acceptance Corp. (ICE LIBOR USD 3 Month + 0.63%), 2.98%, 9/21/2021(a) (b) | | $ | 1,000,000 | | | $ | 1,002,348 | |
| | | | | | | | 4,708,171 | |
| Banks – 24.9% | |
ABN AMRO Bank NV
(ICE LIBOR USD 3 Month + 0.57%), 2.88%, 8/27/2021(a) (b) | | | 1,100,000 | | | | 1,101,353 | |
Bank of America Corp.
(ICE LIBOR USD 3 Month + 0.38%), 2.86%, 1/23/2022(a) | | | 2,274,000 | | | | 2,260,193 | |
Bank of Montreal | | | | | | | | |
1.75%, 9/11/2019 | | | 2,345,000 | | | | 2,320,980 | |
Bank of Nova Scotia (The)
(ICE LIBOR USD 3 Month + 0.29%),
2.70%, 1/8/2021(a) | | | 880,000 | | | | 880,069 | |
Banque Federative du Credit Mutuel SA
(ICE LIBOR USD 3 Month + 0.96%), 3.43%, 7/20/2023(a) (b) | | | 2,000,000 | | | | 2,013,967 | |
Barclays Bank plc
(ICE LIBOR USD 3 Month + 0.65%),
2.99%, 8/7/2020(a) | | | 186,000 | | | | 186,752 | |
Canadian Imperial Bank of Commerce
(ICE LIBOR USD 3 Month + 0.72%), 3.05%, 6/16/2022(a) | | | 1,459,000 | | | | 1,470,221 | |
Capital One NA | | | | | | | | |
1.85%, 9/13/2019 | | | 250,000 | | | | 247,183 | |
Citibank NA
(ICE LIBOR USD 3 Month + 0.57%), 3.05%, 7/23/2021(a) | | | 900,000 | | | | 903,262 | |
See Accompanying Notes to the Financial Statements.
| | | | |
| FLEXSHARES ANNUAL REPORT | | | 337 | |
FlexShares® Ready Access Variable Income Fund (cont.)
| | | | | | | | |
| Investments | | Principal
Amount | | | Value | |
| CORPORATE BONDS – (continued) | |
| Banks – (continued) | |
Citigroup, Inc. | | | | | | | | |
2.05%, 12/7/2018 | | $ | 150,000 | | | $ | 149,917 | |
2.50%, 7/29/2019 | | | 232,000 | | | | 231,291 | |
(ICE LIBOR USD 3 Month + 0.96%), 3.45%, 4/25/2022(a) | | | 135,000 | | | | 136,455 | |
Commonwealth Bank of Australia | | | | | | | | |
2.30%, 9/6/2019 | | | 300,000 | | | | 298,129 | |
Cooperatieve Rabobank UA | | | | | | | | |
(ICE LIBOR USD 3 Month + 0.43%), 2.94%, 4/26/2021(a) | | | 520,000 | | | | 521,419 | |
(ICE LIBOR USD 3 Month + 0.86%), 3.23%, 9/26/2023(a) (b) | | | 1,000,000 | | | | 998,678 | |
Credit Agricole SA
(ICE LIBOR USD 3 Month + 1.02%), 3.51%, 4/24/2023(a) (b) | | | 100,000 | | | | 99,843 | |
DBS Group Holdings Ltd.
(ICE LIBOR USD 3 Month + 0.49%), 2.82%, 6/8/2020(a) (b) | | | 100,000 | | | | 100,274 | |
Fifth Third Bank | | | | | | | | |
2.38%, 4/25/2019 | | | 1,000,000 | | | | 997,363 | |
(ICE LIBOR USD 3 Month + 0.25%), 2.77%, 10/30/2020(a) | | | 1,500,000 | | | | 1,501,129 | |
HSBC Holdings plc | | | | | | | | |
(ICE LIBOR USD 3 Month + 0.60%), 2.92%, 5/18/2021(a) | | | 1,605,000 | | | | 1,607,140 | |
(ICE LIBOR USD 3 Month + 0.65%), 2.98%, 9/11/2021(a) | | | 2,000,000 | | | | 2,004,162 | |
ING Groep NV
(ICE LIBOR USD 3 Month + 1.00%), 3.40%, 10/2/2023(a) | | | 1,800,000 | | | | 1,800,517 | |
JPMorgan Chase & Co.
(ICE LIBOR USD 3 Month + 0.68%),
3.00%, 6/1/2021(a) | | | 658,000 | | | | 659,224 | |
| | | | | | | | |
| Investments | | Principal
Amount | | | Value | |
| Banks – (continued) | |
KeyBank NA | | | | | | | | |
1.60%, 8/22/2019 | | $ | 1,825,000 | | | $ | 1,804,067 | |
Lloyds Bank plc
(ICE LIBOR USD 3 Month + 0.49%),
2.83%, 5/7/2021(a) | | | 1,760,000 | | | | 1,762,924 | |
Manufacturers & Traders Trust Co.
(ICE LIBOR USD 3 Month + 0.27%), 2.76%, 1/25/2021(a) | | | 2,500,000 | | | | 2,500,196 | |
Mitsubishi UFJ Financial Group, Inc. | | | | | | | | |
(ICE LIBOR USD 3 Month + 0.65%), 3.16%, 7/26/2021(a) | | | 905,000 | | | | 908,940 | |
(ICE LIBOR USD 3 Month + 0.86%), 3.37%, 7/26/2023(a) | | | 1,300,000 | | | | 1,302,979 | |
National Australia Bank Ltd. | | | | | | | | |
1.38%, 7/12/2019 | | | 250,000 | | | | 247,371 | |
National Bank of Canada | | | | | | | | |
2.10%, 12/14/2018 | | | 250,000 | | | | 249,861 | |
Nordea Bank AB
(ICE LIBOR USD 3 Month + 0.94%), 3.25%, 8/30/2023(a) (b) | | | 600,000 | | | | 599,859 | |
PNC Bank NA | | | | | | | | |
2.40%, 10/18/2019 | | | 850,000 | | | | 844,811 | |
(ICE LIBOR USD 3 Month + 0.36%), 2.68%, 5/19/2020(a) | | | 900,000 | | | | 901,839 | |
PNC Financial Services Group, Inc. (The) | | | | | | | | |
6.70%, 6/10/2019 | | | 360,000 | | | | 368,051 | |
Royal Bank of Canada
(ICE LIBOR USD 3 Month + 0.38%),
2.70%, 3/2/2020(a) | | | 2,609,000 | | | | 2,614,729 | |
Santander UK plc | | | | | |
2.35%, 9/10/2019 | | | 792,000 | | | | 786,563 | |
(ICE LIBOR USD 3 Month + 0.62%), 2.94%, 6/1/2021(a) | | | 1,900,000 | | | | 1,908,262 | |
See Accompanying Notes to the Financial Statements.
| | |
| 338 | | FLEXSHARES ANNUAL REPORT |
FlexShares® Ready Access Variable Income Fund (cont.)
| | | | | | | | |
| Investments | | Principal
Amount | | | Value | |
| CORPORATE BONDS – (continued) | |
| Banks – (continued) | |
Skandinaviska Enskilda Banken AB
(ICE LIBOR USD 3 Month + 0.43%), 2.74%, 5/17/2021(a) (b) | | $ | 2,700,000 | | | $ | 2,699,247 | |
Sumitomo Mitsui Banking Corp.
(ICE LIBOR USD 3 Month + 0.37%), 2.81%, 10/16/2020(a) | | | 1,000,000 | | | | 1,000,358 | |
Sumitomo Mitsui Financial Group, Inc.
(ICE LIBOR USD 3 Month + 0.86%), 3.31%, 7/19/2023(a) | | | 2,100,000 | | | | 2,111,335 | |
Svenska Handelsbanken AB
(ICE LIBOR USD 3 Month + 0.47%), 2.78%, 5/24/2021(a) | | | 2,250,000 | | | | 2,262,059 | |
Toronto-Dominion Bank (The)
(ICE LIBOR USD 3 Month + 0.26%), 2.59%, 9/17/2020(a) | | | 335,000 | | | | 335,514 | |
US Bank NA | | | | | | | | |
(ICE LIBOR USD 3 Month + 0.13%), 2.57%, 1/17/2020(a) | | | 750,000 | | | | 749,730 | |
2.00%, 1/24/2020 | | | 740,000 | | | | 729,815 | |
Wells Fargo & Co. | | | | | | | | |
Series N, 2.15%, 1/30/2020 | | | 12,000 | | | | 11,846 | |
Wells Fargo Bank NA | | | | | | | | |
(SOFRRATE + 0.48%), 2.66%, 3/25/2020(a) | | | 500,000 | | | | 499,535 | |
(ICE LIBOR USD 3 Month + 0.50%), 2.98%, 7/23/2021(a) | | | 2,400,000 | | | | 2,402,251 | |
Westpac Banking Corp. | | | | | | | | |
1.65%, 5/13/2019 | | | 150,000 | | | | 148,962 | |
(ICE LIBOR USD 3 Month + 0.43%), 2.75%, 3/6/2020(a) | | | 457,000 | | | | 458,320 | |
| | | | | | | | 52,698,945 | |
| | | | | | | | |
| Investments | | Principal
Amount | | | Value | |
| Beverages – 0.1% | |
Diageo Capital plc
(ICE LIBOR USD 3 Month + 0.24%), 2.56%, 5/18/2020(a) | | $ | 300,000 | | | $ | 300,352 | |
| Biotechnology – 1.6% | |
Amgen, Inc. | | | | | | | | |
(ICE LIBOR USD 3 Month + 0.32%), 2.66%, 5/10/2019(a) | | | 1,044,000 | | | | 1,045,156 | |
2.20%, 5/22/2019 | | | 1,752,000 | | | | 1,745,303 | |
Gilead Sciences, Inc. | | | | | | | | |
2.05%, 4/1/2019 | | | 200,000 | | | | 199,241 | |
1.85%, 9/20/2019 | | | 440,000 | | | | 435,567 | |
| | | | | | | | 3,425,267 | |
| Capital Markets – 5.0% | |
Ares Capital Corp. | | | | | | | | |
4.88%, 11/30/2018 | | | 1,492,000 | | | | 1,494,133 | |
Charles Schwab Corp. (The)
(ICE LIBOR USD 3 Month + 0.32%), 2.63%, 5/21/2021(a) | | | 669,000 | | | | 670,348 | |
Credit Suisse AG | | | | | | | | |
2.30%, 5/28/2019 | | | 1,000,000 | | | | 996,854 | |
Goldman Sachs Bank USA | | | | | | | | |
3.20%, 6/5/2020 | | | 350,000 | | | | 349,790 | |
Goldman Sachs Group, Inc. (The) | | | | | | | | |
7.50%, 2/15/2019 | | | 1,439,000 | | | | 1,457,498 | |
1.95%, 7/23/2019 | | | 390,000 | | | | 387,008 | |
2.55%, 10/23/2019 | | | 900,000 | | | | 894,316 | |
Morgan Stanley | | | | | | | | |
2.50%, 1/24/2019 | | | 1,436,000 | | | | 1,435,157 | |
2.38%, 7/23/2019 | | | 470,000 | | | | 468,100 | |
5.63%, 9/23/2019 | | | 1,380,000 | | | | 1,409,898 | |
5.50%, 1/26/2020 | | | 430,000 | | | | 441,492 | |
(ICE LIBOR USD 3 Month + 0.55%), 2.89%, 2/10/2021(a) | | | 146,000 | | | | 146,101 | |
Nasdaq, Inc.
(ICE LIBOR USD 3 Month + 0.39%), 2.76%, 3/22/2019(a) | | | 352,000 | | | | 352,118 | |
| | | | | | | | 10,502,813 | |
See Accompanying Notes to the Financial Statements.
| | | | |
| FLEXSHARES ANNUAL REPORT | | | 339 | |
FlexShares® Ready Access Variable Income Fund (cont.)
| | | | | | | | |
| Investments | | Principal
Amount | | | Value | |
| CORPORATE BONDS – (continued) | |
| Chemicals – 1.5% | |
Dow Chemical Co. (The) | | | | | | | | |
8.55%, 5/15/2019 | | $ | 325,000 | | | $ | 334,311 | |
Eastman Chemical Co. | | | | | | | | |
2.70%, 1/15/2020 | | | 475,000 | | | | 471,586 | |
Ecolab, Inc. | | | | | | | | |
2.00%, 1/14/2019 | | | 124,000 | | | | 123,823 | |
EI du Pont de Nemours & Co.
(ICE LIBOR USD 3 Month + 0.53%),
2.87%, 5/1/2020(a) | | | 130,000 | | | | 130,621 | |
Nutrien Ltd. | | | | | | | | |
6.50%, 5/15/2019 | | | 2,001,000 | | | | 2,037,878 | |
| | | | | | | | 3,098,219 | |
| Commercial Services & Supplies – 1.8% | |
Republic Services, Inc. | | | | | | | | |
5.50%, 9/15/2019 | | | 3,756,000 | | | | 3,834,402 | |
| Communications Equipment – 0.1% | |
Cisco Systems, Inc.
(ICE LIBOR USD 3 Month + 0.50%),
2.82%, 3/1/2019(a) | | | 93,000 | | | | 93,146 | |
| Consumer Finance – 10.0% | |
American Express Co.
(ICE LIBOR USD 3 Month + 0.53%), 2.84%, 5/17/2021(a) | | | 440,000 | | | | 440,734 | |
American Express Credit Corp. | | | | | | | | |
(ICE LIBOR USD 3 Month + 0.49%), 2.80%, 8/15/2019(a) | | | 540,000 | | | | 541,306 | |
(ICE LIBOR USD 3 Month + 0.43%), 2.75%, 3/3/2020(a) | | | 1,207,000 | | | | 1,210,778 | |
2.38%, 5/26/2020 | | | 360,000 | | | | 355,207 | |
American Honda Finance Corp. | | | | | | | | |
2.25%, 8/15/2019 | | | 1,000,000 | | | | 994,588 | |
(ICE LIBOR USD 3 Month + 0.34%), 2.66%, 2/14/2020(a) | | | 410,000 | | | | 410,557 | |
| | | | | | | | |
| Investments | | Principal
Amount | | | Value | |
| Consumer Finance – (continued) | |
(ICE LIBOR USD 3 Month + 0.26%), 2.59%, 6/16/2020(a) | | $ | 400,000 | | | $ | 400,263 | |
(ICE LIBOR USD 3 Month + 0.27%), 2.74%, 7/20/2020(a) | | | 265,000 | | | | 265,325 | |
(ICE LIBOR USD 3 Month + 0.29%), 2.61%, 12/10/2021(a) | | | 1,500,000 | | | | 1,500,203 | |
Capital One Financial Corp.
(ICE LIBOR USD 3 Month + 0.95%),
3.28%, 3/9/2022(a) | | | 305,000 | | | | 305,881 | |
Caterpillar Financial Services Corp.
(ICE LIBOR USD 3 Month + 0.28%),
2.60%, 9/7/2021(a) | | | 2,000,000 | | | | 2,000,749 | |
Ford Motor Credit Co. LLC | | | | | | | | |
Series 1, (ICE LIBOR USD 3 Month + 0.83%), 3.16%, 3/12/2019(a) | | | 705,000 | | | | 705,496 | |
1.90%, 8/12/2019 | | | 250,000 | | | | 247,327 | |
General Motors Financial Co., Inc. | | | | | | | | |
3.10%, 1/15/2019 | | | 744,000 | | | | 744,222 | |
2.40%, 5/9/2019 | | | 880,000 | | | | 878,065 | |
2.45%, 11/6/2020 | | | 989,000 | | | | 962,717 | |
HSBC USA, Inc. | | | | | |
2.38%, 11/13/2019 | | | 1,000,000 | | | | 992,580 | |
John Deere Capital Corp. | | | | | | | | |
(ICE LIBOR USD 3 Month + 0.30%), 2.63%, 3/13/2020(a) | | | 298,000 | | | | 298,541 | |
(ICE LIBOR USD 3 Month + 0.29%), 2.66%, 6/22/2020(a) | | | 792,000 | | | | 793,854 | |
(ICE LIBOR USD 3 Month + 0.17%), 2.59%, 10/9/2020(a) | | | 900,000 | | | | 899,709 | |
(ICE LIBOR USD 3 Month + 0.26%), 2.59%, 9/10/2021(a) | | | 2,030,000 | | | | 2,031,198 | |
See Accompanying Notes to the Financial Statements.
| | |
| 340 | | FLEXSHARES ANNUAL REPORT |
FlexShares® Ready Access Variable Income Fund (cont.)
| | | | | | | | |
| Investments | | Principal
Amount | | | Value | |
| CORPORATE BONDS – (continued) | |
| Consumer Finance – (continued) | |
PACCAR Financial Corp.
(ICE LIBOR USD 3 Month + 0.26%), 2.60%, 5/10/2021(a) | | $ | 2,182,000 | | | $ | 2,186,201 | |
Toyota Motor Credit Corp. | | | | | | | | |
(ICE LIBOR USD 3 Month + 0.10%), 2.51%, 1/10/2020(a) | | | 968,000 | | | | 968,668 | |
(ICE LIBOR USD 3 Month + 0.26%), 2.71%, 4/17/2020(a) | | | 1,028,000 | | | | 1,031,138 | |
| | | | | | | | 21,165,307 | |
| Diversified Financial Services – 2.1% | |
Berkshire Hathaway, Inc. | | | | | | | | |
2.10%, 8/14/2019 | | | 230,000 | | | | 228,637 | |
JPMorgan Chase Bank NA | | | | | | | | |
(SOFRRATE + 0.55%), 2.73%, 10/19/2020(a) | | | 3,000,000 | | | | 3,000,636 | |
(ICE LIBOR USD 3 Month + 0.29%), 2.63%, 2/1/2021(a) | | | 1,105,000 | | | | 1,104,968 | |
Siemens Financieringsmaatschappij NV
(ICE LIBOR USD 3 Month + 0.34%), 2.67%, 3/16/2020(a) (b) | | | 45,000 | | | | 45,084 | |
| | | | | | | | 4,379,325 | |
| Diversified Telecommunication Services – 2.5% | |
AT&T, Inc. | | | | | | | | |
(ICE LIBOR USD 3 Month + 0.65%), 3.09%, 1/15/2020(a) | | | 1,400,000 | | | | 1,405,411 | |
(ICE LIBOR USD 3 Month + 0.95%), 3.39%, 7/15/2021(a) | | | 1,500,000 | | | | 1,516,859 | |
Orange SA | | | | | | | | |
1.63%, 11/3/2019 | | | 1,663,000 | | | | 1,637,196 | |
Verizon Communications, Inc.
(ICE LIBOR USD 3 Month + 0.55%), 2.86%, 5/22/2020(a) | | | 704,000 | | | | 707,388 | |
| | | | | | | | 5,266,854 | |
| | | | | | | | |
| Investments | | Principal
Amount | | | Value | |
| Electric Utilities – 1.2% | |
Duke Energy Corp. | | | | | | | | |
5.05%, 9/15/2019 | | $ | 1,610,000 | | | $ | 1,636,034 | |
Southern Co. (The) | | | | | | | | |
1.85%, 7/1/2019 | | | 825,000 | | | | 818,036 | |
| | | | | | | | 2,454,070 | |
| Electronic Equipment, Instruments & Components – 0.5% | |
Amphenol Corp. | | | | | | | | |
2.55%, 1/30/2019 | | | 989,000 | | | | 988,221 | |
| Energy Equipment & Services – 0.6% | |
Schlumberger Finance Canada Ltd. | | | | | | | | |
2.20%, 11/20/2020(b) | | | 1,053,000 | | | | 1,027,725 | |
Schlumberger Holdings Corp. | | | | | | | | |
2.35%, 12/21/2018(b) | | | 243,000 | | | | 242,893 | |
| | | | | | | | 1,270,618 | |
| Entertainment – 0.5% | |
NBCUniversal Enterprise, Inc. | | | | | | | | |
1.97%, 4/15/2019(b) | | | 1,000,000 | | | | 995,992 | |
| Equity Real Estate Investment Trusts (REITs) – 0.5% | |
Weyerhaeuser Co. | | | | | | | | |
7.38%, 10/1/2019 | | | 1,000,000 | | | | 1,036,880 | |
| Food & Staples Retailing – 2.6% | |
Kroger Co. (The) | | | | | | | | |
2.00%, 1/15/2019 | | | 2,213,000 | | | | 2,208,519 | |
Sysco Corp. | | | | | | | | |
2.60%, 10/1/2020 | | | 1,144,000 | | | | 1,128,074 | |
Walgreens Boots Alliance, Inc. | | | | | | | | |
2.70%, 11/18/2019 | | | 2,197,000 | | | | 2,186,375 | |
| | | | | | | | 5,522,968 | |
| Food Products – 4.3% | |
General Mills, Inc. | | | | | | | | |
5.65%, 2/15/2019 | | | 1,704,000 | | | | 1,716,495 | |
JM Smucker Co. (The) | | | | | | | | |
2.20%, 12/6/2019 | | | 1,757,000 | | | | 1,738,407 | |
Mondelez International Holdings Netherlands BV | | | | | | | | |
1.63%, 10/28/2019(b) | | | 1,140,000 | | | | 1,121,274 | |
See Accompanying Notes to the Financial Statements.
| | | | |
| FLEXSHARES ANNUAL REPORT | | | 341 | |
FlexShares® Ready Access Variable Income Fund (cont.)
| | | | | | | | |
| Investments | | Principal
Amount | | | Value | |
| CORPORATE BONDS – (continued) | |
| Food Products – (continued) | |
Mondelez International, Inc.
(ICE LIBOR USD 3 Month + 0.52%),
2.86%, 2/1/2019(a) | | $ | 1,332,000 | | | $ | 1,333,269 | |
Tyson Foods, Inc. | | | | | | | | |
2.65%, 8/15/2019 | | | 940,000 | | | | 937,537 | |
(ICE LIBOR USD 3 Month + 0.55%), 2.87%, 6/2/2020(a) | | | 2,249,000 | | | | 2,254,102 | |
| | | | | | | | 9,101,084 | |
| Health Care Providers & Services – 4.0% | |
Cardinal Health, Inc. | | | | | | | | |
1.95%, 6/14/2019 | | | 1,678,000 | | | | 1,667,510 | |
CVS Health Corp.
(ICE LIBOR USD 3 Month + 0.63%),
2.96%, 3/9/2020(a) | | | 1,265,000 | | | | 1,269,367 | |
Halfmoon Parent, Inc. | | | | | | | | |
3.20%, 9/17/2020(b) | | | 1,800,000 | | | | 1,791,212 | |
(ICE LIBOR USD 3 Month + 0.89%), 3.33%, 7/15/2023(a) (b) | | | 1,100,000 | | | | 1,099,835 | |
McKesson Corp. | | | | | | | | |
2.28%, 3/15/2019 | | | 675,000 | | | | 673,309 | |
UnitedHealth Group, Inc. | | | | | | | | |
1.70%, 2/15/2019 | | | 1,935,000 | | | | 1,928,979 | |
| | | | | | | | 8,430,212 | |
| Hotels, Restaurants & Leisure – 0.2% | |
McDonald’s Corp. | | | | | | | | |
5.00%, 2/1/2019 | | | 455,000 | | | | 457,270 | |
| Household Durables – 0.4% | |
DR Horton, Inc. | | | | | | | | |
3.75%, 3/1/2019 | | | 217,000 | | | | 217,047 | |
2.55%, 12/1/2020 | | | 568,000 | | | | 555,040 | |
| | | | | | | | 772,087 | |
| Household Products – 0.4% | |
Church & Dwight Co., Inc.
(ICE LIBOR USD 3 Month + 0.15%), 2.64%, 1/25/2019(a) | | | 290,000 | | | | 289,960 | |
| | | | | | | | |
| Investments | | Principal
Amount | | | Value | |
| Household Products – (continued) | |
Kimberly-Clark Corp. | | | | | | | | |
1.90%, 5/22/2019 | | $ | 605,000 | | | $ | 601,906 | |
| | | | | | | | 891,866 | |
| Industrial Conglomerates – 1.0% | |
General Electric Co. | | | | | | | | |
2.30%, 1/14/2019 | | | 600,000 | | | | 599,598 | |
(ICE LIBOR USD 3 Month + 0.51%), 2.95%, 1/14/2019(a) | | | 463,000 | | | | 462,975 | |
Honeywell International, Inc. | | | | | | | | |
1.40%, 10/30/2019 | | | 1,041,000 | | | | 1,025,021 | |
| | | | | | | | 2,087,594 | |
| Insurance – 2.3% | |
Allstate Corp. (The) | | | | | | | | |
7.45%, 5/16/2019 | | | 265,000 | | | | 271,271 | |
(ICE LIBOR USD 3 Month + 0.43%), 2.82%, 3/29/2021(a) | | | 1,298,000 | | | | 1,299,344 | |
American International Group, Inc. | | | | | | | | |
2.30%, 7/16/2019 | | | 475,000 | | | | 472,835 | |
Berkshire Hathaway Finance Corp.
(ICE LIBOR USD 3 Month + 0.32%), 2.73%, 1/10/2020(a) | | | 168,000 | | | | 168,456 | |
Jackson National Life Global Funding
(ICE LIBOR USD 3 Month + 0.30%), 2.74%, 10/15/2020(a) (b) | | | 2,195,000 | | | | 2,195,483 | |
Prudential Financial, Inc. | | | | | | | | |
7.38%, 6/15/2019 | | | 325,000 | | | | 333,628 | |
| | | | | | | | 4,741,017 | |
| Interactive Media & Services – 0.2% | |
Tencent Holdings Ltd.
(ICE LIBOR USD 3 Month + 0.61%), 3.05%, 1/19/2023(a) (b) | | | 455,000 | | | | 452,774 | |
See Accompanying Notes to the Financial Statements.
| | |
| 342 | | FLEXSHARES ANNUAL REPORT |
FlexShares® Ready Access Variable Income Fund (cont.)
| | | | | | | | |
| Investments | | Principal
Amount | | | Value | |
| CORPORATE BONDS – (continued) | |
| Internet & Direct Marketing Retail – 1.4% | |
Amazon.com, Inc. | | | | | | | | |
2.60%, 12/5/2019 | | $ | 2,710,000 | | | $ | 2,701,229 | |
eBay, Inc. | | | | | | | | |
2.20%, 8/1/2019 | | | 314,000 | | | | 312,055 | |
| | | | | | | | 3,013,284 | |
| Machinery – 1.6% | |
Illinois Tool Works, Inc. | | | | | | | | |
6.25%, 4/1/2019 | | | 1,024,000 | | | | 1,038,117 | |
Stanley Black & Decker, Inc. | | | | | | | | |
1.62%, 11/17/2018 | | | 2,362,000 | | | | 2,360,558 | |
| | | | | | | | 3,398,675 | |
| Media – 0.7% | |
Comcast Corp.
(ICE LIBOR USD 3 Month + 0.44%), 2.85%, 10/1/2021(a) | | | 1,500,000 | | | | 1,501,177 | |
| Multiline Retail – 0.1% | |
Dollar Tree, Inc.
(ICE LIBOR USD 3 Month + 0.70%), 3.15%, 4/17/2020(a) | | | 162,000 | | | | 162,143 | |
| Multi-Utilities – 0.5% | |
Dominion Energy, Inc. | | | | | | | | |
Series A, 1.88%, 1/15/2019 | | | 1,020,000 | | | | 1,018,583 | |
| Oil, Gas & Consumable Fuels – 0.2% | |
Enterprise Products Operating LLC | | | | | | | | |
5.25%, 1/31/2020 | | | 453,000 | | | | 463,576 | |
| Pharmaceuticals – 4.9% | |
AstraZeneca plc | | | | | | | | |
1.75%, 11/16/2018 | | | 257,000 | | | | 256,888 | |
(ICE LIBOR USD 3 Month + 0.67%), 2.98%, 8/17/2023(a) | | | 2,800,000 | | | | 2,787,116 | |
Bayer US Finance II LLC
(ICE LIBOR USD 3 Month + 0.63%), 3.00%, 6/25/2021(a) (b) | | | 2,530,000 | | | | 2,531,913 | |
| | | | | | | | |
| Investments | | Principal
Amount | | | Value | |
| Pharmaceuticals – (continued) | |
GlaxoSmithKline Capital plc
(ICE LIBOR USD 3 Month + 0.35%), 2.67%, 5/14/2021(a) | | $ | 295,000 | | | $ | 295,684 | |
Pfizer, Inc.
(ICE LIBOR USD 3 Month + 0.33%), 2.65%, 9/15/2023(a) | | | 3,500,000 | | | | 3,493,066 | |
Shire Acquisitions Investments Ireland DAC | | | | | | | | |
1.90%, 9/23/2019 | | | 1,000,000 | | | | 987,850 | |
| | | | | | | | 10,352,517 | |
| Road & Rail – 0.9% | |
Burlington Northern Santa Fe LLC | | | | | | | | |
4.70%, 10/1/2019 | | | 250,000 | | | | 253,733 | |
Penske Truck Leasing Co. LP | | | | | | | | |
3.05%, 1/9/2020(b) | | | 585,000 | | | | 582,848 | |
Ryder System, Inc. | | | | | | | | |
2.35%, 2/26/2019 | | | 301,000 | | | | 300,349 | |
2.55%, 6/1/2019 | | | 699,000 | | | | 697,532 | |
2.45%, 9/3/2019 | | | 134,000 | | | | 133,284 | |
| | | | | | | | 1,967,746 | |
| Specialty Retail – 1.0% | |
Home Depot, Inc. (The) | | | | | | | | |
2.00%, 6/15/2019 | | | 1,355,000 | | | | 1,347,591 | |
Lowe’s Cos., Inc.
(ICE LIBOR USD 3 Month + 0.42%), 2.75%, 9/10/2019(a) | | | 789,000 | | | | 791,209 | |
| | | | | | | | 2,138,800 | |
| Trading Companies & Distributors – 1.8% | |
Air Lease Corp. | | | | | | | | |
3.38%, 1/15/2019 | | | 2,355,000 | | | | 2,355,670 | |
Aviation Capital Group LLC
(ICE LIBOR USD 3 Month + 0.67%), 3.19%, 7/30/2021(a) (b) | | | 1,500,000 | | | | 1,505,623 | |
| | | | | | | | 3,861,293 | |
Total Corporate Bonds
(Cost $183,527,023) | | | | 183,416,583 | |
See Accompanying Notes to the Financial Statements.
| | | | |
| FLEXSHARES ANNUAL REPORT | | | 343 | |
FlexShares® Ready Access Variable Income Fund (cont.)
| | | | | | | | |
| Investments | | Principal
Amount | | | Value | |
| ASSET-BACKED SECURITIES – 7.6% | |
American Express Credit Account Master Trust | | | | | | | | |
Series 2017-6, Class A, 2.04%, 5/15/2023 | | $ | 1,000,000 | | | $ | 978,535 | |
Series 2017-2, Class A, 2.73%, 9/16/2024(d) | | | 2,000,000 | | | | 2,016,806 | |
Americredit Automobile Receivables Trust | | | | | | | | |
Series 2018-1, Class A2A, 2.71%, 7/19/2021 | | | 670,000 | | | | 669,009 | |
CarMax Auto Owner Trust | | | | | | | | |
Series 2017-1, Class A2, 1.54%, 2/18/2020 | | | 38,044 | | | | 38,025 | |
Series 2018-3, Class A2A, 2.88%, 10/15/2021 | | | 2,000,000 | | | | 1,997,056 | |
CNH Equipment Trust | | | | | | | | |
Series 2018-A, Class A2, 2.78%, 8/16/2021 | | | 1,000,000 | | | | 999,555 | |
Drive Auto Receivables Trust | | | | | | | | |
Series 2018-3, Class A2, 2.75%, 10/15/2020 | | | 2,000,000 | | | | 1,998,626 | |
GM Financial Automobile Leasing Trust | | | | | | | | |
Series 2018-3, Class A2A, 2.89%, 9/21/2020 | | | 500,000 | | | | 499,551 | |
GM Financial Consumer Automobile Receivables Trust | | | | | | | | |
Series 2018-3, Class A2A, 2.74%, 7/16/2021 | | | 1,800,000 | | | | 1,797,984 | |
Honda Auto Receivables Owner Trust | | | | | | | | |
Series 2018-2, Class A2, 2.66%, 12/18/2020 | | | 3,000,000 | | | | 2,995,724 | |
John Deere Owner Trust | | | | | | | | |
Series 2017-A, Class A2, 1.50%, 10/15/2019 | | | 54,271 | | | | 54,241 | |
Santander Drive Auto Receivables Trust | | | | | | | | |
Series 2018-4, Class A2, 2.73%, 3/15/2021 | | | 1,000,000 | | | | 998,906 | |
| | | | | | | | |
| Investments | | Principal
Amount | | | Value | |
Volkswagen Auto Loan Enhanced Trust | | | | | | | | |
Series 2018-1, Class A2A, 2.81%, 7/20/2021 | | $ | 1,000,000 | | | $ | 997,848 | |
Total Asset-Backed Securities
(Cost $16,061,838) | | | | 16,041,866 | |
| | |
| | | | | | | | |
| U.S. TREASURY OBLIGATIONS – 3.0% | |
U.S. Treasury Notes | | | | | | | | |
1.50%, 3/31/2019 | | | 3,000,000 | | | | 2,988,399 | |
1.50%, 11/30/2019 | | | 3,500,000 | | | | 3,454,199 | |
Total U.S. Treasury Obligations
(Cost $6,446,724) | | | | 6,442,598 | |
| | |
| | | | | | | | |
| COLLATERALIZED MORTGAGE OBLIGATIONS – 0.7% | |
Holmes Master Issuer plc | | | | | | | | |
Series 2018-1A, Class A2, 2.80%, 10/15/2054(b) (d) | | | 400,000 | | | | 400,160 | |
Silverstone Master Issuer plc | | | | | | | | |
Series 2018-1A, Class 1A, 2.86%, 1/21/2070(b) (d) | | | 990,000 | | | | 988,588 | |
Total Collateralized Mortgage Obligations
(Cost $1,390,000) | | | | 1,388,748 | |
| | |
| | | | | | | | |
| FOREIGN GOVERNMENT SECURITIES – 0.6% | |
Japan Bank for International Cooperation
(ICE LIBOR USD 3 Month + 0.57%), 2.88%, 2/24/2020(a)
(Cost $1,300,000) | | | 1,300,000 | | | | 1,307,620 | |
| | |
| | | | | | | | |
| SHORT-TERM INVESTMENTS – 6.6% | |
| COMMERCIAL PAPER – 1.9% | |
Johnson Controls International plc | | | | | | | | |
2.35%, 11/1/2018(e) (f) (Cost $4,000,000) | | | 4,000,000 | | | | 3,999,737 | |
See Accompanying Notes to the Financial Statements.
| | |
| 344 | | FLEXSHARES ANNUAL REPORT |
FlexShares® Ready Access Variable Income Fund (cont.)
| | | | | | | | |
| Investments | | Principal
Amount | | | Value | |
| SHORT-TERM INVESTMENTS – (continued) | |
| U.S. GOVERNMENT AGENCY SECURITIES – 4.7% | |
FHLB Discount Notes | | | | | | | | |
2.00%, 11/1/2018(f) | | $ | 3,000,000 | | | $ | 3,000,000 | |
2.16%, 11/2/2018(f) | | | 7,000,000 | | | | 6,999,580 | |
Total U.S. Government Agency Securities
(Cost $9,999,580) | | | | 9,999,580 | |
Total Short-Term Investments
(Cost $13,999,580) | | | | 13,999,317 | |
Total Investments – 105.3%
(Cost $222,725,165) | | | | 222,596,732 | |
Liabilities in excess of other assets – (5.3%) | | | | (11,247,051 | ) |
| NET ASSETS – 100.0% | | | $ | 211,349,681 | |
| (a) | Variable or floating rate security, linked to the referenced benchmark. The interest rate shown is the rate in effect as of October 31, 2018. |
| (b) | Securities exempt from registration under Rule 144A of the Securities Act of 1933. These securities may be resold in transactions exempt from registration, normally to qualified institutional buyers. The value of these securities is determined by valuations supplied by a pricing service or brokers, or, if not available, in accordance with procedures established by the Board of Trustees. |
| (c) | Security fair valued as of October 31, 2018 in accordance with procedures approved by the Board of Trustees. Total value of all such securities at October 31, 2018 amounted to $2,100,567, which represents approximately 0.99% of net assets of the Fund. |
| (d) | Variable or floating rate security, the interest rate of which adjusts periodically based on changes in current interest rates and prepayments on the underlying pool of assets. The interest rate shown was the current rate as of October 31, 2018. |
| (e) | Security exempt from registration under Section 4(2) of the Securities Act of 1933. Such securities may be sold in transactions exempt from registration normally to qualified institutional buyers. |
| (f) | The rate shown was the current yield as of October 31, 2018. |
| Percentages | shown are based on Net Assets. |
Abbreviations
FHLB – Federal Home Loan Bank
ICE – Intercontinental Exchange
LIBOR – London Interbank Offered Rate
SOFRRATE – Secured Overnight Financing Rate
USD – US Dollar
As of October 31, 2018, the gross unrealized appreciation (depreciation) of investments based on the aggregate cost of investments (including derivative instruments, if applicable) for federal income tax purposes was as follows:
| | | | |
| | | | |
Aggregate gross unrealized appreciation | | $ | 162,406 | |
Aggregate gross unrealized depreciation | | | (291,244 | ) |
Net unrealized depreciation | | $ | (128,838 | ) |
Federal income tax cost | | $ | 222,725,570 | |
FlexShares® Ready Access Variable Income Fund invested, as a percentage of net assets, in companies domiciled in the following countries as of October 31, 2018:
| | | | |
Australia | | | 0.5 | % |
Canada | | | 4.7 | |
China | | | 0.2 | |
Finland | | | 0.3 | |
France | | | 1.8 | |
Germany | | | 3.0 | |
Japan | | | 3.1 | |
Netherlands | | | 2.1 | |
Singapore | | | 0.0 | † |
Sweden | | | 2.3 | |
Switzerland | | | 0.5 | |
United Kingdom | | | 6.3 | |
United States | | | 80.5 | |
Other1 | | | (5.3 | ) |
| | | | 100.0 | % |
| † | Amount represents less than 0.05%. |
| 1 | Includes any non-fixed-income securities and net other assets (liabilities). |
See Accompanying Notes to the Financial Statements.
| | | | |
| FLEXSHARES ANNUAL REPORT | | | 345 | |
Schedule of Investments
FlexShares® Core Select Bond Fund
October 31, 2018
| | | | | | | | |
| Investments | | Shares | | | Value | |
| EXCHANGE TRADED FUNDS – 99.4% | |
FlexShares® Credit-Scored US Corporate Bond Index Fund(a) | | | 218,436 | | | $ | 10,633,465 | |
FlexShares® Credit-Scored US Long Corporate Bond Index Fund(a) | | | 121,794 | | | | 5,822,971 | |
FlexShares® Disciplined Duration MBS Index Fund(a) | | | 603,290 | | | | 13,730,880 | |
FlexShares® Ready Access Variable Income Fund(a) | | | 13,416 | | | | 1,012,975 | |
iShares 20+ Year Treasury Bond ETF | | | 7,630 | | | | 866,615 | |
iShares 3-7 Year Treasury Bond ETF | | | 39,120 | | | | 4,652,933 | |
iShares 7-10 Year Treasury Bond ETF | | | 2,518 | | | | 253,462 | |
iShares Short-Term Corporate Bond ETF | | | 26,561 | | | | 1,371,610 | |
Total Exchange Traded Funds
(Cost $39,258,289) | | | | 38,344,911 | |
| | | Principal
Amount | | | | |
| SHORT-TERM INVESTMENTS – 0.2% | |
| U.S. TREASURY OBLIGATIONS – 0.2% | |
U.S. Treasury Bills | |
1.99%, 11/8/2018(b) (Cost $64,975) | | $ | 65,000 | | | | 64,974 | |
Total Investments – 99.6%
(Cost $39,323,264) | | | | 38,409,885 | |
Other Assets Less Liabilities – 0.4% | | | | 173,014 | |
| NET ASSETS – 100.0% | | | $ | 38,582,899 | |
| (a) | Investment in affiliated Fund. Northern Trust Investments, Inc. is the Investment Adviser to both the Fund and the Underlying Funds. |
| (b) | The rate shown was the current yield as of October 31, 2018. |
Percentages shown are based on Net Assets.
As of October 31, 2018, the gross unrealized appreciation (depreciation) of investments based on the aggregate cost of investments (including derivative instruments, if applicable) for federal income tax purposes was as follows:
| | | | |
| | | | |
Aggregate gross unrealized appreciation | | $ | 1,275 | |
Aggregate gross unrealized depreciation | | | (1,005,008 | ) |
Net unrealized depreciation | | $ | (1,003,733 | ) |
Federal income tax cost | | $ | 39,413,618 | |
See Accompanying Notes to the Financial Statements.
| | |
| 346 | | FLEXSHARES ANNUAL REPORT |
FlexShares® Core Select Bond Fund (cont.)
As of October 31, 2018, the FlexShares® Core Select Bond Fund was invested in securities of affiliated FlexShares Funds. The Schedules of Investments of the affiliated FlexShares Funds are located elsewhere in this Report.
Investment in a company which was affiliated for the period ended October 31, 2018, was as follows:
| | | | | | | | | | | | | | | | | | | | | | | | | | | | | | | | |
| Security | | Value
October 31,
2017 | | | Purchases
at Cost | | | Sales
Proceeds | | | Shares
October 31,
2018 | | | Value
October 31,
2018 | | | Change in
Unrealized
Appreciation
(Depreciation) | | | Dividend
Income | | | Realized
Gain/(Loss) | |
FlexShares® Credit-Scored US Corporate Bond Index Fund | | $ | 1,162,832 | | | $ | 11,357,761 | | | $ | 1,661,003 | | | | 218,436 | | | $ | 10,633,465 | | | $ | (178,447 | ) | | $ | 167,773 | | | $ | (47,678 | ) |
FlexShares® Credit-Scored US Long Corporate Bond Index Fund | | | 636,232 | | | | 6,862,278 | | | | 1,212,265 | | | | 121,794 | | | | 5,822,971 | | | | (396,065 | ) | | | 136,995 | | | | (67,209 | ) |
FlexShares® Disciplined Duration MBS Index Fund | | | 1,159,915 | | | | 13,382,281 | | | | 490,380 | | | | 603,290 | | | | 13,730,880 | | | | (309,715 | ) | | | 222,450 | | | | (11,221 | ) |
FlexShares® iBoxx 3-Year Target Duration TIPS Index Fund | | | — | | | | 961,924 | | | | 955,615 | | | | — | | | | — | | | | — | | | | 8,290 | | | | (6,309 | ) |
FlexShares® iBoxx 5-Year Target Duration TIPS Index Fund | | | 141,132 | | | | 1,045,757 | | | | 1,179,380 | | | | — | | | | — | | | | 715 | | | | 8,948 | | | | (8,224 | ) |
FlexShares® Ready Access Variable Income Fund | | | 262,297 | | | | 2,252,752 | | | | 1,502,271 | | | | 13,416 | | | | 1,012,975 | | | | 1,385 | | | | 9,964 | | | | (1,188 | ) |
| | | $ | 3,362,408 | | | $ | 35,862,753 | | | $ | 7,000,914 | | | | 956,936 | | | $ | 31,200,291 | | | $ | (882,127 | ) | | $ | 554,420 | | | $ | (141,829 | ) |
See Accompanying Notes to the Financial Statements.
| | | | |
| FLEXSHARES ANNUAL REPORT | | | 347 | |
Notes to the Financial Statements October 31, 2018
1. Organization
FlexShares® Trust (the “Trust”), a Maryland statutory trust, was formed on May 13, 2010, originally named NT ETF Trust and renamed FlexShares® Trust as of April 12, 2011. The Trust is registered as an open-end management investment company under the Investment Company Act of 1940 (the “1940 Act”), as amended. The Trust consists of twenty-six operational exchange-traded funds as of October 31, 2018 (each a “Fund” and collectively, the “Funds”). The Flex-Shares® Currency Hedged Morningstar DM ex-US Factor Tilt Index Fund, FlexShares® Currency Hedged Morningstar EM Factor Tilt Index Fund, FlexShares® Morningstar Global Upstream Natural Resources Index Fund, FlexShares® STOXX® Global Broad Infrastructure Index Fund, FlexShares® Global Quality Real Estate Index Fund, FlexShares® Real Assets Allocation Index Fund, FlexShares® iBoxx 3-Year Target Duration TIPS Index Fund, FlexShares® iBoxx 5-Year Target Duration TIPS Index Fund, FlexShares® Credit-Scored US Corporate Bond Index Fund, FlexShares® Credit-Scored US Long Corporate Bond Index Fund, and the FlexShares® Ready Access Variable Income Fund are non-diversified series of the Trust, pursuant to the 1940 Act. The FlexShares® Morningstar US Market Factor Tilt Index Fund, FlexShares® Morningstar Developed Markets ex-US Factor Tilt Index Fund, FlexShares® Morningstar Emerging Markets Factor Tilt Index Fund, FlexShares® US Quality Large Cap Index Fund, FlexShares® STOXX® US ESG Impact Index Fund, FlexShares® STOXX® Global ESG Impact Index Fund, FlexShares® Disciplined Duration MBS Index Fund, FlexShares® Quality Dividend Index Fund, FlexShares® Quality Dividend Defensive Index Fund, FlexShares® Quality Dividend Dynamic Index Fund, FlexShares® International Quality Dividend Index Fund, FlexShares® International Quality Dividend Defensive Index Fund, FlexShares® International Quality Dividend Dynamic Index Fund, FlexShares® High Yield Value-Scored Bond Index Fund and the FlexShares® Core Select Bond Fund are diversified series of the Trust, pursuant to the 1940 Act.
The FlexShares High Yield Value-Scored Bond Index Fund commenced operations on July 17, 2018.
Each Fund, except the FlexShares Ready Access Variable Income Fund and the FlexShares Core Select Bond Fund, seeks to provide investment results that correspond generally to the price and yield performance, before fees and expenses, of a specified benchmark index (each an “Underlying Index”). The FlexShares US Quality Large Cap Index Fund, FlexShares Global Quality Real Estate Index Fund, FlexShares Real Assets Allocation Index Fund, FlexShares Quality Dividend Index Fund, FlexShares Quality Dividend Defensive Index Fund, FlexShares Quality Dividend Dynamic Index Fund, FlexShares International Quality Dividend Index Fund, FlexShares International Quality Dividend Defensive Index Fund, FlexShares International Quality Dividend Dynamic Index Fund, FlexShares Credit-Scored US Corporate Bond Index Fund, FlexShares Credit-Scored US Long Corporate Bond Index Fund and the FlexShares High Yield Value-Scored Bond Index Fund seek to track Underlying Indices developed by Northern Trust Investments, Inc. (“NTI” or “Investment Adviser”), a subsidiary of Northern Trust Corporation. The FlexShares Morningstar US Market Factor Tilt Index Fund, FlexShares Morningstar Developed Markets ex-US Factor Tilt Index Fund, FlexShares Morningstar Emerging Markets Factor Tilt Index Fund, FlexShares Currency Hedged Morningstar DM ex-US Factor Tilt Index Fund, FlexShares Currency Hedged Morningstar EM Factor Tilt Index Fund and FlexShares Morningstar Global Upstream Natural Resources Index Fund seek to track Underlying Indices sponsored by Morningstar, Inc. The FlexShares STOXX® US ESG Impact Index Fund, FlexShares STOXX® Global ESG Impact Index Fund, and FlexShares STOXX® Global Broad Infrastructure Index Fund seek to track Underlying Indices sponsored by STOXX. The FlexShares iBoxx 3-Year Target Duration TIPS Index Fund and FlexShares iBoxx 5-Year Target Duration TIPS Index Fund seek to track Underlying Indices sponsored by Markit Indices Limited. The FlexShares Disciplined Duration MBS Index Fund seeks to track an Underlying Index sponsored by ICE Data Indices, LLC.
Each of the FlexShares Currency Hedged Morningstar DM ex-US Factor Tilt Index Fund and FlexShares Currency Hedged Morningstar EM Factor Tilt Index Fund currently seeks its investment objective by investing a substantial amount of its assets in the shares of another FlexShares ETF.
| | |
| 348 | | FLEXSHARES ANNUAL REPORT |
Notes to the Financial Statements (cont.)
Each of these Funds may also invest directly in the securities included in its Underlying Index. The FlexShares Real Assets Allocation Index Fund is a fund of funds that seeks its investment objective by investing primarily in the shares of other FlexShares ETFs that are eligible for inclusion in its Underlying Index, rather than in securities of individual companies. The FlexShares Core Select Bond Fund seeks to achieve its investment objective by investing, under normal circumstances in U.S. dollar-denominated investment-grade fixed-income securities either directly or indirectly through FlexShares ETFs, unaffiliated ETFs and other registered investment companies. The investment performance of each of the FlexShares Currency Hedged Morningstar DM ex-US Factor Tilt Index Fund, FlexShares Currency Hedged Morningstar EM Factor Tilt Index Fund, FlexShares Real Assets Allocation Index Fund and FlexShares Core Select Bond Fund is directly related to the performance of its underlying fund(s).
The FlexShares Ready Access Variable Income Fund and the FlexShares Core Select Bond Fund are actively managed and do not seek to replicate the performance of a specified index. The FlexShares Ready Access Variable Income Fund seeks maximum current income consistent with the preservation of capital and liquidity. The FlexShares Core Select Bond Fund seeks total return and preservation of capital. Each Fund, except the FlexShares Ready Access Variable Income Fund and the FlexShares Core Select Bond Fund, is referred to herein as an “Index Fund.” Each Fund is managed by the Investment Adviser.
2. Significant Accounting Policies
The Trust, which is an investment company, follows accounting and reporting guidance under Financial Accounting Standards Board (“FASB”) Accounting Standards Codification Topic 946, “Financial Services-Investment Companies.” The following is a summary of significant accounting policies followed by the Funds in the preparation of their financial statements. These policies are in conformity with accounting principles generally accepted in the United States of America (“U.S.”) or (“U.S. GAAP”). The preparation of financial statements in conformity with U.S. GAAP requires management to make estimates and assumptions that affect
the reported amounts and disclosures in the financial statements. Actual results could differ from those estimates.
Investment Valuation
Each Fund’s Net Asset Value (“NAV”) is determined daily as of the close of regular trading on the New York Stock Exchange (“NYSE”), normally 4:00 p.m. Eastern time, on each day the NYSE is open for trading, based on prices at the time of closing provided that any U.S. fixed-income assets may be valued as of the announced closing time for trading in fixed-income instruments on any day that the Securities Industry and Financial Markets Association announces an early closing time. The NAV of a fund is calculated by dividing the value of all assets of the Fund (including accrued interest and dividends), less all liabilities (including accrued expenses and dividends declared but unpaid), by the total number of shares outstanding.
The investments of the Funds are valued at fair value pursuant to the pricing policy and procedures approved by the Board of Trustees. The Funds’ investments are valued using market quotations when available. When market quotations are not readily available, are deemed unreliable, or do not reflect material events occurring between the close of local markets and the time of valuation, the Funds value securities at fair value as determined in good faith in accordance with the Funds’ fair value pricing procedures as approved by the Board of Trustees. Such circumstances includes periods when trading in a security is suspended, the exchange or market on which a security trades closes early, the trading volume in a security is limited, corporate actions and announcements take place, or regulatory news affecting an issuer is released, such as government approvals. Additionally, the Trust, in its discretion, may make adjustments to the prices of securities held by a Fund if an event occurs after the publication of market values normally used by a Fund but before the time as of which the Fund calculates its NAV, depending on the nature and significance of the event, consistent with applicable regulatory guidance and the Trust’s fair value procedures. Other events that can trigger fair valuing of foreign securities include, for example, significant fluctuations in general market indicators, government actions, or natural disasters.
| | | | |
| FLEXSHARES ANNUAL REPORT | | | 349 | |
Notes to the Financial Statements (cont.)
The use of fair valuation involves the risk that the values used by the Funds to price their investments may be higher or lower than the values used by other investment companies and investors to price the same investments. Fair value pricing involves subjective judgments and it is possible that a fair value determination for a portfolio security may be materially different than the value that could be realized upon the sale of such security. In addition, fair value pricing could result in a difference between the prices used to calculate a Fund’s NAV and the prices used by an Index Fund’s Underlying Index. This difference may adversely affect an Index Fund’s ability to track its Underlying Index. Portfolio securities of certain Funds are listed on foreign exchanges and their value may change on days when shareholders will not be able to purchase or sell Fund shares.
Security prices are generally provided by independent pricing services. Portfolio securities listed or traded on domestic securities exchanges or the NASDAQ/NMS, including dollar-denominated foreign securities or American Depositary Receipts (“ADRs”), are valued at the closing price, or last sale price, reported on the exchange or system where the security is principally traded. The closing price for securities traded on the NASDAQ/NMS is the Nasdaq Official Closing Price (“NOCP”). If there have been no sales for that day on the exchange or system where the security is principally traded, then the value is determined with reference to the last sale price, or the NOCP, if applicable, on any other exchange or system. If there have been no sales of the security for that day on any exchange or system, the security is valued at fair value pursuant to the Trust’s fair value procedures.
Securities that are traded regularly in the over-the-counter market (other than the NASDAQ/NMS), including securities listed on exchanges but primarily traded over-the-counter, are valued on the basis of bid quotes or the mean between the bid and asked quotes based upon quotes furnished by one or more broker-dealers or market makers for those securities. Securities that may be traded over-the-counter include equity securities, fixed-income securities, non-exchange-listed foreign securities, and certain derivative instruments. Fixed-income securities may be valued using prices provided directly from one or more
broker-dealers, market makers, or independent third-party pricing services which may use matrix pricing and valuation models, as well as recent market transactions for the same or similar assets, to derive values when such prices are believed to reflect fair market values of such securities. Such prices may be determined by taking into account securities prices, yields, maturities, call features, ratings, prepayment speeds, credit risks, cash flows, institutional size trading in similar groups of securities and developments related to specific securities. Fixed-income securities maturing within a relatively short period, less than 60 days, are valued at amortized cost when it approximates fair value.
Foreign equity securities are generally priced at the closing price or last sales price reported on the foreign exchange on which they are principally traded. If there have been no sales for that day on the primary exchange, then the value is determined with reference to the last sale price on any other exchange. If there have been no sales of the security for that day on any exchange, the security will be valued at fair value pursuant to the Trust’s fair value procedures. Spot and forward foreign currency exchange contracts generally are valued using an independent pricing service. The value of assets denominated in foreign currencies is converted into U.S. dollars using exchange rates deemed appropriate by NTI as Investment Adviser. Any use of a different rate from the rates used by the Index Provider may adversely affect the Fund’s ability to track its Underlying Index. The Index Provider determines the composition and relative weightings of the securities in the Underlying Index and publishes information regarding the market value of the Underlying Index.
Exchange-traded financial futures and options thereon are valued at the settlement price as established by the exchange on which they are traded. Over-the-counter options are valued at broker-provided bid prices, as are swaps. The foregoing prices may be obtained from one or more independent pricing services or, as needed or applicable, independent broker-dealers. If there was no sale on that day, and for other non-exchange traded derivatives, the contract is valued at fair value pursuant to the Trust’s fair value procedures.
| | |
| 350 | | FLEXSHARES ANNUAL REPORT |
Notes to the Financial Statements (cont.)
Each Fund relies on various sources to calculate its NAV. The ability of the Funds’ administrator to calculate the NAV per share of the Funds is subject to operational risks associated with processing or human errors, systems or technology failures, and errors caused by third party service providers, data sources, or trading counterparties. Such failures may result in delays in the calculation of the Funds’ NAVs and/or the inability to calculate NAV over extended time periods. The Funds may be unable to recover any losses associated with such failures, and it may be necessary for alternative procedures to be followed to price portfolio securities when determining the Funds’ NAVs.
Various inputs are used in determining the value of each Fund’s investments. These inputs are summarized in three levels listed below:
| | • | | Level 1—Quoted prices in active markets for identical assets on the measurement date. |
| | • | | Level 2—Other significant observable inputs (including quoted prices for similar securities, interest rates, prepayment speeds, credit risk, etc.). |
| | • | | Level 3—Significant unobservable inputs (including the Funds’ own assumptions in determining the fair value of investments). |
The inputs or methodology used for valuing securities are not necessarily an indication of the risk associated with investing in those securities. For example, short-term debt securities may be valued at amortized cost, as long as amortized cost approximates the current fair value of a security, but since the valuation is not obtained from a quoted price in an active market, such securities are reflected as Level 2.
The following is a summary of the valuations as of October 31, 2018 for each Fund based upon the three levels defined above. Please refer to the Schedules of Investments to view equity and debt securities segregated by industry type where applicable.
| | | | | | | | | | | | | | | | |
| | | Level 1 — Quoted
Prices | | | Level 2 — Other
Significant
Observable
Inputs | | | Level 3 —
Significant
Unobservable
Inputs | | | Total | |
| FlexShares Morningstar US Market Factor Tilt Index Fund | |
Investments | |
Common Stocks* | | $ | 1,371,117,202 | | | $ | — | | | $ | — | | | $ | 1,371,117,202 | |
Rights | | | — | | | | — | | | | 18,580 | | | | 18,580 | |
Securities Lending Reinvestments | | | | | | | | | | | | | | | | |
Bank Notes | | | — | | | | 2,000,000 | | | | — | | | | 2,000,000 | |
Certificates of Deposit | | | — | | | | 52,978,685 | | | | — | | | | 52,978,685 | |
Commercial Paper | | | — | | | | 4,002,768 | | | | — | | | | 4,002,768 | |
Funding Agreements | | | — | | | | 3,000,000 | | | | — | | | | 3,000,000 | |
Repurchase Agreements | | | — | | | | 68,673,717 | | | | — | | | | 68,673,717 | |
| Total Investments | | $ | 1,371,117,202 | | | $ | 130,655,170 | | | $ | 18,580 | | | $ | 1,501,790,952 | |
|
Other Financial Instruments | |
Liabilities | | | | | | | | | | | | | | | | |
Futures Contracts | | $ | (1,163,607 | ) | | $ | — | | | $ | — | | | $ | (1,163,607 | ) |
| Total Other Financial Instruments | | $ | (1,163,607 | ) | | $ | — | | | $ | — | | | $ | (1,163,607 | ) |
| | | | |
| | | | | | | | | | | | | | | | |
| | | | |
| FLEXSHARES ANNUAL REPORT | | | 351 | |
Notes to the Financial Statements (cont.)
| | | | | | | | | | | | | | | | |
| | | Level 1 — Quoted
Prices | | | Level 2 — Other
Significant
Observable
Inputs | | | Level 3 —
Significant
Unobservable
Inputs | | | Total | |
| FlexShares Morningstar Developed Markets ex-US Factor Tilt Index Fund | |
Investments | |
Closed End Funds | | $ | 927,949 | | | $ | — | | | $ | — | | | $ | 927,949 | |
Common Stocks | | | | | | | | | | | | | | | | |
Aerospace & Defense | | | 7,509,976 | | | | 4,299 | | | | — | | | | 7,514,275 | |
Banks | | | 105,485,628 | | | | 209,757 | | | | — | | | | 105,695,385 | |
Diversified Financial Services | | | 11,770,501 | | | | 89,706 | | | | — | | | | 11,860,207 | |
Health Care Providers & Services | | | 5,967,077 | | | | 35,031 | | | | — | | | | 6,002,108 | |
Insurance | | | 50,741,793 | | | | 213,081 | | | | — | | | | 50,954,874 | |
Oil, Gas & Consumable Fuels | | | 54,501,124 | | | | 9,595 | | | | — | | | | 54,510,719 | |
Pharmaceuticals | | | 37,730,467 | | | | 10 | | | | — | | | | 37,730,477 | |
Other* | | | 673,353,283 | | | | — | | | | — | | | | 673,353,283 | |
Rights | | | 40,753 | | | | — | | | | — | | | | 40,753 | |
Warrants | | | — | | | | — | | | | — | | | | — | |
Securities Lending Reinvestments | | | | | | | | | | | | | | | | |
Repurchase Agreements | | | — | | | | 14,811,881 | | | | — | | | | 14,811,881 | |
| Total Investments | | $ | 948,028,551 | | | $ | 15,373,360 | | | $ | — | | | $ | 963,401,911 | |
|
Other Financial Instruments | |
Assets | | | | | | | | | | | | | | | | |
Forward Foreign Currency Contracts | | $ | — | | | $ | 31,267 | | | $ | — | | | $ | 31,267 | |
Liabilities | | | | | | | | | | | | | | | | |
Futures Contracts | | | (580,488 | ) | | | — | | | | — | | | | (580,488 | ) |
Forward Foreign Currency Contracts | | | — | | | | (179,231 | ) | | | — | | | | (179,231 | ) |
| Total Other Financial Instruments | | $ | (580,488 | ) | | $ | (147,964 | ) | | $ | — | | | $ | (728,452 | ) |
| | | | |
| | | | | | | | | | | | | | | | |
| | |
| 352 | | FLEXSHARES ANNUAL REPORT |
Notes to the Financial Statements (cont.)
| | | | | | | | | | | | | | | | |
| | | Level 1 — Quoted
Prices | | | Level 2 — Other
Significant
Observable
Inputs | | | Level 3 —
Significant
Unobservable
Inputs | | | Total | |
| FlexShares Morningstar Emerging Markets Factor Tilt Index Fund | |
Investments | | | | | | | | | | | | | | | | |
Common Stocks | | | | | | | | | | | | | | | | |
Auto Components | | $ | 6,383,270 | | | $ | 15,728 | | | $ | — | | | $ | 6,398,998 | |
Building Products | | | 1,136,132 | | | | 438,610 | | | | — | | | | 1,574,742 | |
Capital Markets | | | 10,708,129 | | | | 4,233 | | | | — | | | | 10,712,362 | |
Electrical Equipment | | | 1,779,116 | | | | 157,739 | | | | — | | | | 1,936,855 | |
Entertainment | | | 1,166,791 | | | | 21,491 | | | | — | | | | 1,188,282 | |
Food & Staples Retailing | | | 5,044,276 | | | | 7,354 | | | | — | | | | 5,051,630 | |
Food Products | | | 11,823,711 | | | | 6,184 | | | | — | | | | 11,829,895 | |
Gas Utilities | | | 3,036,148 | | | | 12,601 | | | | — | | | | 3,048,749 | |
Health Care Equipment & Supplies | | | 490,253 | | | | 2,795 | | | | — | | | | 493,048 | |
Hotels, Restaurants & Leisure | | | 3,486,556 | | | | 1,943 | | | | — | | | | 3,488,499 | |
Oil, Gas & Consumable Fuels | | | 35,488,053 | | | | 1,974 | | | | — | | | | 35,490,027 | |
Pharmaceuticals | | | 4,914,954 | | | | 255,555 | | | | — | | | | 5,170,509 | |
Real Estate Management & Development | | | 24,437,083 | | | | 63,218 | | | | — | | | | 24,500,301 | |
Specialty Retail | | | 4,704,553 | | | | 19,231 | | | | — | | | | 4,723,784 | |
Technology Hardware, Storage & Peripherals | | | 18,277,571 | | | | 29,941 | | | | — | | | | 18,307,512 | |
Textiles, Apparel & Luxury Goods | | | 10,210,956 | | | | 165,705 | | | | — | | | | 10,376,661 | |
Other* | | | 341,920,484 | | | | — | | | | — | | | | 341,920,484 | |
Corporate Bonds* | | | — | | | | 9,446 | | | | — | | | | 9,446 | |
Rights | | | 6,475 | | | | 2,024 | | | | — | | | | 8,499 | |
Warrants | | | 276 | | | | — | | | | — | | | | 276 | |
Securities Lending Reinvestments | | | | | | | | | | | | | | | | |
Repurchase Agreements | | | — | | | | 714,117 | | | | — | | | | 714,117 | |
| Total Investments | | $ | 485,014,787 | | | $ | 1,929,889 | | | $ | — | | | $ | 486,944,676 | |
|
Other Financial Instruments | |
Assets | | | | | | | | | | | | | | | | |
Forward Foreign Currency Contracts | | $ | — | | | $ | 13,145 | | | $ | — | | | $ | 13,145 | |
Liabilities | | | | | | | | | | | | | | | | |
Futures Contracts | | | (126,276 | ) | | | — | | | | — | | | | (126,276 | ) |
Forward Foreign Currency Contracts | | | — | | | | (46,527 | ) | | | — | | | | (46,527 | ) |
| Total Other Financial Instruments | | $ | (126,276 | ) | | $ | (33,382 | ) | | $ | — | | | $ | (159,658 | ) |
| | | | |
| | | | | | | | | | | | | | | | |
| | | | |
| FLEXSHARES ANNUAL REPORT | | | 353 | |
Notes to the Financial Statements (cont.)
| | | | | | | | | | | | | | | | |
| | | Level 1 — Quoted
Prices | | | Level 2 — Other
Significant
Observable
Inputs | | | Level 3 —
Significant
Unobservable
Inputs | | | Total | |
| FlexShares Currency Hedged Morningstar DM ex-US Factor Tilt Index Fund | |
Investments | | | | | | | | | | | | | | | | |
| Exchange Traded Funds | | $ | 7,846,364 | | | $ | — | | | $ | — | | | $ | 7,846,364 | |
| Total Investments | | $ | 7,846,364 | | | $ | — | | | $ | — | | | $ | 7,846,364 | |
|
Other Financial Instruments | |
Assets | | | | | | | | | | | | | | | | |
Forward Foreign Currency Contracts | | $ | — | | | $ | 85,584 | | | $ | — | | | $ | 85,584 | |
Liabilities | | | | | | | | | | | | | | | | |
Forward Foreign Currency Contracts | | | — | | | | (40 | ) | | | — | | | | (40 | ) |
| Total Other Financial Instruments | | $ | — | | | $ | 85,544 | | | $ | — | | | $ | 85,544 | |
| | | | |
| | | | | | | | | | | | | | | | |
| | | Level 1 — Quoted
Prices | | | Level 2 — Other
Significant
Observable
Inputs | | | Level 3 —
Significant
Unobservable
Inputs | | | Total | |
| FlexShares Currency Hedged Morningstar EM Factor Tilt Index Fund | |
Investments | | | | | | | | | | | | | | | | |
| Exchange Traded Funds | | $ | 4,467,575 | | | $ | — | | | $ | — | | | $ | 4,467,575 | |
| Total Investments | | $ | 4,467,575 | | | $ | — | | | $ | — | | | $ | 4,467,575 | |
|
Other Financial Instruments | |
Assets | | | | | | | | | | | | | | | | |
Forward Foreign Currency Contracts | | $ | — | | | $ | 46,245 | | | $ | — | | | $ | 46,245 | |
Liabilities | | | | | | | | | | | | | | | | |
Futures Contracts | | | (2,781 | ) | | | — | | | | — | | | | (2,781 | ) |
Forward Foreign Currency Contracts | | | — | | | | (9,041 | ) | | | — | | | | (9,041 | ) |
| Total Other Financial Instruments | | $ | (2,781 | ) | | $ | 37,204 | | | $ | — | | | $ | 34,423 | |
| | | | |
| | | | | | | | | | | | | | | | |
| | | Level 1 — Quoted
Prices | | | Level 2 — Other
Significant
Observable
Inputs | | | Level 3 —
Significant
Unobservable
Inputs | | | Total | |
| FlexShares US Quality Large Cap Index Fund | |
Investments | | | | | | | | | | | | | | | | |
| Common Stocks* | | $ | 61,687,611 | | | $ | — | | | $ | — | | | $ | 61,687,611 | |
| Total Investments | | $ | 61,687,611 | | | $ | — | | | $ | — | | | $ | 61,687,611 | |
|
Other Financial Instruments | |
Liabilities | | | | | | | | | | | | | | | | |
Futures Contracts | | $ | (11,172 | ) | | $ | — | | | $ | — | | | $ | (11,172 | ) |
| Total Other Financial Instruments | | $ | (11,172 | ) | | $ | — | | | $ | — | | | $ | (11,172 | ) |
| | |
| 354 | | FLEXSHARES ANNUAL REPORT |
Notes to the Financial Statements (cont.)
| | | | | | | | | | | | | | | | |
| | | Level 1 — Quoted
Prices | | | Level 2 — Other
Significant
Observable
Inputs | | | Level 3 —
Significant
Unobservable
Inputs | | | Total | |
| FlexShares STOXX® US ESG Impact Index Fund | |
Investments | | | | | | | | | | | | | | | | |
| Common Stocks* | | $ | 28,337,902 | | | $ | — | | | $ | — | | | $ | 28,337,902 | |
| Total Investments | | $ | 28,337,902 | | | $ | — | | | $ | — | | | $ | 28,337,902 | |
|
Other Financial Instruments | |
Liabilities | | | | | | | | | | | | | | | | |
Futures Contracts | | $ | (26,898 | ) | | $ | — | | | $ | — | | | $ | (26,898 | ) |
| Total Other Financial Instruments | | $ | (26,898 | ) | | $ | — | | | $ | — | | | $ | (26,898 | ) |
| | | | |
| | | | | | | | | | | | | | | | |
| | | Level 1 — Quoted
Prices | | | Level 2 — Other
Significant
Observable
Inputs | | | Level 3 —
Significant
Unobservable
Inputs | | | Total | |
| FlexShares STOXX® Global ESG Impact Index Fund | |
Investments | | | | | | | | | | | | | | | | |
Common Stocks | | | | | | | | | | | | | | | | |
Diversified Financial Services | | $ | 140,768 | | | $ | 250 | | | $ | — | | | $ | 141,018 | |
Other* | | | 72,076,544 | | | | — | | | | — | | | | 72,076,544 | |
| Rights | | | 2,263 | | | | — | | | | — | | | | 2,263 | |
| Total Investments | | $ | 72,219,575 | | | $ | 250 | | | $ | — | | | $ | 72,219,825 | |
|
Other Financial Instruments | |
Liabilities | | | | | | | | | | | | | | | | |
Futures Contracts | | $ | (66,174 | ) | | $ | — | | | $ | — | | | $ | (66,174 | ) |
| Total Other Financial Instruments | | $ | (66,174 | ) | | $ | — | | | $ | — | | | $ | (66,174 | ) |
| | | | |
| | | | | | | | | | | | | | | | |
| | | | |
| FLEXSHARES ANNUAL REPORT | | | 355 | |
Notes to the Financial Statements (cont.)
| | | | | | | | | | | | | | | | |
| | | Level 1 — Quoted
Prices | | | Level 2 — Other
Significant
Observable
Inputs | | | Level 3 —
Significant
Unobservable
Inputs | | | Total | |
| FlexShares Morningstar Global Upstream Natural Resources Index Fund | |
Investments | | | | | | | | | | | | | | | | |
Common Stocks* | | $ | 5,407,931,120 | | | $ | — | | | $ | — | | | $ | 5,407,931,120 | |
Securities Lending Reinvestments | | | | | | | | | | | | | | | | |
Bank Notes | | | — | | | | 3,000,000 | | | | — | | | | 3,000,000 | |
Certificates of Deposit | | | — | | | | 59,478,870 | | | | — | | | | 59,478,870 | |
Commercial Paper | | | — | | | | 4,002,768 | | | | — | | | | 4,002,768 | |
Funding Agreements | | | — | | | | 3,000,000 | | | | — | | | | 3,000,000 | |
Repurchase Agreements | | | — | | | | 69,310,398 | | | | — | | | | 69,310,398 | |
| Total Investments | | $ | 5,407,931,120 | | | $ | 138,792,036 | | | $ | — | | | $ | 5,546,723,156 | |
|
Other Financial Instruments | |
Assets | | | | | | | | | | | | | | | | |
Forward Foreign Currency Contracts | | $ | — | | | $ | 386,287 | | | $ | — | | | $ | 386,287 | |
Liabilities | | | | | | | | | | | | | | | | |
Futures Contracts | | | (1,820,621 | ) | | | — | | | | — | | | | (1,820,621 | ) |
Forward Foreign Currency Contracts | | | — | | | | (617,805 | ) | | | — | | | | (617,805 | ) |
| Total Other Financial Instruments | | $ | (1,820,621 | ) | | $ | (231,518 | ) | | $ | — | | | $ | (2,052,139 | ) |
| | | | |
| | | | | | | | | | | | | | | | |
| | | Level 1 — Quoted
Prices | | | Level 2 — Other
Significant
Observable
Inputs | | | Level 3 —
Significant
Unobservable
Inputs | | | Total | |
| FlexShares STOXX® Global Broad Infrastructure Index Fund | |
Investments | | | | | | | | | | | | | | | | |
Common Stocks | | | | | | | | | | | | | | | | |
Commercial Services & Supplies | | $ | 25,790,566 | | | $ | 168,892 | | | $ | — | | | $ | 25,959,458 | |
Other* | | | 741,778,912 | | | | — | | | | — | | | | 741,778,912 | |
Securities Lending Reinvestments | | | | | | | | | | | | | | | | |
Commercial Paper | | | — | | | | 1,000,692 | | | | — | | | | 1,000,692 | |
Repurchase Agreements | | | — | | | | 36,964,782 | | | | — | | | | 36,964,782 | |
| Total Investments | | $ | 767,569,478 | | | $ | 38,134,366 | | | $ | — | | | $ | 805,703,844 | |
|
Other Financial Instruments | |
Assets | | | | | | | | | | | | | | | | |
Forward Foreign Currency Contracts | | $ | — | | | $ | 7,237 | | | $ | — | | | $ | 7,237 | |
Liabilities | | | | | | | | | | | | | | | | |
Futures Contracts | | | (270,093 | ) | | | — | | | | — | | | | (270,093 | ) |
Forward Foreign Currency Contracts | | | — | | | | (21,556 | ) | | | — | | | | (21,556 | ) |
| Total Other Financial Instruments | | $ | (270,093 | ) | | $ | (14,319 | ) | | $ | — | | | $ | (284,412 | ) |
| | | | |
| | | | | | | | | | | | | | | | |
| | |
| 356 | | FLEXSHARES ANNUAL REPORT |
Notes to the Financial Statements (cont.)
| | | | | | | | | | | | | | | | |
| | | Level 1 — Quoted
Prices | | | Level 2 — Other
Significant
Observable
Inputs | | | Level 3 —
Significant
Unobservable
Inputs | | | Total | |
| FlexShares Global Quality Real Estate Index Fund | |
Investments | | | | | | | | | | | | | | | | |
Common Stocks* | | $ | 267,743,073 | | | $ | — | | | $ | — | | | $ | 267,743,073 | |
Securities Lending Reinvestments | | | | | | | | | | | | | | | | |
Repurchase Agreements | | | — | | | | 7,435,740 | | | | — | | | | 7,435,740 | |
| Total Investments | | $ | 267,743,073 | | | $ | 7,435,740 | | | $ | — | | | $ | 275,178,813 | |
|
Other Financial Instruments | |
Assets | | | | | | | | | | | | | | | | |
Forward Foreign Currency Contracts | | $ | — | | | $ | 18,770 | | | $ | — | | | $ | 18,770 | |
Liabilities | | | | | | | | | | | | | | | | |
Futures Contracts | | | (420,389 | ) | | | — | | | | — | | | | (420,389 | ) |
Forward Foreign Currency Contracts | | | — | | | | (6,809 | ) | | | — | | | | (6,809 | ) |
| Total Other Financial Instruments | | $ | (420,389 | ) | | $ | 11,961 | | | $ | — | | | $ | (408,428 | ) |
| | | | |
| | | | | | | | | | | | | | | | |
| | | Level 1 — Quoted
Prices | | | Level 2 — Other
Significant
Observable
Inputs | | | Level 3 —
Significant
Unobservable
Inputs | | | Total | |
| FlexShares Real Assets Allocation Index Fund | |
Investments | | | | | | | | | | | | | | | | |
| Exchange Traded Funds | | $ | 13,881,869 | | | $ | — | | | $ | — | | | $ | 13,881,869 | |
| Total Investments | | $ | 13,881,869 | | | $ | — | | | $ | — | | | $ | 13,881,869 | |
| | | | |
| | | | | | | | | | | | | | | | |
| | | Level 1 — Quoted
Prices | | | Level 2 — Other
Significant
Observable
Inputs | | | Level 3 —
Significant
Unobservable
Inputs | | | Total | |
| FlexShares Quality Dividend Index Fund | |
Investments | | | | | | | | | | | | | | | | |
Common Stocks* | | $ | 1,745,076,088 | | | $ | — | | | $ | — | | | $ | 1,745,076,088 | |
Securities Lending Reinvestments | | | | | | | | | | | | | | | | |
Bank Notes | | | — | | | | 2,000,000 | | | | — | | | | 2,000,000 | |
Certificates of Deposit | | | — | | | | 50,483,888 | | | | — | | | | 50,483,888 | |
Commercial Paper | | | — | | | | 4,002,768 | | | | — | | | | 4,002,768 | |
Funding Agreements | | | — | | | | 4,000,000 | | | | — | | | | 4,000,000 | |
Repurchase Agreements | | | — | | | | 206,842,695 | | | | — | | | | 206,842,695 | |
| Total Investments | | $ | 1,745,076,088 | | | $ | 267,329,351 | | | $ | — | | | $ | 2,012,405,439 | |
|
Other Financial Instruments | |
Liabilities | | | | | | | | | | | | | | | | |
Futures Contracts | | $ | (881,929 | ) | | $ | — | | | $ | — | | | $ | (881,929 | ) |
| Total Other Financial Instruments | | $ | (881,929 | ) | | $ | — | | | $ | — | | | $ | (881,929 | ) |
| | | | |
| FLEXSHARES ANNUAL REPORT | | | 357 | |
Notes to the Financial Statements (cont.)
| | | | | | | | | | | | | | | | |
| | | Level 1 — Quoted
Prices | | | Level 2 — Other
Significant
Observable
Inputs | | | Level 3 —
Significant
Unobservable
Inputs | | | Total | |
| FlexShares Quality Dividend Defensive Index Fund | |
Investments | |
Common Stocks* | | $ | 317,704,572 | | | $ | — | | | $ | — | | | $ | 317,704,572 | |
Securities Lending Reinvestments | | | | | | | | | | | | | | | | |
Certificates of Deposit | | | — | | | | 499,998 | | | | — | | | | 499,998 | |
Repurchase Agreements | | | — | | | | 41,378,173 | | | | — | | | | 41,378,173 | |
| Total Investments | | $ | 317,704,572 | | | $ | 41,878,171 | | | $ | — | | | $ | 359,582,743 | |
|
Other Financial Instruments | |
Liabilities | | | | | | | | | | | | | | | | |
Futures Contracts | | $ | (146,545 | ) | | $ | — | | | $ | — | | | $ | (146,545 | ) |
| Total Other Financial Instruments | | $ | (146,545 | ) | | $ | — | | | $ | — | | | $ | (146,545 | ) |
| | | | |
| | | | | | | | | | | | | | | | |
| | | Level 1 — Quoted
Prices | | | Level 2 — Other
Significant
Observable
Inputs | | | Level 3 —
Significant
Unobservable
Inputs | | | Total | |
| FlexShares Quality Dividend Dynamic Index Fund | |
Investments | |
Common Stocks* | | $ | 43,725,021 | | | $ | — | | | $ | — | | | $ | 43,725,021 | |
Securities Lending Reinvestments | | | | | | | | | | | | | | | | |
Repurchase Agreements | | | — | | | | 4,414,438 | | | | — | | | | 4,414,438 | |
| Total Investments | | $ | 43,725,021 | | | $ | 4,414,438 | | | $ | — | | | $ | 48,139,459 | |
|
Other Financial Instruments | |
Liabilities | | | | | | | | | | | | | | | | |
Futures Contracts | | $ | (30,347 | ) | | $ | — | | | $ | — | | | $ | (30,347 | ) |
| Total Other Financial Instruments | | $ | (30,347 | ) | | $ | — | | | $ | — | | | $ | (30,347 | ) |
| | | | |
| | | | | | | | | | | | | | | | |
| | |
| 358 | | FLEXSHARES ANNUAL REPORT |
Notes to the Financial Statements (cont.)
| | | | | | | | | | | | | | | | |
| | | Level 1 — Quoted
Prices | | | Level 2 — Other
Significant
Observable
Inputs | | | Level 3 —
Significant
Unobservable
Inputs | | | Total | |
| FlexShares International Quality Dividend Index Fund | |
Investments | |
Common Stocks* | | $ | 758,484,526 | | | $ | — | | | $ | — | | | $ | 758,484,526 | |
Securities Lending Reinvestments | | | | | | | | | | | | | | | | |
Repurchase Agreements | | | — | | | | 26,811,607 | | | | — | | | | 26,811,607 | |
| Total Investments | | $ | 758,484,526 | | | $ | 26,811,607 | | | $ | — | | | $ | 785,296,133 | |
|
Other Financial Instruments | |
Assets | | | | | | | | | | | | | | | | |
Forward Foreign Currency Contracts | | $ | — | | | $ | 269,684 | | | $ | — | | | $ | 269,684 | |
Liabilities | | | | | | | | | | | | | | | | |
Futures Contracts | | | (325,745 | ) | | | — | | | | — | | | | (325,745 | ) |
Forward Foreign Currency Contracts | | | — | | | | (286,539 | ) | | | — | | | | (286,539 | ) |
| Total Other Financial Instruments | | $ | (325,745 | ) | | $ | (16,855 | ) | | $ | — | | | $ | (342,600 | ) |
| | | | |
| | | | | | | | | | | | | | | | |
| | | Level 1 — Quoted
Prices | | | Level 2 — Other
Significant
Observable
Inputs | | | Level 3 —
Significant
Unobservable
Inputs | | | Total | |
| FlexShares International Quality Dividend Defensive Index Fund | |
Investments | |
Common Stocks* | | $ | 86,461,789 | | | $ | — | | | $ | — | | | $ | 86,461,789 | |
Securities Lending Reinvestments | | | | | | | | | | | | | | | | |
Repurchase Agreements | | | — | | | | 55,421 | | | | — | | | | 55,421 | |
| Total Investments | | $ | 86,461,789 | | | $ | 55,421 | | | $ | — | | | $ | 86,517,210 | |
|
Other Financial Instruments | |
Assets | | | | | | | | | | | | | | | | |
Forward Foreign Currency Contracts | | $ | — | | | $ | 1,426 | | | $ | — | | | $ | 1,426 | |
Liabilities | | | | | | | | | | | | | | | | |
Futures Contracts | | | (76,010 | ) | | | — | | | | — | | | | (76,010 | ) |
Forward Foreign Currency Contracts | | | — | | | | (2,909 | ) | | | — | | | | (2,909 | ) |
| Total Other Financial Instruments | | $ | (76,010 | ) | | $ | (1,483 | ) | | $ | — | | | $ | (77,493 | ) |
| | | | |
| | | | | | | | | | | | | | | | |
| | | | |
| FLEXSHARES ANNUAL REPORT | | | 359 | |
Notes to the Financial Statements (cont.)
| | | | | | | | | | | | | | | | |
| | | Level 1 — Quoted
Prices | | | Level 2 — Other
Significant
Observable
Inputs | | | Level 3 —
Significant
Unobservable
Inputs | | | Total | |
| FlexShares International Quality Dividend Dynamic Index Fund | |
Investments | |
Common Stocks* | | $ | 62,937,200 | | | $ | — | | | $ | — | | | $ | 62,937,200 | |
Securities Lending Reinvestments | | | | | | | | | | | | | | | | |
Repurchase Agreements | | | — | | | | 454,933 | | | | — | | | | 454,933 | |
| Total Investments | | $ | 62,937,200 | | | $ | 454,933 | | | $ | — | | | $ | 63,392,133 | |
|
Other Financial Instruments | |
Liabilities | | | | | | | | | | | | | | | | |
Futures Contracts | | $ | (29,514 | ) | | $ | — | | | $ | — | | | $ | (29,514 | ) |
| Total Other Financial Instruments | | $ | (29,514 | ) | | $ | — | | | $ | — | | | $ | (29,514 | ) |
| | | | |
| | | | | | | | | | | | | | | | |
| | | Level 1 — Quoted
Prices | | | Level 2 — Other
Significant
Observable
Inputs | | | Level 3 —
Significant
Unobservable
Inputs | | | Total | |
| FlexShares iBoxx 3-Year Target Duration TIPS Index Fund | |
Investments | |
| U.S. Treasury Obligations | | $ | — | | | $ | 1,639,405,709 | | | $ | — | | | $ | 1,639,405,709 | |
| Total Investments | | $ | — | | | $ | 1,639,405,709 | | | $ | — | | | $ | 1,639,405,709 | |
| | | | |
| | | | | | | | | | | | | | | | |
| | | Level 1 — Quoted
Prices | | | Level 2 — Other
Significant
Observable
Inputs | | | Level 3 —
Significant
Unobservable
Inputs | | | Total | |
| FlexShares iBoxx 5-Year Target Duration TIPS Index Fund | |
Investments | |
| U.S. Treasury Obligations | | $ | — | | | $ | 902,085,685 | | | $ | — | | | $ | 902,085,685 | |
| Total Investments | | $ | — | | | $ | 902,085,685 | | | $ | — | | | $ | 902,085,685 | |
| | | | |
| | | | | | | | | | | | | | | | |
| | | Level 1 — Quoted
Prices | | | Level 2 — Other
Significant
Observable
Inputs | | | Level 3 —
Significant
Unobservable
Inputs | | | Total | |
| FlexShares Disciplined Duration MBS Index Fund | |
Investments | |
| Mortgage-Backed Securities | | $ | — | | | $ | 71,184,920 | | | $ | — | | | $ | 71,184,920 | |
| Total Investments | | $ | — | | | $ | 71,184,920 | | | $ | — | | | $ | 71,184,920 | |
| | | | |
| | | | | | | | | | | | | | | | |
| | |
| 360 | | FLEXSHARES ANNUAL REPORT |
Notes to the Financial Statements (cont.)
| | | | | | | | | | | | | | | | |
| | | Level 1 — Quoted
Prices | | | Level 2 — Other
Significant
Observable
Inputs | | | Level 3 —
Significant
Unobservable
Inputs | | | Total | |
| FlexShares Credit-Scored US Corporate Bond Index Fund | |
Investments | |
| Corporate Bonds* | | $ | — | | | $ | 60,097,304 | | | $ | — | | | $ | 60,097,304 | |
| Total Investments | | $ | — | | | $ | 60,097,304 | | | $ | — | | | $ | 60,097,304 | |
| | | | |
| | | | | | | | | | | | | | | | |
| | | Level 1 — Quoted
Prices | | | Level 2 — Other
Significant
Observable
Inputs | | | Level 3 —
Significant
Unobservable
Inputs | | | Total | |
| FlexShares Credit-Scored US Long Corporate Bond Index Fund | |
Investments | |
| Corporate Bonds* | | $ | — | | | $ | 25,960,236 | | | $ | — | | | $ | 25,960,236 | |
| Total Investments | | $ | — | | | $ | 25,960,236 | | | $ | — | | | $ | 25,960,236 | |
| | | | |
| | | | | | | | | | | | | | | | |
| | | Level 1 — Quoted
Prices | | | Level 2 — Other
Significant
Observable
Inputs | | | Level 3 —
Significant
Unobservable
Inputs | | | Total | |
| FlexShares High Yield Value-Scored Bond Index Fund | |
Investments | |
| Corporate Bonds* | | $ | — | | | $ | 47,942,467 | | | $ | — | | | $ | 47,942,467 | |
| Total Investments | | $ | — | | | $ | 47,942,467 | | | $ | — | | | $ | 47,942,467 | |
| | | | |
| | | | | | | | | | | | | | | | |
| | | Level 1 — Quoted
Prices | | | Level 2 — Other
Significant
Observable
Inputs | | | Level 3 —
Significant
Unobservable
Inputs | | | Total | |
| FlexShares Ready Access Variable Income Fund | |
Investments | |
Asset-Backed Securities | | $ | — | | | $ | 16,041,866 | | | $ | — | | | $ | 16,041,866 | |
Collateralized Mortgage Obligations | | | — | | | | 1,388,748 | | | | — | | | | 1,388,748 | |
Corporate Bonds* | | | — | | | | 183,416,583 | | | | — | | | | 183,416,583 | |
Foreign Government Securities | | | — | | | | 1,307,620 | | | | — | | | | 1,307,620 | |
U.S. Treasury Obligations | | | — | | | | 6,442,598 | | | | — | | | | 6,442,598 | |
| Short-Term Investments | | | — | | | | 13,999,317 | | | | — | | | | 13,999,317 | |
| Total Investments | | $ | — | | | $ | 222,596,732 | | | $ | — | | | $ | 222,596,732 | |
| | | | |
| | | | | | | | | | | | | | | | |
| | | | |
| FLEXSHARES ANNUAL REPORT | | | 361 | |
Notes to the Financial Statements (cont.)
| | | | | | | | | | | | | | | | |
| | | Level 1 — Quoted
Prices | | | Level 2 — Other
Significant
Observable
Inputs | | | Level 3 —
Significant
Unobservable
Inputs | | | Total | |
| FlexShares Core Select Bond Fund | |
Investments | |
Exchange Traded Funds | | $ | 38,344,911 | | | $ | — | | | $ | — | | | $ | 38,344,911 | |
| Short-Term Investments | | | — | | | | 64,974 | | | | — | | | | 64,974 | |
| Total Investments | | $ | 38,344,911 | | | $ | 64,974 | | | $ | — | | | $ | 38,409,885 | |
| * | See Schedules of Investments for segregation by industry type. |
Foreign Securities
The FlexShares Morningstar Developed Markets ex-US Factor Tilt Index Fund, FlexShares Morningstar Emerging Markets Factor Tilt Index Fund, FlexShares Currency Hedged Morningstar DM ex-US Factor Tilt Index Fund (through its investment in its Underlying Fund), FlexShares Currency Hedged Morningstar EM Factor Tilt Index Fund (through its investment in its Underlying Fund), FlexShares STOXX® Global ESG Impact Index Fund, FlexShares Morningstar Global Upstream Natural Resources Index Fund, FlexShares STOXX® Global Broad Infrastructure Index Fund, FlexShares Global Quality Real Estate Index Fund, FlexShares Real Assets Allocation Index Fund (through its investment in its Underlying Funds), FlexShares International Quality Dividend Index Fund, FlexShares International Quality Dividend Defensive Index Fund, and the FlexShares International Quality Dividend Dynamic Index Fund invest in publicly-traded equity securities of issuers in countries other than the United States of America (“U.S.”). Such investments include direct investments in non-U.S. dollar denominated securities traded outside the U.S. The Funds’ investments in foreign securities also may be in the form of ADRs and Global Depositary Receipts (“GDRs”) (collectively, “Depositary Receipts”) based on securities in their Underlying Indexes. ADRs are receipts that are traded in the United States evidencing ownership of the underlying foreign securities and are denominated in U.S. dollars. GDRs are receipts issued by a non-U.S. financial institution evidencing ownership of underlying foreign or U.S. securities and usually are denominated in foreign currencies.
GDRs may not be denominated in the same currency as the securities they represent. Generally, GDRs are designed for use in foreign securities markets.
To the extent a Fund invests in ADRs, such ADRs will be listed on a national securities exchange. To the extent a Fund invests in GDRs, such GDRs will be listed on a foreign exchange. A Fund will not invest in any unlisted Depositary Receipt, any Depositary Receipt that NTI deems to be illiquid or any Depositary Receipt for which market quotations are not readily available. Generally, all Depositary Receipts must be sponsored.
The FlexShares Credit-Scored US Corporate Bond Index Fund, FlexShares Credit-Scored US Long Corporate Bond Index Fund and the FlexShares High Yield Value-Scored Bond Index Fund may invest in U.S. dollar denominated bonds of non-U.S. corporations to the extent such bonds are included in each Fund’s underlying index. The FlexShares Core Select Bond Fund may invest in U.S. dollar denominated bonds of non-U.S. corporations, either directly or indirectly through Underlying Funds, to achieve its investment objective.
The FlexShares Ready Access Variable Income Fund may invest, without limitation, in fixed-income securities and instruments of foreign issuers in developed and emerging markets, including debt securities of foreign governments. Investing in foreign securities, including Depositary Receipts, may result in a Fund experiencing more rapid and extreme changes in value than a fund that invests exclusively in U.S. securities, due to less liquid markets, and adverse economic, political, diplomatic, financial, and regulatory
| | |
| 362 | | FLEXSHARES ANNUAL REPORT |
Notes to the Financial Statements (cont.)
factors. Foreign governments also may impose taxes and limits on investment and repatriation. Any of these events could cause the value of a Fund’s foreign investment to decline.
The FlexShares Morningstar Emerging Markets Factor Tilt Index Fund and the FlexShares Currency Hedged Morningstar EM Factor Tilt Index Fund (through its investment in its Underlying Fund) will invest primarily in emerging market countries. In addition, the FlexShares Morningstar Global Upstream Natural Resources Index Fund, FlexShares STOXX® Global Broad Infrastructure Index Fund, FlexShares Global Quality Real Estate Index Fund, FlexShares Real Assets Allocation Index Fund (through its investment in its Underlying Funds), FlexShares International Quality Dividend Index Fund, FlexShares International Quality Dividend Defensive Index Fund, and the FlexShares International Quality Dividend Dynamic Index Fund may invest its assets in emerging market countries. The FlexShares Ready Access Variable Income Fund may invest up to 20% of its total assets in fixed-income securities and instruments of issuers in emerging markets. The markets of emerging market countries are less developed and less liquid, subject to greater price volatility and generally subject to increased economic, political, regulatory and other uncertainties than more developed foreign markets. The risks of foreign investment are increased when the issuer is located in a country with an emerging economy or securities market.
Inflation-Indexed Securities
The FlexShares iBoxx 3-Year Target Duration TIPS Index Fund and the FlexShares iBoxx 5-Year Target Duration TIPS Index Fund invest primarily in U.S. Treasury Inflation-Protected Securities (“TIPS”). The FlexShares Ready Access Variable Income Fund and the FlexShares Core Select Bond Fund may invest in inflation-indexed securities.
TIPS issued by the U.S. Treasury have varying maturities and pay interest on a semiannual basis equal to a fixed percentage of the inflation-adjusted principal amount. If the periodic adjustment rate measuring inflation falls, the principal value of TIPS will be adjusted downward, and consequently the interest payable on these securities
(calculated with respect to a smaller principal amount) will be reduced. Repayment of the original bond principal upon maturity (as adjusted for inflation) is guaranteed in the case of TIPS, even during a period of deflation.
The value of TIPS is expected to change in response to changes in real interest rates. Real interest rates in turn are tied to the relationship between nominal interest rates and the rate of inflation. Therefore, if the rate of inflation rises at a faster rate than nominal interest rates, real interest rates might decline, leading to an increase in value of TIPS. In contrast, if nominal interest rates increase at a faster rate than inflation, real interest rates might rise, leading to a decrease in value of TIPS. Any increase in the principal amount of TIPS will be considered taxable ordinary income, even though investors do not receive their principal until maturity.
While these securities are expected to be protected from long-term inflationary trends, short-term increases in inflation may lead to a decline in value. If interest rates rise due to reasons other than inflation, investors in these securities may not be protected to the extent that the increase is not reflected in the TIPS’ inflation measure.
The periodic adjustment of TIPS is tied to the Consumer Price Index for Urban Consumers (“CPI-U”), which is calculated monthly by the U.S. Bureau of Labor Statistics. The CPI-U is a measurement of changes in the cost of living, made up of components such as housing, food, transportation and energy. There can be no assurance that the CPI-U will accurately measure the real rate of inflation in the prices of goods and services.
Mortgage-Backed Pass-Through Securities
The FlexShares Disciplined Duration MBS Index Fund invests primarily in U.S. agency mortgage-backed pass-through securities (“MBS”), a category of pass-through securities backed by pools of mortgages and issued by one of the following U.S. government agencies: the Federal National Mortgage Association (FNMA or Fannie Mae), the Federal Home Loan Mortgage Corporation (FHLMC or Freddie Mac) or the Government National Mortgage Association (GNMA or Ginnie Mae) (each a “US Agency”).
| | | | |
| FLEXSHARES ANNUAL REPORT | | | 363 | |
Notes to the Financial Statements (cont.)
Under normal circumstances, the Fund will invest at least 80% of its total assets in the securities of its Underlying Index and in “to-be announced transactions” (“TBA transactions”) that represent securities in its Underlying Index. In a TBA transaction, the buyer and seller agree upon general trade parameters such as agency, coupon rate, settlement date, par amount and price. The actual pools delivered generally are determined two days prior to settlement.
Pending settlement of such TBA contracts, the FlexShares Disciplined Duration MBS Index Fund will invest in liquid, short-term instruments. The FlexShares Core Select Bond Fund may also invest either directly or through its Underlying Funds in MBS, including TBA transactions.
Mortgage Dollar Rolls
The FlexShares Disciplined Duration MBS Index Fund and the FlexShares Core Select Bond Fund (directly or through its Underlying Funds) may enter into mortgage dollar roll transactions. A mortgage dollar roll involves the sale by the Fund of securities for delivery in the future (generally within 30 days). The Fund simultaneously contracts with the same counterparty to repurchase substantially similar (same type, coupon and maturity) but not identical securities on a specified future date. During the roll period, the Fund will not be entitled to accrue interest and receive principal payments on the securities sold. However, the Fund benefits to the extent of any difference between (a) the price received for the securities sold and (b) the lower forward price for the future purchase and/or fee income plus the interest earned on the cash proceeds of the securities sold. Successful use of mortgage dollar rolls depends upon the Investment Adviser’s ability to predict correctly interest rates and mortgage prepayments.
For financial reporting and tax purposes, a Fund treats mortgage dollar rolls as two separate transactions: one involving the purchase of a security and a separate transaction involving a sale. The Fund currently does not intend to enter into mortgage dollar rolls that are accounted for as financing and does not treat them as borrowings.
Repurchase Agreements
To the extent consistent with its investment policies, each Fund may enter into repurchase agreements under which it purchases securities (collateral) for cash from a seller and agrees to resell those securities to the same seller within a specified time at a specified price. During the term of a repurchase agreement, the market value of the underlying collateral, including accrued interest, is required to equal or exceed the market value of the repurchase agreement. The underlying collateral for tri-party repurchase agreements is held in accounts at JP Morgan Chase, the Fund’s custodian, and is not reflected in the assets of the Portfolios, at the Bank of New York or JPMorgan Chase which, in turn, holds securities through the book-entry system at the Federal Reserve Bank of New York. The Fund is subject to credit risk on repurchase agreements to the extent that the counterparty fails to perform under the agreement and the value of the collateral received falls below the agreed repurchase price.
The Northern Trust Company, the parent of NTI, currently is a party to various Master Repurchase Agreements with a number of different counterparties, and acts as agent on behalf of various disclosed principals, including the Funds and various other accounts managed by NTI, in entering into repurchase agreements under the Master Repurchase Agreements. NTI administers and manages these repurchase agreements in accordance with and as part of its duties under its investment advisory agreement with the Funds and does not collect any additional fees from the Funds for such services. During the year ended October 31, 2018, the FlexShares Ready Access Variable Income Fund had entered into repurchase agreements. As of October 31, 2018, the Fund had no repurchase agreements outstanding.
As of the year ended October 31, 2018 the FlexShares Morningstar US Market Factor Tilt Index Fund, FlexShares Morningstar Developed Markets ex-US Factor Tilt Index Fund, FlexShares Morningstar Emerging Markets Factor Tilt Index Fund, FlexShares Morningstar Global Upstream Natural Resources Index Fund, FlexShares STOXX Global Broad Infrastructure Index Fund, FlexShares Global Quality Real Estate Index Fund, FlexShares Quality Dividend Index Fund, FlexShares Quality Dividend Defensive Index Fund,
| | |
| 364 | | FLEXSHARES ANNUAL REPORT |
Notes to the Financial Statements (cont.)
FlexShares Quality Dividend Dynamic Index Fund, FlexShares International Quality Dividend Index Fund, FlexShares International Quality Dividend Defensive Index Fund, and the FlexShares International Dividend Dynamic Index Fund invested cash collateral for loans of portfolio securities in repurchase agreements, as reflected in the respective Schedule of Investments under the caption “Securities Lending Reinvestments.”
Securities Lending
Each Fund may lend securities to banks, brokers and dealers or other qualified institutions. In exchange, the Fund is required to receive minimum initial collateral value as follows:
| | | | |
| Type of Loan | | Minimum Initial
Collateral Requirement | |
| U.S. dollar denominated securities secured by U.S. dollar denominated government securities or cash collateral | | | 102 | % |
| U.S. dollar denominated securities secured by non-U.S. dollar denominated government securities or cash collateral | | | 105 | % |
| Non-U.S. dollar denominated securities secured by government securities or cash collateral in the same denomination as the lent securities | | | 102 | % |
| Non-U.S. dollar denominated securities secured by government securities or cash collateral in the different denomination from the lent securities | | | 105 | % |
| U.S. dollar and Non-U.S. dollar denominated securities secured by equity securities collateral | | | 105 | % |
The collateral is maintained thereafter, at a value equal to at least 100% of the value of the securities loaned. The collateral amount is valued at the beginning of each business day and is compared to the market value of the loaned securities from the prior business day to determine if additional collateral is required. If additional collateral is required, a request is sent to the borrower.
Securities lending may represent no more than one-third of the value of a Fund’s total assets (including the loan
collateral). JPMorgan Chase Bank, N.A. (the “Securities Lending Agent”) serves as the securities lending agent for the securities lending program of a Fund.
Collateral for loans of portfolio securities made by a Fund may consist of cash, cash equivalents, securities issued or guaranteed by the U.S. government or foreign governments or its agencies (or any combination thereof). Any cash collateral received by the Fund in connection with these loans may be invested in a variety of short-term investments, either directly or indirectly through money market portfolios. The market value of securities on loan, and the value of investments made with cash collateral received are disclosed in the Schedule of Investments. Securities lending income includes income from the securities lending program recorded when earned from the Securities Lending Agent and any fees charged to borrowers less expenses associated with the loan. The net amount is reflected in the Statement of Operations under “Securities lending income (net of fees).”
When a Fund lends its securities, it will continue to receive payments equal to the dividends and interest paid on the securities loaned and simultaneously may earn interest on the investment of the cash collateral.
A Fund will have the right to terminate a loan at any time and recall the loaned securities within the normal and customary settlement time for securities transactions. A Fund does not have the right to vote securities on loan, but can terminate the loan and regain the right to vote if a material event affecting the securities occurred. A borrower might become insolvent or refuse to honor its obligation to return the securities. In the event of a default by a borrower with respect to any loan, the Securities Lending Agent will exercise any and all remedies provided under the applicable borrower agreement. These remedies include purchasing replacement securities for the Fund by applying the collateral held from the defaulting borrower against the purchase cost of the replacement securities. If the proceeds from the collateral are less than the purchase cost of the replacement securities, the Securities Lending Agent is responsible for such shortfall, subject to certain limitations that are set forth in detail in the Securities Lending Agency Agreement. In this event, a Fund could experience delays in
| | | | |
| FLEXSHARES ANNUAL REPORT | | | 365 | |
Notes to the Financial Statements (cont.)
recovering its securities and possibly may incur a capital loss. Each Fund will be responsible for any loss that might result from its investment of the cash collateral it receives from a borrower.
In accordance with guidance presented in FASB Accounting Standard Update (“ASU”) 2014-11, Transfers and Servicing (Topic 860): Repurchase to-Maturity Transactions, Repurchase Financings, and Disclosures, liabilities under the outstanding securities lending transactions as of October 31, 2018, which were comprised of cash, were as follows:
| | | | |
| Fund | | | |
| FlexShares Morningstar US Market Factor Tilt Index Fund | | $ | 130,654,828 | |
| FlexShares Morningstar Developed Markets ex-US Factor Tilt Index Fund | | | 14,811,881 | |
| FlexShares Morningstar Emerging Markets Factor Tilt Index Fund | | | 714,117 | |
| FlexShares Morningstar Global Upstream Natural Resources Index Fund | | | 138,793,426 | |
| FlexShares STOXX® Global Broad Infrastructure Index Fund | | | 37,964,782 | |
| FlexShares Global Quality Real Estate Index Fund | | | 7,435,740 | |
| FlexShares Quality Dividend Index Fund | | | 267,451,902 | |
| FlexShares Quality Dividend Defensive Index Fund | | | 41,878,173 | |
| FlexShares Quality Dividend Dynamic Index Fund | | | 4,414,438 | |
| FlexShares International Quality Dividend Index Fund | | | 26,811,607 | |
| FlexShares International Quality Dividend Defensive Index Fund | | | 55,421 | |
| FlexShares International Quality Dividend Dynamic Index Fund | | | 454,933 | |
At October 31, 2018, the Securities Lending Agency Agreement does not permit the Funds to enforce a netting arrangement.
Derivative Contracts
Futures Contracts
All of the Index Funds may invest in futures contracts to help track the price and yield performance of their
underlying indexes. At the time a Fund enters into a futures contract, it is generally required to make a margin deposit with the custodian of a specified amount of liquid assets. Subsequent payments to be made or received by the Funds equal to the change in contract value are recorded as variation margin payable or receivable and offset in unrealized gains or losses. Futures are marked to market each day with the change in value reflected in the unrealized gains or losses. A Fund recognizes a realized gain or loss when a contract is closed or expires. The Statements of Operations reflect unrealized gains or losses on open futures contracts, as “Net change in unrealized appreciation (depreciation) on futures contracts”, and any realized gains (losses) on closed futures contracts as “Net realized gain (loss) on futures contracts”.
The FlexShares Core Select Bond Fund may take long or short positions in futures to manage the Fund’s exposure to interest rate risk. The Fund seeks to mitigate the potential impact of interest rates on the performance of bonds by entering into short positions in U.S. Treasury futures or transactions in interest rate swaps. The Fund’s short positions in U.S. Treasury futures and interest rate swaps are not intended to mitigate credit spread risk or other factors influencing the price of bonds, which may have a greater impact than interest rates. In addition, when interest rates fall, long-only bond investments will perform better than the Fund’s investments.
As of October 31, 2018, the FlexShares Morningstar US Market Factor Tilt Index Fund, FlexShares Morningstar Developed Markets ex-US Factor Tilt Index Fund, FlexShares Morningstar Emerging Markets Factor Tilt Index Fund, FlexShares Currency Hedged Morningstar EM Factor Tilt Index Fund, FlexShares US Quality Large Cap Index Fund, FlexShares STOXX® US ESG Impact Index Fund, FlexShares STOXX® Global ESG Impact Index Fund, FlexShares Morningstar Global Upstream Natural Resources Index Fund, FlexShares STOXX® Global Broad Infrastructure Index Fund, FlexShares Global Quality Real Estate Index Fund, FlexShares Quality Dividend Index Fund, FlexShares Quality Dividend Defensive Index Fund, FlexShares Quality Dividend Dynamic Index Fund, FlexShares International Quality Dividend Index Fund, FlexShares International Quality
| | |
| 366 | | FLEXSHARES ANNUAL REPORT |
Notes to the Financial Statements (cont.)
Dividend Defensive Index Fund, and the FlexShares International Quality Dividend Dynamic Index had open futures contracts.
The use of futures contracts involves, to varying degrees, elements of market and counterparty risk, which may exceed the amounts recognized in the Statements of Assets and Liabilities. Futures contracts present the following risks: imperfect correlation between the change in market value of a Fund’s securities and the price of futures contracts; the possible inability to close a futures contract when desired; losses due to unanticipated market movements, which potentially are unlimited; and the possible inability of NTI to correctly predict the direction of securities prices, interest rates, currency exchange rates and other economic factors. Futures markets are highly volatile and the use of futures may increase the volatility of a Fund’s NAV. As a result of the low margin deposits normally required in futures trading, a relatively small price movement in a futures contract may result in substantial losses to a Fund. Futures contracts may be illiquid, and exchanges may limit fluctuations in futures contract prices during a single day. Foreign exchanges or boards of trade generally do not offer the same protection as U.S. exchanges.
Foreign Currency Translations
Values of investments denominated in foreign currencies are converted into U.S. dollars using the prevailing market rates on the date of valuation as quoted by one or more banks or dealers that make a two-way market in such currencies (or a data service provider based on quotations received from such banks or dealers). Any use of a rate different from the rates used by an Index Fund’s index provider may affect a Fund’s ability to track its Underlying Index. The cost of purchases and proceeds from sales of investments, interest and dividend income are translated into U.S. dollars using the spot market rate of exchange prevailing on the respective dates of such transactions. “Net realized gain (loss) on foreign currency transactions” on the Statements of Operations include the effect of changes in exchange rates between trade date and settlement date on investment security transactions, foreign currency transactions and interest and dividends received, and the portion of foreign currency gains and losses related to fluctuation in exchange rates between
the initial purchase trade date and subsequent sale trade date is included in “Net realized gain (loss) on investment in securities” on the Statements of Operations. Unrealized gains and losses on assets and liabilities, other than investments in securities, which result from changes in foreign currency exchange rates have been included in “Net change in unrealized appreciation (depreciation) on translation of other assets and liabilities denominated in foreign currencies” on the Statements of Operations.
Forward Foreign Currency Exchange Contracts
The FlexShares Currency Hedged Morningstar DM ex-US Factor Tilt Index Fund and FlexShares Currency Hedged Morningstar EM Factor Tilt Index Fund expect to use forward foreign currency contracts to hedge the currency exposure resulting from investments in foreign securities, to facilitate local settlements or to protect against currency exposure in connection with their distributions to shareholders. The FlexShares Morningstar Developed Markets ex-US Factor Tilt Index Fund, FlexShares Morningstar Emerging Markets Factor Tilt Index Fund, FlexShares STOXX® Global ESG Impact Index Fund, FlexShares Morningstar Global Upstream Natural Resources Index Fund, FlexShares STOXX® Global Broad Infrastructure Index Fund, FlexShares Global Quality Real Estate Index Fund, FlexShares Real Assets Allocation Index Fund, FlexShares International Quality Dividend Index Fund, FlexShares International Quality Dividend Defensive Index Fund, FlexShares International Quality Dividend Dynamic Index Fund, and the FlexShares Ready Access Variable Income Fund may enter into forward foreign currency exchange contracts to facilitate local settlements or to protect against currency exposure in connection with its distributions to shareholders. The Index Funds, however, do not expect to engage in currency transactions for speculative purposes (e.g., for potential income or capital gain). The FlexShares Ready Access Variable Income Fund also may engage in forward foreign currency transactions for hedging purposes in order to protect against uncertainty in the level of future foreign currency exchange rates. The Fund, however, does not expect to engage in currency transactions for speculative purposes. All forward foreign currency exchange contracts held are “marked-to-market” daily at the applicable
| | | | |
| FLEXSHARES ANNUAL REPORT | | | 367 | |
Notes to the Financial Statements (cont.)
exchange rates and any resulting unrealized gains or losses are recorded. The Funds record realized gains or losses at the time the forward foreign currency exchange contract is offset by entering into a closing transaction or extinguished by delivery of the currency. The difference between the future foreign currency exchange rates at the date of entry into the contract and the rates at the reporting date are included in “Net change in unrealized appreciation (depreciation) on forward foreign currency contracts” in the Statement of Operations. Non-deliverable forward foreign currency exchange contracts are settled with the counterparty in U.S. Dollars without the delivery of foreign currency.
There are several risks associated with these contracts. One risk is the potential inability of counterparties to meet the terms of their contracts, and unanticipated movements in the value of a foreign currency relative to the U.S. dollar. The contractual amounts of forward foreign currency exchange contracts do not necessarily represent the amounts potentially subject to risk. The measurement of the risks associated with these instruments is meaningful only when all related and offsetting transactions are considered. The Statements of Operations reflect (i) realized gains or losses, if any, in “Net realized gain (loss) from settlement of forward foreign currency contracts” and (ii) unrealized gains or losses in “Net change in unrealized appreciation (depreciation) on forward foreign currency contracts”. Forward foreign currency exchange contracts are privately negotiated transactions and can have substantial price volatility. As a result, they offer less protection against default by the other party than is available for instruments traded on an exchange. The institutions that deal in forward foreign currency exchange contracts are not required to continue to make markets in the currencies they trade, and these markets can experience periods of illiquidity.
As of October 31, 2018, the FlexShares Morningstar Developed Markets ex-US Factor Tilt Index Fund, FlexShares Morningstar Emerging Markets Factor Tilt Index Fund, FlexShares Currency Hedged Morningstar DM ex-US Factor Tilt Index Fund, FlexShares Currency Hedged Morningstar EM Factor Tilt Index Fund, FlexShares Morningstar Global Upstream Natural Resources Index Fund, FlexShares
STOXX® Global Broad Infrastructure Index Fund, FlexShares Global Quality Real Estate Index Fund, FlexShares International Quality Dividend Index Fund, and the FlexShares International Quality Dividend Defensive Index Fund had open forward foreign currency contracts.
Offsetting of Financial Assets and Derivative Assets
The Funds’ accounting policy with respect to balance sheet offsetting is that, absent an event of default by the counterparty or a termination of the agreement, the International Swaps and Derivatives Association (ISDA) Master Agreement or similar agreement does not result in an offset of reported amounts of financial assets and financial liabilities in the Statements of Assets and Liabilities across transactions between the Fund and the applicable counterparty. In the event of a default, the agreement provides the right for the non-defaulting party to liquidate the collateral and calculate the net exposure to the defaulting party or request additional collateral. The Funds’ right to setoff may be restricted or prohibited by the bankruptcy or insolvency laws of the particular jurisdiction to which a specific master netting agreement counterparty is subject.
For financial reporting purposes, the Trust can offset financial assets and financial liabilities of the FlexShares Morningstar Developed Markets ex-US Factor Tilt Index Fund, FlexShares Morningstar Emerging Markets Factor Tilt Index Fund, FlexShares Currency Hedged Morningstar DM ex-US Factor Tilt Index Fund, FlexShares Currency Hedged Morningstar EM Factor Tilt Index Fund, FlexShares Morningstar Global Upstream Natural Resources Index Fund, FlexShares STOXX® Global Broad Infrastructure Index Fund, FlexShares Global Quality Real Estate Index Fund, FlexShares International Quality Dividend Index Fund, and
| | |
| 368 | | FLEXSHARES ANNUAL REPORT |
Notes to the Financial Statements (cont.)
the FlexShares International Quality Dividend Defensive Index Fund that are subject to master netting arrangements or similar agreements in the Statements of Assets and
Liabilities. The following table presents the gross and net amounts of these assets and liabilities:
| | | | | | | | | | | | | | | | | | |
| | | | | | | | Gross Amounts Not Offset in the
Statement of Assets and Liabilities | | | | |
| | | | | Gross Amounts of
Assets presented in
Statements of Assets
and Liabilities | | | Financial
Instruments | | | Cash Collateral
Received | | | Net Amount | |
| FlexShares Morningstar Developed Markets ex-US Factor Tilt Index Fund | | Foreign Currency Contracts — Bank of New York | | $ | 10,901 | | | $ | — | | | $ | — | | | $ | 10,901 | |
| | Foreign Currency Contracts — BNP Paribas SA | | | — | | | | — | | | | — | | | | — | |
| | Foreign Currency Contracts — Citibank NA | | | 19,116 | | | | (19,116 | ) | | | — | | | | — | |
| | Foreign Currency Contracts — Goldman Sachs & Co. | | | — | | | | — | | | | — | | | | — | |
| | | Foreign Currency Contracts — Toronto-Dominion Bank (The) | | | 1,250 | | | | (1,250 | ) | | | — | | | | — | |
| | | Total | | $ | 31,267 | | | $ | (20,366 | ) | | $ | — | | | $ | 10,901 | |
| FlexShares Morningstar Emerging Markets Factor Tilt Index Fund | | Foreign Currency Contracts — BNP Paribas SA | | $ | — | | | $ | — | | | $ | — | | | $ | — | |
| | Foreign Currency Contracts — Citibank NA | | | 2,324 | | | | — | | | | — | | | | 2,324 | |
| | Foreign Currency Contracts — Goldman Sachs & Co. | | | 9,114 | | | | (9,114 | ) | | | — | | | | — | |
| | Foreign Currency Contracts — Morgan Stanley | | | 244 | | | | (244 | ) | | | — | | | | — | |
| | | Foreign Currency Contracts — Toronto-Dominion Bank (The) | | | 1,463 | | | | — | | | | — | | | | 1,463 | |
| | | Total | | $ | 13,145 | | | $ | (9,358 | ) | | $ | — | | | $ | 3,787 | |
| FlexShares Currency Hedged Morningstar DM ex-US Factor Tilt Index | | Foreign Currency Contracts — Toronto-Dominion Bank (The) | | $ | 85,584 | | | $ | (40 | ) | | $ | — | | | $ | 85,544 | |
| | | Total | | $ | 85,584 | | | $ | (40 | ) | | $ | — | | | $ | 85,544 | |
| FlexShares Currency Hedged Morningstar EM Factor Tilt Index Fund | | Foreign Currency Contracts — Bank of Montreal | | $ | — | | | $ | — | | | $ | — | | | $ | — | |
| | Foreign Currency Contracts — Bank of New York | | | — | | | | — | | | | — | | | | — | |
| | Foreign Currency Contracts — BNP Paribas SA | | | 5,002 | | | | (2,138 | ) | | | — | | | | 2,864 | |
| | Foreign Currency Contracts — Citibank NA | | | 632 | | | | (632 | ) | | | — | | | | — | |
| | Foreign Currency Contracts — Goldman Sachs & Co. | | | 3,034 | | | | (427 | ) | | | — | | | | 2,607 | |
| | Foreign Currency Contracts — JPMorgan Chase Bank | | | 14,960 | | | | (201 | ) | | | | | | | 14,759 | |
| | Foreign Currency Contracts — Morgan Stanley | | | — | | | | — | | | | — | | | | — | |
| | | Foreign Currency Contracts — Toronto-Dominion Bank (The) | | | 22,617 | | | | (2,310 | ) | | | — | | | | 20,307 | |
| | | Total | | $ | 46,245 | | | $ | (5,708 | ) | | $ | — | | | $ | 40,537 | |
| FlexShares Morningstar Global Upstream Natural Resources Index Fund | | Foreign Currency Contracts — Bank of Montreal | | $ | 58,033 | | | $ | (16,816 | ) | | $ | — | | | $ | 41,217 | |
| | Foreign Currency Contracts — Bank of New York | | | — | | | | — | | | | — | | | | — | |
| | Foreign Currency Contracts — BNP Paribas SA | | | 27,835 | | | | (27,835 | ) | | | — | | | | — | |
| | Foreign Currency Contracts — Citibank NA | | | 2,046 | | | | (2,046 | ) | | | — | | | | — | |
| | Foreign Currency Contracts — Goldman Sachs & Co. | | | 44,686 | | | | (44,686 | ) | | | — | | | | — | |
| | Foreign Currency Contracts — JPMorgan Chase Bank | | | 8,591 | | | | — | | | | — | | | | 8,591 | |
| | Foreign Currency Contracts — Morgan Stanley | | | 59,532 | | | | (978 | ) | | | — | | | | 58,554 | |
| | | Foreign Currency Contracts — Toronto-Dominion Bank (The) | | | 185,564 | | | | (37,878 | ) | | | — | | | | 147,686 | |
| | | Total | | $ | 386,287 | | | $ | (130,239 | ) | | $ | — | | | $ | 256,048 | |
| | | | |
| FLEXSHARES ANNUAL REPORT | | | 369 | |
Notes to the Financial Statements (cont.)
| | | | | | | | | | | | | | | | | | |
| | | | | | | | Gross Amounts Not Offset in the
Statement of Assets and Liabilities | | | | |
| | | | | Gross Amounts of
Assets presented in
Statements of Assets
and Liabilities | | | Financial
Instruments | | | Cash Collateral
Received | | | Net Amount | |
| FlexShares® STOXX® Global Infrastructure Index Fund | | Foreign Currency Contracts — BNP Paribas SA | | $ | 3,039 | | | $ | — | | | $ | — | | | $ | 3,039 | |
| | Foreign Currency Contracts — Citibank NA | | | — | | | | — | | | | — | | | | — | |
| | Foreign Currency Contracts — Goldman Sachs & Co. | | | — | | | | — | | | | — | | | | — | |
| | | Foreign Currency Contracts — Toronto-Dominion Bank (The) | | | 4,198 | | | | (1,036 | ) | | | — | | | | 3,162 | |
| | | Total | | $ | 7,237 | | | $ | (1,036 | ) | | $ | — | | | $ | 6,201 | |
| FlexShares Global Quality Real Estate Index Fund | | Foreign Currency Contracts — BNP Paribas SA | | $ | — | | | $ | — | | | $ | — | | | $ | — | |
| | Foreign Currency Contracts — Citibank NA | | | — | | | | — | | | | — | | | | — | |
| | Foreign Currency Contracts — Goldman Sachs & Co. | | | 1,564 | | | | — | | | | — | | | | 1,564 | |
| | Foreign Currency Contracts — Morgan Stanley | | | 383 | | | | — | | | | — | | | | 383 | |
| | | Foreign Currency Contracts — Toronto-Dominion Bank (The) | | | 16,823 | | | | — | | | | — | | | | 16,823 | |
| | | Total | | $ | 18,770 | | | $ | — | | | $ | — | | | $ | 18,770 | |
| FlexShares International Quality Dividend Index Fund | | Foreign Currency Contracts — Bank of Montreal | | $ | 906 | | | $ | — | | | $ | — | | | $ | 906 | |
| | Foreign Currency Contracts — Bank of New York | | | — | | | | — | | | | — | | | | — | |
| | Foreign Currency Contracts — BNP Paribas SA | | | 5,248 | | | | (5,248 | ) | | | — | | | | — | |
| | Foreign Currency Contracts — Citibank NA | | | — | | | | — | | | | — | | | | — | |
| | Foreign Currency Contracts — Goldman Sachs & Co. | | | 11,747 | | | | (11,747 | ) | | | — | | | | — | |
| | Foreign Currency Contracts — JPMorgan Chase Bank | | | — | | | | — | | | | — | | | | — | |
| | Foreign Currency Contracts — Morgan Stanley | | | 6,512 | | | | (20 | ) | | | — | | | | 6,492 | |
| | | Foreign Currency Contracts — Toronto-Dominion Bank (The) | | | 245,271 | | | | (4,725 | ) | | | — | | | | 240,546 | |
| | | Total | | $ | 269,684 | | | $ | (21,740 | ) | | $ | — | | | $ | 247,944 | |
| FlexShares International Quality Dividend Defensive Index Fund | | Foreign Currency Contracts — Bank of New York | | $ | — | | | $ | — | | | $ | — | | | $ | — | |
| | Foreign Currency Contracts — BNP Paribas SA | | | 1,426 | | | | — | | | | — | | | | 1,426 | |
| | | Foreign Currency Contracts — Goldman Sachs & Co. | | | — | | | | — | | | | — | | | | — | |
| | | Total | | $ | 1,426 | | | $ | — | | | $ | — | | | $ | 1,426 | |
| | | | | | | | | | | | | | | | | | |
| | | | | | | | Gross Amounts Not Offset in the
Statement of Assets and Liabilities | | | | |
| | | | | Gross Amounts of
Liabilities presented in
Statements of Assets
and Liabilities | | | Financial
Instruments | | | Cash Collateral
Pledged | | | Net Amount | |
| FlexShares Morningstar Developed Markets ex-US Factor Tilt Index Fund | | Foreign Currency Contracts — Bank of New York | | $ | — | | | $ | — | | | $ | — | | | $ | — | |
| | Foreign Currency Contracts — BNP Paribas SA | | | (39,231 | ) | | | — | | | | — | | | | (39,231 | ) |
| | Foreign Currency Contracts — Citibank NA | | | (30,393 | ) | | | 19,116 | | | | | | | | (11,277 | ) |
| | Foreign Currency Contracts — Goldman Sachs & Co. | | | (67,175 | ) | | | — | | | | — | | | | (67,175 | ) |
| | | Foreign Currency Contracts — Toronto-Dominion Bank (The) | | | (42,432 | ) | | | 1,250 | | | | — | | | | (41,182 | ) |
| | | Total | | $ | (179,231 | ) | | $ | 20,366 | | | $ | — | | | $ | (158,865 | ) |
| | |
| 370 | | FLEXSHARES ANNUAL REPORT |
Notes to the Financial Statements (cont.)
| | | | | | | | | | | | | | | | | | |
| | | | | | | | Gross Amounts Not Offset in the
Statement of Assets and Liabilities | | | | |
| | | | | Gross Amounts of
Liabilities presented in
Statements of Assets
and Liabilities | | | Financial
Instruments | | | Cash Collateral
Pledged | | | Net Amount | |
| FlexShares Morningstar Emerging Markets Factor Tilt Index Fund | | Foreign Currency Contracts — BNP Paribas SA | | $ | (1,732 | ) | | $ | — | | | $ | — | | | $ | (1,732 | ) |
| | Foreign Currency Contracts — Citibank NA | | | — | | | | — | | | | — | | | | — | |
| | Foreign Currency Contracts — Goldman Sachs & Co. | | | (43,390 | ) | | | 9,114 | | | | — | | | | (34,276 | ) |
| | Foreign Currency Contracts — Morgan Stanley | | | (1,405 | ) | | | 244 | | | | — | | | | (1,161 | ) |
| | | Foreign Currency Contracts — Toronto-Dominion Bank (The) | | | — | | | | — | | | | — | | | | — | |
| | | Total | | $ | (46,527 | ) | | $ | 9,358 | | | $ | — | | | $ | (37,169 | ) |
| FlexShares Currency Hedged Morningstar DM ex-US Factor Tilt Index | | Foreign Currency Contracts — Toronto-Dominion Bank (The) | | $ | (40 | ) | | $ | 40 | | | $ | — | | | $ | — | |
| | | Total | | $ | (40 | ) | | $ | 40 | | | $ | — | | | $ | — | |
| FlexShares Currency Hedged Morningstar EM Factor Tilt Index Fund | | Foreign Currency Contracts — Bank of Montreal | | $ | (508 | ) | | $ | — | | | $ | — | | | $ | (508 | ) |
| | Foreign Currency Contracts — Bank of New York | | | (1,663 | ) | | | — | | | | — | | | | (1,663 | ) |
| | Foreign Currency Contracts — BNP Paribas SA | | | (2,138 | ) | | | 2,138 | | | | — | | | | — | |
| | Foreign Currency Contracts — Citibank NA | | | (693 | ) | | | 632 | | | | — | | | | (61 | ) |
| | Foreign Currency Contracts — Goldman Sachs & Co. | | | (427 | ) | | | 427 | | | | — | | | | — | |
| | Foreign Currency Contracts — JPMorgan Chase Bank | | | (201 | ) | | | 201 | | | | — | | | | — | |
| | Foreign Currency Contracts — Morgan Stanley | | | (1,101 | ) | | | — | | | | — | | | | (1,101 | ) |
| | | Foreign Currency Contracts — Toronto-Dominion Bank (The) | | | (2,310 | ) | | | 2,310 | | | | — | | | | — | |
| | | Total | | $ | (9,041 | ) | | $ | 5,708 | | | $ | — | | | $ | (3,333 | ) |
| FlexShares Morningstar Global Upstream Natural Resources Index Fund | | Foreign Currency Contracts — Bank of Montreal | | $ | (16,816 | ) | | $ | 16,816 | | | $ | — | | | $ | — | |
| | Foreign Currency Contracts — Bank of New York | | | (23,620 | ) | | | — | | | | — | | | | (23,620 | ) |
| | Foreign Currency Contracts — BNP Paribas SA | | | (92,142 | ) | | | 27,835 | | | | — | | | | (64,307 | ) |
| | Foreign Currency Contracts — Citibank NA | | | (52,058 | ) | | | 2,046 | | | | — | | | | (50,012 | ) |
| | Foreign Currency Contracts — Goldman Sachs & Co. | | | (394,313 | ) | | | 44,686 | | | | — | | | | (349,627 | ) |
| | Foreign Currency Contracts — JPMorgan Chase Bank | | | — | | | | — | | | | — | | | | — | |
| | Foreign Currency Contracts — Morgan Stanley | | | (978 | ) | | | 978 | | | | | | | | — | |
| | | Foreign Currency Contracts — Toronto-Dominion Bank (The) | | | (37,878 | ) | | | 37,878 | | | | — | | | | — | |
| | | Total | | $ | (617,805 | ) | | $ | 130,239 | | | $ | — | | | $ | (487,566 | ) |
| FlexShares® STOXX® Global Infrastructure Index Fund | | Foreign Currency Contracts — BNP Paribas SA | | $ | — | | | $ | — | | | $ | — | | | $ | — | |
| | Foreign Currency Contracts — Citibank NA | | | (9,525 | ) | | | — | | | | — | | | | (9,525 | ) |
| | Foreign Currency Contracts — Goldman Sachs & Co. | | | (10,995 | ) | | | — | | | | — | | | | (10,995 | ) |
| | | Foreign Currency Contracts — Toronto-Dominion Bank (The) | | | (1,036 | ) | | | 1,036 | | | | — | | | | — | |
| | | Total | | $ | (21,556 | ) | | $ | 1,036 | | | $ | — | | | $ | (20,520 | ) |
| | | | |
| FLEXSHARES ANNUAL REPORT | | | 371 | |
Notes to the Financial Statements (cont.)
| | | | | | | | | | | | | | | | | | |
| | | | | | | | Gross Amounts Not Offset in the
Statement of Assets and Liabilities | | | | |
| | | | | Gross Amounts of
Liabilities presented in
Statements of Assets
and Liabilities | | | Financial
Instruments | | | Cash Collateral
Pledged | | | Net Amount | |
| FlexShares Global Quality Real Estate Index Fund | | Foreign Currency Contracts — BNP Paribas SA | | $ | (6,282 | ) | | $ | — | | | $ | — | | | $ | (6,282 | ) |
| | Foreign Currency Contracts — Citibank NA | | | (527 | ) | | | — | | | | — | | | | (527 | ) |
| | Foreign Currency Contracts — Goldman Sachs & Co. | | | — | | | | — | | | | — | | | | — | |
| | Foreign Currency Contracts — Morgan Stanley | | | — | | | | — | | | | — | | | | — | |
| | | Foreign Currency Contracts — Toronto-Dominion Bank (The) | | | — | | | | — | | | | — | | | | — | |
| | | Total | | $ | (6,809 | ) | | $ | — | | | $ | — | | | $ | (6,809 | ) |
| FlexShares International Quality Dividend Index Fund | | Foreign Currency Contracts — Bank of Montreal | | $ | — | | | $ | — | | | $ | — | | | $ | — | |
| | Foreign Currency Contracts — Bank of New York | | | (3,187 | ) | | | — | | | | — | | | | (3,187 | ) |
| | Foreign Currency Contracts — BNP Paribas SA | | | (41,797 | ) | | | 5,248 | | | | — | | | | (36,549 | ) |
| | Foreign Currency Contracts — Citibank NA | | | (51,419 | ) | | | — | | | | — | | | | (51,419 | ) |
| | Foreign Currency Contracts — Goldman Sachs & Co. | | | (176,708 | ) | | | 11,747 | | | | — | | | | (164,961 | ) |
| | Foreign Currency Contracts — JPMorgan Chase Bank | | | (8,683 | ) | | | — | | | | — | | | | (8,683 | ) |
| | Foreign Currency Contracts — Morgan Stanley | | | (20 | ) | | | 20 | | | | — | | | | — | |
| | | Foreign Currency Contracts — Toronto-Dominion Bank (The) | | | (4,725 | ) | | | 4,725 | | | | — | | | | — | |
| | | Total | | $ | (286,539 | ) | | $ | 21,740 | | | $ | — | | | $ | (264,799 | ) |
| FlexShares International Quality Dividend Defensive Index Fund | | Foreign Currency Contracts — Bank of New York | | $ | (142 | ) | | $ | — | | | $ | — | | | $ | (142 | ) |
| | Foreign Currency Contracts — BNP Paribas SA | | | — | | | | — | | | | — | | | | — | |
| | | Foreign Currency Contracts — Goldman Sachs & Co. | | | (2,767 | ) | | | — | | | | — | | | | (2,767 | ) |
| | | Total | | $ | (2,909 | ) | | $ | — | | | $ | — | | | $ | (2,909 | ) |
The following tables indicate the location of derivative-related items on the Statements of Assets and Liabilities as well as the effect of derivative instruments on the Statements of Operations during the reporting period.
Fair Value of Derivative Instruments as of October 31, 2018
| | | | | | | | |
| Derivatives by risk type | | Statements of Assets
and Liabilities Location | | Fund | | Value | |
| Equity Index Futures Contracts | | Liabilities — Unrealized depreciation on futures contracts* | | FlexShares Morningstar US Market Factor Tilt Index Fund | | $ | (1,163,607 | ) |
| Equity Index Futures Contracts | | Liabilities — Unrealized depreciation on futures contracts* | | FlexShares Morningstar Developed Markets ex-US Factor Tilt Index Fund | | | (580,488 | ) |
| Foreign Currency Contracts | | Assets — Unrealized appreciation on forward foreign currency contracts | | FlexShares Morningstar Developed Markets ex-US Factor Tilt Index Fund | | | 31,267 | |
| Foreign Currency Contracts | | Liabilities — Unrealized depreciation on forward foreign currency contracts | | FlexShares Morningstar Developed Markets ex-US Factor Tilt Index Fund | | | (179,231 | ) |
| Equity Index Futures Contracts | | Liabilities — Unrealized depreciation on futures contracts* | | FlexShares Morningstar Emerging Markets Factor Tilt Index Fund | | | (126,276 | ) |
| Foreign Currency Contracts | | Assets — Unrealized appreciation on forward foreign currency contracts | | FlexShares Morningstar Emerging Markets Factor Tilt Index Fund | | | 13,145 | |
| | |
| 372 | | FLEXSHARES ANNUAL REPORT |
Notes to the Financial Statements (cont.)
| | | | | | | | |
| Derivatives by risk type | | Statements of Assets
and Liabilities Location | | Fund | | Value | |
| Foreign Currency Contracts | | Liabilities — Unrealized depreciation on forward foreign currency contracts | | FlexShares Morningstar Emerging Markets Factor Tilt Index Fund | | $ | (46,527 | ) |
| Foreign Currency Contracts | | Assets — Unrealized appreciation on forward foreign currency contracts | | FlexShares Currency Hedged Morningstar DM ex-US Factor Tilt Index Fund | | | 85,584 | |
| Foreign Currency Contracts | | Liabilities — Unrealized depreciation on forward foreign currency contracts | | FlexShares Currency Hedged Morningstar DM ex-US Factor Tilt Index Fund | | | (40 | ) |
| Equity Index Futures Contracts | | Liabilities — Unrealized depreciation on futures contracts* | | FlexShares Currency Hedged Morningstar EM Factor Tilt Index Fund | | | (2,781 | ) |
| Foreign Currency Contracts | | Assets — Unrealized appreciation on forward foreign currency contracts | | FlexShares Currency Hedged Morningstar EM Factor Tilt Index Fund | | | 46,245 | |
| Foreign Currency Contracts | | Liabilities — Unrealized depreciation on forward foreign currency contracts | | FlexShares Currency Hedged Morningstar EM Factor Tilt Index Fund | | | (9,041 | ) |
| Equity Index Futures Contracts | | Liabilities — Unrealized depreciation on futures contracts* | | FlexShares US Quality Large Cap Index Fund | | | (11,172 | ) |
| Equity Index Futures Contracts | | Liabilities — Unrealized depreciation on futures contracts* | | FlexShares STOXX® US ESG Impact Index Fund | | | (26,898 | ) |
| Equity Index Futures Contracts | | Liabilities — Unrealized depreciation on futures contracts* | | FlexShares STOXX® Global ESG Impact Index Fund | | | (66,174 | ) |
| Equity Index Futures Contracts | | Liabilities — Unrealized depreciation on futures contracts* | | FlexShares Morningstar Global Upstream Natural Resources Index Fund | | | (1,820,621 | ) |
| Foreign Currency Contracts | | Assets — Unrealized appreciation on forward foreign currency contracts | | FlexShares Morningstar Global Upstream Natural Resources Index Fund | | | 386,287 | |
| Foreign Currency Contracts | | Liabilities — Unrealized depreciation on forward foreign currency contracts | | FlexShares Morningstar Global Upstream Natural Resources Index Fund | | | (617,805 | ) |
| Equity Index Futures Contracts | | Liabilities — Unrealized depreciation on futures contracts* | | FlexShares STOXX® Global Broad Infrastructure Index Fund | | | (270,093 | ) |
| Foreign Currency Contracts | | Assets — Unrealized appreciation on forward foreign currency contracts | | FlexShares STOXX® Global Broad Infrastructure Index Fund | | | 7,237 | |
| Foreign Currency Contracts | | Liabilities — Unrealized depreciation on forward foreign currency contracts | | FlexShares STOXX® Global Broad Infrastructure Index Fund | | | (21,556 | ) |
| Equity Index Futures Contracts | | Liabilities — Unrealized depreciation on futures contracts* | | FlexShares Global Quality Real Estate Index Fund | | | (420,389 | ) |
| Foreign Currency Contracts | | Assets — Unrealized appreciation on forward foreign currency contracts | | FlexShares Global Quality Real Estate Index Fund | | | 18,770 | |
| Foreign Currency Contracts | | Liabilities — Unrealized depreciation on forward foreign currency contracts | | FlexShares Global Quality Real Estate Index Fund | | | (6,809 | ) |
| Equity Index Futures Contracts | | Liabilities — Unrealized depreciation on futures contracts* | | FlexShares Quality Dividend Index Fund | | | (881,929 | ) |
| | | | |
| FLEXSHARES ANNUAL REPORT | | | 373 | |
Notes to the Financial Statements (cont.)
| | | | | | | | |
| Derivatives by risk type | | Statements of Assets
and Liabilities Location | | Fund | | Value | |
| Equity Index Futures Contracts | | Liabilities — Unrealized depreciation on futures contracts* | | FlexShares Quality Dividend Defensive Index Fund | | $ | (146,545 | ) |
| Equity Index Futures Contracts | | Liabilities — Unrealized depreciation on futures contracts* | | FlexShares Quality Dividend Dynamic Index Fund | | | (30,347 | ) |
| Equity Index Futures Contracts | | Liabilities — Unrealized depreciation on futures contracts* | | FlexShares International Quality Dividend Index Fund | | | (325,745 | ) |
| Foreign Currency Contracts | | Assets — Unrealized appreciation on forward foreign currency contracts | | FlexShares International Quality Dividend Index Fund | | | 269,684 | |
| Foreign Currency Contracts | | Liabilities — Unrealized depreciation on forward foreign currency contracts | | FlexShares International Quality Dividend Index Fund | | | (286,539 | ) |
| Equity Index Futures Contracts | | Liabilities — Unrealized depreciation on futures contracts* | | FlexShares International Quality Dividend Defensive Index Fund | | | (76,010 | ) |
| Foreign Currency Contracts | | Assets — Unrealized appreciation on forward foreign currency contracts | | FlexShares International Quality Dividend Defensive Index Fund | | | 1,426 | |
| Foreign Currency Contracts | | Liabilities — Unrealized depreciation on forward foreign currency contracts | | FlexShares International Quality Dividend Defensive Index Fund | | | (2,909 | ) |
| Equity Index Futures Contracts | | Liabilities — Unrealized depreciation on futures contracts* | | FlexShares International Quality Dividend Dynamic Index Fund | | | (29,514 | ) |
| * | Includes cumulative appreciation/depreciation on futures contracts as reported in the Schedule of Investments. Current day’s variation margin is reported within the Statement of Assets and Liabilities for futures contracts. |
The Effect of Derivative Instruments on the Statements of Operations for the Period Ended October 31, 2018
| | | | | | | | | | | | |
| Derivatives by risk type | | Location of Gain or (Loss) on
Derivatives on the Statements of
Operations | | Fund | | Realized
Gain or
(Loss) on
Derivatives | | | Change in Unrealized
Appreciation or
(Depreciation) on
Derivatives | |
| Equity Index Futures Contracts | | Net realized gain (loss) on Futures contracts, Net change in unrealized appreciation (depreciation) on Futures contracts | | FlexShares Morningstar US Market Factor Tilt Index Fund | | $ | 2,336,303 | | | $ | (1,557,640 | ) |
| Equity Index Futures Contracts | | Net realized gain (loss) on Futures contracts, Net change in unrealized appreciation (depreciation) on Futures contracts | | FlexShares Morningstar Developed Markets ex-US Factor Tilt Index Fund | | | 1,392,367 | | | | (1,334,315 | ) |
| Foreign Currency Contracts | | Net realized gain (loss) on Foreign currency transactions, Net change in unrealized appreciation (depreciation) on Forward foreign currency contracts | | FlexShares Morningstar Developed Markets ex-US Factor Tilt Index Fund | | | (379,309 | ) | | | 33,228 | |
| | |
| 374 | | FLEXSHARES ANNUAL REPORT |
Notes to the Financial Statements (cont.)
| | | | | | | | | | | | |
| Derivatives by risk type | | Location of Gain or (Loss) on
Derivatives on the Statements of
Operations | | Fund | | Realized
Gain or
(Loss) on
Derivatives | | | Change in Unrealized
Appreciation or
(Depreciation) on
Derivatives | |
| Equity Index Futures Contracts | | Net realized gain (loss) on Futures contracts, Net change in unrealized appreciation (depreciation) on Futures contracts | | FlexShares Morningstar Emerging Markets Factor Tilt Index Fund | | $ | (564,062 | ) | | $ | (241,123 | ) |
| Foreign Currency Contracts | | Net realized gain (loss) on Foreign currency transactions, Net change in unrealized appreciation (depreciation) on Forward foreign currency contracts | | FlexShares Morningstar Emerging Markets Factor Tilt Index Fund | | | 169,646 | | | | (45,681 | ) |
| Equity Index Futures Contracts | | Net realized gain (loss) on Futures contracts, Net change in unrealized appreciation (depreciation) on Futures contracts | | FlexShares Currency Hedged Morningstar DM ex-US Factor Tilt Index Fund | | | (1,196 | ) | | | — | |
| Foreign Currency Contracts | | Net realized gain (loss) on Foreign currency transactions, Net change in unrealized appreciation (depreciation) on Forward foreign currency contracts | | FlexShares Currency Hedged Morningstar DM ex-US Factor Tilt Index Fund | | | 120,969 | | | | (54,606 | ) |
| Equity Index Futures Contracts | | Net realized gain (loss) on Futures contracts, Net change in unrealized appreciation (depreciation) on Futures contracts | | FlexShares Currency Hedged Morningstar EM Factor Tilt Index Fund | | | (34,901 | ) | | | (2,781 | ) |
| Foreign Currency Contracts | | Net realized gain (loss) on Foreign currency transactions, Net change in unrealized appreciation (depreciation) on Forward foreign currency contracts | | FlexShares Currency Hedged Morningstar EM Factor Tilt Index Fund | | | 755,229 | | | | (59,720 | ) |
| Equity Index Futures Contracts | | Net realized gain (loss) on Futures contracts, Net change in unrealized appreciation (depreciation) on Futures contracts | | FlexShares US Quality Large Cap Index Fund | | | 27,755 | | | | (11,172 | ) |
| Equity Index Futures Contracts | | Net realized gain (loss) on Futures contracts, Net change in unrealized appreciation (depreciation) on Futures contracts | | FlexShares STOXX® US ESG Impact Index Fund | | | 28,334 | | | | (27,543 | ) |
| | | | |
| FLEXSHARES ANNUAL REPORT | | | 375 | |
Notes to the Financial Statements (cont.)
| | | | | | | | | | | | |
| Derivatives by risk type | | Location of Gain or (Loss) on
Derivatives on the Statements of
Operations | | Fund | | Realized
Gain or
(Loss) on
Derivatives | | | Change in Unrealized
Appreciation or
(Depreciation) on
Derivatives | |
| Equity Index Futures Contracts | | Net realized gain (loss) on Futures contracts, Net change in unrealized appreciation (depreciation) on Futures contracts | | FlexShares STOXX® Global ESG Impact Index Fund | | $ | 47,466 | | | $ | (74,839 | ) |
| Equity Index Futures Contracts | | Net realized gain (loss) on Futures contracts, Net change in unrealized appreciation (depreciation) on Futures contracts | | FlexShares Morningstar Global Upstream Natural Resources Index Fund | | | 4,447,203 | | | | (3,517,850 | ) |
| Foreign Currency Contracts | | Net realized gain (loss) on Foreign currency transactions, Net change in unrealized appreciation (depreciation) on Forward foreign currency contracts | | FlexShares Morningstar Global Upstream Natural Resources Index Fund | | | (337,780 | ) | | | (190,105 | ) |
| Equity Index Futures Contracts | | Net realized gain (loss) on Futures contracts, Net change in unrealized appreciation (depreciation) on Futures contracts | | FlexShares STOXX® Global Broad Infrastructure Index Fund | | | 782,656 | | | | (568,768 | ) |
| Foreign Currency Contracts | | Net realized gain (loss) on Foreign currency transactions, Net change in unrealized appreciation (depreciation) on Forward foreign currency contracts | | FlexShares STOXX® Global Broad Infrastructure Index Fund | | | (32,688 | ) | | | 19,229 | |
| Equity Index Futures Contracts | | Net realized gain (loss) on Futures contracts, Net change in unrealized appreciation (depreciation) on Futures contracts | | FlexShares Global Quality Real Estate Index Fund | | | 852,119 | | | | (660,133 | ) |
| Foreign Currency Contracts | | Net realized gain (loss) on Foreign currency transactions, Net change in unrealized appreciation (depreciation) on Forward foreign currency contracts | | FlexShares Global Quality Real Estate Index Fund | | | (440 | ) | | | 9,047 | |
| Equity Index Futures Contracts | | Net realized gain (loss) on Futures contracts, Net change in unrealized appreciation (depreciation) on Futures contracts | | FlexShares Quality Dividend Index Fund | | | 3,737,327 | | | | (1,818,947 | ) |
| | |
| 376 | | FLEXSHARES ANNUAL REPORT |
Notes to the Financial Statements (cont.)
| | | | | | | | | | | | |
| Derivatives by risk type | | Location of Gain or (Loss) on
Derivatives on the Statements of
Operations | | Fund | | Realized
Gain or
(Loss) on
Derivatives | | | Change in Unrealized
Appreciation or
(Depreciation) on
Derivatives | |
| Equity Index Futures Contracts | | Net realized gain (loss) on Futures contracts, Net change in unrealized appreciation (depreciation) on Futures contracts | | FlexShares Quality Dividend Defensive Index Fund | | $ | 417,901 | | | $ | (209,584 | ) |
| Equity Index Futures Contracts | | Net realized gain (loss) on Futures contracts, Net change in unrealized appreciation (depreciation) on Futures contracts | | FlexShares Quality Dividend Dynamic Index Fund | | | 96,880 | | | | (48,373 | ) |
| Equity Index Futures Contracts | | Net realized gain (loss) on Futures contracts, Net change in unrealized appreciation (depreciation) on Futures contracts | | FlexShares International Quality Dividend Index Fund | | | 278,050 | | | | (686,015 | ) |
| Foreign Currency Contracts | | Net realized gain (loss) on Foreign currency transactions, Net change in unrealized appreciation (depreciation) on Forward foreign currency contracts | | FlexShares International Quality Dividend Index Fund | | | (117,158 | ) | | | (13,634 | ) |
| Equity Index Futures Contracts | | Net realized gain (loss) on Futures contracts, Net change in unrealized appreciation (depreciation) on Futures contracts | | FlexShares International Quality Dividend Defensive Index Fund | | | (107,878 | ) | | | (109,958 | ) |
| Foreign Currency Contracts | | Net realized gain (loss) on Foreign currency transactions, Net change in unrealized appreciation (depreciation) on Forward foreign currency contracts | | FlexShares International Quality Dividend Defensive Index Fund | | | 14,411 | | | | (5,644 | ) |
| Equity Index Futures Contracts | | Net realized gain (loss) on Futures contracts, Net change in unrealized appreciation (depreciation) on Futures contracts | | FlexShares International Quality Dividend Dynamic Index Fund | | | (45,528 | ) | | | (52,077 | ) |
| Interest Rate Futures Contracts | | Net realized gain (loss) on Futures contracts, Net change in unrealized appreciation (depreciation) on Futures contracts | | FlexShares Core Select Bond Fund | | | 19,159 | | | | (4,571 | ) |
| | | | |
| FLEXSHARES ANNUAL REPORT | | | 377 | |
Notes to the Financial Statements (cont.)
At October 31, 2018, the volume of derivative activities, which represents activities throughout the period, was as follows:
| | | | | | | | | | | | | | | | | | | | | | | | |
| | | Foreign Exchange Contracts | | | Equity Contracts | |
| Fund | | Number of
Trades | | | Average
Notional
Amount | | | Number of
Trades
Long | | | Average
Notional
Balance Long | | | Number of
Trades
Short | | | Average
Notional
Balance Short | |
| FlexShares Morningstar US Market Factor Tilt Index Fund | | | — | | | $ | — | | | | 956 | | | $ | 126,042 | | | | — | | | $ | — | |
| FlexShares Morningstar Developed Markets ex-US Factor Tilt Index Fund | | | 142 | | | | 794,607 | | | | 1,672 | | | | 72,516 | | | | — | | | | — | |
| FlexShares Morningstar Emerging Markets Factor Tilt Index Fund | | | 140 | | | | 339,095 | | | | 858 | | | | 55,548 | | | | — | | | | — | |
| FlexShares Currency Hedged Morningstar DM ex-US Factor Tilt Index Fund | | | 455 | | | | 760,384 | | | | 4 | | | | 100,867 | | | | — | | | | — | |
| FlexShares Currency Hedged Morningstar EM Factor Tilt Index Fund | | | 854 | | | | 1,353,933 | | | | 42 | | | | 55,432 | | | | — | | | | — | |
| FlexShares US Quality Large Cap Index Fund | | | — | | | | — | | | | 15 | | | | 137,270 | | | | — | | | | — | |
| FlexShares STOXX® US ESG Impact Index Fund | | | — | | | | — | | | | 20 | | | | 121,491 | | | | — | | | | — | |
| FlexShares STOXX® Global ESG Impact Index Fund | | | — | | | | — | | | | 86 | | | | 98,164 | | | | — | | | | — | |
| FlexShares Morningstar Global Upstream Natural Resources Index Fund | | | 335 | | | | 1,131,018 | | | | 3,383 | | | | 120,083 | | | | — | | | | — | |
| FlexShares STOXX® Global Broad Infrastructure Index Fund | | | 93 | | | | 280,306 | | | | 572 | | | | 96,143 | | | | — | | | | — | |
| FlexShares Global Quality Real Estate Index Fund | | | 46 | | | | 360,516 | | | | 399 | | | | 117,739 | | | | — | | | | — | |
| FlexShares Quality Dividend Index Fund | | | — | | | | — | | | | 1,117 | | | | 137,483 | | | | — | | | | — | |
| FlexShares Quality Dividend Defensive Index Fund | | | — | | | | — | | | | 144 | | | | 138,705 | | | | — | | | | — | |
| FlexShares Quality Dividend Dynamic Index Fund | | | — | | | | — | | | | 30 | | | | 137,713 | | | | — | | | | — | |
| FlexShares International Quality Dividend Index Fund | | | 293 | | | | 544,532 | | | | 1,847 | | | | 69,665 | | | | — | | | | — | |
| FlexShares International Quality Dividend Defensive Index Fund | | | 32 | | | | 35,747 | | | | 181 | | | | 86,603 | | | | — | | | | — | |
| FlexShares International Quality Dividend Dynamic Index Fund | | | — | | | | — | | | | 129 | | | | 83,531 | | | | — | | | | — | |
| FlexShares Core Select Bond Fund | | | — | | | | — | | | | 5 | | | | 157,538 | | | | 38 | | | | 121,022 | |
| | |
| 378 | | FLEXSHARES ANNUAL REPORT |
Notes to the Financial Statements (cont.)
Taxes and Distributions
Each Fund has qualified and intends to continue to qualify as a regulated investment company by complying with the requirements under Subchapter M of the Internal Revenue Code of 1986, as amended, which includes distributing substantially all of its net investment income and net capital gains to shareholders. Accordingly, no provision for federal and state income taxes is required in the financial statements.
As of October 31, 2018, management of the Funds has reviewed all open tax years and major jurisdictions and concluded that there is no tax liability resulting from unrecognized tax benefits relating to uncertain income tax positions taken or expected to be taken in future tax returns. The Funds are also not aware of any tax positions for which it is reasonably possible that the total amounts of unrecognized tax benefits will significantly change in the next 12 months. On an ongoing basis management will monitor the tax positions taken to determine if adjustment to conclusions are necessary based on factors including but not limited to further implementation on guidance expected from FASB and on-going analysis of tax law, regulation, and interpretations thereof.
Dividends from net investment income, including any net foreign currency gains, are generally declared and paid by each Fund according to the following schedule:
| | | | | | | | | | | | |
| | | Dividends from Net Investment Income | |
| Fund | | Declared
And Paid
Annually | | | Declared
And Paid
Monthly | | | Declared
And Paid
Quarterly | |
| FlexShares Morningstar US Market Factor Tilt Index Fund | | | | | | | | | | | x | |
| FlexShares Morningstar Developed Markets ex-US Factor Tilt Index Fund | | | | | | | | | | | x | |
| FlexShares Morningstar Emerging Markets Factor Tilt Index Fund | | | | | | | | | | | x | |
| | | | | | | | | | | | |
| | | Dividends from Net Investment Income | |
| Fund | | Declared
And Paid
Annually | | | Declared
And Paid
Monthly | | | Declared
And Paid
Quarterly | |
| FlexShares Currency Hedged Morningstar DM ex-US Factor Tilt Index Fund | | | | | | | | | | | x | |
| FlexShares Currency Hedged Morningstar EM Factor Tilt Index Fund | | | | | | | | | | | x | |
| FlexShares US Quality Large Cap Index Fund | | | | | | | | | | | x | |
| FlexShares STOXX® US ESG Impact Index Fund | | | | | | | | | | | x | |
| FlexShares STOXX® Global ESG Impact Index Fund | | | | | | | | | | | x | |
| FlexShares Morningstar Global Upstream Natural Resources Index Fund | | | | | | | | | | | x | |
| FlexShares STOXX® Global Broad Infrastructure Index Fund | | | | | | | | | | | x | |
| FlexShares Global Quality Real Estate Index Fund | | | | | | | | | | | x | |
| FlexShares Real Assets Allocation Index Fund | | | | | | | | | | | x | |
| FlexShares Quality Dividend Index Fund | | | | | | | | | | | x | |
| FlexShares Quality Dividend Defensive Index Fund | | | | | | | | | | | x | |
| FlexShares Quality Dividend Dynamic Index Fund | | | | | | | | | | | x | |
| FlexShares International Quality Dividend Index Fund | | | | | | | | | | | x | |
| FlexShares International Quality Dividend Defensive Index Fund | | | | | | | | | | | x | |
| | | | |
| FLEXSHARES ANNUAL REPORT | | | 379 | |
Notes to the Financial Statements (cont.)
| | | | | | | | | | |
| | | Dividends from Net Investment Income | |
| Fund | | Declared
And Paid
Annually | | Declared
And Paid
Monthly | | | Declared
And Paid
Quarterly | |
| FlexShares International Quality Dividend Dynamic Index Fund | | | | | | | | | x | |
| FlexShares iBoxx 3-Year Target Duration TIPS Index Fund | | | | | x | | | | | |
| FlexShares iBoxx 5-Year Target Duration TIPS Index Fund | | | | | x | | | | | |
| FlexShares Disciplined Duration MBS Index Fund | | | | | x | | | | | |
| FlexShares Credit-Scored Scored US Corporate Bond Index Fund | | | | | x | | | | | |
| FlexShares Credit-Scored US Long Corporate Bond Index Fund | | | | | x | | | | | |
| FlexShares High Yield Value-Scored Bond Index Fund* | | | | | x | | | | | |
| FlexShares Ready Access Variable Income Fund | | | | | x | | | | | |
| FlexShares Core Select Bond Fund | | | | | x | | | | | |
| * | Commencement of investment operations on July 17, 2018. |
Distribution of net realized securities gains, if any, generally are distributed at least annually. The Trust reserves the right to declare special distributions if, in its reasonable discretion, such action is necessary or advisable to improve tracking error, to preserve its status as a regulated investment company or to avoid imposition of income or excise taxes on undistributed income or realized gains. Tracking error is a measurement of how much the return on a portfolio deviates from the return on its benchmark index.
Dividends and securities gains distributions are distributed in U.S. dollars and cannot be automatically reinvested in additional shares of the Funds. The amount of distributions from net investment income and net realized gains are determined in accordance with federal income tax regulations, which may differ from GAAP. These “book/tax” differences are either considered temporary or permanent in nature. To the extent these differences are permanent in nature, such amounts are reclassified within the composition of net assets based on their federal tax-basis treatment; temporary differences (e.g., wash sales) do not require a reclassification. The Funds may utilize equalization accounting for tax purposes and designate earnings and profits, including net realized gains distributed to shareholders on redemption of shares, as a part of the dividends paid deduction for income tax purposes.
The Funds’ tax year end is October 31st and the tax character of current year distributions and current components of accumulated earnings (deficit) will be determined at the end of the current tax year.
Temporary differences are generally due to different book and tax treatments for the timing of the recognition of gains and losses on certain investment transactions, mark to market of forward foreign currency contracts, mark to market of futures contracts, mark to market of passive foreign investment companies (PFICs), non-taxable special dividends, wash sale loss deferrals and capital loss carryforward.
| | |
| 380 | | FLEXSHARES ANNUAL REPORT |
Notes to the Financial Statements (cont.)
Permanent differences, primarily due to gain (loss) on in-kind redemptions, paydown loss reclassification, foreign currency gains and losses, forward foreign currency gains and losses, PFICs gains and losses, non-taxable special dividends, investments in partnerships, taxable over-distributions, foreign capital gains tax reclassification, perpetual bonds and equalization as of October 31, 2018 (the Funds’ tax year end), among the Funds’ components of net assets are as follows:
| | | | | | | | | | | | |
| Fund | | Accumulated
undistributed net
investment income (loss) | | | Accumulated net
realized gain (loss) on
investments | | | Paid in
capital | |
| FlexShares Morningstar US Market Factor Tilt Index Fund | | $ | (250,331 | ) | | $ | (12,043,590 | ) | | $ | 12,293,921 | |
| FlexShares Morningstar Developed Markets ex-US Factor Tilt Index Fund | | | 2,114,817 | | | | (4,870,116 | ) | | | 2,755,299 | |
| FlexShares Morningstar Emerging Markets Factor Tilt Index Fund | | | (200,802 | ) | | | (2,347,301 | ) | | | 2,548,103 | |
| FlexShares Currency Hedged Morningstar DM ex-US Factor Tilt Index Fund | | | (152,175 | ) | | | (2,015,143 | ) | | | 2,167,318 | |
| FlexShares Currency Hedged Morningstar EM Factor Tilt Index Fund | | | (32,553 | ) | | | (6,224,276 | ) | | | 6,256,829 | |
| FlexShares US Quality Large Cap Index Fund | | | (5,330 | ) | | | (589,272 | ) | | | 594,602 | |
| FlexShares STOXX® US ESG Impact Index Fund | | | (2,683 | ) | | | (399,623 | ) | | | 402,306 | |
| FlexShares STOXX® Global ESG Impact Index Fund | | | (2,092 | ) | | | 2,092 | | | | — | |
| FlexShares Morningstar Global Upstream Natural Resources Index Fund | | | 209,947 | | | | (209,947 | ) | | | — | |
| FlexShares STOXX® Global Broad Infrastructure Index Fund | | | (351,407 | ) | | | (20,798,264 | ) | | | 21,149,671 | |
| FlexShares Global Quality Real Estate Index Fund | | | 687,170 | | | | (687,170 | ) | | | — | |
| FlexShares Real Assets Allocation Index Fund | | | 1,597 | | | | — | | | | (1,597 | ) |
| FlexShares Quality Dividend Index Fund | | | (1,460,912 | ) | | | (78,912,660 | ) | | | 80,373,572 | |
| FlexShares Quality Dividend Defensive Index Fund | | | (165,452 | ) | | | (5,533,456 | ) | | | 5,698,908 | |
| FlexShares Quality Dividend Dynamic Index Fund | | | (64,466 | ) | | | (3,617,502 | ) | | | 3,681,968 | |
| FlexShares International Quality Dividend Index Fund | | | 230,042 | | | | (12,488,313 | ) | | | 12,258,271 | |
| FlexShares International Quality Dividend Defensive Index Fund | | | 9,703 | | | | (9,703 | ) | | | — | |
| FlexShares International Quality Dividend Dynamic Index Fund | | | (79,958 | ) | | | (1,535,182 | ) | | | 1,615,140 | |
| FlexShares iBoxx 3-Year Target Duration TIPS Index Fund | | | — | | | | 5,730,612 | | | | (5,730,612 | ) |
| FlexShares iBoxx 5-Year Target Duration TIPS Index Fund | | | — | | | | 587,059 | | | | (587,059 | ) |
| FlexShares Disciplined Duration MBS Index Fund | | | 577,699 | | | | (577,699 | ) | | | — | |
| FlexShares High Yield Value-Scored Bond Index Fund* | | | 2,426 | | | | (2,426 | ) | | | — | |
| FlexShares Ready Access Variable Income Fund | | | — | | | | (14,884 | ) | | | 14,884 | |
| FlexShares Core Select Bond Fund | | | 224 | | | | (390 | ) | | | 166 | |
| * | Commencement of investment operations on July 17, 2018. |
| | | | |
| FLEXSHARES ANNUAL REPORT | | | 381 | |
Notes to the Financial Statements (cont.)
As of October 31, 2018, the tax character of distributions paid for the tax year ended October 31, 2018, and October 31, 2017, were as follows:
| | | | | | | | | | | | | | | | | | | | | | | | | | | | | | | | |
| | | Year Ended October 31, 2018 | | | Year Ended October 31, 2017 | |
| Fund | | Distributions
paid from
ordinary
income | | | Distributions
paid from net
long term
capital gains | | | Tax Return
of Capital | | | Total
Distributions | | | Distributions
paid from
ordinary
income | | | Distributions
paid from net
long term
capital gains | | | Tax Return
of Capital | | | Total
Distributions | |
| FlexShares Morningstar US Market Factor Tilt Index Fund | | $ | 21,895,299 | | | $ | — | | | $ | — | | | $ | 21,895,299 | | | $ | 17,203,496 | | | $ | — | | | $ | — | | | $ | 17,203,496 | |
| FlexShares Morningstar Developed Markets ex-US Factor Tilt Index Fund | | | 33,761,589 | | | | — | | | | — | | | | 33,761,589 | | | | 20,692,030 | | | | — | | | | — | | | | 20,692,030 | |
| FlexShares Morningstar Emerging Markets Factor Tilt Index Fund | | | 17,566,133 | | | | — | | | | — | | | | 17,566,133 | | | | 10,564,341 | | | | — | | | | — | | | | 10,564,341 | |
| FlexShares Currency Hedged Morningstar DM ex-US Factor Tilt Index Fund | | | 413,050 | | | | — | | | | 152,741 | | | | 565,791 | | | | 386,878 | | | | — | | | | — | | | | 386,878 | |
| FlexShares Currency Hedged Morningstar EM Factor Tilt Index Fund | | | 616,733 | | | | — | | | | 32,884 | | | | 649,617 | | | | 889,287 | | | | — | | | | — | | | | 889,287 | |
| FlexShares US Quality Large Cap Index Fund | | | 695,332 | | | | — | | | | — | | | | 695,332 | | | | 281,734 | | | | — | | | | — | | | | 281,734 | |
| FlexShares STOXX® US ESG Impact Index Fund | | | 364,337 | | | | 23,150 | | | | — | | | | 387,487 | | | | 147,860 | | | | — | | | | — | | | | 147,860 | |
| FlexShares STOXX® Global ESG Impact Index Fund | | | 1,253,536 | | | | — | | | | — | | | | 1,253,536 | | | | 177,721 | | | | — | | | | — | | | | 177,721 | |
| FlexShares Morningstar Global Upstream Natural Resources Index Fund | | | 142,689,396 | | | | — | | | | — | | | | 142,689,396 | | | | 91,591,308 | | | | — | | | | — | | | | 91,591,308 | |
| FlexShares STOXX® Global Broad Infrastructure Index Fund | | | 25,040,675 | | | | — | | | | — | | | | 25,040,675 | | | | 25,424,557 | | | | — | | | | — | | | | 25,424,557 | |
| FlexShares Global Quality Real Estate Index Fund | | | 8,103,123 | | | | — | | | | — | | | | 8,103,123 | | | | 5,694,447 | | | | — | | | | — | | | | 5,694,447 | |
| FlexShares Real Assets Allocation Index Fund | | | 331,490 | | | | — | | | | — | | | | 331,490 | | | | 71,705 | | | | — | | | | — | | | | 71,705 | |
| FlexShares Quality Dividend Index Fund | | | 50,127,940 | | | | 9,015,863 | | | | — | | | | 59,143,803 | | | | 49,628,114 | | | | — | | | | — | | | | 49,628,114 | |
| FlexShares Quality Dividend Defensive Index Fund | | | 8,856,044 | | | | 270,126 | | | | — | | | | 9,126,170 | | | | 8,458,570 | | | | — | | | | — | | | | 8,458,570 | |
| | |
| 382 | | FLEXSHARES ANNUAL REPORT |
Notes to the Financial Statements (cont.)
| | | | | | | | | | | | | | | | | | | | | | | | | | | | | | | | |
| | | Year Ended October 31, 2018 | | | Year Ended October 31, 2017 | |
| Fund | | Distributions
paid from
ordinary
income | | | Distributions
paid from net
long term
capital gains | | | Tax Return
of Capital | | | Total
Distributions | | | Distributions
paid from
ordinary
income | | | Distributions
paid from net
long term
capital gains | | | Tax Return
of Capital | | | Total
Distributions | |
| FlexShares Quality Dividend Dynamic Index Fund | | $ | 1,451,340 | | | $ | — | | | $ | — | | | $ | 1,451,340 | | | $ | 1,825,259 | | | $ | — | | | $ | — | | | $ | 1,825,259 | |
| FlexShares International Quality Dividend Index Fund | | | 48,549,571 | | | | — | | | | — | | | | 48,549,571 | | | | 28,328,453 | | | | — | | | | — | | | | 28,328,453 | |
| FlexShares International Quality Dividend Defensive Index Fund | | | 5,084,444 | | | | — | | | | — | | | | 5,084,444 | | | | 3,119,837 | | | | — | | | | — | | | | 3,119,837 | |
| FlexShares International Quality Dividend Dynamic Index Fund | | | 3,934,883 | | | | — | | | | — | | | | 3,934,883 | | | | 2,117,337 | | | | — | | | | — | | | | 2,117,337 | |
| FlexShares iBoxx 3-Year Target Duration TIPS Index Fund | | | 58,646,589 | | | | — | | | | — | | | | 58,646,589 | | | | 26,104,812 | | | | — | | | | — | | | | 26,104,812 | |
| FlexShares iBoxx 5-Year Target Duration TIPS Index Fund | | | 27,570,542 | | | | — | | | | — | | | | 27,570,542 | | | | 12,089,212 | | | | — | | | | — | | | | 12,089,212 | |
| FlexShares Disciplined Duration MBS Index Fund | | | 1,511,413 | | | | — | | | | — | | | | 1,511,413 | | | | 1,159,790 | | | | — | | | | — | | | | 1,159,790 | |
| FlexShares Credit-Scored US Corporate Bond Index Fund | | | 1,546,217 | | | | — | | | | — | | | | 1,546,217 | | | | 1,090,884 | | | | 38,349 | | | | — | | | | 1,129,233 | |
| FlexShares Credit-Scored US Long Corporate Bond Index Fund | | | 940,216 | | | | — | | | | — | | | | 940,216 | | | | 688,534 | | | | 2,918 | | | | — | | | | 691,452 | |
| FlexShares High Yield Value-Scored Bond Index Fund* | | | 1,244,147 | | | | — | | | | — | | | | 1,244,147 | | | | — | | | | — | | | | — | | | | — | |
| FlexShares Ready Access Variable Income Fund | | | 3,138,154 | | | | — | | | | — | | | | 3,138,154 | | | | 1,720,304 | | | | — | | | | — | | | | 1,720,304 | |
| FlexShares Core Select Bond Fund | | | 583,175 | | | | — | | | | — | | | | 583,175 | | | | 72,451 | | | | — | | | | — | | | | 72,451 | |
| * | Commencement of investment operations on July 17, 2018. |
As of October 31, 2018, the components of accumulated earnings (deficit) on a tax basis were as follows:
| | | | | | | | | | | | | | | | |
| Fund | | Undistributed
Ordinary
Income | | | Undistributed
Long-Term
Capital Gains | | | Accumulated
Capital and
Other Losses | | | Unrealized
Appreciated/
(Depreciated) | |
| FlexShares Morningstar US Market Factor Tilt Index Fund | | $ | 1,893,954 | | | $ | — | | | $ | (16,348,607 | ) | | $ | 372,328,754 | |
| FlexShares Morningstar Developed Markets ex-US Factor Tilt Index Fund | | | 3,092,520 | | | | — | | | | (61,695,972 | ) | | | 33,575,289 | |
| FlexShares Morningstar Emerging Markets Factor Tilt Index Fund | | | 584,719 | | | | — | | | | (29,226,543 | ) | | | (14,228,890 | ) |
| | | | |
| FLEXSHARES ANNUAL REPORT | | | 383 | |
Notes to the Financial Statements (cont.)
| | | | | | | | | | | | | | | | |
| Fund | | Undistributed
Ordinary
Income | | | Undistributed
Long-Term
Capital Gains | | | Accumulated
Capital and
Other Losses | | | Unrealized
Appreciated/
(Depreciated) | |
| FlexShares Currency Hedged Morningstar DM ex-US Factor Tilt Index Fund | | $ | — | | | $ | — | | | $ | (949,641 | ) | | $ | (754,248 | ) |
| FlexShares Currency Hedged Morningstar EM Factor Tilt Index Fund | | | — | | | | — | | | | (1,710,215 | ) | | | (811,859 | ) |
| FlexShares US Quality Large Cap Index Fund | | | 55,532 | | | | — | | | | (767,259 | ) | | | 2,756,798 | |
| FlexShares STOXX® US ESG Impact Index Fund | | | 29,913 | | | | — | | | | — | | | | 2,146,106 | |
| FlexShares STOXX® Global ESG Impact Index Fund | | | 116,242 | | | | — | | | | (943,275 | ) | | | 1,133,104 | |
| FlexShares Morningstar Global Upstream Natural Resources Index Fund | | | 12,726,054 | | | | — | | | | (611,373,141 | ) | | | 367,778,809 | |
| FlexShares STOXX® Global Broad Infrastructure Index Fund | | | 1,830,935 | | | | — | | | | (34,122,458 | ) | | | 24,983,216 | |
| FlexShares Global Quality Real Estate Index Fund | | | 1,665,839 | | | | — | | | | (3,717,691 | ) | | | 8,275,161 | |
| FlexShares Real Assets Allocation Index Fund | | | — | | | | — | | | | (6,302 | ) | | | (563,393 | ) |
| FlexShares Quality Dividend Index Fund | | | 2,837,062 | | | | 21,186,396 | | | | — | | | | 278,604,822 | |
| FlexShares Quality Dividend Defensive Index Fund | | | 586,379 | | | | 12,581,452 | | | | — | | | | 47,623,003 | |
| FlexShares Quality Dividend Dynamic Index Fund | | | 79,078 | | | | — | | | | (256,560 | ) | | | 4,675,288 | |
| FlexShares International Quality Dividend Index Fund | | | 3,150,042 | | | | — | | | | (68,893,436 | ) | | | (57,884,815 | ) |
| FlexShares International Quality Dividend Defensive Index Fund | | | 291,371 | | | | — | | | | (15,282,179 | ) | | | (6,011,738 | ) |
| FlexShares International Quality Dividend Dynamic Index Fund | | | 268,385 | | | | — | | | | (9,635,507 | ) | | | (4,754,746 | ) |
| FlexShares iBoxx 3-Year Target Duration TIPS Index Fund | | | 1,252,915 | | | | — | | | | (60,599,690 | ) | | | (39,298,076 | ) |
| FlexShares iBoxx 5-Year Target Duration TIPS Index Fund | | | 804,092 | | | | — | | | | (14,364,334 | ) | | | (34,236,364 | ) |
| FlexShares Disciplined Duration MBS Index Fund | | | 215,156 | | | | — | | | | (2,188,225 | ) | | | (2,077,339 | ) |
| FlexShares Credit-Scored US Corporate Bond Index Fund | | | 165,445 | | | | — | | | | (732,758 | ) | | | (1,729,604 | ) |
| FlexShares Credit-Scored US Long Corporate Bond Index Fund | | | 98,550 | | | | — | | | | (649,409 | ) | | | (1,813,820 | ) |
| FlexShares High Yield Value-Scored Bond Index Fund* | | | 437,183 | | | | — | | | | (24,712 | ) | | | (1,567,535 | ) |
| FlexShares Ready Access Variable Income Fund | | | 425,780 | | | | — | | | | (6,697 | ) | | | (128,838 | ) |
| FlexShares Core Select Bond Fund | | | — | | | | — | | | | (105,215 | ) | | | (1,003,733 | ) |
| * | Commencement of investment operations on July 17, 2018. |
| | |
| 384 | | FLEXSHARES ANNUAL REPORT |
Notes to the Financial Statements (cont.)
Capital loss carry forwards will retain their character as either short-term or long-term capital losses rather than being considered all short-term as permitted under previous law and may be carried forward indefinitely to offset future gains.
For the tax year ended October 31, 2018, the following Funds had available post-enactment capital loss carryforwards to offset future net capital gains to the extent provided by regulations:
| | | | | | | | | | | | |
| Fund | | Short-Term | | | Long-Term | | | Total | |
| FlexShares Morningstar US Market Factor Tilt Index Fund | | $ | 16,348,607 | | | $ | — | | | $ | 16,348,607 | |
| FlexShares Morningstar Developed Markets ex-US Factor Tilt Index Fund | | | 13,267,926 | | | | 48,428,046 | | | | 61,695,972 | |
| FlexShares Morningstar Emerging Markets Factor Tilt Index Fund | | | 5,500,905 | | | | 23,725,638 | | | | 29,226,543 | |
| FlexShares Currency Hedged Morningstar DM ex-US Factor Tilt Index Fund | | | 337,159 | | | | 612,482 | | | | 949,641 | |
| FlexShares Currency Hedged Morningstar EM Factor Tilt Index Fund | | | 672,524 | | | | 1,037,691 | | | | 1,710,215 | |
| FlexShares US Quality Large Cap Index Fund | | | 767,259 | | | | — | | | | 767,259 | |
| FlexShares STOXX® Global ESG Impact Index Fund | | | 943,275 | | | | — | | | | 943,275 | |
| | | | | | | | | | | | |
| Fund | | Short-Term | | | Long-Term | | | Total | |
| FlexShares Morningstar Global Upstream Natural Resources Index Fund | | $ | 131,998,779 | | | $ | 479,374,362 | | | $ | 611,373,141 | |
| FlexShares STOXX® Global Broad Infrastructure Index Fund | | | 12,294,404 | | | | 21,828,054 | | | | 34,122,458 | |
| FlexShares Global Quality Real Estate Index Fund | | | 3,717,691 | | | | — | | | | 3,717,691 | |
| FlexShares Real Assets Allocation Index Fund | | | 6,302 | | | | — | | | | 6,302 | |
| FlexShares Quality Dividend Dynamic Index Fund | | | 256,560 | | | | — | | | | 256,560 | |
| FlexShares International Quality Dividend Index Fund | | | 52,033,470 | | | | 16,859,966 | | | | 68,893,436 | |
| FlexShares International Quality Dividend Defensive Index Fund | | | 11,070,354 | | | | 4,211,825 | | | | 15,282,179 | |
| FlexShares International Quality Dividend Dynamic Index Fund | | | 6,247,549 | | | | 3,387,958 | | | | 9,635,507 | |
| | | | |
| FLEXSHARES ANNUAL REPORT | | | 385 | |
Notes to the Financial Statements (cont.)
| | | | | | | | | | | | |
| Fund | | Short-Term | | | Long-Term | | | Total | |
| FlexShares iBoxx 3-Year Target Duration TIPS Index Fund | | $ | 51,418,450 | | | $ | 9,181,240 | | | $ | 60,599,690 | |
| FlexShares iBoxx 5-Year Target Duration TIPS Index Fund | | | 10,512,782 | | | | 3,851,552 | | | | 14,364,334 | |
| FlexShares Disciplined Duration MBS Index Fund | | | 1,229,570 | | | | 958,655 | | | | 2,188,225 | |
| FlexShares Credit-Scored US Corporate Bond Index Fund | | | 486,998 | | | | 245,760 | | | | 732,758 | |
| FlexShares Credit-Scored US Long Corporate Bond Index Fund | | | 559,191 | | | | 90,218 | | | | 649,409 | |
| FlexShares High Yield Value-Scored Bond Index Fund* | | | 24,712 | | | | — | | | | 24,712 | |
| FlexShares Ready Access Variable Income Fund | | | 6,697 | | | | — | | | | 6,697 | |
| FlexShares Core Select Bond Fund | | | 105,215 | | | | — | | | | 105,215 | |
| * | Commencement of investment operations on July 17, 2018. |
During the year ended October 31, 2018, the following Funds utilized capital loss carryforwards to offset net capital gains:
| | | | |
| Fund | | Capital Loss
Utilized | |
| FlexShares Morningstar US Market Factor Tilt Index Fund | | $ | 3,420,534 | |
| FlexShares Currency Hedged Morningstar DM ex-US Factor Tilt Index Fund | | | 97,746 | |
| FlexShares Currency Hedged Morningstar EM Factor Tilt Index Fund | | | 866,600 | |
| FlexShares US Quality Large Cap Index Fund | | | 31,339 | |
| FlexShares STOXX® US ESG Impact Index Fund | | | 16,164 | |
| | | | |
| Fund | | Capital Loss
Utilized | |
| FlexShares STOXX® Global ESG Impact Index Fund | | $ | 19,730 | |
| FlexShares Quality Dividend Index Fund | | | 8,486,114 | |
| FlexShares Quality Dividend Defensive Index Fund | | | 1,770,929 | |
| FlexShares Quality Dividend Dynamic Index Fund | | | 1,133,796 | |
| FlexShares International Quality Dividend Index Fund | | | 5,846,403 | |
| FlexShares International Quality Dividend Defensive Index Fund | | | 819,106 | |
| FlexShares Core Select Bond Fund | | | 505 | |
The FlexShares Morningstar US Market Factor Tilt Index Fund, FlexShares Morningstar Developed Markets ex-US Factor Tilt Index Fund, FlexShares Morningstar Emerging Markets Factor Tilt Index Fund, FlexShares STOXX® Global ESG Impact Index Fund, FlexShares Morningstar Global Upstream Natural Resources Index Fund, FlexShares STOXX® Global Broad Infrastructure Index Fund, FlexShares Global Quality Real Estate Index Fund, FlexShares Quality Dividend Index Fund, FlexShares Quality Dividend Defensive Index Fund, FlexShares International Quality Dividend Index Fund, FlexShares International Quality Dividend Defensive Index Fund, FlexShares International Quality Dividend Dynamic Index Fund, and the FlexShares Ready Access Variable Income Fund may be subject to foreign withholding taxes with respect to dividends or interest received from sources in foreign countries. If, at the close of the taxable year, more than 50% in value of a Fund’s assets consists of stock or securities in foreign corporations the Fund will be eligible to make an election to treat a proportionate amount of those taxes as constituting a distribution to each shareholder, which would allow all shareholders to either (1) credit that proportionate amount of taxes against U.S. Federal income tax liability as a foreign tax credit or (2) take that amount as an itemized deduction. If a Fund is not eligible to make this election or is eligible but does not make the election, it will be entitled to deduct such taxes in computing the amounts it is required to distribute.
| | |
| 386 | | FLEXSHARES ANNUAL REPORT |
Notes to the Financial Statements (cont.)
3. Investment Transactions and Related Income and Expense
Throughout the reporting period, investment transactions are accounted for no later than one business day following the trade date. For financial reporting purposes, investment transactions are accounted for on the trade date on the last business day of the reporting period.
Interest income is recognized on an accrual basis. Bond discount is accreted and premium is amortized over the expected life of each applicable security using the yield to maturity method. Dividend income is recorded on the ex-dividend date, or as soon as information is available. Gains or losses realized on sales of securities are determined using the specific identification method by comparing the identified cost of the security lot sold with the net sales proceeds.
Each Fund except the FlexShares iBoxx 3-Year Target Duration TIPs Index Fund, FlexShares iBoxx 5-Year Target Duration TIPs Index Fund and the FlexShares High Yield Value-Scored Bond Index Fund may hold the securities of real estate investment trusts (“REITs”). Distributions from such investments may be comprised of return of capital, capital gains and income. The actual character of amounts received during the year is not known until after the REIT’s fiscal year end. The Fund records the character of distributions received from REITs during the year based on estimates available. The characterization of distributions received by the Fund may be subsequently revised based on information received from the REITs after their tax reporting periods concluded.
All foreign taxes are recorded in accordance with the applicable foreign tax regulations and rates that exist in the foreign markets in which a Fund invests. These foreign taxes, if any, are paid by the Funds and disclosed in the Statements of Operations. Foreign taxes payable, if any, are reflected in the Funds’ Statements of Assets and Liabilities.
Expenses directly attributable to a Fund are charged to that Fund, while expenses which are attributable to more than one Fund are allocated among the respective Funds based upon relative net assets or another reasonable basis.
4. Investment Advisory Fees
NTI serves as the Investment Adviser of the Funds pursuant to the Investment Advisory Agreement. The Investment Adviser is responsible for making investment decisions for the Funds and for placing purchase and sale orders for portfolio securities, subject to the general supervision of the Trust’s Board.
As compensation for its advisory services and assumption of certain Fund expenses, NTI is entitled to a unitary management fee, computed daily and payable monthly, at the annual rates set forth in the table below (expressed as a percentage of each Fund’s respective average daily net assets).
From the unitary management fee, NTI pays most of the expenses of the Fund, including the cost of transfer agency, custody, fund administration, legal, audit and other services (“Covered Expenses”). Covered Expenses do not include the following fees under the Investment Advisory Agreement: interest expenses, brokerage commissions and other trading expenses, fees and expenses of the independent trustees and their independent legal counsel, taxes and other extraordinary costs such as litigation and other expenses not incurred in the ordinary course of business.
The unitary management fee rate payable by each Fund is set forth in the following table:
| | | | |
| Fund | | Unitary
Management Fee | |
| FlexShares Morningstar US Market Factor Tilt Index Fund | | | 0.25 | % |
| FlexShares Morningstar Developed Markets ex-US Factor Tilt Index Fund | | | 0.39 | % |
| FlexShares Morningstar Emerging Markets Factor Tilt Index Fund | | | 0.59 | % |
| FlexShares Currency Hedged Morningstar DM ex-US Factor Tilt Index Fund | | | 0.44 | % |
| FlexShares Currency Hedged EM Morningstar Factor Tilt Index Fund | | | 0.64 | % |
| FlexShares US Quality Large Cap Index Fund | | | 0.32 | % |
| FlexShares STOXX® US ESG Impact Index Fund | | | 0.32 | % |
| | | | |
| FLEXSHARES ANNUAL REPORT | | | 387 | |
Notes to the Financial Statements (cont.)
| | | | |
| Fund | | Unitary
Management Fee | |
| FlexShares STOXX® Global ESG Impact Index Fund | | | 0.42 | % |
| FlexShares Morningstar Global Upstream Natural Resources Index Fund | | | 0.46 | % |
| FlexShares STOXX® Global Broad Infrastructure Index Fund | | | 0.47 | % |
| FlexShares Global Quality Real Estate Index Fund | | | 0.45 | % |
| FlexShares Real Assets Allocation Index Fund | | | 0.57 | % |
| FlexShares Quality Dividend Index Fund | | | 0.37 | % |
| FlexShares Quality Dividend Defensive Index Fund | | | 0.37 | % |
| FlexShares Quality Dividend Dynamic Index Fund | | | 0.37 | % |
| FlexShares International Quality Dividend Index Fund | | | 0.47 | % |
| FlexShares International Quality Dividend Defensive Index Fund | | | 0.47 | % |
| FlexShares International Quality Dividend Dynamic Index Fund | | | 0.47 | % |
| FlexShares iBoxx 3-Year Target Duration TIPS Index Fund | | | 0.18 | % |
| FlexShares iBoxx 5-Year Target Duration TIPS Index Fund | | | 0.18 | % |
| FlexShares Disciplined Duration MBS Index Fund | | | 0.20 | % |
| FlexShares Credit-Scored US Corporate Bond Index Fund | | | 0.22 | % |
| FlexShares Credit-Scored US Long Corporate Bond Index Fund | | | 0.22 | % |
| FlexShares High Yield Value-Scored Bond Index Fund* | | | 0.37 | % |
| FlexShares Ready Access Variable Income Fund | | | 0.25 | % |
| FlexShares Core Select Bond Fund | | | 0.35 | % |
| * | Commencement of investment operations on July 17, 2018. |
The Investment Adviser has contractually agreed until March 1, 2020 in the case of the FlexShares Currency
Hedged Morningstar DM ex-US Factor Tilt Index Fund and FlexShares Currency Hedged Morningstar EM Factor Tilt Index Fund and March 1, 2019 in the case of the FlexShares Real Assets Allocation Index Fund to waive Management Fees or reimburse certain expenses in an amount equal to the acquired fund fees and expenses (“AFFE”) attributable to each Fund’s investments in their respective Underlying Fund(s). In the case of the FlexShares Core Select Bond Fund, the Investment Adviser has contractually agreed to waive Management Fees or reimburse certain expenses in an amount equal to the sum of (a) any AFFE incurred by the Fund that are attributable to the Fund’s investment in Acquired Funds managed by NTI or an investment adviser controlling, controlled by, or under common control with NTI (“Affiliated Funds”); and (b) 0.05% or such lesser amount in AFFE incurred by the Fund that are attributable to the Fund’s investment in Acquired Funds that are not Affiliated Funds, until March 1, 2019. After these dates, the Investment Adviser and a Fund may mutually agree to extend the contractual arrangements. The Fund’s Board of Trustees may terminate the contractual arrangements at any time if it determines that it is in the best interest of a Fund and its shareholders. AFFE are expenses incurred indirectly by the Fund through its ownership of shares in other investment companies. Because AFFE are not direct expenses of the Fund, they are not reflected on the Fund’s financial statements.
The Investment Adviser may voluntarily waive additional management fees. Amounts waived by the Investment Adviser may not be recouped by the Investment Adviser. As of the year ended October 31, 2018, no management fees had been voluntarily waived.
5. Administration Fees
JPMorgan Chase Bank, N.A. (“the Administrator”) serves as administrator of the Funds. The Administrator provides certain administrative services to the Funds. For these services, the Administrator is entitled to certain fees and reasonable out-of-pocket expenses. These fees and expenses are Covered Expenses as defined above.
| | |
| 388 | | FLEXSHARES ANNUAL REPORT |
Notes to the Financial Statements (cont.)
6. Custodian Fees
JPMorgan Chase Bank, N.A. (the “Custodian”) acts as custodian for the Funds in accordance with a Global Custody Agreement. The Custodian holds cash, securities and other assets of the Funds as required by the 1940 Act. As compensation for the services rendered under the agreement, the Custodian is entitled to fees and reasonable out-of-pocket expenses. These fees and expenses are Covered Expenses as defined above.
7. Trustees Fees
The Trust compensates each Trustee who is not an officer, director or employee of Northern Trust Corporation, or its subsidiaries, for his or her services as a Trustee of the Trust and as a member of Board committees.
NTI has contractually agreed with each Fund, except the FlexShares High Yield Value-Scored Bond Index Fund, to reimburse the fees and expenses of the Trust’s independent trustees and their independent legal counsel paid by each Fund until at least March 1, 2019. After this date, NTI and each Fund may mutually agree to extend the contractual arrangement. The Board of Trustees may terminate the contractual arrangement at any time if it determines that it is in the best interest of the Fund and its shareholders.
The Trust has adopted a deferred compensation plan (“DC Plan”) for its Trustees who are not officers of Northern Trust or NTI. Under the DC Plan, an Independent Trustee may elect to defer all or a portion of their compensation. The amount deferred is adjusted periodically based upon the performance of the investment options selected by the Trustees. The investment options currently under the DC Plan are the FlexShares Morningstar US Market Factor Tilt Index Fund, FlexShares Morningstar Emerging Markets Factor Tilt Index Fund, FlexShares Morningstar Global Upstream Natural Resources Index Fund, FlexShares Global Quality Real Estate Index Fund, FlexShares Quality Dividend Index Fund, FlexShares iBoxx 5-Year Target Duration TIPS Index Fund, and the FlexShares Ready Access Variable Income Fund. Expenses related to the DC Plan are stated on the Statements of Operations.
As of the year ended October 31, 2018, NTI voluntarily reimbursed expenses of the FlexShares High Yield Value-Scored Bond Index Fund in the amount of $46 to Deferred Compensation and $788 to Trustee fees. The reimbursed amount is stated in the Statements of Operations under the captions “Deferred compensation reimbursed” and “Trustee fees reimbursed.” NTI may discontinue or change such reimbursements at any time.
8. Distribution and Service Plan
Foreside Fund Services, LLC (the “Distributor”) serves as the Funds’ distributor and distributes Creation Units (as defined in Note 9) for each Fund on an agency basis. The Distributor does not receive a fee from the Funds for its distribution services. However, it receives compensation from NTI for its services as distributor pursuant to a separate letter agreement between it and NTI.
The Trust has adopted a Distribution and Service Plan pursuant to Rule 12b-1 under the 1940 Act. Payments to financial intermediaries under the Plan are tied directly to their own out-of-pocket expenses. The Plan has not been implemented with respect to the Funds. The Plan may not be implemented without further Board of Trustees approval. The maximum distribution fee is 0.25% of each Fund’s respective average daily net assets under the Plan. The Funds did not pay any 12b-1 fees during the fiscal year.
9. Issuance and Redemption of Fund Shares
Each Fund issues and redeems shares only to Authorized Participants (typically market makers, large investors and institutions) in exchange for the deposit or delivery of a basket of assets (securities and/or cash), in large blocks known as Creation Units, each of which is comprised of a specified number of shares.
Retail investors may only purchase and sell fund shares on a national securities exchange through a broker-dealer and such transactions may be subject to customary commission rates imposed by the broker-dealer.
| | | | |
| FLEXSHARES ANNUAL REPORT | | | 389 | |
Notes to the Financial Statements (cont.)
Authorized Participants may pay transaction fees to offset transfer and other transaction costs associated with the issuance and redemption of Creation Units. Transaction fees remaining in the Funds were as follows:
| | | | | | | | |
| Fund | | As of
October 31,
2018 | | | As of
October 31,
2017 | |
| Flexshares® Morningstar US Market Factor Tilt Index Fund | | $ | 12,000 | | | $ | 7,500 | |
| Flexshares® Morningstar Developed Markets ex-US Factor Tilt Index Fund | | | 20,000 | | | | 60,000 | |
| Flexshares® Morningstar Emerging Markets Factor Tilt Index Fund | | | 150,000 | | | | 150,000 | |
| Flexshares® US Quality Large Cap Index Fund | | | 2,500 | | | | 500 | |
| Flexshares® STOXX® US ESG Impact Index Fund | | | 700 | | | | 1,100 | |
| Flexshares® STOXX® Global ESG Impact Index Fund | | | — | | | | 15,000 | |
| Flexshares® Morningstar Global Upstream Natural Resources Index Fund | | | 9,000 | | | | 34,500 | |
| Flexshares® STOXX® Global Broad Infrastructure Index Fund | | | 14,000 | | | | 16,000 | |
| Flexshares® Global Quality Real Estate Index Fund | | | 2,000 | | | | 4,000 | |
| Flexshares® Quality Dividend Index Fund | | | 9,750 | | | | 15,750 | |
| Flexshares® Quality Dividend Defensive Index Fund | | | 3,000 | | | | 4,500 | |
| Flexshares® Quality Dividend Dynamic Index Fund | | | 750 | | | | 3,000 | |
| Flexshares® International Quality Dividend Index Fund | | | 60,000 | | | | 70,000 | |
| Flexshares® International Quality Dividend Defensive Index Fund | | | — | | | | 10,000 | |
| Flexshares® International Quality Dividend Dynamic Index Fund | | | 5,000 | | | | 10,000 | |
| Flexshares® Disciplined Duration MBS Index Fund | | | 1,200 | | | | 1,200 | |
| | | | | | | | |
| Fund | | As of
October 31,
2018 | | | As of
October 31,
2017 | |
| Flexshares® Credit-Scored US Corporate Bond Index Fund | | $ | 500 | | | $ | 1,500 | |
| Flexshares® Credit-Scored US Long Corporate Bond Index Fund | | | — | | | | 1,000 | |
| Flexshares® Ready Access Variable Income Fund | | | 2,100 | | | | — | |
The FlexShares Currency Hedged Morningstar DM ex-US Factor Tilt Index Fund, FlexShares Currency Hedged Morningstar EM Factor Tilt Index Fund, FlexShares Real Assets Allocation Index Fund, FlexShares iBoxx 3-Year Target Duration TIPS Index Fund, FlexShares iBoxx 5-Year Target Duration TIPS Index Fund and the FlexShares Core Select Bond Fund do not charge creation unit transaction fees.
10. Investment Transactions
For the year ended October 31, 2018, the FlexShares iBoxx 3-Year Target Duration TIPS Index, FlexShares iBoxx 5-Year Target Duration TIPS Index and FlexShares Disciplined Duration MBS Index Funds invested solely in U.S. Government securities. The cost of securities purchased by each Fund and proceeds from sales of securities, excluding short-term securities, derivatives and in-kind transactions for the year ended October 31, 2018, were as follows:
| | | | | | | | |
| Fund | | Purchases | | | Sales | |
| FlexShares Morningstar US Market Factor Tilt Index Fund | | $ | 189,933,498 | | | $ | 192,101,694 | |
| FlexShares Morningstar Developed Markets ex-US Factor Tilt Index Fund | | | 362,039,798 | | | | 349,350,856 | |
| FlexShares Morningstar Emerging Markets Factor Tilt Index Fund | | | 335,131,174 | | | | 308,359,499 | |
| FlexShares Currency Hedged Morningstar DM ex-US Factor Tilt Index Fund | | | 1,154,250 | | | | 1,385,956 | |
| | |
| 390 | | FLEXSHARES ANNUAL REPORT |
Notes to the Financial Statements (cont.)
| | | | | | | | |
| Fund | | Purchases | | | Sales | |
| FlexShares Currency Hedged Morningstar EM Factor Tilt Index Fund | | $ | 2,156,051 | | | $ | 1,949,372 | |
| FlexShares US Quality Large Cap Index Fund | | | 43,349,580 | | | | 43,097,775 | |
| FlexShares STOXX® US ESG Impact Index Fund | | | 23,554,056 | | | | 23,762,991 | |
| FlexShares STOXX® Global ESG Impact Index Fund | | | 51,163,425 | | | | 49,650,240 | |
| FlexShares Morningstar Global Upstream Natural Resources Index Fund | | | 1,689,447,130 | | | | 1,610,015,818 | |
| FlexShares STOXX® Global Broad Infrastructure Index Fund | | | 112,020,970 | | | | 118,025,062 | |
| FlexShares Global Quality Real Estate Index Fund | | | 166,725,333 | | | | 160,701,181 | |
| FlexShares Real Assets Allocation Index Fund | | | 524,321 | | | | 531,724 | |
| FlexShares Quality Dividend Index Fund | | | 1,403,598,858 | | | | 1,392,163,395 | |
| FlexShares Quality Dividend Defensive Index Fund | | | 298,813,641 | | | | 298,417,238 | |
| FlexShares Quality Dividend Dynamic Index Fund | | | 39,482,822 | | | | 39,579,454 | |
| FlexShares International Quality Dividend Index Fund | | | 688,302,342 | | | | 702,786,996 | |
| FlexShares International Quality Dividend Defensive Index Fund | | | 66,446,198 | | | | 65,331,992 | |
| FlexShares International Quality Dividend Dynamic Index Fund | | | 61,065,288 | | | | 64,112,514 | |
| FlexShares iBoxx 3-Year Target Duration TIPS Index Fund | | | 1,690,475,985 | | | | 1,739,921,473 | |
| | | | | | | | |
| Fund | | Purchases | | | Sales | |
| FlexShares iBoxx 5-Year Target Duration TIPS Index Fund | | $ | 590,429,388 | | | $ | 611,745,406 | |
| FlexShares Disciplined Duration MBS Index Fund | | | 115,900,692 | | | | 79,838,951 | |
| FlexShares Credit-Scored US Corporate Bond Index Fund | | | 54,958,957 | | | | 42,478,217 | |
| FlexShares Credit-Scored US Long Corporate Bond Index Fund | | | 29,740,533 | | | | 21,797,869 | |
| FlexShares High Yield Value-Scored Bond Index Fund | | | 57,409,283 | | | | 8,582,615 | |
| FlexShares Ready Access Variable Income Fund* | | | 228,829,589 | | | | 168,647,286 | |
| FlexShares Core Select Bond Fund** | | | 11,696,777 | | | | 11,971,237 | |
| * | Include $4,452,595 in purchases and $3,628,257 in sales in U.S. Government Securities. |
| ** | Include $719,242 in purchases and $718,056 in sales in U.S. Government Securities. |
11. In-Kind Transactions
During the year ended October 31, 2018, certain Funds received securities in exchange for subscriptions of shares (subscriptions-in-kind). For the year ended October 31, 2018, the fair value of the securities received for subscriptions for each Fund was as follows:
| | | | |
| Fund | | Fair Value | |
| FlexShares Morningstar US Market Factor Tilt Index Fund | | $ | 240,737,718 | |
| FlexShares Morningstar Developed Markets ex-US Factor Tilt Index Fund | | | 95,545,464 | |
| FlexShares Morningstar Emerging Markets Factor Tilt Index Fund | | | 22,354,262 | |
| FlexShares Currency Hedged Morningstar DM ex-US Factor Tilt Index Fund | | | 8,463,332 | |
| FlexShares US Quality Large Cap Index Fund | | | 37,459,468 | |
| FlexShares STOXX® US ESG Impact Index Fund | | | 15,602,367 | |
| FlexShares STOXX® Global ESG Impact Index Fund | | | 40,830,671 | |
| | | | |
| FLEXSHARES ANNUAL REPORT | | | 391 | |
Notes to the Financial Statements (cont.)
| | | | |
| Fund | | Fair Value | |
| FlexShares Morningstar Global Upstream Natural Resources Index Fund | | $ | 667,036,168 | |
| FlexShares STOXX® Global Broad Infrastructure Index Fund | | | 41,574,304 | |
| FlexShares Global Quality Real Estate Index Fund | | | 43,654,055 | |
| FlexShares Real Assets Allocation Index Fund | | | 8,431,771 | |
| FlexShares Quality Dividend Index Fund | | | 136,086,201 | |
| FlexShares Quality Dividend Defensive Index Fund | | | 11,177,744 | |
| FlexShares Quality Dividend Dynamic Index Fund | | | 2,071,376 | |
| FlexShares International Quality Dividend Index Fund | | | 96,513,478 | |
| FlexShares International Quality Dividend Defensive Index Fund | | | 5,713,590 | |
| FlexShares International Quality Dividend Dynamic Index Fund | | | 4,176,954 | |
| FlexShares iBoxx 3-Year Target Duration TIPS Index Fund | | | 204,311,855 | |
| FlexShares iBoxx 5-Year Target Duration TIPS Index Fund | | | 218,293,919 | |
| FlexShares Credit-Scored US Long Corporate Bond Index Fund | | | 2,406,862 | |
| FlexShares Core Select Bond Fund | | | 36,671,656 | |
During the year ended October 31, 2018, certain Funds delivered securities in exchange for redemption of shares (redemptions-in-kind). For financial reporting purposes, the Funds recorded net realized gains and losses in connection with each transaction. For the year ended October 31, 2018, the fair value and realized gain (losses) of the securities transferred for redemptions for each Fund was as follows:
| | | | | | | | |
| Fund | | Fair Value | | | Net Realized
Gains (Losses) | |
| FlexShares Morningstar US Market Factor Tilt Index Fund | | $ | 28,057,325 | | | $ | 12,271,336 | |
| FlexShares Morningstar Developed Markets ex-US Factor Tilt Index Fund | | | 10,010,182 | | | | 2,875,308 | |
| | | | | | | | |
| Fund | | Fair Value | | | Net Realized
Gains (Losses) | |
| FlexShares Morningstar Emerging Markets Factor Tilt Index Fund | | $ | 17,503,914 | | | $ | 2,656,916 | |
| FlexShares Currency Hedged Morningstar DM ex-US Factor Tilt Index Fund | | | 18,117,264 | | | | 2,168,758 | |
| FlexShares Currency Hedged Morningstar EM Factor Tilt Index Fund | | | 33,283,597 | | | | 6,296,747 | |
| FlexShares US Quality Large Cap Index Fund | | | 3,313,546 | | | | 594,442 | |
| FlexShares STOXX® US ESG Impact Index Fund | | | 1,596,020 | | | | 379,179 | |
| FlexShares STOXX® Global Broad Infrastructure Index Fund | | | 93,371,856 | | | | 21,674,040 | |
| FlexShares Quality Dividend Index Fund | | | 275,180,756 | | | | 71,242,802 | |
| FlexShares Quality Dividend Defensive Index Fund | | | 21,553,113 | | | | 5,405,472 | |
| FlexShares Quality Dividend Dynamic Index Fund | | | 17,349,149 | | | | 3,659,718 | |
| FlexShares International Quality Dividend Index Fund | | | 145,872,489 | | | | 13,395,212 | |
| FlexShares International Quality Dividend Dynamic Index Fund | | | 15,915,739 | | | | 1,647,481 | |
| FlexShares iBoxx 3-Year Target Duration TIPS Index Fund | | | 611,791,661 | | | | (4,382,219 | ) |
| FlexShares iBoxx 5-Year Target Duration TIPS Index Fund | | | 92,659,383 | | | | (279,788 | ) |
| FlexShares Ready Access Variable Income Fund | | | 41,067,759 | | | | 16,179 | |
| FlexShares Core Select Bond Fund | | | 612,945 | | | | 454 | |
12. Guarantees and Indemnifications
In the normal course of business each Fund enters into contracts with third-party service providers that contain a
| | |
| 392 | | FLEXSHARES ANNUAL REPORT |
Notes to the Financial Statements (cont.)
variety of representations and warranties and that provide general indemnifications. Additionally, under the Funds’ organizational documents, the officers and trustees are indemnified against certain liabilities arising out of the performance of their duties to the Funds. The Funds’ maximum exposure under these arrangements is unknown, as it involves possible future claims that may or may not be made against the Funds.
13. Investment Company Modernization
On October 13, 2016, the U.S. Securities and Exchange Commission (“SEC”) adopted new rules and forms, and amended existing rules and forms, to modernize the reporting of information provided by funds and to improve the quality and type of information that funds provide to the SEC and investors. In part, the new and amended rules and forms amend Regulation S-X and require standardized, enhanced disclosure about derivatives in a Fund’s financial statements, as well as other amendments. The Funds have updated disclosure in these financial statements to reflect the amendments, which were effective August 1, 2017. The compliance date for the new form types and other rule amendments is on or after June 1, 2018. The adoption had no effect on the Funds’ net assets or results of operations.
On August 17, 2018, the SEC adopted amendments to certain disclosure requirements that have become duplicative, overlapping, or outdated in light of other SEC disclosure requirements, U.S. GAAP, or changes in the information environment. The amendments permit presentation of the total, rather than the components, of distributable earnings on the balance sheet and presentation of the total, rather than the components, of distributions to shareholders, except for tax return of capital distributions and remove the requirement for disclosure of undistributed net investment income on the statement of changes in net assets. The amendments are intended to simplify and update the disclosure of information to investors. The amendments became effective on November 5, 2018 and the Funds’ Statement of Assets and Liabilities and Statement of Changes in Net Assets for the current reporting period have been modified to these amendments. The adoption of the amendments had no effect on the Funds’ net assets or results of operations.
14. New Accounting Pronouncements
On August 28, 2018, the FASB issued ASU 2018-13, “Disclosure Framework – Changes to the Disclosure Requirements for Fair Value Measurement,” which amends the fair value measurement disclosure requirements of ASC 820. The amendments of ASU 2018-13 include new, eliminated, and modified disclosure requirements of ASC 820. In addition, the amendments clarify that materiality is an appropriate consideration of entities when evaluating disclosure requirements. The ASU is effective for all entities for fiscal years beginning after December 15, 2019, including interim periods therein. Early adoption is permitted for any eliminated or modified disclosures upon issuance of this ASU. The Funds have early adopted ASU 2018-13 for these financial statements.
On March 30, 2017, the FASB issued Accounting Standards Update (ASU) 2017-08 “Premium Amortization on Purchased Callable Debt Securities”, which amends the amortization period for certain purchased callable debt securities held at premium shortening such period to the earliest call date. The new guidance requires an entity to amortize the premium on a callable debt security within its scope to the earliest call date, unless the guidance for considering estimated prepayments as described above is applied. If the call option is not exercised at the earliest call date, the yield is reset to the effective yield using the payment terms of the security. If the security has more than one call date and the premium was amortized to a call price greater than the next call price, any excess of the amortized cost basis over the amount repayable at the next call date will be amortized to that date. If there are no other call dates, any excess of the amortized cost basis over the par amount will be amortized to maturity. Discounts on purchased callable debt securities will continue to be amortized to the security’s maturity date. The ASU 2017-08 is effective for public business entities for fiscal years, and interim periods within those fiscal years, beginning after December 15, 2018. Earlier application is permitted for all entities, including adoption in an interim period. If an entity early adopts the ASU in an interim period, any adjustments must be reflected as of the beginning of the fiscal year that includes that interim period. Management is still assessing the impact of the adoption of
| | | | |
| FLEXSHARES ANNUAL REPORT | | | 393 | |
Notes to the Financial Statements (cont.)
ASU 2017-08 on the financial statements but does not expect it to have a material impact. The Funds have not early adopted ASU 2017-08.
15. Subsequent Events
Management has evaluated subsequent events for the Funds through the date the financial statements were issued, and has concluded that there are no recognized or non-recognized subsequent events relevant for financial statement disclosure.
| | |
| 394 | | FLEXSHARES ANNUAL REPORT |
Report of Independent Registered Public Accounting Firm
To the Shareholders and Board of Trustees of FlexShares® Trust
Opinion on the Financial Statements and Financial Highlights
We have audited the accompanying statements of assets and liabilities of FlexShares® Trust, comprising the funds listed in the table below (collectively, the “Funds”), including the schedules of investments, as of October 31, 2018, the related statements of operations, the statements of changes in net assets, and the financial highlights for each of the periods listed in the table below, and the related notes. In our opinion, the financial statements and financial highlights present fairly, in all material respects, the financial position of each of the funds constituting FlexShares® Trust as of October 31, 2018, and the results of their operations, the changes in their net assets, and the financial highlights for each of the periods listed in the table below in conformity with accounting principles generally accepted in the United States of America.
| | | | | | |
| Fund Name (s) | | Statement of
Operations | | Statements of
Changes in Net
Assets | | Financial Highlights |
| FlexShares® Morningstar US Market Factor Tilt Index Fund, FlexShares® Morningstar Developed Markets ex-US Factor Tilt Index Fund, FlexShares® Morningstar Emerging Markets Factor Tilt Index Fund, FlexShares® Morningstar Global Upstream Natural Resources Index Fund, FlexShares® STOXX® Global Broad Infrastructure Index Fund, FlexShares® Quality Dividend Index Fund, FlexShares® Quality Dividend Defensive Index Fund, FlexShares® Quality Dividend Dynamic Index Fund, FlexShares® International Quality Dividend Index Fund, FlexShares® International Quality Dividend Defensive Index Fund, FlexShares® International Quality Dividend Dynamic Index Fund, FlexShares® iBoxx 3-Year Target Duration TIPS Index Fund, FlexShares® iBoxx 5-Year Target Duration TIPS Index Fund, and FlexShares® Ready Access Variable Income Fund | | For the year
ended
October 31,
2018 | | For the
years ended
October 31,
2018 and
2017 | | For the year ended October 31, 2018, 2017, 2016, 2015, 2014 |
| FlexShares® Global Quality Real Estate Index Fund | | For the year
ended
October 31,
2018 | | For the
years ended
October 31,
2018 and
2017 | | For the year ended October 31, 2018, 2017, 2016, 2015 and for the period from November 5, 2013 (commencement of operations) through October 31, 2014 |
| FlexShares® Disciplined Duration MBS Index Fund | | For the year
ended
October 31,
2018 | | For the
years ended
October 31,
2018 and
2017 | | For the year ended October 31, 2018, 2017, 2016, 2015 and for the period from September 3, 2014 (commencement of operations) through October 31, 2014 |
| FlexShares® Credit-Scored US Corporate Bond Index Fund | | For the year
ended
October 31,
2018 | | For the
years ended
October 31,
2018 and
2017 | | For the year ended October 31, 2018, 2017, 2016 and for the period from November 12, 2014 (commencement of operations) through October 31, 2015 |
| | | | |
| FLEXSHARES ANNUAL REPORT | | | 395 | |
Report of Independent Registered Public Accounting Firm (cont.)
| | | | | | |
| Fund Name (s) | | Statement of
Operations | | Statements of
Changes in Net
Assets | | Financial Highlights |
| FlexShares® US Quality Large Cap Index Fund | | For the year ended October 31, 2018 | | For the years ended October 31, 2018 and 2017 | | For the year ended October 31, 2018, 2017, 2016 and for the period from September 23, 2015 (commencement of operations) through October 31, 2015 |
| FlexShares® Credit-Scored US Long Corporate Bond Index Fund | | For the year ended October 31, 2018 | | For the years ended October 31, 2018 and 2017 | | For the year ended October 31, 2018, 2017, 2016 and for the period from September 23, 2015 (commencement of operations) through October 31, 2015 |
| FlexShares® Currency Hedged Morningstar DM ex-US Factor Tilt Index Fund, FlexShares® Currency Hedged Morningstar EM Factor Tilt Index Fund | | For the year ended October 31, 2018 | | For the years ended October 31, 2018 and 2017 | | For the year ended October 31, 2018, 2017 and for the period from November 9, 2015 (commencement of operations) through October 31, 2016 |
| FlexShares® Real Assets Allocation Index Fund | | For the year ended October 31, 2018 | | For the years ended October 31, 2018 and 2017 | | For the year ended October 31, 2018, 2017 and for the period from November 23, 2015 (commencement of operations) through October 31, 2016 |
| FlexShares® STOXX® US ESG Impact Index Fund, FlexShares® STOXX® Global ESG Impact Index Fund | | For the year ended October 31, 2018 | | For the years ended October 31, 2018 and 2017 | | For the year ended October 31, 2018, 2017 and for the period from July 13, 2016 (commencement of operations) through October 31, 2016 |
| FlexShares® Core Select Bond Fund | | For the year ended October 31, 2018 | | For the year ended October 31, 2018 and for the period from November 18, 2016 (commencement of operations) through October 31, 2017 |
| FlexShares® High Yield Value-Scored Bond Index Fund | | For the period from July 17, 2018 (commencement of operations) through October 31, 2018 |
| | |
| 396 | | FLEXSHARES ANNUAL REPORT |
Report of Independent Registered Public Accounting Firm (cont.)
Basis for Opinion
These financial statements and financial highlights are the responsibility of the Funds’ management. Our responsibility is to express an opinion on the Funds’ financial statements and financial highlights based on our audits. We are a public accounting firm registered with the Public Company Accounting Oversight Board (United States) (PCAOB) and are required to be independent with respect to the Funds in accordance with the U.S. federal securities laws and the applicable rules and regulations of the Securities and Exchange Commission and the PCAOB.
We conducted our audits in accordance with the standards of the PCAOB. Those standards require that we plan and perform the audit to obtain reasonable assurance about whether the financial statements and financial highlights are free of material misstatement, whether due to error or fraud. The Funds are not required to have, nor were we engaged to perform, an audit of their internal control over financial reporting. As part of our audits we are required to obtain an understanding of internal control over financial reporting but not for the purpose of expressing an opinion on the effectiveness of the Funds’ internal control over financial reporting. Accordingly, we express no such opinion.
Our audits included performing procedures to assess the risks of material misstatement of the financial statements and financial highlights, whether due to error or fraud, and performing procedures that respond to those risks. Such procedures included examining, on a test basis, evidence regarding the amounts and disclosures in the financial statements and financial highlights. Our audits also included evaluating the accounting principles used and significant estimates made by management, as well as evaluating the overall presentation of the financial statements and financial highlights. Our procedures included confirmation of securities owned as of October 31, 2018, by correspondence with the custodian and brokers; when replies were not received from brokers, we performed other auditing procedures. We believe that our audits provide a reasonable basis for our opinion.

Chicago, Illinois
December 21, 2018
We have served as the auditor of one or more Northern Trust investment companies since 2002.
| | | | |
| FLEXSHARES ANNUAL REPORT | | | 397 | |
Tax Information October 31, 2018 (Unaudited)
QUALIFIED DIVIDEND INCOME (QDI)
Under the Jobs and Growth Tax Relief Reconciliation Act of 2003 (the “Act”), the following percentages of ordinary dividends paid during the fiscal year ended October 31, 2018 are designated as “qualified dividend income”, as defined in the Act, subject to reduced tax rates in 2018:
| | | | |
| Fund | | QDI PERCENTAGE | |
| FlexShares Morningstar US Market Factor Tilt Index Fund | | | 84.27 | % |
| FlexShares Morningstar Developed Markets ex-US Factor Tilt Index Fund | | | 64.67 | % |
| FlexShares Morningstar Emerging Markets Factor Tilt Index Fund | | | 49.14 | % |
| FlexShares Currency Hedged Morningstar DM ex-US Factor Tilt Index Fund | | | 48.80 | % |
| FlexShares Currency Hedged Morningstar EM Factor Tilt Index Fund | | | 44.22 | % |
| FlexShares US Quality Large Cap Index Fund | | | 100.00 | % |
| FlexShares STOXX® US ESG Impact Index Fund | | | 100.00 | % |
| FlexShares STOXX® Global ESG Impact Index Fund | | | 100.00 | % |
| FlexShares Morningstar Global Upstream Natural Resources Index Fund | | | 77.97 | % |
| FlexShares STOXX® Global Broad Infrastructure Index Fund | | | 77.34 | % |
| FlexShares Global Quality Real Estate Index Fund | | | 25.09 | % |
| FlexShares Real Assets Allocation Index Fund | | | 57.27 | % |
| FlexShares Quality Dividend Index Fund | | | 76.49 | % |
| FlexShares Quality Dividend Defensive Index Fund | | | 76.14 | % |
| FlexShares Quality Dividend Dynamic Index Fund | | | 74.39 | % |
| FlexShares International Quality Dividend Index Fund | | | 53.81 | % |
| FlexShares International Quality Dividend Defensive Index Fund | | | 50.47 | % |
| FlexShares International Quality Dividend Dynamic Index Fund | | | 61.59 | % |
CORPORATE DIVIDENDS RECEIVED DEDUCTION (DRD)
A percentage of the dividends distributed during the fiscal year for the following Funds qualifies for the dividends received deduction for corporate shareholders:
| | | | |
| Fund | | CORPORATE
DRD
PERCENTAGE | |
| FlexShares Morningstar US Market Factor Tilt Index Fund | | | 80.96 | % |
| FlexShares® Morningstar Emerging Markets Factor Tilt Index Fund | | | 0.04 | % |
| FlexShares® Currency Hedged Morningstar EM Factor Tilt Index Fund | | | 0.04 | % |
| FlexShares US Quality Large Cap Index Fund | | | 100.00 | % |
| FlexShares STOXX® US ESG Impact Index Fund | | | 100.00 | % |
| FlexShares STOXX® Global ESG Impact Index Fund | | | 51.91 | % |
| FlexShares Morningstar Global Upstream Natural Resources Index Fund | | | 25.02 | % |
| FlexShares STOXX® Global Broad Infrastructure Index Fund | | | 34.25 | % |
| FlexShares Global Quality Real Estate Index Fund | | | 0.01 | % |
| FlexShares Real Assets Allocation Index Fund | | | 20.75 | % |
| FlexShares Quality Dividend Index Fund | | | 73.94 | % |
| FlexShares Quality Dividend Defensive Index Fund | | | 74.34 | % |
| FlexShares Quality Dividend Dynamic Index Fund | | | 71.68 | % |
| | |
| 398 | | FLEXSHARES ANNUAL REPORT |
Tax Information (cont.)
FOREIGN TAX CREDIT
Each Fund below intends to make an election that will allow its shareholders to treat their proportionate share of foreign taxes paid by the Fund as having been paid by them. The amounts per share, which represent income from sources within, and taxes paid to foreign countries, are as follows:
| | | | | | | | |
| Fund | | TAXES | | | INCOME | |
| FlexShares Morningstar Developed Markets ex-US Factor Tilt Index Fund | | $ | 0.1285 | | | $ | 2.1240 | |
| FlexShares Morningstar Emerging Markets Factor Tilt Index Fund | | | 0.2143 | | | | 2.1773 | |
| FlexShares Currency Hedged Morningstar DM ex-US Factor Tilt Index Fund | | | 0.0920 | | | | 1.4926 | |
| FlexShares Currency Hedged Morningstar EM Factor Tilt Index Fund | | | 0.4681 | | | | 3.7292 | |
| FlexShares Morningstar Global Upstream Natural Resources Index Fund | | | 0.0247 | | | | 0.8043 | |
| FlexShares STOXX Global Broad Infrastructure Index Fund | | | 0.0576 | | | | 1.0596 | |
| FlexShares Real Assets Allocation Index Fund | | | 0.0150 | | | | 0.2502 | |
| FlexShares International Quality Dividend Index Fund | | | 0.1173 | | | | 1.6764 | |
| FlexShares International Quality Dividend Defensive Index Fund | | | 0.0945 | | | | 1.3386 | |
| FlexShares International Quality Dividend Dynamic Index Fund | | | 0.1394 | | | | 1.7909 | |
| | | | |
| FLEXSHARES ANNUAL REPORT | | | 399 | |
Fund Expenses (Unaudited)
As a shareholder, you incur two types of costs: (1) transaction costs for purchasing and selling shares and (2) ongoing costs, including advisory and other Fund expenses. The expense examples below are intended to help you understand your ongoing costs (in dollars) of investing in the Funds and to compare these costs with the ongoing costs of investing in other funds.
Actual Expenses
The actual expense examples are based on an investment of $1,000 invested at the beginning of a six month period and held through the period ended October 31, 2018.
The first line under each Fund in the following tables provides information about actual account values and actual expenses. You may use the information in this line, together with the amount you invested, to estimate the expenses that you paid over the period. Simply divide your account value by $1,000 (for example, an $8,600 account value divided by $1,000 = 8.6), then multiply the result by the number in the first line under the heading “Expenses Paid During the Period” to estimate the expenses you paid on your account during this period.
Hypothetical Example for Comparison Purposes
The hypothetical expense examples are based on an investment of $1,000 invested at the beginning of a six month period and held through the period ended October 31, 2018.
The second line under each Fund in the following table provides information about hypothetical account values and hypothetical expenses based on the Fund’s actual expense ratio and an assumed rate of return of 5% per year before expenses, which is not the Fund’s actual return. The hypothetical account values and expenses may not be used to estimate the actual ending account balance or expenses you paid for the period. You may use this information to compare the ongoing costs of investing in the Funds and other funds. To do so, compare this 5% hypothetical example with the 5% hypothetical examples that appear in the shareholder reports of the other funds.
Please note that the expenses shown in the table are meant to highlight your ongoing costs only and do not reflect any transaction costs, such as brokerage commissions on purchases or sales of Fund shares. Therefore, the second line for each Fund in the table is useful in comparing ongoing costs only, and will not help you determine the relative total costs of owning different funds. In addition, if these transaction costs were included, your costs would have been higher.
| | | | | | | | | | | | | | | | |
| | | Beginning
Account
Value | | | Ending
Account
Value
10/31/18 | | | Expenses Paid
During the
Period* | | | Annualized
Expense Ratio
During Period | |
| FlexShares® Morningstar US Market Factor Tilt Index Fund | | | | | | | | | | | | | | | | |
| Actual | | $ | 1,000.00 | | | $ | 1,010.30 | | | $ | 1.27 | | | | 0.25 | % |
| Hypothetical | | $ | 1,000.00 | | | $ | 1,023.95 | | | $ | 1.28 | | | | 0.25 | % |
| FlexShares® Morningstar Developed Markets ex-US Factor Tilt Index Fund | | | | | | | | | | | | | |
| Actual | | $ | 1,000.00 | | | $ | 883.90 | | | $ | 1.85 | | | | 0.39 | % |
| Hypothetical | | $ | 1,000.00 | | | $ | 1,023.24 | | | $ | 1.99 | | | | 0.39 | % |
| FlexShares® Morningstar Emerging Markets Factor Tilt Index Fund | | | | | | | | | | | | | | | | |
| Actual | | $ | 1,000.00 | | | $ | 817.20 | | | $ | 2.70 | | | | 0.59 | % |
| Hypothetical | | $ | 1,000.00 | | | $ | 1,022.23 | | | $ | 3.01 | | | | 0.59 | % |
| | |
| 400 | | FLEXSHARES ANNUAL REPORT |
Fund Expenses (cont.)
| | | | | | | | | | | | | | | | |
| | | Beginning
Account
Value | | | Ending
Account
Value
10/31/18 | | | Expenses Paid
During the
Period* | | | Annualized
Expense Ratio
During Period | |
| FlexShares® Currency Hedged Morningstar DM ex-US Factor Tilt Index Fund(a) | | | | | | | | | | | | | |
| Actual | | $ | 1,000.00 | | | $ | 937.40 | | | $ | 0.24 | | | | 0.05 | % |
| Hypothetical | | $ | 1,000.00 | | | $ | 1,024.95 | | | $ | 0.26 | | | | 0.05 | % |
| FlexShares® Currency Hedged Morningstar EM Factor Tilt Index Fund(a) | | | | | | | | | | | | | |
| Actual | | $ | 1,000.00 | | | $ | 855.50 | | | $ | 0.23 | | | | 0.05 | % |
| Hypothetical | | $ | 1,000.00 | | | $ | 1,024.95 | | | $ | 0.26 | | | | 0.05 | % |
| FlexShares® US Quality Large Cap Index Fund | | | | | | | | | | | | | | | | |
| Actual | | $ | 1,000.00 | | | $ | 1,006.10 | | | $ | 1.62 | | | | 0.32 | % |
| Hypothetical | | $ | 1,000.00 | | | $ | 1,023.59 | | | $ | 1.63 | | | | 0.32 | % |
| FlexShares® STOXX® US ESG Impact Index Fund | | | | | | | | | | | | | | | | |
| Actual | | $ | 1,000.00 | | | $ | 1,034.40 | | | $ | 1.64 | | | | 0.32 | % |
| Hypothetical | | $ | 1,000.00 | | | $ | 1,023.59 | | | $ | 1.63 | | | | 0.32 | % |
| FlexShares® STOXX® Global ESG Impact Index Fund | | | | | | | | | | | | | | | | |
| Actual | | $ | 1,000.00 | | | $ | 982.30 | | | $ | 2.10 | | | | 0.42 | % |
| Hypothetical | | $ | 1,000.00 | | | $ | 1,023.09 | | | $ | 2.14 | | | | 0.42 | % |
| FlexShares® Morningstar Global Upstream Natural Resources Index Fund | | | | | | | | | | | | | |
| Actual | | $ | 1,000.00 | | | $ | 944.40 | | | $ | 2.25 | | | | 0.46 | % |
| Hypothetical | | $ | 1,000.00 | | | $ | 1,022.89 | | | $ | 2.35 | | | | 0.46 | % |
| FlexShares® STOXX® Global Broad Infrastructure Index Fund | | | | | | | | | | | | | | | | |
| Actual | | $ | 1,000.00 | | | $ | 983.50 | | | $ | 2.35 | | | | 0.47 | % |
| Hypothetical | | $ | 1,000.00 | | | $ | 1,022.84 | | | $ | 2.40 | | | | 0.47 | % |
| FlexShares® Global Quality Real Estate Index Fund | | | | | | | | | | | | | | | | |
| Actual | | $ | 1,000.00 | | | $ | 954.50 | | | $ | 2.22 | | | | 0.45 | % |
| Hypothetical | | $ | 1,000.00 | | | $ | 1,022.94 | | | $ | 2.29 | | | | 0.45 | % |
| FlexShares® Real Assets Allocation Index Fund(a) | | | | | | | | | | | | | | | | |
| Actual | | $ | 1,000.00 | | | $ | 965.40 | | | $ | 0.54 | | | | 0.11 | % |
| Hypothetical | | $ | 1,000.00 | | | $ | 1,024.65 | | | $ | 0.56 | | | | 0.11 | % |
| FlexShares® Quality Dividend Index Fund | | | | | | | | | | | | | | | | |
| Actual | | $ | 1,000.00 | | | $ | 1,022.90 | | | $ | 1.89 | | | | 0.37 | % |
| Hypothetical | | $ | 1,000.00 | | | $ | 1,023.34 | | | $ | 1.89 | | | | 0.37 | % |
| FlexShares® Quality Dividend Defensive Index Fund | | | | | | | | | | | | | | | | |
| Actual | | $ | 1,000.00 | | | $ | 1,039.60 | | | $ | 1.90 | | | | 0.37 | % |
| Hypothetical | | $ | 1,000.00 | | | $ | 1,023.34 | | | $ | 1.89 | | | | 0.37 | % |
| | | | |
| FLEXSHARES ANNUAL REPORT | | | 401 | |
Fund Expenses (cont.)
| | | | | | | | | | | | | | | | |
| | | Beginning
Account
Value | | | Ending
Account
Value
10/31/18 | | | Expenses Paid
During the
Period* | | | Annualized
Expense Ratio
During Period | |
| FlexShares® Quality Dividend Dynamic Index Fund | | | �� | | | | | | | | | | | | | |
| Actual | | $ | 1,000.00 | | | $ | 995.70 | | | $ | 1.86 | | | | 0.37 | % |
| Hypothetical | | $ | 1,000.00 | | | $ | 1,023.34 | | | $ | 1.89 | | | | 0.37 | % |
| FlexShares® International Quality Dividend Index Fund | | | | | | | | | | | | | | | | |
| Actual | | $ | 1,000.00 | | | $ | 877.70 | | | $ | 2.22 | | | | 0.47 | % |
| Hypothetical | | $ | 1,000.00 | | | $ | 1,022.84 | | | $ | 2.40 | | | | 0.47 | % |
| FlexShares® International Quality Dividend Defensive Index Fund | | | | | | | | | | | | | | | | |
| Actual | | $ | 1,000.00 | | | $ | 884.00 | | | $ | 2.23 | | | | 0.47 | % |
| Hypothetical | | $ | 1,000.00 | | | $ | 1,022.84 | | | $ | 2.40 | | | | 0.47 | % |
| FlexShares® International Quality Dividend Dynamic Index Fund | | | | | | | | | | | | | | | | |
| Actual | | $ | 1,000.00 | | | $ | 860.40 | | | $ | 2.20 | | | | 0.47 | % |
| Hypothetical | | $ | 1,000.00 | | | $ | 1,022.84 | | | $ | 2.40 | | | | 0.47 | % |
| FlexShares® iBoxx 3-Year Target Duration TIPS Index Fund | | | | | | | | | | | | | | | | |
| Actual | | $ | 1,000.00 | | | $ | 997.90 | | | $ | 0.91 | | | | 0.18 | % |
| Hypothetical | | $ | 1,000.00 | | | $ | 1,024.30 | | | $ | 0.92 | | | | 0.18 | % |
| FlexShares® iBoxx 5-Year Target Duration TIPS Index Fund | | | | | | | | | | | | | | | | |
| Actual | | $ | 1,000.00 | | | $ | 989.80 | | | $ | 0.90 | | | | 0.18 | % |
| Hypothetical | | $ | 1,000.00 | | | $ | 1,024.30 | | | $ | 0.92 | | | | 0.18 | % |
| FlexShares® Disciplined Duration MBS Index Fund | | | | | | | | | | | | | | | | |
| Actual | | $ | 1,000.00 | | | $ | 996.20 | | | $ | 1.01 | | | | 0.20 | % |
| Hypothetical | | $ | 1,000.00 | | | $ | 1,024.20 | | | $ | 1.02 | | | | 0.20 | % |
| FlexShares® Credit-Scored US Corporate Bond Index Fund | | | | | | | | | | | | | | | | |
| Actual | | $ | 1,000.00 | | | $ | 1,005.20 | | | $ | 1.11 | | | | 0.22 | % |
| Hypothetical | | $ | 1,000.00 | | | $ | 1,024.10 | | | $ | 1.12 | | | | 0.22 | % |
| FlexShares® Credit-Scored US Long Corporate Bond Index Fund | | | | | | | | | | | | | | | | |
| Actual | | $ | 1,000.00 | | | $ | 967.40 | | | $ | 1.09 | | | | 0.22 | % |
| Hypothetical | | $ | 1,000.00 | | | $ | 1,024.10 | | | $ | 1.12 | | | | 0.22 | % |
| FlexShares® High Yield Value-Scored Bond Index Fund(b)(c) | | | | | | | | | | | | | | | | |
| Actual | | $ | 1,000.00 | | | $ | 1,001.30 | | | $ | 1.08 | | | | 0.37 | % |
| Hypothetical | | $ | 1,000.00 | | | $ | 1,023.34 | | | $ | 1.89 | | | | 0.37 | % |
| FlexShares® Ready Access Variable Income Fund | | | | | | | | | | | | | | | | |
| Actual | | $ | 1,000.00 | | | $ | 1,012.30 | | | $ | 1.27 | | | | 0.25 | % |
| Hypothetical | | $ | 1,000.00 | | | $ | 1,023.95 | | | $ | 1.28 | | | | 0.25 | % |
| | |
| 402 | | FLEXSHARES ANNUAL REPORT |
Fund Expenses (cont.)
| | | | | | | | | | | | | | | | |
| | | Beginning
Account
Value | | | Ending
Account
Value
10/31/18 | | | Expenses Paid
During the
Period* | | | Annualized
Expense Ratio
During Period | |
| FlexShares® Core Select Bond Fund(a) | | | | | | | | | | | | | | | | |
| Actual | | $ | 1,000.00 | | | $ | 992.90 | | | $ | 0.80 | | | | 0.16 | % |
| Hypothetical | | $ | 1,000.00 | | | $ | 1,024.40 | | | $ | 0.82 | | | | 0.16 | % |
| * | Expenses are equal to the average account value over the period multiplied by the Fund’s annualized expense ratio, multiplied by the number of days in the most recent fiscal half-year divided by the number of days in the fiscal year (to reflect the one half year period). |
| (a) | Annualized expense ratio and expenses paid during the period do not include fees and expenses of the Underlying Fund(s) in which the Fund invests. |
| (b) | The Fund commenced operations on July 17, 2018. Actual Expenses Paid During the Period are equal to the Fund’s annualized net expense ratio, multiplied by the average account value over the period, multiplied by 106 divided by 365 (to reflect the actual days in the period). Hypothetical Expenses Paid During the Period are equal to the Fund’s annualized net expense ratio, multiplied by the average account value over the period, multiplied by 184 divided by 365 (to reflect the one-half year period). |
| (c) | The Fund’s expenses in the table above reflected voluntary reimbursement by Northern Trust Investments, Inc. Without this reimbursement, the corresponding table above would have read as follows: |
| | | | | | | | | | | | | | | | |
| | | Beginning
Account
Value | | | Ending
Account
Value
10/31/18 | | | Expenses Paid
During the
Period* | | | Annualized
Expense Ratio
During Period | |
| FlexShares® High Yield Value-Scored Bond Index Fund | | | | | | | | | | | | | | | | |
| Actual | | $ | 1,000.00 | | | $ | 1,001.30 | | | $ | 1.10 | | | | 0.38 | % |
| Hypothetical | | $ | 1,000.00 | | | $ | 1,023.29 | | | $ | 1.94 | | | | 0.38 | % |
| | * | Expenses are equal to the average account value over the period multiplied by the Fund’s annualized expense ratio, multiplied by the number of days in the most recent fiscal half-year divided by the number of days in the fiscal year (to reflect the one half year period). |
| | | | |
| FLEXSHARES ANNUAL REPORT | | | 403 | |
Trustees and Officers (Unaudited)
| | | | | | | | | | | | |
| NON-INTERESTED TRUSTEES |
| Name, Address(1) and Age | | Position(s)
Held with
the Trust | | Term of
Office and
Length of
Time Served(2) | | Principal Occupation(s) During
Past 5 Years | | Number of
Funds
in Fund
Complex(3)
Overseen
by Trustee | | | Other
Directorships
Held by
Trustee(4) |
Sarah N. Garvey Age: 66 | | Trustee | | Indefinite; July 2011 to present | | • Chairman of the Board of Navy Pier from 2011 to 2013 and Member of the Board since 2011; • Member of the Board of Directors of The Civic Federation since 2004; • Member of the Executive Committee and Chairman of the Audit Committee since 2017 and Trustee of the Art Institute of Chicago since 2011. | | | 26 | | | None |
Philip G. Hubbard Age: 67 | | Trustee | | Indefinite; July 2011 to present | | • Managing Partner of Solidian Fund, LP and Solidian Management, LLC (a fund of hedge funds platform for family and friends investments) since 2001; • President of Hubbard Management Group, LLC (a personal investment vehicle) since 2001; • Chairman of the Board of Trustees of the Wheaton College Trust Company, N. A. since 2004; • Member since 1998 of the Board of Trustees of Wheaton College; • Chairman of the Board of Directors of the English Language Institute/China (a nonprofit educational organization) since 1993; • Member of the Board of First Cup, LLC (restaurant franchising) since 2014. | | | 26 | | | None |
Eric T. McKissack Age: 64 | | Trustee and Chairman | | Indefinite; July 2011 to present | | • Founder and CEO of Channing Capital Management, LLC (an SEC registered investment adviser) since 2004; • Member of the Board of Trustees, the Investment Committee, and the Finance Committee of the Art Institute of Chicago since 2002; • Member of the Board of Grand Victoria Foundation since 2011; Member of the Board of the Graham Foundation since 2014; • Member of the Keystone Board of the Shirley Ryan AbilityLab since 2001. | | | 26 | | | Consulting
Group Capital
Markets Funds
(10 Portfolios)
Since April
2013 |
| | |
| 404 | | FLEXSHARES ANNUAL REPORT |
Trustees and Officers (cont.)
| | | | | | | | | | | | |
| INTERESTED TRUSTEE |
| Name, Address(1) and Age | | Position(s)
Held with
the Trust | | Term of
Office and
Length of
Time Served(2) | | Principal Occupation(s) During
Past 5 Years | | Number of
Funds
in Fund
Complex(3)
Overseen
by Trustee | | | Other
Directorships
Held by
Trustee(4) |
Shundrawn A. Thomas(5)(6) Age: 44 | | Trustee | | Indefinite; July 2011 to present | | • President of Northern Trust Asset Management since October 2017; • President of the Trust from July 2011 to March 2017; • Executive Vice President, Head of Funds and Managed Accounts, Northern Trust Asset Management from May 2014 to September 2017; • Managing Director and Global Business Head of the Exchange-Traded Funds Group, Northern Trust Asset Management from 2010 to 2014; • Member of the Board of Florida A&M University Foundation since 2014; • Member of the Board of Trustees of Wheaton College since May 2009; • Member of the Board of Trustees of the Wheaton College Trust Company since 2009; • Partner at Tree of Life Resources, LLP (a multi-media company) from 2005 to 2014. | | | 26 | | | Northern Funds
(44 Portfolios)
since October
2017 and
Northern
Institutional
Funds
(7 Portfolios)
since October
2017 |
| (1) | Each Non-Interested Trustee may be contacted by writing to the Trustee, c/o Paulita Pike, Ropes & Gray LLP, 191 North Wacker Drive, 32nd Floor, Chicago, IL 60606. Mr. Thomas may be contacted by writing to him at 50 S. LaSalle St., Chicago, IL 60603. |
| (2) | Each Trustee will hold office for an indefinite term until the earliest of: (i) the next meeting of shareholders, if any, called for the purpose of considering the election or re-election of such Trustee and until the election and qualification of his or her successor, if any, elected at such meeting; or (ii) the date a Trustee resigns or retires, or a Trustee is removed by the Board of Trustees or shareholders, in accordance with the Trust’s Agreement and Declaration of Trust. |
| (3) | The “Fund Complex” consists of the Trust. |
| (4) | This column includes only directorships of companies required to report to the SEC under the Securities Exchange Act of 1934, as amended (i.e., public companies) or other investment companies registered under the 1940 Act. |
| (5) | An “interested person,” as defined by the 1940 Act. Mr. Thomas is deemed to be an “interested” Trustee because he is an officer of NTI and its parent company. |
| (6) | On December 13, 2018, Mr. Thomas resigned as Interested Trustee and the Board of Trustees elected Darek Wojnar as an Interested Trustee of the Trust. |
The Statement of Additional Information (“SAI”) includes additional information about the Trust’s Trustees and is available, without charge, upon request by contacting the Fund directly at (855) 933-6287.
| | | | |
| FLEXSHARES ANNUAL REPORT | | | 405 | |
Trustees and Officers (cont.)
| | | | | | |
| OFFICERS |
| Name, Address and Age | | Position(s)
Held with
the Trust | | Term of
Office(1) and
Length of
Time Served | | Principal Occupation(s) During Past 5 Years |
Darlene Chappell Age: 55 50 South LaSalle Street Chicago, IL 60603 | | Anti-Money Laundering Officer | | Indefinite; July 2011 to present | | Anti-Money Laundering Compliance Officer for Northern Trust Investments, Inc., Northern Trust Securities, Inc., Northern Funds, Northern Institutional Funds, and Alpha Core Strategies Fund (formerly NT Alpha Strategies Fund) since 2009, Equity Long/Short Opportunities Fund (formerly NT Equity Long/ Short Strategies Fund) since 2011 and 50 South Capital Advisors, LLC since 2015; Vice President and Compliance Consultant for The Northern Trust Company since 2006; Anti-Money Laundering Compliance Officer for Northern Trust Company of Connecticut from 2009 to 2013. |
Jose J. Del Real Age: 40 50 South LaSalle Street Chicago, IL 60603 | | Assistant Secretary | | Indefinite; June 2015 to present | | Senior Legal Counsel and Vice President, Asset Management Practice Group of the Legal Department of The Northern Trust Company since August 2015; Assistant Secretary of Northern Trust Investments, Inc. since 2016; Legal Counsel and Vice President, Asset Management Practice Group of the Legal Department of The Northern Trust Company from 2014 until 2015; Assistant Secretary of Northern Funds and Northern Institutional Funds from 2011 to 2014, and since May 2015; Vice President and Regulatory Administration Senior Attorney of The Northern Trust Company from 2012 until 2014. |
Susan W. Yee Age: 49 70 Fargo Street, Suite 4 East, Boston, MA 02110 | | Assistant Secretary | | Indefinite; October 2014 to present | | Vice President, Regulatory Services Group, J.P. Morgan Chase Bank, N.A. since 1994, in various positions. |
Craig R. Carberry, Esq.(2) Age: 57 50 South LaSalle Street Chicago, IL 60603 | | Secretary | | Indefinite; July 2011 to present | | Associate General Counsel and Senior Vice President at The Northern Trust Company since June 2015; Chief Compliance Officer of Northern Trust Investments, Inc., October 2015 to June 2017 and Secretary since 2000; Assistant General Counsel and U.S. Funds General Counsel at The Northern Trust Company from July 2014 to June 2015; Senior Legal Counsel and U.S. Funds General Counsel at The Northern Trust Company from 2000-2014; Secretary of 50 South Capital Advisors, LLC since 2015; Secretary of Alpha Core Strategies Fund (formerly NT Alpha Strategies Fund) since 2004; Secretary of Equity Long/Short Opportunities Fund (formerly NT Equity Long/Short Strategies Fund) since 2011; Secretary of Northern Institutional Funds and Northern Funds since 2010; Secretary of The Northern Trust Company of Connecticut from 2009 to 2013. |
Brian Meikel Age: 51 50 South LaSalle Street Chicago, IL 60603 | | Interim Chief Compliance Officer | | Indefinite; October 2018 to present | | Vice President of Northern Trust Investments, Inc. since June 2014; Chief Compliance Officer of BMO Asset Management – Harris Investment Management from August 2006 to September 2013. |
Randal E. Rein Age: 48 50 South LaSalle Street Chicago, IL 60603 | | Treasurer and Principal Financial Officer | | Indefinite; July 2011 to present | | Senior Vice President of Northern Trust Investments, Inc. since 2010; Treasurer of Northern Funds and Northern Institutional Funds since 2008; Treasurer of Alpha Core Strategies Fund from 2008 to 2018; Treasurer of Equity Long/Short Opportunities Fund from 2011 to 2018. |
| | |
| 406 | | FLEXSHARES ANNUAL REPORT |
Trustees and Officers (cont.)
| | | | | | |
| Name, Address and Age | | Position(s)
Held with
the Trust | | Term of
Office(1) and
Length of
Time Served | | Principal Occupation(s) During Past 5 Years |
Peter K. Ewing Age: 59 50 South LaSalle Street Chicago, IL 60603 | | President and Principal Executive Office | | Indefinite; March 2017 to present | | Vice President of the trust from July 2011 to March 2017; Director of ETF Product Management, Northern Trust Investments, Inc. and Senior Vice President, The Northern Trust Company, since September 2010. |
Peter J. Flood Age: 61 50 South LaSalle Street Chicago, IL 60603 | | Vice President Indefinite; | | July 2011 to present | | Director of ETF Investment Strategy, Northern Trust Investments, Inc. since 2010; Portfolio Manager, Northern Trust Investments, Inc. from 2007 to 2014. |
| (1) | Officers hold office at the pleasure of the Board of Trustees until their successors are duly elected and qualified, or until they die, resign, are removed or become disqualified. |
| (2) | On December 13, 2018, Mr. Carberry resigned as Secretary and the Board of Trustees appointed Jose Del Real as Secretary of the Trust. |
| | | | |
| FLEXSHARES ANNUAL REPORT | | | 407 | |
Approval of Advisory Agreement (Unaudited)
The Board of Trustees (the “Board”) of the FlexShares Trust (the “Trust”) oversees the management of the Trust and each separate series of the Trust covered in this report and, as required by law, determines whether to approve the Trust’s investment advisory and ancillary services agreement (the “Advisory Agreement”) with Northern Trust Investments, Inc. (“NTI”), an indirect subsidiary of the Northern Trust Corporation.
*****
At a meeting on June 15, 2018 (the “June Meeting”), the Board, including all of the Trustees who are not parties to the Advisory Agreement or interested persons of any such party (the “Independent Trustees”), considered whether to approve the continuation of the Advisory Agreement between the Trust, on behalf of the FlexShares® Morningstar US Market Factor Tilt Index Fund, FlexShares® Morningstar Developed Markets ex-US Factor Tilt Index Fund, FlexShares® Morningstar Emerging Markets Factor Tilt Index Fund, FlexShares® Morningstar Global Upstream Natural Resources Index Fund, FlexShares® STOXX® Global Broad Infrastructure Index Fund, FlexShares® Global Quality Real Estate Index Fund, FlexShares® Quality Dividend Index Fund, FlexShares® Quality Dividend Defensive Index Fund, FlexShares® Quality Dividend Dynamic Index Fund, FlexShares® International Quality Dividend Index Fund, FlexShares® International Quality Dividend Defensive Index Fund, FlexShares® International Quality Dividend Dynamic Index Fund, FlexShares® iBoxx 3-Year Target Duration TIPS Index Fund, FlexShares® iBoxx 5-Year Target Duration TIPS Index Fund, FlexShares® Disciplined Duration MBS Index Fund, FlexShares® Credit-Scored US Corporate Bond Index Fund, FlexShares® Credit-Scored US Long Corporate Bond Index Fund, FlexShares® US Quality Large Cap Index Fund, FlexShares® Currency Hedged Morningstar DM ex-US Factor Tilt Index Fund, FlexShares® Currency Hedged Morningstar EM Factor Tilt Index Fund, FlexShares® Real Assets Allocation Index Fund, FlexShares® STOXX® US ESG Impact Index Fund, FlexShares® STOXX® Global ESG Impact Index Fund, FlexShares® Ready Access Variable Income Fund and FlexShares® Core Select Bond Fund (each, a “Fund” and together the “Funds”).
In advance of, and in preparation for, the Trustees’ consideration of the Advisory Agreement at the June Meeting, the Trustees received written materials relating to the Advisory Agreement and had the opportunity to ask questions and request further information in connection with their consideration. At the June Meeting, the Trustees considered NTI’s verbal presentations and discussed all of the information that had been provided. Among other things, the Board considered comparisons with other funds in relevant peer universes and peer groups that had been objectively determined solely by Broadridge Financial Solutions, Inc. (“Broadridge”), an independent provider of fund data, and included the following information: (1) a description of the types of funds chosen by Broadridge to compare to each Fund; (2) comparative performance data for each Fund; (3) data on each Fund’s expenses and fees; and (4) comparative fee data for each Fund’s respective peer group, including comparisons of actual and contractual management fees and total expense ratios.
In considering the Advisory Agreement, the Independent Trustees met with their independent legal counsel separately from the “interested” Trustee of the Trust and officers and employees of NTI. After evaluating all the materials, the Trustees, including the Independent Trustees, concluded that the Advisory Agreement was in the best interest of the Funds and their shareholders and approved the continuation of the Advisory Agreement.
The material factors and conclusions that formed the basis for the Trustees reaching their determinations to approve the Advisory Agreement are separately discussed below.
Nature, Quality and Extent of Services
The Board examined the nature, quality and extent of the services provided by NTI to each Fund. The Board also considered NTI’s responsibilities under the Advisory Agreement to perform securities trading services and ancillary services including, among other things: (i) filing reports with the SEC, (ii) periodically updating the Trust’s registration statement, (iii) establishing and maintaining the Funds’ website to comply with regulatory requirements, (iv) monitoring anticipated purchases and redemptions of creation units by shareholders and new investors,
| | |
| 408 | | FLEXSHARES ANNUAL REPORT |
Approval of Advisory Agreement (cont.)
(v) providing information and assistance as required by the Trust’s administrator and fund accountant in connection with the Trust’s shares, and (vi) providing assistance in connection with the operations of the Trust generally.
The Board also considered the quality of NTI’s resources that are made available to the Trust. The Board noted NTI’s and its affiliates’ financial position, stability, and commitment to growing the exchange-traded funds business. The Board also considered the operation and strength of NTI’s compliance program.
The Board noted that Foreside, an entity unaffiliated with NTI, provides distribution services to the Funds and that JPMorgan, also an unaffiliated entity, provides custody, transfer agency, securities lending and fund administration support services, and that these service provider arrangements are relevant to the Board’s considerations of the totality of the circumstances surrounding renewal of the Advisory Agreement with NTI. The Board concluded that each Fund benefits from the services provided under the Advisory Agreement and as a result of NTI’s operations, resources, experience, reputation and personnel.
Fees and Expenses—Investment Performance of the Funds and NTI
The Board considered the fees, expenses and performance of each Fund and NTI, including comparative information provided by Broadridge. The comparisons ranked each Fund in various quintiles over the since inception, one-year, two-year, three-year, four-year and five-year periods ended March 31, 2018, as applicable, with the first quintile being the lowest or best 20% of the funds in terms of fund cost and fund performance, respectively. The Board also considered that, with the exception of FlexShares® Ready Access Variable Income Fund and FlexShares® Core Select Bond Fund, the investment strategy of each Fund is to track the performance of a specified index (each, an “Underlying Index”). The Board noted that the differences in performance between each Fund and that of its Underlying Index demonstrated NTI’s expertise and effectiveness in managing index-based fixed-income and equity exchange-traded funds. The Board reviewed a report of the Funds’ tracking difference contained in the meeting materials.
In reaching its determinations, the Board considered a large amount of data provided by NTI in response to a written request previously submitted by the Independent Trustees to NTI. Among the information considered by the Board was the following:
FlexShares® Morningstar US Market Factor Tilt Index Fund
The Board considered that the Fund’s performance ranked in the fourth quintile of its performance universe for the one-year, second quintile for the two-year and three-year and third quintile for the four-year and five-year periods ended March 31, 2018. The Board considered NTI’s explanation that performance information with respect to the Broadridge peers had limited relevance because none of the peer funds sought to track an index that was the same as the Fund’s index. The Board also considered the information that NTI provided regarding the difference between the Fund’s performance and the performance of its underlying index for the one-year, three-year, five-year and since inception periods.
The Board noted that the Fund’s total expense ratio ranked third compared to six other multi-cap core ETFs and that its actual advisory fee was equal to its expense group median. The Board also noted that the Fund’s total expense ratio and contractual advisory fee were lower than its expense group medians.
FlexShares® Morningstar Developed Markets ex-US Factor Tilt Index Fund
The Board considered that the Fund’s performance ranked in the third quintile of its performance universe for the one-year and four-year, first quintile for the three-year and second quintile for the two-year and five-year periods ended March 31, 2018. The Board considered NTI’s explanation that performance information with respect to the Broadridge peers had limited relevance because none of the peer funds sought to track an index that was the same as the Fund’s index. The Board also considered the information that NTI provided regarding the difference between the Fund’s performance and the performance of its underlying index for the one-year, three-year, five-year and since inception periods.
| | | | |
| FLEXSHARES ANNUAL REPORT | | | 409 | |
Approval of Advisory Agreement (cont.)
The Board also took into account that the Fund’s total expense ratio ranked fourth compared to five other international multi-cap core ETFs and that its total expense ratio and actual and contractual advisory fees were higher than its expense group medians.
FlexShares® Morningstar Emerging Markets Factor Tilt Index Fund
The Board considered that the Fund’s performance ranked in the fourth quintile of its performance universe for the one-year and in the third quintile for the two-year, three-year, four-year and five-year periods ended March 31, 2018. The Board considered NTI’s explanation that performance information with respect to the Broadridge peers had limited relevance because none of the peer funds sought to track an index that was the same as the Fund’s index. The Board also considered the information that NTI provided regarding the difference between the Fund’s performance and the performance of its underlying index for the one-year, three-year, five-year and since inception periods.
The Board noted that the Fund’s total expense ratio ranked fifth compared to five other emerging market ETFs and that its total expense ratio and actual and contractual advisory fees were higher than its expense group medians.
FlexShares® Morningstar Global Upstream Natural Resources Index Fund
The Board considered that the Fund’s performance ranked in the first quintile of its performance universe for the one-year, two-year, three-year and four-year and second quintile for the five-year periods ended March 31, 2018. The Board considered NTI’s explanation that performance information with respect to the Broadridge peers had limited relevance because none of the peer funds sought to track an index that was the same as the Fund’s index. The Board also considered the information that NTI provided regarding the difference between the Fund’s performance and the performance of its underlying index for the one-year, three-year, five-year and since inception periods.
The Board took into account that the Fund’s total expense ratio ranked second compared to six other global natural resources ETFs and that its total expense ratio was lower
than its expense group median and its actual and contractual advisory fees were equal to its expense group medians.
FlexShares® STOXX® Global Broad Infrastructure Index Fund
The Board considered that the Fund’s performance ranked in the third quintile of its performance universe for the one-year and three-year, fifth quintile for the two-year, second quintile for the four-year and fourth quintile for the since inception periods ended March 31, 2018. The Board considered NTI’s explanation that performance information with respect to the Broadridge peers had limited relevance because none of the peer funds sought to track an index that was the same as the Fund’s index. The Board also considered the information that NTI provided regarding the difference between the Fund’s performance and the performance of its underlying index for the one-year, three-year and since inception periods.
The Board considered that the Fund’s total expense ratio ranked third compared to five other global infrastructure ETFs in its expense group and that its total expense ratio was slightly lower than its expense group median and actual and contractual advisory fees were lower than its expense group medians.
FlexShares® Global Quality Real Estate Index Fund
The Board considered that the Fund’s performance ranked in the second quintile of its performance universe for the one-year and two-year and first quintile for the three-year, four-year and since inception periods ended March 31, 2018. The Board considered NTI’s explanation that performance information with respect to the Broadridge peers had limited relevance because none of the peer funds sought to track an index that was the same as the Fund’s index. The Board also considered the information that NTI provided regarding the difference between the Fund’s performance and the performance of its underlying index for the one-year three-year and since inception periods.
The Board considered that the Fund’s total expense ratio ranked first compared to three other global real estate ETFs in its expense group and that its total expense ratio and actual and contractual advisory fees were lower than its expense group medians.
| | |
| 410 | | FLEXSHARES ANNUAL REPORT |
Approval of Advisory Agreement (cont.)
FlexShares® Quality Dividend Index Fund
The Board considered that the Fund’s performance ranked in the first quintile of its performance universe for the three-year, four-year and five-year and second quintile for the one-year and two-year periods ended March 31, 2018. The Board considered NTI’s explanation that performance information with respect to the Broadridge peers had limited relevance because none of the peer funds sought to track an index that was the same as the Fund’s index. The Board also considered the information that NTI provided regarding the difference between the Fund’s performance and the performance of its underlying index for the one-year, three-year, five-year and since inception periods.
The Board considered that the Fund’s total expense ratio ranked third compared to five other equity income ETFs and that its total expense ratio and actual and contractual advisory fees were equal to its expense group medians.
FlexShares® Quality Dividend Defensive Index Fund
The Board considered that the Fund’s performance ranked in the second quintile of its performance universe for the one-year and three-year, third quintile for the two-year and first quintile for the four-year and five-year periods ended March 31, 2018. The Board considered NTI’s explanation that performance information with respect to the Broadridge peers had limited relevance because none of the peer funds sought to track an index that was the same as the Fund’s index. The Board also considered the information that NTI provided regarding the difference between the Fund’s performance and the performance of its underlying index for the one-year, three-year, five-year and since inception periods.
The Board considered that the Fund’s total expense ratio ranked third compared to five other equity income ETFs and that its actual advisory fees were slightly lower than its expense group median. The Board noted that the Fund’s total expense ratio and contractual advisory fees were equal to its expense group medians.
FlexShares® Quality Dividend Dynamic Index Fund
The Board considered that the Fund’s performance ranked in the third quintile of its performance universe for the
one-year, first quintile for the two-year and five-year and second quintile for the three-year and four-year periods ended March 31, 2018. The Board considered NTI’s explanation that performance information with respect to the Broadridge peers had limited relevance because none of the peer funds sought to track an index that was the same as the Fund’s index. The Board also considered the information that NTI provided regarding the difference between the Fund’s performance and the performance of its underlying index for the one-year, three-year, five-year and since inception periods.
The Board considered that the Fund’s total expense ratio ranked third compared to five other equity income ETFs and that its actual advisory fees were slightly lower than its expense group median. The Board noted that the Fund’s total expense ratio and contractual advisory fees were equal to its expense group medians.
FlexShares® International Quality Dividend Index Fund
The Board considered that the Fund’s performance ranked in the fourth quintile of its performance universe for the one-year, second quintile for the two-year, three-year and four-year and third quintile for the since inception periods ended March 31, 2018. The Board considered NTI’s explanation that performance information with respect to the Broadridge peers had limited relevance because none of the peer funds sought to track an index that was the same as the Fund’s index. The Board also considered the information that NTI provided regarding the difference between the Fund’s performance and the performance of its underlying index for the one-year, three-year and since inception periods.
The Board took into account that the Fund’s total expense ratio ranked fourth compared to six other international equity income ETFs and that its total expense ratio and contractual advisory fees were equal to its expense group medians. The Board noted that the Fund’s actual advisory fees were slightly higher than its expense group median.
FlexShares® International Quality Dividend Defensive Index Fund
The Board considered that the Fund’s performance ranked in the fourth quintile of its performance universe for the
| | | | |
| FLEXSHARES ANNUAL REPORT | | | 411 | |
Approval of Advisory Agreement (cont.)
one-year and two-year, second quintile for the three-year and third quintile for the four-year and since inception periods ended March 31, 2018. The Board considered NTI’s explanation that performance information with respect to the Broadridge peers had limited relevance because none of the peer funds sought to track an index that was the same as the Fund’s index. The Board also considered the information that NTI provided regarding the difference between the Fund’s performance and the performance of its underlying index for the one-year, three-year and since inception periods.
The Board took into account that the Fund’s total expense ratio ranked fourth compared to six other international equity income ETFs and that its total expense ratio and contractual advisory fee were equal to its expense group medians. The Board noted that the Fund’s actual advisory fees were slightly higher than its expense group median.
FlexShares® International Quality Dividend Dynamic Index Fund
The Board considered that the Fund’s performance ranked in the third quintile of its performance universe for the one-year, first quintile for the two-year, three-year and since inception and the second quintile for the four-year periods ended March 31, 2018. The Board considered NTI’s explanation that performance information with respect to the Broadridge peers had limited relevance because none of the peer funds sought to track an index that was the same as the Fund’s index. The Board also considered the information that NTI provided regarding the difference between the Fund’s performance and the performance of its underlying index for the one-year, three-year and since inception periods.
The Board took into account that the Fund’s total expense ratio ranked fourth compared to six other international equity income ETFs and that its total expense ratio and its contractual and actual advisory fees were equal to its expense group medians.
FlexShares® iBoxx 3-Year Target Duration TIPS Index Fund
The Board considered that the Fund’s performance ranked in the fifth quintile of its performance universe for the
one-year and four-year, fourth quintile for the two-year, third quintile for the three-year and second quintile for the five-year periods ended March 31, 2018. The Board considered NTI’s explanation that performance information with respect to the Broadridge peers had limited relevance because none of the peer funds sought to track an index that was the same as the Fund’s index. The Board also considered the information that NTI provided regarding the difference between the Fund’s performance and the performance of its underlying index for the one-year, three-year, five-year and since inception periods.
The Board took into account that the Fund’s total expense ratio ranked fourth compared to four other inflation-protected bond ETFs and that its total expense ratio was slightly higher than its expense group median. The Board noted that the Fund’s actual and contractual advisory fees were equal to its expense group medians.
FlexShares® iBoxx 5-Year Target Duration TIPS Index Fund
The Board noted that the Fund’s performance ranked in the fourth quintile of its performance universe for the one-year and two-year, second quintile for the three-year and five-year and third quintile for the four-year periods ended March 31, 2018. The Board considered NTI’s explanation that performance information with respect to the Broadridge peers had limited relevance because none of the peer funds sought to track an index that was the same as the Fund’s index. The Board also considered the information that NTI provided regarding the difference between the Fund’s performance and the performance of its underlying index for the one-year, three-year, five-year and since inception periods.
The Board took into account that the Fund’s total expense ratio ranked fourth compared to four other inflation-protected bond ETFs and that its total expense ratio was slightly higher than its expense group median. The Board noted that the Fund’s actual and contractual advisory fees were equal to its expense group medians.
FlexShares® Disciplined Duration MBS Index Fund
The Board considered that the Fund’s performance ranked in the fourth quintile of its performance universe for the
| | |
| 412 | | FLEXSHARES ANNUAL REPORT |
Approval of Advisory Agreement (cont.)
one-year, two-year, three-year and since inception periods ended March 31, 2018. The Board considered NTI’s explanation that performance information with respect to the Broadridge peers had limited relevance because none of the peer funds sought to track an index that was the same as the Fund’s index. The Board also considered the information that NTI provided regarding the difference between the Fund’s performance and the performance of its underlying index for the one-year, three-year and since inception periods.
The Board considered that the Fund’s total expense ratio ranked third compared to three other US mortgage ETFs in its expense group and that its total expense ratio and actual advisory fees were slightly higher than its expense group medians. The Board noted that the Fund’s contractual advisory fees were equal to its expense group median.
FlexShares® Credit-Scored US Corporate Bond Index Fund
The Board considered that the Fund’s performance ranked in the fifth quintile of its performance universe for the one-year and two-year and fourth quintile for the three-year and since inception periods ended March 31, 2018. The Board considered NTI’s explanation that performance information with respect to the Broadridge peers had limited relevance because none of the peer funds sought to track an index that was the same as the Fund’s index. The Board also considered the information that NTI provided regarding the difference between the Fund’s performance and the performance of its underlying index for the one-year, three-year and since inception periods.
The Board considered that the Fund’s total expense ratio ranked sixth compared to five other BBB-rated corporate debt ETFs in its expense group and that its total expense ratio and its contractual and actual advisory fees were higher than its expense group medians.
FlexShares® Credit-Scored US Long Corporate Bond Index Fund
The Board considered that the Fund’s performance ranked in the first quintile of its performance universe for the one-year and since inception and the second quintile for the two-year periods ended March 31, 2018. The Board considered NTI’s
explanation that performance information with respect to the Broadridge peers had limited relevance because none of the peer funds sought to track an index that was the same as the Fund’s index. The Board also considered the information that NTI provided regarding the difference between the Fund’s performance and the performance of its underlying index for the one-year and since inception periods.
The Board considered that the Fund’s total expense ratio ranked sixth compared to five other BBB-rated corporate debt ETFs in its expense group and that its total expense ratio and contractual advisory fees were higher than its expense group medians and its actual advisory fees were equal to its expense group median.
FlexShares® US Quality Large Cap Index Fund
The Board considered that the Fund’s performance ranked in the second quintile of its performance universe for the one-year and in the third quintile for the two-year and since inception periods ended March 31, 2018. The Board considered NTI’s explanation that performance information with respect to the Broadridge peers had limited relevance because none of the peer funds sought to track an index that was the same as the Fund’s index. The Board also considered the information that NTI provided regarding the difference between the Fund’s performance and the performance of its underlying index for the one-year and since inception periods.
The Board considered that the Fund’s total expense ratio ranked seventh compared to ten other multi-cap core ETFs in its expense group and that its total expense ratio and actual and contractual advisory fees were higher than its expense group medians.
FlexShares® Currency Hedged Morningstar DM ex-US Factor Tilt Index Fund
The Board considered that the Fund’s performance ranked in the fourth quintile of its performance universe for the one-year and two-year and fifth quintile for the since inception periods ended March 31, 2018. The Board considered NTI’s explanation that performance information with respect to the Broadridge peers had limited relevance because none of the peer funds sought to track an index that
| | | | |
| FLEXSHARES ANNUAL REPORT | | | 413 | |
Approval of Advisory Agreement (cont.)
was the same as the Fund’s index. The Board also considered the information that NTI provided regarding the difference between the Fund’s performance and the performance of its underlying index for the one-year and since inception periods.
The Board considered that the Fund’s total expense ratio ranked third compared to one other international small/mid-cap value ETF, two international small/mid-cap growth ETFs, and two international small/mid-cap core ETFs in its expense group and that its total expense ratio, was slightly lower than its expense group median and its contractual advisory fees and actual advisory fees were lower than its expense group medians.
FlexShares® Currency Hedged Morningstar EM Factor Tilt Index Fund
The Board considered that the Fund’s performance ranked in the fifth quintile of its performance universe for the one-year and fourth quintile for the two-year and since inception periods ended March 31, 2018. The Board considered NTI’s explanation that performance information with respect to the Broadridge peers had limited relevance because none of the peer funds sought to track an index that was the same as the Fund’s index. The Board also considered the information that NTI provided regarding the difference between the Fund’s performance and the performance of its underlying index for the one-year and since inception periods.
The Board considered that the Fund’s total expense ratio ranked fifth compared to seven other emerging markets ETFs in its expense group and that its total expense ratio was higher than its expense group median, its contractual advisory fee was equal to its expense group median and its actual advisory fees were lower than its expense group median.
FlexShares® Real Assets Allocation Index Fund
The Board considered that the Fund’s performance ranked in the fourth quintile of its performance universe for the two-year and the third quintile for the one-year and since inception periods ended March 31, 2018. The Board considered NTI’s explanation that performance information with respect to the Broadridge peers had limited relevance
because none of the peer funds sought to track an index that was the same as the Fund’s index. The Board also considered the information that NTI provided regarding the difference between the Fund’s performance and the performance of its underlying index for the one-year and since inception periods.
The Board considered that the Fund’s total expense ratio ranked third compared to five other specialty and miscellaneous ETFs in its expense group and that its total expense ratio and actual advisory fees were lower than its expense group medians while its contractual advisory fees were higher than its expense group median.
FlexShares® STOXX® US ESG Impact Index Fund
The Board considered that the Fund’s performance ranked in the second quintile of its performance universe for the one-year and since inception periods ended March 31, 2018. The Board consideredNTI’s explanation that performance information with respect to the Broadridge peers had limited relevance because none of the peer funds sought to track an index that was the same as the Fund’s index. The Board also considered the information that NTI provided regarding the difference between the Fund’s performance and the performance of its underlying index for the one-year and since inception periods.
The Board considered that the Fund’s total expense ratio ranked third compared to two other large-cap core ETFs, one large-cap growth ETF and one large-cap value ETF in its expense group and that its total expense ratio was equal to its expense group median, its actual advisory fees were slightly higher than its expense group median and its contractual advisory fees were lower than its expense group median.
FlexShares® STOXX® Global ESG Impact Index Fund
The Board considered that the Fund’s performance ranked in the third quintile of its performance universe for the one-year and first quintile for the since inception periods ended March 31, 2018. The Board considered NTI’s explanation that performance information with respect to the Broadridge peers had limited relevance because none of the peer funds sought to track an index that was the same as
| | |
| 414 | | FLEXSHARES ANNUAL REPORT |
Approval of Advisory Agreement (cont.)
the Fund’s index. The Board also considered the information that NTI provided regarding the difference between the Fund’s performance and the performance of its underlying index for the one-year and since inception periods.
The Board considered that the Fund’s total expense ratio ranked fourth compared to two global multi-cap value ETFs, one international multi-cap core ETF and one international large-cap core ETF in its expense group and that its total expense ratio and actual advisory fees were higher than its expense group medians and its contractual advisory fees were equal to its expense group median.
FlexShares® Ready Access Variable Income Fund
The Board considered that the Fund’s performance ranked in the third quintile of its performance universe for the one-year, three-year and four-year, second quintile for the five-year and fourth quintile for the two-year periods ended March 31, 2018. The Board considered NTI’s assertion that of the five other ETFs in the Fund’s performance universe only one fund, the PIMCO Enhanced Short Maturity Exchange Traded Fund, was comparable to the Fund. The Board also considered NTI’s explanation that the Fund’s performance compared favorably to the performance of such fund on a volatility-adjusted basis.
The Board considered that the Fund’s total expense ratio ranked third compared to four other ultra-short obligation ETFs and one short investment-grade debt ETF, and that its total expense ratio was lower than its expense group median while its actual and contractual advisory fees were higher than its expense group medians.
FlexShares® Core Select Bond Fund
The Board considered that the Fund’s performance ranked in the fourth quintile of its performance universe for the one-year and fifth quintile for the since inception periods ended March 31, 2018. The Board considered NTI’s assertion that none of the other ETFs in the Fund’s performance universe were comparable to the Fund.
The Board considered that the Fund’s total expense ratio ranked third compared to three other general bond ETFs in
its expense group and that its total expense ratio and contractual advisory fees were higher than its expense group medians. The Board noted that the Fund’s actual advisory fees were lower than its expense group median.
Costs of Services and Profits of NTI
The Board considered the unitary fee structure and the expenses for each Fund and noted that, under the Advisory Agreement, NTI was responsible for most expenses of the Funds, including the cost of transfer agency, custody, fund administration, legal, audit and other services. The Board considered that NTI was not responsible under the Advisory Agreement for certain expenses, including the fees and expenses of the Trust’s Independent Trustees and their independent legal counsel, litigation expenses and other extraordinary expenses. The Board also considered the agreement between the Trust and NTI, whereby NTI agreed to reimburse the fees and expenses of the Independent Trustees and their independent legal counsel with respect to each Fund until at least March 1, 2019. The Board also considered that NTI had agreed to waive a portion of its management fee and/or reimburse operating expenses in an amount equal to any acquired fund fees and expenses incurred by the FlexShares® Real Assets Allocation Index Fund, FlexShares® Currency Hedged Morningstar DM ex-US Factor Tilt Index Fund, FlexShares® Currency Hedged Morningstar EM Factor Tilt Index Fund and FlexShares® Core Select Bond Fund that are attributable to their investment in other Funds, as well of up to 0.05% of acquired fund fees and expenses attributable to the FlexShares® Core Select Bond Fund’s investment in unaffiliated funds.
The Board considered the advisory fee for each Fund as compared to that of other comparable funds in relation to its respective Broadridge median. The Board considered NTI’s explanation that each index Fund’s contractual management fee (which, owing to the unitary fee structure and the existence of the expense reimbursement agreement, is identical to its total expense ratio) compared favorably with its respective Broadridge median contractual management fee for comparable funds set forth in the Broadridge report, especially after taking into account, among other factors, important differences between the indexes upon which such comparable funds are based and the Fund’s underlying
| | | | |
| FLEXSHARES ANNUAL REPORT | | | 415 | |
Approval of Advisory Agreement (cont.)
index and differences between the number of portfolio holdings for comparable funds and the Funds.
The Board considered the advisory fee schedules for other accounts with similar investment advisory mandates as those of the Funds, noting that there were no comparable accounts for certain of the Funds. The Board considered (a) the differences in managing ETFs versus separately managed accounts which involve daily purchase and redemption activity along with robust regulatory and governance requirements; and (b) the Funds’ unitary fee structure.
The Board examined NTI’s profitability information provided by NTI and the Trustees considered that NTI was profitable on a pre-distribution basis and post-distribution basis. The Board considered that NTI’s potential for profitability would continue to be subject to financial uncertainties and risks. The Board also considered that NTI would continue to develop and offer additional new products in efforts to complete the over-all integrity of the FlexShares product suite, consistent with its product strategy, and that these products may expose NTI to additional financial risks and uncertainties.
Economies of Scale
The Board considered whether NTI may realize economies of scale in managing and supporting the Funds. The Board reviewed each Fund’s fee arrangements, and considered that, in light of the unitary fee structure and expense reimbursement agreement, NTI’s recent profitability from its services to the Trust and the significant investment that NTI had made and continues to make in the Trust, breakpoints were not necessary at this time. The Board also noted the reduction in the management fee rate payable by the FlexShares® iBoxx 3-Year Target Duration TIPS Index Fund and FlexShares® iBoxx 5-Year Target Duration TIPS Index Fund, as of November 1, 2017.
Other Benefits to NTI
In addition to considering the profits that may be realized by NTI, the Board considered information regarding other direct and indirect benefits NTI may receive as a result of its relationship with the Funds, including whether any
compensation would be paid to its affiliates. The Board also considered that some of the Funds’ shareholders have other client relationships with NTI’s affiliates. The Board also reviewed the extent to which NTI and its other clients, as well as the Funds, benefit from receipt of the research products and services generated by the Funds.
The Board, including the Independent Trustees, considered the data provided by NTI and concluded that sufficient information had been provided to allow them to evaluate the terms of the Advisory Agreement and each Fund’s investment advisory fee. They determined that each Fund’s advisory fee was reasonable in light of the services provided and the performance achieved by the Fund.
*****
At the June Meeting, the Board, including all of the Independent Trustees also considered whether to approve the Advisory Agreement for the FlexShares® High Yield Value-Scored Bond Index Fund (the “New Fund”).
In advance of, and in preparation for, the Trustees’ consideration of the Advisory Agreement at the Meeting, the Trustees received written materials relating to the Advisory Agreement and had the opportunity to ask questions and request further information in connection with their consideration. At the Meeting, the Trustees considered the verbal presentations by NTI and discussed all of the information that had been provided. Among other things, the Board considered comparisons with other funds in relevant peer universes and peer groups that had been objectively determined solely by Broadridge, an independent provider of fund data.
The Independent Trustees met with their independent legal counsel separately from the “interested” Trustee of the Trust and officers and employees of the Trust and NTI to consider approval of the Advisory Agreement. After evaluating all the materials, the Trustees, including the Independent Trustees, concluded that the Advisory Agreement for the New Fund was in the best interest of the New Fund and its shareholders and approved the Advisory Agreement.
In approving the Advisory Agreement, the Board, including the Independent Trustees advised by independent legal
| | |
| 416 | | FLEXSHARES ANNUAL REPORT |
Approval of Advisory Agreement (cont.)
counsel, considered the factors they deemed relevant, including, but not limited to: (1) the nature, extent and quality of the services that NTI is expected to provide to the New Fund; (2) the anticipated fees and projected expenses for the New Fund; (3) the projected profits to be realized by NTI and its affiliates from the relationship with the New Fund; (4) the extent to which economies of scale would be realized if the New Fund grew and whether the fee levels in the Advisory Agreement reflected these economies of scale; and (5) other benefits that NTI and its affiliates may realize as a result of their relationship with the New Fund. In their deliberations, the Trustees did not identify any single factor which alone was responsible for the Board’s decision to approve the Advisory Agreement.
The material factors and conclusions that formed the basis for the Trustees reaching their determinations to approve the Advisory Agreement are separately discussed below.
Nature, Quality and Extent of Services
The Board examined the nature, quality and extent of the services to be provided by NTI to the New Fund. The Board evaluated information regarding NTI’s organizational structure and the experience and professional qualifications of NTI’s key personnel. They also considered NTI’s responsibilities under the Advisory Agreement to perform securities trading services and ancillary services, including among other things, (i) filing reports with the SEC, (ii) periodically updating the New Fund’s registration statement, (iii) establishing and maintaining of the New Fund’s website to comply with regulatory requirements, (iv) monitoring anticipated purchases and redemptions of creation units by shareholders and new investors, (v) providing information and assistance as required by the Trust’s administrator and fund accountant in connection with the Trust’s shares, and (vi) providing assistance with the operations of the Trust generally. The Board also considered the quality of NTI’s resources that would be made available to the New Fund. The Board noted NTI’s and its affiliates’ financial position, stability, and commitment to growing the exchange-traded funds business. The Board also considered the operation and strength of NTI’s compliance program. The Board concluded that they were
satisfied with the nature, quality and extent of the investment management services proposed to be provided by NTI to the New Fund. The Board further determined that there was a reasonable basis on which they could conclude that the New Fund would benefit from the services proposed to be provided by NTI under the Advisory Agreement.
Performance of the New Fund
The Board considered that, because the New Fund had not yet commenced operations, meaningful data relating to its performance was not available and could not be a factor in the initial approval of the Advisory Agreement.
Fees and Expenses for the New Fund
The Board considered the proposed unitary fee structure and the New Fund’s projected expenses, noting that under the Advisory Agreement, NTI would be responsible for most expenses of the New Fund, including the cost of transfer agency, custody, fund administration, legal, audit and other services. The Board considered that NTI was not responsible under the Advisory Agreement for certain expenses, including the fees and expenses of the Trust’s Independent Trustees and their independent legal counsel, litigation expenses, and other extraordinary expenses. The Board considered comparative fee data for the New Fund, which included fees and expenses paid by comparable exchange-traded funds selected by Broadridge.
With respect to the New Fund, the Board noted that the New Fund’s estimated total expense ratio was ranked second compared to five other high yield ETFs chosen by Broadridge. The Board also considered that the New Fund’s projected total expense ratio was lower than its expense group median. The Board also considered that the New Fund’s proposed contractual advisory fee and proposed actual advisory fee were lower than its expense group averages and expense group medians. The Board considered the New Fund’s proposed advisory fee compared to other funds managed by NTI with similar investment policies and strategies. The Trustees also noted that NTI did not manage any other accounts pursuing investment strategies similar to those of the New Fund.
| | | | |
| FLEXSHARES ANNUAL REPORT | | | 417 | |
Approval of Advisory Agreement (cont.)
Projected Profits of NTI for the New Fund
The Board examined NTI’s projected profits in serving as the New Fund’s investment adviser. The Board noted information provided by NTI with respect to the length of time it would take to become profitable with respect to the New Fund. The Trustees also considered NTI’s projected asset levels in the New Fund.
Economies of Scale for the New Fund
The Board considered whether NTI may realize economies of scale in managing and supporting the New Fund. In this regard, the Board considered that the proposed management fee did not contain any breakpoints. The Trustees determined that breakpoints were not necessary at the present time in light of the unitary fee structure, the fact that NTI did not expect to initially make any profit from its services to the New Fund, as well as the significant investment NTI was making in the New Fund.
Other Benefits to NTI for the New Fund
In addition to considering the profits that may be realized by NTI, the Board considered information regarding other direct and indirect benefits NTI may receive as a result of its relationship with the New Fund, including whether any compensation would be paid to NTI’s affiliates. The Board also considered that some of the New Fund’s expected shareholders are expected to have other client relationships with NTI’s affiliates. The Board also reviewed the extent to which NTI and its other clients, as well as the Funds, may benefit from receipt of the research products and services generated by the New Fund.
The Board, including the Independent Trustees, considered the data provided by NTI and concluded that sufficient information had been provided to allow them to evaluate the terms of the Advisory Agreement with respect to the New Fund and the proposed investment advisory fee for the New Fund. They determined that the New Fund’s advisory fee was reasonable in light of the services to be provided.
| | |
| 418 | | FLEXSHARES ANNUAL REPORT |
Supplemental Information (Unaudited)
Principal Risks
As with any investment, you could lose all or part of your investment in a Fund, and the Fund’s performance could trail that of other investments. In addition to the discussion of the risks of certain of the Funds’ investments included in Note 2, some of the principal risks of investment in the Funds are summarized below. A more complete description of principal risks is included in each Fund’s Prospectus.
The following risks apply to all of the Funds:
Cyber Security and Operational Risk
Cyber security and operational risk is the risk that the Fund and its service providers may experience disruptions that arise from breaches in cyber security, human error, processing and communications errors, counterparty or third-party errors, technology or systems failures, any of which may have an adverse impact on the Fund. Failures or breaches of the electronic systems of the Fund, the Fund’s adviser, distributor, and other service providers, market makers, Authorized Participants or the issuers of securities in which the Fund invests have the ability to cause disruptions and negatively impact the Fund’s business operations, potentially resulting in financial losses to the Fund and its shareholders.
Derivatives Risk
Changes in the value of a derivative instrument may not correlate perfectly with the underlying asset, rate or index, and the Funds could lose more than the principal amount invested.
Market Trading Risk
Each Fund’s shares are listed on a securities exchange, which presents risks including the potential lack of an active market for Fund shares, losses from trading in secondary markets, and disruption in the creation/redemption process of the Funds. Any of these factors may lead to the Funds’ shares trading at a premium or discount to NAV.
Valuation Risk
The sale price the Funds could receive for a security may differ from the Funds’ valuation of the security, particularly for securities that trade in low volume or volatile markets, or that are valued using a fair value methodology.
The following risk applies only to the Index Funds:
Tracking Error Risk
Tracking error risk is the risk that an Index Fund’s performance may vary substantially from the performance of the Underlying Index it tracks as a result of imperfect correlation between a Fund’s securities and those of the Underlying Index. Imperfect correlation may result from share purchases and redemptions, expenses, changes in the Underlying Indexes, asset valuations, foreign currency valuations, market impact, corporate actions (such as mergers and spinoffs), legal restrictions (such as tax-related diversification requirements that apply to the Funds but not to the Underlying Index) and timing variances, among other factors.
Calculation Methodology Risk
Each of the Index Funds is subject to Calculation Methodology Risk. This is the risk that the Underlying Index’s calculation methodology or sources of information may not provide an accurate assessment of included issuers or correct valuation of securities, nor is the availability or timeliness of the production of the Index guaranteed.
| | | | |
| FLEXSHARES ANNUAL REPORT | | | 419 | |
Supplemental Information (cont.)
The following risks apply to each Fund as disclosed:
Concentration Risk
Each of the Funds, except the FlexShares iBoxx 3-Year Target Duration TIPS Index Fund and the FlexShares iBoxx 5-Year Target Duration TIPS Index Fund, is subject to Concentration Risk. To the extent that the investments of these Funds are concentrated in the securities of issuers in a particular region, country, market, industry, sector or asset class, the Funds may be subject to increased price volatility and may be more susceptible to adverse economic, market, political or regulatory occurrences affecting that region, country, market, industry, sector or asset class.
Interest Rate/Maturity Risk
The FlexShares iBoxx 3-Year Target Duration TIPS Index Fund, FlexShares iBoxx 5-Year Target Duration TIPS Index Fund, FlexShares Disciplined Duration MBS Index Fund, FlexShares Credit-Scored US Corporate Bond Index Fund, FlexShares Credit-Scored US Long Corporate Bond Index Fund, FlexShares High Yield Value-Scored Bond Index Fund, FlexShares Ready Access Variable Income Fund, and the FlexShares Core Select Bond Fund are subject to the risk that the value of the Funds’ fixed-income assets will decline because of rising interest rates. The magnitude of this decline will often be greater for longer-term fixed income securities than shorter-term fixed-income securities. Duration is a measure used to determine the sensitivity of a security’s price to changes in interest rates. The longer a security’s duration, the more sensitive it will be to changes in interest rates.
MLP Risk
The FlexShares STOXX® Global Broad Infrastructure Index Fund and the FlexShares Real Assets Allocation Index Fund (including through its investment in its Underlying Fund(s)) may invest in Master Limited Partnerships (MLPs). The Fund may not invest more than 25% of its net assets in MLPs. MLP Risk is the risk that accompanies an investment in MLP units. Investing in MLPs involves certain risks related to investing in the underlying assets of the MLPs and risks associated with pooled investment vehicles. MLPs that concentrate in a particular industry or a particular geographic region are subject to risks associated with such industry or region. The benefit derived from the Fund’s investment in MLPs is largely dependent on the MLPs being treated as partnerships for federal income tax purposes. If any of the MLPs owned by the Fund were treated as corporations for U.S. federal income tax purposes, the after-tax return to the Fund with respect to its investment in such MLPs would be materially reduced, which could cause a decline in the value of the Fund’s shares. The Fund must include its allocable share of the MLP’s taxable income in its taxable income, whether or not it receives a distribution of cash from the MLP. In such case, the Fund may have to liquidate securities to make required distributions to the Fund’s shareholders.
Non-diversification Risk
The FlexShares Currency Hedged Morningstar DM ex-US Factor Tilt Index Fund, FlexShares Currency Hedged Morningstar EM Factor Tilt Index Fund, FlexShares Morningstar Global Upstream Natural Resources Index Fund, FlexShares STOXX® Global Broad Infrastructure Index Fund, FlexShares Global Quality Real Estate Index Fund, FlexShares Real Assets Allocation Index Fund, FlexShares iBoxx 3-Year Target Duration TIPS Index Fund, FlexShares iBoxx 5-Year Target Duration TIPS Index Fund, FlexShares Credit-Scored US Corporate Bond Index Fund, FlexShares Credit-Scored US Long Corporate Bond Index Fund, and the FlexShares Ready Access Variable Income Fund (each a “Fund” and collectively the “Funds”) are non-diversified series of the Trust, pursuant to the 1940 Act. Fund performance may depend on the performance of a small number of issuers because the Funds may invest a large percentage of its assets in securities issued by or representing a small number of issuers.
| | |
| 420 | | FLEXSHARES ANNUAL REPORT |
Supplemental Information (cont.)
Large Cap Risk
The FlexShares US Quality Large Cap Index Fund, FlexShares STOXX® US ESG Impact Index Fund, FlexShares STOXX® Global ESG Impact Index Fund, FlexShares Quality Dividend Index Fund, FlexShares Quality Dividend Defensive Index Fund, FlexShares Quality Dividend Dynamic Index Fund, FlexShares International Quality Dividend Index Fund, FlexShares International Quality Dividend Defensive Index Fund, and the FlexShares International Quality Dividend Dynamic Index Fund are subject to the risk that returns on investments in stocks of large U.S. companies could trail the returns on investments in stocks of smaller and mid-sized companies.
Mid Cap Stock Risk
The FlexShares STOXX® US ESG Impact Index Fund and the FlexShares STOXX® Global ESG Impact Index Fund may invest in stocks of mid-sized companies which may be subject to more abrupt or erratic market movements than stocks of larger, more established companies. Mid-sized companies may have limited product lines or financial resources, and may be dependent upon a particular niche of the market.
Mid and Small Cap Stock Risk
The FlexShares Morningstar US Market Factor Tilt Index Fund, FlexShares Morningstar Developed Markets ex-US Factor Tilt Index Fund, FlexShares Morningstar Emerging Markets Factor Tilt Index Fund, FlexShares Currency Hedged Morningstar DM ex-US Factor Tilt Index Fund (including through its investment in its Underlying Fund), FlexShares Currency Hedged Morningstar EM Factor Tilt Index Fund (including through its investment in its Underlying Fund), FlexShares Morningstar Global Upstream Natural Resources Index Fund, FlexShares STOXX® Global Broad Infrastructure Index Fund, FlexShares Global Quality Real Estate Index Fund, and the FlexShares Real Assets Allocation Index Fund (including through its investment in its Underlying Fund(s)) may invest in stocks of smaller companies which may be more volatile than stocks of larger, more established companies. Small companies may have limited product lines or financial resources, or may be dependent upon a small or inexperienced management group, and their securities may trade less frequently and in lower volume than the securities of larger companies, which could lead to higher transaction costs. Generally the smaller the company size, the greater the risk.
Value Investing Risk
The FlexShares Morningstar US Market Factor Tilt Index Fund, FlexShares Morningstar Developed Markets ex-US Factor Tilt Index Fund, FlexShares Morningstar Emerging Markets Factor Tilt Index Fund, FlexShares Currency Hedged Morningstar DM ex-US Factor Tilt Index Fund, FlexShares Currency Hedged Morningstar EM Factor Tilt Index Fund, FlexShares US Quality Large Cap Index Fund, FlexShares Global Quality Real Estate Index Fund, and the FlexShares Real Assets Allocation Index Fund’s (including through its investment in its Underlying Fund(s)) investment in companies whose securities are believed to be undervalued, relative to their underlying profitability, may not appreciate in value as anticipated.
ESG Investment Risk
The FlexShares STOXX® US ESG Impact Index Fund and the FlexShares STOXX® Global ESG Impact Index Fund are subject to the risk that because the methodology of the Underlying Index selects and assigns weights to securities of issuers for nonfinancial reasons, the Fund may underperform the broader equity market or other funds that do not utilize ESG criteria when selecting investments.
| | | | |
| FLEXSHARES ANNUAL REPORT | | | 421 | |
Supplemental Information (cont.)
Global Natural Resources Industry Risk
The FlexShares Morningstar Global Upstream Natural Resources Index Fund (which is also an Underlying Fund of the FlexShares Real Assets Allocation Index Fund) is subject to the risks associated with investment in the global natural resources sector in addition to the general risk of the stock market. The natural resources sector can significantly be affected by events relating to U.S. and foreign political and economic developments and environmental and other government regulations, as well as other factors including, but not limited to: commodity price volatility, technological developments and natural or man-made disasters. Declines in the demand for, or prices of, natural resources generally would be expected to contribute to declines in the value of the Fund’s equity securities. Such declines may occur quickly and without warning and may negatively impact the value of the Fund and your investment.
Hedging Risk
The FlexShares Core Select Bond Fund is subject to the risk that the Fund’s short positions in U.S. Treasury futures and transactions in interest rate swaps will not completely eliminate interest rate risk of long positions in bonds. In certain falling interest rate environments, the Fund’s hedging strategy could result in disproportionately larger losses in the short U.S. Treasury futures and interest rate swaps positions as compared to gains in the long bond positions attributable to interest rate changes.
Corporate Bond Risk
The FlexShares Credit-Scored US Corporate Bond Index Fund and the FlexShares Credit-Scored US Long Corporate Bond Index Fund invest primarily in bonds issued by corporations. Corporate debt securities are subject to the risk of the issuer’s inability to meet principal and interest payments on the obligation and may also be subject to price volatility due to such factors as interest rate sensitivity, market perception of the creditworthiness of the issuer and general market liquidity. When interest rates rise, the value of corporate debt can be expected to decline. Debt securities with longer maturities tend to be more sensitive to interest rate movements than those with shorter maturities.
Interest Rate Risk
The FlexShares STOXX® Global Broad Infrastructure Index Fund and the FlexShares Global Quality Real Estate Index Fund (which is also an Underlying Fund of the FlexShares Real Assets Allocation Index Fund) are subject to the risk that rising interest rates may adversely affect the Fund. Increases in interest rates typically lower the present value of a REIT’s future earnings stream, and may make financing property purchases and improvements more costly. Because the market price of REIT stocks may change based upon investors’ collective perceptions of future earnings, the value of the Fund may decline when investors anticipate or experience rising interest rates.
The following risks apply only to the FlexShares Quality Dividend Index Fund, FlexShares Quality Dividend Defensive Index Fund, FlexShares Quality Dividend Dynamic Index Fund, FlexShares International Quality Dividend Index Fund, FlexShares International Quality Dividend Defensive Index Fund, and the FlexShares International Quality Dividend Dynamic Index Fund:
Dividend Risk
The Fund is subject to the risk that an issuer of stock held by the Fund may choose not to declare a dividend or the dividend rate might not remain at current levels. Dividend paying stocks might not experience the same level of earnings growth or capital appreciation as non-dividend paying stocks. The Fund’s performance during a broad market advance could suffer because dividend paying stocks may not experience the same capital appreciation as non-dividend paying stocks.
| | |
| 422 | | FLEXSHARES ANNUAL REPORT |
Supplemental Information (cont.)
Volatility Risk
The Fund is subject to the risk that the actual level of volatility experienced by the Fund may be greater or lower than the targeted overall volatility of the Underlying Index. Although the Underlying Index is designed to have a targeted overall volatility, there is no guarantee that it will have the targeted overall volatility. The Fund will continue to seek to track the Underlying Index even if the Underlying Index does not have the targeted overall volatility. There is also the risk that the Fund may experience volatility greater or lower than that of the Underlying Index as a result of tracking error. A portfolio of securities with greater volatility is generally considered to have a higher risk profile than a portfolio with lower volatility.
The following risks apply to the FlexShares Global Quality Real Estate Index Fund (which is also an Underlying Fund of the FlexShares Real Assets Allocation Index Fund):
Real Estate Securities Risk
The Fund is subject to the risks associated with investment in the real estate sector in addition to the general risk of the stock market. Investing in securities of real estate companies will make the Fund more susceptible to risks associated with the ownership of real estate and with the real estate industry in general, as well as risks that relate specifically to the way in which real estate companies are organized and operated. Real estate companies may have lower trading volumes and may be subject to more abrupt or erratic price movements than the overall securities markets. The value of real estate securities may underperform other sectors of the economy or broader equity markets. To the extent that the Fund concentrates its investments in the real estate sector, it may be subject to greater risk of loss than if it were diversified across different industry sectors.
Real Estate Investment Trust (REIT) Risk
The Fund is subject to the risk that the Fund’s investments will be affected by factors affecting REITs and the real estate sector generally. Investing in REITs involves certain unique risks in addition to those risks associated with investing in the real estate industry in general. REITs whose underlying properties are concentrated in a particular industry or geographic region are also subject to risks affecting such industries and regions. By investing in REITs through the Fund, a shareholder will bear expenses of the REITs in addition to expenses of the Fund.
The following risk applies only to the FlexShares Currency Hedged Morningstar DM ex-US Factor Tilt Index Fund, FlexShares Currency Hedged Morningstar EM Factor Tilt Index Fund, FlexShares Real Assets Allocation Index Fund, and the FlexShares Core Select Bond Fund:
Fund of Funds Risk
The Fund is subject to the risk that the Fund’s investment performance largely depends on the investment performance of the Underlying Fund(s) in which it primarily invests. The Fund’s NAV will change with changes in the value of the Underlying Fund(s) and other securities in which the Fund invests based on their market valuations.
An investment in the Fund will entail more costs and expenses than direct investments in the Underlying Fund(s). The Fund will indirectly pay a proportional share of the expenses of the Underlying Fund(s) in which it invests (including operating expenses and management fees), in addition to the fees and expenses it pays directly. As the Fund’s allocation to an Underlying Fund changes from time to time, or to the extent that the expense ratio of an Underlying Fund changes, the weighted average operating expenses borne by the Fund may increase or decrease.
| | | | |
| FLEXSHARES ANNUAL REPORT | | | 423 | |
Supplemental Information (cont.)
The following risk applies only to the FlexShares Currency Hedged Morningstar DM ex-US Factor Tilt Index Fund and the FlexShares Currency Hedged Morningstar EM Factor Tilt Index Fund:
Currency Hedging Risk
The Fund is subject to the risk that the Fund’s hedging transactions will not be effective. The Fund enters into foreign currency forward contracts designed to offset the Fund’s currency exposure of non-U.S. dollar denominated securities included in the Underlying Index against the U.S. dollar. These contracts may not be successful. To the extent the Fund’s foreign currency contracts are not successful, the U.S. dollar value of your investment in the Fund may go down. Because the Fund’s currency hedge is reset on a monthly basis, currency risk can develop or increase intra-month. Furthermore, while the Fund is designed to hedge against currency fluctuations, it is possible that a degree of currency exposure may remain even at the time a hedging transaction is implemented. Currency exchange rates can be very volatile and can change quickly and unpredictably. Therefore, the value of an investment in the Fund may also go up or down quickly and unpredictably and investors may lose money. In addition, a Fund’s currency hedging activities may involve frequent trading of currency instruments, which may increase transaction costs and cause the Fund’s return to deviate from the Underlying Index.
In seeking to track the performance of the Underlying Index, the Fund will attempt to hedge the currency exposure of non-U.S. dollar denominated securities held in its portfolio by investing in foreign currency forward contracts, which may include non-deliverable foreign currency forward contracts (“NDFs”). NDFs on currencies are often less liquid than deliverable forward currency contracts. A lack of liquidity in NDFs of the hedged currency could result in the Fund being unable to structure its hedging transactions as intended. In addition, NTI may seek to limit the size of the Fund in order to attempt to reduce a situation where the Fund is unable to obtain sufficient liquidity in an underlying currency to implement its investment objective.
The following risks apply to the FlexShares Disciplined Duration MBS Index Fund, FlexShares Credit-Scored US Corporate Bond Index Fund, FlexShares Credit-Scored US Long Corporate Bond Index Fund, FlexShares High Yield Value-Scored Bond Index Fund, FlexShares Ready Access Variable Income Fund, and the FlexShares Core Select Bond Fund:
Credit (or Default) Risk
The Fund is subject to the risk that the inability or unwillingness of an issuer or guarantor of a fixed-income security, or a counterparty to a TBA, repurchase or other transaction, to meet its payment or other financial obligations will adversely affect the value of the Fund’s investments and its returns. Changes in the credit rating of a debt security held by the Fund could have a similar effect.
Debt Extension Risk
The Fund is subject to the risk that an issuer will exercise its right to pay principal on an obligation held by the Fund (such as a mortgage-backed security) later than expected. This may happen during a period of rising interest rates. Under these circumstances, the value of the obligation will decrease and the Fund will suffer from the inability to invest in higher yielding securities.
Liquidity Risk
The Fund is subject to the risk that certain portfolio securities may be less liquid than others, which may make them difficult or impossible to sell at the time and the price that the Fund would like, adversely affecting the value of the Fund’s investments and its returns.
| | |
| 424 | | FLEXSHARES ANNUAL REPORT |
Supplemental Information (cont.)
Prepayment (or Call) Risk
The Fund is subject to the risk that prepayment of the underlying mortgages or other collateral of some fixed-income securities may result in a decreased rate of return and a decline in value of those securities.
The following risks apply to the FlexShares Disciplined Duration MBS Index Fund, FlexShares Ready Access Variable Income Fund and the FlexShares Core Select Bond Fund:
U.S. Government Securities Risk
The Fund is subject to the risk that the U.S. government will not provide financial support to its agencies, instrumentalities or sponsored enterprises if it is not obligated to do so by law. Many U.S. government securities that may be purchased by the Fund are not backed by the full faith and credit of the United States. It is possible that the issuers of such securities will not have the funds to meet their payment obligations in the future.
Mortgage Related and Other Asset-Backed Risks
The FlexShares Disciplined Duration MBS Index Fund is subject to the risks of investing in mortgage-related and other asset-backed securities, including Interest Rate/Maturity Risk, Debt Extension Risk and Prepayment (or Call) Risk.
The following risk applies to the FlexShares Disciplined Duration MBS Index Fund and the FlexShares Core Select Bond Fund:
Mortgage Backed Pass-Through Securities Risk
The Fund is subject to the risk of investing in mortgage-backed securities issued by a U.S. Agency. These securities may not be backed by the full faith and credit of the U.S. government. Mortgage-backed securities are subject to Credit (or Default) Risk, Interest Rate/ Maturity Risk, Debt Extension Risk and Prepayment (or Call) Risk. Because of these risks, mortgage-backed securities react differently to changes in interest rates than other bonds. Small movements in interest rates (both increases and decreases) may quickly and significantly reduce the value of certain mortgage-backed securities.
The following risks apply to the FlexShares High Yield Value-Scored Bond Index Fund:
Distressed Securities Risk
Distressed securities risk is the substantial risk of investing in distressed securities that is in addition to the risks of investing in non-investment grade securities generally. NTI defines securities issued by companies whose financial condition is troubled or uncertain and that may be involved in bankruptcy proceedings, reorganizations or financial restructurings as “distressed securities.” Distressed securities are speculative and involve a substantial risk that principal will not be paid. In addition, the Fund will generally not receive interest payments on the distressed securities and may incur costs to protect its investment. These securities may present a substantial risk of default. The Fund may incur additional expenses to the extent it is required to seek recovery upon a default in the payment of principal of or interest on its portfolio holdings. In any reorganization or liquidation proceeding relating to a portfolio company, the Fund may lose its entire investment or may be required to accept cash or securities with a value less than its original investment. Distressed securities and any securities received in an exchange for such securities may be subject to restrictions on resale.
High Yield Securities Risk
High yield securities risk is the risk that the Fund will be subject to greater credit risk, price volatility and risk of loss than if it invested primarily in investment grade securities, which can adversely impact the Fund’s return and net asset value. High yield
| | | | |
| FLEXSHARES ANNUAL REPORT | | | 425 | |
Supplemental Information (cont.)
securities are considered highly speculative and are subject to increased risk of an issuer’s inability to make principal and interest payments. The Underlying Index is designed to be comprised of securities with the potential for higher yields as compared to the overall high yield corporate bond market. As such, the Fund is expected to exhibit greater sensitivity to market fluctuations.
New Fund Risk
New Fund Risk is the risk that the Fund will not grow to or maintain an economically viable size, in which case it may experience greater tracking error to its Underlying Index than it otherwise would at higher asset levels, or it could ultimately liquidate without shareholder approval. The timing of such liquidation may not be favorable and could have negative tax consequences for shareholders. From time to time, an Authorized Participant, a third-party investor, the Fund’s adviser or an affiliate of the Fund’s adviser, may invest in the Fund and hold its investment for a specific period of time in order to facilitate commencement of the Fund’s operations or for the Fund to achieve size or scale. There can be no assurance that any such entity would not redeem its investment or that the size of the Fund would be maintained at such levels, which could negatively impact the Fund. The Fund’s Distributor does not maintain a secondary market in the shares.
Substantial Volatility Risk
Substantial volatility risk is the risk that the value of the securities in the Fund’s portfolio may fluctuate, sometimes rapidly and unpredictably at a greater level than the overall market. There is a risk that the Fund could have substantial volatility.
Value Score Risk
Value score risk is the risk that the Fund’s investment in companies whose securities are believed to be undervalued will not appreciate in value as anticipated. Although the Underlying Index is designed to measure a portfolio of bonds of companies with the potential for higher yields and less risk of insolvency relative to the Parent Index, there is no assurance that the Underlying Index or Fund will be comprised of such securities. Accordingly, the Fund may be subject to greater credit risk, price volatility and risk of loss relative to the Parent Index.
The following risk applies to the FlexShares Morningstar US Market Factor Tilt Index Fund, FlexShares Morningstar Developed Markets ex-US Factor Tilt Index Fund, FlexShares Morningstar Emerging Markets Factor Tilt Index Fund, FlexShares Currency Hedged Morningstar DM ex-US Factor Tilt Index Fund, FlexShares Currency Hedged Morningstar EM Factor Tilt Index Fund, FlexShares International Quality Dividend Index Fund, FlexShares International Quality Dividend Defensive Index Fund, FlexShares International Quality Dividend Dynamic Index Fund, FlexShares Credit-Scored US Corporate Bond Index Fund, FlexShares Credit-Scored US Long Corporate Bond Index Fund, FlexShares Ready Access Variable Income Fund, and the FlexShares Core Select Bond Fund:
Financial Sector Risk
The Fund is subject to the risk that the Fund will be impacted by events affecting the U.S. and/or non-U.S. financial sectors if it invests a relatively large percentage of its assets in those sectors, adversely affecting the Fund’s performance. The U.S. and non-U.S. financial sectors can be significantly affected by changes in interest rates, government regulation, the rate of corporate and consumer debt defaulted, price competitions and the availability and cost of capital funds. In 2008 and 2009, the U.S. financial sector was significantly impacted by bankruptcies and consolidations of major financial firms. Events affecting the U.S. and non-U.S. financial sectors have had, and may continue to have, a significant negative impact on the valuations and stock prices of companies in this sector and have increased the volatility of investments in those sectors.
| | |
| 426 | | FLEXSHARES ANNUAL REPORT |
Supplemental Information (cont.)
The following risk applies to the FlexShares Quality Dividend Index Fund, the FlexShares Quality Dividend Defensive Index Fund, the FlexShares Quality Dividend Dynamic Index Fund, the FlexShares STOXX US ESG Impact Index Fund and the FlexShares US Quality Large Cap Index Fund:
Information Technology Sector Risk
The Fund is subject to the risk that the Fund will be impacted by events affecting the U.S. information technology sector if it invests a relatively large percentage of its assets in that sector, adversely affecting the Fund’s price.
Premium/Discount Information
Information about the differences between the daily market prices on secondary markets for shares of the Funds and the Funds’ net asset values for various time periods, as applicable, is available by visiting the Funds’ website at www.flexshares.com.
| | | | |
| FLEXSHARES ANNUAL REPORT | | | 427 | |
For More Information (Unaudited)
Portfolio Holdings
FlexShares® Trust files its complete schedule of portfolio holdings with the Securities and Exchange Commission (“SEC”) for the first and third quarters of each fiscal year on Form N-Q. The Funds’ Forms N-Q are available on the SEC’s Web site at sec.gov.
Proxy Voting
FlexShares® Trust Proxy Voting Policies and Procedures are available upon request and without charge by calling 1-855-FLEXETF (1-855-353-9383) or by visiting the Funds’ Web site www.flexshares.com or the SEC’s Web site at sec.gov. Each Fund’s portfolio securities voting record for the 12-month period ended June 30 is available upon request and without charge by calling 1-855-FLEXETF (1-855-353-9383) or by visiting the SEC’s website at sec.gov.
| | |
| 428 | | FLEXSHARES ANNUAL REPORT |
FlexShares® Trust
50 S. LaSalle Street
Chicago, IL 60603
800.595.9111
www.flexshares.com
FlexShares® is a registered trademark of NTI. Morningstar® is a registered trademark of Morningstar, Inc. (“Morningstar”). Morningstar® US Market Factor Tilt IndexSM, Morningstar® Developed Markets ex-US Factor Tilt IndexSM, Morningstar® Emerging Markets Factor Tilt IndexSM, Morningstar® Developed Markets ex-US Factor Tilt Hedged IndexSM, Morningstar® Emerging Markets Factor Tilt Hedged IndexSM and Morningstar® Global Upstream Natural Resources IndexSM are service marks of Morningstar, Inc. STOXX and its licensors (the “Licensors”) have no relationship to FlexShares® Trust other than the licensing of the STOXX® USA ESG Impact Index, STOXX® Global ESG Impact Index and STOXX® Global Broad Infrastructure Index and the related trademarks for use in connection with the FlexShares® STOXX® US ESG Impact Index Fund, FlexShares® STOXX® Global ESG Impact Index Fund and FlexShares® STOXX® Global Broad Infrastructure Index Fund, respectively. The iBoxx 3-Year Target Duration TIPS Index and iBoxx 5-Year Target Duration TIPS Index are each the property of Markit North America, Inc. (“Markit”) and have been licensed for use in connection the FlexShares iBoxx 3-Year Target Duration TIPS Index Fund and the FlexShares iBoxx 5-Year Target Duration TIPS Index Fund, respectively. Northern Trust Quality Large Cap IndexSM, Northern Trust Quality Dividend IndexSM, Northern Trust Quality Dividend Dynamic IndexSM, Northern Trust Quality Dividend Defensive IndexSM, Northern Trust International Quality Dividend IndexSM, Northern Trust Quality Dividend Dynamic IndexSM, Northern Trust International Quality Dividend Defensive IndexSM, Northern Trust Global Quality Real Estate IndexSM, Northern Trust Credit-Scored US Corporate Bond IndexSM, Northern Trust Credit-Scored US Long Corporate Bond IndexSM, Northern Trust Real Assets Allocation IndexSM, Northern Trust High Yield US Corporate Bond IndexSM, and Northern Trust High Yield Value-Scored US Corporate Bond IndexSM are service marks of NTI and have been licensed for use by FlexShares Trust. The ICE® BofAML® Constrained Duration US Mortgage Backed Securities IndexSM are trademarks of ICE Data Indices, LLC or its affiliates (“ICE”) and have been licensed for use by NTI.
FS00058-1218
Item 2. Code Of Ethics.
| (a) | As of the end of the period, October 31, 2018, the Registrant has adopted a code of ethics that applies to its principal executive officer, principal financial officer, principal accounting officer or controller, or persons performing similar functions, regardless of whether these individuals are employed by the Registrant or a third party (the “Code of Ethics”). |
| (c) | The Registrant has not amended its Code of Ethics during the period covered by this report. |
| (d) | The Registrant has not granted any waivers, including an implicit waiver, from any provisions of its Code of Ethics during the period covered by this report. |
| (f) | A copy of the Registrant’s Code of Ethics is attached as exhibit 13(a)(1) to this Form N-CSR. |
Item 3. Audit Committee Financial Expert.
The Registrant’s Board of Trustees has determined that the Registrant has at least one “audit committee financial expert” (as defined in Item 3 of Form N-CSR), serving on its audit committee. Philip G. Hubbard is the “audit committee financial expert” and is “independent” (as each term is defined in Item 3 of Form N-CSR).
Under applicable securities laws and regulations, a person who is determined to be an audit committee financial expert will not be deemed an “expert” for any purpose, including without limitation for purposes of Section 11 of the Securities Act of 1933, as amended, as a result of being designated or identified as an audit committee financial expert. The designation or identification of a person as an audit committee financial expert does not impose on such person any duties, obligations, or liability that are greater than the duties, obligations, and liability imposed on such person as a member of the Registrant’s Audit Committee and Board of Trustees in the absence of such designation or identification. The designation or identification of a person as an audit committee financial expert does not affect the duties, obligations or liability of any other member of the Registrant’s Audit Committee or Board of Trustees.
Item 4. Principal Accountant Fees and Services.
In response to Items 4(a)-4(d), aggregate fees for professional services rendered for FlexShares Trust by Deloitte & Touche, LLP (“Deloitte”) for the fiscal years ended October 31, 2018 and October 31, 2017 were:
| | | | |
| | | 2018 |
| | | All fees and
services to the
Trust that were
pre-approved | | All fees and
services to
Service Affiliates(a)
that were pre-
approved |
Audit Fees | | $585,000 | | N/A |
Audit Related Fees(b) | | $0 | | $0 |
Tax Fees(c) | | $65,000(1) | | $0 |
All Other Fees (d) | | $0 | | $0 |
Total: | | $650,000 | | $0 |
| | | | | | |
| | | 2017 | | |
| | | All fees and
services to the
Trust that were pre-approved | | All fees and
services to
Service Affiliates(a)
that were pre-
approved | | |
Audit Fees | | $562,500 | | N/A | | |
Audit Related Fees(b) | | $0 | | $0 | | |
Tax Fees(c) | | $62,500(1) | | $0 | | |
All Other Fees (d) | | $0 | | $0 | | |
Total: | | $625,000 | | $0 | | |
| (1) | Amounts relate to tax fees for the review of federal income tax returns, excise tax returns and year end distribution calculations. |
| (a) | “Service affiliates” as it relates to the aggregate “Audit Fees,” “Audit-Related Fees,” “Tax Fees” and “All Other Fees” that were billed by Deloitte for the periods ended October 31, 2018 and October 31, 2017 are Northern Trust Investments, Inc. (“NTI”) and entities controlling, controlled by or under common control with NTI that provide ongoing services to the Registrant. |
| (b) | “Audit-Related Fees” are fees for assurance and related services rendered by Deloitte that are reasonably related to the performance of the audit or review of the Registrant’s financial statements, but not reported as “Audit Fees.” |
| (c) | “Tax Fees” are fees for professional services rendered by Deloitte for tax compliance, tax advice and tax planning. |
| (d) | “All Other Fees” are for products and services provided by Deloitte other than those reported as Audit, Audit-Related or Tax Fees. |
| (e)(1) | The Registrant’s Audit Committee Charter provides that the Audit Committee is responsible for the approval of, prior to the appointment of, the engagement of the principal accountant to annually audit the |
| | Registrant’s financial statements. The Audit Committee must also pre-approve the engagement of the principal accountant to provide non-audit services to the Registrant, NTI or to any entity controlling, controlled by or under common control with NTI that provides ongoing services to the Registrant, if the engagement has a direct impact on the operations or financial reporting of the Registrant. The pre-approvals may be delegated to a designated representative (or representatives) of the audit committee and such pre-approvals and approvals must be reported to the full Audit Committee at its next meeting. Each designated representative must be a member of the Audit Committee. |
| (e)(2) | No percentage of the principal accountant’s fees or services were approved pursuant to the waiver provision of paragraph (c)(7)(i)(C) or (c)(7)(ii) of Rule 2-01 of Regulation S-X. |
| (g) | The aggregate non-audit fees and services billed by Deloitte for services rendered to the Registrant and Service Affiliates for the periods ended October 31, 2018 and October 31, 2017, respectively, were $6,748,000 and $6,588,400. |
| (h) | The Registrant’s Audit Committee has considered whether the provision of non-audit services to Service Affiliates, not pre-approved pursuant to paragraph (c)(7)(ii) of Rule 2-01 of Regulation S-X, is compatible with maintaining the registered public accountant’s independence in performing audit services. |
Item 5. Audit Committee of Listed Registrants.
| (a) | The Registrant has a separately-designated standing Audit Committee in accordance with Section 3(a)(58)(A) of the Securities Exchange Act of 1934. All of the Board’s independent Trustees, Philip G. Hubbard, Eric T. McKissack and Sarah N. Garvey, are members of the Audit Committee. |
Item 6. Investments
| (a) | Schedule I – Investments in Securities of Unaffiliated Issuers. |
| | The complete schedule of investments is included in the report to shareholders in Item 1 of this Form N-CSR. |
| (b) | Securities Divested of in accordance with Section 13(c) of the Investment Company Act of 1940. |
Item 7. Disclosure Of Proxy Voting Policies And Procedures For Closed-End Management Investment Companies.
Not Applicable.
Item 8. Portfolio Managers of Closed-End Management Investment Companies.
Not Applicable.
Item 9. Purchase Of Equity Securities By Closed-End Management Investment Company And Affiliated Purchasers.
Not Applicable.
Item 10. Submission Of Matters To A Vote Of Security Holders.
There were no material changes to the procedures by which shareholders may recommend nominees to the Registrant’s Board of Trustees.
Item 11. Controls And Procedures.
| (a) | The Registrant’s principal executive officer and principal financial officer, or persons performing similar functions, have concluded that the Registrant’s disclosure controls and procedures (as defined in Rule 30a-3(c) under the Investment Company Act of 1940 (the “1940 Act”)) are effective, based on the evaluation of these controls and procedures required by Rule 30a-3(b) under the 1940 Act and Rules 13a-15(b) or 15d-15(b) under the Securities Exchange Act of 1934 as of a date within 90 days of the filing date of this report. |
| (b) | There were no changes in the Registrant’s internal control over financial reporting (as defined in Rule 30a - 3(d) under the 1940 Act) that occurred during the Registrant’s last fiscal quarter of the period covered by this report that have materially affected, or are reasonably likely to materially affect, the Registrant’s internal control over financial reporting. |
Item 12. Disclosure of Securities Lending Activities for Closed-End Management Investment Companies.
Not Applicable.
Item 13. Exhibits.
| (a)(1) | The code of ethics that is the subject of the disclosure required by Item 2 is attached hereto. |
| (a)(2) | Certifications pursuant to Rule 30a-2(a) under the 1940 Act and Section 302 of the Sarbanes-Oxley Act of 2002 are attached hereto. |
| (b) | Certification required by Rule 30a-2(b) under the 1940 Act and Section 906 of the Sarbanes-Oxley Act of 2002 is attached hereto. |
SIGNATURES
Pursuant to the requirements of the Securities Exchange Act of 1934 and the Investment Company Act of 1940, the registrant has duly caused this report to be signed on its behalf by the undersigned, thereunto duly authorized.
FlexShares Trust
| | ---------------------------- |
Pursuant to the requirements of the Securities Exchange Act of 1934 and the Investment Company Act of 1940, this report has been signed below by the following persons on behalf of the registrant and in the capacities and on the dates indicated.
| | ---------------------------- |
| | ---------------------------- |
| | Treasurer and Principal Financial Officer |
