UNITED STATES
SECURITIES AND EXCHANGE COMMISSION
Washington, D.C. 20549
FORM N-CSR
CERTIFIED SHAREHOLDER REPORT OF REGISTERED
MANAGEMENT INVESTMENT COMPANIES
Investment Company Act file number: 811-22555
FlexShares Trust
(Exact name of registrant as specified in charter)
50 South LaSalle Street
Chicago, Illinois 60603
(Address of principal executive offices) (Zip code)
Michael Mabry, Esq.
Stradley Ronon Stevens & Young, LLP
2005 Market Street, Suite 2600
Philadelphia, Pennsylvania 19103-6996
(Name and Address of Agent for Service)
with a copy to:
Himanshu Surti
Jose Del Real, Esq.
Northern Trust Investments, Inc.
50 South LaSalle Street
Chicago, Illinois 60603
(Name and Address of Agent for Service)
Registrant’s telephone number, including area code: 855-353-9383
Date of fiscal year end: October 31
Date of reporting period: October 31, 2021
Item 1. Reports to Stockholders.
| a.) | The following is a copy of the report transmitted to shareholders pursuant to Rule 30e-1 under the Investment Company Act of 1940, as amended (the “1940 Act”) (17 CFR 270.30e-1). |

FlexShares® Trust
Annual Report
October 31, 2021

Table of Contents

Letter to Shareholders
Dear Shareholder,
We are delighted to provide this update for the FlexShares exchange traded funds, sponsored and managed by Northern Trust Asset Management (NTAM)1, for the year ended October 31, 2021.
While COVID-19 continued to influence many aspects of our lives, the focus notably shifted in 2021 to the prospect of moving forward. This was certainly the case for the global economy. We believe that the anticipation of a sustainable turnaround coupled with healthy corporate balance sheets fueled investor confidence, while pent-up demand, the re-opening of businesses and fiscal stimulus boosted consumer spending. Both trends supported positive economic results and prospects across markets, sectors and industries.
Such robust activity, after a virtual shutdown of the global economy, presented unanticipated challenges to business models, manufacturing capacities, logistics and supply chains. That, in turn, has contributed to accelerated price increases for many goods and services. As a result, investors may find themselves grappling with questions about the nature and longevity of these inflationary pressures, how they are being addressed, and how to frame an appropriate response.
This annual report includes financial results for each of the FlexShares ETFs in this environment, and commentary and outlooks from NTAM. We trust this information will provide useful clarity and perspective.
I also want to share three recent FlexShares milestones:
| ¨ | | Efficient access to responsible investing: The FlexShares Core ESG2 and Climate suite introduced a new era for us – strategies that seek to address sustainability and climate issues within a core equity or fixed-income |
| | | portfolio. Please visit www.flexshares.com to explore the features and potential benefits of these new ETFs within the context of your portfolio. |
| ¨ | | Expanded reach: With the launch of our ESG-focused ETFs covering developed markets, FlexShares is giving European investors their first opportunity to experience our investor-first approach. We look forward to expanding our product lineup in the region in the months ahead. |
| ¨ | | 10 years, and we’re just getting started: FlexShares began with a promise to seek to deliver efficient investment vehicles to grow capital, generate income, manage portfolio risks and meet liquidity needs. We look back with pride at what we have accomplished in service to that promise and to our clients. We look forward with a renewed sense of purpose and deep gratitude for your continued confidence. |
On behalf of all our partners and colleagues at NTAM and FlexShares, best wishes for health, well-being and prosperity to you and yours.
Sincerely,
Darek Wojnar, CFA
Head, Funds & Managed Account Solutions, Northern Trust Asset Management
The views in this letter were as of October 31, 2021 and may not necessarily reflect the same views on the date this letter is first published or any time thereafter. These views are intended to help shareholders in understanding the Funds’ investment methodology and do not constitute investment advice.
This report is submitted for the general information of the shareholders of the Funds. It is not authorized for distribution to prospective investors unless preceded or accompanied by an effective prospectus, which includes information regarding the Funds’ risks, objectives, fees and expenses, experience of its management, and other information.
An investment in the Funds’ is subject to numerous risks, including possible loss of principal. Fund returns may not match the return of the respective indexes.
| 1 | Northern Trust Asset Management is the branding name of the asset management business of Northern Trust Corporation, a financial holding company and publicly traded company. |
| 2 | ESG investing commonly means utilizing environmental, social, and governance (ESG) criteria as a set of standards for a company’s operations that socially conscious investors use to screen potential investments. |
| | | | |
| 2 | | FLEXSHARES ANNUAL REPORT | | |
Letter to Shareholders (cont.)
Some of the risks include, but are not limited to, the following: asset class; commodity; concentration; counterparty; currency; derivatives; dividend; emerging markets; equity securities; fluctuation of yield; foreign securities; geographic; income; industry concentration; inflation-protected securities; infrastructure-related companies; interest rate/ maturity risk; issuer; large cap; management; market; market trading; mid cap stock; MLP; momentum; natural resources; new funds; non-diversification; passive investment; privatization; small cap stock; tracking error; value investing; and volatility risk. A full description of risks is in each Fund’s prospectus.
Foreside Fund Services, LLC, distributor.
| | | | | | |
| | FLEXSHARES ANNUAL REPORT | | | 3 | |
| | |
| FlexShares® | | MANAGEMENT’S DISCUSSION OF FUND PERFORMANCE |
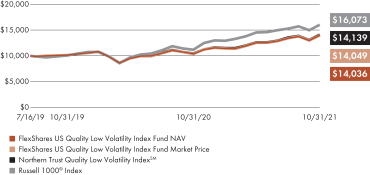
US Quality Low Volatility Index Fund Ticker: QLV
CUMULATIVE PERFORMANCE
Through October 31, 2021
AVERAGE ANNUAL TOTAL RETURN
For the period ended October 31, 2021
| | | | | | | | |
| | | 1 Year | | | Fund
Inception
7/15/2019 | |
| | | | |
| | |
FlexShares US Quality Low Volatility Index Fund (Based on Net Asset Value) | | | 35.05 | % | | | 15.93 | % |
| | |
FlexShares US Quality Low Volatility Index Fund (Based on Market Price) | | | 34.99 | % | | | 15.96 | % |
| | |
Northern Trust Quality Low Volatility Index | | | 35.36 | % | | | 16.24 | % |
| | |
Russell 1000® Index | | | 43.51 | % | | | 22.94 | % |
All data as of 10/31/21. Total returns based on market price do not include brokerage commissions that may be payable on secondary market transactions. If brokerage commissions were included, these returns would be lower. Total returns based on market price and net asset value (“NAV”) assume that dividends and capital gain distributions have been reinvested in the Fund at market price and NAV, respectively. NAV is calculated by dividing the total value of all the securities in the fund’s portfolio plus cash, interest and receivables less any liabilities by the number of fund shares outstanding. Market price is determined by the midpoint of the bid/ask spread at 4:00 p.m. Eastern Time from the primary listing exchange. Market price returns may vary from NAV returns.
Performance quoted represents past performance and does not guarantee future results. The graph and table do not reflect the deduction of taxes that a shareholder would pay on Fund distributions or the redemption or sale of Fund shares. Unlike the index that the Fund seeks to track, the Fund’s total returns are reduced by operating expenses, such as transaction costs and management fees. An investor cannot invest directly in an index.
Performance reflects contractual reimbursements in effect until March 1, 2022. In the absence of such reimbursements, performance would be reduced. The gross expense ratio of the Fund is 0.23% and the net expense ratio is 0.22%. The gross and net expense ratios disclosed are as reported in the Fund’s prospectus, which may differ from the gross and net expense ratios presented in the Fund’s financial reports. Current performance may be higher or lower than performance shown. Investment return and the principal value of an investment will fluctuate. Shares may be worth more or less than original cost when redeemed or sold in the market.
FlexShares ETFs’ performance data current to the most recent month-end is available at www.flexshares.com.
PORTFOLIO ANALYSIS
The Fund seeks to provide investment results that correspond generally to the price and yield performance, before fees and expenses, of the Northern Trust Quality Low Volatility IndexSM (the “Underlying Index”). The Underlying Index is designed to reflect the performance of a selection of companies that, in the aggregate, possess lower absolute volatility characteristics relative to the Northern Trust 1250 Index (“Parent Index”), a float-adjusted market capitalization weighted index of U.S. domiciled large- and mid-capitalization companies. In addition, the Underlying Index is designed to select companies from the Parent Index that exhibit financial strength, stability and enhanced risk-return characteristics, which Northern Trust Investments, Inc. (“NTI”) believes can provide equity-market participation while protecting against downside risks during certain market environments. As of October 31, 2021, there were 109 issues in the Underlying Index. NTI uses a “passive” or indexing approach to try to achieve the Fund’s investment objective. NTI uses a representative sampling strategy to manage the Fund. This means that the Fund invests in a representative sample of securities that collectively has an investment profile similar to the Underlying Index. The Fund may or may not hold all of the securities that are included in the Underlying Index.
During the 12 months ended October 31, 2021, prices on U.S. investments generally traded higher. Through Q4 of 2020, U.S. investments rose as news about the COVID-19 (“COVID”) vaccine advancements were viewed by investors as a catalyst for a potential economic recovery. The passage of the federal fiscal stimulus package (Consolidated Appropriations Act, 2021) in December along with the U.S. Federal Reserve Bank’s actions to keep interest rates low while continuing quantitative easing measures also supported U.S. investments. Despite a volatile start in January 2021, U.S. domestic investments rose in Q1 of 2021 as several sectors that had previously struggled during the pandemic including energy, financials and industrials helped to lead investments higher. Domestic U.S. investments continued to advance in Q2 of 2021 as
| | | | |
| 4 | | FLEXSHARES ANNUAL REPORT | | |
| | |
| FlexShares® | | MANAGEMENT’S DISCUSSION OF FUND PERFORMANCE |
US Quality Low Volatility Index Fund (cont.)
PORTFOLIO ANALYSIS (cont.)
strong consumption growth and industrial production drove those investments higher. The May 2021 report of inflation, as measured by the Consumer Price Index (CPI)1, recorded the largest increase since June 1992, but at the time many investors viewed this as a transitory spike caused by increasing global economic recovery and supply chain disruptions. In Q3 of 2021, U.S. investments remained relatively flat despite strong corporate earnings as investors may have been concerned that future growth would not materialize, and that inflation may be more persistent than previously expected. Domestic U.S. investments advanced in October 2021 due to strong 3rd quarter earnings and robust consumer confidence.
Because U.S. domestic investments trended upwards during the 12 months ended October 31, 2021, we believe the low volatility factor2 approach was a negative driver of Fund performance for the twelve-month period. In addition, we believe that investors once again showed a preference for low quality factor3 companies, resulting in the high-quality factor exposure detracting from Fund performance over the 12 months. Overall, the negative performance derived from the low volatility and quality factor exposures were the primary sources of the Underlying Index’s underperformance against the Russell 1000®4 Index by -8.15%. Tracking difference between the Fund’s NAV and the Underlying Index’s total return for the 12-month period was -31 basis points (“bps”)5, which is reflective of the management fee (-22 bps), stock selection/futures (+3 bps), and the compounding effect of tracking error over time (-12 bps).
| 1 | The Consumer Price Index (CPI) is a measure of the average change over time in the prices paid by urban consumers for a market basket of consumer goods and services. Indexes are available for the U.S. and various geographic areas. |
| 2 | The low volatility factor is based on the measurement of a group of stocks that have been less volatile in their asset class over a defined time frame. |
| 3 | The quality factor is based on a belief that there are a set of clearly defined fundamental criteria that seek to identify companies with outstanding financial characteristics. |
| 4 | The Russell 1000 Index refers to a stock market index that represents the 1000 top companies in the United States. |
| 5 | A unit that is equal to 1/100th of 1% and is used to denote the change in a financial instrument. |
| | | | | | |
| | FLEXSHARES ANNUAL REPORT | | | 5 | |
| | |
| FlexShares® Developed | | MANAGEMENT’S DISCUSSION OF FUND PERFORMANCE |
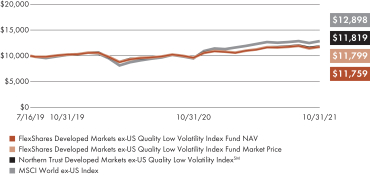
Markets Ex-US Quality Low Volatility Index Fund Ticker: QLVD
CUMULATIVE PERFORMANCE
Through October 31, 2021
AVERAGE ANNUAL TOTAL RETURN
For the period ended October 31, 2021
| | | | | | | | |
| | | 1 Year | | | Fund
Inception
7/15/2019 | |
| | | | |
| | |
FlexShares Developed Markets ex-US Quality Low Volatility Index Fund (Based on Net Asset Value) | | | 22.05 | % | | | 7.32 | % |
| | |
FlexShares Developed Markets ex-US Quality Low Volatility Index Fund (Based on Market Price) | | | 21.88 | % | | | 7.47 | % |
| | |
Northern Trust Developed Markets ex-US Quality Low Volatility Index | | | 22.17 | % | | | 7.55 | % |
| | |
MSCI World ex-US Index | | | 35.59 | % | | | 11.72 | % |
All data as of 10/31/21. Total returns based on market price do not include brokerage commissions that may be payable on secondary market transactions. If brokerage commissions were included, these returns would be lower. Total returns based on market price and net asset value (“NAV”) assume that dividends and capital gain distributions have been reinvested in the Fund at market price and NAV, respectively. NAV is calculated by dividing the total value of all the securities in the fund’s portfolio plus cash, interest and receivables less any liabilities by the number of fund shares outstanding. Market price is determined by the midpoint of the bid/ask spread at 4:00 p.m. Eastern Time from the primary listing exchange. Market price returns may vary from NAV returns.
Performance quoted represents past performance and does not guarantee future results. The graph and table do not reflect the deduction of taxes that a shareholder would pay on Fund distributions or the redemption or sale of Fund shares. Unlike the index that the Fund seeks to track, the Fund’s total returns are reduced by operating expenses, such as transaction costs and management fees. An investor cannot invest directly in an index.
Performance reflects contractual reimbursements in effect until March 1, 2022. In the absence of such reimbursements, performance would be reduced. The gross expense ratio of the Fund is 0.33% and the net expense ratio is 0.32%. The gross and net expense ratios disclosed are as reported in the Fund’s prospectus, which may differ from the gross and net expense ratios presented in the Fund’s financial reports. Current performance may be higher or lower than performance shown. Investment return and the principal value of an investment will fluctuate. Shares may be worth more or less than original cost when redeemed or sold in the market.
FlexShares ETFs’ performance data current to the most recent month-end is available at www.flexshares.com.
PORTFOLIO ANALYSIS
The Fund seeks to provide investment results that correspond generally to the price and yield performance, before fees and expenses, of the Northern Trust Developed Markets ex-US Quality Low Volatility Index SM (the “Underlying Index”). The Underlying Index is designed to reflect the performance of a selection of companies that, in the aggregate, possess lower overall absolute volatility characteristics relative to a broad universe of securities domiciled in developed market countries, excluding the U.S. (the “Parent Index”). The Parent Index is a subset of the Northern Trust Global Index, where eligible securities are limited to those securities domiciled in non-U.S. developed market countries and designated as large- and mid-capitalization companies by Northern Trust Investments, Inc. (“NTI”), acting in its capacity as the index provider. In addition, the Underlying Index is designed to select companies from the Parent Index that exhibit financial strength, stability and enhanced risk-return characteristics, which NTI believes can provide equity-market participation while protecting against downside risks during certain market environments. As of October 31, 2021, there were 190 issues in the Underlying Index. NTI uses a “passive” or indexing approach to try to achieve the Fund’s investment objective. NTI uses a representative sampling strategy to manage the Fund. This means that the Fund invests in a representative sample of securities that collectively has an investment profile similar to the Underlying Index. The Fund may or may not hold all of the securities that are included in the Underlying Index.
During the 12 months ended October 31, 2021, prices on Developed international investments generally traded higher. Over the course of the 12-month period, while the U.S. dollar (USD) started off volatile, it ultimately ended flat against other Developed international currencies and generally for U.S. investors did not impact positively or negatively. Through Q4 of 2020, Developed international investments moved higher as news about the COVID-19 (“COVID”) vaccine advancements were viewed by investors as a catalyst for a potential economic recovery. Developed international investments
| | | | |
| 6 | | FLEXSHARES ANNUAL REPORT | | |
| | |
| FlexShares® Developed | | MANAGEMENT’S DISCUSSION OF FUND PERFORMANCE |
Markets Ex-US Quality Low Volatility Index Fund (cont.)
PORTFOLIO ANALYSIS (cont.)
may have been helped by a Brexit trade agreement between the United Kingdom and the European Union as investor uncertainty around intraregional commerce was alleviated. Developed international investments continued to rise over the 1st half of 2021 due to strong corporate earnings and positive economic data. Sectors that had previously struggled during the pandemic, including energy and financials, helped to lead investments higher. Developed international investments moved modestly lower in Q3 of 2021 due to inflation concerns stemming from supply chain bottlenecks and rising energy prices. Developed international investments rebounded in October 2021 as lockdown policies enacted at the height of the pandemic were eased in many countries and latent consumer demand led to strong corporate earnings.
Because Developed international investments trended upwards during the 12 months ended October 31, 2021, we believe the low volatility factor1 approach was a negative driver of Fund performance for the twelve-month period. Additionally, we believe that investors showed a preference for low quality companies within the Developed international universe. Consequently, the quality factor2 focus of the Fund’s Underlying Index was also a negative driver of Fund performance for the 12-month period. Overall, the negative performance derived from both the low volatility and quality factor exposures were the primary sources of the Underlying Index’s underperformance against the MSCI World ex-US Index3 by -13.42%. The tracking difference between the Fund’s NAV and the Underlying Index’s total return for the 12-month period was -12 basis points (“bps”)4, which is reflective of the
Fund’s management fee (-32 bps), stock selection/futures (+20 bps), securities lending (+1 bps), dividend tax differential (+2 bps), and the compounding effect of tracking error over time (-3 bps).
| 1 | The low volatility factor is based on the measurement of a group of stocks that have been less volatile in their asset class over a defined time frame. |
| 2 | The quality factor is based on a belief that there are a set of clearly defined fundamental criteria that seek to identify companies with outstanding financial characteristics. |
| 3 | The Morgan Stanley Capital International World Index Ex-U.S. is a market-capitalization-weighted index maintained by Morgan Stanley Capital International (MSCI) and is designed to provide a broad measure of stock performance throughout the world, with the exception of U.S.-based companies. |
| 4 | A unit that is equal to 1/100th of 1% and is used to denote the change in a financial instrument. |
| | | | | | |
| | FLEXSHARES ANNUAL REPORT | | | 7 | |
| | |
| FlexShares® Emerging | | MANAGEMENT’S DISCUSSION OF FUND PERFORMANCE |
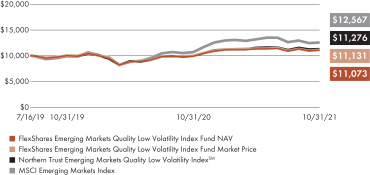
Markets Quality Low Volatility Index Fund Ticker: QLVE
CUMULATIVE PERFORMANCE
Through October 31, 2021
AVERAGE ANNUAL TOTAL RETURN
For the period ended October 31, 2021
| | | | | | | | |
| | | 1 Year | | | Fund
Inception
7/15/2019 | |
| | | | |
| | |
FlexShares Emerging Markets Quality Low Volatility Index Fund (Based on Net Asset Value) | | | 12.09 | % | | | 4.54 | % |
| | |
FlexShares Emerging Markets Quality Low Volatility Index Fund (Based on Market Price) | | | 11.62 | % | | | 4.78 | % |
| | |
Northern Trust Emerging Markets Quality Low Volatility Index | | | 13.47 | % | | | 5.37 | % |
| | |
MSCI Emerging Markets Index | | | 16.96 | % | | | 10.45 | % |
All data as of 10/31/21. Total returns based on market price do not include brokerage commissions that may be payable on secondary market transactions. If brokerage commissions were included, these returns would be lower. Total returns based on market price and net asset value (“NAV”) assume that dividends and capital gain distributions have been reinvested in the Fund at market price and NAV, respectively. NAV is calculated by dividing the total value of all the securities in the fund’s portfolio plus cash, interest and receivables less any liabilities by the number of fund shares outstanding. Market price is determined by the midpoint of the bid/ask spread at 4:00 p.m. Eastern Time from the primary listing exchange. Market price returns may vary from NAV returns.
Performance quoted represents past performance and does not guarantee future results. The graph and table do not reflect the deduction of taxes that a shareholder would pay on Fund distributions or the redemption or sale of Fund shares. Unlike the index that the Fund seeks to track, the Fund’s total returns are reduced by operating expenses, such as transaction costs and management fees. An investor cannot invest directly in an index.
Performance reflects contractual reimbursements in effect until March 1, 2022. In the absence of such reimbursements, performance would be reduced. The gross expense ratio of the Fund is 0.41% and the net expense ratio is 0.40%. The gross and net expense ratios disclosed are as reported in the Fund’s prospectus, which may differ from the gross and net expense ratios presented in the Fund’s financial reports. Current performance may be higher or lower than performance shown. Investment return and the principal value of an investment will fluctuate. Shares may be worth more or less than original cost when redeemed or sold in the market.
FlexShares ETFs’ performance data current to the most recent month-end is available at www.flexshares.com.
PORTFOLIO ANALYSIS
The Fund seeks to provide investment results that correspond generally to the price and yield performance, before fees and expenses, of the Northern Trust Emerging Markets Quality Low Volatility IndexSM (the “Underlying Index”). The Underlying Index is designed to reflect the performance of a selection of companies that, in the aggregate, possess lower overall absolute volatility characteristics relative to a broad universe of securities domiciled in emerging market countries (the “Parent Index”). The Parent Index is a subset of the Northern Trust Global Index, limited to those securities domiciled in emerging markets and designated as large- and mid- capitalization companies by Northern Trust Investments, Inc. (“NTI”), acting in its capacity as the index provider. In addition, the Underlying Index is designed to select companies from the Parent Index that exhibit financial strength, stability and enhanced risk-return characteristics, which NTI believes can provide equity-market participation while protecting against downside risks during certain market environments. As of October 31, 2021, there were 151 issues in the Underlying Index. NTI uses a “passive” or indexing approach to try to achieve the Fund’s investment objective. NTI uses a representative sampling strategy to manage the Fund. This means that the Fund invests in a representative sample of securities that collectively has an investment profile similar to the Underlying Index. The Fund may or may not hold all of the securities that are included in the Underlying Index.
During the 12 months ended October 31, 2021, prices on Emerging market investments generally traded higher. Over the course of the 12-month period, while the U.S. dollar (USD) started off volatile, it ultimately weakened against Emerging market currencies and positively impacted U.S. investors as returns in local currencies generally were enhanced by the falling of the USD. Through Q4 of 2020, Emerging market investments moved higher as overall commodity prices rose, USD weakness and news about the COVID-19 (“COVID”) vaccine advancements were viewed by investors as a catalyst for a potential economic recovery. Chinese investments,
| | | | |
| 8 | | FLEXSHARES ANNUAL REPORT | | |
| | |
| FlexShares® Emerging | | MANAGEMENT’S DISCUSSION OF FUND PERFORMANCE |
Markets Quality Low Volatility Index Fund (cont.)
PORTFOLIO ANALYSIS (cont.)
however, fell due to increased trading tensions between the U.S. and China as well as the Chinese government’s continued investigations which were viewed by some investors as anti-business. Emerging market investments moved higher in Q1 of 2021 but trailed Developed market investments as COVID vaccine rollout rates trailed Developed nations and some countries were forced to reestablish restrictions due to COVID outbreaks. Emerging market investments rose in Q2 of 2021 as continued investor optimism overcame an early quarter selloff driven by concerns of rising inflation and U.S. monetary policy tightening. Emerging market investments sold off in Q3 of 2021 as investor concerns surrounding economic growth in China were driven by the collapse of a large real estate investment company and a subsequent increase in regulatory pressures on some of China’s top performing technology and financial companies. Emerging market investments moved modestly higher in October 2021, however, but trailed Developed market investments as region specific investments, such as in Latin America, struggled.
Investors showed a preference for low quality companies in emerging markets for the twelve months ending October 31, 2021, resulting in the high-quality factor1 exposure being a negative driver of Fund performance. The sharp decline in emerging market equities in Q3 of 2021 resulted in low volatility stocks outperforming high volatility stocks over the twelve-month period. As a result, the low volatility factor2 exposure was a positive driver of Fund performance for the fiscal year. Overall, the positive performance derived from the low volatility factor was not enough to offset the negative performance of the quality factor, leading to the Underlying Index’s underperformance against the MSCI Emerging Markets Index3 by -3.49%. Tracking difference between the Fund’s NAV and the Underlying Index’s total return for the 12-month period was -1.38%, which is reflective of the Fund’s management fee of -40 basis points (“bps”)4, which is reflective of
the Fund’s management fee (-40 bps), stock selection/futures (+9 bps), and dividend tax differential (+10 bps).
| 1 | The quality factor is based on a belief that there are a set of clearly defined fundamental criteria that seek to identify companies with outstanding financial characteristics. |
| 2 | The low volatility factor is based on the measurement of a group of stocks that have been less volatile in their asset class over a defined time frame. |
| 3 | The Morgan Stanley Capital International Emerging Markets Index is a selection of stocks that are designed to track the financial performance of key companies in fast-growing nations. |
| 4 | A unit that is equal to 1/100th of 1% and is used to denote the change in a financial instrument. |
| | | | | | |
| | FLEXSHARES ANNUAL REPORT | | | 9 | |
| | |
| FlexShares® Morningstar® | | MANAGEMENT’S DISCUSSION OF FUND PERFORMANCE |
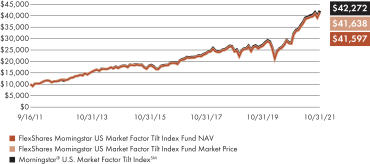
US Market Factor Tilt Index Fund Ticker: TILT
CUMULATIVE PERFORMANCE
Through October 31, 2021
AVERAGE ANNUAL TOTAL RETURN
For the period ended October 31, 2021
| | | | | | | | | | | | | | | | |
| | | 1 Year | | | 5 Year | | | 10 Year | | | Fund
Inception
9/16/2011 | |
| | | | |
| | | | |
FlexShares Morningstar US Market Factor Tilt Index Fund (Based on Net Asset Value) | | | 49.68 | % | | | 17.10 | % | | | 14.93 | % | | | 15.12 | % |
| | | | |
FlexShares Morningstar US Market Factor Tilt Index Fund (Based on Market Price) | | | 49.57 | % | | | 17.08 | % | | | 14.92 | % | | | 15.12 | % |
| | | | |
Morningstar® U.S. Market Factor Tilt IndexSM | | | 50.18 | % | | | 17.24 | % | | | 15.11 | % | | | 15.30 | % |
All data as of 10/31/21. Total returns based on market price do not include brokerage commissions that may be payable on secondary market transactions. If brokerage commissions were included, these returns would be lower. Total returns based on market price and net asset value (“NAV”) assume that dividends and capital gain distributions have been reinvested in the Fund at market price and NAV, respectively. NAV is calculated by dividing the total value of all the securities in the fund’s portfolio plus cash, interest and receivables less any liabilities by the number of fund shares outstanding. Market price is determined by the midpoint of the bid/ask spread at 4:00 p.m. Eastern Time from the primary listing exchange. Market price returns may vary from NAV returns.
Performance quoted represents past performance and does not guarantee future results. The graph and table do not reflect the deduction of taxes that a shareholder would pay on Fund distributions or the redemption or sale of Fund shares. Unlike the index that the Fund seeks to track, the Fund’s total returns are reduced by operating expenses, such as transaction costs and management fees. An investor cannot invest directly in an index.
Performance reflects contractual reimbursements in effect until March 1, 2022. In the absence of such reimbursements, performance would be reduced. The gross expense ratio of the Fund is 0.26% and the net expense ratio is 0.25%. The gross and net expense ratios disclosed are as reported in the Fund’s prospectus, which may differ from the gross and net expense ratios presented in the Fund’s financial reports. Current performance may be higher or lower than performance shown. Investment return and the principal value of an investment will fluctuate. Shares may be worth more or less than original cost when redeemed or sold in the market.
FlexShares ETFs’ performance data current to the most recent month-end is available at www.flexshares.com.
PORTFOLIO ANALYSIS
The Fund seeks to provide investment results that correspond generally to the price and yield performance, before fees and expenses, of the Morningstar® US Market Factor Tilt IndexSM (the “Underlying Index”). The Underlying Index is designed to reflect the performance of a selection of companies that, in the aggregate, possess greater exposure to size and value factors relative to the Morningstar US Market Index (the “Parent Index”), a float-adjusted market-capitalization weighted index of U.S.-incorporated large-, mid-, small- and micro- capitalization companies. The Underlying Index seeks to achieve increased exposures to size and value factors, or a “factor tilt,” by adjusting the Parent Index’s constituent weights to achieve a slightly greater weight on companies with smaller market capitalizations or lower valuations, as determined by Morningstar, Inc. pursuant to its index methodology. As of October 31, 2021, there were 2,733 issues in the Underlying Index. NTI uses a “passive” or indexing approach to try to achieve the Fund’s investment objective. NTI uses a representative sampling strategy to manage the Fund. This means that the Fund invests in a representative sample of securities that collectively has an investment profile similar to the Underlying Index. The Fund may or may not hold all of the securities that are included in the Underlying Index.
During the 12 months ended October 31, 2021, prices on U.S. investments generally traded higher. Through Q4 of 2020, U.S. investments rose as news about the COVID-19 (“COVID”) vaccine advancements were viewed by investors as a catalyst for a potential economic recovery. The passage of the federal fiscal stimulus package (Consolidated Appropriations Act, 2021) in December 2020 along with the U.S. Federal Reserve Bank’s actions to keep interest rates low while continuing quantitative easing measures also supported U.S. investments. Despite a volatile start in January 2021, U.S. domestic investments rose in Q1 of 2021 as several sectors that had previously struggled during the pandemic including energy, financials and industrials helped to lead investments higher. Domestic U.S. investments continued to advance in Q2 of 2021 as strong consumption growth and industrial
| | | | |
| 10 | | FLEXSHARES ANNUAL REPORT | | |
| | |
| FlexShares® Morningstar® | | MANAGEMENT’S DISCUSSION OF FUND PERFORMANCE |
US Market Factor Tilt Index Fund (cont.)
PORTFOLIO ANALYSIS (cont.)
production drove those investments higher. The May 2021 report of inflation, as measured by the Consumer Price Index (CPI), recorded the largest increase since June 1992, but at the time many investors viewed this as a transitory spike caused by increasing global economic recovery and supply chain disruptions. In Q3 of 2021, U.S. investments remained relatively flat despite strong corporate earnings as investors may have been concerned that future growth would not materialize, and that inflation may be more persistent than previously expected. Domestic U.S. investments advanced in October 2021 due to strong 3rd quarter earnings and robust consumer confidence, but at the time many investors viewed this as a transitory spike caused by increasing global economic recovery and supply chain disruptions.
Because U.S. domestic investments trended upwards during the 12 months ended October 31, 2021, we believe the value factor1 was a positive driver of Fund performance during the fiscal year ended October 31, 2021 as value stocks outperformed growth stocks2. In addition, the size factor3 was a positive driver of Fund performance over the twelve months as small cap stocks outperformed large cap stocks. Overall, the positive performance derived from the value and size factor exposures was the primary source of the Underlying Index’s outperformance against the Russell 3000®4 Index by 6.28%. Tracking difference between the Fund’s NAV and the Underlying Index’s total return for the 12-month period was -50 basis points (“bps”)5,
which is reflective of the management fee (-25 bps), stock selection/futures (-9 bps), securities lending (+3 bps), and compounding of tracking error over time (-19 bps).
| 1 | The value factor is based on a belief that stocks that are inexpensive relative to some measure of fundamental value outperform those that are pricier. |
| 2 | Growth stocks are defined as stock in companies that are anticipated to grow at a rate significantly above the average for the market. |
| 3 | The size factor is measured by a stock’s total capitalization which can be found by multiplying the current share price by all the outstanding shares of stock. Large cap generally means stocks with a total capitalization of more than $10 billion. Mid cap is between $2 billion and $10 billion. Small cap is less than $2 billion in total capitalization. |
| 4 | The Russell 3000 Index is a market-capitalization-weighted equity index that seeks to track 3000 of the largest U.S.-traded stocks. |
| 5 | A unit that is equal to 1/100th of 1% and is used to denote the change in a financial instrument. |
| | | | | | |
| | FLEXSHARES ANNUAL REPORT | | | 11 | |
| | |
| FlexShares® Morningstar® | | MANAGEMENT’S DISCUSSION OF FUND PERFORMANCE |
Developed Markets ex-US Factor Tilt Index Fund Ticker: TLTD
CUMULATIVE PERFORMANCE
Through October 31, 2021
AVERAGE ANNUAL TOTAL RETURN
For the period ended October 31, 2021
| | | | | | | | | | | | | | | | |
| | | 1 Year | | | 3 Year | | | 5 Year | | | Fund
Inception
9/25/2012 | |
| | | | |
| | | | |
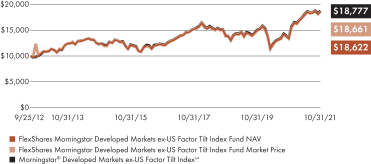
FlexShares Morningstar Developed Markets ex-US Factor Tilt Index Fund (Based on Net Asset Value) | | | 38.79 | % | | | 10.31 | % | | | 8.85 | % | | | 7.07 | % |
| | | | |
FlexShares Morningstar Developed Markets ex-US Factor Tilt Index Fund (Based on Market Price) | | | 38.95 | % | | | 10.50 | % | | | 8.90 | % | | | 7.09 | % |
| | | | |
Morningstar® Developed Markets ex-US Factor Tilt IndexSM | | | 38.92 | % | | | 10.33 | % | | | 8.89 | % | | | 7.17 | % |
All data as of 10/31/21. Total returns based on market price do not include brokerage commissions that may be payable on secondary market transactions. If brokerage commissions were included, these returns would be lower. Total returns based on market price and net asset value (“NAV”) assume that dividends and capital gain distributions have been reinvested in the Fund at market price and NAV, respectively. NAV is calculated by dividing the total value of all the securities in the fund’s portfolio plus cash, interest and receivables less any liabilities by the number of fund shares outstanding. Market price is determined by the midpoint of the bid/ask spread at 4:00 p.m. Eastern Time from the primary listing exchange. Market price returns may vary from NAV returns.
Performance quoted represents past performance and does not guarantee future results. The graph and table do not reflect the deduction of taxes that a shareholder would pay on Fund distributions or the redemption or sale of Fund shares. Unlike the index that the Fund seeks to track, the Fund’s total returns are reduced by operating expenses, such as transaction costs and management fees. An investor cannot invest directly in an index.
Performance reflects contractual reimbursements in effect until March 1, 2022. In the absence of such reimbursements, performance would be reduced. The gross expense ratio of the Fund is 0.40% and the net expense ratio is 0.39%. The gross and net expense ratios disclosed are as reported in the Fund’s prospectus, which may differ from the gross and net expense ratios presented in the Fund’s financial reports. Current performance may be higher or lower than performance shown. Investment return and the principal value of an investment will fluctuate. Shares may be worth more or less than original cost when redeemed or sold in the market.
FlexShares ETFs’ performance data current to the most recent month-end is available at www.flexshares.com.
PORTFOLIO ANALYSIS
The Fund seeks to provide investment results that correspond generally to the price and yield performance, before fees and expenses, of the Morningstar® Developed Markets ex-US Factor Tilt IndexSM (the “Underlying Index”). The Underlying Index is designed to reflect the performance of a selection of companies that, in the aggregate, possess greater exposure to size and value factors relative to the Morningstar Developed Markets ex-US Index (the “Parent Index”), a float adjusted market-capitalization weighted index of companies incorporated in developed-market countries, excluding the U.S. The Underlying Index seeks to achieve increased exposures to size and value factors, or a “factor tilt”, by adjusting the Parent Index’s constituent weights to achieve a slightly greater weight on companies with smaller market capitalizations or lower valuations, as determined by Morningstar, Inc. pursuant to its index methodology. As of October 31, 2021, there were 3,403 issues in the Underlying Index. NTI uses a “passive” or indexing approach to try to achieve the Fund’s investment objective. NTI uses a representative sampling strategy to manage the Fund. This means that the Fund invests in a representative sample of securities that collectively has an investment profile similar to the Underlying Index. The Fund may or may not hold all of the securities that are included in the Underlying Index.
During the 12 months ended October 31, 2021, prices on Developed international investments generally traded higher. Over the course of the 12-month period, while the U.S. dollar (USD) started off volatile, it ultimately ended flat against other Developed international currencies and generally for U.S. investors did not impact positively or negatively. Through Q4 of 2020, Developed international investments moved higher as news about the COVID-19 (“COVID”) vaccine advancements were viewed by investors as a catalyst for a potential economic recovery. Developed international investments may have been helped by a Brexit trade agreement between the United Kingdom and the European Union as investor uncertainty around intraregional commerce was alleviated. Developed international investments
| | | | |
| 12 | | FLEXSHARES ANNUAL REPORT | | |
| | |
| FlexShares® Morningstar® | | MANAGEMENT’S DISCUSSION OF FUND PERFORMANCE |
Developed Markets ex-US Factor Tilt Index Fund (cont.)
PORTFOLIO ANALYSIS (cont.)
continued to rise over the 1st half of 2021 due to strong corporate earnings and positive economic data. Sectors that had previously struggled during the pandemic, including energy and financials, helped to lead investments higher. Developed international investments moved modestly lower in Q3 of 2021 due to inflation concerns stemming from supply chain bottlenecks and rising energy prices. Developed international investments rebounded in October of 2021 as lockdown policies enacted at the height of the pandemic were eased in many countries and latent consumer demand led to strong corporate earnings.
Because Developed international investments trended upwards during the 12 months ended October 31, 2021, we believe the value factor1 was a positive driver of Fund performance during the fiscal year ended October 31, 2021 as value stocks outperformed growth stocks2. The size factor3, however, was a negative driver of Fund performance over the twelve months as small cap stocks underperformed large cap stocks. Overall, the positive performance derived from the value factor exposures offset the negative performance of the size factor, leading to the Underlying Index’s outperformance against the MSCI World ex-USA IMI Index4 by 3.08%. Tracking difference between the Fund’s NAV and the Underlying Index’s total return for the 12-month period was -13 basis points (“bps”)5,
which is reflective of the Fund’s management fee (-39 bps), stock selection/futures (+1 bps), securities lending (+9 bps), dividend tax differential (+21 bps), and compounding of tracking error over time (-5 bps).
| 1 | The value factor is based on a belief that stocks that are inexpensive relative to some measure of fundamental value outperform those that are pricier. |
| 2 | Growth stocks are defined as stock in companies that are anticipated to grow at a rate significantly above the average for the market. |
| 3 | The size factor is measured by a stock’s total capitalization which can be found by multiplying the current share price by all the outstanding shares of stock. Large cap generally means stocks with a total capitalization of more than $10 billion. Mid cap is between $2 billion and $10 billion. Small cap is less than $2 billion in total capitalization. |
| 4 | The Morgan Stanley Capital International World ex USA Investable Market Index captures large, mid and small cap representation across 22 of 23 Developed Markets (DM) countries—excluding the U.S. |
| 5 | A unit that is equal to 1/100th of 1% and is used to denote the change in a financial instrument. |
| | | | | | |
| | FLEXSHARES ANNUAL REPORT | | | 13 | |
| | |
| FlexShares® Morningstar® | | MANAGEMENT’S DISCUSSION OF FUND PERFORMANCE |
Emerging Markets Factor Tilt Index Fund Ticker: TLTE
CUMULATIVE PERFORMANCE
Through October 31, 2021
AVERAGE ANNUAL TOTAL RETURN
For the period ended October 31, 2021
| | | | | | | | | | | | | | | | |
| | | 1 Year | | | 3 Year | | | 5 Year | | | Fund
Inception
9/25/2012 | |
| | | | |
| | | | |
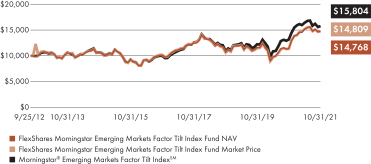
FlexShares Morningstar Emerging Markets Factor Tilt Index Fund (Based on Net Asset Value) | | | 28.95 | % | | | 11.08 | % | | | 7.79 | % | | | 4.38 | % |
| | | | |
FlexShares Morningstar Emerging Markets Factor Tilt Index Fund (Based on Market Price) | | | 30.12 | % | | | 11.50 | % | | | 7.73 | % | | | 4.41 | % |
| | | | |
Morningstar® Emerging Markets Factor Tilt IndexSM | | | 30.40 | % | | | 11.98 | % | | | 8.58 | % | | | 5.13 | % |
All data as of 10/31/21. Total returns based on market price do not include brokerage commissions that may be payable on secondary market transactions. If brokerage commissions were included, these returns would be lower. Total returns based on market price and net asset value (“NAV”) assume that dividends and capital gain distributions have been reinvested in the Fund at market price and NAV, respectively. NAV is calculated by dividing the total value of all the securities in the fund’s portfolio plus cash, interest and receivables less any liabilities by the number of fund shares outstanding. Market price is determined by the midpoint of the bid/ask spread at 4:00 p.m. Eastern Time from the primary listing exchange. Market price returns may vary from NAV returns.
Performance quoted represents past performance and does not guarantee future results. The graph and table do not reflect the deduction of taxes that a shareholder would pay on Fund distributions or the redemption or sale of Fund shares. Unlike the index that the Fund seeks to track, the Fund’s total returns are reduced by operating expenses, such as transaction costs and management fees. An investor cannot invest directly in an index.
Performance reflects contractual reimbursements in effect until March 1, 2022. In the absence of such reimbursements, performance would be reduced. The gross expense ratio of the Fund is 0.60% and the net expense ratio is 0.59%. The gross and net expense ratios disclosed are as reported in the Fund’s prospectus, which may differ from the gross and net expense ratios presented in the Fund’s financial reports. Current performance may be higher or lower than performance shown. Investment return and the principal value of an investment will fluctuate. Shares may be worth more or less than original cost when redeemed or sold in the market.
FlexShares ETFs’ performance data current to the most recent month-end is available at www.flexshares.com.
PORTFOLIO ANALYSIS
The Fund seeks to provide investment results that correspond generally to the price and yield performance, before fees and expenses, of the Morningstar® Emerging Markets Factor Tilt Index SM (the “Underlying Index”). The Underlying Index is designed to reflect the performance of a selection of companies that, in aggregate, possess greater exposure to size and value factors relative to the Morningstar Emerging Markets Index (the “Parent Index”), a float-adjusted market-capitalization weighted index of companies incorporated in emerging-market countries. The Underlying Index seeks to achieve increased exposures to size and value factors, or a “factor tilt,” by adjusting the Parent Index’s constituent weights to achieve a slightly greater weight on companies with smaller market capitalizations or lower valuations, as determined by Morningstar, Inc., pursuant to its index methodology. As of October 31, 2021, there were 3,183 issues in the Underlying Index. NTI uses a “passive” or indexing approach to try to achieve the Fund’s investment objective. NTI uses a representative sampling strategy to manage the Fund. This means that the Fund invests in a representative sample of securities that collectively has an investment profile similar to the Underlying Index. The Fund may or may not hold all of the securities that are included in the Underlying Index.
During the 12 months ended October 31, 2021, prices on Emerging market investments generally traded higher. Over the course of the 12-month period, while the U.S. dollar (USD) started off volatile, it ultimately weakened against Emerging market currencies and positively impacted U.S. investors as returns in local currencies generally were enhanced by the falling of the USD. Through Q4 of 2020, Emerging market investments moved higher as overall commodity prices rose; USD weakness and news about the COVID-19 (“COVID”) vaccine advancements were viewed by investors as a catalyst for a potential economic recovery. Chinese investments, however, fell due to increased trading tensions between the U.S. and China as well as the Chinese government’s continued investigations which were viewed by some investors as anti-business. Emerging market
| | | | |
| 14 | | FLEXSHARES ANNUAL REPORT | | |
| | |
| FlexShares® Morningstar® | | MANAGEMENT’S DISCUSSION OF FUND PERFORMANCE |
Emerging Markets Factor Tilt Index Fund (cont.)
PORTFOLIO ANALYSIS (cont.)
investments moved higher in Q1 of 2021 but trailed Developed market investments as COVID vaccine rollout rates trailed Developed nations and some countries were forced to reestablish restrictions due to COVID outbreaks. Emerging market investments rose in Q2 of 2021 as continued investor optimism overcame an early quarter selloff driven by concerns of rising inflation and U.S. monetary policy tightening. Emerging market investments sold off in Q3 of 2021 as investor concerns surrounding economic growth in China were driven by the collapse of a large real estate investment company and a subsequent increase in regulatory pressures on some of China’s top performing technology and financial companies. Emerging market investments moved modestly higher in October 2021, but trailed Developed market investments as region-specific investments, such as in Latin America, struggled.
Investors showed a preference for value companies in emerging markets for the twelve months ending October 31, 2021, resulting in the high value factor1 exposure being a positive driver of Fund performance as value stocks outperformed growth stocks.2 In addition, the size factor3 was a positive driver of Fund performance over the twelve months as small cap stocks outperformed large cap stocks. Overall, the positive performance derived from the value and size factor exposures was the primary source of the Underlying Index’s outperformance against the MSCI EM IMI Net Index4 by 10.69%. Tracking difference between the Fund’s NAV and the Underlying Index’s total return for the 12-month period was -1.45%, which is reflective of the Fund’s management fee of -59 basis points (“bps”)5, stock selection/futures (-20 bps),
securities lending (+9 bps) and dividend tax differential (+1 bps), performance calculation differences between the Underlying Index and the Fund (+1 bp), India Capital Gains Taxes (-31 bps), and compounding of tracking error over time (-46 bps).
| 1 | The value factor is based on a belief that stocks that are inexpensive relative to some measure of fundamental value outperform those that are pricier. |
| 2 | Growth stocks are defined as stock in companies that are anticipated to grow at a rate significantly above the average for the market. |
| 3 | The size factor is measured by a stock’s total capitalization which can be found by multiplying the current share price by all the outstanding shares of stock. Large cap generally means stocks with a total capitalization of more than $10 billion. Mid cap is between $2 billion and $10 billion. Small cap is less than $2 billion in total capitalization. |
| 4 | The Morgan Stanley Capital International Emerging Markets Investable Market Index (IMI) captures large, mid and small cap representation across 27 Emerging Markets (EM) countries. |
| 5 | A unit that is equal to 1/100th of 1% and is used to denote the change in a financial instrument. |
| | | | | | |
| | FLEXSHARES ANNUAL REPORT | | | 15 | |
| | |
| FlexShares® | | MANAGEMENT’S DISCUSSION OF FUND PERFORMANCE |
US Quality Large Cap Index Fund Ticker: QLC
CUMULATIVE PERFORMANCE
Through October 31, 2021
AVERAGE ANNUAL TOTAL RETURN
For the period ended October 31, 2021
| | | | | | | | | | | | | | | | |
| | | 1 Year | | | 3 Year | | | 5 Year | | | Fund
Inception
9/23/2015 | |
| | | | |
| | | | |
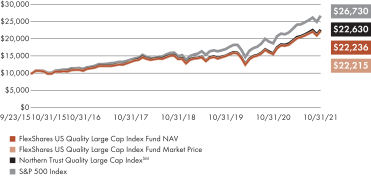
FlexShares US Quality Large Cap Index Fund Index Fund (Based on Net Asset Value) | | | 43.21 | % | | | 16.51 | % | | | 15.83 | % | | | 13.98 | % |
| | | | |
FlexShares US Quality Large Cap Index Fund Index Fund (Based on Market Price) | | | 43.09 | % | | | 16.47 | % | | | 15.82 | % | | | 13.97 | % |
| | | | |
Northern Trust Quality Large Cap IndexSM | | | 43.77 | % | | | 16.80 | % | | | 16.17 | % | | | 14.31 | % |
| | | | |
S&P 500 Index | | | 42.91 | % | | | 21.51 | % | | | 18.95 | % | | | 17.46 | % |
All data as of 10/31/21. Total returns based on market price do not include brokerage commissions that may be payable on secondary market transactions. If brokerage commissions were included, these returns would be lower. Total returns based on market price and net asset value (“NAV”) assume that dividends and capital gain distributions have been reinvested in the Fund at market price and NAV, respectively. NAV is calculated by dividing the total value of all the securities in the fund’s portfolio plus cash, interest and receivables less any liabilities by the number of fund shares outstanding. Market price is determined by the midpoint of the bid/ask spread at 4:00 p.m. Eastern Time from the primary listing exchange. Market price returns may vary from NAV returns.
Performance quoted represents past performance and does not guarantee future results. The graph and table do not reflect the deduction of taxes that a shareholder would pay on Fund distributions or the redemption or sale of Fund shares. Unlike the index that the Fund seeks to track, the Fund’s total returns are reduced by operating expenses, such as transaction costs and management fees. An investor cannot invest directly in an index.
Performance reflects contractual reimbursements in effect until March 1, 2022. In the absence of such reimbursements, performance would be reduced. The gross expense ratio of the Fund is 0.33% and the net expense ratio is 0.32%. The gross and net expense ratios disclosed are as reported in the Fund’s prospectus, which may differ from the gross and net expense ratios presented in the Fund’s financial reports. Current performance may be higher or lower than performance shown. Investment return and the principal value of an investment will fluctuate. Shares may be worth more or less than original cost when redeemed or sold in the market.
FlexShares ETFs’ performance data current to the most recent month-end is available at www.flexshares.com.
PORTFOLIO ANALYSIS
The Fund seeks to provide investment results that correspond generally to the price and yield performance, before fees and expenses, of the Northern Trust Quality Large Cap Index SM (the “Underlying Index”). The Underlying Index is designed to reflect the performance of a selection of companies that, in aggregate, possess greater exposure to quality, value and momentum factors relative to a universe of publicly traded U.S. large-capitalization equity securities. The universe is comprised of the 600 largest companies in the Northern Trust 1250 Index, a float-adjusted market-capitalization weighted index of U.S. domiciled companies. As of October 31, 2021, there were 159 issues in the Underlying Index. NTI uses a “passive” or indexing approach to try to achieve the Fund’s investment objective. NTI uses a representative sampling strategy to manage the Fund. This means that the Fund invests in a representative sample of securities that collectively has an investment profile similar to the Underlying Index. The Fund may or may not hold all of the securities that are included in the Underlying Index.
During the 12 months ended October 31, 2021, prices on U.S. investments generally traded higher. Through Q4 of 2020, U.S. investments rose as news about the COVID-19 (“COVID”) vaccine advancements were viewed by investors as a catalyst for a potential economic recovery. The passage of the federal fiscal stimulus package (Consolidated Appropriations Act, 2021) in December 2020 along with the U.S. Federal Reserve Bank’s actions to keep interest rates low while continuing quantitative easing measures also supported U.S. investments. Despite a volatile start in January 2021, U.S. domestic investments rose in Q1 of 2021 as several sectors that had previously struggled during the pandemic including energy, financials and industrials helped to lead investments higher. Domestic U.S. investments continued to advance in Q2 of 2021 as strong consumption growth and industrial production drove those investments higher. The May 2021 report of inflation, as measured by the Consumer Price Index (CPI), recorded the largest increase since June 1992, but at the time many investors viewed this as
| | | | |
| 16 | | FLEXSHARES ANNUAL REPORT | | |
| | |
| FlexShares® | | MANAGEMENT’S DISCUSSION OF FUND PERFORMANCE |
US Quality Large Cap Index Fund (cont.)
PORTFOLIO ANALYSIS (cont.)
a transitory spike caused by increasing global economic recovery and supply chain disruptions. In Q3 of 2021, U.S. investments remained relatively flat despite strong corporate earnings as investors may have been concerned that future growth would not materialize, and that inflation may be more persistent than previously expected. Domestic U.S. investments advanced in October 2021 due to strong 3rd quarter earnings and robust consumer confidence.
Because U.S. domestic investments trended upwards during the 12 months ended October 31, 2021, we believe the value factor1 was a positive driver of Fund performance during the fiscal year ended October 31, 2021 as value stocks outperformed growth stocks2. In addition, we believe that investors showed a preference for high quality factor3 companies within the large cap universe utilized by the Underlying Index, resulting in the high-quality factor exposure enhancing Fund performance over the 12 months. The momentum exposure4 of the Underlying Index was a negative driver of Fund performance as positive momentum companies underperformed negative momentum companies over the twelve months. Overall, the positive performance from the value and quality exposures offset the negative performance from the momentum exposure and the Underlying Index outperformed the S&P 500 Index5 by 0.86%. Tracking difference between the Fund’s NAV and the Underlying Index’s total return for the 12-month period was -56 basis points (“bps”)6, which is reflective of the management fee
(-32 bps), stock selection/futures (+1 bps), securities lending (+1 bps), performance calculation differences between the Underlying Index and the Fund (-1 bps) and compounding of tracking error over time (-25 bps).
| 1 | The value factor is based on a belief that stocks that are inexpensive relative to some measure of fundamental value outperform those that are pricier. |
| 2 | Growth stocks are defined as stock in companies that are anticipated to grow at a rate significantly above the average for the market. |
| 3 | The quality factor is based on a belief that there are a set of clearly defined fundamental criteria that seek to identify companies with outstanding financial characteristics. |
| 4 | Momentum in a stock is described as the tendency for the stock price to continue rising if it is going up and to continue declining if it is going down. |
| 5 | The Standard & Poor’s 500 Index is a market-capitalization-weighted index of 500 leading publicly traded companies in the U.S. |
| 6 | A unit that is equal to 1/100th of 1% and is used to denote the change in a financial instrument. |
| | | | | | |
| | FLEXSHARES ANNUAL REPORT | | | 17 | |
| | |
| FlexShares® | | MANAGEMENT’S DISCUSSION OF FUND PERFORMANCE |
STOXX® US ESG Select Index Fund Ticker: ESG
CUMULATIVE PERFORMANCE
Through October 31, 2021
AVERAGE ANNUAL TOTAL RETURN
For the period ended October 31, 2021
| | | | | | | | | | | | | | | | |
| | | 1 Year | | | 3 Year | | | 5 Year | | | Fund
Inception
7/13/2016 | |
| | | | |
| | | | |
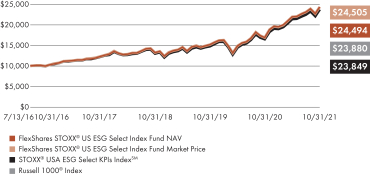
FlexShares STOXX® US ESG Select Index Fund (Based on Net Asset Value) | | | 44.15 | % | | | 22.41 | % | | | 19.56 | % | | | 18.41 | % |
| | | | |
FlexShares STOXX® US ESG Select Index Fund (Based on Market Price) | | | 44.12 | % | | | 22.44 | % | | | 19.56 | % | | | 18.42 | % |
| | | | |
STOXX® USA ESG Select KPIs Index | | | 44.04 | % | | | 22.12 | % | | | 18.97 | % | | | 17.82 | % |
| | | | |
Russell 1000® Index | | | 43.51 | % | | | 22.05 | % | | | 19.19 | % | | | 17.84 | % |
All data as of 10/31/21. Total returns based on market price do not include brokerage commissions that may be payable on secondary market transactions. If brokerage commissions were included, these returns would be lower. Total returns based on market price and net asset value (“NAV”) assume that dividends and capital gain distributions have been reinvested in the Fund at market price and NAV, respectively. NAV is calculated by dividing the total value of all the securities in the fund’s portfolio plus cash, interest and receivables less any liabilities by the number of fund shares outstanding. Market price is determined by the midpoint of the bid/ask spread at 4:00 p.m. Eastern Time from the primary listing exchange. Market price returns may vary from NAV returns.
Performance quoted represents past performance and does not guarantee future results. The graph and table do not reflect the deduction of taxes that a shareholder would pay on Fund distributions or the redemption or sale of Fund shares. Unlike the index that the Fund seeks to track, the Fund’s total returns are reduced by operating expenses, such as transaction costs and management fees. An investor cannot invest directly in an index.
Performance reflects contractual reimbursements in effect until March 1, 2022. In the absence of such reimbursements, performance would be reduced. The gross expense ratio of the Fund is 0.33% and the net expense ratio is 0.32%. The gross and net expense ratios disclosed are as reported in the Fund’s prospectus, which may differ from the gross and net expense ratios presented in the Fund’s financial reports. Current performance may be higher or lower than performance shown. Investment return and the principal value of an investment will fluctuate. Shares may be worth more or less than original cost when redeemed or sold in the market.
FlexShares ETFs’ performance data current to the most recent month-end is available at www.flexshares.com.
PORTFOLIO ANALYSIS
The Fund seeks investment results that correspond generally to the price and yield performance, before fees and expenses, of the STOXX® USA ESG Select KPIs IndexSM (“Underlying Index”). The Underlying Index is designed to reflect the performance of a selection of companies that, in aggregate, possess greater exposure to environmental, social and governance (“ESG”)1 characteristics relative to the STOXX® USA 900 Index, a float adjusted market-capitalization weighted index of U.S.-incorporated companies. As of October 31, 2021, there were 274 issues in the Underlying Index. Northern Trust Investments, Inc. (“NTI”) uses a “passive” or indexing approach to try to achieve the Fund’s investment objective. NTI uses a representative sampling strategy to manage the Fund. This means that the Fund invests in a representative sample of securities that collectively has an investment profile similar to the Underlying Index. The Fund may or may not hold all of the securities that are included in the Underlying Index.
During the 12 months ended October 31, 2021, prices on U.S. investments generally traded higher. Through Q4 of 2020, U.S. investments rose as news about the COVID-19 (“COVID”) vaccine advancements were viewed by investors as a catalyst for a potential economic recovery. The passage of the federal fiscal stimulus package (Consolidated Appropriations Act, 2021) in December along with the U.S. Federal Reserve Bank’s actions to keep interest rates low while continuing quantitative easing measures also supported U.S. investments. Despite a volatile start in January, U.S. domestic investments rose in Q1 of 2021 as several sectors that had previously struggled during the pandemic including energy, financials and industrials helped to lead investments higher. Domestic U.S. investments continued to advance in Q2 of 2021 as strong consumption growth and industrial production drove those investments higher. The May 2021 report of inflation, as measured by the Consumer Price
| 1 | ESG investing is defined as utilizing environmental, social, and governance (ESG) criteria as a set of standards for a company’s operations that socially conscious investors use to screen potential investments. |
| | | | |
| 18 | | FLEXSHARES ANNUAL REPORT | | |
| | |
| FlexShares® | | MANAGEMENT’S DISCUSSION OF FUND PERFORMANCE |
STOXX® US ESG Select Index Fund (cont.)
PORTFOLIO ANALYSIS (cont.)
Index (CPI), recorded the largest increase since June 1992, but at the time many investors viewed this as a transitory spike caused by increasing global economic recovery and supply chain disruptions. In Q3 of 2021, U.S. investments remained relatively flat despite strong corporate earnings as investors may have been concerned that future growth would not materialize, and that inflation may be more persistent than previously expected. Domestic U.S. investments advanced in October due to strong 3rd quarter earnings and robust consumer confidence.
The Underlying Index had a positive total return during the 12 months ended October 31, 2021, and outperformed domestic equity markets, as defined by the Russell 1000 Index2, by 0.53%. The Underlying Index’s ESG-tilted approach led to beneficial overweight Fund exposure to the consumer discretionary, energy and healthcare sectors. Overweight exposure to the consumer staples and communication sectors detracted from Fund performance. Likewise, the ESG tilt led to underweights to the financials, utilities, technology and real estate sectors that were positive drivers of Fund performance but underweights to industrials and materials that detracted from Fund performance. Tracking difference between the Fund’s NAV and the Underlying Index’s total return for the 12-month period was +11 basis points (“bps”)3, which is reflective of the management fee (-32 bps), stock selection/futures (-9 bps), dividend tax differential (+46 bps) and compounding of tracking error over time (+6 bps).
| 2 | The Russell 1000 Index refers to a stock market index that represents the 1000 top companies in the United States. |
| 3 | A unit that is equal to 1/100th of 1% and is used to denote the change in a financial instrument. |
| | | | | | |
| | FLEXSHARES ANNUAL REPORT | | | 19 | |
| | |
| FlexShares® | | MANAGEMENT’S DISCUSSION OF FUND PERFORMANCE |
STOXX® Global ESG Select Index FundTicker: ESGG
CUMULATIVE PERFORMANCE
Through October 31, 2021
AVERAGE ANNUAL TOTAL RETURN
For the period ended October 31, 2021
| | | | | | | | | | | | | | | | |
| | | 1 Year | | | 3 Year | | | 5 Year | | | Fund
Inception
7/13/2016 | |
| | | | |
| | | | |
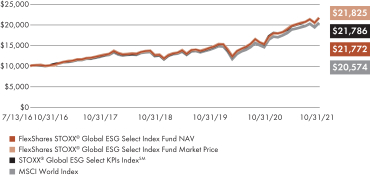
FlexShares STOXX® Global ESG Select Index Fund (Based on Net Asset Value) | | | 42.10 | % | | | 19.58 | % | | | 16.60 | % | | | 15.81 | % |
| | | | |
FlexShares STOXX® Global ESG Select Index Fund (Based on Market Price) | | | 41.84 | % | | | 19.48 | % | | | 16.66 | % | | | 15.86 | % |
| | | | |
STOXX® Global ESG Select KPIs Index | | | 42.22 | % | | | 19.66 | % | | | 16.64 | % | | | 15.83 | % |
| | | | |
MSCI World Index | | | 40.42 | % | | | 18.24 | % | | | 15.47 | % | | | 14.58 | % |
All data as of 10/31/21. Total returns based on market price do not include brokerage commissions that may be payable on secondary market transactions. If brokerage commissions were included, these returns would be lower. Total returns based on market price and net asset value (“NAV”) assume that dividends and capital gain distributions have been reinvested in the Fund at market price and NAV, respectively. NAV is calculated by dividing the total value of all the securities in the fund’s portfolio plus cash, interest and receivables less any liabilities by the number of fund shares outstanding. Market price is determined by the midpoint of the bid/ask spread at 4:00 p.m. Eastern Time from the primary listing exchange. Market price returns may vary from NAV returns.
Performance quoted represents past performance and does not guarantee future results. The graph and table do not reflect the deduction of taxes that a shareholder would pay on Fund distributions or the redemption or sale of Fund shares. Unlike the index that the Fund seeks to track, the Fund’s total returns are reduced by operating expenses, such as transaction costs and management fees. An investor cannot invest directly in an index.
Performance reflects contractual reimbursements in effect until March 1, 2022. In the absence of such reimbursements, performance would be reduced. The gross expense ratio of the Fund is 0.43% and the net expense ratio is 0.42%. The gross and net expense ratios disclosed are as reported in the Fund’s prospectus, which may differ from the gross and net expense ratios presented in the Fund’s financial reports. Current performance may be higher or lower than performance shown. Investment return and the principal value of an investment will fluctuate. Shares may be worth more or less than original cost when redeemed or sold in the market.
FlexShares ETFs’ performance data current to the most recent month-end is available at www.flexshares.com.
PORTFOLIO ANALYSIS
The Fund seeks investment results that correspond generally to the price and yield performance, before fees and expenses, of the STOXX® Global ESG Select KPIs IndexSM (the “Underlying Index”) The Underlying Index is designed to reflect the performance of a selection of companies that, in aggregate, possess greater exposure to environmental, social and governance (“ESG”)1 characteristics relative to the STOXX® Global 1800 Index, the parent index, a float-adjusted market-capitalization weighted index of companies incorporated in the U.S. or in developed international markets. As of October 31, 2021, there were 888 issues in the Underlying Index. Northern Trust Investments, Inc. (“NTI”) uses a “passive” or indexing approach to try to achieve the Fund’s investment objective. NTI uses a representative sampling strategy to manage the Fund. This means that the Fund invests in a representative sample of securities that collectively has an investment profile similar to the Underlying Index. The Fund may or may not hold all of the securities that are included in the Underlying Index.
During the 12 months ended October 31, 2021, prices on Global market investments (including U.S., Developed and Emerging markets) generally traded higher. Through Q4 of 2020, Global market investments moved higher as news about the COVID-19 (“COVID”) vaccine advancements were viewed by investors as a catalyst for a potential economic recovery. Global investments continued to rise over the 1st half of 2021 due to strong corporate earnings and positive economic data. Sectors that had previously struggled during the pandemic, including energy and financials, helped to lead investments higher. Global market investments moved lower in Q3 of 2021 as investor concerns surrounding economic growth in China were driven by the collapse of a large real estate investment company and a subsequent increase in regulatory pressures on some of China’s top performing technology and
| 1 | ESG investing is defined as utilizing environmental, social, and governance (ESG) criteria as a set of standards for a company’s operations that socially conscious investors use to screen potential investments. |
| | | | |
| 20 | | FLEXSHARES ANNUAL REPORT | | |
| | |
| FlexShares® | | MANAGEMENT’S DISCUSSION OF FUND PERFORMANCE |
STOXX® Global ESG Select Index Fund (cont.)
PORTFOLIO ANALYSIS (cont.)
financial companies. Inflation concerns stemming from supply chain bottlenecks and rising energy prices also drove Global market investments lower. Global market investments rebounded in October 2021 as lockdown policies enacted at the height of the pandemic were eased in many countries and latent consumer demand led to strong corporate earnings.
The Underlying Index had a positive total return during the 12 months ended October 31, 2021 and outperformed global equity markets, as defined by the MSCI World Index2, by 1.80%. The Underlying Index’s ESG-tilted approach led to beneficial overweight Fund exposure to the technology, consumer discretionary and energy sectors. The overweight exposure to the consumer staples sector detracted from Fund performance. Likewise, the ESG tilt led to underweights to the financials, utilities, industrials, communications, materials and real estate sectors that were positive drivers of Fund performance. Tracking difference between the Fund’s NAV and the Underlying Index’s total return for the 12-month period was -12 basis points (“bps”)3, which is reflective of the management fee (-42 bps), stock selection/futures (-5 bps), securities lending (+1 bps), dividend tax differential (+40 bps), and compounding of tracking error over time (-6 bps).
| 2 | The Morgan Stanley Capital International World Index captures large and mid-cap representation across 23 Developed Markets countries. |
| 3 | A unit that is equal to 1/100th of 1% and is used to denote the change in a financial instrument. |
| | | | | | |
| | FLEXSHARES ANNUAL REPORT | | | 21 | |
| | |
| FlexShares® Morningstar® | | MANAGEMENT’S DISCUSSION OF FUND PERFORMANCE |
Global Upstream Natural Resources Index Fund Ticker: GUNR
CUMULATIVE PERFORMANCE
Through October 31, 2021
AVERAGE ANNUAL TOTAL RETURN
For the period ended October 31, 2021
| | | | | | | | | | | | | | | | |
| | | 1 Year | | | 5 Year | | | 10 Year | | | Fund
Inception
9/16/2011 | |
| | | | |
| | | | |
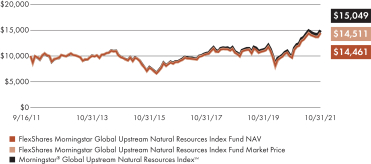
FlexShares Morningstar Global Upstream Natural Resources Index Fund (Based on Net Asset Value) | | | 49.70 | % | | | 10.41 | % | | | 3.76 | % | | | 3.71 | % |
| | | | |
FlexShares Morningstar Global Upstream Natural Resources Index Fund (Based on Market Price) | | | 49.58 | % | | | 10.43 | % | | | 3.85 | % | | | 3.74 | % |
| | | | |
Morningstar® Global Upstream Natural Resources IndexSM | | | 50.56 | % | | | 10.94 | % | | | 4.20 | % | | | 4.12 | % |
All data as of 10/31/21. Total returns based on market price do not include brokerage commissions that may be payable on secondary market transactions. If brokerage commissions were included, these returns would be lower. Total returns based on market price and net asset value (“NAV”) assume that dividends and capital gain distributions have been reinvested in the Fund at market price and NAV, respectively. NAV is calculated by dividing the total value of all the securities in the fund’s portfolio plus cash, interest and receivables less any liabilities by the number of fund shares outstanding. Market price is determined by the midpoint of the bid/ask spread at 4:00 p.m. Eastern Time from the primary listing exchange. Market price returns may vary from NAV returns.
Performance quoted represents past performance and does not guarantee future results. The graph and table do not reflect the deduction of taxes that a shareholder would pay on Fund distributions or the redemption or sale of Fund shares. Unlike the index that the Fund seeks to track, the Fund’s total returns are reduced by operating expenses, such as transaction costs and management fees. An investor cannot invest directly in an index.
Performance reflects contractual reimbursements in effect until March 1, 2022. In the absence of such reimbursements, performance would be reduced. The gross expense ratio of the Fund is 0.47% and the net expense ratio is 0.46%. The gross and net expense ratios disclosed are as reported in the Fund’s prospectus, which may differ from the gross and net expense ratios presented in the Fund’s financial reports. Current performance may be higher or lower than performance shown. Investment return and the principal value of an investment will fluctuate. Shares may be worth more or less than original cost when redeemed or sold in the market.
FlexShares ETFs’ performance data current to the most recent month-end is available at www.flexshares.com.
PORTFOLIO ANALYSIS
The Fund seeks investment results that correspond generally to the price and yield performance, before fees and expenses, of the Morningstar® Global Upstream Natural Resources IndexSM (the “Underlying Index”). The Underlying Index reflects the performance of a selection of equity securities that are traded in or are issued by companies domiciled in global developed or emerging markets (including the U.S.), as determined by Morningstar, Inc., the index provider, pursuant to its index methodology. The companies included in the Underlying Index have significant business operations in the ownership, management and/or production of natural resources in energy, agriculture, precious or industrial metals, timber and water resources sectors, as determined by the index provider, pursuant to its index methodology. As of October 31, 2021, there were 120 issues in the Underlying Index. Northern Trust Investments, Inc. (“NTI”) uses a “passive” or indexing approach to try to achieve the Fund’s investment objective and a representative sampling strategy to manage the Fund. This means that the Fund invests in a representative sample of securities that collectively has an investment profile similar to the Underlying Index. The Fund may or may not hold all of the securities that are included in the Underlying Index.
During the first half of the fiscal year ended October 31, 2021, commodity and natural resources prices in many sectors moved higher as news about the COVID-19 (“COVID”) vaccine advancements were viewed by investors as a catalyst for a potential economic recovery. Over the course of the 12-month period, while the U.S. dollar (USD) started off volatile, it ultimately weakened, and positively impacted U.S. investors as returns in local currencies of natural resources generally were enhanced by the falling of the USD. Emergence of the Delta variant of the COVID virus led to the reimposition of restrictions resulting in a slowdown of economic growth during the calendar third quarter. Global market investments (including U.S., Developed and Emerging markets) rebounded in October.
| | | | |
| 22 | | FLEXSHARES ANNUAL REPORT | | |
| | |
| FlexShares® Morningstar® | | MANAGEMENT’S DISCUSSION OF FUND PERFORMANCE |
Global Upstream Natural Resources Index Fund (cont.)
PORTFOLIO ANALYSIS (cont.)
Production discipline by the Organization of Petroleum Exporting Countries (OPEC) and other oil producers, combined with increased energy demand as economies reopened, led to steadily increasing crude oil and natural gas price increases. West Texas Intermediate (“WTI”) crude oil prices began the fiscal year under $32 per barrel but ended the year over $80 per barrel1. Natural gas was up nearly 80%2 during the same time span, as the sector appeared to have finally worked off excess supplies that had been depressing prices.
Overall Industrial metals prices, such as copper, aluminum, zinc, nickel and tin were higher for the fiscal year. Prices moved higher powered by supply shortages as production was disrupted by COVID induced labor issues. Precious metals price performance was mixed as gold declined while silver posted a small increase. Metals used in electric vehicle and battery product such as cobalt and lithium saw strong price performance due to increasing demand and lack of supply.
Grains posted strong price performance, the highest seen in years in the U.S., as lower global supplies due to weather and COVID labor sourcing issues was met with increased demand for food inputs. Protein prices (cattle, hogs, poultry, and fish) also posted strong price performance. U.S. fertilizer chemical (potash, nitrogen, phosphate) were all materially higher on supply constraints and global demand for agricultural products. U.S. lumber prices were especially volatile during the fiscal year. Robust housing demand combined with lumber mill capacity issues drove lumber futures prices3 up 230% by early May 2021. Once these severe supply issues were overcome, lumber futures had declined by the end of the fiscal year.
For the 12-month period ended October 31, 2021, the Underlying Index underperformed the global natural resource equity markets, as defined by the S&P Global Natural Resources Index4, by -259 basis points (bps)5. Due to the Underlying Index’s focus on the upstream section of the natural resource supply chain, there was no Fund exposure to the steel sector which posted robust returns. Additionally, exposure to underperforming agricultural companies in China and other non-U.S. markets contributed to Fund underperformance. Positive contribution to Fund performance came from the upstream focus in timber and energy sectors. Tracking difference for the period between the Fund’s NAV and the Underlying Index was -86 bps, which is reflective of the Fund’s management fee (-46 bps), futures (-13 bps), foreign dividend tax differential treatment (+5 bps), securities lending (+4 bps), security selection (+3 bps), transaction costs (-3 bps), and other expenses including compounding of expenses during rising markets (-36 bps).
| 1 | Source: Bloomberg, USCRWTIC Index (October 31, 2020 – October 31, 2021). |
| 2 | Source: Bloomberg, NGUSHHUB Commodity (October 31, 2020 – October 31, 2021). |
| 3 | Source: Bloomberg, LB1 Lumber Generic Near Term Commodity Contract (October 31, 2020 – October 31, 2021). |
| 4 | The Standard & Poor’s Global Natural Resources Index includes 90 of the largest publicly-traded companies in natural resources and commodities businesses that meet specific investability requirements, offering investors diversified and investable equity exposure across 3 primary commodity-related sectors: agribusiness, energy, and metals & mining. |
| 5 | A unit that is equal to 1/100th of 1% and is used to denote the change in a financial instrument. |
| | | | | | |
| | FLEXSHARES ANNUAL REPORT | | | 23 | |
| | |
| FlexShares® STOXX® | | MANAGEMENT’S DISCUSSION OF FUND PERFORMANCE |
Global Broad Infrastructure Index Fund Ticker: NFRA
CUMULATIVE PERFORMANCE
Through October 31, 2021
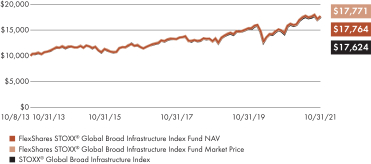
AVERAGE ANNUAL TOTAL RETURN
For the period ended October 31, 2021
| | | | | | | | | | | | | | | | |
| | | 1 Year | | | 3 Year | | | 5 Year | | | Fund
Inception
10/8/2013 | |
| | | | |
| | | | |
FlexShares STOXX® Global Broad Infrastructure Index Fund (Based on Net Asset Value) | | | 22.85 | % | | | 11.25 | % | | | 8.69 | % | | | 7.38 | % |
| | | | |
FlexShares STOXX® Global Broad Infrastructure Index Fund (Based on Market Price) | | | 22.51 | % | | | 11.41 | % | | | 8.66 | % | | | 7.39 | % |
| | | | |
STOXX® Global Broad Infrastructure Index | | | 22.72 | % | | | 11.13 | % | | | 8.55 | % | | | 7.29 | % |
All data as of 10/31/21. Total returns based on market price do not include brokerage commissions that may be payable on secondary market transactions. If brokerage commissions were included, these returns would be lower. Total returns based on market price and net asset value (“NAV”) assume that dividends and capital gain distributions have been reinvested in the Fund at market price and NAV, respectively. NAV is calculated by dividing the total value of all the securities in the fund’s portfolio plus cash, interest and receivables less any liabilities by the number of fund shares outstanding. Market price is determined by the midpoint of the bid/ask spread at 4:00 p.m. Eastern Time from the primary listing exchange. Market price returns may vary from NAV returns.
Performance quoted represents past performance and does not guarantee future results. The graph and table do not reflect the deduction of taxes that a shareholder would pay on Fund distributions or the redemption or sale of Fund shares. Unlike the index that the Fund seeks to track, the Fund’s total returns are reduced by operating expenses, such as transaction costs and management fees. An investor cannot invest directly in an index.
Performance reflects contractual reimbursements in effect until March 1, 2022. In the absence of such reimbursements, performance would be reduced. The gross expense ratio of the Fund is 0.48% and the net expense ratio is 0.47%. The gross and net expense ratios disclosed are as reported in the Fund’s prospectus, which may differ from the gross and net expense ratios presented in the Fund’s financial reports. Current performance may be higher or lower than performance shown. Investment return and the principal value of an investment will fluctuate. Shares may be worth more or less than original cost when redeemed or sold in the market.
FlexShares ETFs’ performance data current to the most recent month-end is available at www.flexshares.com.
PORTFOLIO ANALYSIS
The Fund seeks investment results that correspond generally to the price and yield performance, before fees and expenses, of the STOXX® Global Broad Infrastructure Index (the “Underlying Index”). The Underlying Index is designed to reflect the performance of a selection of companies that, in aggregate, offer broad exposure to publicly traded developed- and emerging-market infrastructure companies, including U.S. companies, as defined by STOXX Ltd. (“STOXX”) pursuant to its index methodology. Infrastructure companies generally include, without limitation, entities that own or operate location-specific capital-intensive assets characterized by high barriers to entry, essential services with inelastic demand, regulated pricing, and reliable or relatively stable revenue streams. As of October 31, 2021, there were 177 issues in the Underlying Index. Northern Trust Investments, Inc. (“NTI”) uses a “passive” or indexing approach to try to achieve the Fund’s investment objective. NTI uses a representative sampling strategy to manage the Fund. This means that the Fund invests in a representative sample of securities that collectively has an investment profile similar to the Underlying Index. The Fund may or may not hold all of the securities that are included in the Underlying Index.
During the 12 months ended October 31, 2021, prices on Global market investments (including U.S., Developed and Emerging markets) generally traded higher. Through Q4 of 2020, Global market investments moved higher as news about the COVID-19 (“COVID”) vaccine advancements were viewed by investors as a catalyst for a potential economic recovery. Global investments continued to rise over the 1st half of 2021 due to strong corporate earnings and positive economic data. Sectors that had previously struggled during the pandemic, including energy and financials, helped to lead investments higher. Global market investments moved lower in Q3 of 2021 as investor concerns surrounding economic growth in China were driven by the collapse of a large real estate investment company and a subsequent increase in regulatory pressures on some of China’s top performing technology and
| | | | |
| 24 | | FLEXSHARES ANNUAL REPORT | | |
| | |
| FlexShares® STOXX® | | MANAGEMENT’S DISCUSSION OF FUND PERFORMANCE |
Global Broad Infrastructure Index Fund (cont.)
PORTFOLIO ANALYSIS (cont.)
financial companies. Inflation concerns stemming from supply chain bottlenecks and rising energy prices also drove Global market investments lower. Global market investments rebounded in October 2021 as lockdown policies enacted at the height of the pandemic were eased in many countries and latent consumer demand led to strong corporate earnings.
The Underlying Index had a positive total return during the 12 months ended October 31, 2021, but underperformed the global equity real estate markets, as defined by the FTSE EPRA/NAREIT Developed Net Index1, by -1.94%. The Underlying Index’s exposures to the communication, transportation and energy sectors negatively contributed to Fund performance, while exposure to utilities and social infrastructure positively benefited Fund performance. The tracking difference between the Fund’s NAV and the Underlying Index’s total return for the 12-month period was +13 basis points (“bps”)2, which is reflective of the Fund’s management fee (-47 bps), stock selection/futures (+6 bps), securities lending (+3 bps), dividend tax differential (+49 bps) and compounding of tracking error over time (+2 bps).
| 1 | The FTSE EPRA/Nareit Global Real Estate Index is an index designed to track the performance of listed real estate companies in both developed and emerging countries worldwide. |
| 2 | A unit that is equal to 1/100th of 1% and is used to denote the change in a financial instrument. |
| | | | | | |
| | FLEXSHARES ANNUAL REPORT | | | 25 | |
| | |
| FlexShares® | | MANAGEMENT’S DISCUSSION OF FUND PERFORMANCE |
Global Quality Real Estate Index Fund Ticker: GQRE
CUMULATIVE PERFORMANCE
Through October 31, 2021
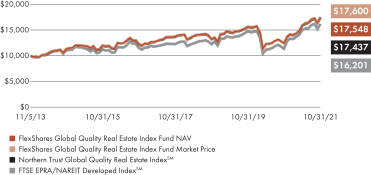
AVERAGE ANNUAL TOTAL RETURN
For the period ended October 31, 2021
| | | | | | | | | | | | | | | | |
| | | 1 Year | | | 3 Year | | | 5 Year | | | Fund
Inception
11/5/2013 | |
| | | | |
| | | | |
FlexShares Global Quality Real Estate Index Fund (Based on Net Asset Value) | | | 40.58 | % | | | 9.87 | % | | | 7.37 | % | | | 7.30 | % |
| | | | |
FlexShares Global Quality Real Estate Index Fund (Based on Market Price) | | | 40.98 | % | | | 10.01 | % | | | 7.40 | % | | | 7.33 | % |
| | | | |
Northern Trust Global Quality Real Estate IndexSM | | | 40.18 | % | | | 9.76 | % | | | 7.29 | % | | | 7.21 | % |
| | | | |
FTSE EPRA/NAREIT Developed IndexSM | | | 42.12 | % | | | 9.64 | % | | | 7.00 | % | | | 6.23 | % |
All data as of 10/31/21. Total returns based on market price do not include brokerage commissions that may be payable on secondary market transactions. If brokerage commissions were included, these returns would be lower. Total returns based on market price and net asset value (“NAV”) assume that dividends and capital gain distributions have been reinvested in the Fund at market price and NAV, respectively. NAV is calculated by dividing the total value of all the securities in the fund’s portfolio plus cash, interest and receivables less any liabilities by the number of fund shares outstanding. Market price is determined by the midpoint of the bid/ask spread at 4:00 p.m. Eastern Time from the primary listing exchange. Market price returns may vary from NAV returns.
Performance quoted represents past performance and does not guarantee future results. The graph and table do not reflect the deduction of taxes that a shareholder would pay on Fund distributions or the redemption or sale of Fund shares. Unlike the index that the Fund seeks to track, the Fund’s total returns are reduced by operating expenses, such as transaction costs and management fees. An investor cannot invest directly in an index.
Performance reflects contractual reimbursements in effect until March 1, 2022. In the absence of such reimbursements, performance would be reduced. The gross expense ratio of the Fund is 0.46% and the net expense ratio is 0.45%. The gross and net expense ratios disclosed are as reported in the Fund’s prospectus, which may differ from the gross and net expense ratios presented in the Fund’s financial reports. Current performance may be higher or lower than performance shown. Investment return and the principal value of an investment will fluctuate. Shares may be worth more or less than original cost when redeemed or sold in the market.
FlexShares ETFs’ performance data current to the most recent month-end is available at www.flexshares.com.
PORTFOLIO ANALYSIS
The Fund seeks investment results that correspond generally to the price and yield performance, before fees and expenses, of the Northern Trust Global Quality Real Estate IndexSM (the “Underlying Index”). The Underlying Index is designed to reflect the performance of a selection of companies that, in aggregate, possess greater exposure to quality, value and momentum factors relative to the Northern Trust Global Real Estate Index, the parent index, a float-adjusted market-capitalization weighted index of publicly traded equity securities of U.S. and non-U.S. real estate investment trusts and real estate operating companies. In addition, the Underlying Index is designed to include companies with enhanced risk-return characteristics relative to the global publicly traded real-estate market by featuring quality, value and momentum risk premiums, which Northern Trust Investments, Inc. (“NTI”) believes have been historically demonstrated over a full market cycle. As of October 31, 2021, there were 140 issues in the Underlying Index. NTI uses a “passive” or indexing approach to try to achieve the Fund’s investment objective. NTI uses a representative sampling strategy to manage the Fund. This means that the Fund invests in a representative sample of securities that collectively has an investment profile similar to the Underlying Index. The Fund may or may not hold all of the securities that are included in the Underlying Index.
During the 12 months ended October 31, 2021, prices on Global market investments (including U.S., Developed and Emerging markets) generally traded higher. Through Q4 of 2020, Global market investments moved higher as news about the COVID-19 (“COVID”) vaccine advancements were viewed by investors as a catalyst for a potential economic recovery. Global investments continued to rise over the 1st half of 2021 due to strong corporate earnings and positive economic data. Sectors that had previously struggled during the pandemic, including energy and financials, helped to lead investments higher. Global market investments moved lower in Q3 of 2021 as investor concerns surrounding economic growth in China were driven by the collapse of a large real
| | | | |
| 26 | | FLEXSHARES ANNUAL REPORT | | |
| | |
| FlexShares® | | MANAGEMENT’S DISCUSSION OF FUND PERFORMANCE |
Global Quality Real Estate Index Fund (cont.)
PORTFOLIO ANALYSIS (cont.)
estate investment company and a subsequent increase in regulatory pressures on some of China’s top performing technology and financial companies. Inflation concerns stemming from supply chain bottlenecks and rising energy prices also drove Global market investments lower. Global market investments rebounded in October 2021 as lockdown policies enacted at the height of the pandemic were eased in many countries and latent consumer demand led to strong corporate earnings.
The Underlying Index had a positive total return during the 12 months ended October 31, 2021, but underperformed the global equity real estate markets, as defined by the FTSE EPRA/NAREIT Developed Net Index1, by -1.94%. The quality2 and momentum3 factor exposures of the Underlying Index were negative drivers of Fund performance while the value4 factor exposure was a positive driver of Fund performance. Overall, the positive exposure to value was not enough to offset the headwinds from the negative performance derived from the quality and momentum exposures. Tracking difference between the Fund’s NAV and the Underlying Index’s total return for the period was +40 basis points (“bps”)5, which is reflective of the Fund’s
management fee (-45 bps), stock selection/futures (+30 bps), securities lending (+2 bps), dividend tax differential (+35 bps), and compounding of tracking error over time (+18 bps).
| 1 | The FTSE EPRA/Nareit Global Real Estate Index is an index designed to track the performance of listed real estate companies in both developed and emerging countries worldwide. |
| 2 | The quality factor is based on a belief that there are a set of clearly defined fundamental criteria that seek to identify companies with outstanding financial characteristics. |
| 3 | Momentum in a stock is described as the tendency for the stock price to continue rising if it is going up and to continue declining if it is going down. |
| 4 | The value factor is based on a belief that stocks that are inexpensive relative to some measure of fundamental value outperform those that are pricier. |
| 5 | A unit that is equal to 1/100th of 1% and is used to denote the change in a financial instrument. |
| | | | | | |
| | FLEXSHARES ANNUAL REPORT | | | 27 | |
| | |
| FlexShares® | | MANAGEMENT’S DISCUSSION OF FUND PERFORMANCE |
Real Assets Allocation Index Fund Ticker: ASET
CUMULATIVE PERFORMANCE
Through October 31, 2021
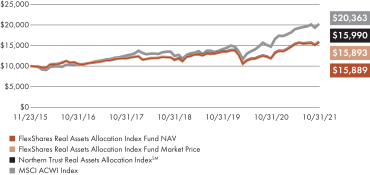
AVERAGE ANNUAL TOTAL RETURN
For the period ended October 31, 2021
| | | | | | | | | | | | | | | | |
| | | 1 Year | | | 3 Year | | | 5 Year | | | Fund
Inception
11/23/2015 | |
| | | | |
| | | | |
FlexShares Real Assets Allocation Index Fund (Based on Net Asset Value) | | | 33.70 | %* | | | 11.27 | % | | | 8.52 | % | | | 8.11 | % |
| | | | |
FlexShares Real Assets Allocation Index Fund (Based on Market Price) | | | 33.74 | % | | | 11.25 | % | | | 8.52 | % | | | 8.11 | % |
| | | | |
Northern Trust Real Assets Allocation IndexSM | | | 33.84 | % | | | 11.41 | % | | | 8.66 | % | | | 8.23 | % |
| | | | |
MSCI ACWI Index | | | 37.28 | % | | | 17.50 | % | | | 14.74 | % | | | 12.72 | % |
All data as of 10/31/21. Total returns based on market price do not include brokerage commissions that may be payable on secondary market transactions. If brokerage commissions were included, these returns would be lower. Total returns based on market price and net asset value (“NAV”) assume that dividends and capital gain distributions have been reinvested in the Fund at market price and NAV, respectively. NAV is calculated by dividing the total value of all the securities in the fund’s portfolio plus cash, interest and receivables less any liabilities by the number of fund shares outstanding. Market price is determined by the midpoint of the bid/ask spread at 4:00 p.m. Eastern Time from the primary listing exchange. Market price returns may vary from NAV returns.
Performance quoted represents past performance and does not guarantee future results. The graph and table do not reflect the deduction of taxes that a shareholder would pay on Fund distributions or the redemption or sale of Fund shares. Unlike the index that the Fund seeks to track, the Fund’s total returns are reduced by operating expenses, such as transaction costs and management fees. An investor cannot invest directly in an index.
Performance reflects contractual reimbursements in effect until March 1, 2022. In the absence of such reimbursements, performance would be reduced. The gross expense ratio of the Fund is 1.05% and the net expense ratio is 0.57%. The gross and net expense ratios disclosed are as reported in the Fund’s prospectus, which may differ from the gross and net expense ratios presented in the Fund’s financial reports. Current performance may be higher or lower than performance shown. Investment return and the principal value of an investment will fluctuate. Shares may be worth more or less than original cost when redeemed or sold in the market.
FlexShares ETFs’ performance data current to the most recent month-end is available at www.flexshares.com.
PORTFOLIO ANALYSIS
The Fund seeks investment results that correspond generally to the price and yield performance, before fees and expenses, of the Northern Trust Real Assets Allocation Index (the “Underlying Index”). The Fund is a fund of funds and seeks its investment objective by investing primarily in the shares of other FlexShares ETFs (together, the “Underlying Funds”) that are eligible for inclusion in the Underlying Index, rather than in securities of individual companies. The Underlying Funds themselves seek investment results corresponding to their own respective underlying indexes. The Underlying Funds invest primarily in separate sets of securities representing or providing exposures to global “real assets.” Real assets are defined by the index provider as physical or tangible assets. Examples of real assets include but are not limited to commodities, precious metals, oil, and real estate. Each Underlying Fund has its own risk profile and will contribute differently to the overall risk profile of the Fund. Each of the Underlying Funds invests in equity securities that are traded in or are issued by companies domiciled in global developed or emerging markets (including the U.S.). Certain of the Underlying Funds may invest in publicly traded units of master limited partnerships and real estate investment trusts. As of October 31, 2021, there were three Underlying Funds in the Underlying Index. Northern Trust Investments, Inc. (“NTI”) uses a “passive” or indexing approach to try to achieve the Fund’s investment objective and to manage the Fund. NTI generally intends to replicate the constituent securities of the Underlying Index to manage the Fund but may use representative sampling in certain circumstances. “Representative sampling” means investing in a representative sample of securities that collectively has an investment profile similar to the Underlying Index. When the Fund uses representative sampling, it may or may not hold all of the securities that are included in the Underlying Index.
During the 12 months ended October 31, 2021, prices on Global market investments (including U.S., Developed and Emerging markets) generally traded higher. Through Q4 of 2020, Global market investments
| | | | |
| 28 | | FLEXSHARES ANNUAL REPORT | | |
| | |
| FlexShares® | | MANAGEMENT’S DISCUSSION OF FUND PERFORMANCE |
Real Assets Allocation Index Fund (cont.)
| * | The return shown is based on net asset value calculated for shareholder transactions and may differ from the return shown in the financial highlights, which reflects adjustments made to the net asset value in accordance with accounting principles generally accepted in the United States of America. The net asset value was $33.66 as of October 31, 2021. |
PORTFOLIO ANALYSIS (cont.)
moved higher as news about the COVID-19 (“COVID”) vaccine advancements were viewed by investors as a catalyst for a potential economic recovery. Global investments continued to rise over the 1st half of 2021 due to strong corporate earnings and positive economic data. Sectors that had previously struggled during the pandemic, including energy and financials, helped to lead investments higher. Global market investments moved lower in Q3 of 2021 as investor concerns surrounding economic growth in China were driven by the collapse of a large real estate investment company and a subsequent increase in regulatory pressures on some of China’s top performing technology and financial companies. Inflation concerns stemming from supply chain bottlenecks and rising energy prices also drove Global market investments lower. Global market investments rebounded in October as lockdown policies enacted at the height of the pandemic were eased in many countries and latent consumer demand led to strong corporate earnings.
The Underlying Index had a positive total return during the 12 months ended October 31, 2021, but underperformed the global equity markets, as defined by the MSCI All Country World Index (ACWI)1 by -4.04%. The Fund underperformed due to the Underlying Index’s greater allocation to infrastructure relative to its real estate and natural resource allocations. Tracking difference between the Fund’s NAV and the Underlying Index’s total return for the period was -14 basis points (“bps”)2, which is largely reflective of the Fund’s management fee (-57 bps), a reimbursement amount equal to the Acquired Fund Fees and Expenses attributable to the Fund’s investments in the Underlying Funds (+46 bps), and compounding of tracking error over time (-3 bps).
| 1 | The Morgan Stanley Capital International All Country World Index is a market-capitalization-weighted index maintained by Morgan Stanley Capital International (MSCI) and is designed to provide a broad measure of stock performance throughout the world. |
| 2 | A unit that is equal to 1/100th of 1% and is used to denote the change in a financial instrument. |
| | | | | | |
| | FLEXSHARES ANNUAL REPORT | | | 29 | |
| | |
| FlexShares® | | MANAGEMENT’S DISCUSSION OF FUND PERFORMANCE |
Quality Dividend Index Fund Ticker: QDF
CUMULATIVE PERFORMANCE
Through October 31, 2021
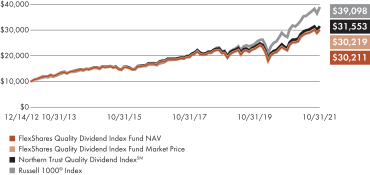
AVERAGE ANNUAL TOTAL RETURN
For the period ended October 31, 2021
| | | | | | | | | | | | | | | | |
| | | 1 Year | | | 3 Year | | | 5 Year | | | Fund
Inception
12/14/2012 | |
| | | | |
| | | | |
FlexShares Quality Dividend Index Fund (Based on Net Asset Value) | | | 37.27 | % | | | 13.04 | % | | | 12.88 | % | | | 13.26 | % |
| | | | |
FlexShares Quality Dividend Index Fund (Based on Market Price) | | | 37.20 | % | | | 13.04 | % | | | 12.86 | % | | | 13.26 | % |
| | | | |
Northern Trust Quality Dividend IndexSM | | | 37.76 | % | | | 13.79 | % | | | 13.52 | % | | | 13.81 | % |
| | | | |
Russell 1000® Index | | | 43.51 | % | | | 22.05 | % | | | 19.19 | % | | | 16.59 | % |
All data as of 10/31/21. Total returns based on market price do not include brokerage commissions that may be payable on secondary market transactions. If brokerage commissions were included, these returns would be lower. Total returns based on market price and net asset value (“NAV”) assume that dividends and capital gain distributions have been reinvested in the Fund at market price and NAV, respectively. NAV is calculated by dividing the total value of all the securities in the fund’s portfolio plus cash, interest and receivables less any liabilities by the number of fund shares outstanding. Market price is determined by the midpoint of the bid/ask spread at 4:00 p.m. Eastern Time from the primary listing exchange. Market price returns may vary from NAV returns.
Performance quoted represents past performance and does not guarantee future results. The graph and table do not reflect the deduction of taxes that a shareholder would pay on Fund distributions or the redemption or sale of Fund shares. Unlike the index that the Fund seeks to track, the Fund’s total returns are reduced by operating expenses, such as transaction costs and management fees. An investor cannot invest directly in an index.
Performance reflects contractual reimbursements in effect until March 1, 2022. In the absence of such reimbursements, performance would be reduced. The gross expense ratio of the Fund is 0.38% and the net expense ratio is 0.37%. The gross and net expense ratios disclosed are as reported in the Fund’s prospectus, which may differ from the gross and net expense ratios presented in the Fund’s financial reports. Current performance may be higher or lower than performance shown. Investment return and the principal value of an investment will fluctuate. Shares may be worth more or less than original cost when redeemed or sold in the market.
FlexShares ETFs’ performance data current to the most recent month-end is available at www.flexshares.com.
PORTFOLIO ANALYSIS
The Fund seeks to provide investment results that correspond generally, before fees and expenses, to the price and yield performance of the Northern Trust Quality Dividend Index SM (the “Underlying Index”). The Underlying Index is designed to reflect the performance of a selection of companies that, in aggregate, possess greater financial strength and stability characteristics relative to the Northern Trust 1250 Index (the “Parent Index”)1. In addition, the Underlying Index is designed to select companies from the Parent Index that in the aggregate have the potential to generate income in excess of the income generated by securities in the Parent Index with a beta2 that is similar to that of the Parent Index. As of October 31, 2021, there were 126 issues in the Underlying Index. Northern Trust Investments, Inc. (“NTI”) uses a “passive” or indexing approach to try to achieve the Fund’s investment objective. NTI uses a representative sampling strategy to manage the Fund. This means that the Fund invests in a representative sample of securities that collectively has an investment profile similar to the Underlying Index. The Fund may or may not hold all of the securities that are included in the Underlying Index.
During the 12 months ended October 31, 2021, prices on U.S. investments generally traded higher. Through Q4 of 2020, U.S. investments rose as news about the COVID-19 (“COVID”) vaccine advancements were viewed by investors as a catalyst for a potential economic recovery. The passage of the federal fiscal stimulus package (Consolidated Appropriations Act, 2021) in December 2020 along with the U.S. Federal Reserve Bank’s actions to keep interest rates
| 1 | Northern Trust 1250 Index is a float-adjusted market-capitalization weighted index comprised of U.S. domiciled large- and mid-capitalization companies. |
| 2 | A statistical measure of the volatility, or sensitivity, of rates of return on a portfolio or security compared to a market index. The beta for an ETF measures the expected change in return of the ETF relative to the return of a designated index. By definition, the beta of the Standard & Poor’s (“S&P”) 500 Index is 1.00. Accordingly, a fund with a 1.10 beta is expected to perform 10% better than the S&P 500 Index in rising markets and 10% worse in falling markets. |
| | | | |
| 30 | | FLEXSHARES ANNUAL REPORT | | |
| | |
| FlexShares® | | MANAGEMENT’S DISCUSSION OF FUND PERFORMANCE |
Quality Dividend Index Fund (cont.)
PORTFOLIO ANALYSIS (cont.)
low while continuing quantitative easing measures also supported U.S. investments. Despite a volatile start in January 2021, U.S. domestic investments rose in Q1 of 2021 as several sectors that had previously struggled during the pandemic including energy, financials and industrials helped to lead investments higher. Domestic U.S. investments continued to advance in Q2 as strong consumption growth and industrial production drove those investments higher. The May 2021 report of inflation, as measured by the Consumer Price Index (CPI), recorded the largest increase since June 1992, but at the time many investors viewed this as a transitory spike caused by increasing global economic recovery and supply chain disruptions. In Q3, U.S. investments remained relatively flat despite strong corporate earnings as investors may have been concerned that future growth would not materialize, and that inflation may be more persistent than previously expected. Domestic U.S. investments advanced in October 2021 due to strong 3rd quarter earnings and robust consumer confidence.
U.S. domestic investments trended upwards during the 12 months ended October 31, 2021, and we believe the quality factor3 was a negative driver of Fund performance during the fiscal year ended October 31, 2021. As the U.S. economy recovered from the global lockdown, however, U.S. investments expanded in several areas hardest hit during the pandemic. Because of this expansion during the second half of the fiscal year, the dividend yield factor4 became a positive driver of Fund performance as high yielding investments outperformed low yielding and non-dividend paying investments. Overall, the positive performance derived from the dividend factor was not enough to offset the negative performance derived from the quality
exposure. Consequently, the Underlying Index underperformed the Russell 1000® Index5 by -5.75%. Tracking difference between the Fund’s NAV and the Underlying Index’s total return for the 12-month period was -49 basis points (“bps”)6, which is reflective of the management fee (-37 bps), securities lending (+1 bps), performance calculation differences between the Underlying Index and the Fund (+1 bps), and compounding of tracking error over time (-14 bps).
| 3 | The quality factor is based on a belief that there are a set of clearly defined fundamental criteria that seek to identify companies with outstanding financial characteristics. |
| 4 | Dividend yield factor is the percentage of an investments price that a company is projected to pay out as dividends. |
| 5 | Russell 1000® Index is a free float-adjusted market capitalization index which measures the performance of the 1,000 largest companies in the Russell 3000 Index, based on market capitalization. |
| 6 | A unit that is equal to 1/100th of 1% and is used to denote the change in a financial instrument. |
| | | | | | |
| | FLEXSHARES ANNUAL REPORT | | | 31 | |
| | |
| FlexShares® | | MANAGEMENT’S DISCUSSION OF FUND PERFORMANCE |
Quality Dividend Defensive Index Fund Ticker: QDEF
CUMULATIVE PERFORMANCE
Through October 31, 2021
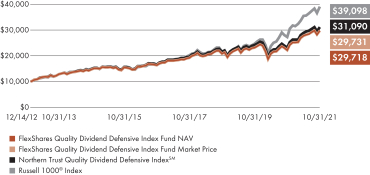
AVERAGE ANNUAL TOTAL RETURN
For the period ended October 31, 2021
| | | | | | | | | | | | | | | | |
| | | 1 Year | | | 3 Year | | | 5 Year | | | Fund
Inception
12/14/2012 | |
| | | | |
| | | | |
FlexShares Quality Dividend Defensive Index Fund (Based on Net Asset Value) | | | 34.28 | % | | | 12.64 | % | | | 12.78 | % | | | 13.05 | % |
| | | | |
FlexShares Quality Dividend Defensive Index Fund (Based on Market Price) | | | 34.19 | % | | | 12.63 | % | | | 12.77 | % | | | 13.05 | % |
| | | | |
Northern Trust Quality Dividend Defensive IndexSM | | | 34.77 | % | | | 13.14 | % | | | 13.44 | % | | | 13.62 | % |
| | | | |
Russell 1000® Index | | | 43.51 | % | | | 22.05 | % | | | 19.19 | % | | | 16.59 | % |
All data as of 10/31/21. Total returns based on market price do not include brokerage commissions that may be payable on secondary market transactions. If brokerage commissions were included, these returns would be lower. Total returns based on market price and net asset value (“NAV”) assume that dividends and capital gain distributions have been reinvested in the Fund at market price and NAV, respectively. NAV is calculated by dividing the total value of all the securities in the fund’s portfolio plus cash, interest and receivables less any liabilities by the number of fund shares outstanding. Market price is determined by the midpoint of the bid/ask spread at 4:00 p.m. Eastern Time from the primary listing exchange. Market price returns may vary from NAV returns.
Performance quoted represents past performance and does not guarantee future results. The graph and table do not reflect the deduction of taxes that a shareholder would pay on Fund distributions or the redemption or sale of Fund shares. Unlike the index that the Fund seeks to track, the Fund’s total returns are reduced by operating expenses, such as transaction costs and management fees. An investor cannot invest directly in an index.
Performance reflects contractual reimbursements in effect until March 1, 2022. In the absence of such reimbursements, performance would be reduced. The gross expense ratio of the Fund is 0.38% and the net expense ratio is 0.37%. The gross and net expense ratios disclosed are as reported in the Fund’s prospectus, which may differ from the gross and net expense ratios presented in the Fund’s financial reports. Current performance may be higher or lower than performance shown. Investment return and the principal value of an investment will fluctuate. Shares may be worth more or less than original cost when redeemed or sold in the market.
FlexShares ETFs’ performance data current to the most recent month-end is available at www.flexshares.com.
PORTFOLIO ANALYSIS
The Fund seeks to provide investment results that correspond generally, before fees and expenses, to the price and yield performance of the Northern Trust Quality Dividend Defensive IndexSM (the “Underlying Index”). The Underlying Index is designed to reflect the performance of a selection of companies that, in aggregate, possess greater financial strength and stability characteristics relative to the Northern Trust 1250 Index (the “Parent Index”)1. In addition, the Underlying Index is designed to select companies from the Parent Index that in the aggregate have the potential to generate income in excess of the income generated by securities in the Parent Index with a beta2 that is lower in relation to that of the Parent Index. As of October 31, 2021, there were 126 issues in the Underlying Index. Northern Trust Investments, Inc. (“NTI”) uses a “passive” or indexing approach to try to achieve the Fund’s investment objective. NTI uses a representative sampling strategy to manage the Fund. This means that the Fund invests in a representative sample of securities that collectively has an investment profile similar to the Underlying Index. The Fund may or may not hold all of the securities that are included in the Underlying Index.
During the 12 months ended October 31, 2021, prices on U.S. investments generally traded higher. Through Q4 of 2020, U.S. investments rose as news about the COVID-19 (“COVID”) vaccine advancements were viewed by investors as a catalyst for a potential economic recovery. The passage of the federal fiscal stimulus package (Consolidated Appropriations Act, 2021) in December 2020 along with the U.S. Federal Reserve Bank’s actions to keep interest rates
| 1 | Northern Trust 1250 Index is a float-adjusted market-capitalization weighted index comprised of U.S. domiciled large- and mid-capitalization companies. |
| 2 | A statistical measure of the volatility, or sensitivity, of rates of return on a portfolio or security compared to a market index. The beta for an ETF measures the expected change in return of the ETF relative to the return of a designated index. By definition, the beta of the Standard & Poor’s (“S&P”) 500 Index is 1.00. Accordingly, a fund with a 1.10 beta is expected to perform 10% better than the S&P 500 Index in rising markets and 10% worse in falling markets. |
| | | | |
| 32 | | FLEXSHARES ANNUAL REPORT | | |
| | |
| FlexShares® | | MANAGEMENT’S DISCUSSION OF FUND PERFORMANCE |
Quality Dividend Defensive Index Fund (cont.)
PORTFOLIO ANALYSIS (cont.)
low while continuing quantitative easing measures also supported U.S. investments. Despite a volatile start in January 2021, U.S. domestic investments rose in Q1 of 2021 as several sectors that had previously struggled during the pandemic including energy, financials and industrials helped to lead investments higher. Domestic U.S. investments continued to advance in Q2 of 2021 as strong consumption growth and industrial production drove those investments higher. The May 2021 report of inflation, as measured by the Consumer Price Index (CPI), recorded the largest increase since June 1992, but at the time many investors viewed this as a transitory spike caused by increasing global economic recovery and supply chain disruptions. In Q3 of 2021, U.S. investments remained relatively flat despite strong corporate earnings as investors may have been concerned that future growth would not materialize, and that inflation may be more persistent than previously expected. Domestic U.S. investments advanced in October 2021 due to strong 3rd quarter earnings and robust consumer confidence.
U.S. domestic investments trended upwards during the 12 months ended October 31, 2021, and we believe both the quality factor3 and the lower beta exposure were negative drivers of Fund performance during the fiscal year ended October 31, 2021. As the U.S. economy recovered from the global lockdown, however, U.S. investments expanded in several areas hardest hit during the pandemic. Because of this expansion during the second half of the fiscal year, the dividend yield factor4 became a positive driver of Fund performance as high yielding investments outperformed low yielding and non-dividend paying investments. Overall, the positive performance derived from the dividend factor was not enough to offset the negative performance derived from the quality and lower beta exposure.
Consequently, the Underlying Index underperformed the Russell 1000® Index5 by -8.74%. Tracking difference between the Fund’s NAV and the Underlying Index’s total return for the 12-month period was -49 basis points (“bps”)6, which is reflective of the management fee (-37 bps), stock selection/futures (+4 bps), securities lending (+1 bps), and compounding of tracking error over time (-17 bps).
| 3 | The quality factor is based on a belief that there are a set of clearly defined fundamental criteria that seek to identify companies with outstanding financial characteristics. |
| 4 | Dividend yield factor is the percentage of an investments price that a company is projected to pay out as dividends. |
| 5 | Russell 1000® Index is a free float-adjusted market capitalization index which measures the performance of the 1,000 largest companies in the Russell 3000 Index, based on market capitalization. |
| 6 | A unit that is equal to 1/100th of 1% and is used to denote the change in a financial instrument. |
| | | | | | |
| | FLEXSHARES ANNUAL REPORT | | | 33 | |
| | |
| FlexShares® | | MANAGEMENT’S DISCUSSION OF FUND PERFORMANCE |
Quality Dividend Dynamic Index Fund Ticker: QDYN
CUMULATIVE PERFORMANCE
Through October 31, 2021
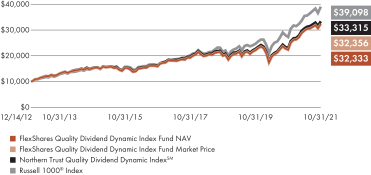
AVERAGE ANNUAL TOTAL RETURN
For the period ended October 31, 2021
| | | | | | | | | | | | | | | | |
| | | 1 Year | | | 3 Year | | | 5 Year | | | Fund
Inception
12/14/2012 | |
| | | | |
| | | | |
FlexShares Quality Dividend Dynamic Index Fund (Based on Net Asset Value) | | | 45.38 | % | | | 17.58 | % | | | 15.46 | % | | | 14.13 | % |
| | | | |
FlexShares Quality Dividend Dynamic Index Fund (Based on Market Price) | | | 45.32 | % | | | 17.59 | % | | | 15.44 | % | | | 14.13 | % |
| | | | |
Northern Trust Quality Dividend Dynamic IndexSM | | | 46.03 | % | | | 17.95 | % | | | 15.83 | % | | | 14.51 | % |
| | | | |
Russell 1000® Index | | | 43.51 | % | | | 22.05 | % | | | 19.19 | % | | | 16.59 | % |
All data as of 10/31/21. Total returns based on market price do not include brokerage commissions that may be payable on secondary market transactions. If brokerage commissions were included, these returns would be lower. Total returns based on market price and net asset value (“NAV”) assume that dividends and capital gain distributions have been reinvested in the Fund at market price and NAV, respectively. NAV is calculated by dividing the total value of all the securities in the fund’s portfolio plus cash, interest and receivables less any liabilities by the number of fund shares outstanding. Market price is determined by the midpoint of the bid/ask spread at 4:00 p.m. Eastern Time from the primary listing exchange. Market price returns may vary from NAV returns.
Performance quoted represents past performance and does not guarantee future results. The graph and table do not reflect the deduction of taxes that a shareholder would pay on Fund distributions or the redemption or sale of Fund shares. Unlike the index that the Fund seeks to track, the Fund’s total returns are reduced by operating expenses, such as transaction costs and management fees. An investor cannot invest directly in an index.
Performance reflects contractual reimbursements in effect until March 1, 2022. In the absence of such reimbursements, performance would be reduced. The gross expense ratio of the Fund is 0.38% and the net expense ratio is 0.37%. The gross and net expense ratios disclosed are as reported in the Fund’s prospectus, which may differ from the gross and net expense ratios presented in the Fund’s financial reports. Current performance may be higher or lower than performance shown. Investment return and the principal value of an investment will fluctuate. Shares may be worth more or less than original cost when redeemed or sold in the market.
FlexShares ETFs’ performance data current to the most recent month-end is available at www.flexshares.com.
PORTFOLIO ANALYSIS
The Fund seeks to provide investment results that correspond generally, before fees and expenses, to the price and yield performance of the Northern Trust Quality Dividend Dynamic IndexSM (the “Underlying Index”). The Underlying Index is designed to reflect the performance of a selection of companies that, in aggregate, possess greater financial strength and stability characteristics relative to the Northern Trust 1250 Index (the “Parent Index”)1. In addition, the Underlying Index is designed to select companies from the Parent Index that in the aggregate have the potential to generate income in excess of the income generated by securities in the Parent Index with a beta2 that is higher in relation to that of the Parent Index. As of October 31, 2021, there were 128 issues in the Underlying Index. Northern Trust Investments, Inc. (“NTI”) uses a “passive” or indexing approach to try to achieve the Fund’s investment objective. NTI uses a representative sampling strategy to manage the Fund. This means that the Fund invests in a representative sample of securities that collectively has an investment profile similar to the Underlying Index. The Fund may or may not hold all of the securities that are included in the Underlying Index.
During the 12 months ended October 31, 2021, prices on U.S. investments generally traded higher. Through Q4 of 2020, U.S. investments rose as news about the COVID-19 (“COVID”) vaccine advancements were viewed by investors as a catalyst for a potential economic recovery. The passage of the federal fiscal stimulus package (Consolidated Appropriations Act, 2021) in December 2020 along with the U.S. Federal Reserve Bank’s actions to keep interest rates low while continuing quantitative easing
| 1 | Northern Trust 1250 Index is a float-adjusted market-capitalization weighted index comprised of U.S. domiciled large- and mid-capitalization companies. |
| 2 | A statistical measure of the volatility, or sensitivity, of rates of return on a portfolio or security compared to a market index. The beta for an ETF measures the expected change in return of the ETF relative to the return of a designated index. By definition, the beta of the Standard & Poor’s (“S&P”) 500 Index is 1.00. Accordingly, a fund with a 1.10 beta is expected to perform 10% better than the S&P 500 Index in rising markets and 10% worse in falling markets. |
| | | | |
| 34 | | FLEXSHARES ANNUAL REPORT | | |
| | |
| FlexShares® | | MANAGEMENT’S DISCUSSION OF FUND PERFORMANCE |
Quality Dividend Dynamic Index Fund (cont.)
PORTFOLIO ANALYSIS (cont.)
measures also supported U.S. investments. Despite a volatile start in January 2021, U.S. domestic investments rose in Q1 of 2021 as several sectors that had previously struggled during the pandemic including energy, financials and industrials helped to lead investments higher. Domestic U.S. investments continued to advance in Q2 of 2021 as strong consumption growth and industrial production drove those investments higher. The May 2021 report of inflation, as measured by the Consumer Price Index (CPI), recorded the largest increase since June 1992, but at the time many investors viewed this as a transitory spike caused by increasing global economic recovery and supply chain disruptions. In Q3 of 2021, U.S. investments remained relatively flat despite strong corporate earnings as investors may have been concerned that future growth would not materialize, and that inflation may be more persistent than previously expected. Domestic U.S. investments advanced in October 2021 due to strong 3rd quarter earnings and robust consumer confidence.
U.S. domestic investments trended upwards during the 12 months ended October 31, 2021, and we believe the quality factor3 was a negative driver of Fund performance during the fiscal year ended October 31, 2021. As the U.S. economy recovered from the global lockdown, however, U.S. investments expanded in several areas hardest hit during the pandemic. Because of this expansion during the second half of the fiscal year, the dividend yield factor4 and the higher beta exposure were positive drivers of Fund performance as high yielding investments outperformed low yielding and non-dividend paying investments and higher beta investments generally fared better than lower beta investments. Consequently, the Underlying Index outperformed the Russell 1000® Index5 by 2.52%. Tracking difference between the Fund’s NAV and the Underlying Index’s total return for the 12-month period was -65 basis points (“bps”)6, which is reflective
of the management fee (-37 bps), stock selection/futures (-20 bps), securities lending (+1 bps), performance calculation differences between the Underling Index and the Fund (+1 bps), and compounding of tracking error over time (-10 bps).
| 3 | The quality factor is based on a belief that there are a set of clearly defined fundamental criteria that seek to identify companies with outstanding financial characteristics. |
| 4 | Dividend yield factor is the percentage of an investments price that a company is projected to pay out as dividends. |
| 5 | Russell 1000® Index is a free float-adjusted market capitalization index which measures the performance of the 1,000 largest companies in the Russell 3000 Index, based on market capitalization. |
| 6 | A unit that is equal to 1/100th of 1% and is used to denote the change in a financial instrument. |
| | | | | | |
| | FLEXSHARES ANNUAL REPORT | | | 35 | |
| | |
| FlexShares® | | MANAGEMENT’S DISCUSSION OF FUND PERFORMANCE |
International Quality Dividend Index Fund Ticker: IQDF
CUMULATIVE PERFORMANCE
Through October 31, 2021
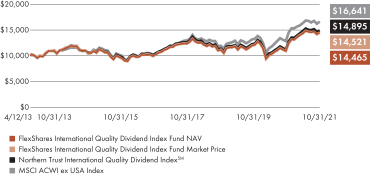
AVERAGE ANNUAL TOTAL RETURN
For the period ended October 31, 2021
| | | | | | | | | | | | | | | | |
| | | 1 Year | | | 3 Year | | | 5 Year | | | Fund
Inception
4/12/2013 | |
| | | | |
| | | | |
FlexShares International Quality Dividend Index Fund (Based on Net Asset Value) | | | 32.42 | % | | | 9.34 | % | | | 7.29 | % | | | 4.40 | % |
| | | | |
FlexShares International Quality Dividend Index Fund (Based on Market Price) | | | 32.85 | % | | | 9.69 | % | | | 7.35 | % | | | 4.46 | % |
| | | | |
Northern Trust International Quality Dividend IndexSM | | | 32.93 | % | | | 9.62 | % | | | 7.52 | % | | | 4.77 | % |
| | | | |
MSCI ACWI ex USA Index | | | 29.66 | % | | | 12.02 | % | | | 9.79 | % | | | 6.14 | % |
All data as of 10/31/21. Total returns based on market price do not include brokerage commissions that may be payable on secondary market transactions. If brokerage commissions were included, these returns would be lower. Total returns based on market price and net asset value (“NAV”) assume that dividends and capital gain distributions have been reinvested in the Fund at market price and NAV, respectively. NAV is calculated by dividing the total value of all the securities in the fund’s portfolio plus cash, interest and receivables less any liabilities by the number of fund shares outstanding. Market price is determined by the midpoint of the bid/ask spread at 4:00 p.m. Eastern Time from the primary listing exchange. Market price returns may vary from NAV returns.
Performance quoted represents past performance and does not guarantee future results. The graph and table do not reflect the deduction of taxes that a shareholder would pay on Fund distributions or the redemption or sale of Fund shares. Unlike the index that the Fund seeks to track, the Fund’s total returns are reduced by operating expenses, such as transaction costs and management fees. An investor cannot invest directly in an index.
Performance reflects contractual reimbursements in effect until March 1, 2022. In the absence of such reimbursements, performance would be reduced. The gross expense ratio of the Fund is 0.48% and the net expense ratio is 0.47%. The gross and net expense ratios disclosed are as reported in the Fund’s prospectus, which may differ from the gross and net expense ratios presented in the Fund’s financial reports. Current performance may be higher or lower than performance shown. Investment return and the principal value of an investment will fluctuate. Shares may be worth more or less than original cost when redeemed or sold in the market.
FlexShares ETFs’ performance data current to the most recent month-end is available at www.flexshares.com.
PORTFOLIO ANALYSIS
The Fund seeks to provide investment results that correspond generally, before fees and expenses, to the price and yield performance of the Northern Trust International Quality Dividend IndexSM (the “Underlying Index”). The Underlying Index is designed to reflect the performance of a selection of companies that, in aggregate, possess greater financial strength and stability characteristics relative to the Northern Trust International Large Cap Index (the “Parent Index”)1. In addition, the Underlying Index is designed to select companies from the Parent Index that in the aggregate have the potential to generate income in excess of the income generated by securities in the Parent Index with a beta2 that is similar to that of the Parent Index. As of October 31, 2021, there were 226 issues in the Underlying Index. Northern Trust Investments, Inc. (“NTI”) uses a “passive” or indexing approach to try to achieve the Fund’s investment objective. NTI uses a representative sampling strategy to manage the Fund. This means that the Fund invests in a representative sample of securities that collectively has an investment profile similar to the Underlying Index. The Fund may or may not hold all of the securities that are included in the Underlying Index.
During the 12 months ended October 31, 2021, prices on International market investments (including Developed and Emerging markets) generally traded higher. Through Q4 of 2020, International market investments moved higher as news about the COVID-19 (“COVID”) vaccine advancements were viewed by investors as a catalyst for a potential economic recovery. International investments continued to rise over the 1st half of 2021 due to strong corporate earnings
| 1 | Northern Trust International Large Cap Index is a float-adjusted market-capitalization weighted index comprised of non-U.S. domiciled large- and mid-capitalization companies. |
| 2 | A statistical measure of the volatility, or sensitivity, of rates of return on a portfolio or security compared to a market index. The beta for an ETF measures the expected change in return of the ETF relative to the return of a designated index. By definition, the beta of the Standard & Poor’s (“S&P”) 500 Index is 1.00. Accordingly, a fund with a 1.10 beta is expected to perform 10% better than the S&P 500 Index in rising markets and 10% worse in falling markets. |
| | | | |
| 36 | | FLEXSHARES ANNUAK REPORT | | |
| | |
| FlexShares® | | MANAGEMENT’S DISCUSSION OF FUND PERFORMANCE |
International Quality Dividend Index Fund (cont.)
PORTFOLIO ANALYSIS (cont.)
and positive economic data. Sectors that had previously struggled during the pandemic, including energy and financials, helped to lead investments higher. International market investments moved lower in Q3 of 2021 as investor concerns surrounding economic growth in China were driven by the collapse of a large real estate investment company and a subsequent increase in regulatory pressures on some of China’s top performing technology and financial companies. Inflation concerns stemming from supply chain bottlenecks and rising energy prices also drove International market investments lower. International market investments rebounded in October 2021 as lockdown policies enacted at the height of the pandemic were eased in many countries and latent consumer demand led to strong corporate earnings.
International investments trended upwards during the 12 months ended October 31, 2021, and we believe the quality factor3 was a negative driver of Fund performance during the fiscal year ended October 31, 2021. As international economies recovered from the global lockdown, however, International investments expanded in several areas hardest hit during the pandemic. Because of this expansion during the second half of the fiscal year, the dividend yield factor4 became a positive driver of Fund performance as high yielding investments outperformed low yielding and non-dividend paying investments. Overall, the positive performance derived from the dividend factor offset the negative performance derived from the quality exposure. Consequently, the Underlying Index overperformed the MSCI ACWI ex USA Index5 by 3.27%. Tracking difference between the Fund’s NAV and the Underlying Index’s total return for the 12-month period was -51 basis points (“bps”)6, which is reflective
of the Fund’s management fee (-47 bps), stock selection/futures (+2 bps), securities lending (+3 bps), performance calculation differences between the Underlying Index and the Fund (+1 bps), and compounding of tracking error over time (-10 bps).
| 3 | The quality factor is based on a belief that there are a set of clearly defined fundamental criteria that seek to identify companies with outstanding financial characteristics. |
| 4 | Dividend yield factor is the percentage of an investments price that a company is projected to pay out as dividends. |
| 5 | The Morgan Stanley Capital International All Country World Index Ex-U.S. is a market-capitalization-weighted index maintained by Morgan Stanley Capital International (MSCI) and is designed to provide a broad measure of stock performance throughout the world, with the exception of U.S.-based companies. |
| 6 | A unit that is equal to 1/100th of 1% and is used to denote the change in a financial instrument. |
| | | | | | |
| | FLEXSHARES ANNUAK REPORT | | | 37 | |
| | |
| FlexShares® International | | MANAGEMENT’S DISCUSSION OF FUND PERFORMANCE |
Quality Dividend Defensive Index Fund Ticker: IQDE
CUMULATIVE PERFORMANCE
Through October 31, 2021
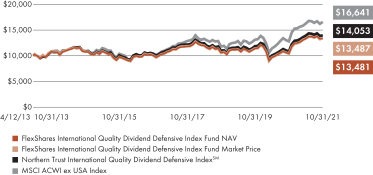
AVERAGE ANNUAL TOTAL RETURN
For the period ended October 31, 2021
| | | | | | | | | | | | | | | | |
| | | 1 Year | | | 3 Year | | | 5 Year | | | Fund
Inception
4/12/2013 | |
| | | | |
| | | | |
FlexShares International Quality Dividend Defensive Index Fund (Based on Net Asset Value) | | | 29.03 | % | | | 8.16 | % | | | 5.98 | % | | | 3.56 | % |
| | | | |
FlexShares International Quality Dividend Defensive Index Fund (Based on Market Price) | | | 28.97 | % | | | 8.31 | % | | | 5.90 | % | | | 3.55 | % |
| | | | |
Northern Trust International Quality Dividend Defensive IndexSM | | | 29.50 | % | | | 8.47 | % | | | 6.23 | % | | | 4.06 | % |
| | | | |
MSCI ACWI ex USA Index | | | 29.66 | % | | | 12.02 | % | | | 9.79 | % | | | 6.14 | % |
All data as of 10/31/21. Total returns based on market price do not include brokerage commissions that may be payable on secondary market transactions. If brokerage commissions were included, these returns would be lower. Total returns based on market price and net asset value (“NAV”) assume that dividends and capital gain distributions have been reinvested in the Fund at market price and NAV, respectively. NAV is calculated by dividing the total value of all the securities in the fund’s portfolio plus cash, interest and receivables less any liabilities by the number of fund shares outstanding. Market price is determined by the midpoint of the bid/ask spread at 4:00 p.m. Eastern Time from the primary listing exchange. Market price returns may vary from NAV returns.
Performance quoted represents past performance and does not guarantee future results. The graph and table do not reflect the deduction of taxes that a shareholder would pay on Fund distributions or the redemption or sale of Fund shares. Unlike the index that the Fund seeks to track, the Fund’s total returns are reduced by operating expenses, such as transaction costs and management fees. An investor cannot invest directly in an index.
Performance reflects contractual reimbursements in effect until March 1, 2022. In the absence of such reimbursements, performance would be reduced. The gross expense ratio of the Fund is 0.48% and the net expense ratio is 0.47%. The gross and net expense ratios disclosed are as reported in the Fund’s prospectus, which may differ from the gross and net expense ratios presented in the Fund’s financial reports. Current performance may be higher or lower than performance shown. Investment return and the principal value of an investment will fluctuate. Shares may be worth more or less than original cost when redeemed or sold in the market.
FlexShares ETFs’ performance data current to the most recent month-end is available at www.flexshares.com.
PORTFOLIO ANALYSIS
The Fund seeks to provide investment results that correspond generally, before fees and expenses, to the price and yield performance of the Northern Trust International Quality Dividend Defensive IndexSM (the “Underlying Index”). The Underlying Index is designed to reflect the performance of a selection of companies that, in aggregate, possess greater financial strength and stability characteristics relative to the Northern Trust International Large Cap Index (the “Parent Index”)1. In addition, the Underlying Index is designed to select companies from the Parent Index that in the aggregate have the potential to generate income in excess of the income generated by securities in the Parent Index with a beta2 that is less than that of the Parent Index. As of October 31, 2021, there were 210 issues in the Underlying Index. Northern Trust Investments, Inc. (“NTI”) uses a “passive” or indexing approach to try to achieve the Fund’s investment objective. NTI uses a representative sampling strategy to manage the Fund. This means that the Fund invests in a representative sample of securities that collectively has an investment profile similar to the Underlying Index. The Fund may or may not hold all of the securities that are included in the Underlying Index.
During the 12 months ended October 31, 2021, prices on International market investments (including Developed and Emerging markets) generally traded higher. Through Q4 of 2020, International market investments moved higher as news about the COVID-19 (“COVID”) vaccine advancements were viewed by investors as a catalyst for a potential economic recovery. International investments continued to rise over the 1st half of 2021 due to strong corporate earnings
| 1 | Northern Trust International Large Cap Index is a float-adjusted market-capitalization weighted index comprised of non-U.S. domiciled large- and mid-capitalization companies. |
| 2 | A statistical measure of the volatility, or sensitivity, of rates of return on a portfolio or security compared to a market index. The beta for an ETF measures the expected change in return of the ETF relative to the return of a designated index. By definition, the beta of the Standard & Poor’s (“S&P”) 500 Index is 1.00. Accordingly, a fund with a 1.10 beta is expected to perform 10% better than the S&P 500 Index in rising markets and 10% worse in falling markets. |
| | | | |
| 38 | | FLEXSHARES ANNUAK REPORT | | |
| | |
| FlexShares® International | | MANAGEMENT’S DISCUSSION OF FUND PERFORMANCE |
Quality Dividend Defensive Index Fund (cont.)
PORTFOLIO ANALYSIS (cont.)
and positive economic data. Sectors that had previously struggled during the pandemic, including energy and financials, helped to lead investments higher. International market investments moved lower in Q3 of 2021 as investor concerns surrounding economic growth in China were driven by the collapse of a large real estate investment company and a subsequent increase in regulatory pressures on some of China’s top performing technology and financial companies. Inflation concerns stemming from supply chain bottlenecks and rising energy prices also drove International market investments lower. International market investments rebounded in October 2021 as lockdown policies enacted at the height of the pandemic were eased in many countries and latent consumer demand led to strong corporate earnings.
International investments trended upwards during the 12 months ended October 31, 2021, and we believe the quality factor4 and the lower beta exposure were negative drivers of Fund performance during the fiscal year ended October 31, 2021. As international economies recovered from the global lockdown, however, International investments expanded in several areas hardest hit during the pandemic. Because of this expansion during the second half of the fiscal year, the dividend yield factor4 became a positive driver of Fund performance as high yielding investments outperformed low yielding and non-dividend paying investments. Overall, the positive performance derived from the dividend factor could not offset the negative performance derived from the quality and lower beta exposure. Consequently, the Underlying Index underperformed the MSCI ACWI ex USA Index5 by -16 basis points (“bps”)6. Tracking difference between the Fund’s NAV and the Underlying Index’s total return for the 12-month period was
-47 bps, which is reflective of the Fund’s management fee (-47 bps), stock selection/futures (+5 bps), securities lending (+3 bps), dividend tax differential (-1 bps), performance calculation differences between the Underlying Index and the Fund (+1 bps), and compounding of tracking error over time (-8 bps).
| 3 | The quality factor is based on a belief that there are a set of clearly defined fundamental criteria that seek to identify companies with outstanding financial characteristics. |
| 4 | Dividend yield factor is the percentage of an investments price that a company is projected to pay out as dividends. |
| 5 | The Morgan Stanley Capital International All Country World Index Ex-U.S. is a market-capitalization-weighted index maintained by Morgan Stanley Capital International (MSCI) and is designed to provide a broad measure of stock performance throughout the world, with the exception of U.S.-based companies. |
| 6 | A unit that is equal to 1/100th of 1% and is used to denote the change in a financial instrument. |
| | | | | | |
| | FLEXSHARES ANNUAK REPORT | | | 39 | |
| | |
| FlexShares® International | | MANAGEMENT’S DISCUSSION OF FUND PERFORMANCE |
Quality Dividend Dynamic Index Fund Ticker: IQDY
CUMULATIVE PERFORMANCE
Through October 31, 2021
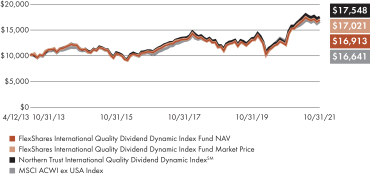
AVERAGE ANNUAL TOTAL RETURN
For the period ended October 31, 2021
| | | | | | | | | | | | | | | | |
| | | 1 Year | | | 3 Year | | | 5 Year | | | Fund
Inception
4/12/2013 | |
| | | | |
| | | | |
FlexShares International Quality Dividend Dynamic Index Fund (Based on Net Asset Value) | | | 39.87 | % | | | 13.13 | % | | | 9.45 | % | | | 6.34 | % |
| | | | |
FlexShares International Quality Dividend Dynamic Index Fund (Based on Market Price) | | | 40.37 | % | | | 13.56 | % | | | 9.61 | % | | | 6.42 | % |
| | | | |
Northern Trust International Quality Dividend Dynamic IndexSM | | | 40.44 | % | | | 13.58 | % | | | 9.80 | % | | | 6.80 | % |
| | | | |
MSCI ACWI ex USA Index | | | 29.66 | % | | | 12.02 | % | | | 9.79 | % | | | 6.14 | % |
All data as of 10/31/21. Total returns based on market price do not include brokerage commissions that may be payable on secondary market transactions. If brokerage commissions were included, these returns would be lower. Total returns based on market price and net asset value (“NAV”) assume that dividends and capital gain distributions have been reinvested in the Fund at market price and NAV, respectively. NAV is calculated by dividing the total value of all the securities in the fund’s portfolio plus cash, interest and receivables less any liabilities by the number of fund shares outstanding. Market price is determined by the midpoint of the bid/ask spread at 4:00 p.m. Eastern Time from the primary listing exchange. Market price returns may vary from NAV returns.
Performance quoted represents past performance and does not guarantee future results. The graph and table do not reflect the deduction of taxes that a shareholder would pay on Fund distributions or the redemption or sale of Fund shares. Unlike the index that the Fund seeks to track, the Fund’s total returns are reduced by operating expenses, such as transaction costs and management fees. An investor cannot invest directly in an index.
Performance reflects contractual reimbursements in effect until March 1, 2022. In the absence of such reimbursements, performance would be reduced. The gross expense ratio of the Fund is 0.48% and the net expense ratio is 0.47%. The gross and net expense ratios disclosed are as reported in the Fund’s prospectus, which may differ from the gross and net expense ratios presented in the Fund’s financial reports. Current performance may be higher or lower than performance shown. Investment return and the principal value of an investment will fluctuate. Shares may be worth more or less than original cost when redeemed or sold in the market.
FlexShares ETFs’ performance data current to the most recent month-end is available at www.flexshares.com.
PORTFOLIO ANALYSIS
The Fund seeks to provide investment results that correspond generally, before fees and expenses, to the price and yield performance of the Northern Trust International Quality Dividend Dynamic IndexSM (the “Underlying Index”). The Underlying Index is designed to reflect the performance of a selection of companies that, in aggregate, possess greater financial strength and stability characteristics relative to the Northern Trust International Large Cap Index (the “Parent Index”)1. In addition, the Underlying Index is designed to select companies from the Parent Index that in the aggregate have the potential to generate income in excess of the income generated by securities in the Parent Index with a beta2 that is higher than that of the Parent Index. As of October 31, 2021, there were 210 issues in the Underlying Index. Northern Trust Investments, Inc. (“NTI”) uses a “passive” or indexing approach to try to achieve the Fund’s investment objective. NTI uses a representative sampling strategy to manage the Fund. This means that the Fund invests in a representative sample of securities that collectively has an investment profile similar to the Underlying Index. The Fund may or may not hold all of the securities that are included in the Underlying Index.
During the 12 months ended October 31, 2021, prices on International market investments (including Developed and Emerging markets) generally traded higher. Through Q4 of 2020, International market investments moved higher as news about the COVID-19 (“COVID”) vaccine advancements were viewed by investors as a catalyst for a potential economic recovery. International investments continued to rise over the 1st half of 2021 due to strong corporate earnings
| 1 | Northern Trust International Large Cap Index is a float-adjusted market-capitalization weighted index comprised of non-U.S. domiciled large- and mid-capitalization companies. |
| 2 | A statistical measure of the volatility, or sensitivity, of rates of return on a portfolio or security compared to a market index. The beta for an ETF measures the expected change in return of the ETF relative to the return of a designated index. By definition, the beta of the Standard & Poor’s (“S&P”) 500 Index is 1.00. Accordingly, a fund with a 1.10 beta is expected to perform 10% better than the S&P 500 Index in rising markets and 10% worse in falling markets. |
| | | | |
| 40 | | FLEXSHARES ANNUAL REPORT | | |
| | |
| FlexShares® International | | MANAGEMENT’S DISCUSSION OF FUND PERFORMANCE |
Quality Dividend Dynamic Index Fund (cont.)
PORTFOLIO ANALYSIS (cont.)
and positive economic data. Sectors that had previously struggled during the pandemic, including energy and financials, helped to lead investments higher. International market investments moved lower in Q3 of 2021 as investor concerns surrounding economic growth in China were driven by the collapse of a large real estate investment company and a subsequent increase in regulatory pressures on some of China’s top performing technology and financial companies. Inflation concerns stemming from supply chain bottlenecks and rising energy prices also drove International market investments lower. International market investments rebounded in October 2021 as lockdown policies enacted at the height of the pandemic were eased in many countries and latent consumer demand led to strong corporate earnings.
International investments trended upwards during the 12 months ended October 31, 2021, and we believe the quality factor3 was a negative driver of Fund performance during the fiscal year ended October 31, 2021. As international economies recovered from the global lockdown, however, International investments expanded in several areas hardest hit during the pandemic. Because of this expansion during the second half of the fiscal year, the dividend yield factor4 and the higher beta exposure were positive drivers of Fund performance as high yielding investments outperformed low yielding and non-dividend paying investments and higher beta investments generally fared better than lower beta investments. Consequently, the Underlying Index outperformed the MSCI ACWI ex USA Index5 by 10.78%. Tracking difference between the Fund’s NAV and the Underlying Index’s total return for the 12-month period was -57 basis points (“bps”)6, which is reflective of the
Fund’s management fee (-47 bps), stock selection/futures (-2 bps), securities lending (+7 bps), dividend tax differential (-1 bps), and compounding of tracking error over time (-14 bps).
| 3 | The quality factor is based on a belief that there are a set of clearly defined fundamental criteria that seek to identify companies with outstanding financial characteristics. |
| 4 | Dividend yield factor is the percentage of an investments price that a company is projected to pay out as dividends. |
| 5 | The Morgan Stanley Capital International All Country World Index Ex-U.S. is a market-capitalization-weighted index maintained by Morgan Stanley Capital International (MSCI) and is designed to provide a broad measure of stock performance throughout the world, with the exception of U.S.-based companies. |
| 6 | A unit that is equal to 1/100th of 1% and is used to denote the change in a financial instrument. |
| | | | | | |
| | FLEXSHARES ANNUAL REPORT | | | 41 | |
| | |
| FlexShares® iBoxx® | | MANAGEMENT’S DISCUSSION OF FUND PERFORMANCE |
3-Year Target Duration TIPS Index Fund Ticker: TDTT
CUMULATIVE PERFORMANCE
Through October 31, 2021
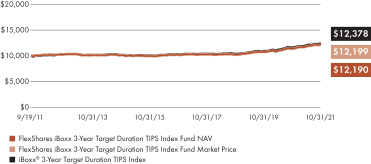
AVERAGE ANNUAL TOTAL RETURN
For the period ended October 31, 2021
| | | | | | | | | | | | | | | | |
| | | 1 Year | | | 3 Year | | | 5 Year | | | Fund
Inception
9/19/2011 | |
| | | | |
| | | | |
FlexShares iBoxx 3-Year Target Duration TIPS Index Fund (Based on Net Asset Value) | | | 6.91 | %* | | | 6.01 | % | | | 3.56 | % | | | 1.97 | % |
| | | | |
FlexShares iBoxx 3-Year Target Duration TIPS Index Fund (Based on Market Price) | | | 6.95 | % | | | 6.05 | % | | | 3.58 | % | | | 1.98 | % |
| | | | |
iBoxx 3-Year Target Duration TIPS Index | | | 7.03 | % | | | 6.21 | % | | | 3.75 | % | | | 2.13 | % |
All data as of 10/31/21. Total returns based on market price do not include brokerage commissions that may be payable on secondary market transactions. If brokerage commissions were included, these returns would be lower. Total returns based on market price and net asset value (“NAV”) assume that dividends and capital gain distributions have been reinvested in the Fund at market price and NAV, respectively. NAV is calculated by dividing the total value of all the securities in the fund’s portfolio plus cash, interest and receivables less any liabilities by the number of fund shares outstanding. Market price is determined by the midpoint of the bid/ask spread at 4:00 p.m. Eastern Time from the primary listing exchange. Market price returns may vary from NAV returns.
Performance quoted represents past performance and does not guarantee future results. The graph and table do not reflect the deduction of taxes that a shareholder would pay on Fund distributions or the redemption or sale of Fund shares. Unlike the index that the Fund seeks to track, the Fund’s total returns are reduced by operating expenses, such as transaction costs and management fees. An investor cannot invest directly in an index.
Performance reflects contractual reimbursements in effect until March 1, 2022. In the absence of such reimbursements, performance would be reduced. The gross expense ratio of the Fund is 0.19% and the net expense ratio is 0.18%. The gross and net expense ratios disclosed are as reported in the Fund’s prospectus, which may differ from the gross and net expense ratios presented in the Fund’s financial reports. Current performance may be higher or lower than performance shown. Investment return and the principal value of an investment will fluctuate. Shares may be worth more or less than original cost when redeemed or sold in the market.
FlexShares ETFs’ performance data current to the most recent month-end is available at www.flexshares.com.
PORTFOLIO ANALYSIS
The Fund seeks to provide investment results that, before fees and expenses, correspond generally to the price and yield performance of the iBoxx 3-Year Target Duration TIPS Index (the “Underlying Index”). The Underlying Index reflects the performance of a selection of inflation protected public obligations of the U.S. Treasury, commonly known as “TIPS,” with a targeted average modified adjusted duration,1 as defined by IHS Markit as the index provider, of approximately three years. The Underlying Index includes publicly issued TIPS that have maturity dates of at least one year but not more than ten years from an index rebalancing date. As of October 31, 2021, there were 18 TIPS in the Underlying Index. Northern Trust Investments, Inc. (“NTI”) uses a “passive” or indexing approach to achieve the Fund’s investment objective. NTI generally intends to replicate the constituent securities of the Underlying Index to manage the Fund but may use representative sampling in certain circumstances. “Representative sampling” means investing in a representative sample of securities that collectively has an investment profile similar to the Underlying Index. When the Fund uses representative sampling, it may or may not hold all of the securities that are included in the Underlying Index.
During the first half of the fiscal year ended October 31, 2021, fixed income investments moved higher as news about the COVID-19 (“COVID”) vaccine advancements were viewed by investors as a catalyst for a potential economic recovery. Quarterly Gross Domestic Product (GDP) as reported by the U.S. Bureau of Economic Analysis rebounded to 4.5% in the fourth quarter of 2020 followed by 6.3% and 6.7% in the first and second quarters of 2021. Emergence of the Delta variant of the COVID virus led to the reimposition of restrictions resulting in a slowdown of GDP to only 2.0% during the calendar third quarter.
| 1 | The duration calculated from the real modified duration of a TIPS security, adjusted for the market’s estimated beta for a TIPS security versus a nominal Treasury security due to the actual and expected changes in inflation. |
| | | | |
| 42 | | FLEXSHARES ANNUAL REPORT | | |
| | |
| FlexShares® iBoxx® | | MANAGEMENT’S DISCUSSION OF FUND PERFORMANCE |
3-Year Target Duration TIPS Index Fund (cont.)
PORTFOLIO ANALYSIS (cont.)
The U.S. yield curve2 steepened in early calendar year 2021 as prospects for economic reopening with the pending distribution of COVID vaccines and the runoff elections for two senate seats in Georgia. Investors began to consider the positive impact on markets of the potential for additional fiscal stimulus with one party in control of the House, Senate and Executive Branch.
Short-term Treasury yields remained at low levels despite the Federal Reserve (Fed) statements indicating the possibility of decreasing the purchases of Treasury and Agency Mortgage Backed Securities (MBS) and the highest consumer price inflation in thirteen years. By the summer of 2021, yields were lower as increased infections from the COVID Delta variant weighed on economic growth outlooks.
By fiscal year-end, 1-month and 3-month Treasury yields were down a couple of basis points (bps)3, 1-year Treasury yields were unchanged, while intermediate- and long-term yields were higher with 2-year yields up +34 bps, 5-year yields up +80 bps, 10-year yields up +68 bps, 30-year yields up +27 bps.
For the fiscal year ended October 31, 2021, the Consumer Price Index (CPI) ended the year meaningfully higher at a 6.2% rate which was the highest level since July 30, 2008 and up from 1.2% for the fiscal year ended October 31, 20204. Our opinion is that commodity prices in general moved higher during the summer of 2020 as economies slowly reopened and consumer demand was met by supply shortages as previous COVID shutdowns of production facilities
ultimately led to higher prices for raw materials. We believe that inflation expectations rose further in early 2021 as the Georgia Senate run-off elections drove expectations for even further fiscal stimulus potentially driving consumer demand higher. Rising wages combined with increasing energy and food prices drove annual CPI above 5% in the summer of 2021. Within the CPI measure, core inflation ex-food and energy prices were higher by 4.6%. As measured by the CPI, individual items were up substantially including energy prices 30% higher, food items up 5.3% and shelter prices showed an increase of 3.5%5.
During the fiscal year, real yields fell on lower nominal treasury yields. Short-term real yields6 fell more than long-term yields in conjunction with the Fed decision to cut the Federal funds rate. 1-year real yields fell 132 bps, while the 5-, 10-, and 30-year real yields were lower by 128 bps, 97 bps, and 77 bps, respectively7.
Highest inflation in 30 years along with falling real interest rates during the fiscal year led to positive total return performance for both the Fund and the Underlying Index. For the 12-month period, the NAV performance of the Fund outperformed the Bloomberg U.S. TIPS 1-10 Year Index8 by +22 bps due to lower duration positioning of the Underlying Index against the backdrop of falling real interest rates. Tracking difference between the Fund’s NAV and the Underlying Index for the 12-month period was -12 bps, reflective of the Fund’s management fee (-18 bps), duration and curve positioning (+1 bps), security selection (-4 bps), trading and pricing differences (+15 bps), and other factors (-6 bps).
| * | The return shown is based on net asset value calculated for shareholder transactions and may differ from the return shown in the financial highlights, which reflects adjustments made to the net asset value in accordance with accounting principles generally accepted in the United States of America. The net asset value was $26.38 as of October 31, 2021. |
| 2 | A yield curve is constructed by plotting a session’s final yields for various maturities including 1-month, 3-month, 6-month, 1-year, 2-year, 3-year, 5-year, 7-year, 10-year, 20-year, and 30-year maturities. |
| 3 | A unit that is equal to 1/100th of 1% and is used to denote the change in a financial instrument. |
| 4 | U.S. Bureau of Labor Statistics, Consumer Price Index, October 31, 2021 and October 31, 2020, respectively. |
| 5 | U.S. Bureau of Labor Statistics, Consumer Price Index, June 30, 2021. |
| 6 | A real yield is the yield to the investor that has been adjusted to remove the effects of inflation. |
| 7 | Bloomberg, In this analysis we are making a comparison between the difference in the real yield rates of the 1-year, 5-year, 10-year and 30-year maturities using data available as of January 1, 2021 and October 31, 2021. |
| 8 | The Bloomberg US Treasury Inflation Notes: 1-10 Year \Index (Series-L) measures the performance of the US Treasury Inflation Protected Securities (TIPS) market with less than 10 years to maturity. |
| | | | | | |
| | FLEXSHARES ANNUAL REPORT | | | 43 | |
| | |
| FlexShares® iBoxx® | | MANAGEMENT’S DISCUSSION OF FUND PERFORMANCE |
5-Year Target Duration TIPS Index Fund Ticker: TDTF
CUMULATIVE PERFORMANCE
Through October 31, 2021
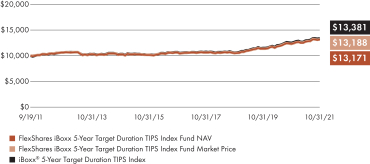
AVERAGE ANNUAL TOTAL RETURN
For the period ended October 31, 2021
| | | | | | | | | | | | | | | | |
| | | 1 Year | | | 3 Year | | | 5 Year | | | Fund
Inception
9/19/2011 | |
| | | | |
| | | | |
FlexShares iBoxx 5-Year Target Duration TIPS Index Fund (Based on Net Asset Value) | | | 6.85 | %* | | | 7.92 | % | | | 4.38 | % | | | 2.76 | % |
| | | | |
FlexShares iBoxx 5-Year Target Duration TIPS Index Fund (Based on Market Price) | | | 6.96 | % | | | 7.96 | % | | | 4.40 | % | | | 2.77 | % |
| | | | |
iBoxx 5-Year Target Duration TIPS Index | | | 7.02 | % | | | 8.17 | % | | | 4.58 | % | | | 2.92 | % |
All data as of 10/31/21. Total returns based on market price do not include brokerage commissions that may be payable on secondary market transactions. If brokerage commissions were included, these returns would be lower. Total returns based on market price and net asset value (“NAV”) assume that dividends and capital gain distributions have been reinvested in the Fund at market price and NAV, respectively. NAV is calculated by dividing the total value of all the securities in the fund’s portfolio plus cash, interest and receivables less any liabilities by the number of fund shares outstanding. Market price is determined by the midpoint of the bid/ask spread at 4:00 p.m. Eastern Time from the primary listing exchange. Market price returns may vary from NAV returns.
Performance quoted represents past performance and does not guarantee future results. The graph and table do not reflect the deduction of taxes that a shareholder would pay on Fund distributions or the redemption or sale of Fund shares. Unlike the index that the Fund seeks to track, the Fund’s total returns are reduced by operating expenses, such as transaction costs and management fees. An investor cannot invest directly in an index.
Performance reflects contractual reimbursements in effect until March 1, 2022. In the absence of such reimbursements, performance would be reduced. The gross expense ratio of the Fund is 0.19% and the net expense ratio is 0.18%. The gross and net expense ratios disclosed are as reported in the Fund’s prospectus, which may differ from the gross and net expense ratios presented in the Fund’s financial reports. Current performance may be higher or lower than performance shown. Investment return and the principal value of an investment will fluctuate. Shares may be worth more or less than original cost when redeemed or sold in the market.
FlexShares ETFs’ performance data current to the most recent month-end is available at www.flexshares.com.
PORTFOLIO ANALYSIS
The Fund seeks to provide investment results that, before fees and expenses, correspond generally to the price and yield performance of the iBoxx 5-Year Target Duration TIPS Index (the “Underlying Index”). The Underlying Index reflects the performance of a selection of inflation protected public obligations of the U.S. Treasury, commonly known as “TIPS,” with a targeted average modified adjusted duration,1 as defined by IHS Markit as the index provider, of approximately five years. The Underlying Index includes publicly issued TIPS that have maturity dates of at least three years but not more than twenty years from an index rebalancing date. As of October 31, 2021, there were 25 TIPS in the Underlying Index. Northern Trust Investments, Inc. (“NTI”) uses a “passive” or indexing approach to achieve the Fund’s investment objective. NTI generally intends to replicate the constituent securities of the Underlying Index to manage the Fund but may use representative sampling in certain circumstances. “Representative sampling” means investing in a representative sample of securities that collectively has an investment profile similar to the Underlying Index. When the Fund uses representative sampling, it may or may not hold all of the securities that are included in the Underlying Index.
During the first half of the fiscal year ended October 31, 2021, fixed income investments moved higher as news about the COVID-19 (“COVID”) vaccine advancements were viewed by investors as a catalyst for a potential economic recovery. Quarterly Gross Domestic Product (GDP) as reported by the U.S. Bureau of Economic Analysis rebounded to 4.5% in the fourth quarter of 2020 followed by 6.3% and 6.7% in the first and second quarters of 2021. Emergence of the Delta variant of the COVID virus led to the reimposition of restrictions resulting in a slowdown of GDP to only 2.0% during the calendar third quarter.
| 1 | The duration calculated from the real modified duration of a TIPS security, adjusted for the market’s estimated beta for a TIPS security versus a nominal Treasury security due to the actual and expected changes in inflation. |
| | | | |
| 44 | | FLEXSHARES ANNUAK REPORT | | |
| | |
| FlexShares® iBoxx® | | MANAGEMENT’S DISCUSSION OF FUND PERFORMANCE |
5-Year Target Duration TIPS Index Fund (cont.)
PORTFOLIO ANALYSIS (cont.)
The U.S. yield curve2 steepened in early calendar year 2021 as prospects for economic reopening with the pending distribution of COVID vaccines and the runoff elections for two senate seats in Georgia. Investors began to consider the positive impact on markets of the potential for additional fiscal stimulus with one party in control of the House, Senate and Executive Branch.
Short-term Treasury yields remained at low levels despite the Federal Reserve (Fed) statements indicating the possibility of decreasing the purchases of Treasury and Agency Mortgage Backed Securities (MBS) and the highest consumer price inflation in thirteen years. By the summer of 2021, yields were lower as increased infections from the COVID Delta variant weighed on economic growth outlooks.
By fiscal year-end, 1-month and 3-month Treasury yields were down a couple of basis points (bps)3, 1-year Treasury yields were unchanged, while intermediate- and long-term yields were higher with 2-year yields up +34 bps, 5-year yields up +80 bps, 10-year yields up +68 bps, and 30-year yields up +27 bps.
For the fiscal year ended October 31, 2021, the Consumer Price Index (CPI) ended the year meaningfully higher at a 6.2% rate which was the highest level since July 30, 2008 and up from 1.2% for the fiscal year ended October 31, 20204. Our opinion is that commodity prices in general moved higher during the summer of 2020 as economies slowly reopened and consumer demand was met by supply shortages as previous COVID shutdowns of production facilities
ultimately led to higher prices for raw materials. We believe that inflation expectations rose further in early 2021 as the Georgia Senate run-off elections drove expectations for even further fiscal stimulus potentially driving consumer demand higher. Rising wages combined with increasing energy and food prices drove annual CPI above 5% in the summer of 2021. Within the CPI measure, core inflation ex-food and energy prices were higher by 4.6%. As measured by the CPI, individual items were up substantially including energy prices 30% higher, food items up 5.3% and shelter prices showed an increase of 3.5%5.
During the fiscal year, real yields fell on lower nominal treasury yields. Short-term real yields6 fell more than long-term yields in conjunction with the Fed decision to cut the Federal funds rate. 1-year real yields fell 132 bps, while the 5-, 10-, and 30-year real yields were lower by 128 bps, 97 bps, and 77 bps, respectively7.
Highest inflation in 30 years along with falling real interest rates during the fiscal year led to positive total return performance for both the Fund and the Underlying Index. For the 12-month period, the NAV performance of the Fund underperformed the Bloomberg U.S. TIPS 1-10 Year Index8 by -30 bps due to higher duration positioning of the Underlying Index against the backdrop of falling real interest rates. Tracking difference between the Fund’s NAV and the Underlying Index for the 12-month period was -17 bps, reflective of the Fund’s management fee (-18 bps), duration and curve positioning (-4 bps), security selection (+3 bps), trading and pricing differences (+8 bps), and other factors (-6 bps).
| * | The return shown is based on net asset value calculated for shareholder transactions and may differ from the return shown in the financial highlights, which reflects adjustments made to the net asset value in accordance with accounting principles generally accepted in the United States of America. The net asset value was $28.02 as of October 31, 2021. |
| 2 | A yield curve is constructed by plotting a session’s final yields for various maturities including 1-month, 3-month, 6-month, 1-year, 2-year, 3-year, 5-year, 7-year, 10-year, 20-year, and 30-year maturities. |
| 3 | A unit that is equal to 1/100th of 1% and is used to denote the change in a financial instrument. |
| 4 | U.S. Bureau of Labor Statistics, Consumer Price Index, October 31, 2021 and October 31, 2020, respectively. |
| 5 | U.S. Bureau of Labor Statistics, Consumer Price Index, June 30, 2021. |
| 6 | A real yield is the yield to the investor that has been adjusted to remove the effects of inflation. |
| 7 | Bloomberg, In this analysis we are making a comparison between the difference in the real yield rates of the 1-year, 5-year, 10-year and 30-year maturities using data available as of January 1, 2021 and October 31, 2021. |
| 8 | The Bloomberg US Treasury Inflation Notes: 1-10 Year \Index (Series-L) measures the performance of the US Treasury Inflation Protected Securities (TIPS) market with less than 10 years to maturity. |
| | | | | | |
| | FLEXSHARES ANNUAL REPORT | | | 45 | |
| | |
| FlexShares® | | MANAGEMENT’S DISCUSSION OF FUND PERFORMANCE |
Disciplined Duration MBS Index Fund Ticker: MBSD
CUMULATIVE PERFORMANCE
Through October 31, 2021
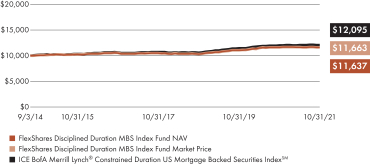
AVERAGE ANNUAL TOTAL RETURN
For the period ended October 31, 2021
| | | | | | | | | | | | | | | | |
| | | 1 Year | | | 3 Year | | | 5 Year | | | Fund
Inception
9/3/2014 | |
| | | | |
| | | | |
FlexShares Disciplined Duration MBS Index Fund (Based on Net Asset Value) | | | -0.28 | % | | | 4.04 | % | | | 1.97 | % | | | 2.14 | % |
| | | | |
FlexShares Disciplined Duration MBS Index Fund (Based on Market Price) | | | -0.11 | % | | | 4.01 | % | | | 2.01 | % | | | 2.17 | % |
| | | | |
ICE BofA Merrill Lynch® Constrained Duration US Mortgage Backed Securities IndexSM | | | 0.73 | % | | | 4.55 | % | | | 2.52 | % | | | 2.61 | % |
All data as of 10/31/21. Total returns based on market price do not include brokerage commissions that may be payable on secondary market transactions. If brokerage commissions were included, these returns would be lower. Total returns based on market price and net asset value (“NAV”) assume that dividends and capital gain distributions have been reinvested in the Fund at market price and NAV, respectively. NAV is calculated by dividing the total value of all the securities in the fund’s portfolio plus cash, interest and receivables less any liabilities by the number of fund shares outstanding. Market price is determined by the midpoint of the bid/ask spread at 4:00 p.m. Eastern Time from the primary listing exchange. Market price returns may vary from NAV returns.
Performance quoted represents past performance and does not guarantee future results. The graph and table do not reflect the deduction of taxes that a shareholder would pay on Fund distributions or the redemption or sale of Fund shares. Unlike the index that the Fund seeks to track, the Fund’s total returns are reduced by operating expenses, such as transaction costs and management fees. An investor cannot invest directly in an index.
Performance reflects contractual reimbursements in effect until March 1, 2022. In the absence of such reimbursements, performance would be reduced. The gross expense ratio of the Fund is 0.19% and the net expense ratio is 0.18%. The gross and net expense ratios disclosed are as reported in the Fund’s prospectus, which may differ from the gross and net expense ratios presented in the Fund’s financial reports. Current performance may be higher or lower than performance shown. Investment return and the principal value of an investment will fluctuate. Shares may be worth more or less than original cost when redeemed or sold in the market.
FlexShares ETFs’ performance data current to the most recent month-end is available at www.flexshares.com.
PORTFOLIO ANALYSIS
The Fund seeks to provide investment results that correspond generally to the price and yield performance, before fees and expenses, of the ICE BofA® Constrained Duration US Mortgage Backed Securities Index (the “Underlying Index”). The Underlying Index reflects the performance of a selection of investment-grade US agency residential mortgage-backed pass-through securities (“MBS”). Pursuant to the Underlying Index’s methodology, the average effective duration,1 of the portfolio of MBS represented in the Underlying Index was between 3.25 and 4.25 years. As of October 31, 2021, there were 109 securities in the Underlying Index. Northern Trust Investments, Inc. (“NTI”) uses a “passive” or indexing approach to try to achieve the Fund’s investment objective. NTI uses a representative sampling strategy to manage the Fund. This means that the Fund invests in a representative sample of securities that collectively has an investment profile similar to the Underlying Index. The Fund may or may not hold all of the securities that are included in the Underlying Index.
During the first half of the fiscal year ended October 31, 2021, fixed income investments moved higher as news about the COVID-19 (“COVID”) vaccine advancements were viewed by investors as a catalyst for a potential economic recovery. Quarterly Gross Domestic Product (GDP) as reported by the U.S. Bureau of Economic Analysis rebounded to 4.5% in the fourth quarter of 2020 followed by 6.3% and 6.7% in the first and second quarters of 2021. Emergence of the Delta variant of the COVID virus led to the reimposition of restrictions resulting in a slowdown of GDP to only 2.0% during the calendar third quarter of 2021.
| 1 | Average effective duration provides a measure of a fund’s interest-rate sensitivity and the longer a fund’s duration, the more sensitive the fund is to shifts in interest rates. Duration also gives an indication of how a fund’s NAV will change as interest rates change. A fund with a five-year duration would be expected to lose 5% of its NAV if interest rates rose by 1 percentage point or gain 5%, if interest rates fell by 1 percentage point. Morningstar surveys fund companies for this information. |
| | | | |
| 46 | | FLEXSHARES ANNUAL REPORT | | |
| | |
| FlexShares® | | MANAGEMENT’S DISCUSSION OF FUND PERFORMANCE |
Disciplined Duration MBS Index Fund (cont.)
PORTFOLIO ANALYSIS (cont.)
The U.S. yield curve2 steepened in early calendar year 2021 as prospects for economic reopening with the pending distribution of COVID vaccines and the runoff elections for two senate seats in Georgia. Investors began to consider the positive impact on markets of the potential for additional fiscal stimulus with one party in control of the House, Senate and Executive Branch.
Short-term Treasury yields remained at low levels despite the Federal Reserve (Fed) statements indicating the possibility of decreasing the purchases of Treasury and Agency MBS and the highest consumer price inflation in thirteen years. By the summer of 2021, yields were lower as increased infections from the COVID Delta variant weighed on economic growth outlooks.
By fiscal year-end, 1-month and 3-month Treasury yields were down a couple of basis points (bps)3, 1-year Treasury yields were unchanged, while intermediate- and long-term yields were higher with 2-year yields up +34 bps, 5-year yields up +80 bps, 10-year yields up +68 bps, 30-year yields up +27 bps.
Prompted by lower interest rates, refinancing activity, housing sales and mortgage applications began to surge
April 2020, as average 30-year mortgage rates (Freddie Mac Index) raised slightly from 2.81% to 3.14% during the fiscal year4. Powered by robust demand and low mortgage rates, existing home sales managed a 16.3% increase5 for the twelve months following September 2020, while new housing starts increased 15.3% for the fiscal year.6
Highest inflation in 30 years along with falling real interest rates during the fiscal year led to positive total return performance for both the Fund and the Underlying Index. For the 12-month period, the NAV performance of the Fund outperformed the Bloomberg U.S. Mortgage Backed Securities Index7 by +30 bps due to the Underlying Index’s exposure to a selection of higher coupon8, more seasoned MBS securities which outperformed newer MBS due in part to less principal prepayment risk. Tracking difference between the Fund’s NAV and the Underlying Index’s total return for the 12-month period was -101 bps, reflective of the Fund’s management fee (-20 bps), trading costs and fees (-8 bps), pricing differences (-83 bps), yield curve positioning (-21 bps), sector allocation (-5 bps), security selection (+37 bps), and other factors (-1 bps).
| 2 | A yield curve is constructed by plotting a session’s final yields for various maturities including 1-month, 3-month, 6-month, 1-year, 2-year, 3-year, 5-year, 7-year, 10-year, 20-year, and 30-year maturities. |
| 3 | A unit that is equal to 1/100th of 1% and is used to denote the change in a financial instrument. |
| 4 | Source: Bloomberg. Federal Home Loan Mortgage Corp. Primary Mortgage Market Survey. October 31, 2020 through November 1, 2021. |
| 5 | Source: Bloomberg. National Association of Realtors, US Existing Homes Sales, September30, 2020 through September 30, 2021. |
| 6 | Source: Bloomberg. U.S. Census Bureau, Us New Privately Owned Housing Unites Starts, October 31, 2020 through October 31, 2021. |
| 7 | The Bloomberg US Mortgage Backed Securities Index tracks fixed-rate agency mortgage backed passthrough securities guaranteed by Ginnie Mae (GNMA), Fannie Mae (FNMA), and Freddie Mac (FHLMC). |
| 8 | A coupon or coupon payment is the annual interest rate paid on a bond, expressed as a percentage of the face value and paid from issue date until maturity. |
| | | | | | |
| | FLEXSHARES ANNUAL REPORT | | | 47 | |
| | |
| FlexShares® Credit-Scored | | MANAGEMENT’S DISCUSSION OF FUND PERFORMANCE |
US Corporate Bond Index Fund Ticker: SKOR
CUMULATIVE PERFORMANCE
Through October 31, 2021
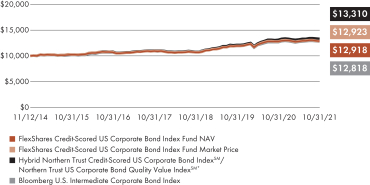
| * | The hybrid index performance information reflects the performance of the Northern Trust Credit-Scored US Corporate Bond IndexSM (Previous Index) through April 30, 2020 and the Northern Trust US Corporate Bond Quality Value IndexSM thereafter. The Previous Index terminated as of May 1, 2020. |
AVERAGE ANNUAL TOTAL RETURN
For the period ended October 31, 2021
| | | | | | | | | | | | | | | | |
| | | 1 Year | | | 3 Year | | | 5 Year | | | Fund
Inception
11/12/2014 | |
| | | | |
| | | | |
FlexShares Credit-Scored US Corporate Bond Index Fund (Based on Net Asset Value) | | | 0.70 | % | | | 6.42 | % | | | 3.76 | % | | | 3.75 | % |
| | | | |
FlexShares Credit-Scored US Corporate Bond Index Fund (Based on Market Price) | | | 0.68 | % | | | 6.39 | % | | | 3.73 | % | | | 3.75 | % |
| | | | |
Hybrid Northern Trust Credit-Scored US Corporate Bond IndexSM/Northern Trust US Corporate Bond Quality Value IndexSM* | | | 1.34 | % | | | 6.97 | % | | | 4.25 | % | | | 4.19 | % |
| | | | |
Bloomberg U.S. Intermediate Corporate Bond Index | | | 0.71 | % | | | 5.80 | % | | | 3.65 | % | | | 3.62 | % |
All data as of 10/31/21. Total returns based on market price do not include brokerage commissions that may be payable on secondary market transactions. If brokerage commissions were included, these returns would be lower. Total returns based on market price and net asset value (“NAV”) assume that dividends and capital gain distributions have been reinvested in the Fund at market price and NAV, respectively. NAV is calculated by dividing the total value of all the securities in the fund’s portfolio plus cash, interest and receivables less any liabilities by the number of fund shares outstanding. Market price is determined by the midpoint of the bid/ask spread at 4:00 p.m. Eastern Time from the primary listing exchange. Market price returns may vary from NAV returns.
Performance quoted represents past performance and does not guarantee future results. The graph and table do not reflect the deduction of taxes that a shareholder would pay on Fund distributions or the redemption or sale of Fund shares. Unlike the index that the Fund seeks to track, the Fund’s total returns are reduced by operating expenses, such as transaction costs and management fees. An investor cannot invest directly in an index.
Performance reflects contractual reimbursements in effect until March 1, 2022. In the absence of such reimbursements, performance would be reduced. The gross expense ratio of the Fund is 0.23% and the net expense ratio is 0.22%. The gross and net expense ratios disclosed are as reported in the Fund’s prospectus, which may differ from the gross and net expense ratios presented in the Fund’s financial reports. Current performance may be higher or lower than performance shown. Investment return and the principal value of an investment will fluctuate. Shares may be worth more or less than original cost when redeemed or sold in the market.
FlexShares ETFs’ performance data current to the most recent month-end is available at www.flexshares.com.
PORTFOLIO ANALYSIS
The Fund seeks to provide investment results that correspond generally to the price and yield performance, before fees and expenses, of the Northern Trust US Corporate Bond Quality Value IndexSM (the “Underlying Index”). The Underlying Index reflects the performance of a broad universe of US-dollar denominated investment grade corporate bonds that can potentially deliver a higher total return than the overall investment grade corporate bond market, as represented by the Northern Trust US Investment-Grade Corporate Bond IndexSM (the “Parent Index”).1 The Underlying Index begins with the Parent Index and then follows a rules-based methodology to select and calculate optimal weights for securities in the Underlying Index based on liquidity and security issuers’ fundamental factors, as determined by Northern Trust Investments, Inc. (“NTI”), in its capacity as index provider (the “Index Provider”). As of October 31, 2021, there were 2,512 issues in the Underlying Index. NTI uses a “passive” or indexing approach to try to achieve the Fund’s investment objective. NTI uses a representative sampling strategy to manage the Fund. This means that the Fund invests in a representative sample of securities that collectively has an investment profile similar to the Underlying Index. The Fund may or may not hold all of the securities that are included in the Underlying Index.
During the first half of the fiscal year ended October 31, 2021, fixed income investments moved higher as news about the COVID-19 (“COVID”) vaccine advancements were viewed by investors as a catalyst for a potential economic recovery. Quarterly Gross Domestic Product (GDP) as reported by the U.S. Bureau of Economic Analysis rebounded to 4.5% in the fourth quarter of 2020 followed by 6.3% and 6.7% in the first and second quarters of 2021. Emergence of the Delta variant of the COVID virus led to the reimposition of restrictions resulting in a slowdown of GDP to only 2.0% during the calendar third quarter of 2021.
| 1 | The Northern Trust US Investment Grade Corporate Bond IndexSM is a market-capitalization weighted index comprised of U.S. dollar-denominated investment grade corporate bonds. |
| | | | |
| 48 | | FLEXSHARES ANNUAL REPORT | | |
| | |
| FlexShares® Credit-Scored | | MANAGEMENT’S DISCUSSION OF FUND PERFORMANCE |
US Corporate Bond Index Fund (cont.)
PORTFOLIO ANALYSIS (cont.)
The U.S. yield curve2 steepened in early calendar year 2021 as prospects for economic reopening with the pending distribution of COVID vaccines and the runoff elections for two senate seats in Georgia. Investors began to consider the positive impact on markets of the potential for additional fiscal stimulus with one party in control of the House, Senate and Executive Branch.
Short-term Treasury yields remained at low levels despite the Federal Reserve (Fed) statements indicating the possibility of decreasing the purchases of Treasury and Agency Mortgage Backed Securities (MBS) and the highest consumer price inflation in thirteen years. By the summer of 2021, yields were lower as increased infections from the COVID Delta variant weighed on economic growth outlooks.
By fiscal year-end, 1-month and 3-month Treasury yields were down a couple of basis points (bps)3, 1-year Treasury yields were unchanged, while intermediate- and long-term yields were higher with 2-year yields up
+34 bps, 5-year yields up +80 bps, 10-year yields up +68 bps, 30-year yields up +27 bps.
We believe that investor expectations for rebounding corporate revenues and earnings along with investor pursuit of higher yields led to increased demand for
U.S. corporate credit securities. Intermediate-term4 credit spreads5 trended lower through February 2021, then widened briefly in March 2021 before once again trending lower into the fiscal year. Further robust economic recovery and consumer/business spending helped drive average Intermediate-term option adjusted spreads (“OAS”)6 to 63 bps in comparison to comparable maturing Treasury securities by fiscal year from 94 bps at the beginning of the fiscal year7.
During the fiscal year, the Fund’s NAV underperformed the Bloomberg U.S. Intermediate Corporate Bond Index8 by -5 bps due in part to the Fund’s management fee. During the fiscal year, relative overweight allocations to fixed income securities in financials, real estate investment trusts (“REIT”) and utilities sectors along with security selection in the banking and utility sectors added to Fund performance while a relative underweighting to the communications sector and security selection in the industrials sector detracted from performance. The tracking difference between the Fund’s NAV and the Underlying Index’s return for the fiscal year was -64 bps, which is reflective of the Fund’s management fee (-22 bps), trading costs and fees (-14 bps), pricing differences (+1 bps), sector and security selection (-31 bps), yield curve positioning (+1 bps), and other factors (+1 bp).
| 2 | A yield curve is constructed by plotting a session’s final yields for various maturities including 1-month, 3-month, 6-month, 1-year, 2-year, 3-year, 5-year, 7-year, 10-year, 20-year, and 30-year maturities. |
| 3 | A unit that is equal to 1/100th of 1% and is used to denote the change in a financial instrument. |
| 4 | Intermediate-term bonds typically mature between 3 – 10 years. |
| 5 | Credit spread is the difference in yield between one debt security and another debt security with the same maturity but of lesser quality. |
| 6 | The option-adjusted spread (OAS) is the measurement of the spread of a fixed-income security rate or portfolio and typically the Treasury securities yield (often referred to as the risk-free rate) and that spread is added to the fixed-income security for comparison purposes. |
| 7 | Source: Bloomberg, in this analysis we are making a comparison between the difference of the Option Adjusted Spread of intermediate-term investment grade corporate bonds using data available on the Bloomberg U.S. Intermediate Corporate Bond Index of October 31, 2020 – October 31, 2021. |
| 8 | Bloomberg U.S. Intermediate Corporate Bond Index measures the investment grade, fixed-rate, taxable corporate bond market that have between 1 and up to, but not including, 10 years to maturity. |
| | | | | | |
| | FLEXSHARES ANNUAL REPORT | | | 49 | |
| | |
| FlexShares® Credit-Scored | | MANAGEMENT’S DISCUSSION OF FUND PERFORMANCE |
US Long Corporate Bond Index Fund Ticker: LKOR
CUMULATIVE PERFORMANCE
Through October 31, 2021
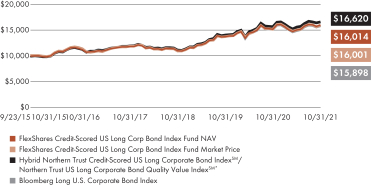
| * | The hybrid index performance information reflects the performance of the Northern Trust Credit-Scored US Long Corporate Bond IndexSM (Previous Index) through April 30, 2020 and the Northern Trust US Long Corporate Bond Quality Value IndexSM thereafter. The Previous Index terminated as of May 1, 2020. |
AVERAGE ANNUAL TOTAL RETURN
For the period ended October 31, 2021
| | | | | | | | | | | | | | | | |
| | | 1 Year | | | 3 Year | | | 5 Year | | | Fund
Inception
9/23/2015 | |
| | | | |
| | | | |
FlexShares Credit-Scored US Long Corp Bond Index Fund (Based on Net Asset Value) | | | 5.14 | % | | | 13.35 | % | | | 7.36 | % | | | 8.02 | % |
| | | | |
FlexShares Credit-Scored US Long Corp Bond Index Fund (Based on Market Price) | | | 5.23 | % | | | 13.45 | % | | | 7.00 | % | | | 8.00 | % |
| | | | |
Hybrid Northern Trust Credit-Scored US Long Corporate Bond IndexSM/Northern Trust US Long Corporate Bond Quality Value IndexSM* | | | 5.86 | % | | | 14.28 | % | | | 8.14 | % | | | 8.73 | % |
| | | | |
Bloomberg Long U.S. Corporate Bond Index | | | 4.55 | % | | | 12.49 | % | | | 7.07 | % | | | 7.89 | % |
All data as of 10/31/21. Total returns based on market price do not include brokerage commissions that may be payable on secondary market transactions. If brokerage commissions were included, these returns would be lower. Total returns based on market price and net asset value (“NAV”) assume that dividends and capital gain distributions have been reinvested in the Fund at market price and NAV, respectively. NAV is calculated by dividing the total value of all the securities in the fund’s portfolio plus cash, interest and receivables less any liabilities by the number of fund shares outstanding. Market price is determined by the midpoint of the bid/ask spread at 4:00 p.m. Eastern Time from the primary listing exchange. Market price returns may vary from NAV returns.
Performance quoted represents past performance and does not guarantee future results. The graph and table do not reflect the deduction of taxes that a shareholder would pay on Fund distributions or the redemption or sale of Fund shares. Unlike the index that the Fund seeks to track, the Fund’s total returns are reduced by operating expenses, such as transaction costs and management fees. An investor cannot invest directly in an index.
Performance reflects contractual reimbursements in effect until March 1, 2022. In the absence of such reimbursements, performance would be reduced. The gross expense ratio of the Fund is 0.23% and the net expense ratio is 0.22%. The gross and net expense ratios disclosed are as reported in the Fund’s prospectus, which may differ from the gross and net expense ratios presented in the Fund’s financial reports. Current performance may be higher or lower than performance shown. Investment return and the principal value of an investment will fluctuate. Shares may be worth more or less than original cost when redeemed or sold in the market.
FlexShares ETFs’ performance data current to the most recent month-end is available at www.flexshares.com.
PORTFOLIO ANALYSIS
The Fund seeks to provide investment results that correspond generally to the price and yield performance, before fees and expenses, of the Northern Trust US Long Corporate Bond Quality Value IndexSM (the “Underlying Index”). The Underlying Index reflects the performance of a broad universe of US-dollar denominated investment grade corporate bonds that can potentially deliver a higher total return than the overall investment grade corporate bond market, as represented by the Northern Trust US Long Corporate Bond IndexSM (the “Parent Index”).1 The Underlying Index begins with the Parent Index and then follows a rules-based methodology to select and calculate optimal weights for securities in the Underlying Index based on liquidity and security issuers’ fundamental factors, as determined by Northern Trust Investments, Inc. (“NTI”), in its capacity as index provider (the “Index Provider”). As of October 31, 2021, there were 1,342 issues in the Underlying Index. NTI uses a “passive” or indexing approach to try to achieve the Fund’s investment objective. NTI uses a representative sampling strategy to manage the Fund. This means that the Fund invests in a representative sample of securities that collectively has an investment profile similar to the Underlying Index. The Fund may or may not hold all of the securities that are included in the Underlying Index.
During the first half of the fiscal year ended October 31, 2021, fixed income investments moved higher as news about the COVID-19 (“COVID”) vaccine advancements were viewed by investors as a catalyst for a potential economic recovery. Quarterly Gross Domestic Product (GDP) as reported by the U.S. Bureau of Economic Analysis rebounded to 4.5% in the fourth quarter of 2020 followed by 6.3% and 6.7% in the first and second quarters of 2021. Emergence of the Delta variant of the COVID virus led to the reimposition of restrictions resulting in a slowdown of GDP to only 2.0% during the calendar third quarter of 2021.
| 1 | The Northern Trust US Long Corporate Bond IndexSM is a market capitalization weighted index comprised of long-term, U.S. dollar- denominated investment grade corporate bonds. |
| | | | |
| 50 | | FLEXSHARES ANNUAL REPORT | | |
| | |
| FlexShares® Credit-Scored | | MANAGEMENT’S DISCUSSION OF FUND PERFORMANCE |
US Long Corporate Bond Index Fund (cont.)
PORTFOLIO ANALYSIS (cont.)
The U.S. yield curve2 steepened in early calendar year 2021 as prospects for economic reopening with the pending distribution of COVID vaccines and the runoff elections for two senate seats in Georgia. Investors began to consider the positive impact on markets of the potential for additional fiscal stimulus with one party in control of the House, Senate and Executive Branch.
Short-term Treasury yields remained at low levels despite the Federal Reserve (Fed) statements indicating the possibility of decreasing the purchases of Treasury and Agency Mortgage Backed Securities (MBS) and the highest consumer price inflation in thirteen years. By the summer of 2021, yields were lower as increased infections from the COVID Delta variant weighed on economic growth outlooks.
By fiscal year-end, 1-month and 3-month Treasury yields were down a couple of basis points (bps)3, 1-year Treasury yields were unchanged, while intermediate- and long-term yields were higher with 2-year yields up +34 bps, 5-year yields up +80 bps, 10-year yields up +68 bps, 30-year yields up +27 bps.
We believe that investor expectations for rebounding corporate revenues and earnings along with investor
pursuit of higher yields led to increased demand for U.S. corporate credit securities. Long-term4 credit spreads5 trended lower through February 2021, then widened briefly in March 2021 before once again trending lower into the fiscal year. Further robust economic recovery and consumer/business spending helped drive average Intermediate-term option adjusted spreads (“OAS”)6 to 63 bps in comparison to comparable maturing Treasury securities by fiscal year from 94 bps at the beginning of the fiscal year7.
During the fiscal year, the Fund’s NAV underperformed the Bloomberg Long U.S. Corporate Bond Index8 by +59 bps. During the fiscal year, positive performance from relative sector overweight allocations to fixed income securities in energy, financials and materials sectors added to Fund performance while a relative underweighting to the communications, consumer staples and industrial sectors detracted from performance. The tracking difference between the Fund’s NAV and the combined Underlying Indexes return for the period was -72 bps, which is reflective of the Fund’s management fee (-22 bps), trading costs and fees (-36 bps), pricing differences (-5 bps), sector and security selection (-17 bps), yield curve positioning (+9 bps), and other factors (-1 bp).
| 2 | A yield curve is constructed by plotting a session’s final yields for various maturities including 1-month, 3-month, 6-month, 1-year, 2-year, 3-year, 5-year, 7-year, 10-year, 20-year, and 30-year maturities. |
| 3 | A unit that is equal to 1/100th of 1% and is used to denote the change in a financial instrument. |
| 4 | Long-term bonds typically mature beyond 10 years. |
| 5 | Credit spread is the difference in yield between one debt security and another debt security with the same maturity but of lesser quality. |
| 6 | The option-adjusted spread (OAS) is the measurement of the spread of a fixed-income security rate or portfolio and typically the Treasury securities yield (often referred to as the risk-free rate) and that spread is added to the fixed-income security for comparison purposes. |
| 7 | Source: Bloomberg, in this analysis we are making a comparison between the difference of the Option Adjusted Spread of intermediate-term investment grade corporate bonds using data available on the Bloomberg U.S. Intermediate Corporate Bond Index as of October 31, 2020 – October 31, 2021. |
| 8 | Bloomberg Long U.S. Corporate Bond Index measures the performance of investment grade U.S. corporate bond market with bonds that have a maturity of more than ten years. |
| | | | | | |
| | FLEXSHARES ANNUAL REPORT | | | 51 | |
| | |
| FlexShares® High Yield | | MANAGEMENT’S DISCUSSION OF FUND PERFORMANCE |
Value-Scored Bond Index Fund Ticker: HYGV
CUMULATIVE PERFORMANCE
Through October 31, 2021
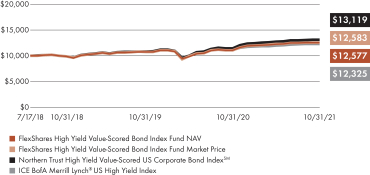
AVERAGE ANNUAL TOTAL RETURN
For the period ended October 31, 2021
| | | | | | | | | | | | |
| | | 1 Year | | | 3 Year | | | Fund
Inception
7/17/2018 | |
| | | | |
| | | |
FlexShares High Yield Value-Scored US Bond Index Fund (Based on Net Asset Value) | | | 13.38 | % | | | 7.88 | % | | | 7.22 | % |
| | | |
FlexShares High Yield Value-Scored US Bond Index Fund (Based on Market Price) | | | 13.20 | % | | | 7.91 | % | | | 7.23 | % |
| | | |
Northern Trust High Yield Value-Scored US Corporate Bond IndexSM | | | 14.14 | % | | | 9.33 | % | | | 8.59 | % |
| | | |
ICE BofA Merrill Lynch® US High Yield Index | | | 10.74 | % | | | 7.15 | % | | | 6.56 | % |
All data as of 10/31/21. Total returns based on market price do not include brokerage commissions that may be payable on secondary market transactions. If brokerage commissions were included, these returns would be lower. Total returns based on market price and net asset value (“NAV”) assume that dividends and capital gain distributions have been reinvested in the Fund at market price and NAV, respectively. NAV is calculated by dividing the total value of all the securities in the fund’s portfolio plus cash, interest and receivables less any liabilities by the number of fund shares outstanding. Market price is determined by the midpoint of the bid/ask spread at 4:00 p.m. Eastern Time from the primary listing exchange. Market price returns may vary from NAV returns.
Performance quoted represents past performance and does not guarantee future results. The graph and table do not reflect the deduction of taxes that a shareholder would pay on Fund distributions or the redemption or sale of Fund shares. Unlike the index that the Fund seeks to track, the Fund’s total returns are reduced by operating expenses, such as transaction costs and management fees. An investor cannot invest directly in an index.
Performance reflects contractual reimbursements in effect until March 1, 2022. In the absence of such reimbursements, performance would be reduced. The gross expense ratio of the Fund is 0.38% and the net expense ratio is 0.37%. The gross and net expense ratios disclosed are as reported in the Fund’s prospectus, which may differ from the gross and net expense ratios presented in the Fund’s financial reports. Current performance may be higher or lower than performance shown. Investment return and the principal value of an investment will fluctuate. Shares may be worth more or less than original cost when redeemed or sold in the market.
FlexShares ETFs’ performance data current to the most recent month-end is available at www.flexshares.com.
PORTFOLIO ANALYSIS
The Fund seeks to provide investment results that correspond generally to the price and yield performance, before fees and expenses, of the Northern Trust High Yield Value-Scored US Corporate Bond IndexSM (the “Underlying Index”). The Underlying Index reflects the performance of a broad universe of US-dollar denominated high yield corporate bonds that seeks a higher total return than the overall high yield corporate bond market, as represented by the Northern Trust High Yield US Corporate Bond IndexSM (the “Parent Index”).1 The securities included in the Underlying Index are a subset of the securities included in the Parent Index. The Underlying Index begins with the Parent Index and then follows a rules-based methodology to select and weight securities, subject to certain constraints, to optimize exposure to a proprietary value score, as determined by Northern Trust Investments, Inc. (“NTI”), acting in its capacity as index provider (“Index Provider”). As of October 31, 2021, there were 970 issues in the Underlying Index. NTI uses a “passive” or indexing approach to try to achieve the Fund’s investment objective. NTI uses a representative sampling strategy to manage the Fund. This means that the Fund invests in a representative sample of securities that collectively has an investment profile similar to the Underlying Index. The Fund may or may not hold all of the securities that are included in the Underlying Index.
During the first half of the fiscal year ended October 31, 2021, fixed income investments moved higher as news about the COVID-19 (“COVID”) vaccine advancements were viewed by investors as a catalyst for a potential economic recovery. Quarterly Gross Domestic Product (GDP) as reported by the U.S. Bureau of Economic Analysis rebounded to 4.5% in the fourth quarter of 2020 followed by 6.3% and 6.7% in the first and second quarters of 2021. Emergence of the Delta variant of the COVID virus led to the
| 1 | The Northern Trust High Yield US Corporate Bond IndexSM is a market capitalization weighted index comprised of U.S. dollar- denominated high yield corporate bonds. |
| | | | |
| 52 | | FLEXSHARES ANNUAK REPORT | | |
| | |
| FlexShares® High Yield | | MANAGEMENT’S DISCUSSION OF FUND PERFORMANCE |
Value-Scored Bond Index Fund (cont.)
PORTFOLIO ANALYSIS (cont.)
reimposition of restrictions resulting in a slowdown of GDP to only 2.0% during the calendar third quarter of 2021.
The U.S. yield curve2 steepened in early calendar year 2021 as prospects for economic reopening with the pending distribution of COVID vaccines and the runoff elections for two senate seats in Georgia. Investors began to consider the positive impact on markets of the potential for additional fiscal stimulus with one party in control of the House, Senate and Executive Branch.
Short-term Treasury yields remained at low levels despite the Federal Reserve (Fed) statements indicating the possibility of decreasing the purchases of Treasury and Agency Mortgage Backed Securities (MBS) and the highest consumer price inflation in thirteen years. By the summer of 2021, yields were lower as increased infections from the COVID Delta variant weighed on economic growth outlooks.
By fiscal year-end, 1-month and 3-month Treasury yields were down a couple of basis points (bps)3, 1-year Treasury yields were unchanged, while intermediate- and long-term yields were higher with 2-year yields up +34 bps, 5-year yields up +80 bps, 10-year yields up +68 bps, 30-year yields up +27 bps.
High Yield4 credit spreads5 from the beginning of the fiscal year with a temporary retreat wider in during July and August when reinstitution of some economic shutdowns due to the COVID Delta variant raised investors’ uncertainty for corporate revenues and earnings. High Yield option adjusted spreads (“OAS”)6 of
the ICE BofA US High Yield Index7 declined from 532 bps to 302 bps in early July 2021, then widened to 321 bps at the end of August 2021 and ended the fiscal year at 315 bps8. We believe the decline in credit spreads was linked to investors continuing search for income, robust economic growth supported by fiscal and monetary policy and lower credit defaults. The Moody’s Investor Services’ annual high yield default rate measure fell from 8.3% in October 2020 to 2.6% as of October 2021. Our analysis, based on increasing issuance of new supply, suggests that High Yield investments have benefitted from the post-COVID recovery and access to capital markets as the year-to-date through October 2021 total gross new issuance of U.S. high yield bonds totaled $462 billion, versus the then record of $450 billion issued in 2020 and the $399 billion issued in 20139.
For the 2021 fiscal year, the Fund’s NAV outperformed the ICE BofA Merrill Lynch US High Yield Index by +264 bps. Performance was driven primarily by security selection and sector allocations as the Fund’s quantitative strategy of identifying better value securities resulted in overweights to and better security selection in lower quality credits which, on average, outperformed higher quality credits during the fiscal year. The tracking difference between the Fund’s NAV and the Underlying Index’s total return for the period was -76 bps, which is reflective of the Fund’s management fee (-37 bps), trading costs and fees (-37 bps), pricing differences (-10 bps), yield curve positioning (-1 bps), sector allocation (-7 bps), security selection (+18 bps) and other factors (-2 bp).
| 2 | A yield curve is constructed by plotting a session’s final yields for various maturities including 1-month, 3-month, 6-month, 1-year, 2-year, 3-year, 5-year, 7-year, 10-year, 20-year, and 30-year maturities. |
| 3 | A unit that is equal to 1/100th of 1% and is used to denote the change in a financial instrument. |
| 4 | High yield are fixed income securities that are rated in the middle rating of Moody’s, Fitch and S&P is Ba1/BB+/BB+ or below. |
| 5 | Credit spread is the difference in yield between one debt security and another debt security with the same maturity but of lesser quality. |
| 6 | The option-adjusted spread (OAS) is the measurement of the spread of a fixed-income security rate or portfolio and typically the Treasury securities yield (often referred to as the risk-free rate) and that spread is added to the fixed-income security for comparison purposes. |
| 7 | The ICE BofA US High Yield Index is market capitalization weighted and is designed to measure the performance of U.S. dollar denominated below investment grade (commonly referred to as “junk”) corporate debt publicly issued in the U.S. domestic market. |
| 8 | Source: Bloomberg, in this analysis we are making a comparison between the difference of the Option Adjusted Spread of long-term High Yield corporate bonds using data available on the ICE BofA US High Yield Index as of October 31, 2020 – October 31, 2021. |
| 9 | Source: JP Morgan, 2022 High Yield Bond and Leverage Loan Supply Outlook, November 12, 2021. |
| | | | | | |
| | FLEXSHARES ANNUAL REPORT | | | 53 | |
| | |
| FlexShares® | | MANAGEMENT’S DISCUSSION OF FUND PERFORMANCE |
Ready Access Variable Income Fund Ticker: RAVI
CUMULATIVE PERFORMANCE
Through October 31, 2021
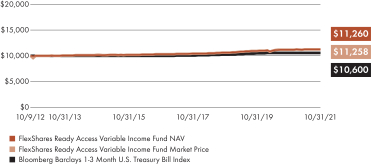
AVERAGE ANNUAL TOTAL RETURN
For the period ended October 31, 2021
| | | | | | | | | | | | | | | | |
| | | 1 Year | | | 3 Year | | | 5 Year | | | Fund
Inception
10/9/2012 | |
| | | | |
| | | | |
FlexShares Ready Access Variable Income Fund
(Based on Net Asset Value) | | | 0.34 | % | | | 1.90 | % | | | 1.74 | % | | | 1.32 | % |
| | | | |
FlexShares Ready Access Variable Income Fund
(Based on Market Price) | | | 0.35 | % | | | 1.89 | % | | | 1.73 | % | | | 1.32 | % |
| | | | |
Bloomberg Barclays 1-3 Month U.S. Treasury Bill Index | | | 0.05 | % | | | 1.05 | % | | | 1.09 | % | | | 0.64 | % |
All data as of 10/31/21. Total returns based on market price do not include brokerage commissions that may be payable on secondary market transactions. If brokerage commissions were included, these returns would be lower. Total returns based on market price and net asset value (“NAV”) assume that dividends and capital gain distributions have been reinvested in the Fund at market price and NAV, respectively. NAV is calculated by dividing the total value of all the securities in the fund’s portfolio plus cash, interest and receivables less any liabilities by the number of fund shares outstanding. Market price is determined by the midpoint of the bid/ask spread at 4:00 p.m. Eastern Time from the primary listing exchange. Market price returns may vary from NAV returns.
Performance quoted represents past performance and does not guarantee future results. The graph and table do not reflect the deduction of taxes that a shareholder would pay on Fund distributions or the redemption or sale of Fund shares. Unlike the index that the Fund seeks to track, the Fund’s total returns are reduced by operating expenses, such as transaction costs and management fees. An investor cannot invest directly in an index.
Performance reflects contractual reimbursements in effect until March 1, 2022. In the absence of such reimbursements, performance would be reduced. The gross expense ratio of the Fund is 0.26% and the net expense ratio is 0.25%. The gross and net expense ratios disclosed are as reported in the Fund’s prospectus, which may differ from the gross and net expense ratios presented in the Fund’s financial reports. Current performance may be higher or lower than performance shown. Investment return and the principal value of an investment will fluctuate. Shares may be worth more or less than original cost when redeemed or sold in the market.
FlexShares ETFs’ performance data current to the most recent month-end is available at www.flexshares.com.
PORTFOLIO ANALYSIS
The Fund seeks maximum current income consistent with the preservation of capital and liquidity. The Fund attempts to achieve its investment objective by investing under normal circumstances at least 80% of its total assets in a non-diversified portfolio of fixed-income instruments, including bonds, debt securities and other similar instruments issued by U.S. and non-U.S. public and private sector entities. Such issuers include, without limitation, U.S. and non-U.S. governments and their agencies, instrumentalities or sponsored enterprises, U.S. state and local governments and U.S. and non-U.S. private-sector entities, such as corporations and banks. The average effective duration1, of the Fund will vary based on the Northern Trust Company Investment Policy Committee’s forecast for interest rates and will normally not exceed one year. The dollar-weighted average portfolio maturity of the Fund is normally not expected to exceed two years.
During the first half of the fiscal year ended October 31, 2021, fixed income investments moved higher as news about the COVID-19 (“COVID”) vaccine advancements were viewed by investors as a catalyst for a potential economic recovery. Quarterly Gross Domestic Product (GDP) as reported by the U.S. Bureau of Economic Analysis rebounded to 4.5% in the fourth quarter of 2020 followed by 6.3% and 6.7% in the first and second quarters of 2021. Emergence of the Delta variant of the COVID virus led to the reimposition of restrictions resulting in a slowdown of GDP to only 2.0% during the calendar third quarter of 2021.
| 1 | Average effective duration provides a measure of a fund’s interest-rate sensitivity and the longer a fund’s duration, the more sensitive the fund is to shifts in interest rates. Duration also gives an indication of how a fund’s NAV will change as interest rates change. A fund with a five- year duration would be expected to lose 5% of its NAV if interest rates rose by 1 percentage point, or gain 5%, if interest rates fell by 1 percentage point. Morningstar surveys fund companies for this information. |
| | | | |
| 54 | | FLEXSHARES ANNUAK REPORT | | |
| | |
| FlexShares® | | MANAGEMENT’S DISCUSSION OF FUND PERFORMANCE |
Ready Access Variable Income Fund (cont.)
PORTFOLIO ANALYSIS (cont.)
The U.S. yield curve2 steepened in early calendar year 2021 as prospects for economic reopening with the pending distribution of COVID vaccines and the runoff elections for two senate seats in Georgia. Investors began to consider the positive impact on markets of the potential for additional fiscal stimulus with one party in control of the House, Senate and Executive Branch.
Short-term Treasury yields remained at low levels despite the Federal Reserve (Fed) statements indicating the possibility of decreasing the purchases of Treasury and Agency Mortgage Backed Securities (MBS) and the highest consumer price inflation in thirteen years. By the summer of 2021, yields were lower as increased infections from the COVID Delta variant weighed on economic growth outlooks.
By fiscal year-end, 1-month and 3-month Treasury yields were down a couple of basis points (bps)3, 1-year Treasury yields were unchanged, while intermediate- and long-term yields were higher with 2-year yields up +34 bps, 5-year yields up +80 bps, 10-year yields up +68 bps, 30-year yields up +27 bps.4
Short-term credit option adjusted spreads (“OAS”)5 were lower for the fiscal year. OAS for the Bloomberg U.S. Treasury Floating Rate Bond Index6 fell -14 bps and the OAS on the Bloomberg 0-3 Year Corporate Index7 was -6 bps lower. Treasury Bill (T-Bill) yields remained near zero for the fiscal year as 1-month and 3-month T-Bills averaged yields of only 0.04%, while 6-month T-Bills averaged yields of 0.05% for the fiscal year8. Our contention is that investor demand for yield likely drove the tightening of corporate credit OAS as investors sought higher yields for current income.
For the 2021 fiscal year, the Fund’s NAV outperformed its market benchmark, the Bloomberg 1-3 Month U.S. Treasury Bill Index, by +29 bps. With short-term Treasury yields remaining historically low, the Fund’s portfolio was weighted towards corporate and asset-backed securities versus Treasuries. Higher average yield from lengthening the fund’s overall duration, the above-mentioned sector allocations and overall security selection drove outperformance. The Fund’s average effective duration, however, detracted from performance due to the increasing of the Treasury yield curve.
| 2 | A yield curve is constructed by plotting a session’s final yields for various maturities including 1-month, 3-month, 6-month, 1-year, 2-year, 3-year, 5-year, 7-year, 10-year, 20-year, and 30-year maturities. |
| 3 | A unit that is equal to 1/100th of 1% and is used to denote the change in a financial instrument. |
| 4 | Bloomberg, In this analysis we are making a comparison between the difference in the yield rates of the 1-month, 3-month, 1-year, 2-year, 5-year, 10-year and 30-year maturities using data available as of October 31, 2020 and October 31, 2021. |
| 5 | The option-adjusted spread (OAS) is the measurement of the spread of a fixed-income security rate or portfolio and typically the Treasury securities yield (often referred to as the risk-free rate) and that spread is added to the fixed-income security for comparison purposes. |
| 6 | The Bloomberg U.S. Treasury Floating Rate Bond Index (BUSYFL) is a rules-based, market value-weighted index engineered to measure the performance of floating rate U.S. Treasury bonds. |
| 7 | The Bloomberg Barclays U.S. 0-3 Year Corporate Bond Index contains fixed-rate, investment-grade US Dollar-denominated bonds from industrial, utility and financial issuers only that have a maturity of less than three years. |
| 8 | Source: Bloomberg, In this analysis we are making a comparison between the difference in the OAS of the Bloomberg U.S. Treasury Floating Rate Bond Index, Bloomberg 0-3 Year Corporate Index, 1-month T-bills, 3-month T-bills maturities using data available as of October 31, 2020 and October 31, 2021. |
| | | | | | |
| | FLEXSHARES ANNUAL REPORT | | | 55 | |
| | |
| FlexShares® | | MANAGEMENT’S DISCUSSION OF FUND PERFORMANCE |
Core Select Bond Fund Ticker: BNDC
CUMULATIVE PERFORMANCE
Through October 31, 2021
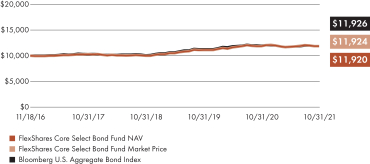
AVERAGE ANNUAL TOTAL RETURN
For the period ended October 31, 2021
| | | | | | | | | | | | |
| | | 1 Year | | | 3 Year | | | Fund
Inception
11/18/2016 | |
| | | | |
| | | |
FlexShares Core Select Bond Fund (Based on Net Asset Value) | | | 0.26 | % | | | 6.01 | % | | | 3.61 | % |
| | | |
FlexShares Core Select Bond Fund (Based on Market Price) | | | 0.30 | % | | | 5.99 | % | | | 3.63 | % |
| | | |
Bloomberg U.S. Aggregate Bond Index | | | -0.48 | % | | | 5.63 | % | | | 3.62 | % |
All data as of 10/31/21. Total returns based on market price do not include brokerage commissions that may be payable on secondary market transactions. If brokerage commissions were included, these returns would be lower. Total returns based on market price and net asset value (“NAV”) assume that dividends and capital gain distributions have been reinvested in the Fund at market price and NAV, respectively. NAV is calculated by dividing the total value of all the securities in the fund’s portfolio plus cash, interest and receivables less any liabilities by the number of fund shares outstanding. Market price is determined by the midpoint of the bid/ask spread at 4:00 p.m. Eastern Time from the primary listing exchange. Market price returns may vary from NAV returns.
Performance quoted represents past performance and does not guarantee future results. The graph and table do not reflect the deduction of taxes that a shareholder would pay on Fund distributions or the redemption or sale of Fund shares. Unlike the index that the Fund seeks to track, the Fund’s total returns are reduced by operating expenses, such as transaction costs and management fees. An investor cannot invest directly in an index.
Performance reflects contractual reimbursements in effect until March 1, 2022. In the absence of such reimbursements, performance would be reduced. The gross expense ratio of the Fund is 0.58% and the net expense ratio is 0.35%. The gross and net expense ratios disclosed are as reported in the Fund’s prospectus, which may differ from the gross and net expense ratios presented in the Fund’s financial reports. Current performance may be higher or lower than performance shown. Investment return and the principal value of an investment will fluctuate. Shares may be worth more or less than original cost when redeemed or sold in the market.
FlexShares ETFs’ performance data current to the most recent month-end is available at www.flexshares.com.
PORTFOLIO ANALYSIS
The Fund seeks total return and preservation of capital. The Fund seeks to achieve its investment objective by investing, under normal circumstances, at least 80% of its net assets in U.S. dollar-denominated investment-grade fixed-income securities either directly or indirectly through exchange-traded funds (“ETFs”) and other registered investment companies (together with ETFs, “Underlying Funds”). The Fund primarily invests in fixed-rate securities of varying maturities, including bonds, debt securities and other similar instruments issued by U.S. public and U.S and non-U.S. private sector entities. Such issuers include, without limitation, U.S. governments and their agencies, instrumentalities or sponsored enterprises, and U.S. and non-U.S. private-sector entities, such as corporations and banks. The Fund may invest in fixed income securities of any maturity.
The Fund seeks to provide attractive risk-adjusted performance by investing in a portfolio of fixed-income securities that is designed to achieve optimal potential for total return after considering various sources of investment risk. The Fund adjusts its allocations to securities based on Northern Trust Investment Inc.’s (“NTI”) assessment of potential changes in interest rate levels, the shape of the yield curve2 and credit spread relationships, which is the difference in yield between one debt security and another debt security with the same maturity but of lesser quality. The Fund also seeks to balance the potential for return and risk while emphasizing liquidity and diversification across a spectrum of U.S. dollar-denominated investment-grade fixed income securities.
During the first half of the fiscal year ended October 31, 2021, fixed income investments moved higher as news about the COVID-19 (“COVID”) vaccine advancements were viewed by investors as a catalyst for a potential economic recovery. Quarterly Gross Domestic Product (GDP) as reported by the U.S. Bureau of Economic Analysis rebounded
| 2 | A yield curve is constructed by plotting a session’s final yields for various maturities including 1-month, 3-month, 6-month, 1-year, 2-year, 3-year, 5-year, 7-year, 10-year, 20-year, and 30-year maturities. |
| | | | |
| 56 | | FLEXSHARES ANNUAL REPORT | | |
| | |
| FlexShares® | | MANAGEMENT’S DISCUSSION OF FUND PERFORMANCE |
Core Select Bond Fund (cont.)
PORTFOLIO ANALYSIS (cont.)
to 4.5% in the fourth quarter of 2020 followed by 6.3% and 6.7% in the first and second quarters of 2021. Emergence of the Delta variant of the COVID virus led to the reimposition of restrictions resulting in a slowdown of GDP to only 2.0% during the calendar third quarter of 2021.
The U.S. yield curve steepened in early calendar year 2021 as prospects for economic reopening with the pending distribution of COVID vaccines and the runoff elections for two senate seats in Georgia. Investors began to consider the positive impact on markets of the potential for additional fiscal stimulus with one party in control of the House, Senate and Executive Branch.
Short-term Treasury yields remained at low levels despite the Federal Reserve (Fed) statements indicating the possibility of decreasing the purchases of Treasury and Agency Mortgage Backed Securities (MBS) and the highest consumer price inflation in thirteen years. By the summer of 2021, yields were lower as increased infections from the COVID Delta variant weighed on economic growth outlooks.
By fiscal year-end, 1-month and 3-month Treasury yields were down a couple of basis points (bps)3, 1-year Treasury yields were unchanged, while intermediate- and long-term yields were higher with 2-year yields up +34 bps, 5-year yields up +80 bps, 10-year yields up +68 bps, 30-year yields up +27 bps.4
Prompted by lower interest rates, refinancing activity, housing sales and mortgage applications began to surge April 2020, as average 30-year mortgage rates (Freddie Mac Index) raised slightly from 2.81% to 3.14% during the fiscal year5. Powered by robust demand and low mortgage rates, existing home sales managed a 16.3% increase for the twelve months following September
20206, while new housing starts increased 15.3% for the fiscal year7.
We believe that investor expectations for rebounding corporate revenues and earnings along with investor pursuit of higher yields led to increased demand for U.S. corporate credit securities. Intermediate-term8 credit spreads trended lower through February 2021, then widened briefly in March 2021 before once again trending lower into the fiscal year. Further robust economic recovery and consumer/business spending helped drive average Intermediate-term option adjusted spreads (“OAS”)9 to 63 bps in comparison to comparable maturing Treasury securities by fiscal year from 94 bps at the beginning of the fiscal year.10
At the beginning of the fiscal year, the Fund, in comparison to the Bloomberg U.S. Aggregate Bond Index, was generally positioned with an underweight to U.S. Treasuries, a slight overweight to mortgage backed securities (MBS) and an overweight to corporate fixed income on our expectations for positive economic growth and corporate earnings during the ongoing COVID reopening which was being fueled by fiscal and monetary support and the potential positive impacts of soon to be available COVID vaccines. During the first quarter of the fiscal year, the slight overweight to MBS was reduced to a slight underweight due to what we believed was the investment risk related to increased prepayments and interest rate volatility and we invested in U.S. Treasuries. Over the balance of the fiscal year, due to interest rate volatility and the on-going economic recovery as COVID vaccines boosted consumer and business spending, the overweight to corporate securities was steadily increased and we decreased exposures to both MBS and Treasuries. Duration11 positioning was generally slightly longer versus the Bloomberg U.S. Aggregate Bond
| 3 | A unit that is equal to 1/100th of 1% and is used to denote the change in a financial instrument. |
| 4 | Bloomberg, In this analysis we are making a comparison between the difference in the yield rates of the 1-month, 3-month, 1-year, 2-year, 5-year, 10-year and 30-year maturities using data available as of October 31, 2020 and October 31, 2021. |
| 5 | Source: Bloomberg. Federal Home Loan Mortgage Corp. Primary Mortgage Market Survey. October 31, 2020 through November 1, 2021. |
| 6 | Source: Bloomberg. National Association of Realtors, US Existing Homes Sales, September 30, 2020 through September 30, 2021. |
| 7 | Source: Bloomberg. U.S. Census Bureau, US New Privately Owned Housing Units Started, October 31, 2020 through October 31, 2021. |
| 8 | Intermediate-term bonds typically mature between 3 – 10 years. |
| 9 | The option-adjusted spread (OAS) is the measurement of the spread of a fixed-income security rate or portfolio and typically the Treasury securities yield (often referred to as the risk-free rate) and that spread is added to the fixed-income security for comparison purposes. |
| 10 | Source: Bloomberg, in this analysis we are making a comparison between the difference of the Option Adjusted Spread of intermediate-term investment grade corporate bonds using data available on the Bloomberg U.S. Intermediate Corporate Bond Index as of October 31, 2020 – October 31, 2021. |
| 11 | Duration is how sensitive a fixed income investment is to a change in interest rates and is expressed as a number of years – the higher the number the more volatile would be the expected change. |
| | | | | | |
| | FLEXSHARES ANNUAL REPORT | | | 57 | |
| | |
| FlexShares® | | MANAGEMENT’S DISCUSSION OF FUND PERFORMANCE |
Core Select Bond Fund (cont.)
PORTFOLIO ANALYSIS (cont.)
Index12 during the fiscal year, providing a positive contribution to overall Fund performance. The difference in the credit spread between various U.S. investment grade-corporate credit narrowed substantially during the fiscal year which also contributed to the Fund’s positive relative performance. The steepening of the Treasury yield curve had a negative impact on the Fund’s returns.
For the 2021 fiscal year, the Fund’s NAV outperformed its market benchmark, the Bloomberg U.S. Aggregate Bond Index, by +74 bps. While the slightly longer overall duration of the fund detracted from performance due to steepening of the Treasury yield curve, portfolio manager security selection and an overweight to long-term corporate credits along with an underweight to MBS and Treasuries all contributed to excess returns versus the Fund’s market benchmark.
| 12 | The Bloomberg Barclays Aggregate Bond Index broadly tracks the U.S. investment-grade bond market. |
| | | | |
| 58 | | FLEXSHARES ANNUAL REPORT | �� | |
FlexShares® Trust
Statements of Assets and Liabilities October 31, 2021
| | | | | | | | | | | | | | | | |
| | | FlexShares®
US Quality
Low Volatility
Index Fund | | | FlexShares®
Developed Markets ex-US
Quality Low Volatility
Index Fund | | | FlexShares®
Emerging Markets
Quality Low Volatility
Index Fund | | | FlexShares®
Morningstar US
Market Factor Tilt
Index Fund | |
|
ASSETS | |
Securities, at cost | | $ | 129,983,210 | | | $ | 67,222,791 | | | $ | 14,649,196 | | | $ | 931,783,626 | |
Affiliate securities, at cost | | | — | | | | — | | | | — | | | | 556,713 | |
Securities Lending Reinvestments, at cost | | | — | | | | — | | | | — | | | | 156,227,116 | |
| | | | |
Securities, at value† | | | 160,818,791 | | | | 74,810,927 | | | | 15,685,907 | | | | 1,713,847,642 | |
Affiliate securities, at value | | | — | | | | — | | | | — | | | | 902,375 | |
Securities Lending Reinvestments, at value | | | — | | | | — | | | | — | | | | 156,227,160 | |
Cash | | | 193,668 | | | | 93,526 | | | | 14,790 | | | | 11,148,150 | |
Cash segregated at broker* | | | — | | | | 57,385 | | | | 27,161 | | | | 333,884 | |
Foreign cash†† | | | — | | | | 73,520 | | | | 154,891 | | | | — | |
Restricted cash** | | | — | | | | — | | | | — | | | | — | |
Due from Authorized Participant | | | — | | | | — | | | | — | | | | — | |
Unrealized appreciation on forward foreign currency contracts | | | — | | | | 14,802 | | | | 2 | | | | — | |
Receivables: | | | | | | | | | | | | | | | | |
Dividends and interest | | | 97,556 | | | | 359,374 | | | | 8,994 | | | | 834,924 | |
Securities lending income | | | — | | | | 467 | | | | — | | | | 24,254 | |
Capital shares issued | | | — | | | | — | | | | — | | | | — | |
Investment adviser | | | 15 | | | | 19 | | | | 4,008 | | | | 699 | |
Securities sold | | | — | | | | 62,698 | | | | 1,609 | | | | — | |
Variation margin on futures contracts | | | 8,541 | | | | 4,500 | | | | — | | | | 447,358 | |
| | | | |
Total Assets | | | 161,118,571 | | | | 75,477,218 | | | | 15,897,362 | | | | 1,883,766,446 | |
| | | | |
|
LIABILITIES | |
Cash overdraft | | | — | | | | — | | | | — | | | | — | |
Unrealized depreciation on forward foreign currency contracts | | | — | | | | 9,585 | | | | — | | | | — | |
Due to brokers | | | 8,058 | | | | — | | | | — | | | | — | |
Payables: | | | | | | | | | | | | | | | | |
Cash collateral received from securities loaned | | | — | | | | — | | | | — | | | | 156,227,373 | |
Deferred compensation (Note 7) | | | 5,307 | | | | 3,155 | | | | 548 | | | | 146,844 | |
Investment advisory fees (Note 4) | | | 28,469 | | | | 21,359 | | | | 5,377 | | | | 357,576 | |
Trustee fees (Note 7) | | | 845 | | | | 464 | | | | 88 | | | | 9,427 | |
Securities purchased | | | — | | | | — | | | | — | | | | — | |
Deferred non-US capital gains taxes | | | — | | | | — | | | | 45,878 | | | | — | |
Due to Authorized Participant | | | — | | | | 62,698 | | | | — | | | | — | |
Variation margin on futures contracts | | | — | | | | — | | | | 1,780 | | | | — | |
Capital shares redeemed | | | — | | | | — | | | | — | | | | 1,708 | |
Other | | | 1,400 | | | | 9,000 | | | | — | | | | 4,500 | |
| | | | |
Total Liabilities | | | 44,079 | | | | 106,261 | | | | 53,671 | | | | 156,747,428 | |
| | | | |
Net Assets | | $ | 161,074,492 | | | $ | 75,370,957 | | | $ | 15,843,691 | | | $ | 1,727,019,018 | |
| | | | |
|
NET ASSETS CONSIST OF: | |
Paid-in capital | | $ | 130,969,714 | | | $ | 67,935,051 | | | $ | 15,170,847 | | | $ | 958,017,061 | |
Distributable earnings (loss) | | | 30,104,778 | | | | 7,435,906 | | | | 672,844 | | | | 769,001,957 | |
| | | | |
Net Assets | | $ | 161,074,492 | | | $ | 75,370,957 | | | $ | 15,843,691 | | | $ | 1,727,019,018 | |
| | | | |
| | | | |
Shares Outstanding (unlimited number of shares authorized $ 0.0001 par value) | | | 2,950,001 | | | | 2,700,001 | | | | 600,001 | | | | 9,650,001 | |
Net Asset Value | | $ | 54.60 | | | $ | 27.92 | | | $ | 26.41 | | | $ | 178.97 | |
| | | | |
† Securities on loan, at value | | $ | — | | | $ | — | | | $ | — | | | $ | 202,123,212 | |
†† Cost of foreign cash | | $ | — | | | $ | 73,033 | | | $ | 156,154 | | | $ | — | |
| * | Includes cash pledged by the Fund to cover margin requirements for open futures contracts as of 10/31. |
| ** | Includes cash pledged by an Authorized Participant for missing deposit securities required to secure Creation Units. |
See Accompanying Notes to the Financial Statements.
| | | | | | |
| | FLEXSHARES ANNUAL REPORT | | | 59 | |
Statements of Assets and Liabilities (cont.)
| | | | | | | | | | | | | | | | |
| | | FlexShares®
Morningstar Developed
Markets ex-US Factor
Tilt Index Fund | | | FlexShares®
Morningstar Emerging
Markets Factor Tilt
Index Fund | | | FlexShares®
US Quality
Large Cap
Index Fund | | | FlexShares®
STOXX® US
ESG Select
Index Fund | |
|
ASSETS | |
Securities, at cost | | $ | 501,167,692 | | | $ | 273,639,114 | | | $ | 111,180,900 | | | $ | 149,948,638 | |
Affiliate securities, at cost | | | — | | | | — | | | | — | | | | — | |
Securities Lending Reinvestments, at cost | | | 13,300,695 | | | | 2,781,579 | | | | 109,616 | | | | — | |
| | | | |
Securities, at value† | | | 635,693,157 | | | | 332,495,145 | | | | 142,459,103 | | | | 190,347,988 | |
Affiliate securities, at value | | | — | | | | — | | | | — | | | | — | |
Securities Lending Reinvestments, at value | | | 13,300,695 | | | | 2,781,579 | | | | 109,616 | | | | — | |
Cash | | | 3,780,766 | | | | 855,389 | | | | 1,706,610 | | | | 954,991 | |
Cash segregated at broker* | | | 1,404,389 | | | | 198,374 | | | | 196,726 | | | | 156,710 | |
Foreign cash†† | | | 3,447,840 | | | | 1,540,099 | | | | — | | | | — | |
Restricted cash** | | | — | | | | — | | | | — | | | | — | |
Due from Authorized Participant | | | — | | | | — | | | | — | | | | — | |
Unrealized appreciation on forward foreign currency contracts | | | 59,353 | | | | 12,559 | | | | — | | | | — | |
Receivables: | | | | | | | | | | | | | | | | |
Dividends and interest | | | 4,184,780 | | | | 390,387 | | | | 112,370 | | | | 202,607 | |
Securities lending income | | | 35,297 | | | | 15,388 | | | | 558 | | | | 98 | |
Capital shares issued | | | — | | | | — | | | | — | | | | — | |
Investment adviser | | | — | | | | 36 | | | | — | | | | 82 | |
Securities sold | | | 456,534 | | | | 112,851 | | | | — | | | | — | |
Variation margin on futures contracts | | | 104,221 | | | | — | | | | 46,837 | | | | 39,500 | |
| | | | |
Total Assets | | | 662,467,032 | | | | 338,401,807 | | | | 144,631,820 | | | | 191,701,976 | |
| | | | |
|
LIABILITIES | |
Cash overdraft | | | — | | | | — | | | | — | | | | — | |
Unrealized depreciation on forward foreign currency contracts | | | 182,098 | | | | 3,323 | | | | — | | | | — | |
Due to brokers | | | — | | | | — | | | | — | | | | — | |
Payables: | | | | | | | | | | | | | | | | |
Cash collateral received from securities loaned | | | 13,300,695 | | | | 2,781,579 | | | | 109,616 | | | | — | |
Deferred compensation (Note 7) | | | 86,420 | | | | 43,252 | | | | 5,466 | | | | 6,573 | |
Investment advisory fees (Note 4) | | | 220,932 | | | | 168,076 | | | | 38,281 | | | | 50,258 | |
Trustee fees (Note 7) | | | 3,689 | | | | 1,851 | | | | 708 | | | | 1,000 | |
Securities purchased | | | — | | | | 192 | | | | — | | | | — | |
Deferred non-US capital gains taxes | | | — | | | | 929,952 | | | | — | | | | — | |
Due to Authorized Participant | | | 7,705 | | | | — | | | | — | | | | — | |
Variation margin on futures contracts | | | — | | | | 51,587 | | | | — | | | | — | |
Capital shares redeemed | | | — | | | | — | | | | — | | | | — | |
Other | | | 27,000 | | | | 50,000 | | | | 2,500 | | | | 1,400 | |
| | | | |
Total Liabilities | | | 13,828,539 | | | | 4,029,812 | | | | 156,571 | | | | 59,231 | |
| | | | |
Net Assets | | $ | 648,638,493 | | | $ | 334,371,995 | | | $ | 144,475,249 | | | $ | 191,642,745 | |
| | | | |
|
NET ASSETS CONSIST OF: | |
Paid-in capital | | $ | 623,021,119 | | | $ | 330,576,703 | | | $ | 115,286,841 | | | $ | 153,299,069 | |
Distributable earnings (loss) | | | 25,617,374 | | | | 3,795,292 | | | | 29,188,408 | | | | 38,343,676 | |
| | | | |
Net Assets | | $ | 648,638,493 | | | $ | 334,371,995 | | | $ | 144,475,249 | | | $ | 191,642,745 | |
| | | | |
| | | | |
Shares Outstanding (unlimited number of shares authorized $ 0.0001 par value) | | | 8,800,001 | | | | 5,500,001 | | | | 2,875,001 | | | | 1,700,001 | |
Net Asset Value | | $ | 73.71 | | | $ | 60.79 | | | $ | 50.25 | | | $ | 112.73 | |
| | | | |
† Securities on loan, at value | | $ | 66,431,697 | | | $ | 11,156,681 | | | $ | 3,078,424 | | | $ | 1,207,643 | |
†† Cost of foreign cash | | $ | 3,429,679 | | | $ | 1,547,215 | | | $ | — | | | $ | — | |
| * | Includes cash pledged by the Fund to cover margin requirements for open futures contracts as of 10/31. |
| ** | Includes cash pledged by an Authorized Participant for missing deposit securities required to secure Creation Units. |
See Accompanying Notes to the Financial Statements.
| | | | |
| 60 | | FLEXSHARES ANNUAL REPORT | | |
Statements of Assets and Liabilities (cont.)
| | | | | | | | | | | | | | | | |
| | | FlexShares®
STOXX®
Global ESG
Select Index
Fund | | | FlexShares®
ESG & Climate US
Large Cap Core
Index Fund | | | FlexShares®
ESG & Climate
Developed
Markets ex-US Core
Index Fund | | | FlexShares®
Morningstar Global
Upstream Natural
Resources Index
Fund | |
|
ASSETS | |
Securities, at cost | | $ | 130,424,244 | | | $ | 2,481,514 | | | $ | 5,003,305 | | | $ | 4,901,271,932 | |
Affiliate securities, at cost | | | — | | | | — | | | | — | | | | — | |
Securities Lending Reinvestments, at cost | | | 1,234,053 | | | | — | | | | — | | | | 60,798,497 | |
| | | | |
Securities, at value† | | | 181,693,556 | | | | 2,647,456 | | | | 5,108,626 | | | | 6,019,017,379 | |
Affiliate securities, at value | | | — | | | | — | | | | — | | | | — | |
Securities Lending Reinvestments, at value | | | 1,234,053 | | | | — | | | | — | | | | 60,798,546 | |
Cash | | | 987,683 | | | | 20,094 | | | | 3,644 | | | | 26,387,049 | |
Cash segregated at broker* | | | 381,475 | | | | — | | | | — | | | | 3,059,528 | |
Foreign cash†† | | | 2,309,088 | | | | — | | | | 7,799 | | | | 5,517,883 | |
Restricted cash** | | | — | | | | — | | | | — | | | | 474,734 | |
Due from Authorized Participant | | | — | | | | — | | | | — | | | | 27,303,600 | |
Unrealized appreciation on forward foreign currency contracts | | | 27,020 | | | | — | | | | 510 | | | | 1,209,027 | |
Receivables: | | | | | | | | | | | | | | | | |
Dividends and interest | | | 318,302 | | | | 1,873 | | | | 11,322 | | | | 4,115,273 | |
Securities lending income | | | 1,127 | | | | — | | | | — | | | | 35,362 | |
Capital shares issued | | | — | | | | — | | | | — | | | | 19,332,095 | |
Investment adviser | | | — | | | | 2 | | | | 4 | | | | — | |
Securities sold | | | 46,567 | | | | — | | | | 4,794 | | | | — | |
Variation margin on futures contracts | | | 55,187 | | | | 1,240 | | | | — | | | | 768,666 | |
| | | | |
Total Assets | | | 187,054,058 | | | | 2,670,665 | | | | 5,136,699 | | | | 6,168,019,142 | |
| | | | |
|
LIABILITIES | |
Cash overdraft | | | — | | | | — | | | | — | | | | — | |
Unrealized depreciation on forward foreign currency contracts | | | 16,181 | | | | — | | | | 1,857 | | | | 814,670 | |
Due to brokers | | | — | | | | 978 | | | | — | | | | — | |
Payables: | | | | | | | | | | | | | | | | |
Cash collateral received from securities loaned | | | 1,234,053 | | | | — | | | | — | | | | 60,798,887 | |
Deferred compensation (Note 7) | | | 7,999 | | | | — | | | | — | | | | 512,673 | |
Investment advisory fees (Note 4) | | | 64,364 | | | | 196 | | | | 513 | | | | 2,360,112 | |
Trustee fees (Note 7) | | | 987 | | | | 5 | | | | 10 | | | | 30,794 | |
Securities purchased | | | — | | | | — | | | | 15,259 | | | | 49,738,533 | |
Deferred non-US capital gains taxes | | | — | | | | — | | | | — | | | | 537,973 | |
Due to Authorized Participant | | | — | | | | — | | | | — | | | | 474,734 | |
Variation margin on futures contracts | | | — | | | | — | | | | — | | | | — | |
Capital shares redeemed | | | — | | | | — | | | | — | | | | — | |
Other | | | 13,000 | | | | — | | | | — | | | | 40,500 | |
| | | | |
Total Liabilities | | | 1,336,584 | | | | 1,179 | | | | 17,639 | | | | 115,308,876 | |
| | | | |
Net Assets | | $ | 185,717,474 | | | $ | 2,669,486 | | | $ | 5,119,060 | | | $ | 6,052,710,266 | |
| | | | |
|
NET ASSETS CONSIST OF: | |
Paid-in capital | | $ | 135,740,847 | | | $ | 2,500,000 | | | $ | 5,000,171 | | | $ | 6,011,428,653 | |
Distributable earnings (loss) | | | 49,976,627 | | | | 169,486 | | | | 118,889 | | | | 41,281,613 | |
| | | | |
Net Assets | | $ | 185,717,474 | | | $ | 2,669,486 | | | $ | 5,119,060 | | | $ | 6,052,710,266 | |
| | | | |
| | | | |
Shares Outstanding (unlimited number of shares authorized $ 0.0001 par value) | | | 1,250,001 | | | | 50,000 | | | | 100,000 | | | | 156,550,001 | |
Net Asset Value | | $ | 148.57 | | | $ | 53.39 | | | $ | 51.19 | | | $ | 38.66 | |
| | | | |
† Securities on loan, at value | | $ | 6,129,923 | | | $ | — | | | $ | — | | | $ | 303,788,929 | |
†† Cost of foreign cash | | $ | 2,318,405 | | | $ | — | | | $ | 7,774 | | | $ | 5,450,348 | |
| * | Includes cash pledged by the Fund to cover margin requirements for open futures contracts as of 10/31. |
| ** | Includes cash pledged by an Authorized Participant for missing deposit securities required to secure Creation Units. |
See Accompanying Notes to the Financial Statements.
| | | | | | |
| | FLEXSHARES ANNUAL REPORT | | | 61 | |
Statements of Assets and Liabilities (cont.)
| | | | | | | | | | | | | | | | |
| | | FlexShares®
STOXX®
Global Broad
Infrastructure
Index Fund | | | FlexShares®
Global Quality
Real Estate
Index Fund | | | FlexShares®
Real Assets
Allocation
Index Fund | | | FlexShares®
Quality
Dividend
Index Fund | |
| | | | |
ASSETS | | | | | | | | | | | | | | | | |
Securities, at cost | | $ | 2,273,516,071 | | | $ | 341,555,980 | | | $ | — | | | $ | 1,244,426,037 | |
Affiliate securities, at cost | | | — | | | | — | | | | 29,129,334 | | | | — | |
Securities Lending Reinvestments, at cost | | | 32,219,867 | | | | 11,192,491 | | | | — | | | | 93,371,909 | |
| | | | |
Securities, at value† | | | 2,621,193,595 | | | | 414,269,818 | | | | — | | | | 1,632,826,679 | |
Affiliate securities, at value | | | — | | | | — | | | | 30,290,663 | | | | — | |
Securities Lending Reinvestments, at value | | | 32,219,867 | | | | 11,192,491 | | | | — | | | | 93,371,945 | |
Cash | | | 10,504,965 | | | | 2,711,966 | | | | 11,264 | | | | 7,342,515 | |
Cash segregated at broker* | | | 1,784,432 | | | | 522,784 | | | | — | | | | 371,176 | |
Foreign cash†† | | | 7,322,870 | | | | 1,672,479 | | | | — | | | | — | |
Restricted cash** | | | — | | | | 154,896 | | | | — | | | | — | |
Due from Authorized Participant | | | — | | | | — | | | | — | | | | — | |
Unrealized appreciation on forward foreign currency contracts | | | 265,525 | | | | 8,285 | | | | — | | | | — | |
Receivables: | | | | | | | | | | | | | | | | |
Dividends and interest | | | 5,657,562 | | | | 565,367 | | | | — | | | | 2,348,886 | |
Securities lending income | | | 19,179 | | | | 6,385 | | | | — | | | | 9,864 | |
Capital shares issued | | | — | | | | — | | | | — | | | | — | |
Investment adviser | | | — | | | | — | | | | 8 | | | | — | |
Securities sold | | | — | | | | 5,411,213 | | | | 5,105,345 | | | | — | |
Variation margin on futures contracts | | | 429,765 | | | | 122,323 | | | | — | | | | 329,859 | |
| | | | |
Total Assets | | | 2,679,397,760 | | | | 436,638,007 | | | | 35,407,280 | | | | 1,736,600,924 | |
| | | | |
| | | | |
LIABILITIES | | | | | | | | | | | | | | | | |
Cash overdraft | | | — | | | | — | | | | — | | | | — | |
Unrealized depreciation on forward foreign currency contracts | | | 516,358 | | | | 14,213 | | | | — | | | | — | |
Due to brokers | | | — | | | | — | | | | — | | | | — | |
Payables: | | | | | | | | | | | | | | | | |
Cash collateral received from securities loaned | | | 32,219,867 | | | | 11,192,491 | | | | — | | | | 93,372,067 | |
Deferred compensation (Note 7) | | | 147,528 | | | | 27,848 | | | | 716 | | | | 164,421 | |
Investment advisory fees (Note 4) | | | 1,057,867 | | | | 155,405 | | | | 3,532 | | | | 505,944 | |
Trustee fees (Note 7) | | | 14,936 | | | | 2,156 | | | | 132 | | | | 9,012 | |
Securities purchased | | | 199 | | | | 6,487,615 | | | | 5,103,214 | | | | — | |
Deferred non-US capital gains taxes | | | 1,506,939 | | | | — | | | | — | | | | — | |
Due to Authorized Participant | | | — | | | | 154,896 | | | | — | | | | — | |
Variation margin on futures contracts | | | — | | | | — | | | | — | | | | — | |
Capital shares redeemed | | | — | | | | — | | | | — | | | | — | |
Other | | | 28,000 | | | | 6,000 | | | | — | | | | 4,600 | |
| | | | |
Total Liabilities | | | 35,491,694 | | | | 18,040,624 | | | | 5,107,594 | | | | 94,056,044 | |
| | | | |
Net Assets | | $ | 2,643,906,066 | | | $ | 418,597,383 | | | $ | 30,299,686 | | | $ | 1,642,544,880 | |
| | | | |
| | | | |
NET ASSETS CONSIST OF: | | | | | | | | | | | | | | | | |
Paid-in capital | | $ | 2,418,455,815 | | | $ | 369,238,075 | | | $ | 29,319,351 | | | $ | 1,256,408,503 | |
Distributable earnings (loss) | | | 225,450,251 | | | | 49,359,308 | | | | 980,335 | | | | 386,136,377 | |
| | | | |
Net Assets | | $ | 2,643,906,066 | | | $ | 418,597,383 | | | $ | 30,299,686 | | | $ | 1,642,544,880 | |
| | | | |
| | | | |
Shares Outstanding (unlimited number of shares authorized $ 0.0001 par value) | | | 45,800,001 | | | | 5,950,001 | | | | 900,001 | | | | 28,150,001 | |
Net Asset Value | | $ | 57.73 | | | $ | 70.35 | | | $ | 33.67 | | | $ | 58.35 | |
| | | | |
† Securities on loan, at value | | $ | 170,013,630 | | | $ | 35,762,241 | | | $ | — | | | $ | 130,499,879 | |
†† Cost of foreign cash | | $ | 7,278,947 | | | $ | 1,667,366 | | | $ | — | | | $ | — | |
| * | Includes cash pledged by the Fund to cover margin requirements for open futures contracts as of 10/31. |
| ** | Includes cash pledged by an Authorized Participant for missing deposit securities required to secure Creation Units. |
See Accompanying Notes to the Financial Statements.
| | | | |
| 62 | | FLEXSHARES ANNUAL REPORT | | |
Statements of Assets and Liabilities (cont.)
| | | | | | | | | | | | | | | | |
| | | FlexShares®
Quality
Dividend
Defensive
Index Fund | | | FlexShares®
Quality
Dividend
Dynamic
Index Fund | | | FlexShares®
International
Quality
Dividend
Index Fund | | | FlexShares®
International
Quality Dividend
Defensive Index
Fund | |
| | | | |
ASSETS | | | | | | | | | | | | | | | | |
Securities, at cost | | $ | 348,365,863 | | | $ | 16,426,689 | | | $ | 536,863,658 | | | $ | 62,598,237 | |
Affiliate securities, at cost | | | — | | | | — | | | | — | | | | — | |
Securities Lending Reinvestments, at cost | | | 23,597,323 | | | | 275,181 | | | | 17,256,554 | | | | 1,625,153 | |
| | | | |
Securities, at value† | | | 445,185,932 | | | | 21,704,940 | | | | 598,831,553 | | | | 70,227,191 | |
Affiliate securities, at value | | | — | | | | — | | | | — | | | | — | |
Securities Lending Reinvestments, at value | | | 23,597,323 | | | | 275,181 | | | | 17,256,554 | | | | 1,625,153 | |
Cash | | | 2,093,272 | | | | 139,128 | | | | 7,623,826 | | | | — | |
Cash segregated at broker* | | | 263,859 | | | | 33,413 | | | | 1,559,620 | | | | 118,993 | |
Foreign cash†† | | | — | | | | — | | | | 5,384,173 | | | | 1,165,489 | |
Restricted cash** | | | — | | | | — | | | | — | | | | — | |
Due from Authorized Participant | | | — | | | | — | | | | — | | | | — | |
Unrealized appreciation on forward foreign currency contracts | | | — | | | | — | | | | 161,905 | | | | 18,838 | |
Receivables: | | | | | | | | | | | | | | | | |
Dividends and interest | | | 597,527 | | | | 31,686 | | | | 3,035,015 | | | | 363,423 | |
Securities lending income | | | 1,732 | | | | 114 | | | | 14,143 | | | | 4,583 | |
Capital shares issued | | | — | | | | — | | | | — | | | | — | |
Investment adviser | | | — | | | | — | | | | — | | | | — | |
Securities sold | | | 13,619 | | | | 494 | | | | — | | | | 1,739 | |
Variation margin on futures contracts | | | 99,046 | | | | 9,470 | | | | 10,222 | | | | — | |
| | | | |
Total Assets | | | 471,852,310 | | | | 22,194,426 | | | | 633,877,011 | | | | 73,525,409 | |
| | | | |
| | | | |
LIABILITIES | | | | | | | | | | | | | | | | |
Cash overdraft | | | — | | | | — | | | | — | | | | 343,136 | |
Unrealized depreciation on forward foreign currency contracts | | | — | | | | — | | | | 259,228 | | | | 5,317 | |
Due to brokers | | | — | | | | — | | | | — | | | | — | |
Payables: | | | | | | | | | | | | | | | | |
Cash collateral received from securities loaned | | | 23,597,323 | | | | 275,181 | | | | 17,256,554 | | | | 1,625,153 | |
Deferred compensation (Note 7) | | | 39,488 | | | | 5,915 | | | | 68,793 | | | | 9,222 | |
Investment advisory fees (Note 4) | | | 138,435 | | | | 6,760 | | | | 243,849 | | | | 28,490 | |
Trustee fees (Note 7) | | | 2,609 | | | | 116 | | | | 3,424 | | | | 411 | |
Securities purchased | | | — | | | | — | | | | — | | | | — | |
Deferred non-US capital gains taxes | | | — | | | | — | | | | 29,760 | | | | 38,404 | |
Due to Authorized Participant | | | 13,619 | | | | — | | | | — | | | | — | |
Variation margin on futures contracts | | | — | | | | — | | | | — | | | | 16,685 | |
Capital shares redeemed | | | — | | | | — | | | | — | | | | — | |
Other | | | 2,850 | | | | 1,450 | | | | 8,500 | | | | — | |
| | | | |
Total Liabilities | | | 23,794,324 | | | | 289,422 | | | | 17,870,108 | | | | 2,066,818 | |
| | | | |
Net Assets | | $ | 448,057,986 | | | $ | 21,905,004 | | | $ | 616,006,903 | | | $ | 71,458,591 | |
| | | | |
| | | | |
NET ASSETS CONSIST OF: | | | | | | | | | | | | | | | | |
Paid-in capital | | $ | 369,065,744 | | | $ | 16,666,681 | | | $ | 696,788,350 | | | $ | 86,812,818 | |
Distributable earnings (loss) | | | 78,992,242 | | | | 5,238,323 | | | | (80,781,447 | ) | | | (15,354,227 | ) |
| | | | |
Net Assets | | $ | 448,057,986 | | | $ | 21,905,004 | | | $ | 616,006,903 | | | $ | 71,458,591 | |
| | | | |
| | | | |
Shares Outstanding (unlimited number of shares authorized $ 0.0001 par value) | | | 8,000,001 | | | | 350,001 | | | | 23,900,001 | | | | 3,000,001 | |
Net Asset Value | | $ | 56.01 | | | $ | 62.59 | | | $ | 25.77 | | | $ | 23.82 | |
| | | | |
† Securities on loan, at value | | $ | 26,242,817 | | | $ | 1,303,514 | | | $ | 49,192,786 | | | $ | 4,373,582 | |
†† Cost of foreign cash | | $ | — | | | $ | — | | | $ | 5,436,548 | | | $ | 1,166,444 | |
| * | Includes cash pledged by the Fund to cover margin requirements for open futures contracts as of 10/31. |
| ** | Includes cash pledged by an Authorized Participant for missing deposit securities required to secure Creation Units. |
See Accompanying Notes to the Financial Statements.
| | | | | | |
| | FLEXSHARES ANNUAL REPORT | | | 63 | |
Statements of Assets and Liabilities (cont.)
| | | | | | | | | | | | | | | | |
| | | FlexShares®
International
Quality Dividend
Dynamic Index
Fund | | | FlexShares®
iBoxx 3-Year
Target
Duration TIPS
Index Fund | | | FlexShares®
iBoxx 5-Year
Target
Duration TIPS
Index Fund | | | FlexShares®
Disciplined
Duration MBS
Index Fund | |
| | | | |
ASSETS | | | | | | | | | | | | | | | | |
Securities, at cost | | $ | 69,384,303 | | | $ | 1,382,590,520 | | | $ | 673,518,839 | | | $ | 108,150,831 | |
Affiliate securities, at cost | | | — | | | | — | | | | — | | | | — | |
Securities Lending Reinvestments, at cost | | | 1,136,015 | | | | 3,852,300 | | | | 2,318,500 | | | | — | |
| | | | |
Securities, at value† | | | 74,373,093 | | | | 1,435,507,055 | | | | 713,145,586 | | | | 108,374,947 | |
Affiliate securities, at value | | | — | | | | — | | | | — | | | | — | |
Securities Lending Reinvestments, at value | | | 1,136,015 | | | | 3,852,300 | | | | 2,318,500 | | | | — | |
Cash | | | 768,294 | | | | 614,235 | | | | 210,451 | | | | 23,089,126 | |
Cash segregated at broker* | | | 139,565 | | | | — | | | | — | | | | — | |
Foreign cash†† | | | 502,772 | | | | — | | | | — | | | | — | |
Restricted cash** | | | — | | | | — | | | | — | | | | — | |
Due from Authorized Participant | | | — | | | | — | | | | — | | | | — | |
Unrealized appreciation on forward foreign currency contracts | | | 12,173 | | | | — | | | | — | | | | — | |
Receivables: | | | | | | | | | | | | | | | | |
Dividends and interest | | | 295,667 | | | | 1,941,648 | | | | 1,114,596 | | | | 242,976 | |
Securities lending income | | | 3,069 | | | | 3,975 | | | | 4,760 | | | | — | |
Capital shares issued | | | — | | | | 9,229,507 | | | | 2,801,018 | | | | 1,171,289 | |
Investment adviser | | | 15 | | | | — | | | | 46,177 | | | | 20 | |
Securities sold | | | — | | | | — | | | | 147,776 | | | | 1,308,594 | |
Variation margin on futures contracts | | | — | | | | — | | | | — | | | | — | |
| | | | |
Total Assets | | | 77,230,663 | | | | 1,451,148,720 | | | | 719,788,864 | | | | 134,186,952 | |
| | | | |
| | | | |
LIABILITIES | | | | | | | | | | | | | | | | |
Cash overdraft | | | — | | | | — | | | | — | | | | — | |
Unrealized depreciation on forward foreign currency contracts | | | 8,111 | | | | — | | | | — | | | | — | |
Due to brokers | | | — | | | | — | | | | — | | | | — | |
Payables: | | | | | | | | | | | | | | | | |
Cash collateral received from securities loaned | | | 1,136,015 | | | | 3,852,300 | | | | 2,318,500 | | | | — | |
Deferred compensation (Note 7) | | | 5,322 | | | | 245,449 | | | | 88,075 | | | | 6,656 | |
Investment advisory fees (Note 4) | | | 29,955 | | | | 224,787 | | | | 107,357 | | | | 18,720 | |
Trustee fees (Note 7) | | | 369 | | | | 8,075 | | | | 3,773 | | | | 618 | |
Securities purchased | | | — | | | | 9,233,690 | | | | 2,791,850 | | | | 22,917,770 | |
Deferred non-US capital gains taxes | | | 60,290 | | | | — | | | | — | | | | — | |
Due to Authorized Participant | | | — | | | | — | | | | — | | | | — | |
Variation margin on futures contracts | | | 8,904 | | | | — | | | | — | | | | — | |
Capital shares redeemed | | | — | | | | — | | | | — | | | | — | |
Other | | | 7,000 | | | | — | | | | — | | | | 400 | |
| | | | |
Total Liabilities | | | 1,255,966 | | | | 13,564,301 | | | | 5,309,555 | | | | 22,944,164 | |
| | | | |
Net Assets | | $ | 75,974,697 | | | $ | 1,437,584,419 | | | $ | 714,479,309 | | | $ | 111,242,788 | |
| | | | |
| | | | |
NET ASSETS CONSIST OF: | | | | | | | | | | | | | | | | |
Paid-in capital | | $ | 83,958,798 | | | $ | 1,424,702,548 | | | $ | 676,790,422 | | | $ | 115,051,750 | |
Distributable earnings (loss) | | | (7,984,101 | ) | | | 12,881,871 | | | | 37,688,887 | | | | (3,808,962 | ) |
| | | | |
Net Assets | | $ | 75,974,697 | | | $ | 1,437,584,419 | | | $ | 714,479,309 | | | $ | 111,242,788 | |
| | | | |
| | | | |
Shares Outstanding (unlimited number of shares authorized $ 0.0001 par value) | | | 2,500,001 | | | | 54,504,000 | | | | 25,500,001 | | | | 4,750,001 | |
Net Asset Value | | $ | 30.39 | | | $ | 26.38 | | | $ | 28.02 | | | $ | 23.42 | |
| | | | |
† Securities on loan, at value | | $ | 5,094,637 | | | $ | 46,120,662 | | | $ | 117,675,275 | | | $ | — | |
†† Cost of foreign cash | | $ | 500,272 | | | $ | — | | | $ | — | | | $ | — | |
| * | Includes cash pledged by the Fund to cover margin requirements for open futures contracts as of 10/31. |
| ** | Includes cash pledged by an Authorized Participant for missing deposit securities required to secure Creation Units. |
See Accompanying Notes to the Financial Statements.
| | | | |
| 64 | | FLEXSHARES ANNUAL REPORT | | |
Statements of Assets and Liabilities (cont.)
| | | | | | | | | | | | | | | | |
| | | FlexShares®
Credit-Scored
US
Corporate Bond
Index Fund | | | FlexShares®
Credit-Scored
US Long
Corporate Bond
Index Fund | | | FlexShares®
High Yield
Value-
Scored Bond
Index Fund | | | FlexShares®
ESG & Climate
High Yield
Corporate Core
Index Fund | |
| | | | |
ASSETS | | | | | | | | | | | | | | | | |
Securities, at cost | | $ | 307,178,946 | | | $ | 57,536,998 | | | $ | 567,263,956 | | | $ | 49,230,381 | |
Affiliate securities, at cost | | | — | | | | — | | | | — | | | | — | |
Securities Lending Reinvestments, at cost | | | — | | | | — | | | | — | | | | — | |
| | | | |
Securities, at value† | | | 308,335,995 | | | | 59,393,212 | | | | 567,330,749 | | | | 48,820,616 | |
Affiliate securities, at value | | | — | | | | — | | | | — | | | | — | |
Securities Lending Reinvestments, at value | | | — | | | | — | | | | — | | | | — | |
Cash | | | 7,713,570 | | | | 695,512 | | | | 5,781,772 | | | | 813,016 | |
Cash segregated at broker* | | | — | | | | — | | | | — | | | | — | |
Foreign cash†† | | | — | | | | — | | | | — | | | | — | |
Restricted cash** | | | — | | | | — | | | | — | | | | — | |
Due from Authorized Participant | | | — | | | | — | | | | — | | | | — | |
Unrealized appreciation on forward foreign currency contracts | | | — | | | | — | | | | — | | | | — | |
Receivables: | | | | | | | | | | | | | | | | |
Dividends and interest | | | 2,474,276 | | | | 546,113 | | | | 9,326,970 | | | | 684,320 | |
Securities lending income | | | — | | | | — | | | | — | | | | — | |
Capital shares issued | | | — | | | | 3,042,319 | | | | — | | | | — | |
Investment adviser | | | 195 | | | | 9 | | | | 447 | | | | 40 | |
Securities sold | | | 12,711,009 | | | | 2,009,742 | | | | 46,611,650 | | | | 947,703 | |
Variation margin on futures contracts | | | — | | | | — | | | | — | | | | — | |
| | | | |
Total Assets | | | 331,235,045 | | | | 65,686,907 | | | | 629,051,588 | | | | 51,265,695 | |
| | | | |
| | | | |
LIABILITIES | | | | | | | | | | | | | | | | |
Cash overdraft | | | — | | | | — | | | | — | | | | — | |
Unrealized depreciation on forward foreign currency contracts | | | — | | | | — | | | | — | | | | — | |
Due to brokers | | | — | | | | — | | | | — | | | | — | |
Payables: | | | | | | | | | | | | | | | | |
Cash collateral received from securities loaned | | | — | | | | — | | | | — | | | | — | |
Deferred compensation (Note 7) | | | 13,781 | | | | 3,171 | | | | 9,415 | | | | — | |
Investment advisory fees (Note 4) | | | 58,694 | | | | 10,713 | | | | 172,578 | | | | 9,725 | |
Trustee fees (Note 7) | | | 1,711 | | | | 317 | | | | 2,381 | | | | 94 | |
Securities purchased | | | 15,418,380 | | | | 4,818,129 | | | | 53,673,014 | | | | 1,489,241 | |
Deferred non-US capital gains taxes | | | — | | | | — | | | | — | | | | — | |
Due to Authorized Participant | | | — | | | | — | | | | — | | | | — | |
Variation margin on futures contracts | | | — | | | | — | | | | — | | | | — | |
Capital shares redeemed | | | — | | | | — | | | | — | | | | — | |
Other | | | 2,500 | | | | — | | | | 10,500 | | | | — | |
| | | | |
Total Liabilities | | | 15,495,066 | | | | 4,832,330 | | | | 53,867,888 | | | | 1,499,060 | |
| | | | |
Net Assets | | $ | 315,739,979 | | | $ | 60,854,577 | | | $ | 575,183,700 | | | $ | 49,766,635 | |
| | | | |
| | | | |
NET ASSETS CONSIST OF: | | | | | | | | | | | | | | | | |
Paid-in capital | | $ | 311,857,929 | | | $ | 57,927,253 | | | $ | 568,874,928 | | | $ | 49,983,980 | |
Distributable earnings (loss) | | | 3,882,050 | | | | 2,927,324 | | | | 6,308,772 | | | | (217,345 | ) |
| | | | |
Net Assets | | $ | 315,739,979 | | | $ | 60,854,577 | | | $ | 575,183,700 | | | $ | 49,766,635 | |
| | | | |
| | | | |
Shares Outstanding (unlimited number of shares authorized $ 0.0001 par value) | | | 5,900,001 | | | | 1,000,001 | | | | 11,600,001 | | | | 1,000,000 | |
Net Asset Value | | $ | 53.52 | | | $ | 60.85 | | | $ | 49.58 | | | $ | 49.77 | |
| | | | |
† Securities on loan, at value | | $ | — | | | $ | — | | | $ | — | | | $ | — | |
†† Cost of foreign cash | | $ | — | | | $ | — | | | $ | — | | | $ | — | |
| * | Includes cash pledged by the Fund to cover margin requirements for open futures contracts as of 10/31. |
| ** | Includes cash pledged by an Authorized Participant for missing deposit securities required to secure Creation Units. |
See Accompanying Notes to the Financial Statements.
| | | | | | |
| | FLEXSHARES ANNUAL REPORT | | | 65 | |
Statements of Assets and Liabilities (cont.)
| | | | | | | | | | | | |
| | | FlexShares®
ESG & Climate
Investment Grade
Corporate Core
Index Fund | | | FlexShares®
Ready
Access
Variable
Income Fund | | | FlexShares®
Core Select
Bond Fund | |
| | | |
ASSETS | | | | | | | | | | | | |
Securities, at cost | | $ | 48,648,615 | | | $ | 372,603,823 | | | $ | 65,497,186 | |
Affiliate securities, at cost | | | — | | | | — | | | | 60,517,810 | |
Securities Lending Reinvestments, at cost | | | — | | | | — | | | | — | |
| | | | |
Securities, at value† | | | 47,966,046 | | | | 373,249,774 | | | | 65,841,943 | |
Affiliate securities, at value | | | — | | | | — | | | | 60,579,157 | |
Securities Lending Reinvestments, at value | | | — | | | | — | | | | — | |
Cash | | | 1,086,217 | | | | 1,002,915 | | | | 113,319 | |
Cash segregated at broker* | | | — | | | | — | | | | — | |
Foreign cash†† | | | — | | | | — | | | | — | |
Restricted cash** | | | — | | | | — | | | | — | |
Due from Authorized Participant | | | — | | | | — | | | | — | |
Unrealized appreciation on forward foreign currency contracts | | | — | | | | — | | | | — | |
Receivables: | | | | | | | | | | | | |
Dividends and interest | | | 378,674 | | | | 1,097,470 | | | | — | |
Securities lending income | | | — | | | | — | | | | — | |
Capital shares issued | | | — | | | | — | | | | 3,277,706 | |
Investment adviser | | | 38 | | | | — | | | | 40 | |
Securities sold | | | 1,275,399 | | | | — | | | | — | |
Variation margin on futures contracts | | | — | | | | — | | | | — | |
| | | | |
Total Assets | | | 50,706,374 | | | | 375,350,159 | | | | 129,812,165 | |
| | | | |
| | | |
LIABILITIES | | | | | | | | | | | | |
Cash overdraft | | | — | | | | — | | | | — | |
Unrealized depreciation on forward foreign currency contracts | | | — | | | | — | | | | — | |
Due to brokers | | | — | | | | — | | | | — | |
Payables: | | | | | | | | | | | | |
Cash collateral received from securities loaned | | | — | | | | — | | | | — | |
Deferred compensation (Note 7) | | | — | | | | 29,507 | | | | 5,535 | |
Investment advisory fees (Note 4) | | | 5,005 | | | | 79,820 | | | | 22,490 | |
Trustee fees (Note 7) | | | 92 | | | | 2,266 | | | | 676 | |
Securities purchased | | | 1,354,221 | | | | 898,902 | | | | 3,266,496 | |
Deferred non-US capital gains taxes | | | — | | | | — | | | | — | |
Due to Authorized Participant | | | — | | | | — | | | | — | |
Variation margin on futures contracts | | | — | | | | — | | | | — | |
Capital shares redeemed | | | — | | | | — | | | | — | |
Other | | | — | | | | 525 | | | | — | |
| | | | |
Total Liabilities | | | 1,359,318 | | | | 1,011,020 | | | | 3,295,197 | |
| | | | |
Net Assets | | $ | 49,347,056 | | | $ | 374,339,139 | | | $ | 126,516,968 | |
| | | | |
| | | |
NET ASSETS CONSIST OF: | | | | | | | | | | | | |
Paid-in capital | | $ | 49,995,317 | | | $ | 372,684,906 | | | $ | 127,353,019 | |
Distributable earnings (loss) | | | (648,261 | ) | | | 1,654,233 | | | | (836,051 | ) |
| | | | |
Net Assets | | $ | 49,347,056 | | | $ | 374,339,139 | | | $ | 126,516,968 | |
| | | | |
| | | |
Shares Outstanding (unlimited number of shares authorized $ 0.0001 par value) | | | 1,000,000 | | | | 4,925,001 | | | | 4,825,001 | |
Net Asset Value | | $ | 49.35 | | | $ | 76.01 | | | $ | 26.22 | |
| | | |
† Securities on loan, at value | | $ | — | | | $ | — | | | $ | — | |
†† Cost of foreign cash | | $ | — | | | $ | — | | | $ | — | |
| * | Includes cash pledged by the Fund to cover margin requirements for open futures contracts as of 10/31. |
| ** | Includes cash pledged by an Authorized Participant for missing deposit securities required to secure Creation Units. |
See Accompanying Notes to the Financial Statements.
| | | | |
| 66 | | FLEXSHARES ANNUAL REPORT | | |
FlexShares® Trust
Statements of Operations
For the year ended October 31, 2021
| | | | | | | | | | | | | | | | |
| | | FlexShares®
US Quality
Low Volatility
Index Fund | | | FlexShares®
Developed
Markets ex-US
Quality Low Volatility
Index Fund | | | FlexShares®
Emerging
Markets Quality
Low Volatility
Index Fund | | | FlexShares®
Morningstar
US Market
Factor Tilt
Index Fund | |
|
INVESTMENT INCOME | |
Dividend income | | $ | 1,960,410 | | | $ | 2,694,925 | | | $ | 502,286 | | | $ | 24,175,508 | |
Income from non-cash dividends | | | — | | | | — | | | | — | | | | — | |
Dividend income received from affiliate | | | — | | | | — | | | | — | | | | 21,094 | |
Interest income | | | 27 | | | | — | | | | — | | | | — | |
Securities lending income (net of fees) (Note 2) | | | 2,616 | | | | 6,328 | | | | 12 | | | | 339,509 | |
Foreign withholding tax on dividends | | | (3,739 | ) | | | (204,616 | ) | | | (57,825 | ) | | | (15,742 | ) |
Foreign withholding tax on interest | | | — | | | | — | | | | — | | | | — | |
| | | | |
Total Investment Income | | | 1,959,314 | | | | 2,496,637 | | | | 444,473 | | | | 24,520,369 | |
| | | | |
|
EXPENSES | |
Deferred compensation (Note 7) | | | 4,266 | | | | 2,537 | | | | 450 | | | | 47,741 | |
Investment advisory fees | | | 308,386 | | | | 265,648 | | | | 59,572 | | | | 3,969,352 | |
Trustee fees (Note 7) | | | 8,674 | | | | 5,186 | | | | 946 | | | | 98,625 | |
Other expenses (Note 4) | | | — | | | | — | | | | — | | | | 1,194 | |
| | | | |
Total Gross Expenses Before Fees Reimbursed | | | 321,326 | | | | 273,371 | | | | 60,968 | | | | 4,116,912 | |
| | | | |
|
Less: | |
Investment advisory fees reimbursed (Note 4) | | | (5,703 | ) | | | (3,428 | ) | | | (633 | ) | | | (64,277 | ) |
| | | | |
Total Net Expenses | | | 315,623 | | | | 269,943 | | | | 60,335 | | | | 4,052,635 | |
| | | | |
Net Investment Income (Loss) | | | 1,643,691 | | | | 2,226,694 | | | | 384,138 | | | | 20,467,734 | |
| | | | |
|
NET REALIZED GAIN (LOSS) FROM: | |
Transactions in investment securities of affiliated issuers | | | — | | | | — | | | | — | | | | 22,960 | |
Transactions in investment securities | | | (132,822 | ) | | | 1,234,397 | | | | 175,858 | (1) | | | 58,792,001 | |
In-kind redemptions on investments in affiliated securities | | | — | | | | — | | | | — | | | | — | |
In-kind redemptions on investments in securities | | | 9,882,528 | | | | 2,677,721 | | | | — | | | | 63,250,899 | |
Expiration or closing of futures contracts | | | 127,448 | | | | 148,680 | | | | 31,848 | | | | 3,657,774 | |
Settlement of forward foreign currency contracts | | | — | | | | 4,409 | | | | (141 | ) | | | — | |
Foreign currency transactions | | | — | | | | (4,971 | ) | | | (3,348 | ) | | | — | |
| | | | |
Net Realized Gain (Loss) | | | 9,877,154 | | | | 4,060,236 | | | | 204,217 | | | | 125,723,634 | |
| | | | |
|
NET CHANGE IN UNREALIZED APPRECIATION (DEPRECIATION) ON: | |
Investments in securities | | | 29,471,830 | | | | 8,894,027 | | | | 673,724 | (2) | | | 435,676,544 | (3) |
Securities lending | | | — | | | | — | | | | — | | | | (2,159 | ) |
Futures contracts | | | 14,590 | | | | 34,155 | | | | (3,337 | ) | | | 629,382 | |
Forward foreign currency contracts | �� | | — | | | | 3,496 | | | | 2 | | | | — | |
Translation of other assets and liabilities denominated in foreign currencies | | | — | | | | (7,171 | ) | | | (1,228 | ) | | | — | |
| | | | |
Net Change in Unrealized Appreciation (Depreciation) | | | 29,486,420 | | | | 8,924,507 | | | | 669,161 | | | | 436,303,767 | |
| | | | |
Net Realized and Unrealized Gain (Loss) | | | 39,363,574 | | | | 12,984,743 | | | | 873,378 | | | | 562,027,401 | |
| | | | |
Net Increase (Decrease) in Net Assets Resulting from Operations | | $ | 41,007,265 | | | $ | 15,211,437 | | | $ | 1,257,516 | | | $ | 582,495,135 | |
| | | | |
| (1) | Net of non-US capital gains tax of $(25,485). |
| (2) | Net of deferred non-US capital gains tax of $45,878. |
| (3) | Includes $305,597 change in unrealized appreciation on investments in affiliates. |
See Accompanying Notes to the Financial Statements.
| | | | | | |
| | FLEXSHARES ANNUAL REPORT | | | 67 | |
Statements of Operations (cont.)
| | | | | | | | | | | | | | | | |
| | | FlexShares®
Morningstar
Developed
Markets ex-US
Factor Tilt
Index Fund | | | FlexShares®
Morningstar Emerging
Markets Factor Tilt
Index Fund | | | FlexShares®
US Quality
Large Cap
Index Fund | | | FlexShares®
STOXX® US
ESG Select
Index Fund | |
|
INVESTMENT INCOME | |
Dividend income | | $ | 17,900,240 | | | $ | 10,486,939 | | | $ | 1,509,720 | | | $ | 2,577,452 | |
Income from non-cash dividends | | | 1,277,437 | | | | — | | | | — | | | | — | |
Dividend income received from affiliate | | | — | | | | — | | | | — | | | | — | |
Interest income | | | 865 | | | | 742 | | | | — | | | | — | |
Securities lending income (net of fees) (Note 2) | | | 487,288 | | | | 215,163 | | | | 5,694 | | | | 4,318 | |
Foreign withholding tax on dividends | | | (1,845,334 | ) | | | (1,240,737 | ) | | | — | | | | — | |
Foreign withholding tax on interest | | | — | | | | (11 | ) | | | — | | | | — | |
| | | | |
Total Investment Income | | | 17,820,496 | | | | 9,462,096 | | | | 1,515,414 | | | | 2,581,770 | |
| | | | |
|
EXPENSES | |
Deferred compensation (Note 7) | | | 19,403 | | | | 9,214 | | | | 2,932 | | | | 4,671 | |
Investment advisory fees | | | 2,461,755 | | | | 1,821,138 | | | | 337,429 | | | | 521,784 | |
Trustee fees (Note 7) | | | 38,193 | | | | 19,072 | | | | 6,451 | | | | 10,278 | |
Other expenses (Note 4) | | | — | | | | — | | | | — | | | | — | |
| | | | |
Total Gross Expenses Before Fees Reimbursed | | | 2,519,351 | | | | 1,849,424 | | | | 346,812 | | | | 536,733 | |
| | | | |
|
Less: | |
Investment advisory fees reimbursed (Note 4) | | | (23,722 | ) | | | (11,515 | ) | | | (3,807 | ) | | | (6,351 | ) |
| | | | |
Total Net Expenses | | | 2,495,629 | | | | 1,837,909 | | | | 343,005 | | | | 530,382 | |
| | | | |
Net Investment Income (Loss) | | | 15,324,867 | | | | 7,624,187 | | | | 1,172,409 | | | | 2,051,388 | |
| | | | |
|
NET REALIZED GAIN (LOSS) FROM: | |
Transactions in investment securities of affiliated issuers | | | — | | | | — | | | | — | | | | — | |
Transactions in investment securities | | | 4,224,755 | | | | 25,155,105 | | | | 1,011,876 | | | | 781,888 | |
In-kind redemptions on investments in affiliated securities | | | — | | | | — | | | | — | | | | — | |
In-kind redemptions on investments in securities | | | 14,065,818 | | | | — | | | | 4,606,626 | | | | 24,349,402 | |
Expiration or closing of futures contracts | | | 3,673,620 | | | | 659,219 | | | | 202,390 | | | | 364,068 | |
Settlement of forward foreign currency contracts | | | (76,242 | ) | | | 41,019 | | | | — | | | | — | |
Foreign currency transactions | | | (31,061 | ) | | | (243,994 | ) | | | — | | | | — | |
| | | | |
Net Realized Gain (Loss) | | | 21,856,890 | | | | 25,611,349 | | | | 5,820,892 | | | | 25,495,358 | |
| | | | |
| | | | |
NET CHANGE IN UNREALIZED APPRECIATION (DEPRECIATION) ON: | | | | | | | | | | | | | | | | |
Investments in securities | | | 151,750,323 | | | | 31,299,941 | (1) | | | 26,066,559 | | | | 24,881,088 | |
Securities lending | | | — | | | | — | | | | — | | | | — | |
Futures contracts | | | 696,497 | | | | (104,240 | ) | | | 59,805 | | | | 54,699 | |
Forward foreign currency contracts | | | (62,544 | ) | | | (2,980 | ) | | | — | | | | — | |
Translation of other assets and liabilities denominated in foreign currencies | | | (81,348 | ) | | | (15,948 | ) | | | — | | | | — | |
| | | | |
Net Change in Unrealized Appreciation (Depreciation) | | | 152,302,928 | | | | 31,176,773 | | | | 26,126,364 | | | | 24,935,787 | |
| | | | |
Net Realized and Unrealized Gain (Loss) | | | 174,159,818 | | | | 56,788,122 | | | | 31,947,256 | | | | 50,431,145 | |
| | | | |
Net Increase (Decrease) in Net Assets Resulting from Operations | | $ | 189,484,685 | | | $ | 64,412,309 | | | $ | 33,119,665 | | | $ | 52,482,533 | |
| | | | |
| (1) | Net of deferred non-US capital gains tax of $929,952. |
See Accompanying Notes to the Financial Statements.
| | | | |
| 68 | | FLEXSHARES ANNUAL REPORT | | |
Statements of Operations (cont.)
| | | | | | | | | | | | | | | | |
| | | FlexShares®
STOXX®
Global ESG
Select
Index Fund | | | FlexShares®
ESG & Climate US
Large Cap Core
Index Fund | | | FlexShares®
ESG & Climate
Developed
Markets ex-US Core
Index Fund | | | FlexShares®
Morningstar Global
Upstream Natural
Resources Index
Fund | |
| | | | | | September 20,
2021* through
October 31, 2021 | | | September 20,
2021* through
October 31, 2021 | | | | |
|
INVESTMENT INCOME | |
Dividend income | | $ | 3,097,926 | | | $ | 3,110 | | | $ | 16,628 | | | $ | 220,259,352 | |
Income from non-cash dividends | | | 228,654 | | | | — | | | | — | | | | — | |
Dividend income received from affiliate | | | — | | | | — | | | | — | | | | — | |
Interest income | | | 226 | | | | — | | | | — | | | | — | |
Securities lending income (net of fees) (Note 2) | | | 12,548 | | | | — | | | | — | | | | 1,266,543 | |
Foreign withholding tax on dividends | | | (190,869 | ) | | | — | | | | (146 | ) | | | (10,289,688 | ) |
Foreign withholding tax on interest | | | — | | | | — | | | | — | | | | — | |
| | | | |
Total Investment Income | | | 3,148,485 | | | | 3,110 | | | | 16,482 | | | | 211,236,207 | |
| | | | |
|
EXPENSES | |
Deferred compensation (Note 7) | | | 4,747 | | | | (2 | )(1) | | | (5 | )(1) | | | 135,136 | |
Investment advisory fees | | | 683,660 | | | | 257 | | | | 679 | | | | 21,980,412 | |
Trustee fees (Note 7) | | | 10,055 | | | | 19 | | | | 38 | | | | 296,195 | |
Other expenses (Note 4) | | | — | | | | — | | | | — | | | | — | |
| | | | |
Total Gross Expenses Before Fees Reimbursed | | | 698,462 | | | | 274 | | | | 712 | | | | 22,411,743 | |
| | | | |
|
Less: | |
Investment advisory fees reimbursed (Note 4) | | | (6,018 | ) | | | (2 | ) | | | (5 | ) | | | (172,689 | ) |
| | | | |
Total Net Expenses | | | 692,444 | | | | 272 | | | | 707 | | | | 22,239,054 | |
| | | | |
Net Investment Income (Loss) | | | 2,456,041 | | | | 2,838 | | | | 15,775 | | | | 188,997,153 | |
| | | | |
|
NET REALIZED GAIN (LOSS) FROM: | |
Transactions in investment securities of affiliated issuers | | | — | | | | — | | | | — | | | | — | |
Transactions in investment securities | | | 3,079,204 | | | | (534 | ) | | | (948 | ) | | | (113,074,043 | )(2) |
In-kind redemptions on investments in affiliated securities | | | — | | | | — | | | | — | | | | — | |
In-kind redemptions on investments in securities | | | 10,142,935 | | | | — | | | | — | | | | 31,786,733 | |
Expiration or closing of futures contracts | | | 566,309 | | | | — | | | | — | | | | 9,279,717 | |
Settlement of forward foreign currency contracts | | | (4,109 | ) | | | — | | | | — | | | | 72,141 | |
Foreign currency transactions | | | 10,909 | | | | — | | | | 171 | | | | 31,107 | |
| | | | |
Net Realized Gain (Loss) | | | 13,795,248 | | | | (534 | ) | | | (777 | ) | | | (71,904,345 | ) |
| | | | |
| | | | |
NET CHANGE IN UNREALIZED APPRECIATION (DEPRECIATION) ON: | | | | | | | | | | | | | | | | |
Investments in securities | | | 34,407,734 | | | | 165,942 | | | | 105,321 | | | | 1,407,033,411 | (3) |
Securities lending | | | — | | | | — | | | | — | | | | (991 | ) |
Futures contracts | | | 96,635 | | | | 1,240 | | | | — | | | | 1,659,537 | |
Forward foreign currency contracts | | | 7,708 | | | | — | | | | (1,347 | ) | | | 318,711 | |
Translation of other assets and liabilities denominated in foreign currencies | | | (13,347 | ) | | | — | | | | (83 | ) | | | 35,353 | |
| | | | |
Net Change in Unrealized Appreciation (Depreciation) | | | 34,498,730 | | | | 167,182 | | | | 103,891 | | | | 1,409,046,021 | |
| | | | |
Net Realized and Unrealized Gain (Loss) | | | 48,293,978 | | | | 166,648 | | | | 103,114 | | | | 1,337,141,676 | |
| | | | |
Net Increase (Decrease) in Net Assets Resulting from Operations | | $ | 50,750,019 | | | $ | 169,486 | | | $ | 118,889 | | | $ | 1,526,138,829 | |
| | | | |
| * | Commencement of investment operations. |
| (1) | The deferred compensation expense reflects the periodic adjustment of the performance of the investment options selected by the Trustees. |
| (2) | Net of non-US capital gains tax of $(26,615). |
| (3) | Net of deferred non-US capital gains tax of $537,973. |
See Accompanying Notes to the Financial Statements.
| | | | | | |
| | FLEXSHARES ANNUAL REPORT | | | 69 | |
Statements of Operations (cont.)
| | | | | | | | | | | | | | | | |
| | | FlexShares®
STOXX®
Global Broad
Infrastructure
Index Fund | | | FlexShares®
Global
Quality
Real Estate
Index Fund | | | FlexShares®
Real Assets
Allocation
Index Fund | | | FlexShares®
Quality
Dividend
Index Fund | |
|
INVESTMENT INCOME | |
Dividend income | | $ | 78,083,218 | | | $ | 9,362,454 | | | $ | — | | | $ | 38,558,474 | |
Income from non-cash dividends | | | — | | | | — | | | | — | | | | — | |
Dividend income received from affiliate | | | — | | | | — | | | | 397,829 | | | | — | |
Interest income | | | — | | | | — | | | | — | | | | — | |
Securities lending income (net of fees) (Note 2) | | | 550,601 | | | | 58,200 | | | | — | | | | 119,288 | |
Foreign withholding tax on dividends | | | (4,844,176 | ) | | | (439,205 | ) | | | — | | | | — | |
Foreign withholding tax on interest | | | — | | | | — | | | | — | | | | — | |
| | | | |
Total Investment Income | | | 73,789,643 | | | | 8,981,449 | | | | 397,829 | | | | 38,677,762 | |
| | | | |
|
EXPENSES | |
Deferred compensation (Note 7) | | | 75,199 | | | | 9,880 | | | | 281 | | | | 46,625 | |
Investment advisory fees | | | 11,848,820 | | | | 1,540,255 | | | | 85,509 | | | | 5,628,359 | |
Trustee fees (Note 7) | | | 155,696 | | | | 20,774 | | | | 888 | | | | 92,889 | |
Other expenses (Note 4) | | | — | | | | — | | | | — | | | | — | |
| | | | |
Total Gross Expenses Before Fees Reimbursed | | | 12,079,715 | | | | 1,570,909 | | | | 86,678 | | | | 5,767,873 | |
| | | | |
|
Less: | |
Investment advisory fees reimbursed (Note 4) | | | (97,737 | ) | | | (12,012 | ) | | | (68,101 | ) | | | (58,241 | ) |
| | | | |
Total Net Expenses | | | 11,981,978 | | | | 1,558,897 | | | | 18,577 | | | | 5,709,632 | |
| | | | |
Net Investment Income (Loss) | | | 61,807,665 | | | | 7,422,552 | | | | 379,252 | | | | 32,968,130 | |
| | | | |
|
NET REALIZED GAIN (LOSS) FROM: | |
Transactions in investment securities of affiliated issuers | | | — | | | | — | | | | 43,863 | | | | — | |
Transactions in investment securities | | | (20,409,066 | )(1) | | | 6,245,084 | | | | — | | | | (248,572 | ) |
In-kind redemptions on investments in affiliated securities | | | — | | | | — | | | | 190,124 | | | | — | |
In-kind redemptions on investments in securities | | | 131,563,099 | | | | 2,563,099 | | | | — | | | | 153,466,309 | |
Expiration or closing of futures contracts | | | 6,508,021 | | | | 1,406,874 | | | | — | | | | 2,049,446 | |
Settlement of forward foreign currency contracts | | | (91,529 | ) | | | (17,118 | ) | | | — | | | | — | |
Foreign currency transactions | | | 145,608 | | | | 56,760 | | | | — | | | | — | |
| | | | |
Net Realized Gain (Loss) | | | 117,716,133 | | | | 10,254,699 | | | | 233,987 | | | | 155,267,183 | |
| | | | |
|
NET CHANGE IN UNREALIZED APPRECIATION (DEPRECIATION) ON: | |
Investments in securities | | | 271,124,341 | (2) | | | 90,873,707 | | | | 1,551,258 | (3) | | | 267,065,309 | |
Securities lending | | | — | | | | — | | | | — | | | | (1,356 | ) |
Futures contracts | | | 1,176,125 | | | | 144,019 | | | | — | | | | 452,671 | |
Forward foreign currency contracts | | | (224,458 | ) | | | (5,310 | ) | | | — | | | | — | |
Translation of other assets and liabilities denominated in foreign currencies | | | (110,858 | ) | | | (2,920 | ) | | | — | | | | — | |
| | | | |
Net Change in Unrealized Appreciation (Depreciation) | | | 271,965,150 | | | | 91,009,496 | | | | 1,551,258 | | | | 267,516,624 | |
| | | | |
Net Realized and Unrealized Gain (Loss) | | | 389,681,283 | | | | 101,264,195 | | | | 1,785,245 | | | | 422,783,807 | |
| | | | |
Net Increase (Decrease) in Net Assets Resulting from Operations | | $ | 451,488,948 | | | $ | 108,686,747 | | | $ | 2,164,497 | | | $ | 455,751,937 | |
| | | | |
| (1) | Net of non-US capital gains tax of $(329,945). |
| (2) | Net of deferred non-US capital gains tax of $1,477,929. |
| (3) | Includes $1,551,258 change in unrealized appreciation on investments in affiliates. |
See Accompanying Notes to the Financial Statements.
| | | | |
| 70 | | FLEXSHARES ANNUAL REPORT | | |
Statements of Operations (cont.)
| | | | | | | | | | | | | | | | |
| | | FlexShares®
Quality
Dividend
Defensive
Index Fund | | | FlexShares®
Quality
Dividend
Dynamic
Index Fund | | | FlexShares®
International
Quality
Dividend
Index Fund | | | FlexShares®
International
Quality Dividend
Defensive Index
Fund | |
|
INVESTMENT INCOME | |
Dividend income | | $ | 11,547,809 | | | $ | 474,130 | | | $ | 27,164,707 | | | $ | 3,435,307 | |
Income from non-cash dividends | | | — | | | | — | | | | — | | | | — | |
Dividend income received from affiliate | | | — | | | | — | | | | — | | | | — | |
Interest income | | | — | | | | — | | | | — | | | | — | |
Securities lending income (net of fees) (Note 2) | | | 33,075 | | | | 1,081 | | | | 155,478 | | | | 29,524 | |
Foreign withholding tax on dividends | | | (3,016 | ) | | | — | | | | (2,568,734 | ) | | | (325,770 | ) |
Foreign withholding tax on interest | | | — | | | | — | | | | — | | | | — | |
| | | | |
Total Investment Income | | | 11,577,868 | | | | 475,211 | | | | 24,751,451 | | | | 3,139,061 | |
| | | | |
|
EXPENSES | |
Deferred compensation (Note 7) | | | 14,832 | | | | 555 | | | | 17,531 | | | | 2,208 | |
Investment advisory fees | | | 1,724,233 | | | | 69,678 | | | | 2,713,722 | | | | 335,748 | |
Trustee fees (Note 7) | | | 28,506 | | | | 1,155 | | | | 35,464 | | | | 4,384 | |
Other expenses (Note 4) | | | — | | | | — | | | | — | | | | — | |
| | | | |
Total Gross Expenses Before Fees Reimbursed | | | 1,767,571 | | | | 71,388 | | | | 2,766,717 | | | | 342,340 | |
| | | | |
|
Less: | |
Investment advisory fees reimbursed (Note 4) | | | (18,457 | ) | | | (701 | ) | | | (21,994 | ) | | | (2,763 | ) |
| | | | |
Total Net Expenses | | | 1,749,114 | | | | 70,687 | | | | 2,744,723 | | | | 339,577 | |
| | | | |
Net Investment Income (Loss) | | | 9,828,754 | | | | 404,524 | | | | 22,006,728 | | | | 2,799,484 | |
| | | | |
|
NET REALIZED GAIN (LOSS) FROM: | |
Transactions in investment securities of affiliated issuers | | | — | | | | — | | | | — | | | | — | |
Transactions in investment securities | | | 504,855 | | | | 1,197,541 | | | | 42,211,633 | | | | 5,331,173 | |
In-kind redemptions on investments in affiliated securities | | | — | | | | — | | | | — | | | | — | |
In-kind redemptions on investments in securities | | | 60,712,638 | | | | 534,654 | | | | 2,149,355 | | | | 266,094 | |
Expiration or closing of futures contracts | | | 426,028 | | | | 49,955 | | | | 3,741,941 | | | | 357,127 | |
Settlement of forward foreign currency contracts | | | — | | | | — | | | | (16,251 | ) | | | (20,078 | ) |
Foreign currency transactions | | | — | | | | — | | | | (21,534 | ) | | | (6,246 | ) |
| | | | |
Net Realized Gain (Loss) | | | 61,643,521 | | | | 1,782,150 | | | | 48,065,144 | | | | 5,928,070 | |
| | | | |
|
NET CHANGE IN UNREALIZED APPRECIATION (DEPRECIATION) ON: | |
Investments in securities | | | 63,305,082 | | | | 4,129,917 | | | | 73,402,581 | (1) | | | 8,152,833 | (2) |
Securities lending | | | — | | | | — | | | | — | | | | — | |
Futures contracts | | | 133,715 | | | | 9,461 | | | | 599,000 | | | | 34,662 | |
Forward foreign currency contracts | | | — | | | | — | | | | (132,128 | ) | | | 12,440 | |
Translation of other assets and liabilities denominated in foreign currencies | | | — | | | | — | | | | (52,901 | ) | | | (4,796 | ) |
| | | | |
Net Change in Unrealized Appreciation (Depreciation) | | | 63,438,797 | | | | 4,139,378 | | | | 73,816,552 | | | | 8,195,139 | |
| | | | |
Net Realized and Unrealized Gain (Loss) | | | 125,082,318 | | | | 5,921,528 | | | | 121,881,696 | | | | 14,123,209 | |
| | | | |
Net Increase (Decrease) in Net Assets Resulting from Operations | | $ | 134,911,072 | | | $ | 6,326,052 | | | $ | 143,888,424 | | | $ | 16,922,693 | |
| | | | |
| (1) | Net of deferred non-US capital gains tax of $29,760. |
| (2) | Net of deferred non-US capital gains tax of $38,404. |
See Accompanying Notes to the Financial Statements.
| | | | | | |
| | FLEXSHARES ANNUAL REPORT | | | 71 | |
Statements of Operations (cont.)
| | | | | | | | | | | | | | | | |
| | | FlexShares®
International
Quality Dividend
Dynamic Index
Fund | | | FlexShares®
iBoxx 3-Year
Target
Duration TIPS
Index Fund | | | FlexShares®
iBoxx 5-Year
Target
Duration TIPS
Index Fund | | | FlexShares®
Disciplined
Duration MBS
Index Fund | |
|
INVESTMENT INCOME | |
Dividend income | | $ | 2,778,396 | | | $ | — | | | $ | — | | | $ | — | |
Income from non-cash dividends | | | — | | | | — | | | | — | | | | — | |
Dividend income received from affiliate | | | — | | | | — | | | | — | | | | — | |
Interest income | | | — | | | | 60,924,971 | | | | 27,119,820 | | | | 599,156 | |
Securities lending income (net of fees) (Note 2) | | | 18,396 | | | | 41,838 | | | | 44,439 | | | | — | |
Foreign withholding tax on dividends | | | (252,244 | ) | | | — | | | | — | | | | — | |
Foreign withholding tax on interest | | | — | | | | — | | | | — | | | | — | |
| | | | |
Total Investment Income | | | 2,544,548 | | | | 60,966,809 | | | | 27,164,259 | | | | 599,156 | |
| | | | |
|
EXPENSES | |
Deferred compensation (Note 7) | | | 1,336 | | | | 43,686 | | | | 18,991 | | | | 3,354 | |
Investment advisory fees | | | 253,214 | | | | 2,531,544 | | | | 1,121,056 | | | | 212,604 | |
Trustee fees (Note 7) | | | 3,394 | | | | 85,201 | | | | 37,701 | | | | 6,578 | |
Other expenses (Note 4) | | | — | | | | — | | | | — | | | | — | |
| | | | |
Total Gross Expenses Before Fees Reimbursed | | | 257,944 | | | | 2,660,431 | | | | 1,177,748 | | | | 222,536 | |
| | | | |
|
Less: | |
Investment advisory fees reimbursed (Note 4) | | | (1,925 | ) | | | (58,667 | ) | | | (25,599 | ) | | | (4,646 | ) |
| | | | |
Total Net Expenses | | | 256,019 | | | | 2,601,764 | | | | 1,152,149 | | | | 217,890 | |
| | | | |
Net Investment Income (Loss) | | | 2,288,529 | | | | 58,365,045 | | | | 26,012,110 | | | | 381,266 | |
| | | | |
|
NET REALIZED GAIN (LOSS) FROM: | |
Transactions in investment securities of affiliated issuers | | | — | | | | — | | | | — | | | | — | |
Transactions in investment securities | | | 1,846,868 | (1) | | | 14,489,204 | | | | 7,518,316 | | | | 1,283,596 | |
In-kind redemptions on investments in affiliated securities | | | — | | | | — | | | | — | | | | — | |
In-kind redemptions on investments in securities | | | — | | | | 22,332,303 | | | | 5,056,858 | | | | — | |
Expiration or closing of futures contracts | | | 99,056 | | | | — | | | | — | | | | — | |
Settlement of forward foreign currency contracts | | | 859 | | | | — | | | | — | | | | — | |
Foreign currency transactions | | | (27,488 | ) | | | — | | | | — | | | | — | |
| | | | |
Net Realized Gain (Loss) | | | 1,919,295 | | | | 36,821,507 | | | | 12,575,174 | | | | 1,283,596 | |
| | | | |
|
NET CHANGE IN UNREALIZED APPRECIATION (DEPRECIATION) ON: | |
Investments in securities | | | 5,795,270 | (2) | | | (1,328,792 | ) | | | 2,282,079 | | | | (2,030,761 | ) |
Securities lending | | | — | | | | — | | | | — | | | | — | |
Futures contracts | | | 5,924 | | | | — | | | | — | | | | — | |
Forward foreign currency contracts | | | 3,870 | | | | — | | | | — | | | | — | |
Translation of other assets and liabilities denominated in foreign currencies | | | 1,168 | | | | — | | | | — | | | | — | |
| | | | |
Net Change in Unrealized Appreciation (Depreciation) | | | 5,806,232 | | | | (1,328,792 | ) | | | 2,282,079 | | | | (2,030,761 | ) |
| | | | |
Net Realized and Unrealized Gain (Loss) | | | 7,725,527 | | | | 35,492,715 | | | | 14,857,253 | | | | (747,165 | ) |
| | | | |
Net Increase (Decrease) in Net Assets Resulting from Operations | | $ | 10,014,056 | | | $ | 93,857,760 | | | $ | 40,869,363 | | | $ | (365,899 | ) |
| | | | |
| (1) | Net of non-US capital gains tax of $(10,955). |
| (2) | Net of deferred non-US capital gains tax of $60,290. |
See Accompanying Notes to the Financial Statements.
| | | | |
| 72 | | FLEXSHARES ANNUAL REPORT | | |
Statements of Operations (cont.)
| | | | | | | | | | | | | | | | |
| | | FlexShares®
Credit-
Scored US
Corporate Bond
Index Fund | | | FlexShares®
Credit-Scored
US Long
Corporate Bond
Index Fund | | | FlexShares®
High Yield
Value-
Scored Bond
Index Fund | | | FlexShares®
ESG & Climate
High Yield
Corporate Core
Index Fund | |
| | | | | | | | | | | | September 20,
2021* through
October 31, 2021 | |
|
INVESTMENT INCOME | |
Dividend income | | $ | — | | | $ | — | | | $ | — | | | $ | — | |
Income from non-cash dividends | | | — | | | | — | | | | — | | | | — | |
Dividend income received from affiliate | | | — | | | | — | | | | — | | | | — | |
Interest income | | | 5,478,421 | | | | 1,823,042 | | | | 16,561,020 | | | | 221,765 | |
Securities lending income (net of fees) (Note 2) | | | — | | | | — | | | | — | | | | — | |
Foreign withholding tax on dividends | | | — | | | | — | | | | — | | | | — | |
Foreign withholding tax on interest | | | — | | | | — | | | | — | | | | — | |
| | | | |
Total Investment Income | | | 5,478,421 | | | | 1,823,042 | | | | 16,561,020 | | | | 221,765 | |
| | | | |
|
EXPENSES | |
Deferred compensation (Note 7) | | | 9,008 | | | | 1,697 | | | | 6,879 | | | | — | |
Investment advisory fees | | | 630,609 | | | | 119,227 | | | | 1,060,642 | | | | 12,878 | |
Trustee fees (Note 7) | | | 18,085 | | | | 3,331 | | | | 16,866 | | | | 330 | |
Other expenses (Note 4) | | | — | | | | — | | | | — | | | | — | |
| | | | |
Total Gross Expenses Before Fees Reimbursed | | | 657,702 | | | | 124,255 | | | | 1,084,387 | | | | 13,208 | |
| | | | |
|
Less: | |
Investment advisory fees reimbursed (Note 4) | | | (12,828 | ) | | | (2,326 | ) | | | (9,242 | ) | | | (57 | ) |
| | | | |
Total Net Expenses | | | 644,874 | | | | 121,929 | | | | 1,075,145 | | | | 13,151 | |
| | | | |
Net Investment Income (Loss) | | | 4,833,547 | | | | 1,701,113 | | | | 15,485,875 | | | | 208,614 | |
| | | | |
|
NET REALIZED GAIN (LOSS) FROM: | |
Transactions in investment securities of affiliated issuers | | | — | | | | — | | | | — | | | | — | |
Transactions in investment securities | | | 2,698,669 | | | | 1,029,123 | | | | 9,388,965 | | | | (16,194 | ) |
In-kind redemptions on investments in affiliated securities | | | — | | | | — | | | | — | | | | — | |
In-kind redemptions on investments in securities | | | 315,686 | | | | — | | | | — | | | | — | |
Expiration or closing of futures contracts | | | — | | | | — | | | | — | | | | — | |
Settlement of forward foreign currency contracts | | | — | | | | — | | | | — | | | | — | |
Foreign currency transactions | | | — | | | | — | | | | — | | | | — | |
| | | | |
Net Realized Gain (Loss) | | | 3,014,355 | | | | 1,029,123 | | | | 9,388,965 | | | | (16,194 | ) |
| | | | |
| | | | |
NET CHANGE IN UNREALIZED APPRECIATION (DEPRECIATION) ON: | | | | | | | | | | | | | | | | |
Investments in securities | | | (6,321,483 | ) | | | (16,024 | ) | | | 1,852,410 | | | | (409,765 | ) |
Securities lending | | | — | | | | — | | | | — | | | | — | |
Futures contracts | | | — | | | | — | | | | — | | | | — | |
Forward foreign currency contracts | | | — | | | | — | | | | — | | | | — | |
Translation of other assets and liabilities denominated in foreign currencies | | | — | | | | — | | | | — | | | | — | |
| | | | |
Net Change in Unrealized Appreciation (Depreciation) | | | (6,321,483 | ) | | | (16,024 | ) | | | 1,852,410 | | | | (409,765 | ) |
| | | | |
Net Realized and Unrealized Gain (Loss) | | | (3,307,128 | ) | | | 1,013,099 | | | | 11,241,375 | | | | (425,959 | ) |
| | | | |
Net Increase (Decrease) in Net Assets Resulting from Operations | | $ | 1,526,419 | | | $ | 2,714,212 | | | $ | 26,727,250 | | | $ | (217,345 | ) |
| | | | |
| * | Commencement of investment operations. |
See Accompanying Notes to the Financial Statements.
| | | | | | |
| | FLEXSHARES ANNUAL REPORT | | | 73 | |
Statements of Operations (cont.)
| | | | | | | | | | | | |
| | | FlexShares®
ESG & Climate
Investment Grade
Corporate Core
Index Fund | | | FlexShares®
Ready Access
Variable
Income Fund | | | FlexShares®
Core Select
Bond Fund | |
| | | September 20,
2021* through
October 31, 2021 | | | | | | | |
| | | |
INVESTMENT INCOME | | | | | | | | | | | | |
Dividend income | | $ | — | | | $ | — | | | $ | 808,357 | |
Income from non-cash dividends | | | — | | | | — | | | | — | |
Dividend income received from affiliate | | | — | | | | — | | | | 1,411,342 | |
Interest income | | | 109,485 | | | | 3,680,722 | | | | 37 | |
Securities lending income (net of fees) (Note 2) | | | — | | | | — | | | | — | |
Foreign withholding tax on dividends | | | — | | | | — | | | | — | |
Foreign withholding tax on interest | | | — | | | | — | | | | — | |
| | | | |
Total Investment Income | | | 109,485 | | | | 3,680,722 | | | | 2,219,736 | |
| | | | |
| | | |
EXPENSES | | | | | | | | | | | | |
Deferred compensation (Note 7) | | | — | | | | 13,906 | | | | 3,656 | |
Investment advisory fees | | | 6,638 | | | | 1,041,826 | | | | 404,146 | |
Trustee fees (Note 7) | | | 326 | | | | 25,411 | | | | 7,103 | |
Other expenses (Note 4) | | | — | | | | — | | | | — | |
| | | | |
Total Gross Expenses Before Fees Reimbursed | | | 6,964 | | | | 1,081,143 | | | | 414,905 | |
| | | | |
| | | |
Less: | | | | | | | | | | | | |
Investment advisory fees reimbursed (Note 4) | | | (57 | ) | | | (18,369 | ) | | | (186,303 | ) |
| | | | |
Total Net Expenses | | | 6,907 | | | | 1,062,774 | | | | 228,602 | |
| | | | |
Net Investment Income (Loss) | | | 102,578 | | | | 2,617,948 | | | | 1,991,134 | |
| | | | |
| | | |
NET REALIZED GAIN (LOSS) FROM: | | | | | | | | | | | | |
Transactions in investment securities of affiliated issuers | | | — | | | | — | | | | (1,286,163 | ) |
Transactions in investment securities | | | (68,270 | ) | | | 1,261,361 | | | | 361,724 | |
In-kind redemptions on investments in affiliated securities | | | — | | | | — | | | | 664,938 | |
In-kind redemptions on investments in securities | | | — | | | | — | | | | 525,227 | |
Expiration or closing of futures contracts | | | — | | | | — | | | | (12,967 | ) |
Settlement of forward foreign currency contracts | | | — | | | | — | | | | — | |
Foreign currency transactions | | | — | | | | — | | | | — | |
| | | | |
Net Realized Gain (Loss) | | | (68,270 | ) | | | 1,261,361 | | | | 252,759 | |
| | | | |
| | | |
NET CHANGE IN UNREALIZED APPRECIATION (DEPRECIATION) ON: | | | | | | | | | | | | |
Investments in securities | | | (682,569 | ) | | | (2,362,864 | ) | | | (1,848,559 | )(2) |
Securities lending | | | — | | | | — | | | | — | |
Futures contracts | | | — | | | | — | | | | — | |
Forward foreign currency contracts | | | — | | | | — | | | | — | |
Translation of other assets and liabilities denominated in foreign currencies | | | — | | | | — | | | | — | |
| | | | |
Net Change in Unrealized Appreciation (Depreciation) | | | (682,569 | ) | | | (2,362,864 | ) | | | (1,848,559 | ) |
| | | | |
Net Realized and Unrealized Gain (Loss) | | | (750,839 | ) | | | (1,101,503 | ) | | | (1,595,800 | ) |
| | | | |
Net Increase (Decrease) in Net Assets Resulting from Operations | | $ | (648,261 | ) | | $ | 1,516,445 | | | $ | 395,334 | |
| | | | |
| * | Commencement of investment operations. |
| (2) | Includes $(1,427,165) change in unrealized depreciation on investments in affiliates. |
See Accompanying Notes to the Financial Statements.
| | | | |
| 74 | | FLEXSHARES ANNUAL REPORT | | |
FlexShares® Trust
Statements of Changes in Net Assets
| | | | | | | | | | | | | | | | |
| | | FlexShares® US Quality Low
Volatility Index Fund | | | FlexShares® Developed Markets
ex-US Quality Low Volatility Index Fund | |
| | | Year Ended
October 31,
2021 | | | Year Ended
October 31,
2020 | | | Year Ended
October 31,
2021 | | | Year Ended
October 31,
2020 | |
|
OPERATIONS | |
Net investment income (loss) | | $ | 1,643,691 | | | $ | 820,548 | | | $ | 2,226,694 | | | $ | 1,041,274 | |
Net realized gain (loss) | | | 9,877,154 | | | | (694,524 | ) | | | 4,060,236 | | | | (1,704,692 | ) |
Net change in unrealized appreciation (depreciation) | | | 29,486,420 | | | | 1,304,851 | | | | 8,924,507 | | | | (1,448,187 | ) |
| | | | |
| | | | |
Net Increase (Decrease) in Net Assets | | | | | | | | | | | | | | | | |
Resulting from Operations | | | 41,007,265 | | | | 1,430,875 | | | | 15,211,437 | | | | (2,111,605 | ) |
| | | | |
|
DISTRIBUTIONS TO SHAREHOLDERS | |
Distributable earnings | | | (1,694,565 | ) | | | (643,733 | ) | | | (2,249,889 | ) | | | (864,658 | ) |
Tax return of capital | | | — | | | | — | | | | — | | | | — | |
| | | | |
Total distributions | | | (1,694,565 | ) | | | (643,733 | ) | | | (2,249,889 | ) | | | (864,658 | ) |
| | | | |
|
CAPITAL TRANSACTIONS(1) | |
Proceeds from shares issued | | | 56,108,720 | | | | 107,381,424 | | | | 13,390,874 | | | | 63,603,016 | |
Cost of shares redeemed | | | (44,870,466 | ) | | | (3,711,596 | ) | | | (16,728,469 | ) | | | — | |
| | | | |
Net Increase (Decrease) from Capital Transactions | | | 11,238,254 | | | | 103,669,828 | | | | (3,337,595 | ) | | | 63,603,016 | |
| | | | |
Total Increase (Decrease) in Net Assets | | | 50,550,954 | | | | 104,456,970 | | | | 9,623,953 | | | | 60,626,753 | |
| | | | |
|
NET ASSETS | |
Beginning of Period | | $ | 110,523,538 | | | $ | 6,066,568 | | | $ | 65,747,004 | (3) | | $ | 5,120,251 | (3) |
| | | | |
End of Period | | $ | 161,074,492 | | | $ | 110,523,538 | | | $ | 75,370,957 | | | $ | 65,747,004 | |
| | | | |
|
SHARE TRANSACTIONS | |
Beginning of period | | | 2,700,001 | | | | 150,001 | | | | 2,800,001 | | | | 200,001 | |
Shares issued | | | — | | | | — | | | | — | | | | — | |
Shares issued in-kind | | | 1,150,000 | | | | 2,650,000 | | | | 500,000 | | | | 2,600,000 | |
Shares redeemed | | | — | | | | — | | | | — | | | | — | |
Shares redeemed in-kind | | | (900,000 | ) | | | (100,000 | ) | | | (600,000 | ) | | | — | |
| | | | |
Shares Outstanding, End of Period | | | 2,950,001 | | | | 2,700,001 | | | | 2,700,001 | | | | 2,800,001 | |
| | | | |
| (1) | Capital transactions may include transaction fees associated with creation and redemption transactions which occurred during the period. See Note 9 to the Financial Statements. |
| (3) | Includes amounts paid in capital from the Authorized Participant in addition to the order’s original cash component. This amount is made to offset taxes, commissions, and price differences from the NAV that would otherwise impact the fund on these order trades. |
See Accompanying Notes to the Financial Statements.
| | | | | | |
| | FLEXSHARES ANNUAL REPORT | | | 75 | |
Statements of Changes in Net Assets (cont.)
| | | | | | | | | | | | | | | | |
| | | FlexShares® Emerging Markets
Quality Low Volatility Index Fund | | | FlexShares® Morningstar US
Market Factor Tilt Index Fund | |
| | | Year Ended
October 31,
2021 | | | Year Ended
October 31,
2020 | | | Year Ended
October 31,
2021 | | | Year Ended
October 31,
2020 | |
|
OPERATIONS | |
Net investment income (loss) | | $ | 384,138 | | | $ | 150,459 | | | $ | 20,467,734 | | | $ | 23,501,673 | |
Net realized gain (loss) | | | 204,217 | | | | (556,324 | ) | | | 125,723,634 | | | | 121,619,088 | |
Net change in unrealized appreciation (depreciation) | | | 669,161 | | | | 322,631 | | | | 436,303,767 | | | | (115,132,476 | ) |
| | | | |
| | | | |
Net Increase (Decrease) in Net Assets | | | | | | | | | | | | | | | | |
Resulting from Operations | | | 1,257,516 | | | | (83,234 | ) | | | 582,495,135 | | | | 29,988,285 | |
| | | | |
|
DISTRIBUTIONS TO SHAREHOLDERS | |
Distributable earnings | | | (269,007 | ) | | | (168,979 | ) | | | (19,993,786 | ) | | | (23,509,426 | ) |
Tax return of capital | | | — | | | | — | | | | — | | | | — | |
| | | | |
Total distributions | | | (269,007 | ) | | | (168,979 | ) | | | (19,993,786 | ) | | | (23,509,426 | ) |
| | | | |
|
CAPITAL TRANSACTIONS(1) | |
Proceeds from shares issued | | | 5,276,872 | | | | 7,242,230 | | | | 95,734,574 | | | | 28,195,556 | |
Cost of shares redeemed | | | — | | | | (2,400,617 | ) | | | (106,003,334 | ) | | | (306,024,565 | ) |
| | | | |
Net Increase (Decrease) from Capital Transactions | | | 5,276,872 | | | | 4,841,613 | | | | (10,268,760 | ) | | | (277,829,009 | ) |
| | | | |
Total Increase (Decrease) in Net Assets | | | 6,265,381 | | | | 4,589,400 | | | | 552,232,589 | | | | (271,350,150 | ) |
| | | | |
|
NET ASSETS | |
Beginning of Period | | $ | 9,578,310 | (3) | | $ | 4,988,910 | (3) | | $ | 1,174,786,429 | | | $ | 1,446,136,579 | |
| | | | |
End of Period | | $ | 15,843,691 | | | $ | 9,578,310 | | | $ | 1,727,019,018 | | | $ | 1,174,786,429 | |
| | | | |
|
SHARE TRANSACTIONS | |
Beginning of period | | | 400,001 | | | | 200,001 | | | | 9,700,001 | | | | 12,100,001 | |
Shares issued | | | — | | | | — | | | | — | | | | — | |
Shares issued in-kind | | | 200,000 | | | | 300,000 | | | | 600,000 | | | | 300,000 | |
Shares redeemed | | | — | | | | — | | | | — | | | | — | |
Shares redeemed in-kind | | | — | | | | (100,000 | ) | | | (650,000 | ) | | | (2,700,000 | ) |
| | | | |
Shares Outstanding, End of Period | | | 600,001 | | | | 400,001 | | | | 9,650,001 | | | | 9,700,001 | |
| | | | |
| (1) | Capital transactions may include transaction fees associated with creation and redemption transactions which occurred during the period. See Note 9 to the Financial Statements. |
| (3) | Includes amounts paid in capital from the Authorized Participant in addition to the order’s original cash component. This amount is made to offset taxes, commissions, and price differences from the NAV that would otherwise impact the fund on these order trades. |
See Accompanying Notes to the Financial Statements.
| | | | |
| 76 | | FLEXSHARES ANNUAL REPORT | | |
Statements of Changes in Net Assets (cont.)
| | | | | | | | | | | | | | | | |
| | | FlexShares® Morningstar
Developed Markets ex-US
Factor Tilt Index Fund | | | FlexShares® Morningstar
Emerging Markets Factor Tilt
Index Fund | |
| | | Year Ended
October 31,
2021 | | | Year Ended
October 31,
2020 | | | Year Ended
October 31,
2021 | | | Year Ended
October 31,
2020 | |
|
OPERATIONS | |
Net investment income (loss) | | $ | 15,324,867 | | | $ | 16,169,983 | | | $ | 7,624,187 | | | $ | 6,156,347 | |
Net realized gain (loss) | | | 21,856,890 | | | | (29,509,439 | ) | | | 25,611,349 | | | | (12,435,161 | ) |
Net change in unrealized appreciation (depreciation) | | | 152,302,928 | | | | (111,181,202 | ) | | | 31,176,773 | | | | (13,844,715 | ) |
| | | | |
| | | | |
Net Increase (Decrease) in Net Assets | | | | | | | | | | | | | | | | |
Resulting from Operations | | | 189,484,685 | | | | (124,520,658 | ) | | | 64,412,309 | | | | (20,123,529 | ) |
| | | | |
|
DISTRIBUTIONS TO SHAREHOLDERS | |
Distributable earnings | | | (13,410,048 | ) | | | (23,632,565 | ) | | | (6,011,707 | ) | | | (8,202,693 | ) |
Tax return of capital | | | — | | | | — | | | | — | | | | — | |
| | | | |
Total distributions | | | (13,410,048 | ) | | | (23,632,565 | ) | | | (6,011,707 | ) | | | (8,202,693 | ) |
| | | | |
|
CAPITAL TRANSACTIONS(1) | |
Proceeds from shares issued | | | 44,016,396 | | | | — | | | | 50,124,591 | | | | — | |
Cost of shares redeemed | | | (70,468,136 | ) | | | (317,973,662 | ) | | | — | | | | (159,241,139 | ) |
| | | | |
Net Increase (Decrease) from Capital Transactions | | | (26,451,740 | ) | | | (317,973,662 | ) | | | 50,124,591 | | | | (159,241,139 | ) |
| | | | |
Total Increase (Decrease) in Net Assets | | | 149,622,897 | | | | (466,126,885 | ) | | | 108,525,193 | | | | (187,567,361 | ) |
| | | | |
|
NET ASSETS | |
Beginning of Period | | $ | 499,015,596 | | | $ | 965,142,481 | | | $ | 225,846,802 | | | $ | 413,414,163 | |
| | | | |
End of Period | | $ | 648,638,493 | | | $ | 499,015,596 | | | $ | 334,371,995 | | | $ | 225,846,802 | |
| | | | |
|
SHARE TRANSACTIONS | |
Beginning of period | | | 9,200,001 | | | | 15,400,001 | | | | 4,700,001 | | | | 8,200,001 | |
Shares issued | | | — | | | | — | | | | — | | | | — | |
Shares issued in-kind | | | 600,000 | | | | — | | | | 800,000 | | | | — | |
Shares redeemed | | | — | | | | — | | | | — | | | | — | |
Shares redeemed in-kind | | | (1,000,000 | ) | | | (6,200,000 | ) | | | — | | | | (3,500,000 | ) |
| | | | |
Shares Outstanding, End of Period | | | 8,800,001 | | | | 9,200,001 | | | | 5,500,001 | | | | 4,700,001 | |
| | | | |
| (1) | Capital transactions may include transaction fees associated with creation and redemption transactions which occurred during the period. See Note 9 to the Financial Statements. |
See Accompanying Notes to the Financial Statements.
| | | | | | |
| | FLEXSHARES ANNUAL REPORT | | | 77 | |
Statements of Changes in Net Assets (cont.)
| | | | | | | | | | | | | | | | |
| | | FlexShares® US Quality
Large Cap Index Fund | | | FlexShares® STOXX® US
ESG Select Index Fund | |
| | | Year Ended
October 31,
2021 | | | Year Ended
October 31,
2020 | | | Year Ended
October 31,
2021 | | | Year Ended
October 31,
2020 | |
|
OPERATIONS | |
Net investment income (loss) | | $ | 1,172,409 | | | $ | 1,048,649 | | | $ | 2,051,388 | | | $ | 1,203,766 | |
Net realized gain (loss) | | | 5,820,892 | | | | 1,168,558 | | | | 25,495,358 | | | | (2,609,895 | ) |
Net change in unrealized appreciation (depreciation) | | | 26,126,364 | | | | 2,315,780 | | | | 24,935,787 | | | | 8,424,199 | |
| | | | |
| | | | |
Net Increase (Decrease) in Net Assets | | | | | | | | | | | | | | | | |
Resulting from Operations | | | 33,119,665 | | | | 4,532,987 | | | | 52,482,533 | | | | 7,018,070 | |
| | | | |
| | | | |
DISTRIBUTIONS TO SHAREHOLDERS | | | | | | | | | | | | | | | | |
Distributable earnings | | | (1,136,947 | ) | | | (976,050 | ) | | | (1,955,493 | ) | | | (1,145,374 | ) |
Tax return of capital | | | — | | | | — | | | | — | | | | — | |
| | | | |
Total distributions | | | (1,136,947 | ) | | | (976,050 | ) | | | (1,955,493 | ) | | | (1,145,374 | ) |
| | | | |
| | | | |
CAPITAL TRANSACTIONS(1) | | | | | | | | | | | | | | | | |
Proceeds from shares issued | | | 54,387,819 | | | | 27,538,152 | | | | 115,766,022 | | | | 28,636,289 | |
Cost of shares redeemed | | | (13,737,728 | ) | | | (10,423,258 | ) | | | (63,701,888 | ) | | | (1,481,524 | ) |
| | | | |
Net Increase (Decrease) from Capital Transactions | | | 40,650,091 | | | | 17,114,894 | | | | 52,064,134 | | | | 27,154,765 | |
| | | | |
Total Increase (Decrease) in Net Assets | | | 72,632,809 | | | | 20,671,831 | | | | 102,591,174 | | | | 33,027,461 | |
| | | | |
| | | | |
NET ASSETS | | | | | | | | | | | | | | | | |
Beginning of Period | | $ | 71,842,440 | | | $ | 51,170,609 | | | $ | 89,051,571 | | | $ | 56,024,110 | |
| | | | |
End of Period | | $ | 144,475,249 | | | $ | 71,842,440 | | | $ | 191,642,745 | | | $ | 89,051,571 | |
| | | | |
| | | | |
SHARE TRANSACTIONS | | | | | | | | | | | | | | | | |
Beginning of period | | | 2,025,001 | | | | 1,475,001 | | | | 1,125,001 | | | | 775,001 | |
Shares issued | | | — | | | | — | | | | — | | | | — | |
Shares issued in-kind | | | 1,150,000 | | | | 850,000 | | | | 1,200,000 | | | | 375,000 | |
Shares redeemed | | | — | | | | — | | | | — | | | | — | |
Shares redeemed in-kind | | | (300,000 | ) | | | (300,000 | ) | | | (625,000 | ) | | | (25,000 | ) |
| | | | |
Shares Outstanding, End of Period | | | 2,875,001 | | | | 2,025,001 | | | | 1,700,001 | | | | 1,125,001 | |
| | | | |
| (1) | Capital transactions may include transaction fees associated with creation and redemption transactions which occurred during the period. See Note 9 to the Financial Statements. |
See Accompanying Notes to the Financial Statements.
| | | | |
| 78 | | FLEXSHARES ANNUAL REPORT | | |
Statements of Changes in Net Assets (cont.)
| | | | | | | | | | | | |
| | | FlexShares® STOXX®
Global ESG Select Index
Fund | | | FlexShares®
ESG & Climate US
Large Cap Core
Index Fund | |
| | | Year Ended
October 31,
2021 | | | Year Ended
October 31,
2020 | | | September 20,
2021*
through
October 31,
2021 | |
|
OPERATIONS | |
Net investment income (loss) | | $ | 2,456,041 | | | $ | 1,657,054 | | | $ | 2,838 | |
Net realized gain (loss) | | | 13,795,248 | | | | (1,568,609 | ) | | | (534 | ) |
Net change in unrealized appreciation (depreciation) | | | 34,498,730 | | | | 6,374,388 | | | | 167,182 | |
| | | | |
| | | |
Net Increase (Decrease) in Net Assets | | | | | | | | | | | | |
Resulting from Operations | | | 50,750,019 | | | | 6,462,833 | | | | 169,486 | |
| | | | |
|
DISTRIBUTIONS TO SHAREHOLDERS | |
Distributable earnings | | | (2,324,712 | ) | | | (1,663,474 | ) | | | | |
Tax return of capital | | | — | | | | — | | | | — | |
| | | | |
Total distributions | | | (2,324,712 | ) | | | (1,663,474 | ) | | | — | |
| | | | |
|
CAPITAL TRANSACTIONS(1) | |
Proceeds from shares issued | | | 53,795,593 | | | | 14,933,528 | | | | — | |
Cost of shares redeemed | | | (27,826,718 | ) | | | — | | | | — | |
| | | | |
Net Increase (Decrease) from Capital Transactions | | | 25,968,875 | | | | 14,933,528 | | | | — | |
| | | | |
Total Increase (Decrease) in Net Assets | | | 74,394,182 | | | | 19,732,887 | | | | 169,486 | |
| | | | |
|
NET ASSETS | |
Beginning of Period | | $ | 111,323,292 | | | $ | 91,590,405 | | | $ | 2,500,000 | (2) |
| | | | |
End of Period | | $ | 185,717,474 | | | $ | 111,323,292 | | | $ | 2,669,486 | |
| | | | |
|
SHARE TRANSACTIONS | |
Beginning of period | | | 1,050,001 | | | | 900,001 | | | | 50,000 | (2) |
Shares issued | | | — | | | | — | | | | — | |
Shares issued in-kind | | | 400,000 | | | | 150,000 | | | | — | |
Shares redeemed | | | — | | | | — | | | | — | |
Shares redeemed in-kind | | | (200,000 | ) | | | — | | | | — | |
| | | | |
Shares Outstanding, End of Period | | | 1,250,001 | | | | 1,050,001 | | | | 50,000 | |
| | | | |
| * | Commencement of investment operations. |
| (1) | Capital transactions may include transaction fees associated with creation and redemption transactions which occurred during the period. See Note 9 to the Financial Statements. |
| (2) | Amount includes the initial subscription. |
See Accompanying Notes to the Financial Statements.
| | | | | | |
| | FLEXSHARES ANNUAL REPORT | | | 79 | |
Statements of Changes in Net Assets (cont.)
| | | | | | | | | | | | |
| | | FlexShares®
ESG & Climate
Developed Markets
ex-US Core
Index Fund | | | FlexShares® Morningstar Global
Upstream Natural Resources
Index Fund | |
| | | September 20,
2021*
through October 31,
2021 | | | Year Ended
October 31,
2021 | | | Year Ended
October 31,
2020 | |
|
OPERATIONS | |
Net investment income (loss) | | $ | 15,775 | | | $ | 188,997,153 | | | $ | 119,595,799 | |
Net realized gain (loss) | | | (777 | ) | | | (71,904,345 | ) | | | (39,761,254 | ) |
Net change in unrealized appreciation (depreciation) | | | 103,891 | | | | 1,409,046,021 | | | | (779,563,599 | ) |
| | | | |
| | | |
Net Increase (Decrease) in Net Assets | | | | | | | | | | | | |
Resulting from Operations | | | 118,889 | | | | 1,526,138,829 | | | | (699,729,054 | ) |
| | | | |
|
DISTRIBUTIONS TO SHAREHOLDERS | |
Distributable earnings | | | | | | | (167,354,837 | ) | | | (122,625,164 | ) |
Tax return of capital | | | — | | | | — | | | | — | |
| | | | |
Total distributions | | | — | | | | (167,354,837 | ) | | | (122,625,164 | ) |
| | | | |
|
CAPITAL TRANSACTIONS(1) | |
Proceeds from shares issued | | | — | | | | 1,894,646,901 | | | | 8,825,295 | |
Cost of shares redeemed | | | — | | | | (125,446,435 | ) | | | (1,771,946,391 | ) |
| | | | |
Net Increase (Decrease) from Capital Transactions | | | — | | | | 1,769,200,466 | | | | (1,763,121,096 | ) |
| | | | |
Total Increase (Decrease) in Net Assets | | | 118,889 | | | | 3,127,984,458 | | | | (2,585,475,314 | ) |
| | | | |
|
NET ASSETS | |
Beginning of Period | | $ | 5,000,171 | (2) | | $ | 2,924,725,808 | | | $ | 5,510,201,122 | |
| | | | |
End of Period | | $ | 5,119,060 | | | $ | 6,052,710,266 | | | $ | 2,924,725,808 | |
| | | | |
|
SHARE TRANSACTIONS | |
Beginning of period | | | 100,000 | (2) | | | 109,500,001 | | | | 175,500,001 | |
Shares issued | | | — | | | | — | | | | — | |
Shares issued in-kind | | | — | | | | 50,850,000 | | | | 250,000 | |
Shares redeemed | | | — | | | | — | | | | — | |
Shares redeemed in-kind | | | — | | | | (3,800,000 | ) | | | (66,250,000 | ) |
| | | | |
Shares Outstanding, End of Period | | | 100,000 | | | | 156,550,001 | | | | 109,500,001 | |
| | | | |
| * | Commencement of investment operations. |
| (1) | Capital transactions may include transaction fees associated with creation and redemption transactions which occurred during the period. See Note 9 to the Financial Statements. |
| (2) | Amount includes the initial subscription. |
See Accompanying Notes to the Financial Statements.
| | | | |
| 80 | | FLEXSHARES ANNUAL REPORT | | |
Statements of Changes in Net Assets (cont.)
| | | | | | | | | | | | | | | | |
| | | FlexShares® STOXX® Global
Broad Infrastructure Index Fund | | | FlexShares® Global Quality
Real Estate Index Fund | |
| | | Year Ended
October 31,
2021 | | | Year Ended
October 31,
2020 | | | Year Ended
October 31,
2021 | | | Year Ended
October 31,
2020 | |
|
OPERATIONS | |
Net investment income (loss) | | $ | 61,807,665 | | | $ | 42,348,376 | | | $ | 7,422,552 | | | $ | 8,457,554 | |
Net realized gain (loss) | | | 117,716,133 | | | | (51,372,425 | ) | | | 10,254,699 | | | | (20,467,829 | ) |
Net change in unrealized appreciation (depreciation) | | | 271,965,150 | | | | (114,928,084 | ) | | | 91,009,496 | | | | (76,869,427 | ) |
| | | | |
| | | | |
Net Increase (Decrease) in Net Assets | | | | | | | | | | | | | | | | |
Resulting from Operations | | | 451,488,948 | | | | (123,952,133 | ) | | | 108,686,747 | | | | (88,879,702 | ) |
| | | | |
|
DISTRIBUTIONS TO SHAREHOLDERS | |
Distributable earnings | | | (58,905,802 | ) | | | (40,390,855 | ) | | | (5,654,125 | ) | | | (14,558,175 | ) |
Tax return of capital | | | — | | | | — | | | | — | | | | (168,159 | ) |
| | | | |
Total distributions | | | (58,905,802 | ) | | | (40,390,855 | ) | | | (5,654,125 | ) | | | (14,726,334 | ) |
| | | | |
|
CAPITAL TRANSACTIONS(1) | |
Proceeds from shares issued | | | 754,964,371 | | | | 660,871,183 | | | | 74,006,928 | | | | 85,130,549 | |
Cost of shares redeemed | | | (360,237,628 | ) | | | (116,962,142 | ) | | | (23,016,532 | ) | | | (93,214,545 | ) |
| | | | |
Net Increase (Decrease) from Capital Transactions | | | 394,726,743 | | | | 543,909,041 | | | | 50,990,396 | | | | (8,083,996 | ) |
| | | | |
Total Increase (Decrease) in Net Assets | | | 787,309,889 | | | | 379,566,053 | | | | 154,023,018 | | | | (111,690,032 | ) |
| | | | |
|
NET ASSETS | |
Beginning of Period | | $ | 1,856,596,177 | | | $ | 1,477,030,124 | | | $ | 264,574,365 | | | $ | 376,264,397 | |
| | | | |
End of Period | | $ | 2,643,906,066 | | | $ | 1,856,596,177 | | | $ | 418,597,383 | | | $ | 264,574,365 | |
| | | | |
|
SHARE TRANSACTIONS | |
Beginning of period | | | 38,600,001 | | | | 28,100,001 | | | | 5,200,001 | | | | 5,650,001 | |
Shares issued | | | — | | | | — | | | | — | | | | — | |
Shares issued in-kind | | | 13,350,000 | | | | 13,400,000 | | | | 1,150,000 | | | | 1,450,000 | |
Shares redeemed | | | — | | | | — | | | | — | | | | — | |
Shares redeemed in-kind | | | (6,150,000 | ) | | | (2,900,000 | ) | | | (400,000 | ) | | | (1,900,000 | ) |
| | | | |
Shares Outstanding, End of Period | | | 45,800,001 | | | | 38,600,001 | | | | 5,950,001 | | | | 5,200,001 | |
| | | | |
| (1) | Capital transactions may include transaction fees associated with creation and redemption transactions which occurred during the period. See Note 9 to the Financial Statements. |
See Accompanying Notes to the Financial Statements.
| | | | | | |
| | FLEXSHARES ANNUAL REPORT | | | 81 | |
Statements of Changes in Net Assets (cont.)
| | | | | | | | | | | | | | | | |
| | | FlexShares® Real Assets
Allocation Index Fund | | | FlexShares® Quality Dividend
Index Fund | |
| | | Year Ended
October 31,
2021 | | | Year Ended
October 31,
2020 | | | Year Ended
October 31,
2021 | | | Year Ended
October 31,
2020 | |
|
OPERATIONS | |
Net investment income (loss) | | $ | 379,252 | | | $ | 278,087 | | | $ | 32,968,130 | | | $ | 41,042,206 | |
Net realized gain (loss) | | | 233,987 | | | | (288,406 | ) | | | 155,267,183 | | | | 63,818,614 | |
Net change in unrealized appreciation (depreciation) | | | 1,551,258 | | | | (1,066,621 | ) | | | 267,516,624 | | | | (185,641,841 | ) |
| | | | |
| | | | |
Net Increase (Decrease) in Net Assets | | | | | | | | | | | | | | | | |
Resulting from Operations | | | 2,164,497 | | | | (1,076,940 | ) | | | 455,751,937 | | | | (80,781,021 | ) |
| | | | |
|
DISTRIBUTIONS TO SHAREHOLDERS | |
Distributable earnings | | | (383,940 | ) | | | (278,767 | ) | | | (31,171,462 | ) | | | (51,028,755 | ) |
Tax return of capital | | | — | | | | — | | | | — | | | | — | |
| | | | |
Total distributions | | | (383,940 | ) | | | (278,767 | ) | | | (31,171,462 | ) | | | (51,028,755 | ) |
| | | | |
|
CAPITAL TRANSACTIONS(1) | |
Proceeds from shares issued | | | 24,868,156 | | | | — | | | | 441,818,714 | | | | 147,107,228 | |
Cost of shares redeemed | | | (850,756 | ) | | | (5,503,899 | ) | | | (489,030,914 | ) | | | (457,464,822 | ) |
| | | | |
Net Increase (Decrease) from Capital Transactions | | | 24,017,400 | | | | (5,503,899 | ) | | | (47,212,200 | ) | | | (310,357,594 | ) |
| | | | |
Total Increase (Decrease) in Net Assets | | | 25,797,957 | | | | (6,859,606 | ) | | | 377,368,275 | | | | (442,167,370 | ) |
| | | | |
|
NET ASSETS | |
Beginning of Period | | $ | 4,501,729 | | | $ | 11,361,335 | | | $ | 1,265,176,605 | | | $ | 1,707,343,975 | |
| | | | |
End of Period | | $ | 30,299,686 | | | $ | 4,501,729 | | | $ | 1,642,544,880 | | | $ | 1,265,176,605 | |
| | | | |
|
SHARE TRANSACTIONS | |
Beginning of period | | | 175,001 | | | | 375,001 | | | | 29,150,001 | | | | 36,850,001 | |
Shares issued | | | — | | | | — | | | | — | | | | — | |
Shares issued in-kind | | | 750,000 | | | | — | | | | 8,100,000 | | | | 3,250,000 | |
Shares redeemed | | | — | | | | — | | | | — | | | | — | |
Shares redeemed in-kind | | | (25,000 | ) | | | (200,000 | ) | | | (9,100,000 | ) | | | (10,950,000 | ) |
| | | | |
Shares Outstanding, End of Period | | | 900,001 | | | | 175,001 | | | | 28,150,001 | | | | 29,150,001 | |
| | | | |
| (1) | Capital transactions may include transaction fees associated with creation and redemption transactions which occurred during the period. See Note 9 to the Financial Statements. |
See Accompanying Notes to the Financial Statements.
| | | | |
| 82 | | FLEXSHARES ANNUAL REPORT | | |
Statements of Changes in Net Assets (cont.)
| | | | | | | | | | | | | | | | |
| | | FlexShares® Quality Dividend
Defensive Index Fund | | | FlexShares® Quality Dividend
Dynamic Index Fund | |
| | | Year Ended
October 31,
2021 | | | Year Ended
October 31,
2020 | | | Year Ended
October 31,
2021 | | | Year Ended
October 31,
2020 | |
|
OPERATIONS | |
Net investment income (loss) | | $ | 9,828,754 | | | $ | 12,604,759 | | | $ | 404,524 | | | $ | 844,204 | |
Net realized gain (loss) | | | 61,643,521 | | | | 9,870,639 | | | | 1,782,150 | | | | 2,220,861 | |
Net change in unrealized appreciation (depreciation) | | | 63,438,797 | | | | (42,112,077 | ) | | | 4,139,378 | | | | (6,207,406 | ) |
| | | | |
| | | | |
Net Increase (Decrease) in Net Assets | | | | | | | | | | | | | | | | |
Resulting from Operations | | | 134,911,072 | | | | (19,636,679 | ) | | | 6,326,052 | | | | (3,142,341 | ) |
| | | | |
|
DISTRIBUTIONS TO SHAREHOLDERS | |
Distributable earnings | | | (9,806,498 | ) | | | (16,131,191 | ) | | | (369,573 | ) | | | (962,948 | ) |
Tax return of capital | | | — | | | | — | | | | — | | | | — | |
| | | | |
Total distributions | | | (9,806,498 | ) | | | (16,131,191 | ) | | | (369,573 | ) | | | (962,948 | ) |
| | | | |
|
CAPITAL TRANSACTIONS(1) | |
Proceeds from shares issued | | | 116,279,178 | | | | 120,783,417 | | | | 5,862,851 | | | | — | |
Cost of shares redeemed | | | (204,498,560 | ) | | | (124,805,477 | ) | | | (3,095,145 | ) | | | (35,021,933 | ) |
| | | | |
Net Increase (Decrease) from Capital Transactions | | | (88,219,382 | ) | | | (4,022,060 | ) | | | 2,767,706 | | | | (35,021,933 | ) |
| | | | |
Total Increase (Decrease) in Net Assets | | | 36,885,192 | | | | (39,789,930 | ) | | | 8,724,185 | | | | (39,127,222 | ) |
| | | | |
|
NET ASSETS | |
Beginning of Period | | $ | 411,172,794 | | | $ | 450,962,724 | | | $ | 13,180,819 | | | $ | 52,308,041 | |
| | | | |
End of Period | | $ | 448,057,986 | | | $ | 411,172,794 | | | $ | 21,905,004 | | | $ | 13,180,819 | |
| | | | |
|
SHARE TRANSACTIONS | |
Beginning of period | | | 9,650,001 | | | | 9,750,001 | | | | 300,001 | | | | 1,150,001 | |
Shares issued | | | — | | | | — | | | | — | | | | — | |
Shares issued in-kind | | | 2,250,000 | | | | 2,800,000 | | | | 100,000 | | | | — | |
Shares redeemed | | | — | | | | — | | | | — | | | | — | |
Shares redeemed in-kind | | | (3,900,000 | ) | | | (2,900,000 | ) | | | (50,000 | ) | | | (850,000 | ) |
| | | | |
Shares Outstanding, End of Period | | | 8,000,001 | | | | 9,650,001 | | | | 350,001 | | | | 300,001 | |
| | | | |
| (1) | Capital transactions may include transaction fees associated with creation and redemption transactions which occurred during the period. See Note 9 to the Financial Statements. |
See Accompanying Notes to the Financial Statements.
| | | | | | |
| | FLEXSHARES ANNUAL REPORT | | | 83 | |
Statements of Changes in Net Assets (cont.)
| | | | | | | | | | | | | | | | |
| | | FlexShares® International
Quality Dividend Index Fund | | | FlexShares® International
Quality Dividend Defensive
Index Fund | |
| | | Year Ended
October 31,
2021 | | | Year Ended
October 31,
2020 | | | Year Ended
October 31,
2021 | | | Year Ended
October 31,
2020 | |
| | | | |
OPERATIONS | | | | | | | | | | | | | | | | |
Net investment income (loss) | | $ | 22,006,728 | | | $ | 21,426,092 | | | $ | 2,799,484 | | | $ | 2,469,326 | |
Net realized gain (loss) | | | 48,065,144 | | | | (49,578,473 | ) | | | 5,928,070 | | | | (6,127,777 | ) |
Net change in unrealized appreciation (depreciation) | | | 73,816,552 | | | | (36,850,169 | ) | | | 8,195,139 | | | | (2,835,580 | ) |
| | | | |
| | | | |
Net Increase (Decrease) in Net Assets | | | | | | | | | | | | | | | | |
Resulting from Operations | | | 143,888,424 | | | | (65,002,550 | ) | | | 16,922,693 | | | | (6,494,031 | ) |
| | | | |
| | | | |
DISTRIBUTIONS TO SHAREHOLDERS | | | | | | | | | | | | | | | | |
Distributable earnings | | | (20,693,535 | ) | | | (22,159,155 | ) | | | (2,683,528 | ) | | | (2,523,077 | ) |
Tax return of capital | | | — | | | | — | | | | — | | | | — | |
| | | | |
Total distributions | | | (20,693,535 | ) | | | (22,159,155 | ) | | | (2,683,528 | ) | | | (2,523,077 | ) |
| | | | |
| | | | |
CAPITAL TRANSACTIONS(1) | | | | | | | | | | | | | | | | |
Proceeds from shares issued | | | 60,426,090 | | | | 9,495,567 | | | | — | | | | 3,677,673 | |
Cost of shares redeemed | | | (21,090,657 | ) | | | (243,541,907 | ) | | | (2,184,308 | ) | | | (13,975,686 | ) |
| | | | |
Net Increase (Decrease) from Capital Transactions | | | 39,335,433 | | | | (234,046,340 | ) | | | (2,184,308 | ) | | | (10,298,013 | ) |
| | | | |
Total Increase (Decrease) in Net Assets | | | 162,530,322 | | | | (321,208,045 | ) | | | 12,054,857 | | | | (19,315,121 | ) |
| | | | |
| | | | |
NET ASSETS | | | | | | | | | | | | | | | | |
Beginning of Period | | $ | 453,476,581 | | | $ | 774,684,626 | | | $ | 59,403,734 | | | $ | 78,718,855 | |
| | | | |
End of Period | | $ | 616,006,903 | | | $ | 453,476,581 | | | $ | 71,458,591 | | | $ | 59,403,734 | |
| | | | |
| | | | |
SHARE TRANSACTIONS | | | | | | | | | | | | | | | | |
Beginning of period | | | 22,500,001 | | | | 33,600,001 | | | | 3,100,001 | | | | 3,600,001 | |
Shares issued | | | — | | | | — | | | | — | | | | — | |
Shares issued in-kind | | | 2,300,000 | | | | 400,000 | | | | — | | | | 200,000 | |
Shares redeemed | | | — | | | | — | | | | — | | | | — | |
Shares redeemed in-kind | | | (900,000 | ) | | | (11,500,000 | ) | | | (100,000 | ) | | | (700,000 | ) |
| | | | |
Shares Outstanding, End of Period | | | 23,900,001 | | | | 22,500,001 | | | | 3,000,001 | | | | 3,100,001 | |
| | | | |
| (1) | Capital transactions may include transaction fees associated with creation and redemption transactions which occurred during the period. See Note 9 to the Financial Statements. |
See Accompanying Notes to the Financial Statements.
| | | | |
| 84 | | FLEXSHARES ANNUAL REPORT | | |
Statements of Changes in Net Assets (cont.)
| | | | | | | | | | | | | | | | |
| | | FlexShares® International
Quality Dividend Dynamic
Index Fund | | | FlexShares® iBoxx 3-Year
Target Duration TIPS Index
Fund | |
| | | Year Ended
October 31,
2021 | | | Year Ended
October 31,
2020 | | | Year Ended
October 31,
2021 | | | Year Ended
October 31,
2020 | |
| | | | |
OPERATIONS | | | | | | | | | | | | | | | | |
Net investment income (loss) | | $ | 2,288,529 | | | $ | 925,989 | | | $ | 58,365,045 | | | $ | 16,808,449 | |
Net realized gain (loss) | | | 1,919,295 | | | | (878,854 | ) | | | 36,821,507 | | | | 12,155,953 | |
Net change in unrealized appreciation (depreciation) | | | 5,806,232 | | | | (3,322,029 | ) | | | (1,328,792 | ) | | | 42,400,460 | |
| | | | |
| | | | |
Net Increase (Decrease) in Net Assets | | | | | | | | | | | | | | | | |
Resulting from Operations | | | 10,014,056 | | | | (3,274,894 | ) | | | 93,857,760 | | | | 71,364,862 | |
| | | | |
| | | | |
DISTRIBUTIONS TO SHAREHOLDERS | | | | | | | | | | | | | | | | |
Distributable earnings | | | (1,876,931 | ) | | | (952,482 | ) | | | (61,292,947 | ) | | | (12,627,726 | ) |
Tax return of capital | | | — | | | | — | | | | — | | | | — | |
| | | | |
Total distributions | | | (1,876,931 | ) | | | (952,482 | ) | | | (61,292,947 | ) | | | (12,627,726 | ) |
| | | | |
| | | | |
CAPITAL TRANSACTIONS(1) | | | | | | | | | | | | | | | | |
Proceeds from shares issued | | | 45,461,250 | | | | 10,025,244 | | | | 302,448,698 | | | | 343,216,451 | |
Cost of shares redeemed | | | — | | | | (30,812,569 | ) | | | (326,919,699 | ) | | | (151,185,194 | ) |
| | | | |
Net Increase (Decrease) from Capital Transactions | | | 45,461,250 | | | | (20,787,325 | ) | | | (24,471,001 | ) | | | 192,031,257 | |
| | | | |
Total Increase (Decrease) in Net Assets | | | 53,598,375 | | | | (25,014,701 | ) | | | 8,093,812 | | | | 250,768,393 | |
| | | | |
| | | | |
NET ASSETS | | | | | | | | | | | | | | | | |
Beginning of Period | | $ | 22,376,322 | | | $ | 47,391,023 | | | $ | 1,429,490,607 | | | $ | 1,178,722,214 | |
| | | | |
End of Period | | $ | 75,974,697 | | | $ | 22,376,322 | | | $ | 1,437,584,419 | | | $ | 1,429,490,607 | |
| | | | |
| | | | |
SHARE TRANSACTIONS | | | | | | | | | | | | | | | | |
Beginning of period | | | 1,000,001 | | | | 1,900,001 | | | | 55,554,000 | | | | 47,954,000 | |
Shares issued | | | — | | | | — | | | | — | | | | 350,000 | |
Shares issued in-kind | | | 1,500,000 | | | | 400,000 | | | | 11,450,000 | | | | 13,350,000 | |
Shares redeemed | | | — | | | | — | | | | — | | | | — | |
Shares redeemed in-kind | | | — | | | | (1,300,000 | ) | | | (12,500,000 | ) | | | (6,100,000 | ) |
| | | | |
Shares Outstanding, End of Period | | | 2,500,001 | | | | 1,000,001 | | | | 54,504,000 | | | | 55,554,000 | |
| | | | |
| (1) | Capital transactions may include transaction fees associated with creation and redemption transactions which occurred during the period. See Note 9 to the Financial Statements. |
See Accompanying Notes to the Financial Statements.
| | | | | | |
| | FLEXSHARES ANNUAL REPORT | | | 85 | |
Statements of Changes in Net Assets (cont.)
| | | | | | | | | | | | | | | | |
| | | FlexShares® iBoxx 5-Year
Target Duration TIPS Index
Fund | | | FlexShares® Disciplined
Duration MBS Index Fund | |
| | | Year Ended
October 31,
2021 | | | Year Ended
October 31,
2020 | | | Year Ended
October 31,
2021 | | | Year Ended
October 31,
2020 | |
|
OPERATIONS | |
Net investment income (loss) | | $ | 26,012,110 | | | $ | 7,386,692 | | | $ | 381,266 | | | $ | 1,028,489 | |
Net realized gain (loss) | | | 12,575,174 | | | | 9,689,662 | | | | 1,283,596 | | | | 348,869 | |
Net change in unrealized appreciation (depreciation) | | | 2,282,079 | | | | 25,429,146 | | | | (2,030,761 | ) | | | 1,683,407 | |
| | | | |
| | | | |
Net Increase (Decrease) in Net Assets | | | | | | | | | | | | | | | | |
Resulting from Operations | | | 40,869,363 | | | | 42,505,500 | | | | (365,899 | ) | | | 3,060,765 | |
| | | | |
|
DISTRIBUTIONS TO SHAREHOLDERS | |
Distributable earnings | | | (26,674,665 | ) | | | (5,908,902 | ) | | | (2,676,548 | ) | | | (1,754,929 | ) |
Tax return of capital | | | — | | | | — | | | | — | | | | — | |
| | | | |
Total distributions | | | (26,674,665 | ) | | | (5,908,902 | ) | | | (2,676,548 | ) | | | (1,754,929 | ) |
| | | | |
|
CAPITAL TRANSACTIONS(1) | |
Proceeds from shares issued | | | 155,885,058 | | | | 119,287,446 | | | | 19,053,611 | | | | 66,955,234 | |
Cost of shares redeemed | | | (51,695,657 | ) | | | (116,973,562 | ) | | | (4,788,861 | ) | | | (3,570,206 | ) |
| | | | |
Net Increase (Decrease) from Capital Transactions | | | 104,189,401 | | | | 2,313,884 | | | | 14,264,750 | | | | 63,385,028 | |
| | | | |
Total Increase (Decrease) in Net Assets | | | 118,384,099 | | | | 38,910,482 | | | | 11,222,303 | | | | 64,690,864 | |
| | | | |
|
NET ASSETS | |
Beginning of Period | | $ | 596,095,210 | | | $ | 557,184,728 | | | $ | 100,020,485 | | | $ | 35,329,621 | |
| | | | |
End of Period | | $ | 714,479,309 | | | $ | 596,095,210 | | | $ | 111,242,788 | | | $ | 100,020,485 | |
| | | | |
|
SHARE TRANSACTIONS | |
Beginning of period | | | 21,800,001 | | | | 21,850,001 | | | | 4,150,001 | | | | 1,500,001 | |
Shares issued | | | — | | | | — | | | | 800,000 | | | | 2,800,000 | |
Shares issued in-kind | | | 5,550,000 | | | | 4,450,000 | | | | — | | | | — | |
Shares redeemed | | | — | | | | — | | | | (200,000 | ) | | | (150,000 | ) |
Shares redeemed in-kind | | | (1,850,000 | ) | | | (4,500,000 | ) | | | — | | | | — | |
| | | | |
Shares Outstanding, End of Period | | | 25,500,001 | | | | 21,800,001 | | | | 4,750,001 | | | | 4,150,001 | |
| | | | |
| (1) | Capital transactions may include transaction fees associated with creation and redemption transactions which occurred during the period. See Note 9 to the Financial Statements. |
See Accompanying Notes to the Financial Statements.
| | | | |
| 86 | | FLEXSHARES ANNUAL REPORT | | |
Statements of Changes in Net Assets (cont.)
| | | | | | | | | | | | | | | | |
| | | FlexShares® Credit-Scored
US Corporate Bond Index
Fund | | | FlexShares® Credit-Scored
US Long Corporate Bond
Index Fund | |
| | | Year Ended
October 31,
2021 | | | Year Ended
October 31,
2020 | | | Year Ended
October 31,
2021 | | | Year Ended
October 31,
2020 | |
|
OPERATIONS | |
Net investment income (loss) | | $ | 4,833,547 | | | $ | 3,543,318 | | | $ | 1,701,113 | | | $ | 1,108,090 | |
Net realized gain (loss) | | | 3,014,355 | | | | 2,972,745 | | | | 1,029,123 | | | | 1,951,533 | |
Net change in unrealized appreciation (depreciation) | | | (6,321,483 | ) | | | 3,098,927 | | | | (16,024 | ) | | | 168,819 | |
| | | | |
| | | | |
Net Increase (Decrease) in Net Assets | | | | | | | | | | | | | | | | |
Resulting from Operations | | | 1,526,419 | | | | 9,614,990 | | | | 2,714,212 | | | | 3,228,442 | |
| | | | |
|
DISTRIBUTIONS TO SHAREHOLDERS | |
Distributable earnings | | | (7,983,218 | ) | | | (3,976,789 | ) | | | (3,440,094 | ) | | | (1,038,434 | ) |
Tax return of capital | | | — | | | | — | | | | — | | | | — | |
| | | | |
Total distributions | | | (7,983,218 | ) | | | (3,976,789 | ) | | | (3,440,094 | ) | | | (1,038,434 | ) |
| | | | |
|
CAPITAL TRANSACTIONS(1) | |
Proceeds from shares issued | | | 133,299,728 | | | | 99,484,140 | | | | 27,084,379 | | | | 26,818,282 | |
Cost of shares redeemed | | | (13,500,359 | ) | | | — | | | | (11,864,331 | ) | | | — | |
| | | | |
Net Increase (Decrease) from Capital Transactions | | | 119,799,369 | | | | 99,484,140 | | | | 15,220,048 | | | | 26,818,282 | |
| | | | |
Total Increase (Decrease) in Net Assets | | | 113,342,570 | | | | 105,122,341 | | | | 14,494,166 | | | | 29,008,290 | |
| | | | |
|
NET ASSETS | |
Beginning of Period | | $ | 202,397,409 | | | $ | 97,275,068 | | | $ | 46,360,411 | | | $ | 17,352,121 | |
| | | | |
End of Period | | $ | 315,739,979 | | | $ | 202,397,409 | | | $ | 60,854,577 | | | $ | 46,360,411 | |
| | | | |
|
SHARE TRANSACTIONS | |
Beginning of period | | | 3,700,001 | | | | 1,850,001 | | | | 750,001 | | | | 300,001 | |
Shares issued | | | 2,250,000 | | | | 1,850,000 | | | | 450,000 | | | | 450,000 | |
Shares issued in-kind | | | 200,000 | | | | — | | | | — | | | | — | |
Shares redeemed | | | — | | | | — | | | | (200,000 | ) | | | — | |
Shares redeemed in-kind | | | (250,000 | ) | | | — | | | | — | | | | — | |
| | | | |
Shares Outstanding, End of Period | | | 5,900,001 | | | | 3,700,001 | | | | 1,000,001 | | | | 750,001 | |
| | | | |
| (1) | Capital transactions may include transaction fees associated with creation and redemption transactions which occurred during the period. See Note 9 to the Financial Statements. |
See Accompanying Notes to the Financial Statements.
| | | | | | |
| | FLEXSHARES ANNUAL REPORT | | | 87 | |
Statements of Changes in Net Assets (cont.)
| | | | | | | | | | | | |
| | | FlexShares® High Yield
Value-Scored Bond Index
Fund | | | FlexShares®
ESG & Climate
High Yield
Corporate
Core Index
Fund | |
| | | Year Ended
October 31,
2021 | | | Year Ended
October 31,
2020 | | | September 20,
2021*
through
October 31,
2021 | |
|
OPERATIONS | |
Net investment income (loss) | | $ | 15,485,875 | | | $ | 10,800,929 | | | $ | 208,614 | |
Net realized gain (loss) | | | 9,388,965 | | | | (4,005,108 | ) | | | (16,194 | ) |
Net change in unrealized appreciation (depreciation) | | | 1,852,410 | | | | (1,237,194 | ) | | | (409,765 | ) |
| | | | |
| | | |
Net Increase (Decrease) in Net Assets | | | | | | | | | | | | |
Resulting from Operations | | | 26,727,250 | | | | 5,558,627 | | | | (217,345 | ) |
| | | | |
|
DISTRIBUTIONS TO SHAREHOLDERS | |
Distributable earnings | | | (14,752,663 | ) | | | (9,992,636 | ) | | | | |
Tax return of capital | | | — | | | | — | | | | — | |
| | | | |
Total distributions | | | (14,752,663 | ) | | | (9,992,636 | ) | | | — | |
| | | | |
|
CAPITAL TRANSACTIONS(1) | |
Proceeds from shares issued | | | 415,533,944 | | | | 93,576,705 | | | | — | |
Cost of shares redeemed | | | (41,947,766 | ) | | | — | | |
| —
|
|
| | | | |
Net Increase (Decrease) from Capital Transactions | | | 373,586,178 | | | | 93,576,705 | | |
| —
|
|
| | | | |
Total Increase (Decrease) in Net Assets | | | 385,560,765 | | | | 89,142,696 | | | | (217,345 | ) |
| | | | |
|
NET ASSETS | |
Beginning of Period | | $ | 189,622,935 | | | $ | 100,480,239 | | | $ | 49,983,980 | (2)(3) |
| | | | |
End of Period | | $ | 575,183,700 | | | $ | 189,622,935 | | | $ | 49,766,635 | |
| | | | |
|
SHARE TRANSACTIONS | |
Beginning of period | | | 4,100,001 | | | | 2,100,001 | | | | 1,000,000 | (2) |
Shares issued | | | 7,200,000 | | | | 2,000,000 | | | | — | |
Shares issued in-kind | | | 1,150,000 | | | | — | | | | — | |
Shares redeemed | | | (850,000 | ) | | | — | | | | — | |
Shares redeemed in-kind | | | — | | | | — | | | | — | |
| | | | |
Shares Outstanding, End of Period | | | 11,600,001 | | | | 4,100,001 | | | | 1,000,000 | |
| | | | |
| * | Commencement of investment operations. |
| (1) | Capital transactions may include transaction fees associated with creation and redemption transactions which occurred during the period. See Note 9 to the Financial Statements. |
| (2) | Amount includes the initial subscription. |
| (3) | Includes amounts paid in capital from the Authorized Participant in addition to the order’s original cash component. This amount is made to offset taxes, commissions, and price differences from the NAV that would otherwise impact the fund on these order trades. |
See Accompanying Notes to the Financial Statements.
| | | | |
| 88 | | FLEXSHARES ANNUAL REPORT | | |
Statements of Changes in Net Assets (cont.)
| | | | | | | | | | | | |
| | | FlexShares®
ESG & Climate
Investment Grade
Corporate Core
Index Fund | | | FlexShares® Ready Access
Variable Income Fund | |
| | | September 20,
2021*
through
October 31,
2021 | | | Year Ended
October 31,
2021 | | | Year Ended
October 31,
2020 | |
|
OPERATIONS | |
Net investment income (loss) | | $ | 102,578 | | | $ | 2,617,948 | | | $ | 4,996,263 | |
Net realized gain (loss) | | | (68,270 | ) | | | 1,261,361 | | | | 169,631 | |
Net change in unrealized appreciation (depreciation) | | | (682,569 | ) | | | (2,362,864 | ) | | | 1,872,649 | |
| | | | |
| | | |
Net Increase (Decrease) in Net Assets | | | | | | | | | | | | |
Resulting from Operations | | | (648,261 | ) | | | 1,516,445 | | | | 7,038,543 | |
| | | | |
|
DISTRIBUTIONS TO SHAREHOLDERS | |
Distributable earnings | | | | | | | (3,046,370 | ) | | | (5,325,015 | ) |
Tax return of capital | | | — | | | | — | | | | — | |
| | | | |
Total distributions | | | — | | | | (3,046,370 | ) | | | (5,325,015 | ) |
| | | | |
|
CAPITAL TRANSACTIONS(1) | |
Proceeds from shares issued | | | — | | | | 55,265,356 | | | | 218,827,724 | |
Cost of shares redeemed | |
| —
|
| | | (148,597,576 | ) | | | (26,436,867 | ) |
| | | | |
Net Increase (Decrease) from Capital Transactions | |
| —
|
| | | (93,332,220 | ) | | | 192,390,857 | |
| | | | |
Total Increase (Decrease) in Net Assets | | | (648,261 | ) | | | (94,862,145 | ) | | | 194,104,385 | |
| | | | |
|
NET ASSETS | |
Beginning of Period | | $ | 49,995,317 | (2)(3) | | $ | 469,201,284 | | | $ | 275,096,899 | |
| | | | |
End of Period | | $ | 49,347,056 | | | $ | 374,339,139 | | | $ | 469,201,284 | |
| | | | |
|
SHARE TRANSACTIONS | |
Beginning of period | | | 1,000,000 | (2) | | | 6,150,001 | | | | 3,625,001 | |
Shares issued | | | — | | | | 725,000 | | | | 2,875,000 | |
Shares issued in-kind | | | — | | | | — | | | | — | |
Shares redeemed | | | — | | | | (1,950,000 | ) | | | (350,000 | ) |
Shares redeemed in-kind | | | — | | | | — | | | | — | |
| | | | |
Shares Outstanding, End of Period | | | 1,000,000 | | | | 4,925,001 | | | | 6,150,001 | |
| | | | |
| * | Commencement of investment operations. |
| (1) | Capital transactions may include transaction fees associated with creation and redemption transactions which occurred during the period. See Note 9 to the Financial Statements. |
| (2) | Amount includes the initial subscription. |
| (3) | Includes amounts paid in capital from the Authorized Participant in addition to the order’s original cash component. This amount is made to offset taxes, commissions, and price differences from the NAV that would otherwise impact the fund on these order trades. |
See Accompanying Notes to the Financial Statements.
| | | | | | |
| | FLEXSHARES ANNUAL REPORT | | | 89 | |
Statements of Changes in Net Assets (cont.)
| | | | | | | | |
| | | FlexShares® Core Select
Bond Fund | |
| | | Year Ended
October 31,
2021 | | | Year Ended
October 31,
2020 | |
|
OPERATIONS | |
Net investment income (loss) | | $ | 1,991,134 | | | $ | 1,184,248 | |
Net realized gain (loss) | | | 252,759 | | | | 770,397 | |
Net change in unrealized appreciation (depreciation) | | | (1,848,559 | ) | | | 1,203,701 | |
| | | | |
| | |
Net Increase (Decrease) in Net Assets | | | | | | | | |
Resulting from Operations | | | 395,334 | | | | 3,158,346 | |
| | | | |
|
DISTRIBUTIONS TO SHAREHOLDERS | |
Distributable earnings | | | (2,693,092 | ) | | | (1,218,108 | ) |
Tax return of capital | | | — | | | | — | |
| | | | |
Total distributions | | | (2,693,092 | ) | | | (1,218,108 | ) |
| | | | |
|
CAPITAL TRANSACTIONS(1) | |
Proceeds from shares issued | | | 36,362,834 | | | | 80,884,377 | |
Cost of shares redeemed | | | (16,671,414 | ) | | | — | |
| | | | |
Net Increase (Decrease) from Capital Transactions | | | 19,691,420 | | | | 80,884,377 | |
| | | | |
Total Increase (Decrease) in Net Assets | | | 17,393,662 | | | | 82,824,615 | |
| | | | |
|
NET ASSETS | |
Beginning of Period | | $ | 109,123,306 | | | $ | 26,298,691 | |
| | | | |
End of Period | | $ | 126,516,968 | | | $ | 109,123,306 | |
| | | | |
|
SHARE TRANSACTIONS | |
Beginning of period | | | 4,075,001 | | | | 1,025,001 | |
Shares issued | | | — | | | | — | |
Shares issued in-kind | | | 1,375,000 | | | | 3,050,000 | |
Shares redeemed | | | — | | | | — | |
Shares redeemed in-kind | | | (625,000 | ) | | | — | |
| | | | |
Shares Outstanding, End of Period | | | 4,825,001 | | | | 4,075,001 | |
| | | | |
| (1) | Capital transactions may include transaction fees associated with creation and redemption transactions which occurred during the period. See Note 9 to the Financial Statements. |
See Accompanying Notes to the Financial Statements.
| | | | |
| 90 | | FLEXSHARES ANNUAL REPORT | | |
FlexShares® Trust
Financial Highlights
| | | | | | | | | | | | |
| | | FlexShares® US Quality
Low Volatility Index Fund | |
| | | | | | | | | For the
period
07/15/19*
through
10/31/19 | |
| | | | | | | |
| | | Year ended
October 31, | |
| | | 2021 | | | 2020 | |
| | | |
Net asset value, beginning of period | | $ | 40.93 | | | $ | 40.44 | | | $ | 40.00 | |
| | | | |
| | | |
PER SHARE | | | | | | | | | | | | |
| | | |
Investment Operations | | | | | | | | | | | | |
Net Investment Income | | | 0.57 | (a) | | | 0.64 | (a) | | | 0.17 | (a) |
Net Realized and Unrealized Gain (Loss) | | | 13.69 | | | | 0.38 | | | | 0.35 | |
| | | | |
Total from Operations | | | 14.26 | | | | 1.02 | | | | 0.52 | |
| | | | |
Distributions | | | | | | | | | | | | |
Net Investment Income | | | (0.59 | ) | | | (0.53 | ) | | | (0.08 | ) |
| | | | |
Total from Distributions | | | (0.59 | ) | | | (0.53 | ) | | | (0.08 | ) |
| | | | |
Net Asset Value, end of period | | $ | 54.60 | | | $ | 40.93 | | | $ | 40.44 | |
| | | | |
Total Return(b) | | | | | | | | | | | | |
Net Asset Value(d) | | | 35.05 | % | | | 2.63 | % | | | 1.30 | % |
Market Value (Unaudited)(e) | | | 34.99 | % | | | 2.60 | % | | | 1.43 | % |
| | | |
RATIOS/SUPPLEMENT DATA | | | | | | | | | | | | |
| | | |
Ratios to Average Net Assets(c) | | | | | | | | | | | | |
Expenses | | | 0.23 | % | | | 0.23 | % | | | 0.23 | % |
Expenses net of reimbursements | | | 0.22 | % | | | 0.22 | % | | | 0.22 | % |
Net Investment Income Before Reimbursements | | | 1.17 | % | | | 1.55 | % | | | 1.45 | % |
Net Investment Income Net of Reimbursements | | | 1.17 | % | | | 1.56 | % | | | 1.45 | % |
| | | |
Supplemental Data | | | | | | | | | | | | |
Portfolio Turnover Rate(b)(f) | | | 43 | % | | | 47 | % | | | 9 | % |
Net assets, end of period (thousands) | | $ | 161,074 | | | $ | 110,524 | | | $ | 6,067 | |
| * | Commencement of investment operations. |
See Accompanying Notes to the Financial Statements.
| | | | | | |
| | FLEXSHARES ANNUAL REPORT | | | 91 | |
Financial Highlights (cont.)
| | | | | | | | | | | | |
| | | FlexShares® Developed Markets ex-US
Quality Low Volatility Index Fund | |
| | | | | | | | | For the
period
07/15/19*
through
10/31/19 | |
| | | | | | | |
| | | Year ended
October 31, | |
| | | 2021 | | | 2020 | |
| | | |
Net asset value, beginning of period | | $ | 23.48 | | | $ | 25.60 | | | $ | 25.00 | |
| | | | |
| | | |
PER SHARE | | | | | | | | | | | | |
| | | |
Investment Operations | | | | | | | | | | | | |
Net Investment Income | | | 0.73 | (a) | | | 0.64 | (a) | | | 0.16 | (a) |
Net Realized and Unrealized Gain (Loss) | | | 4.43 | | | | (2.22 | ) | | | 0.53 | |
| | | | |
Total from Operations | | | 5.16 | | | | (1.58 | ) | | | 0.69 | |
| | | | |
Distributions | | | | | | | | | | | | |
Net Investment Income | | | (0.72 | ) | | | (0.54 | ) | | | (0.09 | ) |
| | | | |
Total from Distributions | | | (0.72 | ) | | | (0.54 | ) | | | (0.09 | ) |
| | | | |
Net Asset Value, end of period | | $ | 27.92 | | | $ | 23.48 | | | $ | 25.60 | |
| | | | |
Total Return(b) | | | | | | | | | | | | |
Net Asset Value(d) | | | 22.05 | % | | | (6.24 | )% | | | 2.76 | % |
Market Value (Unaudited)(e) | | | 21.88 | % | | | (6.06 | )% | | | 3.04 | % |
| | | |
RATIOS/SUPPLEMENT DATA | | | | | | | | | | | | |
| | | |
Ratios to Average Net Assets(c) | | | | | | | | | | | | |
Expenses | | | 0.33 | % | | | 0.33 | % | | | 0.32 | % |
Expenses net of reimbursements | | | 0.32 | % | | | 0.32 | % | | | 0.32 | % |
Net Investment Income Before Reimbursements | | | 2.68 | % | | | 2.63 | % | | | 2.21 | % |
Net Investment Income Net of Reimbursements | | | 2.68 | % | | | 2.64 | % | | | 2.21 | % |
| | | |
Supplemental Data | | | | | | | | | | | | |
Portfolio Turnover Rate(b)(f) | | | 56 | % | | | 62 | % | | | 14 | % |
Net assets, end of period (thousands) | | $ | 75,371 | | | $ | 65,747 | | | $ | 5,120 | |
| * | Commencement of investment operations. |
See Accompanying Notes to the Financial Statements.
| | | | |
| 92 | | FLEXSHARES ANNUAL REPORT | | |
Financial Highlights (cont.)
| | | | | | | | | | | | |
| | | FlexShares® Emerging Markets
Quality Low Volatility Index Fund | |
| | | | | | | | | For the
period
07/15/19*
through
10/31/19 | |
| | | | | | | |
| | | Year ended
October 31, | |
| | | 2021 | | | 2020 | |
| | | |
Net asset value, beginning of period | | $ | 23.95 | | | $ | 24.94 | | | $ | 25.00 | |
| | | | |
| | | |
PER SHARE | | | | | | | | | | | | |
| | | |
Investment Operations | | | | | | | | | | | | |
Net Investment Income | | | 0.69 | (a) | | | 0.56 | (a) | | | 0.23 | (a) |
Net Realized and Unrealized Gain (Loss) | | | 2.22 | | | | (0.91 | ) | | | (0.18 | ) |
| | | | |
Total from Operations | | | 2.91 | | | | (0.35 | ) | | | 0.05 | |
| | | | |
Distributions | | | | | | | | | | | | |
Net Investment Income | | | (0.45 | ) | | | (0.64 | ) | | | (0.11 | ) |
| | | | |
Total from Distributions | | | (0.45 | ) | | | (0.64 | ) | | | (0.11 | ) |
| | | | |
Net Asset Value, end of period | | $ | 26.41 | | | $ | 23.95 | | | $ | 24.94 | |
| | | | |
Total Return(b) | | | | | | | | | | | | |
Net Asset Value(d) | | | 12.09 | % | | | (1.41 | )% | | | 0.19 | % |
Market Value (Unaudited)(e) | | | 11.62 | % | | | (0.59 | )% | | | 0.31 | % |
| | | |
RATIOS/SUPPLEMENT DATA | | | | | | | | | | | | |
| | | |
Ratios to Average Net Assets(c) | | | | | | | | | | | | |
Expenses | | | 0.41 | % | | | 0.41 | % | | | 0.40 | % |
Expenses net of reimbursements | | | 0.40 | % | | | 0.40 | % | | | 0.40 | % |
Net Investment Income Before Reimbursements | | | 2.57 | % | | | 2.38 | % | | | 3.18 | % |
Net Investment Income Net of Reimbursements | | | 2.58 | % | | | 2.39 | % | | | 3.18 | % |
| | | |
Supplemental Data | | | | | | | | | | | | |
Portfolio Turnover Rate(b)(f) | | | 54 | % | | | 81 | % | | | 12 | % |
Net assets, end of period (thousands) | | $ | 15,844 | | | $ | 9,578 | | | $ | 4,989 | |
| * | Commencement of investment operations. |
See Accompanying Notes to the Financial Statements.
| | | | | | |
| | FLEXSHARES ANNUAL REPORT | | | 93 | |
Financial Highlights (cont.)
| | | | | | | | | | | | | | | | | | | | |
| | | FlexShares® Morningstar US Market Factor Tilt Index Fund | |
| | | Year ended October 31, | |
| | | 2021 | | | 2020 | | | 2019 | | | 2018 | | | 2017 | |
| | | | | |
Net asset value, beginning of period | | $ | 121.11 | | | $ | 119.52 | | | $ | 110.13 | | | $ | 107.50 | | | $ | 88.32 | |
| | | | |
| | | | | |
PER SHARE | | | | | | | | | | | | | | | | | | | | |
| | | | | |
Investment Operations | | | | | | | | | | | | | | | | | | | | |
Net Investment Income | | | 2.08 | (a) | | | 2.10 | (a) | | | 1.95 | (a) | | | 2.02 | (a) | | | 1.74 | (a) |
Net Realized and Unrealized Gain (Loss) | | | 57.80 | | | | 1.60 | | | | 9.33 | | | | 2.59 | | | | 19.13 | |
| | | | |
Total from Operations | | | 59.88 | | | | 3.70 | | | | 11.28 | | | | 4.61 | | | | 20.87 | |
| | | | |
Distributions | | | | | | | | | | | | | | | | | | | | |
Net Investment Income | | | (2.02 | ) | | | (2.11 | ) | | | (1.89 | ) | | | (1.98 | ) | | | (1.69 | ) |
| | | | |
Total from Distributions | | | (2.02 | ) | | | (2.11 | ) | | | (1.89 | ) | | | (1.98 | ) | | | (1.69 | ) |
| | | | |
Net Asset Value, end of period | | $ | 178.97 | | | $ | 121.11 | | | $ | 119.52 | | | $ | 110.13 | | | $ | 107.50 | |
| | | | |
Total Return | | | | | | | | | | | | | | | | | | | | |
Net Asset Value(d) | | | 49.68 | % | | | 3.28 | % | | | 10.41 | % | | | 4.22 | % | | | 23.77 | % |
Market Value (Unaudited)(e) | | | 49.57 | % | | | 3.33 | % | | | 10.41 | % | | | 4.19 | % | | | 23.72 | % |
| | | | | |
RATIOS/SUPPLEMENT DATA | | | | | | | | | | | | | | | | | | | | |
| | | | | |
Ratios to Average Net Assets | | | | | | | | | | | | | | | | | | | | |
Expenses | | | 0.26 | % | | | 0.26 | % | | | 0.26 | % | | | 0.25 | % | | | 0.26 | % |
Expenses net of reimbursements | | | 0.25 | % | | | 0.25 | % | | | 0.25 | % | | | 0.25 | % | | | 0.25 | % |
Net Investment Income Before Reimbursements | | | 1.28 | % | | | 1.78 | % | | | 1.72 | % | | | 1.77 | % | | | 1.73 | % |
Net Investment Income Net of Reimbursements | | | 1.29 | % | | | 1.79 | % | | | 1.72 | % | | | 1.77 | % | | | 1.74 | % |
| | | | | |
Supplemental Data | | | | | | | | | | | | | | | | | | | | |
Portfolio Turnover Rate(f) | | | 24 | % | | | 26 | % | | | 28 | % | | | 15 | % | | | 22 | % |
Net assets, end of period (thousands) | | $ | 1,727,019 | | | $ | 11,747,860 | | | $ | 1,446,137 | | | $ | 1,387,665 | | | $ | 1,150,199 | |
See Accompanying Notes to the Financial Statements.
| | | | |
| 94 | | FLEXSHARES ANNUAL REPORT | | |
Financial Highlights (cont.)
| | | | | | | | | | | | | | | | | | | | |
| | | FlexShares® Morningstar Developed Markets ex-US
Factor Tilt Index Fund | |
| | | Year ended October 31, | |
| | | 2021 | | | 2020 | | | 2019 | | | 2018 | | | 2017 | |
| | | | | |
Net asset value, beginning of period | | $ | 54.24 | | | $ | 62.67 | | | $ | 59.76 | | | $ | 67.51 | | | $ | 55.62 | |
| | | | |
| | | | | |
PER SHARE | | | | | | | | | | | | | | | | | | | | |
| | | | | |
Investment Operations | | | | | | | | | | | | | | | | | | | | |
Net Investment Income | | | 1.71 | (a) | | | 1.31 | (a) | | | 1.85 | (a) | | | 1.78 | (a) | | | 1.58 | (a) |
Net Realized and Unrealized Gain (Loss) | | | 19.27 | | | | (7.88 | ) | | | 2.89 | | | | (7.39 | ) | | | 11.91 | (k) |
| | | | |
Total from Operations | | | 20.98 | | | | (6.57 | ) | | | 4.74 | | | | (5.61 | ) | | | 13.49 | |
| | | | |
Distributions | | | | | | | | | | | | | | | | | | | | |
Net Investment Income | | | (1.51 | ) | | | (1.86 | ) | | | (1.83 | ) | | | (2.14 | ) | | | (1.60 | ) |
| | | | |
Total from Distributions | | | (1.51 | ) | | | (1.86 | ) | | | (1.83 | ) | | | (2.14 | ) | | | (1.60 | ) |
| | | | |
Net Asset Value, end of period | | $ | 73.71 | | | $ | 54.24 | | | $ | 62.67 | | | $ | 59.76 | | | $ | 67.51 | |
| | | | |
Total Return | | | | | | | | | | | | | | | | | | | | |
Net Asset Value(d) | | | 38.79 | % | | | (10.57 | )% | | | 8.13 | % | | | (8.61 | )% | | | 24.58 | %(k) |
Market Value (Unaudited)(e) | | | 38.95 | % | | | (10.23 | )% | | | 8.16 | % | | | (9.48 | )% | | | 25.38 | % |
| | | | | |
RATIOS/SUPPLEMENT DATA | | | | | | | | | | | | | | | | | | | | |
| | | | | |
Ratios to Average Net Assets | | | | | | | | | | | | | | | | | | | | |
Expenses | | | 0.40 | % | | | 0.40 | % | | | 0.40 | % | | | 0.39 | % | | | 0.40 | % |
Expenses net of reimbursements | | | 0.39 | % | | | 0.39 | % | | | 0.39 | % | | | 0.39 | % | | | 0.39 | % |
Net Investment Income Before Reimbursements | | | 2.42 | % | | | 2.28 | % | | | 3.09 | % | | | 2.65 | % | | | 2.57 | % |
Net Investment Income Net of Reimbursements | | | 2.42 | % | | | 2.28 | % | | | 3.09 | % | | | 2.65 | % | | | 2.57 | % |
| | | | | |
Supplemental Data | | | | | | | | | | | | | | | | | | | | |
Portfolio Turnover Rate(f) | | | 29 | % | | | 21 | % | | | 25 | % | | | 34 | % | | | 22 | % |
Net assets, end of period (thousands) | | $ | 648,638 | | | $ | 499,016 | | | $ | 965,142 | | | $ | 968,096 | | | $ | 985,608 | |
See Accompanying Notes to the Financial Statements.
| | | | | | |
| | FLEXSHARES ANNUAL REPORT | | | 95 | |
Financial Highlights (cont.)
| | | | | | | | | | | | | | | | | | | | |
| | | FlexShares® Morningstar Emerging Markets
Factor Tilt Index Fund | |
| | | Year ended October 31, | |
| | | 2021 | | | 2020 | | | 2019 | | | 2018 | | | 2017 | |
| | | | | |
Net asset value, beginning of period | | $ | 48.05 | | | $ | 50.42 | | | $ | 47.92 | | | $ | 57.38 | | | $ | 47.52 | |
| | | | |
| | | | | |
PER SHARE | | | | | | | | | | | | | | | | | | | | |
| | | | | |
Investment Operations | | | | | | | | | | | | | | | | | | | | |
Net Investment Income | | | 1.51 | (a) | | | 1.02 | (a) | | | 1.49 | (a) | | | 1.46 | (a) | | | 1.28 | (a) |
Net Realized and Unrealized Gain (Loss) | | | 12.40 | | | | (1.97 | ) | | | 2.46 | | | | (9.34 | ) | | | 9.80 | |
| | | | |
Total from Operations | | | 13.91 | | | | (0.95 | ) | | | 3.95 | | | | (7.88 | ) | | | 11.08 | |
| | | | |
Distributions | | | | | | | | | | | | | | | | | | | | |
Net Investment Income | | | (1.17 | ) | | | (1.42 | ) | | | (1.45 | ) | | | (1.58 | ) | | | (1.22 | ) |
| | | | |
Total from Distributions | | | (1.17 | ) | | | (1.42 | ) | | | (1.45 | ) | | | (1.58 | ) | | | (1.22 | ) |
| | | | |
Net Asset Value, end of period | | $ | 60.79 | | | $ | 48.05 | | | $ | 50.42 | | | $ | 47.92 | | | $ | 57.38 | |
| | | | |
Total Return | | | | | | | | | | | | | | | | | | | | |
Net Asset Value(d) | | | 28.95 | % | | | (1.86 | )% | | | 8.29 | % | | | (14.05 | )% | | | 23.56 | % |
Market Value (Unaudited)(e) | | | 30.12 | % | | | (1.44 | )% | | | 8.08 | % | | | (15.22 | )% | | | 23.47 | % |
| | | | | |
RATIOS/SUPPLEMENT DATA | | | | | | | | | | | | | | | | | | | | |
| | | | | |
Ratios to Average Net Assets | | | | | | | | | | | | | | | | | | | | |
Expenses | | | 0.60 | % | | | 0.60 | % | | | 0.60 | % | | | 0.59 | % | | | 0.60 | % |
Expenses net of reimbursements | | | 0.59 | % | | | 0.59 | % | | | 0.59 | % | | | 0.59 | % | | | 0.59 | % |
Net Investment Income Before Reimbursements | | | 2.46 | % | | | 2.13 | % | | | 2.92 | % | | | 2.56 | % | | | 2.44 | % |
Net Investment Income Net of Reimbursements | | | 2.47 | % | | | 2.14 | % | | | 2.93 | % | | | 2.56 | % | | | 2.44 | % |
| | | | | |
Supplemental Data | | | | | | | | | | | | | | | | | | | | |
Portfolio Turnover Rate(f) | | | 40 | % | | | 41 | % | | | 45 | % | | | 49 | % | | | 34 | % |
Net assets, end of period (thousands) | | $ | 334,372 | | | $ | 225,847 | | | $ | 413,414 | | | $ | 488,736 | | | $ | 568,071 | |
See Accompanying Notes to the Financial Statements.
| | | | |
| 96 | | FLEXSHARES ANNUAL REPORT | | |
Financial Highlights (cont.)
| | | | | | | | | | | | | | | | | | | | |
| | | FlexShares® US Quality Large Cap Index Fund | |
| | | Year ended October 31, | |
| | | 2021 | | | 2020 | | | 2019 | | | 2018 | | | 2017 | |
| | | | | |
Net asset value, beginning of period | | $ | 35.48 | | | $ | 34.69 | | | $ | 33.44 | | | $ | 31.83 | | | $ | 26.15 | |
| | | | |
| | | | | |
PER SHARE | | | | | | | | | | | | | | | | | | | | |
| | | | | |
Investment Operations | | | | | | | | | | | | | | | | | | | | |
Net Investment Income | | | 0.50 | (a) | | | 0.62 | (a) | | | 0.68 | (a) | | | 0.54 | (a) | | | 0.49 | (a) |
Net Realized and Unrealized Gain (Loss) | | | 14.76 | | | | 0.76 | | | | 1.29 | | | | 1.58 | | | | 5.65 | |
| | | | |
Total from Operations | | | 15.26 | | | | 1.38 | | | | 1.97 | | | | 2.12 | | | | 6.14 | |
| | | | |
Distributions | | | | | | | | | | | | | | | | | | | | |
Net Investment Income | | | (0.49 | ) | | | (0.59 | ) | | | (0.72 | ) | | | (0.51 | ) | | | (0.46 | ) |
| | | | |
Total from Distributions | | | (0.49 | ) | | | (0.59 | ) | | | (0.72 | ) | | | (0.51 | ) | | | (0.46 | ) |
| | | | |
Net Asset Value, end of period | | $ | 50.25 | | | $ | 35.48 | | | $ | 34.69 | | | $ | 33.44 | | | $ | 31.83 | |
| | | | |
Total Return | | | | | | | | | | | | | | | | | | | | |
Net Asset Value(d) | | | 43.21 | % | | | 4.13 | % | | | 6.04 | % | | | 6.63 | % | | | 23.65 | % |
Market Value (Unaudited)(e) | | | 43.09 | % | | | 4.16 | % | | | 6.01 | % | | | 6.30 | % | | | 24.08 | % |
| | | | | |
RATIOS/SUPPLEMENT DATA | | | | | | | | | | | | | | | | | | | | |
| | | | | |
Ratios to Average Net Assets | | | | | | | | | | | | | | | | | | | | |
Expenses | | | 0.33 | % | | | 0.33 | % | | | 0.33 | % | | | 0.33 | % | | | 0.34 | % |
Expenses net of reimbursements | | | 0.32 | % | | | 0.32 | % | | | 0.32 | % | | | 0.32 | % | | | 0.32 | % |
Net Investment Income Before Reimbursements | | | 1.11 | % | | | 1.77 | % | | | 2.04 | % | | | 1.56 | % | | | 1.65 | % |
Net Investment Income Net of Reimbursements | | | 1.11 | % | | | 1.77 | % | | | 2.05 | % | | | 1.57 | % | | | 1.67 | % |
| | | | | |
Supplemental Data | | | | | | | | | | | | | | | | | | | | |
Portfolio Turnover Rate(f) | | | 30 | % | | | 48 | % | | | 69 | % | | | 94 | % | | | 64 | % |
Net assets, end of period (thousands) | | $ | 144,475 | | | $ | 71,842 | | | $ | 51,171 | | | $ | 61,859 | | | $ | 27,055 | |
See Accompanying Notes to the Financial Statements.
| | | | | | |
| | FLEXSHARES ANNUAL REPORT | | | 97 | |
Financial Highlights (cont.)
| | | | | | | | | | | | | | | | | | | | |
| | | FlexShares® STOXX® US ESG Select Index Fund | |
| | | Year ended October 31, | |
| | | 2021 | | | 2020 | | | 2019 | | | 2018 | | | 2017 | |
| | | | | |
Net asset value, beginning of period | | $ | 79.16 | | | $ | 72.29 | | | $ | 64.33 | | | $ | 60.49 | | | $ | 49.96 | |
| | | | |
| | | | | |
PER SHARE | | | | | | | | | | | | | | | | | | | | |
| | | | | |
Investment Operations | | | | | | | | | | | | | | | | | | | | |
Net Investment Income | | | 1.26 | (a) | | | 1.27 | (a) | | | 1.21 | (a) | | | 1.09 | (a) | | | 1.05 | (a) |
Net Realized and Unrealized Gain (Loss) | | | 33.50 | | | | 6.81 | | | | 7.83 | | | | 3.84 | | | | 10.45 | |
| | | | |
Total from Operations | | | 34.76 | | | | 8.08 | | | | 9.04 | | | | 4.93 | | | | 11.50 | |
| | | | |
Distributions | | | | | | | | | | | | | | | | | | | | |
Net Investment Income | | | (1.19 | ) | | | (1.21 | ) | | | (1.08 | ) | | | (1.09 | ) | | | (0.97 | ) |
| | | | |
Total from Distributions | | | (1.19 | ) | | | (1.21 | ) | | | (1.08 | ) | | | (1.09 | ) | | | (0.97 | ) |
| | | | |
Net Asset Value, end of period | | $ | 112.73 | | | $ | 79.16 | | | $ | 72.29 | | | $ | 64.33 | | | $ | 60.49 | |
| | | | |
Total Return | | | | | | | | | | | | | | | | | | | | |
Net Asset Value(d) | | | 44.15 | % | | | 11.40 | % | | | 14.21 | % | | | 8.13 | % | | | 23.19 | % |
Market Value (Unaudited)(e) | | | 44.12 | % | | | 11.45 | % | | | 14.26 | % | | | 7.97 | % | | | 23.30 | % |
| | | | | |
RATIOS/SUPPLEMENT DATA | | | | | | | | | | | | | | | | | | | | |
| | | | | |
Ratios to Average Net Assets | | | | | | | | | | | | | | | | | | | | |
Expenses | | | 0.33 | % | | | 0.33 | % | | | 0.33 | % | | | 0.33 | % | | | 0.35 | % |
Expenses net of reimbursements | | | 0.32 | % | | | 0.32 | % | | | 0.32 | % | | | 0.32 | % | | | 0.32 | % |
Net Investment Income Before Reimbursements | | | 1.25 | % | | | 1.67 | % | | | 1.78 | % | | | 1.66 | % | | | 1.82 | % |
Net Investment Income Net of Reimbursements | | | 1.26 | % | | | 1.68 | % | | | 1.79 | % | | | 1.67 | % | | | 1.85 | % |
| | | | | |
Supplemental Data | | | | | | | | | | | | | | | | | | | | |
Portfolio Turnover Rate(f) | | | 40 | % | | | 66 | % | | | 75 | % | | | 110 | % | | | 67 | % |
Net assets, end of period (thousands) | | $ | 191,643 | | | $ | 89,052 | | | $ | 56,024 | | | $ | 28,946 | | | $ | 13,610 | |
See Accompanying Notes to the Financial Statements.
| | | | |
| 98 | | FLEXSHARES ANNUAL REPORT | | |
Financial Highlights (cont.)
| | | | | | | | | | | | | | | | | | | | |
| | | FlexShares® STOXX® Global ESG Select Index Fund | |
| | | Year ended October 31, | |
| | | 2021 | | | 2020 | | | 2019 | | | 2018 | | | 2017 | |
| | | | | |
Net asset value, beginning of period | | $ | 106.02 | | | $ | 101.77 | | | $ | 91.61 | | | $ | 91.97 | | | $ | 75.52 | |
| | | | |
| | | | | |
PER SHARE | | | | | | | | | | | | | | | | | | | | |
| | | | | |
Investment Operations | | | | | | | | | | | | | | | | | | | | |
Net Investment Income | | | 2.03 | (a) | | | 1.72 | (a) | | | 2.05 | (a) | | | 1.95 | (a) | | | 1.56 | (a) |
Net Realized and Unrealized Gain (Loss) | | | 42.38 | | | | 4.26 | | | | 10.12 | | | | (0.61 | ) | | | 16.67 | (m) |
| | | | |
Total from Operations | | | 44.41 | | | | 5.98 | | | | 12.17 | | | | 1.34 | | | | 18.23 | |
| | | | |
Distributions | | | | | | | | | | | | | | | | | | | | |
Net Investment Income | | | (1.86 | ) | | | (1.73 | ) | | | (2.01 | ) | | | (1.70 | ) | | | (1.78 | ) |
| | | | |
Total from Distributions | | | (1.86 | ) | | | (1.73 | ) | | | (2.01 | ) | | | (1.70 | ) | | | (1.78 | ) |
| | | | |
Net Asset Value, end of period | | $ | 148.57 | | | $ | 106.02 | | | $ | 101.77 | | | $ | 91.61 | | | $ | 91.97 | |
| | | | |
Total Return | | | | | | | | | | | | | | | | | | | | |
Net Asset Value(d) | | | 42.10 | % | | | 6.03 | % | | | 13.49 | % | | | 1.38 | % | | | 24.37 | %(m) |
Market Value (Unaudited)(e) | | | 41.84 | % | | | 6.46 | % | | | 12.96 | % | | | 1.71 | % | | | 24.55 | % |
| | | | | |
RATIOS/SUPPLEMENT DATA | | | | | | | | | | | | | | | | | | | | |
|
Ratios to Average Net Assets | |
Expenses | | | 0.43 | % | | | 0.43 | % | | | 0.43 | % | | | 0.43 | % | | | 0.45 | % |
Expenses net of reimbursements | | | 0.42 | % | | | 0.42 | % | | | 0.42 | % | | | 0.42 | % | | | 0.42 | % |
Net Investment Income Before Reimbursements | | | 1.50 | % | | | 1.66 | % | | | 2.15 | % | | | 2.03 | % | | | 1.81 | % |
Net Investment Income Net of Reimbursements | | | 1.51 | % | | | 1.66 | % | | | 2.16 | % | | | 2.04 | % | | | 1.83 | % |
| | | | | |
Supplemental Data | | | | | | | | | | | | | | | | | | | | |
Portfolio Turnover Rate(f) | | | 48 | % | | | 58 | % | | | 66 | % | | | 78 | % | | | 64 | % |
Net assets, end of period (thousands) | | $ | 185,717 | | | $ | 111,323 | | | $ | 91,590 | | | $ | 73,284 | | | $ | 32,189 | |
See Accompanying Notes to the Financial Statements.
| | | | | | |
| | FLEXSHARES ANNUAL REPORT | | | 99 | |
Financial Highlights (cont.)
| | | | |
| | | FlexShares® ESG & Climate
US Large Cap Core Index Fund | |
| | | For the
period
09/20/21*
through
10/31/21 | |
| |
Net asset value, beginning of period | | $ | 50.00 | |
| | | | |
| |
PER SHARE | | | | |
| |
Investment Operations | | | | |
Net Investment Income | | | 0.06 | (a) |
Net Realized and Unrealized Gain (Loss) | | | 3.33 | |
| | | | |
Total from Operations | | | 3.39 | |
| | | | |
Distributions | | | | |
Net Investment Income | | | — | |
| | | | |
Total from Distributions | | | — | |
| | | | |
Net Asset Value, end of period | | $ | 53.39 | |
| | | | |
Total Return(b) | | | | |
Net Asset Value(d) | | | 6.78 | % |
Market Value (Unaudited)(e) | | | 6.76 | % |
| |
RATIOS/SUPPLEMENT DATA | | | | |
|
Ratios to Average Net Assets(c) | |
Expenses | | | 0.09 | % |
Expenses net of reimbursements | | | 0.09 | % |
Net Investment Income Before Reimbursements | | | 0.96 | % |
Net Investment Income Net of Reimbursements | | | 0.96 | % |
| |
Supplemental Data | | | | |
Portfolio Turnover Rate(b)(f) | | | — | %(l) |
Net assets, end of period (thousands) | | $ | 2,669 | |
| * | Commencement of investment operations. |
See Accompanying Notes to the Financial Statements.
| | | | |
| 100 | | FLEXSHARES ANNUAL REPORT | | |
Financial Highlights (cont.)
| | | | |
| | | FlexShares® ESG & Climate
Developed Markets ex-US
Core Index Fund | |
| | | For the
period
09/20/21*
through
10/31/21 | |
| |
Net asset value, beginning of period | | $ | 50.00 | |
| | | | |
| |
PER SHARE | | | | |
| |
Investment Operations | | | | |
Net Investment Income | | | 0.16 | (a) |
Net Realized and Unrealized Gain (Loss) | | | 1.03 | |
| | | | |
Total from Operations | | | 1.19 | |
| | | | |
Distributions | | | | |
Net Investment Income | | | — | |
| | | | |
Total from Distributions | | | — | |
| | | | |
Net Asset Value, end of period | | $ | 51.19 | |
| | | | |
Total Return(b) | | | | |
Net Asset Value(d) | | | 2.38 | % |
Market Value (Unaudited)(e) | | | 2.82 | % |
| |
RATIOS/SUPPLEMENT DATA | | | | |
|
Ratios to Average Net Assets(c) | |
Expenses | | | 0.12 | % |
Expenses net of reimbursements | | | 0.12 | % |
Net Investment Income Before Reimbursements | | | 2.72 | % |
Net Investment Income Net of Reimbursements | | | 2.72 | % |
| |
Supplemental Data | | | | |
Portfolio Turnover Rate(b)(f) | | | — | %(l) |
Net assets, end of period (thousands) | | $ | 5,119 | |
| * | Commencement of investment operations. |
See Accompanying Notes to the Financial Statements.
| | | | | | |
| | FLEXSHARES ANNUAL REPORT | | | 101 | |
Financial Highlights (cont.)
| | | | | | | | | | | | | | | | | | | | |
| | | FlexShares® Morningstar Global Upstream Natural
Resources Index Fund | |
| | | Year ended October 31, | |
| | | 2021 | | | 2020 | | | 2019 | | | 2018 | | | 2017 | |
| | | | | |
Net asset value, beginning of period | | $ | 26.71 | | | $ | 31.40 | | | $ | 31.51 | | | $ | 31.59 | | | $ | 27.40 | |
| | | | |
| | | | | |
PER SHARE | | | | | | | | | | | | | | | | | | | | |
| | | | | |
Investment Operations | | | | | | | | | | | | | | | | | | | | |
Net Investment Income | | | 1.44 | (a) | | | 0.89 | (a) | | | 1.08 | (a) | | | 0.91 | (a) | | | 0.70 | (a) |
Net Realized and Unrealized Gain (Loss) | | | 11.72 | | | | (4.65 | ) | | | (0.09 | ) | | | (0.13 | ) | | | 4.13 | (n) |
| | | | |
Total from Operations | | | 13.16 | | | | (3.76 | ) | | | 0.99 | | | | 0.78 | | | | 4.83 | |
| | | | |
Distributions | | | | | | | | | | | | | | | | | | | | |
Net Investment Income | | | (1.21 | ) | | | (0.93 | ) | | | (1.10 | ) | | | (0.86 | ) | | | (0.64 | ) |
| | | | |
Total from Distributions | | | (1.21 | ) | | | (0.93 | ) | | | (1.10 | ) | | | (0.86 | ) | | | (0.64 | ) |
| | | | |
Net Asset Value, end of period | | $ | 38.66 | | | $ | 26.71 | | | $ | 31.40 | | | $ | 31.51 | | | $ | 31.59 | |
| | | | |
Total Return | | | | | | | | | | | | | | | | | | | | |
Net Asset Value(d) | | | 49.70 | % | | | (11.87 | )% | | | 3.16 | % | | | 2.33 | % | | | 17.81 | %(n) |
Market Value (Unaudited)(e) | | | 49.58 | % | | | (11.46 | )% | | | 3.06 | % | | | 2.01 | % | | | 17.97 | % |
| | | | | |
RATIOS/SUPPLEMENT DATA | | | | | | | | | | | | | | | | | | | | |
|
Ratios to Average Net Assets | |
Expenses | | | 0.47 | % | | | 0.47 | % | | | 0.47 | % | | | 0.46 | % | | | 0.47 | % |
Expenses net of reimbursements | | | 0.46 | % | | | 0.46 | % | | | 0.46 | % | | | 0.46 | % | | | 0.46 | % |
Net Investment Income Before Reimbursements | | | 3.95 | % | | | 3.03 | % | | | 3.40 | % | | | 2.72 | % | | | 2.36 | % |
Net Investment Income Net of Reimbursements | | | 3.95 | % | | | 3.04 | % | | | 3.41 | % | | | 2.72 | % | | | 2.36 | % |
| | | | | |
Supplemental Data | | | | | | | | | | | | | | | | | | | | |
Portfolio Turnover Rate(f) | | | 28 | % | | | 29 | % | | | 24 | % | | | 30 | % | | | 18 | % |
Net assets, end of period (thousands) | | $ | 6,052,710 | | | $ | 2,924,726 | | | $ | 5,510,201 | | | $ | 5,435,783 | | | $ | 4,760,397 | |
See Accompanying Notes to the Financial Statements.
| | | | |
| 102 | | FLEXSHARES ANNUAL REPORT | | |
Financial Highlights (cont.)
| | | | | | | | | | | | | | | | | | | | |
| | | FlexShares® STOXX® Global Broad Infrastructure Index Fund | |
| | | Year ended October 31, | |
| | | 2021 | | | 2020 | | | 2019 | | | 2018 | | | 2017 | |
| | | | | |
Net asset value, beginning of period | | $ | 48.10 | | | $ | 52.56 | | | $ | 45.09 | | | $ | 47.85 | | | $ | 43.49 | |
| | | | |
| | | | | |
PER SHARE | | | | | | | | | | | | | | | | | | | | |
| | | | | |
Investment Operations | | | | | | | | | | | | | | | | | | | | |
Net Investment Income | | | 1.38 | (a) | | | 1.25 | (a) | | | 1.35 | (a) | | | 1.36 | (a) | | | 1.37 | (a) |
Net Realized and Unrealized Gain (Loss) | | | 9.57 | | | | (4.53 | ) | | | 7.34 | | | | (2.71 | ) | | | 4.40 | |
| | | | |
Total from Operations | | | 10.95 | | | | (3.28 | ) | | | 8.69 | | | | (1.35 | ) | | | 5.77 | |
| | | | |
Distributions | | | | | | | | | | | | | | | | | | | | |
Net Investment Income | | | (1.32 | ) | | | (1.18 | ) | | | (1.22 | ) | | | (1.41 | ) | | | (1.41 | ) |
| | | | |
Total from Distributions | | | (1.32 | ) | | | (1.18 | ) | | | (1.22 | ) | | | (1.41 | ) | | | (1.41 | ) |
| | | | |
Net Asset Value, end of period | | $ | 57.73 | | | $ | 48.10 | | | $ | 52.56 | | | $ | 45.09 | | | $ | 47.85 | |
| | | | |
Total Return | | | | | | | | | | | | | | | | | | | | |
Net Asset Value(d) | | | 22.85 | % | | | (6.23 | )% | | | 19.52 | % | | | (2.90 | )% | | | 13.44 | % |
Market Value (Unaudited)(e) | | | 22.51 | % | | | (5.93 | )% | | | 19.99 | % | | | (3.25 | )% | | | 13.23 | % |
| | | | | |
RATIOS/SUPPLEMENT DATA | | | | | | | | | | | | | | | | | | | | |
|
Ratios to Average Net Assets | |
Expenses | | | 0.48 | % | | | 0.48 | % | | | 0.48 | % | | | 0.47 | % | | | 0.48 | % |
Expenses net of reimbursements | | | 0.47 | % | | | 0.47 | % | | | 0.47 | % | | | 0.47 | % | | | 0.47 | % |
Net Investment Income Before Reimbursements | | | 2.45 | % | | | 2.51 | % | | | 2.73 | % | | | 2.88 | % | | | 2.97 | % |
Net Investment Income Net of Reimbursements | | | 2.45 | % | | | 2.52 | % | | | 2.74 | % | | | 2.89 | % | | | 2.98 | % |
| | | | | |
Supplemental Data | | | | | | | | | | | | | | | | | | | | |
Portfolio Turnover Rate(f) | | | 13 | % | | | 13 | % | | | 12 | % | | | 13 | % | | | 12 | % |
Net assets, end of period (thousands) | | $ | 2,643,906 | | | $ | 1,856,596 | | | $ | 1,477,030 | | | $ | 773,363 | | | $ | 875,628 | |
See Accompanying Notes to the Financial Statements.
| | | | | | |
| | FLEXSHARES ANNUAL REPORT | | | 103 | |
Financial Highlights (cont.)
| | | | | | | | | | | | | | | | | | | | |
| | | FlexShares® Global Quality Real Estate Index Fund | |
| | | Year ended October 31, | |
| | | 2021 | | | 2020 | | | 2019 | | | 2018 | | | 2017 | |
| | | | | |
Net asset value, beginning of period | | $ | 50.88 | | | $ | 66.60 | | | $ | 57.96 | | | $ | 62.02 | | | $ | 57.12 | |
| | | | |
| | | | | |
PER SHARE | | | | | | | | | | | | | | | | | | | | |
| | | | | |
Investment Operations | | | | | | | | | | | | | | | | | | | | |
Net Investment Income | | | 1.38 | (a) | | | 1.43 | (a) | | | 1.76 | (a) | | | 1.80 | (a) | | | 0.99 | (a) |
Net Realized and Unrealized Gain (Loss) | | | 19.13 | | | | (14.62 | ) | | | 8.68 | | | | (3.99 | ) | | | 5.54 | |
| | | | |
Total from Operations | | | 20.51 | | | | (13.19 | ) | | | 10.44 | | | | (2.19 | ) | | | 6.53 | |
| | | | |
Distributions | | | | | | | | | | | | | | | | | | | | |
Net Investment Income | | | (1.04 | ) | | | (2.50 | ) | | | (1.80 | ) | | | (1.87 | ) | | | (1.63 | ) |
Tax Return of Capital | | | — | | | | (0.03 | ) | | | — | | | | — | | | | — | |
| | | | |
Total from Distributions | | | (1.04 | ) | | | (2.53 | ) | | | (1.80 | ) | | | (1.87 | ) | | | (1.63 | ) |
| | | | |
Net Asset Value, end of period | | $ | 70.35 | | | $ | 50.88 | | | $ | 66.60 | | | $ | 57.96 | | | $ | 62.02 | |
| | | | |
Total Return | | | | | | | | | | | | | | | | | | | | |
Net Asset Value(d) | | | 40.58 | % | | | (20.29 | )% | | | 18.37 | % | | | (3.69 | )% | | | 11.71 | % |
Market Value (Unaudited)(e) | | | 40.98 | % | | | (20.40 | )% | | | 18.65 | % | | | (3.95 | )% | | | 11.71 | % |
| | | | | |
RATIOS/SUPPLEMENT DATA | | | | | | | | | | | | | | | | | | | | |
|
Ratios to Average Net Assets | |
Expenses | | | 0.46 | % | | | 0.46 | % | | | 0.46 | % | | | 0.46 | % | | | 0.46 | % |
Expenses net of reimbursements | | | 0.45 | % | | | 0.45 | % | | | 0.45 | % | | | 0.45 | % | | | 0.45 | % |
Net Investment Income Before Reimbursements | | | 2.16 | % | | | 2.53 | % | | | 2.80 | % | | | 2.92 | % | | | 1.67 | % |
Net Investment Income Net of Reimbursements | | | 2.17 | % | | | 2.54 | % | | | 2.81 | % | | | 2.92 | % | | | 1.67 | % |
| | | | | |
Supplemental Data | | | | | | | | | | | | | | | | | | | | |
Portfolio Turnover Rate(f) | | | 52 | % | | | 56 | % | | | 53 | % | | | 61 | % | | | 64 | % |
Net assets, end of period (thousands) | | $ | 418,597 | | | $ | 264,574 | | | $ | 376,264 | | | $ | 275,332 | | | $ | 244,970 | |
See Accompanying Notes to the Financial Statements.
| | | | |
| 104 | | FLEXSHARES ANNUAL REPORT | | |
Financial Highlights (cont.)
| | | | | | | | | | | | | | | | | | | | |
| | | FlexShares® Real Assets Allocation Index Fund | |
| | | Year ended October 31, | |
| | | 2021 | | | 2020 | | | 2019 | | | 2018 | | | 2017 | |
| | | | | |
Net asset value, beginning of period | | $ | 25.72 | | | $ | 30.30 | | | $ | 26.45 | | | $ | 28.08 | | | $ | 25.63 | |
| | | | |
| | | | | |
PER SHARE | | | | | | | | | | | | | | | | | | | | |
| | | | | |
Investment Operations | | | | | | | | | | | | | | | | | | | | |
Net Investment Income | | | 0.83 | (a) | | | 0.86 | (a) | | | 0.76 | (a) | | | 0.80 | (a) | | | 0.66 | (a) |
Net Realized and Unrealized Gain (Loss) | | | 7.78 | | | | (4.58 | ) | | | 3.85 | | | | (1.64 | ) | | | 2.54 | |
| | | | |
Total from Operations | | | 8.61 | | | | (3.72 | ) | | | 4.61 | | | | (0.84 | ) | | | 3.20 | |
| | | | |
Distributions | | | | | | | | | | | | | | | | | | | | |
Net Investment Income | | | (0.66 | ) | | | (0.86 | ) | | | (0.76 | ) | | | (0.79 | ) | | | (0.75 | ) |
From Net Realized Gains | | | — | | | | — | | | | — | | | | 0.00 | (h) | | | — | |
| | | | |
Total from Distributions | | | (0.66 | ) | | | (0.86 | ) | | | (0.76 | ) | | | (0.79 | ) | | | (0.75 | ) |
| | | | |
Net Asset Value, end of period | | $ | 33.67 | | | $ | 25.72 | | | $ | 30.30 | | | $ | 26.45 | | | $ | 28.08 | |
| | | | |
Total Return | | | | | | | | | | | | | | | | | | | | |
Net Asset Value(d) | | | 33.66 | % | | | (12.45 | )% | | | 17.69 | % | | | (3.09 | )% | | | 12.73 | % |
Market Value (Unaudited)(e) | | | 33.74 | % | | | (12.54 | )% | | | 17.72 | % | | | (3.32 | )% | | | 13.05 | % |
| | | | | |
RATIOS/SUPPLEMENT DATA | | | | | | | | | | | | | | | | | | | | |
|
Ratios to Average Net Assets | |
Expenses | | | 0.58 | %(i) | | | 0.58 | %(i) | | | 0.58 | %(i) | | | 0.59 | %(i) | | | 0.65 | %(i) |
Expenses net of reimbursements | | | 0.12 | %(i) | | | 0.11 | %(i) | | | 0.11 | %(i) | | | 0.11 | %(i) | | | 0.11 | %(i) |
Net Investment Income Before Reimbursements | | | 2.07 | % | | | 2.65 | % | | | 2.22 | % | | | 2.39 | % | | | 1.88 | % |
Net Investment Income Net of Reimbursements | | | 2.53 | % | | | 3.11 | % | | | 2.69 | % | | | 2.87 | % | | | 2.42 | % |
| | | | | |
Supplemental Data | | | | | | | | | | | | | | | | | | | | |
Portfolio Turnover Rate(f) | | | 40 | % | | | 14 | % | | | 4 | % | | | 5 | % | | | 11 | % |
Net assets, end of period (thousands) | | $ | 30,300 | | | $ | 4,502 | | | $ | 11,361 | | | $ | 13,887 | | | $ | 6,318 | |
See Accompanying Notes to the Financial Statements.
| | | | | | |
| | FLEXSHARES ANNUAL REPORT | | | 105 | |
Financial Highlights (cont.)
| | | | | | | | | | | | | | | | | | | | |
| | | FlexShares® Quality Dividend Index Fund | |
| | | Year ended October 31, | |
| | | 2021 | | | 2020 | | | 2019 | | | 2018 | | | 2017 | |
| | | | | |
Net asset value, beginning of period | | $ | 43.40 | | | $ | 46.33 | | | $ | 44.53 | | | $ | 42.57 | | | $ | 37.11 | |
| | | | |
| | | | | |
PER SHARE | | | | | | | | | | | | | | | | | | | | |
| | | | | |
Investment Operations | | | | | | | | | | | | | | | | | | | | |
Net Investment Income | | | 1.16 | (a) | | | 1.24 | (a) | | | 1.24 | (a) | | | 1.20 | (a) | | | 1.23 | (a) |
Net Realized and Unrealized Gain (Loss) | | | 14.89 | | | | (2.67 | ) | | | 2.29 | | | | 1.98 | | | | 5.43 | |
| | | | |
Total from Operations | | | 16.05 | | | | (1.43 | ) | | | 3.53 | | | | 3.18 | | | | 6.66 | |
| | | | |
Distributions | | | | | | | | | | | | | | | | | | | | |
Net Investment Income | | | (1.10 | ) | | | (1.25 | ) | | | (1.19 | ) | | | (1.22 | ) | | | (1.20 | ) |
From Net Realized Gains | | | — | | | | (0.25 | ) | | | (0.54 | ) | | | — | | | | — | |
| | | | |
Total from Distributions | | | (1.10 | ) | | | (1.50 | ) | | | (1.73 | ) | | | (1.22 | ) | | | (1.20 | ) |
| | | | |
Net Asset Value, end of period | | $ | 58.35 | | | $ | 43.40 | | | $ | 46.33 | | | $ | 44.53 | | | $ | 42.57 | |
| | | | |
Total Return | | | | | | | | | | | | | | | | | | | | |
Net Asset Value(d) | | | 37.27 | % | | | (2.98 | )% | | | 8.45 | % | | | 7.42 | % | | | 18.10 | % |
Market Value (Unaudited)(e) | | | 37.20 | % | | | (2.98 | )% | | | 8.52 | % | | | 7.40 | % | | | 18.03 | % |
| | | | | |
RATIOS/SUPPLEMENT DATA | | | | | | | | | | | | | | | | | | | | |
|
Ratios to Average Net Assets | |
Expenses | | | 0.38 | % | | | 0.38 | % | | | 0.38 | % | | | 0.37 | % | | | 0.38 | % |
Expenses net of reimbursements | | | 0.37 | % | | | 0.37 | % | | | 0.37 | % | | | 0.37 | % | | | 0.37 | % |
Net Investment Income Before Reimbursements | | | 2.16 | % | | | 2.79 | % | | | 2.80 | % | | | 2.64 | % | | | 3.00 | % |
Net Investment Income Net of Reimbursements | | | 2.16 | % | | | 2.79 | % | | | 2.81 | % | | | 2.64 | % | | | 3.00 | % |
| | | | | |
Supplemental Data | | | | | | | | | | | | | | | | | | | | |
Portfolio Turnover Rate(f) | | | 51 | % | | | 75 | % | | | 95 | % | | | 76 | % | | | 89 | % |
Net assets, end of period (thousands) | | $ | 1,642,545 | | | $ | 1,265,177 | | | $ | 1,707,344 | | | $ | 1,759,108 | | | $ | 1,815,665 | |
See Accompanying Notes to the Financial Statements.
| | | | |
| 106 | | FLEXSHARES ANNUAL REPORT | | |
Financial Highlights (cont.)
| | | | | | | | | | | | | | | | | | | | |
| | | FlexShares® Quality Dividend Defensive Index Fund | |
| | | Year ended October 31, | |
| | | 2021 | | | 2020 | | | 2019 | | | 2018 | | | 2017 | |
| | | | | |
Net asset value, beginning of period | | $ | 42.61 | | | $ | 46.25 | | | $ | 44.46 | | | $ | 42.04 | | | $ | 36.82 | |
| | | | |
| | | | | |
PER SHARE | | | | | | | | | | | | | | | | | | | | |
| | | | | |
Investment Operations | | | | | | | | | | | | | | | | | | | | |
Net Investment Income | | | 1.09 | (a) | | | 1.21 | (a) | | | 1.22 | (a) | | | 1.21 | (a) | | | 1.18 | (a) |
Net Realized and Unrealized Gain (Loss) | | | 13.39 | | | | (3.28 | ) | | | 3.35 | | | | 2.45 | | | | 5.18 | |
| | | | |
Total from Operations | | | 14.48 | | | | (2.07 | ) | | | 4.57 | | | | 3.66 | | | | 6.36 | |
| | | | |
Distributions | | | | | | | | | | | | | | | | | | | | |
Net Investment Income | | | (1.08 | ) | | | (1.21 | ) | | | (1.14 | ) | | | (1.24 | ) | | | (1.14 | ) |
From Net Realized Gains | | | — | | | | (0.36 | ) | | | (1.64 | ) | | | — | | | | — | |
| | | | |
Total from Distributions | | | (1.08 | ) | | | (1.57 | ) | | | (2.78 | ) | | | (1.24 | ) | | | (1.14 | ) |
| | | | |
Net Asset Value, end of period | | $ | 56.01 | | | $ | 42.61 | | | $ | 46.25 | | | $ | 44.46 | | | $ | 42.04 | |
| | | | |
Total Return | | | | | | | | | | | | | | | | | | | | |
Net Asset Value(d) | | | 34.28 | % | | | (4.45 | )% | | | 11.40 | % | | | 8.69 | % | | | 17.44 | % |
Market Value (Unaudited)(e) | | | 34.19 | % | | | (4.43 | )% | | | 11.40 | % | | | 8.74 | % | | | 17.41 | % |
| | | | | |
RATIOS/SUPPLEMENT DATA | | | | | | | | | | | | | | | | | | | | |
|
Ratios to Average Net Assets | |
Expenses | | | 0.38 | % | | | 0.38 | % | | | 0.38 | % | | | 0.38 | % | | | 0.38 | % |
Expenses net of reimbursements | | | 0.37 | % | | | 0.37 | % | | | 0.37 | % | | | 0.37 | % | | | 0.37 | % |
Net Investment Income Before Reimbursements | | | 2.10 | % | | | 2.77 | % | | | 2.76 | % | | | 2.70 | % | | | 2.94 | % |
Net Investment Income Net of Reimbursements | | | 2.11 | % | | | 2.77 | % | | | 2.76 | % | | | 2.71 | % | | | 2.95 | % |
| | | | | |
Supplemental Data | | | | | | | | | | | | | | | | | | | | |
Portfolio Turnover Rate(f) | | | 57 | % | | | 76 | % | | | 91 | % | | | 94 | % | | | 74 | % |
Net assets, end of period (thousands) | | $ | 448,058 | | | $ | 411,173 | | | $ | 450,963 | | | $ | 320,091 | | | $ | 313,167 | |
See Accompanying Notes to the Financial Statements.
| | | | | | |
| | FLEXSHARES ANNUAL REPORT | | | 107 | |
Financial Highlights (cont.)
| | | | | | | | | | | | | | | | | | | | |
| | | FlexShares® Quality Dividend Dynamic Index Fund | |
| | | Year ended October 31, | |
| | | 2021 | | | 2020 | | | 2019 | | | 2018 | | | 2017 | |
| | | | | |
Net asset value, beginning of period | | $ | 43.94 | | | $ | 45.49 | | | $ | 42.20 | | | $ | 41.84 | | | $ | 35.32 | |
| | | | |
| | | | | |
PER SHARE | | | | | | | | | | | | | | | | | | | | |
| | | | | |
Investment Operations | | | | | | | | | | | | | | | | | | | | |
Net Investment Income | | | 1.22 | (a) | | | 1.33 | (a) | | | 1.21 | (a) | | | 1.15 | (a) | | | 1.19 | (a) |
Net Realized and Unrealized Gain (Loss) | | | 18.57 | | | | (1.21 | ) | | | 3.26 | | | | 0.40 | | | | 6.45 | |
| | | | |
Total from Operations | | | 19.79 | | | | 0.12 | | | | 4.47 | | | | 1.55 | | | | 7.64 | |
| | | | |
Distributions | | | | | | | | | | | | | | | | | | | | |
Net Investment Income | | | (1.14 | ) | | | (1.67 | ) | | | (1.18 | ) | | | (1.19 | ) | | | (1.12 | ) |
| | | | |
Total from Distributions | | | (1.14 | ) | | | (1.67 | ) | | | (1.18 | ) | | | (1.19 | ) | | | (1.12 | ) |
| | | | |
Net Asset Value, end of period | | $ | 62.59 | | | $ | 43.94 | | | $ | 45.49 | | | $ | 42.20 | | | $ | 41.84 | |
| | | | |
Total Return | | | | | | | | | | | | | | | | | | | | |
Net Asset Value(d) | | | 45.38 | % | | | 0.86 | % | | | 10.86 | % | | | 3.59 | % | | | 21.81 | % |
Market Value (Unaudited)(e) | | | 45.32 | % | | | 0.91 | % | | | 10.89 | % | | | 3.67 | % | | | 21.59 | % |
| | | | | |
RATIOS/SUPPLEMENT DATA | | | | | | | | | | | | | | | | | | | | |
|
Ratios to Average Net Assets | |
Expenses | | | 0.38 | % | | | 0.38 | % | | | 0.38 | % | | | 0.38 | % | | | 0.38 | % |
Expenses net of reimbursements | | | 0.37 | % | | | 0.37 | % | | | 0.37 | % | | | 0.37 | % | | | 0.37 | % |
Net Investment Income Before Reimbursements | | | 2.14 | % | | | 2.93 | % | | | 2.81 | % | | | 2.61 | % | | | 2.99 | % |
Net Investment Income Net of Reimbursements | | | 2.15 | % | | | 2.94 | % | | | 2.82 | % | | | 2.62 | % | | | 3.00 | % |
| | | | | |
Supplemental Data | | | | | | | | | | | | | | | | | | | | |
Portfolio Turnover Rate(f) | | | 53 | % | | | 77 | % | | | 77 | % | | | 77 | % | | | 63 | % |
Net assets, end of period (thousands) | | $ | 21,905 | | | $ | 13,181 | | | $ | 52,308 | | | $ | 44,305 | | | $ | 58,571 | |
See Accompanying Notes to the Financial Statements.
| | | | |
| 108 | | FLEXSHARES ANNUAL REPORT | | |
Financial Highlights (cont.)
| | | | | | | | | | | | | | | | | | | | |
| | | FlexShares® International Quality Dividend Index Fund | |
| | | Year ended October 31, | |
| | | 2021 | | | 2020 | | | 2019 | | | 2018 | | | 2017 | |
| | | | | |
Net asset value, beginning of period | | $ | 20.15 | | | $ | 23.06 | | | $ | 22.37 | | | $ | 26.27 | | | $ | 22.45 | |
| | | | |
| | | | | |
PER SHARE | | | | | | | | | | | | | | | | | | | | |
| | | | | |
Investment Operations | | | | | | | | | | | | | | | | | | | | |
Net Investment Income | | | 0.97 | (a) | | | 0.79 | (a) | | | 1.13 | (a) | | | 1.22 | (a) | | | 1.06 | (a) |
Net Realized and Unrealized Gain (Loss) | | | 5.55 | | | | (2.86 | ) | | | 0.70 | | | | (3.86 | ) | | | 3.69 | |
| | | | |
Total from Operations | | | 6.52 | | | | (2.07 | ) | | | 1.83 | | | | (2.64 | ) | | | 4.75 | |
| | | | |
Distributions | | | | | | | | | | | | | | | | | | | | |
Net Investment Income | | | (0.90 | ) | | | (0.84 | ) | | | (1.14 | ) | | | (1.26 | ) | | | (0.93 | ) |
| | | | |
Total from Distributions | | | (0.90 | ) | | | (0.84 | ) | | | (1.14 | ) | | | (1.26 | ) | | | (0.93 | ) |
| | | | |
Net Asset Value, end of period | | $ | 25.77 | | | $ | 20.15 | | | $ | 23.06 | | | $ | 22.37 | | | $ | 26.27 | |
| | | | |
Total Return | | | | | | | | | | | | | | | | | | | | |
Net Asset Value(d) | | | 32.42 | % | | | (8.94 | )% | | | 8.41 | % | | | (10.48 | )% | | | 21.50 | % |
Market Value (Unaudited)(e) | | | 32.85 | % | | | (8.93 | )% | | | 9.09 | % | | | (11.30 | )% | | | 21.80 | % |
| | | | | |
RATIOS/SUPPLEMENT DATA | | | | | | | | | | | | | | | | | | | | |
|
Ratios to Average Net Assets | |
Expenses | | | 0.48 | % | | | 0.48 | % | | | 0.48 | % | | | 0.47 | % | | | 0.48 | % |
Expenses net of reimbursements | | | 0.47 | % | | | 0.47 | % | | | 0.47 | % | | | 0.47 | % | | | 0.47 | % |
Net Investment Income Before Reimbursements | | | 3.80 | % | | | 3.68 | % | | | 4.98 | % | | | 4.77 | % | | | 4.27 | % |
Net Investment Income Net of Reimbursements | | | 3.81 | % | | | 3.68 | % | | | 4.98 | % | | | 4.78 | % | | | 4.28 | % |
| | | | | |
Supplemental Data | | | | | | | | | | | | | | | | | | | | |
Portfolio Turnover Rate(f) | | | 68 | % | | | 74 | % | | | 71 | % | | | 71 | % | | | 69 | % |
Net assets, end of period (thousands) | | $ | 616,007 | | | $ | 453,477 | | | $ | 774,685 | | | $ | 765,167 | | | $ | 979,701 | |
See Accompanying Notes to the Financial Statements.
| | | | | | |
| | FLEXSHARES ANNUAL REPORT | | | 109 | |
Financial Highlights (cont.)
| | | | | | | | | | | | | | | | | | | | |
| | | FlexShares® International Quality Dividend
Defensive Index Fund | |
| | | Year ended October 31, | |
| | | 2021 | | | 2020 | | | 2019 | | | 2018 | | | 2017 | |
| | | | | |
Net asset value, beginning of period | | $ | 19.16 | | | $ | 21.87 | | | $ | 21.39 | | | $ | 25.06 | | | $ | 22.16 | |
| | | | |
| | | | | |
PER SHARE | | | | | | | | | | | | | | | | | | | | |
| | | | | |
Investment Operations | | | | | | | | | | | | | | | | | | | | |
Net Investment Income | | | 0.93 | (a) | | | 0.74 | (a) | | | 1.09 | (a) | | | 1.14 | (a) | | | 0.99 | (a) |
Net Realized and Unrealized Gain (Loss) | | | 4.62 | | | | (2.70 | ) | | | 0.51 | | | | (3.54 | ) | | | 2.81 | |
| | | | |
Total from Operations | | | 5.55 | | | | (1.96 | ) | | | 1.60 | | | | (2.40 | ) | | | 3.80 | |
| | | | |
Distributions | | | | | | | | | | | | | | | | | | | | |
Net Investment Income | | | (0.89 | ) | | | (0.75 | ) | | | (1.12 | ) | | | (1.27 | ) | | | (0.90 | ) |
| | | | |
Total from Distributions | | | (0.89 | ) | | | (0.75 | ) | | | (1.12 | ) | | | (1.27 | ) | | | (0.90 | ) |
| | | | |
Net Asset Value, end of period | | $ | 23.82 | | | $ | 19.16 | | | $ | 21.87 | | | $ | 21.39 | | | $ | 25.06 | |
| | | | |
Total Return | | | | | | | | | | | | | | | | | | | | |
Net Asset Value(d) | | | 29.03 | % | | | (8.92 | )% | | | 7.66 | % | | | (10.03 | )% | | | 17.45 | % |
Market Value (Unaudited)(e) | | | 28.97 | % | | | (8.88 | )% | | | 8.12 | % | | | (10.91 | )% | | | 17.69 | % |
| | | | | |
RATIOS/SUPPLEMENT DATA | | | | | | | | | | | | | | | | | | | | |
|
Ratios to Average Net Assets | |
Expenses | | | 0.48 | % | | | 0.48 | % | | | 0.48 | % | | | 0.48 | % | | | 0.48 | % |
Expenses net of reimbursements | | | 0.47 | % | | | 0.47 | % | | | 0.47 | % | | | 0.47 | % | | | 0.47 | % |
Net Investment Income Before Reimbursements | | | 3.91 | % | | | 3.65 | % | | | 5.02 | % | | | 4.68 | % | | | 4.18 | % |
Net Investment Income Net of Reimbursements | | | 3.92 | % | | | 3.66 | % | | | 5.03 | % | | | 4.68 | % | | | 4.19 | % |
| | | | | |
Supplemental Data | | | | | | | | | | | | | | | | | | | | |
Portfolio Turnover Rate(f) | | | 65 | % | | | 75 | % | | | 63 | % | | | 69 | % | | | 72 | % |
Net assets, end of period (thousands) | | $ | 71,459 | | | $ | 59,404 | | | $ | 78,719 | | | $ | 87,703 | | | $ | 95,217 | |
See Accompanying Notes to the Financial Statements.
| | | | |
| 110 | | FLEXSHARES ANNUAL REPORT | | |
Financial Highlights (cont.)
| | | | | | | | | | | | | | | | | | | | |
| | | FlexShares® International Quality Dividend
Dynamic Index Fund | |
| | | Year ended October 31, | |
| | | 2021 | | | 2020 | | | 2019 | | | 2018 | | | 2017 | |
| | | | | |
Net asset value, beginning of period | | $ | 22.38 | | | $ | 24.94 | | | $ | 23.51 | | | $ | 27.82 | | | $ | 23.47 | |
| | | | |
| | | | | |
PER SHARE | | | | | | | | | | | | | | | | | | | | |
| | | | | |
Investment Operations | | | | | | | | | | | | | | | | | | | | |
Net Investment Income | | | 1.28 | (a) | | | 0.70 | (a) | | | 1.05 | (a) | | | 1.32 | (a) | | | 1.11 | (a) |
Net Realized and Unrealized Gain (Loss) | | | 7.63 | | | | (2.45 | ) | | | 1.52 | | | | (4.34 | ) | | | 4.08 | |
| | | | |
Total from Operations | | | 8.91 | | | | (1.75 | ) | | | 2.57 | | | | (3.02 | ) | | | 5.19 | |
| | | | |
Distributions | | | | | | | | | | | | | | | | | | | | |
Net Investment Income | | | (0.90 | ) | | | (0.81 | ) | | | (1.14 | ) | | | (1.29 | ) | | | (0.84 | ) |
| | | | |
Total from Distributions | | | (0.90 | ) | | | (0.81 | ) | | | (1.14 | ) | | | (1.29 | ) | | | (0.84 | ) |
| | | | |
Net Asset Value, end of period | | $ | 30.39 | | | $ | 22.38 | | | $ | 24.94 | | | $ | 23.51 | | | $ | 27.82 | |
| | | | |
Total Return | | | | | | | | | | | | | | | | | | | | |
Net Asset Value(d) | | | 39.87 | % | | | (6.99 | )% | | | 11.30 | % | | | (11.34 | )% | | | 22.37 | % |
Market Value (Unaudited)(e) | | | 40.37 | % | | | (7.03 | )% | | | 12.23 | % | | | (12.11 | )% | | | 22.91 | % |
| | | | | |
RATIOS/SUPPLEMENT DATA | | | | | | | | | | | | | | | | | | | | |
|
Ratios to Average Net Assets | |
Expenses | | | 0.48 | % | | | 0.48 | % | | | 0.48 | % | | | 0.48 | % | | | 0.48 | % |
Expenses net of reimbursements | | | 0.47 | % | | | 0.47 | % | | | 0.47 | % | | | 0.47 | % | | | 0.47 | % |
Net Investment Income Before Reimbursements | | | 4.24 | % | | | 2.90 | % | | | 4.36 | % | | | 4.83 | % | | | 4.19 | % |
Net Investment Income Net of Reimbursements | | | 4.25 | % | | | 2.91 | % | | | 4.37 | % | | | 4.83 | % | | | 4.20 | % |
| | | | | |
Supplemental Data | | | | | | | | | | | | | | | | | | | | |
Portfolio Turnover Rate(f) | | | 72 | % | | | 85 | % | | | 88 | % | | | 75 | % | | | 76 | % |
Net assets, end of period (thousands) | | $ | 75,975 | | | $ | 22,376 | | | $ | 47,391 | | | $ | 63,481 | | | $ | 91,796 | |
See Accompanying Notes to the Financial Statements.
| | | | | | |
| | FLEXSHARES ANNUAL REPORT | | | 111 | |
Financial Highlights (cont.)
| | | | | | | | | | | | | | | | | | | | |
| | | FlexShares® iBoxx 3-Year Target Duration TIPS Index Fund | |
| | | Year ended October 31, | |
| | | 2021 | | | 2020 | | | 2019 | | | 2018 | | | 2017 | |
| | | | | |
Net asset value, beginning of period | | $ | 25.73 | | | $ | 24.58 | | | $ | 23.81 | | | $ | 24.60 | | | $ | 24.82 | |
| | | | |
| | | | | |
PER SHARE | | | | | | | | | | | | | | | | | | | | |
| | | | | |
Investment Operations | | | | | | | | | | | | | | | | | | | | |
Net Investment Income | | | 1.09 | (a) | | | 0.33 | (a) | | | 0.46 | (a) | | | 0.68 | (a) | | | 0.37 | (a) |
Net Realized and Unrealized Gain (Loss) | | | 0.68 | | | | 1.09 | | | | 0.79 | | | | (0.78 | ) | | | (0.27 | ) |
| | | | |
Total from Operations | | | 1.77 | | | | 1.42 | | | | 1.25 | | | | (0.10 | ) | | | 0.10 | |
| | | | |
Distributions | | | | | | | | | | | | | | | | | | | | |
Net Investment Income | | | (1.12 | ) | | | (0.27 | ) | | | (0.48 | ) | | | (0.69 | ) | | | (0.32 | ) |
| | | | |
Total from Distributions | | | (1.12 | ) | | | (0.27 | ) | | | (0.48 | ) | | | (0.69 | ) | | | (0.32 | ) |
| | | | |
Net Asset Value, end of period | | $ | 26.38 | | | $ | 25.73 | | | $ | 24.58 | | | $ | 23.81 | | | $ | 24.60 | |
| | | | |
Total Return | | | | | | | | | | | | | | | | | | | | |
Net Asset Value(d) | | | 6.95 | % | | | 5.81 | % | | | 5.30 | % | | | (0.41 | )% | | | 0.42 | % |
Market Value (Unaudited)(e) | | | 6.95 | % | | | 5.85 | % | | | 5.35 | % | | | (0.49 | )% | | | 0.46 | % |
| | | | | |
RATIOS/SUPPLEMENT DATA | | | | | | | | | | | | | | | | | | | | |
| | | | | |
Ratios to Average Net Assets | | | | | | | | | | | | | | | | | | | | |
Expenses | | | 0.19 | % | | | 0.19 | % | | | 0.19 | % | | | 0.18 | % | | | 0.21 | % |
Expenses net of reimbursements | | | 0.18 | % | | | 0.18 | % | | | 0.18 | % | | | 0.18 | % | | | 0.20 | % |
Net Investment Income Before Reimbursements | | | 4.14 | % | | | 1.33 | % | | | 1.89 | % | | | 2.79 | % | | | 1.49 | % |
Net Investment Income Net of Reimbursements | | | 4.15 | % | | | 1.33 | % | | | 1.89 | % | | | 2.80 | % | | | 1.50 | % |
| | | | | |
Supplemental Data | | | | | | | | | | | | | | | | | | | | |
Portfolio Turnover Rate(f) | | | 53 | % | | | 71 | % | | | 52 | % | | | 85 | % | | | 134 | % |
Net assets, end of period (thousands) | | $ | 1,437,584 | | | $ | 1,429,491 | | | $ | 1,178,722 | | | $ | 1,641,610 | | | $ | 2,113,130 | |
See Accompanying Notes to the Financial Statements.
| | | | |
| 112 | | FLEXSHARES ANNUAL REPORT | | |
Financial Highlights (cont.)
| | | | | | | | | | | | | | | | | | | | |
| | | FlexShares® iBoxx 5-Year Target Duration TIPS Index Fund | |
| | | Year ended October 31, | |
| | | 2021 | | | 2020 | | | 2019 | | | 2018 | | | 2017 | |
| | | | | |
Net asset value, beginning of period | | $ | 27.34 | | | $ | 25.50 | | | $ | 23.95 | | | $ | 25.06 | | | $ | 25.45 | |
| | | | |
| | | | | |
PER SHARE | | | | | | | | | | | | | | | | | | | | |
| | | | | |
Investment Operations | | | | | | | | | | | | | | | | | | | | |
Net Investment Income | | | 1.16 | (a) | | | 0.36 | (a) | | | 0.44 | (a) | | | 0.71 | (a) | | | 0.47 | (a) |
Net Realized and Unrealized Gain (Loss) | | | 0.70 | | | | 1.76 | | | | 1.59 | | | | (1.08 | ) | | | (0.45 | ) |
| | | | |
Total from Operations | | | 1.86 | | | | 2.12 | | | | 2.03 | | | | (0.37 | ) | | | 0.02 | |
| | | | |
Distributions | | | | | | | | | | | | | | | | | | | | |
Net Investment Income | | | (1.18 | ) | | | (0.28 | ) | | | (0.48 | ) | | | (0.74 | ) | | | (0.41 | ) |
| | | | |
Total from Distributions | | | (1.18 | ) | | | (0.28 | ) | | | (0.48 | ) | | | (0.74 | ) | | | (0.41 | ) |
| | | | |
Net Asset Value, end of period | | $ | 28.02 | | | $ | 27.34 | | | $ | 25.50 | | | $ | 23.95 | | | $ | 25.06 | |
| | | | |
Total Return | | | | | | | | | | | | | | | | | | | | |
Net Asset Value(d) | | | 6.88 | % | | | 8.39 | % | | | 8.53 | % | | | (1.51 | )% | | | 0.08 | % |
Market Value (Unaudited)(e) | | | 6.96 | % | | | 8.47 | % | | | 8.45 | % | | | (1.51 | )% | | | 0.08 | % |
| | | | | |
RATIOS/SUPPLEMENT DATA | | | | | | | | | | | | | | | | | | | | |
| | | | | |
Ratios to Average Net Assets | | | | | | | | | | | | | | | | | | | | |
Expenses | | | 0.19 | % | | | 0.19 | % | | | 0.19 | % | | | 0.18 | % | | | 0.21 | % |
Expenses net of reimbursements | | | 0.18 | % | | | 0.18 | % | | | 0.18 | % | | | 0.18 | % | | | 0.20 | % |
Net Investment Income Before Reimbursements | | | 4.17 | % | | | 1.35 | % | | | 1.77 | % | | | 2.88 | % | | | 1.86 | % |
Net Investment Income Net of Reimbursements | | | 4.17 | % | | | 1.35 | % | | | 1.78 | % | | | 2.88 | %�� | | | 1.87 | % |
| | | | | |
Supplemental Data | | | | | | | | | | | | | | | | | | | | |
Portfolio Turnover Rate(f) | | | 46 | % | | | 66 | % | | | 41 | % | | | 65 | % | | | 87 | % |
Net assets, end of period (thousands) | | $ | 714,479 | | | $ | 596,095 | | | $ | 557,185 | | | $ | 904,027 | | | $ | 819,372 | |
See Accompanying Notes to the Financial Statements.
| | | | | | |
| | FLEXSHARES ANNUAL REPORT | | | 113 | |
Financial Highlights (cont.)
| | | | | | | | | | | | | | | | | | | | |
| | | FlexShares® Disciplined Duration MBS Index Fund | |
| | | Year ended October 31, | |
| | | 2021 | | | 2020 | | | 2019 | | | 2018 | | | 2017 | |
| | | | | |
Net asset value, beginning of period | | $ | 24.10 | | | $ | 23.55 | | | $ | 22.74 | | | $ | 23.86 | | | $ | 24.74 | |
| | | | |
| | | | | |
PER SHARE | | | | | | | | | | | | | | | | | | | | |
| | | | | |
Investment Operations | | | | | | | | | | | | | | | | | | | | |
Net Investment Income | | | 0.09 | (a) | | | 0.37 | (a) | | | 0.61 | (a) | | | 0.49 | (a) | | | 0.39 | (a) |
Net Realized and Unrealized Gain (Loss) | | | (0.16 | ) | | | 0.85 | | | | 1.03 | | | | (0.88 | ) | | | (0.50 | ) |
| | | | |
Total from Operations | | | (0.07 | ) | | | 1.22 | | | | 1.64 | | | | (0.39 | ) | | | (0.11 | ) |
| | | | |
Distributions | | | | | | | | | | | | | | | | | | | | |
Net Investment Income | | | (0.61 | ) | | | (0.67 | ) | | | (0.83 | ) | | | (0.73 | ) | | | (0.77 | ) |
| | | | |
Total from Distributions | | | (0.61 | ) | | | (0.67 | ) | | | (0.83 | ) | | | (0.73 | ) | | | (0.77 | ) |
| | | | |
Net Asset Value, end of period | | $ | 23.42 | | | $ | 24.10 | | | $ | 23.55 | | | $ | 22.74 | | | $ | 23.86 | |
| | | | |
Total Return | | | | | | | | | | | | | | | | | | | | |
Net Asset Value(d) | | | (0.28 | )% | | | 5.19 | % | | | 7.36 | % | | | (1.65 | )% | | | (0.44 | )% |
Market Value (Unaudited)(e) | | | (0.11 | )% | | | 5.19 | % | | | 7.07 | % | | | (1.31 | )% | | | (0.53 | )% |
| | | | | |
RATIOS/SUPPLEMENT DATA | | | | | | | | | | | | | | | | | | | | |
| | | | | |
Ratios to Average Net Assets | | | | | | | | | | | | | | | | | | | | |
Expenses | | | 0.21 | % | | | 0.21 | % | | | 0.21 | % | | | 0.21 | % | | | 0.21 | % |
Expenses net of reimbursements | | | 0.20 | % | | | 0.20 | % | | | 0.20 | % | | | 0.20 | % | | | 0.20 | % |
Net Investment Income Before Reimbursements | | | 0.35 | % | | | 1.54 | % | | | 2.64 | % | | | 2.09 | % | | | 1.61 | % |
Net Investment Income Net of Reimbursements | | | 0.36 | % | | | 1.54 | % | | | 2.65 | % | | | 2.10 | % | | | 1.62 | % |
| | | | | |
Supplemental Data | | | | | | | | | | | | | | | | | | | | |
Portfolio Turnover Rate(f) | | | 476 | % | | | 175 | % | | | 61 | % | | | 160 | % | | | 61 | % |
Net assets, end of period (thousands) | | $ | 111,243 | | | $ | 100,020 | | | $ | 35,330 | | | $ | 71,628 | | | $ | 38,183 | |
See Accompanying Notes to the Financial Statements.
| | | | |
| 114 | | FLEXSHARES ANNUAL REPORT | | |
Financial Highlights (cont.)
| | | | | | | | | | | | | | | | | | | | |
| | | FlexShares® Credit-Scored US Corporate Bond Index Fund | |
| | | Year ended October 31, | |
| | | 2021 | | | 2020 | | | 2019 | | | 2018 | | | 2017 | |
| | | | | |
Net asset value, beginning of period | | $ | 54.70 | | | $ | 52.58 | | | $ | 48.59 | | | $ | 50.98 | | | $ | 51.49 | |
| | | | |
| | | | | |
PER SHARE | | | | | | | | | | | | | | | | | | | | |
| | | | | |
Investment Operations | | | | | | | | | | | | | | | | | | | | |
Net Investment Income | | | 0.91 | (a) | | | 1.32 | (a) | | | 1.63 | (a) | | | 1.40 | (a) | | | 1.26 | (a) |
Net Realized and Unrealized Gain (Loss) | | | (0.51 | ) | | | 2.39 | | | | 3.94 | | | | (2.43 | ) | | | (0.34 | ) |
| | | | |
Total from Operations | | | 0.40 | | | | 3.71 | | | | 5.57 | | | | (1.03 | ) | | | 0.92 | |
| | | | |
Distributions | | | | | | | | | | | | | | | | | | | | |
Net Investment Income | | | (0.96 | ) | | | (1.37 | ) | | | (1.58 | ) | | | (1.36 | ) | | | (1.23 | ) |
From Net Realized Gains | | | (0.62 | ) | | | (0.22 | ) | | | — | | | | — | | | | (0.20 | ) |
| | | | |
Total from Distributions | | | (1.58 | ) | | | (1.59 | ) | | | (1.58 | ) | | | (1.36 | ) | | | (1.43 | ) |
| | | | |
Net Asset Value, end of period | | $ | 53.52 | | | $ | 54.70 | | | $ | 52.58 | | | $ | 48.59 | | | $ | 50.98 | |
| | | | |
Total Return | | | | | | | | | | | | | | | | | | | | |
Net Asset Value(d) | | | 0.70 | % | | | 7.20 | % | | | 11.66 | % | | | (2.05 | )% | | | 1.85 | % |
Market Value (Unaudited)(e) | | | 0.68 | % | | | 7.22 | % | | | 11.56 | % | | | (2.23 | )% | | | 1.99 | % |
| | | | | |
RATIOS/SUPPLEMENT DATA | | | | | | | | | | | | | | | | | | | | |
| | | | | |
Ratios to Average Net Assets | | | | | | | | | | | | | | | | | | | | |
Expenses | | | 0.23 | % | | | 0.23 | % | | | 0.23 | % | | �� | 0.23 | % | | | 0.23 | % |
Expenses net of reimbursements | | | 0.22 | % | | | 0.22 | % | | | 0.22 | % | | | 0.22 | % | | | 0.22 | % |
Net Investment Income Before Reimbursements | | | 1.68 | % | | | 2.46 | % | | | 3.20 | % | | | 2.83 | % | | | 2.48 | % |
Net Investment Income Net of Reimbursements | | | 1.69 | % | | | 2.46 | % | | | 3.21 | % | | | 2.84 | % | | | 2.49 | % |
| | | | | |
Supplemental Data | | | | | | | | | | | | | | | | | | | | |
Portfolio Turnover Rate(f) | | | 53 | % | | | 62 | % | | | 65 | % | | | 76 | % | | | 65 | % |
Net assets, end of period (thousands) | | $ | 315,740 | | | $ | 202,397 | | | $ | 97,275 | | | $ | 60,736 | | | $ | 50,982 | |
See Accompanying Notes to the Financial Statements.
| | | | | | |
| | FLEXSHARES ANNUAL REPORT | | | 115 | |
Financial Highlights (cont.)
| | | | | | | | | | | | | | | | | | | | |
| | | FlexShares® Credit-Scored US Long Corporate
Bond Index Fund | |
| | | Year ended October 31, | |
| | | 2021 | | | 2020 | | | 2019 | | | 2018 | | | 2017 | |
| | | | | |
Net asset value, beginning of period | | $ | 61.81 | | | $ | 57.84 | | | $ | 48.04 | | | $ | 53.88 | | | $ | 53.83 | |
| | | | |
| | | | | |
PER SHARE | | | | | | | | | | | | | | | | | | | | |
| | | | | |
Investment Operations | | | | | | | | | | | | | | | | | | | | |
Net Investment Income | | | 1.90 | (a) | | | 1.99 | (a) | | | 2.11 | (a) | | | 2.07 | (a) | | | 2.06 | (a) |
Net Realized and Unrealized Gain (Loss) | | | 1.22 | | | | 3.90 | | | | 9.89 | | | | (5.87 | ) | | | 0.74 | |
| | | | |
Total from Operations | | | 3.12 | | | | 5.89 | | | | 12.00 | | | | (3.80 | ) | | | 2.80 | |
| | | | |
Distributions | | | | | | | | | | | | | | | | | | | | |
Net Investment Income | | | (1.88 | ) | | | (1.92 | ) | | | (2.20 | ) | | | (2.04 | ) | | | (2.07 | ) |
From Net Realized Gains | | | (2.20 | ) | | | — | | | | — | | | | — | | | | (0.68 | ) |
| | | | |
Total from Distributions | | | (4.08 | ) | | | (1.92 | ) | | | (2.20 | ) | | | (2.04 | ) | | | (2.75 | ) |
| | | | |
Net Asset Value, end of period | | $ | 60.85 | | | $ | 61.81 | | | $ | 57.84 | | | $ | 48.04 | | | $ | 53.88 | |
| | | | |
Total Return | | | | | | | | | | | | | | | | | | | | |
Net Asset Value(d) | | | 5.14 | % | | | 10.34 | % | | | 25.57 | % | | | (7.24 | )% | | | 5.58 | % |
Market Value (Unaudited)(e) | | | 5.23 | % | | | 10.57 | % | | | 25.51 | % | | | (7.86 | )% | | | 4.25 | % |
| | | | | |
RATIOS/SUPPLEMENT DATA | | | | | | | | | | | | | | | | | | | | |
| | | | | |
Ratios to Average Net Assets | | | | | | | | | | | | | | | | | | | | |
Expenses | | | 0.23 | % | | | 0.23 | % | | | 0.23 | % | | | 0.23 | % | | | 0.24 | % |
Expenses net of reimbursements | | | 0.22 | % | | | 0.22 | % | | | 0.22 | % | | | 0.22 | % | | | 0.22 | % |
Net Investment Income Before Reimbursements | | | 3.13 | % | | | 3.27 | % | | | 4.06 | % | | | 4.05 | % | | | 3.92 | % |
Net Investment Income Net of Reimbursements | | | 3.14 | % | | | 3.28 | % | | | 4.07 | % | | | 4.06 | % | | | 3.94 | % |
| | | | | |
Supplemental Data | | | | | | | | | | | | | | | | | | | | |
Portfolio Turnover Rate(f) | | | 88 | % | | | 74 | % | | | 44 | % | | | 93 | % | | | 91 | % |
Net assets, end of period (thousands) | | $ | 60,855 | | | $ | 46,360 | | | $ | 17,352 | | | $ | 26,424 | | | $ | 18,858 | |
See Accompanying Notes to the Financial Statements.
| | | | |
| 116 | | FLEXSHARES ANNUAL REPORT | | |
Financial Highlights (cont.)
| | | | | | | | | | | | | | | | |
| | | FlexShares® High Yield Value-Scored
Bond Index Fund | |
| | | | | | | | | | | | For the
period
07/17/18*
through
10/31/18 | |
| | | | | | | | | | |
| | | Year ended October 31, | |
| | | 2021 | | | 2020 | | | 2019 | |
| | | | |
Net asset value, beginning of period | | $ | 46.25 | | | $ | 47.85 | | | $ | 48.84 | | | $ | 50.00 | |
| | | | |
| | | | |
PER SHARE | | | | | | | | | | | | | | | | |
| | | | |
Investment Operations | | | | | | | | | | | | | | | | |
Net Investment Income | | | 2.67 | (a) | | | 3.12 | (a) | | | 2.67 | (a) | | | 1.68 | (a) |
Net Realized and Unrealized Gain (Loss) | | | 3.42 | | | | (1.77 | ) | | | 0.78 | | | | (1.60 | ) |
| | | | |
Total from Operations | | | 6.09 | | | | 1.35 | | | | 3.45 | | | | 0.08 | |
| | | | |
Distributions | | | | | | | | | | | | | | | | |
Net Investment Income | | | (2.76 | ) | | | (2.95 | ) | | | (3.57 | ) | | | (1.24 | ) |
Tax Return of Capital | | | — | | | | — | | | | (0.87 | ) | | | — | |
| | | | |
Total from Distributions | | | (2.76 | ) | | | (2.95 | ) | | | (4.44 | ) | | | (1.24 | ) |
| | | | |
Net Asset Value, end of period | | $ | 49.58 | | | $ | 46.25 | | | $ | 47.85 | | | $ | 48.84 | |
| | | | |
Total Return(b) | | | | | | | | | | | | | | | | |
Net Asset Value(d) | | | 13.38 | % | | | 3.07 | % | | | 7.48 | % | | | 0.13 | % |
Market Value (Unaudited)(e) | | | 13.20 | % | | | 3.12 | % | | | 7.64 | % | | | 0.13 | % |
| | | | |
RATIOS/SUPPLEMENT DATA | | | | | | | | | | | | | | | | |
| | | | |
Ratios to Average Net Assets(c) | | | | | | | | | | | | | | | | |
Expenses | | | 0.38 | % | | | 0.38 | % | | | 0.38 | % | | | 0.38 | % |
Expenses net of reimbursements | | | 0.37 | % | | | 0.37 | % | | | 0.37 | % | | | 0.37 | % |
Net Investment Income Before Reimbursements | | | 5.40 | % | | | 6.78 | % | | | 5.56 | % | | | 11.56 | % |
Net Investment Income Net of Reimbursements | | | 5.40 | % | | | 6.78 | % | | | 5.57 | % | | | 11.57 | % |
| | | | |
Supplemental Data | | | | | | | | | | | | | | | | |
Portfolio Turnover Rate(b)(f) | | | 128 | % | | | 95 | % | | | 44 | % | | | 18 | % |
Net assets, end of period (thousands) | | $ | 575,184 | | | $ | 189,623 | | | $ | 100,480 | | | $ | 48,845 | |
| * | Commencement of investment operations. |
See Accompanying Notes to the Financial Statements.
| | | | | | |
| | FLEXSHARES ANNUAL REPORT | | | 117 | |
Financial Highlights (cont.)
| | | | |
| | | FlexShares® ESG & Climate High
Yield Corporate Core Index Fund | |
| | | For the
period
09/20/21*
through
10/31/21 | |
| |
Net asset value, beginning of period | | $ | 50.00 | |
| | | | |
| |
PER SHARE | | | | |
| |
Investment Operations | | | | |
Net Investment Income | | | 0.21 | (a) |
Net Realized and Unrealized Gain (Loss) | | | (0.44 | ) |
| | | | |
Total from Operations | | | (0.23 | ) |
| | | | |
Distributions | | | | |
Net Investment Income | | | — | |
| | | | |
Total from Distributions | | | — | |
| | | | |
Net Asset Value, end of period | | $ | 49.77 | |
| | | | |
Total Return(b) | | | | |
Net Asset Value(d) | | | (0.50 | )% |
Market Value (Unaudited)(e) | | | (0.50 | )% |
| |
RATIOS/SUPPLEMENT DATA | | | | |
|
Ratios to Average Net Assets(c) | |
Expenses | | | 0.23 | % |
Expenses net of reimbursements | | | 0.23 | % |
Net Investment Income Before Reimbursements | | | 3.64 | % |
Net Investment Income Net of Reimbursements | | | 3.64 | % |
| |
Supplemental Data | | | | |
Portfolio Turnover Rate(b)(f) | | | 8 | % |
Net assets, end of period (thousands) | | $ | 49,767 | |
| * | Commencement of investment operations. |
See Accompanying Notes to the Financial Statements.
| | | | |
| 118 | | FLEXSHARES ANNUAL REPORT | | |
Financial Highlights (cont.)
| | | | |
| | | FlexShares® ESG & Climate Investment
Grade Corporate Core Index Fund | |
| | For the
period
09/20/21*
through
10/31/21 | |
| |
Net asset value, beginning of period | | $ | 50.00 | |
| | | | |
| |
PER SHARE | | | | |
| |
Investment Operations | | | | |
Net Investment Income | | | 0.10 | (a) |
Net Realized and Unrealized Gain (Loss) | | | (0.75 | ) |
| | | | |
Total from Operations | | | (0.65 | ) |
| | | | |
Distributions | | | | |
Net Investment Income | | | — | |
| | | | |
Total from Distributions | | | — | |
| | | | |
Net Asset Value, end of period | | $ | 49.35 | |
| | | | |
Total Return(b) | | | | |
Net Asset Value(d) | | | (1.32 | )% |
Market Value (Unaudited)(e) | | | (1.30 | )% |
| |
RATIOS/SUPPLEMENT DATA | | | | |
|
Ratios to Average Net Assets(c) | |
Expenses | | | 0.12 | % |
Expenses net of reimbursements | | | 0.12 | % |
Net Investment Income Before Reimbursements | | | 1.81 | % |
Net Investment Income Net of Reimbursements | | | 1.81 | % |
| |
Supplemental Data | | | | |
Portfolio Turnover Rate(b)(f) | | | 8 | % |
Net assets, end of period (thousands) | | $ | 49,347 | |
| * | Commencement of investment operations. |
See Accompanying Notes to the Financial Statements.
| | | | | | |
| | FLEXSHARES ANNUAL REPORT | | | 119 | |
Financial Highlights (cont.)
| | | | | | | | | | | | | | | | | | | | |
| | | FlexShares® Ready Access Variable Income Fund | |
| | | Year ended October 31, | |
| | | 2021 | | | 2020 | | | 2019 | | | 2018 | | | 2017 | |
| | | | | |
Net asset value, beginning of period | | $ | 76.29 | | | $ | 75.89 | | | $ | 75.48 | | | $ | 75.61 | | | $ | 75.56 | |
| | | | |
| | | | | |
PER SHARE | | | | | | | | | | | | | | | | | | | | |
| | | | | |
Investment Operations | | | | | | | | | | | | | | | | | | | | |
Net Investment Income | | | 0.48 | (a) | | | 1.07 | (a) | | | 1.98 | (a) | | | 1.58 | (a) | | | 0.89 | (a) |
Net Realized and Unrealized Gain (Loss) | | | (0.22 | ) | | | 0.57 | | | | 0.41 | | | | (0.24 | ) | | | 0.00 | (h) |
| | | | |
Total from Operations | | | 0.26 | | | | 1.64 | | | | 2.39 | | | | 1.34 | | | | 0.89 | |
| | | | |
Distributions | | | | | | | | | | | | | | | | | | | | |
Net Investment Income | | | (0.52 | ) | | | (1.23 | ) | | | (1.98 | ) | | | (1.47 | ) | | | (0.84 | ) |
From Net Realized Gains | | | (0.02 | ) | | | (0.01 | ) | | | — | | | | — | | | | — | |
| | | | |
Total from Distributions | | | (0.54 | ) | | | (1.24 | ) | | | (1.98 | ) | | | (1.47 | ) | | | (0.84 | ) |
| | | | |
Net Asset Value, end of period | | $ | 76.01 | | | $ | 76.29 | | | $ | 75.89 | | | $ | 75.48 | | | $ | 75.61 | |
| | | | |
Total Return | | | | | | | | | | | | | | | | | | | | |
Net Asset Value(d) | | | 0.34 | % | | | 2.18 | % | | | 3.21 | % | | | 1.80 | % | | | 1.18 | % |
Market Value (Unaudited)(e) | | | 0.35 | % | | | 2.17 | % | | | 3.18 | % | | | 1.91 | % | | | 1.06 | % |
| | | | | |
RATIOS/SUPPLEMENT DATA | | | | | | | | | | | | | | | | | | | | |
| | | | | |
Ratios to Average Net Assets | | | | | | | | | | | | | | | | | | | | |
Expenses | | | 0.26 | % | | | 0.26 | % | | | 0.26 | % | | | 0.26 | % | | | 0.26 | % |
Expenses net of reimbursements | | | 0.25 | % | | | 0.25 | % | | | 0.25 | % | | | 0.25 | % | | | 0.25 | % |
Net Investment Income Before Reimbursements | | | 0.62 | % | | | 1.41 | % | | | 2.61 | % | | | 2.09 | % | | | 1.17 | % |
Net Investment Income Net of Reimbursements | | | 0.63 | % | | | 1.41 | % | | | 2.62 | % | | | 2.10 | % | | | 1.18 | % |
| | | | | |
Supplemental Data | | | | | | | | | | | | | | | | | | | | |
Portfolio Turnover Rate(f) | | | 84 | % | | | 79 | % | | | 73 | % | | | 131 | % | | | 71 | % |
Net assets, end of period (thousands) | | $ | 374,339 | | | $ | 469,201 | | | $ | 275,097 | | | $ | 211,350 | | | $ | 162,557 | |
See Accompanying Notes to the Financial Statements.
| | | | |
| 120 | | FLEXSHARES ANNUAL REPORT | | |
Financial Highlights (cont.)
| | | | | | | | | | | | | | | | | | | | |
| | | FlexShares® Core Select Bond Fund | |
| | | | | | | | | | | | | | | For the
period
11/18/16*
through
10/31/17 | |
| | | | | | | | | | | | | |
| | | Year ended October 31, | |
| | | 2021 | | | 2020 | | | 2019 | | | 2018 | |
| | | | | |
Net asset value, beginning of period | | $ | 26.78 | | | $ | 25.66 | | | $ | 23.74 | | | $ | 25.08 | | | $ | 25.00 | |
| | | | |
| | | | | |
PER SHARE | | | | | | | | | | | | | | | | | | | | |
| | | | | |
Investment Operations | | | | | | | | | | | | | | | | | | | | |
Net Investment Income | | | 0.46 | (a) | | | 0.51 | (a) | | | 0.73 | (a) | | | 0.63 | (a) | | | 0.55 | (a) |
Net Realized and Unrealized Gain (Loss) | | | (0.39 | ) | | | 1.19 | | | | 1.93 | | | | (1.31 | ) | | | 0.15 | |
| | | | |
Total from Operations | | | 0.07 | | | | 1.70 | | | | 2.66 | | | | (0.68 | ) | | | 0.70 | |
| | | | |
Distributions | | | | | | | | | | | | | | | | | | | | |
Net Investment Income | | | (0.52 | ) | | | (0.58 | ) | | | (0.74 | ) | | | (0.66 | ) | | | (0.62 | ) |
From Net Realized Gains | | | (0.11 | ) | | | — | | | | — | | | | — | | | | — | |
| | | | |
Total from Distributions | | | (0.63 | ) | | | (0.58 | ) | | | (0.74 | ) | | | (0.66 | ) | | | (0.62 | ) |
| | | | |
Net Asset Value, end of period | | $ | 26.22 | | | $ | 26.78 | | | $ | 25.66 | | | $ | 23.74 | | | $ | 25.08 | |
| | | | |
Total Return(b) | | | | | | | | | | | | | | | | | | | | |
Net Asset Value(d) | | | 0.26 | % | | | 6.69 | % | | | 11.38 | % | | | (2.73 | )% | | | 2.86 | % |
Market Value (Unaudited)(e) | | | 0.30 | % | | | 6.57 | % | | | 11.41 | % | | | (2.92 | )% | | | 3.19 | % |
| | | | | |
RATIOS/SUPPLEMENT DATA | | | | | | | | | | | | | | | | | | | | |
| | | | | |
Ratios to Average Net Assets(c) | | | | | | | | | | | | | | | | | | | | |
Expenses | | | 0.36 | %(i) | | | 0.36 | %(i) | | | 0.36 | %(i) | | | 0.36 | %(i) | | | 0.43 | %(i) |
Expenses net of reimbursements | | | 0.20 | %(i) | | | 0.20 | %(i) | | | 0.19 | %(i) | | | 0.16 | %(i) | | | 0.16 | %(i) |
Net Investment Income Before Reimbursements | | | 1.56 | % | | | 1.76 | % | | | 2.80 | % | | | 2.41 | % | | | 2.08 | % |
Net Investment Income Net of Reimbursements | | | 1.72 | % | | | 1.93 | % | | | 2.97 | % | | | 2.61 | % | | | 2.35 | % |
| | | | | |
Supplemental Data | | | | | | | | | | | | | | | | | | | | |
Portfolio Turnover Rate(b)(f) | | | 50 | % | | | 91 | % | | | 135 | % | | | 53 | % | | | 99 | % |
Net assets, end of period (thousands) | | $ | 126,517 | | | $ | 109,123 | | | $ | 26,299 | | | $ | 38,583 | | | $ | 3,762 | |
| * | Commencement of investment operations. |
See Accompanying Notes to the Financial Statements.
| | | | | | |
| | FLEXSHARES ANNUAL REPORT | | | 121 | |
Financial Highlights (cont.)
| (a) | Net investment income per share is based on average shares outstanding. |
| (b) | Not annualized for periods less than one year. |
| (c) | Annualized for periods less than one year. |
| (d) | Net asset value total return is calculated assuming an initial investment made at the net asset value at the beginning of the period, reinvestment of all dividends and distributions at net asset value during the period and redemption on the last day of the period at adjusted net asset value. |
| (e) | Market value total return is calculated assuming an initial investment made at the market value at the beginning of the period, reinvestment of all dividends and distributions at net asset value during the period and redemption on the last day of the period at market value. Market value is determined by the mid point of the bid/ask spread at 4:00 p.m. Eastern Time from the primary listing exchange. Market value returns may vary from net asset value returns. |
| (f) | In-kind transactions are not included in portfolio turnover calculations. |
| (h) | Per share amount is less than $0.005. |
| (i) | The Fund indirectly bears its proportionate share of fees and expenses incurred by the Underlying Fund(s) in which the Fund is invested. This ratio does not include these indirect fees and expenses. |
| (k) | Northern Trust Investments, Inc. reimbursed the Funds for losses incurred related to an error. For the FlexShares Morningstar Developed Markets ex-US Factor Tilt Index Fund, the impact to the net realized and unrealized gain (loss) on investments per share amount is less than $0.005 and the total returns are less than 0.005%. Had these reimbursements not been made, the total returns would have been lower. |
| (m) | Northern Trust Investments, Inc. reimbursed the Funds for losses incurred related to an error. For the FlexShares STOXX Global ESG Select Index Fund, the impact to the net realized and unrealized gain (loss) on investments per share amount is less than $0.005 and the total returns are less than 0.005%. Had these reimbursements not been made, the total returns would have been lower. |
| (n) | Northern Trust Investments, Inc. reimbursed the Funds for losses incurred related to an error. The impact was an increase of $0.02 to the net realized and unrealized gain (loss) on investments per share and an increase of 0.06% to the total return of the FlexShares Morningstar Global Upstream Natural Resources Index Fund. Had these reimbursements not been made, the total returns would have been lower. |
See Accompanying Notes to the Financial Statements.
| | | | |
| 122 | | FLEXSHARES ANNUAL REPORT | | |
Schedule of Investments
FlexShares® US Quality Low Volatility Index Fund
October 31, 2021
| | | | | | | | |
| Investments | | Shares | | | Value | |
|
| COMMON STOCKS – 99.8% | |
|
| Air Freight & Logistics – 2.0% | |
| | |
CH Robinson Worldwide, Inc. | | | 9,204 | | | $ | 892,696 | |
| | |
Expeditors International of Washington, Inc. | | | 10,266 | | | | 1,265,387 | |
| | |
United Parcel Service, Inc., Class B | | | 4,661 | | | | 994,984 | |
| | | | | | | | 3,153,067 | |
|
| Automobiles – 0.4% | |
| | |
Tesla, Inc.* | | | 531 | | | | 591,534 | |
|
| Banks – 0.1% | |
| | |
JPMorgan Chase & Co. | | | 767 | | | | 130,306 | |
| | |
| Beverages – 1.7% | | | | | | |
| | |
Coca-Cola Co. (The) | | | 11,918 | | | | 671,817 | |
| | |
PepsiCo, Inc. | | | 12,508 | | | | 2,021,293 | |
| | | | | | | | 2,693,110 | |
| | |
| Biotechnology – 3.8% | | | | | | |
| | |
AbbVie, Inc. | | | 10,502 | | | | 1,204,264 | |
| | |
Amgen, Inc. | | | 10,266 | | | | 2,124,754 | |
| | |
Gilead Sciences, Inc. | | | 19,411 | | | | 1,259,386 | |
| | |
Regeneron Pharmaceuticals, Inc.* | | | 2,124 | | | | 1,359,233 | |
| | |
United Therapeutics Corp.* | | | 708 | | | | 135,058 | |
| | | | | | | | 6,082,695 | |
|
| Capital Markets – 2.1% | |
| | |
Intercontinental Exchange, Inc. | | | 8,142 | | | | 1,127,341 | |
| | |
Nasdaq, Inc. | | | 4,602 | | | | 965,822 | |
| | |
S&P Global, Inc. | | | 2,714 | | | | 1,286,870 | |
| | | | | | | | 3,380,033 | |
| | |
| Chemicals – 0.9% | | | | | | |
| | |
Ecolab, Inc. | | | 6,254 | | | | 1,389,764 | |
|
| Commercial Services & Supplies – 2.9% | |
| | |
Republic Services, Inc. | | | 7,316 | | | | 984,734 | |
| | |
Tetra Tech, Inc. | | | 9,027 | | | | 1,585,683 | |
| | |
Waste Connections, Inc. | | | 7,021 | | | | 954,926 | |
| | |
Waste Management, Inc. | | | 6,726 | | | | 1,077,707 | |
| | | | | | | | 4,603,050 | |
|
| Diversified Financial Services – 0.2% | |
| | |
Berkshire Hathaway, Inc., Class B* | | | 1,239 | | | | 355,605 | |
| | | | | | | | |
| Investments | | Shares | | | Value | |
|
| Diversified Telecommunication Services – 2.1% | |
| | |
AT&T, Inc. | | | 16,225 | | | $ | 409,843 | |
| | |
Frontier Communications Parent, Inc.* | | | 4,307 | | | | 133,345 | |
| | |
Iridium Communications, Inc.* | | | 20,532 | | | | 832,573 | |
| | |
Verizon Communications, Inc. | | | 36,993 | | | | 1,960,259 | |
| | | | | | | | 3,336,020 | |
| | |
| Electric Utilities – 3.5% | | | | | | |
| | |
American Electric Power Co., Inc. | | | 8,614 | | | | 729,692 | |
| | |
Duke Energy Corp. | | | 1,003 | | | | 102,316 | |
| | |
IDACORP, Inc. | | | 10,974 | | | | 1,144,808 | |
| | |
NextEra Energy, Inc. | | | 17,523 | | | | 1,495,238 | |
| | |
Pinnacle West Capital Corp. | | | 9,617 | | | | 620,200 | |
| | |
PNM Resources, Inc. | | | 16,520 | | | | 821,870 | |
| | |
Xcel Energy, Inc. | | | 11,151 | | | | 720,243 | |
| | | | | | | | 5,634,367 | |
|
| Equity Real Estate Investment Trusts (REITs) – 2.7% | |
| | |
American Tower Corp. | | | 1,180 | | | | 332,724 | |
| | |
Crown Castle International Corp. | | | 3,953 | | | | 712,726 | |
| | |
Equinix, Inc. | | | 354 | | | | 296,323 | |
| | |
Extra Space Storage, Inc. | | | 6,254 | | | | 1,234,352 | |
| | |
Public Storage | | | 4,248 | | | | 1,411,101 | |
| | |
SBA Communications Corp. | | | 1,121 | | | | 387,115 | |
| | | | | | | | 4,374,341 | |
| | |
| Food & Staples Retailing – 5.5% | | | | | | |
| | |
Albertsons Cos., Inc., Class A | | | 27,199 | | | | 841,809 | |
| | |
Costco Wholesale Corp. | | | 7,965 | | | | 3,915,116 | |
| | |
Kroger Co. (The) | | | 19,883 | | | | 795,718 | |
| | |
Walmart, Inc. | | | 22,656 | | | | 3,385,259 | |
| | | | | | | | 8,937,902 | |
| | |
| Food Products – 1.2% | | | | | | |
| | |
Hershey Co. (The) | | | 6,962 | | | | 1,220,787 | |
| | |
Hormel Foods Corp. | | | 18,113 | | | | 766,542 | |
| | | | | | | | 1,987,329 | |
|
| Health Care Equipment & Supplies – 0.8% | |
| | |
Abbott Laboratories | | | 10,679 | | | | 1,376,416 | |
|
| Health Care Providers & Services – 0.8% | |
| | |
Chemed Corp. | | | 2,596 | | | | 1,251,921 | |
See Accompanying Notes to the Financial Statements.
| | | | | | |
| | FLEXSHARES ANNUAL REPORT | | | 123 | |
FlexShares® US Quality Low Volatility Index Fund (cont.)
| | | | | | | | |
| Investments | | Shares | | | Value | |
|
| COMMON STOCKS – (continued) | |
|
| Health Care Providers & Services – (continued) | |
| | |
UnitedHealth Group, Inc. | | | 236 | | | $ | 108,671 | |
| | | | | | | | 1,360,592 | |
|
| Hotels, Restaurants & Leisure – 0.0%(a) | |
| | |
Booking Holdings, Inc.* | | | 24 | | | | 58,099 | |
| | |
| Household Durables – 0.1% | | | | | | |
| | |
Newell Brands, Inc. | | | 10,561 | | | | 241,741 | |
| | |
| Household Products – 0.9% | | | | | | |
| | |
Clorox Co. (The) | | | 4,484 | | | | 730,937 | |
| | |
Procter & Gamble Co. (The) | | | 4,543 | | | | 649,603 | |
| | | | | | | | 1,380,540 | |
|
| Industrial Conglomerates – 0.2% | |
| | |
Roper Technologies, Inc. | | | 531 | | | | 259,059 | |
|
| Insurance – 5.0% | |
| | |
Alleghany Corp.* | | | 1,652 | | | | 1,076,080 | |
| | |
Aon plc, Class A | | | 3,245 | | | | 1,038,141 | |
| | |
Assurant, Inc. | | | 4,956 | | | | 799,452 | |
| | |
Chubb Ltd. | | | 5,723 | | | | 1,118,160 | |
| | |
Markel Corp.* | | | 649 | | | | 852,221 | |
| | |
Progressive Corp. (The) | | | 10,266 | | | | 974,038 | |
| | |
Travelers Cos., Inc. (The) | | | 7,965 | | | | 1,281,409 | |
| | |
W R Berkley Corp. | | | 11,033 | | | | 878,227 | |
| | | | | | | | 8,017,728 | |
|
| Interactive Media & Services – 5.9% | |
| | |
Alphabet, Inc., Class A* | | | 1,268 | | | | 3,754,447 | |
| | |
Alphabet, Inc., Class C* | | | 1,496 | | | | 4,436,253 | |
| | |
Meta Platforms, Inc., Class A* | | | 4,189 | | | | 1,355,435 | |
| | | | | | | | 9,546,135 | |
| | |
| IT Services – 6.8% | | | | | | |
| | |
Accenture plc, Class A | | | 8,850 | | | | 3,175,291 | |
| | |
Akamai Technologies, Inc.* | | | 4,956 | | | | 522,660 | |
| | |
Globant SA* | | | 2,891 | | | | 922,778 | |
| | |
Mastercard, Inc., Class A | | | 6,903 | | | | 2,316,095 | |
| | |
Visa, Inc., Class A | | | 18,644 | | | | 3,948,240 | |
| | | | | | | | 10,885,064 | |
| | | | | | | | |
| Investments | | Shares | | | Value | |
|
| Life Sciences Tools & Services – 2.0% | |
| | |
Charles River Laboratories International, Inc.* | | | 2,065 | | | $ | 926,524 | |
| | |
ICON plc* | | | 5,015 | | | | 1,438,152 | |
| | |
QIAGEN NV* | | | 15,871 | | | | 884,967 | |
| | | | | | | | 3,249,643 | |
| | |
| Media – 1.4% | | | | | | |
| | |
Cable One, Inc. | | | 413 | | | | 706,730 | |
| | |
Charter Communications, Inc., Class A* | | | 2,360 | | | | 1,592,740 | |
| | | | | | | | 2,299,470 | |
| | |
| Metals & Mining – 2.2% | | | | | | |
| | |
Agnico Eagle Mines Ltd. | | | 21,889 | | | | 1,161,212 | |
| | |
Newmont Corp. | | | 23,659 | | | | 1,277,586 | |
| | |
Royal Gold, Inc. | | | 10,915 | | | | 1,080,803 | |
| | | | | | | | 3,519,601 | |
| | |
| Multiline Retail – 2.5% | | | | | | |
| | |
Dollar General Corp. | | | 4,189 | | | | 927,947 | |
| | |
Ollie’s Bargain Outlet Holdings, Inc.* | | | 11,741 | | | | 794,396 | |
| | |
Target Corp. | | | 8,968 | | | | 2,328,272 | |
| | | | | | | | 4,050,615 | |
| | |
| Multi-Utilities – 1.7% | | | | | | |
| | |
Ameren Corp. | | | 6,254 | | | | 527,150 | |
| | |
CMS Energy Corp. | | | 7,906 | | | | 477,127 | |
| | |
Consolidated Edison, Inc. | | | 8,083 | | | | 609,458 | |
| | |
WEC Energy Group, Inc. | | | 12,921 | | | | 1,163,665 | |
| | | | | | | | 2,777,400 | |
| | |
| Pharmaceuticals – 9.1% | | | | | | |
| | |
Bristol-Myers Squibb Co. | | | 9,735 | | | | 568,524 | |
| | |
Eli Lilly and Co. | | | 14,691 | | | | 3,742,679 | |
| | |
Johnson & Johnson | | | 40,179 | | | | 6,544,355 | |
| | |
Merck & Co., Inc. | | | 22,951 | | | | 2,020,836 | |
| | |
Zoetis, Inc. | | | 8,496 | | | | 1,836,835 | |
| | | | | | | | 14,713,229 | |
| | |
| Professional Services – 0.6% | | | | | | |
| | |
Verisk Analytics, Inc. | | | 4,661 | | | | 980,068 | |
| | |
| Road & Rail – 2.8% | | | | | | |
| | |
JB Hunt Transport Services, Inc. | | | 4,897 | | | | 965,639 | |
See Accompanying Notes to the Financial Statements.
| | | | |
| 124 | | FLEXSHARES ANNUAL REPORT | | |
FlexShares® US Quality Low Volatility Index Fund (cont.)
| | | | | | | | |
| Investments | | Shares | | | Value | |
|
| COMMON STOCKS – (continued) | |
| | |
| Road & Rail – (continued) | | | | | | |
| | |
Landstar System, Inc. | | | 5,133 | | | $ | 902,433 | |
| | |
Old Dominion Freight Line, Inc. | | | 4,543 | | | | 1,550,753 | |
| | |
Saia, Inc.* | | | 3,363 | | | | 1,051,408 | |
| | | | | | | | 4,470,233 | |
|
| Semiconductors & Semiconductor Equipment – 0.2% | |
| | |
NVIDIA Corp. | | | 1,062 | | | | 271,522 | |
| | |
| Software – 16.5% | | | | | | |
| | |
Adobe, Inc.* | | | 7,080 | | | | 4,604,549 | |
| | |
Atlassian Corp. plc, Class A* | | | 2,832 | | | | 1,297,424 | |
| | |
Check Point Software Technologies Ltd.* | | | 9,853 | | | | 1,178,419 | |
| | |
Intuit, Inc. | | | 4,779 | | | | 2,991,606 | |
| | |
Microsoft Corp. | | | 44,191 | | | | 14,654,619 | |
| | |
Tyler Technologies, Inc.* | | | 1,770 | | | | 961,499 | |
| | |
Zoom Video Communications, Inc., Class A* | | | 3,245 | | | | 891,239 | |
| | | | | | | | 26,579,355 | |
| | |
| Specialty Retail – 5.3% | | | | | | |
| | |
AutoZone, Inc.* | | | 118 | | | | 210,611 | |
| | |
Home Depot, Inc. (The) | | | 18,998 | | | | 7,062,316 | |
| | |
O’Reilly Automotive, Inc.* | | | 2,065 | | | | 1,285,091 | |
| | | | | | | | 8,558,018 | |
|
| Technology Hardware, Storage & Peripherals – 4.5% | |
| | |
Apple, Inc. | | | 48,852 | | | | 7,318,030 | |
| | |
| Tobacco – 0.0%(a) | | | | | | |
| | |
Philip Morris International, Inc. | | | 767 | | | | 72,512 | |
| | |
| Water Utilities – 0.8% | | | | | | |
| | |
American Water Works Co., Inc. | | | 7,198 | | | | 1,253,748 | |
|
| Wireless Telecommunication Services – 0.6% | |
| | |
T-Mobile US, Inc.* | | | 7,788 | | | | 895,854 | |
Total Common Stocks
(Cost $129,948,213) | | | | 160,783,795 | |
| | | | | | | | |
| Investments | | Principal
Amount | | | Value | |
|
| SHORT-TERM INVESTMENTS – 0.0%(a) | |
|
| U.S. TREASURY OBLIGATIONS – 0.0%(a) | |
| | |
U.S. Treasury Bills 0.04%, 1/27/2022(b) (c) (Cost $34,997) | | $ | 35,000 | | | $ | 34,996 | |
| Total Investments – 99.8% (Cost $129,983,210) | | | | 160,818,791 | |
| |
Other assets less liabilities – 0.2% | | | | 255,701 | |
| NET ASSETS – 100.0% | | | $ | 161,074,492 | |
| * | Non-income producing security. |
| (a) | Represents less than 0.05% of net assets. |
| (b) | All or a portion of the security pledged as collateral for Futures Contracts. |
| (c) | The rate shown was the current yield as of October 31, 2021. |
| Percentages | shown are based on Net Assets. |
As of October 31, 2021, the gross unrealized appreciation (depreciation) of investments based on the aggregate cost of investments (including derivative instruments, if applicable) for federal income tax purposes was as follows:
| | | | |
| | | | |
Aggregate gross unrealized appreciation | | $ | 32,885,740 | |
Aggregate gross unrealized depreciation | | | (2,060,546 | ) |
Net unrealized appreciation | | $ | 30,825,194 | |
Federal income tax cost | | $ | 130,002,138 | |
See Accompanying Notes to the Financial Statements.
| | | | | | |
| | FLEXSHARES ANNUAL REPORT | | | 125 | |
FlexShares® US Quality Low Volatility Index Fund (cont.)
Futures Contracts
FlexShares® US Quality Low Volatility Index Fund had the following open futures contracts as of October 31, 2021:
| | | | | | | | | | | | | | | | | | | | |
| | | Number of
Contracts | | | Expiration
Date | | | Trading
Currency | | | Notional
Amount | | | Value and
Unrealized
Appreciation* | |
Long Contracts | |
Micro E-mini S&P 500 Index | | | 10 | | | | 12/17/2021 | | | | USD | | | $ | 229,850 | | | $ | 8,541 | |
| * | This amount represents the cumulative appreciation/depreciation on futures contracts. Current day’s variation margin is reported within the Statement of Assets and Liabilities for futures contracts. |
Abbreviations:
USD – US Dollar
| | | | |
| Security Type | | % of Net Assets | |
Common Stocks | | | 99.8 | % |
Short-Term Investments | | | 0.0 | † |
Others(1) | | | 0.2 | |
| | | | 100.0 | % |
| † | Amount represents less than 0.05%. |
| (1) | Includes any other net assets/(liabilities). |
See Accompanying Notes to the Financial Statements.
| | | | |
| 126 | | FLEXSHARES ANNUAL REPORT | | |
Schedule of Investments
FlexShares® Developed Markets ex-US Quality Low Volatility Index Fund
October 31, 2021
| | | | | | | | |
| Investments | | Shares | | | Value | |
|
| COMMON STOCKS – 99.3% | |
|
| Aerospace & Defense – 0.1% | |
| | |
Elbit Systems Ltd. | | | 81 | | | $ | 12,778 | |
| | |
Singapore Technologies Engineering Ltd. | | | 18,900 | | | | 53,680 | |
| | | | | | | | 66,458 | |
| | |
| Air Freight & Logistics – 1.2% | | | | | | |
| | |
Deutsche Post AG (Registered) | | | 2,781 | | | | 172,244 | |
| | |
DSV A/S | | | 675 | | | | 157,033 | |
| | |
SG Holdings Co. Ltd. | | | 21,600 | | | | 539,882 | |
| | | | | | | | 869,159 | |
| | |
| Auto Components – 0.6% | | | | | | |
| | |
Bridgestone Corp. | | | 2,700 | | | | 118,845 | |
| | |
Pirelli & C SpA(a) | | | 47,709 | | | | 293,282 | |
| | | | | | | | 412,127 | |
| | |
| Banks – 12.7% | | | | | | |
| | |
Australia & New Zealand Banking Group Ltd. | | | 43,011 | | | | 909,078 | |
| | |
Bank Hapoalim BM | | | 36,396 | | | | 358,559 | |
| | |
Bank Leumi Le-Israel BM | | | 73,602 | | | | 703,414 | |
| | |
Bank of Nova Scotia (The) | | | 17,469 | | | | 1,143,507 | |
| | |
Bankinter SA | | | 51,759 | | | | 285,235 | |
| | |
BOC Hong Kong Holdings Ltd. | | | 189,000 | | | | 600,112 | |
| | |
Chiba Bank Ltd. (The) | | | 32,400 | | | | 200,609 | |
| | |
Commonwealth Bank of Australia | | | 17,064 | | | | 1,341,659 | |
| | |
Danske Bank A/S | | | 4,101 | | | | 69,473 | |
| | |
FinecoBank Banca Fineco SpA* | | | 17,685 | | | | 337,995 | |
| | |
Hang Seng Bank Ltd. | | | 32,400 | | | | 616,425 | |
| | |
Royal Bank of Canada | | | 14,121 | | | | 1,467,522 | |
| | |
Shizuoka Bank Ltd. (The) | | | 40,500 | | | | 325,705 | |
| | |
Skandinaviska Enskilda Banken AB, Class A | | | 3,915 | | | | 61,197 | |
| | |
Sumitomo Mitsui Financial Group, Inc. | | | 18,200 | | | | 593,924 | |
| | |
Swedbank AB, Class A | | | 2,916 | | | | 63,233 | |
| | |
Toronto-Dominion Bank (The) | | | 6,831 | | | | 495,097 | |
| | | | | | | | 9,572,744 | |
| | | | | | | | |
| Investments | | Shares | | | Value | |
| | |
| Beverages – 0.6% | | | | | | |
| | |
Budweiser Brewing Co. APAC Ltd.(a) | | | 37,800 | | | $ | 104,230 | |
| | |
Carlsberg A/S, Class B | | | 648 | | | | 107,003 | |
| | |
Suntory Beverage & Food Ltd. | | | 5,400 | | | | 209,085 | |
| | | | | | | | 420,318 | |
| | |
| Building Products – 0.4% | | | | | | |
| | |
AGC, Inc. | | | 6,700 | | | | 333,164 | |
| | |
| Capital Markets – 2.3% | | | | | | |
| | |
Deutsche Boerse AG | | | 3,726 | | | | 619,191 | |
| | |
Euronext NV(a) | | | 1,809 | | | | 203,903 | |
| | |
Japan Exchange Group, Inc. | | | 16,200 | | | | 382,677 | |
| | |
Singapore Exchange Ltd. | | | 72,900 | | | | 523,301 | |
| | | | | | | | 1,729,072 | |
| | |
| Chemicals – 5.8% | | | | | | |
| | |
Air Liquide SA | | | 6,723 | | | | 1,122,215 | |
| | |
Akzo Nobel NV | | | 3,240 | | | | 372,774 | |
| | |
Chr Hansen Holding A/S | | | 3,105 | | | | 247,305 | |
| | |
Covestro AG(a) | | | 3,699 | | | | 237,149 | |
| | |
Givaudan SA (Registered) | | | 135 | | | | 636,624 | |
| | |
Kansai Paint Co. Ltd. | | | 5,400 | | | | 124,694 | |
| | |
Koninklijke DSM NV | | | 2,835 | | | | 620,236 | |
| | |
Novozymes A/S, Class B | | | 8,667 | | | | 637,990 | |
| | |
Symrise AG | | | 2,916 | | | | 403,426 | |
| | | | | | | | 4,402,413 | |
|
| Commercial Services & Supplies – 1.4% | |
| | |
Brambles Ltd. | | | 47,763 | | | | 360,183 | |
| | |
Secom Co. Ltd. | | | 6,500 | | | | 441,162 | |
| | |
Securitas AB, Class B | | | 16,551 | | | | 273,650 | |
| | | | | | | | 1,074,995 | |
|
| Diversified Financial Services – 0.9% | |
| | |
Groupe Bruxelles Lambert SA | | | 3,105 | | | | 360,224 | |
| | |
Investor AB, Class A | | | 1,836 | | | | 42,438 | |
| | |
Investor AB, Class B | | | 9,180 | | | | 211,530 | |
| | |
L E Lundbergforetagen AB, Class B | | | 297 | | | | 17,104 | |
| | |
Sofina SA | | | 81 | | | | 35,845 | |
| | | | | | | | 667,141 | |
See Accompanying Notes to the Financial Statements.
| | | | | | |
| | FLEXSHARES ANNUAL REPORT | | | 127 | |
FlexShares® Developed Markets ex-US Quality Low Volatility Index Fund (cont.)
| | | | | | | | |
| Investments | | Shares | | | Value | |
|
| COMMON STOCKS – (continued) | |
|
| Diversified Telecommunication Services – 5.1% | |
| | |
BT Group plc* | | | 122,148 | | | $ | 232,566 | |
| | |
Elisa OYJ | | | 9,126 | | | | 551,076 | |
| | |
Koninklijke KPN NV | | | 79,582 | | | | 238,069 | |
| | |
Nippon Telegraph & Telephone Corp. | | | 21,100 | | | | 589,930 | |
| | |
Orange SA | | | 34,695 | | | | 378,823 | |
| | |
Proximus SADP | | | 15,849 | | | | 298,687 | |
| | |
Singapore Telecommunications Ltd. | | | 164,700 | | | | 305,339 | |
| | |
Spark New Zealand Ltd. | | | 11,880 | | | | 38,811 | |
| | |
Swisscom AG (Registered) | | | 1,107 | | | | 603,807 | |
| | |
Telecom Italia SpA | | | 415,908 | | | | 148,292 | |
| | |
Telefonica Deutschland Holding AG | | | 104,112 | | | | 271,450 | |
| | |
Telia Co. AB | | | 8,613 | | | | 33,892 | |
| | |
United Internet AG (Registered) | | | 3,996 | | | | 147,425 | |
| | | | | | | | 3,838,167 | |
| | |
| Electric Utilities – 4.0% | | | | | | |
| | |
Chubu Electric Power Co., Inc. | | | 45,900 | | | | 474,599 | |
| | |
CLP Holdings Ltd. | | | 34,000 | | | | 332,830 | |
| | |
Emera, Inc. | | | 4,212 | | | | 195,657 | |
| | |
Fortis, Inc. | | | 6,372 | | | | 283,194 | |
| | |
Hydro One Ltd.(a) | | | 9,801 | | | | 233,807 | |
| | |
Iberdrola SA | | | 76,626 | | | | 905,820 | |
| | |
Power Assets Holdings Ltd. | | | 94,500 | | | | 576,423 | |
| | | | | | | | 3,002,330 | |
| | |
| Electrical Equipment – 0.3% | | | | | | |
| | |
Signify NV(a) | | | 4,131 | | | | 200,068 | |
|
| Electronic Equipment, Instruments & Components – 1.3% | |
| | |
Halma plc | | | 8,964 | | | | 363,953 | |
| | |
Hirose Electric Co. Ltd. | | | 2,100 | | | | 349,739 | |
| | |
Keyence Corp. | | | 400 | | | | 240,333 | |
| | | | | | | | 954,025 | |
| | |
| Entertainment – 0.0%(b) | | | | | | |
| | |
Bollore SA | | | 4,482 | | | | 25,986 | |
|
| Equity Real Estate Investment Trusts (REITs) – 0.8% | |
| | |
Link REIT | | | 67,500 | | | | 598,723 | |
| | |
| Food & Staples Retailing – 4.9% | | | | | | |
| | |
Coles Group Ltd. | | | 7,101 | | | | 91,417 | |
| | | | | | | | |
| Investments | | Shares | | | Value | |
|
| Food & Staples Retailing – (continued) | |
| | |
Etablissements Franz Colruyt NV | | | 4,104 | | | $ | 201,563 | |
| | |
ICA Gruppen AB | | | 5,319 | | | | 274,977 | |
| | |
J Sainsbury plc | | | 83,295 | | | | 341,845 | |
| | |
Jeronimo Martins SGPS SA | | | 11,097 | | | | 251,703 | |
| | |
Kesko OYJ, Class B | | | 4,806 | | | | 156,229 | |
| | |
Koninklijke Ahold Delhaize NV | | | 22,491 | | | | 732,159 | |
| | |
Lawson, Inc. | | | 4,200 | | | | 202,956 | |
| | |
Loblaw Cos. Ltd. | | | 5,076 | | | | 381,166 | |
| | |
Tesco plc | | | 112,860 | | | | 417,543 | |
| | |
Tsuruha Holdings, Inc. | | | 2,500 | | | | 308,046 | |
| | |
Welcia Holdings Co. Ltd. | | | 8,100 | | | | 302,263 | |
| | | | | | | | 3,661,867 | |
| | |
| Food Products – 5.5% | | | | | | |
| | |
MEIJI Holdings Co. Ltd. | | | 3,700 | | | | 233,309 | |
| | |
Nestle SA (Registered) | | | 27,405 | | | | 3,623,609 | |
| | |
Yakult Honsha Co. Ltd. | | | 5,400 | | | | 271,835 | |
| | | | | | | | 4,128,753 | |
| | |
| Gas Utilities – 1.1% | | | | | | |
| | |
Osaka Gas Co. Ltd. | | | 13,500 | | | | 217,373 | |
| | |
Toho Gas Co. Ltd. | | | 12,200 | | | | 360,570 | |
| | |
Tokyo Gas Co. Ltd. | | | 16,200 | | | | 281,165 | |
| | | | | | | | 859,108 | |
|
| Health Care Equipment & Supplies – 2.9% | |
| | |
Coloplast A/S, Class B | | | 2,673 | | | | 436,189 | |
| | |
ConvaTec Group plc(a) | | | 48,492 | | | | 142,114 | |
| | |
Hoya Corp. | | | 6,000 | | | | 880,070 | |
| | |
Sysmex Corp. | | | 6,000 | | | | 740,364 | |
| | | | | | | | 2,198,737 | |
|
| Health Care Providers & Services – 0.1% | |
| | |
Sonic Healthcare Ltd. | | | 1,566 | | | | 47,084 | |
|
| Hotels, Restaurants & Leisure – 0.3% | |
| | |
McDonald’s Holdings Co. Japan Ltd. | | | 5,400 | | | | 241,052 | |
| | |
| Household Durables – 0.8% | | | | | | |
| | |
Rinnai Corp. | | | 1,100 | | | | 112,484 | |
| | |
SEB SA | | | 1,350 | | | | 211,378 | |
| | |
Sekisui House Ltd. | | | 13,500 | | | | 279,590 | |
| | | | | | | | 603,452 | |
See Accompanying Notes to the Financial Statements.
| | | | |
| 128 | | FLEXSHARES ANNUAL REPORT | | |
FlexShares® Developed Markets ex-US Quality Low Volatility Index Fund (cont.)
| | | | | | | | |
| Investments | | Shares | | | Value | |
|
| COMMON STOCKS – (continued) | |
| | |
| Household Products – 1.0% | | | | | | |
| | |
Lion Corp. | | | 13,400 | | | $ | 222,697 | |
| | |
Reckitt Benckiser Group plc | | | 6,291 | | | | 510,935 | |
| | | | | | | | 733,632 | |
|
Independent Power and Renewable Electricity
Producers – 0.4% | |
| | |
Uniper SE | | | 7,209 | | | | 318,771 | |
| | |
| Industrial Conglomerates – 0.8% | | | | | | |
| | |
Jardine Matheson Holdings Ltd. | | | 10,800 | | | | 625,644 | |
| | |
| Insurance – 2.4% | | | | | | |
| | |
Admiral Group plc | | | 11,826 | | | | 465,241 | |
| | |
Ageas SA | | | 216 | | | | 10,524 | |
| | |
AIA Group Ltd. | | | 10,800 | | | | 121,966 | |
| | |
Direct Line Insurance Group plc | | | 58,698 | | | | 235,266 | |
| | |
Fairfax Financial Holdings Ltd. | | | 1,242 | | | | 502,241 | |
| | |
Gjensidige Forsikring ASA | | | 864 | | | | 21,459 | |
| | |
Japan Post Insurance Co. Ltd. | | | 2,700 | | | | 43,806 | |
| | |
NN Group NV | | | 411 | | | | 22,031 | |
| | |
Sampo OYJ, Class A | | | 2,430 | | | | 129,357 | |
| | |
Tryg A/S | | | 11,720 | | | | 278,125 | |
| | | | | | | | 1,830,016 | |
| | |
| IT Services – 2.7% | | | | | | |
| | |
Adyen NV* (a) | | | 54 | | | | 163,134 | |
| | |
CGI, Inc.* | | | 3,375 | | | | 301,029 | |
| | |
Fujitsu Ltd. | | | 1,900 | | | | 327,012 | |
| | |
Itochu Techno-Solutions Corp. | | | 5,400 | | | | 170,015 | |
| | |
Nomura Research Institute Ltd. | | | 8,100 | | | | 322,508 | |
| | |
NTT Data Corp. | | | 5,400 | | | | 108,118 | |
| | |
Obic Co. Ltd. | | | 3,100 | | | | 570,656 | |
| | |
Shopify, Inc., Class A* | | | 54 | | | | 79,203 | |
| | | | | | | | 2,041,675 | |
| | |
| Leisure Products – 0.4% | | | | | | |
| | |
Bandai Namco Holdings, Inc. | | | 4,000 | | | | 304,740 | |
| | |
| Machinery – 2.0% | | | | | | |
| | |
GEA Group AG | | | 6,777 | | | | 334,020 | |
| | |
Knorr-Bremse AG | | | 2,160 | | | | 227,819 | |
| | |
Kone OYJ, Class B | | | 7,722 | | | | 526,883 | |
| | |
Schindler Holding AG | | | 1,539 | | | | 401,193 | |
| | | | | | | | |
| Investments | | Shares | | | Value | |
| | |
| Machinery – (continued) | | | | | | |
| | |
Schindler Holding AG (Registered) | | | 189 | | | $ | 48,566 | |
| | | | | | | | 1,538,481 | |
| | |
| Marine – 0.8% | | | | | | |
| | |
Hapag-Lloyd AG(a) | | | 108 | | | | 23,234 | |
| | |
Kuehne + Nagel International AG (Registered) | | | 1,917 | | | | 604,839 | |
| | | | | | | | 628,073 | |
| | |
| Media – 0.5% | | | | | | |
| | |
Pearson plc | | | 42,120 | | | | 347,802 | |
| | |
| Metals & Mining – 0.4% | | | | | | |
| | |
Franco-Nevada Corp. | | | 2,301 | | | | 327,807 | |
| | |
| Multiline Retail – 0.9% | | | | | | |
| | |
Wesfarmers Ltd. | | | 16,254 | | | | 698,930 | |
|
| Oil, Gas & Consumable Fuels – 0.1% | |
| | |
Idemitsu Kosan Co. Ltd. | | | 2,700 | | | | 73,760 | |
| | |
| Personal Products – 1.4% | | | | | | |
| | |
Beiersdorf AG | | | 2,484 | | | | 264,177 | |
| | |
Kobayashi Pharmaceutical Co. Ltd. | | | 8,100 | | | | 647,147 | |
| | |
Unilever plc | | | 2,430 | | | | 130,306 | |
| | | | | | | | 1,041,630 | |
|
| Pharmaceuticals – 12.9% | |
| | |
AstraZeneca plc | | | 5,913 | | | | 737,091 | |
| | |
GlaxoSmithKline plc | | | 71,766 | | | | 1,484,059 | |
| | |
Hikma Pharmaceuticals plc | | | 7,614 | | | | 251,216 | |
| | |
Novartis AG (Registered) | | | 2,376 | | | | 196,685 | |
| | |
Novo Nordisk A/S, Class B | | | 26,028 | | | | 2,851,668 | |
| | |
Ono Pharmaceutical Co. Ltd. | | | 2,700 | | | | 56,486 | |
| | |
Roche Holding AG | | | 9,072 | | | | 3,515,121 | |
| | |
Roche Holding AG – BR | | | 108 | | | | 46,450 | |
| | |
Sanofi | | | 3,105 | | | | 310,566 | |
| | |
Santen Pharmaceutical Co. Ltd. | | | 17,000 | | | | 238,693 | |
| | | | | | | | 9,688,035 | |
|
| Professional Services – 1.9% | |
| | |
RELX plc | | | 24,840 | | | | 770,879 | |
| | |
Wolters Kluwer NV | | | 6,102 | | | | 640,058 | |
| | | | | | | | 1,410,937 | |
See Accompanying Notes to the Financial Statements.
| | | | | | |
| | FLEXSHARES ANNUAL REPORT | | | 129 | |
FlexShares® Developed Markets ex-US Quality Low Volatility Index Fund (cont.)
| | | | | | | | |
| Investments | | Shares | | | Value | |
|
| COMMON STOCKS – (continued) | |
|
| Real Estate Management & Development – 3.1% | |
| | |
CK Asset Holdings Ltd. | | | 13,500 | | | $ | 83,387 | |
| | |
Daito Trust Construction Co. Ltd. | | | 400 | | | | 49,533 | |
| | |
Deutsche Wohnen SE* (c) | | | 3,528 | | | | 216,387 | |
| | |
Hang Lung Properties Ltd. | | | 108,000 | | | | 250,735 | |
| | |
Henderson Land Development Co. Ltd. | | | 135,000 | | | | 565,750 | |
| | |
Hongkong Land Holdings Ltd. | | | 2,700 | | | | 14,877 | |
| | |
New World Development Co. Ltd. | | | 27,000 | | | | 117,142 | |
| | |
PSP Swiss Property AG (Registered) | | | 2,295 | | | | 287,330 | |
| | |
Sun Hung Kai Properties Ltd. | | | 45,000 | | | | 598,724 | |
| | |
Wharf Real Estate Investment Co. Ltd. | | | 27,000 | | | | 152,371 | |
| | | | | | | | 2,336,236 | |
|
| Road & Rail – 0.4% | |
| | |
MTR Corp. Ltd. | | | 54,000 | | | | 294,329 | |
|
| Semiconductors & Semiconductor Equipment – 1.0% | |
| | |
ASML Holding NV | | | 972 | | | | 787,955 | |
|
| Software – 2.1% | |
| | |
Dassault Systemes SE | | | 10,800 | | | | 629,664 | |
| | |
Nice Ltd.* | | | 1,134 | | | | 319,777 | |
| | |
Open Text Corp. | | | 5,184 | | | | 260,716 | |
| | |
Oracle Corp. Japan | | | 2,700 | | | | 254,549 | |
| | |
SAP SE | | | 783 | | | | 113,556 | |
| | | | | | | | 1,578,262 | |
|
| Specialty Retail – 1.8% | |
| | |
ABC-Mart, Inc. | | | 5,400 | | | | 258,102 | |
| | |
Nitori Holdings Co. Ltd. | | | 3,200 | | | | 585,275 | |
| | |
Yamada Holdings Co. Ltd. | | | 124,200 | | | | 473,817 | |
| | | | | | | | 1,317,194 | |
|
| Technology Hardware, Storage & Peripherals – 0.8% | |
| | |
FUJIFILM Holdings Corp. | | | 8,100 | | | | 625,197 | |
|
| Textiles, Apparel & Luxury Goods – 2.7% | |
| | |
Hermes International | | | 513 | | | | 813,624 | |
| | |
LVMH Moet Hennessy Louis Vuitton SE | | | 1,566 | | | | 1,227,258 | |
| | | | | | | | 2,040,882 | |
| | | | | | | | |
| Investments | | Shares | | | Value | |
|
| Tobacco – 0.9% | |
| | |
Japan Tobacco, Inc. | | | 35,100 | | | $ | 688,148 | |
|
| Trading Companies & Distributors – 1.6% | |
| | |
ITOCHU Corp. | | | 21,600 | | | | 614,139 | |
| | |
MonotaRO Co. Ltd. | | | 27,000 | | | | 610,919 | |
| | | | | | | | 1,225,058 | |
|
| Water Utilities – 0.8% | |
| | |
Pennon Group plc | | | 15,174 | | | | 242,525 | |
| | |
United Utilities Group plc | | | 23,463 | | | | 334,002 | |
| | | | | | | | 576,527 | |
|
| Wireless Telecommunication Services – 2.4% | |
| | |
KDDI Corp. | | | 25,800 | | | | 798,267 | |
| | |
Rogers Communications, Inc., Class B | | | 729 | | | | 33,852 | |
| | |
SoftBank Corp. | | | 45,900 | | | | 625,753 | |
| | |
Vodafone Group plc | | | 247,401 | | | | 366,391 | |
| | | | | | | | 1,824,263 | |
Total Common Stocks
(Cost $67,222,791) | | | | 74,810,927 | |
| | | | | | | | | |
Total Investments – 99.3%
(Cost $67,222,791) | | | | 74,810,927 | |
| |
Other assets less liabilities – 0.7% | | | | 560,030 | |
| NET ASSETS – 100.0% | | | $ | 75,370,957 | |
| * | Non-income producing security. |
| (a) | Security exempt from registration pursuant to Regulation S under the Securities Act of 1933. Regulation S applies to securities offerings that are made outside of the United States and do not involve direct selling efforts in the United States and as such may have restrictions on resale. |
| (b) | Represents less than 0.05% of net assets. |
| (c) | Security fair valued as of October 31, 2021 in accordance with procedures approved by the Board of Trustees. Total value of all such securities at October 31, 2021 amounted to $216,387, which represents approximately 0.29% of net assets of the Fund. |
Percentages shown are based on Net Assets.
Abbreviations
OYJ – Public Limited Company
See Accompanying Notes to the Financial Statements.
| | | | |
| 130 | | FLEXSHARES ANNUAL REPORT | | |
FlexShares® Developed Markets ex-US Quality Low Volatility Index Fund (cont.)
As of October 31, 2021, the gross unrealized appreciation (depreciation) of investments based on the aggregate cost of investments (including derivative instruments, if applicable) for federal income tax purposes was as follows:
| | | | |
| | | | |
Aggregate gross unrealized appreciation | | $ | 9,905,087 | |
Aggregate gross unrealized depreciation | | | (2,564,444 | ) |
Net unrealized appreciation | | $ | 7,340,643 | |
Federal income tax cost | | $ | 67,480,249 | |
Futures Contracts
FlexShares® Developed Markets ex-US Quality Low Volatility Index Fund had the following open futures contracts as of October 31, 2021:
| | | | | | | | | | | | | | | | | | | | |
| | | Number of
Contracts | | | Expiration
Date | | | Trading
Currency | | | Notional
Amount | | | Value and
Unrealized
Appreciation* | |
Long Contracts | |
MSCI EAFE E-Mini Index | | | 5 | | | | 12/17/2021 | | | | USD | | | $ | 584,900 | | | $ | 4,748 | |
| * | This amount represents the cumulative appreciation/depreciation on futures contracts. Current day’s variation margin is reported within the Statement of Assets and Liabilities for futures contracts. |
Forward Foreign Currency Contracts
FlexShares® Developed Markets ex-US Quality Low Volatility Index Fund had the following outstanding contracts as of October 31, 2021:
| | | | | | | | | | | | | | | | | | | | | | |
| Contracts to Receive | | Counterparty | | In Exchange For | | | Maturity Date | | | Unrealized
Appreciation/
(Depreciation) | |
AUD | | | 141,644 | | | | | Morgan Stanley | | USD | | | 104,952 | | | | 12/15/2021 | | | $ | 1,455 | |
CAD | | | 6,535 | | | | | Citibank NA | | USD | | | 5,246 | | | | 12/15/2021 | | | | 26 | |
CAD | | | 7,999 | | | | | Toronto-Dominion Bank (The) | | USD | | | 6,306 | | | | 12/15/2021 | | | | 147 | |
CHF | | | 37,160 | | | | | Morgan Stanley | | USD | | | 40,039 | | | | 12/15/2021 | | | | 682 | |
DKK | | | 58,667 | | | | | Bank of New York | | USD | | | 9,114 | | | | 12/15/2021 | | | | 22 | |
EUR | | | 79,445 | | | | | Morgan Stanley | | USD | | | 91,822 | | | | 12/15/2021 | | | | 213 | |
GBP | | | 45,643 | | | | | Citibank NA | | USD | | | 62,023 | | | | 12/15/2021 | | | | 552 | |
ILS | | | 38,719 | | | | | Toronto-Dominion Bank (The) | | USD | | | 12,229 | | | | 12/15/2021 | | | | 40 | |
JPY | | | 14,298,839 | | | | | Citibank NA | | USD | | | 125,264 | | | | 12/15/2021 | | | | 200 | |
NOK | | | 170,805 | | | | | Morgan Stanley | | USD | | | 19,986 | | | | 12/15/2021 | | | | 199 | |
NZD | | | 20,383 | | | | | Citibank NA | | USD | | | 14,122 | | | | 12/15/2021 | | | | 454 | |
SEK | | | 92,881 | | | | | Morgan Stanley | | USD | | | 10,598 | | | | 12/15/2021 | | | | 224 | |
SGD | | | 38,124 | | | | | Toronto-Dominion Bank (The) | | USD | | | 28,104 | | | | 12/15/2021 | | | | 162 | |
USD | | | 60,182 | | | | | Bank of New York | | DKK | | | 378,042 | | | | 12/15/2021 | | | | 1,309 | |
USD | | | 145,461 | | | | | BNP Paribas SA | | EUR | | | 122,771 | | | | 12/15/2021 | | | | 3,232 | |
USD | | | 61,642 | | | | | Morgan Stanley | | EUR | | | 52,991 | | | | 12/15/2021 | | | | 253 | |
USD | | | 48,812 | | | | | Morgan Stanley | | GBP | | | 35,259 | | | | 12/15/2021 | | | | 473 | |
USD | | | 160,897 | | | | | Toronto-Dominion Bank (The) | | GBP | | | 116,815 | | | | 12/15/2021 | | | | 746 | |
USD | | | 65,510 | | | | | BNP Paribas SA | | HKD | | | 509,308 | | | | 12/15/2021 | | | | 31 | |
USD | | | 76,299 | | | | | BNP Paribas SA | | JPY | | | 8,587,129 | | | | 12/15/2021 | | | | 952 | |
USD | | | 102,472 | | | | | Citibank NA | | JPY | | | 11,644,786 | | | | 12/15/2021 | | | | 295 | |
USD | | | 169,261 | | | | | Morgan Stanley | | JPY | | | 18,933,055 | | | | 12/15/2021 | | | | 3,135 | |
Total unrealized appreciation | | | $ | 14,802 | |
See Accompanying Notes to the Financial Statements.
| | | | | | |
| | FLEXSHARES ANNUAL REPORT | | | 131 | |
FlexShares® Developed Markets ex-US Quality Low Volatility Index Fund (cont.)
Forward Foreign Currency Contracts (cont.)
| | | | | | | | | | | | | | | | | | | | | | |
| Contracts to Receive | | Counterparty | | In Exchange For | | | Maturity Date | | | Unrealized
Appreciation/
(Depreciation) | |
AUD | | | 15,423 | | | | | Bank of New York | | USD | | | 11,630 | | | | 12/15/2021 | | | $ | (44 | ) |
CAD | | | 10,519 | | | | | Morgan Stanley | | USD | | | 8,518 | | | | 12/15/2021 | | | | (31 | ) |
CHF | | | 25,082 | | | | | BNP Paribas SA | | USD | | | 27,497 | | | | 12/15/2021 | | | | (11 | ) |
DKK | | | 52,098 | | | | | Citibank NA | | USD | | | 8,187 | | | | 12/15/2021 | | | | (73 | ) |
EUR | | | 157,791 | | | | | Toronto-Dominion Bank (The) | | USD | | | 184,527 | | | | 12/15/2021 | | | | (1,728 | ) |
GBP | | | 11,553 | | | | | BNP Paribas SA | | USD | | | 15,940 | | | | 12/15/2021 | | | | (101 | ) |
GBP | | | 20,075 | | | | | Morgan Stanley | | USD | | | 27,817 | | | | 12/15/2021 | | | | (295 | ) |
GBP | | | 16,076 | | | | | Toronto-Dominion Bank (The) | | USD | | | 22,103 | | | | 12/15/2021 | | | | (63 | ) |
HKD | | | 355,868 | | | | | Citibank NA | | USD | | | 45,769 | | | | 12/15/2021 | | | | (16 | ) |
HKD | | | 243,445 | | | | | Toronto-Dominion Bank (The) | | USD | | | 31,301 | | | | 12/15/2021 | | | | (3 | ) |
JPY | | | 2,517,017 | | | | | BNP Paribas SA | | USD | | | 22,903 | | | | 12/15/2021 | | | | (818 | ) |
JPY | | | 2,974,091 | | | | | Morgan Stanley | | USD | | | 27,024 | | | | 12/15/2021 | | | | (928 | ) |
NOK | | | 69,316 | | | | | Citibank NA | | USD | | | 8,317 | | | | 12/15/2021 | | | | (126 | ) |
NZD | | | 12,229 | | | | | Morgan Stanley | | USD | | | 8,803 | | | | 12/15/2021 | | | | (57 | ) |
SEK | | | 109,602 | | | | | Morgan Stanley | | USD | | | 12,835 | | | | 12/15/2021 | | | | (66 | ) |
SGD | | | 8,365 | | | | | Bank of New York | | USD | | | 6,219 | | | | 12/15/2021 | | | | (17 | ) |
SGD | | | 49,238 | | | | | BNP Paribas SA | | USD | | | 36,636 | | | | 12/15/2021 | | | | (130 | ) |
USD | | | 32,125 | | | | | Morgan Stanley | | AUD | | | 43,473 | | | | 12/15/2021 | | | | (533 | ) |
USD | | | 42,200 | | | | | Toronto-Dominion Bank (The) | | CAD | | | 53,830 | | | | 12/15/2021 | | | | (1,231 | ) |
USD | | | 34,997 | | | | | Citibank NA | | CHF | | | 32,252 | | | | 12/15/2021 | | | | (346 | ) |
USD | | | 85,645 | | | | | Morgan Stanley | | CHF | | | 78,437 | | | | 12/15/2021 | | | | (308 | ) |
USD | | | 21,275 | | | | | Toronto-Dominion Bank (The) | | CHF | | | 19,771 | | | | 12/15/2021 | | | | (391 | ) |
USD | | | 247,259 | | | | | Bank of New York | | EUR | | | 214,091 | | | | 12/15/2021 | | | | (761 | ) |
USD | | | 36,526 | | | | | BNP Paribas SA | | HKD | | | 284,118 | | | | 12/15/2021 | | | | (2 | ) |
USD | | | 784 | | | | | BNP Paribas SA | | ILS | | | 2,512 | | | | 12/15/2021 | | | | (12 | ) |
USD | | | 35,545 | | | | | Citibank NA | | NOK | | | 309,199 | | | | 12/15/2021 | | | | (995 | ) |
USD | | | 41,546 | | | | | Toronto-Dominion Bank (The) | | NZD | | | 58,517 | | | | 12/15/2021 | | | | (304 | ) |
USD | | | 85,422 | | | | | Citibank NA | | SEK | | | 734,867 | | | | 12/15/2021 | | | | (195 | ) |
Total unrealized depreciation | | | $ | (9,585 | ) |
Net unrealized appreciation | | | $ | 5,217 | |
Abbreviations:
AUD – Australian Dollar
CAD – Canadian Dollar
CHF – Swiss Franc
DKK – Danish Krone
EUR – Euro
GBP – British Pound
HKD – Hong Kong Dollar
ILS – Israeli Shekel
JPY – Japanese Yen
NOK – Norwegian Krone
NZD – New Zealand Dollar
SEK – Swedish Krona
SGD – Singapore Dollar
USD – US Dollar
See Accompanying Notes to the Financial Statements.
| | | | |
| 132 | | FLEXSHARES ANNUAL REPORT | | |
FlexShares® Developed Markets ex-US Quality Low Volatility Index Fund (cont.)
FlexShares® Developed Markets ex-US Quality Low Volatility Index Fund invested, as a percentage of net assets, in companies domiciled in the following countries as of October 31, 2021:
| | | | |
Australia | | | 4.6 | % |
Belgium | | | 1.2 | |
Canada | | | 7.6 | |
Denmark | | | 6.4 | |
Finland | | | 1.8 | |
France | | | 6.5 | |
Germany | | | 4.4 | |
Hong Kong | | | 6.7 | |
Israel | | | 1.9 | |
Italy | | | 1.0 | |
Japan | | | 23.9 | |
Netherlands | | | 5.0 | |
New Zealand | | | 0.1 | |
Norway | | | 0.0 | † |
Portugal | | | 0.3 | |
Singapore | | | 2.0 | |
Spain | | | 1.6 | |
Sweden | | | 1.3 | |
Switzerland | | | 13.2 | |
United Kingdom | | | 9.8 | |
Other1 | | | 0.7 | |
| | | | 100.0 | % |
| † | Amount represents less than 0.05%. |
| 1 | Includes any non-equity securities and net other assets (liabilities). |
| | | | |
| Security Type | | % of Net Assets | |
Common Stocks | | | 99.3 | % |
Others(1) | | | 0.7 | |
| | | | 100.0 | % |
| (1) | Includes any other net assets/(liabilities). |
See Accompanying Notes to the Financial Statements.
| | | | | | |
| | FLEXSHARES ANNUAL REPORT | | | 133 | |
Schedule of Investments
FlexShares® Emerging Markets Quality Low Volatility Index Fund
October 31, 2021
| | | | | | | | |
| Investments | | Shares | | | Value | |
|
| COMMON STOCKS – 99.0% | |
|
| Air Freight & Logistics – 0.5% | |
| | |
Agility Public Warehousing Co. KSC | | | 25,482 | | | $ | 84,531 | |
|
| Auto Components – 0.7% | |
| | |
MRF Ltd. | | | 108 | | | | 111,500 | |
|
| Automobiles – 1.0% | |
| | |
Bajaj Auto Ltd. | | | 2,370 | | | | 117,335 | |
| | |
Hero MotoCorp Ltd. | | | 1,014 | | | | 35,981 | |
| | | | | | | | 153,316 | |
|
| Banks – 19.8% | |
| | |
Agricultural Bank of China Ltd., Class H | | | 162,000 | | | | 55,187 | |
| | |
Al Rajhi Bank | | | 7,080 | | | | 261,614 | |
| | |
Bank Central Asia Tbk. PT | | | 15,000 | | | | 7,914 | |
| | |
Bank of China Ltd., Class H | | | 804,000 | | | | 284,225 | |
| | |
Bank of Communications Co. Ltd., Class H | | | 162,000 | | | | 96,421 | |
| | |
Banque Centrale Populaire | | | 2,442 | | | | 77,395 | |
| | |
Chang Hwa Commercial Bank Ltd. | | | 121,200 | | | | 71,477 | |
| | |
China Construction Bank Corp., Class H | | | 204,000 | | | | 138,727 | |
| | |
China Merchants Bank Co. Ltd., Class H | | | 2,000 | | | | 16,853 | |
| | |
Commercial Bank PSQC (The) | | | 20,976 | | | | 35,200 | |
| | |
Commercial International Bank Egypt SAE* | | | 43,128 | | | | 140,036 | |
| | |
E.Sun Financial Holding Co. Ltd. | | | 83,519 | | | | 79,739 | |
| | |
First Financial Holding Co. Ltd. | | | 109,260 | | | | 89,974 | |
| | |
Grupo Elektra SAB de CV | | | 330 | | | | 25,396 | |
| | |
Hong Leong Bank Bhd. | | | 18,600 | | | | 84,533 | |
| | |
Hua Nan Financial Holdings Co. Ltd. | | | 135,484 | | | | 99,146 | |
| | |
Industrial & Commercial Bank of China Ltd., Class H | | | 258,000 | | | | 141,287 | |
| | |
Itau Unibanco Holding SA (Preference) | | | 1,200 | | | | 4,962 | |
| | |
Kuwait Finance House KSCP | | | 39,624 | | | | 109,362 | |
| | |
Malayan Banking Bhd. | | | 45,785 | | | | 89,005 | |
| | |
Masraf Al Rayan QSC | | | 103,608 | | | | 135,877 | |
| | |
Mega Financial Holding Co. Ltd. | | | 126,000 | | | | 151,335 | |
| | |
National Bank of Kuwait SAKP | | | 67,110 | | | | 220,398 | |
| | | | | | | | |
| Investments | | Shares | | | Value | |
|
| Banks – (continued) | |
| | |
Postal Savings Bank of China Co. Ltd., Class H(a) | | | 120,000 | | | $ | 87,311 | |
| | |
Qatar Islamic Bank SAQ | | | 25,794 | | | | 130,493 | |
| | |
Qatar National Bank QPSC | | | 45,576 | | | | 256,608 | |
| | |
Saudi National Bank (The) | | | 1,482 | | | | 26,037 | |
| | |
Sberbank of Russia PJSC | | | 12,360 | | | | 62,027 | |
| | |
SinoPac Financial Holdings Co. Ltd. | | | 114,000 | | | | 58,008 | |
| | |
Taiwan Cooperative Financial Holding Co. Ltd. | | | 118,207 | | | | 96,067 | |
| | | | | | | | 3,132,614 | |
|
| Biotechnology – 0.4% | |
| | |
Celltrion, Inc.* | | | 67 | | | | 11,496 | |
| | |
Green Cross Corp. | | | 228 | | | | 53,558 | |
| | |
Seegene, Inc. | | | 66 | | | | 3,005 | |
| | | | | | | | 68,059 | |
|
| Capital Markets – 0.9% | |
| | |
Macquarie Korea Infrastructure Fund | | | 11,664 | | | | 136,748 | |
|
| Chemicals – 4.0% | |
| | |
Asian Paints Ltd. | | | 3,906 | | | | 161,709 | |
| | |
PhosAgro PJSC | | | 1,356 | | | | 107,049 | |
| | |
Pidilite Industries Ltd. | | | 3,012 | | | | 93,063 | |
| | |
SABIC Agri-Nutrients Co. | | | 4,038 | | | | 176,553 | |
| | |
Yanbu National Petrochemical Co. | | | 4,458 | | | | 90,446 | |
| | | | | | | | 628,820 | |
|
| Commercial Services & Supplies – 0.8% | |
| | |
S-1 Corp. | | | 1,710 | | | | 121,897 | |
|
| Construction Materials – 0.7% | |
| | |
ACC Ltd. | | | 348 | | | | 10,844 | |
| | |
LafargeHolcim Maroc SA | | | 396 | | | | 100,404 | |
| | | | | | | | 111,248 | |
|
| Diversified Consumer Services – 0.3% | |
| | |
China East Education Holdings Ltd.* (a) | | | 51,000 | | | | 48,581 | |
|
| Diversified Telecommunication Services – 5.3% | |
| | |
China Tower Corp. Ltd., Class H(a) | | | 516,000 | | | | 66,995 | |
| | |
Chunghwa Telecom Co. Ltd. | | | 39,000 | | | | 154,971 | |
See Accompanying Notes to the Financial Statements.
| | | | |
| 134 | | FLEXSHARES ANNUAL REPORT | | |
FlexShares® Emerging Markets Quality Low Volatility Index Fund (cont.)
| | | | | | | | |
| Investments | | Shares | | | Value | |
|
| COMMON STOCKS – (continued) | |
|
| Diversified Telecommunication Services – (continued) | |
| | |
Emirates Integrated Telecommunications Co. PJSC | | | 46,734 | | | $ | 78,247 | |
| | |
Emirates Telecommunications Group Co. PJSC | | | 12,978 | | | | 90,450 | |
| | |
Itissalat Al-Maghrib | | | 7,830 | | | | 123,691 | |
| | |
Saudi Telecom Co. | | | 6,018 | | | | 187,717 | |
| | |
Telefonica Brasil SA | | | 10,800 | | | | 87,212 | |
| | |
TIME dotCom Bhd. | | | 47,400 | | | | 51,738 | |
| | | | | | | | 841,021 | |
|
| Electric Utilities – 0.6% | |
| | |
Cia de Transmissao de Energia Eletrica Paulista (Preference) | | | 3,600 | | | | 15,531 | |
| | |
Manila Electric Co. | | | 14,400 | | | | 81,984 | |
| | | | | | | | 97,515 | |
|
| Electronic Equipment, Instruments & Components – 1.0% | |
| | |
Hon Hai Precision Industry Co. Ltd. | | | 19,000 | | | | 73,107 | |
| | |
WPG Holdings Ltd. | | | 48,000 | | | | 89,584 | |
| | | | | | | | 162,691 | |
| | |
| Entertainment – 0.4% | | | | | | |
| | |
NetEase, Inc., ADR | | | 576 | | | | 56,212 | |
|
| Food & Staples Retailing – 2.3% | |
| | |
BIM Birlesik Magazalar A/S | | | 13,962 | | | | 90,247 | |
| | |
President Chain Store Corp. | | | 9,000 | | | | 90,943 | |
| | |
Puregold Price Club, Inc. | | | 71,640 | | | | 60,044 | |
| | |
Raia Drogasil SA* | | | 2,400 | | | | 9,899 | |
| | |
Sun Art Retail Group Ltd. | | | 93,000 | | | | 54,755 | |
| | |
Wal-Mart de Mexico SAB de CV | | | 16,800 | | | | 58,726 | |
| | | | | | | | 364,614 | |
|
| Food Products – 6.2% | |
| | |
Almarai Co. JSC | | | 4,284 | | | | 60,418 | |
| | |
Dali Foods Group Co. Ltd.(a) | | | 231,000 | | | | 128,580 | |
| | |
International Holding Co. PJSC* | | | 2,940 | | | | 117,259 | |
| | |
Nestle Malaysia Bhd. | | | 3,900 | | | | 126,672 | |
| | |
Orion Corp. | | | 816 | | | | 82,400 | |
| | |
Tingyi Cayman Islands Holding Corp. | | | 70,000 | | | | 131,019 | |
| | |
Uni-President China Holdings Ltd. | | | 108,000 | | | | 92,186 | |
| | |
Uni-President Enterprises Corp. | | | 42,000 | | | | 100,588 | |
| | | | | | | | |
| Investments | | Shares | | | Value | |
|
| Food Products – (continued) | |
| | |
Want Want China Holdings Ltd. | | | 186,000 | | | $ | 144,180 | |
| | | | | | | | 983,302 | |
|
| Gas Utilities – 1.8% | |
| | |
China Resources Gas Group Ltd. | | | 14,000 | | | | 75,228 | |
| | |
ENN Energy Holdings Ltd. | | | 5,200 | | | | 90,042 | |
| | |
Petronas Gas Bhd. | | | 31,200 | | | | 126,126 | |
| | | | | | | | 291,396 | |
|
| Health Care Providers & Services – 5.0% | |
| | |
Apollo Hospitals Enterprise Ltd. | | | 2,028 | | | | 115,429 | |
| | |
Bangkok Dusit Medical Services PCL, NVDR | | | 163,800 | | | | 116,004 | |
| | |
Bangkok Dusit Medical Services PCL, Class F | | | 17,400 | | | | 12,375 | |
| | |
Bumrungrad Hospital PCL, NVDR | | | 30,600 | | | | 134,176 | |
| | |
Celltrion Healthcare Co. Ltd.* | | | 808 | | | | 55,939 | |
| | |
Dr Sulaiman Al Habib Medical Services Group Co. | | | 1,740 | | | | 76,913 | |
| | |
IHH Healthcare Bhd. | | | 59,400 | | | | 93,812 | |
| | |
Mitra Keluarga Karyasehat Tbk. PT(a) | | | 589,800 | | | | 94,917 | |
| | |
Mouwasat Medical Services Co. | | | 1,542 | | | | 73,916 | |
| | |
Shanghai Pharmaceuticals Holding Co. Ltd., Class H | | | 8,400 | | | | 15,398 | |
| | | | | | | | 788,879 | |
|
| Hotels, Restaurants & Leisure – 1.1% | |
| | |
Jubilant Foodworks Ltd. | | | 1,110 | | | | 54,688 | |
| | |
Yum China Holdings, Inc. | | | 2,214 | | | | 126,375 | |
| | | | | 181,063 | |
|
| Household Durables – 0.6% | |
| | |
Coway Co. Ltd. | | | 1,326 | | | | 90,098 | |
|
| Household Products – 0.1% | |
| | |
Hindustan Unilever Ltd. | | | 528 | | | | 16,875 | |
|
Independent Power and Renewable Electricity
Producers – 0.2% | |
| | |
Unipro PJSC | | | 846,000 | | | | 32,523 | |
|
| Industrial Conglomerates – 0.4% | |
| | |
Enka Insaat ve Sanayi A/S | | | 59,766 | | | | 68,374 | |
See Accompanying Notes to the Financial Statements.
| | | | | | |
| | FLEXSHARES ANNUAL REPORT | | | 135 | |
FlexShares® Emerging Markets Quality Low Volatility Index Fund (cont.)
| | | | | | | | |
| Investments | | Shares | | | Value | |
|
| COMMON STOCKS – (continued) | |
|
| Insurance – 0.5% | |
| | |
Ping An Insurance Group Co. of China Ltd., Class H | | | 12,000 | | | $ | 86,232 | |
|
| Interactive Media & Services – 3.9% | |
| | |
Baidu, Inc., ADR* | | | 264 | | | | 42,831 | |
| | |
Tencent Holdings Ltd. | | | 9,400 | | | | 581,228 | |
| | | | | | | | 624,059 | |
|
| Internet & Direct Marketing Retail – 6.0% | |
| | |
Alibaba Group Holding Ltd., ADR* | | | 4,872 | | | | 803,588 | |
| | |
JD.com, Inc., ADR* | | | 1,314 | | | | 102,860 | |
| | |
Pinduoduo, Inc., ADR* | | | 480 | | | | 42,681 | |
| | | | | | | | 949,129 | |
|
| IT Services – 3.6% | |
| | |
Infosys Ltd. | | | 4,854 | | | | 108,108 | |
| | |
Mphasis Ltd. | | | 210 | | | | 9,074 | |
| | |
Samsung SDS Co. Ltd. | | | 174 | | | | 22,782 | |
| | |
Tata Consultancy Services Ltd. | | | 7,020 | | | | 318,534 | |
| | |
Tech Mahindra Ltd. | | | 5,328 | | | | 105,153 | |
| | | | | | | | 563,651 | |
|
| Life Sciences Tools & Services – 0.0%(b) | |
| | |
Divi’s Laboratories Ltd. | | | 84 | | | | 5,777 | |
|
| Marine – 0.7% | |
| | |
MISC Bhd. | | | 4,200 | | | | 7,171 | |
| | |
Orient Overseas International Ltd. | | | 5,500 | | | | 101,600 | |
| | | | | | | | 108,771 | |
|
| Metals & Mining – 1.1% | |
| | |
Polyus PJSC | | | 546 | | | | 108,298 | |
| | |
Vale SA | | | 5,400 | | | | 68,599 | |
| | | | | | | | 176,897 | |
|
| Multiline Retail – 0.0%(b) | |
| | |
Robinson PCL* (c) | | | 600 | | | | 353 | |
|
| Multi-Utilities – 0.7% | |
| | |
Qatar Electricity & Water Co. QSC | | | 24,546 | | | | 113,258 | |
|
| Oil, Gas & Consumable Fuels – 2.5% | |
| | |
China Shenhua Energy Co. Ltd., Class H | | | 66,000 | | | | 142,197 | |
| | | | | | | | |
| Investments | | Shares | | | Value | |
|
| Oil, Gas & Consumable Fuels – (continued) | |
| | |
Petroleo Brasileiro SA (Preference) | | | 1,200 | | | $ | 5,801 | |
| | |
Petronas Dagangan Bhd. | | | 16,200 | | | | 79,651 | |
| | |
Qatar Fuel QSC | | | 16,242 | | | | 82,035 | |
| | |
Surgutneftegas PJSC (Preference) | | | 156,600 | | | | 85,239 | |
| | | | | | | | 394,923 | |
|
| Personal Products – 0.0%(b) | |
| | |
Hengan International Group Co. Ltd. | | | 500 | | | | 2,613 | |
|
| Pharmaceuticals – 2.8% | |
| | |
Alkem Laboratories Ltd. | | | 2,328 | | | | 112,252 | |
| | |
Cadila Healthcare Ltd. | | | 5,370 | | | | 36,058 | |
| | |
Dr Reddy’s Laboratories Ltd. | | | 552 | | | | 34,346 | |
| | |
Lupin Ltd. | | | 2,262 | | | | 27,879 | |
| | |
Richter Gedeon Nyrt. | | | 2,760 | | | | 77,391 | |
| | |
Sino Biopharmaceutical Ltd. | | | 90,000 | | | | 66,640 | |
| | |
Yuhan Corp. | | | 1,620 | | | | 83,041 | |
| | | | | | | | 437,607 | |
|
| Professional Services – 0.4% | |
| | |
51job, Inc., ADR* | | | 1,134 | | | | 67,541 | |
|
| Road & Rail – 0.4% | |
| | |
CJ Logistics Corp.* | | | 546 | | | | 66,349 | |
|
| Semiconductors & Semiconductor Equipment – 8.4% | |
| | |
MediaTek, Inc. | | | 1,600 | | | | 52,531 | |
| | |
Taiwan Semiconductor Manufacturing Co. Ltd. | | | 60,000 | | | | 1,272,992 | |
| | | | | | | | 1,325,523 | |
|
| Specialty Retail – 2.8% | |
| | |
Abu Dhabi National Oil Co. for Distribution PJSC | | | 98,028 | | | | 114,224 | |
| | |
Home Product Center PCL, NVDR | | | 251,600 | | | | 110,702 | |
| | |
Jarir Marketing Co. | | | 2,154 | | | | 116,460 | |
| | |
Zhongsheng Group Holdings Ltd. | | | 10,500 | | | | 94,957 | |
| | | | | | | | 436,343 | |
|
| Technology Hardware, Storage & Peripherals – 3.6% | |
| | |
Lite-On Technology Corp. | | | 7,000 | | | | 15,430 | |
| | |
Samsung Electronics Co. Ltd. | | | 9,312 | | | | 556,226 | |
| | | | | | | | 571,656 | |
See Accompanying Notes to the Financial Statements.
| | | | |
| 136 | | FLEXSHARES ANNUAL REPORT | | |
FlexShares® Emerging Markets Quality Low Volatility Index Fund (cont.)
| | | | | | | | |
| Investments | | Shares | | | Value | |
|
| COMMON STOCKS – (continued) | |
|
| Textiles, Apparel & Luxury Goods – 0.3% | |
| | |
Li Ning Co. Ltd. | | | 500 | | | $ | 5,560 | |
| | |
Page Industries Ltd. | | | 90 | | | | 45,235 | |
| | | | | | | | 50,795 | |
|
| Thrifts & Mortgage Finance – 0.1% | |
| | |
Housing Development Finance Corp. Ltd. | | | 318 | | | | 12,081 | |
|
| Tobacco – 0.6% | |
| | |
KT&G Corp. | | | 1,398 | | | | 97,024 | |
|
| Transportation Infrastructure – 0.8% | |
| | |
Westports Holdings Bhd. | | | 114,600 | | | | 123,705 | |
|
| Water Utilities – 0.5% | |
| | |
Guangdong Investment Ltd. | | | 62,000 | | | | 78,107 | |
|
| Wireless Telecommunication Services – 5.2% | |
| | |
Advanced Info Service PCL, NVDR | | | 16,800 | | | | 95,689 | |
| | |
Far EasTone Telecommunications Co. Ltd. | | | 38,000 | | | | 83,629 | |
| | |
Globe Telecom, Inc. | | | 1,950 | | | | 115,894 | |
| | |
Intouch Holdings PCL, NVDR | | | 54,000 | | | | 122,459 | |
| | |
Maxis Bhd. | | | 71,400 | | | | 80,521 | |
| | |
Mobile Telecommunications Co. KSCP | | | 42,696 | | | | 84,415 | |
| | |
PLDT, Inc. | | | 3,060 | | | | 99,673 | |
| | |
Taiwan Mobile Co. Ltd. | | | 25,000 | | | | 88,192 | |
| | |
Vodacom Group Ltd. | | | 5,736 | | | | 51,164 | |
| | | | | | | | 821,636 | |
Total Common Stocks
(Cost $14,649,196) | | | | 15,685,907 | |
| | | | | | | | | |
Total Investments – 99.0%
(Cost $14,649,196) | | | | 15,685,907 | |
| |
Other assets less liabilities – 1.0% | | | | 157,784 | |
| NET ASSETS – 100.0% | | | $ | 15,843,691 | |
| * | Non-income producing security. |
| (a) | Security exempt from registration pursuant to Regulation S under the Securities Act of 1933. Regulation S applies to securities offerings that are made outside of the United States and do not involve direct selling efforts in the United States and as such may have restrictions on resale. |
| (b) | Represents less than 0.05% of net assets. |
| (c) | Security fair valued as of October 31, 2021 in accordance with procedures approved by the Board of Trustees. Total value of all such securities at October 31, 2021 amounted to $353, which represents approximately 0.00% of net assets of the Fund. |
Percentages shown are based on Net Assets.
Abbreviations
ADR – American Depositary Receipt
NVDR – Non-Voting Depositary Receipt
PJSC – Public Joint Stock Company
Preference – A special type of equity investment that shares in the earnings of the company, has limited voting rights, and may have a dividend preference. Preference shares may also have liquidation preference.
As of October 31, 2021, the gross unrealized appreciation (depreciation) of investments based on the aggregate cost of investments (including derivative instruments, if applicable) for federal income tax purposes was as follows:
| | | | |
| | | | |
Aggregate gross unrealized appreciation | | $ | 1,953,629 | |
Aggregate gross unrealized depreciation | | | (972,600 | ) |
Net unrealized appreciation | | $ | 981,029 | |
Federal income tax cost | | $ | 14,703,259 | |
See Accompanying Notes to the Financial Statements.
| | | | | | |
| | FLEXSHARES ANNUAL REPORT | | | 137 | |
FlexShares® Emerging Markets Quality Low Volatility Index Fund (cont.)
Futures Contracts
FlexShares® Emerging Markets Quality Low Volatility Index Fund had the following open futures contracts as of October 31, 2021:
| | | | | | | | | | | | | | | | | | | | |
| | | Number of
Contracts | | | Expiration
Date | | | Trading
Currency | | | Notional
Amount | | | Value and
Unrealized
Depreciation* | |
Long Contracts | |
MSCI Emerging Markets E-Mini Index | | | 3 | | | | 12/17/2021 | | | | USD | | | $ | 189,300 | | | $ | (1,621 | ) |
| * | This amount represents the cumulative appreciation/depreciation on futures contracts. Current day’s variation margin is reported within the Statement of Assets and Liabilities for futures contracts. |
Forward Foreign Currency Contracts
FlexShares® Emerging Markets Quality Low Volatility Index Fund had the following outstanding contracts as of October 31, 2021:
| | | | | | | | | | | | | | | | | | | | |
| Contracts to Receive | | | Counterparty | | In Exchange For | | | Maturity Date | | | Unrealized
Appreciation/
(Depreciation) | |
USD | | | 5,145 | | | JPMorgan Chase Bank | | HKD | | | 40,000 | | | | 12/15/2021 | | | $ | 2 | |
Net unrealized appreciation | | | $ | 2 | |
Abbreviations:
HKD — Hong Kong Dollar
USD — US Dollar
FlexShares® Emerging Markets Quality Low Volatility Index Fund invested, as a percentage of net assets, in companies domiciled in the following countries as of October 31, 2021:
| | | | |
Brazil | | | 1.2 | % |
China | | | 25.7 | |
Egypt | | | 0.9 | |
Hungary | | | 0.5 | |
India | | | 9.7 | |
Indonesia | | | 0.7 | |
Kuwait | | | 3.1 | |
Malaysia | | | 5.4 | |
Mexico | | | 0.5 | |
Morocco | | | 1.9 | |
Philippines | | | 2.3 | |
Qatar | | | 4.8 | |
Russia | | | 2.5 | |
Saudi Arabia | | | 6.8 | |
South Africa | | | 0.3 | |
South Korea | | | 8.7 | |
Taiwan | | | 16.8 | |
Thailand | | | 3.7 | |
Turkey | | | 1.0 | |
United Arab Emirates | | | 2.5 | |
Other1 | | | 1.0 | |
| | | | 100.0 | % |
| 1 | Includes any non-equity securities and net other assets (liabilities). |
See Accompanying Notes to the Financial Statements.
| | | | |
| 138 | | FLEXSHARES ANNUAL REPORT | | |
FlexShares® Emerging Markets Quality Low Volatility Index Fund (cont.)
| | | | |
| Security Type | | % of Net Assets | |
Common Stocks | | | 99.0 | % |
Others(1) | | | 1.0 | |
| | | | 100.0 | % |
| (1) | Includes any other net assets/(liabilities). |
See Accompanying Notes to the Financial Statements.
| | | | | | |
| | FLEXSHARES ANNUAL REPORT | | | 139 | |
Schedule of Investments
FlexShares® Morningstar US Market Factor Tilt Index Fund
October 31, 2021
| | | | | | | | |
| Investments | | Shares | | | Value | |
|
| COMMON STOCKS – 99.3% | |
|
| Aerospace & Defense – 1.2% | |
| | |
AAR Corp.* | | | 2,895 | | | $ | 102,396 | |
| | |
Aerojet Rocketdyne Holdings, Inc.(a) | | | 2,123 | | | | 93,433 | |
| | |
AeroVironment, Inc.* (a) | | | 772 | | | | 68,793 | |
| | |
Axon Enterprise, Inc.* | | | 2,509 | | | | 451,520 | |
| | |
Boeing Co. (The)* | | | 14,475 | | | | 2,996,759 | |
| | |
BWX Technologies, Inc.(a) | | | 2,509 | | | | 142,361 | |
| | |
Curtiss-Wright Corp. | | | 2,702 | | | | 344,991 | |
| | |
Ducommun, Inc.* | | | 193 | | | | 9,339 | |
| | |
General Dynamics Corp. | | | 7,334 | | | | 1,486,969 | |
| | |
HEICO Corp. | | | 2,316 | | | | 322,827 | |
| | |
HEICO Corp., Class A | | | 1,930 | | | | 242,562 | |
| | |
Hexcel Corp.* (a) | | | 5,404 | | | | 306,623 | |
| | |
Howmet Aerospace, Inc. | | | 12,738 | | | | 378,191 | |
| | |
Huntington Ingalls Industries, Inc. | | | 1,351 | | | | 273,888 | |
| | |
Kaman Corp.(a) | | | 5,018 | | | | 179,594 | |
| | |
Kratos Defense & Security Solutions, Inc.* (a) | | | 2,702 | | | | 57,796 | |
| | |
L3Harris Technologies, Inc.(a) | | | 6,562 | | | | 1,512,804 | |
| | |
Lockheed Martin Corp. | | | 7,913 | | | | 2,629,648 | |
| | |
Maxar Technologies, Inc.(a) | | | 4,825 | | | | 128,104 | |
| | |
Mercury Systems, Inc.* | | | 5,018 | | | | 258,628 | |
| | |
Moog, Inc., Class A | | | 7,527 | | | | 568,514 | |
| | |
National Presto Industries, Inc. | | | 193 | | | | 16,048 | |
| | |
Northrop Grumman Corp. | | | 5,018 | | | | 1,792,530 | |
| | |
Parsons Corp.* | | | 2,702 | | | | 93,597 | |
| | |
Raytheon Technologies Corp. | | | 49,601 | | | | 4,407,545 | |
| | |
Spirit AeroSystems Holdings, Inc., Class A | | | 7,913 | | | | 326,728 | |
| | |
Textron, Inc. | | | 8,106 | | | | 598,628 | |
| | |
TransDigm Group, Inc.* | | | 1,737 | | | | 1,083,575 | |
| | |
Triumph Group, Inc.* | | | 9,264 | | | | 189,449 | |
| | |
Vectrus, Inc.* | | | 1,158 | | | | 56,082 | |
| | |
Virgin Galactic Holdings, Inc.* (a) | | | 6,948 | | | | 130,275 | |
| | | | | | | | 21,250,197 | |
| | | | | | | | |
| Investments | | Shares | | | Value | |
|
| Air Freight & Logistics – 0.5% | |
| | |
Air Transport Services Group, Inc.* (a) | | | 17,949 | | | $ | 446,751 | |
| | |
Atlas Air Worldwide Holdings, Inc.* | | | 7,141 | | | | 579,278 | |
| | |
CH Robinson Worldwide, Inc. | | | 4,053 | | | | 393,100 | |
| | |
Echo Global Logistics, Inc.* | | | 3,088 | | | | 148,934 | |
| | |
Expeditors International of Washington, Inc. | | | 4,439 | | | | 547,151 | |
| | |
FedEx Corp. | | | 7,913 | | | | 1,863,749 | |
| | |
Forward Air Corp.(a) | | | 965 | | | | 97,040 | |
| | |
Hub Group, Inc., Class A* (a) | | | 9,457 | | | | 743,037 | |
| | |
United Parcel Service, Inc., Class B | | | 19,493 | | | | 4,161,171 | |
| | | | | | | | 8,980,211 | |
| | |
| Airlines – 0.2% | | | | | | |
| | |
Alaska Air Group, Inc.* | | | 5,404 | | | | 285,331 | |
| | |
Allegiant Travel Co.* (a) | | | 965 | | | | 169,136 | |
| | |
American Airlines Group, Inc.* (a) | | | 27,599 | | | | 529,901 | |
| | |
Delta Air Lines, Inc.* | | | 14,282 | | | | 558,855 | |
| | |
Hawaiian Holdings, Inc.* (a) | | | 7,334 | | | | 141,913 | |
| | |
JetBlue Airways Corp.* (a) | | | 23,546 | | | | 330,350 | |
| | |
Mesa Air Group, Inc.* (a) | | | 4,439 | | | | 33,470 | |
| | |
SkyWest, Inc.* (a) | | | 5,404 | | | | 232,534 | |
| | |
Southwest Airlines Co.* (a) | | | 16,984 | | | | 803,003 | |
| | |
Spirit Airlines, Inc.* | | | 193 | | | | 4,217 | |
| | |
United Airlines Holdings, Inc.* (a) | | | 5,983 | | | | 276,056 | |
| | | | | | | | 3,364,766 | |
| | |
| Auto Components – 0.5% | | | | | | |
| | |
Adient plc* (a) | | | 24,318 | | | | 1,012,115 | |
| | |
American Axle & Manufacturing Holdings, Inc.* (a) | | | 11,387 | | | | 103,394 | |
| | |
Aptiv plc* (a) | | | 6,562 | | | | 1,134,504 | |
| | |
Autoliv, Inc.(a) | | | 4,053 | | | | 392,533 | |
| | |
BorgWarner, Inc. | | | 10,808 | | | | 487,117 | |
| | |
Dana, Inc.(a) | | | 28,564 | | | | 633,835 | |
| | |
Dorman Products, Inc.* (a) | | | 965 | | | | 100,727 | |
See Accompanying Notes to the Financial Statements.
| | | | |
| 140 | | FLEXSHARES ANNUAL REPORT | | |
FlexShares® Morningstar US Market Factor Tilt Index Fund (cont.)
| | | | | | | | |
| Investments | | Shares | | | Value | |
|
| COMMON STOCKS – (continued) | |
|
| Auto Components – (continued) | |
| | |
Fox Factory Holding Corp.* (a) | | | 1,930 | | | $ | 310,633 | |
| | |
Gentex Corp.(a) | | | 10,615 | | | | 375,665 | |
| | |
Gentherm, Inc.* (a) | | | 1,158 | | | | 85,263 | |
| | |
Goodyear Tire & Rubber Co. (The)* | | | 58,865 | | | | 1,125,499 | |
| | |
LCI Industries(a) | | | 1,930 | | | | 269,505 | |
| | |
Lear Corp. | | | 2,509 | | | | 431,172 | |
| | |
Luminar Technologies, Inc.* (a) | | | 2,895 | | | | 47,449 | |
| | |
Modine Manufacturing Co.* | | | 772 | | | | 8,492 | |
| | |
Patrick Industries, Inc. | | | 1,737 | | | | 135,330 | |
| | |
Standard Motor Products, Inc.(a) | | | 1,351 | | | | 64,713 | |
| | |
Tenneco, Inc., Class A* | | | 21,037 | | | | 279,161 | |
| | |
Veoneer, Inc.* (a) | | | 24,511 | | | | 862,787 | |
| | |
Visteon Corp.* | | | 2,702 | | | | 305,812 | |
| | | | | | | | 8,165,706 | |
| | |
| Automobiles – 1.8% | | | | | | |
| | |
Ford Motor Co.* | | | 135,100 | | | | 2,307,508 | |
| | |
General Motors Co.* | | | 49,987 | | | | 2,720,792 | |
| | |
Harley-Davidson, Inc. | | | 6,948 | | | | 253,533 | |
| | |
Tesla, Inc.* | | | 22,388 | | | | 24,940,232 | |
| | |
Thor Industries, Inc.(a) | | | 3,088 | | | | 314,852 | |
| | |
Winnebago Industries, Inc. | | | 6,562 | | | | 444,182 | |
| | | | | | | | 30,981,099 | |
| | |
| Banks – 6.6% | | | | | | |
| | |
1st Source Corp. | | | 5,597 | | | | 270,223 | |
| | |
Allegiance Bancshares, Inc. | | | 4,053 | | | | 158,756 | |
| | |
Ameris Bancorp(a) | | | 14,475 | | | | 758,345 | |
| | |
Associated Banc-Corp. | | | 33,775 | | | | 752,507 | |
| | |
Atlantic Union Bankshares Corp. | | | 19,686 | | | | 706,137 | |
| | |
Banc of California, Inc.(a) | | | 3,860 | | | | 78,474 | |
| | |
BancFirst Corp.(a) | | | 3,474 | | | | 225,845 | |
| | |
Bancorp, Inc. (The)* | | | 13,703 | | | | 418,627 | |
| | |
Bank of America Corp. | | | 251,286 | | | | 12,006,445 | |
| | |
Bank of Hawaii Corp.(a) | | | 2,509 | | | | 212,010 | |
| | |
Bank OZK | | | 29,722 | | | | 1,327,682 | |
| | |
BankUnited, Inc.(a) | | | 22,967 | | | | 931,541 | |
| | | | | | | | |
| Investments | | Shares | | | Value | |
| | |
| Banks – (continued) | | | | | | |
| | |
Banner Corp. | | | 5,790 | | | $ | 334,430 | |
| | |
Berkshire Hills Bancorp, Inc.(a) | | | 4,053 | | | | 110,039 | |
| | |
BOK Financial Corp. | | | 7,913 | | | | 800,558 | |
| | |
Brookline Bancorp, Inc.(a) | | | 2,895 | | | | 46,465 | |
| | |
Bryn Mawr Bank Corp. | | | 579 | | | | 26,831 | |
| | |
Cadence Bank(a) | | | 47,555 | | | | 1,380,052 | |
| | |
Camden National Corp. | | | 5,211 | | | | 248,044 | |
| | |
Cathay General Bancorp(a) | | | 15,247 | | | | 643,271 | |
| | |
Central Pacific Financial Corp. | | | 4,053 | | | | 111,417 | |
| | |
CIT Group, Inc.(a) | | | 23,353 | | | | 1,156,674 | |
| | |
Citigroup, Inc. | | | 68,129 | | | | 4,711,802 | |
| | |
Citizens Financial Group, Inc. | | | 15,826 | | | | 749,836 | |
| | |
City Holding Co.(a) | | | 579 | | | | 46,077 | |
| | |
Columbia Banking System, Inc.(a) | | | 6,369 | | | | 217,374 | |
| | |
Comerica, Inc. | | | 6,369 | | | | 541,938 | |
| | |
Commerce Bancshares, Inc.(a) | | | 3,088 | | | | 217,735 | |
| | |
Community Bank System, Inc.(a) | | | 3,474 | | | | 248,982 | |
| | |
Community Trust Bancorp, Inc.(a) | | | 2,123 | | | | 92,733 | |
| | |
ConnectOne Bancorp, Inc. | | | 5,211 | | | | 175,767 | |
| | |
CrossFirst Bankshares, Inc.* (a) | | | 2,702 | | | | 38,449 | |
| | |
Cullen/Frost Bankers, Inc. | | | 3,088 | | | | 399,896 | |
| | |
Customers Bancorp, Inc.* | | | 5,018 | | | | 267,409 | |
| | |
CVB Financial Corp. | | | 23,546 | | | | 471,391 | |
| | |
Dime Community Bancshares, Inc. | | | 11,773 | | | | 420,061 | |
| | |
Eagle Bancorp, Inc.(a) | | | 5,790 | | | | 327,656 | |
| | |
East West Bancorp, Inc. | | | 6,562 | | | | 521,548 | |
| | |
Eastern Bankshares, Inc. | | | 6,176 | | | | 128,275 | |
| | |
Enterprise Financial Services Corp. | | | 11,387 | | | | 535,417 | |
| | |
FB Financial Corp. | | | 1,351 | | | | 61,241 | |
| | |
Fifth Third Bancorp | | | 25,669 | | | | 1,117,371 | |
| | |
Financial Institutions, Inc. | | | 4,825 | | | | 154,014 | |
| | |
First Bancorp/NC(a) | | | 5,983 | | | | 289,697 | |
| | |
First Bancorp/PR | | | 57,707 | | | | 787,700 | |
| | |
First Bancshares, Inc. (The) | | | 4,439 | | | | 178,670 | |
See Accompanying Notes to the Financial Statements.
| | | | | | |
| | FLEXSHARES ANNUAL REPORT | | | 141 | |
FlexShares® Morningstar US Market Factor Tilt Index Fund (cont.)
| | | | | | | | |
| Investments | | Shares | | | Value | |
|
| COMMON STOCKS – (continued) | |
| | |
| Banks – (continued) | | | | | | |
| | |
First Busey Corp. | | | 14,475 | | | $ | 368,968 | |
| | |
First Citizens BancShares, Inc., Class A(a) | | | 386 | | | | 314,165 | |
| | |
First Commonwealth Financial Corp. | | | 25,476 | | | | 389,783 | |
| | |
First Financial Bancorp(a) | | | 16,984 | | | | 403,879 | |
| | |
First Financial Bankshares, Inc.(a) | | | 6,755 | | | | 342,614 | |
| | |
First Financial Corp. | | | 3,860 | | | | 165,401 | |
| | |
First Foundation, Inc.(a) | | | 10,229 | | | | 272,194 | |
| | |
First Hawaiian, Inc. | | | 25,862 | | | | 713,533 | |
| | |
First Horizon Corp. | | | 26,055 | | | | 442,153 | |
| | |
First Interstate BancSystem, Inc., Class A(a) | | | 2,509 | | | | 104,299 | |
| | |
First Merchants Corp. | | | 14,089 | | | | 585,821 | |
| | |
First Midwest Bancorp, Inc. | | | 19,879 | | | | 382,671 | |
| | |
First Republic Bank | | | 4,439 | | | | 960,289 | |
| | |
Flushing Financial Corp.(a) | | | 5,404 | | | | 129,804 | |
| | |
FNB Corp.(a) | | | 64,269 | | | | 748,734 | |
| | |
Fulton Financial Corp. | | | 30,687 | | | | 494,061 | |
| | |
German American Bancorp, Inc.(a) | | | 772 | | | | 30,432 | |
| | |
Glacier Bancorp, Inc. | | | 4,825 | | | | 266,774 | |
| | |
Great Southern Bancorp, Inc. | | | 2,509 | | | | 141,583 | |
| | |
Great Western Bancorp, Inc.(a) | | | 6,755 | | | | 230,008 | |
| | |
Hancock Whitney Corp. | | | 19,686 | | | | 974,063 | |
| | |
Hanmi Financial Corp. | | | 7,720 | | | | 171,307 | |
| | |
HarborOne Bancorp, Inc. | | | 2,316 | | | | 33,281 | |
| | |
Heartland Financial USA, Inc. | | | 9,457 | | | | 473,985 | |
| | |
Heritage Commerce Corp.(a) | | | 13,703 | | | | 164,299 | |
| | |
Heritage Financial Corp.(a) | | | 3,474 | | | | 86,294 | |
| | |
Hilltop Holdings, Inc.(a) | | | 17,370 | | | | 615,593 | |
| | |
Home BancShares, Inc.(a) | | | 36,863 | | | | 875,865 | |
| | |
Hope Bancorp, Inc.(a) | | | 28,757 | | | | 419,565 | |
| | |
Horizon Bancorp, Inc.(a) | | | 12,352 | | | | 235,553 | |
| | |
Huntington Bancshares, Inc. | | | 47,671 | | | | 750,341 | |
| | |
Independent Bank Corp. — MA | | | 1,158 | | | | 97,851 | |
| | |
Independent Bank Corp. — MI | | | 11,773 | | | | 265,246 | |
| | | | | | | | |
| Investments | | Shares | | | Value | |
| | |
| Banks – (continued) | | | | | | |
| | |
Independent Bank Group, Inc. | | | 10,229 | | | $ | 739,454 | |
| | |
International Bancshares Corp.(a) | | | 14,475 | | | | 613,740 | |
| | |
Investors Bancorp, Inc. | | | 58,479 | | | | 894,729 | |
| | |
JPMorgan Chase & Co. | | | 101,132 | | | | 17,181,315 | |
| | |
KeyCorp | | | 36,091 | | | | 839,837 | |
| | |
Lakeland Bancorp, Inc.(a) | | | 12,352 | | | | 222,089 | |
| | |
Lakeland Financial Corp.(a) | | | 772 | | | | 55,484 | |
| | |
Live Oak Bancshares, Inc.(a) | | | 965 | | | | 86,059 | |
| | |
M&T Bank Corp.(a) | | | 4,632 | | | | 681,460 | |
| | |
Metropolitan Bank Holding Corp.* | | | 1,737 | | | | 157,824 | |
| | |
Midland States Bancorp, Inc. | | | 4,825 | | | | 123,809 | |
| | |
National Bank Holdings Corp., Class A(a) | | | 1,158 | | | | 50,222 | |
| | |
NBT Bancorp, Inc.(a) | | | 6,369 | | | | 233,679 | |
| | |
Nicolet Bankshares, Inc.* (a) | | | 3,860 | | | | 277,495 | |
| | |
OceanFirst Financial Corp.(a) | | | 16,791 | | | | 372,256 | |
| | |
OFG Bancorp | | | 15,440 | | | | 399,896 | |
| | |
Old National Bancorp(a) | | | 43,811 | | | | 748,292 | |
| | |
Pacific Premier Bancorp, Inc. | | | 19,107 | | | | 802,303 | |
| | |
PacWest Bancorp | | | 27,792 | | | | 1,319,286 | |
| | |
Park National Corp.(a) | | | 965 | | | | 124,089 | |
| | |
Peoples Bancorp, Inc. | | | 6,369 | | | | 203,553 | |
| | |
People’s United Financial, Inc. | | | 21,809 | | | | 373,806 | |
| | |
Pinnacle Financial Partners, Inc. | | | 18,335 | | | | 1,770,611 | |
| | |
PNC Financial Services Group, Inc. (The) | | | 14,282 | | | | 3,013,930 | |
| | |
Popular, Inc. | | | 20,458 | | | | 1,666,099 | |
| | |
Preferred Bank(a) | | | 2,316 | | | | 158,808 | |
| | |
Prosperity Bancshares, Inc. | | | 20,072 | | | | 1,511,622 | |
| | |
QCR Holdings, Inc.(a) | | | 1,737 | | | | 95,778 | |
| | |
Regions Financial Corp. | | | 35,705 | | | | 845,494 | |
| | |
Renasant Corp.(a) | | | 6,562 | | | | 245,484 | |
| | |
S&T Bancorp, Inc. | | | 4,632 | | | | 141,554 | |
| | |
Sandy Spring Bancorp, Inc. | | | 9,457 | | | | 448,829 | |
| | |
Seacoast Banking Corp. of Florida(a) | | | 5,018 | | | | 182,806 | |
| | |
ServisFirst Bancshares, Inc.(a) | | | 1,544 | | | | 123,999 | |
See Accompanying Notes to the Financial Statements.
| | | | |
| 142 | | FLEXSHARES ANNUAL REPORT | | |
FlexShares® Morningstar US Market Factor Tilt Index Fund (cont.)
| | | | | | | | |
| Investments | | Shares | | | Value | |
|
| COMMON STOCKS – (continued) | |
| | |
| Banks – (continued) | | | | | | |
| | |
Signature Bank | | | 2,123 | | | $ | 632,272 | |
| | |
Silvergate Capital Corp., Class A* | | | 193 | | | | 30,228 | |
| | |
Simmons First National Corp., Class A | | | 21,037 | | | | 628,796 | |
| | |
South State Corp.(a) | | | 1,544 | | | | 120,571 | |
| | |
Southside Bancshares, Inc.(a) | | | 965 | | | | 39,874 | |
| | |
Sterling Bancorp(a) | | | 48,250 | | | | 1,227,962 | |
| | |
Stock Yards Bancorp, Inc.(a) | | | 772 | | | | 47,285 | |
| | |
SVB Financial Group* | | | 1,544 | | | | 1,107,666 | |
| | |
Synovus Financial Corp. | | | 35,705 | | | | 1,663,496 | |
| | |
Texas Capital Bancshares, Inc.* | | | 9,843 | | | | 596,486 | |
| | |
Tompkins Financial Corp. | | | 386 | | | | 31,694 | |
| | |
Towne Bank | | | 14,282 | | | | 450,169 | |
| | |
TriCo Bancshares | | | 772 | | | | 33,837 | |
| | |
TriState Capital Holdings, Inc.* | | | 10,615 | | | | 318,981 | |
| | |
Triumph Bancorp, Inc.* (a) | | | 579 | | | | 67,917 | |
| | |
Truist Financial Corp. | | | 45,355 | | | | 2,878,682 | |
| | |
Trustmark Corp.(a) | | | 16,405 | | | | 521,843 | |
| | |
UMB Financial Corp. | | | 1,351 | | | | 133,506 | |
| | |
Umpqua Holdings Corp.(a) | | | 59,251 | | | | 1,211,683 | |
| | |
United Bankshares, Inc.(a) | | | 26,827 | | | | 992,331 | |
| | |
United Community Banks, Inc. | | | 22,195 | | | | 773,274 | |
| | |
Univest Financial Corp. | | | 5,983 | | | | 171,712 | |
| | |
US Bancorp | | | 46,127 | | | | 2,784,687 | |
| | |
Valley National Bancorp(a) | | | 86,078 | | | | 1,141,394 | |
| | |
Veritex Holdings, Inc. | | | 6,176 | | | | 252,907 | |
| | |
Washington Trust Bancorp, Inc.(a) | | | 5,404 | | | | 295,383 | |
| | |
Webster Financial Corp.(a) | | | 18,914 | | | | 1,058,427 | |
| | |
Wells Fargo & Co. | | | 136,644 | | | | 6,990,707 | |
| | |
WesBanco, Inc.(a) | | | 11,387 | | | | 395,926 | |
| | |
Westamerica Bancorp | | | 2,895 | | | | 161,425 | |
| | |
Western Alliance Bancorp(a) | | | 4,825 | | | | 560,134 | |
| | |
Wintrust Financial Corp. | | | 11,966 | | | | 1,058,991 | |
| | |
Zions Bancorp NA | | | 7,720 | | | | 486,283 | |
| | | | | | | | 113,628,041 | |
| | | | | | | | |
| Investments | | Shares | | | Value | |
| | |
| Beverages – 1.0% | | | | | | |
| | |
Boston Beer Co., Inc. (The), Class A* (a) | | | 193 | | | $ | 95,049 | |
| | |
Brown-Forman Corp., Class A(a) | | | 1,544 | | | | 98,862 | |
| | |
Brown-Forman Corp., Class B | | | 4,825 | | | | 327,569 | |
| | |
Celsius Holdings, Inc.* | | | 1,930 | | | | 186,284 | |
| | |
Coca-Cola Co. (The) | | | 108,273 | | | | 6,103,349 | |
| | |
Coca-Cola Consolidated, Inc.(a) | | | 772 | | | | 309,881 | |
| | |
Constellation Brands, Inc., Class A | | | 5,018 | | | | 1,087,952 | |
| | |
Keurig Dr Pepper, Inc. | | | 28,757 | | | | 1,037,840 | |
| | |
Molson Coors Beverage Co., Class B(a) | | | 7,334 | | | | 323,356 | |
| | |
Monster Beverage Corp.* | | | 11,580 | | | | 984,300 | |
| | |
National Beverage Corp.(a) | | | 772 | | | | 43,541 | |
| | |
PepsiCo, Inc. | | | 38,793 | | | | 6,268,949 | |
| | | | | | | | 16,866,932 | |
| | |
| Biotechnology – 2.4% | | | | | | |
| | |
AbbVie, Inc. | | | 58,865 | | | | 6,750,050 | |
| | |
Abeona Therapeutics, Inc.* (a) | | | 63,690 | | | | 51,735 | |
| | |
ACADIA Pharmaceuticals, Inc.* (a) | | | 14,282 | | | | 256,362 | |
| | |
Acceleron Pharma, Inc.* | | | 1,351 | | | | 235,317 | |
| | |
Adamas Pharmaceuticals, Inc.* | | | 17,949 | | | | 145,566 | |
| | |
Agenus, Inc.* | | | 2,316 | | | | 8,893 | |
| | |
Agios Pharmaceuticals, Inc.* (a) | | | 4,825 | | | | 226,775 | |
| | |
Albireo Pharma, Inc.* | | | 4,246 | | | | 124,068 | |
| | |
Aldeyra Therapeutics, Inc.* | | | 10,615 | | | | 96,597 | |
| | |
Alector, Inc.* (a) | | | 5,211 | | | | 113,287 | |
| | |
Alkermes plc* (a) | | | 5,211 | | | | 157,841 | |
| | |
Allakos, Inc.* (a) | | | 3,088 | | | | 310,591 | |
| | |
Allogene Therapeutics, Inc.* (a) | | | 6,562 | | | | 113,129 | |
| | |
Alnylam Pharmaceuticals, Inc.* | | | 3,860 | | | | 615,902 | |
| | |
Altimmune, Inc.* (a) | | | 7,034 | | | | 75,967 | |
| | |
Amgen, Inc. | | | 18,721 | | | | 3,874,685 | |
| | |
Amicus Therapeutics, Inc.* (a) | | | 17,756 | | | | 186,438 | |
See Accompanying Notes to the Financial Statements.
| | | | | | |
| | FLEXSHARES ANNUAL REPORT | | | 143 | |
FlexShares® Morningstar US Market Factor Tilt Index Fund (cont.)
| | | | | | | | |
| Investments | | Shares | | | Value | |
|
| COMMON STOCKS – (continued) | |
|
| Biotechnology – (continued) | |
| | |
Anavex Life Sciences Corp.* (a) | | | 5,597 | | | $ | 104,888 | |
| | |
Anika Therapeutics, Inc.* (a) | | | 3,281 | | | | 136,654 | |
| | |
Apellis Pharmaceuticals, Inc.* (a) | | | 1,158 | | | | 35,597 | |
| | |
Arena Pharmaceuticals, Inc.* | | | 2,123 | | | | 121,839 | |
| | |
Arrowhead Pharmaceuticals, Inc.* | | | 3,474 | | | | 221,711 | |
| | |
Atara Biotherapeutics, Inc.* | | | 8,492 | | | | 131,456 | |
| | |
Beam Therapeutics, Inc.* (a) | | | 3,088 | | | | 274,122 | |
| | |
BioAtla, Inc.* (a) | | | 2,509 | | | | 73,338 | |
| | |
BioCryst Pharmaceuticals, Inc.* (a) | | | 16,791 | | | | 250,690 | |
| | |
Biogen, Inc.* | | | 4,825 | | | | 1,286,731 | |
| | |
BioMarin Pharmaceutical, Inc.* | | | 3,281 | | | | 259,954 | |
| | |
Bioxcel Therapeutics, Inc.* (a) | | | 193 | | | | 5,624 | |
| | |
Blueprint Medicines Corp.* (a) | | | 3,667 | | | | 412,501 | |
| | |
Bridgebio Pharma, Inc.* | | | 386 | | | | 19,061 | |
| | |
C4 Therapeutics, Inc.* | | | 2,895 | | | | 128,596 | |
| | |
CareDx, Inc.* (a) | | | 1,351 | | | | 68,901 | |
| | |
Catalyst Pharmaceuticals, Inc.* | | | 39,951 | | | | 235,711 | |
| | |
Coherus Biosciences, Inc.* (a) | | | 11,580 | | | | 193,733 | |
| | |
Crinetics Pharmaceuticals, Inc.* (a) | | | 7,334 | | | | 182,837 | |
| | |
CRISPR Therapeutics AG* (a) | | | 2,702 | | | | 246,774 | |
| | |
Curis, Inc.* (a) | | | 7,720 | | | | 50,180 | |
| | |
Cytokinetics, Inc.* | | | 2,123 | | | | 74,114 | |
| | |
CytomX Therapeutics, Inc.* (a) | | | 19,493 | | | | 115,593 | |
| | |
Denali Therapeutics, Inc.* (a) | | | 2,123 | | | | 102,647 | |
| | |
DermTech, Inc.* (a) | | | 2,509 | | | | 68,621 | |
| | |
Dicerna Pharmaceuticals, Inc.* (a) | | | 2,316 | | | | 48,196 | |
| | |
Dynavax Technologies Corp.* (a) | | | 6,369 | | | | 127,189 | |
| | |
Eagle Pharmaceuticals, Inc.* (a) | | | 1,737 | | | | 90,967 | |
| | |
Editas Medicine, Inc.* (a) | | | 4,053 | | | | 148,826 | |
| | | | | | | | |
| Investments | | Shares | | | Value | |
|
| Biotechnology – (continued) | |
| | |
Emergent BioSolutions, Inc.* (a) | | | 9,071 | | | $ | 432,415 | |
| | |
Enanta Pharmaceuticals, Inc.* | | | 1,930 | | | | 165,690 | |
| | |
Epizyme, Inc.* (a) | | | 2,509 | | | | 10,538 | |
| | |
Exact Sciences Corp.* (a) | | | 3,474 | | | | 330,794 | |
| | |
Exelixis, Inc.* | | | 9,650 | | | | 207,572 | |
| | |
Fate Therapeutics, Inc.* (a) | | | 1,930 | | | | 103,834 | |
| | |
Gilead Sciences, Inc. | | | 40,723 | | | | 2,642,108 | |
| | |
Gritstone bio, Inc.* | | | 5,018 | | | | 55,148 | |
| | |
Halozyme Therapeutics, Inc.* (a) | | | 4,053 | | | | 154,298 | |
| | |
Heron Therapeutics, Inc.* (a) | | | 16,019 | | | | 176,369 | |
| | |
Homology Medicines, Inc.* (a) | | | 193 | | | | 1,106 | |
| | |
Horizon Therapeutics plc* | | | 7,141 | | | | 856,277 | |
| | |
Ideaya Biosciences, Inc.* | | | 2,509 | | | | 53,793 | |
| | |
ImmunoGen, Inc.* (a) | | | 24,318 | | | | 146,638 | |
| | |
Incyte Corp.* | | | 4,439 | | | | 297,324 | |
| | |
Inmune Bio, Inc.* (a) | | | 2,316 | | | | 42,591 | |
| | |
Inovio Pharmaceuticals, Inc.* (a) | | | 19,300 | | | | 137,802 | |
| | |
Insmed, Inc.* | | | 2,895 | | | | 87,284 | |
| | |
Intellia Therapeutics, Inc.* (a) | | | 4,053 | | | | 538,968 | |
| | |
Invitae Corp.* (a) | | | 13,124 | | | | 347,786 | |
| | |
Ionis Pharmaceuticals, Inc.* | | | 3,667 | | | | 116,867 | |
| | |
Iovance Biotherapeutics, Inc.* | | | 10,808 | | | | 262,742 | |
| | |
Ironwood Pharmaceuticals, Inc.* (a) | | | 15,054 | | | | 192,240 | |
| | |
IVERIC bio, Inc.* (a) | | | 7,720 | | | | 136,644 | |
| | |
Kadmon Holdings, Inc.* (a) | | | 22,967 | | | | 217,038 | |
| | |
Kodiak Sciences, Inc.* (a) | | | 386 | | | | 45,197 | |
| | |
Krystal Biotech, Inc.* (a) | | | 2,702 | | | | 135,343 | |
| | |
Kura Oncology, Inc.* | | | 9,071 | | | | 148,946 | |
| | |
Kymera Therapeutics, Inc.* | | | 2,316 | | | | 136,366 | |
| | |
Ligand Pharmaceuticals, Inc.* | | | 579 | | | | 84,499 | |
| | |
MacroGenics, Inc.* | | | 5,404 | | | | 105,540 | |
| | |
Madrigal Pharmaceuticals, Inc.* | | | 579 | | | | 45,017 | |
| | |
MEI Pharma, Inc.* | | | 39,179 | | | | 110,485 | |
| | |
MeiraGTx Holdings plc* (a) | | | 11,966 | | | | 257,269 | |
| | |
Mirati Therapeutics, Inc.* (a) | | | 965 | | | | 182,404 | |
| | |
Moderna, Inc.* | | | 11,966 | | | | 4,130,783 | |
See Accompanying Notes to the Financial Statements.
| | | | |
| 144 | | FLEXSHARES ANNUAL REPORT | | |
FlexShares® Morningstar US Market Factor Tilt Index Fund (cont.)
| | | | | | | | |
| Investments | | Shares | | | Value | |
|
| COMMON STOCKS – (continued) | |
|
| Biotechnology – (continued) | |
| | |
Morphic Holding, Inc.* (a) | | | 1,737 | | | $ | 99,878 | |
| | |
Mustang Bio, Inc.* | | | 52,689 | | | | 118,023 | |
| | |
Myriad Genetics, Inc.* | | | 3,281 | | | | 100,956 | |
| | |
Natera, Inc.* | | | 3,474 | | | | 398,016 | |
| | |
Neurocrine Biosciences, Inc.* | | | 2,509 | | | | 264,474 | |
| | |
Novavax, Inc.* (a) | | | 2,509 | | | | 373,414 | |
| | |
Nurix Therapeutics, Inc.* | | | 3,281 | | | | 109,749 | |
| | |
Oncocyte Corp.* (a) | | | 17,756 | | | | 58,240 | |
| | |
OPKO Health, Inc.* (a) | | | 32,231 | | | | 122,155 | |
| | |
Palatin Technologies, Inc.* (a) | | | 180,262 | | | | 73,547 | |
| | |
Precision BioSciences, Inc.* | | | 965 | | | | 9,158 | |
| | |
Prothena Corp. plc* (a) | | | 1,544 | | | | 85,460 | |
| | |
PTC Therapeutics, Inc.* (a) | | | 386 | | | | 14,641 | |
| | |
Regeneron Pharmaceuticals, Inc.* | | | 3,860 | | | | 2,470,168 | |
| | |
REGENXBIO, Inc.* | | | 5,018 | | | | 177,838 | |
| | |
Rigel Pharmaceuticals, Inc.* | | | 6,948 | | | | 23,345 | |
| | |
Sage Therapeutics, Inc.* (a) | | | 9,457 | | | | 381,685 | |
| | |
Sangamo Therapeutics, Inc.* (a) | | | 13,317 | | | | 108,134 | |
| | |
Sarepta Therapeutics, Inc.* | | | 5,790 | | | | 458,163 | |
| | |
Seagen, Inc.* | | | 4,053 | | | | 714,665 | |
| | |
Selecta Biosciences, Inc.* (a) | | | 15,054 | | | | 54,044 | |
| | |
Sorrento Therapeutics, Inc.* (a) | | | 20,458 | | | | 140,342 | |
| | |
Syndax Pharmaceuticals, Inc.* (a) | | | 3,860 | | | | 75,077 | |
| | |
TG Therapeutics, Inc.* (a) | | | 2,509 | | | | 78,331 | |
| | |
Travere Therapeutics, Inc.* (a) | | | 1,158 | | | | 33,362 | |
| | |
Trevena, Inc.* (a) | | | 69,287 | | | | 69,980 | |
| | |
Twist Bioscience Corp.* (a) | | | 3,088 | | | | 366,854 | |
| | |
Ultragenyx Pharmaceutical, Inc.* | | | 1,930 | | | | 161,966 | |
| | |
United Therapeutics Corp.* | | | 2,123 | | | | 404,983 | |
| | |
Vanda Pharmaceuticals, Inc.* | | | 1,544 | | | | 26,433 | |
| | |
Vaxart, Inc.* (a) | | | 11,387 | | | | 76,407 | |
| | |
Veracyte, Inc.* (a) | | | 1,544 | | | | 73,927 | |
| | |
Vertex Pharmaceuticals, Inc.* | | | 7,720 | | | | 1,427,660 | |
| | |
Viking Therapeutics, Inc.* (a) | | | 579 | | | | 3,370 | |
| | | | | | | | |
| Investments | | Shares | | | Value | |
|
| Biotechnology – (continued) | |
| | |
Vir Biotechnology, Inc.* (a) | | | 5,211 | | | $ | 196,611 | |
| | |
XBiotech, Inc.(a) | | | 579 | | | | 8,488 | |
| | |
XOMA Corp.* (a) | | | 3,281 | | | | 82,025 | |
| | |
Y-mAbs Therapeutics, Inc.* | | | 193 | | | | 4,740 | |
| | | | | | | | 41,102,278 | |
| | |
| Building Products – 0.7% | | | | | | |
| | |
A O Smith Corp. | | | 3,667 | | | | 267,948 | |
| | |
AAON, Inc.(a) | | | 2,702 | | | | 193,598 | |
| | |
Advanced Drainage Systems, Inc. | | | 1,737 | | | | 195,934 | |
| | |
Allegion plc | | | 2,895 | | | | 371,428 | |
| | |
American Woodmark Corp.* | | | 193 | | | | 13,267 | |
| | |
Apogee Enterprises, Inc.(a) | | | 5,211 | | | | 218,497 | |
| | |
Armstrong World Industries, Inc. | | | 2,123 | | | | 224,295 | |
| | |
AZEK Co., Inc. (The)* | | | 4,632 | | | | 169,948 | |
| | |
Builders FirstSource, Inc.* (a) | | | 9,457 | | | | 551,059 | |
| | |
Carlisle Cos., Inc. | | | 1,544 | | | | 344,188 | |
| | |
Carrier Global Corp. | | | 25,476 | | | | 1,330,611 | |
| | |
Cornerstone Building Brands, Inc.* (a) | | | 12,352 | | | | 176,757 | |
| | |
Fortune Brands Home & Security, Inc. | | | 4,439 | | | | 450,115 | |
| | |
Gibraltar Industries, Inc.* | | | 965 | | | | 62,879 | |
| | |
Griffon Corp. | | | 6,948 | | | | 184,053 | |
| | |
Insteel Industries, Inc.(a) | | | 386 | | | | 15,699 | |
| | |
JELD-WEN Holding, Inc.* | | | 17,370 | | | | 476,112 | |
| | |
Johnson Controls International plc | | | 25,090 | | | | 1,840,853 | |
| | |
Lennox International, Inc. | | | 965 | | | | 288,805 | |
| | |
Masco Corp. | | | 7,527 | | | | 493,395 | |
| | |
Masonite International Corp.* | | | 6,755 | | | | 810,668 | |
| | |
Owens Corning | | | 4,439 | | | | 414,647 | |
| | |
PGT Innovations, Inc.* | | | 6,369 | | | | 135,978 | |
| | |
Quanex Building Products Corp.(a) | | | 4,632 | | | | 95,975 | |
| | |
Resideo Technologies, Inc.* | | | 33,775 | | | | 832,892 | |
| | |
Simpson Manufacturing Co., Inc. | | | 1,544 | | | | 163,803 | |
| | |
Trane Technologies plc | | | 5,983 | | | | 1,082,504 | |
| | |
Trex Co., Inc.* | | | 3,860 | | | | 410,704 | |
See Accompanying Notes to the Financial Statements.
| | | | | | |
| | FLEXSHARES ANNUAL REPORT | | | 145 | |
FlexShares® Morningstar US Market Factor Tilt Index Fund (cont.)
| | | | | | | | |
| Investments | | Shares | | | Value | |
|
| COMMON STOCKS – (continued) | |
|
| Building Products – (continued) | |
| | |
UFP Industries, Inc.(a) | | | 1,930 | | | $ | 157,932 | |
| | |
Zurn Water Solutions Corp. | | | 4,825 | | | | 175,051 | |
| | | | | | | | 12,149,595 | |
| | |
| Capital Markets – 3.3% | | | | | | |
| | |
Affiliated Managers Group, Inc.(a) | | | 10,422 | | | | 1,749,645 | |
| | |
Ameriprise Financial, Inc. | | | 4,053 | | | | 1,224,533 | |
| | |
Apollo Global Management, Inc.(a) | | | 5,211 | | | | 400,986 | |
| | |
Ares Management Corp. | | | 3,860 | | | | 327,096 | |
| | |
Artisan Partners Asset Management, Inc., Class A(a) | | | 15,440 | | | | 764,898 | |
| | |
AssetMark Financial Holdings, Inc.* | | | 4,825 | | | | 123,713 | |
| | |
B. Riley Financial, Inc.(a) | | | 4,053 | | | | 290,438 | |
| | |
Bank of New York Mellon Corp. (The) | | | 25,090 | | | | 1,485,328 | |
| | |
BGC Partners, Inc., Class A(a) | | | 54,426 | | | | 292,268 | |
| | |
BlackRock, Inc. | | | 4,825 | | | | 4,552,194 | |
| | |
Blackstone, Inc., Class A | | | 18,142 | | | | 2,511,216 | |
| | |
Blucora, Inc.* | | | 16,019 | | | | 264,634 | |
| | |
Brightsphere Investment Group, Inc. | | | 6,562 | | | | 196,729 | |
| | |
Carlyle Group, Inc. (The) | | | 3,088 | | | | 173,391 | |
| | |
Charles Schwab Corp. (The) | | | 40,916 | | | | 3,356,339 | |
| | |
CME Group, Inc. | | | 9,071 | | | | 2,000,609 | |
| | |
Cohen & Steers, Inc.(a) | | | 772 | | | | 73,255 | |
| | |
Cowen, Inc., Class A(a) | | | 8,492 | | | | 320,403 | |
| | |
Evercore, Inc., Class A(a) | | | 2,509 | | | | 380,967 | |
| | |
FactSet Research Systems, Inc. | | | 965 | | | | 428,354 | |
| | |
Federated Hermes, Inc., Class B(a) | | | 19,107 | | | | 636,454 | |
| | |
Focus Financial Partners, Inc., Class A* (a) | | | 11,966 | | | | 752,183 | |
| | |
Franklin Resources, Inc. | | | 11,194 | | | | 352,499 | |
| | |
GCM Grosvenor, Inc., Class A(a) | | | 1,930 | | | | 22,098 | |
| | |
Goldman Sachs Group, Inc. (The) | | | 11,387 | | | | 4,706,816 | |
| | | | | | | | |
| Investments | | Shares | | | Value | |
|
| Capital Markets – (continued) | |
| | |
Greenhill & Co., Inc.(a) | | | 5,211 | | | $ | 81,917 | |
| | |
Hamilton Lane, Inc., Class A(a) | | | 3,088 | | | | 322,727 | |
| | |
Houlihan Lokey, Inc.(a) | | | 1,737 | | | | 194,683 | |
| | |
Interactive Brokers Group, Inc., Class A | | | 2,895 | | | | 205,111 | |
| | |
Intercontinental Exchange, Inc. | | | 16,598 | | | | 2,298,159 | |
| | |
Invesco Ltd. | | | 16,984 | | | | 431,563 | |
| | |
Janus Henderson Group plc(a) | | | 39,179 | | | | 1,821,823 | |
| | |
Jefferies Financial Group, Inc. | | | 10,422 | | | | 448,146 | |
| | |
KKR & Co., Inc. | | | 15,826 | | | | 1,260,857 | |
| | |
LPL Financial Holdings, Inc. | | | 3,088 | | | | 506,494 | |
| | |
MarketAxess Holdings, Inc. | | | 1,158 | | | | 473,240 | |
| | |
Moelis & Co., Class A(a) | | | 1,544 | | | | 112,311 | |
| | |
Moody’s Corp. | | | 4,825 | | | | 1,950,024 | |
| | |
Morgan Stanley | | | 49,408 | | | | 5,078,154 | |
| | |
Morningstar, Inc. | | | 579 | | | | 183,398 | |
| | |
MSCI, Inc. | | | 2,123 | | | | 1,411,540 | |
| | |
Nasdaq, Inc. | | | 3,088 | | | | 648,079 | |
| | |
Northern Trust Corp.(b) | | | 7,334 | | | | 902,375 | |
| | |
Open Lending Corp., Class A* | | | 7,334 | | | | 231,168 | |
| | |
Piper Sandler Cos.(a) | | | 3,474 | | | | 572,133 | |
| | |
PJT Partners, Inc., Class A(a) | | | 1,544 | | | | 126,284 | |
| | |
Raymond James Financial, Inc. | | | 5,790 | | | | 570,836 | |
| | |
S&P Global, Inc. | | | 6,562 | | | | 3,111,438 | |
| | |
Sculptor Capital Management, Inc. | | | 3,281 | | | | 86,947 | |
| | |
SEI Investments Co.(a) | | | 3,281 | | | | 206,834 | |
| | |
State Street Corp. | | | 11,580 | | | | 1,141,209 | |
| | |
StepStone Group, Inc., Class A | | | 2,316 | | | | 108,806 | |
| | |
Stifel Financial Corp. | | | 23,160 | | | | 1,687,669 | |
| | |
StoneX Group, Inc.* | | | 4,825 | | | | 333,456 | |
| | |
T. Rowe Price Group, Inc. | | | 7,527 | | | | 1,632,456 | |
| | |
Tradeweb Markets, Inc., Class A | | | 4,439 | | | | 395,515 | |
| | |
Victory Capital Holdings, Inc., Class A(a) | | | 1,158 | | | | 43,888 | |
| | |
Virtu Financial, Inc., Class A | | | 20,844 | | | | 518,599 | |
See Accompanying Notes to the Financial Statements.
| | | | |
| 146 | | FLEXSHARES ANNUAL REPORT | | |
FlexShares® Morningstar US Market Factor Tilt Index Fund (cont.)
| | | | | | | | |
| Investments | | Shares | | | Value | |
|
| COMMON STOCKS – (continued) | |
|
| Capital Markets – (continued) | |
| | |
Virtus Investment Partners, Inc.(a) | | | 772 | | | $ | 247,040 | |
| | |
WisdomTree Investments, Inc.(a) | | | 20,651 | | | | 131,960 | |
| | | | | | | | 56,863,885 | |
| | |
| Chemicals – 1.9% | | | | | | |
AdvanSix, Inc.* | | | 8,878 | | | | 431,471 | |
Air Products and Chemicals, Inc. | | | 5,597 | | | | 1,678,037 | |
Albemarle Corp. | | | 3,281 | | | | 821,792 | |
Ashland Global Holdings, Inc. | | | 2,123 | | | | 203,829 | |
Avient Corp.(a) | | | 2,895 | | | | 155,983 | |
Axalta Coating Systems Ltd.* | | | 10,808 | | | | 337,102 | |
Balchem Corp.(a) | | | 2,123 | | | | 325,010 | |
Cabot Corp. | | | 13,510 | | | | 720,758 | |
Celanese Corp. | | | 3,860 | | | | 623,429 | |
CF Industries Holdings, Inc. | | | 8,685 | | | | 493,308 | |
Chase Corp.(a) | | | 386 | | | | 37,056 | |
Chemours Co. (The)(a) | | | 40,144 | | | | 1,124,835 | |
Corteva, Inc. | | | 18,914 | | | | 816,139 | |
Diversey Holdings Ltd.* | | | 2,316 | | | | 40,298 | |
Dow, Inc. | | | 23,160 | | | | 1,296,265 | |
DuPont de Nemours, Inc. | | | 16,791 | | | | 1,168,654 | |
Eastman Chemical Co.(a) | | | 4,439 | | | | 461,789 | |
Ecolab, Inc. | | | 6,562 | | | | 1,458,208 | |
Ecovyst, Inc. | | | 10,229 | | | | 119,475 | |
Element Solutions, Inc. | | | 16,598 | | | | 376,941 | |
Ferro Corp.* | | | 6,562 | | | | 137,933 | |
FMC Corp. | | | 4,632 | | | | 421,558 | |
GCP Applied Technologies, Inc.* | | | 3,474 | | | | 78,547 | |
Hawkins, Inc. | | | 772 | | | | 28,309 | |
HB Fuller Co.(a) | | | 1,544 | | | | 108,867 | |
Huntsman Corp. | | | 48,443 | | | | 1,578,273 | |
Ingevity Corp.* | | | 1,544 | | | | 120,293 | |
Innospec, Inc. | | | 772 | | | | 69,951 | |
International Flavors & Fragrances, Inc.(a) | | | 9,457 | | | | 1,394,435 | |
Koppers Holdings, Inc.* (a) | | | 6,948 | | | | 243,805 | |
Kraton Corp.* | | | 7,527 | | | | 343,608 | |
Kronos Worldwide, Inc.(a) | | | 4,632 | | | | 60,355 | |
Linde plc | | | 14,668 | | | | 4,682,026 | |
Livent Corp.* (a) | | | 7,720 | | | | 217,858 | |
| | | | | | | | |
| Investments | | Shares | | | Value | |
| | |
| Chemicals – (continued) | | | | | | |
Loop Industries, Inc.* (a) | | | 7,334 | | | $ | 115,217 | |
LyondellBasell Industries NV, Class A(a) | | | 10,229 | | | | 949,456 | |
Minerals Technologies, Inc. | | | 8,685 | | | | 616,114 | |
Mosaic Co. (The) | | | 8,685 | | | | 361,035 | |
NewMarket Corp.(a) | | | 2,123 | | | | 721,841 | |
Olin Corp. | | | 35,319 | | | | 2,012,477 | |
PPG Industries, Inc.(a) | | | 5,597 | | | | 898,710 | |
Quaker Chemical Corp.(a) | | | 772 | | | | 189,788 | |
RPM International, Inc.(a) | | | 5,211 | | | | 454,399 | |
Scotts Miracle-Gro Co. (The) | | | 1,351 | | | | 200,569 | |
Sensient Technologies Corp.(a) | | | 1,351 | | | | 129,156 | |
Sherwin-Williams Co. (The) | | | 6,369 | | | | 2,016,489 | |
Stepan Co.(a) | | | 579 | | | | 69,492 | |
Trinseo plc | | | 6,562 | | | | 367,866 | |
Tronox Holdings plc, Class A | | | 25,669 | | | | 598,601 | |
Valvoline, Inc. | | | 6,755 | | | | 229,400 | |
| | |
Westlake Chemical Corp. | | | 386 | | | | 37,573 | |
| | | | | | | | 32,144,380 | |
|
| Commercial Services & Supplies – 0.6% | |
| | |
ABM Industries, Inc. | | | 14,475 | | | | 637,045 | |
| | |
ACCO Brands Corp. | | | 28,178 | | | | 233,032 | |
| | |
ADT, Inc.(a) | | | 22,774 | | | | 190,163 | |
| | |
Brady Corp., Class A(a) | | | 4,632 | | | | 241,281 | |
| | |
BrightView Holdings, Inc.* (a) | | | 8,492 | | | | 134,683 | |
| | |
Brink’s Co. (The)(a) | | | 1,544 | | | | 106,351 | |
| | |
Casella Waste Systems, Inc., Class A* (a) | | | 1,351 | | | | 117,159 | |
| | |
Cimpress plc* (a) | | | 2,316 | | | | 206,865 | |
| | |
Cintas Corp. | | | 2,316 | | | | 1,003,060 | |
| | |
Clean Harbors, Inc.* (a) | | | 2,702 | | | | 304,083 | |
| | |
Copart, Inc.* | | | 5,404 | | | | 839,187 | |
| | |
CoreCivic, Inc., REIT* | | | 13,896 | | | | 119,645 | |
| | |
Covanta Holding Corp.(a) | | | 3,667 | | | | 74,000 | |
| | |
Deluxe Corp.(a) | | | 6,562 | | | | 234,067 | |
| | |
Driven Brands Holdings, Inc.* (a) | | | 3,667 | | | | 119,067 | |
| | |
Ennis, Inc. | | | 6,948 | | | | 131,595 | |
| | |
Herman Miller, Inc.(a) | | | 14,862 | | | | 578,410 | |
| | |
HNI Corp.(a) | | | 3,860 | | | | 144,364 | |
| | |
IAA, Inc.* | | | 5,211 | | | | 310,836 | |
| | |
Interface, Inc.(a) | | | 16,212 | | | | 232,804 | |
See Accompanying Notes to the Financial Statements.
| | | | | | |
| | FLEXSHARES ANNUAL REPORT | | | 147 | |
FlexShares® Morningstar US Market Factor Tilt Index Fund (cont.)
| | | | | | | | |
| Investments | | Shares | | | Value | |
|
| COMMON STOCKS – (continued) | |
|
| Commercial Services & Supplies – (continued) | |
| | |
KAR Auction Services, Inc.* (a) | | | 33,003 | | | $ | 484,154 | |
| | |
Kimball International, Inc., Class B | | | 1,351 | | | | 14,685 | |
| | |
Matthews International Corp., Class A(a) | | | 5,018 | | | | 172,469 | |
| | |
MSA Safety, Inc. | | | 2,123 | | | | 324,883 | |
| | |
Pitney Bowes, Inc. | | | 20,651 | | | | 143,318 | |
| | |
Republic Services, Inc. | | | 5,597 | | | | 753,356 | |
| | |
Rollins, Inc. | | | 5,211 | | | | 183,584 | |
| | |
SP Plus Corp.* (a) | | | 5,018 | | | | 161,830 | |
| | |
Steelcase, Inc., Class A | | | 6,369 | | | | 75,791 | |
| | |
Stericycle, Inc.* (a) | | | 3,088 | | | | 206,649 | |
| | |
Tetra Tech, Inc.(a) | | | 2,123 | | | | 372,926 | |
| | |
UniFirst Corp. | | | 772 | | | | 152,825 | |
| | |
US Ecology, Inc.* (a) | | | 5,404 | | | | 173,955 | |
| | |
Viad Corp.* (a) | | | 2,509 | | | | 111,324 | |
| | |
Waste Management, Inc. | | | 10,229 | | | | 1,638,993 | |
| | | | | | | | 10,928,439 | |
|
| Communications Equipment – 0.9% | |
| | |
ADTRAN, Inc.(a) | | | 4,246 | | | | 78,466 | |
| | |
Applied Optoelectronics, Inc.* (a) | | | 10,808 | | | | 82,681 | |
| | |
Arista Networks, Inc.* | | | 1,351 | | | | 553,491 | |
| | |
CalAmp Corp.* (a) | | | 10,229 | | | | 98,403 | |
| | |
Calix, Inc.* (a) | | | 4,246 | | | | 265,757 | |
| | |
Casa Systems, Inc.* | | | 1,351 | | | | 8,552 | |
| | |
Ciena Corp.* | | | 4,053 | | | | 220,037 | |
| | |
Cisco Systems, Inc. | | | 145,522 | | | | 8,144,866 | |
| | |
CommScope Holding Co., Inc.* | | | 39,758 | | | | 425,808 | |
| | |
Comtech Telecommunications Corp.(a) | | | 9,264 | | | | 199,825 | |
| | |
Digi International, Inc.* (a) | | | 3,860 | | | | 83,183 | |
| | |
Extreme Networks, Inc.* | | | 16,212 | | | | 159,364 | |
| | |
F5 Networks, Inc.* | | | 1,544 | | | | 326,016 | |
| | |
Harmonic, Inc.* | | | 3,088 | | | | 28,008 | |
| | |
Infinera Corp.* (a) | | | 7,141 | | | | 54,200 | |
| | |
Juniper Networks, Inc. | | | 13,317 | | | | 393,118 | |
| | |
Lumentum Holdings, Inc.* (a) | | | 19,686 | | | | 1,625,670 | |
| | | | | | | | |
| Investments | | Shares | | | Value | |
|
| Communications Equipment – (continued) | |
| | |
Motorola Solutions, Inc.(a) | | | 4,825 | | | $ | 1,199,447 | |
| | |
NETGEAR, Inc.* (a) | | | 8,299 | | | | 239,260 | |
| | |
NetScout Systems, Inc.* (a) | | | 12,738 | | | | 344,690 | |
| | |
Plantronics, Inc.* (a) | | | 9,650 | | | | 258,234 | |
| | |
Ribbon Communications, Inc.* (a) | | | 30,687 | | | | 167,858 | |
| | |
Ubiquiti, Inc.(a) | | | 386 | | | | 117,935 | |
| | |
Viasat, Inc.* (a) | | | 1,351 | | | | 80,641 | |
| | |
Viavi Solutions, Inc.* | | | 18,721 | | | | 288,304 | |
| | | | | | | | 15,443,814 | |
|
| Construction & Engineering – 0.4% | |
| | |
AECOM* | | | 6,176 | | | | 422,253 | |
| | |
Ameresco, Inc., Class A* (a) | | | 1,351 | | | | 110,958 | |
| | |
API Group Corp.* | | | 39,951 | | | | 870,133 | |
| | |
Arcosa, Inc.(a) | | | 1,544 | | | | 79,871 | |
| | |
Argan, Inc. | | | 386 | | | | 15,926 | |
| | |
Comfort Systems USA, Inc. | | | 3,474 | | | | 317,767 | |
| | |
Construction Partners, Inc., Class A* (a) | | | 1,158 | | | | 41,236 | |
| | |
Dycom Industries, Inc.* (a) | | | 1,544 | | | | 122,625 | |
| | |
EMCOR Group, Inc. | | | 11,773 | | | | 1,430,302 | |
| | |
Granite Construction, Inc.(a) | | | 3,860 | | | | 143,283 | |
| | |
Great Lakes Dredge & Dock Corp.* (a) | | | 11,387 | | | | 173,310 | |
| | |
MasTec, Inc.* | | | 3,088 | | | | 275,233 | |
| | |
MYR Group, Inc.* (a) | | | 2,123 | | | | 216,865 | |
| | |
Orbital Energy Group, Inc.* (a) | | | 13,124 | | | | 35,041 | |
| | |
Primoris Services Corp. | | | 12,159 | | | | 327,685 | |
| | |
Quanta Services, Inc. | | | 5,404 | | | | 655,397 | |
| | |
Sterling Construction Co., Inc.* (a) | | | 6,562 | | | | 157,751 | |
| | |
Tutor Perini Corp.* | | | 11,773 | | | | 160,348 | |
| | |
Valmont Industries, Inc. | | | 772 | | | | 184,477 | |
| | |
WillScot Mobile Mini Holdings Corp.* (a) | | | 13,124 | | | | 456,059 | |
| | | | | | | | 6,196,520 | |
|
| Construction Materials – 0.1% | |
| | |
Eagle Materials, Inc. | | | 1,930 | | | | 286,335 | |
| | |
Forterra, Inc.* (a) | | | 4,632 | | | | 110,334 | |
| | |
Martin Marietta Materials, Inc. | | | 1,737 | | | | 682,363 | |
See Accompanying Notes to the Financial Statements.
| | | | |
| 148 | | FLEXSHARES ANNUAL REPORT | | |
FlexShares® Morningstar US Market Factor Tilt Index Fund (cont.)
| | | | | | | | |
| Investments | | Shares | | | Value | |
|
| COMMON STOCKS – (continued) | |
|
| Construction Materials – (continued) | |
| | |
Summit Materials, Inc., Class A* (a) | | | 5,404 | | | $ | 192,653 | |
| | |
Vulcan Materials Co. | | | 3,474 | | | | 660,477 | |
| | | | | | | | 1,932,162 | |
| | |
| Consumer Finance – 0.8% | | | | | | |
| | |
Ally Financial, Inc. | | | 14,089 | | | | 672,609 | |
| | |
American Express Co. | | | 18,528 | | | | 3,219,796 | |
| | |
Capital One Financial Corp. | | | 15,633 | | | | 2,361,052 | |
| | |
Credit Acceptance Corp.* (a) | | | 579 | | | | 346,364 | |
| | |
Curo Group Holdings Corp. | | | 4,053 | | | | 69,631 | |
| | |
Discover Financial Services | | | 9,843 | | | | 1,115,409 | |
| | |
Encore Capital Group, Inc.* (a) | | | 8,106 | | | | 437,886 | |
| | |
Enova International, Inc.* (a) | | | 7,913 | | | | 256,698 | |
| | |
FirstCash, Inc. | | | 1,351 | | | | 119,523 | |
| | |
Green Dot Corp., Class A* | | | 2,702 | | | | 114,457 | |
| | |
LendingClub Corp.* | | | 9,650 | | | | 443,514 | |
| | |
LendingTree, Inc.* | | | 193 | | | | 31,148 | |
| | |
Navient Corp.(a) | | | 36,477 | | | | 718,597 | |
| | |
Nelnet, Inc., Class A(a) | | | 4,632 | | | | 382,742 | |
| | |
OneMain Holdings, Inc. | | | 5,211 | | | | 275,193 | |
| | |
PRA Group, Inc.* (a) | | | 11,773 | | | | 504,826 | |
| | |
PROG Holdings, Inc. | | | 16,598 | | | | 671,389 | |
| | |
Santander Consumer USA Holdings, Inc. | | | 5,211 | | | | 217,299 | |
| | |
SLM Corp. | | | 76,621 | | | | 1,405,995 | |
| | |
Synchrony Financial | | | 18,914 | | | | 878,555 | |
| | |
Upstart Holdings, Inc.* | | | 1,158 | | | | 372,922 | |
| | |
World Acceptance Corp.* | | | 386 | | | | 71,560 | |
| | | | | | | | 14,687,165 | |
|
| Containers & Packaging – 0.5% | |
| | |
Amcor plc | | | 53,847 | | | | 649,933 | |
| | |
AptarGroup, Inc. | | | 1,544 | | | | 186,484 | |
| | |
Avery Dennison Corp. | | | 1,930 | | | | 420,200 | |
| | |
Ball Corp. | | | 8,685 | | | | 794,504 | |
| | |
Berry Global Group, Inc.* | | | 6,562 | | | | 430,073 | |
| | |
Crown Holdings, Inc. | | | 5,018 | | | | 521,822 | |
| | |
Graphic Packaging Holding Co. | | | 60,988 | | | | 1,215,491 | |
| | |
Greif, Inc., Class A(a) | | | 6,176 | | | | 399,464 | |
| | | | | | | | |
| Investments | | Shares | | | Value | |
|
| Containers & Packaging – (continued) | |
| | |
International Paper Co. | | | 13,317 | | | $ | 661,455 | |
| | |
Myers Industries, Inc. | | | 386 | | | | 7,944 | |
| | |
O-I Glass, Inc.* | | | 38,793 | | | | 506,249 | |
| | |
Packaging Corp. of America | | | 3,474 | | | | 477,223 | |
| | |
Ranpak Holdings Corp.* (a) | | | 6,562 | | | | 226,127 | |
| | |
Sealed Air Corp. | | | 7,334 | | | | 435,053 | |
| | |
Silgan Holdings, Inc.(a) | | | 16,791 | | | | 674,998 | |
| | |
Sonoco Products Co.(a) | | | 21,230 | | | | 1,230,279 | |
| | |
TriMas Corp.* | | | 1,544 | | | | 51,492 | |
| | |
Westrock Co. | | | 9,843 | | | | 473,448 | |
| | | | | | | | 9,362,239 | |
|
| Distributors – 0.1% | |
| | |
Genuine Parts Co. | | | 4,632 | | | | 607,302 | |
| | |
LKQ Corp.* | | | 10,808 | | | | 595,305 | |
| | |
Pool Corp. | | | 965 | | | | 497,129 | |
| | | | | | | | 1,699,736 | |
|
| Diversified Consumer Services – 0.3% | |
| | |
2U, Inc.* (a) | | | 2,895 | | | | 85,518 | |
| | |
Adtalem Global Education, Inc.* (a) | | | 11,580 | | | | 427,650 | |
| | |
American Public Education, Inc.* | | | 386 | | | | 9,646 | |
| | |
Bright Horizons Family Solutions, Inc.* | | | 2,316 | | | | 384,456 | |
| | |
Chegg, Inc.* | | | 3,667 | | | | 217,967 | |
| | |
Coursera, Inc.* (a) | | | 6,176 | | | | 215,604 | |
| | |
frontdoor, Inc.* | | | 1,737 | | | | 64,755 | |
| | |
Graham Holdings Co., Class B(a) | | | 965 | | | | 565,345 | |
| | |
Grand Canyon Education, Inc.* (a) | | | 3,088 | | | | 246,114 | |
| | |
H&R Block, Inc.(a) | | | 44,776 | | | | 1,032,982 | |
| | |
Houghton Mifflin Harcourt Co.* (a) | | | 16,598 | | | | 235,526 | |
| | |
Laureate Education, Inc., Class A* | | | 26,441 | | | | 457,958 | |
| | |
OneSpaWorld Holdings Ltd.* (a) | | | 9,843 | | | | 106,304 | |
| | |
Perdoceo Education Corp.* | | | 4,439 | | | | 47,142 | |
| | |
Service Corp. International(a) | | | 4,825 | | | | 330,464 | |
| | |
Strategic Education, Inc.(a) | | | 3,667 | | | | 250,126 | |
| | |
Stride, Inc.* | | | 12,159 | | | | 431,645 | |
See Accompanying Notes to the Financial Statements.
| | | | | | |
| | FLEXSHARES ANNUAL REPORT | | | 149 | |
FlexShares® Morningstar US Market Factor Tilt Index Fund (cont.)
| | | | | | | | |
| Investments | | Shares | | | Value | |
|
| COMMON STOCKS – (continued) | |
|
| Diversified Consumer Services – (continued) | |
| | |
Terminix Global Holdings, Inc.* | | | 3,474 | | | $ | 140,628 | |
| | |
WW International, Inc.* (a) | | | 6,562 | | | | 113,916 | |
| | | | | | | | 5,363,746 | |
|
| Diversified Financial Services – 1.1% | |
| | |
A-Mark Precious Metals, Inc.(a) | | | 1,544 | | | | 115,785 | |
| | |
Berkshire Hathaway, Inc., Class B* | | | 63,497 | | | | 18,224,274 | |
| | |
Cannae Holdings, Inc.* | | | 15,633 | | | | 533,085 | |
| | |
Equitable Holdings, Inc. | | | 15,633 | | | | 523,706 | |
| | |
Voya Financial, Inc.(a) | | | 5,211 | | | | 363,571 | |
| | | | | | | | 19,760,421 | |
|
| Diversified Telecommunication Services – 0.9% | |
| | |
Anterix, Inc.* (a) | | | 386 | | | | 24,743 | |
| | |
AT&T, Inc. | | | 237,776 | | | | 6,006,222 | |
| | |
ATN International, Inc. | | | 2,123 | | | | 86,576 | |
| | |
Bandwidth, Inc., Class A* (a) | | | 2,316 | | | | 197,508 | |
| | |
Cogent Communications Holdings, Inc.(a) | | | 3,860 | | | | 295,637 | |
| | |
Consolidated Communications Holdings, Inc.* (a) | | | 17,949 | | | | 132,823 | |
| | |
EchoStar Corp., Class A* | | | 193 | | | | 4,528 | |
| | |
Iridium Communications, Inc.* | | | 7,527 | | | | 305,220 | |
| | |
Liberty Latin America Ltd., Class A* | | | 9,264 | | | | 111,353 | |
| | |
Liberty Latin America Ltd., Class C* | | | 17,177 | | | | 206,639 | |
| | |
Lumen Technologies, Inc.(a) | | | 25,669 | | | | 304,434 | |
| | |
Ooma, Inc.* (a) | | | 1,158 | | | | 26,750 | |
| | |
Verizon Communications, Inc. | | | 138,188 | | | | 7,322,582 | |
| | | | | | | | 15,025,015 | |
|
| Electric Utilities – 1.3% | |
| | |
ALLETE, Inc.(a) | | | 4,825 | | | | 296,930 | |
| | |
Alliant Energy Corp. | | | 7,913 | | | | 447,638 | |
| | |
American Electric Power Co., Inc. | | | 16,984 | | | | 1,438,715 | |
| | | | | | | | |
| Investments | | Shares | | | Value | |
|
| Electric Utilities – (continued) | |
| | |
Avangrid, Inc.(a) | | | 965 | | | $ | 50,855 | |
| | |
Duke Energy Corp. | | | 25,090 | | | | 2,559,431 | |
| | |
Edison International | | | 10,615 | | | | 668,002 | |
| | |
Entergy Corp. | | | 5,983 | | | | 616,369 | |
| | |
Evergy, Inc. | | | 5,983 | | | | 381,416 | |
| | |
Eversource Energy | | | 9,650 | | | | 819,285 | |
| | |
Exelon Corp. | | | 32,231 | | | | 1,714,367 | |
| | |
FirstEnergy Corp. | | | 18,721 | | | | 721,320 | |
| | |
Hawaiian Electric Industries, Inc. | | | 7,141 | | | | 289,639 | |
| | |
IDACORP, Inc. | | | 3,088 | | | | 322,140 | |
| | |
MGE Energy, Inc.(a) | | | 1,158 | | | | 87,881 | |
| | |
NextEra Energy, Inc. | | | 52,303 | | | | 4,463,015 | |
| | |
NRG Energy, Inc.(a) | | | 9,843 | | | | 392,637 | |
| | |
OGE Energy Corp. | | | 9,843 | | | | 335,351 | |
| | |
Otter Tail Corp.(a) | | | 772 | | | | 47,872 | |
| | |
PG&E Corp.* (a) | | | 37,635 | | | | 436,566 | |
| | |
Pinnacle West Capital Corp. | | | 2,316 | | | | 149,359 | |
| | |
PNM Resources, Inc. | | | 5,211 | | | | 259,247 | |
| | |
Portland General Electric Co. | | | 23,932 | | | | 1,180,087 | |
| | |
PPL Corp. | | | 24,897 | | | | 717,034 | |
| | |
Southern Co. (The) | | | 35,512 | | | | 2,213,108 | |
| | |
Xcel Energy, Inc. | | | 20,265 | | | | 1,308,916 | |
| | | | | | | | 21,917,180 | |
|
| Electrical Equipment – 0.8% | |
| | |
Acuity Brands, Inc.(a) | | | 2,509 | | | | 515,424 | |
| | |
Advent Technologies Holdings, Inc.* (a) | | | 9,071 | | | | 86,991 | |
| | |
American Superconductor Corp.* (a) | | | 5,211 | | | | 95,778 | |
| | |
AMETEK, Inc. | | | 5,404 | | | | 715,490 | |
| | |
Atkore, Inc.* | | | 11,773 | | | | 1,112,902 | |
| | |
AZZ, Inc.(a) | | | 2,895 | | | | 153,811 | |
| | |
Beam Global* (a) | | | 1,930 | | | | 60,795 | |
| | |
Bloom Energy Corp., Class A* (a) | | | 965 | | | | 30,166 | |
| | |
Eaton Corp. plc | | | 13,510 | | | | 2,225,908 | |
| | |
Emerson Electric Co. | | | 20,265 | | | | 1,965,908 | |
| | |
Encore Wire Corp. | | | 772 | | | | 103,494 | |
| | |
Energous Corp.* (a) | | | 30,108 | | | | 57,807 | |
| | |
EnerSys | | | 3,860 | | | | 308,954 | |
| | |
Generac Holdings, Inc.* | | | 1,737 | | | | 865,999 | |
See Accompanying Notes to the Financial Statements.
| | | | |
| 150 | | FLEXSHARES ANNUAL REPORT | | |
FlexShares® Morningstar US Market Factor Tilt Index Fund (cont.)
| | | | | | | | |
| Investments | | Shares | | | Value | |
|
| COMMON STOCKS – (continued) | |
|
| Electrical Equipment – (continued) | |
| | |
GrafTech International Ltd. | | | 49,987 | | | $ | 534,861 | |
| | |
Hubbell, Inc. | | | 1,351 | | | | 269,349 | |
| | |
nVent Electric plc | | | 41,688 | | | | 1,477,840 | |
| | |
Plug Power, Inc.* (a) | | | 15,633 | | | | 598,275 | |
| | |
Polar Power, Inc.* (a) | | | 7,334 | | | | 37,257 | |
| | |
Powell Industries, Inc.(a) | | | 5,790 | | | | 149,729 | |
| | |
Regal Rexnord Corp. | | | 3,584 | | | | 545,932 | |
| | |
Rockwell Automation, Inc.(a) | | | 3,088 | | | | 986,307 | |
| | |
Sensata Technologies Holding plc* | | | 4,632 | | | | 255,223 | |
| | |
Shoals Technologies Group, Inc., Class A* | | | 6,369 | | | | 197,375 | |
| | |
Sunrun, Inc.* (a) | | | 2,895 | | | | 166,984 | |
| | |
Sunworks, Inc.* (a) | | | 6,948 | | | | 42,174 | |
| | |
Thermon Group Holdings, Inc.* | | | 965 | | | | 16,675 | |
| | |
Vertiv Holdings Co.(a) | | | 4,053 | | | | 104,081 | |
| | |
Vicor Corp.* (a) | | | 772 | | | | 117,027 | |
| | | | | | | | 13,798,516 | |
|
| Electronic Equipment, Instruments & Components – 1.2% | |
| | |
908 Devices, Inc.* (a) | | | 2,123 | | | | 69,847 | |
| | |
Advanced Energy Industries, Inc.(a) | | | 3,281 | | | | 301,261 | |
| | |
Amphenol Corp., Class A(a) | | | 16,598 | | | | 1,274,228 | |
| | |
Arlo Technologies, Inc.* | | | 9,457 | | | | 65,253 | |
| | |
Arrow Electronics, Inc.* | | | 3,667 | | | | 424,455 | |
| | |
Avnet, Inc. | | | 20,265 | | | | 772,299 | |
| | |
Badger Meter, Inc.(a) | | | 965 | | | | 98,671 | |
| | |
Belden, Inc. | | | 4,632 | | | | 278,893 | |
| | |
Benchmark Electronics, Inc.(a) | | | 1,158 | | | | 26,993 | |
| | |
CDW Corp. | | | 3,474 | | | | 648,422 | |
| | |
Cognex Corp. | | | 4,439 | | | | 388,812 | |
| | |
Coherent, Inc.* | | | 772 | | | | 196,397 | |
| | |
Corning, Inc. | | | 24,511 | | | | 871,856 | |
| | |
CTS Corp.(a) | | | 1,158 | | | | 41,248 | |
| | |
ePlus, Inc.* (a) | | | 1,930 | | | | 213,400 | |
| | |
Fabrinet* | | | 1,158 | | | | 111,168 | |
| | |
FARO Technologies, Inc.* (a) | | | 579 | | | | 42,597 | |
| | |
Flex Ltd.* | | | 20,265 | | | | 342,479 | |
| | | | | | | | |
| Investments | | Shares | | | Value | |
|
Electronic Equipment, Instruments & Components –
(continued) | |
| | |
II-VI, Inc.* (a) | | | 22,774 | | | $ | 1,378,055 | |
| | |
Insight Enterprises, Inc.* (a) | | | 8,878 | | | | 840,747 | |
| | |
Intellicheck, Inc.* | | | 5,597 | | | | 49,757 | |
| | |
IPG Photonics Corp.* | | | 965 | | | | 153,445 | |
| | |
Itron, Inc.* | | | 1,158 | | | | 90,058 | |
| | |
Jabil, Inc.(a) | | | 6,948 | | | | 416,602 | |
| | |
Keysight Technologies, Inc.* | | | 4,825 | | | | 868,597 | |
| | |
Kimball Electronics, Inc.* (a) | | | 11,194 | | | | 321,828 | |
| | |
Knowles Corp.* (a) | | | 2,895 | | | | 60,332 | |
| | |
Littelfuse, Inc. | | | 965 | | | | 284,241 | |
| | |
Luna Innovations, Inc.* (a) | | | 6,755 | | | | 65,794 | |
| | |
Methode Electronics, Inc. | | | 10,229 | | | | 430,334 | |
| | |
National Instruments Corp. | | | 3,667 | | | | 155,737 | |
| | |
nLight, Inc.* (a) | | | 386 | | | | 10,854 | |
| | |
Novanta, Inc.* | | | 2,123 | | | | 366,345 | |
| | |
OSI Systems, Inc.* | | | 579 | | | | 53,911 | |
| | |
PAR Technology Corp.* | | | 1,737 | | | | 109,118 | |
| | |
PC Connection, Inc.(a) | | | 3,088 | | | | 142,202 | |
| | |
Plexus Corp.* (a) | | | 8,106 | | | | 707,816 | |
| | |
Rogers Corp.* (a) | | | 579 | | | | 116,448 | |
| | |
Sanmina Corp.* (a) | | | 16,984 | | | | 641,146 | |
| | |
ScanSource, Inc.* | | | 3,474 | | | | 124,300 | |
| | |
SYNNEX Corp.(a) | | | 10,229 | | | | 1,074,045 | |
| | |
TE Connectivity Ltd. | | | 8,878 | | | | 1,296,188 | |
| | |
Teledyne Technologies, Inc.* | | | 1,544 | | | | 693,596 | |
| | |
Trimble, Inc.* | | | 6,755 | | | | 590,184 | |
| | |
TTM Technologies, Inc.* (a) | | | 23,932 | | | | 316,860 | |
| | |
Velodyne Lidar, Inc.* (a) | | | 17,756 | | | | 108,312 | |
| | |
Vishay Intertechnology, Inc. | | | 25,283 | | | | 485,939 | |
| | |
Vontier Corp. | | | 44,004 | | | | 1,488,655 | |
| | |
Zebra Technologies Corp., Class A* | | | 1,351 | | | | 721,366 | |
| | | | | | | | 20,331,091 | |
|
| Energy Equipment & Services – 0.4% | |
| | |
Archrock, Inc.(a) | | | 13,896 | | | | 113,808 | |
| | |
Baker Hughes Co.(a) | | | 23,160 | | | | 580,853 | |
| | |
Cactus, Inc., Class A(a) | | | 6,755 | | | | 293,842 | |
| | |
ChampionX Corp.* | | | 15,247 | | | | 399,929 | |
| | |
Core Laboratories NV | | | 2,509 | | | | 65,259 | |
| | |
Dril-Quip, Inc.* (a) | | | 7,141 | | | | 168,242 | |
| | |
Expro Group Holdings NV* | | | 8,105 | | | | 139,001 | |
See Accompanying Notes to the Financial Statements.
| | | | | | |
| | FLEXSHARES ANNUAL REPORT | | | 151 | |
FlexShares® Morningstar US Market Factor Tilt Index Fund (cont.)
| | | | | | | | |
| Investments | | Shares | | | Value | |
|
| COMMON STOCKS – (continued) | |
|
| Energy Equipment & Services – (continued) | |
| | |
FTS International, Inc., Class A* (a) | | | 1,737 | | | $ | 46,030 | |
| | |
Halliburton Co. | | | 17,949 | | | | 448,545 | |
| | |
Helix Energy Solutions Group, Inc.* | | | 12,159 | | | | 45,961 | |
| | |
Helmerich & Payne, Inc. | | | 30,494 | | | | 946,534 | |
| | |
Liberty Oilfield Services, Inc., Class A* (a) | | | 13,124 | | | | 169,562 | |
| | |
Nabors Industries Ltd.* (a) | | | 386 | | | | 39,592 | |
| | |
NexTier Oilfield Solutions, Inc.* | | | 11,773 | | | | 52,508 | |
| | |
NOV, Inc.* | | | 83,376 | | | | 1,168,932 | |
| | |
Oceaneering International, Inc.* (a) | | | 18,142 | | | | 246,731 | |
| | |
Oil States International, Inc.* (a) | | | 27,792 | | | | 168,420 | |
| | |
Patterson-UTI Energy, Inc. | | | 29,336 | | | | 251,116 | |
| | |
ProPetro Holding Corp.* | | | 5,018 | | | | 48,123 | |
| | |
RPC, Inc.* (a) | | | 19,300 | | | | 104,027 | |
| | |
Schlumberger NV | | | 42,846 | | | | 1,382,212 | |
| | |
Select Energy Services, Inc., Class A* | | | 33,003 | | | | 198,348 | |
| | |
Solaris Oilfield Infrastructure, Inc., Class A | | | 19,107 | | | | 145,022 | |
| | |
Transocean Ltd.* (a) | | | 106,150 | | | | 374,709 | |
| | |
US Silica Holdings, Inc.* (a) | | | 5,597 | | | | 54,179 | |
| | | | | | | | 7,651,485 | |
|
| Entertainment – 1.4% | |
| | |
Activision Blizzard, Inc. | | | 19,686 | | | | 1,539,248 | |
| | |
AMC Entertainment Holdings, Inc., Class A* (a) | | | 23,739 | | | | 839,648 | |
| | |
Cinemark Holdings, Inc.* (a) | | | 11,580 | | | | 217,704 | |
| | |
Electronic Arts, Inc. | | | 7,527 | | | | 1,055,662 | |
| | |
IMAX Corp.* | | | 2,316 | | | | 43,657 | |
| | |
Liberty Media Corp-Liberty Formula One, Class A* | | | 2,123 | | | | 110,714 | |
| | |
Liberty Media Corp-Liberty Formula One, Class C* (a) | | | 5,790 | | | | 323,082 | |
| | |
Lions Gate Entertainment Corp., Class A* | | | 17,756 | | | | 229,940 | |
| | | | | | | | |
| Investments | | Shares | | | Value | |
|
| Entertainment – (continued) | |
| | |
Lions Gate Entertainment Corp., Class B* | | | 34,547 | | | $ | 391,072 | |
| | |
Live Nation Entertainment, Inc.* | | | 3,667 | | | | 370,917 | |
| | |
Madison Square Garden Entertainment Corp.* (a) | | | 1,930 | | | | 136,007 | |
| | |
Madison Square Garden Sports Corp., Class A* (a) | | | 1,158 | | | | 219,453 | |
| | |
Marcus Corp. (The)* (a) | | | 6,176 | | | | 114,688 | |
| | |
Netflix, Inc.* | | | 12,352 | | | | 8,526,709 | |
| | |
Roku, Inc.* | | | 2,702 | | | | 823,840 | |
| | |
Sciplay Corp., Class A* (a) | | | 7,141 | | | | 144,320 | |
| | |
Skillz, Inc.* (a) | | | 1,351 | | | | 15,104 | |
| | |
Take-Two Interactive Software, Inc.* (a) | | | 2,895 | | | | 523,995 | |
| | |
Walt Disney Co. (The)* | | | 50,180 | | | | 8,483,933 | |
| | |
Warner Music Group Corp., Class A | | | 6,562 | | | | 324,753 | |
| | |
World Wrestling Entertainment, Inc., Class A(a) | | | 3,088 | | | | 188,646 | |
| | |
Zynga, Inc., Class A* | | | 25,283 | | | | 186,589 | |
| | | | | | | | 24,809,681 | |
|
| Equity Real Estate Investment Trusts (REITs) – 3.2% | |
| | |
Acadia Realty Trust | | | 4,246 | | | | 90,779 | |
| | |
Agree Realty Corp.(a) | | | 4,825 | | | | 342,865 | |
| | |
Alexander & Baldwin, Inc. | | | 5,983 | | | | 146,763 | |
| | |
Alexander’s, Inc. | | | 386 | | | | 107,609 | |
| | |
Alexandria Real Estate Equities, Inc.(a) | | | 3,281 | | | | 669,783 | |
| | |
American Assets Trust, Inc. | | | 579 | | | | 21,904 | |
| | |
American Campus Communities, Inc. | | | 5,211 | | | | 279,935 | |
| | |
American Finance Trust, Inc. | | | 39,565 | | | | 327,598 | |
| | |
American Homes 4 Rent, Class A | | | 6,755 | | | | 274,253 | |
| | |
American Tower Corp. | | | 12,738 | | | | 3,591,734 | |
| | |
Americold Realty Trust(a) | | | 6,562 | | | | 193,382 | |
| | |
Apartment Income REIT Corp.(a) | | | 10,615 | | | | 569,070 | |
| | |
Apple Hospitality REIT, Inc. | | | 14,668 | | | | 230,434 | |
| | |
Armada Hoffler Properties, Inc. | | | 1,930 | | | | 26,460 | |
| | |
AvalonBay Communities, Inc. | | | 3,860 | | | | 913,585 | |
See Accompanying Notes to the Financial Statements.
| | | | |
| 152 | | FLEXSHARES ANNUAL REPORT | | |
FlexShares® Morningstar US Market Factor Tilt Index Fund (cont.)
| | | | | | | | |
| Investments | | Shares | | | Value | |
|
| COMMON STOCKS – (continued) | |
|
| Equity Real Estate Investment Trusts (REITs) – (continued) | |
| | |
Bluerock Residential Growth REIT, Inc. | | | 8,299 | | | $ | 112,285 | |
| | |
Boston Properties, Inc. | | | 2,702 | | | | 307,055 | |
| | |
Braemar Hotels & Resorts, Inc.* (a) | | | 17,756 | | | | 90,200 | |
| | |
Brandywine Realty Trust | | | 17,756 | | | | 235,267 | |
| | |
Brixmor Property Group, Inc.(a) | | | 11,194 | | | | 262,387 | |
| | |
Broadstone Net Lease, Inc.(a) | | | 12,738 | | | | 338,703 | |
| | |
Camden Property Trust | | | 2,509 | | | | 409,218 | |
| | |
CareTrust REIT, Inc.(a) | | | 11,001 | | | | 228,271 | |
| | |
CatchMark Timber Trust, Inc., Class A | | | 2,123 | | | | 18,173 | |
| | |
Centerspace | | | 4,632 | | | | 468,944 | |
| | |
Chatham Lodging Trust* | | | 7,527 | | | | 95,518 | |
| | |
City Office REIT, Inc. | | | 6,369 | | | | 120,820 | |
| | |
Columbia Property Trust, Inc. | | | 5,983 | | | | 114,694 | |
| | |
Community Healthcare Trust, Inc.(a) | | | 772 | | | | 36,932 | |
| | |
CoreSite Realty Corp. | | | 2,509 | | | | 357,432 | |
| | |
Corporate Office Properties Trust | | | 9,843 | | | | 266,942 | |
| | |
Cousins Properties, Inc.(a) | | | 5,983 | | | | 236,987 | |
| | |
Crown Castle International Corp. | | | 11,580 | | | | 2,087,874 | |
| | |
CubeSmart | | | 8,106 | | | | 445,911 | |
| | |
CyrusOne, Inc. | | | 2,895 | | | | 237,448 | |
| | |
DiamondRock Hospitality Co.* | | | 17,949 | | | | 162,259 | |
| | |
Digital Realty Trust, Inc.(a) | | | 8,299 | | | | 1,309,665 | |
| | |
DigitalBridge Group, Inc.* (a) | | | 26,055 | | | | 174,569 | |
| | |
Diversified Healthcare Trust(a) | | | 18,914 | | | | 68,847 | |
| | |
Douglas Emmett, Inc.(a) | | | 7,913 | | | | 258,597 | |
| | |
Duke Realty Corp. | | | 9,650 | | | | 542,716 | |
| | |
EastGroup Properties, Inc.(a) | | | 2,316 | | | | 458,058 | |
| | |
Empire State Realty Trust, Inc., Class A(a) | | | 17,563 | | | | 170,010 | |
| | |
EPR Properties | | | 6,369 | | | | 319,787 | |
| | |
Equinix, Inc.(a) | | | 2,509 | | | | 2,100,209 | |
| | |
Equity Commonwealth(a) | | | 1,158 | | | | 30,027 | |
| | | | | | | | |
| Investments | | Shares | | | Value | |
|
| Equity Real Estate Investment Trusts (REITs) – (continued) | |
| | |
Equity LifeStyle Properties, Inc. | | | 4,825 | | | $ | 407,761 | |
| | |
Equity Residential | | | 7,913 | | | | 683,683 | |
| | |
Essential Properties Realty Trust, Inc.(a) | | | 6,369 | | | | 189,733 | |
| | |
Essex Property Trust, Inc. | | | 1,544 | | | | 524,852 | |
| | |
Extra Space Storage, Inc. | | | 3,474 | | | | 685,663 | |
| | |
Federal Realty Investment Trust | | | 3,088 | | | | 371,641 | |
| | |
First Industrial Realty Trust, Inc. | | | 7,913 | | | | 460,774 | |
| | |
Four Corners Property Trust, Inc.(a) | | | 8,878 | | | | 257,462 | |
| | |
Franklin Street Properties Corp.(a) | | | 28,757 | | | | 129,407 | |
| | |
Gaming and Leisure Properties, Inc. | | | 7,334 | | | | 355,626 | |
| | |
GEO Group, Inc. (The)(a) | | | 11,194 | | | | 91,567 | |
| | |
Getty Realty Corp. | | | 4,632 | | | | 148,780 | |
| | |
Healthcare Realty Trust, Inc.(a) | | | 8,492 | | | | 280,746 | |
| | |
Healthcare Trust of America, Inc., Class A | | | 11,966 | | | | 399,545 | |
| | |
Healthpeak Properties, Inc. | | | 13,124 | | | | 466,033 | |
| | |
Hersha Hospitality Trust* | | | 13,317 | | | | 118,921 | |
| | |
Highwoods Properties, Inc.(a) | | | 8,106 | | | | 363,473 | |
| | |
Host Hotels & Resorts, Inc.* (a) | | | 18,335 | | | | 308,578 | |
| | |
Hudson Pacific Properties, Inc. | | | 6,562 | | | | 168,972 | |
| | |
Independence Realty Trust, Inc.(a) | | | 3,088 | | | | 72,969 | |
| | |
Industrial Logistics Properties Trust(a) | | | 17,756 | | | | 498,766 | |
| | |
Innovative Industrial Properties, Inc. | | | 965 | | | | 253,882 | |
| | |
Invitation Homes, Inc. | | | 14,282 | | | | 589,132 | |
| | |
Iron Mountain, Inc.(a) | | | 7,527 | | | | 343,532 | |
| | |
iStar, Inc.(a) | | | 6,176 | | | | 155,882 | |
| | |
JBG SMITH Properties | | | 1,544 | | | | 44,560 | |
| | |
Kilroy Realty Corp.(a) | | | 4,632 | | | | 312,104 | |
| | |
Kimco Realty Corp.(a) | | | 22,967 | | | | 519,054 | |
| | |
Kite Realty Group Trust | | | 7,201 | | | | 146,180 | |
See Accompanying Notes to the Financial Statements.
| | | | | | |
| | FLEXSHARES ANNUAL REPORT | | | 153 | |
FlexShares® Morningstar US Market Factor Tilt Index Fund (cont.)
| | | | | | | | |
| Investments | | Shares | | | Value | |
|
| COMMON STOCKS – (continued) | |
|
| Equity Real Estate Investment Trusts (REITs) – (continued) | |
| | |
Lamar Advertising Co., Class A | | | 3,667 | | | $ | 415,104 | |
| | |
Lexington Realty Trust(a) | | | 7,720 | | | | 112,480 | |
| | |
Life Storage, Inc. | | | 4,246 | | | | 568,157 | |
| | |
Macerich Co. (The)(a) | | | 16,212 | | | | 293,275 | |
| | |
Medical Properties Trust, Inc.(a) | | | 13,896 | | | | 296,402 | |
| | |
Mid-America Apartment Communities, Inc. | | | 3,088 | | | | 630,600 | |
| | |
Monmouth Real Estate Investment Corp. | | | 3,474 | | | | 65,485 | |
| | |
National Health Investors, Inc. | | | 4,632 | | | | 249,109 | |
| | |
National Retail Properties, Inc. | | | 6,948 | | | | 315,161 | |
| | |
National Storage Affiliates Trust | | | 1,930 | | | | 120,548 | |
| | |
NexPoint Residential Trust, Inc. | | | – | (c) | | | 21 | |
| | |
Office Properties Income Trust | | | 6,369 | | | | 163,174 | |
| | |
Omega Healthcare Investors, Inc.(a) | | | 11,194 | | | | 328,656 | |
| | |
Outfront Media, Inc. | | | 12,931 | | | | 321,853 | |
| | |
Paramount Group, Inc. | | | 23,932 | | | | 202,943 | |
| | |
Park Hotels & Resorts, Inc.* | | | 57,707 | | | | 1,069,311 | |
| | |
Pebblebrook Hotel Trust(a) | | | 9,843 | | | | 221,074 | |
| | |
Physicians Realty Trust(a) | | | 13,896 | | | | 264,163 | |
| | |
Piedmont Office Realty Trust, Inc., Class A | | | 12,931 | | | | 229,655 | |
| | |
Plymouth Industrial REIT, Inc. | | | 10,229 | | | | 261,453 | |
| | |
PotlatchDeltic Corp. | | | 13,317 | | | | 696,080 | |
| | |
Preferred Apartment Communities, Inc., Class A(a) | | | 18,528 | | | | 233,638 | |
| | |
Prologis, Inc. | | | 20,651 | | | | 2,993,569 | |
| | |
PS Business Parks, Inc. | | | 579 | | | | 102,888 | |
| | |
Public Storage | | | 4,246 | | | | 1,410,436 | |
| | |
Rayonier, Inc.(a) | | | 8,878 | | | | 331,416 | |
| | |
Realty Income Corp.(a) | | | 10,808 | | | | 772,015 | |
| | |
Regency Centers Corp. | | | 2,895 | | | | 203,837 | |
| | |
Retail Opportunity Investments Corp. | | | 7,334 | | | | 130,325 | |
| | | | | | | | |
| Investments | | Shares | | | Value | |
|
| Equity Real Estate Investment Trusts (REITs) – (continued) | |
| | |
Retail Value, Inc. | | | 2,702 | | | $ | 16,915 | |
| | |
Rexford Industrial Realty, Inc.(a) | | | 7,720 | | | | 518,784 | |
| | |
RLJ Lodging Trust | | | 3,088 | | | | 44,529 | |
| | |
RPT Realty | | | 9,650 | | | | 128,249 | |
| | |
Ryman Hospitality Properties, Inc.* (a) | | | 3,667 | | | | 313,675 | |
| | |
Sabra Health Care REIT, Inc. | | | 19,493 | | | | 275,826 | |
| | |
Safehold, Inc. | | | 386 | | | | 28,834 | |
| | |
Saul Centers, Inc. | | | 772 | | | | 35,821 | |
| | |
SBA Communications Corp. | | | 2,895 | | | | 999,730 | |
| | |
Seritage Growth Properties, Class A* (a) | | | 4,053 | | | | 62,416 | |
| | |
Service Properties Trust | | | 13,124 | | | | 141,345 | |
| | |
Simon Property Group, Inc.(a) | | | 8,106 | | | | 1,188,177 | |
| | |
SITE Centers Corp. | | | 5,404 | | | | 85,870 | |
| | |
SL Green Realty Corp. | | | 14,089 | | | | 987,216 | |
| | |
Spirit Realty Capital, Inc. | | | 5,597 | | | | 273,861 | |
| | |
STAG Industrial, Inc. | | | 9,457 | | | | 411,663 | |
| | |
STORE Capital Corp. | | | 10,036 | | | | 344,536 | |
| | |
Summit Hotel Properties, Inc.* | | | 10,808 | | | | 108,080 | |
| | |
Sun Communities, Inc.(a) | | | 3,667 | | | | 718,659 | |
| | |
Sunstone Hotel Investors, Inc.* | | | 9,650 | | | | 119,081 | |
| | |
Tanger Factory Outlet Centers, Inc.(a) | | | 12,352 | | | | 207,514 | |
| | |
Terreno Realty Corp. | | | 4,439 | | | | 324,624 | |
| | |
UDR, Inc.(a) | | | 10,229 | | | | 568,016 | |
| | |
Uniti Group, Inc. | | | 13,896 | | | | 198,852 | |
| | |
Universal Health Realty Income Trust | | | 386 | | | | 21,990 | |
| | |
Urban Edge Properties(a) | | | 5,018 | | | | 87,966 | |
| | |
Urstadt Biddle Properties, Inc., Class A(a) | | | 5,983 | | | | 117,506 | |
| | |
Ventas, Inc. | | | 12,352 | | | | 659,226 | |
| | |
VEREIT, Inc. | | | 4,632 | | | | 232,990 | |
| | |
VICI Properties, Inc.(a) | | | 16,791 | | | | 492,816 | |
| | |
Vornado Realty Trust | | | 5,790 | | | | 246,828 | |
| | |
Washington REIT(a) | | | 6,948 | | | | 176,132 | |
| | |
Welltower, Inc. | | | 10,422 | | | | 837,929 | |
| | |
Weyerhaeuser Co. | | | 19,107 | | | | 682,502 | |
| | |
Whitestone REIT(a) | | | 8,878 | | | | 81,500 | |
See Accompanying Notes to the Financial Statements.
| | | | |
| 154 | | FLEXSHARES ANNUAL REPORT | | |
FlexShares® Morningstar US Market Factor Tilt Index Fund (cont.)
| | | | | | | | |
| Investments | | Shares | | | Value | |
|
| COMMON STOCKS – (continued) | |
|
| Equity Real Estate Investment Trusts (REITs) – (continued) | |
| | |
WP Carey, Inc.(a) | | | 4,825 | | | $ | 372,056 | |
| | |
Xenia Hotels & Resorts, Inc.* (a) | | | 30,494 | | | | 542,793 | |
| | | | | | | | 54,858,572 | |
|
| Food & Staples Retailing – 1.2% | |
| | |
Andersons, Inc. (The)(a) | | | 2,895 | | | | 98,604 | |
| | |
BJ’s Wholesale Club Holdings, Inc.* (a) | | | 33,196 | | | | 1,939,974 | |
| | |
Casey’s General Stores, Inc. | | | 965 | | | | 184,836 | |
| | |
Chefs’ Warehouse, Inc. (The)* | | | 5,790 | | | | 201,897 | |
| | |
Costco Wholesale Corp. | | | 12,352 | | | | 6,071,502 | |
| | |
Ingles Markets, Inc., Class A(a) | | | 2,316 | | | | 160,244 | |
| | |
Kroger Co. (The) | | | 26,248 | | | | 1,050,445 | |
| | |
Performance Food Group Co.* | | | 3,667 | | | | 165,859 | |
| | |
PriceSmart, Inc. | | | 579 | | | | 41,659 | |
| | |
Rite Aid Corp.* (a) | | | 5,597 | | | | 76,063 | |
| | |
SpartanNash Co. | | | 10,615 | | | | 245,631 | |
| | |
Sprouts Farmers Market, Inc.* (a) | | | 30,301 | | | | 670,864 | |
| | |
Sysco Corp. | | | 15,054 | | | | 1,157,653 | |
| | |
United Natural Foods, Inc.* | | | 15,633 | | | | 678,316 | |
| | |
US Foods Holding Corp.* (a) | | | 9,457 | | | | 327,874 | |
| | |
Walgreens Boots Alliance, Inc. | | | 21,616 | | | | 1,016,384 | |
| | |
Walmart, Inc. | | | 38,407 | | | | 5,738,774 | |
| | |
Weis Markets, Inc.(a) | | | 5,018 | | | | 282,564 | |
| | | | | | | | 20,109,143 | |
|
| Food Products – 0.9% | |
| | |
Archer-Daniels-Midland Co. | | | 19,493 | | | | 1,252,230 | |
| | |
B&G Foods, Inc.(a) | | | 16,984 | | | | 500,009 | |
| | |
Beyond Meat, Inc.* (a) | | | 386 | | | | 38,206 | |
| | |
Bunge Ltd. | | | 4,053 | | | | 375,470 | |
| | |
Calavo Growers, Inc. | | | 4,632 | | | | 186,206 | |
| | |
Cal-Maine Foods, Inc.(a) | | | 965 | | | | 34,798 | |
| | |
Campbell Soup Co. | | | 4,053 | | | | 161,917 | |
| | |
Conagra Brands, Inc.(a) | | | 19,879 | | | | 640,104 | |
| | |
Darling Ingredients, Inc.* (a) | | | 5,211 | | | | 440,434 | |
| | | | | | | | |
| Investments | | Shares | | | Value | |
|
| Food Products – (continued) | |
| | |
Flowers Foods, Inc. | | | 12,545 | | | $ | 310,489 | |
| | |
Fresh Del Monte Produce, Inc.(a) | | | 3,667 | | | | 122,808 | |
| | |
Freshpet, Inc.* (a) | | | 1,930 | | | | 300,906 | |
| | |
General Mills, Inc. | | | 22,002 | | | | 1,359,724 | |
| | |
Hain Celestial Group, Inc. (The)* (a) | | | 2,509 | | | | 112,579 | |
| | |
Hershey Co. (The) | | | 3,860 | | | | 676,851 | |
| | |
Hormel Foods Corp.(a) | | | 4,825 | | | | 204,194 | |
| | |
Hostess Brands, Inc.* (a) | | | 4,053 | | | | 76,642 | |
| | |
Ingredion, Inc. | | | 14,475 | | | | 1,378,454 | |
| | |
J & J Snack Foods Corp. | | | 386 | | | | 56,954 | |
| | |
J M Smucker Co. (The) | | | 4,053 | | | | 497,952 | |
| | |
John B Sanfilippo & Son, Inc. | | | 386 | | | | 32,617 | |
| | |
Kellogg Co. | | | 6,562 | | | | 402,251 | |
| | |
Kraft Heinz Co. (The) | | | 23,932 | | | | 858,919 | |
| | |
Lamb Weston Holdings, Inc. | | | 1,737 | | | | 98,054 | |
| | |
Lancaster Colony Corp. | | | 579 | | | | 98,430 | |
| | |
McCormick & Co., Inc. (Non-Voting)(a) | | | 8,492 | | | | 681,313 | |
| | |
Mission Produce, Inc.* | | | 4,632 | | | | 87,962 | |
| | |
Mondelez International, Inc., Class A | | | 45,355 | | | | 2,754,863 | |
| | |
Pilgrim’s Pride Corp.* | | | 10,036 | | | | 282,614 | |
| | |
Post Holdings, Inc.* | | | 3,474 | | | | 352,541 | |
| | |
Sanderson Farms, Inc. | | | 579 | | | | 109,692 | |
| | |
Seaboard Corp.(a) | | | 64 | | | | 246,401 | |
| | |
Simply Good Foods Co. (The)* | | | 2,702 | | | | 107,134 | |
| | |
Tootsie Roll Industries, Inc.(a) | | | 3,088 | | | | 97,736 | |
| | |
TreeHouse Foods, Inc.* (a) | | | 9,843 | | | | 355,726 | |
| | |
Tyson Foods, Inc., Class A | | | 8,299 | | | | 663,671 | |
| | |
Whole Earth Brands, Inc.* (a) | | | 11,387 | | | | 138,124 | |
| | | | | | | | 16,094,975 | |
|
| Gas Utilities – 0.3% | |
| | |
Atmos Energy Corp. | | | 3,088 | | | | 284,467 | |
| | |
Chesapeake Utilities Corp.(a) | | | 579 | | | | 75,889 | |
| | |
National Fuel Gas Co. | | | 24,318 | | | | 1,396,583 | |
| | |
New Jersey Resources Corp.(a) | | | 8,685 | | | | 328,380 | |
| | |
Northwest Natural Holding Co.(a) | | | 965 | | | | 43,512 | |
See Accompanying Notes to the Financial Statements.
| | | | | | |
| | FLEXSHARES ANNUAL REPORT | | | 155 | |
FlexShares® Morningstar US Market Factor Tilt Index Fund (cont.)
| | | | | | | | |
| Investments | | Shares | | | Value | |
|
| COMMON STOCKS – (continued) | |
|
| Gas Utilities – (continued) | |
| | |
ONE Gas, Inc. | | | 4,632 | | | $ | 311,734 | |
| | |
South Jersey Industries, Inc.(a) | | | 29,915 | | | | 680,865 | |
| | |
Southwest Gas Holdings, Inc. | | | 13,896 | | | | 962,298 | |
| | |
Spire, Inc.(a) | | | 10,229 | | | | 641,972 | |
| | |
UGI Corp. | | | 7,913 | | | | 343,503 | |
| | | | | | | | 5,069,203 | |
|
| Health Care Equipment & Supplies – 2.9% | |
| | |
Abbott Laboratories | | | 49,794 | | | | 6,417,949 | |
| | |
ABIOMED, Inc.* | | | 1,158 | | | | 384,502 | |
| | |
Acutus Medical, Inc.* | | | 10,808 | | | | 84,735 | |
| | |
Align Technology, Inc.* | | | 1,930 | | | | 1,205,034 | |
| | |
Alphatec Holdings, Inc.* | | | 7,720 | | | | 90,556 | |
| | |
AngioDynamics, Inc.* (a) | | | 772 | | | | 22,079 | |
| | |
Asensus Surgical, Inc.* (a) | | | 39,179 | | | | 66,213 | |
| | |
AtriCure, Inc.* (a) | | | 2,895 | | | | 217,299 | |
| | |
Avanos Medical, Inc.* | | | 6,755 | | | | 213,053 | |
| | |
Axonics, Inc.* (a) | | | 2,895 | | | | 212,348 | |
| | |
Baxter International, Inc. | | | 13,317 | | | | 1,051,510 | |
| | |
Becton Dickinson and Co. | | | 10,229 | | | | 2,450,766 | |
| | |
Boston Scientific Corp.* | | | 39,758 | | | | 1,714,763 | |
| | |
Cardiovascular Systems, Inc.* (a) | | | 5,404 | | | | 189,572 | |
| | |
Cerus Corp.* (a) | | | 17,949 | | | | 118,463 | |
| | |
Co-Diagnostics, Inc.* (a) | | | 386 | | | | 3,169 | |
| | |
CONMED Corp. | | | 965 | | | | 141,160 | |
| | |
Cooper Cos., Inc. (The) | | | 1,351 | | | | 563,259 | |
| | |
CryoLife, Inc.* (a) | | | 1,351 | | | | 27,885 | |
| | |
CryoPort, Inc.* (a) | | | 1,158 | | | | 94,423 | |
| | |
Cutera, Inc.* (a) | | | 1,351 | | | | 58,093 | |
| | |
Danaher Corp. | | | 17,949 | | | | 5,595,960 | |
| | |
Dentsply Sirona, Inc. | | | 5,983 | | | | 342,287 | |
| | |
DexCom, Inc.* (a) | | | 2,702 | | | | 1,683,913 | |
| | |
Edwards Lifesciences Corp.* | | | 16,212 | | | | 1,942,522 | |
| | |
Envista Holdings Corp.* (a) | | | 7,141 | | | | 279,213 | |
| | |
Establishment Labs Holdings, Inc.* (a) | | | 1,351 | | | | 110,161 | |
| | |
Glaukos Corp.* (a) | | | 579 | | | | 26,466 | |
| | |
Globus Medical, Inc., Class A* | | | 4,632 | | | | 357,452 | |
| | |
Haemonetics Corp.* (a) | | | 579 | | | | 39,783 | |
| | | | | | | | |
| Investments | | Shares | | | Value | |
|
| Health Care Equipment & Supplies – (continued) | |
| | |
Heska Corp.* (a) | | | 193 | | | $ | 43,141 | |
| | |
Hill-Rom Holdings, Inc. | | | 1,737 | | | | 269,061 | |
| | |
Hologic, Inc.* | | | 8,492 | | | | 622,549 | |
| | |
ICU Medical, Inc.* | | | 579 | | | | 135,561 | |
| | |
IDEXX Laboratories, Inc.* | | | 2,509 | | | | 1,671,345 | |
| | |
Inari Medical, Inc.* (a) | | | 2,895 | | | | 262,055 | |
| | |
Insulet Corp.* (a) | | | 1,737 | | | | 538,505 | |
| | |
Integer Holdings Corp.* (a) | | | 965 | | | | 86,869 | |
| | |
Integra LifeSciences Holdings Corp.* | | | 4,439 | | | | 295,016 | |
| | |
Intersect ENT, Inc.* | | | 1,158 | | | | 31,231 | |
| | |
Intuitive Surgical, Inc.* | | | 9,843 | | | | 3,554,603 | |
| | |
iRhythm Technologies, Inc.* | | | 386 | | | | 27,074 | |
| | |
Lantheus Holdings, Inc.* | | | 8,492 | | | | 198,628 | |
| | |
LeMaitre Vascular, Inc.(a) | | | 386 | | | | 20,076 | |
| | |
LivaNova plc* | | | 3,281 | | | | 251,718 | |
| | |
Masimo Corp.* (a) | | | 1,351 | | | | 383,063 | |
| | |
Medtronic plc | | | 38,021 | | | | 4,557,197 | |
| | |
Meridian Bioscience, Inc.* | | | 3,667 | | | | 68,976 | |
| | |
Merit Medical Systems, Inc.* (a) | | | 1,737 | | | | 116,831 | |
| | |
Natus Medical, Inc.* | | | 1,351 | | | | 33,843 | |
| | |
Neogen Corp.* | | | 6,562 | | | | 277,638 | |
| | |
Neuronetics, Inc.* (a) | | | 10,229 | | | | 53,191 | |
| | |
Nevro Corp.* (a) | | | 965 | | | | 109,759 | |
| | |
Novocure Ltd.* (a) | | | 2,123 | | | | 217,756 | |
| | |
NuVasive, Inc.* | | | 1,737 | | | | 92,686 | |
| | |
OraSure Technologies, Inc.* (a) | | | 5,790 | | | | 61,779 | |
| | |
Ortho Clinical Diagnostics Holdings plc* | | | 7,527 | | | | 148,809 | |
| | |
Orthofix Medical, Inc.* | | | 772 | | | | 27,777 | |
| | |
OrthoPediatrics Corp.* (a) | | | 1,544 | | | | 109,887 | |
| | |
Outset Medical, Inc.* (a) | | | 579 | | | | 30,843 | |
| | |
Penumbra, Inc.* (a) | | | 965 | | | | 266,871 | |
| | |
Pulmonx Corp.* | | | 4,439 | | | | 172,810 | |
| | |
Quidel Corp.* (a) | | | 9,650 | | | | 1,281,231 | |
| | |
ResMed, Inc. | | | 3,860 | | | | 1,014,833 | |
| | |
Retractable Technologies, Inc.* (a) | | | 5,790 | | | | 54,773 | |
| | |
Senseonics Holdings, Inc.* (a) | | | 28,950 | | | | 101,325 | |
| | |
Shockwave Medical, Inc.* | | | 2,123 | | | | 453,685 | |
See Accompanying Notes to the Financial Statements.
| | | | |
| 156 | | FLEXSHARES ANNUAL REPORT | | |
FlexShares® Morningstar US Market Factor Tilt Index Fund (cont.)
| | | | | | | | |
| Investments | | Shares | | | Value | |
|
| COMMON STOCKS – (continued) | |
|
| Health Care Equipment & Supplies – (continued) | |
| | |
Silk Road Medical, Inc.* (a) | | | 2,895 | | | $ | 169,966 | |
| | |
STAAR Surgical Co.* (a) | | | 2,316 | | | | 274,353 | |
| | |
STERIS plc(a) | | | 3,088 | | | | 721,789 | |
| | |
Stryker Corp. | | | 9,264 | | | | 2,464,873 | |
| | |
Surmodics, Inc.* (a) | | | 386 | | | | 21,485 | |
| | |
Tandem Diabetes Care, Inc.* | | | 3,474 | | | | 473,610 | |
| | |
Teleflex, Inc. | | | 1,544 | | | | 551,115 | |
| | |
Varex Imaging Corp.* (a) | | | 5,211 | | | | 139,915 | |
| | |
West Pharmaceutical Services, Inc. | | | 1,930 | | | | 829,668 | |
| | |
Wright Medical Group NV* ‡ (d) | | | 4,032 | | | | — | |
| | |
Zimmer Biomet Holdings, Inc. | | | 5,018 | | | | 718,176 | |
| | | | | | | | 49,712,533 | |
|
| Health Care Providers & Services – 2.7% | |
| | |
1Life Healthcare, Inc.* (a) | | | 579 | | | | 12,541 | |
| | |
Acadia Healthcare Co., Inc.* | | | 6,562 | | | | 406,844 | |
| | |
Accolade, Inc.* | | | 5,211 | | | | 207,346 | |
| | |
Addus HomeCare Corp.* | | | 1,544 | | | | 144,364 | |
| | |
Amedisys, Inc.* (a) | | | 965 | | | | 163,413 | |
| | |
AmerisourceBergen Corp. | | | 5,404 | | | | 659,396 | |
| | |
AMN Healthcare Services, Inc.* | | | 3,667 | | | | 361,933 | |
| | |
Anthem, Inc. | | | 8,106 | | | | 3,527,164 | |
| | |
Apollo Medical Holdings, Inc.* (a) | | | 1,737 | | | | 119,210 | |
| | |
Brookdale Senior Living, Inc.* (a) | | | 58,093 | | | | 377,605 | |
| | |
Cardinal Health, Inc. | | | 10,615 | | | | 507,503 | |
| | |
Castle Biosciences, Inc.* (a) | | | 965 | | | | 60,168 | |
| | |
Centene Corp.* | | | 22,002 | | | | 1,567,422 | |
| | |
Chemed Corp.(a) | | | 386 | | | | 186,149 | |
| | |
Cigna Corp. | | | 11,387 | | | | 2,432,377 | |
| | |
Community Health Systems, Inc.* (a) | | | 14,861 | | | | 194,679 | |
| | |
CorVel Corp.* | | | 193 | | | | 35,361 | |
| | |
Covetrus, Inc.* | | | 3,088 | | | | 62,347 | |
| | |
CVS Health Corp. | | | 43,232 | | | | 3,859,753 | |
| | |
DaVita, Inc.* | | | 2,895 | | | | 298,880 | |
| | |
Encompass Health Corp. | | | 2,702 | | | | 171,739 | |
| | |
Ensign Group, Inc. (The)(a) | | | 2,509 | | | | 195,727 | |
| | | | | | | | |
| Investments | | Shares | | | Value | |
|
| Health Care Providers & Services – (continued) | |
| | |
Fulgent Genetics, Inc.* (a) | | | 3,667 | | | $ | 304,068 | |
| | |
Guardant Health, Inc.* (a) | | | 1,737 | | | | 202,864 | |
| | |
HCA Healthcare, Inc. | | | 8,878 | | | | 2,223,584 | |
| | |
HealthEquity, Inc.* (a) | | | 2,123 | | | | 140,500 | |
| | |
Henry Schein, Inc.* | | | 4,632 | | | | 353,653 | |
| | |
Humana, Inc. | | | 4,246 | | | | 1,966,577 | |
| | |
InfuSystem Holdings, Inc.* | | | 4,825 | | | | 80,240 | |
| | |
Innovage Holding Corp.* (a) | | | 7,527 | | | | 49,829 | |
| | |
Laboratory Corp. of America Holdings* | | | 3,474 | | | | 997,108 | |
| | |
LHC Group, Inc.* | | | 965 | | | | 129,879 | |
| | |
Magellan Health, Inc.* (a) | | | 1,351 | | | | 128,115 | |
| | |
McKesson Corp. | | | 5,597 | | | | 1,163,504 | |
| | |
MEDNAX, Inc.* (a) | | | 16,019 | | | | 436,197 | |
| | |
ModivCare, Inc.* (a) | | | 386 | | | | 62,829 | |
| | |
Molina Healthcare, Inc.* | | | 2,123 | | | | 627,814 | |
| | |
National HealthCare Corp. | | | 4,632 | | | | 323,962 | |
| | |
National Research Corp.(a) | | | 386 | | | | 16,714 | |
| | |
Option Care Health, Inc.* | | | 10,808 | | | | 295,383 | |
| | |
Owens & Minor, Inc.(a) | | | 14,282 | | | | 512,438 | |
| | |
Patterson Cos., Inc.(a) | | | 21,809 | | | | 681,749 | |
| | |
Pennant Group, Inc. (The)* (a) | | | 2,895 | | | | 74,025 | |
| | |
Premier, Inc., Class A | | | 26,055 | | | | 1,014,842 | |
| | |
Privia Health Group, Inc.* (a) | | | 3,667 | | | | 94,242 | |
| | |
Progyny, Inc.* (a) | | | 3,474 | | | | 213,408 | |
| | |
Quest Diagnostics, Inc. | | | 4,439 | | | | 651,556 | |
| | |
R1 RCM, Inc.* | | | 3,667 | | | | 79,574 | |
| | |
RadNet, Inc.* | | | 4,246 | | | | 132,008 | |
| | |
Select Medical Holdings Corp. | | | 21,616 | | | | 718,084 | |
| | |
Signify Health, Inc., Class A* (a) | | | 4,439 | | | | 71,335 | |
| | |
Surgery Partners, Inc.* | | | 5,983 | | | | 246,141 | |
| | |
Tenet Healthcare Corp.* (a) | | | 25,669 | | | | 1,839,441 | |
| | |
Tivity Health, Inc.* (a) | | | 6,755 | | | | 169,010 | |
| | |
Triple-S Management Corp., Class B* (a) | | | 5,790 | | | | 204,329 | |
| | |
UnitedHealth Group, Inc. | | | 32,038 | | | | 14,752,538 | |
| | |
Universal Health Services, Inc., Class B | | | 2,509 | | | | 311,367 | |
| | |
US Physical Therapy, Inc. | | | 386 | | | | 41,634 | |
See Accompanying Notes to the Financial Statements.
| | | | | | |
| | FLEXSHARES ANNUAL REPORT | | | 157 | |
FlexShares® Morningstar US Market Factor Tilt Index Fund (cont.)
| | | | | | | | |
| Investments | | Shares | | | Value | |
|
| COMMON STOCKS – (continued) | |
|
| Health Care Providers & Services – (continued) | |
| | |
Vivos Therapeutics, Inc.* (a) | | | 9,264 | | | $ | 33,628 | |
| | | | | | | | 46,896,090 | |
|
| Health Care Technology – 0.4% | |
| | |
Allscripts Healthcare Solutions, Inc.* (a) | | | 38,214 | | | | 526,589 | |
| | |
Cerner Corp. | | | 9,843 | | | | 731,237 | |
| | |
Certara, Inc.* (a) | | | 4,246 | | | | 175,402 | |
| | |
Change Healthcare, Inc.* | | | 52,882 | | | | 1,138,549 | |
| | |
Computer Programs and Systems, Inc.* (a) | | | 3,860 | | | | 139,346 | |
| | |
Evolent Health, Inc., Class A* (a) | | | 9,264 | | | | 271,157 | |
| | |
GoodRx Holdings, Inc., Class A* (a) | | | 4,246 | | | | 189,372 | |
| | |
Health Catalyst, Inc.* (a) | | | 4,632 | | | | 243,829 | |
| | |
HealthStream, Inc.* (a) | | | 386 | | | | 10,271 | |
| | |
Inovalon Holdings, Inc., Class A* (a) | | | 6,948 | | | | 283,409 | |
| | |
Inspire Medical Systems, Inc.* | | | 1,544 | | | | 416,232 | |
| | |
Multiplan Corp.* (a) | | | 22,581 | | | | 97,324 | |
| | |
Omnicell, Inc.* (a) | | | 2,509 | | | | 446,978 | |
| | |
Phreesia, Inc.* (a) | | | 2,702 | | | | 190,599 | |
| | |
Schrodinger, Inc.* | | | 193 | | | | 10,534 | |
| | |
Teladoc Health, Inc.* (a) | | | 3,474 | | | | 519,676 | |
| | |
Veeva Systems, Inc., Class A* | | | 3,281 | | | | 1,040,110 | |
| | |
Vocera Communications, Inc.* (a) | | | 2,123 | | | | 120,119 | |
| | | | | | | | 6,550,733 | |
|
| Hotels, Restaurants & Leisure – 1.9% | |
| | |
Airbnb, Inc., Class A* | | | 9,650 | | | | 1,646,869 | |
| | |
Aramark | | | 6,755 | | | | 246,422 | |
| | |
Bally’s Corp.* | | | 2,316 | | | | 106,096 | |
| | |
BJ’s Restaurants, Inc.* (a) | | | 2,895 | | | | 96,461 | |
| | |
Bloomin’ Brands, Inc.* | | | 7,527 | | | | 162,734 | |
| | |
Booking Holdings, Inc.* | | | 1,158 | | | | 2,803,263 | |
| | |
Boyd Gaming Corp.* | | | 4,439 | | | | 283,119 | |
| | |
Brinker International, Inc.* | | | 4,632 | | | | 194,359 | |
| | |
Caesars Entertainment, Inc.* | | | 6,948 | | | | 760,528 | |
| | | | | | | | |
| Investments | | Shares | | | Value | |
|
| Hotels, Restaurants & Leisure – (continued) | |
| | |
Carnival Corp.* (a) | | | 21,423 | | | $ | 474,734 | |
| | |
Carrols Restaurant Group, Inc.(a) | | | 20,844 | | | | 76,497 | |
| | |
Cheesecake Factory, Inc. (The)* (a) | | | 3,860 | | | | 156,870 | |
| | |
Chipotle Mexican Grill, Inc.* | | | 772 | | | | 1,373,411 | |
| | |
Choice Hotels International, Inc. | | | 965 | | | | 135,698 | |
| | |
Churchill Downs, Inc. | | | 1,544 | | | | 355,120 | |
| | |
Chuy’s Holdings, Inc.* (a) | | | 2,316 | | | | 67,535 | |
| | |
Cracker Barrel Old Country Store, Inc. | | | 1,544 | | | | 205,615 | |
| | |
Darden Restaurants, Inc. | | | 3,088 | | | | 445,104 | |
| | |
Dave & Buster’s Entertainment, Inc.* | | | 4,825 | | | | 179,152 | |
| | |
Del Taco Restaurants, Inc.(a) | | | 6,948 | | | | 57,946 | |
| | |
Denny’s Corp.* (a) | | | 1,930 | | | | 30,687 | |
| | |
Dine Brands Global, Inc.* (a) | | | 1,737 | | | | 146,794 | |
| | |
Domino’s Pizza, Inc. | | | 1,351 | | | | 660,598 | |
| | |
DraftKings, Inc., Class A* (a) | | | 7,141 | | | | 332,699 | |
| | |
Everi Holdings, Inc.* (a) | | | 9,071 | | | | 217,704 | |
| | |
Expedia Group, Inc.* | | | 4,053 | | | | 666,354 | |
| | |
Golden Nugget Online Gaming, Inc.* | | | 3,281 | | | | 55,350 | |
| | |
Hilton Grand Vacations, Inc.* (a) | | | 6,369 | | | | 320,233 | |
| | |
Hilton Worldwide Holdings, Inc.* | | | 7,527 | | | | 1,083,512 | |
| | |
Hyatt Hotels Corp., Class A* (a) | | | 1,158 | | | | 98,662 | |
| | |
Jack in the Box, Inc.(a) | | | 1,737 | | | | 171,876 | |
| | |
Las Vegas Sands Corp.* | | | 6,369 | | | | 247,181 | |
| | |
Lindblad Expeditions Holdings, Inc.* (a) | | | 7,141 | | | | 106,758 | |
| | |
Marriott International, Inc., Class A* | | | 7,334 | | | | 1,173,587 | |
| | |
Marriott Vacations Worldwide Corp. | | | 2,895 | | | | 455,152 | |
| | |
McDonald’s Corp. | | | 20,072 | | | | 4,928,680 | |
| | |
MGM Resorts International | | | 12,931 | | | | 609,826 | |
| | |
Norwegian Cruise Line Holdings Ltd.* (a) | | | 14,475 | | | | 372,297 | |
| | |
Papa John’s International, Inc. | | | 772 | | | | 95,790 | |
See Accompanying Notes to the Financial Statements.
| | | | |
| 158 | | FLEXSHARES ANNUAL REPORT | | |
FlexShares® Morningstar US Market Factor Tilt Index Fund (cont.)
| | | | | | | | |
| Investments | | Shares | | | Value | |
|
| COMMON STOCKS – (continued) | |
|
| Hotels, Restaurants & Leisure – (continued) | |
| | |
Penn National Gaming, Inc.* (a) | | | 5,404 | | | $ | 386,926 | |
| | |
Planet Fitness, Inc., Class A* | | | 2,895 | | | | 230,297 | |
| | |
Red Robin Gourmet Burgers, Inc.* (a) | | | 2,509 | | | | 49,854 | |
| | |
Red Rock Resorts, Inc., Class A* (a) | | | 2,316 | | | | 126,014 | |
| | |
Royal Caribbean Cruises Ltd.* (a) | | | 5,018 | | | | 423,670 | |
| | |
Ruth’s Hospitality Group, Inc.* (a) | | | 5,597 | | | | 108,246 | |
| | |
Scientific Games Corp.* (a) | | | 22,967 | | | | 1,838,508 | |
| | |
SeaWorld Entertainment, Inc.* | | | 3,860 | | | | 245,110 | |
| | |
Shake Shack, Inc., Class A* (a) | | | 965 | | | | 66,749 | |
| | |
Six Flags Entertainment Corp.* (a) | | | 5,597 | | | | 230,205 | |
| | |
Starbucks Corp. | | | 32,231 | | | | 3,418,742 | |
| | |
Texas Roadhouse, Inc.(a) | | | 2,702 | | | | 239,965 | |
| | |
Travel + Leisure Co.(a) | | | 6,562 | | | | 356,579 | |
| | |
Vail Resorts, Inc. | | | 1,158 | | | | 399,174 | |
| | |
Wendy’s Co. (The) | | | 5,790 | | | | 129,117 | |
| | |
Wingstop, Inc.(a) | | | 2,316 | | | | 399,441 | |
| | |
Wyndham Hotels & Resorts, Inc. | | | 3,474 | | | | 293,449 | |
| | |
Wynn Resorts Ltd.* (a) | | | 3,860 | | | | 346,628 | |
| | |
Yum! Brands, Inc. | | | 9,071 | | | | 1,133,331 | |
| | | | | | | | 32,023,278 | |
|
| Household Durables – 0.8% | |
| | |
Aterian, Inc.* | | | 3,088 | | | | 19,732 | |
| | |
Beazer Homes USA, Inc.* | | | 2,316 | | | | 41,943 | |
| | |
Cavco Industries, Inc.* | | | 193 | | | | 46,393 | |
| | |
Century Communities, Inc.(a) | | | 7,913 | | | | 530,646 | |
| | |
DR Horton, Inc. | | | 11,773 | | | | 1,050,976 | |
| | |
Ethan Allen Interiors, Inc. | | | 4,632 | | | | 107,509 | |
| | |
Garmin Ltd. | | | 3,860 | | | | 554,296 | |
| | |
GoPro, Inc., Class A* (a) | | | 3,088 | | | | 26,588 | |
| | |
Green Brick Partners, Inc.* (a) | | | 8,106 | | | | 211,161 | |
| | |
Helen of Troy Ltd.* (a) | | | 965 | | | | 217,077 | |
| | |
Installed Building Products, Inc.(a) | | | 772 | | | | 98,083 | |
| | | | | | | | |
| Investments | | Shares | | | Value | |
|
| Household Durables – (continued) | |
| | |
iRobot Corp.* (a) | | | 772 | | | $ | 64,400 | |
| | |
KB Home(a) | | | 22,002 | | | | 883,380 | |
| | |
La-Z-Boy, Inc. | | | 6,176 | | | | 205,290 | |
| | |
Leggett & Platt, Inc.(a) | | | 9,071 | | | | 424,976 | |
| | |
Lennar Corp., Class A | | | 9,843 | | | | 983,611 | |
| | |
Lennar Corp., Class B | | | 579 | | | | 47,524 | |
| | |
LGI Homes, Inc.* (a) | | | 5,597 | | | | 835,632 | |
| | |
Lovesac Co. (The)* (a) | | | 1,351 | | | | 105,392 | |
| | |
M/I Homes, Inc.* (a) | | | 7,913 | | | | 453,098 | |
| | |
MDC Holdings, Inc.(a) | | | 13,896 | | | | 680,626 | |
| | |
Meritage Homes Corp.* | | | 9,264 | | | | 1,007,089 | |
| | |
Mohawk Industries, Inc.* | | | 1,737 | | | | 307,814 | |
| | |
Newell Brands, Inc. | | | 13,124 | | | | 300,408 | |
| | |
NVR, Inc.* | | | 122 | | | | 597,166 | |
| | |
PulteGroup, Inc. | | | 10,229 | | | | 491,810 | |
| | |
Skyline Champion Corp.* | | | 1,930 | | | | 122,208 | |
| | |
Sonos, Inc.* (a) | | | 5,790 | | | | 188,870 | |
| | |
Taylor Morrison Home Corp., Class A* (a) | | | 32,231 | | | | 984,012 | |
| | |
Tempur Sealy International, Inc. | | | 9,457 | | | | 420,553 | |
| | |
Toll Brothers, Inc. | | | 5,983 | | | | 359,997 | |
| | |
TopBuild Corp.* (a) | | | 1,351 | | | | 347,167 | |
| | |
Tri Pointe Homes, Inc.* | | | 33,003 | | | | 798,343 | |
| | |
Tupperware Brands Corp.* (a) | | | 11,001 | | | | 244,662 | |
| | |
Universal Electronics, Inc.* | | | 2,895 | | | | 119,216 | |
| | |
Vizio Holding Corp., Class A* (a) | | | 3,474 | | | | 71,356 | |
| | |
Vuzix Corp.* (a) | | | 6,562 | | | | 70,148 | |
| | |
Whirlpool Corp. | | | 2,316 | | | | 488,282 | |
| | | | | | | | 14,507,434 | |
|
| Household Products – 0.9% | |
| | |
Central Garden & Pet Co.* (a) | | | 1,737 | | | | 89,594 | |
| | |
Central Garden & Pet Co., Class A* | | | 10,808 | | | | 499,330 | |
| | |
Church & Dwight Co., Inc.(a) | | | 8,299 | | | | 725,001 | |
| | |
Clorox Co. (The) | | | 2,509 | | | | 408,992 | |
| | |
Colgate-Palmolive Co. | | | 21,423 | | | | 1,632,218 | |
| | |
Energizer Holdings, Inc.(a) | | | 11,580 | | | | 422,323 | |
| | |
Kimberly-Clark Corp. | | | 11,580 | | | | 1,499,494 | |
See Accompanying Notes to the Financial Statements.
| | | | | | |
| | FLEXSHARES ANNUAL REPORT | | | 159 | |
FlexShares® Morningstar US Market Factor Tilt Index Fund (cont.)
| | | | | | | | |
| Investments | | Shares | | | Value | |
|
| COMMON STOCKS – (continued) | |
|
| Household Products – (continued) | |
| | |
Procter & Gamble Co. (The) | | | 67,550 | | | $ | 9,658,975 | |
| | |
Reynolds Consumer Products, Inc.(a) | | | 8,299 | | | | 223,907 | |
| | |
Spectrum Brands Holdings, Inc.(a) | | | 9,650 | | | | 904,687 | |
| | |
WD-40 Co.(a) | | | 386 | | | | 87,622 | |
| | | | | | | | 16,152,143 | |
|
Independent Power and Renewable Electricity
Producers – 0.1% | |
| | |
AES Corp. (The) | | | 23,932 | | | | 601,411 | |
| | |
Clearway Energy, Inc., Class A | | | 3,667 | | | | 120,974 | |
| | |
Clearway Energy, Inc., Class C | | | 2,509 | | | | 89,019 | |
| | |
Ormat Technologies, Inc.(a) | | | 1,544 | | | | 111,678 | |
| | |
Sunnova Energy International, Inc.* (a) | | | 6,562 | | | | 292,403 | |
| | |
Vistra Corp. | | | 17,563 | | | | 344,059 | |
| | | | | | | | 1,559,544 | |
|
| Industrial Conglomerates – 0.7% | |
| | |
3M Co. | | | 18,914 | | | | 3,379,554 | |
| | |
General Electric Co. | | | 28,950 | | | | 3,035,986 | |
| | |
Honeywell International, Inc. | | | 19,300 | | | | 4,219,366 | |
| | |
Raven Industries, Inc.* | | | 3,088 | | | | 178,548 | |
| | |
Roper Technologies, Inc.(a) | | | 3,088 | | | | 1,506,543 | |
| | | | | | | | 12,319,997 | |
| | |
| Insurance – 2.6% | | | | | | |
| | |
Aflac, Inc. | | | 22,774 | | | | 1,222,281 | |
| | |
Alleghany Corp.* | | | 386 | | | | 251,433 | |
| | |
Allstate Corp. (The) | | | 10,422 | | | | 1,288,889 | |
| | |
Ambac Financial Group, Inc.* (a) | | | 1,351 | | | | 22,845 | |
| | |
American Equity Investment Life Holding Co.(a) | | | 23,353 | | | | 744,260 | |
| | |
American Financial Group, Inc. | | | 2,895 | | | | 393,836 | |
| | |
American International Group, Inc. | | | 26,827 | | | | 1,585,207 | |
| | |
American National Group, Inc.(a) | | | 2,509 | | | | 475,982 | |
| | | | | | | | |
| Investments | | Shares | | | Value | |
| | |
| Insurance – (continued) | | | | | | |
| | |
AMERISAFE, Inc.(a) | | | 579 | | | $ | 34,329 | |
| | |
Aon plc, Class A | | | 5,790 | | | | 1,852,337 | |
| | |
Arch Capital Group Ltd.* | | | 14,861 | | | | 621,487 | |
| | |
Argo Group International Holdings Ltd.(a) | | | 5,790 | | | | 319,029 | |
| | |
Arthur J Gallagher & Co. | | | 5,018 | | | | 841,368 | |
| | |
Assurant, Inc. | | | 2,316 | | | | 373,594 | |
| | |
Assured Guaranty Ltd.(a) | | | 19,879 | | | | 1,104,875 | |
| | |
Athene Holding Ltd., Class A* | | | 6,369 | | | | 554,167 | |
| | |
Axis Capital Holdings Ltd. | | | 15,633 | | | | 814,010 | |
| | |
Brighthouse Financial, Inc.* (a) | | | 18,528 | | | | 930,661 | |
| | |
Brown & Brown, Inc. | | | 6,176 | | | | 389,767 | |
| | |
Chubb Ltd. | | | 15,054 | | | | 2,941,251 | |
| | |
Cincinnati Financial Corp.(a) | | | 4,246 | | | | 515,634 | |
| | |
CNO Financial Group, Inc.(a) | | | 34,740 | | | | 838,624 | |
| | |
Employers Holdings, Inc.(a) | | | 965 | | | | 37,249 | |
| | |
Enstar Group Ltd.* | | | 3,088 | | | | 712,649 | |
| | |
Erie Indemnity Co., Class A(a) | | | 965 | | | | 198,607 | |
| | |
Everest Re Group Ltd.(a) | | | 1,158 | | | | 302,817 | |
| | |
Fidelity National Financial, Inc. | | | 11,001 | | | | 527,058 | |
| | |
First American Financial Corp. | | | 26,827 | | | | 1,962,127 | |
| | |
Genworth Financial, Inc., Class A* | | | 84,727 | | | | 348,228 | |
| | |
Globe Life, Inc. | | | 2,895 | | | | 257,713 | |
| | |
Goosehead Insurance, Inc., Class A(a) | | | 965 | | | | 139,249 | |
| | |
Greenlight Capital Re Ltd., Class A* (a) | | | 19,300 | | | | 143,399 | |
| | |
Hanover Insurance Group, Inc. (The) | | | 8,106 | | | | 1,021,356 | |
| | |
Hartford Financial Services Group, Inc. (The) | | | 13,124 | | | | 957,133 | |
| | |
HCI Group, Inc.(a) | | | 1,351 | | | | 181,047 | |
| | |
Horace Mann Educators Corp. | | | 6,562 | | | | 257,099 | |
| | |
Kemper Corp. | | | 12,352 | | | | 784,105 | |
| | |
Kinsale Capital Group, Inc.(a) | | | 1,351 | | | | 252,840 | |
See Accompanying Notes to the Financial Statements.
| | | | |
| 160 | | FLEXSHARES ANNUAL REPORT | | |
FlexShares® Morningstar US Market Factor Tilt Index Fund (cont.)
| | | | | | | | |
| Investments | | Shares | | | Value | |
|
| COMMON STOCKS – (continued) | |
| | |
| Insurance – (continued) | | | | | | |
| | |
Lemonade, Inc.* (a) | | | 193 | | | $ | 11,997 | |
| | |
Lincoln National Corp.(a) | | | 7,141 | | | | 515,223 | |
| | |
Loews Corp. | | | 9,071 | | | | 508,611 | |
| | |
Markel Corp.* | | | 386 | | | | 506,868 | |
| | |
Marsh & McLennan Cos., Inc. | | | 14,668 | | | | 2,446,622 | |
| | |
MBIA, Inc.* (a) | | | 6,369 | | | | 98,974 | |
| | |
Mercury General Corp.(a) | | | 7,141 | | | | 389,113 | |
| | |
MetLife, Inc. | | | 26,441 | | | | 1,660,495 | |
| | |
Old Republic International Corp. | | | 14,668 | | | | 378,874 | |
| | |
Oscar Health, Inc., Class A* | | | 4,825 | | | | 83,376 | |
| | |
Palomar Holdings, Inc.* (a) | | | 1,544 | | | | 141,199 | |
| | |
Primerica, Inc. | | | 2,123 | | | | 357,174 | |
| | |
Principal Financial Group, Inc. | | | 9,650 | | | | 647,418 | |
| | |
ProAssurance Corp. | | | 3,860 | | | | 88,433 | |
| | |
Progressive Corp. (The) | | | 18,914 | | | | 1,794,560 | |
| | |
Prudential Financial, Inc. | | | 13,317 | | | | 1,465,536 | |
| | |
Reinsurance Group of America, Inc. | | | 1,158 | | | | 136,737 | |
| | |
RenaissanceRe Holdings Ltd.(a) | | | 2,123 | | | | 301,041 | |
| | |
RLI Corp. | | | 1,351 | | | | 146,327 | |
| | |
Safety Insurance Group, Inc.(a) | | | 1,737 | | | | 136,198 | |
| | |
Selective Insurance Group, Inc.(a) | | | 13,896 | | | | 1,089,030 | |
| | |
Selectquote, Inc.* (a) | | | 10,422 | | | | 138,508 | |
| | |
SiriusPoint Ltd.* (a) | | | 6,369 | | | | 59,869 | |
| | |
Stewart Information Services Corp.(a) | | | 6,948 | | | | 494,489 | |
| | |
Travelers Cos., Inc. (The) | | | 8,685 | | | | 1,397,243 | |
| | |
Trupanion, Inc.* (a) | | | 2,895 | | | | 296,448 | |
| | |
Universal Insurance Holdings, Inc.(a) | | | 15,440 | | | | 228,049 | |
| | |
Unum Group | | | 49,794 | | | | 1,268,253 | |
| | |
W R Berkley Corp. | | | 3,474 | | | | 276,530 | |
| | |
White Mountains Insurance Group Ltd. | | | 193 | | | | 203,613 | |
| | |
Willis Towers Watson plc | | | 3,474 | | | | 841,681 | |
| | | | | | | | 44,307,031 | |
| | | | | | | | |
| Investments | | Shares | | | Value | |
|
| Interactive Media & Services – 4.5% | |
| | |
Alphabet, Inc., Class A* | | | 8,299 | | | $ | 24,572,675 | |
| | |
Alphabet, Inc., Class C* | | | 7,720 | | | | 22,892,965 | |
| | |
Angi, Inc., Class A* | | | 1,737 | | | | 21,765 | |
| | |
Bumble, Inc., Class A* (a) | | | 2,316 | | | | 121,636 | |
| | |
Cargurus, Inc.* (a) | | | 5,983 | | | | 200,670 | |
| | |
Cars.com, Inc.* | | | 20,072 | | | | 261,337 | |
| | |
fuboTV, Inc.* (a) | | | 2,509 | | | | 74,793 | |
| | |
IAC/InterActiveCorp* (a) | | | 1,351 | | | | 205,852 | |
| | |
Match Group, Inc.* (a) | | | 7,720 | | | | 1,164,022 | |
| | |
Meta Platforms, Inc., Class A* | | | 65,813 | | | | 21,295,112 | |
| | |
Pinterest, Inc., Class A* | | | 12,931 | | | | 577,240 | |
| | |
Snap, Inc., Class A* | | | 28,757 | | | | 1,512,043 | |
| | |
TripAdvisor, Inc.* | | | 3,474 | | | | 114,538 | |
| | |
Twitter, Inc.* | | | 19,879 | | | | 1,064,322 | |
| | |
Yelp, Inc.* | | | 6,562 | | | | 253,490 | |
| | |
Ziff Davis, Inc.* | | | 11,580 | | | | 1,485,367 | |
| | |
Zillow Group, Inc., Class A* (a) | | | 2,509 | | | | 265,251 | |
| | |
Zillow Group, Inc., Class C* (a) | | | 3,474 | | | | 360,011 | |
| | |
ZoomInfo Technologies, Inc., Class A* | | | 9,457 | | | | 635,699 | |
| | | | | | | | 77,078,788 | |
|
| Internet & Direct Marketing Retail – 2.8% | |
| | |
1-800-Flowers.com, Inc., Class A* (a) | | | 1,544 | | | | 49,593 | |
| | |
Amazon.com, Inc.* | | | 11,966 | | | | 40,354,497 | |
| | |
Chewy, Inc., Class A* (a) | | | 2,509 | | | | 190,182 | |
| | |
DoorDash, Inc., Class A* | | | 4,439 | | | | 864,717 | |
| | |
eBay, Inc. | | | 21,037 | | | | 1,613,959 | |
| | |
Etsy, Inc.* (a) | | | 3,088 | | | | 774,131 | |
| | |
Groupon, Inc.* (a) | | | 2,895 | | | | 61,432 | |
| | |
MercadoLibre, Inc.* | | | 1,158 | | | | 1,715,021 | |
| | |
Overstock.com, Inc.* (a) | | | 2,702 | | | | 257,311 | |
| | |
PetMed Express, Inc.(a) | | | 772 | | | | 21,948 | |
| | |
Qurate Retail, Inc., Series A | | | 95,149 | | | | 993,356 | |
| | |
Remark Holdings, Inc.* (a) | | | 37,056 | | | | 78,188 | |
| | |
Revolve Group, Inc.* | | | 1,930 | | | | 144,827 | |
| | |
Shutterstock, Inc. | | | 1,930 | | | | 233,820 | |
| | |
Stitch Fix, Inc., Class A* | | | 1,158 | | | | 40,067 | |
See Accompanying Notes to the Financial Statements.
| | | | | | |
| | FLEXSHARES ANNUAL REPORT | | | 161 | |
FlexShares® Morningstar US Market Factor Tilt Index Fund (cont.)
| | | | | | | | |
| Investments | | Shares | | | Value | |
|
| COMMON STOCKS – (continued) | |
|
| Internet & Direct Marketing Retail – (continued) | |
| | |
Wayfair, Inc., Class A* (a) | | | 2,123 | | | $ | 528,839 | |
| | | | | | | | 47,921,888 | |
| | |
| IT Services – 3.8% | | | | | | |
| | |
Accenture plc, Class A(a) | | | 17,177 | | | | 6,162,936 | |
| | |
Akamai Technologies, Inc.* | | | 5,404 | | | | 569,906 | |
| | |
Alliance Data Systems Corp. | | | 10,422 | | | | 888,475 | |
| | |
Automatic Data Processing, Inc. | | | 12,159 | | | | 2,729,574 | |
| | |
BigCommerce Holdings, Inc., Series 1* | | | 4,246 | | | | 196,208 | |
| | |
BM Technologies, Inc.* | | | 1,477 | | | | 13,204 | |
| | |
Broadridge Financial Solutions, Inc. | | | 3,474 | | | | 619,796 | |
| | |
Cantaloupe, Inc.* (a) | | | 3,088 | | | | 38,600 | |
| | |
Cass Information Systems, Inc.(a) | | | 3,474 | | | | 142,399 | |
| | |
Cloudflare, Inc., Class A* (a) | | | 6,755 | | | | 1,315,334 | |
| | |
Cognizant Technology Solutions Corp., Class A | | | 18,142 | | | | 1,416,709 | |
| | |
Concentrix Corp. | | | 1,737 | | | | 308,630 | |
| | |
Conduent, Inc.* | | | 51,917 | | | | 350,440 | |
| | |
CSG Systems International, Inc.(a) | | | 10,615 | | | | 531,281 | |
| | |
DXC Technology Co.* | | | 11,966 | | | | 389,733 | |
| | |
EPAM Systems, Inc.* | | | 1,737 | | | | 1,169,418 | |
| | |
Euronet Worldwide, Inc.* | | | 1,351 | | | | 151,569 | |
| | |
EVERTEC, Inc. | | | 1,930 | | | | 87,255 | |
| | |
Evo Payments, Inc., Class A* | | | 1,544 | | | | 33,474 | |
| | |
ExlService Holdings, Inc.* | | | 1,158 | | | | 142,005 | |
| | |
Fastly, Inc., Class A* (a) | | | 2,509 | | | | 126,980 | |
| | |
Fidelity National Information Services, Inc. | | | 15,826 | | | | 1,752,571 | |
| | |
Fiserv, Inc.* | | | 19,107 | | | | 1,881,848 | |
| | |
FleetCor Technologies, Inc.* | | | 1,737 | | | | 429,751 | |
| | |
Gartner, Inc.* | | | 2,702 | | | | 896,821 | |
| | |
Genpact Ltd. | | | 4,053 | | | | 200,016 | |
| | |
Global Payments, Inc. | | | 7,334 | | | | 1,048,689 | |
| | |
GoDaddy, Inc., Class A* (a) | | | 5,983 | | | | 413,844 | |
| | |
International Business Machines Corp. | | | 29,529 | | | | 3,694,078 | |
| | | | | | | | |
| Investments | | Shares | | | Value | |
| | |
| IT Services – (continued) | | | | | | |
| | |
International Money Express, Inc.* | | | 2,895 | | | $ | 48,462 | |
| | |
Jack Henry & Associates, Inc. | | | 2,123 | | | | 353,437 | |
| | |
Limelight Networks, Inc.* (a) | | | 4,053 | | | | 12,078 | |
| | |
LiveRamp Holdings, Inc.* (a) | | | 2,123 | | | | 113,602 | |
| | |
Mastercard, Inc., Class A | | | 23,546 | | | | 7,900,154 | |
| | |
MAXIMUS, Inc.(a) | | | 3,281 | | | | 277,474 | |
| | |
MongoDB, Inc.* (a) | | | 1,737 | | | | 905,481 | |
| | |
Okta, Inc.* | | | 3,667 | | | | 906,409 | |
| | |
Paya Holdings, Inc.* | | | 9,650 | | | | 87,911 | |
| | |
Paychex, Inc. | | | 8,492 | | | | 1,046,894 | |
| | |
PayPal Holdings, Inc.* | | | 31,845 | | | | 7,406,828 | |
| | |
Perficient, Inc.* (a) | | | 1,158 | | | | 143,129 | |
| | |
Sabre Corp.* (a) | | | 26,055 | | | | 270,451 | |
| | |
Shift4 Payments, Inc., Class A* (a) | | | 1,351 | | | | 85,289 | |
| | |
Snowflake, Inc., Class A* | | | 6,369 | | | | 2,253,607 | |
| | |
SolarWinds Corp.(a) | | | 6,369 | | | | 102,541 | |
| | |
Square, Inc., Class A* | | | 10,615 | | | | 2,701,517 | |
| | |
Switch, Inc., Class A | | | 6,176 | | | | 156,129 | |
| | |
TTEC Holdings, Inc. | | | 579 | | | | 54,652 | |
| | |
Tucows, Inc., Class A* (a) | | | 386 | | | | 31,768 | |
| | |
Twilio, Inc., Class A* | | | 4,246 | | | | 1,237,115 | |
| | |
Unisys Corp.* (a) | | | 16,984 | | | | 434,281 | |
| | |
VeriSign, Inc.* | | | 2,702 | | | | 601,654 | |
| | |
Verra Mobility Corp.* (a) | | | 14,861 | | | | 221,132 | |
| | |
Visa, Inc., Class A(a) | | | 45,741 | | | | 9,686,572 | |
| | |
Western Union Co. (The) | | | 19,879 | | | | 362,195 | |
| | |
WEX, Inc.* (a) | | | 1,930 | | | | 288,921 | |
| | | | | | | | 65,391,227 | |
| | |
| Leisure Products – 0.2% | | | | | | |
| | |
Acushnet Holdings Corp. | | | 1,158 | | | | 58,989 | |
| | |
American Outdoor Brands, Inc.* | | | 4,053 | | | | 92,327 | |
| | |
Brunswick Corp. | | | 3,088 | | | | 287,462 | |
| | |
Callaway Golf Co.* | | | 4,439 | | | | 120,075 | |
| | |
Hasbro, Inc. | | | 3,281 | | | | 314,189 | |
| | |
Johnson Outdoors, Inc., Class A(a) | | | 386 | | | | 40,985 | |
| | |
Malibu Boats, Inc., Class A* | | | 2,895 | | | | 204,416 | |
| | |
MasterCraft Boat Holdings, Inc.* (a) | | | 5,790 | | | | 155,056 | |
See Accompanying Notes to the Financial Statements.
| | | | |
| 162 | | FLEXSHARES ANNUAL REPORT | | |
FlexShares® Morningstar US Market Factor Tilt Index Fund (cont.)
| | | | | | | | |
| Investments | | Shares | | | Value | |
|
| COMMON STOCKS – (continued) | |
|
| Leisure Products – (continued) | |
| | |
Mattel, Inc.* (a) | | | 13,317 | | | $ | 290,444 | |
| | |
Peloton Interactive, Inc., Class A* | | | 7,141 | | | | 652,973 | |
| | |
Polaris, Inc.(a) | | | 2,895 | | | | 332,780 | |
| | |
Smith & Wesson Brands, Inc. | | | 11,773 | | | | 253,120 | |
| | |
Sturm Ruger & Co., Inc. | | | 2,316 | | | | 182,686 | |
| | |
Vista Outdoor, Inc.* | | | 11,773 | | | | 492,582 | |
| | |
YETI Holdings, Inc.* (a) | | | 2,895 | | | | 284,665 | |
| | | | | | | | 3,762,749 | |
|
| Life Sciences Tools & Services – 1.1% | |
| | |
10X Genomics, Inc., Class A* (a) | | | 2,123 | | | | 342,376 | |
| | |
Adaptive Biotechnologies Corp.* (a) | | | 7,913 | | | | 264,373 | |
| | |
Agilent Technologies, Inc. | | | 8,106 | | | | 1,276,614 | |
| | |
Avantor, Inc.* | | | 13,510 | | | | 545,534 | |
| | |
Berkeley Lights, Inc.* | | | 5,983 | | | | 139,105 | |
| | |
Bio-Rad Laboratories, Inc., Class A* | | | 579 | | | | 460,120 | |
| | |
Bio-Techne Corp. | | | 965 | | | | 505,322 | |
| | |
Bruker Corp. | | | 2,702 | | | | 216,971 | |
| | |
Charles River Laboratories International, Inc.* | | | 1,351 | | | | 606,167 | |
| | |
Codexis, Inc.* (a) | | | 8,299 | | | | 288,556 | |
| | |
Illumina, Inc.* | | | 4,246 | | | | 1,762,345 | |
| | |
IQVIA Holdings, Inc.* | | | 5,404 | | | | 1,412,714 | |
| | |
Maravai LifeSciences Holdings, Inc., Class A* | | | 7,527 | | | | 318,317 | |
| | |
Medpace Holdings, Inc.* | | | 965 | | | | 218,621 | |
| | |
Mettler-Toledo International, Inc.* | | | 579 | | | | 857,429 | |
| | |
NanoString Technologies, Inc.* | | | 1,158 | | | | 55,931 | |
| | |
NeoGenomics, Inc.* (a) | | | 7,334 | | | | 337,364 | |
| | |
Pacific Biosciences of California, Inc.* (a) | | | 11,387 | | | | 301,528 | |
| | |
PerkinElmer, Inc. | | | 4,632 | | | | 819,354 | |
| | |
PPD, Inc.* | | | 5,790 | | | | 273,114 | |
| | |
Repligen Corp.* | | | 1,544 | | | | 448,532 | |
| | |
Seer, Inc.* (a) | | | 2,895 | | | | 106,883 | |
| | |
Sotera Health Co.* (a) | | | 3,088 | | | | 76,274 | |
| | | | | | | | |
| Investments | | Shares | | | Value | |
|
| Life Sciences Tools & Services – (continued) | |
| | |
Syneos Health, Inc.* | | | 4,632 | | | $ | 432,351 | |
| | |
Thermo Fisher Scientific, Inc. | | | 10,615 | | | | 6,720,038 | |
| | |
Waters Corp.* | | | 1,737 | | | | 638,434 | |
| | | | | | | | 19,424,367 | |
| | |
| Machinery – 1.8% | | | | | | |
| | |
AGCO Corp. | | | 2,702 | | | | 330,211 | |
| | |
Alamo Group, Inc.(a) | | | 386 | | | | 58,363 | |
| | |
Albany International Corp., Class A(a) | | | 2,316 | | | | 186,785 | |
| | |
Allison Transmission Holdings, Inc. | | | 21,616 | | | | 721,110 | |
| | |
Altra Industrial Motion Corp.(a) | | | 4,053 | | | | 211,364 | |
| | |
Astec Industries, Inc. | | | 1,737 | | | | 92,721 | |
| | |
Barnes Group, Inc. | | | 1,544 | | | | 64,755 | |
| | |
Blue Bird Corp.* (a) | | | 3,860 | | | | 75,695 | |
| | |
Caterpillar, Inc. | | | 14,475 | | | | 2,953,045 | |
| | |
Chart Industries, Inc.* (a) | | | 2,316 | | | | 411,136 | |
| | |
CIRCOR International, Inc.* (a) | | | 2,702 | | | | 77,115 | |
| | |
Colfax Corp.* | | | 8,878 | | | | 458,282 | |
| | |
Columbus McKinnon Corp. | | | 772 | | | | 36,492 | |
| | |
Crane Co. | | | 12,159 | | | | 1,255,782 | |
| | |
Cummins, Inc. | | | 5,018 | | | | 1,203,517 | |
| | |
Deere & Co. | | | 8,106 | | | | 2,774,765 | |
| | |
Desktop Metal, Inc., Class A* | | | 15,633 | | | | 109,275 | |
| | |
Donaldson Co., Inc. | | | 5,018 | | | | 301,130 | |
| | |
Douglas Dynamics, Inc. | | | 4,632 | | | | 195,934 | |
| | |
Dover Corp. | | | 3,860 | | | | 652,649 | |
| | |
Enerpac Tool Group Corp.(a) | | | 4,632 | | | | 96,762 | |
| | |
EnPro Industries, Inc. | | | 1,351 | | | | 121,131 | |
| | |
ESCO Technologies, Inc. | | | 2,895 | | | | 244,801 | |
| | |
Evoqua Water Technologies Corp.* (a) | | | 5,597 | | | | 234,122 | |
| | |
Federal Signal Corp. | | | 1,930 | | | | 82,623 | |
| | |
Flowserve Corp. | | | 3,088 | | | | 103,819 | |
| | |
Fortive Corp. | | | 9,071 | | | | 686,765 | |
| | |
Franklin Electric Co., Inc.(a) | | | 1,158 | | | | 100,028 | |
| | |
Gates Industrial Corp. plc* | | | 22,581 | | | | 371,232 | |
| | |
Gorman-Rupp Co. (The)(a) | | | 1,737 | | | | 73,857 | |
See Accompanying Notes to the Financial Statements.
| | | | | | |
| | FLEXSHARES ANNUAL REPORT | | | 163 | |
FlexShares® Morningstar US Market Factor Tilt Index Fund (cont.)
| | | | | | | | |
| Investments | | Shares | | | Value | |
|
| COMMON STOCKS – (continued) | |
| | |
| Machinery – (continued) | | | | | | |
| | |
Graco, Inc. | | | 4,439 | | | $ | 333,724 | |
| | |
Greenbrier Cos., Inc. (The)(a) | | | 4,439 | | | | 182,088 | |
| | |
Helios Technologies, Inc.(a) | | | 386 | | | | 35,145 | |
| | |
Hillenbrand, Inc. | | | 18,914 | | | | 859,830 | |
| | |
Hydrofarm Holdings Group, Inc.* | | | 2,316 | | | | 76,359 | |
| | |
Hyster-Yale Materials Handling, Inc. | | | 386 | | | | 18,543 | |
| | |
Ideanomics, Inc.* (a) | | | 43,618 | | | | 86,364 | |
| | |
IDEX Corp. | | | 1,737 | | | | 386,604 | |
| | |
Illinois Tool Works, Inc. | | | 7,334 | | | | 1,671,199 | |
| | |
Ingersoll Rand, Inc.* | | | 8,685 | | | | 466,906 | |
| | |
ITT, Inc. | | | 3,474 | | | | 326,799 | |
| | |
John Bean Technologies Corp.(a) | | | 1,544 | | | | 228,126 | |
| | |
Kadant, Inc.(a) | | | 386 | | | | 85,738 | |
| | |
Kennametal, Inc.(a) | | | 5,211 | | | | 207,137 | |
| | |
Lincoln Electric Holdings, Inc. | | | 2,509 | | | | 357,282 | |
| | |
Lindsay Corp. | | | 386 | | | | 56,229 | |
| | |
Luxfer Holdings plc(a) | | | 7,334 | | | | 147,487 | |
| | |
Manitowoc Co., Inc. (The)* | | | 3,474 | | | | 74,448 | |
| | |
Meritor, Inc.* | | | 22,581 | | | | 549,622 | |
| | |
Middleby Corp. (The)* | | | 2,316 | | | | 422,531 | |
| | |
Miller Industries, Inc. | | | 5,018 | | | | 181,351 | |
| | |
Mueller Industries, Inc.(a) | | | 16,598 | | | | 873,719 | |
| | |
Mueller Water Products, Inc., Class A(a) | | | 5,404 | | | | 88,680 | |
| | |
Nikola Corp.* (a) | | | 17,563 | | | | 207,243 | |
| | |
Nordson Corp. | | | 1,351 | | | | 343,438 | |
| | |
Oshkosh Corp. | | | 3,281 | | | | 351,067 | |
| | |
Otis Worldwide Corp. | | | 10,229 | | | | 821,491 | |
| | |
PACCAR, Inc. | | | 10,229 | | | | 916,723 | |
| | |
Parker-Hannifin Corp. | | | 3,474 | | | | 1,030,354 | |
| | |
Pentair plc(a) | | | 4,246 | | | | 314,077 | |
| | |
Proto Labs, Inc.* | | | 772 | | | | 46,173 | |
| | |
RBC Bearings, Inc.* (a) | | | 965 | | | | 225,742 | |
| | |
REV Group, Inc.(a) | | | 6,948 | | | | 104,984 | |
| | |
Snap-on, Inc. | | | 1,737 | | | | 353,010 | |
| | |
SPX Corp.* (a) | | | 1,544 | | | | 89,691 | |
| | |
SPX FLOW, Inc.(a) | | | 1,544 | | | | 115,352 | |
| | |
Standex International Corp. | | | 386 | | | | 42,950 | |
| | |
Stanley Black & Decker, Inc. | | | 5,211 | | | | 936,573 | |
| | | | | | | | |
| Investments | | Shares | | | Value | |
| | |
| Machinery – (continued) | | | | | | |
| | |
Tennant Co. | | | 386 | | | $ | 30,672 | |
| | |
Terex Corp. | | | 5,211 | | | | 233,453 | |
| | |
Timken Co. (The) | | | 15,440 | | | | 1,095,468 | |
| | |
Toro Co. (The) | | | 2,702 | | | | 257,960 | |
| | |
Trinity Industries, Inc.(a) | | | 3,088 | | | | 86,618 | |
| | |
Wabash National Corp. | | | 10,615 | | | | 164,851 | |
| | |
Watts Water Technologies, Inc., Class A | | | 772 | | | | 146,695 | |
| | |
Welbilt, Inc.* | | | 11,966 | | | | 283,116 | |
| | |
Westinghouse Air Brake Technologies Corp.(a) | | | 5,018 | | | | 455,283 | |
| | |
Woodward, Inc. | | | 2,316 | | | | 261,592 | |
| | |
Xylem, Inc.(a) | | | 4,246 | | | | 554,485 | |
| | | | | | | | 31,470,238 | |
| | |
| Marine – 0.1% | | | | | | |
| | |
Eagle Bulk Shipping, Inc.* | | | 3,281 | | | | 141,247 | |
| | |
Kirby Corp.* | | | 5,018 | | | | 262,994 | |
| | |
Matson, Inc.(a) | | | 10,229 | | | | 851,871 | |
| | | | | | | | 1,256,112 | |
| | |
| Media – 1.3% | | | | | | |
| | |
Advantage Solutions, Inc.* (a) | | | 7,913 | | | | 67,577 | |
| | |
Altice USA, Inc., Class A* | | | 7,913 | | | | 128,982 | |
| | |
AMC Networks, Inc., Class A* (a) | | | 4,632 | | | | 184,307 | |
| | |
Boston Omaha Corp., Class A* (a) | | | 1,544 | | | | 54,735 | |
| | |
Cable One, Inc.(a) | | | 193 | | | | 330,264 | |
| | |
Cardlytics, Inc.* (a) | | | 386 | | | | 30,363 | |
| | |
Charter Communications, Inc., Class A* (a) | | | 3,667 | | | | 2,474,822 | |
| | |
Clear Channel Outdoor Holdings, Inc.* | | | 72,761 | | | | 211,007 | |
| | |
Comcast Corp., Class A | | | 154,593 | | | | 7,950,718 | |
| | |
comScore, Inc.* (a) | | | 22,581 | | | | 88,292 | |
| | |
Discovery, Inc., Class A* (a) | | | 5,404 | | | | 126,670 | |
| | |
Discovery, Inc., Class C* (a) | | | 11,387 | | | | 256,891 | |
| | |
DISH Network Corp., Class A* | | | 8,492 | | | | 348,766 | |
| | |
Entercom Communications Corp.* (a) | | | 32,424 | | | | 104,729 | |
See Accompanying Notes to the Financial Statements.
| | | | |
| 164 | | FLEXSHARES ANNUAL REPORT | | |
FlexShares® Morningstar US Market Factor Tilt Index Fund (cont.)
| | | | | | | | |
| Investments | | Shares | | | Value | |
|
| COMMON STOCKS – (continued) | |
| | |
| Media – (continued) | | | | | | |
| | |
EW Scripps Co. (The), Class A | | | 15,633 | | | $ | 290,774 | |
| | |
Fox Corp., Class A(a) | | | 8,685 | | | | 345,142 | |
| | |
Fox Corp., Class B | | | 9,071 | | | | 335,264 | |
| | |
Gannett Co., Inc.* (a) | | | 40,530 | | | | 235,074 | |
| | |
Gray Television, Inc.(a) | | | 24,125 | | | | 565,490 | |
| | |
iHeartMedia, Inc., Class A* | | | 11,001 | | | | 213,199 | |
| | |
Interpublic Group of Cos., Inc. (The) | | | 11,580 | | | | 423,481 | |
| | |
John Wiley & Sons, Inc., Class A(a) | | | 11,387 | | | | 616,834 | |
| | |
Liberty Broadband Corp., Class A* | | | 579 | | | | 93,086 | |
| | |
Liberty Broadband Corp., Class C* | | | 4,632 | | | | 752,468 | |
| | |
Liberty Media Corp-Liberty SiriusXM, Class A* | | | 2,123 | | | | 105,683 | |
| | |
Liberty Media Corp-Liberty SiriusXM, Class C* | | | 4,825 | | | | 237,969 | |
| | |
Magnite, Inc.* (a) | | | 8,299 | | | | 224,322 | |
| | |
Meredith Corp.* (a) | | | 9,071 | | | | 528,295 | |
| | |
New York Times Co. (The), Class A | | | 4,439 | | | | 242,325 | |
| | |
News Corp., Class A | | | 10,229 | | | | 234,244 | |
| | |
News Corp., Class B | | | 3,281 | | | | 74,019 | |
| | |
Nexstar Media Group, Inc., Class A | | | 9,071 | | | | 1,360,015 | |
| | |
Omnicom Group, Inc. | | | 5,983 | | | | 407,323 | |
| | |
Scholastic Corp.(a) | | | 965 | | | | 34,923 | |
| | |
Sinclair Broadcast Group, Inc., Class A(a) | | | 13,124 | | | | 342,930 | |
| | |
Sirius XM Holdings, Inc.(a) | | | 36,477 | | | | 222,145 | |
| | |
TechTarget, Inc.* | | | 1,158 | | | | 109,211 | |
| | |
TEGNA, Inc. | | | 55,005 | | | | 1,081,398 | |
| | |
ViacomCBS, Inc. | | | 17,177 | | | | 622,151 | |
| | |
ViacomCBS, Inc., Class A(a) | | | 1,351 | | | | 52,594 | |
| | |
WideOpenWest, Inc.* (a) | | | 12,352 | | | | 235,306 | |
| | | | | | | | 22,343,788 | |
| | |
| Metals & Mining – 0.8% | | | | | | |
| | |
Alcoa Corp. | | | 45,548 | | | | 2,092,931 | |
| | |
Allegheny Technologies, Inc.* (a) | | | 12,159 | | | | 195,760 | |
| | | | | | | | |
| Investments | | Shares | | | Value | |
|
| Metals & Mining – (continued) | |
| | |
Alpha Metallurgical Resources, Inc.* (a) | | | 3,860 | | | $ | 238,509 | |
| | |
Arconic Corp.* | | | 25,862 | | | | 760,860 | |
| | |
Carpenter Technology Corp.(a) | | | 7,334 | | | | 226,474 | |
| | |
Century Aluminum Co.* (a) | | | 10,422 | | | | 137,675 | |
| | |
Cleveland-Cliffs, Inc.* (a) | | | 21,423 | | | | 516,509 | |
| | |
Coeur Mining, Inc.* (a) | | | 7,720 | | | | 48,868 | |
| | |
Commercial Metals Co.(a) | | | 30,687 | | | | 987,508 | |
| | |
Compass Minerals International, Inc.(a) | | | 3,474 | | | | 227,894 | |
| | |
Freeport-McMoRan, Inc. | | | 46,127 | | | | 1,739,910 | |
| | |
Hecla Mining Co.(a) | | | 30,687 | | | | 177,371 | |
| | |
Kaiser Aluminum Corp.(a) | | | 1,351 | | | | 131,236 | |
| | |
Materion Corp. | | | 579 | | | | 41,792 | |
| | |
McEwen Mining, Inc.* (a) | | | 93,412 | | | | 102,753 | |
| | |
MP Materials Corp.* (a) | | | 4,439 | | | | 150,260 | |
| | |
Newmont Corp. | | | 24,897 | | | | 1,344,438 | |
| | |
Nucor Corp. | | | 9,457 | | | | 1,055,874 | |
| | |
Reliance Steel & Aluminum Co. | | | 2,509 | | | | 366,715 | |
| | |
Royal Gold, Inc. | | | 1,737 | | | | 171,998 | |
| | |
Schnitzer Steel Industries, Inc., Class A | | | 3,281 | | | | 176,518 | |
| | |
Southern Copper Corp. | | | 1,930 | | | | 115,781 | |
| | |
Steel Dynamics, Inc. | | | 8,685 | | | | 573,905 | |
| | |
SunCoke Energy, Inc. | | | 386 | | | | 2,787 | |
| | |
TimkenSteel Corp.* (a) | | | 9,650 | | | | 134,617 | |
| | |
United States Steel Corp.(a) | | | 63,690 | | | | 1,680,779 | |
| | |
Warrior Met Coal, Inc. | | | 12,738 | | | | 305,330 | |
| | |
Worthington Industries, Inc. | | | 9,457 | | | | 513,704 | |
| | | | | | | | 14,218,756 | |
|
| Mortgage Real Estate Investment Trusts (REITs) – 0.6% | |
| | |
AG Mortgage Investment Trust, Inc.(a) | | | 6,562 | | | | 75,922 | |
| | |
AGNC Investment Corp. | | | 9,457 | | | | 150,555 | |
| | |
Annaly Capital Management, Inc. | | | 33,582 | | | | 284,104 | |
| | |
Apollo Commercial Real Estate Finance, Inc.(a) | | | 22,581 | | | | 341,876 | |
| | |
Arbor Realty Trust, Inc.(a) | | | 36,284 | | | | 729,671 | |
| | |
Ares Commercial Real Estate Corp.(a) | | | 17,563 | | | | 274,334 | |
See Accompanying Notes to the Financial Statements.
| | | | | | |
| | FLEXSHARES ANNUAL REPORT | | | 165 | |
FlexShares® Morningstar US Market Factor Tilt Index Fund (cont.)
| | | | | | | | |
| Investments | | Shares | | | Value | |
|
| COMMON STOCKS – (continued) | |
|
| Mortgage Real Estate Investment Trusts (REITs) – (continued) | |
| | |
ARMOUR Residential REIT, Inc.(a) | | | 30,494 | | | $ | 320,797 | |
| | |
Blackstone Mortgage Trust, Inc., Class A(a) | | | 37,442 | | | | 1,231,842 | |
| | |
BrightSpire Capital, Inc. | | | 9,071 | | | | 88,986 | |
| | |
Broadmark Realty Capital, Inc.(a) | | | 18,721 | | | | 193,201 | |
| | |
Cherry Hill Mortgage Investment Corp.(a) | | | 14,861 | | | | 135,532 | |
| | |
Chimera Investment Corp.(a) | | | 47,478 | | | | 741,132 | |
| | |
Dynex Capital, Inc.(a) | | | 5,983 | | | | 104,702 | |
| | |
Ellington Financial, Inc.(a) | | | 13,703 | | | | 249,121 | |
| | |
Franklin BSP Realty Trust, Inc.* (a) | | | 10,217 | | | | 167,658 | |
| | |
Granite Point Mortgage Trust, Inc.(a) | | | 16,019 | | | | 214,655 | |
| | |
Hannon Armstrong Sustainable Infrastructure Capital, Inc.(a) | | | 2,316 | | | | 139,886 | |
| | |
Invesco Mortgage Capital, Inc.(a) | | | 26,055 | | | | 81,813 | |
| | |
KKR Real Estate Finance Trust, Inc.(a) | | | 11,580 | | | | 251,402 | |
| | |
Ladder Capital Corp.(a) | | | 13,703 | | | | 164,436 | |
| | |
MFA Financial, Inc. | | | 65,813 | | | | 296,817 | |
| | |
New Residential Investment Corp. | | | 115,607 | | | | 1,313,295 | |
| | |
New York Mortgage Trust, Inc.(a) | | | 61,567 | | | | 270,279 | |
| | |
Orchid Island Capital, Inc.(a) | | | 55,777 | | | | 276,654 | |
| | |
PennyMac Mortgage Investment Trust(a) | | | 16,598 | | | | 334,450 | |
| | |
Ready Capital Corp.(a) | | | 14,282 | | | | 220,942 | |
| | |
Redwood Trust, Inc. | | | 33,775 | | | | 457,989 | |
| | |
Starwood Property Trust, Inc.(a) | | | 14,861 | | | | 378,510 | |
| | |
TPG RE Finance Trust, Inc. | | | 19,300 | | | | 252,251 | |
| | |
Two Harbors Investment Corp. | | | 54,426 | | | | 349,415 | |
| | | | | | | | 10,092,227 | |
| | |
| Multiline Retail – 0.6% | | | | | | |
| | |
Big Lots, Inc.(a) | | | 9,457 | | | | 418,472 | |
| | | | | | | | |
| Investments | | Shares | | | Value | |
|
| Multiline Retail – (continued) | |
| | |
Dillard’s, Inc., Class A(a) | | | 965 | | | $ | 223,050 | |
| | |
Dollar General Corp.(a) | | | 6,562 | | | | 1,453,614 | |
| | |
Dollar Tree, Inc.* (a) | | | 6,369 | | | | 686,324 | |
| | |
Franchise Group, Inc.(a) | | | 7,913 | | | | 291,198 | |
| | |
Kohl’s Corp.(a) | | | 7,720 | | | | 374,652 | |
| | |
Macy’s, Inc.(a) | | | 73,147 | | | | 1,936,201 | |
| | |
Nordstrom, Inc.* | | | 9,457 | | | | 271,700 | |
| | |
Ollie’s Bargain Outlet Holdings, Inc.* (a) | | | 1,544 | | | | 104,467 | |
| | |
Target Corp. | | | 16,598 | | | | 4,309,173 | |
| | | | | | | | 10,068,851 | |
| | |
| Multi-Utilities – 0.8% | | | | | | |
| | |
Ameren Corp. | | | 6,562 | | | | 553,111 | |
| | |
Avista Corp. | | | 13,317 | | | | 530,150 | |
| | |
Black Hills Corp.(a) | | | 16,984 | | | | 1,127,398 | |
| | |
CenterPoint Energy, Inc. | | | 19,686 | | | | 512,623 | |
| | |
CMS Energy Corp. | | | 8,299 | | | | 500,845 | |
| | |
Consolidated Edison, Inc. | | | 11,001 | | | | 829,475 | |
| | |
Dominion Energy, Inc. | | | 28,564 | | | | 2,168,865 | |
| | |
DTE Energy Co. | | | 6,755 | | | | 765,679 | |
| | |
MDU Resources Group, Inc. | | | 48,443 | | | | 1,488,653 | |
| | |
NiSource, Inc. | | | 18,721 | | | | 461,847 | |
| | |
NorthWestern Corp. | | | 12,738 | | | | 724,283 | |
| | |
Public Service Enterprise Group, Inc.(a) | | | 18,721 | | | | 1,194,400 | |
| | |
Sempra Energy | | | 9,843 | | | | 1,256,262 | |
| | |
Unitil Corp. | | | 3,088 | | | | 128,924 | |
| | |
WEC Energy Group, Inc. | | | 8,878 | | | | 799,553 | |
| | | | | | | | 13,042,068 | |
|
| Oil, Gas & Consumable Fuels – 3.4% | |
| | |
Alto Ingredients, Inc.* | | | 21,230 | | | | 112,944 | |
| | |
Altus Midstream Co.(a) | | | 1,351 | | | | 83,519 | |
| | |
Antero Midstream Corp.(a) | | | 73,919 | | | | 786,498 | |
| | |
Antero Resources Corp.* | | | 70,252 | | | | 1,395,907 | |
| | |
APA Corp. | | | 18,721 | | | | 490,677 | |
| | |
Arch Resources, Inc.* (a) | | | 5,018 | | | | 457,039 | |
| | |
Berry Corp.(a) | | | 27,792 | | | | 267,081 | |
| | |
Bonanza Creek Energy, Inc.(a) | | | 7,913 | | | | 444,236 | |
| | |
Brigham Minerals, Inc., Class A | | | 9,264 | | | | 214,739 | |
See Accompanying Notes to the Financial Statements.
| | | | |
| 166 | | FLEXSHARES ANNUAL REPORT | | |
FlexShares® Morningstar US Market Factor Tilt Index Fund (cont.)
| | | | | | | | |
| Investments | | Shares | | | Value | |
|
| COMMON STOCKS – (continued) | |
|
| Oil, Gas & Consumable Fuels – (continued) | |
| | |
California Resources Corp.* | | | 4,246 | | | $ | 195,868 | |
| | |
Callon Petroleum Co.* (a) | | | 5,597 | | | | 289,533 | |
| | |
Centennial Resource Development, Inc., Class A* | | | 12,931 | | | | 93,103 | |
| | |
Centrus Energy Corp., Class A* (a) | | | 2,316 | | | | 131,248 | |
| | |
Cheniere Energy, Inc.* (a) | | | 8,492 | | | | 878,073 | |
| | |
Chesapeake Energy Corp. | | | 24,511 | | | | 1,562,331 | |
| | |
Chevron Corp. | | | 64,269 | | | | 7,358,158 | |
| | |
Clean Energy Fuels Corp.* (a) | | | 17,756 | | | | 163,710 | |
| | |
CNX Resources Corp.* | | | 54,426 | | | | 795,164 | |
| | |
Comstock Resources, Inc.* (a) | | | 23,739 | | | | 234,304 | |
| | |
ConocoPhillips | | | 43,232 | | | | 3,220,352 | |
| | |
Contango Oil & Gas Co.* (a) | | | 19,686 | | | | 81,303 | |
| | |
Continental Resources, Inc.(a) | | | 5,018 | | | | 244,929 | |
| | |
Coterra Energy, Inc. | | | 27,600 | | | | 588,431 | |
| | |
CVR Energy, Inc. | | | 14,282 | | | | 273,786 | |
| | |
Delek US Holdings, Inc.* | | | 10,037 | | | | 195,213 | |
| | |
Denbury, Inc.* (a) | | | 772 | | | | 65,357 | |
| | |
Devon Energy Corp. | | | 25,862 | | | | 1,036,549 | |
| | |
Diamondback Energy, Inc. | | | 7,527 | | | | 806,819 | |
| | |
Dorian LPG Ltd.(a) | | | 8,299 | | | | 100,584 | |
| | |
Earthstone Energy, Inc., Class A* | | | 6,176 | | | | 62,686 | |
| | |
EOG Resources, Inc. | | | 17,949 | | | | 1,659,565 | |
| | |
EQT Corp.* (a) | | | 20,458 | | | | 407,319 | |
| | |
Equitrans Midstream Corp. | | | 82,797 | | | | 853,637 | |
| | |
Extraction Oil & Gas, Inc.* (a) | | | 1,158 | | | | 77,158 | |
| | |
Exxon Mobil Corp. | | | 141,469 | | | | 9,120,506 | |
| | |
Gevo, Inc.* (a) | | | 14,668 | | | | 106,050 | |
| | |
Green Plains, Inc.* (a) | | | 6,176 | | | | 234,379 | |
| | |
Hess Corp. | | | 9,457 | | | | 780,864 | |
| | |
HollyFrontier Corp. | | | 11,387 | | | | 384,881 | |
| | |
International Seaways, Inc.(a) | | | 3,088 | | | | 54,194 | |
| | |
Kinder Morgan, Inc. | | | 57,900 | | | | 969,825 | |
| | |
Kosmos Energy Ltd.* (a) | | | 67,164 | | | | 241,790 | |
| | | | | | | | |
| Investments | | Shares | | | Value | |
|
| Oil, Gas & Consumable Fuels – (continued) | |
| | |
Laredo Petroleum, Inc.* (a) | | | 3,667 | | | $ | 276,492 | |
| | |
Magnolia Oil & Gas Corp., Class A(a) | | | 14,861 | | | | 310,298 | |
| | |
Marathon Oil Corp. | | | 31,266 | | | | 510,261 | |
| | |
Marathon Petroleum Corp. | | | 23,932 | | | | 1,577,837 | |
| | |
Matador Resources Co. | | | 21,809 | | | | 912,707 | |
| | |
Murphy Oil Corp.(a) | | | 28,371 | | | | 789,565 | |
| | |
Northern Oil and Gas, Inc. | | | 5,404 | | | | 125,157 | |
| | |
Oasis Petroleum, Inc. | | | 3,088 | | | | 372,413 | |
| | |
Occidental Petroleum Corp. | | | 19,300 | | | | 647,129 | |
| | |
ONEOK, Inc. | | | 12,738 | | | | 810,392 | |
| | |
Ovintiv, Inc. | | | 63,304 | | | | 2,375,166 | |
| | |
Par Pacific Holdings, Inc.* (a) | | | 10,229 | | | | 158,140 | |
| | |
PBF Energy, Inc., Class A* | | | 9,650 | | | | 140,986 | |
| | |
PDC Energy, Inc.(a) | | | 25,669 | | | | 1,342,745 | |
| | |
Peabody Energy Corp.* (a) | | | 26,055 | | | | 309,794 | |
| | |
Phillips 66 | | | 10,036 | | | | 750,492 | |
| | |
Pioneer Natural Resources Co. | | | 7,141 | | | | 1,335,224 | |
| | |
Range Resources Corp.* | | | 63,690 | | | | 1,485,251 | |
| | |
Ranger Oil Corp.* | | | 5,404 | | | | 178,548 | |
| | |
Renewable Energy Group, Inc.* (a) | | | 9,264 | | | | 592,896 | |
| | |
REX American Resources Corp.* | | | 193 | | | | 16,974 | |
| | |
SM Energy Co. | | | 6,755 | | | | 231,832 | |
| | |
Southwestern Energy Co.* (a) | | | 168,296 | | | | 821,284 | |
| | |
Targa Resources Corp. | | | 9,071 | | | | 495,912 | |
| | |
Tellurian, Inc.* (a) | | | 193 | | | | 757 | |
| | |
Texas Pacific Land Corp.(a) | | | 193 | | | | 245,818 | |
| | |
Valero Energy Corp. | | | 13,317 | | | | 1,029,804 | |
| | |
Vine Energy, Inc., Class A* | | | 6,755 | | | | 115,308 | |
| | |
W&T Offshore, Inc.* | | | 48,057 | | | | 197,514 | |
| | |
Whiting Petroleum Corp.* | | | 8,878 | | | | 578,224 | |
| | |
Williams Cos., Inc. (The) | | | 46,706 | | | | 1,311,972 | |
| | |
World Fuel Services Corp.(a) | | | 11,001 | | | | 335,860 | |
| | | | | | | | 57,903,061 | |
|
| Paper & Forest Products – 0.2% | |
| | |
Clearwater Paper Corp.* (a) | | | 2,509 | | | | 104,951 | |
| | |
Domtar Corp.* | | | 12,159 | | | | 663,760 | |
| | |
Glatfelter Corp.(a) | | | 17,370 | | | | 285,389 | |
| | |
Louisiana-Pacific Corp.(a) | | | 22,581 | | | | 1,330,698 | |
See Accompanying Notes to the Financial Statements.
| | | | | | |
| | FLEXSHARES ANNUAL REPORT | | | 167 | |
FlexShares® Morningstar US Market Factor Tilt Index Fund (cont.)
| | | | | | | | |
| Investments | | Shares | | | Value | |
|
| COMMON STOCKS – (continued) | |
|
| Paper & Forest Products – (continued) | |
| | |
Mercer International, Inc.(a) | | | 11,966 | | | $ | 128,874 | |
| | |
Neenah, Inc. | | | 579 | | | | 29,263 | |
| | |
Schweitzer-Mauduit International, Inc.(a) | | | 9,457 | | | | 329,482 | |
| | |
Verso Corp., Class A | | | 8,106 | | | | 178,981 | |
| | | | | | | | 3,051,398 | |
| | |
| Personal Products – 0.3% | | | | | | |
| | |
BellRing Brands, Inc., Class A* (a) | | | 3,667 | | | | 98,349 | |
| | |
Coty, Inc., Class A* | | | 22,581 | | | | 191,487 | |
| | |
Edgewell Personal Care Co. | | | 13,896 | | | | 486,221 | |
| | |
elf Beauty, Inc.* (a) | | | 965 | | | | 31,179 | |
| | |
Estee Lauder Cos., Inc. (The), Class A | | | 6,755 | | | | 2,190,849 | |
| | |
Herbalife Nutrition Ltd.* (a) | | | 23,546 | | | | 1,092,534 | |
| | |
Inter Parfums, Inc.(a) | | | 579 | | | | 53,488 | |
| | |
Medifast, Inc. | | | 386 | | | | 75,760 | |
| | |
Nu Skin Enterprises, Inc., Class A(a) | | | 12,931 | | | | 519,180 | |
| | |
Revlon, Inc., Class A* (a) | | | 5,790 | | | | 59,984 | |
| | |
USANA Health Sciences, Inc.* (a) | | | 386 | | | | 37,465 | |
| | |
Veru, Inc.* | | | 4,632 | | | | 37,844 | |
| | | | | | | | 4,874,340 | |
| | |
| Pharmaceuticals – 2.9% | | | | | | |
| | |
Aerie Pharmaceuticals, Inc.* (a) | | | 1,351 | | | | 14,361 | |
| | |
Agile Therapeutics, Inc.* (a) | | | 101,904 | | | | 80,851 | |
| | |
Amneal Pharmaceuticals, Inc.* (a) | | | 31,459 | | | | 172,710 | |
| | |
Amphastar Pharmaceuticals, Inc.* (a) | | | 1,351 | | | | 25,237 | |
| | |
Antares Pharma, Inc.* (a) | | | 965 | | | | 3,609 | |
| | |
Arvinas, Inc.* (a) | | | 2,509 | | | | 217,229 | |
| | |
BioDelivery Sciences International, Inc.* (a) | | | 46,320 | | | | 188,986 | |
| | |
Bristol-Myers Squibb Co. | | | 73,340 | | | | 4,283,056 | |
| | |
Cara Therapeutics, Inc.* (a) | | | 12,352 | | | | 207,884 | |
| | |
Catalent, Inc.* | | | 4,053 | | | | 558,746 | |
| | |
Collegium Pharmaceutical, Inc.* (a) | | | 10,422 | | | | 204,584 | |
| | | | | | | | |
| Investments | | Shares | | | Value | |
|
| Pharmaceuticals – (continued) | |
| | |
Corcept Therapeutics, Inc.* | | | 3,281 | | | $ | 59,058 | |
| | |
Durect Corp.* (a) | | | 114,256 | | | | 146,248 | |
| | |
Elanco Animal Health, Inc.* (a) | | | 14,668 | | | | 482,284 | |
| | |
Eli Lilly and Co. | | | 22,388 | | | | 5,703,567 | |
| | |
Endo International plc* | | | 7,141 | | | | 30,349 | |
| | |
EyePoint Pharmaceuticals, Inc.* (a) | | | 6,176 | | | | 70,839 | |
| | |
Fulcrum Therapeutics, Inc.* (a) | | | 2,509 | | | | 55,549 | |
| | |
Innoviva, Inc.* (a) | | | 10,036 | | | | 175,128 | |
| | |
Intra-Cellular Therapies, Inc.* (a) | | | 1,737 | | | | 74,812 | |
| | |
Jaguar Health, Inc.* (a) | | | 32,038 | | | | 68,241 | |
| | |
Jazz Pharmaceuticals plc* (a) | | | 3,088 | | | | 410,827 | |
| | |
Johnson & Johnson | | | 89,938 | | | | 14,649,101 | |
| | |
Kala Pharmaceuticals, Inc.* (a) | | | 37,056 | | | | 64,477 | |
| | |
Lannett Co., Inc.* (a) | | | 22,002 | | | | 60,065 | |
| | |
Merck & Co., Inc. | | | 84,148 | | | | 7,409,231 | |
| | |
Nektar Therapeutics* (a) | | | 3,088 | | | | 46,814 | |
| | |
Omeros Corp.* (a) | | | 7,527 | | | | 47,194 | |
| | |
Pacira BioSciences, Inc.* | | | 4,632 | | | | 242,161 | |
| | |
Perrigo Co. plc | | | 28,950 | | | | 1,307,092 | |
| | |
Pfizer, Inc. | | | 193,386 | | | | 8,458,704 | |
| | |
Prestige Consumer Healthcare, Inc.* (a) | | | 13,317 | | | | 798,887 | |
| | |
Provention Bio, Inc.* (a) | | | 15,826 | | | | 99,071 | |
| | |
Reata Pharmaceuticals, Inc., Class A* (a) | | | 772 | | | | 74,120 | |
| | |
Relmada Therapeutics, Inc.* | | | 7,527 | | | | 176,659 | |
| | |
Revance Therapeutics, Inc.* | | | 1,737 | | | | 23,884 | |
| | |
Royalty Pharma plc, Class A(a) | | | 13,124 | | | | 518,792 | |
| | |
Supernus Pharmaceuticals, Inc.* (a) | | | 6,755 | | | | 201,637 | |
| | |
TFF Pharmaceuticals, Inc.* (a) | | | 10,422 | | | | 80,354 | |
| | |
Viatris, Inc. | | | 31,459 | | | | 419,978 | |
| | |
VYNE Therapeutics, Inc.* (a) | | | 64,076 | | | | 85,862 | |
| | |
Zoetis, Inc. | | | 13,317 | | | | 2,879,135 | |
| | |
Zynerba Pharmaceuticals, Inc.* (a) | | | 16,019 | | | | 61,353 | |
| | | | | | | | 50,938,726 | |
See Accompanying Notes to the Financial Statements.
| | | | |
| 168 | | FLEXSHARES ANNUAL REPORT | | |
FlexShares® Morningstar US Market Factor Tilt Index Fund (cont.)
| | | | | | | | |
| Investments | | Shares | | | Value | |
|
| COMMON STOCKS – (continued) | |
|
| Professional Services – 0.8% | |
| | |
ASGN, Inc.* | | | 12,738 | | | $ | 1,524,229 | |
| | |
Booz Allen Hamilton Holding Corp. | | | 3,667 | | | | 318,516 | |
| | |
CACI International, Inc., Class A* | | | 5,597 | | | | 1,609,921 | |
| | |
CBIZ, Inc.* | | | 1,930 | | | | 70,850 | |
| | |
Clarivate plc* (a) | | | 4,632 | | | | 108,620 | |
| | |
CoStar Group, Inc.* | | | 11,580 | | | | 996,459 | |
| | |
CRA International, Inc. | | | 193 | | | | 21,195 | |
| | |
Dun & Bradstreet Holdings, Inc.* (a) | | | 11,580 | | | | 218,167 | |
| | |
Equifax, Inc. | | | 3,281 | | | | 910,248 | |
| | |
Exponent, Inc. | | | 3,281 | | | | 376,659 | |
| | |
Forrester Research, Inc.* | | | 386 | | | | 20,555 | |
| | |
FTI Consulting, Inc.* (a) | | | 1,158 | | | | 166,659 | |
| | |
Heidrick & Struggles International, Inc.(a) | | | 3,088 | | | | 144,765 | |
| | |
Huron Consulting Group, Inc.* | | | 772 | | | | 38,724 | |
| | |
ICF International, Inc. | | | 579 | | | | 58,184 | |
| | |
IHS Markit Ltd. | | | 10,615 | | | | 1,387,593 | |
| | |
Insperity, Inc. | | | 1,158 | | | | 144,750 | |
| | |
Jacobs Engineering Group, Inc. | | | 4,632 | | | | 650,425 | |
| | |
KBR, Inc.(a) | | | 10,615 | | | | 450,501 | |
| | |
Kelly Services, Inc., Class A(a) | | | 8,878 | | | | 160,070 | |
| | |
Kforce, Inc.(a) | | | 579 | | | | 37,496 | |
| | |
Korn Ferry | | | 4,246 | | | | 327,834 | |
| | |
Leidos Holdings, Inc. | | | 3,474 | | | | 347,331 | |
| | |
ManpowerGroup, Inc. | | | 3,860 | | | | 373,069 | |
| | |
ManTech International Corp., Class A | | | 772 | | | | 66,562 | |
| | |
Nielsen Holdings plc(a) | | | 17,370 | | | | 351,742 | |
| | |
Resources Connection, Inc. | | | 6,562 | | | | 114,244 | |
| | |
Robert Half International, Inc. | | | 4,439 | | | | 501,918 | |
| | |
Science Applications International Corp.(a) | | | 12,352 | | | | 1,108,963 | |
| | |
TransUnion | | | 5,018 | | | | 578,525 | |
| | |
TriNet Group, Inc.* | | | 1,351 | | | | 136,789 | |
| | |
TrueBlue, Inc.* (a) | | | 2,702 | | | | 75,251 | |
| | |
Upwork, Inc.* | | | 6,369 | | | | 300,107 | |
| | | | | | | | |
| Investments | | Shares | | | Value | |
|
| Professional Services – (continued) | |
| | |
Verisk Analytics, Inc. | | | 4,246 | | | $ | 892,806 | |
| | | | | | | | 14,589,727 | |
|
| Real Estate Management & Development – 0.3% | |
| | |
CBRE Group, Inc., Class A* | | | 11,966 | | | | 1,245,421 | |
| | |
Cushman & Wakefield plc* (a) | | | 34,354 | | | | 631,770 | |
| | |
eXp World Holdings, Inc.(a) | | | 1,544 | | | | 79,670 | |
| | |
Forestar Group, Inc.* | | | 1,351 | | | | 26,439 | |
| | |
Howard Hughes Corp. (The)* | | | 8,299 | | | | 723,092 | |
| | |
Jones Lang LaSalle, Inc.* (a) | | | 2,316 | | | | 598,061 | |
| | |
Kennedy-Wilson Holdings, Inc.(a) | | | 2,702 | | | | 60,444 | |
| | |
Newmark Group, Inc., Class A(a) | | | 36,477 | | | | 542,778 | |
| | |
Opendoor Technologies, Inc.* (a) | | | 12,159 | | | | 288,290 | |
| | |
RE/MAX Holdings, Inc., Class A | | | 3,474 | | | | 110,508 | |
| | |
Realogy Holdings Corp.* | | | 31,073 | | | | 538,184 | |
| | |
Redfin Corp.* (a) | | | 2,702 | | | | 138,721 | |
| | |
St Joe Co. (The) | | | 772 | | | | 36,299 | |
| | | | | | | | 5,019,677 | |
| | |
| Road & Rail – 1.1% | | | | | | |
| | |
AMERCO | | | 193 | | | | 142,239 | |
| | |
ArcBest Corp.(a) | | | 3,281 | | | | 294,798 | |
| | |
Avis Budget Group, Inc.* (a) | | | 11,580 | | | | 2,006,930 | |
| | |
CSX Corp. | | | 57,707 | | | | 2,087,262 | |
| | |
Heartland Express, Inc.(a) | | | 5,790 | | | | 94,551 | |
| | |
JB Hunt Transport Services, Inc. | | | 2,316 | | | | 456,692 | |
| | |
Kansas City Southern | | | 2,702 | | | | 838,295 | |
| | |
Knight-Swift Transportation Holdings, Inc. | | | 4,825 | | | | 273,529 | |
| | |
Landstar System, Inc. | | | 1,544 | | | | 271,451 | |
| | |
Lyft, Inc., Class A* (a) | | | 5,404 | | | | 247,881 | |
| | |
Marten Transport Ltd.(a) | | | 2,895 | | | | 48,144 | |
| | |
Norfolk Southern Corp. | | | 7,334 | | | | 2,149,229 | |
| | |
Old Dominion Freight Line, Inc. | | | 2,702 | | | | 922,328 | |
| | |
Ryder System, Inc.(a) | | | 11,194 | | | | 950,930 | |
| | |
Saia, Inc.* | | | 965 | | | | 301,698 | |
See Accompanying Notes to the Financial Statements.
| | | | | | |
| | FLEXSHARES ANNUAL REPORT | | | 169 | |
FlexShares® Morningstar US Market Factor Tilt Index Fund (cont.)
| | | | | | | | |
| Investments | | Shares | | | Value | |
|
| COMMON STOCKS – (continued) | |
| | |
| Road & Rail – (continued) | | | | | | |
| | |
Schneider National, Inc., Class B(a) | | | 3,088 | | | $ | 77,015 | |
| | |
Uber Technologies, Inc.* | | | 41,109 | | | | 1,801,396 | |
| | |
Union Pacific Corp. | | | 17,370 | | | | 4,193,118 | |
| | |
Werner Enterprises, Inc. | | | 16,598 | | | | 752,221 | |
| | |
XPO Logistics, Inc.* | | | 2,895 | | | | 248,391 | |
| | | | | | | | 18,158,098 | |
|
| Semiconductors & Semiconductor Equipment – 4.4% | |
| | |
Advanced Micro Devices, Inc.* (a) | | | 34,547 | | | | 4,153,586 | |
| | |
Alpha & Omega Semiconductor Ltd.* | | | 5,790 | | | | 200,623 | |
| | |
Ambarella, Inc.* (a) | | | 1,737 | | | | 322,787 | |
| | |
Amkor Technology, Inc. | | | 21,423 | | | | 469,592 | |
| | |
Analog Devices, Inc.(a) | | | 15,054 | | | | 2,611,718 | |
| | |
Applied Materials, Inc. | | | 26,055 | | | | 3,560,416 | |
| | |
Atomera, Inc.* (a) | | | 2,316 | | | | 50,049 | |
| | |
Axcelis Technologies, Inc.* (a) | | | 1,158 | | | | 63,609 | |
| | |
AXT, Inc.* | | | 7,334 | | | | 59,919 | |
| | |
Broadcom, Inc. | | | 14,282 | | | | 7,593,311 | |
| | |
Brooks Automation, Inc.(a) | | | 2,702 | | | | 314,648 | |
| | |
CEVA, Inc.* (a) | | | 193 | | | | 8,803 | |
| | |
Cirrus Logic, Inc.* | | | 3,088 | | | | 249,541 | |
| | |
CMC Materials, Inc. | | | 965 | | | | 123,877 | |
| | |
Cohu, Inc.* (a) | | | 1,351 | | | | 43,286 | |
| | |
Diodes, Inc.* | | | 1,351 | | | | 129,817 | |
| | |
Enphase Energy, Inc.* | | | 2,895 | | | | 670,569 | |
| | |
Entegris, Inc. | | | 3,667 | | | | 516,240 | |
| | |
First Solar, Inc.* | | | 3,281 | | | | 392,375 | |
| | |
FormFactor, Inc.* (a) | | | 2,509 | | | | 99,808 | |
| | |
Ichor Holdings Ltd.* | | | 2,509 | | | | 109,693 | |
| | |
Impinj, Inc.* | | | 1,544 | | | | 107,648 | |
| | |
Intel Corp. | | | 135,486 | | | | 6,638,814 | |
| | |
KLA Corp. | | | 4,053 | | | | 1,510,796 | |
| | |
Kopin Corp.* | | | 6,755 | | | | 35,396 | |
| | |
Kulicke & Soffa Industries, Inc.(a) | | | 2,123 | | | | 121,011 | |
| | |
Lam Research Corp. | | | 3,667 | | | | 2,066,611 | |
| | |
Lattice Semiconductor Corp.* | | | 9,071 | | | | 629,890 | |
| | | | | | | | |
| Investments | | Shares | | | Value | |
|
| Semiconductors & Semiconductor Equipment – (continued) | |
| | |
MACOM Technology Solutions Holdings, Inc.* | | | 1,544 | | | $ | 107,802 | |
| | |
Magnachip Semiconductor Corp.* | | | 5,404 | | | | 102,460 | |
| | |
Marvell Technology, Inc. | | | 22,774 | | | | 1,560,019 | |
| | |
MaxLinear, Inc.* | | | 3,667 | | | | 231,021 | |
| | |
Meta Materials, Inc.* (a) | | | 18,335 | | | | 86,174 | |
| | |
Microchip Technology, Inc. | | | 15,826 | | | | 1,172,548 | |
| | |
Micron Technology, Inc. | | | 36,477 | | | | 2,520,561 | |
| | |
MKS Instruments, Inc. | | | 2,316 | | | | 347,516 | |
| | |
Monolithic Power Systems, Inc. | | | 1,158 | | | | 608,483 | |
| | |
NeoPhotonics Corp.* (a) | | | 6,948 | | | | 70,314 | |
| | |
NVIDIA Corp. | | | 69,094 | | | | 17,665,263 | |
| | |
NXP Semiconductors NV | | | 7,334 | | | | 1,473,107 | |
| | |
ON Semiconductor Corp.* | | | 12,931 | | | | 621,593 | |
| | |
Onto Innovation, Inc.* (a) | | | 4,246 | | | | 336,326 | |
| | |
PDF Solutions, Inc.* | | | 579 | | | | 13,624 | |
| | |
Photronics, Inc.* (a) | | | 16,212 | | | | 210,594 | |
| | |
Power Integrations, Inc.(a) | | | 3,281 | | | | 338,632 | |
| | |
Qorvo, Inc.* | | | 3,281 | | | | 551,963 | |
| | |
QUALCOMM, Inc. | | | 30,494 | | | | 4,056,922 | |
| | |
Rambus, Inc.* (a) | | | 3,860 | | | | 89,822 | |
| | |
Semtech Corp.* (a) | | | 3,667 | | | | 311,805 | |
| | |
Silicon Laboratories, Inc.* | | | 2,509 | | | | 473,599 | |
| | |
SiTime Corp.* (a) | | | 579 | | | | 153,371 | |
| | |
Skyworks Solutions, Inc. | | | 4,439 | | | | 741,890 | |
| | |
SMART Global Holdings, Inc.* (a) | | | 4,632 | | | | 247,627 | |
| | |
SolarEdge Technologies, Inc.* | | | 1,544 | | | | 547,626 | |
| | |
SunPower Corp.* (a) | | | 6,562 | | | | 220,877 | |
| | |
Synaptics, Inc.* | | | 1,737 | | | | 337,968 | |
| | |
Teradyne, Inc.(a) | | | 4,632 | | | | 640,328 | |
| | |
Texas Instruments, Inc. | | | 24,897 | | | | 4,667,689 | |
| | |
Ultra Clean Holdings, Inc.* | | | 11,387 | | | | 564,453 | |
| | |
Universal Display Corp. | | | 1,158 | | | | 212,146 | |
| | |
Veeco Instruments, Inc.* (a) | | | 1,737 | | | | 42,192 | |
| | |
Wolfspeed, Inc.* (a) | | | 4,053 | | | | 486,806 | |
| | |
Xilinx, Inc. | | | 6,562 | | | | 1,181,160 | |
| | | | | | | | 75,848,714 | |
See Accompanying Notes to the Financial Statements.
| | | | |
| 170 | | FLEXSHARES ANNUAL REPORT | | |
FlexShares® Morningstar US Market Factor Tilt Index Fund (cont.)
| | | | | | | | |
| Investments | | Shares | | | Value | |
|
| COMMON STOCKS – (continued) | |
| | |
| Software – 8.3% | | | | | | |
| | |
8x8, Inc.* (a) | | | 7,913 | | | $ | 179,309 | |
| | |
ACI Worldwide, Inc.* | | | 3,474 | | | | 106,582 | |
| | |
Adobe, Inc.* | | | 13,317 | | | | 8,660,844 | |
| | |
Alarm.com Holdings, Inc.* (a) | | | 3,088 | | | | 260,195 | |
| | |
Altair Engineering, Inc., Class A* (a) | | | 1,158 | | | | 90,081 | |
| | |
Alteryx, Inc., Class A* | | | 1,158 | | | | 84,754 | |
| | |
Anaplan, Inc.* | | | 5,790 | | | | 377,566 | |
| | |
ANSYS, Inc.* | | | 2,316 | | | | 879,107 | |
| | |
Appfolio, Inc., Class A* (a) | | | 1,930 | | | | 254,162 | |
| | |
Appian Corp.* (a) | | | 965 | | | | 95,931 | |
| | |
Asana, Inc., Class A* | | | 3,860 | | | | 524,188 | |
| | |
Aspen Technology, Inc.* | | | 1,737 | | | | 272,171 | |
| | |
Autodesk, Inc.* | | | 6,176 | | | | 1,961,559 | |
| | |
Avalara, Inc.* | | | 3,088 | | | | 554,728 | |
| | |
Avaya Holdings Corp.* (a) | | | 20,651 | | | | 384,522 | |
| | |
Benefitfocus, Inc.* (a) | | | 15,440 | | | | 169,222 | |
| | |
Bill.com Holdings, Inc.* (a) | | | 2,123 | | | | 624,820 | |
| | |
Black Knight, Inc.* | | | 5,404 | | | | 378,874 | |
| | |
Blackbaud, Inc.* (a) | | | 1,544 | | | | 109,639 | |
| | |
Blackline, Inc.* (a) | | | 3,088 | | | | 391,775 | |
| | |
Bottomline Technologies DE, Inc.* (a) | | | 1,351 | | | | 62,551 | |
| | |
Box, Inc., Class A* | | | 5,404 | | | | 139,585 | |
| | |
C3.ai, Inc., Class A* (a) | | | 4,632 | | | | 208,996 | |
| | |
Cadence Design Systems, Inc.* | | | 7,334 | | | | 1,269,589 | |
| | |
CDK Global, Inc. | | | 9,071 | | | | 394,770 | |
| | |
Cerence, Inc.* (a) | | | 1,930 | | | | 202,901 | |
| | |
Ceridian HCM Holding, Inc.* | | | 2,702 | | | | 338,425 | |
| | |
ChannelAdvisor Corp.* | | | 3,860 | | | | 98,469 | |
| | |
Citrix Systems, Inc. | | | 3,667 | | | | 347,375 | |
| | |
CommVault Systems, Inc.* | | | 1,351 | | | | 83,086 | |
| | |
Coupa Software, Inc.* | | | 1,737 | | | | 395,515 | |
| | |
Crowdstrike Holdings, Inc., Class A* (a) | | | 5,983 | | | | 1,686,009 | |
| | |
Datadog, Inc., Class A* | | | 7,334 | | | | 1,225,145 | |
| | |
Digital Turbine, Inc.* | | | 3,474 | | | | 298,972 | |
| | |
DocuSign, Inc.* | | | 4,825 | | | | 1,342,749 | |
| | |
Dolby Laboratories, Inc., Class A | | | 3,088 | | | | 272,825 | |
| | | | | | | | |
| Investments | | Shares | | | Value | |
| | |
| Software – (continued) | | | | | | |
| | |
Domo, Inc., Class B* | | | 2,316 | | | $ | 204,619 | |
| | |
Dropbox, Inc., Class A* | | | 12,159 | | | | 370,728 | |
| | |
Duck Creek Technologies, Inc.* | | | 4,246 | | | | 133,749 | |
| | |
Dynatrace, Inc.* | | | 6,369 | | | | 477,675 | |
| | |
Ebix, Inc.(a) | | | 6,369 | | | | 208,967 | |
| | |
Elastic NV* | | | 2,316 | | | | 401,849 | |
| | |
Envestnet, Inc.* | | | 4,246 | | | | 354,541 | |
| | |
Everbridge, Inc.* (a) | | | 1,158 | | | | 184,481 | |
| | |
Fair Isaac Corp.* | | | 772 | | | | 307,410 | |
| | |
Five9, Inc.* | | | 1,930 | | | | 304,959 | |
| | |
Fortinet, Inc.* | | | 3,667 | | | | 1,233,359 | |
| | |
Guidewire Software, Inc.* (a) | | | 3,281 | | | | 412,520 | |
| | |
HubSpot, Inc.* | | | 1,158 | | | | 938,246 | |
| | |
InterDigital, Inc.(a) | | | 965 | | | | 64,607 | |
| | |
Intuit, Inc. | | | 7,334 | | | | 4,591,011 | |
| | |
Jamf Holding Corp.* (a) | | | 4,439 | | | | 211,518 | |
| | |
KnowBe4, Inc., Class A* | | | 2,509 | | | | 58,660 | |
| | |
LivePerson, Inc.* (a) | | | 3,860 | | | | 198,829 | |
| | |
Mandiant Corp.* | | | 5,018 | | | | 87,514 | |
| | |
Manhattan Associates, Inc.* | | | 2,509 | | | | 455,484 | |
| | |
Marathon Digital Holdings, Inc.* (a) | | | 7,141 | | | | 373,046 | |
| | |
Microsoft Corp. | | | 206,896 | | | | 68,610,851 | |
| | |
MicroStrategy, Inc., Class A* (a) | | | 193 | | | | 138,007 | |
| | |
Mimecast Ltd.* | | | 3,088 | | | | 232,959 | |
| | |
Model N, Inc.* (a) | | | 4,632 | | | | 150,123 | |
| | |
Momentive Global, Inc.* | | | 12,545 | | | | 287,531 | |
| | |
nCino, Inc.* (a) | | | 2,123 | | | | 154,257 | |
| | |
NCR Corp.* (a) | | | 31,459 | | | | 1,243,889 | |
| | |
New Relic, Inc.* | | | 3,667 | | | | 297,614 | |
| | |
NortonLifeLock, Inc.(a) | | | 13,703 | | | | 348,741 | |
| | |
Nuance Communications, Inc.* (a) | | | 8,878 | | | | 488,734 | |
| | |
Nutanix, Inc., Class A* | | | 13,703 | | | | 470,150 | |
| | |
ON24, Inc.* (a) | | | 3,088 | | | | 59,073 | |
| | |
OneSpan, Inc.* (a) | | | 4,439 | | | | 90,644 | |
| | |
Oracle Corp. | | | 46,706 | | | | 4,480,974 | |
| | |
PagerDuty, Inc.* | | | 772 | | | | 32,231 | |
| | |
Palantir Technologies, Inc., Class A* (a) | | | 42,846 | | | | 1,108,854 | |
| | |
Palo Alto Networks, Inc.* (a) | | | 2,895 | | | | 1,473,816 | |
See Accompanying Notes to the Financial Statements.
| | | | | | |
| | FLEXSHARES ANNUAL REPORT | | | 171 | |
FlexShares® Morningstar US Market Factor Tilt Index Fund (cont.)
| | | | | | | | |
| Investments | | Shares | | | Value | |
|
| COMMON STOCKS – (continued) | |
| | |
| Software – (continued) | | | | | | |
| | |
Paycom Software, Inc.* | | | 1,351 | | | $ | 740,145 | |
| | |
Paylocity Holding Corp.* | | | 1,158 | | | | 353,352 | |
| | |
Pegasystems, Inc. | | | 965 | | | | 114,565 | |
| | |
Ping Identity Holding Corp.* (a) | | | 4,246 | | | | 120,289 | |
| | |
Progress Software Corp. | | | 1,544 | | | | 79,377 | |
| | |
PROS Holdings, Inc.* | | | 1,351 | | | | 40,530 | |
| | |
PTC, Inc.* | | | 3,281 | | | | 417,835 | |
| | |
Q2 Holdings, Inc.* | | | 1,351 | | | | 105,999 | |
| | |
QAD, Inc., Class A | | | 2,123 | | | | 186,060 | |
| | |
Qualtrics International, Inc., Class A* | | | 4,439 | | | | 205,614 | |
| | |
Qualys, Inc.* (a) | | | 1,544 | | | | 192,197 | |
| | |
Rapid7, Inc.* (a) | | | 4,053 | | | | 521,824 | |
| | |
RingCentral, Inc., Class A* | | | 1,737 | | | | 423,446 | |
| | |
Sailpoint Technologies Holdings, Inc.* (a) | | | 2,895 | | | | 138,902 | |
| | |
salesforce.com, Inc.* | | | 27,213 | | | | 8,155,464 | |
| | |
ServiceNow, Inc.* | | | 5,404 | | | | 3,770,695 | |
| | |
Smartsheet, Inc., Class A* | | | 4,825 | | | | 332,973 | |
| | |
Smith Micro Software, Inc.* (a) | | | 16,405 | | | | 93,508 | |
| | |
Splunk, Inc.* (a) | | | 5,018 | | | | 827,067 | |
| | |
Sprout Social, Inc., Class A* | | | 2,509 | | | | 320,349 | |
| | |
SPS Commerce, Inc.* (a) | | | 2,316 | | | | 353,723 | |
| | |
SS&C Technologies Holdings, Inc. | | | 5,790 | | | | 460,131 | |
| | |
Synchronoss Technologies, Inc.* (a) | | | 19,686 | | | | 51,971 | |
| | |
Synopsys, Inc.* | | | 4,053 | | | | 1,350,379 | |
| | |
Telos Corp.* (a) | | | 3,281 | | | | 85,011 | |
| | |
Tenable Holdings, Inc.* | | | 5,404 | | | | 287,763 | |
| | |
Teradata Corp.* (a) | | | 5,211 | | | | 294,734 | |
| | |
Trade Desk, Inc. (The), Class A* | | | 11,580 | | | | 867,458 | |
| | |
Tyler Technologies, Inc.* | | | 1,351 | | | | 733,890 | |
| | |
Upland Software, Inc.* (a) | | | 772 | | | | 25,762 | |
| | |
Varonis Systems, Inc.* (a) | | | 5,790 | | | | 374,845 | |
| | |
Verint Systems, Inc.* | | | 2,123 | | | | 98,932 | |
| | |
Viant Technology, Inc., Class A* | | | 5,404 | | | | 63,497 | |
| | |
VirnetX Holding Corp.* (a) | | | 15,633 | | | | 60,187 | |
| | | | | | | | |
| Investments | | Shares | | | Value | |
| | |
| Software – (continued) | | | | | | |
| | |
VMware, Inc., Class A* (a) | | | 3,088 | | | $ | 468,450 | |
| | |
Vonage Holdings Corp.* (a) | | | 7,527 | | | | 121,335 | |
| | |
Workday, Inc., Class A* | | | 5,018 | | | | 1,455,120 | |
| | |
Workiva, Inc.* (a) | | | 1,351 | | | | 202,042 | |
| | |
Xperi Holding Corp.(a) | | | 27,599 | | | | 494,574 | |
| | |
Yext, Inc.* (a) | | | 16,212 | | | | 204,109 | |
| | |
Zendesk, Inc.* | | | 4,246 | | | | 432,243 | |
| | |
Zix Corp.* | | | 13,896 | | | | 117,699 | |
| | |
Zoom Video Communications, Inc., Class A* | | | 5,404 | | | | 1,484,209 | |
| | |
Zscaler, Inc.* | | | 1,737 | | | | 553,860 | |
| | |
Zuora, Inc., Class A* (a) | | | 13,510 | | | | 295,329 | |
| | | | | | | | 144,046,655 | |
| | |
| Specialty Retail – 2.7% | | | | | | |
| | |
Aaron’s Co., Inc. (The)(a) | | | 2,702 | | | | 63,200 | |
| | |
Abercrombie & Fitch Co., Class A* (a) | | | 11,001 | | | | 434,980 | |
| | |
Academy Sports & Outdoors, Inc.* (a) | | | 20,651 | | | | 883,450 | |
| | |
Advance Auto Parts, Inc. | | | 1,930 | | | | 435,254 | |
| | |
American Eagle Outfitters, Inc.(a) | | | 11,580 | | | | 274,909 | |
| | |
America’s Car-Mart, Inc.* | | | 1,158 | | | | 138,369 | |
| | |
Asbury Automotive Group, Inc.* (a) | | | 4,825 | | | | 944,301 | |
| | |
AutoNation, Inc.* | | | 2,702 | | | | 327,266 | |
| | |
AutoZone, Inc.* | | | 772 | | | | 1,377,896 | |
| | |
Barnes & Noble Education, Inc.* | | | 5,597 | | | | 58,097 | |
| | |
Bath & Body Works, Inc. | | | 8,492 | | | | 586,712 | |
| | |
Bed Bath & Beyond, Inc.* (a) | | | 30,108 | | | | 422,716 | |
| | |
Best Buy Co., Inc. | | | 8,106 | | | | 990,877 | |
| | |
Big 5 Sporting Goods Corp.(a) | | | 3,474 | | | | 84,001 | |
| | |
Boot Barn Holdings, Inc.* | | | 1,544 | | | | 161,333 | |
| | |
Buckle, Inc. (The) | | | 7,141 | | | | 297,208 | |
| | |
Burlington Stores, Inc.* | | | 1,737 | | | | 479,916 | |
| | |
Caleres, Inc.(a) | | | 3,281 | | | | 75,660 | |
| | |
Camping World Holdings, Inc., Class A(a) | | | 10,229 | | | | 381,030 | |
| | |
CarMax, Inc.* | | | 5,404 | | | | 739,916 | |
| | |
Carvana Co.* (a) | | | 2,509 | | | | 760,679 | |
See Accompanying Notes to the Financial Statements.
| | | | |
| 172 | | FLEXSHARES ANNUAL REPORT | | |
FlexShares® Morningstar US Market Factor Tilt Index Fund (cont.)
| | | | | | | | |
| Investments | | Shares | | | Value | |
|
| COMMON STOCKS – (continued) | |
|
| Specialty Retail – (continued) | |
| | |
Chico’s FAS, Inc.* (a) | | | 579 | | | $ | 3,161 | |
| | |
Children’s Place, Inc. (The)* (a) | | | 2,123 | | | | 175,975 | |
| | |
Citi Trends, Inc.* | | | 965 | | | | 74,652 | |
| | |
Container Store Group, Inc. (The)* (a) | | | 7,913 | | | | 87,518 | |
| | |
Designer Brands, Inc., Class A* (a) | | | 4,825 | | | | 65,282 | |
| | |
Dick’s Sporting Goods, Inc.(a) | | | 16,212 | | | | 2,013,692 | |
| | |
Five Below, Inc.* | | | 1,737 | | | | 342,710 | |
| | |
Floor & Decor Holdings, Inc., Class A* | | | 2,123 | | | | 288,558 | |
| | |
Foot Locker, Inc. | | | 24,125 | | | | 1,150,039 | |
| | |
GameStop Corp., Class A* (a) | | | 2,123 | | | | 389,592 | |
| | |
Gap, Inc. (The) | | | 9,457 | | | | 214,579 | |
| | |
Genesco, Inc.* (a) | | | 1,930 | | | | 116,939 | |
| | |
Group 1 Automotive, Inc.(a) | | | 4,439 | | | | 798,132 | |
| | |
Guess?, Inc.(a) | | | 5,404 | | | | 111,917 | |
| | |
Hibbett, Inc.(a) | | | 3,474 | | | | 269,027 | |
| | |
Home Depot, Inc. (The) | | | 29,529 | | | | 10,977,110 | |
| | |
Leslie’s, Inc.* (a) | | | 7,334 | | | | 151,667 | |
| | |
Lithia Motors, Inc., Class A | | | 1,351 | | | | 431,266 | |
| | |
Lowe’s Cos., Inc. | | | 23,546 | | | | 5,505,526 | |
| | |
Lumber Liquidators Holdings, Inc.* (a) | | | 193 | | | | 3,489 | |
| | |
MarineMax, Inc.* (a) | | | 6,176 | | | | 319,855 | |
| | |
Monro, Inc.(a) | | | 2,895 | | | | 178,795 | |
| | |
Murphy USA, Inc. | | | 5,597 | | | | 912,031 | |
| | |
National Vision Holdings, Inc.* | | | 2,509 | | | | 154,655 | |
| | |
ODP Corp. (The)* | | | 14,282 | | | | 618,411 | |
| | |
O’Reilly Automotive, Inc.* | | | 1,930 | | | | 1,201,078 | |
| | |
Party City Holdco, Inc.* | | | 7,527 | | | | 54,721 | |
| | |
Penske Automotive Group, Inc. | | | 8,299 | | | | 880,109 | |
| | |
Rent-A-Center, Inc.(a) | | | 12,931 | | | | 688,705 | |
| | |
RH* (a) | | | 579 | | | | 381,926 | |
| | |
Ross Stores, Inc. | | | 8,685 | | | | 983,142 | |
| | |
Sally Beauty Holdings, Inc.* | | | 19,493 | | | | 297,463 | |
| | |
Shift Technologies, Inc.* (a) | | | 12,545 | | | | 85,682 | |
| | | | | | | | |
| Investments | | Shares | | | Value | |
|
| Specialty Retail – (continued) | |
| | |
Shoe Carnival, Inc.(a) | | | 3,088 | | | $ | 104,591 | |
| | |
Signet Jewelers Ltd.(a) | | | 11,773 | | | | 1,049,916 | |
| | |
Sleep Number Corp.* (a) | | | 4,246 | | | | 375,092 | |
| | |
Sonic Automotive, Inc., Class A(a) | | | 6,755 | | | | 333,900 | |
| | |
Sportsman’s Warehouse Holdings, Inc.* | | | 11,773 | | | | 203,202 | |
| | |
TJX Cos., Inc. (The) | | | 32,810 | | | | 2,148,727 | |
| | |
Tractor Supply Co. | | | 3,088 | | | | 670,621 | |
| | |
Ulta Beauty, Inc.* | | | 1,351 | | | | 496,303 | |
| | |
Urban Outfitters, Inc.* | | | 6,948 | | | | 221,850 | |
| | |
Vroom, Inc.* (a) | | | 1,351 | | | | 25,845 | |
| | |
Williams-Sonoma, Inc.(a) | | | 2,509 | | | | 465,997 | |
| | |
Zumiez, Inc.* (a) | | | 5,983 | | | | 243,508 | |
| | | | | | | | 46,184,726 | |
|
| Technology Hardware, Storage & Peripherals – 4.1% | |
| | |
3D Systems Corp.* (a) | | | 2,123 | | | | 59,784 | |
| | |
Apple, Inc. | | | 432,320 | | | | 64,761,536 | |
| | |
Dell Technologies, Inc., Class C* | | | 9,071 | | | | 997,719 | |
| | |
Diebold Nixdorf, Inc.* | | | 22,774 | | | | 204,966 | |
| | |
Eastman Kodak Co.* (a) | | | 9,650 | | | | 65,524 | |
| | |
Hewlett Packard Enterprise Co. | | | 47,092 | | | | 689,898 | |
| | |
HP, Inc. | | | 43,232 | | | | 1,311,227 | |
| | |
NetApp, Inc. | | | 7,141 | | | | 637,691 | |
| | |
Pure Storage, Inc., Class A* | | | 14,861 | | | | 399,166 | |
| | |
Quantum Corp.* (a) | | | 26,248 | | | | 149,876 | |
| | |
Seagate Technology Holdings plc | | | 7,913 | | | | 704,811 | |
| | |
Super Micro Computer, Inc.* (a) | | | 11,387 | | | | 402,986 | |
| | |
Western Digital Corp.* | | | 11,001 | | | | 575,242 | |
| | |
Xerox Holdings Corp. | | | 39,179 | | | | 697,386 | |
| | | | | | | | 71,657,812 | |
|
| Textiles, Apparel & Luxury Goods – 0.8% | |
| | |
Capri Holdings Ltd.* | | | 4,632 | | | | 246,608 | |
| | |
Carter’s, Inc. | | | 1,544 | | | | 152,115 | |
| | |
Columbia Sportswear Co. | | | 772 | | | | 80,165 | |
| | |
Crocs, Inc.* (a) | | | 2,509 | | | | 405,078 | |
| | |
Deckers Outdoor Corp.* | | | 965 | | | | 381,474 | |
See Accompanying Notes to the Financial Statements.
| | | | | | |
| | FLEXSHARES ANNUAL REPORT | | | 173 | |
FlexShares® Morningstar US Market Factor Tilt Index Fund (cont.)
| | | | | | | | |
| Investments | | Shares | | | Value | |
|
| COMMON STOCKS – (continued) | |
|
| Textiles, Apparel & Luxury Goods – (continued) | |
| | |
Fossil Group, Inc.* (a) | | | 4,053 | | | $ | 47,906 | |
| | |
G-III Apparel Group Ltd.* (a) | | | 5,790 | | | | 165,941 | |
| | |
Hanesbrands, Inc. | | | 84,534 | | | | 1,440,459 | |
| | |
Kontoor Brands, Inc.(a) | | | 3,860 | | | | 204,580 | |
| | |
Levi Strauss & Co., Class A(a) | | | 772 | | | | 20,211 | |
| | |
Lululemon Athletica, Inc.* | | | 3,281 | | | | 1,528,979 | |
| | |
NIKE, Inc., Class B | | | 34,740 | | | | 5,811,655 | |
| | |
Oxford Industries, Inc. | | | 1,158 | | | | 107,370 | |
| | |
PVH Corp.* | | | 3,667 | | | | 400,913 | |
| | |
Ralph Lauren Corp.(a) | | | 1,544 | | | | 196,350 | |
| | |
Skechers USA, Inc., Class A* | | | 5,018 | | | | 231,882 | |
| | |
Steven Madden Ltd. | | | 5,211 | | | | 235,016 | |
| | |
Tapestry, Inc. | | | 12,545 | | | | 489,004 | |
| | |
Under Armour, Inc., Class A* (a) | | | 5,404 | | | | 118,672 | |
| | |
Under Armour, Inc., Class C* | | | 10,808 | | | | 204,055 | |
| | |
VF Corp. | | | 8,106 | | | | 590,765 | |
| | |
Wolverine World Wide, Inc. | | | 6,176 | | | | 204,858 | |
| | | | | | | | 13,264,056 | |
|
| Thrifts & Mortgage Finance – 0.7% | |
| | |
Axos Financial, Inc.* (a) | | | 12,545 | | | | 664,885 | |
| | |
Essent Group Ltd. | | | 27,406 | | | | 1,315,488 | |
| | |
Federal Agricultural Mortgage Corp., Class C | | | 2,509 | | | | 316,360 | |
| | |
Flagstar Bancorp, Inc. | | | 11,580 | | | | 546,460 | |
| | |
HomeStreet, Inc. | | | 1,351 | | | | 63,713 | |
| | |
Merchants Bancorp | | | 386 | | | | 17,150 | |
| | |
Meridian Bancorp, Inc.(a) | | | 5,018 | | | | 116,418 | |
| | |
Meta Financial Group, Inc. | | | 4,053 | | | | 224,698 | |
| | |
MGIC Investment Corp. | | | 86,271 | | | | 1,394,139 | |
| | |
Mr Cooper Group, Inc.* | | | 18,721 | | | | 820,729 | |
| | |
New York Community Bancorp, Inc.(a) | | | 107,501 | | | | 1,336,237 | |
| | |
NMI Holdings, Inc., Class A* (a) | | | 22,002 | | | | 534,209 | |
| | |
Northfield Bancorp, Inc.(a) | | | 18,721 | | | | 328,553 | |
| | |
Northwest Bancshares, Inc.(a) | | | 19,879 | | | | 274,330 | |
| | |
Ocwen Financial Corp.* | | | 2,316 | | | | 72,746 | |
| | |
PennyMac Financial Services, Inc.(a) | | | 10,036 | | | | 622,834 | |
| | | | | | | | |
| Investments | | Shares | | | Value | |
|
| Thrifts & Mortgage Finance – (continued) | |
| | |
Premier Financial Corp. | | | 11,387 | | | $ | 363,018 | |
| | |
Provident Financial Services, Inc.(a) | | | 14,475 | | | | 358,401 | |
| | |
Radian Group, Inc. | | | 47,092 | | | | 1,124,086 | |
| | |
Rocket Cos., Inc., Class A(a) | | | 24,704 | | | | 407,122 | |
| | |
TFS Financial Corp.(a) | | | 1,930 | | | | 37,558 | |
| | |
TrustCo Bank Corp.(a) | | | 772 | | | | 25,908 | |
| | |
Walker & Dunlop, Inc.(a) | | | 7,334 | | | | 953,933 | |
| | |
Washington Federal, Inc.(a) | | | 18,721 | | | | 661,975 | |
| | |
Waterstone Financial, Inc. | | | 8,492 | | | | 175,530 | |
| | |
WSFS Financial Corp. | | | 4,053 | | | | 209,986 | |
| | | | | | | | 12,966,466 | |
| | |
| Tobacco – 0.5% | | | | | | |
| | |
Altria Group, Inc. | | | 60,023 | | | | 2,647,615 | |
| | |
Philip Morris International, Inc. | | | 52,689 | | | | 4,981,218 | |
| | |
Turning Point Brands, Inc.(a) | | | 193 | | | | 7,367 | |
| | |
Universal Corp.(a) | | | 7,720 | | | | 362,840 | |
| | |
Vector Group Ltd.(a) | | | 20,844 | | | | 276,391 | |
| | | | | | | | 8,275,431 | |
|
| Trading Companies & Distributors – 0.7% | |
| | |
Air Lease Corp.(a) | | | 22,774 | | | | 912,099 | |
| | |
Applied Industrial Technologies, Inc.(a) | | | 2,702 | | | | 263,391 | |
| | |
Beacon Roofing Supply, Inc.* (a) | | | 14,089 | | | | 744,885 | |
| | |
BlueLinx Holdings, Inc.* | | | 2,123 | | | | 101,119 | |
| | |
Boise Cascade Co.(a) | | | 8,878 | | | | 502,672 | |
| | |
CAI International, Inc. | | | 1,737 | | | | 97,150 | |
| | |
DXP Enterprises, Inc.* | | | 5,597 | | | | 184,477 | |
| | |
Fastenal Co.(a) | | | 15,247 | | | | 870,299 | |
| | |
GATX Corp.(a) | | | 3,281 | | | | 311,203 | |
| | |
Global Industrial Co.(a) | | | 579 | | | | 23,496 | |
| | |
GMS, Inc.* | | | 11,580 | | | | 573,557 | |
| | |
H&E Equipment Services, Inc.(a) | | | 5,404 | | | | 243,612 | |
| | |
Herc Holdings, Inc.(a) | | | 2,316 | | | | 421,605 | |
| | |
McGrath RentCorp | | | 3,088 | | | | 222,768 | |
| | |
MRC Global, Inc.* | | | 6,562 | | | | 54,465 | |
| | |
MSC Industrial Direct Co., Inc., Class A(a) | | | 11,194 | | | | 941,080 | |
| | |
NOW, Inc.* | | | 8,299 | | | | 59,919 | |
See Accompanying Notes to the Financial Statements.
| | | | |
| 174 | | FLEXSHARES ANNUAL REPORT | | |
FlexShares® Morningstar US Market Factor Tilt Index Fund (cont.)
| | | | | | | | |
| Investments | | Shares | | | Value | |
|
| COMMON STOCKS – (continued) | |
|
| Trading Companies & Distributors – (continued) | |
| | |
Rush Enterprises, Inc., Class A(a) | | | 7,720 | | | $ | 402,058 | |
| | |
SiteOne Landscape Supply, Inc.* | | | 1,930 | | | | 453,473 | |
| | |
Triton International Ltd. | | | 16,791 | | | | 1,044,232 | |
| | |
United Rentals, Inc.* | | | 2,509 | | | | 951,187 | |
| | |
Univar Solutions, Inc.* (a) | | | 34,933 | | | | 893,586 | |
| | |
Veritiv Corp.* (a) | | | 3,474 | | | | 372,656 | |
| | |
Watsco, Inc. | | | 772 | | | | 223,556 | |
| | |
WESCO International, Inc.* | | | 10,808 | | | | 1,400,284 | |
| | |
WW Grainger, Inc. | | | 1,158 | | | | 536,281 | |
| | | | | | | | 12,805,110 | |
|
| Transportation Infrastructure – 0.0%(e) | |
| | |
Macquarie Infrastructure Holdings LLC | | | 3,667 | | | | 13,531 | |
|
| Water Utilities – 0.1% | |
| | |
American States Water Co.(a) | | | 3,474 | | | | 315,578 | |
| | |
American Water Works Co., Inc. | | | 4,632 | | | | 806,802 | |
| | |
California Water Service Group | | | 1,544 | | | | 93,999 | |
| | |
Essential Utilities, Inc. | | | 8,106 | | | | 381,549 | |
| | |
Middlesex Water Co.(a) | | | 579 | | | | 63,759 | |
| | |
SJW Group(a) | | | 3,281 | | | | 216,284 | |
| | | | | | | | 1,877,971 | |
|
| Wireless Telecommunication Services – 0.1% | |
| | |
Gogo, Inc.* (a) | | | 13,703 | | | | 222,811 | |
| | |
Shenandoah Telecommunications Co.(a) | | | 1,351 | | | | 37,342 | |
| | |
Telephone and Data Systems, Inc.(a) | | | 26,248 | | | | 491,887 | |
| | |
T-Mobile US, Inc.* | | | 15,054 | | | | 1,731,662 | |
| | |
United States Cellular Corp.* (a) | | | 2,123 | | | | 64,900 | |
| | | | | | | | 2,548,602 | |
Total Common Stocks
(Cost $932,319,222) | | | | 1,714,660,136 | |
| | | | | | | | |
| Investments | | Number of
Warrants | | | Value | |
|
| WARRANTS – 0.0%(e) | |
|
| Oil, Gas & Consumable Fuels – 0.0%(e) | |
| | |
Occidental Petroleum Corp., expiring 8/3/2027, price 22.00 USD*
(Cost $21,117) | | | 4,266 | | | $ | 64,161 | |
| | | Number of
Rights | | | | |
|
| RIGHTS – 0.0%(e) | |
|
| Biotechnology – 0.0%(e) | |
| | |
Achillion Pharmaceuticals, Inc., CVR* ‡ (d) | | | 44,344 | | | | 25,720 | |
|
| Media – 0.0% | |
| | |
Media General, Inc., CVR* ‡ (d) | | | 22,261 | | | | — | |
Total Rights
(Cost $—) | | | | 25,720 | |
| | | Principal
Amount | | | | |
|
| SECURITIES LENDING REINVESTMENTS(f) – 9.0% | |
|
| CERTIFICATES OF DEPOSIT – 0.4% | |
| | |
Oversea-Chinese Banking Corp. Ltd., New York
0.14%, 2/24/2022 | | $ | 4,000,000 | | | | 3,999,988 | |
| | |
The Sumitomo Bank Ltd., New York
0.15%, 3/9/2022 | | | 4,000,000 | | | | 4,000,056 | |
Total Certificates of Deposit
(Cost $8,000,000) | | | | 8,000,044 | |
See Accompanying Notes to the Financial Statements.
| | | | | | |
| | FLEXSHARES ANNUAL REPORT | | | 175 | |
FlexShares® Morningstar US Market Factor Tilt Index Fund (cont.)
| | | | | | | | |
| Investments | | Principal
Amount | | | Value | |
|
| SECURITIES LENDING REINVESTMENTS(f) – (continued) | |
|
| REPURCHASE AGREEMENTS – 8.6% | |
| | |
BofA Securities, Inc., 0.52%, dated 10/31/2021, due 1/31/2022, repurchase price $6,007,973, collateralized by various U.S. Treasury Securities, ranging from 0.63% – 4.50%, maturing 12/31/2027 – 8/15/2039; Common Stocks; total market value $6,284,612 | | $ | 6,000,000 | | | $ | 6,000,000 | |
| | |
Cantor Fitzgerald & Co., Inc., 0.05%, dated 10/31/2021, due 11/1/2021, repurchase price $83,000,115, collateralized by various Mortgage-Backed Securities, ranging from 1.50% – 6.00%, maturing 7/1/2036 – 12/15/2062; total market value $113,898,968 | | | 83,000,000 | | | | 83,000,000 | |
| | | | | | | | |
| Investments | | Principal
Amount | | | Value | |
|
| REPURCHASE AGREEMENTS – (continued) | |
| | |
Citigroup Global Markets, Inc., 0.05%, dated 10/31/2021, due 11/1/2021, repurchase price $59,227,199, collateralized by various U.S. Treasury Securities, ranging from 0.75% – 4.63%, maturing 2/15/2040 – 2/15/2042; total market value $59,761,487 | | $ | 59,227,116 | | | $ | 59,227,116 | |
Total Repurchase Agreements
(Cost $148,227,116) | | | | 148,227,116 | |
Total Securities Lending Reinvestments
(Cost $156,227,116) | | | | 156,227,160 | |
Total Investments – 108.3%
(Cost $1,088,567,455) | | | | 1,870,977,177 | |
| |
Liabilities in excess of other assets – (8.3%) | | | | (143,958,159 | ) |
| NET ASSETS – 100.0% | | | $ | 1,727,019,018 | |
| * | Non-income producing security. |
| ‡ | Value determined using significant unobservable inputs. |
| (a) | The security or a portion of this security is on loan at October 31, 2021. The total value of securities on loan at October 31, 2021 was $202,123,212, collateralized in the form of cash with a value of $156,227,373 that was reinvested in the securities shown in the Securities Lending Reinvestment section of the Schedule of Investments; $46,298,478 of collateral in the form of U.S. Government Treasury Securities, interest rates ranging from 0.00% – 7.25%, and maturity dates ranging from November 4, 2021 – February 15, 2051 and $4,766,985 of collateral in the form of Foreign Government Fixed Income Securities, interest rates ranging from 0.00% – 8.50%, and maturity dates ranging from November 17, 2021 – September 20, 2117; a total value of $207,292,836. |
| (b) | Investment in affiliated company. Northern Trust Investments, Inc., the Investment Adviser of the Fund, is a subsidiary of Northern Trust Corporation. |
| (c) | Amount represents less than one share. |
| (d) | Security fair valued as of October 31, 2021 in accordance with procedures approved by the Board of Trustees. Total value of all such securities at October 31, 2021 amounted to $25,720, which represents approximately 0.00% of net assets of the Fund. |
| (e) | Represents less than 0.05% of net assets. |
See Accompanying Notes to the Financial Statements.
| | | | |
| 176 | | FLEXSHARES ANNUAL REPORT | | |
FlexShares® Morningstar US Market Factor Tilt Index Fund (cont.)
| (f) | The security was purchased with cash collateral held from securities on loan at October 31, 2021. The total value of securities purchased was $156,227,160. |
Percentages shown are based on Net Assets.
Abbreviations
CVR –Contingent Value Rights
As of October 31, 2021, the gross unrealized appreciation (depreciation) of investments based on the aggregate cost of
investments (including derivative instruments, if applicable) for federal income tax purposes was as follows:
| | | | |
| | | | |
Aggregate gross unrealized appreciation | | $ | 793,582,567 | |
Aggregate gross unrealized depreciation | | | (11,340,264 | ) |
Net unrealized appreciation | | $ | 782,242,303 | |
Federal income tax cost | | $ | 1,089,191,250 | |
Investment in a company which was affiliated for the period ended October 31, 2021, was as follows:
| | | | | | | | | | | | | | | | | | | | | | | | | | | | | | | | |
| Security | | Value
October 31,
2020 | | | Purchases
at Cost | | | Sales
Proceeds | | | Shares
October 31,
2021 | | | Value
October 31,
2021 | | | Change in
Unrealized
Appreciation
(Depreciation) | | | Dividend
Income | | | Realized
Gain | |
Northern Trust Corp. | | $ | 577,006 | | | $ | 48,032 | | | $ | 51,220 | | | | 7,334 | | | $ | 902,375 | | | $ | 305,597 | | | $ | 21,094 | | | $ | 22,960 | |
Futures Contracts
FlexShares® Morningstar US Market Factor Tilt Index Fund had the following open futures contracts as of October 31, 2021:
| | | | | | | | | | | | | | | | | | | | |
| | | Number of
Contracts | | | Expiration
Date | | | Trading
Currency | | | Notional
Amount | | | Value and
Unrealized
Appreciation* | |
Long Contracts | |
Russell 2000 Emini Index | | | 18 | | | | 12/17/2021 | | | | USD | | | $ | 2,065,770 | | | $ | 65,461 | |
S&P 500 E-Mini Index | | | 30 | | | | 12/17/2021 | | | | USD | | | | 6,895,500 | | | | 311,165 | |
S&P Midcap 400 E-Mini Index | | | 7 | | | | 12/17/2021 | | | | USD | | | | 1,952,580 | | | | 79,750 | |
| | | | | | | | | | | | | | | | | | | $ | 456,376 | |
| * | This amount represents the cumulative appreciation/depreciation on futures contracts. Current day’s variation margin is reported within the Statement of Assets and Liabilities for futures contracts. |
Abbreviations:
USD – US Dollar
| | | | |
| Security Type | | % of Net Assets | |
Common Stocks | | | 99.3 | % |
Warrants | | | 0.0 | † |
Rights | | | 0.0 | † |
Securities Lending Reinvestments | | | 9.0 | |
Others(1) | | | (8.3 | ) |
| | | | 100.0 | % |
| † | Amount represents less than 0.05%. |
| (1) | Includes any other net assets/(liabilities). |
See Accompanying Notes to the Financial Statements.
| | | | | | |
| | FLEXSHARES ANNUAL REPORT | | | 177 | |
Schedule of Investments
FlexShares® Morningstar Developed Markets ex-US Factor Tilt Index Fund
October 31, 2021
| | | | | | | | |
| Investments | | Shares | | | Value | |
|
| COMMON STOCKS – 98.0% | |
|
| Aerospace & Defense – 0.8% | |
| | |
Airbus SE* | | | 10,164 | | | $ | 1,300,909 | |
| | |
Austal Ltd. | | | 71,940 | | | | 101,584 | |
| | |
Babcock International Group plc* | | | 179,608 | | | | 786,109 | |
| | |
BAE Systems plc | | | 70,796 | | | | 535,487 | |
| | |
CAE, Inc.* (a) | | | 4,836 | | | | 146,420 | |
| | |
Chemring Group plc | | | 38,412 | | | | 154,011 | |
| | |
Dassault Aviation SA | | | 550 | | | | 57,443 | |
| | |
Elbit Systems Ltd. | | | 412 | | | | 64,994 | |
| | |
LISI | | | 880 | | | | 24,492 | |
| | |
Meggitt plc* | | | 21,438 | | | | 220,396 | |
| | |
MTU Aero Engines AG | | | 792 | | | | 176,297 | |
| | |
QinetiQ Group plc | | | 36,064 | | | | 133,177 | |
| | |
Rolls-Royce Holdings plc* | | | 201,334 | | | | 363,850 | |
| | |
Saab AB, Class B | | | 2,493 | | | | 69,317 | |
| | |
Safran SA | | | 5,808 | | | | 779,941 | |
| | |
Singapore Technologies Engineering Ltd. | | | 17,900 | | | | 50,840 | |
| | |
Thales SA | | | 1,144 | | | | 105,461 | |
| | |
Ultra Electronics Holdings plc | | | 6,341 | | | | 281,792 | |
| | | | | | | | 5,352,520 | |
|
| Air Freight & Logistics – 0.7% | |
| | |
bpost SA* | | | 45,452 | | | | 389,235 | |
| | |
Cia de Distribucion Integral Logista Holdings SA | | | 28,116 | | | | 599,987 | |
| | |
Deutsche Post AG (Registered) | | | 17,908 | | | | 1,109,150 | |
| | |
DSV A/S | | | 3,205 | | | | 745,615 | |
| | |
Freightways Ltd.(a) | | | 12,987 | | | | 120,359 | |
| | |
ID Logistics Group* | | | 81 | | | | 29,762 | |
| | |
Kerry Logistics Network Ltd.(a) | | | 40,500 | | | | 98,399 | |
| | |
Kintetsu World Express, Inc. | | | 1,900 | | | | 45,390 | |
| | |
Konoike Transport Co. Ltd. | | | 6,400 | | | | 69,655 | |
| | |
Mainfreight Ltd.(a) | | | 2,708 | | | | 174,224 | |
| | |
PostNL NV | | | 40,622 | | | | 176,428 | |
| | |
Royal Mail plc | | | 14,455 | | | | 83,319 | |
| | |
SBS Holdings, Inc. | | | 8,800 | | | | 311,405 | |
| | |
SG Holdings Co. Ltd. | | | 9,000 | | | | 224,951 | |
| | |
Yamato Holdings Co. Ltd. | | | 6,200 | | | | 152,084 | |
| | | | | | | | 4,329,963 | |
| | | | | | | | |
| Investments | | Shares | | | Value | |
|
| Airlines – 0.2% | |
| | |
Air Canada* (a) | | | 7,936 | | | $ | 142,068 | |
| | |
Air France-KLM* (a) | | | 9,504 | | | | 44,764 | |
| | |
Air New Zealand Ltd.* (a) | | | 11,968 | | | | 14,303 | |
| | |
ANA Holdings, Inc.* (a) | | | 4,500 | | | | 104,701 | |
| | |
easyJet plc* | | | 2,628 | | | | 22,443 | |
| | |
Exchange Income Corp.(a) | | | 15,141 | | | | 520,355 | |
| | |
Finnair OYJ* (a) | | | 149,292 | | | | 114,234 | |
| | |
Japan Airlines Co. Ltd.* (a) | | | 500 | | | | 10,748 | |
| | |
JET2 plc* | | | 2,813 | | | | 47,023 | |
| | |
Qantas Airways Ltd.* | | | 35,730 | | | | 143,577 | |
| | |
Singapore Airlines Ltd.* | | | 16,799 | | | | 64,779 | |
| | |
Wizz Air Holdings plc* (b) | | | 728 | | | | 46,113 | |
| | | | | | | | 1,275,108 | |
|
| Auto Components – 1.5% | |
| | |
Aisin Corp. | | | 5,700 | | | | 208,204 | |
| | |
ARB Corp. Ltd. | | | 997 | | | | 36,386 | |
| | |
Brembo SpA | | | 3,647 | | | | 47,903 | |
| | |
Bridgestone Corp. | | | 15,700 | | | | 691,062 | |
| | |
CIE Automotive SA | | | 3,217 | | | | 87,562 | |
| | |
Cie Generale des Etablissements Michelin SCA | | | 4,576 | | | | 718,610 | |
| | |
Cie Plastic Omnium SA | | | 720 | | | | 19,964 | |
| | |
Continental AG* | | | 1,980 | | | | 232,618 | |
| | |
Denso Corp. | | | 8,100 | | | | 584,138 | |
| | |
Dometic Group AB(c) | | | 5,962 | | | | 86,669 | |
| | |
Exedy Corp. | | | 8,800 | | | | 130,659 | |
| | |
Faurecia SE | | | 3,967 | | | | 206,578 | |
| | |
FCC Co. Ltd. | | | 8,800 | | | | 121,552 | |
| | |
Gestamp Automocion SA* (b) | | | 65,516 | | | | 292,811 | |
| | |
G-Tekt Corp. | | | 15,100 | | | | 187,517 | |
| | |
GUD Holdings Ltd. | | | 4,852 | | | | 44,461 | |
| | |
Hella GmbH & Co. KGaA | | | 1,496 | | | | 103,875 | |
| | |
HI-LEX Corp. | | | 8,800 | | | | 140,152 | |
| | |
Ichikoh Industries Ltd. | | | 4,200 | | | | 20,774 | |
| | |
Johnson Electric Holdings Ltd.(a) | | | 133,278 | | | | 296,057 | |
| | |
JTEKT Corp. | | | 2,300 | | | | 20,232 | |
| | |
Koito Manufacturing Co. Ltd. | | | 3,200 | | | | 180,732 | |
| | |
KYB Corp.* | | | 7,900 | | | | 210,621 | |
| | |
Linamar Corp. | | | 2,622 | | | | 143,987 | |
| | |
Magna International, Inc. | | | 7,392 | | | | 600,341 | |
See Accompanying Notes to the Financial Statements.
| | | | |
| 178 | | FLEXSHARES ANNUAL REPORT | | |
FlexShares® Morningstar Developed Markets ex-US Factor Tilt Index Fund (cont.)
| | | | | | | | |
| Investments | | Shares | | | Value | |
|
| COMMON STOCKS – (continued) | |
|
| Auto Components – (continued) | |
| | |
Martinrea International, Inc. | | | 39,776 | | | $ | 368,703 | |
| | |
Musashi Seimitsu Industry Co. Ltd. | | | 17,600 | | | | 329,387 | |
| | |
NGK Spark Plug Co. Ltd.(a) | | | 2,700 | | | | 42,906 | |
| | |
NHK Spring Co. Ltd.(a) | | | 2,900 | | | | 21,796 | |
| | |
Nifco, Inc. | | | 2,400 | | | | 76,299 | |
| | |
Nippon Seiki Co. Ltd. | | | 30,500 | | | | 306,271 | |
| | |
NOK Corp. | | | 200 | | | | 2,305 | |
| | |
Nokian Renkaat OYJ | | | 2,552 | | | | 95,687 | |
| | |
Pacific Industrial Co. Ltd. | | | 16,100 | | | | 163,365 | |
| | |
Piolax, Inc. | | | 17,600 | | | | 252,520 | |
| | |
Pirelli & C SpA(b) | | | 2,876 | | | | 17,680 | |
| | |
Schaeffler AG (Preference) | | | 69,652 | | | | 552,949 | |
| | |
Stanley Electric Co. Ltd.(a) | | | 3,800 | | | | 95,512 | |
| | |
Sumitomo Electric Industries Ltd. | | | 17,600 | | | | 232,531 | |
| | |
Sumitomo Riko Co. Ltd. | | | 30,000 | | | | 194,694 | |
| | |
Sumitomo Rubber Industries Ltd.(a) | | | 9,300 | | | | 114,267 | |
| | |
TI Fluid Systems plc(b) | | | 97,988 | | | | 356,612 | |
| | |
Tokai Rika Co. Ltd. | | | 2,400 | | | | 33,466 | |
| | |
Topre Corp. | | | 13,200 | | | | 151,883 | |
| | |
Toyo Tire Corp. | | | 4,600 | | | | 76,166 | |
| | |
Toyoda Gosei Co. Ltd. | | | 2,000 | | | | 40,710 | |
| | |
Toyota Boshoku Corp. | | | 2,700 | | | | 51,668 | |
| | |
Toyota Industries Corp. | | | 4,500 | | | | 381,232 | |
| | |
TPR Co. Ltd. | | | 5,500 | | | | 69,748 | |
| | |
TS Tech Co. Ltd. | | | 4,800 | | | | 64,028 | |
| | |
Valeo | | | 2,904 | | | | 85,125 | |
| | |
Yokohama Rubber Co. Ltd. (The)(a) | | | 3,600 | | | | 60,681 | |
| | | | | | | | 9,651,656 | |
|
| Automobiles – 2.2% | |
| | |
Aston Martin Lagonda Global Holdings plc* (b) | | | 578 | | | | 13,532 | |
| | |
Bayerische Motoren Werke AG | | | 7,348 | | | | 741,843 | |
| | |
Bayerische Motoren Werke AG (Preference) | | | 2,092 | | | | 178,183 | |
| | |
Daimler AG (Registered) | | | 19,360 | | | | 1,920,950 | |
| | |
Ferrari NV | | | 1,848 | | | | 438,413 | |
| | |
Honda Motor Co. Ltd. | | | 39,600 | | | | 1,163,082 | |
| | |
Isuzu Motors Ltd. | | | 21,000 | | | | 281,596 | |
| | |
Mazda Motor Corp.* | | | 4,100 | | | | 36,640 | |
| | | | | | | | |
| Investments | | Shares | | | Value | |
|
| Automobiles – (continued) | |
| | |
Mitsubishi Motors Corp.* | | | 900 | | | $ | 2,865 | |
| | |
Nissan Motor Co. Ltd.* | | | 44,400 | | | | 224,833 | |
| | |
Nissan Shatai Co. Ltd. | | | 35,200 | | | | 249,124 | |
| | |
Porsche Automobil Holding SE (Preference) | | | 4,444 | | | | 461,928 | |
| | |
Renault SA* | | | 2,728 | | | | 98,056 | |
| | |
Stellantis NV | | | 52,120 | | | | 1,040,116 | |
| | |
Subaru Corp. | | | 13,600 | | | | 265,738 | |
| | |
Suzuki Motor Corp. | | | 13,200 | | | | 587,503 | |
| | |
Toyota Motor Corp. | | | 308,000 | | | | 5,419,882 | |
| | |
Trigano SA | | | 352 | | | | 65,950 | |
| | |
Volkswagen AG (Preference) | | | 4,048 | | | | 907,959 | |
| | |
Yamaha Motor Co. Ltd.(a) | | | 6,900 | | | | 191,524 | |
| | | | | | | | 14,289,717 | |
|
| Banks – 9.7% | |
| | |
77 Bank Ltd. (The) | | | 22,000 | | | | 224,196 | |
| | |
ABN AMRO Bank NV, CVA(b) | | | 12,232 | | | | 180,143 | |
| | |
Aktia Bank OYJ | | | 19,932 | | | | 285,561 | |
| | |
AMCO – Asset Management Co. SpA* (d) | | | 239 | | | | 1,083 | |
| | |
Aozora Bank Ltd. | | | 900 | | | | 20,569 | |
| | |
Australia & New Zealand Banking Group Ltd. | | | 63,668 | | | | 1,345,684 | |
| | |
Awa Bank Ltd. (The)(a) | | | 13,200 | | | | 245,536 | |
| | |
Banca Monte dei Paschi di Siena SpA* (a) | | | 136,487 | | | | 162,846 | |
| | |
Banca Popolare di Sondrio SCPA | | | 47,344 | | | | 205,787 | |
| | |
Banco Bilbao Vizcaya Argentaria SA | | | 143,572 | | | | 1,007,193 | |
| | |
Banco BPM SpA | | | 32,208 | | | | 100,115 | |
| | |
Banco Comercial Portugues SA, Class R* (a) | | | 3,341,448 | | | | 603,622 | |
| | |
Banco de Sabadell SA* | | | 260,524 | | | | 209,959 | |
| | |
Banco Espirito Santo SA (Registered)* ‡ (d) | | | 48,647 | | | | — | |
| | |
Banco Santander SA(a) | | | 389,180 | | | | 1,475,665 | |
| | |
Bank Hapoalim BM | | | 25,652 | | | | 252,713 | |
| | |
Bank Leumi Le-Israel BM | | | 33,308 | | | | 318,324 | |
| | |
Bank Millennium SA* | | | 289,080 | | | | 663,485 | |
| | |
Bank of Ireland Group plc* | | | 19,096 | | | | 114,074 | |
| | |
Bank of Kyoto Ltd. (The)(a) | | | 2,600 | | | | 116,746 | |
| | |
Bank of Montreal(a) | | | 14,872 | | | | 1,612,158 | |
See Accompanying Notes to the Financial Statements.
| | | | | | |
| | FLEXSHARES ANNUAL REPORT | | | 179 | |
FlexShares® Morningstar Developed Markets ex-US Factor Tilt Index Fund (cont.)
| | | | | | | | |
| Investments | | Shares | | | Value | |
|
| COMMON STOCKS – (continued) | |
|
| Banks – (continued) | |
| | |
Bank of Nova Scotia (The) | | | 30,316 | | | $ | 1,984,462 | |
| | |
Bank of Queensland Ltd.(a) | | | 13,492 | | | | 89,178 | |
| | |
Bank Polska Kasa Opieki SA | | | 6,644 | | | | 219,570 | |
| | |
Bankinter SA(a) | | | 21,280 | | | | 117,270 | |
| | |
Banque Cantonale de Geneve | | | 480 | | | | 88,252 | |
| | |
Banque Cantonale Vaudoise (Registered) | | | 701 | | | | 56,540 | |
| | |
Barclays plc | | | 341,396 | | | | 946,466 | |
| | |
BAWAG Group AG(b) | | | 3,120 | | | | 196,598 | |
| | |
Bendigo & Adelaide Bank Ltd. | | | 9,421 | | | | 65,454 | |
| | |
Berner Kantonalbank AG (Registered)(a) | | | 2,112 | | | | 486,540 | |
| | |
BNP Paribas SA | | | 28,776 | | | | 1,928,129 | |
| | |
BPER Banca | | | 364,848 | | | | 799,896 | |
| | |
CaixaBank SA | | | 74,713 | | | | 214,856 | |
| | |
Canadian Imperial Bank of Commerce | | | 10,648 | | | | 1,289,993 | |
| | |
Canadian Western Bank(a) | | | 34,672 | | | | 1,107,389 | |
| | |
Chiba Bank Ltd. (The)(a) | | | 17,400 | | | | 107,734 | |
| | |
Close Brothers Group plc | | | 5,588 | | | | 110,300 | |
| | |
Commerzbank AG* | | | 13,464 | | | | 98,411 | |
| | |
Commonwealth Bank of Australia | | | 28,996 | | | | 2,279,815 | |
| | |
Concordia Financial Group Ltd. | | | 5,921 | | | | 23,523 | |
| | |
Credit Agricole SA | | | 26,010 | | | | 392,505 | |
| | |
Credito Emiliano SpA | | | 23,232 | | | | 176,367 | |
| | |
Dah Sing Banking Group Ltd. | | | 54,640 | | | | 52,399 | |
| | |
Dah Sing Financial Holdings Ltd. | | | 52,800 | | | | 164,596 | |
| | |
Danske Bank A/S | | | 11,000 | | | | 186,346 | |
| | |
DBS Group Holdings Ltd. | | | 44,956 | | | | 1,051,140 | |
| | |
DNB Bank ASA(a) | | | 19,184 | | | | 455,374 | |
| | |
Erste Group Bank AG | | | 6,908 | | | | 296,588 | |
| | |
FIBI Holdings Ltd. | | | 6,028 | | | | 265,420 | |
| | |
FinecoBank Banca Fineco SpA* | | | 14,388 | | | | 274,983 | |
| | |
Fukuoka Financial Group, Inc. | | | 2,800 | | | | 50,266 | |
| | |
Graubuendner Kantonalbank | | | 7 | | | | 11,683 | |
| | |
Gunma Bank Ltd. (The)(a) | | | 175,800 | | | | 542,702 | |
| | |
Hachijuni Bank Ltd. (The)(a) | | | 3,200 | | | | 10,692 | |
| | |
Hang Seng Bank Ltd. | | | 13,200 | | | | 251,136 | |
| | |
Heartland Group Holdings Ltd. | | | 250,052 | | | | 420,532 | |
| | |
Hirogin Holdings, Inc. | | | 14,000 | | | | 76,983 | |
| | | | | | | | |
| Investments | | Shares | | | Value | |
|
| Banks – (continued) | |
| | |
Hokkoku Financial Holdings, Inc.(a) | | | 7,900 | | | $ | 137,527 | |
| | |
Hokuhoku Financial Group, Inc. | | | 39,200 | | | | 280,528 | |
| | |
HSBC Holdings plc | | | 509,740 | | | | 3,084,876 | |
| | |
Hyakugo Bank Ltd. (The) | | | 74,800 | | | | 216,479 | |
| | |
ING Groep NV | | | 85,404 | | | | 1,296,699 | |
| | |
Intesa Sanpaolo SpA | | | 370,084 | | | | 1,052,497 | |
| | |
Israel Discount Bank Ltd., Class A* | | | 39,662 | | | | 239,717 | |
| | |
Iyo Bank Ltd. (The) | | | 21,800 | | | | 106,491 | |
| | |
Juroku Financial Group, Inc. | | | 10,600 | | | | 192,339 | |
| | |
Jyske Bank A/S (Registered)* | | | 1,292 | | | | 63,109 | |
| | |
KBC Group NV | | | 6,468 | | | | 602,999 | |
| | |
Keiyo Bank Ltd. (The) | | | 49,700 | | | | 193,090 | |
| | |
Kiyo Bank Ltd. (The)(a) | | | 24,200 | | | | 317,078 | |
| | |
Kyushu Financial Group, Inc. | | | 7,600 | | | | 25,528 | |
| | |
Laurentian Bank of Canada(a) | | | 14,036 | | | | 471,849 | |
| | |
Liechtensteinische Landesbank AG | | | 6,072 | | | | 358,838 | |
| | |
Lloyds Banking Group plc | | | 1,543,300 | | | | 1,062,393 | |
| | |
Luzerner Kantonalbank AG (Registered) | | | 204 | | | | 94,437 | |
| | |
Mebuki Financial Group, Inc. | | | 28,010 | | | | 57,236 | |
| | |
Mediobanca Banca di Credito Finanziario SpA* | | | 14,784 | | | | 176,477 | |
| | |
Mitsubishi UFJ Financial Group, Inc.(a) | | | 290,400 | | | | 1,585,389 | |
| | |
Mizrahi Tefahot Bank Ltd. | | | 1,889 | | | | 68,754 | |
| | |
Mizuho Financial Group, Inc. | | | 57,229 | | | | 755,358 | |
| | |
Musashino Bank Ltd. (The)(a) | | | 12,100 | | | | 189,525 | |
| | |
Nanto Bank Ltd. (The) | | | 46 | | | | 791 | |
| | |
National Australia Bank Ltd. | | | 58,828 | | | | 1,268,572 | |
| | |
National Bank of Canada | | | 8,272 | | | | 683,756 | |
| | |
NatWest Group plc | | | 55,352 | | | | 167,757 | |
| | |
Nishi-Nippon Financial Holdings, Inc. | | | 44,000 | | | | 256,610 | |
| | |
Nordea Bank Abp | | | 58,388 | | | | 714,239 | |
| | |
North Pacific Bank Ltd.(a) | | | 154,000 | | | | 318,737 | |
| | |
Ogaki Kyoritsu Bank Ltd. (The)(a) | | | 18,800 | | | | 311,946 | |
| | |
Okinawa Financial Group, Inc.(a) | | | 11,140 | | | | 244,342 | |
See Accompanying Notes to the Financial Statements.
| | | | |
| 180 | | FLEXSHARES ANNUAL REPORT | | |
FlexShares® Morningstar Developed Markets ex-US Factor Tilt Index Fund (cont.)
| | | | | | | | |
| Investments | | Shares | | | Value | |
|
| COMMON STOCKS – (continued) | |
|
| Banks – (continued) | |
| | |
Oversea-Chinese Banking Corp. Ltd. | | | 105,670 | | | $ | 924,662 | |
| | |
Powszechna Kasa Oszczednosci Bank Polski SA* | | | 20,768 | | | | 254,218 | |
| | |
Raiffeisen Bank International AG | | | 6,028 | | | | 176,490 | |
| | |
Resona Holdings, Inc. | | | 42,600 | | | | 159,902 | |
| | |
Ringkjoebing Landbobank A/S | | | 1,100 | | | | 139,803 | |
| | |
Royal Bank of Canada | | | 33,440 | | | | 3,475,246 | |
| | |
San-In Godo Bank Ltd. (The)(a) | | | 57,200 | | | | 279,416 | |
| | |
Sbanken ASA(b) | | | 31,592 | | | | 369,724 | |
| | |
Seven Bank Ltd. | | | 47,200 | | | | 99,761 | |
| | |
Shiga Bank Ltd. (The) | | | 23,000 | | | | 370,945 | |
| | |
Shinsei Bank Ltd.(a) | | | 5,200 | | | | 85,964 | |
| | |
Shizuoka Bank Ltd. (The) | | | 8,400 | | | | 67,554 | |
| | |
Skandinaviska Enskilda Banken AB, Class A | | | 32,120 | | | | 502,080 | |
| | |
Skandinaviska Enskilda Banken AB, Class C | | | 684 | | | | 10,959 | |
| | |
Societe Generale SA | | | 15,840 | | | | 528,570 | |
| | |
Spar Nord Bank A/S | | | 34,364 | | | | 443,158 | |
| | |
SpareBank 1 Nord Norge | | | 40,216 | | | | 486,816 | |
| | |
Sparebank 1 Oestlandet | | | 1,329 | | | | 21,869 | |
| | |
SpareBank 1 SMN | | | 3,103 | | | | 51,574 | |
| | |
SpareBank 1 SR-Bank ASA | | | 8,041 | | | | 123,001 | |
| | |
Sparebanken Vest | | | 37,576 | | | | 437,979 | |
| | |
St Galler Kantonalbank AG (Registered) | | | 110 | | | | 50,802 | |
| | |
Standard Chartered plc | | | 48,224 | | | | 327,144 | |
| | |
Sumitomo Mitsui Financial Group, Inc. | | | 35,200 | | | | 1,148,689 | |
| | |
Sumitomo Mitsui Trust Holdings, Inc. | | | 8,800 | | | | 289,719 | |
| | |
Suruga Bank Ltd.(a) | | | 97,600 | | | | 357,788 | |
| | |
Svenska Handelsbanken AB, Class A | | | 26,796 | | | | 306,819 | |
| | |
Svenska Handelsbanken AB, Class B | | | 908 | | | | 11,471 | |
| | |
Swedbank AB, Class A(a) | | | 20,504 | | | | 444,625 | |
| | |
Sydbank A/S | | | 25,432 | | | | 874,326 | |
| | |
TBC Bank Group plc | | | 17,874 | | | | 384,662 | |
| | |
Toronto-Dominion Bank (The) | | | 42,372 | | | | 3,071,034 | |
| | |
Unicaja Banco SA(b) | | | 401,221 | | | | 429,490 | |
| | | | | | | | |
| Investments | | Shares | | | Value | |
|
| Banks – (continued) | |
| | |
UniCredit SpA | | | 45,672 | | | $ | 603,803 | |
| | |
United Overseas Bank Ltd. | | | 37,426 | | | | 742,414 | |
| | |
Valiant Holding AG (Registered) | | | 6,468 | | | | 641,314 | |
| | |
Virgin Money UK plc* | | | 63,052 | | | | 175,709 | |
| | |
Walliser Kantonalbank (Registered) | | | 485 | | | | 53,609 | |
| | |
Westpac Banking Corp. | | | 56,980 | | | | 1,098,616 | |
| | | | | | | | 62,653,235 | |
|
| Beverages – 1.1% | |
| | |
AG Barr plc | | | 4,785 | | | | 32,566 | |
| | |
Anheuser-Busch InBev SA/NV(a) | | | 13,024 | | | | 795,351 | |
| | |
Asahi Group Holdings Ltd. | | | 12,700 | | | | 574,382 | |
| | |
Britvic plc | | | 7,320 | | | | 89,101 | |
| | |
Budweiser Brewing Co. APAC
Ltd.(a) (b) | | | 39,600 | | | | 109,193 | |
| | |
C&C Group plc* (a) | | | 23,522 | | | | 83,573 | |
| | |
Carlsberg A/S, Class B | | | 1,716 | | | | 283,360 | |
| | |
Coca-Cola Bottlers Japan Holdings, Inc.(a) | | | 3,354 | | | | 46,004 | |
| | |
Coca-Cola Europacific Partners plc | | | 3,487 | | | | 183,591 | |
| | |
Coca-Cola HBC AG, DI* | | | 4,000 | | | | 138,884 | |
| | |
Davide Campari-Milano NV | | | 13,420 | | | | 190,712 | |
| | |
Diageo plc | | | 40,040 | | | | 1,993,417 | |
| | |
Fevertree Drinks plc | | | 2,199 | | | | 68,394 | |
| | |
Heineken Holding NV | | | 1,496 | | | | 138,846 | |
| | |
Heineken NV | | | 3,212 | | | | 356,171 | |
| | |
Ito En Ltd.(a) | | | 800 | | | | 53,181 | |
| | |
Kirin Holdings Co. Ltd. | | | 13,238 | | | | 229,989 | |
| | |
Molson Coors Canada, Inc., Class B | | | 156 | | | | 6,890 | |
| | |
Pernod Ricard SA | | | 3,608 | | | | 829,644 | |
| | |
Primo Water Corp. | | | 5,512 | | | | 87,601 | |
| | |
Remy Cointreau SA | | | 584 | | | | 118,001 | |
| | |
Royal Unibrew A/S | | | 1,264 | | | | 156,989 | |
| | |
Sapporo Holdings Ltd.(a) | | | 1,800 | | | | 38,991 | |
| | |
Suntory Beverage & Food Ltd. | | | 3,000 | | | | 116,159 | |
| | |
Takara Holdings, Inc. | | | 8,600 | | | | 117,432 | |
| | |
Treasury Wine Estates Ltd. | | | 8,668 | | | | 75,001 | |
| | | | | | | | 6,913,423 | |
See Accompanying Notes to the Financial Statements.
| | | | | | |
| | FLEXSHARES ANNUAL REPORT | | | 181 | |
FlexShares® Morningstar Developed Markets ex-US Factor Tilt Index Fund (cont.)
| | | | | | | | |
| Investments | | Shares | | | Value | |
|
| COMMON STOCKS – (continued) | |
|
| Biotechnology – 0.6% | |
| | |
Abcam plc* | | | 4,545 | | | $ | 103,045 | |
| | |
AnGes, Inc.* (a) | | | 17,600 | | | | 83,504 | |
| | |
Argenx SE* | | | 704 | | | | 210,927 | |
| | |
Bavarian Nordic A/S* | | | 2,132 | | | | 102,150 | |
| | |
BioGaia AB, Class B | | | 1,134 | | | | 69,716 | |
| | |
Clinuvel Pharmaceuticals Ltd. | | | 1,368 | | | | 39,672 | |
| | |
CSL Ltd. | | | 7,964 | | | | 1,797,459 | |
| | |
Galapagos NV* | | | 924 | | | | 48,979 | |
| | |
Genmab A/S* | | | 1,320 | | | | 592,202 | |
| | |
Genus plc | | | 520 | | | | 39,417 | |
| | |
Grifols SA(a) | | | 3,564 | | | | 81,643 | |
| | |
Grifols SA (Preference), Class B | | | 5,680 | | | | 74,737 | |
| | |
Hansa Biopharma AB* | | | 2,660 | | | | 30,148 | |
| | |
HEALIOS KK* | | | 1,100 | | | | 16,602 | |
| | |
Imugene Ltd.* | | | 402,116 | | | | 149,505 | |
| | |
MorphoSys AG* | | | 880 | | | | 41,499 | |
| | |
Oncopeptides AB* (a) (b) | | | 12,100 | | | | 5,472 | |
| | |
PeptiDream, Inc.* | | | 2,500 | | | | 60,360 | |
| | |
Pharma Mar SA(a) | | | 414 | | | | 32,167 | |
| | |
PureTech Health plc* | | | 5,168 | | | | 25,077 | |
| | |
SanBio Co. Ltd.* (a) | | | 2,200 | | | | 23,172 | |
| | |
Swedish Orphan Biovitrum AB* | | | 5,369 | | | | 145,657 | |
| | |
Takara Bio, Inc. | | | 400 | | | | 10,391 | |
| | |
Trillium Therapeutics, Inc.* (a) | | | 10,992 | | | | 198,549 | |
| | |
Vitrolife AB | | | 1,652 | | | | 107,524 | |
| | | | | | | | 4,089,574 | |
|
| Building Products – 1.3% | |
| | |
AGC, Inc.(a) | | | 4,400 | | | | 218,794 | |
| | |
Aica Kogyo Co. Ltd. | | | 1,500 | | | | 45,845 | |
| | |
Assa Abloy AB, Class B | | | 15,928 | | | | 466,425 | |
| | |
Bunka Shutter Co. Ltd.(a) | | | 28,100 | | | | 273,052 | |
| | |
Carel Industries SpA(a) (b) | | | 4,028 | | | | 116,535 | |
| | |
Central Glass Co. Ltd. | | | 17,800 | | | | 330,008 | |
| | |
Cie de Saint-Gobain | | | 13,640 | | | | 940,148 | |
| | |
Daikin Industries Ltd. | | | 5,300 | | | | 1,156,913 | |
| | |
dormakaba Holding AG | | | 132 | | | | 98,016 | |
| | |
Fletcher Building Ltd.(a) | | | 17,649 | | | | 90,561 | |
| | |
Geberit AG (Registered) | | | 528 | | | | 413,039 | |
| | |
Genuit Group plc | | | 15,664 | | | | 142,570 | |
| | |
GWA Group Ltd.(a) | | | 17,760 | | | | 36,284 | |
| | |
Inwido AB | | | 7,358 | | | | 134,935 | |
| | | | | | | | |
| Investments | | Shares | | | Value | |
|
| Building Products – (continued) | |
| | |
James Halstead plc | | | 4,686 | | | $ | 35,714 | |
| | |
Kingspan Group plc | | | 2,641 | | | | 304,529 | |
| | |
Lindab International AB | | | 3,680 | | | | 120,574 | |
| | |
Lixil Corp. | | | 4,400 | | | | 112,831 | |
| | |
Munters Group AB(b) | | | 10,384 | | | | 76,654 | |
| | |
Nibe Industrier AB, Class B | | | 30,184 | | | | 449,325 | |
| | |
Nichias Corp. | | | 800 | | | | 19,526 | |
| | |
Nichiha Corp.(a) | | | 13,200 | | | | 378,549 | |
| | |
Nippon Sheet Glass Co. Ltd.* | | | 48,400 | | | | 269,537 | |
| | |
Noritz Corp. | | | 22,000 | | | | 351,923 | |
| | |
Reliance Worldwide Corp. Ltd. | | | 23,739 | | | | 102,881 | |
| | |
ROCKWOOL International A/S, Class A | | | 220 | | | | 88,467 | |
| | |
ROCKWOOL International A/S, Class B | | | 174 | | | | 79,579 | |
| | |
Sanwa Holdings Corp. | | | 9,800 | | | | 113,793 | |
| | |
Schweiter Technologies AG | | | 56 | | | | 80,530 | |
| | |
Sekisui Jushi Corp.(a) | | | 16,800 | | | | 311,911 | |
| | |
Takara Standard Co. Ltd. | | | 15,376 | | | | 203,620 | |
| | |
Takasago Thermal Engineering Co. Ltd.(a) | | | 22,000 | | | | 401,315 | |
| | |
TOTO Ltd. | | | 3,900 | | | | 188,117 | |
| | |
Tyman plc | | | 26,048 | | | | 133,359 | |
| | |
Uponor OYJ | | | 4,092 | | | | 99,634 | |
| | | | | | | | 8,385,493 | |
|
| Capital Markets – 3.7% | |
| | |
3i Group plc | | | 22,528 | | | | 421,207 | |
| | |
ABG Sundal Collier Holding ASA | | | 103,928 | | | | 114,379 | |
| | |
Abrdn plc | | | 27,500 | | | | 95,747 | |
| | |
AJ Bell plc | | | 33,088 | | | | 185,957 | |
| | |
Amundi SA(b) | | | 1,440 | | | | 128,399 | |
| | |
Anima Holding SpA(b) | | | 116,996 | | | | 621,457 | |
| | |
Ashmore Group plc | | | 9,588 | | | | 44,344 | |
| | |
ASX Ltd. | | | 2,104 | | | | 131,198 | |
| | |
Avanza Bank Holding AB | | | 2,704 | | | | 107,329 | |
| | |
Azimut Holding SpA | | | 5,680 | | | | 163,606 | |
| | |
Banca Generali SpA* | | | 1,397 | | | | 65,734 | |
| | |
Brederode SA* (a) | | | 80 | | | | 11,295 | |
| | |
Brewin Dolphin Holdings plc | | | 17,746 | | | | 91,585 | |
| | |
Brookfield Asset Management, Inc., Class A | | | 23,584 | | | | 1,421,612 | |
See Accompanying Notes to the Financial Statements.
| | | | |
| 182 | | FLEXSHARES ANNUAL REPORT | | |
FlexShares® Morningstar Developed Markets ex-US Factor Tilt Index Fund (cont.)
| | | | | | | | |
| Investments | | Shares | | | Value | |
|
| COMMON STOCKS – (continued) | |
|
| Capital Markets – (continued) | |
| | |
Bure Equity AB | | | 1,980 | | | $ | 91,801 | |
| | |
Canaccord Genuity Group, Inc. | | | 44,616 | | | | 515,430 | |
| | |
CI Financial Corp.(a) | | | 5,304 | | | | 120,753 | |
| | |
Cie Financiere Tradition SA(a) | | | 1,628 | | | | 198,656 | |
| | |
Credit Suisse Group AG (Registered) | | | 66,880 | | | | 697,675 | |
| | |
Daiwa Securities Group, Inc. | | | 48,400 | | | | 271,108 | |
| | |
Deutsche Bank AG (Registered)* | | | 27,852 | | | | 359,255 | |
| | |
Deutsche Boerse AG | | | 2,684 | | | | 446,030 | |
| | |
Draper Esprit plc* | | | 49,588 | | | | 657,296 | |
| | |
EFG International AG* (a) | | | 34,100 | | | | 239,959 | |
| | |
EQT AB | | | 5,104 | | | | 268,973 | |
| | |
Euronext NV(b) | | | 1,962 | | | | 221,149 | |
| | |
Fairfax India Holdings Corp.* (a) (b) | | | 42,724 | | | | 555,412 | |
| | |
flatexDEGIRO AG* | | | 4,400 | | | | 100,107 | |
| | |
Flow Traders(b) | | | 15,004 | | | | 509,789 | |
| | |
Gimv NV | | | 8,673 | | | | 561,059 | |
| | |
GMO Financial Holdings, Inc. | | | 10,800 | | | | 82,403 | |
| | |
Haitong International Securities Group Ltd. | | | 528,000 | | | | 121,496 | |
| | |
Hargreaves Lansdown plc | | | 5,061 | | | | 106,627 | |
| | |
Hong Kong Exchanges & Clearing Ltd. | | | 21,658 | | | | 1,310,775 | |
| | |
IG Group Holdings plc | | | 673 | | | | 7,320 | |
| | |
IGM Financial, Inc.(a) | | | 2,200 | | | | 87,216 | |
| | |
Intermediate Capital Group plc | | | 6,864 | | | | 206,147 | |
| | |
Investec plc | | | 16,636 | | | | 75,663 | |
| | |
IOOF Holdings Ltd.(a) | | | 43,472 | | | | 133,219 | |
| | |
IP Group plc | | | 452,452 | | | | 747,959 | |
| | |
JAFCO Group Co. Ltd. | | | 300 | | | | 18,917 | |
| | |
Japan Exchange Group, Inc. | | | 7,600 | | | | 179,527 | |
| | |
Julius Baer Group Ltd. | | | 5,720 | | | | 414,281 | |
| | |
Jupiter Fund Management plc | | | 204,468 | | | | 699,005 | |
| | |
Liontrust Asset Management plc | | | 5,896 | | | | 176,186 | |
| | |
London Stock Exchange Group plc | | | 5,060 | | | | 492,456 | |
| | |
Macquarie Group Ltd.(d) | | | 5,984 | | | | 889,163 | |
| | |
Magellan Financial Group Ltd. | | | 2,640 | | | | 68,747 | |
| | |
Man Group plc | | | 61,623 | | | | 196,561 | |
| | |
Monex Group, Inc. | | | 9,200 | | | | 59,545 | |
| | | | | | | | |
| Investments | | Shares | | | Value | |
|
| Capital Markets – (continued) | |
| | |
Ninety One plc | | | 39,732 | | | $ | 142,039 | |
| | |
Nomura Holdings, Inc. | | | 61,000 | | | | 294,234 | |
| | |
Okasan Securities Group, Inc. | | | 69,700 | | | | 237,784 | |
| | |
Onex Corp. | | | 157 | | | | 11,682 | |
| | |
Partners Group Holding AG | | | 352 | | | | 615,398 | |
| | |
Pendal Group Ltd. | | | 6,964 | | | | 34,784 | |
| | |
Perpetual Ltd. | | | 3,971 | | | | 112,325 | |
| | |
Pinnacle Investment Management Group Ltd. | | | 16,676 | | | | 214,935 | |
| | |
Platinum Asset Management Ltd. | | | 16 | | | | 37 | |
| | |
Quilter plc(a) (b) | | | 80,080 | | | | 170,802 | |
| | |
Rathbone Brothers plc | | | 26,224 | | | | 708,866 | |
| | |
Ratos AB, Class B | | | 18,348 | | | | 105,493 | |
| | |
Rothschild & Co. | | | 12,584 | | | | 554,116 | |
| | |
Sanne Group plc | | | 9,329 | | | | 115,601 | |
| | |
SBI Holdings, Inc. | | | 4,800 | | | | 123,847 | |
| | |
Schroders plc | | | 960 | | | | 47,636 | |
| | |
Schroders plc (Non-Voting) | | | 96 | | | | 3,250 | |
| | |
Singapore Exchange Ltd. | | | 7,600 | | | | 54,555 | |
| | |
St James’s Place plc | | | 8,712 | | | | 188,623 | |
| | |
Swissquote Group Holding SA (Registered) | | | 880 | | | | 178,552 | |
| | |
Tamburi Investment Partners SpA | | | 16,588 | | | | 187,165 | |
| | |
TMX Group Ltd. | | | 1,313 | | | | 141,930 | |
| | |
Tokai Tokyo Financial Holdings, Inc. | | | 26,400 | | | | 91,222 | |
| | |
TP ICAP Group plc | | | 270,952 | | | | 576,796 | |
| | |
UBS Group AG (Registered) | | | 89,188 | | | | 1,624,661 | |
| | |
UOB-Kay Hian Holdings Ltd. | | | 176,000 | | | | 206,214 | |
| | |
Uzabase, Inc.* | | | 4,400 | | | | 78,565 | |
| | |
Value Partners Group Ltd.(a) | | | 536,000 | | | | 275,612 | |
| | |
Van Lanschot Kempen NV, CVA | | | 14,784 | | | | 410,611 | |
| | |
VNV Global AB* (a) | | | 36,564 | | | | 536,422 | |
| | |
Vontobel Holding AG (Registered) | | | 339 | | | | 31,424 | |
| | |
VZ Holding AG | | | 285 | | | | 29,038 | |
| | |
Warsaw Stock Exchange | | | 18,040 | | | | 199,195 | |
| | | | | | | | 23,794,928 | |
|
| Chemicals – 3.0% | |
| | |
ADEKA Corp. | | | 4,200 | | | | 93,190 | |
See Accompanying Notes to the Financial Statements.
| | | | | | |
| | FLEXSHARES ANNUAL REPORT | | | 183 | |
FlexShares® Morningstar Developed Markets ex-US Factor Tilt Index Fund (cont.)
| | | | | | | | |
| Investments | | Shares | | | Value | |
|
| COMMON STOCKS – (continued) | |
|
| Chemicals – (continued) | |
| | |
Air Liquide SA | | | 8,184 | | | $ | 1,366,088 | |
| | |
Air Water, Inc. | | | 6,000 | | | | 91,664 | |
| | |
Akzo Nobel NV | | | 3,344 | | | | 384,740 | |
| | |
Arkema SA | | | 1,716 | | | | 234,726 | |
| | |
Asahi Kasei Corp. | | | 35,200 | | | | 369,365 | |
| | |
BASF SE | | | 21,384 | | | | 1,541,220 | |
| | |
Borregaard ASA | | | 1,692 | | | | 41,003 | |
| | |
C Uyemura & Co. Ltd. | | | 4,400 | | | | 181,364 | |
| | |
Chr Hansen Holding A/S(a) | | | 1,584 | | | | 126,161 | |
| | |
Chugoku Marine Paints Ltd.(a) | | | 27,100 | | | | 208,909 | |
| | |
CI Takiron Corp. | | | 18,400 | | | | 97,789 | |
| | |
Clariant AG (Registered)* | | | 2,836 | | | | 59,777 | |
| | |
Corbion NV | | | 1,352 | | | | 64,305 | |
| | |
Covestro AG(b) | | | 5,940 | | | | 380,823 | |
| | |
Croda International plc | | | 2,552 | | | | 330,855 | |
| | |
Daicel Corp. | | | 100 | | | | 749 | |
| | |
DIC Corp.(a) | | | 2,899 | | | | 76,654 | |
| | |
Elkem ASA* (b) | | | 7 | | | | 28 | |
| | |
EMS-Chemie Holding AG (Registered)(a) | | | 156 | | | | 154,933 | |
| | |
Evonik Industries AG | | | 4,160 | | | | 134,893 | |
| | |
FUCHS PETROLUB SE | | | 55 | | | | 2,025 | |
| | |
FUCHS PETROLUB SE (Preference) | | | 1,182 | | | | 56,684 | |
| | |
Fujimori Kogyo Co. Ltd.(a) | | | 4,400 | | | | 180,013 | |
| | |
Fuso Chemical Co. Ltd. | | | 1,100 | | | | 50,357 | |
| | |
Givaudan SA (Registered) | | | 132 | | | | 622,477 | |
| | |
Grupa Azoty SA* | | | 28,292 | | | | 211,481 | |
| | |
Hexpol AB | | | 5,784 | | | | 67,548 | |
| | |
ICL Group Ltd. | | | 5,140 | | | | 44,043 | |
| | |
Israel Corp. Ltd. (The)* | | | 104 | | | | 38,354 | |
| | |
JCU Corp. | | | 500 | | | | 19,974 | |
| | |
Johnson Matthey plc | | | 3,360 | | | | 125,874 | |
| | |
JSP Corp. | | | 2,300 | | | | 30,902 | |
| | |
JSR Corp. | | | 3,100 | | | | 111,739 | |
| | |
K+S AG (Registered)* | | | 8,712 | | | | 150,171 | |
| | |
Kansai Paint Co. Ltd. | | | 5,300 | | | | 122,385 | |
| | |
Koninklijke DSM NV | | | 2,921 | | | | 639,051 | |
| | |
Konishi Co. Ltd. | | | 8,100 | | | | 125,380 | |
| | |
Kumiai Chemical Industry Co. Ltd.(a) | | | 8,000 | | | | 59,426 | |
| | |
Kuraray Co. Ltd.(a) | | | 2,300 | | | | 20,776 | |
| | |
Kureha Corp.(a) | | | 6,500 | | | | 420,697 | |
| | | | | | | | |
| Investments | | Shares | | | Value | |
|
| Chemicals – (continued) | |
| | |
LANXESS AG | | | 2,156 | | | $ | 145,360 | |
| | |
Lenzing AG* | | | 485 | | | | 58,372 | |
| | |
Lintec Corp. | | | 1,800 | | | | 40,128 | |
| | |
Methanex Corp.(a) | | | 1,290 | | | | 57,696 | |
| | |
Mitsubishi Chemical Holdings Corp. | | | 27,100 | | | | 224,049 | |
| | |
Mitsubishi Gas Chemical Co., Inc. | | | 6,200 | | | | 124,680 | |
| | |
Mitsui Chemicals, Inc. | | | 5,600 | | | | 165,999 | |
| | |
Nihon Parkerizing Co. Ltd.(a) | | | 50,300 | | | | 499,361 | |
| | |
Nippon Kayaku Co. Ltd. | | | 3,700 | | | | 38,906 | |
| | |
Nippon Paint Holdings Co. Ltd.(a) | | | 29,200 | | | | 312,167 | |
| | |
Nippon Sanso Holdings Corp. | | | 7,200 | | | | 169,542 | |
| | |
Nippon Shokubai Co. Ltd. | | | 400 | | | | 20,838 | |
| | |
Nippon Soda Co. Ltd. | | | 12,039 | | | | 360,563 | |
| | |
Nissan Chemical Corp. | | | 3,800 | | | | 210,954 | |
| | |
Nitto Denko Corp. | | | 3,300 | | | | 256,996 | |
| | |
NOF Corp. | | | 2,000 | | | | 100,153 | |
| | |
Novozymes A/S, Class B | | | 3,828 | | | | 281,785 | |
| | |
Nufarm Ltd.* | | | 23,520 | | | | 76,847 | |
| | |
Nutrien Ltd. | | | 9,152 | | | | 638,658 | |
| | |
OCI NV* | | | 1,318 | | | | 37,369 | |
| | |
Okamoto Industries, Inc.(a) | | | 5,000 | | | | 174,962 | |
| | |
Orica Ltd. | | | 4,722 | | | | 53,661 | |
| | |
Osaka Soda Co. Ltd. | | | 9,400 | | | | 238,081 | |
| | |
Sakata INX Corp. | | | 17,600 | | | | 169,479 | |
| | |
Sanyo Chemical Industries Ltd.(a) | | | 6,900 | | | | 340,688 | |
| | |
Shikoku Chemicals Corp. | | | 20,800 | | | | 255,018 | |
| | |
Shin-Etsu Chemical Co. Ltd. | | | 6,600 | | | | 1,172,401 | |
| | |
Shin-Etsu Polymer Co. Ltd. | | | 22,200 | | | | 199,951 | |
| | |
Showa Denko KK(a) | | | 1,700 | | | | 42,655 | |
| | |
Sika AG (Registered) | | | 2,640 | | | | 895,650 | |
| | |
SOL SpA | | | 3,009 | | | | 69,156 | |
| | |
Solvay SA | | | 1,584 | | | | 188,441 | |
| | |
Sumitomo Bakelite Co. Ltd. | | | 2,400 | | | | 107,555 | |
| | |
Sumitomo Chemical Co. Ltd. | | | 38,200 | | | | 187,608 | |
| | |
Symrise AG | | | 1,980 | | | | 273,931 | |
| | |
Synthomer plc | | | 18,524 | | | | 128,609 | |
| | |
T Hasegawa Co. Ltd. | | | 900 | | | | 21,895 | |
| | |
Taiyo Holdings Co. Ltd. | | | 1,800 | | | | 47,989 | |
| | |
Teijin Ltd. | | | 3,000 | | | | 40,228 | |
See Accompanying Notes to the Financial Statements.
| | | | |
| 184 | | FLEXSHARES ANNUAL REPORT | | |
FlexShares® Morningstar Developed Markets ex-US Factor Tilt Index Fund (cont.)
| | | | | | | | |
| Investments | | Shares | | | Value | |
|
| COMMON STOCKS – (continued) | |
|
| Chemicals – (continued) | |
| | |
Tenma Corp.(a) | | | 5,700 | | | $ | 135,570 | |
| | |
Tessenderlo Group SA* | | | 2,990 | | | | 109,169 | |
| | |
Toagosei Co. Ltd. | | | 5,300 | | | | 59,077 | |
| | |
Tokai Carbon Co. Ltd. | | | 6,600 | | | | 86,128 | |
| | |
Tokuyama Corp. | | | 3,200 | | | | 54,697 | |
| | |
Tokyo Ohka Kogyo Co. Ltd.(a) | | | 700 | | | | 44,262 | |
| | |
Toray Industries, Inc. | | | 39,600 | | | | 246,195 | |
| | |
Tosoh Corp. | | | 12,200 | | | | 205,322 | |
| | |
Toyo Ink SC Holdings Co. Ltd. | | | 1,600 | | | | 28,120 | |
| | |
Toyobo Co. Ltd. | | | 39,600 | | | | 475,096 | |
| | |
Ube Industries Ltd.(a) | | | 3,900 | | | | 72,510 | |
| | |
Umicore SA(a) | | | 3,256 | | | | 186,818 | |
| | |
Victrex plc | | | 2,830 | | | | 88,757 | |
| | |
Wacker Chemie AG | | | 256 | | | | 46,201 | |
| | |
Yara International ASA | | | 3,432 | | | | 178,836 | |
| | |
Zeon Corp. | | | 8,000 | | | | 94,716 | |
| | | | | | | | 19,578,448 | |
|
| Commercial Services & Supplies – 0.9% | |
| | |
Befesa SA(b) | | | 2,288 | | | | 170,253 | |
| | |
Biffa plc* (b) | | | 5,928 | | | | 32,341 | |
| | |
Boyd Group Services, Inc.(a) | | | 208 | | | | 40,306 | |
| | |
Brambles Ltd. | | | 25,652 | | | | 193,443 | |
| | |
Bravida Holding AB(b) | | | 988 | | | | 14,851 | |
| | |
Cleanaway Waste Management Ltd. | | | 56,747 | | | | 114,229 | |
| | |
Coor Service Management Holding AB(b) | | | 6,692 | | | | 64,906 | |
| | |
Dai Nippon Printing Co. Ltd. | | | 3,900 | | | | 96,111 | |
| | |
Daiseki Co. Ltd. | | | 2,999 | | | | 139,660 | |
| | |
Derichebourg SA* | | | 38,324 | | | | 435,965 | |
| | |
Downer EDI Ltd. | | | 24,464 | | | | 115,762 | |
| | |
Duskin Co. Ltd. | | | 3,700 | | | | 88,845 | |
| | |
Elis SA* | | | 2,812 | | | | 53,336 | |
| | |
Elis SA – XLON* | | | 4,520 | | | | 85,889 | |
| | |
HomeServe plc | | | 7,771 | | | | 91,075 | |
| | |
Intrum AB | | | 4,268 | | | | 120,857 | |
| | |
Kokuyo Co. Ltd. | | | 5,600 | | | | 84,866 | |
| | |
Lassila & Tikanoja OYJ(a) | | | 960 | | | | 15,109 | |
| | |
Loomis AB | | | 2,271 | | | | 61,320 | |
| | |
Matsuda Sangyo Co. Ltd.(a) | | | 8,800 | | | | 261,627 | |
| | |
Mitie Group plc* | | | 608,872 | | | | 545,836 | |
| | | | | | | | |
| Investments | | Shares | | | Value | |
|
| Commercial Services & Supplies – (continued) | |
| | |
Mitsubishi Pencil Co. Ltd. | | | 1,800 | | | $ | 21,532 | |
| | |
Nippon Kanzai Co. Ltd. | | | 1,300 | | | | 31,501 | |
| | |
Okamura Corp. | | | 37,000 | | | | 486,086 | |
| | |
Park24 Co. Ltd. | | | 2,200 | | | | 33,591 | |
| | |
Pilot Corp. | | | 500 | | | | 18,285 | |
| | |
Prestige International, Inc. | | | 4,000 | | | | 27,292 | |
| | |
Prosegur Cash SA(b) | | | 163,760 | | | | 112,191 | |
| | |
Prosegur Cia de Seguridad SA | | | 101,332 | | | | 287,303 | |
| | |
Rentokil Initial plc | | | 32,208 | | | | 259,773 | |
| | |
Ritchie Bros Auctioneers, Inc. | | | 2,886 | | | | 196,948 | |
| | |
Sato Holdings Corp. | | | 1,100 | | | | 25,256 | |
| | |
Secom Co. Ltd. | | | 4,400 | | | | 298,633 | |
| | |
Securitas AB, Class B | | | 7,047 | | | | 116,513 | |
| | |
Serco Group plc | | | 57,046 | | | | 98,761 | |
| | |
Smart Metering Systems plc | | | 5,165 | | | | 57,772 | |
| | |
Sohgo Security Services Co. Ltd. | | | 2,900 | | | | 123,604 | |
| | |
SPIE SA | | | 1,216 | | | | 29,552 | |
| | |
TOMRA Systems ASA | | | 2,590 | | | | 166,925 | |
| | |
TOPPAN, Inc. | | | 4,400 | | | | 70,732 | |
| | |
Waste Connections, Inc. | | | 4,928 | | | | 669,497 | |
| | | | | | | | 5,958,334 | |
|
| Communications Equipment – 0.3% | |
| | |
BATM Advanced Communications Ltd.* | | | 10,755 | | | | 12,258 | |
| | |
Gilat Satellite Networks Ltd. | | | 21,780 | | | | 180,416 | |
| | |
Nokia OYJ* | | | 97,636 | | | | 561,557 | |
| | |
Spirent Communications plc | | | 56,452 | | | | 222,859 | |
| | |
Telefonaktiebolaget LM Ericsson, Class A | | | 3,789 | | | | 41,470 | |
| | |
Telefonaktiebolaget LM Ericsson, Class B | | | 40,139 | | | | 439,316 | |
| | |
VTech Holdings Ltd. | | | 66,000 | | | | 507,787 | |
| | | | | | | | 1,965,663 | |
|
| Construction & Engineering – 1.9% | |
| | |
ACS Actividades de Construccion y Servicios SA | | | 3,426 | | | | 89,722 | |
| | |
AF Gruppen ASA | | | 2,860 | | | | 66,604 | |
| | |
Arcadis NV | | | 2,876 | | | | 140,452 | |
| | |
Ashtrom Group Ltd. | | | 4,545 | | | | 106,420 | |
| | |
Badger Infrastructure Solutions
Ltd.(a) | | | 2,812 | | | | 77,471 | |
See Accompanying Notes to the Financial Statements.
| | | | | | |
| | FLEXSHARES ANNUAL REPORT | | | 185 | |
FlexShares® Morningstar Developed Markets ex-US Factor Tilt Index Fund (cont.)
| | | | | | | | |
| Investments | | Shares | | | Value | |
|
| COMMON STOCKS – (continued) | |
|
| Construction & Engineering – (continued) | |
| | |
Balfour Beatty plc | | | 6,760 | | | $ | 23,536 | |
| | |
Boskalis Westminster | | | 218 | | | | 6,509 | |
| | |
Bouygues SA | | | 7,440 | | | | 301,348 | |
| | |
Chiyoda Corp.* (a) | | | 34,800 | | | | 126,656 | |
| | |
Cie d’Entreprises CFE | | | 968 | | | | 99,139 | |
| | |
CIMIC Group Ltd. | | | 1,232 | | | | 18,433 | |
| | |
COMSYS Holdings Corp.(a) | | | 4,300 | | | | 106,345 | |
| | |
Dai-Dan Co. Ltd.(a) | | | 8,900 | | | | 186,937 | |
| | |
Daiho Corp.(a) | | | 4,400 | | | | 147,985 | |
| | |
Eiffage SA | | | 1,760 | | | | 181,190 | |
| | |
Elco Ltd. | | | 231 | | | | 14,993 | |
| | |
Elecnor SA | | | 20,900 | | | | 253,959 | |
| | |
Electra Ltd. | | | 103 | | | | 67,865 | |
| | |
EXEO Group, Inc. | | | 3,900 | | | | 89,886 | |
| | |
Ferrovial SA | | | 11,572 | | | | 365,058 | |
| | |
Fomento de Construcciones y Contratas SA | | | 3,843 | | | | 48,920 | |
| | |
GOLD FIN HLDG* ‡ (d) | | | 89,827 | | | | — | |
| | |
Hazama Ando Corp.(a) | | | 81,600 | | | | 551,037 | |
| | |
HOCHTIEF AG | | | 442 | | | | 34,117 | |
| | |
INFRONEER Holdings, Inc.(a) | | | 10,835 | | | | 89,702 | |
| | |
Instalco AB(b) | | | 2,482 | | | | 131,491 | |
| | |
JDC Corp. | | | 13,200 | | | | 69,111 | |
| | |
JGC Holdings Corp.(a) | | | 1,000 | | | | 9,349 | |
| | |
Kajima Corp. | | | 12,700 | | | | 155,931 | |
| | |
Kandenko Co. Ltd. | | | 3,000 | | | | 23,205 | |
| | |
Kinden Corp. | | | 2,300 | | | | 37,639 | |
| | |
Kumagai Gumi Co. Ltd. | | | 14,000 | | | | 345,749 | |
| | |
Kyudenko Corp. | | | 2,100 | | | | 66,485 | |
| | |
Maire Tecnimont SpA(a) | | | 56,848 | | | | 245,124 | |
| | |
Mirait Holdings Corp. | | | 6,700 | | | | 128,271 | |
| | |
Morgan Sindall Group plc | | | 17,556 | | | | 547,476 | |
| | |
NCC AB, Class B | | | 246 | | | | 4,259 | |
| | |
Nippo Corp. | | | 2,000 | | | | 70,599 | |
| | |
Nippon Densetsu Kogyo Co. Ltd.(a) | | | 23,700 | | | | 364,775 | |
| | |
Nippon Road Co. Ltd. (The) | | | 1,900 | | | | 137,137 | |
| | |
Nishimatsu Construction Co. Ltd.(a) | | | 15,800 | | | | 455,190 | |
| | |
NRW Holdings Ltd. | | | 182,424 | | | | 250,059 | |
| | |
Obayashi Corp. | | | 8,900 | | | | 74,775 | |
| | |
Okumura Corp. | | | 16,200 | | | | 417,698 | |
| | |
Peab AB, Class B | | | 3,999 | | | | 50,148 | |
| | | | | | | | |
| Investments | | Shares | | | Value | |
|
| Construction & Engineering – (continued) | |
| | |
Penta-Ocean Construction Co. Ltd. | | | 1,500 | | | $ | 10,300 | |
| | |
Raito Kogyo Co. Ltd. | | | 25,200 | | | | 446,649 | |
| | |
Raiznext Corp. | | | 4,400 | | | | 47,463 | |
| | |
Sacyr SA – BATE(a) | | | 154,843 | | | | 440,812 | |
| | |
Sanki Engineering Co. Ltd. | | | 19,200 | | | | 241,463 | |
| | |
Shapir Engineering and Industry Ltd. | | | 7,497 | | | | 61,413 | |
| | |
Shikun & Binui Ltd.* | | | 10,568 | | | | 62,936 | |
| | |
Shimizu Corp.(a) | | | 9,000 | | | | 65,749 | |
| | |
SHO-BOND Holdings Co. Ltd. | | | 1,200 | | | | 50,094 | |
| | |
Skanska AB, Class B | | | 5,096 | | | | 129,351 | |
| | |
Sumitomo Densetsu Co. Ltd.(a) | | | 8,800 | | | | 168,630 | |
| | |
Sumitomo Mitsui Construction Co. Ltd. | | | 41,240 | | | | 174,689 | |
| | |
Sweco AB, Class B(a) | | | 7,413 | | | | 117,990 | |
| | |
Taikisha Ltd. | | | 15,200 | | | | 432,572 | |
| | |
Taisei Corp. | | | 3,500 | | | | 109,581 | |
| | |
Takamatsu Construction Group Co. Ltd. | | | 4,500 | | | | 78,812 | |
| | |
Tess Holdings Co. Ltd. | | | 4,200 | | | | 86,192 | |
| | |
Toda Corp. | | | 14,000 | | | | 88,033 | |
| | |
Toenec Corp.(a) | | | 4,400 | | | | 129,270 | |
| | |
Tokyu Construction Co. Ltd.(a) | | | 22,800 | | | | 160,965 | |
| | |
Totetsu Kogyo Co. Ltd.(a) | | | 10,600 | | | | 230,081 | |
| | |
Veidekke ASA | | | 3,088 | | | | 44,389 | |
| | |
Vinci SA | | | 7,920 | | | | 846,610 | |
| | |
Webuild SpA(a) | | | 180,136 | | | | 446,110 | |
| | |
WSP Global, Inc. | | | 1,210 | | | | 163,780 | |
| | |
YIT OYJ | | | 68,409 | | | | 403,748 | |
| | |
Yokogawa Bridge Holdings Corp. | | | 18,000 | | | | 362,131 | |
| | |
Yurtec Corp. | | | 4,600 | | | | 26,868 | |
| | | | | | | | 12,405,436 | |
|
| Construction Materials – 0.6% | |
| | |
Boral Ltd.* | | | 13,964 | | | | 66,916 | |
| | |
Breedon Group plc | | | 45,296 | | | | 60,848 | |
| | |
Brickworks Ltd.(a) | | | 3,147 | | | | 56,114 | |
| | |
Buzzi Unicem SpA | | | 3,148 | | | | 73,480 | |
| | |
Cementir Holding NV | | | 19,404 | | | | 204,118 | |
| | |
CRH plc | | | 12,981 | | | | 623,847 | |
| | |
CSR Ltd. | | | 29,348 | | | | 130,717 | |
| | |
HeidelbergCement AG | | | 3,300 | | | | 248,765 | |
See Accompanying Notes to the Financial Statements.
| | | | |
| 186 | | FLEXSHARES ANNUAL REPORT | | |
FlexShares® Morningstar Developed Markets ex-US Factor Tilt Index Fund (cont.)
| | | | | | | | |
| Investments | | Shares | | | Value | |
|
| COMMON STOCKS – (continued) | |
|
| Construction Materials – (continued) | |
| | |
Holcim Ltd.* | | | 11,880 | | | $ | 594,293 | |
| | |
Ibstock plc(b) | | | 9,600 | | | | 26,266 | |
| | |
Imerys SA | | | 1,103 | | | | 47,841 | |
| | |
James Hardie Industries plc, CHDI | | | 6,640 | | | | 257,594 | |
| | |
Marshalls plc | | | 15,362 | | | | 149,192 | |
| | |
Mitani Sekisan Co. Ltd.(a) | | | 4,500 | | | | 285,332 | |
| | |
Sumitomo Osaka Cement Co.
Ltd.(a) | | | 14,900 | | | | 416,847 | |
| | |
Taiheiyo Cement Corp. | | | 100 | | | | 2,114 | |
| | |
Titan Cement International SA* | | | 13,420 | | | | 234,197 | |
| | |
Vicat SA | | | 9,504 | | | | 405,295 | |
| | |
Wienerberger AG | | | 3,846 | | | | 136,283 | |
| | | | | | | | 4,020,059 | |
|
| Consumer Finance – 0.3% | |
| | |
Acom Co. Ltd.(a) | | | 24,400 | | | | 81,102 | |
| | |
AEON Financial Service Co. Ltd. | | | 400 | | | | 5,059 | |
| | |
Aiful Corp.(a) | | | 145,200 | | | | 481,347 | |
| | |
B2Holding ASA* | | | 107,052 | | | | 117,058 | |
| | |
Cembra Money Bank AG | | | 726 | | | | 48,506 | |
| | |
Credit Corp. Group Ltd. | | | 3,350 | | | | 78,882 | |
| | |
Credit Saison Co. Ltd. | | | 6,200 | | | | 75,634 | |
| | |
goeasy Ltd.(a) | | | 1,320 | | | | 206,527 | |
| | |
Isracard Ltd. | | | 11,630 | | | | 46,751 | |
| | |
Jaccs Co. Ltd. | | | 13,200 | | | | 350,765 | |
| | |
Provident Financial plc* | | | 11,220 | | | | 56,690 | |
| | |
Resurs Holding AB(b) | | | 36,300 | | | | 195,268 | |
| | |
Sun Hung Kai & Co. Ltd. | | | 105,996 | | | | 55,185 | |
| | |
Zip Co. Ltd.* (a) | | | 14,040 | | | | 68,545 | |
| | | | | | | | 1,867,319 | |
|
| Containers & Packaging – 0.5% | |
| | |
BillerudKorsnas AB | | | 2,965 | | | | 61,969 | |
| | |
Cascades, Inc. | | | 27,764 | | | | 321,194 | |
| | |
CCL Industries, Inc., Class B | | | 2,960 | | | | 161,546 | |
| | |
DS Smith plc | | | 27,632 | | | | 145,219 | |
| | |
FP Corp. | | | 1,200 | | | | 40,675 | |
| | |
Fuji Seal International, Inc. | | | 19,600 | | | | 429,215 | |
| | |
Huhtamaki OYJ | | | 2,051 | | | | 89,387 | |
| | |
Intertape Polymer Group, Inc. | | | 23,540 | | | | 534,020 | |
| | | | | | | | |
| Investments | | Shares | | | Value | |
|
| Containers & Packaging – (continued) | |
| | |
Mayr Melnhof Karton AG | | | 275 | | | $ | 54,165 | |
| | |
Pact Group Holdings Ltd. | | | 77,704 | | | | 180,927 | |
| | |
Rengo Co. Ltd. | | | 700 | | | | 5,298 | |
| | |
SIG Combibloc Group AG* | | | 8,228 | | | | 215,391 | |
| | |
Smurfit Kappa Group plc | | | 5,148 | | | | 269,816 | |
| | |
Toyo Seikan Group Holdings Ltd. | | | 5,600 | | | | 66,203 | |
| | |
Transcontinental, Inc., Class A(a) | | | 29,040 | | | | 459,186 | |
| | |
Vidrala SA | | | 396 | | | | 42,023 | |
| | |
Winpak Ltd. | | | 74 | | | | 2,312 | |
| | | | | | | | 3,078,546 | |
|
| Distributors – 0.2% | |
| | |
Arata Corp.(a) | | | 7,900 | | | | 278,864 | |
| | |
Bapcor Ltd. | | | 16,060 | | | | 95,898 | |
| | |
Doshisha Co. Ltd. | | | 7,000 | | | | 109,397 | |
| | |
Inchcape plc | | | 8,938 | | | | 101,200 | |
| | |
Inter Cars SA | | | 4,400 | | | | 504,383 | |
| | |
PALTAC Corp.(a) | | | 800 | | | | 35,361 | |
| | | | | | | | 1,125,103 | |
|
| Diversified Consumer Services – 0.1% | |
| | |
AcadeMedia AB(b) | | | 28,644 | | | | 205,112 | |
| | |
Benesse Holdings, Inc. | | | 2,000 | | | | 45,604 | |
| | |
G8 Education Ltd.* | | | 457,072 | | | | 377,638 | |
| | |
IDP Education Ltd. | | | 2,501 | | | | 70,350 | |
| | |
InvoCare Ltd.(a) | | | 4,432 | | | | 37,716 | |
| | | | | | | | 736,420 | |
|
| Diversified Financial Services – 1.1% | |
| | |
Ackermans & van Haaren NV | | | 454 | | | | 78,126 | |
| | |
Aker ASA, Class A(a) | | | 760 | | | | 69,807 | |
| | |
Banca Mediolanum SpA | | | 9,158 | | | | 92,267 | |
| | |
Banque Nationale de Belgique | | | 44 | | | | 87,071 | |
| | |
BFF Bank SpA(b) | | | 16,974 | | | | 152,038 | |
| | |
Burford Capital Ltd. | | | 3,373 | | | | 34,653 | |
| | |
Cerved Group SpA* | | | 2,271 | | | | 27,280 | |
| | |
Creades AB, Class A(a) | | | 18,920 | | | | 263,032 | |
| | |
ECN Capital Corp.(a) | | | 98,428 | | | | 854,411 | |
| | |
Element Fleet Management Corp.(a) | | | 14,568 | | | | 158,073 | |
| | |
Eurazeo SE | | | 1,664 | | | | 156,075 | |
| | |
EXOR NV | | | 2,816 | | | | 265,593 | |
See Accompanying Notes to the Financial Statements.
| | | | | | |
| | FLEXSHARES ANNUAL REPORT | | | 187 | |
FlexShares® Morningstar Developed Markets ex-US Factor Tilt Index Fund (cont.)
| | | | | | | | |
| Investments | | Shares | | | Value | |
|
| COMMON STOCKS – (continued) | |
|
| Diversified Financial Services – (continued) | |
| | |
Fuyo General Lease Co. Ltd. | | | 700 | | | $ | 45,367 | |
| | |
GRENKE AG | | | 495 | | | | 19,310 | |
| | |
Groupe Bruxelles Lambert SA | | | 2,616 | | | | 303,493 | |
| | |
HAL Trust | | | 1,025 | | | | 179,113 | |
| | |
Industrivarden AB, Class A(a) | | | 1,922 | | | | 63,384 | |
| | |
Industrivarden AB, Class C | | | 3,828 | | | | 124,309 | |
| | |
Investment AB Oresund(a) | | | 15,532 | | | | 270,185 | |
| | |
Investor AB, Class A | | | 8,368 | | | | 193,423 | |
| | |
Investor AB, Class B | | | 29,516 | | | | 680,121 | |
| | |
Japan Securities Finance Co. Ltd. | | | 17,600 | | | | 133,978 | |
| | |
KBC Ancora | | | 1,377 | | | | 71,805 | |
| | |
Kinnevik AB, Class B* (a) | | | 4,796 | | | | 187,992 | |
| | |
L E Lundbergforetagen AB, Class B | | | 1,348 | | | | 77,629 | |
| | |
M&G plc | | | 72,688 | | | | 199,075 | |
| | |
Mitsubishi HC Capital, Inc. | | | 33,229 | | | | 166,109 | |
| | |
Mizuho Leasing Co. Ltd. | | | 13,338 | | | | 411,165 | |
| | |
ORIX Corp. | | | 27,900 | | | | 551,761 | |
| | |
PEUGEOT INVEST | | | 308 | | | | 42,986 | |
| | |
Plus500 Ltd. | | | 46,156 | | | | 832,928 | |
| | |
Ricoh Leasing Co. Ltd. | | | 4,400 | | | | 139,110 | |
| | |
Sofina SA | | | 330 | | | | 146,036 | |
| | |
SRH NV* ‡ (d) | | | 2,857 | | | | — | |
| | |
Tokyo Century Corp. | | | 600 | | | | 34,203 | |
| | |
Wendel SE | | | 497 | | | | 66,200 | |
| | |
Zenkoku Hosho Co. Ltd.(a) | | | 1,600 | | | | 77,176 | |
| | | | | | | | 7,255,284 | |
|
| Diversified Telecommunication Services – 1.2% | |
| | |
ARTERIA Networks Corp. | | | 1,900 | | | | 26,711 | |
| | |
BCE, Inc.(a) | | | 3,652 | | | | 187,704 | |
| | |
Bezeq The Israeli Telecommunication Corp. Ltd.* | | | 52,780 | | | | 66,225 | |
| | |
BT Group plc* | | | 172,524 | | | | 328,481 | |
| | |
Cellnex Telecom SA(b) | | | 10,692 | | | | 658,013 | |
| | |
Chorus Ltd. | | | 13,585 | | | | 61,930 | |
| | |
Deutsche Telekom AG (Registered) | | | 77,396 | | | | 1,440,050 | |
| | |
Elisa OYJ | | | 1,820 | | | | 109,901 | |
| | |
Gamma Communications plc | | | 8,008 | | | | 198,903 | |
| | | | | | | | |
| Investments | | Shares | | | Value | |
|
| Diversified Telecommunication Services – (continued) | |
| | |
Helios Towers plc* (a) | | | 64,372 | | | $ | 136,239 | |
| | |
HKBN Ltd. | | | 51,500 | | | | 61,834 | |
| | |
HKT Trust & HKT Ltd. | | | 53,400 | | | | 72,490 | |
| | |
Infrastrutture Wireless Italiane SpA(b) | | | 5,179 | | | | 57,273 | |
| | |
Koninklijke KPN NV | | | 57,464 | | | | 171,903 | |
| | |
Nippon Telegraph & Telephone Corp. | | | 31,800 | | | | 889,089 | |
| | |
NOS SGPS SA(a) | | | 105,600 | | | | 412,322 | |
| | |
Orange SA | | | 40,612 | | | | 443,428 | |
| | |
PCCW Ltd. | | | 127,035 | | | | 65,485 | |
| | |
Singapore Telecommunications Ltd. | | | 167,200 | | | | 309,974 | |
| | |
Spark New Zealand Ltd. | | | 59,346 | | | | 193,880 | |
| | |
Swisscom AG (Registered) | | | 308 | | | | 167,997 | |
| | |
Telecom Italia SpA | | | 97,108 | | | | 34,624 | |
| | |
Telefonica SA(a) | | | 109,639 | | | | 477,639 | |
| | |
Telekom Austria AG* | | | 1,426 | | | | 12,344 | |
| | |
Telenor ASA(a) | | | 5,588 | | | | 88,088 | |
| | |
Telia Co. AB(a) | | | 64,504 | | | | 253,818 | |
| | |
Telstra Corp. Ltd. | | | 52,988 | | | | 152,033 | |
| | |
TELUS Corp. | | | 10,203 | | | | 233,684 | |
| | |
Uniti Group Ltd.* (a) | | | 66,616 | | | | 203,643 | |
| | | | | | | | 7,515,705 | |
|
| Electric Utilities – 1.3% | |
| | |
Acciona SA | | | 857 | | | | 164,434 | |
| | |
AusNet Services Ltd. | | | 46,020 | | | | 85,377 | |
| | |
BKW AG | | | 773 | | | | 102,531 | |
| | |
Chubu Electric Power Co., Inc. | | | 13,200 | | | | 136,486 | |
| | |
Chugoku Electric Power Co., Inc. (The)(a) | | | 4,206 | | | | 34,858 | |
| | |
CK Infrastructure Holdings Ltd. | | | 500 | | | | 3,014 | |
| | |
CLP Holdings Ltd. | | | 22,500 | | | | 220,255 | |
| | |
Contact Energy Ltd. | | | 20,140 | | | | 117,900 | |
| | |
EDP – Energias de Portugal SA | | | 32,564 | | | | 184,052 | |
| | |
Electricite de France SA(a) | | | 12,702 | | | | 187,123 | |
| | |
Elia Group SA/NV(a) | | | 794 | | | | 92,713 | |
| | |
Emera, Inc.(a) | | | 2,950 | | | | 137,034 | |
| | |
Endesa SA | | | 3,376 | | | | 77,923 | |
| | |
Enea SA* | | | 108,460 | | | | 275,051 | |
| | |
Enel SpA | | | 181,676 | | | | 1,521,330 | |
| | |
EVN AG | | | 2,240 | | | | 63,251 | |
| | |
Fortis, Inc.(a) | | | 6,132 | | | | 272,528 | |
See Accompanying Notes to the Financial Statements.
| | | | |
| 188 | | FLEXSHARES ANNUAL REPORT | | |
FlexShares® Morningstar Developed Markets ex-US Factor Tilt Index Fund (cont.)
| | | | | | | | |
| Investments | | Shares | | | Value | |
|
| COMMON STOCKS – (continued) | |
|
| Electric Utilities – (continued) | |
| | |
Fortum OYJ | | | 9,900 | | | $ | 294,439 | |
| | |
Genesis Energy Ltd. | | | 14,326 | | | | 33,423 | |
| | |
HK Electric Investments & HK Electric Investments Ltd.(b) | | | 500 | | | | 498 | |
| | |
Hokkaido Electric Power Co., Inc.(a) | | | 59,700 | | | | 247,648 | |
| | |
Hokuriku Electric Power Co.(a) | | | 92,900 | | | | 441,586 | |
| | |
Hydro One Ltd.(b) | | | 8,976 | | | | 214,126 | |
| | |
Iberdrola SA | | | 99,182 | | | | 1,172,461 | |
| | |
Kansai Electric Power Co., Inc. (The) | | | 12,900 | | | | 118,563 | |
| | |
Kyushu Electric Power Co., Inc. | | | 4,400 | | | | 30,986 | |
| | |
Mercury NZ Ltd. | | | 17,270 | | | | 75,824 | |
| | |
Okinawa Electric Power Co., Inc. (The) | | | 18,370 | | | | 225,225 | |
| | |
Origin Energy Ltd. | | | 15,620 | | | | 59,248 | |
| | |
Orsted A/S(b) | | | 3,080 | | | | 435,048 | |
| | |
Power Assets Holdings Ltd. | | | 17,000 | | | | 103,695 | |
| | |
Red Electrica Corp. SA | | | 11,943 | | | | 248,917 | |
| | |
Romande Energie Holding SA (Registered) | | | 21 | | | | 31,256 | |
| | |
Shikoku Electric Power Co., Inc. | | | 4,200 | | | | 27,331 | |
| | |
Spark Infrastructure Group | | | 1,271 | | | | 2,683 | |
| | |
SSE plc | | | 18,034 | | | | 406,275 | |
| | |
Terna – Rete Elettrica Nazionale | | | 22,982 | | | | 171,331 | |
| | |
Tohoku Electric Power Co., Inc. | | | 10,900 | | | | 70,643 | |
| | |
Tokyo Electric Power Co. Holdings, Inc.* | | | 400 | | | | 1,105 | |
| | |
Trustpower Ltd. | | | 5,123 | | | | 27,240 | |
| | |
Verbund AG(a) | | | 1,385 | | | | 144,411 | |
| | | | | | | | 8,259,822 | |
|
| Electrical Equipment – 1.3% | |
| | |
ABB Ltd. (Registered) | | | 31,768 | | | | 1,053,081 | |
| | |
Alfen Beheer BV* (b) | | | 1,892 | | | | 213,040 | |
| | |
Ballard Power Systems, Inc.* (a) | | | 1,824 | | | | 33,006 | |
| | |
Daihen Corp. | | | 8,800 | | | | 366,200 | |
| | |
Fagerhult AB | | | 13,084 | | | | 104,964 | |
| | |
Fuji Electric Co. Ltd. | | | 4,500 | | | | 219,031 | |
| | |
Fujikura Ltd.* | | | 110,000 | | | | 590,397 | |
| | |
Huber + Suhner AG (Registered) | | | 867 | | | | 77,235 | |
| | | | | | | | |
| Investments | | Shares | | | Value | |
|
| Electrical Equipment – (continued) | |
| | |
ITM Power plc* (a) | | | 10,192 | | | $ | 68,317 | |
| | |
Legrand SA | | | 4,972 | | | | 542,243 | |
| | |
Mabuchi Motor Co. Ltd. | | | 2,000 | | | | 68,757 | |
| | |
Mitsubishi Electric Corp. | | | 32,700 | | | | 437,338 | |
| | |
NEL ASA* (a) | | | 12,688 | | | | 26,743 | |
| | |
Nexans SA | | | 1,218 | | | | 122,136 | |
| | |
Nidec Corp.(a) | | | 8,910 | | | | 982,229 | |
| | |
Nissin Electric Co. Ltd. | | | 1,200 | | | | 14,797 | |
| | |
Nitto Kogyo Corp. | | | 15,000 | | | | 222,320 | |
| | |
NKT A/S* | | | 2,904 | | | | 140,132 | |
| | |
Nordex SE* | | | 4,144 | | | | 76,251 | |
| | |
Prysmian SpA | | | 5,460 | | | | 206,618 | |
| | |
Schneider Electric SE | | | 10,076 | | | | 1,736,241 | |
| | |
Siemens Energy AG* | | | 3,564 | | | | 102,369 | |
| | |
Siemens Gamesa Renewable Energy SA* | | | 6,044 | | | | 163,879 | |
| | |
Signify NV(b) | | | 3,848 | | | | 186,362 | |
| | |
Somfy SA | | | 275 | | | | 54,101 | |
| | |
TKH Group NV, CVA | | | 2,194 | | | | 125,071 | |
| | |
Ushio, Inc. | | | 5,900 | | | | 105,194 | |
| | |
Vestas Wind Systems A/S | | | 14,740 | | | | 638,133 | |
| | | | | | | | 8,676,185 | |
|
| Electronic Equipment, Instruments & Components – 2.0% | |
| | |
Alps Alpine Co. Ltd.(a) | | | 948 | | | | 9,229 | |
| | |
ALSO Holding AG (Registered)* | | | 52 | | | | 15,422 | |
| | |
Amano Corp. | | | 2,600 | | | | 64,051 | |
| | |
Anritsu Corp.(a) | | | 500 | | | | 8,266 | |
| | |
Azbil Corp. | | | 3,000 | | | | 127,604 | |
| | |
Barco NV | | | 7,700 | | | | 173,405 | |
| | |
Canon Marketing Japan, Inc. | | | 3,700 | | | | 73,075 | |
| | |
Citizen Watch Co. Ltd.(a) | | | 136,800 | | | | 593,870 | |
| | |
Comet Holding AG (Registered) | | | 352 | | | | 130,977 | |
| | |
CONEXIO Corp. | | | 2,200 | | | | 28,092 | |
| | |
Daiwabo Holdings Co. Ltd. | | | 39,600 | | | | 694,237 | |
| | |
FIH Mobile Ltd.* (a) | | | 768,000 | | | | 119,459 | |
| | |
Fingerprint Cards AB, Class B* (a) | | | 10,108 | | | | 24,209 | |
| | |
FIT Hon Teng Ltd.* (a) (b) | | | 924,000 | | | | 185,298 | |
| | |
Halma plc | | | 8,140 | | | | 330,497 | |
| | |
Hamamatsu Photonics KK | | | 3,400 | | | | 200,973 | |
See Accompanying Notes to the Financial Statements.
| | | | | | |
| | FLEXSHARES ANNUAL REPORT | | | 189 | |
FlexShares® Morningstar Developed Markets ex-US Factor Tilt Index Fund (cont.)
| | | | | | | | |
| Investments | | Shares | | | Value | |
|
| COMMON STOCKS – (continued) | |
|
Electronic Equipment, Instruments & Components –
(continued) | |
| | |
Hexagon AB, Class B | | | 49,368 | | | $ | 793,245 | |
| | |
Hirose Electric Co. Ltd. | | | 782 | | | | 130,236 | |
| | |
Horiba Ltd. | | | 800 | | | | 52,199 | |
| | |
Hosiden Corp.(a) | | | 13,200 | | | | 138,570 | |
| | |
Ibiden Co. Ltd. | | | 4,000 | | | | 238,895 | |
| | |
Inficon Holding AG (Registered) | | | 110 | | | | 141,089 | |
| | |
Iriso Electronics Co. Ltd. | | | 1,200 | | | | 54,725 | |
| | |
Japan Aviation Electronics Industry Ltd. | | | 2,044 | | | | 33,754 | |
| | |
Jenoptik AG | | | 2,585 | | | | 98,959 | |
| | |
Kaga Electronics Co. Ltd. | | | 8,900 | | | | 243,916 | |
| | |
Keyence Corp. | | | 3,300 | | | | 1,982,749 | |
| | |
Koa Corp. | | | 17,600 | | | | 236,776 | |
| | |
Kyocera Corp. | | | 5,300 | | | | 309,331 | |
| | |
Lagercrantz Group AB, Class B | | | 5,832 | | | | 78,090 | |
| | |
Landis+Gyr Group AG* (a) | | | 1,102 | | | | 75,979 | |
| | |
LEM Holding SA (Registered) | | | 27 | | | | 65,598 | |
| | |
Macnica Fuji Electronics Holdings, Inc. | | | 22,100 | | | | 517,686 | |
| | |
Meiko Electronics Co. Ltd. | | | 8,800 | | | | 242,719 | |
| | |
Murata Manufacturing Co. Ltd. | | | 10,700 | | | | 811,989 | |
| | |
Mycronic AB | | | 3,001 | | | | 69,605 | |
| | |
Nichicon Corp. | | | 7,600 | | | | 71,651 | |
| | |
Nippon Ceramic Co. Ltd. | | | 900 | | | | 23,292 | |
| | |
Nippon Signal Co. Ltd. | | | 10,300 | | | | 88,795 | |
| | |
Nissha Co. Ltd.(a) | | | 22,000 | | | | 358,290 | |
| | |
Nohmi Bosai Ltd.(a) | | | 15,700 | | | | 286,531 | |
| | |
Oki Electric Industry Co. Ltd. | | | 26,400 | | | | 216,479 | |
| | |
Omron Corp. | | | 4,300 | | | | 409,919 | |
| | |
Optex Group Co. Ltd. | | | 1,000 | | | | 12,681 | |
| | |
Oxford Instruments plc | | | 4,444 | | | | 140,412 | |
| | |
PAX Global Technology Ltd.(a) (d) | | | 308,000 | | | | 213,805 | |
| | |
Renishaw plc | | | 1,617 | | | | 111,379 | |
| | |
Restar Holdings Corp.(a) | | | 13,200 | | | | 219,952 | |
| | |
Shimadzu Corp. | | | 6,200 | | | | 250,936 | |
| | |
Siix Corp.(a) | | | 17,428 | | | | 192,430 | |
| | |
Spectris plc | | | 3,026 | | | | 156,127 | |
| | |
Taiyo Yuden Co. Ltd. | | | 2,500 | | | | 126,069 | |
| | |
TDK Corp. | | | 8,700 | | | | 315,115 | |
| | |
Topcon Corp. | | | 2,200 | | | | 39,167 | |
| | | | | | | | |
| Investments | | Shares | | | Value | |
|
Electronic Equipment, Instruments & Components –
(continued) | |
| | |
Venture Corp. Ltd. | | | 4,500 | | | $ | 62,770 | |
| | |
VSTECS Holdings Ltd. | | | 356,000 | | | | 337,280 | |
| | |
Yokogawa Electric Corp. | | | 1,600 | | | | 31,881 | |
| | |
Yokowo Co. Ltd.(a) | | | 8,800 | | | | 194,715 | |
| | | | | | | | 12,954,450 | |
|
| Energy Equipment & Services – 0.3% | |
| | |
BW Offshore Ltd.(a) | | | 44,206 | | | | 143,394 | |
| | |
Drilling Co. of 1972 A/S (The)* | | | 3,256 | | | | 116,800 | |
| | |
John Wood Group plc* | | | 251,504 | | | | 736,039 | |
| | |
Modec, Inc. | | | 10,800 | | | | 185,644 | |
| | |
Ocean Yield ASA | | | 34,086 | | | | 165,206 | |
| | |
Odfjell Drilling Ltd.* | | | 32,516 | | | | 82,181 | |
| | |
Saipem SpA* (a) | | | 191,136 | | | | 419,491 | |
| | |
SBM Offshore NV | | | 5,113 | | | | 80,826 | |
| | |
Subsea 7 SA | | | 26 | | | | 233 | |
| | |
TechnipFMC plc* | | | 12,457 | | | | 92,188 | |
| | |
Vallourec SA* | | | — | (e) | | | 1 | |
| | |
Worley Ltd. | | | 10,916 | | | | 88,713 | |
| | | | | | | | 2,110,716 | |
|
| Entertainment – 0.4% | |
| | |
Akatsuki, Inc.(a) | | | 4,400 | | | | 119,623 | |
| | |
Bollore SA | | | 12,858 | | | | 74,548 | |
| | |
Capcom Co. Ltd. | | | 5,200 | | | | 139,548 | |
| | |
CD Projekt SA | | | 1,193 | | | | 52,033 | |
| | |
CTS Eventim AG & Co. KGaA* | | | 1,375 | | | | 100,024 | |
| | |
Daiichikosho Co. Ltd. | | | 1,100 | | | | 39,842 | |
| | |
DeNA Co. Ltd. | | | 4,000 | | | | 73,844 | |
| | |
Embracer Group AB* (a) | | | 16,016 | | | | 148,887 | |
| | |
EVENT Hospitality and Entertainment Ltd.* | | | 2,282 | | | | 28,144 | |
| | |
IGG, Inc.(a) | | | 323,000 | | | | 300,618 | |
| | |
Kinepolis Group NV* (a) | | | 1,030 | | | | 64,903 | |
| | |
Koei Tecmo Holdings Co. Ltd. | | | 2,246 | | | | 104,002 | |
| | |
Konami Holdings Corp. | | | 2,200 | | | | 120,781 | |
| | |
Modern Times Group MTG AB, Class B* | | | 586 | | | | 6,707 | |
| | |
Nexon Co. Ltd.(a) | | | 9,200 | | | | 155,801 | |
| | |
Nintendo Co. Ltd. | | | 2,100 | | | | 924,534 | |
| | |
Paradox Interactive AB | | | 952 | | | | 13,967 | |
See Accompanying Notes to the Financial Statements.
| | | | |
| 190 | | FLEXSHARES ANNUAL REPORT | | |
FlexShares® Morningstar Developed Markets ex-US Factor Tilt Index Fund (cont.)
| | | | | | | | |
| Investments | | Shares | | | Value | |
|
| COMMON STOCKS – (continued) | |
|
| Entertainment – (continued) | |
| | |
Shochiku Co. Ltd.* | | | 300 | | | $ | 32,598 | |
| | |
Square Enix Holdings Co. Ltd. | | | 1,800 | | | | 98,347 | |
| | |
Toei Animation Co. Ltd. | | | 200 | | | | 31,046 | |
| | |
Toho Co. Ltd. | | | 4,100 | | | | 192,370 | |
| | |
Ubisoft Entertainment SA* | | | 1,425 | | | | 74,588 | |
| | | | | | | | 2,896,755 | |
|
| Equity Real Estate Investment Trusts (REITs) – 2.4% | |
| | |
Activia Properties, Inc.(a) | | | 15 | | | | 61,434 | |
| | |
Advance Residence Investment Corp. | | | 18 | | | | 59,040 | |
| | |
Aedifica SA | | | 1,039 | | | | 138,635 | |
| | |
AEON REIT Investment Corp. | | | 29 | | | | 39,167 | |
| | |
ALE Property Group(a) | | | 9,620 | | | | 40,752 | |
| | |
Allied Properties REIT | | | 1,540 | | | | 53,137 | |
| | |
alstria office REIT-AG | | | 6,756 | | | | 126,345 | |
| | |
Altarea SCA | | | 359 | | | | 76,859 | |
| | |
ARGAN SA | | | 5,808 | | | | 729,934 | |
| | |
Argosy Property Ltd. | | | 68,432 | | | | 76,398 | |
| | |
Artis REIT | | | 22,836 | | | | 215,915 | |
| | |
Ascendas REIT | | | 68,635 | | | | 157,273 | |
| | |
Ascott Residence Trust | | | 30,164 | | | | 23,040 | |
| | |
Assura plc | | | 57,957 | | | | 57,915 | |
| | |
Aventus Group | | | 20,768 | | | | 53,348 | |
| | |
Befimmo SA | | | 11,352 | | | | 465,053 | |
| | |
Big Yellow Group plc | | | 7,176 | | | | 145,482 | |
| | |
Boardwalk REIT | | | 616 | | | | 26,532 | |
| | |
British Land Co. plc (The) | | | 2,332 | | | | 15,801 | |
| | |
BWP Trust(a) | | | 12,444 | | | | 39,630 | |
| | |
Capital & Counties Properties plc | | | 43,340 | | | | 98,024 | |
| | |
CapitaLand China Trust | | | 3,414 | | | | 3,089 | |
| | |
CapitaLand Integrated Commercial Trust | | | 46,746 | | | | 74,530 | |
| | |
Carmila SA(a) | | | 18,907 | | | | 286,630 | |
| | |
CDL Hospitality Trusts | | | 36,800 | | | | 32,747 | |
| | |
Centuria Office REIT(a) | | | 160,732 | | | | 290,949 | |
| | |
Champion REIT | | | 24,000 | | | | 12,619 | |
| | |
Charter Hall Group | | | 5,096 | | | | 66,332 | |
| | |
Charter Hall Long Wale REIT | | | 3,940 | | | | 14,382 | |
| | |
Charter Hall Retail REIT | | | 25,935 | | | | 79,867 | |
| | |
Charter Hall Social Infrastructure REIT | | | 31 | | | | 89 | |
| | | | | | | | |
| Investments | | Shares | | | Value | |
|
| Equity Real Estate Investment Trusts (REITs) – (continued) | |
| | |
Choice Properties REIT(a) | | | 3,957 | | | $ | 47,533 | |
| | |
Cofinimmo SA | | | 507 | | | | 81,848 | |
| | |
Comforia Residential REIT, Inc. | | | 34 | | | | 98,996 | |
| | |
Cominar REIT | | | 45,255 | | | | 421,681 | |
| | |
Covivio | | | 1,449 | | | | 125,429 | |
| | |
Cromwell European REIT(b) | | | 23,174 | | | | 71,067 | |
| | |
Cromwell Property Group | | | 48,403 | | | | 29,448 | |
| | |
Daiwa House REIT Investment Corp. | | | 42 | | | | 120,447 | |
| | |
Daiwa Securities Living Investments Corp. | | | 26 | | | | 26,222 | |
| | |
Derwent London plc | | | 1,508 | | | | 69,909 | |
| | |
Dexus | | | 8,888 | | | | 72,566 | |
| | |
Dream Office REIT(a) | | | 3,966 | | | | 74,709 | |
| | |
ESR-REIT | | | 1,044,000 | | | | 371,613 | |
| | |
Far East Hospitality Trust | | | 53,976 | | | | 25,817 | |
| | |
First Capital REIT(a) | | | 1,819 | | | | 25,945 | |
| | |
Fortune REIT | | | 48,000 | | | | 49,795 | |
| | |
Frasers Centrepoint Trust | | | 33,249 | | | | 59,422 | |
| | |
Frasers Hospitality Trust | | | 39,200 | | | | 13,953 | |
| | |
Frasers Logistics & Commercial Trust(b) | | | 4,239 | | | | 4,778 | |
| | |
Frontier Real Estate Investment Corp.(a) | | | 12 | | | | 53,041 | |
| | |
Fukuoka REIT Corp. | | | 26 | | | | 38,558 | |
| | |
GCP Student Living plc | | | 55,216 | | | | 159,322 | |
| | |
Gecina SA | | | 1,496 | | | | 209,567 | |
| | |
Global One Real Estate Investment Corp. | | | 48 | | | | 49,379 | |
| | |
GLP J-REIT | | | 74 | | | | 120,645 | |
| | |
Goodman Group | | | 30,052 | | | | 494,328 | |
| | |
Goodman Property Trust | | | 19,085 | | | | 33,941 | |
| | |
GPT Group (The) | | | 41,404 | | | | 160,468 | |
| | |
Granite REIT(a) | | | 1,072 | | | | 86,760 | |
| | |
Great Portland Estates plc | | | 14,916 | | | | 149,666 | |
| | |
Growthpoint Properties Australia Ltd. | | | 19,121 | | | | 59,601 | |
| | |
H&R REIT(a) | | | 5,632 | | | | 77,286 | |
| | |
Hamborner REIT AG | | | 6,058 | | | | 68,010 | |
| | |
Hammerson plc(a) | | | 400,796 | | | | 176,684 | |
| | |
Hankyu Hanshin REIT, Inc. | | | 26 | | | | 38,376 | |
| | |
Heiwa Real Estate REIT, Inc. | | | 87 | | | | 121,392 | |
| | |
Hibernia REIT plc | | | 34,222 | | | | 49,900 | |
See Accompanying Notes to the Financial Statements.
| | | | | | |
| | FLEXSHARES ANNUAL REPORT | | | 191 | |
FlexShares® Morningstar Developed Markets ex-US Factor Tilt Index Fund (cont.)
| | | | | | | | |
| Investments | | Shares | | | Value | |
|
| COMMON STOCKS – (continued) | |
|
| Equity Real Estate Investment Trusts (REITs) – (continued) | |
| | |
Hoshino Resorts REIT, Inc.(a) | | | 24 | | | $ | 156,387 | |
| | |
Hulic Reit, Inc. | | | 23 | | | | 34,795 | |
| | |
ICADE | | | 158 | | | | 12,397 | |
| | |
Ichigo Office REIT Investment
Corp.(a) | | | 40 | | | | 30,274 | |
| | |
Ingenia Communities Group | | | 35,948 | | | | 175,774 | |
| | |
Inmobiliaria Colonial Socimi SA | | | 7,185 | | | | 69,928 | |
| | |
InterRent REIT(a) | | | 28,380 | | | | 415,094 | |
| | |
Invesco Office J-Reit, Inc.(a) | | | 968 | | | | 192,539 | |
| | |
Invincible Investment Corp. | | | 121 | | | | 47,753 | |
| | |
Irongate Group | | | 263,164 | | | | 317,248 | |
| | |
Japan Hotel REIT Investment Corp. | | | 77 | | | | 46,460 | |
| | |
Japan Logistics Fund, Inc. | | | 19 | | | | 56,738 | |
| | |
Japan Metropolitan Fund Invest | | | 147 | | | | 134,720 | |
| | |
Japan Prime Realty Investment
Corp.(a) | | | 25 | | | | 91,537 | |
| | |
Japan Real Estate Investment Corp. | | | 24 | | | | 146,915 | |
| | |
Kenedix Office Investment Corp.(a) | | | 9 | | | | 56,909 | |
| | |
Kenedix Residential Next Investment Corp. | | | 34 | | | | 65,361 | |
| | |
Kenedix Retail REIT Corp. | | | 31 | | | | 79,005 | |
| | |
Keppel DC REIT | | | 47,500 | | | | 84,186 | |
| | |
Keppel Pacific Oak US REIT(b) | | | 154,000 | | | | 122,430 | |
| | |
Keppel REIT | | | 80,733 | | | | 67,652 | |
| | |
Kiwi Property Group Ltd. | | | 3,973 | | | | 3,327 | |
| | |
Klepierre SA | | | 1,540 | | | | 36,641 | |
| | |
Land Securities Group plc | | | 8,228 | | | | 77,484 | |
| | |
LaSalle Logiport REIT | | | 44 | | | | 73,163 | |
| | |
Link REIT | | | 37,500 | | | | 332,624 | |
| | |
LondonMetric Property plc | | | 31,861 | | | | 114,162 | |
| | |
LXI REIT plc(b) | | | 81,418 | | | | 163,834 | |
| | |
Mapletree Commercial Trust | | | 34,368 | | | | 55,560 | |
| | |
Mapletree Industrial Trust | | | 35,086 | | | | 71,551 | |
| | |
Mapletree Logistics Trust | | | 73,207 | | | | 109,661 | |
| | |
Mapletree North Asia Commercial Trust(b) | | | 49,500 | | | | 37,442 | |
| | |
Merlin Properties Socimi SA | | | 2,992 | | | | 32,437 | |
| | |
Mirvac Group | | | 45,364 | | | | 96,086 | |
| | | | | | | | |
| Investments | | Shares | | | Value | |
|
| Equity Real Estate Investment Trusts (REITs) – (continued) | |
| | |
Mori Hills REIT Investment Corp. | | | 16 | | | $ | 21,665 | |
| | |
National Storage REIT | | | 83,662 | | | | 150,184 | |
| | |
Nippon Accommodations Fund, Inc. | | | 8 | | | | 44,552 | |
| | |
Nippon Building Fund, Inc.(a) | | | 17 | | | | 110,327 | |
| | |
Nippon Prologis REIT, Inc. | | | 41 | | | | 136,816 | |
| | |
NIPPON REIT Investment Corp. | | | 23 | | | | 88,349 | |
| | |
Nomura Real Estate Master Fund, Inc. | | | 51 | | | | 76,349 | |
| | |
NTT UD REIT Investment Corp.(a) | | | 67 | | | | 88,961 | |
| | |
One REIT, Inc. | | | 14 | | | | 37,509 | |
| | |
Orix JREIT, Inc. | | | 49 | | | | 81,176 | |
| | |
OUE Commercial REIT | | | 2,977 | | | | 993 | |
| | |
Parkway Life REIT | | | 12,500 | | | | 43,196 | |
| | |
Precinct Properties New Zealand Ltd. | | | 22,735 | | | | 27,171 | |
| | |
Primary Health Properties plc | | | 6,239 | | | | 13,136 | |
| | |
Property for Industry Ltd.(a) | | | 26,697 | | | | 56,266 | |
| | |
Reit 1 Ltd. | | | 27,148 | | | | 170,102 | |
| | |
Retail Estates NV | | | 3,784 | | | | 303,029 | |
| | |
Safestore Holdings plc | | | 6,952 | | | | 114,544 | |
| | |
Sasseur REIT(b) | | | 277,200 | | | | 174,727 | |
| | |
Scentre Group | | | 43,560 | | | | 98,808 | |
| | |
Secure Income REIT plc | | | 14,030 | | | | 78,657 | |
| | |
Segro plc | | | 19,096 | | | | 338,323 | |
| | |
Sekisui House Reit, Inc.(a) | | | 55 | | | | 41,579 | |
| | |
Shaftesbury plc(a) | | | 14,432 | | | | 123,543 | |
| | |
Shopping Centres Australasia Property Group(a) | | | 54,215 | | | | 113,204 | |
| | |
SPH REIT(d) | | | 44,800 | | | | 32,392 | |
| | |
Star Asia Investment Corp. | | | 156 | | | | 82,635 | |
| | |
Starhill Global REIT | | | 542,296 | | | | 259,385 | |
| | |
Stockland | | | 57,904 | | | | 197,887 | |
| | |
Summit Industrial Income REIT | | | 10,032 | | | | 191,325 | |
| | |
Sunlight REIT | | | 55,000 | | | | 31,816 | |
| | |
Suntec REIT | | | 3,900 | | | | 4,309 | |
| | |
Tokyu REIT, Inc. | | | 21 | | | | 35,195 | |
| | |
Tritax Big Box REIT plc | | | 47,975 | | | | 147,964 | |
| | |
UK Commercial Property REIT Ltd. | | | 18,880 | | | | 19,669 | |
| | |
Unibail-Rodamco-Westfield* (a) | | | 3,124 | | | | 223,459 | |
| | |
Unibail-Rodamco-Westfield* | | | 880 | | | | 62,946 | |
See Accompanying Notes to the Financial Statements.
| | | | |
| 192 | | FLEXSHARES ANNUAL REPORT | | |
FlexShares® Morningstar Developed Markets ex-US Factor Tilt Index Fund (cont.)
| | | | | | | | |
| Investments | | Shares | | | Value | |
|
| COMMON STOCKS – (continued) | |
|
| Equity Real Estate Investment Trusts (REITs) – (continued) | |
| | |
Unibail-Rodamco-Westfield, CHDI* | | | 5 | | | $ | 18 | |
| | |
UNITE Group plc (The) | | | 9,194 | | | | 137,180 | |
| | |
United Urban Investment Corp. | | | 84 | | | | 104,609 | |
| | |
Vicinity Centres | | | 65,692 | | | | 85,114 | |
| | |
Vital Healthcare Property Trust | | | 46,210 | | | | 96,896 | |
| | |
Warehouses De Pauw CVA | | | 4,323 | | | | 197,110 | |
| | |
Waypoint REIT | | | 46,112 | | | | 94,553 | |
| | |
Workspace Group plc | | | 8,954 | | | | 100,890 | |
| | | | | | | | 15,745,642 | |
|
| Food & Staples Retailing – 1.7% | |
| | |
Aeon Co. Ltd. | | | 14,713 | | | | 337,809 | |
| | |
Ain Holdings, Inc.(a) | | | 800 | | | | 47,077 | |
| | |
Alimentation Couche-Tard, Inc.(a) | | | 608 | | | | 23,103 | |
| | |
Alimentation Couche-Tard, Inc., Class B | | | 12,408 | | | | 464,668 | |
| | |
Arcs Co. Ltd.(a) | | | 24,818 | | | | 476,445 | |
| | |
Axfood AB | | | 3,184 | | | | 78,038 | |
| | |
Axial Retailing, Inc. | | | 8,800 | | | | 279,377 | |
| | |
Belc Co. Ltd. | | | 800 | | | | 39,430 | |
| | |
Carrefour SA | | | 10,949 | | | | 198,360 | |
| | |
Cawachi Ltd. | | | 1,000 | | | | 19,461 | |
| | |
Coles Group Ltd. | | | 14,872 | | | | 191,460 | |
| | |
Cosmos Pharmaceutical Corp.(a) | | | 200 | | | | 30,467 | |
| | |
Create SD Holdings Co. Ltd.(a) | | | 2,000 | | | | 61,390 | |
| | |
Daikokutenbussan Co. Ltd. | | | 400 | | | | 22,732 | |
| | |
Dairy Farm International Holdings Ltd. | | | 7,600 | | | | 27,132 | |
| | |
Empire Co. Ltd., Class A | | | 1,666 | | | | 49,729 | |
| | |
Etablissements Franz Colruyt NV | | | 1,044 | | | | 51,275 | |
| | |
Fuji Co. Ltd.(a) | | | 13,200 | | | | 232,107 | |
| | |
George Weston Ltd. | | | 1,559 | | | | 168,182 | |
| | |
GrainCorp Ltd., Class A | | | 10,837 | | | | 51,117 | |
| | |
Heiwado Co. Ltd. | | | 18,800 | | | | 324,311 | |
| | |
ICA Gruppen AB | | | 1,916 | | | | 99,052 | |
| | |
Inageya Co. Ltd. | | | 2,398 | | | | 28,917 | |
| | |
Itochu-Shokuhin Co. Ltd. | | | 400 | | | | 18,452 | |
| | |
J Sainsbury plc | | | 65,796 | | | | 270,028 | |
| | |
Jeronimo Martins SGPS SA | | | 988 | | | | 22,410 | |
| | | | | | | | |
| Investments | | Shares | | | Value | |
|
| Food & Staples Retailing – (continued) | |
| | |
JM Holdings Co. Ltd.(a) | | | 8,800 | | | $ | 144,165 | |
| | |
Kato Sangyo Co. Ltd. | | | 10,200 | | | | 286,700 | |
| | |
Kesko OYJ, Class A | | | 2,248 | | | | 68,680 | |
| | |
Kesko OYJ, Class B | | | 6,424 | | | | 208,826 | |
| | |
Kobe Bussan Co. Ltd.(a) | | | 3,200 | | | | 109,871 | |
| | |
Koninklijke Ahold Delhaize NV | | | 25,960 | | | | 845,087 | |
| | |
Kusuri no Aoki Holdings Co. Ltd.(a) | | | 600 | | | | 39,833 | |
| | |
Loblaw Cos. Ltd. | | | 2,640 | | | | 198,242 | |
| | |
MARR SpA | | | 1,155 | | | | 27,214 | |
| | |
MatsukiyoCocokara & Co. | | | 3,600 | | | | 158,807 | |
| | |
Maxvalu Tokai Co. Ltd. | | | 2,400 | | | | 54,935 | |
| | |
Metcash Ltd.(a) | | | 43,474 | | | | 132,899 | |
| | |
Metro, Inc.(a) | | | 4,532 | | | | 227,669 | |
| | |
Nihon Chouzai Co. Ltd. | | | 1,600 | | | | 22,998 | |
| | |
North West Co., Inc. (The)(a) | | | 22,132 | | | | 600,459 | |
| | |
Ocado Group plc* | | | 10,340 | | | | 255,549 | |
| | |
Rami Levy Chain Stores Hashikma Marketing 2006 Ltd. | | | 4,379 | | | | 330,140 | |
| | |
San-A Co. Ltd. | | | 8,800 | | | | 316,036 | |
| | |
Seven & i Holdings Co. Ltd. | | | 17,900 | | | | 750,693 | |
| | |
Sheng Siong Group Ltd. | | | 51,500 | | | | 54,231 | |
| | |
Shufersal Ltd. | | | 3,578 | | | | 29,650 | |
| | |
Sligro Food Group NV* (a) | | | 4,620 | | | | 123,771 | |
| | |
Sonae SGPS SA | | | 301,268 | | | | 331,733 | |
| | |
Sugi Holdings Co. Ltd. | | | 800 | | | | 57,251 | |
| | |
Sundrug Co. Ltd. | | | 1,600 | | | | 46,797 | |
| | |
Tesco plc | | | 178,592 | | | | 660,729 | |
| | |
Tsuruha Holdings, Inc. | | | 900 | | | | 110,897 | |
| | |
United Super Markets Holdings, Inc. | | | 2,000 | | | | 18,224 | |
| | |
Valor Holdings Co. Ltd. | | | 16,000 | | | | 338,031 | |
| | |
Welcia Holdings Co. Ltd. | | | 3,600 | | | | 134,339 | |
| | |
Woolworths Group Ltd. | | | 19,272 | | | | 551,216 | |
| | |
Zur Rose Group AG* (a) | | | 260 | | | | 92,476 | |
| | | | | | | | 10,940,677 | |
|
| Food Products – 3.0% | |
| | |
a2 Milk Co. Ltd. (The)* (a) | | | 12,579 | | | | 59,144 | |
| | |
AAK AB | | | 5,004 | | | | 109,361 | |
| | |
Agrana Beteiligungs AG | | | 6,028 | | | | 127,241 | |
| | |
Ajinomoto Co., Inc. | | | 8,100 | | | | 241,952 | |
| | |
Ariake Japan Co. Ltd. | | | 800 | | | | 51,918 | |
See Accompanying Notes to the Financial Statements.
| | | | | | |
| | FLEXSHARES ANNUAL REPORT | | | 193 | |
FlexShares® Morningstar Developed Markets ex-US Factor Tilt Index Fund (cont.)
| | | | | | | | |
| Investments | | Shares | | | Value | |
|
| COMMON STOCKS – (continued) | |
|
| Food Products – (continued) | |
| | |
Associated British Foods plc | | | 2,992 | | | $ | 73,331 | |
| | |
Austevoll Seafood ASA | | | 8,913 | | | | 120,220 | |
| | |
Bakkafrost P/F | | | 1,281 | | | | 118,146 | |
| | |
Bakkavor Group plc(a) (b) | | | 109,164 | | | | 189,141 | |
| | |
Barry Callebaut AG (Registered) | | | 38 | | | | 88,081 | |
| | |
Bega Cheese Ltd. | | | 8,671 | | | | 35,299 | |
| | |
Bell Food Group AG (Registered) | | | 1,100 | | | | 353,926 | |
| | |
Bonduelle SCA | | | 2,860 | | | | 73,311 | |
| | |
Calbee, Inc. | | | 3,200 | | | | 82,368 | |
| | |
Chocoladefabriken Lindt & Spruengli AG | | | 24 | | | | 283,404 | |
| | |
Chocoladefabriken Lindt & Spruengli AG (Registered) | | | 3 | | | | 360,821 | |
| | |
Costa Group Holdings Ltd.(a) | | | 16,050 | | | | 35,201 | |
| | |
Danone SA | | | 10,208 | | | | 665,674 | |
| | |
DyDo Group Holdings, Inc. | | | 500 | | | | 23,767 | |
| | |
Ebro Foods SA | | | 1,618 | | | | 32,131 | |
| | |
Elders Ltd. | | | 1,508 | | | | 13,626 | |
| | |
Emmi AG (Registered) | | | 41 | | | | 42,828 | |
| | |
First Pacific Co. Ltd. | | | 704,000 | | | | 281,453 | |
| | |
First Resources Ltd. | | | 5,100 | | | | 6,732 | |
| | |
Fraser and Neave Ltd. | | | 154,000 | | | | 165,591 | |
| | |
Fuji Oil Holdings, Inc. | | | 3,400 | | | | 79,704 | |
| | |
Fujicco Co. Ltd.(a) | | | 2,000 | | | | 33,519 | |
| | |
Fujiya Co. Ltd. | | | 400 | | | | 8,261 | |
| | |
Glanbia plc | | | 7,586 | | | | 124,046 | |
| | |
Golden Agri-Resources Ltd. | | | 213,400 | | | | 41,936 | |
| | |
Grieg Seafood ASA* (a) | | | 3,299 | | | | 36,600 | |
| | |
House Foods Group, Inc. | | | 2,400 | | | | 68,722 | |
| | |
Inghams Group Ltd.(a) | | | 151,800 | | | | 423,003 | |
| | |
Itoham Yonekyu Holdings, Inc. | | | 2,100 | | | | 12,763 | |
| | |
Japfa Ltd. | | | 201,820 | | | | 102,519 | |
| | |
J-Oil Mills, Inc. | | | 4,400 | | | | 70,770 | |
| | |
Kagome Co. Ltd. | | | 900 | | | | 22,811 | |
| | |
Kameda Seika Co. Ltd. | | | 900 | | | | 35,163 | |
| | |
Kernel Holding SA | | | 26,180 | | | | 395,328 | |
| | |
Kerry Group plc, Class A(a) | | | 2,244 | | | | 301,497 | |
| | |
Kikkoman Corp. | | | 4,000 | | | | 326,946 | |
| | |
Kotobuki Spirits Co. Ltd. | | | 1,000 | | | | 66,652 | |
| | |
Leroy Seafood Group ASA | | | 11,649 | | | | 105,759 | |
| | |
Lotus Bakeries NV | | | 13 | | | | 86,354 | |
| | | | | | | | |
| Investments | | Shares | | | Value | |
|
| Food Products – (continued) | |
| | |
Maple Leaf Foods, Inc. | | | 301 | | | $ | 6,552 | |
| | |
Maruha Nichiro Corp.(a) | | | 17,600 | | | | 396,376 | |
| | |
Megmilk Snow Brand Co. Ltd. | | | 22,000 | | | | 425,433 | |
| | |
Mehadrin Ltd.* | | | — | (e) | | | 20 | |
| | |
MEIJI Holdings Co. Ltd.(a) | | | 1,600 | | | | 100,890 | |
| | |
Morinaga & Co. Ltd. | | | 1,100 | | | | 38,781 | |
| | |
Morinaga Milk Industry Co. Ltd. | | | 1,200 | | | | 70,300 | |
| | |
Mowi ASA | | | 9,988 | | | | 288,802 | |
| | |
Nestle SA (Registered) | | | 46,464 | | | | 6,143,672 | |
| | |
Neto Malinda Trading Ltd.* | | | 2,288 | | | | 71,390 | |
| | |
NH Foods Ltd.(a) | | | 4,400 | | | | 154,545 | |
| | |
Nichirei Corp. | | | 3,500 | | | | 85,332 | |
| | |
Nippn Corp. | | | 32,300 | | | | 462,015 | |
| | |
Nippon Suisan Kaisha Ltd. | | | 132,000 | | | | 748,994 | |
| | |
Nisshin Oillio Group Ltd. (The) | | | 9,900 | | | | 262,206 | |
| | |
Nisshin Seifun Group, Inc. | | | 7,090 | | | | 111,861 | |
| | |
Nissin Foods Holdings Co. Ltd. | | | 1,500 | | | | 114,580 | |
| | |
Norway Royal Salmon ASA | | | 2,678 | | | | 56,160 | |
| | |
Orkla ASA | | | 13,798 | | | | 134,012 | |
| | |
Premier Foods plc | | | 280,104 | | | | 421,580 | |
| | |
Premium Brands Holdings Corp. | | | 1,100 | | | | 118,692 | |
| | |
Riken Vitamin Co. Ltd.(a) | | | 13,600 | | | | 222,681 | |
| | |
S Foods, Inc. | | | 8,800 | | | | 253,909 | |
| | |
S&B Foods, Inc. | | | 4,400 | | | | 171,138 | |
| | |
Sakata Seed Corp. | | | 2,800 | | | | 84,227 | |
| | |
Salmar ASA | | | 52 | | | | 3,953 | |
| | |
Saputo, Inc. | | | 4,455 | | | | 106,240 | |
| | |
Savencia SA | | | 1,716 | | | | 127,094 | |
| | |
Schouw & Co. A/S | | | 5,896 | | | | 574,159 | |
| | |
Showa Sangyo Co. Ltd.(a) | | | 13,200 | | | | 327,960 | |
| | |
Societe LDC SA | | | 1,734 | | | | 195,851 | |
| | |
Strauss Group Ltd. | | | 952 | | | | 28,025 | |
| | |
Suedzucker AG | | | 1,979 | | | | 31,422 | |
| | |
SunOpta, Inc.* | | | 5,588 | | | | 43,278 | |
| | |
Synlait Milk Ltd.* (a) | | | 1,760 | | | | 4,534 | |
| | |
Tassal Group Ltd.(a) | | | 119,771 | | | | 319,358 | |
| | |
Tate & Lyle plc | | | 3,262 | | | | 28,984 | |
| | |
Toyo Suisan Kaisha Ltd. | | | 2,800 | | | | 120,570 | |
| | |
Vilmorin & Cie SA | | | 1,612 | | | | 102,602 | |
| | |
Viscofan SA | | | 825 | | | | 56,472 | |
| | |
Vitasoy International Holdings
Ltd.(a) | | | 16,000 | | | | 38,503 | |
See Accompanying Notes to the Financial Statements.
| | | | |
| 194 | | FLEXSHARES ANNUAL REPORT | | |
FlexShares® Morningstar Developed Markets ex-US Factor Tilt Index Fund (cont.)
| | | | | | | | |
| Investments | | Shares | | | Value | |
|
| COMMON STOCKS – (continued) | |
|
| Food Products – (continued) | |
| | |
WH Group Ltd.(b) | | | 154,000 | | | $ | 108,090 | |
| | |
Wilmar International Ltd. | | | 74,800 | | | | 239,626 | |
| | |
Yakult Honsha Co. Ltd. | | | 1,700 | | | | 85,578 | |
| | |
Yamazaki Baking Co. Ltd. | | | 2,900 | | | | 43,999 | |
| | | | | | | | 19,507,466 | |
|
| Gas Utilities – 0.3% | |
| | |
AltaGas Ltd.(a) | | | 6,799 | | | | 140,527 | |
| | |
APA Group | | | 16,324 | | | | 100,540 | |
| | |
Enagas SA | | | 5,500 | | | | 123,510 | |
| | |
Hong Kong & China Gas Co. Ltd. | | | 158,907 | | | | 247,174 | |
| | |
Keppel Infrastructure Trust | | | 170,047 | | | | 66,833 | |
| | |
Naturgy Energy Group SA(a) | | | 6,820 | | | | 179,395 | |
| | |
Nippon Gas Co. Ltd. | | | 6,000 | | | | 74,142 | |
| | |
Osaka Gas Co. Ltd. | | | 14,500 | | | | 233,475 | |
| | |
Rubis SCA | | | 2,784 | | | | 89,211 | |
| | |
Saibu Gas Holdings Co. Ltd.(a) | | | 3,600 | | | | 73,373 | |
| | |
Shizuoka Gas Co. Ltd.(a) | | | 26,400 | | | | 277,834 | |
| | |
Snam SpA | | | 23,751 | | | | 134,598 | |
| | |
Superior Plus Corp.(a) | | | 14,520 | | | | 161,301 | |
| | |
Toho Gas Co. Ltd. | | | 2,000 | | | | 59,110 | |
| | |
Tokyo Gas Co. Ltd. | | | 6,800 | | | | 118,020 | |
| | | | | | | | 2,079,043 | |
|
| Health Care Equipment & Supplies – 1.3% | |
| | |
Alcon, Inc. | | | 7,832 | | | | 648,503 | |
| | |
Ambu A/S, Class B(a) | | | 3,172 | | | | 90,447 | |
| | |
Ansell Ltd. | | | 52 | | | | 1,231 | |
| | |
Arjo AB, Class B | | | 4,131 | | | | 56,276 | |
| | |
Asahi Intecc Co. Ltd. | | | 3,200 | | | | 84,164 | |
| | |
BioMerieux | | | 825 | | | | 105,068 | |
| | |
Carl Zeiss Meditec AG | | | 715 | | | | 143,932 | |
| | |
Cochlear Ltd. | | | 886 | | | | 146,697 | |
| | |
Coloplast A/S, Class B | | | 1,496 | | | | 244,122 | |
| | |
ConvaTec Group plc(b) | | | 5,396 | | | | 15,814 | |
| | |
CYBERDYNE, Inc.* (a) | | | 4,500 | | | | 15,668 | |
| | |
Demant A/S* | | | 2,922 | | | | 141,683 | |
| | |
DiaSorin SpA | | | 293 | | | | 66,238 | |
| | |
Draegerwerk AG & Co. KGaA | | | 1,496 | | | | 111,665 | |
| | |
Draegerwerk AG & Co. KGaA (Preference) | | | 2,816 | | | | 221,925 | |
| | | | | | | | |
| Investments | | Shares | | | Value | |
|
| Health Care Equipment & Supplies – (continued) | |
| | |
Eckert & Ziegler Strahlen- und Medizintechnik AG | | | 1,408 | | | $ | 211,008 | |
| | |
Eiken Chemical Co. Ltd. | | | 1,600 | | | | 26,801 | |
| | |
Elekta AB, Class B | | | 6,069 | | | | 70,466 | |
| | |
Fisher & Paykel Healthcare Corp. Ltd. | | | 10,847 | | | | 242,273 | |
| | |
Getinge AB, Class B | | | 3,120 | | | | 139,607 | |
| | |
GN Store Nord A/S | | | 2,064 | | | | 125,381 | |
| | |
Hogy Medical Co. Ltd. | | | 1,200 | | | | 32,782 | |
| | |
Hoya Corp. | | | 6,800 | | | | 997,413 | |
| | |
Japan Lifeline Co. Ltd. | | | 3,000 | | | | 32,230 | |
| | |
Koninklijke Philips NV | | | 14,785 | | | | 696,802 | |
| | |
Mani, Inc. | | | 3,900 | | | | 66,354 | |
| | |
Menicon Co. Ltd. | | | 3,200 | | | | 120,114 | |
| | |
Nagaileben Co. Ltd. | | | 1,500 | | | | 30,757 | |
| | |
Nakanishi, Inc. | | | 5,100 | | | | 118,079 | |
| | |
Nanosonics Ltd.* | | | 16,777 | | | | 74,599 | |
| | |
Nihon Kohden Corp. | | | 2,300 | | | | 73,120 | |
| | |
Nipro Corp. | | | 5,200 | | | | 52,718 | |
| | |
Olympus Corp. | | | 22,000 | | | | 474,729 | |
| | |
Paramount Bed Holdings Co. Ltd. | | | 1,600 | | | | 29,790 | |
| | |
PolyNovo Ltd.* (a) | | | 32,604 | | | | 44,570 | |
| | |
Revenio Group OYJ | | | 1,760 | | | | 116,401 | |
| | |
Sartorius AG (Preference) | | | 524 | | | | 339,826 | |
| | |
Siemens Healthineers AG(b) | | | 5,896 | | | | 392,058 | |
| | |
Smith & Nephew plc | | | 15,444 | | | | 265,682 | |
| | |
Sonova Holding AG (Registered) | | | 842 | | | | 348,595 | |
| | |
Straumann Holding AG (Registered) | | | 187 | | | | 389,247 | |
| | |
Sysmex Corp. | | | 2,400 | | | | 296,146 | |
| | |
Terumo Corp. | | | 11,800 | | | | 519,293 | |
| | |
Ypsomed Holding AG (Registered) | | | 81 | | | | 13,474 | |
| | | | | | | | 8,433,748 | |
|
| Health Care Providers & Services – 0.6% | |
| | |
AEVIS VICTORIA SA* | | | 7,323 | | | | 100,578 | |
| | |
Alfresa Holdings Corp. | | | 1,100 | | | | 15,435 | |
| | |
Ambea AB(b) | | | 21,007 | | | | 146,023 | |
| | |
Amplifon SpA | | | 3,067 | | | | 155,991 | |
| | |
As One Corp. | | | 700 | | | | 95,523 | |
| | |
BML, Inc. | | | 12,100 | | | | 423,938 | |
| | |
CareTech Holdings plc | | | 47,696 | | | | 407,967 | |
See Accompanying Notes to the Financial Statements.
| | | | | | |
| | FLEXSHARES ANNUAL REPORT | | | 195 | |
FlexShares® Morningstar Developed Markets ex-US Factor Tilt Index Fund (cont.)
| | | | | | | | |
| Investments | | Shares | | | Value | |
|
| COMMON STOCKS – (continued) | |
|
| Health Care Providers & Services – (continued) | |
| | |
Chartwell Retirement Residences(a) | | | 5,472 | | | $ | 52,709 | |
| | |
China Evergrande New Energy Vehicle Group Ltd.* (a) | | | 40,000 | | | | 19,231 | |
| | |
CVS Group plc* | | | 5,896 | | | | 201,644 | |
| | |
EBOS Group Ltd. | | | 2,014 | | | | 52,248 | |
| | |
Fagron | | | 2,504 | | | | 43,408 | |
| | |
Fresenius Medical Care AG & Co. KGaA | | | 2,728 | | | | 181,400 | |
| | |
Fresenius SE & Co. KGaA | | | 8,052 | | | | 365,878 | |
| | |
Galenica AG(b) | | | 132 | | | | 9,679 | |
| | |
Healius Ltd. | | | 27,458 | | | | 99,406 | |
| | |
Korian SA | | | 2,669 | | | | 88,954 | |
| | |
Mediclinic International plc* | | | 22,600 | | | | 103,470 | |
| | |
Medipal Holdings Corp. | | | 700 | | | | 12,616 | |
| | |
NMC Health plc* (d) | | | 2,074 | | | | 591 | |
| | |
Orpea SA | | | 950 | | | | 99,165 | |
| | |
Raffles Medical Group Ltd. | | | 4,124 | | | | 4,190 | |
| | |
Ramsay Health Care Ltd. | | | 2,240 | | | | 118,479 | |
| | |
Ryman Healthcare Ltd.(a) | | | 2,860 | | | | 29,576 | |
| | |
Ship Healthcare Holdings, Inc. | | | 1,800 | | | | 47,153 | |
| | |
Sonic Healthcare Ltd. | | | 9,467 | | | | 284,640 | |
| | |
Summerset Group Holdings Ltd. | | | 11,645 | | | | 120,923 | |
| | |
Suzuken Co. Ltd. | | | 3,380 | | | | 93,671 | |
| | |
Toho Holdings Co. Ltd.(a) | | | 30,600 | | | | 492,981 | |
| | | | | | | | 3,867,467 | |
|
| Health Care Technology – 0.1% | |
| | |
AGFA-Gevaert NV* | | | 15,224 | | | | 66,244 | |
| | |
CompuGroup Medical SE & Co. KGaA | | | 624 | | | | 52,209 | |
| | |
M3, Inc. | | | 6,800 | | | | 400,039 | |
| | |
Sectra AB* (a) | | | 5,149 | | | | 539 | |
| | |
Sectra AB, Class B* (a) | | | 5,149 | | | | 125,660 | |
| | | | | | | | 644,691 | |
|
| Hotels, Restaurants & Leisure – 1.4% | |
| | |
888 Holdings plc | | | 32,824 | | | | 172,235 | |
| | |
Accor SA* | | | 792 | | | | 28,330 | |
| | |
Arcland Service Holdings Co. Ltd. | | | 1,400 | | | | 27,687 | |
| | |
Aristocrat Leisure Ltd. | | | 9,366 | | | | 328,385 | |
| | |
Atom Corp.* (a) | | | 5,800 | | | | 39,065 | |
| | | | | | | | |
| Investments | | Shares | | | Value | |
|
| Hotels, Restaurants & Leisure – (continued) | |
| | |
Autogrill SpA* (a) | | | 24,905 | | | $ | 195,293 | |
| | |
Basic-Fit NV* (b) | | | 1,196 | | | | 58,131 | |
| | |
Betsson AB, Class B* | | | 46,024 | | | | 320,456 | |
| | |
Colowide Co. Ltd.(a) | | | 3,500 | | | | 50,585 | |
| | |
Compass Group plc* | | | 30,272 | | | | 643,178 | |
| | |
Corporate Travel Management Ltd.* (a) | | | 3,366 | | | | 61,916 | |
| | |
Create Restaurants Holdings, Inc.(a) | | | 4,400 | | | | 30,214 | |
| | |
Crown Resorts Ltd.* | | | 11,014 | | | | 82,395 | |
| | |
Domino’s Pizza Enterprises Ltd. | | | 1,398 | | | | 142,238 | |
| | |
Domino’s Pizza Group plc | | | 15,345 | | | | 81,402 | |
| | |
Doutor Nichires Holdings Co. Ltd. | | | 7,100 | | | | 101,620 | |
| | |
Elior Group SA* (a) (b) | | | 7,543 | | | | 59,533 | |
| | |
Entain plc* | | | 12,408 | | | | 348,329 | |
| | |
Evolution AB(b) | | | 2,640 | | | | 427,023 | |
| | |
Flutter Entertainment plc* | | | 1,493 | | | | 282,319 | |
| | |
Flutter Entertainment plc – XDUB* (a) | | | 1,008 | | | | 190,841 | |
| | |
Fuji Kyuko Co. Ltd. | | | 1,000 | | | | 40,167 | |
| | |
Galaxy Entertainment Group Ltd.* | | | 36,000 | | | | 194,831 | |
| | |
Genting Singapore Ltd. | | | 20,800 | | | | 12,031 | |
| | |
Greggs plc | | | 3,864 | | | | 161,810 | |
| | |
Hiday Hidaka Corp. | | | 2,191 | | | | 31,244 | |
| | |
HIS Co. Ltd.* (a) | | | 22,800 | | | | 511,688 | |
| | |
Ichibanya Co. Ltd. | | | 1,000 | | | | 40,386 | |
| | |
InterContinental Hotels Group plc* | | | 4,532 | | | | 317,942 | |
| | |
J D Wetherspoon plc* | | | 3,795 | | | | 53,216 | |
| | |
Kindred Group plc, SDR | | | 7,392 | | | | 103,282 | |
| | |
Kisoji Co. Ltd.(a) | | | 1,700 | | | | 31,890 | |
| | |
KOMEDA Holdings Co. Ltd. | | | 1,200 | | | | 21,711 | |
| | |
Kyoritsu Maintenance Co. Ltd.(a) | | | 1,600 | | | | 59,776 | |
| | |
La Francaise des Jeux SAEM(b) | | | 3,300 | | | | 171,470 | |
| | |
Mandarin Oriental International Ltd.* | | | 8,000 | | | | 18,560 | |
| | |
McDonald’s Holdings Co. Japan Ltd.(a) | | | 1,100 | | | | 49,103 | |
| | |
Melco International Development Ltd.* (a) | | | 21,000 | | | | 27,428 | |
| | |
MGM China Holdings Ltd.* (a) | | | 32,400 | | | | 23,866 | |
| | |
Miramar Hotel & Investment | | | 44,000 | | | | 73,757 | |
See Accompanying Notes to the Financial Statements.
| | | | |
| 196 | | FLEXSHARES ANNUAL REPORT | | |
FlexShares® Morningstar Developed Markets ex-US Factor Tilt Index Fund (cont.)
| | | | | | | | |
| Investments | | Shares | | | Value | |
|
| COMMON STOCKS – (continued) | |
|
| Hotels, Restaurants & Leisure – (continued) | |
| | |
Mitchells & Butlers plc* | | | 38,104 | | | $ | 132,249 | |
| | |
MOS Food Services, Inc.(a) | | | 2,100 | | | | 58,382 | |
| | |
NagaCorp Ltd.(a) | | | 90,000 | | | | 82,722 | |
| | |
Ohsho Food Service Corp. | | | 1,504 | | | | 78,745 | |
| | |
Oriental Land Co. Ltd.(a) | | | 3,900 | | | | 613,602 | |
| | |
Pandox AB* | | | 5,720 | | | | 100,833 | |
| | |
Penn National Gaming, Inc.* | | | 220 | | | | 15,752 | |
| | |
Playtech plc* | | | 33,220 | | | | 316,933 | |
| | |
Plenus Co. Ltd. | | | 5,400 | | | | 91,733 | |
| | |
PointsBet Holdings Ltd.* | | | 13,297 | | | | 82,396 | |
| | |
Restaurant Brands International, Inc. | | | 4,048 | | | | 228,828 | |
| | |
Restaurant Brands New Zealand Ltd.* (a) | | | 1,154 | | | | 12,867 | |
| | |
Restaurant Group plc (The)* | | | 101,062 | | | | 122,323 | |
| | |
Ringer Hut Co. Ltd.* (a) | | | 1,700 | | | | 32,934 | |
| | |
Round One Corp. | | | 5,100 | | | | 61,142 | |
| | |
Royal Holdings Co. Ltd.* | | | 1,600 | | | | 29,004 | |
| | |
Saizeriya Co. Ltd. | | | 1,800 | | | | 48,463 | |
| | |
Sands China Ltd.* | | | 22,800 | | | | 52,112 | |
| | |
Scandic Hotels Group AB* (a) (b) | | | 29,480 | | | | 142,105 | |
| | |
Shangri-La Asia Ltd.* (a) | | | 32,000 | | | | 26,080 | |
| | |
SJM Holdings Ltd.* (a) | | | 76,000 | | | | 56,763 | |
| | |
SkiStar AB* | | | 2,828 | | | | 58,941 | |
| | |
Skylark Holdings Co. Ltd.* | | | 3,700 | | | | 50,069 | |
| | |
Sodexo SA* | | | 988 | | | | 96,043 | |
| | |
SSP Group plc* | | | 35,420 | | | | 125,021 | |
| | |
Star Entertainment Grp Ltd. (The)* (a) | | | 11,421 | | | | 31,397 | |
| | |
Tabcorp Holdings Ltd. | | | 44,620 | | | | 166,230 | |
| | |
Toridoll Holdings Corp. | | | 3,200 | | | | 76,924 | |
| | |
TUI AG, DI* | | | 2,728 | | | | 9,173 | |
| | |
Webjet Ltd.* | | | 39,908 | | | | 189,441 | |
| | |
Whitbread plc* | | | 5,500 | | | | 246,529 | |
| | |
Wynn Macau Ltd.* (a) | | | 12,800 | | | | 11,518 | |
| | |
Yoshinoya Holdings Co. Ltd. | | | 4,900 | | | | 95,357 | |
| | |
Zensho Holdings Co. Ltd.(a) | | | 3,600 | | | | 82,971 | |
| | | | | | | | 9,240,915 | |
|
| Household Durables – 1.4% | |
| | |
Azorim-Investment Development & Construction Co. Ltd.* | | | 4,285 | | | | 19,166 | |
| | | | | | | | |
| Investments | | Shares | | | Value | |
|
| Household Durables – (continued) | |
| | |
Barratt Developments plc | | | 28,996 | | | $ | 263,518 | |
| | |
Bellway plc | | | 3,680 | | | | 167,120 | |
| | |
Berkeley Group Holdings plc | | | 1,345 | | | | 80,268 | |
| | |
Bonava AB, Class B | | | 32,392 | | | | 319,639 | |
| | |
Breville Group Ltd. | | | 4,514 | | | | 99,374 | |
| | |
Cairn Homes plc(a) | | | 38,456 | | | | 49,972 | |
| | |
Casio Computer Co. Ltd.(a) | | | 3,600 | | | | 50,705 | |
| | |
Countryside Properties plc* (b) | | | 13,624 | | | | 87,848 | |
| | |
Crest Nicholson Holdings plc | | | 12,364 | | | | 60,335 | |
| | |
De’ Longhi SpA | | | 2,352 | | | | 91,999 | |
| | |
DFS Furniture plc* | | | 105,952 | | | | 396,488 | |
| | |
Dom Development SA | | | 5,544 | | | | 186,346 | |
| | |
Electra Consumer Products 1970 Ltd. | | | 4,888 | | | | 229,470 | |
| | |
Electrolux AB, Class B(a) | | | 7,237 | | | | 164,230 | |
| | |
Fiskars OYJ Abp | | | 574 | | | | 14,116 | |
| | |
Forbo Holding AG (Registered) | | | 24 | | | | 46,700 | |
| | |
Fujitsu General Ltd. | | | 2,100 | | | | 51,494 | |
| | |
Haseko Corp. | | | 3,500 | | | | 45,459 | |
| | |
Husqvarna AB, Class B | | | 10,433 | | | | 148,383 | |
| | |
Iida Group Holdings Co. Ltd. | | | 5,400 | | | | 132,745 | |
| | |
JM AB | | | 1,842 | | | | 74,529 | |
| | |
Kaufman & Broad SA(a) | | | 6,468 | | | | 258,984 | |
| | |
Man Wah Holdings Ltd. | | | 54,400 | | | | 84,617 | |
| | |
Nagawa Co. Ltd.(a) | | | 500 | | | | 47,270 | |
| | |
Neinor Homes SA* (a) (b) | | | 16,280 | | | | 209,878 | |
| | |
Nikon Corp. | | | 1,400 | | | | 15,335 | |
| | |
Nobia AB | | | 53,372 | | | | 328,429 | |
| | |
Open House Co. Ltd. | | | 1,800 | | | | 113,975 | |
| | |
Panasonic Corp. | | | 52,800 | | | | 644,806 | |
| | |
Persimmon plc | | | 7,436 | | | | 277,349 | |
| | |
Pressance Corp.(a) | | | 13,200 | | | | 217,868 | |
| | |
Redrow plc | | | 16,632 | | | | 147,095 | |
| | |
Rinnai Corp. | | | 100 | | | | 10,226 | |
| | |
Sangetsu Corp. | | | 2,256 | | | | 30,964 | |
| | |
SEB SA | | | 616 | | | | 96,451 | |
| | |
Sekisui Chemical Co. Ltd. | | | 8,500 | | | | 139,026 | |
| | |
Sekisui House Ltd. | | | 16,600 | | | | 343,792 | |
| | |
Sharp Corp. | | | 6,200 | | | | 72,916 | |
| | |
Sony Group Corp. | | | 20,900 | | | | 2,408,472 | |
| | |
Sumitomo Forestry Co. Ltd.(a) | | | 7,700 | | | | 146,538 | |
| | |
Tama Home Co. Ltd.(a) | | | 8,800 | | | | 180,978 | |
| | |
Taylor Wimpey plc | | | 87,516 | | | | 185,402 | |
See Accompanying Notes to the Financial Statements.
| | | | | | |
| | FLEXSHARES ANNUAL REPORT | | | 197 | |
FlexShares® Morningstar Developed Markets ex-US Factor Tilt Index Fund (cont.)
| | | | | | | | |
| Investments | | Shares | | | Value | |
|
| COMMON STOCKS – (continued) | |
|
| Household Durables – (continued) | |
| | |
Token Corp. | | | 3,100 | | | $ | 252,567 | |
| | |
TomTom NV* (a) | | | 15,532 | | | | 133,819 | |
| | |
Vistry Group plc | | | 10,222 | | | | 170,944 | |
| | |
Zojirushi Corp.(a) | | | 1,300 | | | | 17,934 | |
| | | | | | | | 9,315,539 | |
|
| Household Products – 0.4% | |
| | |
Earth Corp. | | | 600 | | | | 36,729 | |
| | |
Essity AB, Class A | | | 616 | | | | 19,939 | |
| | |
Essity AB, Class B | | | 9,592 | | | | 310,259 | |
| | |
Henkel AG & Co. KGaA | | | 1,770 | | | | 147,685 | |
| | |
Henkel AG & Co. KGaA (Preference) | | | 2,288 | | | | 204,886 | |
| | |
Lion Corp. | | | 2,400 | | | | 39,886 | |
| | |
Pigeon Corp.(a) | | | 2,400 | | | | 55,504 | |
| | |
PZ Cussons plc | | | 28,228 | | | | 83,191 | |
| | |
Reckitt Benckiser Group plc | | | 11,484 | | | | 932,695 | |
| | |
Sano-Brunos Enterprises Ltd. | | | 1,408 | | | | 158,736 | |
| | |
Unicharm Corp. | | | 9,600 | | | | 386,610 | |
| | | | | | | | 2,376,120 | |
|
Independent Power and Renewable Electricity
Producers – 0.4% | |
| | |
Albioma SA | | | 42 | | | | 1,653 | |
| | |
Boralex, Inc., Class A(a) | | | 2,081 | | | | 64,299 | |
| | |
Brookfield Renewable Corp. | | | 5,298 | | | | 219,092 | |
| | |
Capital Power Corp. | | | 4,094 | | | | 134,259 | |
| | |
ContourGlobal plc(b) | | | 17,776 | | | | 48,489 | |
| | |
Doral Group Renewable Energy Resources Ltd.* | | | 2,244 | | | | 10,918 | |
| | |
Drax Group plc | | | 168,036 | | | | 1,221,929 | |
| | |
EDP Renovaveis SA | | | 7,524 | | | | 209,842 | |
| | |
Electric Power Development Co. Ltd.(a) | | | 3,100 | | | | 40,835 | |
| | |
Encavis AG | | | 3,746 | | | | 78,465 | |
| | |
Enlight Renewable Energy Ltd.* | | | 32,188 | | | | 79,531 | |
| | |
ERG SpA | | | 2,090 | | | | 75,510 | |
| | |
Innergex Renewable Energy, Inc. | | | 559 | | | | 9,290 | |
| | |
Meridian Energy Ltd. | | | 28,875 | | | | 103,115 | |
| | |
Northland Power, Inc.(a) | | | 2,116 | | | | 67,924 | |
| | |
Scatec ASA(b) | | | 988 | | | | 19,400 | |
| | |
TransAlta Corp. | | | 20,548 | | | | 230,089 | |
| | | | | | | | |
| Investments | | Shares | | | Value | |
|
Independent Power and Renewable Electricity
Producers – (continued) | |
| | |
Uniper SE | | | 2,028 | | | $ | 89,675 | |
| | | | | | | | 2,704,315 | |
|
| Industrial Conglomerates – 1.1% | |
| | |
Arad Investment & Industrial Development Ltd. | | | 1,408 | | | | 159,852 | |
| | |
Bonheur ASA | | | 3,702 | | | | 145,948 | |
| | |
CK Hutchison Holdings Ltd. | | | 64,356 | | | | 433,091 | |
| | |
DCC plc | | | 988 | | | | 82,694 | |
| | |
Guoco Group Ltd. | | | 4,000 | | | | 46,792 | |
| | |
Hitachi Ltd. | | | 22,000 | | | | 1,264,530 | |
| | |
Indus Holding AG | | | 7,285 | | | | 286,639 | |
| | |
Investment AB Latour, Class B | | | 3,256 | | | | 117,980 | |
| | |
Italmobiliare SpA | | | 245 | | | | 8,605 | |
| | |
Jardine Matheson Holdings Ltd. | | | 4,400 | | | | 254,892 | |
| | |
Keihan Holdings Co. Ltd.(a) | | | 4,400 | | | | 115,301 | |
| | |
Keppel Corp. Ltd. | | | 13,200 | | | | 52,663 | |
| | |
Lifco AB, Class B | | | 6,732 | | | | 196,038 | |
| | |
Melrose Industries plc | | | 73,220 | | | | 158,378 | |
| | |
Nisshinbo Holdings, Inc. | | | 47,400 | | | | 364,983 | |
| | |
Nolato AB, Class B | | | 7,100 | | | | 93,746 | |
| | |
Noritsu Koki Co. Ltd. | | | 800 | | | | 16,572 | |
| | |
Rheinmetall AG | | | 1,144 | | | | 110,995 | |
| | |
Shun Tak Holdings Ltd.* (a) | | | 616,000 | | | | 168,668 | |
| | |
Siemens AG (Registered) | | | 13,068 | | | | 2,121,446 | |
| | |
Smiths Group plc | | | 2,860 | | | | 53,140 | |
| | |
TOKAI Holdings Corp. | | | 55,595 | | | | 421,259 | |
| | |
Toshiba Corp. | | | 8,800 | | | | 378,935 | |
| | | | | | | | 7,053,147 | |
|
| Insurance – 4.1% | |
| | |
Admiral Group plc | | | 4,708 | | | | 185,215 | |
| | |
Aegon NV(a) | | | 53,179 | | | | 269,859 | |
| | |
Ageas SA | | | 5,544 | | | | 270,105 | |
| | |
AIA Group Ltd. | | | 204,800 | | | | 2,312,838 | |
| | |
Allianz SE (Registered) | | | 9,349 | | | | 2,176,268 | |
| | |
Alm Brand A/S(a) | | | 8,488 | | | | 65,492 | |
| | |
ASR Nederland NV | | | 3,620 | | | | 169,497 | |
| | |
Assicurazioni Generali SpA(a) | | | 24,640 | | | | 537,501 | |
| | |
AUB Group Ltd. | | | 2,255 | | | | 36,771 | |
| | |
Aviva plc | | | 76,824 | | | | 415,645 | |
| | |
AXA SA | | | 48,400 | | | | 1,409,234 | |
See Accompanying Notes to the Financial Statements.
| | | | |
| 198 | | FLEXSHARES ANNUAL REPORT | | |
FlexShares® Morningstar Developed Markets ex-US Factor Tilt Index Fund (cont.)
| | | | | | | | |
| Investments | | Shares | | | Value | |
|
| COMMON STOCKS – (continued) | |
|
| Insurance – (continued) | |
| | |
Baloise Holding AG (Registered) | | | 1,056 | | | $ | 168,729 | |
| | |
Beazley plc* | | | 5,676 | | | | 30,343 | |
| | |
Clal Insurance Enterprises Holdings Ltd.* | | | 24,068 | | | | 595,591 | |
| | |
Coface SA | | | 5,065 | | | | 72,389 | |
| | |
Conduit Holdings Ltd.(a) | | | 23,874 | | | | 143,991 | |
| | |
Dai-ichi Life Holdings, Inc. | | | 24,400 | | | | 513,893 | |
| | |
Direct Line Insurance Group plc | | | 46,112 | | | | 184,820 | |
| | |
Fairfax Financial Holdings Ltd. | | | 484 | | | | 195,720 | |
| | |
Gjensidige Forsikring ASA | | | 945 | | | | 23,471 | |
| | |
Great Eastern Holdings Ltd. | | | 2,400 | | | | 38,300 | |
| | |
Great-West Lifeco, Inc.(a) | | | 6,344 | | | | 186,346 | |
| | |
Grupo Catalana Occidente SA | | | 2,102 | | | | 74,801 | |
| | |
Hannover Rueck SE | | | 1,898 | | | | 347,041 | |
| | |
Harel Insurance Investments & Financial Services Ltd. | | | 8,005 | | | | 89,487 | |
| | |
Helvetia Holding AG (Registered) | | | 1,265 | | | | 150,900 | |
| | |
iA Financial Corp., Inc. | | | 4,092 | | | | 241,681 | |
| | |
Insurance Australia Group Ltd. | | | 17,160 | | | | 61,867 | |
| | |
Intact Financial Corp. | | | 2,816 | | | | 376,913 | |
| | |
Japan Post Holdings Co. Ltd.* | | | 24,900 | | | | 191,076 | |
| | |
Just Group plc* | | | 331,980 | | | | 418,202 | |
| | |
Lancashire Holdings Ltd. | | | 24,992 | | | | 173,344 | |
| | |
Legal & General Group plc | | | 125,576 | | | | 497,293 | |
| | |
Manulife Financial Corp. | | | 41,404 | | | | 805,333 | |
| | |
Medibank Pvt Ltd. | | | 52,475 | | | | 130,854 | |
| | |
Menora Mivtachim Holdings Ltd. | | | 13,157 | | | | 304,247 | |
| | |
Migdal Insurance & Financial Holdings Ltd. | | | 90,400 | | | | 153,805 | |
| | |
MS&AD Insurance Group Holdings, Inc. | | | 8,800 | | | | 284,471 | |
| | |
Muenchener Rueckversicherungs-Gesellschaft AG in Muenchen (Registered) | | | 3,652 | | | | 1,082,772 | |
| | |
nib holdings Ltd. | | | 11,260 | | | | 55,988 | |
| | |
NN Group NV | | | 6,640 | | | | 355,929 | |
| | |
Phoenix Group Holdings plc | | | 29,128 | | | | 262,162 | |
| | |
Phoenix Holdings Ltd. (The) | | | 5,085 | | | | 64,222 | |
| | |
Poste Italiane SpA(b) | | | 12,259 | | | | 175,064 | |
| | |
Power Corp. of Canada | | | 12,945 | | | | 430,473 | |
| | | | | | | | |
| Investments | | Shares | | | Value | |
|
| Insurance – (continued) | |
| | |
Powszechny Zaklad Ubezpieczen SA | | | 23,012 | | | $ | 230,313 | |
| | |
Prudential plc | | | 65,340 | | | | 1,338,546 | |
| | |
QBE Insurance Group Ltd.(a) | | | 33,264 | | | | 295,568 | |
| | |
Sabre Insurance Group plc(b) | | | 21,200 | | | | 57,190 | |
| | |
Sampo OYJ, Class A | | | 13,811 | | | | 735,208 | |
| | |
SCOR SE | | | 1,012 | | | | 34,080 | |
| | |
Societa Cattolica Di Assicurazione SpA* | | | 52,835 | | | | 402,323 | |
| | |
Sompo Holdings, Inc. | | | 8,500 | | | | 368,849 | |
| | |
Steadfast Group Ltd. | | | 30,934 | | | | 108,041 | |
| | |
Storebrand ASA | | | 17,930 | | | | 191,905 | |
| | |
Sun Life Financial, Inc. | | | 15,620 | | | | 888,773 | |
| | |
Suncorp Group Ltd. | | | 40,876 | | | | 359,827 | |
| | |
Swiss Life Holding AG (Registered) | | | 704 | | | | 387,229 | |
| | |
Swiss Re AG | | | 6,248 | | | | 606,099 | |
| | |
T&D Holdings, Inc. | | | 8,800 | | | | 112,831 | |
| | |
Tokio Marine Holdings, Inc. | | | 17,600 | | | | 925,804 | |
| | |
Topdanmark A/S | | | 1,650 | | | | 87,732 | |
| | |
Tryg A/S | | | 5,124 | | | | 121,597 | |
| | |
Unipol Gruppo SpA | | | 6,080 | | | | 34,969 | |
| | |
UnipolSai Assicurazioni SpA(a) | | | 27,841 | | | | 80,676 | |
| | |
UNIQA Insurance Group AG | | | 39,072 | | | | 363,989 | |
| | |
Wuestenrot & Wuerttembergische AG | | | 7,744 | | | | 161,491 | |
| | |
Yunfeng Financial Group Ltd.* (a) | | | 664,000 | | | | 176,690 | |
| | |
Zurich Insurance Group AG | | | 3,784 | | | | 1,680,903 | |
| | | | | | | | 26,480,576 | |
|
| Interactive Media & Services – 0.2% | |
| | |
Adevinta ASA* | | | 470 | | | | 7,726 | |
| | |
Auto Trader Group plc(b) | | | 15,928 | | | | 132,222 | |
| | |
carsales.com Ltd. | | | 7,568 | | | | 140,175 | |
| | |
Dip Corp. | | | 1,400 | | | | 50,217 | |
| | |
Kakaku.com, Inc.(a) | | | 1,600 | | | | 52,831 | |
| | |
New Work SE | | | 159 | | | | 38,825 | |
| | |
REA Group Ltd.(a) | | | 1,596 | | | | 191,969 | |
| | |
Rightmove plc | | | 17,688 | | | | 167,636 | |
| | |
Scout24 SE(b) | | | 1,879 | | | | 130,903 | |
| | |
SEEK Ltd.(a) | | | 5,653 | | | | 138,843 | |
| | |
Z Holdings Corp. | | | 37,200 | | | | 230,328 | |
| | | | | | | | 1,281,675 | |
See Accompanying Notes to the Financial Statements.
| | | | | | |
| | FLEXSHARES ANNUAL REPORT | | | 199 | |
FlexShares® Morningstar Developed Markets ex-US Factor Tilt Index Fund (cont.)
| | | | | | | | |
| Investments | | Shares | | | Value | |
|
| COMMON STOCKS – (continued) | |
|
| Internet & Direct Marketing Retail – 0.6% | |
| | |
Allegro.eu SA* (b) | | | 12,540 | | | $ | 141,925 | |
| | |
ASKUL Corp. | | | 1,000 | | | | 13,558 | |
| | |
ASOS plc* | | | 1,370 | | | | 46,610 | |
| | |
Auction Technology Group plc* | | | 10,604 | | | | 205,531 | |
| | |
Belluna Co. Ltd. | | | 15,600 | | | | 109,176 | |
| | |
boohoo Group plc* | | | 15,511 | | | | 38,643 | |
| | |
Delivery Hero SE* (b) | | | 3,652 | | | | 454,536 | |
| | |
Dustin Group AB(a) (b) | | | 3,680 | | | | 45,033 | |
| | |
HelloFresh SE* | | | 3,420 | | | | 277,046 | |
| | |
Just Eat Takeaway.com NV* (b) | | | 3,476 | | | | 249,785 | |
| | |
Mercari, Inc.* | | | 1,900 | | | | 102,477 | |
| | |
Moneysupermarket.com Group plc | | | 22,168 | | | | 64,420 | |
| | |
Prosus NV* | | | 14,652 | | | | 1,292,219 | |
| | |
Rakuten Group, Inc.(a) | | | 20,200 | | | | 221,443 | |
| | |
Shop Apotheke Europe NV* (a) (b) | | | 748 | | | | 113,397 | |
| | |
THG plc* (a) | | | 21,032 | | | | 62,445 | |
| | |
Zalando SE* (b) (d) | | | 938 | | | | 88,555 | |
| | |
Zalando SE* (b) | | | 2,820 | | | | 266,232 | |
| | |
zooplus AG* | | | 528 | | | | 292,316 | |
| | |
ZOZO, Inc. | | | 2,800 | | | | 89,507 | |
| | | | | | | | 4,174,854 | |
|
| IT Services – 2.1% | |
| | |
AddNode Group AB(a) | | | 3,740 | | | | 154,808 | |
| | |
Adyen NV* (b) | | | 528 | | | | 1,595,089 | |
| | |
Afterpay Ltd.* | | | 4,149 | | | | 384,210 | |
| | |
Alten SA | | | 900 | | | | 144,980 | |
| | |
Amadeus IT Group SA* | | | 7,832 | | | | 524,238 | |
| | |
Appen Ltd.(a) | | | 16,514 | | | | 133,339 | |
| | |
Atea ASA* | | | 4,972 | | | | 92,865 | |
| | |
Atos SE | | | 880 | | | | 45,807 | |
| | |
Bechtle AG | | | 2,019 | | | | 151,404 | |
| | |
Bell System24 Holdings, Inc. | | | 5,600 | | | | 71,704 | |
| | |
CANCOM SE | | | 1,981 | | | | 137,001 | |
| | |
Capgemini SE | | | 2,552 | | | | 594,500 | |
| | |
CGI, Inc.* | | | 4,532 | | | | 404,226 | |
| | |
Computacenter plc | | | 1,092 | | | | 40,266 | |
| | |
Computershare Ltd. | | | 15,875 | | | | 223,689 | |
| | | | | | | | |
| Investments | | Shares | | | Value | |
|
| IT Services – (continued) | |
| | |
Digital Garage, Inc. | | | 1,300 | | | $ | 60,425 | |
| | |
DTS Corp.(a) | | | 4,000 | | | | 88,472 | |
| | |
Econocom Group SA/NV | | | 64,548 | | | | 273,022 | |
| | |
Edenred | | | 3,260 | | | | 176,446 | |
| | |
FDM Group Holdings plc | | | 3,850 | | | | 63,434 | |
| | |
Formula Systems 1985 Ltd. | | | 829 | | | | 89,075 | |
| | |
Fujitsu Ltd. | | | 3,200 | | | | 550,756 | |
| | |
GMO internet, Inc. | | | 1,200 | | | | 32,993 | |
| | |
GMO Payment Gateway, Inc.(a) | | | 1,400 | | | | 177,294 | |
| | |
Indra Sistemas SA* | | | 47,080 | | | | 569,351 | |
| | |
Infocom Corp. | | | 1,600 | | | | 30,618 | |
| | |
Infomart Corp. | | | 5,300 | | | | 51,594 | |
| | |
Itochu Techno-Solutions Corp. | | | 2,400 | | | | 75,562 | |
| | |
Kainos Group plc | | | 8,184 | | | | 222,121 | |
| | |
Keywords Studios plc | | | 1,144 | | | | 44,472 | |
| | |
Matrix IT Ltd. | | | 2,464 | | | | 66,977 | |
| | |
Megaport Ltd.* (a) | | | 7,072 | | | | 95,134 | |
| | |
Mitsubishi Research Institute, Inc. | | | 4,400 | | | | 163,613 | |
| | |
NEC Corp. | | | 7,300 | | | | 372,603 | |
| | |
NEC Networks & System Integration Corp. | | | 2,400 | | | | 38,497 | |
| | |
NET One Systems Co. Ltd. | | | 3,800 | | | | 124,139 | |
| | |
Network International Holdings plc* (b) | | | 22,792 | | | | 100,975 | |
| | |
Nexi SpA* (b) | | | 8,052 | | | | 140,006 | |
| | |
NEXTDC Ltd.* | | | 15,925 | | | | 140,425 | |
| | |
Nihon Unisys Ltd. | | | 2,600 | | | | 72,738 | |
| | |
Nomura Research Institute Ltd. | | | 5,745 | | | | 228,742 | |
| | |
NS Solutions Corp. | | | 800 | | | | 26,801 | |
| | |
NSD Co. Ltd. | | | 5,160 | | | | 97,973 | |
| | |
NTT Data Corp. | | | 10,400 | | | | 208,228 | |
| | |
Nuvei Corp.* (b) | | | 1,760 | | | | 211,191 | |
| | |
Obic Co. Ltd. | | | 1,500 | | | | 276,124 | |
| | |
Otsuka Corp.(a) | | | 3,400 | | | | 166,981 | |
| | |
Relia, Inc.(a) | | | 24,100 | | | | 246,442 | |
| | |
Reply SpA | | | 842 | | | | 163,408 | |
| | |
S&T AG(a) | | | 228 | | | | 5,483 | |
| | |
SCSK Corp. | | | 2,700 | | | | 54,462 | |
| | |
Shopify, Inc., Class A* | | | 1,892 | | | | 2,758,164 | |
| | |
Softcat plc | | | 364 | | | | 9,695 | |
| | |
Solutions 30 SE* (a) | | | 5,136 | | | | 46,450 | |
| | |
Sopra Steria Group SACA | | | 792 | | | | 155,904 | |
See Accompanying Notes to the Financial Statements.
| | | | |
| 200 | | FLEXSHARES ANNUAL REPORT | | |
FlexShares® Morningstar Developed Markets ex-US Factor Tilt Index Fund (cont.)
| | | | | | | | |
| Investments | | Shares | | | Value | |
|
| COMMON STOCKS – (continued) | |
|
| IT Services – (continued) | |
| | |
SUNeVision Holdings Ltd. | | | 90,000 | | | $ | 82,722 | |
| | |
TietoEVRY OYJ | | | 1,598 | | | | 49,006 | |
| | |
TIS, Inc. | | | 6,100 | | | | 165,573 | |
| | |
Transcosmos, Inc. | | | 2,100 | | | | 63,078 | |
| | |
Tyro Payments Ltd.* | | | 55,200 | | | | 167,501 | |
| | |
Worldline SA* (b) | | | 3,094 | | | | 180,387 | |
| | | | | | | | 13,883,183 | |
|
| Leisure Products – 0.4% | |
| | |
Bandai Namco Holdings, Inc. | | | 4,500 | | | | 342,833 | |
| | |
BRP, Inc. | | | 639 | | | | 56,098 | |
| | |
Games Workshop Group plc | | | 684 | | | | 90,431 | |
| | |
Heiwa Corp. | | | 2,450 | | | | 43,575 | |
| | |
MIPS AB(b) | | | 440 | | | | 53,127 | |
| | |
Mizuno Corp.(a) | | | 8,800 | | | | 203,899 | |
| | |
Sega Sammy Holdings, Inc.(a) | | | 5,300 | | | | 75,020 | |
| | |
Shimano, Inc. | | | 1,700 | | | | 470,827 | |
| | |
Technogym SpA(b) | | | 4,905 | | | | 51,541 | |
| | |
Thule Group AB(b) | | | 2,805 | | | | 161,601 | |
| | |
Tomy Co. Ltd.(a) | | | 40,100 | | | | 379,811 | |
| | |
Universal Entertainment Corp.* | | | 300 | | | | 7,098 | |
| | |
Yamaha Corp. | | | 4,200 | | | | 264,468 | |
| | |
Yonex Co. Ltd.(a) | | | 10,000 | | | | 65,600 | |
| | | | | | | | 2,265,929 | |
|
| Life Sciences Tools & Services – 0.4% | |
| | |
Biotage AB | | | 7,040 | | | | 227,549 | |
| | |
Chemometec A/S | | | 1,408 | | | | 212,897 | |
| | |
Clinigen Group plc | | | 5,270 | | | | 44,282 | |
| | |
Eurofins Scientific SE(a) | | | 2,200 | | | | 259,534 | |
| | |
Evotec SE* | | | 3,042 | | | | 147,327 | |
| | |
Gerresheimer AG | | | 755 | | | | 69,286 | |
| | |
Lonza Group AG (Registered) | | | 1,188 | | | | 975,883 | |
| | |
QIAGEN NV* | | | 4,369 | | | | 243,615 | |
| | |
Sartorius Stedim Biotech | | | 260 | | | | 143,282 | |
| | |
Siegfried Holding AG (Registered)* | | | 165 | | | | 158,815 | |
| | |
Tecan Group AG (Registered) | | | 291 | | | | 178,342 | |
| | | | | | | | 2,660,812 | |
|
| Machinery – 3.3% | |
| | |
Aalberts NV | | | 1,404 | | | | 77,746 | |
| | |
Aichi Corp.(a) | | | 26,400 | | | | 186,612 | |
| | | | | | | | |
| Investments | | Shares | | | Value | |
|
| Machinery – (continued) | |
| | |
Aida Engineering Ltd. | | | 26,000 | | | $ | 235,089 | |
| | |
Alfa Laval AB | | | 5,280 | | | | 226,053 | |
| | |
Alstom SA | | | 4,634 | | | | 165,064 | |
| | |
Amada Co. Ltd. | | | 7,200 | | | | 70,848 | |
| | |
ANDRITZ AG(a) | | | 2,081 | | | | 117,955 | |
| | |
Atlas Copco AB, Class A | | | 11,044 | | | | 709,563 | |
| | |
Atlas Copco AB, Class B | | | 6,952 | | | | 375,992 | |
| | |
ATS Automation Tooling Systems, Inc.* | | | 6,312 | | | | 214,431 | |
| | |
Beijer Alma AB | | | 2,304 | | | | 57,811 | |
| | |
Bobst Group SA (Registered)* | | | 52 | | | | 4,245 | |
| | |
Bodycote plc | | | 11,283 | | | | 123,652 | |
| | |
Bucher Industries AG (Registered) | | | 275 | | | | 138,922 | |
| | |
Bystronic AG | | | 55 | | | | 75,721 | |
| | |
Cargotec OYJ, Class B | | | 684 | | | | 35,493 | |
| | |
CKD Corp. | | | 2,500 | | | | 49,309 | |
| | |
CNH Industrial NV | | | 22,220 | | | | 383,911 | |
| | |
Concentric AB | | | 914 | | | | 26,871 | |
| | |
Construcciones y Auxiliar de Ferrocarriles SA | | | 720 | | | | 31,621 | |
| | |
Daetwyler Holding AG | | | 352 | | | | 136,948 | |
| | |
Daifuku Co. Ltd. | | | 2,800 | | | | 256,610 | |
| | |
Daiwa Industries Ltd. | | | 1,600 | | | | 17,722 | |
| | |
Danieli & C Officine Meccaniche SpA(a) | | | 2,024 | | | | 68,160 | |
| | |
Danieli & C Officine Meccaniche SpA (Retirement Savings Plan) | | | 18,815 | | | | 406,732 | |
| | |
DMG Mori AG | | | 1,007 | | | | 48,945 | |
| | |
DMG Mori Co. Ltd.(a) | | | 2,100 | | | | 36,005 | |
| | |
Duerr AG | | | 2,684 | | | | 121,447 | |
| | |
Ebara Corp.(a) | | | 3,500 | | | | 190,309 | |
| | |
Electrolux Professional AB, Class B* | | | 4,532 | | | | 34,933 | |
| | |
Epiroc AB, Class A | | | 10,130 | | | | 252,056 | |
| | |
Epiroc AB, Class B | | | 7,876 | | | | 167,360 | |
| | |
FANUC Corp. | | | 3,100 | | | | 606,542 | |
| | |
Fincantieri SpA* (a) | | | 213,096 | | | | 168,185 | |
| | |
FLSmidth & Co. A/S(a) | | | 4,972 | | | | 189,186 | |
| | |
Fluidra SA | | | 912 | | | | 34,881 | |
| | |
Fuji Corp. | | | 1,000 | | | | 23,197 | |
| | |
Fujitec Co. Ltd. | | | 2,400 | | | | 54,283 | |
| | |
GEA Group AG | | | 4,200 | | | | 207,007 | |
See Accompanying Notes to the Financial Statements.
| | | | | | |
| | FLEXSHARES ANNUAL REPORT | | | 201 | |
FlexShares® Morningstar Developed Markets ex-US Factor Tilt Index Fund (cont.)
| | | | | | | | |
| Investments | | Shares | | | Value | |
|
| COMMON STOCKS – (continued) | |
|
| Machinery – (continued) | |
| | |
Georg Fischer AG (Registered) | | | 93 | | | $ | 140,963 | |
| | |
Glory Ltd. | | | 22,100 | | | | 474,077 | |
| | |
Harmonic Drive Systems, Inc.(a) | | | 1,500 | | | | 67,617 | |
| | |
Hino Motors Ltd. | | | 10,300 | | | | 97,196 | |
| | |
Hitachi Construction Machinery Co. Ltd. | | | 4,400 | | | | 139,882 | |
| | |
Hitachi Zosen Corp. | | | 21,200 | | | | 165,472 | |
| | |
Hoshizaki Corp.(a) | | | 1,200 | | | | 100,609 | |
| | |
IHI Corp. | | | 2,500 | | | | 58,189 | |
| | |
IMI plc | | | 1,824 | | | | 40,854 | |
| | |
Indutrade AB | | | 6,594 | | | | 191,866 | |
| | |
Interpump Group SpA | | | 2,231 | | | | 164,591 | |
| | |
Interroll Holding AG (Registered) | | | 34 | | | | 165,395 | |
| | |
Japan Steel Works Ltd. (The) | | | 2,200 | | | | 64,346 | |
| | |
Jungheinrich AG (Preference) | | | 3,036 | | | | 153,958 | |
| | |
Kawasaki Heavy Industries Ltd. | | | 2,800 | | | | 56,626 | |
| | |
KION Group AG | | | 1,848 | | | | 201,884 | |
| | |
Kitz Corp. | | | 30,700 | | | | 204,622 | |
| | |
Komatsu Ltd. | | | 16,900 | | | | 439,674 | |
| | |
Kone OYJ, Class B | | | 6,336 | | | | 432,315 | |
| | |
Konecranes OYJ | | | 2,273 | | | | 94,643 | |
| | |
Krones AG | | | 926 | | | | 95,641 | |
| | |
Kubota Corp.(a) | | | 17,600 | | | | 373,918 | |
| | |
Kurita Water Industries Ltd. | | | 3,400 | | | | 166,981 | |
| | |
Kyokuto Kaihatsu Kogyo Co. Ltd. | | | 17,700 | | | | 241,226 | |
| | |
Makita Corp. | | | 5,800 | | | | 267,708 | |
| | |
Manitou BF SA | | | 6,888 | | | | 234,750 | |
| | |
Max Co. Ltd. | | | 2,800 | | | | 44,446 | |
| | |
Meidensha Corp. | | | 16,700 | | | | 350,184 | |
| | |
Metso Outotec OYJ | | | 17,994 | | | | 180,748 | |
| | |
MINEBEA MITSUMI, Inc. | | | 8,811 | | | | 222,158 | |
| | |
MISUMI Group, Inc. | | | 2,900 | | | | 121,061 | |
| | |
Mitsubishi Heavy Industries Ltd. | | | 8,800 | | | | 224,505 | |
| | |
Mitsuboshi Belting Ltd.(a) | | | 8,800 | | | | 155,741 | |
| | |
Miura Co. Ltd. | | | 3,300 | | | | 126,328 | |
| | |
Morgan Advanced Materials plc | | | 30,448 | | | | 144,409 | |
| | |
Morita Holdings Corp. | | | 2,600 | | | | 32,607 | |
| | |
Nabtesco Corp.(a) | | | 4,400 | | | | 142,390 | |
| | |
Nachi-Fujikoshi Corp. | | | 8,700 | | | | 328,467 | |
| | | | | | | | |
| Investments | | Shares | | | Value | |
|
| Machinery – (continued) | |
| | |
Neles OYJ | | | 989 | | | $ | 14,833 | |
| | |
NGK Insulators Ltd. | | | 7,900 | | | | 131,084 | |
| | |
Nikkiso Co. Ltd.(a) | | | 22,400 | | | | 197,823 | |
| | |
Nitta Corp. | | | 12,200 | | | | 278,827 | |
| | |
Norma Group SE | | | 3,772 | | | | 162,383 | |
| | |
NSK Ltd. | | | 18,400 | | | | 123,447 | |
| | |
NTN Corp.* | | | 171,600 | | | | 370,214 | |
| | |
Obara Group, Inc.(a) | | | 4,400 | | | | 140,653 | |
| | |
OC Oerlikon Corp. AG (Registered) | | | 469 | | | | 4,771 | |
| | |
OKUMA Corp. | | | 1,000 | | | | 47,533 | |
| | |
Organo Corp. | | | 4,200 | | | | 265,942 | |
| | |
OSG Corp. | | | 1,500 | | | | 24,916 | |
| | |
Palfinger AG | | | 787 | | | | 34,791 | |
| | |
Pfeiffer Vacuum Technology AG | | | 398 | | | | 99,486 | |
| | |
Rational AG | | | 55 | | | | 54,712 | |
| | |
Rotork plc | | | 23,256 | | | | 112,912 | |
| | |
Sandvik AB | | | 16,280 | | | | 412,284 | |
| | |
Schindler Holding AG | | | 706 | | | | 184,043 | |
| | |
Schindler Holding AG (Registered) | | | 660 | | | | 169,596 | |
| | |
Sembcorp Marine Ltd.* | | | 791,769 | | | | 46,385 | |
| | |
SFS Group AG | | | 593 | | | | 79,954 | |
| | |
Shibaura Machine Co. Ltd. | | | 4,449 | | | | 103,553 | |
| | |
Shima Seiki Manufacturing Ltd. | | | 1,300 | | | | 24,888 | |
| | |
Shinmaywa Industries Ltd. | | | 12,600 | | | | 102,767 | |
| | |
SKF AB, Class A | | | 2,427 | | | | 57,083 | |
| | |
SKF AB, Class B | | | 3,728 | | | | 86,380 | |
| | |
SMC Corp. | | | 1,100 | | | | 655,418 | |
| | |
Spirax-Sarco Engineering plc | | | 1,437 | | | | 307,382 | |
| | |
Stabilus SA | | | 582 | | | | 43,779 | |
| | |
Sumitomo Heavy Industries Ltd. | | | 5,200 | | | | 133,620 | |
| | |
Tadano Ltd. | | | 8,900 | | | | 96,864 | |
| | |
Takeuchi Manufacturing Co. Ltd. | | | 4,400 | | | | 112,870 | |
| | |
Takuma Co. Ltd. | | | 4,600 | | | | 59,908 | |
| | |
Techtronic Industries Co. Ltd. | | | 32,500 | | | | 668,880 | |
| | |
Tocalo Co. Ltd.(a) | | | 8,200 | | | | 100,104 | |
| | |
Trelleborg AB, Class B | | | 6,724 | | | | 153,567 | |
| | |
Tsubakimoto Chain Co. | | | 11,000 | | | | 323,657 | |
| | |
Tsugami Corp. | | | 3,400 | | | | 46,516 | |
| | |
Tsukishima Kikai Co. Ltd. | | | 8,800 | | | | 89,679 | |
See Accompanying Notes to the Financial Statements.
| | | | |
| 202 | | FLEXSHARES ANNUAL REPORT | | |
FlexShares® Morningstar Developed Markets ex-US Factor Tilt Index Fund (cont.)
| | | | | | | | |
| Investments | | Shares | | | Value | |
|
| COMMON STOCKS – (continued) | |
|
| Machinery – (continued) | |
| | |
Union Tool Co. | | | 500 | | | $ | 16,838 | |
| | |
Valmet OYJ | | | 4,237 | | | | 172,105 | |
| | |
VAT Group AG(b) | | | 660 | | | | 315,789 | |
| | |
Vesuvius plc | | | 1,150 | | | | 7,440 | |
| | |
Volvo AB, Class A | | | 5,280 | | | | 124,676 | |
| | |
Volvo AB, Class B | | | 30,360 | | | | 706,709 | |
| | |
Wacker Neuson SE | | | 1,713 | | | | 56,220 | |
| | |
Wartsila OYJ Abp | | | 10,560 | | | | 146,586 | |
| | |
Weir Group plc (The) | | | 3,920 | | | | 93,227 | |
| | |
Yaskawa Electric Corp. | | | 4,400 | | | | 189,853 | |
| | | | | | | | 21,188,411 | |
|
| Marine – 0.5% | |
| | |
AP Moller – Maersk A/S, Class A | | | 52 | | | | 142,531 | |
| | |
AP Moller – Maersk A/S, Class B | | | 132 | | | | 381,830 | |
| | |
D/S Norden A/S | | | 12,496 | | | | 301,886 | |
| | |
Dfds A/S* | | | 1,804 | | | | 93,450 | |
| | |
Golden Ocean Group Ltd. | | | 49,236 | | | | 443,510 | |
| | |
Kawasaki Kisen Kaisha Ltd.* | | | 1,300 | | | | 62,478 | |
| | |
Kuehne + Nagel International AG (Registered) | | | 748 | | | | 236,004 | |
| | |
Mitsui OSK Lines Ltd. | | | 4,300 | | | | 270,011 | |
| | |
Nippon Yusen KK | | | 4,400 | | | | 315,650 | |
| | |
Pacific Basin Shipping Ltd.(a) | | | 2,024,000 | | | | 936,670 | |
| | |
Stolt-Nielsen Ltd. | | | 12,604 | | | | 193,694 | |
| | |
Wallenius Wilhelmsen ASA* | | | 19,236 | | | | 87,547 | |
| | |
Wilh Wilhelmsen Holding ASA, Class A | | | 2,468 | | | | 54,557 | |
| | | | | | | | 3,519,818 | |
|
| Media – 1.1% | |
| | |
4imprint Group plc | | | 3,450 | | | | 135,252 | |
| | |
Ascential plc* (b) | | | 19,337 | | | | 107,085 | |
| | |
Atresmedia Corp. de Medios de Comunicacion SA* | | | 55,220 | | | | 225,707 | |
| | |
Cogeco, Inc. | | | 3,080 | | | | 204,696 | |
| | |
Corus Entertainment, Inc., Class B(a) | | | 94,160 | | | | 426,153 | |
| | |
CyberAgent, Inc. | | | 8,800 | | | | 146,635 | |
| | |
Daily Mail & General Trust plc, Class A | | | 6,037 | | | | 86,062 | |
| | |
Dentsu Group, Inc.(a) | | | 2,100 | | | | 76,799 | |
| | | | | | | | |
| Investments | | Shares | | | Value | |
|
| Media – (continued) | |
| | |
Euromoney Institutional Investor plc | | | 4,083 | | | $ | 58,654 | |
| | |
Future plc | | | 3,272 | | | | 158,234 | |
| | |
Hakuhodo DY Holdings, Inc.(a) | | | 7,400 | | | | 120,581 | |
| | |
Informa plc* | | | 12,188 | | | | 86,775 | |
| | |
IPSOS | | | 16,412 | | | | 768,258 | |
| | |
ITV plc* | | | 33,220 | | | | 49,020 | |
| | |
JCDecaux SA* | | | 968 | | | | 25,272 | |
| | |
Lagardere SA* | | | 4,213 | | | | 111,356 | |
| | |
Mediaset Espana Comunicacion SA* | | | 67,232 | | | | 350,119 | |
| | |
Mediaset NV* | | | 33,079 | | | | 92,946 | |
| | |
Metropole Television SA | | | 7,314 | | | | 161,326 | |
| | |
Nine Entertainment Co. Holdings Ltd. | | | 10,556 | | | | 21,883 | |
| | |
Nippon Television Holdings, Inc. | | | 2,400 | | | | 25,889 | |
| | |
Pearson plc | | | 16,422 | | | | 135,603 | |
| | |
ProSiebenSat.1 Media SE | | | 9,500 | | | | 159,246 | |
| | |
Publicis Groupe SA | | | 4,512 | | | | 302,534 | |
| | |
Quebecor, Inc., Class B | | | 4,781 | | | | 121,651 | |
| | |
RAI Way SpA(b) | | | 8,120 | | | | 49,240 | |
| | |
Reach plc | | | 132,880 | | | | 576,490 | |
| | |
Schibsted ASA, Class A | | | 2,349 | | | | 120,986 | |
| | |
Schibsted ASA, Class B | | | 2,493 | | | | 112,401 | |
| | |
Seven West Media Ltd.* (a) | | | 520,432 | | | | 177,858 | |
| | |
Shaw Communications, Inc., Class B | | | 6,892 | | | | 198,161 | |
| | |
Singapore Press Holdings Ltd.(d) | | | 27,000 | | | | 39,844 | |
| | |
SKY Perfect JSAT Holdings, Inc. | | | 82,200 | | | | 307,822 | |
| | |
Stroeer SE & Co. KGaA | | | 620 | | | | 52,592 | |
| | |
Television Francaise 1 | | | 37,972 | | | | 406,913 | |
| | |
TX Group AG* | | | 650 | | | | 107,557 | |
| | |
Vivendi SE | | | 15,180 | | | | 195,609 | |
| | |
WPP plc | | | 23,942 | | | | 346,563 | |
| | |
YouGov plc(a) | | | 10,604 | | | | 191,868 | |
| | |
Zenrin Co. Ltd. | | | 2,400 | | | | 22,058 | |
| | | | | | | | 7,063,698 | |
|
| Metals & Mining – 5.0% | |
| | |
Acerinox SA | | | 11,176 | | | | 155,654 | |
| | |
Agnico Eagle Mines Ltd. | | | 2,999 | | | | 158,932 | |
| | |
Aichi Steel Corp. | | | 1,700 | | | | 39,524 | |
See Accompanying Notes to the Financial Statements.
| | | | | | |
| | FLEXSHARES ANNUAL REPORT | | | 203 | |
FlexShares® Morningstar Developed Markets ex-US Factor Tilt Index Fund (cont.)
| | | | | | | | |
| Investments | | Shares | | | Value | |
|
| COMMON STOCKS – (continued) | |
|
| Metals & Mining – (continued) | |
| | |
Alamos Gold, Inc., Class A | | | 3,957 | | | $ | 29,305 | |
| | |
Alumina Ltd.(a) | | | 7,644 | | | | 11,425 | |
| | |
Anglo American plc | | | 33,924 | | | | 1,293,899 | |
| | |
Antofagasta plc | | | 7,124 | | | | 139,203 | |
| | |
Aperam SA | | | 2,438 | | | | 145,527 | |
| | |
ArcelorMittal SA | | | 17,556 | | | | 595,787 | |
| | |
Asahi Holdings, Inc.(a) | | | 32,400 | | | | 577,673 | |
| | |
Aura Minerals, Inc.(a) | | | 17,996 | | | | 177,993 | |
| | |
Aurubis AG | | | 1,748 | | | | 150,987 | |
| | |
B2Gold Corp. | | | 13,052 | | | | 53,806 | |
| | |
Barrick Gold Corp. | | | 4,064 | | | | 74,457 | |
| | |
Barrick Gold Corp. – XLON | | | 22,380 | | | | 415,065 | |
| | |
Bekaert SA | | | 2,904 | | | | 127,302 | |
| | |
Bellevue Gold Ltd.* | | | 49,941 | | | | 32,259 | |
| | |
BHP Group Ltd.(a) | | | 48,136 | | | | 1,322,548 | |
| | |
BHP Group plc | | | 49,984 | | | | 1,325,776 | |
| | |
BlueScope Steel Ltd. | | | 13,860 | | | | 214,659 | |
| | |
Boliden AB | | | 5,544 | | | | 195,526 | |
| | |
Centamin plc | | | 509,520 | | | | 654,843 | |
| | |
Centerra Gold, Inc. | | | 10,411 | | | | 77,943 | |
| | |
Chalice Mining Ltd.* (a) | | | 23,892 | | | | 119,695 | |
| | |
Champion Iron Ltd.* | | | 27,104 | | | | 89,574 | |
| | |
Daido Steel Co. Ltd. | | | 2,000 | | | | 76,562 | |
| | |
Dowa Holdings Co. Ltd. | | | 2,200 | | | | 91,550 | |
| | |
Dundee Precious Metals, Inc. | | | 78,012 | | | | 512,297 | |
| | |
Eldorado Gold Corp.* (a) | | | 78,804 | | | | 703,772 | |
| | |
Endeavour Mining plc(a) | | | 2,501 | | | | 63,435 | |
| | |
Equinox Gold Corp.* (a) | | | 112,112 | | | | 830,292 | |
| | |
Eramet SA* | | | 4,664 | | | | 390,233 | |
| | |
Evolution Mining Ltd. | | | 35,786 | | | | 97,570 | |
| | |
Evraz plc | | | 23,537 | | | | 200,549 | |
| | |
Ferrexpo plc | | | 22,440 | | | | 95,970 | |
| | |
First Majestic Silver Corp.(a) | | | 7,676 | | | | 97,099 | |
| | |
First Quantum Minerals Ltd. | | | 13,288 | | | | 314,097 | |
| | |
Fortescue Metals Group Ltd. | | | 40,568 | | | | 424,456 | |
| | |
Fortuna Silver Mines, Inc.* (a) | | | 105,732 | | | | 511,792 | |
| | |
Franco-Nevada Corp. | | | 2,581 | | | | 367,697 | |
| | |
Glencore plc* | | | 239,140 | | | | 1,197,294 | |
| | |
Granges AB(a) | | | 35,024 | | | | 381,090 | |
| | |
Hill & Smith Holdings plc | | | 3,264 | | | | 82,056 | |
| | |
Hitachi Metals Ltd.* | | | 4,740 | | | | 89,666 | |
| | |
Hochschild Mining plc(a) | | | 152,856 | | | | 298,786 | |
| | | | | | | | |
| Investments | | Shares | | | Value | |
|
| Metals & Mining – (continued) | |
| | |
Hudbay Minerals, Inc.(a) | | | 19,756 | | | $ | 137,545 | |
| | |
IAMGOLD Corp.* (a) | | | 182,556 | | | | 502,211 | |
| | |
IGO Ltd. | | | 19,186 | | | | 138,918 | |
| | |
Iluka Resources Ltd. | | | 6,916 | | | | 48,829 | |
| | |
Ivanhoe Mines Ltd., Class A* (a) | | | 21,170 | | | | 165,835 | |
| | |
Jastrzebska Spolka Weglowa SA* | | | 25,872 | | | | 336,164 | |
| | |
JFE Holdings, Inc. | | | 8,800 | | | | 134,518 | |
| | |
KGHM Polska Miedz SA | | | 4,840 | | | | 186,236 | |
| | |
Kinross Gold Corp. | | | 24,079 | | | | 144,526 | |
| | |
Kirkland Lake Gold Ltd.(a) | | | 7,876 | | | | 331,484 | |
| | |
Kobe Steel Ltd.(a) | | | 7,000 | | | | 41,131 | |
| | |
Kyoei Steel Ltd. | | | 3,900 | | | | 48,021 | |
| | |
Labrador Iron Ore Royalty Corp.(a) | | | 27,236 | | | | 787,274 | |
| | |
Lithium Americas Corp.* | | | 7,392 | | | | 214,088 | |
| | |
Lundin Gold, Inc.* | | | 6,342 | | | | 57,968 | |
| | |
Lundin Mining Corp.(a) | | | 8,112 | | | | 70,482 | |
| | |
Lynas Rare Earths Ltd.* | | | 28,584 | | | | 157,371 | |
| | |
MAG Silver Corp.* | | | 4,656 | | | | 92,590 | |
| | |
Mineral Resources Ltd. | | | 3,784 | | | | 109,679 | |
| | |
Mitsubishi Materials Corp. | | | 900 | | | | 17,412 | |
| | |
Mount Gibson Iron Ltd. | | | 218,737 | | | | 69,003 | |
| | |
New Gold, Inc.* (a) | | | 287,012 | | | | 402,889 | |
| | |
Newcrest Mining Ltd. | | | 10,692 | | | | 199,886 | |
| | |
Nippon Light Metal Holdings Co. Ltd. | | | 22,000 | | | | 364,078 | |
| | |
Nippon Steel Corp. | | | 24,115 | | | | 422,766 | |
| | |
Norsk Hydro ASA | | | 42,080 | | | | 307,816 | |
| | |
Northern Star Resources Ltd. | | | 25,378 | | | | 176,127 | |
| | |
Novagold Resources, Inc.* (a) | | | 7,962 | | | | 58,067 | |
| | |
OceanaGold Corp.* | | | 1,000 | | | | 1,864 | |
| | |
OceanaGold Corp.* (a) | | | 252,836 | | | | 471,180 | |
| | |
Osisko Gold Royalties Ltd. | | | 5,548 | | | | 69,957 | |
| | |
Osisko Mining, Inc.* (a) | | | 50,028 | | | | 107,761 | |
| | |
Outokumpu OYJ* (a) | | | 14,960 | | | | 93,487 | |
| | |
OZ Minerals Ltd.(a) | | | 10,560 | | | | 199,322 | |
| | |
Pan American Silver Corp. | | | 4,082 | | | | 104,293 | |
| | |
Perenti Global Ltd.(a) | | | 411,532 | | | | 315,284 | |
| | |
Perseus Mining Ltd.* | | | 561,352 | | | | 666,178 | |
| | |
Petropavlovsk plc* | | | 1,133,396 | | | | 370,379 | |
| | |
Polymetal International plc | | | 5,376 | | | | 99,852 | |
| | |
Pretium Resources, Inc.* | | | 5,096 | | | | 61,544 | |
See Accompanying Notes to the Financial Statements.
| | | | |
| 204 | | FLEXSHARES ANNUAL REPORT | | |
FlexShares® Morningstar Developed Markets ex-US Factor Tilt Index Fund (cont.)
| | | | | | | | |
| Investments | | Shares | | | Value | |
|
| COMMON STOCKS – (continued) | |
|
| Metals & Mining – (continued) | |
| | |
Ramelius Resources Ltd.(a) | | | 381,920 | | | $ | 456,108 | |
| | |
Regis Resources Ltd. | | | 339,372 | | | | 509,805 | |
| | |
Rio Tinto Ltd. | | | 9,548 | | | | 647,515 | |
| | |
Rio Tinto plc | | | 23,936 | | | | 1,496,312 | |
| | |
Salzgitter AG* | | | 16,852 | | | | 620,553 | |
| | |
Sandfire Resources Ltd.(a) | | | 154,176 | | | | 643,857 | |
| | |
Sandstorm Gold Ltd.* | | | 13,772 | | | | 86,995 | |
| | |
Sanyo Special Steel Co. Ltd. | | | 4,800 | | | | 78,846 | |
| | |
Silver Lake Resources Ltd.* (a) | | | 413,556 | | | | 526,504 | |
| | |
Sims Ltd. | | | 5,980 | | | | 64,185 | |
| | |
South32 Ltd. | | | 149,850 | | | | 401,812 | |
| | |
SSAB AB, Class A* | | | 13,394 | | | | 76,261 | |
| | |
SSR Mining, Inc. | | | 8,601 | | | | 135,446 | |
| | |
St Barbara Ltd.(a) | | | 205,612 | | | | 226,248 | |
| | |
Stelco Holdings, Inc. | | | 18,216 | | | | 631,472 | |
| | |
Sumitomo Metal Mining Co. Ltd. | | | 5,100 | | | | 197,828 | |
| | |
Teck Resources Ltd., Class B | | | 12,320 | | | | 343,296 | |
| | |
Toho Titanium Co. Ltd. | | | 200 | | | | 2,096 | |
| | |
Tokyo Steel Manufacturing Co.
Ltd.(a) | | | 35,200 | | | | 390,820 | |
| | |
Torex Gold Resources, Inc.* (a) | | | 26,268 | | | | 304,947 | |
| | |
Turquoise Hill Resources Ltd.* (a) | | | 8,140 | | | | 102,969 | |
| | |
UACJ Corp.* | | | 9,600 | | | | 221,594 | |
| | |
voestalpine AG(a) | | | 1,880 | | | | 71,448 | |
| | |
Westgold Resources Ltd.(a) | | | 160,719 | | | | 235,396 | |
| | |
Wheaton Precious Metals Corp. | | | 6,328 | | | | 255,050 | |
| | |
Yamana Gold, Inc.(a) | | | 24,430 | | | | 95,785 | |
| | |
Yodogawa Steel Works Ltd.(a) | | | 2,900 | | | | 63,176 | |
| | | | | | | | 32,175,964 | |
|
| Multiline Retail – 0.5% | |
| | |
B&M European Value Retail SA | | | 23,980 | | | | 208,137 | |
| | |
Canadian Tire Corp. Ltd., Class A(a) | | | 1,248 | | | | 176,978 | |
| | |
Dollarama, Inc. | | | 4,444 | | | | 200,554 | |
| | |
Europris ASA(b) | | | 67,716 | | | | 499,507 | |
| | |
H2O Retailing Corp. | | | 14,415 | | | | 114,663 | |
| | |
Harvey Norman Holdings Ltd.(a) | | | 5,610 | | | | 20,900 | |
| | | | | | | | |
| Investments | | Shares | | | Value | |
|
| Multiline Retail – (continued) | |
| | |
Isetan Mitsukoshi Holdings Ltd. | | | 300 | | | $ | 2,184 | |
| | |
Izumi Co. Ltd. | | | 1,300 | | | | 39,276 | |
| | |
J Front Retailing Co. Ltd. | | | 300 | | | | 2,765 | |
| | |
Marks & Spencer Group plc* | | | 63,352 | | | | 159,438 | |
| | |
Marui Group Co. Ltd. | | | 5,500 | | | | 107,516 | |
| | |
Next plc | | | 2,420 | | | | 264,249 | |
| | |
Pan Pacific International Holdings Corp. | | | 11,900 | | | | 249,010 | |
| | |
Ryohin Keikaku Co. Ltd. | | | 6,000 | | | | 117,764 | |
| | |
Seria Co. Ltd. | | | 1,000 | | | | 32,975 | |
| | |
Warehouse Group Ltd. (The)(a) | | | 11,552 | | | | 33,317 | |
| | |
Wesfarmers Ltd. | | | 20,260 | | | | 871,190 | |
| | | | | | | | 3,100,423 | |
|
| Multi-Utilities – 0.7% | |
| | |
A2A SpA | | | 78,430 | | | | 165,007 | |
| | |
ACEA SpA | | | 1,552 | | | | 33,694 | |
| | |
AGL Energy Ltd.(a) | | | 1,188 | | | | 5,104 | |
| | |
Algonquin Power & Utilities Corp.(a) | | | 8,846 | | | | 127,314 | |
| | |
Atco Ltd., Class I | | | 1,064 | | | | 36,052 | |
| | |
Centrica plc* | | | 35,992 | | | | 29,760 | |
| | |
E.ON SE | | | 58,960 | | | | 748,226 | |
| | |
Engie SA | | | 35,728 | | | | 508,393 | |
| | |
Hera SpA | | | 30,628 | | | | 125,366 | |
| | |
Iren SpA | | | 34,534 | | | | 107,345 | |
| | |
National Grid plc | | | 61,183 | | | | 784,488 | |
| | |
REN – Redes Energeticas Nacionais SGPS SA | | | 161,524 | | | | 492,544 | |
| | |
RWE AG | | | 9,680 | | | | 372,697 | |
| | |
Sembcorp Industries Ltd. | | | 4,000 | | | | 5,962 | |
| | |
Suez SA | | | 9,640 | | | | 219,604 | |
| | |
Telecom Plus plc | | | 4,843 | | | | 82,849 | |
| | |
Veolia Environnement SA | | | 18,127 | | | | 592,194 | |
| | | | | | | | 4,436,599 | |
|
| Oil, Gas & Consumable Fuels – 4.4% | |
| | |
Aker BP ASA | | | 1,828 | | | | 69,993 | |
| | |
Ampol Ltd. | | | 6,084 | | | | 139,604 | |
| | |
ARC Resources Ltd.(a) | | | 27,764 | | | | 265,870 | |
| | |
Beach Energy Ltd.(a) | | | 90,532 | | | | 94,858 | |
| | |
BP plc | | | 499,488 | | | | 2,397,725 | |
| | |
BRIGHTOIL*‡ (d) | | | 50,147 | | | | — | |
| | |
BW LPG Ltd.(b) | | | 36,652 | | | | 194,974 | |
See Accompanying Notes to the Financial Statements.
| | | | | | |
| | FLEXSHARES ANNUAL REPORT | | | 205 | |
FlexShares® Morningstar Developed Markets ex-US Factor Tilt Index Fund (cont.)
| | | | | | | | |
| Investments | | Shares | | | Value | |
|
| COMMON STOCKS – (continued) | |
|
| Oil, Gas & Consumable Fuels – (continued) | |
| | |
Cairn Energy plc | | | 23,656 | | | $ | 59,308 | |
| | |
Cameco Corp.(a) | | | 9,372 | | | | 227,353 | |
| | |
Canadian Natural Resources Ltd.(a) | | | 30,844 | | | | 1,308,858 | |
| | |
Cenovus Energy, Inc.(a) | | | 30,536 | | | | 364,594 | |
| | |
China Aviation Oil Singapore Corp. Ltd. | | | 3,600 | | | | 2,670 | |
| | |
Cosmo Energy Holdings Co. Ltd. | | | 5,000 | | | | 102,302 | |
| | |
Crescent Point Energy Corp. | | | 223,784 | | | | 1,122,937 | |
| | |
CropEnergies AG | | | 14,916 | | | | 214,043 | |
| | |
Diversified Energy Co. plc(b) | | | 286,352 | | | | 452,965 | |
| | |
DNO ASA* | | | 261,448 | | | | 380,151 | |
| | |
Enbridge, Inc. | | | 31,724 | | | | 1,326,749 | |
| | |
ENEOS Holdings, Inc. | | | 57,250 | | | | 230,757 | |
| | |
Energean plc* | | | 3,432 | | | | 42,222 | |
| | |
Eni SpA | | | 52,536 | | | | 754,129 | |
| | |
Equinor ASA | | | 22,924 | | | | 579,245 | |
| | |
Equital Ltd.* | | | 8,140 | | | | 250,529 | |
| | |
Euronav NV | | | 85,976 | | | | 914,366 | |
| | |
FLEX LNG Ltd. | | | 13,244 | | | | 267,094 | |
| | |
Galp Energia SGPS SA | | | 2,640 | | | | 27,472 | |
| | |
Gaztransport Et Technigaz SA | | | 660 | | | | 54,534 | |
| | |
Gibson Energy, Inc. | | | 7,971 | | | | 160,378 | |
| | |
Hafnia Ltd.* | | | 46,860 | | | | 99,489 | |
| | |
Idemitsu Kosan Co. Ltd. | | | 4,282 | | | | 116,978 | |
| | |
Imperial Oil Ltd.(a) | | | 6,600 | | | | 223,097 | |
| | |
Inpex Corp.(a) | | | 15,200 | | | | 126,905 | |
| | |
Itochu Enex Co. Ltd.(a) | | | 17,700 | | | | 155,695 | |
| | |
Iwatani Corp. | | | 2,197 | | | | 129,094 | |
| | |
Japan Petroleum Exploration Co. Ltd.(a) | | | 14,900 | | | | 271,408 | |
| | |
Keyera Corp.(a) | | | 1,840 | | | | 47,085 | |
| | |
Koninklijke Vopak NV | | | 1,558 | | | | 62,023 | |
| | |
Lundin Energy AB | | | 4,170 | | | | 164,693 | |
| | |
Mitsuuroko Group Holdings Co. Ltd. | | | 1,200 | | | | 14,281 | |
| | |
Neste OYJ | | | 7,656 | | | | 426,959 | |
| | |
New Hope Corp. Ltd.(a) | | | 213,268 | | | | 321,973 | |
| | |
NexGen Energy Ltd.* (a) | | | 37,092 | | | | 204,679 | |
| | |
Norwegian Energy Co.* (a) | | | 13,420 | | | | 259,856 | |
| | |
Oil Refineries Ltd.* | | | 562,716 | | | | 152,584 | |
| | | | | | | | |
| Investments | | Shares | | | Value | |
|
| Oil, Gas & Consumable Fuels – (continued) | |
| | |
OMV AG(a) | | | 4,884 | | | $ | 296,165 | |
| | |
Parex Resources, Inc. | | | 52,272 | | | | 1,013,348 | |
| | |
Parkland Corp. | | | 2,207 | | | | 64,115 | |
| | |
Paz Oil Co. Ltd.* | | | 3,916 | | | | 498,920 | |
| | |
Pembina Pipeline Corp. | | | 10,648 | | | | 351,941 | |
| | |
Polski Koncern Naftowy ORLEN SA | | | 11,308 | | | | 244,106 | |
| | |
PrairieSky Royalty Ltd.(a) | | | 8,096 | | | | 99,473 | |
| | |
Repsol SA | | | 26,400 | | | | 337,776 | |
| | |
Royal Dutch Shell plc, Class A | | | 92,884 | | | | 2,140,262 | |
| | |
Royal Dutch Shell plc, Class B | | | 82,940 | | | | 1,915,677 | |
| | |
San-Ai Oil Co. Ltd.(a) | | | 26,100 | | | | 338,310 | |
| | |
Santos Ltd.(a) | | | 38,368 | | | | 201,151 | |
| | |
Suncor Energy, Inc. | | | 21,516 | | | | 565,000 | |
| | |
TC Energy Corp. | | | 16,060 | | | | 867,425 | |
| | |
TotalEnergies SE | | | 57,992 | | | | 2,910,615 | |
| | |
Tourmaline Oil Corp. | | | 7,144 | | | | 257,796 | |
| | |
Tullow Oil plc* | | | 130,944 | | | | 82,512 | |
| | |
United Energy Group Ltd.(a) | | | 198,000 | | | | 17,563 | |
| | |
Washington H Soul Pattinson & Co. Ltd. | | | 3,009 | | | | 73,407 | |
| | |
Whitecap Resources, Inc.(a) | | | 199,804 | | | | 1,197,647 | |
| | |
Whitehaven Coal Ltd.* (a) | | | 98,472 | | | | 193,042 | |
| | |
Woodside Petroleum Ltd. | | | 10,868 | | | | 189,870 | |
| | |
Z Energy Ltd. | | | 38,324 | | | | 98,736 | |
| | | | | | | | 28,737,336 | |
|
| Paper & Forest Products – 0.5% | |
| | |
Canfor Corp.* | | | 1,464 | | | | 30,283 | |
| | |
Daiken Corp. | | | 6,500 | | | | 141,658 | |
| | |
Daio Paper Corp. | | | 3,745 | | | | 65,654 | |
| | |
Hokuetsu Corp.(a) | | | 57,300 | | | | 376,891 | |
| | |
Holmen AB, Class B | | | 1,540 | | | | 68,281 | |
| | |
Interfor Corp. | | | 25,168 | | | | 575,419 | |
| | |
Metsa Board OYJ | | | 6,595 | | | | 61,056 | |
| | |
Mondi plc | | | 11,176 | | | | 279,581 | |
| | |
Navigator Co. SA (The)(a) | | | 5,269 | | | | 20,610 | |
| | |
Nippon Paper Industries Co. Ltd.(a) | | | 47,700 | | | | 487,354 | |
| | |
Oji Holdings Corp. | | | 26,000 | | | | 128,603 | |
| | |
Stella-Jones, Inc. | | | 3,652 | | | | 130,901 | |
| | |
Stora Enso OYJ, Class R | | | 9,108 | | | | 151,569 | |
| | |
Svenska Cellulosa AB SCA, Class A | | | 3,160 | | | | 49,745 | |
See Accompanying Notes to the Financial Statements.
| | | | |
| 206 | | FLEXSHARES ANNUAL REPORT | | |
FlexShares® Morningstar Developed Markets ex-US Factor Tilt Index Fund (cont.)
| | | | | | | | |
| Investments | | Shares | | | Value | |
|
| COMMON STOCKS – (continued) | |
|
| Paper & Forest Products – (continued) | |
| | |
Svenska Cellulosa AB SCA, Class B | | | 6,688 | | | $ | 104,270 | |
| | |
Tokushu Tokai Paper Co. Ltd.(a) | | | 4,400 | | | | 170,945 | |
| | |
UPM-Kymmene OYJ | | | 10,208 | | | | 360,539 | |
| | |
West Fraser Timber Co. Ltd.(a) | | | 2,747 | | | | 219,596 | |
| | | | | | | | 3,422,955 | |
|
| Personal Products – 1.0% | |
| | |
Beiersdorf AG | | | 1,320 | | | | 140,384 | |
| | |
Blackmores Ltd. | | | 46 | | | | 3,254 | |
| | |
euglena Co. Ltd.* (a) | | | 17,600 | | | | 124,562 | |
| | |
Fancl Corp. | | | 400 | | | | 12,067 | |
| | |
Interparfums SA | | | 719 | | | | 58,078 | |
| | |
Jamieson Wellness, Inc.(a) (b) | | | 2,330 | | | | 71,636 | |
| | |
Kao Corp.(a) | | | 7,800 | | | | 439,919 | |
| | |
Kobayashi Pharmaceutical Co.
Ltd.(a) | | | 1,400 | | | | 111,853 | |
| | |
Kose Corp.(a) | | | 700 | | | | 80,973 | |
| | |
L’Occitane International SA | | | 15,500 | | | | 55,293 | |
| | |
L’Oreal SA | | | 4,224 | | | | 1,930,604 | |
| | |
Mandom Corp. | | | 2,600 | | | | 37,715 | |
| | |
Milbon Co. Ltd. | | | 1,000 | | | | 59,636 | |
| | |
Noevir Holdings Co. Ltd. | | | 1,900 | | | | 92,646 | |
| | |
Ontex Group NV* (a) | | | 23,804 | | | | 224,234 | |
| | |
Pola Orbis Holdings, Inc.(a) | | | 2,000 | | | | 42,622 | |
| | |
Rohto Pharmaceutical Co. Ltd. | | | 2,000 | | | | 60,952 | |
| | |
Shiseido Co. Ltd.(a) | | | 6,700 | | | | 445,100 | |
| | |
Unilever plc | | | 20,736 | | | | 1,111,942 | |
| | |
Unilever plc | | | 23,440 | | | | 1,256,202 | |
| | | | | | | | 6,359,672 | |
|
| Pharmaceuticals – 4.5% | |
| | |
ALK-Abello A/S* | | | 208 | | | | 90,210 | |
| | |
Almirall SA | | | 4,404 | | | | 65,490 | |
| | |
Astellas Pharma, Inc. | | | 30,600 | | | | 514,450 | |
| | |
AstraZeneca plc | | | 26,048 | | | | 3,247,040 | |
| | |
Bausch Health Cos., Inc.* | | | 7,348 | | | | 205,641 | |
| | |
Bayer AG (Registered) | | | 21,868 | | | | 1,231,679 | |
| | |
Canopy Growth Corp.* | | | 6,156 | | | | 77,723 | |
| | |
Chugai Pharmaceutical Co. Ltd. | | | 9,200 | | | | 342,665 | |
| | |
COSMO Pharmaceuticals NV* (a) | | | 413 | | | | 31,503 | |
| | |
Cronos Group, Inc.* | | | 13,640 | | | | 70,646 | |
| | | | | | | | |
| Investments | | Shares | | | Value | |
|
| Pharmaceuticals – (continued) | |
| | |
Daiichi Sankyo Co. Ltd. | | | 30,300 | | | $ | 761,851 | |
| | |
Dechra Pharmaceuticals plc | | | 3,080 | | | | 216,162 | |
| | |
Eisai Co. Ltd. | | | 5,500 | | | | 387,183 | |
| | |
Faes Farma SA | | | 16,374 | | | | 66,851 | |
| | |
Financiere de Tubize SA(a) | | | 751 | | | | 82,825 | |
| | |
GlaxoSmithKline plc | | | 114,312 | | | | 2,363,873 | |
| | |
H Lundbeck A/S | | | 484 | | | | 13,470 | |
| | |
Haw Par Corp. Ltd. | | | 3,200 | | | | 29,900 | |
| | |
HEXO Corp.* | | | 8,008 | | | | 11,629 | |
| | |
Hikma Pharmaceuticals plc | | | 2,900 | | | | 95,682 | |
| | |
Hisamitsu Pharmaceutical Co., Inc. | | | 1,900 | | | | 64,486 | |
| | |
Hutchmed China Ltd.* (a) | | | 7,150 | | | | 42,879 | |
| | |
Indivior plc* | | | 61,154 | | | | 203,867 | |
| | |
Ipsen SA | | | 770 | | | | 79,663 | |
| | |
JCR Pharmaceuticals Co. Ltd.(a) | | | 2,400 | | | | 58,913 | |
| | |
Kaken Pharmaceutical Co. Ltd.(a) | | | 1,500 | | | | 59,066 | |
| | |
Kissei Pharmaceutical Co. Ltd. | | | 1,400 | | | | 27,957 | |
| | |
KYORIN Holdings, Inc. | | | 22,000 | | | | 336,873 | |
| | |
Kyowa Kirin Co. Ltd. | | | 4,400 | | | | 144,319 | |
| | |
Merck KGaA | | | 2,508 | | | | 592,667 | |
| | |
Mochida Pharmaceutical Co. Ltd. | | | 900 | | | | 26,126 | |
| | |
Nichi-iko Pharmaceutical Co. Ltd.(a) | | | 30,400 | | | | 230,083 | |
| | |
Nippon Shinyaku Co. Ltd. | | | 2,000 | | | | 159,790 | |
| | |
Novartis AG (Registered) | | | 41,712 | | | | 3,452,909 | |
| | |
Novo Nordisk A/S, Class B | | | 28,336 | | | | 3,104,536 | |
| | |
Ono Pharmaceutical Co. Ltd. | | | 5,000 | | | | 104,604 | |
| | |
Orion OYJ, Class A | | | 1,474 | | | | 63,626 | |
| | |
Orion OYJ, Class B | | | 1,404 | | | | 60,815 | |
| | |
Otsuka Holdings Co. Ltd.(a) | | | 10,100 | | | | 398,065 | |
| | |
Recordati Industria Chimica e Farmaceutica SpA | | | 2,359 | | | | 147,745 | |
| | |
Roche Holding AG | | | 11,792 | | | | 4,569,037 | |
| | |
Roche Holding AG – BR | | | 496 | | | | 213,328 | |
| | |
Sanofi | | | 19,360 | | | | 1,936,409 | |
| | |
Santen Pharmaceutical Co. Ltd. | | | 4,500 | | | | 63,184 | |
| | |
Seikagaku Corp. | | | 1,800 | | | | 15,849 | |
| | |
Shionogi & Co. Ltd. | | | 4,100 | | | | 266,334 | |
| | |
Sosei Group Corp.* (a) | | | 9,600 | | | | 152,977 | |
| | |
Sumitomo Dainippon Pharma Co. Ltd.(a) | | | 3,600 | | | | 50,736 | |
See Accompanying Notes to the Financial Statements.
| | | | | | |
| | FLEXSHARES ANNUAL REPORT | | | 207 | |
FlexShares® Morningstar Developed Markets ex-US Factor Tilt Index Fund (cont.)
| | | | | | | | |
| Investments | | Shares | | | Value | |
|
| COMMON STOCKS – (continued) | |
|
| Pharmaceuticals – (continued) | |
| | |
Taisho Pharmaceutical Holdings Co. Ltd. | | | 600 | | | $ | 32,098 | |
| | |
Takeda Pharmaceutical Co. Ltd. | | | 39,617 | | | | 1,112,855 | |
| | |
Teva Pharmaceutical Industries Ltd.* | | | 17,072 | | | | 150,881 | |
| | |
Tilray, Inc.* | | | 10,564 | | | | 108,406 | |
| | |
Torii Pharmaceutical Co. Ltd. | | | 800 | | | | 20,697 | |
| | |
Towa Pharmaceutical Co. Ltd.(a) | | | 10,000 | | | | 256,523 | |
| | |
Tsumura & Co. | | | 900 | | | | 27,941 | |
| | |
UCB SA | | | 3,652 | | | | 435,729 | |
| | |
Vifor Pharma AG | | | 837 | | | | 108,180 | |
| | |
Virbac SA | | | 212 | | | | 107,335 | |
| | |
ZERIA Pharmaceutical Co. Ltd.(a) | | | 1,800 | | | | 32,109 | |
| | | | | | | | 28,926,070 | |
|
| Professional Services – 1.5% | |
| | |
Adecco Group AG (Registered)(a) | | | 3,960 | | | | 199,658 | |
| | |
AFRY AB, Class B | | | 4,429 | | | | 131,913 | |
| | |
ALS Ltd. | | | 13,503 | | | | 133,977 | |
| | |
Applus Services SA | | | 59,004 | | | | 534,651 | |
| | |
BayCurrent Consulting, Inc. | | | 400 | | | | 164,525 | |
| | |
Benefit One, Inc. | | | 2,000 | | | | 100,855 | |
| | |
Bureau Veritas SA | | | 4,296 | | | | 136,519 | |
| | |
DKSH Holding AG | | | 660 | | | | 52,945 | |
| | |
en-japan, Inc. | | | 1,700 | | | | 67,240 | |
| | |
Experian plc | | | 15,972 | | | | 732,779 | |
| | |
Funai Soken Holdings, Inc. | | | 2,700 | | | | 74,707 | |
| | |
Hays plc | | | 34,264 | | | | 77,966 | |
| | |
Intertek Group plc | | | 2,376 | | | | 159,425 | |
| | |
Intertrust NV* (b) | | | 35,860 | | | | 542,807 | |
| | |
IPH Ltd. | | | 21,158 | | | | 136,034 | |
| | |
JAC Recruitment Co. Ltd. | | | 1,300 | | | | 25,447 | |
| | |
LifeWorks, Inc. | | | 2,428 | | | | 62,661 | |
| | |
McMillan Shakespeare Ltd.(a) | | | 34,804 | | | | 357,874 | |
| | |
Meitec Corp. | | | 1,500 | | | | 89,717 | |
| | |
Nihon M&A Center Holdings, Inc. | | | 4,800 | | | | 146,705 | |
| | |
Nomura Co. Ltd. | | | 6,000 | | | | 58,934 | |
| | |
Omni Bridgeway Ltd.* (a) | | | 113,564 | | | | 264,424 | |
| | |
Outsourcing, Inc. | | | 4,800 | | | | 91,601 | |
| | | | | | | | |
| Investments | | Shares | | | Value | |
|
| Professional Services – (continued) | |
| | |
Pagegroup plc | | | 20,728 | | | $ | 188,662 | |
| | |
Persol Holdings Co. Ltd. | | | 5,700 | | | | 152,467 | |
| | |
Randstad NV | | | 2,596 | | | | 186,863 | |
| | |
Recruit Holdings Co. Ltd. | | | 28,100 | | | | 1,866,022 | |
| | |
RELX plc | | | 32,560 | | | | 1,010,460 | |
| | |
RWS Holdings plc | | | 13,752 | | | | 117,250 | |
| | |
SGS SA (Registered) | | | 88 | | | | 260,798 | |
| | |
SmartGroup Corp. Ltd. | | | 7,766 | | | | 46,781 | |
| | |
SMS Co. Ltd. | | | 3,200 | | | | 124,043 | |
| | |
Stantec, Inc. | | | 1,027 | | | | 56,671 | |
| | |
Synergie SE | | | 440 | | | | 20,342 | |
| | |
TechnoPro Holdings, Inc. | | | 1,100 | | | | 34,970 | |
| | |
Teleperformance | | | 924 | | | | 386,124 | |
| | |
Thomson Reuters Corp. | | | 2,072 | | | | 248,847 | |
| | |
Wolters Kluwer NV | | | 5,324 | | | | 558,451 | |
| | | | | | | | 9,602,115 | |
|
| Real Estate Management & Development – 2.5% | |
| | |
ADLER Group SA(a) (b) | | | 5,290 | | | | 71,809 | |
| | |
Aedas Homes SA(b) | | | 8,624 | | | | 248,006 | |
| | |
Aeon Mall Co. Ltd. | | | 1,990 | | | | 29,006 | |
| | |
AFI Properties Ltd.* | | | 165 | | | | 8,572 | |
| | |
Airport City Ltd.* | | | 1,928 | | | | 36,815 | |
| | |
Allreal Holding AG (Registered) | | | 366 | | | | 77,546 | |
| | |
Alrov Properties and Lodgings Ltd.* | | | 108 | | | | 5,956 | |
| | |
Altus Group Ltd. | | | 1,792 | | | | 93,839 | |
| | |
Amot Investments Ltd. | | | 11,168 | | | | 85,294 | |
| | |
Aroundtown SA | | | 8,756 | | | | 60,899 | |
| | |
Atrium Ljungberg AB, Class B | | | 2,912 | | | | 66,862 | |
| | |
Azrieli Group Ltd. | | | 1,016 | | | | 95,071 | |
| | |
Big Shopping Centers Ltd. | | | 16 | | | | 2,401 | |
| | |
Blue Square Real Estate Ltd. | | | 283 | | | | 21,874 | |
| | |
Bukit Sembawang Estates Ltd. | | | 44,000 | | | | 170,649 | |
| | |
C C Land Holdings Ltd. | | | 138,000 | | | | 30,868 | |
| | |
CA Immobilien Anlagen AG | | | 1,760 | | | | 75,360 | |
| | |
Capitaland Investment Ltd.* | | | 62,731 | | | | 160,026 | |
| | |
Castellum AB(a) | | | 6,732 | | | | 179,029 | |
| | |
Catena AB | | | 1,676 | | | | 102,061 | |
| | |
Cibus Nordic Real Estate AB(a) | | | 5,094 | | | | 134,757 | |
| | |
City Developments Ltd. | | | 600 | | | | 3,257 | |
| | |
CK Asset Holdings Ltd. | | | 44,000 | | | | 271,781 | |
| | |
CLS Holdings plc | | | 14,403 | | | | 44,224 | |
See Accompanying Notes to the Financial Statements.
| | | | |
| 208 | | FLEXSHARES ANNUAL REPORT | | |
FlexShares® Morningstar Developed Markets ex-US Factor Tilt Index Fund (cont.)
| | | | | | | | |
| Investments | | Shares | | | Value | |
|
| COMMON STOCKS – (continued) | |
|
| Real Estate Management & Development – (continued) | |
| | |
Colliers International Group, Inc.(a) | | | 1,142 | | | $ | 165,411 | |
| | |
Corem Property Group AB, Class B | | | 67,178 | | | | 222,923 | |
| | |
Daibiru Corp.(a) | | | 3,300 | | | | 45,698 | |
| | |
Daito Trust Construction Co. Ltd.(a) | | | 1,900 | | | | 235,282 | |
| | |
Daiwa House Industry Co. Ltd. | | | 16,200 | | | | 532,920 | |
| | |
Deutsche EuroShop AG | | | 19,844 | | | | 403,486 | |
| | |
Deutsche Wohnen SE* (d) | | | 6,110 | | | | 374,752 | |
| | |
Dios Fastigheter AB | | | 40,744 | | | | 474,165 | |
| | |
Fabege AB | | | 8,276 | | | | 139,917 | |
| | |
Far East Consortium International Ltd. | | | 504,358 | | | | 166,627 | |
| | |
Fastighets AB Balder, Class B* | | | 2,816 | | | | 204,007 | |
| | |
FastPartner AB, Class A | | | 6,642 | | | | 94,659 | |
| | |
FirstService Corp. | | | 676 | | | | 134,616 | |
| | |
Gav-Yam Lands Corp. Ltd. | | | 977 | | | | 11,643 | |
| | |
Gazit-Globe Ltd. | | | 23,040 | | | | 187,204 | |
| | |
Goldcrest Co. Ltd. | | | 1,000 | | | | 14,286 | |
| | |
Grand City Properties SA | | | 2,508 | | | | 64,317 | |
| | |
Great Eagle Holdings Ltd.(a) | | | 143,555 | | | | 395,839 | |
| | |
GuocoLand Ltd.* | | | 36,400 | | | | 45,888 | |
| | |
Henderson Land Development Co. Ltd. | | | 33,239 | | | | 139,296 | |
| | |
Hiag Immobilien Holding AG | | | 355 | | | | 37,685 | |
| | |
Ho Bee Land Ltd. | | | 82,200 | | | | 171,898 | |
| | |
Hufvudstaden AB, Class A | | | 2,610 | | | | 41,694 | |
| | |
Hulic Co. Ltd. | | | 4,900 | | | | 46,970 | |
| | |
Hysan Development Co. Ltd. | | | 19,000 | | | | 66,068 | |
| | |
Ichigo, Inc.(a) | | | 5,500 | | | | 16,400 | |
| | |
Immobel SA(a) | | | 1,100 | | | | 96,873 | |
| | |
IMMOFINANZ AG* | | | 2,253 | | | | 54,023 | |
| | |
Intershop Holding AG | | | 76 | | | | 47,659 | |
| | |
Israel Canada T.R Ltd. | | | 26,616 | | | | 128,660 | |
| | |
Isras Investment Co. Ltd. | | | 312 | | | | 69,687 | |
| | |
IWG plc* | | | 18,668 | | | | 79,198 | |
| | |
Jeudan A/S | | | 560 | | | | 23,869 | |
| | |
K Wah International Holdings Ltd. | | | 409,089 | | | | 163,550 | |
| | |
Kerry Properties Ltd. | | | 38,500 | | | | 108,635 | |
| | |
Kowloon Development Co. Ltd. | | | 180,000 | | | | 213,342 | |
| | |
Kungsleden AB(a) | | | 208 | | | | 2,858 | |
| | | | | | | | |
| Investments | | Shares | | | Value | |
|
| Real Estate Management & Development – (continued) | |
| | |
LEG Immobilien SE | | | 1,144 | | | $ | 170,319 | |
| | |
Lendlease Corp. Ltd. | | | 14,937 | | | | 117,353 | |
| | |
Mega Or Holdings Ltd. | | | 3,373 | | | | 133,559 | |
| | |
Melisron Ltd.* | | | 944 | | | | 79,931 | |
| | |
Mitsubishi Estate Co. Ltd. | | | 20,400 | | | | 309,153 | |
| | |
Mitsui Fudosan Co. Ltd. | | | 21,900 | | | | 499,076 | |
| | |
Mivne Real Estate KD Ltd. | | | 14,248 | | | | 51,994 | |
| | |
Mobimo Holding AG (Registered)* | | | 232 | | | | 78,328 | |
| | |
New World Development Co. Ltd. | | | 33,590 | | | | 145,733 | |
| | |
Nexity SA | | | 18,436 | | | | 842,308 | |
| | |
Nomura Real Estate Holdings, Inc. | | | 5,800 | | | | 140,848 | |
| | |
NP3 Fastigheter AB | | | 1,584 | | | | 56,252 | |
| | |
OUE Ltd. | | | 41,600 | | | | 42,572 | |
| | |
PATRIZIA AG | | | 3,248 | | | | 89,834 | |
| | |
Property & Building Corp. Ltd.* | | | 480 | | | | 68,347 | |
| | |
PSP Swiss Property AG (Registered) | | | 531 | | | | 66,480 | |
| | |
Real Matters, Inc.* | | | 423 | | | | 3,088 | |
| | |
Relo Group, Inc. | | | 2,270 | | | | 46,923 | |
| | |
S IMMO AG | | | 2,564 | | | | 60,827 | |
| | |
Sagax AB, Class B | | | 3,740 | | | | 146,317 | |
| | |
Samhallsbyggnadsbolaget i Norden AB | | | 32,240 | | | | 216,222 | |
| | |
SAMTY Co. Ltd.(a) | | | 13,500 | | | | 299,184 | |
| | |
Savills plc | | | 10,452 | | | | 203,158 | |
| | |
Sella Capital Real Estate Ltd., REIT | | | 65,936 | | | | 218,265 | |
| | |
Selvaag Bolig ASA | | | 2,860 | | | | 17,547 | |
| | |
Singapore Land Group Ltd. | | | 5,656 | | | | 11,367 | |
| | |
Sino Land Co. Ltd. | | | 31,136 | | | | 40,906 | |
| | |
Sirius Real Estate Ltd. | | | 90,433 | | | | 167,595 | |
| | |
Starts Corp., Inc. | | | 13,200 | | | | 316,383 | |
| | |
Sumitomo Realty & Development Co. Ltd.(a) | | | 11,800 | | | | 425,328 | |
| | |
Summit Real Estate Holdings Ltd.* | | | 14,606 | | | | 265,623 | |
| | |
Sun Hung Kai Properties Ltd. | | | 31,500 | | | | 419,106 | |
| | |
Swire Pacific Ltd., Class A | | | 3,500 | | | | 22,024 | |
| | |
Swire Properties Ltd. | | | 24,800 | | | | 66,471 | |
| | |
Swiss Prime Site AG (Registered) | | | 1,314 | | | | 133,737 | |
See Accompanying Notes to the Financial Statements.
| | | | | | |
| | FLEXSHARES ANNUAL REPORT | | | 209 | |
FlexShares® Morningstar Developed Markets ex-US Factor Tilt Index Fund (cont.)
| | | | | | | | |
| Investments | | Shares | | | Value | |
|
| COMMON STOCKS – (continued) | |
|
| Real Estate Management & Development – (continued) | |
| | |
TAG Immobilien AG | | | 4,270 | | | $ | 129,862 | |
| | |
Tokyo Tatemono Co. Ltd. | | | 9,600 | | | | 140,601 | |
| | |
Tokyu Fudosan Holdings Corp. | | | 20,000 | | | | 115,589 | |
| | |
Tricon Residential, Inc. | | | 87,428 | | | | 1,270,282 | |
| | |
UOL Group Ltd. | | | 15,599 | | | | 83,634 | |
| | |
Vonovia SE | | | 9,122 | | | | 553,791 | |
| | |
Wallenstam AB, Class B | | | 7,068 | | | | 123,773 | |
| | |
Wharf Real Estate Investment Co. Ltd. | | | 25,000 | | | | 141,084 | |
| | |
Wihlborgs Fastigheter AB | | | 5,830 | | | | 137,935 | |
| | |
Wing Tai Holdings Ltd. | | | 59,200 | | | | 85,167 | |
| | |
YH Dimri Construction & Development Ltd. | | | 1,596 | | | | 114,663 | |
| | |
Zensun Enterprises Ltd.(a) | | | 276,000 | | | | 157,531 | |
| | | | | | | | 16,524,037 | |
|
| Road & Rail – 1.6% | |
| | |
Aurizon Holdings Ltd. | | | 31,840 | | | | 80,594 | |
| | |
Canadian National Railway Co. | | | 11,044 | | | | 1,465,465 | |
| | |
Canadian Pacific Railway Ltd.(a) | | | 17,072 | | | | 1,319,291 | |
| | |
Central Japan Railway Co. | | | 4,000 | | | | 592,852 | |
| | |
ComfortDelGro Corp. Ltd. | | | 18,400 | | | | 21,286 | |
| | |
East Japan Railway Co.(a) | | | 5,100 | | | | 317,025 | |
| | |
Europcar Mobility Group* (b) | | | 1,340,328 | | | | 782,992 | |
| | |
Firstgroup plc* (a) | | | 533,107 | | | | 736,602 | |
| | |
Fukuyama Transporting Co. Ltd. | | | 1,000 | | | | 39,728 | |
| | |
Hamakyorex Co. Ltd.(a) | | | 7,000 | | | | 193,379 | |
| | |
Hankyu Hanshin Holdings, Inc. | | | 4,600 | | | | 142,206 | |
| | |
Hitachi Transport System Ltd. | | | 2,700 | | | | 106,082 | |
| | |
Keikyu Corp.(a) | | | 1,300 | | | | 14,616 | |
| | |
Keio Corp. | | | 2,800 | | | | 140,952 | |
| | |
Keisei Electric Railway Co. Ltd. | | | 4,500 | | | | 144,245 | |
| | |
Kintetsu Group Holdings Co. Ltd.* | | | 3,900 | | | | 122,276 | |
| | |
Kyushu Railway Co. | | | 2,100 | | | | 46,890 | |
| | |
Maruzen Showa Unyu Co. Ltd. | | | 8,100 | | | | 246,499 | |
| | |
MTR Corp. Ltd. | | | 25,764 | | | | 140,428 | |
| | |
Mullen Group Ltd.(a) | | | 5,238 | | | | 54,089 | |
| | |
Nankai Electric Railway Co. Ltd. | | | 3,000 | | | | 59,329 | |
| | |
National Express Group plc* | | | 55,968 | | | | 175,378 | |
| | |
Nikkon Holdings Co. Ltd. | | | 29,000 | | | | 563,850 | |
| | | | | | | | |
| Investments | | Shares | | | Value | |
|
| Road & Rail – (continued) | |
| | |
Nippon Express Co. Ltd. | | | 1,600 | | | $ | 99,908 | |
| | |
Nishi-Nippon Railroad Co. Ltd.(a) | | | 1,000 | | | | 24,530 | |
| | |
Nobina AB(b) | | | 29,304 | | | | 280,467 | |
| | |
Northgate plc | | | 107,712 | | | | 587,632 | |
| | |
Odakyu Electric Railway Co. Ltd. | | | 4,600 | | | | 99,362 | |
| | |
Sankyu, Inc. | | | 2,333 | | | | 104,962 | |
| | |
SBS Transit Ltd. | | | 4,000 | | | | 8,928 | |
| | |
Seibu Holdings, Inc.* | | | 2,600 | | | | 28,320 | |
| | |
Seino Holdings Co. Ltd. | | | 7,500 | | | | 90,572 | |
| | |
Senko Group Holdings Co. Ltd.(a) | | | 60,800 | | | | 538,549 | |
| | |
Sixt SE* | | | 550 | | | | 94,773 | |
| | |
Sixt SE (Preference) | | | 298 | | | | 29,520 | |
| | |
Stef SA | | | 1,320 | | | | 165,283 | |
| | |
TFI International, Inc. | | | 2,200 | | | | 243,561 | |
| | |
Tobu Railway Co. Ltd. | | | 4,000 | | | | 99,311 | |
| | |
Tokyu Corp. | | | 8,900 | | | | 125,041 | |
| | |
Trancom Co. Ltd. | | | 600 | | | | 41,885 | |
| | |
Transport International Holdings Ltd. | | | 105,600 | | | | 178,917 | |
| | |
West Japan Railway Co. | | | 4,400 | | | | 206,948 | |
| | | | | | | | 10,554,523 | |
|
| Semiconductors & Semiconductor Equipment – 1.9% | |
| | |
Advantest Corp. | | | 3,100 | | | | 253,655 | |
| | |
AIXTRON SE | | | 7,964 | | | | 189,396 | |
| | |
ams AG* (a) | | | 8,459 | | | | 167,467 | |
| | |
ASM International NV | | | 836 | | | | 378,664 | |
| | |
ASM Pacific Technology Ltd. | | | 5,000 | | | | 54,023 | |
| | |
ASML Holding NV | | | 7,128 | | | | 5,778,339 | |
| | |
BE Semiconductor Industries NV | | | 2,068 | | | | 188,967 | |
| | |
Disco Corp. | | | 700 | | | | 187,854 | |
| | |
Ferrotec Holdings Corp. | | | 13,200 | | | | 439,904 | |
| | |
Infineon Technologies AG | | | 22,616 | | | | 1,057,233 | |
| | |
Japan Material Co. Ltd. | | | 3,900 | | | | 54,109 | |
| | |
Lasertec Corp. | | | 1,000 | | | | 219,513 | |
| | |
Melexis NV | | | 495 | | | | 57,055 | |
| | |
Mimasu Semiconductor Industry Co. Ltd. | | | 200 | | | | 4,366 | |
| | |
Mitsui High-Tec, Inc.(a) | | | 2,600 | | | | 200,658 | |
| | |
Nordic Semiconductor ASA* | | | 5,500 | | | | 162,543 | |
See Accompanying Notes to the Financial Statements.
| | | | |
| 210 | | FLEXSHARES ANNUAL REPORT | | |
FlexShares® Morningstar Developed Markets ex-US Factor Tilt Index Fund (cont.)
| | | | | | | | |
| Investments | | Shares | | | Value | |
|
| COMMON STOCKS – (continued) | |
|
| Semiconductors & Semiconductor Equipment – (continued) | |
| | |
Renesas Electronics Corp.* | | | 28,800 | | | $ | 354,112 | |
| | |
Rohm Co. Ltd. | | | 2,000 | | | | 182,065 | |
| | |
SCREEN Holdings Co. Ltd. | | | 1,800 | | | | 166,858 | |
| | |
Shinko Electric Industries Co. Ltd. | | | 1,400 | | | | 55,988 | |
| | |
Siltronic AG | | | 405 | | | | 63,179 | |
| | |
SOITEC* | | | 748 | | | | 198,920 | |
| | |
STMicroelectronics NV | | | 11,836 | | | | 560,421 | |
| | |
SUMCO Corp. | | | 7,800 | | | | 148,031 | |
| | |
Tokyo Electron Ltd. | | | 2,700 | | | | 1,251,436 | |
| | |
Tower Semiconductor Ltd.* | | | 3,423 | | | | 111,358 | |
| | |
Ulvac, Inc. | | | 1,700 | | | | 94,821 | |
| | | | | | | | 12,580,935 | |
|
| Software – 1.3% | |
| | |
Altium Ltd. | | | 1,716 | | | | 47,328 | |
| | |
AVEVA Group plc | | | 3,354 | | | | 163,579 | |
| | |
BlackBerry Ltd.* (a) | | | 8,682 | | | | 93,646 | |
| | |
Blue Prism Group plc* | | | 10,248 | | | | 158,596 | |
| | |
Constellation Software, Inc. | | | 356 | | | | 624,659 | |
| | |
Dassault Systemes SE | | | 11,320 | | | | 659,981 | |
| | |
Descartes Systems Group, Inc. (The)* | | | 832 | | | | 67,839 | |
| | |
Dye & Durham Ltd. | | | 3,388 | | | | 103,508 | |
| | |
Enghouse Systems Ltd. | | | 1,300 | | | | 56,287 | |
| | |
FD Technologies plc* | | | 3,344 | | | | 95,801 | |
| | |
Fuji Soft, Inc. | | | 1,600 | | | | 81,105 | |
| | |
GB Group plc | | | 17,952 | | | | 218,147 | |
| | |
Hilan Ltd. | | | 1,569 | | | | 86,978 | |
| | |
IRESS Ltd. | | | 19,140 | | | | 172,513 | |
| | |
Kinaxis, Inc.* | | | 520 | | | | 80,579 | |
| | |
Learning Technologies Group plc | | | 64,284 | | | | 172,534 | |
| | |
Lightspeed Commerce, Inc.* (a) | | | 2,184 | | | | 212,542 | |
| | |
Micro Focus International plc | | | 129,228 | | | | 631,856 | |
| | |
Miroku Jyoho Service Co. Ltd.(a) | | | 1,000 | | | | 15,725 | |
| | |
Nemetschek SE | | | 884 | | | | 101,482 | |
| | |
Nice Ltd.* | | | 1,189 | | | | 335,286 | |
| | |
Open Text Corp. | | | 3,696 | | | | 185,881 | |
| | |
Oracle Corp. Japan | | | 800 | | | | 75,422 | |
| | |
PKSHA Technology, Inc.* (a) | | | 4,400 | | | | 68,648 | |
| | | | | | | | |
| Investments | | Shares | | | Value | |
|
| Software – (continued) | |
| | |
Sage Group plc (The) | | | 16,500 | | | $ | 160,764 | |
| | |
SAP SE | | | 18,392 | | | | 2,667,329 | |
| | |
SimCorp A/S | | | 1,100 | | | | 133,026 | |
| | |
Sinch AB* (b) | | | 7,462 | | | | 141,490 | |
| | |
Software AG | | | 1,320 | | | | 54,320 | |
| | |
Systena Corp. | | | 5,200 | | | | 95,586 | |
| | |
Technology One Ltd. | | | 7,884 | | | | 72,304 | |
| | |
Temenos AG (Registered)(a) | | | 765 | | | | 117,084 | |
| | |
Trend Micro, Inc.(a) | | | 2,500 | | | | 140,978 | |
| | |
Vitec Software Group AB, Class B | | | 3,300 | | | | 194,807 | |
| | |
Vobile Group Ltd.* (b) | | | 46,000 | | | | 40,388 | |
| | |
WiseTech Global Ltd. | | | 4,739 | | | | 181,817 | |
| | | | | | | | 8,509,815 | |
|
| Specialty Retail – 1.9% | |
| | |
ABC-Mart, Inc. | | | 700 | | | | 33,458 | |
| | |
Adairs Ltd.(a) | | | 76,956 | | | | 213,288 | |
| | |
Adastria Co. Ltd. | | | 13,200 | | | | 244,841 | |
| | |
Alpen Co. Ltd.(a) | | | 200 | | | | 4,866 | |
| | |
Arcland Sakamoto Co. Ltd.(a) | | | 12,700 | | | | 189,456 | |
| | |
Aritzia, Inc.* | | | 2,860 | | | | 112,457 | |
| | |
Autobacs Seven Co. Ltd. | | | 2,100 | | | | 27,110 | |
| | |
Bic Camera, Inc.(a) | | | 4,100 | | | | 35,274 | |
| | |
Bilia AB, Class A | | | 33,880 | | | | 601,583 | |
| | |
CECONOMY AG* | | | 64,548 | | | | 314,629 | |
| | |
Clas Ohlson AB, Class B | | | 13,508 | | | | 145,327 | |
| | |
Currys plc | | | 410,916 | | | | 683,801 | |
| | |
DCM Holdings Co. Ltd. | | | 2,400 | | | | 23,342 | |
| | |
Delek Automotive Systems Ltd. | | | 17,264 | | | | 226,242 | |
| | |
Dufry AG (Registered)* | | | 1,188 | | | | 62,901 | |
| | |
Dunelm Group plc | | | 2,604 | | | | 45,653 | |
| | |
Eagers Automotive Ltd.(a) | | | 4,180 | | | | 46,529 | |
| | |
EDION Corp. | | | 30,800 | | | | 291,725 | |
| | |
Fast Retailing Co. Ltd. | | | 1,100 | | | | 728,445 | |
| | |
Fenix Outdoor International AG | | | 369 | | | | 54,307 | |
| | |
Fielmann AG | | | 607 | | | | 40,040 | |
| | |
Fnac Darty SA | | | 6,336 | | | | 410,977 | |
| | |
Fox Wizel Ltd. | | | 123 | | | | 16,968 | |
| | |
GrandVision NV(b) | | | 1,506 | | | | 49,496 | |
| | |
H & M Hennes & Mauritz AB, Class B(a) | | | 11,440 | | | | 214,481 | |
See Accompanying Notes to the Financial Statements.
| | | | | | |
| | FLEXSHARES ANNUAL REPORT | | | 211 | |
FlexShares® Morningstar Developed Markets ex-US Factor Tilt Index Fund (cont.)
| | | | | | | | |
| Investments | | Shares | | | Value | |
|
| COMMON STOCKS – (continued) | |
|
| Specialty Retail – (continued) | |
| | |
Halfords Group plc | | | 87,736 | | | $ | 320,384 | |
| | |
Hikari Tsushin, Inc. | | | 600 | | | | 92,348 | |
| | |
Hornbach Baumarkt AG | | | 748 | | | | 33,629 | |
| | |
Hornbach Holding AG & Co. KGaA | | | 3,784 | | | | 478,628 | |
| | |
IDOM, Inc. | | | 20,000 | | | | 136,461 | |
| | |
Industria de Diseno Textil SA(a) | | | 17,072 | | | | 617,195 | |
| | |
JB Hi-Fi Ltd.(a) | | | 2,881 | | | | 109,256 | |
| | |
JD Sports Fashion plc | | | 8,827 | | | | 131,644 | |
| | |
JINS Holdings, Inc.(a) | | | 900 | | | | 56,751 | |
| | |
Joshin Denki Co. Ltd.(a) | | | 8,800 | | | | 182,598 | |
| | |
Joyful Honda Co. Ltd. | | | 28,400 | | | | 389,294 | |
| | |
Kathmandu Holdings Ltd. | | | 266,816 | | | | 303,605 | |
| | |
Kid ASA(b) | | | 8,096 | | | | 108,147 | |
| | |
Kingfisher plc | | | 45,013 | | | | 206,700 | |
| | |
Kohnan Shoji Co. Ltd. | | | 8,800 | | | | 274,361 | |
| | |
Kojima Co. Ltd.(a) | | | 13,200 | | | | 67,722 | |
| | |
Komeri Co. Ltd. | | | 13,200 | | | | 304,460 | |
| | |
K’s Holdings Corp. | | | 6,100 | | | | 62,805 | |
| | |
Leon’s Furniture Ltd. | | | 12,116 | | | | 246,318 | |
| | |
Luk Fook Holdings International Ltd. | | | 104,672 | | | | 285,932 | |
| | |
Mekonomen AB* | | | 16,060 | | | | 330,980 | |
| | |
Nafco Co. Ltd. | | | 4,400 | | | | 66,449 | |
| | |
Nick Scali Ltd. | | | 12,374 | | | | 134,486 | |
| | |
Nishimatsuya Chain Co. Ltd.(a) | | | 1,300 | | | | 16,531 | |
| | |
Nitori Holdings Co. Ltd. | | | 1,600 | | | | 292,638 | |
| | |
Nojima Corp. | | | 17,600 | | | | 384,800 | |
| | |
PAL GROUP Holdings Co. Ltd. | | | 8,800 | | | | 126,955 | |
| | |
Pets at Home Group plc | | | 11,308 | | | | 74,774 | |
| | |
Premier Investments Ltd. | | | 5,764 | | | | 132,391 | |
| | |
Sanrio Co. Ltd. | | | 4,200 | | | | 93,743 | |
| | |
Super Retail Group Ltd.(a) | | | 5,324 | | | | 51,705 | |
| | |
T-Gaia Corp. | | | 9,800 | | | | 174,299 | |
| | |
United Arrows Ltd.(a) | | | 4,400 | | | | 87,788 | |
| | |
USS Co. Ltd. | | | 1,000 | | | | 16,049 | |
| | |
Vivo Energy plc(b) | | | 154,220 | | | | 223,235 | |
| | |
Watches of Switzerland Group plc* (c) | | | 10,868 | | | | 168,638 | |
| | |
WH Smith plc* | | | 3,950 | | | | 84,574 | |
| | |
Yamada Holdings Co. Ltd.(a) | | | 17,300 | | | | 65,999 | |
| | |
Yellow Hat Ltd.(a) | | | 17,800 | | | | 289,577 | |
| | | | | | | | 12,041,045 | |
| | | | | | | | |
| Investments | | Shares | | | Value | |
|
| Technology Hardware, Storage & Peripherals – 0.5% | |
| | |
Brother Industries Ltd. | | | 7,600 | | | $ | 146,501 | |
| | |
Canon, Inc.(a) | | | 16,800 | | | | 376,886 | |
| | |
Eizo Corp.(a) | | | 10,100 | | | | 385,310 | |
| | |
Elecom Co. Ltd. | | | 1,600 | | | | 24,416 | |
| | |
FUJIFILM Holdings Corp. | | | 6,700 | | | | 517,138 | |
| | |
Konica Minolta, Inc. | | | 1,300 | | | | 6,407 | |
| | |
Logitech International SA (Registered) | | | 3,109 | | | | 259,336 | |
| | |
Maxell Ltd. | | | 26,400 | | | | 316,499 | |
| | |
MCJ Co. Ltd. | | | 30,800 | | | | 346,019 | |
| | |
Quadient SA | | | 14,740 | | | | 352,415 | |
| | |
Ricoh Co. Ltd. | | | 17,200 | | | | 166,834 | |
| | |
Riso Kagaku Corp. | | | 1,700 | | | | 35,752 | |
| | |
Seiko Epson Corp. | | | 8,300 | | | | 147,475 | |
| | |
Toshiba TEC Corp. | | | 1,100 | | | | 43,122 | |
| | | | | | | | 3,124,110 | |
|
| Textiles, Apparel & Luxury Goods – 1.9% | |
| | |
adidas AG | | | 3,036 | | | | 995,349 | |
| | |
Asics Corp. | | | 5,200 | | | | 129,151 | |
| | |
Brunello Cucinelli SpA* | | | 1,368 | | | | 82,955 | |
| | |
Burberry Group plc | | | 7,700 | | | | 203,602 | |
| | |
Canada Goose Holdings, Inc.* | | | 5,852 | | | | 216,697 | |
| | |
Chow Sang Sang Holdings International Ltd. | | | 152,000 | | | | 216,109 | |
| | |
Cie Financiere Richemont SA (Registered) | | | 8,888 | | | | 1,100,118 | |
| | |
Coats Group plc | | | 98,856 | | | | 87,266 | |
| | |
Crystal International Group Ltd.(b) | | | 369,500 | | | | 118,748 | |
| | |
Delta Galil Industries Ltd. | | | 4,626 | | | | 237,246 | |
| | |
Descente Ltd.* | | | 2,400 | | | | 90,506 | |
| | |
EssilorLuxottica SA – IM | | | 2,578 | | | | 533,072 | |
| | |
EssilorLuxottica SA – MO | | | 2,934 | | | | 607,432 | |
| | |
Gildan Activewear, Inc. | | | 2,703 | | | | 99,131 | |
| | |
Goldwin, Inc. | | | 1,900 | | | | 114,475 | |
| | |
Gunze Ltd. | | | 5,100 | | | | 196,128 | |
| | |
Hermes International | | | 529 | | | | 839,000 | |
| | |
HUGO BOSS AG | | | 1,980 | | | | 123,871 | |
| | |
Japan Wool Textile Co. Ltd. (The) | | | 24,400 | | | | 194,301 | |
| | |
Kering SA | | | 1,232 | | | | 924,160 | |
| | |
LVMH Moet Hennessy Louis Vuitton SE | | | 4,488 | | | | 3,517,199 | |
See Accompanying Notes to the Financial Statements.
| | | | |
| 212 | | FLEXSHARES ANNUAL REPORT | | |
FlexShares® Morningstar Developed Markets ex-US Factor Tilt Index Fund (cont.)
| | | | | | | | |
| Investments | | Shares | | | Value | |
|
| COMMON STOCKS – (continued) | |
|
| Textiles, Apparel & Luxury Goods – (continued) | |
| | |
Moncler SpA | | | 3,061 | | | $ | 220,050 | |
| | |
Pacific Textiles Holdings Ltd.(a) | | | 308,000 | | | | 153,623 | |
| | |
Pandora A/S | | | 1,848 | | | | 258,326 | |
| | |
Puma SE | | | 1,760 | | | | 218,544 | |
| | |
Samsonite International SA* (a) (b) | | | 118,200 | | | | 254,662 | |
| | |
Seiko Holdings Corp. | | | 4,700 | | | | 98,967 | |
| | |
Seiren Co. Ltd. | | | 25,600 | | | | 515,031 | |
| | |
Stella International Holdings Ltd. | | | 110,500 | | | | 131,679 | |
| | |
Swatch Group AG (The)(a) | | | 364 | | | | 100,068 | |
| | |
Swatch Group AG (The) (Registered) | | | 8 | | | | 426 | |
| | |
Tod’s SpA* | | | 245 | | | | 13,519 | |
| | |
Wacoal Holdings Corp. | | | 1,500 | | | | 29,915 | |
| | | | | | | | 12,621,326 | |
|
| Thrifts & Mortgage Finance – 0.7% | |
| | |
Aareal Bank AG | | | 26,708 | | | | 854,292 | |
| | |
Aruhi Corp.(a) | | | 17,600 | | | | 203,745 | |
| | |
Deutsche Pfandbriefbank AG(b) | | | 43,296 | | | | 537,369 | |
| | |
Equitable Group, Inc. | | | 9,064 | | | | 565,170 | |
| | |
Genworth Mortgage Insurance Australia Ltd. | | | 204,248 | | | | 352,845 | |
| | |
Home Capital Group, Inc.* (a) | | | 22,616 | | | | 732,732 | |
| | |
OSB Group plc | | | 19,688 | | | | 136,286 | |
| | |
Paragon Banking Group plc | | | 101,332 | | | | 761,871 | |
| | |
Resimac Group Ltd.(a) | | | 81,400 | | | | 104,549 | |
| | | | | | | | 4,248,859 | |
|
| Tobacco – 0.5% | |
| | |
British American Tobacco plc | | | 51,920 | | | | 1,812,327 | |
| | |
Imperial Brands plc | | | 18,304 | | | | 386,891 | |
| | |
Japan Tobacco, Inc. | | | 22,000 | | | | 431,318 | |
| | |
Scandinavian Tobacco Group A/S(a) (b) | | | 20,153 | | | | 453,324 | |
| | |
Swedish Match AB | | | 33,000 | | | | 290,404 | |
| | | | | | | | 3,374,264 | |
|
| Trading Companies & Distributors – 1.8% | |
| | |
AddTech AB, Class B | | | 2,196 | | | | 49,093 | |
| | |
Ashtead Group plc | | | 6,424 | | | | 539,261 | |
| | |
Beijer Ref AB | | | 2,340 | | | | 48,061 | |
| | | | | | | | |
| Investments | | Shares | | | Value | |
|
| Trading Companies & Distributors – (continued) | |
| | |
Brenntag SE | | | 2,205 | | | $ | 209,855 | |
| | |
Bunzl plc | | | 5,984 | | | | 221,633 | |
| | |
Electrocomponents plc | | | 2,548 | | | | 39,293 | |
| | |
Ferguson plc | | | 3,564 | | | | 537,145 | |
| | |
Finning International, Inc. | | | 4,111 | | | | 121,517 | |
| | |
Grafton Group plc | | | 7,976 | | | | 146,613 | |
| | |
Hanwa Co. Ltd. | | | 17,600 | | | | 525,569 | |
| | |
Howden Joinery Group plc | | | 15,972 | | | | 201,377 | |
| | |
IMCD NV | | | 1,360 | | | | 302,260 | |
| | |
Inaba Denki Sangyo Co. Ltd. | | | 19,200 | | | | 459,015 | |
| | |
Inabata & Co. Ltd. | | | 13,400 | | | | 198,018 | |
| | |
ITOCHU Corp.(a) | | | 36,300 | | | | 1,032,095 | |
| | |
Japan Pulp & Paper Co. Ltd.(a) | | | 6,100 | | | | 205,429 | |
| | |
Kanamoto Co. Ltd.(a) | | | 14,323 | | | | 305,742 | |
| | |
Kanematsu Corp.(a) | | | 30,800 | | | | 356,553 | |
| | |
Kloeckner & Co. SE* | | | 30,228 | | | | 407,183 | |
| | |
Marubeni Corp. | | | 47,000 | | | | 396,197 | |
| | |
Mitsubishi Corp. | | | 35,200 | | | | 1,115,040 | |
| | |
Mitsui & Co. Ltd. | | | 36,000 | | | | 818,347 | |
| | |
MonotaRO Co. Ltd. | | | 5,600 | | | | 126,709 | |
| | |
Nagase & Co. Ltd. | | | 4,900 | | | | 82,594 | |
| | |
Nippon Steel Trading Corp. | | | 5,000 | | | | 225,389 | |
| | |
Nishio Rent All Co. Ltd.(a) | | | 5,700 | | | | 140,419 | |
| | |
Reece Ltd.(a) | | | 5,999 | | | | 89,621 | |
| | |
Rexel SA* | | | 4,641 | | | | 92,163 | |
| | |
Richelieu Hardware Ltd. | | | 1,340 | | | | 47,231 | |
| | |
Russel Metals, Inc.(a) | | | 21,692 | | | | 571,022 | |
| | |
Seven Group Holdings Ltd. | | | 104 | | | | 1,682 | |
| | |
Sojitz Corp. | | | 6,899 | | | | 113,445 | |
| | |
Sumitomo Corp. | | | 24,200 | | | | 343,183 | |
| | |
Theme International Holdings Ltd.* (a) | | | 1,320,000 | | | | 161,202 | |
| | |
Toromont Industries Ltd. | | | 2,360 | | | | 209,640 | |
| | |
Toyota Tsusho Corp. | | | 5,300 | | | | 229,151 | |
| | |
Travis Perkins plc | | | 7,703 | | | | 162,924 | |
| | |
Wakita & Co. Ltd. | | | 26,400 | | | | 238,474 | |
| | |
Yamazen Corp.(a) | | | 33,000 | | | | 304,460 | |
| | |
Yuasa Trading Co. Ltd. | | | 8,800 | | | | 234,229 | |
| | | | | | | | 11,608,834 | |
|
| Transportation Infrastructure – 0.4% | |
| | |
Aena SME SA* (a) (b) | | | 1,100 | | | | 180,317 | |
| | |
Aeroports de Paris* | | | 555 | | | | 73,797 | |
See Accompanying Notes to the Financial Statements.
| | | | | | |
| | FLEXSHARES ANNUAL REPORT | | | 213 | |
FlexShares® Morningstar Developed Markets ex-US Factor Tilt Index Fund (cont.)
| | | | | | | | |
| Investments | | Shares | | | Value | |
|
| COMMON STOCKS – (continued) | |
|
| Transportation Infrastructure – (continued) | |
| | |
Atlantia SpA* | | | 3,344 | | | $ | 64,646 | |
| | |
Atlas Arteria Ltd.(a) | | | 25,621 | | | | 119,312 | |
| | |
Auckland International Airport Ltd.* (a) | | | 22,876 | | | | 130,806 | |
| | |
Enav SpA* (b) | | | 12,657 | | | | 55,513 | |
| | |
Flughafen Zurich AG (Registered)* (a) | | | 320 | | | | 57,784 | |
| | |
Fraport AG Frankfurt Airport Services Worldwide* | | | 890 | | | | 63,548 | |
| | |
Getlink SE | | | 8,876 | | | | 136,460 | |
| | |
Hamburger Hafen und Logistik AG | | | 1,220 | | | | 27,376 | |
| | |
Kamigumi Co. Ltd. | | | 800 | | | | 16,046 | |
| | |
Port of Tauranga Ltd. | | | 5,225 | | | | 25,801 | |
| | |
Qube Holdings Ltd. | | | 55,759 | | | | 133,180 | |
| | |
SATS Ltd.* | | | 19,000 | | | | 59,036 | |
| | |
Sumitomo Warehouse Co. Ltd.
(The)(a) | | | 26,400 | | | | 422,770 | |
| | |
Sydney Airport* | | | 7,964 | | | | 48,991 | |
| | |
Transurban Group | �� | | 50,308 | | | | 507,848 | |
| | |
Westshore Terminals Investment Corp. | | | 16,456 | | | | 355,393 | |
| | | | | | | | 2,478,624 | |
|
| Water Utilities – 0.1% | |
| | |
Pennon Group plc | | | 2,970 | | | | 47,469 | |
| | |
Severn Trent plc | | | 5,280 | | | | 198,165 | |
| | |
United Utilities Group plc | | | 11,220 | | | | 159,719 | |
| | | | | | | | 405,353 | |
|
| Wireless Telecommunication Services – 0.8% | |
| | |
Airtel Africa plc(b) | | | 34,804 | | | | 52,287 | |
| | |
Cellcom Israel Ltd.* | | | 10,252 | | | | 38,776 | |
| | |
Freenet AG | | | 2,198 | | | | 56,672 | |
| | |
KDDI Corp. | | | 41,400 | | | | 1,280,940 | |
| | |
Okinawa Cellular Telephone Co. | | | 4,400 | | | | 197,957 | |
| | |
Orange Belgium SA | | | 1,188 | | | | 27,001 | |
| | |
Rogers Communications, Inc., Class B | | | 6,820 | | | | 316,695 | |
| | |
SoftBank Corp. | | | 70,500 | | | | 961,125 | |
| | |
SoftBank Group Corp. | | | 22,582 | | | | 1,220,745 | |
| | |
Tele2 AB, Class B(a) | | | 11,244 | | | | 158,609 | |
| | | | | | | | |
| Investments | | Shares | | | Value | |
|
| Wireless Telecommunication Services – (continued) | |
| | |
Vodafone Group plc | | | 584,320 | | | $ | 865,353 | |
| | | | | | | | 5,176,160 | |
Total Common Stocks
(Cost $501,068,108) | | | | | | | 635,576,607 | |
| | |
| | | | | | | | |
|
| CLOSED END FUNDS – 0.0%(f) | |
|
Independent Power and Renewable Electricity
Producers – 0.0%(f) | |
| | |
Renewables Infrastructure Group Ltd. (The) (Cost $88,261) | | | 58,642 | | | | 106,428 | |
| | | Principal
Amount | | | | |
|
| CONVERTIBLE BONDS – 0.0%(f) | |
| | |
| Airlines – 0.0%(f) | | | | | | |
| | |
Singapore Airlines Ltd. Zero Coupon, 6/8/2030 (Cost $11,323) | | SGD | 14,885 | | | | 10,122 | |
| | | Number of
Warrants | | | | |
| | |
| WARRANTS – 0.0% | | | | | | |
|
| Construction & Engineering – 0.0% | |
| | |
Webuild SpA, expiring 8/2/2030* ‡ (d)
(Cost $–) | | | 10,785 | | | | — | |
| | | Principal
Amount | | | | |
|
| SECURITIES LENDING REINVESTMENTS(g) – 2.1% | |
|
| REPURCHASE AGREEMENTS – 2.1% | |
| | |
Cantor Fitzgerald & Co., Inc., 0.05%, dated 10/31/2021, due 11/1/2021, repurchase price $2,000,003, collateralized by various Mortgage-Backed Securities, ranging from 1.50% – 6.00%, maturing 7/1/2036 – 12/15/2062; total market value $2,744,553 | | $ | 2,000,000 | | | | 2,000,000 | |
See Accompanying Notes to the Financial Statements.
| | | | |
| 214 | | FLEXSHARES ANNUAL REPORT | | |
FlexShares® Morningstar Developed Markets ex-US Factor Tilt Index Fund (cont.)
| | | | | | | | |
| Investments | | Principal
Amount | | | Value | |
|
| SECURITIES LENDING REINVESTMENTS – (continued) | |
|
| REPURCHASE AGREEMENTS – (continued) | |
| | |
Citigroup Global Markets, Inc., 0.05%, dated 10/31/2021, due 11/1/2021, repurchase price $11,300,711, collateralized by various U.S. Treasury Securities, ranging from 0.75% – 4.63%, maturing 2/15/2040 – 2/15/2042; total market value $11,402,654 | | $ | 11,300,695 | | | $ | 11,300,695 | |
| | | | | 13,300,695 | |
Total Securities Lending Reinvestments
(Cost $13,300,695) | | | | 13,300,695 | |
Total Investments – 100.1%
(Cost $514,468,387) | | | | 648,993,852 | |
| |
Liabilities in excess of other assets – (0.1%) | | | | (355,359 | ) |
| Net Assets – 100.0% | | | $ | 648,638,493 | |
| * | Non-income producing security. |
| ‡ | Value determined using significant unobservable inputs. |
| (a) | The security or a portion of this security is on loan at October 31, 2021. The total value of securities on loan at October 31, 2021 was $66,431,697, collateralized in the form of cash with a value of $13,300,695 that was reinvested in the securities shown in the Securities Lending Reinvestment section of the Schedule of Investments; $31,611,651 of collateral in the form of U.S. Government Treasury Securities, interest rates ranging from 0.00% – 6.88%, and maturity dates ranging from November 4, 2021 – August 15, 2051 and $27,449,051 of collateral in the form of Foreign Government Fixed Income Securities, interest rates ranging from 0.00% – 8.50%, and maturity dates ranging from November 17, 2021 – June 30, 2120; a total value of $72,361,397. |
| (b) | Security exempt from registration pursuant to Regulation S under the Securities Act of 1933. Regulation S applies to securities offerings that are made outside of the United States and do not involve direct selling efforts in the United States and as such may have restrictions on resale. |
| (c) | Securities exempt from registration under Rule 144A of the Securities Act of 1933. These securities may be resold in transactions exempt from registration, normally to qualified institutional buyers. The value of these securities is determined by valuations supplied by a pricing service or brokers, or, if not available, in accordance with procedures established by the Board of Trustees. |
| (d) | Security fair valued as of October 31, 2021 in accordance with procedures approved by the Board of Trustees. Total value of all such securities at October 31, 2021 amounted to $1,640,185, which represents approximately 0.25% of net assets of the Fund. |
| (e) | Amount represents less than one share. |
| (f) | Represents less than 0.05% of net assets. |
| (g) | The security was purchased with cash collateral held from securities on loan at October 31, 2021. The total value of securities purchased was $13,300,695. |
Percentages shown are based on Net Assets.
Abbreviations
CHDI – Clearing House Electronic Subregister System (CHESS) Depository Interest
CVA – Dutch Certification
DI – Depositary Interest
OYJ – Public Limited Company
Preference A special type of equity investment that shares in the earnings of the company, has limited voting rights, and may have a dividend preference. Preference shares may also have liquidation preference.
SCA – Limited partnership with share capital
SDR – Swedish Depositary Receipt
As of October 31, 2021, the gross unrealized appreciation (depreciation) of investments based on the aggregate cost of investments (including derivative instruments, if applicable) for federal income tax purposes was as follows:
| | | | |
| | | | |
Aggregate gross unrealized appreciation | | $ | 158,796,866 | |
Aggregate gross unrealized depreciation | | | (31,913,558 | ) |
Net unrealized appreciation | | $ | 126,883,308 | |
Federal income tax cost | | $ | 522,105,888 | |
See Accompanying Notes to the Financial Statements.
| | | | | | |
| | FLEXSHARES ANNUAL REPORT | | | 215 | |
FlexShares® Morningstar Developed Markets ex-US Factor Tilt Index Fund (cont.)
Futures Contracts
FlexShares® Morningstar Developed Markets ex-US Factor Tilt Index Fund had the following open futures contracts as of October 31, 2021:
| | | | | | | | | | | | | | | | | | | | |
| | | Number of
Contracts | | | Expiration
Date | | | Trading
Currency | | | Notional
Amount | | | Value and
Unrealized
Appreciation/
(Depreciation)* | |
Long Contracts | |
EURO STOXX 50 Index | | | 69 | | | | 12/17/2021 | | | | EUR | | | $ | 3,383,255 | | | $ | 73,393 | |
FTSE 100 Index | | | 30 | | | | 12/17/2021 | | | | GBP | | | | 2,970,689 | | | | 79,924 | |
Hang Seng Index | | | 1 | | | | 11/29/2021 | | | | HKD | | | | 162,642 | | | | (4,427 | ) |
Nikkei 225 Index | | | 28 | | | | 12/09/2021 | | | | JPY | | | | 3,534,225 | | | | (71,424 | ) |
S&P/TSX 60 Index | | | 9 | | | | 12/16/2021 | | | | CAD | | | | 1,830,422 | | | | 53,063 | |
SPI 200 Index | | | 8 | | | | 12/16/2021 | | | | AUD | | | | 1,093,602 | | | | (12,440 | ) |
| | | | | | | | | | | | | | | | | | | $ | 118,089 | |
| * | This amount represents the cumulative appreciation/depreciation on futures contracts. Current day’s variation margin is reported within the Statement of Assets and Liabilities for futures contracts. |
Forward Foreign Currency Contracts
FlexShares® Morningstar Developed Markets ex-US Factor Tilt Index Fund had the following outstanding contracts as of October 31, 2021:
| | | | | | | | | | | | | | | | | | | | | | |
| Contracts to Receive | | Counterparty | | In Exchange For | | | Maturity Date | | | Unrealized
Appreciation/
(Depreciation) | |
AUD | | | 568,763 | | | | | Morgan Stanley | | USD | | | 420,596 | | | | 12/15/2021 | | | $ | 6,675 | |
CAD | | | 1,644,150 | | | | | Citibank NA | | USD | | | 1,296,907 | | | | 12/15/2021 | | | | 29,600 | |
NOK | | | 1,450,557 | | | | | BNP Paribas SA | | USD | | | 166,712 | | | | 12/15/2021 | | | | 4,706 | |
SEK | | | 554,576 | | | | | Morgan Stanley | | USD | | | 64,470 | | | | 12/15/2021 | | | | 143 | |
USD | | | 424,737 | | | | | Bank of New York | | DKK | | | 2,668,253 | | | | 12/15/2021 | | | | 9,200 | |
USD | | | 2,044,805 | | | | | Toronto-Dominion Bank (The) | | EUR | | | 1,760,000 | | | | 12/15/2021 | | | | 5,876 | |
USD | | | 962,399 | | | | | Toronto-Dominion Bank (The) | | GBP | | | 700,000 | | | | 12/15/2021 | | | | 2,719 | |
USD | | | 219,968 | | | | | Toronto-Dominion Bank (The) | | SGD | | | 296,100 | | | | 12/15/2021 | | | | 434 | |
Total unrealized appreciation | | | $ | 59,353 | |
EUR | | | 1,317,687 | | | | | JPMorgan Chase Bank | | USD | | | 1,561,790 | | | | 12/15/2021 | | | $ | (35,273 | ) |
EUR | | | 1,400,000 | | | | | Toronto-Dominion Bank (The) | | USD | | | 1,645,889 | | | | 12/15/2021 | | | | (24,013 | ) |
GBP | | | 763,203 | | | | | Morgan Stanley | | USD | | | 1,056,781 | | | | 12/15/2021 | | | | (10,451 | ) |
HKD | | | 7,052,598 | | | | | Citibank NA | | USD | | | 907,107 | | | | 12/15/2021 | | | | (385 | ) |
JPY | | | 290,750,889 | | | | | Toronto-Dominion Bank (The) | | USD | | | 2,647,757 | | | | 12/15/2021 | | | | (96,590 | ) |
USD | | | 503,199 | | | | | JPMorgan Chase Bank | | CHF | | | 460,788 | | | | 12/15/2021 | | | | (1,746 | ) |
USD | | | 534,563 | | | | | Goldman Sachs & Co. | | ILS | | | 1,713,030 | | | | 12/15/2021 | | | | (8,238 | ) |
USD | | | 3,264,088 | | | | | Toronto-Dominion Bank (The) | | JPY | | | 372,170,000 | | | | 12/15/2021 | | | | (1,484 | ) |
USD | | | 504,606 | | | | | Goldman Sachs & Co. | | NZD | | | 711,055 | | | | 12/15/2021 | | | | (3,918 | ) |
Total unrealized depreciation | | | $ | (182,098 | ) |
Net unrealized depreciation | | | $ | (122,745 | ) |
See Accompanying Notes to the Financial Statements.
| | | | |
| 216 | | FLEXSHARES ANNUAL REPORT | | |
FlexShares® Morningstar Developed Markets ex-US Factor Tilt Index Fund (cont.)
Abbreviations:
AUD – Australian Dollar
CAD – Canadian Dollar
CHF – Swiss Franc
DKK – Danish Krone
EUR – Euro
GBP – British Pound
HKD – Hong Kong Dollar
ILS – Israeli Shekel
JPY – Japanese Yen
NOK – Norwegian Krone
NZD – New Zealand Dollar
SEK – Swedish Krona
SGD – Singapore Dollar
USD – US Dollar
FlexShares® Morningstar Developed Markets ex-US Factor Tilt Index Fund invested, as a percentage of net assets, in companies domiciled in the following countries as of October 31, 2021:
| | | | |
Australia | | | 5.6 | % |
Austria | | | 0.4 | |
Belgium | | | 1.3 | |
Canada | | | 10.6 | |
Denmark | | | 1.9 | |
Finland | | | 0.9 | |
France | | | 7.2 | |
Germany | | | 6.2 | |
Hong Kong | | | 2.4 | |
Ireland | | | 0.3 | |
Israel | | | 1.3 | |
Italy | | | 2.4 | |
Japan | | | 25.9 | |
Netherlands | | | 3.1 | |
New Zealand | | | 0.4 | |
Norway | | | 1.3 | |
Poland | | | 0.6 | |
Portugal | | | 0.4 | |
Singapore | | | 1.1 | |
Spain | | | 2.2 | |
Sweden | | | 3.7 | |
Switzerland | | | 5.7 | |
United Kingdom | | | 13.1 | |
United States | | | 0.0 | † |
Other1 | | | 2.0 | |
| | | | 100.0 | % |
| † | Amount represents less than 0.05%. |
| 1 | Includes any non-equity securities, securities lending reinvestments and net other assets (liabilities). |
See Accompanying Notes to the Financial Statements.
| | | | | | |
| | FLEXSHARES ANNUAL REPORT | | | 217 | |
FlexShares® Morningstar Developed Markets ex-US Factor Tilt Index Fund (cont.)
| | | | |
| Security Type | | % of Net Assets | |
Common Stocks | | | 98.0 | % |
Closed End Funds | | | 0.0 | † |
Convertible Bonds | | | 0.0 | † |
Warrants | | | 0.0 | † |
Securities Lending Reinvestments | | | 2.1 | |
Others(1) | | | (0.1 | ) |
| | | | 100.0 | % |
| † | Amount represents less than 0.05%. |
| (1) | Includes any other net assets/(liabilities). |
See Accompanying Notes to the Financial Statements.
| | | | |
| 218 | | FLEXSHARES ANNUAL REPORT | | |
Schedule of Investments
FlexShares® Morningstar Emerging Markets Factor Tilt Index Fund
October 31, 2021
| | | | | | | | |
| Investments | | Shares | | | Value | |
|
| COMMON STOCKS – 99.5% | |
|
| Aerospace & Defense – 0.2% | |
| | |
AECC Aviation Power Co. Ltd., Class A | | | 4,700 | | | $ | 43,450 | |
| | |
Aselsan Elektronik Sanayi ve Ticaret A/S | | | 24,132 | | | | 41,236 | |
| | |
AVIC Electromechanical Systems Co. Ltd., Class A | | | 5,300 | | | | 12,589 | |
| | |
AviChina Industry & Technology Co. Ltd., Class H | | | 41,000 | | | | 26,142 | |
| | |
Bharat Electronics Ltd. | | | 17,280 | | | | 47,734 | |
| | |
Hanwha Aerospace Co. Ltd. | | | 899 | | | | 34,620 | |
| | |
Hanwha Systems Co. Ltd. | | | 689 | | | | 9,669 | |
| | |
Hindustan Aeronautics Ltd.(a) | | | 2,256 | | | | 39,365 | |
| | |
Korea Aerospace Industries Ltd. | | | 1,608 | | | | 42,039 | |
| | |
LIG Nex1 Co. Ltd. | | | 6,112 | | | | 243,737 | |
| | |
United Aircraft Corp. PJSC* ^ | | | 25,155,036 | | | | 254,701 | |
| | | | | | | | 795,282 | |
|
| Air Freight & Logistics – 0.5% | |
| | |
Agility Public Warehousing Co. KSC | | | 47,910 | | | | 158,932 | |
| | |
Aramex PJSC | | | 358,985 | | | | 427,090 | |
| | |
Blue Dart Express Ltd. | | | 265 | | | | 23,550 | |
| | |
Hanjin Transportation Co. Ltd. | | | 5,005 | | | | 148,409 | |
| | |
Hyundai Glovis Co. Ltd. | | | 770 | | | | 110,372 | |
| | |
Imperial Logistics Ltd. | | | 95,590 | | | | 394,309 | |
| | |
Kerry TJ Logistics Co. Ltd. | | | 4,000 | | | | 6,235 | |
| | |
SF Holding Co. Ltd., Class A | | | 5,500 | | | | 55,547 | |
| | |
Sinotrans Ltd., Class A | | | 23,500 | | | | 16,599 | |
| | |
Sinotrans Ltd., Class H | | | 83,000 | | | | 27,208 | |
| | |
YTO Express Group Co. Ltd., Class A | | | 4,700 | | | | 10,723 | |
| | |
Yunda Holding Co. Ltd., Class A | | | 10,600 | | | | 30,925 | |
| | |
ZTO Express Cayman, Inc., ADR | | | 12,705 | | | | 372,638 | |
| | | | | | | | 1,782,537 | |
|
| Airlines – 0.3% | |
| | |
Aeroflot PJSC* | | | 74,029 | | | | 71,753 | |
| | |
Air Arabia PJSC* | | | 136,316 | | | | 51,585 | |
| | | | | | | | |
| Investments | | Shares | | | Value | |
|
| Airlines – (continued) | |
| | |
AirAsia Group Bhd.* | | | 174,900 | | | $ | 48,994 | |
| | |
Asiana Airlines, Inc.* | | | 19,494 | | | | 376,184 | |
| | |
Azul SA (Preference)* | | | 11,700 | | | | 51,620 | |
| | |
China Airlines Ltd.* | | | 84,000 | | | | 51,955 | |
| | |
China Eastern Airlines Corp. Ltd., Class A* | | | 14,300 | | | | 10,793 | |
| | |
China Southern Airlines Co. Ltd., Class A* | | | 14,100 | | | | 14,454 | |
| | |
Controladora Vuela Cia de Aviacion SAB de CV, Class A* | | | 38,500 | | | | 70,186 | |
| | |
Eva Airways Corp.* | | | 74,798 | | | | 50,702 | |
| | |
Gol Linhas Aereas Inteligentes SA (Preference)* | | | 10,600 | | | | 28,545 | |
| | |
Hanjin Kal Corp.* | | | 273 | | | | 12,803 | |
| | |
InterGlobe Aviation Ltd.* (a) | | | 2,103 | | | | 61,089 | |
| | |
Jeju Air Co. Ltd.* | | | 1,962 | | | | 36,770 | |
| | |
Jin Air Co. Ltd.* | | | 583 | | | | 10,502 | |
| | |
Korean Air Lines Co. Ltd.* | | | 3,747 | | | | 97,639 | |
| | |
Pegasus Hava Tasimaciligi A/S* | | | 2,391 | | | | 19,807 | |
| | |
Turk Hava Yollari AO* | | | 16,292 | | | | 25,365 | |
| | | | | | | | 1,090,746 | |
|
| Auto Components – 1.1% | |
| | |
Apollo Tyres Ltd. | | | 170,665 | | | | 485,229 | |
| | |
Balkrishna Industries Ltd. | | | 1,925 | | | | 63,243 | |
| | |
Bharat Forge Ltd. | | | 6,473 | | | | 66,315 | |
| | |
Bosch Ltd. | | | 208 | | | | 47,089 | |
| | |
Cayman Engley Industrial Co. Ltd. | | | 28,000 | | | | 65,448 | |
| | |
Cheng Shin Rubber Industry Co. Ltd. | | | 55,000 | | | | 67,443 | |
| | |
Endurance Technologies Ltd.(a) | | | 1,456 | | | | 35,403 | |
| | |
Exide Industries Ltd. | | | 28,330 | | | | 65,414 | |
| | |
Fuyao Glass Industry Group Co. Ltd., Class A | | | 4,800 | | | | 37,054 | |
| | |
Fuyao Glass Industry Group Co. Ltd., Class H(a) | | | 8,400 | | | | 48,484 | |
| | |
Hankook & Co. Co Ltd. | | | 907 | | | | 12,962 | |
| | |
Hankook Tire & Technology Co. Ltd. | | | 2,792 | | | | 98,797 | |
See Accompanying Notes to the Financial Statements.
| | | | | | |
| | FLEXSHARES ANNUAL REPORT | | | 219 | |
FlexShares® Morningstar Emerging Markets Factor Tilt Index Fund (cont.)
| | | | | | | | |
| Investments | | Shares | | | Value | |
|
| COMMON STOCKS – (continued) | |
|
| Auto Components – (continued) | |
| | |
Hanon Systems | | | 2,756 | | | $ | 33,962 | |
| | |
Hota Industrial Manufacturing Co. Ltd. | | | 16,134 | | | | 54,363 | |
| | |
Huayu Automotive Systems Co. Ltd., Class A | | | 9,400 | | | | 39,279 | |
| | |
Hyundai Mobis Co. Ltd. | | | 2,310 | | | | 498,156 | |
| | |
Hyundai Wia Corp. | | | 583 | | | | 41,958 | |
| | |
Kumho Tire Co., Inc.* | | | 59,896 | | | | 274,223 | |
| | |
Mando Corp.* | | | 1,155 | | | | 61,677 | |
| | |
Minda Industries Ltd. | | | 6,270 | | | | 65,441 | |
| | |
Minth Group Ltd. | | | 12,000 | | | | 47,975 | |
| | |
Motherson Sumi Systems Ltd. | | | 28,296 | | | | 84,437 | |
| | |
MRF Ltd. | | | 38 | | | | 39,232 | |
| | |
Myoung Shin Industrial Co. Ltd.* | | | 220 | | | | 5,516 | |
| | |
Nan Kang Rubber Tire Co. Ltd. | | | 14,000 | | | | 20,138 | |
| | |
Nexen Tire Corp. | | | 18,935 | | | | 122,663 | |
| | |
Nexteer Automotive Group Ltd.(b) | | | 28,000 | | | | 34,554 | |
| | |
Ningbo Joyson Electronic Corp., Class A | | | 4,700 | | | | 13,022 | |
| | |
S&T Motiv Co. Ltd. | | | 4,400 | | | | 189,397 | |
| | |
Sri Trang Agro-Industry PCL, NVDR | | | 28,200 | | | | 27,620 | |
| | |
Sundram Fasteners Ltd. | | | 5,005 | | | | 55,844 | |
| | |
Tianneng Power International
Ltd.(b) | | | 378,000 | | | | 431,983 | |
| | |
Tong Yang Industry Co. Ltd. | | | 220,000 | | | | 267,400 | |
| | |
Tube Investments of India Ltd. | | | 1,200 | | | | 22,379 | |
| | |
Weifu High-Technology Group Co. Ltd., Class A | | | 4,700 | | | | 14,271 | |
| | | | | | | | 3,538,371 | |
|
| Automobiles – 2.6% | |
| | |
Astra International Tbk. PT | | | 643,500 | | | | 273,661 | |
| | |
BAIC Motor Corp. Ltd., Class H(a) | | | 828,000 | | | | 274,615 | |
| | |
Bajaj Auto Ltd. | | | 1,289 | | | | 63,816 | |
| | |
Brilliance China Automotive Holdings Ltd.* (c) | | | 96,000 | | | | 31,776 | |
| | |
BYD Co. Ltd., Class A | | | 2,400 | | | | 116,754 | |
| | |
BYD Co. Ltd., Class H | | | 15,000 | | | | 571,921 | |
| | | | | | | | |
| Investments | | Shares | | | Value | |
|
| Automobiles – (continued) | |
| | |
China Motor Corp. | | | 5,400 | | | $ | 13,457 | |
| | |
Chongqing Changan Automobile Co. Ltd., Class A | | | 13,160 | | | | 40,101 | |
| | |
Chongqing Changan Automobile Co. Ltd., Class B | | | 5,300 | | | | 3,420 | |
| | |
Dongfeng Motor Group Co. Ltd., Class H | | | 1,254,000 | | | | 1,171,940 | |
| | |
DRB-Hicom Bhd. | | | 396,000 | | | | 157,788 | |
| | |
Eicher Motors Ltd. | | | 2,770 | | | | 91,917 | |
| | |
Ford Otomotiv Sanayi A/S | | | 3,376 | | | | 65,166 | |
| | |
Geely Automobile Holdings Ltd. | | | 110,000 | | | | 382,502 | |
| | |
Great Wall Motor Co. Ltd., Class A | | | 4,700 | | | | 49,943 | |
| | |
Great Wall Motor Co. Ltd., Class H(b) | | | 55,000 | | | | 248,167 | |
| | |
Guangzhou Automobile Group Co. Ltd., Class H | | | 110,000 | | | | 104,074 | |
| | |
Hero MotoCorp Ltd. | | | 2,255 | | | | 80,017 | |
| | |
Hyundai Motor Co. | | | 4,950 | | | | 881,092 | |
| | |
Hyundai Motor Co. (2nd Preference) | | | 1,265 | | | | 105,981 | |
| | |
Hyundai Motor Co. (3rd Preference) | | | 54 | | | | 4,298 | |
| | |
Hyundai Motor Co. (Preference) | | | 715 | | | | 59,657 | |
| | |
Kia Corp. | | | 9,350 | | | | 680,917 | |
| | |
Li Auto, Inc., ADR* (b) | | | 6,105 | | | | 199,206 | |
| | |
Mahindra & Mahindra Ltd. | | | 17,380 | | | | 205,235 | |
| | |
Maruti Suzuki India Ltd. | | | 2,475 | | | | 247,311 | |
| | |
NIO, Inc., ADR* | | | 27,500 | | | | 1,083,775 | |
| | |
Niu Technologies, ADR* | | | 2,730 | | | | 71,471 | |
| | |
Oriental Holdings Bhd. | | | 30,500 | | | | 39,331 | |
| | |
SAIC Motor Corp. Ltd., Class A | | | 27,500 | | | | 87,150 | |
| | |
Sanyang Motor Co. Ltd. | | | 330,000 | | | | 320,999 | |
| | |
Tata Motors Ltd.* | | | 61,435 | | | | 396,843 | |
| | |
Tata Motors Ltd., Class A* | | | 14,002 | | | | 45,999 | |
| | |
Tofas Turk Otomobil Fabrikasi A/S | | | 3,233 | | | | 19,771 | |
| | |
TVS Motor Co. Ltd. | | | 3,564 | | | | 31,534 | |
| | |
UMW Holdings Bhd. | | | 209,000 | | | | 172,106 | |
See Accompanying Notes to the Financial Statements.
| | | | |
| 220 | | FLEXSHARES ANNUAL REPORT | | |
FlexShares® Morningstar Emerging Markets Factor Tilt Index Fund (cont.)
| | | | | | | | |
| Investments | | Shares | | | Value | |
|
| COMMON STOCKS – (continued) | |
|
| Automobiles – (continued) | |
| | |
XPeng, Inc., ADR* | | | 6,985 | | | $ | 325,711 | |
| | |
Yadea Group Holdings Ltd.(a) | | | 16,000 | | | | 27,561 | |
| | |
Yulon Motor Co. Ltd. | | | 26,986 | | | | 39,884 | |
| | | | | | | | 8,786,867 | |
|
| Banks – 13.1% | |
| | |
Absa Group Ltd. | | | 23,815 | | | | 219,349 | |
| | |
Abu Dhabi Commercial Bank PJSC | | | 109,270 | | | | 246,911 | |
| | |
Abu Dhabi Islamic Bank PJSC | | | 19,571 | | | | 31,116 | |
| | |
AFFIN Bank Bhd. | | | 213,227 | | | | 87,536 | |
| | |
Agricultural Bank of China Ltd., Class A | | | 441,100 | | | | 202,653 | |
| | |
Agricultural Bank of China Ltd., Class H | | | 990,000 | | | | 337,252 | |
| | |
Akbank TAS | | | 22,667 | | | | 13,815 | |
| | |
Akbank TAS, ADR | | | 20,016 | | | | 25,821 | |
| | |
Al Khalij Commercial Bank PQSC(c) | | | 924,464 | | | | 568,745 | |
| | |
Al Rajhi Bank | | | 25,190 | | | | 930,799 | |
| | |
Alinma Bank | | | 20,900 | | | | 140,136 | |
| | |
Alliance Bank Malaysia Bhd. | | | 579,300 | | | | 384,708 | |
| | |
Alpha Services and Holdings SA* | | | 70,730 | | | | 89,915 | |
| | |
AMMB Holdings Bhd.* | | | 82,500 | | | | 66,940 | |
| | |
AU Small Finance Bank Ltd.* (a) | | | 2,288 | | | | 37,166 | |
| | |
Axis Bank Ltd.* | | | 46,090 | | | | 456,707 | |
| | |
Banco Bradesco SA* | | | 44,000 | | | | 132,695 | |
| | |
Banco Bradesco SA (Preference)* | | | 165,220 | | | | 583,267 | |
| | |
Banco de Bogota SA | | | 2,014 | | | | 40,280 | |
| | |
Banco de Chile | | | 1,541,320 | | | | 134,124 | |
| | |
Banco de Credito e Inversiones SA | | | 1,728 | | | | 58,346 | |
| | |
Banco del Bajio SA(a) | | | 396,000 | | | | 745,042 | |
| | |
Banco do Brasil SA | | | 49,500 | | | | 250,266 | |
| | |
Banco do Estado do Rio Grande do Sul SA (Preference), Class B | | | 100,000 | | | | 193,188 | |
| | |
Banco Inter SA* | | | 11,000 | | | | 69,274 | |
| | |
Banco Pan SA (Preference) | | | 10,600 | | | | 24,991 | |
| | | | | | | | |
| Investments | | Shares | | | Value | |
|
| Banks – (continued) | |
| | |
Banco Santander Chile | | | 2,123,165 | | | $ | 93,163 | |
| | |
Banco Santander Mexico SA Institucion de Banca Multiple Grupo Financiero Santand(b) | | | 11,800 | | | | 15,061 | |
| | |
Bancolombia SA | | | 9,900 | | | | 87,861 | |
| | |
Bancolombia SA (Preference) | | | 18,122 | | | | 161,403 | |
| | |
Bandhan Bank Ltd.(a) | | | 14,388 | | | | 56,000 | |
| | |
Bangkok Bank PCL, NVDR | | | 22,000 | | | | 81,218 | |
| | |
Bank Al Habib Ltd. | | | 522,500 | | | | 214,065 | |
| | |
Bank AlBilad* | | | 8,745 | | | | 98,387 | |
| | |
Bank Al-Jazira | | | 6,066 | | | | 31,050 | |
| | |
Bank Central Asia Tbk. PT | | | 1,148,500 | | | | 605,967 | |
| | |
Bank Jago Tbk. PT* | | | 82,500 | | | | 90,259 | |
| | |
Bank Mandiri Persero Tbk. PT | | | 632,500 | | | | 320,324 | |
| | |
Bank Negara Indonesia Persero Tbk. PT | | | 313,500 | | | | 154,897 | |
| | |
Bank of Ayudhya PCL, NVDR | | | 66,000 | | | | 64,643 | |
| | |
Bank of Baroda* | | | 41,116 | | | | 53,536 | |
| | |
Bank of Beijing Co. Ltd., Class A | | | 74,200 | | | | 51,366 | |
| | |
Bank of Changsha Co. Ltd., Class A | | | 9,400 | | | | 11,825 | |
| | |
Bank of Chengdu Co. Ltd., Class A | | | 10,600 | | | | 21,136 | |
| | |
Bank of China Ltd., Class A | | | 225,500 | | | | 107,477 | |
| | |
Bank of China Ltd., Class H | | | 2,640,000 | | | | 933,276 | |
| | |
Bank of Communications Co. Ltd., Class A | | | 132,000 | | | | 93,235 | |
| | |
Bank of Communications Co. Ltd., Class H | | | 716,000 | | | | 426,155 | |
| | |
Bank of Hangzhou Co. Ltd., Class A | | | 18,800 | | | | 41,952 | |
| | |
Bank of India* | | | 5,936 | | | | 4,748 | |
| | |
Bank of Jiangsu Co. Ltd., Class A | | | 53,880 | | | | 52,960 | |
| | |
Bank of Nanjing Co. Ltd., Class A | | | 31,800 | | | | 48,202 | |
| | |
Bank of Ningbo Co. Ltd., Class A | | | 16,500 | | | | 98,495 | |
| | |
Bank of Qingdao Co. Ltd., Class H(a) | | | 53,000 | | | | 27,866 | |
| | |
Bank of Shanghai Co. Ltd., Class A | | | 49,500 | | | | 56,390 | |
See Accompanying Notes to the Financial Statements.
| | | | | | |
| | FLEXSHARES ANNUAL REPORT | | | 221 | |
FlexShares® Morningstar Emerging Markets Factor Tilt Index Fund (cont.)
| | | | | | | | |
| Investments | | Shares | | | Value | |
|
| COMMON STOCKS – (continued) | |
|
| Banks – (continued) | |
| | |
Bank of the Philippine Islands | | | 61,600 | | | $ | 106,251 | |
| | |
Bank of Zhengzhou Co. Ltd., Class A* | | | 15,900 | | | | 8,398 | |
| | |
Bank of Zhengzhou Co. Ltd., Class H* (a) | | | 106,000 | | | | 25,209 | |
| | |
Bank Pan Indonesia Tbk. PT* | | | 1,903,000 | | | | 106,114 | |
| | |
Bank Pembangunan Daerah Jawa Barat Dan Banten Tbk. PT | | | 2,524,500 | | | | 253,920 | |
| | |
Bank Rakyat Indonesia Persero Tbk. PT | | | 2,260,519 | | | | 678,116 | |
| | |
Bank Tabungan Negara Persero Tbk. PT* | | | 2,139,500 | | | | 268,806 | |
| | |
Banque Saudi Fransi | | | 19,580 | | | | 220,548 | |
| | |
BDO Unibank, Inc. | | | 58,300 | | | | 143,524 | |
| | |
BIMB Holdings Bhd. | | | 15,880 | | | | 12,271 | |
| | |
BNK Financial Group, Inc. | | | 5,936 | | | | 44,702 | |
| | |
BOC Hong Kong Holdings Ltd. | | | 137,500 | | | | 436,589 | |
| | |
Boubyan Bank KSCP* | | | 10,735 | | | | 27,848 | |
| | |
Burgan Bank SAK | | | 28,576 | | | | 22,561 | |
| | |
Canara Bank* | | | 2,332 | | | | 6,680 | |
| | |
Capitec Bank Holdings Ltd. | | | 1,892 | | | | 212,449 | |
| | |
Chang Hwa Commercial Bank Ltd. | | | 125,722 | | | | 74,144 | |
| | |
China Bohai Bank Co. Ltd., Class H(a) (b) | | | 137,500 | | | | 52,143 | |
| | |
China CITIC Bank Corp. Ltd., Class H | | | 385,000 | | | | 169,262 | |
| | |
China Construction Bank Corp., Class A | | | 28,200 | | | | 26,132 | |
| | |
China Construction Bank Corp., Class H | | | 3,520,000 | | | | 2,393,711 | |
| | |
China Everbright Bank Co. Ltd., Class A | | | 132,000 | | | | 70,958 | |
| | |
China Everbright Bank Co. Ltd., Class H | | | 53,000 | | | | 18,668 | |
| | |
China Merchants Bank Co. Ltd., Class A | | | 55,000 | | | | 463,855 | |
| | |
China Merchants Bank Co. Ltd., Class H | | | 129,500 | | | | 1,091,229 | |
| | |
China Minsheng Banking Corp. Ltd., Class A | | | 93,500 | | | | 56,837 | |
| | | | | | | | |
| Investments | | Shares | | | Value | |
|
| Banks – (continued) | |
| | |
China Minsheng Banking Corp. Ltd., Class H(b) | | | 220,000 | | | $ | 87,389 | |
| | |
China Zheshang Bank Co. Ltd., Class A | | | 47,000 | | | | 25,265 | |
| | |
China Zheshang Bank Co. Ltd., Class H(b) | | | 53,000 | | | | 21,393 | |
| | |
Chongqing Rural Commercial Bank Co. Ltd., Class A | | | 18,800 | | | | 11,223 | |
| | |
Chongqing Rural Commercial Bank Co. Ltd., Class H | | | 94,000 | | | | 33,834 | |
| | |
CIMB Group Holdings Bhd. | | | 247,948 | | | | 312,555 | |
| | |
City Union Bank Ltd. | | | 9,675 | | | | 21,726 | |
| | |
Commercial Bank PSQC (The) | | | 78,789 | | | | 132,217 | |
| | |
Commercial International Bank Egypt SAE* | | | 60,940 | | | | 197,871 | |
| | |
Credicorp Ltd. | | | 2,090 | | | | 270,989 | |
| | |
Credit Agricole Egypt SAE* | | | 66,167 | | | | 114,897 | |
| | |
Credit Bank of Moscow PJSC* | | | 5,773,590 | | | | 581,987 | |
| | |
CTBC Financial Holding Co. Ltd. | | | 660,000 | | | | 550,623 | |
| | |
DGB Financial Group, Inc. | | | 2,525 | | | | 22,364 | |
| | |
Doha Bank QPSC | | | 41,736 | | | | 33,059 | |
| | |
Dubai Islamic Bank PJSC | | | 82,500 | | | | 114,772 | |
| | |
E.Sun Financial Holding Co. Ltd. | | | 291,879 | | | | 278,670 | |
| | |
Emirates NBD Bank PJSC | | | 77,385 | | | | 293,895 | |
| | |
EnTie Commercial Bank Co. Ltd. | | | 440,000 | | | | 264,236 | |
| | |
Eurobank Ergasias Services and Holdings SA* (b) | | | 91,190 | | | | 95,335 | |
| | |
Far Eastern International Bank | | | 58,088 | | | | 21,829 | |
| | |
Federal Bank Ltd. | | | 779,773 | | | | 1,014,792 | |
| | |
First Abu Dhabi Bank PJSC | | | 146,685 | | | | 711,631 | |
| | |
First Financial Holding Co. Ltd. | | | 397,267 | | | | 327,145 | |
| | |
Grupo Aval Acciones y Valores SA (Preference) | | | 162,021 | | | | 49,097 | |
| | |
Grupo Elektra SAB de CV | | | 1,100 | | | | 84,654 | |
| | |
Grupo Financiero Banorte SAB de CV, Class O | | | 82,500 | | | | 523,481 | |
| | |
Grupo Financiero Inbursa SAB de CV, Class O* | | | 71,500 | | | | 71,942 | |
See Accompanying Notes to the Financial Statements.
| | | | |
| 222 | | FLEXSHARES ANNUAL REPORT | | |
FlexShares® Morningstar Emerging Markets Factor Tilt Index Fund (cont.)
| | | | | | | | |
| Investments | | Shares | | | Value | |
|
| COMMON STOCKS – (continued) | |
|
| Banks – (continued) | |
| | |
Gulf Bank KSCP | | | 45,315 | | | $ | 36,980 | |
| | |
Habib Bank Ltd. | | | 32,200 | | | | 23,722 | |
| | |
Hana Financial Group, Inc. | | | 9,790 | | | | 377,006 | |
| | |
Hong Leong Bank Bhd. | | | 27,500 | | | | 124,982 | |
| | |
Hong Leong Financial Group Bhd. | | | 5,000 | | | | 22,144 | |
| | |
Hua Nan Financial Holdings Co. Ltd. | | | 173,473 | | | | 126,946 | |
| | |
Huaxia Bank Co. Ltd., Class A | | | 47,000 | | | | 41,350 | |
| | |
Huishang Bank Corp. Ltd., Class H* (b) | | | 485,000 | | | | 165,219 | |
| | |
ICICI Bank Ltd. | | | 103,620 | | | | 1,109,870 | |
| | |
IDFC First Bank Ltd.* | | | 61,957 | | | | 40,956 | |
| | |
Indian Bank | | | 128,315 | | | | 294,907 | |
| | |
Industrial & Commercial Bank of China Ltd., Class A | | | 286,000 | | | | 208,713 | |
| | |
Industrial & Commercial Bank of China Ltd., Class H | | | 2,255,000 | | | | 1,234,894 | |
| | |
Industrial Bank Co. Ltd., Class A | | | 60,500 | | | | 176,131 | |
| | |
Industrial Bank of Korea | | | 10,945 | | | | 103,498 | |
| | |
Intercorp Financial Services,
Inc.(a) | | | 1,040 | | | | 29,640 | |
| | |
Itau CorpBanca Chile SA* | | | 1,015,777 | | | | 2,260 | |
| | |
Itau Unibanco Holding SA (Preference) | | | 165,000 | | | | 682,304 | |
| | |
Itausa SA | | | 28,109 | | | | 51,511 | |
| | |
Itausa SA (Preference) | | | 154,000 | | | | 280,025 | |
| | |
JB Financial Group Co. Ltd. | | | 1,500 | | | | 11,386 | |
| | |
Jiangsu Changshu Rural Commercial Bank Co. Ltd., Class A | | | 6,700 | | | | 7,601 | |
| | |
Kasikornbank PCL, NVDR | | | 46,400 | | | | 197,164 | |
| | |
KB Financial Group, Inc. | | | 13,090 | | | | 634,029 | |
| | |
Kiatnakin Phatra Bank PCL, NVDR | | | 20,800 | | | | 37,610 | |
| | |
King’s Town Bank Co. Ltd. | | | 55,000 | | | | 82,079 | |
| | |
Komercni Banka A/S | | | 1,272 | | | | 49,401 | |
| | |
Kotak Mahindra Bank Ltd. | | | 22,165 | | | | 601,224 | |
| | |
Krung Thai Bank PCL, NVDR | | | 153,700 | | | | 53,268 | |
| | |
Kuwait Finance House KSCP | | | 99,825 | | | | 275,516 | |
| | |
Kuwait International Bank KSCP* | | | 382,965 | | | | 284,572 | |
| | | | | | | | |
| Investments | | Shares | | | Value | |
|
| Banks – (continued) | |
| | |
Malayan Banking Bhd. | | | 225,500 | | | $ | 438,366 | |
| | |
Malaysia Building Society Bhd. | | | 1,409,517 | | | | 217,844 | |
| | |
Masraf Al Rayan QSC | | | 63,281 | | | | 82,990 | |
| | |
MCB Bank Ltd. | | | 16,300 | | | | 15,606 | |
| | |
Meezan Bank Ltd. | | | 198,110 | | | | 154,173 | |
| | |
Mega Financial Holding Co. Ltd. | | | 404,000 | | | | 485,233 | |
| | |
Metropolitan Bank & Trust Co. | | | 38,560 | | | | 36,487 | |
| | |
Moneta Money Bank A/S* (a) | | | 20,195 | | | | 79,023 | |
| | |
National Bank of Greece SA* | | | 15,389 | | | | 48,440 | |
| | |
National Bank of Kuwait SAKP | | | 148,390 | | | | 487,332 | |
| | |
Nedbank Group Ltd. | | | 13,420 | | | | 153,544 | |
| | |
O-Bank Co. Ltd. | | | 106,000 | | | | 29,732 | |
| | |
OTP Bank Nyrt.* | | | 7,535 | | | | 452,973 | |
| | |
Philippine National Bank* | | | 309,600 | | | | 123,447 | |
| | |
Ping An Bank Co. Ltd., Class A | | | 55,000 | | | | 167,596 | |
| | |
Postal Savings Bank of China Co. Ltd., Class H(a) (b) | | | 330,000 | | | | 240,106 | |
| | |
Public Bank Bhd. | | | 511,500 | | | | 515,082 | |
| | |
Punjab National Bank* | | | 43,248 | | | | 24,315 | |
| | |
Qatar International Islamic Bank QSC | | | 9,789 | | | | 26,321 | |
| | |
Qatar Islamic Bank SAQ | | | 45,815 | | | | 231,780 | |
| | |
Qatar National Bank QPSC | | | 148,720 | | | | 837,341 | |
| | |
Qingdao Rural Commercial Bank Corp., Class A | | | 18,800 | | | | 11,223 | |
| | |
RBL Bank Ltd.* (a) | | | 235,126 | | | | 566,924 | |
| | |
RHB Bank Bhd. | | | 75,591 | | | | 101,859 | |
| | |
Riyad Bank | | | 45,111 | | | | 355,389 | |
| | |
Saudi British Bank (The) | | | 15,015 | | | | 132,701 | |
| | |
Saudi Investment Bank (The) | | | 6,493 | | | | 31,194 | |
| | |
Saudi National Bank (The) | | | 73,040 | | | | 1,283,248 | |
| | |
Sberbank of Russia PJSC | | | 369,050 | | | | 1,852,030 | |
| | |
Sberbank of Russia PJSC (Preference) | | | 39,708 | | | | 179,561 | |
| | |
Security Bank Corp. | | | 2,550 | | | | 6,116 | |
| | |
Shanghai Commercial & Savings Bank Ltd. (The) | | | 165,000 | | | | 261,071 | |
See Accompanying Notes to the Financial Statements.
| | | | | | |
| | FLEXSHARES ANNUAL REPORT | | | 223 | |
FlexShares® Morningstar Emerging Markets Factor Tilt Index Fund (cont.)
| | | | | | | | |
| Investments | | Shares | | | Value | |
|
| COMMON STOCKS – (continued) | |
|
| Banks – (continued) | |
| | |
Shanghai Pudong Development Bank Co. Ltd., Class A | | | 82,500 | | | $ | 115,255 | |
| | |
Shinhan Financial Group Co. Ltd. | | | 17,270 | | | | 565,297 | |
| | |
Siam Commercial Bank PCL (The), NVDR | | | 60,800 | | | | 230,869 | |
| | |
SinoPac Financial Holdings Co. Ltd. | | | 440,000 | | | | 223,888 | |
| | |
Standard Bank Group Ltd. | | | 42,367 | | | | 377,484 | |
| | |
State Bank of India | | | 60,115 | | | | 403,128 | |
| | |
Taichung Commercial Bank Co. Ltd. | | | 87,564 | | | | 37,628 | |
| | |
Taishin Financial Holding Co. Ltd. | | | 431,566 | | | | 283,226 | |
| | |
Taiwan Business Bank | | | 86,892 | | | | 29,559 | |
| | |
Taiwan Cooperative Financial Holding Co. Ltd. | | | 325,200 | | | | 264,290 | |
| | |
Thanachart Capital PCL, NVDR | | | 6,400 | | | | 6,799 | |
| | |
Tisco Financial Group PCL, NVDR | | | 9,900 | | | | 27,523 | |
| | |
TMBThanachart Bank PCL, NVDR | | | 1,875,900 | | | | 65,578 | |
| | |
Turkiye Garanti Bankasi A/S | | | 61,490 | | | | 62,992 | |
| | |
Turkiye Halk Bankasi A/S* | | | 28,578 | | | | 13,167 | |
| | |
Turkiye Is Bankasi A/S, Class C | | | 67,999 | | | | 39,816 | |
| | |
Turkiye Vakiflar Bankasi TAO, Class D* | | | 51,728 | | | | 18,507 | |
| | |
Union Bank of India* | | | 10,017 | | | | 6,174 | |
| | |
Union Bank of Taiwan* | | | 124,325 | | | | 52,755 | |
| | |
United Bank Ltd. | | | 217,656 | | | | 177,976 | |
| | |
VTB Bank PJSC | | | 136,511,531 | | | | 101,757 | |
| | |
Woori Financial Group, Inc. | | | 16,390 | | | | 185,844 | |
| | |
Yapi ve Kredi Bankasi A/S | | | 80,342 | | | | 22,811 | |
| | |
Yes Bank Ltd.* | | | 38,361 | | | | 6,557 | |
| | | | | | | | 43,748,590 | |
|
| Beverages – 1.0% | |
| | |
Ambev SA | | | 93,500 | | | | 281,810 | |
| | |
Anadolu Efes Biracilik ve Malt Sanayii A/S | | | 9,872 | | | | 22,793 | |
| | | | | | | | |
| Investments | | Shares | | | Value | |
|
| Beverages – (continued) | |
| | |
Arca Continental SAB de CV(b) | | | 16,500 | | | $ | 100,825 | |
| | |
Becle SAB de CV | | | 10,700 | | | | 24,512 | |
| | |
Carabao Group PCL, NVDR | | | 2,800 | | | | 10,463 | |
| | |
China Foods Ltd. | | | 330,000 | | | | 126,416 | |
| | |
China Resources Beer Holdings Co. Ltd. | | | 27,107 | | | | 224,758 | |
| | |
Cia Cervecerias Unidas SA | | | 6,875 | | | | 57,756 | |
| | |
Coca-Cola Femsa SAB de CV | | | 16,500 | | | | 89,114 | |
| | |
Coca-Cola Icecek A/S | | | 2,875 | | | | 25,446 | |
| | |
Distell Group Holdings Ltd.* | | | 3,420 | | | | 41,123 | |
| | |
Embotelladora Andina SA (Preference), Class B | | | 9,513 | | | | 19,699 | |
| | |
Emperador, Inc. | | | 55,200 | | | | 20,039 | |
| | |
Fomento Economico Mexicano SAB de CV | | | 38,500 | | | | 317,213 | |
| | |
Fraser & Neave Holdings Bhd. | | | 3,700 | | | | 24,178 | |
| | |
Hebei Hengshui Laobaigan Liquor Co. Ltd., Class A | | | 5,500 | | | | 18,504 | |
| | |
Heineken Malaysia Bhd. | | | 3,800 | | | | 21,106 | |
| | |
Hite Jinro Co. Ltd. | | | 348 | | | | 10,364 | |
| | |
Jiangsu Yanghe Brewery Joint-Stock Co. Ltd., Class A | | | 2,100 | | | | 61,097 | |
| | |
Kweichow Moutai Co. Ltd., Class A | | | 1,900 | | | | 542,177 | |
| | |
Lotte Chilsung Beverage Co. Ltd. | | | 150 | | | | 18,677 | |
| | |
Luzhou Laojiao Co. Ltd., Class A | | | 2,400 | | | | 85,866 | |
| | |
Nongfu Spring Co. Ltd., Class H(a) (b) | | | 36,200 | | | | 183,582 | |
| | |
Osotspa PCL, NVDR | | | 20,400 | | | | 20,134 | |
| | |
Radico Khaitan Ltd. | | | 5,940 | | | | 88,785 | |
| | |
Shanxi Xinghuacun Fen Wine Factory Co. Ltd., Class A | | | 1,960 | | | | 92,344 | |
| | |
Tsingtao Brewery Co. Ltd., Class H(b) | | | 8,000 | | | | 69,571 | |
| | |
United Breweries Ltd. | | | 1,379 | | | | 30,544 | |
| | |
United Spirits Ltd.* | | | 6,262 | | | | 79,223 | |
| | |
Varun Beverages Ltd. | | | 1,741 | | | | 19,747 | |
| | |
Vina Concha y Toro SA | | | 261,661 | | | | 381,535 | |
| | |
Wuliangye Yibin Co. Ltd., Class A | | | 6,600 | | | | 223,300 | |
See Accompanying Notes to the Financial Statements.
| | | | |
| 224 | | FLEXSHARES ANNUAL REPORT | | |
FlexShares® Morningstar Emerging Markets Factor Tilt Index Fund (cont.)
| | | | | | | | |
| Investments | | Shares | | | Value | |
|
| COMMON STOCKS – (continued) | |
|
| Beverages – (continued) | |
| | |
Yantai Changyu Pioneer Wine Co. Ltd., Class A | | | 5,500 | | | $ | 27,099 | |
| | |
Yantai Changyu Pioneer Wine Co. Ltd., Class B | | | 15,000 | | | | 26,957 | |
| | | | | | | | 3,386,757 | |
|
| Biotechnology – 0.8% | |
| | |
3SBio, Inc.* (a) | | | 45,980 | | | | 42,085 | |
| | |
ABLBio, Inc.* | | | 2,133 | | | | 38,971 | |
| | |
Adimmune Corp. | | | 19,000 | | | | 30,029 | |
| | |
Akeso, Inc.* (a) (b) | | | 11,000 | | | | 61,653 | |
| | |
Alphamab Oncology* (a) | | | 24,000 | | | | 49,610 | |
| | |
Alteogen, Inc.* | | | 780 | | | | 46,725 | |
| | |
Amicogen, Inc.* | | | 514 | | | | 14,207 | |
| | |
Anterogen Co. Ltd.* | | | 477 | | | | 23,839 | |
| | |
AptaBio Therapeutics, Inc.* | | | 954 | | | | 41,228 | |
| | |
BeiGene Ltd.* | | | 13,000 | | | | 363,978 | |
| | |
Beijing Tiantan Biological Products Corp. Ltd., Class A | | | 5,300 | | | | 23,911 | |
| | |
Biocon Ltd.* | | | 6,644 | | | | 31,152 | |
| | |
Bioneer Corp.* | | | 1,045 | | | | 44,803 | |
| | |
Burning Rock Biotech Ltd., ADR* (b) | | | 1,431 | | | | 20,163 | |
| | |
Cellid Co. Ltd.* | | | 424 | | | | 25,907 | |
| | |
Celltrion, Inc.* | | | 2,032 | | | | 348,651 | |
| | |
CrystalGenomics, Inc.* | | | 5,353 | | | | 31,379 | |
| | |
CStone Pharmaceuticals* (a) | | | 25,000 | | | | 31,045 | |
| | |
Daan Gene Co. Ltd., Class A | | | 8,000 | | | | 24,065 | |
| | |
Eubiologics Co. Ltd.* | | | 1,650 | | | | 67,353 | |
| | |
GeneOne Life Science, Inc.* | | | 2,485 | | | | 53,270 | |
| | |
Genetron Holdings Ltd., ADR* | | | 1,643 | | | | 22,624 | |
| | |
Genexine, Inc.* | | | 282 | | | | 15,783 | |
| | |
Green Cross Cell Corp.(c) | | | 258 | | | | 8,511 | |
| | |
Green Cross Corp. | | | 163 | | | | 38,290 | |
| | |
Green Cross Holdings Corp. | | | 1,219 | | | | 30,565 | |
| | |
Green Cross LabCell Corp. | | | 371 | | | | 30,796 | |
| | |
Helixmith Co. Ltd.* | | | 1,719 | | | | 35,011 | |
| | |
Hualan Biological Engineering, Inc., Class A | | | 5,300 | | | | 24,598 | |
| | |
Hugel, Inc.* | | | 126 | | | | 19,495 | |
| | | | | | | | |
| Investments | | Shares | | | Value | |
|
| Biotechnology – (continued) | |
| | |
I-Mab, ADR* | | | 742 | | | $ | 45,848 | |
| | |
Innovent Biologics, Inc.* (a) | | | 17,000 | | | | 152,538 | |
| | |
iNtRON Biotechnology, Inc.* | | | 1,643 | | | | 27,136 | |
| | |
Kintor Pharmaceutical Ltd.* (a) (b) | | | 7,000 | | | | 34,914 | |
| | |
KoBioLabs, Inc.* | | | 1,166 | | | | 25,893 | |
| | |
L&C Bio Co. Ltd. | | | 1,325 | | | | 38,779 | |
| | |
Medigen Vaccine Biologics Corp.* | | | 4,000 | | | | 34,522 | |
| | |
MedPacto, Inc.* | | | 235 | | | | 11,362 | |
| | |
Medy-Tox, Inc.* | | | 115 | | | | 14,722 | |
| | |
Naturecell Co. Ltd.* | | | 2,743 | | | | 46,243 | |
| | |
OBI Pharma, Inc.* | | | 12,000 | | | | 45,957 | |
| | |
OliX Pharmaceuticals, Inc.* | | | 901 | | | | 29,685 | |
| | |
Pharmicell Co. Ltd.* | | | 2,919 | | | | 31,100 | |
| | |
Seegene, Inc. | | | 1,623 | | | | 73,889 | |
| | |
Shanghai Haohai Biological Technology Co. Ltd., Class A | | | 770 | | | | 18,741 | |
| | |
Shanghai Junshi Biosciences Co. Ltd., Class A* | | | 1,113 | | | | 8,397 | |
| | |
Shanghai RAAS Blood Products Co. Ltd., Class A | | | 9,400 | | | | 9,695 | |
| | |
SillaJen, Inc.* ‡ (c) | | | 2,522 | | | | 13,057 | |
| | |
SK Bioscience Co. Ltd.* | | | 495 | | | | 97,428 | |
| | |
Taigen Biopharmaceuticals Holdings Ltd.* | | | 55,000 | | | | 31,546 | |
| | |
TaiMed Biologics, Inc.* | | | 1,000 | | | | 2,402 | |
| | |
Vaxcell-Bio Therapeutics Co. Ltd.* | | | 371 | | | | 20,478 | |
| | |
Zai Lab Ltd., ADR* | | | 1,494 | | | | 155,974 | |
| | | | | | | | 2,610,003 | |
|
| Building Products – 0.2% | |
| | |
Astral Ltd. | | | 886 | | | | 25,849 | |
| | |
Beijing New Building Materials plc, Class A | | | 5,300 | | | | 23,389 | |
| | |
Blue Star Ltd. | | | 2,703 | | | | 34,657 | |
| | |
China Lesso Group Holdings Ltd. | | | 33,000 | | | | 51,246 | |
| | |
Kajaria Ceramics Ltd. | | | 2,608 | | | | 42,534 | |
| | |
Kyung Dong Navien Co. Ltd. | | | 208 | | | | 11,926 | |
| | |
LX Hausys Ltd. | | | 2,970 | | | | 176,896 | |
| | |
Taiwan Glass Industry Corp. | | | 55,000 | | | | 53,994 | |
See Accompanying Notes to the Financial Statements.
| | | | | | |
| | FLEXSHARES ANNUAL REPORT | | | 225 | |
FlexShares® Morningstar Emerging Markets Factor Tilt Index Fund (cont.)
| | | | | | | | |
| Investments | | Shares | | | Value | |
|
| COMMON STOCKS – (continued) | |
|
| Building Products – (continued) | |
| | |
Xinyi Glass Holdings Ltd. | | | 50,000 | | | $ | 141,084 | |
| | |
Zhejiang Weixing New Building Materials Co. Ltd., Class A | | | 10,800 | | | | 30,378 | |
| | |
Zhuzhou Kibing Group Co. Ltd., Class A | | | 5,300 | | | | 13,169 | |
| | | | | | | | 605,122 | |
|
| Capital Markets – 2.1% | |
| | |
B3 SA – Brasil Bolsa Balcao | | | 126,500 | | | | 267,273 | |
| | |
Bairong, Inc.* (a) | | | 26,500 | | | | 41,969 | |
| | |
Banco BTG Pactual SA* | | | 22,000 | | | | 88,008 | |
| | |
Bangkok Commercial Asset Management PCL, NVDR | | | 25,000 | | | | 14,315 | |
| | |
Bolsa Mexicana de Valores SAB de CV | | | 29,100 | | | | 55,868 | |
| | |
Boursa Kuwait Securities Co. KPSC | | | 4,876 | | | | 32,512 | |
| | |
Bursa Malaysia Bhd. | | | 8,000 | | | | 14,509 | |
| | |
Caitong Securities Co. Ltd., Class A | | | 9,400 | | | | 15,071 | |
| | |
Capital Securities Corp. | | | 110,000 | | | | 59,928 | |
| | |
Changjiang Securities Co. Ltd., Class A | | | 14,100 | | | | 15,952 | |
| | |
China Bills Finance Corp. | | | 53,000 | | | | 31,733 | |
| | |
China Cinda Asset Management Co. Ltd., Class H | | | 330,000 | | | | 55,148 | |
| | |
China Everbright Ltd.(b) | | | 440,000 | | | | 495,485 | |
| | |
China Galaxy Securities Co. Ltd., Class A | | | 5,200 | | | | 8,028 | |
| | |
China Galaxy Securities Co. Ltd., Class H | | | 61,000 | | | | 34,032 | |
| | |
China Huarong Asset Management Co. Ltd., Class H* ‡ (a) (c) | | | 208,000 | | | | 21,543 | |
| | |
China International Capital Corp. Ltd., Class H(a) | | | 19,200 | | | | 47,784 | |
| | |
China Merchants Securities Co. Ltd., Class A | | | 12,220 | | | | 32,768 | |
| | |
China Merchants Securities Co. Ltd., Class H(a) (b) | | | 16,600 | | | | 26,247 | |
| | |
China Renaissance Holdings Ltd.* (a) | | | 10,600 | | | | 25,509 | |
| | | | | | | | |
| Investments | | Shares | | | Value | |
|
| Capital Markets – (continued) | |
| | |
CITIC Securities Co. Ltd., Class A | | | 16,500 | | | $ | 66,729 | |
| | |
CITIC Securities Co. Ltd., Class H(b) | | | 43,000 | | | | 109,558 | |
| | |
Coronation Fund Managers Ltd. | | | 7,009 | | | | 23,337 | |
| | |
CSC Financial Co. Ltd., Class H(a) (b) | | | 467,500 | | | | 495,803 | |
| | |
Daishin Securities Co. Ltd. | | | 212 | | | | 3,774 | |
| | |
Daishin Securities Co. Ltd. (Preference) | | | 530 | | | | 8,595 | |
| | |
Daou Data Corp. | | | 7,150 | | | | 82,602 | |
| | |
Daou Technology, Inc. | | | 12,458 | | | | 248,403 | |
| | |
Dhani Services Ltd.* | | | 14,469 | | | | 34,317 | |
| | |
Dubai Financial Market PJSC* | | | 67,052 | | | | 18,620 | |
| | |
Egyptian Financial Group-Hermes Holding Co.* | | | 362,523 | | | | 286,603 | |
| | |
Everbright Securities Co. Ltd., Class A | | | 9,400 | | | | 22,372 | |
| | |
Founder Securities Co. Ltd., Class A | | | 14,100 | | | | 17,979 | |
| | |
GF Securities Co. Ltd., Class A | | | 14,100 | | | | 44,332 | |
| | |
GF Securities Co. Ltd., Class H | | | 48,000 | | | | 81,573 | |
| | |
Glory Sun Financial Group Ltd.* | | | 1,272,000 | | | | 44,149 | |
| | |
Guangzhou Yuexiu Financial Holdings Group Co. Ltd., Class A | | | 8,640 | | | | 10,437 | |
| | |
Guosen Securities Co. Ltd., Class A | | | 14,100 | | | | 25,118 | |
| | |
Guotai Junan International Holdings Ltd.(b) | | | 1,355,000 | | | | 196,830 | |
| | |
Guotai Junan Securities Co. Ltd., Class A | | | 22,000 | | | | 60,232 | |
| | |
Guotai Junan Securities Co. Ltd., Class H(a) | | | 21,200 | | | | 28,997 | |
| | |
Haitong Securities Co. Ltd., Class A | | | 18,800 | | | | 36,282 | |
| | |
Haitong Securities Co. Ltd., Class H | | | 110,000 | | | | 97,994 | |
| | |
Hanwha Investment & Securities Co. Ltd.* | | | 5,088 | | | | 24,122 | |
| | |
HDFC Asset Management Co. Ltd.(a) | | | 782 | | | | 27,645 | |
See Accompanying Notes to the Financial Statements.
| | | | |
| 226 | | FLEXSHARES ANNUAL REPORT | | |
FlexShares® Morningstar Emerging Markets Factor Tilt Index Fund (cont.)
| | | | | | | | |
| Investments | | Shares | | | Value | |
|
| COMMON STOCKS – (continued) | |
|
| Capital Markets – (continued) | |
| | |
Huatai Securities Co. Ltd., Class A | | | 26,100 | | | $ | 64,727 | |
| | |
Huatai Securities Co. Ltd., Class H(a) | | | 51,000 | | | | 76,050 | |
| | |
IBF Financial Holdings Co. Ltd. | | | 49,893 | | | | 28,527 | |
| | |
ICICI Securities Ltd.(a) | | | 1,880 | | | | 18,529 | |
| | |
IDFC Ltd.* | | | 691,240 | | | | 508,636 | |
| | |
Indian Energy Exchange Ltd.(a) | | | 7,260 | | | | 68,672 | |
| | |
Industrial Securities Co. Ltd., Class A | | | 26,500 | | | | 37,808 | |
| | |
Investec Ltd. | | | 158,565 | | | | 730,234 | |
| | |
Is Yatirim Menkul Degerler A/S | | | 63,690 | | | | 105,983 | |
| | |
Jih Sun Financial Holdings Co. Ltd.* | | | 50,000 | | | | 23,374 | |
| | |
JM Financial Ltd. | | | 223,355 | | | | 262,187 | |
| | |
JSE Ltd. | | | 2,795 | | | | 19,622 | |
| | |
KIWOOM Securities Co. Ltd. | | | 640 | | | | 57,507 | |
| | |
Korea Investment Holdings Co. Ltd. | | | 1,375 | | | | 102,370 | |
| | |
Meritz Securities Co. Ltd. | | | 6,708 | | | | 26,751 | |
| | |
Mirae Asset Securities Co. Ltd. | | | 7,745 | | | | 57,530 | |
| | |
Mirae Asset Securities Co. Ltd. (2nd Preference) | | | 6,840 | | | | 28,301 | |
| | |
Moscow Exchange MICEX-RTS PJSC | | | 29,911 | | | | 73,280 | |
| | |
Multi Commodity Exchange of India Ltd. | | | 583 | | | | 13,265 | |
| | |
Nanjing Securities Co. Ltd., Class A | | | 9,400 | | | | 14,263 | |
| | |
NH Investment & Securities Co. Ltd. | | | 5,665 | | | | 63,750 | |
| | |
Nippon Life India Asset Management Ltd.(a) | | | 5,244 | | | | 29,297 | |
| | |
Noah Holdings Ltd., ADR* | | | 1,113 | | | | 47,314 | |
| | |
Orient Securities Co. Ltd., Class A | | | 9,400 | | | | 20,212 | |
| | |
Orient Securities Co. Ltd., Class H(a) (b) | | | 42,400 | | | | 34,829 | |
| | |
Pacific Securities Co. Ltd., Class A* | | | 37,100 | | | | 18,088 | |
| | | | | | | | |
| Investments | | Shares | | | Value | |
|
| Capital Markets – (continued) | |
| | |
President Securities Corp. | | | 53,000 | | | $ | 43,168 | |
| | |
PSG Konsult Ltd. | | | 3,256 | | | | 2,975 | |
| | |
Reinet Investments SCA | | | 4,345 | | | | 78,810 | |
| | |
Samsung Securities Co. Ltd. | | | 2,255 | | | | 91,373 | |
| | |
Saratoga Investama Sedaya Tbk. PT | | | 891,000 | | | | 131,441 | |
| | |
SDIC Capital Co. Ltd., Class A | | | 14,288 | | | | 18,309 | |
| | |
Shenwan Hongyuan Group Co. Ltd., Class A | | | 42,400 | | | | 33,990 | |
| | |
Shenwan Hongyuan Group Co. Ltd., Class H(a) | | | 75,200 | | | | 19,044 | |
| | |
Sinolink Securities Co. Ltd., Class A | | | 9,400 | | | | 15,747 | |
| | |
Tata Liquid Fund* ‡ (c) | | | 5,000 | | | | — | |
| | |
UTI Asset Management Co. Ltd. | | | 1,378 | | | | 19,056 | |
| | |
Western Securities Co. Ltd., Class A | | | 26,500 | | | | 31,721 | |
| | |
Woori Investment Bank Co. Ltd. | | | 192,115 | | | | 163,747 | |
| | |
Woori Technology Investment Co. Ltd.* | | | 3,763 | | | | 38,160 | |
| | |
Yuanta Securities Korea Co. Ltd. | | | 44,364 | | | | 170,463 | |
| | |
Zheshang Securities Co. Ltd., Class A* | | | 4,700 | | | | 9,063 | |
| | |
Zhongtai Securities Co. Ltd., Class A | | | 15,900 | | | | 22,983 | |
| | | | | | | | 6,901,241 | |
|
| Chemicals – 3.8% | |
| | |
Aarti Industries Ltd. | | | 5,940 | | | | 76,478 | |
| | |
Advanced Petrochemical Co. | | | 1,686 | | | | 33,442 | |
| | |
Alkyl Amines Chemicals | | | 220 | | | | 10,590 | |
| | |
Alpek SAB de CV(b) | | | 201,200 | | | | 220,759 | |
| | |
Alujain Holding* | | | 795 | | | | 13,438 | |
| | |
Asian Paints Ltd. | | | 9,735 | | | | 403,031 | |
| | |
Atul Ltd. | | | 259 | | | | 31,573 | |
| | |
Balaji Amines Ltd. | | | 742 | | | | 34,284 | |
| | |
Barito Pacific Tbk. PT | | | 474,700 | | | | 31,328 | |
| | |
Batu Kawan Bhd. | | | 6,300 | | | | 33,927 | |
| | |
Bayer CropScience Ltd. | | | 141 | | | | 9,393 | |
| | |
Berger Paints India Ltd. | | | 5,765 | | | | 57,087 | |
See Accompanying Notes to the Financial Statements.
| | | | | | |
| | FLEXSHARES ANNUAL REPORT | | | 227 | |
FlexShares® Morningstar Emerging Markets Factor Tilt Index Fund (cont.)
| | | | | | | | |
| Investments | | Shares | | | Value | |
|
| COMMON STOCKS – (continued) | |
|
| Chemicals – (continued) | |
| | |
Boubyan Petrochemicals Co. KSCP | | | 7,344 | | | $ | 22,413 | |
| | |
Braskem SA (Preference), Class A* | | | 5,500 | | | | 53,136 | |
| | |
Carborundum Universal Ltd. | | | 6,985 | | | | 78,291 | |
| | |
Castrol India Ltd. | | | 40,480 | | | | 74,682 | |
| | |
Chambal Fertilizers and Chemicals Ltd. | | | 87,615 | | | | 432,568 | |
| | |
Chandra Asri Petrochemical Tbk. PT | | | 74,200 | | | | 39,804 | |
| | |
China Lumena New Materials Corp.* ‡ (c) | | | 22,200 | | | | — | |
| | |
China Man-Made Fiber Corp. | | | 744,042 | | | | 271,573 | |
| | |
China Petrochemical Development Corp.* | | | 76,000 | | | | 33,069 | |
| | |
China Risun Group Ltd.(a) | | | 660,000 | | | | 400,460 | |
| | |
Chunbo Co. Ltd. | | | 141 | | | | 34,172 | |
| | |
CNNC Hua Yuan Titanium Dioxide Co. Ltd., Class A | | | 5,500 | | | | 11,869 | |
| | |
Coromandel International Ltd. | | | 1,898 | | | | 19,912 | |
| | |
D&L Industries, Inc. | | | 110,800 | | | | 18,551 | |
| | |
DCM Shriram Ltd. | | | 1,375 | | | | 18,137 | |
| | |
Deepak Nitrite Ltd. | | | 1,219 | | | | 36,308 | |
| | |
Dongjin Semichem Co. Ltd. | | | 206 | | | | 6,170 | |
| | |
Ecopro Co. Ltd. | | | 242 | | | | 20,730 | |
| | |
Egypt Kuwait Holding Co. SAE* | | | 489,390 | | | | 674,869 | |
| | |
ENF Technology Co. Ltd. | | | 5,555 | | | | 137,384 | |
| | |
Engro Corp. Ltd. | | | 148,479 | | | | 245,560 | |
| | |
Engro Fertilizers Ltd. | | | 268,556 | | | | 112,002 | |
| | |
Fauji Fertilizer Co. Ltd. | | | 314,972 | | | | 189,057 | |
| | |
Finolex Industries Ltd. | | | 24,750 | | | | 72,748 | |
| | |
Foosung Co. Ltd.* | | | 1,768 | | | | 30,184 | |
| | |
Formosa Chemicals & Fibre Corp. | | | 74,000 | | | | 214,215 | |
| | |
Formosa Plastics Corp. | | | 94,000 | | | | 363,378 | |
| | |
Grand Pacific Petrochemical | | | 55,000 | | | | 53,401 | |
| | |
Guangzhou Tinci Materials Technology Co. Ltd., Class A | | | 700 | | | | 18,041 | |
| | |
Hansol Chemical Co. Ltd. | | | 232 | | | | 65,319 | |
| | |
Hanwha Solutions Corp.* | | | 4,607 | | | | 161,051 | |
| | | | | | | | |
| Investments | | Shares | | | Value | |
|
| Chemicals – (continued) | |
| | |
HDC Holdings Co. Ltd. | | | 18,466 | | | $ | 166,716 | |
| | |
Hengli Petrochemical Co. Ltd., Class A | | | 16,500 | | | | 56,828 | |
| | |
Hengyi Petrochemical Co. Ltd., Class A | | | 14,100 | | | | 24,127 | |
| | |
Ho Tung Chemical Corp. | | | 440,000 | | | | 164,554 | |
| | |
Huabao International Holdings Ltd.(b) | | | 17,000 | | | | 31,950 | |
| | |
Huafon Chemical Co. Ltd., Class A | | | 5,300 | | | | 9,847 | |
| | |
Huchems Fine Chemical Corp. | | | 9,482 | | | | 213,813 | |
| | |
Hyosung Advanced Materials Corp.* | | | 110 | | | | 66,741 | |
| | |
Hyosung Chemical Corp.* | | | 53 | | | | 13,040 | |
| | |
Indorama Ventures PCL, NVDR | | | 82,500 | | | | 104,422 | |
| | |
Inner Mongolia Junzheng Energy & Chemical Industry Group Co. Ltd., Class A | | | 23,500 | | | | 18,839 | |
| | |
International CSRC Investment Holdings Co. | | | 53,000 | | | | 45,741 | |
| | |
Jiangsu Eastern Shenghong Co. Ltd., Class A | | | 5,300 | | | | 22,569 | |
| | |
Kansai Nerolac Paints Ltd. | | | 2,196 | | | | 15,984 | |
| | |
KCC Corp. | | | 106 | | | | 30,207 | |
| | |
Kingfa Sci & Tech Co. Ltd., Class A | | | 16,200 | | | | 29,695 | |
| | |
Kolon Industries, Inc. | | | 674 | | | | 51,449 | |
| | |
Korea Petrochemical Ind Co. Ltd. | | | 135 | | | | 21,373 | |
| | |
Kumho Petrochemical Co. Ltd. | | | 715 | | | | 105,242 | |
| | |
LB Group Co. Ltd., Class A | | | 4,700 | | | | 20,851 | |
| | |
LG Chem Ltd. | | | 990 | | | | 708,262 | |
| | |
LG Chem Ltd. (Preference) | | | 170 | | | | 55,791 | |
| | |
Linde India Ltd. | | | 1,378 | | | | 42,409 | |
| | |
Lotte Chemical Corp. | | | 550 | | | | 105,665 | |
| | |
LOTTE Fine Chemical Co. Ltd. | | | 397 | | | | 28,912 | |
| | |
Luxi Chemical Group Co. Ltd., Class A | | | 10,800 | | | | 27,678 | |
| | |
Mesaieed Petrochemical Holding Co. | | | 76,751 | | | | 50,591 | |
| | |
Miwon Commercial Co. Ltd. | | | 212 | | | | 37,645 | |
See Accompanying Notes to the Financial Statements.
| | | | |
| 228 | | FLEXSHARES ANNUAL REPORT | | |
FlexShares® Morningstar Emerging Markets Factor Tilt Index Fund (cont.)
| | | | | | | | |
| Investments | | Shares | | | Value | |
|
| COMMON STOCKS – (continued) | |
|
| Chemicals – (continued) | |
| | |
Nan Pao Resins Chemical Co. Ltd. | | | 31,000 | | | $ | 154,953 | |
| | |
Nan Ya Plastics Corp. | | | 110,000 | | | | 336,624 | |
| | |
Nantex Industry Co. Ltd. | | | 7,000 | | | | 20,515 | |
| | |
National Industrialization Co.* | | | 5,584 | | | | 37,069 | |
| | |
National Petrochemical Co. | | | 1,669 | | | | 21,403 | |
| | |
Navin Fluorine International Ltd. | | | 1,910 | | | | 85,153 | |
| | |
Ningxia Baofeng Energy Group Co. Ltd., Class A | | | 10,600 | | | | 24,184 | |
| | |
Nizhnekamskneftekhim PJSC | | | 151,250 | | | | 271,759 | |
| | |
Nizhnekamskneftekhim PJSC (Preference) | | | 123,200 | | | | 181,081 | |
| | |
OCI Co. Ltd.* | | | 333 | | | | 36,903 | |
| | |
Orbia Advance Corp. SAB de CV | | | 33,533 | | | | 87,346 | |
| | |
Oriental Union Chemical Corp.* | | | 38,000 | | | | 32,591 | |
| | |
Petkim Petrokimya Holding A/S* | | | 57,016 | | | | 38,722 | |
| | |
Petronas Chemicals Group Bhd. | | | 55,000 | | | | 115,419 | |
| | |
PhosAgro PJSC | | | 1,870 | | | | 147,626 | |
| | |
PI Advanced Materials Co. Ltd. | | | 520 | | | | 20,114 | |
| | |
PI Industries Ltd. | | | 1,314 | | | | 52,642 | |
| | |
Pidilite Industries Ltd. | | | 2,750 | | | | 84,968 | |
| | |
PTT Global Chemical PCL, NVDR | | | 55,000 | | | | 104,008 | |
| | |
Qurain Petrochemical Industries Co. | | | 15,408 | | | | 19,372 | |
| | |
Rongsheng Petrochemical Co. Ltd., Class A | | | 27,500 | | | | 74,086 | |
| | |
SABIC Agri-Nutrients Co. | | | 4,125 | | | | 180,357 | |
| | |
Sahara International Petrochemical Co. | | | 5,929 | | | | 69,392 | |
| | |
Sasa Polyester Sanayi A/S* | | | 7,379 | | | | 23,821 | |
| | |
Sasol Ltd.* | | | 20,117 | | | | 339,620 | |
| | |
Satellite Chemical Co. Ltd., Class A | | | 2,380 | | | | 14,486 | |
| | |
Saudi Basic Industries Corp. | | | 18,590 | | | | 639,343 | |
| | | | | | | | |
| Investments | | Shares | | | Value | |
|
| Chemicals – (continued) | |
| | |
Saudi Industrial Investment Group | | | 4,770 | | | $ | 48,134 | |
| | |
Saudi Kayan Petrochemical Co.* | | | 17,930 | | | | 97,325 | |
| | |
Scientex Bhd. | | | 26,100 | | | | 29,371 | |
| | |
Shandong Hualu Hengsheng Chemical Co. Ltd., Class A | | | 6,110 | | | | 29,675 | |
| | |
Shinkong Synthetic Fibers Corp. | | | 53,000 | | | | 35,926 | |
| | |
Sichuan Yahua Industrial Group Co. Ltd., Class A | | | 5,300 | | | | 27,165 | |
| | |
SK Chemicals Co. Ltd. | | | 412 | | | | 63,463 | |
| | |
SK Materials Co. Ltd. | | | 65 | | | | 21,187 | |
| | |
SKC Co. Ltd. | | | 440 | | | | 67,023 | |
| | |
Sociedad Quimica y Minera de Chile SA (Preference), Class B | | | 2,763 | | | | 150,459 | |
| | |
Solar Industries India Ltd. | | | 1,040 | | | | 34,542 | |
| | |
Songwon Industrial Co. Ltd. | | | 8,085 | | | | 123,847 | |
| | |
Soulbrain Co. Ltd. | | | 141 | | | | 31,565 | |
| | |
SRF Ltd. | | | 2,075 | | | | 58,672 | |
| | |
Sumitomo Chemical India Ltd. | | | 2,585 | | | | 12,987 | |
| | |
Supreme Industries Ltd. | | | 1,204 | | | | 37,447 | |
| | |
Swancor Holding Co. Ltd. | | | 42,000 | | | | 149,070 | |
| | |
Taekwang Industrial Co. Ltd. | | | 165 | | | | 141,201 | |
| | |
Tata Chemicals Ltd. | | | 3,975 | | | | 47,847 | |
| | |
TOA Paint Thailand PCL, NVDR | | | 12,000 | | | | 11,934 | |
| | |
Tongkun Group Co. Ltd., Class A | | | 9,400 | | | | 29,290 | |
| | |
TSRC Corp. | | | 7,000 | | | | 8,068 | |
| | |
Unid Co. Ltd. | | | 3,025 | | | | 301,581 | |
| | |
Unipar Carbocloro SA (Preference) | | | 2,779 | | | | 36,812 | |
| | |
UPL Ltd. | | | 20,405 | | | | 201,703 | |
| | |
USI Corp. | | | 28,000 | | | | 34,637 | |
| | |
Vinythai PCL, NVDR | | | 21,200 | | | | 24,278 | |
| | |
Wanhua Chemical Group Co. Ltd., Class A | | | 5,500 | | | | 90,648 | |
| | |
Wonik Materials Co. Ltd. | | | 4,235 | | | | 117,966 | |
| | |
Xinjiang Zhongtai Chemical Co. Ltd., Class A | | | 10,600 | | | | 17,475 | |
| | |
Yanbu National Petrochemical Co. | | | 6,105 | | | | 123,861 | |
See Accompanying Notes to the Financial Statements.
| | | | | | |
| | FLEXSHARES ANNUAL REPORT | | | 229 | |
FlexShares® Morningstar Emerging Markets Factor Tilt Index Fund (cont.)
| | | | | | | | |
| Investments | | Shares | | | Value | |
|
| COMMON STOCKS – (continued) | |
|
| Chemiacals – (continued) | |
| | |
Zhejiang Longsheng Group Co. Ltd., Class A | | | 9,400 | | | $ | 18,288 | |
| | | | | | | | 12,572,329 | |
|
| Commercial Services & Supplies – 0.1% | |
| | |
China Everbright Environment Group Ltd. | | | 110,000 | | | | 75,652 | |
| | |
Dynagreen Environmental Protection Group Co. Ltd., Class H(a) | | | 50,000 | | | | 25,582 | |
| | |
Frontken Corp. Bhd. | | | 88,000 | | | | 80,966 | |
| | |
Indian Railway Catering & Tourism Corp. Ltd. | | | 6,050 | | | | 68,328 | |
| | |
KEPCO Plant Service & Engineering Co. Ltd. | | | 954 | | | | 34,166 | |
| | |
PNB Holdings Corp.* (c) | | | 46,815 | | | | 38,769 | |
| | |
S-1 Corp. | | | 347 | | | | 24,736 | |
| | |
Saudi Airlines Catering Co.* | | | 2,585 | | | | 65,471 | |
| | |
Taiwan Secom Co. Ltd. | | | 3,165 | | | | 11,438 | |
| | | | | | | | 425,108 | |
|
| Communications Equipment – 0.4% | |
| | |
Accton Technology Corp. | | | 10,000 | | | | 87,563 | |
| | |
Ace Technologies Corp.* | | | 705 | | | | 8,627 | |
| | |
Addsino Co. Ltd., Class A | | | 5,300 | | | | 12,713 | |
| | |
Advanced Ceramic X Corp. | | | 2,000 | | | | 24,669 | |
| | |
Arcadyan Technology Corp. | | | 92,000 | | | | 347,376 | |
| | |
BYD Electronic International Co. Ltd.(b) | | | 10,000 | | | | 29,759 | |
| | |
D-Link Corp. | | | 53,000 | | | | 39,071 | |
| | |
Glarun Technology Co. Ltd., Class A | | | 10,600 | | | | 24,466 | |
| | |
KMW Co. Ltd.* | | | 563 | | | | 19,850 | |
| | |
Seojin System Co. Ltd.* | | | 795 | | | | 23,403 | |
| | |
Sterlite Technologies Ltd. | | | 11,660 | | | | 42,642 | |
| | |
Tianjin 712 Communication & Broadcasting Co. Ltd., Class A | | | 900 | | | | 5,299 | |
| | |
Wistron NeWeb Corp. | | | 165,000 | | | | 459,841 | |
| | |
ZTE Corp., Class A | | | 4,700 | | | | 23,958 | |
| | |
ZTE Corp., Class H | | | 10,600 | | | | 31,886 | |
| | | | | | | | 1,181,123 | |
| | | | | | | | |
| Investments | | Shares | | | Value | |
|
| Construction & Engineering – 1.0% | |
| | |
BES Engineering Corp. | | | 105,000 | | | $ | 33,152 | |
| | |
China Communications Services Corp. Ltd., Class H | | | 1,256,000 | | | | 694,275 | |
| | |
China Conch Venture Holdings Ltd. | | | 55,000 | | | | 268,670 | |
| | |
China Railway Group Ltd., Class A | | | 47,000 | | | | 38,559 | |
| | |
China Railway Group Ltd., Class H | | | 110,000 | | | | 53,875 | |
| | |
Continental Holdings Corp. | | | 220,000 | | | | 199,364 | |
| | |
CTCI Corp. | | | 22,000 | | | | 28,837 | |
| | |
DA CIN Construction Co. Ltd. | | | 165,000 | | | | 180,080 | |
| | |
Daewoo Engineering & Construction Co. Ltd.* | | | 3,901 | | | | 20,865 | |
| | |
DL Construction Co. Ltd. | | | 4,290 | | | | 108,117 | |
| | |
DL Holdings Co. Ltd. | | | 397 | | | | 22,321 | |
| | |
Gamuda Bhd.* | | | 48,221 | | | | 37,729 | |
| | |
GEK Terna Holding Real Estate Construction SA* | | | 1,216 | | | | 13,608 | |
| | |
GS Engineering & Construction Corp. | | | 2,750 | | | | 97,311 | |
| | |
HDC Hyundai Development Co-Engineering & Construction, Class E | | | 1,236 | | | | 27,025 | |
| | |
Hyundai Engineering & Construction Co. Ltd. | | | 2,556 | | | | 110,023 | |
| | |
IJM Corp. Bhd. | | | 78,400 | | | | 35,025 | |
| | |
IS Dongseo Co. Ltd. | | | 808 | | | | 31,254 | |
| | |
KEC International Ltd. | | | 6,678 | | | | 42,597 | |
| | |
KEPCO Engineering & Construction Co., Inc. | | | 602 | | | | 36,525 | |
| | |
Larsen & Toubro Ltd. | | | 23,079 | | | | 544,496 | |
| | |
Larsen & Toubro Ltd., GDR(a) | | | 296 | | | | 7,222 | |
| | |
Malaysian Resources Corp. Bhd. | | | 85,090 | | | | 8,425 | |
| | |
Metallurgical Corp. of China Ltd., Class A | | | 65,800 | | | | 41,746 | |
| | |
Metallurgical Corp. of China Ltd., Class H | | | 106,000 | | | | 29,433 | |
| | |
NBCC India Ltd. | | | 41,870 | | | | 24,966 | |
| | |
Power Construction Corp. of China Ltd., Class A | | | 37,600 | | | | 48,239 | |
| | |
Samsung Engineering Co. Ltd.* | | | 5,555 | | | | 117,893 | |
See Accompanying Notes to the Financial Statements.
| | | | |
| 230 | | FLEXSHARES ANNUAL REPORT | | |
FlexShares® Morningstar Emerging Markets Factor Tilt Index Fund (cont.)
| | | | | | | | |
| Investments | | Shares | | | Value | |
|
| COMMON STOCKS – (continued) | |
|
| Construction & Engineering – (continued) | |
| | |
Shanghai Construction Group Co. Ltd., Class A | | | 23,500 | | | $ | 12,008 | |
| | |
Shanghai Tunnel Engineering Co. Ltd., Class A | | | 14,100 | | | | 11,281 | |
| | |
Suzhou Gold Mantis Construction Decoration Co. Ltd., Class A | | | 9,400 | | | | 8,769 | |
| | |
Tekfen Holding A/S | | | 105,270 | | | | 165,649 | |
| | |
TY Holdings Co. Ltd.* | | | 1,908 | | | | 44,330 | |
| | |
United Integrated Services Co. Ltd. | | | 6,000 | | | | 39,592 | |
| | |
Voltas Ltd. | | | 4,455 | | | | 71,664 | |
| | |
Waskita Karya Persero Tbk. PT* | | | 249,100 | | | | 16,176 | |
| | |
Wijaya Karya Persero Tbk. PT* | | | 281,200 | | | | 24,711 | |
| | | | | | | | 3,295,812 | |
|
| Construction Materials – 1.5% | |
| | |
ACC Ltd. | | | 1,404 | | | | 43,751 | |
| | |
Ambuja Cements Ltd. | | | 11,597 | | | | 62,692 | |
| | |
Anhui Conch Cement Co. Ltd., Class A | | | 11,000 | | | | 65,457 | |
| | |
Anhui Conch Cement Co. Ltd., Class H | | | 43,000 | | | | 213,921 | |
| | |
Asia Cement China Holdings Corp. | | | 200,000 | | | | 152,461 | |
| | |
Asia Cement Co. Ltd. | | | 825 | | | | 96,017 | |
| | |
Asia Cement Corp. | | | 88,000 | | | | 140,187 | |
| | |
BBMG Corp., Class A | | | 42,300 | | | | 18,574 | |
| | |
Birla Corp. Ltd. | | | 15,125 | | | | 308,696 | |
| | |
Cementos Argos SA | | | 5,520 | | | | 9,236 | |
| | |
Cemex SAB de CV* | | | 535,200 | | | | 344,937 | |
| | |
Chia Hsin Cement Corp. | | | 275,000 | | | | 199,759 | |
| | |
China Jushi Co. Ltd., Class A | | | 5,143 | | | | 15,383 | |
| | |
China National Building Material Co. Ltd., Class H | | | 146,050 | | | | 183,617 | |
| | |
China Resources Cement Holdings Ltd. | | | 68,000 | | | | 57,344 | |
| | |
CSG Holding Co. Ltd., Class A | | | 16,200 | | | | 22,885 | |
| | |
Dalmia Bharat Ltd. | | | 1,710 | | | | 45,952 | |
| | |
GCC SAB de CV | | | 2,300 | | | | 17,147 | |
| | | | | | | | |
| Investments | | Shares | | | Value | |
|
| Construction Materials – (continued) | |
| | |
Goldsun Building Materials Co. Ltd. | | | 55,000 | | | $ | 50,830 | |
| | |
Grasim Industries Ltd. | | | 6,710 | | | | 154,225 | |
| | |
Grupo Argos SA | | | 178,032 | | | | 553,566 | |
| | |
Grupo Argos SA (Preference) | | | 109,117 | | | | 247,275 | |
| | |
Hanil Cement Co. Ltd. | | | 14,135 | | | | 233,457 | |
| | |
Huaxin Cement Co. Ltd., Class A | | | 3,700 | | | | 9,679 | |
| | |
Huaxin Cement Co. Ltd., Class B | | | 10,400 | | | | 18,470 | |
| | |
Indocement Tunggal Prakarsa Tbk. PT | | | 32,900 | | | | 27,460 | |
| | |
JK Cement Ltd. | | | 530 | | | | 23,469 | |
| | |
Lucky Cement Ltd.* | | | 5,787 | | | | 26,114 | |
| | |
Next Science Co. Ltd.* | | | 2,640 | | | | 41,795 | |
| | |
Nuh Cimento Sanayi A/S | | | 31,350 | | | | 142,092 | |
| | |
POSCO Chemical Co. Ltd. | | | 715 | | | | 89,027 | |
| | |
Qassim Cement Co. (The) | | | 2,860 | | | | 62,219 | |
| | |
Ramco Cements Ltd. (The) | | | 2,289 | | | | 32,601 | |
| | |
Saudi Cement Co. | | | 2,022 | | | | 31,913 | |
| | |
Semen Indonesia Persero Tbk. PT | | | 57,600 | | | | 36,997 | |
| | |
Shree Cement Ltd. | | | 220 | | | | 84,130 | |
| | |
Siam Cement PCL (The), NVDR | | | 11,000 | | | | 130,943 | |
| | |
Southern Province Cement Co. | | | 1,634 | | | | 31,191 | |
| | |
SSANGYONG C&E Co. Ltd. | | | 290 | | | | 1,948 | |
| | |
Taiwan Cement Corp. | | | 181,452 | | | | 314,834 | |
| | |
Tangshan Jidong Cement Co. Ltd., Class A | | | 4,700 | | | | 8,549 | |
| | |
Tipco Asphalt PCL, NVDR | | | 324,500 | | | | 178,960 | |
| | |
TPI Polene PCL, NVDR | | | 395,400 | | | | 20,376 | |
| | |
UltraTech Cement Ltd. | | | 2,367 | | | | 241,376 | |
| | |
Universal Cement Corp. | | | 220,000 | | | | 162,972 | |
| | |
Yamama Cement Co.* | | | 3,763 | | | | 27,789 | |
| | |
Yanbu Cement Co. | | | 2,888 | | | | 29,489 | |
| | | | | | | | 5,011,762 | |
|
| Consumer Finance – 1.1% | |
| | |
360 DigiTech, Inc., ADR* (b) | | | 3,465 | | | | 70,721 | |
| | |
AEON Credit Service M Bhd. | | | 49,500 | | | | 167,112 | |
| | |
Bajaj Finance Ltd. | | | 5,445 | | | | 538,107 | |
| | |
BFI Finance Indonesia Tbk. PT | | | 3,982,000 | | | | 295,119 | |
See Accompanying Notes to the Financial Statements.
| | | | | | |
| | FLEXSHARES ANNUAL REPORT | | | 231 | |
FlexShares® Morningstar Emerging Markets Factor Tilt Index Fund (cont.)
| | | | | | | | |
| Investments | | Shares | | | Value | |
|
| COMMON STOCKS – (continued) | |
|
| Consumer Finance – (continued) | |
| | |
Cholamandalam Investment and Finance Co. Ltd. | | | 8,525 | | | $ | 69,987 | |
| | |
CreditAccess Grameen Ltd.* | | | 1,166 | | | | 9,784 | |
| | |
FinVolution Group, ADR(b) | | | 74,415 | | | | 455,420 | |
| | |
Krungthai Card PCL, NVDR | | | 21,200 | | | | 36,896 | |
| | |
LexinFintech Holdings Ltd., ADR* (b) | | | 59,400 | | | | 317,196 | |
| | |
Mahindra & Mahindra Financial Services Ltd. | | | 20,141 | | | | 48,281 | |
| | |
Manappuram Finance Ltd. | | | 267,064 | | | | 741,119 | |
| | |
Muangthai Capital PCL, NVDR | | | 20,600 | | | | 37,559 | |
| | |
Muthoot Finance Ltd. | | | 2,226 | | | | 43,632 | |
| | |
Samsung Card Co. Ltd. | | | 1,140 | | | | 33,413 | |
| | |
SBI Cards & Payment Services Ltd.* | | | 5,555 | | | | 78,272 | |
| | |
Shriram City Union Finance Ltd. | | | 11,660 | | | | 337,158 | |
| | |
Shriram Transport Finance Co. Ltd. | | | 7,590 | | | | 145,574 | |
| | |
Srisawad Corp. PCL, NVDR | | | 15,203 | | | | 29,322 | |
| | |
Sundaram Finance Ltd. | | | 1,445 | | | | 46,121 | |
| | |
Transaction Capital Ltd. | | | 28,985 | | | | 84,056 | |
| | |
Yixin Group Ltd.* (a) | | | 153,000 | | | | 28,716 | |
| | |
Yulon Finance Corp. | | | 1,391 | | | | 8,428 | |
| | | | | | | | 3,621,993 | |
|
| Containers & Packaging – 0.2% | |
| | |
Cheng Loong Corp. | | | 55,000 | | | | 67,246 | |
| | |
Klabin SA* | | | 27,500 | | | | 111,912 | |
| | |
M2N Co. Ltd.* | | | 848 | | | | 7,177 | |
| | |
Polyplex Thailand PCL, NVDR | | | 242,000 | | | | 177,949 | |
| | |
SCG Packaging PCL, NVDR | | | 27,500 | | | | 53,247 | |
| | |
Taiwan Hon Chuan Enterprise Co. Ltd. | | | 138,000 | | | | 323,060 | |
| | |
Ton Yi Industrial Corp. | | | 53,000 | | | | 24,777 | |
| | |
Yunnan Energy New Material Co. Ltd. | | | 900 | | | | 41,030 | |
| | | | | | | | 806,398 | |
|
| Distributors – 0.1% | |
| | |
Liaoning Cheng Da Co. Ltd., Class A | | | 10,600 | | | | 33,708 | |
| | | | | | | | |
| Investments | | Shares | | | Value | |
|
| Distributors – (continued) | |
| | |
Test Rite International Co. Ltd. | | | 110,000 | | | $ | 95,528 | |
| | |
Wuchan Zhongda Group Co. Ltd., Class A | | | 13,800 | | | | 13,521 | |
| | |
Xinhua Winshare Publishing and Media Co. Ltd., Class H(b) | | | 215,000 | | | | 157,539 | |
| | | | | | | | 300,296 | |
|
| Diversified Consumer Services – 0.2% | |
| | |
17 Education & Technology Group, Inc., ADR* | | | 25,650 | | | | 21,161 | |
| | |
Cairo Investment & Real Estate Development Co. SAE | | | 14,617 | | | | 11,817 | |
| | |
China Education Group Holdings
Ltd.(a) (b) | | | 26,000 | | | | 44,653 | |
| | |
China New Higher Education Group Ltd.(a) | | | 53,000 | | | | 26,776 | |
| | |
China Yuhua Education Corp.
Ltd.(a) (b) | | | 106,000 | | | | 48,237 | |
| | |
Cogna Educacao* | | | 863,500 | | | | 379,897 | |
| | |
Gaotu Techedu, Inc., ADR* (b) | | | 13,017 | | | | 38,270 | |
| | |
Hope Education Group Co. Ltd.(a) (b) | | | 202,000 | | | | 36,354 | |
| | |
Humansoft Holding Co. KSC | | | 1,431 | | | | 15,893 | |
| | |
Koolearn Technology Holding Ltd.* (a) | | | 27,500 | | | | 15,024 | |
| | |
Lung Yen Life Service Corp. | | | 2,000 | | | | 3,237 | |
| | |
New Oriental Education & Technology Group, Inc., ADR* | | | 31,427 | | | | 64,425 | |
| | |
Offcn Education Technology Co. Ltd., Class A* | | | 4,700 | | | | 7,668 | |
| | |
TAL Education Group, ADR* (b) | | | 13,675 | | | | 55,931 | |
| | |
Tianli Education International Holdings Ltd.(a) | | | 106,000 | | | | 22,211 | |
| | |
YDUQS Participacoes SA | | | 10,500 | | | | 38,856 | |
| | | | | | | | 830,410 | |
|
| Diversified Financial Services – 0.7% | |
| | |
AVIC Industry-Finance Holdings Co. Ltd., Class A | | | 23,500 | | | | 14,285 | |
| | |
Bajaj Finserv Ltd. | | | 704 | | | | 167,546 | |
See Accompanying Notes to the Financial Statements.
| | | | |
| 232 | | FLEXSHARES ANNUAL REPORT | | |
FlexShares® Morningstar Emerging Markets Factor Tilt Index Fund (cont.)
| | | | | | | | |
| Investments | | Shares | | | Value | |
|
| COMMON STOCKS – (continued) | |
|
| Diversified Financial Services – (continued) | |
| | |
Bajaj Holdings & Investment Ltd. | | | 750 | | | $ | 48,374 | |
| | |
Chailease Holding Co. Ltd. | | | 29,883 | | | | 285,843 | |
| | |
China Shandong Hi-Speed Financial Group Ltd.* (b) | | | 636,000 | | | | 48,237 | |
| | |
Corp. Financiera Colombiana SA* | | | 3,252 | | | | 25,425 | |
| | |
CSSC Hong Kong Shipping Co.
Ltd.(a) | | | 484,000 | | | | 71,551 | |
| | |
Far East Horizon Ltd.(b) | | | 55,000 | | | | 52,532 | |
| | |
FirstRand Ltd. | | | 188,925 | | | | 721,022 | |
| | |
Grupo de Inversiones Suramericana SA | | | 2,756 | | | | 15,941 | |
| | |
Grupo de Inversiones Suramericana SA (Preference) | | | 4,992 | | | | 24,848 | |
| | |
Haci Omer Sabanci Holding A/S | | | 21,041 | | | | 24,334 | |
| | |
L&T Finance Holdings Ltd.* | | | 26,381 | | | | 28,907 | |
| | |
Meritz Financial Group, Inc. | | | 947 | | | | 26,946 | |
| | |
Metro Pacific Investments Corp. | | | 381,000 | | | | 28,343 | |
| | |
National Investments Co. | | | 124,465 | | | | 90,835 | |
| | |
NICE Holdings Co. Ltd. | | | 728 | | | | 10,529 | |
| | |
Piramal Enterprises Ltd. | | | 2,322 | | | | 80,678 | |
| | |
Power Finance Corp. Ltd. | | | 40,192 | | | | 71,441 | |
| | |
REC Ltd. | | | 22,048 | | | | 43,768 | |
| | |
Remgro Ltd. | | | 15,345 | | | | 135,914 | |
| | |
Yuanta Financial Holding Co. Ltd. | | | 440,000 | | | | 390,816 | |
| | | | | | | | 2,408,115 | |
|
| Diversified Telecommunication Services – 1.1% | |
| | |
Asia Pacific Telecom Co. Ltd.* | | | 68,164 | | | | 20,173 | |
| | |
China Tower Corp. Ltd., Class H(a) | | | 880,000 | | | | 114,255 | |
| | |
Chunghwa Telecom Co. Ltd. | | | 82,000 | | | | 325,836 | |
| | |
CITIC Telecom International Holdings Ltd. | | | 802,000 | | | | 284,549 | |
| | |
Emirates Telecommunications Group Co. PJSC | | | 36,080 | | | | 251,459 | |
| | |
Hellenic Telecommunications Organization SA | | | 8,305 | | | | 147,048 | |
| | | | | | | | |
| Investments | | Shares | | | Value | |
|
| Diversified Telecommunication Services – (continued) | |
| | |
Indus Towers Ltd. | | | 18,920 | | | $ | 68,599 | |
| | |
Jasmine International PCL, NVDR | | | 409,700 | | | | 35,312 | |
| | |
KT Corp. | | | 3,575 | | | | 93,310 | |
| | |
LG Uplus Corp. | | | 8,377 | | | | 102,871 | |
| | |
Magyar Telekom Telecommunications plc | | | 224,049 | | | | 309,075 | |
| | |
O2 Czech Republic A/S | | | 106 | | | | 1,218 | |
| | |
Oi SA* | | | 257,200 | | | | 40,608 | |
| | |
Ooredoo QPSC | | | 38,060 | | | | 72,336 | |
| | |
Rostelecom PJSC | | | 33,770 | | | | 44,363 | |
| | |
Rostelecom PJSC (Preference) | | | 15,392 | | | | 18,318 | |
| | |
Sarana Menara Nusantara Tbk. PT | | | 315,700 | | | | 25,849 | |
| | |
Saudi Telecom Co. | | | 12,320 | | | | 384,292 | |
| | |
Sejong Telecom, Inc.* | | | 166,265 | | | | 82,524 | |
| | |
Tata Communications Ltd. | | | 1,646 | | | | 28,738 | |
| | |
Telefonica Brasil SA | | | 16,689 | | | | 134,767 | |
| | |
Telekom Malaysia Bhd. | | | 48,000 | | | | 67,114 | |
| | |
Telesites SAB de CV(b) | | | 22,200 | | | | 20,295 | |
| | |
Telkom Indonesia Persero Tbk. PT | | | 1,743,500 | | | | 467,641 | |
| | |
Telkom SA SOC Ltd.* | | | 160,722 | | | | 536,410 | |
| | |
TIME dotCom Bhd. | | | 9,000 | | | | 9,824 | |
| | |
Tower Bersama Infrastructure Tbk. PT | | | 121,300 | | | | 25,172 | |
| | |
True Corp. PCL, NVDR | | | 562,500 | | | | 68,824 | |
| | |
Turk Telekomunikasyon A/S | | | 19,746 | | | | 15,464 | |
| | | | | | | | 3,796,244 | |
|
| Electric Utilities – 1.2% | |
| | |
Adani Transmission Ltd.* | | | 5,667 | | | | 133,757 | |
| | |
Alupar Investimento SA | | | 3,500 | | | | 14,740 | |
| | |
Celsia SA ESP | | | 266,695 | | | | 301,060 | |
| | |
Centrais Eletricas Brasileiras SA | | | 12,900 | | | | 77,418 | |
| | |
Centrais Eletricas Brasileiras SA (Preference), Class B | | | 11,000 | | | | 66,035 | |
| | |
CESC Ltd. | | | 328,110 | | | | 382,088 | |
| | |
CEZ A/S | | | 5,665 | | | | 187,196 | |
| | |
Cia de Transmissao de Energia Eletrica Paulista (Preference) | | | 5,200 | | | | 22,435 | |
See Accompanying Notes to the Financial Statements.
| | | | | | |
| | FLEXSHARES ANNUAL REPORT | | | 233 | |
FlexShares® Morningstar Emerging Markets Factor Tilt Index Fund (cont.)
| | | | | | | | |
| Investments | | Shares | | | Value | |
|
| COMMON STOCKS – (continued) | |
|
| Electric Utilities – (continued) | |
| | |
Cia Energetica de Minas Gerais | | | 7,197 | | | $ | 21,220 | |
| | |
Cia Energetica de Minas Gerais (Preference) | | | 40,194 | | | | 91,839 | |
| | |
CPFL Energia SA | | | 4,700 | | | | 21,937 | |
| | |
EDP – Energias do Brasil SA | | | 9,400 | | | | 32,684 | |
| | |
Enel Americas SA | | | 816,974 | | | | 93,145 | |
| | |
Enel Chile SA | | | 730,608 | | | | 30,014 | |
| | |
Energisa SA | | | 4,800 | | | | 33,737 | |
| | |
Enerjisa Enerji A/S(a) | | | 7,676 | | | | 9,388 | |
| | |
Engie Energia Chile SA | | | 193,765 | | | | 112,954 | |
| | |
Equatorial Energia SA | | | 27,500 | | | | 111,620 | |
| | |
Federal Grid Co. Unified Energy System PJSC | | | 12,705,298 | | | | 33,195 | |
| | |
First Philippine Holdings Corp. | | | 86,900 | | | | 128,428 | |
| | |
Holding Co. ADMIE IPTO SA | | | 59,575 | | | | 175,805 | |
| | |
Inter RAO UES PJSC | | | 1,596,292 | | | | 108,079 | |
| | |
Interconexion Electrica SA ESP | | | 14,520 | | | | 86,508 | |
| | |
Korea Electric Power Corp. | | | 7,260 | | | | 140,410 | |
| | |
Light SA | | | 148,500 | | | | 255,008 | |
| | |
Manila Electric Co. | | | 12,350 | | | | 70,312 | |
| | |
Mosenergo PJSC | | | 4,455,000 | | | | 140,943 | |
| | |
Neoenergia SA | | | 4,700 | | | | 12,924 | |
| | |
Power Grid Corp. of India Ltd. | | | 119,072 | | | | 294,256 | |
| | |
Public Power Corp. SA* | | | 2,126 | | | | 23,065 | |
| | |
ROSSETI PJSC | | | 1,466,436 | | | | 28,774 | |
| | |
RusHydro PJSC | | | 821,000 | | | | 9,407 | |
| | |
Saudi Electricity Co. | | | 26,510 | | | | 201,428 | |
| | |
SJVN Ltd. | | | 254,705 | | | | 96,431 | |
| | |
Tata Power Co. Ltd. (The) | | | 36,575 | | | | 104,673 | |
| | |
Tenaga Nasional Bhd. | | | 100,900 | | | | 235,377 | |
| | |
Torrent Power Ltd. | | | 6,625 | | | | 44,232 | |
| | |
Transmissora Alianca de Energia Eletrica SA | | | 5,800 | | | | 37,720 | |
| | | | | | | | 3,970,242 | |
|
| Electrical Equipment – 1.2% | |
| | |
ABB India Ltd. | | | 427 | | | | 12,088 | |
| | |
ABB Power Products & Systems India Ltd. | | | 371 | | | | 10,962 | |
| | |
AcBel Polytech, Inc. | | | 43,000 | | | | 53,502 | |
| | | | | | | | |
| Investments | | Shares | | | Value | |
|
| Electrical Equipment – (continued) | |
| | |
Aeris Industria E Comercio De Equipamentos Para Geracao De Energia SA* | | | 5,500 | | | $ | 7,689 | |
| | |
Amara Raja Batteries Ltd. | | | 1,222 | | | | 11,108 | |
| | |
Bharat Heavy Electricals Ltd.* | | | 62,699 | | | | 57,147 | |
| | |
CG Power & Industrial Solutions Ltd.* | | | 336,545 | | | | 657,528 | |
| | |
Chicony Power Technology Co. Ltd. | | | 71,000 | | | | 177,956 | |
| | |
China High Speed Transmission Equipment Group Co. Ltd.* (b) | | | 220,000 | | | | 170,818 | |
| | |
Chung-Hsin Electric & Machinery Manufacturing Corp. | | | 28,000 | | | | 41,433 | |
| | |
CS Wind Corp. | | | 636 | | | | 37,772 | |
| | |
Dongfang Electric Corp. Ltd., Class A | | | 9,400 | | | | 26,661 | |
| | |
Doosan Fuel Cell Co. Ltd.* | | | 690 | | | | 30,823 | |
| | |
Doosan Heavy Industries & Construction Co. Ltd.* | | | 5,500 | | | | 114,843 | |
| | |
Ecopro BM Co. Ltd. | | | 220 | | | | 77,171 | |
| | |
ElSewedy Electric Co. | | | 265,033 | | | | 145,085 | |
| | |
Fangda Carbon New Material Co. Ltd., Class A | | | 5,300 | | | | 8,895 | |
| | |
Gotion High-tech Co. Ltd., Class A* | | | 4,800 | | | | 44,180 | |
| | |
Graphite India Ltd. | | | 4,240 | | | | 30,373 | |
| | |
Havells India Ltd. | | | 4,620 | | | | 77,921 | |
| | |
HEG Ltd. | | | 1,060 | | | | 29,131 | |
| | |
Hyosung Heavy Industries Corp.* | | | 2,530 | | | | 146,143 | |
| | |
Hyundai Electric & Energy System Co. Ltd.* | | | 12,265 | | | | 231,960 | |
| | |
Korea Electric Terminal Co. Ltd. | | | 3,795 | | | | 244,545 | |
| | |
Kung Long Batteries Industrial Co. Ltd. | | | 1,000 | | | | 5,070 | |
| | |
LS Corp. | | | 1,320 | | | | 70,713 | |
| | |
LS Electric Co. Ltd. | | | 456 | | | | 22,984 | |
| | |
Ming Yang Smart Energy Group Ltd., Class A | | | 10,000 | | | | 48,427 | |
| | |
NARI Technology Co. Ltd., Class A | | | 12,400 | | | | 75,435 | |
See Accompanying Notes to the Financial Statements.
| | | | |
| 234 | | FLEXSHARES ANNUAL REPORT | | |
FlexShares® Morningstar Emerging Markets Factor Tilt Index Fund (cont.)
| | | | | | | | |
| Investments | | Shares | | | Value | |
|
| COMMON STOCKS – (continued) | |
|
| Electrical Equipment – (continued) | |
| | |
Sarkuysan Elektrolitik Bakir Sanayi ve Ticaret A/S | | | 124,410 | | | $ | 239,112 | |
| | |
Shanghai Electric Group Co. Ltd., Class A | | | 24,000 | | | | 17,814 | |
| | |
Shanghai Electric Group Co. Ltd., Class H(b) | | | 94,000 | | | | 26,463 | |
| | |
Shanghai Liangxin Electrical Co. Ltd., Class A | | | 6,500 | | | | 16,557 | |
| | |
Ta Ya Electric Wire & Cable | | | 51,750 | | | | 46,058 | |
| | |
Taihan Electric Wire Co. Ltd.* | | | 25,960 | | | | 50,096 | |
| | |
Tatung Co. Ltd.* | | | 46,000 | | | | 56,904 | |
| | |
TBEA Co. Ltd., Class A | | | 10,600 | | | | 44,740 | |
| | |
Teco Electric and Machinery Co. Ltd. | | | 22,000 | | | | 23,852 | |
| | |
Unison Co. Ltd.* | | | 8,480 | | | | 25,036 | |
| | |
V-Guard Industries Ltd. | | | 11,448 | | | | 39,275 | |
| | |
Voltronic Power Technology Corp. | | | 1,458 | | | | 85,199 | |
| | |
Walsin Lihwa Corp. | | | 53,000 | | | | 49,458 | |
| | |
WEG SA | | | 33,000 | | | | 216,605 | |
| | |
Xinjiang Goldwind Science & Technology Co. Ltd., Class A | | | 10,600 | | | | 30,694 | |
| | |
Xinjiang Goldwind Science & Technology Co. Ltd., Class H | | | 28,200 | | | | 63,222 | |
| | |
Zhefu Holding Group Co. Ltd., Class A | | | 21,200 | | | | 23,720 | |
| | |
Zhejiang Chint Electrics Co. Ltd., Class A | | | 4,700 | | | | 44,244 | |
| | |
Zhuzhou CRRC Times Electric Co. Ltd., Class H* | | | 23,400 | | | | 112,201 | |
| | | | | | | | 3,879,613 | |
|
| Electronic Equipment, Instruments & Components – 3.4% | |
| | |
AAC Technologies Holdings, Inc.(b) | | | 14,000 | | | | 61,100 | |
| | |
Apex International Co. Ltd. | | | 60,000 | | | | 168,294 | |
| | |
AU Optronics Corp. | | | 330,000 | | | | 227,844 | |
| | |
Aurora Corp. | | | 8,900 | | | | 28,420 | |
| | |
Avary Holding Shenzhen Co. Ltd., Class A | | | 4,700 | | | | 25,699 | |
| | |
BH Co. Ltd. | | | 11,880 | | | | 190,113 | |
| | | | | | | | |
| Investments | | Shares | | | Value | |
|
| Electronic Equipment, Instruments & Components – (continued) | |
| | |
BOE Technology Group Co. Ltd., Class A | | | 66,500 | | | $ | 51,024 | |
| | |
Career Technology MFG. Co. Ltd.* | | | 22,556 | | | | 20,278 | |
| | |
Chang Wah Electromaterials, Inc. | | | 32,000 | | | | 38,895 | |
| | |
Cheng Uei Precision Industry Co. Ltd. | | | 180,000 | | | | 249,852 | |
| | |
Chilisin Electronics Corp. | | | 113,490 | | | | 351,385 | |
| | |
Chroma ATE, Inc. | | | 8,000 | | | | 52,070 | |
| | |
Compeq Manufacturing Co. Ltd. | | | 40,000 | | | | 58,040 | |
| | |
Coretronic Corp. | | | 23,000 | | | | 47,475 | |
| | |
Daeduck Electronics Co. Ltd. | | | 2,067 | | | | 30,336 | |
| | |
Daejoo Electronic Materials Co. Ltd. | | | 742 | | | | 66,291 | |
| | |
Delta Electronics Thailand PCL, NVDR | | | 7,800 | | | | 97,786 | |
| | |
Delta Electronics, Inc. | | | 39,000 | | | | 343,600 | |
| | |
Dynapack International Technology Corp. | | | 66,000 | | | | 227,844 | |
| | |
E Ink Holdings, Inc. | | | 11,000 | | | | 36,352 | |
| | |
Elite Material Co. Ltd. | | | 5,000 | | | | 43,242 | |
| | |
Erajaya Swasembada Tbk. PT | | | 3,899,500 | | | | 178,908 | |
| | |
FLEXium Interconnect, Inc.* | | | 10,000 | | | | 34,558 | |
| | |
Foxconn Technology Co. Ltd. | | | 32,000 | | | | 79,170 | |
| | |
General Interface Solution Holding Ltd. | | | 5,000 | | | | 17,459 | |
| | |
Genius Electronic Optical Co. Ltd. | | | 2,237 | | | | 34,389 | |
| | |
Global Brands Manufacture Ltd. | | | 151,800 | | | | 192,967 | |
| | |
GoerTek, Inc., Class A | | | 4,700 | | | | 31,978 | |
| | |
Gold Circuit Electronics Ltd. | | | 21,000 | | | | 50,143 | |
| | |
Hana Microelectronics PCL, NVDR | | | 17,100 | | | | 41,227 | |
| | |
Hannstar Board Corp. | | | 165,000 | | | | 247,424 | |
| | |
HannStar Display Corp. | | | 39,000 | | | | 19,775 | |
| | |
HannsTouch Solution, Inc. | | | 106,000 | | | | 45,360 | |
| | |
Hengdian Group DMEGC Magnetics Co. Ltd., Class A | | | 10,600 | | | | 23,405 | |
| | |
Holy Stone Enterprise Co. Ltd. | | | 69,000 | | | | 292,788 | |
See Accompanying Notes to the Financial Statements.
| | | | | | |
| | FLEXSHARES ANNUAL REPORT | | | 235 | |
FlexShares® Morningstar Emerging Markets Factor Tilt Index Fund (cont.)
| | | | | | | | |
| Investments | | Shares | | | Value | |
|
| COMMON STOCKS – (continued) | |
|
| Electronic Equipment, Instruments & Components – (continued) | |
| | |
Hon Hai Precision Industry Co. Ltd. | | | 440,000 | | | $ | 1,693,007 | |
| | |
Honeywell Automation India Ltd. | | | 32 | | | | 17,920 | |
| | |
Huagong Tech Co. Ltd., Class A | | | 4,700 | | | | 21,152 | |
| | |
Iljin Materials Co. Ltd. | | | 477 | | | | 41,024 | |
| | |
Inari Amertron Bhd. | | | 71,600 | | | | 66,914 | |
| | |
Innolux Corp. | | | 385,000 | | | | 231,206 | |
| | |
INTOPS Co. Ltd. | | | 6,325 | | | | 126,116 | |
| | |
JNTC Co. Ltd.* | | | 9,240 | | | | 65,156 | |
| | |
KCE Electronics PCL, NVDR | | | 18,900 | | | | 49,553 | |
| | |
Kingboard Holdings Ltd. | | | 28,000 | | | | 122,560 | |
| | |
Kingboard Laminates Holdings Ltd. | | | 10,000 | | | | 15,683 | |
| | |
L&F Co. Ltd. | | | 550 | | | | 86,650 | |
| | |
Largan Precision Co. Ltd. | | | 2,000 | | | | 148,875 | |
| | |
LG Display Co. Ltd.* | | | 7,134 | | | | 120,269 | |
| | |
LG Innotek Co. Ltd. | | | 495 | | | | 88,745 | |
| | |
Lingyi iTech Guangdong Co., Class A* | | | 15,900 | | | | 16,548 | |
| | |
Lotes Co. Ltd. | | | 2,299 | | | | 47,785 | |
| | |
Luxshare Precision Industry Co. Ltd., Class A | | | 16,500 | | | | 99,630 | |
| | |
Mcnex Co. Ltd. | | | 7,015 | | | | 260,237 | |
| | |
Merry Electronics Co. Ltd. | | | 99,235 | | | | 293,332 | |
| | |
MH Development Ltd.* ‡ (c) | | | 22,000 | | | | — | |
| | |
Nan Ya Printed Circuit Board Corp. | | | 5,000 | | | | 88,192 | |
| | |
OFILM Group Co. Ltd., Class A | | | 4,700 | | | | 5,494 | |
| | |
Park Systems Corp. | | | 371 | | | | 37,686 | |
| | |
Partron Co. Ltd. | | | 23,285 | | | | 186,113 | |
| | |
Raytron Technology Co. Ltd., Class A | | | 2,491 | | | | 28,171 | |
| | |
Samsung Electro-Mechanics Co. Ltd. | | | 2,090 | | | | 284,378 | |
| | |
Samsung SDI Co. Ltd. | | | 1,155 | | | | 725,489 | |
| | |
Sang-A Frontec Co. Ltd. | | | 275 | | | | 14,826 | |
| | |
Shengyi Technology Co. Ltd., Class A | | | 4,700 | | | | 16,342 | |
| | | | | | | | |
| Investments | | Shares | | | Value | |
|
| Electronic Equipment, Instruments & Components – (continued) | |
| | |
Shenzhen Kinwong Electronic Co. Ltd., Class A | | | 5,000 | | | $ | 20,197 | |
| | |
Shenzhen Sunlord Electronics Co. Ltd., Class A | | | 5,500 | | | | 28,405 | |
| | |
Simplo Technology Co. Ltd. | | | 5,200 | | | | 55,911 | |
| | |
Sinbon Electronics Co. Ltd. | | | 3,000 | | | | 24,813 | |
| | |
SOLUM Co. Ltd.* | | | 1,802 | | | | 40,325 | |
| | |
Solus Advanced Materials Co. Ltd. | | | 329 | | | | 23,171 | |
| | |
Speed Tech Corp. | | | 55,000 | | | | 167,718 | |
| | |
Sunny Optical Technology Group Co. Ltd. | | | 14,100 | | | | 381,000 | |
| | |
Supreme Electronics Co. Ltd. | | | 196,331 | | | | 316,646 | |
| | |
Synnex Technology International Corp. | | | 61,000 | | | | 118,014 | |
| | |
Taiflex Scientific Co. Ltd. | | | 95,000 | | | | 162,783 | |
| | |
Taiwan PCB Techvest Co. Ltd. | | | 110,000 | | | | 185,519 | |
| | |
Taiwan Union Technology Corp. | | | 17,000 | | | | 58,381 | |
| | |
Tianma Microelectronics Co. Ltd., Class A | | | 9,400 | | | | 18,082 | |
| | |
Tong Hsing Electronic Industries Ltd. | | | 3,022 | | | | 28,689 | |
| | |
Tripod Technology Corp. | | | 14,000 | | | | 59,155 | |
| | |
Unimicron Technology Corp. | | | 24,000 | | | | 163,979 | |
| | |
Unisplendour Corp. Ltd., Class A | | | 6,580 | | | | 28,503 | |
| | |
Unitech Printed Circuit Board Corp.* | | | 53,000 | | | | 34,497 | |
| | |
Universal Scientific Industrial Shanghai Co. Ltd., Class A | | | 4,700 | | | | 10,194 | |
| | |
Vidente Co. Ltd.* | | | 1,431 | | | | 17,634 | |
| | |
VS Industry Bhd. | | | 45,600 | | | | 17,399 | |
| | |
Wah Lee Industrial Corp. | | | 85,640 | | | | 261,769 | |
| | |
Walsin Technology Corp.* | | | 9,378 | | | | 50,922 | |
| | |
Wingtech Technology Co. Ltd., Class A | | | 3,400 | | | | 58,316 | |
| | |
Wintek Corp.* ‡ (c) | | | 64,000 | | | | — | |
| | |
WPG Holdings Ltd. | | | 55,440 | | | | 103,470 | |
| | |
Wuhan Guide Infrared Co. Ltd., Class A | | | 6,580 | | | | 22,313 | |
| | |
WUS Printed Circuit Kunshan Co. Ltd., Class A | | | 16,170 | | | | 25,875 | |
See Accompanying Notes to the Financial Statements.
| | | | |
| 236 | | FLEXSHARES ANNUAL REPORT | | |
FlexShares® Morningstar Emerging Markets Factor Tilt Index Fund (cont.)
| | | | | | | | |
| Investments | | Shares | | | Value | |
|
| COMMON STOCKS – (continued) | |
|
| Electronic Equipment, Instruments & Components – (continued) | |
| | |
Yageo Corp. | | | 13,575 | | | $ | 211,861 | |
| | |
Zhejiang Dahua Technology Co. Ltd., Class A | | | 2,900 | | | | 9,870 | |
| | |
Zhen Ding Technology Holding Ltd. | | | 23,150 | | | | 79,918 | |
| | | | | | | | 11,489,873 | |
|
| Energy Equipment & Services – 0.1% | |
| | |
Bumi Armada Bhd.* | | | 1,743,500 | | | | 214,727 | |
| | |
China Oilfield Services Ltd., Class A | | | 9,400 | | | | 21,858 | |
| | |
China Oilfield Services Ltd., Class H | | | 18,000 | | | | 17,331 | |
| | |
Dialog Group Bhd. | | | 51,700 | | | | 35,332 | |
| | |
Sapura Energy Bhd.* | | | 5,049,000 | | | | 121,927 | |
| | |
Serba Dinamik Holdings Bhd.(c) | | | 54,180 | | | | 4,579 | |
| | | | | | | | 415,754 | |
|
| Entertainment – 1.0% | |
| | |
Alibaba Pictures Group Ltd.* (b) | | | 160,000 | | | | 17,072 | |
| | |
Archosaur Games, Inc.(a) (b) | | | 110,000 | | | | 131,790 | |
| | |
Bilibili, Inc., ADR* (b) | | | 4,675 | | | | 342,678 | |
| | |
CJ CGV Co. Ltd.* | | | 1,732 | | | | 47,356 | |
| | |
CMGE Technology Group Ltd.* (b) | | | 770,000 | | | | 301,901 | |
| | |
Com2uSCorp | | | 133 | | | | 14,625 | |
| | |
DouYu International Holdings Ltd., ADR* | | | 1,081 | | | | 3,405 | |
| | |
Fire Rock Holdings Ltd. | | | 106,000 | | | | 33,657 | |
| | |
GOLFZON Co. Ltd. | | | 1,650 | | | | 199,799 | |
| | |
HUYA, Inc., ADR* (b) | | | 3,314 | | | | 27,241 | |
| | |
HYBE Co. Ltd.* | | | 385 | | | | 110,372 | |
| | |
International Games System Co. Ltd. | | | 1,000 | | | | 25,676 | |
| | |
iQIYI, Inc., ADR* (b) | | | 4,876 | | | | 40,373 | |
| | |
JYP Entertainment Corp. | | | 1,589 | | | | 71,254 | |
| | |
Kakao Games Corp.* | | | 611 | | | | 41,725 | |
| | |
Kingsoft Corp. Ltd. | | | 16,000 | | | | 68,800 | |
| | |
NCSoft Corp. | | | 311 | | | | 166,871 | |
| | |
Neowiz* | | | 7,535 | | | | 168,942 | |
| | | | | | | | |
| Investments | | Shares | | | Value | |
|
| Entertainment – (continued) | |
| | |
NetDragon Websoft Holdings Ltd. | | | 120,500 | | | $ | 264,885 | |
| | |
NetEase, Inc. | | | 39,500 | | | | 780,449 | |
| | |
Netmarble Corp.(a) | | | 410 | | | | 43,331 | |
| | |
NHN Corp.* | | | 315 | | | | 21,565 | |
| | |
Pearl Abyss Corp.* | | | 990 | | | | 88,024 | |
| | |
Perfect World Co. Ltd., Class A | | | 4,100 | | | | 11,135 | |
| | |
PVR Ltd.* | | | 2,703 | | | | 60,558 | |
| | |
RS PCL, NVDR* | | | 47,700 | | | | 25,156 | |
| | |
SM Entertainment Co. Ltd.* | | | 1,029 | | | | 68,861 | |
| | |
SMI Holdings Group Ltd.* ‡ (c) | | | 72,000 | | | | — | |
| | |
Tencent Music Entertainment Group, ADR* | | | 10,537 | | | | 82,821 | |
| | |
Webzen, Inc.* | | | 474 | | | | 10,952 | |
| | |
Wemade Co. Ltd. | | | 598 | | | | 93,547 | |
| | |
Wuhu Sanqi Interactive Entertainment Network Technology Group Co. Ltd., Class A | | | 4,700 | | | | 17,480 | |
| | |
XD, Inc.* (a) | | | 8,000 | | | | 45,558 | |
| | |
XPEC Entertainment, Inc.* ‡ (c) | | | 14,800 | | | | — | |
| | |
Zhejiang Century Huatong Group Co. Ltd., Class A* | | | 11,280 | | | | 13,097 | |
| | | | | | | | 3,440,956 | |
|
| Equity Real Estate Investment Trusts (REITs) – 1.3% | |
| | |
Concentradora Fibra Danhos SA de CV | | | 444,600 | | | | 538,463 | |
| | |
CPN Retail Growth Leasehold REIT* | | | 44,100 | | | | 28,441 | |
| | |
DDMP Reit, Inc. | | | 3,520,000 | | | | 125,689 | |
| | |
Embassy Office Parks REIT | | | 9,600 | | | | 44,825 | |
| | |
Emlak Konut Gayrimenkul Yatirim Ortakligi A/S | | | 1,052,700 | | | | 215,682 | |
| | |
Equites Property Fund Ltd.(b) | | | 27,560 | | | | 36,970 | |
| | |
Fibra Uno Administracion SA de CV(b) | | | 104,500 | | | | 104,078 | |
| | |
Fortress REIT Ltd., Class A | | | 31,313 | | | | 27,399 | |
| | |
Growthpoint Properties Ltd. | | | 114,331 | | | | 97,482 | |
| | |
Hyprop Investments Ltd. | | | 150,975 | | | | 293,905 | |
| | |
IGB REIT | | | 6,200 | | | | 2,515 | |
| | |
JR Reit XXVII | | | 62,150 | | | | 296,244 | |
See Accompanying Notes to the Financial Statements.
| | | | | | |
| | FLEXSHARES ANNUAL REPORT | | | 237 | |
FlexShares® Morningstar Emerging Markets Factor Tilt Index Fund (cont.)
| | | | | | | | |
| Investments | | Shares | | | Value | |
|
| COMMON STOCKS – (continued) | |
|
| Equity Real Estate Investment Trusts (REITs) – (continued) | |
| | |
KLCCP Stapled Group | | | 6,900 | | | $ | 11,347 | |
| | |
Korea Asset In Trust Co. Ltd. | | | 27,225 | | | | 102,745 | |
| | |
LOTTE Reit Co. Ltd. | | | 9,858 | | | | 47,748 | |
| | |
Pavilion REIT | | | 15,000 | | | | 5,144 | |
| | |
PLA Administradora Industrial S de RL de CV | | | 414,100 | | | | 581,349 | |
| | |
Prologis Property Mexico SA de CV(b) | | | 10,400 | | | | 23,991 | |
| | |
Redefine Properties Ltd.* | | | 2,815,147 | | | | 833,432 | |
| | |
Resilient REIT Ltd. | | | 165,440 | | | | 609,516 | |
| | |
Sunway REIT | | | 39,400 | | | | 13,891 | |
| | |
Vukile Property Fund Ltd. | | | 451,550 | | | | 360,943 | |
| | |
Yuexiu REIT | | | 53,000 | | | | 23,097 | |
| | | | | | | | 4,424,896 | |
|
| Food & Staples Retailing – 0.9% | |
| | |
Abdullah Al Othaim Markets Co. | | | 944 | | | | 29,144 | |
| | |
Al Meera Consumer Goods Co. QSC | | | 1,990 | | | | 10,707 | |
| | |
Atacadao SA | | | 7,700 | | | | 22,730 | |
| | |
Avenue Supermarts Ltd.* (a) | | | 3,575 | | | | 221,307 | |
| | |
Berli Jucker PCL | | | 500 | | | | 509 | |
| | |
Berli Jucker PCL, NVDR | | | 27,700 | | | | 28,174 | |
| | |
BGF retail Co. Ltd. | | | 239 | | | | 33,031 | |
| | |
Bid Corp. Ltd. | | | 6,160 | | | | 132,861 | |
| | |
BIM Birlesik Magazalar A/S | | | 7,621 | | | | 49,260 | |
| | |
Cencosud SA | | | 49,665 | | | | 72,846 | |
| | |
Cia Brasileira de Distribuicao | | | 6,430 | | | | 29,121 | |
| | |
Clicks Group Ltd. | | | 4,675 | | | | 85,762 | |
| | |
Cosco Capital, Inc. | | | 1,674,400 | | | | 173,386 | |
| | |
CP ALL PCL, NVDR | | | 88,000 | | | | 169,728 | |
| | |
Dis-Chem Pharmacies Ltd.(a) | | | 17,784 | | | | 37,382 | |
| | |
Dongsuh Cos., Inc. | | | 859 | | | | 25,434 | |
| | |
E-MART, Inc. | | | 605 | | | | 86,980 | |
| | |
Grupo Comercial Chedraui SA de CV | | | 60,500 | | | | 119,569 | |
| | |
GS Retail Co. Ltd. | | | 1,333 | | | | 36,723 | |
| | |
Hyundai Greenfood Co. Ltd. | | | 27,205 | | | | 225,360 | |
| | |
InRetail Peru Corp.(a) | | | 848 | | | | 31,376 | |
| | |
Magnit PJSC | | | 2,296 | | | | 209,244 | |
| | |
Migros Ticaret A/S* | | | 152 | | | | 556 | |
| | | | | | | | |
| Investments | | Shares | | | Value | |
|
| Food & Staples Retailing – (continued) | |
| | |
Organizacion Soriana SAB de CV, Class B* (b) | | | 135,500 | | | $ | 163,381 | |
| | |
Philippine Seven Corp.* | | | 5,321 | | | | 9,605 | |
| | |
Pick n Pay Stores Ltd. | | | 6,784 | | | | 26,645 | |
| | |
President Chain Store Corp. | | | 13,000 | | | | 131,363 | |
| | |
Puregold Price Club, Inc. | | | 26,060 | | | | 21,842 | |
| | |
Raia Drogasil SA* | | | 20,900 | | | | 86,203 | |
| | |
Sendas Distribuidora SA | | | 27,500 | | | | 74,592 | |
| | |
Shoprite Holdings Ltd. | | | 10,010 | | | | 119,521 | |
| | |
SMU SA | | | 1,112,815 | | | | 111,087 | |
| | |
Sok Marketler Ticaret A/S | | | 7,298 | | | | 8,425 | |
| | |
SPAR Group Ltd. (The) | | | 3,102 | | | | 39,791 | |
| | |
Sumber Alfaria Trijaya Tbk. PT | | | 445,200 | | | | 37,552 | |
| | |
Sun Art Retail Group Ltd.(b) | | | 24,000 | | | | 14,130 | |
| | |
Wal-Mart de Mexico SAB de CV | | | 104,500 | | | | 365,290 | |
| | |
Yonghui Superstores Co. Ltd., Class A | | | 26,500 | | | | 16,274 | |
| | | | | | | | 3,056,891 | |
|
| Food Products – 2.8% | |
| | |
Agthia Group PJSC | | | 11,024 | | | | 17,827 | |
| | |
Alicorp SAA | | | 246,345 | | | | 398,637 | |
| | |
Almarai Co. JSC | | | 5,995 | | | | 84,549 | |
| | |
Astra Agro Lestari Tbk. PT | | | 20,800 | | | | 15,746 | |
| | |
Avanti Feeds Ltd. | | | 507 | | | | 3,770 | |
| | |
AVI Ltd. | | | 16,464 | | | | 85,678 | |
| | |
Beijing Dabeinong Technology Group Co. Ltd., Class A | | | 5,300 | | | | 7,106 | |
| | |
Binggrae Co. Ltd. | | | 2,808 | | | | 133,846 | |
| | |
Bombay Burmah Trading Co. | | | 9,324 | | | | 134,366 | |
| | |
BRF SA* | | | 17,100 | | | | 70,469 | |
| | |
Britannia Industries Ltd. | | | 2,183 | | | | 107,159 | |
| | |
Century Pacific Food, Inc. | | | 17,700 | | | | 9,937 | |
| | |
Charoen Pokphand Foods PCL, NVDR | | | 121,000 | | | | 92,074 | |
| | |
Charoen Pokphand Indonesia Tbk. PT | | | 134,300 | | | | 58,773 | |
| | |
Cherkizovo Group PJSC | | | 2,594 | | | | 129,533 | |
| | |
China Feihe Ltd.(a) | | | 55,000 | | | | 91,631 | |
| | |
China Huiyuan Juice Group Ltd.* ‡ (c) | | | 24,000 | | | | – | |
See Accompanying Notes to the Financial Statements.
| | | | |
| 238 | | FLEXSHARES ANNUAL REPORT | | |
FlexShares® Morningstar Emerging Markets Factor Tilt Index Fund (cont.)
| | | | | | | | |
| Investments | | Shares | | | Value | |
|
| COMMON STOCKS – (continued) | |
|
| Food Products – (continued) | |
| | |
China Mengniu Dairy Co. Ltd.* | | | 55,000 | | | $ | 350,332 | |
| | |
China Modern Dairy Holdings
Ltd.(b) | | | 2,090,000 | | | | 394,945 | |
| | |
Chongqing Fuling Zhacai Group Co. Ltd., Class A | | | 5,000 | | | | 27,253 | |
| | |
CJ CheilJedang Corp. | | | 349 | | | | 113,491 | |
| | |
CJ CheilJedang Corp. (Preference) | | | 104 | | | | 17,266 | |
| | |
COFCO Joycome Foods Ltd.* (a) (b) | | | 1,210,000 | | | | 469,749 | |
| | |
CP Pokphand Co. Ltd. | | | 334,000 | | | | 47,229 | |
| | |
Daesang Corp. | | | 11,330 | | | | 231,244 | |
| | |
Dali Foods Group Co. Ltd.(a) | | | 45,500 | | | | 25,326 | |
| | |
Dongwon F&B Co. Ltd. | | | 582 | | | | 102,101 | |
| | |
Dongwon Industries Co. Ltd. | | | 550 | | | | 107,077 | |
| | |
Foshan Haitian Flavouring & Food Co. Ltd., Class A | | | 4,550 | | | | 83,203 | |
| | |
Genting Plantations Bhd. | | | 10,400 | | | | 18,334 | |
| | |
Gruma SAB de CV, Class B | | | 5,225 | | | | 61,488 | |
| | |
Grupo Bimbo SAB de CV, Series A | | | 33,000 | | | | 97,893 | |
| | |
Grupo Nutresa SA | | | 3,592 | | | | 20,833 | |
| | |
Harim Holdings Co. Ltd. | | | 18,127 | | | | 150,005 | |
| | |
Health & Happiness H&H International Holdings Ltd. | | | 110,000 | | | | 258,206 | |
| | |
Heilongjiang Agriculture Co. Ltd., Class A | | | 10,600 | | | | 22,793 | |
| | |
Henan Shuanghui Investment & Development Co. Ltd., Class A | | | 4,700 | | | | 21,666 | |
| | |
Hortifrut SA | | | 143,935 | | | | 152,978 | |
| | |
HUISHAN DAIRY* ‡ (c) | | | 158,000 | | | | — | |
| | |
Indofood CBP Sukses Makmur Tbk. PT | | | 51,800 | | | | 32,175 | |
| | |
Indofood Sukses Makmur Tbk. PT | | | 100,800 | | | | 45,179 | |
| | |
Industrias Bachoco SAB de CV, Series B | | | 85,500 | | | | 303,909 | |
| | |
Inner Mongolia Yili Industrial Group Co. Ltd., Class A | | | 8,200 | | | | 55,100 | |
| | |
International Holding Co. PJSC* | | | 9,625 | | | | 383,884 | |
| | | | | | | | |
| Investments | | Shares | | | Value | |
|
| Food Products – (continued) | |
| | |
IOI Corp. Bhd. | | | 66,000 | | | $ | 62,637 | |
| | |
Japfa Comfeed Indonesia Tbk. PT | | | 249,100 | | | | 30,330 | |
| | |
JBS SA | | | 33,100 | | | | 229,298 | |
| | |
Jiangxi Zhengbang Technology Co. Ltd., Class A | | | 4,700 | | | | 7,359 | |
| | |
Kuala Lumpur Kepong Bhd. | | | 10,831 | | | | 56,548 | |
| | |
Lien Hwa Industrial Holdings Corp. | | | 15,400 | | | | 30,901 | |
| | |
Lotte Confectionery Co. Ltd. | | | 990 | | | | 108,866 | |
| | |
M Dias Branco SA* | | | 5,300 | | | | 29,100 | |
| | |
Maeil Dairies Co. Ltd. | | | 2,255 | | | | 136,047 | |
| | |
Marfrig Global Foods SA | | | 10,600 | | | | 49,831 | |
| | |
Mayora Indah Tbk. PT | | | 83,900 | | | | 13,917 | |
| | |
Mezzan Holding Co. KSCC | | | 92,345 | | | | 192,379 | |
| | |
Muyuan Foods Co. Ltd., Class A | | | 7,420 | | | | 66,219 | |
| | |
Namchow Holdings Co. Ltd. | | | 74,000 | | | | 128,795 | |
| | |
Nestle India Ltd. | | | 825 | | | | 209,333 | |
| | |
Nestle Malaysia Bhd. | | | 900 | | | | 29,232 | |
| | |
New Hope Liuhe Co. Ltd., Class A* | | | 20,000 | | | | 44,974 | |
| | |
NongShim Co. Ltd. | | | 56 | | | | 13,586 | |
| | |
Orion Corp. | | | 550 | | | | 55,539 | |
| | |
Orion Holdings Corp. | | | 12,828 | | | | 175,643 | |
| | |
Ottogi Corp. | | | 15 | | | | 6,174 | |
| | |
Perusahaan Perkebunan London Sumatra Indonesia Tbk. PT | | | 1,666,500 | | | | 164,092 | |
| | |
PPB Group Bhd. | | | 14,080 | | | | 61,815 | |
| | |
QL Resources Bhd. | | | 25,395 | | | | 30,970 | |
| | |
R&B Food Supply PCL, NVDR | | | 53,000 | | | | 32,583 | |
| | |
Samyang Corp. | | | 1,980 | | | | 115,728 | |
| | |
Samyang Foods Co. Ltd. | | | 2,563 | | | | 179,413 | |
| | |
Samyang Holdings Corp. | | | 3,080 | | | | 271,482 | |
| | |
San Miguel Food and Beverage, Inc. | | | 15,960 | | | | 24,062 | |
| | |
Sao Martinho SA | | | 5,300 | | | | 36,010 | |
| | |
Saudia Dairy & Foodstuff Co. | | | 1,166 | | | | 50,981 | |
| | |
Savola Group (The) | | | 6,215 | | | | 60,644 | |
| | |
Sichuan Teway Food Group Co. Ltd., Class A | | | 10,800 | | | | 41,888 | |
| | |
Sime Darby Plantation Bhd. | | | 61,003 | | | | 59,073 | |
See Accompanying Notes to the Financial Statements.
| | | | | | |
| | FLEXSHARES ANNUAL REPORT | | | 239 | |
FlexShares® Morningstar Emerging Markets Factor Tilt Index Fund (cont.)
| | | | | | | | |
| Investments | | Shares | | | Value | |
|
| COMMON STOCKS – (continued) | |
|
| Food Products – (continued) | |
| | |
Standard Foods Corp. | | | 14,652 | | | $ | 27,293 | |
| | |
Sunjin Co. Ltd. | | | 6,270 | | | | 69,485 | |
| | |
Taiwan TEA Corp.* | | | 63,000 | | | | 47,349 | |
| | |
Tata Consumer Products Ltd. | | | 11,679 | | | | 126,255 | |
| | |
Tech-Bank Food Co. Ltd., Class A | | | 7,000 | | | | 6,870 | |
| | |
Thai Union Group PCL, NVDR | | | 88,000 | | | | 55,427 | |
| | |
Thai Vegetable Oil PCL, NVDR | | | 15,570 | | | | 14,663 | |
| | |
Tiger Brands Ltd. | | | 3,445 | | | | 43,668 | |
| | |
Tingyi Cayman Islands Holding Corp. | | | 28,000 | | | | 52,407 | |
| | |
Toly Bread Co. Ltd., Class A | | | 5,300 | | | | 26,089 | |
| | |
Tongwei Co. Ltd., Class A | | | 11,000 | | | | 98,375 | |
| | |
Ulker Biskuvi Sanayi A/S | | | 87,175 | | | | 182,960 | |
| | |
Uni-President China Holdings Ltd. | | | 3,000 | | | | 2,561 | |
| | |
Uni-President Enterprises Corp. | | | 165,000 | | | | 395,167 | |
| | |
Universal Robina Corp. | | | 16,800 | | | | 45,991 | |
| | |
Want Want China Holdings Ltd. | | | 110,000 | | | | 85,267 | |
| | |
Yihai International Holding Ltd.* (b) | | | 7,000 | | | | 41,168 | |
| | |
Yuan Longping High-tech Agriculture Co. Ltd., Class A* | | | 10,600 | | | | 34,769 | |
| | |
Zhou Hei Ya International Holdings Co. Ltd.* (a) (b) | | | 14,000 | | | | 12,616 | |
| | |
Zydus Wellness Ltd. | | | 1,870 | | | | 51,307 | |
| | | | | | | | 9,259,896 | |
|
| Gas Utilities – 0.7% | |
| | |
Adani Total Gas Ltd. | | | 5,391 | | | | 103,632 | |
| | |
Beijing Enterprises Holdings Ltd. | | | 16,000 | | | | 61,498 | |
| | |
China Gas Holdings Ltd. | | | 44,000 | | | | 110,070 | |
| | |
China Resources Gas Group Ltd. | | | 26,000 | | | | 139,709 | |
| | |
ENN Energy Holdings Ltd. | | | 16,500 | | | | 285,710 | |
| | |
GAIL India Ltd. | | | 67,320 | | | | 133,820 | |
| | |
Grupo Energia Bogota SA ESP | | | 102,740 | | | | 73,637 | |
| | | | | | | | |
| Investments | | Shares | | | Value | |
|
| Gas Utilities – (continued) | |
| | |
Gujarat Gas Ltd. | | | 2,679 | | | $ | 22,264 | |
| | |
Gujarat State Petronet Ltd. | | | 14,375 | | | | 58,580 | |
| | |
Indraprastha Gas Ltd. | | | 4,564 | | | | 28,884 | |
| | |
Korea Gas Corp.* | | | 999 | | | | 37,872 | |
| | |
Kunlun Energy Co. Ltd. | | | 130,000 | | | | 118,986 | |
| | |
Mahanagar Gas Ltd.(a) | | | 1,456 | | | | 19,505 | |
| | |
Perusahaan Gas Negara Tbk. PT* | | | 435,600 | | | | 46,427 | |
| | |
Petronas Gas Bhd. | | | 16,500 | | | | 66,701 | |
| | |
Promigas SA ESP | | | 144,460 | | | | 280,546 | |
| | |
Towngas China Co. Ltd.* | | | 495,000 | | | | 340,434 | |
| | |
Zhongyu Gas Holdings Ltd. | | | 440,000 | | | | 421,954 | |
| | | | | | | | 2,350,229 | |
|
| Health Care Equipment & Supplies – 0.3% | |
| | |
AK Medical Holdings Ltd.(a) (b) | | | 24,000 | | | | 24,959 | |
| | |
Blue Sail Medical Co. Ltd., Class A | | | 4,700 | | | | 10,635 | |
| | |
Boditech Med, Inc. | | | 689 | | | | 9,463 | |
| | |
DIO Corp.* | | | 520 | | | | 16,754 | |
| | |
Eoflow Co. Ltd.* | | | 689 | | | | 31,427 | |
| | |
Hartalega Holdings Bhd. | | | 31,800 | | | | 45,001 | |
| | |
Humasis Co. Ltd.* | | | 2,650 | | | | 36,511 | |
| | |
Jiangsu Yuyue Medical Equipment & Supply Co. Ltd., Class A | | | 5,300 | | | | 29,178 | |
| | |
Kangji Medical Holdings Ltd. | | | 25,000 | | | | 28,377 | |
| | |
Kossan Rubber Industries Bhd. | | | 22,800 | | | | 12,994 | |
| | |
Lifetech Scientific Corp.* | | | 110,000 | | | | 51,189 | |
| | |
Microport Scientific Corp.(b) | | | 11,498 | | | | 54,245 | |
| | |
Osstem Implant Co. Ltd. | | | 318 | | | | 33,608 | |
| | |
PCL, Inc.* | | | 530 | | | | 20,932 | |
| | |
Peijia Medical Ltd.* (a) | | | 21,000 | | | | 51,292 | |
| | |
Poly Medicure Ltd. | | | 3,604 | | | | 44,455 | |
| | |
Shandong Pharmaceutical Glass Co. Ltd., Class A | | | 5,300 | | | | 28,168 | |
| | |
Shandong Weigao Group Medical Polymer Co. Ltd., Class H | | | 36,000 | | | | 61,365 | |
| | |
Sri Trang Gloves Thailand PCL, NVDR | | | 45,300 | | | | 41,638 | |
| | |
St Shine Optical Co. Ltd. | | | 2,000 | | | | 21,181 | |
| | |
Sugentech, Inc.* | | | 7,865 | | | | 92,209 | |
See Accompanying Notes to the Financial Statements.
| | | | |
| 240 | | FLEXSHARES ANNUAL REPORT | | |
FlexShares® Morningstar Emerging Markets Factor Tilt Index Fund (cont.)
| | | | | | | | |
| Investments | | Shares | | | Value | |
|
| COMMON STOCKS – (continued) | |
|
| Health Care Equipment & Supplies – (continued) | |
| | |
Suheung Co. Ltd. | | | 4,015 | | | $ | 164,407 | |
| | |
Supermax Corp. Bhd. | | | 64,124 | | | | 29,731 | |
| | |
Top Glove Corp. Bhd. | | | 180,600 | | | | 118,626 | |
| | |
Venus MedTech Hangzhou, Inc., Class H* (a) (b) | | | 4,000 | | | | 18,537 | |
| | | | | | | | 1,076,882 | |
|
| Health Care Providers & Services – 0.7% | |
| | |
Al Hammadi Co. for Development and Investment | | | 5,225 | | | | 58,924 | |
| | |
Apollo Hospitals Enterprise Ltd. | | | 1,800 | | | | 102,451 | |
| | |
Bangkok Chain Hospital PCL, NVDR | | | 4,800 | | | | 2,936 | |
| | |
Bangkok Dusit Medical Services PCL, NVDR | | | 88,000 | | | | 62,322 | |
| | |
Bumrungrad Hospital PCL, NVDR | | | 6,600 | | | | 28,940 | |
| | |
Celltrion Healthcare Co. Ltd.* | | | 1,885 | | | | 130,501 | |
| | |
Chabiotech Co. Ltd.* | | | 3,303 | | | | 55,260 | |
| | |
China National Accord Medicines Corp. Ltd., Class B | | | 9,964 | | | | 24,951 | |
| | |
China Resources Medical Holdings Co. Ltd. | | | 26,500 | | | | 18,566 | |
| | |
Chularat Hospital PCL, NVDR | | | 183,100 | | | | 20,968 | |
| | |
Cleopatra Hospital* | | | 33,041 | | | | 10,558 | |
| | |
Dallah Healthcare Co. | | | 2,544 | | | | 49,172 | |
| | |
Diagnosticos da America SA* | | | 990 | | | | 6,152 | |
| | |
Dr Lal PathLabs Ltd.(a) | | | 430 | | | | 20,149 | |
| | |
Dr Sulaiman Al Habib Medical Services Group Co. | | | 1,760 | | | | 77,797 | |
| | |
Fleury SA | | | 3,600 | | | | 12,026 | |
| | |
Fortis Healthcare Ltd.* | | | 28,990 | | | | 94,580 | |
| | |
Genertec Universal Medical Group Co. Ltd.(a) (b) | | | 455,000 | | | | 343,924 | |
| | |
Hapvida Participacoes e Investimentos SA(a) | | | 26,900 | | | | 55,069 | |
| | |
HLB Life Science CO Ltd.* | | | 3,795 | | | | 48,552 | |
| | | | | | | | |
| Investments | | Shares | | | Value | |
|
| Health Care Providers & Services – (continued) | |
| | |
Huadong Medicine Co. Ltd., Class A | | | 5,300 | | | $ | 30,346 | |
| | |
Hygeia Healthcare Holdings Co.
Ltd.(a) | | | 6,400 | | | | 56,439 | |
| | |
IHH Healthcare Bhd. | | | 66,000 | | | | 104,236 | |
| | |
Jinxin Fertility Group Ltd.* (a) (b) | | | 12,000 | | | | 17,000 | |
| | |
KPJ Healthcare Bhd. | | | 14,124 | | | | 3,888 | |
| | |
Life Healthcare Group Holdings Ltd.* | | | 30,687 | | | | 49,099 | |
| | |
Max Healthcare Institute Ltd.* | | | 3,575 | | | | 15,819 | |
| | |
Medipost Co. Ltd.* | | | 446 | | | | 8,664 | |
| | |
Meinian Onehealth Healthcare Holdings Co. Ltd., Class A* | | | 9,400 | | | | 10,606 | |
| | |
Metro Healthcare Indonesia TBK PT* | | | 641,300 | | | | 20,732 | |
| | |
Metropolis Healthcare Ltd.(a) | | | 1,540 | | | | 60,920 | |
| | |
Mitra Keluarga Karyasehat Tbk. PT(a) | | | 100,200 | | | | 16,125 | |
| | |
Mouwasat Medical Services Co. | | | 688 | | | | 32,979 | |
| | |
Netcare Ltd.* | | | 79,319 | | | | 88,242 | |
| | |
Notre Dame Intermedica Participacoes SA | | | 12,144 | | | | 138,265 | |
| | |
Odontoprev SA | | | 4,900 | | | | 11,657 | |
| | |
Ping An Healthcare and Technology Co. Ltd.* (a) (b) | | | 11,000 | | | | 53,522 | |
| | |
Qualicorp Consultoria e Corretora de Seguros SA | | | 14,700 | | | | 44,619 | |
| | |
Rede D’Or Sao Luiz SA(a) | | | 16,500 | | | | 172,698 | |
| | |
Shanghai Pharmaceuticals Holding Co. Ltd., Class A | | | 4,700 | | | | 13,698 | |
| | |
Shanghai Pharmaceuticals Holding Co. Ltd., Class H | | | 23,500 | | | | 43,079 | |
| | |
Sinopharm Group Co. Ltd., Class H | | | 44,000 | | | | 104,979 | |
| | | | | | | | 2,321,410 | |
|
| Health Care Technology –0.0%(d) | |
| | |
Alibaba Health Information Technology Ltd.* (b) | | | 84,000 | | | | 106,147 | |
| | |
Yidu Tech, Inc.* (a) (b) | | | 10,600 | | | | 34,066 | |
| | | | | | | | 140,213 | |
See Accompanying Notes to the Financial Statements.
| | | | | | |
| | FLEXSHARES ANNUAL REPORT | | | 241 | |
FlexShares® Morningstar Emerging Markets Factor Tilt Index Fund (cont.)
| | | | | | | | |
| Investments | | Shares | | | Value | |
|
| COMMON STOCKS – (continued) | |
|
| Hotels, Restaurants & Leisure – 0.8% | |
| | |
Alsea SAB de CV* | | | 27,500 | | | $ | 57,857 | |
| | |
Ananti, Inc.* | | | 4,503 | | | | 50,866 | |
| | |
Asset World Corp. PCL, NVDR* | | | 312,700 | | | | 42,972 | |
| | |
Berjaya Sports Toto Bhd. | | | 409,013 | | | | 205,445 | |
| | |
Bloomberry Resorts Corp.* | | | 346,200 | | | | 46,700 | |
| | |
Central Plaza Hotel PCL* | | | 1,600 | | | | 1,736 | |
| | |
Central Plaza Hotel PCL, NVDR* | | | 8,600 | | | | 9,330 | |
| | |
DoubleUGames Co. Ltd. | | | 5,327 | | | | 292,665 | |
| | |
Genting Bhd. | | | 77,000 | | | | 96,320 | |
| | |
Genting Malaysia Bhd. | | | 61,100 | | | | 46,773 | |
| | |
Grand Korea Leisure Co. Ltd.* | | | 1,040 | | | | 14,551 | |
| | |
Haidilao International Holding
Ltd.(a) (b) | | | 13,164 | | | | 36,891 | |
| | |
Hana Tour Service, Inc.* | | | 403 | | | | 28,866 | |
| | |
Huazhu Group Ltd., ADR* | | | 2,979 | | | | 138,106 | |
| | |
Indian Hotels Co. Ltd. (The) | | | 45,170 | | | | 118,623 | |
| | |
Jiumaojiu International Holdings
Ltd.(a) | | | 6,000 | | | | 15,040 | |
| | |
Jollibee Foods Corp. | | | 10,380 | | | | 48,430 | |
| | |
Jubilant Foodworks Ltd. | | | 1,760 | | | | 86,713 | |
| | |
Kangwon Land, Inc.* | | | 2,365 | | | | 56,264 | |
| | |
Lotte Tour Development Co. Ltd.* | | | 1,961 | | | | 33,899 | |
| | |
Magnum Bhd. | | | 19,594 | | | | 10,220 | |
| | |
Minor International PCL, NVDR* | | | 66,000 | | | | 65,140 | |
| | |
MK Restaurants Group PCL, NVDR | | | 10,400 | | | | 17,160 | |
| | |
OPAP SA | | | 4,386 | | | | 68,268 | |
| | |
Paradise Co. Ltd.* | | | 421 | | | | 6,269 | |
| | |
Seera Group Holding* | | | 11,330 | | | | 70,078 | |
| | |
Shenzhen Overseas Chinese Town Co. Ltd., Class A | | | 22,200 | | | | 21,717 | |
| | |
Tongcheng-Elong Holdings Ltd.* (a) (b) | | | 18,800 | | | | 42,100 | |
| | |
Travellers International Hotel Group, Inc.* ‡ (c) | | | 209,900 | | | | 11,284 | |
| | |
Trip.com Group Ltd., ADR* | | | 9,264 | | | | 264,580 | |
| | | | | | | | |
| Investments | | Shares | | | Value | |
|
| Hotels, Restaurants & Leisure – (continued) | |
| | |
Xiabuxiabu Catering Management China Holdings Co. Ltd.* (a) | | | 26,500 | | | $ | 19,417 | |
| | |
Yum China Holdings, Inc. | | | 8,855 | | | | 505,443 | |
| | | | | | | | 2,529,723 | |
|
| Household Durables – 0.8% | |
| | |
Amber Enterprises India Ltd.* | | | 1,320 | | | | 58,273 | |
| | |
AmTRAN Technology Co. Ltd.* (c) | | | 53,000 | | | | 33,734 | |
| | |
Arcelik A/S | | | 4,982 | | | | 17,451 | |
| | |
Bajaj Electricals Ltd.* | | | 2,173 | | | | 32,087 | |
| | |
Coway Co. Ltd. | | | 2,036 | | | | 138,341 | |
| | |
Crompton Greaves Consumer Electricals Ltd. | | | 15,345 | | | | 95,413 | |
| | |
Cyrela Brazil Realty SA Empreendimentos e Participacoes | | | 142,400 | | | | 355,937 | |
| | |
Dixon Technologies India Ltd.(a) | | | 705 | | | | 47,014 | |
| | |
Ecovacs Robotics Co. Ltd., Class A | | | 1,500 | | | | 40,200 | |
| | |
Ez Tec Empreendimentos e Participacoes SA | | | 5,300 | | | | 17,159 | |
| | |
Haier Smart Home Co. Ltd., Class A | | | 10,600 | | | | 45,055 | |
| | |
Haier Smart Home Co. Ltd., Class H | | | 44,000 | | | | 164,596 | |
| | |
Hang Zhou Great Star Industrial Co. Ltd., Class A* | | | 5,000 | | | | 25,026 | |
| | |
Hangzhou Robam Appliances Co. Ltd., Class A | | | 5,300 | | | | 25,948 | |
| | |
Hanssem Co. Ltd. | | | 303 | | | | 26,318 | |
| | |
Hisense Home Appliances Group Co. Ltd., Class A | | | 10,000 | | | | 18,252 | |
| | |
Kinpo Electronics | | | 105,000 | | | | 49,086 | |
| | |
LG Electronics, Inc. | | | 3,797 | | | | 391,544 | |
| | |
LG Electronics, Inc. (Preference) | | | 584 | | | | 32,035 | |
| | |
Lock&Lock Co. Ltd.* | | | 728 | | | | 6,541 | |
| | |
Midea Group Co. Ltd., Class A | | | 11,000 | | | | 118,211 | |
| | |
MRV Engenharia e Participacoes SA | | | 138,500 | | | | 249,383 | |
See Accompanying Notes to the Financial Statements.
| | | | |
| 242 | | FLEXSHARES ANNUAL REPORT | | |
FlexShares® Morningstar Emerging Markets Factor Tilt Index Fund (cont.)
| | | | | | | | |
| Investments | | Shares | | | Value | |
|
| COMMON STOCKS – (continued) | |
|
| Household Durables – (continued) | |
| | |
NavInfo Co. Ltd., Class A* | | | 4,700 | | | $ | 8,593 | |
| | |
Nien Made Enterprise Co. Ltd. | | | 2,000 | | | | 27,474 | |
| | |
PIK Group PJSC | | | 4,646 | | | | 77,022 | |
| | |
Sampo Corp. | | | 165,000 | | | | 175,630 | |
| | |
TCL Electronics Holdings Ltd.* | | | 440,000 | | | | 239,258 | |
| | |
TCL Technology Group Corp., Class A | | | 28,200 | | | | 26,705 | |
| | |
Vestel Elektronik Sanayi ve Ticaret A/S | | | 38,675 | | | | 101,925 | |
| | |
Whirlpool of India Ltd. | | | 674 | | | | 19,913 | |
| | | | | | | | 2,664,124 | |
|
| Household Products – 0.2% | |
| | |
Blue Moon Group Holdings
Ltd.(a) (b) | | | 26,500 | | | | 23,846 | |
| | |
C&S Paper Co. Ltd., Class A | | | 5,000 | | | | 13,314 | |
| | |
Cheerwin Group Ltd.(a) | | | 26,500 | | | | 13,047 | |
| | |
Hindustan Unilever Ltd. | | | 18,040 | | | | 576,545 | |
| | |
Kimberly-Clark de Mexico SAB de CV, Class A(b) | | | 27,000 | | | | 42,808 | |
| | |
Unilever Indonesia Tbk. PT | | | 75,200 | | | | 23,461 | |
| | |
Vinda International Holdings Ltd.(b) | | | 3,000 | | | | 8,272 | |
| | | | | | | | 701,293 | |
|
Independent Power and Renewable Electricity
Producers – 1.5% | |
| | |
Aboitiz Power Corp. | | | 34,200 | | | | 21,812 | |
| | |
AC Energy Corp. | | | 196,100 | | | | 47,693 | |
| | |
Adani Green Energy Ltd.* | | | 7,920 | | | | 121,934 | |
| | |
Adani Power Ltd.* | | | 16,869 | | | | 22,640 | |
| | |
AES Andes SA | | | 88,486 | | | | 9,118 | |
| | |
AES Brasil Energia SA | | | 5,300 | | | | 10,248 | |
| | |
Aksa Enerji Uretim A/S* | | | 142,120 | | | | 111,152 | |
| | |
B Grimm Power PCL, NVDR | | | 15,300 | | | | 19,596 | |
| | |
Banpu Power PCL, NVDR | | | 11,700 | | | | 6,170 | |
| | |
Canvest Environmental Protection Group Co. Ltd.(a) | | | 275,000 | | | | 158,021 | |
| | |
CGN Power Co. Ltd., Class H(a) | | | 440,000 | | | | 118,781 | |
| | | | | | | | |
| Investments | | Shares | | | Value | |
|
Independent Power and Renewable Electricity
Producers – (continued) | |
| | |
China Longyuan Power Group Corp. Ltd., Class H | | | 110,000 | | | $ | 257,075 | |
| | |
China National Nuclear Power Co. Ltd., Class A | | | 42,300 | | | | 45,279 | |
| | |
China Power International Development Ltd.(b) | | | 2,145,000 | | | | 1,078,146 | |
| | |
China Resources Power Holdings Co. Ltd. | | | 54,000 | | | | 139,529 | |
| | |
China Yangtze Power Co. Ltd., Class A | | | 38,500 | | | | 127,846 | |
| | |
Cia Energetica de Sao Paulo (Preference), Class B | | | 10,600 | | | | 47,951 | |
| | |
Colbun SA | | | 238,159 | | | | 16,468 | |
| | |
Datang International Power Generation Co. Ltd., Class H | | | 212,000 | | | | 38,426 | |
| | |
Electricity Generating PCL, NVDR | | | 4,700 | | | | 25,283 | |
| | |
Energy Absolute PCL, NVDR | | | 38,500 | | | | 75,996 | |
| | |
Eneva SA* | | | 22,000 | | | | 56,200 | |
| | |
Engie Brasil Energia SA | | | 10,000 | | | | 69,026 | |
| | |
First Gen Corp. | | | 29,500 | | | | 17,615 | |
| | |
Global Power Synergy PCL, NVDR | | | 21,200 | | | | 49,833 | |
| | |
Guangxi Guiguan Electric Power Co. Ltd., Class A | | | 15,000 | | | | 13,572 | |
| | |
Gulf Energy Development PCL, NVDR | | | 110,000 | | | | 143,374 | |
| | |
Huadian Power International Corp. Ltd., Class A | | | 26,500 | | | | 18,262 | |
| | |
Huaneng Lancang River Hydropower, Inc., Class A | | | 23,500 | | | | 24,935 | |
| | |
Huaneng Power International, Inc., Class A | | | 24,300 | | | | 29,277 | |
| | |
Huaneng Power International, Inc., Class H(b) | | | 112,000 | | | | 58,023 | |
| | |
Hub Power Co. Ltd. (The) | | | 504,515 | | | | 223,902 | |
| | |
Hubei Energy Group Co. Ltd., Class A | | | 23,500 | | | | 18,214 | |
| | |
JSW Energy Ltd. | | | 8,692 | | | | 40,470 | |
| | |
Malakoff Corp. Bhd. | | | 951,500 | | | | 186,118 | |
| | |
Mega First Corp. Bhd. | | | 379,500 | | | | 329,920 | |
| | |
NHPC Ltd. | | | 79,420 | | | | 32,561 | |
See Accompanying Notes to the Financial Statements.
| | | | | | |
| | FLEXSHARES ANNUAL REPORT | | | 243 | |
FlexShares® Morningstar Emerging Markets Factor Tilt Index Fund (cont.)
| | | | | | | | |
| Investments | | Shares | | | Value | |
|
| COMMON STOCKS – (continued) | |
|
Independent Power and Renewable Electricity
Producers – (continued) | |
| | |
NTPC Ltd. | | | 161,004 | | | $ | 285,214 | |
| | |
OGK-2 PJSC | | | 16,271,280 | | | | 160,509 | |
| | |
Omega Geracao SA* | | | 5,300 | | | | 30,773 | |
| | |
Ratch Group PCL, NVDR | | | 9,300 | | | | 12,752 | |
| | |
SDIC Power Holdings Co. Ltd., Class A | | | 23,500 | | | | 38,743 | |
| | |
Shanghai Electric Power Co. Ltd., Class A | | | 14,100 | | | | 24,369 | |
| | |
Shenergy Co. Ltd., Class A | | | 14,100 | | | | 13,639 | |
| | |
Shenzhen Energy Group Co. Ltd., Class A | | | 10,600 | | | | 13,450 | |
| | |
Sichuan Chuantou Energy Co. Ltd., Class A | | | 9,400 | | | | 19,228 | |
| | |
SPCG PCL, NVDR | | | 254,700 | | | | 136,628 | |
| | |
Super Energy Corp. PCL, NVDR | | | 1,192,500 | | | | 34,859 | |
| | |
Taiwan Cogeneration Corp. | | | 3,000 | | | | 4,126 | |
| | |
Terna Energy SA | | | 933 | | | | 12,633 | |
| | |
TPI Polene Power PCL, NVDR | | | 1,481,800 | | | | 189,342 | |
| | |
Unipro PJSC | | | 5,337,000 | | | | 205,173 | |
| | | | | | | | 4,991,904 | |
|
| Industrial Conglomerates – 1.8% | |
| | |
3M India Ltd.* | | | 69 | | | | 23,406 | |
| | |
Aamal Co. | | | 21,949 | | | | 6,577 | |
| | |
Aboitiz Equity Ventures, Inc. | | | 84,290 | | | | 80,929 | |
| | |
AG Anadolu Grubu Holding A/S | | | 69,300 | | | | 197,915 | |
| | |
Alarko Holding A/S | | | 81,180 | | | | 79,448 | |
| | |
Alfa SAB de CV, Class A | | | 88,000 | | | | 63,870 | |
| | |
Alliance Global Group, Inc. | | | 157,700 | | | | 32,535 | |
| | |
AntarChile SA | | | 1,696 | | | | 14,250 | |
| | |
Ayala Corp. | | | 5,500 | | | | 94,158 | |
| | |
Bidvest Group Ltd. (The) | | | 12,155 | | | | 153,049 | |
| | |
China Baoan Group Co. Ltd., Class A | | | 5,500 | | | | 17,972 | |
| | |
CJ Corp. | | | 564 | | | | 46,238 | |
| | |
DMCI Holdings, Inc. | | | 1,985,500 | | | | 313,127 | |
| | |
Dogan Sirketler Grubu Holding A/S | | | 571,725 | | | | 158,166 | |
| | |
Doosan Co. Ltd. | | | 6,404 | | | | 564,471 | |
| | | | | | | | |
| Investments | | Shares | | | Value | |
|
| Industrial Conglomerates – (continued) | |
| | |
Dubai Investments PJSC | | | 1,091,896 | | | $ | 505,349 | |
| | |
Enka Insaat ve Sanayi A/S | | | 50,808 | | | | 58,126 | |
| | |
Far Eastern New Century Corp. | | | 133,000 | | | | 139,177 | |
| | |
Fosun International Ltd. | | | 82,500 | | | | 97,039 | |
| | |
Godrej Industries Ltd.* | | | 3,377 | | | | 26,179 | |
| | |
Grupo Carso SAB de CV, Series A1(b) | | | 11,100 | | | | 37,418 | |
| | |
GT Capital Holdings, Inc. | | | 2,280 | | | | 25,554 | |
| | |
Hanwha Corp. | | | 1,692 | | | | 48,506 | |
| | |
Hanwha Corp. (3rd Preference) | | | 1,425 | | | | 19,999 | |
| | |
HAP Seng Consolidated Bhd. | | | 11,900 | | | | 22,530 | |
| | |
Hong Leong Industries Bhd. | | | 34,200 | | | | 75,321 | |
| | |
Hyosung Corp. | | | 201 | | | | 17,717 | |
| | |
Industries Qatar QSC | | | 37,455 | | | | 163,152 | |
| | |
JG Summit Holdings, Inc. | | | 66,111 | | | | 78,950 | |
| | |
KAP Industrial Holdings Ltd. | | | 1,316,700 | | | | 408,870 | |
| | |
KOC Holding A/S | | | 31,460 | | | | 77,152 | |
| | |
LG Corp. | | | 4,260 | | | | 332,474 | |
| | |
Lotte Corp. | | | 1,392 | | | | 38,953 | |
| | |
LT Group, Inc. | | | 131,600 | | | | 26,263 | |
| | |
Mytilineos SA | | | 4,982 | | | | 90,921 | |
| | |
National Industries Group Holding SAK* | | | 715,330 | | | | 650,192 | |
| | |
PSG Group Ltd.(b) | | | 7,795 | | | | 39,221 | |
| | |
Quinenco SA | | | 12,939 | | | | 24,401 | |
| | |
Samsung C&T Corp. | | | 1,622 | | | | 158,237 | |
| | |
San Miguel Corp. | | | 13,510 | | | | 31,329 | |
| | |
Shanghai Industrial Holdings Ltd.(b) | | | 207,000 | | | | 309,207 | |
| | |
Siemens Ltd. | | | 1,416 | | | | 41,349 | |
| | |
Sime Darby Bhd. | | | 54,600 | | | | 29,930 | |
| | |
SK, Inc. | | | 1,198 | | | | 249,124 | |
| | |
SM Investments Corp. | | | 8,490 | | | | 162,524 | |
| | |
Sunway Bhd. | | | 50,749 | | | | 21,814 | |
| | |
Thoresen Thai Agencies PCL, NVDR | | | 53,000 | | | | 18,528 | |
| | |
Turkiye Sise ve Cam Fabrikalari A/S | | | 49,404 | | | | 44,496 | |
| | | | | | | | 5,916,113 | |
See Accompanying Notes to the Financial Statements.
| | | | |
| 244 | | FLEXSHARES ANNUAL REPORT | | |
FlexShares® Morningstar Emerging Markets Factor Tilt Index Fund (cont.)
| | | | | | | | |
| Investments | | Shares | | | Value | |
|
| COMMON STOCKS – (continued) | |
|
| Insurance – 2.7% | |
| | |
Allianz Malaysia Bhd. | | | 27,500 | | | $ | 87,527 | |
| | |
Bangkok Insurance PCL, NVDR | | | 11,000 | | | | 92,489 | |
| | |
Bangkok Life Assurance PCL, NVDR | | | 35,000 | | | | 31,380 | |
| | |
BB Seguridade Participacoes SA | | | 16,500 | | | | 64,659 | |
| | |
Bupa Arabia for Cooperative Insurance Co. | | | 262 | | | | 10,100 | |
| | |
Cathay Financial Holding Co. Ltd. | | | 275,000 | | | | 574,555 | |
| | |
China Development Financial Holding Corp. | | | 550,000 | | | | 280,849 | |
| | |
China Life Insurance Co. Ltd. | | | 84,697 | | | | 88,326 | |
| | |
China Life Insurance Co. Ltd., Class H | | | 135,000 | | | | 235,324 | |
| | |
China Pacific Insurance Group Co. Ltd., Class A | | | 21,000 | | | | 89,916 | |
| | |
China Pacific Insurance Group Co. Ltd., Class H | | | 99,000 | | | | 305,436 | |
| | |
China Taiping Insurance Holdings Co. Ltd. | | | 31,800 | | | | 48,646 | |
| | |
Co. for Cooperative Insurance (The) | | | 974 | | | | 22,332 | |
| | |
DB Insurance Co. Ltd. | | | 2,014 | | | | 102,031 | |
| | |
Discovery Ltd.* | | | 7,242 | | | | 66,669 | |
| | |
Fubon Financial Holding Co. Ltd. | | | 284,453 | | | | 752,854 | |
| | |
General Insurance Corp. of India* (a) | | | 8,949 | | | | 15,931 | |
| | |
Hanwha General Insurance Co. Ltd.* | | | 29,920 | | | | 115,604 | |
| | |
Hanwha Life Insurance Co. Ltd. | | | 12,318 | | | | 36,631 | |
| | |
HDFC Life Insurance Co. Ltd.(a) | | | 17,875 | | | | 162,431 | |
| | |
Hyundai Marine & Fire Insurance Co. Ltd. | | | 2,970 | | | | 66,717 | |
| | |
ICICI Lombard General Insurance Co. Ltd.(a) | | | 4,049 | | | | 80,111 | |
| | |
ICICI Prudential Life Insurance Co. Ltd.(a) | | | 6,030 | | | | 49,798 | |
| | |
IRB Brasil Resseguros S/A* | | | 31,951 | | | | 26,583 | |
| | | | | | | | |
| Investments | | Shares | | | Value | |
|
| Insurance – (continued) | |
| | |
Korean Reinsurance Co. | | | 39,738 | | | $ | 328,500 | |
| | |
Liberty Holdings Ltd.* | | | 68,992 | | | | 409,549 | |
| | |
Max Financial Services Ltd.* | | | 2,721 | | | | 35,378 | |
| | |
Mercuries & Associates Holding Ltd. | | | 260,500 | | | | 216,861 | |
| | |
Mercuries Life Insurance Co. Ltd.* | | | 111,700 | | | | 36,874 | |
| | |
Meritz Fire & Marine Insurance Co. Ltd. | | | 1,643 | | | | 38,947 | |
| | |
Mirae Asset Life Insurance Co. Ltd. | | | 30,610 | | | | 111,983 | |
| | |
Momentum Metropolitan Holdings | | | 24,539 | | | | 31,739 | |
| | |
New China Life Insurance Co. Ltd., Class A | | | 4,700 | | | | 28,769 | |
| | |
New China Life Insurance Co. Ltd., Class H | | | 31,100 | | | | 90,153 | |
| | |
Old Mutual Ltd. | | | 172,110 | | | | 176,526 | |
| | |
People’s Insurance Co. Group of China Ltd. (The), Class H | | | 249,000 | | | | 77,782 | |
| | |
PICC Property & Casualty Co. Ltd., Class H | | | 220,000 | | | | 205,886 | |
| | |
Ping An Insurance Group Co. of China Ltd., Class A | | | 27,600 | | | | 213,794 | |
| | |
Ping An Insurance Group Co. of China Ltd., Class H | | | 201,500 | | | | 1,447,972 | |
| | |
Porto Seguro SA | | | 9,600 | | | | 39,749 | |
| | |
Qatar Insurance Co. SAQ* | | | 94,985 | | | | 63,915 | |
| | |
Qualitas Controladora SAB de CV(b) | | | 104,500 | | | | 485,137 | |
| | |
Rand Merchant Investment Holdings Ltd.(b) | | | 33,144 | | | | 88,987 | |
| | |
Samsung Fire & Marine Insurance Co. Ltd. | | | 1,115 | | | | 220,414 | |
| | |
Samsung Life Insurance Co. Ltd. | | | 3,371 | | | | 194,145 | |
| | |
Sanlam Ltd. | | | 63,153 | | | | 260,714 | |
| | |
Santam Ltd. | | | 723 | | | | 12,082 | |
| | |
SBI Life Insurance Co. Ltd.(a) | | | 8,278 | | | | 126,639 | |
| | |
Shin Kong Financial Holding Co. Ltd. | | | 550,000 | | | | 194,023 | |
| | |
Shinkong Insurance Co. Ltd. | | | 110,000 | | | | 182,354 | |
| | |
Sul America SA | | | 10,377 | | | | 47,808 | |
See Accompanying Notes to the Financial Statements.
| | | | | | |
| | FLEXSHARES ANNUAL REPORT | | | 245 | |
FlexShares® Morningstar Emerging Markets Factor Tilt Index Fund (cont.)
| | | | | | | | |
| Investments | | Shares | | | Value | |
|
| COMMON STOCKS – (continued) | |
|
| Insurance – (continued) | |
| | |
Syarikat Takaful Malaysia Keluarga BHD | | | 152,260 | | | $ | 145,973 | |
| | |
Turkiye Sigorta A/S | | | 118,030 | | | | 60,027 | |
| | |
ZhongAn Online P&C Insurance Co. Ltd., Class H* (a) (b) | | | 16,500 | | | | 60,557 | |
| | | | | | | | 9,040,136 | |
|
| Interactive Media & Services – 3.6% | |
| | |
AfreecaTV Co. Ltd. | | | 495 | | | | 81,755 | |
| | |
Autohome, Inc., ADR(b) | | | 954 | | | | 37,540 | |
| | |
Baidu, Inc., ADR* | | | 5,390 | | | | 874,474 | |
| | |
Hello Group, Inc., ADR | | | 85,812 | | | | 1,068,359 | |
| | |
Hong Seng Consolidated Bhd.* | | | 90,100 | | | | 72,889 | |
| | |
Info Edge India Ltd. | | | 1,474 | | | | 119,590 | |
| | |
JOYY, Inc., ADR(b) | | | 1,210 | | | | 60,972 | |
| | |
Kakao Corp. | | | 6,275 | | | | 673,923 | |
| | |
Kuaishou Technology* (a) | | | 27,500 | | | | 365,887 | |
| | |
NAVER Corp. | | | 2,970 | | | | 1,034,436 | |
| | |
Tencent Holdings Ltd. | | | 121,000 | | | | 7,481,762 | |
| | |
Tongdao Liepin Group* (a) (b) | | | 10,000 | | | | 14,449 | |
| | |
Weibo Corp., ADR* | | | 1,467 | | | | 65,986 | |
| | |
Zhihu, Inc., ADR* (b) | | | 1,113 | | | | 9,193 | |
| | | | | | | | 11,961,215 | |
|
| Internet & Direct Marketing Retail – 3.8% | |
| | |
Alibaba Group Holding Ltd.* | | | 297,000 | | | | 6,223,253 | |
| | |
Americanas SA* | | | 9,192 | | | | 48,430 | |
| | |
Baozun, Inc., Class A* | | | 2,500 | | | | 14,462 | |
| | |
CJ ENM Co. Ltd. | | | 140 | | | | 21,134 | |
| | |
HengTen Networks Group Ltd.* (b) | | | 30,799 | | | | 10,571 | |
| | |
Hyundai Home Shopping Network Corp. | | | 3,081 | | | | 184,826 | |
| | |
JD Health International, Inc.* (a) (b) | | | 22,000 | | | | 194,857 | |
| | |
JD.com, Inc., Class A* | | | 36,350 | | | | 1,450,439 | |
| | |
Lojas Americanas SA* | | | 5,349 | | | | 4,678 | |
| | |
Lojas Americanas SA (Preference)* | | | 16,274 | | | | 13,944 | |
| | |
Maoyan Entertainment* (a) (b) | | | 44,000 | | | | 53,282 | |
| | | | | | | | |
| Investments | | Shares | | | Value | |
|
| Internet & Direct Marketing Retail – (continued) | |
| | |
Meituan, Class B* (a) | | | 82,500 | | | $ | 2,859,218 | |
| | |
momo.com, Inc. | | | 1,300 | | | | 83,679 | |
| | |
Naspers Ltd., Class N | | | 4,345 | | | | 740,405 | |
| | |
Pinduoduo, Inc., ADR* | | | 8,855 | | | | 787,387 | |
| | |
Vipshop Holdings Ltd., ADR* | | | 8,085 | | | | 90,229 | |
| | | | | | | | 12,780,794 | |
|
| IT Services – 1.7% | |
| | |
China TransInfo Technology Co. Ltd., Class A | | | 4,700 | | | | 9,827 | |
| | |
Chinasoft International Ltd.* | | | 46,000 | | | | 76,991 | |
| | |
Chindata Group Holdings Ltd., ADR* (b) | | | 5,665 | | | | 56,423 | |
| | |
Cielo SA | | | 602,300 | | | | 233,996 | |
| | |
Coforge Ltd. | | | 1,078 | | | | 70,116 | |
| | |
Computer Age Management Services Ltd. | | | 1,007 | | | | 40,507 | |
| | |
DHC Software Co. Ltd., Class A | | | 9,400 | | | | 10,194 | |
| | |
Digital China Holdings Ltd.(b) | | | 495,000 | | | | 267,256 | |
| | |
Fawry for Banking & Payment Technology Services SAE* | | | 18,921 | | | | 18,114 | |
| | |
Firstsource Solutions Ltd. | | | 22,385 | | | | 59,086 | |
| | |
GDS Holdings Ltd., ADR* (b) | | | 2,365 | | | | 140,481 | |
| | |
Happiest Minds Technologies Ltd. | | | 2,491 | | | | 42,394 | |
| | |
HCL Technologies Ltd. | | | 22,000 | | | | 336,032 | |
| | |
Hyundai Autoever Corp. | | | 212 | | | | 21,136 | |
| | |
Infosys Ltd. | | | 74,965 | | | | 1,669,615 | |
| | |
Kginicis Co. Ltd. | | | 8,610 | | | | 137,415 | |
| | |
Kingsoft Cloud Holdings Ltd., ADR* (b) | | | 982 | | | | 22,557 | |
| | |
Larsen & Toubro Infotech Ltd.(a) | | | 721 | | | | 64,341 | |
| | |
Locaweb Servicos de Internet SA* (a) | | | 4,800 | | | | 15,583 | |
| | |
Lotte Data Communication Co. | | | 3,465 | | | | 113,419 | |
| | |
Mindtree Ltd. | | | 720 | | | | 43,195 | |
| | |
Mphasis Ltd. | | | 1,925 | | | | 83,184 | |
| | |
My EG Services Bhd. | | | 86,314 | | | | 21,678 | |
| | |
Persistent Systems Ltd. | | | 2,695 | | | | 141,215 | |
| | |
Posco ICT Co. Ltd. | | | 2,080 | | | | 11,908 | |
| | |
Samsung SDS Co. Ltd. | | | 770 | | | | 100,817 | |
See Accompanying Notes to the Financial Statements.
| | | | |
| 246 | | FLEXSHARES ANNUAL REPORT | | |
FlexShares® Morningstar Emerging Markets Factor Tilt Index Fund (cont.)
| | | | | | | | |
| Investments | | Shares | | | Value | |
|
| COMMON STOCKS – (continued) | |
|
| IT Services – (continued) | |
| | |
Systex Corp. | | | 110,000 | | | $ | 341,371 | |
| | |
Tata Consultancy Services Ltd. | | | 20,790 | | | | 943,350 | |
| | |
Tech Mahindra Ltd. | | | 11,000 | | | | 217,095 | |
| | |
TravelSky Technology Ltd., Class H | | | 41,000 | | | | 76,740 | |
| | |
Vnet Group, Inc., ADR* (b) | | | 1,563 | | | | 24,508 | |
| | |
Wipro Ltd. | | | 28,641 | | | | 247,373 | |
| | |
Yeahka Ltd.* (b) | | | 2,400 | | | | 7,327 | |
| | | | | | | | 5,665,244 | |
|
| Leisure Products – 0.1% | |
| | |
Dyaco International, Inc. | | | 55,000 | | | | 128,162 | |
| | |
Fusheng Precision Co. Ltd. | | | 7,000 | | | | 47,450 | |
| | |
Giant Manufacturing Co. Ltd. | | | 5,000 | | | | 57,986 | |
| | |
HLB, Inc.* | | | 2,035 | | | | 73,316 | |
| | |
Merida Industry Co. Ltd. | | | 5,350 | | | | 55,600 | |
| | | | | | | | 362,514 | |
|
| Life Sciences Tools & Services – 0.6% | |
| | |
Cellivery Therapeutics, Inc.* | | | 188 | | | | 8,076 | |
| | |
Divi’s Laboratories Ltd. | | | 2,622 | | | | 180,335 | |
| | |
Genscript Biotech Corp.* | | | 20,000 | | | | 88,828 | |
| | |
Hangzhou Tigermed Consulting Co. Ltd., Class H(a) | | | 6,500 | | | | 126,757 | |
| | |
LegoChem Biosciences, Inc.* | | | 270 | | | | 10,386 | |
| | |
Pharmaron Beijing Co. Ltd., Class H(a) | | | 5,700 | | | | 124,199 | |
| | |
Samsung Biologics Co. Ltd.* (a) | | | 311 | | | | 231,810 | |
| | |
ST Pharm Co. Ltd.* | | | 344 | | | | 25,758 | |
| | |
Viva Biotech Holdings(a) (b) | | | 50,000 | | | | 37,858 | |
| | |
WuXi AppTec Co. Ltd., Class A | | | 5,260 | | | | 113,439 | |
| | |
WuXi AppTec Co. Ltd., Class H(a) (b) | | | 7,418 | | | | 158,582 | |
| | |
Wuxi Biologics Cayman, Inc.* (a) | | | 65,500 | | | | 996,934 | |
| | | | | | | | 2,102,962 | |
|
| Machinery – 1.1% | |
| | |
AIA Engineering Ltd. | | | 972 | | | | 24,892 | |
| | |
Airtac International Group | | | 2,913 | | | | 86,944 | |
| | | | | | | | |
| Investments | | Shares | | | Value | |
|
| Machinery – (continued) | |
| | |
Ashok Leyland Ltd. | | | 34,234 | | | $ | 65,102 | |
| | |
China CSSC Holdings Ltd., Class A | | | 10,600 | | | | 37,353 | |
| | |
China International Marine Containers Group Co. Ltd., Class H(b) | | | 15,900 | | | | 31,436 | |
| | |
CIMC Enric Holdings Ltd.(b) | | | 312,000 | | | | 403,484 | |
| | |
CNHTC Jinan Truck Co. Ltd., Class A | | | 1,260 | | | | 2,607 | |
| | |
CNPC Capital Co. Ltd., Class A | | | 29,200 | | | | 23,134 | |
| | |
Creative & Innovative System* | | | 2,703 | | | | 42,446 | |
| | |
CSBC Corp. Taiwan* | | | 53,000 | | | | 41,548 | |
| | |
Cummins India Ltd. | | | 2,280 | | | | 27,272 | |
| | |
Daewoo Shipbuilding & Marine Engineering Co. Ltd.* | | | 705 | | | | 15,565 | |
| | |
Doosan Bobcat, Inc.* | | | 1,272 | | | | 41,419 | |
| | |
Dufu Technology Corp. Bhd. | | | 37,100 | | | | 39,779 | |
| | |
Escorts Ltd. | | | 3,135 | | | | 65,705 | |
| | |
Estun Automation Co. Ltd., Class A | | | 5,000 | | | | 20,666 | |
| | |
Haitian International Holdings Ltd. | | | 16,000 | | | | 46,895 | |
| | |
Hangzhou Oxygen Plant Group Co. Ltd. | | | 5,000 | | | | 20,237 | |
| | |
Hanjin Heavy Industries & Construction Co. Ltd.* | | | 1,060 | | | | 8,672 | |
| | |
Hiwin Technologies Corp. | | | 5,372 | | | | 59,692 | |
| | |
Hyundai Construction Equipment Co. Ltd.* | | | 636 | | | | 21,907 | |
| | |
Hyundai Doosan Infracore Co. Ltd.* | | | 1,370 | | | | 12,310 | |
| | |
Hyundai Elevator Co. Ltd. | | | 208 | | | | 8,588 | |
| | |
Hyundai Heavy Industries Holdings Co. Ltd. | | | 1,430 | | | | 77,340 | |
| | |
Hyundai Mipo Dockyard Co. Ltd.* | | | 602 | | | | 38,998 | |
| | |
Hyundai Rotem Co. Ltd.* | | | 1,766 | | | | 34,004 | |
| | |
Infore Environment Technology Group Co. Ltd., Class A | | | 9,400 | | | | 9,195 | |
See Accompanying Notes to the Financial Statements.
| | | | | | |
| | FLEXSHARES ANNUAL REPORT | | | 247 | |
FlexShares® Morningstar Emerging Markets Factor Tilt Index Fund (cont.)
| | | | | | | | |
| Investments | | Shares | | | Value | |
|
| COMMON STOCKS – (continued) | |
|
| Machinery – (continued) | |
| | |
Korea Shipbuilding & Offshore Engineering Co. Ltd.* | | | 990 | | | $ | 87,262 | |
| | |
LK Technology Holdings Ltd. | | | 22,000 | | | | 55,374 | |
| | |
Lonking Holdings Ltd. | | | 1,045,000 | | | | 306,284 | |
| | |
Pentamaster Corp. Bhd. | | | 21,200 | | | | 27,390 | |
| | |
People & Technology, Inc. | | | 10,120 | | | | 302,245 | |
| | |
Rechi Precision Co. Ltd. | | | 55,000 | | | | 36,886 | |
| | |
Rexon Industrial Corp. Ltd. | | | 74,000 | | | | 178,291 | |
| | |
Riyue Heavy Industry Co. Ltd., Class A | | | 5,000 | | | | 30,402 | |
| | |
SAM KANG M&T Co. Ltd.* | | | 1,219 | | | | 21,646 | |
| | |
Samsung Heavy Industries Co. Ltd.* | | | 15,922 | | | | 86,930 | |
| | |
Sany Heavy Equipment International Holdings Co. Ltd. | | | 12,000 | | | | 13,760 | |
| | |
Sany Heavy Industry Co. Ltd., Class A | | | 16,500 | | | | 59,200 | |
| | |
Schaeffler India Ltd. | | | 220 | | | | 21,746 | |
| | |
SFA Engineering Corp. | | | 1,089 | | | | 32,804 | |
| | |
Shanghai Mechanical and Electrical Industry Co. Ltd., Class B | | | 21,200 | | | | 27,242 | |
| | |
Shin Zu Shing Co. Ltd. | | | 83,000 | | | | 297,575 | |
| | |
Sinotruk Hong Kong Ltd. | | | 30,500 | | | | 42,109 | |
| | |
SKF India Ltd. | | | 624 | | | | 27,674 | |
| | |
Sunonwealth Electric Machine Industry Co. Ltd. | | | 110,000 | | | | 152,292 | |
| | |
Tianshan Aluminum Group Co. Ltd., Class A | | | 10,600 | | | | 13,864 | |
| | |
UWC Bhd. | | | 10,600 | | | | 15,717 | |
| | |
Weichai Power Co. Ltd., Class A | | | 17,300 | | | | 40,822 | |
| | |
Weichai Power Co. Ltd., Class H | | | 74,000 | | | | 132,988 | |
| | |
XCMG Construction Machinery Co. Ltd., Class A | | | 18,800 | | | | 17,950 | |
| | |
Yangzijiang Shipbuilding Holdings Ltd. | | | 104,500 | | | | 110,041 | |
| | |
Zhejiang Sanhua Intelligent Controls Co. Ltd., Class A | | | 9,400 | | | | 34,843 | |
| | | | | | | | |
| Investments | | Shares | | | Value | |
|
| Machinery – (continued) | |
| | |
Zhengzhou Coal Mining Machinery Group Co. Ltd., Class A | | | 9,400 | | | $ | 14,865 | |
| | |
Zhengzhou Coal Mining Machinery Group Co. Ltd., Class H(b) | | | 10,000 | | | | 10,515 | |
| | |
Zoomlion Heavy Industry Science and Technology Co. Ltd., Class A | | | 17,700 | | | | 20,164 | |
| | |
Zoomlion Heavy Industry Science and Technology Co. Ltd., Class H | | | 62,200 | | | | 44,937 | |
| | | | | | | | 3,571,008 | |
|
| Marine – 0.5% | |
| | |
Cia Sud Americana de Vapores SA | | | 636,473 | | | | 41,461 | |
| | |
COSCO SHIPPING Holdings Co. Ltd., Class H* (b) | | | 116,450 | | | | 180,834 | |
| | |
Evergreen Marine Corp. Taiwan Ltd. | | | 91,558 | | | | 327,598 | |
| | |
HMM Co. Ltd.* | | | 10,120 | | | | 230,797 | |
| | |
MISC Bhd. | | | 60,500 | | | | 103,293 | |
| | |
Orient Overseas International Ltd. | | | 6,500 | | | | 120,073 | |
| | |
Pan Ocean Co. Ltd. | | | 5,613 | | | | 28,916 | |
| | |
Precious Shipping PCL, NVDR | | | 47,700 | | | | 26,019 | |
| | |
Qatar Navigation QSC | | | 20,237 | | | | 42,180 | |
| | |
Regional Container Lines PCL, NVDR | | | 132,000 | | | | 174,038 | |
| | |
Transcoal Pacific Tbk. PT* | | | 32,900 | | | | 20,087 | |
| | |
U-Ming Marine Transport Corp. | | | 2,000 | | | | 3,783 | |
| | |
Wan Hai Lines Ltd. | | | 42,900 | | | | 246,831 | |
| | |
Wisdom Marine Lines Co. Ltd. | | | 11,898 | | | | 27,939 | |
| | |
Yang Ming Marine Transport Corp.* | | | 58,000 | | | | 201,269 | |
| | | | | | | | 1,775,118 | |
|
| Media – 0.4% | |
| | |
Affle India Ltd.* | | | 2,120 | | | | 29,727 | |
| | |
Astro Malaysia Holdings Bhd. | | | 139,200 | | | | 33,447 | |
| | |
Cheil Worldwide, Inc. | | | 1,074 | | | | 21,920 | |
| | |
China Literature Ltd.* (a) (b) | | | 6,200 | | | | 43,158 | |
See Accompanying Notes to the Financial Statements.
| | | | |
| 248 | | FLEXSHARES ANNUAL REPORT | | |
FlexShares® Morningstar Emerging Markets Factor Tilt Index Fund (cont.)
| | | | | | | | |
| Investments | | Shares | | | Value | |
|
| COMMON STOCKS – (continued) | |
|
| Media – (continued) | |
| | |
Elang Mahkota Teknologi Tbk. PT* | | | 376,300 | | | $ | 51,129 | |
| | |
Focus Media Information Technology Co. Ltd., Class A | | | 23,500 | | | | 27,028 | |
| | |
Grupo Televisa SAB, Series CPO | | | 49,500 | | | | 100,720 | |
| | |
iClick Interactive Asia Group Ltd., ADR* (b) | | | 5,088 | | | | 35,056 | |
| | |
Innocean Worldwide, Inc. | | | 4,968 | | | | 249,984 | |
| | |
KMH Co. Ltd.* | | | 12,100 | | | | 93,089 | |
| | |
Leo Group Co. Ltd., Class A | | | 18,800 | | | | 6,698 | |
| | |
Media Nusantara Citra Tbk. PT | | | 3,624,500 | | | | 230,249 | |
| | |
Megacable Holdings SAB de CV | | | 16,500 | | | | 48,722 | |
| | |
MultiChoice Group | | | 7,645 | | | | 61,095 | |
| | |
NanJi E-Commerce Co. Ltd., Class A | | | 4,700 | | | | 5,266 | |
| | |
Plan B Media PCL, NVDR | | | 72,800 | | | | 14,041 | |
| | |
Saudi Research & Media Group* | | | 1,430 | | | | 64,430 | |
| | |
Sun TV Network Ltd. | | | 1,889 | | | | 14,152 | |
| | |
Surya Citra Media Tbk. PT* | | | 427,000 | | | | 12,659 | |
| | |
Zee Entertainment Enterprises Ltd. | | | 19,580 | | | | 78,693 | |
| | | | | | | | 1,221,263 | |
|
| Metals & Mining – 4.2% | |
| | |
African Rainbow Minerals Ltd. | | | 4,290 | | | | 57,444 | |
| | |
Alrosa PJSC | | | 85,800 | | | | 151,042 | |
| | |
Aluminum Corp. of China Ltd., Class A* | | | 26,500 | | | | 25,426 | |
| | |
Aluminum Corp. of China Ltd., Class H* (b) | | | 60,000 | | | | 35,866 | |
| | |
Aneka Tambang Tbk. | | | 201,400 | | | | 33,265 | |
| | |
Angang Steel Co. Ltd., Class H | | | 38,000 | | | | 20,468 | |
| | |
Anglo American Platinum Ltd. | | | 2,090 | | | | 212,217 | |
| | |
AngloGold Ashanti Ltd. | | | 15,125 | | | | 283,872 | |
| | |
APL Apollo Tubes Ltd.* | | | 9,974 | | | | 106,571 | |
| | |
Baoshan Iron & Steel Co. Ltd., Class A | | | 66,000 | | | | 73,536 | |
| | | | | | | | |
| Investments | | Shares | | | Value | |
|
| Metals & Mining – (continued) | |
| | |
Beijing Shougang Co. Ltd., Class A* | | | 10,600 | | | $ | 9,541 | |
| | |
Bradespar SA (Preference) | | | 6,186 | | | | 53,399 | |
| | |
CAP SA | | | 2,756 | | | | 27,352 | |
| | |
Century Iron & Steel Industrial Co. Ltd. | | | 6,000 | | | | 24,381 | |
| | |
Chengtun Mining Group Co. Ltd., Class A | | | 10,600 | | | | 16,962 | |
| | |
Chifeng Jilong Gold Mining Co. Ltd., Class A* | | | 10,000 | | | | 25,518 | |
| | |
China Gold International Resources Corp. Ltd. | | | 121,000 | | | | 361,644 | |
| | |
China Hongqiao Group Ltd.(b) | | | 82,500 | | | | 91,737 | |
| | |
China Metal Products | | | 110,000 | | | | 126,580 | |
| | |
China Metal Recycling Holdings Ltd.* ‡ (c) | | | 51,000 | | | | — | |
| | |
China Molybdenum Co. Ltd., Class A | | | 22,500 | | | | 21,061 | |
| | |
China Molybdenum Co. Ltd., Class H | | | 57,000 | | | | 35,391 | |
| | |
China Nonferrous Mining Corp. Ltd. | | | 605,000 | | | | 259,762 | |
| | |
China Northern Rare Earth Group High-Tech Co. Ltd., Class A | | | 5,300 | | | | 41,908 | |
| | |
China Steel Corp. | | | 275,000 | | | | 332,272 | |
| | |
China Zhongwang Holdings Ltd.* ‡ (b) (c) | | | 699,600 | | | | 161,297 | |
| | |
Chung Hung Steel Corp. | | | 23,000 | | | | 29,031 | |
| | |
Cia Siderurgica Nacional SA | | | 22,000 | | | | 88,905 | |
| | |
Citic Pacific Special Steel Group Co. Ltd., Class A | | | 10,600 | | | | 31,555 | |
| | |
Dongkuk Steel Mill Co. Ltd. | | | 2,067 | | | | 30,159 | |
| | |
DRDGOLD Ltd. | | | 20,448 | | | | 18,457 | |
| | |
Eregli Demir ve Celik Fabrikalari TAS | | | 45,320 | | | | 92,807 | |
| | |
Feng Hsin Steel Co. Ltd. | | | 16,000 | | | | 45,051 | |
| | |
Ganfeng Lithium Co. Ltd., Class A | | | 2,600 | | | | 68,014 | |
| | |
Ganfeng Lithium Co. Ltd., Class H(a) | �� | | 5,200 | | | | 97,529 | |
| | |
GEM Co. Ltd., Class A | | | 5,300 | | | | 9,028 | |
| | |
Gerdau SA (Preference) | | | 35,700 | | | | 170,362 | |
See Accompanying Notes to the Financial Statements.
| | | | | | |
| | FLEXSHARES ANNUAL REPORT | | | 249 | |
FlexShares® Morningstar Emerging Markets Factor Tilt Index Fund (cont.)
| | | | | | | | |
| Investments | | Shares | | | Value | |
|
| COMMON STOCKS – (continued) | |
|
| Metals & Mining – (continued) | |
| | |
Gold Fields Ltd. | | | 32,534 | | | $ | 306,740 | |
| | |
Grupo Mexico SAB de CV, Series B | | | 110,000 | | | | 483,629 | |
| | |
Harmony Gold Mining Co. Ltd.(b) | | | 18,648 | | | | 68,077 | |
| | |
Henan Shenhuo Coal & Power Co. Ltd., Class A | | | 5,500 | | | | 8,156 | |
| | |
Hesteel Co. Ltd., Class A | | | 37,600 | | | | 14,454 | |
| | |
Hindalco Industries Ltd. | | | 51,370 | | | | 315,432 | |
| | |
Hindustan Copper Ltd. | | | 16,483 | | | | 27,944 | |
| | |
Hunan Valin Steel Co. Ltd., Class A | | | 23,500 | | | | 19,610 | |
| | |
Hyundai Steel Co. | | | 1,128 | | | | 42,908 | |
| | |
Impala Platinum Holdings Ltd. | | | 27,805 | | | | 362,178 | |
| | |
Industrias Penoles SAB de CV* (b) | | | 4,525 | | | | 58,149 | |
| | |
Inner Mongolia BaoTou Steel Union Co. Ltd., Class A* | | | 70,500 | | | | 30,957 | |
| | |
Inner Mongolia Eerduosi Resources Co. Ltd., Class A | | | 5,300 | | | | 24,523 | |
| | |
Inner Mongolia Eerduosi Resources Co. Ltd., Class B | | | 5,300 | | | | 10,160 | |
| | |
Jiangsu Shagang Co. Ltd., Class A | | | 9,400 | | | | 9,122 | |
| | |
Jiangxi Copper Co. Ltd., Class A | | | 9,400 | | | | 34,211 | |
| | |
Jiangxi Copper Co. Ltd., Class H | | | 18,000 | | | | 31,515 | |
| | |
Jinchuan Group International Resources Co. Ltd.(b) | | | 144,000 | | | | 23,139 | |
| | |
Jindal Steel & Power Ltd.* | | | 14,485 | | | | 80,722 | |
| | |
JSW Steel Ltd. | | | 20,735 | | | | 185,291 | |
| | |
Kardemir Karabuk Demir Celik Sanayi ve Ticaret A/S, Class A* | | | 122,870 | | | | 82,551 | |
| | |
Kardemir Karabuk Demir Celik Sanayi ve Ticaret A/S, Class D* | | | 408,892 | | | | 317,243 | |
| | |
KISCO Corp. | | | 9,460 | | | | 72,779 | |
| | |
Korea Zinc Co. Ltd. | | | 440 | | | | 202,199 | |
| | |
Koza Altin Isletmeleri A/S* | | | 2,182 | | | | 24,350 | |
| | |
Koza Anadolu Metal Madencilik Isletmeleri A/S* | | | 96,305 | | | | 168,769 | |
| | | | | | | | |
| Investments | | Shares | | | Value | |
|
| Metals & Mining – (continued) | |
| | |
Kumba Iron Ore Ltd. | | | 2,200 | | | $ | 67,187 | |
| | |
Maanshan Iron & Steel Co. Ltd., Class A | | | 21,200 | | | | 14,047 | |
| | |
Maanshan Iron & Steel Co. Ltd., Class H | | | 110,000 | | | | 46,947 | |
| | |
Magnitogorsk Iron & Steel Works PJSC | | | 45,174 | | | | 42,127 | |
| | |
Merdeka Copper Gold Tbk. PT* | | | 338,500 | | | | 75,501 | |
| | |
Metalurgica Gerdau SA (Preference) | | | 22,200 | | | | 49,268 | |
| | |
MMC Norilsk Nickel PJSC | | | 2,090 | | | | 651,670 | |
| | |
Nickel Asia Corp. | | | 233,200 | | | | 25,351 | |
| | |
NMDC Ltd. | | | 36,355 | | | | 69,500 | |
| | |
Northam Platinum Holdings Ltd.* | | | 12,943 | | | | 194,784 | |
| | |
Novolipetsk Steel PJSC | | | 51,150 | | | | 161,218 | |
| | |
Polyus PJSC | | | 1,155 | | | | 229,092 | |
| | |
Poongsan Corp. | | | 9,376 | | | | 265,582 | |
| | |
POSCO | | | 2,585 | | | | 654,794 | |
| | |
Press Metal Aluminium Holdings Bhd. | | | 66,000 | | | | 88,616 | |
| | |
Qatar Aluminum Manufacturing Co. | | | 42,858 | | | | 22,318 | |
| | |
Raspadskaya OJSC | | | 4,240 | | | | 25,765 | |
| | |
Royal Bafokeng Platinum Ltd. | | | 5,141 | | | | 37,049 | |
| | |
Sansteel Minguang Co. Ltd. Fujian, Class A | | | 14,100 | | | | 15,093 | |
| | |
Saudi Arabian Mining Co.* | | | 7,498 | | | | 163,117 | |
| | |
Seah Besteel Corp. | | | 6,490 | | | | 120,242 | |
| | |
Severstal PAO | | | 7,040 | | | | 159,826 | |
| | |
Shandong Gold Mining Co. Ltd., Class A | | | 5,100 | | | | 15,875 | |
| | |
Shandong Gold Mining Co. Ltd., Class H(a) (b) | | | 13,650 | | | | 24,812 | |
| | |
Shandong Nanshan Aluminum Co. Ltd., Class A | | | 42,400 | | | | 28,623 | |
| | |
Shanxi Taigang Stainless Steel Co. Ltd., Class A | | | 15,900 | | | | 19,132 | |
| | |
Shougang Fushan Resources Group Ltd.(b) | | | 1,656,000 | | | | 436,403 | |
| | |
Sibanye Stillwater Ltd. | | | 97,735 | | | | 342,973 | |
| | |
Steel Authority of India Ltd. | | | 51,824 | | | | 79,659 | |
| | |
TA Chen Stainless Pipe* | | | 37,793 | | | | 60,002 | |
See Accompanying Notes to the Financial Statements.
| | | | |
| 250 | | FLEXSHARES ANNUAL REPORT | | |
FlexShares® Morningstar Emerging Markets Factor Tilt Index Fund (cont.)
| | | | | | | | |
| Investments | | Shares | | | Value | |
|
| COMMON STOCKS – (continued) | |
|
| Metals & Mining – (continued) | |
| | |
Tata Steel BSL Ltd.* | | | 150,315 | | | $ | 173,437 | |
| | |
Tata Steel Ltd. | | | 27,106 | | | | 476,356 | |
| | |
Tiangong International Co. Ltd. | | | 110,000 | | | | 66,461 | |
| | |
Tung Ho Steel Enterprise Corp. | | | 15,000 | | | | 21,792 | |
| | |
United Co. RUSAL International PJSC* | | | 75,100 | | | | 76,157 | |
| | |
Usinas Siderurgicas de Minas Gerais SA Usiminas | | | 400 | | | | 914 | |
| | |
Usinas Siderurgicas de Minas Gerais SA Usiminas (Preference), Class A | | | 12,400 | | | | 29,147 | |
| | |
Vale Indonesia Tbk. PT | | | 58,300 | | | | 19,958 | |
| | |
Vale SA | | | 137,500 | | | | 1,746,740 | |
| | |
Vedanta Ltd. | | | 43,340 | | | | 175,950 | |
| | |
Volcan Cia Minera SAA, Class B* | | | 151,729 | | | | 27,027 | |
| | |
VSMPO-AVISMA Corp. PJSC* | | | 53 | | | | 27,919 | |
| | |
Xiamen Tungsten Co. Ltd., Class A | | | 9,400 | | | | 33,344 | |
| | |
YC INOX Co. Ltd. | | | 165,000 | | | | 187,200 | |
| | |
Yieh Phui Enterprise Co. Ltd.* | | | 55,000 | | | | 49,050 | |
| | |
Young Poong Corp. | | | 348 | | | | 204,294 | |
| | |
Yunnan Copper Co. Ltd., Class A | | | 9,400 | | | | 19,448 | |
| | |
Zhaojin Mining Industry Co. Ltd., Class H(b) | | | 75,000 | | | | 53,702 | |
| | |
Zhejiang Huayou Cobalt Co. Ltd., Class A | | | 2,800 | | | | 48,590 | |
| | |
Zijin Mining Group Co. Ltd., Class A | | | 35,900 | | | | 58,680 | |
| | |
Zijin Mining Group Co. Ltd., Class H | | | 110,000 | | | | 153,283 | |
| | | | | | | | 14,110,240 | |
|
| Multiline Retail – 0.2% | |
| | |
Central Retail Corp. PCL, NVDR | | | 75,375 | | | | 78,936 | |
| | |
El Puerto de Liverpool SAB de CV, Class C1(b) | | | 2,700 | | | | 11,972 | |
| | |
Falabella SA | | | 29,041 | | | | 80,524 | |
| | | | | | | | |
| Investments | | Shares | | | Value | |
|
| Multiline Retail – (continued) | |
| | |
Golden Eagle Retail Group Ltd. | | | 225,000 | | | $ | 195,814 | |
| | |
Hyundai Department Store Co. Ltd. | | | 760 | | | | 53,851 | |
| | |
Lojas Renner SA | | | 16,500 | | | | 94,340 | |
| | |
Lotte Shopping Co. Ltd. | | | 211 | | | | 18,959 | |
| | |
Magazine Luiza SA* | | | 55,000 | | | | 105,473 | |
| | |
MINISO Group Holding Ltd., ADR(b) | | | 954 | | | | 14,320 | |
| | |
Mitra Adiperkasa Tbk. PT* | | | 154,600 | | | | 9,603 | |
| | |
Shinsegae, Inc. | | | 212 | | | | 44,993 | |
| | |
Woolworths Holdings Ltd. | | | 22,660 | | | | 80,368 | |
| | | | | | | | 789,153 | |
|
| Multi-Utilities – 0.0%(d) | |
| | |
Qatar Electricity & Water Co. QSC | | | 9,684 | | | | 44,683 | |
| | |
SPIC Dongfang New Energy Corp., Class A* | | | 25,000 | | | | 18,362 | |
| | |
YTL Corp. Bhd. | | | 78,870 | | | | 11,999 | |
| | |
YTL Power International Bhd. | | | 128,031 | | | | 21,797 | |
| | | | | | | | 96,841 | |
|
| Oil, Gas & Consumable Fuels – 5.2% | |
| | |
Adaro Energy Tbk. PT | | | 428,300 | | | | 50,788 | |
| | |
Aegis Logistics Ltd. | | | 10,017 | | | | 28,453 | |
| | |
AKR Corporindo Tbk. PT | | | 826,200 | | | | 249,012 | |
| | |
Aldrees Petroleum and Transport Services Co. | | | 3,190 | | | | 62,934 | |
| | |
Bangchak Corp. PCL, NVDR | | | 177,200 | | | | 146,855 | |
| | |
Banpu PCL, NVDR | | | 68,900 | | | | 23,671 | |
| | |
Bashneft PJSC* | | | 1,305 | | | | 27,659 | |
| | |
Bashneft PJSC (Preference) | | | 1,163 | | | | 18,741 | |
| | |
Bharat Petroleum Corp. Ltd. | | | 31,884 | | | | 177,854 | |
| | |
Bukit Asam Tbk. PT | | | 106,000 | | | | 20,052 | |
| | |
China Coal Energy Co. Ltd., Class A | | | 23,500 | | | | 25,633 | |
| | |
China Coal Energy Co. Ltd., Class H(b) | | | 83,000 | | | | 50,574 | |
| | |
China Merchants Energy Shipping Co. Ltd., Class A | | | 16,920 | | | | 12,110 | |
| | |
China Petroleum & Chemical Corp., Class A | | | 117,500 | | | | 78,036 | |
See Accompanying Notes to the Financial Statements.
| | | | | | |
| | FLEXSHARES ANNUAL REPORT | | | 251 | |
FlexShares® Morningstar Emerging Markets Factor Tilt Index Fund (cont.)
| | | | | | | | |
| Investments | | Shares | | | Value | |
|
| COMMON STOCKS – (continued) | |
|
| Oil, Gas & Consumable Fuels – (continued) | |
| | |
China Petroleum & Chemical Corp., Class H | | | 836,000 | | | $ | 410,528 | |
| | |
China Shenhua Energy Co. Ltd., Class A | | | 22,000 | | | | 68,379 | |
| | |
China Shenhua Energy Co. Ltd., Class H | | | 110,000 | | | | 236,996 | |
| | |
China Suntien Green Energy Corp. Ltd., Class H(b) | | | 50,000 | | | | 39,851 | |
| | |
Coal India Ltd. | | | 59,290 | | | | 130,209 | |
| | |
Cosan SA | | | 39,664 | | | | 139,250 | |
| | |
Dana Gas PJSC | | | 166,367 | | | | 46,652 | |
| | |
Ecopetrol SA | | | 164,395 | | | | 123,329 | |
| | |
Empresas COPEC SA | | | 8,250 | | | | 65,080 | |
| | |
Esso Thailand PCL, NVDR* | | | 117,400 | | | | 28,127 | |
| | |
Exxaro Resources Ltd. | | | 9,631 | | | | 105,973 | |
| | |
Formosa Petrochemical Corp. | | | 29,000 | | | | 104,285 | |
| | |
Gazprom PJSC | | | 412,500 | | | | 2,034,212 | |
| | |
GS Holdings Corp. | | | 2,530 | | | | 91,474 | |
| | |
Guanghui Energy Co. Ltd., Class A* | | | 37,100 | | | | 38,322 | |
| | |
Hellenic Petroleum SA | | | 3,199 | | | | 22,064 | |
| | |
Hindustan Petroleum Corp. Ltd. | | | 26,455 | | | | 109,662 | |
| | |
Huolinhe Opencut Coal Industry Corp. Ltd. of Inner Mongolia, Class A | | | 5,300 | | | | 10,502 | |
| | |
Indian Oil Corp. Ltd. | | | 80,630 | | | | 137,773 | |
| | |
Inner Mongolia Yitai Coal Co. Ltd., Class B | | | 550,000 | | | | 476,850 | |
| | |
LUKOIL PJSC | | | 12,265 | | | | 1,251,281 | |
| | |
Mari Petroleum Co. Ltd. | | | 1,984 | | | | 19,699 | |
| | |
Medco Energi Internasional Tbk. PT* | | | 3,533,440 | | | | 142,161 | |
| | |
MOL Hungarian Oil & Gas plc | | | 20,405 | | | | 174,535 | |
| | |
Motor Oil Hellas Corinth Refineries SA* | | | 2,820 | | | | 47,907 | |
| | |
Novatek PJSC | | | 33,220 | | | | 841,908 | |
| | |
Oil & Gas Development Co. Ltd. | | | 38,500 | | | | 19,163 | |
| | |
Oil & Natural Gas Corp. Ltd. | | | 126,280 | | | | 251,358 | |
| | |
Oil India Ltd. | | | 176,935 | | | | 531,765 | |
| | |
Pakistan Oilfields Ltd. | | | 73,095 | | | | 163,370 | |
| | | | | | | | |
| Investments | | Shares | | | Value | |
|
| Oil, Gas & Consumable Fuels – (continued) | |
| | |
Pakistan Petroleum Ltd. | | | 29,830 | | | $ | 13,214 | |
| | |
Pakistan State Oil Co. Ltd. | | | 155,430 | | | | 172,729 | |
| | |
Petro Rio SA* | | | 22,000 | | | | 91,598 | |
| | |
PetroChina Co. Ltd., Class H | | | 726,000 | | | | 350,912 | |
| | |
Petroleo Brasileiro SA | | | 126,500 | | | | 620,943 | |
| | |
Petroleo Brasileiro SA (Preference) | | | 160,300 | | | | 774,911 | |
| | |
Petronas Dagangan Bhd. | | | 6,600 | | | | 32,450 | |
| | |
Petronet LNG Ltd. | | | 28,756 | | | | 88,152 | |
| | |
PTT Exploration & Production PCL | | | 469 | | | | 1,661 | |
| | |
PTT Exploration & Production PCL, NVDR | | | 52,331 | | | | 185,305 | |
| | |
PTT PCL, NVDR | | | 297,000 | | | | 340,119 | |
| | |
Qatar Fuel QSC | | | 9,120 | | | | 46,063 | |
| | |
Qatar Gas Transport Co. Ltd. | | | 60,844 | | | | 54,310 | |
| | |
Reliance Industries Ltd. | | | 64,515 | | | | 2,185,142 | |
| | |
Rosneft Oil Co. PJSC | | | 72,122 | | | | 647,013 | |
| | |
Rosneft Oil Co. PJSC, GDR(a) | | | 1,920 | | | | 17,107 | |
| | |
Saudi Arabian Oil Co.(a) | | | 37,565 | | | | 378,064 | |
| | |
Semirara Mining & Power Corp. | | | 581,200 | | | | 299,766 | |
| | |
Shaanxi Coal Industry Co. Ltd., Class A | | | 27,500 | | | | 53,760 | |
| | |
Shanxi Coking Coal Energy Group Co. Ltd., Class A | | | 5,500 | | | | 7,942 | |
| | |
Shanxi Lu’an Environmental Energy Development Co. Ltd., Class A | | | 15,900 | | | | 32,151 | |
| | |
Siamgas & Petrochemicals PCL, NVDR | | | 264,000 | | | | 114,566 | |
| | |
SK Discovery Co. Ltd. | | | 5,885 | | | | 240,225 | |
| | |
SK Gas Ltd. | | | 1,302 | | | | 153,203 | |
| | |
SK Innovation Co. Ltd.* | | | 1,104 | | | | 229,104 | |
| | |
S-Oil Corp. | | | 826 | | | | 72,453 | |
| | |
Star Petroleum Refining PCL, NVDR* | | | 20,000 | | | | 6,329 | |
| | |
Surgutneftegas PJSC | | | 319,000 | | | | 153,338 | |
| | |
Surgutneftegas PJSC (Preference) | | | 225,500 | | | | 122,742 | |
| | |
Tatneft PJSC | | | 22,094 | | | | 168,598 | |
| | |
Tatneft PJSC, ADR | | | 4,806 | | | | 219,875 | |
| | |
Tatneft PJSC (Preference) | | | 7,005 | | | | 48,173 | |
| | |
Thai Oil PCL, NVDR | | | 21,200 | | | | 35,618 | |
See Accompanying Notes to the Financial Statements.
| | | | |
| 252 | | FLEXSHARES ANNUAL REPORT | | |
FlexShares® Morningstar Emerging Markets Factor Tilt Index Fund (cont.)
| | | | | | | | |
| Investments | | Shares | | | Value | |
|
| COMMON STOCKS – (continued) | |
|
| Oil, Gas & Consumable Fuels – (continued) | |
| | |
Transneft PJSC (Preference) | | | 55 | | | $ | 117,888 | |
| | |
Turkiye Petrol Rafinerileri A/S* | | | 4,290 | | | | 62,375 | |
| | |
Ultrapar Participacoes SA | | | 15,900 | | | | 36,809 | |
| | |
United Tractors Tbk. PT | | | 66,000 | | | | 109,709 | |
| | |
Yanzhou Coal Mining Co. Ltd., Class A | | | 5,300 | | | | 18,701 | |
| | |
Yanzhou Coal Mining Co. Ltd., Class H(b) | | | 52,000 | | | | 77,141 | |
| | | | | | | | 17,215,196 | |
|
| Paper & Forest Products – 0.5% | |
| | |
Asia Paper Manufacturing Co. Ltd. | | | 2,530 | | | | 99,377 | |
| | |
Chung Hwa Pulp Corp.* | | | 55,000 | | | | 43,907 | |
| | |
Dexco SA | | | 8,874 | | | | 24,417 | |
| | |
Empresas CMPC SA | | | 26,895 | | | | 49,758 | |
| | |
Indah Kiat Pulp & Paper Tbk. PT | | | 90,900 | | | | 54,376 | |
| | |
Kuk-il Paper Manufacturing Co. Ltd.* | | | 2,756 | | | | 10,118 | |
| | |
Lee & Man Paper Manufacturing Ltd. | | | 47,000 | | | | 35,285 | |
| | |
Nine Dragons Paper Holdings Ltd. | | | 55,000 | | | | 69,147 | |
| | |
Pabrik Kertas Tjiwi Kimia Tbk. PT | | | 53,800 | | | | 31,708 | |
| | |
Sappi Ltd.* | | | 289,245 | | | | 887,335 | |
| | |
Shandong Chenming Paper Holdings Ltd., Class A | | | 21,200 | | | | 23,422 | |
| | |
Shandong Chenming Paper Holdings Ltd., Class B | | | 15,900 | | | | 7,195 | |
| | |
Shandong Sun Paper Industry JSC Ltd., Class A | | | 9,400 | | | | 16,863 | |
| | |
Suzano SA* | | | 16,500 | | | | 144,101 | |
| | |
YFY, Inc. | | | 47,000 | | | | 54,084 | |
| | | | | | | | 1,551,093 | |
|
| Personal Products – 0.4% | |
| | |
Amorepacific Corp. | | | 607 | | | | 94,280 | |
| | |
AMOREPACIFIC Group | | | 611 | | | | 25,934 | |
| | |
Colgate-Palmolive India Ltd. | | | 3,836 | | | | 79,024 | |
| | |
Cosmax, Inc.* | | | 547 | | | | 58,045 | |
| | | | | | | | |
| Investments | | Shares | | | Value | |
|
| Personal Products – (continued) | |
| | |
Dabur India Ltd. | | | 12,155 | | | $ | 95,097 | |
| | |
Emami Ltd. | | | 4,717 | | | | 33,465 | |
| | |
Gillette India Ltd. | | | 103 | | | | 7,760 | |
| | |
Godrej Consumer Products Ltd.* | | | 9,039 | | | | 115,478 | |
| | |
Hengan International Group Co.
Ltd.(b) | | | 27,500 | | | | 143,703 | |
| | |
Hyundai Bioscience Co. Ltd.* | | | 1,007 | | | | 20,251 | |
| | |
Kolmar Korea Co. Ltd. | | | 142 | | | | 5,426 | |
| | |
Kolmar Korea Holdings Co. Ltd. | | | 4,620 | | | | 91,131 | |
| | |
LG Household & Health Care Ltd. | | | 165 | | | | 165,346 | |
| | |
LG Household & Health Care Ltd. (Preference) | | | 43 | | | | 22,042 | |
| | |
Marico Ltd. | | | 9,900 | | | | 75,154 | |
| | |
Microbio Co. Ltd.* | | | 18,669 | | | | 42,496 | |
| | |
Natura & Co. Holding SA* | | | 17,058 | | | | 117,715 | |
| | |
TCI Co. Ltd. | | | 7,000 | | | | 56,763 | |
| | |
Yatsen Holding Ltd., ADR* (b) | | | 4,876 | | | | 13,653 | |
| | | | | | | | 1,262,763 | |
|
| Pharmaceuticals – 1.4% | |
| | |
Aarti Drugs Ltd. | | | 2,809 | | | | 21,966 | |
| | |
Ajanta Pharma Ltd. | | | 384 | | | | 10,870 | |
| | |
Alkem Laboratories Ltd. | | | 516 | | | | 24,881 | |
| | |
Apeloa Pharmaceutical Co. Ltd., Class A | | | 4,700 | | | | 25,500 | |
| | |
Aspen Pharmacare Holdings Ltd. | | | 12,705 | | | | 203,322 | |
| | |
AstraZeneca Pharma India Ltd. | | | 235 | | | | 9,437 | |
| | |
Aurobindo Pharma Ltd. | | | 6,629 | | | | 61,026 | |
| | |
Beijing Tong Ren Tang Chinese Medicine Co. Ltd.(b) | | | 20,000 | | | | 25,530 | |
| | |
Binex Co. Ltd.* | | | 1,942 | | | | 27,421 | |
| | |
Bukwang Pharmaceutical Co. Ltd. | | | 1,431 | | | | 15,981 | |
| | |
Cadila Healthcare Ltd. | | | 4,844 | | | | 32,526 | |
| | |
CanSino Biologics, Inc., Class A* | | | 318 | | | | 13,611 | |
| | |
CanSino Biologics, Inc., Class H* (a) (b) | | | 800 | | | | 20,609 | |
See Accompanying Notes to the Financial Statements.
| | | | | | |
| | FLEXSHARES ANNUAL REPORT | | | 253 | |
FlexShares® Morningstar Emerging Markets Factor Tilt Index Fund (cont.)
| | | | | | | | |
| Investments | | Shares | | | Value | |
|
| COMMON STOCKS – (continued) | |
|
| Pharmaceuticals – (continued) | |
| | |
Celltrion Pharm, Inc.* | | | 447 | | | $ | 43,340 | |
| | |
Center Laboratories, Inc. | | | 9,088 | | | | 21,733 | |
| | |
Changchun High & New Technology Industry Group, Inc., Class A | | | 600 | | | | 25,574 | |
| | |
China Grand Pharmaceutical and Healthcare Holdings Ltd.(b) | | | 24,000 | | | | 19,283 | |
| | |
China Medical System Holdings Ltd. | | | 28,000 | | | | 47,728 | |
| | |
China Resources Pharmaceutical Group Ltd.(a) | | | 26,500 | | | | 12,775 | |
| | |
China Traditional Chinese Medicine Holdings Co. Ltd. | | | 120,000 | | | | 57,076 | |
| | |
Chong Kun Dang Pharmaceutical Corp. | | | 98 | | | | 9,854 | |
| | |
Chongkundang Holdings Corp. | | | 1,540 | | | | 107,934 | |
| | |
Cipla Ltd. | | | 9,054 | | | | 109,431 | |
| | |
CSPC Pharmaceutical Group Ltd. | | | 178,080 | | | | 186,343 | |
| | |
Daewoong Co. Ltd. | | | 339 | | | | 9,167 | |
| | |
Daewoong Pharmaceutical Co. Ltd. | | | 49 | | | | 5,870 | |
| | |
Dong-A Socio Holdings Co. Ltd. | | | 104 | | | | 9,389 | |
| | |
Dong-A ST Co. Ltd. | | | 94 | | | | 5,848 | |
| | |
DongKook Pharmaceutical Co. Ltd. | | | 2,120 | | | | 40,729 | |
| | |
Dr Reddy’s Laboratories Ltd. | | | 2,200 | | | | 136,887 | |
| | |
Duopharma Biotech Bhd. | | | 49,466 | | | | 20,188 | |
| | |
Enzychem Lifesciences Corp.* | | | 212 | | | | 12,137 | |
| | |
Genomma Lab Internacional SAB de CV, Class B* | | | 12,000 | | | | 11,508 | |
| | |
Gland Pharma Ltd.* (a) | | | 1,265 | | | | 62,509 | |
| | |
GlaxoSmithKline Pharmaceuticals Ltd. | | | 1,140 | | | | 22,896 | |
| | |
Glenmark Pharmaceuticals Ltd. | | | 8,121 | | | | 54,649 | |
| | |
Granules India Ltd. | | | 9,381 | | | | 38,824 | |
| | |
Guangzhou Baiyunshan Pharmaceutical Holdings Co. Ltd., Class H | | | 12,000 | | | | 30,389 | |
| | | | | | | | |
| Investments | | Shares | | | Value | |
|
| Pharmaceuticals – (continued) | |
| | |
Hanall Biopharma Co. Ltd.* | | | 919 | | | $ | 16,043 | |
| | |
Hanmi Pharm Co. Ltd. | | | 98 | | | | 22,140 | |
| | |
Hanmi Science Co. Ltd. | | | 646 | | | | 31,511 | |
| | |
Hansoh Pharmaceutical Group Co. Ltd.(a) | | | 16,000 | | | | 35,747 | |
| | |
Hua Han Health Industry Holdings Ltd.* ‡ (c) | | | 3,780,000 | | | | — | |
| | |
Hubei Jumpcan Pharmaceutical Co. Ltd., Class A | | | 4,700 | | | | 11,832 | |
| | |
Huons Global Co. Ltd. | | | 477 | | | | 20,083 | |
| | |
Hypera SA* | | | 8,900 | | | | 44,303 | |
| | |
Ilyang Pharmaceutical Co. Ltd. | | | 795 | | | | 20,274 | |
| | |
Ipca Laboratories Ltd. | | | 1,540 | | | | 44,060 | |
| | |
JB Chemicals & Pharmaceuticals Ltd. | | | 2,226 | | | | 49,886 | |
| | |
Jeil Pharmaceutical Co. Ltd. | | | 371 | | | | 10,795 | |
| | |
JETEMA Co. Ltd.* | | | 954 | | | | 22,410 | |
| | |
Jiangsu Hengrui Medicine Co. Ltd., Class A | | | 8,400 | | | | 64,635 | |
| | |
Joincare Pharmaceutical Group Industry Co. Ltd., Class A | | | 4,700 | | | | 8,468 | |
| | |
Jubilant Pharmova Ltd. | | | 4,141 | | | | 32,970 | |
| | |
JW Pharmaceutical Corp. | | | 236 | | | | 4,716 | |
| | |
Kalbe Farma Tbk. PT | | | 491,100 | | | | 55,462 | |
| | |
Komipharm International Co. Ltd.* | | | 1,425 | | | | 10,963 | |
| | |
Korea United Pharm, Inc. | | | 636 | | | | 26,533 | |
| | |
Kwang Dong Pharmaceutical Co. Ltd. | | | 16,445 | | | | 109,488 | |
| | |
Laurus Labs Ltd.(a) | | | 9,122 | | | | 62,834 | |
| | |
Livzon Pharmaceutical Group, Inc., Class H(b) | | | 3,930 | | | | 12,984 | |
| | |
Lupin Ltd. | | | 4,620 | | | | 56,941 | |
| | |
Luye Pharma Group Ltd.* (a) (b) | | | 880,000 | | | | 419,691 | |
| | |
Mega Lifesciences PCL, NVDR | | | 26,500 | | | | 37,136 | |
| | |
Mezzion Pharma Co. Ltd.* | | | 212 | | | | 28,465 | |
| | |
Natco Pharma Ltd. | | | 4,950 | | | | 54,682 | |
| | |
Ocumension Therapeutics* (a) | | | 16,000 | | | | 34,801 | |
| | |
Oneness Biotech Co. Ltd.* | | | 3,000 | | | | 28,265 | |
See Accompanying Notes to the Financial Statements.
| | | | |
| 254 | | FLEXSHARES ANNUAL REPORT | | |
FlexShares® Morningstar Emerging Markets Factor Tilt Index Fund (cont.)
| | | | | | | | |
| Investments | | Shares | | | Value | |
|
| COMMON STOCKS – (continued) | |
|
| Pharmaceuticals – (continued) | |
| | |
Oscotec, Inc.* | | | 1,510 | | | $ | 38,701 | |
| | |
Pfizer Ltd. | | | 341 | | | | 22,985 | |
| | |
Pharmally International Holding Co. Ltd.* ‡ (c) | | | 2,564 | | | | 3,914 | |
| | |
Procter & Gamble Health Ltd. | | | 636 | | | | 46,066 | |
| | |
Richter Gedeon Nyrt. | | | 2,695 | | | | 75,568 | |
| | |
Sam Chun Dang Pharm Co. Ltd.* | | | 890 | | | | 35,835 | |
| | |
Sanofi India Ltd. | | | 163 | | | | 18,169 | |
| | |
SciClone Pharmaceuticals Holdings Ltd.* (a) (b) | | | 82,500 | | | | 112,205 | |
| | |
ScinoPharm Taiwan Ltd. | | | 53,000 | | | | 47,266 | |
| | |
Sequent Scientific Ltd. | | | 3,975 | | | | 10,158 | |
| | |
Shandong Buchang Pharmaceuticals Co. Ltd., Class A | | | 4,700 | | | | 12,846 | |
| | |
Shanghai Fosun Pharmaceutical Group Co. Ltd., Class A | | | 4,700 | | | | 36,723 | |
| | |
Shanghai Fosun Pharmaceutical Group Co. Ltd., Class H(b) | | | 8,000 | | | | 37,742 | |
| | |
Shin Poong Pharmaceutical Co. Ltd. | | | 432 | | | | 19,150 | |
| | |
Sihuan Pharmaceutical Holdings Group Ltd.(b) | | | 99,000 | | | | 20,871 | |
| | |
Sino Biopharmaceutical Ltd. | | | 193,999 | | | | 143,647 | |
| | |
SK Biopharmaceuticals Co. Ltd.* | | | 605 | | | | 48,978 | |
| | |
SSY Group Ltd.(b) | | | 110,000 | | | | 52,461 | |
| | |
Strides Shasun Ltd. | | | 3,604 | | | | 25,737 | |
| | |
Sun Pharmaceutical Industries Ltd. | | | 22,275 | | | | 236,489 | |
| | |
Suven Pharmaceuticals Ltd. | | | 6,784 | | | | 46,077 | |
| | |
Tianjin ZhongXin Pharmaceutical Group Corp. Ltd., Class S | | | 15,000 | | | | 16,800 | |
| | |
Tonghua Dongbao Pharmaceutical Co. Ltd., Class A | | | 4,700 | | | | 8,953 | |
| | |
Torrent Pharmaceuticals Ltd. | | | 717 | | | | 27,389 | |
| | |
TTY Biopharm Co. Ltd. | | | 15,000 | | | | 37,003 | |
| | | | | | | | |
| Investments | | Shares | | | Value | |
|
| Pharmaceuticals – (continued) | |
| | |
United Laboratories International Holdings Ltd. (The) | | | 440,000 | | | $ | 278,852 | |
| | |
Yifan Pharmaceutical Co. Ltd., Class A | | | 4,700 | | | | 12,038 | |
| | |
Yuhan Corp. | | | 1,091 | | | | 55,925 | |
| | |
Yungjin Pharmaceutical Co. Ltd.* | | | 1,602 | | | | 6,430 | |
| | |
Yunnan Baiyao Group Co. Ltd., Class A | | | 1,100 | | | | 15,402 | |
| | |
Zhangzhou Pientzehuang Pharmaceutical Co. Ltd., Class A | | | 700 | | | | 45,168 | |
| | |
Zhejiang Huahai Pharmaceutical Co. Ltd., Class A | | | 4,700 | | | | 13,536 | |
| | |
Zhejiang NHU Co. Ltd., Class A | | | 5,640 | | | | 23,920 | |
| | | | | | | | 4,605,863 | |
|
| Professional Services – 0.0%(d) | |
| | |
51job, Inc., ADR* | | | 710 | | | | 42,288 | |
| | |
Boa Vista Servicos SA | | | 5,500 | | | | 8,908 | |
| | |
Guangzhou GRG Metrology & Test Co. Ltd., Class A* | | | 5,500 | | | | 22,105 | |
| | |
L&T Technology Services Ltd.(a) | | | 689 | | | | 43,476 | |
| | |
Quess Corp. Ltd.(a) | | | 3,339 | | | | 38,631 | |
| | | | | | | | 155,408 | |
|
| Real Estate Management & Development – 4.4% | |
| | |
Agile Group Holdings Ltd. | | | 46,000 | | | | 36,189 | |
| | |
Aldar Properties PJSC | | | 62,601 | | | | 68,853 | |
| | |
Aliansce Sonae Shopping Centers sa | | | 5,300 | | | | 18,033 | |
| | |
A-Living Smart City Services Co.
Ltd.(a) (b) | | | 13,250 | | | | 44,456 | |
| | |
AP Thailand PCL, NVDR | | | 429,000 | | | | 114,417 | |
| | |
Arabian Centres Co. Ltd. | | | 1,662 | | | | 11,299 | |
| | |
Ayala Land, Inc. | | | 93,500 | | | | 65,103 | |
| | |
Barwa Real Estate Co. | | | 87,450 | | | | 75,657 | |
| | |
BR Malls Participacoes SA* | | | 31,500 | | | | 40,067 | |
| | |
Bumi Serpong Damai Tbk. PT* | | | 168,600 | | | | 13,210 | |
See Accompanying Notes to the Financial Statements.
| | | | | | |
| | FLEXSHARES ANNUAL REPORT | | | 255 | |
FlexShares® Morningstar Emerging Markets Factor Tilt Index Fund (cont.)
| | | | | | | | |
| Investments | | Shares | | | Value | |
|
| COMMON STOCKS – (continued) | |
|
| Real Estate Management & Development – (continued) | |
| | |
C&D International Investment Group Ltd.(b) | | | 286,791 | | | $ | 536,048 | |
| | |
Cathay Real Estate Development Co. Ltd. | | | 33,100 | | | | 23,211 | |
| | |
Cencosud Shopping SA | | | 11,704 | | | | 11,358 | |
| | |
Central China New Life Ltd.* (a) (b) | | | 165,000 | | | | 120,902 | |
| | |
Central China Real Estate Ltd.(b) | | | 440,000 | | | | 66,178 | |
| | |
Central Pattana PCL, NVDR | | | 26,500 | | | | 47,318 | |
| | |
China Aoyuan Group Ltd.(b) | | | 53,000 | | | | 20,916 | |
| | |
China Dili Group* | | | 100,000 | | | | 24,553 | |
| | |
China Evergrande Group | | | 66,000 | | | | 19,684 | |
| | |
China Fortune Land Development Co. Ltd., Class A* | | | 21,110 | | | | 12,140 | |
| | |
China Jinmao Holdings Group Ltd. | | | 220,000 | | | | 64,481 | |
| | |
China Logistics Property Holdings Co. Ltd.* (a) (b) | | | 59,000 | | | | 31,703 | |
| | |
China Merchants Property Operation & Service Co. Ltd., Class A | | | 4,700 | | | | 9,915 | |
| | |
China Merchants Shekou Industrial Zone Holdings Co. Ltd., Class A | | | 18,800 | | | | 30,641 | |
| | |
China Overseas Grand Oceans Group Ltd. | | | 849,000 | | | | 407,090 | |
| | |
China Overseas Land & Investment Ltd. | | | 118,500 | | | | 261,402 | |
| | |
China Overseas Property Holdings Ltd.(b) | | | 50,000 | | | | 44,993 | |
| | |
China Resources Land Ltd. | | | 90,000 | | | | 350,557 | |
| | |
China Resources Mixc Lifestyle Services Ltd.(a) | | | 10,600 | | | | 55,800 | |
| | |
China SCE Group Holdings Ltd.(b) | | | 854,000 | | | | 266,770 | |
| | |
China Vanke Co. Ltd., Class A | | | 33,000 | | | | 93,906 | |
| | |
China Vanke Co. Ltd., Class H | | | 58,100 | | | | 136,081 | |
| | |
Chong Hong Construction Co. Ltd. | | | 112,000 | | | | 297,233 | |
| | |
CIFI Ever Sunshine Services Group Ltd.(a) (b) | | | 10,000 | | | | 18,151 | |
| | | | | | | | |
| Investments | | Shares | | | Value | |
|
| Real Estate Management & Development – (continued) | |
| | |
CIFI Holdings Group Co. Ltd. | | | 133,144 | | | $ | 73,940 | |
| | |
Ciputra Development Tbk. PT | | | 179,449 | | | | 13,616 | |
| | |
Corp. Inmobiliaria Vesta SAB de CV | | | 23,200 | | | | 40,475 | |
| | |
Country Garden Holdings Co. Ltd.(b) | | | 230,832 | | | | 216,914 | |
| | |
Country Garden Services Holdings Co. Ltd. | | | 33,887 | | | | 263,549 | |
| | |
DAMAC Properties Dubai Co. PJSC* | | | 26,553 | | | | 9,036 | |
| | |
Dar Al Arkan Real Estate Development Co.* | | | 8,271 | | | | 21,808 | |
| | |
Datang Group Holdings Ltd.(a) (b) | | | 275,000 | | | | 149,183 | |
| | |
Dexin China Holdings Co. Ltd.* (a) (b) | | | 440,000 | | | | 147,627 | |
| | |
DLF Ltd. | | | 15,220 | | | | 81,017 | |
| | |
Dongwon Development Co. Ltd. | | | 20,625 | | | | 94,781 | |
| | |
Eco World Development Group Bhd. | | | 599,500 | | | | 147,667 | |
| | |
E-House China Enterprise Holdings Ltd.(a) (b) | | | 594,000 | | | | 112,248 | |
| | |
Emaar Development PJSC* | | | 39,052 | | | | 41,464 | |
| | |
Emaar Economic City* | | | 23,375 | | | | 79,144 | |
| | |
Emaar Malls PJSC* | | | 46,896 | | | | 25,534 | |
| | |
Emaar Properties PJSC | | | 98,285 | | | | 107,298 | |
| | |
Evergrande Property Services Group Ltd.* (a) | | | 106,000 | | | | 54,233 | |
| | |
Ganglong China Property Group
Ltd.(a) (b) | | | 220,000 | | | | 122,174 | |
| | |
Gemdale Corp., Class A | | | 14,100 | | | | 22,364 | |
| | |
Gemdale Properties & Investment Corp. Ltd. | | | 2,860,000 | | | | 279,417 | |
| | |
Godrej Properties Ltd.* | | | 1,507 | | | | 44,946 | |
| | |
Greenland Holdings Corp. Ltd., Class A | | | 29,610 | | | | 19,017 | |
| | |
Greenland Hong Kong Holdings
Ltd.(b) | | | 440,000 | | | | 93,893 | |
| | |
Greentown China Holdings Ltd.(b) | | | 26,500 | | | | 36,655 | |
| | |
Greentown China Holdings
Ltd.(a) (b) | | | 53,000 | | | | 26,162 | |
| | |
Greentown Service Group Co.
Ltd.(a) (b) | | | 30,000 | | | | 29,811 | |
See Accompanying Notes to the Financial Statements.
| | | | |
| 256 | | FLEXSHARES ANNUAL REPORT | | |
FlexShares® Morningstar Emerging Markets Factor Tilt Index Fund (cont.)
| | | | | | | | |
| Investments | | Shares | | | Value | |
|
| COMMON STOCKS – (continued) | |
|
| Real Estate Management & Development – (continued) | |
| | |
Guangzhou R&F Properties Co. Ltd., Class H(b) | | | 42,400 | | | $ | 26,599 | |
| | |
Hanson International Tbk. PT* ‡ (c) | | | 2,409,275 | | | | 4,251 | |
| | |
Highwealth Construction Corp. | | | 32,500 | | | | 52,533 | |
| | |
Hopson Development Holdings
Ltd.(b) | | | 25,080 | | | | 68,511 | |
| | |
Huaku Development Co. Ltd. | | | 110,000 | | | | 359,962 | |
| | |
Huang Hsiang Construction Corp. | | | 55,000 | | | | 72,289 | |
| | |
Huijing Holdings Co. Ltd. | | | 106,000 | | | | 26,026 | |
| | |
Iguatemi Empresa de Shopping Centers SA | | | 5,300 | | | | 28,150 | |
| | |
IOI Properties Group Bhd. | | | 52,800 | | | | 16,321 | |
| | |
Jiangsu Zhongnan Construction Group Co. Ltd., Class A | | | 14,100 | | | | 8,439 | |
| | |
Jiayuan International Group Ltd.(b) | | | 683,243 | | | | 264,372 | |
| | |
Jinke Properties Group Co. Ltd., Class A | | | 14,100 | | | | 9,783 | |
| | |
Jinke Smart Services Group Co. Ltd., Class H(a) | | | 5,300 | | | | 28,683 | |
| | |
Kaisa Group Holdings Ltd.* (b) | | | 119,714 | | | | 18,467 | |
| | |
KE Holdings, Inc., ADR* | | | 10,505 | | | | 191,401 | |
| | |
Kindom Development Co. Ltd. | | | 197,400 | | | | 272,584 | |
| | |
King’s Town Construction Co. Ltd.* | | | 55,000 | | | | 72,190 | |
| | |
Korea Real Estate Investment & Trust Co. Ltd. | | | 76,745 | | | | 153,680 | |
| | |
Kuo Yang Construction Co. Ltd. | | | 53,000 | | | | 45,741 | |
| | |
KWG Group Holdings Ltd.(b) | | | 26,500 | | | | 23,165 | |
| | |
KWG Living Group Holdings
Ltd.(a) (b) | | | 53,000 | | | | 36,042 | |
| | |
LAMDA Development SA* | | | 1,368 | | | | 11,240 | |
| | |
Logan Group Co. Ltd.(b) | | | 29,000 | | | | 29,115 | |
| | |
Longfor Group Holdings Ltd.(a) | | | 60,000 | | | | 291,552 | |
| | |
LSR Group PJSC | | | 25,915 | | | | 272,073 | |
| | | | | | | | |
| Investments | | Shares | | | Value | |
|
| Real Estate Management & Development – (continued) | |
| | |
LVGEM China Real Estate Investment Co. Ltd.* (b) | | | 550,000 | | | $ | 125,144 | |
| | |
Mabanee Co. KPSC | | | 18,444 | | | | 48,152 | |
| | |
Mah Sing Group Bhd. | | | 836,000 | | | | 163,526 | |
| | |
MBK PCL, NVDR* | | | 58,344 | | | | 24,616 | |
| | |
Megaworld Corp. | | | 444,200 | | | | 27,052 | |
| | |
Midea Real Estate Holding Ltd.(a) | | | 9,400 | | | | 16,216 | |
| | |
MNC Land Tbk. PT* | | | 1,111,000 | | | | 7,999 | |
| | |
Multiplan Empreendimentos Imobiliarios SA* | | | 500 | | | | 1,643 | |
| | |
National Real Estate Co. KPSC* | | | 9,515 | | | | 6,818 | |
| | |
NEPI Rockcastle plc | | | 16,231 | | | | 109,346 | |
| | |
Oberoi Realty Ltd.* | | | 2,915 | | | | 35,242 | |
| | |
Origin Property PCL, NVDR | | | 533,500 | | | | 181,679 | |
| | |
Pakuwon Jati Tbk. PT* | | | 534,400 | | | | 18,860 | |
| | |
Parque Arauco SA* | | | 15,651 | | | | 15,491 | |
| | |
Phoenix Mills Ltd. (The) | | | 5,214 | | | | 67,127 | |
| | |
Poly Developments and Holdings Group Co. Ltd., Class A | | | 38,500 | | | | 75,564 | |
| | |
Poly Property Group Co. Ltd.(b) | | | 1,045,000 | | | | 257,924 | |
| | |
Poly Property Services Co. Ltd., Class H(a) (b) | | | 4,800 | | | | 26,965 | |
| | |
Powerlong Real Estate Holdings Ltd. | | | 41,000 | | | | 28,250 | |
| | |
Prestige Estates Projects Ltd. | | | 6,042 | | | | 34,381 | |
| | |
Prince Housing & Development Corp. | | | 50,000 | | | | 23,824 | |
| | |
Pruksa Holding PCL, NVDR | | | 326,900 | | | | 135,952 | |
| | |
Quality Houses PCL, NVDR | | | 2,380,200 | | | | 164,980 | |
| | |
Radiance Holdings Group Co. Ltd.* (a) (b) | | | 330,000 | | | | 172,656 | |
| | |
Redco Properties Group Ltd.(a) (b) | | | 492,000 | | | | 151,160 | |
| | |
Redsun Properties Group Ltd.(b) | | | 476,000 | | | | 137,066 | |
| | |
RiseSun Real Estate Development Co. Ltd., Class A | | | 9,400 | | | | 6,302 | |
| | |
Road King Infrastructure Ltd.(b) | | | 134,000 | | | | 135,567 | |
See Accompanying Notes to the Financial Statements.
| | | | | | |
| | FLEXSHARES ANNUAL REPORT | | | 257 | |
FlexShares® Morningstar Emerging Markets Factor Tilt Index Fund (cont.)
| | | | | | | | |
| Investments | | Shares | | | Value | |
|
| COMMON STOCKS – (continued) | |
|
| Real Estate Management & Development – (continued) | |
| | |
Robinsons Land Corp. | | | 56,106 | | | $ | 18,921 | |
| | |
Ronshine China Holdings Ltd.* (a) (b) | | | 262,500 | | | | 106,295 | |
| | |
Ruentex Development Co. Ltd. | | | 76,600 | | | | 195,298 | |
| | |
Salhia Real Estate Co. KSCP | | | 203,940 | | | | 389,681 | |
| | |
Saudi Real Estate Co.* | | | 2,226 | | | | 13,258 | |
| | |
Seazen Group Ltd.* | | | 80,000 | | | | 63,452 | |
| | |
Seazen Holdings Co. Ltd., Class A | | | 4,700 | | | | 25,148 | |
| | |
Shanghai Jinqiao Export Processing Zone Development Co. Ltd., Class B | | | 137,500 | | | | 123,612 | |
| | |
Shanghai Lingang Holdings Corp. Ltd., Class A | | | 5,640 | | | | 12,965 | |
| | |
Shanghai Lujiazui Finance & Trade Zone Development Co. Ltd., Class A | | | 15,900 | | | | 26,909 | |
| | |
Shanghai Lujiazui Finance & Trade Zone Development Co. Ltd., Class B | | | 17,540 | | | | 15,593 | |
| | |
Shanghai Zhangjiang High-Tech Park Development Co. Ltd., Class A | | | 4,700 | | | | 12,258 | |
| | |
Shenzhen Investment Ltd. | | | 99,930 | | | | 24,536 | |
| | |
Shimao Group Holdings Ltd.(b) | | | 32,000 | | | | 50,351 | |
| | |
Shimao Services Holdings Ltd.(a) (b) | | | 11,000 | | | | 20,985 | |
| | |
Shining Building Business Co. Ltd.* | | | 55,000 | | | | 21,954 | |
| | |
Shinsun Holdings Group Co. Ltd.* (a) (b) | | | 330,000 | | | | 195,139 | |
| | |
Shoucheng Holdings
Ltd.(b) | | | 110,000 | | | | 23,332 | |
| | |
Shui On Land Ltd. | | | 1,870,000 | | | | 276,448 | |
| | |
Sichuan Languang Justbon Services Group Co. Ltd., Class H* (c) | | | 26,500 | | | | 184,467 | |
| | |
Sime Darby Property Bhd. | | | 178,200 | | | | 31,199 | |
| | |
Sinic Holdings Group Co. Ltd., Class H* ‡ (a) (c) | | | 318,000 | | | | 20,627 | |
| | |
Sino-Ocean Group Holding Ltd. | | | 1,622,500 | | | | 352,488 | |
| | | | | | | | |
| Investments | | Shares | | | Value | |
|
| Real Estate Management & Development – (continued) | |
| | |
SK D&D Co. Ltd. | | | 3,822 | | | $ | 103,191 | |
| | |
Skyfame Realty Holdings Ltd. | | | 1,650,000 | | | | 195,139 | |
| | |
SM Prime Holdings, Inc. | | | 242,000 | | | | 158,901 | |
| | |
SOHO China Ltd.* | | | 76,000 | | | | 19,247 | |
| | |
SP Setia Bhd. Group* | | | 75,694 | | | | 28,515 | |
| | |
Summarecon Agung Tbk. PT* | | | 227,900 | | | | 14,719 | |
| | |
Sunac China Holdings Ltd. | | | 90,000 | | | | 193,905 | |
| | |
Sunac Services Holdings Ltd.(a) | | | 24,000 | | | | 48,685 | |
| | |
Supalai PCL, NVDR | | | 29,000 | | | | 20,451 | |
| | |
Talaat Moustafa Group | | | 508,281 | | | | 239,419 | |
| | |
Times China Holdings Ltd.(b) | | | 29,000 | | | | 19,795 | |
| | |
United Development Co. QSC | | | 67,999 | | | | 29,004 | |
| | |
UOA Development Bhd. | | | 20,600 | | | | 8,706 | |
| | |
Vista Land & Lifescapes, Inc. | | | 1,565,200 | | | | 117,056 | |
| | |
WHA Corp. PCL, NVDR | | | 113,390 | | | | 11,550 | |
| | |
Wharf Holdings Ltd. (The) | | | 55,000 | | | | 190,897 | |
| | |
Yango Group Co. Ltd., Class A | | | 14,100 | | | | 7,095 | |
| | |
Yuexiu Property Co. Ltd. | | | 63,600 | | | | 56,086 | |
| | |
Yuzhou Group Holdings Co.
Ltd.(b) | | | 1,094,349 | | | | 119,577 | |
| | |
Zhenro Properties Group
Ltd.(a) (b) | | | 87,000 | | | | 41,380 | |
| | |
Zhongliang Holdings Group Co. Ltd.(a) (b) | | | 341,500 | | | | 157,601 | |
| | |
Zhongtian Financial Group Co. Ltd., Class A* | | | 28,200 | | | | 11,061 | |
| | |
Zhuguang Holdings Group Co. Ltd.(b) | | | 1,210,000 | | | | 265,984 | |
| | | | | | | | 14,637,839 | |
|
| Road & Rail – 0.1% | |
| | |
BTS Group Holdings PCL, NVDR | | | 103,040 | | | | 29,655 | |
| | |
Cia de Locacao das Americas* | | | 4,500 | | | | 15,750 | |
| | |
CJ Logistics Corp.* | | | 150 | | | | 18,228 | |
| | |
Container Corp. of India Ltd. | | | 4,571 | | | | 39,989 | |
| | |
Dazhong Transportation Group Co. Ltd., Class B* | | | 200 | | | | 57 | |
| | |
Localiza Rent a Car SA | | | 10,050 | | | | 80,764 | |
| | |
Rumo SA* | | | 22,000 | | | | 62,406 | |
See Accompanying Notes to the Financial Statements.
| | | | |
| 258 | | FLEXSHARES ANNUAL REPORT | | |
FlexShares® Morningstar Emerging Markets Factor Tilt Index Fund (cont.)
| | | | | | | | |
| Investments | | Shares | | | Value | |
|
| COMMON STOCKS – (continued) | |
|
| Road & Rail – (continued) | |
| | |
SIMPAR SA | | | 17,376 | | | $ | 31,596 | |
| | |
Vamos Locacao de Caminhoes Maquinas e Equipamentos SA* | | | 5,500 | | | | 11,055 | |
| | | | | | | | 289,500 | |
|
| Semiconductors & Semiconductor Equipment – 5.6% | |
| | |
ADATA Technology Co. Ltd. | | | 16,000 | | | | 47,755 | |
| | |
Advanced Wireless Semiconductor Co. | | | 11,000 | | | | 63,092 | |
| | |
Alchip Technologies Ltd. | | | 1,000 | | | | 37,039 | |
| | |
Ardentec Corp. | | | 220,000 | | | | 469,928 | |
| | |
ASE Technology Holding Co. Ltd. | | | 121,000 | | | | 434,249 | |
| | |
ASMedia Technology, Inc. | | | 1,000 | | | | 58,435 | |
| | |
Chipbond Technology Corp. | | | 15,000 | | | | 34,684 | |
| | |
ChipMOS Technologies, Inc. | | | 31,000 | | | | 51,446 | |
| | |
D&O Green Technologies Bhd. | | | 31,800 | | | | 43,311 | |
| | |
Daqo New Energy Corp., ADR* | | | 1,463 | | | | 113,807 | |
| | |
DB HiTek Co. Ltd. | | | 1,839 | | | | 90,490 | |
| | |
Elan Microelectronics Corp. | | | 4,000 | | | | 24,021 | |
| | |
eMemory Technology, Inc. | | | 1,000 | | | | 82,709 | |
| | |
ENNOSTAR, Inc. | | | 7,000 | | | | 18,376 | |
| | |
Eo Technics Co. Ltd. | | | 134 | | | | 12,304 | |
| | |
Episil Technologies, Inc.* | | | 17,259 | | | | 94,647 | |
| | |
Eugene Technology Co. Ltd. | | | 1,219 | | | | 46,473 | |
| | |
Everlight Electronics Co. Ltd. | | | 220,000 | | | | 391,607 | |
| | |
Flat Glass Group Co. Ltd., Class A | | | 5,000 | | | | 42,981 | |
| | |
Flat Glass Group Co. Ltd., Class H(b) | | | 7,000 | | | | 37,794 | |
| | |
FocalTech Systems Co. Ltd. | | | 4,000 | | | | 23,015 | |
| | |
Foxsemicon Integrated Technology, Inc. | | | 6,000 | | | | 44,123 | |
| | |
GCL System Integration Technology Co. Ltd., Class A* | | | 53,000 | | | | 33,377 | |
| | |
GemVax & Kael Co. Ltd.* | | | 920 | | | | 14,683 | |
| | |
Gigadevice Semiconductor Beijing, Inc., Class A | | | 2,240 | | | | 59,335 | |
| | | | | | | | |
| Investments | | Shares | | | Value | |
|
| Semiconductors & Semiconductor Equipment – (continued) | |
| | |
Global Lighting Technologies, Inc. | | | 41,000 | | | $ | 118,687 | |
| | |
Globalwafers Co. Ltd. | | | 4,000 | | | | 109,319 | |
| | |
Gudeng Precision Industrial Co. Ltd. | | | 4,000 | | | | 34,810 | |
| | |
Hana Materials, Inc. | | | 318 | | | | 13,906 | |
| | |
Hangzhou Silan Microelectronics Co. Ltd., Class A | | | 5,000 | | | | 48,185 | |
| | |
Holtek Semiconductor, Inc. | | | 6,000 | | | | 22,223 | |
| | |
Hua Hong Semiconductor Ltd.* (a) (b) | | | 11,000 | | | | 55,431 | |
| | |
Innox Advanced Materials Co. Ltd.* | | | 1,870 | | | | 67,852 | |
| | |
ITE Technology, Inc. | | | 11,000 | | | | 41,139 | |
| | |
JA Solar Technology Co. Ltd., Class A | | | 5,000 | | | | 71,297 | |
| | |
JCET Group Co. Ltd., Class A | | | 5,300 | | | | 25,600 | |
| | |
Jusung Engineering Co. Ltd.* | | | 2,862 | | | | 27,553 | |
| | |
KC Tech Co. Ltd. | | | 7,095 | | | | 136,308 | |
| | |
King Yuan Electronics Co. Ltd. | | | 35,000 | | | | 50,030 | |
| | |
Kinsus Interconnect Technology Corp. | | | 3,000 | | | | 26,323 | |
| | |
Koh Young Technology, Inc. | | | 1,007 | | | | 15,899 | |
| | |
LandMark Optoelectronics Corp. | | | 5,000 | | | | 32,095 | |
| | |
LEENO Industrial, Inc. | | | 180 | | | | 26,371 | |
| | |
LONGi Green Energy Technology Co. Ltd., Class A | | | 7,620 | | | | 116,325 | |
| | |
LX Semicon Co. Ltd. | | | 411 | | | | 38,548 | |
| | |
Macronix International Co. Ltd. | | | 80,000 | | | | 112,771 | |
| | |
Malaysian Pacific Industries Bhd. | | | 5,500 | | | | 63,328 | |
| | |
MediaTek, Inc. | | | 31,000 | | | | 1,017,782 | |
| | |
Mi Technovation Bhd. | | | 26,500 | | | | 24,574 | |
| | |
MiCo Ltd.* | | | 1,855 | | | | 22,145 | |
| | |
MLS Co. Ltd., Class A | | | 6,600 | | | | 14,367 | |
| | |
Nanya Technology Corp. | | | 21,000 | | | | 50,218 | |
| | |
NAURA Technology Group Co. Ltd., Class A | | | 1,200 | | | | 69,617 | |
| | |
NEPES Corp.* | | | 1,325 | | | | 39,743 | |
| | |
NEXTIN, Inc.* | | | 265 | | | | 12,042 | |
See Accompanying Notes to the Financial Statements.
| | | | | | |
| | FLEXSHARES ANNUAL REPORT | | | 259 | |
FlexShares® Morningstar Emerging Markets Factor Tilt Index Fund (cont.)
| | | | | | | | |
| Investments | | Shares | | �� | Value | |
|
| COMMON STOCKS – (continued) | |
|
| Semiconductors & Semiconductor Equipment – (continued) | |
| | |
Novatek Microelectronics Corp. | | | 10,000 | | | $ | 149,415 | |
| | |
Nuvoton Technology Corp. | | | 9,000 | | | | 41,426 | |
| | |
Pan Jit International, Inc. | | | 13,000 | | | | 52,592 | |
| | |
Parade Technologies Ltd. | | | 1,400 | | | | 89,865 | |
| | |
Phison Electronics Corp. | | | 3,000 | | | | 42,127 | |
| | |
Pixart Imaging, Inc. | | | 9,000 | | | | 50,974 | |
| | |
Powertech Technology, Inc. | | | 21,000 | | | | 73,553 | |
| | |
Radiant Opto-Electronics Corp. | | | 14,330 | | | | 50,140 | |
| | |
RDC Semiconductor Co. Ltd.* | | | 3,000 | | | | 42,721 | |
| | |
Realtek Semiconductor Corp. | | | 10,070 | | | | 180,698 | |
| | |
RFHIC Corp. | | | 829 | | | | 22,205 | |
| | |
S&S Tech Corp. | | | 423 | | | | 13,285 | |
| | |
Sanan Optoelectronics Co. Ltd., Class A | | | 9,400 | | | | 49,355 | |
| | |
Seoul Semiconductor Co. Ltd. | | | 1,370 | | | | 17,469 | |
| | |
SFA Semicon Co. Ltd.* | | | 3,233 | | | | 17,513 | |
| | |
Shenzhen Goodix Technology Co. Ltd., Class A | | | 1,800 | | | | 28,800 | |
| | |
Shinsung E&G Co. Ltd.* | | | 7,632 | | | | 15,414 | |
| | |
Sigurd Microelectronics Corp. | | | 220,000 | | | | 463,599 | |
| | |
Silergy Corp. | | | 2,000 | | | | 329,396 | |
| | |
Silicon Integrated Systems Corp. | | | 17,240 | | | | 14,817 | |
| | |
SIMMTECH Co. Ltd. | | | 10,010 | | | | 262,553 | |
| | |
Sino-American Silicon Products, Inc. | | | 13,000 | | | | 88,588 | |
| | |
Sitronix Technology Corp. | | | 1,000 | | | | 9,583 | |
| | |
SK Hynix, Inc. | | | 18,755 | | | | 1,653,130 | |
| | |
Taiwan Mask Corp. | | | 13,000 | | | | 37,305 | |
| | |
Taiwan Semiconductor Manufacturing Co. Ltd. | | | 385,000 | | | | 8,168,366 | |
| | |
Taiwan Surface Mounting Technology Corp. | | | 13,000 | | | | 52,358 | |
| | |
Tianjin Zhonghuan Semiconductor Co. Ltd., Class A | | | 4,700 | | | | 38,456 | |
| | |
Tianshui Huatian Technology Co. Ltd., Class A | | | 10,800 | | | | 21,687 | |
| | |
Tokai Carbon Korea Co. Ltd. | | | 86 | | | | 9,199 | |
| | | | | | | | |
| Investments | | Shares | | | Value | |
|
| Semiconductors & Semiconductor Equipment – (continued) | |
| | |
TongFu Microelectronics Co. Ltd., Class A | | | 4,700 | | | $ | 14,704 | |
| | |
Topco Scientific Co. Ltd. | | | 80,000 | | | | 397,001 | |
| | |
TSE Co. Ltd. | | | 165 | | | | 8,486 | |
| | |
United Microelectronics Corp. | | | 220,000 | | | | 458,853 | |
| | |
United Renewable Energy Co. Ltd.* | | | 56,574 | | | | 48,622 | |
| | |
UniTest, Inc.* | | | 636 | | | | 16,056 | |
| | |
Vanguard International Semiconductor Corp. | | | 13,000 | | | | 67,551 | |
| | |
Via Technologies, Inc. | | | 110,000 | | | | 245,644 | |
| | |
ViTrox Corp. Bhd. | | | 4,800 | | | | 22,812 | |
| | |
Wafer Works Corp. | | | 34,511 | | | | 79,674 | |
| | |
Will Semiconductor Co. Ltd. Shanghai, Class A | | | 600 | | | | 24,940 | |
| | |
Win Semiconductors Corp. | | | 6,961 | | | | 89,489 | |
| | |
Winbond Electronics Corp. | | | 59,000 | | | | 55,799 | |
| | |
Wonik Holdings Co. Ltd.* | | | 19,305 | | | | 85,906 | |
| | |
WONIK IPS Co. Ltd. | | | 824 | | | | 28,523 | |
| | |
Wuxi Taiji Industry Co. Ltd., Class A | | | 21,200 | | | | 26,503 | |
| | |
XinTec, Inc. | | | 3,000 | | | | 14,564 | |
| | |
Xinyi Solar Holdings Ltd. | | | 81,343 | | | | 170,235 | |
| | | | | | | | 18,816,120 | |
|
| Software – 0.3% | |
| | |
360 Security Technology, Inc., Class A* | | | 26,500 | | | | 49,859 | |
| | |
Agora, Inc., ADR* | | | 1,696 | | | | 36,973 | |
| | |
Ahnlab, Inc. | | | 190 | | | | 13,333 | |
| | |
AsiaInfo Technologies Ltd.(a) | | | 21,200 | | | | 34,992 | |
| | |
Birlasoft Ltd. | | | 9,845 | | | | 53,438 | |
| | |
China Youzan Ltd.* (b) | | | 300,000 | | | | 38,179 | |
| | |
Cyient Ltd. | | | 4,950 | | | | 70,616 | |
| | |
Douzone Bizon Co. Ltd. | | | 530 | | | | 36,874 | |
| | |
Iflytek Co. Ltd., Class A | | | 4,700 | | | | 41,438 | |
| | |
Intellect Design Arena Ltd.* | | | 5,035 | | | | 44,018 | |
| | |
Kingdee International Software Group Co. Ltd.* (b) | | | 55,000 | | | | 181,706 | |
| | |
Ming Yuan Cloud Group Holdings Ltd.* (b) | | | 11,000 | | | | 36,058 | |
| | |
Oracle Financial Services Software Ltd. | | | 632 | | | | 37,343 | |
See Accompanying Notes to the Financial Statements.
| | | | |
| 260 | | FLEXSHARES ANNUAL REPORT | | |
FlexShares® Morningstar Emerging Markets Factor Tilt Index Fund (cont.)
| | | | | | | | |
| Investments | | Shares | | | Value | |
|
| COMMON STOCKS – (continued) | |
|
| Software – (continued) | |
| | |
Route Mobile Ltd. | | | 954 | | | $ | 23,922 | |
| | |
Shanghai Baosight Software Co. Ltd., Class A | | | 5,200 | | | | 56,881 | |
| | |
Shanghai Baosight Software Co. Ltd., Class B | | | 14,430 | | | | 57,677 | |
| | |
Tanla Platforms Ltd. | | | 3,710 | | | | 60,480 | |
| | |
Tata Elxsi Ltd. | | | 990 | | | | 77,637 | |
| | |
TOTVS SA | | | 11,100 | | | | 64,509 | |
| | |
Weimob, Inc.* (a) (b) | | | 25,000 | | | | 38,758 | |
| | |
Yonyou Network Technology Co. Ltd., Class A | | | 4,700 | | | | 23,356 | |
| | | | | | | | 1,078,047 | |
|
| Specialty Retail – 1.5% | |
| | |
Abu Dhabi National Oil Co. for Distribution PJSC | | | 54,340 | | | | 63,318 | |
| | |
Ace Hardware Indonesia Tbk. PT | | | 206,000 | | | | 20,502 | |
| | |
China Meidong Auto Holdings Ltd. | | | 8,000 | | | | 41,548 | |
| | |
China Tourism Group Duty Free Corp. Ltd., Class A | | | 2,500 | | | | 104,879 | |
| | |
China Yongda Automobiles Services Holdings Ltd. | | | 61,500 | | | | 98,349 | |
| | |
Cuckoo Homesys Co. Ltd. | | | 3,410 | | | | 126,939 | |
| | |
Detsky Mir PJSC(a) | | | 270,050 | | | | 521,291 | |
| | |
EEKA Fashion Holdings Ltd.(b) | | | 137,500 | | | | 213,522 | |
| | |
Foschini Group Ltd. (The)* | | | 11,456 | | | | 97,753 | |
| | |
GOME Retail Holdings Ltd.* (b) | | | 603,447 | | | | 61,283 | |
| | |
Grupo SBF SA* | | | 5,300 | | | | 19,688 | |
| | |
Home Product Center PCL, NVDR | | | 63,300 | | | | 27,851 | |
| | |
Hotai Motor Co. Ltd. | | | 6,000 | | | | 132,046 | |
| | |
Hotel Shilla Co. Ltd. | | | 396 | | | | 29,618 | |
| | |
Italtile Ltd. | | | 10,931 | | | | 12,700 | |
| | |
Jarir Marketing Co. | | | 839 | | | | 45,362 | |
| | |
JUMBO SA | | | 2,397 | | | | 35,617 | |
| | |
LOTTE Himart Co. Ltd. | | | 4,606 | | | | 108,986 | |
| | |
M.Video PJSC | | | 31,680 | | | | 263,266 | |
| | |
Motus Holdings Ltd. | | | 91,300 | | | | 612,251 | |
| | |
MR DIY Group M Bhd.(a) | | | 42,400 | | | | 38,601 | |
| | | | | | | | |
| Investments | | Shares | | | Value | |
|
| Specialty Retail – (continued) | |
| | |
Mr Price Group Ltd. | | | 5,830 | | | $ | 76,695 | |
| | |
Pan German Universal Motors Ltd. | | | 18,000 | | | | 138,843 | |
| | |
Pepkor Holdings Ltd.* (a) | | | 10,335 | | | | 16,339 | |
| | |
Pet Center Comercio e Participacoes SA | | | 11,807 | | | | 39,315 | |
| | |
Pop Mart International Group Ltd.* (a) | | | 11,000 | | | | 64,976 | |
| | |
Pou Sheng International Holdings Ltd.* | | | 1,213,000 | | | | 204,270 | |
| | |
PTG Energy PCL, NVDR | | | 26,300 | | | | 12,364 | |
| | |
PTT Oil & Retail Business PCL, NVDR | | | 82,500 | | | | 68,372 | |
| | |
Shanghai Yuyuan Tourist Mart Group Co. Ltd. | | | 18,800 | | | | 28,879 | |
| | |
Shinsegae International, Inc. | | | 81 | | | | 11,645 | |
| | |
Siam Global House PCL, NVDR | | | 16,622 | | | | 10,219 | |
| | |
Suning.com Co. Ltd., Class A* | | | 23,500 | | | | 16,415 | |
| | |
Super Group Ltd. | | | 193,930 | | | | 407,253 | |
| | |
Topsports International Holdings Ltd.(a) (b) | | | 55,000 | | | | 66,885 | |
| | |
Truworths International Ltd. | | | 225,390 | | | | 799,541 | |
| | |
United Electronics Co. | | | 2,035 | | | | 76,389 | |
| | |
Via S/A* | | | 28,700 | | | | 31,312 | |
| | |
Vibra Energia SA | | | 22,000 | | | | 81,880 | |
| | |
Zhongsheng Group Holdings
Ltd.(b) | | | 9,000 | | | | 81,392 | |
| | | | | | | | 4,908,354 | |
|
| Technology Hardware, Storage & Peripherals – 4.9% | |
| | |
Acer, Inc. | | | 47,858 | | | | 44,746 | |
| | |
Advantech Co. Ltd. | | | 7,941 | | | | 103,658 | |
| | |
Asia Vital Components Co. Ltd. | | | 122,000 | | | | 363,695 | |
| | |
Asustek Computer, Inc. | | | 24,000 | | | | 304,655 | |
| | |
AURAS Technology Co. Ltd. | | | 37,000 | | | | 212,219 | |
| | |
Catcher Technology Co. Ltd. | | | 24,000 | | | | 138,950 | |
| | |
Chicony Electronics Co. Ltd. | | | 15,992 | | | | 45,661 | |
| | |
Clevo Co. | | | 55,000 | | | | 68,136 | |
| | |
CMC Magnetics Corp.* | | | 55,000 | | | | 17,444 | |
| | |
Compal Electronics, Inc. | | | 165,000 | | | | 145,073 | |
| | |
CosmoAM&T Co. Ltd.* | | | 1,166 | | | | 41,958 | |
| | |
Getac Holdings Corp. | | | 13,000 | | | | 24,449 | |
See Accompanying Notes to the Financial Statements.
| | | | | | |
| | FLEXSHARES ANNUAL REPORT | | | 261 | |
FlexShares® Morningstar Emerging Markets Factor Tilt Index Fund (cont.)
| | | | | | | | |
| Investments | | Shares | | | Value | |
|
| COMMON STOCKS – (continued) | |
|
| Technology Hardware, Storage & Peripherals – (continued) | |
| | |
Gigabyte Technology Co. Ltd. | | | 20,000 | | | $ | 80,910 | |
| | |
HTC Corp.* | | | 18,000 | | | | 42,462 | |
| | |
Innodisk Corp. | | | 4,733 | | | | 32,593 | |
| | |
Inventec Corp. | | | 142,000 | | | | 135,574 | |
| | |
KONA I Co. Ltd.* | | | 689 | | | | 20,342 | |
| | |
Legend Holdings Corp., Class H(a) | | | 312,500 | | | | 549,553 | |
| | |
Lenovo Group Ltd.(b) | | | 220,000 | | | | 239,258 | |
| | |
Lite-On Technology Corp. | | | 83,000 | | | | 182,962 | |
| | |
Micro-Star International Co. Ltd. | | | 31,000 | | | | 156,067 | |
| | |
Mitac Holdings Corp. | | | 46,600 | | | | 48,178 | |
| | |
Ninestar Corp., Class A | | | 4,700 | | | | 26,977 | |
| | |
Pegatron Corp. | | | 81,000 | | | | 198,069 | |
| | |
Primax Electronics Ltd. | | | 220,000 | | | | 407,429 | |
| | |
Qisda Corp. | | | 62,000 | | | | 69,116 | |
| | |
Quanta Computer, Inc. | | | 98,000 | | | | 274,880 | |
| | |
Samsung Electronics Co. Ltd. | | | 176,715 | | | | 10,555,566 | |
| | |
Samsung Electronics Co. Ltd. (Preference) | | | 28,600 | | | | 1,566,386 | |
| | |
Shenzhen Kaifa Technology Co. Ltd., Class A | | | 4,700 | | | | 10,870 | |
| | |
Sunrex Technology Corp. | | | 39,000 | | | | 60,866 | |
| | |
Wistron Corp. | | | 110,000 | | | | 115,504 | |
| | |
Wiwynn Corp. | | | 3,000 | | | | 95,906 | |
| | | | | | | | 16,380,112 | |
|
| Textiles, Apparel & Luxury Goods – 1.4% | |
| | |
Aditya Birla Fashion and Retail Ltd.* | | | 6,536 | | | | 22,956 | |
| | |
Aksa Akrilik Kimya Sanayii A/S | | | 70,895 | | | | 172,829 | |
| | |
Alok Industries Ltd.* | | | 659,670 | | | | 193,810 | |
| | |
Alpargatas SA (Preference)* | | | 5,500 | | | | 37,691 | |
| | |
ANTA Sports Products Ltd. | | | 22,000 | | | | 343,898 | |
| | |
Arezzo Industria e Comercio SA | | | 3,752 | | | | 49,188 | |
| | |
Bata India Ltd. | | | 848 | | | | 22,416 | |
| | |
Bosideng International Holdings Ltd.(b) | | | 96,000 | | | | 74,539 | |
| | |
Eclat Textile Co. Ltd. | | | 4,698 | | | | 102,547 | |
| | |
F&F Holdings Co. Ltd. | | | 103 | | | | 3,438 | |
| | | | | | | | |
| Investments | | Shares | | | Value | |
|
| Textiles, Apparel & Luxury Goods – (continued) | |
| | |
Feng TAY Enterprise Co. Ltd. | | | 10,600 | | | $ | 82,335 | |
| | |
FF Group* ‡ (c) | | | 3,536 | | | | — | |
| | |
Fila Holdings Corp. | | | 1,167 | | | | 37,051 | |
| | |
Fuguiniao Group Ltd.* ‡ (c) | | | 334,800 | | | | — | |
| | |
Grendene SA | | | 8,264 | | | | 12,579 | |
| | |
Grupo de Moda Soma SA* | | | 15,900 | | | | 37,007 | |
| | |
Guararapes Confeccoes SA* | | | 13,200 | | | | 25,641 | |
| | |
Handsome Co. Ltd. | | | 5,445 | | | | 196,403 | |
| | |
Hansae Co. Ltd. | | | 1,281 | | | | 25,433 | |
| | |
Hwaseung Enterprise Co. Ltd. | | | 331 | | | | 4,872 | |
| | |
Hyosung TNC Corp. | | | 110 | | | | 56,198 | |
| | |
JNBY Design Ltd.(a) | | | 27,500 | | | | 46,169 | |
| | |
Lao Feng Xiang Co. Ltd., Class B | | | 2,500 | | | | 8,820 | |
| | |
LF Corp. | | | 9,405 | | | | 147,286 | |
| | |
Li Ning Co. Ltd. | | | 41,500 | | | | 461,464 | |
| | |
Li Peng Enterprise Co. Ltd.* | | | 55,000 | | | | 20,470 | |
| | |
Makalot Industrial Co. Ltd. | | | 4,334 | | | | 37,794 | |
| | |
Nan Liu Enterprise Co. Ltd. | | | 23,000 | | | | 101,731 | |
| | |
Page Industries Ltd. | | | 130 | | | | 65,339 | |
| | |
Pou Chen Corp. | | | 110,000 | | | | 134,887 | |
| | |
Rajesh Exports Ltd. | | | 69,004 | | | | 588,155 | |
| | |
Ruentex Industries Ltd. | | | 20,540 | | | | 80,141 | |
| | |
Shenzhou International Group Holdings Ltd. | | | 16,500 | | | | 355,917 | |
| | |
Tainan Spinning Co. Ltd. | | | 48,555 | | | | 39,635 | |
| | |
Taiwan Paiho Ltd. | | | 17,000 | | | | 52,818 | |
| | |
Texhong Textile Group Ltd. | | | 137,500 | | | | 205,745 | |
| | |
Titan Co. Ltd. | | | 8,195 | | | | 260,856 | |
| | |
Trident Ltd. | | | 601,920 | | | | 305,055 | |
| | |
Vaibhav Global Ltd. | | | 3,286 | | | | 25,217 | |
| | |
Vivara Participacoes SA | | | 5,300 | | | | 24,389 | |
| | |
Welspun India Ltd. | | | 7,370 | | | | 13,553 | |
| | |
Youngone Corp. | | | 890 | | | | 34,007 | |
| | |
Youngone Holdings Co. Ltd. | | | 2,708 | | | | 108,918 | |
| | | | | | | | 4,619,197 | |
|
| Thrifts & Mortgage Finance – 0.5% | |
| | |
Aavas Financiers Ltd.* | | | 611 | | | | 22,853 | |
| | |
Can Fin Homes Ltd. | | | 4,876 | | | | 40,818 | |
| | |
Housing Development Finance Corp. Ltd. | | | 36,135 | | | | 1,372,750 | |
| | |
LIC Housing Finance Ltd. | | | 11,330 | | | | 61,559 | |
See Accompanying Notes to the Financial Statements.
| | | | |
| 262 | | FLEXSHARES ANNUAL REPORT | | |
FlexShares® Morningstar Emerging Markets Factor Tilt Index Fund (cont.)
| | | | | | | | |
| Investments | | Shares | | | Value | |
|
| COMMON STOCKS – (continued) | |
|
| Thrifts & Mortgage Finance – (continued) | |
| | |
PNB Housing Finance Ltd.* (a) | | | 13,255 | | | $ | 85,471 | |
| | | | | | | | 1,583,451 | |
|
| Tobacco – 0.3% | |
| | |
British American Tobacco Malaysia Bhd. | | | 5,900 | | | | 21,514 | |
| | |
Eastern Co. SAE | | | 29,100 | | | | 21,487 | |
| | |
Gudang Garam Tbk. PT | | | 14,900 | | | | 35,232 | |
| | |
ITC Ltd. | | | 65,395 | | | | 194,924 | |
| | |
KT&G Corp. | | | 3,520 | | | | 244,296 | |
| | |
Philip Morris CR A/S | | | 220 | | | | 156,503 | |
| | |
RLX Technology, Inc., ADR* | | | 31,680 | | | | 153,965 | |
| | |
Smoore International Holdings
Ltd.(a) (b) | | | 33,000 | | | | 158,233 | |
| | | | | | | | 986,154 | |
|
| Trading Companies & Distributors – 0.5% | |
| | |
Adani Enterprises Ltd. | | | 5,186 | | | | 98,593 | |
| | |
ALAFCO Aviation Lease & Finance Co. KSCP* | | | 161,535 | | | | 127,535 | |
| | |
Barloworld Ltd. | | | 105,348 | | | | 889,151 | |
| | |
BOC Aviation Ltd.(a) (b) | | | 9,400 | | | | 82,472 | |
| | |
COSCO SHIPPING Development Co. Ltd., Class A | | | 37,600 | | | | 20,388 | |
| | |
IndiaMart InterMesh Ltd.(a) | | | 192 | | | | 18,324 | |
| | |
LX International Corp. | | | 13,310 | | | | 309,244 | |
| | |
Posco International Corp. | | | 1,484 | | | | 27,558 | |
| | |
SK Networks Co. Ltd. | | | 2,415 | | | | 10,519 | |
| | |
Xiamen C & D, Inc., Class A | | | 9,400 | | | | 11,766 | |
| | | | | | | | 1,595,550 | |
|
| Transportation Infrastructure – 1.2% | |
| | |
Adani Ports & Special Economic Zone Ltd. | | | 13,038 | | | | 120,662 | |
| | |
Airports of Thailand PCL | | | 54,000 | | | | 104,965 | |
| | |
Airports of Thailand PCL, NVDR | | | 28,500 | | | | 55,398 | |
| | |
Anhui Expressway Co. Ltd., Class H | | | 148,000 | | | | 87,898 | |
| | |
Bangkok Expressway & Metro PCL, NVDR | | | 136,300 | | | | 36,968 | |
| | | | | | | | |
| Investments | | Shares | | | Value | |
|
| Transportation Infrastructure – (continued) | |
| | |
Beijing Capital International Airport Co. Ltd., Class H* (b) | | | 110,000 | | | $ | 71,410 | |
| | |
CCR SA | | | 14,100 | | | | 28,590 | |
| | |
China Merchants Port Holdings Co. Ltd. | | | 55,407 | | | | 92,594 | |
| | |
COSCO SHIPPING Ports Ltd. | | | 888,749 | | | | 740,334 | |
| | |
EcoRodovias Infraestrutura e Logistica SA* | | | 4,700 | | | | 6,829 | |
| | |
Evergreen International Storage & Transport Corp. | | | 50,000 | | | | 48,636 | |
| | |
GMR Infrastructure Ltd.* | | | 48,418 | | | | 26,219 | |
| | |
Grupo Aeroportuario del Centro Norte SAB de CV* | | | 12,181 | | | | 73,662 | |
| | |
Grupo Aeroportuario del Pacifico SAB de CV, Class B* | | | 5,500 | | | | 69,484 | |
| | |
Grupo Aeroportuario del Sureste SAB de CV, Class B | | | 3,800 | | | | 76,801 | |
| | |
Hainan Meilan International Airport Co. Ltd.* | | | 6,000 | | | | 24,335 | |
| | |
International Container Terminal Services, Inc. | | | 18,150 | | | | 64,809 | |
| | |
Jasa Marga Persero Tbk. PT* | | | 39,723 | | | | 11,776 | |
| | |
Jiangsu Expressway Co. Ltd., Class H | | | 20,000 | | | | 18,923 | |
| | |
Lingkaran Trans Kota Holdings Bhd. | | | 132,000 | | | | 122,724 | |
| | |
Malaysia Airports Holdings Bhd.* | | | 27,900 | | | | 43,659 | |
| | |
MMC Corp. Bhd. | | | 478,500 | | | | 228,792 | |
| | |
Ningbo Zhoushan Port Co. Ltd., Class A | | | 23,500 | | | | 13,771 | |
| | |
Novorossiysk Commercial Sea Port PJSC | | | 1,526,196 | | | | 167,005 | |
| | |
Promotora y Operadora de Infraestructura SAB de CV | | | 2,160 | | | | 15,919 | |
| | |
Qingdao Port International Co. Ltd., Class H(a) (b) | | | 47,000 | | | | 23,624 | |
| | |
Santos Brasil Participacoes SA* | | | 31,800 | | | | 29,053 | |
| | |
Saudi Ground Services Co.* | | | 636 | | | | 6,325 | |
| | |
Shanghai International Airport Co. Ltd., Class A* | | | 5,300 | | | | 43,730 | |
| | |
Shanghai International Port Group Co. Ltd., Class A | | | 63,300 | | | | 55,987 | |
See Accompanying Notes to the Financial Statements.
| | | | | | |
| | FLEXSHARES ANNUAL REPORT | | | 263 | |
FlexShares® Morningstar Emerging Markets Factor Tilt Index Fund (cont.)
| | | | | | | | |
| Investments | | Shares | | | Value | |
|
| COMMON STOCKS – (continued) | |
|
| Transportation Infrastructure – (continued) | |
| | |
Shenzhen Airport Co. Ltd., Class A* | | | 9,400 | | | $ | 11,105 | |
| | |
Shenzhen Expressway Co. Ltd., Class A | | | 9,400 | | | | 14,248 | |
| | |
Shenzhen Expressway Co. Ltd., Class H | | | 22,000 | | | | 20,730 | |
| | |
Shenzhen International Holdings Ltd. | | | 33,343 | | | | 40,248 | |
| | |
Shenzhen Investment Holdings Bay Area Development Co. Ltd. | | | 275,000 | | | | 100,398 | |
| | |
Sichuan Expressway Co. Ltd., Class H(b) | | | 330,000 | | | | 76,359 | |
| | |
Sociedad Matriz SAAM SA | | | 2,531,540 | | | | 158,480 | |
| | |
Taiwan High Speed Rail Corp. | | | 56,000 | | | | 58,500 | |
| | |
TAV Havalimanlari Holding A/S* | | | 10,176 | | | | 28,130 | |
| | |
Westports Holdings Bhd. | | | 17,500 | | | | 18,890 | |
| | |
Yuexiu Transport Infrastructure Ltd. | | | 440,000 | | | | 281,680 | |
| | |
Zhejiang Expressway Co. Ltd., Class H | | | 770,000 | | | | 683,978 | |
| | | | | | | | 4,003,628 | |
|
| Water Utilities – 0.5% | |
| | |
Aguas Andinas SA, Class A | | | 36,828 | | | | 7,036 | |
| | |
Beijing Enterprises Water Group Ltd.(b) | | | 242,000 | | | | 92,394 | |
| | |
China Water Affairs Group Ltd.(b) | | | 440,000 | | | | 453,629 | |
| | |
Chongqing Water Group Co. Ltd., Class A | | | 18,800 | | | | 16,481 | |
| | |
Cia de Saneamento Basico do Estado de Sao Paulo* | | | 10,000 | | | | 62,445 | |
| | |
Cia de Saneamento de Minas Gerais-COPASA | | | 99,000 | | | | 239,026 | |
| | |
Cia de Saneamento do Parana* | | | 121,000 | | | | 391,742 | |
| | |
Grandblue Environment Co. Ltd., Class A | | | 4,700 | | | | 16,232 | |
| | |
Guangdong Investment Ltd. | | | 110,000 | | | | 138,577 | |
| | |
Inversiones Aguas Metropolitanas SA | | | 266,242 | | | | 125,469 | |
| | | | | | | | |
| Investments | | Shares | | | Value | |
|
| Water Utilities – (continued) | |
| | |
Luenmei Quantum Co. Ltd., Class A | | | 9,400 | | | $ | 12,133 | |
| | | | | | | | 1,555,164 | |
|
| Wireless Telecommunication Services – 1.1% | |
| | |
Advanced Info Service PCL, NVDR | | | 20,400 | | | | 116,194 | |
| | |
America Movil SAB de CV, Series L | | | 786,500 | | | | 702,540 | |
| | |
Axiata Group Bhd. | | | 86,304 | | | | 82,323 | |
| | |
Bharti Airtel Ltd.* (c) | | | 3,279 | | | | 14,792 | |
| | |
Bharti Airtel Ltd. – XNSE* | | | 45,915 | | | | 420,237 | |
| | |
DiGi.Com Bhd. | | | 71,500 | | | | 73,037 | |
| | |
Empresa Nacional de Telecomunicaciones SA | | | 1,467 | | | | 5,043 | |
| | |
Etihad Etisalat Co. | | | 5,160 | | | | 41,614 | |
| | |
Far EasTone Telecommunications Co. Ltd. | | | 30,000 | | | | 66,023 | |
| | |
Globe Telecom, Inc. | | | 1,100 | | | | 65,376 | |
| | |
Indosat Tbk. PT* | | | 31,800 | | | | 15,544 | |
| | |
Intouch Holdings PCL, NVDR | | | 21,200 | | | | 48,076 | |
| | |
Maxis Bhd. | | | 32,900 | | | | 37,103 | |
| | |
Mobile Telecommunications Co. KSCP | | | 79,695 | | | | 157,566 | |
| | |
Mobile Telecommunications Co. Saudi Arabia* | | | 15,658 | | | | 56,689 | |
| | |
Mobile TeleSystems PJSC | | | 31,356 | | | | 137,003 | |
| | |
MTN Group Ltd.* | | | 59,015 | | | | 531,834 | |
| | |
PLDT, Inc. | | | 3,440 | | | | 112,051 | |
| | |
Sistema PJSFC | | | 122,643 | | | | 46,595 | |
| | |
SK Telecom Co. Ltd.(c) | | | 1,237 | | | | 327,629 | |
| | |
Smartfren Telecom Tbk. PT* | | | 2,936,200 | | | | 22,383 | |
| | |
Taiwan Mobile Co. Ltd. | | | 30,000 | | | | 105,831 | |
| | |
TIM SA* | | | 24,700 | | | | 49,163 | |
| | |
Total Access Communication PCL, NVDR | | | 15,200 | | | | 17,521 | |
| | |
Turkcell Iletisim Hizmetleri A/S | | | 42,625 | | | | 67,782 | |
| | |
Vodacom Group Ltd. | | | 26,675 | | | | 237,934 | |
| | |
Vodafone Idea Ltd.* | | | 97,468 | | | | 12,431 | |
| | |
Vodafone Qatar QSC | | | 151,140 | | | | 67,247 | |
| | | | | | | | 3,637,561 | |
Total Common Stocks
(Cost $273,639,108) | | | | | | | 332,482,606 | |
See Accompanying Notes to the Financial Statements.
| | | | |
| 264 | | FLEXSHARES ANNUAL REPORT | | |
FlexShares® Morningstar Emerging Markets Factor Tilt Index Fund (cont.)
| | | | | | | | |
| Investments | | Principal
Amount | | | Value | |
|
| CORPORATE BONDS – 0.0%(d) | |
|
Independent Power and Renewable Electricity
Producers – 0.0%(d) | |
| | |
NTPC Ltd.
Series 54, 8.49%, 3/25/2025
(Cost $—) | | | INR 49,126 | | | $ | 9,152 | |
| | | Number of
Rights | | | | |
|
| RIGHTS – 0.0%(d) | |
|
| Airlines – 0.0%(d) | |
| | |
Jin Air Co. Ltd.,
expiring 11/2/2021, price 17,200.00 KRW* (c) | | | 75 | | | | 257 | |
|
| Banks – 0.0%(d) | |
| | |
Itau CorpBanca Chile SA, expiring 11/2/2021, price 3.79 CLP* | | | 914,090 | | | | 1 | |
|
| Biotechnology – 0.0%(d) | |
| | |
GeneOne Life Science, Inc., expiring 11/25/2021, price 23,500.00 KRW* | | | 317 | | | | 1,004 | |
|
| Electrical Equipment – 0.0%(d) | |
| | |
Ta Ya Electric Wire & Cable, expiring 11/10/2021, price 21.00 TWD* (c) | | | 1,890 | | | | 255 | |
|
| Oil, Gas & Consumable Fuels – 0.0%(d) | |
| | |
Ultrapar Participacoes SA, expiring 11/3/2021, price 94.10 BRL* (c) | | | 1,140 | | | | 2 | |
|
| Pharmaceuticals – 0.0%(d) | |
| | |
Enzychem Lifesciences Corp., expiring 12/17/2021, price 56,900.00 KRW* (c) | | | 128 | | | | 1,095 | |
Total Rights
(Cost $6) | | | | 2,614 | |
| | | | | | | | |
| Investments | | Number of
Warrants | | | Value | |
| | |
| WARRANTS – 0.0%(d) | | | | | | |
|
| Real Estate Management & Development – 0.0%(d) | |
| | |
MBK PCL, expiring 10/25/2022, price 1.00 THB* (c) | | | 2,333 | | | $ | 773 | |
|
| Road & Rail – 0.0% | |
| | |
BTS Group Holdings PCL, expiring 12/31/2025, price 14.900000 THB* ‡ (c) | | | 20,608 | | | | – | |
| | |
BTS Group Holdings PCL, expiring 12/31/2025, price 11.900000 THB* ‡ (c) | | | 10,304 | | | | – | |
Total Warrants
(Cost $–) | | | | | | | 773 | |
| | | Principal
Amount | | | | |
|
| SECURITIES LENDING REINVESTMENTS(e) – 0.8% | |
|
| REPURCHASE AGREEMENTS – 0.8% | |
| | |
Citigroup Global Markets, Inc., 0.05%, dated 10/31/2021, due 11/1/2021, repurchase price $2,781,582, collateralized by various U.S. Treasury Securities, ranging from 0.75% –4.63%, maturing 2/15/2040 –2/15/2042; total market value $2,806,675
(Cost $2,781,579) | | $ | 2,781,579 | | | | 2,781,579 | |
Total Investments – 100.3%
(Cost $276,420,693) | | | | 335,276,724 | |
| |
Liabilities in excess of other assets – (0.3%) | | | | (904,729 | ) |
| NET ASSETS – 100.0% | | | | 334,371,995 | |
| * | Non-income producing security. |
| ^ | Security subject to restrictions on resale. |
| ‡ | Value determined using significant unobservable inputs. |
See Accompanying Notes to the Financial Statements.
| | | | | | |
| | FLEXSHARES ANNUAL REPORT | | | 265 | |
FlexShares® Morningstar Emerging Markets Factor Tilt Index Fund (cont.)
| (a) | Security exempt from registration pursuant to Regulation S under the Securities Act of 1933. Regulation S applies to securities offerings that are made outside of the United States and do not involve direct selling efforts in the United States and as such may have restrictions on resale. |
| (b) | The security or a portion of this security is on loan at October 31, 2021. The total value of securities on loan at October 31, 2021 was $11,156,681, collateralized in the form of cash with a value of $2,781,579 that was reinvested in the securities shown in the Securities Lending Reinvestment section of the Schedule of Investments; $4,007,396 of collateral in the form of U.S. Government Treasury Securities, interest rates ranging from 0.00% – 6.88%, and maturity dates ranging from November 4, 2021 – August 15, 2051 and $5,426,821 of collateral in the form of Foreign Government Fixed Income Securities, interest rates ranging from 0.00% – 8.50%, and maturity dates ranging from November 17, 2021 – June 30, 2120; a total value of $12,215,796. |
| (c) | Security fair valued as of October 31, 2021 in accordance with procedures approved by the Board of Trustees. Total value of all such securities at October 31, 2021 amounted to $1,451,357, which represents approximately 0.43% of net assets of the Fund. |
| (d) | Represents less than 0.05% of net assets. |
| (e) | The security was purchased with cash collateral held from securities on loan at October 31, 2021. The total value of securities purchased was $2,781,579. |
Percentages shown are based on Net Assets.
Abbreviations
ADR – American Depositary Receipt
GDR – Global Depositary Receipt
NVDR – Non-Voting Depositary Receipt
OJSC – Open Joint Stock Company
PJSC – Public Joint Stock Company
Preference – A special type of equity investment that shares in the earnings of the company, has limited voting rights, and may have a dividend preference. Preference shares may also have liquidation preference.
SCA – Limited partnership with share capital
As of October 31, 2021, the gross unrealized appreciation (depreciation) of investments based on the aggregate cost of investments (including derivative instruments, if applicable) for federal income tax purposes was as follows:
| | | | |
| | | | |
Aggregate gross unrealized appreciation | | $ | 81,703,247 | |
Aggregate gross unrealized depreciation | | | (26,739,743 | ) |
Net unrealized appreciation | | $ | 54,963,504 | |
Federal income tax cost | | $ | 280,273,085 | |
Futures Contracts
FlexShares® Morningstar Emerging Markets Factor Tilt Index Fund had the following open futures contracts as of October 31, 2021:
| | | | | | | | | | | | | | | | | | | | |
| | | Number of
Contracts | | | Expiration
Date | | | Trading
Currency | | | Notional
Amount | | | Value and
Unrealized
Depreciation* | |
Long Contracts | | | | | |
MSCI Emerging Markets E-Mini Index | | | 48 | | | | 12/17/2021 | | | | USD | | | $ | 3,028,800 | | | $ | (49,371 | ) |
| * | This amount represents the cumulative appreciation/depreciation on futures contracts. Current day’s variation margin is reported within the Statement of Assets and Liabilities for futures contracts. |
See Accompanying Notes to the Financial Statements.
| | | | |
| 266 | | FLEXSHARES ANNUAL REPORT | | |
FlexShares® Morningstar Emerging Markets Factor Tilt Index Fund (cont.)
Forward Foreign Currency Contracts
FlexShares® Morningstar Emerging Markets Factor Tilt Index Fund had the following outstanding contracts as of October 31, 2021:
| | | | | | | | | | | | | | | | | | | | | | | | |
| Contracts to Receive | | Counterparty | | In Exchange For | | | Maturity Date | | | Unrealized
Appreciation/
(Depreciation) | |
HKD | | | 3,300,000 | | | | | Citibank NA | | | USD | | | | 424,009 | | | | 12/15/2021 | | | $ | 258 | |
KRW* | | | 364,610,000 | | | | | Citibank NA | | | USD | | | | 306,960 | | | | 12/15/2021 | | | | 4,740 | |
USD | | | 63,986 | | | | | Goldman Sachs & Co. | | | BRL* | | | | 339,553 | | | | 12/15/2021 | | | | 4,292 | |
USD | | | 1,254,837 | | | | | Citibank NA | | | HKD | | | | 9,756,137 | | | | 12/15/2021 | | | | 532 | |
USD | | | 76,582 | | | | | Citibank NA | | | INR* | | | | 5,688,500 | | | | 12/15/2021 | | | | 995 | |
USD | | | 263,446 | | | | | Goldman Sachs & Co. | | | KRW* | | | | 307,426,590 | | | | 12/15/2021 | | | | 631 | |
USD | | | 31,750 | | | | | Toronto-Dominion Bank (The) | | | TWD* | | | | 876,120 | | | | 12/15/2021 | | | | 241 | |
USD | | | 11,773 | | | | | Morgan Stanley | | | ZAR | | | | 170,000 | | | | 12/15/2021 | | | | 650 | |
ZAR | | | 1,500,000 | | | | | JPMorgan Chase Bank | | | USD | | | | 97,930 | | | | 12/15/2021 | | | | 220 | |
Total unrealized appreciation | | | | | | | $ | 12,559 | |
USD | | | 82,161 | | | | | Goldman Sachs & Co. | | | RUB | * | | | 6,123,045 | | | | 12/15/2021 | | | $ | (3,323 | ) |
Total unrealized depreciation | | | | | | | $ | (3,323 | ) |
Net unrealized appreciation | | | | | | | $ | 9,236 | |
| * | Non-deliverable forward. See Note 2 in the Notes to Financial Statements. |
Abbreviations:
BRL – Brazilian Real
HKD – Hong Kong Dollar
INR – Indian Rupee
KRW – Korean Won
RUB – Russian Ruble
TWD – Taiwan Dollar
USD – US Dollar
ZAR – South African Rand
See Accompanying Notes to the Financial Statements.
| | | | | | |
| | FLEXSHARES ANNUAL REPORT | | | 267 | |
FlexShares® Morningstar Emerging Markets Factor Tilt Index Fund (cont.)
FlexShares® Morningstar Emerging Markets Factor Tilt Index Fund invested, as a percentage of net assets, in companies domiciled in the following countries as of October 31, 2021:
| | | | |
Brazil | | | 3.9 | % |
Chile | | | 0.6 | |
China | | | 28.2 | |
Colombia | | | 0.6 | |
Czech Republic | | | 0.2 | |
Egypt | | | 0.5 | |
Greece | | | 0.3 | |
Hungary | | | 0.3 | |
India | | | 11.1 | |
Indonesia | | | 1.8 | |
Kuwait | | | 0.9 | |
Malaysia | | | 2.3 | |
Mexico | | | 2.3 | |
Pakistan | | | 0.5 | |
Peru | | | 0.2 | |
Philippines | | | 0.9 | |
Qatar | | | 0.8 | |
Russia | | | 4.0 | |
Saudi Arabia | | | 2.1 | |
South Africa | | | 4.9 | |
South Korea | | | 15.2 | |
Taiwan | | | 14.0 | |
Thailand | | | 1.8 | |
Turkey | | | 1.1 | |
United Arab Emirates | | | 1.0 | |
Other1 | | | 0.5 | |
| | | | 100.0 | % |
| 1 | Includes any non-equity securities, securities lending reinvestments and net other assets (liabilities). |
| | | | |
| Security Type | | % of Net Assets | |
Common Stocks | | | 99.5 | % |
Corporate Bonds | | | 0.0 | † |
Rights | | | 0.0 | † |
Warrants | | | 0.0 | † |
Securities Lending Reinvestments | | | 0.8 | |
Others(1) | | | (0.3 | ) |
| | | | 100.0 | % |
| † | Amount represents less than 0.05%. |
| (1) | Includes any other net assets/(liabilities). |
See Accompanying Notes to the Financial Statements.
| | | | |
| 268 | | FLEXSHARES ANNUAL REPORT | | |
Schedule of Investments
FlexShares® US Quality Large Cap Index Fund
October 31, 2021
| | | | | | | | |
| Investments | | Shares | | | Value | |
|
| COMMON STOCKS – 98.6% | |
|
| Aerospace & Defense – 0.3% | |
| | |
Lockheed Martin Corp. | | | 920 | | | $ | 305,735 | |
| | |
Textron, Inc. | | | 805 | | | | 59,449 | |
| | | | | | | | 365,184 | |
|
| Air Freight & Logistics – 1.2% | |
| | |
Expeditors International of Washington, Inc. | | | 6,095 | | | | 751,270 | |
| | |
United Parcel Service, Inc., Class B | | | 4,945 | | | | 1,055,609 | |
| | | | | | | | 1,806,879 | |
|
| Automobiles – 1.4% | |
| | |
Ford Motor Co.* | | | 19,665 | | | | 335,878 | |
| | |
Tesla, Inc.* | | | 1,495 | | | | 1,665,430 | |
| | | | | | | | 2,001,308 | |
|
| Banks – 4.4% | |
| | |
Bank of America Corp. | | | 20,930 | | | | 1,000,035 | |
| | |
Citigroup, Inc. | | | 28,635 | | | | 1,980,397 | |
| | |
Citizens Financial Group, Inc. | | | 14,720 | | | | 697,434 | |
| | |
JPMorgan Chase & Co. | | | 690 | | | | 117,224 | |
| | |
Wells Fargo & Co. | | | 51,060 | | | | 2,612,229 | |
| | | | | | | | 6,407,319 | |
|
| Beverages – 0.3% | |
| | |
Monster Beverage Corp.* | | | 4,830 | | | | 410,550 | |
|
| Biotechnology – 1.7% | |
| | |
AbbVie, Inc. | | | — | (a) | | | 46 | |
| | |
Amgen, Inc. | | | 7,475 | | | | 1,547,101 | |
| | |
Gilead Sciences, Inc. | | | 3,335 | | | | 216,375 | |
| | |
Moderna, Inc.* | | | 1,380 | | | | 476,390 | |
| | |
Regeneron Pharmaceuticals, Inc.* | | | 43 | | | | 27,517 | |
| | |
Vertex Pharmaceuticals, Inc.* | | | 920 | �� | | | 170,136 | |
| | | | | | | | 2,437,565 | |
|
| Building Products – 1.1% | |
| | |
Lennox International, Inc. | | | 1,265 | | | | 378,589 | |
| | |
Masco Corp. | | | 10,005 | | | | 655,828 | |
| | |
Trane Technologies plc | | | 3,450 | | | | 624,208 | |
| | | | | | | | 1,658,625 | |
| | | | | | | | |
| Investments | | Shares | | | Value | |
|
| Capital Markets – 1.8% | |
| | |
Ameriprise Financial, Inc. | | | 345 | | | $ | 104,235 | |
| | |
Bank of New York Mellon Corp. (The) | | | 13,570 | | | | 803,344 | |
| | |
Goldman Sachs Group, Inc. (The) | | | 805 | | | | 332,747 | |
| | |
Morgan Stanley | | | 13,570 | | | | 1,394,724 | |
| | | | | | | | 2,635,050 | |
|
| Chemicals – 1.0% | |
| | |
Dow, Inc. | | | 12,880 | | | | 720,894 | |
| | |
DuPont de Nemours, Inc. | | | 11,040 | | | | 768,384 | |
| | | | | | | | 1,489,278 | |
|
| Communications Equipment – 1.6% | |
| | |
Cisco Systems, Inc. | | | 40,710 | | | | 2,278,539 | |
|
| Consumer Finance – 2.3% | |
| | |
Ally Financial, Inc. | | | 4,025 | | | | 192,153 | |
| | |
American Express Co. | | | 2,760 | | | | 479,633 | |
| | |
Capital One Financial Corp. | | | 7,935 | | | | 1,198,423 | |
| | |
Discover Financial Services | | | 6,555 | | | | 742,813 | |
| | |
Synchrony Financial | | | 16,215 | | | | 753,187 | |
| | | | | | | | 3,366,209 | |
|
| Distributors – 0.6% | |
| | |
LKQ Corp.* | | | 805 | | | | 44,339 | |
| | |
Pool Corp. | | | 1,610 | | | | 829,408 | |
| | | | | | | | 873,747 | |
|
| Diversified Financial Services – 1.6% | |
| | |
Berkshire Hathaway, Inc., Class B* | | | 7,935 | | | | 2,277,424 | |
|
| Diversified Telecommunication Services – 0.7% | |
| | |
AT&T, Inc. | | | 20,470 | | | | 517,072 | |
| | |
Verizon Communications, Inc. | | | 9,315 | | | | 493,602 | |
| | | | | | | | 1,010,674 | |
|
| Electric Utilities – 2.1% | |
| | |
Duke Energy Corp. | | | 2,185 | | | | 222,892 | |
| | |
Evergy, Inc. | | | 10,925 | | | | 696,469 | |
| | |
Exelon Corp. | | | 17,365 | | | | 923,644 | |
| | |
Southern Co. (The) | | | 18,285 | | | | 1,139,521 | |
| | | | | | | | 2,982,526 | |
See Accompanying Notes to the Financial Statements.
| | | | | | |
| | FLEXSHARES ANNUAL REPORT | | | 269 | |
FlexShares® US Quality Large Cap Index Fund (cont.)
| | | | | | | | |
| Investments | | Shares | | | Value | |
|
| COMMON STOCKS – (continued) | |
|
| Electrical Equipment – 0.7% | |
| | |
Eaton Corp. plc | | | 2,185 | | | $ | 360,001 | |
| | |
Emerson Electric Co. | | | 1,265 | | | | 122,718 | |
| | |
Generac Holdings, Inc.* | | | 1,035 | | | | 516,009 | |
| | | | | | | | 998,728 | |
|
| Energy Equipment & Services – 0.2% | |
| | |
Schlumberger NV | | | 8,510 | | | | 274,533 | |
|
| Entertainment – 1.4% | |
| | |
Activision Blizzard, Inc. | | | 13,225 | | | | 1,034,063 | |
| | |
Electronic Arts, Inc. | | | 5,175 | | | | 725,794 | |
| | |
Netflix, Inc.* | | | 284 | | | | 196,048 | |
| | | | | | | | 1,955,905 | |
|
| Equity Real Estate Investment Trusts (REITs) – 1.7% | |
| | |
Essex Property Trust, Inc. | | | 115 | | | | 39,092 | |
| | |
Iron Mountain, Inc. | | | 16,215 | | | | 740,052 | |
| | |
Mid-America Apartment Communities, Inc. | | | 230 | | | | 46,968 | |
| | |
Public Storage | | | 2,760 | | | | 916,817 | |
| | |
Weyerhaeuser Co. | | | 19,665 | | | | 702,434 | |
| | | | | | | | 2,445,363 | |
|
| Food & Staples Retailing – 0.3% | |
| | |
Walmart, Inc. | | | 2,530 | | | | 378,033 | |
|
| Food Products – 0.7% | |
| | |
Campbell Soup Co. | | | 4,485 | | | | 179,176 | |
| | |
General Mills, Inc. | | | 2,990 | | | | 184,782 | |
| | |
Hershey Co. (The) | | | 1,495 | | | | 262,148 | |
| | |
Kraft Heinz Co. (The) | | | 9,200 | | | | 330,188 | |
| | | | | | | | 956,294 | |
|
| Health Care Equipment & Supplies – 1.6% | |
| | |
Abbott Laboratories | | | 2,070 | | | | 266,803 | |
| | |
Danaher Corp. | | | 460 | | | | 143,414 | |
| | |
Hologic, Inc.* | | | 4,830 | | | | 354,087 | |
| | |
IDEXX Laboratories, Inc.* | | | 1,495 | | | | 995,879 | |
| | |
ResMed, Inc. | | | 2,070 | | | | 544,224 | |
| | | | | | | | 2,304,407 | |
|
| Health Care Providers & Services – 3.5% | |
| | |
Anthem, Inc. | | | 575 | | | | 250,200 | |
| | | | | | | | |
| Investments | | Shares | | | Value | |
|
| Health Care Providers & Services – (continued) | |
| | |
Cardinal Health, Inc. | | | 8,855 | | | $ | 423,357 | |
| | |
Cigna Corp. | | | 345 | | | | 73,695 | |
| | |
DaVita, Inc.* | | | 2,990 | | | | 308,688 | |
| | |
HCA Healthcare, Inc. | | | 4,715 | | | | 1,180,919 | |
| | |
Laboratory Corp. of America Holdings* | | | 2,645 | | | | 759,168 | |
| | |
McKesson Corp. | | | 3,795 | | | | 788,905 | |
| | |
UnitedHealth Group, Inc. | | | 2,645 | | | | 1,217,943 | |
| | | | | | | | 5,002,875 | |
|
| Health Care Technology – 0.5% | |
| | |
Cerner Corp. | | | 8,280 | | | | 615,121 | |
| | |
Veeva Systems, Inc., Class A* | | | 115 | | | | 36,456 | |
| | | | | | | | 651,577 | |
|
| Hotels, Restaurants & Leisure – 0.3% | |
| | |
Yum! Brands, Inc. | | | 2,990 | | | | 373,571 | |
|
| Household Durables – 0.9% | |
| | |
Lennar Corp., Class A | | | 5,520 | | | | 551,614 | |
| | |
PulteGroup, Inc. | | | 12,420 | | | | 597,153 | |
| | |
Whirlpool Corp. | | | 1,035 | | | | 218,209 | |
| | | | | | | | 1,366,976 | |
|
| Household Products – 2.2% | |
| | |
Colgate-Palmolive Co. | | | 12,995 | | | | 990,089 | |
| | |
Procter & Gamble Co. (The) | | | 15,525 | | | | 2,219,920 | |
| | | | | | | | 3,210,009 | |
|
Independent Power and Renewable Electricity
Producers – 0.5% | |
| | |
AES Corp. (The) | | | 31,625 | | | | 794,736 | |
|
| Industrial Conglomerates – 0.4% | |
| | |
Honeywell International, Inc. | | | 2,415 | | | | 527,967 | |
|
| Insurance – 2.2% | |
| | |
Aflac, Inc. | | | 5,405 | | | | 290,086 | |
| | |
Allstate Corp. (The) | | | 5,865 | | | | 725,325 | |
| | |
American International Group, Inc. | | | 14,030 | | | | 829,033 | |
| | |
MetLife, Inc. | | | 13,340 | | | | 837,752 | |
| | |
Prudential Financial, Inc. | | | 4,025 | | | | 442,951 | |
| | | | | | | | 3,125,147 | |
See Accompanying Notes to the Financial Statements.
| | | | |
| 270 | | FLEXSHARES ANNUAL REPORT | | |
FlexShares® US Quality Large Cap Index Fund (cont.)
| | | | | | | | |
| Investments | | Shares | | | Value | |
|
| COMMON STOCKS – (continued) | |
|
| Interactive Media & Services – 8.7% | |
| | |
Alphabet, Inc., Class A* | | | 1,693 | | | $ | 5,012,839 | |
| | |
Alphabet, Inc., Class C* | | | 1,610 | | | | 4,774,310 | |
| | |
Meta Platforms, Inc., Class A* | | | 8,740 | | | | 2,828,002 | |
| | | | | | | | 12,615,151 | |
|
| Internet & Direct Marketing Retail – 3.0% | |
| | |
Amazon.com, Inc.* | | | 953 | | | | 3,213,925 | |
| | |
eBay, Inc. | | | 11,040 | | | | 846,989 | |
| | |
Etsy, Inc.* (b) | | | 1,265 | | | | 317,123 | |
| | | | | | | | 4,378,037 | |
|
| IT Services – 4.2% | |
| | |
Accenture plc, Class A | | | 3,910 | | | | 1,402,869 | |
| | |
Cognizant Technology Solutions Corp., Class A | | | 5,175 | | | | 404,116 | |
| | |
Gartner, Inc.* | | | 2,070 | | | | 687,054 | |
| | |
Jack Henry & Associates, Inc. | | | 2,760 | | | | 459,485 | |
| | |
Mastercard, Inc., Class A | | | 1,495 | | | | 501,602 | |
| | |
Paychex, Inc. | | | 1,955 | | | | 241,012 | |
| | |
Square, Inc., Class A* (b) | | | 460 | | | | 117,070 | |
| | |
Visa, Inc., Class A(b) | | | 10,925 | | | | 2,313,587 | |
| | | | | | | | 6,126,795 | |
|
| Life Sciences Tools & Services – 1.1% | |
| | |
ICON plc* | | | 345 | | | | 98,936 | |
| | |
Mettler-Toledo International, Inc.* | | | 529 | | | | 783,385 | |
| | |
Waters Corp.* | | | 1,955 | | | | 718,560 | |
| | | | | | | | 1,600,881 | |
|
| Machinery – 1.4% | |
| | |
Dover Corp. | | | 460 | | | | 77,777 | |
| | |
Illinois Tool Works, Inc. | | | 5,290 | | | | 1,205,432 | |
| | |
Parker-Hannifin Corp. | | | 2,530 | | | | 750,373 | |
| | | | | | | | 2,033,582 | |
|
| Media – 1.9% | |
| | |
Comcast Corp., Class A | | | 7,820 | | | | 402,183 | |
| | |
Discovery, Inc., Class A* (b) | | | 24,610 | | | | 576,858 | |
| | |
Discovery, Inc., Class C* (b) | | | 12,995 | | | | 293,167 | |
| | |
DISH Network Corp., Class A* | | | 3,105 | | | | 127,522 | |
| | |
Fox Corp., Class A | | | 1,265 | | | | 50,271 | |
| | |
Interpublic Group of Cos., Inc. (The) | | | 20,585 | | | | 752,794 | |
| | | | | | | | |
| Investments | | Shares | | | Value | |
|
| Media – (continued) | |
| | |
Omnicom Group, Inc. | | | 7,590 | | | $ | 516,727 | |
| | | | | | | | 2,719,522 | |
|
| Metals & Mining – 0.8% | |
| | |
Freeport-McMoRan, Inc. | | | 10,810 | | | | 407,753 | |
| | |
Newmont Corp. | | | 13,455 | | | | 726,570 | |
| | | | | | | | 1,134,323 | |
|
| Multiline Retail – 1.3% | |
| | |
Target Corp. | | | 7,245 | | | | 1,880,947 | |
|
| Multi-Utilities – 0.7% | |
| | |
DTE Energy Co. | | | 920 | | | | 104,282 | |
| | |
Public Service Enterprise Group, Inc. | | | 12,075 | | | | 770,385 | |
| | |
WEC Energy Group, Inc. | | | 1,380 | | | | 124,283 | |
| | | | | | | | 998,950 | |
|
| Oil, Gas & Consumable Fuels – 1.6% | |
| | |
EOG Resources, Inc. | | | 12,880 | | | | 1,190,885 | |
| | |
Kinder Morgan, Inc. | | | 31,280 | | | | 523,940 | |
| | |
Occidental Petroleum Corp. | | | 19,780 | | | | 663,223 | |
| | | | | | | | 2,378,048 | |
|
| Pharmaceuticals – 4.8% | |
| | |
Eli Lilly and Co. | | | 9,315 | | | | 2,373,089 | |
| | |
Johnson & Johnson | | | 17,940 | | | | 2,922,067 | |
| | |
Pfizer, Inc. | | | 37,605 | | | | 1,644,843 | |
| | | | | | | | 6,939,999 | |
|
| Real Estate Management & Development – 0.6% | |
| | |
CBRE Group, Inc., Class A* | | | 8,510 | | | | 885,721 | |
|
| Road & Rail – 0.5% | |
| | |
Old Dominion Freight Line, Inc. | | | 2,070 | | | | 706,595 | |
|
| Semiconductors & Semiconductor Equipment – 5.5% | |
| | |
Applied Materials, Inc. | | | 6,210 | | | | 848,597 | |
| | |
Broadcom, Inc. | | | 1,725 | | | | 917,131 | |
| | |
Intel Corp. | | | 22,310 | | | | 1,093,190 | |
| | |
KLA Corp. | | | 1,840 | | | | 685,878 | |
| | |
Lam Research Corp. | | | 2,070 | | | | 1,166,590 | |
| | |
Microchip Technology, Inc. | | | 690 | | | | 51,122 | |
| | |
NVIDIA Corp. | | | 2,185 | | | | 558,639 | |
| | |
QUALCOMM, Inc. | | | 3,105 | | | | 413,089 | |
See Accompanying Notes to the Financial Statements.
| | | | | | |
| | FLEXSHARES ANNUAL REPORT | | | 271 | |
FlexShares® US Quality Large Cap Index Fund (cont.)
| | | | | | | | |
| Investments | | Shares | | | Value | |
|
| COMMON STOCKS – (continued) | |
|
| Semiconductors & Semiconductor Equipment – (continued) | |
| | |
Texas Instruments, Inc. | | | 11,730 | | | $ | 2,199,140 | |
| | | | | | | | 7,933,376 | |
|
| Software – 11.7% | |
| | |
Adobe, Inc.* | | | 4,255 | | | | 2,767,282 | |
| | |
Autodesk, Inc.* | | | 1,265 | | | | 401,776 | |
| | |
Check Point Software Technologies Ltd.* | | | 5,060 | | | | 605,176 | |
| | |
Fair Isaac Corp.* | | | 575 | | | | 228,965 | |
| | |
Fortinet, Inc.* | | | 1,955 | | | | 657,545 | |
| | |
Intuit, Inc. | | | 4,025 | | | | 2,519,610 | |
| | |
Microsoft Corp. | | | 20,585 | | | | 6,826,398 | |
| | |
Oracle Corp. | | | 25,990 | | | | 2,493,480 | |
| | |
SS&C Technologies Holdings, Inc. | | | 345 | | | | 27,417 | |
| | |
Zoom Video Communications, Inc., Class A* | | | 1,380 | | | | 379,017 | |
| | | | | | | | 16,906,666 | |
|
| Specialty Retail – 2.8% | |
| | |
AutoZone, Inc.* | | | 460 | | | | 821,027 | |
| | |
Bath & Body Works, Inc. | | | 5,980 | | | | 413,158 | |
| | |
Best Buy Co., Inc. | | | 3,910 | | | | 477,958 | |
| | |
Home Depot, Inc. (The) | | | 3,565 | | | | 1,325,253 | |
| | |
Lowe’s Cos., Inc. | | | 4,255 | | | | 994,904 | |
| | | | | | | | 4,032,300 | |
|
| Technology Hardware, Storage & Peripherals – 7.6% | |
| | |
Apple, Inc. | | | 69,460 | | | | 10,405,108 | |
| | |
HP, Inc. | | | 14,375 | | | | 435,994 | |
| | |
NetApp, Inc. | | | 1,150 | | | | 102,695 | |
| | |
Seagate Technology Holdings plc | | | 920 | | | | 81,944 | |
| | | | | | | | 11,025,741 | |
|
| Tobacco – 0.7% | |
| | |
Altria Group, Inc. | | | 4,600 | | | | 202,906 | |
| | |
Philip Morris International, Inc. | | | 9,315 | | | | 880,640 | |
| | | | | | | | 1,083,546 | |
|
| Trading Companies & Distributors – 0.5% | |
| | |
United Rentals, Inc.* | | | 1,035 | | | | 392,379 | |
| | |
WW Grainger, Inc. | | | 690 | | | | 319,546 | |
| | | | | | | | 711,925 | |
Total Common Stocks
(Cost $111,180,900) | | | | 142,459,103 | |
| | | | | | | | |
| Investments | | Principal
Amount | | | Value ($) | |
|
| SECURITIES LENDING REINVESTMENTS(c) – 0.1% | |
|
| REPURCHASE AGREEMENTS – 0.1% | |
| | |
Citigroup Global Markets, Inc., 0.05%, dated 10/31/2021, due 11/1/2021, repurchase price $109,616, collateralized by various U.S. Treasury Securities, ranging from 0.75% – 4.63%, maturing 2/15/2040 – 2/15/2042; total market value $110,605
(Cost $109,616) | | $ | 109,616 | | | $ | 109,616 | |
Total Investments – 98.7%
(Cost $111,290,516) | | | | 142,568,719 | |
| |
Other assets less liabilities – 1.3% | | | | 1,906,530 | |
| NET ASSETS – 100.0% | | | $ | 144,475,249 | |
| * | Non-income producing security. |
| (a) | Amount represents less than one share. |
| (b) | The security or a portion of this security is on loan at October 31, 2021. The total value of securities on loan at October 31, 2021 was $3,078,424, collateralized in the form of cash with a value of $109,616 that was reinvested in the securities shown in the Securities Lending Reinvestment section of the Schedule of Investments and $3,031,300 of collateral in the form of U.S. Government Treasury Securities, interest rates ranging from 0.00% – 7.25%, and maturity dates ranging from November 23, 2021 – February 15, 2051; a total value of $3,140,916. |
| (c) | The security was purchased with cash collateral held from securities on loan at October 31, 2021. The total value of securities purchased was $109,616. |
Percentages shown are based on Net Assets.
As of October 31, 2021, the gross unrealized appreciation (depreciation) of investments based on the aggregate cost of investments (including derivative instruments, if applicable) for federal income tax purposes was as follows:
| | | | |
| | |
Aggregate gross unrealized appreciation | | $ | 32,899,365 | |
Aggregate gross unrealized depreciation | | | (1,626,181 | ) |
Net unrealized appreciation | | $ | 31,273,184 | |
Federal income tax cost | | $ | 111,342,358 | |
See Accompanying Notes to the Financial Statements.
| | | | |
| 272 | | FLEXSHARES ANNUAL REPORT | | |
FlexShares® US Quality Large Cap Index Fund (cont.)
Futures Contracts
FlexShares® US Quality Large Cap Index Fund had the following open futures contracts as of October 31, 2021:
| | | | | | | | | | | | | | | | | | | | |
| | | Number of
Contracts | | | Expiration
Date | | | Trading
Currency | | | Notional
Amount | | | Value and
Unrealized
Appreciation* | |
Long Contracts | | | | | |
S&P 500 E-Mini Index | | | 8 | | | | 12/17/2021 | | | | USD | | | $ | 1,838,800 | | | $ | 46,823 | |
| * | This amount represents the cumulative appreciation/depreciation on futures contracts. Current day’s variation margin is reported within the Statement of Assets and Liabilities for futures contracts. |
Abbreviations:
USD – US Dollar
| | | | |
| Security Type | | % of Net Assets | |
Common Stocks | | | 98.6 | % |
Securities Lending Reinvestments | | | 0.1 | |
Others(1) | | | 1.3 | |
| | | | 100.0 | % |
| (1) | Includes any other net assets/(liabilities). |
See Accompanying Notes to the Financial Statements.
| | | | | | |
| | FLEXSHARES ANNUAL REPORT | | | 273 | |
Schedule of Investments
FlexShares® STOXX® US ESG Select Index Fund
October 31, 2021
| | | | | | | | |
| Investments | | Shares | | | Value | |
|
| COMMON STOCKS – 99.3% | |
|
| Air Freight & Logistics – 0.5% | |
| | |
CH Robinson Worldwide, Inc. | | | 1,360 | | | $ | 131,906 | |
| | |
FedEx Corp. | | | 1,428 | | | | 336,337 | |
| | |
United Parcel Service, Inc., Class B | | | 2,380 | | | | 508,059 | |
| | | | | | | | 976,302 | |
|
| Auto Components – 0.1% | |
| | |
Aptiv plc* (a) | | | 952 | | | | 164,591 | |
|
| Automobiles – 5.2% | |
| | |
Ford Motor Co.* | | | 12,580 | | | | 214,866 | |
| | |
General Motors Co.* | | | 14,416 | | | | 784,663 | |
| | |
Tesla, Inc.* | | | 8,092 | | | | 9,014,488 | |
| | | | | | | | 10,014,017 | |
|
| Banks – 6.3% | |
| | |
Bank of America Corp. | | | 73,372 | | | | 3,505,714 | |
| | |
Citigroup, Inc. | | | 20,740 | | | | 1,434,378 | |
| | |
Fifth Third Bancorp | | | 5,508 | | | | 239,763 | |
| | |
Huntington Bancshares, Inc. | | | 9,724 | | | | 153,056 | |
| | |
JPMorgan Chase & Co. | | | 25,432 | | | | 4,320,643 | |
| | |
KeyCorp | | | 9,248 | | | | 215,201 | |
| | |
PNC Financial Services Group, Inc. (The) | | | 3,400 | | | | 717,502 | |
| | |
Regions Financial Corp. | | | 6,460 | | | | 152,973 | |
| | |
Truist Financial Corp. | | | 9,384 | | | | 595,603 | |
| | |
US Bancorp | | | 13,328 | | | | 804,611 | |
| | | | | | | | 12,139,444 | |
|
| Beverages – 2.0% | |
| | |
Coca-Cola Co. (The) | | | 27,200 | | | | 1,533,264 | |
| | |
Coca-Cola Europacific Partners plc | | | 1,972 | | | | 103,826 | |
| | |
Keurig Dr Pepper, Inc. | | | 1,836 | | | | 66,261 | |
| | |
PepsiCo, Inc. | | | 13,328 | | | | 2,153,805 | |
| | | | | | | | 3,857,156 | |
|
| Biotechnology – 1.1% | |
| | |
AbbVie, Inc. | | | 8,840 | | | | 1,013,683 | |
| | |
Gilead Sciences, Inc. | | | 4,352 | | | | 282,358 | |
| | |
Regeneron Pharmaceuticals, Inc.* | | | 476 | | | | 304,611 | |
| | |
Vertex Pharmaceuticals, Inc.* | | | 2,584 | | | | 477,859 | |
| | | | | | | | 2,078,511 | |
| | | | | | | | |
| Investments | | Shares | | | Value | |
|
| Building Products – 0.4% | |
| | |
Johnson Controls International plc | | | 5,372 | | | $ | 394,144 | |
| | |
Trane Technologies plc | | | 1,700 | | | | 307,581 | |
| | | | | | | | 701,725 | |
|
| Capital Markets – 3.3% | |
| | |
Bank of New York Mellon Corp. (The) | | | 3,060 | | | | 181,152 | |
| | |
BlackRock, Inc. | | | 1,428 | | | | 1,347,261 | |
| | |
CME Group, Inc. | | | 1,292 | | | | 284,951 | |
| | |
FactSet Research Systems, Inc. | | | 136 | | | | 60,369 | |
| | |
Goldman Sachs Group, Inc. (The) | | | 3,264 | | | | 1,349,174 | |
| | |
Moody’s Corp. | | | 1,020 | | | | 412,233 | |
| | |
Morgan Stanley | | | 14,008 | | | | 1,439,742 | |
| | |
Raymond James Financial, Inc. | | | 1,122 | | | | 110,618 | |
| | |
S&P Global, Inc. | | | 1,972 | | | | 935,044 | |
| | |
State Street Corp. | | | 3,060 | | | | 301,563 | |
| | | | | | | | 6,422,107 | |
|
| Chemicals – 1.2% | |
| | |
Air Products and Chemicals, Inc. | | | 1,156 | | | | 346,580 | |
| | |
Albemarle Corp. | | | 340 | | | | 85,160 | |
| | |
Celanese Corp. | | | 1,224 | | | | 197,688 | |
| | |
Corteva, Inc. | | | 2,652 | | | | 114,434 | |
| | |
Ecolab, Inc. | | | 2,380 | | | | 528,884 | |
| | |
International Flavors & Fragrances, Inc. | | | 1,632 | | | | 240,638 | |
| | |
PPG Industries, Inc. | | | 1,224 | | | | 196,538 | |
| | |
Sherwin-Williams Co. (The) | | | 1,972 | | | | 624,355 | |
| | | | | | | | 2,334,277 | |
|
| Commercial Services & Supplies – 0.2% | |
| | |
Cintas Corp. | | | 952 | | | | 412,311 | |
|
| Communications Equipment – 0.8% | |
| | |
Arista Networks, Inc.* | | | 68 | | | | 27,859 | |
| | |
Cisco Systems, Inc. | | | 27,472 | | | | 1,537,608 | |
| | | | | | | | 1,565,467 | |
|
| Consumer Finance – 0.7% | |
| | |
American Express Co. | | | 3,196 | | | | 555,401 | |
| | |
Capital One Financial Corp. | | | 3,400 | | | | 513,502 | |
| | |
Synchrony Financial | | | 5,236 | | | | 243,212 | |
| | | | | | | | 1,312,115 | |
See Accompanying Notes to the Financial Statements.
| | | | |
| 274 | | FLEXSHARES ANNUAL REPORT | | |
FlexShares® STOXX® US ESG Select Index Fund (cont.)
| | | | | | | | |
| Investments | | Shares | | | Value | |
|
| COMMON STOCKS – (continued) | |
|
| Containers & Packaging – 0.3% | |
| | |
Amcor plc | | | 4,692 | | | $ | 56,632 | |
| | |
Ball Corp. | | | 2,448 | | | | 223,943 | |
| | |
International Paper Co. | | | 1,632 | | | | 81,062 | |
| | |
Packaging Corp. of America | | | 816 | | | | 112,094 | |
| | |
Westrock Co. | | | 1,632 | | | | 78,499 | |
| | | | | | | | 552,230 | |
|
| Distributors – 0.1% | |
| | |
LKQ Corp.* | | | 204 | | | | 11,236 | |
| | |
Pool Corp. | | | 340 | | | | 175,155 | |
| | | | | | | | 186,391 | |
|
| Diversified Telecommunication Services – 1.6% | |
| | |
AT&T, Inc. | | | 47,396 | | | | 1,197,223 | |
| | |
Lumen Technologies, Inc.(a) | | | 7,888 | | | | 93,552 | |
| | |
Verizon Communications, Inc. | | | 34,136 | | | | 1,808,866 | |
| | | | | | | | 3,099,641 | |
|
| Electric Utilities – 0.9% | |
| | |
Alliant Energy Corp. | | | 2,176 | | | | 123,096 | |
| | |
Duke Energy Corp. | | | 5,100 | | | | 520,251 | |
| | |
Edison International | | | 2,312 | | | | 145,494 | |
| | |
Entergy Corp. | | | 1,360 | | | | 140,107 | |
| | |
Eversource Energy | | | 2,584 | | | | 219,382 | |
| | |
FirstEnergy Corp. | | | 4,420 | | | | 170,303 | |
| | |
NextEra Energy, Inc. | | | 5,984 | | | | 510,615 | |
| | | | | | | | 1,829,248 | |
|
| Electrical Equipment – 0.8% | |
| | |
AMETEK, Inc. | | | 1,768 | | | | 234,083 | |
| | |
Eaton Corp. plc | | | 3,060 | | | | 504,166 | |
| | |
Emerson Electric Co. | | | 6,052 | | | | 587,104 | |
| | |
Rockwell Automation, Inc. | | | 952 | | | | 304,069 | |
| | | | | | | | 1,629,422 | |
|
| Electronic Equipment, Instruments & Components – 0.5% | |
| | |
Amphenol Corp., Class A | | | 2,448 | | | | 187,933 | |
| | |
Keysight Technologies, Inc.* | | | 1,020 | | | | 183,620 | |
| | |
TE Connectivity Ltd. | | | 1,904 | | | | 277,984 | |
| | |
Teledyne Technologies, Inc.* | | | 408 | | | | 183,282 | |
| | |
Trimble, Inc.* | | | 1,496 | | | | 130,706 | |
| | | | | | | | 963,525 | |
| | | | | | | | |
| Investments | | Shares | | | Value | |
|
| Energy Equipment & Services – 0.4% | |
| | |
Baker Hughes Co. | | | 3,740 | | | $ | 93,799 | |
| | |
Halliburton Co. | | | 6,868 | | | | 171,632 | |
| | |
Schlumberger NV | | | 14,824 | | | | 478,222 | |
| | | | | | | | 743,653 | |
|
| Entertainment – 1.3% | |
| | |
Walt Disney Co. (The)* | | | 14,960 | | | | 2,529,287 | |
|
| Equity Real Estate Investment Trusts (REITs) – 2.5% | |
| | |
American Tower Corp. | | | 3,672 | | | | 1,035,394 | |
| | |
AvalonBay Communities, Inc. | | | 612 | | | | 144,848 | |
| | |
Digital Realty Trust, Inc. | | | 2,244 | | | | 354,126 | |
| | |
Duke Realty Corp. | | | 408 | | | | 22,946 | |
| | |
Equinix, Inc.(a) | | | 748 | | | | 626,128 | |
| | |
Equity LifeStyle Properties, Inc. | | | 1,904 | | | | 160,907 | |
| | |
Essex Property Trust, Inc. | | | 340 | | | | 115,576 | |
| | |
Healthpeak Properties, Inc. | | | 5,916 | | | | 210,077 | |
| | |
Host Hotels & Resorts, Inc.* (a) | | | 5,236 | | | | 88,122 | |
| | |
Invitation Homes, Inc. | | | 1,768 | | | | 72,930 | |
| | |
Iron Mountain, Inc. | | | 2,108 | | | | 96,209 | |
| | |
Prologis, Inc. | | | 4,216 | | | | 611,151 | |
| | |
Realty Income Corp. | | | 1,904 | | | | 136,003 | |
| | |
Simon Property Group, Inc. | | | 1,632 | | | | 239,219 | |
| | |
UDR, Inc.(a) | | | 680 | | | | 37,761 | |
| | |
Ventas, Inc. | | | 3,468 | | | | 185,087 | |
| | |
Welltower, Inc. | | | 4,148 | | | | 333,499 | |
| | |
Weyerhaeuser Co. | | | 5,032 | | | | 179,743 | |
| | |
WP Carey, Inc.(a) | | | 2,244 | | | | 173,035 | |
| | | | | | | | 4,822,761 | |
|
| Food & Staples Retailing – 0.3% | |
| | |
Kroger Co. (The) | | | 5,576 | | | | 223,151 | |
| | |
Sysco Corp. | | | 1,904 | | | | 146,418 | |
| | |
Walgreens Boots Alliance, Inc. | | | 4,488 | | | | 211,026 | |
| | | | | | | | 580,595 | |
|
| Food Products – 0.5% | |
| | |
Archer-Daniels-Midland Co. | | | 2,380 | | | | 152,891 | |
| | |
General Mills, Inc. | | | 3,468 | | | | 214,323 | |
| | |
Hershey Co. (The) | | | 612 | | | | 107,314 | |
| | |
Hormel Foods Corp. | | | 1,972 | | | | 83,455 | |
| | |
J M Smucker Co. (The) | | | 1,020 | | | | 125,317 | |
| | |
Kellogg Co. | | | 2,040 | | | | 125,052 | |
| | |
McCormick & Co., Inc. (Non-Voting) | | | 680 | | | | 54,557 | |
See Accompanying Notes to the Financial Statements.
| | | | | | |
| | FLEXSHARES ANNUAL REPORT | | | 275 | |
FlexShares® STOXX® US ESG Select Index Fund (cont.)
| | | | | | | | |
| Investments | | Shares | | | Value | |
|
| COMMON STOCKS – (continued) | |
|
| Food Products – (continued) | |
| | |
Tyson Foods, Inc., Class A | | | 1,292 | | | $ | 103,321 | |
| | | | | | | | 966,230 | |
|
| Health Care Equipment & Supplies – 3.6% | |
| | |
Abbott Laboratories | | | 14,552 | | | | 1,875,607 | |
| | |
Align Technology, Inc.* | | | 204 | | | | 127,371 | |
| | |
Baxter International, Inc. | | | 2,244 | | | | 177,186 | |
| | |
Becton Dickinson and Co. | | | 2,380 | | | | 570,224 | |
| | |
Boston Scientific Corp.* | | | 11,424 | | | | 492,717 | |
| | |
Danaher Corp. | | | 2,380 | | | | 742,013 | |
| | |
Edwards Lifesciences Corp.* | | | 4,352 | | | | 521,457 | |
| | |
Hologic, Inc.* | | | 2,516 | | | | 184,448 | |
| | |
IDEXX Laboratories, Inc.* | | | 408 | | | | 271,785 | |
| | |
Insulet Corp.* | | | 544 | | | | 168,651 | |
| | |
Medtronic plc | | | 7,140 | | | | 855,800 | |
| | |
ResMed, Inc. | | | 1,156 | | | | 303,924 | |
| | |
STERIS plc | | | 340 | | | | 79,472 | |
| | |
West Pharmaceutical Services, Inc. | | | 476 | | | | 204,623 | |
| | |
Zimmer Biomet Holdings, Inc. | | | 1,700 | | | | 243,304 | |
| | | | | | | | 6,818,582 | |
|
| Health Care Providers & Services – 2.5% | |
| | |
AmerisourceBergen Corp. | | | 816 | | | | 99,568 | |
| | |
Anthem, Inc. | | | 2,448 | | | | 1,065,198 | |
| | |
CVS Health Corp. | | | 8,636 | | | | 771,022 | |
| | |
Humana, Inc. | | | 748 | | | | 346,444 | |
| | |
Laboratory Corp. of America Holdings* | | | 408 | | | | 117,104 | |
| | |
McKesson Corp. | | | 1,088 | | | | 226,174 | |
| | |
UnitedHealth Group, Inc. | | | 4,556 | | | | 2,097,901 | |
| | | | | | | | 4,723,411 | |
|
| Health Care Technology – 0.2% | |
| | |
Cerner Corp. | | | 544 | | | | 40,414 | |
| | |
Veeva Systems, Inc., Class A* | | | 1,292 | | | | 409,577 | |
| | | | | | | | 449,991 | |
|
| Hotels, Restaurants & Leisure – 1.2% | |
| | |
Booking Holdings, Inc.* | | | 204 | | | | 493,839 | |
| | |
Domino’s Pizza, Inc. | | | 340 | | | | 166,250 | |
| | |
Marriott International, Inc., Class A* | | | 2,788 | | | | 446,136 | |
| | |
MGM Resorts International | | | 2,720 | | | | 128,275 | |
| | | | | | | | |
| Investments | | Shares | | | Value | |
|
| Hotels, Restaurants & Leisure – (continued) | |
| | |
Starbucks Corp. | | | 6,460 | | | $ | 685,212 | |
| | |
Wynn Resorts Ltd.* (a) | | | 68 | | | | 6,107 | |
| | |
Yum! Brands, Inc. | | | 2,312 | | | | 288,861 | |
| | | | | | | | 2,214,680 | |
|
| Household Durables – 0.0%(b) | |
| | |
Whirlpool Corp. | | | 272 | | | | 57,346 | |
|
| Household Products – 2.3% | |
| | |
Church & Dwight Co., Inc. | | | 1,700 | | | | 148,512 | |
| | |
Clorox Co. (The) | | | 1,020 | | | | 166,270 | |
| | |
Colgate-Palmolive Co. | | | 6,936 | | | | 528,454 | |
| | |
Kimberly-Clark Corp. | | | 952 | | | | 123,275 | |
| | |
Procter & Gamble Co. (The) | | | 24,004 | | | | 3,432,332 | |
| | | | | | | | 4,398,843 | |
|
Independent Power and Renewable Electricity Producers –
0.0%(b) | |
| | |
AES Corp. (The) | | | 2,176 | | | | 54,683 | |
|
| Industrial Conglomerates – 1.3% | |
| | |
3M Co. | | | 5,848 | | | | 1,044,921 | |
| | |
General Electric Co. | | | 10,880 | | | | 1,140,985 | |
| | |
Roper Technologies, Inc. | | | 476 | | | | 232,226 | |
| | | | | | | | 2,418,132 | |
|
| Insurance – 1.2% | |
| | |
Aflac, Inc. | | | 5,372 | | | | 288,315 | |
| | |
Aon plc, Class A | | | 1,292 | | | | 413,337 | |
| | |
Hartford Financial Services Group, Inc. (The) | | | 1,632 | | | | 119,022 | |
| | |
Loews Corp. | | | 544 | | | | 30,502 | |
| | |
MetLife, Inc. | | | 5,712 | | | | 358,714 | |
| | |
Principal Financial Group, Inc. | | | 2,176 | | | | 145,988 | |
| | |
Progressive Corp. (The) | | | 5,100 | | | | 483,888 | |
| | |
Prudential Financial, Inc. | | | 1,904 | | | | 209,535 | |
| | |
Travelers Cos., Inc. (The) | | | 1,088 | | | | 175,037 | |
| | | | | | | | 2,224,338 | |
|
| Interactive Media & Services – 8.4% | |
| | |
Alphabet, Inc., Class C* | | | 2,788 | | | | 8,267,563 | |
| | |
Meta Platforms, Inc., Class A* | | | 23,732 | | | | 7,678,963 | |
| | |
Pinterest, Inc., Class A* | | | 2,788 | | | | 124,456 | |
| | |
Zillow Group, Inc., Class C* (a) | | | 68 | | | | 7,047 | |
| | | | | | | | 16,078,029 | |
See Accompanying Notes to the Financial Statements.
| | | | |
| 276 | | FLEXSHARES ANNUAL REPORT | | |
FlexShares® STOXX® US ESG Select Index Fund (cont.)
| | | | | | | | |
| Investments | | Shares | | | Value | |
|
| COMMON STOCKS – (continued) | |
|
| Internet & Direct Marketing Retail – 5.1% | |
| | |
Amazon.com, Inc.* | | | 2,652 | | | $ | 8,943,684 | |
| | |
eBay, Inc. | | | 5,168 | | | | 396,489 | |
| | |
Etsy, Inc.* (a) | | | 1,020 | | | | 255,704 | |
| | |
Farfetch Ltd., Class A* | | | 3,128 | | | | 122,649 | |
| | | | | | | | 9,718,526 | |
|
| IT Services – 3.9% | |
| | |
Accenture plc, Class A | | | 6,460 | | | | 2,317,784 | |
| | |
Akamai Technologies, Inc.* | | | 544 | | | | 57,370 | |
| | |
Automatic Data Processing, Inc. | | | 2,108 | | | | 473,225 | |
| | |
Broadridge Financial Solutions, Inc. | | | 408 | | | | 72,791 | |
| | |
Cognizant Technology Solutions Corp., Class A | | | 4,352 | | | | 339,848 | |
| | |
EPAM Systems, Inc.* | | | 136 | | | | 91,561 | |
| | |
Fidelity National Information Services, Inc. | | | 3,264 | | | | 361,455 | |
| | |
Gartner, Inc.* | | | 408 | | | | 135,419 | |
| | |
International Business Machines Corp. | | | 8,432 | | | | 1,054,843 | |
| | |
Mastercard, Inc., Class A | | | 7,208 | | | | 2,418,428 | |
| | |
Wix.com Ltd.* (a) | | | 476 | | | | 88,517 | |
| | | | | | | | 7,411,241 | |
|
| Leisure Products – 0.0%(b) | |
| | |
Hasbro, Inc. | | | 680 | | | | 65,117 | |
|
| Life Sciences Tools & Services – 1.0% | |
| | |
Agilent Technologies, Inc. | | | 2,108 | | | | 331,989 | |
| | |
Bio-Rad Laboratories, Inc., Class A* | | | 136 | | | | 108,076 | |
| | |
Charles River Laboratories International, Inc.* | | | 204 | | | | 91,531 | |
| | |
Illumina, Inc.* | | | 748 | | | | 310,465 | |
| | |
Mettler-Toledo International, Inc.* | | | 204 | | | | 302,100 | |
| | |
Thermo Fisher Scientific, Inc. | | | 1,292 | | | | 817,926 | |
| | | | | | | | 1,962,087 | |
|
| Machinery – 1.7% | |
| | |
Caterpillar, Inc. | | | 5,440 | | | | 1,109,814 | |
| | |
Cummins, Inc. | | | 952 | | | | 228,328 | |
| | |
Deere & Co. | | | 2,244 | | | | 768,144 | |
| | |
Graco, Inc. | | | 952 | | | | 71,571 | |
| | |
Illinois Tool Works, Inc. | | | 1,224 | | | | 278,913 | |
| | |
Ingersoll Rand, Inc.* | | | 884 | | | | 47,524 | |
| | | | | | | | |
| Investments | | Shares | | | Value | |
|
| Machinery – (continued) | |
| | |
Otis Worldwide Corp. | | | 2,380 | | | $ | 191,138 | |
| | |
PACCAR, Inc. | | | 1,292 | | | | 115,789 | |
| | |
Parker-Hannifin Corp. | | | 680 | | | | 201,681 | |
| | |
Stanley Black & Decker, Inc. | | | 748 | | | | 134,438 | |
| | |
Xylem, Inc. | | | 884 | | | | 115,441 | |
| | | | | | | | 3,262,781 | |
|
| Media – 1.2% | |
| | |
Comcast Corp., Class A | | | 38,012 | | | | 1,954,957 | |
| | |
Interpublic Group of Cos., Inc. (The) | | | 2,788 | | | | 101,957 | |
| | |
Omnicom Group, Inc. | | | 2,380 | | | | 162,031 | |
| | | | | | | | 2,218,945 | |
|
| Metals & Mining – 0.3% | |
| | |
Freeport-McMoRan, Inc. | | | 7,276 | | | | 274,451 | |
| | |
Newmont Corp. | | | 6,868 | | | | 370,872 | |
| | | | | | | | 645,323 | |
|
| Multiline Retail – 0.5% | |
| | |
Target Corp. | | | 3,468 | | | | 900,362 | |
|
| Multi-Utilities – 0.5% | |
| | |
CMS Energy Corp. | | | 1,904 | | | | 114,906 | |
| | |
Dominion Energy, Inc. | | | 3,264 | | | | 247,835 | |
| | |
Public Service Enterprise Group, Inc. | | | 1,836 | | | | 117,137 | |
| | |
Sempra Energy | | | 3,128 | | | | 399,227 | |
| | |
WEC Energy Group, Inc. | | | 1,768 | | | | 159,226 | |
| | | | | | | | 1,038,331 | |
|
| Oil, Gas & Consumable Fuels – 2.5% | |
| | |
Chevron Corp. | | | 18,428 | | | | 2,109,822 | |
| | |
ConocoPhillips | | | 8,772 | | | | 653,426 | |
| | |
Exxon Mobil Corp. | | | 22,304 | | | | 1,437,939 | |
| | |
Hess Corp. | | | 1,360 | | | | 112,295 | |
| | |
Occidental Petroleum Corp. | | | 1,904 | | | | 63,841 | |
| | |
Phillips 66 | | | 4,624 | | | | 345,783 | |
| | |
Valero Energy Corp. | | | 1,632 | | | | 126,203 | |
| | | | | | | | 4,849,309 | |
|
| Paper & Forest Products – 0.0%(b) | |
| | |
Sylvamo Corp.* | | | — | (c) | | | 10 | |
|
| Personal Products – 0.3% | |
| | |
Estee Lauder Cos., Inc. (The), Class A | | | 1,904 | | | | 617,524 | |
See Accompanying Notes to the Financial Statements.
| | | | | | |
| | FLEXSHARES ANNUAL REPORT | | | 277 | |
FlexShares® STOXX® US ESG Select Index Fund (cont.)
| | | | | | | | |
| Investments | | Shares | | | Value | |
|
| COMMON STOCKS – (continued) | |
|
| Pharmaceuticals – 6.0% | |
| | |
Bristol-Myers Squibb Co. | | | 17,272 | | | $ | 1,008,685 | |
| | |
Catalent, Inc.* | | | 884 | | | | 121,868 | |
| | |
Eli Lilly and Co. | | | 4,488 | | | | 1,143,363 | |
| | |
Johnson & Johnson | | | 26,044 | | | | 4,242,047 | |
| | |
Merck & Co., Inc. | | | 25,364 | | | | 2,233,300 | |
| | |
Pfizer, Inc. | | | 46,376 | | | | 2,028,486 | |
| | |
Zoetis, Inc. | | | 3,060 | | | | 661,572 | |
| | | | | | | | 11,439,321 | |
|
| Professional Services – 0.1% | |
| | |
Booz Allen Hamilton Holding Corp. | | | 816 | | | | 70,878 | |
| | |
Leidos Holdings, Inc. | | | 544 | | | | 54,389 | |
| | | | | | | | 125,267 | |
|
| Real Estate Management & Development – 0.1% | |
| | |
CBRE Group, Inc., Class A* | | | 2,040 | | | | 212,323 | |
|
| Road & Rail – 0.3% | |
| | |
CSX Corp. | | | 8,908 | | | | 322,202 | |
| | |
JB Hunt Transport Services, Inc. | | | 748 | | | | 147,498 | |
| | |
Lyft, Inc., Class A* | | | 1,088 | | | | 49,907 | |
| | | | | | | | 519,607 | |
|
| Semiconductors & Semiconductor Equipment – 4.8% | |
| | |
Analog Devices, Inc. | | | 1,836 | | | | 318,528 | |
| | |
Applied Materials, Inc. | | | 7,412 | | | | 1,012,850 | |
| | |
Broadcom, Inc. | | | 2,720 | | | | 1,446,142 | |
| | |
Intel Corp. | | | 40,460 | | | | 1,982,540 | |
| | |
Lam Research Corp. | | | 1,156 | | | | 651,487 | |
| | |
Microchip Technology, Inc. | | | 2,720 | | | | 201,525 | |
| | |
Micron Technology, Inc. | | | 11,356 | | | | 784,700 | |
| | |
ON Semiconductor Corp.* | | | 1,360 | | | | 65,375 | |
| | |
QUALCOMM, Inc. | | | 7,004 | | | | 931,812 | |
| | |
Texas Instruments, Inc. | | | 9,180 | | | | 1,721,066 | |
| | | | | | | | 9,116,025 | |
|
| Software – 9.5% | |
| | |
Adobe, Inc.* | | | 3,196 | | | | 2,078,550 | |
| | |
Autodesk, Inc.* | | | 2,176 | | | | 691,119 | |
| | |
Coupa Software, Inc.* | | | 272 | | | | 61,934 | |
| | |
Crowdstrike Holdings, Inc., Class A* | | | 1,156 | | | | 325,761 | |
| | |
DocuSign, Inc.* | | | 544 | | | | 151,390 | |
| | | | | | | | |
| Investments | | Shares | | | Value | |
|
| Software – (continued) | |
| | |
Fortinet, Inc.* | | | 884 | | | $ | 297,324 | |
| | |
HubSpot, Inc.* | | | 340 | | | | 275,478 | |
| | |
Intuit, Inc. | | | 1,428 | | | | 893,914 | |
| | |
Microsoft Corp. | | | 31,348 | | | | 10,395,624 | |
| | |
NortonLifeLock, Inc. | | | 2,448 | | | | 62,302 | |
| | |
Oracle Corp. | | | 16,388 | | | | 1,572,265 | |
| | |
salesforce.com, Inc.* | | | 3,264 | | | | 978,188 | |
| | |
Synopsys, Inc.* | | | 1,088 | | | | 362,500 | |
| | | | | | | | 18,146,349 | |
|
| Specialty Retail – 3.3% | |
| | |
Advance Auto Parts, Inc. | | | 136 | | | | 30,671 | |
| | |
AutoZone, Inc.* | | | 68 | | | | 121,369 | |
| | |
Best Buy Co., Inc. | | | 1,088 | | | | 132,997 | |
| | |
Burlington Stores, Inc.* | | | 612 | | | | 169,089 | |
| | |
Carvana Co.* (a) | | | 544 | | | | 164,930 | |
| | |
Home Depot, Inc. (The) | | | 10,608 | | | | 3,943,418 | |
| | |
Lowe’s Cos., Inc. | | | 4,964 | | | | 1,160,683 | |
| | |
TJX Cos., Inc. (The) | | | 7,888 | | | | 516,585 | |
| | |
Ulta Beauty, Inc.* | | | 340 | | | | 124,902 | |
| | | | | | | | 6,364,644 | |
|
| Technology Hardware, Storage & Peripherals – 5.2% | |
| | |
Apple, Inc. | | | 60,520 | | | | 9,065,896 | |
| | |
Dell Technologies, Inc., Class C* | | | 1,496 | | | | 164,545 | |
| | |
Hewlett Packard Enterprise Co. | | | 8,364 | | | | 122,533 | |
| | |
HP, Inc. | | | 11,968 | | | | 362,989 | |
| | |
NetApp, Inc. | | | 1,700 | | | | 151,810 | |
| | |
Western Digital Corp.* | | | 2,244 | | | | 117,339 | |
| | | | | | | | 9,985,112 | |
|
| Textiles, Apparel & Luxury Goods – 0.9% | |
| | |
Lululemon Athletica, Inc.* | | | 1,156 | | | | 538,708 | |
| | |
NIKE, Inc., Class B | | | 6,732 | | | | 1,126,196 | |
| | |
VF Corp. | | | 204 | | | | 14,867 | |
| | | | | | | | 1,679,771 | |
|
| Tobacco – 0.2% | |
| | |
Altria Group, Inc. | | | 7,548 | | | | 332,942 | |
|
| Trading Companies & Distributors – 0.1% | |
| | |
WW Grainger, Inc. | | | 340 | | | | 157,457 | |
See Accompanying Notes to the Financial Statements.
| | | | |
| 278 | | FLEXSHARES ANNUAL REPORT | | |
FlexShares® STOXX® US ESG Select Index Fund (cont.)
| | | | | | | | |
| Investments | | Shares | | | Value | |
|
| COMMON STOCKS – (continued) | |
|
| Water Utilities – 0.1% | |
| | |
American Water Works Co., Inc. | | | 1,496 | | | $ | 260,573 | |
Total Common Stocks
(Cost $149,948,638) | | | | 190,347,988 | |
| | | | | | | | | |
Total Investments – 99.3%
(Cost $149,948,638) | | | | 190,347,988 | |
| |
Other assets less liabilities – 0.7% | | | | 1,294,757 | |
| Net Assets – 100.0% | | | $ | 191,642,745 | |
| * | Non-income producing security. |
| (a) | The security or a portion of this security is on loan at October 31, 2021. The total value of securities on loan at October 31, 2021 was $1,207,643, collateralized in the form of U.S. Government |
| | Treasury Securities, interest rates ranging from 0.00% – 7.25%, and maturity dates ranging from November 23, 2021 – February 15, 2051; a total value of $1,250,931. |
| (b) | Represents less than 0.05% of net assets. |
| (c) | Amount represents less than one share. |
Percentages shown are based on Net Assets.
As of October 31, 2021, the gross unrealized appreciation (depreciation) of investments based on the aggregate cost of investments (including derivative instruments, if applicable) for federal income tax purposes was as follows:
| | | | |
| | | | |
Aggregate gross unrealized appreciation | | $ | 41,314,617 | |
Aggregate gross unrealized depreciation | | | (918,965 | ) |
Net unrealized appreciation | | $ | 40,395,652 | |
Federal income tax cost | | $ | 149,991,827 | |
Futures Contracts
FlexShares® STOXX® US ESG Select Index Fund had the following open futures contracts as of October 31, 2021:
| | | | | | | | | | | | | | | | | | | | |
| | | Number of
Contracts | | | Expiration
Date | | | Trading
Currency | | | Notional
Amount | | | Value and
Unrealized
Appreciation* | |
Long Contracts | | | | | |
S&P 500 E-Mini Index | | | 5 | | | | 12/17/2021 | | | | USD | | | $ | 1,149,250 | | | $ | 39,491 | |
| * | This amount represents the cumulative appreciation/depreciation on futures contracts. Current day’s variation margin is reported within the Statement of Assets and Liabilities for futures contracts. |
Abbreviations:
USD – US Dollar
| | | | |
| Security Type | | % of Net Assets | |
Common Stocks | | | 99.3 | % |
Others(1) | | | 0.7 | |
| | | | 100.0 | % |
| (1) | Includes any other net assets/(liabilities). |
See Accompanying Notes to the Financial Statements.
| | | | | | |
| | FLEXSHARES ANNUAL REPORT | | | 279 | |
Schedule of Investments
FlexShares® STOXX® Global ESG Select Index Fund
October 31, 2021
| | | | | | | | |
| Investments | | Shares | | | Value | |
|
| COMMON STOCKS – 97.8% | |
|
| Aerospace & Defense – 0.0%(a) | |
| | |
Meggitt plc* | | | 8,343 | | | $ | 85,771 | |
|
| Air Freight & Logistics – 0.4% | |
| | |
CH Robinson Worldwide, Inc.(b) | | | 725 | | | | 70,318 | |
| | |
Deutsche Post AG (Registered) | | | 3,708 | | | | 229,659 | |
| | |
DSV A/S | | | 1,377 | | | | 320,347 | |
| | |
Royal Mail plc | | | 4,100 | | | | 23,633 | |
| | |
SG Holdings Co. Ltd. | | | 2,500 | | | | 62,486 | |
| | |
Yamato Holdings Co. Ltd.(b) | | | 2,500 | | | | 61,324 | |
| | | | | | | | 767,767 | |
|
| Airlines – 0.1% | |
| | |
ANA Holdings, Inc.* (b) | | | 2,500 | | | | 58,167 | |
| | |
International Consolidated Airlines Group SA* | | | 2,675 | | | | 6,007 | |
| | |
Qantas Airways Ltd.* | | | 2,075 | | | | 8,338 | |
| | |
Ryanair Holdings plc* | | | 100 | | | | 1,962 | |
| | |
Singapore Airlines Ltd.* | | | 7,500 | | | | 28,921 | |
| | | | | | | | 103,395 | |
|
| Auto Components – 0.3% | |
| | |
Bridgestone Corp. | | | 5,000 | | | | 220,083 | |
| | |
Cie Generale des Etablissements Michelin SCA | | | 1,080 | | | | 169,602 | |
| | |
Continental AG* | | | 150 | | | | 17,623 | |
| | |
Dometic Group AB(c) | | | 2,375 | | | | 34,525 | |
| | |
Faurecia SE | | | 1,050 | | | | 54,697 | |
| | |
Magna International, Inc. | | | 96 | | | | 7,797 | |
| | |
Nokian Renkaat OYJ | | | 1,175 | | | | 44,057 | |
| | |
Valeo | | | 375 | | | | 10,992 | |
| | | | | | | | 559,376 | |
|
| Automobiles – 4.2% | |
| | |
Bayerische Motoren Werke AG | | | 1,917 | | | | 193,537 | |
| | |
Ferrari NV | | | 432 | | | | 102,486 | |
| | |
General Motors Co.* | | | 8,050 | | | | 438,162 | |
| | |
Honda Motor Co. Ltd. | | | 7,500 | | | | 220,281 | |
| | |
Nissan Motor Co. Ltd.* | | | 1,700 | | | | 8,608 | |
| | |
Renault SA* | | | 800 | | | | 28,755 | |
| | |
Stellantis NV(b) | | | 8,400 | | | | 167,605 | |
| | |
Suzuki Motor Corp. | | | 2,500 | | | | 111,270 | |
| | | | | | | | |
| Investments | | Shares | | | Value | |
|
| Automobiles – (continued) | |
| | |
Tesla, Inc.* | | | 4,400 | | | $ | 4,901,600 | |
| | |
Toyota Motor Corp. | | | 75,000 | | | | 1,319,776 | |
| | |
Volkswagen AG (Preference) | | | 1,025 | | | | 229,906 | |
| | | | | | | | 7,721,986 | |
|
| Banks – 8.8% | |
| | |
ABN AMRO Bank NV, CVA(d) | | | 3,475 | | | | 51,177 | |
| | |
Australia & New Zealand Banking Group Ltd. | | | 9,925 | | | | 209,774 | |
| | |
Banco Bilbao Vizcaya Argentaria SA | | | 44,241 | | | | 310,362 | |
| | |
Banco BPM SpA | | | 8,950 | | | | 27,820 | |
| | |
Banco de Sabadell SA* | | | 85,860 | | | | 69,195 | |
| | |
Banco Santander SA(b) | | | 63,801 | | | | 241,916 | |
| | |
Bank of America Corp. | | | 62,225 | | | | 2,973,111 | |
| | |
Bank of Ireland Group plc* (b) | | | 13,284 | | | | 79,355 | |
| | |
Bank of Montreal | | | 2,268 | | | | 245,856 | |
| | |
Bank of Nova Scotia (The) | | | 5,646 | | | | 369,583 | |
| | |
Bank Polska Kasa Opieki SA | | | 575 | | | | 19,002 | |
| | |
Bankinter SA(b) | | | 5,000 | | | | 27,554 | |
| | |
Barclays plc | | | 107,775 | | | | 298,789 | |
| | |
BAWAG Group AG(d) | | | 1,080 | | | | 68,053 | |
| | |
BNP Paribas SA | | | 5,725 | | | | 383,602 | |
| | |
CaixaBank SA | | | 18,600 | | | | 53,489 | |
| | |
Citigroup, Inc. | | | 17,475 | | | | 1,208,571 | |
| | |
Commerzbank AG* | | | 4,625 | | | | 33,805 | |
| | |
Commonwealth Bank of Australia | | | 12,232 | | | | 961,743 | |
| | |
Danske Bank A/S | | | 4,100 | | | | 69,456 | |
| | |
DBS Group Holdings Ltd. | | | 3,294 | | | | 77,019 | |
| | |
DNB Bank ASA(b) | | | 6,588 | | | | 156,381 | |
| | |
Erste Group Bank AG | | | 1,450 | | | | 62,254 | |
| | |
Fifth Third Bancorp | | | 2,975 | | | | 129,502 | |
| | |
Hang Seng Bank Ltd. | | | 5,000 | | | | 95,127 | |
| | |
HSBC Holdings plc | | | 123,152 | | | | 745,299 | |
| | |
Huntington Bancshares, Inc. | | | 4,450 | | | | 70,043 | |
| | |
ING Groep NV | | | 15,201 | | | | 230,799 | |
| | |
Intesa Sanpaolo SpA | | | 122,900 | | | | 349,520 | |
| | |
JPMorgan Chase & Co. | | | 13,340 | | | | 2,266,333 | |
| | |
KBC Group NV | | | 1,375 | | | | 128,189 | |
| | |
KeyCorp | | | 4,933 | | | | 114,791 | |
| | |
Lloyds Banking Group plc | | | 436,350 | | | | 300,379 | |
See Accompanying Notes to the Financial Statements.
| | | | |
| 280 | | FLEXSHARES ANNUAL REPORT | | |
FlexShares® STOXX® Global ESG Select Index Fund (cont.)
| | | | | | | | |
| Investments | | Shares | | | Value | |
|
| COMMON STOCKS – (continued) | |
|
| Banks – (continued) | |
| | |
Mitsubishi UFJ Financial Group, Inc. | | | 92,500 | | | $ | 504,988 | |
| | |
Mizuho Financial Group, Inc. | | | 10,000 | | | | 131,989 | |
| | |
National Australia Bank Ltd. | | | 14,661 | | | | 316,151 | |
| | |
NatWest Group plc | | | 20,995 | | | | 63,630 | |
| | |
PNC Financial Services Group, Inc. (The) | | | 1,400 | | | | 295,442 | |
| | |
Royal Bank of Canada | | | 6,825 | | | | 709,287 | |
| | |
Skandinaviska Enskilda Banken AB, Class A | | | 9,406 | | | | 147,029 | |
| | |
Societe Generale SA | | | 6,399 | | | | 213,530 | |
| | |
Standard Chartered plc | | | 3,101 | | | | 21,037 | |
| | |
Sumitomo Mitsui Trust Holdings, Inc. | | | 2,500 | | | | 82,307 | |
| | |
Svenska Handelsbanken AB, Class A | | | 8,264 | | | | 94,624 | |
| | |
Swedbank AB, Class A(b) | | | 2,350 | | | | 50,959 | |
| | |
Toronto-Dominion Bank (The) | | | 6,416 | | | | 465,018 | |
| | |
US Bancorp | | | 7,375 | | | | 445,229 | |
| | |
Westpac Banking Corp. | | | 15,613 | | | | 301,030 | |
| | | | | | | | 16,270,099 | |
|
| Beverages – 1.8% | |
| | |
Anheuser-Busch InBev SA/NV(b) | | | 2,426 | | | | 148,151 | |
| | |
Britvic plc | | | 6,350 | | | | 77,294 | |
| | |
Budweiser Brewing Co. APAC Ltd.(b) (d) | | | 22,500 | | | | 62,042 | |
| | |
Carlsberg A/S, Class B | | | 348 | | | | 57,465 | |
| | |
Coca-Cola Bottlers Japan Holdings, Inc.(b) | | | 2,500 | | | | 34,291 | |
| | |
Coca-Cola Co. (The) | | | 12,690 | | | | 715,335 | |
| | |
Coca-Cola Europacific Partners plc | | | 1,109 | | | | 58,389 | |
| | |
Diageo plc | | | 7,472 | | | | 371,998 | |
| | |
Heineken NV | | | 1,200 | | | | 133,065 | |
| | |
Kirin Holdings Co. Ltd. | | | 2,500 | | | | 43,433 | |
| | |
PepsiCo, Inc. | | | 7,263 | | | | 1,173,701 | |
| | |
Pernod Ricard SA | | | 1,350 | | | | 310,427 | |
| | |
Remy Cointreau SA(b) | | | 125 | | | | 25,257 | |
| | |
Royal Unibrew A/S | | | 375 | | | | 46,575 | |
| | |
Thai Beverage PCL | | | 57,500 | | | | 30,274 | |
| | | | | | | | |
| Investments | | Shares | | | Value | |
|
| Beverages – (continued) | |
| | |
Treasury Wine Estates Ltd. | | | 9,350 | | | $ | 80,902 | |
| | | | | | | | 3,368,599 | |
|
| Biotechnology – 0.9% | |
| | |
AbbVie, Inc. | | | 4,976 | | | | 570,583 | |
| | |
CSL Ltd. | | | 2,550 | | | | 575,530 | |
| | |
Genmab A/S* | | | 120 | | | | 53,836 | |
| | |
Genus plc | | | 250 | | | | 18,951 | |
| | |
Grifols SA(b) | | | 200 | | | | 4,582 | |
| | |
PeptiDream, Inc.* | | | 2,500 | | | | 60,360 | |
| | |
Regeneron Pharmaceuticals, Inc.* | | | 250 | | | | 159,985 | |
| | |
Swedish Orphan Biovitrum AB* | | | 1,025 | | | | 27,807 | |
| | |
Vertex Pharmaceuticals, Inc.* | | | 888 | | | | 164,218 | |
| | |
Vitrolife AB | | | 175 | | | | 11,390 | |
| | | | | | | | 1,647,242 | |
|
| Building Products – 0.5% | |
| | |
AGC, Inc.(b) | | | 2,500 | | | | 124,315 | |
| | |
Assa Abloy AB, Class B | | | 5,840 | | | | 171,015 | |
| | |
Cie de Saint-Gobain | | | 3,726 | | | | 256,817 | |
| | |
Geberit AG (Registered) | | | 250 | | | | 195,568 | |
| | |
Johnson Controls International plc | | | 1,500 | | | | 110,055 | |
| | |
Lixil Corp. | | | 2,500 | | | | 64,109 | |
| | |
ROCKWOOL International A/S, Class B | | | 25 | | | | 11,434 | |
| | |
Trane Technologies plc | | | 350 | | | | 63,325 | |
| | | | | | | | 996,638 | |
|
| Capital Markets – 2.9% | |
| | |
3i Group plc | | | 4,850 | | | | 90,681 | |
| | |
Abrdn plc | | | 13,650 | | | | 47,525 | |
| | |
Ashmore Group plc | | | 15,850 | | | | 73,305 | |
| | |
BlackRock, Inc. | | | 918 | | | | 866,096 | |
| | |
Credit Suisse Group AG (Registered) | | | 2,987 | | | | 31,160 | |
| | |
Euronext NV(d) | | | 100 | | | | 11,272 | |
| | |
Goldman Sachs Group, Inc. (The) | | | 2,598 | | | | 1,073,883 | |
| | |
Hong Kong Exchanges & Clearing Ltd. | | | 5,000 | | | | 302,608 | |
| | |
IG Group Holdings plc | | | 2,325 | | | | 25,289 | |
| | |
Intermediate Capital Group plc | | | 2,160 | | | | 64,872 | |
See Accompanying Notes to the Financial Statements.
| | | | | | |
| | FLEXSHARES ANNUAL REPORT | | | 281 | |
FlexShares® STOXX® Global ESG Select Index Fund (cont.)
| | | | | | | | |
| Investments | | Shares | | | Value | |
|
| COMMON STOCKS – (continued) | |
|
| Capital Markets – (continued) | |
| | |
Julius Baer Group Ltd. | | | 1,566 | | | $ | 113,420 | |
| | |
London Stock Exchange Group plc | | | 2,250 | | | | 218,977 | |
| | |
Macquarie Group Ltd.(e) | | | 2,714 | | | | 403,274 | |
| | |
Moody’s Corp. | | | 175 | | | | 70,726 | |
| | |
Morgan Stanley | | | 9,248 | | | | 950,509 | |
| | |
S&P Global, Inc. | | | 775 | | | | 367,474 | |
| | |
State Street Corp. | | | 2,000 | | | | 197,100 | |
| | |
UBS Group AG (Registered) | | | 25,888 | | | | 471,579 | |
| | | | | | | | 5,379,750 | |
|
| Chemicals – 1.6% | |
| | |
Air Liquide SA | | | 2,100 | | | | 350,536 | |
| | |
Akzo Nobel NV | | | 1,225 | | | | 140,941 | |
| | |
Arkema SA | | | 730 | | | | 99,854 | |
| | |
Asahi Kasei Corp. | | | 2,500 | | | | 26,233 | |
| | |
BASF SE | | | 2,350 | | | | 169,373 | |
| | |
Celanese Corp. | | | 600 | | | | 96,906 | |
| | |
Chr Hansen Holding A/S(b) | | | 100 | | | | 7,965 | |
| | |
Clariant AG (Registered)* | | | 2,125 | | | | 44,791 | |
| | |
Covestro AG(d) | | | 375 | | | | 24,042 | |
| | |
Croda International plc | | | 621 | | | | 80,510 | |
| | |
Ecolab, Inc. | | | 1,150 | | | | 255,553 | |
| | |
Evonik Industries AG | | | 1,701 | | | | 55,157 | |
| | |
FUCHS PETROLUB SE (Preference) | | | 700 | | | | 33,569 | |
| | |
Givaudan SA (Registered) | | | 50 | | | | 235,787 | |
| | |
Hexpol AB | | | 2,042 | | | | 23,847 | |
| | |
Johnson Matthey plc | | | 1,725 | | | | 64,623 | |
| | |
Koninklijke DSM NV | | | 1,126 | | | | 246,344 | |
| | |
Kuraray Co. Ltd.(b) | | | 5,000 | | | | 45,165 | |
| | |
LANXESS AG | | | 325 | | | | 21,912 | |
| | |
Mitsubishi Chemical Holdings Corp. | | | 10,000 | | | | 82,675 | |
| | |
Mitsui Chemicals, Inc. | | | 2,500 | | | | 74,107 | |
| | |
Nippon Paint Holdings Co. Ltd.(b) | | | 2,500 | | | | 26,727 | |
| | |
Novozymes A/S, Class B | | | 1,080 | | | | 79,500 | |
| | |
Orica Ltd. | | | 1,300 | | | | 14,773 | |
| | |
Sherwin-Williams Co. (The) | | | 800 | | | | 253,288 | |
| | |
Sika AG (Registered) | | | 750 | | | | 254,446 | |
| | |
Solvay SA | | | 425 | | | | 50,560 | |
| | | | | | | | |
| Investments | | Shares | | | Value | |
|
| Chemicals – (continued) | |
| | |
Symrise AG | | | 300 | | | $ | 41,505 | |
| | |
Yara International ASA | | | 150 | | | | 7,816 | |
| | | | | | | | 2,908,505 | |
|
| Commercial Services & Supplies – 0.3% | |
| | |
Brambles Ltd. | | | 7,300 | | | | 55,050 | |
| | |
Cintas Corp. | | | 450 | | | | 194,895 | |
| | |
Downer EDI Ltd. | | | 1,286 | | | | 6,085 | |
| | |
Elis SA* | | | 2,325 | | | | 44,099 | |
| | |
HomeServe plc | | | 4,025 | | | | 47,173 | |
| | |
ISS A/S* | | | 1,050 | | | | 20,924 | |
| | |
Rentokil Initial plc | | | 13,548 | | | | 109,271 | |
| | |
Secom Co. Ltd. | | | 1,600 | | | | 108,594 | |
| | |
SPIE SA | | | 962 | | | | 23,379 | |
| | |
TOPPAN, Inc. | | | 2,500 | | | | 40,188 | |
| | | | | | | | 649,658 | |
|
| Communications Equipment – 0.2% | |
| | |
Nokia OYJ* | | | 22,163 | | | | 127,471 | |
| | |
Telefonaktiebolaget LM Ericsson, Class B | | | 15,147 | | | | 165,782 | |
| | | | | | | | 293,253 | |
|
| Construction & Engineering – 0.4% | |
| | |
Bouygues SA | | | 2,550 | | | | 103,285 | |
| | |
Eiffage SA | | | 725 | | | | 74,638 | |
| | |
Ferrovial SA | | | 1,662 | | | | 52,431 | |
| | |
Kajima Corp. | | | 2,500 | | | | 30,695 | |
| | |
Obayashi Corp. | | | 10,000 | | | | 84,017 | |
| | |
Skanska AB, Class B | | | 2,694 | | | | 68,381 | |
| | |
Sweco AB, Class B | | | 975 | | | | 15,519 | |
| | |
Taisei Corp. | | | 2,500 | | | | 78,272 | |
| | |
Vinci SA | | | 2,075 | | | | 221,807 | |
| | | | | | | | 729,045 | |
|
| Construction Materials – 0.2% | |
| | |
CRH plc(b) | | | 4,058 | | | | 194,795 | |
| | |
HeidelbergCement AG | | | 756 | | | | 56,990 | |
| | |
Holcim Ltd.* | | | 2,024 | | | | 101,250 | |
| | |
Taiheiyo Cement Corp. | | | 2,500 | | | | 52,861 | |
| | | | | | | | 405,896 | |
|
| Consumer Finance – 0.2% | |
| | |
Capital One Financial Corp. | | | 1,630 | | | | 246,179 | |
See Accompanying Notes to the Financial Statements.
| | | | |
| 282 | | FLEXSHARES ANNUAL REPORT | | |
FlexShares® STOXX® Global ESG Select Index Fund (cont.)
| | | | | | | | |
| Investments | | Shares | | | Value | |
|
| COMMON STOCKS – (continued) | |
|
| Consumer Finance – (continued) | |
| | |
Synchrony Financial | | | 1,250 | | | $ | 58,062 | |
| | | | | | | | 304,241 | |
|
| Containers & Packaging – 0.2% | |
| | |
Ball Corp. | | | 1,539 | | | | 140,788 | |
| | |
DS Smith plc | | | 7,125 | | | | 37,445 | |
| | |
Orora Ltd. | | | 1,625 | | | | 4,028 | |
| | |
Packaging Corp. of America | | | 625 | | | | 85,856 | |
| | |
SIG Combibloc Group AG* | | | 1,377 | | | | 36,047 | |
| | |
Smurfit Kappa Group plc | | | 1,020 | | | | 53,460 | |
| | | | | | | | 357,624 | |
|
| Distributors – 0.0%(a) | |
| | |
Pool Corp. | | | 125 | | | | 64,395 | |
|
| Diversified Financial Services – 0.1% | |
| | |
EXOR NV | | | 730 | | | | 68,851 | |
| | |
Groupe Bruxelles Lambert SA | | | 759 | | | | 88,055 | |
| | |
Industrivarden AB, Class A(b) | | | — | (f) | | | 4 | |
| | |
Kinnevik AB, Class B* (b) | | | 1,341 | | | | 52,564 | |
| | |
L E Lundbergforetagen AB, Class B | | | 756 | | | | 43,537 | |
| | |
Wendel SE | | | 150 | | | | 19,980 | |
| | | | | | | | 272,991 | |
|
| Diversified Telecommunication Services – 0.8% | |
| | |
BT Group plc* | | | 30,000 | | | | 57,119 | |
| | |
Cellnex Telecom SA(d) | | | 3,390 | | | | 208,629 | |
| | |
Deutsche Telekom AG (Registered) | | | 18,441 | | | | 343,118 | |
| | |
Elisa OYJ | | | 788 | | | | 47,584 | |
| | |
Koninklijke KPN NV | | | 26,895 | | | | 80,456 | |
| | |
Orange SA | | | 870 | | | | 9,499 | |
| | |
PCCW Ltd. | | | 25,000 | | | | 12,887 | |
| | |
Proximus SADP | | | 1,750 | | | | 32,980 | |
| | |
Singapore Telecommunications Ltd. | | | 74,100 | | | | 137,375 | |
| | |
Spark New Zealand Ltd. | | | 11,150 | | | | 36,426 | |
| | |
Swisscom AG (Registered) | | | 150 | | | | 81,817 | |
| | |
Telecom Italia SpA | | | 164,700 | | | | 58,724 | |
| | |
Telenor ASA(b) | | | 5,300 | | | | 83,548 | |
| | |
Telia Co. AB(b) | | | 12,200 | | | | 48,006 | |
| | |
Telstra Corp. Ltd. | | | 88,226 | | | | 253,138 | |
| | | | | | | | |
| Investments | | Shares | | | Value | |
|
| Diversified Telecommunication Services – (continued) | |
| | |
TELUS Corp. | | | 3,668 | | | $ | 84,010 | |
| | | | | | | | 1,575,316 | |
|
| Electric Utilities – 0.9% | |
| | |
Chubu Electric Power Co., Inc.(b) | | | 5,000 | | | | 51,699 | |
| | |
CLP Holdings Ltd. | | | 12,500 | | | | 122,364 | |
| | |
Duke Energy Corp. | | | 1,475 | | | | 150,465 | |
| | |
EDP – Energias de Portugal SA | | | 8,254 | | | | 46,652 | |
| | |
Electricite de France SA | | | 5,481 | | | | 80,745 | |
| | |
Elia Group SA/NV(b) | | | 125 | | | | 14,596 | |
| | |
Endesa SA | | | 225 | | | | 5,193 | |
| | |
Enel SpA | | | 19,799 | | | | 165,794 | |
| | |
Eversource Energy | | | 2,025 | | | | 171,923 | |
| | |
FirstEnergy Corp. | | | 3,036 | | | | 116,977 | |
| | |
Fortum OYJ | | | 2,627 | | | | 78,131 | |
| | |
Iberdrola SA | | | 21,751 | | | | 257,125 | |
| | |
Kansai Electric Power Co., Inc. (The) | | | 2,500 | | | | 22,977 | |
| | |
Origin Energy Ltd. | | | 1,750 | | | | 6,638 | |
| | |
Orsted A/S(d) | | | 850 | | | | 120,062 | |
| | |
Red Electrica Corp. SA | | | 625 | | | | 13,026 | |
| | |
SSE plc | | | 7,175 | | | | 161,640 | |
| | |
Terna – Rete Elettrica Nazionale | | | 10,014 | | | | 74,654 | |
| | |
Verbund AG | | | 891 | | | | 92,903 | |
| | | | | | | | 1,753,564 | |
|
| Electrical Equipment – 1.3% | |
| | |
ABB Ltd. (Registered) | | | 10,396 | | | | 344,618 | |
| | |
AMETEK, Inc. | | | 450 | | | | 59,580 | |
| | |
Eaton Corp. plc | | | 1,525 | | | | 251,259 | |
| | |
Emerson Electric Co. | | | 4,075 | | | | 395,316 | |
| | |
Legrand SA | | | 1,318 | | | | 143,740 | |
| | |
Nidec Corp.(b) | | | 4,000 | | | | 440,956 | |
| | |
Prysmian SpA | | | 1,572 | | | | 59,488 | |
| | |
Rockwell Automation, Inc.(b) | | | 400 | | | | 127,760 | |
| | |
Schneider Electric SE | | | 2,000 | | | | 344,629 | |
| | |
Siemens Energy AG* | | | 2,250 | | | | 64,627 | |
| | |
Signify NV(d) | | | 319 | | | | 15,449 | |
| | |
Vestas Wind Systems A/S | | | 4,070 | | | | 176,201 | |
| | | | | | | | 2,423,623 | |
|
| Electronic Equipment, Instruments & Components – 1.0% | |
| | |
Alps Alpine Co. Ltd.(b) | | | 2,500 | | | | 24,337 | |
| | |
Amphenol Corp., Class A | | | 675 | | | | 51,820 | |
See Accompanying Notes to the Financial Statements.
| | | | | | |
| | FLEXSHARES ANNUAL REPORT | | | 283 | |
FlexShares® STOXX® Global ESG Select Index Fund (cont.)
| | | | | | | | |
| Investments | | Shares | | | Value | |
|
| COMMON STOCKS – (continued) | |
|
Electronic Equipment, Instruments &
Components – (continued) | |
| | |
Halma plc | | | 2,200 | | | $ | 89,323 | |
| | |
Hexagon AB, Class B | | | 8,350 | | | | 134,168 | |
| | |
Ibiden Co. Ltd. | | | 1,800 | | | | 107,503 | |
| | |
Keysight Technologies, Inc.* | | | 475 | | | | 85,509 | |
| | |
Kyocera Corp. | | | 2,500 | | | | 145,911 | |
| | |
Murata Manufacturing Co. Ltd. | | | 5,000 | | | | 379,434 | |
| | |
Omron Corp. | | | 1,200 | | | | 114,396 | |
| | |
Shimadzu Corp. | | | 2,500 | | | | 101,184 | |
| | |
Taiyo Yuden Co. Ltd. | | | 100 | | | | 5,043 | |
| | |
TDK Corp. | | | 3,600 | | | | 130,392 | |
| | |
TE Connectivity Ltd. | | | 1,296 | | | | 189,216 | |
| | |
Teledyne Technologies, Inc.* | | | 200 | | | | 89,844 | |
| | |
Trimble, Inc.* | | | 400 | | | | 34,948 | |
| | |
Venture Corp. Ltd. | | | 2,500 | | | | 34,872 | |
| | |
Yokogawa Electric Corp. | | | 2,500 | | | | 49,814 | |
| | | | | | | | 1,767,714 | |
|
| Energy Equipment & Services – 0.2% | |
| | |
Halliburton Co. | | | 4,300 | | | | 107,457 | |
| | |
Schlumberger NV | | | 8,175 | | | | 263,725 | |
| | |
Worley Ltd. | | | 252 | | | | 2,048 | |
| | | | | | | | 373,230 | |
|
| Entertainment – 1.1% | |
| | |
Nintendo Co. Ltd. | | | 500 | | | | 220,127 | |
| | |
Ubisoft Entertainment SA* | | | 25 | | | | 1,309 | |
| | |
Walt Disney Co. (The)* | | | 10,250 | | | | 1,732,967 | |
| | | | | | | | 1,954,403 | |
|
| Equity Real Estate Investment Trusts (REITs) – 1.3% | |
| | |
alstria office REIT-AG | | | 3,357 | | | | 62,780 | |
| | |
American Tower Corp. | | | 1,100 | | | | 310,167 | |
| | |
Assura plc | | | 16,850 | | | | 16,838 | |
| | |
Big Yellow Group plc | | | 1,375 | | | | 27,876 | |
| | |
British Land Co. plc (The) | | | 11,610 | | | | 78,665 | |
| | |
CapitaLand Integrated Commercial Trust | | | 324 | | | | 517 | |
| | |
Cofinimmo SA | | | 118 | | | | 19,049 | |
| | |
Covivio | | | 575 | | | | 49,773 | |
| | |
Derwent London plc | | | 1,350 | | | | 62,584 | |
| | |
Dexus | | | 11,300 | | | | 92,258 | |
| | | | | | | | |
| Investments | | Shares | | | Value | |
|
| Equity Real Estate Investment Trusts (REITs) – (continued) | |
| | |
Digital Realty Trust, Inc.(b) | | | 625 | | | $ | 98,631 | |
| | |
Equinix, Inc. | | | 200 | | | | 167,414 | |
| | |
Equity LifeStyle Properties, Inc. | | | 1,725 | | | | 145,780 | |
| | |
Essex Property Trust, Inc. | | | 50 | | | | 16,997 | |
| | |
Gecina SA | | | 168 | | | | 23,534 | |
| | |
Goodman Group | | | 10,499 | | | | 172,699 | |
| | |
GPT Group (The) | | | 630 | | | | 2,442 | |
| | |
Healthpeak Properties, Inc. | | | 3,807 | | | | 135,187 | |
| | |
Iron Mountain, Inc.(b) | | | 350 | | | | 15,974 | |
| | |
Klepierre SA | | | 1,825 | | | | 43,422 | |
| | |
Land Securities Group plc | | | 4,650 | | | | 43,789 | |
| | |
Link REIT | | | 10,000 | | | | 88,700 | |
| | |
Mirvac Group | | | 17,082 | | | | 36,181 | |
| | |
Orix JREIT, Inc. | | | 25 | | | | 41,416 | |
| | |
Segro plc | | | 2,598 | | | | 46,029 | |
| | |
Stockland | | | 15,417 | | | | 52,688 | |
| | |
Unibail-Rodamco-Westfield* | | | 550 | | | | 39,341 | |
| | |
UNITE Group plc (The) | | | 2,550 | | | | 38,048 | |
| | |
Welltower, Inc.(b) | | | 2,875 | | | | 231,150 | |
| | |
Weyerhaeuser Co. | | | 1,975 | | | | 70,547 | |
| | |
WP Carey, Inc.(b) | | | 1,650 | | | | 127,231 | |
| | | | | | | | 2,357,707 | |
|
| Food & Staples Retailing – 0.5% | |
| | |
Aeon Co. Ltd. | | | 7,500 | | | | 172,199 | |
| | |
Carrefour SA | | | 750 | | | | 13,588 | |
| | |
Coles Group Ltd. | | | 5,550 | | | | 71,450 | |
| | |
Etablissements Franz Colruyt NV | | | 109 | | | | 5,353 | |
| | |
J Sainsbury plc | | | 6,050 | | | | 24,829 | |
| | |
Jeronimo Martins SGPS SA | | | 1,254 | | | | 28,443 | |
| | |
Kesko OYJ, Class B | | | 1,283 | | | | 41,707 | |
| | |
Koninklijke Ahold Delhaize NV | | | 5,250 | | | | 170,906 | |
| | |
Tesco plc | | | 48,375 | | | | 178,971 | |
| | |
Woolworths Group Ltd. | | | 5,925 | | | | 169,466 | |
| | | | | | | | 876,912 | |
|
| Food Products – 1.5% | |
| | |
AAK AB | | | 698 | | | | 15,255 | |
| | |
Ajinomoto Co., Inc. | | | 2,500 | | | | 74,677 | |
| | |
Associated British Foods plc | | | 25 | | | | 613 | |
| | |
Barry Callebaut AG (Registered) | | | 25 | | | | 57,948 | |
| | |
Danone SA | | | 2,073 | | | | 135,182 | |
| | |
General Mills, Inc. | | | 2,540 | | | | 156,972 | |
See Accompanying Notes to the Financial Statements.
| | | | |
| 284 | | FLEXSHARES ANNUAL REPORT | | |
FlexShares® STOXX® Global ESG Select Index Fund (cont.)
| | | | | | | | |
| Investments | | Shares | | | Value | |
|
| COMMON STOCKS – (continued) | |
|
| Food Products – (continued) | |
| | |
J M Smucker Co. (The) | | | 100 | | | $ | 12,286 | |
| | |
Kagome Co. Ltd. | | | 2,500 | | | | 63,363 | |
| | |
Kerry Group plc, Class A(b) | | | 775 | | | | 104,126 | |
| | |
Mowi ASA | | | 2,598 | | | | 75,121 | |
| | |
Nestle SA (Registered) | | | 14,874 | | | | 1,966,705 | |
| | |
Orkla ASA | | | 4,975 | | | | 48,319 | |
| | |
Salmar ASA | | | 225 | | | | 17,103 | |
| | | | | | | | 2,727,670 | |
|
| Gas Utilities – 0.1% | |
| | |
Enagas SA | | | 2,175 | | | | 48,843 | |
| | |
Italgas SpA | | | 3,500 | | | | 22,236 | |
| | |
Naturgy Energy Group SA(b) | | | 825 | | | | 21,701 | |
| | |
Rubis SCA | | | 1,650 | | | | 52,873 | |
| | |
Snam SpA | | | 13,327 | | | | 75,525 | |
| | |
Tokyo Gas Co. Ltd. | | | 2,500 | | | | 43,390 | |
| | | | | | | | 264,568 | |
|
| Health Care Equipment & Supplies – 3.0% | |
| | |
Abbott Laboratories | | | 9,074 | | | | 1,169,548 | |
| | |
Alcon, Inc. | | | 1,500 | | | | 124,202 | |
| | |
Ambu A/S, Class B(b) | | | 325 | | | | 9,267 | |
| | |
Ansell Ltd. | | | 1,350 | | | | 31,951 | |
| | |
Baxter International, Inc. | | | 800 | | | | 63,168 | |
| | |
Becton Dickinson and Co. | | | 1,025 | | | | 245,580 | |
| | |
BioMerieux | | | 200 | | | | 25,471 | |
| | |
Boston Scientific Corp.* | | | 7,560 | | | | 326,063 | |
| | |
Cochlear Ltd. | | | 379 | | | | 62,752 | |
| | |
Coloplast A/S, Class B | | | 475 | | | | 77,512 | |
| | |
Danaher Corp. | | | 2,106 | | | | 656,588 | |
| | |
Edwards Lifesciences Corp.* | | | 2,268 | | | | 271,752 | |
| | |
Fisher & Paykel Healthcare Corp. Ltd. | | | 2,325 | | | | 51,930 | |
| | |
Getinge AB, Class B | | | 904 | | | | 40,450 | |
| | |
Hologic, Inc.* | | | 1,525 | | | | 111,798 | |
| | |
Hoya Corp. | | | 3,400 | | | | 498,706 | |
| | |
Insulet Corp.* | | | 375 | | | | 116,257 | |
| | |
Koninklijke Philips NV | | | 4,175 | | | | 196,764 | |
| | |
Medtronic plc | | | 4,557 | | | | 546,202 | |
| | |
Olympus Corp. | | | 5,000 | | | | 107,893 | |
| | |
ResMed, Inc. | | | 575 | | | | 151,173 | |
| | |
Sartorius AG (Preference) | | | 150 | | | | 97,278 | |
| | | | | | | | |
| Investments | | Shares | | | Value | |
|
| Health Care Equipment & Supplies – (continued) | |
| | |
Smith & Nephew plc | | | 2,325 | | | $ | 39,997 | |
| | |
Sonova Holding AG (Registered) | | | 414 | | | | 171,399 | |
| | |
Straumann Holding AG (Registered) | | | 75 | | | | 156,115 | |
| | |
Sysmex Corp. | | | 900 | | | | 111,055 | |
| | |
West Pharmaceutical Services, Inc. | | | 75 | | | | 32,241 | |
| | |
Zimmer Biomet Holdings, Inc. | | | 600 | | | | 85,872 | |
| | | | | | | | 5,578,984 | |
|
| Health Care Providers & Services – 0.6% | |
| | |
Anthem, Inc. | | | 1,633 | | | | 710,567 | |
| | |
Fresenius Medical Care AG & Co. KGaA | | | 75 | | | | 4,987 | |
| | |
Fresenius SE & Co. KGaA | | | 842 | | | | 38,260 | |
| | |
Humana, Inc. | | | 300 | | | | 138,948 | |
| | |
Laboratory Corp. of America Holdings* | | | 175 | | | | 50,229 | |
| | |
Orpea SA | | | 425 | | | | 44,363 | |
| | |
Ramsay Health Care Ltd. | | | 486 | | | | 25,706 | |
| | |
Sonic Healthcare Ltd. | | | 3,475 | | | | 104,481 | |
| | | | | | | | 1,117,541 | |
|
| Health Care Technology – 0.1% | |
| | |
M3, Inc. | | | 2,500 | | | | 147,073 | |
|
| Hotels, Restaurants & Leisure – 1.0% | |
| | |
Accor SA* | | | 1,750 | | | | 62,599 | |
| | |
Aristocrat Leisure Ltd. | | | 5,082 | | | | 178,182 | |
| | |
Booking Holdings, Inc.* | | | 100 | | | | 242,078 | |
| | |
Crown Resorts Ltd.* | | | 1,450 | | | | 10,847 | |
| | |
Domino’s Pizza Enterprises Ltd. | | | 437 | | | | 44,462 | |
| | |
Domino’s Pizza, Inc. | | | 225 | | | | 110,018 | |
| | |
Entain plc* | | | 3,550 | | | | 99,659 | |
| | |
Genting Singapore Ltd. | | | 2,500 | | | | 1,446 | |
| | |
Greggs plc | | | 725 | | | | 30,360 | |
| | |
InterContinental Hotels Group plc* | | | 525 | | | | 36,831 | |
| | |
Marriott International, Inc., Class A* | | | 2,075 | | | | 332,042 | |
| | |
MGM Resorts International | | | 1,950 | | | | 91,962 | |
| | |
Oriental Land Co. Ltd.(b) | | | 1,400 | | | | 220,268 | |
| | |
Restaurant Brands International, Inc. | | | 1,775 | | | | 100,338 | |
See Accompanying Notes to the Financial Statements.
| | | | | | |
| | FLEXSHARES ANNUAL REPORT | | | 285 | |
FlexShares® STOXX® Global ESG Select Index Fund (cont.)
| | | | | | | | |
| Investments | | Shares | | | Value | |
|
| COMMON STOCKS – (continued) | |
|
| Hotels, Restaurants & Leisure – (continued) | |
| | |
Sands China Ltd.* | | | 10,000 | | | $ | 22,856 | |
| | |
Skylark Holdings Co. Ltd.* | | | 2,500 | | | | 33,830 | |
| | |
Sodexo SA* | | | 125 | | | | 12,151 | |
| | |
Star Entertainment Grp Ltd. (The)* (b) | | | 17,650 | | | | 48,520 | |
| | |
TUI AG, DI* | | | 6,425 | | | | 21,604 | |
| | |
Whitbread plc* | | | 275 | | | | 12,327 | |
| | |
Yum! Brands, Inc. | | | 1,100 | | | | 137,434 | |
| | | | | | | | 1,849,814 | |
|
| Household Durables – 0.9% | |
| | |
Barratt Developments plc | | | 1,550 | | | | 14,087 | |
| | |
Berkeley Group Holdings plc | | | 780 | | | | 46,564 | |
| | |
Casio Computer Co. Ltd.(b) | | | 2,500 | | | | 35,212 | |
| | |
Countryside Properties plc* (d) | | | 1,525 | | | | 9,833 | |
| | |
Electrolux AB, Class B(b) | | | 425 | | | | 9,645 | |
| | |
Husqvarna AB, Class B | | | 3,299 | | | | 46,920 | |
| | |
Panasonic Corp. | | | 10,000 | | | | 122,122 | |
| | |
Persimmon plc | | | 1,675 | | | | 62,474 | |
| | |
SEB SA | | | 50 | | | | 7,829 | |
| | |
Sekisui House Ltd. | | | 5,000 | | | | 103,552 | |
| | |
Sharp Corp. | | | 2,500 | | | | 29,401 | |
| | |
Sony Group Corp. | | | 10,000 | | | | 1,152,379 | |
| | |
Taylor Wimpey plc | | | 31,175 | | | | 66,044 | |
| | | | | | | | 1,706,062 | |
|
| Household Products – 1.8% | |
| | |
Colgate-Palmolive Co. | | | 3,325 | | | | 253,332 | |
| | |
Essity AB, Class B | | | 2,575 | | | | 83,290 | |
| | |
Henkel AG & Co. KGaA (Preference) | | | 96 | | | | 8,596 | |
| | |
Lion Corp. | | | 2,500 | | | | 41,548 | |
| | |
Procter & Gamble Co. (The) | | | 17,809 | | | | 2,546,509 | |
| | |
Reckitt Benckiser Group plc | | | 3,814 | | | | 309,761 | |
| | |
Unicharm Corp. | | | 2,500 | | | | 100,680 | |
| | | | | | | | 3,343,716 | |
|
Independent Power and Renewable Electricity
Producers – 0.0%(a) | |
| | |
Meridian Energy Ltd. | | | 6,250 | | | | 22,319 | |
|
| Industrial Conglomerates – 1.4% | |
| | |
3M Co. | | | 3,075 | | | | 549,441 | |
| | | | | | | | |
| Investments | | Shares | | | Value | |
|
| Industrial Conglomerates – (continued) | |
| | |
CK Hutchison Holdings Ltd.(b) | | | 12,500 | | | $ | 84,120 | |
| | |
General Electric Co. | | | 9,075 | | | | 951,695 | |
| | |
Hitachi Ltd. | | | 5,000 | | | | 287,393 | |
| | |
Rheinmetall AG | | | 1,050 | | | | 101,875 | |
| | |
Roper Technologies, Inc. | | | 225 | | | | 109,771 | |
| | |
Siemens AG (Registered) | | | 2,889 | | | | 468,998 | |
| | |
Smiths Group plc | | | 1,625 | | | | 30,193 | |
| | | | | | | | 2,583,486 | |
|
| Insurance – 2.2% | |
| | |
Admiral Group plc | | | 846 | | | | 33,282 | |
| | |
Aegon NV | | | 3,875 | | | | 19,664 | |
| | |
Aflac, Inc. | | | 2,650 | | | | 142,226 | |
| | |
AIA Group Ltd. | | | 20,000 | | | | 225,863 | |
| | |
Allianz SE (Registered) | | | 380 | | | | 88,457 | |
| | |
ASR Nederland NV | | | 1,428 | | | | 66,862 | |
| | |
Assicurazioni Generali SpA(b) | | | 6,540 | | | | 142,665 | |
| | |
Aviva plc | | | 26,082 | | | | 141,113 | |
| | |
AXA SA | | | 10,307 | | | | 300,103 | |
| | |
Dai-ichi Life Holdings, Inc. | | | 7,500 | | | | 157,959 | |
| | |
Direct Line Insurance Group plc | | | 15,325 | | | | 61,424 | |
| | |
Gjensidige Forsikring ASA | | | 525 | | | | 13,039 | |
| | |
Hannover Rueck SE | | | 175 | | | | 31,998 | |
| | |
Insurance Australia Group Ltd. | | | 24,570 | | | | 88,582 | |
| | |
Japan Post Holdings Co. Ltd.* (b) | | | 17,700 | | | | 135,825 | |
| | |
Japan Post Insurance Co. Ltd. | | | 2,500 | | | | 40,561 | |
| | |
Legal & General Group plc | | | 32,535 | | | | 128,842 | |
| | |
Medibank Pvt Ltd. | | | 12,876 | | | | 32,108 | |
| | |
MetLife, Inc. | | | 2,250 | | | | 141,300 | |
| | |
Muenchener Rueckversicherungs-Gesellschaft AG in Muenchen (Registered) | | | 575 | | | | 170,480 | |
| | |
Poste Italiane SpA(d) | | | 3,679 | | | | 52,538 | |
| | |
Power Corp. of Canada | | | 3,036 | | | | 100,959 | |
| | |
Powszechny Zaklad Ubezpieczen SA | | | 1,625 | | | | 16,264 | |
| | |
Principal Financial Group, Inc. | | | 850 | | | | 57,027 | |
| | |
Progressive Corp. (The) | | | 3,300 | | | | 313,104 | |
| | |
Prudential plc | | | 15,550 | | | | 318,555 | |
| | |
QBE Insurance Group Ltd. | | | 13,258 | | | | 117,804 | |
| | |
Sampo OYJ, Class A | | | 2,569 | | | | 136,757 | |
| | |
Storebrand ASA | | | 720 | | | | 7,706 | |
| | |
Sun Life Financial, Inc. | | | 2,241 | | | | 127,512 | |
See Accompanying Notes to the Financial Statements.
| | | | |
| 286 | | FLEXSHARES ANNUAL REPORT | | |
FlexShares® STOXX® Global ESG Select Index Fund (cont.)
| | | | | | | | |
| Investments | | Shares | | | Value | |
|
| COMMON STOCKS – (continued) | |
|
| Insurance – (continued) | |
| | |
Suncorp Group Ltd. | | | 13,885 | | | $ | 122,228 | |
| | |
Swiss Life Holding AG (Registered) | | | 150 | | | | 82,506 | |
| | |
Swiss Re AG | | | 887 | | | | 86,045 | |
| | |
Zurich Insurance Group AG | | | 1,075 | | | | 477,529 | |
| | | | | | | | 4,178,887 | |
|
| Interactive Media & Services – 5.1% | |
| | |
Alphabet, Inc., Class C* | | | 1,975 | | | | 5,856,685 | |
| | |
Meta Platforms, Inc., Class A* | | | 10,307 | | | | 3,335,036 | |
| | |
Pinterest, Inc., Class A* | | | 2,225 | | | | 99,324 | |
| | |
Rightmove plc | | | 5,342 | | | | 50,628 | |
| | |
Z Holdings Corp. | | | 20,800 | | | | 128,786 | |
| | |
Zillow Group, Inc., Class C* | | | 50 | | | | 5,181 | |
| | | | | | | | 9,475,640 | |
|
| Internet & Direct Marketing Retail – 5.1% | |
| | |
Amazon.com, Inc.* | | | 2,606 | | | | 8,788,553 | |
| | |
Delivery Hero SE* (d) | | | 702 | | | | 87,373 | |
| | |
eBay, Inc. | | | 2,470 | | | | 189,498 | |
| | |
Etsy, Inc.* (b) | | | 775 | | | | 194,285 | |
| | |
Farfetch Ltd., Class A* | | | 100 | | | | 3,921 | |
| | |
HelloFresh SE* | | | 459 | | | | 37,182 | |
| | |
Just Eat Takeaway.com NV* (d) | | | 567 | | | | 40,761 | |
| | |
Rakuten Group, Inc.(b) | | | 2,500 | | | | 27,406 | |
| | |
Zalando SE* (d) | | | 1,292 | | | | 121,976 | |
| | |
Zalando SE* (d) (e) | | | 233 | | | | 21,997 | |
| | | | | | | | 9,512,952 | |
|
| IT Services – 3.0% | |
| | |
Accenture plc, Class A | | | 5,879 | | | | 2,109,326 | |
| | |
Afterpay Ltd.* | | | 1,125 | | | | 104,178 | |
| | |
Alten SA | | | 100 | | | | 16,109 | |
| | |
Amadeus IT Group SA* | | | 456 | | | | 30,522 | |
| | |
Atos SE | | | 650 | | | | 33,834 | |
| | |
Capgemini SE | | | 775 | | | | 180,540 | |
| | |
Cognizant Technology Solutions Corp., Class A | | | 2,625 | | | | 204,986 | |
| | |
Computershare Ltd. | | | 1,170 | | | | 16,486 | |
| | |
Edenred | | | 1,325 | | | | 71,715 | |
| | |
Fujitsu Ltd. | | | 1,900 | | | | 327,012 | |
| | |
Gartner, Inc.* | | | 225 | | | | 74,680 | |
| | | | | | | | |
| Investments | | Shares | | | Value | |
|
| IT Services – (continued) | |
| | |
International Business Machines Corp. | | | 6,902 | | | $ | 863,440 | |
| | |
Mastercard, Inc., Class A | | | 3,475 | | | | 1,165,932 | |
| | |
Nexi SpA* (d) | | | 1,225 | | | | 21,300 | |
| | |
Nomura Research Institute Ltd. | | | 2,500 | | | | 99,540 | |
| | |
NTT Data Corp. | | | 5,000 | | | | 100,110 | |
| | |
Sopra Steria Group SACA | | | 75 | | | | 14,764 | |
| | |
Wix.com Ltd.* (b) | | | 300 | | | | 55,788 | |
| | |
Worldline SA* (d) | | | 1,000 | | | | 58,302 | |
| | | | | | | | 5,548,564 | |
|
| Leisure Products – 0.1% | |
| | |
Bandai Namco Holdings, Inc. | | | 1,400 | | | | 106,659 | |
| | |
Hasbro, Inc. | | | 475 | | | | 45,486 | |
| | |
Yamaha Corp. | | | 900 | | | | 56,672 | |
| | | | | | | | 208,817 | |
|
| Life Sciences Tools & Services – 0.7% | |
| | |
Agilent Technologies, Inc. | | | 1,225 | | | | 192,925 | |
| | |
Bio-Rad Laboratories, Inc., Class A* | | | 162 | | | | 128,738 | |
| | |
Eurofins Scientific SE(b) | | | 600 | | | | 70,782 | |
| | |
Illumina, Inc.* | | | 425 | | | | 176,401 | |
| | |
Lonza Group AG (Registered) | | | 405 | | | | 332,687 | |
| | |
Mettler-Toledo International, Inc.* | | | 150 | | | | 222,132 | |
| | |
Sartorius Stedim Biotech | | | 189 | | | | 104,155 | |
| | | | | | | | 1,227,820 | |
|
| Machinery – 1.8% | |
| | |
Aalberts NV | | | 600 | | | | 33,225 | |
| | |
Alfa Laval AB | | | 2,013 | | | | 86,183 | |
| | |
Alstom SA | | | 275 | | | | 9,796 | |
| | |
Atlas Copco AB, Class A(b) | | | 3,213 | | | | 206,431 | |
| | |
Caterpillar, Inc. | | | 3,025 | | | | 617,130 | |
| | |
CNH Industrial NV | | | 7,050 | | | | 121,808 | |
| | |
Cummins, Inc. | | | 425 | | | | 101,932 | |
| | |
Daifuku Co. Ltd. | | | 800 | | | | 73,317 | |
| | |
Deere & Co. | | | 1,146 | | | | 392,287 | |
| | |
Epiroc AB, Class A(b) | | | 4,380 | | | | 108,984 | |
| | |
FANUC Corp. | | | 800 | | | | 156,527 | |
| | |
GEA Group AG | | | 1,000 | | | | 49,287 | |
| | |
Georg Fischer AG (Registered) | | | 25 | | | | 37,893 | |
| | |
IMI plc | | | 2,200 | | | | 49,276 | |
See Accompanying Notes to the Financial Statements.
| | | | | | |
| | FLEXSHARES ANNUAL REPORT | | | 287 | |
FlexShares® STOXX® Global ESG Select Index Fund (cont.)
| | | | | | | | |
| Investments | | Shares | | | Value | |
|
| COMMON STOCKS – (continued) | |
|
| Machinery – (continued) | |
| | |
Kawasaki Heavy Industries Ltd.(b) | | | 2,500 | | | $ | 50,559 | |
| | |
KION Group AG | | | 379 | | | | 41,404 | |
| | |
Komatsu Ltd. | | | 5,000 | | | | 130,081 | |
| | |
Kone OYJ, Class B | | | 1,665 | | | | 113,605 | |
| | |
Kubota Corp.(b) | | | 5,000 | | | | 106,227 | |
| | |
Metso Outotec OYJ | | | 8,019 | | | | 80,550 | |
| | |
MINEBEA MITSUMI, Inc. | | | 2,500 | | | | 63,034 | |
| | |
Nabtesco Corp.(b) | | | 2,600 | | | | 84,139 | |
| | |
NSK Ltd. | | | 10,000 | | | | 67,091 | |
| | |
Otis Worldwide Corp. | | | 350 | | | | 28,108 | |
| | |
Parker-Hannifin Corp. | | | 27 | | | | 8,008 | |
| | |
Rotork plc | | | 6,190 | | | | 30,054 | |
| | |
Schindler Holding AG | | | 275 | | | | 71,688 | |
| | |
Spirax-Sarco Engineering plc | | | 500 | | | | 106,953 | |
| | |
Trelleborg AB, Class B | | | 2,550 | | | | 58,239 | |
| | |
Valmet OYJ | | | 466 | | | | 18,929 | |
| | |
Volvo AB, Class B | | | 5,925 | | | | 137,920 | |
| | |
Wartsila OYJ Abp | | | 4,203 | | | | 58,343 | |
| | |
Weir Group plc (The) | | | 150 | | | | 3,567 | |
| | |
Xylem, Inc. | | | 175 | | | | 22,853 | |
| | | | | | | | 3,325,428 | |
|
| Marine – 0.1% | |
| | |
AP Moller – Maersk A/S, Class B | | | 25 | | | | 72,316 | |
| | |
Kuehne + Nagel International AG (Registered) | | | 50 | | | | 15,776 | |
| | |
Nippon Yusen KK | | | 1,500 | | | | 107,608 | |
| | | | | | | | 195,700 | |
|
| Media – 0.3% | |
| | |
Informa plc* | | | 13,554 | | | | 96,500 | |
| | |
Interpublic Group of Cos., Inc. (The) | | | 850 | | | | 31,085 | |
| | |
ITV plc* | | | 42,000 | | | | 61,976 | |
| | |
Omnicom Group, Inc. | | | 1,975 | | | | 134,458 | |
| | |
Pearson plc | | | 8,019 | | | | 66,216 | |
| | |
Publicis Groupe SA | | | 1,628 | | | | 109,159 | |
| | |
SES SA, Receipts | | | 3,000 | | | | 26,969 | |
| | |
Vivendi SE | | | 3,630 | | | | 46,776 | |
| | | | | | | | |
| Investments | | Shares | | | Value | |
|
| Media – (continued) | |
| | |
WPP plc | | | 1,550 | | | $ | 22,436 | |
| | | | | | | | 595,575 | |
|
| Metals & Mining – 0.8% | |
| | |
Alumina Ltd.(b) | | | 2,425 | | | | 3,625 | |
| | |
Antofagasta plc | | | 300 | | | | 5,862 | |
| | |
ArcelorMittal SA(b) | | | 2,772 | | | | 94,072 | |
| | |
BlueScope Steel Ltd. | | | 3,708 | | | | 57,428 | |
| | |
Boliden AB | | | 2,250 | | | | 79,353 | |
| | |
Evraz plc | | | 1,460 | | | | 12,440 | |
| | |
Fortescue Metals Group Ltd. | | | 9,225 | | | | 96,520 | |
| | |
Glencore plc* | | | 60,400 | | | | 302,403 | |
| | |
JFE Holdings, Inc. | | | 2,500 | | | | 38,215 | |
| | |
Newmont Corp. | | | 2,650 | | | | 143,066 | |
| | |
Norsk Hydro ASA | | | 5,725 | | | | 41,878 | |
| | |
Northern Star Resources Ltd. | | | 1,225 | | | | 8,502 | |
| | |
Polymetal International plc | | | 3,500 | | | | 65,008 | |
| | |
Rio Tinto Ltd. | | | 1,450 | | | | 98,334 | |
| | |
Rio Tinto plc | | | 4,733 | | | | 295,874 | |
| | |
South32 Ltd. | | | 50,787 | | | | 136,182 | |
| | |
Sumitomo Metal Mining Co. Ltd. | | | 2,500 | | | | 96,974 | |
| | | | | | | | 1,575,736 | |
|
| Multiline Retail – 0.3% | |
| | |
Marks & Spencer Group plc* | | | 7,550 | | | | 19,001 | |
| | |
Marui Group Co. Ltd. | | | 2,500 | | | | 48,871 | |
| | |
Next plc | | | 759 | | | | 82,878 | |
| | |
Target Corp. | | | 1,701 | | | | 441,614 | |
| | | | | | | | 592,364 | |
|
| Multi-Utilities – 0.5% | |
| | |
A2A SpA | | | 16,060 | | | | 33,788 | |
| | |
AGL Energy Ltd.(b) | | | 5,000 | | | | 21,481 | |
| | |
Centrica plc* | | | 63,575 | | | | 52,566 | |
| | |
E.ON SE | | | 4,730 | | | | 60,026 | |
| | |
Engie SA | | | 5,200 | | | | 73,994 | |
| | |
National Grid plc(b) | | | 24,844 | | | | 318,550 | |
| | |
RWE AG | | | 1,712 | | | | 65,915 | |
| | |
Sempra Energy | | | 1,250 | | | | 159,537 | |
| | |
Suez SA | | | 875 | | | | 19,933 | |
| | |
Veolia Environnement SA | | | 4,162 | | | | 135,969 | |
| | | | | | | | 941,759 | |
See Accompanying Notes to the Financial Statements.
| | | | |
| 288 | | FLEXSHARES ANNUAL REPORT | | |
FlexShares® STOXX® Global ESG Select Index Fund (cont.)
| | | | | | | | |
| Investments | | Shares | | | Value | |
|
| COMMON STOCKS – (continued) | |
|
| Oil, Gas & Consumable Fuels – 2.7% | |
| | |
Aker BP ASA | | | 1,700 | | | $ | 65,092 | |
| | |
Ampol Ltd. | | | 50 | | | | 1,147 | |
| | |
BP plc | | | 88,751 | | | | 426,037 | |
| | |
Canadian Natural Resources Ltd. | | | 4,380 | | | | 185,864 | |
| | |
Chevron Corp. | | | 12,378 | | | | 1,417,157 | |
| | |
ENEOS Holdings, Inc. | | | 1,500 | | | | 6,046 | |
| | |
Eni SpA | | | 7,030 | | | | 100,912 | |
| | |
Equinor ASA | | | 4,975 | | | | 125,709 | |
| | |
Exxon Mobil Corp. | | | 13,701 | | | | 883,303 | |
| | |
Galp Energia SGPS SA | | | 7,592 | | | | 79,002 | |
| | |
Koninklijke Vopak NV | | | 75 | | | | 2,986 | |
| | |
Lundin Energy AB | | | 1,593 | | | | 62,915 | |
| | |
Neste OYJ | | | 2,625 | | | | 146,391 | |
| | |
Oil Search Ltd. | | | 3,575 | | | | 11,519 | |
| | |
OMV AG | | | 575 | | | | 34,868 | |
| | |
Phillips 66 | | | 3,200 | | | | 239,296 | |
| | |
Polski Koncern Naftowy ORLEN SA | | | 1,400 | | | | 30,222 | |
| | |
Repsol SA | | | 9,375 | | | | 119,949 | |
| | |
Royal Dutch Shell plc, Class A | | | 23,254 | | | | 537,353 | |
| | |
Santos Ltd.(b) | | | 25 | | | | 131 | |
| | |
Suncor Energy, Inc. | | | 8,560 | | | | 224,782 | |
| | |
TotalEnergies SE | | | 7,353 | | | | 369,047 | |
| | |
Woodside Petroleum Ltd. | | | 325 | | | | 5,678 | |
| | | | | | | | 5,075,406 | |
|
| Paper & Forest Products – 0.1% | |
| | |
Mondi plc | | | 2,306 | | | | 57,687 | |
| | |
Stora Enso OYJ, Class R | | | 4,800 | | | | 79,878 | |
| | |
Svenska Cellulosa AB SCA, Class B | | | 3,150 | | | | 49,111 | |
| | | | | | | | 186,676 | |
|
| Personal Products – 1.0% | |
| | |
Beiersdorf AG | | | 336 | | | | 35,734 | |
| | |
Estee Lauder Cos., Inc. (The), Class A | | | 1,196 | | | | 387,899 | |
| | |
L’Oreal SA | | | 1,458 | | | | 666,387 | |
| | |
Pola Orbis Holdings, Inc.(b) | | | 2,500 | | | | 53,278 | |
| | |
Shiseido Co. Ltd.(b) | | | 2,500 | | | | 166,082 | |
| | |
Unilever plc | | | 5,649 | | | | 302,743 | |
| | | | | | | | |
| Investments | | Shares | | | Value | |
|
| Personal Products – (continued) | |
| | |
Unilever plc | | | 3,201 | | | $ | 171,649 | |
| | | | | | | | 1,783,772 | |
|
| Pharmaceuticals – 7.3% | |
| | |
Astellas Pharma, Inc. | | | 10,000 | | | | 168,121 | |
| | |
AstraZeneca plc | | | 9,798 | | | | 1,221,380 | |
| | |
Bayer AG (Registered) | | | 998 | | | | 56,211 | |
| | |
Bristol-Myers Squibb Co. | | | 8,111 | | | | 473,682 | |
| | |
Eli Lilly and Co. | | | 2,781 | | | | 708,488 | |
| | |
GlaxoSmithKline plc | | | 13,341 | | | | 275,880 | |
| | |
Hikma Pharmaceuticals plc | | | 379 | | | | 12,505 | |
| | |
Ipsen SA | | | 400 | | | | 41,383 | |
| | |
Johnson & Johnson | | | 22,683 | | | | 3,694,607 | |
| | |
Merck & Co., Inc. | | | 12,669 | | | | 1,115,505 | |
| | |
Merck KGaA | | | 700 | | | | 165,417 | |
| | |
Novartis AG (Registered) | | | 6,700 | | | | 554,624 | |
| | |
Novo Nordisk A/S, Class B | | | 6,425 | | | | 703,933 | |
| | |
Ono Pharmaceutical Co. Ltd. | | | 5,000 | | | | 104,604 | |
| | |
Orion OYJ, Class B | | | 1,350 | | | | 58,476 | |
| | |
Otsuka Holdings Co. Ltd.(b) | | | 2,500 | | | | 98,531 | |
| | |
Pfizer, Inc. | | | 31,100 | | | | 1,360,314 | |
| | |
Roche Holding AG | | | 3,925 | | | | 1,520,817 | |
| | |
Sanofi | | | 5,185 | | | | 518,610 | |
| | |
Santen Pharmaceutical Co. Ltd. | | | 5,000 | | | | 70,204 | |
| | |
Shionogi & Co. Ltd. | | | 2,500 | | | | 162,399 | |
| | |
Sumitomo Dainippon Pharma Co. Ltd.(b) | | | 2,500 | | | | 35,234 | |
| | |
UCB SA | | | 756 | | | | 90,200 | |
| | |
Vifor Pharma AG | | | 50 | | | | 6,462 | |
| | |
Zoetis, Inc. | | | 1,200 | | | | 259,440 | |
| | | | | | | | 13,477,027 | |
|
| Professional Services – 0.5% | |
| | |
Adecco Group AG (Registered) | | | 200 | | | | 10,084 | |
| | |
Booz Allen Hamilton Holding Corp. | | | 575 | | | | 49,945 | |
| | |
Bureau Veritas SA | | | 2,071 | | | | 65,812 | |
| | |
Intertek Group plc | | | 161 | | | | 10,803 | |
| | |
Randstad NV | | | 150 | | | | 10,797 | |
| | |
RELX plc | | | 14,250 | | | | 442,231 | |
| | |
SGS SA (Registered) | | | 25 | | | | 74,090 | |
| | |
Teleperformance | | | 405 | | | | 169,243 | |
See Accompanying Notes to the Financial Statements.
| | | | | | |
| | FLEXSHARES ANNUAL REPORT | | | 289 | |
FlexShares® STOXX® Global ESG Select Index Fund (cont.)
| | | | | | | | |
| Investments | | Shares | | | Value | |
|
| COMMON STOCKS – (continued) | |
|
| Professional Services – (continued) | |
| | |
Wolters Kluwer NV | | | 1,431 | | | $ | 150,102 | |
| | | | | | | | 983,107 | |
|
| Real Estate Management & Development – 0.4% | |
| | |
Aroundtown SA(b) | | | 4,899 | | | | 34,073 | |
| | |
Capitaland Investment Ltd.* | | | 2,100 | | | | 5,357 | |
| | |
Castellum AB(b) | | | 1,634 | | | | 43,454 | |
| | |
CBRE Group, Inc., Class A* | | | 750 | | | | 78,060 | |
| | |
City Developments Ltd. | | | 7,500 | | | | 40,712 | |
| | |
CK Asset Holdings Ltd. | | | 12,500 | | | | 77,211 | |
| | |
Deutsche Wohnen SE* (e) | | | 400 | | | | 24,534 | |
| | |
Entra ASA(b) (d) | | | 2,835 | | | | 70,646 | |
| | |
Grand City Properties SA | | | 2,725 | | | | 69,882 | |
| | |
Lendlease Corp. Ltd. | | | 25 | | | | 196 | |
| | |
Mitsubishi Estate Co. Ltd. | | | 5,000 | | | | 75,773 | |
| | |
Swire Properties Ltd. | | | 15,000 | | | | 40,204 | |
| | |
Swiss Prime Site AG (Registered) | | | 918 | | | | 93,432 | |
| | |
Tokyo Tatemono Co. Ltd. | | | 2,500 | | | | 36,615 | |
| | |
Vonovia SE | | | 162 | | | | 9,835 | |
| | |
Wihlborgs Fastigheter AB | | | 1,175 | | | | 27,800 | |
| | | | | | | | 727,784 | |
|
| Road & Rail – 0.5% | |
| | |
Aurizon Holdings Ltd. | | | 2,366 | | | | 5,989 | |
| | |
Canadian National Railway Co. | | | 4,293 | | | | 569,652 | |
| | |
ComfortDelGro Corp. Ltd. | | | 57,500 | | | | 66,518 | |
| | |
JB Hunt Transport Services, Inc. | | | 200 | | | | 39,438 | |
| | |
Kyushu Railway Co. | | | 2,500 | | | | 55,821 | |
| | |
MTR Corp. Ltd. | | | 12,500 | | | | 68,132 | |
| | |
Tokyu Corp. | | | 2,500 | | | | 35,124 | |
| | | | | | | | 840,674 | |
|
| Semiconductors & Semiconductor Equipment – 5.3% | |
| | |
Advantest Corp. | | | 1,100 | | | | 90,007 | |
| | |
ams AG* (b) | | | 730 | | | | 14,452 | |
| | |
Analog Devices, Inc.(b) | | | 1,275 | | | | 221,200 | |
| | |
Applied Materials, Inc. | | | 4,800 | | | | 655,920 | |
| | |
ASM International NV | | | 250 | | | | 113,237 | |
| | |
ASM Pacific Technology Ltd. | | | 2,500 | | | | 27,012 | |
| | |
ASML Holding NV | | | 2,500 | | | | 2,026,634 | |
| | |
Broadcom, Inc.(b) | | | 1,625 | | | | 863,964 | |
| | |
Infineon Technologies AG | | | 7,398 | | | | 345,835 | |
| | | | | | | | |
| Investments | | Shares | | | Value | |
|
| Semiconductors & Semiconductor Equipment – (continued) | |
| | |
Intel Corp. | | | 33,975 | | | $ | 1,664,775 | |
| | |
Lam Research Corp. | | | 825 | | | | 464,945 | |
| | |
Microchip Technology, Inc. | | | 1,400 | | | | 103,726 | |
| | |
Micron Technology, Inc. | | | 7,775 | | | | 537,252 | |
| | |
Nordic Semiconductor ASA* | | | 575 | | | | 16,993 | |
| | |
ON Semiconductor Corp.* | | | 1,125 | | | | 54,079 | |
| | |
QUALCOMM, Inc. | | | 5,479 | | | | 728,926 | |
| | |
Renesas Electronics Corp.* | | | 10,000 | | | | 122,955 | |
| | |
Rohm Co. Ltd. | | | 400 | | | | 36,413 | |
| | |
STMicroelectronics NV | | | 3,825 | | | | 181,021 | |
| | |
SUMCO Corp. | | | 2,500 | | | | 47,446 | |
| | |
Texas Instruments, Inc. | | | 8,268 | | | | 1,550,085 | |
| | | | | | | | 9,866,877 | |
|
| Software – 8.8% | |
| | |
Adobe, Inc.* | | | 2,141 | | | | 1,392,421 | |
| | |
Autodesk, Inc.* | | | 1,767 | | | | 561,217 | |
| | |
Avast plc(d) | | | 2,000 | | | | 15,341 | |
| | |
Coupa Software, Inc.* | | | 175 | | | | 39,848 | |
| | |
Crowdstrike Holdings, Inc., Class A* | | | 500 | | | | 140,900 | |
| | |
Dassault Systemes SE | | | 3,807 | | | | 221,957 | |
| | |
Fortinet, Inc.* | | | 375 | | | | 126,128 | |
| | |
HubSpot, Inc.* (b) | | | 150 | | | | 121,535 | |
| | |
Intuit, Inc. | | | 1,296 | | | | 811,283 | |
| | |
Microsoft Corp. | | | 30,562 | | | | 10,134,969 | |
| | |
Oracle Corp. | | | 15,046 | | | | 1,443,513 | |
| | |
Sage Group plc (The) | | | 6,014 | | | | 58,596 | |
| | |
SAP SE | | | 5,325 | | | | 772,266 | |
| | |
SimCorp A/S | | | 475 | | | | 57,443 | |
| | |
Synopsys, Inc.* | | | 926 | | | | 308,525 | |
| | |
WiseTech Global Ltd. | | | 500 | | | | 19,183 | |
| | |
Xero Ltd.* (b) | | | 600 | | | | 67,378 | |
| | | | | | | | 16,292,503 | |
|
| Specialty Retail – 2.2% | |
| | |
Best Buy Co., Inc. | | | 1,126 | | | | 137,642 | |
| | |
Burlington Stores, Inc.* | | | 475 | | | | 131,238 | |
| | |
Carvana Co.* (b) | | | 225 | | | | 68,216 | |
| | |
Dufry AG (Registered)* (b) | | | 400 | | | | 21,179 | |
| | |
Fast Retailing Co. Ltd. | | | 200 | | | | 132,445 | |
| | |
H & M Hennes & Mauritz AB, Class B(b) | | | 3,075 | | | | 57,651 | |
See Accompanying Notes to the Financial Statements.
| | | | |
| 290 | | FLEXSHARES ANNUAL REPORT | | |
FlexShares® STOXX® Global ESG Select Index Fund (cont.)
| | | | | | | | |
| Investments | | Shares | | | Value | |
|
| COMMON STOCKS – (continued) | |
|
| Specialty Retail – (continued) | |
| | |
Home Depot, Inc. (The) | | | 6,237 | | | $ | 2,318,542 | |
| | |
Industria de Diseno Textil SA(b) | | | 3,175 | | | | 114,784 | |
| | |
Kingfisher plc | | | 10,862 | | | | 49,878 | |
| | |
Lowe’s Cos., Inc. | | | 3,051 | | | | 713,385 | |
| | |
TJX Cos., Inc. (The) | | | 4,903 | | | | 321,097 | |
| | |
WH Smith plc* | | | 1,100 | | | | 23,552 | |
| | | | | | | | 4,089,609 | |
|
| Technology Hardware, Storage & Peripherals – 5.3% | |
| | |
Apple, Inc. | | | 59,001 | | | | 8,838,351 | |
| | |
Canon, Inc.(b) | | | 5,000 | | | | 112,169 | |
| | |
Dell Technologies, Inc., Class C* | | | 891 | | | | 98,001 | |
| | |
FUJIFILM Holdings Corp. | | | 2,500 | | | | 192,962 | |
| | |
Hewlett Packard Enterprise Co. | | | 4,685 | | | | 68,635 | |
| | |
HP, Inc. | | | 11,043 | | | | 334,934 | |
| | |
NetApp, Inc. | | | 698 | | | | 62,332 | |
| | |
Ricoh Co. Ltd. | | | 2,500 | | | | 24,249 | |
| | |
Seiko Epson Corp. | | | 2,500 | | | | 44,420 | |
| | |
Western Digital Corp.* | | | 3,025 | | | | 158,177 | |
| | | | | | | | 9,934,230 | |
|
| Textiles, Apparel & Luxury Goods – 1.8% | |
| | |
adidas AG | | | 875 | | | | 286,868 | |
| | |
Burberry Group plc | | | 1,150 | | | | 30,408 | |
| | |
EssilorLuxottica SA – IM | | | 282 | | | | 58,311 | |
| | |
EssilorLuxottica SA – MO | | | 1,418 | | | | 293,572 | |
| | |
Hermes International | | | 125 | | | | 198,251 | |
| | |
Kering SA | | | 400 | | | | 300,052 | |
| | |
Lululemon Athletica, Inc.* | | | 702 | | | | 327,139 | |
| | |
LVMH Moet Hennessy Louis Vuitton SE | | | 1,150 | | | | 901,243 | |
| | |
Moncler SpA | | | 1,431 | | | | 102,872 | |
| | |
NIKE, Inc., Class B | | | 3,525 | | | | 589,697 | |
| | |
Pandora A/S | | | 611 | | | | 85,410 | |
| | |
Shenzhou International Group Holdings Ltd. | | | 2,500 | | | | 53,927 | |
| | |
Swatch Group AG (The) | | | 200 | | | | 54,982 | |
| | | | | | | | 3,282,732 | |
|
| Tobacco – 0.1% | |
| | |
Imperial Brands plc | | | 6,250 | | | | 132,106 | |
| | | | | | | | |
| Investments | | Shares | | | Value | |
|
| Tobacco – (continued) | |
| | |
Japan Tobacco, Inc.(b) | | | 2,500 | | | $ | 49,013 | |
| | | | | | | | 181,119 | |
|
| Trading Companies & Distributors – 0.8% | |
| | |
Brenntag SE | | | 640 | | | | 60,910 | |
| | |
Bunzl plc | | | 3,625 | | | | 134,262 | |
| | |
Diploma plc | | | 375 | | | | 15,442 | |
| | |
Electrocomponents plc | | | 1,575 | | | | 24,288 | |
| | |
Ferguson plc | | | 837 | | | | 126,148 | |
| | |
ITOCHU Corp.(b) | | | 5,000 | | | | 142,162 | |
| | |
Mitsubishi Corp. | | | 7,500 | | | | 237,579 | |
| | |
Mitsui & Co. Ltd. | | | 12,500 | | | | 284,148 | |
| | |
Rexel SA* | | | 2,300 | | | | 45,674 | |
| | |
Sojitz Corp. | | | 3,999 | | | | 65,759 | |
| | |
Sumitomo Corp. | | | 10,000 | | | | 141,811 | |
| | |
Toyota Tsusho Corp. | | | 2,500 | | | | 108,090 | |
| | |
WW Grainger, Inc. | | | 150 | | | | 69,466 | |
| | | | | | | | 1,455,739 | |
|
| Transportation Infrastructure – 0.2% | |
| | |
Aena SME SA* (d) | | | 250 | | | | 40,981 | |
| | |
Aeroports de Paris* (b) | | | 668 | | | | 88,823 | |
| | |
Atlantia SpA* | | | 200 | | | | 3,867 | |
| | |
Auckland International Airport Ltd.* | | | 7,756 | | | | 44,349 | |
| | |
Flughafen Zurich AG (Registered)* (b) | | | 25 | | | | 4,514 | |
| | |
Getlink SE | | | 2,949 | | | | 45,338 | |
| | |
Transurban Group | | | 15,528 | | �� | | 156,752 | |
| | | | | | | | 384,624 | |
|
| Water Utilities – 0.1% | |
| | |
American Water Works Co., Inc. | | | 850 | | | | 148,053 | |
| | |
Pennon Group plc | | | 100 | | | | 1,598 | |
| | |
Severn Trent plc | | | 1,984 | | | | 74,462 | |
| | | | | | | | 224,113 | |
|
| Wireless Telecommunication Services – 0.1% | |
| | |
Millicom International Cellular SA, SDR* | | | 575 | | | | 20,112 | |
| | |
Vodafone Group plc | | | 132,108 | | | | 195,646 | |
| | | | | | | | 215,758 | |
Total Common Stocks
(Cost $130,421,300) | | | | | | | 181,690,925 | |
See Accompanying Notes to the Financial Statements.
| | | | | | |
| | FLEXSHARES ANNUAL REPORT | | | 291 | |
FlexShares® STOXX® Global ESG Select Index Fund (cont.)
| | | | | | | | |
| Investments | | Principal
Amount | | | Value | |
|
| CONVERTIBLE BONDS – 0.0%(a) | |
|
| Airlines – 0.0%(a) | |
| | |
Singapore Airlines Ltd. Zero Coupon, 6/8/2030 (Cost $2,944) | | SGD | 3,869 | | | $ | 2,631 | |
|
| SECURITIES LENDING REINVESTMENTS(g) – 0.7% | |
|
| REPURCHASE AGREEMENTS – 0.7% | |
| | |
Citigroup Global Markets, Inc., 0.05%, dated 10/31/2021, due 11/1/2021, repurchase price $1,234,055, collateralized by various U.S. Treasury Securities, ranging from 0.75% – 4.63%, maturing 2/15/2040 – 2/15/2042; total market value $1,245,187
(Cost $1,234,053) | | $ | 1,234,053 | | | | 1,234,053 | |
Total Investments – 98.5%
(Cost $131,658,297) | | | | 182,927,609 | |
| |
Other assets less liabilities – 1.5% | | | | 2,789,865 | |
| NET ASSETS – 100.0% | | | $ | 185,717,474 | |
| * | Non-income producing security. |
| (a) | Represents less than 0.05% of net assets. |
| (b) | The security or a portion of this security is on loan at October 31, 2021. The total value of securities on loan at October 31, 2021 was $6,129,923, collateralized in the form of cash with a value of $1,234,053 that was reinvested in the securities shown in the Securities Lending Reinvestment section of the Schedule of Investments; $3,029,277 of collateral in the form of U.S. Government Treasury Securities, interest rates ranging from 0.00% – 7.25%, and maturity dates ranging from November 4, 2021 – August 15, 2051 and $2,343,048 of collateral in the form of Foreign Government Fixed Income Securities, interest rates ranging from 0.00% – 8.50%, and maturity dates ranging from November 17, 2021 – June 30, 2120; a total value of $6,606,378. |
| (c) | Securities exempt from registration under Rule 144A of the Securities Act of 1933. These securities may be resold in transactions exempt from registration, normally to qualified institutional buyers. The value of these securities is determined by valuations supplied by a pricing service or brokers, or, if not available, in accordance with procedures established by the Board of Trustees. |
| (d) | Security exempt from registration pursuant to Regulation S under the Securities Act of 1933. Regulation S applies to securities offerings that are made outside of the United States and do not involve direct selling efforts in the United States and as such may have restrictions on resale. |
| (e) | Security fair valued as of October 31, 2021 in accordance with procedures approved by the Board of Trustees. Total value of all such securities at October 31, 2021 amounted to $449,805, which represents approximately 0.24% of net assets of the Fund. |
| (f) | Amount represents less than one share. |
| (g) | The security was purchased with cash collateral held from securities on loan at October 31, 2021. The total value of securities purchased was $1,234,053. |
Percentages shown are based on Net Assets.
Abbreviations
CVA – Dutch Certification
DI – Depositary Interest
OYJ – Public Limited Company
Preference – A special type of equity investment that shares in the earnings of the company, has limited voting rights, and may have a dividend preference. Preference shares may also have liquidation preference.
SCA – Limited partnership with share capital
SDR – Swedish Depositary Receipt
As of October 31, 2021, the gross unrealized appreciation (depreciation) of investments based on the aggregate cost of investments (including derivative instruments, if applicable) for federal income tax purposes was as follows:
| | | | |
| | | | |
Aggregate gross unrealized appreciation | | $ | 52,509,084 | |
Aggregate gross unrealized depreciation | | | (1,372,079 | ) |
Net unrealized appreciation | | $ | 51,137,005 | |
Federal income tax cost | | $ | 131,857,139 | |
See Accompanying Notes to the Financial Statements.
| | | | |
| 292 | | FLEXSHARES ANNUAL REPORT | | |
FlexShares® STOXX® Global ESG Select Index Fund (cont.)
Futures Contracts
FlexShares® STOXX® Global ESG Select Index Fund had the following open futures contracts as of October 31, 2021:
| | | | | | | | | | | | | | | | | | | | |
| | | Number of
Contracts | | | Expiration
Date | | | Trading
Currency | | | Notional
Amount | | | Value and
Unrealized
Appreciation/
(Depreciation)* | |
Long Contracts | |
EURO STOXX 50 Index | | | 9 | | | | 12/17/2021 | | | | EUR | | | $ | 441,294 | | | $ | 15,704 | |
MSCI EAFE E-Mini Index | | | 13 | | | | 12/17/2021 | | | | USD | | | | 1,520,740 | | | | (11,178 | ) |
S&P 500 E-Mini Index | | | 9 | | | | 12/17/2021 | | | | USD | | | | 2,068,650 | | | | 51,170 | |
| | | | | | | | | | | | | | | | | | | $ | 55,696 | |
| * | This amount represents the cumulative appreciation/depreciation on futures contracts. Current day’s variation margin is reported within the Statement of Assets and Liabilities for futures contracts. |
Forward Foreign Currency Contracts
FlexShares® STOXX® Global ESG Select Index Fund had the following outstanding contracts as of October 31, 2021:
| | | | | | | | | | | | | | | | | | | | | | |
| Contracts to Receive | | Counterparty | | In Exchange For | | | Maturity Date | | | Unrealized
Appreciation/
(Depreciation) | |
USD | | | 592,626 | | | | | JPMorgan Chase Bank | | EUR | | | 500,000 | | | | 12/15/2021 | | | $ | 13,384 | |
USD | | | 69,233 | | | | | Morgan Stanley | | GBP | | | 50,000 | | | | 12/15/2021 | | | | 685 | |
USD | | | 349,011 | | | | | Toronto-Dominion Bank (The) | | JPY | | | 38,300,000 | | | | 12/15/2021 | | | | 12,951 | |
Total unrealized appreciation | | | $ | 27,020 | |
USD | | | 44,370 | | | | | Morgan Stanley | | AUD | | | 60,000 | | | | 12/15/2021 | | | $ | (704 | ) |
USD | | | 312,860 | | | | | Toronto-Dominion Bank (The) | | AUD | | | 430,000 | | | | 12/15/2021 | | | | (10,168 | ) |
USD | | | 215,216 | | | | | Toronto-Dominion Bank (The) | | CHF | | | 200,000 | | | | 12/15/2021 | | | | (3,950 | ) |
USD | | | 120,974 | | | | | Toronto-Dominion Bank (The) | | SEK | | | 1,050,000 | | | | 12/15/2021 | | | | (1,359 | ) |
Total unrealized depreciation | | | $ | (16,181 | ) |
Net unrealized appreciation | | | $ | 10,839 | |
Abbreviations:
AUD – Australian Dollar
CHF – Swiss Franc
EUR – Euro
GBP – British Pound
JPY – Japanese Yen
SEK – Swedish Krona
USD – US Dollar
See Accompanying Notes to the Financial Statements.
| | | | | | |
| | FLEXSHARES ANNUAL REPORT | | | 293 | |
FlexShares® STOXX® Global ESG Select Index Fund (cont.)
FlexShares® STOXX® Global ESG Select Index Fund invested, as a percentage of net assets, in companies domiciled in the following countries as of October 31, 2021:
| | | | |
Australia | | | 2.9 | % |
Austria | | | 0.1 | |
Belgium | | | 0.3 | |
Canada | | | 1.7 | |
Colombia | | | 0.0 | † |
Denmark | | | 1.1 | |
Finland | | | 0.6 | |
France | | | 4.7 | |
Germany | | | 2.7 | |
Hong Kong | | | 0.7 | |
Ireland | | | 0.2 | |
Israel | | | 0.0 | † |
Italy | | | 1.0 | |
Japan | | | 7.6 | |
Luxembourg | | | 0.1 | |
Netherlands | | | 2.0 | |
New Zealand | | | 0.1 | |
Norway | | | 0.4 | |
Poland | | | 0.0 | † |
Portugal | | | 0.1 | |
Singapore | | | 0.2 | |
Spain | | | 0.9 | |
Sweden | | | 1.2 | |
Switzerland | | | 4.2 | |
United Kingdom | | | 6.0 | |
United States | | | 59.0 | |
Other1 | | | 2.2 | |
| | | | 100.0 | % |
| † | Amount represents less than 0.05%. |
| 1 | Includes any non-equity securities, securities lending reinvestments and net other assets (liabilities). |
| | | | |
| Security Type | | % of Net Assets | |
Common Stocks | | | 97.8 | % |
Convertible Bonds | �� | | 0.0 | † |
Securities Lending Reinvestments | | | 0.7 | |
Others(1) | | | 1.5 | |
| | | | 100.0 | % |
| † | Amount represents less than 0.05%. |
| (1) | Includes any other net assets/(liabilities). |
See Accompanying Notes to the Financial Statements.
| | | | |
| 294 | | FLEXSHARES ANNUAL REPORT | | |
Schedule of Investments
FlexShares® ESG & Climate US Large Cap Core Index Fund
October 31, 2021
| | | | | | | | |
| Investments | | Shares | | | Value | |
|
| COMMON STOCKS – 99.0% | |
|
| Air Freight & Logistics – 0.2% | |
| | |
United Parcel Service, Inc., Class B | | | 20 | | | $ | 4,269 | |
|
| Automobiles – 2.9% | |
| | |
Ford Motor Co.* | | | 86 | | | | 1,469 | |
| | |
General Motors Co.* | | | 20 | | | | 1,088 | |
| | |
Tesla, Inc.* | | | 68 | | | | 75,752 | |
| | | | | | | | 78,309 | |
|
| Banks – 4.3% | |
| | |
Bank of America Corp. | | | 956 | | | | 45,678 | |
| | |
Citigroup, Inc. | | | 278 | | | | 19,226 | |
| | |
Fifth Third Bancorp | | | 58 | | | | 2,525 | |
| | |
JPMorgan Chase & Co. | | | 246 | | | | 41,793 | |
| | |
KeyCorp | | | 82 | | | | 1,908 | |
| | |
PNC Financial Services Group, Inc. (The) | | | 12 | | | | 2,532 | |
| | | | | | | | 113,662 | |
|
| Beverages – 1.4% | |
| | |
Coca-Cola Co. (The) | | | 72 | | | | 4,059 | |
| | |
PepsiCo, Inc. | | | 214 | | | | 34,582 | |
| | | | | | | | 38,641 | |
|
| Biotechnology – 2.0% | |
| | |
AbbVie, Inc. | | | 106 | | | | 12,155 | |
| | |
Amgen, Inc. | | | 110 | | | | 22,767 | |
| | |
Biogen, Inc.* | | | 38 | | | | 10,134 | |
| | |
Moderna, Inc.* | | | 12 | | | | 4,142 | |
| | |
Regeneron Pharmaceuticals, Inc.* | | | 4 | | | | 2,560 | |
| | |
Vertex Pharmaceuticals, Inc.* | | | 12 | | | | 2,219 | |
| | | | | | | | 53,977 | |
|
| Building Products – 1.1% | |
| | |
Johnson Controls International plc | | | 224 | | | | 16,435 | |
| | |
Trane Technologies plc | | | 72 | | | | 13,027 | |
| | | | | | | | 29,462 | |
|
| Capital Markets – 4.0% | |
| | |
Bank of New York Mellon Corp. (The) | | | 20 | | | | 1,184 | |
| | |
BlackRock, Inc. | | | 2 | | | | 1,887 | |
| | |
Goldman Sachs Group, Inc. (The) | | | 36 | | | | 14,881 | |
| | |
Moody’s Corp. | | | 52 | | | | 21,016 | |
| | | | | | | | |
| Investments | | Shares | | | Value | |
|
| Capital Markets – (continued) | |
| | |
Morgan Stanley | | | 240 | | | $ | 24,667 | |
| | |
MSCI, Inc. | | | 10 | | | | 6,649 | |
| | |
S&P Global, Inc. | | | 52 | | | | 24,656 | |
| | |
State Street Corp. | | | 106 | | | | 10,446 | |
| | | | | | | | 105,386 | |
|
| Chemicals – 1.5% | |
| | |
Ecolab, Inc. | | | 34 | | | | 7,555 | |
| | |
International Flavors & Fragrances, Inc. | | | 64 | | | | 9,437 | |
| | |
Linde plc | | | 4 | | | | 1,277 | |
| | |
PPG Industries, Inc. | | | 72 | | | | 11,561 | |
| | |
Sherwin-Williams Co. (The) | | | 34 | | | | 10,765 | |
| | | | | | | | 40,595 | |
|
| Commercial Services & Supplies – 0.9% | |
| | |
Republic Services, Inc. | | | 12 | | | | 1,615 | |
| | |
Waste Management, Inc. | | | 138 | | | | 22,112 | |
| | | | | | | | 23,727 | |
|
| Communications Equipment – 1.4% | |
| | |
Arista Networks, Inc.* | | | 18 | | | | 7,374 | |
| | |
Cisco Systems, Inc. | | | 436 | | | | 24,403 | |
| | |
Motorola Solutions, Inc. | | | 22 | | | | 5,469 | |
| | | | | | | | 37,246 | |
|
| Consumer Finance – 0.1% | |
| | |
American Express Co. | | | 16 | | | | 2,780 | |
|
| Containers & Packaging – 0.1% | |
| | |
Packaging Corp. of America | | | 14 | | | | 1,923 | |
|
| Diversified Financial Services – 0.6% | |
| | |
Berkshire Hathaway, Inc., Class B* | | | 44 | | | | 12,628 | |
| | |
Equitable Holdings, Inc. | | | 118 | | | | 3,953 | |
| | | | | | | | 16,581 | |
|
| Diversified Telecommunication Services – 1.2% | |
| | |
AT&T, Inc. | | | 738 | | | | 18,642 | |
| | |
Verizon Communications, Inc. | | | 234 | | | | 12,400 | |
| | | | | | | | 31,042 | |
|
| Electric Utilities – 1.1% | |
| | |
Eversource Energy | | | 106 | | | | 8,999 | |
| | |
Exelon Corp. | | | 298 | | | | 15,851 | |
See Accompanying Notes to the Financial Statements.
| | | | | | |
| | FLEXSHARES ANNUAL REPORT | | | 295 | |
FlexShares® ESG & Climate US Large Cap Core Index Fund (cont.)
| | | | | | | | |
| Investments | | Shares | | | Value | |
|
| COMMON STOCKS – (continued) | |
|
| Electric Utilities – (continued) | |
| | |
NextEra Energy, Inc. | | | 50 | | | $ | 4,266 | |
| | | | | | | | 29,116 | |
|
| Electrical Equipment – 0.4% | |
| | |
Plug Power, Inc.* | | | 174 | | | | 6,659 | |
| | |
Rockwell Automation, Inc. | | | 14 | | | | 4,472 | |
| | | | | | | | 11,131 | |
|
| Electronic Equipment, Instruments & Components – 0.3% | |
| | |
TE Connectivity Ltd. | | | 60 | | | | 8,789 | |
|
| Energy Equipment & Services – 0.7% | |
| | |
Baker Hughes Co. | | | 238 | | | | 5,969 | |
| | |
Halliburton Co. | | | 178 | | | | 4,448 | |
| | |
Schlumberger NV | | | 214 | | | | 6,904 | |
| | | | | | | | 17,321 | |
|
| Entertainment – 1.7% | |
| | |
AMC Entertainment Holdings, Inc., Class A* | | | 48 | | | | 1,698 | |
| | |
Electronic Arts, Inc. | | | 32 | | | | 4,488 | |
| | |
Roku, Inc.* | | | 4 | | | | 1,220 | |
| | |
Spotify Technology SA* | | | 26 | | | | 7,524 | |
| | |
Walt Disney Co. (The)* | | | 186 | | | | 31,447 | |
| | | | | | | | 46,377 | |
|
| Equity Real Estate Investment Trusts (REITs) – 2.9% | |
| | |
Boston Properties, Inc. | | | 46 | | | | 5,228 | |
| | |
Equinix, Inc. | | | 28 | | | | 23,438 | |
| | |
Healthpeak Properties, Inc. | | | 226 | | | | 8,025 | |
| | |
Prologis, Inc. | | | 194 | | | | 28,122 | |
| | |
Ventas, Inc. | | | 114 | | | | 6,084 | |
| | |
Weyerhaeuser Co. | | | 190 | | | | 6,787 | |
| | | | | | | | 77,684 | |
|
| Food & Staples Retailing – 0.6% | |
| | |
Kroger Co. (The) | | | 70 | | | | 2,801 | |
| | |
Walgreens Boots Alliance, Inc. | | | 192 | | | | 9,028 | |
| | |
Walmart, Inc. | | | 30 | | | | 4,483 | |
| | | | | | | | 16,312 | |
| | | | | | | | |
| Investments | | Shares | | | Value | |
|
| Food Products – 0.6% | |
| | |
General Mills, Inc. | | | 54 | | | $ | 3,337 | |
| | |
Kellogg Co. | | | 78 | | | | 4,782 | |
| | |
Mondelez International, Inc., Class A | | | 108 | | | | 6,560 | |
| | | | | | | | 14,679 | |
|
| Gas Utilities – 0.1% | |
| | |
Atmos Energy Corp. | | | 38 | | | | 3,501 | |
|
| Health Care Equipment & Supplies – 2.8% | |
| | |
Abbott Laboratories | | | 152 | | | | 19,591 | |
| | |
Baxter International, Inc. | | | 66 | | | | 5,212 | |
| | |
Boston Scientific Corp.* | | | 162 | | | | 6,987 | |
| | |
Edwards Lifesciences Corp.* | | | 88 | | | | 10,544 | |
| | |
Insulet Corp.* | | | 6 | | | | 1,860 | |
| | |
Medtronic plc | | | 184 | | | | 22,054 | |
| | |
ResMed, Inc. | | | 8 | | | | 2,103 | |
| | |
West Pharmaceutical Services, Inc. | | | 14 | | | | 6,019 | |
| | | | | | | | 74,370 | |
|
| Health Care Providers & Services – 3.2% | |
| | |
AmerisourceBergen Corp. | | | 10 | | | | 1,220 | |
| | |
Anthem, Inc. | | | 62 | | | | 26,978 | |
| | |
Cigna Corp. | | | 108 | | | | 23,070 | |
| | |
CVS Health Corp. | | | 68 | | | | 6,071 | |
| | |
Humana, Inc. | | | 28 | | | | 12,969 | |
| | |
UnitedHealth Group, Inc. | | | 34 | | | | 15,656 | |
| | | | | | | | 85,964 | |
|
| Health Care Technology – 0.2% | |
| | |
Veeva Systems, Inc., Class A* | | | 16 | | | | 5,072 | |
|
| Hotels, Restaurants & Leisure – 1.7% | |
| | |
Caesars Entertainment, Inc.* | | | 30 | | | | 3,284 | |
| | |
Hilton Worldwide Holdings, Inc.* | | | 10 | | | | 1,440 | |
| | |
Las Vegas Sands Corp.* | | | 94 | | | | 3,648 | |
| | |
McDonald’s Corp. | | | 108 | | | | 26,519 | |
| | |
Starbucks Corp. | | | 90 | | | | 9,546 | |
| | | | | | | | 44,437 | |
|
| Household Durables – 0.2% | |
| | |
Whirlpool Corp. | | | 20 | | | | 4,217 | |
|
| Household Products – 1.7% | |
| | |
Church & Dwight Co., Inc. | | | 22 | | | | 1,922 | |
See Accompanying Notes to the Financial Statements.
| | | | |
| 296 | | FLEXSHARES ANNUAL REPORT | | |
FlexShares® ESG & Climate US Large Cap Core Index Fund (cont.)
| | | | | | | | |
| Investments | | Shares | | | Value | |
|
| COMMON STOCKS – (continued) | |
|
| Household Products – (continued) | |
| | |
Clorox Co. (The) | | | 26 | | | $ | 4,238 | |
| | |
Colgate-Palmolive Co. | | | 170 | | | | 12,952 | |
| | |
Kimberly-Clark Corp. | | | 38 | | | | 4,921 | |
| | |
Procter & Gamble Co. (The) | | | 156 | | | | 22,307 | |
| | | | | | | | 46,340 | |
|
| Industrial Conglomerates – 0.5% | |
| | |
3M Co. | | | 24 | | | | 4,288 | |
| | |
General Electric Co. | | | 86 | | | | 9,019 | |
| | | | | | | | 13,307 | |
|
| Insurance – 2.5% | |
| | |
American International Group, Inc. | | | 76 | | | | 4,491 | |
| | |
Chubb Ltd. | | | 64 | | | | 12,593 | |
| | |
Hartford Financial Services Group, Inc. (The) | | | 106 | | | | 7,731 | |
| | |
Marsh & McLennan Cos., Inc. | | | 96 | | | | 16,013 | |
| | |
MetLife, Inc. | | | 228 | | | | 14,318 | |
| | |
Principal Financial Group, Inc. | | | 16 | | | | 1,074 | |
| | |
Prudential Financial, Inc. | | | 82 | | | | 9,024 | |
| | |
Travelers Cos., Inc. (The) | | | 16 | | | | 2,574 | |
| | | | | | | | 67,818 | |
|
| Interactive Media & Services – 7.1% | |
| | |
Alphabet, Inc., Class A* | | | 24 | | | | 71,062 | |
| | |
Alphabet, Inc., Class C* | | | 24 | | | | 71,170 | |
| | |
Meta Platforms, Inc., Class A* | | | 140 | | | | 45,300 | |
| | |
Pinterest, Inc., Class A* | | | 22 | | | | 982 | |
| | |
Snap, Inc., Class A* | | | 16 | | | | 841 | |
| | |
Twitter, Inc.* | | | 20 | | | | 1,071 | |
| | | | | | | | 190,426 | |
|
| Internet & Direct Marketing Retail – 4.5% | |
| | |
Amazon.com, Inc.* | | | 28 | | | | 94,428 | |
| | |
eBay, Inc. | | | 192 | | | | 14,731 | |
| | |
Etsy, Inc.* | | | 38 | | | | 9,526 | |
| | |
MercadoLibre, Inc.* | | | 1 | | | | 1,481 | |
| | | | | | | | 120,166 | |
|
| IT Services – 4.5% | |
| | |
Accenture plc, Class A | | | 14 | | | | 5,023 | |
| | |
Akamai Technologies, Inc.* | | | 42 | | | | 4,429 | |
| | | | | | | | |
| Investments | | Shares | | | Value | |
|
| IT Services – (continued) | |
| | |
Automatic Data Processing, Inc. | | | 100 | | | $ | 22,449 | |
| | |
Cloudflare, Inc., Class A* | | | 24 | | | | 4,673 | |
| | |
International Business Machines Corp. | | | 152 | | | | 19,015 | |
| | |
Mastercard, Inc., Class A | | | 108 | | | | 36,236 | |
| | |
Okta, Inc.* | | | 22 | | | | 5,438 | |
| | |
Square, Inc., Class A* | | | 10 | | | | 2,545 | |
| | |
Twilio, Inc., Class A* | | | 12 | | | | 3,497 | |
| | |
Visa, Inc., Class A | | | 66 | | | | 13,977 | |
| | |
Wix.com Ltd.* | | | 10 | | | | 1,860 | |
| | | | | | | | 119,142 | |
|
| Leisure Products – 0.1% | |
| | |
Hasbro, Inc. | | | 40 | | | | 3,830 | |
|
| Life Sciences Tools & Services – 0.8% | |
| | |
10X Genomics, Inc., Class A* | | | 8 | | | | 1,290 | |
| | |
Agilent Technologies, Inc. | | | 28 | | | | 4,410 | |
| | |
Illumina, Inc.* | | | 14 | | | | 5,811 | |
| | |
Mettler-Toledo International, Inc.* | | | 4 | | | | 5,923 | |
| | |
Repligen Corp.* | | | 4 | | | | 1,162 | |
| | |
Thermo Fisher Scientific, Inc. | | | 4 | | | | 2,532 | |
| | | | | | | | 21,128 | |
|
| Machinery – 2.1% | |
| | |
Caterpillar, Inc. | | | 40 | | | | 8,161 | |
| | |
Cummins, Inc. | | | 44 | | | | 10,553 | |
| | |
Deere & Co. | | | 36 | | | | 12,323 | |
| | |
Illinois Tool Works, Inc. | | | 30 | | | | 6,836 | |
| | |
Stanley Black & Decker, Inc. | | | 56 | | | | 10,065 | |
| | |
Xylem, Inc. | | | 56 | | | | 7,313 | |
| | | | | | | | 55,251 | |
|
| Media – 0.6% | |
| | |
Comcast Corp., Class A | | | 176 | | | | 9,052 | |
| | |
Omnicom Group, Inc. | | | 56 | | | | 3,812 | |
| | |
ViacomCBS, Inc. | | | 100 | | | | 3,622 | |
| | | | | | | | 16,486 | |
|
| Metals & Mining – 0.4% | |
| | |
Freeport-McMoRan, Inc. | | | 156 | | | | 5,884 | |
| | |
Newmont Corp. | | | 108 | | | | 5,832 | |
| | | | | | | | 11,716 | |
See Accompanying Notes to the Financial Statements.
| | | | | | |
| | FLEXSHARES ANNUAL REPORT | | | 297 | |
FlexShares® ESG & Climate US Large Cap Core Index Fund (cont.)
| | | | | | | | |
| Investments | | Shares | | | Value | |
|
| COMMON STOCKS – (continued) | |
|
| Multiline Retail – 0.7% | |
| | |
Target Corp. | | | 70 | | | $ | 18,173 | |
|
| Multi-Utilities – 0.7% | |
| | |
Consolidated Edison, Inc. | | | 108 | | | | 8,143 | |
| | |
Sempra Energy | | | 86 | | | | 10,976 | |
| | | | | | | | 19,119 | |
|
| Oil, Gas & Consumable Fuels – 1.7% | |
| | |
ConocoPhillips | | | 142 | | | | 10,578 | |
| | |
Devon Energy Corp. | | | 44 | | | | 1,763 | |
| | |
Diamondback Energy, Inc. | | | 14 | | | | 1,501 | |
| | |
Exxon Mobil Corp. | | | 44 | | | | 2,837 | |
| | |
Hess Corp. | | | 80 | | | | 6,606 | |
| | |
Marathon Petroleum Corp. | | | 104 | | | | 6,857 | |
| | |
Occidental Petroleum Corp. | | | 168 | | | | 5,633 | |
| | |
Pioneer Natural Resources Co. | | | 32 | | | | 5,983 | |
| | |
Valero Energy Corp. | | | 26 | | | | 2,010 | |
| | |
Williams Cos., Inc. (The) | | | 56 | | | | 1,573 | |
| | | | | | | | 45,341 | |
|
| Personal Products – 0.7% | |
| | |
Estee Lauder Cos., Inc. (The), Class A | | | 58 | | | | 18,811 | |
|
| Pharmaceuticals – 3.8% | |
| | |
Bristol-Myers Squibb Co. | | | 184 | | | | 10,746 | |
| | |
Eli Lilly and Co. | | | 78 | | | | 19,871 | |
| | |
Johnson & Johnson | | | 218 | | | | 35,508 | |
| | |
Merck & Co., Inc. | | | 168 | | | | 14,792 | |
| | |
Pfizer, Inc. | | | 494 | | | | 21,608 | |
| | | | | | | | 102,525 | |
|
| Professional Services – 0.9% | |
| | |
Equifax, Inc. | | | 34 | | | | 9,433 | |
| | |
IHS Markit Ltd. | | | 62 | | | | 8,105 | |
| | |
TransUnion | | | 14 | | | | 1,614 | |
| | |
Verisk Analytics, Inc. | | | 24 | | | | 5,046 | |
| | | | | | | | 24,198 | |
|
| Road & Rail – 1.8% | |
| | |
CSX Corp. | | | 396 | | | | 14,323 | |
| | |
Kansas City Southern | | | 8 | | | | 2,482 | |
| | |
Norfolk Southern Corp. | | | 66 | | | | 19,341 | |
| | | | | | | | |
| Investments | | Shares | | | Value | |
|
| Road & Rail – (continued) | |
| | |
Union Pacific Corp. | | | 44 | | | $ | 10,622 | |
| | | | | | | | 46,768 | |
|
| Semiconductors & Semiconductor Equipment – 4.8% | |
| | |
Advanced Micro Devices, Inc.* | | | 54 | | | | 6,493 | |
| | |
Applied Materials, Inc. | | | 84 | | | | 11,479 | |
| | |
Enphase Energy, Inc.* | | | 40 | | | | 9,265 | |
| | |
Intel Corp. | | | 348 | | | | 17,052 | |
| | |
Micron Technology, Inc. | | | 104 | | | | 7,186 | |
| | |
NVIDIA Corp. | | | 212 | | | | 54,202 | |
| | |
NXP Semiconductors NV | | | 8 | | | | 1,607 | |
| | |
QUALCOMM, Inc. | | | 74 | | | | 9,845 | |
| | |
SolarEdge Technologies, Inc.* | | | 16 | | | | 5,675 | |
| | |
Texas Instruments, Inc. | | | 32 | | | | 5,999 | |
| | | | | | | | 128,803 | |
|
| Software – 11.3% | |
| | |
Adobe, Inc.* | | | 60 | | | | 39,022 | |
| | |
Autodesk, Inc.* | | | 34 | | | | 10,799 | |
| | |
Bill.com Holdings, Inc.* | | | 6 | | | | 1,766 | |
| | |
Cadence Design Systems, Inc.* | | | 6 | | | | 1,039 | |
| | |
Crowdstrike Holdings, Inc., Class A* | | | 10 | | | | 2,818 | |
| | |
DocuSign, Inc.* | | | 4 | | | | 1,113 | |
| | |
HubSpot, Inc.* | | | 2 | | | | 1,620 | |
| | |
Intuit, Inc. | | | 6 | | | | 3,756 | |
| | |
Microsoft Corp. | | | 498 | | | | 165,147 | |
| | |
NortonLifeLock, Inc. | | | 40 | | | | 1,018 | |
| | |
Oracle Corp. | | | 128 | | | | 12,280 | |
| | |
salesforce.com, Inc.* | | | 136 | | | | 40,758 | |
| | |
VMware, Inc., Class A* | | | 26 | | | | 3,944 | |
| | |
Workday, Inc., Class A* | | | 50 | | | | 14,499 | |
| | |
Zoom Video Communications, Inc., Class A* | | | 10 | | | | 2,746 | |
| | | | | | | | 302,325 | |
|
| Specialty Retail – 1.6% | |
| | |
Best Buy Co., Inc. | | | 16 | | | | 1,956 | |
| | |
Home Depot, Inc. (The) | | | 56 | | | | 20,817 | |
| | |
Lowe’s Cos., Inc. | | | 66 | | | | 15,432 | |
| | |
TJX Cos., Inc. (The) | | | 54 | | | | 3,537 | |
| | | | | | | | 41,742 | |
See Accompanying Notes to the Financial Statements.
| | | | |
| 298 | | FLEXSHARES ANNUAL REPORT | | |
FlexShares® ESG & Climate US Large Cap Core Index Fund (cont.)
| | | | | | | | |
| Investments | | Shares | | | Value | |
|
| COMMON STOCKS – (continued) | |
|
| Technology Hardware, Storage & Peripherals – 6.9% | |
| | |
Apple, Inc. | | | 1,038 | | | $ | 155,492 | |
| | |
Dell Technologies, Inc., Class C* | | | 78 | | | | 8,579 | |
| | |
Hewlett Packard Enterprise Co. | | | 74 | | | | 1,084 | |
| | |
HP, Inc. | | | 368 | | | | 11,162 | |
| | |
NetApp, Inc. | | | 64 | | | | 5,715 | |
| | |
Western Digital Corp.* | | | 28 | | | | 1,464 | |
| | | | | | | | 183,496 | |
|
| Textiles, Apparel & Luxury Goods – 1.1% | |
| | |
Lululemon Athletica, Inc.* | | | 6 | | | | 2,796 | |
| | |
NIKE, Inc., Class B | | | 126 | | | | 21,078 | |
| | |
VF Corp. | | | 70 | | | | 5,102 | |
| | | | | | | | 28,976 | |
Total Common Stocks
(Cost $2,476,514) | | | | | | | 2,642,457 | |
| | | Principal
Amount | | | | |
|
| SHORT-TERM INVESTMENTS – 0.2% | |
|
| U.S. TREASURY OBLIGATIONS – 0.2% | |
| | |
U.S. Treasury Bills 0.07%, 1/27/2022(a) (b)
(Cost $5,000) | | $ | 5,000 | | | | 4,999 | |
Total Investments – 99.2%
(Cost $2,481,514) | | | | 2,647,456 | |
| |
Other assets less liabilities – 0.8% | | | | 22,030 | |
| NET ASSETS – 100.0% | | | $ | 2,669,486 | |
| * | Non-income producing security. |
| (a) | All or a portion of the security pledged as collateral for Futures Contracts. |
| (b) | The rate shown was the current yield as of October 31, 2021. |
Percentages shown are based on Net Assets.
Abbreviations
As of October 31, 2021, the gross unrealized appreciation (depreciation) of investments based on the aggregate cost of investments (including derivative instruments, if applicable) for federal income tax purposes was as follows:
| | | | |
| | | | |
Aggregate gross unrealized appreciation | | $ | 192,233 | |
Aggregate gross unrealized depreciation | | | (26,291 | ) |
Net unrealized appreciation | | $ | 165,942 | |
Federal income tax cost | | $ | 2,482,754 | |
Futures Contracts
FlexShares® ESG & Climate US Large Cap Core Index Fund had the following open futures contract as of October 31, 2021:
| | | | | | | | | | | | | | | | | | | | |
| | | Number of
Contracts | | | Expiration
Date | | | Trading
Currency | | | Notional
Amount | | | Value and
Unrealized
Appreciation* | |
Long Contracts | |
Micro E-mini S&P 500 Index | | | 1 | | | | 12/17/2021 | | | | USD | | | $ | 22,985 | | | $ | 1,240 | |
Abbreviations:
USD – US Dollar
| | | | |
| Security Type | | % of Net Assets | |
Common Stocks | | | 99.0 | % |
Short-Term Investments | | | 0.2 | |
Others(1) | | | 0.8 | |
| | | | 100.0 | % |
| (1) | Includes any other net assets/(liabilities). |
See Accompanying Notes to the Financial Statements.
| | | | | | |
| | FLEXSHARES ANNUAL REPORT | | | 299 | |
Schedule of Investments
FlexShares® ESG & Climate Developed Markets ex-US Core Index Fund
October 31, 2021
| | | | | | | | |
| Investments | | Shares | | | Value | |
| |
| COMMON STOCKS – 99.8% | | | |
|
| Air Freight & Logistics – 0.6% | |
| | |
Deutsche Post AG (Registered) | | | 390 | | | $ | 24,155 | |
| | |
DSV A/S | | | 20 | | | | 4,653 | |
| | | | | | | | 28,808 | |
|
| Airlines – 0.0%(a) | |
| | |
International Consolidated Airlines Group SA* | | | 974 | | | | 2,187 | |
|
| Auto Components – 1.2% | |
| | |
Bridgestone Corp. | | | 400 | | | | 17,607 | |
| | |
Cie Generale des Etablissements Michelin SCA | | | 114 | | | | 17,902 | |
| | |
Magna International, Inc. | | | 40 | | | | 3,249 | |
| | |
Pirelli & C SpA(b) | | | 390 | | | | 2,397 | |
| | |
Stanley Electric Co. Ltd. | | | 200 | | | | 5,027 | |
| | |
Sumitomo Electric Industries Ltd. | | | 1,000 | | | | 13,212 | |
| | | | | | | | 59,394 | |
|
| Automobiles – 2.3% | |
| | |
Bayerische Motoren Werke AG | | | 78 | | | | 7,875 | |
| | |
Daimler AG (Registered) | | | 238 | | | | 23,615 | |
| | |
Honda Motor Co. Ltd. | | | 200 | | | | 5,874 | |
| | |
Nissan Motor Co. Ltd.* | | | 1,000 | | | | 5,064 | |
| | |
Porsche Automobil Holding SE (Preference) | | | 152 | | | | 15,799 | |
| | |
Toyota Motor Corp. | | | 3,000 | | | | 52,791 | |
| | |
Volkswagen AG (Preference) | | | 32 | | | | 7,178 | |
| | | | | | | | 118,196 | |
|
| Banks – 11.3% | |
| | |
ABN AMRO Bank NV, CVA(b) | | | 360 | | | | 5,302 | |
| | |
Australia & New Zealand Banking Group Ltd. | | | 1,164 | | | | 24,602 | |
| | |
Banco Bilbao Vizcaya Argentaria SA | | | 1,048 | | | | 7,352 | |
| | |
Banco Santander SA | | | 4,500 | | | | 17,063 | |
| | |
Bank of Montreal | | | 196 | | | | 21,247 | |
| | |
Bank of Nova Scotia (The) | | | 596 | | | | 39,014 | |
| | |
Barclays plc | | | 3,346 | | | | 9,276 | |
| | |
BNP Paribas SA | | | 554 | | | | 37,121 | |
| | |
Canadian Imperial Bank of Commerce | | | 58 | | | | 7,027 | |
| | |
Commonwealth Bank of Australia | | | 618 | | | | 48,590 | |
| | | | | | | | |
| Investments | | Shares | | | Value | |
|
| Banks – (continued) | |
| | |
Credit Agricole SA | | | 358 | | | $ | 5,402 | |
| | |
DBS Group Holdings Ltd. | | | 200 | | | | 4,676 | |
| | |
HSBC Holdings plc | | | 6,072 | | | | 36,747 | |
| | |
ING Groep NV | | | 1,802 | | | | 27,360 | |
| | |
Intesa Sanpaolo SpA | | | 4,750 | | | | 13,509 | |
| | |
KBC Group NV | | | 76 | | | | 7,085 | |
| | |
Lloyds Banking Group plc | | | 8,288 | | | | 5,705 | |
| | |
Mitsubishi UFJ Financial Group, Inc. | | | 4,400 | | | | 24,021 | |
| | |
Mizuho Financial Group, Inc. | | | 400 | | | | 5,280 | |
| | |
National Australia Bank Ltd. | | | 1,242 | | | | 26,783 | |
| | |
NatWest Group plc | | | 2,312 | | | | 7,007 | |
| | |
Nordea Bank Abp | | | 426 | | | | 5,211 | |
| | |
Resona Holdings, Inc. | | | 1,200 | | | | 4,504 | |
| | |
Royal Bank of Canada | | | 618 | | | | 64,226 | |
| | |
Skandinaviska Enskilda Banken AB, Class A | | | 1,220 | | | | 19,070 | |
| | |
Societe Generale SA | | | 460 | | | | 15,350 | |
| | |
Svenska Handelsbanken AB, Class A | | | 458 | | | | 5,244 | |
| | |
Toronto-Dominion Bank (The) | | | 690 | | | | 50,010 | |
| | |
UniCredit SpA | | | 500 | | | | 6,610 | |
| | |
Westpac Banking Corp. | | | 1,524 | | | | 29,384 | |
| | | | | | | | 579,778 | |
|
| Beverages – 2.4% | |
| | |
Anheuser-Busch InBev SA/NV | | | 300 | | | | 18,320 | |
| | |
Asahi Group Holdings Ltd. | | | 200 | | | | 9,045 | |
| | |
Carlsberg A/S, Class B | | | 70 | | | | 11,559 | |
| | |
Coca-Cola HBC AG, DI* | | | 166 | | | | 5,764 | |
| | |
Diageo plc | | | 860 | | | | 42,816 | |
| | |
Heineken NV | | | 20 | | | | 2,218 | |
| | |
Kirin Holdings Co. Ltd. | | | 600 | | | | 10,424 | |
| | |
Pernod Ricard SA | | | 62 | | | | 14,256 | |
| | |
Suntory Beverage & Food Ltd. | | | 200 | | | | 7,744 | |
| | |
Thai Beverage PCL | | | 3,800 | | | | 2,001 | |
| | | | | | | | 124,147 | |
|
| Biotechnology – 0.8% | |
| | |
CSL Ltd. | | | 142 | | | | 32,049 | |
| | |
Grifols SA | | | 386 | | | | 8,843 | |
| | |
Swedish Orphan Biovitrum AB* | | | 54 | | | | 1,465 | |
| | | | | | | | 42,357 | |
See Accompanying Notes to the Financial Statements.
| | | | |
| 300 | | FLEXSHARES ANNUAL REPORT | | |
FlexShares® ESG & Climate Developed Markets ex-US Core Index Fund (cont.)
| | | | | | | | |
| Investments | | Shares | | | Value | |
|
| COMMON STOCKS – (continued) | |
|
| Building Products – 1.6% | |
| | |
Assa Abloy AB, Class B | | | 610 | | | $ | 17,863 | |
| | |
Cie de Saint-Gobain | | | 256 | | | | 17,645 | |
| | |
Geberit AG (Registered) | | | 28 | | | | 21,904 | |
| | |
Kingspan Group plc | | | 218 | | | | 25,137 | |
| | |
Nibe Industrier AB, Class B | | | 86 | | | | 1,280 | |
| | | | | | | | 83,829 | |
|
| Capital Markets – 2.8% | |
| | |
Abrdn plc | | | 1,398 | | | | 4,867 | |
| | |
Credit Suisse Group AG (Registered) | | | 558 | | | | 5,821 | |
| | |
Daiwa Securities Group, Inc. | | | 1,400 | | | | 7,842 | |
| | |
Deutsche Bank AG (Registered)* | | | 386 | | | | 4,979 | |
| | |
Deutsche Boerse AG | | | 36 | | | | 5,983 | |
| | |
EQT AB | | | 142 | | | | 7,483 | |
| | |
Hong Kong Exchanges & Clearing Ltd. | | | 300 | | | | 18,156 | |
| | |
IGM Financial, Inc. | | | 134 | | | | 5,312 | |
| | |
London Stock Exchange Group plc | | | 100 | | | | 9,732 | |
| | |
Macquarie Group Ltd.(c) | | | 132 | | | | 19,614 | |
| | |
Nomura Holdings, Inc. | | | 2,200 | | | | 10,612 | |
| | |
St James’s Place plc | | | 560 | | | | 12,125 | |
| | |
UBS Group AG (Registered) | | | 1,586 | | | | 28,891 | |
| | | | | | | | 141,417 | |
|
| Chemicals – 4.1% | |
| | |
Air Liquide SA | | | 44 | | | | 7,345 | |
| | |
Akzo Nobel NV | | | 20 | | | | 2,301 | |
| | |
Arkema SA | | | 54 | | | | 7,386 | |
| | |
Chr Hansen Holding A/S | | | 134 | | | | 10,673 | |
| | |
Clariant AG (Registered)* | | | 280 | | | | 5,902 | |
| | |
Covestro AG(b) | | | 106 | | | | 6,796 | |
| | |
Croda International plc | | | 142 | | | | 18,410 | |
| | |
Givaudan SA (Registered) | | | 6 | | | | 28,294 | |
| | |
Koninklijke DSM NV | | | 130 | | | | 28,441 | |
| | |
Mitsui Chemicals, Inc. | | | 200 | | | | 5,928 | |
| | |
Nissan Chemical Corp. | | | 200 | | | | 11,103 | |
| | |
Novozymes A/S, Class B | | | 122 | | | | 8,981 | |
| | |
Nutrien Ltd. | | | 168 | | | | 11,724 | |
| | |
Shin-Etsu Chemical Co. Ltd. | | | 100 | | | | 17,764 | |
| | |
Sika AG (Registered) | | | 46 | | | | 15,606 | |
| | |
Solvay SA | | | 24 | | | | 2,855 | |
| | |
Sumitomo Chemical Co. Ltd. | | | 1,600 | | | | 7,858 | |
| | |
Umicore SA | | | 36 | | | | 2,065 | |
| | | | | | | | |
| Investments | | Shares | | | Value | |
|
| Chemicals – (continued) | |
| | |
Wacker Chemie AG | | | 20 | | | $ | 3,609 | |
| | |
Yara International ASA | | | 84 | | | | 4,377 | |
| | | | | | | | 207,418 | |
|
| Commercial Services & Supplies – 0.4% | |
| | |
Brambles Ltd. | | | 1,026 | | | | 7,737 | |
| | |
Dai Nippon Printing Co. Ltd. | | | 300 | | | | 7,393 | |
| | |
TOPPAN, Inc. | | | 200 | | | | 3,215 | |
| | | | | | | | 18,345 | |
|
| Communications Equipment – 0.4% | |
| | |
Nokia OYJ* | | | 1,940 | | | | 11,158 | |
| | |
Telefonaktiebolaget LM Ericsson, Class B | | | 840 | | | | 9,194 | |
| | | | | | | | 20,352 | |
|
| Construction & Engineering – 0.2% | |
| | |
Vinci SA | | | 18 | | | | 1,924 | |
| | |
WSP Global, Inc. | | | 56 | | | | 7,580 | |
| | | | | | | | 9,504 | |
|
| Diversified Financial Services – 0.2% | |
| | |
Industrivarden AB, Class A | | | — | (d) | | | 2 | |
| | |
M&G plc | | | 2,598 | | | | 7,115 | |
| | |
ORIX Corp. | | | 200 | | | | 3,955 | |
| | | | | | | | 11,072 | |
|
| Diversified Telecommunication Services – 2.1% | |
| | |
BT Group plc* | | | 1,786 | | | | 3,400 | |
| | |
Deutsche Telekom AG (Registered) | | | 1,662 | | | | 30,924 | |
| | |
Koninklijke KPN NV | | | 1,686 | | | | 5,044 | |
| | |
Nippon Telegraph & Telephone Corp. | | | 500 | | | | 13,979 | |
| | |
Singapore Telecommunications Ltd. | | | 3,600 | | | | 6,674 | |
| | |
Swisscom AG (Registered) | | | 34 | | | | 18,545 | |
| | |
Telecom Italia SpA | | | 6,782 | | | | 2,418 | |
| | |
Telefonica Deutschland Holding AG | | | 1,058 | | | | 2,759 | |
| | |
Telefonica SA | | | 1,344 | | | | 5,855 | |
| | |
Telia Co. AB | | | 596 | | | | 2,345 | |
| | |
TELUS Corp. | | | 580 | | | | 13,284 | |
| | | | | | | | 105,227 | |
|
| Electric Utilities – 1.9% | |
| | |
Acciona SA | | | 12 | | | | 2,303 | |
| | |
Electricite de France SA | | | 170 | | | | 2,504 | |
See Accompanying Notes to the Financial Statements.
| | | | | | |
| | FLEXSHARES ANNUAL REPORT | | | 301 | |
FlexShares® ESG & Climate Developed Markets ex-US Core Index Fund (cont.)
| | | | | | | | |
| Investments | | Shares | | | Value | |
|
| COMMON STOCKS – (continued) | |
|
| Electric Utilities – (continued) | |
| | |
Enel SpA | | | 2,946 | | | $ | 24,669 | |
| | |
Hydro One Ltd.(b) | | | 84 | | | | 2,004 | |
| | |
Iberdrola SA | | | 2,592 | | | | 30,641 | |
| | |
Red Electrica Corp. SA | | | 558 | | | | 11,630 | |
| | |
Terna – Rete Elettrica Nazionale | | | 1,866 | | | | 13,911 | |
| | |
Verbund AG | | | 86 | | | | 8,967 | |
| | | | | | | | 96,629 | |
|
| Electrical Equipment – 2.7% | |
| | |
ABB Ltd. (Registered) | | | 150 | | | | 4,972 | |
| | |
Nidec Corp. | | | 200 | | | | 22,048 | |
| | |
Schneider Electric SE | | | 308 | | | | 53,073 | |
| | |
Siemens Gamesa Renewable Energy SA* | | | 306 | | | | 8,297 | |
| | |
Signify NV(b) | | | 124 | | | | 6,006 | |
| | |
Vestas Wind Systems A/S | | | 992 | | | | 42,946 | |
| | | | | | | | 137,342 | |
|
| Electronic Equipment, Instruments & Components – 0.8% | |
| | |
Halma plc | | | 136 | | | | 5,522 | |
| | |
Murata Manufacturing Co. Ltd. | | | 200 | | | | 15,177 | |
| | |
Omron Corp. | | | 200 | | | | 19,066 | |
| | | | | | | | 39,765 | |
|
| Energy Equipment & Services – 0.0%(a) | |
| | |
Tenaris SA | | | 204 | | | | 2,273 | |
|
| Equity Real Estate Investment Trusts (REITs) – 1.4% | |
| | |
British Land Co. plc (The) | | | 884 | | | | 5,990 | |
| | |
Covivio | | | 68 | | | | 5,886 | |
| | |
Gecina SA | | | 60 | | | | 8,405 | |
| | |
GPT Group (The) | | | 762 | | | | 2,953 | |
| | |
Japan Real Estate Investment Corp. | | | 2 | | | | 12,243 | |
| | |
Land Securities Group plc | | | 236 | | | | 2,222 | |
| | |
Nippon Prologis REIT, Inc. | | | 2 | | | | 6,674 | |
| | |
Segro plc | | | 810 | | | | 14,351 | |
| | |
Stockland | | | 702 | | | | 2,399 | |
| | |
Unibail-Rodamco-Westfield* | | | 80 | | | | 5,722 | |
| | |
Vicinity Centres | | | 4,744 | | | | 6,147 | |
| | | | | | | | 72,992 | |
| | | | | | | | |
| Investments | | Shares | | | Value | |
|
| Food & Staples Retailing – 1.4% | |
| | |
Aeon Co. Ltd. | | | 200 | | | $ | 4,592 | |
| | |
Carrefour SA | | | 202 | | | | 3,660 | |
| | |
Jeronimo Martins SGPS SA | | | 238 | | | | 5,398 | |
| | |
Kesko OYJ, Class B | | | 130 | | | | 4,226 | |
| | |
Loblaw Cos. Ltd. | | | 74 | | | | 5,557 | |
| | |
Ocado Group plc* | | | 86 | | | | 2,125 | |
| | |
Tesco plc | | | 5,198 | | | | 19,231 | |
| | |
Woolworths Group Ltd. | | | 1,000 | | | | 28,602 | |
| | | | | | | | 73,391 | |
|
| Food Products – 2.5% | |
| | |
Ajinomoto Co., Inc. | | | 200 | | | | 5,974 | |
| | |
Danone SA | | | 46 | | | | 3,000 | |
| | |
Nestle SA (Registered) | | | 858 | | | | 113,448 | |
| | |
Orkla ASA | | | 744 | | | | 7,226 | |
| | | | | | | | 129,648 | |
|
| Gas Utilities – 0.4% | |
| | |
Hong Kong & China Gas Co. Ltd. | | | 12,000 | | | | 18,666 | |
| | |
Toho Gas Co. Ltd. | | | 100 | | | | 2,955 | |
| | | | | | | | 21,621 | |
|
| Health Care Equipment & Supplies – 2.7% | |
| | |
Coloplast A/S, Class B | | | 48 | | | | 7,833 | |
| | |
ConvaTec Group plc(b) | | | 654 | | | | 1,917 | |
| | |
Fisher & Paykel Healthcare Corp. Ltd. | | | 412 | | | | 9,202 | |
| | |
Koninklijke Philips NV | | | 1,014 | | | | 47,789 | |
| | |
Olympus Corp. | | | 600 | | | | 12,947 | |
| | |
Sonova Holding AG (Registered) | | | 36 | | | | 14,904 | |
| | |
Straumann Holding AG (Registered) | | | 4 | | | | 8,326 | |
| | |
Sysmex Corp. | | | 200 | | | | 24,679 | |
| | |
Terumo Corp. | | | 200 | | | | 8,801 | |
| | | | | | | | 136,398 | |
|
| Health Care Providers & Services – 0.2% | |
| | |
Amplifon SpA | | | 34 | | | | 1,729 | |
| | |
Fresenius Medical Care AG & Co. KGaA | | | 70 | | | | 4,655 | |
| | |
Fresenius SE & Co. KGaA | | | 114 | | | | 5,180 | |
| | | | | | | | 11,564 | |
|
| Hotels, Restaurants & Leisure – 1.2% | |
| | |
Compass Group plc* | | | 614 | | | | 13,045 | |
| | |
Entain plc* | | | 68 | | | | 1,909 | |
See Accompanying Notes to the Financial Statements.
| | | | |
| 302 | | FLEXSHARES ANNUAL REPORT | | |
FlexShares® ESG & Climate Developed Markets ex-US Core Index Fund (cont.)
| | | | | | | | |
| Investments | | Shares | | | Value | |
|
| COMMON STOCKS – (continued) | |
|
| Hotels, Restaurants & Leisure – (continued) | |
| | |
Evolution AB(b) | | | 32 | | | $ | 5,176 | |
| | |
Flutter Entertainment plc* | | | 26 | | | | 4,917 | |
| | |
Galaxy Entertainment Group Ltd.* | | | 2,000 | | | | 10,824 | |
| | |
Genting Singapore Ltd. | | | 8,800 | | | | 5,090 | |
| | |
La Francaise des Jeux SAEM(b) | | | 52 | | | | 2,702 | |
| | |
Sands China Ltd.* | | | 2,400 | | | | 5,486 | |
| | |
Whitbread plc* | | | 258 | | | | 11,564 | |
| | |
Wynn Macau Ltd.* | | | 1,600 | | | | 1,440 | |
| | | | | | | | 62,153 | |
|
| Household Durables – 2.0% | |
| | |
Barratt Developments plc | | | 528 | | | | 4,798 | |
| | |
Berkeley Group Holdings plc | | | 78 | | | | 4,656 | |
| | |
Electrolux AB, Class B | | | 272 | | | | 6,173 | |
| | |
Husqvarna AB, Class B | | | 530 | | | | 7,538 | |
| | |
JS Global Lifestyle Co. Ltd.(b) | | | 1,000 | | | | 1,854 | |
| | |
Panasonic Corp. | | | 1,200 | | | | 14,655 | |
| | |
SEB SA | | | 34 | | | | 5,324 | |
| | |
Sekisui House Ltd. | | | 500 | | | | 10,355 | |
| | |
Sony Group Corp. | | | 400 | | | | 46,095 | |
| | | | | | | | 101,448 | |
|
| Household Products – 0.7% | |
| | |
Henkel AG & Co. KGaA (Preference) | | | 226 | | | | 20,238 | |
| | |
Reckitt Benckiser Group plc | | | 184 | | | | 14,944 | |
| | | | | | | | 35,182 | |
|
Independent Power and Renewable Electricity
Producers – 0.2% | |
| | |
EDP Renovaveis SA | | | 368 | | | | 10,263 | |
|
| Industrial Conglomerates – 1.6% | |
| | |
Hitachi Ltd. | | | 600 | | | | 34,487 | |
| | |
Lifco AB, Class B | | | 184 | | | | 5,358 | |
| | |
Siemens AG (Registered) | | | 260 | | | | 42,208 | |
| | | | | | | | 82,053 | |
|
| Insurance – 6.1% | |
| | |
AIA Group Ltd. | | | 3,600 | | | | 40,655 | |
| | |
Allianz SE (Registered) | | | 196 | | | | 45,625 | |
| | |
ASR Nederland NV | | | 110 | | | | 5,151 | |
| | |
Aviva plc | | | 4,832 | | | | 26,143 | |
| | | | | | | | |
| Investments | | Shares | | | Value | |
|
| Insurance – (continued) | |
| | |
AXA SA | | | 1,404 | | | $ | 40,880 | |
| | |
Dai-ichi Life Holdings, Inc. | | | 100 | | | | 2,106 | |
| | |
Insurance Australia Group Ltd. | | | 1,302 | | | | 4,694 | |
| | |
Japan Post Insurance Co. Ltd. | | | 200 | | | | 3,245 | |
| | |
Legal & General Group plc | | | 5,188 | | | | 20,545 | |
| | |
MS&AD Insurance Group Holdings, Inc. | | | 600 | | | | 19,396 | |
| | |
Muenchener Rueckversicherungs-Gesellschaft AG in Muenchen (Registered) | | | 48 | | | | 14,231 | |
| | |
NN Group NV | | | 338 | | | | 18,118 | |
| | |
QBE Insurance Group Ltd. | | | 582 | | | | 5,171 | |
| | |
Sun Life Financial, Inc. | | | 476 | | | | 27,084 | |
| | |
Suncorp Group Ltd. | | | 120 | | | | 1,056 | |
| | |
Swiss Life Holding AG (Registered) | | | 4 | | | | 2,200 | |
| | |
Swiss Re AG | | | 74 | | | | 7,179 | |
| | |
Zurich Insurance Group AG | | | 66 | | | | 29,318 | |
| | | | | | | | 312,797 | |
|
| Interactive Media & Services – 0.5% | |
| | |
SEEK Ltd. | | | 394 | | | | 9,677 | |
| | |
Z Holdings Corp. | | | 2,200 | | | | 13,622 | |
| | | | | | | | 23,299 | |
|
| Internet & Direct Marketing Retail – 0.2% | |
| | |
HelloFresh SE* | | | 34 | | | | 2,754 | |
| | |
Zalando SE* (b) | | | 72 | | | | 6,798 | |
| | | | | | | | 9,552 | |
|
| IT Services – 3.1% | |
| | |
Afterpay Ltd.* | | | 84 | | | | 7,779 | |
| | |
Amadeus IT Group SA* | | | 30 | | | | 2,008 | |
| | |
Capgemini SE | | | 84 | | | | 19,568 | |
| | |
CGI, Inc.* | | | 166 | | | | 14,806 | |
| | |
Edenred | | | 106 | | | | 5,737 | |
| | |
Fujitsu Ltd. | | | 100 | | | | 17,211 | |
| | |
Itochu Techno-Solutions Corp. | | | 200 | | | | 6,297 | |
| | |
Nexi SpA* (b) | | | 146 | | | | 2,539 | |
| | |
Nomura Research Institute Ltd. | | | 400 | | | | 15,926 | |
| | |
Shopify, Inc., Class A* | | | 34 | | | | 49,869 | |
| | |
Worldline SA* (b) | | | 282 | | | | 16,441 | |
| | | | | | | | 158,181 | |
|
| Leisure Products – 0.2% | |
| | |
Yamaha Corp. | | | 200 | | | | 12,594 | |
See Accompanying Notes to the Financial Statements.
| | | | | | |
| | FLEXSHARES ANNUAL REPORT | | | 303 | |
FlexShares® ESG & Climate Developed Markets ex-US Core Index Fund (cont.)
| | | | | | | | |
| Investments | | Shares | | | Value | |
|
| COMMON STOCKS – (continued) | |
|
| Machinery – 2.5% | |
| | |
Alstom SA | | | 356 | | | $ | 12,681 | |
| | |
Atlas Copco AB, Class A | | | 226 | | | | 14,520 | |
| | |
Epiroc AB, Class A | | | 322 | | | | 8,012 | |
| | |
GEA Group AG | | | 132 | | | | 6,506 | |
| | |
Hitachi Construction Machinery Co. Ltd. | | | 200 | | | | 6,358 | |
| | |
KION Group AG | | | 88 | | | | 9,613 | |
| | |
Knorr-Bremse AG | | | 12 | | | | 1,266 | |
| | |
Komatsu Ltd. | | | 600 | | | | 15,610 | |
| | |
Kone OYJ, Class B | | | 24 | | | | 1,638 | |
| | |
Kubota Corp. | | | 200 | | | | 4,249 | |
| | |
Makita Corp. | | | 200 | | | | 9,231 | |
| | |
MINEBEA MITSUMI, Inc. | | | 200 | | | | 5,043 | |
| | |
Rational AG | | | 6 | | | | 5,969 | |
| | |
SKF AB, Class B | | | 340 | | | | 7,878 | |
| | |
Volvo AB, Class B | | | 790 | | | | 18,389 | |
| | |
Weir Group plc (The) | | | 82 | | | | 1,950 | |
| | | | | | | | 128,913 | |
|
| Media – 1.1% | |
| | |
Dentsu Group, Inc. | | | 300 | | | | 10,971 | |
| | |
Informa plc* | | | 692 | | | | 4,927 | |
| | |
Pearson plc | | | 572 | | | | 4,723 | |
| | |
Publicis Groupe SA | | | 186 | | | | 12,472 | |
| | |
Quebecor, Inc., Class B | | | 74 | | | | 1,883 | |
| | |
WPP plc | | | 1,356 | | | | 19,628 | |
| | | | | | | | 54,604 | |
|
| Metals & Mining – 2.9% | |
| | |
BHP Group Ltd. | | | 384 | | | | 10,550 | |
| | |
BHP Group plc | | | 78 | | | | 2,069 | |
| | |
BlueScope Steel Ltd. | | | 452 | | | | 7,000 | |
| | |
Boliden AB | | | 98 | | | | 3,456 | |
| | |
Evolution Mining Ltd. | | | 992 | | | | 2,705 | |
| | |
First Quantum Minerals Ltd. | | | 198 | | | | 4,680 | |
| | |
Fortescue Metals Group Ltd. | | | 508 | | | | 5,315 | |
| | |
Fresnillo plc | | | 224 | | | | 2,650 | |
| | |
Glencore plc* | | | 326 | | | | 1,632 | |
| | |
Hitachi Metals Ltd.* | | | 300 | | | | 5,675 | |
| | |
Kinross Gold Corp. | | | 1,156 | | | | 6,939 | |
| | |
Kirkland Lake Gold Ltd. | | | 156 | | | | 6,566 | |
| | |
Newcrest Mining Ltd. | | | 116 | | | | 2,169 | |
| | |
Norsk Hydro ASA | | | 1,716 | | | | 12,553 | |
| | | | | | | | |
| Investments | | Shares | | | Value | |
|
| Metals & Mining – (continued) | |
| | |
Polymetal International plc | | | 418 | | | $ | 7,764 | |
| | |
Rio Tinto Ltd. | | | 196 | | | | 13,292 | |
| | |
Rio Tinto plc | | | 426 | | | | 26,631 | |
| | |
Sumitomo Metal Mining Co. Ltd. | | | 200 | | | | 7,758 | |
| | |
Teck Resources Ltd., Class B | | | 384 | | | | 10,700 | |
| | |
thyssenkrupp AG* | | | 188 | | | | 1,956 | |
| | |
Wheaton Precious Metals Corp. | | | 112 | | | | 4,514 | |
| | | | | | | | 146,574 | |
|
| Multiline Retail – 0.3% | |
| | |
Canadian Tire Corp. Ltd., Class A | | | 74 | | | | 10,494 | |
| | |
Next plc | | | 24 | | | | 2,621 | |
| | | | | | | | 13,115 | |
|
| Multi-Utilities – 0.3% | |
| | |
Engie SA | | | 354 | | | | 5,037 | |
| | |
National Grid plc | | | 654 | | | | 8,386 | |
| | |
Veolia Environnement SA | | | 60 | | | | 1,960 | |
| | | | | | | | 15,383 | |
|
| Oil, Gas & Consumable Fuels – 4.3% | |
| | |
Canadian Natural Resources Ltd. | | | 154 | | | | 6,535 | |
| | |
Cenovus Energy, Inc. | | | 810 | | | | 9,671 | |
| | |
Enbridge, Inc. | | | 852 | | | | 35,632 | |
| | |
Eni SpA | | | 1,096 | | | | 15,733 | |
| | |
Equinor ASA | | | 326 | | | | 8,237 | |
| | |
Imperial Oil Ltd. | | | 94 | | | | 3,177 | |
| | |
Inpex Corp. | | | 200 | | | | 1,670 | |
| | |
Inter Pipeline Ltd. | | | 148 | | | | 2,250 | |
| | |
Lundin Energy AB | | | 154 | | | | 6,082 | |
| | |
Neste OYJ | | | 152 | | | | 8,477 | |
| | |
Oil Search Ltd. | | | 1,068 | | | | 3,441 | |
| | |
Pembina Pipeline Corp. | | | 66 | | | | 2,182 | |
| | |
Repsol SA | | | 914 | | | | 11,694 | |
| | |
Royal Dutch Shell plc, Class A | | | 1,372 | | | | 31,614 | |
| | |
Royal Dutch Shell plc, Class B | | | 1,088 | | | | 25,130 | |
| | |
Suncor Energy, Inc. | | | 410 | | | | 10,766 | |
| | |
TotalEnergies SE | | | 714 | | | | 35,836 | |
| | |
Woodside Petroleum Ltd. | | | 98 | | | | 1,712 | |
| | | | | | | | 219,839 | |
|
| Paper & Forest Products – 0.8% | |
| | |
Mondi plc | | | 620 | | | | 15,510 | |
| | |
Oji Holdings Corp. | | | 200 | | | | 989 | |
See Accompanying Notes to the Financial Statements.
| | | | |
| 304 | | FLEXSHARES ANNUAL REPORT | | |
FlexShares® ESG & Climate Developed Markets ex-US Core Index Fund (cont.)
| | | | | | | | |
| Investments | | Shares | | | Value | |
|
| COMMON STOCKS – (continued) | |
|
| Paper & Forest Products – (continued) | |
| | |
Stora Enso OYJ, Class R | | | 378 | | | $ | 6,291 | |
| | |
UPM-Kymmene OYJ | | | 554 | | | | 19,567 | |
| | | | | | | | 42,357 | |
|
| Personal Products – 2.5% | |
| | |
Kao Corp. | | | 600 | | | | 33,840 | |
| | |
L’Oreal SA | | | 116 | | | | 53,019 | |
| | |
Shiseido Co. Ltd. | | | 100 | | | | 6,643 | |
| | |
Unilever plc | | | 618 | | | | 33,139 | |
| | | | | | | | 126,641 | |
|
| Pharmaceuticals – 8.3% | |
| | |
Astellas Pharma, Inc. | | | 400 | | | | 6,725 | |
| | |
AstraZeneca plc | | | 454 | | | | 56,594 | |
| | |
Bayer AG (Registered) | | | 94 | | | | 5,294 | |
| | |
Chugai Pharmaceutical Co. Ltd. | | | 200 | | | | 7,449 | |
| | |
Daiichi Sankyo Co. Ltd. | | | 800 | | | | 20,115 | |
| | |
Eisai Co. Ltd. | | | 100 | | | | 7,040 | |
| | |
GlaxoSmithKline plc | | | 2,014 | | | | 41,648 | |
| | |
H Lundbeck A/S | | | 68 | | | | 1,892 | |
| | |
Kyowa Kirin Co. Ltd. | | | 200 | | | | 6,560 | |
| | |
Merck KGaA | | | 38 | | | | 8,980 | |
| | |
Novartis AG (Registered) | | | 450 | | | | 37,251 | |
| | |
Novo Nordisk A/S, Class B | | | 574 | | | | 62,888 | |
| | |
Ono Pharmaceutical Co. Ltd. | | | 500 | | | | 10,460 | |
| | |
Roche Holding AG | | | 216 | | | | 83,693 | |
| | |
Sanofi | | | 404 | | | | 40,409 | |
| | |
Takeda Pharmaceutical Co. Ltd. | | | 700 | | | | 19,663 | |
| | |
UCB SA | | | 50 | | | | 5,966 | |
| | | | | | | | 422,627 | |
|
| Professional Services – 2.2% | |
| | |
Adecco Group AG (Registered) | | | 196 | | | | 9,882 | |
| | |
Experian plc | | | 154 | | | | 7,065 | |
| | |
Randstad NV | | | 178 | | | | 12,813 | |
| | |
Recruit Holdings Co. Ltd. | | | 400 | | | | 26,563 | |
| | |
RELX plc | | | 1,840 | | | | 57,102 | |
| | | | | | | | 113,425 | |
|
| Real Estate Management & Development – 1.0% | |
| | |
Capitaland Investment Ltd.* | | | 6,000 | | | | 15,306 | |
| | |
City Developments Ltd. | | | 600 | | | | 3,257 | |
| | | | | | | | |
| Investments | | Shares | | | Value | |
|
| Real Estate Management & Development – (continued) | |
| | |
Daiwa House Industry Co. Ltd. | | | 400 | | | $ | 13,158 | |
| | |
ESR Cayman Ltd.* (b) | | | 2,400 | | | | 7,790 | |
| | |
Lendlease Corp. Ltd. | | | 210 | | | | 1,650 | |
| | |
Mitsubishi Estate Co. Ltd. | | | 200 | | | | 3,031 | |
| | |
New World Development Co. Ltd. | | | 2,000 | | | | 8,677 | |
| | | | | | | | 52,869 | |
|
| Road & Rail – 2.0% | |
| | |
Canadian National Railway Co. | | | 268 | | | | 35,562 | |
| | |
Canadian Pacific Railway Ltd. | | | 298 | | | | 23,029 | |
| | |
East Japan Railway Co. | | | 400 | | | | 24,865 | |
| | |
MTR Corp. Ltd. | | | 2,000 | | | | 10,901 | |
| | |
West Japan Railway Co. | | | 200 | | | | 9,406 | |
| | | | | | | | 103,763 | |
|
| Semiconductors & Semiconductor Equipment – 2.6% | |
| | |
Advantest Corp. | | | 200 | | | | 16,365 | |
| | |
ASML Holding NV | | | 120 | | | | 97,278 | |
| | |
Infineon Technologies AG | | | 112 | | | | 5,236 | |
| | |
Renesas Electronics Corp.* | | | 200 | | | | 2,459 | |
| | |
STMicroelectronics NV | | | 220 | | | | 10,417 | |
| | | | | | | | 131,755 | |
|
| Software – 1.8% | |
| | |
Open Text Corp. | | | 150 | | | | 7,544 | |
| | |
SAP SE | | | 460 | | | | 66,712 | |
| | |
Sinch AB* (b) | | | 108 | | | | 2,048 | |
| | |
WiseTech Global Ltd. | | | 44 | | | | 1,688 | |
| | |
Xero Ltd.* | | | 122 | | | | 13,700 | |
| | | | | | | | 91,692 | |
|
| Specialty Retail – 0.8% | |
| | |
Chow Tai Fook Jewellery Group Ltd. | | | 800 | | | | 1,637 | |
| | |
H & M Hennes & Mauritz AB, Class B | | | 404 | | | | 7,574 | |
| | |
Industria de Diseno Textil SA | | | 672 | | | | 24,295 | |
| | |
Kingfisher plc | | | 2,030 | | | | 9,322 | |
| | | | | | | | 42,828 | |
|
| Technology Hardware, Storage & Peripherals – 0.8% | |
| | |
Brother Industries Ltd. | | | 200 | | | | 3,855 | |
| | |
Canon, Inc. | | | 900 | | | | 20,190 | |
| | |
Logitech International SA (Registered) | | | 54 | | | | 4,505 | |
| | |
Ricoh Co. Ltd. | | | 800 | | | | 7,760 | |
See Accompanying Notes to the Financial Statements.
| | | | | | |
| | FLEXSHARES ANNUAL REPORT | | | 305 | |
FlexShares® ESG & Climate Developed Markets ex-US Core Index Fund (cont.)
| | | | | | | | |
| Investments | | Shares | | | Value | |
|
| COMMON STOCKS – (continued) | |
|
| Technology Hardware, Storage & Peripherals – (continued) | |
| | |
Seiko Epson Corp. | | | 400 | | | $ | 7,107 | |
| | | | | | | | 43,417 | |
|
| Textiles, Apparel & Luxury Goods – 2.9% | |
| | |
adidas AG | | | 56 | | | | 18,360 | |
| | |
Burberry Group plc | | | 330 | | | | 8,726 | |
| | |
Cie Financiere Richemont SA (Registered) | | | 168 | | | | 20,794 | |
| | |
Hermes International | | | 6 | | | | 9,516 | |
| | |
Kering SA | | | 30 | | | | 22,504 | |
| | |
LVMH Moet Hennessy Louis Vuitton SE | | | 76 | | | | 59,560 | |
| | |
Puma SE | | | 80 | | | | 9,934 | |
| | | | | | | | 149,394 | |
|
| Trading Companies & Distributors – 0.7% | |
| | |
Ferguson plc | | | 54 | | | | 8,139 | |
| | |
Mitsui & Co. Ltd. | | | 1,200 | | | | 27,278 | |
| | |
Rexel SA* | | | 90 | | | | 1,787 | |
| | | | | | | | 37,204 | |
|
| Transportation Infrastructure – 0.5% | |
| | |
Getlink SE | | | 572 | | | | 8,794 | |
| | |
Sydney Airport* | | | 1,258 | | | | 7,738 | |
| | |
Transurban Group | | | 778 | | | | 7,854 | |
| | | | | | | | 24,386 | |
|
| Water Utilities – 0.4% | |
| | |
Severn Trent plc | | | 318 | | | | 11,935 | |
| | |
United Utilities Group plc | | | 644 | | | | 9,167 | |
| | | | | | | | 21,102 | |
|
| Wireless Telecommunication Services – 0.9% | |
| | |
KDDI Corp. | | | 200 | | | | 6,188 | |
| | |
Rogers Communications, Inc., Class B | | | 48 | | | | 2,229 | |
| | |
SoftBank Corp. | | | 200 | | | | 2,727 | |
| | |
SoftBank Group Corp. | | | 400 | | | | 21,623 | |
| | | | | | | | |
| Investments | | Shares | | | Value | |
|
| Wireless Telecommunication Services – (continued) | |
| | |
Vodafone Group plc | | | 8,640 | | | $ | 12,795 | |
| | | | | | | | 45,562 | |
Total Common Stocks
(Cost $5,003,305) | | | | 5,108,626 | |
| | | | | | | | | |
Total Investments – 99.8%
(Cost $5,003,305) | | | | 5,108,626 | |
| |
Other assets less liabilities – 0.2% | | | | 10,434 | |
| NET ASSETS – 100.0% | | | $ | 5,119,060 | |
| * | Non-income producing security. |
| (a) | Represents less than 0.05% of net assets. |
| (b) | Security exempt from registration pursuant to Regulation S under the Securities Act of 1933. Regulation S applies to securities offerings that are made outside of the United States and do not involve direct selling efforts in the United States and as such may have restrictions on resale. |
| (c) | Security fair valued as of October 31, 2021 in accordance with procedures approved by the Board of Trustees. Total value of all such securities at October 31, 2021 amounted to $19,614, which represents approximately 0.38% of net assets of the Fund. |
| (d) | Amount represents less than one share. |
Percentages shown are based on Net Assets.
Abbreviations
CVA – Dutch Certification
DI – Depositary Interest
OYJ – Public Limited Company
Preference – A special type of equity investment that shares in the earnings of the company, has limited voting rights, and may have a dividend preference. Preference shares may also have liquidation preference.
SCA – Limited partnership with share capital
As of October 31, 2021, the gross unrealized appreciation (depreciation) of investments based on the aggregate cost of investments (including derivative instruments, if applicable) for federal income tax purposes was as follows:
| | | | |
| | | | |
Aggregate gross unrealized appreciation | | $ | 231,921 | |
Aggregate gross unrealized depreciation | | | (126,563 | ) |
Net unrealized appreciation | | $ | 105,358 | |
Federal income tax cost | | $ | 5,001,921 | |
See Accompanying Notes to the Financial Statements.
| | | | |
| 306 | | FLEXSHARES ANNUAL REPORT | | |
FlexShares® ESG & Climate Developed Markets ex-US Core Index Fund (cont.)
Forward Foreign Currency Contracts
FlexShares® ESG & Climate Developed Markets ex-US Core Index Fund had the following outstanding contracts as of October 31, 2021:
| | | | | | | | | | | | | | | | | | | | | | |
| Contracts to Receive | | Counterparty | | In Exchange For | | | Maturity Date | | | Unrealized
Appreciation/
(Depreciation) | |
AUD | | | 1,971 | | | | | Bank of New York | | USD | | | 1,481 | | | | 12/15/2021 | | | $ | — | |
CHF | | | 1,375 | | | | | Goldman Sachs & Co. | | USD | | | 1,502 | | | | 12/15/2021 | | | | 5 | |
HKD | | | 9,725 | | | | | Bank of New York | | USD | | | 1,251 | | | | 12/15/2021 | | | | — | |
ILS | | | 7,190 | | | | | Goldman Sachs & Co. | | USD | | | 2,240 | | | | 12/15/2021 | | | | 38 | |
SGD | | | 11,613 | | | | | Goldman Sachs & Co. | | USD | | | 8,554 | | | | 12/15/2021 | | | | 56 | |
USD | | | 28,779 | | | | | Citibank NA | | EUR | | | 24,593 | | | | 12/15/2021 | | | | 288 | |
USD | | | 5,346 | | | | | Goldman Sachs & Co. | | JPY | | | 598,045 | | | | 12/15/2021 | | | | 99 | |
USD | | | 15,568 | | | | | Citibank NA | | SGD | | | 20,966 | | | | 12/15/2021 | | | | 24 | |
Total unrealized appreciation | | | | | | | $ | 510 | |
CAD | | | 1,417 | | | | | Bank of Montreal | | USD | | | 1,145 | | | | 12/15/2021 | | | $ | (2 | ) |
DKK | | | 7,958 | | | | | Goldman Sachs & Co. | | USD | | | 1,246 | | | | 12/15/2021 | | | | (6 | ) |
EUR | | | 4,493 | | | | | Goldman Sachs & Co. | | USD | | | 5,229 | | | | 12/15/2021 | | | | (24 | ) |
GBP | | | 1,494 | | | | | Bank of Montreal | | USD | | | 2,056 | | | | 12/15/2021 | | | | (7 | ) |
JPY | | | 5,792,098 | | | | | Citibank NA | | USD | | | 52,021 | | | | 12/15/2021 | | | | (1,199 | ) |
JPY | | | 739,713 | | | | | Goldman Sachs & Co. | | USD | | | 6,510 | | | | 12/15/2021 | | | | (20 | ) |
USD | | | 2,646 | | | | | Citibank NA | | AUD | | | 3,656 | | | | 12/15/2021 | | | | (101 | ) |
USD | | | 8,908 | | | | | Bank of New York | | CAD | | | 11,308 | | | | 12/15/2021 | | | | (215 | ) |
USD | | | 5,044 | | | | | Bank of New York | | CHF | | | 4,676 | | | | 12/15/2021 | | | | (80 | ) |
USD | | | 10,940 | | | | | Bank of Montreal | | GBP | | | 8,081 | | | | 12/15/2021 | | | | (139 | ) |
USD | | | 2,741 | | | | | Goldman Sachs & Co. | | HKD | | | 21,332 | | | | 12/15/2021 | | | | (2 | ) |
USD | | | 3,716 | | | | | Citibank NA | | SEK | | | 32,429 | | | | 12/15/2021 | | | | (62 | ) |
Total unrealized depreciation | | | | | | | | | | | | | | $ | (1,857 | ) |
Net unrealized depreciation | | | | | | | | | | | | | | $ | (1,347 | ) |
Abbreviations:
AUD – Australian Dollar
CAD – Canadian Dollar
CHF – Swiss Franc
DKK – Danish Krone
EUR – Euro
GBP – British Pound
HKD – Hong Kong Dollar
ILS – Israeli Shekel
JPY – Japanese Yen
SEK – Swedish Krona
SGD – Singapore Dollar
USD – US Dollar
| | | | |
| Security Type | | % of Net Assets | |
Common Stocks | | | 99.8 | % |
Others(1) | | | 0.2 | |
| | | | 100.0 | % |
| (1) | Includes any other net assets/(liabilities). |
See Accompanying Notes to the Financial Statements.
| | | | | | |
| | FLEXSHARES ANNUAL REPORT | | | 307 | |
Schedule of Investments
FlexShares® Morningstar Global Upstream Natural Resources Index Fund
October 31, 2021
| | | | | | | | |
| Investments | | Shares | | | Value | |
|
| COMMON STOCKS – 99.4% | |
|
| Building Products – 0.2% | |
| | |
UFP Industries, Inc.(a) | | | 162,812 | | | $ | 13,322,906 | |
|
| Chemicals – 15.4% | |
| | |
CF Industries Holdings, Inc. | | | 1,365,116 | | | | 77,538,589 | |
| | |
Corteva, Inc. | | | 4,574,391 | | | | 197,384,972 | |
| | |
FMC Corp. | | | 776,488 | | | | 70,668,173 | |
| | |
ICL Group Ltd. | | | 4,305,125 | | | | 36,889,187 | |
| | |
Mosaic Co. (The) | | | 2,226,141 | | | | 92,540,681 | |
| | |
Nutrien Ltd. | | | 3,575,602 | | | | 249,517,626 | |
| | |
PI Industries Ltd. | | | 510,353 | | | | 20,446,153 | |
| | |
SABIC Agri-Nutrients Co. | | | 1,202,304 | | | | 52,568,145 | |
| | |
Scotts Miracle-Gro Co. (The) | | | 256,742 | | | | 38,115,917 | |
| | |
Shandong Hualu Hengsheng Chemical Co. Ltd., Class A | | | 939,309 | | | | 4,562,018 | |
| | |
UPL Ltd. | | | 3,372,087 | | | | 33,333,028 | |
| | |
Yara International ASA | | | 1,145,946 | | | | 59,713,333 | |
| | | | | | | | 933,277,822 | |
|
| Equity Real Estate Investment Trusts (REITs) – 1.1% | |
| | |
Weyerhaeuser Co. | | | 1,925,565 | | | | 68,781,182 | |
|
| Food Products – 15.1% | |
| | |
a2 Milk Co. Ltd. (The)* (a) | | | 4,821,740 | | | | 22,670,956 | |
| | |
Archer-Daniels-Midland Co. | | | 3,491,065 | | | | 224,266,016 | |
| | |
Bakkafrost P/F | | | 319,362 | | | | 29,454,710 | |
| | |
Bunge Ltd. | | | 873,549 | | | | 80,925,579 | |
| | |
Charoen Pokphand Foods PCL, NVDR | | | 22,543,200 | | | | 17,154,096 | |
| | |
Charoen Pokphand Indonesia Tbk. PT | | | 46,338,800 | | | | 20,278,847 | |
| | |
International Holding Co. PJSC* | | | 2,053,936 | | | | 81,919,231 | |
| | |
IOI Corp. Bhd. | | | 20,351,500 | | | | 19,314,512 | |
| | |
Kuala Lumpur Kepong Bhd. | | | 3,444,100 | | | | 17,981,512 | |
| | |
Mowi ASA | | | 2,792,852 | | | | 80,755,098 | |
| | |
Muyuan Foods Co. Ltd., Class A | | | 2,509,120 | | | | 22,392,425 | |
| | |
New Hope Liuhe Co. Ltd., Class A* | | | 1,878,688 | | | | 4,224,575 | |
| | |
PPB Group Bhd. | | | 4,383,400 | | | | 19,244,195 | |
| | |
Salmar ASA | | | 344,410 | | | | 26,178,955 | |
| | | | | | | | |
| Investments | | Shares | | | Value | |
|
| Food Products – (continued) | |
| | |
Sime Darby Plantation Bhd. | | | 15,655,000 | | | $ | 15,159,756 | |
| | |
Tongwei Co. Ltd., Class A | | | 2,504,825 | | | | 22,401,065 | |
| | |
Tyson Foods, Inc., Class A | | | 1,894,255 | | | | 151,483,572 | |
| | |
Wilmar International Ltd. | | | 17,846,700 | | | | 57,172,966 | |
| | | | | | | | 912,978,066 | |
|
| Metals & Mining – 26.6% | |
| | |
Agnico Eagle Mines Ltd.(a) | | | 554,187 | | | | 29,369,162 | |
| | |
Anglo American plc | | | 3,080,904 | | | | 117,509,126 | |
| | |
AngloGold Ashanti Ltd. | | | 1,008,182 | | | | 18,921,984 | |
| | |
Antofagasta plc | | | 804,667 | | | | 15,723,226 | |
| | |
Barrick Gold Corp. | | | 4,038,990 | | | | 73,999,002 | |
| | |
BHP Group Ltd.(a) | | | 7,185,645 | | | | 197,427,307 | |
| | |
Boliden AB | | | 629,331 | | | | 22,195,303 | |
| | |
First Quantum Minerals Ltd. | | | 1,380,771 | | | | 32,638,127 | |
| | |
Fortescue Metals Group Ltd. | | | 4,383,400 | | | | 45,862,738 | |
| | |
Franco-Nevada Corp.(a) | | | 429,858 | | | | 61,238,856 | |
| | |
Freeport-McMoRan, Inc. | | | 3,472,279 | | | | 130,974,364 | |
| | |
Glencore plc* | | | 24,074,259 | | | | 120,531,735 | |
| | |
Gold Fields Ltd. | | | 2,169,783 | | | | 20,457,342 | |
| | |
Grupo Mexico SAB de CV, Series B | | | 7,612,441 | | | | 33,469,098 | |
| | |
Impala Platinum Holdings Ltd.(a) | | | 2,022,626 | | | | 26,346,034 | |
| | |
Kinross Gold Corp. | | | 2,899,306 | | | | 17,402,151 | |
| | |
Kirkland Lake Gold Ltd.(a) | | | 572,973 | | | | 24,115,204 | |
| | |
MMC Norilsk Nickel PJSC | | | 24,494 | | | | 7,637,327 | |
| | |
MMC Norilsk Nickel PJSC, ADR | | | 1,105,367 | | | | 34,586,934 | |
| | |
Newcrest Mining Ltd. | | | 1,862,945 | | | | 34,827,531 | |
| | |
Newmont Corp.(a) | | | 151,950 | | | | 8,205,300 | |
| | |
Newmont Corp. | | | 1,654,637 | | | | 89,350,398 | |
| | |
Norsk Hydro ASA | | | 2,883,651 | | | | 21,093,982 | |
| | |
Northern Star Resources Ltd.(a) | | | 2,689,529 | | | | 18,665,772 | |
| | |
Rio Tinto plc | | | 2,457,835 | | | | 153,646,772 | |
| | |
Sibanye Stillwater Ltd. | | | 6,853,759 | | | | 24,051,283 | |
| | |
South32 Ltd. | | | 9,875,174 | | | | 26,479,558 | |
| | |
Sumitomo Metal Mining Co. Ltd.(a) | | | 626,200 | | | | 24,290,135 | |
| | |
Teck Resources Ltd., Class B | | | 989,396 | | | | 27,569,471 | |
| | |
Vale SA | | | 8,194,244 | | | | 104,096,117 | |
See Accompanying Notes to the Financial Statements.
| | | | |
| 308 | | FLEXSHARES ANNUAL REPORT | | |
FlexShares® Morningstar Global Upstream Natural Resources Index Fund (cont.)
| | | | | | | | |
| Investments | | Shares | | | Value | |
|
| COMMON STOCKS – (continued) | |
|
| Metals & Mining – (continued) | |
| | |
Wheaton Precious Metals Corp. | | | 1,001,920 | | | $ | 40,382,335 | |
| | |
Zijin Mining Group Co. Ltd., Class A | | | 3,757,292 | | | | 6,141,496 | |
| | | | | | | | 1,609,205,170 | |
|
| Multi-Utilities – 1.1% | |
| | |
Suez SA | | | 1,026,968 | | | | 23,394,810 | |
| | |
Veolia Environnement SA(a) | | | 1,382,489 | | | | 45,164,765 | |
| | | | | | | | 68,559,575 | |
|
| Oil, Gas & Consumable Fuels – 32.8% | |
| | |
BP plc | | | 26,344,234 | | | | 126,461,978 | |
| | |
Canadian Natural Resources Ltd.(a) | | | 1,527,928 | | | | 64,837,250 | |
| | |
Chevron Corp. | | | 2,548,634 | | | | 291,793,107 | |
| | |
China Petroleum & Chemical Corp., Class H | | | 31,310,000 | | | | 15,375,168 | |
| | |
ConocoPhillips | | | 134,177 | | | | 9,994,845 | |
| | |
ConocoPhillips | | | 1,644,231 | | | | 122,478,767 | |
| | |
Devon Energy Corp. | | | 814,060 | | | | 32,627,525 | |
| | |
Diamondback Energy, Inc. | | | 244,218 | | | | 26,177,727 | |
| | |
Eni SpA | | | 3,275,026 | | | | 47,011,456 | |
| | |
EOG Resources, Inc. | | | 767,095 | | | | 70,925,604 | |
| | |
Equinor ASA | | | 1,315,020 | | | | 33,227,989 | |
| | |
Exxon Mobil Corp. | | | 5,004,896 | | | | 322,665,645 | |
| | |
Exxon Mobil Corp. | | | 258,315 | | | | 16,653,568 | |
| | |
Gazprom PJSC | | | 14,903,560 | | | | 73,495,771 | |
| | |
Hess Corp. | | | 360,065 | | | | 29,730,567 | |
| | |
LUKOIL PJSC | | | 236,599 | | | | 24,137,941 | |
| | |
LUKOIL PJSC, ADR | | | 228,957 | | | | 23,353,614 | |
| | |
Novatek PJSC | | | 1,145,946 | | | | 29,042,178 | |
| | |
Occidental Petroleum Corp. | | | 1,133,422 | | | | 38,003,640 | |
| | |
Petroleo Brasileiro SA (Preference) | | | 6,888,200 | | | | 33,298,465 | |
| | |
Pioneer Natural Resources Co. | | | 313,100 | | | | 58,543,438 | |
| | |
PTT PCL, NVDR | | | 11,897,800 | | | | 13,625,146 | |
| | |
Repsol SA | | | 1,887,993 | | | | 24,156,032 | |
| | |
Rosneft Oil Co. PJSC | | | 2,802,245 | | | | 25,139,202 | |
| | |
Royal Dutch Shell plc, Class A | | | 5,391,582 | | | | 124,234,490 | |
| | | | | | | | |
| Investments | | Shares | | | Value | |
|
| Oil, Gas & Consumable Fuels – (continued) | |
| | |
Santos Ltd.(a) | | | 2,385,822 | | | $ | 12,508,096 | |
| | |
Saudi Arabian Oil Co.(b) | | | 2,648,826 | | | | 26,658,450 | |
| | |
Suncor Energy, Inc. | | | 2,025,757 | | | | 53,195,426 | |
| | |
Tatneft PJSC | | | 2,057,067 | | | | 15,697,325 | |
| | |
Texas Pacific Land Corp. | | | 12,524 | | | | 15,951,443 | |
| | |
TotalEnergies SE | | | 3,284,419 | | | | 164,844,768 | |
| | |
Woodside Petroleum Ltd. | | | 1,252,400 | | | | 21,880,162 | |
| | | | | | | | 1,987,726,783 | |
|
| Paper & Forest Products – 2.9% | |
| | |
Canfor Corp.* | | | 144,026 | | | | 2,979,167 | |
| | |
Chengxin Lithium Group Co. Ltd., Class A* | | | 137,660 | | | | 1,244,668 | |
| | |
Dexco SA | | | 939,300 | | | | 2,584,450 | |
| | |
Dongwha Enterprise Co. Ltd.* | | | 12,524 | | | | 904,562 | |
| | |
Interfor Corp. | | | 153,419 | | | | 3,507,639 | |
| | |
Mondi plc | | | 1,221,090 | | | | 30,547,016 | |
| | |
Stella-Jones, Inc. | | | 169,074 | | | | 6,060,230 | |
| | |
Stora Enso OYJ, Class R | | | 1,477,832 | | | | 24,592,979 | |
| | |
Suzano SA* | | | 1,878,600 | | | | 16,406,507 | |
| | |
Svenska Cellulosa AB SCA, Class B | | | 1,496,618 | | | | 23,333,196 | |
| | |
UPM-Kymmene OYJ | | | 1,327,544 | | | | 46,887,885 | |
| | |
West Fraser Timber Co. Ltd.(a) | | | 175,336 | | | | 14,016,413 | |
| | | | | | | | 173,064,712 | |
|
| Trading Companies & Distributors – 0.9% | |
| | |
Boise Cascade Co.(a) | | | 103,323 | | | | 5,850,148 | |
| | |
Mitsui & Co. Ltd. | | | 2,011,300 | | | | 45,720,584 | |
| | | | | | | | 51,570,732 | |
|
| Water Utilities – 3.3% | |
| | |
American States Water Co.(a) | | | 90,799 | | | | 8,248,181 | |
| | |
American Water Works Co., Inc. | | | 435,209 | | | | 75,804,704 | |
| | |
Beijing Capital Eco-Environment Protection Group Co. Ltd., Class A | | | 1,252,489 | | | | 657,629 | |
| | |
Beijing Enterprises Water Group Ltd. | | | 12,524,000 | | | | 4,781,597 | |
See Accompanying Notes to the Financial Statements.
| | | | | | |
| | FLEXSHARES ANNUAL REPORT | | | 309 | |
FlexShares® Morningstar Global Upstream Natural Resources Index Fund (cont.)
| | | | | | | | |
| Investments | | Shares | | | Value | |
|
| COMMON STOCKS – (continued) | |
|
| Water Utilities – (continued) | |
| | |
California Water Service Group(a) | | | 122,109 | | | $ | 7,433,996 | |
| | |
Cia de Saneamento Basico do Estado de Sao Paulo* | | | 939,300 | | | | 5,865,418 | |
| | |
Cia de Saneamento do Parana* | | | 626,200 | | | | 2,027,346 | |
| | |
Essential Utilities, Inc. | | | 544,794 | | | | 25,643,453 | |
| | |
Guangdong Investment Ltd. | | | 6,706,000 | | | | 8,448,178 | |
| | |
Pennon Group plc | | | 695,082 | | | | 11,109,457 | |
| | |
Severn Trent plc | | | 585,497 | | | | 21,974,367 | |
| | |
SJW Group(a) | | | 65,751 | | | | 4,334,306 | |
| | |
United Utilities Group plc | | | 1,700,133 | | | | 24,201,799 | |
| | | | | | | | 200,530,431 | |
Total Common Stocks
(Cost $4,901,271,932) | | | | 6,019,017,379 | |
| | | Principal
Amount | | | | |
|
| SECURITIES LENDING REINVESTMENTS(c) – 1.0% | |
|
| CERTIFICATES OF DEPOSIT – 0.2% | |
| | |
Oversea-Chinese Banking Corp. Ltd., New York 0.14%, 2/24/2022 | | $ | 7,000,000 | | | | 6,999,979 | |
| | |
The Sumitomo Bank Ltd., New York 0.15%, 3/9/2022 | | | 5,000,000 | | | | 5,000,070 | |
Total Certificates of Deposit
(Cost $12,000,000) | | | | 12,000,049 | |
| | |
| | | | | | | | |
|
| REPURCHASE AGREEMENTS – 0.8% | |
| | |
BofA Securities, Inc., 0.52%, dated 10/31/2021, due 1/31/2022, repurchase price $8,010,631, collateralized by various U.S. Treasury Securities, ranging from 0.63% – 4.50%, maturing 12/31/2027 – 8/15/2039; Common Stocks; total market value $8,379,483 | | | 8,000,000 | | | | 8,000,000 | |
| | | | | | | | |
| Investments | | Principal
Amount | | | Value | |
|
| REPURCHASE AGREEMENTS – (continued) | |
| | |
Cantor Fitzgerald & Co., Inc., 0.05%, dated 10/31/2021, due 11/1/2021, repurchase price $15,000,021, collateralized by various Mortgage-Backed Securities, ranging from 1.50% – 6.00%, maturing 7/1/2036 – 12/15/2062; total market value $20,584,151 | | $ | 15,000,000 | | | $ | 15,000,000 | |
| | |
Citigroup Global Markets, Inc., 0.05%, dated 10/31/2021, due 11/1/2021, repurchase price $25,798,532, collateralized by various U.S. Treasury Securities, ranging from 0.75% – 4.63%, maturing 2/15/2040 – 2/15/2042; total market value $26,031,261 | | | 25,798,497 | | | | 25,798,497 | |
Total Repurchase Agreements
(Cost $48,798,497) | | | | 48,798,497 | |
Total Securities Lending Reinvestments
(Cost $60,798,497) | | | | 60,798,546 | |
Total Investments – 100.4%
(Cost $4,962,070,429) | | | | 6,079,815,925 | |
| |
Liabilities in excess of other assets – (0.4%) | | | | (27,105,659 | ) |
| NET ASSETS – 100.0% | | | $ | 6,052,710,266 | |
| * | Non-income producing security. |
| (a) | The security or a portion of this security is on loan at October 31, 2021. The total value of securities on loan at October 31, 2021 was $303,788,929, collateralized in the form of cash with a value of $60,798,887 that was reinvested in the securities shown in the Securities Lending Reinvestment section of the Schedule of Investments; $86,716,371 of collateral in the form of U.S. Government |
See Accompanying Notes to the Financial Statements.
| | | | |
| 310 | | FLEXSHARES ANNUAL REPORT | | |
FlexShares® Morningstar Global Upstream Natural Resources Index Fund (cont.)
| | Treasury Securities, interest rates ranging from 0.00% – 6.25%, and maturity dates ranging from November 4, 2021 – February 15, 2051 and $177,989,580 of collateral in the form of Foreign Government Fixed Income Securities, interest rates ranging from 0.00% – 8.50%, and maturity dates ranging from November 17, 2021 – June 30, 2120; a total value of $325,504,838. |
| (b) | Security exempt from registration pursuant to Regulation S under the Securities Act of 1933. Regulation S applies to securities offerings that are made outside of the United States and do not involve direct selling efforts in the United States and as such may have restrictions on resale. |
| (c) | The security was purchased with cash collateral held from securities on loan at October 31, 2021. The total value of securities purchased was $60,798,546. |
Percentages shown are based on Net Assets.
Abbreviations
ADR – American Depositary Receipt
NVDR – Non-Voting Depositary Receipt
OYJ – Public Limited Company
PJSC – Public Joint Stock Company
Preference – A special type of equity investment that shares in the earnings of the company, has limited voting rights, and may have a dividend preference. Preference shares may also have liquidation preference.
SCA – Limited partnership with share capital
As of October 31, 2021, the gross unrealized appreciation (depreciation) of investments based on the aggregate cost of investments (including derivative instruments, if applicable) for federal income tax purposes was as follows:
| | | | |
| | | | |
Aggregate gross unrealized appreciation | | $ | 1,122,291,428 | |
Aggregate gross unrealized depreciation | | | (47,869,760 | ) |
Net unrealized appreciation | | $ | 1,074,421,668 | |
Federal income tax cost | | $ | 5,006,620,909 | |
Futures Contracts
FlexShares® Morningstar Global Upstream Natural Resources Index Fund had the following open futures contracts as of October 31, 2021:
| | | | | | | | | | | | | | | | | | | | |
| | | Number of
Contracts | | | Expiration
Date | | | Trading
Currency | | | Notional
Amount | | | Value and
Unrealized
Appreciation/
(Depreciation)* | |
Long Contracts | |
EURO STOXX 50 Index | | | 2 | | | | 12/17/2021 | | | | EUR | | | $ | 98,065 | | | $ | 2,730 | |
FTSE 100 Index | | | 105 | | | | 12/17/2021 | | | | GBP | | | | 10,397,413 | | | | 291,313 | |
FTSE/JSE Top 40 Index | | | 21 | | | | 12/15/2021 | | | | ZAR | | | | 844,380 | | | | 51,566 | |
Hang Seng Index | | | 2 | | | | 11/29/2021 | | | | HKD | | | | 325,284 | | | | (9,516 | ) |
MSCI Emerging Markets E-Mini Index | | | 25 | | | | 12/17/2021 | | | | USD | | | | 1,577,500 | | | | (17,633 | ) |
S&P Midcap 400 E-Mini Index | | | 18 | | | | 12/17/2021 | | | | USD | | | | 5,020,920 | | | | 200,698 | |
S&P/TSX 60 Index | | | 53 | | | | 12/16/2021 | | | | CAD | | | | 10,779,154 | | | | 332,584 | |
SPI 200 Index | | | 35 | | | | 12/16/2021 | | | | AUD | | | | 4,784,507 | | | | (10,303 | ) |
TOPIX Index | | | 4 | | | | 12/09/2021 | | | | JPY | | | | 698,969 | | | | (9,144 | ) |
| | | | | | | | | | | | | | | | | | | $ | 832,295 | |
| * | This amount represents the cumulative appreciation/depreciation on futures contracts. Current day’s variation margin is reported within the Statement of Assets and Liabilities for futures contracts. |
See Accompanying Notes to the Financial Statements.
| | | | | | |
| | FLEXSHARES ANNUAL REPORT | | | 311 | |
FlexShares® Morningstar Global Upstream Natural Resources Index Fund (cont.)
Forward Foreign Currency Contracts
FlexShares® Morningstar Global Upstream Natural Resources Index Fund had the following outstanding contracts as of October 31, 2021:
| | | | | | | | | | | | | | | | | | | | | | |
| Contracts to Receive | | Counterparty | | In Exchange For | | | Maturity Date | | | Unrealized
Appreciation/
(Depreciation) | |
AUD | | | 8,285,000 | | | | | JPMorgan Chase Bank | | USD | | | 6,108,640 | | | | 12/15/2021 | | | $ | 115,284 | |
AUD | | | 6,198,480 | | | | | Morgan Stanley | | USD | | | 4,557,697 | | | | 12/15/2021 | | | | 98,774 | |
CAD | | | 500,000 | | | | | Bank of Montreal | | USD | | | 401,838 | | | | 12/15/2021 | | | | 1,564 | |
CAD | | | 9,034,539 | | | | | Citibank NA | | USD | | | 7,120,081 | | | | 12/15/2021 | | | | 169,019 | |
CAD | | | 3,140,000 | | | | | Morgan Stanley | | USD | | | 2,484,598 | | | | 12/15/2021 | | | | 48,766 | |
GBP | | | 1,000,000 | | | | | BNP Paribas SA | | USD | | | 1,366,379 | | | | 12/15/2021 | | | | 4,593 | |
GBP | | | 9,000,000 | | | | | JPMorgan Chase Bank | | USD | | | 12,298,627 | | | | 12/15/2021 | | | | 40,116 | |
MYR* | | | 504,831 | | | | | Morgan Stanley | | USD | | | 121,139 | | | | 12/15/2021 | | | | 540 | |
NOK | | | 20,661,048 | | | | | BNP Paribas SA | | USD | | | 2,374,562 | | | | 12/15/2021 | | | | 67,035 | |
NOK | | | 6,500,000 | | | | | Citibank NA | | USD | | | 762,574 | | | | 12/15/2021 | | | | 5,556 | |
NZD | | | 576,346 | | | | | Goldman Sachs & Co. | | USD | | | 409,009 | | | | 12/15/2021 | | | | 3,176 | |
SEK | | | 5,649,173 | | | | | Morgan Stanley | | USD | | | 656,720 | | | | 12/15/2021 | | | | 1,452 | |
USD | | | 9,787,555 | | | | | Citibank NA | | BRL* | | | 53,000,000 | | | | 12/15/2021 | | | | 470,044 | |
USD | | | 811,014 | | | | | Bank of Montreal | | CAD | | | 1,000,000 | | | | 12/15/2021 | | | | 4,210 | |
USD | | | 2,227,529 | | | | | JPMorgan Chase Bank | | EUR | | | 1,900,000 | | | | 12/15/2021 | | | | 26,412 | |
USD | | | 5,033,452 | | | | | Morgan Stanley | | GBP | | | 3,635,140 | | | | 12/15/2021 | | | | 49,779 | |
USD | | | 9,610,243 | | | | | Toronto-Dominion Bank (The) | | GBP | | | 6,990,000 | | | | 12/15/2021 | | | | 27,153 | |
USD | | | 148,472 | | | | | Citibank NA | | HKD | | | 1,154,345 | | | | 12/15/2021 | | | | 63 | |
USD | | | 448,764 | | | | | JPMorgan Chase Bank | | HKD | | | 3,490,000 | | | | 12/15/2021 | | | | 70 | |
USD | | | 858,104 | | | | | BNP Paribas SA | | JPY | | | 97,300,000 | | | | 12/15/2021 | | | | 4,354 | |
USD | | | 676,877 | | | | | Toronto-Dominion Bank (The) | | JPY | | | 74,279,584 | | | | 12/15/2021 | | | | 25,118 | |
USD | | | 299,973 | | | | | Goldman Sachs & Co. | | KRW* | | | 350,052,156 | | | | 12/15/2021 | | | | 718 | |
USD | | | 638,028 | | | | | JPMorgan Chase Bank | | MXN | | | 13,000,000 | | | | 12/15/2021 | | | | 9,711 | |
USD | | | 73,867 | | | | | UBS AG | | MXN | | | 1,490,000 | | | | 12/15/2021 | | | | 1,852 | |
USD | | | 718,008 | | | | | Bank of Montreal | | NOK | | | 6,000,000 | | | | 12/15/2021 | | | | 8,964 | |
USD | | | 373,158 | | | | | BNP Paribas SA | | SEK | | | 3,200,000 | | | | 12/15/2021 | | | | 334 | |
USD | | | 890,522 | | | | | JPMorgan Chase Bank | | SGD | | | 1,200,000 | | | | 12/15/2021 | | | | 822 | |
USD | | | 203,141 | | | | | BNP Paribas SA | | ZAR | | | 3,000,000 | | | | 12/15/2021 | | | | 6,842 | |
USD | | | 710,295 | | | | | Citibank NA | | ZAR | | | 10,600,000 | | | | 12/15/2021 | | | | 16,706 | |
Total unrealized appreciation | | | $ | 1,209,027 | |
BRL* | | | 60,000,000 | | | | | Citibank NA | | USD | | | 10,756,445 | | | | 12/15/2021 | | | $ | (208,320 | ) |
BRL* | | | 959,240 | | | | | Goldman Sachs & Co. | | USD | | | 180,760 | | | | 12/15/2021 | | | | (12,124 | ) |
CAD | | | 310,000 | | | | | Bank of Montreal | | USD | | | 251,325 | | | | 12/15/2021 | | | | (1,215 | ) |
EUR | | | 698,602 | | | | | JPMorgan Chase Bank | | USD | | | 827,953 | | | | 12/15/2021 | | | | (18,635 | ) |
EUR | | | 520,000 | | | | | Morgan Stanley | | USD | | | 607,949 | | | | 12/15/2021 | | | | (5,538 | ) |
EUR | | | 1,520,000 | | | | | Toronto-Dominion Bank (The) | | USD | | | 1,786,965 | | | | 12/15/2021 | | | | (26,072 | ) |
GBP | | | 2,140,000 | | | | | Bank of New York | | USD | | | 2,964,135 | | | | 12/15/2021 | | | | (30,256 | ) |
GBP | | | 80,000 | | | | | JPMorgan Chase Bank | | USD | | | 110,455 | | | | 12/15/2021 | | | | (777 | ) |
HKD | | | 6,220,000 | | | | | Toronto-Dominion Bank (The) | | USD | | | 799,823 | | | | 12/15/2021 | | | | (143 | ) |
INR* | | | 6,925,711 | | | | | Citibank NA | | USD | | | 93,239 | | | | 12/15/2021 | | | | (1,212 | ) |
MXN | | | 13,970,000 | | | | | Citibank NA | | USD | | | 690,286 | | | | 12/15/2021 | | | | (15,088 | ) |
MXN | | | 7,900,000 | | | | | UBS AG | | USD | | | 386,041 | | | | 12/15/2021 | | | | (4,219 | ) |
SGD | | | 379,915 | | | | | Toronto-Dominion Bank (The) | | USD | | | 282,233 | | | | 12/15/2021 | | | | (558 | ) |
SGD | | | 790,000 | | | | | UBS AG | | USD | | | 587,739 | | | | 12/15/2021 | | | | (2,020 | ) |
USD | | | 862,397 | | | | | Bank of Montreal | | AUD | | | 1,150,000 | | | | 12/15/2021 | | | | (1,516 | ) |
USD | | | 4,873,534 | | | | | JPMorgan Chase Bank | | AUD | | | 6,610,000 | | | | 12/15/2021 | | | | (92,082 | ) |
See Accompanying Notes to the Financial Statements.
| | | | |
| 312 | | FLEXSHARES ANNUAL REPORT | | |
FlexShares® Morningstar Global Upstream Natural Resources Index Fund (cont.)
Forward Foreign Currency Contracts (cont.)
| | | | | | | | | | | | | | | | | | | | | | |
| Contracts to Receive | | Counterparty | | In Exchange For | | | Maturity
Date | | | Unrealized
Appreciation/
(Depreciation) | |
USD | | | 3,936,213 | | | | | Toronto-Dominion Bank (The) | | AUD | | | 5,410,000 | | | | 12/15/2021 | | | $ | (127,930 | ) |
USD | | | 6,271,495 | | | | | Toronto-Dominion Bank (The) | | CAD | | | 8,000,000 | | | | 12/15/2021 | | | | (182,935 | ) |
USD | | | 1,050,035 | | | | | JPMorgan Chase Bank | | CHF | | | 961,534 | | | | 12/15/2021 | | | | (3,643 | ) |
USD | | | 359,678 | | | | | Toronto-Dominion Bank (The) | | HKD | | | 2,800,000 | | | | 12/15/2021 | | | | (306 | ) |
USD | | | 836,954 | | | | | Citibank NA | | NOK | | | 7,240,000 | | | | 12/15/2021 | | | | (18,625 | ) |
USD | | | 321,255 | | | | | Toronto-Dominion Bank (The) | | NZD | | | 450,000 | | | | 12/15/2021 | | | | (571 | ) |
USD | | | 16,315 | | | | | Goldman Sachs & Co. | | RUB* | | | 1,215,850 | | | | 12/15/2021 | | | | (660 | ) |
ZAR | | | 15,760,000 | | | | | Morgan Stanley | | USD | | | 1,091,448 | | | | 12/15/2021 | | | | (60,225 | ) |
Total unrealized depreciation | | | $ | (814,670 | ) |
Net unrealized appreciation | | | $ | 394,357 | |
| * | Non-deliverable forward. See Note 2 in the Notes to Financial Statements. |
Abbreviations:
AUD – Australian Dollar
BRL – Brazilian Real
CAD – Canadian Dollar
CHF – Swiss Franc
EUR – Euro
GBP – British Pound
HKD – Hong Kong Dollar
INR – Indian Rupee
JPY – Japanese Yen
KRW – Korean Won
MXN – Mexican Peso
MYR – Malaysian Ringgit
NOK – Norwegian Krone
NZD – New Zealand Dollar
RUB – Russian Ruble
SEK – Swedish Krona
SGD – Singapore Dollar
USD – US Dollar
ZAR – South African Rand
See Accompanying Notes to the Financial Statements.
| | | | | | |
| | FLEXSHARES ANNUAL REPORT | | | 313 | |
FlexShares® Morningstar Global Upstream Natural Resources Index Fund (cont.)
FlexShares® Morningstar Global Upstream Natural Resources Index Fund invested, as a percentage of net assets, in companies domiciled in the following countries as of October 31, 2021:
| | | | |
Australia | | | 5.9 | % |
Brazil | | | 2.7 | |
Canada | | | 11.6 | |
China | | | 1.5 | |
Finland | | | 1.2 | |
France | | | 3.9 | |
India | | | 0.9 | |
Indonesia | | | 0.3 | |
Israel | | | 0.6 | |
Italy | | | 0.8 | |
Japan | | | 1.2 | |
Malaysia | | | 1.2 | |
Mexico | | | 0.5 | |
New Zealand | | | 0.4 | |
Norway | | | 4.1 | |
Russia | | | 3.8 | |
Saudi Arabia | | | 1.3 | |
Singapore | | | 0.9 | |
South Africa | | | 1.5 | |
South Korea | | | 0.0 | † |
Spain | | | 0.4 | |
Sweden | | | 0.7 | |
Thailand | | | 0.5 | |
United Arab Emirates | | | 1.4 | |
United Kingdom | | | 12.3 | |
United States | | | 39.8 | |
Other1 | | | 0.6 | |
| | | | 100.0 | % |
| † | Amount represents less than 0.05%. |
| 1 | Includes any non-equity securities, securities lending reinvestments and net other assets (liabilities). |
| | | | |
| Security Type | | % of Net Assets | |
Common Stocks | | | 99.4 | % |
Securities Lending Reinvestments | | | 1.0 | |
Others(1) | | | (0.4 | ) |
| | | | 100.0 | % |
| (1) | Includes any other net assets/(liabilities). |
See Accompanying Notes to the Financial Statements.
| | | | |
| 314 | | FLEXSHARES ANNUAL REPORT | | |
Schedule of Investments
FlexShares® STOXX® Global Broad Infrastructure Index Fund
October 31, 2021
| | | | | | | | |
| Investments | | Shares | | | Value | |
|
| COMMON STOCKS – 99.2% | |
|
| Air Freight & Logistics – 3.7% | |
| | |
bpost SA* (a) | | | 115,416 | | | $ | 988,382 | |
| | |
Deutsche Post AG (Registered) | | | 1,382,244 | | | | 85,610,692 | |
| | |
Oesterreichische Post AG(a) | | | 40,304 | | | | 1,702,426 | |
| | |
PostNL NV | | | 599,590 | | | | 2,604,115 | |
| | |
Royal Mail plc | | | 1,150,496 | | | | 6,631,463 | |
| | |
Singapore Post Ltd. | | | 1,648,800 | | | | 800,863 | |
| | | | | | | | 98,337,941 | |
|
| Commercial Services & Supplies – 4.4% | |
| | |
Befesa SA(b) | | | 52,212 | | | | 3,885,156 | |
| | |
Biffa plc* (b) | | | 467,160 | | | | 2,548,631 | |
| | |
Casella Waste Systems, Inc., Class A* | | | 21,068 | | | | 1,827,017 | |
| | |
China Everbright Environment Group Ltd. | | | 5,496,000 | | | | 3,779,844 | |
| | |
Clean Harbors, Inc.* | | | 21,068 | | | | 2,370,993 | |
| | |
Cleanaway Co. Ltd. | | | 100,000 | | | | 769,549 | |
| | |
Cleanaway Waste Management Ltd. | | | 2,770,900 | | | | 5,577,678 | |
| | |
CoreCivic, Inc., REIT* | | | 23,816 | | | | 205,056 | |
| | |
Covanta Holding Corp.(a) | | | 56,792 | | | | 1,146,062 | |
| | |
Daiseki Co. Ltd. | | | 72,360 | | | | 3,369,714 | |
| | |
Insun ENT Co. Ltd.* | | | 36,640 | | | | 379,397 | |
| | |
Koentec Co. Ltd. | | | 3,664 | | | | 28,345 | |
| | |
Lassila & Tikanoja OYJ(a) | | | 39,388 | | | | 619,912 | |
| | |
Republic Services, Inc. | | | 83,356 | | | | 11,219,718 | |
| | |
Shanghai Youngsun Investment Co. Ltd., Class B* ^ ‡ (c) | | | 57,800 | | | | — | |
| | |
Stericycle, Inc.* (a) | | | 32,976 | | | | 2,206,754 | |
| | |
US Ecology, Inc.* (a) | | | 9,160 | | | | 294,860 | |
| | |
Waste Connections, Inc. | | | 367,316 | | | | 49,901,992 | |
| | |
Waste Management, Inc. | | | 165,796 | | | | 26,565,493 | |
| | | | | | | | 116,696,171 | |
|
| Diversified Financial Services – 0.0%(d) | |
| | |
Metro Pacific Investments Corp. | | | 15,572,000 | | | | 1,158,401 | |
|
| Diversified Telecommunication Services – 11.8% | |
| | |
AT&T, Inc. | | | 2,791,052 | | | | 70,501,973 | |
| | |
BCE, Inc.(a) | | | 493,724 | | | | 25,376,270 | |
| | |
BT Group plc* | | | 4,001,088 | | | | 7,617,959 | |
| | | | | | | | |
| Investments | | Shares | | | Value | |
|
| Diversified Telecommunication Services – (continued) | |
| | |
Cellnex Telecom SA(b) | | | 292,204 | | | $ | 17,982,981 | |
| | |
China Tower Corp. Ltd., Class H(b) | | | 21,984,000 | | | | 2,854,313 | |
| | |
Deutsche Telekom AG (Registered) | | | 1,765,132 | | | | 32,842,515 | |
| | |
Hellenic Telecommunications Organization SA | | | 133,736 | | | | 2,367,920 | |
| | |
HKT Trust & HKT Ltd. | | | 1,832,000 | | | | 2,486,926 | |
| | |
Indus Towers Ltd. | | | 765,776 | | | | 2,776,505 | |
| | |
Infrastrutture Wireless Italiane SpA(b) | | | 172,208 | | | | 1,904,393 | |
| | |
Liberty Global plc, Class C* (a) | | | 138,316 | | | | 3,989,033 | |
| | |
Lumen Technologies, Inc.(a) | | | 378,308 | | | | 4,486,733 | |
| | |
Nippon Telegraph & Telephone Corp. | | | 1,282,400 | | | | 35,854,341 | |
| | |
Spark New Zealand Ltd. | | | 1,070,804 | | | | 3,498,255 | |
| | |
Swisscom AG (Registered) | | | 13,740 | | | | 7,494,409 | |
| | |
Telecom Italia SpA | | | 5,015,100 | | | | 1,788,127 | |
| | |
Telesites SAB de CV(a) | | | 1,557,200 | | | | 1,423,561 | |
| | |
Verizon Communications, Inc. | | | 1,618,572 | | | | 85,768,130 | |
| | | | | | | | 311,014,344 | |
|
| Electric Utilities – 13.0% | |
| | |
American Electric Power Co., Inc. | | | 194,192 | | | | 16,450,004 | |
| | |
Duke Energy Corp. | | | 300,448 | | | | 30,648,700 | |
| | |
Enel SpA | | | 7,746,612 | | | | 64,869,052 | |
| | |
Eversource Energy | | | 132,820 | | | | 11,276,418 | |
| | |
Exelon Corp. | | | 386,552 | | | | 20,560,701 | |
| | |
Iberdrola SA | | | 5,795,535 | | | | 68,510,809 | |
| | |
NextEra Energy, Inc. | | | 770,356 | | | | 65,734,477 | |
| | |
Orsted A/S(b) | | | 188,696 | | | | 26,653,180 | |
| | |
Southern Co. (The) | | | 417,696 | | | | 26,030,815 | |
| | |
Xcel Energy, Inc. | | | 207,932 | | | | 13,430,328 | |
| | | | | | | | 344,164,484 | |
|
| Equity Real Estate Investment Trusts (REITs) – 5.7% | |
| | |
American Tower Corp. | | | 177,704 | | | | 50,107,197 | |
| | |
CoreSite Realty Corp. | | | 17,404 | | | | 2,479,374 | |
| | |
Crown Castle International Corp. | | | 168,544 | | | | 30,388,483 | |
| | |
CyrusOne, Inc. | | | 45,800 | | | | 3,756,516 | |
See Accompanying Notes to the Financial Statements.
| | | | | | |
| | FLEXSHARES ANNUAL REPORT | | | 315 | |
FlexShares® STOXX® Global Broad Infrastructure Index Fund (cont.)
| | | | | | | | |
| Investments | | Shares | | | Value | |
|
| COMMON STOCKS – (continued) | |
|
| Equity Real Estate Investment Trusts (REITs) – (continued) | |
| | |
Digital Realty Trust, Inc.(a) | | | 109,004 | | | $ | 17,201,921 | |
| | |
Equinix, Inc. | | | 35,370 | | | | 29,607,166 | |
| | |
GEO Group, Inc. (The)(a) | | | 19,236 | | | | 157,351 | |
| | |
Keppel DC REIT | | | 577,622 | | | | 1,023,742 | |
| | |
SBA Communications Corp. | | | 43,052 | | | | 14,867,147 | |
| | | | | | | | 149,588,897 | |
|
| Gas Utilities – 1.1% | |
| | |
APA Group | | | 1,021,340 | | | | 6,290,454 | |
| | |
Beijing Enterprises Holdings Ltd. | | | 458,000 | | | | 1,760,395 | |
| | |
Enagas SA | | | 243,656 | | | | 5,471,645 | |
| | |
Keppel Infrastructure Trust | | | 4,488,400 | | | | 1,764,073 | |
| | |
Petronas Gas Bhd. | | | 549,600 | | | | 2,221,759 | |
| | |
Snam SpA | | | 2,075,656 | | | | 11,762,853 | |
| | | | | | | | 29,271,179 | |
|
| Health Care Providers & Services – 3.3% | |
| | |
Acadia Healthcare Co., Inc.* (a) | | | 32,060 | | | | 1,987,720 | |
| | |
Apollo Hospitals Enterprise Ltd. | | | 161,216 | | | | 9,176,004 | |
| | |
Bangkok Dusit Medical Services PCL, NVDR | | | 16,762,800 | | | | 11,871,493 | |
| | |
Bumrungrad Hospital PCL, NVDR | | | 732,800 | | | | 3,213,212 | |
| | |
Encompass Health Corp. | | | 36,640 | | | | 2,328,838 | |
| | |
Fortis Healthcare Ltd.* | | | 713,564 | | | | 2,328,002 | |
| | |
HCA Healthcare, Inc. | | | 99,844 | | | | 25,006,928 | |
| | |
IHH Healthcare Bhd. | | | 3,297,600 | | | | 5,207,994 | |
| | |
Life Healthcare Group Holdings Ltd.* | | | 1,614,908 | | | | 2,583,853 | |
| | |
Mitra Keluarga Karyasehat Tbk. PT(b) | | | 6,412,000 | | | | 1,031,894 | |
| | |
Netcare Ltd.* | | | 1,505,904 | | | | 1,675,318 | |
| | |
Ramsay Health Care Ltd.(a) | | | 263,808 | | | | 13,953,455 | |
| | |
Tenet Healthcare Corp.* (a) | | | 43,052 | | | | 3,085,106 | |
| | |
Universal Health Services, Inc., Class B | | | 27,480 | | | | 3,410,268 | |
| | | | | | | | 86,860,085 | |
|
| IT Services – 0.2% | |
| | |
Fastly, Inc., Class A* (a) | | | 34,808 | | | | 1,761,633 | |
| | | | | | | | |
| Investments | | Shares | | | Value | |
|
| IT Services – (continued) | |
| | |
NEXTDC Ltd.* | | | 256,480 | | | $ | 2,261,618 | |
| | | | | | | | 4,023,251 | |
|
| Media – 5.7% | |
| | |
Altice USA, Inc., Class A* | | | 84,272 | | | | 1,373,634 | |
| | |
Cable One, Inc.(a) | | | 2,157 | | | | 3,691,080 | |
| | |
Charter Communications, Inc., Class A* | | | 48,548 | | | | 32,764,560 | |
| | |
Comcast Corp., Class A | | | 1,793,528 | | | | 92,241,145 | |
| | |
DISH Network Corp., Class A* | | | 97,096 | | | | 3,987,733 | |
| | |
Liberty Broadband Corp., Class C* | | | 60,456 | | | | 9,821,077 | |
| | |
Shaw Communications, Inc., Class B | | | 233,580 | | | | 6,715,978 | |
| | | | | | | | 150,595,207 | |
|
| Multi-Utilities – 9.5% | |
| | |
Consolidated Edison, Inc. | | | 135,568 | | | | 10,221,827 | |
| | |
Dominion Energy, Inc. | | | 314,188 | | | | 23,856,295 | |
| | |
DTE Energy Co. | | | 74,196 | | | | 8,410,117 | |
| | |
E.ON SE | | | 2,115,960 | | | | 26,852,386 | |
| | |
Engie SA | | | 1,863,144 | | | | 26,511,693 | |
| | |
National Grid plc(a) | | | 3,610,872 | | | | 46,298,584 | |
| | |
Public Service Enterprise Group, Inc. | | | 196,024 | | | | 12,506,331 | |
| | |
RWE AG | | | 676,924 | | | | 26,062,730 | |
| | |
Sempra Energy | | | 124,576 | | | | 15,899,635 | |
| | |
Suez SA | | | 590,820 | | | | 13,459,155 | |
| | |
Veolia Environnement SA(a) | | | 910,161 | | | | 29,734,202 | |
| | |
WEC Energy Group, Inc. | | | 121,828 | | | | 10,971,830 | |
| | | | | | | | 250,784,785 | |
|
| Oil, Gas & Consumable Fuels – 8.2% | |
| | |
Antero Midstream Corp.(a) | | | 129,156 | | | | 1,374,220 | |
| | |
Enbridge, Inc. | | | 2,018,864 | | | | 84,432,181 | |
| | |
Equitrans Midstream Corp. | | | 181,368 | | | | 1,869,904 | |
| | |
Inter Pipeline Ltd. | | | 133,110 | | | | 2,023,147 | |
| | |
Keyera Corp.(a) | | | 227,168 | | | | 5,813,214 | |
| | |
Kinder Morgan, Inc.(a) | | | 863,788 | | | | 14,468,449 | |
| | |
Koninklijke Vopak NV | | | 59,540 | | | | 2,370,252 | |
| | |
ONEOK, Inc. | | | 171,292 | | | | 10,897,597 | |
| | |
Pembina Pipeline Corp.(a) | | | 553,264 | | | | 18,286,657 | |
| | |
Petronet LNG Ltd. | | | 687,000 | | | | 2,106,012 | |
See Accompanying Notes to the Financial Statements.
| | | | |
| 316 | | FLEXSHARES ANNUAL REPORT | | |
FlexShares® STOXX® Global Broad Infrastructure Index Fund (cont.)
| | | | | | | | |
| Investments | | Shares | | | Value | |
|
| COMMON STOCKS – (continued) | |
|
| Oil, Gas & Consumable Fuels – (continued) | |
| | |
Targa Resources Corp. | | | 86,104 | | | $ | 4,707,306 | |
| | |
TC Energy Corp. | | | 977,372 | | | | 52,789,363 | |
| | |
Transneft PJSC (Preference) | | | 1,466 | | | | 3,142,259 | |
| | |
Williams Cos., Inc. (The) | | | 468,076 | | | | 13,148,255 | |
| | | | | | | | 217,428,816 | |
|
| Road & Rail – 17.9% | |
| | |
Aurizon Holdings Ltd. | | | 2,503,428 | | | | 6,336,695 | |
| | |
Canadian National Railway Co. | | | 992,944 | | | | 131,757,032 | |
| | |
Canadian Pacific Railway Ltd.(a) | | | 936,152 | | | | 72,343,996 | |
| | |
Central Japan Railway Co. | | | 290,200 | | | | 43,011,445 | |
| | |
CSX Corp. | | | 883,940 | | | | 31,972,110 | |
| | |
East Japan Railway Co.(a) | | | 534,100 | | | | 33,200,621 | |
| | |
Kansas City Southern | | | 35,724 | | | | 11,083,371 | |
| | |
Keikyu Corp.(a) | | | 404,400 | | | | 4,546,729 | |
| | |
Keisei Electric Railway Co. Ltd. | | | 249,300 | | | | 7,991,155 | |
| | |
MTR Corp. Ltd. | | | 2,151,000 | | | | 11,724,105 | |
| | |
Norfolk Southern Corp. | | | 96,180 | | | | 28,185,549 | |
| | |
Odakyu Electric Railway Co. Ltd.(a) | | | 496,900 | | | | 10,733,301 | |
| | |
Tobu Railway Co. Ltd. | | | 302,200 | | | | 7,502,988 | |
| | |
Union Pacific Corp. | | | 254,648 | | | | 61,472,027 | |
| | |
West Japan Railway Co. | | | 265,300 | | | | 12,478,000 | |
| | | | | | | | 474,339,124 | |
|
| Transportation Infrastructure – 7.7% | |
| | |
Adani Ports & Special Economic Zone Ltd. | | | 1,123,016 | | | | 10,393,124 | |
| | |
Aena SME SA* (a) (b) | | | 103,508 | | | | 16,967,493 | |
| | |
Aeroports de Paris* (a) | | | 37,556 | | | | 4,993,747 | |
| | |
Airports of Thailand PCL, NVDR | | | 6,045,600 | | | | 11,751,411 | |
| | |
Atlantia SpA* | | | 721,808 | | | | 13,953,892 | |
| | |
Atlas Arteria Ltd. | | | 1,377,664 | | | | 6,415,533 | |
| | |
Auckland International Airport Ltd.* (a) | | | 1,649,716 | | | | 9,433,148 | |
| | |
Bangkok Expressway & Metro PCL, NVDR | | | 12,549,200 | | | | 3,403,686 | |
| | |
CCR SA | | | 1,648,800 | | | | 3,343,229 | |
| | |
China Merchants Port Holdings Co. Ltd. | | | 1,832,000 | | | | 3,061,556 | |
| | | | | | | | |
| Investments | | Shares | | | Value | |
|
| Transportation Infrastructure – (continued) | |
| | |
COSCO SHIPPING Ports Ltd. | | | 2,656,000 | | | $ | 2,212,466 | |
| | |
Getlink SE | | | 599,064 | | | | 9,210,050 | |
| | |
Grupo Aeroportuario del Pacifico SAB de CV, Class B* | | | 563,340 | | | | 7,116,956 | |
| | |
Grupo Aeroportuario del Sureste SAB de CV, Class B | | | 293,120 | | | | 5,924,183 | |
| | |
International Container Terminal Services, Inc. | | | 2,509,840 | | | | 8,961,936 | |
| | |
Japan Airport Terminal Co. Ltd.* (a) | | | 131,600 | | | | 6,497,768 | |
| | |
Promotora y Operadora de Infraestructura SAB de CV | | | 283,960 | | | | 2,092,759 | |
| | |
Qube Holdings Ltd. | | | 2,740,672 | | | | 6,546,090 | |
| | |
Shenzhen International Holdings Ltd. | | | 1,832,679 | | | | 2,212,205 | |
| | |
Sydney Airport* | | | 3,794,988 | | | | 23,344,903 | |
| | |
Transurban Group | | | 4,281,801 | | | | 43,223,856 | |
| | |
Westports Holdings Bhd. | | | 1,465,600 | | | | 1,582,041 | |
| | |
Westshore Terminals Investment Corp.(a) | | | 65,952 | | | | 1,424,336 | |
| | | | | | | | 204,066,368 | |
|
| Water Utilities – 2.6% | |
| | |
Aguas Andinas SA, Class A | | | 2,824,028 | | | | 539,525 | |
| | |
American States Water Co.(a) | | | 12,824 | | | | 1,164,932 | |
| | |
American Water Works Co., Inc. | | | 71,448 | | | | 12,444,813 | |
| | |
Beijing Enterprises Water Group Ltd.(a) | | | 5,496,000 | | | | 2,098,344 | |
| | |
California Water Service Group | | | 22,900 | | | | 1,394,152 | |
| | |
Cia de Saneamento Basico do Estado de Sao Paulo* | | | 458,000 | | | | 2,859,961 | |
| | |
Cia de Saneamento de Minas Gerais-COPASA | | | 274,800 | | | | 663,478 | |
| | |
Cia de Saneamento do Parana (Preference)* | | | 1,190,800 | | | | 785,839 | |
| | |
Essential Utilities, Inc. | | | 87,020 | | | | 4,096,031 | |
| | |
Guangdong Investment Ltd. | | | 4,130,000 | | | | 5,202,949 | |
| | |
Middlesex Water Co. | | | 8,244 | | | | 907,829 | |
| | |
Pennon Group plc | | | 378,645 | | | | 6,051,863 | |
| | |
Severn Trent plc | | | 359,988 | | | | 13,510,758 | |
| | |
SJW Group(a) | | | 14,656 | | | | 966,124 | |
See Accompanying Notes to the Financial Statements.
| | | | | | |
| | FLEXSHARES ANNUAL REPORT | | | 317 | |
FlexShares® STOXX® Global Broad Infrastructure Index Fund (cont.)
| | | | | | | | |
| Investments | | Shares | | | Value | |
|
| COMMON STOCKS – (continued) | |
|
| Water Utilities – (continued) | |
| | |
TTW PCL, NVDR | | | 2,381,600 | | | $ | 839,741 | |
| | |
United Utilities Group plc | | | 968,212 | | | | 13,782,729 | |
| | |
WHA Utilities and Power PCL, NVDR | | | 3,206,000 | | | | 407,725 | |
| | | | | | | | 67,716,793 | |
|
| Wireless Telecommunication Services – 4.4% | |
| | |
KDDI Corp. | | | 896,500 | | | | 27,738,233 | |
| | |
SoftBank Group Corp. | | | 681,200 | | | | 36,824,528 | |
| | |
T-Mobile US, Inc.* | | | 237,244 | | | | 27,290,177 | |
| | |
Vodafone Group plc | | | 15,729,552 | | | | 23,294,811 | |
| | | | | | | | 115,147,749 | |
Total Common Stocks
(Cost $2,273,516,071) | | | | 2,621,193,595 | |
| | | Principal
Amount | | | | |
|
| SECURITIES LENDING REINVESTMENTS(e) – 1.2% | |
|
| REPURCHASE AGREEMENTS – 1.2% | |
| | |
BofA Securities, Inc., 0.52%, dated 10/31/2021, due 1/31/2022, repurchase price $2,002,658, collateralized by various U.S. Treasury Securities, ranging from 0.63% – 4.50%, maturing 12/31/2027 – 8/15/2039; Common Stocks; total market value $2,094,871 | | $ | 2,000,000 | | | | 2,000,000 | |
| | |
Cantor Fitzgerald & Co., Inc., 0.05%, dated 10/31/2021, due 11/1/2021, repurchase price $25,000,035, collateralized by various Mortgage-Backed Securities, ranging from 1.50% – 6.00%, maturing 7/1/2036 – 12/15/2062; total market value $34,306,918 | | | 25,000,000 | | | | 25,000,000 | |
| | | | | | | | |
| Investments | | Principal
Amount | | | Value | |
|
| REPURCHASE AGREEMENTS – (continued) | |
| | |
Citigroup Global Markets, Inc., 0.05%, dated 10/31/2021, due 11/1/2021, repurchase price $5,219,874, collateralized by various U.S. Treasury Securities, ranging from 0.75% – 4.63%, maturing 2/15/2040 – 2/15/2042; total market value $5,266,963 | | $ | 5,219,867 | | | $ | 5,219,867 | |
| | | | | 32,219,867 | |
Total Securities Lending Reinvestments
(Cost $32,219,867) | | | | | | | 32,219,867 | |
Total Investments – 100.4%
(Cost $2,305,735,938) | | | | 2,653,413,462 | |
| |
Liabilities in excess of other assets – (0.4%) | | | | (9,507,396 | ) |
| NET ASSETS – 100.0% | | | $ | 2,643,906,066 | |
| * | Non-income producing security. |
| ^ | Security subject to restrictions on resale. |
| (a) | The security or a portion of this security is on loan at October 31, 2021. The total value of securities on loan at October 31, 2021 was $170,013,630, collateralized in the form of cash with a value of $32,219,867 that was reinvested in the securities shown in the Securities Lending Reinvestment section of the Schedule of Investments; $132,749,716 of collateral in the form of U.S. Government Treasury Securities, interest rates ranging from 0.00% – 7.25%, and maturity dates ranging from November 4, 2021 – August 15, 2051 and $16,809,393 of collateral in the form of Foreign Government Fixed Income Securities, interest rates ranging from 0.00% – 8.50%, and maturity dates ranging from November 17, 2021 – June 30, 2120; a total value of $181,778,976. |
| (b) | Security exempt from registration pursuant to Regulation S under the Securities Act of 1933. Regulation S applies to securities offerings that are made outside of the United States and do not involve direct selling efforts in the United States and as such may have restrictions on resale. |
| (c) | Security fair valued as of October 31, 2021 in accordance with procedures approved by the Board of Trustees. Total value of all such securities at October 31, 2021 amounted to $0, which represents approximately 0.00% of net assets of the Fund. |
| (d) | Represents less than 0.05% of net assets. |
See Accompanying Notes to the Financial Statements.
| | | | |
| 318 | | FLEXSHARES ANNUAL REPORT | | |
FlexShares® STOXX® Global Broad Infrastructure Index Fund (cont.)
| (e) | The security was purchased with cash collateral held from securities on loan at October 31, 2021. The total value of securities purchased was $32,219,867. |
| ‡ | Value determined using significant unobservable inputs. |
Percentages shown are based on Net Assets.
Abbreviations
NVDR – Non-Voting Depositary Receipt
OYJ – Public Limited Company
PJSC – Public Joint Stock Company
Preference – A special type of equity investment that shares in the earnings of the company, has limited voting rights, and may have a dividend preference. Preference shares may also have liquidation preference.
As of October 31, 2021, the gross unrealized appreciation (depreciation) of investments based on the aggregate cost of investments (including derivative instruments, if applicable) for federal income tax purposes was as follows:
| | | | |
| | | | |
Aggregate gross unrealized appreciation | | $ | 424,617,819 | |
Aggregate gross unrealized depreciation | | | (92,786,811 | ) |
Net unrealized appreciation | | $ | 331,831,008 | |
Federal income tax cost | | $ | 2,321,768,573 | |
Futures Contracts
FlexShares® STOXX® Global Broad Infrastructure Index Fund had the following open futures contracts as of October 31, 2021:
| | | | | | | | | | | | | | | | | | | | |
| | | Number of
Contracts | | | Expiration
Date | | | Trading
Currency | | | Notional
Amount | | | Value and
Unrealized
Appreciation/
(Depreciation)* | |
Long Contracts | | | | | | | | | | | | | | | | | | | | |
EURO STOXX 50 Index | | | 1 | | | | 12/17/2021 | | | | EUR | | | $ | 49,033 | | | $ | 282 | |
FTSE 100 Index | | | 61 | | | | 12/17/2021 | | | | GBP | | | | 6,040,402 | | | | 152,453 | |
S&P 500 E-Mini Index | | | 30 | | | | 12/17/2021 | | | | USD | | | | 6,895,500 | | | | 227,361 | |
S&P/TSX 60 Index | | | 27 | | | | 12/16/2021 | | | | CAD | | | | 5,491,267 | | | | 120,533 | |
SPI 200 Index | | | 23 | | | | 12/16/2021 | | | | AUD | | | | 3,144,104 | | | | (42,352 | ) |
TOPIX Index | | | 13 | | | | 12/09/2021 | | | | JPY | | | | 2,271,651 | | | | (21,325 | ) |
| | | | | | | | | | | | | | | | | | | $ | 436,952 | |
| * | This amount represents the cumulative appreciation/depreciation on futures contracts. Current day’s variation margin is reported within the Statement of Assets and Liabilities for futures contracts. |
| | | | | | | | | | | | | | | | | | | | | | |
| Forward Foreign Currency Contracts | |
| FlexShares® STOXX® Global Broad Infrastructure Index Fund had the following outstanding contracts as of October 31, 2021: | |
|
| | |
| Contracts to Receive | | | | | Counterparty | | In Exchange For | | | Maturity Date | | | Unrealized
Appreciation/
(Depreciation) | |
USD | | | 7,053,810 | | | | | Toronto-Dominion Bank (The) | | EUR | | | 6,000,000 | | | | 12/15/2021 | | | $ | 102,915 | |
USD | | | 419,354 | | | | | Citibank NA | | HKD | | | 3,260,399 | | | | 12/15/2021 | | | | 178 | |
USD | | | 4,549,636 | | | | | Toronto-Dominion Bank (The) | | JPY | | | 500,000,000 | | | | 12/15/2021 | | | | 162,432 | |
Total unrealized appreciation | | | | | | | | | | | | $ | 265,525 | |
CAD | | | 8,850,000 | | | | | JPMorgan Chase Bank | | USD | | | 7,161,971 | | | | 12/15/2021 | | | $ | (21,759 | ) |
EUR | | | 2,520,000 | | | | | Bank of Montreal | | USD | | | 2,935,996 | | | | 12/15/2021 | | | | (16,620 | ) |
EUR | | | 5,340,130 | | | | | JPMorgan Chase Bank | | USD | | | 6,329,397 | | | | 12/15/2021 | | | | (142,950 | ) |
GBP | | | 328,747 | | | | | Morgan Stanley | | USD | | | 455,205 | | | | 12/15/2021 | | | | (4,502 | ) |
JPY | | | 361,346,439 | | | | | Toronto-Dominion Bank (The) | | USD | | | 3,292,790 | | | | 12/15/2021 | | | | (122,189 | ) |
USD | | | 1,799,065 | | | | | Morgan Stanley | | AUD | | | 2,432,839 | | | | 12/15/2021 | | | | (28,551 | ) |
USD | | | 823,653 | | | | | Citibank NA | | CAD | | | 1,044,184 | | | | 12/15/2021 | | | | (18,798 | ) |
USD | | | 5,487,558 | | | | | Toronto-Dominion Bank (The) | | CAD | | | 7,000,000 | | | | 12/15/2021 | | | | (160,068 | ) |
USD | | | 265,366 | | | | | JPMorgan Chase Bank | | CHF | | | 243,000 | | | | 12/15/2021 | | | | (921 | ) |
Total unrealized depreciation | | | | | | | | | | | | $ | (516,358 | ) |
Net unrealized depreciation | | | | | | | | | | | | $ | (250,833 | ) |
See Accompanying Notes to the Financial Statements.
| | | | | | |
| | FLEXSHARES ANNUAL REPORT | | | 319 | |
FlexShares® STOXX�� Global Broad Infrastructure Index Fund (cont.)
Abbreviations:
AUD – Australian Dollar
CAD – Canadian Dollar
CHF – Swiss Franc
EUR – Euro
GBP – British Pound
HKD – Hong Kong Dollar
JPY – Japanese Yen
USD – US Dollar
FlexShares® STOXX® Global Broad Infrastructure Index Fund invested, as a percentage of net assets, in companies domiciled in the following countries as of October 31, 2021:
| | | | |
Australia | | | 4.3 | % |
Austria | | | 0.1 | |
Belgium | | | 0.0 | † |
Brazil | | | 0.3 | |
Canada | | | 17.1 | |
Chile | | | 0.0 | † |
China | | | 0.9 | |
Denmark | | | 1.0 | |
Finland | | | 0.0 | † |
France | | | 3.2 | |
Germany | | | 6.6 | |
Greece | | | 0.1 | |
Hong Kong | | | 0.5 | |
India | | | 1.0 | |
Indonesia | | | 0.1 | |
Italy | | | 3.6 | |
Japan | | | 8.7 | |
Malaysia | | | 0.4 | |
Mexico | | | 0.6 | |
Netherlands | | | 0.2 | |
New Zealand | | | 0.5 | |
Philippines | | | 0.4 | |
Russia | | | 0.1 | |
Singapore | | | 0.1 | |
South Africa | | | 0.2 | |
South Korea | | | 0.0 | † |
Spain | | | 4.1 | |
Switzerland | | | 0.3 | |
Taiwan | | | 0.0 | † |
Thailand | | | 1.2 | |
United Kingdom | | | 4.5 | |
United States | | | 39.1 | |
Other1 | | | 0.8 | |
| | | | 100.0 | % |
| † | Amount represents less than 0.05%. |
| 1 | Includes any non-equity securities, securities lending reinvestments and net other assets (liabilities). |
| | | | |
| Security Type | | % of Net Assets | |
Common Stocks | | | 99.2 | % |
Securities Lending Reinvestments | | | 1.2 | |
Others(1) | | | (0.4 | ) |
| | | | 100.0 | % |
| (1) | Includes any other net assets/(liabilities). |
See Accompanying Notes to the Financial Statements.
| | | | |
| 320 | | FLEXSHARES ANNUAL REPORT | | |
Schedule of Investments
FlexShares® Global Quality Real Estate Index Fund
October 31, 2021
| | | | | | | | |
| Investments | | Shares | | | Value | |
|
| COMMON STOCKS – 98.9% | |
|
| Equity Real Estate Investment Trusts (REITs) – 80.8% | |
| | |
Acadia Realty Trust | | | 54,383 | | | $ | 1,162,709 | |
| | |
AEON REIT Investment Corp. | | | 833 | | | | 1,125,034 | |
| | |
alstria office REIT-AG | | | 78,421 | | | | 1,466,564 | |
| | |
American Homes 4 Rent, Class A | | | 136,612 | | | | 5,546,447 | |
| | |
American Tower Corp. | | | 45,934 | | | | 12,952,010 | |
| | |
Argosy Property Ltd. | | | 910,173 | | | | 1,016,130 | |
| | |
AvalonBay Communities, Inc. | | | 68,187 | | | | 16,138,499 | |
| | |
Befimmo SA | | | 21,182 | | | | 867,756 | |
| | |
Big Yellow Group plc | | | 83,895 | | | | 1,700,836 | |
| | |
Brandywine Realty Trust | | | 86,632 | | | | 1,147,874 | |
| | |
Brixmor Property Group, Inc. | | | 144,942 | | | | 3,397,440 | |
| | |
BWP Trust | | | 316,183 | | | | 1,006,937 | |
| | |
Camden Property Trust | | | 37,247 | | | | 6,074,986 | |
| | |
Canadian Apartment Properties REIT(a) | | | 39,032 | | | | 1,902,871 | |
| | |
Centerspace | | | 10,115 | | | | 1,024,043 | |
| | |
Charter Hall Group | | | 226,814 | | | | 2,952,339 | |
| | |
Columbia Property Trust, Inc. | | | 62,118 | | | | 1,190,802 | |
| | |
Cousins Properties, Inc.(a) | | | 72,114 | | | | 2,856,436 | |
| | |
Covivio | | | 7,259 | | | | 628,356 | |
| | |
Crombie REIT(a) | | | 63,546 | | | | 947,384 | |
| | |
Cromwell European REIT(b) | | | 47,600 | | | | 145,975 | |
| | |
Crown Castle International Corp. | | | 29,274 | | | | 5,278,102 | |
| | |
CT REIT(a) | | | 65,212 | | | | 933,817 | |
| | |
Daiwa Office Investment Corp. | | | 164 | | | | 1,057,137 | |
| | |
Dexus | | | 14,756 | | | | 120,475 | |
| | |
Dream Industrial REIT(a) | | | 79,135 | | | | 1,082,117 | |
| | |
Dream Office REIT(a) | | | 46,886 | | | | 883,214 | |
| | |
EastGroup Properties, Inc. | | | 19,278 | | | | 3,812,803 | |
| | |
Empire State Realty Trust, Inc., Class A(a) | | | 104,720 | | | | 1,013,690 | |
| | |
Equinix, Inc.(a) | | | 4,879 | | | | 4,084,065 | |
| | |
Equity Commonwealth | | | 60,095 | | | | 1,558,263 | |
| | |
Equity Residential | | | 173,859 | | | | 15,021,418 | |
| | |
Essex Property Trust, Inc. | | | 31,773 | | | | 10,800,596 | |
| | |
Eurocommercial Properties NV | | | 38,675 | | | | 903,637 | |
| | |
Extra Space Storage, Inc. | | | 65,331 | | | | 12,894,379 | |
| | |
First Capital REIT(a) | | | 68,544 | | | | 977,660 | |
| | |
First Industrial Realty Trust, Inc. | | | 63,070 | | | | 3,672,566 | |
| | | | | | | | |
| Investments | | Shares | | | Value | |
|
| Equity Real Estate Investment Trusts (REITs) – (continued) | |
| | |
Frasers Logistics & Commercial Trust(b) | | | 1,201,900 | | | $ | 1,354,756 | |
| | |
Frontier Real Estate Investment Corp.(a) | | | 271 | | | | 1,197,843 | |
| | |
Fukuoka REIT Corp. | | | 595 | | | | 882,390 | |
| | |
GCP Student Living plc | | | 379,848 | | | | 1,096,024 | |
| | |
Gecina SA | | | 22,491 | | | | 3,150,654 | |
| | |
GEO Group, Inc. (The)(a) | | | 79,730 | | | | 652,191 | |
| | |
Goodman Group | | | 658,546 | | | | 10,832,482 | |
| | |
Goodman Property Trust | | | 635,460 | | | | 1,130,096 | |
| | |
Granite REIT(a) | | | 16,184 | | | | 1,309,813 | |
| | |
Growthpoint Properties Australia Ltd. | | | 318,801 | | | | 993,723 | |
| | |
Healthpeak Properties, Inc. | | | 263,347 | | | | 9,351,452 | |
| | |
Heiwa Real Estate REIT, Inc. | | | 595 | | | | 830,208 | |
| | |
Highwoods Properties, Inc. | | | 50,932 | | | | 2,283,791 | |
| | |
Hoshino Resorts REIT, Inc.(a) | | | 161 | | | | 1,049,094 | |
| | |
Ichigo Office REIT Investment Corp.(a) | | | 1,190 | | | | 900,653 | |
| | |
Industrial Logistics Properties Trust | | | 39,865 | | | | 1,119,808 | |
| | |
InterRent REIT(a) | | | 74,494 | | | | 1,089,570 | |
| | |
Iron Mountain, Inc. | | | 141,134 | | | | 6,441,356 | |
| | |
Japan Excellent, Inc.(a) | | | 714 | | | | 862,248 | |
| | |
Japan Logistics Fund, Inc. | | | 398 | | | | 1,188,502 | |
| | |
Japan Metropolitan Fund Invest | | | 2,618 | | | | 2,399,307 | |
| | |
Kenedix Office Investment Corp.(a) | | | 191 | | | | 1,207,726 | |
| | |
Kenedix Retail REIT Corp. | | | 357 | | | | 909,837 | |
| | |
Killam Apartment REIT(a) | | | 55,573 | | | | 1,019,507 | |
| | |
Kilroy Realty Corp. | | | 51,289 | | | | 3,455,853 | |
| | |
Kimco Realty Corp. | | | 1,002 | | | | 22,656 | |
| | |
Kimco Realty Corp. | | | 211,413 | | | | 4,777,923 | |
| | |
Kite Realty Group Trust(a) | | | 149,227 | | | | 3,029,300 | |
| | |
Lamar Advertising Co., Class A | | | 23,800 | | | | 2,694,160 | |
| | |
Lexington Realty Trust(a) | | | 134,946 | | | | 1,966,163 | |
| | |
Life Storage, Inc. | | | 35,462 | | | | 4,745,170 | |
| | |
Macerich Co. (The)(a) | | | 71,876 | | | | 1,300,237 | |
| | |
Mack-Cali Realty Corp.* | | | 58,786 | | | | 1,069,317 | |
| | |
Mercialys SA | | | 82,705 | | | | 897,285 | |
| | |
Mid-America Apartment Communities, Inc. | | | 56,168 | | | | 11,470,067 | |
| | |
Mirvac Group | | | 1,921,731 | | | | 4,070,422 | |
See Accompanying Notes to the Financial Statements.
| | | | | | |
| | FLEXSHARES ANNUAL REPORT | | | 321 | |
FlexShares® Global Quality Real Estate Index Fund (cont.)
| | | | | | | | |
| Investments | | Shares | | | Value | |
|
| COMMON STOCKS – (continued) | |
|
| Equity Real Estate Investment Trusts (REITs) – (continued) | |
| | |
Monmouth Real Estate Investment Corp. | | | 54,145 | | | $ | 1,020,633 | |
| | |
Mori Trust Sogo Reit, Inc.(a) | | | 595 | | | | 767,590 | |
| | |
NorthWest Healthcare Properties REIT(a) | | | 80,801 | | | | 865,667 | |
| | |
NTT UD REIT Investment Corp.(a) | | | 714 | | | | 948,034 | |
| | |
Office Properties Income Trust | | | 36,295 | | | | 929,878 | |
| | |
Paramount Group, Inc. | | | 102,102 | | | | 865,825 | |
| | |
Park Hotels & Resorts, Inc.* | | | 89,131 | | | | 1,651,597 | |
| | |
Parkway Life REIT | | | 297,500 | | | | 1,028,068 | |
| | |
Piedmont Office Realty Trust, Inc., Class A | | | 65,450 | | | | 1,162,392 | |
| | |
PotlatchDeltic Corp. | | | 32,844 | | | | 1,716,756 | |
| | |
Prologis, Inc. | | | 212,415 | | | | 30,791,679 | |
| | |
PS Business Parks, Inc. | | | 10,472 | | | | 1,860,874 | |
| | |
Public Storage | | | 63,665 | | | | 21,148,240 | |
| | |
Retail Opportunity Investments Corp. | | | 62,356 | | | | 1,108,066 | |
| | |
RPT Realty | | | 79,968 | | | | 1,062,775 | |
| | |
Safestore Holdings plc(a) | | | 100,079 | | | | 1,648,943 | |
| | |
Saul Centers, Inc.(a) | | | 19,873 | | | | 922,107 | |
| | |
Simon Property Group, Inc. | | | 109,004 | | | | 15,977,806 | |
| | |
SITE Centers Corp. | | | 80,682 | | | | 1,282,037 | |
| | |
SL Green Realty Corp. | | | 34,986 | | | | 2,451,469 | |
| | |
Summit Industrial Income REIT(a) | | | 66,640 | | | | 1,270,921 | |
| | |
Tanger Factory Outlet Centers, Inc.(a) | | | 66,759 | | | | 1,121,551 | |
| | |
Tritax Big Box REIT plc | | | 530,859 | | | | 1,637,269 | |
| | |
Urban Edge Properties | | | 60,452 | | | | 1,059,724 | |
| | |
VICI Properties, Inc.(a) | | | 262,633 | | | | 7,708,279 | |
| | |
Waypoint REIT(a) | | | 467,313 | | | | 958,227 | |
| | |
Weyerhaeuser Co. | | | 366,639 | | | | 13,096,345 | |
| | | | | | | | 338,159,703 | |
|
| Household Durables – 0.4% | |
| | |
Iida Group Holdings Co. Ltd. | | | 71,400 | | | | 1,755,178 | |
|
| Real Estate Management & Development – 17.7% | |
| | |
AFI Properties Ltd.* | | | 19,754 | | | | 1,026,231 | |
| | |
Airport City Ltd.* | | | 56,049 | | | | 1,070,255 | |
| | |
Aroundtown SA | | | 181,305 | | | | 1,260,989 | |
| | |
Ascendas India Trust | | | 821,100 | | | | 846,369 | |
| | | | | | | | |
| Investments | | Shares | | | Value | |
|
| Real Estate Management & Development – (continued) | |
| | |
Atrium Ljungberg AB, Class B | | | 40,103 | | | $ | 920,802 | |
| | |
Bukit Sembawang Estates Ltd. | | | 11,900 | | | | 46,153 | |
| | |
CA Immobilien Anlagen AG | | | 24,990 | | | | 1,070,028 | |
| | |
Castellum AB(a) | | | 113,288 | | | | 3,012,747 | |
| | |
CK Asset Holdings Ltd. | | | 952,000 | | | | 5,880,358 | |
| | |
CLS Holdings plc | | | 239,547 | | | | 735,524 | |
| | |
Daibiru Corp.(a) | | | 71,400 | | | | 988,736 | |
| | |
Daito Trust Construction Co. Ltd.(a) | | | 31,500 | | | | 3,900,724 | |
| | |
Deutsche Wohnen SE* (c) | | | 149,034 | | | | 9,140,889 | |
| | |
Dios Fastigheter AB | | | 83,062 | | | | 966,647 | |
| | |
DREAM Unlimited Corp., Class A | | | 46,053 | | | | 1,148,028 | |
| | |
Entra ASA(a) (b) | | | 60,690 | | | | 1,512,354 | |
| | |
Fabege AB | | | 126,854 | | | | 2,144,635 | |
| | |
Heiwa Real Estate Co. Ltd. | | | 23,800 | | | | 749,327 | |
| | |
Helical plc | | | 19,754 | | | | 124,558 | |
| | |
Henderson Land Development Co. Ltd. | | | 714,000 | | | | 2,992,191 | |
| | |
Kennedy-Wilson Holdings, Inc. | | | 60,690 | | | | 1,357,635 | |
| | |
Kerry Properties Ltd. | | | 297,500 | | | | 839,450 | |
| | |
Kojamo OYJ | | | 60,571 | | | | 1,354,952 | |
| | |
Kungsleden AB(a) | | | 87,108 | | | | 1,196,803 | |
| | |
Mivne Real Estate KD Ltd. | | | 361,879 | | | | 1,320,571 | |
| | |
Nomura Real Estate Holdings, Inc. | | | 59,500 | | | | 1,444,907 | |
| | |
Platzer Fastigheter Holding AB, Class B | | | 54,026 | | | | 880,671 | |
| | |
Realogy Holdings Corp.* | | | 68,782 | | | | 1,191,304 | |
| | |
Sirius Real Estate Ltd.(a) | | | 637,483 | | | | 1,181,418 | |
| | |
St Joe Co. (The) | | | 18,564 | | | | 872,879 | |
| | |
Sumitomo Realty & Development Co. Ltd. | | | 147,800 | | | | 5,327,411 | |
| | |
Sun Hung Kai Properties Ltd. | | | 621,000 | | | | 8,262,384 | |
| | |
Swire Properties Ltd. | | | 380,800 | | | | 1,020,649 | |
| | |
TAG Immobilien AG | | | 71,162 | | | | 2,164,216 | |
| | |
Tokyo Tatemono Co. Ltd. | | | 95,200 | | | | 1,394,291 | |
| | |
Tricon Residential, Inc.(a) | | | 100,198 | | | | 1,455,823 | |
| | |
VGP NV | | | 4,641 | | | | 1,203,059 | |
| | |
Wihlborgs Fastigheter AB | | | 67,116 | | | | 1,587,934 | |
| | |
Yanlord Land Group Ltd. | | | 916,300 | | | | 761,035 | |
| | | | | | | | 74,354,937 | |
Total Common Stocks
(Cost $341,555,980) | | | | 414,269,818 | |
See Accompanying Notes to the Financial Statements.
| | | | |
| 322 | | FLEXSHARES ANNUAL REPORT | | |
FlexShares® Global Quality Real Estate Index Fund (cont.)
| | | | | | | | |
| Investments | | Principal
Amount | | | Value | |
|
| SECURITIES LENDING REINVESTMENTS(d) – 2.7% | |
|
| REPURCHASE AGREEMENTS – 2.7% | |
| | |
Cantor Fitzgerald & Co., Inc., 0.05%, dated 10/31/2021, due 11/1/2021, repurchase price $3,000,004, collateralized by various Mortgage-Backed Securities, ranging from 1.50% – 6.00%, maturing 7/1/2036 –12/15/2062; total market value $4,116,830 | | $ | 3,000,000 | | | $ | 3,000,000 | |
| | |
Citigroup Global Markets, Inc., 0.05%, dated 10/31/2021, due 11/1/2021, repurchase price $8,192,502, collateralized by various U.S. Treasury Securities, ranging from 0.75% – 4.63%, maturing 2/15/2040 – 2/15/2042; total market value $8,266,407 | | | 8,192,491 | | | | 8,192,491 | |
| | | | | 11,192,491 | |
Total Securities Lending Reinvestments
(Cost $11,192,491) | | | | 11,192,491 | |
Total Investments – 101.6%
(Cost $352,748,471) | | | | 425,462,309 | |
| |
Liabilities in excess of other assets – (1.6%) | | | | (6,864,926 | ) |
| Net Assets – 100.0% | | | $ | 418,597,383 | |
| * | Non-income producing security. |
| (a) | The security or a portion of this security is on loan at October 31, 2021. The total value of securities on loan at October 31, 2021 was $35,762,241, collateralized in the form of cash with a value of $11,192,491 that was reinvested in the securities shown in the Securities Lending Reinvestment section of the Schedule of Investments; $15,024,065 of collateral in the form of U.S. Government Treasury Securities, interest rates ranging from 0.00% – 7.25%, and maturity dates ranging from November 23, 2021 – February 15, 2051 and $12,477,085 of collateral in the form of Foreign Government Fixed Income Securities, interest rates ranging from 0.00% – 8.50%, and maturity dates ranging from November 17, 2021 – June 30, 2120; a total value of $38,693,641. |
| (b) | Security exempt from registration pursuant to Regulation S under the Securities Act of 1933. Regulation S applies to securities offerings that are made outside of the United States and do not involve direct selling efforts in the United States and as such may have restrictions on resale. |
| (c) | Security fair valued as of October 31, 2021 in accordance with procedures approved by the Board of Trustees. Total value of all such securities at October 31, 2021 amounted to $9,140,889, which represents approximately 2.18% of net assets of the Fund. |
| (d) | The security was purchased with cash collateral held from securities on loan at October 31, 2021. The total value of securities purchased was $11,192,491. |
Percentages shown are based on Net Assets.
Abbreviations
OYJ – Public Limited Company
As of October 31, 2021, the gross unrealized appreciation (depreciation) of investments based on the aggregate cost of investments (including derivative instruments, if applicable) for federal income tax purposes was as follows:
| | | | |
| | | | |
Aggregate gross unrealized appreciation | | $ | 73,930,237 | |
Aggregate gross unrealized depreciation | | | (4,830,810 | ) |
Net unrealized appreciation | | $ | 69,099,427 | |
Federal income tax cost | | $ | 356,479,672 | |
See Accompanying Notes to the Financial Statements.
| | | | | | |
| | FLEXSHARES ANNUAL REPORT | | | 323 | |
FlexShares® Global Quality Real Estate Index Fund (cont.)
Futures Contracts
FlexShares® Global Quality Real Estate Index Fund had the following open futures contracts as of October 31, 2021:
| | | | | | | | | | | | | | | | | | | | |
| | | Number of
Contracts | | | Expiration
Date | | | Trading
Currency | | | Notional
Amount | | | Value and
Unrealized
Appreciation/
(Depreciation)* | |
Long Contracts | | | | | |
EURO STOXX 50 Index | | | 9 | | | | 12/17/2021 | | | | EUR | | | $ | 441,294 | | | $ | 3,142 | |
S&P Midcap 400 E-Mini Index | | | 33 | | | | 12/17/2021 | | | | USD | | | | 9,205,020 | | | | 131,398 | |
SPI 200 Index | | | 29 | | | | 12/16/2021 | | | | AUD | | | | 3,964,306 | | | | (11,822 | ) |
| | | | | | | | | | | | | | | | | | | $ | 122,718 | |
| * | This amount represents the cumulative appreciation/depreciation on futures contracts. Current day’s variation margin is reported within the Statement of Assets and Liabilities for futures contracts. |
Forward Foreign Currency Contracts
FlexShares® Global Quality Real Estate Index Fund had the following outstanding contracts as of October 31, 2021:
| | | | | | | | | | | | | | | | | | | | | | |
| Contracts to Receive | | Counterparty | | In Exchange For | | | Maturity Date | | | Unrealized
Appreciation/
(Depreciation) | |
AUD | | | 674,104 | | | | | Goldman Sachs & Co. | | USD | | | 506,397 | | | | 12/15/2021 | | | $ | 9 | |
CAD | | | 743,625 | | | | | Goldman Sachs & Co. | | USD | | | 599,910 | | | | 12/15/2021 | | | | 49 | |
GBP | | | 228,560 | | | | | Goldman Sachs & Co. | | USD | | | 313,288 | | | | 12/15/2021 | | | | 61 | |
ILS | | | 385,426 | | | | | Goldman Sachs & Co. | | USD | | | 122,126 | | | | 12/15/2021 | | | | 2 | |
JPY | | | 131,318,092 | | | | | Goldman Sachs & Co. | | USD | | | 1,151,996 | | | | 12/15/2021 | | | | 243 | |
SEK | | | 2,739,649 | | | | | Goldman Sachs & Co. | | USD | | | 319,103 | | | | 12/15/2021 | | | | 87 | |
SEK | | | 968,851 | | | | | Morgan Stanley | | USD | | | 112,630 | | | | 12/15/2021 | | | | 249 | |
USD | | | 65,994 | | | | | Bank of Montreal | | CAD | | | 81,495 | | | | 12/15/2021 | | | | 244 | |
USD | | | 147,952 | | | | | Morgan Stanley | | GBP | | | 106,850 | | | | 12/15/2021 | | | | 1,463 | |
USD | | | 33,740 | | | | | Citibank NA | | HKD | | | 262,326 | | | | 12/15/2021 | | | | 14 | |
USD | | | 261,917 | | | | | Bank of Montreal | | JPY | | | 29,693,553 | | | | 12/15/2021 | | | | 1,373 | |
USD | | | 2,759 | | | | | Toronto-Dominion Bank (The) | | JPY | | | 302,807 | | | | 12/15/2021 | | | | 103 | |
USD | | | 184,449 | | | | | UBS AG | | NOK | | | 1,537,310 | | | | 12/15/2021 | | | | 2,779 | |
USD | | | 104,646 | | | | | Bank of New York | | NZD | | | 145,356 | | | | 12/15/2021 | | | | 692 | |
USD | | | 176,346 | | | | | Bank of Montreal | | SEK | | | 1,505,729 | | | | 12/15/2021 | | | | 917 | |
USD | | | 38,180 | | | | | Goldman Sachs & Co. | | SGD | | | 51,495 | | | | 12/15/2021 | | | | — | |
Total unrealized appreciation | | | | | | | $ | 8,285 | |
AUD | | | 262,333 | | | | | Bank of New York | | USD | | | 197,855 | | | | 12/15/2021 | | | $ | (783 | ) |
EUR | | | 121,202 | | | | | JPMorgan Chase Bank | | USD | | | 142,512 | | | | 12/15/2021 | | | | (2,102 | ) |
HKD | | | 5,520,817 | | | | | Goldman Sachs & Co. | | USD | | | 709,804 | | | | 12/15/2021 | | | | (16 | ) |
HKD | | | 1,846,539 | | | | | JPMorgan Chase Bank | | USD | | | 237,454 | | | | 12/15/2021 | | | | (52 | ) |
NOK | | | 1,162,537 | | | | | Goldman Sachs & Co. | | USD | | | 137,389 | | | | 12/15/2021 | | | | (7 | ) |
NZD | | | 113,758 | | | | | Goldman Sachs & Co. | | USD | | | 81,357 | | | | 12/15/2021 | | | | (2 | ) |
SGD | | | 52,965 | | | | | Toronto-Dominion Bank (The) | | USD | | | 39,347 | | | | 12/15/2021 | | | | (78 | ) |
USD | | | 130,965 | | | | | Morgan Stanley | | AUD | | | 177,101 | | | | 12/15/2021 | | | | (2,078 | ) |
USD | | | 254,805 | | | | | Citibank NA | | CAD | | | 323,029 | | | | 12/15/2021 | | | | (5,816 | ) |
USD | | | 139,097 | | | | | JPMorgan Chase Bank | | CHF | | | 127,373 | | | | 12/15/2021 | | | | (483 | ) |
USD | | | 8,933,578 | | | | | Goldman Sachs & Co. | | EUR | | | 7,713,382 | | | | 12/15/2021 | | | | (2,241 | ) |
USD | | | 157,013 | | | | | JPMorgan Chase Bank | | ILS | | | 497,272 | | | | 12/15/2021 | | | | (555 | ) |
Total unrealized depreciation | | | | | | | $ | (14,213 | ) |
Net unrealized depreciation | | | | | | | $ | (5,928 | ) |
See Accompanying Notes to the Financial Statements.
| | | | |
| 324 | | FLEXSHARES ANNUAL REPORT | | |
FlexShares® Global Quality Real Estate Index Fund (cont.)
Abbreviations:
AUD – Australian Dollar
CAD – Canadian Dollar
CHF – Swiss Franc
EUR – Euro
GBP – British Pound
HKD – Hong Kong Dollar
ILS – Israeli Shekel
JPY – Japanese Yen
NOK – Norwegian Krone
NZD – New Zealand Dollar
SEK – Swedish Krona
SGD – Singapore Dollar
USD – US Dollar
FlexShares® Global Quality Real Estate Index Fund invested, as a percentage of net assets, in companies domiciled in the following countries as of October 31, 2021:
| | | | |
Australia | | | 5.0 | % |
Austria | | | 0.3 | |
Belgium | | | 0.5 | |
Canada | | | 3.6 | |
Finland | | | 0.3 | |
France | | | 1.1 | |
Germany | | | 3.3 | |
Hong Kong | | | 4.5 | |
Israel | | | 0.8 | |
Japan | | | 7.4 | |
Netherlands | | | 0.2 | |
New Zealand | | | 0.5 | |
Norway | | | 0.4 | |
Singapore | | | 1.0 | |
Sweden | | | 2.6 | |
United Kingdom | | | 1.9 | |
United States | | | 65.5 | |
Other1 | | | 1.1 | |
| | | | 100.0 | % |
| 1 | Includes any non-equity securities, securities lending reinvestments and net other assets (liabilities). |
| | | | |
| Security Type | | % of Net Assets | |
Common Stocks | | | 98.9 | % |
Securities Lending Reinvestments | | | 2.7 | |
Others(1) | | | (1.6 | ) |
| | | | 100.0 | % |
| (1) | Includes any other net assets/(liabilities). |
See Accompanying Notes to the Financial Statements.
| | | | | | |
| | FLEXSHARES ANNUAL REPORT | | | 325 | |
Schedule of Investments
FlexShares® Real Assets Allocation Index Fund
October 31, 2021
| | | | | | | | |
| Investments | | Shares | | | Value | |
|
| EXCHANGE TRADED FUNDS – 100.0% | |
| | |
FlexShares® Global Quality Real Estate Index Fund(a) | | | 125,820 | | | $ | 8,892,328 | |
| | |
FlexShares® Global Upstream Natural Resources Index Fund(a) | | | 161,064 | | | | 6,247,673 | |
| | |
FlexShares® STOXX® Global Broad Infrastructure Index Fund(a) | | | 262,440 | | | | 15,150,662 | |
Total Exchange Traded Funds
(Cost $29,129,334) | | | | 30,290,663 | |
| | | | | | | | | |
Total Investments – 100.0%
(Cost $29,129,334) | | | | 30,290,663 | |
| |
Other assets less liabilities – 0.0% | | | | 9,023 | |
| NET ASSETS – 100.0% | | | $ | 30,299,686 | |
| (a) | Investment in affiliated Fund. Northern Trust Investments, Inc. is the Investment Adviser to both the Fund and the affiliated Funds. |
| (b) | Represents less than 0.05% of net assets. |
Percentages shown are based on Net Assets.
As of October 31, 2021, the gross unrealized appreciation (depreciation) of investments based on the aggregate cost of investments (including derivative instruments, if applicable) for federal income tax purposes was as follows:
| | | | |
| | | | |
Aggregate gross unrealized appreciation | | $ | 1,143,210 | |
Aggregate gross unrealized depreciation | | | — | |
Net unrealized appreciation | | $ | 1,143,210 | |
Federal income tax cost | | $ | 29,147,453 | |
The underlying index of the FlexShares® Real Assets Allocation Index Fund is comprised of securities of affiliated FlexShares® Funds. The Schedules of Investments of the affiliated FlexShares® Funds are located elsewhere in this Report.
Investment in a company which was affiliated for the period ended October 31, 2021, was as follows:
| | | | | | | | | | | | | | | | | | | | | | | | | | | | | | | | |
| Security | | Value
October 31,
2020 | | | Purchases at
Cost | | | Sales
Proceeds | | | Shares
October 31,
2021 | | | Value
October 31,
2021 | | | Change in
Unrealized
Appreciation
(Depreciation) | | | Dividend
Income | | | Realized
Gain | |
FlexShares® Global Quality Real Estate Index Fund | | $ | 917,016 | | | $ | 8,178,765 | | | $ | 729,728 | | | | 125,820 | | | $ | 8,892,328 | | | $ | 503,542 | | | $ | 29,163 | | | $ | 22,733 | |
FlexShares® Global Upstream Natural Resources Index Fund | | | 1,335,592 | | | | 9,647,616 | | | | 5,572,005 | | | | 161,064 | | | | 6,247,673 | | | | 689,626 | | | | 206,150 | | | | 146,844 | |
FlexShares® STOXX® Global Broad Infrastructure Index Fund | | | 2,249,624 | | | | 13,093,546 | | | | 615,008 | | | | 262,440 | | | | 15,150,662 | | | | 358,090 | | | | 162,516 | | | | 64,410 | |
| | | $ | 4,502,232 | | | $ | 30,919,927 | | | $ | 6,916,741 | | | | 549,324 | | | $ | 30,290,663 | | | $ | 1,551,258 | | | $ | 397,829 | | | $ | 233,987 | |
| | | | |
| Security Type | | % of Net Assets | |
Exchange Traded Funds | | | 100.0 | % |
Others(1) | | | 0.0 | † |
| | | | 100.0 | % |
| (1) | Includes any other net assets/(liabilities). |
| † | Amount represents less than 0.05%. |
See Accompanying Notes to the Financial Statements.
| | | | |
| 326 | | FLEXSHARES ANNUAL REPORT | | |
Schedule of Investments
FlexShares® Quality Dividend Index Fund
October 31, 2021
| | | | | | | | |
| Investments | | Shares | | | Value | |
|
| COMMON STOCKS – 99.4% | |
|
| Aerospace & Defense – 0.5% | |
| | |
Lockheed Martin Corp. | | | 23,083 | | | $ | 7,670,943 | |
|
| Auto Components – 0.5% | |
| | |
Gentex Corp.(a) | | | 213,377 | | | | 7,551,412 | |
|
| Banks – 4.0% | |
| | |
Bank of America Corp. | | | 79,946 | | | | 3,819,820 | |
| | |
First Citizens BancShares, Inc., Class A(a) | | | 1,126 | | | | 916,451 | |
| | |
JPMorgan Chase & Co. | | | 360,320 | | | | 61,214,765 | |
| | |
Zions Bancorp NA | | | 6,193 | | | | 390,097 | |
| | | | | | | | 66,341,133 | |
|
| Beverages – 0.1% | |
| | |
Coca-Cola Co. (The) | | | 14,075 | | | | 793,408 | |
| | |
PepsiCo, Inc. | | | 2,252 | | | | 363,923 | |
| | | | | | | | 1,157,331 | |
|
| Biotechnology – 1.3% | |
| | |
AbbVie, Inc. | | | 2,815 | | | | 322,796 | |
| | |
Amgen, Inc. | | | 105,844 | | | | 21,906,533 | |
| | | | | | | | 22,229,329 | |
|
| Building Products – 1.1% | |
| | |
A O Smith Corp.(a) | | | 118,793 | | | | 8,680,205 | |
| | |
Trane Technologies plc | | | 50,107 | | | | 9,065,859 | |
| | | | | | | | 17,746,064 | |
|
| Capital Markets – 3.4% | |
| | |
Blackstone, Inc., Class A | | | 127,238 | | | | 17,612,284 | |
| | |
Lazard Ltd., Class A | | | 153,136 | | | | 7,502,133 | |
| | |
Moody’s Corp. | | | 17,453 | | | | 7,053,630 | |
| | |
StepStone Group, Inc., Class A | | | 106,407 | | | | 4,999,001 | |
| | |
Stifel Financial Corp.(a) | | | 119,356 | | | | 8,697,472 | |
| | |
T. Rowe Price Group, Inc. | | | 45,603 | | | | 9,890,378 | |
| | | | | | | | 55,754,898 | |
|
| Chemicals – 1.8% | |
| | |
Eastman Chemical Co.(a) | | | 67,560 | | | | 7,028,267 | |
| | |
Olin Corp. | | | 189,731 | | | | 10,810,872 | |
| | | | | | | | |
| Investments | | Shares | | | Value | |
|
| Chemicals – (continued) | |
| | |
Sherwin-Williams Co. (The) | | | 37,721 | | | $ | 11,942,846 | |
| | | | | | | | 29,781,985 | |
|
| Commercial Services & Supplies – 0.6% | |
| | |
Cintas Corp. | | | 6,193 | | | | 2,682,188 | |
| | |
Rollins, Inc.(a) | | | 206,058 | | | | 7,259,424 | |
| | | | | | | | 9,941,612 | |
|
| Communications Equipment – 2.6% | |
| | |
Cisco Systems, Inc. | | | 776,377 | | | | 43,453,821 | |
|
| Consumer Finance – 2.0% | |
| | |
Ally Financial, Inc. | | | 170,589 | | | | 8,143,919 | |
| | |
Discover Financial Services | | | 74,879 | | | | 8,485,288 | |
| | |
OneMain Holdings, Inc.(a) | | | 148,069 | | | | 7,819,524 | |
| | |
Synchrony Financial | | | 184,101 | | | | 8,551,491 | |
| | | | | | | | 33,000,222 | |
|
| Containers & Packaging – 0.4% | |
| | |
International Paper Co. | | | 138,498 | | | | 6,879,196 | |
|
| Diversified Consumer Services – 0.4% | |
| | |
H&R Block, Inc. | | | 323,725 | | | | 7,468,336 | |
|
| Diversified Telecommunication Services – 1.9% | |
| | |
AT&T, Inc. | | | 547,799 | | | | 13,837,403 | |
| | |
Lumen Technologies, Inc.(a) | | | 176,219 | | | | 2,089,957 | |
| | |
Verizon Communications, Inc. | | | 297,264 | | | | 15,752,019 | |
| | | | | | | | 31,679,379 | |
|
| Electric Utilities – 1.0% | |
| | |
IDACORP, Inc.(a) | | | 42,225 | | | | 4,404,912 | |
| | |
Southern Co. (The) | | | 194,798 | | | | 12,139,811 | |
| | | | | | | | 16,544,723 | |
|
| Entertainment – 0.7% | |
| | |
Activision Blizzard, Inc. | | | 143,002 | | | | 11,181,326 | |
|
| Equity Real Estate Investment Trusts (REITs) – 2.9% | |
| | |
AvalonBay Communities, Inc. | | | 41,099 | | | | 9,727,311 | |
| | |
Extra Space Storage, Inc. | | | 50,670 | | | | 10,000,738 | |
| | |
Highwoods Properties, Inc. | | | 180,723 | | | | 8,103,619 | |
| | |
Public Storage | | | 30,402 | | | | 10,098,937 | |
See Accompanying Notes to the Financial Statements.
| | | | | | |
| | FLEXSHARES ANNUAL REPORT | | | 327 | |
FlexShares® Quality Dividend Index Fund (cont.)
| | | | | | | | |
| Investments | | Shares | | | Value | |
|
| COMMON STOCKS – (continued) | |
|
| Equity Real Estate Investment Trusts (REITs) – (continued) | |
| | |
SL Green Realty Corp. | | | 11,260 | | | $ | 788,988 | |
| | |
Weyerhaeuser Co. | | | 239,838 | | | | 8,567,013 | |
| | | | | | | | 47,286,606 | |
|
| Food & Staples Retailing – 1.9% | |
| | |
Walmart, Inc. | | | 204,932 | | | | 30,620,939 | |
|
| Health Care Equipment & Supplies – 1.5% | |
| | |
Abbott Laboratories | | | 126,112 | | | | 16,254,575 | |
| | |
ResMed, Inc. | | | 33,780 | | | | 8,881,100 | |
| | | | | | | | 25,135,675 | |
|
| Health Care Providers & Services – 1.9% | |
| | |
Cardinal Health, Inc. | | | 150,884 | | | | 7,213,764 | |
| | |
Chemed Corp. | | | 13,512 | | | | 6,516,162 | |
| | |
McKesson Corp. | | | 45,603 | | | | 9,479,951 | |
| | |
UnitedHealth Group, Inc. | | | 16,327 | | | | 7,518,094 | |
| | | | | | | | 30,727,971 | |
|
| Health Care Technology – 0.5% | |
| | |
Cerner Corp. | | | 100,777 | | | | 7,486,723 | |
|
| Hotels, Restaurants & Leisure – 0.6% | |
| | |
Domino’s Pizza, Inc. | | | 3,941 | | | | 1,927,031 | |
| | |
Wingstop, Inc.(a) | | | 45,040 | | | | 7,768,049 | |
| | | | | | | | 9,695,080 | |
|
| Household Durables – 0.3% | |
| | |
Tempur Sealy International, Inc. | | | 127,801 | | | | 5,683,310 | |
|
| Household Products – 3.3% | |
| | |
Clorox Co. (The) | | | 5,630 | | | | 917,747 | |
| | |
Colgate-Palmolive Co. | | | 33,217 | | | | 2,530,803 | |
| | |
Procter & Gamble Co. (The) | | | 360,883 | | | | 51,602,660 | |
| | | | | | | | 55,051,210 | |
|
Independent Power and Renewable Electricity
Producers – 0.3% | |
| | |
AES Corp. (The) | | | 182,975 | | | | 4,598,162 | |
|
| Industrial Conglomerates – 1.2% | |
| | |
3M Co. | | | 106,407 | | | | 19,012,803 | |
| | | | | | | | |
| Investments | | Shares | | | Value | |
|
| Insurance – 3.8% | |
| | |
Aflac, Inc. | | | 166,648 | | | $ | 8,943,998 | |
| | |
Allstate Corp. (The) | | | 69,812 | | | | 8,633,650 | |
| | |
American Financial Group, Inc. | | | 62,493 | | | | 8,501,548 | |
| | |
Aon plc, Class A | | | 27,587 | | | | 8,825,633 | |
| | |
Cincinnati Financial Corp.(a) | | | 71,501 | | | | 8,683,082 | |
| | |
Old Republic International Corp. | | | 313,028 | | | | 8,085,513 | |
| | |
Progressive Corp. (The) | | | 107,533 | | | | 10,202,731 | |
| | | | | | | | 61,876,155 | |
|
| Internet & Direct Marketing Retail – 0.8% | |
| | |
eBay, Inc.(a) | | | 134,557 | | | | 10,323,213 | |
| | |
Shutterstock, Inc. | | | 17,453 | | | | 2,114,431 | |
| | | | | | | | 12,437,644 | |
|
| IT Services – 2.9% | |
| | |
International Business Machines Corp.(a) | | | 164,959 | | | | 20,636,371 | |
| | |
Mastercard, Inc., Class A | | | 13,512 | | | | 4,533,546 | |
| | |
Paychex, Inc.(a) | | | 81,635 | | | | 10,063,963 | |
| | |
Visa, Inc., Class A(a) | | | 30,965 | | | | 6,557,458 | |
| | |
Western Union Co. (The)(a) | | | 287,130 | | | | 5,231,509 | |
| | | | | | | | 47,022,847 | |
|
| Leisure Products – 0.9% | |
| | |
Brunswick Corp.(a) | | | 78,257 | | | | 7,284,944 | |
| | |
Polaris, Inc.(a) | | | 62,493 | | | | 7,183,570 | |
| | | | | | | | 14,468,514 | |
|
| Life Sciences Tools & Services – 0.0%(b) | |
| | |
Thermo Fisher Scientific, Inc. | | | 1,126 | | | | 712,837 | |
|
| Machinery – 1.3% | |
| | |
Illinois Tool Works, Inc. | | | 57,989 | | | | 13,213,954 | |
| | |
Pentair plc(a) | | | 108,659 | | | | 8,037,506 | |
| | | | | | | | 21,251,460 | |
|
| Media – 3.7% | |
| | |
Comcast Corp., Class A | | | 304,583 | | | | 15,664,704 | |
| | |
Fox Corp., Class A(a) | | | 56,300 | | | | 2,237,362 | |
| | |
Interpublic Group of Cos., Inc. (The) | | | 236,460 | | | | 8,647,342 | |
See Accompanying Notes to the Financial Statements.
| | | | |
| 328 | | FLEXSHARES ANNUAL REPORT | | |
FlexShares® Quality Dividend Index Fund (cont.)
| | | | | | | | |
| Investments | | Shares | | | Value | |
|
| COMMON STOCKS – (continued) | |
|
| Media – (continued) | |
| | |
New York Times Co. (The), Class A | | | 170,589 | | | $ | 9,312,453 | |
| | |
Nexstar Media Group, Inc., Class A(a) | | | 58,552 | | | | 8,778,701 | |
| | |
Omnicom Group, Inc. | | | 120,482 | | | | 8,202,415 | |
| | |
Sirius XM Holdings, Inc.(a) | | | 1,334,873 | | | | 8,129,377 | |
| | | | | | | | 60,972,354 | |
|
| Metals & Mining – 1.6% | |
| | |
Freeport-McMoRan, Inc. | | | 301,205 | | | | 11,361,453 | |
| | |
Newmont Corp. | | | 156,514 | | | | 8,451,756 | |
| | |
Southern Copper Corp. | | | 105,844 | | | | 6,349,581 | |
| | | | | | | | 26,162,790 | |
|
| Mortgage Real Estate Investment Trusts (REITs) – 0.5% | |
| | |
Annaly Capital Management, Inc.(a) | | | 905,867 | | | | 7,663,635 | |
|
| Multiline Retail – 0.6% | |
| | |
Target Corp. | | | 37,721 | | | | 9,793,126 | |
|
| Multi-Utilities – 1.4% | |
| | |
MDU Resources Group, Inc. | | | 239,838 | | | | 7,370,222 | |
| | |
Public Service Enterprise Group, Inc. | | | 143,002 | | | | 9,123,527 | |
| | |
WEC Energy Group, Inc.(a) | | | 79,946 | | | | 7,199,937 | |
| | | | | | | | 23,693,686 | |
|
| Oil, Gas & Consumable Fuels – 2.5% | |
| | |
Antero Midstream Corp.(a) | | | 931,202 | | | | 9,907,989 | |
| | |
Coterra Energy, Inc. | | | 565,053 | | | | 12,046,930 | |
| | |
Exxon Mobil Corp. | | | 5,630 | | | | 362,966 | |
| | |
Kinder Morgan, Inc.(a) | | | 499,944 | | | | 8,374,062 | |
| | |
Targa Resources Corp. | | | 193,109 | | | | 10,557,269 | |
| | | | | | | | 41,249,216 | |
|
| Paper & Forest Products – 0.5% | |
| | |
Louisiana-Pacific Corp.(a) | | | 144,128 | | | | 8,493,463 | |
| | |
Sylvamo Corp.* | | | 1 | | | | 18 | |
| | | | | | | | 8,493,481 | |
|
| Pharmaceuticals – 5.8% | |
| | |
Eli Lilly and Co. | | | 108,659 | | | | 27,681,967 | |
| | | | | | | | |
| Investments | | Shares | | | Value | |
|
| Pharmaceuticals – (continued) | |
| | |
Johnson & Johnson | | | 316,969 | | | $ | 51,627,911 | |
| | |
Pfizer, Inc. | | | 358,068 | | | | 15,661,894 | |
| | | | | | | | 94,971,772 | |
|
| Road & Rail – 2.2% | |
| | |
Old Dominion Freight Line, Inc. | | | 32,091 | | | | 10,954,263 | |
| | |
Union Pacific Corp.(a) | | | 106,407 | | | | 25,686,650 | |
| | | | | | | | 36,640,913 | |
|
| Semiconductors & Semiconductor Equipment – 7.8% | |
| | |
Analog Devices, Inc.(a) | | | 68,123 | | | | 11,818,659 | |
| | |
Broadcom, Inc. | | | 75,442 | | | | 40,110,248 | |
| | |
Intel Corp. | | | 725,144 | | | | 35,532,056 | |
| | |
Microchip Technology, Inc.(a) | | | 109,222 | | | | 8,092,258 | |
| | |
Texas Instruments, Inc. | | | 170,589 | | | | 31,982,026 | |
| | | | | | | | 127,535,247 | |
|
| Software – 7.5% | |
| | |
CDK Global, Inc.(a) | | | 202,117 | | | | 8,796,132 | |
| | |
Microsoft Corp. | | | 279,811 | | | | 92,790,924 | |
| | |
NortonLifeLock, Inc.(a) | | | 331,607 | | | | 8,439,398 | |
| | |
Oracle Corp. | | | 140,187 | | | | 13,449,541 | |
| | | | | | | | 123,475,995 | |
|
| Specialty Retail – 5.9% | |
| | |
Bath & Body Works, Inc. | | | 72,064 | | | | 4,978,902 | |
| | |
Best Buy Co., Inc. | | | 76,568 | | | | 9,359,672 | |
| | |
Dick’s Sporting Goods, Inc.(a) | | | 78,820 | | | | 9,790,232 | |
| | |
Home Depot, Inc. (The) | | | 87,265 | | | | 32,439,891 | |
| | |
Lowe’s Cos., Inc. | | | 130,053 | | | | 30,408,993 | |
| | |
Williams-Sonoma, Inc.(a) | | | 52,922 | | | | 9,829,203 | |
| | | | | | | | 96,806,893 | |
|
| Technology Hardware, Storage & Peripherals – 8.5% | |
| | |
Apple, Inc. | | | 882,221 | | | | 132,156,707 | |
| | |
Seagate Technology Holdings plc | | | 86,702 | | | | 7,722,547 | |
| | | | | | | | 139,879,254 | |
See Accompanying Notes to the Financial Statements.
| | | | | | |
| | FLEXSHARES ANNUAL REPORT | | | 329 | |
FlexShares® Quality Dividend Index Fund (cont.)
| | | | | | | | |
| Investments | | Shares | | | Value | |
|
| COMMON STOCKS – (continued) | |
|
| Thrifts & Mortgage Finance – 0.4% | |
| | |
PennyMac Financial Services, Inc. | | | 113,726 | | | $ | 7,057,835 | |
|
| Tobacco – 2.6% | |
| | |
Altria Group, Inc. | | | 339,489 | | | | 14,974,860 | |
| | |
Philip Morris International, Inc. | | | 287,130 | | | | 27,145,270 | |
| | | | | | | | 42,120,130 | |
|
| Trading Companies & Distributors – 1.5% | |
| | |
Fastenal Co.(a) | | | 166,648 | | | | 9,512,268 | |
| | |
MSC Industrial Direct Co., Inc., Class A | | | 83,324 | | | | 7,005,048 | |
| | |
WW Grainger, Inc. | | | 18,016 | | | | 8,343,390 | |
| | | | | | | | 24,860,706 | |
Total Common Stocks
(Cost $1,244,426,037) | | | | 1,632,826,679 | |
| | | Principal
Amount | | | | |
|
| SECURITIES LENDING REINVESTMENTS(c) – 5.7% | |
|
| CERTIFICATES OF DEPOSIT – 0.3% | |
| | |
Oversea-Chinese Banking Corp. Ltd., New York 0.14%, 2/24/2022 | | $ | 2,000,000 | | | | 1,999,994 | |
| | |
The Sumitomo Bank Ltd., New York 0.15%, 3/9/2022 | | | 3,000,000 | | | | 3,000,042 | |
Total Certificates of Deposit
(Cost $5,000,000) | | | | 5,000,036 | |
| | |
| | | | | | | | |
|
| REPURCHASE AGREEMENTS – 5.4% | |
| | |
BofA Securities, Inc., 0.52%, dated 10/31/2021, due 1/31/2022, repurchase price $8,010,631, collateralized by various U.S. Treasury Securities, ranging from 0.63% – 4.50%, maturing 12/31/2027 – 8/15/2039; Common Stocks; total market value $8,379,483 | | | 8,000,000 | | | | 8,000,000 | |
| | | | | | | | |
| Investments | | Principal
Amount | | | Value | |
|
| REPURCHASE AGREEMENTS – (continued) | |
| | |
Cantor Fitzgerald & Co., Inc., 0.05%, dated 10/31/2021, due 11/1/2021, repurchase price $30,000,042, collateralized by various Mortgage-Backed Securities, ranging from 1.50% – 6.00%, maturing 7/1/2036 – 12/15/2062; total market value $41,168,302 | | $ | 30,000,000 | | | $ | 30,000,000 | |
| | |
Citigroup Global Markets, Inc., 0.05%, dated 10/31/2021, due 11/1/2021, repurchase price $50,371,979, collateralized by various U.S. Treasury Securities, ranging from 0.75% – 4.63%, maturing 2/15/2040 – 2/15/2042; total market value $50,826,385 | | | 50,371,909 | | | | 50,371,909 | |
Total Repurchase Agreements
(Cost $88,371,909) | | | | 88,371,909 | |
Total Securities Lending Reinvestments
(Cost $93,371,909) | | | | 93,371,945 | |
Total Investments – 105.1%
(Cost $1,337,797,946) | | | | 1,726,198,624 | |
| |
Liabilities in excess of other assets – (5.1%) | | | | (83,653,744 | ) |
| NET ASSETS – 100.0% | | | $ | 1,642,544,880 | |
| * | Non-income producing security. |
| (a) | The security or a portion of this security is on loan at October 31, 2021. The total value of securities on loan at October 31, 2021 was $130,499,879, collateralized in the form of cash with a value of $93,372,067 that was reinvested in the securities shown in the Securities Lending Reinvestment section of the Schedule of Investments; $37,150,968 of collateral in the form of U.S. Government Treasury Securities, interest rates ranging from 0.00% – 7.25%, and maturity dates ranging from November 4, 2021 – February 15, 2051 and $2,857,489 of collateral in the form of Foreign |
See Accompanying Notes to the Financial Statements.
| | | | |
| 330 | | FLEXSHARES ANNUAL REPORT | | |
FlexShares® Quality Dividend Index Fund (cont.)
| | Government Fixed Income Securities, interest rates ranging from 0.00% – 8.50%, and maturity dates ranging from November 17, 2021 – September 20, 2117; a total value of $133,380,524. |
| (b) | Represents less than 0.05% of net assets. |
| (c) | The security was purchased with cash collateral held from securities on loan at October 31, 2021. The total value of securities purchased was $93,371,945. |
Percentages shown are based on Net Assets.
As of October 31, 2021, the gross unrealized appreciation (depreciation) of investments based on the aggregate cost of
investments (including derivative instruments, if applicable) for federal income tax purposes was as follows:
| | | | |
| | |
Aggregate gross unrealized appreciation | | $ | 406,382,644 | |
Aggregate gross unrealized depreciation | | | (18,066,669 | ) |
Net unrealized appreciation | | $ | 388,315,975 | |
Federal income tax cost | | $ | 1,338,213,450 | |
Futures Contracts
FlexShares® Quality Dividend Index Fund had the following open futures contracts as of October 31, 2021:
| | | | | | | | | | | | | | | | | | | | |
| | | Number of
Contracts | | | Expiration
Date | | | Trading
Currency | | | Notional
Amount | | | Value and
Unrealized
Appreciation* | |
Long Contracts | | | | | |
S&P 500 E-Mini Index | | | 41 | | | | 12/17/2021 | | | | USD | | | $ | 9,423,850 | | | $ | 330,801 | |
| * | This amount represents the cumulative appreciation/depreciation on futures contracts. Current day’s variation margin is reported within the Statement of Assets and Liabilities for futures contracts. |
Abbreviations:
USD – US Dollar
| | | | |
| Security Type | | % of Net Assets | |
Common Stocks | | | 99.4 | % |
Securities Lending Reinvestments | | | 5.7 | |
Others(1) | | | (5.1 | ) |
| | | | 100.0 | % |
| (1) | Includes any other net assets/(liabilities). |
See Accompanying Notes to the Financial Statements.
| | | | | | |
| | FLEXSHARES ANNUAL REPORT | | | 331 | |
Schedule of Investments
FlexShares® Quality Dividend Defensive Index Fund
October 31, 2021
| | | | | | | | |
| Investments | | Shares | | | Value | |
|
| COMMON STOCKS – 99.3% | |
|
| Banks – 4.1% | |
| | |
Bank of America Corp. | | | 22,400 | | | $ | 1,070,272 | |
| | |
JPMorgan Chase & Co. | | | 88,320 | | | | 15,004,685 | |
| | |
Popular, Inc.(a) | | | 30,240 | | | | 2,462,745 | |
| | | | | | | | 18,537,702 | |
|
| Beverages – 0.1% | |
| | |
Coca-Cola Co. (The) | | | 3,680 | | | | 207,442 | |
| | |
PepsiCo, Inc. | | | 480 | | | | 77,568 | |
| | | | | | | | 285,010 | |
|
| Biotechnology – 3.5% | |
| | |
AbbVie, Inc. | | | 69,920 | | | | 8,017,727 | |
| | |
Amgen, Inc. | | | 28,960 | | | | 5,993,851 | |
| | |
Gilead Sciences, Inc. | | | 27,840 | | | | 1,806,259 | |
| | | | | | | | 15,817,837 | |
|
| Building Products – 2.2% | |
| | |
A O Smith Corp.(a) | | | 32,320 | | | | 2,361,622 | |
| | |
Advanced Drainage Systems, Inc. | | | 20,000 | | | | 2,256,000 | |
| | |
Carrier Global Corp. | | | 17,600 | | | | 919,248 | |
| | |
Lennox International, Inc. | | | 6,720 | | | | 2,011,162 | |
| | |
Trane Technologies plc | | | 13,760 | | | | 2,489,597 | |
| | | | | | | | 10,037,629 | |
|
| Capital Markets – 2.9% | |
| | |
Blackstone, Inc., Class A | | | 34,720 | | | | 4,805,943 | |
| | |
LPL Financial Holdings, Inc. | | | 15,360 | | | | 2,519,347 | |
| | |
StepStone Group, Inc., Class A(a) | | | 49,280 | | | | 2,315,175 | |
| | |
T. Rowe Price Group, Inc. | | | 12,480 | | | | 2,706,662 | |
| | |
Virtu Financial, Inc., Class A | | | 19,040 | | | | 473,715 | |
| | | | | | | | 12,820,842 | |
|
| Chemicals – 1.6% | |
| | |
CF Industries Holdings, Inc. | | | 41,120 | | | | 2,335,616 | |
| | |
Chemours Co. (The)(a) | | | 64,480 | | | | 1,806,730 | |
| | |
Olin Corp.(a) | | | 51,840 | | | | 2,953,843 | |
| | | | | | | | 7,096,189 | |
| | | | | | | | |
| Investments | | Shares | | | Value | |
|
| Commercial Services & Supplies – 0.5% | |
| | |
Rollins, Inc. | | | 58,240 | | | $ | 2,051,795 | |
|
| Communications Equipment – 3.3% | |
| | |
Cisco Systems, Inc. | | | 212,800 | | | | 11,910,416 | |
| | |
Motorola Solutions, Inc. | | | 10,880 | | | | 2,704,659 | |
| | | | | | | | 14,615,075 | |
|
| Consumer Finance – 0.5% | |
| | |
Santander Consumer USA Holdings, Inc. | | | 49,427 | | | | 2,061,106 | |
|
| Containers & Packaging – 0.5% | |
| | |
Avery Dennison Corp. | | | 5,440 | | | | 1,184,397 | |
| | |
International Paper Co. | | | 11,520 | | | | 572,198 | |
| | |
Packaging Corp. of America | | | 3,840 | | | | 527,501 | |
| | | | | | | | 2,284,096 | |
|
| Distributors – 0.1% | |
| | |
Pool Corp. | | | 1,280 | | | | 659,405 | |
|
| Diversified Consumer Services – 0.6% | |
| | |
H&R Block, Inc. | | | 88,160 | | | | 2,033,851 | |
| | |
Service Corp. International(a) | | | 8,800 | | | | 602,712 | |
| | | | | | | | 2,636,563 | |
|
| Diversified Telecommunication Services – 1.9% | |
| | |
AT&T, Inc. | | | 152,000 | | | | 3,839,520 | |
| | |
Lumen Technologies, Inc.(a) | | | 48,800 | | | | 578,768 | |
| | |
Verizon Communications, Inc. | | | 81,120 | | | | 4,298,549 | |
| | | | | | | | 8,716,837 | |
|
| Electric Utilities – 2.4% | |
| | |
Duke Energy Corp. | | | 16,320 | | | | 1,664,803 | |
| | |
Exelon Corp. | | | 20,960 | | | | 1,114,862 | |
| | |
IDACORP, Inc. | | | 20,480 | | | | 2,136,474 | |
| | |
NextEra Energy, Inc. | | | 41,760 | | | | 3,563,381 | |
| | |
PPL Corp. | | | 23,040 | | | | 663,552 | |
| | |
Southern Co. (The) | | | 23,360 | | | | 1,455,795 | |
| | | | | | | | 10,598,867 | |
|
| Entertainment – 0.7% | |
| | |
Activision Blizzard, Inc. | | | 39,200 | | | | 3,065,048 | |
See Accompanying Notes to the Financial Statements.
| | | | |
| 332 | | FLEXSHARES ANNUAL REPORT | | |
FlexShares® Quality Dividend Defensive Index Fund (cont.)
| | | | | | | | |
| Investments | | Shares | | | Value | |
|
| COMMON STOCKS – (continued) | |
|
| Equity Real Estate Investment Trusts (REITs) – 5.8% | |
| | |
American Tower Corp. | | | 23,040 | | | $ | 6,496,589 | |
| | |
CoreSite Realty Corp. | | | 3,360 | | | | 478,666 | |
| | |
CubeSmart | | | 12,480 | | | | 686,525 | |
| | |
Duke Realty Corp. | | | 46,720 | | | | 2,627,533 | |
| | |
Equity Residential | | | 24,000 | | | | 2,073,600 | |
| | |
Extra Space Storage, Inc. | | | 13,760 | | | | 2,715,811 | |
| | |
Gaming and Leisure Properties, Inc. | | | 11,840 | | | | 574,121 | |
| | |
Healthpeak Properties, Inc. | | | 67,840 | | | | 2,408,998 | |
| | |
Iron Mountain, Inc.(a) | | | 50,400 | | | | 2,300,256 | |
| | |
Mid-America Apartment Communities, Inc. | | | 12,800 | | | | 2,613,888 | |
| | |
National Retail Properties, Inc. | | | 2,720 | | | | 123,379 | |
| | |
Public Storage | | | 8,320 | | | | 2,763,738 | |
| | | | | | | | 25,863,104 | |
|
| Food & Staples Retailing – 1.9% | |
| | |
Walmart, Inc. | | | 56,960 | | | | 8,510,963 | |
|
| Food Products – 1.0% | |
| | |
Hershey Co. (The) | | | 13,600 | | | | 2,384,760 | |
| | |
Sanderson Farms, Inc. | | | 11,520 | | | | 2,182,464 | |
| | | | | | | | 4,567,224 | |
|
| Health Care Equipment & Supplies – 2.3% | |
| | |
Abbott Laboratories | | | 61,760 | | | | 7,960,247 | |
| | |
ResMed, Inc. | | | 9,120 | | | | 2,397,739 | |
| | | | | | | | 10,357,986 | |
|
| Health Care Providers & Services – 1.4% | |
| | |
Chemed Corp. | | | 4,160 | | | | 2,006,160 | |
| | |
UnitedHealth Group, Inc. | | | 9,120 | | | | 4,199,486 | |
| | | | | | | | 6,205,646 | |
|
| Health Care Technology – 0.0%(b) | |
| | |
Cerner Corp. | | | 2,720 | | | | 202,069 | |
|
| Hotels, Restaurants & Leisure – 1.1% | |
| | |
Domino’s Pizza, Inc. | | | 4,640 | | | | 2,268,821 | |
| | |
Starbucks Corp. | | | 16,640 | | | | 1,765,005 | |
| | |
Yum! Brands, Inc. | | | 6,080 | | | | 759,635 | |
| | | | | | | | 4,793,461 | |
| | | | | | | | |
| Investments | | Shares | | | Value | |
|
| Household Products – 2.5% | |
| | |
Clorox Co. (The) | | | 12,160 | | | $ | 1,982,202 | |
| | |
Procter & Gamble Co. (The) | | | 64,800 | | | | 9,265,752 | |
| | | | | | | | 11,247,954 | |
|
Independent Power and Renewable Electricity
Producers – 0.6% | |
| | |
AES Corp. (The) | | | 76,160 | | | | 1,913,901 | |
| | |
NextEra Energy Partners LP(a) | | | 6,560 | | | | 566,128 | |
| | | | | | | | 2,480,029 | |
|
| Industrial Conglomerates – 1.2% | |
| | |
3M Co. | | | 29,280 | | | | 5,231,750 | |
|
| Insurance – 3.7% | |
| | |
Aflac, Inc. | | | 45,600 | | | | 2,447,352 | |
| | |
American Financial Group, Inc. | | | 16,960 | | | | 2,307,238 | |
| | |
Aon plc, Class A(a) | | | 11,360 | | | | 3,634,291 | |
| | |
Brown & Brown, Inc. | | | 10,400 | | | | 656,344 | |
| | |
Cincinnati Financial Corp.(a) | | | 19,520 | | | | 2,370,509 | |
| | |
Old Republic International Corp. | | | 86,560 | | | | 2,235,845 | |
| | |
Progressive Corp. (The) | | | 29,600 | | | | 2,808,448 | |
| | | | | | | | 16,460,027 | |
|
| Internet & Direct Marketing Retail – 0.8% | |
| | |
eBay, Inc.(a) | | | 37,280 | | | | 2,860,121 | |
| | |
Shutterstock, Inc. | | | 4,640 | | | | 562,136 | |
| | | | | | | | 3,422,257 | |
|
| IT Services – 2.8% | |
| | |
International Business Machines Corp. | | | 42,880 | | | | 5,364,288 | |
| | |
Mastercard, Inc., Class A | | | 3,520 | | | | 1,181,031 | |
| | |
Paychex, Inc. | | | 22,400 | | | | 2,761,472 | |
| | |
Visa, Inc., Class A(a) | | | 8,320 | | | | 1,761,926 | |
| | |
Western Union Co. (The) | | | 87,200 | | | | 1,588,784 | |
| | | | | | | | 12,657,501 | |
|
| Life Sciences Tools & Services – 0.0%(b) | |
| | |
Thermo Fisher Scientific, Inc. | | | 320 | | | | 202,582 | |
|
| Machinery – 2.7% | |
| | |
Deere & Co. | | | 6,240 | | | | 2,136,015 | |
| | |
Graco, Inc. | | | 30,080 | | | | 2,261,414 | |
| | |
Illinois Tool Works, Inc. | | | 16,000 | | | | 3,645,920 | |
See Accompanying Notes to the Financial Statements.
| | | | | | |
| | FLEXSHARES ANNUAL REPORT | | | 333 | |
FlexShares® Quality Dividend Defensive Index Fund (cont.)
| | | | | | | | |
| Investments | | Shares | | | Value | |
|
| COMMON STOCKS – (continued) | |
|
| Machinery – (continued) | |
| | |
Otis Worldwide Corp. | | | 28,160 | | | $ | 2,261,530 | |
| | |
Toro Co. (The) | | | 16,320 | | | | 1,558,070 | |
| | | | | | | | 11,862,949 | |
|
| Media – 3.7% | |
| | |
Comcast Corp., Class A | | | 83,680 | | | | 4,303,662 | |
| | |
Fox Corp., Class A(a) | | | 15,360 | | | | 610,406 | |
| | |
Interpublic Group of Cos., Inc. (The) | | | 65,280 | | | | 2,387,290 | |
| | |
New York Times Co. (The), Class A | | | 46,400 | | | | 2,532,976 | |
| | |
Nexstar Media Group, Inc., Class A(a) | | | 16,000 | | | | 2,398,880 | |
| | |
Omnicom Group, Inc. | | | 32,800 | | | | 2,233,024 | |
| | |
Sirius XM Holdings, Inc.(a) | | | 365,600 | | | | 2,226,504 | |
| | | | | | | | 16,692,742 | |
|
| Metals & Mining – 1.0% | |
| | |
Newmont Corp. | | | 42,240 | | | | 2,280,960 | |
| | |
Southern Copper Corp. | | | 37,120 | | | | 2,226,829 | |
| | | | | | | | 4,507,789 | |
|
| Mortgage Real Estate Investment Trusts (REITs) – 0.9% | |
| | |
AGNC Investment Corp.(a) | | | 120,960 | | | | 1,925,683 | |
| | |
Annaly Capital Management, Inc.(a) | | | 244,160 | | | | 2,065,594 | |
| | | | | | | | 3,991,277 | |
|
| Multiline Retail – 1.4% | |
| | |
Target Corp. | | | 24,960 | | | | 6,480,115 | |
|
| Multi-Utilities – 1.6% | |
| | |
CMS Energy Corp. | | | 15,360 | | | | 926,976 | |
| | |
Dominion Energy, Inc. | | | 18,560 | | | | 1,409,261 | |
| | |
Public Service Enterprise Group, Inc. | | | 37,120 | | | | 2,368,256 | |
| | |
WEC Energy Group, Inc. | | | 25,920 | | | | 2,334,355 | |
| | | | | | | | 7,038,848 | |
|
| Oil, Gas & Consumable Fuels – 0.3% | |
| | |
Coterra Energy, Inc. | | | 63,040 | | | | 1,344,013 | |
| | |
Exxon Mobil Corp. | | | 1,280 | | | | 82,521 | |
| | | | | | | | 1,426,534 | |
| | | | | | | | |
| Investments | | Shares | | | Value | |
|
| Paper & Forest Products – 0.0%(b) | |
| | |
Sylvamo Corp.* | | | 1 | | | $ | 23 | |
|
| Pharmaceuticals – 5.6% | |
| | |
Eli Lilly and Co. | | | 40,960 | | | | 10,434,970 | |
| | |
Johnson & Johnson | | | 88,000 | | | | 14,333,440 | |
| | |
Pfizer, Inc. | | | 11,200 | | | | 489,888 | |
| | | | | | | | 25,258,298 | |
|
| Semiconductors & Semiconductor Equipment – 6.0% | |
| | |
Applied Materials, Inc. | | | 6,720 | | | | 918,288 | |
| | |
Broadcom, Inc. | | | 20,640 | | | | 10,973,669 | |
| | |
Intel Corp. | | | 28,320 | | | | 1,387,680 | |
| | |
KLA Corp. | | | 8,000 | | | | 2,982,080 | |
| | |
Lam Research Corp. | | | 3,040 | | | | 1,713,253 | |
| | |
QUALCOMM, Inc. | | | 2,240 | | | | 298,009 | |
| | |
Texas Instruments, Inc. | | | 46,560 | | | | 8,729,069 | |
| | | | | | | | 27,002,048 | |
|
| Software – 7.5% | |
| | |
CDK Global, Inc. | | | 55,680 | | | | 2,423,193 | |
| | |
Microsoft Corp. | | | 76,480 | | | | 25,362,298 | |
| | |
NortonLifeLock, Inc. | | | 90,240 | | | | 2,296,608 | |
| | |
Oracle Corp. | | | 38,560 | | | | 3,699,446 | |
| | | | | | | | 33,781,545 | |
|
| Specialty Retail – 5.6% | |
| | |
Best Buy Co., Inc. | | | 18,400 | | | | 2,249,216 | |
| | |
Dick’s Sporting Goods, Inc.(a) | | | 3,360 | | | | 417,346 | |
| | |
Home Depot, Inc. (The) | | | 44,640 | | | | 16,594,474 | |
| | |
Lowe’s Cos., Inc. | | | 13,920 | | | | 3,254,774 | |
| | |
Williams-Sonoma, Inc.(a) | | | 13,280 | | | | 2,466,494 | |
| | | | | | | | 24,982,304 | |
|
| Technology Hardware, Storage & Peripherals – 8.9% | |
| | |
Apple, Inc. | | | 236,960 | �� | | | 35,496,608 | |
| | |
HP, Inc. | | | 80,640 | | | | 2,445,811 | |
| | |
Seagate Technology Holdings plc | | | 23,520 | | | | 2,094,927 | |
| | | | | | | | 40,037,346 | |
|
| Thrifts & Mortgage Finance – 0.4% | |
| | |
PennyMac Financial Services, Inc. | | | 31,360 | | | | 1,946,202 | |
See Accompanying Notes to the Financial Statements.
| | | | |
| 334 | | FLEXSHARES ANNUAL REPORT | | |
FlexShares® Quality Dividend Defensive Index Fund (cont.)
| | | | | | | | |
| Investments | | Shares | | | Value | |
|
| COMMON STOCKS – (continued) | |
|
| Tobacco – 2.6% | |
| | |
Altria Group, Inc.(a) | | | 93,440 | | | $ | 4,121,638 | |
| | |
Philip Morris International, Inc. | | | 78,720 | | | | 7,442,189 | |
| | | | | | | | 11,563,827 | |
|
| Trading Companies & Distributors – 1.1% | |
| | |
Fastenal Co.(a) | | | 45,920 | | | | 2,621,114 | |
| | |
MSC Industrial Direct Co., Inc., Class A | | | 23,200 | | | | 1,950,424 | |
| | |
Watsco, Inc. | | | 1,920 | | | | 555,993 | |
| | | | | | | | 5,127,531 | |
Total Common Stocks
(Cost $348,365,863) | | | | 445,185,932 | |
| | | Principal
Amount | | | | |
|
| SECURITIES LENDING REINVESTMENTS(c) – 5.3% | |
|
| REPURCHASE AGREEMENTS – 5.3% | |
| | |
BofA Securities, Inc., 0.52%, dated 10/31/2021, due 1/31/2022, repurchase price $1,001,329, collateralized by various U.S. Treasury Securities, ranging from 0.63% – 4.50%, maturing 12/31/2027 – 8/15/2039; Common Stocks; total market value $1,047,435 | | $ | 1,000,000 | | | | 1,000,000 | |
| | | | | | | | |
| Investments | | Principal
Amount | | | Value | |
|
| REPURCHASE AGREEMENTS – (continued) | |
| | |
Citigroup Global Markets, Inc., 0.05%, dated 10/31/2021, due 11/1/2021, repurchase price $22,597,354, collateralized by various U.S. Treasury Securities, ranging from 0.75% – 4.63%, maturing 2/15/2040 – 2/15/2042; total market value $22,801,205 | | $ | 22,597,323 | | | $ | 22,597,323 | |
| | | | | 23,597,323 | |
Total Securities Lending Reinvestments
(Cost $23,597,323) | | | | 23,597,323 | |
Total Investments – 104.6%
(Cost $371,963,186) | | | | 468,783,255 | |
| |
Liabilities in excess of other assets – (4.6%) | | | | (20,725,269 | ) |
| NET ASSETS – 100.0% | | | $ | 448,057,986 | |
| * | Non-income producing security. |
| (a) | The security or a portion of this security is on loan at October 31, 2021. The total value of securities on loan at October 31, 2021 was $26,242,817, collateralized in the form of cash with a value of $23,597,323 that was reinvested in the securities shown in the Securities Lending Reinvestment section of the Schedule of Investments and $3,202,417 of collateral in the form of U.S. Government Treasury Securities, interest rates ranging from 0.00% – 7.25%, and maturity dates ranging from November 23, 2021 – February 15, 2051; a total value of $26,799,740. |
| (b) | Represents less than 0.05% of net assets. |
| (c) | The security was purchased with cash collateral held from securities on loan at October 31, 2021. The total value of securities purchased was $23,597,323. |
Percentages shown are based on Net Assets.
As of October 31, 2021, the gross unrealized appreciation (depreciation) of investments based on the aggregate cost of investments (including derivative instruments, if applicable) for federal income tax purposes was as follows:
| | | | |
| | | | |
Aggregate gross unrealized appreciation | | $ | 102,473,500 | |
Aggregate gross unrealized depreciation | | | (5,731,470 | ) |
Net unrealized appreciation | | $ | 96,742,030 | |
Federal income tax cost | | $ | 372,140,758 | |
See Accompanying Notes to the Financial Statements.
| | | | | | |
| | FLEXSHARES ANNUAL REPORT | | | 335 | |
FlexShares® Quality Dividend Defensive Index Fund (cont.)
Futures Contracts
FlexShares® Quality Dividend Defensive Index Fund had the following open futures contracts as of October 31, 2021:
| | | | | | | | | | | | | | | | | | | | |
| | | Number of
Contracts | | | Expiration
Date | | | Trading
Currency | | | Notional
Amount | | | Value and
Unrealized
Appreciation* | |
Long Contracts | |
S&P 500 E-Mini Index | | | 12 | | | | 12/17/2021 | | | | USD | | | $ | 2,758,200 | | | $ | 99,533 | |
| * | This amount represents the cumulative appreciation/depreciation on futures contracts. Current day’s variation margin is reported within the Statement of Assets and Liabilities for futures contracts. |
Abbreviations:
USD – US Dollar
| | | | |
| Security Type | | % of Net Assets | |
Common Stocks | | | 99.3 | % |
Securities Lending Reinvestments | | | 5.3 | |
Others(1) | | | (4.6 | ) |
| | | | 100.0 | % |
| (1) | Includes any other net assets/(liabilities). |
See Accompanying Notes to the Financial Statements.
| | | | |
| 336 | | FLEXSHARES ANNUAL REPORT | | |
Schedule of Investments
FlexShares® Quality Dividend Dynamic Index Fund
October 31, 2021
| | | | | | | | |
| Investments | | Shares | | | Value | |
|
| COMMON STOCKS – 99.0% | |
|
| Air Freight & Logistics – 0.1% | |
| | |
United Parcel Service, Inc., Class B | | | 154 | | | $ | 32,874 | |
|
| Auto Components – 0.4% | |
| | |
Gentex Corp. | | | 2,667 | | | | 94,385 | |
|
| Banks – 5.4% | |
| | |
Bank of America Corp. | | | 1,295 | | | | 61,875 | |
| | |
Citigroup, Inc. | | | 4,823 | | | | 333,559 | |
| | |
JPMorgan Chase & Co. | | | 4,690 | | | | 796,784 | |
| | | | | | | | 1,192,218 | |
|
| Beverages – 0.1% | |
| | |
Coca-Cola Co. (The) | | | 217 | | | | 12,232 | |
| | |
PepsiCo, Inc. | | | 21 | | | | 3,394 | |
| | | | | | | | 15,626 | |
|
| Biotechnology – 1.3% | |
| | |
AbbVie, Inc. | | | 21 | | | | 2,408 | |
| | |
Amgen, Inc. | | | 1,372 | | | | 283,963 | |
| | | | | | | | 286,371 | |
|
| Building Products – 2.1% | |
| | |
A O Smith Corp. | | | 1,561 | | | | 114,062 | |
| | |
Advanced Drainage Systems, Inc. | | | 952 | | | | 107,385 | |
| | |
Masco Corp. | | | 1,603 | | | | 105,077 | |
| | |
Trane Technologies plc | | | 693 | | | | 125,384 | |
| | | | | | | | 451,908 | |
|
| Capital Markets – 3.1% | |
| | |
Apollo Global Management, Inc.(a) | | | 1,232 | | | | 94,802 | |
| | |
Blackstone, Inc., Class A | | | 1,589 | | | | 219,949 | |
| | |
Lazard Ltd., Class A | | | 2,275 | | | | 111,452 | |
| | |
LPL Financial Holdings, Inc. | | | 735 | | | | 120,555 | |
| | |
T. Rowe Price Group, Inc. | | | 644 | | | | 139,671 | |
| | | | | | | | 686,429 | |
|
| Chemicals – 3.1% | |
| | |
Celanese Corp. | | | 672 | | | | 108,535 | |
| | |
Chemours Co. (The) | | | 3,465 | | | | 97,089 | |
| | |
Dow, Inc. | | | 2,170 | | | | 121,455 | |
| | |
Eastman Chemical Co.(a) | | | 910 | | | | 94,667 | |
| | | | | | | | |
| Investments | | Shares | | | Value | |
|
| Chemicals – (continued) | |
| | |
Olin Corp. | | | 1,029 | | | $ | 58,633 | |
| | |
Sherwin-Williams Co. (The) | | | 595 | | | | 188,383 | |
| | | | | | | | 668,762 | |
|
| Commercial Services & Supplies – 0.6% | |
| | |
Cintas Corp. | | | 315 | | | | 136,426 | |
|
| Communications Equipment – 2.6% | |
| | |
Cisco Systems, Inc. | | | 10,313 | | | | 577,219 | |
|
| Consumer Finance – 3.4% | |
| | |
Ally Financial, Inc. | | | 854 | | | | 40,770 | |
| | |
American Express Co. | | | 1,176 | | | | 204,365 | |
| | |
Capital One Financial Corp. | | | 1,064 | | | | 160,696 | |
| | |
Discover Financial Services | | | 1,043 | | | | 118,193 | |
| | |
OneMain Holdings, Inc. | | | 1,953 | | | | 103,138 | |
| | |
Synchrony Financial | | | 2,499 | | | | 116,078 | |
| | | | | | | | 743,240 | |
|
| Containers & Packaging – 0.2% | |
| | |
International Paper Co. | | | 959 | | | | 47,634 | |
|
| Diversified Telecommunication Services – 1.9% | |
| | |
AT&T, Inc. | | | 7,504 | | | | 189,551 | |
| | |
Lumen Technologies, Inc.(a) | | | 2,009 | | | | 23,827 | |
| | |
Verizon Communications, Inc. | | | 3,682 | | | | 195,109 | |
| | | | | | | | 408,487 | |
|
| Electric Utilities – 0.3% | |
| | |
PPL Corp. | | | 2,415 | | | | 69,552 | |
|
| Electrical Equipment – 0.8% | |
| | |
Emerson Electric Co. | | | 1,442 | | | | 139,888 | |
| | |
Rockwell Automation, Inc.(a) | | | 105 | | | | 33,537 | |
| | | | | | | | 173,425 | |
|
| Electronic Equipment, Instruments & Components – 0.6% | |
| | |
CDW Corp. | | | 189 | | | | 35,277 | |
| | |
SYNNEX Corp. | | | 847 | | | | 88,935 | |
| | | | | | | | 124,212 | |
|
| Entertainment – 0.6% | |
| | |
Activision Blizzard, Inc. | | | 1,827 | | | | 142,853 | |
See Accompanying Notes to the Financial Statements.
| | | | | | |
| | FLEXSHARES ANNUAL REPORT | | | 337 | |
FlexShares® Quality Dividend Dynamic Index Fund (cont.)
| | | | | | | | |
| Investments | | Shares | | | Value | |
|
| COMMON STOCKS – (continued) | |
|
| Equity Real Estate Investment Trusts (REITs) – 3.0% | |
| | |
AvalonBay Communities, Inc. | | | 532 | | | $ | 125,914 | |
| | |
Brixmor Property Group, Inc. | | | 4,823 | | | | 113,051 | |
| | |
Highwoods Properties, Inc. | | | 2,492 | | | | 111,741 | |
| | |
Kimco Realty Corp. | | | 5,656 | | | | 127,825 | |
| | |
SL Green Realty Corp. | | | 770 | | | | 53,954 | |
| | |
Weyerhaeuser Co. | | | 3,458 | | | | 123,520 | |
| | | | | | | | 656,005 | |
|
| Food & Staples Retailing – 0.6% | |
| | |
Costco Wholesale Corp. | | | 217 | | | | 106,664 | |
| | |
Walmart, Inc. | | | 161 | | | | 24,057 | |
| | | | | | | | 130,721 | |
|
| Health Care Equipment & Supplies – 0.6% | |
| | |
Abbott Laboratories | | | 945 | | | | 121,801 | |
|
| Health Care Providers & Services – 0.8% | |
| | |
Cardinal Health, Inc. | | | 1,449 | | | | 69,277 | |
| | |
UnitedHealth Group, Inc. | | | 238 | | | | 109,592 | |
| | | | | | | | 178,869 | |
|
| Household Durables – 0.7% | |
| | |
Tempur Sealy International, Inc. | | | 2,527 | | | | 112,376 | |
| | |
Whirlpool Corp. | | | 161 | | | | 33,943 | |
| | | | | | | | 146,319 | |
|
| Household Products – 0.4% | |
| | |
Procter & Gamble Co. (The) | | | 679 | | | | 97,090 | |
|
Independent Power and Renewable Electricity
Producers – 0.4% | |
| | |
AES Corp. (The) | | | 3,591 | | | | 90,242 | |
|
| Industrial Conglomerates – 1.1% | |
| | |
3M Co. | | | 1,407 | | | | 251,403 | |
|
| Insurance – 1.1% | |
| | |
Aflac, Inc. | | | 2,254 | | | | 120,972 | |
| | |
Old Republic International Corp. | | | 4,459 | | | | 115,176 | |
| | | | | | | | 236,148 | |
| | | | | | | | |
| Investments | | Shares | | | Value | |
|
| Internet & Direct Marketing Retail – 0.8% | |
| | |
eBay, Inc. | | | 1,897 | | | $ | 145,538 | |
| | |
Shutterstock, Inc. | | | 210 | | | | 25,441 | |
| | | | | | | | 170,979 | |
|
| IT Services – 4.7% | |
| | |
Accenture plc, Class A | | | 1,197 | | | | 429,472 | |
| | |
Genpact Ltd.(a) | | | 1,547 | | | | 76,344 | |
| | |
International Business Machines Corp. | | | 2,184 | | | | 273,218 | |
| | |
Mastercard, Inc., Class A | | | 161 | | | | 54,019 | |
| | |
Paychex, Inc. | | | 917 | | | | 113,048 | |
| | |
Visa, Inc., Class A(a) | | | 392 | | | | 83,014 | |
| | | | | | | | 1,029,115 | |
|
| Leisure Products – 0.9% | |
| | |
Brunswick Corp. | | | 1,043 | | | | 97,093 | |
| | |
Polaris, Inc.(a) | | | 791 | | | | 90,925 | |
| | | | | | | | 188,018 | |
|
| Life Sciences Tools & Services – 2.7% | |
| | |
Thermo Fisher Scientific, Inc. | | | 945 | | | | 598,251 | |
|
| Machinery – 2.0% | |
| | |
Crane Co. | | | 1,085 | | | | 112,059 | |
| | |
Cummins, Inc. | | | 154 | | | | 36,936 | |
| | |
Illinois Tool Works, Inc. | | | 784 | | | | 178,650 | |
| | |
Parker-Hannifin Corp. | | | 392 | | | | 116,263 | |
| | | | | | | | 443,908 | |
|
| Media – 3.6% | |
| | |
Comcast Corp., Class A | | | 4,081 | | | | 209,886 | |
| | |
Fox Corp., Class A | | | 714 | | | | 28,374 | |
| | |
Interpublic Group of Cos., Inc. (The) | | | 3,227 | | | | 118,012 | |
| | |
New York Times Co. (The), Class A | | | 2,170 | | | | 118,460 | |
| | |
Nexstar Media Group, Inc., Class A | | | 749 | | | | 112,298 | |
| | |
Omnicom Group, Inc. | | | 1,435 | | | | 97,695 | |
| | |
Sirius XM Holdings, Inc.(a) | | | 17,759 | | | | 108,152 | |
| | | | | | | | 792,877 | |
|
| Metals & Mining – 1.3% | |
| | |
Freeport-McMoRan, Inc. | | | 4,032 | | | | 152,087 | |
| | |
Newmont Corp. | | | 1,183 | | | | 63,882 | |
| | |
Southern Copper Corp. | | | 1,232 | | | | 73,908 | |
| | | | | | | | 289,877 | |
See Accompanying Notes to the Financial Statements.
| | | | |
| 338 | | FLEXSHARES ANNUAL REPORT | | |
FlexShares® Quality Dividend Dynamic Index Fund (cont.)
| | | | | | | | |
| Investments | | Shares | | | Value | |
|
| COMMON STOCKS – (continued) | |
|
| Mortgage Real Estate Investment Trusts (REITs) – 0.8% | |
| | |
AGNC Investment Corp. | | | 5,271 | | | $ | 83,914 | |
| | |
Annaly Capital Management, Inc. | | | 10,710 | | | | 90,607 | |
| | | | | | | | 174,521 | |
|
| Multiline Retail – 1.4% | |
| | |
Target Corp. | | | 1,197 | | | | 310,765 | |
|
| Oil, Gas & Consumable Fuels – 4.8% | |
| | |
Antero Midstream Corp. | | | 12,425 | | | | 132,202 | |
| | |
APA Corp. | | | 6,776 | | | | 177,599 | |
| | |
Continental Resources, Inc.(a) | | | 3,136 | | | | 153,068 | |
| | |
Coterra Energy, Inc. | | | 7,475 | | | | 159,367 | |
| | |
Exxon Mobil Corp. | | | 7 | | | | 451 | |
| | |
Kinder Morgan, Inc. | | | 5,936 | | | | 99,428 | |
| | |
PDC Energy, Inc.(a) | | | 2,905 | | | | 151,960 | |
| | |
Plains GP Holdings LP, Class A* | | | 2,744 | | | | 29,910 | |
| | |
Targa Resources Corp. | | | 2,695 | | | | 147,336 | |
| | | | | | | | 1,051,321 | |
|
| Paper & Forest Products – 0.5% | |
| | |
Louisiana-Pacific Corp.(a) | | | 1,862 | | | | 109,728 | |
|
| Pharmaceuticals – 5.6% | |
| | |
Johnson & Johnson | | | 4,165 | | | | 678,395 | |
| | |
Pfizer, Inc. | | | 12,453 | | | | 544,694 | |
| | | | | | | | 1,223,089 | |
|
| Professional Services – 0.6% | |
| | |
Robert Half International, Inc. | | | 1,183 | | | | 133,762 | |
|
| Road & Rail – 1.8% | |
| | |
Union Pacific Corp. | | | 1,610 | | | | 388,654 | |
|
| Semiconductors & Semiconductor Equipment – 6.7% | |
| | |
Analog Devices, Inc. | | | 910 | | | | 157,876 | |
| | |
Applied Materials, Inc. | | | 938 | | | | 128,178 | |
| | |
Broadcom, Inc.(a) | | | 917 | | | | 487,541 | |
| | |
Intel Corp. | | | 441 | | | | 21,609 | |
| | |
KLA Corp. | | | 378 | | | | 140,903 | |
| | |
Microchip Technology, Inc. | | | 1,428 | | | | 105,801 | |
| | |
Texas Instruments, Inc. | | | 2,226 | | | | 417,330 | |
| | | | | | | | 1,459,238 | |
| | | | | | | | |
| Investments | | Shares | | | Value | |
|
| Software – 7.4% | |
| | |
CDK Global, Inc. | | | 1,680 | | | $ | 73,114 | |
| | |
Microsoft Corp. | | | 3,815 | | | | 1,265,130 | |
| | |
NortonLifeLock, Inc. | | | 4,221 | | | | 107,425 | |
| | |
Oracle Corp. | | | 1,946 | | | | 186,699 | |
| | | | | | | | 1,632,368 | |
|
| Specialty Retail – 5.8% | |
| | |
Bath & Body Works, Inc. | | | 1,295 | | | | 89,472 | |
| | |
Best Buy Co., Inc. | | | 1,050 | | | | 128,352 | |
| | |
Dick’s Sporting Goods, Inc.(a) | | | 1,015 | | | | 126,073 | |
| | |
Home Depot, Inc. (The) | | | 1,043 | | | | 387,725 | |
| | |
Lowe’s Cos., Inc. | | | 1,743 | | | | 407,548 | |
| | |
Williams-Sonoma, Inc. | | | 686 | | | | 127,411 | |
| | | | | | | | 1,266,581 | |
|
| Technology Hardware, Storage & Peripherals – 8.5% | |
| | |
Apple, Inc. | | | 11,578 | | | | 1,734,385 | |
| | |
HP, Inc. | | | 637 | | | | 19,320 | |
| | |
Seagate Technology Holdings plc | | | 1,127 | | | | 100,382 | |
| | | | | | | | 1,854,087 | |
|
| Thrifts & Mortgage Finance – 0.3% | |
| | |
PennyMac Financial Services, Inc. | | | 973 | | | | 60,384 | |
|
| Tobacco – 2.5% | |
| | |
Altria Group, Inc. | | | 4,459 | | | | 196,686 | |
| | |
Philip Morris International, Inc. | | | 3,738 | | | | 353,391 | |
| | | | | | | | 550,077 | |
|
| Trading Companies & Distributors – 1.0% | |
| | |
Fastenal Co. | | | 2,247 | | | | 128,259 | |
| | |
MSC Industrial Direct Co., Inc., Class A | | | 1,057 | | | | 88,862 | |
| | | | | | | | 217,121 | |
Total Common Stocks
(Cost $16,426,689) | | | | 21,704,940 | |
See Accompanying Notes to the Financial Statements.
| | | | | | |
| | FLEXSHARES ANNUAL REPORT | | | 339 | |
FlexShares® Quality Dividend Dynamic Index Fund (cont.)
| | | | | | | | |
| Investments | | Principal
Amount | | | Value | |
|
| SECURITIES LENDING REINVESTMENTS(b) – 1.3% | |
|
| REPURCHASE AGREEMENTS – 1.3% | |
| | |
Citigroup Global Markets, Inc., 0.05%, dated 10/31/2021, due 11/1/2021, repurchase price $275,181, collateralized by various U.S. Treasury Securities, ranging from 0.75% – 4.63%, maturing 2/15/2040 – 2/15/2042; total market value $277,664
(Cost $275,181) | | $ | 275,181 | | | $ | 275,181 | |
Total Investments – 100.3%
(Cost $16,701,870) | | | | 21,980,121 | |
| |
Liabilities in excess of other assets – (0.3%) | | | | (75,117 | ) |
| NET ASSETS – 100.0% | | | $ | 21,905,004 | |
| * | Non-income producing security. |
| (a) | The security or a portion of this security is on loan at October 31, 2021. The total value of securities on loan at October 31, 2021 |
| | was $1,303,514, collateralized in the form of cash with a value of $275,181 that was reinvested in the securities shown in the Securities Lending Reinvestment section of the Schedule of Investments; $726,140 of collateral in the form of U.S. Government Treasury Securities, interest rates ranging from 0.00% – 7.25%, and maturity dates ranging from November 23, 2021 – February 15, 2051 and $351,771 of collateral in the form of Foreign Government Fixed Income Securities, interest rates ranging from 0.00% – 8.50%, and maturity dates ranging from November 17, 2021 – September 20, 2117; a total value of $1,353,092. |
| (b) | The security was purchased with cash collateral held from securities on loan at October 31, 2021. The total value of securities purchased was $275,181. |
Percentages shown are based on Net Assets.
As of October 31, 2021, the gross unrealized appreciation (depreciation) of investments based on the aggregate cost of investments (including derivative instruments, if applicable) for federal income tax purposes was as follows:
| | | | |
| | | | |
Aggregate gross unrealized appreciation | | $ | 5,470,919 | |
Aggregate gross unrealized depreciation | | | (190,463 | ) |
Net unrealized appreciation | | $ | 5,280,456 | |
Federal income tax cost | | $ | 16,709,126 | |
Futures Contracts
FlexShares® Quality Dividend Dynamic Index Fund had the following open futures contracts as of October 31, 2021:
| | | | | | | | | | | | | | | | | | | | |
| | | Number of
Contracts | | | Expiration
Date | | | Trading
Currency | | | Notional
Amount | | | Value and
Unrealized
Appreciation* | |
Long Contracts | |
Micro E-mini S&P 500 Index | | | 8 | | | | 12/17/2021 | | | | USD | | | $ | 183,880 | | | $ | 9,461 | |
| * | This amount represents the cumulative appreciation/depreciation on futures contracts. Current day’s variation margin is reported within the Statement of Assets and Liabilities for futures contracts. |
Abbreviations:
USD – US Dollar
| | | | |
| Security Type | | % of Net Assets | |
Common Stocks | | | 99.0 | % |
Securities Lending Reinvestments | | | 1.3 | |
Others(1) | | | (0.3 | ) |
| | | | 100.0 | % |
| (1) | Includes any other net assets/(liabilities). |
See Accompanying Notes to the Financial Statements.
| | | | |
| 340 | | FLEXSHARES ANNUAL REPORT | | |
Schedule of Investments
FlexShares® International Quality Dividend Index Fund
October 31, 2021
| | | | | | | | |
| Investments | | Shares | | | Value | |
|
| COMMON STOCKS – 97.2% | |
|
| Auto Components – 1.1% | |
| | |
Bridgestone Corp. | | | 113,200 | | | $ | 4,982,686 | |
| | |
Fuyao Glass Industry Group Co. Ltd., Class H(a) | | | 316,800 | | | | 1,828,542 | |
| | | | | | | | 6,811,228 | |
|
| Automobiles – 1.2% | |
| | |
Bajaj Auto Ltd. | | | 62,618 | | | | 3,100,116 | |
| | |
Ford Otomotiv Sanayi A/S | | | 217,968 | | | | 4,207,408 | |
| | | | | | | | 7,307,524 | |
|
| Banks – 8.1% | |
| | |
Al Rajhi Bank | | | 8,126 | | | | 300,265 | |
| | |
Banco Santander Chile | | | 88,364,992 | | | | 3,877,401 | |
| | |
Bank of China Ltd., Class H | | | 13,623,000 | | | | 4,815,916 | |
| | |
Bank of Communications Co. Ltd., Class H | | | 7,409,000 | | | | 4,409,750 | |
| | |
BOC Hong Kong Holdings Ltd. | | | 916,000 | | | | 2,908,478 | |
| | |
Commonwealth Bank of Australia | | | 478 | | | | 37,583 | |
| | |
Hana Financial Group, Inc. | | | 123,324 | | | | 4,749,116 | |
| | |
Hang Seng Bank Ltd. | | | 32,800 | | | | 624,035 | |
| | |
Industrial & Commercial Bank of China Ltd., Class H | | | 2,868,000 | | | | 1,570,588 | |
| | |
KB Financial Group, Inc. | | | 54,014 | | | | 2,616,227 | |
| | |
Nordea Bank Abp | | | 114,959 | | | | 1,406,252 | |
| | |
Royal Bank of Canada | | | 48,039 | | | | 4,992,444 | |
| | |
Saudi National Bank (The) | | | 7,648 | | | | 134,369 | |
| | |
Sberbank of Russia PJSC | | | 1,266,700 | | | | 6,356,773 | |
| | |
Sberbank of Russia PJSC (Preference) | | | 1,123,300 | | | | 5,079,614 | |
| | |
Skandinaviska Enskilda Banken AB, Class A | | | 242,585 | | | | 3,791,935 | |
| | |
Swedbank AB, Class A(b) | | | 110,657 | | | | 2,399,576 | |
| | | | | | | | 50,070,322 | |
|
| Beverages – 0.7% | |
| | |
Thai Beverage PCL | | | 8,030,400 | | | | 4,228,093 | |
|
| Building Products – 0.7% | |
| | |
Geberit AG (Registered) | | | 4,063 | | | | 3,178,366 | |
| | |
Lixil Corp. | | | 39,900 | | | | 1,023,176 | |
| | | | | | | | 4,201,542 | |
| | | | | | | | |
| Investments | | Shares | | | Value | |
|
| Capital Markets – 3.0% | |
| | |
3i Group plc | | | 27,724 | | | $ | 518,356 | |
| | |
Abrdn plc | | | 1,265,027 | | | | 4,404,451 | |
| | |
China Galaxy Securities Co. Ltd., Class H | | | 239,000 | | | | 133,340 | |
| | |
CSC Financial Co. Ltd., Class H(a) (b) | | | 956,000 | | | | 1,013,877 | |
| | |
Daiwa Securities Group, Inc. | | | 334,600 | | | | 1,874,230 | |
| | |
Hong Kong Exchanges & Clearing Ltd. | | | 23,900 | | | | 1,446,465 | |
| | |
IGM Financial, Inc.(b) | | | 127,865 | | | | 5,069,006 | |
| | |
Moscow Exchange MICEX-RTS PJSC | | | 97,990 | | | | 240,068 | |
| | |
Partners Group Holding AG | | | 1,071 | | | | 1,872,419 | |
| | |
SBI Holdings, Inc. | | | 85,600 | | | | 2,208,596 | |
| | | | | | | | 18,780,808 | |
|
| Chemicals – 1.0% | |
| | |
Kumho Petrochemical Co. Ltd. | | | 11,233 | | | | 1,653,396 | |
| | |
Nissan Chemical Corp. | | | 8,500 | | | | 471,870 | |
| | |
Nitto Denko Corp. | | | 17,300 | | | | 1,347,283 | |
| | |
Wacker Chemie AG | | | 16,730 | | | | 3,019,316 | |
| | | | | | | | 6,491,865 | |
|
| Construction & Engineering – 0.5% | |
| | |
HOCHTIEF AG | | | 37,762 | | | | 2,914,795 | |
|
| Construction Materials – 1.1% | |
| | |
Ambuja Cements Ltd. | | | 843,670 | | | | 4,560,790 | |
| | |
Anhui Conch Cement Co. Ltd., Class H | | | 96,000 | | | | 477,590 | |
| | |
China Resources Cement Holdings Ltd. | | | 1,738,000 | | | | 1,465,639 | |
| | | | | | | | 6,504,019 | |
|
| Diversified Financial Services – 2.6% | |
| | |
Banca Mediolanum SpA | | | 457,924 | | | | 4,613,593 | |
| | |
Investor AB, Class B | | | 55,209 | | | | 1,272,150 | |
| | |
M&G plc | | | 1,630,458 | | | | 4,465,431 | |
| | |
Power Finance Corp. Ltd. | | | 786,310 | | | | 1,397,651 | |
| | |
REC Ltd. | | | 2,207,643 | | | | 4,382,487 | |
| | | | | | | | 16,131,312 | |
See Accompanying Notes to the Financial Statements.
| | | | | | |
| | FLEXSHARES ANNUAL REPORT | | | 341 | |
FlexShares® International Quality Dividend Index Fund (cont.)
| | | | | | | | |
| Investments | | Shares | | | Value | |
|
| COMMON STOCKS – (continued) | |
|
| Diversified Telecommunication Services – 1.8% | |
| | |
Elisa OYJ | | | 7,648 | | | $ | 461,827 | |
| | |
Hellenic Telecommunications Organization SA | | | 55,687 | | | | 985,990 | |
| | |
Koninklijke KPN NV | | | 1,410,578 | | | | 4,219,731 | |
| | |
Proximus SADP | | | 57,360 | | | | 1,080,996 | |
| | |
Spark New Zealand Ltd. | | | 70,266 | | | | 229,555 | |
| | |
Swisscom AG (Registered) | | | 3,585 | | | | 1,955,419 | |
| | |
Telefonica SA(b) | | | 27,963 | | | | 121,820 | |
| | |
Turk Telekomunikasyon A/S | | | 2,350,087 | | | | 1,840,445 | |
| | | | | | | | 10,895,783 | |
|
| Electric Utilities – 2.4% | |
| | |
CPFL Energia SA | | | 71,700 | | | | 334,651 | |
| | |
Endesa SA(b) | | | 192,395 | | | | 4,440,737 | |
| | |
Fortum OYJ | | | 54,014 | | | | 1,606,448 | |
| | |
Power Assets Holdings Ltd. | | | 160,500 | | | | 979,004 | |
| | |
SSE plc | | | 226,094 | | | | 5,093,508 | |
| | |
Verbund AG(b) | | | 24,378 | | | | 2,541,851 | |
| | | | | | | | 14,996,199 | |
|
| Electrical Equipment – 0.9% | |
| | |
Mitsubishi Electric Corp. | | | 283,100 | | | | 3,786,253 | |
| | |
WEG SA | | | 239,000 | | | | 1,568,742 | |
| | | | | | | | 5,354,995 | |
|
| Electronic Equipment, Instruments & Components – 0.6% | |
| | |
Hexagon AB, Class B | | | 177,816 | | | | 2,857,147 | |
| | |
Kingboard Laminates Holdings Ltd. | | | 239,000 | | | | 374,827 | |
| | |
Shimadzu Corp. | | | 10,200 | | | | 412,831 | |
| | | | | | | | 3,644,805 | |
|
| Energy Equipment & Services – 0.0%(c) | |
| | |
Tenaris SA | | | 15,296 | | | | 170,463 | |
|
| Entertainment – 1.6% | |
| | |
NetEase, Inc., ADR | | | 46,844 | | | | 4,571,506 | |
| | |
Nintendo Co. Ltd. | | | 12,500 | | | | 5,503,179 | |
| | | | | | | | 10,074,685 | |
|
| Equity Real Estate Investment Trusts (REITs) – 0.2% | |
| | |
Gecina SA | | | 9,321 | | | | 1,305,733 | |
| | | | | | | | |
| Investments | | Shares | | | Value | |
|
| Food & Staples Retailing – 0.7% | |
| | |
Magnit PJSC | | | 45,171 | | | $ | 4,116,625 | |
|
| Food Products – 2.1% | |
| | |
Dali Foods Group Co. Ltd.(a) | | | 239,000 | | | | 133,033 | |
| | |
Nestle SA (Registered) | | | 83,889 | | | | 11,092,168 | |
| | |
Want Want China Holdings Ltd. | | | 1,912,000 | | | | 1,482,104 | |
| | | | | | | | 12,707,305 | |
|
| Gas Utilities – 1.8% | |
| | |
Enagas SA | | | 186,420 | | | | 4,186,329 | |
| | |
Kunlun Energy Co. Ltd. | | | 276,000 | | | | 252,617 | |
| | |
Naturgy Energy Group SA(b) | | | 177,816 | | | | 4,677,324 | |
| | |
Snam SpA | | | 351,091 | | | | 1,989,651 | |
| | | | | | | | 11,105,921 | |
|
| Health Care Equipment & Supplies – 0.8% | |
| | |
Coloplast A/S, Class B | | | 2,390 | | | | 390,008 | |
| | |
Hartalega Holdings Bhd. | | | 932,100 | | | | 1,319,031 | |
| | |
Hoya Corp. | | | 5,800 | | | | 850,735 | |
| | |
Top Glove Corp. Bhd. | | | 3,298,200 | | | | 2,166,410 | |
| | | | | | | | 4,726,184 | |
|
| Hotels, Restaurants & Leisure – 0.2% | |
| | |
La Francaise des Jeux SAEM(a) | | | 25,812 | | | | 1,341,205 | |
|
| Household Durables – 1.8% | |
| | |
Electrolux AB, Class B(b) | | | 34,894 | | | | 791,854 | |
| | |
Iida Group Holdings Co. Ltd. | | | 16,100 | | | | 395,775 | |
| | |
Nien Made Enterprise Co. Ltd. | | | 313,000 | | | | 4,299,621 | |
| | |
Persimmon plc | | | 112,808 | | | | 4,207,525 | |
| | |
Sekisui House Ltd. | | | 71,700 | | | | 1,484,934 | |
| | |
Sony Group Corp. | | | 1,800 | | | | 207,428 | |
| | | | | | | | 11,387,137 | |
|
| Household Products – 0.5% | |
| | |
Unilever Indonesia Tbk. PT | | | 9,034,200 | | | | 2,818,505 | |
|
| Industrial Conglomerates – 0.3% | |
| | |
Industries Qatar QSC | | | 375,947 | | | | 1,637,605 | |
|
| Insurance – 7.5% | |
| | |
Ageas SA | | | 29,158 | | | | 1,420,584 | |
| | |
AIA Group Ltd. | | | 41,400 | | | | 467,537 | |
See Accompanying Notes to the Financial Statements.
| | | | |
| 342 | | FLEXSHARES ANNUAL REPORT | | |
FlexShares® International Quality Dividend Index Fund (cont.)
| | | | | | | | |
| Investments | | Shares | | | Value | |
|
| COMMON STOCKS – (continued) | |
|
| Insurance – (continued) | |
| | |
Allianz SE (Registered) | | | 45,888 | | | $ | 10,681,847 | |
| | |
Aviva plc | | | 291,580 | | | | 1,577,550 | |
| | |
BB Seguridade Participacoes SA | | | 645,300 | | | | 2,528,770 | |
| | |
Great-West Lifeco, Inc.(b) | | | 153,916 | | | | 4,521,061 | |
| | |
Manulife Financial Corp. | | | 69,788 | | | | 1,357,419 | |
| | |
Muenchener Rueckversicherungs-Gesellschaft AG in Muenchen (Registered) | | | 8,126 | | | | 2,409,257 | |
| | |
New China Life Insurance Co. Ltd., Class H | | | 71,700 | | | | 207,845 | |
| | |
PICC Property & Casualty Co. Ltd., Class H | | | 5,112,000 | | | | 4,784,050 | |
| | |
Poste Italiane SpA(a) | | | 178,294 | | | | 2,546,121 | |
| | |
SCOR SE | | | 128,343 | | | | 4,322,076 | |
| | |
Suncorp Group Ltd. | | | 421,596 | | | | 3,711,264 | |
| | |
Zurich Insurance Group AG | | | 12,428 | | | | 5,520,684 | |
| | | | | | | | 46,056,065 | |
|
| Interactive Media & Services – 1.3% | |
| | |
Kakaku.com, Inc.(b) | | | 41,500 | | | | 1,370,292 | |
| | |
Rightmove plc | | | 30,831 | | | | 292,197 | |
| | |
Tencent Holdings Ltd. | | | 103,300 | | | | 6,387,322 | |
| | | | | | | | 8,049,811 | |
|
| Internet & Direct Marketing Retail – 1.4% | |
| | |
momo.com, Inc. | | | 71,600 | | | | 4,608,807 | |
| | |
ZOZO, Inc. | | | 124,700 | | | | 3,986,244 | |
| | | | | | | | 8,595,051 | |
|
| IT Services – 1.9% | |
| | |
Edenred | | | 26,768 | | | | 1,448,807 | |
| | |
Infosys Ltd. | | | 59,272 | | | | 1,320,102 | |
| | |
Itochu Techno-Solutions Corp. | | | 95,600 | | | | 3,009,901 | |
| | |
Nomura Research Institute Ltd. | | | 66,900 | | | | 2,663,679 | |
| | |
Obic Co. Ltd. | | | 4,800 | | | | 883,596 | |
| | |
Otsuka Corp.(b) | | | 23,900 | | | | 1,173,778 | |
| | |
SCSK Corp. | | | 67,300 | | | | 1,357,509 | |
| | | | | | | | 11,857,372 | |
|
| Leisure Products – 0.2% | |
| | |
Yamaha Corp. | | | 16,100 | | | | 1,013,795 | |
| | | | | | | | |
| Investments | | Shares | | | Value | |
|
| Machinery – 2.6% | |
| | |
Atlas Copco AB, Class A | | | 42,303 | | | $ | 2,717,913 | |
| | |
Atlas Copco AB, Class B | | | 10,277 | | | | 555,821 | |
| | |
Daifuku Co. Ltd. | | | 6,200 | | | | 568,209 | |
| | |
Epiroc AB, Class A(b) | | | 109,462 | | | | 2,723,645 | |
| | |
Epiroc AB, Class B | | | 10,277 | | | | 218,379 | |
| | |
FANUC Corp. | | | 9,000 | | | | 1,760,930 | |
| | |
Kone OYJ, Class B | | | 59,272 | | | | 4,044,215 | |
| | |
Schindler Holding AG | | | 1,195 | | | | 311,517 | |
| | |
Schindler Holding AG (Registered) | | | 717 | | | | 184,242 | |
| | |
Sinotruk Hong Kong Ltd. | �� | | 1,314,500 | | | | 1,814,840 | |
| | |
Yaskawa Electric Corp. | | | 32,800 | | | | 1,415,269 | |
| | | | | | | | 16,314,980 | |
|
| Marine – 1.3% | |
| | |
AP Moller – Maersk A/S, Class A | | | 129 | | | | 353,587 | |
| | |
AP Moller – Maersk A/S, Class B | | | 239 | | | | 691,345 | |
| | |
Hapag-Lloyd AG(a) | | | 478 | | | | 102,833 | |
| | |
Nippon Yusen KK | | | 61,400 | | | | 4,404,753 | |
| | |
SITC International Holdings Co. Ltd. | | | 660,000 | | | | 2,235,620 | |
| | | | | | | | 7,788,138 | |
|
| Media – 0.8% | |
| | |
Publicis Groupe SA | | | 76,002 | | | | 5,096,015 | |
|
| Metals & Mining – 5.9% | |
| | |
BHP Group Ltd.(b) | | | 89,147 | | | | 2,449,335 | |
| | |
BHP Group plc | | | 40,391 | | | | 1,071,331 | |
| | |
Cia Siderurgica Nacional SA | | | 71,700 | | | | 289,751 | |
| | |
Evraz plc | | | 499,271 | | | | 4,254,079 | |
| | |
Fortescue Metals Group Ltd. | | | 350,135 | | | | 3,663,400 | |
| | |
Grupo Mexico SAB de CV, Series B | | | 1,003,800 | | | | 4,413,339 | |
| | |
Kumba Iron Ore Ltd.(b) | | | 113,286 | | | | 3,459,695 | |
| | |
MMC Norilsk Nickel PJSC | | | 15,535 | | | | 4,843,875 | |
| | |
Polymetal International plc | | | 10,755 | | | | 199,760 | |
| | |
Rio Tinto plc | | | 124,758 | | | | 7,799,004 | |
| | |
Severstal PAO | | | 56,165 | | | | 1,275,088 | |
| | |
Vedanta Ltd. | | | 493,057 | | | | 2,001,694 | |
| | |
Wheaton Precious Metals Corp. | | | 11,233 | | | | 452,745 | |
| | | | | | | | 36,173,096 | |
See Accompanying Notes to the Financial Statements.
| | | | | | |
| | FLEXSHARES ANNUAL REPORT | | | 343 | |
FlexShares® International Quality Dividend Index Fund (cont.)
| | | | | | | | |
| Investments | | Shares | | | Value | |
|
| COMMON STOCKS – (continued) | |
|
| Multiline Retail – 0.5% | |
| | |
B&M European Value Retail SA | | | 20,793 | | | $ | 180,475 | |
| | |
Wesfarmers Ltd. | | | 71,461 | | | | 3,072,857 | |
| | | | | | | | 3,253,332 | |
|
| Multi-Utilities – 0.2% | |
| | |
A2A SpA | | | 601,802 | | | | 1,266,119 | |
|
| Oil, Gas & Consumable Fuels – 7.3% | |
| | |
Adaro Energy Tbk. PT | | | 48,875,500 | | | | 5,795,718 | |
| | |
BP plc | | | 1,111,589 | | | | 5,336,035 | |
| | |
Canadian Natural Resources Ltd.(b) | | | 166,105 | | | | 7,048,625 | |
| | |
China Shenhua Energy Co. Ltd., Class H | | | 2,390,000 | | | | 5,149,266 | |
| | |
Enbridge, Inc. | | | 229,679 | | | | 9,605,550 | |
| | |
Exxaro Resources Ltd. | | | 159,891 | | | | 1,759,327 | |
| | |
Formosa Petrochemical Corp. | | | 330,000 | | | | 1,186,688 | |
| | |
Lundin Energy AB | | | 145,312 | | | | 5,739,050 | |
| | |
Petroleo Brasileiro SA (Preference) | | | 95,600 | | | | 462,143 | |
| | |
Royal Dutch Shell plc, Class A | | | 50,190 | | | | 1,156,493 | |
| | |
Royal Dutch Shell plc, Class B | | | 23,900 | | | | 552,022 | |
| | |
TotalEnergies SE | | | 23,900 | | | | 1,199,539 | |
| | | | | | | | 44,990,456 | |
|
| Personal Products – 2.3% | |
| | |
Hengan International Group Co. Ltd.(b) | | | 119,500 | | | | 624,456 | |
| | |
L’Oreal SA | | | 28,202 | | | | 12,889,890 | |
| | |
Unilever plc | | | 8,365 | | | | 448,563 | |
| | | | | | | | 13,962,909 | |
|
| Pharmaceuticals – 7.8% | |
| | |
Astellas Pharma, Inc. | | | 23,900 | | | | 401,809 | |
| | |
AstraZeneca plc | | | 22,944 | | | | 2,860,107 | |
| | |
China Medical System Holdings Ltd. | | | 239,000 | | | | 407,394 | |
| | |
Chugai Pharmaceutical Co. Ltd. | | | 109,000 | | | | 4,059,838 | |
| | |
GlaxoSmithKline plc | | | 294,209 | | | | 6,083,987 | |
| | |
Livzon Pharmaceutical Group, Inc., Class H(b) | | | 334,600 | | | | 1,105,433 | |
| | |
Novartis AG (Registered) | | | 101,814 | | | | 8,428,138 | |
| | | | | | | | |
| Investments | | Shares | | | Value | |
|
| Pharmaceuticals – (continued) | |
| | |
Novo Nordisk A/S, Class B | | | 72,178 | | | $ | 7,907,934 | |
| | |
Orion OYJ, Class B(b) | | | 84,606 | | | | 3,664,782 | |
| | |
Roche Holding AG | | | 32,504 | | | | 12,594,300 | |
| | |
Roche Holding AG – BR | | | 478 | | | | 205,586 | |
| | |
Sanofi | | | 3,585 | | | | 358,576 | |
| | | | | | | | 48,077,884 | |
|
| Professional Services – 2.0% | |
| | |
Nihon M&A Center Holdings, Inc. | | | 106,700 | | | | 3,261,123 | |
| | |
Randstad NV | | | 20,793 | | | | 1,496,700 | |
| | |
Recruit Holdings Co. Ltd. | | | 42,500 | | | | 2,822,276 | |
| | |
RELX plc | | | 61,901 | | | | 1,921,022 | |
| | |
SGS SA (Registered) | | | 1,065 | | | | 3,156,246 | |
| | | | | | | | 12,657,367 | |
|
| Real Estate Management & Development – 2.6% | |
| | |
Agile Group Holdings Ltd. | | | 3,824,000 | | | | 3,008,449 | |
| | |
China Vanke Co. Ltd., Class H | | | 71,700 | | | | 167,935 | |
| | |
CK Asset Holdings Ltd. | | | 44,000 | | | | 271,781 | |
| | |
Country Garden Holdings Co. Ltd.(b) | | | 1,615,000 | | | | 1,517,621 | |
| | |
Country Garden Services Holdings Co. Ltd. | | | 49,000 | | | | 381,088 | |
| | |
Daito Trust Construction Co. Ltd.(b) | | | 38,800 | | | | 4,804,701 | |
| | |
Hopson Development Holdings Ltd.(b) | | | 547,470 | | | | 1,495,522 | |
| | |
Land & Houses PCL, NVDR | | | 5,258,000 | | | | 1,338,962 | |
| | |
Logan Group Co. Ltd.(b) | | | 2,629,000 | | | | 2,639,460 | |
| | |
Sunac Services Holdings Ltd.(a) | | | 182,000 | | | | 369,191 | |
| | | | | | | | 15,994,710 | |
|
| Road & Rail – 0.6% | |
| | |
Aurizon Holdings Ltd. | | | 1,566,406 | | | | 3,964,898 | |
|
| Semiconductors & Semiconductor Equipment – 4.0% | |
| | |
ASML Holding NV | | | 5,497 | | | | 4,456,163 | |
| | |
Novatek Microelectronics Corp. | | | 268,000 | | | | 4,004,315 | |
| | |
Taiwan Semiconductor Manufacturing Co. Ltd. | | | 641,222 | | | | 13,604,509 | |
| | |
United Microelectronics Corp. | | | 583,000 | | | | 1,215,959 | |
See Accompanying Notes to the Financial Statements.
| | | | |
| 344 | | FLEXSHARES ANNUAL REPORT | | |
FlexShares® International Quality Dividend Index Fund (cont.)
| | | | | | | | |
| Investments | | Shares | | | Value | |
|
| COMMON STOCKS – (continued) | |
|
| Semiconductors & Semiconductor Equipment – (continued) | |
| | |
Vanguard International Semiconductor Corp. | | | 300,000 | | | $ | 1,558,876 | |
| | | | | | | | 24,839,822 | |
|
| Software – 1.9% | |
| | |
SAP SE | | | 62,140 | | | | 9,011,951 | |
| | |
Temenos AG (Registered)(b) | | | 16,491 | | | | 2,523,958 | |
| | | | | | | | 11,535,909 | |
|
| Specialty Retail – 2.1% | |
| | |
Chow Tai Fook Jewellery Group Ltd.(b) | | | 956,000 | | | | 1,956,475 | |
| | |
Industria de Diseno Textil SA(b) | | | 145,312 | | | | 5,253,391 | |
| | |
Nitori Holdings Co. Ltd. | | | 4,700 | | | | 859,623 | |
| | |
Topsports International Holdings Ltd.(a) (b) | | | 554,000 | | | | 673,712 | |
| | |
USS Co. Ltd. | | | 176,900 | | | | 2,839,088 | |
| | |
Vibra Energia SA | | | 286,800 | | | | 1,067,423 | |
| | |
Workman Co. Ltd.(b) | | | 3,000 | | | | 159,176 | |
| | | | | | | | 12,808,888 | |
|
| Technology Hardware, Storage & Peripherals – 2.0% | |
| | |
Brother Industries Ltd. | | | 158,800 | | | | 3,061,104 | |
| | |
Inventec Corp. | | | 478,000 | | | | 456,368 | |
| | |
Lite-On Technology Corp. | | | 768,000 | | | | 1,692,950 | |
| | |
Quanta Computer, Inc. | | | 1,154,000 | | | | 3,236,852 | |
| | |
Samsung Electronics Co. Ltd. | | | 60,706 | | | | 3,626,100 | |
| | | | | | | | 12,073,374 | |
|
| Textiles, Apparel & Luxury Goods – 1.9% | |
| | |
Bosideng International Holdings Ltd.(b) | | | 478,000 | | | | 371,140 | |
| | |
Eclat Textile Co. Ltd. | | | 74,000 | | | | 1,615,262 | |
| | |
Hermes International | | | 2,026 | | | | 3,213,259 | |
| | |
Li Ning Co. Ltd. | | | 392,000 | | | | 4,358,887 | |
| | |
LVMH Moet Hennessy Louis Vuitton SE | | | 2,390 | | | | 1,873,018 | |
| | | | | | | | 11,431,566 | |
|
| Tobacco – 1.6% | |
| | |
Imperial Brands plc | | | 233,981 | | | | 4,945,648 | |
| | |
Japan Tobacco, Inc.(b) | | | 229,200 | | | | 4,493,546 | |
| | | | | | | | |
| Investments | | Shares | | | Value | |
|
| Tobacco – (continued) | |
| | |
Swedish Match AB | | | 68,832 | | | $ | 605,732 | |
| | | | | | | | 10,044,926 | |
|
| Trading Companies & Distributors – 0.9% | |
| | |
Ashtead Group plc | | | 20,554 | | | | 1,725,400 | |
| | |
Marubeni Corp. | | | 47,800 | | | | 402,941 | |
| | |
MonotaRO Co. Ltd. | | | 154,100 | | | | 3,486,762 | |
| | | | | | | | 5,615,103 | |
|
| Wireless Telecommunication Services – 0.9% | |
| | |
Mobile TeleSystems PJSC | | | 169,690 | | | | 741,424 | |
| | |
Total Access Communication PCL, NVDR | | | 4,254,200 | | | | 4,903,885 | |
| | | | | | | | 5,645,309 | |
Total Common Stocks
(Cost $536,863,658) | | | | 598,831,553 | |
| | | Principal
Amount | | | | |
|
| SECURITIES LENDING REINVESTMENTS(d) – 2.8% | |
|
| REPURCHASE AGREEMENTS – 2.8% | |
| | |
Citigroup Global Markets, Inc., 0.05%, dated 10/31/2021, due 11/1/2021, repurchase price $17,256,578, collateralized by various U.S. Treasury Securities, ranging from 0.75% – 4.63%, maturing 2/15/2040 – 2/15/2042; total market value $17,412,249
(Cost $17,256,554) | | $ | 17,256,554 | | | | 17,256,554 | |
Total Investments – 100.0%
(Cost $554,120,212) | | | | 616,088,107 | |
| |
Liabilities in excess of other assets – 0.0% | | | | (81,204 | ) |
| NET ASSETS – 100.0% | | | $ | 616,006,903 | |
| (a) | Security exempt from registration pursuant to Regulation S under the Securities Act of 1933. Regulation S applies to securities offerings that are made outside of the United States and do not involve direct selling efforts in the United States and as such may have restrictions on resale. |
See Accompanying Notes to the Financial Statements.
| | | | | | |
| | FLEXSHARES ANNUAL REPORT | | | 345 | |
FlexShares® International Quality Dividend Index Fund (cont.)
| (b) | The security or a portion of this security is on loan at October 31, 2021. The total value of securities on loan at October 31, 2021 was $49,192,786, collateralized in the form of cash with a value of $17,256,554 that was reinvested in the securities shown in the Securities Lending Reinvestment section of the Schedule of Investments; $15,181,435 of collateral in the form of U.S. Government Treasury Securities, interest rates ranging from 0.00% – 6.25%, and maturity dates ranging from December 2, 2021 – August 15, 2051 and $20,265,985 of collateral in the form of Foreign Government Fixed Income Securities, interest rates ranging from 0.00% – 8.50%, and maturity dates ranging from November 17, 2021 – June 30, 2120; a total value of $52,703,974. |
| (c) | Represents less than 0.05% of net assets. |
| (d) | The security was purchased with cash collateral held from securities on loan at October 31, 2021. The total value of securities purchased was $17,256,554. |
Percentages shown are based on Net Assets.
Abbreviations
ADR – American Depositary Receipt
NVDR – Non-Voting Depositary Receipt
OYJ – Public Limited Company
PJSC – Public Joint Stock Company
Preference – A special type of equity investment that shares in the earnings of the company, has limited voting rights, and may have a dividend preference. Preference shares may also have liquidation preference.
As of October 31, 2021, the gross unrealized appreciation (depreciation) of investments based on the aggregate cost of investments (including derivative instruments, if applicable) for federal income tax purposes was as follows:
| | | | |
| | | | |
Aggregate gross unrealized appreciation | | $ | 93,708,152 | |
Aggregate gross unrealized depreciation | | | (34,226,432 | ) |
Net unrealized appreciation | | $ | 59,481,720 | |
Federal income tax cost | | $ | 556,519,712 | |
Futures Contracts
FlexShares® International Quality Dividend Index Fund had the following open futures contracts as of October 31, 2021:
| | | | | | | | | | | | | | | | | | | | |
| | | Number of
Contracts | | | Expiration
Date | | | Trading
Currency | | | Notional
Amount | | | Value and
Unrealized
Appreciation/
(Depreciation)* | |
Long Contracts | |
EURO STOXX 50 Index | | | 74 | | | | 12/17/2021 | | | | EUR | | | $ | 3,628,419 | | | $ | 71,859 | |
FTSE 100 Index | | | 35 | | | | 12/17/2021 | | | | GBP | | | | 3,465,804 | | | | 91,811 | |
Hang Seng Index | | | 1 | | | | 11/29/2021 | | | | HKD | | | | 162,642 | | | | (4,800 | ) |
MSCI Emerging Markets E-Mini Index | | | 80 | | | | 12/17/2021 | | | | USD | | | | 5,048,000 | | | | (129,356 | ) |
S&P/TSX 60 Index | | | 8 | | | | 12/16/2021 | | | | CAD | | | | 1,627,042 | | | | 34,364 | |
SPI 200 Index | | | 9 | | | | 12/16/2021 | | | | AUD | | | | 1,230,302 | | | | (14,958 | ) |
TOPIX Index | | | 13 | | | | 12/09/2021 | | | | JPY | | | | 2,271,651 | | | | (38,272 | ) |
| | | | | | | | | | | | | | | | | | | $ | 10,648 | |
| * | This amount represents the cumulative appreciation/depreciation on futures contracts. Current day’s variation margin is reported within the Statement of Assets and Liabilities for futures contracts. |
Forward Foreign Currency Contracts
FlexShares® International Quality Dividend Index Fund had the following outstanding contracts as of October 31, 2021:
| | | | | | | | | | | | | | | | | | | | | | |
| Contracts to Receive | | Counterparty | | In Exchange For | | | Maturity Date | | | Unrealized
Appreciation/
(Depreciation) | |
AUD | | | 1,158,289 | | | | | Citibank NA | | USD | | | 868,013 | | | | 12/15/2021 | | | $ | 2,126 | |
AUD | | | 283,289 | | | | | Morgan Stanley | | USD | | | 209,490 | | | | 12/15/2021 | | | | 3,324 | |
CAD | | | 685,357 | | | | | Citibank NA | | USD | | | 540,610 | | | | 12/15/2021 | | | | 12,339 | |
CHF | | | 430,575 | | | | | JPMorgan Chase Bank | | USD | | | 470,206 | | | | 12/15/2021 | | | | 1,631 | |
GBP | | | 56,261 | | | | | Morgan Stanley | | USD | | | 75,546 | | | | 12/15/2021 | | | | 1,586 | |
NOK | | | 365,576 | | | | | Toronto-Dominion Bank (The) | | USD | | | 42,068 | | | | 12/15/2021 | | | | 1,134 | |
SEK | | | 5,935,315 | | | | | Morgan Stanley | | USD | | | 689,984 | | | | 12/15/2021 | | | | 1,526 | |
See Accompanying Notes to the Financial Statements.
| | | | |
| 346 | | FLEXSHARES ANNUAL REPORT | | |
FlexShares® International Quality Dividend Index Fund (cont.)
Forward Foreign Currency Contracts (cont.)
| | | | | | | | | | | | | | | | | | | | | | |
| Contracts to Receive | | Counterparty | | In Exchange For | | | Maturity Date | | | Unrealized
Appreciation/
(Depreciation) | |
USD | | | 535,803 | | | | | Goldman Sachs & Co. | | BRL* | | | 2,843,346 | | | | 12/15/2021 | | | $ | 35,937 | |
USD | | | 186,944 | | | | | UBS AG | | CZK | | | 4,025,838 | | | | 12/15/2021 | | | | 5,764 | |
USD | | | 118,493 | | | | | Toronto-Dominion Bank (The) | | DKK | | | 749,599 | | | | 12/15/2021 | | | | 1,756 | |
USD | | | 1,490,178 | | | | | Toronto-Dominion Bank (The) | | EUR | | | 1,267,552 | | | | 12/15/2021 | | | | 21,742 | |
USD | | | 798,850 | | | | | Toronto-Dominion Bank (The) | | GBP | | | 581,042 | | | | 12/15/2021 | | | | 2,257 | |
USD | | | 445,724 | | | | | Morgan Stanley | | JPY | | | 49,857,410 | | | | 12/15/2021 | | | | 8,255 | |
USD | | | 1,034,741 | | | | | Toronto-Dominion Bank (The) | | JPY | | | 113,716,940 | | | | 12/15/2021 | | | | 36,942 | |
USD | | | 281,804 | | | | | Goldman Sachs & Co. | | KRW* | | | 328,849,715 | | | | 12/15/2021 | | | | 675 | |
USD | | | 75,701 | | | | | Citibank NA | | MXN | | | 1,532,040 | | | | 12/15/2021 | | | | 1,655 | |
USD | | | 307,864 | | | | | Morgan Stanley | | PLN | | | 1,176,488 | | | | 12/15/2021 | | | | 13,043 | |
USD | | | 146,749 | | | | | Citibank NA | | SGD | | | 197,899 | | | | 12/15/2021 | | | | 23 | |
USD | | | 57,358 | | | | | Citibank NA | | TRY | | | 518,579 | | | | 12/15/2021 | | | | 4,554 | |
USD | | | 330,632 | | | | | Toronto-Dominion Bank (The) | | TWD* | | | 9,123,516 | | | | 12/15/2021 | | | | 2,512 | |
USD | | | 56,609 | | | | | Morgan Stanley | | ZAR | | | 817,401 | | | | 12/15/2021 | | | | 3,124 | |
Total unrealized appreciation | | | $ | 161,905 | |
DKK | | | 1,195,930 | | | | | Bank of New York | | USD | | | 190,370 | | | | 12/15/2021 | | | $ | (4,123 | ) |
EUR | | | 2,659,635 | | | | | JPMorgan Chase Bank | | USD | | | 3,152,337 | | | | 12/15/2021 | | | | (71,196 | ) |
EUR | | | 72,446 | | | | | Morgan Stanley | | USD | | | 84,273 | | | | 12/15/2021 | | | | (346 | ) |
EUR | | | 203,957 | | | | | Toronto-Dominion Bank (The) | | USD | | | 241,068 | | | | 12/15/2021 | | | | (4,787 | ) |
GBP | | | 75,264 | | | | | Goldman Sachs & Co. | | USD | | | 104,178 | | | | 12/15/2021 | | | | (994 | ) |
GBP | | | 917,920 | | | | | JPMorgan Chase Bank | | USD | | | 1,265,301 | | | | 12/15/2021 | | | | (6,858 | ) |
GBP | | | 440,542 | | | | | Morgan Stanley | | USD | | | 610,003 | | | | 12/15/2021 | | | | (6,033 | ) |
HKD | | | 3,122,873 | | | | | Citibank NA | | USD | | | 401,665 | | | | 12/15/2021 | | | | (170 | ) |
HKD | | | 3,720,602 | | | | | Goldman Sachs & Co. | | USD | | | 478,586 | | | | 12/15/2021 | | | | (244 | ) |
INR* | | | 9,479,319 | | | | | Citibank NA | | USD | | | 127,617 | | | | 12/15/2021 | | | | (1,659 | ) |
JPY | | | 60,287,555 | | | | | BNP Paribas SA | | USD | | | 530,213 | | | | 12/15/2021 | | | | (1,225 | ) |
JPY | | | 265,277,169 | | | | | Toronto-Dominion Bank (The) | | USD | | | 2,417,354 | | | | 12/15/2021 | | | | (89,703 | ) |
SGD | | | 124,092 | | | | | Toronto-Dominion Bank (The) | | USD | | | 92,186 | | | | 12/15/2021 | | | | (182 | ) |
TRY | | | 1,283,264 | | | | | JPMorgan Chase Bank | | USD | | | 144,437 | | | | 12/15/2021 | | | | (13,768 | ) |
USD | | | 499,287 | | | | | Morgan Stanley | | AUD | | | 677,434 | | | | 12/15/2021 | | | | (9,620 | ) |
USD | | | 262,117 | | | | | Toronto-Dominion Bank (The) | | AUD | | | 360,258 | | | | 12/15/2021 | | | | (8,519 | ) |
USD | | | 408,708 | | | | | Toronto-Dominion Bank (The) | | CAD | | | 521,353 | | | | 12/15/2021 | | | | (11,922 | ) |
USD | | | 643,243 | | | | | Toronto-Dominion Bank (The) | | CHF | | | 597,766 | | | | 12/15/2021 | | | | (11,807 | ) |
USD | | | 529,819 | | | | | Citibank NA | | HKD | | | 4,121,407 | | | | 12/15/2021 | | | | (53 | ) |
USD | | | 60,244 | | | | | BNP Paribas SA | | NOK | | | 524,179 | | | | 12/15/2021 | | | | (1,701 | ) |
USD | | | 123,519 | | | | | Goldman Sachs & Co. | | NZD | | | 174,054 | | | | 12/15/2021 | | | | (959 | ) |
USD | | | 235,912 | | | | | Goldman Sachs & Co. | | RUB* | | | 17,581,399 | | | | 12/15/2021 | | | | (9,540 | ) |
USD | | | 283,241 | | | | | Toronto-Dominion Bank (The) | | SEK | | | 2,458,400 | | | | 12/15/2021 | | | | (3,182 | ) |
USD | | | 190,107 | | | | | Morgan Stanley | | ZAR | | | 2,915,106 | | | | 12/15/2021 | | | | (637 | ) |
Total unrealized depreciation | | | $ | (259,228 | ) |
Net unrealized depreciation | | | $ | (97,323 | ) |
| * | Non-deliverable forward. See Note 2 in the Notes to Financial Statements. |
Abbreviations:
AUD – Australian Dollar
BRL – Brazilian Real
CAD – Canadian Dollar
CHF – Swiss Franc
CZK – Czech Koruna
See Accompanying Notes to the Financial Statements.
| | | | | | |
| | FLEXSHARES ANNUAL REPORT | | | 347 | |
FlexShares® International Quality Dividend Index Fund (cont.)
DKK – Danish Krone
EUR – Euro
GBP – British Pound
HKD – Hong Kong Dollar
INR – Indian Rupee
JPY – Japanese Yen
KRW – Korean Won
MXN – Mexican Peso
NOK – Norwegian Krone
NZD – New Zealand Dollar
PLN – Polish Zloty
RUB – Russian Ruble
SEK – Swedish Krona
SGD – Singapore Dollar
TRY – Turkish Lira
TWD – Taiwan Dollar
USD – US Dollar
ZAR – South African Rand
FlexShares® International Quality Dividend Index Fund invested, as a percentage of net assets, in companies domiciled in the following countries as of October 31, 2021:
| | | | |
Australia | | | 2.7 | % |
Austria | | | 0.4 | |
Belgium | | | 0.4 | |
Brazil | | | 1.0 | |
Canada | | | 5.4 | |
Chile | | | 0.6 | |
China | | | 9.4 | |
Denmark | | | 1.5 | |
Finland | | | 1.6 | |
France | | | 5.4 | |
Germany | | | 4.6 | |
Greece | | | 0.2 | |
Hong Kong | | | 1.8 | |
India | | | 2.7 | |
Indonesia | | | 1.4 | |
Italy | | | 1.7 | |
Japan | | | 12.8 | |
Malaysia | | | 0.6 | |
Mexico | | | 0.7 | |
Netherlands | | | 1.6 | |
New Zealand | | | 0.0 | † |
Qatar | | | 0.3 | |
Russia | | | 3.7 | |
Saudi Arabia | | | 0.1 | |
Singapore | | | 0.7 | |
South Africa | | | 0.8 | |
South Korea | | | 2.0 | |
Spain | | | 3.0 | |
Sweden | | | 4.1 | |
Switzerland | | | 8.3 | |
Taiwan | | | 6.1 | |
Thailand | | | 1.0 | |
Turkey | | | 1.0 | |
United Kingdom | | | 9.6 | |
Other1 | | | 2.8 | |
| | | | 100.0 | % |
| † | Amount represents less than 0.05%. |
| 1 | Includes any non-equity securities, securities lending reinvestments and net other assets (liabilities). |
See Accompanying Notes to the Financial Statements.
| | | | |
| 348 | | FLEXSHARES ANNUAL REPORT | | |
FlexShares® International Quality Dividend Index Fund (cont.)
| | | | |
| Security Type | | % of Net Assets | |
Common Stocks | | | 97.2 | % |
Securities Lending Reinvestments | | | 2.8 | |
Others(1) | | | 0.0 | † |
| | | | 100.0 | % |
| (1) | Includes any other net assets/(liabilities). |
| † | Amount represents less than 0.05%. |
See Accompanying Notes to the Financial Statements.
| | | | | | |
| | FLEXSHARES ANNUAL REPORT | | | 349 | |
Schedule of Investments
FlexShares® International Quality Dividend Defensive Index Fund
October 31, 2021
| | | | | | | | |
| Investments | | Shares | | | Value | |
|
| COMMON STOCKS – 98.3% | |
|
| Aerospace & Defense – 0.1% | |
| | |
Bharat Electronics Ltd. | | | 20,160 | | | $ | 55,689 | |
|
| Air Freight & Logistics – 0.3% | |
| | |
Deutsche Post AG (Registered) | | | 990 | | | | 61,317 | |
| | |
SG Holdings Co. Ltd. | | | 6,000 | | | | 149,967 | |
| | | | | | | | 211,284 | |
|
| Auto Components – 0.9% | |
| | |
Bridgestone Corp. | | | 14,000 | | | | 616,233 | |
|
| Automobiles – 2.1% | |
| | |
Bajaj Auto Ltd. | | | 9,870 | | | | 488,648 | |
| | |
Ford Otomotiv Sanayi A/S | | | 24,690 | | | | 476,588 | |
| | |
Hero MotoCorp Ltd. | | | 12,120 | | | | 430,068 | |
| | |
Subaru Corp. | | | 7,200 | | | | 140,685 | |
| | | | | | | | 1,535,989 | |
|
| Banks – 8.4% | |
| | |
Banco de Chile | | | 1,678,800 | | | | 146,088 | |
| | |
Banco Santander Chile | | | 10,346,220 | | | | 453,986 | |
| | |
Bank of China Ltd., Class H | | | 1,590,000 | | | | 562,087 | |
| | |
Bank of Communications Co. Ltd., Class H | | | 180,000 | | | | 107,134 | |
| | |
BOC Hong Kong Holdings Ltd. | | | 165,000 | | | | 523,907 | |
| | |
China CITIC Bank Corp. Ltd., Class H | | | 60,000 | | | | 26,379 | |
| | |
China Everbright Bank Co. Ltd., Class H | | | 1,320,000 | | | | 464,941 | |
| | |
China Minsheng Banking Corp. Ltd., Class H(a) | | | 315,000 | | | | 125,124 | |
| | |
Commonwealth Bank of Australia | | | 12,210 | | | | 960,013 | |
| | |
Credit Agricole SA | | | 12,990 | | | | 196,026 | |
| | |
Grupo Aval Acciones y Valores SA (Preference) | | | 490,950 | | | | 148,773 | |
| | |
Hang Seng Bank Ltd. | | | 9,000 | | | | 171,229 | |
| | |
Kasikornbank PCL | | | 42,000 | | | | 177,202 | |
| | |
Malayan Banking Bhd. | | | 39,791 | | | | 77,353 | |
| | |
Masraf Al Rayan QSC | | | 59,700 | | | | 78,294 | |
| | |
National Bank of Canada | | | 2,730 | | | | 225,659 | |
| | |
Nordea Bank Abp | | | 14,520 | | | | 177,618 | |
| | |
Royal Bank of Canada | | | 9,600 | | | | 997,678 | |
| | | | | | | | |
| Investments | | Shares | | | Value | |
|
| Banks – (continued) | |
| | |
Sberbank of Russia PJSC | | | 79,800 | | | $ | 400,466 | |
| | | | | | | | 6,019,957 | |
|
| Beverages – 0.8% | |
| | |
Emperador, Inc. | | | 1,581,000 | | | | 573,940 | |
|
| Biotechnology – 0.2% | |
| | |
CSL Ltd.(a) | | | 60 | | | | 13,542 | |
| | |
Grifols SA(a) | | | 6,480 | | | | 148,442 | |
| | | | | | | | 161,984 | |
|
| Capital Markets – 2.6% | |
| | |
Abrdn plc | | | 125,100 | | | | 435,561 | |
| | |
Macquarie Korea Infrastructure Fund | | | 51,870 | | | | 608,120 | |
| | |
Moscow Exchange MICEX-RTS PJSC | | | 227,100 | | | | 556,379 | |
| | |
Singapore Exchange Ltd. | | | 39,000 | | | | 279,956 | |
| | | | | | | | 1,880,016 | |
|
| Chemicals – 0.7% | |
| | |
Evonik Industries AG | | | 4,830 | | | | 156,618 | |
| | |
Nissan Chemical Corp. | | | 6,000 | | | | 333,085 | |
| | | | | | | | 489,703 | |
|
| Construction & Engineering – 1.4% | |
| | |
ACS Actividades de Construccion y Servicios SA | | | 5,368 | | | | 140,580 | |
| | |
Bouygues SA | | | 4,080 | | | | 165,255 | |
| | |
HOCHTIEF AG | | | 1,500 | | | | 115,783 | |
| | |
Metallurgical Corp. of China Ltd., Class H | | | 1,740,000 | | | | 483,144 | |
| | |
Taisei Corp. | | | 4,000 | | | | 125,236 | |
| | | | | | | | 1,029,998 | |
|
| Construction Materials – 1.4% | |
| | |
Ambuja Cements Ltd. | | | 101,160 | | | | 546,860 | |
| | |
China Resources Cement Holdings Ltd. | | | 540,000 | | | | 455,377 | |
| | | | | | | | 1,002,237 | |
|
| Diversified Financial Services – 1.7% | |
| | |
Banca Mediolanum SpA | | | 53,460 | | | | 538,611 | |
See Accompanying Notes to the Financial Statements.
| | | | |
| 350 | | FLEXSHARES ANNUAL REPORT | | |
FlexShares® International Quality Dividend Defensive Index Fund (cont.)
| | | | | | | | |
| Investments | | Shares | | | Value | |
|
| COMMON STOCKS – (continued) | |
|
| Diversified Financial Services – (continued) | |
| | |
Power Finance Corp. Ltd. | | | 101,760 | | | $ | 180,876 | |
| | |
REC Ltd. | | | 265,560 | | | | 527,175 | |
| | | | | | | | 1,246,662 | |
|
| Diversified Telecommunication Services – 2.8% | |
| | |
Hellenic Telecommunications Organization SA | | | 8,700 | | | | 154,042 | |
| | |
Koninklijke KPN NV | | | 168,060 | | | | 502,750 | |
| | |
Nippon Telegraph & Telephone Corp. | | | 8,000 | | | | 223,670 | |
| | |
Orange SA | | | 17,490 | | | | 190,967 | |
| | |
Proximus SADP | | | 7,560 | | | | 142,474 | |
| | |
Spark New Zealand Ltd. | | | 9,440 | | | | 30,840 | |
| | |
Telefonica Deutschland Holding AG | | | 52,530 | | | | 136,961 | |
| | |
Telefonica SA(a) | | | 46,997 | | | | 204,741 | |
| | |
Telenor ASA(a) | | | 25,290 | | | | 398,664 | |
| | | | | | | | 1,985,109 | |
|
| Electric Utilities – 3.2% | |
| | |
CPFL Energia SA | | | 15,000 | | | | 70,011 | |
| | |
EDP – Energias de Portugal SA | | | 30,180 | | | | 170,578 | |
| | |
Endesa SA | | | 5,760 | | | | 132,948 | |
| | |
Enel SpA | | | 54,690 | | | | 457,966 | |
| | |
Iberdrola SA | | | 9,120 | | | | 107,810 | |
| | |
Red Electrica Corp. SA | | | 9,690 | | | | 201,960 | |
| | |
SSE plc | | | 27,090 | | | | 610,291 | |
| | |
Transmissora Alianca de Energia Eletrica SA | | | 21,000 | | | | 136,573 | |
| | |
Verbund AG | | | 3,690 | | | | 384,750 | |
| | | | | | | | 2,272,887 | |
|
| Electrical Equipment – 0.1% | |
| | |
Mitsubishi Electric Corp. | | | 3,000 | | | | 40,123 | |
|
| Electronic Equipment, Instruments & Components – 0.3% | |
| | |
Kingboard Laminates Holdings Ltd. | | | 150,000 | | | | 235,247 | |
|
| Equity Real Estate Investment Trusts (REITs) – 0.1% | |
| | |
Gecina SA | | | 360 | | | | 50,431 | |
|
| Food & Staples Retailing – 1.7% | |
| | |
BIM Birlesik Magazalar A/S | | | 16,440 | | | | 106,264 | |
| | | | | | | | |
| Investments | | Shares | | | Value | |
|
| Food & Staples Retailing – (continued) | |
| | |
Etablissements Franz Colruyt NV | | | 2,340 | | | $ | 114,926 | |
| | |
ICA Gruppen AB | | | 3,210 | | | | 165,947 | |
| | |
Magnit PJSC | | | 7,380 | | | | 672,571 | |
| | |
Welcia Holdings Co. Ltd. | | | 3,900 | | | | 145,534 | |
| | | | | | | | 1,205,242 | |
|
| Food Products – 3.6% | |
| | |
Nestle SA (Registered) | | | 17,130 | | | | 2,265,003 | |
| | |
Orkla ASA | | | 12,810 | | | | 124,416 | |
| | |
Sime Darby Plantation Bhd. | | | 36,000 | | | | 34,861 | |
| | |
Uni-President Enterprises Corp. | | | 60,000 | | | | 143,697 | |
| | | | | | | | 2,567,977 | |
|
| Gas Utilities – 1.8% | |
| | |
Enagas SA | | | 22,470 | | | | 504,596 | |
| | |
Naturgy Energy Group SA(a) | | | 21,060 | | | | 553,968 | |
| | |
Snam SpA | | | 34,698 | | | | 196,636 | |
| | | | | | | | 1,255,200 | |
|
| Health Care Equipment & Supplies – 2.1% | |
| | |
Coloplast A/S, Class B | | | 2,700 | | | | 440,595 | |
| | |
Fisher & Paykel Healthcare Corp. Ltd. | | | 24,210 | | | | 540,741 | |
| | |
Hartalega Holdings Bhd. | | | 90,000 | | | | 127,361 | |
| | |
Top Glove Corp. Bhd. | | | 609,000 | | | | 400,019 | |
| | | | | | | | 1,508,716 | |
|
| Hotels, Restaurants & Leisure – 0.2% | |
| | |
McDonald’s Holdings Co. Japan Ltd.(a) | | | 3,200 | | | | 142,846 | |
|
| Household Durables – 1.3% | |
| | |
Electrolux AB, Class B(a) | | | 7,980 | | | | 181,091 | |
| | |
Persimmon plc | | | 13,800 | | | | 514,714 | |
| | |
SEB SA | | | 90 | | | | 14,092 | |
| | |
Sekisui House Ltd. | | | 9,000 | | | | 186,393 | |
| | |
Sony Group Corp. | | | 300 | | | | 34,572 | |
| | | | | | | | 930,862 | |
|
| Industrial Conglomerates – 3.0% | |
| | |
Aboitiz Equity Ventures, Inc. | | | 183,000 | | | | 175,703 | |
| | |
Alfa SAB de CV, Class A | | | 69,000 | | | | 50,080 | |
| | |
CITIC Ltd. | | | 30,000 | | | | 30,081 | |
| | |
Enka Insaat ve Sanayi A/S | | | 369,180 | | | | 422,352 | |
See Accompanying Notes to the Financial Statements.
| | | | | | |
| | FLEXSHARES ANNUAL REPORT | | | 351 | |
FlexShares® International Quality Dividend Defensive Index Fund (cont.)
| | | | | | | | |
| Investments | | Shares | | | Value | |
|
| COMMON STOCKS – (continued) | |
|
| Industrial Conglomerates – (continued) | |
| | |
Jardine Matheson Holdings Ltd. | | | 9,000 | | | $ | 521,370 | |
| | |
Siemens AG (Registered) | | | 5,130 | | | | 832,799 | |
| | |
Toshiba Corp.(a) | | | 3,000 | | | | 129,182 | |
| | | | | | | | 2,161,567 | |
|
| Insurance – 6.3% | |
| | |
Ageas SA | | | 3,600 | | | | 175,393 | |
| | |
AIA Group Ltd. | | | 6,000 | | | | 67,759 | |
| | |
Allianz SE (Registered) | | | 1,830 | | | | 425,989 | |
| | |
Aviva plc | | | 35,190 | | | | 190,390 | |
| | |
BB Seguridade Participacoes SA | | | 99,000 | | | | 387,956 | |
| | |
Direct Line Insurance Group plc | | | 38,160 | | | | 152,948 | |
| | |
Great-West Lifeco, Inc.(a) | | | 13,110 | | | | 385,087 | |
| | |
Legal & General Group plc | | | 56,400 | | | | 223,349 | |
| | |
Medibank Pvt Ltd. | | | 77,370 | | | | 192,934 | |
| | |
Muenchener Rueckversicherungs-Gesellschaft AG in Muenchen (Registered) | | | 990 | | | | 293,523 | |
| | |
PICC Property & Casualty Co. Ltd., Class H | | | 582,000 | | | | 544,663 | |
| | |
Sampo OYJ, Class A | | | 4,170 | | | | 221,984 | |
| | |
SCOR SE | | | 18,210 | | | | 613,240 | |
| | |
Zurich Insurance Group AG | | | 1,440 | | | | 639,667 | |
| | | | | | | | 4,514,882 | |
|
| Interactive Media & Services – 0.8% | |
| | |
Tencent Holdings Ltd. | | | 9,000 | | | | 556,495 | |
|
| Internet & Direct Marketing Retail – 0.7% | |
| | |
ZOZO, Inc. | | | 15,000 | | | | 479,500 | |
|
| IT Services – 3.4% | |
| | |
Edenred | | | 718 | | | | 38,862 | |
| | |
Itochu Techno-Solutions Corp. | | | 12,000 | | | | 377,812 | |
| | |
Mindtree Ltd. | | | 12,300 | | | | 737,922 | |
| | |
NTT Data Corp. | | | 9,000 | | | | 180,197 | |
| | |
Otsuka Corp.(a) | | | 9,000 | | | | 442,008 | |
| | |
Tata Consultancy Services Ltd. | | | 13,860 | | | | 628,900 | |
| | | | | | | | 2,405,701 | |
|
| Leisure Products – 0.9% | |
| | |
Shimano, Inc. | | | 2,200 | | | | 609,305 | |
| | | | | | | | |
| Investments | | Shares | | | Value | |
|
| Life Sciences Tools & Services – 0.1% | |
| | |
Sartorius Stedim Biotech | | | 180 | | | $ | 99,195 | |
|
| Machinery – 1.4% | |
| | |
Atlas Copco AB, Class B | | | 1,200 | | | | 64,901 | |
| | |
Knorr-Bremse AG | | | 1,470 | | | | 155,043 | |
| | |
Kone OYJ, Class B | | | 6,960 | | | | 474,891 | |
| | |
Rational AG | | | 120 | | | | 119,373 | |
| | |
Sinotruk Hong Kong Ltd. | | | 150,000 | | | | 207,095 | |
| | | | | | | | 1,021,303 | |
|
| Marine – 0.6% | |
| | |
SITC International Holdings Co. Ltd. | | | 132,000 | | | | 447,124 | |
|
| Media – 0.5% | |
| | |
Publicis Groupe SA | | | 3,424 | | | | 229,583 | |
| | |
Quebecor, Inc., Class B | | | 6,210 | | | | 158,012 | |
| | | | | | | | 387,595 | |
|
| Metals & Mining – 4.6% | |
| | |
Evolution Mining Ltd. | | | 64,020 | | | | 174,550 | |
| | |
Fortescue Metals Group Ltd. | | | 34,860 | | | | 364,734 | |
| | |
Fresnillo plc(a) | | | 46,620 | | | | 551,622 | |
| | |
Grupo Mexico SAB de CV, Series B | | | 60,000 | | | | 263,798 | |
| | |
Kumba Iron Ore Ltd. | | | 11,700 | | | | 357,312 | |
| | |
Magnitogorsk Iron & Steel Works PJSC | | | 172,884 | | | | 161,223 | |
| | |
Novolipetsk Steel PJSC | | | 47,108 | | | | 148,478 | |
| | |
Polymetal International plc | | | 7,170 | | | | 133,173 | |
| | |
Rio Tinto Ltd. | | | 420 | | | | 28,483 | |
| | |
Rio Tinto plc | | | 15,060 | | | | 941,447 | |
| | |
Severstal PAO | | | 6,212 | | | | 141,028 | |
| | | | | | | | 3,265,848 | |
|
| Multiline Retail – 1.4% | |
| | |
Canadian Tire Corp. Ltd., Class A(a) | | | 900 | | | | 127,629 | |
| | |
Dollarama, Inc. | | | 4,080 | | | | 184,127 | |
| | |
Wesfarmers Ltd. | | | 15,300 | | | | 657,907 | |
| | | | | | | | 969,663 | |
|
| Oil, Gas & Consumable Fuels – 7.0% | |
| | |
BP plc | | | 131,880 | | | | 633,072 | |
See Accompanying Notes to the Financial Statements.
| | | | |
| 352 | | FLEXSHARES ANNUAL REPORT | | |
FlexShares® International Quality Dividend Defensive Index Fund (cont.)
| | | | | | | | |
| Investments | | Shares | | | Value | |
|
| COMMON STOCKS – (continued) | |
|
| Oil, Gas & Consumable Fuels – (continued) | |
| | |
China Petroleum & Chemical Corp., Class H | | | 360,000 | | | $ | 176,783 | |
| | |
China Shenhua Energy Co. Ltd., Class H | | | 255,000 | | | | 549,399 | |
| | |
Enbridge, Inc. | | | 27,030 | | | | 1,130,439 | |
| | |
Equinor ASA | | | 9,900 | | | | 250,154 | |
| | |
Exxaro Resources Ltd. | | | 47,250 | | | | 519,905 | |
| | |
LUKOIL PJSC | | | 420 | | | | 42,849 | |
| | |
Neste OYJ | | | 8,850 | | | | 493,546 | |
| | |
Royal Dutch Shell plc, Class A | | | 26,430 | | | | 609,008 | |
| | |
Royal Dutch Shell plc, Class B | | | 2,970 | | | | 68,598 | |
| | |
Surgutneftegas PJSC (Preference) | | | 276,000 | | | | 150,230 | |
| | |
TotalEnergies SE | | | 7,800 | | | | 391,481 | |
| | | | | | | | 5,015,464 | |
|
| Personal Products – 1.5% | |
| | |
L’Oreal SA | | | 2,250 | | | | 1,028,376 | |
| | |
Unilever plc | | | 1,110 | | | | 59,522 | |
| | | | | | | | 1,087,898 | |
|
| Pharmaceuticals – 8.6% | |
| | |
AstraZeneca plc | | | 1,140 | | | | 142,108 | |
| | |
Chugai Pharmaceutical Co. Ltd. | | | 12,000 | | | | 446,955 | |
| | |
Daiichi Sankyo Co. Ltd. | | | 27,000 | | | | 678,877 | |
| | |
GlaxoSmithKline plc | | | 42,090 | | | | 870,385 | |
| | |
Novartis AG (Registered) | | | 7,440 | | | | 615,881 | |
| | |
Novo Nordisk A/S, Class B | | | 1,230 | | | | 134,761 | |
| | |
Orion OYJ, Class B | | | 10,530 | | | | 456,116 | |
| | |
Roche Holding AG | | | 7,050 | | | | 2,731,658 | |
| | |
Sanofi | | | 630 | | | | 63,013 | |
| | | | | | | | 6,139,754 | |
|
| Professional Services – 0.0%(b) | |
| | |
RELX plc | | | 510 | | | | 15,827 | |
|
| Real Estate Management & Development – 1.9% | |
| | |
Agile Group Holdings Ltd. | | | 450,000 | | | | 354,028 | |
| | |
Daito Trust Construction Co. Ltd. | | | 5,000 | | | | 619,162 | |
| | |
Deutsche Wohnen SE*(c) | | | 390 | | | | 23,920 | |
| | |
Guangzhou R&F Properties Co. Ltd., Class H(a) | | | 168,000 | | | | 105,391 | |
| | |
KWG Group Holdings Ltd.(a) | | | 105,000 | | | | 91,785 | |
| | | | | | | | |
| Investments | | Shares | | | Value | |
|
| Real Estate Management & Development – (continued) | |
| | |
Land & Houses PCL, NVDR | | | 570,000 | | | $ | 145,152 | |
| | | | | | | | 1,339,438 | |
|
| Road & Rail – 1.1% | |
| | |
Aurizon Holdings Ltd. | | | 183,360 | | | | 464,122 | |
| | |
Canadian National Railway Co. | | | 2,340 | | | | 310,502 | |
| | | | | | | | 774,624 | |
|
| Semiconductors & Semiconductor Equipment – 2.9% | |
| | |
ASML Holding NV | | | 660 | | | | 535,031 | |
| | |
Novatek Microelectronics Corp. | | | 33,000 | | | | 493,069 | |
| | |
Taiwan Semiconductor Manufacturing Co. Ltd. | | | 48,000 | | | | 1,018,394 | |
| | | | | | | | 2,046,494 | |
|
| Software – 0.1% | |
| | |
SAP SE | | | 330 | | | | 47,859 | |
|
| Specialty Retail – 1.3% | |
| | |
Home Product Center PCL, NVDR | | | 360,000 | | | | 158,397 | |
| | |
Industria de Diseno Textil SA(a) | | | 17,010 | | | | 614,954 | |
| | |
USS Co. Ltd. | | | 11,100 | | | | 178,145 | |
| | | | | | | | 951,496 | |
|
| Technology Hardware, Storage & Peripherals – 4.2% | |
| | |
Asustek Computer, Inc. | | | 15,000 | | | | 190,409 | |
| | |
Compal Electronics, Inc. | | | 180,000 | | | | 158,261 | |
| | |
FUJIFILM Holdings Corp. | | | 7,700 | | | | 594,323 | |
| | |
Inventec Corp. | | | 168,000 | | | | 160,397 | |
| | |
Lite-On Technology Corp. | | | 270,000 | | | | 595,178 | |
| | |
Logitech International SA (Registered) | | | 4,200 | | | | 350,341 | |
| | |
Pegatron Corp. | | | 60,000 | | | | 146,718 | |
| | |
Quanta Computer, Inc. | | | 54,000 | | | | 151,464 | |
| | |
Samsung Electronics Co. Ltd. | | | 8,250 | | | | 492,790 | |
| | |
Wistron Corp. | | | 150,000 | | | | 157,506 | |
| | | | | | | | 2,997,387 | |
|
| Textiles, Apparel & Luxury Goods – 1.9% | |
| | |
Bosideng International Holdings Ltd.(a) | | | 300,000 | | | | 232,933 | |
| | |
Li Ning Co. Ltd. | | | 48,000 | | | | 533,741 | |
| | |
LVMH Moet Hennessy Louis Vuitton SE | | | 240 | | | | 188,086 | |
See Accompanying Notes to the Financial Statements.
| | | | | | |
| | FLEXSHARES ANNUAL REPORT | | | 353 | |
FlexShares® International Quality Dividend Defensive Index Fund (cont.)
| | | | | | | | |
| Investments | | Shares | | | Value | |
|
| COMMON STOCKS – (continued) | |
|
| Textiles, Apparel & Luxury Goods – (continued) | |
| | |
Page Industries Ltd. | | | 750 | | | $ | 376,957 | |
| | | | | | | | 1,331,717 | |
|
| Tobacco – 2.9% | |
| | |
British American Tobacco plc | | | 14,910 | | | | 520,451 | |
| | |
Imperial Brands plc | | | 27,660 | | | | 584,648 | |
| | |
ITC Ltd. | | | 86,550 | | | | 257,981 | |
| | |
Japan Tobacco, Inc.(a) | | | 30,000 | | | | 588,161 | |
| | |
Swedish Match AB | | | 16,410 | | | | 144,410 | |
| | | | | | | | 2,095,651 | |
|
| Trading Companies & Distributors – 1.0% | |
| | |
ITOCHU Corp.(a) | | | 9,000 | | | | 255,891 | |
| | |
Mitsubishi Corp. | | | 9,000 | | | | 285,095 | |
| | |
Sumitomo Corp. | | | 13,500 | | | | 191,445 | |
| | | | | | | | 732,431 | |
|
| Transportation Infrastructure – 0.7% | |
| | |
Westports Holdings Bhd. | | | 471,000 | | | | 508,421 | |
|
| Wireless Telecommunication Services – 1.7% | |
| | |
Globe Telecom, Inc. | | | 3,450 | | | | 205,042 | |
| | |
KDDI Corp. | | | 12,000 | | | | 371,287 | |
| | |
Mobile TeleSystems PJSC | | | 39,300 | | | | 171,713 | |
| | |
SoftBank Corp. | | | 14,400 | | | | 196,315 | |
| | |
Vodafone Group plc | | | 176,820 | | | | 261,863 | |
| | | | | | | | 1,206,220 | |
Total Common Stocks
(Cost $62,598,237) | | | | | | | 70,227,191 | |
| | | | | | | | |
| Investments | | Principal
Amount | | | Value | |
|
| SECURITIES LENDING REINVESTMENTS(d) – 2.3% | |
|
| REPURCHASE AGREEMENTS – 2.3% | |
| | |
Citigroup Global Markets, Inc., 0.05%, dated 10/31/2021, due 11/1/2021, repurchase price $1,625,155, collateralized by various U.S. Treasury Securities, ranging from 0.75% – 4.63%, maturing 2/15/2040 – 2/15/2042; total market value $1,639,815
(Cost $1,625,153) | | $ | 1,625,153 | | | $ | 1,625,153 | |
Total Investments – 100.6%
(Cost $64,223,390) | | | | 71,852,344 | |
| |
Liabilities in excess of other assets – (0.6%) | | | | (393,753 | ) |
| NET ASSETS – 100.0% | | | $ | 71,458,591 | |
| (a) | The security or a portion of this security is on loan at October 31, 2021. The total value of securities on loan at October 31, 2021 was $4,373,582, collateralized in the form of cash with a value of $1,625,153 that was reinvested in the securities shown in the Securities Lending Reinvestment section of the Schedule of Investments; $988,552 of collateral in the form of U.S. Government Treasury Securities, interest rates ranging from 0.00% – 6.25%, and maturity dates ranging from November 12, 2021 – August 15, 2051 and $2,143,314 of collateral in the form of Foreign Government Fixed Income Securities, interest rates ranging from 0.00% – 8.50%, and maturity dates ranging from December 10, 2021 – June 30, 2120; a total value of $4,757,019. |
| (b) | Represents less than 0.05% of net assets. |
| (c) | Security fair valued as of October 31, 2021 in accordance with procedures approved by the Board of Trustees. Total value of all such securities at October 31, 2021 amounted to $23,920, which represents approximately 0.03% of net assets of the Fund. |
| (d) | The security was purchased with cash collateral held from securities on loan at October 31, 2021. The total value of securities purchased was $1,625,153. |
Percentages shown are based on Net Assets.
Abbreviations
NVDR – Non-Voting Depositary Receipt
OYJ – Public Limited Company
PJSC – Public Joint Stock Company
Preference – A special type of equity investment that shares in the earnings of the company, has limited voting rights, and may have a dividend preference. Preference shares may also have liquidation preference.
See Accompanying Notes to the Financial Statements.
| | | | |
| 354 | | FLEXSHARES ANNUAL REPORT | | |
FlexShares® International Quality Dividend Defensive Index Fund (cont.)
As of October 31, 2021, the gross unrealized appreciation (depreciation) of investments based on the aggregate cost of investments (including derivative instruments, if applicable) for federal income tax purposes was as follows:
| | | | |
| | | | |
Aggregate gross unrealized appreciation | | $ | 11,408,376 | |
Aggregate gross unrealized depreciation | | | (4,020,306 | ) |
Net unrealized appreciation | | $ | 7,388,070 | |
Federal income tax cost | | $ | 64,462,563 | |
Futures Contracts
FlexShares® International Quality Dividend Defensive Index Fund had the following open futures contracts as of October 31, 2021:
| | | | | | | | | | | | | | | | | | | | |
| | | Number of
Contracts | | | Expiration
Date | | | Trading
Currency | | | Notional
Amount | | | Value and
Unrealized
Depreciation* | |
Long Contracts | |
MSCI EAFE E-Mini Index | | | 8 | | | | 12/17/2021 | | | | USD | | | $ | 935,840 | | | $ | (6,425 | ) |
MSCI Emerging Markets E-Mini Index | | | 6 | | | | 12/17/2021 | | | | USD | | | | 378,600 | | | | (8,807 | ) |
| | | | | | | | | | | | | | | | | | | $ | (15,232 | ) |
| * | This amount represents the cumulative appreciation/depreciation on futures contracts. Current day’s variation margin is reported within the Statement of Assets and Liabilities for futures contracts. |
Forward Foreign Currency Contracts
FlexShares® International Quality Dividend Defensive Index Fund had the following outstanding contracts as of October 31, 2021:
| | | | | | | | | | | | | | | | | | | | | | |
| Contracts to Receive | | Counterparty | | In Exchange For | | | Maturity Date | | | Unrealized
Appreciation/
(Depreciation) | |
NOK | | | 59,477 | | | | | BNP Paribas SA | | USD | | | 6,836 | | | | 12/15/2021 | | | $ | 193 | |
USD | | | 18,844 | | | | | Goldman Sachs & Co. | | BRL* | | | 100,000 | | | | 12/15/2021 | | | | 1,264 | |
USD | | | 142,230 | | | | | JPMorgan Chase Bank | | EUR | | | 120,000 | | | | 12/15/2021 | | | | 3,212 | |
USD | | | 72,900 | | | | | Toronto-Dominion Bank (The) | | JPY | | | 8,000,000 | | | | 12/15/2021 | | | | 2,705 | |
USD | | | 207,763 | | | | | Morgan Stanley | | ZAR | | | 3,000,000 | | | | 12/15/2021 | | | | 11,464 | |
Total unrealized appreciation | | | | | | | $ | 18,838 | |
USD | | | 284,974 | | | | | Morgan Stanley | | AUD | | | 385,364 | | | | 12/15/2021 | | | $ | (4,522 | ) |
USD | | | 229,329 | | | | | JPMorgan Chase Bank | | CHF | | | 210,000 | | | | 12/15/2021 | | | | (795 | ) |
Total unrealized depreciation | | | | | | | $ | (5,317 | ) |
Net unrealized appreciation | | | | | | | $ | 13,521 | |
| * | Non-deliverable forward. See Note 2 in the Notes to Financial Statements. |
Abbreviations:
AUD – Australian Dollar
BRL – Brazilian Real
CHF – Swiss Franc
EUR – Euro
JPY – Japanese Yen
NOK – Norwegian Krone
USD – US Dollar
ZAR – South African Rand
See Accompanying Notes to the Financial Statements.
| | | | | | |
| | FLEXSHARES ANNUAL REPORT | | | 355 | |
FlexShares® International Quality Dividend Defensive Index Fund (cont.)
FlexShares® International Quality Dividend Defensive Index Fund invested, as a percentage of net assets, in companies domiciled in the following countries as of October 31, 2021:
| | | | |
Australia | | | 4.0 | % |
Austria | | | 0.5 | |
Belgium | | | 0.6 | |
Brazil | | | 0.8 | |
Canada | | | 4.9 | |
Chile | | | 0.9 | |
China | | | 8.2 | |
Colombia | | | 0.2 | |
Denmark | | | 0.8 | |
Finland | | | 2.3 | |
France | | | 4.6 | |
Germany | | | 3.3 | |
Greece | | | 0.2 | |
Hong Kong | | | 1.7 | |
India | | | 5.9 | |
Italy | | | 1.7 | |
Japan | | | 12.3 | |
Malaysia | | | 1.6 | |
Mexico | | | 0.4 | |
Netherlands | | | 1.5 | |
New Zealand | | | 0.8 | |
Norway | | | 1.1 | |
Philippines | | | 1.3 | |
Portugal | | | 0.2 | |
Qatar | | | 0.1 | |
Russia | | | 3.4 | |
Singapore | | | 1.1 | |
South Africa | | | 1.2 | |
South Korea | | | 1.6 | |
Spain | | | 3.7 | |
Sweden | | | 1.0 | |
Switzerland | | | 9.3 | |
Taiwan | | | 4.5 | |
Thailand | | | 0.7 | |
Turkey | | | 1.4 | |
United Kingdom | | | 10.5 | |
Other1 | | | 1.7 | |
| | | | 100.0 | % |
| 1 | Includes any non-equity securities, securities lending reinvestments and net other assets (liabilities). |
| | | | |
| Security Type | | % of
Net Assets | |
Common Stocks | | | 98.3 | % |
Securities Lending Reinvestments | | | 2.3 | |
Others(1) | | | (0.6 | ) |
| | | | 100.0 | % |
| (1) | Includes any other net assets/(liabilities). |
See Accompanying Notes to the Financial Statements.
| | | | |
| 356 | | FLEXSHARES ANNUAL REPORT | | |
Schedule of Investments
FlexShares® International Quality Dividend Dynamic Index Fund
October 31, 2021
| | | | | | | | |
| Investments | | Shares | | | Value | |
|
| COMMON STOCKS – 97.9% | |
|
| Auto Components – 1.3% | |
| | |
Fuyao Glass Industry Group Co. Ltd., Class H(a) | | | 90,000 | | | $ | 519,472 | |
| | |
Koito Manufacturing Co. Ltd. | | | 2,500 | | | | 141,197 | |
| | |
Magna International, Inc. | | | 2,225 | | | | 180,703 | |
| | |
Nexteer Automotive Group Ltd.(b) | | | 100,000 | | | | 123,409 | |
| | | | | | | | 964,781 | |
|
| Automobiles – 3.0% | |
| | |
Daimler AG (Registered) | | | 11,575 | | | | 1,148,502 | |
| | |
Ford Otomotiv Sanayi A/S | | | 27,950 | | | | 539,515 | |
| | |
Geely Automobile Holdings Ltd. | | | 50,000 | | | | 173,864 | |
| | |
Isuzu Motors Ltd. | | | 12,500 | | | | 167,617 | |
| | |
Porsche Automobil Holding SE (Preference) | | | 2,150 | | | | 223,480 | |
| | | | | | | | 2,252,978 | |
|
| Banks – 8.1% | |
| | |
Agricultural Bank of China Ltd., Class H | | | 425,000 | | | | 144,780 | |
| | |
Australia & New Zealand Banking Group Ltd. | | | 18,600 | | | | 393,129 | |
| | |
BNP Paribas SA | | | 7,425 | | | | 497,510 | |
| | |
China Construction Bank Corp., Class H | | | 700,000 | | | | 476,022 | |
| | |
China Everbright Bank Co. Ltd., Class H | | | 500,000 | | | | 176,114 | |
| | |
China Merchants Bank Co. Ltd., Class H | | | 27,000 | | | | 227,515 | |
| | |
Credit Agricole SA | | | 14,100 | | | | 212,777 | |
| | |
DBS Group Holdings Ltd. | | | 12,863 | | | | 300,757 | |
| | |
DNB Bank ASA(b) | | | 9,575 | | | | 227,283 | |
| | |
Hana Financial Group, Inc. | | | 16,425 | | | | 632,515 | |
| | |
Hang Seng Bank Ltd. | | | 10,000 | | | | 190,255 | |
| | |
ING Groep NV | | | 26,975 | | | | 409,565 | |
| | |
National Bank of Canada | | | 2,925 | | | | 241,778 | |
| | |
Nordea Bank Abp | | | 56,825 | | | | 695,119 | |
| | |
Royal Bank of Canada | | | 9,650 | | | | 1,002,874 | |
| | |
Sberbank of Russia PJSC (Preference) | | | 65,000 | | | | 293,933 | |
| | | | | | | | |
| Investments | | Shares | | | Value | |
|
| Banks – (continued) | |
| | |
Skandinaviska Enskilda Banken AB, Class A | | | 3,775 | | | $ | 59,008 | |
| | | | | | | | 6,180,934 | |
|
| Beverages – 1.1% | |
| | |
Anheuser-Busch InBev SA/NV(b) | | | 4,900 | | | | 299,234 | |
| | |
Thai Beverage PCL | | | 987,500 | | | | 519,929 | |
| | | | | | | | 819,163 | |
|
| Building Products – 0.3% | |
| | |
Cie de Saint-Gobain | | | 3,650 | | | | 251,579 | |
|
| Capital Markets – 3.2% | |
| | |
Abrdn plc | | | 152,925 | | | | 532,440 | |
| | |
Macquarie Group Ltd.(c) | | | 2,600 | | | | 386,334 | |
| | |
Magellan Financial Group Ltd. | | | 4,450 | | | | 115,881 | |
| | |
Meritz Securities Co. Ltd. | | | 137,050 | | | | 546,535 | |
| | |
SBI Holdings, Inc. | | | 23,200 | | | | 598,591 | |
| | |
St James’s Place plc | | | 10,650 | | | | 230,583 | |
| | | | | | | | 2,410,364 | |
|
| Chemicals – 3.0% | |
| | |
BASF SE | | | 6,625 | | | | 477,487 | |
| | |
Evonik Industries AG | | | 4,625 | | | | 149,971 | |
| | |
Nippon Sanso Holdings Corp. | | | 7,500 | | | | 176,606 | |
| | |
Nissan Chemical Corp.(b) | | | 8,300 | | | | 460,768 | |
| | |
Shin-Etsu Chemical Co. Ltd. | | | 2,500 | | | | 444,091 | |
| | |
Wacker Chemie AG | | | 3,300 | | | | 595,561 | |
| | | | | | | | 2,304,484 | |
|
| Construction & Engineering – 1.1% | |
| | |
ACS Actividades de Construccion y Servicios SA | | | 5,949 | | | | 155,796 | |
| | |
Bouygues SA | | | 4,500 | | | | 182,267 | |
| | |
HOCHTIEF AG | | | 6,700 | | | | 517,163 | |
| | | | | | | | 855,226 | |
|
| Construction Materials – 0.4% | |
| | |
China Resources Cement Holdings Ltd. | | | 300,000 | | | | 252,987 | |
| | |
CRH plc | | | 1,200 | | | | 57,603 | |
| | | | | | | | 310,590 | |
See Accompanying Notes to the Financial Statements.
| | | | | | |
| | FLEXSHARES ANNUAL REPORT | | | 357 | |
FlexShares® International Quality Dividend Dynamic Index Fund (cont.)
| | | | | | | | |
| Investments | | Shares | | | Value | |
|
| COMMON STOCKS – (continued) | |
|
| Diversified Financial Services – 2.2% | |
| | |
Banca Mediolanum SpA | | | 57,450 | | | $ | 578,810 | |
| | |
M&G plc | | | 204,225 | | | | 559,323 | |
| | |
REC Ltd. | | | 274,400 | | | | 544,723 | |
| | | | | | | | 1,682,856 | |
|
| Diversified Telecommunication Services – 1.5% | |
| | |
Telefonica SA(b) | | | 123,875 | | | | 539,657 | |
| | |
Telenor ASA(b) | | | 8,125 | | | | 128,080 | |
| | |
Turk Telekomunikasyon A/S | | | 651,475 | | | | 510,196 | |
| | | | | | | | 1,177,933 | |
|
| Electric Utilities – 2.3% | |
| | |
Endesa SA(b) | | | 23,925 | | | | 552,222 | |
| | |
Enel SpA | | | 26,350 | | | | 220,651 | |
| | |
Fortum OYJ | | | 6,900 | | | | 205,215 | |
| | |
SSE plc | | | 28,150 | | | | 634,171 | |
| | |
Transmissora Alianca de Energia Eletrica SA | | | 20,000 | | | | 130,069 | |
| | | | | | | | 1,742,328 | |
|
| Electrical Equipment – 2.6% | |
| | |
Fuji Electric Co. Ltd. | | | 3,400 | | | | 165,490 | |
| | |
Mitsubishi Electric Corp. | | | 40,000 | | | | 534,971 | |
| | |
Schneider Electric SE | | | 3,850 | | | | 663,411 | |
| | |
WEG SA | | | 92,500 | | | | 607,149 | |
| | | | | | | | 1,971,021 | |
|
Electronic Equipment, Instruments &
Components – 0.3% | |
| | |
Omron Corp. | | | 2,500 | | | | 238,325 | |
|
| Entertainment – 0.4% | |
| | |
Nintendo Co. Ltd.(b) | | | 700 | | | | 308,178 | |
|
| Equity Real Estate Investment Trusts (REITs) – 0.6% | |
| | |
Growthpoint Properties Ltd. | | | 152,775 | | | | 130,261 | |
| | |
RioCan REIT(b) | | | 9,925 | | | | 178,475 | |
| | |
Stockland | | | 47,425 | | | | 162,075 | |
| | | | | | | | 470,811 | |
|
| Food & Staples Retailing – 0.2% | |
| | |
Magnit PJSC | | | 1,875 | | | | 170,877 | |
| | | | | | | | |
| Investments | | Shares | | | Value | |
|
| Food Products – 1.3% | |
| | |
Nestle SA (Registered) | | | 3,750 | | | $ | 495,841 | |
| | |
Want Want China Holdings Ltd. | | | 625,000 | | | | 484,475 | |
| | | | | | | | 980,316 | |
|
| Gas Utilities – 2.0% | |
| | |
AltaGas Ltd.(b) | | | 8,700 | | | | 179,818 | |
| | |
Enagas SA | | | 18,250 | | | | 409,830 | |
| | |
Kunlun Energy Co. Ltd. | | | 400,000 | | | | 366,112 | |
| | |
Naturgy Energy Group SA(b) | | | 22,250 | | | | 585,270 | |
| | | | | | | | 1,541,030 | |
|
| Health Care Equipment & Supplies – 1.6% | |
| | |
Hoya Corp. | | | 3,900 | | | | 572,046 | |
| | |
Straumann Holding AG (Registered) | | | 100 | | | | 208,153 | |
| | |
Top Glove Corp. Bhd. | | | 640,000 | | | | 420,381 | |
| | | | | | | | 1,200,580 | |
|
| Health Care Providers & Services – 0.1% | |
| | |
Notre Dame Intermedica Participacoes SA | | | 10,000 | | | | 113,855 | |
|
| Hotels, Restaurants & Leisure – 0.6% | |
| | |
Aristocrat Leisure Ltd. | | | 7,262 | | | | 254,616 | |
| | |
OPAP SA | | | 12,400 | | | | 193,006 | |
| | | | | | | | 447,622 | |
|
| Household Durables – 2.2% | |
| | |
Barratt Developments plc | | | 15,875 | | | | 144,273 | |
| | |
Electrolux AB, Class B(b) | | | 6,425 | | | | 145,803 | |
| | |
Haier Smart Home Co. Ltd., Class H | | | 160,000 | | | | 598,531 | |
| | |
Panasonic Corp. | | | 17,500 | | | | 213,714 | |
| | |
Persimmon plc | | | 15,300 | | | | 570,661 | |
| | | | | | | | 1,672,982 | |
|
| Industrial Conglomerates – 1.4% | |
| | |
Siemens AG (Registered) | | | 5,375 | | | | 872,572 | |
| | |
SK, Inc. | | | 750 | | | | 155,963 | |
| | | | | | | | 1,028,535 | |
|
| Insurance – 7.5% | |
| | |
Allianz SE (Registered) | | | 5,625 | | | | 1,309,392 | |
| | |
Aviva plc | | | 37,900 | | | | 205,052 | |
See Accompanying Notes to the Financial Statements.
| | | | |
| 358 | | FLEXSHARES ANNUAL REPORT | | |
FlexShares® International Quality Dividend Dynamic Index Fund (cont.)
| | | | | | | | |
| Investments | | Shares | | | Value | |
|
| COMMON STOCKS – (continued) | |
|
| Insurance – (continued) | |
| | |
AXA SA | | | 13,800 | | | $ | 401,806 | |
| | |
BB Seguridade Participacoes SA | | | 20,000 | | | | 78,375 | |
| | |
China Pacific Insurance Group Co. Ltd., Class H | | | 55,000 | | | | 169,687 | |
| | |
Legal & General Group plc | | | 56,350 | | | | 223,151 | |
| | |
Manulife Financial Corp. | | | 17,025 | | | | 331,147 | |
| | |
PICC Property & Casualty Co. Ltd., Class H | | | 100,000 | | | | 93,585 | |
| | |
Ping An Insurance Group Co. of China Ltd., Class H | | | 25,000 | | | | 179,649 | |
| | |
Poste Italiane SpA(a) | | | 7,925 | | | | 113,173 | |
| | |
Prudential plc | | | 35,950 | | | | 736,467 | |
| | |
SCOR SE | | | 18,975 | | | | 639,002 | |
| | |
Suncorp Group Ltd. | | | 42,800 | | | | 376,764 | |
| | |
Swiss Re AG | | | 2,400 | | | | 232,816 | |
| | |
Zurich Insurance Group AG | | | 1,300 | | | | 577,477 | |
| | | | | | | | 5,667,543 | |
|
| Interactive Media & Services – 0.5% | |
| | |
Tencent Holdings Ltd. | | | 6,200 | | | | 383,363 | |
|
| Internet & Direct Marketing Retail – 0.9% | |
| | |
CJ ENM Co. Ltd. | | | 1,150 | | | | 173,600 | |
| | |
ZOZO, Inc. | | | 15,300 | | | | 489,090 | |
| | | | | | | | 662,690 | |
|
| IT Services – 0.5% | |
| | |
Capgemini SE | | | 1,200 | | | | 279,545 | |
| | |
Infosys Ltd. | | | 5,900 | | | | 131,405 | |
| | | | | | | | 410,950 | |
|
| Machinery – 2.4% | |
| | |
Atlas Copco AB, Class B | | | 1,225 | | | | 66,253 | |
| | |
FANUC Corp. | | | 2,800 | | | | 547,845 | |
| | |
Komatsu Ltd. | | | 7,500 | | | | 195,122 | |
| | |
MINEBEA MITSUMI, Inc.(b) | | | 5,000 | | | | 126,069 | |
| | |
SKF AB, Class B | | | 5,750 | | | | 133,230 | |
| | |
Volvo AB, Class B | | | 9,675 | | | | 225,211 | |
| | |
Wartsila OYJ Abp | | | 35,800 | | | | 496,947 | |
| | |
Weichai Power Co. Ltd., Class H | | | 7,000 | | | | 12,580 | |
| | | | | | | | 1,803,257 | |
| | | | | | | | |
| Investments | | Shares | | | Value | |
|
| Marine – 0.8% | |
| | |
Nippon Yusen KK | | | 8,000 | | | $ | 573,909 | |
|
| Media – 0.3% | |
| | |
Publicis Groupe SA | | | 3,525 | | | | 236,355 | |
|
| Metals & Mining – 5.9% | |
| | |
Anglo American Platinum Ltd. | | | 1,275 | | | | 129,463 | |
| | |
BHP Group Ltd.(b) | | | 6,500 | | | | 178,589 | |
| | |
BHP Group plc | | | 10,625 | | | | 281,818 | |
| | |
Evraz plc | | | 60,850 | | | | 518,477 | |
| | |
Fortescue Metals Group Ltd. | | | 38,225 | | | | 399,941 | |
| | |
Gerdau SA (Preference) | | | 25,000 | | | | 119,301 | |
| | |
Impala Platinum Holdings Ltd. | | | 32,050 | | | | 417,472 | |
| | |
Kumba Iron Ore Ltd. | | | 13,750 | | | | 419,918 | |
| | |
MMC Norilsk Nickel PJSC | | | 1,925 | | | | 600,223 | |
| | |
Rio Tinto plc | | | 12,200 | | | | 762,659 | |
| | |
Severstal PAO | | | 7,225 | | | | 164,026 | |
| | |
Vedanta Ltd. | | | 127,150 | | | | 516,199 | |
| | | | | | | | 4,508,086 | |
|
| Oil, Gas & Consumable Fuels – 7.5% | |
| | |
Adaro Energy Tbk. PT | | | 5,992,500 | | | | 710,598 | |
| | |
Aker BP ASA | | | 20,875 | | | | 799,287 | |
| | |
BP plc | | | 124,875 | | | | 599,446 | |
| | |
Canadian Natural Resources Ltd. | | | 20,100 | | | | 852,938 | |
| | |
China Shenhua Energy Co. Ltd., Class H | | | 212,500 | | | | 457,832 | |
| | |
Exxaro Resources Ltd. | | | 49,800 | | | | 547,964 | |
| | |
Keyera Corp.(b) | | | 7,675 | | | | 196,403 | |
| | |
Pembina Pipeline Corp.(b) | | | 20,425 | | | | 675,094 | |
| | |
TotalEnergies SE | | | 16,825 | | | | 844,446 | |
| | | | | | | | 5,684,008 | |
|
| Personal Products – 2.1% | |
| | |
L’Oreal SA | | | 3,425 | | | | 1,565,416 | |
|
| Pharmaceuticals – 5.2% | |
| | |
Astellas Pharma, Inc. | | | 12,500 | | | | 210,151 | |
| | |
Bayer AG (Registered) | | | 6,525 | | | | 367,510 | |
| | |
China Medical System Holdings Ltd. | | | 200,000 | | | | 340,916 | |
| | |
GlaxoSmithKline plc | | | 36,825 | | | | 761,509 | |
| | |
Novartis AG (Registered) | | | 9,275 | | | | 767,782 | |
| | |
Orion OYJ, Class B | | | 9,125 | | | | 395,257 | |
See Accompanying Notes to the Financial Statements.
| | | | | | |
| | FLEXSHARES ANNUAL REPORT | | | 359 | |
FlexShares® International Quality Dividend Dynamic Index Fund (cont.)
| | | | | | | | |
| Investments | | Shares | | | Value | |
|
| COMMON STOCKS – (continued) | |
|
| Pharmaceuticals – (continued) | |
| | |
Roche Holding AG | | | 1,767 | | | $ | 684,658 | |
| | |
Roche Holding AG – BR | | | 625 | | | | 268,810 | |
| | |
Takeda Pharmaceutical Co. Ltd. | | | 5,000 | | | | 140,452 | |
| | | | | | | | 3,937,045 | |
|
| Professional Services – 2.4% | |
| | |
Adecco Group AG (Registered)(b) | | | 2,400 | | | | 121,005 | |
| | |
Nihon M&A Center Holdings, Inc. | | | 15,000 | | | | 458,452 | |
| | |
Recruit Holdings Co. Ltd. | | | 18,500 | | | | 1,228,520 | |
| | | | | | | | 1,807,977 | |
|
| Real Estate Management & Development – 2.9% | |
| | |
Agile Group Holdings Ltd. | | | 100,000 | | | | 78,673 | |
| | |
China Resources Land Ltd. | | | 54,000 | | | | 210,334 | |
| | |
CK Asset Holdings Ltd. | | | 75,000 | | | | 463,263 | |
| | |
Country Garden Holdings Co. Ltd.(b) | | | 330,109 | | | | 310,205 | |
| | |
Daiwa House Industry Co. Ltd. | | | 2,500 | | | | 82,241 | |
| | |
Guangzhou R&F Properties Co. Ltd., Class H(b) | | | 100,000 | | | | 62,733 | |
| | |
KWG Group Holdings Ltd.(b) | | | 100,000 | | | | 87,414 | |
| | |
Land & Houses PCL, NVDR | | | 700,000 | | | | 178,257 | |
| | |
Logan Group Co. Ltd.(b) | | | 100,000 | | | | 100,398 | |
| | |
NEPI Rockcastle plc | | | 23,950 | | | | 161,347 | |
| | |
Sunac Services Holdings Ltd.(a) | | | 225,000 | | | | 456,418 | |
| | | | | | | | 2,191,283 | |
|
| Road & Rail – 0.7% | |
| | |
Aurizon Holdings Ltd. | | | 195,650 | | | | 495,231 | |
|
| Semiconductors & Semiconductor Equipment – 6.5% | |
| | |
Advantest Corp. | | | 5,100 | | | | 417,303 | |
| | |
ASML Holding NV | | | 2,125 | | | | 1,722,639 | |
| | |
Globalwafers Co. Ltd. | | | 6,000 | | | | 163,979 | |
| | |
MediaTek, Inc. | | | 10,000 | | | | 328,317 | |
| | |
Nanya Technology Corp. | | | 57,000 | | | | 136,307 | |
| | |
Novatek Microelectronics Corp. | | | 33,000 | | | | 493,069 | |
| | |
Phison Electronics Corp. | | | 20,000 | | | | 280,849 | |
| | |
Taiwan Semiconductor Manufacturing Co. Ltd. | | | 43,000 | | | | 912,311 | |
| | |
Tokyo Electron Ltd. | | | 1,000 | | | | 463,495 | |
| | | | | | | | 4,918,269 | |
| | | | | | | | |
| Investments | | Shares | | | Value | |
|
| Software – 1.0% | |
| | |
Nemetschek SE | | | 1,850 | | | $ | 212,378 | |
| | |
SAP SE | | | 3,650 | | | | 529,347 | |
| | | | | | | | 741,725 | |
|
| Specialty Retail – 2.0% | |
| | |
Fast Retailing Co. Ltd. | | | 300 | | | | 198,667 | |
| | |
Hotai Motor Co. Ltd. | | | 7,000 | | | | 154,054 | |
| | |
Industria de Diseno Textil SA(b) | | | 19,500 | | | | 704,973 | |
| | |
JD Sports Fashion plc | | | 13,025 | | | | 194,252 | |
| | |
USS Co. Ltd. | | | 10,000 | | | | 160,491 | |
| | |
Vibra Energia SA | | | 35,000 | | | | 130,264 | |
| | | | | | | | 1,542,701 | |
|
| Technology Hardware, Storage & Peripherals – 2.1% | |
| | |
Lite-On Technology Corp. | | | 83,000 | | | | 182,962 | |
| | |
Pegatron Corp. | | | 75,000 | | | | 183,397 | |
| | |
Quanta Computer, Inc. | | | 211,000 | | | | 591,833 | |
| | |
Samsung Electronics Co. Ltd. | | | 6,300 | | | | 376,313 | |
| | |
Samsung Electronics Co. Ltd. (Preference) | | | 5,300 | | | | 290,274 | |
| | | | | | | | 1,624,779 | |
|
| Textiles, Apparel & Luxury Goods – 1.1% | |
| | |
Burberry Group plc | | | 7,550 | | | | 199,635 | |
| | |
Eclat Textile Co. Ltd. | | | 27,000 | | | | 589,352 | |
| | |
LVMH Moet Hennessy Louis Vuitton SE | | | 50 | | | | 39,185 | |
| | | | | | | | 828,172 | |
|
| Tobacco – 1.7% | |
| | |
British American Tobacco plc | | | 5,475 | | | | 191,111 | |
| | |
Imperial Brands plc | | | 27,925 | | | | 590,250 | |
| | |
Japan Tobacco, Inc.(b) | | | 27,500 | | | | 539,147 | |
| | | | | | | | 1,320,508 | |
|
| Trading Companies & Distributors – 1.1% | |
| | |
Ashtead Group plc | | | 8,550 | | | | 717,727 | |
| | |
Toyota Tsusho Corp. | | | 3,500 | | | | 151,327 | |
| | | | | | | | 869,054 | |
|
| Transportation Infrastructure – 0.4% | |
| | |
CCR SA | | | 60,000 | | | | 121,660 | |
| | |
China Merchants Port Holdings Co. Ltd. | | | 100,000 | | | | 167,116 | |
| | | | | | | | 288,776 | |
See Accompanying Notes to the Financial Statements.
| | | | |
| 360 | | FLEXSHARES ANNUAL REPORT | | |
FlexShares® International Quality Dividend Dynamic Index Fund (cont.)
| | | | | | | | |
| Investments | | Shares | | | Value | |
|
| COMMON STOCKS – (continued) | |
|
| Wireless Telecommunication Services – 1.6% | |
| | |
Mobile TeleSystems PJSC | | | 35,000 | | | $ | 152,925 | |
| | |
SoftBank Group Corp. | | | 6,600 | | | | 356,785 | |
| | |
Total Access Communication PCL, NVDR | | | 547,500 | | | | 631,112 | |
| | |
Vodafone Group plc | | | 49,850 | | | | 73,826 | |
| | | | | | | | 1,214,648 | |
Total Common Stocks
(Cost $69,384,303) | | | | 74,373,093 | |
| | | Principal
Amount | | | | |
|
| SECURITIES LENDING REINVESTMENTS(d) – 1.5% | |
|
| REPURCHASE AGREEMENTS – 1.5% | |
| | |
Citigroup Global Markets, Inc., 0.05%, dated 10/31/2021, due 11/1/2021, repurchase price $1,136,017, collateralized by various U.S. Treasury Securities, ranging from 0.75% – 4.63%, maturing 2/15/2040 – 2/15/2042; total market value $1,146,265
(Cost $1,136,015) | | $ | 1,136,015 | | | | 1,136,015 | |
Total Investments – 99.4%
(Cost $70,520,318) | | | | 75,509,108 | |
| |
Other assets less liabilities – 0.6% | | | | 465,589 | |
| NET ASSETS – 100.0% | | | $ | 75,974,697 | |
| (a) | Security exempt from registration pursuant to Regulation S under the Securities Act of 1933. Regulation S applies to securities offerings that are made outside of the United States and do not involve direct selling efforts in the United States and as such may have restrictions on resale. |
| (b) | The security or a portion of this security is on loan at October 31, 2021. The total value of securities on loan at October 31, 2021 was $5,094,637, collateralized in the form of cash with a value of $1,136,015 that was reinvested in the securities shown in the Securities Lending Reinvestment section of the Schedule of Investments; $1,960,940 of collateral in the form of U.S. Government Treasury Securities, interest rates ranging from 0.00% – 6.25%, and maturity dates ranging from November 4, 2021 – August 15, 2051 and $2,406,853 of collateral in the form of Foreign Government Fixed Income Securities, interest rates ranging from 0.00% – 8.50%, and maturity dates ranging from November 17, 2021 – June 30, 2120; a total value of $5,503,808. |
| (c) | Security fair valued as of October 31, 2021 in accordance with procedures approved by the Board of Trustees. Total value of all such securities at October 31, 2021 amounted to $386,334, which represents approximately 0.51% of net assets of the Fund. |
| (d) | The security was purchased with cash collateral held from securities on loan at October 31, 2021. The total value of securities purchased was $1,136,015. |
Percentages shown are based on Net Assets.
Abbreviations
NVDR – Non-Voting Depositary Receipt
OYJ – Public Limited Company
PJSC – Public Joint Stock Company
Preference – A special type of equity investment that shares in the earnings of the company, has limited voting rights, and may have a dividend preference. Preference shares may also have liquidation preference.
As of October 31, 2021, the gross unrealized appreciation (depreciation) of investments based on the aggregate cost of investments (including derivative instruments, if applicable) for federal income tax purposes was as follows:
| | | | |
| | | | |
Aggregate gross unrealized appreciation | | $ | 8,041,355 | |
Aggregate gross unrealized depreciation | | | (3,234,335 | ) |
Net unrealized appreciation | | $ | 4,807,020 | |
Federal income tax cost | | $ | 70,698,589 | |
See Accompanying Notes to the Financial Statements.
| | | | | | |
| | FLEXSHARES ANNUAL REPORT | | | 361 | |
FlexShares® International Quality Dividend Dynamic Index Fund (cont.)
Futures Contracts
FlexShares® International Quality Dividend Dynamic Index Fund had the following open futures contracts as of October 31, 2021:
| | | | | | | | | | | | | | | | | | | | |
| | | Number of
Contracts | | | Expiration
Date | | | Trading
Currency | | | Notional
Amount | | | Value and
Unrealized
Appreciation/
(Depreciation)* | |
Long Contracts | | | | | |
MSCI EAFE E-Mini Index | | | 10 | | | | 12/17/2021 | | | | USD | | | $ | 1,169,800 | | | $ | 1,531 | |
MSCI Emerging Markets E-Mini Index | | | 7 | | | | 12/17/2021 | | | | USD | | | | 441,700 | | | | (9,092 | ) |
| | | | | | | | | | | | | | | | | | | $ | (7,561 | ) |
| * | This amount represents the cumulative appreciation/depreciation on futures contracts. Current day’s variation margin is reported within the Statement of Assets and Liabilities for futures contracts. |
Forward Foreign Currency Contracts
FlexShares® International Quality Dividend Dynamic Index Fund had the following outstanding contracts as of October 31, 2021:
| | | | | | | | | | | | | | | | | | | | | | |
| Contracts to Receive | | Counterparty | | In Exchange For | | | Maturity Date | | | Unrealized
Appreciation/
(Depreciation) | |
CAD | | | 71,604 | | | | | Citibank NA | | USD | | | 56,579 | | | | 12/15/2021 | | | $ | 1,191 | |
CHF | | | 22,025 | | | | | Toronto-Dominion Bank (The) | | USD | | | 23,701 | | | | 12/15/2021 | | | | 435 | |
NOK | | | 96,000 | | | | | BNP Paribas SA | | USD | | | 11,033 | | | | 12/15/2021 | | | | 312 | |
USD | | | 20,534 | | | | | Bank of New York | | DKK | | | 129,000 | | | | 12/15/2021 | | | | 445 | |
USD | | | 94,618 | | | | | Citibank NA | | EUR | | | 81,512 | | | | 12/15/2021 | | | | 187 | |
USD | | | 90,079 | | | | | JPMorgan Chase Bank | | EUR | | | 76,000 | | | | 12/15/2021 | | | | 2,034 | |
USD | | | 35,827 | | | | | Toronto-Dominion Bank (The) | | EUR | | | 30,475 | | | | 12/15/2021 | | | | 523 | |
USD | | | 167,545 | | | | | Morgan Stanley | | GBP | | | 121,000 | | | | 12/15/2021 | | | | 1,657 | |
USD | | | 30,108 | | | | | Toronto-Dominion Bank (The) | | GBP | | | 21,899 | | | | 12/15/2021 | | | | 85 | |
USD | | | 74,038 | | | | | Morgan Stanley | | JPY | | | 8,281,675 | | | | 12/15/2021 | | | | 1,371 | |
USD | | | 105,296 | | | | | Toronto-Dominion Bank (The) | | JPY | | | 11,555,000 | | | | 12/15/2021 | | | | 3,908 | |
USD | | | 12,629 | | | | | Toronto-Dominion Bank (The) | | SGD | | | 17,000 | | | | 12/15/2021 | | | | 25 | |
Total unrealized appreciation | | | | | | | $ | 12,173 | |
EUR | | | 43,702 | | | | | Toronto-Dominion Bank (The) | | USD | | | 51,654 | | | | 12/15/2021 | | | $ | (1,026 | ) |
GBP | | | 25,981 | | | | | Goldman Sachs & Co. | | USD | | | 35,961 | | | | 12/15/2021 | | | | (343 | ) |
HKD | | | 582,000 | | | | | Citibank NA | | USD | | | 74,857 | | | | 12/15/2021 | | | | (32 | ) |
JPY | | | 3,367,857 | | | | | BNP Paribas SA | | USD | | | 30,645 | | | | 12/15/2021 | | | | (1,094 | ) |
JPY | | | 7,033,291 | | | | | Toronto-Dominion Bank (The) | | USD | | | 63,998 | | | | 12/15/2021 | | | | (2,285 | ) |
USD | | | 92,233 | | | | | Morgan Stanley | | AUD | | | 124,932 | | | | 12/15/2021 | | | | (1,619 | ) |
USD | | | 43,166 | | | | | Toronto-Dominion Bank (The) | | CAD | | | 55,063 | | | | 12/15/2021 | | | | (1,259 | ) |
USD | | | 128,861 | | | | | JPMorgan Chase Bank | | CHF | | | 118,000 | | | | 12/15/2021 | | | | (447 | ) |
USD | | | 53,155 | | | | | BNP Paribas SA | | HKD | | | 413,467 | | | | 12/15/2021 | | | | (3 | ) |
USD | | | 33,016 | | | | | Citibank NA | | HKD | | | 256,831 | | | | 12/15/2021 | | | | (3 | ) |
Total unrealized depreciation | | | | | | | $ | (8,111 | ) |
Net unrealized appreciation | | | | | | | $ | 4,062 | |
See Accompanying Notes to the Financial Statements.
| | | | |
| 362 | | FLEXSHARES ANNUAL REPORT | | |
FlexShares® International Quality Dividend Dynamic Index Fund (cont.)
Abbreviations:
AUD – Australian Dollar
CAD – Canadian Dollar
CHF – Swiss Franc
DKK – Danish Krone
EUR – Euro
GBP – British Pound
HKD – Hong Kong Dollar
JPY – Japanese Yen
NOK – Norwegian Krone
SGD – Singapore Dollar
USD – US Dollar
FlexShares® International Quality Dividend Dynamic Index Fund invested, as a percentage of net assets, in companies domiciled in the following countries as of October 31, 2021:
| | | | |
Australia | | | 3.6 | % |
Belgium | | | 0.4 | |
Brazil | | | 1.7 | |
Canada | | | 5.0 | |
China | | | 8.8 | |
Finland | | | 1.4 | |
France | | | 7.6 | |
Germany | | | 8.4 | |
Greece | | | 0.3 | |
Hong Kong | | | 0.9 | |
India | | | 1.6 | |
Indonesia | | | 0.9 | |
Italy | | | 1.2 | |
Japan | | | 13.6 | |
Malaysia | | | 0.6 | |
Netherlands | | | 2.8 | |
Norway | | | 1.5 | |
Russia | | | 1.8 | |
Singapore | | | 1.1 | |
South Africa | | | 2.4 | |
South Korea | | | 2.9 | |
Spain | | | 3.9 | |
Sweden | | | 1.7 | |
Switzerland | | | 4.4 | |
Taiwan | | | 5.3 | |
Thailand | | | 1.1 | |
Turkey | | | 1.4 | |
United Kingdom | | | 11.6 | |
Other1 | | | 2.1 | |
| | | | 100.0 | % |
| 1 | Includes any non-equity securities, securities lending reinvestments and net other assets (liabilities). |
| | | | |
| Security Type | | % of Net Assets | |
Common Stocks | | | 97.9 | % |
Securities Lending Reinvestments | | | 1.5 | |
Others(1) | | | 0.6 | |
| | | | 100.0 | % |
| (1) | Includes any other net assets/(liabilities). |
See Accompanying Notes to the Financial Statements.
| | | | | | |
| | FLEXSHARES ANNUAL REPORT | | | 363 | |
Schedule of Investments
FlexShares® iBoxx 3-Year Target Duration TIPS Index Fund
October 31, 2021
| | | | | | | | |
| Investments | | Principal
Amount | | | Value | |
|
| U.S. TREASURY OBLIGATIONS – 99.8% | |
| | |
U.S. Treasury Inflation Linked Bonds | | | | | | | | |
2.38%, 1/15/2025 | | $ | 142,650,711 | | | $ | 164,183,561 | |
2.00%, 1/15/2026 | | | 28,185,470 | | | | 32,965,578 | |
2.38%, 1/15/2027 | | | 23,065,420 | | | | 28,131,952 | |
| | |
U.S. Treasury Inflation Linked Notes | | | | | | | | |
0.13%, 1/15/2023 | | | 50,160,796 | | | | 52,092,277 | |
0.63%, 4/15/2023 | | | 53,498,076 | | | | 56,263,797 | |
0.38%, 7/15/2023 | | | 49,669,669 | | | | 52,571,611 | |
0.63%, 1/15/2024 | | | 49,601,247 | | | | 53,110,960 | |
0.50%, 4/15/2024 | | | 36,060,519 | | | | 38,683,057 | |
0.13%, 7/15/2024 | | | 166,065,425 | | | | 178,088,983 | |
0.13%, 10/15/2024 | | | 131,880,539 | | | | 141,741,744 | |
0.25%, 1/15/2025 | | | 166,432,035 | | | | 179,603,032 | |
0.13%, 4/15/2025 | | | 132,341,959 | | | | 142,658,484 | |
0.38%, 7/15/2025 | | | 48,763,403 | | | | 53,432,958 | |
0.13%, 10/15/2025 | | | 37,291,652 | | | | 40,534,891 | |
0.63%, 1/15/2026 | | | 50,387,520 | | | | 55,840,082 | |
0.13%, 4/15/2026(a) | | | 42,895,371 | | | | 46,717,135 | |
0.13%, 7/15/2026(a) | | | 43,391,466 | | | | 47,562,732 | |
0.13%, 10/15/2026 | | | 19,648,177 | | | | 21,539,303 | |
0.38%, 1/15/2027(a) | | | 44,870,046 | | | | 49,784,918 | |
Total U.S. Treasury Obligations
(Cost $1,382,590,520) | | | | 1,435,507,055 | |
| | | | | | | | |
| Investments | | Principal
Amount | | | Value | |
|
| SECURITIES LENDING REINVESTMENTS(b) – 0.3% | |
|
| REPURCHASE AGREEMENTS – 0.3% | |
| | |
Citigroup Global Markets, Inc., 0.05%, dated 10/31/2021, due 11/1/2021, repurchase price $3,852,305, collateralized by various U.S. Treasury Securities, ranging from 0.75% – 4.63%, maturing 2/15/2040 – 2/15/2042; total market value $3,887,057
(Cost $3,852,300) | | $ | 3,852,300 | | | $ | 3,852,300 | |
Total Investments – 100.1%
(Cost $1,386,442,820) | | | | 1,439,359,355 | |
| |
Liabilities in excess of other
assets – (0.1%) | | | | (1,774,936 | ) |
| NET ASSETS – 100.0% | | | $ | 1,437,584,419 | |
| (a) | The security or a portion of this security is on loan at October 31, 2021. The total value of securities on loan at October 31, 2021 was $46,120,662, collateralized in the form of cash with a value of $3,852,300 that was reinvested in the securities shown in the Securities Lending Reinvestment section of the Schedule of Investments and $43,227,092 of collateral in the form of U.S. Government Treasury Securities, interest rates ranging from 0.00% – 7.63%, and maturity dates ranging from October 31, 2021 – August 15, 2051; a total value of $47,079,392. |
| (b) | The security was purchased with cash collateral held from securities on loan at October 31, 2021. The total value of securities purchased was $3,852,300. |
Percentages shown are based on Net Assets.
As of October 31, 2021, the gross unrealized appreciation (depreciation) of investments based on the aggregate cost of investments (including derivative instruments, if applicable) for federal income tax purposes was as follows:
| | | | |
| | | | |
Aggregate gross unrealized appreciation | | $ | 52,943,448 | |
Aggregate gross unrealized depreciation | | | (110,609 | ) |
Net unrealized appreciation | | $ | 52,832,839 | |
Federal income tax cost | | $ | 1,386,526,516 | |
See Accompanying Notes to the Financial Statements.
| | | | |
| 364 | | FLEXSHARES ANNUAL REPORT | | |
FlexShares® iBoxx 3-Year Target Duration TIPS Index Fund (cont.)
| | | | | |
| Security Type | | % of Net Assets |
U.S. Treasury Obligations | | | | 99.8 | % |
Securities Lending Reinvestments | | | | 0.3 | |
Others(1) | | | | (0.1 | ) |
| | | | | 100.0 | % |
| (1) | Includes any other net assets/(liabilities). |
See Accompanying Notes to the Financial Statements.
| | | | | | |
| | FLEXSHARES ANNUAL REPORT | | | 365 | |
Schedule of Investments
FlexShares® iBoxx 5-Year Target Duration TIPS Index Fund
October 31, 2021
| | | | | | | | |
| Investments | | Principal
Amount | | | Value | |
|
| U.S. TREASURY OBLIGATIONS – 99.8% | |
| | |
U.S. Treasury Inflation Linked Bonds
2.38%, 1/15/2025 | | $ | 24,956,727 | | | $ | 28,723,897 | |
2.00%, 1/15/2026 | | | 16,924,514 | | | | 19,794,823 | |
2.38%, 1/15/2027 | | | 23,559,204 | | | | 28,734,201 | |
1.75%, 1/15/2028 | | | 12,816,721 | | | | 15,479,611 | |
3.63%, 4/15/2028(a) | | | 29,961,460 | | | | 40,117,248 | |
2.50%, 1/15/2029 | | | 11,070,076 | | | | 14,234,673 | |
3.88%, 4/15/2029 | | | 20,403,530 | | | | 28,574,279 | |
3.38%, 4/15/2032 | | | 4,817,854 | | | | 7,117,164 | |
| | |
U.S. Treasury Inflation Linked Notes
0.25%, 1/15/2025 | | | 29,084,055 | | | | 31,385,691 | |
0.13%, 4/15/2025 | | | 23,122,271 | | | | 24,924,734 | |
0.38%, 7/15/2025 | | | 29,048,550 | | | | 31,830,222 | |
0.13%, 10/15/2025 | | | 22,202,081 | | | | 24,132,987 | |
0.63%, 1/15/2026 | | | 30,004,551 | | | | 33,251,419 | |
0.13%, 4/15/2026(a) | | | 25,546,744 | | | | 27,822,831 | |
0.13%, 7/15/2026(a) | | | 25,824,884 | | | | 28,307,457 | |
0.13%, 10/15/2026 | | | 20,100,688 | | | | 22,035,368 | |
0.38%, 1/15/2027(a) | | | 45,936,871 | | | | 50,968,598 | |
0.38%, 7/15/2027 | | | 43,513,491 | | | | 48,663,120 | |
0.50%, 1/15/2028 | | | 26,425,573 | | | | 29,732,653 | |
0.75%, 7/15/2028 | | | 24,518,130 | | | | 28,210,026 | |
0.88%, 1/15/2029(a) | | | 24,007,504 | | | | 27,888,089 | |
0.25%, 7/15/2029 | | | 26,128,466 | | | | 29,286,055 | |
0.13%, 1/15/2030 | | | 26,757,693 | | | | 29,648,392 | |
0.13%, 7/15/2030(a) | | | 28,097,048 | | | | 31,288,879 | |
0.13%, 1/15/2031(a) | | | 27,920,311 | | | | 30,993,169 | |
Total U.S. Treasury Obligations
(Cost $673,518,839) | | | | 713,145,586 | |
| | | | | | | | |
| Investments | | Principal
Amount | | | Value | |
|
| SECURITIES LENDING REINVESTMENTS(b) – 0.3% | |
|
| REPURCHASE AGREEMENTS – 0.3% | |
| | |
Citigroup Global Markets, Inc., 0.05%, dated 10/31/2021, due 11/1/2021, repurchase price $2,318,503, collateralized by various U.S. Treasury Securities, ranging from 0.75% – 4.63%, maturing 2/15/2040 – 2/15/2042; total market value $2,339,418
(Cost $2,318,500) | | $ | 2,318,500 | | | $ | 2,318,500 | |
Total Investments – 100.1%
(Cost $675,837,339) | | | | 715,464,086 | |
| |
Liabilities in excess of other assets – (0.1%) | | | | (984,777 | ) |
| NET ASSETS – 100.0% | | | $ | 714,479,309 | |
| (a) | The security or a portion of this security is on loan at October 31, 2021. The total value of securities on loan at October 31, 2021 was $117,675,275, collateralized in the form of cash with a value of $2,318,500 that was reinvested in the securities shown in the Securities Lending Reinvestment section of the Schedule of Investments; $56,373,511 of collateral in the form of U.S. Government Treasury Securities, interest rates ranging from 0.00% – 6.25%, and maturity dates ranging from November 4, 2021 – August 15, 2051 and $63,486,417 of collateral in the form of Foreign Government Fixed Income Securities, interest rates ranging from 0.00% – 7.00%, and maturity dates ranging from November 11, 2021 – June 30, 2120; a total value of $122,178,428. |
| (b) | The security was purchased with cash collateral held from securities on loan at October 31, 2021. The total value of securities purchased was $2,318,500. |
Percentages shown are based on Net Assets.
As of October 31, 2021, the gross unrealized appreciation (depreciation) of investments based on the aggregate cost of investments (including derivative instruments, if applicable) for federal income tax purposes was as follows:
| | | | |
| | | | |
Aggregate gross unrealized appreciation | | $ | 39,208,721 | |
Aggregate gross unrealized depreciation | | | (103,863 | ) |
Net unrealized appreciation | | $ | 39,104,858 | |
Federal income tax cost | | $ | 676,359,228 | |
See Accompanying Notes to the Financial Statements.
| | | | |
| 366 | | FLEXSHARES ANNUAL REPORT | | |
FlexShares® iBoxx 5-Year Target Duration TIPS Index Fund (cont.)
| | | | | |
| Security Type | | % of Net Assets |
U.S. Treasury Obligations | | | | 99.8 | % |
Securities Lending Reinvestments | | | | 0.3 | |
Others(1) | | | | (0.1 | ) |
| | | | | 100.0 | % |
| (1) | Includes any other net assets/(liabilities). |
See Accompanying Notes to the Financial Statements.
| | | | | | |
| | FLEXSHARES ANNUAL REPORT | | | 367 | |
Schedule of Investments
FlexShares® Disciplined Duration MBS Index Fund
October 31, 2021
| | | | | | | | |
| Investments | | Principal
Amount | | | Value | |
|
| MORTGAGE-BACKED SECURITIES – 97.4% | |
|
FHLMC | |
2.00%, 8/1/2031 | | $ | 174,385 | | | $ | 179,705 | |
2.00%, 10/1/2031 | | | 37,238 | | | | 38,362 | |
3.00%, 4/1/2033 | | | 150,318 | | | | 160,103 | |
3.00%, 6/1/2033 | | | 120,989 | | | | 128,866 | |
3.00%, 7/1/2033 | | | 1,597,492 | | | | 1,702,920 | |
5.00%, 5/1/2034 | | | 56,008 | | | | 63,820 | |
5.00%, 7/1/2034 | | | 326,134 | | | | 372,958 | |
3.00%, 5/1/2035 | | | 20,880 | | | | 22,150 | |
5.00%, 7/1/2035 | | | 305,248 | | | | 348,980 | |
5.00%, 8/1/2035 | | | 120,532 | | | | 137,280 | |
5.00%, 10/1/2035 | | | 18,904 | | | | 21,620 | |
3.00%, 11/1/2035 | | | 24,846 | | | | 26,416 | |
5.00%, 11/1/2035 | | | 191,533 | | | | 219,050 | |
5.00%, 12/1/2035 | | | 119,843 | | | | 137,087 | |
6.00%, 1/1/2037 | | | 76,944 | | | | 91,024 | |
6.00%, 4/1/2037 | | | 40,850 | | | | 48,324 | |
6.00%, 5/1/2037 | | | 68,720 | | | | 81,296 | |
5.00%, 2/1/2038 | | | 59,194 | | | | 67,621 | |
5.00%, 7/1/2038 | | | 175,418 | | | | 201,015 | |
5.00%, 10/1/2038 | | | 53,655 | | | | 61,450 | |
5.00%, 11/1/2038 | | | 207,865 | | | | 238,253 | |
5.00%, 12/1/2038 | | | 348,947 | | | | 399,963 | |
5.00%, 2/1/2039 | | | 146,289 | | | | 167,117 | |
5.00%, 5/1/2039 | | | 78,846 | | | | 90,386 | |
5.00%, 6/1/2039 | | | 32,485 | | | | 37,229 | |
5.00%, 7/1/2039 | | | 51,058 | | | | 58,532 | |
5.00%, 9/1/2039 | | | 73,978 | | | | 84,472 | |
6.00%, 11/1/2039 | | | 43,303 | | | | 51,145 | |
5.00%, 12/1/2039 | | | 249,701 | | | | 286,248 | |
5.00%, 1/1/2040 | | | 18,927 | | | | 21,635 | |
5.00%, 3/1/2040 | | | 51,807 | | | | 59,159 | |
5.00%, 4/1/2040 | | | 22,863 | | | | 26,203 | |
6.00%, 4/1/2040 | | | 49,281 | | | | 58,147 | |
5.00%, 5/1/2040 | | | 20,622 | | | | 23,641 | |
6.00%, 5/1/2040 | | | 117,203 | | | | 138,437 | |
5.00%, 7/1/2040 | | | 113,532 | | | | 129,897 | |
6.00%, 7/1/2040 | | | 185,606 | | | | 219,218 | |
5.00%, 9/1/2040 | | | 98,893 | | | | 113,362 | |
4.00%, 1/1/2041 | | | 16,365 | | | | 18,100 | |
5.00%, 5/1/2041 | | | 163,591 | | | | 187,356 | |
5.00%, 7/1/2041 | | | 242,950 | | | | 278,112 | |
3.50%, 11/1/2041 | | | 78,898 | | | | 85,298 | |
3.00%, 3/1/2042 | | | 13,544 | | | | 14,365 | |
| | | | | | | | |
| Investments | | Principal
Amount | | | Value | |
4.50%, 3/1/2042 | | $ | 656,056 | | | $ | 733,427 | |
3.00%, 4/1/2042 | | | 98,233 | | | | 104,601 | |
3.00%, 6/1/2042 | | | 81,197 | | | | 86,500 | |
3.00%, 8/1/2042 | | | 46,497 | | | | 49,535 | |
3.00%, 11/1/2042 | | | 313,695 | | | | 334,143 | |
3.00%, 12/1/2042 | | | 96,119 | | | | 102,389 | |
3.00%, 1/1/2043 | | | 50,287 | | | | 53,566 | |
3.00%, 2/1/2043 | | | 26,422 | | | | 28,027 | |
3.00%, 3/1/2043 | | | 137,001 | | | | 147,411 | |
3.00%, 4/1/2043 | | | 32,854 | | | | 34,991 | |
3.00%, 6/1/2043 | | | 20,523 | | | | 22,078 | |
3.00%, 10/1/2043 | | | 63,279 | | | | 67,359 | |
4.00%, 8/1/2044 | | | 15,572 | | | | 17,074 | |
5.00%, 8/1/2044 | | | 44,622 | | | | 51,080 | |
4.00%, 1/1/2045 | | | 49,713 | | | | 54,673 | |
4.00%, 2/1/2045 | | | 101,668 | | | | 112,833 | |
4.00%, 8/1/2045 | | | 122,510 | | | | 134,369 | |
4.00%, 9/1/2045 | | | 21,078 | | | | 23,025 | |
4.00%, 10/1/2045 | | | 195,270 | | | | 214,568 | |
4.00%, 11/1/2045 | | | 41,674 | | | | 45,436 | |
4.00%, 12/1/2045 | | | 17,650 | | | | 19,239 | |
4.00%, 1/1/2046 | | | 53,559 | | | | 58,602 | |
2.50%, 9/1/2046 | | | 28,600 | | | | 29,570 | |
3.00%, 11/1/2046 | | | 32,514 | | | | 34,189 | |
3.00%, 12/1/2046 | | | 164,329 | | | | 173,217 | |
3.00%, 1/1/2047 | | | 1,051,111 | | | | 1,116,343 | |
|
FHLMC UMBS | |
2.00%, 8/1/2031 | | | 42,550 | | | | 43,836 | |
2.00%, 11/1/2031 | | | 67,932 | | | | 69,980 | |
2.50%, 12/1/2031 | | | 926,630 | | | | 966,870 | |
2.00%, 2/1/2032 | | | 74,729 | | | | 76,994 | |
5.00%, 8/1/2035 | | | 444,246 | | | | 507,934 | |
2.00%, 3/1/2036 | | | 936,331 | | | | 970,601 | |
1.50%, 4/1/2036 | | | 957,488 | | | | 966,579 | |
6.00%, 4/1/2036 | | | 523,545 | | | | 613,795 | |
2.50%, 10/1/2036 | | | 868,818 | | | | 895,691 | |
5.00%, 3/1/2038 | | | 68,104 | | | | 77,966 | |
5.00%, 7/1/2039 | | | 80,235 | | | | 91,951 | |
5.00%, 10/1/2039 | | | 32,719 | | | | 37,496 | |
5.00%, 1/1/2040 | | | 32,148 | | | | 36,955 | |
5.00%, 3/1/2040 | | | 54,970 | | | | 63,149 | |
5.00%, 5/1/2040 | | | 78,467 | | | | 89,520 | |
2.00%, 7/1/2040 | | | 132,203 | | | | 132,950 | |
6.00%, 7/1/2040 | | | 851,818 | | | | 1,006,766 | |
2.50%, 8/1/2040 | | | 690,718 | | | | 710,069 | |
See Accompanying Notes to the Financial Statements.
| | | | |
| 368 | | FLEXSHARES ANNUAL REPORT | | |
FlexShares® Disciplined Duration MBS Index Fund (cont.)
| | | | | | | | |
| Investments | | Principal
Amount | | | Value | |
|
| MORTGAGE-BACKED SECURITIES – (continued) | |
2.50%, 9/1/2040 | | $ | 1,234,551 | | | $ | 1,270,472 | |
1.50%, 10/1/2040 | | | 644,111 | | | | 634,350 | |
3.50%, 12/1/2040 | | | 51,579 | | | | 55,603 | |
2.00%, 1/1/2041 | | | 205,352 | | | | 209,307 | |
1.50%, 3/1/2041 | | | 835,550 | | | | 822,880 | |
2.00%, 3/1/2041 | | | 733,857 | | | | 747,093 | |
4.50%, 3/1/2041 | | | 102,557 | | | | 114,219 | |
1.50%, 4/1/2041 | | | 238,044 | | | | 234,434 | |
2.00%, 4/1/2041 | | | 190,554 | | | | 194,227 | |
4.50%, 4/1/2041 | | | 20,642 | | | | 23,070 | |
1.50%, 5/1/2041 | | | 724,204 | | | | 713,221 | |
2.50%, 6/1/2041 | | | 966,822 | | | | 997,738 | |
4.00%, 1/1/2042 | | | 73,574 | | | | 81,645 | |
5.00%, 2/1/2042 | | | 65,058 | | | | 74,156 | |
3.00%, 3/1/2042 | | | 133,605 | | | | 142,088 | |
3.50%, 11/1/2042 | | | 93,486 | | | | 101,068 | |
3.00%, 12/1/2042 | | | 596,067 | | | | 634,706 | |
3.50%, 1/1/2043 | | | 48,866 | | | | 53,393 | |
3.50%, 2/1/2043 | | | 35,382 | | | | 38,158 | |
2.50%, 6/1/2043 | | | 494,381 | | | | 512,755 | |
4.00%, 12/1/2043 | | | 15,615 | | | | 17,213 | |
4.50%, 3/1/2044 | | | 77,036 | | | | 85,851 | |
4.00%, 6/1/2044 | | | 5,755 | | | | 6,328 | |
4.50%, 7/1/2044 | | | 30,772 | | | | 34,275 | |
4.00%, 8/1/2044 | | | 16,827 | | | | 18,445 | |
4.50%, 12/1/2044 | | | 18,100 | | | | 20,017 | |
5.00%, 12/1/2044 | | | 169,239 | | | | 192,355 | |
4.00%, 2/1/2045 | | | 20,334 | | | | 22,560 | |
4.50%, 9/1/2045 | | | 15,321 | | | | 16,691 | |
4.00%, 10/1/2045 | | | 56,353 | | | | 61,511 | |
4.00%, 12/1/2045 | | | 28,786 | | | | 31,793 | |
4.50%, 12/1/2045 | | | 843,450 | | | | 933,011 | |
3.00%, 1/1/2046 | | | 52,405 | | | | 56,169 | |
4.00%, 1/1/2046 | | | 45,029 | | | | 49,602 | |
4.50%, 4/1/2046 | | | 44,416 | | | | 49,671 | |
3.00%, 11/1/2046 | | | 575,469 | | | | 607,859 | |
2.50%, 12/1/2046 | | | 153,855 | | | | 159,030 | |
4.50%, 8/1/2048 | | | 634,138 | | | | 692,788 | |
4.50%, 4/1/2050 | | | 1,297,712 | | | | 1,408,679 | |
2.50%, 11/1/2050 | | | 181,130 | | | | 187,692 | |
3.00%, 3/1/2051 | | | 839,406 | | | | 880,489 | |
3.00%, 4/1/2051 | | | 593,392 | | | | 619,385 | |
|
FNMA UMBS | |
3.50%, 10/1/2030 | | | 73,245 | | | | 77,390 | |
3.50%, 11/1/2030 | | | 13,347 | | | | 14,102 | |
| | | | | | | | |
| Investments | | Principal
Amount | | | Value | |
2.00%, 9/1/2031 | | $ | 34,721 | | | $ | 35,771 | |
2.00%, 11/1/2031 | | | 81,507 | | | | 83,972 | |
2.00%, 2/1/2032 | | | 71,069 | | | | 73,219 | |
6.00%, 12/1/2032 | | | 14,248 | | | | 16,676 | |
6.00%, 4/1/2033 | | | 8,280 | | | | 9,708 | |
3.00%, 5/1/2033 | | | 137,053 | | | | 145,510 | |
3.00%, 6/1/2033 | | | 132,730 | | | | 141,274 | |
3.00%, 7/1/2033 | | | 17,377 | | | | 18,501 | |
3.00%, 8/1/2033 | | | 1,392,062 | | | | 1,476,111 | |
3.00%, 10/1/2033 | | | 30,111 | | | | 32,056 | |
6.00%, 3/1/2034 | | | 281,634 | | | | 327,039 | |
6.00%, 8/1/2034 | | | 45,897 | | | | 54,082 | |
6.50%, 9/1/2034 | | | 139,461 | | | | 162,316 | |
6.00%, 12/1/2034 | | | 215,898 | | | | 253,253 | |
6.00%, 4/1/2035 | | | 820,839 | | | | 937,422 | |
2.50%, 7/1/2035 | | | 948,295 | | | | 986,961 | |
5.00%, 8/1/2035 | | | 28,623 | | | | 32,689 | |
1.50%, 11/1/2035 | | | 994,510 | | | | 1,004,393 | |
6.00%, 11/1/2035 | | | 41,709 | | | | 48,813 | |
5.00%, 12/1/2035 | | | 64,489 | | | | 73,692 | |
2.00%, 1/1/2036 | | | 641,473 | | | | 664,757 | |
3.00%, 1/1/2036 | | | 864,015 | | | | 918,596 | |
5.00%, 2/1/2036 | | | 245,012 | | | | 280,070 | |
4.50%, 6/1/2036 | | | 652,878 | | | | 727,756 | |
6.00%, 6/1/2036 | | | 58,866 | | | | 69,617 | |
2.00%, 7/1/2036 | | | 1,172,233 | | | | 1,209,960 | |
2.50%, 7/1/2036 | | | 966,719 | | | | 1,006,458 | |
5.00%, 7/1/2036 | | | 28,868 | | | | 32,850 | |
6.50%, 8/1/2036 | | | 22,519 | | | | 26,620 | |
6.00%, 9/1/2036 | | | 885,340 | | | | 1,037,025 | |
2.50%, 11/1/2036 | | | 1,057,102 | | | | 1,089,737 | |
6.00%, 11/1/2036 | | | 59,242 | | | | 70,062 | |
3.00%, 1/1/2037 | | | 1,203,945 | | | | 1,276,814 | |
6.00%, 6/1/2037 | | | 121,125 | | | | 143,256 | |
6.00%, 8/1/2037 | | | 197,338 | | | | 231,647 | |
6.00%, 9/1/2037 | | | 29,535 | | | | 34,929 | |
6.50%, 10/1/2037 | | | 47,405 | | | | 54,312 | |
5.00%, 3/1/2038 | | | 66,972 | | | | 76,693 | |
5.00%, 5/1/2038 | | | 53,975 | | | | 61,681 | |
6.00%, 5/1/2038 | | | 19,331 | | | | 22,864 | |
6.00%, 9/1/2038 | | | 34,969 | | | | 41,361 | |
5.00%, 6/1/2039 | | | 64,671 | | | | 74,011 | |
5.00%, 10/1/2039 | | | 67,038 | | | | 76,827 | |
2.50%, 12/1/2039 | | | 376,502 | | | | 388,134 | |
5.00%, 2/1/2040 | | | 52,119 | | | | 60,350 | |
5.00%, 3/1/2040 | | | 190,630 | | | | 218,461 | |
2.50%, 6/1/2040 | | | 297,921 | | | | 306,267 | |
See Accompanying Notes to the Financial Statements.
| | | | | | |
| | FLEXSHARES ANNUAL REPORT | | | 369 | |
FlexShares® Disciplined Duration MBS Index Fund (cont.)
| | | | | | | | |
| Investments | | Principal
Amount | | | Value | |
|
| MORTGAGE-BACKED SECURITIES – (continued) | |
5.00%, 6/1/2040 | | $ | 20,615 | | | $ | 23,534 | |
6.00%, 6/1/2040 | | | 139,056 | | | | 164,205 | |
2.50%, 8/1/2040 | | | 341,888 | | | | 352,150 | |
2.00%, 11/1/2040 | | | 856,790 | | | | 870,399 | |
2.50%, 11/1/2040 | | | 155,201 | | | | 160,059 | |
2.00%, 12/1/2040 | | | 460,926 | | | | 466,679 | |
2.50%, 12/1/2040 | | | 149,864 | | | | 154,289 | |
2.00%, 1/1/2041 | | | 208,213 | | | | 212,227 | |
3.50%, 1/1/2041 | | | 47,576 | | | | 51,535 | |
1.50%, 2/1/2041 | | | 927,076 | | | | 913,038 | |
2.50%, 2/1/2041 | | | 351,688 | | | | 362,716 | |
3.50%, 2/1/2041 | | | 30,947 | | | | 33,439 | |
4.50%, 2/1/2041 | | | 154,928 | | | | 173,292 | |
1.50%, 4/1/2041 | | | 493,504 | | | | 484,673 | |
2.00%, 5/1/2041 | | | 964,141 | | | | 982,724 | |
4.50%, 5/1/2041 | | | 51,175 | | | | 57,241 | |
5.00%, 5/1/2041 | | | 41,388 | | | | 47,222 | |
6.00%, 5/1/2041 | | | 32,296 | | | | 38,136 | |
4.50%, 6/1/2041 | | | 702,239 | | | | 779,107 | |
6.00%, 6/1/2041 | | | 1,349,767 | | | | 1,589,710 | |
2.50%, 7/1/2041 | | | 975,088 | | | | 1,006,270 | |
5.00%, 7/1/2041 | | | 571,636 | | | | 651,743 | |
6.00%, 7/1/2041 | | | 2,558,709 | | | | 3,027,810 | |
4.50%, 8/1/2041 | | | 163,363 | | | | 182,493 | |
5.00%, 8/1/2041 | | | 80,372 | | | | 91,864 | |
4.00%, 9/1/2041 | | | 251,334 | | | | 278,794 | |
4.50%, 9/1/2041 | | | 98,746 | | | | 110,088 | |
3.50%, 10/1/2041 | | | 157,517 | | | | 171,481 | |
4.00%, 10/1/2041 | | | 68,508 | | | | 76,032 | |
5.00%, 10/1/2041 | | | 86,977 | | | | 99,167 | |
4.00%, 11/1/2041 | | | 104,806 | | | | 115,868 | |
4.00%, 12/1/2041 | | | 23,142 | | | | 25,512 | |
4.00%, 1/1/2042 | | | 206,288 | | | | 227,889 | |
4.50%, 1/1/2042 | | | 23,816 | | | | 26,618 | |
6.00%, 1/1/2042 | | | 93,233 | | | | 110,579 | |
3.00%, 3/1/2042 | | | 186,731 | | | | 198,862 | |
4.00%, 3/1/2042 | | | 107,059 | | | | 119,432 | |
3.00%, 4/1/2042 | | | 61,768 | | | | 65,781 | |
4.50%, 4/1/2042 | | | 114,240 | | | | 126,422 | |
3.50%, 5/1/2042 | | | 32,319 | | | | 34,856 | |
4.50%, 5/1/2042 | | | 91,273 | | | | 102,010 | |
3.50%, 6/1/2042 | | | 58,172 | | | | 63,143 | |
3.50%, 7/1/2042 | | | 156,507 | | | | 169,982 | |
4.00%, 7/1/2042 | | | 146,301 | | | | 163,460 | |
3.50%, 8/1/2042 | | | 50,779 | | | | 55,125 | |
| | | | | | | | |
| Investments | | Principal
Amount | | | Value | |
3.00%, 9/1/2042 | | $ | 86,812 | | | $ | 92,438 | |
3.50%, 9/1/2042 | | | 19,854 | | | | 21,551 | |
4.00%, 9/1/2042 | | | 88,223 | | | | 97,904 | |
3.00%, 10/1/2042 | | | 183,175 | | | | 195,784 | |
3.50%, 10/1/2042 | | | 34,213 | | | | 36,892 | |
2.50%, 12/1/2042 | | | 293,817 | | | | 304,773 | |
3.00%, 12/1/2042 | | | 173,970 | | | | 185,271 | |
2.50%, 1/1/2043 | | | 8,748 | | | | 9,049 | |
3.00%, 1/1/2043 | | | 171,238 | | | | 182,304 | |
3.50%, 1/1/2043 | | | 49,630 | | | | 53,878 | |
4.00%, 1/1/2043 | | | 94,058 | | | | 103,921 | |
4.50%, 1/1/2043 | | | 244,197 | | | | 272,299 | |
2.50%, 2/1/2043 | | | 897,889 | | | | 930,895 | |
3.00%, 2/1/2043 | | | 231,594 | | | | 246,601 | |
3.50%, 2/1/2043 | | | 91,387 | | | | 99,223 | |
3.50%, 3/1/2043 | | | 109,684 | | | | 119,401 | |
2.50%, 5/1/2043 | | | 15,622 | | | | 16,091 | |
2.50%, 6/1/2043 | | | 8,044 | | | | 8,334 | |
4.00%, 8/1/2043 | | | 55,812 | | | | 61,423 | |
4.00%, 9/1/2043 | | | 126,467 | | | | 139,821 | |
4.50%, 9/1/2043 | | | 32,995 | | | | 36,722 | |
4.00%, 10/1/2043 | | | 154,056 | | | | 170,084 | |
4.00%, 11/1/2043 | | | 330,410 | | | | 365,197 | |
4.50%, 11/1/2043 | | | 113,338 | | | | 126,844 | |
4.50%, 12/1/2043 | | | 87,212 | | | | 97,114 | |
4.00%, 1/1/2044 | | | 121,031 | | | | 133,828 | |
4.50%, 2/1/2044 | | | 25,863 | | | | 28,635 | |
3.00%, 3/1/2044 | | | 1,025,268 | | | | 1,090,550 | |
4.50%, 3/1/2044 | | | 128,991 | | | | 146,671 | |
5.00%, 3/1/2044 | | | 26,384 | | | | 30,109 | |
4.50%, 4/1/2044 | | | 257,694 | | | | 286,094 | |
5.00%, 6/1/2044 | | | 42,821 | | | | 48,258 | |
3.00%, 10/1/2044 | | | 869,182 | | | | 928,427 | |
4.00%, 10/1/2044 | | | 46,846 | | | | 51,869 | |
4.50%, 10/1/2044 | | | 12,527 | | | | 13,835 | |
4.50%, 12/1/2044 | | | 49,068 | | | | 54,756 | |
4.00%, 2/1/2045 | | | 35,853 | | | | 39,622 | |
4.50%, 2/1/2045 | | | 165,265 | | | | 183,846 | |
4.00%, 4/1/2045 | | | 31,510 | | | | 34,835 | |
4.00%, 8/1/2045 | | | 17,220 | | | | 18,947 | |
4.00%, 11/1/2045 | | | 65,455 | | | | 71,466 | |
4.50%, 11/1/2045 | | | 100,434 | | | | 111,682 | |
4.00%, 12/1/2045 | | | 399,442 | | | | 440,286 | |
4.00%, 2/1/2046 | | | 12,734 | | | | 13,940 | |
4.50%, 3/1/2046 | | | 182,480 | | | | 203,037 | |
4.00%, 4/1/2046 | | | 15,225 | | | | 16,801 | |
2.50%, 6/1/2046 | | | 88,316 | | | | 91,609 | |
See Accompanying Notes to the Financial Statements.
| | | | |
| 370 | | FLEXSHARES ANNUAL REPORT | | |
FlexShares® Disciplined Duration MBS Index Fund (cont.)
| | | | | | | | |
| Investments | | Principal
Amount | | | Value | |
|
| MORTGAGE-BACKED SECURITIES – (continued) | |
4.50%, 6/1/2046 | | $ | 113,411 | | | $ | 125,173 | |
4.50%, 7/1/2046 | | | 25,290 | | | | 27,670 | |
4.50%, 8/1/2046 | | | 24,160 | | | | 26,828 | |
2.50%, 9/1/2046 | | | 159,570 | | | | 164,816 | |
2.50%, 10/1/2046 | | | 76,410 | | | | 78,924 | |
4.50%, 10/1/2046 | | | 44,928 | | | | 49,327 | |
2.50%, 12/1/2046 | | | 26,201 | | | | 26,996 | |
4.50%, 1/1/2047 | | | 39,734 | | | | 43,420 | |
4.00%, 2/1/2047 | | | 41,356 | | | | 45,315 | |
4.50%, 2/1/2047 | | | 47,165 | | | | 52,540 | |
2.50%, 3/1/2047 | | | 160,971 | | | | 166,324 | |
4.50%, 3/1/2047 | | | 232,177 | | | | 261,717 | |
4.50%, 5/1/2047 | | | 826,764 | | | | 897,311 | |
4.50%, 7/1/2047 | | | 100,581 | | | | 111,883 | |
5.00%, 7/1/2047 | | | 329,254 | | | | 376,780 | |
4.00%, 7/1/2048 | | | 176,845 | | | | 194,139 | |
4.50%, 11/1/2048 | | | 1,006,115 | | | | 1,087,197 | |
6.00%, 2/1/2049 | | | 118,672 | | | | 141,783 | |
3.00%, 9/1/2050 | | | 787,411 | | | | 825,880 | |
2.50%, 11/1/2050 | | | 187,794 | | | | 194,221 | |
| | |
FNMA/FHLMC UMBS, 15 Year, Single Family | | | | | | | | |
TBA 1.50%, 11/25/2036 | | | 1,000,000 | | | | 1,005,937 | |
TBA 2.00%, 11/25/2036 | | | 1,950,000 | | | | 2,000,807 | |
| | |
FNMA/FHLMC UMBS, 30 Year, Single Family | | | | | | | | |
TBA 1.50%, 11/25/2051 | | | 4,300,000 | | | | 4,164,113 | |
TBA 2.00%, 11/25/2051 | | | 4,000,000 | | | | 3,999,531 | |
TBA 2.50%, 11/25/2051 | | | 4,100,000 | | | | 4,210,829 | |
|
GNMA | |
6.00%, 3/15/2033 | | | 61,539 | | | | 72,784 | |
5.50%, 8/20/2033 | | | 38,176 | | | | 44,745 | |
5.50%, 11/20/2033 | | | 35,535 | | | | 41,724 | |
6.00%, 12/15/2033 | | | 112,198 | | | | 132,586 | |
5.50%, 3/20/2034 | | | 41,942 | | | | 49,320 | |
5.50%, 7/20/2034 | | | 27,141 | | | | 31,937 | |
5.50%, 9/20/2034 | | | 11,519 | | | | 13,574 | |
6.00%, 2/15/2035 | | | 26,085 | | | | 30,722 | |
5.50%, 3/20/2036 | | | 86,475 | | | | 100,260 | |
5.50%, 9/20/2038 | | | 50,949 | | | | 60,058 | |
5.50%, 2/20/2039 | | | 84,894 | | | | 100,071 | |
5.00%, 11/15/2039 | | | 716,729 | | | | 830,044 | |
5.50%, 12/20/2040 | | | 24,754 | | | | 28,449 | |
5.50%, 1/20/2041 | | | 23,853 | | | | 28,146 | |
5.50%, 5/20/2041 | | | 148,909 | | | | 175,502 | |
4.00%, 9/15/2041 | | | 1,256,388 | | | | 1,387,667 | |
4.50%, 11/15/2041 | | | 587,600 | | | | 662,420 | |
5.50%, 11/20/2041 | | | 267,694 | | | | 315,480 | |
| | | | | | | | |
| Investments | | Principal
Amount | | | Value | |
5.50%, 12/20/2041 | | $ | 66,643 | | | $ | 76,653 | |
5.50%, 2/20/2042 | | | 17,305 | | | | 20,396 | |
3.50%, 6/15/2042 | | | 591,149 | | | | 635,660 | |
2.50%, 3/20/2043 | | | 52,072 | | | | 54,142 | |
2.50%, 5/20/2043 | | | 74,996 | | | | 77,974 | |
5.50%, 3/20/2044 | | | 81,138 | | | | 95,641 | |
2.50%, 11/20/2044 | | | 47,274 | | | | 49,097 | |
5.00%, 6/20/2045 | | | 212,713 | | | | 241,629 | |
4.00%, 8/15/2045 | | | 2,657,084 | | | | 2,935,449 | |
5.50%, 3/20/2046 | | | 771,889 | | | | 909,743 | |
5.00%, 5/20/2046 | | | 479,660 | | | | 546,147 | |
5.50%, 2/20/2047 | | | 301,990 | | | | 355,942 | |
5.50%, 7/20/2049 | | | 19,092 | | | | 21,203 | |
3.00%, 4/20/2051 | | | 469,183 | | | | 487,611 | |
TBA 2.00%, 11/15/2051 | | | 2,000,000 | | | | 2,024,531 | |
TBA 2.50%, 11/15/2051 | | | 4,000,000 | | | | 4,111,875 | |
Total Mortgage-Backed Securities
(Cost $108,150,831) | | | | 108,374,947 | |
| | | | | | | | | |
Total Investments – 97.4%
(Cost $108,150,831) | | | | 108,374,947 | |
| |
Other assets less liabilities – 2.6% | | | | 2,867,841 | |
| NET ASSETS – 100.0% | | | $ | 111,242,788 | |
Percentages shown are based on Net Assets.
Abbreviations
FHLMC – Federal Home Loan Mortgage Corp.
FNMA – Federal National Mortgage Association
GNMA – Government National Mortgage Association
TBA – To Be Announced; Security is subject to delayed delivery.
UMBS – Uniform Mortgage-Backed Securities
As of October 31, 2021, the gross unrealized appreciation (depreciation) of investments based on the aggregate cost of investments (including derivative instruments, if applicable) for federal income tax purposes was as follows:
| | | | |
| | | | |
Aggregate gross unrealized appreciation | | $ | 688,795 | |
Aggregate gross unrealized depreciation | | | (471,150 | ) |
Net unrealized appreciation | | $ | 217,645 | |
Federal income tax cost | | $ | 108,157,302 | |
| | | | |
| Security Type | | % of Net Assets | |
Mortgage-Backed Securities | | | 97.4 | % |
Others(1) | | | 2.6 | |
| | | | 100.0 | % |
| (1) | Includes any other net assets/(liabilities). |
See Accompanying Notes to the Financial Statements.
| | | | | | |
| | FLEXSHARES ANNUAL REPORT | | | 371 | |
Schedule of Investments
FlexShares® Credit-Scored US Corporate Bond Index Fund
October 31, 2021
| | | | | | | | |
| Investments | | Principal
Amount | | | Value | |
|
| CORPORATE BONDS – 97.7% | |
|
| Aerospace & Defense – 1.6% | |
| | |
Boeing Co. (The) | | | | | | | | |
5.15%, 5/1/2030 | | $ | 150,000 | | | $ | 175,167 | |
| | |
General Dynamics Corp. | | | | | | | | |
3.50%, 5/15/2025 | | | 375,000 | | | | 403,445 | |
3.75%, 5/15/2028 | | | 600,000 | | | | 671,720 | |
| | |
Huntington Ingalls Industries, Inc. | | | | | | | | |
3.84%, 5/1/2025 | | | 100,000 | | | | 107,602 | |
3.48%, 12/1/2027 | | | 200,000 | | | | 213,554 | |
2.04%, 8/16/2028(a) | | | 200,000 | | | | 196,290 | |
| | |
L3Harris Technologies, Inc. | | | | | | | | |
3.85%, 12/15/2026 | | | 500,000 | | | | 551,335 | |
4.40%, 6/15/2028 | | | 500,000 | | | | 570,988 | |
| | |
Lockheed Martin Corp. | | | | | | | | |
3.55%, 1/15/2026 | | | 605,000 | | | | 659,392 | |
| | |
Northrop Grumman Corp. | | | | | | | | |
2.93%, 1/15/2025 | | | 800,000 | | | | 839,451 | |
3.25%, 1/15/2028 | | | 500,000 | | | | 538,897 | |
| | |
Precision Castparts Corp. | | | | | | | | |
3.25%, 6/15/2025 | | | 185,000 | | | | 198,175 | |
| | | | | | | | 5,126,016 | |
|
| Air Freight & Logistics – 0.1% | |
| | |
CH Robinson Worldwide, Inc. | | | | | | | | |
4.20%, 4/15/2028 | | | 210,000 | | | | 237,069 | |
| | |
United Parcel Service, Inc. | | | | | | | | |
3.40%, 3/15/2029 | | | 200,000 | | | | 220,965 | |
| | | | | | | | 458,034 | |
|
| Auto Components – 0.1% | |
| | |
Lear Corp. | | | | | | | | |
3.80%, 9/15/2027 | | | 200,000 | | | | 218,574 | |
|
| Banks – 24.8% | |
| | |
Australia & New Zealand Banking Group Ltd. | | | | | | | | |
2.63%, 11/9/2022 | | | 250,000 | | | | 255,835 | |
| | |
Banco Santander SA | | | | | | | | |
5.18%, 11/19/2025 | | | 600,000 | | | | 674,510 | |
| | |
Bancolombia SA | | | | | | | | |
3.00%, 1/29/2025 | | | 250,000 | | | | 252,503 | |
| | | | | | | | |
| Investments | | Principal
Amount | | | Value | |
|
| Banks – (continued) | |
| | |
Bank of America Corp. | | | | | | | | |
3.00%, 12/20/2023(b) | | $ | 500,000 | | | $ | 513,280 | |
4.20%, 8/26/2024 | | | 200,000 | | | | 216,436 | |
4.00%, 1/22/2025 | | | 945,000 | | | | 1,018,984 | |
Series L, 3.95%, 4/21/2025 | | | 500,000 | | | | 540,105 | |
0.98%, 9/25/2025(b) | | | 750,000 | | | | 745,581 | |
4.45%, 3/3/2026 | | | 500,000 | | | | 554,332 | |
1.32%, 6/19/2026(b) | | | 500,000 | | | | 496,380 | |
1.20%, 10/24/2026(b) | | | 1,000,000 | | | | 983,899 | |
Series L, 4.18%, 11/25/2027 | | | 615,000 | | | | 677,996 | |
3.82%, 1/20/2028(b) | | | 500,000 | | | | 545,695 | |
3.71%, 4/24/2028(b) | | | 5,000 | | | | 5,421 | |
3.42%, 12/20/2028(b) | | | 250,000 | | | | 267,521 | |
4.27%, 7/23/2029(b) | | | 550,000 | | | | 619,177 | |
3.97%, 2/7/2030(b) | | | 300,000 | | | | 333,758 | |
3.19%, 7/23/2030(b) | | | 250,000 | | | | 265,440 | |
2.50%, 2/13/2031(b) | | | 600,000 | | | | 602,458 | |
2.59%, 4/29/2031(b) | | | 188,000 | | | | 190,411 | |
1.90%, 7/23/2031(b) | | | 250,000 | | | | 239,157 | |
2.69%, 4/22/2032(b) | | | 212,000 | | | | 214,944 | |
2.30%, 7/21/2032(b) | | | 500,000 | | | | 489,865 | |
| | |
Bank of Montreal | | | | | | | | |
4.34%, 10/5/2028(b) | | | 300,000 | | | | 318,757 | |
3.80%, 12/15/2032(b) | | | 500,000 | | | | 540,322 | |
| | |
Bank of Nova Scotia (The) | | | | | | | | |
3.40%, 2/11/2024 | | | 250,000 | | | | 263,963 | |
4.50%, 12/16/2025 | | | 350,000 | | | | 389,899 | |
2.15%, 8/1/2031 | | | 250,000 | | | | 247,415 | |
Series 2, 3.62%, 10/27/2081(b) | | | 250,000 | | | | 246,143 | |
| | |
Barclays plc | | | | | | | | |
4.38%, 9/11/2024 | | | 490,000 | | | | 528,885 | |
3.65%, 3/16/2025 | | | 200,000 | | | | 213,341 | |
5.20%, 5/12/2026 | | | 300,000 | | | | 339,428 | |
4.84%, 5/9/2028 | | | 300,000 | | | | 334,491 | |
2.67%, 3/10/2032(b) | | | 50,000 | | | | 49,858 | |
| | |
BBVA USA | | | | | | | | |
3.88%, 4/10/2025 | | | 250,000 | | | | 270,278 | |
| | |
Canadian Imperial Bank of Commerce | | | | | | | | |
2.25%, 1/28/2025 | | | 300,000 | | | | 309,664 | |
See Accompanying Notes to the Financial Statements.
| | | | |
| 372 | | FLEXSHARES ANNUAL REPORT | | |
FlexShares® Credit-Scored US Corporate Bond Index Fund (cont.)
| | | | | | | | |
| Investments | | Principal
Amount | | | Value | |
|
| CORPORATE BONDS – (continued) | |
|
| Banks – (continued) | |
| | |
Citigroup, Inc. | | | | | | | | |
3.35%, 4/24/2025(b) | | $ | 600,000 | | | $ | 632,249 | |
3.30%, 4/27/2025 | | | 200,000 | | | | 213,622 | |
4.40%, 6/10/2025 | | | 825,000 | | | | 901,453 | |
5.50%, 9/13/2025 | | | 650,000 | | | | 741,742 | |
4.60%, 3/9/2026 | | | 380,000 | | | | 424,064 | |
3.11%, 4/8/2026(b) | | | 500,000 | | | | 526,872 | |
3.40%, 5/1/2026 | | | 300,000 | | | | 323,046 | |
3.20%, 10/21/2026 | | | 350,000 | | | | 372,254 | |
1.46%, 6/9/2027(b) | | | 750,000 | | | | 739,187 | |
4.45%, 9/29/2027 | | | 200,000 | | | | 224,445 | |
3.89%, 1/10/2028(b) | | | 500,000 | | | | 544,915 | |
3.67%, 7/24/2028(b) | | | 255,000 | | | | 276,078 | |
2.98%, 11/5/2030(b) | | | 500,000 | | | | 522,304 | |
2.67%, 1/29/2031(b) | | | 500,000 | | | | 509,080 | |
4.41%, 3/31/2031(b) | | | 636,000 | | | | 729,721 | |
2.57%, 6/3/2031(b) | | | 500,000 | | | | 504,753 | |
2.56%, 5/1/2032(b) | | | 100,000 | | | | 100,560 | |
| | |
Citizens Bank NA | | | | | | | | |
3.70%, 3/29/2023 | | | 300,000 | | | | 312,273 | |
| | |
Citizens Financial Group, Inc. | | | | | | | | |
3.25%, 4/30/2030 | | | 200,000 | | | | 213,433 | |
| | |
Comerica, Inc. | | | | | | | | |
3.70%, 7/31/2023 | | | 250,000 | | | | 262,281 | |
| | |
Cooperatieve Rabobank UA | | | | | | | | |
3.75%, 7/21/2026 | | | 250,000 | | | | 271,929 | |
| | |
Discover Bank | | | | | | | | |
3.35%, 2/6/2023 | | | 300,000 | | | | 309,522 | |
4.20%, 8/8/2023 | | | 400,000 | | | | 424,262 | |
2.45%, 9/12/2024 | | | 500,000 | | | | 517,305 | |
4.65%, 9/13/2028 | | | 500,000 | | | | 576,143 | |
| | |
Fifth Third Bancorp | | | | | | | | |
4.30%, 1/16/2024 | | | 250,000 | | | | 267,054 | |
3.65%, 1/25/2024 | | | 500,000 | | | | 529,170 | |
2.55%, 5/5/2027 | | | 250,000 | | | | 259,841 | |
| | |
Fifth Third Bank NA | | | | | | | | |
3.85%, 3/15/2026 | | | 400,000 | | | | 436,353 | |
| | |
First Horizon Corp. | | | | | | | | |
3.55%, 5/26/2023 | | | 250,000 | | | | 259,618 | |
| | |
HSBC Holdings plc | | | | | | | | |
3.80%, 3/11/2025(b) | | | 750,000 | | | | 794,178 | |
4.25%, 8/18/2025 | | | 1,040,000 | | | | 1,128,294 | |
1.64%, 4/18/2026(b) | | | 500,000 | | | | 498,745 | |
| | | | | | | | |
| Investments | | Principal
Amount | | | Value | |
|
| Banks – (continued) | |
3.90%, 5/25/2026 | | $ | 1,000,000 | | | $ | 1,087,268 | |
4.29%, 9/12/2026(b) | | | 650,000 | | | | 708,442 | |
1.59%, 5/24/2027(b) | | | 250,000 | | | | 245,808 | |
4.04%, 3/13/2028(b) | | | 700,000 | | | | 762,811 | |
4.58%, 6/19/2029(b) | | | 670,000 | | | | 757,462 | |
4.95%, 3/31/2030 | | | 500,000 | | | | 589,432 | |
3.97%, 5/22/2030(b) | | | 300,000 | | | | 328,477 | |
2.80%, 5/24/2032(b) | | | 200,000 | | | | 201,610 | |
| | |
Huntington Bancshares, Inc. | | | | | | | | |
4.00%, 5/15/2025 | | | 200,000 | | | | 217,457 | |
2.55%, 2/4/2030 | | | 250,000 | | | | 256,734 | |
| | |
ING Groep NV | | | | | | | | |
3.55%, 4/9/2024 | | | 200,000 | | | | 212,430 | |
1.73%, 4/1/2027(b) | | | 500,000 | | | | 499,394 | |
4.55%, 10/2/2028 | | | 350,000 | | | | 405,237 | |
4.05%, 4/9/2029 | | | 250,000 | | | | 282,302 | |
| | |
JPMorgan Chase & Co. | | | | | | | | |
0.70%, 3/16/2024(b) | | | 500,000 | | | | 500,313 | |
3.56%, 4/23/2024(b) | | | 300,000 | | | | 312,379 | |
3.88%, 9/10/2024 | | | 1,127,000 | | | | 1,212,194 | |
0.65%, 9/16/2024(b) | | | 285,000 | | | | 284,411 | |
4.02%, 12/5/2024(b) | | | 40,000 | | | | 42,551 | |
3.90%, 7/15/2025 | | | 395,000 | | | | 429,338 | |
2.30%, 10/15/2025(b) | | | 120,000 | | | | 123,554 | |
2.00%, 3/13/2026(b) | | | 115,000 | | | | 117,254 | |
4.13%, 12/15/2026 | | | 369,000 | | | | 409,120 | |
3.96%, 1/29/2027(b) | | | 750,000 | | | | 817,756 | |
1.58%, 4/22/2027(b) | | | 250,000 | | | | 247,735 | |
8.00%, 4/29/2027 | | | 250,000 | | | | 327,004 | |
3.63%, 12/1/2027 | | | 250,000 | | | | 269,947 | |
3.78%, 2/1/2028(b) | | | 925,000 | | | | 1,008,868 | |
4.01%, 4/23/2029(b) | | | 130,000 | | | | 144,435 | |
4.20%, 7/23/2029(b) | | | 450,000 | | | | 505,288 | |
4.45%, 12/5/2029(b) | | | 500,000 | | | | 571,269 | |
3.70%, 5/6/2030(b) | | | 250,000 | | | | 273,538 | |
2.74%, 10/15/2030(b) | | | 200,000 | | | | 205,214 | |
4.49%, 3/24/2031(b) | | | 200,000 | | | | 232,214 | |
2.96%, 5/13/2031(b) | | | 500,000 | | | | 516,818 | |
1.95%, 2/4/2032(b) | | | 450,000 | | | | 431,135 | |
| | |
KeyCorp | | | | | | | | |
2.25%, 4/6/2027 | | | 500,000 | | | | 512,110 | |
4.10%, 4/30/2028 | | | 200,000 | | | | 227,579 | |
2.55%, 10/1/2029 | | | 200,000 | | | | 206,900 | |
| | |
Lloyds Banking Group plc | | | | | | | | |
4.05%, 8/16/2023 | | | 300,000 | | | | 317,567 | |
See Accompanying Notes to the Financial Statements.
| | | | | | |
| | FLEXSHARES ANNUAL REPORT | | | 373 | |
FlexShares® Credit-Scored US Corporate Bond Index Fund (cont.)
| | | | | | | | |
| Investments | | Principal
Amount | | | Value | |
|
| CORPORATE BONDS – (continued) | |
|
| Banks – (continued) | |
2.91%, 11/7/2023(b) | | $ | 300,000 | | | $ | 306,786 | |
| | |
Mitsubishi UFJ Financial Group, Inc. | | | | | | | | |
3.76%, 7/26/2023 | | | 50,000 | | | | 52,674 | |
3.41%, 3/7/2024 | | | 50,000 | | | | 52,763 | |
2.19%, 2/25/2025 | | | 700,000 | | | | 719,139 | |
3.68%, 2/22/2027 | | | 350,000 | | | | 381,948 | |
3.29%, 7/25/2027 | | | 750,000 | | | | 806,429 | |
3.74%, 3/7/2029 | | | 200,000 | | | | 221,322 | |
2.05%, 7/17/2030 | | | 100,000 | | | | 97,597 | |
| | |
Mizuho Financial Group, Inc. | | | | | | | | |
3.55%, 3/5/2023 | | | 450,000 | | | | 467,588 | |
2.55%, 9/13/2025(b) | | | 250,000 | | | | 259,383 | |
2.23%, 5/25/2026(b) | | | 750,000 | | | | 765,843 | |
3.17%, 9/11/2027 | | | 500,000 | | | | 532,430 | |
4.02%, 3/5/2028 | | | 390,000 | | | | 435,804 | |
4.25%, 9/11/2029(b) | | | 500,000 | | | | 562,855 | |
3.15%, 7/16/2030(b) | | | 200,000 | | | | 211,192 | |
2.59%, 5/25/2031(b) | | | 250,000 | | | | 252,494 | |
| | |
National Australia Bank Ltd. | | | | | | | | |
3.63%, 6/20/2023 | | | 250,000 | | | | 262,632 | |
| | |
PNC Bank NA | | | | | | | | |
3.50%, 6/8/2023 | | | 250,000 | | | | 261,071 | |
3.25%, 1/22/2028 | | | 250,000 | | | | 272,422 | |
4.05%, 7/26/2028 | | | 250,000 | | | | 282,945 | |
2.70%, 10/22/2029 | | | 500,000 | | | | 522,143 | |
| | |
PNC Financial Services Group, Inc. (The) | | | | | | | | |
3.90%, 4/29/2024 | | | 550,000 | | | | 588,104 | |
3.15%, 5/19/2027 | | | 80,000 | | | | 86,625 | |
2.55%, 1/22/2030 | | | 300,000 | | | | 310,200 | |
| | |
Royal Bank of Canada | | | | | | | | |
1.95%, 1/17/2023 | | | 150,000 | | | | 152,671 | |
4.65%, 1/27/2026 | | | 650,000 | | | | 729,579 | |
| | |
Santander Holdings USA, Inc. | | | | | | | | |
4.50%, 7/17/2025 | | | 240,000 | | | | 262,877 | |
4.40%, 7/13/2027 | | | 500,000 | | | | 556,613 | |
| | |
Santander UK Group Holdings plc | | | | | | | | |
3.82%, 11/3/2028(b) | | | 200,000 | | | | 215,956 | |
| | |
Sumitomo Mitsui Financial Group, Inc. | | | | | | | | |
3.10%, 1/17/2023 | | | 950,000 | | | | 978,661 | |
| | | | | | | | |
| Investments | | Principal
Amount | | | Value | |
|
| Banks – (continued) | |
2.70%, 7/16/2024 | | $ | 1,000,000 | | | $ | 1,042,397 | |
2.35%, 1/15/2025 | | | 250,000 | | | | 257,953 | |
1.47%, 7/8/2025 | | | 500,000 | | | | 500,385 | |
3.78%, 3/9/2026 | | | 50,000 | | | | 54,486 | |
2.63%, 7/14/2026 | | | 600,000 | | | | 623,387 | |
3.45%, 1/11/2027 | | | 250,000 | | | | 269,743 | |
3.36%, 7/12/2027 | | | 450,000 | | | | 488,273 | |
3.04%, 7/16/2029 | | | 300,000 | | | | 315,314 | |
2.72%, 9/27/2029 | | | 250,000 | | | | 256,789 | |
2.75%, 1/15/2030 | | | 200,000 | | | | 205,969 | |
2.13%, 7/8/2030 | | | 300,000 | | | | 294,865 | |
2.14%, 9/23/2030 | | | 250,000 | | | | 240,709 | |
| | |
SVB Financial Group | | | | | | | | |
1.80%, 2/2/2031 | | | 200,000 | | | | 191,197 | |
| | |
Toronto-Dominion Bank (The) | | | | | | | | |
3.25%, 3/11/2024 | | | 450,000 | | | | 474,725 | |
3.62%, 9/15/2031(b) | | | 250,000 | | | | 271,207 | |
| | |
Truist Bank | | | | | | | | |
3.63%, 9/16/2025 | | | 250,000 | | | | 270,480 | |
3.30%, 5/15/2026 | | | 200,000 | | | | 215,380 | |
| | |
Truist Financial Corp. | | | | | | | | |
2.85%, 10/26/2024 | | | 150,000 | | | | 158,008 | |
4.00%, 5/1/2025 | | | 210,000 | | | | 229,020 | |
1.89%, 6/7/2029(b) | | | 500,000 | | | | 495,239 | |
| | |
US Bancorp | | | | | | | | |
3.38%, 2/5/2024 | | | 200,000 | | | | 211,141 | |
3.95%, 11/17/2025 | | | 200,000 | | | | 220,575 | |
Series V, 2.38%, 7/22/2026 | | | 500,000 | | | | 522,683 | |
3.00%, 7/30/2029 | | | 200,000 | | | | 212,861 | |
| | |
Wells Fargo & Co. | | | | | | | | |
3.07%, 1/24/2023 | | | 500,000 | | | | 502,960 | |
4.48%, 1/16/2024 | | | 325,000 | | | | 349,432 | |
1.65%, 6/2/2024(b) | | | 500,000 | | | | 507,458 | |
3.00%, 2/19/2025 | | | 500,000 | | | | 526,631 | |
3.55%, 9/29/2025 | | | 1,190,000 | | | | 1,282,035 | |
2.41%, 10/30/2025(b) | | | 500,000 | | | | 516,690 | |
4.10%, 6/3/2026 | | | 500,000 | | | | 548,596 | |
3.20%, 6/17/2027(b) | | | 1,000,000 | | | | 1,062,363 | |
4.30%, 7/22/2027 | | | 1,000,000 | | | | 1,120,357 | |
3.58%, 5/22/2028(b) | | | 1,110,000 | | | | 1,197,939 | |
2.39%, 6/2/2028(b) | | | 1,500,000 | | | | 1,525,446 | |
2.88%, 10/30/2030(b) | | | 450,000 | | | | 466,808 | |
2.57%, 2/11/2031(b) | | | 200,000 | | | | 202,541 | |
4.48%, 4/4/2031(b) | | | 200,000 | | | | 231,491 | |
See Accompanying Notes to the Financial Statements.
| | | | |
| 374 | | FLEXSHARES ANNUAL REPORT | | |
FlexShares® Credit-Scored US Corporate Bond Index Fund (cont.)
| | | | | | | | |
| Investments | | Principal
Amount | | | Value | |
|
| CORPORATE BONDS – (continued) | |
|
| Banks – (continued) | |
| | |
Westpac Banking Corp. | | | | | | | | |
2.75%, 1/11/2023 | | $ | 600,000 | | | $ | 616,844 | |
2.89%, 2/4/2030(b) | | | 300,000 | | | | 308,478 | |
4.32%, 11/23/2031(b) | | | 250,000 | | | | 272,436 | |
4.11%, 7/24/2034(b) | | | 150,000 | | | | 162,350 | |
2.67%, 11/15/2035(b) | | | 300,000 | | | | 293,029 | |
| | | | | | | | 78,229,649 | |
|
| Beverages – 1.0% | |
| | |
Anheuser-Busch InBev Worldwide, Inc. | | | | | | | | |
4.75%, 1/23/2029 | | | 250,000 | | | | 293,807 | |
| | |
Coca-Cola Co. (The) | | | | | | | | |
1.00%, 3/15/2028 | | | 1,000,000 | | | | 958,117 | |
3.45%, 3/25/2030 | | | 200,000 | | | | 222,960 | |
| | |
Constellation Brands, Inc. | | | | | | | | |
3.60%, 2/15/2028 | | | 260,000 | | | | 285,050 | |
4.65%, 11/15/2028 | | | 500,000 | | | | 578,577 | |
| | |
Keurig Dr Pepper, Inc. | | | | | | | | |
4.60%, 5/25/2028 | | | 200,000 | | | | 230,589 | |
| | |
PepsiCo, Inc. | | | | | | | | |
7.00%, 3/1/2029 | | | 500,000 | | | | 684,285 | |
| | | | | | | | 3,253,385 | |
|
| Biotechnology – 0.8% | |
| | |
AbbVie, Inc. | | | | | | | | |
3.20%, 11/21/2029 | | | 210,000 | | | | 224,659 | |
| | |
Amgen, Inc. | | | | | | | | |
2.60%, 8/19/2026 | | | 500,000 | | | | 522,709 | |
2.20%, 2/21/2027 | | | 300,000 | | | | 306,239 | |
2.45%, 2/21/2030 | | | 300,000 | | | | 305,204 | |
| | |
Gilead Sciences, Inc. | | | | | | | | |
3.65%, 3/1/2026 | | | 330,000 | | | | 358,008 | |
2.95%, 3/1/2027 | | | 800,000 | | | | 848,350 | |
| | | | | | | | 2,565,169 | |
|
| Building Products – 0.5% | |
| | |
Carlisle Cos., Inc. | | | | | | | | |
3.75%, 12/1/2027 | | | 200,000 | | | | 218,864 | |
| | |
Carrier Global Corp. | | | | | | | | |
2.72%, 2/15/2030 | | | 250,000 | | | | 256,864 | |
| | | | | | | | |
| Investments | | Principal
Amount | | | Value | |
|
| Building Products – (continued) | |
| | |
Fortune Brands Home & Security, Inc. | | | | | | | | |
4.00%, 6/15/2025 | | $ | 150,000 | | | $ | 162,803 | |
| | |
Lennox International, Inc. | | | | | | | | |
1.35%, 8/1/2025 | | | 450,000 | | | | 447,455 | |
| | |
Masco Corp. | | | | | | | | |
3.50%, 11/15/2027 | | | 500,000 | | | | 540,564 | |
| | | | | | | | 1,626,550 | |
|
| Capital Markets – 6.1% | |
| | |
Ameriprise Financial, Inc. | | | | | | | | |
3.70%, 10/15/2024 | | | 250,000 | | | | 270,094 | |
2.88%, 9/15/2026 | | | 200,000 | | | | 212,135 | |
| | |
Ares Capital Corp. | | | | | | | | |
4.20%, 6/10/2024 | | | 300,000 | | | | 319,428 | |
3.88%, 1/15/2026 | | | 500,000 | | | | 530,497 | |
2.15%, 7/15/2026 | | | 500,000 | | | | 495,484 | |
2.88%, 6/15/2028 | | | 500,000 | | | | 502,618 | |
| | |
Bain Capital Specialty Finance, Inc. | | | | | | | | |
2.55%, 10/13/2026 | | | 250,000 | | | | 244,691 | |
| | |
Bank of New York Mellon Corp. (The) | | | | | | | | |
Series 0012, 3.65%, 2/4/2024 | | | 300,000 | | | | 318,502 | |
2.45%, 8/17/2026 | | | 300,000 | | | | 313,702 | |
| | |
BlackRock, Inc. | | | | | | | | |
3.20%, 3/15/2027 | | | 200,000 | | | | 217,059 | |
3.25%, 4/30/2029 | | | 400,000 | | | | 438,774 | |
| | |
Blackstone Secured Lending Fund | | | | | | | | |
3.65%, 7/14/2023 | | | 150,000 | | | | 156,052 | |
3.63%, 1/15/2026 | | | 250,000 | | | | 261,577 | |
2.75%, 9/16/2026 | | | 250,000 | | | | 252,457 | |
2.13%, 2/15/2027(a) | | | 250,000 | | | | 244,679 | |
| | |
Cboe Global Markets, Inc. | | | | | | | | |
3.65%, 1/12/2027 | | | 200,000 | | | | 219,302 | |
| | |
Charles Schwab Corp. (The) | | | | | | | | |
4.20%, 3/24/2025 | | | 400,000 | | | | 438,419 | |
3.20%, 1/25/2028 | | | 100,000 | | | | 108,461 | |
4.00%, 2/1/2029 | | | 400,000 | | | | 453,841 | |
| | |
CME Group, Inc. | | | | | | | | |
3.00%, 3/15/2025 | | | 325,000 | | | | 343,083 | |
See Accompanying Notes to the Financial Statements.
| | | | | | |
| | FLEXSHARES ANNUAL REPORT | | | 375 | |
FlexShares® Credit-Scored US Corporate Bond Index Fund (cont.)
| | | | | | | | |
| Investments | | Principal
Amount | | | Value | |
|
| CORPORATE BONDS – (continued) | |
|
| Capital Markets – (continued) | |
| | |
Credit Suisse Group AG | | | | | | | | |
3.75%, 3/26/2025 | | $ | 250,000 | | | $ | 267,713 | |
| | |
Deutsche Bank AG | | | | | | | | |
3.70%, 5/30/2024 | | | 645,000 | | | | 682,955 | |
3.96%, 11/26/2025(b) | | | 100,000 | | | | 106,964 | |
4.10%, 1/13/2026 | | | 100,000 | | | | 108,174 | |
2.13%, 11/24/2026(b) | | | 1,000,000 | | | | 1,005,274 | |
3.55%, 9/18/2031(b) | | | 250,000 | | | | 264,886 | |
| | |
Goldman Sachs BDC, Inc. | | | | | | | | |
3.75%, 2/10/2025 | | | 200,000 | | | | 210,390 | |
| | |
Goldman Sachs Group, Inc. (The) | | | | | | | | |
3.63%, 1/22/2023 | | | 600,000 | | | | 622,174 | |
4.00%, 3/3/2024 | | | 500,000 | | | | 533,935 | |
3.85%, 7/8/2024 | | | 500,000 | | | | 533,363 | |
3.50%, 1/23/2025 | | | 465,000 | | | | 494,674 | |
3.50%, 4/1/2025 | | | 500,000 | | | | 533,876 | |
1.43%, 3/9/2027(b) | | | 250,000 | | | | 246,306 | |
4.22%, 5/1/2029(b) | | | 250,000 | | | | 280,224 | |
| | |
Jefferies Group LLC | | | | | | | | |
4.15%, 1/23/2030 | | | 200,000 | | | | 223,733 | |
| | |
Lazard Group LLC | | | | | | | | |
3.75%, 2/13/2025 | | | 450,000 | | | | 482,542 | |
4.50%, 9/19/2028 | | | 250,000 | | | | 287,177 | |
| | |
Moody’s Corp. | | | | | | | | |
2.63%, 1/15/2023 | | | 200,000 | | | | 204,491 | |
3.75%, 3/24/2025 | | | 300,000 | | | | 323,321 | |
4.25%, 2/1/2029 | | | 250,000 | | | | 285,635 | |
| | |
Morgan Stanley | | | | | | | | |
3.75%, 2/25/2023 | | | 800,000 | | | | 832,764 | |
0.79%, 5/30/2025(b) | | | 500,000 | | | | 494,733 | |
2.72%, 7/22/2025(b) | | | 500,000 | | | | 519,272 | |
3.77%, 1/24/2029(b) | | | 500,000 | | | | 549,644 | |
1.93%, 4/28/2032(b) | | | 250,000 | | | | 238,427 | |
| | |
Nasdaq, Inc. | | | | | | | | |
3.85%, 6/30/2026 | | | 215,000 | | | | 236,880 | |
| | |
Nomura Holdings, Inc. | | | | | | | | |
3.10%, 1/16/2030 | | | 250,000 | | | | 258,814 | |
| | |
Owl Rock Capital Corp. | | | | | | | | |
3.40%, 7/15/2026 | | | 750,000 | | | | 771,170 | |
2.88%, 6/11/2028 | | | 250,000 | | | | 246,859 | |
| | |
S&P Global, Inc. | | | | | | | | |
2.95%, 1/22/2027 | | | 200,000 | | | | 212,975 | |
| | | | | | | | |
| Investments | | Principal
Amount | | | Value | |
|
| Capital Markets – (continued) | |
1.25%, 8/15/2030 | | $ | 300,000 | | | $ | 281,113 | |
| | |
State Street Corp. | | | | | | | | |
3.10%, 5/15/2023 | | | 200,000 | | | | 207,915 | |
3.55%, 8/18/2025 | | | 300,000 | | | | 325,782 | |
| | | | | | | | 19,215,010 | |
|
| Chemicals – 1.6% | |
| | |
Air Products and Chemicals, Inc. | | | | | | | | |
3.35%, 7/31/2024 | | | 521,000 | | | | 552,548 | |
| | |
Cabot Corp. | | | | | | | | |
4.00%, 7/1/2029 | | | 250,000 | | | | 271,626 | |
| | |
Celanese US Holdings LLC | | | | | | | | |
3.50%, 5/8/2024 | | | 200,000 | | | | 211,216 | |
| | |
FMC Corp. | | | | | | | | |
3.20%, 10/1/2026 | | | 200,000 | | | | 212,240 | |
| | |
Huntsman International LLC | | | | | | | | |
4.50%, 5/1/2029 | | | 250,000 | | | | 281,129 | |
| | |
Nutrien Ltd. | | | | | | | | |
4.00%, 12/15/2026 | | | 250,000 | | | | 276,937 | |
4.20%, 4/1/2029 | | | 500,000 | | | | 567,835 | |
| | |
PPG Industries, Inc. | | | | | | | | |
2.40%, 8/15/2024 | | | 200,000 | | | | 207,460 | |
3.75%, 3/15/2028 | | | 250,000 | | | | 281,290 | |
| | |
Rohm and Haas Co. | | | | | | | | |
7.85%, 7/15/2029 | | | 300,000 | | | | 411,932 | |
| | |
RPM International, Inc. | | | | | | | | |
3.75%, 3/15/2027 | | | 100,000 | | | | 108,947 | |
4.55%, 3/1/2029 | | | 250,000 | | | | 284,712 | |
| | |
Sherwin-Williams Co. (The) | | | | | | | | |
3.45%, 8/1/2025 | | | 500,000 | | | | 537,275 | |
3.45%, 6/1/2027 | | | 700,000 | | | | 759,967 | |
2.95%, 8/15/2029 | | | 100,000 | | | | 106,021 | |
| | | | | | | | 5,071,135 | |
|
| Commercial Services & Supplies – 0.9% | |
| | |
Cintas Corp. No. 2 | | | | | | | | |
3.70%, 4/1/2027 | | | 350,000 | | | | 386,013 | |
| | |
RELX Capital, Inc. | | | | | | | | |
3.00%, 5/22/2030 | | | 200,000 | | | | 211,383 | |
| | |
Republic Services, Inc. | | | | | | | | |
2.50%, 8/15/2024 | | | 567,000 | | | | 589,252 | |
3.38%, 11/15/2027 | | | 100,000 | | | | 107,859 | |
3.95%, 5/15/2028 | | | 200,000 | | | | 223,881 | |
See Accompanying Notes to the Financial Statements.
| | | | |
| 376 | | FLEXSHARES ANNUAL REPORT | | |
FlexShares® Credit-Scored US Corporate Bond Index Fund (cont.)
| | | | | | | | |
| Investments | | Principal
Amount | | | Value | |
|
| CORPORATE BONDS – (continued) | |
|
| Commercial Services & Supplies – (continued) | |
| | |
Steelcase, Inc. | | | | | | | | |
5.13%, 1/18/2029 | | $ | 150,000 | | | $ | 170,945 | |
| | |
Waste Connections, Inc. | | | | | | | | |
4.25%, 12/1/2028 | | | 250,000 | | | | 285,592 | |
| | |
Waste Management, Inc. | | | | | | | | |
3.15%, 11/15/2027 | | | 350,000 | | | | 375,861 | |
1.15%, 3/15/2028 | | | 350,000 | | | | 334,494 | |
| | | | | | | | 2,685,280 | |
|
| Communications Equipment – 0.4% | |
| | |
Cisco Systems, Inc. | | | | | | | | |
2.20%, 9/20/2023 | | | 417,000 | | | | 429,130 | |
3.63%, 3/4/2024 | | | 300,000 | | | | 320,002 | |
2.95%, 2/28/2026 | | | 100,000 | | | | 107,307 | |
| | |
Motorola Solutions, Inc. | | | | | | | | |
4.60%, 2/23/2028 | | | 100,000 | | | | 114,624 | |
4.60%, 5/23/2029 | | | 300,000 | | | | 345,652 | |
| | | | | | | | 1,316,715 | |
|
| Construction Materials – 0.1% | |
| | |
Martin Marietta Materials, Inc. | | | | | | | | |
3.50%, 12/15/2027 | | | 250,000 | | | | 271,857 | |
|
| Consumer Finance – 2.1% | |
| | |
AerCap Ireland Capital DAC | | | | | | | | |
4.50%, 9/15/2023 | | | 500,000 | | | | 530,080 | |
3.15%, 2/15/2024 | | | 150,000 | | | | 155,828 | |
3.88%, 1/23/2028 | | | 350,000 | | | | 375,385 | |
| | |
Ally Financial, Inc. | | | | | | | | |
3.05%, 6/5/2023 | | | 400,000 | | | | 412,786 | |
| | |
American Express Co. | | | | | | | | |
3.00%, 10/30/2024 | | | 690,000 | | | | 729,761 | |
| | |
Capital One Financial Corp. | | | | | | | | |
3.50%, 6/15/2023 | | | 320,000 | | | | 334,175 | |
3.90%, 1/29/2024 | | | 50,000 | | | | 53,118 | |
3.30%, 10/30/2024 | | | 200,000 | | | | 212,541 | |
3.20%, 2/5/2025 | | | 650,000 | | | | 687,931 | |
| | |
General Motors Financial Co., Inc. | | | | | | | | |
5.25%, 3/1/2026 | | | 500,000 | | | | 565,721 | |
2.70%, 6/10/2031 | | | 300,000 | | | | 297,360 | |
| |
Synchrony Financial | | | | | |
4.25%, 8/15/2024 | | | 426,000 | | | | 457,242 | |
| | | | | | | | |
| Investments | | Principal
Amount | | | Value | |
|
| Consumer Finance – (continued) | |
4.50%, 7/23/2025 | | $ | 600,000 | | | $ | 656,730 | |
3.70%, 8/4/2026 | | | 355,000 | | | | 381,719 | |
5.15%, 3/19/2029 | | | 200,000 | | | | 233,084 | |
| |
Toyota Motor Credit Corp. | | | | | |
3.05%, 1/11/2028 | | | 450,000 | | | | 485,354 | |
| | | | | | | | 6,568,815 | |
|
| Containers & Packaging – 0.2% | |
| |
Amcor Finance USA, Inc. | | | | | |
4.50%, 5/15/2028 | | | 300,000 | | | | 342,885 | |
| |
Avery Dennison Corp. | | | | | |
3.35%, 4/15/2023 | | | 50,000 | | | | 51,475 | |
4.88%, 12/6/2028 | | | 200,000 | | | | 235,863 | |
| | | | | | | | 630,223 | |
|
| Diversified Financial Services – 0.6% | |
| |
Berkshire Hathaway, Inc. | | | | | |
3.13%, 3/15/2026 | | | 330,000 | | | | 355,509 | |
| |
Block Financial LLC | | | | | |
2.50%, 7/15/2028 | | | 400,000 | | | | 398,887 | |
| | |
National Rural Utilities Cooperative Finance Corp. | | | | | | | | |
5.25%, 4/20/2046(b) | | | 150,000 | | | | 164,806 | |
| |
Voya Financial, Inc. | | | | | |
3.65%, 6/15/2026 | | | 500,000 | | | | 542,905 | |
4.70%, 1/23/2048(b) | | | 100,000 | | | | 104,850 | |
5.65%, 5/15/2053(b) | | | 350,000 | | | | 367,031 | |
| | | | | | | | 1,933,988 | |
|
| Diversified Telecommunication Services – 2.0% | |
| |
AT&T, Inc. | | | | | |
4.30%, 2/15/2030 | | | 295,000 | | | | 335,350 | |
2.75%, 6/1/2031 | | | 335,000 | | | | 341,175 | |
| |
British Telecommunications plc | | | | | |
9.62%, 12/15/2030(c) | | | 150,000 | | | | 225,318 | |
| | |
Deutsche Telekom International Finance BV | | | | | | | | |
8.75%, 6/15/2030(c) | | | 100,000 | | | | 146,275 | |
| |
TELUS Corp. | | | | | |
3.70%, 9/15/2027 | | | 200,000 | | | | 220,254 | |
| |
Verizon Communications, Inc. | | | | | |
4.13%, 3/16/2027 | | | 700,000 | | | | 782,758 | |
2.10%, 3/22/2028 | | | 1,000,000 | | | | 1,003,653 | |
4.33%, 9/21/2028 | | | 1,560,000 | | | | 1,782,300 | |
4.02%, 12/3/2029 | | | 225,000 | | | | 252,424 | |
See Accompanying Notes to the Financial Statements.
| | | | | | |
| | FLEXSHARES ANNUAL REPORT | | | 377 | |
FlexShares® Credit-Scored US Corporate Bond Index Fund (cont.)
| | | | | | | | |
| Investments | | Principal
Amount | | | Value | |
|
| CORPORATE BONDS – (continued) | |
|
| Diversified Telecommunication Services – (continued) | |
1.68%, 10/30/2030 | | $ | 313,000 | | | $ | 295,847 | |
1.75%, 1/20/2031 | | | 500,000 | | | | 472,755 | |
2.55%, 3/21/2031 | | | 450,000 | | | | 454,090 | |
| | | | | | | | 6,312,199 | |
|
| Electric Utilities – 4.0% | |
| |
AEP Texas, Inc. | | | | | |
3.95%, 6/1/2028 | | | 500,000 | | | | 555,330 | |
| |
American Electric Power Co., Inc. | | | | | |
Series J, 4.30%, 12/1/2028 | | | 295,000 | | | | 333,980 | |
| |
Appalachian Power Co. | | | | | |
Series X, 3.30%, 6/1/2027 | | | 96,000 | | | | 103,412 | |
| |
Duke Energy Corp. | | | | | |
3.15%, 8/15/2027 | | | 200,000 | | | | 212,977 | |
2.45%, 6/1/2030 | | | 300,000 | | | | 300,095 | |
| |
Edison International | | | | | |
4.95%, 4/15/2025 | | | 700,000 | | | | 767,669 | |
5.75%, 6/15/2027 | | | 300,000 | | | | 343,760 | |
| |
Emera US Finance LP | | | | | |
3.55%, 6/15/2026 | | | 150,000 | | | | 161,070 | |
| |
Enel Chile SA | | | | | |
4.88%, 6/12/2028 | | | 250,000 | | | | 283,182 | |
| |
Eversource Energy | | | | | |
Series L, 2.90%, 10/1/2024 | | | 300,000 | | | | 314,354 | |
Series U, 1.40%, 8/15/2026 | | | 500,000 | | | | 493,972 | |
Series M, 3.30%, 1/15/2028 | | | 100,000 | | | | 107,465 | |
| |
Fortis, Inc. | | | | | |
3.06%, 10/4/2026 | | | 200,000 | | | | 210,547 | |
| |
Georgia Power Co. | | | | | |
3.25%, 4/1/2026 | | | 500,000 | | | | 534,078 | |
| |
Interstate Power and Light Co. | | | | | |
4.10%, 9/26/2028 | | | 250,000 | | | | 282,658 | |
| |
ITC Holdings Corp. | | | | | |
2.70%, 11/15/2022 | | | 200,000 | | | | 203,948 | |
3.35%, 11/15/2027 | | | 200,000 | | | | 214,201 | |
| |
MidAmerican Energy Co. | | | | | |
3.70%, 9/15/2023 | | | 472,000 | | | | 494,491 | |
3.65%, 4/15/2029 | | | 1,000,000 | | | | 1,113,260 | |
| | |
NextEra Energy Capital Holdings, Inc. | | | | | | | | |
2.75%, 5/1/2025 | | | 1,000,000 | | | | 1,049,744 | |
| | | | | | | | |
| Investments | | Principal
Amount | | | Value | |
|
| Electric Utilities – (continued) | |
3.55%, 5/1/2027 | | $ | 300,000 | | | $ | 325,632 | |
2.25%, 6/1/2030 | | | 375,000 | | | | 375,442 | |
4.80%, 12/1/2077(b) | | | 100,000 | | | | 112,224 | |
5.65%, 5/1/2079(b) | | | 400,000 | | | | 465,101 | |
| |
Pacific Gas and Electric Co. | | | | | |
3.15%, 1/1/2026 | | | 250,000 | | | | 257,617 | |
| | |
Public Service Electric and Gas Co. | | | | | | | | |
3.00%, 5/15/2027 | | | 200,000 | | | | 215,177 | |
3.65%, 9/1/2028 | | | 500,000 | | | | 557,126 | |
| |
Sierra Pacific Power Co. | | | | | |
2.60%, 5/1/2026 | | | 20,000 | | | | 20,924 | |
| |
Southern Co. (The) | | | | | |
2.95%, 7/1/2023 | | | 300,000 | | | | 309,914 | |
3.25%, 7/1/2026 | | | 384,000 | | | | 409,266 | |
Series A, 3.70%, 4/30/2030 | | | 250,000 | | | | 271,288 | |
Series B, 4.00%, 1/15/2051(b) | | | 350,000 | | | | 365,890 | |
Series 21-A, 3.75%, 9/15/2051(b) | | | 500,000 | | | | 509,230 | |
| |
Southwestern Electric Power Co. | | | | | |
Series M, 4.10%, 9/15/2028 | | | 200,000 | | | | 224,296 | |
| | | | | | | | 12,499,320 | |
|
| Electrical Equipment – 0.4% | |
| |
ABB Finance USA, Inc. | | | | | |
3.80%, 4/3/2028 | | | 300,000 | | | | 337,336 | |
| |
Emerson Electric Co. | | | | | |
0.88%, 10/15/2026 | | | 200,000 | | | | 194,494 | |
| | |
Hubbell, Inc. | | | | | | | | |
3.35%, 3/1/2026 | | | 200,000 | | | | 213,451 | |
3.50%, 2/15/2028 | | | 250,000 | | | | 271,829 | |
| | |
Rockwell Automation, Inc. | | | | | | | | |
2.88%, 3/1/2025 | | | 150,000 | | | | 158,057 | |
| | | | | | | | 1,175,167 | |
|
Electronic Equipment, Instruments &
Components – 1.5% | |
| | |
Allegion US Holding Co., Inc. | | | | | | | | |
3.20%, 10/1/2024 | | | 200,000 | | | | 210,533 | |
| | |
Amphenol Corp. | | | | | | | | |
2.05%, 3/1/2025 | | | 1,000,000 | | | | 1,026,100 | |
| | |
Arrow Electronics, Inc. | | | | | | | | |
4.00%, 4/1/2025 | | | 400,000 | | | | 429,733 | |
See Accompanying Notes to the Financial Statements.
| | | | |
| 378 | | FLEXSHARES ANNUAL REPORT | | |
FlexShares® Credit-Scored US Corporate Bond Index Fund (cont.)
| | | | | | | | |
| Investments | | Principal
Amount | | | Value | |
|
| CORPORATE BONDS – (continued) | |
|
| Electronic Equipment, Instruments & Components – (continued) | |
| | |
Avnet, Inc. | | | | | | | | |
4.63%, 4/15/2026 | | $ | 175,000 | | | $ | 193,450 | |
| | |
Flex Ltd. | | | | | | | | |
4.88%, 6/15/2029 | | | 250,000 | | | | 284,552 | |
| | |
Keysight Technologies, Inc. | | | | | | | | |
4.60%, 4/6/2027 | | | 200,000 | | | | 226,414 | |
| | |
SYNNEX Corp. | | | | | | | | |
1.75%, 8/9/2026(a) | | | 450,000 | | | | 440,948 | |
2.38%, 8/9/2028(a) | | | 250,000 | | | | 245,135 | |
| | |
Teledyne Technologies, Inc. | | | | | | | | |
2.25%, 4/1/2028 | | | 400,000 | | | | 402,834 | |
| | |
Trimble, Inc. | | | | | | | | |
4.90%, 6/15/2028 | | | 250,000 | | | | 286,890 | |
| | |
Tyco Electronics Group SA | | | | | | | | |
3.70%, 2/15/2026 | | | 200,000 | | | | 216,547 | |
3.13%, 8/15/2027 | | | 200,000 | | | | 216,596 | |
| | |
Vontier Corp. | | | | | | | | |
2.40%, 4/1/2028(a) | | | 450,000 | | | | 441,095 | |
| | | | | | | | 4,620,827 | |
|
| Entertainment – 0.2% | |
| | |
Activision Blizzard, Inc. | | | | | | | | |
3.40%, 9/15/2026 | | | 300,000 | | | | 323,292 | |
3.40%, 6/15/2027 | | | 200,000 | | | | 216,794 | |
| | |
Electronic Arts, Inc. | | | | | | | | |
4.80%, 3/1/2026 | | | 100,000 | | | | 112,951 | |
| | | | | | | | 653,037 | |
|
| Equity Real Estate Investment Trusts (REITs) – 6.4% | |
| |
Agree LP | | | | | |
2.00%, 6/15/2028 | | | 250,000 | | | | 245,721 | |
| | |
Alexandria Real Estate Equities, Inc. | | | | | | | | |
3.95%, 1/15/2028 | | | 100,000 | | | | 111,816 | |
2.75%, 12/15/2029 | | | 100,000 | | | | 103,715 | |
4.70%, 7/1/2030 | | | 100,000 | | | | 118,163 | |
4.90%, 12/15/2030 | | | 100,000 | | | | 120,969 | |
| | |
American Campus Communities Operating Partnership LP | | | | | | | | |
3.63%, 11/15/2027 | | | 200,000 | | | | 216,290 | |
| | |
American Homes 4 Rent LP | | | | | | | | |
4.25%, 2/15/2028 | | | 200,000 | | | | 224,714 | |
4.90%, 2/15/2029 | | | 300,000 | | | | 349,283 | |
| | | | | | | | |
| Investments | | Principal
Amount | | | Value | |
|
| Equity Real Estate Investment Trusts (REITs) – (continued) | |
| | |
American Tower Corp. | | | | | | | | |
5.00%, 2/15/2024 | | $ | 490,000 | | | $ | 533,614 | |
3.38%, 10/15/2026 | | | 200,000 | | | | 213,877 | |
3.55%, 7/15/2027 | | | 400,000 | | | | 431,824 | |
3.60%, 1/15/2028 | | | 500,000 | | | | 541,685 | |
3.80%, 8/15/2029 | | | 338,000 | | | | 371,889 | |
| | |
AvalonBay Communities, Inc. | | | | | | | | |
3.45%, 6/1/2025 | | | 200,000 | | | | 214,621 | |
3.50%, 11/15/2025 | | | 50,000 | | | | 53,942 | |
| | |
Brandywine Operating Partnership LP | | | | | | | | |
4.10%, 10/1/2024 | | | 50,000 | | | | 53,442 | |
3.95%, 11/15/2027 | | | 250,000 | | | | 269,190 | |
| | |
Brixmor Operating Partnership LP | | | | | | | | |
2.50%, 8/16/2031 | | | 250,000 | | | | 245,070 | |
| | |
Columbia Property Trust Operating Partnership LP | | | | | | | | |
4.15%, 4/1/2025 | | | 200,000 | | | | 214,654 | |
| | |
Crown Castle International Corp. | | | | | | | | |
3.10%, 11/15/2029 | | | 500,000 | | | | 523,339 | |
| | |
CubeSmart LP | | | | | | | | |
4.00%, 11/15/2025 | | | 250,000 | | | | 271,399 | |
3.00%, 2/15/2030 | | | 200,000 | | | | 209,057 | |
| | |
CyrusOne LP | | | | | | | | |
2.90%, 11/15/2024 | | | 200,000 | | | | 209,106 | |
| | |
Duke Realty LP | | | | | | | | |
3.25%, 6/30/2026 | | | 250,000 | | | | 268,044 | |
2.88%, 11/15/2029 | | | 100,000 | | | | 104,909 | |
| | |
EPR Properties | | | | | | | | |
4.95%, 4/15/2028 | | | 250,000 | | | | 274,019 | |
| | |
Equinix, Inc. | | | | | | | | |
3.20%, 11/18/2029 | | | 210,000 | | | | 221,496 | |
2.15%, 7/15/2030 | | | 150,000 | | | | 146,307 | |
| | |
ERP Operating LP | | | | | | | | |
2.85%, 11/1/2026 | | | 200,000 | | | | 211,839 | |
3.25%, 8/1/2027 | | | 45,000 | | | | 48,468 | |
| | |
Essex Portfolio LP | | | | | | | | |
3.88%, 5/1/2024 | | | 200,000 | | | | 212,465 | |
3.00%, 1/15/2030 | | | 200,000 | | | | 209,965 | |
| | |
GLP Capital LP | | | | | | | | |
5.38%, 11/1/2023 | | | 555,000 | | | | 596,278 | |
5.25%, 6/1/2025 | | | 200,000 | | | | 222,112 | |
5.38%, 4/15/2026 | | | 500,000 | | | | 563,815 | |
5.75%, 6/1/2028 | | | 500,000 | | | | 581,210 | |
See Accompanying Notes to the Financial Statements.
| | | | | | |
| | FLEXSHARES ANNUAL REPORT | | | 379 | |
FlexShares® Credit-Scored US Corporate Bond Index Fund (cont.)
| | | | | | | | |
| Investments | | Principal
Amount | | | Value | |
|
| CORPORATE BONDS – (continued) | |
|
| Equity Real Estate Investment Trusts (REITs) – (continued) | |
| | |
Healthpeak Properties, Inc. | | | | | | | | |
3.00%, 1/15/2030 | | $ | 250,000 | | | $ | 263,351 | |
| | |
Highwoods Realty LP | | | | | | | | |
4.13%, 3/15/2028 | | | 200,000 | | | | 221,952 | |
4.20%, 4/15/2029 | | | 100,000 | | | | 111,652 | |
| | |
Host Hotels & Resorts LP | | | | | | | | |
Series E, 4.00%, 6/15/2025 | | | 250,000 | | | | 266,023 | |
| | |
Hudson Pacific Properties LP | | | | | | | | |
3.25%, 1/15/2030 | | | 100,000 | | | | 104,256 | |
| | |
Kilroy Realty LP | | | | | | | | |
4.38%, 10/1/2025 | | | 400,000 | | | | 440,818 | |
4.25%, 8/15/2029 | | | 100,000 | | | | 112,423 | |
| | |
Kite Realty Group LP | | | | | | | | |
4.00%, 10/1/2026 | | | 100,000 | | | | 106,660 | |
| | |
Life Storage LP | | | | | | | | |
2.20%, 10/15/2030 | | | 200,000 | | | | 197,051 | |
| | |
LifeStorage LP | | | | | | | | |
3.50%, 7/1/2026 | | | 200,000 | | | | 215,997 | |
| |
Mid-America Apartments LP | | | | | |
3.95%, 3/15/2029 | | | 50,000 | | | | 56,287 | |
2.75%, 3/15/2030 | | | 150,000 | | | | 155,454 | |
| |
National Retail Properties, Inc. | | | | | |
3.90%, 6/15/2024 | | | 500,000 | | | | 532,956 | |
3.50%, 10/15/2027 | | | 150,000 | | | | 161,247 | |
4.30%, 10/15/2028 | | | 140,000 | | | | 158,375 | |
| |
Office Properties Income Trust | | | | | |
2.65%, 6/15/2026 | | | 300,000 | | | | 300,104 | |
| |
Omega Healthcare Investors, Inc. | | | | | |
4.38%, 8/1/2023 | | | 52,000 | | | | 54,781 | |
4.95%, 4/1/2024 | | | 10,000 | | | | 10,787 | |
5.25%, 1/15/2026 | | | 300,000 | | | | 337,284 | |
4.50%, 4/1/2027 | | | 500,000 | | | | 552,692 | |
3.63%, 10/1/2029 | | | 150,000 | | | | 157,032 | |
| |
Physicians Realty LP | | | | | |
4.30%, 3/15/2027 | | | 200,000 | | | | 223,690 | |
| | |
Piedmont Operating Partnership LP | | | | | | | | |
3.15%, 8/15/2030 | | | 100,000 | | | | 102,262 | |
| |
Prologis LP | | | | | |
2.25%, 4/15/2030 | | | 200,000 | | | | 202,111 | |
| |
Public Storage | | | | | |
3.09%, 9/15/2027 | | | 200,000 | | | | 215,882 | |
1.85%, 5/1/2028 | | | 300,000 | | | | 299,982 | |
| | | | | | | | |
| Investments | | Principal
Amount | | | Value | |
|
| Equity Real Estate Investment Trusts (REITs) – (continued) | |
| |
Realty Income Corp. | | | | | |
4.13%, 10/15/2026 | | $ | 300,000 | | | $ | 335,108 | |
| | |
Retail Properties of America, Inc. | | | | | | | | |
4.75%, 9/15/2030 | | | 200,000 | | | | 219,762 | |
| |
Sabra Health Care LP | | | | | |
5.13%, 8/15/2026 | | | 200,000 | | | | 222,122 | |
3.90%, 10/15/2029 | | | 200,000 | | | | 209,819 | |
| |
Simon Property Group LP | | | | | |
3.38%, 10/1/2024 | | | 600,000 | | | | 637,649 | |
| |
SITE Centers Corp. | | | | | |
3.63%, 2/1/2025 | | | 129,000 | | | | 135,752 | |
| |
Spirit Realty LP | | | | | |
4.45%, 9/15/2026 | | | 200,000 | | | | 221,240 | |
2.10%, 3/15/2028 | | | 250,000 | | | | 245,684 | |
3.40%, 1/15/2030 | | | 200,000 | | | | 210,543 | |
| |
STORE Capital Corp. | | | | | |
4.50%, 3/15/2028 | | | 150,000 | | | | 168,377 | |
| |
Tanger Properties LP | | | | | |
3.88%, 7/15/2027 | | | 150,000 | | | | 162,031 | |
| |
Ventas Realty LP | | | | | |
3.50%, 2/1/2025 | | | 50,000 | | | | 53,206 | |
4.40%, 1/15/2029 | | | 750,000 | | | | 852,628 | |
4.75%, 11/15/2030 | | | 200,000 | | | | 234,313 | |
| | |
VEREIT Operating Partnership LP | | | | | | | | |
4.63%, 11/1/2025 | | | 200,000 | | | | 223,385 | |
| |
Welltower, Inc. | | | | | |
4.00%, 6/1/2025 | | | 200,000 | | | | 216,797 | |
3.10%, 1/15/2030 | | | 250,000 | | | | 263,124 | |
| |
Weyerhaeuser Co. | | | | | |
4.00%, 4/15/2030 | | | 250,000 | | | | 280,799 | |
| |
WP Carey, Inc. | | | | | |
4.60%, 4/1/2024 | | | 195,000 | | | | 209,966 | |
4.00%, 2/1/2025 | | | 150,000 | | | | 161,579 | |
| | | | | | | | 20,333,300 | |
|
| Food & Staples Retailing – 0.6% | |
| |
Costco Wholesale Corp. | | | | | |
2.75%, 5/18/2024 | | | 300,000 | | | | 314,062 | |
3.00%, 5/18/2027 | | | 375,000 | | | | 406,621 | |
1.38%, 6/20/2027 | | | 300,000 | | | | 298,124 | |
| |
Walmart, Inc. | | | | | |
1.50%, 9/22/2028 | | | 500,000 | | | | 495,166 | |
1.80%, 9/22/2031 | | | 500,000 | | | | 493,372 | |
| | | | | | | | 2,007,345 | |
See Accompanying Notes to the Financial Statements.
| | | | |
| 380 | | FLEXSHARES ANNUAL REPORT | | |
FlexShares® Credit-Scored US Corporate Bond Index Fund (cont.)
| | | | | | | | |
| Investments | | Principal
Amount | | | Value | |
|
| CORPORATE BONDS – (continued) | |
|
| Food Products – 1.5% | |
| | |
Bunge Ltd. Finance Corp. | | | | | | | | |
3.75%, 9/25/2027 | | $ | 200,000 | | | $ | 218,784 | |
| | |
Campbell Soup Co. | | | | | | | | |
4.15%, 3/15/2028 | | | 150,000 | | | | 168,287 | |
| | |
Flowers Foods, Inc. | | | | | | | | |
3.50%, 10/1/2026 | | | 250,000 | | | | 269,364 | |
| | |
General Mills, Inc. | | | | | | | | |
4.20%, 4/17/2028 | | | 200,000 | | | | 226,759 | |
2.88%, 4/15/2030 | | | 190,000 | | | | 199,164 | |
| | |
J M Smucker Co. (The) | | | | | | | | |
3.38%, 12/15/2027 | | | 100,000 | | | | 107,754 | |
| | |
Kellogg Co. | | | | | | | | |
3.40%, 11/15/2027 | | | 300,000 | | | | 324,560 | |
| | |
McCormick & Co., Inc. | | | | | | | | |
3.15%, 8/15/2024 | | | 200,000 | | | | 211,260 | |
3.40%, 8/15/2027 | | | 200,000 | | | | 217,148 | |
| | |
Mondelez International, Inc. | | | | | | | | |
1.50%, 5/4/2025 | | | 400,000 | | | | 403,536 | |
2.75%, 4/13/2030 | | | 200,000 | | | | 208,580 | |
| | |
Unilever Capital Corp. | | | | | | | | |
2.60%, 5/5/2024 | | | 1,200,000 | | | | 1,250,333 | |
2.90%, 5/5/2027 | | | 200,000 | | | | 212,975 | |
3.50%, 3/22/2028 | | | 600,000 | | | | 664,025 | |
| | | | | | | | 4,682,529 | |
|
| Gas Utilities – 0.5% | |
| | |
Atmos Energy Corp. | | | | | | | | |
0.63%, 3/9/2023 | | | 500,000 | | | | 499,958 | |
| | |
Eastern Energy Gas Holdings LLC | | | | | | | | |
Series A, 2.50%, 11/15/2024 | | | 410,000 | | | | 426,740 | |
3.60%, 12/15/2024 | | | 54,000 | | | | 57,399 | |
| | |
National Fuel Gas Co. | | | | | | | | |
5.20%, 7/15/2025 | | | 200,000 | | | | 220,884 | |
5.50%, 1/15/2026 | | | 275,000 | | | | 314,064 | |
4.75%, 9/1/2028 | | | 150,000 | | | | 167,770 | |
| | | | | | | | 1,686,815 | |
|
| Health Care Equipment & Supplies – 0.5% | |
| | |
Abbott Laboratories | | | | | | | | |
3.88%, 9/15/2025 | | | 500,000 | | | | 546,006 | |
| | |
Baxter International, Inc. | | | | | | | | |
2.60%, 8/15/2026 | | | 200,000 | | | | 209,200 | |
| | | | | | | | |
| Investments | | Principal
Amount | | | Value | |
|
| Health Care Equipment & Supplies – (continued) | |
| | |
Boston Scientific Corp. | | | | | | | | |
2.65%, 6/1/2030 | | $ | 100,000 | | | $ | 102,663 | |
| | |
DH Europe Finance II Sarl | | | | | | | | |
2.20%, 11/15/2024 | | | 250,000 | | | | 258,642 | |
| | |
Edwards Lifesciences Corp. | | | | | | | | |
4.30%, 6/15/2028 | | | 200,000 | | | | 229,044 | |
| | |
Stryker Corp. | | | | | | | | |
1.95%, 6/15/2030 | | | 100,000 | | | | 98,546 | |
| | | | | | | | 1,444,101 | |
|
| Health Care Providers & Services – 1.5% | |
| | |
AmerisourceBergen Corp. | | | | | | | | |
3.40%, 5/15/2024 | | | 250,000 | | | | 263,112 | |
3.45%, 12/15/2027 | | | 200,000 | | | | 216,176 | |
| | |
Cigna Corp. | | | | | | | | |
4.38%, 10/15/2028 | | | 350,000 | | | | 401,588 | |
| | |
CVS Health Corp. | | | | | | | | |
4.30%, 3/25/2028 | | | 159,000 | | | | 180,161 | |
| | |
HCA, Inc. | | | | | | | | |
5.25%, 6/15/2026 | | | 200,000 | | | | 226,870 | |
4.13%, 6/15/2029 | | | 250,000 | | | | 277,169 | |
| | |
Humana, Inc. | | | | | | | | |
3.85%, 10/1/2024 | | | 500,000 | | | | 537,036 | |
3.95%, 3/15/2027 | | | 300,000 | | | | 330,914 | |
| | |
Laboratory Corp. of America Holdings | | | | | | | | |
3.60%, 2/1/2025 | | | 300,000 | | | | 319,713 | |
1.55%, 6/1/2026 | | | 750,000 | | | | 745,528 | |
| | |
McKesson Corp. | | | | | | | | |
1.30%, 8/15/2026 | | | 500,000 | | | | 490,509 | |
| | |
Quest Diagnostics, Inc. | | | | | | | | |
2.95%, 6/30/2030 | | | 200,000 | | | | 209,813 | |
| | |
UnitedHealth Group, Inc. | | | | | | | | |
2.95%, 10/15/2027 | | | 250,000 | | | | 268,310 | |
3.88%, 12/15/2028 | | | 315,000 | | | | 356,832 | |
| | | | | | | | 4,823,731 | |
|
| Hotels, Restaurants & Leisure – 0.7% | |
| | |
Expedia Group, Inc. | | | | | | | | |
2.95%, 3/15/2031 | | | 250,000 | | | | 252,601 | |
| | |
Hyatt Hotels Corp. | | | | | | | | |
4.85%, 3/15/2026 | | | 200,000 | | | | 220,463 | |
| | |
Marriott International, Inc. | | | | | | | | |
Series EE, 5.75%, 5/1/2025 | | | 12,000 | | | | 13,607 | |
Series HH, 2.85%, 4/15/2031 | | | 150,000 | | | | 151,250 | |
See Accompanying Notes to the Financial Statements.
| | | | | | |
| | FLEXSHARES ANNUAL REPORT | | | 381 | |
FlexShares® Credit-Scored US Corporate Bond Index Fund (cont.)
| | | | | | | | |
| Investments | | Principal
Amount | | | Value | |
|
| CORPORATE BONDS – (continued) | |
|
| Hotels, Restaurants & Leisure – (continued) | |
| | |
McDonald’s Corp. | | | | | | | | |
3.80%, 4/1/2028 | | $ | 390,000 | | | $ | 435,381 | |
2.63%, 9/1/2029 | | | 100,000 | | | | 103,684 | |
3.60%, 7/1/2030 | | | 300,000 | | | | 333,043 | |
| | |
Starbucks Corp. | | | | | | | | |
4.00%, 11/15/2028 | | | 500,000 | | | | 566,566 | |
2.55%, 11/15/2030 | | | 250,000 | | | | 256,056 | |
| | | | | | | | 2,332,651 | |
|
| Household Durables – 0.6% | |
| | |
DR Horton, Inc. | | | | | | | | |
2.50%, 10/15/2024 | | | 200,000 | | | | 208,175 | |
1.30%, 10/15/2026 | | | 500,000 | | | | 490,070 | |
| | |
Lennar Corp. | | | | | | | | |
4.75%, 11/29/2027 | | | 300,000 | | | | 341,370 | |
| | |
PulteGroup, Inc. | | | | | | | | |
5.50%, 3/1/2026 | | | 500,000 | | | | 574,100 | |
| | |
Whirlpool Corp. | | | | | | | | |
4.75%, 2/26/2029 | | | 200,000 | | | | 232,668 | |
| | | | | | | | 1,846,383 | |
|
| Household Products – 0.4% | |
| | |
Clorox Co. (The) | | | | | | | | |
3.90%, 5/15/2028 | | | 50,000 | | | | 56,339 | |
| | |
Colgate-Palmolive Co. | | | | | | | | |
3.25%, 3/15/2024 | | | 250,000 | | | | 264,769 | |
| | |
Procter & Gamble Co. (The) | | | | | | | | |
3.10%, 8/15/2023 | | | 150,000 | | | | 156,906 | |
2.70%, 2/2/2026 | | | 250,000 | | | | 265,273 | |
2.80%, 3/25/2027 | | | 185,000 | | | | 197,835 | |
3.00%, 3/25/2030 | | | 400,000 | | | | 435,828 | |
| | | | | | | | 1,376,950 | |
|
| Industrial Conglomerates – 1.4% | |
| | |
3M Co. | | | | | | | | |
2.25%, 3/15/2023 | | | 520,000 | | | | 531,961 | |
2.65%, 4/15/2025 | | | 500,000 | | | | 524,314 | |
3.63%, 9/14/2028 | | | 300,000 | | | | 334,482 | |
3.38%, 3/1/2029 | | | 200,000 | | | | 219,947 | |
2.38%, 8/26/2029 | | | 250,000 | | | | 257,691 | |
| | |
Honeywell International, Inc. | | | | | | | | |
1.35%, 6/1/2025 | | | 250,000 | | | | 252,176 | |
2.50%, 11/1/2026 | | | 300,000 | | | | 316,055 | |
| | | | | | | | |
| Investments | | Principal
Amount | | | Value | |
|
| Industrial Conglomerates – (continued) | |
2.70%, 8/15/2029 | | $ | 100,000 | | | $ | 105,795 | |
| | |
Roper Technologies, Inc. | | | | | | | | |
3.80%, 12/15/2026 | | | 200,000 | | | | 219,459 | |
4.20%, 9/15/2028 | | | 200,000 | | | | 226,180 | |
1.75%, 2/15/2031 | | | 250,000 | | | | 236,416 | |
| | |
Trane Technologies Global Holding Co. Ltd. | | | | | | | | |
3.75%, 8/21/2028 | | | 200,000 | | | | 220,872 | |
| | |
Trane Technologies Luxembourg Finance SA | | | | | | | | |
3.50%, 3/21/2026 | | | 250,000 | | | | 269,112 | |
3.80%, 3/21/2029 | | | 500,000 | | | | 554,234 | |
| | | | | | | | 4,268,694 | |
| | |
| Insurance – 3.6% | | | | | | |
| | |
Aflac, Inc. | | | | | | | | |
3.25%, 3/17/2025 | | | 200,000 | | | | 213,746 | |
2.88%, 10/15/2026 | | | 100,000 | | | | 106,477 | |
3.60%, 4/1/2030 | | | 250,000 | | | | 277,911 | |
| | |
Allied World Assurance Co. Holdings Ltd. | | | | | | | | |
4.35%, 10/29/2025 | | | 200,000 | | | | 216,191 | |
| | |
Allstate Corp. (The) | | | | | | | | |
Series B, 5.75%, 8/15/2053(b) | | | 400,000 | | | | 424,200 | |
| | |
American Equity Investment Life Holding Co. | | | | | | | | |
5.00%, 6/15/2027 | | | 150,000 | | | | 170,929 | |
| | |
American Financial Group, Inc. | | | | | | | | |
3.50%, 8/15/2026 | | | 200,000 | | | | 215,830 | |
| | |
American International Group, Inc. | | | | | | | | |
2.50%, 6/30/2025 | | | 500,000 | | | | 519,629 | |
3.40%, 6/30/2030 | | | 250,000 | | | | 271,118 | |
Series A-9, 5.75%, 4/1/2048(b) | | | 200,000 | | | | 229,760 | |
| | |
Aon Corp. | | | | | | | | |
2.20%, 11/15/2022 | | | 500,000 | | | | 508,519 | |
2.80%, 5/15/2030 | | | 250,000 | | | | 259,407 | |
| | |
Aon plc | | | | | | | | |
3.88%, 12/15/2025 | | | 400,000 | | | | 437,214 | |
| | |
Assurant, Inc. | | | | | | | | |
3.70%, 2/22/2030 | | | 100,000 | | | | 108,203 | |
| | |
Athene Holding Ltd. | | | | | | | | |
4.13%, 1/12/2028 | | | 300,000 | | | | 332,594 | |
6.15%, 4/3/2030 | | | 250,000 | | | | 312,176 | |
See Accompanying Notes to the Financial Statements.
| | | | |
| 382 | | FLEXSHARES ANNUAL REPORT | | |
FlexShares® Credit-Scored US Corporate Bond Index Fund (cont.)
| | | | | | | | |
| Investments | | Principal
Amount | | | Value | |
|
| CORPORATE BONDS – (continued) | |
|
| Insurance – (continued) | |
| | |
AXIS Specialty Finance LLC | | | | | | | | |
4.90%, 1/15/2040(b) | | $ | 100,000 | | | $ | 105,764 | |
| | |
AXIS Specialty Finance plc | | | | | | | | |
4.00%, 12/6/2027 | | | 200,000 | | | | 221,123 | |
| | |
Brown & Brown, Inc. | | | | | | | | |
4.20%, 9/15/2024 | | | 200,000 | | | | 215,944 | |
2.38%, 3/15/2031 | | | 250,000 | | | | 247,233 | |
| | |
Chubb INA Holdings, Inc. | | | | | | | | |
3.15%, 3/15/2025 | | | 270,000 | | | | 287,774 | |
| | |
Enstar Group Ltd. | | | | | | | | |
4.95%, 6/1/2029 | | | 250,000 | | | | 282,877 | |
| | |
Fairfax Financial Holdings Ltd. | | | | | | | | |
4.85%, 4/17/2028 | | | 250,000 | | | | 283,668 | |
| | |
Fidelity National Financial, Inc. | | | | | | | | |
3.40%, 6/15/2030 | | | 250,000 | | | | 266,592 | |
| | |
First American Financial Corp. | | | | | | | | |
4.60%, 11/15/2024 | | | 200,000 | | | | 219,166 | |
| | |
Globe Life, Inc. | | | | | | | | |
4.55%, 9/15/2028 | | | 150,000 | | | | 172,970 | |
| | |
Hanover Insurance Group, Inc. (The) | | | | | | | | |
2.50%, 9/1/2030 | | | 250,000 | | | | 250,366 | |
| | |
Manulife Financial Corp. | | | | | | | | |
4.15%, 3/4/2026 | | | 200,000 | | | | 221,574 | |
2.48%, 5/19/2027 | | | 250,000 | | | | 258,996 | |
4.06%, 2/24/2032(b) | | | 50,000 | | | | 54,378 | |
| | |
Markel Corp. | | | | | | | | |
3.35%, 9/17/2029 | | | 300,000 | | | | 324,580 | |
| | |
Marsh & McLennan Cos., Inc. | | | | | | | | |
3.50%, 6/3/2024 | | | 16,000 | | | | 16,988 | |
3.50%, 3/10/2025 | | | 75,000 | | | | 80,222 | |
3.75%, 3/14/2026 | | | 75,000 | | | | 81,812 | |
4.38%, 3/15/2029 | | | 500,000 | | | | 578,127 | |
| | |
Old Republic International Corp. | | | | | | | | |
4.88%, 10/1/2024 | | | 200,000 | | | | 219,769 | |
| | |
Progressive Corp. (The) | | | | | | | | |
2.45%, 1/15/2027 | | | 200,000 | | | | 210,789 | |
3.20%, 3/26/2030 | | | 100,000 | | | | 108,784 | |
| | |
Prudential Financial, Inc. | | | | | | | | |
5.63%, 6/15/2043(b) | | | 150,000 | | | | 158,474 | |
5.20%, 3/15/2044(b) | | | 10,000 | | | | 10,585 | |
5.38%, 5/15/2045(b) | | | 500,000 | | | | 544,685 | |
5.70%, 9/15/2048(b) | | | 500,000 | | | | 567,845 | |
3.70%, 10/1/2050(b) | | | 100,000 | | | | 103,261 | |
| | | | | | | | |
| Investments | | Principal
Amount | | | Value | |
|
| Insurance – (continued) | |
| | |
RenaissanceRe Finance, Inc. | | | | | | | | |
3.45%, 7/1/2027 | | $ | 100,000 | | | $ | 107,727 | |
| | |
Trinity Acquisition plc | | | | | | | | |
4.40%, 3/15/2026 | | | 200,000 | | | | 220,968 | |
| | |
Willis North America, Inc. | | | | | | | | |
3.60%, 5/15/2024 | | | 150,000 | | | | 158,792 | |
2.95%, 9/15/2029 | | | 250,000 | | | | 258,448 | |
| | | | | | | | 11,444,185 | |
|
| Interactive Media & Services – 0.1% | |
| | |
Alphabet, Inc. | | | | | | | | |
0.80%, 8/15/2027 | | | 85,000 | | | | 81,535 | |
| | |
Weibo Corp. | | | | | | | | |
3.50%, 7/5/2024 | | | 200,000 | | | | 207,918 | |
| | | | | | | | 289,453 | |
|
| Internet & Direct Marketing Retail – 0.8% | |
| | |
Alibaba Group Holding Ltd. | | | | | | | | |
3.60%, 11/28/2024 | | | 1,000,000 | | | | 1,063,921 | |
3.40%, 12/6/2027 | | | 500,000 | | | | 531,252 | |
2.13%, 2/9/2031 | | | 200,000 | | | | 192,109 | |
| | |
Amazon.com, Inc. | | | | | | | | |
5.20%, 12/3/2025 | | | 500,000 | | | | 573,782 | |
| | | | | | | | 2,361,064 | |
| | |
| IT Services – 2.4% | | | | | | |
| | |
Automatic Data Processing, Inc. | | | | | | | | |
1.70%, 5/15/2028 | | | 380,000 | | | | 378,488 | |
1.25%, 9/1/2030 | | | 200,000 | | | | 189,079 | |
| | |
Broadridge Financial Solutions, Inc. | | | | | | | | |
3.40%, 6/27/2026 | | | 200,000 | | | | 214,817 | |
| | |
Fiserv, Inc. | | | | | | | | |
3.80%, 10/1/2023 | | | 500,000 | | | | 527,719 | |
3.50%, 7/1/2029 | | | 250,000 | | | | 270,100 | |
| | |
Genpact Luxembourg Sarl | | | | | | | | |
3.38%, 12/1/2024 | | | 250,000 | | | | 264,628 | |
| | |
Global Payments, Inc. | | | | | | | | |
4.80%, 4/1/2026 | | | 250,000 | | | | 280,126 | |
4.45%, 6/1/2028 | | | 160,000 | | | | 180,222 | |
| | |
International Business Machines Corp. | | | | | | | | |
1.95%, 5/15/2030 | | | 150,000 | | | | 147,013 | |
See Accompanying Notes to the Financial Statements.
| | | | | | |
| | FLEXSHARES ANNUAL REPORT | | | 383 | |
FlexShares® Credit-Scored US Corporate Bond Index Fund (cont.)
| | | | | | | | |
| Investments | | Principal
Amount | | | Value | |
|
| CORPORATE BONDS – (continued) | |
|
| IT Services – (continued) | |
| | |
Mastercard, Inc. | | | | | | | | |
2.00%, 3/3/2025 | | $ | 850,000 | | | $ | 875,062 | |
2.95%, 11/21/2026 | | | 100,000 | | | | 107,432 | |
2.95%, 6/1/2029 | | | 150,000 | | | | 161,305 | |
| | |
PayPal Holdings, Inc. | | | | | | | | |
1.65%, 6/1/2025 | | | 150,000 | | | | 152,217 | |
2.65%, 10/1/2026 | | | 100,000 | | | | 105,562 | |
2.85%, 10/1/2029 | | | 200,000 | | | | 211,464 | |
2.30%, 6/1/2030 | | | 50,000 | | | | 50,952 | |
| | |
VeriSign, Inc. | | | | | | | | |
4.75%, 7/15/2027 | | | 500,000 | | | | 524,075 | |
| | |
Visa, Inc. | | | | | | | | |
2.80%, 12/14/2022 | | | 1,100,000 | | | | 1,126,534 | |
3.15%, 12/14/2025 | | | 650,000 | | | | 698,828 | |
1.90%, 4/15/2027 | | | 275,000 | | | | 280,839 | |
2.05%, 4/15/2030 | | | 500,000 | | | | 507,842 | |
| | |
Western Union Co. (The) | | | | | | | | |
2.85%, 1/10/2025 | | | 350,000 | | | | 364,345 | |
| | | | | | | | 7,618,649 | |
|
| Leisure Products – 0.1% | |
| | |
Hasbro, Inc. | | | | | | | | |
3.90%, 11/19/2029 | | | 150,000 | | | | 164,938 | |
|
| Life Sciences Tools & Services – 0.4% | |
| | |
Agilent Technologies, Inc. | | | | | | | | |
3.88%, 7/15/2023 | | | 200,000 | | | | 209,479 | |
| | |
Thermo Fisher Scientific, Inc. | | | | | | | | |
2.95%, 9/19/2026 | | | 590,000 | | | | 628,616 | |
3.20%, 8/15/2027 | | | 500,000 | | | | 539,282 | |
| | | | | | | | 1,377,377 | |
|
| Machinery – 0.8% | |
| | |
Cummins, Inc. | | | | | | | | |
3.65%, 10/1/2023 | | | 100,000 | | | | 104,925 | |
1.50%, 9/1/2030 | | | 150,000 | | | | 143,150 | |
| | |
Dover Corp. | | | | | | | | |
3.15%, 11/15/2025 | | | 200,000 | | | | 213,590 | |
| | |
Fortive Corp. | | | | | | | | |
3.15%, 6/15/2026 | | | 100,000 | | | | 106,709 | |
| | |
Illinois Tool Works, Inc. | | | | | | | | |
2.65%, 11/15/2026 | | | 200,000 | | | | 212,450 | |
| | | | | | | | |
| Investments | | Principal
Amount | | | Value | |
|
| Machinery – (continued) | |
| | |
nVent Finance Sarl | | | | | | | | |
4.55%, 4/15/2028 | | $ | 300,000 | | | $ | 330,699 | |
| | |
Otis Worldwide Corp. | | | | | | | | |
2.06%, 4/5/2025 | | | 300,000 | | | | 307,442 | |
2.29%, 4/5/2027 | | | 200,000 | | | | 205,316 | |
2.57%, 2/15/2030 | | | 200,000 | | | | 204,250 | |
| | |
Parker-Hannifin Corp. | | | | | | | | |
3.25%, 6/14/2029 | | | 45,000 | | | | 48,272 | |
| | |
Stanley Black & Decker, Inc. | | | | | | | | |
4.00%, 3/15/2060(b) | | | 300,000 | | | | 318,339 | |
| | |
Westinghouse Air Brake Technologies Corp. | | | | | | | | |
4.95%, 9/15/2028(c) | | | 150,000 | | | | 172,712 | |
| | | | | | | | 2,367,854 | |
|
| Media – 0.7% | |
| | |
Charter Communications Operating LLC | | | | | | | | |
4.91%, 7/23/2025 | | | 500,000 | | | | 556,264 | |
4.20%, 3/15/2028 | | | 500,000 | | | | 555,327 | |
| | |
Comcast Corp. | | | | | | | | |
4.15%, 10/15/2028 | | | 350,000 | | | | 399,777 | |
| | |
Fox Corp. | | | | | | | | |
4.71%, 1/25/2029 | | | 600,000 | | | | 693,889 | |
| | | | | | | | 2,205,257 | |
|
| Metals & Mining – 0.8% | |
| | |
ArcelorMittal SA | | | | | | | | |
4.25%, 7/16/2029 | | | 250,000 | | | | 274,876 | |
| | |
BHP Billiton Finance USA Ltd. | | | | | | | | |
3.85%, 9/30/2023 | | | 300,000 | | | | 318,602 | |
| | |
Reliance Steel & Aluminum Co. | | | | | | | | |
1.30%, 8/15/2025 | | | 250,000 | | | | 247,240 | |
| | |
Rio Tinto Finance USA Ltd. | | | | | | | | |
3.75%, 6/15/2025 | | | 650,000 | | | | 708,371 | |
7.13%, 7/15/2028 | | | 200,000 | | | | 265,257 | |
| | |
Steel Dynamics, Inc. | | | | | | | | |
2.80%, 12/15/2024 | | | 100,000 | | | | 104,613 | |
| | |
Vale Overseas Ltd. | | | | | | | | |
6.25%, 8/10/2026 | | | 379,000 | | | | 438,598 | |
3.75%, 7/8/2030 | | | 250,000 | | | | 254,681 | |
| | | | | | | | 2,612,238 | |
See Accompanying Notes to the Financial Statements.
| | | | |
| 384 | | FLEXSHARES ANNUAL REPORT | | |
FlexShares® Credit-Scored US Corporate Bond Index Fund (cont.)
| | | | | | | | |
| Investments | | Principal
Amount | | | Value | |
|
| CORPORATE BONDS – (continued) | |
|
| Multiline Retail – 0.7% | |
| | |
Dollar General Corp. | | | | | | | | |
3.88%, 4/15/2027 | | $ | 700,000 | | | $ | 773,223 | |
| | |
Dollar Tree, Inc. | | | | | | | | |
4.00%, 5/15/2025 | | | 130,000 | | | | 140,958 | |
4.20%, 5/15/2028 | | | 500,000 | | | | 563,467 | |
| | |
Target Corp. | | | | | | | | |
3.50%, 7/1/2024 | | | 500,000 | | | | 535,717 | |
2.25%, 4/15/2025 | | | 250,000 | | | | 259,460 | |
| | | | | | | | 2,272,825 | |
| | |
| Multi-Utilities – 1.6% | | | | | | |
| | |
Ameren Corp. | | | | | | | | |
2.50%, 9/15/2024 | | | 700,000 | | | | 727,884 | |
1.75%, 3/15/2028 | | | 500,000 | | | | 490,078 | |
| | |
Berkshire Hathaway Energy Co. | | | | | | | | |
3.75%, 11/15/2023 | | | 100,000 | | | | 105,417 | |
4.05%, 4/15/2025 | | | 1,100,000 | | | | 1,200,508 | |
3.25%, 4/15/2028 | | | 100,000 | | | | 108,459 | |
| | |
CMS Energy Corp. | | | | | | | | |
3.45%, 8/15/2027 | | | 200,000 | | | | 216,568 | |
| | |
Dominion Energy, Inc. | | | | | | | | |
5.75%, 10/1/2054(b) | | | 200,000 | | | | 218,416 | |
| | |
DTE Energy Co. | | | | | | | | |
Series C, 2.53%, 10/1/2024(c) | | | 252,000 | | | | 262,566 | |
| | |
Public Service Enterprise Group, Inc. | | | | | | | | |
2.65%, 11/15/2022 | | | 200,000 | | | | 203,835 | |
2.88%, 6/15/2024 | | | 400,000 | | | | 417,385 | |
| | |
Sempra Energy | | | | | | | | |
3.40%, 2/1/2028 | | | 347,000 | | | | 373,268 | |
| | |
Southern Co. Gas Capital Corp. | | | | | | | | |
2.45%, 10/1/2023 | | | 300,000 | | | | 308,702 | |
| | |
WEC Energy Group, Inc. | | | | | | | | |
0.55%, 9/15/2023 | | | 500,000 | | | | 498,644 | |
| | | | | | | | 5,131,730 | |
|
| Oil, Gas & Consumable Fuels – 6.1% | |
| | |
Boardwalk Pipelines LP | | | | | | | | |
4.45%, 7/15/2027 | | | 250,000 | | | | 278,013 | |
4.80%, 5/3/2029 | | | 250,000 | | | | 285,712 | |
| | | | | | | | |
| Investments | | Principal
Amount | | | Value | |
|
| Oil, Gas & Consumable Fuels – (continued) | |
| | |
Canadian Natural Resources Ltd. | | | | | | | | |
2.05%, 7/15/2025 | | $ | 500,000 | | | $ | 507,872 | |
3.85%, 6/1/2027 | | | 400,000 | | | | 433,926 | |
| | |
Cheniere Corpus Christi Holdings LLC | | | | | | | | |
5.88%, 3/31/2025 | | | 200,000 | | | | 223,965 | |
5.13%, 6/30/2027 | | | 500,000 | | | | 571,740 | |
| | |
ConocoPhillips | | | | | | | | |
4.30%, 8/15/2028(a) | | | 200,000 | | | | 229,642 | |
| | |
ConocoPhillips Co. | | | | | | | | |
6.95%, 4/15/2029 | | | 500,000 | | | | 663,862 | |
| | |
Devon Energy Corp. | | | | | | | | |
4.50%, 1/15/2030(a) | | | 500,000 | | | | 543,931 | |
| | |
Eastern Gas Transmission & Storage, Inc. | | | | | | | | |
3.60%, 12/15/2024(a) | | | 26,000 | | | | 27,636 | |
| | |
Enable Midstream Partners LP | | | | | | | | |
4.40%, 3/15/2027 | | | 250,000 | | | | 273,569 | |
4.95%, 5/15/2028 | | | 250,000 | | | | 279,556 | |
| | |
Enbridge, Inc. | | | | | | | | |
3.70%, 7/15/2027 | | | 200,000 | | | | 218,463 | |
Series 16-A, 6.00%, 1/15/2077(b) | | | 350,000 | | | | 387,163 | |
5.50%, 7/15/2077(b) | | | 350,000 | | | | 377,872 | |
6.25%, 3/1/2078(b) | | | 350,000 | | | | 386,621 | |
| | |
Energy Transfer LP | | | | | | | | |
4.05%, 3/15/2025 | | | 20,000 | | | | 21,446 | |
4.75%, 1/15/2026 | | | 300,000 | | | | 332,308 | |
5.25%, 4/15/2029 | | | 150,000 | | | | 174,386 | |
3.75%, 5/15/2030 | | | 200,000 | | | | 213,390 | |
| |
Enterprise Products Operating LLC | | | | | |
3.75%, 2/15/2025 | | | 700,000 | | | | 753,902 | |
4.15%, 10/16/2028 | | | 350,000 | | | | 395,989 | |
3.13%, 7/31/2029 | | | 300,000 | | | | 320,251 | |
Series E, 5.25%, 8/16/2077(b) | | | 200,000 | | | | 210,239 | |
5.38%, 2/15/2078(b) | | | 350,000 | | | | 359,882 | |
| | |
Exxon Mobil Corp. | | | | | | | | |
3.48%, 3/19/2030 | | | 200,000 | | | | 221,777 | |
| | |
Hess Corp. | | | | | | | | |
4.30%, 4/1/2027 | | | 300,000 | | | | 329,251 | |
7.88%, 10/1/2029 | | | 200,000 | | | | 271,907 | |
| | |
HollyFrontier Corp. | | | | | | | | |
5.88%, 4/1/2026 | | | 400,000 | | | | 456,043 | |
See Accompanying Notes to the Financial Statements.
| | | | | | |
| | FLEXSHARES ANNUAL REPORT | | | 385 | |
FlexShares® Credit-Scored US Corporate Bond Index Fund (cont.)
| | | | | | | | |
| Investments | | Principal
Amount | | | Value | |
|
| CORPORATE BONDS – (continued) | |
|
| Oil, Gas & Consumable Fuels – (continued) | |
| | |
Magellan Midstream Partners LP | | | | | | | | |
5.00%, 3/1/2026 | | $ | 250,000 | | | $ | 282,289 | |
| | |
Marathon Petroleum Corp. | | | | | | | | |
5.13%, 12/15/2026 | | | 250,000 | | | | 287,801 | |
3.80%, 4/1/2028 | | | 250,000 | | | | 272,472 | |
| | |
MPLX LP | | | | | | | | |
1.75%, 3/1/2026 | | | 500,000 | | | | 498,336 | |
4.00%, 3/15/2028 | | | 1,000,000 | | | | 1,100,448 | |
2.65%, 8/15/2030 | | | 500,000 | | | | 498,334 | |
| | |
ONEOK Partners LP | | | | | | | | |
4.90%, 3/15/2025 | | | 400,000 | | | | 440,364 | |
| | |
ONEOK, Inc. | | | | | | | | |
4.55%, 7/15/2028 | | | 250,000 | | | | 281,787 | |
4.35%, 3/15/2029 | | | 250,000 | | | | 279,162 | |
3.10%, 3/15/2030 | | | 400,000 | | | | 412,930 | |
| | |
Pioneer Natural Resources Co. | | | | | | | | |
1.13%, 1/15/2026 | | | 500,000 | | | | 489,614 | |
2.15%, 1/15/2031 | | | 150,000 | | | | 144,827 | |
| | |
Plains All American Pipeline LP | | | | | | | | |
4.65%, 10/15/2025 | | | 500,000 | | | | 549,144 | |
| | |
Sabine Pass Liquefaction LLC | | | | | | | | |
5.63%, 3/1/2025 | | | 700,000 | | | | 785,387 | |
5.88%, 6/30/2026 | | | 125,000 | | | | 145,124 | |
4.50%, 5/15/2030 | | | 450,000 | | | | 513,299 | |
| | |
Spectra Energy Partners LP | | | | | | | | |
4.75%, 3/15/2024 | | | 640,000 | | | | 689,782 | |
3.38%, 10/15/2026 | | | 500,000 | | | | 537,412 | |
| | |
TC PipeLines LP | | | | | | | | |
4.38%, 3/13/2025 | | | 100,000 | | | | 108,561 | |
| | |
TransCanada PipeLines Ltd. | | | | | | | | |
4.25%, 5/15/2028 | | | 200,000 | | | | 225,911 | |
| | |
Transcanada Trust | | | | | | | | |
Series 16-A, 5.87%, 8/15/2076(b) | | | 300,000 | | | | 331,500 | |
5.30%, 3/15/2077(b) | | | 300,000 | | | | 315,855 | |
5.50%, 9/15/2079(b) | | | 200,000 | | | | 218,750 | |
| | |
Valero Energy Partners LP | | | | | | | | |
4.50%, 3/15/2028 | | | 200,000 | | | | 225,028 | |
| | | | | | | | 19,384,431 | |
|
| Paper & Forest Products – 0.1% | |
| | |
Suzano Austria GmbH | | | | | | | | |
6.00%, 1/15/2029 | | | 250,000 | | | | 287,500 | |
| | | | | | | | |
| Investments | | Principal
Amount | | | Value | |
|
| Paper & Forest Products – (continued) | |
3.75%, 1/15/2031 | | $ | 150,000 | | | $ | 150,407 | |
| | | | | | | | 437,907 | |
| | |
| Pharmaceuticals – 1.5% | | | | | | |
| | |
Bristol-Myers Squibb Co. | | | | | | | | |
3.40%, 7/26/2029 | | | 250,000 | | | | 275,191 | |
| | |
Johnson & Johnson | | | | | | | | |
2.95%, 3/3/2027 | | | 650,000 | | | | 701,198 | |
2.90%, 1/15/2028 | | | 500,000 | | | | 537,962 | |
| | |
Merck Sharp & Dohme Corp. | | | | | | | | |
6.40%, 3/1/2028 | | | 150,000 | | | | 190,534 | |
| | |
Novartis Capital Corp. | | | | | | | | |
3.40%, 5/6/2024 | | | 403,000 | | | | 428,271 | |
1.75%, 2/14/2025 | | | 150,000 | | | | 153,066 | |
3.00%, 11/20/2025 | | | 500,000 | | | | 534,219 | |
2.20%, 8/14/2030 | | | 200,000 | | | | 204,437 | |
| | |
Pfizer, Inc. | | | | | | | | |
2.63%, 4/1/2030 | | | 200,000 | | | | 210,385 | |
| | |
Royalty Pharma plc | | | | | | | | |
2.20%, 9/2/2030 | | | 400,000 | | | | 387,694 | |
| | |
Zoetis, Inc. | | | | | | | | |
3.25%, 2/1/2023 | | | 650,000 | | | | 667,430 | |
3.00%, 9/12/2027 | | | 145,000 | | | | 154,937 | |
3.90%, 8/20/2028 | | | 250,000 | | | | 280,198 | |
| | | | | | | | 4,725,522 | |
| | |
| Professional Services – 0.7% | | | | | | |
| | |
Equifax, Inc. | | | | | | | | |
3.95%, 6/15/2023 | | | 500,000 | | | | 524,717 | |
2.60%, 12/1/2024 | | | 150,000 | | | | 156,223 | |
3.10%, 5/15/2030 | | | 250,000 | | | | 263,384 | |
| | |
IHS Markit Ltd. | | | | | | | | |
4.75%, 8/1/2028 | | | 500,000 | | | | 583,832 | |
| | |
Verisk Analytics, Inc. | | | | | | | | |
4.00%, 6/15/2025 | | | 250,000 | | | | 272,594 | |
4.13%, 3/15/2029 | | | 250,000 | | | | 282,915 | |
| | | | | | | | 2,083,665 | |
|
| Real Estate Management & Development – 0.1% | |
| | |
CBRE Services, Inc. | | | | | | | | |
4.88%, 3/1/2026 | | | 200,000 | | | | 225,969 | |
| | |
| Road & Rail – 0.9% | | | | | | |
| |
Burlington Northern Santa Fe LLC | | | | | |
3.40%, 9/1/2024 | | | 500,000 | | | | 532,600 | |
3.25%, 6/15/2027 | | | 224,000 | | | | 244,402 | |
See Accompanying Notes to the Financial Statements.
| | | | |
| 386 | | FLEXSHARES ANNUAL REPORT | | |
FlexShares® Credit-Scored US Corporate Bond Index Fund (cont.)
| | | | | | | | |
| Investments | | Principal
Amount | | | Value | |
|
| CORPORATE BONDS – (continued) | |
|
| Road & Rail – (continued) | |
| | |
Canadian Pacific Railway Co. | | | | | | | | |
2.90%, 2/1/2025 | | $ | 250,000 | | | $ | 262,757 | |
3.70%, 2/1/2026 | | | 20,000 | | | | 21,609 | |
| | |
CSX Corp. | | | | | | | | |
3.80%, 3/1/2028 | | | 100,000 | | | | 111,055 | |
4.25%, 3/15/2029 | | | 200,000 | | | | 229,270 | |
| | |
JB Hunt Transport Services, Inc. | | | | | | | | |
3.88%, 3/1/2026 | | | 300,000 | | | | 329,173 | |
| | |
Norfolk Southern Corp. | | | | | | | | |
3.15%, 6/1/2027 | | | 200,000 | | | | 214,650 | |
| | |
Union Pacific Corp. | | | | | | | | |
3.00%, 4/15/2027 | | | 300,000 | | | | 321,154 | |
2.38%, 5/20/2031 | | | 500,000 | | | | 511,116 | |
| | | | | | | | 2,777,786 | |
|
| Semiconductors & Semiconductor Equipment – 2.7% | |
| | |
Analog Devices, Inc. | | | | | | | | |
3.50%, 12/5/2026 | | | 405,000 | | | | 443,514 | |
| | |
Broadcom Corp. | | | | | | | | |
3.88%, 1/15/2027 | | | 900,000 | | | | 976,090 | |
| | |
Broadcom, Inc. | | | | | | | | |
4.25%, 4/15/2026 | | | 500,000 | | | | 550,130 | |
3.46%, 9/15/2026 | | | 500,000 | | | | 534,054 | |
1.95%, 2/15/2028(a) | | | 700,000 | | | | 686,267 | |
4.11%, 9/15/2028 | | | 775,000 | | | | 856,389 | |
4.75%, 4/15/2029 | | | 510,000 | | | | 581,957 | |
5.00%, 4/15/2030 | | | 300,000 | | | | 348,505 | |
4.15%, 11/15/2030 | | | 350,000 | | | | 384,965 | |
2.45%, 2/15/2031(a) | | | 400,000 | | | | 387,687 | |
| | |
KLA Corp. | | | | | | | | |
4.65%, 11/1/2024 | | | 200,000 | | | | 219,567 | |
| | |
Maxim Integrated Products, Inc. | | | | | | | | |
3.45%, 6/15/2027 | | | 200,000 | | | | 217,380 | |
| | |
Micron Technology, Inc. | | | | | | | | |
2.50%, 4/24/2023 | | | 250,000 | | | | 257,200 | |
4.19%, 2/15/2027 | | | 500,000 | | | | 551,805 | |
4.66%, 2/15/2030 | | | 200,000 | | | | 228,558 | |
| | |
NXP BV | | | | | | | | |
5.55%, 12/1/2028(a) | | | 200,000 | | | | 242,226 | |
| | |
Qorvo, Inc. | | | | | | | | |
4.38%, 10/15/2029 | | | 250,000 | | | | 268,750 | |
| | |
QUALCOMM, Inc. | | | | | | | | |
3.25%, 5/20/2027 | | | 200,000 | | | | 216,645 | |
| | | | | | | | |
| Investments | | Principal
Amount | | | Value | |
|
| Semiconductors & Semiconductor Equipment – (continued) | |
| | |
Skyworks Solutions, Inc. | | | | | | | | |
0.90%, 6/1/2023 | | $ | 250,000 | | | $ | 250,079 | |
| | |
Texas Instruments, Inc. | | | | | | | | |
1.38%, 3/12/2025 | | | 200,000 | | | | 201,809 | |
2.90%, 11/3/2027 | | | 250,000 | | | | 269,738 | |
| | | | | | | | 8,673,315 | |
| | |
| Software – 2.4% | | | | | | |
| | |
Adobe, Inc. | | | | | | | | |
3.25%, 2/1/2025 | | | 250,000 | | | | 266,225 | |
2.30%, 2/1/2030 | | | 350,000 | | | | 359,238 | |
| | |
Autodesk, Inc. | | | | | | | | |
3.50%, 6/15/2027 | | | 200,000 | | | | 217,285 | |
| | |
CA, Inc. | | | | | | | | |
4.70%, 3/15/2027 | | | 200,000 | | | | 221,018 | |
| | |
Citrix Systems, Inc. | | | | | | | | |
4.50%, 12/1/2027 | | | 200,000 | | | | 216,850 | |
| | |
Intuit, Inc. | | | | | | | | |
1.35%, 7/15/2027 | | | 300,000 | | | | 294,305 | |
| | |
Microsoft Corp. | | | | | | | | |
3.63%, 12/15/2023 | | | 375,000 | | | | 396,418 | |
2.70%, 2/12/2025 | | | 640,000 | | | | 674,960 | |
3.13%, 11/3/2025 | | | 500,000 | | | | 536,700 | |
2.40%, 8/8/2026 | | | 100,000 | | | | 104,987 | |
3.30%, 2/6/2027 | | | 615,000 | | | | 672,069 | |
| | |
Oracle Corp. | | | | | | | | |
2.50%, 4/1/2025 | | | 500,000 | | | | 518,716 | |
1.65%, 3/25/2026 | | | 500,000 | | | | 502,008 | |
2.65%, 7/15/2026 | | | 400,000 | | | | 415,998 | |
2.80%, 4/1/2027 | | | 500,000 | | | | 522,822 | |
3.25%, 11/15/2027 | | | 800,000 | | | | 855,643 | |
2.30%, 3/25/2028 | | | 500,000 | | | | 507,822 | |
2.88%, 3/25/2031 | | | 300,000 | | | | 307,620 | |
| | | | | | | | 7,590,684 | |
| | |
| Specialty Retail – 2.5% | | | | | | |
| | |
Advance Auto Parts, Inc. | | | | | | | | |
1.75%, 10/1/2027 | | | 60,000 | | | | 59,027 | |
| | |
AutoZone, Inc. | | | | | | | | |
3.25%, 4/15/2025 | | | 540,000 | | | | 572,717 | |
3.13%, 4/21/2026 | | | 125,000 | | | | 133,126 | |
3.75%, 6/1/2027 | | | 250,000 | | | | 275,269 | |
| | |
Best Buy Co., Inc. | | | | | | | | |
4.45%, 10/1/2028 | | | 200,000 | | | | 228,648 | |
See Accompanying Notes to the Financial Statements.
| | | | | | |
| | FLEXSHARES ANNUAL REPORT | | | 387 | |
FlexShares® Credit-Scored US Corporate Bond Index Fund (cont.)
| | | | | | | | |
| Investments | | Principal
Amount | | | Value | |
|
| CORPORATE BONDS – (continued) | |
|
| Specialty Retail – (continued) | |
| | |
Home Depot, Inc. (The) | | | | | | | | |
3.35%, 9/15/2025 | | $ | 3,000 | | | $ | 3,233 | |
3.00%, 4/1/2026 | | | 330,000 | | | | 352,855 | |
2.13%, 9/15/2026 | | | 500,000 | | | | 517,516 | |
2.50%, 4/15/2027 | | | 200,000 | | | | 210,163 | |
2.80%, 9/14/2027 | | | 450,000 | | | | 478,830 | |
0.90%, 3/15/2028 | | | 1,000,000 | | | | 951,484 | |
3.90%, 12/6/2028 | | | 60,000 | | | | 68,291 | |
| | |
Lowe’s Cos., Inc. | | | | | | | | |
4.00%, 4/15/2025 | | | 100,000 | | | | 108,934 | |
3.38%, 9/15/2025 | | | 600,000 | | | | 645,011 | |
2.50%, 4/15/2026 | | | 300,000 | | | | 313,802 | |
3.10%, 5/3/2027 | | | 500,000 | | | | 535,871 | |
1.30%, 4/15/2028 | | | 250,000 | | | | 240,825 | |
3.65%, 4/5/2029 | | | 1,000,000 | | | | 1,105,360 | |
2.63%, 4/1/2031 | | | 200,000 | | | | 204,740 | |
| | |
O’Reilly Automotive, Inc. | | | | | | | | |
3.55%, 3/15/2026 | | | 300,000 | | | | 325,313 | |
3.60%, 9/1/2027 | | | 200,000 | | | | 219,735 | |
4.35%, 6/1/2028 | | | 250,000 | | | | 286,106 | |
| | | | | | | | 7,836,856 | |
|
| Technology Hardware, Storage & Peripherals – 3.0% | |
| | |
Apple, Inc. | | | | | | | | |
2.40%, 5/3/2023 | | | 2,300,000 | | | | 2,365,685 | |
3.45%, 5/6/2024 | | | 865,000 | | | | 921,047 | |
1.13%, 5/11/2025 | | | 500,000 | | | | 500,066 | |
3.20%, 5/13/2025 | | | 300,000 | | | | 321,322 | |
3.25%, 2/23/2026 | | | 518,000 | | | | 558,931 | |
3.35%, 2/9/2027 | | | 830,000 | | | | 904,712 | |
3.20%, 5/11/2027 | | | 625,000 | | | | 678,687 | |
2.90%, 9/12/2027 | | | 500,000 | | | | 534,795 | |
3.00%, 11/13/2027 | | | 1,500,000 | | | | 1,614,805 | |
| | |
HP, Inc. | | | | | | | | |
1.45%, 6/17/2026(a) | | | 500,000 | | | | 492,901 | |
3.00%, 6/17/2027 | | | 400,000 | | | | 422,916 | |
| | |
NetApp, Inc. | | | | | | | | |
1.88%, 6/22/2025 | | | 200,000 | | | | 203,530 | |
| | | | | | | | 9,519,397 | |
|
| Textiles, Apparel & Luxury Goods – 0.2% | |
| | |
NIKE, Inc. | | | | | | | | |
2.75%, 3/27/2027 | | | 360,000 | | | | 382,850 | |
| | | | | | | | |
| Investments | | Principal
Amount | | | Value | |
|
| Textiles, Apparel & Luxury Goods – (continued) | |
| | |
Tapestry, Inc. | | | | | | | | |
4.13%, 7/15/2027 | | $ | 250,000 | | | $ | 271,720 | |
| | | | | | | | 654,570 | |
| | |
| Tobacco – 1.7% | | | | | | |
| | |
Altria Group, Inc. | | | | | | | | |
2.35%, 5/6/2025 | | | 360,000 | | | | 371,309 | |
4.40%, 2/14/2026 | | | 250,000 | | | | 277,609 | |
4.80%, 2/14/2029 | | | 500,000 | | | | 570,236 | |
3.40%, 5/6/2030 | | | 300,000 | | | | 314,471 | |
| | |
BAT Capital Corp. | | | | | | | | |
3.56%, 8/15/2027 | | | 1,000,000 | | | | 1,061,642 | |
2.73%, 3/25/2031 | | | 400,000 | | | | 391,108 | |
| | |
Philip Morris International, Inc. | | | | | | | | |
2.88%, 5/1/2024 | | | 500,000 | | | | 523,684 | |
1.50%, 5/1/2025 | | | 473,000 | | | | 477,147 | |
2.75%, 2/25/2026 | | | 500,000 | | | | 525,959 | |
0.88%, 5/1/2026 | | | 500,000 | | | | 486,051 | |
| | |
Reynolds American, Inc. | | | | | | | | |
4.45%, 6/12/2025 | | | 200,000 | | | | 218,293 | |
| | | | | | | | 5,217,509 | |
|
| Trading Companies & Distributors – 0.5% | |
| | |
Air Lease Corp. | | | | | | | | |
3.00%, 9/15/2023 | | | 205,000 | | | | 212,189 | |
2.30%, 2/1/2025 | | | 250,000 | | | | 255,167 | |
| | |
Aircastle Ltd. | | | | | | | | |
4.40%, 9/25/2023 | | | 750,000 | | | | 794,443 | |
4.25%, 6/15/2026 | | | 200,000 | | | | 217,052 | |
| | | | | | | | 1,478,851 | |
| | |
| Water Utilities – 0.1% | | | | | | |
| | |
American Water Capital Corp. | | | | | | | | |
2.95%, 9/1/2027 | | | 200,000 | | | | 212,644 | |
|
| Wireless Telecommunication Services – 0.1% | |
| | |
T-Mobile USA, Inc. | | | | | | | | |
3.88%, 4/15/2030 | | | 400,000 | | | | 437,870 | |
Total Corporate Bonds
(Cost $307,178,946) | | | | 308,335,995 | |
| | | | | | | | | |
Total Investments – 97.7%
(Cost $307,178,946) | | | | 308,335,995 | |
| |
Other assets less liabilities – 2.3% | | | | 7,403,984 | |
| NET ASSETS – 100.0% | | | $ | 315,739,979 | |
See Accompanying Notes to the Financial Statements.
| | | | |
| 388 | | FLEXSHARES ANNUAL REPORT | | |
FlexShares® Credit-Scored US Corporate Bond Index Fund (cont.)
| (a) | Securities exempt from registration under Rule 144A of the Securities Act of 1933. These securities may be resold in transactions exempt from registration, normally to qualified institutional buyers. The value of these securities is determined by valuations supplied by a pricing service or brokers, or, if not available, in accordance with procedures established by the Board of Trustees. |
| (b) | Security issued at a fixed coupon rate, which converts to a variable rate at a future date. Rate shown is the rate in effect as of period end. |
| (c) | Step bond. Interest rate is a fixed rate for an initial period that either resets at a specific date or may reset in the future at a contingent upon predetermined trigger. The interest rate shown was the current rate as of October 31, 2021. |
Percentages shown are based on Net Assets.
As of October 31, 2021, the gross unrealized appreciation (depreciation) of investments based on the aggregate cost of investments (including derivative instruments, if applicable) for federal income tax purposes was as follows:
| | | | |
| | | | |
Aggregate gross unrealized appreciation | | $ | 3,462,071 | |
Aggregate gross unrealized depreciation | | | (2,587,249 | ) |
Net unrealized appreciation | | $ | 874,822 | |
Federal income tax cost | | $ | 307,461,173 | |
| | | | | |
| Security Type | | % of Net Assets |
Corporate Bonds | | | | 97.7 | % |
Others(1) | | | | 2.3 | |
| | | | | 100.0 | % |
| (1) | Includes any other net assets/(liabilities). |
See Accompanying Notes to the Financial Statements.
| | | | | | |
| | FLEXSHARES ANNUAL REPORT | | | 389 | |
Schedule of Investments
FlexShares® Credit-Scored US Long Corporate Bond Index Fund
October 31, 2021
| | | | | | | | |
| Investments | | Principal
Amount | | | Value | |
|
| CORPORATE BONDS – 97.6% | |
|
| Aerospace & Defense – 1.7% | |
| | |
Boeing Co. (The) | | | | | | | | |
5.81%, 5/1/2050 | | $ | 150,000 | | | $ | 205,795 | |
| | |
L3Harris Technologies, Inc. | | | | | | | | |
5.05%, 4/27/2045 | | | 220,000 | | | | 292,946 | |
| | |
Lockheed Martin Corp. | | | | | | | | |
4.70%, 5/15/2046 | | | 100,000 | | | | 132,400 | |
4.09%, 9/15/2052 | | | 125,000 | | | | 156,820 | |
| | |
Northrop Grumman Corp. | | | | | | | | |
5.25%, 5/1/2050 | | | 100,000 | | | | 142,340 | |
| | |
Precision Castparts Corp. | | | | | | | | |
3.90%, 1/15/2043 | | | 100,000 | | | | 115,450 | |
| | | | | | | | 1,045,751 | |
| | |
| Auto Components – 0.3% | | | | | | |
| | |
Aptiv plc | | | | | | | | |
5.40%, 3/15/2049 | | | 50,000 | | | | 70,082 | |
| | |
Lear Corp. | | | | | | | | |
5.25%, 5/15/2049 | | | 75,000 | | | | 95,142 | |
| | | | | | | | 165,224 | |
| | |
| Automobiles – 0.3% | | | | | | |
| | |
General Motors Co. | | | | | | | | |
6.25%, 10/2/2043 | | | 100,000 | | | | 136,448 | |
5.95%, 4/1/2049 | | | 50,000 | | | | 67,985 | |
| | | | | | | | 204,433 | |
| | |
| Banks – 8.2% | | | | | | |
| | |
Bank of America Corp. | | | | | | | | |
6.11%, 1/29/2037 | | | 250,000 | | | | 338,228 | |
7.75%, 5/14/2038 | | | 200,000 | | | | 313,392 | |
4.08%, 3/20/2051(a) | | | 250,000 | | | | 302,057 | |
| | |
Citigroup, Inc. | | | | | | | | |
3.88%, 1/24/2039(a) | | | 100,000 | | | | 114,234 | |
5.88%, 1/30/2042 | | | 135,000 | | | | 192,825 | |
6.68%, 9/13/2043 | | | 150,000 | | | | 229,124 | |
4.75%, 5/18/2046 | | | 135,000 | | | | 171,342 | |
4.65%, 7/23/2048 | | | 195,000 | | | | 256,236 | |
| | |
Cooperatieve Rabobank UA | | | | | | | | |
5.25%, 5/24/2041 | | | 100,000 | | | | 138,647 | |
| | |
Fifth Third Bancorp | | | | | | | | |
8.25%, 3/1/2038 | | | 125,000 | | | | 206,417 | |
| | | | | | | | |
| Investments | | Principal
Amount | | | Value | |
|
| Banks – (continued) | |
| | |
HSBC Holdings plc | | | | | | | | |
6.50%, 5/2/2036 | | $ | 200,000 | | | $ | 273,001 | |
6.80%, 6/1/2038 | | | 100,000 | | | | 143,211 | |
5.25%, 3/14/2044 | | | 200,000 | | | | 258,692 | |
| | |
JPMorgan Chase & Co. | | | | | | | | |
6.40%, 5/15/2038 | | | 35,000 | | | | 50,803 | |
3.11%, 4/22/2041(a) | | | 100,000 | | | | 103,576 | |
2.53%, 11/19/2041(a) | | | 65,000 | | | | 61,720 | |
4.95%, 6/1/2045 | | | 50,000 | | | | 65,789 | |
3.11%, 4/22/2051(a) | | | 125,000 | | | | 129,404 | |
| | |
Lloyds Banking Group plc | | | | | | | | |
4.34%, 1/9/2048 | | | 200,000 | | | | 240,590 | |
| | |
Regions Financial Corp. | | | | | | | | |
7.38%, 12/10/2037 | | | 100,000 | | | | 151,294 | |
| | |
Wells Fargo & Co. | | | | | | | | |
3.07%, 4/30/2041(a) | | | 200,000 | | | | 205,298 | |
5.38%, 11/2/2043 | | | 265,000 | | | | 353,036 | |
5.61%, 1/15/2044 | | | 100,000 | | | | 136,792 | |
4.90%, 11/17/2045 | | | 300,000 | | | | 385,748 | |
5.01%, 4/4/2051(a) | | | 100,000 | | | | 138,176 | |
| | | | | | | | 4,959,632 | |
| | |
| Beverages – 1.8% | | | | | | |
| | |
Anheuser-Busch Cos. LLC | | | | | | | | |
4.90%, 2/1/2046 | | | 50,000 | | | | 63,641 | |
| | |
Anheuser-Busch InBev Worldwide, Inc. | | | | | | | | |
4.60%, 4/15/2048 | | | 25,000 | | | | 30,959 | |
5.55%, 1/23/2049 | | | 50,000 | | | | 70,156 | |
4.50%, 6/1/2050 | | | 100,000 | | | | 123,904 | |
5.80%, 1/23/2059 | | | 100,000 | | | | 148,043 | |
| | |
Coca-Cola Co. (The) | | | | | | | | |
3.00%, 3/5/2051 | | | 100,000 | | | | 106,440 | |
| | |
Coca-Cola Femsa SAB de CV | | | | | | | | |
5.25%, 11/26/2043 | | | 150,000 | | | | 199,357 | |
| | |
Constellation Brands, Inc. | | | | | | | | |
5.25%, 11/15/2048 | | | 75,000 | | | | 100,645 | |
3.75%, 5/1/2050 | | | 100,000 | | | | 111,264 | |
| | |
Keurig Dr Pepper, Inc. | | | | | | | | |
5.09%, 5/25/2048 | | | 100,000 | | | | 132,790 | |
| | | | | | | | 1,087,199 | |
See Accompanying Notes to the Financial Statements.
| | | | |
| 390 | | FLEXSHARES ANNUAL REPORT | | |
FlexShares® Credit-Scored US Long Corporate Bond Index Fund (cont.)
| | | | | | | | |
| Investments | | Principal
Amount | | | Value | |
|
| CORPORATE BONDS – (continued) | |
|
| Biotechnology – 3.9% | |
| | |
AbbVie, Inc. | | | | | | | | |
4.70%, 5/14/2045 | | $ | 100,000 | | | $ | 125,385 | |
4.88%, 11/14/2048 | | | 100,000 | | | | 131,299 | |
4.25%, 11/21/2049 | | | 100,000 | | | | 120,290 | |
| | |
Amgen, Inc. | | | | | | | | |
5.15%, 11/15/2041 | | | 228,000 | | | | 294,278 | |
4.40%, 5/1/2045 | | | 200,000 | | | | 241,002 | |
4.56%, 6/15/2048 | | | 100,000 | | | | 124,956 | |
3.38%, 2/21/2050 | | | 100,000 | | | | 105,299 | |
4.66%, 6/15/2051 | | | 250,000 | | | | 322,572 | |
2.77%, 9/1/2053 | | | 137,000 | | | | 129,281 | |
| | |
Gilead Sciences, Inc. | | | | | | | | |
4.80%, 4/1/2044 | | | 150,000 | | | | 189,706 | |
4.75%, 3/1/2046 | | | 300,000 | | | | 383,482 | |
4.15%, 3/1/2047 | | | 100,000 | | | | 119,059 | |
| | |
Regeneron Pharmaceuticals, Inc. | | | | | | | | |
2.80%, 9/15/2050 | | | 100,000 | | | | 94,257 | |
| | | | | | | | 2,380,866 | |
| | |
| Building Products – 0.7% | | | | | | |
| | |
Johnson Controls International plc | | | | | | | | |
5.13%, 9/14/2045 | | | 200,000 | | | | 263,407 | |
4.95%, 7/2/2064(b) | | | 50,000 | | | | 68,621 | |
| | |
Masco Corp. | | | | | | | | |
4.50%, 5/15/2047 | | | 50,000 | | | | 60,915 | |
| | |
Owens Corning | | | | | | | | |
4.40%, 1/30/2048 | | | 50,000 | | | | 59,488 | |
| | | | | | | | 452,431 | |
| | |
| Capital Markets – 2.1% | | | | | | |
| | |
Goldman Sachs Group, Inc. (The) | | | | | | | | |
6.75%, 10/1/2037 | | | 100,000 | | | | 142,422 | |
4.02%, 10/31/2038(a) | | | 130,000 | | | | 148,900 | |
4.75%, 10/21/2045 | | | 85,000 | | | | 111,225 | |
| | |
Jefferies Group LLC | | | | | | | | |
6.50%, 1/20/2043 | | | 100,000 | | | | 140,015 | |
| | |
Legg Mason, Inc. | | | | | | | | |
5.63%, 1/15/2044 | | | 75,000 | | | | 104,190 | |
| | |
Moody’s Corp. | | | | | | | | |
5.25%, 7/15/2044 | | | 100,000 | | | | 135,881 | |
4.88%, 12/17/2048 | | | 50,000 | | | | 67,176 | |
| | | | | | | | |
| Investments | | Principal
Amount | | | Value | |
|
| Capital Markets – (continued) | |
| | |
Morgan Stanley | | | | | | | | |
6.38%, 7/24/2042 | | $ | 75,000 | | | $ | 114,317 | |
4.30%, 1/27/2045 | | | 60,000 | | | | 74,163 | |
| | |
Nasdaq, Inc. | | | | | | | | |
3.25%, 4/28/2050 | | | 100,000 | | | | 102,457 | |
| | |
Raymond James Financial, Inc. | | | | | | | | |
4.95%, 7/15/2046 | | | 45,000 | | | | 59,146 | |
| | |
S&P Global, Inc. | | | | | | | | |
2.30%, 8/15/2060 | | | 100,000 | | | | 87,385 | |
| | | | | | | | 1,287,277 | |
| | |
| Chemicals – 1.2% | | | | | | |
| | |
Albemarle Corp. | | | | | | | | |
5.45%, 12/1/2044 | | | 50,000 | | | | 64,581 | |
| | |
Dow Chemical Co. (The) | | | | | | | | |
9.40%, 5/15/2039 | | | 58,000 | | | | 104,352 | |
| | |
FMC Corp. | | | | | | | | |
4.50%, 10/1/2049 | | | 50,000 | | | | 60,582 | |
| | |
LyondellBasell Industries NV | | | | | | | | |
4.63%, 2/26/2055 | | | 100,000 | | | | 124,242 | |
| | |
RPM International, Inc. | | | | | | | | |
4.25%, 1/15/2048 | | | 50,000 | | | | 57,233 | |
| | |
Sherwin-Williams Co. (The) | | | | | | | | |
4.50%, 6/1/2047 | | | 145,000 | | | | 181,443 | |
3.80%, 8/15/2049 | | | 100,000 | | | | 114,818 | |
3.30%, 5/15/2050 | | | 50,000 | | | | 53,118 | |
| | | | | | | | 760,369 | |
|
| Commercial Services & Supplies – 0.4% | |
| | |
Republic Services, Inc. | | | | | | | | |
6.20%, 3/1/2040 | | | 150,000 | | | | 215,497 | |
|
| Communications Equipment – 0.7% | |
| | |
Cisco Systems, Inc. | | | | | | | | |
5.90%, 2/15/2039 | | | 185,000 | | | | 267,962 | |
5.50%, 1/15/2040 | | | 100,000 | | | | 140,467 | |
| | | | | | | | 408,429 | |
|
| Construction & Engineering – 0.2% | |
| | |
Valmont Industries, Inc. | | | | | | | | |
5.00%, 10/1/2044 | | | 100,000 | | | | 124,356 | |
See Accompanying Notes to the Financial Statements.
| | | | | | |
| | FLEXSHARES ANNUAL REPORT | | | 391 | |
FlexShares® Credit-Scored US Long Corporate Bond Index Fund (cont.)
| | | | | | | | |
| Investments | | Principal
Amount | | | Value | |
|
| CORPORATE BONDS – (continued) | |
|
| Construction Materials – 0.1% | |
| | |
Martin Marietta Materials, Inc. | | | | | | | | |
4.25%, 12/15/2047 | | $ | 50,000 | | | $ | 59,576 | |
|
| Diversified Telecommunication Services – 4.7% | |
| | |
AT&T, Inc. | | | | | | | | |
6.25%, 3/29/2041 | | | 50,000 | | | | 69,540 | |
4.50%, 3/9/2048 | | | 100,000 | | | | 118,208 | |
5.15%, 2/15/2050 | | | 100,000 | | | | 128,597 | |
3.65%, 6/1/2051 | | | 200,000 | | | | 208,505 | |
3.30%, 2/1/2052 | | | 50,000 | | | | 49,092 | |
3.55%, 9/15/2055 | | | 100,000 | | | | 101,503 | |
3.80%, 12/1/2057 | | | 482,000 | | | | 507,293 | |
| | |
Bell Canada | | | | | | | | |
4.30%, 7/29/2049 | | | 25,000 | | | | 30,774 | |
| | |
Bell Canada (The) | | | | | | | | |
4.46%, 4/1/2048 | | | 150,000 | | | | 186,878 | |
| | |
Telefonica Emisiones SA | | | | | | | | |
5.52%, 3/1/2049 | | | 150,000 | | | | 197,977 | |
| | |
TELUS Corp. | | | | | | | | |
4.30%, 6/15/2049 | | | 50,000 | | | | 61,608 | |
| | |
Verizon Communications, Inc. | | | | | | | | |
4.27%, 1/15/2036 | | | 339,000 | | | | 397,030 | |
4.52%, 9/15/2048 | | | 100,000 | | | | 126,882 | |
4.00%, 3/22/2050 | | | 300,000 | | | | 343,923 | |
2.88%, 11/20/2050 | | | 100,000 | | | | 95,322 | |
3.55%, 3/22/2051 | | | 200,000 | | | | 215,629 | |
| | | | | | | | 2,838,761 | |
|
| Electric Utilities – 6.0% | |
| | |
AEP Texas, Inc. | | | | | | | | |
3.80%, 10/1/2047 | | | 100,000 | | | | 110,102 | |
3.45%, 5/15/2051 | | | 250,000 | | | | 265,303 | |
| | |
American Electric Power Co., Inc. | | | | | | | | |
3.25%, 3/1/2050 | | | 150,000 | | | | 154,746 | |
| | |
Appalachian Power Co. | | | | | | | | |
7.00%, 4/1/2038 | | | 100,000 | | | | 147,392 | |
| | |
Duke Energy Corp. | | | | | | | | |
3.75%, 9/1/2046 | | | 250,000 | | | | 272,094 | |
| | |
Emera US Finance LP | | | | | | | | |
4.75%, 6/15/2046 | | | 150,000 | | | | 179,815 | |
| | |
Georgia Power Co. | | | | | | | | |
Series 10-C, 4.75%, 9/1/2040 | | | 200,000 | | | | 240,686 | |
4.30%, 3/15/2042 | | | 100,000 | | | | 115,330 | |
| | | | | | | | |
| Investments | | Principal
Amount | | | Value | |
|
| Electric Utilities – (continued) | |
4.30%, 3/15/2043 | | $ | 100,000 | | | $ | 115,779 | |
Series B, 3.70%, 1/30/2050 | | | 100,000 | | | | 108,883 | |
Series A, 3.25%, 3/15/2051 | | | 150,000 | | | | 153,554 | |
| | |
International Transmission Co. | | | | | | | | |
4.63%, 8/15/2043 | | | 100,000 | | | | 125,230 | |
| | |
Interstate Power and Light Co. | | | | | | | | |
6.25%, 7/15/2039 | | | 150,000 | | | | 213,662 | |
| | |
MidAmerican Energy Co. | | | | | | | | |
4.25%, 7/15/2049 | | | 100,000 | | | | 125,743 | |
| | |
Pacific Gas and Electric Co. | | | | | | | | |
4.95%, 7/1/2050 | | | 50,000 | | | | 55,356 | |
| | |
PacifiCorp | | | | | | | | |
6.25%, 10/15/2037 | | | 100,000 | | | | 141,126 | |
| | |
Southern California Edison Co. | | | | | | | | |
4.50%, 9/1/2040 | | | 125,000 | | | | 144,365 | |
4.65%, 10/1/2043 | | | 100,000 | | | | 118,788 | |
4.00%, 4/1/2047 | | | 75,000 | | | | 83,410 | |
| | |
Southern Co. (The) | | | | | | | | |
4.40%, 7/1/2046 | | | 150,000 | | | | 178,822 | |
| | |
Southwestern Electric Power Co. | | | | | | | | |
Series L, 3.85%, 2/1/2048 | | | 200,000 | | | | 223,780 | |
| | |
Tampa Electric Co. | | | | | | | | |
6.15%, 5/15/2037 | | | 100,000 | | | | 139,679 | |
| | |
Tucson Electric Power Co. | | | | | | | | |
4.00%, 6/15/2050 | | | 100,000 | | | | 119,497 | |
| | |
Wisconsin Public Service Corp. | | | | | | | | |
4.75%, 11/1/2044 | | | 100,000 | | | | 128,359 | |
| | | | | | | | 3,661,501 | |
|
| Electrical Equipment – 0.1% | |
| | |
Emerson Electric Co. | | | | | | | | |
5.25%, 11/15/2039 | | | 50,000 | | | | 66,633 | |
|
Electronic Equipment, Instruments &
Components – 0.8% | |
| | |
Corning, Inc. | | | | | | | | |
4.75%, 3/15/2042 | | | 45,000 | | | | 56,546 | |
4.38%, 11/15/2057 | | | 125,000 | | | | 152,862 | |
5.45%, 11/15/2079 | | | 100,000 | | | | 134,307 | |
| | |
Tyco Electronics Group SA | | | | | | | | |
7.13%, 10/1/2037 | | | 100,000 | | | | 151,579 | |
| | | | | | | | 495,294 | |
See Accompanying Notes to the Financial Statements.
| | | | |
| 392 | | FLEXSHARES ANNUAL REPORT | | |
FlexShares® Credit-Scored US Long Corporate Bond Index Fund (cont.)
| | | | | | | | |
| Investments | | Principal
Amount | | | Value | |
|
| CORPORATE BONDS – (continued) | |
|
| Energy Equipment & Services – 0.2% | |
| | |
Halliburton Co. | | | | | | | | |
7.45%, 9/15/2039 | | $ | 50,000 | | | $ | 74,585 | |
5.00%, 11/15/2045 | | | 50,000 | | | | 61,986 | |
| | | | | | | | 136,571 | |
|
| Entertainment – 0.3% | |
| | |
Activision Blizzard, Inc. | | | | | | | | |
2.50%, 9/15/2050 | | | 130,000 | | | | 116,679 | |
| | |
Electronic Arts, Inc. | | | | | | | | |
2.95%, 2/15/2051 | | | 50,000 | | | | 48,777 | |
| | | | | | | | 165,456 | |
|
| Equity Real Estate Investment Trusts (REITs) – 1.6% | |
| | |
Alexandria Real Estate Equities, Inc. | | | | | | | | |
4.00%, 2/1/2050 | | | 100,000 | | | | 118,012 | |
| | |
American Tower Corp. | | | | | | | | |
3.10%, 6/15/2050 | | | 150,000 | | | | 148,823 | |
| | |
Crown Castle International Corp. | | | | | | | | |
4.15%, 7/1/2050 | | | 100,000 | | | | 115,714 | |
3.25%, 1/15/2051 | | | 100,000 | | | | 100,621 | |
| | |
Kimco Realty Corp. | | | | | | | | |
3.70%, 10/1/2049 | | | 50,000 | | | | 54,823 | |
| | |
National Retail Properties, Inc. | | | | | | | | |
3.50%, 4/15/2051 | | | 150,000 | | | | 160,076 | |
| | |
Regency Centers LP | | | | | | | | |
4.40%, 2/1/2047 | | | 50,000 | | | | 59,770 | |
| | |
Ventas Realty LP | | | | | | | | |
5.70%, 9/30/2043 | | | 50,000 | | | | 67,117 | |
| | |
Welltower, Inc. | | | | | | | | |
4.95%, 9/1/2048 | | | 50,000 | | | | 65,649 | |
| | |
Weyerhaeuser Co. | | | | | | | | |
7.38%, 3/15/2032 | | | 50,000 | | | | 71,034 | |
| | | | | | | | 961,639 | |
|
| Food Products – 0.6% | |
| | |
Campbell Soup Co. | | | | | | | | |
3.13%, 4/24/2050 | | | 100,000 | | | | 99,331 | |
| | |
Mondelez International, Inc. | | | | | | | | |
2.63%, 9/4/2050 | | | 150,000 | | | | 141,426 | |
| | |
Tyson Foods, Inc. | | | | | | | | |
5.10%, 9/28/2048 | | | 100,000 | | | | 135,770 | |
| | | | | | | | 376,527 | |
| | | | | | | | |
| Investments | | Principal
Amount | | | Value | |
|
| Gas Utilities – 0.5% | |
| | |
Atmos Energy Corp. | | | | | | | | |
5.50%, 6/15/2041 | | $ | 50,000 | | | $ | 67,435 | |
4.13%, 10/15/2044 | | | 115,000 | | | | 134,539 | |
4.30%, 10/1/2048 | | | 100,000 | | | | 122,310 | |
| | | | | | | | 324,284 | |
|
| Health Care Equipment & Supplies – 0.4% | |
| | |
Becton Dickinson and Co. | | | | | | | | |
3.79%, 5/20/2050 | | | 150,000 | | | | 170,766 | |
| | |
DH Europe Finance II Sarl | | | | | | | | |
3.40%, 11/15/2049 | | | 50,000 | | | | 55,984 | |
| | | | | | | | 226,750 | |
|
| Health Care Providers & Services – 2.7% | |
| | |
AmerisourceBergen Corp. | | | | | | | | |
4.30%, 12/15/2047 | | | 75,000 | | | | 88,769 | |
| | |
Cardinal Health, Inc. | | | | | | | | |
4.37%, 6/15/2047 | | | 150,000 | | | | 171,657 | |
| | |
CVS Health Corp. | | | | | | | | |
5.05%, 3/25/2048 | | | 150,000 | | | | 197,371 | |
| | |
HCA, Inc. | | | | | | | | |
5.50%, 6/15/2047 | | | 100,000 | | | | 132,033 | |
5.25%, 6/15/2049 | | | 100,000 | | | | 129,696 | |
| | |
Humana, Inc. | | | | | | | | |
8.15%, 6/15/2038 | | | 25,000 | | | | 40,127 | |
4.95%, 10/1/2044 | | | 115,000 | | | | 149,094 | |
3.95%, 8/15/2049 | | | 100,000 | | | | 116,590 | |
| | |
Laboratory Corp. of America Holdings | | | | | | | | |
4.70%, 2/1/2045 | | | 100,000 | | | | 123,508 | |
| | |
UnitedHealth Group, Inc. | | | | | | | | |
5.95%, 2/15/2041 | | | 100,000 | | | | 145,357 | |
3.70%, 8/15/2049 | | | 75,000 | | | | 86,826 | |
3.88%, 8/15/2059 | | | 100,000 | | | | 120,433 | |
3.13%, 5/15/2060 | | | 125,000 | | | | 130,896 | |
| | | | | | | | 1,632,357 | |
|
| Hotels, Restaurants & Leisure – 2.6% | |
| | |
McDonald’s Corp. | | | | | | | | |
4.88%, 7/15/2040 | | | 50,000 | | | | 63,464 | |
4.88%, 12/9/2045 | | | 125,000 | | | | 163,019 | |
4.45%, 3/1/2047 | | | 200,000 | | | | 249,482 | |
4.45%, 9/1/2048 | | | 100,000 | | | | 125,428 | |
3.63%, 9/1/2049 | | | 250,000 | | | | 279,373 | |
4.20%, 4/1/2050 | | | 100,000 | | | | 122,499 | |
See Accompanying Notes to the Financial Statements.
| | | | | | |
| | FLEXSHARES ANNUAL REPORT | | | 393 | |
FlexShares® Credit-Scored US Long Corporate Bond Index Fund (cont.)
| | | | | | | | |
| Investments | | Principal
Amount | | | Value | |
|
| CORPORATE BONDS – (continued) | |
|
| Hotels, Restaurants & Leisure – (continued) | |
| | |
Starbucks Corp. | | | | | | | | |
4.50%, 11/15/2048 | | $ | 100,000 | | | $ | 126,042 | |
4.45%, 8/15/2049 | | | 200,000 | | | | 248,975 | |
3.50%, 11/15/2050 | | | 200,000 | | | | 216,928 | |
| | | | | | | | 1,595,210 | |
|
| Household Durables – 0.2% | |
| | |
MDC Holdings, Inc. | | | | | | | | |
3.97%, 8/6/2061 | | | 100,000 | | | | 95,668 | |
|
| Household Products – 0.3% | |
| | |
Church & Dwight Co., Inc. | | | | | | | | |
3.95%, 8/1/2047 | | | 50,000 | | | | 59,502 | |
| | |
Kimberly-Clark Corp. | | | | | | | | |
5.30%, 3/1/2041 | | | 100,000 | | | | 137,557 | |
| | | | | | | | 197,059 | |
|
Independent Power and Renewable Electricity
Producers – 0.5% | |
| | |
Exelon Generation Co. LLC | | | | | | | | |
5.75%, 10/1/2041 | | | 100,000 | | | | 122,511 | |
5.60%, 6/15/2042 | | | 100,000 | | | | 121,205 | |
| | |
Southern Power Co. | | | | | | | | |
5.15%, 9/15/2041 | | | 50,000 | | | | 61,317 | |
| | | | | | | | 305,033 | |
|
| Industrial Conglomerates – 0.6% | |
| | |
3M Co. | | | | | | | | |
5.70%, 3/15/2037 | | | 100,000 | | | | 138,932 | |
| | |
Honeywell International, Inc. | | | | | | | | |
5.70%, 3/15/2036 | | | 100,000 | | | | 136,259 | |
| | |
Trane Technologies Luxembourg Finance SA | | | | | | | | |
4.50%, 3/21/2049 | | | 50,000 | | | | 63,024 | |
| | | | | | | | 338,215 | |
|
| Insurance – 5.7% | |
| | |
Aflac, Inc. | | | | | | | | |
6.45%, 8/15/2040 | | | 50,000 | | | | 72,064 | |
4.75%, 1/15/2049 | | | 50,000 | | | | 66,566 | |
| | |
Alleghany Corp. | | | | | | | | |
4.90%, 9/15/2044 | | | 75,000 | | | | 94,241 | |
| | |
Allstate Corp. (The) | | | | | | | | |
6.50%, 5/15/2057(a) | | | 15,000 | | | | 20,014 | |
| | | | | | | | |
| Investments | | Principal
Amount | | | Value | |
|
| Insurance – (continued) | |
| | |
American International Group, Inc. | | | | | | | | |
3.88%, 1/15/2035 | | $ | 110,000 | | | $ | 123,008 | |
| | |
Aon Corp. | | | | | | | | |
6.25%, 9/30/2040 | | | 50,000 | | | | 72,390 | |
| | |
Aon plc | | | | | | | | |
4.60%, 6/14/2044 | | | 55,000 | | | | 68,302 | |
4.75%, 5/15/2045 | | | 100,000 | | | | 128,986 | |
| | |
Arch Capital Group Ltd. | | | | | | | | |
7.35%, 5/1/2034 | | | 200,000 | | | | 293,803 | |
| | |
Arthur J Gallagher & Co. | | | | | | | | |
3.50%, 5/20/2051 | | | 50,000 | | | | 54,456 | |
| | |
Berkshire Hathaway Finance Corp. | | | | | | | | |
5.75%, 1/15/2040 | | | 115,000 | | | | 164,167 | |
4.25%, 1/15/2049 | | | 150,000 | | | | 186,728 | |
2.85%, 10/15/2050 | | | 50,000 | | | | 50,175 | |
| | |
Brighthouse Financial, Inc. | | | | | | | | |
4.70%, 6/22/2047 | | | 50,000 | | | | 57,401 | |
| | |
Everest Reinsurance Holdings, Inc. | | | | | | | | |
3.50%, 10/15/2050 | | | 100,000 | | | | 106,584 | |
| | |
Hartford Financial Services Group, Inc. (The) | | | | | | | | |
3.60%, 8/19/2049 | | | 100,000 | | | | 111,039 | |
2.90%, 9/15/2051 | | | 200,000 | | | | 198,666 | |
| | |
Markel Corp. | | | | | | | | |
5.00%, 4/5/2046 | | | 100,000 | | | | 130,109 | |
4.15%, 9/17/2050 | | | 125,000 | | | | 147,445 | |
3.45%, 5/7/2052 | | | 200,000 | | | | 212,034 | |
| | |
Marsh & McLennan Cos., Inc. | | | | | | | | |
4.75%, 3/15/2039 | | | 100,000 | | | | 126,688 | |
4.90%, 3/15/2049 | | | 100,000 | | | | 136,470 | |
| | |
MetLife, Inc. | | | | | | | | |
4.13%, 8/13/2042 | | | 150,000 | | | | 178,521 | |
| | |
Progressive Corp. (The) | | | | | | | | |
4.13%, 4/15/2047 | | | 100,000 | | | | 122,851 | |
| | |
Prudential Financial, Inc. | | | | | | | | |
3.70%, 3/13/2051 | | | 50,000 | | | | 57,965 | |
| | |
Selective Insurance Group, Inc. | | | | | | | | |
5.38%, 3/1/2049 | | | 25,000 | | | | 33,359 | |
| | |
Unum Group | | | | | | | | |
4.13%, 6/15/2051 | | | 30,000 | | | | 31,015 | |
| | |
W R Berkley Corp. | | | | | | | | |
6.25%, 2/15/2037 | | | 100,000 | | | | 133,175 | |
4.75%, 8/1/2044 | | | 100,000 | | | | 126,342 | |
| | |
Willis North America, Inc. | | | | | | | | |
5.05%, 9/15/2048 | | | 100,000 | | | | 131,182 | |
See Accompanying Notes to the Financial Statements.
| | | | |
| 394 | | FLEXSHARES ANNUAL REPORT | | |
FlexShares® Credit-Scored US Long Corporate Bond Index Fund (cont.)
| | | | | | | | |
| Investments | | Principal
Amount | | | Value | |
|
| CORPORATE BONDS – (continued) | |
|
| Insurance – (continued) | |
3.88%, 9/15/2049 | | $ | 50,000 | | | $ | 55,547 | |
| | | | | | | | 3,491,293 | |
|
| Interactive Media & Services – 0.1% | |
| | |
Alphabet, Inc. | | | | | | | | |
2.25%, 8/15/2060 | | | 75,000 | | | | 67,360 | |
|
| Internet & Direct Marketing Retail – 2.0% | |
| | |
Alibaba Group Holding Ltd. | | | | | | | | |
4.00%, 12/6/2037 | | | 200,000 | | | | 217,037 | |
2.70%, 2/9/2041 | | | 200,000 | | | | 182,957 | |
4.20%, 12/6/2047 | | | 225,000 | | | | 253,075 | |
3.15%, 2/9/2051 | | | 200,000 | | | | 190,669 | |
4.40%, 12/6/2057 | | | 50,000 | | | | 57,701 | |
| | |
Amazon.com, Inc. | | | | | | | | |
4.25%, 8/22/2057 | | | 165,000 | | | | 216,442 | |
2.70%, 6/3/2060 | | | 100,000 | | | | 96,369 | |
| | | | | | | | 1,214,250 | |
|
| IT Services – 1.2% | |
| | |
Fiserv, Inc. | | | | | | | | |
4.40%, 7/1/2049 | | | 30,000 | | | | 36,235 | |
| | |
Global Payments, Inc. | | | | | | | | |
4.15%, 8/15/2049 | | | 100,000 | | | | 113,326 | |
| | |
International Business Machines Corp. | | | | | | | | |
4.25%, 5/15/2049 | | | 100,000 | | | | 122,911 | |
| | |
Mastercard, Inc. | | | | | | | | |
3.65%, 6/1/2049 | | | 100,000 | | | | 117,185 | |
| | |
Visa, Inc. | | | | | | | | |
4.30%, 12/14/2045 | | | 170,000 | | | | 217,872 | |
| | |
Western Union Co. (The) | | | | | | | | |
6.20%, 6/21/2040 | | | 100,000 | | | | 127,330 | |
| | | | | | | | 734,859 | |
|
| Leisure Products – 0.1% | |
| | |
Hasbro, Inc. | | | | | | | | |
6.35%, 3/15/2040 | | | 50,000 | | | | 68,849 | |
|
| Machinery – 0.8% | |
| | |
Dover Corp. | | | | | | | | |
5.38%, 3/1/2041 | | | 100,000 | | | | 130,218 | |
| | | | | | | | |
| Investments | | Principal
Amount | | | Value | |
|
| Machinery – (continued) | |
| | |
Fortive Corp. | | | | | | | | |
4.30%, 6/15/2046 | | $ | 25,000 | | | $ | 30,147 | |
| | |
Illinois Tool Works, Inc. | | | | | | | | |
3.90%, 9/1/2042 | | | 25,000 | | | | 29,279 | |
| | |
Otis Worldwide Corp. | | | | | | | | |
3.11%, 2/15/2040 | | | 50,000 | | | | 51,457 | |
3.36%, 2/15/2050 | | | 100,000 | | | | 107,022 | |
| | |
Parker-Hannifin Corp. | | | | | | | | |
4.00%, 6/14/2049 | | | 100,000 | | | | 117,349 | |
| | | | | | | | 465,472 | |
|
| Media – 3.8% | |
| | |
Charter Communications Operating LLC | | | | | | | | |
3.50%, 6/1/2041 | | | 250,000 | | | | 245,387 | |
6.48%, 10/23/2045 | | | 100,000 | | | | 138,033 | |
5.75%, 4/1/2048 | | | 400,000 | | | | 511,565 | |
3.70%, 4/1/2051 | | | 250,000 | | | | 245,584 | |
| | |
Comcast Corp. | | | | | | | | |
2.94%, 11/1/2056(c) | | | 135,000 | | | | 130,238 | |
2.99%, 11/1/2063(c) | | | 100,000 | | | | 95,736 | |
| | |
Fox Corp. | | | | | | | | |
5.48%, 1/25/2039 | | | 100,000 | | | | 129,295 | |
5.58%, 1/25/2049 | | | 150,000 | | | | 205,825 | |
| | |
Interpublic Group of Cos., Inc. (The) | | | | | | | | |
5.40%, 10/1/2048 | | | 50,000 | | | | 69,420 | |
| | |
Time Warner Cable LLC | | | | | | | | |
7.30%, 7/1/2038 | | | 200,000 | | | | 287,856 | |
6.75%, 6/15/2039 | | | 100,000 | | | | 136,934 | |
5.88%, 11/15/2040 | | | 100,000 | | | | 126,002 | |
| | | | | | | | 2,321,875 | |
|
| Metals & Mining – 4.3% | |
| | |
ArcelorMittal SA | | | | | | | | |
6.75%, 3/1/2041(b) | | | 100,000 | | | | 137,979 | |
| | |
Barrick Gold Corp. | | | | | | | | |
5.25%, 4/1/2042 | | | 100,000 | | | | 130,701 | |
| | |
Barrick North America Finance LLC | | | | | | | | |
5.70%, 5/30/2041 | | | 50,000 | | | | 68,283 | |
| | |
Barrick PD Australia Finance Pty. Ltd. | | | | | | | | |
5.95%, 10/15/2039 | | | 80,000 | | | | 110,143 | |
| | |
BHP Billiton Finance USA Ltd. | | | | | | | | |
4.13%, 2/24/2042 | | | 50,000 | | | | 59,342 | |
5.00%, 9/30/2043 | | | 245,000 | | | | 325,691 | |
See Accompanying Notes to the Financial Statements.
| | | | | | |
| | FLEXSHARES ANNUAL REPORT | | | 395 | |
FlexShares® Credit-Scored US Long Corporate Bond Index Fund (cont.)
| | | | | | | | |
| Investments | | Principal
Amount | | | Value | |
|
| CORPORATE BONDS – (continued) | |
|
| Metals & Mining – (continued) | |
| | |
Newmont Corp. | | | | | | | | |
5.88%, 4/1/2035 | | $ | 200,000 | | | $ | 263,964 | |
4.88%, 3/15/2042 | | | 100,000 | | | | 126,255 | |
| | |
Rio Tinto Finance USA Ltd. | | | | | | | | |
5.20%, 11/2/2040 | | | 75,000 | | | | 101,127 | |
| | |
Southern Copper Corp. | | | | | | | | |
7.50%, 7/27/2035 | | | 200,000 | | | | 285,759 | |
6.75%, 4/16/2040 | | | 50,000 | | | | 69,507 | |
5.88%, 4/23/2045 | | | 250,000 | | | | 339,702 | |
| | |
Vale Overseas Ltd. | | | | | | | | |
6.88%, 11/21/2036 | | | 150,000 | | | | 196,324 | |
6.88%, 11/10/2039 | | | 200,000 | | | | 263,851 | |
| | |
Vale SA | | | | | | | | |
5.63%, 9/11/2042 | | | 100,000 | | | | 119,417 | |
| | | | | | | | 2,598,045 | |
|
| Multiline Retail – 0.1% | |
| | |
Dollar General Corp. | | | | | | | | |
4.13%, 4/3/2050 | | | 50,000 | | | | 59,336 | |
|
| Multi-Utilities – 2.5% | |
| | |
Ameren Illinois Co. | | | | | | | | |
4.80%, 12/15/2043 | | | 100,000 | | | | 128,603 | |
| | |
Berkshire Hathaway Energy Co. | | | | | | | | |
6.13%, 4/1/2036 | | | 200,000 | | | | 275,473 | |
4.45%, 1/15/2049 | | | 100,000 | | | | 126,489 | |
4.25%, 10/15/2050 | | | 150,000 | | | | 186,719 | |
2.85%, 5/15/2051 | | | 200,000 | | | | 195,658 | |
| | |
CMS Energy Corp. | | | | | | | | |
4.88%, 3/1/2044 | | | 100,000 | | | | 128,211 | |
| | |
Consolidated Edison Co. of New York, Inc. | | | | | | | | |
4.50%, 5/15/2058 | | | 130,000 | | | | 162,172 | |
| | |
Sempra Energy | | | | | | | | |
4.00%, 2/1/2048 | | | 100,000 | | | | 112,976 | |
| | |
Southern Co. Gas Capital Corp. | | | | | | | | |
3.95%, 10/1/2046 | | | 84,000 | | | | 95,299 | |
4.40%, 5/30/2047 | | | 100,000 | | | | 119,416 | |
| | | | | | | | 1,531,016 | |
|
| Oil, Gas & Consumable Fuels – 11.5% | |
| | |
Canadian Natural Resources Ltd. | | | | | | | | |
6.50%, 2/15/2037 | | | 100,000 | | | | 134,378 | |
| | | | | | | | |
| Investments | | Principal
Amount | | | Value | |
|
| Oil, Gas & Consumable Fuels – (continued) | |
6.25%, 3/15/2038 | | $ | 100,000 | | | $ | 133,712 | |
| | |
Columbia Pipeline Group, Inc. | | | | | | | | |
5.80%, 6/1/2045 | | | 50,000 | | | | 68,345 | |
| | |
Enable Midstream Partners LP | | | | | | | | |
5.00%, 5/15/2044(b) | | | 50,000 | | | | 54,220 | |
| | |
Enbridge Energy Partners LP | | | | | | | | |
5.50%, 9/15/2040 | | | 150,000 | | | | 192,948 | |
| | |
Enbridge, Inc. | | | | | | | | |
5.50%, 12/1/2046 | | | 25,000 | | | | 34,122 | |
4.00%, 11/15/2049 | | | 150,000 | | | | 171,857 | |
3.40%, 8/1/2051 | | | 100,000 | | | | 102,913 | |
| | |
Energy Transfer LP | | | | | | | | |
5.80%, 6/15/2038 | | | 100,000 | | | | 122,318 | |
6.50%, 2/1/2042 | | | 200,000 | | | | 260,641 | |
6.13%, 12/15/2045 | | | 100,000 | | | | 128,258 | |
6.25%, 4/15/2049 | | | 200,000 | | | | 265,782 | |
| | |
Enterprise Products Operating LLC | | | | | | | | |
5.95%, 2/1/2041 | | | 180,000 | | | | 244,538 | |
4.45%, 2/15/2043 | | | 300,000 | | | | 344,129 | |
4.85%, 3/15/2044 | | | 230,000 | | | | 278,685 | |
4.25%, 2/15/2048 | | | 85,000 | | | | 97,274 | |
3.95%, 1/31/2060 | | | 150,000 | | | | 164,434 | |
| | |
Exxon Mobil Corp. | | | | | | | | |
4.33%, 3/19/2050 | | | 50,000 | | | | 63,090 | |
3.45%, 4/15/2051 | | | 100,000 | | | | 110,911 | |
| | |
Hess Corp. | | | | | | | | |
6.00%, 1/15/2040 | | | 50,000 | | | | 65,087 | |
5.80%, 4/1/2047 | | | 100,000 | | | | 133,631 | |
| | |
Kinder Morgan Energy Partners LP | | | | | | | | |
6.95%, 1/15/2038 | | | 100,000 | | | | 141,033 | |
6.38%, 3/1/2041 | | | 100,000 | | | | 136,497 | |
| | |
Kinder Morgan, Inc. | | | | | | | | |
5.55%, 6/1/2045 | | | 125,000 | | | | 160,842 | |
5.20%, 3/1/2048 | | | 100,000 | | | | 125,189 | |
3.60%, 2/15/2051 | | | 100,000 | | | | 101,892 | |
| | |
Magellan Midstream Partners LP | | | | | | | | |
5.15%, 10/15/2043 | | | 15,000 | | | | 18,351 | |
4.20%, 10/3/2047 | | | 145,000 | | | | 162,224 | |
4.85%, 2/1/2049 | | | 100,000 | | | | 122,269 | |
3.95%, 3/1/2050 | | | 100,000 | | | | 107,825 | |
| | |
Marathon Oil Corp. | | | | | | | | |
5.20%, 6/1/2045 | | | 100,000 | | | | 122,824 | |
| | |
Marathon Petroleum Corp. | | | | | | | | |
6.50%, 3/1/2041 | | | 150,000 | | | | 207,663 | |
4.50%, 4/1/2048 | | | 100,000 | | | | 116,838 | |
See Accompanying Notes to the Financial Statements.
| | | | |
| 396 | | FLEXSHARES ANNUAL REPORT | | |
FlexShares® Credit-Scored US Long Corporate Bond Index Fund (cont.)
| | | | | | | | |
| Investments | | Principal
Amount | | | Value | |
|
| CORPORATE BONDS – (continued) | |
|
| Oil, Gas & Consumable Fuels – (continued) | |
| | |
MPLX LP | | | | | | | | |
4.70%, 4/15/2048 | | $ | 200,000 | | | $ | 234,325 | |
5.50%, 2/15/2049 | | | 150,000 | | | | 193,641 | |
4.90%, 4/15/2058 | | | 150,000 | | | | 178,523 | |
| | |
ONEOK Partners LP | | | | | | | | |
6.85%, 10/15/2037 | | | 200,000 | | | | 272,571 | |
6.13%, 2/1/2041 | | | 100,000 | | | | 129,280 | |
| | |
ONEOK, Inc. | | | | | | | | |
4.95%, 7/13/2047 | | | 150,000 | | | | 178,676 | |
7.15%, 1/15/2051 | | | 100,000 | | | | 149,545 | |
| | |
Phillips 66 Partners LP | | | | | | | | |
4.90%, 10/1/2046 | | | 75,000 | | | | 94,807 | |
| | |
Plains All American Pipeline LP | | | | | | | | |
5.15%, 6/1/2042 | | | 185,000 | | | | 208,564 | |
4.70%, 6/15/2044 | | | 100,000 | | | | 108,410 | |
| | |
Spectra Energy Partners LP | | | | | | | | |
5.95%, 9/25/2043 | | | 100,000 | | | | 138,338 | |
| | |
TransCanada PipeLines Ltd. | | | | | | | | |
7.63%, 1/15/2039 | | | 150,000 | | | | 232,343 | |
5.10%, 3/15/2049 | | | 100,000 | | | | 132,538 | |
| | |
Williams Cos., Inc. (The) | | | | | | | | |
5.40%, 3/4/2044 | | | 50,000 | | | | 63,102 | |
| | | | | | | | 7,009,383 | |
|
| Pharmaceuticals – 1.6% | |
| | |
Johnson & Johnson | | | | | | | | |
5.85%, 7/15/2038 | | | 150,000 | | | | 219,623 | |
3.70%, 3/1/2046 | | | 55,000 | | | | 66,033 | |
| | |
Pfizer, Inc. | | | | | | | | |
7.20%, 3/15/2039 | | | 100,000 | | | | 161,565 | |
| | |
Royalty Pharma plc | | | | | | | | |
3.55%, 9/2/2050 | | | 50,000 | | | | 49,702 | |
3.35%, 9/2/2051 | | | 100,000 | | | | 95,955 | |
| | |
Zoetis, Inc. | | | | | | | | |
4.45%, 8/20/2048 | | | 200,000 | | | | 256,294 | |
3.00%, 5/15/2050 | | | 100,000 | | | | 104,979 | |
| | | | | | | | 954,151 | |
|
| Professional Services – 0.2% | |
| | |
Equifax, Inc. | | | | | | | | |
7.00%, 7/1/2037 | | | 50,000 | | | | 71,033 | |
| | | | | | | | |
| Investments | | Principal
Amount | | | Value | |
|
| Professional Services – (continued) | |
| | |
Verisk Analytics, Inc. | | | | | | | | |
3.63%, 5/15/2050 | | $ | 50,000 | | | $ | 54,817 | |
| | | | | | | | 125,850 | |
|
| Road & Rail – 2.9% | |
| | |
Burlington Northern Santa Fe LLC | | | | | | | | |
4.90%, 4/1/2044 | | | 300,000 | | | | 395,250 | |
3.90%, 8/1/2046 | | | 300,000 | | | | 357,107 | |
| | |
Canadian Pacific Railway Co. | | | | | | | | |
6.13%, 9/15/2115 | | | 100,000 | | | | 155,385 | |
| | |
CSX Corp. | | | | | | | | |
4.50%, 8/1/2054 | | | 50,000 | | | | 64,567 | |
| | |
Kansas City Southern | | | | | | | | |
4.30%, 5/15/2043 | | | 100,000 | | | | 118,087 | |
4.20%, 11/15/2069 | | | 50,000 | | | | 59,696 | |
| | |
Norfolk Southern Corp. | | | | | | | | |
5.10%, 8/1/2118 | | | 50,000 | | | | 68,278 | |
| | |
Union Pacific Corp. | | | | | | | | |
3.80%, 10/1/2051 | | | 100,000 | | | | 118,745 | |
3.84%, 3/20/2060 | | | 75,000 | | | | 88,765 | |
4.10%, 9/15/2067 | | | 200,000 | | | | 246,270 | |
3.75%, 2/5/2070 | | | 100,000 | | | | 116,244 | |
| | | | | | | | 1,788,394 | |
|
| Semiconductors & Semiconductor Equipment – 2.8% | |
| | |
Broadcom, Inc. | | | | | | | | |
3.47%, 4/15/2034(c) | | | 500,000 | | | | 516,843 | |
3.14%, 11/15/2035(c) | | | 200,000 | | | | 197,303 | |
3.50%, 2/15/2041(c) | | | 400,000 | | | | 398,082 | |
3.75%, 2/15/2051(c) | | | 100,000 | | | | 103,237 | |
| | |
Intel Corp. | | | | | | | | |
4.75%, 3/25/2050 | | | 150,000 | | | | 199,088 | |
4.95%, 3/25/2060 | | | 50,000 | | | | 70,650 | |
| | |
Micron Technology, Inc. | | | | | | | | |
3.37%, 11/1/2041 | | | 100,000 | | | | 100,098 | |
| | |
Texas Instruments, Inc. | | | | | | | | |
4.15%, 5/15/2048 | | | 100,000 | | | | 126,937 | |
| | | | | | | | 1,712,238 | |
|
| Software – 2.5% | |
| | |
Microsoft Corp. | | | | | | | | |
2.92%, 3/17/2052 | | | 100,000 | | | | 105,995 | |
2.68%, 6/1/2060 | | | 56,000 | | | | 55,746 | |
3.04%, 3/17/2062 | | | 269,000 | | | | 289,636 | |
See Accompanying Notes to the Financial Statements.
| | | | | | |
| | FLEXSHARES ANNUAL REPORT | | | 397 | |
FlexShares® Credit-Scored US Long Corporate Bond Index Fund (cont.)
| | | | | | | | |
| Investments | | Principal
Amount | | | Value | |
|
| CORPORATE BONDS – (continued) | |
|
| Software – (continued) | |
| | |
Oracle Corp. | | | | | | | | |
6.13%, 7/8/2039 | | $ | 105,000 | | | $ | 142,988 | |
3.65%, 3/25/2041 | | | 200,000 | | | | 209,599 | |
4.13%, 5/15/2045 | | | 225,000 | | | | 247,161 | |
3.60%, 4/1/2050 | | | 200,000 | | | | 204,261 | |
4.38%, 5/15/2055 | | | 115,000 | | | | 131,620 | |
3.85%, 4/1/2060 | | | 125,000 | | | | 130,593 | |
| | | | | | | | 1,517,599 | |
|
| Specialty Retail – 3.6% | |
| | |
Home Depot, Inc. (The) | | | | | | | | |
5.88%, 12/16/2036 | | | 200,000 | | | | 282,250 | |
5.95%, 4/1/2041 | | | 100,000 | | | | 144,683 | |
4.88%, 2/15/2044 | | | 75,000 | | | | 98,981 | |
4.50%, 12/6/2048 | | | 300,000 | | | | 393,164 | |
2.75%, 9/15/2051 | | | 250,000 | | | | 251,048 | |
| | |
Lowe’s Cos., Inc. | | | | | | | | |
5.00%, 4/15/2040 | | | 200,000 | | | | 254,497 | |
2.80%, 9/15/2041 | | | 200,000 | | | | 196,795 | |
4.05%, 5/3/2047 | | | 200,000 | | | | 233,518 | |
4.55%, 4/5/2049 | | | 150,000 | | | | 190,295 | |
5.13%, 4/15/2050 | | | 100,000 | | | | 138,228 | |
| | | | | | | | 2,183,459 | |
|
| Technology Hardware, Storage & Peripherals – 2.5% | |
| | |
Apple, Inc. | | | | | | | | |
4.38%, 5/13/2045 | | | 100,000 | | | | 127,983 | |
4.65%, 2/23/2046 | | | 190,000 | | | | 251,162 | |
2.95%, 9/11/2049 | | | 100,000 | | | | 103,728 | |
2.65%, 2/8/2051 | | | 100,000 | | | | 98,823 | |
2.55%, 8/20/2060 | | | 100,000 | | | | 93,902 | |
2.80%, 2/8/2061 | | | 100,000 | | | | 98,969 | |
| | |
Dell International LLC | | | | | | | | |
8.35%, 7/15/2046 | | | 250,000 | | | | 415,735 | |
| | |
Hewlett Packard Enterprise Co. | | | | | | | | |
6.35%, 10/15/2045(b) | | | 150,000 | | | | 205,902 | |
| | |
HP, Inc. | | | | | | | | |
6.00%, 9/15/2041 | | | 100,000 | | | | 132,217 | |
| | | | | | | | 1,528,421 | |
|
| Tobacco – 4.7% | |
| | |
Altria Group, Inc. | | | | | | | | |
5.80%, 2/14/2039 | | | 300,000 | | | | 366,725 | |
| | | | | | | | |
| Investments | | Principal
Amount | | | Value | |
|
| Tobacco – (continued) | |
4.25%, 8/9/2042 | | $ | 140,000 | | | $ | 144,228 | |
4.50%, 5/2/2043 | | | 100,000 | | | | 106,985 | |
5.38%, 1/31/2044 | | | 125,000 | | | | 146,625 | |
5.95%, 2/14/2049 | | | 250,000 | | | | 319,302 | |
3.70%, 2/4/2051 | | | 100,000 | | | | 95,182 | |
| | |
BAT Capital Corp. | | | | | | | | |
4.39%, 8/15/2037 | | | 150,000 | | | | 160,353 | |
3.73%, 9/25/2040 | | | 100,000 | | | | 97,212 | |
4.54%, 8/15/2047 | | | 100,000 | | | | 104,850 | |
4.76%, 9/6/2049 | | | 100,000 | | | | 108,500 | |
| | |
Philip Morris International, Inc. | | | | | | | | |
6.38%, 5/16/2038 | | | 50,000 | | | | 70,562 | |
4.13%, 3/4/2043 | | | 330,000 | | | | 369,324 | |
4.25%, 11/10/2044 | | | 350,000 | | | | 402,711 | |
| | |
Reynolds American, Inc. | | | | | | | | |
6.15%, 9/15/2043 | | | 100,000 | | | | 125,207 | |
5.85%, 8/15/2045 | | | 175,000 | | | | 214,296 | |
| | | | | | | | 2,832,062 | |
|
| Trading Companies & Distributors – 0.2% | |
| | |
WW Grainger, Inc. | | | | | | | | |
4.60%, 6/15/2045 | | | 100,000 | | | | 131,242 | |
|
| Water Utilities – 0.5% | |
| | |
American Water Capital Corp. | | | | | | | | |
3.45%, 5/1/2050 | | | 200,000 | | | | 217,959 | |
3.25%, 6/1/2051 | | | 100,000 | | | | 105,692 | |
| | | | | | | | 323,651 | |
|
| Wireless Telecommunication Services – 0.3% | |
| | |
Rogers Communications, Inc. | | | | | | | | |
4.35%, 5/1/2049 | | | 100,000 | | | | 114,496 | |
3.70%, 11/15/2049 | | | 50,000 | | | | 51,913 | |
| | | | | | | | 166,409 | |
Total Corporate Bonds
(Cost $57,536,998) | | | | 59,393,212 | |
| | | | | | | | | |
Total Investments – 97.6%
(Cost $57,536,998) | | | | 59,393,212 | |
| |
Other assets less liabilities – 2.4% | | | | 1,461,365 | |
| NET ASSETS – 100.0% | | | $ | 60,854,577 | |
See Accompanying Notes to the Financial Statements.
| | | | |
| 398 | | FLEXSHARES ANNUAL REPORT | | |
FlexShares® Credit-Scored US Long Corporate Bond Index Fund (cont.)
| (a) | Security issued at a fixed coupon rate, which converts to a variable rate at a future date. Rate shown is the rate in effect as of period end. |
| (b) | Step bond. Interest rate is a fixed rate for an initial period that either resets at a specific date or may reset in the future at a contingent upon predetermined trigger. The interest rate shown was the current rate as of October 31, 2021. |
| (c) | Securities exempt from registration under Rule 144A of the Securities Act of 1933. These securities may be resold in transactions exempt from registration, normally to qualified institutional buyers. The value of these securities is determined by valuations supplied by a pricing service or brokers, or, if not available, in accordance with procedures established by the Board of Trustees. |
Percentages shown are based on Net Assets.
As of October 31, 2021, the gross unrealized appreciation (depreciation) of investments based on the aggregate cost of investments (including derivative instruments, if applicable) for federal income tax purposes was as follows:
| | | | |
| | | | |
Aggregate gross unrealized appreciation | | $ | 2,227,888 | |
Aggregate gross unrealized depreciation | | | (389,622 | ) |
Net unrealized appreciation | | $ | 1,838,266 | |
Federal income tax cost | | $ | 57,554,946 | |
| | | | | |
| Security Type | | % of Net Assets |
Corporate Bonds | | | | 97.6 | % |
Others(1) | | | | 2.4 | |
| | | | | 100.0 | % |
| (1)�� | Includes any other net assets/(liabilities). |
See Accompanying Notes to the Financial Statements.
| | | | | | |
| | FLEXSHARES ANNUAL REPORT | | | 399 | |
Schedule of Investments
FlexShares® High Yield Value-Scored Bond Index Fund
October 31, 2021
| | | | | | | | |
| Investments | | Principal
Amount | | | Value | |
|
| CORPORATE BONDS – 98.6% | |
|
| Aerospace & Defense – 2.5% | |
| | |
Bombardier, Inc. | | | | | | | | |
7.13%, 6/15/2026(a) | | $ | 1,645,000 | | | $ | 1,727,168 | |
6.00%, 2/15/2028(a) | | | 1,125,000 | | | | 1,136,250 | |
| | |
BWX Technologies, Inc. | | | | | | | | |
4.13%, 6/30/2028(a) | | | 200,000 | | | | 202,759 | |
4.13%, 4/15/2029(a) | | | 250,000 | | | | 254,020 | |
| |
F-Brasile SpA | | | | | |
Series NR,
7.38%, 8/15/2026(a) | | | 320,000 | | | | 325,552 | |
Series XR,
7.38%, 8/15/2026(a) | | | 175,000 | | | | 178,036 | |
| | |
Howmet Aerospace, Inc. | | | | | | | | |
5.95%, 2/1/2037 | | | 50,000 | | | | 60,239 | |
| | |
Maxar Technologies, Inc. | | | | | | | | |
7.54%, 12/31/2027(a) | | | 85,000 | | | | 90,515 | |
| | |
Spirit AeroSystems, Inc. | | | | | | | | |
7.50%, 4/15/2025(a) | | | 675,000 | | | | 713,475 | |
| | |
TransDigm UK Holdings plc | | | | | | | | |
6.88%, 5/15/2026 | | | 305,000 | | | | 321,614 | |
| | |
TransDigm, Inc. | | | | | | | | |
8.00%, 12/15/2025(a) | | | 745,000 | | | | 793,425 | |
6.25%, 3/15/2026(a) | | | 3,020,000 | | | | 3,159,675 | |
6.38%, 6/15/2026 | | | 1,060,000 | | | | 1,097,100 | |
7.50%, 3/15/2027 | | | 195,000 | | | | 204,750 | |
5.50%, 11/15/2027 | | | 2,830,000 | | | | 2,900,750 | |
4.63%, 1/15/2029 | | | 645,000 | | | | 641,775 | |
| | |
Triumph Group, Inc. | | | | | | | | |
8.88%, 6/1/2024(a) | | | 408,000 | | | | 449,926 | |
| | | | | | | | 14,257,029 | |
|
| Air Freight & Logistics – 0.2% | |
| | |
Cargo Aircraft Management, Inc. | | | | | | | | |
4.75%, 2/1/2028(a) | | | 100,000 | | | | 102,383 | |
| | |
Western Global Airlines LLC | | | | | | | | |
10.38%, 8/15/2025(a) | | | 865,000 | | | | 962,957 | |
| | | | | | | | 1,065,340 | |
|
| Airlines – 0.8% | |
| | |
American Airlines, Inc. | | | | | | | | |
11.75%, 7/15/2025(a) | | | 2,595,000 | | | | 3,217,800 | |
5.50%, 4/20/2026(a) | | | 1,110,000 | | | | 1,165,474 | |
| | | | | | | | 4,383,274 | |
| | | | | | | | |
| Investments | | Principal
Amount | | | Value | |
|
| Auto Components – 1.5% | |
| | |
Allison Transmission, Inc. | | | | | | | | |
5.88%, 6/1/2029(a) | | $ | 295,000 | | | $ | 317,863 | |
3.75%, 1/30/2031(a) | | | 285,000 | | | | 274,325 | |
| |
American Axle & Manufacturing, Inc. | | | | | |
6.88%, 7/1/2028 | | | 160,000 | | | | 170,136 | |
5.00%, 10/1/2029 | | | 200,000 | | | | 191,479 | |
| | |
Clarios Global LP | | | | | | | | |
6.75%, 5/15/2025(a) | | | 605,000 | | | | 638,196 | |
6.25%, 5/15/2026(a) | | | 466,000 | | | | 488,135 | |
8.50%, 5/15/2027(a) | | | 1,760,000 | | | | 1,871,795 | |
| | |
Cooper-Standard Automotive, Inc. | | | | | | | | |
13.00%, 6/1/2024(a) | | | 90,000 | | | | 97,793 | |
| | |
Dana Financing Luxembourg Sarl | | | | | | | | |
5.75%, 4/15/2025(a) | | | 100,000 | | | | 103,125 | |
| | |
Dealer Tire LLC | | | | | | | | |
8.00%, 2/1/2028(a) | | | 855,000 | | | | 890,581 | |
| | |
Icahn Enterprises LP | | | | | | | | |
5.25%, 5/15/2027 | | | 1,305,000 | | | | 1,358,831 | |
4.38%, 2/1/2029 | | | 95,000 | | | | 95,119 | |
| | |
IHO Verwaltungs GmbH | | | | | | | | |
6.00%, 5/15/2027(a)(b) | | | 215,000 | | | | 223,331 | |
6.38%, 5/15/2029(a)(b) | | | 400,000 | | | | 433,000 | |
| | |
Patrick Industries, Inc. | | | | | | | | |
7.50%, 10/15/2027(a) | | | 180,000 | | | | 193,050 | |
4.75%, 5/1/2029(a) | | | 100,000 | | | | 99,375 | |
| | |
Real Hero Merger Sub 2, Inc. | | | | | | | | |
6.25%, 2/1/2029(a) | | | 840,000 | | | | 864,150 | |
| | |
Wheel Pros, Inc. | | | | | | | | |
6.50%, 5/15/2029(a) | | | 580,000 | | | | 565,752 | |
| | | | | | | | 8,876,036 | |
|
| Automobiles – 1.6% | |
| | |
Ford Motor Co. | | | | | | | | |
6.63%, 10/1/2028 | | | 330,000 | | | | 396,281 | |
6.38%, 2/1/2029 | | | 150,000 | | | | 175,883 | |
9.63%, 4/22/2030 | | | 750,000 | | | | 1,081,410 | |
7.45%, 7/16/2031 | | | 1,482,000 | | | | 1,963,650 | |
8.90%, 1/15/2032 | | | 95,000 | | | | 128,873 | |
4.75%, 1/15/2043 | | | 1,031,000 | | | | 1,126,244 | |
7.40%, 11/1/2046 | | | 700,000 | | | | 960,004 | |
5.29%, 12/8/2046 | | | 400,000 | | | | 460,522 | |
9.98%, 2/15/2047 | | | 295,000 | | | | 476,642 | |
See Accompanying Notes to the Financial Statements.
| | | | |
| 400 | | FLEXSHARES ANNUAL REPORT | | |
FlexShares® High Yield Value-Scored Bond Index Fund (cont.)
| | | | | | | | |
| Investments | | Principal
Amount | | | Value | |
|
| CORPORATE BONDS – (continued) | |
|
| Automobiles – (continued) | |
| | |
Mclaren Finance plc | | | | | | | | |
7.50%, 8/1/2026(a) | | $ | 1,060,000 | | | $ | 1,062,385 | |
| | |
PM General Purchaser LLC | | | | | | | | |
9.50%, 10/1/2028(a) | | | 1,125,000 | | | | 1,174,747 | |
| | |
Winnebago Industries, Inc. | | | | | | | | |
6.25%, 7/15/2028(a) | | | 100,000 | | | | 107,875 | |
| | | | | | | | 9,114,516 | |
|
| Banks – 0.9% | |
| | |
Intesa Sanpaolo SpA | | | | | | | | |
4.20%, 6/1/2032(a) | | | 85,000 | | | | 85,815 | |
4.95%, 6/1/2042(a) | | | 200,000 | | | | 206,531 | |
| | |
UniCredit SpA | | | | | | | | |
5.86%, 6/19/2032(a)(c) | | | 450,000 | | | | 497,074 | |
7.30%, 4/2/2034(a)(c) | | | 1,310,000 | | | | 1,581,256 | |
5.46%, 6/30/2035(a)(c) | | | 2,460,000 | | | | 2,694,377 | |
| | | | | | | | 5,065,053 | |
|
| Beverages – 0.4% | |
| | |
Primo Water Holdings, Inc. | | | | | | | | |
4.38%, 4/30/2029(a) | | | 1,030,000 | | | | 1,022,092 | |
| | |
Triton Water Holdings, Inc. | | | | | | | | |
6.25%, 4/1/2029(a) | | | 1,240,000 | | | | 1,237,495 | |
| | | | | | | | 2,259,587 | |
|
| Biotechnology – 0.1% | |
| | |
Emergent BioSolutions, Inc. | | | | | | | | |
3.88%, 8/15/2028(a) | | | 100,000 | | | | 96,125 | |
| | |
Horizon Therapeutics USA, Inc. | | | | | | | | |
5.50%, 8/1/2027(a) | | | 220,000 | | | | 232,100 | |
| | | | | | | | 328,225 | |
|
| Building Products – 1.1% | |
| | |
Advanced Drainage Systems, Inc. | | | | | | | | |
5.00%, 9/30/2027(a) | | | 140,000 | | | | 145,775 | |
| | |
Associated Materials LLC | | | | | | | | |
9.00%, 9/1/2025(a) | | | 100,000 | | | | 106,411 | |
| | |
Builders FirstSource, Inc. | | | | | | | | |
6.75%, 6/1/2027(a) | | | 325,000 | | | | 342,875 | |
4.25%, 2/1/2032(a) | | | 125,000 | | | | 126,172 | |
| | |
Cornerstone Building Brands, Inc. | | | | | | | | |
6.13%, 1/15/2029(a) | | | 190,000 | | | | 197,363 | |
| | | | | | | | |
| Investments | | Principal
Amount | | | Value | |
|
| Building Products – (continued) | |
| | |
CP Atlas Buyer, Inc. | | | | | | | | |
7.00%, 12/1/2028(a) | | $ | 1,064,000 | | | $ | 1,031,170 | |
| | |
Griffon Corp. | | | | | | | | |
5.75%, 3/1/2028 | | | 670,000 | | | | 700,988 | |
| | |
New Enterprise Stone & Lime Co., Inc. | | | | | | | | |
9.75%, 7/15/2028(a) | | | 415,000 | | | | 445,803 | |
| | |
SRM Escrow Issuer LLC | | | | | | | | |
6.00%, 11/1/2028(a) | | | 1,385,000 | | | | 1,442,131 | |
| | |
Standard Industries, Inc. | | | | | | | | |
4.38%, 7/15/2030(a) | | | 405,000 | | | | 405,506 | |
3.38%, 1/15/2031(a) | | | 420,000 | | | | 390,027 | |
| | |
Victors Merger Corp. | | | | | | | | |
6.38%, 5/15/2029(a) | | | 785,000 | | | | 739,238 | |
| | | | | | | | 6,073,459 | |
|
| Capital Markets – 0.6% | |
| | |
Advisor Group Holdings, Inc. | | | | | | | | |
10.75%, 8/1/2027(a) | | | 330,000 | | | | 367,645 | |
| | |
AG Issuer LLC | | | | | | | | |
6.25%, 3/1/2028(a) | | | 550,000 | | | | 574,062 | |
| | |
Aretec Escrow Issuer, Inc. | | | | | | | | |
7.50%, 4/1/2029(a) | | | 710,000 | | | | 737,946 | |
| | |
Coinbase Global, Inc. | | | | | | | | |
3.38%, 10/1/2028(a) | | | 125,000 | | | | 120,781 | |
3.63%, 10/1/2031(a) | | | 125,000 | | | | 119,219 | |
| | |
Compass Group Diversified Holdings LLC | | | | | | | | |
5.25%, 4/15/2029(a) | | | 100,000 | | | | 104,125 | |
| | |
FS Energy & Power Fund | | | | | | | | |
7.50%, 8/15/2023(a) | | | 185,000 | | | | 192,651 | |
| | |
Hightower Holding LLC | | | | | | | | |
6.75%, 4/15/2029(a) | | | 410,000 | | | | 419,038 | |
| | |
LPL Holdings, Inc. | | | | | | | | |
4.63%, 11/15/2027(a) | | | 80,000 | | | | 82,500 | |
4.38%, 5/15/2031(a) | | | 200,000 | | | | 205,005 | |
| | |
Nomura Holdings, Inc. | | | | | | | | |
2.65%, 1/16/2025 | | | 465,000 | | | | 481,532 | |
| | |
StoneX Group, Inc. | | | | | | | | |
8.63%, 6/15/2025(a) | | | 140,000 | | | | 148,925 | |
| | | | | | | | 3,553,429 | |
|
| Chemicals – 3.7% | |
| | |
Ashland LLC | | | | | | | | |
6.88%, 5/15/2043 | | | 45,000 | | | | 58,568 | |
See Accompanying Notes to the Financial Statements.
| | | | | | |
| | FLEXSHARES ANNUAL REPORT | | | 401 | |
FlexShares® High Yield Value-Scored Bond Index Fund (cont.)
| | | | | | | | |
| Investments | | Principal
Amount | | | Value | |
|
| CORPORATE BONDS – (continued) | |
|
| Chemicals – (continued) | |
| | |
Axalta Coating Systems LLC | | | | | | | | |
4.75%, 6/15/2027(a) | | $ | 185,000 | | | $ | 190,550 | |
3.38%, 2/15/2029(a) | | | 150,000 | | | | 143,221 | |
| | |
Chemours Co. (The) | | | | | | | | |
5.75%, 11/15/2028(a) | | | 760,000 | | | | 781,850 | |
4.63%, 11/15/2029(a) | | | 1,150,000 | | | | 1,108,313 | |
| | |
Cornerstone Chemical Co. | | | | | | | | |
6.75%, 8/15/2024(a) | | | 485,000 | | | | 437,657 | |
| | |
CVR Partners LP | | | | | | | | |
6.13%, 6/15/2028(a) | | | 930,000 | | | | 963,713 | |
| | |
FXI Holdings, Inc. | | | | | | | | |
12.25%, 11/15/2026(a) | | | 702,000 | | | | 782,102 | |
| | |
Gates Global LLC | | | | | | | | |
6.25%, 1/15/2026(a) | | | 510,000 | | | | 527,850 | |
| | |
GCP Applied Technologies, Inc. | | | | | | | | |
5.50%, 4/15/2026(a) | | | 230,000 | | | | 235,807 | |
| | |
Herens Holdco Sarl | | | | | | | | |
4.75%, 5/15/2028(a) | | | 590,000 | | | | 586,047 | |
| | |
Hexion, Inc. | | | | | | | | |
7.88%, 7/15/2027(a) | | | 165,000 | | | | 175,106 | |
| | |
Illuminate Buyer LLC | | | | | | | | |
9.00%, 7/1/2028(a) | | | 305,000 | | | | 329,850 | |
| | |
Ingevity Corp. | | | | | | | | |
4.50%, 2/1/2026(a) | | | 150,000 | | | | 151,687 | |
| | |
LSB Industries, Inc. | | | | | | | | |
6.25%, 10/15/2028(a) | | | 680,000 | | | | 687,650 | |
| | |
LSF11 A5 HoldCo LLC | | | | | | | | |
6.63%, 10/15/2029(a) | | | 620,000 | | | | 621,370 | |
| | |
Minerals Technologies, Inc. | | | | | | | | |
5.00%, 7/1/2028(a) | | | 230,000 | | | | 237,181 | |
| | |
NOVA Chemicals Corp. | | | | | | | | |
4.25%, 5/15/2029(a) | | | 400,000 | | | | 395,300 | |
| | |
Olympus Water US Holding Corp. | | | | | | | | |
6.25%, 10/1/2029(a) | | | 700,000 | | | | 699,241 | |
| | |
Polar US Borrower LLC | | | | | | | | |
6.75%, 5/15/2026(a) | | | 450,000 | | | | 448,828 | |
| | |
Rain CII Carbon LLC | | | | | | | | |
7.25%, 4/1/2025(a) | | | 460,000 | | | | 470,350 | |
| | |
SCIH Salt Holdings, Inc. | | | | | | | | |
4.88%, 5/1/2028(a) | | | 2,000,000 | | | | 1,957,500 | |
6.63%, 5/1/2029(a) | | | 1,200,000 | | | | 1,131,432 | |
| | | | | | | | |
| Investments | | Principal
Amount | | | Value | |
|
| Chemicals – (continued) | |
| | |
TPC Group, Inc. | | | | | | | | |
10.50%, 8/1/2024(a) | | $ | 1,715,000 | | | $ | 1,563,351 | |
| | |
Trinseo Materials Operating SCA | | | | | | | | |
5.38%, 9/1/2025(a) | | | 745,000 | | | | 760,928 | |
5.13%, 4/1/2029(a) | | | 920,000 | | | | 923,726 | |
| | |
Tronox, Inc. | | | | | | | | |
6.50%, 5/1/2025(a) | | | 100,000 | | | | 105,250 | |
4.63%, 3/15/2029(a) | | | 400,000 | | | | 392,632 | |
| | |
Unifrax Escrow Issuer Corp. | | | | | | | | |
5.25%, 9/30/2028(a) | | | 1,385,000 | | | | 1,383,269 | |
7.50%, 9/30/2029(a) | | | 695,000 | | | | 691,778 | |
| | |
Valvoline, Inc. | | | | | | | | |
4.25%, 2/15/2030(a) | | | 100,000 | | | | 102,233 | |
| | |
Venator Finance Sarl | | | | | | | | |
9.50%, 7/1/2025(a) | | | 150,000 | | | | 165,187 | |
| | |
WR Grace Holdings LLC | | | | | | | | |
5.63%, 8/15/2029(a) | | | 2,030,000 | | | | 2,052,838 | |
| | | | | | | | 21,262,365 | |
|
| Commercial Services & Supplies – 5.8% | |
| | |
ADT Security Corp. (The) | | | | | | | | |
4.13%, 8/1/2029(a) | | | 255,000 | | | | 251,654 | |
| | |
Allied Universal Holdco LLC | | | | | | | | |
4.63%, 6/1/2028(a) | | | 2,865,000 | | | | 2,844,273 | |
6.00%, 6/1/2029(a) | | | 1,530,000 | | | | 1,510,148 | |
| | |
APi Group DE, Inc. | | | | | | | | |
4.13%, 7/15/2029(a) | | | 375,000 | | | | 373,594 | |
| | |
Aptim Corp. | | | | | | | | |
7.75%, 6/15/2025(a) | | | 885,000 | | | | 722,381 | |
| | |
APX Group, Inc. | | | | | | | | |
6.75%, 2/15/2027(a) | | | 540,000 | | | | 570,375 | |
5.75%, 7/15/2029(a) | | | 1,225,000 | | | | 1,215,812 | |
| | |
Aramark Services, Inc. | | | | | | | | |
6.38%, 5/1/2025(a) | | | 890,000 | | | | 937,740 | |
5.00%, 2/1/2028(a) | | | 468,000 | | | | 479,115 | |
| | |
Cimpress plc | | | | | | | | |
7.00%, 6/15/2026(a) | | | 550,000 | | | | 572,000 | |
| | |
CoreCivic, Inc. | | | | | | | | |
4.63%, 5/1/2023 | | | 275,000 | | | | 280,156 | |
8.25%, 4/15/2026 | | | 960,000 | | | | 982,848 | |
4.75%, 10/15/2027 | | | 780,000 | | | | 719,102 | |
| | |
Covanta Holding Corp. | | | | | | | | |
5.88%, 7/1/2025 | | | 110,000 | | | | 113,506 | |
6.00%, 1/1/2027 | | | 100,000 | | | | 103,500 | |
5.00%, 9/1/2030 | | | 100,000 | | | | 99,625 | |
See Accompanying Notes to the Financial Statements.
| | | | |
| 402 | | FLEXSHARES ANNUAL REPORT | | |
FlexShares® High Yield Value-Scored Bond Index Fund (cont.)
| | | | | | | | |
| Investments | | Principal
Amount | | | Value | |
|
| CORPORATE BONDS – (continued) | |
|
| Commercial Services & Supplies – (continued) | |
| | |
Deluxe Corp. | | | | | | | | |
8.00%, 6/1/2029(a) | | $ | 860,000 | | | $ | 906,591 | |
| | |
Garda World Security Corp. | | | | | | | | |
4.63%, 2/15/2027(a) | | | 380,000 | | | | 376,690 | |
9.50%, 11/1/2027(a) | | | 600,000 | | | | 648,750 | |
6.00%, 6/1/2029(a) | | | 915,000 | | | | 895,849 | |
| | |
GFL Environmental, Inc. | | | | | | | | |
5.13%, 12/15/2026(a) | | | 135,000 | | | | 141,244 | |
4.00%, 8/1/2028(a) | | | 150,000 | | | | 146,437 | |
4.75%, 6/15/2029(a) | | | 160,000 | | | | 161,600 | |
| | |
Harsco Corp. | | | | | | | | |
5.75%, 7/31/2027(a) | | | 330,000 | | | | 343,551 | |
| | |
IAA, Inc. | | | | | | | | |
5.50%, 6/15/2027(a) | | | 100,000 | | | | 104,000 | |
| | |
Interface, Inc. | | | | | | | | |
5.50%, 12/1/2028(a) | | | 100,000 | | | | 103,877 | |
| | |
Intrado Corp. | | | | | | | | |
8.50%, 10/15/2025(a) | | | 1,095,000 | | | | 1,080,415 | |
| | |
KAR Auction Services, Inc. | | | | | | | | |
5.13%, 6/1/2025(a) | | | 805,000 | | | | 808,019 | |
| | |
Legends Hospitality Holding Co. LLC | | | | | | | | |
5.00%, 2/1/2026(a) | | | 260,000 | | | | 264,225 | |
| | |
Madison IAQ LLC | | | | | | | | |
4.13%, 6/30/2028(a) | | | 285,000 | | | | 283,880 | |
5.88%, 6/30/2029(a) | | | 1,795,000 | | | | 1,783,781 | |
| | |
Nielsen Co. Luxembourg SARL (The) | | | | | | | | |
5.00%, 2/1/2025(a) | | | 180,000 | | | | 183,375 | |
| | |
Nielsen Finance LLC | | | | | | | | |
5.63%, 10/1/2028(a) | | | 1,435,000 | | | | 1,493,814 | |
4.50%, 7/15/2029(a) | | | 920,000 | | | | 900,680 | |
5.88%, 10/1/2030(a) | | | 1,145,000 | | | | 1,200,017 | |
4.75%, 7/15/2031(a) | | | 1,520,000 | | | | 1,483,292 | |
| | |
Pitney Bowes, Inc. | | | | | | | | |
6.88%, 3/15/2027(a) | | | 275,000 | | | | 284,969 | |
7.25%, 3/15/2029(a) | | | 340,000 | | | | 351,718 | |
| | |
Prime Security Services Borrower LLC | | | | | | | | |
3.38%, 8/31/2027(a) | | | 1,240,000 | | | | 1,189,340 | |
6.25%, 1/15/2028(a) | | | 2,205,000 | | | | 2,262,881 | |
| | |
Stericycle, Inc. | | | | | | | | |
5.38%, 7/15/2024(a) | | | 610,000 | | | | 629,368 | |
3.88%, 1/15/2029(a) | | | 45,000 | | | | 44,381 | |
| | | | | | | | |
| Investments | | Principal
Amount | | | Value | |
|
| Commercial Services & Supplies – (continued) | |
| | |
Vericast Corp. | | | | | | | | |
11.00%, 9/15/2026(a) | | $ | 2,280,000 | | | $ | 2,391,150 | |
| | |
WASH Multifamily Acquisition, Inc. | | | | | | | | |
5.75%, 4/15/2026(a) | | | 745,000 | | | | 771,075 | |
| | |
Waste Pro USA, Inc. | | | | | | | | |
5.50%, 2/15/2026(a) | | | 360,000 | | | | 356,400 | |
| | | | | | | | 33,367,198 | |
|
| Communications Equipment – 0.2% | |
| | |
Avaya, Inc. | | | | | | | | |
6.13%, 9/15/2028(a) | | | 660,000 | | | | 687,423 | |
| | |
Viasat, Inc. | | | | | | | | |
5.63%, 4/15/2027(a) | | | 320,000 | | | | 333,200 | |
6.50%, 7/15/2028(a) | | | 230,000 | | | | 241,787 | |
| | | | | | | | 1,262,410 | |
|
| Construction & Engineering – 1.1% | |
| | |
Arcosa, Inc. | | | | | | | | |
4.38%, 4/15/2029(a) | | | 100,000 | | | | 101,625 | |
| | |
Artera Services LLC | | | | | | | | |
9.03%, 12/4/2025(a) | | | 930,000 | | | | 994,165 | |
| | |
Brand Industrial Services, Inc. | | | | | | | | |
8.50%, 7/15/2025(a) | | | 1,770,000 | | | | 1,761,460 | |
| | |
Brundage-Bone Concrete Pumping Holdings, Inc. | | | | | | | | |
6.00%, 2/1/2026(a) | | | 280,000 | | | | 293,510 | |
| | |
Global Infrastructure Solutions, Inc. | | | | | | | | |
5.63%, 6/1/2029(a) | | | 730,000 | | | | 749,374 | |
| | |
Great Lakes Dredge & Dock Corp. | | | | | | | | |
5.25%, 6/1/2029(a) | | | 640,000 | | | | 651,853 | |
| | |
IEA Energy Services LLC | | | | | | | | |
6.63%, 8/15/2029(a) | | | 475,000 | | | | 468,637 | |
| | |
Pike Corp. | | | | | | | | |
5.50%, 9/1/2028(a) | | | 750,000 | | | | 764,063 | |
| | |
VM Consolidated, Inc. | | | | | | | | |
5.50%, 4/15/2029(a) | | | 620,000 | | | | 629,300 | |
| | |
Weekley Homes LLC | | | | | | | | |
4.88%, 9/15/2028(a) | | | 120,000 | | | | 124,568 | |
| | | | | | | | 6,538,555 | |
See Accompanying Notes to the Financial Statements.
| | | | | | |
| | FLEXSHARES ANNUAL REPORT | | | 403 | |
FlexShares® High Yield Value-Scored Bond Index Fund (cont.)
| | | | | | | | |
| Investments | | Principal
Amount | | | Value | |
|
| CORPORATE BONDS – (continued) | |
|
| Consumer Finance – 1.9% | |
| | |
Cobra AcquisitionCo LLC | | | | | | | | |
6.38%, 11/1/2029(a) | | $ | 710,000 | | | $ | 702,836 | |
| | |
Credit Acceptance Corp. | | | | | | | | |
5.13%, 12/31/2024(a) | | | 690,000 | | | | 706,388 | |
| | |
Curo Group Holdings Corp. | | | | | | | | |
7.50%, 8/1/2028(a) | | | 1,350,000 | | | | 1,374,138 | |
| | |
Enova International, Inc. | | | | | | | | |
8.50%, 9/1/2024(a) | | | 130,000 | | | | 132,394 | |
| | |
FirstCash, Inc. | | | | | | | | |
4.63%, 9/1/2028(a) | | | 602,000 | | | | 621,565 | |
| | |
Ford Motor Credit Co. LLC | | | | | | | | |
4.13%, 8/17/2027 | | | 760,000 | | | | 807,500 | |
3.82%, 11/2/2027 | | | 400,000 | | | | 415,536 | |
2.90%, 2/16/2028 | | | 900,000 | | | | 893,277 | |
5.11%, 5/3/2029 | | | 952,000 | | | | 1,059,100 | |
4.00%, 11/13/2030 | | | 1,040,000 | | | | 1,086,800 | |
3.63%, 6/17/2031 | | | 610,000 | | | | 617,625 | |
| | |
goeasy Ltd. | | | | | | | | |
5.38%, 12/1/2024(a) | | | 405,000 | | | | 416,137 | |
4.38%, 5/1/2026(a) | | | 175,000 | | | | 178,720 | |
| | |
LFS Topco LLC | | | | | | | | |
5.88%, 10/15/2026(a) | | | 125,000 | | | | 128,750 | |
| | |
OneMain Finance Corp. | | | | | | | | |
5.38%, 11/15/2029 | | | 285,000 | | | | 304,594 | |
| | |
PRA Group, Inc. | | | | | | | | |
7.38%, 9/1/2025(a) | | | 100,000 | | | | 106,750 | |
5.00%, 10/1/2029(a) | | | 435,000 | | | | 430,406 | |
| | |
World Acceptance Corp. | | | | | | | | |
7.00%, 11/1/2026(a) | | | 860,000 | | | | 848,536 | |
| | | | | | | | 10,831,052 | |
|
| Containers & Packaging – 1.0% | |
| | |
Ardagh Metal Packaging Finance USA LLC | | | | | | | | |
4.00%, 9/1/2029(a) | | | 200,000 | | | | 199,130 | |
| | |
Ball Corp. | | | | | | | | |
2.88%, 8/15/2030 | | | 210,000 | | | | 202,125 | |
3.13%, 9/15/2031 | | | 105,000 | | | | 102,244 | |
| | |
Berry Global, Inc. | | | | | | | | |
4.50%, 2/15/2026(a) | | | 90,000 | | | | 91,462 | |
5.63%, 7/15/2027(a) | | | 200,000 | | | | 209,722 | |
| | |
Cascades, Inc. | | | | | | | | |
5.38%, 1/15/2028(a) | | | 250,000 | | | | 261,875 | |
| | | | | | | | |
| Investments | | Principal
Amount | | | Value | |
|
| Containers & Packaging – (continued) | |
| | |
Graphic Packaging International LLC | | | | | | | | |
3.50%, 3/1/2029(a) | | $ | 250,000 | | | $ | 247,812 | |
| | |
Greif, Inc. | | | | | | | | |
6.50%, 3/1/2027(a) | | | 280,000 | | | | 291,550 | |
| | |
Intelligent Packaging Ltd. Finco, Inc. | | | | | | | | |
6.00%, 9/15/2028(a) | | | 495,000 | | | | 509,850 | |
| | |
Mauser Packaging Solutions Holding Co. | | | | | | | | |
7.25%, 4/15/2025(a) | | | 2,370,000 | | | | 2,298,260 | |
| | |
Owens-Brockway Glass Container, Inc. | | | | | | | | |
6.63%, 5/13/2027(a) | | | 260,000 | | | | 278,200 | |
| | |
Pactiv Evergreen Group Issuer LLC | | | | | | | | |
4.38%, 10/15/2028(a) | | | 115,000 | | | | 113,563 | |
| | |
Pactiv Evergreen Group Issuer, Inc. | | | | | | | | |
4.00%, 10/15/2027(a) | | | 290,000 | | | | 284,128 | |
| | |
Pactiv LLC | | | | | | | | |
7.95%, 12/15/2025 | | | 160,000 | | | | 178,600 | |
| | |
Trivium Packaging Finance BV | | | | | | | | |
8.50%, 8/15/2027(a)(d) | | | 400,000 | | | | 422,422 | |
| | | | | | | | 5,690,943 | |
|
| Distributors – 0.7% | |
| | |
BCPE Empire Holdings, Inc. | | | | | | | | |
7.63%, 5/1/2027(a) | | | 1,150,000 | | | | 1,140,392 | |
| | |
Wolverine Escrow LLC | | | | | | | | |
8.50%, 11/15/2024(a) | | | 1,410,000 | | | | 1,310,116 | |
9.00%, 11/15/2026(a) | | | 1,480,000 | | | | 1,362,769 | |
13.13%, 11/15/2027(a) | | | 745,000 | | | | 495,425 | |
| | | | | | | | 4,308,702 | |
|
| Diversified Consumer Services – 0.9% | |
| | |
Adtalem Global Education, Inc. | | | | | | | | |
5.50%, 3/1/2028(a) | | | 1,480,000 | | | | 1,496,650 | |
| | |
Carriage Services, Inc. | | | | | | | | |
4.25%, 5/15/2029(a) | | | 620,000 | | | | 621,860 | |
| | |
Graham Holdings Co. | | | | | | | | |
5.75%, 6/1/2026(a) | | | 140,000 | | | | 146,013 | |
| | |
Metis Merger Sub LLC | | | | | | | | |
6.50%, 5/15/2029(a) | | | 1,430,000 | | | | 1,417,866 | |
| | |
Service Corp. International | | | | | | | | |
3.38%, 8/15/2030 | | | 135,000 | | | | 133,049 | |
See Accompanying Notes to the Financial Statements.
| | | | |
| 404 | | FLEXSHARES ANNUAL REPORT | | |
FlexShares® High Yield Value-Scored Bond Index Fund (cont.)
| | | | | | | | |
| Investments | | Principal
Amount | | | Value | |
|
| CORPORATE BONDS – (continued) | |
|
| Diversified Consumer Services – (continued) | |
| | |
Signal Parent, Inc. | | | | | | | | |
6.13%, 4/1/2029(a) | | $ | 475,000 | | | $ | 442,615 | |
| | |
Sotheby’s | | | | | | | | |
5.88%, 6/1/2029(a) | | | 425,000 | | | | 434,563 | |
| | |
StoneMor, Inc. | | | | | | | | |
8.50%, 5/15/2029(a) | | | 595,000 | | | | 615,685 | |
| | |
WW International, Inc. | | | | | | | | |
4.50%, 4/15/2029(a) | | | 105,000 | | | | 100,669 | |
| | | | | | | | 5,408,970 | |
|
| Diversified Financial Services – 1.1% | |
| | |
Armor Holdco, Inc. | | | | | | | | |
8.50%, 11/15/2029(a)(e) | | | 200,000 | | | | 202,727 | |
| | |
CPI CG, Inc. | | | | | | | | |
8.63%, 3/15/2026(a) | | | 410,000 | | | | 443,312 | |
| | |
Ford Holdings LLC | | | | | | | | |
9.30%, 3/1/2030 | | | 210,000 | | | | 286,669 | |
| | |
Jefferies Finance LLC | | | | | | | | |
5.00%, 8/15/2028(a) | | | 1,455,000 | | | | 1,476,549 | |
| | |
Jefferson Capital Holdings LLC | | | | | | | | |
6.00%, 8/15/2026(a) | | | 450,000 | | | | 456,257 | |
| | |
Midcap Financial Issuer Trust | | | | | | | | |
6.50%, 5/1/2028(a) | | | 1,760,000 | | | | 1,828,200 | |
5.63%, 1/15/2030(a) | | | 645,000 | | | | 635,325 | |
| | |
Sabre GLBL, Inc. | | | | | | | | |
7.38%, 9/1/2025(a) | | | 885,000 | | | | 941,419 | |
| | | | | | | | 6,270,458 | |
|
| Diversified Telecommunication Services – 6.7% | |
| | |
Altice France SA | | | | | | | | |
5.50%, 1/15/2028(a) | | | 1,460,000 | | | | 1,465,110 | |
5.13%, 1/15/2029(a) | | | 660,000 | | | | 641,025 | |
5.13%, 7/15/2029(a) | | | 4,370,000 | | | | 4,261,536 | |
5.50%, 10/15/2029(a) | | | 680,000 | | | | 667,400 | |
| | |
CCO Holdings LLC | | | | | | | | |
4.00%, 3/1/2023(a) | | | 270,000 | | | | 270,337 | |
5.13%, 5/1/2027(a) | | | 430,000 | | | | 446,125 | |
5.00%, 2/1/2028(a) | | | 1,598,000 | | | | 1,663,917 | |
5.38%, 6/1/2029(a) | | | 270,000 | | | | 290,250 | |
4.75%, 3/1/2030(a) | | | 1,365,000 | | | | 1,411,069 | |
4.50%, 8/15/2030(a) | | | 805,000 | | | | 820,094 | |
4.25%, 2/1/2031(a) | | | 785,000 | | | | 782,551 | |
4.50%, 5/1/2032 | | | 757,000 | | | | 761,546 | |
| | | | | | | | |
| Investments | | Principal
Amount | | | Value | |
|
| Diversified Telecommunication Services – (continued) | |
4.50%, 6/1/2033(a) | | $ | 495,000 | | | $ | 494,399 | |
4.25%, 1/15/2034(a) | | | 595,000 | | | | 577,837 | |
| |
Frontier Communications Holdings LLC | | | | | |
5.88%, 10/15/2027(a) | | | 1,435,000 | | | | 1,504,956 | |
5.00%, 5/1/2028(a) | | | 345,000 | | | | 351,038 | |
6.75%, 5/1/2029(a) | | | 1,840,000 | | | | 1,906,700 | |
5.88%, 11/1/2029 | | | 1,190,000 | | | | 1,187,025 | |
6.00%, 1/15/2030(a) | | | 1,755,000 | | | | 1,765,495 | |
| | |
Iliad Holding SAS | | | | | | | | |
6.50%, 10/15/2026(a) | | | 2,105,000 | | | | 2,171,202 | |
7.00%, 10/15/2028(a) | | | 1,575,000 | | | | 1,625,463 | |
| | |
Lumen Technologies, Inc. | | | | | | | | |
5.38%, 6/15/2029(a) | | | 1,460,000 | | | | 1,467,300 | |
| | |
Sprint Capital Corp. | | | | | | | | |
6.88%, 11/15/2028 | | | 495,000 | | | | 627,358 | |
8.75%, 3/15/2032 | | | 690,000 | | | | 1,033,620 | |
| | |
Telecom Italia Capital SA | | | | | | | | |
6.38%, 11/15/2033 | | | 230,000 | | | | 264,179 | |
6.00%, 9/30/2034 | | | 275,000 | | | | 306,327 | |
7.20%, 7/18/2036 | | | 393,000 | | | | 478,894 | |
7.72%, 6/4/2038 | | | 190,000 | | | | 242,513 | |
| | |
Telesat Canada | | | | | | | | |
5.63%, 12/6/2026(a) | | | 685,000 | | | | 640,701 | |
4.88%, 6/1/2027(a) | | | 785,000 | | | | 702,960 | |
6.50%, 10/15/2027(a) | | | 1,055,000 | | | | 858,000 | |
| | |
Virgin Media Finance plc | | | | | | | | |
5.00%, 7/15/2030(a) | | | 1,355,000 | | | | 1,349,021 | |
| | |
Virgin Media Secured Finance plc | | | | | | | | |
5.50%, 5/15/2029(a) | | | 1,250,000 | | | | 1,320,512 | |
4.50%, 8/15/2030(a) | | | 200,000 | | | | 200,002 | |
| | |
Windstream Escrow LLC | | | | | | | | |
7.75%, 8/15/2028(a) | | | 1,846,000 | | | | 1,954,877 | |
| | |
Zayo Group Holdings, Inc. | | | | | | | | |
4.00%, 3/1/2027(a) | | | 210,000 | | | | 204,225 | |
6.13%, 3/1/2028(a) | | | 1,845,000 | | | | 1,803,488 | |
| | | | | | | | 38,519,052 | |
|
| Electric Utilities – 0.5% | |
| |
FirstEnergy Corp. | | | | | |
Series C, 7.38%, 11/15/2031 | | | 55,000 | | | | 75,065 | |
Series C, 5.35%, 7/15/2047(d) | | | 225,000 | | | | 273,158 | |
Series C,
3.40%, 3/1/2050 | | | 385,000 | | | | 382,882 | |
See Accompanying Notes to the Financial Statements.
| | | | | | |
| | FLEXSHARES ANNUAL REPORT | | | 405 | |
FlexShares® High Yield Value-Scored Bond Index Fund (cont.)
| | | | | | | | |
| Investments | | Principal
Amount | | | Value | |
|
| CORPORATE BONDS – (continued) | |
|
| Electric Utilities – (continued) | |
| | |
NRG Energy, Inc. | | | | | | | | |
6.63%, 1/15/2027 | | $ | 367,000 | | | $ | 380,529 | |
3.88%, 2/15/2032(a) | | | 415,000 | | | | 407,219 | |
| | |
PG&E Corp. | | | | | | | | |
5.25%, 7/1/2030 | | | 200,000 | | | | 209,200 | |
| | |
Vistra Operations Co. LLC | | | | | | | | |
5.63%, 2/15/2027(a) | | | 920,000 | | | | 949,044 | |
4.38%, 5/1/2029(a) | | | 140,000 | | | | 138,775 | |
| | | | | | | | 2,815,872 | |
|
| Electronic Equipment, Instruments & Components – 0.1% | |
| | |
TTM Technologies, Inc. | | | | | | | | |
4.00%, 3/1/2029(a) | | | 310,000 | | | | 308,033 | |
|
| Energy Equipment & Services – 1.3% | |
| | |
Archrock Partners LP | | | | | | | | |
6.88%, 4/1/2027(a) | | | 335,000 | | | | 349,656 | |
6.25%, 4/1/2028(a) | | | 1,160,000 | | | | 1,202,050 | |
| | |
Bristow Group, Inc. | | | | | | | | |
6.88%, 3/1/2028(a) | | | 455,000 | | | | 472,631 | |
| | |
CSI Compressco LP | | | | | | | | |
7.50%, 4/1/2025(a) | | | 175,000 | | | | 173,558 | |
| | |
Oceaneering International, Inc. | | | | | | | | |
6.00%, 2/1/2028 | | | 390,000 | | | | 401,548 | |
| | |
Precision Drilling Corp. | | | | | | | | |
7.13%, 1/15/2026(a) | | | 200,000 | | | | 205,957 | |
6.88%, 1/15/2029(a) | | | 625,000 | | | | 646,422 | |
| | |
Tervita Corp. | | | | | | | | |
11.00%, 12/1/2025(a) | | | 364,000 | | | | 419,073 | |
| | |
Transocean Guardian Ltd. | | | | | | | | |
5.88%, 1/15/2024(a) | | | 539,350 | | | | 526,775 | |
| | |
Transocean Phoenix 2 Ltd. | | | | | | | | |
7.75%, 10/15/2024(a) | | | 112,500 | | | | 114,577 | |
| | |
Transocean Proteus Ltd. | | | | | | | | |
6.25%, 12/1/2024(a) | | | 134,750 | | | | 136,280 | |
| | |
Transocean Sentry Ltd. | | | | | | | | |
5.38%, 5/15/2023(a) | | | 215,958 | | | | 212,514 | |
| | |
USA Compression Partners LP | | | | | | | | |
6.88%, 4/1/2026 | | | 605,000 | | | | 626,175 | |
6.88%, 9/1/2027 | | | 700,000 | | | | 728,000 | |
| | |
Valaris Ltd. | | | | | | | | |
8.25%, 4/30/2028(a)(b) | | | 825,000 | | | | 860,178 | |
| | | | | | | | |
| Investments | | Principal
Amount | | | Value | |
|
| Energy Equipment & Services – (continued) | |
| | |
Weatherford International Ltd. | | | | | | | | |
11.00%, 12/1/2024(a) | | $ | 295,000 | | | $ | 308,011 | |
| | |
Welltec International ApS | | | | | | | | |
8.25%, 10/15/2026(a) | | | 380,000 | | | | 390,167 | |
| | | | | | | | 7,773,572 | |
|
| Entertainment – 1.2% | |
| | |
Allen Media LLC | | | | | | | | |
10.50%, 2/15/2028(a) | | | 1,440,000 | | | | 1,545,106 | |
| | |
Banijay Entertainment SASU | | | | | | | | |
5.38%, 3/1/2025(a) | | | 150,000 | | | | 154,500 | |
| | |
Lions Gate Capital Holdings LLC | | | | | | | | |
5.50%, 4/15/2029(a) | | | 1,105,000 | | | | 1,131,244 | |
| | |
Live Nation Entertainment, Inc. | | | | | | | | |
4.88%, 11/1/2024(a) | | | 345,000 | | | | 349,516 | |
5.63%, 3/15/2026(a) | | | 300,000 | | | | 310,500 | |
6.50%, 5/15/2027(a) | | | 910,000 | | | | 997,587 | |
4.75%, 10/15/2027(a) | | | 935,000 | | | | 954,869 | |
| | |
Netflix, Inc. | | | | | | | | |
5.88%, 11/15/2028 | | | 560,000 | | | | 682,483 | |
| | |
Playtika Holding Corp. | | | | | | | | |
4.25%, 3/15/2029(a) | | | 1,025,000 | | | | 1,029,151 | |
| | | | | | | | 7,154,956 | |
|
| Equity Real Estate Investment Trusts (REITs) – 2.0% | |
| | |
Brookfield Property REIT, Inc. | | | | | | | | |
5.75%, 5/15/2026(a) | | | 785,000 | | | | 813,064 | |
4.50%, 4/1/2027(a) | | | 1,130,000 | | | | 1,103,162 | |
| | |
GEO Group, Inc. (The) | | | | | | | | |
5.88%, 10/15/2024 | | | 312,000 | | | | 282,802 | |
6.00%, 4/15/2026 | | | 765,000 | | | | 665,041 | |
| | |
Iron Mountain, Inc. | | | | | | | | |
4.88%, 9/15/2027(a) | | | 260,000 | | | | 268,614 | |
5.25%, 3/15/2028(a) | | | 405,000 | | | | 422,212 | |
5.00%, 7/15/2028(a) | | | 457,000 | | | | 473,018 | |
5.25%, 7/15/2030(a) | | | 1,475,000 | | | | 1,542,120 | |
4.50%, 2/15/2031(a) | | | 400,000 | | | | 404,518 | |
5.63%, 7/15/2032(a) | | | 820,000 | | | | 875,502 | |
| | |
iStar, Inc. | | | | | | | | |
4.25%, 8/1/2025 | | | 450,000 | | | | 461,812 | |
5.50%, 2/15/2026 | | | 265,000 | | | | 275,600 | |
| | |
Park Intermediate Holdings LLC | | | | | | | | |
7.50%, 6/1/2025(a) | | | 535,000 | | | | 569,152 | |
See Accompanying Notes to the Financial Statements.
| | | | |
| 406 | | FLEXSHARES ANNUAL REPORT | | |
FlexShares® High Yield Value-Scored Bond Index Fund (cont.)
| | | | | | | | |
| Investments | | Principal
Amount | | | Value | |
|
| CORPORATE BONDS – (continued) | |
|
| Equity Real Estate Investment Trusts (REITs) – (continued) | |
| | |
SBA Communications Corp. | | | | | | | | |
3.13%, 2/1/2029(a) | | $ | 580,000 | | | $ | 557,525 | |
| | |
Service Properties Trust | | | | | | | | |
4.65%, 3/15/2024 | | | 400,000 | | | | 404,000 | |
4.50%, 3/15/2025 | | | 485,000 | | | | 485,509 | |
5.25%, 2/15/2026 | | | 145,000 | | | | 146,315 | |
4.75%, 10/1/2026 | | | 270,000 | | | | 267,975 | |
| | |
Uniti Group LP | | | | | | | | |
7.88%, 2/15/2025(a) | | | 1,355,000 | | | | 1,426,747 | |
| | |
XHR LP | | | | | | | | |
6.38%, 8/15/2025(a) | | | 190,000 | | | | 200,688 | |
| | | | | | | | 11,645,376 | |
|
| Food & Staples Retailing – 0.4% | |
| | |
Albertsons Cos., Inc. | | | | | | | | |
5.88%, 2/15/2028(a) | | | 680,000 | | | | 723,350 | |
| | |
C&S Group Enterprises LLC | | | | | | | | |
5.00%, 12/15/2028(a) | | | 605,000 | | | | 563,815 | |
| | |
Performance Food Group, Inc. | | | | | | | | |
6.88%, 5/1/2025(a) | | | 175,000 | | | | 184,844 | |
5.50%, 10/15/2027(a) | | | 505,000 | | | | 527,093 | |
| | |
SEG Holding LLC | | | | | | | | |
5.63%, 10/15/2028(a) | | | 125,000 | | | | 131,719 | |
| | |
United Natural Foods, Inc. | | | | | | | | |
6.75%, 10/15/2028(a) | | | 285,000 | | | | 308,869 | |
| | | | | | | | 2,439,690 | |
|
| Food Products – 2.0% | |
| | |
B&G Foods, Inc. | | | | | | | | |
5.25%, 9/15/2027 | | | 185,000 | | | | 189,956 | |
| | |
Darling Ingredients, Inc. | | | | | | | | |
5.25%, 4/15/2027(a) | | | 175,000 | | | | 181,563 | |
| | |
Del Monte Foods, Inc. | | | | | | | | |
11.88%, 5/15/2025(a) | | | 585,000 | | | | 657,014 | |
| | |
Kraft Heinz Foods Co. | | | | | | | | |
6.88%, 1/26/2039 | | | 145,000 | | | | 213,138 | |
6.50%, 2/9/2040 | | | 110,000 | | | | 157,000 | |
5.00%, 6/4/2042 | | | 190,000 | | | | 235,219 | |
5.20%, 7/15/2045 | | | 475,000 | | | | 604,467 | |
4.38%, 6/1/2046 | | | 465,000 | | | | 540,754 | |
4.88%, 10/1/2049 | | | 575,000 | | | | 712,103 | |
5.50%, 6/1/2050 | | | 415,000 | | | | 556,097 | |
| | | | | | | | |
| Investments | | Principal
Amount | | | Value | |
|
| Food Products – (continued) | |
| | |
Pilgrim’s Pride Corp. | | | | | | | | |
5.88%, 9/30/2027(a) | | $ | 391,000 | | | $ | 412,773 | |
| | |
Post Holdings, Inc. | | | | | | | | |
5.75%, 3/1/2027(a) | | | 875,000 | | | | 908,906 | |
5.63%, 1/15/2028(a) | | | 705,000 | | | | 736,690 | |
5.50%, 12/15/2029(a) | | | 550,000 | | | | 585,337 | |
4.63%, 4/15/2030(a) | | | 2,303,000 | | | | 2,317,394 | |
4.50%, 9/15/2031(a) | | | 1,080,000 | | | | 1,062,643 | |
| | |
Sigma Holdco BV | | | | | | | | |
7.88%, 5/15/2026(a) | | | 570,000 | | | | 557,907 | |
| | |
Simmons Foods, Inc. | | | | | | | | |
4.63%, 3/1/2029(a) | | | 980,000 | | | | 991,025 | |
| | | | | | | | 11,619,986 | |
|
| Gas Utilities – 0.2% | |
| | |
Ferrellgas LP | | | | | | | | |
5.38%, 4/1/2026(a) | | | 630,000 | | | | 614,606 | |
5.88%, 4/1/2029(a) | | | 115,000 | | | | 112,044 | |
| | |
Suburban Propane Partners LP | | | | | | | | |
5.88%, 3/1/2027 | | | 110,000 | | | | 114,385 | |
5.00%, 6/1/2031(a) | | | 110,000 | | | | 112,888 | |
| | |
Superior Plus LP | | | | | | | | |
4.50%, 3/15/2029(a) | | | 410,000 | | | | 419,820 | |
| | | | | | | | 1,373,743 | |
|
| Health Care Equipment & Supplies – 0.6% | |
| | |
Avantor Funding, Inc. | | | | | | | | |
4.63%, 7/15/2028(a) | | | 300,000 | | | | 311,610 | |
| | |
Mozart Debt Merger Sub, Inc. | | | | | | | | |
3.88%, 4/1/2029(a) | | | 1,485,000 | | | | 1,480,500 | |
5.25%, 10/1/2029(a) | | | 775,000 | | | | 787,594 | |
| | |
Ortho-Clinical Diagnostics, Inc. | | | | | | | | |
7.25%, 2/1/2028(a) | | | 249,000 | | | | 265,496 | |
| | |
Teleflex, Inc. | | | | | | | | |
4.25%, 6/1/2028(a) | | | 400,000 | | | | 411,490 | |
| | |
Varex Imaging Corp. | | | | | | | | |
7.88%, 10/15/2027(a) | | | 170,000 | | | | 189,372 | |
| | | | | | | | 3,446,062 | |
|
| Health Care Providers & Services – 3.1% | |
| | |
Acadia Healthcare Co., Inc. | | | | | | | | |
5.50%, 7/1/2028(a) | | | 300,000 | | | | 313,125 | |
| | |
AdaptHealth LLC | | | | | | | | |
6.13%, 8/1/2028(a) | | | 145,000 | | | | 153,700 | |
See Accompanying Notes to the Financial Statements.
| | | | | | |
| | FLEXSHARES ANNUAL REPORT | | | 407 | |
FlexShares® High Yield Value-Scored Bond Index Fund (cont.)
| | | | | | | | |
| Investments | | Principal
Amount | | | Value | |
|
| CORPORATE BONDS – (continued) | |
|
| Health Care Providers & Services – (continued) | |
| | |
AHP Health Partners, Inc. | | | | | | | | |
5.75%, 7/15/2029(a) | | $ | 360,000 | | | $ | 362,250 | |
| | |
Air Methods Corp. | | | | | | | | |
8.00%, 5/15/2025(a) | | | 225,000 | | | | 172,477 | |
| | |
Cano Health LLC | | | | | | | | |
6.25%, 10/1/2028(a) | | | 330,000 | | | | 332,389 | |
| | |
Centene Corp. | | | | | | | | |
4.63%, 12/15/2029 | | | 610,000 | | | | 658,800 | |
3.00%, 10/15/2030 | | | 320,000 | | | | 325,661 | |
2.50%, 3/1/2031 | | | 310,000 | | | | 302,644 | |
| | |
Community Health Systems, Inc. | | | | | | | | |
5.63%, 3/15/2027(a) | | | 105,000 | | | | 110,009 | |
| | |
DaVita, Inc. | | | | | | | | |
4.63%, 6/1/2030(a) | | | 825,000 | | | | 830,123 | |
3.75%, 2/15/2031(a) | | | 270,000 | | | | 256,163 | |
| | |
Encompass Health Corp. | | | | | | | | |
4.50%, 2/1/2028 | | | 500,000 | | | | 509,674 | |
4.75%, 2/1/2030 | | | 530,000 | | | | 543,936 | |
| | |
Global Medical Response, Inc. | | | | | | | | |
6.50%, 10/1/2025(a) | | | 415,000 | | | | 411,605 | |
| | |
Hadrian Merger Sub, Inc. | | | | | | | | |
8.50%, 5/1/2026(a) | | | 55,000 | | | | 56,994 | |
| | |
HCA, Inc. | | | | | | | | |
5.63%, 9/1/2028 | | | 150,000 | | | | 175,985 | |
3.50%, 9/1/2030 | | | 775,000 | | | | 815,939 | |
| | |
Legacy LifePoint Health LLC | | | | | | | | |
4.38%, 2/15/2027(a) | | | 330,000 | | | | 327,112 | |
| | |
LifePoint Health, Inc. | | | | | | | | |
5.38%, 1/15/2029(a) | | | 715,000 | | | | 701,594 | |
| | |
MEDNAX, Inc. | | | | | | | | |
6.25%, 1/15/2027(a) | | | 605,000 | | | | 635,141 | |
| | |
ModivCare Escrow Issuer, Inc. | | | | | | | | |
5.00%, 10/1/2029(a) | | | 885,000 | | | | 901,302 | |
| | |
ModivCare, Inc. | | | | | | | | |
5.88%, 11/15/2025(a) | | | 394,000 | | | | 414,193 | |
| | |
Molina Healthcare, Inc. | | | | | | | | |
4.38%, 6/15/2028(a) | | | 405,000 | | | | 419,681 | |
| | |
Prime Healthcare Services, Inc. | | | | | | | | |
7.25%, 11/1/2025(a) | | | 915,000 | | | | 975,619 | |
| | |
Radiology Partners, Inc. | | | | | | | | |
9.25%, 2/1/2028(a) | | | 590,000 | | | | 626,385 | |
| | |
RP Escrow Issuer LLC | | | | | | | | |
5.25%, 12/15/2025(a) | | | 465,000 | | | | 465,581 | |
| | | | | | | | |
| Investments | | Principal
Amount | | | Value | |
|
| Health Care Providers & Services – (continued) | |
| | |
Select Medical Corp. | | | | | | | | |
6.25%, 8/15/2026(a) | | $ | 1,095,000 | | | $ | 1,146,702 | |
| | |
Tenet Healthcare Corp. | | | | | | | | |
6.25%, 2/1/2027(a) | | | 915,000 | | | | 951,600 | |
6.13%, 10/1/2028(a) | | | 2,130,000 | | | | 2,239,056 | |
| | |
US Acute Care Solutions LLC | | | | | | | | |
6.38%, 3/1/2026(a) | | | 355,000 | | | | 368,756 | |
| | |
US Renal Care, Inc. | | | | | | | | |
10.63%, 7/15/2027(a) | | | 1,110,000 | | | | 1,152,707 | |
| | | | | | | | 17,656,903 | |
|
| Health Care Technology – 0.3% | |
| | |
IQVIA, Inc. | | | | | | | | |
5.00%, 10/15/2026(a) | | | 570,000 | | | | 586,359 | |
5.00%, 5/15/2027(a) | | | 970,000 | | | | 1,006,685 | |
| | | | | | | | 1,593,044 | |
|
| Hotels, Restaurants & Leisure – 6.5% | |
| | |
1011778 BC ULC | | | | | | | | |
5.75%, 4/15/2025(a) | | | 175,000 | | | | 182,000 | |
4.38%, 1/15/2028(a) | | | 665,000 | | | | 669,323 | |
3.50%, 2/15/2029(a) | | | 125,000 | | | | 121,406 | |
4.00%, 10/15/2030(a) | | | 810,000 | | | | 785,692 | |
| | |
Affinity Gaming | | | | | | | | |
6.88%, 12/15/2027(a) | | | 1,065,000 | | | | 1,105,417 | |
| | |
Arrow Bidco LLC | | | | | | | | |
9.50%, 3/15/2024(a) | | | 190,000 | | | | 194,101 | |
| | |
Boyd Gaming Corp. | | | | | | | | |
4.75%, 6/15/2031(a) | | | 485,000 | | | | 499,558 | |
| | |
Boyne USA, Inc. | | | | | | | | |
4.75%, 5/15/2029(a) | | | 95,000 | | | | 97,256 | |
| | |
Caesars Entertainment, Inc. | | | | | | | | |
6.25%, 7/1/2025(a) | | | 652,000 | | | | 686,621 | |
8.13%, 7/1/2027(a) | | | 1,554,000 | | | | 1,742,500 | |
| | |
CCM Merger, Inc. | | | | | | | | |
6.38%, 5/1/2026(a) | | | 200,000 | | | | 209,888 | |
| | |
CEC Entertainment LLC | | | | | | | | |
6.75%, 5/1/2026(a) | | | 965,000 | | | | 965,907 | |
| | |
Cedar Fair LP | | | | | | | | |
5.38%, 6/1/2024 | | | 135,000 | | | | 136,181 | |
5.38%, 4/15/2027 | | | 130,000 | | | | 134,063 | |
6.50%, 10/1/2028 | | | 215,000 | | | | 230,856 | |
5.25%, 7/15/2029 | | | 925,000 | | | | 959,688 | |
See Accompanying Notes to the Financial Statements.
| | | | |
| 408 | | FLEXSHARES ANNUAL REPORT | | |
FlexShares® High Yield Value-Scored Bond Index Fund (cont.)
| | | | | | | | |
| Investments | | Principal
Amount | | | Value | |
|
| CORPORATE BONDS – (continued) | |
|
| Hotels, Restaurants & Leisure – (continued) | |
| | |
Churchill Downs, Inc. | | | | | | | | |
5.50%, 4/1/2027(a) | | $ | 354,000 | | | $ | 366,390 | |
4.75%, 1/15/2028(a) | | | 75,000 | | | | 77,625 | |
| | |
Dave & Buster’s, Inc. | | | | | | | | |
7.63%, 11/1/2025(a) | | | 395,000 | | | | 424,668 | |
| | |
GPS Hospitality Holding Co. LLC | | | | | | | | |
7.00%, 8/15/2028(a) | | | 855,000 | | | | 810,407 | |
| | |
Hilton Domestic Operating Co., Inc. | | | | | | | | |
3.63%, 2/15/2032(a) | | | 378,000 | | | | 369,268 | |
| | |
Hilton Grand Vacations Borrower Escrow LLC | | | | | | | | |
5.00%, 6/1/2029(a) | | | 1,150,000 | | | | 1,174,150 | |
4.88%, 7/1/2031(a) | | | 85,000 | | | | 84,676 | |
| | |
KFC Holding Co. | | | | | | | | |
4.75%, 6/1/2027(a) | | | 350,000 | | | | 362,688 | |
| | |
Life Time, Inc. | | | | | | | | |
5.75%, 1/15/2026(a) | | | 1,045,000 | | | | 1,074,124 | |
8.00%, 4/15/2026(a) | | | 850,000 | | | | 893,903 | |
| | |
MajorDrive Holdings IV LLC | | | | | | | | |
6.38%, 6/1/2029(a) | | | 1,115,000 | | | | 1,074,303 | |
| | |
Marriott Ownership Resorts, Inc. | | | | | | | | |
4.75%, 1/15/2028 | | | 465,000 | | | | 473,719 | |
4.50%, 6/15/2029(a) | | | 275,000 | | | | 275,344 | |
| | |
MGM Resorts International | | | | | | | | |
6.75%, 5/1/2025 | | | 360,000 | | | | 380,025 | |
| | |
Midwest Gaming Borrower LLC | | | | | | | | |
4.88%, 5/1/2029(a) | | | 1,200,000 | | | | 1,212,174 | |
| | |
Mohegan Gaming & Entertainment | | | | | | | | |
8.00%, 2/1/2026(a) | | | 2,060,000 | | | | 2,121,800 | |
| | |
Motion Bondco DAC | | | | | | | | |
6.63%, 11/15/2027(a) | | | 600,000 | | | | 602,559 | |
| | |
Peninsula Pacific Entertainment LLC | | | | | | | | |
8.50%, 11/15/2027(a) | | | 1,525,000 | | | | 1,629,470 | |
| | |
Powdr Corp. | | | | | | | | |
6.00%, 8/1/2025(a) | | | 90,000 | | | | 94,298 | |
| | |
Premier Entertainment Sub LLC | | | | | | | | |
5.63%, 9/1/2029(a) | | | 1,040,000 | | | | 1,059,500 | |
| | |
Raptor Acquisition Corp. | | | | | | | | |
4.88%, 11/1/2026(a) | | | 300,000 | | | | 303,127 | |
| | | | | | | | |
| Investments | | Principal
Amount | | | Value | |
|
| Hotels, Restaurants & Leisure – (continued) | |
| | |
Resorts World Las Vegas LLC | | | | | | | | |
4.63%, 4/16/2029(a) | | $ | 200,000 | | | $ | 203,331 | |
4.63%, 4/6/2031(a) | | | 200,000 | | | | 199,628 | |
| | |
Royal Caribbean Cruises Ltd. | | | | | | | | |
9.13%, 6/15/2023(a) | | | 535,000 | | | | 581,561 | |
| | |
Scientific Games International, Inc. | | | | | | | | |
8.63%, 7/1/2025(a) | | | 787,000 | | | | 850,314 | |
| | |
SeaWorld Parks & Entertainment, Inc. | | | | | | | | |
5.25%, 8/15/2029(a) | | | 1,140,000 | | | | 1,162,800 | |
| | |
Six Flags Entertainment Corp. | | | | | | | | |
4.88%, 7/31/2024(a) | | | 525,000 | | | | 529,594 | |
5.50%, 4/15/2027(a) | | | 280,000 | | | | 290,150 | |
| | |
Sizzling Platter LLC | | | | | | | | |
8.50%, 11/28/2025(a) | | | 510,000 | | | | 513,394 | |
| | |
Speedway Motorsports LLC | | | | | | | | |
4.88%, 11/1/2027(a) | | | 215,000 | | | | 219,984 | |
| | |
TKC Holdings, Inc. | | | | | | | | |
6.88%, 5/15/2028(a) | | | 775,000 | | | | 797,634 | |
10.50%, 5/15/2029(a) | | | 1,045,000 | | | | 1,130,329 | |
| | |
Travel + Leisure Co. | | | | | | | | |
4.63%, 3/1/2030(a) | | | 200,000 | | | | 207,784 | |
| | |
Viking Cruises Ltd. | | | | | | | | |
6.25%, 5/15/2025(a) | | | 235,000 | | | | 234,186 | |
5.88%, 9/15/2027(a) | | | 1,820,000 | | | | 1,761,878 | |
7.00%, 2/15/2029(a) | | | 430,000 | | | | 432,853 | |
| | |
Viking Ocean Cruises Ship VII Ltd. | | | | | | | | |
5.63%, 2/15/2029(a) | | | 460,000 | | | | 457,125 | |
| | |
VOC Escrow Ltd. | | | | | | | | |
5.00%, 2/15/2028(a) | | | 1,250,000 | | | | 1,242,188 | |
| | |
Wynn Las Vegas LLC | | | | | | | | |
4.25%, 5/30/2023(a) | | | 115,000 | | | | 116,006 | |
5.50%, 3/1/2025(a) | | | 1,710,000 | | | | 1,739,925 | |
| | |
Wynn Resorts Finance LLC | | | | | | | | |
7.75%, 4/15/2025(a) | | | 280,000 | | | | 294,994 | |
| | |
Yum! Brands, Inc. | | | | | | | | |
7.75%, 4/1/2025(a) | | | 255,000 | | | | 271,499 | |
4.75%, 1/15/2030(a) | | | 170,000 | | | | 182,112 | |
3.63%, 3/15/2031 | | | 200,000 | | | | 197,920 | |
4.63%, 1/31/2032 | | | 195,000 | | | | 203,531 | |
6.88%, 11/15/2037 | | | 100,000 | | | | 126,152 | |
| | | | | | | | 37,531,547 | |
See Accompanying Notes to the Financial Statements.
| | | | | | |
| | FLEXSHARES ANNUAL REPORT | | | 409 | |
FlexShares® High Yield Value-Scored Bond Index Fund (cont.)
| | | | | | | | |
| Investments | | Principal
Amount | | | Value | |
|
| CORPORATE BONDS – (continued) | |
|
| Household Durables – 1.1% | |
| | |
Ashton Woods USA LLC | | | | | | | | |
6.63%, 1/15/2028(a) | | $ | 150,000 | | | $ | 158,825 | |
4.63%, 8/1/2029(a) | | | 550,000 | | | | 545,875 | |
4.63%, 4/1/2030(a) | | | 495,000 | | | | 486,956 | |
| | |
Beazer Homes USA, Inc. | | | | | | | | |
7.25%, 10/15/2029 | | | 385,000 | | | | 421,094 | |
| | |
Brookfield Residential Properties, Inc. | | | | | | | | |
6.25%, 9/15/2027(a) | | | 425,000 | | | | 443,062 | |
5.00%, 6/15/2029(a) | | | 720,000 | | | | 723,640 | |
4.88%, 2/15/2030(a) | | | 730,000 | | | | 732,431 | |
| | |
Empire Communities Corp. | | | | | | | | |
7.00%, 12/15/2025(a) | | | 355,000 | | | | 367,869 | |
| | |
Installed Building Products, Inc. | | | | | | | | |
5.75%, 2/1/2028(a) | | | 75,000 | | | | 78,656 | |
| | |
Mattamy Group Corp. | | | | | | | | |
5.25%, 12/15/2027(a) | | | 50,000 | | | | 52,062 | |
4.63%, 3/1/2030(a) | | | 615,000 | | | | 624,583 | |
| | |
New Home Co., Inc. (The) | | | | | | | | |
7.25%, 10/15/2025(a) | | | 295,000 | | | | 304,956 | |
| | |
Newell Brands, Inc. | | | | | | | | |
6.00%, 4/1/2046(d) | | | 291,000 | | | | 365,880 | |
| | |
Picasso Finance Sub, Inc. | | | | | | | | |
6.13%, 6/15/2025(a) | | | 430,000 | | | | 453,112 | |
| | |
Shea Homes LP | | | | | | | | |
4.75%, 2/15/2028(a) | | | 175,000 | | | | 176,531 | |
4.75%, 4/1/2029(a) | | | 395,000 | | | | 397,469 | |
| | |
Taylor Morrison Communities, Inc. | | | | | | | | |
5.13%, 8/1/2030(a) | | | 90,000 | | | | 95,513 | |
| | |
Tri Pointe Homes, Inc. | | | | | | | | |
5.70%, 6/15/2028 | | | 95,000 | | | | 103,431 | |
| | | | | | | | 6,531,945 | |
|
| Household Products – 0.4% | |
| | |
Central Garden & Pet Co. | | | | | | | | |
4.13%, 4/30/2031(a) | | | 100,000 | | | | 100,125 | |
| | |
Energizer Holdings, Inc. | | | | | | | | |
4.75%, 6/15/2028(a) | | | 400,000 | | | | 400,000 | |
4.38%, 3/31/2029(a) | | | 325,000 | | | | 311,838 | |
| | |
Kronos Acquisition Holdings, Inc. | | | | | | | | |
5.00%, 12/31/2026(a) | | | 450,000 | | | | 446,062 | |
7.00%, 12/31/2027(a) | | | 860,000 | | | | 833,104 | |
| | | | | | | | 2,091,129 | |
| | | | | | | | |
| Investments | | Principal
Amount | | | Value | |
|
Independent Power and Renewable Electricity
Producers – 0.3% | |
| | |
Calpine Corp. | | | | | | | | |
5.13%, 3/15/2028(a) | | $ | 950,000 | | | $ | 946,437 | |
4.63%, 2/1/2029(a) | | | 70,000 | | | | 67,988 | |
5.00%, 2/1/2031(a) | | | 360,000 | | | | 353,315 | |
3.75%, 3/1/2031(a) | | | 100,000 | | | | 96,127 | |
| | |
TransAlta Corp. | | | | | | | | |
6.50%, 3/15/2040 | | | 35,000 | | | | 41,283 | |
| | | | | | | | 1,505,150 | |
|
| Insurance – 2.1% | |
| | |
Acrisure LLC | | | | | | | | |
7.00%, 11/15/2025(a) | | | 955,000 | | | | 965,744 | |
4.25%, 2/15/2029(a) | | | 640,000 | | | | 618,400 | |
6.00%, 8/1/2029(a) | | | 745,000 | | | | 732,219 | |
| | |
Alliant Holdings Intermediate LLC | | | | | | | | |
4.25%, 10/15/2027(a) | | | 465,000 | | | | 464,419 | |
6.75%, 10/15/2027(a) | | | 1,385,000 | | | | 1,431,744 | |
| | |
AmWINS Group, Inc. | | | | | | | | |
4.88%, 6/30/2029(a) | | | 830,000 | | | | 829,627 | |
| | |
Assurant, Inc. | | | | | | | | |
7.00%, 3/27/2048(c) | | | 240,000 | | | | 280,169 | |
| | |
AssuredPartners, Inc. | | | | | | | | |
5.63%, 1/15/2029(a) | | | 745,000 | | | | 740,344 | |
| | |
BroadStreet Partners, Inc. | | | | | | | | |
5.88%, 4/15/2029(a) | | | 1,290,000 | | | | 1,269,437 | |
| | |
Enstar Finance LLC | | | | | | | | |
5.75%, 9/1/2040(c) | | | 225,000 | | | | 237,656 | |
| | |
GTCR AP Finance, Inc. | | | | | | | | |
8.00%, 5/15/2027(a) | | | 595,000 | | | | 626,981 | |
| | |
Liberty Mutual Group, Inc. | | | | | | | | |
7.80%, 3/15/2037(a) | | | 275,000 | | | | 387,918 | |
4.30%, 2/1/2061(a) | | | 125,000 | | | | 116,748 | |
| | |
NFP Corp. | | | | | | | | |
6.88%, 8/15/2028(a) | | | 3,090,000 | | | | 3,144,008 | |
| | | | | | | | 11,845,414 | |
|
| Interactive Media & Services – 0.2% | |
| | |
Cars.com, Inc. | | | | | | | | |
6.38%, 11/1/2028(a) | | | 260,000 | | | | 272,441 | |
| | |
Rackspace Technology Global, Inc. | | | | | | | | |
5.38%, 12/1/2028(a) | | | 835,000 | | | | 804,731 | |
| | |
TripAdvisor, Inc. | | | | | | | | |
7.00%, 7/15/2025(a) | | | 125,000 | | | | 132,344 | |
| | | | | | | | 1,209,516 | |
See Accompanying Notes to the Financial Statements.
| | | | |
| 410 | | FLEXSHARES ANNUAL REPORT | | |
FlexShares® High Yield Value-Scored Bond Index Fund (cont.)
| | | | | | | | |
| Investments | | Principal
Amount | | | Value | |
|
| CORPORATE BONDS – (continued) | |
|
| Internet & Direct Marketing Retail – 0.8% | |
| | |
ANGI Group LLC | | | | | | | | |
3.88%, 8/15/2028(a) | | $ | 785,000 | | | $ | 768,319 | |
| | |
Go Daddy Operating Co. LLC | | | | | | | | |
5.25%, 12/1/2027(a) | | | 780,000 | | | | 810,225 | |
| | |
Match Group Holdings II LLC | | | | | | | | |
5.00%, 12/15/2027(a) | | | 140,000 | | | | 146,125 | |
5.63%, 2/15/2029(a) | | | 435,000 | | | | 465,994 | |
| | |
Millennium Escrow Corp. | | | | | | | | |
6.63%, 8/1/2026(a) | | | 1,330,000 | | | | 1,353,787 | |
| | |
Photo Holdings Merger Sub, Inc. | | | | | | | | |
8.50%, 10/1/2026(a) | | | 685,000 | | | | 720,158 | |
| | |
QVC, Inc. | | | | | | | | |
5.45%, 8/15/2034 | | | 100,000 | | | | 104,648 | |
| | | | | | | | 4,369,256 | |
|
| IT Services – 1.5% | |
| | |
Acuris Finance Us, Inc. | | | | | | | | |
5.00%, 5/1/2028(a) | | | 690,000 | | | | 680,512 | |
| | |
Ahead DB Holdings LLC | | | | | | | | |
6.63%, 5/1/2028(a) | | | 700,000 | | | | 714,952 | |
| | |
Arches Buyer, Inc. | | | | | | | | |
6.13%, 12/1/2028(a) | | | 1,065,000 | | | | 1,075,650 | |
| | |
Austin BidCo, Inc. | | | | | | | | |
7.13%, 12/15/2028(a) | | | 425,000 | | | | 439,488 | |
| | |
Black Knight InfoServ LLC | | | | | | | | |
3.63%, 9/1/2028(a) | | | 880,000 | | | | 876,700 | |
| | |
Booz Allen Hamilton, Inc. | | | | | | | | |
4.00%, 7/1/2029(a) | | | 150,000 | | | | 152,063 | |
| | |
CA Magnum Holdings | | | | | | | | |
5.38%, 10/31/2026(a) | | | 200,000 | | | | 205,357 | |
| | |
Cablevision Lightpath LLC | | | | | | | | |
3.88%, 9/15/2027(a) | | | 200,000 | | | | 194,990 | |
5.63%, 9/15/2028(a) | | | 695,000 | | | | 687,848 | |
| | |
Conduent Business Services LLC | | | | | | | | |
6.00%, 11/1/2029(a) | | | 730,000 | | | | 729,088 | |
| | |
Endure Digital, Inc. | | | | | | | | |
6.00%, 2/15/2029(a) | | | 1,200,000 | | | | 1,106,052 | |
| | |
ION Trading Technologies Sarl | | | | | | | | |
5.75%, 5/15/2028(a) | | | 625,000 | | | | 641,406 | |
| | |
Northwest Fiber LLC | | | | | | | | |
6.00%, 2/15/2028(a) | | | 395,000 | | | | 379,872 | |
10.75%, 6/1/2028(a) | | | 80,000 | | | | 88,123 | |
| | | | | | | | |
| Investments | | Principal
Amount | | | Value | |
|
| IT Services – (continued) | |
| | |
Presidio Holdings, Inc. | | | | | | | | |
8.25%, 2/1/2028(a) | | $ | 285,000 | | | $ | 303,183 | |
| | |
Unisys Corp. | | | | | | | | |
6.88%, 11/1/2027(a) | | | 295,000 | | | | 321,919 | |
| | | | | | | | 8,597,203 | |
|
| Leisure Products – 0.1% | |
| | |
Vista Outdoor, Inc. | | | | | | | | |
4.50%, 3/15/2029(a) | | | 440,000 | | | | 441,100 | |
|
| Machinery – 1.0% | |
| | |
Amsted Industries, Inc. | | | | | | | | |
4.63%, 5/15/2030(a) | | | 580,000 | | | | 596,762 | |
| | |
EnPro Industries, Inc. | | | | | | | | |
5.75%, 10/15/2026 | | | 165,000 | | | | 172,838 | |
| | |
Granite US Holdings Corp. | | | | | | | | |
11.00%, 10/1/2027(a) | | | 75,000 | | | | 82,245 | |
| | |
HTA Group Ltd. | | | | | | | | |
7.00%, 12/18/2025(a) | | | 890,000 | | | | 933,806 | |
| | |
Interpipe Holdings plc | | | | | | | | |
8.38%, 5/13/2026(a) | | | 500,000 | | | | 490,313 | |
| | |
Stevens Holding Co., Inc. | | | | | | | | |
6.13%, 10/1/2026(a) | | | 180,000 | | | | 194,175 | |
| | |
Titan Acquisition Ltd. | | | | | | | | |
7.75%, 4/15/2026(a) | | | 595,000 | | | | 607,837 | |
| | |
Titan International, Inc. | | | | | | | | |
7.00%, 4/30/2028(a) | | | 815,000 | | | | 837,730 | |
| | |
TK Elevator Holdco GmbH | | | | | | | | |
7.63%, 7/15/2028(a) | | | 650,000 | | | | 689,812 | |
| | |
TK Elevator US Newco, Inc. | | | | | | | | |
5.25%, 7/15/2027(a) | | | 885,000 | | | | 901,859 | |
| | |
Wabash National Corp. | | | | | | | | |
4.50%, 10/15/2028(a) | | | 500,000 | | | | 486,740 | |
| | | | | | | | 5,994,117 | |
|
| Marine – 0.1% | |
| | |
Stena AB | | | | | | | | |
7.00%, 2/1/2024(a) | | | 395,000 | | | | 410,634 | |
|
| Media – 8.1% | |
| | |
Advantage Sales & Marketing, Inc. | | | | | | | | |
6.50%, 11/15/2028(a) | | | 1,180,000 | | | | 1,228,675 | |
See Accompanying Notes to the Financial Statements.
| | | | | | |
| | FLEXSHARES ANNUAL REPORT | | | 411 | |
FlexShares® High Yield Value-Scored Bond Index Fund (cont.)
| | | | | | | | |
| Investments | | Principal
Amount | | | Value | |
|
| CORPORATE BONDS – (continued) | |
|
| Media – (continued) | |
| | |
Altice Financing SA | | | | | | | | |
5.00%, 1/15/2028(a) | | $ | 2,510,000 | | | $ | 2,421,824 | |
5.75%, 8/15/2029(a) | | | 3,410,000 | | | | 3,358,850 | |
| | |
Belo Corp. | | | | | | | | |
7.75%, 6/1/2027 | | | 215,000 | | | | 253,458 | |
7.25%, 9/15/2027 | | | 175,000 | | | | 203,243 | |
| | |
CSC Holdings LLC | | | | | | | | |
7.50%, 4/1/2028(a) | | | 1,340,000 | | | | 1,428,775 | |
6.50%, 2/1/2029(a) | | | 1,325,000 | | | | 1,422,719 | |
5.75%, 1/15/2030(a) | | | 3,850,000 | | | | 3,803,607 | |
4.13%, 12/1/2030(a) | | | 200,000 | | | | 191,771 | |
4.63%, 12/1/2030(a) | | | 1,005,000 | | | | 922,123 | |
3.38%, 2/15/2031(a) | | | 270,000 | | | | 246,240 | |
4.50%, 11/15/2031(a) | | | 400,000 | | | | 388,090 | |
5.00%, 11/15/2031(a) | | | 200,000 | | | | 185,980 | |
| | |
DIRECTV Holdings LLC | | | | | | | | |
5.88%, 8/15/2027(a) | | | 2,370,000 | | | | 2,459,823 | |
| | |
DISH DBS Corp. | | | | | | | | |
5.88%, 11/15/2024 | | | 1,120,000 | | | | 1,194,200 | |
7.75%, 7/1/2026 | | | 2,200,000 | | | | 2,447,500 | |
7.38%, 7/1/2028 | | | 1,877,000 | | | | 1,975,542 | |
5.13%, 6/1/2029 | | | 2,574,000 | | | | 2,480,693 | |
| | |
GCI LLC | | | | | | | | |
4.75%, 10/15/2028(a) | | | 790,000 | | | | 818,637 | |
| | |
Gray Escrow II, Inc. | | | | | | | | |
5.38%, 11/15/2031(a) | | | 300,000 | | | | 304,305 | |
| | |
Gray Television, Inc. | | | | | | | | |
7.00%, 5/15/2027(a) | | | 500,000 | | | | 535,625 | |
4.75%, 10/15/2030(a) | | | 70,000 | | | | 69,136 | |
| | |
iHeartCommunications, Inc. | | | | | | | | |
8.38%, 5/1/2027 | | | 860,000 | | | | 916,975 | |
| | |
Liberty Interactive LLC | | | | | | | | |
8.50%, 7/15/2029 | | | 140,000 | | | | 156,383 | |
8.25%, 2/1/2030 | | | 550,000 | | | | 600,520 | |
| | |
Mav Acquisition Corp. | | | | | | | | |
5.75%, 8/1/2028(a) | | | 1,540,000 | | | | 1,515,899 | |
8.00%, 8/1/2029(a) | | | 1,290,000 | | | | 1,256,770 | |
| | |
Nexstar Media, Inc. | | | | | | | | |
5.63%, 7/15/2027(a) | | | 1,070,000 | | | | 1,130,187 | |
| | |
Outfront Media Capital LLC | | | | | | | | |
5.00%, 8/15/2027(a) | | | 150,000 | | | | 153,187 | |
| | |
Radiate Holdco LLC | | | | | | | | |
4.50%, 9/15/2026(a) | | | 425,000 | | | | 432,348 | |
6.50%, 9/15/2028(a) | | | 1,890,000 | | | | 1,892,892 | |
| | | | | | | | |
| Investments | | Principal
Amount | | | Value | |
|
| Media – (continued) | |
| | |
Scripps Escrow II, Inc. | | | | | | | | |
5.38%, 1/15/2031(a) | | $ | 725,000 | | | $ | 710,522 | |
| | |
Sinclair Television Group, Inc. | | | | | | | | |
5.88%, 3/15/2026(a) | | | 125,000 | | | | 128,281 | |
| | |
Sirius XM Radio, Inc. | | | | | | | | |
4.00%, 7/15/2028(a) | | | 375,000 | | | | 377,793 | |
5.50%, 7/1/2029(a) | | | 466,000 | | | | 503,280 | |
4.13%, 7/1/2030(a) | | | 250,000 | | | | 248,731 | |
3.88%, 9/1/2031(a) | | | 265,000 | | | | 254,811 | |
| | |
Summer BC Bidco B LLC | | | | | | | | |
5.50%, 10/31/2026(a) | | | 510,000 | | | | 519,563 | |
| | |
TEGNA, Inc. | | | | | | | | |
4.63%, 3/15/2028 | | | 1,090,000 | | | | 1,100,900 | |
5.00%, 9/15/2029 | | | 1,380,000 | | | | 1,398,872 | |
| | |
Terrier Media Buyer, Inc. | | | | | | | | |
8.88%, 12/15/2027(a) | | | 990,000 | | | | 1,048,489 | |
| | |
Univision Communications, Inc. | | | | | | | | |
6.63%, 6/1/2027(a) | | | 410,000 | | | | 444,055 | |
4.50%, 5/1/2029(a) | | | 115,000 | | | | 116,489 | |
| | |
UPC Broadband Finco BV | | | | | | | | |
4.88%, 7/15/2031(a) | | | 400,000 | | | | 407,170 | |
| | |
UPC Holding BV | | | | | | | | |
5.50%, 1/15/2028(a) | | | 340,000 | | | | 352,325 | |
| | |
Videotron Ltd. | | | | | | | | |
5.13%, 4/15/2027(a) | | | 600,000 | | | | 621,000 | |
| | |
Virgin Media Vendor Financing Notes IV DAC | | | | | | | | |
5.00%, 7/15/2028(a) | | | 250,000 | | | | 254,219 | |
| | |
Ziggo Bond Co. BV | | | | | | | | |
5.13%, 2/28/2030(a) | | | 700,000 | | | | 709,327 | |
| | |
Ziggo BV | | | | | | | | |
4.88%, 1/15/2030(a) | | | 905,000 | | | | 920,955 | |
| | | | | | | | 46,512,759 | |
|
| Metals & Mining – 1.6% | |
| | |
Allegheny Technologies, Inc. | | | | | | | | |
5.88%, 12/1/2027 | | | 145,000 | | | | 152,431 | |
5.13%, 10/1/2031 | | | 200,000 | | | | 199,500 | |
| | |
Arconic Corp. | | | | | | | | |
6.13%, 2/15/2028(a) | | | 390,000 | | | | 412,160 | |
| | |
Baffinland Iron Mines Corp. | | | | | | | | |
8.75%, 7/15/2026(a) | | | 420,000 | | | | 445,561 | |
| | |
Century Aluminum Co. | | | | | | | | |
7.50%, 4/1/2028(a) | | | 375,000 | | | | 397,414 | |
See Accompanying Notes to the Financial Statements.
| | | | |
| 412 | | FLEXSHARES ANNUAL REPORT | | |
FlexShares® High Yield Value-Scored Bond Index Fund (cont.)
| | | | | | | | |
| Investments | | Principal
Amount | | | Value | |
|
| CORPORATE BONDS – (continued) | |
|
| Metals & Mining – (continued) | |
| | |
Cleveland-Cliffs, Inc. | | | | | | | | |
5.88%, 6/1/2027 | | $ | 445,000 | | | $ | 463,356 | |
| | |
Coeur Mining, Inc. | | | | | | | | |
5.13%, 2/15/2029(a) | | | 520,000 | | | | 504,478 | |
| | |
Commercial Metals Co. | | | | | | | | |
5.38%, 7/15/2027 | | | 250,000 | | | | 261,562 | |
| | |
Compass Minerals International, Inc. | | | | | | | | |
4.88%, 7/15/2024(a) | | | 135,000 | | | | 140,737 | |
6.75%, 12/1/2027(a) | | | 590,000 | | | | 625,400 | |
| | |
Eldorado Gold Corp. | | | | | | | | |
6.25%, 9/1/2029(a) | | | 750,000 | | | | 762,413 | |
| | |
Endeavour Mining plc | | | | | | | | |
5.00%, 10/14/2026(a) | | | 670,000 | | | | 677,337 | |
| | |
FMG Resources August 2006 Pty. Ltd. | | | | | | | | |
4.38%, 4/1/2031(a) | | | 365,000 | | | | 370,019 | |
| | |
Hudbay Minerals, Inc. | | | | | | | | |
4.50%, 4/1/2026(a) | | | 570,000 | | | | 569,288 | |
| | |
Infrabuild Australia Pty. Ltd. | | | | | | | | |
12.00%, 10/1/2024(a) | | | 200,000 | | | | 212,155 | |
| | |
Joseph T Ryerson & Son, Inc. | | | | | | | | |
8.50%, 8/1/2028(a) | | | 195,000 | | | | 217,181 | |
| | |
New Gold, Inc. | | | | | | | | |
7.50%, 7/15/2027(a) | | | 230,000 | | | | 248,687 | |
| | |
Novelis Corp. | | | | | | | | |
3.88%, 8/15/2031(a) | | | 90,000 | | | | 87,980 | |
| | |
Perenti Finance Pty. Ltd. | | | | | | | | |
6.50%, 10/7/2025(a) | | | 200,000 | | | | 208,972 | |
| | |
SunCoke Energy, Inc. | | | | | | | | |
4.88%, 6/30/2029(a) | | | 100,000 | | | | 99,375 | |
| | |
Tacora Resources, Inc. | | | | | | | | |
8.25%, 5/15/2026(a) | | | 250,000 | | | | 251,050 | |
| | |
Taseko Mines Ltd. | | | | | | | | |
7.00%, 2/15/2026(a) | | | 515,000 | | | | 533,025 | |
| | |
TMS International Corp. | | | | | | | | |
6.25%, 4/15/2029(a) | | | 415,000 | | | | 429,006 | |
| | |
United States Steel Corp. | | | | | | | | |
6.88%, 3/1/2029 | | | 770,000 | | | | 824,863 | |
| | |
Warrior Met Coal, Inc. | | | | | | | | |
8.00%, 11/1/2024(a) | | | 230,000 | | | | 232,322 | |
| | | | | | | | 9,326,272 | |
| | | | | | | | |
| Investments | | Principal
Amount | | | Value | |
|
| Mortgage Real Estate Investment Trusts (REITs) – 0.3% | |
| | |
Apollo Commercial Real Estate Finance, Inc. | | | | | | | | |
4.63%, 6/15/2029(a) | | $ | 875,000 | | | $ | 843,281 | |
| | |
New Residential Investment Corp. | | | | | | | | |
6.25%, 10/15/2025(a) | | | 665,000 | | | | 666,051 | |
| | | | | | | | 1,509,332 | |
|
| Multiline Retail – 0.1% | |
| | |
NMG Holding Co., Inc. | | | | | | | | |
7.13%, 4/1/2026(a) | | | 695,000 | | | | 730,827 | |
|
| Oil, Gas & Consumable Fuels – 12.2% | |
| | |
Aethon United BR LP | | | | | | | | |
8.25%, 2/15/2026(a) | | | 615,000 | | | | 661,408 | |
| | |
Alliance Resource Operating Partners LP | | | | | | | | |
7.50%, 5/1/2025(a) | | | 450,000 | | | | 457,517 | |
| | |
Antero Midstream Partners LP | | | | | | | | |
7.88%, 5/15/2026(a) | | | 160,000 | | | | 175,200 | |
5.75%, 3/1/2027(a) | | | 450,000 | | | | 465,188 | |
5.75%, 1/15/2028(a) | | | 385,000 | | | | 402,806 | |
5.38%, 6/15/2029(a) | | | 185,000 | | | | 193,098 | |
| | |
Apache Corp. | | | | | | | | |
5.35%, 7/1/2049 | | | 45,000 | | | | 51,726 | |
| | |
Ascent Resources Utica Holdings LLC | | | | | | | | |
7.00%, 11/1/2026(a) | | | 310,000 | | | | 320,199 | |
8.25%, 12/31/2028(a) | | | 500,000 | | | | 545,922 | |
5.88%, 6/30/2029(a) | | | 475,000 | | | | 481,427 | |
| | |
Baytex Energy Corp. | | | | | | | | |
8.75%, 4/1/2027(a) | | | 705,000 | | | | 753,832 | |
| | |
Berry Petroleum Co. LLC | | | | | | | | |
7.00%, 2/15/2026(a) | | | 535,000 | | | | 543,622 | |
| | |
Buckeye Partners LP | | | | | | | | |
5.85%, 11/15/2043 | | | 120,000 | | | | 118,462 | |
| | |
California Resources Corp. | | | | | | | | |
7.13%, 2/1/2026(a) | | | 671,000 | | | | 708,720 | |
| | |
Callon Petroleum Co. | | | | | | | | |
6.13%, 10/1/2024 | | | 345,000 | | | | 340,899 | |
8.25%, 7/15/2025 | | | 125,000 | | | | 124,029 | |
| | |
Calumet Specialty Products Partners LP | | | | | | | | |
7.75%, 4/15/2023 | | | 200,000 | | | | 198,757 | |
11.00%, 4/15/2025(a) | | | 860,000 | | | | 935,534 | |
See Accompanying Notes to the Financial Statements.
| | | | | | |
| | FLEXSHARES ANNUAL REPORT | | | 413 | |
FlexShares® High Yield Value-Scored Bond Index Fund (cont.)
| | | | | | | | |
| Investments | | Principal
Amount | | | Value | |
|
| CORPORATE BONDS – (continued) | |
|
| Oil, Gas & Consumable Fuels – (continued) | |
| | |
Centennial Resource Production LLC | | | | | | | | |
5.38%, 1/15/2026(a) | | $ | 130,000 | | | $ | 129,802 | |
6.88%, 4/1/2027(a) | | | 695,000 | | | | 711,506 | |
| | |
Cheniere Energy, Inc. | | | | | | | | |
4.63%, 10/15/2028 | | | 300,000 | | | | 314,985 | |
| | |
Chesapeake Energy Corp. | | | | | | | | |
5.50%, 2/1/2026(a) | | | 795,000 | | | | 829,781 | |
5.88%, 2/1/2029(a) | | | 155,000 | | | | 164,882 | |
| | |
Citgo Holding, Inc. | | | | | | | | |
9.25%, 8/1/2024(a) | | | 1,585,000 | | | | 1,611,271 | |
| | |
CITGO Petroleum Corp. | | | | | | | | |
7.00%, 6/15/2025(a) | | | 649,000 | | | | 669,671 | |
6.38%, 6/15/2026(a) | | | 540,000 | | | | 556,875 | |
| | |
Civitas Resources, Inc. | | | | | | | | |
5.00%, 10/15/2026(a) | | | 520,000 | | | | 525,954 | |
| | |
CNX Resources Corp. | | | | | | | | |
7.25%, 3/14/2027(a) | | | 740,000 | | | | 787,730 | |
| | |
Colgate Energy Partners III LLC | | | | | | | | |
7.75%, 2/15/2026(a) | | | 190,000 | | | | 203,063 | |
5.88%, 7/1/2029(a) | | | 680,000 | | | | 697,000 | |
| | |
Comstock Resources, Inc. | | | | | | | | |
6.75%, 3/1/2029(a) | | | 1,195,000 | | | | 1,286,119 | |
5.88%, 1/15/2030(a) | | | 811,000 | | | | 844,291 | |
| | |
Continental Resources, Inc. | | | | | | | | |
5.75%, 1/15/2031(a) | | | 125,000 | | | | 149,844 | |
4.90%, 6/1/2044 | | | 100,000 | | | | 113,607 | |
| | |
CQP Holdco LP | | | | | | | | |
5.50%, 6/15/2031(a) | | | 2,685,000 | | | | 2,795,756 | |
| | |
Crestwood Midstream Partners LP | | | | | | | | |
5.75%, 4/1/2025 | | | 185,000 | | | | 189,962 | |
5.63%, 5/1/2027(a) | | | 300,000 | | | | 307,528 | |
6.00%, 2/1/2029(a) | | | 695,000 | | | | 721,177 | |
| | |
CVR Energy, Inc. | | | | | | | | |
5.25%, 2/15/2025(a) | | | 365,000 | | | | 361,025 | |
5.75%, 2/15/2028(a) | | | 480,000 | | | | 473,400 | |
| | |
DCP Midstream Operating LP | | | | | | | | |
6.45%, 11/3/2036(a) | | | 125,000 | | | | 161,962 | |
6.75%, 9/15/2037(a) | | | 100,000 | | | | 133,854 | |
| | |
Delek Logistics Partners LP | | | | | | | | |
6.75%, 5/15/2025 | | | 110,000 | | | | 112,337 | |
7.13%, 6/1/2028(a) | | | 285,000 | | | | 298,894 | |
| | | | | | | | |
| Investments | | Principal
Amount | | | Value | |
|
| Oil, Gas & Consumable Fuels – (continued) | |
| | |
DT Midstream, Inc. | | | | | | | | |
4.38%, 6/15/2031(a) | | $ | 110,000 | | | $ | 111,587 | |
| | |
Encino Acquisition Partners Holdings LLC | | | | | | | | |
8.50%, 5/1/2028(a) | | | 1,365,000 | | | | 1,428,800 | |
| | |
Energy Ventures Gom LLC | | | | | | | | |
11.75%, 4/15/2026(a) | | | 620,000 | | | | 644,304 | |
| | |
EnLink Midstream Partners LP | | | | | | | | |
5.05%, 4/1/2045 | | | 125,000 | | | | 119,243 | |
5.45%, 6/1/2047 | | | 125,000 | | | | 125,166 | |
| | |
EQM Midstream Partners LP | | | | | | | | |
6.50%, 7/15/2048 | | | 70,000 | | | | 83,367 | |
| | |
Genesis Energy LP | | | | | | | | |
5.63%, 6/15/2024 | | | 255,000 | | | | 254,363 | |
6.50%, 10/1/2025 | | | 370,000 | | | | 368,477 | |
6.25%, 5/15/2026 | | | 450,000 | | | | 436,136 | |
8.00%, 1/15/2027 | | | 1,560,000 | | | | 1,569,781 | |
7.75%, 2/1/2028 | | | 1,635,000 | | | | 1,617,824 | |
| | |
Global Partners LP | | | | | | | | |
7.00%, 8/1/2027 | | | 175,000 | | | | 182,656 | |
6.88%, 1/15/2029 | | | 895,000 | | | | 929,189 | |
| | |
Great Western Petroleum LLC | | | | | | | | |
12.00%, 9/1/2025(a) | | | 545,000 | | | | 554,352 | |
| | |
Gulfport Energy Operating Corp. | | | | | | | | |
8.00%, 5/17/2026(a) | | | 725,000 | | | | 803,844 | |
| | |
Harvest Midstream I LP | | | | | | | | |
7.50%, 9/1/2028(a) | | | 750,000 | | | | 788,723 | |
| | |
Hilcorp Energy I LP | | | | | | | | |
6.25%, 11/1/2028(a) | | | 385,000 | | | | 395,647 | |
6.00%, 2/1/2031(a) | | | 65,000 | | | | 66,811 | |
| | |
Independence Energy Finance LLC | | | | | | | | |
7.25%, 5/1/2026(a) | | | 365,000 | | | | 380,056 | |
| | |
Ithaca Energy North Sea plc | | | | | | | | |
9.00%, 7/15/2026(a) | | | 1,070,000 | | | | 1,110,922 | |
| | |
ITT Holdings LLC | | | | | | | | |
6.50%, 8/1/2029(a) | | | 2,025,000 | | | | 2,038,071 | |
| | |
Magnolia Oil & Gas Operating LLC | | | | | | | | |
6.00%, 8/1/2026(a) | | | 290,000 | | | | 298,029 | |
| | |
Martin Midstream Partners LP | | | | | | | | |
11.50%, 2/28/2025(a) | | | 115,000 | | | | 119,809 | |
| | |
Matador Resources Co. | | | | | | | | |
5.88%, 9/15/2026 | | | 590,000 | | | | 609,977 | |
See Accompanying Notes to the Financial Statements.
| | | | |
| 414 | | FLEXSHARES ANNUAL REPORT | | |
FlexShares® High Yield Value-Scored Bond Index Fund (cont.)
| | | | | | | | |
| Investments | | Principal
Amount | | | Value | |
|
| CORPORATE BONDS – (continued) | |
|
| Oil, Gas & Consumable Fuels – (continued) | |
| | |
MEG Energy Corp. | | | | | | | | |
7.13%, 2/1/2027(a) | | $ | 615,000 | | | $ | 646,519 | |
5.88%, 2/1/2029(a) | | | 65,000 | | | | 66,950 | |
| | |
Moss Creek Resources Holdings, Inc. | | | | | | | | |
10.50%, 5/15/2027(a) | | | 870,000 | | | | 862,801 | |
| | |
Murphy Oil Corp. | | | | | | | | |
5.75%, 8/15/2025 | | | 180,000 | | | | 184,725 | |
5.88%, 12/1/2027 | | | 255,000 | | | | 265,838 | |
6.38%, 7/15/2028 | | | 525,000 | | | | 555,240 | |
6.37%, 12/1/2042(d) | | | 35,000 | | | | 35,612 | |
| | |
NGL Energy Operating LLC | | | | | | | | |
7.50%, 2/1/2026(a) | | | 2,135,000 | | | | 2,168,093 | |
| | |
NGL Energy Partners LP | | | | | | | | |
7.50%, 11/1/2023 | | | 1,180,000 | | | | 1,134,606 | |
6.13%, 3/1/2025 | | | 455,000 | | | | 387,373 | |
7.50%, 4/15/2026 | | | 555,000 | | | | 475,302 | |
| | |
Northern Oil and Gas, Inc. | | | | | | | | |
8.13%, 3/1/2028(a) | | | 750,000 | | | | 807,506 | |
| | |
NuStar Logistics LP | | | | | | | | |
6.38%, 10/1/2030 | | | 75,000 | | | | 82,302 | |
| | |
Oasis Midstream Partners LP | | | | | | | | |
8.00%, 4/1/2029(a) | | | 635,000 | | | | 690,563 | |
| | |
Oasis Petroleum, Inc. | | | | | | | | |
6.38%, 6/1/2026(a) | | | 435,000 | | | | 460,556 | |
| | |
Occidental Petroleum Corp. | | | | | | | | |
7.15%, 5/15/2028 | | | 75,000 | | | | 88,720 | |
8.88%, 7/15/2030 | | | 555,000 | | | | 752,719 | |
6.63%, 9/1/2030 | | | 1,415,000 | | | | 1,733,233 | |
6.13%, 1/1/2031 | | | 400,000 | | | | 479,500 | |
7.50%, 5/1/2031 | | | 515,000 | | | | 671,223 | |
7.88%, 9/15/2031 | | | 245,000 | | | | 328,012 | |
6.45%, 9/15/2036 | | | 95,000 | | | | 121,025 | |
Zero Coupon, 10/10/2036 | | | 1,175,000 | | | | 663,517 | |
7.95%, 6/15/2039 | | | 225,000 | | | | 300,763 | |
6.20%, 3/15/2040 | | | 105,000 | | | | 127,365 | |
6.60%, 3/15/2046 | | | 155,000 | | | | 198,540 | |
| | |
Parkland Corp. | | | | | | | | |
5.88%, 7/15/2027(a) | | | 320,000 | | | | 338,400 | |
| | |
PBF Holding Co. LLC | | | | | | | | |
9.25%, 5/15/2025(a) | | | 2,300,000 | | | | 2,247,526 | |
7.25%, 6/15/2025 | | | 1,210,000 | | | | 949,850 | |
6.00%, 2/15/2028 | | | 1,575,000 | | | | 1,144,828 | |
| | | | | | | | |
| Investments | | Principal
Amount | | | Value | |
|
| Oil, Gas & Consumable Fuels – (continued) | |
| | |
PBF Logistics LP | | | | | | | | |
6.88%, 5/15/2023 | | $ | 125,000 | | | $ | 121,357 | |
| | |
Penn Virginia Escrow LLC | | | | | | | | |
9.25%, 8/15/2026(a) | | | 555,000 | | | | 579,281 | |
| | |
Range Resources Corp. | | | | | | | | |
9.25%, 2/1/2026 | | | 825,000 | | | | 892,032 | |
8.25%, 1/15/2029(a) | | | 265,000 | | | | 299,516 | |
| | |
Renewable Energy Group, Inc. | | | | | | | | |
5.88%, 6/1/2028(a) | | | 760,000 | | | | 799,900 | |
| | |
Rockcliff Energy II LLC | | | | | | | | |
5.50%, 10/15/2029(a) | | | 100,000 | | | | 102,725 | |
| | |
Rockies Express Pipeline LLC | | | | | | | | |
4.80%, 5/15/2030(a) | | | 150,000 | | | | 159,938 | |
6.88%, 4/15/2040(a) | | | 90,000 | | | | 102,064 | |
| | |
Rockpoint Gas Storage Canada Ltd. | | | | | | | | |
7.00%, 3/31/2023(a) | | | 100,000 | | | | 100,554 | |
| | |
SM Energy Co. | | | | | | | | |
5.63%, 6/1/2025 | | | 250,000 | | | | 250,937 | |
6.50%, 7/15/2028 | | | 300,000 | | | | 313,875 | |
| | |
Southwestern Energy Co. | | | | | | | | |
7.75%, 10/1/2027 | | | 175,000 | | | | 188,125 | |
8.38%, 9/15/2028 | | | 130,000 | | | | 145,113 | |
| | |
Strathcona Resources Ltd. | | | | | | | | |
6.88%, 8/1/2026(a) | | | 685,000 | | | | 682,099 | |
| | |
Sunoco LP | | | | | | | | |
6.00%, 4/15/2027 | | | 555,000 | | | | 582,056 | |
5.88%, 3/15/2028 | | | 330,000 | | | | 349,738 | |
4.50%, 5/15/2029 | | | 400,000 | | | | 405,000 | |
| | |
Tallgrass Energy Partners LP | | | | | | | | |
6.00%, 3/1/2027(a) | | | 240,000 | | | | 249,000 | |
5.50%, 1/15/2028(a) | | | 720,000 | | | | 723,513 | |
6.00%, 12/31/2030(a) | | | 1,170,000 | | | | 1,171,726 | |
| | |
Talos Production, Inc. | | | | | | | | |
12.00%, 1/15/2026 | | | 945,000 | | | | 1,026,700 | |
| | |
Tap Rock Resources LLC | | | | | | | | |
7.00%, 10/1/2026(a) | | | 340,000 | | | | 350,737 | |
| | |
Teine Energy Ltd. | | | | | | | | |
6.88%, 4/15/2029(a) | | | 515,000 | | | | 526,093 | |
| | |
Topaz Solar Farms LLC | | | | | | | | |
5.75%, 9/30/2039(a) | | | 91,748 | | | | 111,619 | |
| | |
Venture Global Calcasieu Pass LLC | | | | | | | | |
4.13%, 8/15/2031(a) | | | 220,000 | | | | 227,964 | |
See Accompanying Notes to the Financial Statements.
| | | | | | |
| | FLEXSHARES ANNUAL REPORT | | | 415 | |
FlexShares® High Yield Value-Scored Bond Index Fund (cont.)
| | | | | | | | |
| Investments | | Principal
Amount | | | Value | |
|
| CORPORATE BONDS – (continued) | |
|
| Oil, Gas & Consumable Fuels – (continued) | |
| | |
Vine Energy Holdings LLC | | | | | | | | |
6.75%, 4/15/2029(a) | | $ | 1,370,000 | | | $ | 1,472,750 | |
| | |
W&T Offshore, Inc. | | | | | | | | |
9.75%, 11/1/2023(a) | | | 790,000 | | | | 771,214 | |
| | |
Western Midstream Operating LP | | | | | | | | |
5.45%, 4/1/2044 | | | 75,000 | | | | 88,114 | |
5.30%, 3/1/2048 | | | 250,000 | | | | 291,602 | |
6.50%, 2/1/2050(d) | | | 225,000 | | | | 269,655 | |
| | | | | | | | 69,991,960 | |
|
| Paper & Forest Products – 0.7% | |
| | |
Glatfelter Corp. | | | | | | | | |
4.75%, 11/15/2029(a) | | | 100,000 | | | | 101,915 | |
| | |
Mercer International, Inc. | | | | | | | | |
5.13%, 2/1/2029 | | | 1,270,000 | | | | 1,264,247 | |
| | |
Pearl Merger Sub, Inc. | | | | | | | | |
6.75%, 10/1/2028(a) | | | 1,360,000 | | | | 1,352,411 | |
| | |
Resolute Forest Products, Inc. | | | | | | | | |
4.88%, 3/1/2026(a) | | | 300,000 | | | | 305,625 | |
| | |
Schweitzer-Mauduit International, Inc. | | | | | | | | |
6.88%, 10/1/2026(a) | | | 405,000 | | | | 423,225 | |
| | |
Sylvamo Corp. | | | | | | | | |
7.00%, 9/1/2029(a) | | | 740,000 | | | | 745,058 | |
| | | | | | | | 4,192,481 | |
|
| Personal Products – 0.3% | |
| | |
Avon Products, Inc. | | | | | | | | |
6.50%, 3/15/2023(d) | | | 110,000 | | | | 116,050 | |
| | |
Coty, Inc. | | | | | | | | |
5.00%, 4/15/2026(a) | | | 635,000 | | | | 651,669 | |
| | |
Oriflame Investment Holding plc | | | | | | | | |
5.13%, 5/4/2026(a) | | | 365,000 | | | | 362,390 | |
| | |
Prestige Brands, Inc. | | | | | | | | |
5.13%, 1/15/2028(a) | | | 145,000 | | | | 151,344 | |
3.75%, 4/1/2031(a) | | | 200,000 | | | | 193,500 | |
| | | | | | | | 1,474,953 | |
|
| Pharmaceuticals – 2.8% | |
| | |
Bausch Health Americas, Inc. | | | | | | | | |
9.25%, 4/1/2026(a) | | | 1,040,000 | | | | 1,106,300 | |
8.50%, 1/31/2027(a) | | | 2,070,000 | | | | 2,199,375 | |
| | | | | | | | |
| Investments | | Principal
Amount | | | Value | |
|
| Pharmaceuticals – (continued) | |
| | |
Bausch Health Cos., Inc. | | | | | | | | |
6.13%, 4/15/2025(a) | | $ | 1,860,000 | | | $ | 1,896,772 | |
7.00%, 1/15/2028(a) | | | 1,315,000 | | | | 1,333,903 | |
5.00%, 1/30/2028(a) | | | 2,195,000 | | | | 2,030,375 | |
4.88%, 6/1/2028(a) | | | 500,000 | | | | 513,750 | |
6.25%, 2/15/2029(a) | | | 1,585,000 | | | | 1,537,902 | |
7.25%, 5/30/2029(a) | | | 1,315,000 | | | | 1,335,120 | |
| | |
Catalent Pharma Solutions, Inc. | | | | | | | | |
5.00%, 7/15/2027(a) | | | 405,000 | | | | 418,669 | |
| | |
Cheplapharm Arzneimittel GmbH | | | | | | | | |
5.50%, 1/15/2028(a) | | | 825,000 | | | | 851,297 | |
| | |
Herbalife Nutrition Ltd. | | | | | | | | |
7.88%, 9/1/2025(a) | | | 422,000 | | | | 453,633 | |
| | |
HLF Financing Sarl LLC | | | | | | | | |
4.88%, 6/1/2029(a) | | | 1,010,000 | | | | 1,018,565 | |
| | |
Organon & Co. | | | | | | | | |
4.13%, 4/30/2028(a) | | | 450,000 | | | | 456,750 | |
5.13%, 4/30/2031(a) | | | 577,000 | | | | 595,856 | |
| | |
P&L Development LLC | | | | | | | | |
7.75%, 11/15/2025(a) | | | 300,000 | | | | 307,621 | |
| | | | | | | | 16,055,888 | |
|
| Professional Services – 0.5% | |
| | |
AMN Healthcare, Inc. | | | | | | | | |
4.63%, 10/1/2027(a) | | | 310,000 | | | | 318,919 | |
| | |
ASGN, Inc. | | | | | | | | |
4.63%, 5/15/2028(a) | | | 295,000 | | | | 304,956 | |
| | |
CoreLogic, Inc. | | | | | | | | |
4.50%, 5/1/2028(a) | | | 1,150,000 | | | | 1,137,718 | |
| | |
Dun & Bradstreet Corp. (The) | | | | | | | | |
6.88%, 8/15/2026(a) | | | 85,000 | | | | 88,719 | |
10.25%, 2/15/2027(a) | | | 445,000 | | | | 478,041 | |
| | |
KBR, Inc. | | | | | | | | |
4.75%, 9/30/2028(a) | | | 280,000 | | | | 286,464 | |
| | |
Korn Ferry | | | | | | | | |
4.63%, 12/15/2027(a) | | | 160,000 | | | | 165,200 | |
| | |
Science Applications International Corp. | | | | | | | | |
4.88%, 4/1/2028(a) | | | 220,000 | | | | 226,875 | |
| | | | | | | | 3,006,892 | |
|
| Real Estate Management & Development – 1.0% | |
| | |
Cushman & Wakefield US Borrower LLC | | | | | | | | |
6.75%, 5/15/2028(a) | | | 435,000 | | | | 464,906 | |
See Accompanying Notes to the Financial Statements.
| | | | |
| 416 | | FLEXSHARES ANNUAL REPORT | | |
FlexShares® High Yield Value-Scored Bond Index Fund (cont.)
| | | | | | | | |
| Investments | | Principal
Amount | | | Value | |
|
| CORPORATE BONDS – (continued) | |
|
| Real Estate Management & Development – (continued) | |
| | |
Forestar Group, Inc. | | | | | | | | |
3.85%, 5/15/2026(a) | | $ | 321,000 | | | $ | 321,400 | |
5.00%, 3/1/2028(a) | | | 150,000 | | | | 154,191 | |
| | |
Howard Hughes Corp. (The) | | | | | | | | |
5.38%, 8/1/2028(a) | | | 725,000 | | | | 761,250 | |
4.13%, 2/1/2029(a) | | | 200,000 | | | | 200,464 | |
| | |
Hunt Cos., Inc. | | | | | | | | |
5.25%, 4/15/2029(a) | | | 955,000 | | | | 937,094 | |
| | |
Kennedy-Wilson, Inc. | | | | | | | | |
4.75%, 3/1/2029 | | | 800,000 | | | | 817,000 | |
5.00%, 3/1/2031 | | | 150,000 | | | | 153,562 | |
| | |
Realogy Group LLC | | | | | | | | |
5.75%, 1/15/2029(a) | | | 700,000 | | | | 726,250 | |
| | |
WeWork Cos., Inc. | | | | | | | | |
7.88%, 5/1/2025(a) | | | 985,000 | | | | 999,568 | |
| | | | | | | | 5,535,685 | |
|
| Road & Rail – 0.9% | |
| | |
Carriage Purchaser, Inc. | | | | | | | | |
7.88%, 10/15/2029(a) | | | 535,000 | | | | 532,601 | |
| | |
First Student Bidco, Inc. | | | | | | | | |
4.00%, 7/31/2029(a) | | | 120,000 | | | | 117,450 | |
| | |
NESCO Holdings II, Inc. | | | | | | | | |
5.50%, 4/15/2029(a) | | | 1,475,000 | | | | 1,495,281 | |
| | |
Uber Technologies, Inc. | | | | | | | | |
7.50%, 5/15/2025(a) | | | 842,000 | | | | 898,599 | |
7.50%, 9/15/2027(a) | | | 1,095,000 | | | | 1,199,135 | |
6.25%, 1/15/2028(a) | | | 525,000 | | | | 564,401 | |
4.50%, 8/15/2029(a) | | | 215,000 | | | | 216,785 | |
| | |
Watco Cos. LLC | | | | | | | | |
6.50%, 6/15/2027(a) | | | 355,000 | | | | 377,631 | |
| | | | | | | | 5,401,883 | |
|
| Software – 1.7% | |
| | |
ACI Worldwide, Inc. | | | | | | | | |
5.75%, 8/15/2026(a) | | | 100,000 | | | | 104,625 | |
| | |
Change Healthcare Holdings LLC | | | | | | | | |
5.75%, 3/1/2025(a) | | | 740,000 | | | | 746,475 | |
| | |
Clarivate Science Holdings Corp. | | | | | | | | |
4.88%, 7/1/2029(a) | | | 1,615,000 | | | | 1,610,074 | |
| | |
Consensus Cloud Solutions, Inc. | | | | | | | | |
6.00%, 10/15/2026(a) | | | 320,000 | | | | 326,800 | |
6.50%, 10/15/2028(a) | | | 875,000 | | | | 912,187 | |
| | | | | | | | |
| Investments | | Principal
Amount | | | Value | |
|
| Software – (continued) | |
| | |
Elastic NV | | | | | | | | |
4.13%, 7/15/2029(a) | | $ | 95,000 | | | $ | 94,633 | |
| | |
Helios Software Holdings, Inc. | | | | | | | | |
4.63%, 5/1/2028(a) | | | 540,000 | | | | 533,925 | |
| | |
LogMeIn, Inc. | | | | | | | | |
5.50%, 9/1/2027(a) | | | 1,000,000 | | | | 1,002,140 | |
| | |
NortonLifeLock, Inc. | | | | | | | | |
5.00%, 4/15/2025(a) | | | 795,000 | | | | 801,956 | |
| | |
Open Text Corp. | | | | | | | | |
5.88%, 6/1/2026(a) | | | 665,000 | | | | 687,444 | |
3.88%, 2/15/2028(a) | | | 250,000 | | | | 252,187 | |
| | |
Open Text Holdings, Inc. | | | | | | | | |
4.13%, 2/15/2030(a) | | | 210,000 | | | | 213,749 | |
| | |
PTC, Inc. | | | | | | | | |
3.63%, 2/15/2025(a) | | | 200,000 | | | | 203,505 | |
| | |
Rocket Software, Inc. | | | | | | | | |
6.50%, 2/15/2029(a) | | | 1,290,000 | | | | 1,234,111 | |
| | |
SS&C Technologies, Inc. | | | | | | | | |
5.50%, 9/30/2027(a) | | | 1,225,000 | | | | 1,290,844 | |
| | | | | | | | 10,014,655 | |
|
| Specialty Retail – 4.5% | |
| | |
99 Escrow Issuer, Inc. | | | | | | | | |
7.50%, 1/15/2026(a) | | | 450,000 | | | | 405,700 | |
| | |
AAG FH LP | | | | | | | | |
9.75%, 7/15/2024(a) | | | 100,000 | | | | 99,319 | |
| | |
Academy Ltd. | | | | | | | | |
6.00%, 11/15/2027(a) | | | 240,000 | | | | 255,900 | |
| | |
Ambience Merger Sub, Inc. | | | | | | | | |
7.13%, 7/15/2029(a) | | | 955,000 | | | | 921,771 | |
| | |
BCPE Ulysses Intermediate, Inc. | | | | | | | | |
7.75%, 4/1/2027(a)(b) | | | 760,000 | | | | 733,693 | |
| | |
Carvana Co. | | | | | | | | |
5.63%, 10/1/2025(a) | | | 335,000 | | | | 342,537 | |
5.50%, 4/15/2027(a) | | | 920,000 | | | | 928,050 | |
5.88%, 10/1/2028(a) | | | 1,470,000 | | | | 1,497,562 | |
4.88%, 9/1/2029(a) | | | 1,310,000 | | | | 1,269,063 | |
| | |
eG Global Finance plc | | | | | | | | |
6.75%, 2/7/2025(a) | | | 585,000 | | | | 599,625 | |
| | |
Ken Garff Automotive LLC | | | | | | | | |
4.88%, 9/15/2028(a) | | | 265,000 | | | | 268,644 | |
| | |
LBM Acquisition LLC | | | | | | | | |
6.25%, 1/15/2029(a) | | | 1,280,000 | | | | 1,245,050 | |
See Accompanying Notes to the Financial Statements.
| | | | | | |
| | FLEXSHARES ANNUAL REPORT | | | 417 | |
FlexShares® High Yield Value-Scored Bond Index Fund (cont.)
| | | | | | | | |
| Investments | | Principal
Amount | | | Value | |
|
| CORPORATE BONDS – (continued) | |
|
| Specialty Retail – (continued) | |
| | |
LCM Investments Holdings II LLC | | | | | | | | |
4.88%, 5/1/2029(a) | | $ | 75,000 | | | $ | 77,105 | |
| | |
LSF9 Atlantis Holdings LLC | | | | | | | | |
7.75%, 2/15/2026(a) | | | 1,170,000 | | | | 1,187,755 | |
| | |
Michaels Cos., Inc. (The) | | | | | | | | |
5.25%, 5/1/2028(a) | | | 1,280,000 | | | | 1,294,464 | |
7.88%, 5/1/2029(a) | | | 2,515,000 | | | | 2,543,897 | |
| | |
Murphy Oil USA, Inc. | | | | | | | | |
5.63%, 5/1/2027 | | | 85,000 | | | | 88,445 | |
3.75%, 2/15/2031(a) | | | 150,000 | | | | 147,750 | |
| | |
Park River Holdings, Inc. | | | | | | | | |
5.63%, 2/1/2029(a) | | | 765,000 | | | | 714,751 | |
6.75%, 8/1/2029(a) | | | 535,000 | | | | 525,148 | |
| | |
PetSmart, Inc. | | | | | | | | |
4.75%, 2/15/2028(a) | | | 500,000 | | | | 514,375 | |
7.75%, 2/15/2029(a) | | | 1,225,000 | | | | 1,325,413 | |
| | |
Rent-A-Center, Inc. | | | | | | | | |
6.38%, 2/15/2029(a) | | | 740,000 | | | | 774,225 | |
| | |
Sally Holdings LLC | | | | | | | | |
5.63%, 12/1/2025 | | | 305,000 | | | | 311,481 | |
| | |
Sonic Automotive, Inc. | | | | | | | | |
4.63%, 11/15/2029(a) | | | 150,000 | | | | 150,623 | |
4.88%, 11/15/2031(a) | | | 150,000 | | | | 150,562 | |
| | |
SRS Distribution, Inc. | | | | | | | | |
4.63%, 7/1/2028(a) | | | 115,000 | | | | 117,708 | |
6.13%, 7/1/2029(a) | | | 880,000 | | | | 906,400 | |
| | |
Staples, Inc. | | | | | | | | |
7.50%, 4/15/2026(a) | | | 3,320,000 | | | | 3,358,113 | |
10.75%, 4/15/2027(a) | | | 1,993,000 | | | | 1,906,534 | |
| | |
White Cap Buyer LLC | | | | | | | | |
6.88%, 10/15/2028(a) | | | 1,350,000 | | | | 1,392,066 | |
| | | | | | | | 26,053,729 | |
|
| Technology Hardware, Storage & Peripherals – 0.6% | |
| | |
Dell International LLC | | | | | | | | |
7.13%, 6/15/2024(a) | | | 1,195,000 | | | | 1,216,390 | |
| | |
Diebold Nixdorf, Inc. | | | | | | | | |
9.38%, 7/15/2025(a) | | | 330,000 | | | | 355,987 | |
| | |
Seagate HDD Cayman | | | | | | | | |
5.75%, 12/1/2034 | | | 50,000 | | | | 57,637 | |
| | |
Xerox Corp. | | | | | | | | |
6.75%, 12/15/2039 | | | 75,000 | | | | 81,702 | |
| | | | | | | | |
| Investments | | Principal
Amount | | | Value | |
|
| Technology Hardware, Storage & Peripherals – (continued) | |
| | |
Xerox Holdings Corp. | | | | | | | | |
5.00%, 8/15/2025(a) | | $ | 865,000 | | | $ | 899,600 | |
5.50%, 8/15/2028(a) | | | 1,130,000 | | | | 1,144,133 | |
| | | | | | | | 3,755,449 | |
|
| Textiles, Apparel & Luxury Goods – 0.3% | |
| | |
Crocs, Inc. | | | | | | | | |
4.25%, 3/15/2029(a) | | | 240,000 | | | | 243,300 | |
| | |
Eagle Intermediate Global Holding BV | | | | | | | | |
7.50%, 5/1/2025(a) | | | 1,100,000 | | | | 1,057,837 | |
| | |
G-III Apparel Group Ltd. | | | | | | | | |
7.88%, 8/15/2025(a) | | | 95,000 | | | | 101,412 | |
| | |
William Carter Co. (The) | | | | | | | | |
5.50%, 5/15/2025(a) | | | 145,000 | | | | 151,888 | |
5.63%, 3/15/2027(a) | | | 350,000 | | | | 362,687 | |
| | | | | | | | 1,917,124 | |
|
| Thrifts & Mortgage Finance – 1.9% | |
| | |
Freedom Mortgage Corp. | | | | | | | | |
7.63%, 5/1/2026(a) | | | 1,295,000 | | | | 1,264,924 | |
6.63%, 1/15/2027(a) | | | 1,085,000 | | | | 1,029,806 | |
| | |
Home Point Capital, Inc. | | | | | | | | |
5.00%, 2/1/2026(a) | | | 1,005,000 | | | | 904,947 | |
| |
Ladder Capital Finance Holdings LLLP | | | | | |
REIT, 5.25%, 10/1/2025(a) | | | 235,000 | | | | 237,056 | |
REIT, 4.25%, 2/1/2027(a) | | | 815,000 | | | | 820,216 | |
REIT, 4.75%, 6/15/2029(a) | | | 65,000 | | | | 65,569 | |
| | |
Nationstar Mortgage Holdings, Inc. | | | | | | | | |
5.50%, 8/15/2028(a) | | | 1,270,000 | | | | 1,300,207 | |
5.13%, 12/15/2030(a) | | | 230,000 | | | | 232,124 | |
| | |
PennyMac Financial Services, Inc. | | | | | | | | |
5.38%, 10/15/2025(a) | | | 510,000 | | | | 526,575 | |
4.25%, 2/15/2029(a) | | | 1,120,000 | | | | 1,057,000 | |
5.75%, 9/15/2031(a) | | | 1,030,000 | | | | 1,014,550 | |
| | |
Provident Funding Associates LP | | | | | | | | |
6.38%, 6/15/2025(a) | | | 180,000 | | | | 181,125 | |
| | |
Rocket Mortgage LLC | | | | | | | | |
3.88%, 3/1/2031(a) | | | 350,000 | | | | 346,175 | |
| | |
United Wholesale Mortgage LLC | | | | | | | | |
5.50%, 11/15/2025(a) | | | 660,000 | | | | 657,637 | |
5.50%, 4/15/2029(a) | | | 1,615,000 | | | | 1,572,606 | |
| | | | | | | | 11,210,517 | |
See Accompanying Notes to the Financial Statements.
| | | | |
| 418 | | FLEXSHARES ANNUAL REPORT | | |
��
FlexShares® High Yield Value-Scored Bond Index Fund (cont.)
| | | | | | | | |
| Investments | | Principal
Amount | | | Value | |
|
| CORPORATE BONDS – (continued) | |
|
| Tobacco – 0.4% | |
| | |
Turning Point Brands, Inc. | | | | | | | | |
5.63%, 2/15/2026(a) | | $ | 155,000 | | | $ | 157,329 | |
| | |
Vector Group Ltd. | | | | | | | | |
10.50%, 11/1/2026(a) | | | 795,000 | | | | 840,373 | |
5.75%, 2/1/2029(a) | | | 1,375,000 | | | | 1,369,844 | |
| | | | | | | | 2,367,546 | |
|
| Trading Companies & Distributors – 1.0% | |
| | |
Alta Equipment Group, Inc. | | | | | | | | |
5.63%, 4/15/2026(a) | | | 285,000 | | | | 292,186 | |
| | |
Beacon Roofing Supply, Inc. | | | | | | | | |
4.13%, 5/15/2029(a) | | | 200,000 | | | | 197,000 | |
| | |
BlueLinx Holdings, Inc. | | | | | | | | |
6.00%, 11/15/2029(a) | | | 535,000 | | | | 523,374 | |
| | |
Brightstar Escrow Corp. | | | | | | | | |
9.75%, 10/15/2025(a) | | | 480,000 | | | | 514,200 | |
| | |
Fortress Transportation & Infrastructure Investors LLC | | | | | | | | |
6.50%, 10/1/2025(a) | | | 895,000 | | | | 922,119 | |
| | |
Fortress Transportation and Infrastructure Investors LLC | | | | | | | | |
9.75%, 8/1/2027(a) | | | 450,000 | | | | 507,375 | |
5.50%, 5/1/2028(a) | | | 1,755,000 | | | | 1,761,581 | |
| | |
Foundation Building Materials, Inc. | | | | | | | | |
6.00%, 3/1/2029(a) | | | 525,000 | | | | 507,444 | |
| | |
Imola Merger Corp. | | | | | | | | |
4.75%, 5/15/2029(a) | | | 580,000 | | | | 596,646 | |
| | | | | | | | 5,821,925 | |
|
| Transportation Infrastructure – 0.1% | |
| | |
North Queensland Export Terminal Pty. Ltd. | | | | | | | | |
4.45%, 12/15/2022(a) | | | 315,000 | | | | 304,760 | |
|
| Water Utilities – 0.1% | |
| | |
Solaris Midstream Holdings LLC | | | | | | | | |
7.63%, 4/1/2026(a) | | | 415,000 | | | | 438,219 | |
|
| Wireless Telecommunication Services – 0.9% | |
| | |
C&W Senior Financing DAC | | | | | | | | |
6.88%, 9/15/2027(a) | | | 720,000 | | | | 759,600 | |
| | |
Connect Finco SARL | | | | | | | | |
6.75%, 10/1/2026(a) | | | 1,795,000 | | | | 1,864,951 | |
| | | | | | | | |
| Investments | | Principal
Amount | | | Value | |
|
| Wireless Telecommunication Services – (continued) | |
| | |
Vmed O2 UK Financing I plc | | | | | | | | |
4.25%, 1/31/2031(a) | | $ | 1,786,000 | | | $ | 1,741,270 | |
4.75%, 7/15/2031(a) | | | 260,000 | | | | 261,625 | |
| | |
Vodafone Group plc | | | | | | | | |
7.00%, 4/4/2079(c) | | | 240,000 | | | | 290,497 | |
| | | | | | | | 4,917,943 | |
Total Corporate Bonds
(Cost $567,263,925) | | | | 567,330,700 | |
| | | Shares | | | | |
|
| COMMON STOCKS – 0.0%(f) | |
|
| Oil, Gas & Consumable Fuels – 0.0%(f) | |
| | |
Whiting Petroleum Corp.*
(Cost $31) | | | 1 | | | | 49 | |
Total Investments – 98.6%
(Cost $567,263,956) | | | | 567,330,749 | |
| |
Other assets less liabilities – 1.4% | | | | 7,852,951 | |
| NET ASSETS – 100.0% | | | $ | 575,183,700 | |
| * | Non-income producing security. |
| (a) | Securities exempt from registration under Rule 144A of the Securities Act of 1933. These securities may be resold in transactions exempt from registration, normally to qualified institutional buyers. The value of these securities is determined by valuations supplied by a pricing service or brokers, or, if not available, in accordance with procedures established by the Board of Trustees. |
| (b) | Payment in-kind security. |
| (c) | Security issued at a fixed coupon rate, which converts to a variable rate at a future date. Rate shown is the rate in effect as of period end. |
| (d) | Step bond. Interest rate is a fixed rate for an initial period that either resets at a specific date or may reset in the future at a contingent upon predetermined trigger. The interest rate shown was the current rate as of October 31, 2021. |
| (e) | Security fair valued as of October 31, 2021 in accordance with procedures approved by the Board of Trustees. Total value of all such securities at October 31, 2021 amounted to $202,727, which represents approximately 0.04% of net assets of the Fund. |
| (f) | Represents less than 0.05% of net assets. |
Percentages shown are based on Net Assets.
Abbreviations
SCA – Limited partnership with share capital
See Accompanying Notes to the Financial Statements.
| | | | | | |
| | FLEXSHARES ANNUAL REPORT | | | 419 | |
FlexShares® High Yield Value-Scored Bond Index Fund (cont.)
As of October 31, 2021, the gross unrealized appreciation (depreciation) of investments based on the aggregate cost of investments (including derivative instruments, if applicable) for federal income tax purposes was as follows:
| | | | |
| | | | |
Aggregate gross unrealized appreciation | | $ | 4,738,248 | |
Aggregate gross unrealized depreciation | | | (5,542,267 | ) |
Net unrealized depreciation | | $ | (804,019 | ) |
Federal income tax cost | | $ | 568,134,768 | |
| | | | |
| Security Type | | % of Net Assets | |
Corporate Bonds | | | 98.6 | % |
Common Stocks | | | 0.0 | † |
Others(1) | | | 1.4 | |
| | | | 100.0 | % |
| † | Amount represents less than 0.05%. |
| (1) | Includes any other net assets/(liabilities). |
See Accompanying Notes to the Financial Statements.
| | | | |
| 420 | | FLEXSHARES ANNUAL REPORT | | |
Schedule of Investments
FlexShares® ESG & Climate High Yield Corporate Core Index Fund
October 31, 2021
| | | | | | | | |
| Investments | | Principal
Amount | | | Value | |
|
| CORPORATE BONDS – 98.1% | |
|
| Aerospace & Defense – 0.8% | |
| | |
Bombardier, Inc. | | | | | | | | |
7.50%, 3/15/2025(a) | | $ | 175,000 | | | $ | 179,858 | |
7.13%, 6/15/2026(a) | | | 100,000 | | | | 104,995 | |
7.88%, 4/15/2027(a) | | | 125,000 | | | | 130,116 | |
| | | | | | | | 414,969 | |
|
| Airlines – 2.1% | |
| | |
American Airlines Group, Inc. | | | | | | | | |
3.75%, 3/1/2025(a) | | | 40,000 | | | | 36,592 | |
| | |
American Airlines, Inc. | | | | | | | | |
11.75%, 7/15/2025(a) | | | 195,000 | | | | 241,800 | |
5.50%, 4/20/2026(a) | | | 270,000 | | | | 283,494 | |
5.75%, 4/20/2029(a) | | | 230,000 | | | | 247,825 | |
| | |
Delta Air Lines, Inc. | | | | | | | | |
7.38%, 1/15/2026 | | | 90,000 | | | | 105,893 | |
| | |
United Airlines, Inc. | | | | | | | | |
4.38%, 4/15/2026(a) | | | 50,000 | | | | 51,786 | |
4.63%, 4/15/2029(a) | | | 50,000 | | | | 51,611 | |
| | | | | | | | 1,019,001 | |
|
| Auto Components – 1.9% | |
| | |
Dealer Tire LLC | | | | | | | | |
8.00%, 2/1/2028(a) | | | 30,000 | | | | 31,248 | |
| | |
Goodyear Tire & Rubber Co. (The) | | | | | | | | |
5.00%, 5/31/2026 | | | 150,000 | | | | 153,750 | |
5.25%, 4/30/2031 | | | 125,000 | | | | 133,918 | |
5.63%, 4/30/2033 | | | 85,000 | | | | 91,481 | |
| | |
Icahn Enterprises LP | | | | | | | | |
6.38%, 12/15/2025 | | | 60,000 | | | | 61,275 | |
6.25%, 5/15/2026 | | | 70,000 | | | | 73,413 | |
| | |
IHO Verwaltungs GmbH | | | | | | | | |
6.00%, 5/15/2027(a)(b) | | | 200,000 | | | | 207,750 | |
| | |
Real Hero Merger Sub 2, Inc. | | | | | | | | |
6.25%, 2/1/2029(a) | | | 35,000 | | | | 36,006 | |
| | |
Tenneco, Inc. | | | | | | | | |
5.13%, 4/15/2029(a) | | | 100,000 | | | | 99,250 | |
| | |
Wheel Pros, Inc. | | | | | | | | |
6.50%, 5/15/2029(a) | | | 50,000 | | | | 48,772 | |
| | | | | | | | 936,863 | |
| | | | | | | | |
| Investments | | Principal
Amount | | | Value | |
|
| Automobiles – 1.0% | |
| | |
Ford Motor Co. | | | | | | | | |
9.00%, 4/22/2025 | | $ | 200,000 | | | $ | 240,750 | |
7.45%, 7/16/2031 | | | 135,000 | | | | 178,875 | |
5.29%, 12/8/2046 | | | 60,000 | | | | 69,078 | |
| | | | | | | | 488,703 | |
|
| Banks – 1.1% | |
| | |
Goldman Sachs Capital I | | | | | | | | |
6.35%, 2/15/2034 | | | 70,000 | | | | 97,076 | |
| | |
Intesa Sanpaolo SpA | | | | | | | | |
5.02%, 6/26/2024(a) | | | 75,000 | | | | 80,442 | |
4.95%, 6/1/2042(a) | | | 50,000 | | | | 51,633 | |
| | |
UniCredit SpA | | | | | | | | |
5.86%, 6/19/2032(a)(c) | | | 150,000 | | | | 165,692 | |
5.46%, 6/30/2035(a)(c) | | | 150,000 | | | | 164,291 | |
| | | | | | | | 559,134 | |
|
| Beverages – 0.1% | |
| | |
Primo Water Holdings, Inc. | | | | | | | | |
4.38%, 4/30/2029(a) | | | 60,000 | | | | 59,539 | |
|
| Biotechnology – 0.1% | |
| | |
Grifols Escrow Issuer SA | | | | | | | | |
4.75%, 10/15/2028(a) | | | 60,000 | | | | 60,975 | |
|
| Building Products – 0.4% | |
| | |
New Enterprise Stone & Lime Co., Inc. | | | | | | | | |
9.75%, 7/15/2028(a) | | | 10,000 | | | | 10,742 | |
| | |
SRM Escrow Issuer LLC | | | | | | | | |
6.00%, 11/1/2028(a) | | | 60,000 | | | | 62,475 | |
| | |
Standard Industries, Inc. | | | | | | | | |
4.75%, 1/15/2028(a) | | | 100,000 | | | | 103,250 | |
| | | | | | | | 176,467 | |
|
| Capital Markets – 1.8% | |
| | |
Advisor Group Holdings, Inc. | | | | | | | | |
10.75%, 8/1/2027(a) | | | 25,000 | | | | 27,852 | |
| | |
AG Issuer LLC | | | | | | | | |
6.25%, 3/1/2028(a) | | | 15,000 | | | | 15,656 | |
| | |
Aretec Escrow Issuer, Inc. | | | | | | | | |
7.50%, 4/1/2029(a) | | | 25,000 | | | | 25,984 | |
See Accompanying Notes to the Financial Statements.
| | | | | | |
| | FLEXSHARES ANNUAL REPORT | | | 421 | |
FlexShares® ESG & Climate High Yield Corporate Core Index Fund (cont.)
| | | | | | | | |
| Investments | | Principal
Amount | | | Value | |
|
| CORPORATE BONDS – (continued) | |
|
| Capital Markets – (continued) | |
| | |
Deutsche Bank AG | | | | | | | | |
4.50%, 4/1/2025 | | $ | 200,000 | | | $ | 214,714 | |
3.73%, 1/14/2032(c) | | | 200,000 | | | | 205,290 | |
| | |
Dresdner Funding Trust | | | | | | | | |
I 8.15%, 6/30/2031(a) | | | 100,000 | | | | 141,870 | |
| | |
MSCI, Inc. | | | | | | | | |
4.00%, 11/15/2029(a) | | | 125,000 | | | | 130,937 | |
3.88%, 2/15/2031(a) | | | 150,000 | | | | 154,944 | |
| | | | | | | | 917,247 | |
|
| Chemicals – 1.3% | |
| | |
Avient Corp. | | | | | | | | |
5.75%, 5/15/2025(a) | | | 70,000 | | | | 73,238 | |
| | |
Axalta Coating Systems | | | | | | | | |
LLC 3.38%, 2/15/2029(a) | | | 150,000 | | | | 143,222 | |
| | |
Chemours Co. (The) | | | | | | | | |
5.75%, 11/15/2028(a) | | | 35,000 | | | | 36,006 | |
| | |
Cornerstone Chemical Co. | | | | | | | | |
6.75%, 8/15/2024(a) | | | 50,000 | | | | 45,119 | |
| | |
CVR Partners LP | | | | | | | | |
6.13%, 6/15/2028(a) | | | 30,000 | | | | 31,088 | |
| | |
Gates Global LLC | | | | | | | | |
6.25%, 1/15/2026(a) | | | 45,000 | | | | 46,575 | |
| | |
GPD Cos., Inc. | | | | | | | | |
10.13%, 4/1/2026(a) | | | 30,000 | | | | 32,137 | |
| | |
Illuminate Buyer LLC | | | | | | | | |
9.00%, 7/1/2028(a) | | | 25,000 | | | | 27,037 | |
| | |
Methanex Corp. | | | | | | | | |
5.25%, 12/15/2029 | | | 30,000 | | | | 31,837 | |
| | |
SCIH Salt Holdings, Inc. | | | | | | | | |
6.63%, 5/1/2029(a) | | | 40,000 | | | | 37,714 | |
| | |
TPC Group, Inc. | | | | | | | | |
10.50%, 8/1/2024(a) | | | 60,000 | | | | 54,694 | |
| | |
Valvoline, Inc. | | | | | | | | |
4.25%, 2/15/2030(a) | | | 80,000 | | | | 81,787 | |
| | |
Venator Finance Sarl | | | | | | | | |
5.75%, 7/15/2025(a) | | | 25,000 | | | | 23,399 | |
| | | | | | | | 663,853 | |
|
| Commercial Services & Supplies – 2.4% | |
| | |
Allied Universal Holdco LLC | | | | | | | | |
6.63%, 7/15/2026(a) | | | 175,000 | | | | 184,231 | |
6.00%, 6/1/2029(a) | | | 150,000 | | | | 148,054 | |
| | | | | | | | |
| Investments | | Principal
Amount | | | Value | |
|
| Commercial Services & Supplies – (continued) | |
| | |
Aptim Corp. | | | | | | | | |
7.75%, 6/15/2025(a) | | $ | 30,000 | | | $ | 24,488 | |
| | |
APX Group, Inc. | | | | | | | | |
6.75%, 2/15/2027(a) | | | 35,000 | | | | 36,969 | |
5.75%, 7/15/2029(a) | | | 65,000 | | | | 64,512 | |
| | |
Aramark Services, Inc. | | | | | | | | |
6.38%, 5/1/2025(a) | | | 100,000 | | | | 105,364 | |
5.00%, 2/1/2028(a) | | | 65,000 | | | | 66,544 | |
| | |
Garda World Security Corp. | | | | | | | | |
4.63%, 2/15/2027(a) | | | 20,000 | | | | 19,826 | |
9.50%, 11/1/2027(a) | | | 70,000 | | | | 75,687 | |
6.00%, 6/1/2029(a) | | | 30,000 | | | | 29,372 | |
| | |
GFL Environmental, Inc. | | | | | | | | |
5.13%, 12/15/2026(a) | | | 30,000 | | | | 31,387 | |
| | |
Interface, Inc. | | | | | | | | |
5.50%, 12/1/2028(a) | | | 50,000 | | | | 51,939 | |
| | |
Intrado Corp. | | | | | | | | |
8.50%, 10/15/2025(a) | | | 40,000 | | | | 39,467 | |
| | |
Nielsen Finance LLC | | | | | | | | |
5.63%, 10/1/2028(a) | | | 150,000 | | | | 156,148 | |
5.88%, 10/1/2030(a) | | | 60,000 | | | | 62,883 | |
4.75%, 7/15/2031(a) | | | 75,000 | | | | 73,189 | |
| | |
WASH Multifamily Acquisition, Inc. | | | | | | | | |
5.75%, 4/15/2026(a) | | | 45,000 | | | | 46,575 | |
| | | | | | | | 1,216,635 | |
|
| Communications Equipment – 0.8% | |
| | |
CommScope Technologies LLC | | | | | | | | |
5.00%, 3/15/2027(a) | | | 100,000 | | | | 92,986 | |
| | |
CommScope, Inc. | | | | | | | | |
6.00%, 3/1/2026(a) | | | 100,000 | | | | 103,125 | |
8.25%, 3/1/2027(a) | | | 125,000 | | | | 127,544 | |
4.75%, 9/1/2029(a) | | | 50,000 | | | | 49,122 | |
| | | | | | | | 372,777 | |
|
| Construction & Engineering – 0.6% | |
| | |
AECOM | | | | | | | | |
5.13%, 3/15/2027 | | | 75,000 | | | | 82,875 | |
| | |
Artera Services LLC | | | | | | | | |
9.03%, 12/4/2025(a) | | | 55,000 | | | | 58,795 | |
| | |
Brand Industrial Services, Inc. | | | | | | | | |
8.50%, 7/15/2025(a) | | | 55,000 | | | | 54,735 | |
| | |
Cellnex Finance Co. SA | | | | | | | | |
3.88%, 7/7/2041(a) | | | 50,000 | | | | 48,952 | |
See Accompanying Notes to the Financial Statements.
| | | | |
| 422 | | FLEXSHARES ANNUAL REPORT | | |
FlexShares® ESG & Climate High Yield Corporate Core Index Fund (cont.)
| | | | | | | | |
| Investments | | Principal
Amount | | | Value | |
|
| CORPORATE BONDS – (continued) | |
|
| Construction & Engineering – (continued) | |
| | |
Pike Corp. | | | | | | | | |
5.50%, 9/1/2028(a) | | $ | 30,000 | | | $ | 30,562 | |
| | | | | | | | 275,919 | |
|
| Consumer Finance – 2.9% | |
| | |
Finance of America Funding LLC | | | | | | | | |
7.88%, 11/15/2025(a) | | | 25,000 | | | | 24,107 | |
| | |
Ford Motor Credit Co. LLC | | | | | | | | |
5.13%, 6/16/2025 | | | 300,000 | | | | 325,874 | |
3.38%, 11/13/2025 | | | 275,000 | | | | 282,838 | |
4.00%, 11/13/2030 | | | 100,000 | | | | 104,500 | |
| | |
OneMain Finance Corp. | | | | | | | | |
5.63%, 3/15/2023 | | | 100,000 | | | | 105,297 | |
6.13%, 3/15/2024 | | | 150,000 | | | | 159,750 | |
6.88%, 3/15/2025 | | | 225,000 | | | | 251,437 | |
3.50%, 1/15/2027 | | | 100,000 | | | | 97,875 | |
4.00%, 9/15/2030 | | | 100,000 | | | | 97,256 | |
| | | | | | | | 1,448,934 | |
|
| Containers & Packaging – 1.1% | |
| | |
Cascades, Inc. | | | | | | | | |
5.38%, 1/15/2028(a) | | | 60,000 | | | | 62,850 | |
| | |
Crown Americas LLC | | | | | | | | |
4.75%, 2/1/2026 | | | 125,000 | | | | 128,944 | |
4.25%, 9/30/2026 | | | 75,000 | | | | 80,016 | |
| | |
Graphic Packaging International LLC | | | | | | | | |
4.13%, 8/15/2024 | | | 60,000 | | | | 63,485 | |
3.50%, 3/1/2029(a) | | | 60,000 | | | | 59,475 | |
| | |
Sealed Air Corp. | | | | | | | | |
5.25%, 4/1/2023(a) | | | 50,000 | | | | 52,337 | |
4.00%, 12/1/2027(a) | | | 90,000 | | | | 94,168 | |
| | | | | | | | 541,275 | |
|
| Distributors – 0.2% | |
| | |
American Builders & Contractors Supply Co., Inc. | | | | | | | | |
4.00%, 1/15/2028(a) | | | 40,000 | | | | 40,600 | |
3.88%, 11/15/2029(a) | | | 20,000 | | | | 19,700 | |
| | |
BCPE Empire Holdings, Inc. | | | | | | | | |
7.63%, 5/1/2027(a) | | | 35,000 | | | | 34,708 | |
| | | | | | | | 95,008 | |
| | | | | | | | |
| Investments | | Principal
Amount | | | Value | |
|
| Diversified Consumer Services – 0.7% | |
| | |
Adtalem Global Education, Inc. | | | | | | | | |
5.50%, 3/1/2028(a) | | $ | 60,000 | | | $ | 60,675 | |
| | |
Service Corp. International | | | | | | | | |
4.63%, 12/15/2027 | | | 75,000 | | | | 78,750 | |
3.38%, 8/15/2030 | | | 150,000 | | | | 147,833 | |
| | |
Signal Parent, Inc. | | | | | | | | |
6.13%, 4/1/2029(a) | | | 20,000 | | | | 18,636 | |
| | |
Sotheby’s | | | | | | | | |
7.38%, 10/15/2027(a) | | | 50,000 | | | | 52,872 | |
| | | | | | | | 358,766 | |
|
| Diversified Financial Services – 0.4% | |
| | |
Armor Holdco, Inc. | | | | | | | | |
8.50%, 11/15/2029(a)(d) | | | 25,000 | | | | 25,341 | |
| | |
CPI CG, Inc. | | | | | | | | |
8.63%, 3/15/2026(a) | | | 50,000 | | | | 54,063 | |
| | |
Sabre GLBL, Inc. | | | | | | | | |
9.25%, 4/15/2025(a) | | | 50,000 | | | | 57,783 | |
7.38%, 9/1/2025(a) | | | 50,000 | | | | 53,187 | |
| | | | | | | | 190,374 | |
|
| Diversified Telecommunication Services – 5.3% | |
| | |
Altice France SA | | | | | | | | |
5.13%, 7/15/2029(a) | | | 105,000 | | | | 102,394 | |
| | |
CCO Holdings LLC | | | | | | | | |
5.13%, 5/1/2027(a) | | | 250,000 | | | | 259,375 | |
5.00%, 2/1/2028(a) | | | 100,000 | | | | 104,125 | |
4.50%, 8/15/2030(a) | | | 125,000 | | | | 127,344 | |
4.50%, 5/1/2032 | | | 300,000 | | | | 301,801 | |
| | |
Iliad Holding SAS | | | | | | | | |
6.50%, 10/15/2026(a) | | | 60,000 | | | | 61,887 | |
7.00%, 10/15/2028(a) | | | 50,000 | | | | 51,602 | |
| | |
Level 3 Financing, Inc. | | | | | | | | |
5.38%, 5/1/2025 | | | 60,000 | | | | 61,485 | |
4.63%, 9/15/2027(a) | | | 150,000 | | | | 153,938 | |
| | |
Lumen Technologies, Inc. | | | | | | | | |
5.63%, 4/1/2025 | | | 50,000 | | | | 53,750 | |
5.13%, 12/15/2026(a) | | | 175,000 | | | | 179,284 | |
4.00%, 2/15/2027(a) | | | 150,000 | | | | 150,946 | |
| | |
Sprint Capital Corp. | | | | | | | | |
6.88%, 11/15/2028 | | | 155,000 | | | | 196,445 | |
8.75%, 3/15/2032 | | | 125,000 | | | | 187,250 | |
| | |
Switch Ltd. | | | | | | | | |
3.75%, 9/15/2028(a) | | | 80,000 | | | | 79,700 | |
See Accompanying Notes to the Financial Statements.
| | | | | | |
| | FLEXSHARES ANNUAL REPORT | | | 423 | |
FlexShares® ESG & Climate High Yield Corporate Core Index Fund (cont.)
| | | | | | | | |
| Investments | | Principal
Amount | | | Value | |
|
| CORPORATE BONDS – (continued) | |
|
| Diversified Telecommunication Services – (continued) | |
| | |
Telecom Italia Capital SA | | | | | | | | |
6.38%, 11/15/2033 | | $ | 150,000 | | | $ | 172,291 | |
| | |
Telecom Italia SpA | | | | | | | | |
5.30%, 5/30/2024(a) | | | 100,000 | | | | 106,625 | |
| | |
Telesat Canada | | | | | | | | |
6.50%, 10/15/2027(a) | | | 25,000 | | | | 20,332 | |
| | |
Virgin Media Finance plc | | | | | | | | |
5.00%, 7/15/2030(a) | | | 175,000 | | | | 174,228 | |
| | |
Windstream Escrow LLC | | | | | | | | |
7.75%, 8/15/2028(a) | | | 80,000 | | | | 84,718 | |
| | | | | | | | 2,629,520 | |
|
| Electric Utilities – 0.4% | |
| |
FirstEnergy Corp. | | | | | |
Series B,
4.40%, 7/15/2027(e) | | | 90,000 | | | | 97,709 | |
Series C,
7.38%, 11/15/2031 | | | 50,000 | | | | 68,241 | |
Series C,
3.40%, 3/1/2050 | | | 45,000 | | | | 44,752 | |
| | | | | | | | 210,702 | |
|
| Electrical Equipment – 0.6% | |
| | |
Sensata Technologies BV | | | | | | | | |
5.00%, 10/1/2025(a) | | | 200,000 | | | | 219,334 | |
4.00%, 4/15/2029(a) | | | 90,000 | | | | 91,522 | |
| | | | | | | | 310,856 | |
|
| Energy Equipment & Services – 1.6% | |
| | |
Archrock Partners LP | | | | | | | | |
6.25%, 4/1/2028(a) | | | 100,000 | | | | 103,625 | |
| | |
CGG SA | | | | | | | | |
8.75%, 4/1/2027(a) | | | 50,000 | | | | 49,309 | |
| | |
Nine Energy Service, Inc. | | | | | | | | |
8.75%, 11/1/2023(a) | | | 20,000 | | | | 10,332 | |
| | |
Precision Drilling Corp. | | | | | | | | |
6.88%, 1/15/2029(a) | | | 45,000 | | | | 46,542 | |
| | |
TechnipFMC plc | | | | | | | | |
6.50%, 2/1/2026(a) | | | 85,000 | | | | 90,677 | |
| | |
Tervita Corp. | | | | | | | | |
11.00%, 12/1/2025(a) | | | 23,000 | | | | 26,480 | |
| | |
Transocean Guardian Ltd. | | | | | | | | |
5.88%, 1/15/2024(a) | | | 50,250 | | | | 49,078 | |
| | | | | | | | |
| Investments | | Principal
Amount | | | Value | |
|
| Energy Equipment & Services – (continued) | |
| | |
Transocean Poseidon Ltd. | | | | | | | | |
6.88%, 2/1/2027(a) | | $ | 100,000 | | | $ | 99,901 | |
| | |
Transocean, Inc. | | | | | | | | |
7.50%, 1/15/2026(a) | | | 95,000 | | | | 76,606 | |
11.50%, 1/30/2027(a) | | | 100,000 | | | | 102,171 | |
6.80%, 3/15/2038 | | | 30,000 | | | | 18,000 | |
| | |
USA Compression Partners LP | | | | | | | | |
6.88%, 4/1/2026 | | | 90,000 | | | | 93,150 | |
| | |
Valaris Ltd. | | | | | | | | |
8.25%, 4/30/2028(a)(b) | | | 30,000 | | | | 31,279 | |
| | |
Weatherford International Ltd. | | | | | | | | |
11.00%, 12/1/2024(a) | | | 17,000 | | | | 17,750 | |
| | | | | | | | 814,900 | |
|
| Entertainment – 0.3% | |
| | |
Allen Media LLC | | | | | | | | |
10.50%, 2/15/2028(a) | | | 20,000 | | | | 21,460 | |
| | |
Lions Gate Capital Holdings LLC | | | | | | | | |
5.50%, 4/15/2029(a) | | | 60,000 | | | | 61,425 | |
| | |
Netflix, Inc. | | | | | | | | |
5.88%, 11/15/2028 | | | 60,000 | | | | 73,123 | |
| | | | | | | | 156,008 | |
|
| Equity Real Estate Investment Trusts (REITs) – 3.8% | |
| | |
EPR Properties | | | | | | | | |
5.25%, 7/15/2023 | | | 40,000 | | | | 42,585 | |
3.75%, 8/15/2029 | | | 110,000 | | | | 113,098 | |
| | |
HAT Holdings I LLC | | | | | | | | |
3.38%, 6/15/2026(a) | | | 140,000 | | | | 138,952 | |
| | |
Iron Mountain, Inc. | | | | | | | | |
4.88%, 9/15/2027(a) | | | 100,000 | | | | 103,313 | |
4.88%, 9/15/2029(a) | | | 150,000 | | | | 155,443 | |
4.50%, 2/15/2031(a) | | | 125,000 | | | | 126,412 | |
| | |
MGM Growth Properties Operating Partnership LP | | | | | | | | |
3.88%, 2/15/2029(a) | | | 50,000 | | | | 53,014 | |
| | |
MPT Operating Partnership LP | | | | | | | | |
5.00%, 10/15/2027 | | | 150,000 | | | | 157,950 | |
3.50%, 3/15/2031 | | | 100,000 | | | | 100,895 | |
| | |
Park Intermediate Holdings LLC | | | | | | | | |
5.88%, 10/1/2028(a) | | | 60,000 | | | | 62,775 | |
4.88%, 5/15/2029(a) | | | 60,000 | | | | 60,826 | |
See Accompanying Notes to the Financial Statements.
| | | | |
| 424 | | FLEXSHARES ANNUAL REPORT | | |
FlexShares® ESG & Climate High Yield Corporate Core Index Fund (cont.)
| | | | | | | | |
| Investments | | Principal
Amount | | | Value | |
|
| CORPORATE BONDS – (continued) | |
|
| Equity Real Estate Investment Trusts (REITs) – (continued) | |
| | |
SBA Communications Corp. | | | | | | | | |
3.88%, 2/15/2027 | | $ | 200,000 | | | $ | 206,506 | |
3.13%, 2/1/2029(a) | | | 75,000 | | | | 72,094 | |
| | |
VICI Properties LP | | | | | | | | |
3.50%, 2/15/2025(a) | | | 100,000 | | | | 101,875 | |
4.25%, 12/1/2026(a) | | | 175,000 | | | | 181,946 | |
3.75%, 2/15/2027(a) | | | 80,000 | | | | 82,300 | |
4.13%, 8/15/2030(a) | | | 125,000 | | | | 131,406 | |
| | | | | | | | 1,891,390 | |
|
| Food & Staples Retailing – 0.6% | |
| | |
Rite Aid Corp. | | | | | | | | |
8.00%, 11/15/2026(a) | | | 125,000 | | | | 125,826 | |
| | |
United Natural Foods, Inc. | | | | | | | | |
6.75%, 10/15/2028(a) | | | 30,000 | | | | 32,513 | |
| | |
US Foods, Inc. | | | | | | | | |
6.25%, 4/15/2025(a) | | | 75,000 | | | | 78,469 | |
4.75%, 2/15/2029(a) | | | 70,000 | | | | 70,911 | |
| | | | | | | | 307,719 | |
|
| Food Products – 3.7% | |
| | |
JBS USA LUX SA | | | | | | | | |
6.50%, 4/15/2029(a) | | | 45,000 | | | | 49,838 | |
5.50%, 1/15/2030(a) | | | 40,000 | | | | 43,850 | |
| | |
Kraft Heinz Foods Co. | | | | | | | | |
3.00%, 6/1/2026 | | | 275,000 | | | | 287,801 | |
4.25%, 3/1/2031 | | | 275,000 | | | | 310,942 | |
5.20%, 7/15/2045 | | | 225,000 | | | | 286,327 | |
4.38%, 6/1/2046 | | | 525,000 | | | | 610,528 | |
| | |
Lamb Weston Holdings, Inc. | | | | | | | | |
4.88%, 11/1/2026(a) | | | 160,000 | | | | 164,325 | |
4.88%, 5/15/2028(a) | | | 80,000 | | | | 85,949 | |
| | | | | | | | 1,839,560 | |
|
| Gas Utilities – 0.5% | |
| | |
AmeriGas Partners LP | | | | | | | | |
5.63%, 5/20/2024 | | | 75,000 | | | | 81,094 | |
5.88%, 8/20/2026 | | | 100,000 | | | | 111,625 | |
| | |
Suburban Propane Partners LP | | | | | | | | |
5.00%, 6/1/2031(a) | | | 60,000 | | | | 61,575 | |
| | | | | | | | 254,294 | |
| | | | | | | | |
| Investments | | Principal
Amount | | | Value | |
|
| Health Care Equipment & Supplies – 0.4% | |
| | |
Hologic, Inc. | | | | | | | | |
3.25%, 2/15/2029(a) | | $ | 100,000 | | | $ | 99,312 | |
| | |
Mozart Debt Merger Sub, Inc. | | | | | | | | |
3.88%, 4/1/2029(a) | | | 90,000 | | | | 89,727 | |
5.25%, 10/1/2029(a) | | | 30,000 | | | | 30,488 | |
| | | | | | | | 219,527 | |
|
| Health Care Providers & Services – 6.6% | |
| | |
Acadia Healthcare Co., Inc. | | | | | | | | |
5.00%, 4/15/2029(a) | | | 70,000 | | | | 71,488 | |
| | |
AHP Health Partners, Inc. | | | | | | | | |
5.75%, 7/15/2029(a) | | | 50,000 | | | | 50,312 | |
| | |
Air Methods Corp. | | | | | | | | |
8.00%, 5/15/2025(a) | | | 30,000 | | | | 22,997 | |
| | |
Akumin, Inc. | | | | | | | | |
7.00%, 11/1/2025(a) | | | 50,000 | | | | 47,828 | |
| | |
Centene Corp. | | | | | | | | |
4.25%, 12/15/2027 | | | 275,000 | | | | 288,406 | |
4.63%, 12/15/2029 | | | 300,000 | | | | 324,000 | |
3.00%, 10/15/2030 | | | 475,000 | | | | 483,403 | |
| | |
Community Health Systems, Inc. | | | | | | | | |
5.63%, 3/15/2027(a) | | | 60,000 | | | | 62,862 | |
| | |
DaVita, Inc. | | | | | | | | |
4.63%, 6/1/2030(a) | | | 275,000 | | | | 276,708 | |
| | |
Encompass Health Corp. | | | | | | | | |
4.50%, 2/1/2028 | | | 80,000 | | | | 81,548 | |
4.75%, 2/1/2030 | | | 100,000 | | | | 102,629 | |
| | |
Envision Healthcare Corp. | | | | | | | | |
8.75%, 10/15/2026(a) | | | 75,000 | | | | 50,664 | |
| | |
Global Medical Response, Inc. | | | | | | | | |
6.50%, 10/1/2025(a) | | | 35,000 | | | | 34,714 | |
| | |
HCA, Inc. | | | | | | | | |
5.88%, 5/1/2023 | | | 250,000 | | | | 267,500 | |
5.38%, 2/1/2025 | | | 175,000 | | | | 194,906 | |
5.63%, 9/1/2028 | | | 125,000 | | | | 146,654 | |
3.50%, 9/1/2030 | | | 400,000 | | | | 421,130 | |
| | |
Radiology Partners, Inc. | | | | | | | | |
9.25%, 2/1/2028(a) | | | 40,000 | | | | 42,467 | |
| | |
RegionalCare Hospital Partners Holdings, Inc. | | | | | | | | |
9.75%, 12/1/2026(a) | | | 110,000 | | | | 116,187 | |
| | |
Surgery Center Holdings, Inc. | | | | | | | | |
10.00%, 4/15/2027(a) | | | 30,000 | | | | 32,243 | |
See Accompanying Notes to the Financial Statements.
| | | | | | |
| | FLEXSHARES ANNUAL REPORT | | | 425 | |
FlexShares® ESG & Climate High Yield Corporate Core Index Fund (cont.)
| | | | | | | | |
| Investments | | Principal
Amount | | | Value | |
|
| CORPORATE BONDS – (continued) | |
|
| Health Care Providers & Services – (continued) | |
| | |
Team Health Holdings, Inc. | | | | | | | | |
6.38%, 2/1/2025(a) | | $ | 40,000 | | | $ | 35,466 | |
| | |
Tenet Healthcare Corp. | | | | | | | | |
4.88%, 1/1/2026(a) | | | 40,000 | | | | 41,050 | |
6.13%, 10/1/2028(a) | | | 35,000 | | | | 36,792 | |
| | |
US Renal Care, Inc. | | | | | | | | |
10.63%, 7/15/2027(a) | | | 30,000 | | | | 31,154 | |
| | | | | | | | 3,263,108 | |
|
| Hotels, Restaurants & Leisure – 7.7% | |
| | |
1011778 BC ULC | | | | | | | | |
4.00%, 10/15/2030(a) | | | 40,000 | | | | 38,800 | |
| | |
Caesars Entertainment, Inc. | | | | | | | | |
6.25%, 7/1/2025(a) | | | 200,000 | | | | 210,620 | |
8.13%, 7/1/2027(a) | | | 125,000 | | | | 140,163 | |
| | |
Caesars Resort Collection LLC | | | | | | | | |
5.75%, 7/1/2025(a) | | | 55,000 | | | | 57,860 | |
| | |
Carnival Corp. | | | | | | | | |
5.75%, 3/1/2027(a) | | | 75,000 | | | | 76,429 | |
4.00%, 8/1/2028(a) | | | 25,000 | | | | 25,031 | |
| | |
CEC Entertainment LLC | | | | | | | | |
6.75%, 5/1/2026(a) | | | 35,000 | | | | 35,033 | |
| | |
Cedar Fair LP | | | | | | | | |
5.38%, 6/1/2024 | | | 75,000 | | | | 75,656 | |
| | |
Dave & Buster’s, Inc. | | | | | | | | |
7.63%, 11/1/2025(a) | | | 30,000 | | | | 32,253 | |
| | |
Golden Nugget, Inc. | | | | | | | | |
6.75%, 10/15/2024(a) | | | 75,000 | | | | 75,281 | |
| | |
Hilton Domestic Operating Co., Inc. | | | | | | | | |
5.75%, 5/1/2028(a) | | | 100,000 | | | | 107,500 | |
4.00%, 5/1/2031(a) | | | 100,000 | | | | 100,606 | |
3.63%, 2/15/2032(a) | | | 185,000 | | | | 180,726 | |
| | |
Hilton Worldwide Finance LLC | | | | | | | | |
4.88%, 4/1/2027 | | | 100,000 | | | | 103,600 | |
| | |
International Game Technology plc | | | | | | | | |
4.13%, 4/15/2026(a) | | | 200,000 | | | | 205,750 | |
| | |
IRB Holding Corp. | | | | | | | | |
7.00%, 6/15/2025(a) | | | 40,000 | | | | 42,300 | |
6.75%, 2/15/2026(a) | | | 25,000 | | | | 25,594 | |
| | |
Life Time, Inc. | | | | | | | | |
8.00%, 4/15/2026(a) | | | 25,000 | | | | 26,291 | |
| | | | | | | | |
| Investments | | Principal
Amount | | | Value | |
|
| Hotels, Restaurants & Leisure – (continued) | |
| | |
MGM Resorts International | | | | | | | | |
6.00%, 3/15/2023 | | $ | 150,000 | | | $ | 158,470 | |
5.75%, 6/15/2025 | | | 100,000 | | | | 108,125 | |
4.75%, 10/15/2028 | | | 100,000 | | | | 104,071 | |
| | |
Mohegan Gaming & Entertainment | | | | | | | | |
8.00%, 2/1/2026(a) | | | 65,000 | | | | 66,950 | |
| | |
Peninsula Pacific Entertainment LLC | | | | | | | | |
8.50%, 11/15/2027(a) | | | 65,000 | | | | 69,453 | |
| | |
Powdr Corp. | | | | | | | | |
6.00%, 8/1/2025(a) | | | 30,000 | | | | 31,433 | |
| | |
Royal Caribbean Cruises Ltd. | | | | | | | | |
9.13%, 6/15/2023(a) | | | 125,000 | | | | 135,879 | |
11.50%, 6/1/2025(a) | | | 225,000 | | | | 255,938 | |
4.25%, 7/1/2026(a) | | | 125,000 | | | | 121,406 | |
5.50%, 4/1/2028(a) | | | 135,000 | | | | 137,531 | |
| | |
Six Flags Entertainment Corp. | | | | | | | | |
5.50%, 4/15/2027(a) | | | 150,000 | | | | 155,437 | |
| | |
Sizzling Platter LLC | | | | | | | | |
8.50%, 11/28/2025(a) | | | 20,000 | | | | 20,133 | |
| | |
TKC Holdings, Inc. | | | | | | | | |
6.88%, 5/15/2028(a) | | | 25,000 | | | | 25,730 | |
10.50%, 5/15/2029(a) | | | 40,000 | | | | 43,266 | |
| | |
Vail Resorts, Inc. | | | | | | | | |
6.25%, 5/15/2025(a) | | | 45,000 | | | | 47,455 | |
| | |
Viking Cruises Ltd. | | | | | | | | |
6.25%, 5/15/2025(a) | | | 50,000 | | | | 49,827 | |
| | |
Wynn Las Vegas LLC | | | | | | | | |
5.50%, 3/1/2025(a) | | | 130,000 | | | | 132,275 | |
5.25%, 5/15/2027(a) | | | 55,000 | | | | 55,756 | |
| | |
Wynn Resorts Finance LLC | | | | | | | | |
5.13%, 10/1/2029(a) | | | 80,000 | | | | 80,500 | |
| | |
Yum! Brands, Inc. | | | | | | | | |
3.88%, 11/1/2023 | | | 100,000 | | | | 104,625 | |
4.75%, 1/15/2030(a) | | | 50,000 | | | | 53,563 | |
3.63%, 3/15/2031 | | | 175,000 | | | | 173,180 | |
4.63%, 1/31/2032 | | | 150,000 | | | | 156,562 | |
| | | | | | | | 3,847,058 | |
|
| Household Durables – 1.8% | |
| | |
Century Communities, Inc. | | | | | | | | |
6.75%, 6/1/2027 | | | 50,000 | | | | 53,152 | |
| | |
Empire Communities Corp. | | | | | | | | |
7.00%, 12/15/2025(a) | | | 50,000 | | | | 51,813 | |
See Accompanying Notes to the Financial Statements.
| | | | |
| 426 | | FLEXSHARES ANNUAL REPORT | | |
FlexShares® ESG & Climate High Yield Corporate Core Index Fund (cont.)
| | | | | | | | |
| Investments | | Principal
Amount | | | Value | |
|
| CORPORATE BONDS – (continued) | |
|
| Household Durables – (continued) | |
| | |
KB Home | | | | | | | | |
6.88%, 6/15/2027 | | $ | 100,000 | | | $ | 118,231 | |
| | |
Newell Brands, Inc. | | | | | | | | |
4.70%, 4/1/2026(e) | | | 230,000 | | | | 252,169 | |
6.00%, 4/1/2046(e) | | | 40,000 | | | | 50,293 | |
| | |
Taylor Morrison Communities, Inc. | | | | | | | | |
5.88%, 6/15/2027(a) | | | 140,000 | | | | 156,808 | |
| | |
Tempur Sealy International, Inc. | | | | | | | | |
4.00%, 4/15/2029(a) | | | 60,000 | | | | 61,033 | |
| | |
Toll Brothers Finance Corp. | | | | | | | | |
4.88%, 3/15/2027 | | | 150,000 | | | | 166,688 | |
| | | | | | | | 910,187 | |
|
| Household Products – 0.4% | |
| | |
Energizer Holdings, Inc. | | | | | | | | |
4.38%, 3/31/2029(a) | | | 80,000 | | | | 76,760 | |
| | |
Spectrum Brands, Inc. | | | | | | | | |
5.00%, 10/1/2029(a) | | | 125,000 | | | | 133,594 | |
| | | | | | | | 210,354 | |
|
Independent Power and Renewable Electricity
Producers – 0.3% | |
| | |
Clearway Energy Operating LLC | | | | | | | | |
3.75%, 2/15/2031(a) | | | 150,000 | | | | 148,691 | |
|
| Insurance – 1.7% | |
| | |
Acrisure LLC | | | | | | | | |
7.00%, 11/15/2025(a) | | | 90,000 | | | | 91,012 | |
4.25%, 2/15/2029(a) | | | 60,000 | | | | 57,975 | |
| | |
Alliant Holdings Intermediate LLC | | | | | | | | |
4.25%, 10/15/2027(a) | | | 30,000 | | | | 29,963 | |
6.75%, 10/15/2027(a) | | | 75,000 | | | | 77,531 | |
| | |
AssuredPartners, Inc. | | | | | | | | |
7.00%, 8/15/2025(a) | | | 30,000 | | | | 30,450 | |
| | |
BroadStreet Partners, Inc. | | | | | | | | |
5.88%, 4/15/2029(a) | | | 25,000 | | | | 24,602 | |
| | |
Genworth Holdings, Inc. | | | | | | | | |
4.80%, 2/15/2024 | | | 70,000 | | | | 71,656 | |
6.50%, 6/15/2034 | | | 20,000 | | | | 20,850 | |
| | |
GTCR AP Finance, Inc. | | | | | | | | |
8.00%, 5/15/2027(a) | | | 60,000 | | | | 63,225 | |
| | |
HUB International Ltd. | | | | | | | | |
7.00%, 5/1/2026(a) | | | 125,000 | | | | 129,062 | |
| | | | | | | | |
| Investments | | Principal
Amount | | | Value | |
|
| Insurance – (continued) | |
| | |
Liberty Mutual Group, Inc. | | | | | | | | |
4.30%, 2/1/2061(a) | | $ | 100,000 | | | $ | 93,399 | |
| | |
NFP Corp. | | | | | | | | |
6.88%, 8/15/2028(a) | | | 125,000 | | | | 127,185 | |
| | |
USI, Inc. | | | | | | | | |
6.88%, 5/1/2025(a) | | | 50,000 | | | | 50,812 | |
| | | | | | | | 867,722 | |
|
| Interactive Media & Services – 0.2% | |
| | |
Twitter, Inc. | | | | | | | | |
3.88%, 12/15/2027(a) | | | 55,000 | | | | 57,912 | |
| | |
Ziff Davis, Inc. | | | | | | | | |
4.63%, 10/15/2030(a) | | | 53,000 | | | | 55,584 | |
| | | | | | | | 113,496 | |
|
| Internet & Direct Marketing Retail – 0.3% | |
| | |
Go Daddy Operating Co. LLC | | | | | | | | |
3.50%, 3/1/2029(a) | | | 90,000 | | | | 87,187 | |
| | |
Photo Holdings Merger Sub, Inc. | | | | | | | | |
8.50%, 10/1/2026(a) | | | 45,000 | | | | 47,310 | |
| | | | | | | | 134,497 | |
|
| IT Services – 1.5% | |
| | |
Ahead DB Holdings LLC | | | | | | | | |
6.63%, 5/1/2028(a) | | | 20,000 | | | | 20,427 | |
| | |
Austin BidCo, Inc. | | | | | | | | |
7.13%, 12/15/2028(a) | | | 50,000 | | | | 51,705 | |
| | |
Black Knight InfoServ LLC | | | | | | | | |
3.63%, 9/1/2028(a) | | | 60,000 | | | | 59,775 | |
| | |
Endure Digital, Inc. | | | | | | | | |
6.00%, 2/15/2029(a) | | | 60,000 | | | | 55,303 | |
| | |
Exela Intermediate LLC | | | | | | | | |
10.00%, 7/15/2023(a) | | | 55,000 | | | | 46,150 | |
| | |
Gartner, Inc. | | | | | | | | |
3.63%, 6/15/2029(a) | | | 150,000 | | | | 150,938 | |
| | |
ION Trading Technologies Sarl | | | | | | | | |
5.75%, 5/15/2028(a) | | | 50,000 | | | | 51,312 | |
| | |
Northwest Fiber LLC | | | | | | | | |
10.75%, 6/1/2028(a) | | | 50,000 | | | | 55,077 | |
| | |
Presidio Holdings, Inc. | | | | | | | | |
8.25%, 2/1/2028(a) | | | 50,000 | | | | 53,190 | |
| | |
Square, Inc. | | | | | | | | |
2.75%, 6/1/2026(a) | | | 60,000 | | | | 60,735 | |
3.50%, 6/1/2031(a) | | | 60,000 | | | | 61,575 | |
See Accompanying Notes to the Financial Statements.
| | | | | | |
| | FLEXSHARES ANNUAL REPORT | | | 427 | |
FlexShares® ESG & Climate High Yield Corporate Core Index Fund (cont.)
| | | | | | | | |
| Investments | | Principal
Amount | | | Value | |
|
| CORPORATE BONDS – (continued) | |
|
| IT Services – (continued) | |
| | |
Twilio, Inc. | | | | | | | | |
3.63%, 3/15/2029 | | $ | 90,000 | | | $ | 91,012 | |
| | | | | | | | 757,199 | |
|
| Leisure Products – 0.4% | |
| | |
Mattel, Inc. | | | | | | | | |
3.75%, 4/1/2029(a) | | | 160,000 | | | | 166,408 | |
5.45%, 11/1/2041 | | | 25,000 | | | | 29,533 | |
| | | | | | | | 195,941 | |
|
| Machinery – 0.2% | |
| | |
JPW Industries Holding Corp. | | | | | | | | |
9.00%, 10/1/2024(a) | | | 50,000 | | | | 52,247 | |
| | |
Maxim Crane Works Holdings Capital LLC | | | | | | | | |
10.13%, 8/1/2024(a) | | | 1,000 | | | | 1,030 | |
| | |
Terex Corp. | | | | | | | | |
5.00%, 5/15/2029(a) | | | 45,000 | | | | 45,956 | |
| | | | | | | | 99,233 | |
|
| Media – 5.3% | |
| | |
Altice Financing SA | | | | | | | | |
5.75%, 8/15/2029(a) | | | 100,000 | | | | 98,500 | |
| | |
Beasley Mezzanine Holdings LLC | | | | | | | | |
8.63%, 2/1/2026(a) | | | 50,000 | | | | 50,372 | |
| | |
Clear Channel Outdoor Holdings, Inc. | | | | | | | | |
7.75%, 4/15/2028(a) | | | 80,000 | | | | 82,956 | |
7.50%, 6/1/2029(a) | | | 65,000 | | | | 66,585 | |
| | |
Clear Channel Worldwide Holdings, Inc. | | | | | | | | |
5.13%, 8/15/2027(a) | | | 100,000 | | | | 102,745 | |
| | |
CSC Holdings LLC | | | | | | | | |
5.75%, 1/15/2030(a) | | | 60,000 | | | | 59,277 | |
| | |
Cumulus Media New Holdings, Inc. | | | | | | | | |
6.75%, 7/1/2026(a) | | | 25,000 | | | | 26,031 | |
| | |
DIRECTV Holdings LLC | | | | | | | | |
5.88%, 8/15/2027(a) | | | 25,000 | | | | 25,948 | |
| | |
DISH DBS Corp. | | | | | | | | |
5.88%, 11/15/2024 | | | 15,000 | | | | 15,994 | |
7.75%, 7/1/2026 | | | 20,000 | | | | 22,250 | |
| | |
iHeartCommunications, Inc. | | | | | | | | |
8.38%, 5/1/2027 | | | 150,000 | | | | 159,937 | |
5.25%, 8/15/2027(a) | | | 150,000 | | | | 153,392 | |
| | | | | | | | |
| Investments | | Principal
Amount | | | Value | |
|
| Media – (continued) | |
| | |
Lamar Media Corp. | | | | | | | | |
3.75%, 2/15/2028 | | $ | 35,000 | | | $ | 35,422 | |
4.00%, 2/15/2030 | | | 70,000 | | | | 71,156 | |
| | |
News Corp. | | | | | | | | |
3.88%, 5/15/2029(a) | | | 60,000 | | | | 60,975 | |
| | |
Nexstar Media, Inc. | | | | | | | | |
5.63%, 7/15/2027(a) | | | 30,000 | | | | 31,687 | |
| | |
Outfront Media Capital LLC | | | | | | | | |
5.00%, 8/15/2027(a) | | | 80,000 | | | | 81,700 | |
4.63%, 3/15/2030(a) | | | 40,000 | | | | 40,038 | |
| | |
Sirius XM Radio, Inc. | | | | | | | | |
5.00%, 8/1/2027(a) | | | 150,000 | | | | 156,937 | |
4.00%, 7/15/2028(a) | | | 200,000 | | | | 201,490 | |
4.13%, 7/1/2030(a) | | | 150,000 | | | | 149,239 | |
| | |
Spanish Broadcasting System, Inc. | | | | | | | | |
9.75%, 3/1/2026(a) | | | 15,000 | | | | 15,680 | |
| | |
Summer BC Bidco B LLC | | | | | | | | |
5.50%, 10/31/2026(a) | | | 25,000 | | | | 25,469 | |
| | |
TEGNA, Inc. | | | | | | | | |
4.63%, 3/15/2028 | | | 160,000 | | | | 161,600 | |
5.00%, 9/15/2029 | | | 85,000 | | | | 86,162 | |
| | |
Terrier Media Buyer, Inc. | | | | | | | | |
8.88%, 12/15/2027(a) | | | 55,000 | | | | 58,249 | |
| | |
Townsquare Media, Inc. | | | | | | | | |
6.88%, 2/1/2026(a) | | | 30,000 | | | | 31,388 | |
| | |
Univision Communications, Inc. | | | | | | | | |
5.13%, 2/15/2025(a) | | | 100,000 | | | | 101,625 | |
6.63%, 6/1/2027(a) | | | 85,000 | | | | 92,060 | |
| | |
UPC Holding BV | | | | | | | | |
5.50%, 1/15/2028(a) | | | 100,000 | | | | 103,625 | |
| | |
Urban One, Inc. | | | | | | | | |
7.38%, 2/1/2028(a) | | | 45,000 | | | | 47,297 | |
| | |
Videotron Ltd. | | | | | | | | |
5.13%, 4/15/2027(a) | | | 150,000 | | | | 155,250 | |
| | |
Ziggo Bond Co. BV | | | | | | | | |
5.13%, 2/28/2030(a) | | | 50,000 | | | | 50,666 | |
| | | | | | | | 2,621,702 | |
|
| Metals & Mining – 2.0% | |
| | |
Baffinland Iron Mines Corp. | | | | | | | | |
8.75%, 7/15/2026(a) | | | 75,000 | | | | 79,564 | |
| | |
Cleveland-Cliffs, Inc. | | | | | | | | |
6.75%, 3/15/2026(a) | | | 25,000 | | | | 26,656 | |
4.63%, 3/1/2029(a) | | | 25,000 | | | | 25,844 | |
See Accompanying Notes to the Financial Statements.
| | | | |
| 428 | | FLEXSHARES ANNUAL REPORT | | |
FlexShares® ESG & Climate High Yield Corporate Core Index Fund (cont.)
| | | | | | | | |
| Investments | | Principal
Amount | | | Value | |
|
| CORPORATE BONDS – (continued) | |
|
| Metals & Mining – (continued) | |
| | |
Freeport-McMoRan, Inc. | | | | | | | | |
3.88%, 3/15/2023 | | $ | 250,000 | | | $ | 257,813 | |
5.00%, 9/1/2027 | | | 125,000 | | | | 130,531 | |
4.63%, 8/1/2030 | | | 150,000 | | | | 161,813 | |
5.45%, 3/15/2043 | | | 150,000 | | | | 188,887 | |
| | |
Hudbay Minerals, Inc. | | | | | | | | |
4.50%, 4/1/2026(a) | | | 35,000 | | | | 34,957 | |
6.13%, 4/1/2029(a) | | | 35,000 | | | | 36,881 | |
| | |
Taseko Mines Ltd. | | | | | | | | |
7.00%, 2/15/2026(a) | | | 25,000 | | | | 25,875 | |
| | |
TMS International Corp. | | | | | | | | |
6.25%, 4/15/2029(a) | | | 20,000 | | | | 20,675 | |
| | | | | | | | 989,496 | |
|
| Mortgage Real Estate Investment Trusts (REITs) – 0.2% | |
| | |
Apollo Commercial Real Estate Finance, Inc. | | | | | | | | |
4.63%, 6/15/2029(a) | | | 30,000 | | | | 28,913 | |
| | |
New Residential Investment Corp. | | | | | | | | |
6.25%, 10/15/2025(a) | | | 45,000 | | | | 45,071 | |
| | | | | | | | 73,984 | |
|
| Multiline Retail – 0.6% | |
| | |
Macy’s Retail Holdings LLC | | | | | | | | |
5.88%, 4/1/2029(a) | | | 125,000 | | | | 133,371 | |
4.50%, 12/15/2034 | | | 90,000 | | | | 88,173 | |
5.13%, 1/15/2042 | | | 10,000 | | | | 9,364 | |
| | |
Nordstrom, Inc. | | | | | | | | |
5.00%, 1/15/2044 | | | 70,000 | | | | 69,344 | |
| | | | | | | | 300,252 | |
|
| Oil, Gas & Consumable Fuels – 11.3% | |
| | |
Aethon United BR LP | | | | | | | | |
8.25%, 2/15/2026(a) | | | 40,000 | | | | 43,018 | |
| | |
Antero Resources Corp. | | | | | | | | |
7.63%, 2/1/2029(a) | | | 125,000 | | | | 138,531 | |
| | |
Ascent Resources Utica Holdings LLC | | | | | | | | |
8.25%, 12/31/2028(a) | | | 90,000 | | | | 98,266 | |
| | |
Baytex Energy Corp. | | | | | | | | |
8.75%, 4/1/2027(a) | | | 50,000 | | | | 53,463 | |
| | |
Blue Racer Midstream LLC | | | | | | | | |
6.63%, 7/15/2026(a) | | | 50,000 | | | | 51,892 | |
| | | | | | | | |
| Investments | | Principal
Amount | | | Value | |
|
| Oil, Gas & Consumable Fuels – (continued) | |
| | |
Buckeye Partners LP | | | | | | | | |
3.95%, 12/1/2026 | | $ | 90,000 | | | $ | 92,378 | |
4.50%, 3/1/2028(a) | | | 130,000 | | | | 128,537 | |
| | |
Calumet Specialty Products Partners LP | | | | | | | | |
7.75%, 4/15/2023 | | | 75,000 | | | | 74,534 | |
| | |
Cheniere Energy Partners LP | | | | | | | | |
4.50%, 10/1/2029 | | | 115,000 | | | | 122,927 | |
4.00%, 3/1/2031(a) | | | 115,000 | | | | 119,746 | |
3.25%, 1/31/2032(a) | | | 40,000 | | | | 39,698 | |
| | |
Cheniere Energy, Inc. | | | | | | | | |
4.63%, 10/15/2028 | | | 75,000 | | | | 78,746 | |
| | |
Citgo Holding, Inc. | | | | | | | | |
9.25%, 8/1/2024(a) | | | 90,000 | | | | 91,492 | |
| | |
CITGO Petroleum Corp. | | | | | | | | |
7.00%, 6/15/2025(a) | | | 100,000 | | | | 103,185 | |
| | |
Colgate Energy Partners III LLC | | | | | | | | |
5.88%, 7/1/2029(a) | | | 45,000 | | | | 46,125 | |
| | |
CQP Holdco LP | | | | | | | | |
5.50%, 6/15/2031(a) | | | 125,000 | | | | 130,156 | |
| | |
Crestwood Midstream Partners LP | | | | | | | | |
5.63%, 5/1/2027(a) | | | 100,000 | | | | 102,509 | |
| | |
CrownRock LP | | | | | | | | |
5.63%, 10/15/2025(a) | | | 65,000 | | | | 66,544 | |
5.00%, 5/1/2029(a) | | | 50,000 | | | | 51,562 | |
| | |
DCP Midstream Operating LP | | | | | | | | |
5.38%, 7/15/2025 | | | 50,000 | | | | 55,312 | |
5.13%, 5/15/2029 | | | 100,000 | | | | 113,377 | |
5.85%, 5/21/2043(a)(c) | | | 30,000 | | | | 28,032 | |
| | |
Delek Logistics Partners LP | | | | | | | | |
7.13%, 6/1/2028(a) | | | 30,000 | | | | 31,463 | |
| | |
DT Midstream, Inc. | | | | | | | | |
4.13%, 6/15/2029(a) | | | 55,000 | | | | 55,462 | |
| | |
Encino Acquisition Partners Holdings LLC | | | | | | | | |
8.50%, 5/1/2028(a) | | | 40,000 | | | | 41,870 | |
| | |
Endeavor Energy Resources LP | | | | | | | | |
6.63%, 7/15/2025(a) | | | 45,000 | | | | 47,510 | |
5.75%, 1/30/2028(a) | | | 75,000 | | | | 78,844 | |
| | |
Energy Ventures Gom LLC | | | | | | | | |
11.75%, 4/15/2026(a) | | | 23,000 | | | | 23,902 | |
| | |
Enviva Partners LP | | | | | | | | |
6.50%, 1/15/2026(a) | | | 50,000 | | | | 51,776 | |
See Accompanying Notes to the Financial Statements.
| | | | | | |
| | FLEXSHARES ANNUAL REPORT | | | 429 | |
FlexShares® ESG & Climate High Yield Corporate Core Index Fund (cont.)
| | | | | | | | |
| Investments | | Principal
Amount | | | Value | |
|
| CORPORATE BONDS – (continued) | |
|
| Oil, Gas & Consumable Fuels – (continued) | |
| | |
EQM Midstream Partners LP | | | | | | | | |
5.50%, 7/15/2028 | | $ | 125,000 | | | $ | 137,835 | |
| | |
EQT Corp. | | | | | | | | |
6.63%, 2/1/2025(e) | | | 125,000 | | | | 140,781 | |
3.90%, 10/1/2027 | | | 125,000 | | | | 133,531 | |
3.63%, 5/15/2031(a) | | | 75,000 | | | | 76,688 | |
| | |
Genesis Energy LP | | | | | | | | |
8.00%, 1/15/2027 | | | 175,000 | | | | 176,097 | |
| | |
Global Partners LP | | | | | | | | |
7.00%, 8/1/2027 | | | 45,000 | | | | 46,969 | |
| | |
Gran Tierra Energy, Inc. | | | | | | | | |
7.75%, 5/23/2027(a) | | | 30,000 | | | | 27,952 | |
| | |
Great Western Petroleum LLC | | | | | | | | |
12.00%, 9/1/2025(a) | | | 15,000 | | | | 15,257 | |
| | |
Harvest Midstream I LP | | | | | | | | |
7.50%, 9/1/2028(a) | | | 45,000 | | | | 47,323 | |
| | |
Hess Midstream Operations LP | | | | | | | | |
5.13%, 6/15/2028(a) | | | 80,000 | | | | 83,196 | |
| | |
Hilcorp Energy I LP | | | | | | | | |
6.25%, 11/1/2028(a) | | | 110,000 | | | | 113,042 | |
| | |
Holly Energy Partners LP | | | | | | | | |
5.00%, 2/1/2028(a) | | | 40,000 | | | | 40,145 | |
| | |
Independence Energy Finance LLC | | | | | | | | |
7.25%, 5/1/2026(a) | | | 30,000 | | | | 31,238 | |
| | |
ITT Holdings LLC | | | | | | | | |
6.50%, 8/1/2029(a) | | | 70,000 | | | | 70,452 | |
| | |
MEG Energy Corp. | | | | | | | | |
7.13%, 2/1/2027(a) | | | 170,000 | | | | 178,713 | |
| | |
Moss Creek Resources Holdings, Inc. | | | | | | | | |
7.50%, 1/15/2026(a) | | | 90,000 | | | | 82,029 | |
| | |
Murphy Oil Corp. | | | | | | | | |
5.88%, 12/1/2027 | | | 35,000 | | | | 36,487 | |
| | |
NGL Energy Operating LLC | | | | | | | | |
7.50%, 2/1/2026(a) | | | 100,000 | | | | 101,550 | |
| | |
NGL Energy Partners LP | | | | | | | | |
7.50%, 11/1/2023 | | | 50,000 | | | | 48,076 | |
6.13%, 3/1/2025 | | | 50,000 | | | | 42,569 | |
| | |
Northriver Midstream Finance LP | | | | | | | | |
5.63%, 2/15/2026(a) | | | 50,000 | | | | 51,736 | |
| | |
NuStar Logistics LP | | | | | | | | |
5.75%, 10/1/2025 | | | 60,000 | | | | 64,275 | |
6.38%, 10/1/2030 | | | 60,000 | | | | 65,841 | |
| | | | | | | | |
| Investments | | Principal
Amount | | | Value | |
|
| Oil, Gas & Consumable Fuels – (continued) | |
| | |
Occidental Petroleum Corp. | | | | | | | | |
6.95%, 7/1/2024 | | $ | 60,000 | | | $ | 67,575 | |
2.90%, 8/15/2024 | | | 175,000 | | | | 178,491 | |
6.63%, 9/1/2030 | | | 125,000 | | | | 153,112 | |
6.45%, 9/15/2036 | | | 185,000 | | | | 235,681 | |
4.20%, 3/15/2048 | | | 125,000 | | | | 122,001 | |
| | |
Parkland Corp. | | | | | | | | |
4.50%, 10/1/2029(a) | | | 90,000 | | | | 90,675 | |
| | |
PBF Logistics LP | | | | | | | | |
6.88%, 5/15/2023 | | | 30,000 | | | | 29,126 | |
| | |
Renewable Energy Group, Inc. | | | | | | | | |
5.88%, 6/1/2028(a) | | | 40,000 | | | | 42,100 | |
| | |
Rockies Express Pipeline LLC | | | | | | | | |
4.95%, 7/15/2029(a) | | | 80,000 | | | | 85,700 | |
| | |
Strathcona Resources Ltd. | | | | | | | | |
6.88%, 8/1/2026(a) | | | 30,000 | | | | 29,873 | |
| | |
Sunnova Energy Corp. | | | | | | | | |
5.88%, 9/1/2026(a) | | | 20,000 | | | | 20,325 | |
| | |
Sunoco LP | | | | | | | | |
6.00%, 4/15/2027 | | | 100,000 | | | | 104,875 | |
| | |
Tallgrass Energy Partners LP | | | | | | | | |
7.50%, 10/1/2025(a) | | | 50,000 | | | | 54,125 | |
6.00%, 12/31/2030(a) | | | 85,000 | | | | 85,125 | |
| | |
Teine Energy Ltd. | | | | | | | | |
6.88%, 4/15/2029(a) | | | 50,000 | | | | 51,077 | |
| | |
Vine Energy Holdings LLC | | | | | | | | |
6.75%, 4/15/2029(a) | | | 55,000 | | | | 59,125 | |
| | |
Western Midstream Operating LP | | | | | | | | |
4.35%, 2/1/2025(e) | | | 75,000 | | | | 78,656 | |
5.30%, 2/1/2030(e) | | | 125,000 | | | | 137,188 | |
| | | | | | | | 5,597,469 | |
|
| Paper & Forest Products – 0.2% | |
| | |
Mercer International, Inc. | | | | | | | | |
5.13%, 2/1/2029 | | | 95,000 | | | | 94,570 | |
|
| Personal Products – 0.4% | |
| | |
Avon Products, Inc. | | | | | | | | |
6.50%, 3/15/2023(e) | | | 60,000 | | | | 63,300 | |
8.45%, 3/15/2043(e) | | | 15,000 | | | | 18,772 | |
| | |
Coty, Inc. | | | | | | | | |
5.00%, 4/15/2026(a) | | | 70,000 | | | | 71,837 | |
6.50%, 4/15/2026(a) | | | 45,000 | | | | 46,294 | |
| | | | | | | | 200,203 | |
See Accompanying Notes to the Financial Statements.
| | | | |
| 430 | | FLEXSHARES ANNUAL REPORT | | |
FlexShares® ESG & Climate High Yield Corporate Core Index Fund (cont.)
| | | | | | | | |
| Investments | | Principal
Amount | | | Value | |
|
| CORPORATE BONDS – (continued) | |
|
| Pharmaceuticals – 3.3% | |
| | |
Bausch Health Americas, Inc. | | | | | | | | |
8.50%, 1/31/2027(a) | | $ | 250,000 | | | $ | 265,625 | |
| | |
Bausch Health Cos., Inc. | | | | | | | | |
6.13%, 4/15/2025(a) | | | 550,000 | | | | 560,873 | |
5.00%, 1/30/2028(a) | | | 100,000 | | | | 92,500 | |
4.88%, 6/1/2028(a) | | | 125,000 | | | | 128,438 | |
6.25%, 2/15/2029(a) | | | 155,000 | | | | 150,394 | |
5.25%, 1/30/2030(a) | | | 225,000 | | | | 203,202 | |
| | |
Endo Dac | | | | | | | | |
9.50%, 7/31/2027(a) | | | 20,000 | | | | 19,882 | |
6.00%, 6/30/2028(a) | | | 50,000 | | | | 34,965 | |
| | |
Lannett Co., Inc. | | | | | | | | |
7.75%, 4/15/2026(a) | | | 25,000 | | | | 23,105 | |
| | |
Organon & Co. | | | | | | | | |
5.13%, 4/30/2031(a) | | | 50,000 | | | | 51,634 | |
| | |
P&L Development LLC | | | | | | | | |
7.75%, 11/15/2025(a) | | | 25,000 | | | | 25,635 | |
| | |
Par Pharmaceutical, Inc. | | | | | | | | |
7.50%, 4/1/2027(a) | | | 50,000 | | | | 50,518 | |
| | |
Perrigo Finance Unlimited Co. | | | | | | | | |
4.90%, 12/15/2044 | | | 25,000 | | | | 24,778 | |
| | | | | | | | 1,631,549 | |
|
| Professional Services – 0.2% | |
| | |
AMN Healthcare, Inc. | | | | | | | | |
4.63%, 10/1/2027(a) | | | 50,000 | | | | 51,438 | |
| | |
CoreLogic, Inc. | | | | | | | | |
4.50%, 5/1/2028(a) | | | 40,000 | | | | 39,573 | |
| | | | | | | | 91,011 | |
|
| Real Estate Management & Development – 0.9% | |
| | |
Howard Hughes Corp. (The) | | | | | | | | |
5.38%, 8/1/2028(a) | | | 75,000 | | | | 78,750 | |
4.38%, 2/1/2031(a) | | | 75,000 | | | | 75,121 | |
| | |
Kennedy-Wilson, Inc. | | | | | | | | |
4.75%, 3/1/2029 | | | 50,000 | | | | 51,062 | |
5.00%, 3/1/2031 | | | 50,000 | | | | 51,188 | |
| | |
Realogy Group LLC | | | | | | | | |
7.63%, 6/15/2025(a) | | | 90,000 | | | | 96,273 | |
5.75%, 1/15/2029(a) | | | 75,000 | | | | 77,812 | |
| | | | | | | | 430,206 | |
| | | | | | | | |
| Investments | | Principal
Amount | | | Value | |
|
| Road & Rail – 0.9% | |
| | |
First Student Bidco, Inc. | | | | | | | | |
4.00%, 7/31/2029(a) | | $ | 45,000 | | | $ | 44,044 | |
| | |
NESCO Holdings II, Inc. | | | | | | | | |
5.50%, 4/15/2029(a) | | | 50,000 | | | | 50,687 | |
| | |
Uber Technologies, Inc. | | | | | | | | |
7.50%, 5/15/2025(a) | | | 75,000 | | | | 80,042 | |
7.50%, 9/15/2027(a) | | | 95,000 | | | | 104,034 | |
6.25%, 1/15/2028(a) | | | 75,000 | | | | 80,629 | |
| | |
XPO Logistics, Inc. | | | | | | | | |
6.25%, 5/1/2025(a) | | | 75,000 | | | | 79,102 | |
| | | | | | | | 438,538 | |
|
| Semiconductors & Semiconductor Equipment – 0.3% | |
| | |
Microchip Technology, Inc. | | | | | | | | |
4.25%, 9/1/2025 | | | 90,000 | | | | 93,634 | |
| | |
ON Semiconductor Corp. | | | | | | | | |
3.88%, 9/1/2028(a) | | | 55,000 | | | | 55,688 | |
| | | | | | | | 149,322 | |
|
| Software – 1.8% | |
| | |
Boxer Parent Co., Inc. | | | | | | | | |
7.13%, 10/2/2025(a) | | | 50,000 | | | | 53,312 | |
| | |
Camelot Finance SA | | | | | | | | |
4.50%, 11/1/2026(a) | | | 40,000 | | | | 41,515 | |
| | |
Castle US Holding Corp. | | | | | | | | |
9.50%, 2/15/2028(a) | | | 50,000 | | | | 52,492 | |
| | |
Change Healthcare Holdings LLC | | | | | | | | |
5.75%, 3/1/2025(a) | | | 80,000 | | | | 80,700 | |
| | |
Crowdstrike Holdings, Inc. | | | | | | | | |
3.00%, 2/15/2029 | | | 60,000 | | | | 59,325 | |
| | |
Elastic NV | | | | | | | | |
4.13%, 7/15/2029(a) | | | 45,000 | | | | 44,826 | |
| | |
LogMeIn, Inc. | | | | | | | | |
5.50%, 9/1/2027(a) | | | 55,000 | | | | 55,118 | |
| | |
NortonLifeLock, Inc. | | | | | | | | |
5.00%, 4/15/2025(a) | | | 85,000 | | | | 85,744 | |
| | |
Nuance Communications, Inc. | | | | | | | | |
5.63%, 12/15/2026 | | | 40,000 | | | | 41,325 | |
| | |
Open Text Corp. | | | | | | | | |
5.88%, 6/1/2026(a) | | | 75,000 | | | | 77,531 | |
| | |
Open Text Holdings, Inc. | | | | | | | | |
4.13%, 2/15/2030(a) | | | 125,000 | | | | 127,231 | |
| | |
PTC, Inc. | | | | | | | | |
4.00%, 2/15/2028(a) | | | 60,000 | | | | 60,900 | |
See Accompanying Notes to the Financial Statements.
| | | | | | |
| | FLEXSHARES ANNUAL REPORT | | | 431 | |
FlexShares® ESG & Climate High Yield Corporate Core Index Fund (cont.)
| | | | | | | | |
| Investments | | Principal
Amount | | | Value | |
|
| CORPORATE BONDS – (continued) | |
|
| Software – (continued) | |
| | |
Rocket Software, Inc. | | | | | | | | |
6.50%, 2/15/2029(a) | | $ | 35,000 | | | $ | 33,484 | |
| | |
Veritas US, Inc. | | | | | | | | |
7.50%, 9/1/2025(a) | | | 95,000 | | | | 98,563 | |
| | | | | | | | 912,066 | |
|
| Specialty Retail – 3.1% | |
| | |
99 Escrow Issuer, Inc. | | | | | | | | |
7.50%, 1/15/2026(a) | | | 20,000 | | | | 18,031 | |
| | |
Ambience Merger Sub, Inc. | | | | | | | | |
4.88%, 7/15/2028(a) | | | 30,000 | | | | 29,492 | |
7.13%, 7/15/2029(a) | | | 50,000 | | | | 48,260 | |
| | |
Bath & Body Works, Inc. | | | | | | | | |
9.38%, 7/1/2025(a) | | | 75,000 | | | | 93,094 | |
5.25%, 2/1/2028 | | | 60,000 | | | | 64,755 | |
6.63%, 10/1/2030(a) | | | 75,000 | | | | 84,076 | |
6.88%, 11/1/2035 | | | 150,000 | | | | 182,433 | |
| | |
BCPE Ulysses Intermediate, Inc. | | | | | | | | |
7.75%, 4/1/2027(a)(b) | | | 25,000 | | | | 24,135 | |
| | |
Carvana Co. | | | | | | | | |
5.50%, 4/15/2027(a) | | | 125,000 | | | | 126,094 | |
| | |
Gap, Inc. (The) | | | | | | | | |
3.63%, 10/1/2029(a) | | | 25,000 | | | | 24,531 | |
3.88%, 10/1/2031(a) | | | 25,000 | | | | 24,531 | |
| | |
LBM Acquisition LLC | | | | | | | | |
6.25%, 1/15/2029(a) | | | 50,000 | | | | 48,635 | |
| | |
LSF9 Atlantis Holdings LLC | | | | | | | | |
7.75%, 2/15/2026(a) | | | 60,000 | | | | 60,910 | |
| | |
Michaels Cos., Inc. (The) | | | | | | | | |
5.25%, 5/1/2028(a) | | | 65,000 | | | | 65,735 | |
7.88%, 5/1/2029(a) | | | 90,000 | | | | 91,034 | |
| | |
Park River Holdings, Inc. | | | | | | | | |
5.63%, 2/1/2029(a) | | | 40,000 | | | | 37,373 | |
| | |
Penske Automotive Group, Inc. | | | | | | | | |
3.75%, 6/15/2029 | | | 80,000 | | | | 79,661 | |
| | |
Sally Holdings LLC | | | | | | | | |
5.63%, 12/1/2025 | | | 50,000 | | | | 51,062 | |
| | |
Specialty Building Products Holdings LLC | | | | | | | | |
6.38%, 9/30/2026(a) | | | 50,000 | | | | 52,125 | |
| | |
SRS Distribution, Inc. | | | | | | | | |
6.13%, 7/1/2029(a) | | | 60,000 | | | | 61,800 | |
| | |
Staples, Inc. | | | | | | | | |
7.50%, 4/15/2026(a) | | | 115,000 | | | | 116,320 | |
10.75%, 4/15/2027(a) | | | 60,000 | | | | 57,397 | |
| | | | | | | | |
| Investments | | Principal
Amount | | | Value | |
|
| Specialty Retail – (continued) | |
| | |
Victoria’s Secret & Co. | | | | | | | | |
4.63%, 7/15/2029(a) | | $ | 50,000 | | | $ | 50,282 | |
| | |
White Cap Buyer LLC | | | | | | | | |
6.88%, 10/15/2028(a) | | | 35,000 | | | | 36,091 | |
| | |
White Cap Parent LLC | | | | | | | | |
8.25%, 3/15/2026(a)(b) | | | 15,000 | | | | 15,188 | |
| | | | | | | | 1,543,045 | |
|
| Technology Hardware, Storage & Peripherals – 1.1% | |
| | |
Dell, Inc. | | | | | | | | |
7.10%, 4/15/2028 | | | 25,000 | | | | 32,257 | |
6.50%, 4/15/2038 | | | 30,000 | | | | 39,835 | |
5.40%, 9/10/2040 | | | 30,000 | | | | 36,136 | |
| | |
Western Digital Corp. | | | | | | | | |
4.75%, 2/15/2026 | | | 175,000 | | | | 192,062 | |
| | |
Xerox Corp. | | | | | | | | |
4.38%, 3/15/2023(e) | | | 75,000 | | | | 77,469 | |
6.75%, 12/15/2039 | | | 30,000 | | | | 32,681 | |
| | |
Xerox Holdings Corp. | | | | | | | | |
5.00%, 8/15/2025(a) | | | 75,000 | | | | 78,000 | |
5.50%, 8/15/2028(a) | | | 75,000 | | | | 75,938 | |
| | | | | | | | 564,378 | |
|
| Textiles, Apparel & Luxury Goods – 0.1% | |
| | |
Eagle Intermediate Global Holding BV | | | | | | | | |
7.50%, 5/1/2025(a) | | | 50,000 | | | | 48,083 | |
|
| Thrifts & Mortgage Finance – 1.2% | |
| | |
Enact Holdings, Inc. | | | | | | | | |
6.50%, 8/15/2025(a) | | | 30,000 | | | | 32,887 | |
| | |
Freedom Mortgage Corp. | | | | | | | | |
8.13%, 11/15/2024(a) | | | 50,000 | | | | 50,549 | |
7.63%, 5/1/2026(a) | | | 80,000 | | | | 78,142 | |
| | |
LD Holdings Group LLC | | | | | | | | |
6.50%, 11/1/2025(a) | | | 30,000 | | | | 29,454 | |
| | |
MGIC Investment Corp. | | | | | | | | |
5.25%, 8/15/2028 | | | 100,000 | | | | 106,510 | |
| | |
Nationstar Mortgage Holdings, Inc. | | | | | | | | |
5.50%, 8/15/2028(a) | | | 75,000 | | | | 76,784 | |
5.13%, 12/15/2030(a) | | | 75,000 | | | | 75,693 | |
| | |
PennyMac Financial Services, Inc. | | | | | | | | |
4.25%, 2/15/2029(a) | | | 80,000 | | | | 75,500 | |
See Accompanying Notes to the Financial Statements.
| | | | |
| 432 | | FLEXSHARES ANNUAL REPORT | | |
FlexShares® ESG & Climate High Yield Corporate Core Index Fund (cont.)
| | | | | | | | |
| Investments | | Principal
Amount | | | Value | |
|
| CORPORATE BONDS – (continued) | |
|
| Thrifts & Mortgage Finance – (continued) | |
| | |
United Wholesale Mortgage LLC | | | | | | | | |
5.50%, 11/15/2025(a) | | $ | 45,000 | | | $ | 44,839 | |
| | | | | | | | 570,358 | |
|
| Trading Companies & Distributors – 1.9% | |
| | |
Ahern Rentals, Inc. | | | | | | | | |
7.38%, 5/15/2023(a) | | | 30,000 | | | | 28,800 | |
| | |
Boise Cascade Co. | | | | | | | | |
4.88%, 7/1/2030(a) | | | 30,000 | | | | 31,538 | |
| | |
Brightstar Escrow Corp. | | | | | | | | |
9.75%, 10/15/2025(a) | | | 25,000 | | | | 26,781 | |
| | |
Fortress Transportation and Infrastructure Investors LLC | | | | | | | | |
9.75%, 8/1/2027(a) | | | 100,000 | | | | 112,750 | |
5.50%, 5/1/2028(a) | | | 30,000 | | | | 30,112 | |
| | |
Foundation Building Materials, Inc. | | | | | | | | |
6.00%, 3/1/2029(a) | | | 25,000 | | | | 24,164 | |
| | |
Imola Merger Corp. | | | | | | | | |
4.75%, 5/15/2029(a) | | | 110,000 | | | | 113,157 | |
| | |
United Rentals North America, Inc. | | | | | | | | |
4.88%, 1/15/2028 | | | 150,000 | | | | 158,520 | |
5.25%, 1/15/2030 | | | 100,000 | | | | 108,375 | |
3.88%, 2/15/2031 | | | 75,000 | | | | 75,649 | |
| | |
WESCO Distribution, Inc. | | | | | | | | |
7.13%, 6/15/2025(a) | | | 100,000 | | | | 106,125 | |
7.25%, 6/15/2028(a) | | | 100,000 | | | | 110,416 | |
| | | | | | | | 926,387 | |
|
| Water Utilities – 0.1% | |
| | |
Solaris Midstream Holdings LLC | | | | | | | | |
7.63%, 4/1/2026(a) | | | 50,000 | | | | 52,797 | |
|
| Wireless Telecommunication Services – 5.2% | |
| |
Ligado Networks LLC | | | | | |
+ 0.00%), 15.50%, 11/1/2023(a)(b)(f) | | | 180,000 | | | | 148,421 | |
17.50%, 5/1/2024(a)(b) | | | 60,000 | | | | 35,651 | |
| | |
Sprint Communications, Inc. | | | | | | | | |
6.00%, 11/15/2022 | | | 150,000 | | | | 157,535 | |
| | |
Sprint Corp. | | | | | | | | |
7.88%, 9/15/2023 | | | 450,000 | | | | 499,500 | |
7.13%, 6/15/2024 | | | 155,000 | | | | 175,344 | |
7.63%, 3/1/2026 | | | 125,000 | | | | 150,000 | |
| | | | | | | | |
| Investments | | Principal
Amount | | | Value | |
|
| Wireless Telecommunication Services – (continued) | |
| | |
T-Mobile USA, Inc. | | | | | | | | |
2.63%, 4/15/2026 | | $ | 200,000 | | | $ | 203,276 | |
4.75%, 2/1/2028 | | | 200,000 | | | | 211,250 | |
3.50%, 4/15/2031 | | | 325,000 | | | | 336,815 | |
| | |
Vmed O2 UK Financing I plc | | | | | | | | |
4.25%, 1/31/2031(a) | | | 100,000 | | | | 97,495 | |
4.75%, 7/15/2031(a) | | | 175,000 | | | | 176,094 | |
| | |
Vodafone Group plc | | | | | | | | |
7.00%, 4/4/2079(c) | | | 250,000 | | | | 302,601 | |
5.12%, 6/4/2081(c) | | | 110,000 | | | | 112,817 | |
| | | | | | | | 2,606,799 | |
Total Corporate Bonds
(Cost $49,230,381) | | | | 48,820,616 | |
Total Investments – 98.1%
(Cost $49,230,381) | | | | 48,820,616 | |
| |
Other assets less liabilities – 1.9% | | | | 946,019 | |
| NET ASSETS – 100.0% | | | $ | 49,766,635 | |
| (a) | Securities exempt from registration under Rule 144A of the Securities Act of 1933. These securities may be resold in transactions exempt from registration, normally to qualified institutional buyers. The value of these securities is determined by valuations supplied by a pricing service or brokers, or, if not available, in accordance with procedures established by the Board of Trustees. |
| (b) | Payment in-kind security. |
| (c) | Security issued at a fixed coupon rate, which converts to a variable rate at a future date. Rate shown is the rate in effect as of period end. |
| (d) | Security fair valued as of October 31, 2021 in accordance with procedures approved by the Board of Trustees. Total value of all such securities at October 31, 2021 amounted to $25,341, which represents approximately 0.05% of net assets of the Fund. |
| (e) | Step bond. Interest rate is a fixed rate for an initial period that either resets at a specific date or may reset in the future at a contingent upon predetermined trigger. The interest rate shown was the current rate as of October 31, 2021. |
| (f) | Variable or floating rate security, linked to the referenced benchmark. The interest rate shown is the rate in effect as of October 31, 2021. |
Percentages shown are based on Net Assets.
See Accompanying Notes to the Financial Statements.
| | | | | | |
| | FLEXSHARES ANNUAL REPORT | | | 433 | |
FlexShares® ESG & Climate High Yield Corporate Core Index Fund (cont.)
As of October 31, 2021, the gross unrealized appreciation (depreciation) of investments based on the aggregate cost of investments (including derivative instruments, if applicable) for federal income tax purposes was as follows:
| | | | |
| | | | |
Aggregate gross unrealized appreciation | | $ | 82,264 | |
Aggregate gross unrealized depreciation | | | (521,272 | ) |
Net unrealized depreciation | | $ | (439,008 | ) |
Federal income tax cost | | $ | 49,259,624 | |
| | | | |
| Security Type | | % of Net Assets | |
Corporate Bonds | | | 98.1 | % |
Others(1) | | | 1.9 | |
| | | | 100.0 | % |
| (1) | Includes any other net assets/(liabilities). |
See Accompanying Notes to the Financial Statements.
| | | | |
| 434 | | FLEXSHARES ANNUAL REPORT | | |
Schedule of Investments
FlexShares® ESG & Climate Investment Grade Corporate Core Index Fund
October 31, 2021
| | | | | | | | |
| Investments | | Principal
Amount | | | Value | |
|
| CORPORATE BONDS – 97.2% | |
|
| Air Freight & Logistics – 0.7% | |
| | |
United Parcel Service, Inc. | | | | | | | | |
2.20%, 9/1/2024 | | $ | 200,000 | | | $ | 207,676 | |
5.30%, 4/1/2050 | | | 100,000 | | | | 148,934 | |
| | | | | | | | 356,610 | |
|
| Automobiles – 0.8% | |
| | |
General Motors Co. | | | | | | | | |
6.80%, 10/1/2027 | | | 200,000 | | | | 246,680 | |
5.95%, 4/1/2049 | | | 100,000 | | | | 135,969 | |
| | | | | | | | 382,649 | |
|
| Banks – 16.4% | |
| | |
Banco Santander SA | | | | | | | | |
2.75%, 5/28/2025 | | | 200,000 | | | | 207,960 | |
2.75%, 12/3/2030 | | | 200,000 | | | | 196,533 | |
| | |
Bank of America Corp. | | | | | | | | |
3.46%, 3/15/2025(a) | | | 200,000 | | | | 210,866 | |
3.09%, 10/1/2025(a) | | | 200,000 | | | | 210,356 | |
1.73%, 7/22/2027(a) | | | 200,000 | | | | 198,809 | |
3.42%, 12/20/2028(a) | | | 200,000 | | | | 214,016 | |
4.27%, 7/23/2029(a) | | | 150,000 | | | | 168,867 | |
2.69%, 4/22/2032(a) | | | 200,000 | | | | 202,777 | |
6.11%, 1/29/2037 | | | 200,000 | | | | 270,582 | |
2.68%, 6/19/2041(a) | | | 100,000 | | | | 96,508 | |
| | |
Barclays plc | | | | | | | | |
3.93%, 5/7/2025(a) | | | 200,000 | | | | 212,767 | |
5.20%, 5/12/2026 | | | 200,000 | | | | 226,285 | |
4.97%, 5/16/2029(a) | | | 200,000 | | | | 231,311 | |
| | |
Citigroup, Inc. | | | | | | | | |
3.35%, 4/24/2025(a) | | | 250,000 | | | | 263,437 | |
3.11%, 4/8/2026(a) | | | 150,000 | | | | 158,061 | |
3.20%, 10/21/2026 | | | 150,000 | | | | 159,537 | |
4.45%, 9/29/2027 | | | 150,000 | | | | 168,334 | |
4.41%, 3/31/2031(a) | | | 150,000 | | | | 172,104 | |
2.57%, 6/3/2031(a) | | | 150,000 | | | | 151,426 | |
8.13%, 7/15/2039 | | | 100,000 | | | | 169,788 | |
4.75%, 5/18/2046 | | | 100,000 | | | | 126,920 | |
4.65%, 7/23/2048 | | | 50,000 | | | | 65,702 | |
| | |
HSBC Holdings plc | | | | | | | | |
3.80%, 3/11/2025(a) | | | 200,000 | | | | 211,781 | |
4.30%, 3/8/2026 | | | 200,000 | | | | 220,444 | |
4.29%, 9/12/2026(a) | | | 200,000 | | | | 217,982 | |
4.58%, 6/19/2029(a) | | | 200,000 | | | | 226,108 | |
| | | | | | | | |
| Investments | | Principal
Amount | | | Value | |
|
| Banks – (continued) | |
2.80%, 5/24/2032(a) | | $ | 200,000 | | | $ | 201,610 | |
6.50%, 9/15/2037 | | | 150,000 | | | | 207,479 | |
| | |
ING Groep NV | | | | | | | | |
4.05%, 4/9/2029 | | | 200,000 | | | | 225,842 | |
| | |
JPMorgan Chase & Co. | | | | | | | | |
3.80%, 7/23/2024(a) | | | 100,000 | | | | 105,140 | |
3.88%, 9/10/2024 | | | 150,000 | | | | 161,339 | |
1.58%, 4/22/2027(a) | | | 200,000 | | | | 198,188 | |
3.78%, 2/1/2028(a) | | | 200,000 | | | | 218,134 | |
4.45%, 12/5/2029(a) | | | 150,000 | | | | 171,381 | |
2.74%, 10/15/2030(a) | | | 150,000 | | | | 153,911 | |
4.49%, 3/24/2031(a) | | | 150,000 | | | | 174,160 | |
2.58%, 4/22/2032(a) | | | 100,000 | | | | 100,988 | |
5.60%, 7/15/2041 | | | 100,000 | | | | 137,963 | |
5.63%, 8/16/2043 | | | 100,000 | | | | 138,560 | |
| | |
Mitsubishi UFJ Financial Group, Inc. | | | | | | | | |
3.46%, 3/2/2023 | | | 200,000 | | | | 207,564 | |
2.19%, 2/25/2025 | | | 200,000 | | | | 205,468 | |
2.31%, 7/20/2032(a) | | | 200,000 | | | | 196,320 | |
| | |
Royal Bank of Canada | | | | | | | | |
2.55%, 7/16/2024 | | | 100,000 | | | | 104,192 | |
1.15%, 6/10/2025 | | | 200,000 | | | | 199,072 | |
| | | | | | | | 8,066,572 | |
|
| Beverages – 2.7% | |
| | |
Anheuser-Busch Cos. LLC | | | | | | | | |
3.65%, 2/1/2026 | | | 100,000 | | | | 108,764 | |
4.70%, 2/1/2036 | | | 100,000 | | | | 121,160 | |
| | |
Anheuser-Busch InBev Worldwide, Inc. | | | | | | | | |
4.75%, 1/23/2029 | | | 100,000 | | | | 117,523 | |
5.45%, 1/23/2039 | | | 100,000 | | | | 131,377 | |
5.55%, 1/23/2049 | | | 300,000 | | | | 420,933 | |
| | |
PepsiCo, Inc. | | | | | | | | |
2.25%, 3/19/2025 | | | 100,000 | | | | 104,061 | |
2.63%, 7/29/2029 | | | 100,000 | | | | 105,714 | |
3.50%, 3/19/2040 | | | 200,000 | | | | 228,258 | |
| | | | | | | | 1,337,790 | |
|
| Biotechnology – 1.0% | |
| | |
Amgen, Inc. | | | | | | | | |
1.90%, 2/21/2025 | | | 100,000 | | | | 102,238 | |
1.65%, 8/15/2028 | | | 100,000 | | | | 97,083 | |
4.66%, 6/15/2051 | | | 200,000 | | | | 258,058 | |
See Accompanying Notes to the Financial Statements.
| | | | | | |
| | FLEXSHARES ANNUAL REPORT | | | 435 | |
FlexShares® ESG & Climate Investment Grade Corporate Core Index Fund (cont.)
| | | | | | | | |
| Investments | | Principal
Amount | | | Value | |
|
| CORPORATE BONDS – (continued) | |
|
| Biotechnology – (continued) | |
| | |
Biogen, Inc. | | | | | | | | |
3.15%, 5/1/2050 | | $ | 50,000 | | | $ | 49,117 | |
| | | | | | | | 506,496 | |
|
| Building Products – 0.3% | |
| | |
Johnson Controls International plc | | | | | | | | |
4.95%, 7/2/2064(b) | | | 50,000 | | | | 68,621 | |
| | |
Owens Corning | | | | | | | | |
4.30%, 7/15/2047 | | | 50,000 | | | | 58,922 | |
| | | | | | | | 127,543 | |
|
| Capital Markets – 4.9% | |
| | |
Bank of New York Mellon Corp. (The) | | | | | | | | |
2.95%, 1/29/2023 | | | 100,000 | | | | 102,886 | |
2.10%, 10/24/2024 | | | 10,000 | | | | 10,354 | |
3.40%, 1/29/2028 | | | 100,000 | | | | 109,417 | |
| | |
BlackRock, Inc. | | | | | | | | |
1.90%, 1/28/2031 | | | 200,000 | | | | 198,114 | |
| | |
CME Group, Inc. | | | | | | | | |
4.15%, 6/15/2048 | | | 100,000 | | | | 129,754 | |
| | |
Deutsche Bank AG | | | | | | | | |
2.22%, 9/18/2024(a) | | | 150,000 | | | | 152,946 | |
| | |
Goldman Sachs Group, Inc. (The) | | | | | | | | |
6.75%, 10/1/2037 | | | 100,000 | | | | 142,422 | |
| | |
Morgan Stanley | | | | | | | | |
Series F,
3.88%, 4/29/2024 | | | 200,000 | | | | 213,615 | |
3.88%, 1/27/2026 | | | 200,000 | | | | 218,440 | |
3.13%, 7/27/2026 | | | 200,000 | | | | 212,603 | |
0.98%, 12/10/2026(a) | | | 200,000 | | | | 194,208 | |
2.70%, 1/22/2031(a) | | | 200,000 | | | | 204,665 | |
2.24%, 7/21/2032(a) | | | 100,000 | | | | 97,718 | |
5.60%, 3/24/2051(a) | | | 150,000 | | | | 227,021 | |
| | |
State Street Corp. | | | | | | | | |
2.90%, 3/30/2026(a) | | | 100,000 | | | | 105,543 | |
2.40%, 1/24/2030 | | | 100,000 | | | | 102,854 | |
| | | | | | | | 2,422,560 | |
|
| Chemicals – 1.6% | |
| | |
Dow Chemical Co. (The) | | | | | | | | |
5.55%, 11/30/2048 | | | 50,000 | | | | 70,632 | |
| | |
DuPont de Nemours, Inc. | | | | | | | | |
5.42%, 11/15/2048 | | | 50,000 | | | | 69,947 | |
| | | | | | | | |
| Investments | | Principal
Amount | | | Value | |
|
| Chemicals – (continued) | |
| | |
Ecolab, Inc. | | | | | | | | |
4.80%, 3/24/2030 | | $ | 200,000 | | | $ | 241,672 | |
| | |
International Flavors & Fragrances, Inc. | | | | | | | | |
5.00%, 9/26/2048 | | | 50,000 | | | | 65,753 | |
| | |
Nutrien Ltd. | | | | | | | | |
5.88%, 12/1/2036 | | | 100,000 | | | | 134,135 | |
| | |
Sherwin-Williams Co. (The) | | | | | | | | |
2.95%, 8/15/2029 | | | 200,000 | | | | 212,042 | |
| | | | | | | | 794,181 | |
|
| Commercial Services & Supplies – 0.6% | |
| | |
Waste Management, Inc. | | | | | | | | |
0.75%, 11/15/2025 | | | 300,000 | | | | 293,386 | |
|
| Consumer Finance – 2.0% | |
| | |
American Express Co. | | | | | | | | |
3.40%, 2/27/2023 | | | 100,000 | | | | 103,544 | |
3.13%, 5/20/2026 | | | 100,000 | | | | 107,206 | |
| | |
Caterpillar Financial Services Corp. | | | | | | | | |
1.10%, 9/14/2027 | | | 200,000 | | | | 195,111 | |
| | |
General Motors Financial Co., Inc. | | | | | | | | |
1.25%, 1/8/2026 | | | 250,000 | | | | 245,265 | |
| | |
John Deere Capital Corp. | | | | | | | | |
3.45%, 3/7/2029 | | | 200,000 | | | | 221,658 | |
| | |
Synchrony Financial | | | | | | | | |
4.38%, 3/19/2024 | | | 100,000 | | | | 106,933 | |
| | | | | | | | 979,717 | |
|
| Containers & Packaging – 0.4% | |
| | |
International Paper Co. | | | | | | | | |
6.00%, 11/15/2041 | | | 100,000 | | | | 141,556 | |
| | |
Packaging Corp. of America | | | | | | | | |
3.05%, 10/1/2051 | | | 50,000 | | | | 50,681 | |
| | | | | | | | 192,237 | |
|
| Diversified Financial Services – 1.7% | |
| | |
National Rural Utilities Cooperative Finance Corp. | | | | | | | | |
0.35%, 2/8/2024 | | | 200,000 | | | | 197,610 | |
| | |
Shell International Finance BV | | | | | | | | |
2.38%, 4/6/2025 | | | 200,000 | | | | 207,704 | |
3.88%, 11/13/2028 | | | 100,000 | | | | 113,023 | |
6.38%, 12/15/2038 | | | 100,000 | | | | 148,065 | |
4.38%, 5/11/2045 | | | 150,000 | | | | 188,279 | |
| | | | | | | | 854,681 | |
See Accompanying Notes to the Financial Statements.
| | | | |
| 436 | | FLEXSHARES ANNUAL REPORT | | |
FlexShares® ESG & Climate Investment Grade Corporate Core Index Fund (cont.)
| | | | | | | | |
| Investments | | Principal
Amount | | | Value | |
|
| CORPORATE BONDS – (continued) | |
|
| Diversified Telecommunication Services – 6.4% | |
| | |
AT&T, Inc. | | | | | | | | |
1.70%, 3/25/2026 | | $ | 200,000 | | | $ | 200,923 | |
4.35%, 3/1/2029 | | | 150,000 | | | | 170,466 | |
4.30%, 2/15/2030 | | | 150,000 | | | | 170,517 | |
2.55%, 12/1/2033 | | | 200,000 | | | | 194,539 | |
3.50%, 6/1/2041 | | | 100,000 | | | | 103,174 | |
3.55%, 9/15/2055 | | | 200,000 | | | | 203,007 | |
3.80%, 12/1/2057 | | | 200,000 | | | | 210,495 | |
3.65%, 9/15/2059 | | | 200,000 | | | | 203,267 | |
| | |
Orange SA | | | | | | | | |
9.00%, 3/1/2031(b) | | | 100,000 | | | | 153,492 | |
| | |
Telefonica Emisiones SA | | | | | | | | |
5.21%, 3/8/2047 | | | 150,000 | | | | 189,362 | |
| | |
Verizon Communications, Inc. | | | | | | | | |
4.13%, 3/16/2027 | | | 150,000 | | | | 167,734 | |
4.33%, 9/21/2028 | | | 200,000 | | | | 228,500 | |
2.36%, 3/15/2032(c) | | | 100,000 | | | | 98,569 | |
4.50%, 8/10/2033 | | | 150,000 | | | | 177,337 | |
4.27%, 1/15/2036 | | | 150,000 | | | | 175,677 | |
3.40%, 3/22/2041 | | | 100,000 | | | | 104,874 | |
4.86%, 8/21/2046 | | | 150,000 | | | | 197,027 | |
4.52%, 9/15/2048 | | | 150,000 | | | | 190,324 | |
| | | | | | | | 3,139,284 | |
|
| Electric Utilities – 2.3% | |
| | |
Arizona Public Service Co. | | | | | | | | |
3.35%, 5/15/2050 | | | 100,000 | | | | 105,374 | |
| | |
Commonwealth Edison Co. | | | | | | | | |
Series 130,
3.13%, 3/15/2051 | | | 100,000 | | | | 105,401 | |
| | |
Connecticut Light and Power Co. (The) | | | | | | | | |
Series A,
2.05%, 7/1/2031 | | | 100,000 | | | | 99,201 | |
| | |
Edison International | | | | | | | | |
4.13%, 3/15/2028 | | | 300,000 | | | | 321,052 | |
| | |
Eversource Energy | | | | | | | | |
3.45%, 1/15/2050 | | | 100,000 | | | | 107,204 | |
| | |
Exelon Corp. | | | | | | | | |
4.70%, 4/15/2050 | | | 100,000 | | | | 128,768 | |
| | |
Oncor Electric Delivery Co. LLC | | | | | | | | |
2.75%, 6/1/2024 | | | 200,000 | | | | 209,357 | |
| | |
Southern California Edison Co. | | | | | | | | |
Series C,
4.13%, 3/1/2048 | | | 50,000 | | | | 56,350 | |
| | | | | | | | 1,132,707 | |
| | | | | | | | |
| Investments | | Principal
Amount | | | Value | |
|
| Energy Equipment & Services – 0.6% | |
| | |
Baker Hughes Holdings LLC | | | | | | | | |
4.08%, 12/15/2047 | | $ | 50,000 | | | $ | 57,106 | |
| | |
Halliburton Co. | | | | | | | | |
2.92%, 3/1/2030 | | | 100,000 | | | | 103,451 | |
4.85%, 11/15/2035 | | | 100,000 | | | | 118,789 | |
| | | | | | | | 279,346 | |
|
| Entertainment – 0.7% | |
| |
Walt Disney Co. (The) | | | | | |
2.00%, 9/1/2029 | | | 200,000 | | | | 200,378 | |
6.65%, 11/15/2037 | | | 100,000 | | | | 149,210 | |
| | | | | | | | 349,588 | |
|
| Equity Real Estate Investment Trusts (REITs) – 2.8% | |
| | |
Alexandria Real Estate Equities, Inc. | | | | | | | | |
2.75%, 12/15/2029 | | | 200,000 | | | | 207,431 | |
| | |
AvalonBay Communities, Inc. | | | | | | | | |
2.95%, 5/11/2026 | | | 200,000 | | | | 212,444 | |
| | |
Boston Properties LP | | | | | | | | |
3.25%, 1/30/2031 | | | 200,000 | | | | 210,099 | |
| | |
Equinix, Inc. | | | | | | | | |
3.20%, 11/18/2029 | | | 100,000 | | | | 105,474 | |
| | |
ERP Operating LP | | | | | | | | |
4.50%, 7/1/2044 | | | 100,000 | | | | 125,393 | |
| | |
Prologis LP | | | | | | | | |
3.00%, 4/15/2050 | | | 100,000 | | | | 104,163 | |
| | |
Ventas Realty LP | | | | | | | | |
4.00%, 3/1/2028 | | | 200,000 | | | | 221,002 | |
| | |
Welltower, Inc. | | | | | | | | |
3.10%, 1/15/2030 | | | 200,000 | | | | 210,499 | |
| | | | | | | | 1,396,505 | |
|
| Food & Staples Retailing – 1.3% | |
| | |
Kroger Co. (The) | | | | | | | | |
2.65%, 10/15/2026 | | | 100,000 | | | | 104,806 | |
1.70%, 1/15/2031 | | | 100,000 | | | | 95,372 | |
3.95%, 1/15/2050 | | | 100,000 | | | | 115,750 | |
| | |
Walgreens Boots Alliance, Inc. | | | | | | | | |
3.45%, 6/1/2026 | | | 100,000 | | | | 107,253 | |
| | |
Walmart, Inc. | | | | | | | | |
3.40%, 6/26/2023 | | | 200,000 | | | | 209,159 | |
| | | | | | | | 632,340 | |
See Accompanying Notes to the Financial Statements.
| | | | | | |
| | FLEXSHARES ANNUAL REPORT | | | 437 | |
FlexShares® ESG & Climate Investment Grade Corporate Core Index Fund (cont.)
| | | | | | | | |
| Investments | | Principal
Amount | | | Value | |
|
| CORPORATE BONDS – (continued) | |
|
| Food Products – 1.7% | |
| | |
Campbell Soup Co. | | | | | | | | |
4.15%, 3/15/2028 | | $ | 100,000 | | | $ | 112,191 | |
| | |
General Mills, Inc. | | | | | | | | |
3.70%, 10/17/2023 | | | 100,000 | | | | 105,548 | |
2.88%, 4/15/2030 | | | 100,000 | | | | 104,823 | |
| | |
Kellogg Co. | | | | | | | | |
2.65%, 12/1/2023 | | | 300,000 | | | | 311,711 | |
| | |
Mondelez International, Inc. | | | | | | | | |
2.63%, 9/4/2050 | | | 100,000 | | | | 94,284 | |
| | |
Unilever Capital Corp. | | | | | | | | |
3.50%, 3/22/2028 | | | 100,000 | | | | 110,671 | |
| | | | | | | | 839,228 | |
|
| Gas Utilities – 0.2% | |
| | |
Atmos Energy Corp. | | | | | | | | |
3.38%, 9/15/2049 | | | 100,000 | | | | 107,477 | |
|
| Health Care Equipment & Supplies – 1.7% | |
| | |
Abbott Laboratories | | | | | | | | |
3.40%, 11/30/2023 | | | 300,000 | | | | 314,757 | |
4.90%, 11/30/2046 | | | 150,000 | | | | 208,767 | |
| | |
Baxter International, Inc. | | | | | | | | |
1.73%, 4/1/2031 | | | 100,000 | | | | 95,572 | |
| | |
Boston Scientific Corp. | | | | | | | | |
2.65%, 6/1/2030 | | | 100,000 | | | | 102,664 | |
| | |
Medtronic, Inc. | | | | | | | | |
4.63%, 3/15/2045 | | | 100,000 | | | | 133,299 | |
| | | | | | | | 855,059 | |
|
| Health Care Providers & Services – 5.5% | |
| | |
Aetna, Inc. | | | | | | | | |
2.80%, 6/15/2023 | | | 200,000 | | | | 206,194 | |
3.88%, 8/15/2047 | | | 50,000 | | | | 57,008 | |
| | |
AmerisourceBergen Corp. | | | | | | | | |
2.70%, 3/15/2031 | | | 100,000 | | | | 101,824 | |
| | |
Anthem, Inc. | | | | | | | | |
2.38%, 1/15/2025 | | | 200,000 | | | | 207,108 | |
2.25%, 5/15/2030 | | | 100,000 | | | | 99,977 | |
3.60%, 3/15/2051 | | | 200,000 | | | | 223,035 | |
| | |
Cardinal Health, Inc. | | | | | | | | |
3.08%, 6/15/2024 | | | 100,000 | | | | 104,952 | |
4.90%, 9/15/2045 | | | 50,000 | | | | 60,743 | |
| | |
Cigna Corp. | | | | | | | | |
4.50%, 2/25/2026 | | | 100,000 | | | | 111,460 | |
| | | | | | | | |
| Investments | | Principal
Amount | | | Value | |
|
| Health Care Providers & Services – (continued) | |
4.38%, 10/15/2028 | | $ | 150,000 | | | $ | 172,109 | |
4.90%, 12/15/2048 | | | 150,000 | | | | 194,229 | |
| | |
CommonSpirit Health | | | | | | | | |
4.19%, 10/1/2049 | | | 100,000 | | | | 117,627 | |
| | |
CVS Health Corp. | | | | | | | | |
3.70%, 3/9/2023 | | | 100,000 | | | | 103,896 | |
3.88%, 7/20/2025 | | | 100,000 | | | | 108,592 | |
4.30%, 3/25/2028 | | | 200,000 | | | | 226,618 | |
4.78%, 3/25/2038 | | | 100,000 | | | | 122,306 | |
5.05%, 3/25/2048 | | | 150,000 | | | | 197,371 | |
| | |
Kaiser Foundation Hospitals | | | | | | | | |
Series 2021,
2.81%, 6/1/2041 | | | 100,000 | | | | 101,337 | |
| | |
Laboratory Corp. of America Holdings | | | | | | | | |
1.55%, 6/1/2026 | | | 100,000 | | | | 99,404 | |
2.70%, 6/1/2031 | | | 100,000 | | | | 101,953 | |
| | | | | | | | 2,717,743 | |
|
| Hotels, Restaurants & Leisure – 1.5% | |
| | |
Las Vegas Sands Corp. | | | | | | | | |
3.20%, 8/8/2024 | | | 100,000 | | | | 102,261 | |
| | |
Marriott International, Inc. | | | | | | | | |
Series II,
2.75%, 10/15/2033 | | | 100,000 | | | | 97,793 | |
| | |
McDonald’s Corp. | | | | | | | | |
3.50%, 7/1/2027 | | | 100,000 | | | | 109,103 | |
3.63%, 9/1/2049 | | | 200,000 | | | | 223,498 | |
| | |
Sands China Ltd. | | | | | | | | |
5.40%, 8/8/2028 | | | 200,000 | | | | 216,300 | |
| | | | | | | | 748,955 | |
|
| Household Durables – 0.2% | |
| | |
Lennar Corp. | | | | | | | | |
4.50%, 4/30/2024 | | | 100,000 | | | | 107,000 | |
|
| Household Products – 0.2% | |
| | |
Kimberly-Clark Corp. | | | | | | | | |
3.10%, 3/26/2030 | | | 100,000 | | | | 108,873 | |
|
Independent Power and Renewable Electricity
Producers – 0.3% | |
| | |
Exelon Generation Co. LLC | | | | | | | | |
5.75%, 10/1/2041 | | | 100,000 | | | | 122,512 | |
See Accompanying Notes to the Financial Statements.
| | | | |
| 438 | | FLEXSHARES ANNUAL REPORT | | |
FlexShares® ESG & Climate Investment Grade Corporate Core Index Fund (cont.)
| | | | | | | | |
| Investments | | Principal
Amount | | | Value | |
|
| CORPORATE BONDS – (continued) | |
|
| Insurance – 4.7% | |
| | |
Allstate Corp. (The) | | | | | | | | |
3.85%, 8/10/2049 | | $ | 100,000 | | | $ | 119,845 | |
| | |
American International Group, Inc. | | | | | | | | |
2.50%, 6/30/2025 | | | 200,000 | | | | 207,852 | |
4.25%, 3/15/2029 | | | 200,000 | | | | 227,863 | |
4.75%, 4/1/2048 | | | 150,000 | | | | 193,259 | |
| | |
Chubb INA Holdings, Inc. | | | | | | | | |
4.35%, 11/3/2045 | | | 100,000 | | | | 127,856 | |
| | |
Hartford Financial Services Group, Inc. (The) | | | | | | | | |
3.60%, 8/19/2049 | | | 100,000 | | | | 111,038 | |
| | |
Lincoln National Corp. | | | | | | | | |
4.00%, 9/1/2023 | | | 200,000 | | | | 211,914 | |
| | |
Marsh & McLennan Cos., Inc. | | | | | | | | |
4.35%, 1/30/2047 | | | 100,000 | | | | 126,247 | |
| | |
MetLife, Inc. | | | | | | | | |
3.60%, 4/10/2024 | | | 200,000 | | | | 213,276 | |
4.60%, 5/13/2046 | | | 100,000 | | | | 130,145 | |
| | |
Progressive Corp. (The) | | | | | | | | |
4.20%, 3/15/2048 | | | 100,000 | | | | 125,202 | |
| | |
Prudential Financial, Inc. | | | | | | | | |
4.50%, 9/15/2047(a) | | | 100,000 | | | | 106,452 | |
4.35%, 2/25/2050 | | | 150,000 | | | | 191,218 | |
| | |
Travelers Cos., Inc. (The) | | | | | | | | |
4.00%, 5/30/2047 | | | 150,000 | | | | 182,895 | |
| | |
Unum Group | | | | | | | | |
4.13%, 6/15/2051 | | | 50,000 | | | | 51,692 | |
| | | | | | | | 2,326,754 | |
|
| Interactive Media & Services – 0.6% | |
| | |
Alphabet, Inc. | | | | | | | | |
0.45%, 8/15/2025 | | | 100,000 | | | | 98,028 | |
1.10%, 8/15/2030 | | | 100,000 | | | | 92,669 | |
2.05%, 8/15/2050 | | | 100,000 | | | | 89,844 | |
| | | | | | | | 280,541 | |
|
| Internet & Direct Marketing Retail – 1.6% | |
| | |
Amazon.com, Inc. | | | | | | | | |
0.45%, 5/12/2024 | | | 250,000 | | | | 248,228 | |
1.00%, 5/12/2026 | | | 200,000 | | | | 198,397 | |
1.65%, 5/12/2028 | | | 250,000 | | | | 249,404 | |
| | |
eBay, Inc. | | | | | | | | |
2.70%, 3/11/2030 | | | 100,000 | | | | 102,961 | |
| | | | | | | | 798,990 | |
| | | | | | | | |
| Investments | | Principal
Amount | | | Value | |
|
| IT Services – 2.5% | |
| | |
International Business Machines Corp. | | | | | | | | |
3.50%, 5/15/2029 | | $ | 150,000 | | | $ | 164,523 | |
4.25%, 5/15/2049 | | | 150,000 | | | | 184,367 | |
| | |
Mastercard, Inc. | | | | | | | | |
2.95%, 6/1/2029 | | | 200,000 | | | | 215,073 | |
| | |
PayPal Holdings, Inc. | | | | | | | | |
1.35%, 6/1/2023 | | | 200,000 | | | | 202,628 | |
2.85%, 10/1/2029 | | | 100,000 | | | | 105,732 | |
3.25%, 6/1/2050 | | | 50,000 | | | | 54,261 | |
| | |
Visa, Inc. | | | | | | | | |
3.15%, 12/14/2025 | | | 150,000 | | | | 161,268 | |
4.30%, 12/14/2045 | | | 100,000 | | | | 128,160 | |
| | | | | | | | 1,216,012 | |
|
| Machinery – 1.1% | |
| |
Caterpillar, Inc. | | | | | |
5.20%, 5/27/2041 | | | 100,000 | | | | 137,308 | |
| |
Deere & Co. | | | | | |
3.90%, 6/9/2042 | | | 50,000 | | | | 60,214 | |
| |
Illinois Tool Works, Inc. | | | | | |
2.65%, 11/15/2026 | | | 200,000 | | | | 212,450 | |
| |
Stanley Black & Decker, Inc. | | | | | |
4.00%, 3/15/2060(a) | | | 100,000 | | | | 106,113 | |
| | | | | | | | 516,085 | |
|
| Media – 0.8% | |
| | |
Fox Corp. | | | | | | | | |
4.71%, 1/25/2029 | | | 100,000 | | | | 115,648 | |
| | |
ViacomCBS, Inc. | | | | | | | | |
4.95%, 1/15/2031 | | | 200,000 | | | | 237,749 | |
4.95%, 5/19/2050 | | | 50,000 | | | | 63,167 | |
| | | | | | | | 416,564 | |
|
| Metals & Mining – 0.5% | |
| | |
ArcelorMittal SA | | | | | | | | |
6.75%, 3/1/2041(b) | | | 50,000 | | | | 68,990 | |
| | |
Newmont Corp. | | | | | | | | |
5.88%, 4/1/2035 | | | 100,000 | | | | 131,982 | |
| | |
Teck Resources Ltd. | | | | | | | | |
6.25%, 7/15/2041 | | | 50,000 | | | | 66,848 | |
| | | | | | | | 267,820 | |
See Accompanying Notes to the Financial Statements.
| | | | | | |
| | FLEXSHARES ANNUAL REPORT | | | 439 | |
FlexShares® ESG & Climate Investment Grade Corporate Core Index Fund (cont.)
| | | | | | | | |
| Investments | | Principal
Amount | | | Value | |
|
| CORPORATE BONDS – (continued) | |
|
| Multiline Retail – 0.2% | |
| | |
Target Corp. | | | | | | | | |
2.25%, 4/15/2025 | | $ | 100,000 | | | $ | 103,784 | |
|
| Multi-Utilities – 1.1% | |
| | |
Consolidated Edison Co. of New York, Inc. | | | | | | | | |
2.40%, 6/15/2031 | | | 200,000 | | | | 201,192 | |
3.70%, 11/15/2059 | | | 100,000 | | | | 108,840 | |
| | |
NiSource, Inc. | | | | | | | | |
4.38%, 5/15/2047 | | | 100,000 | | | | 120,836 | |
| | |
Sempra Energy | | | | | | | | |
4.00%, 2/1/2048 | | | 100,000 | | | | 112,976 | |
| | | | | | | | 543,844 | |
|
| Oil, Gas & Consumable Fuels – 7.3% | |
| | |
Canadian Natural Resources Ltd. | | | | | | | | |
6.25%, 3/15/2038 | | | 100,000 | | | | 133,712 | |
| | |
Cenovus Energy, Inc. | | | | | | | | |
5.38%, 7/15/2025 | | | 300,000 | | | | 337,163 | |
| | |
Devon Energy Corp. | | | | | | | | |
5.00%, 6/15/2045 | | | 50,000 | | | | 60,858 | |
| | |
Enbridge, Inc. | | | | | | | | |
3.40%, 8/1/2051 | | | 100,000 | | | | 102,913 | |
5.50%, 7/15/2077(a) | | | 100,000 | | | | 107,963 | |
| | |
Enterprise Products Operating LLC | | | | | | | | |
6.45%, 9/1/2040 | | | 100,000 | | | | 141,587 | |
4.25%, 2/15/2048 | | | 100,000 | | | | 114,440 | |
4.80%, 2/1/2049 | | | 50,000 | | | | 61,705 | |
| | |
Hess Corp. | | | | | | | | |
3.50%, 7/15/2024 | | | 300,000 | | | | 315,208 | |
6.00%, 1/15/2040 | | | 50,000 | | | | 65,086 | |
| | |
Kinder Morgan Energy Partners LP | | | | | | | | |
6.95%, 1/15/2038 | | | 100,000 | | | | 141,034 | |
| | |
Kinder Morgan, Inc. | | | | | | | | |
2.00%, 2/15/2031 | | | 100,000 | | | | 95,296 | |
5.55%, 6/1/2045 | | | 100,000 | | | | 128,673 | |
| | |
Magellan Midstream Partners LP | | | | | | | | |
3.95%, 3/1/2050 | | | 50,000 | | | | 53,913 | |
| | |
Marathon Petroleum Corp. | | | | | | | | |
4.50%, 5/1/2023 | | | 300,000 | | | | 315,259 | |
4.50%, 4/1/2048 | | | 50,000 | | | | 58,419 | |
| | |
MPLX LP | | | | | | | | |
2.65%, 8/15/2030 | | | 100,000 | | | | 99,667 | |
5.50%, 2/15/2049 | | | 100,000 | | | | 129,094 | |
| | | | | | | | |
| Investments | | Principal
Amount | | | Value | |
|
| Oil, Gas & Consumable Fuels – (continued) | |
| | |
Plains All American Pipeline LP | | | | | | | | |
4.65%, 10/15/2025 | | $ | 300,000 | | | $ | 329,486 | |
| | |
Sabine Pass Liquefaction LLC | | | | | | | | |
4.50%, 5/15/2030 | | | 100,000 | | | | 114,067 | |
| | |
Suncor Energy, Inc. | | | | | | | | |
3.75%, 3/4/2051 | | | 100,000 | | | | 109,220 | |
| | |
TotalEnergies Capital International SA | | | | | | | | |
2.83%, 1/10/2030 | | | 100,000 | | | | 106,430 | |
3.13%, 5/29/2050 | | | 100,000 | | | | 105,004 | |
| | |
Transcontinental Gas Pipe Line Co. LLC | | | | | | | | |
3.25%, 5/15/2030 | | | 50,000 | | | | 53,087 | |
| | |
Valero Energy Corp. | | | | | | | | |
4.00%, 4/1/2029 | | | 100,000 | | | | 109,828 | |
| | |
Williams Cos., Inc. (The) | | | | | | | | |
6.30%, 4/15/2040 | | | 100,000 | | | | 136,535 | |
5.75%, 6/24/2044 | | | 50,000 | | | | 65,764 | |
| | | | | | | | 3,591,411 | |
|
| Paper & Forest Products – 0.2% | |
| | |
Suzano Austria GmbH | | | | | | | | |
3.13%, 1/15/2032 | | | 100,000 | | | | 94,536 | |
|
| Personal Products – 0.2% | |
| | |
Estee Lauder Cos., Inc. (The) | | | | | | | | |
3.13%, 12/1/2049 | | | 100,000 | | | | 109,479 | |
|
| Pharmaceuticals – 4.4% | |
| | |
AstraZeneca plc | | | | | | | | |
6.45%, 9/15/2037 | | | 100,000 | | | | 148,852 | |
| | |
GlaxoSmithKline Capital, Inc. | | | | | | | | |
6.38%, 5/15/2038 | | | 100,000 | | | | 148,015 | |
| | |
Johnson & Johnson | | | | | | | | |
2.63%, 1/15/2025 | | | 100,000 | | | | 105,071 | |
1.30%, 9/1/2030 | | | 100,000 | | | | 95,965 | |
3.63%, 3/3/2037 | | | 200,000 | | | | 232,418 | |
3.70%, 3/1/2046 | | | 100,000 | | | | 120,061 | |
| | |
Merck & Co., Inc. | | | | | | | | |
2.90%, 3/7/2024 | | | 100,000 | | | | 104,825 | |
3.40%, 3/7/2029 | | | 100,000 | | | | 109,925 | |
2.35%, 6/24/2040 | | | 100,000 | | | | 95,620 | |
3.70%, 2/10/2045 | | | 100,000 | | | | 116,124 | |
| | |
Novartis Capital Corp. | | | | | | | | |
3.40%, 5/6/2024 | | | 100,000 | | | | 106,271 | |
See Accompanying Notes to the Financial Statements.
| | | | |
| 440 | | FLEXSHARES ANNUAL REPORT | | |
FlexShares® ESG & Climate Investment Grade Corporate Core Index Fund (cont.)
| | | | | | | | |
| Investments | | Principal
Amount | | | Value | |
|
| CORPORATE BONDS – (continued) | |
|
| Pharmaceuticals – (continued) | |
2.00%, 2/14/2027 | | $ | 100,000 | | | $ | 102,444 | |
2.75%, 8/14/2050 | | | 100,000 | | | | 102,363 | |
| | |
Pfizer, Inc. | | | | | | | | |
3.45%, 3/15/2029 | | | 100,000 | | | | 110,834 | |
7.20%, 3/15/2039 | | | 100,000 | | | | 161,565 | |
4.13%, 12/15/2046 | | | 100,000 | | | | 124,518 | |
| | |
Takeda Pharmaceutical Co. Ltd. | | | | | | | | |
2.05%, 3/31/2030 | | | 200,000 | | | | 195,848 | |
| | | | | | | | 2,180,719 | |
|
| Road & Rail – 2.0% | |
| | |
Canadian National Railway Co. | | | | | | | | |
4.45%, 1/20/2049 | | | 100,000 | | | | 130,198 | |
| | |
Canadian Pacific Railway Co. | | | | | | | | |
4.80%, 8/1/2045 | | | 100,000 | | | | 128,844 | |
| | |
CSX Corp. | | | | | | | | |
3.40%, 8/1/2024 | | | 200,000 | | | | 212,804 | |
4.30%, 3/1/2048 | | | 100,000 | | | | 123,487 | |
3.80%, 4/15/2050 | | | 100,000 | | | | 116,415 | |
| | |
Union Pacific Corp. | | | | | | | | |
3.20%, 5/20/2041 | | | 200,000 | | | | 213,725 | |
3.75%, 2/5/2070 | | | 50,000 | | | | 58,122 | |
| | | | | | | | 983,595 | |
|
| Semiconductors & Semiconductor Equipment – 1.5% | |
| | |
Intel Corp. | | | | | | | | |
2.88%, 5/11/2024 | | | 100,000 | | | | 104,897 | |
3.40%, 3/25/2025 | | | 100,000 | | | | 107,206 | |
2.45%, 11/15/2029 | | | 200,000 | | | | 207,091 | |
4.75%, 3/25/2050 | | | 150,000 | | | | 199,088 | |
4.95%, 3/25/2060 | | | 100,000 | | | | 141,300 | |
| | | | | | | | 759,582 | |
|
| Software – 3.3% | |
| | |
Microsoft Corp. | | | | | | | | |
3.13%, 11/3/2025 | | | 150,000 | | | | 161,010 | |
2.40%, 8/8/2026 | | | 200,000 | | | | 209,974 | |
3.30%, 2/6/2027 | | | 200,000 | | | | 218,559 | |
2.53%, 6/1/2050 | | | 250,000 | | | | 246,376 | |
2.92%, 3/17/2052 | | | 250,000 | | | | 264,987 | |
| | |
Oracle Corp. | | | | | | | | |
3.60%, 4/1/2040 | | | 200,000 | | | | 208,455 | |
4.00%, 7/15/2046 | | | 100,000 | | | | 108,037 | |
| | | | | | | | |
| Investments | | Principal
Amount | | | Value | |
|
| Software – (continued) | |
| | |
salesforce.com, Inc. | | | | | | | | |
1.50%, 7/15/2028 | | $ | 100,000 | | | $ | 98,561 | |
2.90%, 7/15/2051 | | | 100,000 | | | | 102,955 | |
| | | | | | | | 1,618,914 | |
|
| Specialty Retail – 2.4% | |
| | |
Home Depot, Inc. (The) | | | | | | | | |
3.90%, 12/6/2028 | | | 200,000 | | | | 227,638 | |
5.88%, 12/16/2036 | | | 150,000 | | | | 211,687 | |
3.35%, 4/15/2050 | | | 100,000 | | | | 111,222 | |
| | |
Lowe’s Cos., Inc. | | | | | | | | |
2.50%, 4/15/2026 | | | 200,000 | | | | 209,202 | |
3.65%, 4/5/2029 | | | 250,000 | | | | 276,340 | |
3.00%, 10/15/2050 | | | 150,000 | | | | 150,276 | |
| | | | | | | | 1,186,365 | |
|
| Technology Hardware, Storage & Peripherals – 3.5% | |
| | |
Apple, Inc. | | | | | | | | |
2.40%, 5/3/2023 | | | 300,000 | | | | 308,567 | |
3.25%, 2/23/2026 | | | 300,000 | | | | 323,705 | |
1.65%, 2/8/2031 | | | 300,000 | | | | 291,090 | |
3.85%, 5/4/2043 | | | 150,000 | | | | 177,308 | |
4.65%, 2/23/2046 | | | 150,000 | | | | 198,286 | |
| | |
Dell International LLC | | | | | | | | |
5.30%, 10/1/2029 | | | 100,000 | | | | 120,424 | |
| | |
Hewlett Packard Enterprise Co. | | | | | | | | |
4.45%, 10/2/2023 | | | 100,000 | | | | 106,423 | |
6.35%, 10/15/2045(b) | | | 50,000 | | | | 68,634 | |
| | |
HP, Inc. | | | | | | | | |
2.65%, 6/17/2031(c) | | | 150,000 | | | | 147,860 | |
| | | | | | | | 1,742,297 | |
|
| Wireless Telecommunication Services – 0.8% | |
| | |
Vodafone Group plc | | | | | | | | |
4.38%, 5/30/2028 | | | 100,000 | | | | 114,099 | |
5.25%, 5/30/2048 | | | 200,000 | | | | 263,616 | |
| | | | | | | | 377,715 | |
Total Corporate Bonds
(Cost $48,648,615) | | | | | | | 47,966,046 | |
Total Investments – 97.2%
(Cost $48,648,615) | | | | | | | 47,966,046 | |
| | |
Other assets less liabilities – 2.8% | | | | | | | 1,381,010 | |
| NET ASSETS – 100.0% | | | | | | $ | 49,347,056 | |
See Accompanying Notes to the Financial Statements.
| | | | | | |
| | FLEXSHARES ANNUAL REPORT | | | 441 | |
FlexShares® ESG & Climate Investment Grade Corporate Core Index Fund (cont.)
| (a) | Security issued at a fixed coupon rate, which converts to a variable rate at a future date. Rate shown is the rate in effect as of period end. |
| (b) | Step bond. Interest rate is a fixed rate for an initial period that either resets at a specific date or may reset in the future at a contingent upon predetermined trigger. The interest rate shown was the current rate as of October 31, 2021. |
| (c) | Securities exempt from registration under Rule 144A of the Securities Act of 1933. These securities may be resold in transactions exempt from registration, normally to qualified institutional buyers. The value of these securities is determined by valuations supplied by a pricing service or brokers, or, if not available, in accordance with procedures established by the Board of Trustees. |
Percentages shown are based on Net Assets.
As of October 31, 2021, the gross unrealized appreciation (depreciation) of investments based on the aggregate cost of investments (including derivative instruments, if applicable) for federal income tax purposes was as follows:
| | | | |
| | | | |
Aggregate gross unrealized appreciation | | $ | 22,499 | |
Aggregate gross unrealized depreciation | | | (709,172 | ) |
Net unrealized depreciation | | $ | (686,673 | ) |
Federal income tax cost | | $ | 48,652,719 | |
| | | | |
| Security Type | | % of Net Assets | |
Corporate Bonds | | | 97.2 | % |
Others(1) | | | 2.8 | |
| | | | 100.0 | % |
| (1) | Includes any other net assets/(liabilities). |
See Accompanying Notes to the Financial Statements.
| | | | |
| 442 | | FLEXSHARES ANNUAL REPORT | | |
Schedule of Investments
FlexShares® Ready Access Variable Income Fund
October 31, 2021
| | | | | | | | |
| Investments | | Principal
Amount | | | Value | |
|
| CORPORATE BONDS – 92.7% | |
|
| Aerospace & Defense – 0.4% | |
| | |
Boeing Co. (The) | | | | | | | | |
1.17%, 2/4/2023 | | $ | 600,000 | | | $ | 600,777 | |
1.95%, 2/1/2024 | | | 1,000,000 | | | | 1,018,530 | |
| | | | | | | | 1,619,307 | |
|
| Agricultural & Farm Machinery – 0.3% | |
| | |
CNH Industrial Capital LLC | | | | | | | | |
4.38%, 4/5/2022 | | | 474,000 | | | | 481,224 | |
1.95%, 7/2/2023 | | | 730,000 | | | | 743,375 | |
| | | | | | | | 1,224,599 | |
|
| Agricultural Products – 0.3% | |
| | |
Cargill, Inc. | | | | | | | | |
0.40%, 2/2/2024(a) | | | 1,200,000 | | | | 1,189,987 | |
|
| Airlines – 0.5% | |
| | |
Southwest Airlines Co. | | | | | | | | |
4.75%, 5/4/2023 | | | 1,670,000 | | | | 1,767,928 | |
|
| Apparel, Accessories & Luxury Goods – 0.4% | |
| | |
VF Corp. | | | | | | | | |
2.05%, 4/23/2022 | | | 1,500,000 | | | | 1,511,527 | |
|
| Asset Management & Custody Banks – 1.3% | |
| | |
Ares Capital Corp. | | | | | | | | |
3.50%, 2/10/2023 | | | 1,100,000 | | | | 1,134,098 | |
| |
Bank of New York Mellon Corp. (The) | | | | | |
Series J, (SOFR + 0.20%), 0.25%, 10/25/2024(b) | | | 2,900,000 | | | | 2,898,435 | |
| | |
FS KKR Capital Corp. | | | | | | | | |
1.65%, 10/12/2024 | | | 980,000 | | | | 968,321 | |
| | | | | | | | 5,000,854 | |
|
| Automobile Manufacturers – 3.5% | |
| | |
BMW US Capital LLC | | | | | | | | |
3.80%, 4/6/2023(a) | | | 1,500,000 | | | | 1,567,452 | |
(SOFR + 0.53%), 0.58%, 4/1/2024(a)(b) | | | 900,000 | | | | 908,234 | |
| | |
Daimler Finance North America LLC | | | | | | | | |
0.75%, 3/1/2024(a) | | | 2,600,000 | | | | 2,589,592 | |
| | | | | | | | |
| Investments | | Principal
Amount | | | Value | |
|
| Automobile Manufacturers – (continued) | |
| | |
Hyundai Capital America | | | | | | | | |
1.25%, 9/18/2023(a) | | $ | 910,000 | | | $ | 914,281 | |
0.80%, 1/8/2024(a) | | | 1,900,000 | | | | 1,884,605 | |
0.88%, 6/14/2024(a) | | | 1,000,000 | | | | 989,202 | |
| |
Nissan Motor Acceptance Co. LLC | | | | | |
(ICE LIBOR USD 3 Month + 0.89%), 1.01%, 1/13/2022(a)(b) | | | 1,000,000 | | | | 1,000,907 | |
1.13%, 9/16/2024(a) | | | 900,000 | | | | 893,111 | |
| | |
Volkswagen Group of America Finance LLC | | | | | | | | |
0.75%, 11/23/2022(a) | | | 1,000,000 | | | | 1,000,912 | |
3.13%, 5/12/2023(a) | | | 1,410,000 | | | | 1,459,002 | |
| | | | | | | | 13,207,298 | |
|
| Automotive Retail – 0.6% | |
| | |
Advance Auto Parts, Inc. | | | | | | | | |
4.50%, 12/1/2023 | | | 250,000 | | | | 265,494 | |
| | |
AutoZone, Inc. | | | | | | | | |
3.70%, 4/15/2022 | | | 2,000,000 | | | | 2,013,340 | |
| | | | | | | | 2,278,834 | |
|
| Biotechnology – 0.7% | |
| | |
AbbVie, Inc. | | | | | | | | |
2.15%, 11/19/2021 | | | 500,000 | | | | 500,435 | |
| | |
Gilead Sciences, Inc. | | | | | | | | |
0.75%, 9/29/2023 | | | 2,300,000 | | | | 2,297,681 | |
| | | | | | | | 2,798,116 | |
|
| Broadcasting – 0.2% | |
| | |
Fox Corp. | | | | | | | | |
3.67%, 1/25/2022 | | | 800,000 | | | | 806,184 | |
|
| Cable & Satellite – 0.6% | |
| |
Comcast Corp. | | | | | |
(ICE LIBOR USD 3 Month + 0.63%), 0.75%, 4/15/2024(b) | | | 1,100,000 | | | | 1,111,927 | |
| | |
Sky Ltd. | | | | | | | | |
3.75%, 9/16/2024(a) | | | 1,140,000 | | | | 1,228,427 | |
| | | | | | | | 2,340,354 | |
See Accompanying Notes to the Financial Statements.
| | | | | | |
| | FLEXSHARES ANNUAL REPORT | | | 443 | |
FlexShares® Ready Access Variable Income Fund (cont.)
| | | | | | | | |
| Investments | | Principal
Amount | | | Value | |
|
| CORPORATE BONDS – (continued) | |
|
| Commodity Chemicals – 0.1% | |
| | |
Westlake Chemical Corp. | | | | | | | | |
0.88%, 8/15/2024 | | $ | 400,000 | | | $ | 400,018 | |
|
| Construction Materials – 0.3% | |
| | |
Martin Marietta Materials, Inc. | | | | | | | | |
0.65%, 7/15/2023 | | | 1,080,000 | | | | 1,080,325 | |
|
| Consumer Finance – 5.9% | |
| |
AerCap Ireland Capital DAC | | | | | |
(SOFR + 0.68%), 0.73%, 9/29/2023(b) | | | 900,000 | | | | 901,816 | |
1.65%, 10/29/2024 | | | 900,000 | | | | 901,228 | |
| | |
American Express Co. | | | | | | | | |
2.50%, 8/1/2022 | | | 670,000 | | | | 679,512 | |
| |
American Honda Finance Corp. | | | | | |
(ICE LIBOR USD 3 Month + 0.37%), 0.50%, 5/10/2023(b) | | | 2,500,000 | | | | 2,510,179 | |
0.88%, 7/7/2023 | | | 2,670,000 | | | | 2,685,280 | |
(ICE LIBOR USD 3 Month + 0.42%), 0.53%, 9/8/2023(b) | | | 600,000 | | | | 603,914 | |
| |
Capital One Financial Corp. | | | | | |
(ICE LIBOR USD 3 Month + 0.95%), 1.07%, 3/9/2022(b) | | | 235,000 | | | | 235,536 | |
(ICE LIBOR USD 3 Month + 0.72%), 0.85%, 1/30/2023(b) | | | 1,500,000 | | | | 1,508,862 | |
3.50%, 6/15/2023 | | | 1,000,000 | | | | 1,044,298 | |
| |
General Motors Financial Co., Inc. | | | | | |
(ICE LIBOR USD 3 Month + 1.10%), 1.22%, 11/6/2021(b) | | | 1,500,000 | | | | 1,500,236 | |
4.15%, 6/19/2023 | | | 765,000 | | | | 803,524 | |
1.70%, 8/18/2023 | | | 380,000 | | | | 385,383 | |
(SOFR + 0.76%), 0.81%, 3/8/2024(b) | | | 800,000 | | | | 805,099 | |
3.50%, 11/7/2024 | | | 600,000 | | | | 636,714 | |
| |
John Deere Capital Corp. | | | | | |
(SOFR + 0.12%), 0.17%, 7/10/2023(b) | | | 3,800,000 | | | | 3,802,267 | |
| | |
PACCAR Financial Corp. | | | | | | | | |
2.00%, 9/26/2022 | | | 200,000 | | | | 202,982 | |
2.65%, 4/6/2023 | | | 1,000,000 | | | | 1,030,446 | |
| | | | | | | | |
| Investments | | Principal
Amount | | | Value | |
|
| Consumer Finance – (continued) | |
| | |
Synchrony Financial | | | | | | | | |
4.25%, 8/15/2024 | | $ | 1,543,000 | | | $ | 1,656,161 | |
| | | | | | | | 21,893,437 | |
|
| Data Processing & Outsourced Services – 1.2% | |
| | |
Fidelity National Information Services, Inc. | | | | | | | | |
0.60%, 3/1/2024 | | | 910,000 | | | | 902,292 | |
| | |
PayPal Holdings, Inc. | | | | | | | | |
1.35%, 6/1/2023 | | | 3,640,000 | | | | 3,687,832 | |
| | | | | | | | 4,590,124 | |
|
| Diversified Banks – 23.2% | |
| |
Bank of America Corp. | | | | | |
(BSBY3M + 0.43%), 0.53%, 5/28/2024(b) | | | 4,000,000 | | | | 4,011,040 | |
(SOFR + 0.73%), 0.78%, 10/24/2024(b) | | | 2,200,000 | | | | 2,214,908 | |
| | |
Bank of Montreal | | | | | | | | |
0.63%, 7/9/2024 | | | 1,100,000 | | | | 1,090,005 | |
(SOFR + 0.62%), 0.67%, 9/15/2026(b) | | | 3,500,000 | | | | 3,511,061 | |
| |
Bank of Nova Scotia (The) | | | | | |
(SOFR + 0.55%), 0.59%, 3/2/2026(b) | | | 5,000,000 | | | | 5,004,625 | |
| |
Banque Federative du Credit Mutuel SA | | | | | |
(ICE LIBOR USD 3 Month + 0.96%), 1.09%, 7/20/2023(a)(b) | | | 1,000,000 | | | | 1,014,615 | |
| | |
Barclays Bank plc | | | | | | | | |
1.70%, 5/12/2022 | | | 1,090,000 | | | | 1,096,884 | |
| | |
BNP Paribas SA | | | | | | | | |
2.95%, 5/23/2022(a) | | | 300,000 | | | | 304,240 | |
4.25%, 10/15/2024 | | | 1,000,000 | | | | 1,091,058 | |
| |
Canadian Imperial Bank of Commerce | | | | | |
(SOFR + 0.80%), 0.85%, 3/17/2023(b) | | | 2,400,000 | | | | 2,417,777 | |
| |
Citigroup, Inc. | | | | | |
(SOFR + 0.67%), 0.72%, 5/1/2025(b) | | | 950,000 | | | | 956,571 | |
| |
Commonwealth Bank of Australia | | | | | |
(SOFR + 0.40%), 0.45%, 7/7/2025(a)(b) | | | 1,800,000 | | | | 1,804,115 | |
See Accompanying Notes to the Financial Statements.
| | | | |
| 444 | | FLEXSHARES ANNUAL REPORT | | |
FlexShares® Ready Access Variable Income Fund (cont.)
| | | | | | | | |
| Investments | | Principal
Amount | | | Value | |
|
| CORPORATE BONDS – (continued) | |
|
| Diversified Banks – (continued) | |
(SOFR + 0.52%), 0.57%, 6/15/2026(a)(b) | | $ | 2,100,000 | | | $ | 2,115,843 | |
| |
Cooperatieve Rabobank UA | | | | | |
(SOFR + 0.30%), 0.35%, 1/12/2024(b) | | | 2,000,000 | | | | 2,006,884 | |
| | |
HSBC Holdings plc | | | | | | | | |
3.26%, 3/13/2023(c) | | | 1,100,000 | | | | 1,110,966 | |
0.73%, 8/17/2024(c) | | | 2,240,000 | | | | 2,232,488 | |
| | |
ING Groep NV | | | | | | | | |
3.15%, 3/29/2022 | | | 291,000 | | | | 294,268 | |
(SOFR + 1.01%), 1.06%, 4/1/2027(b) | | | 4,000,000 | | | | 4,043,088 | |
| | |
JPMorgan Chase & Co. | | | | | | | | |
3.21%, 4/1/2023(c) | | | 1,000,000 | | | | 1,011,079 | |
2.78%, 4/25/2023(c) | | | 100,000 | | | | 101,096 | |
1.51%, 6/1/2024(c) | | | 2,650,000 | | | | 2,684,168 | |
0.77%, 8/9/2025(c) | | | 1,000,000 | | | | 988,475 | |
(SOFR + 0.77%), 0.81%, 9/22/2027(b) | | | 2,500,000 | | | | 2,518,732 | |
| | |
Lloyds Banking Group plc | | | | | | | | |
2.86%, 3/17/2023(c) | | | 2,600,000 | | | | 2,622,584 | |
1.33%, 6/15/2023(c) | | | 400,000 | | | | 401,886 | |
4.05%, 8/16/2023 | | | 650,000 | | | | 688,063 | |
| | |
Mitsubishi UFJ Financial Group, Inc. | | | | | | | | |
3.22%, 3/7/2022 | | | 700,000 | | | | 706,902 | |
2.62%, 7/18/2022 | | | 2,970,000 | | | | 3,016,698 | |
3.46%, 3/2/2023 | | | 500,000 | | | | 518,910 | |
| |
Mizuho Financial Group, Inc. | | | | | |
(ICE LIBOR USD 3 Month + 0.88%), 0.99%, 9/11/2022(b) | | | 600,000 | | | | 604,157 | |
(ICE LIBOR USD 3 Month + 0.84%), 0.96%, 7/16/2023(b) | | | 700,000 | | | | 703,748 | |
(ICE LIBOR USD 3 Month + 0.85%), 0.96%, 9/13/2023(b) | | | 2,250,000 | | | | 2,264,807 | |
(ICE LIBOR USD 3 Month + 0.61%), 0.72%, 9/8/2024(b) | | | 3,100,000 | | | | 3,117,096 | |
| | |
National Bank of Canada | | | | | | | | |
0.75%, 8/6/2024 | | | 1,900,000 | | | | 1,886,034 | |
| |
NatWest Markets plc | | | | | |
(SOFR + 0.53%), 0.58%, 8/12/2024(a)(b) | | | 600,000 | | | | 602,565 | |
| | | | | | | | |
| Investments | | Principal
Amount | | | Value | |
|
| Diversified Banks – (continued) | |
| | |
Nordea Bank Abp | | | | | | | | |
1.00%, 6/9/2023(a) | | $ | 640,000 | | | $ | 645,135 | |
0.63%, 5/24/2024(a) | | | 2,100,000 | | | | 2,085,659 | |
| | |
Royal Bank of Canada | | | | | | | | |
2.75%, 2/1/2022 | | | 600,000 | | | | 603,723 | |
(SOFR + 0.53%), 0.57%, 1/20/2026(b) | | | 3,000,000 | | | | 3,010,713 | |
(SOFR + 0.57%), 0.62%, 4/27/2026(b) | | | 2,000,000 | | | | 2,006,729 | |
| | |
Skandinaviska Enskilda Banken AB | | | | | | | | |
2.20%, 12/12/2022(a) | | | 600,000 | | | | 611,871 | |
(ICE LIBOR USD 3 Month + 0.32%), 0.44%, 9/1/2023(a)(b) | | | 3,000,000 | | | | 3,013,376 | |
0.65%, 9/9/2024(a) | | | 1,500,000 | | | | 1,485,353 | |
| | |
Societe Generale SA | | | | | | | | |
2.63%, 10/16/2024(a) | | | 1,000,000 | | | | 1,034,753 | |
| | |
Sumitomo Mitsui Financial Group, Inc. | | | | | | | | |
0.51%, 1/12/2024 | | | 300,000 | | | | 297,556 | |
| | |
Sumitomo Mitsui Trust Bank Ltd. | | | | | | | | |
0.80%, 9/12/2023(a) | | | 900,000 | | | | 901,576 | |
0.85%, 3/25/2024(a) | | | 400,000 | | | | 398,466 | |
| | |
Swedbank AB | | | | | | | | |
1.30%, 6/2/2023(a) | | | 400,000 | | | | 404,276 | |
| |
Toronto-Dominion Bank (The) | | | | | |
(SOFR + 0.24%), 0.29%, 1/6/2023(b) | | | 3,000,000 | | | | 3,003,796 | |
0.55%, 3/4/2024 | | | 2,000,000 | | | | 1,985,059 | |
(SOFR + 0.59%), 0.64%, 9/10/2026(b) | | | 2,000,000 | | | | 2,014,577 | |
| |
Westpac Banking Corp. | | | | | |
(SOFR + 0.52%), 0.57%, 6/3/2026(b) | | | 2,668,000 | | | | 2,686,499 | |
| | | | | | | | 86,946,553 | |
|
| Diversified Capital Markets – 2.9% | |
| |
Credit Suisse AG | | | | | |
(SOFR + 0.45%), 0.50%, 2/4/2022(b) | | | 3,000,000 | | | | 3,002,682 | |
2.80%, 4/8/2022 | | | 1,300,000 | | | | 1,314,045 | |
See Accompanying Notes to the Financial Statements.
| | | | | | |
| | FLEXSHARES ANNUAL REPORT | | | 445 | |
FlexShares® Ready Access Variable Income Fund (cont.)
| | | | | | | | |
| Investments | | Principal
Amount | | | Value | |
|
| CORPORATE BONDS – (continued) | |
|
| Diversified Capital Markets – (continued) | |
| |
Deutsche Bank AG | | | | | |
(ICE LIBOR USD 3 Month + 1.19%), 1.31%, 11/16/2022(b) | | $ | 1,250,000 | | | $ | 1,259,400 | |
0.90%, 5/28/2024 | | | 1,100,000 | | | | 1,091,701 | |
| | |
Macquarie Bank Ltd. | | | | | | | | |
2.10%, 10/17/2022(a) | | | 700,000 | | | | 710,675 | |
| |
UBS AG | | | | | |
(SOFR + 0.32%), 0.37%, 6/1/2023(a)(b) | | | 2,500,000 | | | | 2,507,964 | |
0.70%, 8/9/2024(a) | | | 200,000 | | | | 198,772 | |
| | |
UBS Group AG | | | | | | | | |
3.49%, 5/23/2023(a) | | | 620,000 | | | | 629,879 | |
| | | | | | | | 10,715,118 | |
|
| Diversified Metals & Mining – 0.3% | |
| | |
Glencore Finance Canada Ltd. | | | | | | | | |
4.95%, 11/15/2021(a) | | | 1,000,000 | | | | 1,002,450 | |
|
| Electric Utilities – 4.3% | |
| |
American Electric Power Co., Inc. | | | | | |
Series A, (ICE LIBOR USD 3 Month + 0.48%), 0.61%, 11/1/2023(b) | | | 1,500,000 | | | | 1,500,484 | |
| | |
Duke Energy Corp. | | | | | | | | |
2.40%, 8/15/2022 | | | 250,000 | | | | 253,528 | |
| |
Duke Energy Progress LLC | | | | | |
Series A, (ICE LIBOR USD 3 Month + 0.18%), 0.30%, 2/18/2022(b) | | | 2,600,000 | | | | 2,599,280 | |
| | |
Entergy Louisiana LLC | | | | | | | | |
0.62%, 11/17/2023 | | | 1,500,000 | | | | 1,498,255 | |
| |
Eversource Energy | | | | | |
Series T, (SOFR + 0.25%), 0.30%, 8/15/2023(b) | | | 1,500,000 | | | | 1,501,150 | |
| |
Mississippi Power Co. | | | | | |
Series A, (SOFR + 0.30%), 0.35%, 6/28/2024(b) | | | 1,000,000 | | | | 999,862 | |
| |
NextEra Energy Capital Holdings, Inc. | | | | | |
(ICE LIBOR USD 3 Month + 0.27%), 0.40%, 2/22/2023(b) | | | 2,221,000 | | | | 2,221,725 | |
| | |
OGE Energy Corp. | | | | | | | | |
0.70%, 5/26/2023 | | | 1,540,000 | | | | 1,537,874 | |
| | | | | | | | |
| Investments | | Principal
Amount | | | Value | |
|
| Electric Utilities – (continued) | |
| |
PPL Electric Utilities Corp. | | | | | |
(ICE LIBOR USD 3 Month + 0.25%), 0.38%, 9/28/2023(b) | | $ | 850,000 | | | $ | 850,023 | |
(SOFR + 0.33%), 0.38%, 6/24/2024(b) | | | 1,360,000 | | | | 1,360,925 | |
| |
Southern Co. (The) | | | | | |
Series 21-A, 0.60%, 2/26/2024 | | | 1,940,000 | | | | 1,924,086 | |
| | | | | | | | 16,247,192 | |
|
| Financial Exchanges & Data – 0.3% | |
| | |
Nasdaq, Inc. | | | | | | | | |
0.45%, 12/21/2022 | | | 1,200,000 | | | | 1,198,883 | |
|
| Food Retail – 0.0%(d) | |
| |
7-Eleven, Inc. | | | | | |
(ICE LIBOR USD 3 Month + 0.45%), 0.58%, 8/10/2022(a)(b) | | | 150,000 | | | | 150,032 | |
|
| Gas Utilities – 1.2% | |
| | |
CenterPoint Energy Resources Corp. | | | | | | | | |
0.70%, 3/2/2023 | | | 1,420,000 | | | | 1,416,606 | |
3.55%, 4/1/2023 | | | 750,000 | | | | 777,852 | |
| |
ONE Gas, Inc. | | | | | |
(ICE LIBOR USD 3 Month + 0.61%), 0.72%, 3/11/2023(b) | | | 2,050,000 | | | | 2,050,210 | |
| | |
Southern Natural Gas Co. LLC | | | | | | | | |
0.63%, 4/28/2023(a) | | | 180,000 | | | | 179,500 | |
| | | | | | | | 4,424,168 | |
|
| Health Care Equipment – 2.3% | |
| | |
Abbott Laboratories | | | | | | | | |
2.55%, 3/15/2022 | | | 1,262,000 | | | | 1,272,799 | |
| |
Becton Dickinson and Co. | | | | | |
(ICE LIBOR USD 3 Month + 1.03%), 1.15%, 6/6/2022(b) | | | 2,000,000 | | | | 2,010,840 | |
| | |
DH Europe Finance II Sarl | | | | | | | | |
2.05%, 11/15/2022 | | | 3,300,000 | | | | 3,352,567 | |
| | |
Stryker Corp. | | | | | | | | |
0.60%, 12/1/2023 | | | 1,910,000 | | | | 1,906,226 | |
| | | | | | | | 8,542,432 | |
See Accompanying Notes to the Financial Statements.
| | | | |
| 446 | | FLEXSHARES ANNUAL REPORT | | |
FlexShares® Ready Access Variable Income Fund (cont.)
| | | | | | | | |
| Investments | | Principal
Amount | | | Value | |
|
| CORPORATE BONDS – (continued) | |
|
| Health Care Facilities – 0.1% | |
| | |
HCA, Inc. | | | | | | | | |
5.00%, 3/15/2024 | | $ | 400,000 | | | $ | 435,406 | |
|
| Health Care Services – 0.6% | |
| | |
CVS Health Corp. | | | | | | | | |
2.75%, 12/1/2022 | | | 610,000 | | | | 621,206 | |
3.70%, 3/9/2023 | | | 1,614,000 | | | | 1,676,881 | |
| | | | | | | | 2,298,087 | |
|
| Homebuilding – 0.4% | |
| | |
DR Horton, Inc. | | | | | | | | |
4.38%, 9/15/2022 | | | 500,000 | | | | 511,458 | |
| | |
Lennar Corp. | | | | | | | | |
4.88%, 12/15/2023 | | | 940,000 | | | | 1,008,949 | |
| | | | | | | | 1,520,407 | |
|
| Household Products – 0.3% | |
| | |
Clorox Co. (The) | | | | | | | | |
3.80%, 11/15/2021 | | | 1,000,000 | | | | 1,001,310 | |
|
| Industrial Conglomerates – 1.6% | |
| | |
General Electric Co. | | | | | | | | |
3.15%, 9/7/2022 | | | 2,800,000 | | | | 2,867,610 | |
(ICE LIBOR USD 3 Month + 0.30%), 0.42%, 5/13/2024(b) | | | 3,000,000 | | | | 2,986,733 | |
| | |
Roper Technologies, Inc. | | | | | | | | |
0.45%, 8/15/2022 | | | 290,000 | | | | 290,059 | |
| | | | | | | | 6,144,402 | |
|
| Industrial Machinery – 0.7% | |
| |
Otis Worldwide Corp. | | | | | |
(ICE LIBOR USD 3 Month + 0.45%), 0.58%, 4/5/2023(b) | | | 2,705,000 | | | | 2,705,213 | |
|
| Insurance Brokers – 0.5% | |
| | |
Aon Corp. | | | | | | | | |
2.20%, 11/15/2022 | | | 1,752,000 | | | | 1,781,852 | |
|
| Integrated Oil & Gas – 1.1% | |
| | |
BP Capital Markets America, Inc. | | | | | | | | |
2.94%, 4/6/2023 | | | 300,000 | | | | 309,769 | |
| | | | | | | | |
| Investments | | Principal
Amount | | | Value | |
|
| Integrated Oil & Gas – (continued) | |
| | |
Chevron Corp. | | | | | | | | |
2.41%, 3/3/2022 | | $ | 600,000 | | | $ | 602,243 | |
| | |
Saudi Arabian Oil Co. | | | | | | | | |
1.25%, 11/24/2023(a) | | | 200,000 | | | | 200,754 | |
| | |
TotalEnergies Capital SA | | | | | | | | |
4.25%, 12/15/2021 | | | 3,000,000 | | | | 3,013,391 | |
| | | | | | | | 4,126,157 | |
|
| Integrated Telecommunication Services – 3.2% | |
| | |
AT&T, Inc. | | | | | | | | |
(SOFR + 0.64%), 0.69%, 3/25/2024(b) | | | 1,160,000 | | | | 1,161,214 | |
(ICE LIBOR USD 3 Month + 1.18%), 1.29%, 6/12/2024(b) | | | 3,800,000 | | | | 3,878,111 | |
| |
Bell Canada | | | | | |
Series US-3, 0.75%, 3/17/2024 | | | 3,000,000 | | | | 2,985,869 | |
| |
Verizon Communications, Inc. | | | | | |
(ICE LIBOR USD 3 Month + 1.10%), 1.22%, 5/15/2025(b) | | | 1,000,000 | | | | 1,023,032 | |
(SOFR + 0.79%), 0.84%, 3/20/2026(b) | | | 3,000,000 | | | | 3,055,696 | |
| | | | | | | | 12,103,922 | |
|
| Internet & Direct Marketing Retail – 0.9% | |
| | |
Amazon.com, Inc. | | | | | | | | |
0.45%, 5/12/2024 | | | 1,640,000 | | | | 1,628,377 | |
| |
eBay, Inc. | | | | | |
(ICE LIBOR USD 3 Month + 0.87%), 1.00%, 1/30/2023(b) | | | 1,610,000 | | | | 1,625,038 | |
| | | | | | | | 3,253,415 | |
|
| Investment Banking & Brokerage – 2.9% | |
| |
Charles Schwab Corp. (The) | | | | | |
(SOFR + 0.50%), 0.55%, 3/18/2024(b) | | | 1,640,000 | | | | 1,646,767 | |
| |
Goldman Sachs Group, Inc. (The) | | | | | |
(SOFR + 0.41%), 0.46%, 1/27/2023(b) | | | 1,000,000 | | | | 1,000,556 | |
(SOFR + 0.54%), 0.59%, 11/17/2023(b) | | | 300,000 | | | | 300,562 | |
See Accompanying Notes to the Financial Statements.
| | | | | | |
| | FLEXSHARES ANNUAL REPORT | | | 447 | |
FlexShares® Ready Access Variable Income Fund (cont.)
| | | | | | | | |
| Investments | | Principal
Amount | | | Value | |
|
| CORPORATE BONDS – (continued) | |
|
| Investment Banking & Brokerage – (continued) | |
(SOFR + 0.58%), 0.63%, 3/8/2024(b) | | $ | 2,800,000 | | | $ | 2,804,412 | |
| | |
Morgan Stanley | | | | | | | | |
2.75%, 5/19/2022 | | | 845,000 | | | | 856,108 | |
0.56%, 11/10/2023(c) | | | 3,560,000 | | | | 3,557,937 | |
1.16%, 10/21/2025(c) | | | 500,000 | | | | 497,777 | |
| | | | | | | | 10,664,119 | |
|
| Life & Health Insurance – 1.8% | |
| | |
Athene Global Funding | | | | | | | | |
3.00%, 7/1/2022(a) | | | 269,000 | | | | 273,196 | |
1.20%, 10/13/2023(a) | | | 2,400,000 | | | | 2,420,377 | |
(ICE LIBOR USD 3 Month + 0.73%), 0.85%, 1/8/2024(a)(b) | | | 1,000,000 | | | | 1,007,325 | |
| | |
Brighthouse Financial Global Funding | | | | | | | | |
0.60%, 6/28/2023(a) | | | 680,000 | | | | 678,646 | |
| | |
Jackson National Life Global Funding | | | | | | | | |
2.50%, 6/27/2022(a) | | | 670,000 | | | | 679,605 | |
| | |
Protective Life Global Funding | | | | | | | | |
0.63%, 10/13/2023(a) | | | 900,000 | | | | 900,428 | |
| | |
Security Benefit Global Funding | | | | | | | | |
1.25%, 5/17/2024(a) | | | 700,000 | | | | 700,508 | |
| | | | | | | | 6,660,085 | |
|
| Life Sciences Tools & Services – 0.8% | |
| |
Thermo Fisher Scientific, Inc. | | | | | |
(SOFR + 0.53%), 0.57%, 10/18/2024(b) | | | 550,000 | | | | 550,927 | |
1.22%, 10/18/2024 | | | 2,590,000 | | | | 2,593,398 | |
| | | | | | | | 3,144,325 | |
|
| Managed Health Care – 2.5% | |
| |
Cigna Corp. | | | | | |
(ICE LIBOR USD
3 Month + 0.89%),
1.01%, 7/15/2023(b) | | | 2,600,000 | | | | 2,628,503 | |
| | |
Humana, Inc. | | | | | | | | |
0.65%, 8/3/2023 | | | 760,000 | | | | 759,584 | |
| | |
UnitedHealth Group, Inc. | | | | | | | | |
3.35%, 7/15/2022 | | | 4,026,000 | | | | 4,112,143 | |
0.55%, 5/15/2024 | | | 1,680,000 | | | | 1,668,336 | |
| | | | | | | | 9,168,566 | |
| | | | | | | | |
| Investments | | Principal
Amount | | | Value | |
|
| Multi-Utilities – 3.5% | |
| | |
Ameren Illinois Co. | | | | | | | | |
2.70%, 9/1/2022 | | $ | 1,000,000 | | | $ | 1,013,794 | |
0.38%, 6/15/2023 | | | 670,000 | | | | 668,109 | |
| | |
Black Hills Corp. | | | | | | | | |
1.04%, 8/23/2024 | | | 960,000 | | | | 957,902 | |
| |
CenterPoint Energy, Inc. | | | | | |
(SOFR + 0.65%),
0.70%, 5/13/2024(b) | | | 1,180,000 | | | | 1,181,209 | |
| |
Consolidated Edison, Inc. | | | | | |
Series A,
0.65%, 12/1/2023 | | | 4,100,000 | | | | 4,092,483 | |
| |
Dominion Energy, Inc. | | | | | |
Series D, (ICE LIBOR USD
3 Month + 0.53%), 0.65%, 9/15/2023(b) | | | 2,000,000 | | | | 2,001,451 | |
| |
DTE Energy Co. | | | | | |
Series H,
0.55%, 11/1/2022 | | | 3,000,000 | | | | 3,001,525 | |
| | | | | | | | 12,916,473 | |
|
| Oil & Gas Exploration & Production – 0.9% | |
| | |
Pioneer Natural Resources Co. | | | | | | | | |
0.75%, 1/15/2024 | | | 3,500,000 | | | | 3,480,650 | |
|
| Oil & Gas Refining & Marketing – 3.0% | |
| | |
Phillips 66 | | | | | | | | |
4.30%, 4/1/2022 | | | 940,000 | | | | 955,320 | |
3.70%, 4/6/2023 | | | 600,000 | | | | 625,320 | |
(ICE LIBOR USD
3 Month + 0.62%), 0.74%, 2/15/2024(b) | | | 3,800,000 | | | | 3,800,870 | |
| | |
Valero Energy Corp. | | | | | | | | |
1.20%, 3/15/2024 | | | 5,840,000 | | | | 5,829,697 | |
| | | | | | | | 11,211,207 | |
|
| Oil & Gas Storage & Transportation – 0.3% | |
| |
Enbridge, Inc. | | | | | |
(SOFR + 0.40%), 0.45%, 2/17/2023(b) | | | 690,000 | | | | 691,573 | |
| | |
TransCanada PipeLines Ltd. | | | | | | | | |
1.00%, 10/12/2024 | | | 520,000 | | | | 518,025 | |
| | | | | | | | 1,209,598 | |
See Accompanying Notes to the Financial Statements.
| | | | |
| 448 | | FLEXSHARES ANNUAL REPORT | | |
FlexShares® Ready Access Variable Income Fund (cont.)
| | | | | | | | |
| Investments | | Principal
Amount | | | Value | |
|
| CORPORATE BONDS – (continued) | |
|
| Other Diversified Financial Services – 0.3% | |
| | |
Synchrony Bank | | | | | | | | |
3.00%, 6/15/2022 | | $ | 1,000,000 | | | $ | 1,012,929 | |
|
| Packaged Foods & Meats – 1.3% | |
| | |
Campbell Soup Co. | | | | | | | | |
2.50%, 8/2/2022 | | | 1,926,000 | | | | 1,955,516 | |
| | |
Conagra Brands, Inc. | | | | | | | | |
0.50%, 8/11/2023 | | | 560,000 | | | | 557,820 | |
| |
General Mills, Inc. | | | | | |
(ICE LIBOR USD
3 Month + 1.01%), 1.13%, 10/17/2023(b) | | | 650,000 | | | | 662,494 | |
| | |
Hormel Foods Corp. | | | | | | | | |
0.65%, 6/3/2024 | | | 280,000 | | | | 279,147 | |
| | |
McCormick & Co., Inc. | | | | | | | | |
0.90%, 2/15/2026 | | | 670,000 | | | | 651,737 | |
| | |
Nestle Holdings, Inc. | | | | | | | | |
0.61%, 9/14/2024(a) | | | 900,000 | | | | 896,107 | |
| | | | | | | | 5,002,821 | |
|
| Paper Packaging – 0.3% | |
| | |
Avery Dennison Corp. | | | | | | | | |
0.85%, 8/15/2024 | | | 1,040,000 | | | | 1,033,229 | |
|
| Paper Products – 0.6% | |
| | |
Georgia-Pacific LLC | | | | | | | | |
0.63%, 5/15/2024(a) | | | 2,300,000 | | | | 2,285,058 | |
|
| Pharmaceuticals – 1.3% | |
| |
AstraZeneca plc | | | | | |
(ICE LIBOR USD
3 Month + 0.67%), 0.79%, 8/17/2023(b) | | | 580,000 | | | | 585,470 | |
| | |
Bristol-Myers Squibb Co. | | | | | | | | |
0.54%, 11/13/2023 | | | 700,000 | | | | 699,704 | |
| | |
Shire Acquisitions Investments Ireland DAC | | | | | | | | |
2.88%, 9/23/2023 | | | 1,120,000 | | | | 1,161,186 | |
| | |
Viatris, Inc. | | | | | | | | |
1.13%, 6/22/2022 | | | 2,379,000 | | | | 2,387,627 | |
| | | | | | | | 4,833,987 | |
|
| Railroads – 0.3% | |
| | |
Canadian Pacific Railway Co. | | | | | | | | |
4.50%, 1/15/2022 | | | 999,000 | | | | 1,007,177 | |
| | | | | | | | |
| Investments | | Principal
Amount | | | Value | |
|
| Regional Banks – 4.3% | |
| | |
Capital One Bank USA NA | | | | | | | | |
2.01%, 1/27/2023(c) | | $ | 3,150,000 | | | $ | 3,161,254 | |
3.38%, 2/15/2023 | | | 350,000 | | | | 361,926 | |
| |
Citizens Bank NA | | | | | |
(ICE LIBOR USD
3 Month + 0.72%), 0.84%, 2/14/2022(b) | | | 2,000,000 | | | | 2,002,049 | |
| |
KeyBank NA | | | | | |
(SOFR + 0.34%), 0.39%, 1/3/2024(b) | | | 5,100,000 | | | | 5,105,741 | |
| | |
Truist Financial Corp. | | | | | | | | |
3.05%, 6/20/2022 | | | 1,268,000 | | | | 1,286,921 | |
(SOFR + 0.40%), 0.45%, 6/9/2025(b) | | | 4,000,000 | | | | 4,005,661 | |
| | | | | | | | 15,923,552 | |
|
| Residential REITs – 0.3% | |
| | |
American Campus Communities Operating Partnership LP | | | | | | | | |
REIT, 3.75%, 4/15/2023 | | | 985,000 | | | | 1,021,042 | |
|
| Semiconductors – 1.4% | |
| | |
Analog Devices, Inc. | | | | | | | | |
(SOFR + 0.25%), 0.30%, 10/1/2024(b) | | | 710,000 | | | | 711,035 | |
| | |
Microchip Technology, Inc. | | | | | | | | |
0.98%, 9/1/2024(a) | | | 870,000 | | | | 861,277 | |
| | |
NVIDIA Corp. | | | | | | | | |
0.31%, 6/15/2023 | | | 3,640,000 | | | | 3,631,100 | |
| | | | | | | | 5,203,412 | |
|
| Soft Drinks – 1.0% | |
| | |
Keurig Dr Pepper, Inc. | | | | | | | | |
0.75%, 3/15/2024 | | | 3,700,000 | | | | 3,686,957 | |
|
| Specialized Finance – 0.3% | |
| | |
Element Fleet Management Corp. | | | | | | | | |
1.60%, 4/6/2024(a) | | | 500,000 | | | | 503,527 | |
| | |
NTT Finance Corp. | | | | | | | | |
0.58%, 3/1/2024(a) | | | 600,000 | | | | 595,774 | |
| | | | | | | | 1,099,301 | |
See Accompanying Notes to the Financial Statements.
| | | | | | |
| | FLEXSHARES ANNUAL REPORT | | | 449 | |
FlexShares® Ready Access Variable Income Fund (cont.)
| | | | | | | | |
| Investments | | Principal
Amount | | | Value | |
|
| CORPORATE BONDS – (continued) | |
|
| Specialized REITs – 2.0% | |
| | |
American Tower Corp. | | | | | | | | |
REIT, 2.25%, 1/15/2022 | | $ | 640,000 | | | $ | 642,364 | |
| | |
Crown Castle International Corp. | | | | | | | | |
REIT, 3.15%, 7/15/2023 | | | 1,800,000 | | | | 1,870,887 | |
| | |
Public Storage | | | | | | | | |
REIT, (SOFR + 0.47%), 0.52%, 4/23/2024(b) | | | 5,000,000 | | | | 5,004,511 | |
| | | | | | | | 7,517,762 | |
|
| Specialty Chemicals – 0.2% | |
| | |
International Flavors & Fragrances, Inc. | | | | | | | | |
3.20%, 5/1/2023 | | | 750,000 | | | | 773,068 | |
|
| Systems Software – 0.2% | |
| | |
VMware, Inc. | | | | | | | | |
0.60%, 8/15/2023 | | | 590,000 | | | | 589,058 | |
|
| Technology Hardware, Storage & Peripherals – 0.4% | |
| | |
Dell International LLC | | | | | | | | |
5.45%, 6/15/2023 | | | 1,000,000 | | | | 1,065,319 | |
| | |
Hewlett Packard Enterprise Co. | | | | | | | | |
2.25%, 4/1/2023 | | | 400,000 | | | | 408,405 | |
| | | | | | | | 1,473,724 | |
|
| Trading Companies & Distributors – 1.7% | |
| | |
Air Lease Corp. | | | | | | | | |
3.50%, 1/15/2022 | | | 960,000 | | | | 965,753 | |
3.75%, 2/1/2022 | | | 1,000,000 | | | | 1,002,341 | |
(ICE LIBOR USD
3 Month + 0.35%), 0.47%, 12/15/2022(b) | | | 2,000,000 | | | | 2,000,807 | |
0.70%, 2/15/2024 | | | 1,000,000 | | | | 988,806 | |
0.80%, 8/18/2024 | | | 980,000 | | | | 964,322 | |
| | |
GATX Corp. | | | | | | | | |
4.75%, 6/15/2022 | | | 539,000 | | | | 552,515 | |
| | | | | | | | 6,474,544 | |
|
| Trucking – 0.6% | |
| | |
Ryder System, Inc. | | | | | | | | |
2.88%, 6/1/2022 | | | 1,180,000 | | | | 1,193,621 | |
3.40%, 3/1/2023 | | | 300,000 | | | | 310,528 | |
| | | | | | | | |
| Investments | | Principal
Amount | | | Value | |
|
| Trucking – (continued) | |
| | |
SMBC Aviation Capital Finance DAC | | | | | | | | |
4.13%, 7/15/2023(a) | | $ | 700,000 | | | $ | 736,365 | |
| | | | | | | | 2,240,514 | |
|
| Wireless Telecommunication Services – 0.3% | |
| | |
Rogers Communications, Inc. | | | | | | | | |
(ICE LIBOR USD
3 Month + 0.60%), 0.73%, 3/22/2022(b) | | | 1,100,000 | | | | 1,102,373 | |
Total Corporate Bonds
(Cost $346,536,857) | | | | 347,041,422 | |
| | |
| | | | | | | | |
|
| ASSET-BACKED SECURITIES – 4.5% | |
| | |
AmeriCredit Automobile Receivables Trust | | | | | | | | |
Series 2020-3, Class A2, 0.42%, 3/18/2024 | | | 746,756 | | | | 747,077 | |
Series 2021-1, Class A2, 0.28%, 6/18/2024 | | | 1,192,808 | | | | 1,192,686 | |
Series 2021-2, Class A2, 0.26%, 11/18/2024 | | | 1,000,000 | | | | 999,857 | |
| | |
BA Credit Card Trust | | | | | | | | |
Series 2019-A1, Class A1, 1.74%, 1/15/2025 | | | 880,000 | | | | 890,411 | |
| | |
Barclays Dryrock Issuance Trust | | | | | | | | |
Series 2019-1, Class A, 1.96%, 5/15/2025 | | | 700,000 | | | | 708,472 | |
| | |
BMW Vehicle Owner Trust | | | | | | | | |
Series 2020-A, Class A2, 0.39%, 2/27/2023 | | | 80,500 | | | | 80,515 | |
| | |
Capital One Multi-Asset Execution Trust | | | | | | | | |
Series 2019-A2, Class A2, 1.72%, 8/15/2024 | | | 900,000 | | | | 910,505 | |
| | |
CarMax Auto Owner Trust | | | | | | | | |
Series 2020-3, Class A2A, 0.49%, 6/15/2023 | | | 69,667 | | | | 69,687 | |
| | |
Enterprise Fleet Financing LLC | | | | | | | | |
Series 2019-2, Class A2, 2.29%, 2/20/2025(a) | | | 494,434 | | | | 499,647 | |
| | |
Ford Credit Auto Owner Trust | | | | | | | | |
Series 2020-B, Class A2, 0.50%, 2/15/2023 | | | 188,909 | | | | 188,953 | |
See Accompanying Notes to the Financial Statements.
| | | | |
| 450 | | FLEXSHARES ANNUAL REPORT | | |
FlexShares® Ready Access Variable Income Fund (cont.)
| | | | | | | | |
| Investments | | Principal
Amount | | | Value | |
|
| ASSET-BACKED SECURITIES – (continued) | |
Series 2020-C, Class A2, 0.25%, 10/15/2023 | | $ | 430,643 | | | $ | 430,708 | |
| | |
Ford Credit Floorplan Master Owner Trust A | | | | | | | | |
Series 2019-1, Class A, 2.84%, 3/15/2024 | | | 500,000 | | | | 504,910 | |
| | |
GM Financial Automobile Leasing Trust | | | | | | | | |
Series 2020-1, Class A3, 1.67%, 12/20/2022 | | | 341,681 | | | | 342,820 | |
| | |
Honda Auto Receivables Owner Trust | | | | | | | | |
Series 2020-2, Class A2, 0.74%, 11/15/2022 | | | 57,772 | | | | 57,790 | |
| | |
Hyundai Auto Receivables Trust | | | | | | | | |
Series 2020-B, Class A2, 0.38%, 3/15/2023 | | | 200,665 | | | | 200,716 | |
| | |
John Deere Owner Trust | | | | | | | | |
Series 2020-B, Class A2, 0.41%, 3/15/2023 | | | 99,772 | | | | 99,801 | |
| | |
Mercedes-Benz Auto Lease Trust | | | | | | | | |
Series 2020-B, Class A2, 0.31%, 2/15/2023 | | | 250,672 | | | | 250,767 | |
| | |
Mercedes-Benz Auto Receivables Trust | | | | | | | | |
Series 2020-1, Class A2, 0.46%, 3/15/2023 | | | 133,017 | | | | 133,059 | |
| | |
Santander Drive Auto Receivables Trust | | | | | | | | |
Series 2020-4, Class A2, 0.42%, 9/15/2023 | | | 180,356 | | | | 180,374 | |
Series 2021-1, Class A2, 0.29%, 11/15/2023 | | | 939,125 | | | | 939,223 | |
Series 2021-4, Class A2, 0.37%, 8/15/2024 | | | 500,000 | | | | 499,990 | |
| | |
Synchrony Card Funding LLC | | | | | | | | |
Series 2019-A1, Class A, 2.95%, 3/15/2025 | | | 2,000,000 | | | | 2,020,676 | |
| | |
Toyota Auto Receivables Owner Trust | | | | | | | | |
Series 2020-C, Class A2, 0.36%, 2/15/2023 | | | 421,860 | | | | 421,965 | |
| | |
Verizon Owner Trust | | | | | | | | |
Series 2020-A, Class A1A, 1.85%, 7/22/2024 | | | 1,500,000 | | | | 1,516,505 | |
| | | | | | | | |
| Investments | | Principal
Amount | | | Value | |
|
| ASSET-BACKED SECURITIES – (continued) | |
| | |
World Financial Network Credit Card Master Trust | | | | | | | | |
Series 2019-B, Class A, 2.49%, 4/15/2026 | | $ | 1,000,000 | | | $ | 1,014,023 | |
Series 2019-C, Class A, 2.21%, 7/15/2026 | | | 1,000,000 | | | | 1,016,304 | |
| | |
World Omni Automobile Lease Securitization Trust | | | | | | | | |
Series 2020-B, Class A2, 0.32%, 9/15/2023 | | | 722,256 | | | | 722,647 | |
Total Asset-Backed Securities
(Cost $16,529,986) | | | | 16,640,088 | |
| | |
| | | | | | | | |
|
| MUNICIPAL BONDS – 2.3% | |
| | |
University of Missouri, System Facilities Revenue Bonds | | | | | | | | |
Series 2020-A, 1.47%, 11/1/2023 | | | 1,000,000 | | | | 1,017,779 | |
| | |
City of New York | | | | | | | | |
Series 2021-D, 0.43%, 8/1/2022 | | | 830,000 | | | | 831,177 | |
Series 2021-D, 0.59%, 8/1/2023 | | | 1,800,000 | | | | 1,794,689 | |
| | |
Anaheim Public Financing Authority | | | | | | | | |
Series 2021-A, 0.63%, 7/1/2024 | | | 500,000 | | | | 494,609 | |
| | |
California Earthquake Authority | | | | | | | | |
Series 2020-B, 1.33%, 7/1/2022 | | | 500,000 | | | | 503,306 | |
| | |
Miami-Dade County, Capital Asset Acquisition Special Obligation Bonds | | | | | | | | |
Series 2020-B, 0.38%, 4/1/2023 | | | 1,110,000 | | | | 1,108,732 | |
| | |
New York City Transitional Finance Authority, Building Aid | | | | | | | | |
Series 2022 Subseries S-1B, 0.64%, 7/15/2024 | | | 1,000,000 | | | | 995,092 | |
| | |
New York Transportation Development Corp., Terminal 4 John F. Kennedy International Airport Project | | | | | | | | |
Series 2020-B, 1.36%, 12/1/2021 | | | 1,000,000 | | | | 1,000,716 | |
See Accompanying Notes to the Financial Statements.
| | | | | | |
| | FLEXSHARES ANNUAL REPORT | | | 451 | |
FlexShares® Ready Access Variable Income Fund (cont.)
| | | | | | | | |
| Investments | | Principal
Amount | | | Value | |
|
| MUNICIPAL BONDS – (continued) | |
| | |
Port Authority of New York & New Jersey | | | | | | | | |
Series AAA, 1.09%, 7/1/2023 | | $ | 1,000,000 | | | $ | 1,009,386 | |
Total Municipal Bonds
(Cost $8,738,043) | | | | | | | 8,755,486 | |
| | |
| | | | | | | | |
|
| FOREIGN GOVERNMENT SECURITIES – 0.2% | |
| | |
Japan Bank for International Cooperation 1.75%, 1/23/2023
(Cost $798,937) | | | 800,000 | | | | 812,778 | |
Total Investments – 99.7%
(Cost $372,603,823) | | | | 373,249,774 | |
| |
Other assets less liabilities – 0.3% | | | | 1,089,365 | |
| NET ASSETS – 100.0% | | | $ | 374,339,139 | |
| (a) | Securities exempt from registration under Rule 144A of the Securities Act of 1933. These securities may be resold in transactions exempt from registration, normally to qualified institutional buyers. The value of these securities is determined by valuations supplied by a pricing service or brokers, or, if not available, in accordance with procedures established by the Board of Trustees. |
| (b) | Variable or floating rate security, linked to the referenced benchmark. The interest rate shown is the rate in effect as of October 31, 2021. |
| (c) | Security issued at a fixed coupon rate, which converts to a variable rate at a future date. Rate shown is the rate in effect as of period end. |
| (d) | Represents less than 0.05% of net assets. |
Percentages shown are based on Net Assets.
Abbreviations
ICE – Intercontinental Exchange
LIBOR – London Interbank Offered Rate
SOFR – Secured Overnight Financing Rate
USD – US Dollar
As of October 31, 2021, the gross unrealized appreciation (depreciation) of investments based on the aggregate cost of investments (including derivative instruments, if applicable) for federal income tax purposes was as follows:
| | | | |
| | | | |
Aggregate gross unrealized appreciation | | $ | 1,045,247 | |
Aggregate gross unrealized depreciation | | | (496,437 | ) |
Net unrealized appreciation | | $ | 548,810 | |
Federal income tax cost | | $ | 372,700,964 | |
FlexShares® Ready Access Variable Income Fund invested, as a percentage of net assets, in companies domiciled in the following countries as of October 31, 2021:
| | | | |
Australia | | | 2.0 | % |
Canada | | | 8.9 | |
Finland | | | 0.7 | |
France | | | 1.7 | |
Germany | | | 2.6 | |
Ireland | | | 0.7 | |
Japan | | | 3.7 | |
Netherlands | | | 1.7 | |
Saudi Arabia | | | 0.1 | |
Sweden | | | 1.5 | |
Switzerland | | | 2.3 | |
United Kingdom | | | 2.8 | |
United States | | | 71.0 | |
Other1 | | | 0.3 | |
| | | | 100.0 | % |
| 1 | Includes any non-fixed-income securities and net other assets (liabilities). |
| | | | |
| Security Type | | % of Net Assets | |
Corporate Bonds | | | 92.7 | % |
Asset-Backed Securities | | | 4.5 | |
Municipal Bonds | | | 2.3 | |
Foreign Government Securities | | | 0.2 | |
Others(1) | | | 0.3 | |
| | | | 100.0 | % |
| (1) | Includes any other net assets/(liabilities). |
See Accompanying Notes to the Financial Statements.
| | | | |
| 452 | | FLEXSHARES ANNUAL REPORT | | |
Schedule of Investments
FlexShares® Core Select Bond Fund
October 31, 2021
| | | | | | | | |
| Investments | | Shares | | | Value | |
|
| EXCHANGE TRADED FUNDS – 99.7% | |
| | |
FlexShares® Credit-Scored US Corporate Bond Index Fund(a) | | | 704,981 | | | $ | 37,734,108 | |
| | |
FlexShares® Credit-Scored US Long Corporate Bond Index Fund(a) | | | 98,715 | | | | 5,998,595 | |
| | |
FlexShares® Disciplined Duration MBS Index Fund(a) | | | 632,191 | | | | 14,831,201 | |
| | |
FlexShares® Ready Access Variable Income Fund(a) | | | 26,513 | | | | 2,015,253 | |
| | |
iShares 10+ Year Investment Grade Corporate Bond ETF | | | 85,179 | | | | 5,994,898 | |
| | |
iShares 20+ Year Treasury
Bond ETF | | | 78,540 | | | | 11,599,572 | |
| | |
iShares 3-7 Year Treasury Bond ETF | | | 27,698 | | | | 3,574,427 | |
| | |
iShares 5-10 Year Investment Grade Corporate Bond ETF | | | 189,880 | | | | 11,337,735 | |
| | |
iShares 7-10 Year Treasury
Bond ETF | | | 49,520 | | | | 5,676,477 | |
| | |
iShares MBS ETF | | | 137,378 | | | | 14,813,470 | |
| | |
iShares Trust iShares 1-5 Year Investment Grade Corporate Bond ETF | | | 231,499 | | | | 12,570,396 | |
Total Exchange Traded Funds
(Cost $125,740,025) | | | | 126,146,132 | |
| | | Principal
Amount | | | | |
|
| SHORT-TERM INVESTMENTS – 0.2% | |
|
| U.S. TREASURY OBLIGATIONS – 0.2% | |
| | |
U.S. Treasury Bills 0.05%, 1/20/2022(b)
(Cost $274,971) | | $ | 275,000 | | | | 274,968 | |
Total Investments – 99.9%
(Cost $126,014,996) | | | | 126,421,100 | |
| |
Other assets less liabilities – 0.1% | | | | 95,868 | |
| Net Assets – 100.0% | | | $ | 126,516,968 | |
| (a) | Investment in affiliated Fund. Northern Trust Investments, Inc. is the Investment Adviser to both the Fund and the affiliated Funds. |
| (b) | The rate shown was the current yield as of October 31, 2021. |
Percentages shown are based on Net Assets.
As of October 31, 2021, the gross unrealized appreciation (depreciation) of investments based on the aggregate cost of investments (including derivative instruments, if applicable) for federal income tax purposes was as follows:
| | | | |
| | | | |
Aggregate gross unrealized appreciation | | $ | 988,661 | |
Aggregate gross unrealized depreciation | | | (971,678 | ) |
Net unrealized appreciation | | $ | 16,983 | |
Federal income tax cost | | $ | 126,404,117 | |
See Accompanying Notes to the Financial Statements.
| | | | | | |
| | FLEXSHARES ANNUAL REPORT | | | 453 | |
FlexShares® Core Select Bond Fund (cont.)
For the period ended October 31, 2021, the FlexShares® Core Select Bond Fund was invested in securities of affiliated FlexShares® Funds. The Schedules of Investments of the affiliated FlexShares® Funds are located elsewhere in this Report.
Investment in a company which was affiliated for the period ended October 31, 2021, was as follows:
| | | | | | | | | | | | | | | | | | | | | | | | | | | | | | | | |
| Security | | Value
October 31,
2020 | | | Purchases
at Cost | | | Sales Proceeds | | | Shares
October 31,
2021 | | | Value
October 31,
2021 | | | Change in
Unrealized
Appreciation
(Depreciation) | | | Dividend
Income | | | Realized
Loss | |
FlexShares® Credit-Scored US Corporate Bond Index Fund | | $ | 44,169,956 | | | $ | 19,165,187 | | | $ | 24,614,099 | | | | 704,981 | | | $ | 37,734,108 | | | $ | (1,070,790 | ) | | $ | 725,634 | | | $ | 83,854 | |
FlexShares® Credit-Scored US Long Corporate Bond Index Fund | | | 13,498,994 | | | | 3,967,005 | | | | 10,818,484 | | | | 98,715 | | | | 5,998,595 | | | | 12,071 | | | | 283,367 | | | | (660,991 | ) |
FlexShares® Disciplined Duration MBS Index Fund | | | 19,196,179 | | | | 5,008,757 | | | | 8,968,985 | | | | 632,191 | | | | 14,831,201 | | | | (365,716 | ) | | | 396,660 | | | | (39,034 | ) |
FlexShares® Ready Access Variable Income Fund | | | 1,805,563 | | | | 5,161,468 | | | | 4,943,994 | | | | 26,513 | | | | 2,015,253 | | | | (2,730 | ) | | | 5,681 | | | | (5,054 | ) |
| | | $ | 78,670,692 | | | $ | 33,302,417 | | | $ | 49,345,562 | | | | 1,462,400 | | | $ | 60,579,157 | | | $ | (1,427,165 | ) | | $ | 1,411,342 | | | $ | (621,225 | ) |
| | | | |
| Security Type | | % of Net Assets | |
Exchange Traded Funds | | | 99.7 | % |
Short-Term Investments | | | 0.2 | |
Others(1) | | | 0.1 | |
| | | | 100.0 | % |
| (1) | Includes any other net assets/(liabilities). |
See Accompanying Notes to the Financial Statements.
| | | | |
| 454 | | FLEXSHARES ANNUAL REPORT | | |
Notes to the Financial Statements October 31, 2021
1. Organization
FlexShares® Trust (the “Trust”), a Maryland statutory trust, was formed on May 13, 2010, originally named NT ETF Trust and renamed FlexShares® Trust as of April 12, 2011. The Trust is registered as an open-end management investment company under the Investment Company Act of 1940 (the “1940 Act”), as amended. The Trust consists of thirty-one operational exchange-traded funds as of October 31, 2021 (each a “Fund” and collectively, the “Funds”).
The FlexShares ESG & Climate US Large Cap Core Index Fund, FlexShares ESG & Climate Developed Markets ex-US Core Index Fund, FlexShares ESG & Climate High Yield Corporate Core Index Fund, and FlexShares ESG & Climate Investment Grade Corporate Core Index Fund (together, the “New Funds”) commenced operations on September 20, 2021.
Effective June 1, 2021, the name of the FlexShares® STOXX® US ESG Impact Index Fund was changed to FlexShares® STOXX® US ESG Select Index Fund and the name of the FlexShares® STOXX® Global ESG Impact Index Fund was changed to FlexShares® STOXX® Global ESG Select Index Fund.
The FlexShares® US Quality Low Volatility Index Fund, FlexShares® Developed Markets ex-US Quality Low Volatility Index Fund, FlexShares® Emerging Markets Quality Low Volatility Index Fund, FlexShares® ESG & Climate US Large Cap Core Index Fund, FlexShares® ESG & Climate Developed Markets ex-US Core Index Fund, FlexShares® Morningstar Global Upstream Natural Resources Index Fund, FlexShares® STOXX® Global Broad Infrastructure Index Fund, FlexShares® Global Quality Real Estate Index Fund, FlexShares® Real Assets Allocation Index Fund, FlexShares® iBoxx 3-Year Target Duration TIPS Index Fund, FlexShares® iBoxx 5-Year Target Duration TIPS Index Fund, FlexShares® Credit-Scored US Corporate Bond Index Fund, FlexShares® Credit-Scored US Long Corporate Bond Index Fund, FlexShares® ESG & Climate High Yield Corporate Core Index Fund, FlexShares® ESG & Climate Investment Grade Corporate Core Index Fund, and the FlexShares® Ready Access Variable Income Fund are non-diversified series of the Trust, pursuant to the 1940 Act.
The FlexShares® Morningstar US Market Factor Tilt Index Fund, FlexShares® Morningstar Developed Markets ex-US Factor Tilt Index Fund, FlexShares® Morningstar Emerging Markets Factor Tilt Index Fund, FlexShares® US Quality Large Cap Index Fund, FlexShares® STOXX® US ESG Select Index Fund (formerly known as the FlexShares® STOXX® US ESG Impact Index Fund), FlexShares® STOXX® Global ESG Select Index Fund (formerly known as the FlexShares® STOXX® Global ESG Impact Index Fund), FlexShares® Quality Dividend Index Fund, FlexShares® Quality Dividend Defensive Index Fund, FlexShares® Quality Dividend Dynamic Index Fund, FlexShares® International Quality Dividend Index Fund, FlexShares® International Quality Dividend Defensive Index Fund, FlexShares® International Quality Dividend Dynamic Index Fund, FlexShares® Disciplined Duration MBS Index Fund, FlexShares® High Yield Value-Scored Bond Index Fund, and the FlexShares® Core Select Bond Fund are diversified series of the Trust, pursuant to the 1940 Act.
Each Fund, except the FlexShares Ready Access Variable Income Fund and the FlexShares Core Select Bond Fund, seeks to provide investment results that correspond generally to the price and yield performance, before fees and expenses, of a specified benchmark index (each an “Underlying Index”). The FlexShares US Quality Low Volatility Index Fund, FlexShares Developed Markets ex-US Quality Low Volatility Index Fund, FlexShares Emerging Markets Quality Low Volatility Index Fund, FlexShares US Quality Large Cap Index Fund, FlexShares Global Quality Real Estate Index Fund, FlexShares Real Assets Allocation Index Fund, FlexShares Quality Dividend Index Fund, FlexShares Quality Dividend Defensive Index Fund, FlexShares Quality Dividend Dynamic Index Fund, FlexShares International Quality Dividend Index Fund, FlexShares International Quality Dividend Defensive Index Fund, FlexShares International Quality Dividend Dynamic Index Fund, FlexShares Credit-Scored US Corporate Bond Index Fund, FlexShares Credit-Scored US Long Corporate Bond Index Fund, FlexShares High Yield Value-Scored Bond Index Fund, FlexShares ESG & Climate US Large Cap Core Index Fund, FlexShares ESG & Climate Developed Markets ex-US Core Index Fund, FlexShares ESG & Climate High Yield Corporate Core Index Fund and the FlexShares ESG & Climate
| | | | | | |
| | FLEXSHARES ANNUAL REPORT | | | 455 | |
Notes to the Financial Statements (cont.)
Investment Grade Corporate Core Index Fund seek to track Underlying Indexes developed by Northern Trust Investments, Inc. (“NTI” or “Investment Adviser”), an indirect subsidiary of Northern Trust Corporation. The FlexShares Morningstar US Market Factor Tilt Index Fund, FlexShares Morningstar Developed Markets ex-US Factor Tilt Index Fund, FlexShares Morningstar Emerging Markets Factor Tilt Index Fund and FlexShares Morningstar Global Upstream Natural Resources Index Fund seek to track Underlying Indexes sponsored by Morningstar, Inc. The FlexShares STOXX® US ESG Select Index Fund, FlexShares STOXX® Global ESG Select Index Fund, and FlexShares STOXX® Global Broad Infrastructure Index Fund seek to track Underlying Indexes sponsored by STOXX. The FlexShares iBoxx 3-Year Target Duration TIPS Index Fund and FlexShares iBoxx 5-Year Target Duration TIPS Index Fund seek to track Underlying Indexes sponsored by Markit Indexes Limited. The FlexShares Disciplined Duration MBS Index Fund seeks to track an Underlying Index sponsored by ICE Data Indexes, LLC.
The FlexShares Real Assets Allocation Index Fund is a fund of funds that seeks its investment objective by investing primarily in the shares of other FlexShares ETFs that are eligible for inclusion in its Underlying Index, rather than in securities of individual companies. The FlexShares Core Select Bond Fund seeks to achieve its investment objective by investing, under normal circumstances in U.S. dollar-denominated investment-grade fixed-income securities either directly or indirectly through FlexShares ETFs, unaffiliated ETFs and other registered investment companies. The investment performance of each of the FlexShares Real Assets Allocation Index Fund and FlexShares Core Select Bond Fund is directly related to the performance of the underlying fund(s) in which it invests (“Underlying Fund”).
The FlexShares Ready Access Variable Income Fund and the FlexShares Core Select Bond Fund are actively managed and do not seek to replicate the performance of a specified index. The FlexShares Ready Access Variable Income Fund seeks maximum current income consistent with the preservation of capital and liquidity. The FlexShares Core Select Bond Fund seeks total return and preservation of capital. Each Fund, except the FlexShares Ready Access Variable Income
Fund and the FlexShares Core Select Bond Fund, is referred to herein as an “Index Fund.” Each Fund is managed by the Investment Adviser.
2. Significant Accounting Policies
The Trust, which is an investment company, follows accounting and reporting guidance under Financial Accounting Standards Board (“FASB”) Accounting Standards Codification Topic 946, “Financial Services-Investment Companies.” The following is a summary of significant accounting policies followed by the Funds in the preparation of their financial statements. These policies are in conformity with accounting principles generally accepted in the United States of America (“U.S. GAAP”). The preparation of financial statements in conformity with U.S. GAAP requires management to make estimates and assumptions that affect the reported amounts and disclosures in the financial statements. Actual results could differ from those estimates.
Investment Valuation
Each Fund’s net asset value (“NAV”) is determined daily as of the close of regular trading on the New York Stock Exchange (“NYSE”), normally 4:00 p.m. Eastern time, on each day the NYSE is open for trading, based on prices at the time of closing provided that any U.S. fixed-income assets may be valued as of the announced closing time for trading in fixed-income instruments on any day that the Securities Industry and Financial Markets Association announces an early closing time. The NAV of a Fund is calculated by dividing the value of all assets of the Fund (including accrued interest and dividends), less all liabilities (including accrued expenses and dividends declared but unpaid), by the total number of shares outstanding.
The investments of the Funds are valued at fair value pursuant to the pricing policy and procedures approved by the Trust’s Board of Trustees (“Board”). The Funds’ investments are valued using market quotations when available. When market quotations are not readily available, are deemed unreliable, or do not reflect material events occurring between the close of local markets and the time of valuation, the Funds value securities at fair value as determined in good faith in accordance with the Funds’ fair value pricing procedures as approved by
| | | | |
| 456 | | FLEXSHARES ANNUAL REPORT | | |
Notes to the Financial Statements (cont.)
the Board. Such circumstances include periods when trading in a security is suspended, the exchange or market on which a security trades closes early, the trading volume in a security is limited, corporate actions and announcements take place, or regulatory news affecting an issuer is released, such as government approvals. Additionally, the Trust, in its discretion, may make adjustments to the prices of securities held by a Fund if an event occurs after the publication of market values normally used by a Fund but before the time as of which the Fund calculates its NAV, depending on the nature and significance of the event, consistent with applicable regulatory guidance and the Trust’s fair value procedures. Other events that can trigger fair valuing of foreign securities include, for example, significant fluctuations in general market indicators, government actions, or natural disasters.
The use of fair valuation involves the risk that the values used by the Funds to price their investments may be higher or lower than the values used by other investment companies and investors to price the same investments. Fair value pricing involves subjective judgments and it is possible that a fair value determination for a portfolio security may be materially different than the value that could be realized upon the sale of such security. In addition, fair value pricing could result in a difference between the prices used to calculate a Fund’s NAV and the prices used by an Index Fund’s Underlying Index. This difference may adversely affect an Index Fund’s ability to track its Underlying Index. Portfolio securities of certain Funds are listed on foreign exchanges and their value may change on days when shareholders will not be able to purchase or sell Fund shares.
Security prices are generally provided by independent pricing services. Portfolio securities listed or traded on domestic securities exchanges or the NASDAQ/NMS, including dollar-denominated foreign securities or American Depositary Receipts (“ADRs”), are valued at the closing price, or last sale price, reported on the exchange or system where the security is principally traded. The closing price for securities traded on the NASDAQ/NMS is the Nasdaq Official Closing Price (“NOCP”). If there have been no sales for that day on the exchange or system where the security is principally traded, then the value is determined with reference to the last sale price, or the NOCP, if applicable, on any other
exchange or system. If there have been no sales of the security for that day on any exchange or system, the security is valued at fair value pursuant to the Trust’s fair value procedures.
Securities that are traded regularly in the over-the-counter market (other than the NASDAQ/NMS), including securities listed on exchanges but primarily traded over-the-counter, are valued on the basis of bid quotes or the mean between the bid and asked quotes based upon quotes furnished by one or more broker-dealers or market makers for those securities. Securities that may be traded over-the-counter include equity securities, fixed-income securities, non-exchange-listed foreign securities, and certain derivative instruments. Fixed-income securities may be valued using prices provided directly from one or more broker-dealers, market makers, or independent third-party pricing services which may use matrix pricing and valuation models, as well as recent market transactions for the same or similar assets, to derive values when such prices are believed to reflect fair market values of such securities. Such prices may be determined by taking into account securities prices, yields, maturities, call features, ratings, prepayment speeds, credit risks, cash flows, institutional size trading in similar groups of securities and developments related to specific securities. Fixed-income securities maturing within a relatively short period, less than 60 days, are valued at amortized cost when it approximates fair value.
Foreign equity securities are generally priced at the closing price or last sales price reported on the foreign exchange on which they are principally traded. If there have been no sales for that day on the primary exchange, then the value is
determined with reference to the last sale price on any other exchange. If there have been no sales of the security for that day on any exchange, the security will be valued at fair value pursuant to the Trust’s fair value procedures. Spot and forward foreign currency exchange contracts generally are valued using an independent pricing service. The value of assets denominated in foreign currencies is converted into U.S. dollars using exchange rates deemed appropriate by NTI as Investment Adviser. Any use of a different rate from the rates used by the index provider may adversely affect the Fund’s ability to track its Underlying Index. The index provider
| | | | | | |
| | FLEXSHARES ANNUAL REPORT | | | 457 | |
Notes to the Financial Statements (cont.)
determines the composition and relative weightings of the securities in the Underlying Index and publishes information regarding the market value of the Underlying Index.
Exchange-traded financial futures and options thereon are valued at the settlement price as established by the exchange on which they are traded. Over-the-counter options are valued at broker-provided bid prices, as are swaps. The foregoing prices may be obtained from one or more independent pricing services or, as needed or applicable, independent broker-dealers. If there was no sale on that day, and for other non-exchange traded derivatives, the contract is valued at fair value pursuant to the Trust’s fair value procedures.
Each Fund relies on various sources to calculate its NAV. The ability of the Funds’ administrator to calculate the NAV per share of the Funds is subject to operational risks associated with processing or human errors, systems or technology failures, and errors caused by third party service providers, data sources, or trading counterparties. Such failures may result in delays in the calculation of the Funds’ NAVs and/or the inability to calculate NAV over extended time periods. The Funds may be unable to recover any losses
associated with such failures, and it may be necessary for alternative procedures to be followed to price portfolio securities when determining the Funds’ NAVs.
Various inputs are used in determining the value of each Fund’s investments. These inputs are summarized in three levels listed below:
| | • | | Level 1—Quoted prices in active markets for identical assets on the measurement date. |
| | • | | Level 2—Other significant observable inputs (including quoted prices for similar securities, interest rates, prepayment speeds, credit risk, etc.). |
| | • | | Level 3—Significant unobservable inputs (including the Funds’ own assumptions in determining the fair value of investments). |
The inputs or methodology used for valuing securities are not necessarily an indication of the risk associated with
investing in those securities. For example, short-term debt securities may be valued at amortized cost, as long as
amortized cost approximates the current fair value of a security, but since the valuation is not obtained from a quoted price in an active market, such securities are reflected as Level 2.
The following is a summary of the valuations as of October 31, 2021 for each Fund based upon the three levels defined above. Please refer to the Schedules of Investments to view equity and debt securities segregated by industry type, where applicable.
| | | | | | | | | | | | | | | | |
| | | Level 1 — Quoted
Prices | | | Level 2 — Other
Significant
Observable
Inputs | | | Level 3 —
Significant
Unobservable
Inputs | | | Total | |
|
| FlexShares US Quality Low Volatility Index Fund | |
Investments | | | | | | | | | | | | | | | | |
Common Stocks* | | $ | 160,783,795 | | | $ | — | | | $ | — | | | $ | 160,783,795 | |
| | | | |
| Short-Term Investments | | | — | | | | 34,996 | | | | — | | | | 34,996 | |
| | | | |
| Total Investments | | $ | 160,783,795 | | | $ | 34,996 | | | $ | — | | | $ | 160,818,791 | |
| | | | |
Other Financial Instruments | | | | | | | | | | | | | | | | |
Assets | | | | | | | | | | | | | | | | |
| | | | |
Futures Contracts | | $ | 8,541 | | | $ | — | | | $ | — | | | $ | 8,541 | |
| | | | |
| Total Other Financial Instruments | | $ | 8,541 | | | $ | — | | | $ | — | | | $ | 8,541 | |
| | | | |
| | | | | | | | | | | | | | | | |
| | | | |
| 458 | | FLEXSHARES ANNUAL REPORT | | |
Notes to the Financial Statements (cont.)
| | | | | | | | | | | | | | | | |
| | | Level 1 — Quoted
Prices | | | Level 2 — Other
Significant
Observable
Inputs | | | Level 3 —
Significant
Unobservable
Inputs | | | Total | |
|
| FlexShares Developed Markets ex-US Quality Low Volatility Index Fund | |
Investments | | | | | | | | | | | | | | | | |
Common Stocks | | | | | | | | | | | | | | | | |
Real Estate Management & Development | | $ | 2,119,849 | | | $ | 216,387 | | | $ | — | | | $ | 2,336,236 | |
| | | | |
Other* | | | 72,474,691 | | | | — | | | | — | | | | 72,474,691 | |
| | | | |
| Total Investments | | $ | 74,594,540 | | | $ | 216,387 | | | $ | — | | | $ | 74,810,927 | |
| | | | |
Other Financial Instruments | | | | | | | | | | | | | | | | |
Assets | | | | | | | | | | | | | | | | |
Futures Contracts | | $ | 4,748 | | | $ | — | | | $ | — | | | $ | 4,748 | |
Forward Foreign Currency Contracts | | | — | | | | 14,802 | | | | — | | | | 14,802 | |
Liabilities | | | | | | | | | | | | | | | | |
| | | | |
Forward Foreign Currency Contracts | | | — | | | | (9,585 | ) | | | — | | | | (9,585 | ) |
| | | | |
| Total Other Financial Instruments | | $ | 4,748 | | | $ | 5,217 | | | $ | — | | | $ | 9,965 | |
| | | | |
| | | | | | | | | | | | | | | | |
| | | Level 1 — Quoted
Prices | | | Level 2 — Other
Significant
Observable
Inputs | | | Level 3 —
Significant
Unobservable
Inputs | | | Total | |
|
| FlexShares Emerging Markets Quality Low Volatility Index Fund | |
Investments | | | | | | | | | | | | | | | | |
Common Stocks | | | | | | | | | | | | | | | | |
Multiline Retail | | $ | — | | | $ | 353 | | | $ | — | | | $ | 353 | |
| | | | |
Other* | | | 15,685,554 | | | | — | | | | — | | | | 15,685,554 | |
| | | | |
| Total Investments | | $ | 15,685,554 | | | $ | 353 | | | $ | — | | | $ | 15,685,907 | |
| | | | |
Other Financial Instruments | | | | | | | | | | | | | | | | |
Assets | | | | | | | | | | | | | | | | |
Forward Foreign Currency Contracts | | $ | — | | | $ | 2 | | | $ | — | | | $ | 2 | |
Liabilities | | | | | | | | | | | | | | | | |
| | | | |
Futures Contracts | | | (1,621 | ) | | | — | | | | — | | | | (1,621 | ) |
| | | | |
| Total Other Financial Instruments | | $ | (1,621 | ) | | $ | 2 | | | $ | — | | | $ | (1,619 | ) |
| | | | | | |
| | FLEXSHARES ANNUAL REPORT | | | 459 | |
Notes to the Financial Statements (cont.)
| | | | | | | | | | | | | | | | |
| | | Level 1 — Quoted
Prices | | | Level 2 — Other
Significant
Observable
Inputs | | | Level 3 —
Significant
Unobservable
Inputs | | | Total | |
|
| FlexShares Morningstar US Market Factor Tilt Index Fund | |
Investments | | | | | | | | | | | | | | | | |
Common Stocks* | | $ | 1,714,660,136 | | | $ | — | | | $ | — | | | $ | 1,714,660,136 | |
Rights | | | — | | | | — | | | | 25,720 | | | | 25,720 | |
Warrants | | | 64,161 | | | | — | | | | — | | | | 64,161 | |
Securities Lending Reinvestments | | | | | | | | | | | | | | | | |
Certificates of Deposit | | | — | | | | 8,000,044 | | | | — | | | | 8,000,044 | |
| | | | |
Repurchase Agreements | | | — | | | | 148,227,116 | | | | — | | | | 148,227,116 | |
| | | | |
| Total Investments | | $ | 1,714,724,297 | | | $ | 156,227,160 | | | $ | 25,720 | | | $ | 1,870,977,177 | |
| | | | |
Other Financial Instruments | | | | | | | | | | | | | | | | |
Assets | | | | | | | | | | | | | | | | |
| | | | |
Futures Contracts | | $ | 456,376 | | | $ | — | | | $ | — | | | $ | 456,376 | |
| | | | |
| Total Other Financial Instruments | | $ | 456,376 | | | $ | — | | | $ | — | | | $ | 456,376 | |
| | | | |
| | | | | | | | | | | | | | | | |
| | | Level 1 — Quoted
Prices | | | Level 2 — Other
Significant
Observable
Inputs | | | Level 3 —
Significant
Unobservable
Inputs | | | Total | |
|
| FlexShares Morningstar Developed Markets ex-US Factor Tilt Index Fund | |
Investments | | | | | | | | | | | | | | | | |
Closed End Funds | | $ | 106,428 | | | $ | — | | | $ | — | | | $ | 106,428 | |
Common Stocks | | | | | | | | | | | | | | | | |
Banks | | | 62,652,152 | | | | 1,083 | | | | — | | | | 62,653,235 | |
Capital Markets | | | 22,905,765 | | | | 889,163 | | | | — | | | | 23,794,928 | |
Electronic Equipment, Instruments & Components | | | 12,740,645 | | | | 213,805 | | | | — | | | | 12,954,450 | |
Equity Real Estate Investment Trusts (REITs) | | | 15,713,250 | | | | 32,392 | | | | — | | | | 15,745,642 | |
Health Care Providers & Services | | | 3,866,876 | | | | 591 | | | | — | | | | 3,867,467 | |
Internet & Direct Marketing Retail | | | 4,086,299 | | | | 88,555 | | | | — | | | | 4,174,854 | |
Media | | | 7,023,854 | | | | 39,844 | | | | — | | | | 7,063,698 | |
Real Estate Management & Development | | | 16,149,285 | | | | 374,752 | | | | — | | | | 16,524,037 | |
Other* | | | 488,798,296 | | | | — | | | | — | | | | 488,798,296 | |
Convertible Bonds | | | 10,122 | | | | — | | | | — | | | | 10,122 | |
Warrants | | | — | | | | — | | | | — | | | | — | |
| | | | |
| Securities Lending Reinvestments Repurchase Agreements | | | — | | | | 13,300,695 | | | | — | | | | 13,300,695 | |
| | | | |
| Total Investments | | $ | 634,052,972 | | | $ | 14,940,880 | | | $ | — | | | $ | 648,993,852 | |
| | | | |
Other Financial Instruments | | | | | | | | | | | | | | | | |
Assets | | | | | | | | | | | | | | | | |
Futures Contracts | | $ | 206,380 | | | $ | — | | | $ | — | | | $ | 206,380 | |
Forward Foreign Currency Contracts | | | — | | | | 59,353 | | | | — | | | | 59,353 | |
Liabilities | | | | | | | | | | | | | | | | |
Futures Contracts | | | (88,291 | ) | | | — | | | | — | | | | (88,291 | ) |
| | | | |
Forward Foreign Currency Contracts | | | — | | | | (182,098 | ) | | | — | | | | (182,098 | ) |
| | | | |
| Total Other Financial Instruments | | $ | 118,089 | | | $ | (122,745 | ) | | $ | — | | | $ | (4,656 | ) |
| | | | |
| 460 | | FLEXSHARES ANNUAL REPORT | | |
Notes to the Financial Statements (cont.)
| | | | | | | | | | | | | | | | |
| | | Level 1 — Quoted
Prices | | | Level 2 — Other
Significant
Observable
Inputs | | | Level 3 —
Significant
Unobservable
Inputs | | | Total | |
|
| FlexShares Morningstar Emerging Markets Factor Tilt Index Fund | |
Investments | | | | | | | | | | | | | | | | |
Common Stocks | | | | | | | | | | | | | | | | |
Automobiles | | $ | 8,755,091 | | | $ | 31,776 | | | $ | — | | | $ | 8,786,867 | |
Banks | | | 43,179,845 | | | | 568,745 | | | | — | | | | 43,748,590 | |
Biotechnology | | | 2,588,435 | | | | 8,511 | | | | 13,057 | | | | 2,610,003 | |
Capital Markets | | | 6,879,698 | | | | — | | | | 21,543 | | | | 6,901,241 | |
Commercial Services & Supplies | | | 386,339 | | | | 38,769 | | | | — | | | | 425,108 | |
Energy Equipment & Services | | | 411,175 | | | | 4,579 | | | | — | | | | 415,754 | |
Equity Real Estate Investment Trusts (REITs) | | | 4,396,455 | | | | 28,441 | | | | — | | | | 4,424,896 | |
Food & Staples Retailing | | | 3,056,382 | | | | 509 | | | | — | | | | 3,056,891 | |
Hotels, Restaurants & Leisure | | | 2,516,703 | | | | 1,736 | | | | 11,284 | | | | 2,529,723 | |
Household Durables | | | 2,630,390 | | | | 33,734 | | | | — | | | | 2,664,124 | |
Metals & Mining | | | 13,948,943 | | | | — | | | | 161,297 | | | | 14,110,240 | |
Oil, Gas & Consumable Fuels | | | 17,213,535 | | | | 1,661 | | | | — | | | | 17,215,196 | |
Pharmaceuticals | | | 4,601,949 | | | | — | | | | 3,914 | | | | 4,605,863 | |
Real Estate Management & Development | | | 14,428,494 | | | | 184,467 | | | | 24,878 | | | | 14,637,839 | |
Transportation Infrastructure | | | 3,898,663 | | | | 104,965 | | | | — | | | | 4,003,628 | |
Wireless Telecommunication Services | | | 3,295,140 | | | | 342,421 | | | | — | | | | 3,637,561 | |
Other* | | | 198,709,082 | | | | — | | | | — | | | | 198,709,082 | |
Corporate Bonds* | | | — | | | | 9,152 | | | | — | | | | 9,152 | |
Rights | | | 1,005 | | | | 1,609 | | | | — | | | | 2,614 | |
Warrants | | | — | | | | 773 | | | | — | | | | 773 | |
| | | | |
| Securities Lending Reinvestments Repurchase Agreements | | | — | | | | 2,781,579 | | | | — | | | | 2,781,579 | |
| | | | |
| Total Investments | | $ | 330,897,324 | | | $ | 4,143,427 | | | $ | 235,973 | | | $ | 335,276,724 | |
| | | | |
Other Financial Instruments | | | | | | | | | | | | | | | | |
Assets | | | | | | | | | | | | | | | | |
Forward Foreign Currency Contracts | | $ | — | | | $ | 12,559 | | | $ | — | | | $ | 12,559 | |
Liabilities | | | | | | | | | | | | | | | | |
Futures Contracts | | | (49,371 | ) | | | — | | | | — | | | | (49,371 | ) |
| | | | |
Forward Foreign Currency Contracts | | | — | | | | (3,323 | ) | | | — | | | | (3,323 | ) |
| | | | |
| Total Other Financial Instruments | | $ | (49,371 | ) | | $ | 9,236 | | | $ | — | | | $ | (40,135 | ) |
| | | | |
| | | | | | | | | | | | | | | | |
| | | Level 1 — Quoted
Prices | | | Level 2 — Other
Significant
Observable
Inputs | | | Level 3 —
Significant
Unobservable
Inputs | | | Total | |
|
| FlexShares US Quality Large Cap Index Fund | |
Investments | |
Common Stocks* | | $ | 142,459,103 | | | $ | — | | | $ | — | | | $ | 142,459,103 | |
| | | | |
| Securities Lending Reinvestments Repurchase Agreements | | | — | | | | 109,616 | | | | — | | | | 109,616 | |
| | | | |
| Total Investments | | $ | 142,459,103 | | | $ | 109,616 | | | $ | — | | | $ | 142,568,719 | |
| | | | |
Other Financial Instruments | | | | | | | | | | | | | | | | |
Assets | | | | | | | | | | | | | | | | |
| | | | |
Futures Contracts | | $ | 46,823 | | | $ | — | | | $ | — | | | $ | 46,823 | |
| | | | |
| Total Other Financial Instruments | | $ | 46,823 | | | $ | — | | | $ | — | | | $ | 46,823 | |
| | | | | | |
| | FLEXSHARES ANNUAL REPORT | | | 461 | |
Notes to the Financial Statements (cont.)
| | | | | | | | | | | | | | | | |
| | | Level 1 — Quoted
Prices | | | Level 2 — Other
Significant
Observable
Inputs | | | Level 3 —
Significant
Unobservable
Inputs | | | Total | |
|
| FlexShares STOXX® US ESG Select Index Fund | |
Investments | |
| | | | |
| Common Stocks* | | $ | 190,347,988 | | | $ | — | | | $ | — | | | $ | 190,347,988 | |
| | | | |
| Total Investments | | $ | 190,347,988 | | | $ | — | | | $ | — | | | $ | 190,347,988 | |
|
Other Financial Instruments | |
Assets | | | | | | | | | | | | | | | | |
| | | | |
Futures Contracts | | $ | 39,491 | | | $ | — | | | $ | — | | | $ | 39,491 | |
| | | | |
| Total Other Financial Instruments | | $ | 39,491 | | | $ | — | | | $ | — | | | $ | 39,491 | |
| | | | |
| | | | | | | | | | | | | | | | |
| | | Level 1 — Quoted
Prices | | | Level 2 — Other
Significant
Observable
Inputs | | | Level 3 —
Significant
Unobservable
Inputs | | | Total | |
|
| FlexShares STOXX® Global ESG Select Index Fund | |
Investments | |
Common Stocks | | | | | | | | | | | | | | | | |
Capital Markets | | $ | 4,976,476 | | | $ | 403,274 | | | $ | — | | | $ | 5,379,750 | |
Internet & Direct Marketing Retail | | | 9,490,955 | | | | 21,997 | | | | — | | | | 9,512,952 | |
Real Estate Management & Development | | | 703,250 | | | | 24,534 | | | | — | | | | 727,784 | |
Other* | | | 166,070,439 | | | | — | | | | — | | | | 166,070,439 | |
Convertible Bonds | | | 2,631 | | | | — | | | | — | | | | 2,631 | |
| | | | |
| Securities Lending Reinvestments Repurchase Agreements | | | — | | | | 1,234,053 | | | | — | | | | 1,234,053 | |
| | | | |
| Total Investments | | $ | 181,243,751 | | | $ | 1,683,858 | | | $ | — | | | $ | 182,927,609 | |
|
Other Financial Instruments | |
Assets | | | | | | | | | | | | | | | | |
Futures Contracts | | $ | 66,874 | | | $ | — | | | $ | — | | | $ | 66,874 | |
Forward Foreign Currency Contracts | | | — | | | | 27,020 | | | | — | | | | 27,020 | |
Liabilities | | | | | | | | | | | | | | | | |
Futures Contracts | | | (11,178 | ) | | | — | | | | — | | | | (11,178 | ) |
| | | | |
Forward Foreign Currency Contracts | | | — | | | | (16,181 | ) | | | — | | | | (16,181 | ) |
| | | | |
| Total Other Financial Instruments | | $ | 55,696 | | | $ | 10,839 | | | $ | — | | | $ | 66,535 | |
| | | | |
| | | | | | | | | | | | | | | | |
| | | | |
| 462 | | FLEXSHARES ANNUAL REPORT | | |
Notes to the Financial Statements (cont.)
| | | | | | | | | | | | | | | | |
| | | Level 1 — Quoted
Prices | | | Level 2 — Other
Significant
Observable
Inputs | | | Level 3 —
Significant
Unobservable
Inputs | | | Total | |
|
| FlexShares ESG & Climate US Large Cap Core Index Fund | |
Investments | |
Common Stocks* | | $ | 2,642,457 | | | $ | — | | | $ | — | | | $ | 2,642,457 | |
| | | | |
Short-Term Investments | | | — | | | | 4,999 | | | | — | | | | 4,999 | |
| | | | |
| Total Investments | | $ | 2,642,457 | | | $ | 4,999 | | | $ | — | | | $ | 2,647,456 | |
|
Other Financial Instruments | |
Assets | | | | | | | | | | | | | | | | |
| | | | |
Futures Contracts | | $ | 1,240 | | | $ | — | | | $ | — | | | $ | 1,240 | |
| | | | |
| Total Other Financial Instruments | | $ | 1,240 | | | $ | — | | | $ | — | | | $ | 1,240 | |
| | | | |
| | | | | | | | | | | | | | | | |
| | | | | | | | | | | | | | | | |
| | | Level 1 — Quoted
Prices | | | Level 2 — Other
Significant
Observable
Inputs | | | Level 3 —
Significant
Unobservable
Inputs | | | Total | |
|
| FlexShares ESG & Climate Developed Markets ex-US Core Index Fund | |
Investments | |
Common Stocks | | | | | | | | | | | | | | | | |
Capital Markets | | $ | 121,803 | | | $ | 19,614 | | | $ | — | | | $ | 141,417 | |
| | | | |
Other* | | | 4,967,209 | | | | — | | | | — | | | | 4,967,209 | |
| | | | |
Total Investments | | $ | 5,089,012 | | | $ | 19,614 | | | $ | — | | | $ | 5,108,626 | |
|
Other Financial Instruments | |
Assets | | | | | | | | | | | | | | | | |
Forward Foreign Currency Contracts | | $ | — | | | $ | 510 | | | $ | — | | | $ | 510 | |
Liabilities | | | | | | | | | | | | | | | | |
| | | | |
Forward Foreign Currency Contracts | | | — | | | | (1,857 | ) | | | — | | | | (1,857 | ) |
| | | | |
| Total Other Financial Instruments | | $ | — | | | $ | (1,347 | ) | | $ | — | | | $ | (1,347 | ) |
| | | | |
| | | | | | | | | | | | | | | | |
| | | | | | |
| | FLEXSHARES ANNUAL REPORT | | | 463 | |
Notes to the Financial Statements (cont.)
| | | | | | | | | | | | | | | | |
| | | Level 1 — Quoted
Prices | | | Level 2 — Other
Significant
Observable
Inputs | | | Level 3 —
Significant
Unobservable
Inputs | | | Total | |
|
| FlexShares Morningstar Global Upstream Natural Resources Index Fund | |
Investments | |
Common Stocks* | | $ | 6,019,017,379 | | | $ | — | | | $ | — | | | $ | 6,019,017,379 | |
Securities Lending Reinvestments Certificates of Deposit | | | — | | | | 12,000,049 | | | | — | | | | 12,000,049 | |
| | | | |
Repurchase Agreements | | | — | | | | 48,798,497 | | | | — | | | | 48,798,497 | |
| | | | |
| Total Investments | | $ | 6,019,017,379 | | | $ | 60,798,546 | | | $ | — | | | $ | 6,079,815,925 | |
|
Other Financial Instruments | |
Assets | | | | | | | | | | | | | | | | |
Futures Contracts | | $ | 878,891 | | | $ | — | | | $ | — | | | $ | 878,891 | |
Forward Foreign Currency Contracts | | | — | | | | 1,209,027 | | | | — | | | | 1,209,027 | |
Liabilities | | | | | | | | | | | | | | | | |
Futures Contracts | | | (46,596 | ) | | | — | | | | — | | | | (46,596 | ) |
| | | | |
Forward Foreign Currency Contracts | | | — | | | | (814,670 | ) | | | — | | | | (814,670 | ) |
| | | | |
| Total Other Financial Instruments | | $ | 832,295 | | | $ | 394,357 | | | $ | — | | | $ | 1,226,652 | |
| | | | |
| | | | | | | | | | | | | | | | |
| | | Level 1 — Quoted
Prices | | | Level 2 — Other
Significant
Observable
Inputs | | | Level 3 —
Significant
Unobservable
Inputs | | | Total | |
|
| FlexShares STOXX® Global Broad Infrastructure Index Fund | |
Investments | |
Common Stocks* | | $ | 2,621,193,595 | | | $ | — | | | $ | — | | | $ | 2,621,193,595 | |
| | | | |
| Securities Lending Reinvestments Repurchase Agreements | | | — | | | | 32,219,867 | | | | — | | | | 32,219,867 | |
| | | | |
| Total Investments | | $ | 2,621,193,595 | | | $ | 32,219,867 | | | $ | — | | | $ | 2,653,413,462 | |
Other Financial Instruments | |
Assets | | | | | | | | | | | | | | | | |
Futures Contracts | | $ | 500,629 | | | $ | — | | | $ | — | | | $ | 500,629 | |
Forward Foreign Currency Contracts | | | — | | | | 265,525 | | | | — | | | | 265,525 | |
Liabilities | | | | | | | | | | | | | | | | |
Futures Contracts | | | (63,677 | ) | | | — | | | | — | | | | (63,677 | ) |
| | | | |
Forward Foreign Currency Contracts | | | — | | | | (516,358 | ) | | | — | | | | (516,358 | ) |
| | | | |
| Total Other Financial Instruments | | $ | 436,952 | | | $ | (250,833 | ) | | $ | — | | | $ | 186,119 | |
| | | | |
| 464 | | FLEXSHARES ANNUAL REPORT | | |
Notes to the Financial Statements (cont.)
| | | | | | | | | | | | | | | | |
| | | Level 1 — Quoted
Prices | | | Level 2 — Other
Significant
Observable
Inputs | | | Level 3 —
Significant
Unobservable
Inputs | | | Total | |
|
| FlexShares Global Quality Real Estate Index Fund | |
Investments | |
Common Stocks | | | | | | | | | | | | | | | | |
Real Estate Management & Development | | $ | 65,214,048 | | | $ | 9,140,889 | | | $ | — | | | $ | 74,354,937 | |
Other* | | | 339,914,881 | | | | — | | | | — | | �� | | 339,914,881 | |
| | | | |
| Securities Lending Reinvestments Repurchase Agreements | | | — | | | | 11,192,491 | | | | — | | | | 11,192,491 | |
| | | | |
| Total Investments | | $ | 405,128,929 | | | $ | 20,333,380 | | | $ | — | | | $ | 425,462,309 | |
|
Other Financial Instruments | |
Assets | | | | | | | | | | | | | | | | |
Futures Contracts | | $ | 134,540 | | | $ | — | | | $ | — | | | $ | 134,540 | |
Forward Foreign Currency Contracts | | | — | | | | 8,285 | | | | — | | | | 8,285 | |
Liabilities | | | | | | | | | | | | | | | | |
Futures Contracts | | | (11,822 | ) | | | — | | | | — | | | | (11,822 | ) |
| | | | |
Forward Foreign Currency Contracts | | | — | | | | (14,213 | ) | | | — | | | | (14,213 | ) |
| | | | |
| Total Other Financial Instruments | | $ | 122,718 | | | $ | (5,928 | ) | | $ | — | | | $ | 116,790 | |
| | | | |
| | | | | | | | | | | | | | | | |
| | | Level 1 — Quoted
Prices | | | Level 2 — Other
Significant
Observable
Inputs | | | Level 3 —
Significant
Unobservable
Inputs | | | Total | |
|
| FlexShares Real Assets Allocation Index Fund | |
Investments | |
| | | | |
Exchange Traded Funds | | $ | 30,290,663 | | | $ | — | | | $ | — | | | $ | 30,290,663 | |
| | | | |
| Total Investments | | $ | 30,290,663 | | | $ | — | | | $ | — | | | $ | 30,290,663 | |
| | | | |
| | | | | | | | | | | | | | | | |
| | | Level 1 — Quoted
Prices | | | Level 2 — Other
Significant
Observable
Inputs | | | Level 3 —
Significant
Unobservable
Inputs | | | Total | |
|
| FlexShares Quality Dividend Index Fund | |
Investments | |
Common Stocks* | | $ | 1,632,826,679 | | | $ | — | | | $ | — | | | $ | 1,632,826,679 | |
Securities Lending Reinvestments Certificates of Deposit | | | — | | | | 5,000,036 | | | | — | | | | 5,000,036 | |
| | | | |
Repurchase Agreements | | | — | | | | 88,371,909 | | | | — | | | | 88,371,909 | |
| | | | |
| Total Investments | | $ | 1,632,826,679 | | | $ | 93,371,945 | | | $ | — | | | $ | 1,726,198,624 | |
|
Other Financial Instruments | |
Assets | | | | | | | | | | | | | | | | |
| | | | |
Futures Contracts | | $ | 330,801 | | | $ | — | | | $ | — | | | $ | 330,801 | |
| | | | |
| Total Other Financial Instruments | | $ | 330,801 | | | $ | — | | | $ | — | | | $ | 330,801 | |
| | | | | | |
| | FLEXSHARES ANNUAL REPORT | | | 465 | |
Notes to the Financial Statements (cont.)
| | | | | | | | | | | | | | | | |
| | | Level 1 — Quoted
Prices | | | Level 2 — Other
Significant
Observable
Inputs | | | Level 3 —
Significant
Unobservable
Inputs | | | Total | |
|
| FlexShares Quality Dividend Defensive Index Fund | |
Investments | |
Common Stocks* | | $ | 445,185,932 | | | $ | — | | | $ | — | | | $ | 445,185,932 | |
| | | | |
Securities Lending Reinvestments Repurchase Agreements | | | — | | | | 23,597,323 | | | | — | | | | 23,597,323 | |
| | | | |
| Total Investments | | $ | 445,185,932 | | | $ | 23,597,323 | | | $ | — | | | $ | 468,783,255 | |
|
Other Financial Instruments | |
Assets | | | | | | | | | | | | | | | | |
| | | | |
Futures Contracts | | $ | 99,533 | | | $ | — | | | $ | — | | | $ | 99,533 | |
| | | | |
| Total Other Financial Instruments | | $ | 99,533 | | | $ | — | | | $ | — | | | $ | 99,533 | |
| | | | |
| | | | | | | | | | | | | | | | |
| | | Level 1 — Quoted
Prices | | | Level 2 — Other
Significant
Observable
Inputs | | | Level 3 —
Significant
Unobservable
Inputs | | | Total | |
|
| FlexShares Quality Dividend Dynamic Index Fund | |
Investments | |
Common Stocks* | | $ | 21,704,940 | | | $ | — | | | $ | — | | | $ | 21,704,940 | |
| | | | |
Securities Lending Reinvestments Repurchase Agreements | | | — | | | | 275,181 | | | | — | | | | 275,181 | |
| | | | |
| Total Investments | | $ | 21,704,940 | | | $ | 275,181 | | | $ | — | | | $ | 21,980,121 | |
|
Other Financial Instruments | |
Assets | | | | | | | | | | | | | | | | |
| | | | |
Futures Contracts | | $ | 9,461 | | | $ | — | | | $ | — | | | $ | 9,461 | |
| | | | |
| Total Other Financial Instruments | | $ | 9,461 | | | $ | — | | | $ | — | | | $ | 9,461 | |
| | | | |
| | | | | | | | | | | | | | | | |
| | | | |
| 466 | | FLEXSHARES ANNUAL REPORT | | |
Notes to the Financial Statements (cont.)
| | | | | | | | | | | | | | | | |
| | | Level 1 — Quoted
Prices | | | Level 2 — Other
Significant
Observable
Inputs | | | Level 3 —
Significant
Unobservable
Inputs | | | Total | |
|
| FlexShares International Quality Dividend Index Fund | |
Investments | |
Common Stocks* | | $ | 598,831,553 | | | $ | — | | | $ | — | | | $ | 598,831,553 | |
| | | | |
Securities Lending Reinvestments Repurchase Agreements | | | — | | | | 17,256,554 | | | | — | | | | 17,256,554 | |
| | | | |
| Total Investments | | $ | 598,831,553 | | | $ | 17,256,554 | | | $ | — | | | $ | 616,088,107 | |
|
Other Financial Instruments | |
Assets | | | | | | | | | | | | | | | | |
Futures Contracts | | $ | 198,034 | | | $ | — | | | $ | — | | | $ | 198,034 | |
Forward Foreign Currency Contracts | | | — | | | | 161,905 | | | | — | | | | 161,905 | |
Liabilities | | | | | | | | | | | | | | | | |
Futures Contracts | | | (187,386 | ) | | | — | | | | — | | | | (187,386 | ) |
| | | | |
Forward Foreign Currency Contracts | | | — | | | | (259,228 | ) | | | — | | | | (259,228 | ) |
| | | | |
| Total Other Financial Instruments | | $ | 10,648 | | | $ | (97,323 | ) | | $ | — | | | $ | (86,675 | ) |
| | | | |
| | | | | | | | | | | | | | | | |
| | | Level 1 — Quoted
Prices | | | Level 2 — Other
Significant
Observable
Inputs | | | Level 3 —
Significant
Unobservable
Inputs | | | Total | |
|
| FlexShares International Quality Dividend Defensive Index Fund | |
Investments | |
Common Stocks | | | | | | | | | | | | | | | | |
Real Estate Management & Development | | $ | 1,315,518 | | | $ | 23,920 | | | $ | — | | | $ | 1,339,438 | |
Other* | | | 68,887,753 | | | | — | | | | — | | | | 68,887,753 | |
| | | | |
Securities Lending Reinvestments Repurchase Agreements | | | — | | | | 1,625,153 | | | | — | | | | 1,625,153 | |
| | | | |
| Total Investments | | $ | 70,203,271 | | | $ | 1,649,073 | | | $ | — | | | $ | 71,852,344 | |
|
Other Financial Instruments | |
Assets | | | | | | | | | | | | | | | | |
Forward Foreign Currency Contracts | | $ | — | | | $ | 18,838 | | | $ | — | | | $ | 18,838 | |
Liabilities | | | | | | | | | | | | | | | | |
Futures Contracts | | | (15,232 | ) | | | — | | | | — | | | | (15,232 | ) |
| | | | |
Forward Foreign Currency Contracts | | | — | | | | (5,317 | ) | | | — | | | | (5,317 | ) |
| | | | |
| Total Other Financial Instruments | | $ | (15,232 | ) | | $ | 13,521 | | | $ | — | | | $ | (1,711 | ) |
| | | | |
| | | | | | | | | | | | | | | | |
| | | | | | |
| | FLEXSHARES ANNUAL REPORT | | | 467 | |
Notes to the Financial Statements (cont.)
| | | | | | | | | | | | | | | | |
| | | Level 1 — Quoted
Prices | | | Level 2 — Other
Significant
Observable
Inputs | | | Level 3 —
Significant
Unobservable
Inputs | | | Total | |
|
| FlexShares International Quality Dividend Dynamic Index Fund | |
Investments | |
Common Stocks | | | | | | | | | | | | | | | | |
Capital Markets | | $ | 2,024,030 | | | $ | 386,334 | | | $ | — | | | $ | 2,410,364 | |
Other* | | | 71,962,729 | | | | — | | | | — | | | | 71,962,729 | |
| | | | |
Securities Lending Reinvestments Repurchase Agreements | | | — | | | | 1,136,015 | | | | — | | | | 1,136,015 | |
| | | | |
| Total Investments | | $ | 73,986,759 | | | $ | 1,522,349 | | | $ | — | | | $ | 75,509,108 | |
|
Other Financial Instruments | |
Assets | | | | | | | | | | | | | | | | |
Futures Contracts | | $ | 1,531 | | | $ | — | | | $ | — | | | $ | 1,531 | |
Forward Foreign Currency Contracts | | | — | | | | 12,173 | | | | — | | | | 12,173 | |
Liabilities | | | | | | | | | | | | | | | | |
Futures Contracts | | | (9,092 | ) | | | — | | | | — | | | | (9,092 | ) |
| | | | |
Forward Foreign Currency Contracts | | | — | | | | (8,111 | ) | | | — | | | | (8,111 | ) |
| | | | |
| Total Other Financial Instruments | | $ | (7,561 | ) | | $ | 4,062 | | | $ | — | | | $ | (3,499 | ) |
| | | | |
| | | | | | | | | | | | | | | | |
| | | Level 1 — Quoted
Prices | | | Level 2 — Other
Significant
Observable
Inputs | | | Level 3 —
Significant
Unobservable
Inputs | | | Total | |
|
| FlexShares iBoxx 3-Year Target Duration TIPS Index Fund | |
Investments | |
U.S. Treasury Obligations | | $ | — | | | $ | 1,435,507,055 | | | $ | — | | | $ | 1,435,507,055 | |
| | | | |
Securities Lending Reinvestments Repurchase Agreements | | | — | | | | 3,852,300 | | | | — | | | | 3,852,300 | |
| | | | |
| Total Investments | | $ | — | | | $ | 1,439,359,355 | | | $ | — | | | $ | 1,439,359,355 | |
| | | | | | | | | | | | | | | | |
| | | | |
| | | | | | | | | | | | | | | | |
| | | Level 1 — Quoted
Prices | | | Level 2 — Other
Significant
Observable
Inputs | | | Level 3 —
Significant
Unobservable
Inputs | | | Total | |
|
| FlexShares iBoxx 5-Year Target Duration TIPS Index Fund | |
Investments | |
U.S. Treasury Obligations | | $ | — | | | $ | 713,145,586 | | | $ | — | | | $ | 713,145,586 | |
| | | | |
Securities Lending Reinvestments Repurchase Agreements | | | — | | | | 2,318,500 | | | | — | | | | 2,318,500 | |
| | | | |
| Total Investments | | $ | — | | | $ | 715,464,086 | | | $ | — | | | $ | 715,464,086 | |
| | | | |
| | | | | | | | | | | | | | | | |
| | | | |
| 468 | | FLEXSHARES ANNUAL REPORT | | |
Notes to the Financial Statements (cont.)
| | | | | | | | | | | | | | | | |
| | | Level 1 — Quoted
Prices | | | Level 2 — Other
Significant
Observable
Inputs | | | Level 3 —
Significant
Unobservable
Inputs | | | Total | |
|
| FlexShares Disciplined Duration MBS Index Fund | |
Investments | |
| | | | |
Mortgage-Backed Securities | | $ | — | | | $ | 108,374,947 | | | $ | — | | | $ | 108,374,947 | |
| | | | |
| Total Investments | | $ | — | | | $ | 108,374,947 | | | $ | — | | | $ | 108,374,947 | |
| | | | |
| | | | | | | | | | | | | | | | |
| | | Level 1 — Quoted
Prices | | | Level 2 — Other
Significant
Observable
Inputs | | | Level 3 —
Significant
Unobservable
Inputs | | | Total | |
|
| FlexShares Credit-Scored US Corporate Bond Index Fund | |
Investments | |
| | | | |
Corporate Bonds* | | $ | — | | | $ | 308,335,995 | | | $ | — | | | $ | 308,335,995 | |
| | | | |
| Total Investments | | $ | — | | | $ | 308,335,995 | | | $ | — | | | $ | 308,335,995 | |
| | | | |
| | | | | | | | | | | | | | | | |
| | | Level 1 — Quoted
Prices | | | Level 2 — Other
Significant
Observable
Inputs | | | Level 3 —
Significant
Unobservable
Inputs | | | Total | |
|
| FlexShares Credit-Scored US Long Corporate Bond Index Fund | |
Investments | |
| | | | |
Corporate Bonds* | | $ | — | | | $ | 59,393,212 | | | $ | — | | | $ | 59,393,212 | |
| | | | |
| Total Investments | | $ | — | | | $ | 59,393,212 | | | $ | — | | | $ | 59,393,212 | |
| | | | |
| | | | | | | | | | | | | | | | |
| | | Level 1 — Quoted
Prices | | | Level 2 — Other
Significant
Observable
Inputs | | | Level 3 —
Significant
Unobservable
Inputs | | | Total | |
|
| FlexShares High Yield Value-Scored Bond Index Fund | |
Investments | |
Common Stocks* | | $ | 49 | | | $ | — | | | $ | — | | | $ | 49 | |
| | | | |
Corporate Bonds* | | | — | | | | 567,330,700 | | | | — | | | | 567,330,700 | |
| | | | |
| Total Investments | | $ | 49 | | | $ | 567,330,700 | | | $ | — | | | $ | 567,330,749 | |
| | | | |
| | | | | | | | | | | | | | | | |
| | | | | | |
| | FLEXSHARES ANNUAL REPORT | | | 469 | |
Notes to the Financial Statements (cont.)
| | | | | | | | | | | | | | | | |
| | | Level 1 — Quoted
Prices | | | Level 2 — Other
Significant
Observable
Inputs | | | Level 3 —
Significant
Unobservable
Inputs | | | Total | |
|
| FlexShares ESG & Climate High Yield Corporate Core Index Fund | |
Investments | |
| | | | |
Corporate Bonds* | | $ | — | | | $ | 48,820,616 | | | $ | — | | | $ | 48,820,616 | |
| | | | |
| Total Investments | | $ | — | | | $ | 48,820,616 | | | $ | — | | | $ | 48,820,616 | |
| | | | |
| | | | | | | | | | | | | | | | |
| | | Level 1 — Quoted
Prices | | | Level 2 — Other
Significant
Observable
Inputs | | | Level 3 —
Significant
Unobservable
Inputs | | | Total | |
|
| FlexShares ESG & Climate Investment Grade Corporate Core Index Fund | |
Investments | |
| | | | |
Corporate Bonds* | | $ | — | | | $ | 47,966,046 | | | $ | — | | | $ | 47,966,046 | |
| | | | |
| Total Investments | | $ | — | | | $ | 47,966,046 | | | $ | — | | | $ | 47,966,046 | |
| | | | |
| | | | | | | | | | | | | | | | |
| | | Level 1 — Quoted
Prices | | | Level 2 — Other
Significant
Observable
Inputs | | | Level 3 —
Significant
Unobservable
Inputs | | | Total | |
|
| FlexShares Ready Access Variable Income Fund | |
Investments | |
Asset-Backed Securities | | $ | — | | | $ | 16,640,088 | | | $ | — | | | $ | 16,640,088 | |
Corporate Bonds* | | | — | | | | 347,041,422 | | | | — | | | | 347,041,422 | |
Municipal Bonds | | | — | | | | 8,755,486 | | | | — | | | | 8,755,486 | |
| | | | |
Foreign Government Securities | | | — | | | | 812,778 | | | | — | | | | 812,778 | |
| | | | |
| Total Investments | | $ | — | | | $ | 373,249,774 | | | $ | — | | | $ | 373,249,774 | |
|
Other Financial Instruments | |
Assets | | | | | | | | | | | | | | | | |
| | | | |
Asset-Backed Security | | $ | — | | | $ | — | | | $ | — | | | $ | — | |
| | | | |
| Total Other Financial Instruments | | $ | — | | | $ | — | | | $ | — | | | $ | — | |
| | | | |
| | | | | | | | | | | | | | | | |
| | | Level 1 — Quoted
Prices | | | Level 2 — Other
Significant
Observable
Inputs | | | Level 3 —
Significant
Unobservable
Inputs | | | Total | |
|
| FlexShares Core Select Bond Fund | |
Investments | |
Exchange Traded Funds | | $ | 126,146,132 | | | $ | — | | | $ | — | | | $ | 126,146,132 | |
| | | | |
Short-Term Investments | | | — | | | | 274,968 | | | | — | | | | 274,968 | |
| | | | |
| Total Investments | | $ | 126,146,132 | | | $ | 274,968 | | | $ | — | | | $ | 126,421,100 | |
| * | See Schedules of Investments for segregation by industry type. |
| | | | |
| 470 | | FLEXSHARES ANNUAL REPORT | | |
Notes to the Financial Statements (cont.)
Foreign Securities
The FlexShares Developed Markets ex-US Quality Low Volatility Index Fund, FlexShares Emerging Markets Quality Low Volatility Index Fund, FlexShares Morningstar Developed Markets ex-US Factor Tilt Index Fund, FlexShares Morningstar Emerging Markets Factor Tilt Index Fund, FlexShares STOXX® Global ESG Select Index Fund, FlexShares Morningstar Global Upstream Natural Resources Index Fund, FlexShares STOXX® Global Broad Infrastructure Index Fund, FlexShares Global Quality Real Estate Index Fund, FlexShares Real Assets Allocation Index Fund (through its investment in its Underlying Funds), FlexShares International Quality Dividend Index Fund, FlexShares International Quality Dividend Defensive Index Fund, FlexShares International Quality Dividend Dynamic Index Fund and the FlexShares ESG & Climate Developed Markets ex-US Core Index Fund invest in publicly-traded equity securities of issuers in countries other than the United States of America (“U.S.”). Such investments include direct investments in non-U.S. dollar denominated securities traded outside the U.S. The Funds’ investments in foreign securities also may be in the form of ADRs and Global Depositary Receipts (“GDRs”) (collectively, “Depositary Receipts”) based on securities in their Underlying Indexes. ADRs are receipts that are traded in the United States evidencing ownership of the underlying foreign securities and are denominated in U.S. dollars. GDRs are receipts issued by a non-U.S. financial institution evidencing ownership of underlying foreign or U.S. securities and usually are denominated in foreign currencies. GDRs may not be denominated in the same currency as the securities they represent. Generally, GDRs are designed for use in foreign securities markets.
In addition to investment risks associated with the underlying issuer, ADRs and GDRs expose a Fund to risk associated with non-uniform terms that apply to ADR and GDR programs, credit exposure to the depository bank and to the sponsors and other parties with whom the depository bank establishes the programs, currency and liquidity risk. ADRs and GDRs are generally subject to the same risks as the foreign securities that they evidence or into which they may be converted.
To the extent a Fund invests in ADRs, such ADRs will be listed on a national securities exchange. To the extent a Fund invests in GDRs, such GDRs will be listed on a foreign exchange. A Fund will not invest in any unlisted Depositary Receipt, any Depositary Receipt that NTI deems to be illiquid or any Depositary Receipt for which market quotations are not readily available. Generally, all Depositary Receipts must be sponsored.
The FlexShares Credit-Scored US Corporate Bond Index Fund, FlexShares Credit-Scored US Long Corporate Bond Index Fund, FlexShares High Yield Value-Scored Bond Index Fund, FlexShares ESG & Climate High Yield Corporate Core Index Fund and the FlexShares ESG & Climate Investment Grade Corporate Core Index Fund may invest in U.S. dollar denominated bonds of non-U.S. corporations to the extent such bonds are included in each Fund’s Underlying Index. The FlexShares Core Select Bond Fund may invest in U.S. dollar denominated bonds of non-U.S. corporations, either directly or indirectly through Underlying Funds, to achieve its investment objective.
The FlexShares Ready Access Variable Income Fund may invest, without limitation, in fixed-income securities and instruments of foreign issuers in developed and emerging markets, including debt securities of foreign governments.
Investing in foreign securities, including Depositary Receipts, may result in a Fund experiencing more rapid and extreme changes in value than a fund that invests exclusively in U.S. securities, due to less liquid markets, and adverse economic, political, diplomatic, financial, and regulatory factors. Foreign governments also may impose taxes and limits on investment and repatriation. Any of these events could cause the value of a Fund’s foreign investment to decline. To the extent that a Fund’s assets are significantly invested in a single country or geographic region, a Fund will be subject to the risks associated with that particular country or region.
The FlexShares Emerging Markets Quality Low Volatility Fund and FlexShares Morningstar Emerging Markets Factor Tilt Index Fund will invest primarily in emerging market countries. In addition, the FlexShares Morningstar Global Upstream Natural Resources Index Fund, FlexShares
| | | | | | |
| | FLEXSHARES ANNUAL REPORT | | | 471 | |
Notes to the Financial Statements (cont.)
STOXX® Global Broad Infrastructure Index Fund, FlexShares Global Quality Real Estate Index Fund, FlexShares Real Assets Allocation Index Fund (through its investment in its Underlying Funds), FlexShares International Quality Dividend Index Fund, FlexShares International Quality Dividend Defensive Index Fund, and the FlexShares International Quality Dividend Dynamic Index Fund may invest its assets in emerging market countries. The FlexShares Ready Access Variable Income Fund may invest up to 20% of its total assets in fixed-income securities and instruments of issuers in emerging markets. The markets of emerging market countries are less developed and less liquid, subject to greater price volatility and generally subject to increased economic, political, regulatory and other uncertainties than more developed foreign markets. The risks of foreign investment are increased when the issuer is located in a country with an emerging economy or securities market.
Inflation-Indexed Securities
The FlexShares iBoxx 3-Year Target Duration TIPS Index Fund and the FlexShares iBoxx 5-Year Target Duration TIPS Index Fund invest primarily in U.S. Treasury Inflation-Protected Securities (“TIPS”). The FlexShares Ready Access Variable Income Fund and the FlexShares Core Select Bond Fund (directly or through its Underlying Funds) may invest in inflation-indexed securities.
TIPS have varying maturities and pay interest on a semiannual basis equal to a fixed percentage of the inflation-adjusted principal amount. If the periodic adjustment rate measuring inflation falls, the principal value of TIPS will be adjusted downward, and consequently the interest payable on these securities (calculated with respect to a smaller principal amount) will be reduced. Repayment of the original bond principal upon maturity (as adjusted for inflation) is guaranteed in the case of TIPS, even during a period of deflation.
The value of TIPS is expected to change in response to changes in real interest rates. Real interest rates in turn are tied to the relationship between nominal interest rates and the rate of inflation. Therefore, if the rate of inflation rises at a faster rate than nominal interest rates, real interest rates
might decline, leading to an increase in value of TIPS. In contrast, if nominal interest rates increase at a faster rate than inflation, real interest rates might rise, leading to a decrease in value of TIPS. Any increase in the principal amount of TIPS will be considered taxable ordinary income, even though investors do not receive their principal until maturity.
While these securities are expected to be protected from long-term inflationary trends, short-term increases in inflation may lead to a decline in value. If interest rates rise due to reasons other than inflation, investors in these securities may not be protected to the extent that the increase is not reflected in the TIPS’ inflation measure.
The periodic adjustment of TIPS is tied to the Consumer Price Index for Urban Consumers (“CPI-U”), which is calculated monthly by the U.S. Bureau of Labor Statistics. The CPI-U is a measurement of changes in the cost of living, made up of components such as housing, food, transportation and energy. There can be no assurance that the CPI-U will accurately measure the real rate of inflation in the prices of goods and services.
Mortgage-Backed Pass-Through Securities
The FlexShares Disciplined Duration MBS Index Fund invests primarily in U.S. agency mortgage-backed pass-through securities (“MBS”), a category of pass-through securities backed by pools of mortgages and issued by one of the following U.S. government agencies: the Federal National Mortgage Association (FNMA or Fannie Mae), the Federal Home Loan Mortgage Corporation (FHLMC or Freddie Mac) or the Government National Mortgage Association (GNMA or Ginnie Mae) (each a “US Agency”). Under normal circumstances, the Fund will invest at least 80% of its total assets in the securities of its Underlying Index and in “to-be announced transactions” (“TBA transactions”) that represent securities in its Underlying Index. In a TBA transaction, the buyer and seller agree upon general trade parameters such as agency, coupon rate, settlement date, par amount and price. The actual pools delivered generally are determined two days prior to settlement.
| | | | |
| 472 | | FLEXSHARES ANNUAL REPORT | | |
Notes to the Financial Statements (cont.)
Pending settlement of such TBA contracts, the FlexShares Disciplined Duration MBS Index Fund will invest in liquid, short-term instruments. The FlexShares Core Select Bond Fund may also invest either directly or through its Underlying Funds in MBS, including TBA transactions.
Mortgage Dollar Rolls
The FlexShares Disciplined Duration MBS Index Fund and the FlexShares Core Select Bond Fund (directly or through its Underlying Funds) may enter into mortgage dollar roll transactions. A mortgage dollar roll involves the sale by the Fund of securities for delivery in the future (generally within 30 days). The Fund simultaneously contracts with the same counterparty to repurchase substantially similar (same type, coupon and maturity) but not identical securities on a specified future date. During the roll period, the Fund will not be entitled to accrue interest and receive principal payments on the securities sold. However, the Fund benefits to the extent of any difference between (a) the price received for the securities sold and (b) the lower forward price for the future purchase and/or fee income plus the interest earned on the cash proceeds of the securities sold. Successful use of mortgage dollar rolls depends upon the Investment Adviser’s ability to predict correctly interest rates and mortgage prepayments. The use of this technique may diminish the investment performance of the Fund compared with what such performance would have been without the use of mortgage dollar rolls.
For financial reporting and tax purposes, a Fund treats mortgage dollar rolls as two separate transactions: one involving the purchase of a security and a separate transaction involving a sale. The Fund currently does not intend to enter into mortgage dollar rolls that are accounted for as financing and does not treat them as borrowings.
Repurchase Agreements
To the extent consistent with its investment policies, each Fund may enter into repurchase agreements under which it purchases securities (collateral) for cash from a seller and agrees to resell those securities to the same seller within a specified time at a specified price. During the term of a repurchase agreement, the market value of the underlying collateral, including accrued interest, is required to equal or
exceed the market value of the repurchase agreement. The underlying collateral for tri-party repurchase agreements is held in accounts at JPMorgan Chase, the Fund’s custodian, and is not reflected in the assets of the Funds, at the Bank of New York or JPMorgan Chase which, in turn, holds securities through the book-entry system at the Federal Reserve Bank of New York. The Fund is subject to credit risk on repurchase agreements to the extent that the counterparty fails to perform under the agreement and the value of the collateral received falls below the agreed repurchase price.
The Northern Trust Company, the parent of NTI, currently is a party to various Master Repurchase Agreements with a number of different counterparties, and acts as agent on behalf of various disclosed principals, including the Funds and various other accounts managed by NTI, in entering into repurchase agreements under the Master Repurchase Agreements. NTI administers and manages these repurchase agreements in accordance with and as part of its duties under its investment advisory agreement with the Funds and does not collect any additional fees from the Funds for such services. As of October 31, 2021, none of the Funds presented in these financial statements had repurchase agreements outstanding except as discussed below.
As of October 31, 2021, the FlexShares Morningstar US Market Factor Tilt Index Fund, FlexShares Morningstar Developed Markets ex-US Factor Tilt Index Fund, FlexShares Morningstar Emerging Markets Factor Tilt Index Fund, FlexShares US Quality Large Cap Index Fund, FlexShares STOXX® Global ESG Select Index Fund, FlexShares Morningstar Global Upstream Natural Resources Index Fund, FlexShares STOXX® Global Broad Infrastructure Index Fund, FlexShares Global Quality Real Estate Index Fund, FlexShares Quality Dividend Index Fund, FlexShares Quality Dividend Defensive Index Fund, FlexShares Quality Dividend Dynamic Index Fund, FlexShares International Quality Dividend Index Fund, FlexShares International Quality Dividend Defensive Index Fund, FlexShares International Quality Dividend Dynamic Index Fund, FlexShares iBoxx 3-Year Target Duration TIPS Index Fund, and the FlexShares iBoxx 5-Year Target Duration TIPS Index Fund invested cash collateral for loans of portfolio securities in repurchase agreements, as reflected in the respective Schedule of Investments under the caption “Securities Lending Reinvestments.”
| | | | | | |
| | FLEXSHARES ANNUAL REPORT | | | 473 | |
Notes to the Financial Statements (cont.)
Securities Lending
Each Fund may lend securities to banks, brokers and dealers or other qualified institutions. In exchange, the Fund is required to receive minimum initial collateral value as follows:
| | | | |
| Type of Loan | | Minimum Initial
Collateral Requirement | |
| |
| U.S. dollar denominated securities secured by U.S. dollar denominated government securities or cash collateral | | | 102 | % |
| |
| U.S. dollar denominated securities secured by non-U.S. dollar denominated government securities or cash collateral | | | 105 | % |
| |
| Non-U.S. dollar denominated securities secured by government securities or cash collateral in the same denomination as the lent securities | | | 102 | % |
| |
| Non-U.S. dollar denominated securities secured by government securities or cash collateral in the different denomination from the lent securities | | | 105 | % |
| |
| U.S. dollar and Non-U.S. dollar denominated securities secured by equity securities collateral | | | 105 | % |
The collateral is maintained thereafter, at a value equal to at least 100% of the value of the securities loaned. The collateral amount is valued at the beginning of each business day and is compared to the market value of the loaned securities from the prior business day to determine if additional collateral is required. If additional collateral is required, a request is sent to the borrower.
Securities lending may represent no more than one-third of the value of a Fund’s total assets (including the loan collateral). JPMorgan Chase Bank, N.A. (the “Securities Lending Agent”) serves as the securities lending agent for the securities lending program of a Fund.
Collateral for loans of portfolio securities made by a Fund may consist of cash, cash equivalents, securities issued or guaranteed by the U.S. government or foreign governments or its agencies (or any combination thereof). Any cash collateral received by the Fund in connection with these loans may be invested in a variety of short-term investments,
either directly or indirectly through money market portfolios. The market value of securities on loan and the value of investments made with cash collateral received are disclosed in the Schedules of Investments. Securities lending income includes income from the securities lending program recorded when earned from the Securities Lending Agent and any fees charged to borrowers less expenses associated with the loan. The net amount is reflected in the Statement of Operations under “Securities lending income (net of fees).” The market value of the loaned securities is determined at the close of each business day of the Fund and any additional required collateral is delivered to the Fund, or excess collateral returned by the Fund, on the next business day.
When a Fund lends its securities, it will continue to receive payments equal to the dividends and interest paid on the securities loaned and simultaneously may earn interest on the investment of the cash collateral.
A Fund will have the right to terminate a loan at any time and recall the loaned securities within the normal and customary settlement time for securities transactions. A Fund does not have the right to vote securities on loan, but can terminate the loan and regain the right to vote if a material event affecting the securities occurred. A borrower might become insolvent or refuse to honor its obligation to return the securities. In the event of a default by a borrower with respect to any loan, the Securities Lending Agent will exercise any and all remedies provided under the applicable borrower agreement. These remedies include purchasing replacement securities for the Fund by applying the collateral held from the defaulting borrower against the purchase cost of the replacement securities. If the proceeds from the collateral are less than the purchase cost of the replacement securities, the Securities Lending Agent is responsible for such shortfall, subject to certain limitations that are set forth in detail in the Securities Lending Agency Agreement. In this event, a Fund could experience delays in recovering its securities and possibly may incur a capital loss. Each Fund will be responsible for any loss that might result from its investment of the cash collateral it receives from a borrower.
| | | | |
| 474 | | FLEXSHARES ANNUAL REPORT | | |
Notes to the Financial Statements (cont.)
In accordance with guidance presented in FASB Accounting Standard Update (“ASU”) 2014-11, Transfers and Servicing (Topic 860): Repurchase-to-Maturity Transactions, Repurchase Financings, and Disclosures, liabilities under the outstanding securities lending transactions as of October 31, 2021, which were comprised of cash, were as follows:
| | | | |
| Fund | | | |
| |
| FlexShares® Morningstar US Market Factor Tilt Index Fund | | $ | 156,227,373 | |
| |
| FlexShares® Morningstar Developed Markets ex-US Factor Tilt Index Fund | | | 13,300,695 | |
| |
| FlexShares® Morningstar Emerging Markets Factor Tilt Index Fund | | | 2,781,579 | |
| |
| FlexShares® US Quality Large Cap Index Fund | | | 109,616 | |
| |
| FlexShares® STOXX® Global ESG Select Index Fund | | | 1,234,053 | |
| |
| FlexShares® Morningstar Global Upstream Natural Resources Index Fund | | | 60,798,887 | |
| |
| FlexShares® STOXX® Global Broad Infrastructure Index Fund | | | 32,219,867 | |
| |
| FlexShares® Global Quality Real Estate Index Fund | | | 11,192,491 | |
| |
| FlexShares® Quality Dividend Index Fund | | | 93,372,067 | |
| |
| FlexShares® Quality Dividend Defensive Index Fund | | | 23,597,323 | |
| |
| FlexShares® Quality Dividend Dynamic Index Fund | | | 275,181 | |
| |
| FlexShares® International Quality Dividend Index Fund | | | 17,256,554 | |
| |
| FlexShares® International Quality Dividend Defensive Index Fund | | | 1,625,153 | |
| |
| FlexShares® International Quality Dividend Dynamic Index Fund | | | 1,136,015 | |
| |
| FlexShares® iBoxx 3-Year Target Duration TIPS Index Fund | | | 3,852,300 | |
| |
| FlexShares® iBoxx 5-Year Target Duration TIPS Index Fund | | | 2,318,500 | |
At October 31, 2021, the Securities Lending Agency Agreement does not permit the Funds to enforce a netting arrangement.
The cash collateral received from securities loaned as disclosed in the Statements of Assets and Liabilities is collateralized by securities on loan as disclosed within the Schedules of Investments and such borrowings have maturities that are overnight and continuous.
Securities lending agreements may be subject to regulation as qualified financial contracts (“QFCs”). Regulations adopted by federal banking regulators under the Dodd-Frank Act, which took effect in 2019, require that certain QFCs with counterparties that are part of U.S. or foreign global systemically important banking organizations be amended to include contractual restrictions on close-out and cross-default rights. If a covered counterparty of a Fund or certain of the covered counterparty’s affiliates were to become subject to certain insolvency proceedings, the Fund may be temporarily unable to exercise certain default rights, and the QFC may be transferred to another entity. These requirements may impact a Fund’s credit and counterparty risks. The remaining maturities of the securities lending transactions are considered overnight and continuous.
Derivative Contracts
Futures Contracts
All of the Index Funds may invest in futures contracts to help track the price and yield performance of their Underlying Indexes. At the time a Fund enters into a futures contract, it is generally required to make a margin deposit with the custodian of a specified amount of liquid assets. Subsequent payments to be made or received by the Funds equal to the change in contract value are recorded as variation margin payable or receivable and offset in unrealized gains or losses. Futures are marked to market each day with the change in value reflected in the unrealized gains or losses. A Fund recognizes a realized gain or loss when a contract is closed or expires. The Statements of Operations reflect unrealized gains or losses on open futures contracts, as “Net change in unrealized appreciation (depreciation) on futures contracts”, and any realized gains (losses) on closed futures contracts as “Net realized gain (loss) from Expiration or closing of futures contracts”.
The FlexShares Core Select Bond Fund may take long or short positions in futures to manage the Fund’s exposure to
| | | | | | |
| | FLEXSHARES ANNUAL REPORT | | | 475 | |
Notes to the Financial Statements (cont.)
interest rate risk. When applicable, the Fund seeks to mitigate the potential impact of interest rates on the performance of bonds by entering into short positions in U.S. Treasury futures or transactions in interest rate swaps. The Fund’s short positions in U.S. Treasury futures and interest rate swaps are not intended to mitigate credit spread risk or other factors influencing the price of bonds, which may have a greater impact than interest rates. In addition, when interest rates fall, long-only bond investments will perform better than the Fund’s investments. As of October 31, 2021, the FlexShares Core Select Bond Fund did not hold swaps.
As of October 31, 2021, the FlexShares US Quality Low Volatility Index Fund, FlexShares Developed Markets ex-US Quality Low Volatility Index Fund, FlexShares Emerging Markets Quality Low Volatility Index Fund, FlexShares Morningstar US Market Factor Tilt Index Fund, FlexShares Morningstar Developed Markets ex-US Factor Tilt Index Fund, FlexShares Morningstar Emerging Markets Factor Tilt Index Fund, FlexShares US Quality Large Cap Index Fund, FlexShares STOXX® US ESG Select Index Fund, FlexShares STOXX® Global ESG Select Index Fund, FlexShares ESG & Climate US Large Cap Core Index Fund, FlexShares Morningstar Global Upstream Natural Resources Index Fund, FlexShares STOXX® Global Broad Infrastructure Index Fund, FlexShares Global Quality Real Estate Index Fund, FlexShares Quality Dividend Index Fund, FlexShares Quality Dividend Defensive Index Fund, FlexShares Quality Dividend Dynamic Index Fund, FlexShares International Quality Dividend Index Fund, FlexShares International Quality Dividend Defensive Index Fund, and the FlexShares International Quality Dividend Dynamic Index Fund had open futures contracts.
The use of futures contracts involves, to varying degrees, elements of market and counterparty risk, which may exceed the amounts recognized in the Statements of Assets and Liabilities. Futures contracts present the following risks: imperfect correlation between the change in market value of a Fund’s securities and the price of futures contracts; the possible inability to close a futures contract when desired; losses due to unanticipated market movements, which potentially are unlimited; and the possible inability of NTI to correctly predict the direction of securities prices, interest
rates, currency exchange rates and other economic factors. Futures markets are highly volatile and the use of futures may increase the volatility of a Fund’s NAV. As a result of the low margin deposits normally required in futures trading, a relatively small price movement in a futures contract may result in substantial losses to a Fund. Futures contracts may be illiquid, and exchanges may limit fluctuations in futures contract prices during a single day. Foreign exchanges or boards of trade generally do not offer the same protection as U.S. exchanges.
Foreign Currency Translations
Values of investments denominated in foreign currencies are converted into U.S. dollars using the prevailing market rates on the date of valuation as quoted by one or more banks or dealers that make a two-way market in such currencies (or a data service provider based on quotations received from such banks or dealers). Any use of a rate different from the rates used by an Index Fund’s index provider may affect a Fund’s ability to track its Underlying Index. The cost of purchases and proceeds from sales of investments, interest and dividend income are translated into U.S. dollars using the spot market rate of exchange prevailing on the respective dates of such transactions. “Net realized gain (loss) on foreign currency transactions” on the Statements of Operations include the effect of changes in exchange rates between trade date and settlement date on investment security transactions, foreign currency transactions and interest and dividends received, and the portion of foreign currency gains and losses related to fluctuation in exchange rates between the initial purchase trade date and subsequent sale trade date is included in “Net realized gain (loss) on investment in securities” on the Statements of Operations. Unrealized gains and losses on assets and liabilities, other than investments in securities, which result from changes in foreign currency exchange rates have been included in “Net change in unrealized appreciation (depreciation) on translation of other assets and liabilities denominated in foreign currencies” on the Statements of Operations.
Forward Foreign Currency Exchange Contracts
The FlexShares Developed Markets ex-US Quality Low Volatility Index Fund, FlexShares Emerging Markets Quality Low
| | | | |
| 476 | | FLEXSHARES ANNUAL REPORT | | |
Notes to the Financial Statements (cont.)
Volatility Index Fund, FlexShares Morningstar Developed Markets ex-US Factor Tilt Index Fund, FlexShares Morningstar Emerging Markets Factor Tilt Index Fund, FlexShares STOXX® Global ESG Select Index Fund, FlexShares ESG & Climate Developed Markets ex-US Core Index Fund, FlexShares Morningstar Global Upstream Natural Resources Index Fund, FlexShares STOXX® Global Broad Infrastructure Index Fund, FlexShares Global Quality Real Estate Index Fund, FlexShares Real Assets Allocation Index Fund, FlexShares International Quality Dividend Index Fund, FlexShares International Quality Dividend Defensive Index Fund, FlexShares International Quality Dividend Dynamic Index Fund, and the FlexShares Ready Access Variable Income Fund may enter into forward foreign currency exchange contracts to facilitate local settlements or to protect against currency exposure in connection with its distributions to shareholders. The FlexShares Ready Access Variable Income Fund also may engage in forward foreign currency transactions for hedging purposes in order to protect against uncertainty in the level of future foreign currency exchange rates. The Funds, however, do not expect to engage in currency transactions for speculative purposes (e.g., for potential income or capital gain). All forward foreign currency exchange contracts held are “marked-to-market” daily at the applicable exchange rates and any resulting unrealized gains or losses are recorded. The Funds record realized gains or losses at the time the forward foreign currency exchange contract is offset by entering into a closing transaction or extinguished by delivery of the currency. The difference between the future foreign currency exchange rates at the date of entry into the contract and the rates at the reporting date are included in “Net change in unrealized appreciation (depreciation) on forward foreign currency contracts” in the Statements of Operations. Non-deliverable forward foreign currency exchange contracts are settled with the counterparty in U.S. Dollars without the delivery of foreign currency.
There are several risks associated with these contracts. One risk is the potential inability of counterparties to meet the terms of their contracts, and unanticipated movements in the value of a foreign currency relative to the U.S. dollar. The contractual amounts of forward foreign currency exchange contracts do not necessarily represent the amounts
potentially subject to risk. The measurement of the risks associated with these instruments is meaningful only when all related and offsetting transactions are considered. The Statements of Operations reflect (i) realized gains or losses, if any, in “Net realized gain (loss) from settlement of forward foreign currency contracts” and (ii) unrealized gains or losses in “Net change in unrealized appreciation (depreciation) on forward foreign currency contracts”. Forward foreign currency exchange contracts are privately negotiated transactions and can have substantial price volatility. As a result, they offer less protection against default by the other party than is available for instruments traded on an exchange. The institutions that deal in forward foreign currency exchange contracts are not required to continue to make markets in the currencies they trade, and these markets can experience periods of illiquidity.
As of October 31, 2021, the FlexShares Developed Markets ex-US Quality Low Volatility Index Fund, FlexShares Emerging Markets Quality Low Volatility Index Fund, FlexShares Morningstar Developed Markets ex-US Factor Tilt Index Fund, FlexShares Morningstar Emerging Markets Factor Tilt Index Fund, FlexShares STOXX Global ESG Select Index Fund, FlexShares ESG & Climate Developed Markets ex-US Core Index Fund, FlexShares Morningstar Global Upstream Natural Resources Index Fund, FlexShares STOXX® Global Broad Infrastructure Index Fund, FlexShares Global Quality Real Estate Index Fund, FlexShares International Quality Dividend Index Fund, FlexShares International Quality Dividend Defensive Index Fund, and the FlexShares International Quality Dividend Dynamic Index Fund had open forward foreign currency contracts.
Offsetting of Financial Assets and Derivative Assets
The Funds’ accounting policy with respect to balance sheet offsetting is that, absent an event of default by the counterparty or a termination of the agreement, the International Swaps and Derivatives Association (ISDA) Master Agreement or similar agreement does not result in an offset of reported amounts of financial assets and financial liabilities in the Statements of Assets and Liabilities across transactions between the Fund and the applicable counterparty. In the event of a default, the agreement provides the right for the
| | | | | | |
| | FLEXSHARES ANNUAL REPORT | | | 477 | |
Notes to the Financial Statements (cont.)
non-defaulting party to liquidate the collateral and calculate the net exposure to the defaulting party or request additional collateral. The Funds’ right to setoff may be restricted or prohibited by the bankruptcy or insolvency laws of the particular jurisdiction to which a specific master netting agreement counterparty is subject.
For financial reporting purposes, the Trust can offset financial assets and financial liabilities of the FlexShares Developed Markets ex-US Quality Low Volatility Index Fund, FlexShares Emerging Markets Quality Low Volatility Index Fund, FlexShares Morningstar Developed Markets ex-US Factor Tilt Index Fund, FlexShares Morningstar Emerging
Markets Factor Tilt Index Fund, FlexShares STOXX® Global ESG Select Index Fund, FlexShares ESG & Climate Developed Markets ex-US Core Index Fund, FlexShares Morningstar Global Upstream Natural Resources Index Fund, FlexShares STOXX® Global Broad Infrastructure Index Fund, FlexShares Global Quality Real Estate Index Fund, FlexShares International Quality Dividend Index Fund, FlexShares International Quality Dividend Defensive Index Fund and the FlexShares International Quality Dividend Dynamic Index Fund that are subject to master netting arrangements or similar agreements in the Statements of Assets and Liabilities. The following table presents the gross and net amounts of these assets and liabilities:
| | | | | | | | | | | | | | | | | | |
| | | | | | | | Gross Amounts Not Offset in the
Statement of Assets and Liabilities | | | | |
| | | | | Gross Amounts of
Assets presented in
Statements of Assets
and Liabilities | | | Financial Instruments | | | Cash Collateral
Received | | | Net Amount | |
| FlexShares Developed Markets ex-US Quality Low Volatility Index Fund | | | | | | | | | | | | | | | | | | |
| | Foreign Currency Contracts — Bank of New York | | $ | 1,331 | | | $ | (822) | | | | $ — | | | $ | 509 | |
| | Foreign Currency Contracts — BNP Paribas SA | | | 4,215 | | | | (1,074) | | | | — | | | | 3,141 | |
| | Foreign Currency Contracts — Citibank NA | | | 1,527 | | | | (1,527) | | | | — | | | | — | |
| | Foreign Currency Contracts — Morgan Stanley | | | 6,634 | | | | (2,218) | | | | — | | | | 4,416 | |
| | | Foreign Currency Contracts — Toronto-Dominion Bank (The) | | | 1,095 | | | | (1,095) | | | | — | | | | — | |
| | | Total | | $ | 14,802 | | | $ | (6,736) | | | | $ — | | | $ | 8,066 | |
| FlexShares Emerging Markets Quality Low Volatility Index Fund | | | | | | | | | | | | | | | | | | |
| | Foreign Currency Contracts — JPMorgan Chase Bank | | $ | 2 | | | $ | — | | | | $ — | | | | 2 | |
| | | | | | | | | — | | | | — | | | | — | |
| | | | | | | | | | — | | | | — | | | | — | |
| | | Total | | $ | 2 | | | $ | — | | | | $ — | | | $ | 2 | |
| FlexShares Morningstar Developed Markets ex-US Factor Tilt Index Fund | | | | | | | | | | | | | | | | | | |
| | Foreign Currency Contracts — Bank of New York | | $ | 9,200 | | | | | | | | $ — | | | $ | 9,200 | |
| | Foreign Currency Contracts — BNP Paribas SA | | | 4,706 | | | | | | | | — | | | | 4,706 | |
| | Foreign Currency Contracts — Citibank NA | | | 29,600 | | | | (385) | | | | | | | | 29,215 | |
| | Foreign Currency Contracts — Morgan Stanley | | | 6,818 | | | | (6,818) | | | | | | | | — | |
| | | Foreign Currency Contracts — Toronto-Dominion Bank (The) | | | 9,029 | | | | (9,029) | | | | | | | | — | |
| | | Total | | $ | 59,353 | | | $ | (16,232) | | | | $ — | | | $ | 43,121 | |
| | | | |
| 478 | | FLEXSHARES ANNUAL REPORT | | |
Notes to the Financial Statements (cont.)
| | | | | | | | | | | | | | | | | | |
| | | | | | | | Gross Amounts Not Offset in the
Statement of Assets and Liabilities | | | | |
| | | | | Gross Amounts of
Assets presented in
Statements of Assets
and Liabilities | | | Financial Instruments | | | Cash Collateral
Received | | | Net Amount | |
| FlexShares Morningstar Emerging Markets Factor Tilt Index Fund | | | | | | | | | | | | | | | | | | |
| | Foreign Currency Contracts — Citibank NA | | $ | 6,525 | | | | | | | | $ — | | | $ | 6,525 | |
| | Foreign Currency Contracts — Goldman Sachs & Co. | | | 4,923 | | | | (3,323) | | | | — | | | | 1,600 | |
| | Foreign Currency Contracts — JPMorgan Chase Bank | | | 220 | | | | — | | | | — | | | | 220 | |
| | Foreign Currency Contracts — Morgan Stanley | | | 650 | | | | — | | | | — | | | | 650 | |
| | | Foreign Currency Contracts — Toronto-Dominion Bank (The) | | | 241 | | | | — | | | | — | | | | 241 | |
| | | Total | | $ | 12,559 | | | $ | (3,323) | | | | $ — | | | $ | 9,236 | |
| FlexShares STOXX® Global ESG Select Index Fund | | Foreign Currency Contracts — JPMorgan Chase Bank | | $ | 13,384 | | | $ | — | | | | $ — | | | $ | 13,384 | |
| | Foreign Currency Contracts — Morgan Stanley | | $ | 685 | | | $ | (685) | | | | | | | | | |
| | | Foreign Currency Contracts — Toronto-Dominion Bank (The) | | | 12,951 | | | | (12,951) | | | | — | | | | — | |
| | | Total | | $ | 27,020 | | | $ | (13,636) | | | | $ — | | | $ | 13,384 | |
| FlexShares® ESG & Climate Developed Markets ex-US Core Index Fund | | | | | | | | | | | | | | | | | | |
| | Foreign Currency Contracts — Citibank NA | | $ | 312 | | | $ | (312) | | | | $ — | | | $ | — | |
| | | Foreign Currency Contracts — Goldman Sachs & Co. | | | 198 | | | | (52) | | | | — | | | | 146 | |
| | | Total | | $ | 510 | | | $ | (364) | | | | $ — | | | $ | 146 | |
| FlexShares Morningstar Global Upstream Natural Resources Index Fund | | | | | | | | | | | | | | | | | | |
| | Foreign Currency Contracts — Bank of Montreal | | $ | 14,738 | | | $ | (2,731) | | | | $ — | | | $ | 12,007 | |
| | Foreign Currency Contracts — BNP Paribas SA | | | 83,158 | | | | — | | | | — | | | | 83,158 | |
| | Foreign Currency Contracts — Citibank NA | | | 661,388 | | | | (243,245) | | | | — | | | | 418,143 | |
| | Foreign Currency Contracts — Goldman Sachs & Co. | | | 3,894 | | | | (3,894) | | | | — | | | | — | |
| | Foreign Currency Contracts — JPMorgan Chase Bank | | | 192,415 | | | | (115,137) | | | | — | | | | 77,278 | |
| | Foreign Currency Contracts — Morgan Stanley | | | 199,311 | | | | (65,763) | | | | — | | | | 133,548 | |
| | Foreign Currency Contracts — Toronto-Dominion Bank (The) | | | 52,271 | | | | (52,271) | | | | — | | | | — | |
| | | Foreign Currency Contracts — UBS AG | | | 1,852 | | | | (1,852) | | | | — | | | | — | |
| | | Total | | $ | 1,209,027 | | | $ | (484,893) | | | | $ — | | | $ | 724,134 | |
| FlexShares STOXX® Global Broad Infrastructure Index Fund | | Foreign Currency Contracts — Citibank NA | | $ | 178 | | | $ | (178) | | | | $ — | | | $ | — | |
| | | Foreign Currency Contracts — Toronto-Dominion Bank (The) | | $ | 265,347 | | | | (265,347) | | | | — | | | | — | |
| | | Total | | $ | 265,525 | | | $ | (265,525) | | | | $ — | | | $ | — | |
| | | | | | |
| | FLEXSHARES ANNUAL REPORT | | | 479 | |
Notes to the Financial Statements (cont.)
| | | | | | | | | | | | | | | | | | |
| | | | | | | | Gross Amounts Not Offset in the
Statement of Assets and Liabilities | | | | |
| | | | | Gross Amounts of
Assets presented in
Statements of Assets
and Liabilities | | | Financial
Instruments | | | Cash Collateral
Received | | | Net Amount | |
| FlexShares Global Quality Real Estate Index Fund | | Foreign Currency Contracts — Bank of Montreal | | $ | 2,534 | | | $ | — | | | $ | — | | | $ | 2,534 | |
| | Foreign Currency Contracts — Bank of New York | | | 692 | | | | (692 | ) | | | — | | | | — | |
| | Foreign Currency Contracts — Citibank NA | | | 14 | | | | (14 | ) | | | — | | | | — | |
| | Foreign Currency Contracts — Goldman Sachs & Co. | | | 451 | | | | (451 | ) | | | — | | | | — | |
| | Foreign Currency Contracts — Morgan Stanley | | | 1,712 | | | | (1,712 | ) | | | — | | | | — | |
| | Foreign Currency Contracts — Toronto-Dominion Bank (The) | | | 103 | | | | (78 | ) | | | — | | | | 25 | |
| | | Foreign Currency Contracts — UBS AG | | | 2,779 | | | | | | | | — | | | | 2,779 | |
| | | Total | | $ | 8,285 | | | $ | (2,947 | ) | | $ | — | | | $ | 5,338 | |
| FlexShares International Quality Dividend Index Fund | | Foreign Currency Contracts — Bank of New York | | $ | — | | | $ | — | | | $ | — | | | $ | — | |
| | Foreign Currency Contracts — BNP Paribas SA | | | — | | | | — | | | | — | | | | — | |
| | Foreign Currency Contracts — Citibank NA | | | 20,697 | | | | (1,882 | ) | | | — | | | | 18,815 | |
| | Foreign Currency Contracts — Goldman Sachs & Co. | | | 36,612 | | | | (11,737 | ) | | | — | | | | 24,875 | |
| | Foreign Currency Contracts — JPMorgan Bank | | | 1,631 | | | | (1,631 | ) | | | — | | | | — | |
| | Foreign Currency Contracts — Morgan Stanley | | | 30,858 | | | | (16,636 | ) | | | — | | | | 14,222 | |
| | Foreign Currency Contracts — Toronto-Dominion Bank (The) | | | 66,343 | | | | (66,343 | ) | | | — | | | | — | |
| | | Foreign Currency Contracts — UBS AG | | | 5,764 | | | | | | | | — | | | | 5,764 | |
| | | Total | | $ | 161,905 | | | $ | (98,229 | ) | | $ | — | | | $ | 63,676 | |
| FlexShares International Quality Dividend Defensive Index Fund | | Foreign Currency Contracts — BNP Paribas SA | | $ | 193 | | | $ | — | | | $ | — | | | $ | 193 | |
| | Foreign Currency Contracts — Goldman Sachs & Co. | | | 1,264 | | | | | | | | — | | | | 1,264 | |
| | Foreign Currency Contracts — JPMorgan Chase Bank | | | 3,212 | | | | (795 | ) | | $ | — | | | | 2,417 | |
| | Foreign Currency Contracts — Morgan Stanley | | | 11,464 | | | | (4,522 | ) | | | — | | | | 6,942 | |
| | | Foreign Currency Contracts — Toronto-Dominion Bank (The) | | | 2,705 | | | | | | | | — | | | | 2,705 | |
| | | Total | | $ | 18,838 | | | $ | (5,317 | ) | | $ | — | | | $ | 13,521 | |
| FlexShares International Quality Dividend Dynamic Index Fund | | Foreign Currency Contracts — Bank of New York | | $ | 445 | | | $ | — | | | $ | — | | | $ | 445 | |
| | Foreign Currency Contracts — BNP Paribas SA | | | 312 | | | | (312 | ) | | | — | | | | — | |
| | Foreign Currency Contracts — Citibank NA | | | 1,378 | | | | (35 | ) | | | — | | | | 1,343 | |
| | Foreign Currency Contracts — JPMorgan Chase Bank | | | 2,034 | | | | (447 | ) | | | — | | | | 1,587 | |
| | Foreign Currency Contracts — Morgan Stanley | | | 3,028 | | | | (1,619 | ) | | | — | | | | 1,409 | |
| | | Foreign Currency Contracts — Toronto-Dominion Bank (The) | | | 4,976 | | | | (4,570 | ) | | | — | | | | 406 | |
| | | Total | | $ | 12,173 | | | $ | (6,983 | ) | | $ | — | | | $ | 5,190 | |
| | | | |
| 480 | | FLEXSHARES ANNUAL REPORT | | |
Notes to the Financial Statements (cont.)
| | | | | | | | | | | | | | | | | | |
| | | | | | | | Gross Amounts Not Offset in the
Statement of Assets and Liabilities | | | | |
| | | | | Gross Amounts of
Liabilities presented in
Statements of Assets
and Liabilities | | | Financial
Instruments | | | Cash Collateral
Pledged | | | Net Amount | |
| FlexShares Developed Markets ex-US Quality Low Volatility Index Fund | | Foreign Currency Contracts — Bank of New York | | $ | (822 | ) | | $ | 822 | | | $ | — | | | $ | — | |
| | Foreign Currency Contracts — BNP Paribas SA | | | (1,074 | ) | | | 1,074 | | | | — | | | | — | |
| | Foreign Currency Contracts — Citibank NA | | | (1,751 | ) | | | 1,527 | | | | — | | | | (224 | ) |
| | Foreign Currency Contracts — Morgan Stanley | | | (2,218 | ) | | | 2,218 | | | | — | | | | — | |
| | | Foreign Currency Contracts — Toronto-Dominion Bank (The) | | | (3,720 | ) | | | 1,095 | | | | — | | | | (2,625 | ) |
| | | Total | | $ | (9,585 | ) | | $ | 6,736 | | | $ | — | | | $ | (2,849 | ) |
| FlexShares Morningstar Developed Markets ex-US Factor Tilt Index Fund | | Foreign Currency Contracts — Citibank NA | | $ | (385 | ) | | $ | 385 | | | $ | — | | | $ | — | |
| | Foreign Currency Contracts — Goldman Sachs & Co. | | | (12,156 | ) | | | — | | | | — | | | $ | (12,156 | ) |
| | Foreign Currency Contracts — JPMorgan Chase Bank | | | (37,019 | ) | | | — | | | | — | | | $ | (37,019 | ) |
| | Foreign Currency Contracts — Morgan Stanley | | | (10,451 | ) | | | 6,818 | | | | — | | | $ | (3,633 | ) |
| | | Foreign Currency Contracts — Toronto-Dominion Bank (The) | | | (122,087 | ) | | | 9,029 | | | | — | | | $ | (113,058 | ) |
| | | Total | | $ | (182,098 | ) | | $ | 16,232 | | | $ | — | | | $ | (165,866 | ) |
| FlexShares Morningstar Emerging Markets Factor Tilt Index Fund | | Foreign Currency Contracts — Goldman Sachs & Co. | | $ | (3,323 | ) | | $ | 3,323 | | | $ | — | | | $ | — | |
| | | Total | | $ | (3,323 | ) | | $ | 3,323 | | | $ | — | | | $ | — | |
| FlexShares STOXX® Global ESG Select Index Fund | | Foreign Currency Contracts — Morgan Stanley | | $ | (704 | ) | | $ | 685 | | | $ | — | | | $ | (19 | ) |
| | | Foreign Currency Contracts — Toronto-Dominion Bank (The) | | | (15,477 | ) | | | 12,951 | | | | — | | | | (2,526 | ) |
| | | Total | | $ | (16,181 | ) | | $ | 13,636 | | | $ | — | | | $ | (2,545 | ) |
| FlexShares® ESG & Climate Developed Markets ex-US Core Index Fund | | Foreign Currency Contracts — Bank of Montreal | | $ | (148 | ) | | | — | | | $ | — | | | $ | (148 | ) |
| | Foreign Currency Contracts — Bank of New York | | | (295 | ) | | | — | | | | — | | | | (295 | ) |
| | Foreign Currency Contracts — Citibank NA | | | (1,362 | ) | | | 312 | | | | — | | | | (1,050 | ) |
| | | Foreign Currency Contracts — Goldman Sachs & Co. | | | (52 | ) | | | 52 | | | | — | | | | — | |
| | | Total | | $ | (1,857 | ) | | $ | 364 | | | $ | — | | | $ | (1,493 | ) |
| FlexShares Morningstar Global Upstream Natural Resources Index Fund | | Foreign Currency Contracts — Bank of Montreal | | $ | (2,731 | ) | | $ | 2,731 | | | $ | — | | | $ | — | |
| | Foreign Currency Contracts — Bank of New York | | | (30,256 | ) | | | | | | | — | | | | (30,256 | ) |
| | Foreign Currency Contracts — Citibank NA | | | (243,245 | ) | | | 243,245 | | | | — | | | | — | |
| | Foreign Currency Contracts — Goldman Sachs & Co. | | | (12,784 | ) | | | 3,894 | | | | — | | | | (8,890 | ) |
| | Foreign Currency Contracts — JPMorgan Chase Bank | | | (115,137 | ) | | | 115,137 | | | | — | | | | — | |
| | Foreign Currency Contracts — Morgan Stanley | | | (65,763 | ) | | | 65,763 | | | | — | | | | — | |
| | Foreign Currency Contracts — Toronto-Dominion Bank (The) | | | (338,515 | ) | | | 52,271 | | | | — | | | | (286,244 | ) |
| | | Foreign Currency Contracts — UBS AG | | | (6,239 | ) | | | 1,852 | | | | — | | | | (4,387 | ) |
| | | Total | | $ | (814,670 | ) | | $ | 484,893 | | | $ | — | | | $ | (329,777 | ) |
| FlexShares STOXX® Global Broad Infrastructure Index Fund | | Foreign Currency Contracts — Bank of Montreal | | $ | (16,620 | ) | | $ | — | | | $ | — | | | $ | (16,620 | ) |
| | Foreign Currency Contracts — Citibank NA | | | (18,798 | ) | | | 178 | | | | — | | | | (18,620 | ) |
| | Foreign Currency Contracts — JPMorgan Chase Bank | | | (165,630 | ) | | | — | | | | — | | | | (165,630 | ) |
| | Foreign Currency Contracts — Morgan Stanley | | | (33,053 | ) | | | — | | | | — | | | | (33,053 | ) |
| | | Foreign Currency Contracts — Toronto-Dominion Bank (The) | | | (282,257 | ) | | | 265,347 | | | | — | | | | (16,910 | ) |
| | | Total | | $ | (516,358 | ) | | $ | 265,525 | | | $ | — | | | $ | (250,833 | ) |
| | | | | | |
| | FLEXSHARES ANNUAL REPORT | | | 481 | |
Notes to the Financial Statements (cont.)
| | | | | | | | | | | | | | | | | | |
| | | | | | | | Gross Amounts Not Offset in the
Statement of Assets and Liabilities | | | | |
| | | | | Gross Amounts of
Liabilities presented in
Statements of Assets
and Liabilities | | | Financial
Instruments | | | Cash Collateral
Pledged | | | Net Amount | |
| FlexShares Global Quality Real Estate Index Fund | | Foreign Currency Contracts — Bank of Montreal | | $ | — | | | $ | — | | | $ | — | | | $ | — | |
| | Foreign Currency Contracts — Bank of New York | | | (783 | ) | | | 692 | | | | — | | | | (91 | ) |
| | Foreign Currency Contracts — Citibank NA | | | (5,816 | ) | | | 14 | | | | — | | | | (5,802 | ) |
| | Foreign Currency Contracts — Goldman Sachs & Co. | | | (2,266 | ) | | | 451 | | | | — | | | | (1,815 | ) |
| | Foreign Currency Contracts — JPMorgan Chase Bank | | | (3,192 | ) | | | — | | | | — | | | | (3,192 | ) |
| | Foreign Currency Contracts — Morgan Stanley | | | (2,078 | ) | | | 1,712 | | | | — | | | | (366 | ) |
| | Foreign Currency Contracts — Toronto-Dominion Bank (The) | | | (78 | ) | | | 78 | | | | — | | | | — | |
| | | Foreign Currency Contracts — UBS AG | | | — | | | | — | | | | — | | | | — | |
| | | Total | | $ | (14,213 | ) | | $ | 2,947 | | | $ | — | | | $ | (11,266 | ) |
| FlexShares International Quality Dividend Index Fund | | Foreign Currency Contracts — Bank of New York | | $ | (4,123 | ) | | $ | — | | | $ | — | | | $ | (4,123 | ) |
| | Foreign Currency Contracts — BNP Paribas SA | | | (2,926 | ) | | | — | | | | — | | | | (2,926 | ) |
| | Foreign Currency Contracts — Citibank NA | | | (1,882 | ) | | | 1,882 | | | | — | | | | — | |
| | Foreign Currency Contracts — Goldman Sachs & Co. | | | (11,737 | ) | | | 11,737 | | | | — | | | | — | |
| | Foreign Currency Contracts — JPMorgan Bank | | | (91,822 | ) | | | 1,631 | | | | — | | | | (90,191 | ) |
| | Foreign Currency Contracts — Morgan Stanley | | | (16,636 | ) | | | 16,636 | | | | — | | | | — | |
| | | Foreign Currency Contracts — Toronto-Dominion Bank (The) | | | (130,102 | ) | | | 66,343 | | | | — | | | | (63,759 | ) |
| | | Total | | $ | (259,228 | ) | | $ | 98,229 | | | $ | — | | | $ | (160,999 | ) |
| FlexShares International Quality Dividend Defensive Index Fund | | Foreign Currency Contracts — JPMorgan Chase Bank | | $ | (795 | ) | | $ | 795 | | | $ | — | | | $ | — | |
| | | Foreign Currency Contracts — Morgan Stanley | | | (4,522 | ) | | $ | 4,522 | | | | — | | | | — | |
| | | Total | | $ | (5,317 | ) | | $ | 5,317 | | | $ | — | | | $ | — | |
| FlexShares International Quality Dividend Dynamic Index Fund | | Foreign Currency Contracts — BNP Paribas SA | | $ | (1,097 | ) | | $ | 312 | | | $ | — | | | $ | (785 | ) |
| | Foreign Currency Contracts — Citibank NA | | | (35 | ) | | | 35 | | | | — | | | | — | |
| | Foreign Currency Contracts — Goldman Sachs & Co. | | | (343 | ) | | | — | | | | — | | | | (343 | ) |
| | Foreign Currency Contracts — JPMorgan Chase Bank | | | (447 | ) | | $ | 447 | | | | — | | | | — | |
| | Foreign Currency Contracts — Morgan Stanley | | | (1,619 | ) | | $ | 1,619 | | | | — | | | | — | |
| | | Foreign Currency Contracts — Toronto-Dominion Bank (The) | | | (4,570 | ) | | $ | 4,570 | | | | — | | | | — | |
| | | Total | | $ | (8,111 | ) | | $ | 6,983 | | | $ | — | | | $ | (1,128 | ) |
The following tables indicate the location of derivative-related items on the Statements of Assets and Liabilities as well as the effect of derivative instruments on the Statements of Operations during the reporting period.
| | | | |
| 482 | | FLEXSHARES ANNUAL REPORT | | |
Notes to the Financial Statements (cont.)
Fair Value of Derivative Instruments as of October 31, 2021
| | | | | | | | |
| Derivatives by risk type | | Statements of Assets and Liabilities Location | | Fund | | Value | |
| | | |
| Equity Index Futures Contracts | | Assets — Unrealized appreciation on futures contracts* | | FlexShares US Quality Low Volatility Index Fund | | $ | 8,541 | |
| | | |
| Equity Index Futures Contracts | | Assets — Unrealized appreciation on futures contracts* | | FlexShares Developed Markets ex-US Quality Low Volatility Index Fund | | | 4,748 | |
| | | |
| Foreign Currency Contracts | | Assets — Unrealized appreciation on forward foreign currency contracts | | FlexShares Developed Markets ex-US Quality Low Volatility Index Fund | | | 14,802 | |
| | | |
| Foreign Currency Contracts | | Liabilities — Unrealized depreciation on forward foreign currency contracts | | FlexShares Developed Markets ex-US Quality Low Volatility Index Fund | | | (9,585 | ) |
| | | |
| Equity Index Futures Contracts | | Liabilities — Unrealized depreciation on futures contracts* | | FlexShares Emerging Markets Quality Low Volatility Index Fund | | | (1,621 | ) |
| | | |
| Foreign Currency Contracts | | Assets — Unrealized appreciation on forward foreign currency contracts | | FlexShares Emerging Markets Quality Low Volatility Index Fund | | | 2 | |
| | | |
| Equity Index Futures Contracts | | Assets — Unrealized appreciation on futures contracts* | | FlexShares Morningstar US Market Factor Tilt Index Fund | | | 456,376 | |
| | | |
| Equity Index Futures Contracts | | Assets — Unrealized appreciation on futures contracts* | | FlexShares Morningstar Developed Markets ex-US Factor Tilt Index Fund | | | 206,380 | |
| | | |
| Equity Index Futures Contracts | | Liabilities — Unrealized depreciation on futures contracts* | | FlexShares Morningstar Developed Markets ex-US Factor Tilt Index Fund | | | (88,291 | ) |
| | | |
| Foreign Currency Contracts | | Assets — Unrealized appreciation on forward foreign currency contracts | | FlexShares Morningstar Developed Markets ex-US Factor Tilt Index Fund | | | 59,353 | |
| | | |
| Foreign Currency Contracts | | Liabilities — Unrealized depreciation on forward foreign currency contracts | | FlexShares Morningstar Developed Markets ex-US Factor Tilt Index Fund | | | (182,098 | ) |
| | | |
| Equity Index Futures Contracts | | Liabilities — Unrealized depreciation on futures contracts* | | FlexShares Morningstar Emerging Markets Factor Tilt Index Fund | | | (49,371 | ) |
| | | |
| Foreign Currency Contracts | | Assets — Unrealized appreciation on forward foreign currency contracts | | FlexShares Morningstar Emerging Markets Factor Tilt Index Fund | | | 12,559 | |
| | | |
| Foreign Currency Contracts | | Liabilities — Unrealized depreciation on forward foreign currency contracts | | FlexShares Morningstar Emerging Markets Factor Tilt Index Fund | | | (3,323 | ) |
| | | |
| Equity Index Futures Contracts | | Assets — Unrealized appreciation on futures contracts* | | FlexShares US Quality Large Cap Index Fund | | | 46,823 | |
| | | |
| Equity Index Futures Contracts | | Assets — Unrealized appreciation on futures contracts* | | FlexShares STOXX® US ESG Select Index Fund | | | 39,491 | |
| | | |
| Equity Index Futures Contracts | | Assets — Unrealized appreciation on futures contracts* | | FlexShares STOXX® Global ESG Select Index Fund | | | 66,874 | |
| | | |
| Equity Index Futures Contracts | | Liabilities — Unrealized depreciation on futures contracts* | | FlexShares STOXX® Global ESG Select Index Fund | | | (11,178 | ) |
| | | | | | |
| | FLEXSHARES ANNUAL REPORT | | | 483 | |
Notes to the Financial Statements (cont.)
| | | | | | | | |
| Derivatives by risk type | | Statements of Assets and Liabilities Location | | Fund | | Value | |
| | | |
| Foreign Currency Contracts | | Assets — Unrealized appreciation on forward foreign currency contracts | | FlexShares STOXX® Global ESG Select Index Fund | | $ | 27,020 | |
| | | |
| Foreign Currency Contracts | | Liabilities — Unrealized depreciation on forward foreign currency contracts | | FlexShares STOXX® Global ESG Select Index Fund | | | (16,181 | ) |
| | | |
| Equity Index Futures Contracts | | Assets — Unrealized appreciation on futures contracts | | FlexShares ESG & Climate US Large Cap Core Index Fund | | | 1,240 | |
| | | |
| Foreign Currency Contracts | | Assets — Unrealized appreciation on forward foreign currency contracts | | FlexShares ESG & Climate Developed Markets ex-US Core Index Fund | | | 510 | |
| | | |
| Foreign Currency Contracts | | Liabilities — Unrealized depreciation on forward foreign currency contracts | | FlexShares ESG & Climate Developed Markets ex-US Core Index Fund | | | (1,857 | ) |
| | | |
| Equity Index Futures Contracts | | Assets — Unrealized appreciation on futures contracts* | | FlexShares Morningstar Global Upstream Natural Resources Index Fund | | | 878,891 | |
| | | |
| Equity Index Futures Contracts | | Liabilities — Unrealized depreciation on futures contracts* | | FlexShares Morningstar Global Upstream Natural Resources Index Fund | | | (46,596 | ) |
| | | |
| Foreign Currency Contracts | | Assets — Unrealized appreciation on forward foreign currency contracts | | FlexShares Morningstar Global Upstream Natural Resources Index Fund | | | 1,209,027 | |
| | | |
| Foreign Currency Contracts | | Liabilities — Unrealized depreciation on forward foreign currency contracts | | FlexShares Morningstar Global Upstream Natural Resources Index Fund | | | (814,670 | ) |
| | | |
| Equity Index Futures Contracts | | Assets — Unrealized appreciation on futures contracts* | | FlexShares STOXX® Global Broad Infrastructure Index Fund | | | 500,629 | |
| | | |
| Equity Index Futures Contracts | | Liabilities — Unrealized depreciation on futures contracts* | | FlexShares STOXX® Global Broad Infrastructure Index Fund | | | (63,677 | ) |
| | | |
| Foreign Currency Contracts | | Assets — Unrealized appreciation on forward foreign currency contracts | | FlexShares STOXX® Global Broad Infrastructure Index Fund | | | 265,525 | |
| | | |
| Foreign Currency Contracts | | Liabilities — Unrealized depreciation on forward foreign currency contracts | | FlexShares STOXX® Global Broad Infrastructure Index Fund | | | (516,358 | ) |
| | | |
| Equity Index Futures Contracts | | Assets — Unrealized appreciation on futures contracts* | | FlexShares Global Quality Real Estate Index Fund | | | 134,540 | |
| | | |
| Equity Index Futures Contracts | | Liabilities — Unrealized depreciation on futures contracts* | | FlexShares Global Quality Real Estate Index Fund | | | (11,822 | ) |
| | | |
| Foreign Currency Contracts | | Assets — Unrealized appreciation on forward foreign currency contracts | | FlexShares Global Quality Real Estate Index Fund | | | 8,285 | |
| | | |
| Foreign Currency Contracts | | Liabilities — Unrealized depreciation on forward foreign currency contracts | | FlexShares Global Quality Real Estate Index Fund | | | (14,213 | ) |
| | | |
| Equity Index Futures Contracts | | Assets — Unrealized appreciation on futures contracts* | | FlexShares Quality Dividend Index Fund | | | 330,801 | |
| | | |
| Equity Index Futures Contracts | | Assets — Unrealized appreciation on futures contracts* | | FlexShares Quality Dividend Defensive Index Fund | | | 99,533 | |
| | | |
| Equity Index Futures Contracts | | Assets — Unrealized appreciation on futures contracts* | | FlexShares Quality Dividend Dynamic Index Fund | | | 9,461 | |
| | | | |
| 484 | | FLEXSHARES ANNUAL REPORT | | |
Notes to the Financial Statements (cont.)
| | | | | | | | |
| Derivatives by risk type | | Statements of Assets
and Liabilities Location | | Fund | | Value | |
| | | |
| Equity Index Futures Contracts | | Assets — Unrealized appreciation on futures contracts* | | FlexShares International Quality Dividend Index Fund | | $ | 198,034 | |
| | | |
| Equity Index Futures Contracts | | Liabilities — Unrealized depreciation on futures contracts* | | FlexShares International Quality Dividend Index Fund | | | (187,386 | ) |
| | | |
| Foreign Currency Contracts | | Assets — Unrealized appreciation on forward foreign currency contracts | | FlexShares International Quality Dividend Index Fund | | | 161,905 | |
| | | |
| Foreign Currency Contracts | | Liabilities — Unrealized depreciation on forward foreign currency contracts | | FlexShares International Quality Dividend Index Fund | | | (259,228 | ) |
| | | |
| Equity Index Futures Contracts | | Liabilities — Unrealized depreciation on futures contracts* | | FlexShares International Quality Dividend Defensive Index Fund | | | (15,232 | ) |
| | | |
| Foreign Currency Contracts | | Assets — Unrealized appreciation on forward foreign currency contracts | | FlexShares International Quality Dividend Defensive Index Fund | | | 18,838 | |
| | | |
| Foreign Currency Contracts | | Liabilities — Unrealized depreciation on forward foreign currency contracts | | FlexShares International Quality Dividend Defensive Index Fund | | | (5,317 | ) |
| | | |
| Equity Index Futures Contracts | | Assets — Unrealized appreciation on futures contracts* | | FlexShares International Quality Dividend Dynamic Index Fund | | | 1,531 | |
| | | |
| Equity Index Futures Contracts | | Liabilities — Unrealized depreciation on futures contracts* | | FlexShares International Quality Dividend Dynamic Index Fund | | | (9,092 | ) |
| | | |
| Foreign Currency Contracts | | Assets — Unrealized appreciation on forward foreign currency contracts | | FlexShares International Quality Dividend Dynamic Index Fund | | | 12,173 | |
| | | |
| Foreign Currency Contracts | | Liabilities — Unrealized depreciation on forward foreign currency contracts | | FlexShares International Quality Dividend Dynamic Index Fund | | | (8,111 | ) |
| * | Includes cumulative appreciation/depreciation on futures contracts as reported in the Schedule of Investments. Current day’s variation margin is reported within the Statement of Assets and Liabilities for futures contracts. |
The Effect of Derivative Instruments on the Statements of Operations for the Year Ended October 31, 2021
| | | | | | | | | | | | |
Derivatives by
risk type | | Location of Gain or (Loss) on Derivatives on the Statements of
Operations | | Fund | | Realized Gain or (Loss) on Derivatives | | | Change in Unrealized Appreciation or (Depreciation) on Derivattives | |
| | | | |
Equity
Index Futures
Contracts | | Net realized gain (loss) on
Futures contracts,
Net change in
unrealized appreciation
(depreciation) on
Futures contracts | | FlexShares US Quality Low Volatility Index Fund | | $ | 127,448 | | | $ | 14,590 | |
| | | | | | |
| | FLEXSHARES ANNUAL REPORT | | | 485 | |
Notes to the Financial Statements (cont.)
| | | | | | | | | | | | |
Derivatives by
risk type | | Location of Gain or (Loss) on Derivatives on the Statements of
Operations | | Fund | | Realized Gain or (Loss) on Derivatives | | | Change in Unrealized Appreciation or (Depreciation) on Derivattives | |
| | | | |
Equity
Index Futures
Contracts | | Net realized gain (loss) on
Futures contracts,
Net change in
unrealized appreciation
(depreciation) on
Futures contracts | | FlexShares Developed Markets ex-US Quality Low Volatility Index Fund | | $ | 148,680 | | | $ | 34,155 | |
| | | | |
Foreign
Currency
Contracts | | Net realized gain (loss) on
Foreign currency transactions, Net change in
unrealized appreciation
(depreciation) on Forward foreign currency contracts | | FlexShares Developed Markets ex-US Quality Low Volatility Index Fund | | | 4,409 | | | | 3,496 | |
| | | | |
Equity
Index Futures
Contracts | | Net realized gain (loss) on
Futures contracts,
Net change in
unrealized appreciation
(depreciation) on
Futures contracts | | FlexShares Emerging Markets Quality Low Volatility Index Fund | | | 31,848 | | | | (3,337 | ) |
| | | | |
Foreign
Currency
Contracts | | Net realized gain (loss) on
Foreign currency transactions, Net change in
unrealized appreciation
(depreciation) on Forward foreign currency contracts | | FlexShares Emerging Markets Quality Low Volatility Index Fund | | | (141 | ) | | | 2 | |
| | | | |
Equity
Index Futures
Contracts | | Net realized gain (loss) on
Futures contracts,
Net change in
unrealized appreciation
(depreciation) on
Futures contracts | | FlexShares Morningstar US Market Factor Tilt Index Fund | | $ | 3,657,774 | | | $ | 629,382 | |
| | | | |
Equity
Index Futures
Contracts | | Net realized gain (loss) on
Futures contracts,
Net change in
unrealized appreciation
(depreciation) on
Futures contracts | | FlexShares Morningstar Developed Markets ex-US Factor Tilt Index Fund | | | 3,673,620 | | | | 696,497 | |
| | | | |
Foreign
Currency
Contracts | | Net realized gain (loss) on
Foreign currency transactions, Net change in
unrealized appreciation
(depreciation) on Forward foreign currency contracts | | FlexShares Morningstar Developed Markets ex-US Factor Tilt Index Fund | | | (76,242 | ) | | | (62,544 | ) |
| | | | |
| 486 | | FLEXSHARES ANNUAL REPORT | | |
Notes to the Financial Statements (cont.)
| | | | | | | | | | | | |
Derivatives by
risk type | | Location of Gain or (Loss) on Derivatives on the Statements of
Operations | | Fund | | Realized Gain or (Loss) on Derivatives | | | Change in Unrealized Appreciation or (Depreciation) on Derivattives | |
| | | | |
Equity
Index Futures
Contracts | | Net realized gain (loss) on
Futures contracts,
Net change in
unrealized appreciation
(depreciation) on
Futures contracts | | FlexShares Morningstar Emerging Markets Factor Tilt Index Fund | | $ | 659,219 | | | $ | (104,240 | ) |
| | | | |
Foreign
Currency
Contracts | | Net realized gain (loss) on
Foreign currency transactions, Net change in
unrealized appreciation
(depreciation) on Forward foreign currency contracts | | FlexShares Morningstar Emerging Markets Factor Tilt Index Fund | | | 41,019 | | | | (2,980 | ) |
| | | | |
Equity
Index Futures
Contracts | | Net realized gain (loss) on Futures contracts, Net change in unrealized appreciation (depreciation) on Futures contracts | | FlexShares US Quality Large Cap Index Fund | | | 202,390 | | | | 59,805 | |
| | | | |
Equity
Index Futures
Contracts | | Net realized gain (loss) on Futures contracts, Net change in unrealized appreciation (depreciation) on Futures contracts | | FlexShares STOXX® US ESG Select Index Fund | | | 364,068 | | | | 54,699 | |
| | | | |
Equity
Index Futures
Contracts | | Net realized gain (loss) on
Futures contracts,
Net change in unrealized appreciation
(depreciation) on
Futures contracts | | FlexShares STOXX® Global ESG Select Index Fund | | | 566,309 | | | | 96,635 | |
| | | | |
Foreign
Currency Contracts | | Net realized gain (loss) on
Foreign currency transactions, Net change in unrealized appreciation
(depreciation) on Forward foreign currency contracts | | FlexShares STOXX® Global ESG Select Index Fund | | | (4,109 | ) | | | 7,708 | |
| | | | |
Equity
Index Futures
Contracts | | Net realized gain (loss) on
Futures contracts,
Net change in unrealized appreciation
(depreciation) on
Futures contracts | | FlexShares® ESG & Climate US Large Cap Core Index Fund | | | — | | | | 1,240 | |
| | | | |
Foreign
Currency Contracts | | Net realized gain (loss) on
Foreign currency transactions, Net change in unrealized appreciation
(depreciation) on Forward foreign currency contracts | | FlexShares® ESG & Climate Developed Markets ex-US Core Index Fund | | | — | | | | (1347 | ) |
| | | | | | |
| | FLEXSHARES ANNUAL REPORT | | | 487 | |
Notes to the Financial Statements (cont.)
| | | | | | | | | | | | |
Derivatives by
risk type | | Location of Gain or (Loss) on Derivatives on the Statements of
Operations | | Fund | | Realized Gain or (Loss) on Derivatives | | | Change in Unrealized Appreciation or (Depreciation) on Derivattives | |
| | | | |
Equity
Index Futures
Contracts | | Net realized gain (loss) on
Futures contracts,
Net change in unrealized appreciation
(depreciation) on
Futures contracts | | FlexShares Morningstar Global Upstream Natural Resources Index Fund | | $ | 9,279,717 | | | $ | 1,659,537 | |
| | | | |
Foreign
Currency Contracts | | Net realized gain (loss) on
Foreign currency transactions, Net change in unrealized appreciation
(depreciation) on Forward foreign currency contracts | | FlexShares Morningstar Global Upstream Natural Resources Index Fund | | | 72,141 | | | | 318,711 | |
| | | | |
Equity
Index Futures
Contracts | | Net realized gain (loss) on
Futures contracts,
Net change in unrealized appreciation
(depreciation) on
Futures contracts | | FlexShares STOXX® Global Broad Infrastructure Index Fund | | | 6,508,021 | | | | 1,176,125 | |
| | | | |
Foreign
Currency Contracts | | Net realized gain (loss) on
Foreign currency transactions, Net change in unrealized appreciation
(depreciation) on Forward foreign currency contracts | | FlexShares STOXX® Global Broad Infrastructure Index Fund | | | (91,529 | ) | | | (224,458 | ) |
| | | | |
Equity
Index Futures Contracts | | Net realized gain (loss) on Futures contracts, Net change in unrealized appreciation (depreciation) on Futures contracts | | FlexShares Global Quality Real Estate Index Fund | | | 1,406,874 | | | | 144,019 | |
| | | | |
Foreign
Currency Contracts | | Net realized gain (loss) on Foreign currency transactions, Net change in unrealized appreciation (depreciation) on Forward foreign currency contracts | | FlexShares Global Quality Real Estate Index Fund | | | (17,118 | ) | | | (5,310 | ) |
| | | | |
Equity
Index Futures Contracts | | Net realized gain (loss) on Futures contracts, Net change in unrealized appreciation (depreciation) on Futures contracts | | FlexShares Quality Dividend Index Fund | | | 2,049,446 | | | | 452,671 | |
| | | | |
Equity
Index Futures Contracts | | Net realized gain (loss) on Futures contracts, Net change in unrealized appreciation (depreciation) on Futures contracts | | FlexShares Quality Dividend Defensive Index Fund | | | 426,028 | | | | 133,715 | |
| | | | |
Equity
Index Futures Contracts | | Net realized gain (loss) on Futures contracts, Net change in unrealized appreciation (depreciation) on Futures contracts | | FlexShares Quality Dividend Dynamic Index Fund | | | 49,955 | | | | 9,461 | |
| | | | |
| 488 | | FLEXSHARES ANNUAL REPORT | | |
Notes to the Financial Statements (cont.)
| | | | | | | | | | | | |
Derivatives by
risk type | | Location of Gain or (Loss) on Derivatives on the Statements of
Operations | | Fund | | Realized Gain or (Loss) on Derivatives | | | Change in Unrealized Appreciation or (Depreciation) on Derivattives | |
| | | | |
Equity
Index Futures Contracts | | Net realized gain (loss) on Futures contracts, Net change in unrealized appreciation (depreciation) on Futures contracts | | FlexShares International Quality Dividend Index Fund | | $ | 3,741,941 | | | $ | 599,000 | |
| | | | |
Foreign
Currency Contracts | | Net realized gain (loss) on Foreign currency transactions, Net change in unrealized appreciation (depreciation) on Forward foreign currency contracts | | FlexShares International Quality Dividend Index Fund | | | (16,251 | ) | | | (132,128 | ) |
| | | | |
Equity
Index Futures Contracts | | Net realized gain (loss) on Futures contracts, Net change in unrealized appreciation (depreciation) on Futures contracts | | FlexShares International Quality Dividend Defensive Index Fund | | | 357,127 | | | | 34,662 | |
| | | | |
Foreign
Currency Contracts | | Net realized gain (loss) on Foreign currency transactions, Net change in unrealized appreciation (depreciation) on Forward foreign currency contracts | | FlexShares International Quality Dividend Defensive Index Fund | | | (20,078 | ) | | | 12,440 | |
| | | | |
Equity
Index Futures Contracts | | Net realized gain (loss) on Futures contracts, Net change in unrealized appreciation (depreciation) on Futures contracts | | FlexShares International Quality Dividend Dynamic Index Fund | | | 99,056 | | | | 5,924 | |
| | | | |
Foreign
Currency Contracts | | Net realized gain (loss) on Foreign currency transactions, Net change in unrealized appreciation (depreciation) on Forward foreign currency contracts | | FlexShares International Quality Dividend Dynamic Index Fund | | | 859 | | | | 3,870 | |
| | | | |
Interest Rate
Futures Contracts | | Net realized gain (loss) on Futures contracts, Net change in unrealized appreciation (depreciation) on Futures contracts | | FlexShares Core Select Bond Fund | | | (12,967 | ) | | | — | |
| | | | | | |
| | FLEXSHARES ANNUAL REPORT | | | 489 | |
Notes to the Financial Statements (cont.)
At October 31, 2021, the volume of derivative activities, which represents activities throughout the period, was as follows:
| | | | | | | | | | | | | | | | | | | | | | | | | | | | | | | | | | | | | | | | |
| | | Foreign Exchange
Contracts | | | Equity Futures Contracts | | | Interest Rate future | |
| Fund | | Number of
Trades | | | Average
Notional
Amount | | | Number of
Trades
Long | | | Average
Notional
Balance
Long | | | Number
of
Trades
Short | | | Average
Notional
Balance Short | | | Number
of
Trades
Long | | | Average
Notional
Balance Long | | | Number of
Trades
Short | | | Average
Notional
Balance Short | |
| | | | | | | | | | |
| FlexShares US Quality Low Volatility Index Fund | | | — | | | $ | — | | | | 16 | | | $ | 239,352 | | | | — | | | $ | — | | | | — | | | $ | — | | | | — | | | $ | — | |
| | | | | | | | | | |
| FlexShares Developed Markets Ex-US Quality Low Volatility Index Fund | | | 232 | | | | 64,117 | | | | 43 | | | | 163,869 | | | | — | | | | — | | | | — | | | | — | | | | — | | | | — | |
| | | | | | | | | | |
| FlexShares Emerging Markets Quality Low Volatility Index Fund | | | 14 | | | | 62,551 | | | | 31 | | | | 89,159 | | | | — | | | | — | | | | — | | | | — | | | | — | | | | — | |
| | | | | | | | | | |
| FlexShares Morningstar US Market Factor Tilt Index Fund | | | — | | | | — | | | | 154 | | | | 734,052 | | | | — | | | | — | | | | — | | | | — | | | | — | | | | — | |
| | | | | | | | | | |
| FlexShares Morningstar Developed Markets ex-US Factor Tilt Index Fund | | | 123 | | | | 678,551 | | | | 144 | | | | 630,283 | | | | — | | | | — | | | | — | | | | — | | | | — | | | | — | |
| | | | | | | | | | |
| FlexShares Morningstar Emerging Markets Factor Tilt Index Fund | | | 71 | | | | 233,397 | | | | 78 | | | | 440,993 | | | | — | | | | — | | | | — | | | | — | | | | — | | | | — | |
| | | | | | | | | | |
| FlexShares US Quality Large Cap Index Fund | | | — | | | | — | | | | 26 | | | | 249,248 | | | | — | | | | — | | | | — | | | | — | | | | — | | | | — | |
| | | | | | | | | | |
| FlexShares STOXX US ESG Select Index Fund | | | — | | | | — | | | | 37 | | | | 279,594 | | | | — | | | | — | | | | — | | | | — | | | | — | | | | — | |
| | | | | | | | | | |
| FlexShares STOXX Global ESG Select Index Fund | | | 35 | | | | 187,917 | | | | 75 | | | | 207,438 | | | | — | | | | — | | | | — | | | | — | | | | — | | | | — | |
| | | | | | | | | | |
| FlexShares® ESG & Climate US Large Cap Core Index Fund | | | — | | | | — | | | | 1 | | | | 21,745 | | | | — | | | | — | | | | — | | | | — | | | | — | | | | — | |
| | | | | | | | | | |
| FlexShares® ESG & Climate Developed Markets ex-US Core Index Fund | | | 21 | | | | 7,949 | | | | — | | | | — | | | | — | | | | — | | | | — | | | | — | | | | — | | | | — | |
| | | | | | | | | | |
| FlexShares Morningstar Global Upstream Natural Resources Index Fund | | | 370 | | | | 1,052,231 | | | | 521 | | | | 989,080 | | | | — | | | | — | | | | — | | | | — | | | | — | | | | — | |
| | | | | | | | | | |
| FlexShares STOXX Global Broad Infrastructure Index Fund | | | 137 | | | | 1,038,880 | | | | 332 | | | | 713,933 | | | | — | | | | — | | | | — | | | | — | | | | — | | | | — | |
| | | | | | | | | | |
| FlexShares Global Quality Real Estate Index Fund | | | 118 | | | | 206,333 | | | | 121 | | | | 398,296 | | | | — | | | | — | | | | — | | | | — | | | | — | | | | — | |
| | | | | | | | | | |
| FlexShares Quality Dividend Index Fund | | | — | | | | — | | | | 97 | | | | 1,047,291 | | | | — | | | | — | | | | — | | | | — | | | | — | | | | — | |
| | | | | | | | | | |
| FlexShares Quality Dividend Defensive Index Fund | | | — | | | | — | | | | 71 | | | | 346,501 | | | | — | | | | — | | | | — | | | | — | | | | — | | | | — | |
| | | | | | | | | | |
| FlexShares Quality Dividend Dynamic Index Fund | | | — | | | | — | | | | 12 | | | | 155,517 | | | | — | | | | — | | | | — | | | | — | | | | — | | | | — | |
| | | | | | | | | | |
| FlexShares International Quality Dividend Index Fund | | | 323 | | | | 437,479 | | | | 273 | | | | 437,523 | | | | — | | | | — | | | | — | | | | — | | | | — | | | | — | |
| | | | | | | | | | |
| FlexShares International Quality Dividend Defensive Index Fund | | | 60 | | | | 125,875 | | | | 77 | | | | 146,709 | | | | — | | | | — | | | | — | | | | — | | | | — | | | | — | |
| | | | | | | | | | |
| FlexShares International Quality Dividend Dynamic Index Fund | | | 189 | | | | 38,089 | | | | 64 | | | | 117,443 | | | | — | | | | — | | | | — | | | | — | | | | — | | | | — | |
| | | | | | | | | | |
| FlexShares Core Select Bond Fund | | | — | | | | — | | | | — | | | | — | | | | — | | | | — | | | | — | | | | — | | | | 58 | | | | 133,932 | |
| | | | |
| 490 | | FLEXSHARES ANNUAL REPORT | | |
Notes to the Financial Statements (cont.)
Taxes and Distributions
Each Fund has qualified and intends to continue to qualify as a regulated investment company by complying with the requirements under Subchapter M of the Internal Revenue Code of 1986, as amended, which includes distributing substantially all of its net investment income and net capital gains to shareholders. Accordingly, no provision for federal and state income taxes is required in the financial statements.
As of October 31, 2021, management of the Funds has reviewed all open tax years and major jurisdictions and concluded that there is no tax liability resulting from unrecognized tax benefits relating to uncertain income tax positions taken or expected to be taken in future tax returns. The Funds are also not aware of any tax positions for which it is reasonably possible that the total amounts of unrecognized tax benefits will significantly change in the next 12 months. On an ongoing basis management will monitor the tax positions taken to determine if adjustment to conclusions are necessary based on factors including but not limited to further implementation on guidance expected from FASB and on-going analysis of tax law, regulation, and interpretations thereof.
Dividends from net investment income, including any net foreign currency gains, are generally declared and paid by each Fund according to the following schedule:
| | | | | | | | |
| Fund | | Declared And Paid
Monthly | | | Declared And Paid
Quarterly | |
| | |
| FlexShares US Quality Low Volatility Index Fund | | | | | | | x | |
| | |
| FlexShares Developed Markets ex-US Quality Low Volatility Index Fund | | | | | | | x | |
| | |
| FlexShares Emerging Markets Quality Low Volatility Index Fund | | | | | | | x | |
| | |
| FlexShares Morningstar US Market Factor Tilt Index Fund | | | | | | | x | |
| | |
| FlexShares Morningstar Developed Markets ex-US Factor Tilt Index Fund | | | | | | | x | |
| | |
| FlexShares Morningstar Emerging Markets Factor Tilt Index Fund | | | | | | | x | |
| | | | | | | | |
| Fund | | Declared And Paid
Monthly | | | Declared And Paid
Quarterly | |
| | |
| FlexShares US Quality Large Cap Index Fund | | | | | | | x | |
| | |
| FlexShares STOXX® US ESG Select Index Fund | | | | | | | x | |
| | |
| FlexShares STOXX® Global ESG Select Index Fund | | | | | | | x | |
| | |
| FlexShares ESG & Climate US Large Cap Core Index Fund | | | | | | | x | |
| | |
| FlexShares ESG & Climate Developed Markets ex-US Core Index Fund | | | | | | | x | |
| | |
FlexShares Morningstar Global Upstream Natural Resources Index Fund | | | | | | | x | |
| | |
| FlexShares STOXX® Global Broad Infrastructure Index Fund | | | | | | | x | |
| | |
| FlexShares Global Quality Real Estate Index Fund | | | | | | | x | |
| | |
| FlexShares Real Assets Allocation Index Fund | | | | | | | x | |
| | |
| FlexShares Quality Dividend Index Fund | | | | | | | x | |
| | |
| FlexShares Quality Dividend Defensive Index Fund | | | | | | | x | |
| | |
FlexShares Quality Dividend Dynamic Index Fund | | | | | | | x | |
| | |
FlexShares International Quality Dividend Index Fund | | | | | | | x | |
| | |
| FlexShares International Quality Dividend Defensive Index Fund | | | | | | | x | |
| | |
| FlexShares International Quality Dividend Dynamic Index Fund | | | | | | | x | |
| | |
| FlexShares iBoxx 3-Year Target Duration TIPS Index Fund | | | x | | | | | |
| | |
| FlexShares iBoxx 5-Year Target Duration TIPS Index Fund | | | x | | | | | |
| | |
| FlexShares Disciplined Duration MBS Index Fund | | | x | | | | | |
| | |
| FlexShares Credit-Scored US Corporate Bond Index Fund | | | x | | | | | |
| | | | | | |
| | FLEXSHARES ANNUAL REPORT | | | 491 | |
Notes to the Financial Statements (cont.)
| | | | | | | | |
| Fund | | Declared And Paid
Monthly | | | Declared And Paid
Quarterly | |
| | |
| FlexShares Credit-Scored US Long Corporate Bond Index Fund | | | x | | | | | |
| | |
| FlexShares High Yield Value-Scored Bond Index Fund | | | x | | | | | |
| | |
| FlexShares ESG & Climate High Yield Corporate Core Index Fund | | | x | | | | | |
| | |
| FlexShares ESG & Climate Investment Grade Corporate Core Index Fund | | | x | | | | | |
| | |
| FlexShares Ready Access Variable Income Fund | | | x | | | | | |
| | |
| FlexShares Core Select Bond Fund | | | x | | | | | |
Distribution of net realized securities gains, if any, generally are distributed at least annually. The Trust reserves the right to declare special distributions if, in its reasonable discretion, such action is necessary or advisable to improve tracking error, to preserve its status as a regulated investment company or to avoid imposition of income or excise taxes on undistributed income or realized gains. Tracking error is a measurement of how much the return on a portfolio deviates from the return on its benchmark index.
Dividends and securities gains distributions are distributed in U.S. dollars and cannot be automatically reinvested in
additional shares of the Funds. The amount of distributions from net investment income and net realized gains are determined in accordance with federal income tax regulations, which may differ from GAAP. These “book/tax” differences are either considered temporary or permanent in nature. To the extent these differences are permanent in nature, such amounts are reclassified within the composition of net assets based on their federal tax-basis treatment; temporary differences (e.g., wash sales) do not require a reclassification. The Funds may utilize equalization accounting for tax purposes and designate earnings and profits, including net realized gains distributed to shareholders on redemption of shares, as a part of the dividends paid deduction for income tax purposes.
The Funds’ tax year end is October 31st and the tax character of current year distributions and current components of accumulated earnings (deficit) will be determined at the end of the current tax year.
Temporary differences are generally due to different book and tax treatments for the timing of the recognition of gains and losses on certain investment transactions, mark to market of forward foreign currency contracts, mark to market of futures contracts, mark to market of passive foreign investment companies (“PFICs”), non-taxable special dividends, wash sale loss deferrals and capital loss carryforward.
Permanent differences, primarily due to gain (loss) on in-kind redemptions, paydown loss reclassification, foreign currency gains and losses, forward foreign currency gains and losses, PFICs gains and losses, non-taxable special dividends, investments in partnerships, taxable over-distributions, foreign capital gains tax reclassification, perpetual bonds and equalization as of October 31, 2021 (the Funds’ tax year end), among the Funds’ components of net assets are as follows:
| | | | | | | | | | | | |
| Fund | | Accumulated
undistributed net
investment income (loss) | | | Accumulated net
realized gain (loss)
on investments | | | Paid in
capital | |
| | | |
| FlexShares US Quality Low Volatility Index Fund | | $ | (9,176) | | | $ | (9,868,569) | | | $ | 9,877,745 | |
| | | |
| FlexShares Developed Markets ex-US Quality Low Volatility Index Fund | | | 136,368 | | | | (2,805,584) | | | | 2,669,216 | |
| | | |
| FlexShares Emerging Markets Quality Low Volatility Index Fund | | | (24,406) | | | | 24,406 | | | | — | |
| | | |
| FlexShares Morningstar US Market Factor Tilt Index Fund | | | (258,860) | | | | (63,077,842) | | | | 63,336,702 | |
| | | |
| FlexShares Morningstar Developed Markets ex-US Factor Tilt Index Fund | | | 1,699,854 | | | | (15,485,814) | | | | 13,785,960 | |
| | | | |
| 492 | | FLEXSHARES ANNUAL REPORT | | |
Notes to the Financial Statements (cont.)
| | | | | | | | | | | | |
| Fund | | Accumulated
undistributed net
investment income (loss) | | | Accumulated net
realized gain (loss)
on investments | | | Paid in
capital | |
| | | |
| FlexShares Morningstar Emerging Markets Factor Tilt Index Fund | | $ | 1,466,157 | | | $ | (1,466,157) | | | $ | — | |
| | | |
| FlexShares US Quality Large Cap Index Fund | | | (3,538) | | | | (4,603,273) | | | | 4,606,811 | |
| | | |
| FlexShares STOXX® US ESG Select Index Fund | | | (6,821) | | | | (24,335,425) | | | | 24,342,246 | |
| | | |
| FlexShares STOXX® Global ESG Select Index Fund | | | 60,106 | | | | (10,202,928) | | | | 10,142,822 | |
| | | |
| FlexShares ESG & Climate Developed Markets ex-US Core Index Fund* | | | 1,165 | | | | (1,165) | | | | — | |
| | | |
| FlexShares Morningstar Global Upstream Natural Resources Index Fund | | | (283,486) | | | | (31,260,555) | | | | 31,544,041 | |
| | | |
| FlexShares STOXX® Global Broad Infrastructure Index Fund | | | 128,964 | | | | (131,100,737) | | | | 130,971,773 | |
| | | |
| FlexShares Global Quality Real Estate Index Fund | | | 709,553 | | | | (3,129,564) | | | | 2,420,011 | |
| | | |
| FlexShares Real Assets Allocation Index Fund | | | 4,617 | | | | (182,015) | | | | 177,398 | |
| | | |
| FlexShares Quality Dividend Index Fund | | | (361,542) | | | | (153,132,935) | | | | 153,494,477 | |
| | | |
| FlexShares Quality Dividend Defensive Index Fund | | | (143,915) | | | | (60,582,621) | | | | 60,726,536 | |
| | | |
| FlexShares Quality Dividend Dynamic Index Fund | | | (13,412) | | | | (520,545) | | | | 533,957 | |
| | | |
| FlexShares International Quality Dividend Index Fund | | | 466,545 | | | | (2,615,900) | | | | 2,149,355 | |
| | | |
| FlexShares International Quality Dividend Defensive Index Fund | | | 3,885 | | | | (269,980) | | | | 266,095 | |
| | | |
| FlexShares International Quality Dividend Dynamic Index Fund | | | (19,198) | | | | 19,198 | | | | — | |
| | | |
| FlexShares iBoxx 3-Year Target Duration TIPS Index Fund | | | — | | | | (22,245,102) | | | | 22,245,102 | |
| | | |
| FlexShares iBoxx 5-Year Target Duration TIPS Index Fund | | | — | | | | (4,944,588) | | | | 4,944,588 | |
| | | |
| FlexShares Disciplined Duration MBS Index Fund | | | 2,262,955 | | | | (2,262,955) | | | | — | |
| | | |
| FlexShares Credit-Scored US Corporate Bond Index Fund | | | 236,923 | | | | (621,875) | | | | 384,952 | |
| | | |
| FlexShares Credit-Scored US Long Corporate Bond Index Fund | | | 4,600 | | | | (104,486) | | | | 99,886 | |
| | | |
| FlexShares High Yield Value-Scored Bond Index Fund | | | 641,259 | | | | (718,402) | | | | 77,143 | |
| | | |
| FlexShares ESG & Climate High Yield Corporate Core Index Fund* | | | 29,990 | | | | (29,990) | | | | — | |
| | | |
| FlexShares ESG & Climate Investment Grade Corporate Core Index Fund* | | | 4,657 | | | | (4,657) | | | | — | |
| | | |
| FlexShares Ready Access Variable Income Fund | | | 134,618 | | | | (339,812) | | | | 205,194 | |
| | | |
| FlexShares Core Select Bond Fund | | | 264,009 | | | | (1,390,852) | | | | 1,126,843 | |
| * | Commencement of operations on September 20, 2021 |
| | | | | | |
| | FLEXSHARES ANNUAL REPORT | | | 493 | |
Notes to the Financial Statements (cont.)
As of October 31, 2021, the tax character of distributions paid for the tax year ended October 31, 2021, and October 31, 2020, were as follows:
| | | | | | | | | | | | | | | | | | | | | | | | | | | | | | | | |
| | | Year Ended October 31, 2021 | | | Year Ended October 31, 2020 | |
| Fund | | Distributions
paid from
ordinary
income | | | Distributions
paid from net
long term
capital gains | | | Tax Return
of Capital | | | Total
Distributions | | | Distributions
paid from
ordinary
income | | | Distributions
paid from net
long term
capital gains | | | Tax Return
of Capital | | | Total
Distributions | |
| FlexShares US Quality Low Volatility Index Fund* | | $ | 1,694,565 | | | $ | — | | | $ | — | | | $ | 1,694,565 | | | $ | 643,733 | | | $ | — | | | $ | — | | | $ | 643,733 | |
| FlexShares Developed Markets ex-US Quality Low Volatility Index Fund* | | | 2,249,889 | | | | — | | | | — | | | | 2,249,889 | | | | 864,658 | | | | — | | | | — | | | | 864,658 | |
| FlexShares Emerging Markets Quality Low Volatility Index Fund* | | | 269,007 | | | | — | | | | — | | | | 269,007 | | | | 168,979 | | | | — | | | | — | | | | 168,979 | |
| FlexShares Morningstar US Market Factor Tilt Index Fund | | | 19,993,786 | | | | — | | | | — | | | | 19,993,786 | | | | 23,509,426 | | | | — | | | | — | | | | 23,509,426 | |
| FlexShares Morningstar Developed Markets ex-US Factor Tilt Index Fund | | | 13,410,048 | | | | — | | | | — | | | | 13,410,048 | | | | 23,632,565 | | | | — | | | | — | | | | 23,632,565 | |
| FlexShares Morningstar Emerging Markets Factor Tilt Index Fund | | | 6,011,707 | | | | — | | | | — | | | | 6,011,707 | | | | 8,202,693 | | | | — | | | | — | | | | 8,202,693 | |
| FlexShares US Quality Large Cap Index Fund | | | 1,136,947 | | | | — | | | | — | | | | 1,136,947 | | | | 976,050 | | | | — | | | | — | | | | 976,050 | |
| FlexShares STOXX® US ESG Select Index Fund | | | 1,955,493 | | | | — | | | | — | | | | 1,955,493 | | | | 1,145,374 | | | | — | | | | — | | | | 1,145,374 | |
| FlexShares STOXX® Global ESG Select Index Fund | | | 2,324,712 | | | | — | | | | — | | | | 2,324,712 | | | | 1,663,474 | | | | — | | | | — | | | | 1,663,474 | |
| FlexShares Morningstar Global Upstream Natural Resources Index Fund | | | 167,354,837 | | | | — | | | | — | | | | 167,354,837 | | | | 122,625,164 | | | | — | | | | — | | | | 122,625,164 | |
| FlexShares STOXX® Global Broad Infrastructure Index Fund | | | 58,905,802 | | | | — | | | | — | | | | 58,905,802 | | | | 40,390,855 | | | | — | | | | — | | | | 40,390,855 | |
| FlexShares Global Quality Real Estate Index Fund | | | 5,654,125 | | | | — | | | | — | | | | 5,654,125 | | | | 14,558,175 | | | | — | | | | 168,159 | | | | 14,726,334 | |
| FlexShares Real Assets Allocation Index Fund | | | 383,940 | | | | — | | | | — | | | | 383,940 | | | | 278,767 | | | | — | | | | — | | | | 278,767 | |
| FlexShares Quality Dividend Index Fund | | | 31,171,462 | | | | — | | | | — | | | | 31,171,462 | | | | 41,958,188 | | | | 9,070,567 | | | | — | | | | 51,028,755 | |
| FlexShares Quality Dividend Defensive Index Fund | | | 9,806,498 | | | | — | | | | — | | | | 9,806,498 | | | | 12,460,723 | | | | 3,670,468 | | | | — | | | | 16,131,191 | |
| | | | |
| 494 | | FLEXSHARES ANNUAL REPORT | | |
Notes to the Financial Statements (cont.)
| | | | | | | | | | | | | | | | | | | | | | | | | | | | | | | | |
| | | Year Ended October 31, 2021 | | | Year Ended October 31, 2020 | |
| Fund | | Distributions
paid from
ordinary
income | | | Distributions
paid from net
long term
capital gains | | | Tax Return
of Capital | | | Total
Distributions | | | Distributions
paid from
ordinary
income | | | Distributions
paid from net
long term
capital gains | | | Tax Return
of Capital | | | Total
Distributions | |
| FlexShares Quality Dividend Dynamic Index Fund | | $ | 369,573 | | | $ | — | | | $ | — | | | $ | 369,573 | | | $ | 962,948 | | | $ | — | | | $ | — | | | $ | 962,948 | |
| FlexShares International Quality Dividend Index Fund | | | 20,693,535 | | | | — | | | | — | | | | 20,693,535 | | | | 22,159,155 | | | | — | | | | — | | | | 22,159,155 | |
| FlexShares International Quality Dividend Defensive Index Fund | | | 2,683,528 | | | | — | | | | — | | | | 2,683,528 | | | | 2,523,077 | | | | — | | | | — | �� | | | 2,523,077 | |
| FlexShares International Quality Dividend Dynamic Index Fund | | | 1,876,931 | | | | — | | | | — | | | | 1,876,931 | | | | 952,482 | | | | — | | | | — | | | | 952,482 | |
| FlexShares iBoxx 3-Year Target Duration TIPS Index Fund | | | 61,292,947 | | | | — | | | | — | | | | 61,292,947 | | | | 12,627,726 | | | | — | | | | — | | | | 12,627,726 | |
| FlexShares iBoxx 5-Year Target Duration TIPS Index Fund | | | 26,674,665 | | | | — | | | | — | | | | 26,674,665 | | | | 5,908,902 | | | | — | | | | — | | | | 5,908,902 | |
| FlexShares Disciplined Duration MBS Index Fund | | | 2,676,548 | | | | — | | | | — | | | | 2,676,548 | | | | 1,754,929 | | | | — | | | | — | | | | 1,754,929 | |
| FlexShares Credit-Scored US Corporate Bond Index Fund | | | 5,773,883 | | | | 2,289,107 | | | | — | | | | 8,062,990 | | | | 3,976,789 | | | | — | | | | — | | | | 3,976,789 | |
| FlexShares Credit-Scored US Long Corporate Bond Index Fund | | | 2,144,280 | | | | 1,395,700 | | | | — | | | | 3,539,980 | | | | 1,038,434 | | | | — | | | | — | | | | 1,038,434 | |
| FlexShares High Yield Value-Scored Bond Index Fund** | | | 14,813,070 | | | | 16,736 | | | | — | | | | 14,829,806 | | | | 9,992,636 | | | | — | | | | — | | | | 9,992,636 | |
| FlexShares Ready Access Variable Income Fund | | | 3,117,345 | | | | 134,219 | | | | — | | | | 3,251,564 | | | | 5,343,876 | | | | — | | | | — | | | | 5,343,876 | |
| FlexShares Core Select Bond Fund | | | 2,693,092 | | | | — | | | | — | | | | 2,693,092 | | | | 1,218,108 | | | | — | | | | — | | | | 1,218,108 | |
As of October 31, 2021, the components of accumulated earnings (deficit) on a tax basis were as follows:
| | | | | | | | | | | | | | | | |
| Fund | | Undistributed
Ordinary
Income | | | Undistributed
Long-Term
Capital Gains | | | Accumulated
Capital and
Other Losses | | | Unrealized
Appreciated/
(Depreciated) | |
| | | | |
| FlexShares US Quality Low Volatility Index Fund | | $ | 124,071 | | | $ | — | | | $ | (844,487 | ) | | $ | 30,825,194 | |
| | | | |
| FlexShares Developed Markets ex-US Quality Low Volatility Index Fund | | | 523,158 | | | | — | | | | (425,362 | ) | | | 7,338,110 | |
| | | | |
| FlexShares Emerging Markets Quality Low Volatility Index Fund | | | 109,243 | | | | — | | | | (370,242 | ) | | | 933,842 | |
| | | | |
| FlexShares Morningstar US Market Factor Tilt Index Fund | | | 2,703,213 | | | | — | | | | (15,943,559 | ) | | | 782,242,303 | |
| | | | |
| FlexShares Morningstar Developed Markets ex-US Factor Tilt Index Fund | | | 8,658,871 | | | | — | | | | (110,017,527 | ) | | | 126,976,030 | |
| | | | |
| FlexShares Morningstar Emerging Markets Factor Tilt Index Fund | | | 4,037,400 | | | | — | | | | (54,264,664 | ) | | | 54,022,556 | |
| | | | |
| FlexShares US Quality Large Cap Index Fund | | | 160,827 | | | | — | | | | (2,245,601 | ) | | | 31,273,184 | |
| | | | | | |
| | FLEXSHARES ANNUAL REPORT | | | 495 | |
Notes to the Financial Statements (cont.)
| | | | | | | | | | | | | | | | |
| Fund | | Undistributed
Ordinary
Income | | | Undistributed
Long-Term
Capital Gains | | | Accumulated
Capital and
Other Losses | | | Unrealized
Appreciated/
(Depreciated) | |
| | | | |
| FlexShares STOXX® US ESG Select Index Fund | | $ | 257,792 | | | $ | — | | | $ | (2,309,775 | ) | | $ | 40,395,659 | |
| | | | |
| FlexShares STOXX® Global ESG Select Index Fund | | | 513,264 | | | | — | | | | (1,664,647 | ) | | | 51,128,010 | |
| | | | |
| FlexShares ESG & Climate US Large Cap Core Index Fund* | | | 2,838 | | | | 706 | | | | — | | | | 165,942 | |
| | | | |
| FlexShares ESG & Climate Developed Markets ex-US Core Index Fund* | | | 16,974 | | | | — | | | | (3,360 | ) | | | 105,275 | |
| | | | |
| FlexShares Morningstar Global Upstream Natural Resources Index Fund | | | 36,354,392 | | | | — | | | | (1,069,128,895 | ) | | | 1,074,056,116 | |
| | | | |
| FlexShares STOXX® Global Broad Infrastructure Index Fund | | | 15,377,762 | | | | — | | | | (120,309,979 | ) | | | 330,382,468 | |
| | | | |
| FlexShares Global Quality Real Estate Index Fund | | | 3,621,497 | | | | — | | | | (23,371,075 | ) | | | 69,108,886 | |
| | | | |
| FlexShares Real Assets Allocation Index Fund | | | — | | | | — | | | | (162,875 | ) | | | 1,143,210 | |
| | | | |
| FlexShares Quality Dividend Index Fund | | | 4,903,247 | | | | — | | | | (7,082,845 | ) | | | 388,315,975 | |
| | | | |
| FlexShares Quality Dividend Defensive Index Fund | | | 1,294,211 | | | | — | | | | (19,043,999 | ) | | | 96,742,030 | |
| | | | |
| FlexShares Quality Dividend Dynamic Index Fund | | | 59,908 | | | | — | | | | (102,041 | ) | | | 5,280,456 | |
| | | | |
| FlexShares International Quality Dividend Index Fund | | | 3,412,771 | | | | — | | | | (143,687,637 | ) | | | 59,493,420 | |
| | | | |
| FlexShares International Quality Dividend Defensive Index Fund | | | 299,193 | | | | — | | | | (23,011,126 | ) | | | 7,357,706 | |
| | | | |
| FlexShares International Quality Dividend Dynamic Index Fund | | | 503,188 | | | | — | | | | (13,238,901 | ) | | | 4,751,612 | |
| | | | |
| FlexShares iBoxx 3-Year Target Duration TIPS Index Fund | | | 1,429,536 | | | | — | | | | (41,380,504 | ) | | | 52,832,839 | |
| | | | |
| FlexShares iBoxx 5-Year Target Duration TIPS Index Fund | | | 910,284 | | | | — | | | | (2,326,255 | ) | | | 39,104,858 | |
| | | | |
| FlexShares Disciplined Duration MBS Index Fund | | | 209,563 | | | | — | | | | (4,236,170 | ) | | | 217,645 | |
| | | | |
| FlexShares Credit-Scored US Corporate Bond Index Fund | | | 1,003,980 | | | | 2,010,194 | | | | — | | | | 867,876 | |
| | | | |
| FlexShares Credit-Scored US Long Corporate Bond Index Fund | | | 405,385 | | | | 685,037 | | | | — | | | | 1,836,902 | |
| | | | |
| FlexShares High Yield Value-Scored Bond Index Fund | | | 6,125,243 | | | | 1,007,533 | | | | — | | | | (824,004 | ) |
| | | | |
| FlexShares ESG & Climate High Yield Corporate Core Index Fund* | | | 238,604 | | | | — | | | | (16,941 | ) | | | (439,008 | ) |
| | | | |
| FlexShares ESG & Climate Investment Grade Corporate Core Index Fund* | | | 107,235 | | | | — | | | | (68,823 | ) | | | (686,673 | ) |
| | | | |
| FlexShares Ready Access Variable Income Fund | | | 481,429 | | | | 627,909 | | | | — | | | | 544,895 | |
| | | | |
| FlexShares Core Select Bond Fund | | | — | | | | — | | | | (853,034 | ) | | | 16,983 | |
| * | Commencement of operations on September 20, 2021 |
| | | | |
| 496 | | FLEXSHARES ANNUAL REPORT | | |
Notes to the Financial Statements (cont.)
Capital loss carry forwards will retain their character as either short-term or long-term capital losses rather than being considered all short-term as permitted under previous law and may be carried forward indefinitely to offset future gains.
For the tax year ended October 31, 2021, the following Funds had available post-enactment capital loss carryforwards to offset future net capital gains to the extent provided by regulations:
| | | | | | | | | | | | |
| Fund | | Short-Term | | | Long-Term | | | Total | |
| | | |
| FlexShares US Quality Low Volatility Index Fund | | $ | 475,988 | | | $ | 368,499 | | | $ | 844,487 | |
| | | |
| FlexShares Developed Markets ex-US Quality Low Volatility Index Fund | | | 425,362 | | | | — | | | | 425,362 | |
| | | |
| FlexShares Emerging Markets Quality Low Volatility Index Fund | | | 256,273 | | | | 113,969 | | | | 370,242 | |
| | | |
| FlexShares Morningstar US Market Factor Tilt Index Fund | | | 15,943,559 | | | | — | | | | 15,943,559 | |
| | | |
| FlexShares Morningstar Developed Markets ex-US Factor Tilt Index Fund | | | 18,726,426 | | | | 91,291,101 | | | | 110,017,527 | |
| | | |
| FlexShares Morningstar Emerging Markets Factor Tilt Index Fund | | | 11,550,443 | | | | 42,714,221 | | | | 54,264,664 | |
| | | |
| FlexShares US Quality Large Cap Index Fund | | | 1,218,160 | | | | 1,027,441 | | | | 2,245,601 | |
| | | | | | | | | | | | |
| Fund | | Short-Term | | | Long-Term | | | Total | |
| | | |
| FlexShares STOXX® US ESG Select Index Fund | | $ | 2,309,775 | | | $ | — | | | $ | 2,309,775 | |
| | | |
| FlexShares STOXX® Global ESG Select Index Fund | | | 1,664,647 | | | | — | | | | 1,664,647 | |
| | | |
| FlexShares ESG & Climate Developed Markets ex-US Core Index Fund* | | | 1,890 | | | | 1,470 | | | | 3,360 | |
| | | |
| FlexShares Morningstar Global Upstream Natural Resources Index Fund | | | 236,739,616 | | | | 832,389,279 | | | | 1,069,128,895 | |
| | | |
| FlexShares STOXX® Global Broad Infrastructure Index Fund | | | 34,835,961 | | | | 85,474,018 | | | | 120,309,979 | |
| | | |
| FlexShares Global Quality Real Estate Index Fund | | | 19,967,461 | | | | 3,403,614 | | | | 23,371,075 | |
| | | |
| FlexShares Real Assets Allocation Index Fund | | | — | | | | 162,875 | | | | 162,875 | |
| | | |
| FlexShares Quality Dividend Index Fund | | | 7,082,845 | | | | — | | | | 7,082,845 | |
| | | |
| FlexShares Quality Dividend Defensive Index Fund | | | 19,015,073 | | | | 28,926 | | | | 19,043,999 | |
| | | | | | |
| | FLEXSHARES ANNUAL REPORT | | | 497 | |
Notes to the Financial Statements (cont.)
| | | | | | | | | | | | |
| Fund | | Short-Term | | | Long-Term | | | Total | |
| | | |
| FlexShares Quality Dividend Dynamic Index Fund | | $ | 102,041 | | | $ | — | | | $ | 102,041 | |
| | | |
| FlexShares International Quality Dividend Index Fund | | | 85,597,476 | | | | 58,090,161 | | | | 143,687,637 | |
| | | |
| FlexShares International Quality Dividend Defensive Index Fund | | | 13,702,062 | | | | 9,309,064 | | | | 23,011,126 | |
| | | |
| FlexShares International Quality Dividend Dynamic Index Fund | | | 7,962,812 | | | | 5,276,089 | | | | 13,238,901 | |
| | | |
| FlexShares iBoxx 3-Year Target Duration TIPS Index Fund | | | 39,309,276 | | | | 2,071,228 | | | | 41,380,504 | |
| | | |
| FlexShares iBoxx 5-Year Target Duration TIPS Index Fund | | | 2,326,255 | | | | — | | | | 2,326,255 | |
| | | |
| FlexShares Disciplined Duration MBS Index Fund | | | 2,846,423 | | | | 1,389,747 | | | | 4,236,170 | |
| | | |
| FlexShares ESG & Climate High Yield Corporate Core Index Fund* | | | 16,941 | | | | — | | | | 16,941 | |
| | | |
| FlexShares ESG & Climate Investment Grade Corporate Core Index Fund* | | | 68,823 | | | | — | | | | 68,823 | |
| | | |
| FlexShares Core Select Bond Fund | | | 853,034 | | | | — | | | | 853,034 | |
| * | Commencement of operations on September 20, 2021 |
During the year ended October 31, 2021, the following Funds utilized capital loss carryforwards to offset net capital gains:
| | | | |
| Fund | | Capital Loss
Utilized | |
| |
| FlexShares US Quality Low Volatility Index Fund | | $ | 392,736 | |
| |
| FlexShares Developed Markets ex-US Quality Low Volatility Index Fund | | | 1,282,892 | |
| |
| FlexShares Emerging Markets Quality Low Volatility Index Fund | | | 197,686 | |
| |
| FlexShares Morningstar US Market Factor Tilt Index Fund | | | 63,152,557 | |
| |
| FlexShares Morningstar Developed Markets ex-US Factor Tilt Index Fund | | | 15,564,673 | |
| |
| FlexShares Morningstar Emerging Markets Factor Tilt Index Fund | | | 23,746,341 | |
| |
| FlexShares US Quality Large Cap Index Fund | | | 1,261,799 | |
| |
| FlexShares STOXX® US ESG Select Index Fund | | | 1,203,972 | |
| |
| FlexShares STOXX® Global ESG Select Index Fund | | | 3,701,503 | |
| |
| FlexShares STOXX® Global Broad Infrastructure Index Fund | | | 9,607,303 | |
| |
| FlexShares Global Quality Real Estate Index Fund | | | 7,194,502 | |
| |
| FlexShares Real Assets Allocation Index Fund | | | 58,567 | |
| |
| FlexShares Quality Dividend Index Fund | | | 2,834,525 | |
| |
| FlexShares Quality Dividend Defensive Index Fund | | | 956,272 | |
| |
| FlexShares Quality Dividend Dynamic Index Fund | | | 1,269,388 | |
| |
| FlexShares International Quality Dividend Index Fund | | | 45,607,308 | |
| |
| FlexShares International Quality Dividend Defensive Index Fund | | | 5,641,949 | |
| |
| FlexShares International Quality Dividend Dynamic Index Fund | | | 1,981,804 | |
| |
| FlexShares iBoxx 3-Year Target Duration TIPS Index Fund | | | 14,398,367 | |
| |
| FlexShares iBoxx 5-Year Target Duration TIPS Index Fund | | | 7,884,447 | |
| |
| FlexShares Disciplined Duration MBS Index Fund | | | 381,169 | |
| |
| FlexShares High Yield Value-Scored Bond Index Fund | | | 4,549,296 | |
| | | | |
| 498 | | FLEXSHARES ANNUAL REPORT | | |
Notes to the Financial Statements (cont.)
The FlexShares US Quality Low Volatility Index Fund, FlexShares Developed Markets ex-US Quality Low Volatility Index Fund, FlexShares Emerging Markets Quality Low Volatility Index Fund, FlexShares Morningstar US Market Factor Tilt Index Fund, FlexShares Morningstar Developed Markets ex-US Factor Tilt Index Fund, FlexShares Morningstar Emerging Markets Factor Tilt Index Fund, FlexShares US Quality Large Cap Index Fund, FlexShares STOXX® Global ESG Select Index Fund, FlexShares ESG & Climate Developed Markets ex-US Core Index Fund, FlexShares Morningstar Global Upstream Natural Resources Index Fund, FlexShares STOXX® Global Broad Infrastructure Index Fund, FlexShares Global Quality Real Estate Index Fund, FlexShares Quality Dividend Defensive Index Fund, FlexShares Quality Dividend Dynamic Index Fund, FlexShares International Quality Dividend Index Fund, FlexShares International Quality Dividend Defensive Index Fund, FlexShares International Quality Dividend Dynamic Index Fund, FlexShares ESG & Climate High Yield Corporate Core Index Fund and the FlexShares ESG & Climate Investment Grade Corporate Core Index Fund may be subject to foreign withholding taxes with respect to dividends or interest received from sources in foreign countries. If, at the close of the taxable year, more than 50% in value of a Fund’s assets consists of stock or securities in foreign corporations the Fund will be eligible to make an election to treat a proportionate amount of those taxes as constituting a distribution to each shareholder, which would allow all shareholders to either (1) credit that proportionate amount of taxes against U.S. Federal income tax liability as a foreign tax credit or (2) take that amount as an itemized deduction. If a Fund is not eligible to make this election or is eligible but does not make the election, it will be entitled to deduct such taxes in computing the amounts it is required to distribute.
3. Investment Transactions and Related Income and Expense
Throughout the reporting period, investment transactions are accounted for no later than one business day following the trade date. For financial reporting purposes, investment transactions are accounted for on the trade date on the last business day of the reporting period.
Interest income is recognized on an accrual basis. Bond discount is accreted and premium is amortized using the effective yield method. Dividend income is recorded on the ex-dividend date, or as soon as information is available. Gains or losses realized on sales of securities are determined using the specific identification method by comparing the identified cost of the security lot sold with the net sales proceeds.
Each Fund except the FlexShares iBoxx 3-Year Target Duration TIPs Index Fund and the FlexShares iBoxx 5-Year Target Duration TIPs Index Fund may hold the securities of real estate investment trusts (“REITs”). Distributions from such investments may be comprised of return of capital, capital gains and income. The actual character of amounts received during the year is not known until after the REIT’s fiscal year end. The Fund records the character of distributions received from REITs during the year based on estimates available. The characterization of distributions received by the Fund may be subsequently revised based on information received from the REITs after their tax reporting periods concluded.
All foreign taxes are recorded in accordance with the applicable foreign tax regulations and rates that exist in the foreign markets in which a Fund invests. These foreign taxes, if any, are paid by the Funds and disclosed in the Statements of Operations. Foreign taxes payable, if any, are reflected in the Funds’ Statements of Assets and Liabilities.
Expenses directly attributable to a Fund are charged to that Fund, while expenses which are attributable to more than one Fund are allocated among the respective Funds based upon relative net assets or another reasonable basis.
4. Investment Advisory Fees
NTI serves as the Investment Adviser of the Funds pursuant to the Investment Advisory Agreement. The Investment Adviser is responsible for making investment decisions for the Funds and for placing purchase and sale orders for portfolio securities, subject to the general supervision of the Board.
As compensation for its advisory services and assumption of certain Fund expenses, NTI is entitled to a unitary management fee (“Management Fee”), computed daily and payable
| | | | | | |
| | FLEXSHARES ANNUAL REPORT | | | 499 | |
Notes to the Financial Statements (cont.)
monthly, at the annual rates set forth in the table below (expressed as a percentage of each Fund’s respective average daily net assets).
From the Management Fee, NTI pays most of the expenses of the Fund, including the cost of transfer agency, custody, fund administration, legal, audit and other services (“Covered Expenses”). Covered Expenses do not include the following fees under the Investment Advisory Agreement: interest expenses, brokerage commissions and other trading expenses, fees and expenses of the independent trustees and their independent legal counsel, taxes and other extraordinary costs such as litigation and other expenses not incurred in the ordinary course of business.
The Management Fee rate payable by each Fund is set forth in the following table:
| | | | |
| Fund | | Unitary
Management Fee | |
| |
| FlexShares US Quality Low Volatility Index Fund | | | 0.22 | % |
| |
| FlexShares Developed Markets ex-US Quality Low Volatility Index Fund | | | 0.32 | % |
| |
| FlexShares Emerging Markets Quality Low Volatility Index Fund | | | 0.40 | % |
| |
| FlexShares Morningstar US Market Factor Tilt Index Fund | | | 0.25 | % |
| |
| FlexShares Morningstar Developed Markets ex-US Factor Tilt Index Fund | | | 0.39 | % |
| |
| FlexShares Morningstar Emerging Markets Factor Tilt Index Fund | | | 0.59 | % |
| |
| FlexShares US Quality Large Cap Index Fund | | | 0.32 | % |
| |
| FlexShares STOXX® US ESG Select Index Fund | | | 0.32 | % |
| |
| FlexShares STOXX® Global ESG Select Index Fund | | | 0.42 | % |
| |
| FlexShares ESG & Climate US Large Cap Core Index Fund | | | 0.09 | % |
| |
| FlexShares ESG & Climate Developed Markets ex-US Core Index Fund | | | 0.12 | % |
| |
| FlexShares Morningstar Global Upstream Natural Resources Index Fund | | | 0.46 | % |
| | | | |
| Fund | | Unitary
Management Fee | |
| |
| FlexShares STOXX® Global Broad Infrastructure Index Fund | | | 0.47 | % |
| |
| FlexShares Global Quality Real Estate Index Fund | | | 0.45 | % |
| |
| FlexShares Real Assets Allocation Index Fund | | | 0.57 | % |
| |
| FlexShares Quality Dividend Index Fund | | | 0.37 | % |
| |
| FlexShares Quality Dividend Defensive Index Fund | | | 0.37 | % |
| |
| FlexShares Quality Dividend Dynamic Index Fund | | | 0.37 | % |
| |
| FlexShares International Quality Dividend Index Fund | | | 0.47 | % |
| |
| FlexShares International Quality Dividend Defensive Index Fund | | | 0.47 | % |
| |
| FlexShares International Quality Dividend Dynamic Index Fund | | | 0.47 | % |
| |
| FlexShares iBoxx 3-Year Target Duration TIPS Index Fund | | | 0.18 | % |
| |
| FlexShares iBoxx 5-Year Target Duration TIPS Index Fund | | | 0.18 | % |
| |
| FlexShares Disciplined Duration MBS Index Fund | | | 0.20 | % |
| |
| FlexShares Credit-Scored US Corporate Bond Index Fund | | | 0.22 | % |
| |
| FlexShares Credit-Scored US Long Corporate Bond Index Fund | | | 0.22 | % |
| |
| FlexShares High Yield Value-Scored Bond Index Fund | | | 0.37 | % |
| |
| FlexShares ESG & Climate High Yield Corporate Core Index Fund | | | 0.23 | % |
| |
| FlexShares ESG & Climate Investment Grade Corporate Core Index Fund | | | 0.12 | % |
| |
| FlexShares Ready Access Variable Income Fund | | | 0.25 | % |
| |
| FlexShares Core Select Bond Fund | | | 0.35 | % |
Effective March 1, 2021 (August 20, 2021, with respect to the FlexShares ESG & Climate US Large Cap Core Index Fund, FlexShares ESG & Climate Developed Markets ex-US Core Index Fund, FlexShares ESG & Climate High Yield Corporate Core Index Fund and the FlexShares ESG & Climate
| | | | |
| 500 | | FLEXSHARES ANNUAL REPORT | | |
Notes to the Financial Statements (cont.)
Investment Grade Corporate Core Index Fund (the “ESG & Climate Funds”)), the Investment Adviser has contractually agreed until March 1, 2022 (September 7, 2022, with respect to the ESG & Climate Funds) to reimburse a portion of the operating expenses of each Fund (other than acquired fund fees and expenses (“AFFE”)) so the “Total Annual Fund Operating Expenses After Expense Reimbursement” do not exceed the Fund’s Management Fee plus (+) 0.0049%. In the case of the FlexShares Real Assets Allocation Index Fund, the Investment Adviser has contractually agreed until March 1, 2022 to waive Management Fees or reimburse certain expenses in an amount equal to the AFFE attributable to the Fund’s investments in its Underlying Funds. After these dates, the contractual arrangements will continue automatically thereafter for periods of one year (each such one-year period, a “Renewal Year”). The contractual arrangements may be terminated, with respect to a Fund, as to any succeeding Renewal Year, by NTI or the Fund upon 60 days’ written notice prior to the end of the current Renewal Year. The Board may terminate the arrangements at any time with respect to a Fund if it determines that it is in the best interest of the Fund and its shareholders. In the case of the FlexShares Core Select Bond Fund, the Investment Adviser has contractually agreed until March 1, 2022 to waive Management Fees or reimburse certain expenses in an amount equal to the sum of (a) any AFFE incurred by the Fund that are attributable to the Fund’s investment in Acquired Funds managed by NTI or an investment adviser controlling, controlled by, or under common control with NTI (“Affiliated Funds”); and (b) 0.05% or such lesser amount in AFFE incurred by the Fund that are attributable to the Fund’s investment in Underlying Funds that are not Affiliated Funds. AFFE are expenses incurred indirectly by the Fund through its ownership of shares in other investment companies. Because AFFE are not direct expenses of a Fund, they are not reflected on a Fund’s financial statements. After these dates, the contractual expense reimbursement agreements continue automatically for periods of one year unless terminated, as to any succeeding renewal year, by either party upon 60 days’ written notice prior to the end of the current term. The Board may terminate the contractual expense reimbursement agreements discussed above with respect to any Fund at any time if it determines that it is in
the best interest of a Fund and its shareholders. These expenses and the reimbursements are shown as “Investment advisory fees reimbursed” on the Statements of Operations.
In addition, effective October 29, 2018, NTI contractually agreed to reimburse the Funds for certain other fees and expenses that are not Covered Expenses. These fees and expenses and the reimbursements are shown as Other expenses and Other expenses reimbursed, respectively, in the Statements of Operations.
The Investment Adviser may voluntarily waive or reimburse additional management fees or expenses. Any such additional voluntary expense reimbursement or fee waiver could be implemented, increased or decreased, or discontinued at any time. Amounts waived or reimbursed by the Investment Adviser pursuant to voluntary or contractual agreements discussed above may not be recouped by the Investment Adviser. These waivers and/or reimbursements are shown as Expenses waived and/or reimbursed by Advisor on the Statements of Operations. As of the year ended October 31, 2021, the Investment Adviser did not voluntarily waive or reimburse additional management fees.
5. Administration Fees
Per terms of agreements JPMorgan Chase Bank, N.A. (the “Administrator”) serves as administrator of the Funds. The Administrator provides certain administrative services to the Funds. For these services, the Administrator is entitled to certain fees and reasonable out-of-pocket expenses. These fees and expenses are Covered Expenses as defined above.
6. Custodian Fees
JPMorgan Chase Bank, N.A. (the “Custodian”) acts as custodian for the Funds in accordance with a Global Custody Agreement. The Custodian holds cash, securities and other assets of the Funds as required by the 1940 Act. As compensation for the services rendered under the agreement, the Custodian is entitled to fees and reasonable out-of-pocket expenses. These fees and expenses are Covered Expenses as defined above.
7. Trustees Fees
The Trust compensates each Trustee who is not an officer, director or employee of Northern Trust Corporation, or its
| | | | | | |
| | FLEXSHARES ANNUAL REPORT | | | 501 | |
Notes to the Financial Statements (cont.)
subsidiaries, for his or her services as a Trustee of the Trust and as a member of Board committees.
The Trust has adopted a deferred compensation plan (the “DC Plan”) for its Trustees who are not officers of Northern Trust or NTI. Under the DC Plan, Independent Trustees may elect to defer all or a portion of their compensation. The amount deferred is adjusted periodically based upon the performance of the investment options selected by the Trustees. The investment options currently available under the DC Plan are the FlexShares Morningstar US Market Factor Tilt Index Fund, FlexShares Morningstar Emerging Markets Factor Tilt Index Fund, FlexShares STOXX® US ESG Select Index Fund, FlexShares Morningstar Global Upstream Natural Resources Index Fund, FlexShares Global Quality Real Estate Index Fund, FlexShares Quality Dividend Index Fund, FlexShares iBoxx 5-Year Target Duration TIPS Index Fund, and the FlexShares Ready Access Variable Income Fund. Expenses related to the DC Plan are stated on the Statements of Operations.
8. Distribution and Service Plan
Foreside Fund Services, LLC (the “Distributor”) serves as the Funds’ distributor and distributes Creation Units (as described in Note 9) for each Fund on an agency basis. The Distributor does not receive a fee from the Funds for its distribution services. However, it receives compensation from NTI for its services as distributor pursuant to a separate letter agreement between it and NTI.
The Trust has adopted a Distribution and Service Plan (“the Plan”) pursuant to Rule 12b-1 under the 1940 Act. Payments to financial intermediaries under the Plan are tied directly to their own out-of-pocket expenses. The Plan has not been implemented with respect to the Funds. The Plan may not be implemented without further Board approval. The maximum distribution fee is 0.25% of each Fund’s respective average daily net assets under the Plan. The Funds did not pay any 12b-1 fees during the fiscal year.
9. Issuance and Redemption of Fund Shares
Each Fund only issues and redeems shares to Authorized Participants in exchange for the deposit or delivery of a basket of assets (securities and/or cash), in large blocks known as Creation Units, each of which is comprised of a specified number of shares.
Retail investors may only purchase and sell fund shares in the secondary market through a broker-dealer and such transactions may be subject to customary commission and fee rates imposed by the broker-dealer.
Authorized Participants may pay transaction fees to offset transfer and other transaction costs associated with the issuance and redemption of Creation Units. The transaction fees are paid directly to the Fund and used to offset Fund custody fees. Certain fees or costs associated with Creation Unit purchases may be paid by NTI in certain circumstances. In addition, the Trust may from time to time waive the standard transaction fee. The net custody fees charged to the Fund are paid for by the Investment Adviser through the Fund’s Unitary Fee. Transaction fees remaining in the Funds were as follows:
| | | | | | | | |
| Fund | | As of
October 31,
2021 | | | As of
October 31,
2020 | |
| | |
| FlexShares US Quality Low Volatility Index Fund | | $ | 1,400 | | | $ | 3,150 | |
| | |
| FlexShares Developed Markets ex-US Quality Low Volatility Index Fund | | | 9,000 | | | | 6,750 | |
| | |
| FlexShares Morningstar US Market Factor Tilt Index Fund | | | 4,500 | | | | 21,000 | |
| | |
| FlexShares Morningstar Developed Markets ex-US Factor Tilt Index Fund | | | 27,000 | | | | 80,000 | |
| | |
| FlexShares Morningstar Emerging Markets Factor Tilt Index Fund | | | 50,000 | | | | — | |
| | |
| FlexShares US Quality Large Cap Index Fund | | | 2,500 | | | | 3,000 | |
| | |
| FlexShares STOXX® US ESG Select Index Fund | | | 1,400 | | | | 1,400 | |
| | |
| FlexShares STOXX® Global ESG Select Index Fund | | | 13,000 | | | | 7,500 | |
| | |
| FlexShares Morningstar Global Upstream Natural Resources Index Fund | | | 40,500 | | | | 21,000 | |
| | |
| FlexShares STOXX® Global Broad Infrastructure Index Fund | | | 28,000 | | | | 26,000 | |
| | |
| FlexShares Global Quality Real Estate Index Fund | | | 6,000 | | | | 12,000 | |
| | | | |
| 502 | | FLEXSHARES ANNUAL REPORT | | |
Notes to the Financial Statements (cont.)
| | | | | | | | |
| Fund | | As of
October 31,
2021 | | | As of
October 31,
2020 | |
| | |
| FlexShares Quality Dividend Index Fund | | $ | 4,600 | | | $ | 10,550 | |
| | |
| FlexShares Quality Dividend Defensive Index Fund | | | 2,850 | | | | 4,950 | |
| | |
| FlexShares Quality Dividend Dynamic Index Fund | | | 1,450 | | | | 1,100 | |
| | |
| FlexShares International Quality Dividend Index Fund | | | 8,500 | | | | 15,000 | |
| | |
| FlexShares International Quality Dividend Defensive Index Fund | | | — | | | | 5,000 | |
| | |
| FlexShares International Quality Dividend Dynamic Index Fund | | | 7,000 | | | | 5,000 | |
| | |
| FlexShares Disciplined Duration MBS Index Fund | | | 400 | | | | 4,800 | |
| | |
| FlexShares Credit-Scored US Corporate Bond Index Fund | | | 2,500 | | | | 4,000 | |
| | |
| FlexShares Credit-Scored US Long Corporate Bond Index Fund | | | — | | | | 500 | |
| | |
| FlexShares High Yield Value-Scored Bond Index Fund | | | 10,500 | | | | 3,000 | |
| | |
| FlexShares Ready Access Variable Income Fund | | | 525 | | | | 3,675 | |
The FlexShares Real Assets Allocation Index Fund, FlexShares iBoxx 3-Year Target Duration TIPS Index Fund, FlexShares iBoxx 5-Year Target Duration TIPS Index Fund and the FlexShares Core Select Bond Fund do not charge standard creation unit transaction fees.
10. Investment Transactions
For the year ended October 31, 2021, the FlexShares iBoxx 3-Year Target Duration TIPS Index, FlexShares iBoxx 5-Year Target Duration TIPS Index and FlexShares Disciplined Duration MBS Index Funds invested solely in U.S. Government, including U.S. government agency, securities. The cost of securities purchased by each Fund and proceeds from sales of securities, excluding short-term securities, derivatives and in-kind transactions for the year ended October 31, 2021, were as follows:
| | | | | | | | |
| Fund | | Purchases | | | Sales | |
| | |
| FlexShares US Quality Low Volatility Index Fund | | $ | 61,057,045 | | | $ | 61,919,769 | |
| | |
| FlexShares Developed Markets ex-US Quality Low Volatility Index Fund | | | 45,111,218 | | | | 44,963,381 | |
| | |
| FlexShares Emerging Markets Quality Low Volatility Index Fund | | | 11,804,575 | | | | 7,759,654 | |
| | |
| FlexShares Morningstar US Market Factor Tilt Index Fund | | | 373,223,795 | | | | 368,691,882 | |
| | |
| FlexShares Morningstar Developed Markets ex-US Factor Tilt Index Fund | | | 173,117,976 | | | | 177,702,746 | |
| | |
| FlexShares Morningstar Emerging Markets Factor Tilt Index Fund | | | 163,667,120 | | | | 118,948,774 | |
| | |
| FlexShares US Quality Large Cap Index Fund | | | 31,835,970 | | | | 32,077,625 | |
| | |
| FlexShares STOXX® US ESG Select Index Fund | | | 64,232,764 | | | | 63,520,919 | |
| | |
| FlexShares STOXX® Global ESG Select Index Fund | | | 76,199,759 | | | | 75,206,346 | |
| | |
| FlexShares ESG & Climate US Large Cap Core Index Fund | | | 59,408 | | | | 6,663 | |
| | |
| FlexShares ESG & Climate Developed Markets ex-US Core Index Fund | | | 430,323 | | | | 5,364 | |
| | |
| FlexShares Morningstar Global Upstream Natural Resources Index Fund | | | 1,583,934,587 | | | | 1,326,907,406 | |
| | |
| FlexShares STOXX® Global Broad Infrastructure Index Fund | | | 338,741,238 | | | | 318,128,264 | |
| | |
| FlexShares Global Quality Real Estate Index Fund | | | 180,885,076 | | | | 172,947,980 | |
| | | | | | |
| | FLEXSHARES ANNUAL REPORT | | | 503 | |
Notes to the Financial Statements (cont.)
| | | | | | | | |
| Fund | | Purchases | | | Sales | |
| | |
| FlexShares Real Assets Allocation Index Fund | | $ | 6,117,909 | | | $ | 6,066,212 | |
| | |
| FlexShares Quality Dividend Index Fund | | | 780,746,353 | | | | 779,830,561 | |
| | |
| FlexShares Quality Dividend Defensive Index Fund | | | 263,506,188 | | | | 265,940,978 | |
| | |
| FlexShares Quality Dividend Dynamic Index Fund | | | 9,864,483 | | | | 10,025,691 | |
| | |
| FlexShares International Quality Dividend Index Fund | | | 389,170,013 | | | | 374,993,601 | |
| | |
| FlexShares International Quality Dividend Defensive Index Fund | | | 44,927,111 | | | | 45,305,551 | |
| | |
| FlexShares International Quality Dividend Dynamic Index Fund | | | 50,116,871 | | | | 37,594,813 | |
| | |
| FlexShares iBoxx 3-Year Target Duration TIPS Index Fund | | | 742,865,128 | | | | 796,758,587 | |
| | |
| FlexShares iBoxx 5-Year Target Duration TIPS Index Fund | | | 285,606,110 | | | | 309,132,797 | |
| | |
| FlexShares Disciplined Duration MBS Index Fund † | | | 508,943,721 | | | | 496,769,311 | |
| | |
| FlexShares Credit-Scored US Corporate Bond Index Fund | | | 266,365,059 | | | | 147,992,173 | |
| | |
| FlexShares Credit-Scored US Long Corporate Bond Index Fund | | | 60,169,395 | | | | 47,398,839 | |
| | |
| FlexShares High Yield Value-Scored Bond Index Fund | | | 684,524,048 | | | | 369,046,470 | |
| | |
| FlexShares ESG & Climate High Yield Corporate Core Index Fund | | | 53,116,046 | | | | 3,725,488 | |
| | |
| FlexShares ESG & Climate Investment Grade Corporate Core Index Fund | | | 52,548,651 | | | | 3,767,791 | |
| | |
| FlexShares Ready Access Variable Income Fund†† | | | 304,098,032 | | | | 320,230,722 | |
| | |
| FlexShares Core Select Bond Fund | | | 57,572,504 | | | | 57,493,128 | |
| † | Include $4,697,055 in purchases and $4,700,750 in sales in U.S. Government Securities. |
| †† | Include $18,015,784 in sales in U.S. Government Securities. |
11. In-Kind Transactions
During the year ended October 31, 2021, certain Funds received securities in exchange for subscriptions of shares (subscriptions-in-kind). For the year ended October 31, 2021, the fair value of the securities received for subscriptions for each Fund was as follows:
| | | | |
| Fund | | Fair Value | |
| |
| FlexShares US Quality Low Volatility Index Fund* | | $ | 55,780,963 | |
| |
| FlexShares Developed Markets ex-US Quality Low Volatility Index Fund | | | 12,008,884 | |
| |
| FlexShares Emerging Markets Quality Low Volatility Index Fund | | | 1,280,087 | |
| |
| FlexShares Morningstar US Market Factor Tilt Index Fund | | | 94,563,355 | |
| |
| FlexShares Morningstar Developed Markets ex-US Factor Tilt Index Fund | | | 32,651,926 | |
| |
| FlexShares Morningstar Emerging Markets Factor Tilt Index Fund | | | 7,628,117 | |
| |
| FlexShares US Quality Large Cap Index Fund | | | 53,487,836 | |
| |
| FlexShares STOXX® US ESG Select Index Fund | | | 114,217,428 | |
| |
| FlexShares STOXX® Global ESG Select Index Fund | | | 50,958,702 | |
| |
| FlexShares ESG & Climate US Large Cap Core Index Fund* | | | 2,424,324 | |
| |
| FlexShares ESG & Climate Developed Markets ex-US Core Index Fund* | | | 4,579,294 | |
| |
| FlexShares Morningstar Global Upstream Natural Resources Index Fund | | | 1,644,136,901 | |
| |
| FlexShares STOXX® Global Broad Infrastructure Index Fund | | | 715,932,322 | |
| |
| FlexShares Global Quality Real Estate Index Fund | | | 67,709,999 | |
| |
| FlexShares Real Assets Allocation Index Fund | | | 24,802,017 | |
| |
| FlexShares Quality Dividend Index Fund | | | 438,574,165 | |
| |
| FlexShares Quality Dividend Defensive Index Fund | | | 115,664,861 | |
| |
| FlexShares Quality Dividend Dynamic Index Fund | | | 5,747,170 | |
| | | | |
| 504 | | FLEXSHARES ANNUAL REPORT | | |
Notes to the Financial Statements (cont.)
| | | | |
| Fund | | Fair Value | |
| |
| FlexShares International Quality Dividend Index Fund | | $ | 39,274,624 | |
| |
| FlexShares International Quality Dividend Dynamic Index Fund | | | 32,128,050 | |
| |
| FlexShares iBoxx 3-Year Target Duration TIPS Index Fund | | | 302,603,375 | |
| |
| FlexShares iBoxx 5-Year Target Duration TIPS Index Fund | | | 155,931,033 | |
| |
| FlexShares Credit-Scored US Corporate Bond Index Fund | | | 10,018,743 | |
| |
| FlexShares High Yield Value-Scored Bond Index Fund | | | 57,324,170 | |
| |
| FlexShares Core Select Bond Fund | | | 36,286,290 | |
| * | Commencement of operation on September 20, 2021 |
During the year ended October 31, 2021, certain Funds delivered securities in exchange for redemption of shares (redemptions-in-kind). For financial reporting purposes, the Funds recorded net realized gains and losses in connection with each transaction. For the year ended October 31, 2021, the fair value and realized gain (losses) of the securities transferred for redemptions for each Fund were as follows:
| | | | | | | | |
| Fund | | Fair Value | | | Net Realized
Gains(Losses) | |
| | |
| FlexShares US Quality Low Volatility Index Fund | | $ | 43,501,967 | | | $ | 9,882,528 | |
| | |
| FlexShares Developed Markets ex-US Quality Low Volatility Index Fund | | | 15,192,344 | | | | 2,677,721 | |
| | |
| FlexShares Morningstar US Market Factor Tilt Index Fund | | | 105,355,192 | | | | 63,273,859 | |
| | |
| FlexShares Morningstar Developed Markets ex-US Factor Tilt Index Fund | | | 52,069,847 | | | | 14,065,818 | |
| | |
| FlexShares US Quality Large Cap Index Fund | | | 13,519,068 | | | | 4,606,626 | |
| | |
| FlexShares STOXX® US ESG Select Index Fund | | | 62,662,743 | | | | 24,349,402 | |
| | |
| FlexShares STOXX® Global ESG Select Index Fund | | | 27,885,092 | | | | 10,142,935 | |
| | | | | | | | |
| Fund | | Fair Value | | | Net Realized
Gains(Losses) | |
| | |
| FlexShares Morningstar Global Upstream Natural Resources Index Fund | | $ | 108,919,743 | | | $ | 31,786,733 | |
| | |
| FlexShares STOXX® Global Broad Infrastructure Index Fund | | | 340,211,427 | | | | 131,563,099 | |
| | |
| FlexShares Global Quality Real Estate Index Fund | | | 20,957,509 | | | | 2,563,099 | |
| | |
| FlexShares Real Assets Allocation Index Fund | | | 850,529 | | | | 190,124 | |
| | |
| FlexShares Quality Dividend Index Fund | | | 486,679,340 | | | | 153,466,309 | |
| | |
| FlexShares Quality Dividend Defensive Index Fund | | | 201,920,419 | | | | 60,712,638 | |
| | |
| FlexShares Quality Dividend Dynamic Index Fund | | | 2,815,406 | | | | 534,654 | |
| | |
| FlexShares International Quality Dividend Index Fund | | | 13,657,341 | | | | 2,149,355 | |
| | |
| FlexShares International Quality Dividend Defensive Index Fund | | | 1,528,532 | | | | 266,094 | |
| | |
| FlexShares iBoxx 3-Year Target Duration TIPS Index Fund | | | 327,586,039 | | | | 22,332,303 | |
| | |
| FlexShares iBoxx 5-Year Target Duration TIPS Index Fund | | | 51,644,853 | | | | 5,056,858 | |
| | |
| FlexShares Credit-Scored US Corporate Bond Index Fund | | | 13,233,869 | | | | 315,686 | |
| | |
| FlexShares Core Select Bond Fund | | | 16,587,588 | | | | 1,190,165 | |
12. Guarantees and Indemnifications
In the normal course of business each Fund enters into contracts with third-party service providers that contain a variety of representations and warranties and that provide general indemnifications. Additionally, under the Funds’ organizational documents, the officers and trustees are indemnified against certain liabilities arising out of the performance of their duties to the Funds. The Funds’ maximum exposure under these arrangements is unknown, as it involves possible future claims that may or may not be made against the Funds.
| | | | | | |
| | FLEXSHARES ANNUAL REPORT | | | 505 | |
Notes to the Financial Statements (cont.)
13. New Accounting Pronouncements
In March 2020, the FASB issued Accounting Standards Update (ASU) 2020-04, Reference Rate Reform (Topic 848) “Facilitation of the Effects of Reference Rate Reform on Financial Reporting” (“ASU 2020-04”), which provides optional temporary financial reporting relief from the effect of certain types of contract modifications due to the planned discontinuation of the London Interbank Offered Rate (“LIBOR”) and other interbank-offered based reference rates as of the end of 2021. The new guidance is effective for certain reference rate-related contract modifications that occur during the period March 12, 2020 through December 31, 2022, and the adoption of ASU 2020-04 is elective. Management does not believe this update has a material impact on the Funds’ financial statements and disclosures.
14. LIBOR Transition
Certain of the Funds’ investments, payment obligations and financing terms may be based on floating rates, such as LIBOR, Euro Interbank Offered Rate and other similar types of reference rates (each, a “Reference Rate”). On July 27, 2017, the Chief Executive of the UK Financial Conduct Authority (FCA), which regulates LIBOR, announced that the FCA will no longer persuade nor compel banks to submit rates for the calculation of LIBOR and certain other Reference Rates after 2021. The FCA and ICE Benchmark Administrator have since announced that while most LIBOR settings will cease to be published after December 31, 2021 as originally contemplated, a majority of U.S. dollar LIBOR settings will continue to be published until June 30, 2023. The U.S. Federal Reserve, based on the recommendations of the New York Federal Reserve’s Alternative Reference Rate Committee (comprised of major derivative market participants and their regulators), has begun publishing the secured overnight financing rate (“SOFR”) that is intended to replace U.S. dollar LIBOR. Proposals for alternative reference rates for other currencies have also been announced or have already begun publication. Uncertainty related to the liquidity and value impact of the change to alternative rates, and how to appropriately adjust these rates at the time of transition, poses risks for the Funds. The effect of any changes to, or discontinuation of, LIBOR on the Funds will depend on, among other things, (1) existing fallback or
termination provisions in individual contracts, and (2) whether, how, and when industry participants develop and adopt new reference rates and fallbacks for both legacy and new instruments and contracts. The expected discontinuation of LIBOR could have a significant impact on the financial markets in general and may also present heightened risk to market participants, including public companies, investment advisers, investment companies, and broker-dealers. The risks associated with this discontinuation and transition will be exacerbated if the work necessary to effect an orderly transition to an alternative reference rate is not completed in a timely manner. Accordingly, it is difficult to predict the full impact of the transition away from LIBOR on the Funds until new reference rates and fallbacks for both legacy and new instruments and contracts are commercially accepted and market practices become settled. Until then, the Funds may continue to invest in instruments that reference such rates or otherwise use such Reference Rates due to favorable liquidity or pricing.
15. Legal Proceedings
On or about February 14, 2020, Marc S. Kirschner, as Trustee for NWHI Litigation Trust (the “Trust”), and Wilmington Savings Fund Society, FSB, as successor indenture trustee for various notes issued by Nine West Holdings, Inc. (together with the Trustee, “Plaintiffs”), filed separate complaints in the United States District Court for the Northern District of Illinois (case nos. 20-cv-01129 and 20-cv-01136, respectively) against a group of defendants that includes the FlexShares Morningstar US Market Factor Tilt Index Fund in its capacity as a former public shareholder of The Jones Group Inc. (“Jones Group”). The claims in these actions stem from a series of merger transactions (“Transactions”) entered into by Jones Group in 2014 that allegedly rendered Jones Group insolvent. The FlexShares Morningstar US Market Factor Tilt Index Fund allegedly received $224,910 as a result of the Transactions. The Plaintiffs seek to clawback these proceeds for the benefit of the Trust and the noteholders on the basis that they allegedly were fraudulent conveyances.
During the quarter ended June 30, 2020, the Judicial Panel on Multidistrict Litigation ordered the transfer of these actions and several substantially similar actions filed in other
| | | | |
| 506 | | FLEXSHARES ANNUAL REPORT | | |
Notes to the Financial Statements (cont.)
districts to the Southern District of New York for consolidated pre-trial proceedings. On June 29, 2020, the former public shareholder defendants, including FlexShares Morningstar US Market Factor Tilt Index Fund, filed a motion to dismiss on the basis that the payments made to them in connection with the Transactions were shielded from the fraudulent conveyance claims under Section 546(e) of the Bankruptcy Code. On August 27, 2020, all fraudulent conveyance claims against the former public shareholder defendants were dismissed. Plaintiffs appealed from that decision and the actions are currently on appeal before the U.S. Court of Appeals for the Second Circuit.
Since it is presently not possible to determine the outcome of these matters, no provision has been made in the financial statements for their ultimate resolution. In management of the Fund’s opinion, the final resolution of the above legal matters will not have a material adverse effect on the Fund’s financial statements. The Fund intends to vigorously defend these actions.
16. Coronavirus (COVID-19) Pandemic
The outbreak of a respiratory disease caused by a novel coronavirus was first detected in December 2019 and has spread internationally. The outbreak and efforts to contain its spread have resulted in closing borders and quarantines, restricting international and domestic travel, enhanced health screenings, cancellations, disrupted supply chains and customer activity, responses by businesses (including changes to operations and reducing staff), and have produced general concern and uncertainty. The impact of the coronavirus pandemic, and other epidemics and pandemics that may arise in the future could adversely affect national and global economies, individual companies and the market in general in a manner and for a period of time that cannot be foreseen at the present time and may adversely affect the value, volatility and liquidity of securities held by a Fund. In addition, during periods of market disruption or other abnormal market conditions, the Funds’ exposure to the risks described in their respective prospectuses and statements of additional information will likely increase. In the event of a pandemic outbreak, there can be no assurance that the Funds and their service providers will be able to maintain normal business operations for an extended period
of time or will not lose the services of key personnel on a temporary or long-term basis due to illness or other reasons, which could otherwise disrupt the ability of the Fund’s service providers to perform essential services. Certain economic and market conditions arising out of the coronavirus pandemic or an outbreak could result in a Fund’s inability to achieve its investment objectives, cause the postponement of reconstitution or rebalance dates for benchmark or underlying indices, adversely affect the prices and liquidity of the securities and other instruments in which a Fund invests, and negatively impact a Fund’s performance. Management is monitoring the development of the pandemic, which was ongoing as of the date of the financial statements and is evaluating its impact on the financial position and operating results of the Funds.
17. Subsequent Events
Management has evaluated subsequent events for the Funds through the date the financial statements were issued and has concluded that there are no recognized or non-recognized subsequent events relevant for financial statement disclosure.
| | | | | | |
| | FLEXSHARES ANNUAL REPORT | | | 507 | |
Report of Independent Registered Public Accounting Firm
To the Shareholders and Board of Trustees of FlexShares® Trust
Opinion on the Financial Statements and Financial Highlights
We have audited the accompanying statements of assets and liabilities of FlexShares® Trust, comprising the funds listed in the table below (collectively, the “Funds”), including the schedules of investments, as of October 31, 2021, the related statements of operations, the statements of changes in net assets, and the financial highlights for each of the periods listed in the table below, and the related notes. In our opinion, the financial statements and financial highlights present fairly, in all material respects, the financial position of each of the funds constituting FlexShares® Trust as of October 31, 2021, and the results of their operations, the changes in their net assets, and the financial highlights for each of the periods listed in the table below in conformity with accounting principles generally accepted in the United States of America.
| | | | | | |
| Fund Name(s) | | Statement of
Operations | | Statements of
Changes in Net
Assets | | Financial Highlights |
| | | |
FlexShares® Morningstar US Market Factor Tilt Index Fund FlexShares® Morningstar Developed Markets ex-US Factor Tilt Index Fund FlexShares® Morningstar Emerging Markets Factor Tilt Index Fund FlexShares® Morningstar Global Upstream Natural Resources Index Fund FlexShares® STOXX® Global Broad Infrastructure Index Fund FlexShares® Global Quality Real Estate Index Fund FlexShares® Quality Dividend Index Fund FlexShares® Quality Dividend Defensive Index Fund FlexShares® Quality Dividend Dynamic Index Fund FlexShares® International Quality Dividend Index Fund FlexShares® International Quality Dividend Defensive Index Fund FlexShares® International Quality Dividend Dynamic Index Fund FlexShares® iBoxx 3-Year Target Duration TIPS Index Fund FlexShares® iBoxx 5-Year Target Duration TIPS Index Fund FlexShares® Disciplined Duration MBS Index Fund FlexShares® Ready Access Variable Income Fund FlexShares® US Quality Large Cap Index Fund FlexShares® Credit-Scored US Long Corporate Bond Index Fund FlexShares® Credit-Scored US Corporate Bond Index Fund FlexShares® Real Assets Allocation Index Fund FlexShares® STOXX® US ESG Select Index Fund (formerly known as FlexShares® STOXX® US ESG Impact Index Fund) FlexShares® STOXX® Global ESG Select Index Fund (formerly known as FlexShares® STOXX® Global ESG Impact Index Fund) | | For the year
ended
October 31,
2021 | | For the years
ended
October 31,
2021 and
2020 | | For the years ended October 31,
2021, 2020, 2019, 2018, and
2017 |
| | | |
| FlexShares® High Yield Value-Scored Bond Index Fund | | For the year
ended
October 31,
2021 | | For the years
ended
October 31,
2021 and
2020 | | For the years ended October 31,
2021, 2020, 2019 and for the
period from July 17, 2018
(commencement of operations)
through October 31, 2018 |
| | | |
| FlexShares® Core Select Bond Fund | | For the year
ended
October 31,
2021 | | For the years
ended
October 31,
2021 and
2020 | | For the years ended October 31,
2021, 2020, 2019, 2018 and
for the period from
November 18, 2016
(commencement of operations)
through October 31, 2017 |
| | | | |
| 508 | | FLEXSHARES ANNUAL REPORT | | |
Report of Independent Registered Public Accounting Firm (cont.)
| | | | | | |
| Fund Name(s) | | Statement of
Operations | | Statements of
Changes in Net
Assets | | Financial Highlights |
| | | |
FlexShares® US Quality Low Volatility Index Fund FlexShares® Developed Markets ex-US Quality Low Volatility Index Fund FlexShares® Emerging Markets Quality Low Volatility Index Fund | | For the year
ended
October 31,
2021 | | For the years
ended
October 31,
2021 and
2020 | | For the years ended October 31,
2021, 2020 and for the period
from July 15, 2019
(commencement of operations)
through October 31, 2019 |
| |
FlexShares® ESG & Climate Developed Markets ex-US Core Index Fund FlexShares® ESG & Climate US Large Cap Core Index Fund FlexShares® ESG & Climate High Yield Corporate Core Index Fund FlexShares® ESG & Climate Investment Grade Corporate Core Index Fund | | For the period from September 20, 2021 (commencement of operations) through October 31, 2021 |
Basis for Opinion
These financial statements and financial highlights are the responsibility of the Funds’ management. Our responsibility is to express an opinion on the Funds’ financial statements and financial highlights based on our audits. We are a public accounting firm registered with the Public Company Accounting Oversight Board (United States) (PCAOB) and are required to be independent with respect to the Funds in accordance with the U.S. federal securities laws and the applicable rules and regulations of the Securities and Exchange Commission and the PCAOB.
We conducted our audits in accordance with the standards of the PCAOB. Those standards require that we plan and perform the audit to obtain reasonable assurance about whether the financial statements and financial highlights are free of material misstatement, whether due to error or fraud. The Funds are not required to have, nor were we engaged to perform, an audit of their internal control over financial reporting. As part of our audits we are required to obtain an understanding of internal control over financial reporting but not for the purpose of expressing an opinion on the effectiveness of the Funds’ internal control over financial reporting. Accordingly, we express no such opinion.
Our audits included performing procedures to assess the risks of material misstatement of the financial statements and financial highlights, whether due to error or fraud, and performing procedures that respond to those risks. Such procedures included examining, on a test basis, evidence regarding the amounts and disclosures in the financial statements and financial highlights. Our audits also included evaluating the accounting principles used and significant estimates made by management, as well as evaluating the overall presentation of the financial statements and financial highlights. Our procedures included confirmation of securities owned as of October 31, 2021, by correspondence with the custodian and brokers; when replies were not received from brokers, we performed other auditing procedures. We believe that our audits provide a reasonable basis for our opinion.

Chicago, Illinois
December 21, 2021
We have served as the auditor of one or more Northern Trust investment companies since 2002.
| | | | | | |
| | FLEXSHARES ANNUAL REPORT | | | 509 | |
Tax Information October 31, 2021 (Unaudited)
QUALIFIED DIVIDEND INCOME (QDI)
Under the Jobs and Growth Tax Relief Reconciliation Act of 2003 (the “Act”), the following percentages of ordinary dividends paid during the fiscal year ended October 31, 2021 are designated as “qualified dividend income”, as defined in the Act, subject to reduced tax rates in 2021:
| | | | |
| Fund | | QDI PERCENTAGE | |
| |
| FlexShares US Quality Low Volatility Index Fund | | | 100.00 | % |
| |
| FlexShares Developed Markets Ex-US Quality Low Volatility Index Fund | | | 94.39 | |
| |
| FlexShares Emerging Markets Quality Low Volatility Index Fund | | | 73.93 | |
| |
| FlexShares Morningstar US Market Factor Tilt Index Fund | | | 98.33 | |
| |
| FlexShares Morningstar Developed Markets ex-US Factor Tilt Index Fund | | | 87.27 | |
| |
| FlexShares Morningstar Emerging Markets Factor Tilt Index Fund | | | 77.39 | |
| |
| FlexShares US Quality Large Cap Index Fund | | | 100.00 | |
| |
| FlexShares STOXX® US ESG Select Index Fund | | | 100.00 | |
| |
| FlexShares STOXX® Global ESG Select Index Fund | | | 100.00 | |
| |
| FlexShares ESG & Climate Developed Markets ex-US Core Index Fund | | | 100.00 | |
| |
| FlexShares Morningstar Global Upstream Natural Resources Index Fund | | | 89.62 | |
| |
| FlexShares STOXX® Global Broad Infrastructure Index Fund | | | 85.86 | |
| |
| FlexShares Global Quality Real Estate Index Fund | | | 26.07 | |
| |
| FlexShares Real Assets Allocation Index Fund | | | 83.58 | |
| |
| FlexShares Quality Dividend Index Fund | | | 100.00 | |
| |
| FlexShares Quality Dividend Defensive Index Fund | | | 100.00 | |
| |
| FlexShares Quality Dividend Dynamic Index Fund | | | 95.49 | |
| |
| FlexShares International Quality Dividend Index Fund | | | 70.22 | |
| | | | |
| Fund | | QDI PERCENTAGE | |
| |
| FlexShares International Quality Dividend Defensive Index Fund | | | 80.28 | % |
| |
| FlexShares International Quality Dividend Dynamic Index Fund | | | 70.20 | |
CORPORATE DIVIDENDS RECEIVED
DEDUCTION (DRD)
A percentage of the dividends distributed during the fiscal year for the following Funds qualifies for the dividends received deduction for corporate shareholders:
| | | | |
| Fund | | CORPORATE DRD
PERCENTAGE | |
| |
| FlexShares US Quality Low Volatility Index Fund | | | 100.00 | % |
| |
| FlexShares Emerging Markets Quality Low Volatility Index Fund | | | 0.16 | |
| |
| FlexShares Morningstar US Market Factor Tilt Index Fund | | | 94.21 | |
| |
| FlexShares Morningstar Emerging Markets Factor Tilt Index Fund | | | 0.03 | |
| |
| FlexShares US Quality Large Cap Index Fund | | | 100.00 | |
| |
| FlexShares STOXX® US ESG Select Index Fund | | | 100.00 | |
| |
| FlexShares STOXX® Global ESG Select Index Fund | | | 52.93 | |
| |
| FlexShares Morningstar Global Upstream Natural Resources Index Fund | | | 28.04 | |
| |
| FlexShares STOXX® Global Broad Infrastructure Index Fund | | | 40.91 | |
| |
| FlexShares Global Quality Real Estate Index Fund | | | 0.26 | |
| |
| FlexShares Real Assets Allocation Index Fund | | | 31.32 | |
| |
| FlexShares Quality Dividend Index Fund | | | 98.94 | |
| |
| FlexShares Quality Dividend Defensive Index Fund | | | 100.00 | |
| |
| FlexShares Quality Dividend Dynamic Index Fund | | | 94.58 | |
| | | | |
| 510 | | FLEXSHARES ANNUAL REPORT | | |
Tax Information (cont.)
FOREIGN TAX CREDIT
Each Fund below intends to make an election that will allow its shareholders to treat their proportionate share of foreign taxes paid by the Fund as having been paid by them. The amounts per share, which represent income from sources within, and taxes paid to foreign countries, are as follows:
| | | | | | | | |
| Fund | | TAXES | | | INCOME | |
| | |
| FlexShares Developed Markets Ex-US Quality Low Volatility Index Fund | | $ | 0.0757 | | | $ | 0.9115 | |
| | |
| FlexShares Emerging Markets Quality Low Volatility Index Fund | | | 0.1389 | | | | 0.6420 | |
| | |
| FlexShares Morningstar Developed Markets ex-US Factor Tilt Index Fund | | | 0.1434 | | | | 2.0268 | |
| | |
| FlexShares Morningstar Emerging Markets Factor Tilt Index Fund | | | 0.2176 | | | | 1.7333 | |
| | |
| FlexShares ESG & Climate Developed Markets ex-US Core Index Fund | | | 0.0015 | | | | 0.1597 | |
| | |
| FlexShares Morningstar Global Upstream Natural Resources Index Fund | | | 0.0300 | | | | 0.9676 | |
| | |
| FlexShares STOXX Global Broad Infrastructure Index Fund | | | 0.0584 | | | | 0.9068 | |
| | |
| FlexShares Real Assets Allocation Index Fund | | | 0.0146 | | | | 0.3083 | |
| | |
| FlexShares International Quality Dividend Index Fund | | | 0.0748 | | | | 1.0279 | |
| | |
| FlexShares International Quality Dividend Defensive Index Fund | | | 0.0744 | | | | 0.9874 | |
| | |
| FlexShares International Quality Dividend Dynamic Index Fund | | | 0.0714 | | | | 1.0221 | |
| | | | | | |
| | FLEXSHARES ANNUAL REPORT | | | 511 | |
Fund Expenses (Unaudited)
As a shareholder, you incur two types of costs:
(1) Transaction costs for purchasing and selling shares and (2) ongoing costs, including advisory and other Fund expenses. The expense examples below are intended to help you understand your ongoing costs (in dollars) of investing in the Funds and to compare these costs with the ongoing costs of investing in other funds.
Actual Expenses
The actual expense examples are based on an investment of $1,000 invested at the beginning of a six month period and held through the period ended October 31, 2021.
The first line under each Fund in the following tables provides information about actual account values and actual expenses. You may use the information in this line, together with the amount you invested, to estimate the expenses that you paid over the period. Simply divide your account value by $1,000 (for example, an $8,600 account value divided by $1,000 = 8.6), then multiply the result by the number in the first line under the heading “Expenses Paid During the Period” to estimate the expenses you paid on your account during this period.
Hypothetical Example for Comparison Purposes
The hypothetical expense examples are based on an investment of $1,000 invested at the beginning of a six month period and held through the period ended October 31, 2021.
The second line under each Fund in the following table provides information about hypothetical account values and hypothetical expenses based on the Fund’s actual expense ratio and an assumed rate of return of 5% per year before expenses, which is not the Fund’s actual return. The hypothetical account values and expenses may not be used to estimate the actual ending account balance or expenses you paid for the period. You may use this information to compare the ongoing costs of investing in the Funds and other funds. To do so, compare this 5% hypothetical example with the 5% hypothetical examples that appear in the shareholder reports of the other funds.
Please note that the expenses shown in the table are meant to highlight your ongoing costs only and do not reflect any transaction costs, such as brokerage commissions on purchases or sales of Fund shares. Therefore, the second line for each Fund in the table is useful in comparing ongoing costs only, and will not help you determine the relative total costs of owning different funds. In addition, if these transaction costs were included, your costs would have been higher.
| | | | | | | | | | | | | | | | |
| | | Beginning
Account
Value | | | Ending
Account
Value
10/31/21 | | | Expenses Paid
During the
Period* | | | Annualized Expense Ratio
During Period | |
|
| FlexShares® US Quality Low Volatility Index Fund | |
| | | | |
| Actual | | $ | 1,000.00 | | | $ | 1,116.10 | | | $ | 1.17 | | | | 0.22 | % |
| | | | |
| Hypothetical | | $ | 1,000.00 | | | $ | 1,024.10 | | | $ | 1.12 | | | | 0.22 | % |
|
| FlexShares® Developed Markets ex-US Quality Low Volatility Index Fund | |
| | | | |
| Actual | | $ | 1,000.00 | | | $ | 1,046.20 | | | $ | 1.65 | | | | 0.32 | % |
| | | | |
| Hypothetical | | $ | 1,000.00 | | | $ | 1,023.59 | | | $ | 1.63 | | | | 0.32 | % |
|
| FlexShares® Emerging Markets Quality Low Volatility Index Fund | |
| | | | |
| Actual | | $ | 1,000.00 | | | $ | 974.90 | | | $ | 1.99 | | | | 0.40 | % |
| | | | |
| Hypothetical | | $ | 1,000.00 | | | $ | 1,023.19 | | | $ | 2.04 | | | | 0.40 | % |
| | | | |
| 512 | | FLEXSHARES ANNUAL REPORT | | |
Fund Expenses (cont.)
| | | | | | | | | | | | | | | | |
| | | Beginning
Account
Value | | | Ending
Account
Value
10/31/21 | | | Expenses Paid
During the
Period* | | | Annualized Expense Ratio
During Period | |
|
| FlexShares® Morningstar US Market Factor Tilt Index Fund | |
| | | | |
| Actual | | $ | 1,000.00 | | | $ | 1,079.30 | | | $ | 1.31 | | | | 0.25 | % |
| | | | |
| Hypothetical | | $ | 1,000.00 | | | $ | 1,023.95 | | | $ | 1.28 | | | | 0.25 | % |
|
| FlexShares® Morningstar Developed Markets ex-US Factor Tilt Index Fund | |
| | | | |
| Actual | | $ | 1,000.00 | | | $ | 1,036.40 | | | $ | 2.00 | | | | 0.39 | % |
| | | | |
| Hypothetical | | $ | 1,000.00 | | | $ | 1,023.24 | | | $ | 1.99 | | | | 0.39 | % |
|
| FlexShares® Morningstar Emerging Markets Factor Tilt Index Fund | |
| | | | |
| Actual | | $ | 1,000.00 | | | $ | 972.30 | | | $ | 2.93 | | | | 0.59 | % |
| | | | |
| Hypothetical | | $ | 1,000.00 | | | $ | 1,022.23 | | | $ | 3.01 | | | | 0.59 | % |
|
| FlexShares® US Quality Large Cap Index Fund | |
| | | | |
| Actual | | $ | 1,000.00 | | | $ | 1,105.10 | | | $ | 1.70 | | | | 0.32 | % |
| | | | |
| Hypothetical | | $ | 1,000.00 | | | $ | 1,023.59 | | | $ | 1.63 | | | | 0.32 | % |
|
| FlexShares® STOXX® US ESG Select Index Fund | |
| | | | |
| Actual | | $ | 1,000.00 | | | $ | 1,110.80 | | | $ | 1.70 | | | | 0.32 | % |
| | | | |
| Hypothetical | | $ | 1,000.00 | | | $ | 1,023.59 | | | $ | 1.63 | | | | 0.32 | % |
|
| FlexShares® STOXX® Global ESG Select Index Fund | |
| | | | |
| Actual | | $ | 1,000.00 | | | $ | 1,098.20 | | | $ | 2.22 | | | | 0.42 | % |
| | | | |
| Hypothetical | | $ | 1,000.00 | | | $ | 1,023.09 | | | $ | 2.14 | | | | 0.42 | % |
|
| FlexShares® ESG & Climate US Large Cap Core Index Fund(a) | |
| | | | |
| Actual | | $ | 1,000.00 | | | $ | 1,067.80 | | | $ | 0.11 | | | | 0.09 | % |
| | | | |
| Hypothetical | | $ | 1,000.00 | | | $ | 1,024.75 | | | $ | 0.46 | | | | 0.09 | % |
|
| FlexShares® ESG & Climate Developed Markets ex-US Core Index Fund(a) | |
| | | | |
| Actual | | $ | 1,000.00 | | | $ | 1,023.80 | | | $ | 0.14 | | | | 0.12 | % |
| | | | |
| Hypothetical | | $ | 1,000.00 | | | $ | 1,024.60 | | | $ | 0.61 | | | | 0.12 | % |
|
| FlexShares® Morningstar Global Upstream Natural Resources Index Fund | |
| | | | |
| Actual | | $ | 1,000.00 | | | $ | 1,047.60 | | | $ | 2.37 | | | | 0.46 | % |
| | | | |
| Hypothetical | | $ | 1,000.00 | | | $ | 1,022.89 | | | $ | 2.35 | | | | 0.46 | % |
|
| FlexShares® STOXX® Global Broad Infrastructure Index Fund | |
| | | | |
| Actual | | $ | 1,000.00 | | | $ | 1,012.60 | | | $ | 2.38 | | | | 0.47 | % |
| | | | |
| Hypothetical | | $ | 1,000.00 | | | $ | 1,022.84 | | | $ | 2.40 | | | | 0.47 | % |
|
| FlexShares® Global Quality Real Estate Index Fund | |
| | | | |
| Actual | | $ | 1,000.00 | | | $ | 1,100.00 | | | $ | 2.38 | | | | 0.45 | % |
| | | | |
| Hypothetical | | $ | 1,000.00 | | | $ | 1,022.94 | | | $ | 2.29 | | | | 0.45 | % |
| | | | | | |
| | FLEXSHARES ANNUAL REPORT | | | 513 | |
Fund Expenses (cont.)
| | | | | | | | | | | | | | | | |
| | | Beginning
Account
Value | | | Ending
Account
Value
10/31/21 | | | Expenses Paid
During the
Period* | | | Annualized Expense Ratio
During Period | |
|
| FlexShares® Real Assets Allocation Index Fund(b) | |
| | | | |
| Actual | | $ | 1,000.00 | | | $ | 1,037.60 | | | $ | 0.67 | | | | 0.13 | % |
| | | | |
| Hypothetical | | $ | 1,000.00 | | | $ | 1,024.55 | | | $ | 0.66 | | | | 0.13 | % |
|
| FlexShares® Quality Dividend Index Fund | |
| | | | |
| Actual | | $ | 1,000.00 | | | $ | 1,072.50 | | | $ | 1.93 | | | | 0.37 | % |
| | | | |
| Hypothetical | | $ | 1,000.00 | | | $ | 1,023.34 | | | $ | 1.89 | | | | 0.37 | % |
|
| FlexShares® Quality Dividend Defensive Index Fund | |
| | | | |
| Actual | | $ | 1,000.00 | | | $ | 1,074.10 | | | $ | 1.93 | | | | 0.37 | % |
| | | | |
| Hypothetical | | $ | 1,000.00 | | | $ | 1,023.34 | | | $ | 1.89 | | | | 0.37 | % |
|
| FlexShares® Quality Dividend Dynamic Index Fund | |
| | | | |
| Actual | | $ | 1,000.00 | | | $ | 1,088.00 | | | $ | 1.95 | | | | 0.37 | % |
| | | | |
| Hypothetical | | $ | 1,000.00 | | | $ | 1,023.34 | | | $ | 1.89 | | | | 0.37 | % |
|
| FlexShares® International Quality Dividend Index Fund | |
| | | | |
| Actual | | $ | 1,000.00 | | | $ | 1,005.60 | | | $ | 2.38 | | | | 0.47 | % |
| | | | |
| Hypothetical | | $ | 1,000.00 | | | $ | 1,022.84 | | | $ | 2.40 | | | | 0.47 | % |
|
| FlexShares® International Quality Dividend Defensive Index Fund | |
| | | | |
| Actual | | $ | 1,000.00 | | | $ | 1,005.50 | | | $ | 2.38 | | | | 0.47 | % |
| | | | |
| Hypothetical | | $ | 1,000.00 | | | $ | 1,022.84 | | | $ | 2.40 | | | | 0.47 | % |
|
| FlexShares® International Quality Dividend Dynamic Index Fund | |
| | | | |
| Actual | | $ | 1,000.00 | | | $ | 1,003.90 | | | $ | 2.37 | | | | 0.47 | % |
| | | | |
| Hypothetical | | $ | 1,000.00 | | | $ | 1,022.84 | | | $ | 2.40 | | | | 0.47 | % |
|
| FlexShares® iBoxx 3-Year Target Duration TIPS Index Fund | |
| | | | |
| Actual | | $ | 1,000.00 | | | $ | 1,027.80 | | | $ | 0.92 | | | | 0.18 | % |
| | | | |
| Hypothetical | | $ | 1,000.00 | | | $ | 1,024.30 | | | $ | 0.92 | | | | 0.18 | % |
|
| FlexShares® iBoxx 5-Year Target Duration TIPS Index Fund | |
| | | | |
| Actual | | $ | 1,000.00 | | | $ | 1,036.00 | | | $ | 0.92 | | | | 0.18 | % |
| | | | |
| Hypothetical | | $ | 1,000.00 | | | $ | 1,024.30 | | | $ | 0.92 | | | | 0.18 | % |
|
| FlexShares® Disciplined Duration MBS Index Fund | |
| | | | |
| Actual | | $ | 1,000.00 | | | $ | 997.30 | | | $ | 1.01 | | | | 0.20 | % |
| | | | |
| Hypothetical | | $ | 1,000.00 | | | $ | 1,024.20 | | | $ | 1.02 | | | | 0.20 | % |
|
| FlexShares® Credit-Scored US Corporate Bond Index Fund | |
| | | | |
| Actual | | $ | 1,000.00 | | | $ | 1,003.90 | | | $ | 1.11 | | | | 0.22 | % |
| | | | |
| Hypothetical | | $ | 1,000.00 | | | $ | 1,024.10 | | | $ | 1.12 | | | | 0.22 | % |
| | | | |
| 514 | | FLEXSHARES ANNUAL REPORT | | |
Fund Expenses (cont.)
| | | | | | | | | | | | | | | | |
| | | Beginning
Account
Value | | | Ending
Account
Value
10/31/21 | | | Expenses Paid
During the
Period* | | | Annualized Expense Ratio
During Period | |
|
| FlexShares® Credit-Scored US Long Corporate Bond Index Fund | |
| | | | |
| Actual | | $ | 1,000.00 | | | $ | 1,063.10 | | | $ | 1.14 | | | | 0.22 | % |
| | | | |
| Hypothetical | | $ | 1,000.00 | | | $ | 1,024.10 | | | $ | 1.12 | | | | 0.22 | % |
|
| FlexShares® High Yield Value-Scored Bond Index Fund | |
| | | | |
| Actual | | $ | 1,000.00 | | | $ | 1,022.90 | | | $ | 1.89 | | | | 0.37 | % |
| | | | |
| Hypothetical | | $ | 1,000.00 | | | $ | 1,023.34 | | | $ | 1.89 | | | | 0.37 | % |
|
| FlexShares® ESG & Climate High Yield Corporate Core Index Fund(a) | |
| | | | |
| Actual | | $ | 1,000.00 | | | $ | 995.00 | | | $ | 0.26 | | | | 0.23 | % |
| | | | |
| Hypothetical | | $ | 1,000.00 | | | $ | 1,024.05 | | | $ | 1.17 | | | | 0.23 | % |
|
| FlexShares® ESG & Climate Investment Grade Corporate Core Index Fund(a) | |
| | | | |
| Actual | | $ | 1,000.00 | | | $ | 986.80 | | | $ | 0.14 | | | | 0.12 | % |
| | | | |
| Hypothetical | | $ | 1,000.00 | | | $ | 1,024.60 | | | $ | 0.61 | | | | 0.12 | % |
|
| FlexShares® Ready Access Variable Income Fund | |
| | | | |
| Actual | | $ | 1,000.00 | | | $ | 1,000.60 | | | $ | 1.26 | | | | 0.25 | % |
| | | | |
| Hypothetical | | $ | 1,000.00 | | | $ | 1,023.95 | | | $ | 1.28 | | | | 0.25 | % |
|
| FlexShares® Core Select Bond Fund(b) | |
| | | | |
| Actual | | $ | 1,000.00 | | | $ | 1,011.60 | | | $ | 1.12 | | | | 0.22 | % |
| | | | |
| Hypothetical | | $ | 1,000.00 | | | $ | 1,024.10 | | | $ | 1.12 | | | | 0.22 | % |
| * | Expenses are equal to the average account value over the period multiplied by the Fund’s annualized expense ratio, multiplied by the number of days in the most recent fiscal half-year divided by the number of days in the fiscal year (to reflect the one half year period). |
| (a) | The Fund commenced operations on September 20, 2021. Actual Expenses Paid During the Period are equal to the Fund’s annualized net expense ratio, multiplied by the average account value over the period, multiplied by 42 divided by 365 (to reflect the actual days in the period). Hypothetical Expenses Paid During the Period are equal to the Fund’s annualized net expense ratio, multiplied by the average account value over the period, multiplied by 184 divided by 365 (to reflect the one-half year period). |
| (b) | Annualized expense ratio and expenses paid during the period do not include fees and expenses of the Underlying Fund(s) in which the Fund invests. |
| | | | | | |
| | FLEXSHARES ANNUAL REPORT | | | 515 | |
Trustees and Officers (Unaudited)
| | | | | | | | | | | | |
| NON-INTERESTED TRUSTEES |
| Name, Address(1) and Age | | Position(s)
Held with
the Trust | | Term of Office and Length of
Time Served(2) | | Principal Occupation(s) During
Past 5 Years | | Number of Funds in Fund
Complex(3) Overseen by Trustee | | | Other
Directorships
Held by Trustee(4) |
Sarah N. Garvey Age: 69 | | Trustee | | July 2011
to present | | • Chairman of the Board of Navy Pier from 2011 to 2013 and Member of the Board from 2011 to 2020; • Member of the Board of Directors of The Civic Federation since 2004; • Member of the Executive Committee and Chairman of the Audit Committee since 2017 and Trustee of the Art Institute of Chicago since 2011. | | | 31 | | | None |
Philip G. Hubbard Age: 70 | | Trustee | | July 2011
to present | | • Managing Partner of Solidian Fund, LP and Solidian Management, LLC (a fund of hedge funds platform for family and friends investments) since 2001; • President of Hubbard Management Group, LLC (a personal investment vehicle) since 2001; • Chairman of the Board of Trustees of the Wheaton College Trust Company, N. A. since 2004; • Member of the Board of Trustees of Wheaton College since 1998; • Chairman of the Board of Directors of the English Language Institute/China (a nonprofit educational organization) since 1993; • Member of the Board of First Cup, LLC (restaurant franchising) since 2014. | | | 31 | | | None |
| | | | |
| 516 | | FLEXSHARES ANNUAL REPORT | | |
Trustees and Officers (cont.)
| | | | | | | | | | | | |
| Name, Address(1) and Age | | Position(s)
Held with
the Trust | | Term of Office and Length of
Time Served(2) | | Principal Occupation(s) During
Past 5 Years | | Number of Funds in Fund
Complex(3) Overseen by Trustee | | | Other
Directorships
Held by Trustee(4) |
Eric T. McKissack Age: 67 | | Trustee and Chairman | | July 2011
to present | | • CEO Emeritus and Founder; CEO and Founder from 2004 to 2020 of Channing Capital Management, LLC (an SEC registered investment adviser); • Member of the Board of Trustees, the Investment Committee, and the Finance Committee of the Art Institute of Chicago since 2002; • Member of the Board of Grand Victoria Foundation since 2011; • Member of the Board of the Graham Foundation since 2014. | | | 31 | | | Morgan
Stanley
Pathway
Funds
(formerly,
Consulting
Group
Capital
Markets
Funds) (11
Portfolios)
Since April
2013 |
| | | | | |
| INTERESTED TRUSTEE | | | | | | | | | | | | |
Darek Wojnar(5) Age: 56 | | Trustee | | December
2018 to
present | | • Director and Executive Vice President, Head of Funds and Managed Accounts, Northern Trust Investments Inc. since 2018; • Managing Member of the Wojnar Group LLC (a publishing industry consulting company) since 2013; • Head of Exchange-Traded Funds at Hartford Funds from 2016 to 2017 and Managing Director of Lattice Strategies LLC from 2014 to 2016; • Managing Director and Head of US iShares Product at BlackRock (including Barclays Global Investors acquired by BlackRock) from 2005 to 2013 and the Equity Long/Short Opportunities Fund (formerly, NT Equity Long/Short Strategies Fund) from 2011 to 2019. | | | 31 | | | Northern
Funds (43
Portfolios)
since
January 1,
2019 and
Northern
Institutional
Funds (6
Portfolios)
since
January 1,
2019 |
| (1) | Each Non-Interested Trustee may be contacted by writing to the Trustee, c/o Paulita Pike, Ropes & Gray LLP, 191 North Wacker Drive, 32nd Floor, Chicago, IL 60606. Mr. Wojnar may be contacted by writing to him at 50 S. LaSalle St., Chicago, IL 60603. |
| (2) | Each Trustee will hold office for an indefinite term until the earliest of: (i) the next meeting of shareholders, if any, called for the purpose of considering the election or re-election of such Trustee and until the election and qualification of his or her successor, if any, elected at such meeting; or (ii) the date a Trustee resigns or retires, or a Trustee is removed by the Board or shareholders, in accordance with the Trust’s Agreement and Declaration of Trust. |
| (3) | The “Fund Complex” consists of the Trust. |
| (4) | This column includes only directorships of companies required to report to the SEC under the Securities Exchange Act of 1934, as amended (i.e., public companies) or other investment companies registered under the 1940 Act. |
| (5) | An “interested person,” as defined by the 1940 Act. Mr. Wojnar is deemed to be an “interested” Trustee because he is an officer of NTI and its parent company. |
The Statement of Additional Information (“SAI”) includes additional information about the Trust’s Trustees and is available, without charge, upon request by contacting the Fund directly at (855) 933-6287.
| | | | | | |
| | FLEXSHARES ANNUAL REPORT | | | 517 | |
Trustees and Officers (cont.)
| | | | | | |
| OFFICERS |
| Name, Address and Age | | Position(s)
Held with
the Trust | | Term of
Office(1) and
Length of Time Served | | Principal Occupation(s) During Past 5 Years |
Darlene Chappell Age: 58 50 South LaSalle Street Chicago, IL 60603 | | Anti-Money Laundering Officer | | July 2011 to present | | Anti-Money Laundering Compliance Officer for Northern Trust Investments, Inc., Northern Trust Securities, Inc., Northern Funds, Northern Institutional Funds, and Alpha Core Strategies Fund since 2009, Equity Long/Short Opportunities Fund (formerly NT Equity Long/ Short Strategies Fund) from 2011 to 2019 and 50 South Capital Advisors, LLC since 2015 and Belvedere Advisors LLC since 2019; Vice President and Compliance Consultant for The Northern Trust Company since 2006. |
Susan W. Yee Age: 51 70 Fargo Street,
Boston, MA 02110 | | Assistant Secretary | | October 2014 to present | | Vice President, Regulatory Services Group, J.P. Morgan Chase Bank, N.A. since 1994, in various positions. |
Jose J. Del Real, Esq. Age: 43 50 South LaSalle Street Chicago, IL 60603 | | Secretary | | December 2018 to present | | Senior Legal Counsel and Senior Vice President, Asset Management Practice Group of the Legal Department of The Northern Trust Company since March 2017; Senior Legal Counsel and Vice President, Asset Management Practice Group of the Legal Department of The Northern Trust Company from August 2015 to March 2017; Assistant Secretary of Northern Trust Investments, Inc. since 2016; Secretary of Northern Funds and Northern Institutional Funds since November 2018; Assistant Secretary of Northern Funds and Northern Institutional Funds from 2011 to 2014 and from May 2015 to November 2018; Assistant Secretary of FlexShares Trust from June 2015 to December 2018. |
Maya Teufel Age: 49 50 South LaSalle Street Chicago, IL 60603 | | Chief Compliance Officer | | July 2019 to present | | Chief Compliance Officer of FlexShares Trust since July 2019; Chief Compliance Officer of Northern Trust Investments, Inc. since July 2019; Co-Head of U.S. Regulatory Compliance Group of Goldman Sachs Asset Management, LP from September 2016 to June 2019; General Counsel and Chief Compliance Officer of Emerging Global Advisors, LLC from November 2013 to August 2016; and Vice President and Corporate Counsel of Jennison Associates LLC from July 2005 to November 2013. |
Randal E. Rein Age: 51 50 South LaSalle Street Chicago, IL 60603 | | Treasurer and Principal Financial Officer | | July 2011 to present | | Senior Vice President of Northern Trust Investments, Inc. since 2010; Treasurer of Northern Funds and Northern Institutional Funds since 2008; Treasurer of Alpha Core Strategies Fund from 2008 to 2018; Treasurer of Equity Long/Short Opportunities Fund from 2011 to 2018. |
Peter K. Ewing Age: 62 50 South LaSalle Street Chicago, IL 60603 | | President | | March 2017 to present | | President of Northern Funds and Northern Institutional Funds and the Trust since March 2017; Vice President of the Trust from July 2011 to February 2017; Director of Product Management, ETFs & Mutual Funds, and Director of Northern Trust Investments, Inc. since March 2017; Senior Vice President of, The Northern Trust Company and Northern Trust Investments, Inc., since September 2010; Director of ETF Product Management of, Northern Trust Investments, Inc. from September 2010 to February 2017. |
| | | | |
| 518 | | FLEXSHARES ANNUAL REPORT | | |
Trustees and Officers (cont.)
| | | | | | |
| Name, Address and Age | | Position(s)
Held with
the Trust | | Term of
Office(1) and
Length of Time Served | | Principal Occupation(s) During Past 5 Years |
Peter J. Flood Age: 63 50 South LaSalle Street Chicago, IL 60603 | | Vice President | | July 2011 to present | | Director of ETF Investment Strategy, Northern Trust Investments, Inc. since 2010. |
Craig R. Carberry, Esq. Age: 60
50 South LaSalle Street Chicago, IL 60603 | | Chief Legal Officer | | June 2019
to present | | Chief Legal Officer and Secretary of Northern Trust Investments, Inc. since May 2000; Chief Compliance Officer of Northern Trust Investments, Inc. from October 2015 to June 2017; Chief Legal Officer and Secretary of 50 South Capital Advisors, LLC since 2015; Chief Legal Officer and Secretary of Belvedere Advisors LLC since September 2019; Deputy General Counsel and Senior Vice President at The Northern Trust Company since June 2020; Secretary of Alpha Core Strategies Fund (formerly NT Alpha Strategies Fund) since 2004; Secretary of Equity Long/Short Opportunities Fund (formerly NT Equity Long/Short Strategies Fund) from 2011-2109; Secretary of Northern Institutional Funds and Northern Funds from 2010-2018; Secretary of FlexShares Trust from 2011-2018; Chief Legal Officer and Secretary of Northern Trust Securities, Inc. since October 2020. |
Christopher P. Fair Age: 39 50 South LaSalle Street Chicago, IL 60603 | | Vice President | | June 2019 to present | | Vice President, The Northern Trust Company since March 2020; ETF Services Manager, Northern Trust Investments, Inc. since June 2019; Second Vice President, The Northern Trust Company from November 2015 to March 2020; ETF Product Manager, Northern Trust Investments, Inc. from November 2015 to June 2019; Fund Administration Supervisor, Calamos Investments LLC from February 2015 to November 2015; Senior Mutual Fund Accountant, Calamos Investments LLC from February 2009 to January 2015. |
Himanshu S. Surti Age: 46 50 South LaSalle Street Chicago, IL 60603 | | Vice President | | December 2020 to present | | Senior ETF Product Manager, Northern Trust Investments, Inc. since November 2020; Senior Vice President, The Northern Trust Company since November 2020; Portfolio Manager and Chief Operating Officer, Cambria Investment Management from June 2014 to November 2020; Vice President, Cambria ETF Trust from March 2018 to November 2020. |
| (1) | Officers hold office at the pleasure of the Board until their successors are duly elected and qualified, or until their death, resignation, or disqualification. |
| | | | | | |
| | FLEXSHARES ANNUAL REPORT | | | 519 | |
Approval of Advisory Agreement (Unaudited)
The Board of Trustees (the “Board”) of the FlexShares Trust (the “Trust”) oversees the management of the Trust and each separate series of the Trust covered in this report (each, a “Fund” and, collectively, the “Funds”) and, as required by law, determines whether to approve the Trust’s investment advisory and ancillary services agreement (the “Advisory Agreement”) with Northern Trust Investments, Inc. (the “Adviser”), an indirect subsidiary of the Northern Trust Corporation.
* * * * *
At a meeting on June 11, 2021 (the “June Meeting”), the Board, including all of the Trustees who are not parties to the Advisory Agreement or interested persons of any such party (the “Independent Trustees”), considered whether to approve the continuation of the Advisory Agreement between the Adviser and the Trust, on behalf of each Fund.
In advance of, and in preparation for, the Trustees’ consideration of the Advisory Agreement at the June Meeting, the Trustees received written materials relating to the Advisory Agreement and had the opportunity to ask questions and request further information in connection with their consideration. At the June Meeting, the Trustees considered the Adviser’s presentations and discussed all of the information that had been provided. Among other things, the Board considered comparisons with other funds in relevant peer universes and peer groups that had been objectively determined by Broadridge Financial Solutions, Inc. (“Broadridge”), an independent provider of fund data, which included, among other things, the following information: (1) a description of the types of funds chosen by Broadridge to compare to each Fund; (2) comparative performance data for each Fund; (3) data on each Fund’s expenses and fees; and (4) comparative fee data for each Fund’s respective peer group, including comparisons of advisory fees and total expense ratios. In considering the Advisory Agreement, the Independent Trustees met with their independent legal counsel separately from the “interested” Trustee of the Trust and officers and employees of the Adviser. After evaluating all the materials, the Trustees, including the Independent Trustees, concluded that the Advisory Agreement was in the best interest of each of the
Funds and their shareholders and approved the continuation of the Advisory Agreement on behalf of the Funds.
The material factors and conclusions that formed the basis for the Trustees reaching their determination to approve the continuation of the Advisory Agreement are separately discussed below.
Nature, Quality and Extent of Services
The Board examined the nature, quality and extent of the services provided by the Adviser to each Fund. The Board also considered the Adviser’s responsibilities under the Advisory Agreement to perform securities trading services and ancillary services including, among other things: (i) filing reports with the SEC, (ii) periodically updating the Trust’s registration statement, (iii) establishing and maintaining the Funds’ website to comply with regulatory requirements, (iv) monitoring anticipated purchases and redemptions of creation units by shareholders and new investors, (v) providing information and assistance as required by the Trust’s administrator and fund accountant in connection with the Trust’s shares, and (vi) providing assistance in connection with the operations of the Trust generally.
The Board also considered the quality of the Adviser’s resources that are made available to the Trust. The Board noted the Adviser’s and its affiliates’ financial position, stability and commitment to growing their exchange-traded funds (“ETFs”) business. The Board also considered the operation and strength of the Adviser’s compliance program.
The Board noted that Foreside Fund Services, LLC, an entity unaffiliated with the Adviser, provides distribution services to the Funds and that JPMorgan Chase Bank, N.A., also an unaffiliated entity, provides custody, transfer agency, securities lending and fund administration support services, and that these service provider arrangements were relevant to the Board’s considerations of the totality of the circumstances surrounding renewal of the Advisory Agreement. The Board concluded that each Fund benefited from the services provided under the Advisory Agreement and as a result of the Adviser’s operations, resources, experience, reputation and personnel.
| | | | |
| 520 | | FLEXSHARES ANNUAL REPORT | | |
Approval of Advisory Agreement (cont.)
Performance, Fees and Expenses
The Board considered that, unlike FlexShares® Ready Access Variable Income Fund and FlexShares® Core Select Bond Fund (each, an “Active Fund”), the investment objective of each Fund other than the Active Funds (each, an “Index Fund”) is to seek investment results that correspond generally to the price and yield performance, before fees and expenses, of a specified index (each, an “Underlying Index”). The Board considered the Adviser’s explanation that performance information with respect to funds in relevant peer universes and peer groups selected by Broadridge is only one of several comparative data points and that none of the peer funds sought to track an index that was the same as any Index Fund’s Underlying Index. The Board considered the information that the Adviser provided regarding the difference between each Fund’s performance, after fees and expenses, and the performance of its Underlying Index or benchmark index (as applicable) over certain periods of time, including as noted further below, ended March 31, 2021 (the “Tracking Difference”). The Board considered the Adviser’s expectations for each Index Fund’s Tracking Difference and noted the Adviser’s view that all instances of Tracking Difference for the Index Funds reflect results well within appropriate expectations after taking into account (i) all of the factors that affect Tracking Difference and (ii) the ancillary objectives of minimizing portfolio transaction costs and tax-related inefficiencies.
The Board also considered comparative performance, fee and expense information of each Fund provided by Broadridge. The Broadridge comparisons ranked each Fund in various quintiles over certain periods of time, including as noted further below, ended March 31, 2021, with the first quintile being the lowest or best 20% of the funds in terms of fund cost and fund performance, respectively. The Board noted that, in certain cases, the Broadridge peer funds included funds sponsored by an “at cost” service provider and that there were limitations in providing comparable peer funds.
The Board considered that the Adviser contractually agreed to reimburse the portion of the operating expenses of each Fund until at least March 1, 2022, so that, after such reimbursement, the total annual fund operating expenses of
a Fund, excluding any acquired fund fees and expenses, expressed as a percentage of average daily net assets, does not exceed an amount equal to the sum of (i) the Fund’s advisory fee rate and (ii) 0.0049% (the “Expense Reimbursement Agreement”).
In reaching its determinations, the Board considered a large amount of data provided by the Adviser in response to a written request previously submitted by the Independent Trustees to the Adviser. Among the information considered by the Board was the following information:
Index Funds:
FlexShares® Morningstar US Market Factor Tilt Index Fund (TILT)
The Board considered that the Fund’s performance, after fees and expenses, differed from the performance of its Underlying Index by less than 20 basis points for all periods, except for the one-year period. The Board considered the factors that influenced the Fund’s Tracking Difference including, among other things, compounding, transaction costs and the Adviser’s tax optimization efforts designed to limit realized capital gains and futures basis.
The Board also considered that the Fund’s performance was in the first quintile of its performance universe for the one-year period and in the second quintile for the three-year, five-year and since inception periods.
The Board noted that the Fund’s advisory fee net of waivers (“Net Advisory Fee”), contractual advisory fee (“Contractual Advisory Fee”) and total expense ratio (which represents the total cost to investors) were lower than its expense group median.
FlexShares® Morningstar Developed Markets ex-US Factor Tilt Index Fund (TLTD)
The Board considered that the Fund’s performance, after fees and expenses, was above the performance of its Underlying Index for the three-year period and differed from the performance of the Underlying Index by less than 30 basis points for the remaining periods. The Board considered the factors that influenced the Fund’s Tracking Difference including, among other things, compounding, the use of
| | | | | | |
| | FLEXSHARES ANNUAL REPORT | | | 521 | |
Approval of Advisory Agreement (cont.)
broad equity index futures used to equitize cash and accruals which can perform differently than the Fund’s index, trade related stamp taxes in certain foreign jurisdictions, transactions costs and dividend tax differentials whereby the Fund may be eligible for different tax withholding and tax reclaim rates than those assumed under the methodology of its Underlying Index.
The Board also considered that the Fund’s performance ranked in the second quintile of its performance universe for the three-year, five-year and since inception periods and the third quintile for the one-year period.
The Board took into account that the Fund’s total expense ratio (which represents the total cost to investors), Net Advisory Fee and Contractual Advisory Fee were lower than its expense group median.
FlexShares® Morningstar Emerging Markets Factor Tilt Index Fund (TLTE)
The Board considered that the Fund’s performance, after fees and expenses, differed from the performance of its Underlying Index by less than 100 basis points for all periods. The Board considered the factors that influenced the Fund’s Tracking Difference including, among other things, dividend tax differentials whereby the Fund may be eligible for different tax withholding and tax reclaim rates than those assumed under the methodology of its Underlying Index, transactions costs, compounding and stock selection and trade related stamp taxes in certain emerging market countries.
The Board noted that the Fund’s performance ranked in the third quintile of its performance universe for the one-year period, though it was in the fourth or the fifth quintile for the remaining periods.
The Board considered that the Fund’s total expense ratio (which represents the total cost to investors), Net Advisory Fee and Contractual Advisory Fee were higher than its expense group median and its total expense ratio was within 0.13% of its expense group median.
FlexShares® US Quality Large Cap Index Fund (QLC)
The Board considered that the Fund’s performance, after fees and expenses, differed from the performance of its
Underlying Index by less than 60 basis points for all periods. The Board considered the factors that influenced the Fund’s Tracking Difference and noted the Adviser’s assertion that the Fund’s Tracking Difference experienced a compounding effect during periods of high market volatility.
The Board noted that the Fund’s performance ranked in the fourth or fifth quintile of its performance universe for all periods.
The Board considered that the Fund’s total expense ratio (which represents the total cost to investors), Net Advisory Fee and Contractual Advisory Fee were higher than its expense group median and its total expense ratio was within 0.04% of its expense group median.
FlexShares® STOXX® US ESG Select Index Fund (ESG)
The Board considered that the Fund’s performance, after fees and expenses, was above the performance of its Underlying Index for all periods. The Board considered the factors that influenced the Fund’s Tracking Difference including dividend tax differentials, compounding and securities selection.
The Board also considered that the Fund’s performance ranked in the first or second quintile of its performance universe for all periods.
The Board considered that the Fund’s total expense ratio (which represents the total cost to investors), Net Advisory Fee and Contractual Advisory Fee were higher than its expense group median and its total expense ratio was within 0.04% of its expense group median.
FlexShares® STOXX® Global ESG Select Index Fund (ESGG)
The Board considered that the Fund’s performance, after fees and expenses, differed from the performance of its Underlying Index by less than 5 basis points for the one-year period, exceeded the performance of its Underlying Index for the three-year period and was equal to the performance of its Underlying Index for the since inception period. The Board considered the factors that influenced the Fund’s Tracking Difference including, among other things, transaction costs associated with markets with trade related stamp taxes, tax reclaim rates and dividend tax differentials
| | | | |
| 522 | | FLEXSHARES ANNUAL REPORT | | |
Approval of Advisory Agreement (cont.)
whereby the Fund may be eligible for different tax withholding and tax reclaim rates than those assumed under the methodology of its Underlying Index.
The Board noted that the Fund’s performance ranked in the first or second quintile of its performance universe for all periods.
The Board considered that the Fund’s total expense ratio (which represents the total cost to investors), Net Advisory Fee and Contractual Advisory Fee were higher than its expense group median and noted that the Fund’s total expense ratio was within 0.13% of its expense group median.
FlexShares® Morningstar Global Upstream Natural Resources Index Fund (GUNR)
The Board considered that the Fund’s performance, after fees and expenses, differed from the performance of its Underlying Index by less than 110 basis points for all periods. The Board considered the factors that influenced the Fund’s Tracking Difference including, among other things, the use of futures and securities selection.
The Board also considered that the Fund’s performance ranked in the fourth quintile of its performance universe for the one-year period and in the first quintile for the remaining periods.
The Board considered that the Fund’s total expense ratio (which represents the total cost to investors) and Contractual Advisory Fee were lower than its expense group median and its Net Advisory Fee was higher than its expense group median Net Advisory Fee. The Board noted that the Fund’s Net Advisory Fee was within 0.03% of the expense group median Net Advisory Fee.
FlexShares® STOXX® Global Broad Infrastructure Index Fund (NFRA)
The Board considered that the Fund’s performance, after fees and expenses, exceeded the performance of its Underlying Index for all periods. The Board considered the factors that influenced the Fund’s Tracking Difference including, among other things, transaction costs associated with markets with trade related stamp taxes, tax reclaim rates and dividend tax differentials whereby the Fund may be eligible
for different tax withholding and tax reclaim rates than those assumed under the methodology of its Underlying Index. The Board also considered the Adviser’s assertion that the use of broad equity index futures used to equitize cash and accruals can perform differently than the Fund’s index.
The Board considered that the Fund’s performance ranked in the first or second quintile of its performance universe for all periods.
The Board considered that the Fund’s total expense ratio (which represents the total cost to investors), Net Advisory Fee and Contractual Advisory Fee were higher than its expense group median and the Fund’s total expense ratio was within 0.03% of its expense group median.
FlexShares® Global Quality Real Estate Index Fund (GQRE)
The Board considered that the Fund’s performance, after fees and expenses, exceeded the performance of its Underlying Index for all periods. The Board considered the factors that influenced the Fund’s Tracking Difference including, among other things, transaction costs associated with markets with trade related stamp taxes, tax reclaim rates and dividend tax differentials whereby the Fund may be eligible for different tax withholding and tax reclaim rates than those assumed under the methodology of its Underlying Index. The Board also noted that the use of broad equity index futures used to equitize cash and accruals can perform differently than the Fund’s index.
The Board also considered that the Fund’s performance ranked in the third quintile of its performance universe for the since inception period and the fifth quintile for the remaining periods.
The Board considered that the Fund’s total expense ratio (which represents the total cost to investors) was equal to its expense group median while its Net Advisory Fee and Contractual Advisory Fee were higher than its expense group median. The Board noted that the Fund’s Net Advisory Fee was within 0.07% of its expense group median Net Advisory Fee and that the Fund’s Contractual Advisory Fee was within 0.05% of its expense group median Contractual Advisory Fee.
| | | | | | |
| | FLEXSHARES ANNUAL REPORT | | | 523 | |
Approval of Advisory Agreement (cont.)
FlexShares® Real Assets Allocation Index Fund (ASET)
The Board considered that the Fund’s performance, after fees and expenses, differed from the performance of its Underlying Index by less than 20 basis points for all periods. The Board considered the factors that influenced the Fund’s Tracking Difference including, among other things, dividend tax differentials whereby the Fund may be eligible for different tax withholding and tax reclaim rates than those assumed under the methodology of its Underlying Index.
The Board noted that the Fund’s performance was in the first or second quintile of its performance universe for all periods.
The Board considered that the Fund’s total expense ratio (which represents the total cost to investors) and Net Advisory Fee were lower than its expense group median while the Fund’s Contractual Advisory Fee was higher than its expense group median Contractual Advisory Fee. The Board noted that the Fund’s Contractual Advisory Fee was within 0.07% of its expense group median Contractual Advisory Fee. The Board also considered that the Adviser had agreed to waive a portion of its advisory fee and/or reimburse operating expenses in an amount equal to any acquired fund fees and expenses incurred by the Fund that were attributable to its investment in other Funds.
FlexShares® Quality Dividend Index Fund (QDF)
The Board considered that the Fund’s performance, after fees and expenses, differed from the performance of its Underlying Index by less than 80 basis points for all periods. The Board considered the factors that influenced the Fund’s Tracking Difference including, among other things, stock selection, the compounding effect of Tracking Difference during periods of market volatility and differences in security-level weights relative to the Underlying Index which can be impacted by multiple factors including, but not limited to, pending corporate actions, round lot conventions, multiple share classes, transaction cost minimization, and security specific liquidity constraints.
The Board also considered that the Fund’s performance ranked in the second quintile of its performance universe for the one-year period, the first quintile for the since inception period and the third quintile for the remaining periods.
The Board considered that the Fund’s total expense ratio (which represents the total cost to investors) was equal to its expense group median while its Net Advisory Fee and Contractual Advisory Fee were lower than its expense group median.
FlexShares® Quality Dividend Defensive Index Fund (QDEF)
The Board considered that the Fund’s performance, after fees and expenses, differed from the performance of its Underlying Index by less than 70 basis points for all periods. The Board considered the factors that influenced the Fund’s Tracking Difference including, among other things, the compounding effect of Tracking Difference during periods of market volatility and the use of broad equity index futures used to equitize cash and accruals which can perform differently than the Fund’s index.
The Board considered that the Fund’s performance ranked in the first quintile of its performance universe for the since inception period and the third or fourth quintile for the remaining periods.
The Board considered that the Fund’s total expense ratio (which represents the total cost to investors) was equal to its expense group median while its Net Advisory Fee and Contractual Advisory Fee were lower than its expense group median.
FlexShares® Quality Dividend Dynamic Index Fund (QDYN)
The Board considered that the Fund’s performance, after fees and expenses, differed from the performance of its Underlying Index by less than 120 basis points for the one-year period and less than 40 basis points for the remaining periods. The Board considered the factors that influenced the Fund’s Tracking Difference including, among other things, tax optimization designed to limit realized capital gains, volatility-related compounding and stock selection as well as the use of broad equity index futures used to equitize cash and accruals which can perform differently than the Fund’s index. The Board also noted the Fund’s relatively small size compared to other funds in its performance universe.
| | | | |
| 524 | | FLEXSHARES ANNUAL REPORT | | |
Approval of Advisory Agreement (cont.)
The Board also considered that the Fund’s performance ranked in the first or second quintile of its performance universe for all periods.
The Board considered that the Fund’s total expense ratio (which represents the total cost to investors) and Contractual Advisory Fee were below its expense group median while its Net Advisory Fee was equal to its expense group median Net Advisory Fee.
FlexShares® International Quality Dividend Index Fund (IQDF)
The Board considered that the Fund’s performance, after fees and expenses, differed from the performance of its Underlying Index by less than 40 basis points for all periods. The Board considered the factors that influenced the Fund’s Tracking Difference including, among other things, volatility-related compounding, the use of broad equity index futures used to equitize cash and accruals which can perform differently than the Fund’s index, dividend tax differentials whereby the Fund may be eligible for different tax withholding and tax reclaim rates than those assumed under the methodology of its Underlying Index and trade related stamp taxes in certain foreign jurisdictions.
The Board also considered that the Fund’s performance ranked in the first quintile for the one-year period and the third quintile for the remaining periods.
The Board took into account that the Fund’s total expense ratio (which represents the total cost to investors) and Contractual Advisory Fee were equal to its expense group median while its Net Advisory Fee was higher than its expense group median Net Advisory Fee. The Board noted that the Fund’s Net Advisory Fee was within 0.01% of its expense group median Net Advisory Fee.
FlexShares® International Quality Dividend Defensive Index Fund (IQDE)
The Board considered that the Fund’s performance, after fees and expenses, differed from the performance of its Underlying Index by less than 55 basis points for all periods. The Board considered the factors that influenced the Fund’s Tracking Difference including, among other things, the
compounding effect of Tracking Difference during periods of market volatility, differences in security-level weights relative to the Underlying Index which can be impacted by multiple factors including, but not limited to, pending corporate actions, round lot conventions, multiple share classes, transaction cost minimization, and security specific liquidity constraints, dividend tax differentials whereby the Fund may be eligible for different tax withholding and tax reclaim rates than those assumed under the methodology of its Underlying Index and trade related stamp taxes in certain foreign jurisdictions.
The Board also considered that the Fund’s performance ranked in the second quintile of its performance universe for the one-year period, the third quintile for the since inception period and the fourth quintile for the remaining periods.
The Board considered that the Fund’s total expense ratio (which represents the total cost to investors) and Contractual Advisory Fee were equal to its expense group median while its Net Advisory Fee was higher than its expense group median Net Advisory Fee. The Board noted that the Fund’s Net Advisory Fee was within 0.01% of its expense group median Net Advisory Fee.
FlexShares® International Quality Dividend Dynamic Index Fund (IQDY)
The Board considered that the Fund’s performance, after fees and expenses, differed from the performance of its Underlying Index by less than 65 basis points for all periods. The Board considered the factors that influenced the Fund’s Tracking Difference including, among other things, the compounding effect of Tracking Difference during periods of market volatility, differences in security-level weights relative to the Underlying Index which can be impacted by multiple factors including, but not limited to, pending corporate actions, round lot conventions, multiple share classes, transaction cost minimization, and security specific liquidity constraints, dividend tax differentials whereby the Fund may be eligible for different tax withholding and tax reclaim rates than those assumed under the methodology of its Underlying Index and trade related stamp taxes in certain foreign jurisdictions.
| | | | | | |
| | FLEXSHARES ANNUAL REPORT | | | 525 | |
Approval of Advisory Agreement (cont.)
The Board also considered that the Fund’s performance ranked in the first or second quintile of its performance universe for all periods.
The Board took into account that the Fund’s total expense ratio (which represents the total cost to investors) and Contractual Advisory Fee were equal to its expense group median while its Net Advisory Fee was higher than its expense group median Net Advisory Fee. The Board noted that the Fund’s Net Advisory Fee was within 0.01% of its expense group median Net Advisory Fee.
FlexShares® iBoxx 3-Year Target Duration TIPS Index Fund (TDTT)
The Board considered that the Fund’s performance, after fees and expenses, differed from the performance of its Underlying Index by less than 30 basis points for all periods. The Board considered the factors that influenced the Fund’s Tracking Difference including, among other things, security positioning, liquidity considerations and market volatility.
The Board also considered that the Fund’s performance ranked in the third or fourth quintile of its performance universe for all periods.
The Board took into account that the Fund’s total expense ratio (which represents the total cost to investors), Net Advisory Fee and Contractual Advisory Fee were higher than its expense group median and the Fund’s total expense ratio was within 0.07% of its expense group median.
FlexShares® iBoxx 5-Year Target Duration TIPS Index Fund (TDTF)
The Board considered that the Fund’s performance, after fees and expenses, differed from the performance of its Underlying Index by less than 35 basis points for all periods. The Board considered the factors that influenced the Fund’s Tracking Difference including, among other things, security positioning, liquidity considerations and market volatility.
The Board also considered that the Fund’s performance ranked in the third quintile of its performance universe for the one-year period, the first quintile for the three-year period and the second quintile for the five-year and since inception periods.
The Board took into account that the Fund’s total expense ratio (which represents the total cost to investors), Net Advisory Fee and Contractual Advisory Fee were higher than its expense group median and the Fund’s total expense ratio was within 0.07% of its expense group median.
FlexShares® Disciplined Duration MBS Index Fund (MBSD)
The Board considered that the Fund’s performance, after fees and expenses, exceeded the performance of its Underlying Index for the one-year period and differed from its Underlying Index by less than 40 basis points for the remaining periods. The Board considered the factors that influenced the Fund’s Tracking Difference including, among other things, portfolio turnover due to changes in the underlying index prepayment model assumptions, trading costs, and heightened volatility in the market.
The Board also considered that the Fund’s performance ranked in the third or fourth quintile of its performance universe for all periods.
The Board considered that the Fund’s total expense ratio (which represents the total cost to investors) and Net Advisory Fee were higher than its expense group median while the Fund’s Contractual Advisory Fee was equal to its expense group median Contractual Advisory Fee. The Board noted its total expense ratio was within 0.15% of its expense group median.
FlexShares® Credit-Scored US Corporate Bond Index Fund (SKOR)
The Board considered that the Fund’s performance, after fees and expenses, differed from the performance of its Underlying Index by less than 80 basis points for all periods. The Board considered the factors that influenced the Fund’s Tracking Difference including, among other things, market volatility that led to rapid changes in the benchmark, trading costs due to significant index turnover, sampling costs, and pricing differences.
The Board also considered that the Fund’s performance ranked in the third or fourth quintile for all periods.
The Board considered that the Fund’s total expense ratio (which represents the total cost to investors), Net Advisory
| | | | |
| 526 | | FLEXSHARES ANNUAL REPORT | | |
Approval of Advisory Agreement (cont.)
Fee and Contractual Advisory Fee were higher than its expense group median and its total expense ratio was within 0.08% of its expense group median.
FlexShares® Credit-Scored US Long Corporate Bond Index Fund (LKOR)
The Board considered that the Fund’s performance, after fees and expenses, differed from the performance of its Underlying Index by less than 200 basis points for the one-year period and less than 100 basis points for the remaining periods. The Board considered the factors that influenced the Fund’s Tracking Difference including, among other things, the restructuring and rebalancing of the Underlying Index in 2020 and turnover in connection therewith which resulted in higher trading and sampling costs that contributed to the Tracking Difference. The Board also considered the Adviser’s assertion that market volatility leading to rapid benchmark changes contributed to high turnover, also impacting the Fund’s performance.
The Board also considered that the Fund’s performance ranked in the fifth quintile for the one-year period and the first quintile of its performance universe for the remaining periods.
The Board considered that the Fund’s total expense ratio (which represents the total cost to investors), Net Advisory Fee and Contractual Advisory Fee were higher than its expense group median and its Fund’s total expense ratio was within 0.08% of its expense group median.
FlexShares® High Yield Value-Scored Bond Index Fund (HYGV)
The Board considered that the Fund’s performance, after fees and expenses, differed from its Underlying Index by less than 350 basis points for the one-year period and less than 175 basis points for the since inception period. The Board considered the factors that influenced the Fund’s Tracking Difference including, among other things, security selection, turnover and market volatility.
The Board also considered that the Fund’s performance ranked in the first quintile of its performance universe for both the one-year and since inception periods. Further, the Board considered the Fund’s relatively short performance
record and noted that it would be prudent to allow the Adviser more time to develop the Fund’s performance record.
The Board considered that the Fund’s total expense ratio (which represents the total cost to investors), Net Advisory Fee and Contractual Advisory Fee were higher than its expense group median and its total expense ratio was within 0.03% of its expense group median.
FlexShares® US Quality Low Volatility Index Fund (QLV)
The Board considered that the Fund’s performance, after fees and expenses, differed from its Underlying Index by less than 35 basis points for both the one-year and since inception periods. The Board considered the factors that influenced the Fund’s Tracking Difference including, among other things, the compounding effect of tracking error in periods of high volatility and the use of broad equity index futures used to equitize cash and accruals which can perform differently than the Fund’s index.
The Board also considered that the Fund’s performance ranked in the fifth quintile of its performance universe for both the one-year and since inception periods. Further, the Board considered the Fund’s relatively short performance record and noted that it would be prudent to allow the Adviser more time to develop the Fund’s performance record.
The Board considered that the Fund’s total expense ratio (which represents the total cost to investors), Net Advisory Fee and Contractual Advisory Fee were equal to its expense group median.
FlexShares® Developed Markets ex-US Quality Low Volatility Index Fund (QLVD)
The Board considered that the Fund’s performance, after fees and expenses, differed from its Underlying Index by less than 30 basis points for both the one-year and since inception periods. The Board considered the factors that influenced the Fund’s Tracking Difference including, among other things, dividend tax differentials whereby the Fund may be eligible for different tax withholding and tax reclaim rates than those assumed under the methodology of its
| | | | | | |
| | FLEXSHARES ANNUAL REPORT | | | 527 | |
Approval of Advisory Agreement (cont.)
Underlying Index and the use of broad equity index futures used to equitize cash and accruals can perform differently than the Fund’s index.
The Board also considered that the Fund’s performance ranked in the fifth quintile of its performance universe for both the one-year and since inception periods. Further, the Board considered the Fund’s relatively short performance record and noted that it would be prudent to allow the Adviser more time to develop the Fund’s performance record.
The Board considered that the Fund’s total expense ratio (which represents the total cost to investors) and Contractual Advisory Fee were lower than its expense group median and its Net Advisory Fee was within 0.02% its expense group median Net Advisory Fee.
FlexShares® Emerging Markets Quality Low Volatility Index Fund (QLVE)
The Board considered that the Fund’s performance, after fees and expenses, differed from its Underlying Index by less than 150 basis points for the one-year period and less than 90 basis points for the since inception period. The Board considered the factors that influenced the Fund’s Tracking Difference including, among other things, rebalancing of the Underlying Index, security selection and the compounding effect of tracking error in periods of high volatility.
The Board also considered that the Fund’s performance ranked in the fifth quintile of its performance universe for both the one-year and since inception periods. Further, the Board considered the Fund’s relatively short performance record and noted that it would be prudent to allow the Adviser more time to develop the Fund’s performance record.
The Board considered that the Fund’s total expense ratio (which represents the total cost to investors), Net Advisory Fee and Contractual Advisory Fee were lower than its expense group median.
Active Funds:
FlexShares® Ready Access Variable Income Fund (RAVI)
The Board considered that the Fund’s performance ranked in the second quintile for the five-year period, the third quintile for the one-year period and the first quintile for the remaining periods. The Board also considered that the Fund outperformed its benchmark index for the three- and five-year and since inception periods and underperformed its benchmark index for the one-year period.
The Board considered that the Fund’s total expense ratio (which represents the total cost to investors), Net Advisory Fee and Contractual Advisory Fee were higher than its expense group median and the Fund’s total expense ratio was within 0.06% of its expense group median.
FlexShares® Core Select Bond Fund (BNDC)
The Board considered that the Fund’s performance ranked in the third or fourth quintile of its performance universe for all periods. The Board also considered that the Fund underperformed its benchmark index for the one-year, three-year and since inception periods.
The Board considered that the Fund’s total expense ratio (which represents the total cost to investors) was within 0.07% of its expense group median, and that the Fund’s Net Advisory Fee and Contractual Advisory Fee were higher than its expense group median. The Board also considered that the Adviser had agreed to waive a portion of its advisory fee and/or reimburse operating expenses in an amount equal to any acquired fund fees and expenses incurred by the Fund that were attributable to its investment in other Funds, as well as up to 0.05% of acquired fund fees and expenses attributable to the Fund’s investment in unaffiliated funds.
Costs of Services and Profits of the Adviser
The Board considered the unitary fee structure and the expenses for each Fund and noted that, under the Advisory Agreement, the Adviser was responsible for most expenses of the Funds, including the cost of transfer agency, custody, fund administration, legal, audit and other services. The Board considered that the Adviser was not responsible under the Advisory Agreement for certain expenses, including the
| | | | |
| 528 | | FLEXSHARES ANNUAL REPORT | | |
Approval of Advisory Agreement (cont.)
fees and expenses of the Trust’s Independent Trustees and their independent legal counsel, litigation expenses and other extraordinary expenses.
The Board considered the advisory fee for each Fund as compared to that of other comparable funds in relation to its respective Broadridge median. The Board considered the Adviser’s explanation that each Index Fund’s advisory fee (both gross and net of waivers) compared favorably with its respective Broadridge median advisory fee (both gross and net of waivers) for comparable funds set forth in the Broadridge report, especially taking into account, among other factors, important differences between the indexes upon which such comparable funds are based and each Index Fund’s Underlying Index, including in certain cases differences between the number of portfolio holdings for comparable funds and the Funds. The Board considered the advisory fee schedules for other accounts with similar investment advisory mandates as those of the Funds, noting that there were no comparable accounts for certain of the Funds. The Board considered (a) the differences in managing ETFs versus separately managed accounts which involve daily purchase and redemption activity along with robust regulatory and governance requirements; and (b) the Funds’ unitary fee structure.
The Board examined the Adviser’s profitability information provided by the Adviser, and the Trustees considered that the Adviser was profitable on a pre-distribution basis but not on a post-distribution basis. The Board considered that the Adviser’s potential for profitability would continue to be subject to financial uncertainties and risks. The Board also considered that the Adviser would continue to develop and offer additional new products in efforts to complete the overall integrity of the Trust’s product suite, consistent with its product strategy, and that these products may expose the Adviser to additional financial risks and uncertainties.
Economies of Scale
The Board considered whether the Adviser may realize economies of scale in managing and supporting the Funds. The Board reviewed each Fund’s fee arrangements, which did not include breakpoints, and considered that, in light of the unitary fee structure, the Adviser’s profitability from its
services to the Trust and the significant investment that the Adviser had made and continues to make in the Trust, breakpoints were not necessary at this time. The Board also noted the Expense Reimbursement Agreement.
Other Benefits to the Adviser
In addition to considering the profits that may be realized by the Adviser, the Board considered information regarding other direct and indirect benefits the Adviser may receive as a result of its relationship with the Funds, including whether any compensation would be paid to its affiliates. The Board also considered that some of the Funds’ shareholders have other client relationships with the Adviser or its affiliates. The Board also reviewed the extent to which the Adviser and its other clients, as well as the Funds, benefit from receipt of the research products and services generated by the Funds.
The Board, including the Independent Trustees, considered the data provided by the Adviser and concluded that sufficient information had been provided to allow them to evaluate the terms of the Advisory Agreement and each Fund’s investment advisory fee. They determined that each Fund’s advisory fee was reasonable in light of the services provided and the performance achieved by the Fund.
| | | | | | |
| | FLEXSHARES ANNUAL REPORT | | | 529 | |
Approval of Advisory Agreement (Unaudited)
The Board of Trustees (the “Board”) of the FlexShares Trust (the “Trust”) oversees the management of the Trust and each separate series of the Trust covered in this report and, as required by law, determines whether to approve the Trust’s investment advisory and ancillary services agreement (the “Advisory Agreement”) with Northern Trust Investments, Inc. (the “Adviser”), an indirect subsidiary of the Northern Trust Corporation.
* * * * *
At a meeting on August 20, 2021 (the “August Meeting”), the Board, including all of the Trustees who are not parties to the Advisory Agreement or interested persons of any such party (the “Independent Trustees”), considered whether to provide initial approval of the Advisory Agreement between the Adviser and the Trust, with regard to the following proposed new series of the Trust: FlexShares® ESG & Climate US Large Cap Core Index Fund, FlexShares® ESG & Climate Developed Markets ex-US Core Index Fund, FlexShares® ESG & Climate High Yield Corporate Core Index Fund and FlexShares® ESG & Climate Investment Grade Corporate Core Index Fund (each, a “Fund” and, collectively, the “Funds”).
In advance of, and in preparation for, the Trustees’ consideration of the Advisory Agreement at the August Meeting, the Trustees received written materials relating to the Advisory Agreement and had the opportunity to ask questions and request further information in connection with their consideration. At the August Meeting, the Trustees considered the Adviser’s presentations and discussed all of the information that had been provided. Among other things, the Board considered comparisons with other funds in relevant peer universes and peer groups that had been objectively determined by Broadridge Financial Solutions, Inc. (“Broadridge”), an independent provider of fund data, which included, among other things, the following information: (1) a description of the types of funds chosen by Broadridge to compare to each Fund; (2) data on each Fund’s expenses and fees; and (3) comparative fee data for each Fund’s respective peer group, including comparisons of advisory fees and total expense ratios. In considering the Advisory Agreement, the Independent Trustees met with their independent legal counsel separately from the
“interested” Trustee of the Trust and officers and employees of the Adviser. After evaluating all the materials, the Trustees, including the Independent Trustees, concluded that the Advisory Agreement was in the best interest of each of the Funds and their prospective shareholders and approved the Advisory Agreement on behalf of the Funds.
The material factors and conclusions that formed the basis for the Trustees reaching their determination to approve the continuation of the Advisory Agreement are separately discussed below.
Nature, Quality and Extent of Services
The Board examined the nature, quality and extent of the services to be provided by the Adviser to each Fund. The Board also considered the Adviser’s responsibilities under the Advisory Agreement to perform securities trading services and ancillary services including, among other things: (i) filing reports with the SEC, (ii) periodically updating the Trust’s registration statement, (iii) establishing and maintaining the Funds’ website to comply with regulatory requirements, (iv) monitoring anticipated purchases and redemptions of creation units by shareholders and new investors, (v) providing information and assistance as required by the Trust’s administrator and fund accountant in connection with the Trust’s shares, and (vi) providing assistance in connection with the operations of the Trust generally.
The Board also considered the quality of the Adviser’s resources that are made available to the Trust. The Board noted the Adviser’s and its affiliates’ financial position, stability and commitment to growing their exchange-traded funds (“ETFs”) business. The Board also considered the operation and strength of the Adviser’s compliance program.
The Board noted that it is proposed that Foreside Fund Services, LLC, an entity unaffiliated with the Adviser, provide distribution services to the Funds and that JPMorgan Chase Bank, N.A., also an unaffiliated entity, provide custody, transfer agency, securities lending and fund administration support services, and that these service provider arrangements were relevant to the Board’s considerations of the totality of the circumstances surrounding renewal of the
| | | | |
| 530 | | FLEXSHARES ANNUAL REPORT | | |
Approval of Advisory Agreement (cont.)
Advisory Agreement. The Board concluded that each Fund is expected to benefit from the services provided under the Advisory Agreement and as a result of the Adviser’s operations, resources, experience, reputation and personnel.
Performance, Fees and Expenses
The Board considered that the investment objective of each Fund is to seek investment results that correspond generally to the price and yield performance, before fees and expenses, of a specified index (each, an “Underlying Index”).
The Board noted that because the Funds had not yet commenced operations, there was no performance information to consider. The Board considered fee and expense information of each Fund provided by Broadridge. The Broadridge comparisons ranked each Fund in various quintiles with the first quintile being the lowest 20% of the funds in terms of fund cost. The Board noted that, in certain cases, the Broadridge peer funds included funds sponsored by an “at cost” service provider and that there were limitations in providing comparable peer funds.
The Board considered that, effective as of the date of the Funds’ prospectus, the Adviser contractually agreed to reimburse the portion of the operating expenses of each Fund until at least one year thereafter, so that, after such reimbursement, the total annual fund operating expenses of a Fund, excluding any acquired fund fees and expenses, expressed as a percentage of average daily net assets, does not exceed an amount equal to the sum of (i) the Fund’s advisory fee rate and (ii) 0.0049% (the “Expense Reimbursement Agreement”).
In reaching its determinations, the Board considered a large amount of data provided by the Adviser in response to a written request previously submitted by the Independent Trustees to the Adviser. Among the information considered by the Board was the following information:
Funds:
FlexShares® ESG & Climate US Large Cap Core Index Fund
The Board considered that the Fund’s total expenses were in the first quintile of its expense group. The Board also considered that the Fund’s advisory fee net of waivers (“Net Advisory
Fee”), contractual advisory fee (“Contractual Advisory Fee”) and total expense ratio (which represents the total cost to investors) were lower than its expense group median.
FlexShares® ESG & Climate Developed Markets ex-US Core Index Fund
The Board considered that the Fund’s total expenses were in the first quintile of its expense group. The Board also considered that the Fund’s Net Advisory Fee, Contractual Advisory Fee and total expense ratio were lower than its expense group median.
FlexShares® ESG & Climate High Yield Corporate Core Index Fund
The Board considered that the Fund’s total expenses were in the second quintile of its expense group. The Board also considered that the Fund’s Net Advisory Fee, Contractual Advisory Fee and total expense ratio were lower than its expense group median.
FlexShares® ESG & Climate Investment Grade Corporate Core Index Fund
The Board considered that the Fund’s total expenses were in the second quintile of its expense group. The Board also considered that the Fund’s Net Advisory Fee, Contractual Advisory Fee and total expense ratio were lower than its expense group median.
Costs of Services and Profits of the Adviser
The Board considered the unitary fee structure and the expenses for each Fund and noted that, under the Advisory Agreement, the Adviser will be responsible for most expenses of the Funds, including the cost of transfer agency, custody, fund administration, legal, audit and other services. The Board considered that the Adviser will not be responsible under the Advisory Agreement for certain expenses, including the fees and expenses of the Trust’s Independent Trustees and their independent legal counsel, litigation expenses and other extraordinary expenses.
The Board considered the advisory fee for each Fund as compared to that of other comparable funds in relation to its respective Broadridge median. The Board considered the
| | | | | | |
| | FLEXSHARES ANNUAL REPORT | | | 531 | |
Approval of Advisory Agreement (cont.)
Adviser’s explanation that each Fund’s advisory fee (both gross and net of waivers) compared favorably with its respective Broadridge median advisory fee (both gross and net of waivers) for comparable funds set forth in the Broadridge report, especially taking into account, among other factors, important differences between the indexes upon which such comparable funds are based and the Fund’s Underlying Index. The Board considered the advisory fee schedules for other accounts with similar investment advisory mandates as those of the Funds, noting that there were no comparable accounts for the Funds. The Board considered (a) the differences in managing ETFs versus separately managed accounts which involve daily purchase and redemption activity along with robust regulatory and governance requirements; and (b) the Funds’ unitary fee structure.
The Board considered the Adviser’s estimated profitability information provided by the Adviser. The Board noted that the Adviser’s potential for profitability would be subject to financial uncertainties and risks. The Board also considered that the Adviser would continue to develop and offer additional new products in efforts to complete the overall integrity of the Trust’s product suite, consistent with its product strategy, and that these products may expose the Adviser to additional financial risks and uncertainties.
Economies of Scale
The Board considered whether the Adviser may realize economies of scale in managing and supporting the Funds. The Board reviewed each Fund’s fee arrangements, which did not include breakpoints, and considered that, in light of the unitary fee structure and expense reimbursement agreement, the Adviser’s estimated profitability from services to be provided to the Funds and the significant investment that the Adviser had made and continues to make in the Trust, breakpoints were not necessary at this time. The Board also noted the Expense Reimbursement Agreement.
Other Benefits to the Adviser
In addition to considering the profits that may be realized by the Adviser, the Board considered information regarding other direct and indirect benefits the Adviser may receive as a result of its relationship with the Funds, including whether
any compensation would be paid to its affiliates. The Board also reviewed the extent to which the Adviser and its other clients, as well as the Funds, benefit from receipt of the research products and services generated by the Funds.
The Board, including the Independent Trustees, considered the data provided by the Adviser and concluded that sufficient information had been provided to allow them to evaluate the terms of the Advisory Agreement and each Fund’s investment advisory fee. They determined that each Fund’s advisory fee was reasonable in light of the services to be provided.
| | | | |
| 532 | | FLEXSHARES ANNUAL REPORT | | |
Supplemental Information (Unaudited)
Principal Risks
As with any investment, you could lose all or part of your investment in a Fund, and the Fund’s performance could trail that of other investments. In addition to the discussion of the risks of certain of the Funds’ investments included in Note 2, some of the principal risks of investment in the Funds are summarized below. A more complete description of principal risks is included in each Fund’s Prospectus.
The following risks apply to all of the Funds:
Cyber Security and Operational Risk
Cyber security and operational risk is the risk that the Fund and its service providers may experience disruptions that arise from breaches in cyber security, human error, processing and communications errors, counterparty or third-party errors, technology or systems failures, any of which may have an adverse impact on the Fund. Failures or breaches of the electronic systems of the Fund, the Investment Adviser, distributor, and other service providers, market makers, Authorized Participants or the issuers of securities in which the Fund invests have the ability to cause disruptions and negatively impact the Fund’s business operations, potentially resulting in financial losses to the Fund and its shareholders.
Derivatives Risk
Changes in the value of a derivative instrument may not correlate perfectly with the underlying asset, rate or index, and the Funds could lose more than the principal amount invested.
Market Trading Risk
Each Fund’s shares are listed on a securities exchange, which presents risks including the potential lack of an active market for Fund shares, losses from trading in secondary markets, periods of high volatility, and disruption in the creation/redemption process of the Funds. Any of these factors may lead to the Funds’ shares trading at a premium or discount to NAV.
Valuation Risk
The sale price the Funds could receive for a security may differ from the Funds’ valuation of the security, particularly for securities that trade in low volume or volatile markets, or that are valued using a fair value methodology.
Authorized Participant Concentration Risk
Only an Authorized Participant may engage in creation or redemption transactions directly with the Funds. The Funds have a limited number of institutions that act as Authorized Participants. To the extent that these institutions exit the business or are unable to proceed with creation and/or redemption orders with respect to the Funds and no other Authorized Participant is able to step forward to create or redeem Creation Units, Fund shares may trade at a discount to NAV and possibly face trading halts and/or delisting. This risk may be heightened for a Fund if it invests in non-U.S. securities or other securities or instruments that are less widely traded. Such securities or instruments often involve greater settlement and operational issues and capital costs for Authorized Participants.
Market Risk
Market risk is the risk that general market conditions, such as real or perceived adverse economic or political conditions, inflation, changes in interest rates, lack of liquidity in the bond markets, volatility in the equities market or adverse investor sentiment could cause the value of your investment in a Fund to decline. Market disruptions caused by local or regional
| | | | | | |
| | FLEXSHARES ANNUAL REPORT | | | 533 | |
Supplemental Information (cont.)
events such as war, acts of terrorism, the spread of infectious illness (including epidemics and pandemics) or other public health issues, recessions or other events or adverse investor sentiment could have a significant impact on the Fund and its investments and could result in the Fund’s shares trading at increased premiums or discounts to the Fund’s NAV. The outbreak of COVID-19, a respiratory disease caused by a novel coronavirus, has negatively affected the worldwide economy, the financial health of individual companies and the market in significant and unforeseen ways. The future impact of COVID-19 is currently unknown. The effects to public health, business and market conditions resulting from the COVID-19 pandemic may have a significant negative impact on the performance of the Fund’s investments. Market risk also includes the risk that a particular style of investing, such as growth or value, may underperform the market generally. The value of the securities in which a Fund invests may go up or down in response to the prospects of individual issuers and/or general economic conditions. Securities markets may experience great short-term volatility and may fall sharply at times. Different markets may behave differently from each other and a foreign market may move in the opposite direction from the U.S. market. Price changes may be temporary or last for extended periods. You could lose money over short periods due to fluctuation in a Fund’s NAV in response to market movements, and over longer periods during market downturns.
The following risk applies only to the Index Funds:
Tracking Error Risk
Tracking error risk is the risk that an Index Fund’s performance may vary substantially from the performance of the Underlying Index it tracks as a result of imperfect correlation between a Fund’s securities and those of the Underlying Index. Imperfect correlation may result from share purchases and redemptions, expenses, accepting custom baskets, changes in the Underlying Indexes, asset valuations, foreign currency valuations, market impact, corporate actions (such as mergers and spinoffs), legal restrictions (such as tax-related diversification requirements that apply to the Funds but not to the Underlying Index) and timing variances, among other factors.
Calculation Methodology Risk
Each of the Index Funds is subject to Calculation Methodology Risk. This is the risk that the Underlying Index’s calculation methodology or sources of information may not provide an accurate assessment of included issuers or correct valuation of securities, nor is the availability or timeliness of the production of the Index guaranteed.
The following risks apply to each Fund, as disclosed:
Concentration Risk
Each of the Funds, except the FlexShares iBoxx 3-Year Target Duration TIPS Index Fund and FlexShares iBoxx 5-Year Target Duration TIPS Index Fund, is subject to Concentration Risk. To the extent that the investments of these Funds are concentrated in the securities of issuers in a particular region, country, market, industry, sector or asset class, the Funds may be subject to increased price volatility and may be more susceptible to adverse economic, market, political or regulatory occurrences affecting that region, country, market, industry, sector or asset class.
Interest Rate/Maturity Risk
The FlexShares iBoxx 3-Year Target Duration TIPS Index Fund, FlexShares iBoxx 5-Year Target Duration TIPS Index Fund, FlexShares Disciplined Duration MBS Index Fund, FlexShares Credit-Scored US Corporate Bond Index Fund, FlexShares Credit-Scored US Long Corporate Bond Index Fund, FlexShares High Yield Value-Scored Bond Index Fund, FlexShares Ready Access Variable Income Fund, FlexShares ESG & Climate High Yield Corporate Core Index Fund, FlexShares ESG & Climate Investment Grade Corporate Core Index Fund, and FlexShares Core Select Bond Fund are subject to the risk that the value of the Funds’
| | | | |
| 534 | | FLEXSHARES ANNUAL REPORT | | |
Supplemental Information (cont.)
fixed-income assets will decline because of rising interest rates. The magnitude of this decline will often be greater for longer-term fixed income securities than shorter-term fixed-income securities. Duration is a measure used to determine the sensitivity of a security’s price to changes in interest rates. The longer a security’s duration, the more sensitive it will be to changes in interest rates.
MLP Risk
The FlexShares STOXX® Global Broad Infrastructure Index Fund and FlexShares Real Assets Allocation Index Fund (including through its investment in its Underlying Fund(s)) may invest in Master Limited Partnerships (“MLPs”). The FlexShares STOXX® Global Broad Infrastructure Index Fund may not invest more than 25% of its net assets in MLPs. MLP Risk is the risk that accompanies an investment in MLP units. Investing in MLPs involves certain risks related to investing in the underlying assets of the MLPs and risks associated with pooled investment vehicles. MLPs that concentrate in a particular industry or a particular geographic region are subject to risks associated with such industry or region. MLPs may also be sensitive to changes in interest rates and, during periods of interest rate volatility, limited capital markets access and/or low commodities pricing and may not provide attractive returns. The benefit derived from the Fund’s investment in MLPs is largely dependent on the MLPs being treated as partnerships for federal income tax purposes. If any of the MLPs owned by the Fund were treated as corporations for U.S. federal income tax purposes, the after-tax return to the Fund with respect to its investment in such MLPs would be materially reduced, which could cause a decline in the value of the Fund’s shares. The Fund must include its allocable share of the MLP’s taxable income in its taxable income, whether or not it receives a distribution of cash from the MLP. In such case, the Fund may have to liquidate securities to make required distributions to the Fund’s shareholders.
The following risk applies to the FlexShares ESG & Climate US Large Cap Core Index Fund, FlexShares ESG & Climate Developed Markets ex-US Core Index Fund, FlexShares ESG & Climate High Yield Corporate Core Index Fund, and FlexShares ESG & Climate Investment Grade Corporate Core Index Fund:
New Fund Risk
New Fund Risk is the risk that the Fund will not grow to or maintain an economically viable size, in which case it may experience greater tracking error to its Underlying Index than it otherwise would at higher asset levels, or it could ultimately liquidate without shareholder approval. The timing of such liquidation may not be favorable and could have negative tax consequences for shareholders. From time to time, an Authorized Participant, a third-party investor, the Fund’s adviser or an affiliate of the Fund’s adviser, may invest in the Fund and hold its investment for a specific period of time in order to facilitate commencement of the Fund’s operations or for the Fund to achieve size or scale. There can be no assurance that any such entity would not redeem its investment or that the size of the Fund would be maintained at such levels, which could negatively impact the Fund. The Fund’s Distributor does not maintain a secondary market in the shares.
Non-diversification Risk
The FlexShares Morningstar Global Upstream Natural Resources Index Fund, FlexShares STOXX® Global Broad Infrastructure Index Fund, FlexShares Global Quality Real Estate Index Fund, FlexShares Real Assets Allocation Index Fund, FlexShares iBoxx 3-Year Target Duration TIPS Index Fund, FlexShares iBoxx 5-Year Target Duration TIPS Index Fund, FlexShares Credit-Scored US Corporate Bond Index Fund, FlexShares Credit-Scored US Long Corporate Bond Index Fund, FlexShares Ready Access Variable Income Fund, FlexShares US Quality Low Volatility Index Fund, FlexShares Developed Markets ex-US Quality Low Volatility Index Fund, FlexShares ESG & Climate US Large Cap Core Index Fund, FlexShares ESG & Climate Developed Markets ex-US Core Index Fund, FlexShares ESG & Climate High Yield Corporate Core Index Fund, FlexShares ESG & Climate Investment
| | | | | | |
| | FLEXSHARES ANNUAL REPORT | | | 535 | |
Supplemental Information (cont.)
Grade Corporate Core Index Fund, and FlexShares Emerging Markets Quality Low Volatility Index Fund are non-diversified series of the Trust, pursuant to the 1940 Act. The performance of these Funds may depend on the performance of a small number of issuers because the Funds may invest a large percentage of its assets in securities issued by or representing a small number of issuers.
Large Cap Risk
The FlexShares US Quality Large Cap Index Fund, FlexShares STOXX® US ESG Select Index Fund, FlexShares STOXX® Global ESG Select Index Fund, FlexShares Quality Dividend Index Fund, FlexShares Quality Dividend Defensive Index Fund, FlexShares Quality Dividend Dynamic Index Fund, FlexShares International Quality Dividend Index Fund, FlexShares International Quality Dividend Defensive Index Fund, FlexShares International Quality Dividend Dynamic Index Fund, FlexShares US Quality Low Volatility Index Fund, FlexShares Developed Markets ex-US Quality Low Volatility Index Fund, FlexShares ESG & Climate US Large Cap Core Index Fund, FlexShares ESG & Climate Developed Markets ex-US Core Index Fund, and FlexShares Emerging Markets Quality Low Volatility Index Fund are subject to the risk that returns on investments in stocks of large U.S. companies could trail the returns on investments in stocks of smaller and mid-sized companies. In addition, larger companies may grow more slowly or be slower to respond to business developments than smaller companies.
Mid Cap Stock Risk
The FlexShares ESG & Climate Developed Markets ex-US Core Index Fund, FlexShares STOXX® US ESG Select Index Fund, FlexShares STOXX® Global ESG Select Index Fund, FlexShares US Quality Low Volatility Index Fund, FlexShares Developed Markets ex-US Quality Low Volatility Index Fund, and FlexShares Emerging Markets Quality Low Volatility Index Fund may invest in stocks of mid-sized companies which may be subject to more abrupt or erratic market movements than stocks of larger, more established companies. Mid-sized companies may have limited product lines or financial resources, and may be dependent upon a particular niche of the market.
Mid and Small Cap Stock Risk
The FlexShares Morningstar US Market Factor Tilt Index Fund, FlexShares Morningstar Developed Markets ex-US Factor Tilt Index Fund, FlexShares Morningstar Emerging Markets Factor Tilt Index Fund, FlexShares Morningstar Global Upstream Natural Resources Index Fund, FlexShares STOXX® Global Broad Infrastructure Index Fund, FlexShares Global Quality Real Estate Index Fund, FlexShares Real Assets Allocation Index Fund (including through its investment in its Underlying Fund(s)), FlexShares International Quality Dividend Index Fund, FlexShares International Quality Dividend Defensive Index Fund, and FlexShares International Quality Dividend Dynamic Index Fund may invest in stocks of smaller companies which may be more volatile than stocks of larger, more established companies. Small companies may have limited product lines or financial resources, or may be dependent upon a small or inexperienced management group, and their securities may trade less frequently and in lower volume than the securities of larger companies, which could lead to higher transaction costs. Generally the smaller the company size, the greater the risk.
Value Investing Risk
The FlexShares Morningstar US Market Factor Tilt Index Fund, FlexShares Morningstar Developed Markets ex-US Factor Tilt Index Fund, FlexShares Morningstar Emerging Markets Factor Tilt Index Fund, FlexShares US Quality Large Cap Index Fund, FlexShares Global Quality Real Estate Index Fund, and FlexShares Real Assets Allocation Index Fund’s (including through its investment in its Underlying Fund(s)) investment in companies whose securities are believed to be undervalued, relative to their underlying profitability, may not appreciate in value as anticipated.
| | | | |
| 536 | | FLEXSHARES ANNUAL REPORT | | |
Supplemental Information (cont.)
ESG Investment Risk
The FlexShares STOXX® US ESG Select Index Fund, FlexShares ESG & Climate US Large Cap Core Index Fund, FlexShares ESG & Climate Developed Markets ex-US Core Index Fund, FlexShares ESG & Climate High Yield Corporate Core Index Fund, FlexShares ESG & Climate Investment Grade Corporate Core Index Fund, and FlexShares STOXX® Global ESG Select Index Fund, are subject to the risk that because the methodology of the Underlying Index selects and assigns weights to securities of issuers for nonfinancial reasons, the Fund may underperform the broader equity market or other funds that do not utilize ESG criteria when selecting investments.
High Portfolio Turnover Risk
The FlexShares STOXX® US ESG Select Index Fund, FlexShares Ready Access Variable Income Fund, FlexShares Core Select Bond Fund, FlexShares iBoxx 3-Year Target Duration TIPS Index Fund, FlexShares Disciplined Duration MBS Index Fund, FlexShares Credit-Scored US Long Corporate Bond Index Fund, FlexShares ESG & Climate High Yield Corporate Core Index Fund, FlexShares ESG & Climate Investment Grade Corporate Core Index Fund, and FlexShares High Yield Value-Scored Bond Index Fund are subject to the risk that active and frequent trading of the Fund’s portfolio securities may result in increased transaction costs to the Fund, including brokerage commissions, dealer mark-ups and other transaction costs, which could reduce the Fund’s return.
Global Natural Resources Risk
The FlexShares Morningstar Global Upstream Natural Resources Index Fund (which is also an Underlying Fund of FlexShares Real Assets Allocation Index Fund) is subject to the risks associated with investment in the global natural resources sector in addition to the general risk of the stock market. The natural resources sector can significantly be affected by events relating to U.S. and foreign political and economic developments and environmental and other government regulations, as well as other factors including, but not limited to: commodity price volatility, technological developments and natural or man-made disasters. Declines in the demand for, or prices of, natural resources generally would be expected to contribute to declines in the value of the Fund’s equity securities. Such declines may occur quickly and without warning and may negatively impact the value of the Fund and your investment.
Hedging Risk
The FlexShares Core Select Bond Fund is subject to the risk that the Fund’s short positions in U.S. Treasury futures and transactions in interest rate swaps will not completely eliminate interest rate risk of long positions in bonds. In certain falling interest rate environments, the Fund’s hedging strategy could result in disproportionately larger losses in the short U.S. Treasury futures and interest rate swaps positions as compared to gains in the long bond positions attributable to interest rate changes.
Corporate Bond Risk
The FlexShares Credit-Scored US Corporate Bond Index Fund, FlexShares ESG & Climate High Yield Corporate Core Index Fund, FlexShares ESG & Climate Investment Grade Corporate Core Index Fund, and FlexShares Credit-Scored US Long Corporate Bond Index Fund invest primarily in bonds issued by corporations. Corporate debt securities are subject to the risk of the issuer’s inability to meet principal and interest payments on the obligation and may also be subject to price volatility due to such factors as interest rate sensitivity, market perception of the creditworthiness of the issuer and general market liquidity. When interest rates rise, the value of corporate debt can be expected to decline. Debt securities with longer maturities tend to be more sensitive to interest rate movements than those with shorter maturities.
| | | | | | |
| | FLEXSHARES ANNUAL REPORT | | | 537 | |
Supplemental Information (cont.)
Interest Rate Risk
The FlexShares STOXX® Global Broad Infrastructure Index Fund and FlexShares Global Quality Real Estate Index Fund (which is also an Underlying Fund of FlexShares Real Assets Allocation Index Fund) are subject to the risk that rising interest rates may adversely affect the Fund. Increases in interest rates typically lower the present value of a REIT’s future earnings stream, and may make financing property purchases and improvements more costly. Because the market price of REIT stocks may change based upon investors’ collective perceptions of future earnings, the value of the Fund may decline when investors anticipate or experience rising interest rates.
Cash Transactions Risk
The FlexShares Disciplined Duration MBS Index Fund and FlexShares Ready Access Variable Income Fund may effect a creation or redemption order of its shares entirely for cash, rather than for in-kind securities. Paying redemption proceeds entirely in cash rather than through in-kind delivery of portfolio securities may require the Fund to dispose of or sell portfolio securities or other assets at an inopportune time to obtain the cash needed to meet redemption orders. This may cause a Fund to sell a security or other financial instrument and recognize a capital gain or loss that might not have been incurred if it had not effected a redemption order entirely for cash. As a result, the Fund may pay out higher or lower annual capital gains distributions than ETFs that meet redemption orders entirely in-kind with portfolio securities. The use of all cash creations and redemption orders may also cause a Fund’s shares to trade in the secondary market at wider bid-ask spreads and/or greater premiums or discounts to the Fund’s NAV. To the extent that the maximum additional variable charge for cash creation or cash redemption transactions is insufficient to cover the transaction costs of purchasing or selling portfolio securities, the Fund’s performance could be negatively impacted.
China Investment Risk
The FlexShares Emerging Markets Quality Low Volatility Index Fund, and FlexShares Morningstar Emerging Markets Factor Tilt Index Fund expects to have significant investment in securities of Chinese issuers. Investment exposure to China subjects a Fund to risks specific to China. China may be subject to considerable degrees of economic, political and social instability. China is a developing market and demonstrates significantly higher volatility from time to time in comparison to developed markets. Over the past 25 years, the Chinese government has undertaken reform of economic and market practices and expansion of the sphere for private ownership of property in China. However, Chinese markets generally continue to experience inefficiency, volatility, currency fluctuations and pricing anomalies resulting from governmental influence, a lack of publicly available information and/or political and social instability. Internal social unrest or confrontations with other neighboring countries, including military conflicts in response to such events, may also disrupt economic development in China and result in a greater risk of currency fluctuations, currency convertibility, interest rate fluctuations and higher rates of inflation. The Chinese economy is export-driven and highly reliant on trade. Reduction in spending on Chinese products and services, institution of tariffs or other trade barriers, or a downturn in any of the economies of China’s key trading partners, such as the United States, Japan and South Korea, may have an adverse impact on the Chinese economy.
Currency Risk
The FlexShares Morningstar Developed Markets ex-US Factor Tilt Index Fund, FlexShares Morningstar Emerging Markets Factor Tilt Index Fund, FlexShares STOXX® Global ESG Select Index Fund, FlexShares Morningstar Global Upstream Natural Resources Index Fund, FlexShares STOXX ® Global Broad Infrastructure Index Fund, FlexShares Global Quality Real Estate Index Fund, FlexShares Real Assets Allocation Index Fund, FlexShares International Quality Dividend Index Fund, FlexShares International Quality Dividend Defensive Index Fund, FlexShares International Quality Dividend Dynamic Index Fund, FlexShares Ready
| | | | |
| 538 | | FLEXSHARES ANNUAL REPORT | | |
Supplemental Information (cont.)
Access Variable Income Fund, FlexShares Developed Markets ex-US Quality Low Volatility Index Fund, FlexShares ESG & Climate Developed Markets ex-US Core Index Fund, and FlexShares Emerging Markets Quality Low Volatility Index Fund may invest in securities denominated in foreign currencies. While each Fund’s investments may be denominated in foreign currencies, the portfolio securities and other assets held by each Fund are valued in U.S. dollars. Price fluctuations may occur in the dollar value of foreign securities because of changing currency exchange rates. Currency exchange rates may fluctuate significantly over short periods of time causing a Fund’s NAV to fluctuate as well. Currency exchange rates can be affected unpredictably by the intervention or the failure to intervene by U.S. or foreign governments or central banks, or by currency controls or political developments in the U.S. or abroad. To the extent that a Fund’s total assets, adjusted to reflect the Fund’s net position after giving effect to currency transactions, are denominated in the currencies of foreign countries, that Fund will be more susceptible to the risk of adverse economic and political developments within those countries.
Foreign Securities Risk
The FlexShares Morningstar Developed Markets ex-US Factor Tilt Index Fund, FlexShares Morningstar Emerging Markets Factor Tilt Index Fund, FlexShares STOXX® Global ESG Select Index Fund, FlexShares Morningstar Global Upstream Natural Resources Index Fund, FlexShares STOXX® Global Broad Infrastructure Index Fund, FlexShares Global Quality Real Estate Index Fund, FlexShares Real Assets Allocation Index Fund, FlexShares International Quality Dividend Index Fund, FlexShares International Quality Dividend Defensive Index Fund, FlexShares International Quality Dividend Dynamic Index Fund, FlexShares Developed Markets ex-US Quality Low Volatility Index Fund, FlexShares Emerging Markets Quality Low Volatility Index Fund, FlexShares ESG & Climate Developed Markets ex-US Core Index Fund, and FlexShares Ready Access Variable Income Fund will invest in foreign securities. Foreign securities include direct investments in non-U.S. dollar-denominated securities traded primarily outside of the United States and dollar-denominated securities of foreign issuers. Foreign securities also include indirect investments such as American Depositary Receipts (“ADRs”) and Global Depositary Receipts (“GDRs”). ADRs are U.S. dollar-denominated receipts representing shares of foreign-based corporations. ADRs are receipts that are traded in the U.S., and entitle the holder to all dividend and capital gain distributions that are paid out on the underlying foreign shares. GDRs are receipts that often trade on foreign exchanges. They represent ownership in an underlying foreign or U.S. security and generally are denominated in a foreign currency.
Emerging Markets Risk
The FlexShares Morningstar Emerging Markets Factor Tilt Index Fund, FlexShares Real Assets Allocation Index Fund, FlexShares International Quality Dividend Index Fund, FlexShares International Quality Dividend Defensive Index Fund, FlexShares International Quality Dividend Dynamic Index Fund, FlexShares Emerging Markets Quality Low Volatility Index Fund, FlexShares Morningstar Global Upstream Natural Resources Index Fund, FlexShares STOXX® Global Broad Infrastructure Index Fund, FlexShares Global Quality Real Estate Index Fund, and FlexShares Ready Access Variable Income Fund invest in emerging market countries. The risks of foreign investment are increased when the issuer is located in a country with an emerging economy or securities market. Political and economic structures in many of these countries may be undergoing significant evolution and rapid development, and these countries may lack the social, political and economic stability characteristics of developed countries. The securities laws of emerging market countries may be relatively new and unsettled and, consequently, there is a risk of rapid and unpredictable change in laws regarding foreign investment, securities regulation, title to securities and shareholder rights. Global factors and foreign actions may inhibit the flow of foreign capital on which a country is dependent to sustain its growth. In general, securities markets of emerging countries are less liquid, are especially subject to greater price volatility, have smaller market capitalizations, and have problems with securities registration and custody. These securities markets also have less government regulation and are not subject to as extensive and frequent accounting, financial and other reporting requirements as the securities markets of more developed countries. In addition, because the securities
| | | | | | |
| | FLEXSHARES ANNUAL REPORT | | | 539 | |
Supplemental Information (cont.)
settlement procedures are less developed in these countries, a Fund may be required to deliver securities before receiving payment and also may be unable to complete transactions during market disruptions. As a result of these and other risks, investments in these countries generally present a greater risk of loss to a Fund.
Japan Investment Risk
The FlexShares Morningstar Developed Markets ex-US Factor Tilt Index Fund, FlexShares ESG & Climate Developed Markets ex-US Core Index Fund, and FlexShares Developed Markets ex-US Quality Low Volatility Index Fund expects to have significant investment in securities of Japanese issuers. The Japanese economy may be subject to considerable degrees of economic, political and social instability, which could negatively impact Japanese issuers. In recent times, Japan’s economic growth rate has remained low, and it may remain low in the future. In addition, Japan is subject to the risk of natural disasters, such as earthquakes, volcanic eruptions, typhoons and tsunamis, which could negatively affect a Fund. The growth of Japan’s economy has historically lagged that of its Asian neighbors and other major developed economies. The Japanese economy is heavily dependent on international trade and has been adversely affected by trade tariffs, other protectionist measures, competition from emerging economies and the economic conditions of its trading partners. Japan’s relations with its neighbors, particularly China, North Korea, South Korea and Russia, have at times been strained due to territorial disputes, historical animosities and defense concerns. Most recently, the Japanese government has shown concern over the increased nuclear and military activity by North Korea. Strained relations may cause uncertainty in the Japanese markets and adversely affect the overall Japanese economy in times of crisis. China has become an important trading partner with Japan, yet the countries’ political relationship has become strained. Should political tension increase, it could adversely affect the economy, especially the export sector, and destabilize the region as a whole.
U.S. Issuer Risk
The FlexShares Morningstar US Market Factor Tilt Index Fund, FlexShares US Quality Large Cap Index Fund, FlexShares STOXX US ESG Select Index Fund, FlexShares STOXX Global ESG Select Index Fund, FlexShares Morningstar Global Upstream Natural Resources Index Fund, FlexShares STOXX Global Broad Infrastructure Index Fund, FlexShares Global Quality Real Estate Index Fund, FlexShares Real Assets Allocation Index Fund, FlexShares Quality Dividend Index Fund, FlexShares Quality Dividend Defensive Index Fund, FlexShares Quality Dividend Dynamic Index Fund, FlexShares Disciplined Duration MBS Index Fund, FlexShares Credit-Scored U.S. Corporate Bond Index Fund, FlexShares Credit-Scored US Long Corporate Bond Index Fund, FlexShares High Yield Value-Scored Bond Index Fund, FlexShares US Quality Low Volatility Index Fund, FlexShares Ready Access Variable Income Fund, FlexShares ESG & Climate US Large Cap Core Index Fund, FlexShares ESG & Climate High Yield Corporate Core Index Fund, FlexShares ESG & Climate Investment Grade Corporate Core Index Fund, and FlexShares Core Select Bond Fund has significant exposure to U.S. issuers. Decreasing imports or exports, changes in trade regulations and/or an economic recession in the United States may have a material adverse effect on the U.S. economy. The financial crisis that began in 2007 caused a significant decline in the value and liquidity of issuers in the United States. Policy and legislative changes in the United States are changing many aspects of financial and other regulation and may have a significant effect on the U.S. markets generally, as well as the value of certain securities. In addition, a continued rise in the U.S. public debt level or U.S. austerity measures may adversely affect U.S. economic growth and the securities to which the Funds have exposure.
The following risks apply to the FlexShares Quality Dividend Index Fund, FlexShares Quality Dividend Defensive Index Fund, FlexShares Quality Dividend Dynamic Index Fund, FlexShares International Quality Dividend Index Fund, FlexShares International Quality Dividend Defensive Index Fund, and FlexShares International Quality Dividend Dynamic Index Fund:
| | | | |
| 540 | | FLEXSHARES ANNUAL REPORT | | |
Supplemental Information (cont.)
Dividend Risk
The Fund is subject to the risk that an issuer of stock held by a Fund may choose not to declare a dividend or the dividend rate might not remain at current levels. Dividend paying stocks might not experience the same level of earnings growth or capital appreciation as non-dividend paying stocks. A Fund’s performance during a broad market advance could suffer because dividend paying stocks may not experience the same capital appreciation as non-dividend paying stocks.
Volatility Risk
The Fund is subject to the risk that the actual level of volatility experienced by a Fund may be greater or lower than the targeted overall volatility of the Fund’s Underlying Index. Although a Fund’s Underlying Index is designed to have a targeted overall volatility, there is no guarantee that it will have the targeted overall volatility. A Fund will continue to seek to track the Underlying Index even if the Underlying Index does not have the targeted overall volatility. There is also the risk that a Fund may experience volatility greater or lower than that of the Underlying Index as a result of tracking error. A portfolio of securities with greater volatility is generally considered to have a higher risk profile than a portfolio with lower volatility.
The following risk applies to the FlexShares Global Quality Real Estate Index Fund (which is also an Underlying Fund of the FlexShares Real Assets Allocation Index Fund):
Real Estate Securities Risk
The Fund is subject to the risks associated with investment in the real estate sector in addition to the general risk of the stock market. Investing in securities of real estate companies will make the Fund more susceptible to risks associated with the ownership of real estate and with the real estate industry in general, as well as risks that relate specifically to the way in which real estate companies are organized and operated. Real estate companies may have lower trading volumes and may be subject to more abrupt or erratic price movements than the overall securities markets. The value of real estate securities may underperform other sectors of the economy or broader equity markets. To the extent that the Fund concentrates its investments in the real estate sector, it may be subject to greater risk of loss than if it were diversified across different industry sectors.
The following risk applies to the FlexShares Global Quality Real Estate Index Fund (which is also an Underlying Fund of FlexShares Real Assets Allocation Index Fund) and FlexShares STOXX® Global Broad Infrastructure Index Fund:
Real Estate Investment Trust (REIT) Risk
The Fund is subject to the risk that the Fund’s investments will be affected by factors affecting REITs and the real estate sector generally. Investing in REITs involves certain unique risks in addition to those risks associated with investing in the real estate industry in general. REITs whose underlying properties are concentrated in a particular industry or geographic region are also subject to risks affecting such industries and regions. By investing in REITs through the Fund, a shareholder will bear expenses of the REITs in addition to expenses of the Fund.
The following risk apply to the FlexShares Real Assets Allocation Index Fund:
Fund of Funds Risk (or Underlying Funds Risk)
The Fund is subject to the risk that the Fund’s investment performance largely depends on the investment performance of the Underlying Fund(s) in which it primarily invests. The Fund’s NAV will change with changes in the value of the Underlying Fund(s) and other securities in which the Fund invests based on their market valuations.
| | | | | | |
| | FLEXSHARES ANNUAL REPORT | | | 541 | |
Supplemental Information (cont.)
An investment in the Fund will entail more costs and expenses than direct investments in the Underlying Fund(s). The Fund will indirectly pay a proportional share of the expenses of the Underlying Fund(s) in which it invests (including operating expenses and management fees), in addition to the fees and expenses it pays directly. As the Fund’s allocation to an Underlying Fund changes from time to time, or to the extent that the expense ratio of an Underlying Fund changes, the weighted average operating expenses borne by the Fund may increase or decrease.
The following risks apply to the FlexShares Disciplined Duration MBS Index Fund, FlexShares Credit-Scored US Corporate Bond Index Fund, FlexShares Credit-Scored US Long Corporate Bond Index Fund, FlexShares High Yield Value-Scored Bond Index Fund, FlexShares Ready Access Variable Income Fund, FlexShares ESG & Climate High Yield Corporate Core Index Fund, FlexShares ESG & Climate Investment Grade Corporate Core Index Fund, and FlexShares Core Select Bond Fund:
Credit (or Default) Risk
The Fund is subject to the risk that the inability or unwillingness of an issuer or guarantor of a fixed-income security, or a counterparty to a TBA, repurchase or other transaction, to meet its payment or other financial obligations will adversely affect the value of the Fund’s investments and its returns. The credit quality of a debt security or of the issuer of a debt security held by the Fund could deteriorate rapidly, which may impair the Fund’s liquidity or cause a deterioration in the Fund’s NAV. The Fund could also be delayed or hindered in its enforcement of rights against an issuer, guarantor or counterparty. The degree of credit risk depends on the issuer’s or counterparty’s financial condition and on the terms of the securities.
Debt Extension Risk
The Fund is subject to the risk that an issuer will exercise its right to pay principal on an obligation held by the Fund (such as a mortgage-backed security) later than expected. This may happen during a period of rising interest rates. Under these circumstances, the value of the obligation will decrease and the Fund will suffer from the inability to invest in higher yielding securities.
Liquidity Risk
The Fund is subject to the risk that certain portfolio securities may be less liquid than others, which may make them difficult or impossible to sell at the time and the price that the Fund would like, adversely affecting the value of the Fund’s investments and its returns.
Prepayment (or Call) Risk
The Fund is subject to the risk that prepayment of the underlying mortgages or other collateral of some fixed-income securities may result in a decreased rate of return and a decline in value of those securities.
U.S. Government Securities Risk
The FlexShares Disciplined Duration MBS Index Fund, FlexShares Ready Access Variable Income Fund and FlexShares Core Select Bond Fund are subject to the risk that the U.S. government will not provide financial support to its agencies, instrumentalities or sponsored enterprises if it is not obligated to do so by law. Many U.S. government securities that may be purchased by the Fund are not backed by the full faith and credit of the United States. It is possible that the issuers of such securities will not have the funds to meet their payment obligations in the future.
Mortgage-Related and Other Asset-Backed Risks
The FlexShares Ready Access Variable Income Fund and FlexShares Core Select Bond Fund is subject to the risks of investing in mortgage-related and other asset-backed securities, including Interest Rate/Maturity Risk, Debt Extension Risk and Prepayment (or Call) Risk.
| | | | |
| 542 | | FLEXSHARES ANNUAL REPORT | | |
Supplemental Information (cont.)
The following risk applies to the FlexShares Disciplined Duration MBS Index Fund:
Mortgage Backed Pass-Through Securities Risk
The Fund is subject to the risk of investing in mortgage-backed securities issued by a U.S. Agency. These securities may not be backed by the full faith and credit of the U.S. government. Mortgage-backed securities are subject to Credit (or Default) Risk, Interest Rate/ Maturity Risk, Debt Extension Risk and Prepayment (or Call) Risk. Because of these risks, mortgage-backed securities react differently to changes in interest rates than other bonds. Small movements in interest rates (both increases and decreases) may quickly and significantly reduce the value of certain mortgage-backed securities.
The following risks apply to the FlexShares High Yield Value-Scored Bond Index Fund and FlexShares ESG & Climate High Yield Corporate Core Index Fund:
Distressed Securities Risk
Distressed securities risk is the substantial risk of investing in distressed securities that is in addition to the risks of investing in non-investment grade securities generally. NTI defines securities issued by companies whose financial condition is troubled or uncertain and that may be involved in bankruptcy proceedings, reorganizations or financial restructurings as “distressed securities.” Distressed securities are speculative and involve a substantial risk that principal will not be paid. In addition, the Fund will generally not receive interest payments on the distressed securities and may incur costs to protect its investment. These securities may present a substantial risk of default. The Fund may incur additional expenses to the extent it is required to seek recovery upon a default in the payment of principal of or interest on its portfolio holdings. In any reorganization or liquidation proceeding relating to a portfolio company, the Fund may lose its entire investment or may be required to accept cash or securities with a value less than its original investment. Distressed securities and any securities received in an exchange for such securities may be subject to restrictions on resale.
High Yield Securities Risk
High yield securities risk is the risk that the Fund will be subject to greater credit risk, price volatility and risk of loss than if it invested primarily in investment grade securities, which can adversely impact the Fund’s return and net asset value. High yield securities are considered highly speculative and are subject to increased risk of an issuer’s inability to make principal and interest payments. The FlexShares High Yield Value-Scored Bond Index Fund’s Underlying Index is designed to be comprised of securities with the potential for higher yields as compared to the overall high yield corporate bond market. As such, the FlexShares High Yield Value-Scored Bond Index Fund is expected to exhibit greater sensitivity to market fluctuations.
Substantial Volatility Risk
Substantial volatility risk is the risk that the value of the securities in the Fund’s portfolio may fluctuate, sometimes rapidly and unpredictably at a greater level than the overall market. There is a risk that the Fund could have substantial volatility.
The following risk applies to the FlexShares High Yield Value-Scored Bond Index Fund:
Value Score Risk
Value score risk is the risk that the Fund’s investment in companies whose securities are believed to be undervalued will not appreciate in value as anticipated. Although the Underlying Index is designed to measure a portfolio of bonds of companies with the potential for higher yields and less risk of insolvency relative to the Parent Index, there is no assurance that the Underlying Index or Fund will be comprised of such securities. Accordingly, the Fund may be subject to greater credit risk, price volatility and risk of loss relative to the Parent Index.
| | | | | | |
| | FLEXSHARES ANNUAL REPORT | | | 543 | |
Supplemental Information (cont.)
The following risk applies to the FlexShares ESG & Climate Developed Markets ex-US Core Index Fund, FlexShares Morningstar US Market Factor Tilt Index Fund, FlexShares Morningstar Developed Markets ex-US Factor Tilt Index Fund, FlexShares Morningstar Emerging Markets Factor Tilt Index Fund, FlexShares International Quality Dividend Index Fund, FlexShares International Quality Dividend Defensive Index Fund, FlexShares International Quality Dividend Dynamic Index Fund, FlexShares Credit-Scored US Corporate Bond Index Fund, FlexShares Credit-Scored US Long Corporate Bond Index Fund, FlexShares Ready Access Variable Income Fund, FlexShares Core Select Bond Fund, FlexShares US Quality Low Volatility Index Fund, FlexShares Developed Markets ex-US Quality Low Volatility Index Fund, and FlexShares Emerging Markets Quality Low Volatility Index Fund:
Financial Sector Risk
The Fund is subject to the risk that the Fund will be impacted by events affecting the U.S. and/or non-U.S. financial sectors if it invests a relatively large percentage of its assets in those sectors, adversely affecting the Fund’s performance. The U.S. and non-U.S. financial sectors can be significantly affected by changes in interest rates, government regulation, the rate of corporate and consumer debt defaulted, price competitions and the availability and cost of capital funds, among other factors. The impact of changes in capital requirements and recent or future regulation of any individual financial company, or of the financials sector as a whole, cannot be predicted. In recent years, cyberattacks and technology malfunctions and
failures have become increasingly frequent in this sector and have caused significant losses to companies in this sector, which may negatively impact the Fund.
The following risk applies to the FlexShares US Quality Low Volatility Index Fund, FlexShares Morningstar US Market Factor Tilt Index Fund, FlexShares US Quality Large Cap Index Fund, FlexShares STOXX US ESG Select Index Fund, FlexShares STOXX Global ESG Select Index Fund, FlexShares Quality Dividend Index Fund, FlexShares Quality Dividend Defensive Index Fund, and FlexShares Quality Dividend Dynamic Index Fund:
Information Technology Sector Risk
The Fund is subject to the risk that the Fund will be impacted by events affecting the U.S. information technology sector if it invests a relatively large percentage of its assets in that sector, adversely affecting the Fund’s price.
The following risk applies to the FlexShares US Quality Low Volatility Index Fund, FlexShares Developed Markets ex-US Quality Low Volatility Index Fund, FlexShares Emerging Markets Quality Low Volatility Index Fund, FlexShares Morningstar US Market Factor Tilt Index Fund, FlexShares Morningstar Developed Markets ex-US Factor Tilt Index Fund, FlexShares Morningstar Emerging Markets Factor Tilt Index Fund, FlexShares US Quality Large Cap Index Fund, FlexShares STOXX US ESG Select Index Fund, FlexShares STOXX Global ESG Select Index Fund, FlexShares Morningstar Global Upstream Natural Resources Index Fund, FlexShares STOXX Global Broad Infrastructure Index Fund, FlexShares Global Quality Real Estate Index Fund, FlexShares Real Assets Allocation Index Fund, FlexShares Quality Dividend Index Fund, FlexShares Quality Dividend Defensive Index Fund, FlexShares Quality Dividend Dynamic Index Fund, FlexShares International Quality Dividend Index Fund, FlexShares International Quality Dividend Defensive Index Fund, FlexShares ESG & Climate Developed Markets ex-US Core Index Fund, FlexShares ESG & Climate US Large Cap Core Index Fund, and FlexShares International Quality Dividend Dynamic Index Fund:
Equity Securities Risk
Each Fund invests in equity securities, primarily in the form of common stocks. Each of these Funds may also invest in preferred stocks and REITs. Preferred stocks are securities that represent an ownership interest providing the holder with claims on the issuer’s earnings and assets before common stock owners but after bond owners. REITs are pooled investment vehicles that invest primarily in real estate or real estate related loans.
| | | | |
| 544 | | FLEXSHARES ANNUAL REPORT | | |
Supplemental Information (cont.)
Equity securities are subject to changes in value that may be attributable to market perception of a particular issuer, general stock market fluctuations that affect all issuers, or as a result of such factors as a company’s business performance, investor perceptions, stock market trends and general economic conditions. The equity securities owned by a Fund may be more volatile and underperform other asset classes and the general securities markets.
The following risk applies to the FlexShares US Quality Low Volatility Index Fund, FlexShares Developed Markets ex-US Quality Low Volatility Index Fund, FlexShares ESG & Climate Developed Markets ex-US Core Index Fund, FlexShares ESG & Climate High Yield Corporate Core Index Fund, FlexShares ESG & Climate Investment Grade Corporate Core Index Fund, FlexShares ESG & Climate US Large Cap Core Index Fund, and FlexShares Emerging Markets Quality Low Volatility Index Fund:
Large Shareholder Risk
Certain shareholders, including other funds advised by the Investment Adviser, may from time to time own a substantial amount of the Fund’s shares. In addition, a third party investor, the Investment Adviser or an affiliate of the Investment Adviser, an authorized participant, a lead market maker, or another entity may invest in the Fund and hold its investment for a limited period of time solely to facilitate commencement of the Fund or to facilitate the Fund’s achieving a specified size or scale. There can be no assurance that any large shareholder would not redeem its investment, that the size of the Fund would be maintained at such levels or that the Fund would continue to meet applicable listing requirements. Redemptions by large shareholders could have a significant negative impact on the Fund. In addition, transactions by large shareholders may account for a large percentage of the trading volume on Fund’s listing exchange and may, therefore, have a material upward or downward effect on the market price of the shares.
To the extent a significant percentage of the shares of a Fund are owned or controlled by a small number of account shareholders (or a single account shareholder), including funds or accounts over which the Investment Adviser or an affiliate of the Investment Adviser has investment discretion, the Fund is subject to the risk that those shareholders may purchase or redeem Fund shares in significant amounts rapidly or unexpectedly, including as a result of an asset allocation decision made by the Investment Adviser or an affiliate of the Investment Adviser and may adversely affect a Fund’s performance if the Investment Adviser is forced to sell portfolio securities or invest cash when the Investment Adviser would not otherwise choose to do so. Redemptions of a large number of shares may affect the liquidity of a Fund’s portfolio, increase the Fund’s transaction costs, and accelerate the realization of taxable income and/or gains.
The following risk applies to the FlexShares US Quality Low Volatility Index Fund, FlexShares Developed Markets ex-US Quality Low Volatility Index Fund, and FlexShares Emerging Markets Quality Low Volatility Index Fund:
Low Volatility Risk
Although the Underlying Index is designed to have overall volatility that is lower than that of the Parent Index, there is no guarantee it will be successful. Securities or other assets in the Fund’s portfolio may be subject to price volatility and the prices may not be any less volatile than the market as a whole and could be more volatile. Events or financial circumstances affecting individual securities or sectors may increase the volatility of a Fund. The price of a security may fluctuate due to factors affecting markets generally or particular industries. The market prices of the securities or other assets in a Fund’s portfolio may fluctuate, sometimes rapidly and unpredictably. The Fund will continue to seek to track the Underlying Index even if the Underlying Index does not have lower overall volatility than the Parent Index. There is also the risk that a Fund may experience volatility greater than that of its Parent Index as a result of tracking error. A portfolio of securities with greater volatility is generally considered to have a higher risk profile than a portfolio with lower volatility. In addition, a large redemption could result in a Fund’s current expenses being allocated over a smaller asset base, leading to an increase in the Fund’s gross expense
| | | | | | |
| | FLEXSHARES ANNUAL REPORT | | | 545 | |
Supplemental Information (cont.)
ratio. Large purchases of a Fund’s shares may also adversely affect the Fund’s performance to the extent that a Fund is delayed in investing new cash or otherwise maintains a larger cash position than it ordinarily would to the extent that the Fund accepts cash for an order for the purchase of creation units of the Fund’s shares.
Passive Investment Risk
The FlexShares US Quality Low Volatility Index Fund, FlexShares Developed Markets ex-US Quality Low Volatility Index Fund, FlexShares Emerging Markets Quality Low Volatility Index Fund, FlexShares Morningstar US Market Factor Tilt Index Fund, FlexShares Morningstar Developed Markets ex-US Factor Tilt Index Fund, FlexShares Morningstar Emerging Markets Factor Tilt Index Fund, FlexShares US Quality Large Cap Index Fund, FlexShares STOXX US ESG Select Index Fund, FlexShares STOXX Global ESG Select Index Fund, FlexShares Morningstar Global Upstream Natural Resources Index Fund, FlexShares STOXX Global Broad Infrastructure Index Fund, FlexShares Global Quality Real Estate Index Fund, FlexShares Real Assets Allocation Index Fund, FlexShares Quality Dividend Index Fund, FlexShares Quality Dividend Defensive Index Fund, FlexShares Quality Dividend Dynamic Index Fund, FlexShares International Quality Dividend Index Fund, FlexShares International Quality Dividend Defensive Index Fund, FlexShares International Quality Dividend Dynamic Index Fund, FlexShares iBoxx 3-Year Target Duration TIPS Index Fund, FlexShares iBoxx 5-Year Target Duration TIPS Index Fund, FlexShares Disciplined Duration MBS Index Fund, FlexShares Credit-Scored U.S. Corporate Bond Index Fund, FlexShares Credit-Scored US Long Corporate Bond Index Fund, FlexShares ESG & Climate Developed Markets ex-US Core Index Fund, FlexShares ESG & Climate High Yield Corporate Core Index Fund, FlexShares ESG & Climate Investment Grade Corporate Core Index Fund, FlexShares ESG & Climate US Large Cap Core Index Fund, and FlexShares High Yield Value-Scored Bond Index Fund are not actively managed. Each Fund may be affected by a general decline in the market segments relating to its Underlying Index. Each Fund invests in securities included in, or representative of, its Underlying Index regardless of their investment merit. NTI does not attempt to take defensive positions in any market conditions, including declining markets.
Premium/Discount Information
Information about the differences between the daily market prices on secondary markets for shares of the Funds and the Funds’ net asset values for various time periods, as applicable, is available by visiting the Funds’ website at flexshares.com.
| | | | |
| 546 | | FLEXSHARES ANNUAL REPORT | | |
For More Information (Unaudited)
Portfolio Holdings
FlexShares® Trust files its complete schedule of portfolio holdings with the Securities and Exchange Commission (“SEC”) for the first and third quarters of each fiscal year an exhibit to its reports on Form N-PORT. The Funds’ Forms N-PORT are available on the SEC’s website at sec.gov.
Proxy Voting
FlexShares® Trust Proxy Voting Policies and Procedures are available upon request and without charge by calling 1-855-FLEXETF (1-855-353-9383) or by visiting the Funds’ website flexshares.com or the SEC’s website at sec.gov. Each Fund’s portfolio securities voting record for the 12-month period ended June 30 is available upon request and without charge by calling 1-855-FLEXETF (1-855-353-9383) or by visiting the SEC’s website at sec.gov.
| | | | | | |
| | FLEXSHARES ANNUAL REPORT | | | 547 | |
FlexShares® Trust
50 S. LaSalle Street
Chicago, IL 60603
800.595.9111
www.flexshares.com
FlexShares® is a registered trademark of NTI. Morningstar® is a registered trademark of Morningstar, Inc. (“Morningstar”). Morningstar® US Market Factor Tilt IndexSM, Morningstar® Developed Markets ex-US Factor Tilt IndexSM, Morningstar® Emerging Markets Factor Tilt IndexSM, and Morningstar® Global Upstream Natural Resources IndexSM are service marks of Morningstar, Inc. STOXX and its licensors (the “Licensors”) have no relationship to FlexShares® Trust other than the licensing of the STOXX® USA ESG Select KPIs Index, STOXX® Global ESG Select KPIs Index and STOXX® Global Broad Infrastructure Index and the related trademarks for use in connection with the FlexShares® STOXX® US ESG Select Index Fund, FlexShares® STOXX® Global ESG Select Index Fund and FlexShares®STOXX® Global Broad Infrastructure Index Fund, respectively. The iBoxx 3-Year Target Duration TIPS Index and iBoxx 5-Year Target Duration TIPS Index are each the property of Markit North America, Inc. (“Markit”) and have been licensed for use in connection the FlexShares iBoxx 3-Year Target Duration TIPS Index Fund and the FlexShares iBoxx 5-Year Target Duration TIPS Index Fund, respectively. Northern Trust Quality Low Volatility IndexSM, Northern Trust Developed Markets ex-US Quality Low Volatility IndexSM, Northern Trust Emerging Markets Quality Low Volatility IndexSM, Northern Trust Quality Large Cap IndexSM, Northern Trust Quality Dividend IndexSM, Northern Trust Quality Dividend Dynamic IndexSM, Northern Trust Quality Dividend Defensive IndexSM, Northern Trust International Quality Dividend IndexSM, Northern Trust Quality Dividend Dynamic IndexSM, Northern Trust International Quality Dividend Defensive IndexSM, Northern Trust Global Quality Real Estate IndexSM, Northern Trust Credit-Scored US Corporate Bond IndexSM, Northern Trust Credit-Scored US Long Corporate Bond IndexSM, Northern Trust Real Assets Allocation IndexSM, Northern Trust High Yield US Corporate Bond IndexSM, and Northern Trust High Yield Value-Scored US Corporate Bond IndexSM are service marks of NTI and have been licensed for use by FlexShares Trust. The ICE® BofAML® Constrained Duration US Mortgage Backed Securities IndexSM are trademarks of ICE Data Indices, LLC or its affiliates (“ICE”) and have been licensed for use by NTI.
FS00058-1221
| b.) | A copy of the notice transmitted to shareholders in reliance on Rule 30e-3 under the Investment Company Act of 1940 (17 CFR 270.30e-3). Not applicable. |
Item 2. Code of Ethics.
| (a) | As of the end of the period, October 31, 2021, the Registrant has adopted a code of ethics that applies to its principal executive officer, principal financial officer, principal accounting officer or controller, or persons performing similar functions, regardless of whether these individuals are employed by the Registrant or a third party (the “Code of Ethics”). |
| (c) | The Registrant has not amended its Code of Ethics during the period covered by this report. |
| (d) | The Registrant has not granted any waivers, including an implicit waiver, from any provisions of its Code of Ethics during the period covered by this report. |
| (f) | A copy of the Registrant’s Code of Ethics is attached as exhibit 13(a)(1) to this Form N-CSR. |
Item 3. Audit Committee Financial Expert.
The Registrant’s Board of Trustees has determined that the Registrant has at least one “audit committee financial expert” (as defined in Item 3 of Form N-CSR), serving on its audit committee. Philip G. Hubbard is the “audit committee financial expert” and is “independent” (as each term is defined in Item 3 of Form N-CSR).
Under applicable securities laws and regulations, a person who is determined to be an audit committee financial expert will not be deemed an “expert” for any purpose, including without limitation for purposes of Section 11 of the Securities Act of 1933, as amended, as a result of being designated or identified as an audit committee financial expert. The designation or identification of a person as an audit committee financial expert does not impose on such person any duties, obligations, or liability that are greater than the duties, obligations, and liability imposed on such person as a member of the Registrant’s Audit Committee and Board of Trustees in the absence of such designation or identification. The designation or identification of a person as an audit committee financial expert does not affect the duties, obligations or liability of any other member of the Registrant’s Audit Committee or Board of Trustees.
Item 4. Principal Accountant Fees and Services.
In response to Items 4(a)-4(d), aggregate fees for professional services rendered for FlexShares® Trust (the “Trust”) by Deloitte & Touche, LLP (“Deloitte”) for the fiscal years ended October 31, 2021 and October 31, 2020 were:
| | | | | | | | |
| | | 2021 | |
| | | All fees and
services to the
Trust that were
pre-approved | | | All fees and
services to
Service Affiliates(a)
that were pre-
approved | |
Audit Fees | | $ | 673,500 | | | | N/A | |
Audit Related Fees(b) | | $ | 0 | | | $ | 0 | |
Tax Fees(c) | | $ | 80,600 | (1) | | $ | 0 | |
All Other Fees(d) | | $ | 0 | | | $ | 0 | |
| | | | | | | | |
Total: | | $ | 754,100 | | | $ | 0 | |
| | | | | | | | |
| | | | | | | | |
| | | 2020 | |
| | | All fees and
services to the
Trust that were
pre-approved | | | All fees and
services to
Service Affiliates(a)
that were pre-
approved | |
Audit Fees | | $ | 652,500 | | | | N/A | |
Audit Related Fees(b) | | $ | 0 | | | $ | 0 | |
Tax Fees(c) | | $ | 72,500 | (1) | | $ | 0 | |
All Other Fees(d) | | $ | 0 | | | $ | 0 | |
| | | | | | | | |
Total: | | $ | 725,000 | | | $ | 0 | |
| | | | | | | | |
| (1) | Amounts relate to tax fees for the review of federal income tax returns, excise tax returns and year end distribution calculations. |
| (a) | “Service affiliates” as it relates to the aggregate “Audit Fees,” “Audit-Related Fees,” “Tax Fees” and “All Other Fees” that were billed by Deloitte for the periods ended October 31, 2021 and October 31, 2020 are Northern Trust Investments, Inc. (“NTI”) and entities controlling, controlled by or under common control with NTI that provide ongoing services to the Registrant. |
| (b) | “Audit-Related Fees” are fees for assurance and related services rendered by Deloitte that are reasonably related to the performance of the audit or review of the Registrant’s financial statements, but not reported as “Audit Fees.” |
| (c) | “Tax Fees” are fees for professional services rendered by Deloitte for tax compliance, tax advice and tax planning. |
| (d) | “All Other Fees” are for products and services provided by Deloitte other than those reported as Audit, Audit-Related or Tax Fees. |
| (e)(1) | The Registrant’s Audit Committee Charter provides that the Audit Committee is responsible for the approval of, prior to the appointment of, the engagement of the principal accountant to annually audit the Registrant’s financial statements. The Audit Committee must also pre-approve the engagement of the principal accountant to provide non-audit services to the Registrant, NTI or to any entity controlling, controlled by or under common control with NTI that provides ongoing services to the Registrant, if the engagement has a direct impact on the operations or financial reporting of the Registrant. The pre-approvals may be delegated to a designated representative (or representatives) of the audit committee and such pre-approvals and approvals must be reported to the full Audit Committee at its next meeting. Each designated representative must be a member of the Audit Committee. |
| (e)(2) | No percentage of the principal accountant’s fees or services were approved pursuant to the waiver provision of paragraph (c)(7)(i)(C) or (c)(7)(ii) of Rule 2-01 of Regulation S-X. |
| (g) | The aggregate non-audit fees and services billed by Deloitte for services rendered to the Registrant and Service Affiliates for the periods ended October 31, 2021 and October 31, 2020, respectively, were $4,875,322 and $5,610,208. |
| (h) | The Registrant’s Audit Committee has considered whether the provision of non-audit services to Service Affiliates, not pre-approved pursuant to paragraph (c)(7)(ii) of Rule 2-01 of Regulation S-X, is compatible with maintaining the registered public accountant’s independence in performing audit services. |
| (i) | The Registrant is not a foreign issuer, as identified by the Securities and Exchange Commission (“Commission”) pursuant to Section 104(i)(2)(A) of the Sarbanes-Oxley Act of 2002 (15 U.S.C. 7214(i)(2)(A)), as having retained, for the preparation of the audit report on its financial statements included in the Form N- CSR, a registered public accounting firm that has a branch or office that is located in a foreign jurisdiction and that the Public Company Accounting Oversight Board (“PCAOB”) has determined it is unable to inspect or investigate completely because of a position taken by an authority in the foreign jurisdiction must electronically submit to the Commission on a supplemental basis documentation that establishes that the Registrant is not owned or controlled by a governmental entity in the foreign jurisdiction. |
| (j) | The Registrant is not a foreign issuer, as defined in 17 CFR 240.3b-4, identified by the Commission pursuant to Section 104(i)(2)(A) of the Sarbanes-Oxley Act of 2002 (15 U.S.C. 7214(i)(2)(A)), as having retained, for the preparation of the audit report on its financial statements included in the Form N-CSR, a registered public accounting firm that has a branch or office that is located in a foreign jurisdiction and that the PCAOB has determined it is unable to inspect or investigate completely because of a position taken by an authority in the foreign jurisdiction, for each year in which the Registrant is so identified. |
(1) Not Applicable.
(2) Not Applicable.
(3) Not Applicable.
(4) Not Applicable.
(5) Not Applicable.
Item 5. Audit Committee of Listed Registrants.
| (a) | The Registrant has a separately-designated standing Audit Committee in accordance with Section 3(a)(58)(A) of the Securities Exchange Act of 1934. All of the Board’s independent Trustees, Philip G. Hubbard, Eric T. McKissack and Sarah N. Garvey, are members of the Audit Committee. |
Item 6. Investments
| (a) | Schedule I – Investments in Securities of Unaffiliated Issuers. |
The complete schedule of investments is included in the report to shareholders in Item 1 of this Form N-CSR.
| (b) | Securities Divested of in accordance with Section 13(c) of the 1940 Act. |
Not Applicable.
Item 7. Disclosure of Proxy Voting Policies and Procedures for Closed-End Management Investment Companies.
Not Applicable.
Item 8. Portfolio Managers of Closed-End Management Investment Companies.
Not Applicable.
Item 9. Purchase of Equity Securities by Closed-End Management Investment Company and Affiliated Purchasers.
Not Applicable.
Item 10. Submission of Matters to a Vote of Security Holders.
There were no material changes to the procedures by which shareholders may recommend nominees to the Registrant’s Board of Trustees.
Item 11. Controls and Procedures.
| (a) | The Registrant’s principal executive officer and principal financial officer, or persons performing similar functions, have concluded that the Registrant’s disclosure controls and procedures (as defined in Rule 30a-3(c) under the 1940 Act) are effective, based on the evaluation of these controls and procedures required by Rule 30a-3(b) under the 1940 Act and Rules 13a-15(b) or 15d-15(b) under the Securities Exchange Act of 1934 as of a date within 90 days of the filing date of this report. |
| (b) | There were no changes in the Registrant’s internal control over financial reporting (as defined in Rule 30a - 3(d) under the 1940 Act) that occurred during the period covered by this report that have materially affected, or are reasonably likely to materially affect, the Registrant’s internal control over financial reporting. |
Item 12. Disclosure of Securities Lending Activities for Closed-End Management Investment Companies.
Not Applicable.
Item 13. Exhibits.
SIGNATURES
Pursuant to the requirements of the Securities Exchange Act of 1934 and the Investment Company Act of 1940, the registrant has duly caused this report to be signed on its behalf by the undersigned, thereunto duly authorized.
| | |
| FlexShares® Trust |
| |
| By: | | /s/ Peter Ewing |
| | Peter K. Ewing |
| | President and Principal Executive Officer |
| | January 7, 2022 |
Pursuant to the requirements of the Securities Exchange Act of 1934 and the Investment Company Act of 1940, this report has been signed below by the following persons on behalf of the registrant and in the capacities and on the dates indicated.
| | |
| By: | | /s/ Peter Ewing |
| | Peter K. Ewing |
| | President and Principal Executive Officer |
| | January 7, 2022 |
| |
| By: | | /s/ Randal Rein |
| | Randal E. Rein |
| | Treasurer and Principal Financial Officer |
| | January 7, 2022 |
