UNITED STATES
SECURITIES AND EXCHANGE COMMISSION
Washington, D.C. 20549
FORM 10-K
| | | | | |
| ☒ | ANNUAL REPORT PURSUANT TO SECTION 13 OR 15(d) OF THE SECURITIES EXCHANGE ACT OF 1934 |
For the fiscal year ended December 31, 2024
or
| | | | | |
| ☐ | TRANSITION REPORT PURSUANT TO SECTION 13 OR 15(d) OF THE SECURITIES EXCHANGE ACT OF 1934 |
For the transition period from ______________ to ______________
Commission file number 1-1043
Brunswick Corporation
(Exact name of registrant as specified in its charter)
| | | | | | | | |
| Delaware | | 36-0848180 |
| (State or other jurisdiction of incorporation or organization) | | (I.R.S. Employer Identification No.) |
26125 N. Riverwoods Blvd., Suite 500, Mettawa, IL 60045-3420
(Address of principal executive offices, including zip code)
(847) 735-4700
(Registrant's telephone number, including area code)
Securities registered pursuant to Section 12(b) of the Act:
| | | | | | | | | | | | | | |
| Title of Each Class | | Trading Symbol(s) | | Name of Each Exchange on Which Registered |
| Common stock, par value $0.75 per share | | BC | | New York Stock Exchange |
| | Chicago Stock Exchange |
| 6.500% Senior Notes due 2048 | | BC-A | | New York Stock Exchange |
| 6.375% Senior Notes due 2049 | | BC-C | | New York Stock Exchange |
Securities registered pursuant to Section 12(g) of the Act: None
Indicate by check mark if the registrant is a well-known seasoned issuer, as defined in Rule 405 of the Securities Act. Yes ☒ No ☐
Indicate by check mark if the registrant is not required to file reports pursuant to Section 13 or Section 15(d) of the Act. Yes ☐ No ☒
Indicate by check mark whether the registrant (1) has filed all reports required to be filed by Section 13 or 15(d) of the Securities Exchange Act of 1934 during the preceding 12 months (or for such shorter period that the registrant was required to file such reports), and (2) has been subject to such filing requirements for the past 90 days. Yes ☒ No ☐
Indicate by check mark whether the registrant has submitted electronically every Interactive Data File required to be submitted pursuant to Rule 405 of Regulation S-T (§232.405 of this chapter) during the preceding 12 months (or for such shorter period that the registrant was required to submit such files). Yes ☒ No ☐
Indicate by check mark whether the registrant is a large accelerated filer, an accelerated filer, a non-accelerated filer, a smaller reporting company, or an emerging growth company. See the definitions of “large accelerated filer,” “accelerated filer,” “smaller reporting company” and "emerging growth company" in Rule 12b-2 of the Exchange Act. (Check one): | | | | | | | | | | | |
| Large accelerated filer | ☒ | Accelerated filer | ☐ |
| Non-accelerated filer | ☐ | Smaller reporting company | ☐ |
| Emerging growth company | ☐ | | |
If an emerging growth company, indicate by check mark if the registrant has elected not to use the extended transition period for complying with any new or revised financial accounting standards provided pursuant to Section 13(a) of the Exchange Act. o
Indicate by check mark whether the registrant has filed a report on and attestation to its management’s assessment of the effectiveness of its internal control over financial reporting under Section 404(b) of the Sarbanes-Oxley Act (15 U.S.C. 7262(b)) by the registered public accounting firm that prepared or issued its audit report. ☒
If securities are registered pursuant to Section 12(b) of the Act, indicate by check mark whether the financial statements of the registrant included in the filing reflect the correction of an error to previously issued financial statements. ☐
Indicate by check mark whether any of those error corrections are restatements that required a recovery analysis of incentive-based compensation received by any of the registrant’s executive officers during the relevant recovery period pursuant to §240.10D-1(b). ☐
Indicate by check mark whether the registrant is a shell company (as defined in Rule 12b-2 of the Act). Yes ☐ No ☒
As of June 29, 2024, the last business day of the registrant’s most recently completed second fiscal quarter, the aggregate market value of the voting stock of the registrant held by non-affiliates was $4,771,734,967. Such number excludes stock beneficially owned by executive officers and directors. This does not constitute an admission that they are affiliates.
The number of shares of Common Stock ($0.75 par value) of the registrant outstanding as of February 10, 2025 was 65,838,981.
DOCUMENTS INCORPORATED BY REFERENCE
Part III of this Report on Form 10-K incorporates by reference certain information that will be set forth in the Company's definitive Proxy Statement for the Annual Meeting of Shareholders scheduled to be held on May 7, 2025.
BRUNSWICK CORPORATION
INDEX TO ANNUAL REPORT ON FORM 10-K
December 31, 2024
TABLE OF CONTENTS
| | | | | | | | |
| PART I | Page |
| | |
| | |
| | |
| | |
| | |
| | |
| | |
| | |
| PART II | | |
| | |
| | |
| | |
| | |
| | |
| | |
| | |
| | |
| | |
| | |
| PART III | | |
| | |
| | |
| | |
| | |
| | |
| | |
| PART IV | | |
| | |
| | |
Forward-Looking Statements
Certain statements in this Annual Report on Form 10-K are forward-looking statements as defined in the Private Securities Litigation Reform Act of 1995. Forward-looking statements are based on current expectations, estimates and projections about Brunswick's business and by their nature address matters that are, to different degrees, uncertain. Words such as "may," "could," "should," "expect," "anticipate," "project," "position," "intend," "target," "plan," "seek," "estimate," "believe," "predict," "outlook," and similar expressions are intended to identify forward-looking statements. Forward-looking statements are not guarantees of future performance and involve certain risks and uncertainties that may cause actual results to differ materially from expectations as of the date of this Annual Report on Form 10-K. These risks include, but are not limited to, those set forth under Item 1A of this Annual Report on Form 10-K. Forward-looking statements speak only as of the date on which they are made and Brunswick does not undertake any obligation to update them to reflect events or circumstances after the date of this Annual Report.
PART I
Item 1. Business
References to "we," "us," "our," the "Company," "Brunswick," and "Brunswick Corporation" refer to Brunswick Corporation and its consolidated subsidiaries unless the context specifically states or implies otherwise.
Brunswick Corporation is a global leader in marine recreation, delivering innovation that transforms experiences on the water and beyond. Our unique, technology-driven solutions are informed and inspired by deep consumer insights and powered by our belief that “Next Never Rests.™” We design, manufacture, and market recreational marine products, including leading marine propulsion products and boats, as well as parts and accessories for the marine and RV markets, and we operate the world's largest boat club. We are dedicated to industry leadership, to being the best and most trusted partner to our many customers, and to building synergies and ecosystems that enable us to challenge convention and define the future. Incorporated in Delaware on December 31, 1907, Brunswick has traded on the New York Stock Exchange for 100 years.
Our strategy is focused on:
•Understanding and addressing the changing needs and behaviors of global boating participants;
•Investing in innovative, global product leadership and leveraging our leading brands to meet consumer needs;
•Providing customers industry leading quality and customer support;
•Delivering distinctive, elevated ownership and shared-access experiences that expand boating participation;
•Being the partner of choice to our customers by offering integrated technical and business solutions;
•Engaging consumers with the richest, most intuitive digital experiences;
•Leading the industry in Autonomy, Connectivity, Electrification, and Shared Access (ACES) strategies, with an expanding set of commercially available products in each category;
•Unlocking unique and profound enterprise synergies;
•Investing in increasing global business resiliency;
•Being an acknowledged marine industry leader in sustainability; and
•Being an employer of choice through our clear purpose and culture of inclusiveness.
These strategies support our aim to create exceptional experiences, expand participation in recreational boating, deliver industry-transforming technology, and leverage our leading businesses to grow earnings and enhance shareholder value. Our integrated business strategy is supported by a balanced capital strategy that includes critical investments in new products and technology to further our market leadership position, organic growth initiatives, and our ACES and technology strategies, while also managing debt levels and maturities, maintaining strong cash and liquidity positions, and continuing to return capital to shareholders through dividends and moderate share repurchases.
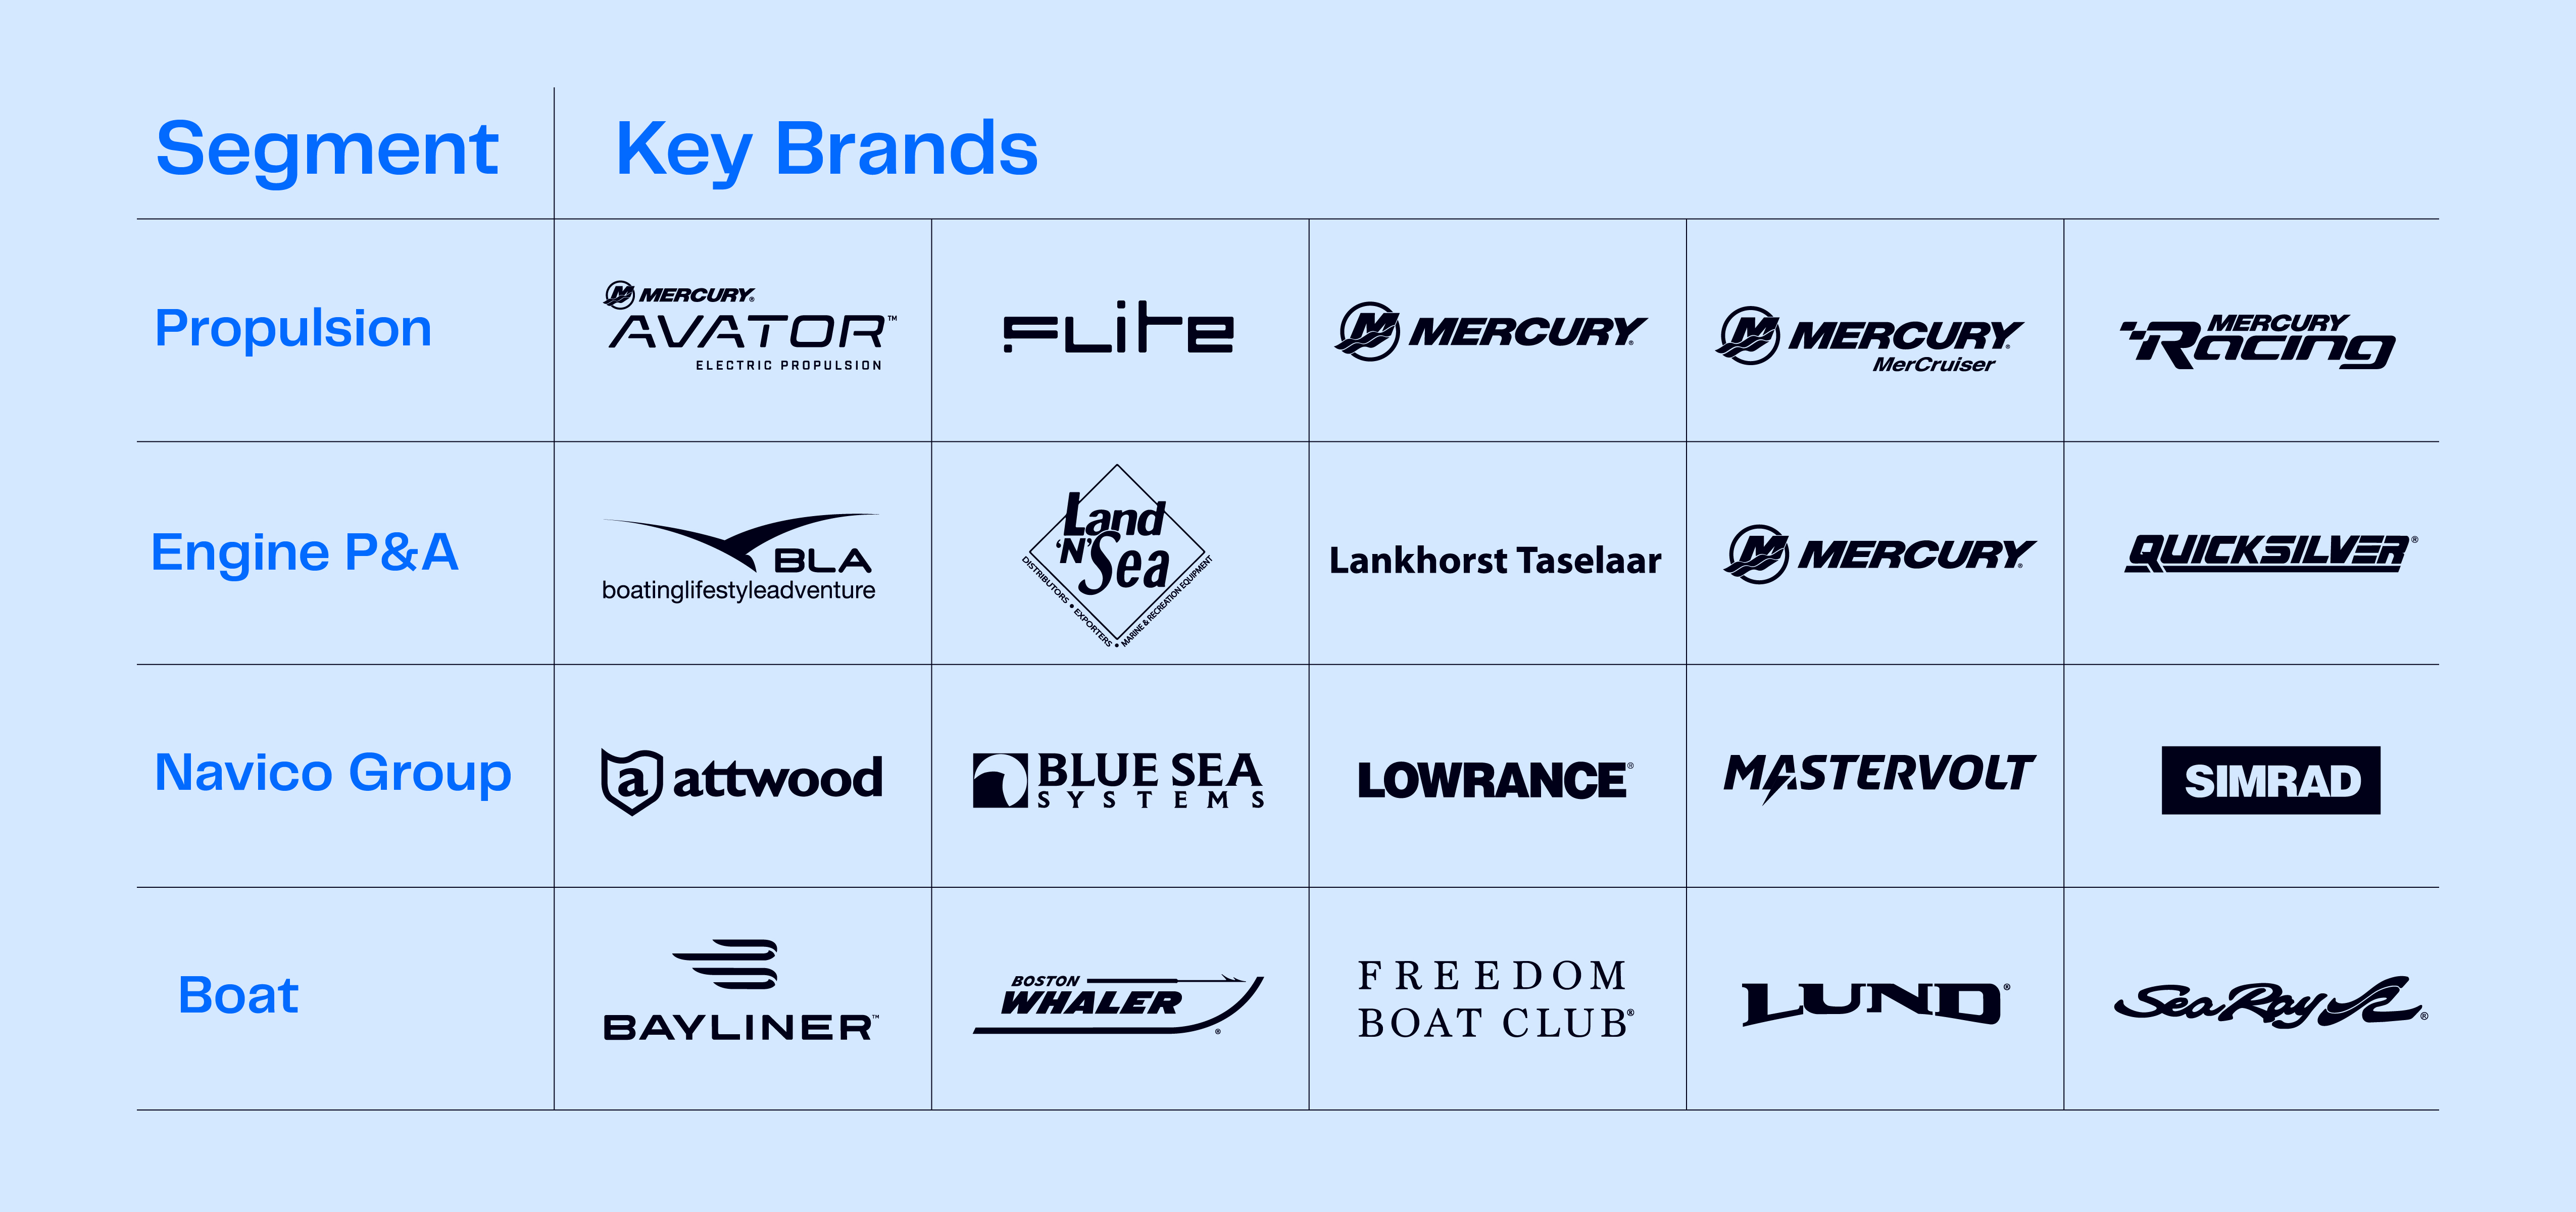
Key brands associated with each of our segments are listed below.
Refer to Note 5 – Segment Information in the Notes to Consolidated Financial Statements for additional information regarding our segments.
Propulsion Segment
The Propulsion segment, which we believe is a world leader in the manufacturing and sale of recreational marine engines and propulsion systems, had net sales of $2,074.2 million in 2024. The Propulsion segment designs, manufactures, and sells engines, controls, rigging, and propellers globally to over 860 boat builders (both independent and Brunswick's Boat segment) and a network of more than 8,900 marine dealers and distributors, specialty marine retailers, marine service centers, and various local, state, and federal governmental accounts. White River Marine Group, LLC (including Tracker and Ranger Boats) and Brunswick Boat Group are significant customers.
Propulsion segment engines are designed for use in recreational, commercial, and racing applications. Mercury designs and sells four-stroke outboard engine models ranging from 2.5 to 600 horsepower; Mercury Marine and Mercury Racing manufacture gas and diesel inboard and sterndrive engine models ranging from 115 to 1,550 horsepower. Mercury Marine also manufactures two-stroke, non-DFI (direct fuel injection) engines for certain markets outside the United States and Avator™ electric propulsion systems in models ranging from 7.5e to 110e. In 2023, Brunswick acquired Fliteboard Pty Ltd (Fliteboard), a leader in eFoiling technology, to further enhance our electrification and shared-access strategies.
Engine P&A Segment
The Engine P&A segment had net sales of $1,160.8 million in 2024. Engine P&A sells products such as engine parts and consumables including oils and lubricants, electrical products, boat parts and systems, and also includes our marine parts and accessories distribution businesses.
Engine P&A products are designed for and sold mostly to aftermarket retailers, dealers, distributors, and original equipment manufacturers (including Brunswick Boat segment brands) for both marine and non-marine markets. The Engine P&A distribution businesses are leading distributors of Brunswick and third party marine parts and accessories throughout North America, Europe, and Asia-Pacific, offering same-day or next-day delivery service to a broad array of marine service facilities.
Navico Group Segment
The Navico Group segment, which had net sales of $800.2 million in 2024, designs, develops, manufactures, and markets products and systems for the marine, RV, specialty vehicle, mobile and industrial markets, as well as aftermarket channels. Navico Group products include cartography, marine electronics (including sensors, sonar, radar, control and monitoring systems, fish finders, and multifunction displays), trolling motors, batteries, power management and conversion, electrical systems, and other functional components such as water, fuel, lighting, and HVAC solutions. Navico Group sells its products to aftermarket distributors and retailers as well as original equipment manufacturers. White River Marine Group, LLC, Brunswick's Engine P&A distribution businesses, and Brunswick Boat Group are significant customers.
Boat Segment
The Boat segment consists of the Brunswick Boat Group (Boat Group), which manufactures and distributes recreational boats, and Business Acceleration. We believe that the Boat segment, which had net sales of $1,553.5 million during 2024, is a world leader in the manufacture and sale of pleasure boats. The Boat segment manages Brunswick's boat brands, evaluates and optimizes the Boat segment's boat portfolio and strategy, promotes recreational boating services and activities to enhance the consumer experience and dealer profitability, including through its Business Acceleration initiatives, and speeds the introduction of new technologies into boat manufacturing and design processes.
The Boat segment procures substantially all of its engines from Brunswick's Propulsion segment, and boats often include other parts and accessories supplied by the Engine P&A and Navico Group segments. The Boat Group sells its products through a global network of more than 1,300 dealers and distributors, with some operating in more than one location and some carrying more than one of our boat brands. The Boat Group's largest dealer, MarineMax, Inc., is a significant external customer which carries a number of the Boat Group's product lines and has multiple locations.
Included within the Boat segment is the Business Acceleration business, which is dedicated to developing emerging and disruptive business models, focusing on services and subscriptions, and engaging the next generation of diverse boaters. Business Acceleration businesses accounted for 13 percent of Boat segment net sales in 2024.
Business Acceleration's Freedom Boat Club is the world's largest boat club network. Freedom Boat Club operates in more than 400 locations across the U.S., Canada, Australia, New Zealand, and Europe, and has approximately 60,000 memberships. Members pay an upfront initiation fee and ongoing monthly dues in exchange for gaining shared access to their local club’s diverse fleet of boats and reciprocal privileges at all other Freedom Boat Club locations. Business Acceleration also operates a variety of other businesses including dealer and retail financing; retail extended warranty and insurance businesses; Boateka, a certified pre-owned boat platform; and other marine services businesses.
Financing Services
Through our Brunswick Financial Services Corporation subsidiary, we own a 49 percent interest in a joint venture, Brunswick Acceptance Company, LLC (BAC). Under the terms of the joint venture agreement (JV Agreement), BAC provides secured wholesale inventory floor plan financing to our boat and engine dealers as well as Freedom Boat Club franchisees. A subsidiary of Wells Fargo & Company owns the remaining 51 percent.
The JV Agreement contains a financial covenant that conforms to the maximum leverage ratio test in the Credit Facility described in Note 14 – Debt in the Notes to Consolidated Financial Statements. The JV Agreement contains provisions allowing for the renewal of the JV Agreement or the purchase of the other party's interest in the joint venture at the end of its term. Alternatively, either partner may terminate the JV Agreement at the end of its term. Refer to Note 8 – Financing Joint Venture in the Notes to Consolidated Financial Statements for more information about our financial services offered through BAC.
Many dealers secure floor plan financing from BAC, and, to a lesser extent, from other third party financing companies, enabling them to stock product in advance of the peak selling season and providing stable channels for our products. Brunswick provides risk mitigation to BAC and other finance companies in the form of inventory repurchase commitments, under which we are obligated to repurchase inventory in the event of a dealer's default. This risk mitigation is reflected in our estimate of repurchase liabilities. Our business units, along with BAC, maintain active credit operations to manage this financial exposure, and we continually seek opportunities to sustain and improve the financial health of our various distribution channel partners. Refer to Note 11 – Commitments and Contingencies in the Notes to Consolidated Financial Statements for further discussion of these arrangements.
In addition to floor plan financing, Business Acceleration provides a digital retail finance solution, Brunswick Finance, that simplifies the purchase process from applying for pre-qualification to underwriting, finalizing agreements, and e-signing for loans.
Distribution
We utilize independent distributors, dealers, and retailers (Dealers) for the majority of our boat sales, sales of parts and accessories, and some sales of marine engines. We have over 19,000 active Dealers serving our business segments worldwide. Our Dealers typically carry one or more product categories and are independent companies or proprietors that range in size from small, family-owned businesses to a large, publicly traded corporation with substantial revenues and multiple locations. Some Dealers sell our products exclusively, while a majority also carry competitor and complementary products. We partner with our Dealer network to improve quality, service, distribution, and delivery of parts and accessories to enhance the boating customer's experience.
Besides our network of independent Dealers, we sell parts and accessories to boat builders and operate our own wholesale parts and accessories distribution companies, which are leading distributors of marine parts and accessories with a network of warehouses located throughout the markets they serve, offering same or next-day delivery to a broad array of marine service facilities and Dealers. In addition, we operate a leading boat dealer in the Southeastern U.S. with four locations selling boats and parts and accessories.
Technology and Innovation
We believe Brunswick is uniquely positioned to continue to define the future of the global marine industry. We are continuously and consistently innovating the future of recreational boating through frequent releases of new products, features, and functions; delivering intuitive and seamless solutions; and growing service, connectivity, autonomy, and alternative participation capabilities and businesses. To support our goal, we have established cross-functional and cross-business investments and initiatives, and hire leaders with strong technology experience.
In 2024, Brunswick broadened our ACES strategy through the addition of Boating Intelligence, with the intention to use artificial intelligence to deliver simpler, safer, smarter, and more sustainable products, refocusing our Boating Intelligence Design Lab at the University of Illinois Urbana-Champaign on these initiatives. Brunswick is in the final stages of development and validation of our autonomous docking technology system, with an expected commercial release in 2025. In 2024 we launched over 100 products. Some highlights include Mercury Marine's new joystick piloting system for single-engine outboards and the Boat Group's launch of the 2024 Harris Crowne, a full keel-up redesign with significant enhancements to the model. Harris Boats also announced the launch of the Cruiser e-210, the brand’s first all-electric pontoon, powered by Mercury’ s innovative and award-winning Avator 35e Outboard. Freedom Boat Club launched the Apple iOS version of its new member app. Navico Group’s Simrad brand launched the NSX ULTRAWIDE, the world’s first fully-featured ultrawide marine display; Lowrance and Simrad introduced Recon™, an electric-steer trolling motor featuring a unique joystick remote and GPS positioning capability; and Lowrance launched Eagle Eye™, with what we believe is the world’s most accessible all-in-one live sonar solution.
Brunswick won numerous awards in 2024 for our groundbreaking products, including:
•Multiple NMMA Innovation Awards at the 2024 Miami International Boat Show, including for the Boston Whaler 365 Conquest, Boston Whaler 210 Vantage, and the Mercury Racing 500R outboard engine.
•The selection of the all-new Harris Crowne 250 as an NMMA Innovation Award winner in the pontoon category at the Minneapolis boat show.
•Boating Magazine's selection of Mercury Racing's 500R outboard as a Boating Marine Power Innovation Award winner.
•For the second consecutive year, 11 Boating Industry Magazine Top Product Awards for products across our portfolio.
•An IBEX Innovation Award for the newly launched Lenco Pro Control boat stabilization system, and an Honorable Mention for Mercury Marine's Precision Joystick Piloting system.
International Operations
Non-U.S. sales are set forth in Note 2 – Revenue Recognition and Note 5 – Segment Information in the Notes to Consolidated Financial Statements and are also included in the table below, which details our non-U.S. sales by region:
| | | | | | | | | | | | | | | | | | | | |
| (in millions) | | 2024 | | 2023 | | 2022 |
| Europe | | $ | 744.4 | | | $ | 837.3 | | | $ | 904.4 | |
| Canada | | 275.2 | | | 373.0 | | | 458.2 | |
| Asia-Pacific | | 357.1 | | | 410.0 | | | 466.0 | |
| Rest-of-World | | 312.8 | | | 331.3 | | | 284.4 | |
| Total | | $ | 1,689.5 | | | $ | 1,951.6 | | | $ | 2,113.0 | |
| Total International Sales as a Percentage of Net Sales | | 32 | % | | 30 | % | | 31 | % |
We transact a portion of our sales in non-U.S. markets in local currencies, while a meaningful portion of our product costs are denominated in U.S. dollars as a result of our U.S. manufacturing operations. As a result, the strengthening or weakening of the U.S. dollar affects the financial results of our non-U.S. operations.
Propulsion non-U.S. sales comprised approximately 44 percent of our non-U.S. sales in 2024. Engine P&A non-U.S. sales comprised approximately 21 percent of our non-U.S. sales in 2024. Navico Group non-U.S. sales comprised approximately 19 percent of our non-U.S. sales in 2024. Boat non-U.S. sales comprised approximately 18 percent of our non-U.S. sales in 2024.
Raw Materials and Supplies
We purchase a wide variety of raw materials from our supplier base, including commodities such as aluminum, copper, resins, oil, and steel, as well as product parts and components, such as boat windshields. The prices for these raw materials, parts, and components fluctuate depending on market conditions and inflation. In 2024, our operations continued to experience intermittent supply chain uncertainty and disruptions. Our global procurement operations constantly strive to obtain adequate supplies, better leverage purchasing power across our divisions, and improve cost efficiencies. We mitigate commodity price risk on certain raw material purchases by entering into fixed priced contracts or derivatives to reduce our exposure related to changes in commodity prices.
Intellectual Property
We own intellectual property, including patents, trademarks, and trade secrets, related to our current and future products and production methods, in the U.S. and certain other countries. By law, patents have a limited term, so our patents expire over time. Our trademarks and trade secrets have potentially indefinite lives. We consider our collection of intellectual property to be a valuable asset that is important to our competitive position. As of December 31, 2024, we own more than:
•1,100 active U.S. patents;
•530 pending U.S. patent applications;
•700 active foreign patents;
•230 pending foreign patent applications;
•370 U.S. registered trademarks; and
•1,800 foreign registered trademarks.
We invest substantial resources in acquiring, maintaining, and defending our intellectual property rights, and we expect to continue to do so. When feasible, we seek patent protection on products and production methods that are under development, and in areas of possible future development. We require employees who will develop intellectual property, or who have access to intellectual property, to sign confidentiality and intellectual property assignment agreements. We invest in physical and IT security programs to prevent theft and inadvertent disclosure of trade secrets. In addition to "Brunswick," our primary trademarks include Mercury Marine, Boston Whaler, Lund, and Sea Ray.
Market and Competitive Conditions
Demand for our products is typically seasonal, with sales generally highest in the second quarter of the calendar year. Strong competition exists in each of our product groups, but no single enterprise competes with us in all product groups. In each product area, competitors range in size from large, highly-diversified companies to small, single-product businesses. We also indirectly compete with businesses that offer alternative leisure products or activities. The following summarizes our competitive position in each segment:
Propulsion. The marine engine market is highly competitive among several major international companies, including outboard engine manufacturers based in Japan and several smaller companies. Our competitive advantage is a function of product features, technology, quality and durability, breadth of product line, performance, distribution, and manufacturing capabilities, along with effective promotion, after-sales service, and distribution.
Engine P&A. The marine parts and accessories market is highly competitive and fragmented. Our competitive advantage in this market includes our product breadth and quality, proprietary parts and technology, global distribution network, extensive portfolio of recognized brands, sales team, delivery timing, and service.
Navico Group. Navico Group competes in the marine, RV, and specialty vehicle parts and accessories markets, which are also highly competitive and fragmented. Our competitive advantage in these markets includes our extensive portfolio of recognized brands, proprietary technology, integrated solutions, product quality, sales team, and service offering.
Boat. Although there are many boat manufacturers, few manufacturers compete in the breadth of categories or geographies in which our Boat segment competes. We compete on the bases of product features, technology, quality, brand strength, dealer service, pricing, performance, value, durability, and styling, along with effective promotion and distribution. In addition, FBC competes on number and quality of locations, pricing, and service.
Climate Change and Environmental Compliance
Our customers rely on clean air and water to enjoy our products and services, and we are committed to practices and policies designed to help protect the environment and the well-being of our employees, customers, and the public. We seek to comply with applicable environmental regulatory and industry standards across all our facilities and in the products we manufacture. We strive continually to improve energy efficiency, minimize the carbon emissions of our operations, supply chain, and product portfolio, and deliver more cost-effective and lower carbon technology products and solutions to our customers. These environmental sustainability efforts are integrated into our business strategy and operations.
During 2024, Mercury Marine again expanded the Avator™ electric outboard motor line to include the 75e and 110e models. Other sustainability projects and accomplishments recently completed in Brunswick facility operations include:
| | | | | | | | |
| Energy Management | Waste Reduction | Water Reduction |
| Mercury Marine completed three solar installations at facilities in Australia and China. | Mercury Marine’s European headquarters in Belgium has achieved a certified 95.9% waste diversion rate. | Boat Group's Venture facility in Portugal implemented a reuse system for water used in testing protocols. |
| Boat Group’s Venture facility in Portugal converted its diesel heating system to a lower carbon emitting natural gas system. | Land 'N' Sea Canada attained 90% waste to landfill reduction at all three of its distribution facilities. | Boat Group’s Reynosa, Mexico facility further reduced its water consumption by finding additional uses for wastewater sent through an osmosis recovery system. |
| Mercury Marine’s Plant 4 in Fond du Lac, Wisconsin implemented weekend equipment shutdowns to avoid electricity use of equipment in idle. | Navico Group attained a 90% waste-to-landfill reduction at its Ensenada, Mexico facility. | Mercury Marine's facility in Juarez, Mexico installed a water recycling system which filters water from a cleaning process to be reused multiple times, reducing both water consumption and wastewater. |
| Several Mercury Marine and Boat Group manufacturing facilities completed compressed air audits and implemented identified improvements for electricity reduction. | The BLA distribution facility in Queensland, Australia began a waste reduction effort and attained an 85% waste diversion rate. | |
| Mercury Marine’s facility in Juarez, Mexico completed an upgrade to 100% LED lighting. | | |
In recognition of its sustainability efforts, Brunswick was again listed among USA Today's America's Climate Leaders and Newsweek’s America’s Greenest Companies. Mercury Marine received the Wisconsin Manufacturers and Commerce 2024 Business Friend of the Environment Award for Environmental Innovation and received Green Masters status from the Wisconsin Sustainable Business Council for the 14th consecutive year. Additionally, Brunswick was recognized among Newsweek’s America's Most Responsible Companies and Most Trustworthy Companies in America, as well as Forbes' inaugural list of Most Trusted Companies in America.
For more information on our sustainability strategy, programming, data, and goals, we refer you to our annual Sustainability Report (which is not incorporated by reference herein), available on our website at https://www.brunswick.com/corporate-responsibility/sustainability.
For further information, refer to Section 1A, Risk Factors, for a discussion of risks related to environmental compliance and to Note 11 – Commitments and Contingencies in the Notes to Consolidated Financial Statements for a description of certain environmental proceedings.
Human Capital Resources
Brunswick is dedicated to creating an inspiring and inclusive work environment that attracts, develops, and retains top talent. We designed our Employee Value Proposition (EVP) to reflect the shared values that allow our employees to continue to transform the marine industry. The EVP is built around five key behaviors:
•Innovative: Encourages creativity and problem-solving
•Driven: Focuses on achieving goals and continuous improvement
•Exceptional: Strives for excellence in all endeavors
•Authentic: Promotes genuine care and respect for one another
•United: Emphasizes collaboration and teamwork
We thoughtfully incorporate the EVP into various aspects of our business, and the EVP serves as a cultural anchor behind our purpose and strategy.
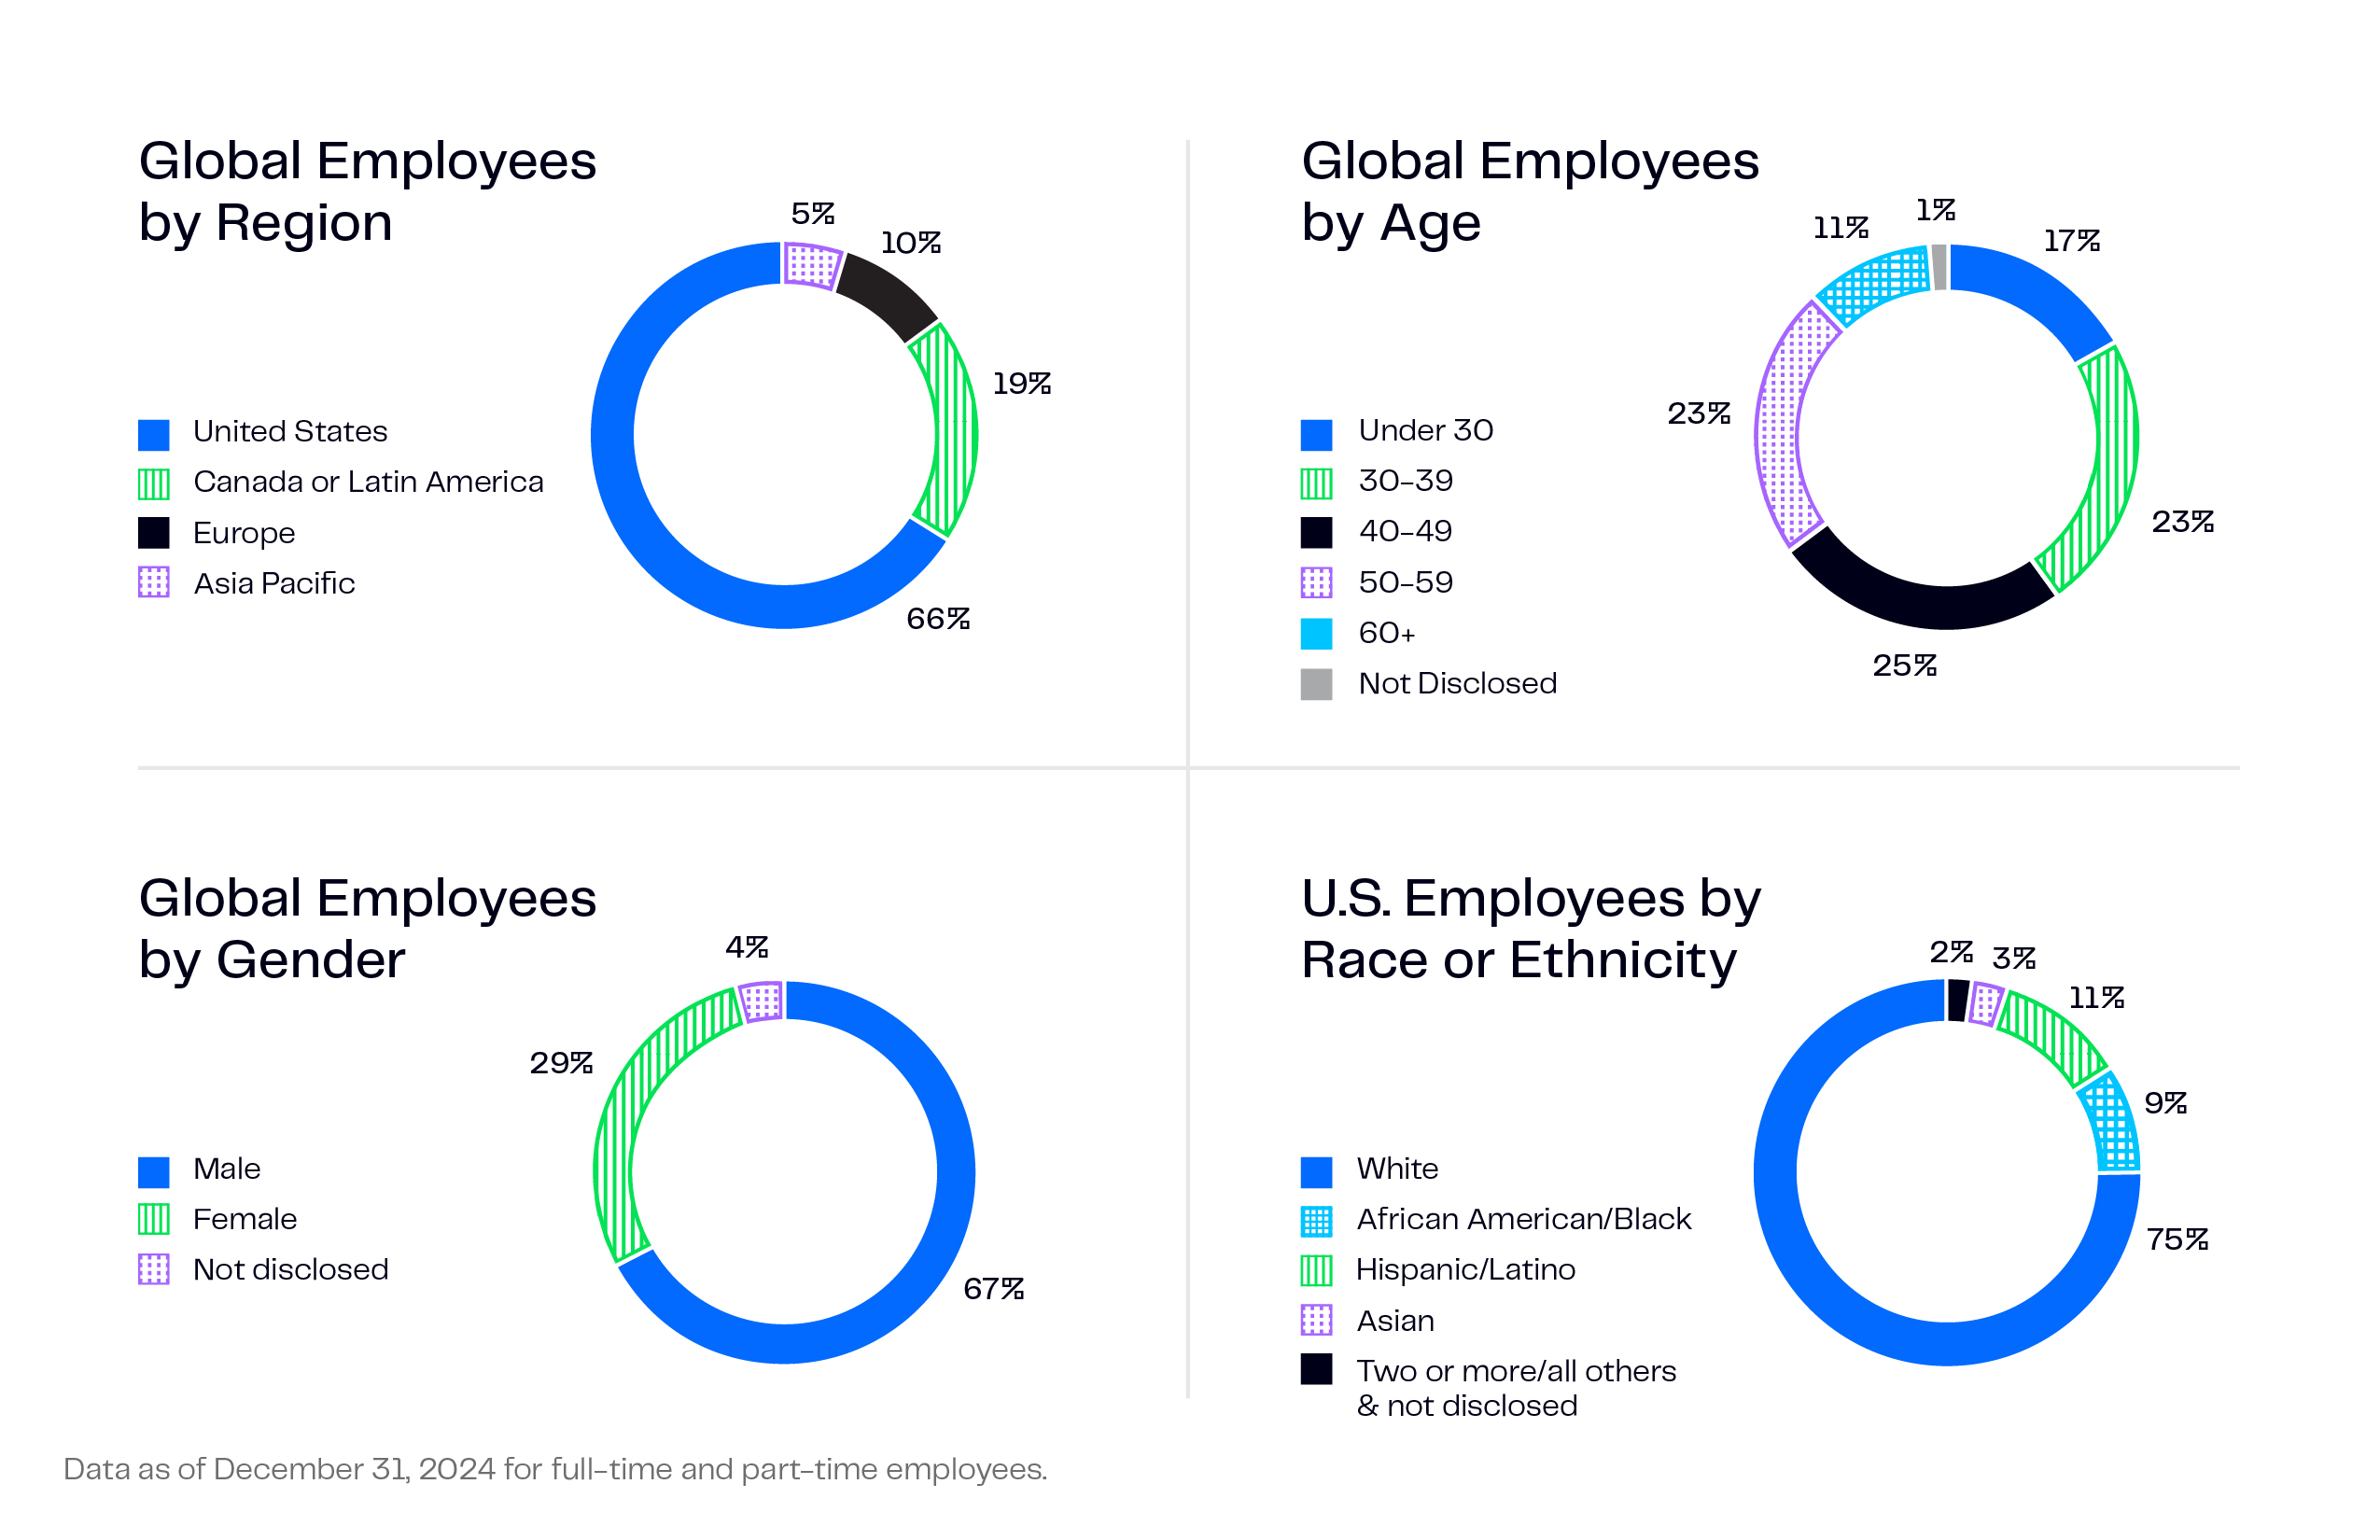
Employee Information
As of December 31, 2024, we employed approximately 15,000 employees, 95 percent of whom were full-time. Our employee base is approximately 60 percent hourly and 40 percent salaried. Temporary and contingent employees (including interns and co-ops) and contractors accounted for approximately 1,800 additional workers.
Approximately 1,800 of our U.S. employees belong to labor unions and approximately 1,000 additional employees are members of international unions or work councils. We believe that the relationships among our employees, the unions or work councils, and the Company remain stable.
Health and Safety
Employee health and safety are top priorities. We proactively identify and address potential safety risks in our business and operations. Our goal is to achieve zero work-related incidents and injuries. We maintain a Safety Management System (SMS) to formally address safety risks throughout the workplace and use our SMS to manage potential work-related hazards that pose a risk of high consequence of potential injury. Implementing processes and systems that meet our SMS criteria is designed to result in less frequent and less severe work-related incidents and injuries, while meeting or exceeding applicable regulatory requirements.
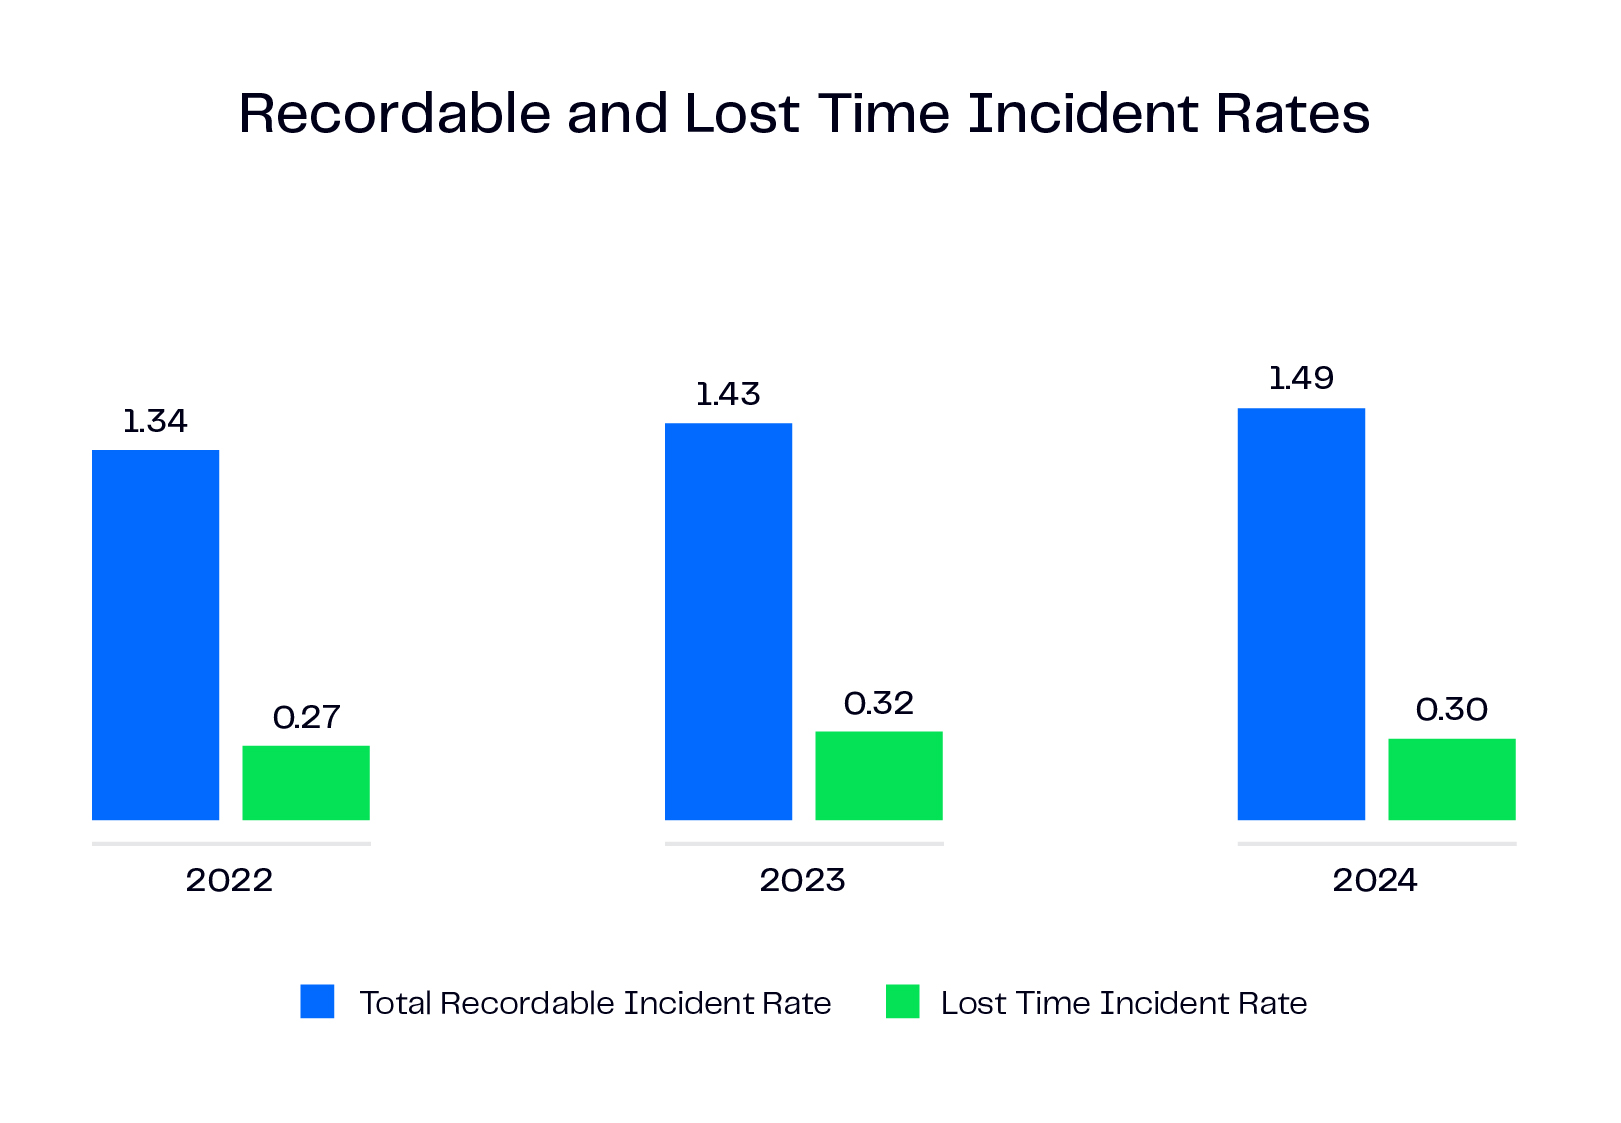
The Company's recordable and lost-time incident rates* from 2022 to 2024, recorded as of December 31, are as follows:
*Recordable Rate is the rate of injuries involving treatment beyond first aid per 100 employees; Lost Time Incident Rate is the rate of injuries per 100 employees in which an employee was not able to work at least one day.
Our global recordable incident rate is considerably lower than the benchmarks of the U.S. Bureau of Labor Statistics for similar businesses and operations. Additionally, we reported no occupational fatalities in 2024.
Compensation and Benefits
Our compensation philosophy is to encourage performance that creates sustainable, long-term shareholder value; motivates achievement of financial and strategic goals; attracts, retains, and motivates talent; and reinforces our pay-for-performance culture. We are committed, and strive to ensure, that employees are paid equitably for their work, regardless of their race or gender.
We offer market-competitive salaries and wages including incentive bonus opportunities for managers and senior individual contributors, an equity incentive program for director-level positions and above, and a discretionary retirement contribution dependent on the Company’s performance. We also provide a range of benefits (varying by country) that includes paid time off, healthcare coverage, wellness initiatives, and financial savings and protection programs.
Learning and Development
We support career advancement and create a rewarding environment for employees to learn, grow, and perform at their best. We provide opportunities for continuous learning and development, skill building, mentoring, and tuition reimbursement. We recognize the challenges of competing for top talent, particularly in technical fields, and strive to offer our employees career-specific tools, skilled apprenticeship programs, and robust on-the-job training opportunities. Our technical career tracks provide development for engineers and technology personnel who will shape our future ACES initiatives. We also incentivize innovation through a long-established inventor recognition award program.
Our employee development activities include a standard annual performance feedback and management process that engages employees at every stage to continue their professional growth. We also prioritize succession planning to foster internal promotion to key positions, ensuring a strong pipeline of talent to meet future business needs.
Engagement, Inclusion, and Belonging
During 2024, Brunswick again completed a global employee engagement survey, in which approximately 77 percent of employees participated. Insights from the survey will be used to develop action plans at the manager, facility, division, and corporate level to further enhance employee satisfaction and positive connections to Brunswick.
We view inclusion and belonging as strategic business initiatives. We maintain five employee resource groups (ERGs): Women on Water, Brunswick Black Professionals Network, Asians and Pacific Islanders in Marine, Organization for Hispanic/Latinos for Leadership and Advancement, and Brunswick Veterans Network. These ERGs are self-organized and open to all employees, focused on cultivating a sense of belonging and inclusion at Brunswick. Each ERG strives to support employees by deepening engagement, unifying and connecting communities, and fostering individual growth.
Ethics and Human Rights
We believe our strong compliance culture plays a central role in our success. The Integrity Playbook, Brunswick’s code of conduct, serves as the foundation of our Ethics Program. In 2024, 98 percent of our active global salaried population completed our annual code of conduct training. In addition, we maintain a global ethics hotline for anyone to ask questions or raise concerns, including anonymously, and we forbid retaliation for good faith reports.
We are committed to upholding human rights in all respects of our operations, as set forth in our global Human Rights Policy, Integrity Playbook, and Supplier Code of Conduct. We prohibit all forms of child labor and forced, bonded, or indentured labor, and human trafficking in our operations and supply chain. We expect our business partners and suppliers to comply with local labor and employment laws wherever they operate.
Please see our Sustainability Report (which is not incorporated by reference herein), available on our website, for additional information about our human capital management programs.
Available Information
Brunswick maintains an Internet website at http://www.brunswick.com that includes links to our Annual Report on Form 10-K, Quarterly Reports on Form 10-Q, Current Reports on Form 8-K and any amendments to those reports, and Proxy Statements (SEC Filings). The SEC Filings are available without charge as soon as reasonably practicable following the time that they are filed with, or furnished to, the SEC. Shareholders and other interested parties may request email notification of the posting of these documents through the Investors section of our website. Brunswick’s SEC Filings are also available on the SEC’s website at http://www.sec.gov.
Item 1A. Risk Factors
Our operations and financial results are subject to certain risks and uncertainties, including those described below, which could adversely affect our business, financial condition, results of operations, cash flows, and the trading price of our common stock.
RISKS RELATED TO ECONOMIC AND MARKET CONDITIONS
Worldwide economic conditions significantly affect our industries and businesses, and economic decline can materially impact our financial results.
In times of economic uncertainty or recession, consumers tend to have less discretionary income and defer significant spending on non-essential items, which may adversely affect our financial performance. Economic uncertainty caused by international conflicts, the risk of inflation, and the macroeconomic environment may lead to unfavorable business outcomes. We continue to enhance our portfolio with new and/or expanded technologies, business models, services, and solutions that are less susceptible to economic cycles, but a portion of our business remains cyclical and sensitive to consumer spending on new engines, boats, and associated parts and accessories.
Deterioration in general economic conditions that in turn diminishes consumer confidence or discretionary income may reduce our sales, or we may decide to lower pricing for our products, thus adversely affecting our financial results, including increasing the potential for future impairment charges. Further, most of our products are recreational, and consumers’ limited discretionary income may be diverted to other activities that occupy their time, such as other forms of recreational, religious, cultural, or community activities. We cannot predict the strength of global economies or the timing of economic recoveries, either worldwide or in the specific markets in which we compete.
Changes in currency exchange rates can adversely affect our results.
Some of our sales are denominated in a currency other than the U.S. dollar. Consequently, a strong U.S. dollar may adversely affect reported revenues and our profitability. We have hedging programs in place to reduce our risk to currency fluctuations; however, we cannot hedge against all currency risks, especially over the long term. We maintain a portion of our cost structure in currencies other than the U.S. dollar, which partially mitigates the impact of a strengthening U.S. dollar. This includes boats manufactured in Europe and Canada, and smaller outboard engines either manufactured in China or purchased from our joint venture in Japan. We also continue to evaluate the supply chain and cost structure for opportunities to further mitigate foreign currency risks.
We sell products manufactured in the U.S. into certain international markets, including Europe, Canada, Latin America and Asia-Pacific in U.S. dollars. Demand for our products in these markets may be diminished by a strengthening U.S. dollar, or we may need to lower prices to remain competitive. Some of our competitors with cost positions based outside the U.S., including Asian-based outboard engine manufacturers and European-based large fiberglass boat manufacturers, may have an improved cost position due to a strengthening U.S. dollar, which could result in pricing pressures on our products. Although these factors have existed for several years, we do not believe they have had a material adverse effect on our competitive position to date.
Changes to trade policy, tariffs, and import/export regulations may have a material adverse effect on our business, financial condition, and results of operations.
Changes in laws and policies governing trade could adversely affect our business and trigger retaliatory actions by affected countries. We continue to be subject to meaningful tariffs, such as China Section 301 investigation tariffs, and there is no assurance that we will be granted exclusions in the future. In addition, given the new administration's orders and policies yet to be determined, we will likely be subject to significant additional future tariffs related to goods from China, Mexico, Canada, or other jurisdictions, for which there may be no available exclusions, or for which we are not granted exclusions. Like many other multinational corporations, we do a significant amount of business that would be affected by changes to the trade policies of the U.S. and foreign countries (including governmental action related to tariffs and international trade agreements). Such changes have the potential to adversely impact the U.S. economy, our industry, our suppliers, and global demand for our products and, as a result, could have a material adverse effect on our business, financial condition, and results of operations.
Fiscal and monetary policy changes may negatively impact worldwide economic and credit conditions and adversely affect our industries, businesses, and financial condition.
Fiscal and monetary policy could have a material adverse impact on worldwide economic conditions, the financial markets, and availability of credit and, consequently, may negatively affect our industries, businesses, and overall financial condition. Customers often finance purchases of our products, particularly boats, and as interest rates rise, the cost of financing the purchase also increases. If credit conditions worsen and adversely affect the ability of customers to finance potential purchases at acceptable terms and interest rates, it could result in a decrease in sales or delay improvement in sales.
Adverse capital market conditions could have a negative impact on our financial results.
We may rely on short-term capital markets to meet our working capital requirements, fund capital expenditures or pay dividends, and we maintain short-term borrowing facilities that can be used to meet these capital requirements. In addition, over the long term, we may determine that it is necessary to access the capital markets to refinance existing long-term indebtedness or to raise capital for other initiatives. Adverse economic and capital market conditions, market volatility, and regulatory uncertainty could negatively affect our ability to access capital markets or increase the cost to do so, which could adversely impact our business, financial results, and competitive position.
Our profitability may suffer as a result of competitive pricing and other pressures.
The introduction of lower-priced alternative products or services by other companies can hurt our competitive position in all of our businesses. We are constantly subject to competitive pressures in which predominantly international manufacturers may pursue a strategy of aggressive pricing, particularly during periods when their local currency weakens versus the U.S. dollar. Such pricing pressure may limit our ability to increase prices for our products in response to raw material and other cost increases and negatively affect our profit margins.
In addition, our independent boat builder customers may react negatively to potential competition for their products from Brunswick's own boat brands, which can lead them to purchase marine engines, boat systems, parts and accessories, and marine engine supplies from competing manufacturers and may negatively affect demand for our products.
Higher energy and fuel costs can affect our results.
Higher energy and fuel costs increase operating expenses at our manufacturing facilities and the cost of shipping products to customers. In addition, increases in energy costs can adversely affect the pricing and availability of petroleum-based raw materials such as resins and foam that are used in many of our marine products. Higher fuel prices may also have an adverse effect on demand for our parts and accessories businesses, as they increase the cost of boat ownership and possibly affect product use.
RISKS RELATED TO OUR BUSINESS AND OPERATIONS
Successfully managing our manufacturing operations is critical to our operating and financial results.
Over the past several years, we have made strategic capital investments in capacity expansion activities to successfully capture growth opportunities and enhance product offerings, and we also continue to implement manufacturing efficiency enhancements that are important to our success. Conversely, in an uncertain economic environment, we may make decisions to decrease production at existing facilities or reduce our manufacturing footprint in accordance with our business strategy. We must carefully manage these capital improvement projects, expansions, efficiency enhancements, and any consolidation or decrease in capacity utilization to ensure the projects meet cost targets, comply with applicable environmental, safety, and other regulations, uphold high-quality workmanship, and meet our business goals.
Decreasing or ceasing production at a facility, moving production to a different plant, or expanding capacity at an existing facility all involve risks, including difficulties initiating production within the cost and timeframe estimated, supplying product to customers when expected, integrating new products, and attracting and retaining skilled workers. If we fail to meet these objectives, it could adversely affect our ability to meet customer demand for products and increase the cost of production versus projections, both of which could result in a significant adverse impact on operating and financial results. Additionally, plant consolidation or expansion can result in manufacturing inefficiencies, additional expenses, including higher wages or severance costs, and cost inefficiencies, which could negatively impact financial results.
Loss of key customers could harm our business.
In each segment, we have important relationships with key customers, including White River Marine Group, LLC for the Propulsion and Navico Group segments and MarineMax, Inc. for the Boat segment. From time to time, contracts with these customers come up for renewal. We cannot be certain we will renew such contracts, or renew them on favorable terms. If we lose a key customer, or a significant portion of its business, we could be adversely affected. In addition, certain customers could try to negotiate more favorable pricing of our products, which could depress earnings. In an effort to mitigate the risk associated with reliance on key customer accounts, we continually monitor these relationships and maintain a complete and competitive product lineup.
A material portion of our revenue is derived from international sources, which creates additional uncertainty.
We intend to continue to expand our international operations and customer base as part of our growth strategy. Sales outside the United States, especially in emerging markets, are subject to various risks, including government embargoes or foreign trade restrictions, foreign currency effects, tariffs, customs duties, inflation, difficulties in enforcing agreements and collecting receivables through foreign legal systems, compliance with international laws, treaties, and regulations, changes in regulatory environments, disruptions in distribution, dependence on foreign personnel and unions, economic and social instability, and public health crises. In addition, there may be tax inefficiencies in repatriating cash from non-U.S. subsidiaries, or changes to tax laws that affect cash repatriation.
Instability, including, but not limited to, political events, civil unrest, and an increase in criminal activity in locations where we maintain a significant presence could adversely impact our manufacturing and business operations. Decreased stability poses a risk of business interruption and delays in shipments of materials, components, and finished goods, as well as a risk of decreased local retail demand for our products.
In addition, political and economic uncertainty and shifts pose risks of volatility in other global markets, which could affect our operations and financial results. Changes in U.S. policy regarding foreign trade or manufacturing may create negative sentiment about the U.S. among non-U.S. customers, employees, or prospective employees, which could adversely affect our business, sales, hiring, and employee retention. If we continue to expand our business globally, our success will depend, in part, on our ability to anticipate and effectively manage these and other risks, which could materially impact international operations or the business as a whole.
Our financial results may be adversely affected by our third party suppliers' increased costs or inability to meet required production levels due to increased demand or disruption of supply of raw materials, parts, and product components.
We rely on third parties to supply raw materials used in the manufacturing process, including oil, aluminum, copper, steel, and resins, as well as product parts and components. The prices for these raw materials, parts, and components fluctuate depending on market conditions and, in some instances, commodity prices or trade policies, including tariffs. Substantial increases in the prices of raw materials, parts, and components would increase our operating costs, and could reduce our profitability if we are unable to recoup the increased costs through higher product prices or improved operating efficiencies. Similarly, if a critical supplier were to close its operations, cease manufacturing, or otherwise fail to deliver an essential component necessary to our manufacturing operations, that could detrimentally affect our ability to manufacture and sell our products, resulting in an interruption in business operations and/or a loss of sales.
In addition, some components used in our manufacturing processes, including certain engine components, furniture, upholstery, and boat windshields, are available from a sole supplier or a limited number of suppliers. Operational and financial difficulties that these or other suppliers may face in the future could adversely affect their ability to supply us with the parts and components we need, which could significantly disrupt our operations. It may be difficult to find a replacement supplier for a limited or sole source raw material, part, or component without significant delay or on commercially reasonable terms. In addition, an uncorrected defect or supplier's variation in a raw material, part, or component, either unknown to us or incompatible with our manufacturing process, could jeopardize our ability to manufacture products.
Some additional supply risks that could disrupt our operations, impair our ability to deliver products to customers, and negatively affect our financial results include:
•financial pressures on our suppliers due to a weakening economy or unfavorable conditions in other end markets;
•supplier manufacturing constraints and investment requirements;
•deterioration of our relationships with suppliers;
•events such as natural disasters, power outages, or labor strikes;
•disruption at major global ports and shipping hubs; or
•an outbreak of disease or facility closures due to a public health threat.
These risks are exacerbated in the case of single-source suppliers, and the exclusive supplier of a key component could potentially exert significant bargaining power over price, quality, warranty claims, or other terms.
We experienced supply shortages and increases in costs to certain materials in 2024. We continue to address these issues by identifying alternative suppliers for key materials and components, working to secure adequate inventories of critical supplies, and continually monitoring the capabilities of our supplier base. In the future, however, we may experience shortages, delayed delivery, and/or increased prices for key materials, parts, and supplies that are essential to our manufacturing operations.
Adverse weather conditions and climate change events can have a negative effect on revenues.
Changes in seasonal weather conditions can have a significant effect on our operating and financial results. Sales of our marine products are typically stronger just before and during spring and summer, and favorable weather during these months generally has a positive effect on consumer demand. Conversely, unseasonably cool weather, excessive rainfall, or drought conditions during these periods can reduce or change the timing of demand. Climate change could have an impact on longer-term natural weather trends, resulting in environmental changes including, but not limited to, increases in severe weather; changing sea levels; changes in sea, land, and air temperatures; poor water conditions; and reduced access to water, which could disrupt or negatively affect our business.
Catastrophic events, including natural and environmental disasters, acts of terrorism, or civil unrest, could have a negative effect on our operations and financial results.
Hurricanes, floods, earthquakes, storms, wildfires, and catastrophic natural or environmental disasters, as well as acts of terrorism or civil unrest, could disrupt our distribution channel, operations, or supply chain and decrease consumer demand. If a catastrophic event takes place in one of our major markets, our sales could be diminished or our assets could be damaged. Additionally, if such an event occurs near our business locations, manufacturing facilities, or key supplier facilities, business operations and/or operating systems could be interrupted. We could be uniquely affected by weather-related catastrophic events, the severity of which may increase as a result of climate change, due to the location of certain of our boat facilities in coastal Florida, the size of the manufacturing operation in Fond du Lac, Wisconsin, and Freedom Boat Club locations on waterfronts.
Our ability to remain competitive depends on successfully introducing new products, experiences, and services that meet customer expectations.
We believe that our customers look for and expect quality, innovation, and advanced features when evaluating and making purchasing decisions about products and services in the marketplace. Our ability to remain competitive and meet our growth objectives may be adversely affected by difficulties or delays in product development, such as an inability to develop viable new products or customer solutions, gain market acceptance of new products, generate sufficient capital to fund new product development, or obtain adequate intellectual property protection for new products. To meet ever-changing consumer demands, timing of market entry, pricing of new products, and satisfying customers are all critical. As a result, we may not be able to introduce new products that are necessary to remain competitive in all markets that we serve. Furthermore, we must continue to meet or exceed customers' expectations regarding product quality, experiences, and after-sales service or our operating results could suffer.
We have a fixed cost base that can affect our profitability if demand decreases.
The fixed cost levels of operating production facilities can put pressure on profit margins when sales and production decline. We have maintained discipline over our fixed cost base, and improvements in gross margin can help mitigate the risks related to a fixed cost base. However, our profitability is dependent, in part, on our ability to absorb fixed costs over an increasing number of products sold and shipped. Decreased demand or the need to reduce inventories can lower our production levels and impact our ability to absorb fixed costs, consequently materially affecting our results.
Our ability to meet demand in a rapidly changing environment may adversely affect our results of operations.
Although we have remained focused on our strategic priorities, our businesses may experience difficulty in meeting demand, particularly in rapidly changing economic conditions. We may not be able to recruit or retain sufficient skilled labor or our suppliers may not be able to deliver sufficient quantities of parts and components for us to match production with forecasted demand. Competitors may adopt new technologies and technological advancements, such as using artificial intelligence and machine learning to pursue new products, services, and approaches more quickly, successfully and effectively. Consumers may purchase from competitors or pursue other recreational activities if our products are not readily available, or our fixed costs may grow, all of which could adversely impact our results of operations.
Actual or potential public health emergencies, epidemics, or pandemics could have a material adverse effect on our business, results of operations, or financial condition.
The impact of actual or potential public health emergencies, epidemics, or pandemics on the Company, our suppliers, dealers, and customers, and the general economy could be wide-ranging and significant, depending on the nature of the issue, governmental actions taken in response, and the public reaction. The impact of such events could include employee illness, quarantines, cancellation of events and travel, business and school shutdowns, reduction in economic activity, and supply chain interruptions, which could cause significant disruptions to global economies and financial markets. In addition, these events could result in future significant volatility in demand, positively or negatively, for one or more of our products and have a negative effect on our business, financial condition, and results of operations.
Some of our operations are conducted by joint ventures that are not operated solely for our benefit.
We share ownership and management responsibilities with jointly owned companies such as BAC and Tohatsu Marine Corporation. These joint ventures may not have the same goals, strategies, priorities, or resources as we do because they are intended to be operated for the benefit of all co-owners, rather than for our exclusive benefit. If our interests are not aligned, it could negatively impact our sales or financial results.
RISKS RELATED TO OUR STRATEGIC PLANS
Failure to execute our strategic plan and growth initiatives could have a material adverse effect on our business and financial condition.
Our ability to continue generating strong cash flow and profits depends partly on the sustained successful execution of our strategic plan and growth initiatives, including optimizing our business and product portfolio, continuing to successfully integrate acquisitions, improving operating efficiency, and expanding into new adjacent markets. To address risks associated with our plan and growth initiatives, we have established processes to regularly review, manage, and modify our plans, and we believe we have appropriate oversight to monitor initiatives and their impact. However, our strategic plan and growth initiatives may require significant investment and management attention, which could result in the diversion of these resources from the core business and other business issues and opportunities. Additionally, any strategic plan is subject to certain risks, including market conditions, customer acceptance, competition, the ability to manufacture products on schedule and to specification, the supply chain, and/or the ability to attract and retain qualified management and other personnel. There is no assurance that we will be able to develop and successfully implement our strategic plan and growth initiatives in a manner that fully achieves our strategic objectives.
Our business and operations are dependent on the expertise of our key contributors, our successful implementation of succession plans, and our ability to attract and retain management employees and skilled labor.
The talents and efforts of our employees, particularly key managers, are vital to our success. Our management team has significant industry experience and would be difficult to replace. We may be unable to retain them or to attract other highly qualified employees. Failure to hire, develop, and retain highly qualified and diverse employee talent and to develop and implement an adequate succession plan for the management team could disrupt our operations and adversely affect our business and our future success. We perform an annual review of management succession plans with the Board of Directors, including reviewing executive officer and other important positions to substantially mitigate the risk associated with key contributor transitions, but we cannot ensure that all transitions will be implemented successfully.
Our ability to continue to execute our growth strategy could potentially be adversely affected by the effectiveness of organizational changes. Any disruption or uncertainty resulting from such changes could have a material adverse impact on our business, results of operations, and financial condition.
Much of our future success depends on, among other factors, our ability to attract and retain skilled labor. If we are not successful in these efforts, we may be unable to meet our operating goals and plans, which may impact our financial results. We continually invest in automation and improve our efficiency, but availability and retention of skilled hourly workers remains critical to our operations. In order to manage this risk, we regularly monitor and make improvements to wages and benefit programs, as well as develop and improve recruiting, training, and safety programs to attract and retain an experienced and skilled workforce.
The inability to successfully integrate acquisitions could negatively impact financial results.
Our strategic acquisitions pose risks, such as our ability to project and evaluate market demand; maximize potential synergies and cost savings; make accurate accounting estimates; and achieve anticipated business objectives. Acquisitions present integration risks, including:
•disruptions in core, adjacent, or acquired businesses that could make it more difficult to maintain business and operational relationships, including customer and supplier relationships;
•the possibility that the expected synergies and value creation will not be realized or will not be realized within the expected time period;
•the possibility that we will incur unexpected costs and liabilities;
•diversion of management attention; and
•difficulties recruiting and retaining employees.
If we fail to timely and successfully integrate acquired businesses into existing operations, we may see higher costs, lost sales, or otherwise diminished earnings and financial results.
There can be no assurance that strategic divestitures or restructurings will provide business benefits.
As part of our strategy, we continuously evaluate our portfolio of businesses to further maximize shareholder value. We have previously, and may in the future, make changes to our portfolio which may be material. Divestitures involve risks, including difficulties in the separation of operations, services, products, and personnel, disruption in our operations or businesses, finding a suitable purchaser, the diversion of management's attention from our other businesses, the potential loss of key employees, adverse effects on relationships with our dealer or supplier partners or their businesses, the erosion of employee morale or customer confidence, and the retention of contingent liabilities related to the divested business. If we do not successfully manage the risks associated with divestitures, our business, financial condition, and results of operations could be adversely affected as the potential strategic benefits may not be realized or may take longer to realize than expected.
An inability to identify and complete targeted acquisitions could negatively impact financial results.
Our growth initiatives include making strategic acquisitions when appropriate, which depend on the availability of suitable targets at acceptable terms and our ability to complete the transactions. In managing our acquisition strategy, we conduct rigorous due diligence, involve various functions, and continually review target acquisitions, all of which we believe mitigates some of our acquisition risks. However, we cannot assure that suitable acquisitions will be identified or consummated or that, if consummated, they will be successful. Acquisitions include a number of risks, including our ability to project and evaluate market demand, identify and realize potential synergies and cost savings, and make accurate financial forecasts, as well as diversion of management attention during the pursuit of acquisitions. Uncertainties exist in assessing the value, risks, profitability, and liabilities associated with certain businesses or assets, negotiating acceptable terms, obtaining financing on acceptable terms, and receiving any necessary regulatory approvals. As we continue to grow, in part, through acquisitions, our success depends on our ability to anticipate and effectively manage these risks. Our failure to successfully do so could have a material adverse effect on our financial condition and results of operations.
RISKS RELATED TO OUR DEALERS, DISTRIBUTORS, AND FRANCHISEES
Our financial results could be adversely affected if we are unable to maintain effective distribution.
We rely on third-party dealers and distributors to sell most of our products. Maintaining a reliable network of dealers is essential to our success. We face competition from other manufacturers in attracting and retaining distributors and independent boat dealers. In addition, dealers or distributors could decide to reduce their level of inventory of our products. A significant deterioration in the number or effectiveness of our dealers and distributors, and their inventory levels of our products, could have a material adverse effect on our financial results.
Although at present we believe dealer health to be generally favorable, continued weakening demand for marine products could hurt our dealers’ financial performance. In particular, reduced cash flow from decreases in sales and tightening credit markets could impair dealers' ability to fund operations. Inability to fund operations can force dealers to cease business, and we may be unable to obtain alternate distribution in the vacated market. An inability to obtain alternate distribution could unfavorably affect our net sales through reduced market presence. If economic conditions deteriorate, we anticipate that dealer failures or voluntary market exits would increase, especially if overall retail demand materially further declines.
Dealer or distributor inability to secure adequate access to capital could adversely affect our sales.
Our dealers require adequate liquidity to finance their operations, including purchasing our products. Dealers are subject to numerous risks and uncertainties that could unfavorably affect their liquidity positions, including, among other things, continued access to adequate financing sources on a timely basis on reasonable terms. These financing sources are vital to our ability to sell products through our distribution network, particularly to boat and engine dealers. Entities affiliated with Wells Fargo & Company, including BAC, our 49 percent owned joint venture, finance a significant portion of our boat and engine sales to dealers through floor plan financing to marine dealers.
Many factors continue to influence the availability and terms of financing that our dealer floor plan financing providers offer, including:
•their ability to access certain capital markets, such as the securitization and the commercial paper markets, and to fund their operations in a cost effective manner;
•the performance of their overall credit portfolios;
•their willingness to accept the risks associated with lending to marine dealers;
•the overall creditworthiness of those dealers; and
•the overall aging and level of pipeline inventories.
Our sales could be adversely affected if financing terms change unfavorably or if BAC were to be terminated. This could require dealers to find alternative sources of financing, including our direct financing to dealers, which could require additional capital to fund the associated receivables.
Inventory reductions by major dealers, retailers, and independent boat builders driven by weaker demand for our products could adversely affect our financial results.
If demand for our products declines or if new product introductions are expected to replace existing products, our dealers, retailers, and other distributors could decide to reduce the number of units they hold. In the future, customers may have fewer hybrid or flexible work opportunities, which could reduce their available recreational time or willingness to purchase our products. These factors and recent economic headwinds could weaken demand for marine products and result in sustained lower dealer stocking levels. These actions could result in wholesale sales reductions in excess of retail sales reductions and would likely result in lower production levels of certain products, potentially causing lower rates of absorption of fixed costs in our manufacturing facilities and lower margins. While we have processes in place to help manage dealer inventories at appropriate levels, potential inventory reductions remain a risk to our future sales and results of operations.
We may be required to repurchase inventory or accounts of certain dealers.
We have agreements with certain third-party finance companies to provide financing to our customers, enabling them to purchase our products. In connection with these agreements, we may either have obligations to repurchase our products from the finance company or have recourse obligations. These obligations may be triggered if our dealers default on their payment or other obligations to the finance companies.
Our maximum contingent obligation to repurchase inventory and our maximum contingent recourse obligations on customer receivables are less than the total balances of dealer financings outstanding under these programs, because our obligations under certain of these arrangements are subject to caps or are limited based on the age of product. Our risk related to these arrangements is partially mitigated by the proceeds we receive on the resale of repurchased product to other dealers, or by recoveries on receivables purchased under the recourse obligations.
Our inventory repurchase obligations relate mainly to the inventory floor plan credit facilities of our boat and engine dealers. Our actual historical repurchase experience related to these arrangements has been substantially less than our maximum contractual obligations. If dealers default on their obligations, file for bankruptcy, or cease operations, we could incur losses associated with the repurchase of our products. In addition, our net sales and earnings may be unfavorably affected due to reduced market coverage and an associated decline in sales.
Future declines in marine industry demand could cause an increase in repurchase activity, or could require us to incur losses in excess of established reserves. In addition, our cash flow and loss experience could be adversely affected if repurchased inventory is not successfully distributed to other dealers in a timely manner, or if the recovery rate on the resale of the product declines. The finance companies could require changes in repurchase or recourse terms that would result in an increase in our contractual contingent obligations.
The franchise business model of Freedom Boat Club presents risks.
Our franchisees are an integral part of Freedom Boat Club business and its growth strategies. We may be unable to successfully implement our growth strategies if our franchisees do not participate in the implementation of those strategies or if we are unable to attract a sufficient number of qualified franchisees. While our franchisees are required to comply with franchise and related agreements, our franchisees are independent and manage their boat clubs as independent businesses, responsible for day-to-day operations of their boat clubs. If these franchisees fail to maintain or act in accordance with applicable brand standards; experience service, safety, or other operational problems, including any data breach involving club member information; or project a brand image inconsistent with ours, our image and reputation could suffer, which in turn could hurt our business and operating results.
RISKS RELATED TO CYBERSECURITY AND TECHNOLOGY
Our business operations could be negatively impacted by a system outage caused by a breach of our information technology systems or operational technology systems.
We manage our global business operations through a variety of information technology (IT) and operational technology systems which we continually enhance to increase efficiency and security. We depend on these systems for commercial transactions, customer interactions, manufacturing, branding, employee tracking, and other applications. Some of the systems are based on legacy technology and operate with a minimal level of available support, and recent acquisitions using other systems have added to the complexity of our IT infrastructure. New system implementations across the enterprise also pose risks of outages or disruptions, which could affect our suppliers, commercial operations, and customers. We continue to upgrade, streamline, and integrate these systems and have invested in strategies to prevent a failure or breach but, like those of other companies, our systems are susceptible to outages due to natural disasters, power loss, computer viruses, security breaches, hardware or software vulnerabilities, disruptions, and similar events.
In June 2023, Brunswick disclosed an IT security incident that impacted some systems and global facilities. We activated our response protocols, which included pausing operations in some locations, engaging leading security experts and coordinating with relevant law enforcement agencies. Normal global business operations resumed over the course of nine days following the incident. However, if a similar event occurred, and if legacy systems or other key systems were to fail or if our IT systems were unable to communicate effectively, this could result in missed or delayed sales or lost opportunities for cost-reduction or efficient cash management.
We exchange information with many trading partners across all aspects of our commercial operations through our IT systems. A breakdown, outage, malicious intrusion, breach, ransom attack, or other disruption of communications could result in erroneous or fraudulent transactions, disclosure of confidential information, loss of reputation and confidence, and may also result in legal claims or proceedings, penalties, and remediation costs. We have numerous e-commerce and e-marketing portals and our systems may contain personal information of customers or employees; therefore, we must continue to be diligent in protecting against malicious cyber attacks. We have been the target of attempted cyber attacks and other security threats and we may be subject to future breaches of our IT systems. We have programs in place that are intended to detect, contain, and respond to data security incidents and that provide at least annual employee awareness training regarding phishing, malware, and other cyber risks. However, because the techniques used to obtain unauthorized access, disable or degrade service, or sabotage systems change frequently and may be difficult to detect, we may be unable to anticipate these techniques or implement adequate preventive measures. Moreover, the rapid evolution and increased adoption of artificial intelligence technologies may intensify our cybersecurity risks. If our security measures are breached or fail, unauthorized persons may be able to obtain access to or acquire personal or other confidential data. Depending on the nature of the information compromised, we may also have obligations to notify consumers and/or employees about the incident, and we may need to provide some form of remedy, such as a subscription to a credit monitoring service, for the individuals affected by the incident. For example, we provided certain affected individuals credit monitoring as a result of the IT security incident in June 2023. This or future events could negatively affect our relationships with customers or trading partners, lead to potential claims against us, and damage our image and reputation.
We rely on third parties for computing, storage, processing, and similar services. Any disruption of or interference with our use of these third-party services could have an adverse effect on our business, financial condition, and operating results.
Most of our business systems reside on third-party outsourced cloud infrastructure providers. We are therefore vulnerable to service interruptions experienced by these providers and could experience interruptions, delays, or outages in service availability in the future due to a variety of factors, including infrastructure changes, human, hardware or software errors, cyber-attacks, hosting disruptions, and capacity constraints. While we have mitigation and service redundancy plans in place, outages and/or capacity constraints could still arise from a number of causes such as technical failures, natural disasters, fraud, or internal or third-party security attacks on us or our third-party providers, which could negatively impact our ability to manufacture and/or operate our business.
We collect, store, process, share, and use personal information, and rely on third parties that are not directly under our control to do so as well, which subjects us to legal obligations, laws and regulations related to security and privacy, and any actual or perceived failure to meet those obligations could harm our business.
We are subject to various data protection and privacy laws and regulations in the countries where we operate because we collect, store, process, share, and use personal information, and we rely on third parties that are not directly under our control to do so as well. For example, we are subject to the General Data Protection Regulation (GDPR) in the European Union (EU) and the California Consumer Privacy Act (CCPA). Although we have implemented plans to comply with these laws, GDPR, CCPA, and future laws and regulations could impose even greater compliance burdens and risks with respect to privacy and data security than prior laws. The EU (through the GDPR) and a growing number of legislative and regulatory bodies elsewhere in the world have adopted consumer notification requirements in the event of unauthorized access to or acquisition of certain types of personal information. These breach notification laws continue to evolve and may be inconsistent from one jurisdiction to another. Complying with these obligations could cause us to incur substantial costs, require significant management time and attention, and increase negative publicity surrounding any incident that compromises personal information.
RISKS RELATED TO OUR INTELLECTUAL PROPERTY
Our success depends upon the continued strength of our brands.
We believe that our brands, particularly including Mercury Marine, Boston Whaler, Lund, and Sea Ray, significantly contribute to our success, and that maintaining and enhancing these brands is important to expanding our customer base. A failure to adequately promote, protect, and strengthen our brands could adversely affect our business and results of operations. Further, in connection with the divestiture of the bowling and billiards businesses, we licensed certain trademarks and servicemarks, including use of the name "Brunswick," to the acquiring companies. Our reputation may be adversely affected by the purchasers' inappropriate use of the marks or of the name Brunswick, including potential negative publicity, loss of confidence, or other damage to our image due to this licensed use.
Either inadequate intellectual property protection that could allow others to use our technologies and impair our ability to compete or the failure to successfully defend against patent infringement claims could have a material adverse effect on our financial condition and results of operations.
We regard much of the technology underlying our products as proprietary. We rely on a combination of patents, trademark, copyright, and trade secret laws; employee and third-party non-disclosure agreements; and other contracts to establish and protect our technology and other intellectual property rights. However, we remain subject to risks, including:
•the steps we take to protect our proprietary technology may be inadequate to prevent misappropriation of our technology;
•third parties may independently develop similar technology;
•agreements containing protections may be breached or terminated;
•we may not have adequate remedies for breaches;
•existing patent, trademark, copyright, and trade secret laws may afford limited protection;
•a third party could copy or otherwise obtain and use our products or technology without authorization; or
•we may be required to litigate to enforce our intellectual property rights, and we may not be successful.
Policing unauthorized use of our intellectual property is difficult, particularly outside the U.S., and litigating intellectual property claims may result in substantial cost and divert management’s attention.
In addition, we may be required to defend our products against patent or other intellectual property infringement claims or litigation. Besides defense expenses and costs, we may not prevail in such cases, forcing us to seek licenses or royalty arrangements from third parties, which we may not be able to obtain on reasonable terms, or subjecting us to an order or requirement to stop manufacturing, using, selling, or distributing products that included challenged intellectual property, which could harm our business and financial results.
RISKS RELATED TO OUR REGULATORY, ACCOUNTING, LEGAL, AND TAX ENVIRONMENT
An impairment in the carrying value of goodwill, trade names, and other long-lived assets could negatively affect our consolidated results of operations and net worth.
Goodwill and indefinite-lived intangible assets, such as our trade names, are recorded at fair value at the time of acquisition and are not amortized, but are reviewed for impairment at least annually or more frequently if impairment indicators arise. In evaluating the potential for impairment of goodwill and trade names, we make assumptions regarding future operating performance, business trends, and market and economic conditions. Such analyses further require us to make certain assumptions about sales, operating margins, growth rates, and discount rates. Uncertainties are inherent in evaluating and applying these factors to the assessment of goodwill and trade name recoverability. We could be required to evaluate the recoverability of goodwill or trade names prior to the annual assessment if we experience business disruptions, unexpected significant declines in operating results, a divestiture of a significant component of our business, or declines in market capitalization.
We also continually evaluate whether events or circumstances have occurred that indicate the remaining estimated useful lives of our definite-lived intangible assets and other long-lived assets may warrant revision or whether the remaining balance of such assets may not be recoverable. We use an estimate of the related undiscounted cash flow over the remaining life of the asset in measuring whether the asset is recoverable.
As of December 31, 2024, the balance of total goodwill and indefinite lived intangible assets was $1,270.3 million, which represents approximately 22 percent of total assets. If the future operating performance of either the Company or individual operating segments is not sufficient, we could be required to record non-cash impairment charges. Impairment charges could substantially affect our reported earnings in the periods such charges are recorded. In addition, impairment charges could indicate a reduction in business value which could limit our ability to obtain adequate financing in the future.
We manufacture and sell products that create exposure to potential claims and litigation.
Our manufacturing operations and the products we produce could result in product quality, warranty, personal injury, property damage, and other claims. The adoption of new technologies, such as artificial intelligence or autonomous products, may result in new or enhanced regulations, litigation or liability. To manage these risks, we have established a global, enterprise-wide program charged with the responsibility for reviewing, addressing, and reporting on product integrity issues. Historically, the resolution of such claims has not had a materially adverse effect on our business, and we maintain what we believe to be adequate insurance coverage to mitigate a portion of these risks. However, we may experience material losses in the future, incur significant costs to defend claims or issue product recalls, experience claims in excess of our insurance coverage or that are not covered by insurance, or be subjected to fines or penalties. Our reputation may be adversely affected by such claims, whether or not successful, including potential negative publicity about our products, and such claims could divert the efforts of our personnel, even if we are successful in defending them. We record accruals for known potential liabilities, but there is the possibility that actual losses may exceed these accruals and therefore negatively impact earnings.
Compliance with environmental, health, safety, zoning, and other laws and regulations may increase costs and reduce demand for our products.
We are subject to federal, state, local, and foreign laws and regulations, including product safety, environmental, health and safety, and other regulations. While we believe that we maintain the requisite licenses and permits and that we are in material compliance with applicable laws and regulations, a failure to satisfy these and other regulatory requirements could result in fines or penalties, and compliance could increase the cost of operations. The adoption of additional laws, rules, and regulations, including stricter emissions standards or limitations on the use of internal combustion engines, could increase our manufacturing costs, require additional product development investment, increase consumer pricing, and reduce consumer demand for our products or boat club operations.
Environmental restrictions, boat plant emission restrictions, and permitting and zoning requirements can limit production capacity, access to water for boating (or certain types of boats or propulsion) and marinas, and storage space. While future requirements, including any imposed on recreational boating, are not expected to be unduly restrictive, they may deter potential customers, thereby reducing our sales. Furthermore, regulations allowing the sale of fuel containing higher levels of ethanol for automobiles, which is not appropriate or intended for use in marine engines, may nonetheless result in increased warranty, service costs, customer dissatisfaction with products, and other claims against us if boaters mistakenly use this fuel in marine engines, causing damage to and the degradation of components in their marine engines. Many of our customers use our products for fishing and related recreational activities. Regulatory or commercial policies and practices impacting access to water, including availability of slip locations and/or the ability to transfer boats among different waterways, access to fisheries, or the ability to fish in some areas could negatively affect demand for our products. As we evolve our product electrification strategy, we are potentially subject to emerging regulations and requirements under the proposed European Union Battery Directive or other similar regulations regarding transportation, storage, handling, and use of batteries and the components used in battery manufacturing. These requirements, if adopted, could increase our costs, potentially reducing consumer demand for our products.
Our manufacturing processes involve the use, handling, storage, and contracting for recycling or disposal of hazardous or toxic substances or wastes. Accordingly, we are subject to regulations regarding these substances, and the misuse or mishandling of such substances could expose us to liabilities, including claims for property, personal injury, or natural resources damages, or fines. We are also subject to laws requiring the cleanup of contaminated property, including cleanup efforts currently underway. If a release of hazardous substances occurs at or from one of our current or former properties or another location where we have disposed of hazardous materials, we may be held liable for the contamination, regardless of knowledge or whether we were at fault, and the amount of such liability could be material.
We anticipate that increased global regulation relating to climate change, such as climate disclosure requirements, will require us to comply or potentially face market access limitations or other penalties, including fines. Our products are subject to increasingly stringent regulations regarding chemical and material composition, and we are subject to extended producer responsibility laws and regulations requiring manufacturers to be responsible for collection, recovery, and recycling of wastes from certain products. These requirements could increase our costs or could result in fines, suspension of production, the need to alter manufacturing processes, and legal liability, and could negatively affect our competitive position.
Additionally, we are subject to laws governing our relationships with employees, including, but not limited to, employment obligations as a federal contractor and employee wage, hour, and benefits issues, such as health care benefits. Compliance with these rules and regulations, and compliance with any changes to current regulations, could increase the cost of our operations.
Changes in income tax laws or enforcement could have a material adverse impact on our financial results.
Our provision for income taxes and cash tax liability may be adversely impacted by changes in tax laws and interpretations in the U.S. or in other countries in which we operate. The Inflation Reduction Act of 2022 (IRA) included various tax provisions, including a 15 percent minimum tax on global adjusted financial statement income. While we do not believe the IRA will have a material negative impact on our business, it is possible that future interpretations or additional tax law changes could have a material impact on the Company’s tax rate. In addition, many non-U.S. jurisdictions are implementing local legislation based upon the Organization for Economic Co-operation and Development’s base erosion and profit shifting project. These changes could negatively impact our tax provision, cash flows, and/or tax-related balance sheet amounts, including our deferred tax asset values, and increase the complexity, burden, and cost of tax compliance.
RISKS RELATED TO OUR COMMON STOCK
The timing and amount of our share repurchases are subject to a number of uncertainties.
The Board of Directors has authorized our discretionary repurchase of outstanding common stock, to be systematically completed in the open market or through privately negotiated transactions. In 2024, we repurchased $200.0 million of shares, and we plan to continue share repurchases in 2025 and beyond. The amount and timing of share repurchases are based on a variety of factors. Important considerations that could cause us to limit, suspend, or delay future stock repurchases include:
•unfavorable market and economic conditions;
•the trading price of our common stock;
•the nature and magnitude of other investment opportunities available to us from time to time;
•the availability of cash; and
•additional taxes imposed on share repurchases.
Delaying, limiting, or suspending our stock repurchase program may negatively affect performance versus earnings per share targets, and ultimately our stock price.
Certain activist shareholder actions could cause us to incur expense and hinder execution of our strategy.
We may at times be subject to certain divisive activist shareholder tactics, which can take many forms. Some shareholder activism, including potential proxy contests, could result in substantial costs, such as legal fees and expenses, and divert management’s and our Board’s attention and resources from our businesses and strategic plans. Additionally, public shareholder activism could give rise to perceived uncertainties as to our future, adversely affect our relationships with dealers, distributors, or customers, make it more difficult to attract and retain qualified personnel, and cause our stock price to fluctuate based on temporary or speculative market perceptions or other factors that do not necessarily reflect the underlying fundamentals and prospects of our business. These risks could adversely affect our business and operating results.
Item 1B. Unresolved Staff Comments
None.
Item 1C. Cybersecurity
Brunswick’s leadership recognizes the importance of information security and managing cybersecurity risks across the enterprise. We manage our global business operations through a variety of systems for commercial transactions, customer interactions, manufacturing, branding, employee tracking, and other applications. Systems based on legacy technology, sometimes added through acquisitions or hosted by third parties, and/or that contain personal information of customers or employees, present risks of erroneous or fraudulent transactions, disclosure of personal, sensitive, and confidential information, loss of reputation and confidence, potential impacts on our operations, and may result in legal claims or proceedings, penalties, and remediation costs.
Brunswick’s cybersecurity risk management program is managed by a dedicated cybersecurity team. The team is led by the Chief Information Security Officer (CISO), who reports directly to the Chief Executive Officer (CEO) and the Chief Information Officer (CIO), and has over 20 years of experience in information security, cybersecurity, and IT risk management. Brunswick’s CISO holds a BBA, majoring in Accounting and Management Information Systems, and an MBA in Strategy and General Management. The CISO is supported by a leadership team with backgrounds in cybersecurity, risk management, and other related capabilities.
Brunswick’s cybersecurity risk management program leverages the National Institute of Standards and Technology (NIST) framework as guidance for the program. The team regularly assesses the threat landscape to manage risks through a layered cybersecurity strategy based on prevention, detection, and containment, including processes for escalating information about threats or cyber incidents to management and the Board of Directors. We have other policies and procedures that directly or indirectly relate to cybersecurity, including those related to remote access monitoring, encryption, antivirus protection, multifactor authentication, confidential information, and the use of the internet, email, and wireless devices. The Company also engages third parties in connection with the assessment of our cybersecurity risk management processes against the NIST framework. We actively engage with key vendors, industry participants, and law enforcement communities as part of our continuing efforts to evaluate and improve our program. Internally, our employees are a key part of our program: Brunswick enables a culture in which security is everyone’s responsibility. Employees are trained through various methods throughout the year, including annual security training.
Our regular interactions with third party vendors and suppliers pose a potential cybersecurity risk that could adversely impact our business or employees. We conduct information security assessments before onboarding. In addition, we require providers to meet appropriate security requirements, controls, and responsibilities, and include additional security and privacy addenda to our contracts where applicable. We also make cybersecurity education and awareness materials available to our suppliers.
Brunswick’s Board of Directors (the Board) and its committees are actively engaged in managing cybersecurity risk and overseeing our information security programs. The Audit and Finance Committee (the Committee) is primarily responsible for oversight of our information technology and information security/cybersecurity programs. The Committee is composed of directors with expertise in technology, audit, finance, and compliance, equipping them to effectively oversee the program. The CISO updates the Committee at each of its regularly scheduled meetings. These reports include updates on our information security/cybersecurity programs and key performance indicators, assessment of the program, emerging risks, policies, procedures, training, and risk mitigation strategies. The CIO and CISO also provide the full Board with information technology and cybersecurity reports on at least an annual basis and with greater frequency as necessary. In addition, the Board oversees Brunswick’s long-standing enterprise risk management (ERM) process, which regularly identifies, assesses, and mitigates enterprise and emerging risks, including cyber risks.
In 2024, Brunswick did not identify any cyber events or risks from cybersecurity threats that could be considered material, individually or in the aggregate.
Notwithstanding our program, we may not be successful in preventing or mitigating a cybersecurity incident that could have a material adverse effect on us. For further information, refer to Section 1A, Risk Factors for a discussion of risks related to cybersecurity and technology.
Item 2. Properties
We have numerous manufacturing plants, distribution warehouses, sales and engineering offices, and product test sites around the world. Research and development facilities are primarily located at manufacturing sites. We believe our facilities are suitable and adequate for our current needs and are well maintained and in good operating condition. Most plants and warehouses are of modern, single-story construction, providing efficient manufacturing and distribution operations. We believe our manufacturing facilities have the capacity, or we are investing to increase capacity, to meet current and anticipated demand. Our principal properties are as follows:
| | | | | | | | | | | |
| Segment | Location | Primary Use | Ownership |
| All Segments | Mettawa, IL (US) | Corporate headquarters | Leased |
| Propulsion and Engine P&A | Fond du Lac, WI (US) | Manufacturing and office | Owned |
| Propulsion and Engine P&A | Melbourne, Australia | Distribution and office | Leased |
| Propulsion, Engine P&A and Boat | Petit-Rechain, Belgium | Distribution and office | Owned |
| Propulsion and Engine P&A | Suzhou, China | Manufacturing, distribution, office | Owned/Leased |
| Propulsion, Engine P&A, Navico Group and Boat | Auckland, New Zealand | Manufacturing, light assembly, engineering, distribution, office | Leased |
| Propulsion and Engine P&A | Juarez, Mexico | Light assembly and distribution | Owned/Leased |
| Engine P&A | Brisbane, Australia | Distribution | Leased |
| Engine P&A | Brownsburg, IN (US) | Distribution | Leased |
| Engine P&A | Heerenveen, Netherlands | Distribution | Leased |
| Navico Group | Lowell, MI (US) | Manufacturing and office | Leased |
| Navico Group | Menomonee Falls, WI (US) | Light assembly, distribution, office | Leased |
| Navico Group | Stuart, FL (US) | Manufacturing and distribution | Owned |
| Navico Group | Ensenada, Mexico | Manufacturing and distribution | Owned |
| Navico Group | Amsterdam, Netherlands | Engineering, distribution, office | Leased |
| Boat | Edgewater, FL (US) | Manufacturing | Owned |
| Boat | Palm Coast, FL (US) | Manufacturing | Owned |
| Boat | Merritt Island, FL (US) | Manufacturing | Owned |
| Boat | Venice, FL (US) | Office | Leased |
| Boat | Fort Wayne, IN (US) | Manufacturing | Owned |
| Boat | New York Mills, MN (US) | Manufacturing | Owned |
| Boat | Lebanon, MO (US) | Manufacturing | Owned |
| Boat | Knoxville, TN (US) | Office | Leased |
| Boat | Vonore, TN (US) | Manufacturing | Owned |
| Boat | Princeville, Quebec, Canada | Manufacturing | Owned |
| Boat | Reynosa, Mexico | Manufacturing | Owned |
| Boat | Vila Nova de Cerveira, Portugal | Manufacturing | Owned |
Item 3. Legal Proceedings
Refer to Note 11 – Commitments and Contingencies in the Notes to Consolidated Financial Statements for information about our legal proceedings.
Item 4. Mine Safety Disclosures
Not applicable.
Information About Our Executive Officers
Brunswick's Executive Officers are listed in the following table:
| | | | | | | | | | | |
| Officer Name | Present Position | First Became an Executive Officer | Age |
| David M. Foulkes | Chief Executive Officer | 2019 | 63 |
| Ryan M. Gwillim | Executive Vice President and Chief Financial and Strategy Officer | 2020 | 45 |
| John G. Buelow | Executive Vice President and President — Mercury Marine | 2023 | 54 |
| Christopher F. Dekker | Executive Vice President, General Counsel, Secretary, and Chief Compliance Officer | 2014 | 56 |
| Aine L. Denari | Executive Vice President and President — Navico Group and Chief Technology Officer | 2020 | 52 |
| Brenna D. Preisser | Executive Vice President and President — Brunswick Boat Group | 2016 | 47 |
| Jill M. Wrobel | Executive Vice President and Chief Human Resources Officer | 2021 | 44 |
| Randall S. Altman | Senior Vice President and Controller | 2019 | 53 |
The executive officers named above have been appointed to serve until their successors are chosen and qualified or until the executive officer's earlier resignation or removal.
David M. Foulkes was named Chief Executive Officer of Brunswick in 2019. He served as Chief Technology Officer and President, Brunswick Marine Consumer Solutions from May 2018 to 2019, as Vice President and Brunswick Chief Technology Officer from 2014 to 2018, as Vice President of Product Development and Engineering, Mercury Marine, from 2010 to 2018 and as President of Mercury Racing from 2012 to 2018. Previously, Mr. Foulkes held positions of increasing responsibility at Mercury Marine from the start of his employment in 2007.
Ryan M. Gwillim has served as Executive Vice President and Chief Financial Officer of Brunswick since June 2020. Mr. Gwillim assumed additional responsibility as Chief Strategy Officer in November 2023. Previously, he served as Vice President – Finance and Treasurer from 2019 to 2020, and Vice President – Investor Relations from 2017 to 2019. Mr. Gwillim held positions of increasing responsibility within the Brunswick Legal Department since his employment began in 2011.
John G. Buelow was named Executive Vice President and President – Mercury Marine in February 2023. He previously served as Vice President of Global Operations, Mercury Marine, from June 2018 to February 2023, and as Vice President Category Management, Mercury Marine, from 2016 to 2018. Prior to 2016, Mr. Buelow served in a variety of positions of increasing responsibility at Mercury Marine since he was hired in 2004.
Christopher F. Dekker has served as Executive Vice President, General Counsel, Secretary, and Chief Compliance Officer since 2014. Prior to his appointment, Mr. Dekker served as Brunswick's Associate General Counsel, with responsibilities for litigation, employment, and compliance matters, from the start of his employment with Brunswick in 2010.
Aine L. Denari was named Executive Vice President and President – Navico Group and Chief Technology Officer in August 2024. She had served as Executive Vice President and President – Brunswick Boat Group since October 2020. Prior to joining Brunswick, Ms. Denari worked at ZF AG as Senior Vice President and General Manager, Global Electronics ADAS (Advanced Driver Assistance Systems) from 2017 to 2020, as Senior Vice President, Planning and Business Development from 2015 to 2017, and as Vice President, Business Development and Product Planning from 2014 to 2017. Ms. Denari previously served in a variety of executive positions within the automotive industry, and in leadership positions at major global consulting firms.
Brenna D. Preisser has served in her role as Executive Vice President and President – Brunswick Boat Group since August 2024. She previously served as Executive Vice President and President – Business Acceleration since 2020. She held the role of Chief Human Resources Officer from 2016 to 2021. Ms. Preisser has served in a variety of roles of increasing responsibility since she started with Brunswick in 2004.
Jill M. Wrobel was named Executive Vice President and Chief Human Resources Officer in December 2021. Ms. Wrobel was named Brunswick's Vice President, Enterprise Human Resources and Transformation Leader in December 2020 when she joined Brunswick from Walgreens Boots Alliance, Inc., an integrated global pharmacy, healthcare and retail leader. Ms. Wrobel served as Group Vice President, Global HR Business Strategy and HR M&A Integration during 2020, Vice President, Global HRBP Development, Digital and HR M&A Integration from 2018 to 2019, and Vice President HR Mergers & Acquisitions and Rite Aid HR Lead from 2016 to 2018. Prior to Walgreens Boots Alliance, Inc., Ms. Wrobel worked in a variety of human resources and leadership roles at Walgreens and PricewaterhouseCoopers LLP.
Randall S. Altman was named Brunswick's Senior Vice President and Controller in 2022 and served as Vice President and Controller since June 2019. Previously, he served as Vice President – Treasurer from 2013 to 2019. Mr. Altman has held a series of roles of increasing responsibility within Brunswick since he joined Brunswick in 2003.
PART II
Item 5. Market for Registrant's Common Equity, Related Stockholder Matters and Issuer Purchases of Equity Securities
Brunswick's common stock is traded on the New York and Chicago Stock Exchanges under the symbol "BC". As of February 10, 2025, there were 6,114 shareholders of record of our common stock.
We expect to continue to pay quarterly dividends at the discretion of the Board of Directors, subject to continued capital availability and a determination that cash dividends continue to be in the best interest of our shareholders. Our dividend and share repurchase policies may be affected by, among other things, our views on future liquidity, potential future capital requirements and restrictions contained in certain credit agreements.
Performance Graph
Comparison of Cumulative Total Shareholder Return among Brunswick, S&P 400 Index and S&P 400 Global Industry Classification Standard (GICS) Consumer Discretionary Index
| | | | | | | | | | | | | | | | | | | | |
| 2019 | 2020 | 2021 | 2022 | 2023 | 2024 |
| Brunswick | 100.00 | | 128.96 | | 171.03 | | 126.14 | | 172.04 | | 117.40 | |
| S&P 400 GICS Consumer Discretionary Index | 100.00 | | 125.94 | | 209.13 | | 165.18 | | 206.61 | | 224.22 | |
| S&P 400 Index | 100.00 | | 125.87 | | 175.79 | | 153.10 | | 179.79 | | 202.67 | |
The basis of comparison is a $100 investment made on December 31, 2019 in each of: (i) Brunswick, (ii) the S&P 400 GICS Consumer Discretionary Index and (iii) the S&P 400 Index. All dividends are assumed to be reinvested. The S&P 400 GICS Consumer Discretionary Index encompasses industries including household durable goods, textiles and apparel and leisure equipment. Brunswick believes the companies included in this index provide the most representative sample of enterprises that are in primary lines of business that are similar to ours.
Issuer Purchases of Equity Securities
On both July 19, 2022 and January 30, 2024, our Board of Directors approved $500.0 million increases to our outstanding share repurchase authorization. During 2024, we repurchased $200.0 million of stock and as of December 31, 2024, the remaining authorization under the share repurchase program was $421.5 million.
During the three months ended December 31, 2024, we repurchased the following shares of common stock:
| | | | | | | | | | | | | | | | | | | | | | | | | | |
| Period | | Total Number of Shares Purchased | | Weighted Average Price Paid per Share | | Total Number of Shares Purchased as Part of Publicly Announced Program | | Maximum Amount of Dollars that May Yet Be Used to Purchase Shares Under the Program |
| September 29 to October 26 | | 121,746 | | | $ | 82.14 | | | 121,746 | | | |
| October 27 to November 23 | | — | | | — | | | — | | | |
| November 24 to December 31 | | — | | | — | | | — | | | |
| Total | | 121,746 | | | 82.14 | | | 121,746 | | | $ | 421,468,944 | |
Item 6. Reserved
Item 7. Management's Discussion and Analysis of Financial Condition and Results of Operations
Certain statements in Management’s Discussion and Analysis of Financial Condition and Results of Operations of Brunswick Corporation (the Company, we, us, our) are forward-looking statements. Forward-looking statements are based on current expectations, estimates, and projections about our business and by their nature address matters that are, to different degrees, uncertain. Actual results may differ materially from expectations and projections as of the date of this filing due to various risks and uncertainties. For additional information regarding forward-looking statements, refer to Forward-Looking Statements above.
Certain statements in Management's Discussion and Analysis are based on non-GAAP financial measures. GAAP refers to generally accepted accounting principles in the United States. A "non-GAAP financial measure" is a numerical measure of a registrant’s historical or future financial performance, financial position or cash flows that excludes amounts, or is subject to adjustments that have the effect of excluding amounts, that are included in the most directly comparable measure calculated and presented in accordance with GAAP in the consolidated statements of operations, balance sheets or statements of cash flows of the issuer; or includes amounts, or is subject to adjustments that have the effect of including amounts, that are excluded from the most directly comparable measure so calculated and presented. For example, the discussion of our cash flows includes an analysis of free cash flows and total liquidity; the discussion of our net sales includes net sales on a constant currency basis; the discussion of our net sales includes net sales excluding acquisitions; and the discussion of our earnings includes a presentation of operating earnings and operating margin excluding restructuring, exit and impairment charges, purchase accounting amortization, acquisition, integration, and IT related costs, IT security incident costs and other applicable charges and of diluted earnings per common share, as adjusted. Non-GAAP financial measures do not include operating and statistical measures.
We include non-GAAP financial measures in Management's Discussion and Analysis as management believes these measures and the information they provide are useful to investors because they permit investors to view our performance using the same tools that management uses to evaluate our ongoing business performance. In order to better align our reported results with the internal metrics management uses to evaluate business performance as well as to provide better comparisons to prior periods and peer data, non-GAAP measures exclude the impact of purchase accounting amortization related to acquisitions, among other adjustments.
We do not provide forward-looking guidance for certain financial measures on a GAAP basis because we are unable to predict certain items contained in the GAAP measures without unreasonable efforts. These items may include restructuring, exit and impairment costs, special tax items, acquisition-related costs, and certain other unusual adjustments.
For a discussion of Brunswick's consolidated results of operations for the year ended December 31, 2023 compared to the year ended December 31, 2022, refer to Part II, Item 7. "Management's Discussion and Analysis of Financial Condition and Results of Operations" in our 2023 Annual Report on Form 10-K filed with the Securities and Exchange Commission on February 16, 2024.
IT Security Incident
In June 2023, the Company experienced an IT security incident that impacted some of its systems and global facilities. Please refer to Note 1 – Significant Accounting Policies in the Notes to the Consolidated Financial Statements for further details.
Change in Reportable Segments
Effective January 1, 2023, the Company changed its management reporting and updated its reportable segments to Propulsion, Engine Parts and Accessories (Engine P&A), Navico Group and Boat to align with its internal operating structure. For further information, refer to Note 5 – Segment Information in the Notes to the Consolidated Financial Statements.
Acquisitions
On September 12, 2024, we acquired additional Freedom Boat Club franchise operations and territories in Southeast Florida for net cash consideration of $31.2 million. Refer to Note 4 – Acquisitions in the Notes to the Consolidated Financial Statements for further information.
During the fourth quarter of 2023, we acquired additional Freedom Boat Club franchise operations and territory rights as well as certain marine assets in the Southeast United States for net cash consideration of $16.0 million.
On September 1, 2023, the Company acquired all of the issued and outstanding shares of Fliteboard Pty Ltd for $88.3 million net cash consideration. Refer to Note 4 – Acquisitions in the Notes to the Consolidated Financial Statements for further information.
Matters Affecting Comparability
Changes in Foreign Currency Rates. Percentage changes in net sales expressed in constant currency reflect the impact that changes in currency exchange rates had on comparisons of net sales. To determine this information, net sales transacted in currencies other than the U.S. dollar have been translated to U.S. dollars using the average exchange rates that were in effect during the comparative period. The percentage change in net sales expressed on a constant currency basis better reflects the changes in the underlying business trends, excluding the impact of translation arising from foreign currency exchange rate fluctuations. Approximately 25 percent of our annual net sales are transacted in a currency other than the U.S. dollar. Our most material exposures include sales in Euros, Canadian dollars, Australian dollars and Brazilian real.
The table below summarizes the impact of changes in currency exchange rates and also the impact of acquisitions on our net sales:
| | | | | | | | | | | | | | | | | | | | | | | | | | | | | | | | | | | | | | | | | | |
| Net Sales | | 2024 vs. 2023 | | | |
| (in millions) | 2024 | | 2023 | | | | GAAP | | Currency Impact | | | | Acquisitions Impact | | | | | | | | | |
| Propulsion | $ | 2,074.2 | | | $ | 2,763.8 | | | | | (25.0)% | | (0.4)% | | | | 1.2% | | | | | | | | | |
| Engine P&A | 1,160.8 | | | 1,199.8 | | | | | (3.3)% | | (0.3)% | | | | —% | | | | | | | | | |
| Navico Group | 800.2 | | | 914.7 | | | | | (12.5)% | | 0.1% | | | | —% | | | | | | | | | |
| Boat | 1,553.5 | | | 1,989.4 | | | | | (21.9)% | | —% | | | | 0.6% | | | | | | | | | |
| Segment Eliminations | (351.6) | | | (466.3) | | | | | (24.6)% | | —% | | | | —% | | | | | | | | | |
| Total | $ | 5,237.1 | | | $ | 6,401.4 | | | | | (18.2)% | | (0.2)% | | | | 0.7% | | | | | | | | | |
Results of Operations
Consolidated
The following table sets forth certain amounts, ratios and relationships calculated from the Consolidated Statements of Operations for 2024 and 2023:
| | | | | | | | | | | | | | | | | | | | | | | | | | | | | | | | | |
| | | | | 2024 vs. 2023 | | | | |
| (in millions, except per share data) | 2024 | | 2023 | | | | $ | | % | | | | | | | | |
| Net sales | $ | 5,237.1 | | $ | 6,401.4 | | | | $ | (1,164.3) | | (18.2)% | | | | | | | | |
Gross margin (A) | 1,350.8 | | 1,787.0 | | | | (436.2) | | (24.4)% | | | | | | | | |
| Restructuring, exit and impairment charges | 121.7 | | 54.7 | | | | 67.0 | | NM | | | | | | | | |
| Operating earnings | 311.6 | | 734.9 | | | | (423.3) | | (57.6)% | | | | | | | | |
| Loss on early extinguishment of debt | (12.7) | | — | | | | (12.7) | | NM | | | | | | | | |
| | | | | | | | | | | | | | | | | |
| Net earnings from continuing operations | 149.3 | | 432.6 | | | | (283.3) | | (65.5)% | | | | | | | | |
| | | | | | | | | | | | | | | | | |
Diluted earnings per common share from continuing operations | $ | 2.21 | | $ | 6.13 | | | | $ | (3.92) | | (63.9)% | | | | | | | | |
| | | | | | | | | | | | | | | | | |
| Expressed as a percentage of Net sales: | | | | | | | | | | | | | | | | | |
Gross margin (A) | 25.8 | % | | 27.9 | % | | | | | | (210) bps | | | | | | | | |
| Selling, general and administrative expense | 14.3 | % | | 12.7 | % | | | | | | 160 bps | | | | | | | | |
| Research and development expense | 3.2 | % | | 2.9 | % | | | | | | 30 bps | | | | | | | | |
| Restructuring, exit and impairment charges | 2.3 | % | | 0.9 | % | | | | | | 140 bps | | | | | | | | |
| Operating margin | 5.9 | % | | 11.5 | % | | | | | | (560) bps | | | | | | | | |
NM = not meaningful
bps = basis points
(A)Gross margin is defined as Net sales less Cost of sales as presented in the Consolidated Statements of Operations.
The following is a reconciliation of our non-GAAP measures, adjusted operating earnings and adjusted diluted earnings per common share from continuing operations for 2024 and 2023:
| | | | | | | | | | | | | | | | | | | | | | | | | | | |
| Operating Earnings | | Diluted Earnings Per Share |
| (in millions, except per share data) | 2024 | | 2023 | | | | 2024 | | 2023 | | |
| GAAP | $ | 311.6 | | | $ | 734.9 | | | | | $ | 2.21 | | | $ | 6.13 | | | |
| Restructuring, exit and impairment charges | 121.7 | | | 54.7 | | | | | 1.41 | | | 0.61 | | | |
| Purchase accounting amortization | 58.5 | | | 57.5 | | | | | 0.68 | | | 0.64 | | | |
| Acquisition, integration, and IT related costs | 3.6 | | | 12.1 | | | | | 0.04 | | | 0.14 | | | |
| IT security incident costs | — | | | 10.1 | | | | | — | | | 0.12 | | | |
| | | | | | | | | | | |
Special tax items (A) | — | | | — | | | | | 0.19 | | | 0.95 | | | |
| Loss on early extinguishment of debt | — | | | — | | | | | 0.15 | | | — | | | |
| Release of dissolved entity foreign currency translation | — | | | — | | | | | 0.01 | | | — | | | |
| TN-BC Holdings LLC joint venture impairment | — | | | — | | | | | — | | | 0.21 | | | |
| Gain on sale of business | — | | | — | | | | | (0.12) | | | — | | | |
| | | | | | | | | | | |
| As Adjusted | $ | 495.4 | | | $ | 869.3 | | | | | $ | 4.57 | | | $ | 8.80 | | | |
| | | | | | | | | | | |
| GAAP operating margin | 5.9 | % | | 11.5 | % | | | | | | | | |
| Adjusted operating margin | 9.5 | % | | 13.6 | % | | | | | | | | |
(A) Special tax items during the year ended December 31, 2024 primarily relate to the discrete income tax expense recorded associated with an increase in the state valuation allowance.
2024 vs. 2023
Net sales decreased 18.2 percent during 2024 when compared with 2023. The components of the consolidated net sales change were as follows:
| | | | | |
| Percent change in net sales compared to the prior year |
| 2024 |
| Volume | (21.9) | % |
| Product Mix and Price | 3.2 | % |
| |
| Acquisitions | 0.7 | % |
| Currency | (0.2) | % |
| (18.2) | % |
Sales in 2024 were below the prior year as the impact of lower wholesale ordering patterns by dealers, OEMs and retailers, coupled with higher discounts in select segments, and unfavorable changes in foreign currency exchange rates, were only partially offset by annual price increases and well received new products. Refer to the Propulsion, Engine P&A, Navico Group and Boat segments for further details on the drivers of net sales changes.
Gross margin decreased 210 basis points in 2024 when compared with 2023 driven by lower absorption from decreased production levels (90 bps), material and labor inflation (60 bps), sales-related drivers (60 bps), and foreign currency exchange-rate fluctuations (20 bps), partially offset by acquisitions (20 bps).
Selling, general and administrative expenses as a percentage of net sales increased 160 basis points during 2024 when compared with the same prior year period, due to lower sales (280 bps), partially offset by cost control measures across the enterprise, including lower employee compensation costs associated with headcount reductions and lower variable compensation (120 bps). Research and development expense decreased during 2024 versus 2023.
During 2024, we recorded restructuring, exit and impairment charges of $121.7 million compared with $54.7 million in 2023. The Company estimates the restructuring actions executed in 2024 will result in approximately $24.0 million of annualized cost savings. See Note 3 – Restructuring, Exit and Impairment Activities in the Notes to Consolidated Financial Statements for further details.
We recognized Equity earnings (loss) of $8.6 million and $(11.4) million in 2024 and 2023, respectively. The primary driver of the loss in 2023 is the impairment charge taken related to our investment in TN-BC Holdings LLC. Refer to Note 1 – Significant Accounting Policies in the Notes to Consolidated Financial Statements for further information.
We recognized $9.0 million and $7.6 million in 2024 and 2023, respectively, in Other income (expense), net. Other income (expense), net primarily includes remeasurement gains and losses resulting from changes in foreign currency rates and other postretirement benefit costs as well as the gain on sale of one of our businesses in 2024.
Net interest expense increased in 2024 compared with 2023 due to an increase in average daily debt outstanding, which was influenced by the timing of debt issuances. We also recognized a loss on early extinguishment of debt related to the redemption of our 2027 Notes. Refer to Note 14 – Debt in the Notes to Consolidated Financial Statements.
We recognized an income tax provision of $54.0 million and $196.3 million in 2024 and 2023, respectively. The decrease is primarily due to lower pretax income and the prior year intercompany sale of certain intellectual property rights. The effective tax rate, which is calculated as the income tax provision as a percentage of earnings before income taxes, was 26.6 percent and 31.2 percent for 2024 and 2023, respectively. We have also evaluated the effects of Pillar Two legislation and concluded that the tax effects are not material to the financial statements. See Note 10 – Income Taxes in the Notes to Consolidated Financial Statements for a reconciliation of our effective tax rate and statutory Federal income tax rate.
Due to the factors described in the preceding paragraphs, Operating earnings, Net earnings from continuing operations, and Diluted earnings per common share from continuing operations decreased during 2024. Diluted earnings per common share from continuing operations benefited from common stock repurchases in both years.
Segments
We have four reportable segments: Propulsion, Engine P&A, Navico Group, and Boat. Refer to Note 5 – Segment Information in the Notes to Consolidated Financial Statements for details on the segment operations.
Propulsion Segment
The following table sets forth Propulsion segment results and a reconciliation to our non-GAAP measure of adjusted operating earnings for the years ended December 31, 2024 and 2023:
| | | | | | | | | | | | | | | | | | | | | | | | | | | | | | | |
| | | | | | | 2024 vs. 2023 | | | | |
| (in millions) | 2024 | | 2023 | | | | $ | | % | | | | | | |
| Net sales | $ | 2,074.2 | | $ | 2,763.8 | | | | $ | (689.6) | | | (25.0) | % | | | | | | |
| | | | | | | | | | | | | | | |
| GAAP operating earnings | $ | 242.6 | | $ | 494.7 | | | | $ | (252.1) | | | (51.0) | % | | | | | | |
| Restructuring, exit and impairment charges | 9.6 | | 2.7 | | | | 6.9 | | | NM | | | | | | |
| IT security incident costs | — | | 3.4 | | | | (3.4) | | | NM | | | | | | |
| Acquisition, integration, and IT related costs | 1.5 | | 2.5 | | | | (1.0) | | | (40.0) | % | | | | | | |
| Purchase accounting amortization | 1.5 | | 0.9 | | | | 0.6 | | | 66.7 | % | | | | | | |
| Adjusted operating earnings | $ | 255.2 | | $ | 504.2 | | | | $ | (249.0) | | | (49.4) | % | | | | | | |
| | | | | | | | | | | | | | | |
| GAAP operating margin | 11.7 | % | | 17.9 | % | | | | | | (620) bps | | | | | | |
| Adjusted operating margin | 12.3 | % | | 18.2 | % | | | | | | (590) bps | | | | | | |
NM = not meaningful
bps = basis points
2024 vs. 2023
Propulsion segment's net sales decreased in 2024 versus prior year due to softer market conditions resulting in lower OEM production rates and engine orders and unfavorable changes in foreign currency exchange rates, partially offset by the impact of annual pricing and market share gains in outboard engines. The components of the Propulsion segment's net sales change were as follows:
| | | | | |
| Percent change in net sales compared to the prior year |
| 2024 |
| Volume | (29.4) | % |
| Product Mix and Price | 3.6 | % |
| |
| Acquisitions | 1.2 | % |
| Currency | (0.4) | % |
| (25.0) | % |
International sales were 36 percent of the Propulsion segment's net sales in 2024. International sales decreased 15 percent year-over-year on a GAAP basis and 14 percent on a constant currency basis.
Propulsion segment's operating earnings decreased versus the prior year, primarily due to the impact of lower sales and lower absorption from declines in production, partially offset by cost control measures.
Engine P&A Segment
The following table sets forth Engine P&A segment results and a reconciliation to our non-GAAP measure of adjusted operating earnings for the years ended December 31, 2024 and 2023:
| | | | | | | | | | | | | | | | | | | | | | | | | | | | | | | |
| | | | | | | 2024 vs. 2023 | | | | |
| (in millions) | 2024 | | 2023 | | | | $ | | % | | | | | | |
| Net sales | $ | 1,160.8 | | $ | 1,199.8 | | | | $ | (39.0) | | | (3.3) | % | | | | | | |
| | | | | | | | | | | | | | | |
| GAAP operating earnings | $ | 219.9 | | $ | 217.4 | | | | $ | 2.5 | | | 1.1 | % | | | | | | |
| Restructuring, exit and impairment charges | 4.8 | | 3.3 | | | | 1.5 | | | 45.5 | % | | | | | | |
| Acquisition, integration, and IT related costs | — | | 0.6 | | | | (0.6) | | | NM | | | | | | |
| IT security incident costs | — | | 0.5 | | | | (0.5) | | | NM | | | | | | |
| Adjusted operating earnings | $ | 224.7 | | $ | 221.8 | | | | $ | 2.9 | | | 1.3 | % | | | | | | |
| | | | | | | | | | | | | | | |
| GAAP operating margin | 18.9 | % | | 18.1 | % | | | | | | 80 bps | | | | | | |
| Adjusted operating margin | 19.4 | % | | 18.5 | % | | | | | | 90 bps | | | | | | |
NM = not meaningful
bps = basis points
2024 vs. 2023
Engine P&A segment's net sales decreased in 2024 versus the prior year as a result of softer market conditions. The components of the Engine P&A segment's net sales change were as follows:
| | | | | |
| Percent change in net sales compared to the prior year |
| 2024 |
| Volume | (3.9) | % |
| Product Mix and Price | 0.9 | % |
| |
| Currency | (0.3) | % |
| |
| (3.3) | % |
International sales were 30 percent of the Engine P&A segment's net sales in 2024. International sales increased slightly year-over-year on a GAAP basis and increased 1 percent on a constant currency basis.
Engine P&A segment's operating earnings increased versus the prior year, as the impact of the operational efficiencies resulting from the completed transition to the Brownsburg, Indiana distribution center, annual pricing, and lower operating expenses more than offset lower volumes and higher material inflation.
Navico Group Segment
The following table sets forth Navico Group segment results and a reconciliation to our non-GAAP measure of adjusted operating earnings for the years ended December 31, 2024 and 2023:
| | | | | | | | | | | | | | | | | | | | | | | | | | | | | | | |
| | | | | | | 2024 vs. 2023 | | | | |
| (in millions) | 2024 | | 2023 | | | | $ | | % | | | | | | |
| Net sales | $ | 800.2 | | $ | 914.7 | | | | $ | (114.5) | | | (12.5) | % | | | | | | |
| | | | | | | | | | | | | | | |
| GAAP operating (loss) earnings | $ | (100.6) | | $ | 5.2 | | | | $ | (105.8) | | | NM | | | | | | |
| Restructuring, exit and impairment charges | 98.6 | | 30.5 | | | | 68.1 | | | NM | | | | | | |
| Purchase accounting amortization | 53.0 | | 53.0 | | | | — | | | NM | | | | | | |
| Acquisition, integration, and IT related costs | 1.7 | | 2.1 | | | | (0.4) | | | (19.0) | % | | | | | | |
| IT security incident costs | — | | 0.5 | | | | (0.5) | | | NM | | | | | | |
| | | | | | | | | | | | | | | |
| Adjusted operating earnings | $ | 52.7 | | $ | 91.3 | | | | $ | (38.6) | | | (42.3) | % | | | | | | |
| | | | | | | | | | | | | | | |
| GAAP operating margin | (12.6) | % | | 0.6 | % | | | | | | NM | | | | | | |
| Adjusted operating margin | 6.6 | % | | 10.0 | % | | | | | | (340) bps | | | | | | |
NM = not meaningful
bps = basis points
2024 vs. 2023
Navico Group segment's net sales decreased in 2024 versus the prior year due to reduced sales to marine OEMs resulting from lower boat production levels to match retail ordering patterns and a weak RV manufacturing environment, partially offset by strong new product momentum. The components of the Navico Group segment's net sales change were as follows:
| | | | | |
| Percent change in net sales compared to the prior year |
| 2024 |
| Volume | (12.4) | % |
| |
| Product Mix and Price | (0.2) | % |
| Currency | 0.1 | % |
| |
| (12.5) | % |
International sales were 41 percent of the Navico Group segment's net sales in 2024. International sales decreased 5 percent year-over-year on a GAAP and constant currency basis.
Navico Group segment's operating earnings decreased versus the prior year due to intangible asset impairment charges and the impact from lower sales, partially offset by cost control measures.
Boat Segment
The following table sets forth Boat segment results and a reconciliation to our non-GAAP measure of adjusted operating earnings for the years ended December 31, 2024 and 2023:
| | | | | | | | | | | | | | | | | | | | | | | | | | | | | | | |
| | | | | | | 2024 vs. 2023 | | | | |
| (in millions) | 2024 | | 2023 | | | | $ | | % | | | | | | |
| Net sales | $ | 1,553.5 | | $ | 1,989.4 | | | | $ | (435.9) | | | (21.9) | % | | | | | | |
| | | | | | | | | | | | | | | |
| GAAP operating earnings | $ | 63.3 | | $ | 155.6 | | | | $ | (92.3) | | | (59.3) | % | | | | | | |
| Restructuring, exit and impairment charges | 6.3 | | 10.5 | | | | (4.2) | | | (40.0) | % | | | | | | |
| Acquisition, integration, and IT related costs | 0.4 | | 5.2 | | | | (4.8) | | | (92.3) | % | | | | | | |
| Purchase accounting amortization | 4.0 | | 3.6 | | | | 0.4 | | | 11.1 | % | | | | | | |
| IT security incident costs | — | | 1.0 | | | | (1.0) | | | NM | | | | | | |
| | | | | | | | | | | | | | | |
| | | | | | | | | | | | | | | |
| Adjusted operating earnings | $ | 74.0 | | $ | 175.9 | | | | $ | (101.9) | | | (57.9) | % | | | | | | |
| | | | | | | | | | | | | | | |
| GAAP operating margin | 4.1 | % | | 7.8 | % | | | | | | (370) bps | | | | | | |
| Adjusted operating margin | 4.8 | % | | 8.8 | % | | | | | | (400) bps | | | | | | |
| | | | | | | | | | | | | | | |
NM = not meaningful
bps = basis points
2024 vs. 2023
Boat segment's net sales decreased in 2024 versus the prior year resulting from lower wholesale orders, as dealers continue to manage pipeline levels, along with higher levels of selective discounting, partially offset by the favorable impact of modest model-year pricing.
| | | | | |
| Percent change in net sales compared to the prior year |
| 2024 |
| Volume | (21.6) | % |
| Product Mix and Price | (0.9) | % |
| Acquisitions | 0.6 | % |
| Currency | — | % |
| |
| (21.9) | % |
International sales were 20 percent of the Boat segment's net sales in 2024. International sales decreased 31 percent year-over-year on a GAAP basis and 30 percent on a constant currency basis.
Boat segment operating earnings decreased versus the prior year due the impact of the net sales declines and lower absorption from reduced production, partially offset by pricing and cost control measures.
Corporate/Other
The following table sets forth Corporate/Other results and a reconciliation to our non-GAAP measure of adjusted operating loss for the years ended December 31, 2024 and 2023:
| | | | | | | | | | | | | | | | | | | | | | | | | | | | | |
| | | | | 2024 vs. 2023 | | |
| (in millions) | 2024 | | 2023 | | | | $ | | % | | | | |
| GAAP operating loss | $ | (113.6) | | | $ | (138.0) | | | | | $ | 24.4 | | | (17.7) | % | | | | |
| Restructuring, exit and impairment charges | 2.4 | | | 7.7 | | | | | (5.3) | | | (68.8) | % | | | | |
| IT security incident costs | — | | | 4.7 | | | | | (4.7) | | | NM | | | | |
| Acquisition, integration, and IT related costs | — | | | 1.7 | | | | | (1.7) | | | NM | | | | |
| Adjusted operating loss | $ | (111.2) | | | $ | (123.9) | | | | | $ | 12.7 | | | (10.3) | % | | | | |
NM = not meaningful
Corporate operating loss decreased compared with 2023 driven by lower variable compensation costs along with the impact of both the IT security incident and restructuring charges in the prior year.
Cash Flow, Liquidity and Capital Resources
The following table sets forth an analysis of free cash flow for the years ended December 31, 2024 and 2023:
| | | | | | | | | | | | | |
| (in millions) | 2024 | | 2023 | | |
| Net cash provided by operating activities of continuing operations | $ | 449.5 | | | $ | 745.2 | | | |
| Net cash (used for) provided by: | | | | | |
| Plus: Capital expenditures | (167.4) | | | (289.3) | | | |
| Plus: Proceeds from the sale of property, plant and equipment | 15.0 | | | 14.8 | | | |
| Plus: Effect of exchange rate changes on cash and cash equivalents | (12.8) | | | 2.7 | | | |
| | | | | |
Total free cash flow (A) | $ | 284.3 | | | $ | 473.4 | | | |
(A) We define "Free cash flow" as cash flow from operating and investing activities of continuing operations (excluding cash provided by or used for acquisitions, investments, purchases or sales/maturities of marketable securities and other investing activities, net of tax) and the effect of exchange rate changes on cash and cash equivalents. Free cash flow is not intended as an alternative measure of cash flow from operations, as determined in accordance with GAAP in the United States. We use this financial measure both in presenting results to shareholders and the investment community and in our internal evaluation and management of our businesses. We believe that this financial measure and the information it provides are useful to investors because it permits investors to view our performance using the same tool that we use to gauge progress in achieving our goals. We believe that the non-GAAP financial measure "Free cash flow" is also useful to investors because it is an indication of cash flow that may be available to fund investments in future growth initiatives.
Our major sources of funds for capital investments, acquisitions, share repurchase programs and dividend payments are cash generated from operating activities, available cash and marketable securities balances, divestitures and borrowings. We evaluate potential acquisitions, divestitures and joint ventures in the ordinary course of business.
2024 Cash Flow
Net cash provided by operating activities of continuing operations in 2024 totaled $449.5 million versus $745.2 million in 2023. The decrease is primarily due to lower net earnings.
The primary drivers of Net cash provided by operating activities of continuing operations in 2024 were net earnings, net of non-cash items, partially offset by working capital. Working capital is defined as Accounts and notes receivable, Inventories and Prepaid expenses and other, net of Accounts payable and Accrued expenses as presented in the Consolidated Balance Sheets, excluding the impact of acquisitions and non-cash adjustments. Net inventory decreased $112.8 million primarily due to lower planned production. Accounts and notes receivable decreased $45.0 million primarily due to lower sales and timing of collections. Accounts payable decreased $144.2 million, primarily due to lower purchasing resulting from reduced production. Accrued expenses decreased $104.0 million, primarily driven by a reduction in accrued variable compensation.
Net cash used for investing activities was $168.9 million, which included $167.4 million of capital expenditures, $80.9 million of purchases of marketable securities and $31.8 million of cash paid for acquisitions, net of cash acquired, partially offset by $82.1 million of sales or maturities of marketable securities and $15.0 million of proceeds from sales of property, plant and equipment. Our capital spending was focused on investments in new products and technologies.
Net cash used for financing activities was $442.7 million, which included $613.2 million of payments of long-term debt including current maturities, $200.0 million of common stock repurchases, $112.3 million of cash dividends paid to common shareholders, and $87.4 million of payments of short-term debt, partially offset by $396.9 million of proceeds from issuances of long-term debt and $201.1 million of proceeds from issuances of short-term debt. Refer to Note 14 – Debt in the Notes to Consolidated Financial Statements for further details on our debt activity during the year ended December 31, 2024.
Liquidity and Capital Resources
We view our highly liquid assets as of December 31, 2024 and 2023 as:
| | | | | | | | | | | |
| (in millions) | 2024 | | 2023 |
| Cash and cash equivalents, at cost, which approximates fair value | $ | 269.0 | | | $ | 467.8 | |
| Short-term investments in marketable securities | 0.8 | | | 0.8 | |
| | | |
| Total cash, cash equivalents and marketable securities | $ | 269.8 | | | $ | 468.6 | |
The following table sets forth an analysis of Total liquidity as of December 31, 2024 and 2023:
| | | | | | | | | | | |
| (in millions) | 2024 | | 2023 |
| Cash, cash equivalents and marketable securities | $ | 269.8 | | | $ | 468.6 | |
Amounts available under lending facilities(A) | 997.0 | | | 741.9 | |
Total liquidity (B) | $ | 1,266.8 | | | $ | 1,210.5 | |
(A) See Note 14 – Debt in the Notes to Consolidated Financial Statements for further details on our lending facilities.
(B) We define Total liquidity as Cash and cash equivalents and Short-term investments in marketable securities as presented in the Consolidated Balance Sheets, plus amounts available for borrowing under our lending facilities. Total liquidity is not intended as an alternative measure to Cash and cash equivalents and Short-term investments in marketable securities as determined in accordance with GAAP in the United States. We use this financial measure both in presenting our results to shareholders and the investment community and in our internal evaluation and management of our businesses. We believe that this financial measure and the information it provides are useful to investors because it permits investors to view our performance using the same metric that we use to gauge progress in achieving our goals. We believe that the non-GAAP financial measure "Total liquidity" is also useful to investors because it is an indication of our available highly liquid assets and immediate sources of financing.
Cash, cash equivalents and marketable securities totaled $269.8 million as of December 31, 2024, a decrease of $198.8 million from $468.6 million as of December 31, 2023. Total debt as of December 31, 2024 and December 31, 2023 was $2,340.6 million and $2,430.4 million, respectively. Our debt-to-capitalization ratio was 55 percent and 54 percent as of December 31, 2024 and December 31, 2023, respectively.
There were no borrowings under the Revolving Credit Agreement (Credit Facility) during 2024. Available borrowing capacity under the Credit Facility as of December 31, 2024 totaled $997.0 million, net of $3.0 million of letters of credit outstanding. During 2024, the maximum amount utilized under our unsecured commercial paper program (CP Program) was $280.0 million and as of December 31, 2024, the Company had $115.0 million of borrowings outstanding under the CP Program.
There were no borrowings under the Credit Facility during 2023. Available borrowing capacity under the Credit Facility as of December 31, 2023 totaled $741.9 million, net of $8.1 million of letters of credit outstanding. During 2023, the maximum amount utilized under our CP Program was $125.0 million.
The level of borrowing capacity under our Credit Facility and CP Program is limited by both a leverage and interest coverage test. These covenants also pertain to termination provisions included in our wholesale financing joint-venture arrangements with Wells Fargo Commercial Distribution Finance. Based on our anticipated earnings generation throughout the year, we expect to maintain sufficient cushion against the existing debt covenants. As of December 31, 2024, we were in compliance with the financial covenants in the Credit Facility and CP Program.
We believe that we have adequate sources of liquidity to meet our short-term and long-term needs.
2025 Capital Strategy
We anticipate executing a thoughtful capital strategy in 2025 with planned debt reductions of $125 million, capital expenditures at levels similar to 2024 of $160 million, and a minimum of $80 million of share repurchases, which could increase in the event cash generation outpaces initial expectations.
Financial Services
Refer to Note 8 – Financing Joint Venture in the Notes to Consolidated Financial Statements for more information about our financial services.
Off-Balance Sheet Arrangements
Guarantees. We have reserves to cover potential losses associated with guarantees and repurchase obligations based on historical experience and current facts and circumstances. Historical cash requirements and losses associated with these obligations have not been significant. See Note 11 – Commitments and Contingencies in the Notes to Consolidated Financial Statements for a description of these arrangements.
Contractual Obligations
The following table sets forth a summary of our contractual cash obligations as of December 31, 2024:
| | | | | | | | | | | | | | | | | | | | | | | | | | | | | |
| Payments due by period |
| (in millions) | Total | | Less than 1 year | | 1-3 years | | 3-5 years | | More than 5 years |
| Contractual Obligations | | | | | | | | | |
Debt (A) | $ | 2,374.0 | | | $ | 246.4 | | | $ | 8.5 | | | $ | 404.1 | | | $ | 1,715.0 | |
| Interest payments on long-term debt | 1,418.9 | | | 86.7 | | | 297.3 | | | 244.1 | | | 790.8 | |
Operating leases (B) | 232.4 | | | 35.5 | | | 57.6 | | | 41.0 | | | 98.3 | |
| | | | | | | | | |
Purchase obligations (C) | 103.3 | | | 102.4 | | | 0.6 | | | 0.3 | | | — | |
Deferred management compensation (D) | 31.8 | | | 5.0 | | | 6.0 | | | 6.0 | | | 14.8 | |
| | | | | | | | | |
Other long-term liabilities (E) | 159.8 | | | 3.8 | | | 80.3 | | | 54.5 | | | 21.2 | |
| Total contractual obligations | $ | 4,320.2 | | | $ | 479.8 | | | $ | 450.3 | | | $ | 750.0 | | | $ | 2,640.1 | |
(A) See Note 14 – Debt in the Notes to Consolidated Financial Statements for additional information on our debt. "Debt" refers to future cash principal payments. Debt also includes our finance leases as discussed in Note 19 – Leases in the Notes to Consolidated Financial Statements.
(B) See Note 19 – Leases in the Notes to Consolidated Financial Statements for additional information.
(C) Purchase obligations represent agreements with suppliers and vendors as part of the normal course of business.
(D) Amounts primarily represent long-term deferred compensation plans.
(E) Other long-term liabilities primarily includes long-term warranty contracts, future projected payments related to our nonqualified pension plans and deferred revenue.
Legal Proceedings
See Note 11 – Commitments and Contingencies in the Notes to Consolidated Financial Statements.
Critical Accounting Estimates
The preparation of the consolidated financial statements in accordance with accounting principles generally accepted in the United States requires management to make certain estimates and assumptions that affect the amount of reported assets and liabilities and disclosure of contingent assets and liabilities at the date of the consolidated financial statements and revenues and expenses during the periods reported. Actual results may differ from those estimates. If current estimates for the cost of resolving any specific matters are later determined to be inadequate, results of operations could be adversely affected in the period in which additional provisions are required. We have discussed the development and selection of the critical accounting policies with the Audit and Finance Committee of the Board of Directors and believe the following are the most critical accounting policies that could have an effect on our reported results.
Revenue Recognition and Sales Incentives. Revenue is recognized as performance obligations under the terms of contracts with customers are satisfied; this occurs when control of promised goods (engines, parts and accessories, and boats) is transferred to the customer. We exercise judgment and consider the timing of right to payment, transfer of risk and rewards, transfer of title, transfer of physical possession, and customer acceptance when determining when control transfers to the customer. We recognize revenue related to the sale of extended warranty contracts that extend the coverage period beyond the standard warranty period over the life of the extended warranty period.
Revenue is measured as the amount of consideration expected to be entitled to in exchange for transferring goods or providing services. We have excluded sales, value add, and other taxes collected concurrent with revenue-producing activities from the determination of the transaction price for all contracts. We exercise judgment when determining the transaction price, including the estimate of discounts, which is partly based on estimates of customer sales volumes. These estimates are subject to uncertainty as historical discount experience and sales volumes may not be consistent with future activity. We have elected to account for shipping and handling activities that occur after the customer has obtained control of a good as a fulfillment activity. For all contracts with customers, we have not adjusted the promised amount of consideration for the effects of a significant financing component as the period between the transfer of the promised goods and the customer's payment is expected to be one year or less.
See Note 2 – Revenue Recognition in the Notes to Consolidated Financial Statements for more information.
Warranty Reserves. We record an estimated liability for product warranties at the time revenue is recognized. The liability is estimated using historical warranty experience, projected claim rates and expected costs per claim. We exercise judgment when determining the appropriate historical periods to project claim rates and expected costs per claim. Further, these estimates are subject to uncertainty as historical warranty experience may not be consistent with future warranty claims. We adjust our liability for specific warranty matters when they become known and the exposure can be estimated. Our warranty liabilities are affected by product failure rates as well as material usage and labor costs incurred in correcting a product failure. If actual costs differ from estimated costs, we must make a revision to the warranty liability, which could have an adverse impact on our results of operations and cash flows.
Goodwill. Goodwill results from the excess of purchase price over the net assets of businesses acquired. We review goodwill for impairment annually and whenever events or changes in circumstances indicate that the fair value of a reporting unit may be below its carrying value. As part of the annual test, we may perform a qualitative, rather than quantitative, assessment to determine whether the fair values of our reporting units are "more likely than not" to exceed their carrying values. In performing this qualitative analysis, we consider various factors, including the effect of market or industry changes and the reporting units' actual results compared with projected results. We exercise judgment when evaluating the impact of market and industry changes and when comparing actual results to projected results.
If the fair value of a reporting unit does not meet the "more likely than not" criteria discussed above, we perform a quantitative assessment which begins by measuring the fair value of the reporting unit. If the carrying value of the reporting unit exceeds its fair value, a goodwill impairment is recorded equal to the carrying value of the reporting unit less its fair value, not to exceed the carrying value of goodwill.
We calculate the fair value of our reporting units considering both the income approach and the guideline public company method, a form of the market approach. The income approach calculates the fair value of the reporting unit using a discounted cash flow approach utilizing a Gordon Growth model. Internally forecasted future cash flows, which we believe reasonably approximates market participant assumptions, are discounted using a weighted average cost of capital (Discount Rate) developed for each reporting unit. The Discount Rate is developed using market observable inputs, as well as considering whether or not there is a measure of risk related to the specific reporting unit’s forecasted performance. We exercise judgment when forecasting future cash flows including the performance of the underlying market in which the reporting unit operates as well as the impact of specific initiatives. We exercise judgment when determining the level of risk associated with achieving the forecasted future cash flows. These estimates are subject to uncertainty as actual results may differ from our forecast. If actual results differ from the forecast, our results of operations could be materially adversely affected. Fair value under the guideline public company method is determined for each reporting unit by applying market multiples for comparable public companies to the unit’s current and forecasted financial results. We exercise judgment when determining the comparable public companies and market multiples. The key uncertainties in these calculations are the assumptions used in determining the reporting unit’s forecasted future performance, including revenue growth and operating margins, as well as the perceived risk associated with those forecasts in determining the Discount Rate, along with selecting representative market multiples.
We recorded an $80.0 million impairment of the Navico Group reporting unit's goodwill during the year ended December 31, 2024. We did not record any goodwill impairments in 2023 or 2022.
Other Intangible Assets. Our primary other intangible assets are customer relationships, trade names, and developed technology acquired in business combinations. Intangible assets are initially valued using a methodology commensurate with the intended use of the asset. Customer relationships, trade names, and developed technology are valued using the income approach. The fair value of customer relationships is measured using the multi-period excess earnings method (MPEEM). The fair value of trade names and developed technology are measured using a relief-from-royalty (RFR) approach, which assumes the value of the trade name or technology is the discounted amount of cash flows that would be paid to third parties had we not owned the trade name or technology and instead licensed the trade name or technology from another company. Higher royalty rates are assigned to premium brands within the marketplace based on name recognition and profitability, while other brands receive lower royalty rates. We exercise judgment when selecting the royalty rates and evaluating profitability. The basis for future sales projections for both the RFR and MPEEM are internal revenue forecasts which we believe represent reasonable market participant assumptions. We exercise judgment when forecasting revenue including the performance of the underlying market in which the intangible asset operates as well as the impact of specific initiatives. The future cash flows are discounted using an applicable Discount Rate as well as any potential risk premium to reflect the inherent risk of holding a standalone intangible asset. We exercise judgment when determining the level of risk associated with achieving the forecasted revenue. For MPEEM calculations, we exercise judgment in determining the customer attrition rate, which is generally based on historical experience. These estimates are subject to uncertainty as actual results may differ from our forecast. If actual results differ from the forecast including higher than anticipated customer attrition, our results of operations could be materially adversely affected.
The key uncertainties in the RFR and MPEEM calculations, as applicable, are: the selection of an appropriate royalty rate, assumptions used in developing internal revenue growth and expense forecasts, assumed customer attrition rates, as well as the perceived risk associated with those forecasts in determining the Discount Rate and risk premium.
The costs of amortizable intangible assets are recognized over their expected useful lives, typically between three and fifteen years, using the straight-line method. Intangible assets that are subject to amortization are evaluated for impairment using a process similar to that used to evaluate long-lived assets. Intangible assets not subject to amortization are assessed for impairment at least annually and whenever events or changes in circumstances indicate that it is more likely than not that an asset may be impaired. The impairment test for indefinite-lived intangible assets consists of a comparison of the fair value of the intangible asset with its carrying amount. An impairment loss is recognized for the amount by which the carrying value exceeds the fair value of the asset. The Company recorded impairment charges of $5.0 million during the year ended December 31, 2024 related to the Navico trade name. The Company recorded impairment charges of $16.6 million during the year ended December 31, 2023 including a $13.0 million impairment of the Navico trade name. The Company recorded impairment charges of $17.4 million during the year ended December 31, 2022 related to capitalized software intangible assets that will not be placed into service.
Refer to Note 4 – Acquisitions and Note 9 – Goodwill and Other Intangibles in the Notes to Consolidated Financial Statements for more information.
Recent Accounting Pronouncements
See Note 1 – Significant Accounting Policies in the Notes to Consolidated Financial Statements for the recent accounting pronouncements that have been adopted during the year ended December 31, 2024, or will be adopted in future periods.
Item 7A. Quantitative and Qualitative Disclosures About Market Risk
We are exposed to market risk from changes in foreign currency exchange rates, commodity prices and interest rates. We enter into various hedging transactions to mitigate certain risks in accordance with guidelines established by our management. We do not use financial instruments for trading or speculative purposes.
We use foreign currency forward and option contracts to manage foreign exchange rate exposure related to anticipated transactions, and assets and liabilities that are subject to risk from foreign currency rate changes. Our principal currency exposures mainly relate to the Euro, Canadian dollar, Australian dollar, and the Brazilian Real. We hedge certain anticipated transactions with financial instruments whose maturity date, along with the realized gain or loss, occurs on or near the execution of the anticipated transaction. We manage foreign currency exposure of certain assets or liabilities through the use of derivative financial instruments such that the gain or loss on the derivative financial instrument offsets the loss or gain recognized on the underlying asset or liability, respectively.
We use fixed-to-floating interest rate swaps to convert a portion of our long-term debt from fixed-to-floating rate debt. An interest rate swap is entered into with the expectation that the change in the fair value of the interest rate swap will offset the change in the fair value of the debt instrument attributable to changes in the benchmark interest rate. Each period, the change in the fair value of the interest rate swap asset or liability is recorded as a change in the fair value of the corresponding debt instrument.
The following analyses provide quantitative information regarding our exposure to foreign currency exchange rate risk and interest rate risk as it relates to our derivative financial instruments. We use a model to evaluate the sensitivity of the fair value of financial instruments with exposure to market risk that assumes instantaneous, parallel shifts in exchange rates. For options and instruments with nonlinear returns, models appropriate to the instrument are utilized to determine the impact of market shifts. There are certain shortcomings inherent in the sensitivity analyses presented, primarily due to the assumption that exchange rates change in a parallel fashion.
The estimated reduction in fair market value that we would incur on our derivative financial instruments from a 10 percent adverse change in quoted foreign currency rates are $69.3 million and $91.7 million for the years 2024 and 2023, respectively.
Item 8. Financial Statements and Supplementary Data
See Index to Financial Statements and Financial Statement Schedule on page 52.
Item 9. Changes in and Disagreements with Accountants on Accounting and Financial Disclosure
None.
Item 9A. Controls and Procedures
Conclusion Regarding the Effectiveness of Disclosure Controls and Procedures
Under the supervision and with the participation of our management, including the Chief Executive Officer and the Chief Financial Officer of the Company (our principal executive officer and principal financial officer, respectively), we have evaluated our disclosure controls and procedures (as defined in Securities Exchange Act Rules 13a -15(e) and 15d -15(e)) as of the end of the period covered by this Annual Report on Form 10-K. Based upon that evaluation, the Chief Executive Officer and Chief Financial Officer have concluded that our disclosure controls and procedures are effective.
Management's Report on Internal Control Over Financial Reporting
Pursuant to Section 404 of the Sarbanes-Oxley Act of 2002, we included a report of management's assessment of the effectiveness of its internal control over financial reporting as part of this Annual Report on Form 10-K for the fiscal year ended December 31, 2024. Management's report is included in our 2024 Financial Statements under the captions entitled “Report of Management on Internal Control Over Financial Reporting” and is incorporated herein by reference.
Changes in Internal Control Over Financial Reporting
There were no changes in our internal control over financial reporting during the quarter ended December 31, 2024 that have materially affected, or are reasonably likely to materially affect, our internal control over financial reporting.
Item 9B. Other Information
Securities Trading Plans of Executive Officers and Directors
Rule 10b5-1 under the Exchange Act provides an affirmative defense that enables pre-arranged transactions in securities in a manner that avoids concerns about initiating transactions at a future date while possibly in possession of material nonpublic information. Our Insider Trading and Unauthorized Disclosures Policy permits our officers and directors to enter into trading plans designed to comply with Rule 10b5-1.
During the quarterly period ended December 31, 2024, none of our officers (as defined in Rule 16a-1(f) under the Exchange Act) or directors adopted or terminated a Rule 10b5-1 trading plan or adopted or terminated a non-Rule 10b5-1 trading arrangement (as defined in Item 408(c) of Regulation S-K).
Item 9C. Disclosure Regarding Foreign Jurisdictions that Prevent Inspections
Not Applicable.
PART III
Item 10. Directors, Executive Officers and Corporate Governance
Information pursuant to this Item with respect to our Directors, our Audit and Finance Committee, and our code of ethics is incorporated by reference from the discussion under the headings Proposal 1: Election of Directors, Corporate Governance, and Governance Policies and Practices in our Proxy Statement for the Annual Meeting of Shareholders to be held on May 7, 2025 (Proxy Statement). Information concerning Section 16(a) compliance is incorporated herein by reference from the discussion in the Proxy Statement under the heading Stock Held by Directors, Executive Officers, and Principal Shareholders under the subheading Delinquent Section 16(a) Reports.
The information required by Item 401 of Regulation S-K regarding executive officers is included under “Information about our Executive Officers” following Item 4 in Part I of this Annual Report.
Item 11. Executive Compensation
Information pursuant to this Item with respect to compensation paid to our Directors is incorporated by reference from the discussion under the heading Director Compensation in the Proxy Statement. Information pursuant to this Item with respect to executive compensation is incorporated by reference from the discussion under the heading Executive Compensation in the Proxy Statement.
Item 12. Security Ownership of Certain Beneficial Owners and Management and Related Stockholder Matters
Information pursuant to this Item with respect to our securities owned by our Directors and certain officers, by our Directors and officers as a group, and by the persons known to us to own beneficially more than 5 percent of our outstanding voting securities is incorporated by reference from the discussion under the heading Stock Held by Directors, Executive Officers, and Principal Shareholders in the Proxy Statement. Information pursuant to this Item with respect to securities authorized for issuance under our equity compensation plans is hereby incorporated by reference from the discussion under the heading Equity Compensation Plan in the Proxy Statement.
Item 13. Certain Relationships and Related Transactions, and Director Independence
Information pursuant to this Item with respect to certain relationships and related transactions is incorporated by reference from the discussion under the headings Proposal 1: Election of Directors, Corporate Governance, and Governance Policies and Practices in the Proxy Statement.
Item 14. Principal Accounting Fees and Services
Information pursuant to this Item with respect to fees for professional services rendered by our independent registered public accounting firm and the Audit and Finance Committee's policy on pre-approval of audit and permissible non-audit services of our independent registered public accounting firm is incorporated by reference from the discussion in the Proxy Statement under the heading Audit-Related Matters.
PART IV
Item 15. Exhibits and Financial Statement Schedules
| | |
The financial statements and schedule filed as part of this Annual Report on Form 10-K are listed in the accompanying Index to Financial Statements and Financial Statement Schedule on page 48. The exhibits filed as a part of this Annual Report are listed in the Exhibit Index below.
|
| | | | | | | | |
| Exhibit No. | Description | |
| 3.1 | | |
| 3.2 | Certificate of Designation, Preferences and Rights of Series A Junior Participating Preferred Stock, filed as Exhibit 3.2 to the Company's Annual Report on Form 10-K for 1995 as filed with the Securities and Exchange Commission on March 23, 1995, and hereby incorporated by reference. | |
| 3.3 | | |
| 4.1 | | |
| 4.2 | | |
| 4.3 | | |
| 4.4 | | |
| 4.5 | | |
| 4.6 | | |
| 4.7 | | |
| 4.8 | | |
| 4.9 | | |
| 4.10 | | |
| 4.11 | Indenture, dated as of March 15, 1987, between the Company and Continental Illinois National Bank and Trust Company of Chicago, filed as Exhibit 4.1 to the Company's Quarterly Report on Form 10- Q for the quarter ended March 31, 1987, and hereby incorporated by reference. | |
| 4.12 | The Company's agreement to furnish additional debt instruments upon request by the Securities and Exchange Commission, filed as Exhibit 4.10 to the Company's Annual Report on Form 10-K for 1980, and hereby incorporated by reference. | |
| 10.1 | Amended and Restated Credit Agreement, dated as of October 11, 2024, among Brunswick Corporation, the subsidiary borrowers party thereto, the lenders party thereto and JPMorgan Chase Bank, N.A., as administrative agent, filed as Exhibit 10.1 to the Company's Current Report on Form 8-K as filed with the Securities and Exchange Commission on October 11, 2024, and hereby incorporated by reference. | |
| 10.2 | | |
| | | | | | | | |
10.3*
| | |
| 10.4* | | |
| 10.5* | | |
| 10.6* | | |
| 10.7* | | |
| 10.8* | | |
| 10.9* | | |
| 10.10* | | |
| 10.11* | | |
| 10.12* | | |
| 10.13* | | |
| 10.14* | | |
| 10.15* | | |
| 10.16* | | |
| 10.17* | | |
| 10.18* | | |
| 19.1 | | |
| 21.1 | | |
| 23.1 | | |
| 24.1 | | |
| 31.1 | | |
| 31.2 | | |
| 32.1 | | |
| 32.2 | | |
| 97.1 | | |
| 101.INS | Inline XBRL Instance Document. | |
| 101.SCH | Inline XBRL Taxonomy Extension Schema Document. | |
| 101.CAL | Inline XBRL Taxonomy Extension Calculation Linkbase Document. | |
| 101.DEF | Inline XBRL Taxonomy Extension Definition Linkbase Document. | |
| | | | | | | | |
| 101.LAB | Inline XBRL Taxonomy Extension Label Linkbase Document. | |
| 101.PRE | Inline XBRL Taxonomy Extension Presentation Linkbase Document. | |
| 104.1 | Cover Page Interactive Data File, formatted in Inline XBRL, is contained in Exhibit 101. | |
* Management contract or compensatory plan or arrangement.
Index to Financial Statements and Financial Statement Schedule
Brunswick Corporation
| | | | | |
| Page |
| Financial Statements: | |
| |
| |
| |
| |
| |
| |
| |
| |
| |
| |
| Financial Statement Schedule: | |
| |
| |
BRUNSWICK CORPORATION
REPORT OF MANAGEMENT ON INTERNAL CONTROL OVER FINANCIAL REPORTING
The Company's management is responsible for the preparation, integrity, and objectivity of the financial statements and other financial information presented in this Annual Report. The financial statements have been prepared in conformity with accounting principles generally accepted in the United States and reflect the effects of certain estimates and judgments made by management.
The Company's management is also responsible for establishing and maintaining adequate internal control over financial reporting, as defined in Securities Exchange Act Rule 13a-15(f). Under the supervision and with the participation of the Company's management, including the Chief Executive Officer and the Chief Financial Officer, the Company conducted an evaluation of the effectiveness of its internal control over financial reporting based on the framework in Internal Control - Integrated Framework issued by the Committee of Sponsoring Organizations of the Treadway Commission (2013 framework).
Based on the Company's evaluation under the framework in Internal Control - Integrated Framework, management concluded that internal control over financial reporting was effective as of December 31, 2024.
The effectiveness of internal control over financial reporting as of December 31, 2024 has been audited by Deloitte & Touche LLP, an independent registered public accounting firm, as stated in its attestation report, which is included herein.
Brunswick Corporation
Mettawa, Illinois
February 14, 2025
BRUNSWICK CORPORATION
REPORT OF INDEPENDENT REGISTERED PUBLIC ACCOUNTING FIRM
To the shareholders and the Board of Directors of Brunswick Corporation
Opinion on Internal Control over Financial Reporting
We have audited the internal control over financial reporting of Brunswick Corporation and subsidiaries (the “Company”) as of December 31, 2024, based on criteria established in Internal Control — Integrated Framework (2013) issued by the Committee of Sponsoring Organizations of the Treadway Commission (COSO). In our opinion, the Company maintained, in all material respects, effective internal control over financial reporting as of December 31, 2024, based on criteria established in Internal Control — Integrated Framework (2013) issued by COSO.
We have also audited, in accordance with the standards of the Public Company Accounting Oversight Board (United States) (PCAOB), the consolidated financial statements as of and for the year ended December 31, 2024, of the Company and our report dated February 14, 2025, expressed an unqualified opinion on those financial statements.
Basis for Opinion
The Company’s management is responsible for maintaining effective internal control over financial reporting and for its assessment of the effectiveness of internal control over financial reporting, included in the accompanying Report of Management on Internal Control over Financial Reporting. Our responsibility is to express an opinion on the Company’s internal control over financial reporting based on our audit. We are a public accounting firm registered with the PCAOB and are required to be independent with respect to the Company in accordance with the U.S. federal securities laws and the applicable rules and regulations of the Securities and Exchange Commission and the PCAOB.
We conducted our audit in accordance with the standards of the PCAOB. Those standards require that we plan and perform the audit to obtain reasonable assurance about whether effective internal control over financial reporting was maintained in all material respects. Our audit included obtaining an understanding of internal control over financial reporting, assessing the risk that a material weakness exists, testing and evaluating the design and operating effectiveness of internal control based on the assessed risk, and performing such other procedures as we considered necessary in the circumstances. We believe that our audit provides a reasonable basis for our opinion.
Definition and Limitations of Internal Control over Financial Reporting
A company’s internal control over financial reporting is a process designed to provide reasonable assurance regarding the reliability of financial reporting and the preparation of financial statements for external purposes in accordance with generally accepted accounting principles. A company’s internal control over financial reporting includes those policies and procedures that (1) pertain to the maintenance of records that, in reasonable detail, accurately and fairly reflect the transactions and dispositions of the assets of the company; (2) provide reasonable assurance that transactions are recorded as necessary to permit preparation of financial statements in accordance with generally accepted accounting principles, and that receipts and expenditures of the company are being made only in accordance with authorizations of management and directors of the company; and (3) provide reasonable assurance regarding prevention or timely detection of unauthorized acquisition, use, or disposition of the company’s assets that could have a material effect on the financial statements.
Because of its inherent limitations, internal control over financial reporting may not prevent or detect misstatements. Also, projections of any evaluation of effectiveness to future periods are subject to the risk that controls may become inadequate because of changes in conditions, or that the degree of compliance with the policies or procedures may deteriorate.
/s/ DELOITTE & TOUCHE LLP
Chicago, Illinois
February 14, 2025
BRUNSWICK CORPORATION
REPORT OF INDEPENDENT REGISTERED PUBLIC ACCOUNTING FIRM
To the shareholders and the Board of Directors of Brunswick Corporation
Opinion on the Financial Statements
We have audited the accompanying consolidated balance sheets of Brunswick Corporation and subsidiaries (the "Company") as of December 31, 2024 and 2023, the related consolidated statements of operations, comprehensive income, shareholders' equity, and cash flows, for each of the three years in the period ended December 31, 2024, and the related notes and the schedule listed in the Index at Item 15 (collectively referred to as the "financial statements"). In our opinion, the financial statements present fairly, in all material respects, the financial position of the Company as of December 31, 2024 and 2023, and the results of its operations and its cash flows for each of the three years in the period ended December 31, 2024, in conformity with accounting principles generally accepted in the United States of America.
We have also audited, in accordance with the standards of the Public Company Accounting Oversight Board (United States) (PCAOB), the Company's internal control over financial reporting as of December 31, 2024, based on criteria established in Internal Control — Integrated Framework (2013) issued by the Committee of Sponsoring Organizations of the Treadway Commission and our report dated February 14, 2025, expressed an unqualified opinion on the Company’s internal control over financial reporting.
Basis for Opinion
These financial statements are the responsibility of the Company's management. Our responsibility is to express an opinion on the Company's financial statements based on our audits. We are a public accounting firm registered with the PCAOB and are required to be independent with respect to the Company in accordance with the U.S. federal securities laws and the applicable rules and regulations of the Securities and Exchange Commission and the PCAOB.
We conducted our audits in accordance with the standards of the PCAOB. Those standards require that we plan and perform the audit to obtain reasonable assurance about whether the financial statements are free of material misstatement, whether due to error or fraud. Our audits included performing procedures to assess the risks of material misstatement of the financial statements, whether due to error or fraud, and performing procedures that respond to those risks. Such procedures included examining, on a test basis, evidence regarding the amounts and disclosures in the financial statements. Our audits also included evaluating the accounting principles used and significant estimates made by management, as well as evaluating the overall presentation of the financial statements. We believe that our audits provide a reasonable basis for our opinion.
Critical Audit Matter
The critical audit matter communicated below is a matter arising from the current-period audit of the financial statements that was communicated or required to be communicated to the audit committee and that (1) relates to accounts or disclosures that are material to the financial statements and (2) involved our especially challenging, subjective, or complex judgments. The communication of critical audit matters does not alter in any way our opinion on the financial statements, taken as a whole, and we are not, by communicating the critical audit matter below, providing a separate opinion on the critical audit matter or on the accounts or disclosures to which it relates.
Navico Reporting Unit Goodwill Impairment – Refer to Notes 1 and 9 to the financial statements
Critical Audit Matter Description
The Company’s evaluation of goodwill is performed at least annually by comparing the fair value of each respective reporting unit and asset group to its carrying value. The Company estimates the fair value of its reporting units using a discounted cash flow approach and guideline public company method approach, a form of the market approach. The fair value determination required management to make significant estimates and assumptions related to business and valuation assumptions including the revenue growth rate, profitability margin, and the discount rate. Changes in these assumptions could have a significant impact on either the fair value, the amount of any impairment charge, or both. The goodwill balance recorded as of December 31, 2024 was $966.1 million. $513.4
million of the balance relates to the Navico Group reporting unit. Impairment charges for the Navico Group reporting unit for the year ended December 31, 2024 were $80.0 million.
We identified management's estimate of the fair value of the Navico Group reporting unit goodwill as a critical audit matter because of the significant judgements made by management to estimate the fair value. This required a high degree of auditor judgement and an increased extent of effort, including the need to involve our fair value specialists, when performing audit procedures to evaluate the reasonableness of management's projected future cash flows and the selection of valuation assumptions.
How the Critical Audit Matter Was Addressed in the Audit
Our audit procedures related to the projected future cash flows and selection of valuation assumptions for goodwill included the following, among others:
•We tested the effectiveness of controls over management’s determination of the fair values of the reporting unit, including those over the projected future cash flows and selection of revenue growth, profitability margin, and discount rate assumptions.
•We evaluated management’s ability to accurately forecast future revenues and profitability margins by comparing actual results to management’s historical forecasts.
•We evaluated the reasonableness of management’s projected future cash flows by comparing the projections to historical results, internal communications to management and certain industry and market trends.
•With the assistance of our fair value specialists, we evaluated the reasonableness of the valuation assumptions including the discount rate and developed a range of independent estimates and compared those to the valuation assumptions selected by management.
•We tested the source information underlying the determination of the valuation assumptions as well as the mathematical accuracy of the calculation.
/s/ DELOITTE & TOUCHE LLP
Chicago, Illinois
February 14, 2025
We have served as the Company’s auditor since 2014.
BRUNSWICK CORPORATION
Consolidated Statements of Operations
| | | | | | | | | | | | | | | | | | | | |
| | | For the Years Ended December 31 |
| (in millions, except per share data) | | | | 2024 | | 2023 | | 2022 |
| Net sales | | | | $ | 5,237.1 | | | $ | 6,401.4 | | | $ | 6,812.2 | |
| Cost of sales | | | | 3,886.3 | | | 4,614.4 | | | 4,865.0 | |
| Selling, general and administrative expense | | | | 747.9 | | | 812.2 | | | 771.4 | |
| Research and development expense | | | | 169.6 | | | 185.2 | | | 202.9 | |
| Restructuring, exit and impairment charges | | | | 121.7 | | | 54.7 | | | 25.1 | |
| Operating earnings | | | | 311.6 | | | 734.9 | | | 947.8 | |
| Equity earnings (loss) | | | | 8.6 | | | (11.4) | | | 4.0 | |
| | | | | | | | |
| Other income (expense), net | | | | 9.0 | | | 7.6 | | | (6.1) | |
| Earnings before interest and income taxes | | | | 329.2 | | | 731.1 | | | 945.7 | |
| Interest expense | | | | (126.6) | | | (112.4) | | | (98.1) | |
| Interest income | | | | 13.4 | | | 10.2 | | | 6.1 | |
| Loss on early extinguishment of debt | | | | (12.7) | | | — | | | (0.1) | |
| | | | | | | | |
| Earnings before income taxes | | | | 203.3 | | | 628.9 | | | 853.6 | |
| Income tax provision | | | | 54.0 | | | 196.3 | | | 172.3 | |
| Net earnings from continuing operations | | | | 149.3 | | | 432.6 | | | 681.3 | |
| | | | | | | | |
| | | | | | | | |
| | | | | | | | |
| | | | | | | | |
| Net loss from discontinued operations, net of tax | | | | (19.2) | | | (12.2) | | | (4.3) | |
| Net earnings | | | | $ | 130.1 | | | $ | 420.4 | | | $ | 677.0 | |
| | | | | | | | |
| Earnings per common share: | | | | | | | | |
| Basic | | | | | | | | |
| Earnings from continuing operations | | | | $ | 2.22 | | | $ | 6.16 | | | $ | 9.11 | |
| Loss from discontinued operations | | | | (0.28) | | | (0.17) | | | (0.06) | |
| Net earnings | | | | $ | 1.94 | | | $ | 5.99 | | | $ | 9.05 | |
| | | | | | | | |
| Diluted | | | | | | | | |
| Earnings from continuing operations | | | | $ | 2.21 | | | $ | 6.13 | | | $ | 9.06 | |
| Loss from discontinued operations | | | | (0.28) | | | (0.17) | | | (0.06) | |
| Net earnings | | | | $ | 1.93 | | | $ | 5.96 | | | $ | 9.00 | |
| | | | | | | | |
| Weighted average shares used for computation of: | | | | | | | | |
| Basic earnings per common share | | | | 67.2 | | | 70.2 | | | 74.8 | |
| Diluted earnings per common share | | | | 67.4 | | | 70.5 | | | 75.2 | |
| | | | | | | | |
| | | | | | | | |
The Notes to Consolidated Financial Statements are an integral part of these consolidated statements.
BRUNSWICK CORPORATION
Consolidated Statements of Comprehensive Income
| | | | | | | | | | | | | | | | | | | | |
| | | For the Years Ended December 31 |
| (in millions) | | | | 2024 | | 2023 | | 2022 |
| Net earnings | | | | $ | 130.1 | | | $ | 420.4 | | | $ | 677.0 | |
| Other comprehensive income (loss), net of tax: | | | | | | | | |
| Foreign currency translation: | | | | | | | | |
| | | | | | | | |
| | | | | | | | |
Net foreign currency translation (A) | | | | (47.4) | | | 21.8 | | | (36.8) | |
| Defined benefit plans: | | | | | | | | |
Net actuarial gains (losses) (A) | | | | 3.1 | | | (4.0) | | | 12.5 | |
Amortization of prior service credits (B) | | | | (0.5) | | | (3.3) | | | (0.4) | |
Amortization of net actuarial (gains) losses (B) | | | | (0.5) | | | 2.2 | | | 0.6 | |
| Net defined benefit plans | | | | 2.1 | | | (5.1) | | | 12.7 | |
| | | | | | | | |
| | | | | | | | |
| | | | | | | | |
| | | | | | | | |
| Derivatives: | | | | | | | | |
Net deferred gains (losses) on derivatives (A) | | | | 19.0 | | | (3.3) | | | 46.1 | |
Net (gains) losses reclassified into Net earnings (B) | | | | (1.4) | | | (9.6) | | | (20.0) | |
| Net activity for derivatives | | | | 17.6 | | | (12.9) | | | 26.1 | |
| Other comprehensive (loss) income | | | | (27.7) | | | 3.8 | | | 2.0 | |
| Comprehensive income | | | | $ | 102.4 | | | $ | 424.2 | | | $ | 679.0 | |
(A) The tax effects for the year ended December 31, 2024 were $8.9 million for foreign currency translation, $(0.5) million for net actuarial gains arising during the period and $(6.3) million for derivatives. The tax effects for the year ended December 31, 2023 were $(2.3) million for foreign currency translation, $1.3 million for net actuarial losses arising during the period and $0.6 million for derivatives. The tax effects for the year ended December 31, 2022 were $5.9 million for foreign currency translation, $(4.2) million for net actuarial gains arising during the period and $(15.9) million for derivatives.
(B) See Note 17 – Comprehensive Income (Loss) for the tax effects for the years ended December 31, 2024, December 31, 2023 and December 31, 2022.
The Notes to Consolidated Financial Statements are an integral part of these consolidated statements.
BRUNSWICK CORPORATION
Consolidated Balance Sheets
| | | | | | | | | | | |
| As of December 31 |
| (in millions) | 2024 | | 2023 |
| Assets | | | |
| Current assets | | | |
| Cash and cash equivalents, at cost, which approximates fair value | $ | 269.0 | | | $ | 467.8 | |
| Restricted cash | 16.9 | | | 11.1 | |
| Short-term investments in marketable securities | 0.8 | | | 0.8 | |
| Total cash and short-term investments in marketable securities | 286.7 | | | 479.7 | |
| Accounts and notes receivable, less allowances of $10.3 and $10.8 | 429.0 | | | 493.2 | |
| Inventories | | | |
| Finished goods | 846.9 | | | 932.0 | |
| Work-in-process | 148.1 | | | 181.6 | |
| Raw materials | 307.6 | | | 363.2 | |
| Net inventories | 1,302.6 | | | 1,476.8 | |
| Prepaid expenses and other | 95.5 | | | 60.0 | |
| | | |
| Current assets | 2,113.8 | | | 2,509.7 | |
| | | |
| Property | | | |
| Land | 44.0 | | | 44.1 | |
| Buildings and improvements | 642.1 | | | 619.7 | |
| Equipment | 1,544.7 | | | 1,551.5 | |
| Total land, buildings and improvements and equipment | 2,230.8 | | | 2,215.3 | |
| Accumulated depreciation | (1,186.9) | | | (1,135.5) | |
| Net land, buildings and improvements and equipment | 1,043.9 | | | 1,079.8 | |
| Unamortized product tooling costs | 207.6 | | | 236.0 | |
| Net property | 1,251.5 | | | 1,315.8 | |
| | | |
| Other assets | | | |
| Goodwill | 966.1 | | | 1,030.7 | |
| Other intangibles, net | 918.3 | | | 978.0 | |
| Equity investments | 35.0 | | | 38.7 | |
| Deferred income tax asset | 197.5 | | | 186.8 | |
| Operating lease assets | 161.8 | | | 152.2 | |
| Other long-term assets | 33.7 | | | 18.6 | |
| | | |
| Other assets | 2,312.4 | | | 2,405.0 | |
| | | |
| Total assets | $ | 5,677.7 | | | $ | 6,230.5 | |
| | | |
| | | | | | | | | | | |
| | | |
| As of December 31 |
| (in millions) | 2024 | | 2023 |
| Liabilities and shareholders' equity | | | |
| Current liabilities | | | |
| Short-term debt and current maturities of long-term debt | $ | 242.8 | | | $ | 454.7 | |
| Accounts payable | 393.4 | | | 558.0 | |
| Accrued expenses | 643.7 | | | 739.4 | |
| | | |
| Current liabilities | 1,279.9 | | | 1,752.1 | |
| | | |
| Long-term liabilities | | | |
| Debt | 2,097.8 | | | 1,975.7 | |
| Operating lease liabilities | 145.1 | | | 133.9 | |
| Deferred income tax liability | 10.4 | | | 12.4 | |
| Postretirement benefits | 46.4 | | | 52.5 | |
| Other | 205.8 | | | 216.5 | |
| | | |
| Long-term liabilities | 2,505.5 | | | 2,391.0 | |
| | | |
| Shareholders' equity | | | |
| Common stock; authorized: 200,000,000 shares, $0.75 par value; issued: 102,538,000 shares; outstanding: 65,987,000 and 68,227,000 shares | 76.9 | | | 76.9 | |
| Additional paid-in capital | 401.8 | | | 392.0 | |
| Retained earnings | 3,614.7 | | | 3,596.9 | |
| Treasury stock, at cost: 36,551,000 and 34,311,000 shares | (2,147.7) | | | (1,952.7) | |
| Accumulated other comprehensive income (loss), net of tax: | | | |
| Foreign currency translation | (96.9) | | | (49.5) | |
| Defined benefit plans: | | | |
| Prior service credits | (7.9) | | | (7.4) | |
| Net actuarial gains (losses) | 10.5 | | | 7.9 | |
| Unrealized investment gains (losses) | 0.2 | | | 0.2 | |
| Unrealized gains (losses) on derivatives | 40.7 | | | 23.1 | |
| Accumulated other comprehensive income (loss), net of tax | (53.4) | | | (25.7) | |
| Shareholders' equity | 1,892.3 | | | 2,087.4 | |
| | | |
| Total liabilities and shareholders' equity | $ | 5,677.7 | | | $ | 6,230.5 | |
The Notes to Consolidated Financial Statements are an integral part of these consolidated statements.
BRUNSWICK CORPORATION
Consolidated Statements of Cash Flows
| | | | | | | | | | | | | | | | | |
| | For the Years Ended December 31 |
| (in millions) | 2024 | | 2023 | | 2022 |
| Cash flows from operating activities | | | | | |
| Net earnings | $ | 130.1 | | | $ | 420.4 | | | $ | 677.0 | |
| Less: net loss from discontinued operations, net of tax | (19.2) | | | (12.2) | | | (4.3) | |
| Net earnings from continuing operations | 149.3 | | | 432.6 | | | 681.3 | |
| Depreciation and amortization | 288.8 | | | 272.9 | | | 231.2 | |
| Stock compensation expense | 23.4 | | | 22.4 | | | 21.9 | |
| | | | | |
| Asset impairment charges | 91.7 | | | 19.5 | | | 18.9 | |
| Deferred income taxes | (15.6) | | | 16.4 | | | (18.9) | |
| | | | | |
| Impairment of equity method investment | — | | | 19.2 | | | — | |
| Changes in certain current assets and current liabilities | | | | | |
| Change in accounts and notes receivable | 45.0 | | | 54.5 | | | (74.6) | |
| Change in inventory | 112.8 | | | 0.7 | | | (292.8) | |
| Change in prepaid expenses and other, excluding income taxes | 5.8 | | | 23.3 | | | 37.9 | |
| Change in accounts payable | (144.2) | | | (86.1) | | | (12.2) | |
| Change in accrued expenses | (104.0) | | | (22.8) | | | (8.9) | |
| Extended warranty contracts and other deferred revenue | 9.5 | | | 14.6 | | | 13.0 | |
| | | | | |
| | | | | |
| Income taxes | (26.5) | | | (2.4) | | | (1.0) | |
| Other, net | 13.5 | | | (19.6) | | | (15.4) | |
| Net cash provided by operating activities of continuing operations | 449.5 | | | 745.2 | | | 580.4 | |
| Net cash (used for) provided by operating activities of discontinued operations | (18.1) | | | (11.6) | | | 5.7 | |
| Net cash provided by operating activities | 431.4 | | | 733.6 | | | 586.1 | |
| | | | | |
| Cash flows from investing activities | | | | | |
| Capital expenditures | (167.4) | | | (289.3) | | | (388.3) | |
| Purchases of marketable securities | (80.9) | | | — | | | (60.1) | |
| Sales or maturities of marketable securities | 82.1 | | | 3.8 | | | 56.4 | |
| | | | | |
| Investments | 2.9 | | | (4.6) | | | (11.2) | |
| Acquisition of businesses, net of cash acquired | (31.8) | | | (103.6) | | | (93.8) | |
| Proceeds from the sale of property, plant and equipment | 15.0 | | | 14.8 | | | 11.3 | |
| Proceeds from the sale of business | 9.5 | | | — | | | — | |
| Cross currency swap settlements | 1.7 | | | — | | | 42.5 | |
| | | | | |
| | | | | |
| | | | | |
| Net cash used for investing activities | (168.9) | | | (378.9) | | | (443.2) | |
| | | | | |
| Cash flows from financing activities | | | | | |
| Proceeds from issuances of short-term debt | 201.1 | | | 4.7 | | | 132.2 | |
| Payments of short-term debt | (87.4) | | | (8.6) | | | (125.0) | |
| Net proceeds from issuances of long-term debt | 396.9 | | | — | | | 741.8 | |
| Payments of long-term debt including current maturities | (613.2) | | | (82.3) | | | (59.1) | |
| Net premium paid on early extinguishment of debt | (12.5) | | | — | | | (0.1) | |
| Common stock repurchases | (200.0) | | | (275.0) | | | (450.0) | |
| Cash dividends paid | (112.3) | | | (112.0) | | | (108.6) | |
| | | | | |
| Tax withholding associated with shares issued for share-based compensation | (9.3) | | | (13.8) | | | (16.4) | |
| Other, net | (6.0) | | | — | | | (4.0) | |
| | | | | |
| | | | | |
| Net cash (used for) provided by financing activities | (442.7) | | | (487.0) | | | 110.8 | |
| | | | | |
| Effect of exchange rate changes | (12.8) | | | 2.7 | | | (11.9) | |
| Net (decrease) increase in Cash and cash equivalents and Restricted cash | (193.0) | | | (129.6) | | | 241.8 | |
| Cash and cash equivalents and Restricted cash at beginning of period | 478.9 | | | 608.5 | | | 366.7 | |
| | | | | |
| Cash and cash equivalents and Restricted cash at end of period | 285.9 | | | 478.9 | | | 608.5 | |
| Less: Restricted cash | 16.9 | | | 11.1 | | | 12.9 | |
| Cash and cash equivalents at end of period | $ | 269.0 | | | $ | 467.8 | | | $ | 595.6 | |
| | | | | |
| Supplemental cash flow disclosures: | | | | | |
| Interest paid | $ | 140.2 | | | $ | 117.2 | | | $ | 95.3 | |
| Income taxes paid, net | $ | 93.5 | | | $ | 175.4 | | | $ | 196.9 | |
The Notes to Consolidated Financial Statements are an integral part of these consolidated statements.
BRUNSWICK CORPORATION
Consolidated Statements of Shareholders' Equity
| | | | | | | | | | | | | | | | | | | | | | | | | | | | | | | | | | | |
| (in millions, except per share data) | Common Stock | | Additional Paid-in Capital | | Retained Earnings | | Treasury Stock | | Accumulated Other Comprehensive Income (Loss) | | Total |
| Balance, December 31, 2021 | $ | 76.9 | | | $ | 394.5 | | | $ | 2,720.1 | | | $ | (1,245.8) | | | $ | (31.5) | | | $ | 1,914.2 | |
| Net earnings | — | | | — | | | 677.0 | | | — | | | — | | | 677.0 | |
| Other comprehensive income | — | | | — | | | — | | | — | | | 2.0 | | | 2.0 | |
| Dividends ($1.46 per common share) | — | | | — | | | (108.6) | | | — | | | — | | | (108.6) | |
| Compensation plans and other | — | | | (3.2) | | | — | | | 10.9 | | | — | | | 7.7 | |
| Common stock repurchases | — | | | — | | | — | | | (450.0) | | | — | | | (450.0) | |
| Balance, December 31, 2022 | 76.9 | | | 391.3 | | | 3,288.5 | | | (1,684.9) | | | (29.5) | | | 2,042.3 | |
| Net earnings | — | | | — | | | 420.4 | | | — | | | — | | | 420.4 | |
| Other comprehensive income | — | | | — | | | — | | | — | | | 3.8 | | | 3.8 | |
| Dividends ($1.60 per common share) | — | | | — | | | (112.0) | | | — | | | — | | | (112.0) | |
| Compensation plans and other | — | | | 0.7 | | | — | | | 9.7 | | | — | | | 10.4 | |
| Common stock repurchases | — | | | — | | | — | | | (277.5) | | | — | | | (277.5) | |
| Balance, December 31, 2023 | 76.9 | | | 392.0 | | | 3,596.9 | | | (1,952.7) | | | (25.7) | | | 2,087.4 | |
| Net earnings | — | | | — | | | 130.1 | | | — | | | — | | | 130.1 | |
| Other comprehensive loss | — | | | — | | | — | | | — | | | (27.7) | | | (27.7) | |
| Dividends ($1.68 per common share) | — | | | — | | | (112.3) | | | — | | | — | | | (112.3) | |
| Compensation plans and other | — | | | 9.8 | | | — | | | 6.8 | | | — | | | 16.6 | |
| Common stock repurchases | — | | | — | | | — | | | (201.8) | | | — | | | (201.8) | |
| Balance, December 31, 2024 | $ | 76.9 | | | $ | 401.8 | | | $ | 3,614.7 | | | $ | (2,147.7) | | | $ | (53.4) | | | $ | 1,892.3 | |
The Notes to Consolidated Financial Statements are an integral part of these consolidated statements.
BRUNSWICK CORPORATION
Notes to Consolidated Financial Statements
Note 1 – Significant Accounting Policies
Basis of Presentation. Effective January 1, 2023, Brunswick Corporation (we, us, our, the Company, or Brunswick) changed its management reporting and updated its reportable segments to Propulsion, Engine Parts and Accessories (Engine P&A), Navico Group and Boat to align with our internal operating structure. As a result of this change, the Company has recast all segment information for all prior periods presented. For further information, refer to Note 5 –Segment Information. The Company has prepared its consolidated financial statements pursuant to the rules and regulations of the Securities and Exchange Commission (SEC). Certain previously reported amounts have been reclassified to conform with current period presentation. Brunswick's results reflect continuing operations only, unless otherwise noted.
Principles of Consolidation. Brunswick's consolidated financial statements include the accounts of all majority owned and controlled domestic and foreign subsidiaries. Intercompany balances and transactions have been eliminated.
Use of Estimates. The preparation of the consolidated financial statements in accordance with accounting principles generally accepted in the United States (GAAP) requires management to make certain estimates. Actual results could differ materially from those estimates. These estimates affect:
•The reported amounts of revenues and expenses during the reporting periods;
•The reported amounts of assets and liabilities at the date of the financial statements; and
•The disclosure of contingent assets and liabilities at the date of the financial statements.
Estimates in these consolidated financial statements include, but are not limited to:
•Allowances for doubtful accounts;
•Inventory valuation reserves;
•Variable consideration related to recorded revenue;
•Reserves related to repurchase and recourse obligations;
•Warranty related reserves;
•Losses on litigation and other contingencies;
•Environmental reserves;
•Insurance reserves;
•Valuation of goodwill and other intangible assets;
•Impairments of long-lived assets;
•Reserves related to restructuring, exit and impairment activities;
•Postretirement benefit liabilities;
•Valuation allowances on deferred tax assets; and
•Income tax reserves.
Cash and Cash Equivalents. The Company considers all highly liquid investments with a maturity of three months or less when purchased to be cash equivalents. These investments include, but are not limited to, investments in money market funds, bank deposits, federal government and agency debt securities and commercial paper.
Restricted Cash. Restricted Cash is primarily related to cash deposited in a trust that is pledged as collateral against certain workers' compensation-related obligations. Refer to Note 11 – Commitments and Contingencies for more information.
BRUNSWICK CORPORATION
Notes to Consolidated Financial Statements
Investments in Marketable Securities. The Company classifies investments in debt securities that are not considered to be cash equivalents as Short-term investments in marketable securities as discussed in Note 7 - Investments. Short-term investments in marketable securities have a stated maturity of twelve months or less from the balance sheet date. These securities are considered as available-for-sale and are reported at fair value. Unrealized gains and losses on these debt securities are recorded net of tax as a component of Accumulated other comprehensive income (loss) in Unrealized investment gains (losses) within Shareholders' equity. Declines in market value from the original cost deemed to be "other-than-temporary" are charged to Other income (expense), net in the Consolidated Statements of Operations in the period in which the loss occurs. The Company considers both the duration and extent of which a decline in value has occurred in its determination of whether a decline in value has been "other-than-temporary." Realized gains and losses are calculated based on the specific identification method and are included in Other income (expense), net in the Consolidated Statements of Operations.
Accounts and Notes Receivable and Allowance for Doubtful Accounts. The Company carries its accounts and notes receivable at their face amounts less an allowance for doubtful accounts. On a regular basis, the Company records an allowance for uncollectible receivables based upon known bad debt risks and past loss history, customer payment practices and economic conditions. Actual collection experience may differ from the current estimate of net receivables. A change to the allowance for doubtful accounts may be required if a future event or other change in circumstances results in a change in the estimate of the ultimate collectability of a specific account.
Inventories. Inventories are valued at the lower of cost or net realizable value, with net realizable value equal to the estimated selling price less the estimated costs to transact. Approximately 51 percent of the Company's inventories were determined by the first-in, first-out method (FIFO) as of both December 31, 2024 and December 31, 2023, respectively. Remaining inventories valued at the last-in, first-out method (LIFO) were $212.4 million and $192.1 million lower than the FIFO cost of inventories as of December 31, 2024 and 2023, respectively. Inventory cost includes material, labor and manufacturing overhead. During 2024, a reduction in inventory quantities resulted in a liquidation of applicable LIFO inventory quantities carried at lower costs in prior years. The decrease in cost of sales as a result of this LIFO liquidation was not material. There were no liquidations of LIFO inventory layers in 2023 or 2022.
Property. Property, including major improvements and product tooling costs, is recorded at cost. Product tooling costs principally comprise the cost to acquire and construct various long-lived molds, dies and other tooling the Company uses in its manufacturing processes. Design and prototype development costs associated with product tooling are expensed as incurred. Maintenance and repair costs are also expensed as incurred. Depreciation is recorded over the estimated service lives of the related assets, principally using the straight-line method. Buildings and improvements are depreciated over a useful life of five to forty years. Equipment is depreciated over a useful life of two to twenty years. Product tooling costs are amortized over the shorter of the useful life of the tooling or the anticipated life of the applicable product, for a period up to eight years. The Company capitalizes interest on qualifying assets during the construction period. Capitalized interest is not material in any period presented. The Company presents capital expenditures on a cash basis within the Consolidated Statements of Cash Flows. There were $18.7 million and $34.1 million of unpaid capital expenditures within Accounts payable as of December 31, 2024 and 2023, respectively. The Company includes gains and losses recognized on the sale and disposal of property in either Cost of sales, Selling, general and administrative expenses or Restructuring, exit and impairment charges as appropriate. The amount of gains and losses related to the sale of property were not material in any period presented.
Goodwill. Goodwill results from the excess of purchase price over the net assets of businesses acquired. The Company reviews goodwill for impairment annually and whenever events or changes in circumstances indicate that the fair value of a reporting unit may be below its carrying value. As part of the annual test, the Company may perform a qualitative, rather than quantitative, assessment to determine whether the fair values of its reporting units are "more likely than not" to exceed their carrying values. In performing this qualitative analysis, the Company considers various factors, including the effect of market or industry changes and the reporting units' actual results compared to projected results.
If the fair value of a reporting unit does not meet the "more likely than not" criteria discussed above, the Company performs a quantitative assessment, which begins by measuring the fair value of the reporting unit. If the carrying value of the reporting unit exceeds its fair value, a goodwill impairment is recorded equal to the carrying value of the reporting unit less its fair value, not to exceed the carrying value of goodwill.
BRUNSWICK CORPORATION
Notes to Consolidated Financial Statements
The Company calculates the fair value of its reporting units considering both the income approach and the guideline public company method, a form of the market approach. The income approach calculates the fair value of the reporting unit using a discounted cash flow approach utilizing a Gordon Growth model. Internally forecasted future cash flows, which the Company believes reasonably approximate market participant assumptions, are discounted using a weighted average cost of capital (Discount Rate) developed for each reporting unit. The Discount Rate is developed using market observable inputs, as well as considering whether or not there is a measure of risk related to the specific reporting unit’s forecasted performance. Fair value under the guideline public company method is determined for each reporting unit by applying market multiples for comparable public companies to the reporting unit’s current and forecasted financial results. The key uncertainties in these calculations are the assumptions used in determining the reporting unit’s forecasted future performance, including revenue growth and operating margins, as well as the perceived risk associated with those forecasts in determining the Discount Rate, along with selecting representative market multiples.
The Company recorded an $80.0 million impairment of the Navico Group reporting unit's goodwill during the year ended December 31, 2024, recognized in Restructuring, exit and impairment charges in the Consolidated Statements of Operations. Company did not record any goodwill impairments in 2023 or 2022.
Other intangible assets. The Company's primary other intangible assets are customer relationships, trade names, and developed technology acquired in business combinations. Intangible assets are initially valued using a methodology commensurate with the intended use of the asset. Customer relationships, trade names and developed technology are valued using the income approach. The fair value of customer relationships is measured using the multi-period excess earnings method (MPEEM). The fair value of trade names and developed technology are measured using a relief-from-royalty (RFR) approach, which assumes the value of the trade name or technology is the discounted amount of cash flows that would be paid to third parties had the Company not owned the trade name or technology and instead licensed the trade name or technology from another company. Higher royalty rates are assigned to premium brands within the marketplace based on name recognition and profitability, while other brands receive lower royalty rates. The basis for future sales projections for both the RFR and MPEEM are internal revenue forecasts which the Company believes represent reasonable market participant assumptions. The future cash flows are discounted using an applicable Discount Rate as well as any potential risk premium to reflect the inherent risk of holding a standalone intangible asset.
The key uncertainties in the RFR and MPEEM calculations, as applicable, are: the selection of an appropriate royalty rate, assumptions used in developing internal revenue growth and expense forecasts, assumed customer attrition rates, as well as the perceived risk associated with those forecasts in determining the Discount Rate and risk premium.
The costs of amortizable intangible assets are recognized over their expected useful lives, typically between three and fifteen years, using the straight-line method. Intangible assets that are subject to amortization are evaluated for impairment using a process similar to that used to evaluate long-lived assets described below. Intangible assets not subject to amortization are assessed for impairment at least annually and whenever events or changes in circumstances indicate that it is more likely than not that an asset may be impaired. The impairment test for indefinite-lived intangible assets consists of a comparison of the fair value of the intangible asset with its carrying amount. An impairment loss is recognized for the amount by which the carrying value exceeds the fair value of the asset. The Company recorded $5.0 million of intangible asset impairment charges in 2024 recognized in Restructuring, exit and impairment charges in the Consolidated Statements of Operations, related to an impairment of the Navico trade name. The Company recorded $16.6 million of intangible asset impairment charges in 2023 recognized in Restructuring, exit and impairment charges in the Consolidated Statements of Operations, including a $13.0 million impairment of the Navico trade name and a $3.0 million impairment associated with the Garelick trade name. The Company recorded $17.4 million of intangible asset impairment charges in 2022 recognized in Restructuring, exit and impairment charges in the Consolidated Statements of Operations related to capitalized software intangible assets that were not placed into service.
Refer to Note 4 – Acquisitions and Note 9 – Goodwill and Other Intangibles in the Notes to Consolidated Financial Statements for more information.
BRUNSWICK CORPORATION
Notes to Consolidated Financial Statements
Software Development Costs for Internal Use. The Company expenses all software development and implementation costs incurred until the Company has determined that the software will result in probable future economic benefit and management has committed to funding the project. Once this is determined, external direct costs of material and services, payroll-related costs of employees working on the project and related interest costs incurred during the application development stage are capitalized. These capitalized costs are amortized over three to seven years. All other related costs, including training costs and costs to re-engineer business processes, are expensed as incurred.
Equity Investments. For investments in which the Company owns or controls from 20 percent to 50 percent of the voting shares, the Company uses the equity method of accounting. The Company's share of net earnings or losses from equity method investments is included in the Consolidated Statements of Operations. The Company carries other investments, for which the Company does not have the ability to exercise significant influence, at fair value, with changes in fair value recognized in net income. For equity investments that do not have a readily determinable fair value, the Company measures the investment at cost less impairment, plus or minus observable equity price changes. The Company periodically evaluates the carrying value of its investments. During the year ended December 31, 2023, the Company recorded an impairment charge of $19.2 million due to a decline in the fair value of its investment in TN-BC Holdings LLC (the Joint Venture), as a result of a reduction in value of certain of the Joint Venture's underlying investments. See Note 7 - Investments for further details about the Company's evaluation of the fair value of its investments.
Long-Lived Assets. The Company continually evaluates whether events and circumstances have occurred that indicate the remaining estimated useful lives of its definite-lived intangible assets and other long-lived assets may warrant revision or that the remaining balance of such assets may not be recoverable. Once an impairment indicator is identified, the Company tests for recoverability of the related asset group using an estimate of undiscounted cash flows over the asset group's remaining life. If an asset group's carrying value is not recoverable, the Company records an impairment loss based on the excess of the carrying value of the asset group over the long-lived asset group's fair value. Fair value is determined using observable inputs, including the use of appraisals from independent third parties, when available, and, when observable inputs are not available, based on the Company's assumptions of the data that market participants would use in pricing the asset, based on the best information available in the circumstances. Specifically, the Company uses discounted cash flows to determine the fair value of the asset when observable inputs are unavailable. Long-lived asset impairment charges were not material in any period presented.
Other Long-Term Assets. Other long-term assets consists mainly of capitalized financing costs and deposits.
Revenue Recognition. Revenue is recognized as performance obligations under the terms of contracts with customers are satisfied; this occurs when control of promised goods is transferred to the customer. The Company recognizes revenue related to the sale of extended warranty contracts that extend the coverage period beyond the standard warranty period over the life of the extended warranty period. The Company recognizes revenue related to the upfront membership dues from its Freedom Boat Club business over the estimated membership life.
Revenue is measured as the amount of consideration the Company expects to be entitled to in exchange for transferring goods or providing services. The Company has excluded sales, value add and other taxes collected concurrent with revenue-producing activities from the determination of the transaction price for all contracts. The Company has elected to account for shipping and handling activities that occur after the customer has obtained control of a good as a fulfillment activity. For all contracts with customers, the Company has not adjusted the promised amount of consideration for the effects of a significant financing component as the period between the transfer of the promised goods and the customer's payment is expected to be one year or less.
BRUNSWICK CORPORATION
Notes to Consolidated Financial Statements
For product sales, the Company transfers control and recognizes revenue at the time the product ships from a manufacturing or distribution facility ("free on board shipping point"), or at the time the product arrives at the customer's facility ("free on board destination"). When the shipping terms are "free on board shipping point", the customer obtains control and is able to direct the use of, and obtain substantially all of the benefits from, the products at the time the products are shipped. For shipments provided under "free on board destination", control transfers to the customer upon delivery. Payment terms vary but are generally due within 30 days of transferring control. For the Company's Boat and Propulsion segments, most product sales to dealers are wholesale financed through the Company's joint venture, Brunswick Acceptance Company, LLC (BAC), or other lending institutions, and payment is typically due in the month of shipment. For further information on the BAC joint venture, refer to Note 8 – Financing Joint Venture. In addition, periodically the Company may require the customer to provide upfront cash deposits in advance of performance.
The Company also sells separately priced, extended warranty contracts that extend the coverage period beyond the standard warranty period. When determining an appropriate allocation of the transaction price to the extended warranty performance obligation, the Company uses an observable price to determine the stand-alone selling price. Extended warranties typically range from an additional 1 to 3 years. The Company receives payment at the inception of the contract and recognizes revenue over the extended warranty coverage period. This time-elapsed method is used to measure progress because the Company, on average, satisfies its performance obligation evenly over the warranty period.
See Note 2 – Revenue Recognition for more information.
Advertising Costs. The Company records advertising and promotion costs in Selling, general and administrative expense in the Consolidated Statements of Operations in the period when the advertising first takes place. Advertising and promotion costs were $27.3 million, $28.5 million and $39.9 million for the years ended December 31, 2024, 2023 and 2022, respectively.
Foreign Currency. The functional currency for the majority of Brunswick's operations is the U.S. dollar. All assets and liabilities of operations with a functional currency other than the U.S. dollar are translated at period-end currency exchange rates. The resulting translation adjustments are recorded in Accumulated other comprehensive income (loss). Revenues and expenses of operations with a functional currency other than the U.S. dollar are translated at the average exchange rates for the period. Transaction gains and losses resulting from changes in foreign currency exchange rates are recorded in either Cost of sales or Other income (expense), net in the Consolidated Statements of Operations.
Share-Based Compensation. The Company records amounts for all share-based compensation, including non-vested stock awards and performance-based share awards, over the vesting period in the Consolidated Statements of Operations based upon their fair values at the date of the grant. Share-based compensation costs are included in Selling, general and administrative expense in the Consolidated Statements of Operations. See Note 16 – Stock Plans and Management Compensation for a description of the Company's accounting for share-based compensation plans.
Research and Development. Research and development costs are expensed as incurred.
Derivatives. The Company uses derivative financial instruments to manage its risk associated with movements in foreign currency exchange rates, interest rates and commodity prices. These instruments are used in accordance with guidelines established by the Company's management and are not used for trading or speculative purposes. The Company records all derivatives on the Consolidated Balance Sheets at fair value. See Note 12 – Financial Instruments for further discussion.
BRUNSWICK CORPORATION
Notes to Consolidated Financial Statements
IT Security Incident. In 2023, the Company experienced an IT security incident that impacted some of its systems and global facilities. The Company activated its response protocols, including pausing operations in some locations, engaging leading security experts and coordinating with relevant law enforcement agencies. Normal global business operations resumed over the course of nine days following the incident. While we were able to quickly restore our operations, the incident resulted in disruption to sales as well as non-recurring costs. We are attempting to recover a portion of the lost operating earnings from lost sales and non-recurring costs from our insurance carriers. Non-recurring costs include labor while plants were idle, IT related costs and costs for legal, consulting and other professional services directly related to this incident. The Company incurred non-recurring costs related to the IT security incident of $10.1 million during the year ended December 31, 2023. Non-recurring costs related to the IT security incident incurred in 2024 were not material. A portion of the non-recurring costs are included in Cost of sales and a portion in Selling, general and administrative expense in the Consolidated Statements of Operations.
Recently Adopted Accounting Standards
Segment Reporting: In November 2023, the Financial Accounting Standards Board (FASB) issued Accounting Standards Update (ASU) 2023-07, Segment Reporting (Topic 280) — Improvements to Reportable Segment Disclosures, which adds new disclosure requirements related to significant segment expenses regularly provided to the chief operating decision maker (CODM) and included in each reported measure of segment profit or loss, other segment items that constitute the difference between segment revenues less significant segment expenses and the measure of profit or loss, disclosure of the CODMs title and position as well as an explanation of how the CODM uses the reported measures and expanded interim disclosures. ASU 2023-07 is effective for financial statements for annual periods beginning after December 15, 2023 and interim periods within fiscal years beginning after December 15, 2024. The Company adopted the guidance in ASU 2023-07 for the year ended December 31, 2024. See Note 5 – Segment Information for further information.
Supplier Finance Programs: In September 2022, the FASB issued ASU 2022-04, Liabilities — Supplier Finance Programs (Subtopic 405-50): Disclosure of Supplier Finance Program Obligations, which adds disclosure requirements associated with participation in supplier finance programs. ASU 2022-04 requires the buyer in a supplier finance program to disclose qualitative and quantitative information about the program including key terms and obligations outstanding at the end of the reporting period. ASU 2022-04 is effective for financial statements for interim and annual periods beginning after December 15, 2022. The Company adopted the guidance in ASU 2022-04 on January 1, 2023. For further information, refer to Note 20 – Supplier Finance Program Obligations.
Fair Value Hedge Accounting: In March 2022, the FASB issued ASU 2022-01, Fair Value Hedging — Portfolio Layer Method, which clarifies the guidance in Accounting Standares Codification (ASC) 815 on fair value hedge accounting of interest-rate risk for portfolios of financial assets. The ASU amends the guidance that established the “last-of-layer” method for making the fair value hedge accounting for these portfolios more accessible. The amendment was effective for financial statements for interim and annual periods beginning after December 15, 2022. The adoption of this standard did not have a material impact on the Company's consolidated financial statements.
Revenue Contracts Acquired in Business Combinations: In October 2021, the FASB issued ASU 2021-08, Accounting for Contract Assets and Contract Liabilities From Contracts With Customers, which amended the guidance in ASC 805 to require that the acquirer recognize and measure contract assets and contract liabilities acquired in a business combination in accordance with ASC 606. The Company early adopted the guidance in ASU 2021-08 on July 2, 2022. The adoption of this standard did not have a material impact on the Company's consolidated financial statements.
Recently Issued Accounting Standards
Income Statement: In November 2024, the FASB issued ASU 2024-03, Income Statement - Reporting Comprehensive Income - Expense Disaggregation Disclosures (Subtopic 220-40). This guidance requires disclosures about significant expense categories, including but not limited to, inventory purchases, employee compensation, depreciation, amortization, and selling expenses. ASU 2024-03 is effective for financial statements for annual periods beginning after December 15, 2026. We are currently evaluating the impact of adopting this guidance on the consolidated financial statements.
BRUNSWICK CORPORATION
Notes to Consolidated Financial Statements
Income Taxes: In December 2023, the FASB issued ASU 2023-09, Income Taxes (Topic 740) — Improvements to Income Tax Disclosures. Under this ASU, entities must disclose, on an annual basis, specific categories in the rate reconciliation and provide additional information for reconciling items that meet a quantitative threshold. In addition, ASU 2023-09 requires entities to disclose additional information about income taxes paid. ASU 2023-09 is effective for financial statements for annual periods beginning after December 15, 2024. We are currently evaluating the potential impact of adopting this guidance on the consolidated financial statements.
Note 2 – Revenue Recognition
The following tables present the Company's revenue in categories that depict how the nature, amount, timing and uncertainty of revenue and cash flows are affected by economic factors:
| | | | | | | | | | | | | | | | | | | | | | | | | | | | | |
| Year Ended December 31, 2024 |
| (in millions) | Propulsion | | Engine P&A | | Navico Group | | Boat | | Total |
| Geographic Markets | | | | | | | | | |
| United States | $ | 1,328.1 | | | $ | 812.1 | | | $ | 474.1 | | | $ | 1,247.3 | | | $ | 3,861.6 | |
| Europe | 313.5 | | | 115.3 | | | 216.9 | | | 112.9 | | | 758.6 | |
| Asia-Pacific | 163.7 | | | 100.6 | | | 72.8 | | | 23.7 | | | 360.8 | |
| Canada | 64.0 | | | 78.8 | | | 14.1 | | | 136.8 | | | 293.7 | |
| Rest-of-World | 204.9 | | | 54.0 | | | 22.3 | | | 32.8 | | | 314.0 | |
| Segment Eliminations | (265.2) | | | (6.3) | | | (80.1) | | | — | | | (351.6) | |
| Total | $ | 1,809.0 | | | $ | 1,154.5 | | | $ | 720.1 | | | $ | 1,553.5 | | | $ | 5,237.1 | |
| | | | | | | | | |
| Major Product Lines | | | | | | | | | |
| Outboard Engines | $ | 1,600.5 | | | $ | — | | | $ | — | | | $ | — | | | $ | 1,600.5 | |
| Controls, Rigging, and Propellers | 343.9 | | | — | | | — | | | — | | | 343.9 | |
| Sterndrive Engines | 129.8 | | | — | | | — | | | — | | | 129.8 | |
| Distribution | — | | | 657.1 | | | — | | | — | | | 657.1 | |
| Products | — | | | 503.7 | | | — | | | — | | | 503.7 | |
| Navico Group | — | | | — | | | 800.2 | | | — | | | 800.2 | |
| Aluminum Freshwater Boats | — | | | — | | | — | | | 551.2 | | | 551.2 | |
| Recreational Fiberglass Boats | — | | | — | | | — | | | 439.7 | | | 439.7 | |
| Saltwater Fishing Boats | — | | | — | | | — | | | 395.7 | | | 395.7 | |
| Business Acceleration | — | | | — | | | — | | | 199.2 | | | 199.2 | |
| Boat Eliminations/Other | — | | | — | | | — | | | (32.3) | | | (32.3) | |
| Segment Eliminations | (265.2) | | | (6.3) | | | (80.1) | | | — | | | (351.6) | |
| Total | $ | 1,809.0 | | | $ | 1,154.5 | | | $ | 720.1 | | | $ | 1,553.5 | | | $ | 5,237.1 | |
BRUNSWICK CORPORATION
Notes to Consolidated Financial Statements
| | | | | | | | | | | | | | | | | | | | | | | | | | | | | |
| Year Ended December 31, 2023 |
| (in millions) | Propulsion | | Engine P&A | | Navico Group | | Boat | | Total |
| Geographic Markets | | | | | | | | | |
| United States | $ | 1,881.7 | | | $ | 852.6 | | | $ | 573.0 | | | $ | 1,548.8 | | | $ | 4,856.1 | |
| Europe | 367.0 | | | 108.7 | | | 221.2 | | | 162.9 | | | 859.8 | |
| Asia-Pacific | 201.7 | | | 103.2 | | | 79.6 | | | 32.0 | | | 416.5 | |
| Canada | 93.1 | | | 83.2 | | | 19.4 | | | 206.8 | | | 402.5 | |
| Rest-of-World | 220.3 | | | 52.1 | | | 21.5 | | | 38.9 | | | 332.8 | |
| Segment Eliminations | (357.3) | | | (7.1) | | | (101.2) | | | (0.7) | | | (466.3) | |
| Total | $ | 2,406.5 | | | $ | 1,192.7 | | | $ | 813.5 | | | $ | 1,988.7 | | | $ | 6,401.4 | |
| | | | | | | | | |
| Major Product Lines | | | | | | | | | |
| Outboard Engines | $ | 2,198.9 | | | $ | — | | | $ | — | | | $ | — | | | $ | 2,198.9 | |
| Controls, Rigging, and Propellers | 391.6 | | | — | | | — | | | — | | | 391.6 | |
| Sterndrive Engines | 173.3 | | | — | | | — | | | — | | | 173.3 | |
| Distribution | — | | | 691.8 | | | — | | | — | | | 691.8 | |
| Products | — | | | 508.0 | | | — | | | — | | | 508.0 | |
| Navico Group | — | | | — | | | 914.7 | | | — | | | 914.7 | |
| Aluminum Freshwater Boats | — | | | — | | | — | | | 726.0 | | | 726.0 | |
| Recreational Fiberglass Boats | — | | | — | | | — | | | 643.0 | | | 643.0 | |
| Saltwater Fishing Boats | — | | | — | | | — | | | 472.8 | | | 472.8 | |
| Business Acceleration | — | | | — | | | — | | | 167.6 | | | 167.6 | |
| Boat Eliminations/Other | — | | | — | | | — | | | (20.0) | | | (20.0) | |
| Segment Eliminations | (357.3) | | | (7.1) | | | (101.2) | | | (0.7) | | | (466.3) | |
| Total | $ | 2,406.5 | | | $ | 1,192.7 | | | $ | 813.5 | | | $ | 1,988.7 | | | $ | 6,401.4 | |
| | | | | | | | | | | | | | | | | | | | | | | | | | | | | |
| Year Ended December 31, 2022 |
| (in millions) | Propulsion | | Engine P&A | | Navico Group | | Boat | | Total |
| Geographic Markets | | | | | | | | | |
| United States | $ | 1,909.9 | | | $ | 922.1 | | | $ | 691.8 | | | $ | 1,617.0 | | | $ | 5,140.8 | |
| Europe | 391.5 | | | 117.5 | | | 236.3 | | | 181.8 | | | 927.1 | |
| Asia-Pacific | 223.0 | | | 117.4 | | | 98.0 | | | 35.7 | | | 474.1 | |
| Canada | 114.2 | | | 100.8 | | | 27.8 | | | 251.7 | | | 494.5 | |
| Rest-of-World | 185.4 | | | 52.4 | | | 15.4 | | | 33.2 | | | 286.4 | |
| Segment Eliminations | (398.3) | | | (7.6) | | | (104.5) | | | (0.3) | | | (510.7) | |
| Total | $ | 2,425.7 | | | $ | 1,302.6 | | | $ | 964.8 | | | $ | 2,119.1 | | | $ | 6,812.2 | |
| | | | | | | | | |
| Major Product Lines | | | | | | | | | |
| Outboard Engines | $ | 2,221.5 | | | $ | — | | | $ | — | | | $ | — | | | $ | 2,221.5 | |
| Controls, Rigging, and Propellers | 382.1 | | | — | | | — | | | — | | | 382.1 | |
| Sterndrive Engines | 220.4 | | | — | | | — | | | — | | | 220.4 | |
| Distribution | — | | | 781.7 | | | — | | | — | | | 781.7 | |
| Products | — | | | 528.5 | | | — | | | — | | | 528.5 | |
| Navico Group | — | | | — | | | 1,069.3 | | | — | | | 1,069.3 | |
| Aluminum Freshwater Boats | — | | | — | | | — | | | 874.1 | | | 874.1 | |
| Recreational Fiberglass Boats | — | | | — | | | — | | | 727.4 | | | 727.4 | |
| Saltwater Fishing Boats | — | | | — | | | — | | | 404.3 | | | 404.3 | |
| Business Acceleration | — | | | — | | | — | | | 126.0 | | | 126.0 | |
| Boat Eliminations/Other | — | | | — | | | — | | | (12.4) | | | (12.4) | |
| Segment Eliminations | (398.3) | | | (7.6) | | | (104.5) | | | (0.3) | | | (510.7) | |
| Total | $ | 2,425.7 | | | $ | 1,302.6 | | | $ | 964.8 | | | $ | 2,119.1 | | | $ | 6,812.2 | |
BRUNSWICK CORPORATION
Notes to Consolidated Financial Statements
As of January 1, 2024, $187.1 million of contract liabilities associated with extended warranties, deferred revenue and customer deposits were reported in Accrued expenses and Other Long-term liabilities, of which $66.5 million of this amount was recognized as revenue during year ended December 31, 2024. As of December 31, 2024, total contract liabilities were $191.2 million. The total amount of the transaction price allocated to unsatisfied performance obligations as of December 31, 2024 is $187.1 million for contracts greater than one year, which primarily relates to extended warranties. The Company expects to recognize approximately $60.5 million of this amount in 2025 and $126.6 million thereafter. Contract assets as of January 1, 2024 and December 31, 2024 were not material. In addition, costs to obtain and fulfill contracts during the period were not material.
Note 3 – Restructuring, Exit and Impairment Activities
The Company has announced and implemented a number of initiatives designed to improve its cost structure, general operating efficiencies and its utilization of production capacity. These initiatives resulted in the recognition of restructuring, exit and impairment charges in the Consolidated Statements of Operations during 2024, 2023 and 2022. Restructuring, exit and impairment costs include employee termination and other benefits, inventory adjustments to lower of cost or net realizable value, costs to retain and relocate employees, consulting costs, consolidation of manufacturing footprint, facility shutdown costs, and asset disposition and impairment actions. The Company recognizes the expense in the accounting period when it has committed to or incurred the cost, as appropriate.
The following table is a summary of the net expense associated with the restructuring, exit and impairment activities. Restructuring, exit and impairment charges in 2024 relate to headcount reductions and related costs associated with streamlining the enterprise-wide cost structure and improving operating efficiencies, as well as asset-related impairments. The Company also incurred charges related to the rationalization of its manufacturing footprint. Restructuring, exit and impairment charges in 2023 relate to headcount reductions and related costs associated with streamlining the enterprise-wide cost structure and improving operating efficiencies as well as asset-related impairments. Restructuring, exit and impairment charges in 2022 primarily relate to asset-related impairments and headcount reductions associated with the integration of Navico.
| | | | | | | | | | | | | | | | | | | | | | | | | | | | | | | | | | | |
| (in millions) | Propulsion | | Engine P&A | | Navico Group | | Boat | | Corporate | | Total |
| Restructuring, exit and impairment activities: | | | | | | | | | | | |
| Employee termination and other benefits | $ | 9.6 | | | $ | 4.8 | | | $ | 7.0 | | | $ | 6.2 | | | $ | 2.4 | | | $ | 30.0 | |
Asset-related (A) | — | | | — | | | 91.6 | | | 0.1 | | | — | | | 91.7 | |
| | | | | | | | | | | |
| Total 2024 restructuring, exit and impairment charges | $ | 9.6 | | | $ | 4.8 | | | $ | 98.6 | | | $ | 6.3 | | | $ | 2.4 | | | $ | 121.7 | |
| | | | | | | | | | | |
| Employee termination and other benefits | $ | 2.7 | | | $ | 3.3 | | | $ | 11.6 | | | $ | 10.5 | | | $ | 2.8 | | | $ | 30.9 | |
Asset-related (B) | — | | | — | | | 18.9 | | | — | | | — | | | 18.9 | |
| Professional fees | — | | | — | | | — | | | — | | | 4.9 | | | 4.9 | |
| Total 2023 restructuring, exit and impairment charges | $ | 2.7 | | | $ | 3.3 | | | $ | 30.5 | | | $ | 10.5 | | | $ | 7.7 | | | $ | 54.7 | |
| | | | | | | | | | | |
| Employee termination and other benefits | $ | — | | | $ | — | | | $ | 7.7 | | | $ | — | | | $ | — | | | $ | 7.7 | |
Asset-related (C) | — | | | — | | | — | | | — | | | 17.4 | | | 17.4 | |
| | | | | | | | | | | |
| Total 2022 restructuring, exit and impairment charges | $ | — | | | $ | — | | | $ | 7.7 | | | $ | — | | | $ | 17.4 | | | $ | 25.1 | |
(A) Includes impairment charges of $85.0 million associated with an impairment of the Navico Group reporting unit's goodwill and the Navico trade name during the year ended December 31, 2024.
(B) Includes impairment charges of $13.0 million associated with an impairment of the Navico trade name during the year ended December 31, 2023.
(C) Includes impairment charges of $17.4 million related to the Company's decision not to place certain capitalized software intangible assets into service during the year ended December 31, 2022.
BRUNSWICK CORPORATION
Notes to Consolidated Financial Statements
The following tables summarize the change in accrued restructuring, exit and impairment charges within Accrued expenses in the Consolidated Balance Sheets for the years ended December 31, 2024, 2023 and 2022:
| | | | | | | | | | | | | | | | | | | | | | | | | | | | | | | | | | | |
| (in millions) | Propulsion | | Engine P&A | | Navico Group | | Boat | | Corporate | | Total |
| Accrued Charges as of December 31, 2021 | $ | — | | | $ | — | | | $ | — | | | $ | 0.2 | | | $ | — | | | $ | 0.2 | |
| Total Charges | — | | | — | | | 7.7 | | | — | | | 17.4 | | | 25.1 | |
| Non-Cash Charges | — | | | — | | | — | | | — | | | (17.4) | | | (17.4) | |
Payments (A) | — | | | — | | | (3.6) | | | (0.2) | | | — | | | (3.8) | |
| Accrued Charges as of December 31, 2022 | $ | — | | | $ | — | | | $ | 4.1 | | | $ | — | | | $ | — | | | $ | 4.1 | |
| Total Charges | 2.7 | | | 3.3 | | | 30.5 | | | 10.5 | | | 7.7 | | | 54.7 | |
| Non-Cash Charges | — | | | — | | | (18.9) | | | 1.2 | | | — | | | (17.7) | |
Payments (A) | (1.5) | | | (2.6) | | | (10.6) | | | (10.0) | | | (7.1) | | | (31.8) | |
| Accrued Charges as of December 31, 2023 | $ | 1.2 | | | $ | 0.7 | | | $ | 5.1 | | | $ | 1.7 | | | $ | 0.6 | | | $ | 9.3 | |
| Total Charges | 9.6 | | | 4.8 | | | 98.6 | | | 6.3 | | | 2.4 | | | 121.7 | |
| Non-Cash Charges | — | | | — | | | (91.6) | | | 0.3 | | | — | | | (91.3) | |
Payments (A) | (9.4) | | | (4.8) | | | (10.6) | | | (6.3) | | | (2.1) | | | (33.2) | |
Accrued Charges as of December 31, 2024 (B) | $ | 1.4 | | | $ | 0.7 | | | $ | 1.5 | | | $ | 2.0 | | | $ | 0.9 | | | $ | 6.5 | |
(A) Cash payments may include payments related to prior period charges.
(B) The accrued charges as of December 31, 2024 are expected to be paid in the next twelve months.
Reductions in demand for the Company's products, further refinement of its product portfolio, further opportunities to reduce costs or the cost of integrating future acquisitions may result in additional restructuring, exit and impairment charges in future periods.
Note 4 – Acquisitions
2024 Acquisition
On September 12, 2024, the Company acquired additional Freedom Boat Club franchise operations and territories in Southeast Florida. The acquisition enhances Freedom Boat Club's presence in Florida and provides an opportunity to leverage synergies across Brunswick's portfolio of brands. The acquisition is included as part of the Company's Boat segment.
The Company paid net cash consideration of $31.2 million for the acquisition. The opening balance sheet, which is preliminary and subject to change in the measurement period as the Company finalizes the purchase price allocation and fair value estimates, includes $26.7 million of goodwill and $5.2 million of customer relationships. The amount assigned to customer relationships will be amortized over the estimated useful life of 10 years. Transaction costs associated with the acquisition were not material to the Company's consolidated results of operations. The acquisition is not material to the Company's net sales, results of operations, or total assets during any period presented. Accordingly, the Company's consolidated results of operations do not differ materially from historical performance as a result of the acquisition, and pro forma results for prior periods are not presented.
2023 Acquisitions
During the fourth quarter of 2023, the Company acquired additional Freedom Boat Club franchise operations and territories in the Southeast United States. These acquisitions should unlock operational efficiencies while providing members with additional boating destinations, as the Company plans for continued expansion across the Southeast Coastal region. These acquisitions are included as part of the Company's Boat segment.
BRUNSWICK CORPORATION
Notes to Consolidated Financial Statements
The Company paid net cash consideration of $16.0 million for these acquisitions. The opening balance sheets include $12.9 million of goodwill and $3.3 million of customer relationships. The amount assigned to customer relationships will be amortized over the estimated useful life of 10 years. Transaction costs associated with these acquisitions were not material to the Company's consolidated results of operations.
On September 1, 2023, the Company acquired all of the issued and outstanding shares of Fliteboard Pty Ltd (Fliteboard) for $88.3 million net cash consideration. Fliteboard is a leader in eFoiling technology, which combines advanced hydrofoils and electric propulsion on the water. The acquisition of Fliteboard allows the Company to enter the emerging electric-foiling surfboard market and presents the opportunity for technological, manufacturing, commercial and consumer synergies with our existing portfolio. Fliteboard is included as part of the Company's Propulsion segment.
The opening balance sheet includes $38.0 million of goodwill, $20.7 million of trade names, $8.4 million of customer relationships, and $7.1 million of developed technology. The amounts assigned to customer relationships and developed technology will be amortized over the estimated useful lives of 15 years and 10 years, respectively. Transaction costs associated with the acquisition were not material to the Company's consolidated results of operations.
These 2023 acquisitions are not material to the Company's net sales, results of operations or total assets during any period presented. Accordingly, the Company's consolidated results of operations do not differ materially from historical performance as a result of the acquisitions, and pro forma results for prior periods are not presented. Purchase accounting is final for these acquisitions.
2022 Acquisitions
During the second quarter of 2022, the Company acquired certain Freedom Boat Club franchise operations and territory rights as well as certain marine assets in the Southeast United States. These acquisitions enable opportunities across a wide spectrum, building upon the growth Brunswick has cultivated throughout the Company's shared access portfolio and new digital platforms. These acquisitions are included as part of the Company's Boat segment.
The Company paid net cash consideration of $93.9 million for these acquisitions. The opening balance sheets include $71.4 million of goodwill and $11.9 million of customer relationships. The amount assigned to customer relationships will be amortized over the estimated useful life of 10 years. Transaction costs associated with these acquisitions were not material to the Company's consolidated results of operations. The acquisitions are not material to the Company's net sales, results of operations or total assets during any period presented. Accordingly, the Company's consolidated results of operations do not differ materially from historical performance as a result of the acquisitions, and pro forma results for prior periods are not presented. Purchase accounting is final for these acquisitions.
Note 5 – Segment Information
Effective January 1, 2023, the Company changed its management reporting and updated its reportable segments to Propulsion, Engine P&A, Navico Group and Boat to align with our internal operating structure.
The Company's segments are defined by management's reporting structure and operating activities. The Company's reportable segments are the following:
Propulsion. The Propulsion segment manufactures and markets a full range of outboard, sterndrive, and inboard engines, as well as propulsion-related controls, rigging, and propellers. These products are principally sold directly to boat builders, including Brunswick's Boat segment, and through marine retail dealers worldwide. The Propulsion segment primarily markets under the Mercury, Mercury MerCruiser, Mariner, Mercury Racing, Mercury Diesel, Avator and Fliteboard brands. The segment's engine manufacturing plants are located mainly in the United States and China, along with a joint venture in Japan, with sales mainly to markets in the Americas, Europe and Asia-Pacific.
BRUNSWICK CORPORATION
Notes to Consolidated Financial Statements
Engine P&A. The Engine P&A segment manufactures, markets, supplies and distributes products for both marine and non-marine markets. These products are designed for and sold mostly to aftermarket retailers, distributors, and distribution businesses, as well as original equipment manufacturers (including Brunswick brands). Company-branded products include consumables, such as engine oils and lubricants, and are sold under the Mercury, Mercury Precision Parts, Quicksilver and Seachoice brands. The Engine P&A segment also includes distribution businesses such as Land 'N' Sea, Kellogg Marine Supply, Lankhorst Taselaar, BLA and Payne's Marine Group, which distribute third party and Company products. These businesses are leading distributors of marine parts and accessories throughout North America, Europe and Asia-Pacific. The segment's manufacturing and distribution facilities are primarily located in North America, Europe, Australia and New Zealand.
Navico Group. The Navico Group segment designs, develops, manufactures, and markets products and systems for the marine, RV, specialty vehicle, mobile and industrial markets, as well as aftermarket channels. Navico Group's brand portfolio includes the Ancor, Attwood, B&G, BEP, Blue Sea Systems, C-MAP, CZone, Lenco, Lowrance, Marinco, Mastervolt, MotorGuide, Progressive Industries, ProMariner, RELiON, Simrad and Whale brand names. These brands span multiple categories, including marine electronics, sensors, control systems, instruments, power systems and general accessories. The segment's manufacturing and distribution facilities are primarily located in North America, Europe, Australia and New Zealand.
Boat. The Boat segment designs, manufactures, and markets the following boat brands and products: Sea Ray sport boats and cruisers; Bayliner sport cruisers, runabouts, and Heyday wake boats; Boston Whaler fiberglass offshore boats; Lund fiberglass fishing boats; Crestliner, Harris, Lowe, Lund, and Princecraft aluminum fishing, utility, pontoon boats, and deck boats; Navan premium adventure boats; and Thunder Jet heavy-gauge aluminum boats. The Boat segment also includes Brunswick boat brands based in Europe and Asia-Pacific, which include Quicksilver, Rayglass (including Protector and Legend) and Uttern. The Boat segment procures substantially all of its engines from Brunswick's Propulsion segment, and boats often include other parts and accessories supplied by the Engine P&A and Navico Group segments. The Boat segment's products are manufactured mainly in the United States, Europe, Mexico and Canada and sold through a global network of dealer and distributor locations, primarily in North America and Europe.
The Boat segment also includes Business Acceleration which, through innovative service models, shared access solutions, including the Freedom Boat Club business acquired in 2019, dealer services and emerging technology, aims to provide exceptional experiences to attract a wide range of customers to the marine industry and shape the future of boating.
Brunswick Corporation’s chief operating decision maker (CODM) is the Chief Executive Officer. The CODM uses operating earnings to allocate resources (including employees, property, and financial or capital resources) for each segment predominantly in the annual budget and forecasting process. The CODM considers forecast-to-actual variances when making decisions about allocating capital and personnel to the segments. The CODM also uses segment operating earnings for evaluating product pricing and cost structure, to assess the performance of each segment by comparing the results with one another, and in the compensation of certain employees. Segment operating earnings do not include the expenses of corporate administration, impairments or gains on the sale of equity investments, earnings from unconsolidated affiliates, other expenses and income of a non-operating nature, transaction financing charges, interest expense and income or provisions or benefits for income taxes.
Corporate/Other results include items such as corporate staff and administrative costs, investments in technology solutions, business development and other growth-related expenses, including IT enhancements. Corporate/Other total assets consist of mainly cash, cash equivalents and investments in short-term marketable securities, restricted cash, income tax balances and investments in unconsolidated affiliates.
Segment eliminations adjust for sales between the Company's reportable segments and primarily relate to the sale of engines and parts and accessories to various boat brands, which are consummated at established arm's length transfer prices as the intersegment pricing for these engines and parts and accessories are based upon and consistent with selling prices to third-party customers.
BRUNSWICK CORPORATION
Notes to Consolidated Financial Statements
Information about the operations of Brunswick's reportable segments is set forth below:
| | | | | | | | | | | | | | | | | | | | | | | | | | | | | | | | | | | |
| | For the Year Ended December 31, 2024 |
| (in millions) | Propulsion | | Engine P&A | | Navico Group | | Boat | | Corporate/Other | | Total |
Net sales (A) | $ | 1,809.0 | | | $ | 1,154.5 | | | $ | 720.1 | | | $ | 1,553.5 | | | $ | — | | | $ | 5,237.1 | |
Cost of sales (B) | 1,315.0 | | 826.3 | | 471.5 | | 1,288.2 | | — | | | 3,901.0 | |
Operating expenses (C) | 251.4 | | 108.3 | | 349.2 | | 202.0 | | 113.6 | | 1,024.5 | |
| Operating earnings | $ | 242.6 | | | $ | 219.9 | | | $ | (100.6) | | | $ | 63.3 | | | $ | (113.6) | | | $ | 311.6 | |
(A) Net sales includes $265.2 million, $6.3 million and $80.1 million of segment eliminations for the Propulsion, Engine P&A and Navico Group reportable segments, respectively.
(B) Includes $14.7 million of Cost of sales related Restructuring, exit and impairment charges.
(C) Includes $747.9 million of Selling, general and administrative expense, $169.6 million of Research and development expense and $107.0 million of Restructuring, exit and impairment charges.
| | | | | | | | | | | | | | | | | | | | | | | | | | | | | | | | | | | |
| | For the Year Ended December 31, 2023 |
| (in millions) | Propulsion | | Engine P&A | | Navico Group | | Boat | | Corporate/Other | | Total |
Net sales (A) | $ | 2,406.5 | | | $ | 1,192.7 | | | $ | 813.5 | | | $ | 1,988.7 | | | $ | — | | | $ | 6,401.4 | |
Cost of sales (B) | 1,643.2 | | 856.9 | | 512.6 | | 1,612.6 | | — | | | 4,625.3 | |
Operating expenses (C) | 268.6 | | 118.4 | | 295.7 | | 220.5 | | 138.0 | | 1,041.2 | |
| Operating earnings | $ | 494.7 | | | $ | 217.4 | | | $ | 5.2 | | | $ | 155.6 | | | $ | (138.0) | | | $ | 734.9 | |
(A) Net sales includes $357.3 million, $7.1 million, $101.2 million and $0.7 million of segment eliminations for the Propulsion, Engine P&A, Navico Group and Boat reportable segments, respectively.
(B) Includes $10.9 million of Cost of sales related Restructuring, exit and impairment charges.
(C) Includes $812.2 million of Selling, general and administrative expense, $185.2 million of Research and development expense and $43.8 million of Restructuring, exit and impairment charges.
| | | | | | | | | | | | | | | | | | | | | | | | | | | | | | | | | | | |
| | For the Year Ended December 31, 2022 |
| (in millions) | Propulsion | | Engine P&A | | Navico Group | | Boat | | Corporate/Other | | Total |
Net sales (A) | $ | 2,425.7 | | | $ | 1,302.6 | | | $ | 964.8 | | | $ | 2,119.1 | | | $ | — | | | $ | 6,812.2 | |
Cost of sales (B) | 1,650.3 | | 912.3 | | 594.7 | | 1,707.8 | | — | | | 4,865.1 | |
Operating expenses (C) | 252.5 | | 122.3 | | 301.9 | | 198.5 | | 124.1 | | 999.3 | |
| Operating earnings | $ | 522.9 | | | $ | 268.0 | | | $ | 68.2 | | | $ | 212.8 | | | $ | (124.1) | | | $ | 947.8 | |
(A) Net Sales includes $398.3 million, $7.6 million, $104.5 million and $0.3 million of segment eliminations for the Propulsion, Engine P&A, Navico Group and Boat reportable segments, respectively.
(B) Includes $0.1 million of Cost of sales related Restructuring, exit and impairment charges.
(C) Includes $771.4 million of Selling, general and administrative expense, $202.9 million of Research and development expense and $25.0 million of Restructuring, exit and impairment charges.
| | | | | | | | | | | | | | | | | | | | | | | | | | | | | | | | | | | |
| | Depreciation | | Amortization |
| (in millions) | 2024 | | 2023 | | 2022 | | 2024 | | 2023 | | 2022 |
| Propulsion | $ | 127.0 | | | $ | 124.3 | | | $ | 98.8 | | | $ | 8.7 | | | $ | 4.7 | | | $ | 3.1 | |
| Engine P&A | 16.9 | | | 15.2 | | | 11.0 | | | 0.9 | | | 0.7 | | | 0.7 | |
| Navico Group | 12.3 | | | 12.3 | | | 13.5 | | | 55.9 | | | 55.7 | | | 55.2 | |
| Boat | 52.8 | | | 49.0 | | | 42.1 | | | 5.8 | | | 5.0 | | | 3.3 | |
| Corporate/Other | 5.0 | | | 3.5 | | | 2.5 | | | 3.5 | | | 2.5 | | | 1.0 | |
| Total | $ | 214.0 | | | $ | 204.3 | | | $ | 167.9 | | | $ | 74.8 | | | $ | 68.6 | | | $ | 63.3 | |
BRUNSWICK CORPORATION
Notes to Consolidated Financial Statements
| | | | | | | | | | | | | | | | | | | | | | | | | | | | | | | | | | | | | | | | | | | | | | | |
| | Total Assets | | Capital Expenditures | | Research & Development Expense |
| (in millions) | 2024 | | 2023 | | 2024 | | 2023 | | 2022 | | 2024 | | 2023 | | 2022 |
| Propulsion | $ | 1,507.3 | | | $ | 1,648.7 | | | $ | 81.4 | | | $ | 157.1 | | | $ | 236.1 | | | $ | 88.2 | | | $ | 99.6 | | | $ | 104.6 | |
| Engine P&A | 803.5 | | | 855.6 | | | 8.4 | | | 17.9 | | | 25.7 | | | 1.3 | | | 1.4 | | | 1.3 | |
| Navico Group | 1,877.6 | | | 2,074.3 | | | 21.8 | | | 26.3 | | | 24.4 | | | 46.6 | | | 48.0 | | | 66.1 | |
| Boat | 868.3 | | | 874.8 | | | 47.3 | | | 72.3 | | | 86.6 | | | 25.2 | | | 26.9 | | | 26.7 | |
| Corporate/Other | 621.0 | | | 777.1 | | | 8.5 | | | 15.7 | | | 15.5 | | | 8.3 | | | 9.3 | | | 4.2 | |
| Total | $ | 5,677.7 | | | $ | 6,230.5 | | | $ | 167.4 | | | $ | 289.3 | | | $ | 388.3 | | | $ | 169.6 | | | $ | 185.2 | | | $ | 202.9 | |
Geographic Segments
| | | | | | | | | | | | | | | | | | | | | | | | | | | | | |
| Net sales | | Net property |
| (in millions) | 2024 | | 2023 | | 2022 | | 2024 | | 2023 |
| United States | $ | 3,547.6 | | | $ | 4,449.8 | | | $ | 4,699.2 | | | $ | 1,127.8 | | | $ | 1,182.7 | |
| International | 1,689.5 | | | 1,951.6 | | | 2,113.0 | | | 105.2 | | | 111.4 | |
| Corporate/Other | — | | | — | | | — | | | 18.5 | | | 21.7 | |
| Total | $ | 5,237.1 | | | $ | 6,401.4 | | | $ | 6,812.2 | | | $ | 1,251.5 | | | $ | 1,315.8 | |
Note 6 – Fair Value Measurements
Fair value is defined as the exchange price that would be received for an asset or paid to transfer a liability (an exit price) in the principal or most advantageous market for the asset or liability in an orderly transaction between market participants on the measurement date. Valuation techniques used to measure fair value must maximize the use of observable inputs and minimize the use of unobservable inputs. There is a fair value hierarchy based on three levels of inputs, of which the first two are considered observable and the last unobservable.
•Level 1 - Quoted prices in active markets for identical assets or liabilities. These are typically obtained from real-time quotes for transactions in active exchange markets involving identical assets or liabilities.
•Level 2 - Inputs, other than quoted prices included within Level 1, which are observable for the asset or liability, either directly or indirectly. These are typically obtained from readily available pricing sources for comparable instruments.
•Level 3 - Unobservable inputs for which there is little or no market activity for the asset or liability. These inputs reflect the reporting entity's own assumptions of the data that market participants would use in pricing the asset or liability, based on the best information available in the circumstances.
The following table summarizes the Company's financial assets and liabilities measured at fair value on a recurring basis:
| | | | | | | | | | | | | | | | | | | | |
| | | | Fair Value |
| (in millions) | | Fair Value Level | | December 31, 2024 | | December 31, 2023 |
| Cash equivalents | | 1 | | $ | 12.3 | | | $ | 0.4 | |
| Short-term investments in marketable securities | | 1 | | 0.8 | | | 0.8 | |
| Restricted cash | | 1 | | 16.9 | | | 11.1 | |
| Derivative assets | | 2 | | 22.1 | | | 5.2 | |
| Derivative liabilities | | 2 | | 9.4 | | | 13.7 | |
| Deferred compensation | | 1 | | 1.0 | | | 1.5 | |
| Deferred compensation | | 2 | | 19.2 | | | 16.1 | |
| Liabilities measured at net asset value | | | | 14.3 | | | 12.9 | |
| | | | | | |
BRUNSWICK CORPORATION
Notes to Consolidated Financial Statements
Fair Value of Other Financial Instruments. The carrying values of the Company’s short-term financial instruments, including cash and cash equivalents and accounts and notes receivable, approximate their fair values because of the short maturity of these instruments. As of December 31, 2024 and December 31, 2023, the fair value of the Company’s long-term debt, including current maturities, and short-term debt was approximately $2,161.3 million and $2,228.2 million, respectively, and was determined using Level 1 and Level 2 inputs described above. The carrying value of long-term debt, including current maturities, and short-term debt was $2,370.2 million and $2,458.7 million as of December 31, 2024 and December 31, 2023, respectively.
Refer to Note 12 – Financial Instruments for additional information related to the fair value of derivative assets and liabilities by class.
Note 7 - Investments
Investments in Marketable Securities
The Company may invest a portion of its cash reserves in marketable debt securities. These investments are reported in Short-term investments in marketable securities on the Consolidated Balance Sheets.
The following is a summary of the fair values, which were equal to the amortized costs, of the Company's available-for-sale securities, all due in one year or less, as of December 31, 2024 and 2023.
| | | | | | | | | | | |
| (in millions) | December 31, 2024 | | December 31, 2023 |
| | | |
| | | |
| U.S. Treasury Bills | $ | 0.8 | | | $ | 0.8 | |
| | | |
The Company had $82.1 million, $3.8 million and $56.4 million of maturities of available-for-sale securities in 2024, 2023, and 2022, respectively.
Equity Investments
The Company has certain unconsolidated international and domestic affiliates that are accounted for using the equity method. The equity method is applied in situations in which the Company has the ability to exercise significant influence, but not control, over the investees. Management reviews equity investments for impairment whenever indicators are present, suggesting that the carrying value of an investment is not recoverable. The following items are examples of impairment indicators: significant, sustained declines in an investee’s revenue, earnings, and cash flow trends; adverse market conditions of the investee’s industry or geographic area; the investee’s inability to execute its operating plan; the investee’s inability to continue operations measured by several items, including liquidity; and other factors. Once an impairment indicator is identified, management uses considerable judgment to determine if the decline in value is other-than-temporary. If the decline in value is determined to be other-than-temporary, then the equity investment is written down to its estimated fair value. Such a write down could negatively impact reported results of operations.
The Company has a 50 percent interest in TN-BC Holdings LLC (the Joint Venture), which is a joint venture accounted for as an equity method investment, between the Company and TechNexus Holdings LLC formed in 2017. During the year ended December 31, 2023, the Company recorded an impairment charge of $19.2 million due to a decline in the fair value of its investment in the Joint Venture, as a result of a reduction in value of certain of the Joint Venture's underlying investments. The impairment charge is included in Equity earnings (loss) in the Consolidated Statements of Operations.
The Company has a 50 percent interest in a Japanese manufacturing company, Tohatsu Marine Corporation (TMC), which is accounted for as an equity method investment. The Company purchases engines from TMC, which are sold mostly in international markets. The Company reported a net amount payable to TMC of $14.4 million and $15.5 million as of December 31, 2024 and December 31, 2023, respectively, within Accounts payable in the Consolidated Balance Sheets. Purchases from TMC were $79.6 million, $80.2 million and $137.7 million in 2024, 2023, and 2022, respectively.
BRUNSWICK CORPORATION
Notes to Consolidated Financial Statements
Refer to Note 8 – Financing Joint Venture for more details on the Company’s Brunswick Acceptance Company, LLC joint venture.
Note 8 – Financing Joint Venture
The Company, through its Brunswick Financial Services Corporation (BFS) subsidiary, owns a 49 percent interest in a joint venture, Brunswick Acceptance Company, LLC (BAC). CDF Joint Ventures, LLC (CDFJV), a subsidiary of Wells Fargo and Company, owns the remaining 51 percent.
In December of 2024, the parties entered into an amended and restated joint venture agreement (JV Agreement) to extend the term of their financial services through December 31, 2030. The JV Agreement contains a financial covenant that conforms to the maximum net leverage ratio test in the Credit Facility described in Note 14 – Debt. The JV Agreement contains provisions allowing for the renewal of the agreement or the purchase of the other party's interest in the joint venture at the end of its term. Alternatively, either partner may terminate the agreement at the end of its term.
BAC is funded in part through a $1.0 billion secured borrowing facility from Wells Fargo Commercial Distribution Finance, LLC (WFCDF), which is in place through the term of the joint venture, and with equity contributions from both partners. BAC also may sell a portion of its receivables to a securitization facility, the Wells Fargo Dealer Floorplan Master Note Trust, which is arranged by Wells Fargo. The sales of these receivables meet the requirements of a "true sale" and are therefore not retained on the financial statements of BAC. Neither the Company nor any of its subsidiaries guarantee the indebtedness of BAC. In addition, BAC is not responsible for any continuing servicing costs or obligations with respect to the securitized receivables.
The Company considers BFS's investment in BAC as an investment in a variable interest entity of which the Company is not the primary beneficiary. As a result, the Company accounts for BFS's investment in BAC under the equity method and records it as a component of Equity investments in its Consolidated Balance Sheets. The Company records BFS's share of income or loss in BAC based on its ownership percentage in the joint venture in Equity earnings (loss) in its Consolidated Statements of Operations. BFS's equity investment is adjusted monthly to maintain a 49 percent interest in accordance with the capital provisions of the JV Agreement. The Company funds its investment in BAC through cash contributions and reinvested earnings. BFS's total investment in BAC as of December 31, 2024 and December 31, 2023 was $24.0 million and $27.2 million, respectively.
The Company's maximum loss exposure relating to BAC is detailed as follows:
| | | | | | | | | | | |
| (in millions) | December 31,
2024 | | December 31,
2023 |
| Investment | $ | 24.0 | | | $ | 27.2 | |
Repurchase and recourse obligations (A) | 52.6 | | | 43.1 | |
Liabilities (B) | (1.5) | | | (2.2) | |
| Total maximum loss exposure | $ | 75.1 | | | $ | 68.1 | |
(A)Repurchase and recourse obligations are off-balance sheet obligations provided by the Company for the Propulsion, Engine P&A, Navico Group and Boat segments, respectively, and are included within the Maximum Potential Obligations disclosed in Note 11 – Commitments and Contingencies. Repurchase and recourse obligations include a North American repurchase agreement with WFCDF and could be reduced by repurchase activity occurring under other similar agreements with WFCDF and affiliates. The Company's risk under these repurchase arrangements is partially mitigated by the value of the products repurchased as part of the transaction. Amounts above exclude any potential recoveries from the value of the repurchased product.
(B)Represents accrued amounts for potential losses related to recourse exposure and the Company's expected losses on obligations to repurchase products, after giving effect to proceeds anticipated to be received from the resale of these products to alternative dealers.
BFS recorded income related to the operations of BAC of $8.0 million, $8.6 million and $4.5 million in Equity earnings (loss) in the Consolidated Statements of Operations for the years ended December 31, 2024, 2023 and 2022, respectively.
Cash Flows
BFS reported cash flows from operating activities of $8.7 million, $8.2 million and $4.3 million within Other, net on the Consolidated Statements of Cash Flows in 2024, 2023 and 2022, respectively.
BRUNSWICK CORPORATION
Notes to Consolidated Financial Statements
In 2024, BFS reported net cash flows from investing activities within Investments on the Consolidated Statements of Cash Flows. Such cash flows for 2024 were $2.5 million, consisting of $8.7 million of cash received and $(6.2) million of cash contributions; in 2023 were $(6.4) million, consisting of $7.2 million of cash received and $(13.6) million of cash contributions; and in 2022 were $(9.2) million, consisting of $2.8 million of cash received and $(12.0) million of cash contributions.
Note 9 – Goodwill and Other Intangibles
Changes in the Company's goodwill by segment during the periods ended December 31, 2024 and 2023 are summarized below:
| | | | | | | | | | | | | | | | | | | | | | | | | | | | | | | | | |
| (in millions) | Propulsion | | | | | | Engine P&A | | Navico Group | | Boat | | Total |
| December 31, 2022 | $ | 14.0 | | | | | | | $ | 232.8 | | | $ | 595.8 | | | $ | 125.0 | | | $ | 967.6 | |
| Acquisitions | 38.5 | | | | | | | — | | | — | | | 14.0 | | | 52.5 | |
| Adjustments | 1.6 | | | | | | | 0.2 | | | 3.9 | | | 4.9 | | | 10.6 | |
| December 31, 2023 | $ | 54.1 | | | | | | | $ | 233.0 | | | $ | 599.7 | | | $ | 143.9 | | | $ | 1,030.7 | |
| Acquisitions | — | | | | | | | — | | | — | | | 26.7 | | | 26.7 | |
| Impairments | — | | | | | | | — | | | (80.0) | | | — | | | (80.0) | |
| Adjustments | (3.3) | | | | | | | (0.4) | | | (6.3) | | | (1.3) | | | (11.3) | |
| December 31, 2024 | $ | 50.8 | | | | | | | $ | 232.6 | | | $ | 513.4 | | | $ | 169.3 | | | $ | 966.1 | |
See Note 4 – Acquisitions for further details on the Company's acquisitions. Adjustments in both periods include the effect of foreign currency translation on goodwill denominated in currencies other than the U.S. dollar. In addition, adjustments during the year ended December 31, 2024 also include $1.6 million of purchase accounting adjustments from the 2023 Fliteboard and Freedom Boat Club acquisitions, primarily related to income taxes. Adjustments during the year ended December 31, 2023 also include $4.8 million of purchase accounting
adjustments from 2022 Freedom Boat Club acquisitions, a majority of which related to boat fleet fair market value adjustments.
As discussed in Note 1 – Significant Accounting Policies, effective January 1, 2023, we changed our reportable segments. Concurrent with the change in reportable segments, the Navico Group operating segment is now also the reporting unit at which we evaluate goodwill for impairment. As a result of this change, we evaluated impairment indicators at the previous reporting units immediately prior to the change and at the Navico Group reporting unit immediately following the change and concluded there were no indicators of impairment.
The Company performed its fourth quarter goodwill impairment assessment and determined the fair value of its reporting units exceeded the carrying value, with the exception of the Navico Group reporting unit. As a result of unfavorable movements in the underlying inputs impacting the discount rate, the Company recorded an $80.0 million impairment of the Navico Group reporting unit's goodwill during the year ended December 31, 2024. Following the impairment charge, the Navico Group reporting unit has goodwill assigned to it of $513.4 million as of December 31, 2024 and its fair value approximates its carrying value. The accumulated impairment loss on Goodwill as of December 31, 2024 was $80.0 million. There was no accumulated impairment loss on Goodwill as of December 31, 2023.
BRUNSWICK CORPORATION
Notes to Consolidated Financial Statements
The Company's intangible assets, included within Other intangibles, net on the Consolidated Balance Sheets as of December 31, 2024 and 2023, are summarized by intangible asset type below:
| | | | | | | | | | | | | | | | | | | | | | | |
| 2024 | | 2023 |
| (in millions) | Gross Amount | | Accumulated Amortization | | Gross Amount | | Accumulated Amortization |
| Intangible assets: | | | | | | | |
Customer relationships (A) | $ | 909.4 | | | $ | (473.5) | | | $ | 907.3 | | | $ | (428.6) | |
| Trade names | 304.2 | | | — | | | 311.5 | | | — | |
Developed technology (A) | 166.8 | | | (35.6) | | | 167.5 | | | (24.3) | |
Other (A) | 113.7 | | | (66.7) | | | 91.2 | | | (46.6) | |
| Total | $ | 1,494.1 | | | $ | (575.8) | | | $ | 1,477.5 | | | $ | (499.5) | |
(A) The weighted average remaining amortization period for Customer relationships, Developed technology and Other intangibles assets was 9.6, 11.6, and 2.9, respectively, as of December 31, 2024.
Other intangible assets primarily consist of software, patents and franchise agreements. Gross and related accumulated amortization amounts include adjustments related to the impact of foreign currency translation. See Note 4 – Acquisitions for further details on intangibles acquired during 2024 and 2023. Aggregate amortization expense for intangibles was $74.8 million, $68.6 million and $63.3 million for the years ended December 31, 2024, 2023 and 2022, respectively. The following table is the estimated future amortization expense for intangible assets:
| | | | | |
| (in millions) | |
| 2025 | $ | 75.1 | |
| 2026 | 75.1 | |
| 2027 | 75.1 | |
| 2028 | 74.9 | |
| 2029 | 74.1 | |
The Company tests its intangible assets for impairment during the fourth quarter of each year, or whenever a change in events and circumstances (triggering event) occurs that indicates the fair value of intangible assets may be below their carrying values. The Company recorded impairment charges of $5.0 million during the year ended December 31, 2024 related to the Navico trade name as a result of unfavorable movements in the underlying inputs impacting the discount rate. The Company recorded $16.6 million of impairment charges during the year ended December 31, 2023, including a $13.0 million impairment of its Navico trade name as a result of declines in forecasted revenues primarily driven by macroeconomic factors and a decline in market conditions and a $3.0 million impairment associated with the decision to no longer go to market under the Garelick trade name. The Company recorded $17.4 million of impairment charges during the year ended December 31, 2022 related to the Company's decision not to place certain capitalized software intangible assets into service.
Note 10 – Income Taxes
The sources of Earnings before income taxes were as follows:
| | | | | | | | | | | | | | | | | |
| (in millions) | 2024 | | 2023 | | 2022 |
| United States | $ | 89.9 | | | $ | 364.4 | | | $ | 603.2 | |
| Foreign | 113.4 | | | 264.5 | | | 250.4 | |
| Earnings before income taxes | $ | 203.3 | | | $ | 628.9 | | | $ | 853.6 | |
BRUNSWICK CORPORATION
Notes to Consolidated Financial Statements
The Income tax provision consisted of the following:
| | | | | | | | | | | | | | | | | |
| (in millions) | 2024 | | 2023 | | 2022 |
| Current tax expense: | | | | | |
| U.S. Federal | $ | 20.2 | | | $ | 88.7 | | | $ | 109.8 | |
| State and local | 7.8 | | | 17.3 | | | 20.3 | |
| Foreign | 41.6 | | | 73.9 | | | 61.1 | |
| Total current | 69.6 | | | 179.9 | | | 191.2 | |
| | | | | |
| Deferred tax (benefit) expense: | | | | | |
| U.S. Federal | (13.1) | | | 17.2 | | | (24.6) | |
| State and local | 11.7 | | | 10.2 | | | 1.5 | |
| Foreign | (14.2) | | | (11.0) | | | 4.2 | |
| Total deferred | (15.6) | | | 16.4 | | | (18.9) | |
| | | | | |
| Income tax provision | $ | 54.0 | | | $ | 196.3 | | | $ | 172.3 | |
Temporary differences and carryforwards giving rise to deferred tax assets and liabilities as of December 31, 2024, and 2023 are summarized in the table below:
| | | | | | | | | | | |
| (in millions) | 2024 | | 2023 |
| Deferred tax assets: | | | |
| | | |
| Loss carryforwards | $ | 60.5 | | | $ | 59.9 | |
| Tax credit carryforwards | 53.0 | | | 56.1 | |
| Deferred revenue | 40.2 | | | 38.0 | |
| Product warranties | 34.4 | | | 35.4 | |
| Interest expense | 33.5 | | | 17.6 | |
| Sales incentives and discounts | 30.3 | | | 33.3 | |
| Operating lease liabilities | 30.1 | | | 29.8 | |
| | | |
| | | |
| | | |
| | | |
| Equity compensation | 13.0 | | | 13.1 | |
| | | |
| Other | 82.5 | | | 73.2 | |
| Gross deferred tax assets | 377.5 | | | 356.4 | |
| Valuation allowance | (75.1) | | | (71.3) | |
| Deferred tax assets | 302.4 | | | 285.1 | |
| | | |
| Deferred tax liabilities: | | | |
| | | |
| Depreciation and amortization | (54.3) | | | (54.5) | |
| Operating lease assets | (28.3) | | | (27.6) | |
| State and Local income taxes | (22.6) | | | (22.7) | |
| Other | (10.1) | | | (5.9) | |
| Deferred tax liabilities | (115.3) | | | (110.7) | |
| | | |
| Total net deferred tax assets | $ | 187.1 | | | $ | 174.4 | |
BRUNSWICK CORPORATION
Notes to Consolidated Financial Statements
As of December 31, 2024, the Company had a total valuation allowance against its deferred tax assets of $75.1 million. The remaining realizable value of deferred tax assets as of December 31, 2024 was determined by evaluating the potential to recover the value of these assets through the utilization of tax loss and credit carrybacks, the reversal of existing taxable temporary differences and carryforwards, certain tax planning strategies and future taxable income exclusive of reversing temporary differences and carryforwards. As of December 31, 2024, the Company retained valuation allowance reserves of $57.3 million against deferred tax assets in the U.S. primarily related to state tax credits that are subject to restrictive rules for future utilization, various state operating loss carryforwards, and non-amortizable intangibles and valuation allowances of $17.8 million for deferred tax assets related to foreign jurisdictions, primarily Luxembourg.
As of December 31, 2024, the tax benefit of loss carryforwards totaling $60.6 million was available to reduce future tax liabilities. This deferred tax asset was comprised of $1.0 million for the tax benefit of federal net operating loss (NOL) carryforwards, $23.2 million for the tax benefit of state NOL carryforwards and $36.4 million for the tax benefit of foreign NOL carryforwards. NOL carryforwards of $41.2 million expire at various intervals between the years 2025 and 2044, while $19.4 million have an unlimited life.
As of December 31, 2024, tax credit carryforwards totaling $53.0 million were available to reduce future tax liabilities. This deferred tax asset was comprised of $1.4 million related to federal tax credits, $49.8 million of various state tax credits related to research and development, capital investment and job incentives and $1.8 million related to foreign tax credits. These tax credit carryforwards expire at various intervals between the years 2025 and 2043.
No deferred income taxes have been provided as of December 31, 2024 or 2023 on the applicable undistributed earnings of the non-U.S. subsidiaries where the indefinite reinvestment assertion has been applied. If at some future date these earnings cease to be indefinitely reinvested and are repatriated, the Company may be subject to additional U.S. income taxes and foreign withholding and other taxes on such amounts. Remittances from foreign subsidiaries are generally not subject to U.S. income taxation. These remittances are either excluded from U.S. taxable income as earnings that have already been subjected to taxation or in the alternative are subject to a 100 percent foreign dividends received deduction. The Company continues to provide deferred taxes, primarily related to foreign withholding taxes, on the undistributed net earnings of foreign subsidiaries and unconsolidated affiliates that are not deemed to be indefinitely reinvested in operations outside the United States, although such amounts were immaterial as of December 31, 2024, and 2023. We have not provided for deferred taxes on the outside basis differences in our investments in our foreign subsidiaries. A determination of the unrecognized deferred taxes related to these outside basis differences is not practicable.
The balance of gross unrecognized tax benefits and related activity were not material in any period presented. The Company is regularly audited by federal, state and foreign tax authorities. The Internal Revenue Service (IRS) has completed its field examination and has issued its Revenue Agents Report through the 2014 tax year and all open issues have been resolved. The Company is currently open to tax examinations by the IRS for the 2020 through 2022 tax years. The Company is open to state and local tax audits in major tax jurisdictions dating back to the 2017 taxable year. The Company is no longer subject to income tax examinations by any major foreign tax jurisdiction for years prior to 2015.
The Company has evaluated the effects of the Global Anti-Base Erosion Model Rules set forth by the Organization for Economic Co-operation and Development (OECD), referred to as “Pillar Two”, which establishes a global minimum corporate tax rate of 15 percent. The Company has determined that Pillar Two legislation has been enacted in one or more of the jurisdictions in which we operate and the Company is within the scope of the legislation. The Company assessed such enacted legislation, and, as applicable, the transitional safe harbor provisions of Pillar Two, and concluded that the tax effects are not material to the Company's consolidated financial statements.
BRUNSWICK CORPORATION
Notes to Consolidated Financial Statements
The difference between the actual income tax provision and the tax provision computed by applying the statutory Federal income tax rate to Earnings before income taxes is attributable to the following:
| | | | | | | | | | | | | | | | | |
| (in millions) | 2024 | | 2023 | | 2022 |
| Income tax provision at 21 percent | $ | 42.7 | | | $ | 132.1 | | | $ | 179.3 | |
| State and local income taxes, net of federal income tax effect | 4.2 | | | 13.3 | | | 19.5 | |
| Deferred tax asset valuation allowance | 5.0 | | | 17.8 | | | (10.4) | |
| | | | | |
| | | | | |
| Change in estimates related to prior years and prior years amended tax return filings | 3.4 | | | 1.8 | | | (1.3) | |
| Federal and state tax credits | (10.2) | | | (15.2) | | | (16.6) | |
| Taxes related to foreign income, net of credits | 2.6 | | | (4.5) | | | 12.1 | |
| | | | | |
| Deferred tax reassessment | 7.3 | | | 2.5 | | | 6.4 | |
| Tax reserve reassessment | (3.4) | | | 0.8 | | | (0.1) | |
| Asset impairment | 6.8 | | | — | | | — | |
| | | | | |
| | | | | |
| FDII deduction | (8.7) | | | (16.6) | | | (18.4) | |
| Intercompany sales of intellectual property rights | — | | | 53.1 | | | — | |
| Nondeductible loss on intercompany sale | — | | | 6.9 | | | — | |
| Other | 4.3 | | | 4.3 | | | 1.8 | |
| Actual income tax provision | $ | 54.0 | | | $ | 196.3 | | | $ | 172.3 | |
| | | | | |
| Effective tax rate | 26.6 | % | | 31.2 | % | | 20.2 | % |
For the year ended December 31, 2024, the Company recorded $5.0 million of income tax expense related to an increase in its valuation allowance on deferred tax assets and $6.8 million of income tax expense related to the impairment of the Navico Group reporting unit's goodwill. The valuation allowance increase is primarily due to certain federal tax credits, state credits and NOLs that may not be realized in future years.
For the year ended December 31, 2023, the Company recorded $17.8 million of income tax expense related to an increase in its valuation allowance on deferred tax assets and $53.1 million of income tax expense related to the intercompany sales of intellectual property (IP) rights. The valuation allowance increase is primarily due to certain federal tax credits, impairment of certain investments, and state credits and NOLs that may not be realized in future years. The sales of the IP rights were to better align the ownership of these rights with how our business operates.
Note 11 – Commitments and Contingencies
Repurchase Obligations
The Company has entered into arrangements with third party lenders in which it has agreed, in the event of a customer or franchisee default, to repurchase from the third party lender those Brunswick products repossessed from the customer or franchisee. These arrangements are typically subject to a maximum repurchase amount. The single year and maximum potential cash payments the Company could be required to make to repurchase collateral as of December 31, 2024 and December 31, 2023 were $79.8 million and $81.1 million, respectively. Included within these repurchase amounts are amounts related to BAC, as discussed in Note 8 – Financing Joint Venture.
The Company’s risk under these repurchase arrangements is partially mitigated by the value of the products repurchased as part of the transaction. Accruals for potential losses related to repurchase exposure were not material in any period presented. The Company’s repurchase accrual represents the expected losses that could result from obligations to repurchase products, after giving effect to proceeds anticipated to be received from the resale of those products to alternative dealers.
The Company has recorded its estimated net liability associated with losses from these repurchase obligations on its Consolidated Balance Sheets based on historical experience and current facts and circumstances. Historical cash requirements and losses associated with these obligations have not been significant, but could increase if dealer defaults exceed current expectations.
BRUNSWICK CORPORATION
Notes to Consolidated Financial Statements
Recourse Guarantees
The Company has also entered into guarantees of indebtedness of third parties, primarily in connection with customer financing programs. Under these arrangements, the Company has guaranteed customer obligations to the financial institutions in the event of customer default, generally subject to a maximum amount that is less than the total outstanding obligations. The Company has also extended guarantees to third parties that have purchased customer receivables from Brunswick and, in certain instances, has guaranteed secured term financing of its customers. Potential payments in connection with these customer financing arrangements generally extend over several years. The single year and maximum potential cash obligations associated with these customer financing arrangements as of December 31, 2024 and December 31, 2023 were $10.3 million and $66.6 million, respectively. Accruals for potential losses related to recourse guarantees were not material in any period presented.
In certain instances, upon repurchase of the receivable or note, the Company receives rights to the collateral securing the financing. The Company’s risk under these arrangements is partially mitigated by the value of the collateral that secures the financing.
Receivable Factoring
The Company has accounts receivable sale arrangements with third parties which are included in the guarantee arrangements discussed above. The Company treats the sale of receivables in which the Company retains an interest as a secured obligation as the transfers of the receivables under these arrangements do not meet the requirements of a "true sale." The current portion of receivables recorded in Accounts and notes receivable and liabilities recorded in Accrued expenses were not material in any period presented. As of December 31, 2024 and 2023, the Company did not have any long-term receivables related to these arrangements.
Letters of Credit, Surety Bonds and Other Arrangements
Financial institutions have issued standby letters of credit and surety bonds conditionally guaranteeing obligations on behalf of the Company totaling $3.3 million and $44.9 million, respectively, as of December 31, 2024. A large portion of these standby letters of credit and surety bonds are related to the Company’s self-insured workers' compensation program as required by its insurance companies and various state agencies. The Company has recorded reserves to cover the anticipated liabilities associated with these programs. Under certain circumstances, such as an event of default under the Company's revolving credit facility, or, in the case of surety bonds, a ratings downgrade, the Company could be required to post collateral to support the outstanding letters of credit and surety bonds. The Company was not required to post letters of credit as collateral against surety bonds as of December 31, 2024.
The Company has a collateral trust arrangement with insurance carriers and a trustee bank. The trust is owned by the Company, but the assets are pledged as collateral against workers’ compensation related obligations in lieu of other forms of collateral including letters of credit. In connection with this arrangement, the Company had $10.0 million and $8.3 million of cash in the trust as of December 31, 2024 and December 31, 2023, respectively, which was classified as Restricted cash in the Company's Consolidated Balance Sheets.
Product Warranties
The Company records a liability for product warranties at the time of the related product sale. The liability is estimated using historical warranty experience, projected claim rates and expected costs per claim. The Company adjusts its liability for specific warranty matters when they become known and the exposure can be estimated. Product failure rates as well as material usage and labor costs incurred in correcting a product failure affect the Company's warranty liabilities. If actual costs differ from estimated costs, the Company must make a revision to the warranty liability. Changes in the Company's warranty liabilities resulting from the Company's experience and adjustments related to changes in estimates are included as aggregate changes for preexisting warranties presented in the table below.
BRUNSWICK CORPORATION
Notes to Consolidated Financial Statements
The following activity related to product warranty liabilities was recorded in Accrued expenses during the years ended December 31, 2024 and December 31, 2023:
| | | | | | | | | | | |
| (in millions) | 2024 | | 2023 |
| Balance at beginning of period | $ | 157.6 | | | $ | 146.7 | |
| Payments | (102.3) | | | (92.4) | |
| | | |
| Provisions/additions for contracts issued/sold | 83.0 | | | 89.9 | |
| Aggregate changes for preexisting warranties | 16.6 | | | 9.3 | |
| | | |
| Foreign currency translation | (2.0) | | | 0.8 | |
| Acquisitions | — | | | 0.3 | |
| Other | (0.1) | | | 3.0 | |
| Balance at end of period | $ | 152.8 | | | $ | 157.6 | |
Extended Product Warranties
End users of the Company's products may purchase a contract from the Company that extends product warranty beyond the standard period. For certain extended warranty contracts in which the Company retains the warranty or administration obligation, a deferred revenue liability is recorded based on the aggregate sales price for contracts sold. The liability is reduced and revenue is recognized on a straight-line basis over the contract period during which corresponding costs are expected to be incurred.
The following activity related to deferred revenue for extended product warranty contracts was recorded in Accrued expenses and Other long-term liabilities during the years ended December 31, 2024 and December 31, 2023:
| | | | | | | | | | | | | | |
| (in millions) | 2024 | | 2023 |
| Balance at beginning of period | $ | 127.2 | | | $ | 112.5 | |
| Extended warranty contracts sold | 41.4 | | | 41.8 | |
| Revenue recognized on existing extended warranty contracts | (31.1) | | | (26.9) | |
| Foreign currency translation | (0.7) | | | 0.2 | |
| Other | (0.2) | | | (0.4) | |
| Balance at end of period | $ | 136.6 | | | $ | 127.2 | |
Legal
The Company accrues for litigation exposure when it is probable that future costs will be incurred and such costs can be reasonably estimated. Adjustments to estimates are recorded in the period they are identified. Management does not believe that there is a reasonable possibility that a material loss exceeding the amounts already recognized for the Company's litigation claims and matters, if any, has been incurred. In light of existing accruals, the Company's litigation claims, when finally resolved, are not expected, in the opinion of management, to have a material adverse effect on the Company's consolidated financial position, results of operations or cash flows.
Environmental
The Company is involved in certain legal and administrative proceedings under the Comprehensive Environmental Response, Compensation, and Liability Act of 1980 and other federal and state legislation governing the generation and disposal of certain hazardous wastes. These proceedings, which involve both on- and off-site waste disposal or other contamination, in many instances seek compensation or remedial action from the Company as a waste generator under Superfund legislation, which authorizes action regardless of fault, legality of original disposition or ownership of a disposal site. The Company has established accruals based on a range of cost estimates for all known claims.
BRUNSWICK CORPORATION
Notes to Consolidated Financial Statements
The environmental remediation and clean-up projects in which the Company is involved have an aggregate estimated range of exposure of approximately $14.0 million to $37.5 million as of December 31, 2024. As of December 31, 2024 and 2023, the Company had accruals for environmental liabilities of $14.1 million and $14.7 million, respectively, which were recorded within Accrued expenses and Other long-term liabilities in the Consolidated Balance Sheets. Environmental provisions recorded were not material in any period presented.
The Company accrues for environmental remediation-related activities for which commitments or clean-up plans have been developed and for which costs can be reasonably estimated. All accrued amounts are generally determined in consultation with third party experts on an undiscounted basis and do not consider recoveries from third parties until such recoveries are realized. In light of existing accruals, the Company's environmental claims, when finally resolved, are not expected to have a material adverse effect on the Company's consolidated financial position, results of operations or cash flows.
Note 12 – Financial Instruments
The Company operates globally with manufacturing and sales facilities around the world, and therefore, is subject to both financial and market risk. The Company utilizes normal operating and financing activities, along with derivative financial instruments, to minimize these risks.
Derivative Financial Instruments. The Company uses derivative financial instruments to manage its risks associated with movements in foreign currency exchange rates and interest rates. Derivative instruments are not used for trading or speculative purposes. The Company formally documents its hedge relationships, including identification of the hedging instruments and the hedged items, as well as its risk management objectives and strategies for undertaking the hedge transaction. This process includes linking derivatives that are designated as hedges to specific forecasted transactions. The Company also assesses, both at the hedge’s inception and monthly thereafter, whether the derivatives used in hedging transactions are highly effective in offsetting the changes in the anticipated cash flows of the hedged item. If the hedging relationship ceases to be highly effective, or it becomes probable that a forecasted transaction is no longer expected to occur, the Company discontinues hedge accounting prospectively and immediately recognizes the gains and losses associated with those hedges. There were no material adjustments as a result of ineffectiveness to the results of operations for the years ended December 31, 2024, 2023 and 2022. The fair value of derivative financial instruments is determined through market-based valuations and may not be representative of the actual gains or losses that will be recorded when these instruments mature due to future fluctuations in the markets in which they are traded. The effects of derivative financial instruments are not expected to be material to the Company’s financial position or results of operations when considered together with the underlying exposure being hedged. Use of derivative financial instruments exposes the Company to credit-risk with its counterparties when the fair value of a derivative contract is an asset. The Company mitigates this risk by entering into derivative contracts with highly rated counterparties. The maximum amount of loss due to counterparty credit-risk is limited to the asset value of derivative financial instruments.
Cash Flow Hedges. The Company enters into certain derivative instruments that are designated and qualify as cash flow hedges. The Company executes both forward and option contracts, based on forecasted transactions, to manage foreign currency exchange exposure mainly related to inventory purchase and sales transactions.
A cash flow hedge requires that as changes in the fair value of derivatives occur, the portion of the change deemed to be effective is recorded temporarily in Accumulated other comprehensive income (loss) and reclassified into earnings in the same period or periods during which the hedged transaction affects earnings. As of December 31, 2024, the term of derivative instruments hedging forecasted transactions ranged up to 24 months.
Other Hedging Activity. The Company has entered into certain foreign currency forward contracts that have not been designated as a hedge for accounting purposes. These contracts are used to manage foreign currency exposure related to changes in the value of assets or liabilities caused by changes in foreign exchange rates. The change in the fair value of the foreign currency derivative contract and the corresponding change in the fair value of the asset or liability of the Company are both recorded through earnings, each period as incurred.
BRUNSWICK CORPORATION
Notes to Consolidated Financial Statements
Cross-Currency Swaps. The Company enters into cross-currency swaps to hedge Euro currency exposures of the net investment in certain foreign subsidiaries. The cross-currency swaps are designated as net investment hedges, with the amount of gain or loss associated with the change in fair value of these instruments deferred within Accumulated other comprehensive income (loss) and recognized upon termination of the respective investment. During 2024, the company entered into $450.0 million of cross-currency swap contracts and settled $300.0 million of cross-currency swap contracts previously entered into, resulting in a deferred gain of $1.7 million within Accumulated other comprehensive income (loss). During 2023, the company entered into $250.0 million of cross-currency swap contracts.
Commodity Price. The Company uses commodity swaps to hedge anticipated purchases of aluminum and copper. The amount of gain or loss associated with the change in fair value of these instruments is deferred in Accumulated other comprehensive income (loss) and recognized in Cost of sales in the same period or periods during which the hedged transaction affects earnings.
Foreign Currency Derivatives. The Company enters into forward and option contracts to manage foreign exchange exposure related to forecasted transactions and assets and liabilities that are subject to risk from foreign currency rate changes. These exposures include: product costs; revenues and expenses; associated receivables and payables; intercompany obligations and receivables and other related cash flows.
Interest-Rate Derivatives. The Company previously entered into forward-starting interest rate swaps and treasury-lock swaps to hedge interest rate risk associated with debt issuances. There were no forward-starting interest rate swaps or treasury-lock swaps outstanding as of December 31, 2024 and December 31, 2023.
The following table summarizes the notional values of the Company's derivative instruments as of December 31, 2024 and December 31, 2023:
| | | | | | | | | | | | | | |
| (in millions) | | Notional Value |
| Instruments | | December 31, 2024 | | December 31, 2023 |
| Cross-currency swaps | | $ | 400.0 | | | $ | 250.0 | |
Commodity contracts (A)(C) | | 26.9 | | | 31.8 | |
Foreign exchange contracts (B)(C) | | 571.2 | | | 694.6 | |
| | | | |
(A) Commodity contracts outstanding as of December 31, 2024 mature through 2026.
(B) Forward contracts outstanding as of December 31, 2024 mature through 2026 and mainly relate to the Euro, Australian dollar, Norwegian krone and Mexican peso.
(C) The amount of gain or loss that is expected to be reclassified from Accumulated other comprehensive income (loss) to earnings in the next twelve months is immaterial.
BRUNSWICK CORPORATION
Notes to Consolidated Financial Statements
As of December 31, 2024 and December 31, 2023, the fair values of the Company’s derivative instruments were:
| | | | | | | | | | | | | | |
| (in millions) | | Fair Value |
| Asset Derivatives | | December 31, 2024 | | December 31, 2023 |
| Derivatives Designated as Cash Flow Hedges | | | | |
| Foreign exchange contracts | | $ | 13.2 | | | $ | 4.1 | |
| Commodity contracts | | 0.8 | | | 0.9 | |
| | | | |
| Total | | $ | 14.0 | | | $ | 5.0 | |
| | | | |
| Derivatives Designated as Net Investment Hedges | | | | |
| Cross-currency swaps | | $ | 5.1 | | | $ | — | |
| | | | |
| | | | |
| | | | |
| Other Hedging Activity | | | | |
| Foreign exchange contracts | | $ | 3.0 | | | $ | 0.2 | |
| | | | |
| Liability Derivatives | | | | |
| Derivatives Designated as Cash Flow Hedges | | | | |
| Foreign exchange contracts | | $ | 5.8 | | | $ | 6.1 | |
| Commodity contracts | | 0.4 | | | 0.8 | |
| | | | |
| Total | | $ | 6.2 | | | $ | 6.9 | |
| | | | |
| Derivatives Designated as Net Investment Hedges | | | | |
| Cross-currency swaps | | $ | — | | | $ | 5.0 | |
| | | | |
| | | | |
| Other Hedging Activity | | | | |
| Foreign exchange contracts | | $ | 3.2 | | | $ | 1.8 | |
As of December 31, 2024 and December 31, 2023, asset derivatives are included within Prepaid expenses and other and Other long-term assets, and liability derivatives are included within Accrued expenses and Other long-term liabilities in the Consolidated Balance Sheets.
The effect of derivative instruments on the Consolidated Statements of Operations for the years ended December 31, 2024 and December 31, 2023 is as shown in the tables below.
The amount of gain (loss) on derivatives recognized in Accumulated other comprehensive income (loss) was as follows:
| | | | | | | | | | | | | | |
| (in millions) | | |
| Derivatives Designated as Cash Flow Hedging Instruments | | December 31, 2024 | | December 31, 2023 |
| | | | |
| Foreign exchange contracts | | $ | 13.8 | | | $ | 3.2 | |
| Commodity contracts | | (0.3) | | | (2.1) | |
| Total | | $ | 13.5 | | | $ | 1.1 | |
| | | | |
| Derivatives Designated as Net Investment Hedging Instruments | | | | |
| Cross-currency swaps | | $ | 11.8 | | | $ | (5.0) | |
BRUNSWICK CORPORATION
Notes to Consolidated Financial Statements
The amount of gain (loss) reclassified from Accumulated other comprehensive income (loss) into earnings was as follows:
| | | | | | | | | | | | | | | | | | | | | | | | |
| (in millions) | | | | | | | | |
| Derivatives Designated as Cash Flow Hedging Instruments | | Location of Gain (Loss) | | | | | | December 31, 2024 | | December 31, 2023 |
| Interest-rate contracts | | Interest expense | | | | | | $ | 0.1 | | | $ | (0.1) | |
| Foreign exchange contracts | | Cost of sales | | | | | | 2.9 | | | 16.8 | |
| Commodity contracts | | Cost of sales | | | | | | (1.0) | | | (3.1) | |
| Total | | | | | | | | $ | 2.0 | | | $ | 13.6 | |
The amount of gain (loss) on derivatives recognized directly into earnings was as follows:
| | | | | | | | | | | | | | | | | | | | | | | | |
| (in millions) | | | | | | | | |
| Derivatives Designated as Fair Value Hedging Instruments | | Location of Gain (Loss) | | | | | | December 31, 2024 | | December 31, 2023 |
| Interest-rate contracts | | Interest expense | | | | | | $ | — | | | $ | 0.4 | |
| | | | | | | | | | |
| Other Hedging Activity | | | | | | | | | | |
| Foreign exchange contracts | | Cost of sales | | | | | | $ | 7.7 | | | $ | (2.8) | |
| Foreign exchange contracts | | Other income (expense), net | | | | | | (6.1) | | | 0.6 | |
| Total | | | | | | | | 1.6 | | | (2.2) | |
Note 13 – Accrued Expenses
Accrued Expenses as of December 31, 2024 and 2023 were as follows:
| | | | | | | | | | | |
| (in millions) | 2024 | | 2023 |
| Sales incentives and discounts | $ | 162.7 | | | $ | 186.0 | |
| Product warranties | 152.8 | | | 157.6 | |
| Compensation and benefit plans | 95.2 | | | 159.4 | |
| Deferred revenue and customer deposits | 72.9 | | | 73.7 | |
| Interest | 29.0 | | | 28.6 | |
| Current operating lease liabilities | 26.0 | | | 28.3 | |
| Product Liability | 20.8 | | | 22.2 | |
| Legal fees | 14.7 | | | 4.0 | |
| Insurance reserves | 12.2 | | | 8.7 | |
| Derivatives | 9.4 | | | 8.7 | |
| Real property, personal property and other non-income taxes | 6.4 | | | 7.2 | |
| Environmental reserves | 5.8 | | | 6.2 | |
| | | |
| Other | 35.8 | | | 48.8 | |
| Total accrued expenses | $ | 643.7 | | | $ | 739.4 | |
BRUNSWICK CORPORATION
Notes to Consolidated Financial Statements
Note 14 – Debt
The following table provides the changes in the Company's debt for the year ended December 31, 2024:
| | | | | | | | | | | | | | | | | | | | |
| (in millions) | | Short-term debt and current maturities of long-term debt | | Long-term debt | | Total |
| Balance as of December 31, 2023 | | $ | 454.7 | | | $ | 1,975.7 | | | $ | 2,430.4 | |
Proceeds from issuances of debt (A) (B) | | 201.1 | | | 396.9 | | | 598.0 | |
Repayments of debt (A)(C)(D) | | (539.9) | | | (160.7) | | | (700.6) | |
| Reclassification of long-term debt | | 123.9 | | | (123.9) | | | — | |
| Other | | 3.0 | | | 9.8 | | | 12.8 | |
| Balance as of December 31, 2024 | | $ | 242.8 | | | $ | 2,097.8 | | | $ | 2,340.6 | |
(A) During 2024, the Company had short-term borrowings and repayments under its unsecured commercial paper program and borrowings outstanding of $115.0 million as of December 31, 2024.
(B) During 2024, $400.0 million of 5.850% Senior Notes due 2029 were issued.
(C) During 2024, the Company made the remaining principal repayments, totaling $450.0 million, of its 0.850% Senior Notes due 2024.
(D) During 2024, the Company made the remaining principal repayments, totaling $160.7 million, of its 7.125% Notes due 2027.
Long-term debt as of December 31, 2024 and December 31, 2023 consisted of the following:
| | | | | | | | | | | |
| (in millions) | 2024 | | 2023 |
| Senior Notes, 2.4% due 2031 | $ | 550.0 | | | $ | 550.0 | |
| Senior Notes, 4.400% due 2032 | 450.0 | | | 450.0 | |
| Senior Notes, 5.850% due 2029 | 400.0 | | | — | |
| Senior Notes, 5.100% due 2052 | 300.0 | | | 300.0 | |
| Senior Notes, 6.375% due 2049 | 230.0 | | | 230.0 | |
| Senior Notes, 6.500% due 2048 | 185.0 | | | 185.0 | |
| Senior Notes, 6.625% due 2049 | 125.0 | | | 125.0 | |
| Short-term Unsecured Commercial Paper | 115.0 | | | — | |
| Senior Notes, 0.85% due 2024 | — | | | 450.0 | |
| Notes, 7.125% due 2027 | — | | | 160.7 | |
| Other debt | 19.0 | | | 12.2 | |
| Total debt, excluding unamortized discount and issuance costs | 2,374.0 | | | 2,462.9 | |
| Unamortized discount and issuance costs | (33.4) | | | (32.5) | |
| Short-term debt and current maturities of long-term debt | (242.8) | | | (454.7) | |
| Total long-term debt | $ | 2,097.8 | | | $ | 1,975.7 | |
Debt issuance costs paid for the year ended December 31, 2024 were $3.1 million. There were no debt issuance costs paid in 2023. Debt issuance costs paid for the year ended December 31, 2022 were $8.2 million. Debt issuance costs are reported in Net proceeds from issuances of long-term debt within cash flows from financing activities on the Consolidated Statements of Cash Flows.
Scheduled maturities as of December 31, 2024 consisted of the following:
| | | | | |
| (in millions) | |
| 2025 | $ | 246.4 | |
| 2026 | 4.6 | |
| 2027 | 3.9 | |
| 2028 | 3.0 | |
| 2029 | 401.1 | |
| Thereafter | 1,715.0 | |
| Total debt, excluding unamortized discount and issuance costs | $ | 2,374.0 | |
BRUNSWICK CORPORATION
Notes to Consolidated Financial Statements
Activity
2049 Notes
During the fourth quarter of 2024, the Company issued an irrevocable notice of redemption to the holders of its 6.625% Senior Notes due 2049 (2049 Notes). The 2049 Notes were redeemed in the first quarter of 2025 at a redemption price equal to 100 percent of the outstanding principal amount of $125.0 million plus accrued interest of $2.1 million in accordance with the redemption provision of the 2049 Notes. The Company financed the retirement of the 2049 Notes using commercial paper borrowings. The liability associated with the 2049 Notes is included in Short-term debt and current maturities of long-term debt in the Consolidated Balance Sheets as of December 31, 2024.
2027 Notes
During the fourth quarter of 2024, the Company issued an irrevocable notice of redemption to the holders of its 7.125% Notes due 2027 (2027 Notes). The 2027 Notes were redeemed at a redemption price equal to 100 percent of the outstanding principal amount of $160.7 million plus accrued interest of $3.5 million and a make-whole redemption premium of $12.5 million in accordance with the redemption provision of the 2027 Notes. The Company recognized a loss on early extinguishment of debt which included the make-whole redemption premium of $12.5 million plus an immaterial amount of unamortized issuance costs. The Company financed the retirement of the 2027 Notes using commercial paper borrowings.
2024 Notes
During the third quarter of 2024, the Company made the remaining principal repayments, totaling $450.0 million, of its 0.850% Senior Notes due 2024 (2024 Notes). The 2024 Notes were repaid at 100 percent of the principal amount plus accrued interest in accordance with the provisions of the notes.
2029 Notes
In March 2024, the Company issued an aggregate principal amount of $400.0 million of 5.850% Senior Notes due 2029 (2029 Notes) in a public offering, which resulted in aggregate net proceeds to the Company of $396.9 million. The Company intends to use the net proceeds from the sale of the 2029 Notes for general corporate purposes, which may include the repayment, repurchase or redemption of certain of its outstanding securities.
The 2029 Notes bear interest at a rate of 5.850% per year. Interest on the 2029 Notes is payable semiannually in arrears on March 18 and September 18 of each year, and the first interest payment date was September 18, 2024. The 2029 Notes will mature on March 18, 2029.
The Company may, at its option, redeem the 2029 Notes, in whole or in part, at any time and from time to time prior to maturity. If the Company elects to redeem any (or all) of the 2029 Notes at any time prior to February 18, 2029 (the date that is one month prior to the maturity of the 2029 Notes), it will pay a "make-whole" redemption price set forth in the Sixth Supplemental Indenture dated as of March 18, 2024 (Sixth Supplemental Indenture) to the Indenture dated as of October 3, 2018. On or after February 18, 2029, the Company may, at its option, redeem the 2029 Notes, in whole or in part at any time and from time to time, at a redemption price equal to 100 percent of the principal amount thereof. In addition to the redemption price, the Company will pay accrued and unpaid interest, if any.
If the Company experiences a change of control triggering event with respect to the 2029 Notes, as defined in the Sixth Supplemental Indenture, each holder of the 2029 Notes may require the Company to repurchase some or all of its 2029 Notes at a price equal to 101 percent of their principal amount, plus accrued and unpaid interest.
Debentures
During 2023, the Company made the remaining principal repayments, totaling $79.7 million, of its 2023 Debentures. The debentures were repaid at 100 percent of the principal amount plus accrued interest in accordance with the provisions of the debentures.
BRUNSWICK CORPORATION
Notes to Consolidated Financial Statements
2032 and 2052 Notes
In March 2022, the Company issued an aggregate principal amount of $450.0 million of 4.400% Senior Notes due 2032 (2032 Notes) and $300.0 million of 5.100% Senior Notes due 2052 (the 2052 Notes and, together with the 2032 Notes, the Notes) in a public offering, which resulted in aggregate net proceeds to the Company of $741.8 million. The Company used the net proceeds from the sale of the Notes for general corporate purposes.
Term Loan
During 2022, the Company made the remaining principal repayments, totaling $56.3 million, of its 2023 floating-rate term loan. The term loan was redeemed at 100 percent of the principal amount plus accrued interest in accordance with the redemption provisions of the term loan. The Company recognized a loss on early extinguishment of debt of $0.1 million related to the term loan redemption.
Credit Facility
The Company maintains a Revolving Credit Agreement (Credit Facility). In the fourth quarter of 2024, the Company amended its Credit Facility with certain wholly-owned subsidiaries of the Company as subsidiary borrowers and lenders as parties, and JPMorgan Chase Bank, N.A. as administrative agent. This amends and restates the Credit Facility, dated as of March 21, 2011, as amended and restated through March 31, 2022. The amended Credit Facility increased the revolving commitments to $1.0 billion, with the capacity to add up to $250.0 million of additional revolving commitments, and amended the Credit Facility in certain respects, including, among other things, extending the maturity date to October 11, 2029, with up to two one-year extensions available.
The Company currently pays a credit facility fee of 15 basis points per annum. The facility fee per annum will be within a range of 10 to 25 basis points based on the Company's credit rating. Under the terms of the Credit Facility, the Company has two borrowing options: borrowing at a rate tied to adjusted SOFR rate plus 10 basis points plus a spread of 110 basis points or a base rate plus a margin of 10 basis points. The rates are determined by the Company's credit ratings, with spreads ranging from 90 to 150 basis points for SOFR rate borrowings and 0 to 50 basis points for base rate borrowings. The Company is required to maintain compliance with two financial covenants included in the Credit Facility: a minimum interest coverage ratio and a maximum net leverage ratio. The minimum interest coverage ratio, as defined in the agreement, is not permitted to be less than 3.00 to 1.00. The maximum net leverage ratio, as defined in the agreement, is not permitted to be more than 3.75 to 1.00 but allows for a 12-month increase to 4.25 to 1.00 following the consummation of a Qualified Acquisition (as such term is defined in the Amended Credit Facility). As of December 31, 2024, the Company was in compliance with the financial covenants in the Credit Facility.
During 2024, there were no borrowings under the Credit Facility, and available borrowing capacity as of December 31, 2024 totaled $997.0 million, net of $3.0 million of letters of credit outstanding under the Credit Facility.
During 2023, there were no borrowings under the Credit Facility, and available borrowing capacity as of December 31, 2023 totaled $741.9 million, net of $8.1 million of letters of credit outstanding under the Credit Facility.
BRUNSWICK CORPORATION
Notes to Consolidated Financial Statements
Commercial Paper
In December 2019, the Company entered into an unsecured commercial paper program (CP Program) pursuant to which the Company may issue short-term, unsecured commercial paper notes (CP Notes). During 2024, the Company increased the size of its CP Program to permit the issuance of CP Notes in an aggregate principal amount not to exceed $1.0 billion at any time outstanding. The CP Program previously allowed the Company to issue CP Notes in an aggregate principal amount not to exceed $500.0 million at any time outstanding. Amounts available under the CP Program may be borrowed, repaid and re-borrowed from time to time with the aggregate principal amount of CP Notes outstanding under the CP Program at any time not exceeding the lower of $1.0 billion or the available borrowing amount under the Credit Facility. The net proceeds of the issuances of the CP Notes are expected to be used for general corporate purposes. The maturities of the CP Notes will vary but may not exceed 397 days from the date of issue. The CP Notes will be sold under customary terms in the commercial paper market and will be issued at a discount to par or alternatively, will be issued at par and bear varying interest rates on a fixed or floating basis. During 2024, borrowings under the CP Program totaled $915.0 million. As of December 31, 2024, the Company had $115.0 million of borrowings outstanding under the CP Program with a weighted average interest rate of 5.01%. During 2024, the maximum amount utilized under the CP Program was $280.0 million. During 2023, borrowings under the CP Program totaled $485.0 million, all of which were repaid during the period. During 2023, the maximum amount utilized under the CP Program was $125.0 million.
General Provisions
The table below summarizes the general provisions of these long-term debt instruments.
| | | | | | | | | | | | | | | | | | | | | | | | | | | | | | | | | | | | | | | | | | | |
| Senior Notes Due 2029 | | Senior Notes due 2031 | | Senior Notes Due 2032 | | Senior Notes Due 2052 | | | | Senior Notes due 2048 | | Senior Notes due 2049 | | Senior Notes due 2049 |
| Coupon Rate | 5.850% | | 2.400% | | 4.400% | | 5.100% | | | | 6.500% | | 6.625% | | 6.375% |
| Maturity Date | 3/18/2029 | | 8/18/2031 | | 9/15/2032 | | 4/1/2052 | | | | 10/15/2048 | | 1/15/2049 | | 4/15/2049 |
| Interest Payment Frequency | Semi-Annually | | Semi-Annually | | Semi-Annually | | Semi-Annually | | | | Quarterly | | Quarterly | | Quarterly |
| Callable | No | | No | | No | | No | | | | Yes | | Yes | | Yes |
| Price Callable at: | N/A | | N/A | | N/A | | N/A | | | | Par | | Par | | Par |
| Callable as of: | N/A | | N/A | | N/A | | N/A | | | | 10/15/2023 | | 1/15/2024 | | 4/15/2024 |
Redeemable (A) | Yes | | Yes | | Yes | | Yes | | | | No | | No | | No |
| Redeemable at: | Make-Whole Premium | | Make-Whole Premium | | Make-Whole Premium | | Make-Whole Premium | | | | N/A | | N/A | | N/A |
| Redeemable until: | 1-month prior to Maturity | | 3-months prior to Maturity | | 3-months prior to Maturity | | 6-months prior to Maturity | | | | N/A | | N/A | | N/A |
Change of Control (B) | Yes | | Yes | | Yes | | Yes | | | | Yes | | Yes | | Yes |
(A) If the Company elects to redeem the debt instrument, it will pay a "make-whole" redemption price set forth in the respective indenture.
(B) If the Company experiences a change of control, subject to certain circumstances, the Company may be required to repurchase some or all of the notes for an amount equal to 101 percent of the outstanding principal plus any accrued and unpaid interest.
Note 15 – Postretirement Benefits
Defined Contribution Plan and Other Pension/Postretirement Benefit Plans. The Company has defined contribution plans and makes contributions including matching and annual discretionary contributions which are based on various percentages of compensation and in some instances, are based on the amount of the employees' contributions to the plans. The expense related to the defined contribution plans was $31.9 million in 2024, $47.0 million in 2023 and $58.0 million in 2022.
The Company also maintains a nonqualified pension plan and an other postretirement benefit plan. The funded status of the nonqualified pension plan includes projected and accumulated benefit obligations of $15.4 million and $17.0 million as of December 31, 2024 and 2023, respectively. The other postretirement plan is frozen. The funded status of the other postretirement benefit plan includes projected and accumulated benefit obligations of $18.6 million and $19.9 million as of December 31, 2024 and 2023, respectively.
BRUNSWICK CORPORATION
Notes to Consolidated Financial Statements
The Company's foreign pension and other postretirement plans are not significant, individually or in the aggregate. The projected benefit obligation, net of plan assets for the Company's foreign pension plans, was $10.8 million and $15.1 million as of December 31, 2024 and 2023, respectively.
Activity impacting the Consolidated Statements of Operations and Consolidated Statements of Cash Flows related to these plans was immaterial in 2024, 2023, and 2022.
Note 16 – Stock Plans and Management Compensation
On May 3, 2023, the Company's shareholders approved the Brunswick Corporation 2023 Stock Incentive Plan (Plan), which replaced the Company's 2014 Stock Incentive Plan. Under the Plan, the Company may grant stock options, stock appreciation rights (SARs), non-vested stock units, performance awards, and other share-based or cash-based awards to executives, other employees, non-employee directors and persons expected to become officers with shares from treasury shares and from authorized, but unissued, shares of common stock initially available for grant, in addition to: (i) the forfeiture of past awards; or (ii) shares delivered to or withheld by the Company to pay the withholding taxes related to awards. As of December 31, 2024, 3.2 million shares remained available for grant.
Share grant amounts, fair values and fair value assumptions reflect all outstanding awards for both continuing and discontinued operations.
Non-Vested Stock Units
The Company grants both stock-settled and cash-settled non-vested stock units to key employees as determined by management and the Human Resources and Compensation Committee of the Board of Directors. Non-vested stock units typically vest in three equal annual installments on the first through third anniversaries of the grant date. Non-vested stock units are eligible for dividends, which are reinvested, and are non-voting. All non-vested units have restrictions on the sale or transfer of such awards during the vesting period.
Generally, grants of non-vested stock units are forfeited if employment is terminated prior to vesting. Non-vested stock units vest pro rata over one year if (i) the grantee has attained the age of 62, as long as the grantee also has a minimum of three years of continuous service from his or her most recent hire date, or (ii) the grantee's age plus total years of service equals 70 or more.
The Company recognizes the cost of non-vested stock units on a straight-line basis over the requisite service period. Additionally, cash-settled, non-vested stock units are recorded as a liability on the balance sheet and adjusted to fair value each reporting period through stock compensation expense. During the years ended December 31, 2024, 2023 and 2022, the Company charged $23.3 million, $20.4 million and $18.2 million, respectively, to compensation expense for non-vested stock units. The related income tax benefit recognized in 2024, 2023 and 2022 was $5.7 million, $5.0 million and $4.5 million, respectively. The fair value of shares vested during 2024, 2023 and 2022 was $10.9 million, $24.5 million and $16.7 million, respectively.
The weighted average price per non-vested stock unit at grant date was $87.16, $88.00 and $93.62 for units granted in 2024, 2023 and 2022, respectively. Non-vested stock unit activity for the year ended December 31, 2024 was as follows:
| | | | | | | | | | | | | | | | | | | |
| | | | | |
| (in thousands, except grant date fair value) | Non-vested Stock Unit Activity | | Weighted Average Grant Date Fair
Value ($) | | | | | | | | |
| Non-vested units, unvested as of January 1, 2024 | 577 | | | 90.72 | | | | | | | | | |
| Awarded | 350 | | | 87.16 | | | | | | | | | |
| Forfeited | (37) | | | 89.19 | | | | | | | | | |
| Vested | (168) | | | 91.11 | | | | | | | | | |
| Non-vested units, unvested as of December 31, 2024 | 722 | | | 88.97 | | | | | | | | | |
BRUNSWICK CORPORATION
Notes to Consolidated Financial Statements
As of December 31, 2024, there was $18.8 million of total unrecognized compensation cost related to non-vested share-based compensation arrangements. The Company expects this expense to be recognized over a weighted average period of 1.5 years.
Performance Awards
In 2024, 2023 and 2022, the Company granted performance shares to certain officers and senior leaders. Performance share awards are based on three performance measures: a cash flow return on investment (CFROI) measure, an operating margin (OM) measure and a total shareholder return (TSR) modifier. Performance shares are earned based on a three-year performance period commencing at the beginning of the calendar year of each grant. The performance shares earned are then subject to a TSR modifier based on Brunswick's stock return measured against stock returns of a predefined comparator group over a three-year performance period. Additionally, in 2024, 2023 and 2022, the Company granted 33,610, 36,170 and 24,320 performance shares, respectively, to certain officers and certain senior leaders based on the respective measures and performance periods described above but excluding a TSR modifier.
The fair values of the senior leaders' performance share award grants with a TSR modifier at the grant date in 2024, 2023 and 2022 were $85.52, $88.47 and $94.59, respectively, which were estimated using the Monte Carlo valuation model, and incorporated the following assumptions:
| | | | | | | | | | | | | | | | | | | | |
| 2024 | | 2023 | | 2022 | | | |
| Risk-free interest rate | 4.3 | % | | 4.3 | % | | 1.7 | % | | | |
| Dividend yield | 1.9 | % | | 1.8 | % | | 1.5 | % | | | |
| Volatility factor | 40.5 | % | | 49.8 | % | | 54.8 | % | | | |
| Expected life of award | 2.9 years | | 2.9 years | | 2.9 years | | | |
The fair value of certain officers' and certain senior managers' performance awards granted based solely on the CFROI and OM performance factors was $83.39, $83.97 and $91.62, which was equal to the stock price on the date of grant in 2024, 2023 and 2022, respectively, less the present value of dividend payments over the vesting period.
The Company recorded compensation expense related to performance awards of $0.0 million, $2.1 million and $3.6 million in 2024, 2023 and 2022, respectively. The related income tax benefit recognized in 2024, 2023 and 2022 was $0.0 million, $0.5 million and $0.9 million, respectively. The fair value of awards vested during 2024, 2023 and 2022 was $7.5 million, $16.2 million and $14.6 million, respectively.
Performance award activity for the year ended December 31, 2024 was as follows:
| | | | | | | | | | | | | |
| (in thousands, except grant date fair value) | Performance Awards | | Weighted Average Grant Date Fair Value ($) | | |
| Performance awards, unvested at January 1 | 217 | | | 90.09 | | | |
| Awarded | 174 | | | 83.20 | | | |
| Forfeited | (15) | | | 50.74 | | | |
| Vested and earned | (117) | | | 100.42 | | | |
| Performance awards, unvested at December 31 | 259 | | | 83.09 | | | |
As of December 31, 2024, the Company had $3.4 million of total unrecognized compensation expense related to performance awards. The Company expects this expense to be recognized over a weighted average period of 1.6 years.
BRUNSWICK CORPORATION
Notes to Consolidated Financial Statements
Director Awards
The Company issues stock awards to non-employee directors in accordance with the terms and conditions determined by the Nominating and Corporate Governance Committee of the Board of Directors. A portion of each director’s annual fee is paid in Brunswick common stock, the receipt of which may be deferred until a director retires from the Board of Directors. Each director may elect to have the remaining portion paid in cash, in Brunswick common stock distributed at the time of the award, or in deferred Brunswick common stock units with a 20 percent premium.
Note 17 – Comprehensive Income (Loss)
The following table presents reclassification adjustments out of Accumulated other comprehensive income (loss) during the years ended December 31, 2024, 2023 and 2022:
| | | | | | | | | | | | | | | | | | | | | | | | | | |
| (in millions) | | | | |
| Details about Accumulated other comprehensive income (loss) components | | 2024 | | 2023 | | 2022 | | Affected line item in the statement where net income is presented |
| | | | | | | | |
| | | | | | | | |
| | | | | | | | |
| | | | | | | | |
| | | | | | | | |
| | | | | | | | |
| | | | | | | | |
| Amortization of defined benefit items: | | | | | | | | |
| Prior service credits | | $ | 0.7 | | | $ | 4.3 | | | $ | 0.7 | | | Other income (expense), net |
| Net actuarial gains (losses) | | 0.7 | | | (2.2) | | | (0.9) | | | Other income (expense), net |
| | | | | | | | |
| | 1.4 | | | 2.1 | | | (0.2) | | | Earnings before income taxes |
| | (0.4) | | | (1.0) | | | — | | | Income tax provision |
| | $ | 1.0 | | | $ | 1.1 | | | $ | (0.2) | | | Net earnings from continuing operations |
| | | | | | | | |
| Amount of gain (loss) reclassified into earnings on derivative contracts: | | | | | | | | |
| Interest rate contracts | | $ | 0.1 | | | $ | (0.1) | | | $ | (0.3) | | | Interest expense |
| Foreign exchange contracts | | 2.9 | | | 16.8 | | | 26.0 | | | Cost of sales |
| Commodity contracts | | (1.0) | | | (3.1) | | | 1.4 | | | Cost of sales |
| | 2.0 | | | 13.6 | | | 27.1 | | | Earnings before income taxes |
| | (0.6) | | | (4.0) | | | (7.1) | | | Income tax provision |
| | $ | 1.4 | | | $ | 9.6 | | | $ | 20.0 | | | Net earnings from continuing operations |
Note 18 – Treasury Stock
The Company has executed share repurchases against authorizations approved by the Board of Directors. In 2024, the Company repurchased $200.0 million of stock under these authorizations and as of December 31, 2024, the remaining authorization was $421.5 million.
Treasury stock activity for the years ended December 31, 2024, 2023 and 2022 was as follows:
| | | | | | | | | | | | | | | | | |
| (Shares in thousands) | 2024 | | 2023 | | 2022 |
| Balance as of January 1 | 34,311 | | | 31,173 | | | 25,605 | |
| Compensation plans and other | (212) | | | (298) | | | (343) | |
| Share repurchases | 2,452 | | | 3,436 | | | 5,911 | |
| Balance as of December 31 | 36,551 | | | 34,311 | | | 31,173 | |
Note 19 – Leases
The Company has operating lease agreements for offices, branches, factories, distribution and service facilities and certain personal property. Leases with an initial lease term of 12 months or less are not recorded on the balance sheet. Finance leases are not material to the Company's consolidated financial statements.
BRUNSWICK CORPORATION
Notes to Consolidated Financial Statements
The Company determines if an arrangement is a lease at lease inception. Operating lease assets and operating lease liabilities are recognized based on the present value of the future minimum lease payments over the lease term at commencement date. As most of the Company's lease contracts do not include an implicit rate, the Company uses its incremental borrowing rate, based on information available at commencement date, in determining the present value of future payments. The incremental borrowing rate is estimated to approximate the interest rate on a collateralized basis with similar terms and payments, and in economic environments where the leased asset is located. The operating lease asset also includes any initial direct costs and lease payments made prior to lease commencement and excludes lease incentives incurred.
Several leases include one or more options to renew, with renewal terms that can extend the lease term from one to five years or more. The exercise of lease renewal options is at our sole discretion. The Company's lease terms may include options to extend or terminate the lease when it is reasonably certain that the Company will exercise that option. Certain of our lease agreements include rental payments that vary based on changes in volume activity, storage activity or changes in the Consumer Price Index or other indices. Our lease agreements do not contain any material residual value guarantees or material restrictive covenants.
Operating lease expense for minimum lease payments is recognized on a straight-line basis over the lease term. The Company has certain lease agreements that contain both lease and non-lease components, which it has elected to account for as a single lease component for all asset classes.
A summary of the Company's lease assets and lease liabilities as of December 31, 2024 and December 31, 2023 is as follows:
| | | | | | | | | | | | | | | | | |
| (in millions) | Classification | | 2024 | | 2023 |
| Lease Assets | | | | | |
| Operating lease assets | Operating lease assets | | $ | 161.8 | | | $ | 152.2 | |
| | | | | |
| Lease Liabilities | | | | | |
| Current operating lease liabilities | Accrued expenses | | 26.0 | | | 28.3 | |
| Non-current operating lease liabilities | Operating lease liabilities | | 145.1 | | | 133.9 | |
| Total lease liabilities | | | $ | 171.1 | | | $ | 162.2 | |
A summary of the Company's total lease cost for the years ended December 31, 2024, December 31, 2023 and December 31, 2022 is as follows:
| | | | | | | | | | | | | | | | | | | | | | | |
| (in millions) | Classification | | 2024 | | 2023 | | 2022 |
| Operating lease cost | Selling, general and administrative expense | | $ | 17.7 | | | $ | 20.1 | | | $ | 16.2 | |
| Cost of sales | | 45.4 | | | 39.3 | | | 34.0 | |
| Variable lease cost | Selling, general and administrative expense | | 0.8 | | | 1.6 | | | 1.3 | |
| Cost of sales | | 6.3 | | | 6.2 | | | 5.5 | |
Total lease cost (A) | | | $ | 70.2 | | | $ | 67.2 | | | $ | 57.0 | |
(A) Includes total short-term lease cost which is immaterial.
BRUNSWICK CORPORATION
Notes to Consolidated Financial Statements
The Company's maturity analysis of its operating lease liabilities as of December 31, 2024 is as follows:
| | | | | |
| (in millions) | |
| 2025 | $ | 35.5 | |
| 2026 | 32.2 | |
| 2027 | 25.4 | |
| 2028 | 22.4 | |
| 2029 | 18.6 | |
| Thereafter | 98.3 | |
| Total lease payments | 232.4 | |
| Less: Interest | (61.3) | |
| Present value of lease liabilities | $ | 171.1 | |
The total weighted-average discount rate and remaining lease term for the Company's operating leases were 6.5 percent and 8.9 years, respectively, as of December 31, 2024. Total operating lease payments reflected in operating cash flows were $39.3 million for the year ended December 31, 2024.
As of December 31, 2024, we have entered into leases with total lease payments of approximately $61.3 million, primarily for equipment, that have not yet commenced. These leases are expected to commence in 2025, with lease terms of up to 10 years.
Note 20 – Supplier Finance Program Obligations
Under our supplier finance program, the Company agrees to pay Bank of America (the Bank) the stated amount of confirmed invoices from our suppliers on the original invoice payment due date. Our suppliers may request payment from the Bank at a date earlier than the payment due date stated on the original invoice in exchange for a fee in the form of a discounted invoice amount. Brunswick or the Bank may terminate the agreement upon at least 90 days’ notice. The supplier invoices that have been confirmed as valid under the program require payment ranging from 60 to 120 days from the invoice date, consistent with the terms of the original invoice. The Company does not pay the Bank any service fees or subscription fees under the program. In addition, the Company does not pledge any assets as security or provide other forms of guarantees for the committed payment to the Bank. As of December 31, 2024 and 2023, the Company had $8.2 million and $11.6 million confirmed invoices under the supplier finance program, respectively, which were included in Accounts payable on the Consolidated Balance Sheets. The roll-forward of the Company's outstanding obligations confirmed as valid under its supplier finance program for the years ended December 31, 2024 and December 31, 2023 is as follows:
| | | | | | | | | | | |
| (in millions) | 2024 | | 2023 |
| Confirmed obligations outstanding at the beginning of the year | $ | 11.6 | | | $ | 18.2 | |
| Invoices confirmed during the year | 58.4 | | | 99.3 | |
| Confirmed invoices paid during the year | (61.8) | | | (105.9) | |
| Confirmed obligations outstanding at the end of the year | $ | 8.2 | | | $ | 11.6 | |
BRUNSWICK CORPORATION
Schedule II - Valuation and Qualifying Accounts
(in millions)
| | | | | | | | | | | | | | | | | | | | | | | | | | | | | | | | | | | | | | |
Allowances for Losses on Receivables | | Balance at
Beginning
of Year | |
Charges to
Profit and Loss | | Write-offs | | Recoveries | | Other | |
Balance at End of Year |
| 2024 | | $ | 10.8 | | | $ | 3.0 | | | $ | (3.8) | | | $ | 0.2 | | | $ | 0.1 | | | $ | 10.3 | |
| | | | | | | | | | | | |
| 2023 | | 10.2 | | | 3.2 | | | (4.2) | | | 1.4 | | | 0.2 | | | 10.8 | |
| | | | | | | | | | | | |
| 2022 | | 9.7 | | | 2.0 | | | (2.6) | | | 0.3 | | | 0.8 | | | 10.2 | |
| | | | | | | | | | | | | | | | | | | | | | | | | | | | | | | | | | | | | | |
Deferred Tax Asset Valuation Allowance | | Balance at
Beginning
of Year | |
Charges to Profit and Loss (A) | | Write-offs | | Recoveries | | Other (B) | |
Balance at End of Year |
| 2024 | | $ | 71.3 | | | $ | 5.0 | | | $ | — | | | $ | — | | | $ | (1.2) | | | $ | 75.1 | |
| | | | | | | | | | | | |
| 2023 | | 52.8 | | | 17.8 | | | — | | | — | | | 0.7 | | | 71.3 | |
| | | | | | | | | | | | |
| 2022 | | 97.9 | | | (10.4) | | | — | | | — | | | (34.7) | | | 52.8 | |
(A) For the year ended December 31, 2024, the deferred tax asset valuation expense primarily relates to reassessments of certain federal losses, state tax credits, and NOL's. For the year ended December 31, 2023, the deferred tax asset valuation expense activity primarily relates to reassessments of certain federal tax credits, impairment of certain investments, and state tax credits and NOL's. For the year ended December 31, 2022, the deferred tax asset valuation benefit activity primarily relates to reassessments for state tax credits and NOL’s and certain federal losses.
(B) For the years ended December 31, 2024 and December 31, 2023, the activity primarily relates to currency translation of foreign balances. For the year ended December 31, 2022, the activity primarily relates to final adjustments to the opening balances of foreign entities acquired during the fourth quarter of 2021.
Item 16. Form 10-K Summary
None.
SIGNATURES
Pursuant to the requirements of Section 13 or 15(d) of the Securities Exchange Act of 1934, the registrant has duly caused this report to be signed on its behalf by the undersigned, thereunto duly authorized.
| | | | | | | | |
| | BRUNSWICK CORPORATION
|
| February 14, 2025 | By: | /S/ RANDALL S. ALTMAN |
| | | Randall S. Altman |
| | | Senior Vice President and Controller |
Pursuant to the requirements of the Securities Exchange Act of 1934, this report has been signed below by the following persons on behalf of the registrant and in the capacities and on the date indicated.
| | | | | | | | |
| February 14, 2025 | By: | /S/ DAVID M. FOULKES |
| | | David M. Foulkes |
| | | Chief Executive Officer and Director |
| | (Principal Executive Officer) |
| | | | | | | | |
| February 14, 2025 | By: | /S/ RYAN M. GWILLIM |
| | | Ryan M. Gwillim |
| | | Executive Vice President and Chief Financial and Strategy Officer |
| | (Principal Financial Officer) |
| | | | | | | | |
| February 14, 2025 | By: | /S/ RANDALL S. ALTMAN |
| | | Randall S. Altman |
| | | Senior Vice President and Controller |
| | (Principal Accounting Officer) |
This report has been signed by the following directors, constituting the remainder of the Board of Directors, by Ryan M. Gwillim, as Attorney-in-Fact.
| | |
| Nancy E. Cooper |
| David C. Everitt |
| Reginald Fils-Aimé |
| Lauren Patricia Flaherty |
| Joseph W. McClanathan |
| David V. Singer |
| J. Steven Whisler |
| Roger J. Wood |
| MaryAnn Wright |
| | | | | | | | |
| February 14, 2025 | By: | /S/ RYAN M. GWILLIM |
| | | Ryan M. Gwillim |
| | | Attorney-in-Fact |