UNITED STATES
SECURITIES AND EXCHANGE COMMISSION
Washington, D.C. 20549
CERTIFIED SHAREHOLDER REPORT OF REGISTERED MANAGEMENT INVESTMENT COMPANIES
Investment Company Act file number 811-22442
First Trust High Income Long/Short Fund
(Exact name of registrant as specified in charter)
120 East Liberty Drive, Suite 400
Wheaton, IL 60187
(Address of principal executive offices) (Zip code)
W. Scott Jardine, Esq.
First Trust Portfolios L.P.
120 East Liberty Drive, Suite 400
Wheaton, IL 60187
(Name and address of agent for service)
registrant’s telephone number, including area code: 630-765-8000
Date of fiscal year end: October 31
Date of reporting period: April 30, 2021
Form N-CSR is to be used by management investment companies to file reports with the Commission not later than 10 days after the transmission to stockholders of any report that is required to be transmitted to stockholders under Rule 30e-1 under the Investment Company Act of 1940 (17 CFR 270.30e-1). The Commission may use the information provided on Form N-CSR in its regulatory, disclosure review, inspection, and policymaking roles.
A registrant is required to disclose the information specified by Form N-CSR, and the Commission will make this information public. A registrant is not required to respond to the collection of information contained in Form N-CSR unless the Form displays a currently valid Office of Management and Budget (“OMB”) control number. Please direct comments concerning the accuracy of the information collection burden estimate and any suggestions for reducing the burden to Secretary, Securities and Exchange Commission, 100 F Street, NE, Washington, DC 20549. The OMB has reviewed this collection of information under the clearance requirements of 44 U.S.C. § 3507.
Item 1. Reports to Stockholders.
| (a) | | The Report to Shareholders is attached herewith. |

First Trust
High Income Long/Short Fund (FSD)
Semi-Annual Report
For the Six Months Ended
April 30, 2021
First Trust High Income Long/Short Fund (FSD)
Semi-Annual Report
April 30, 2021
Caution Regarding Forward-Looking Statements
This report contains certain forward-looking statements within the meaning of the Securities Act of 1933, as amended, and the Securities Exchange Act of 1934, as amended. Forward-looking statements include statements regarding the goals, beliefs, plans or current expectations of First Trust Advisors L.P. (“First Trust” or the “Advisor”) and/or MacKay Shields LLC (“MacKay” or the “Sub-Advisor”) and their respective representatives, taking into account the information currently available to them. Forward-looking statements include all statements that do not relate solely to current or historical fact. For example, forward-looking statements include the use of words such as “anticipate,” “estimate,” “intend,” “expect,” “believe,” “plan,” “may,” “should,” “would” or other words that convey uncertainty of future events or outcomes.
Forward-looking statements involve known and unknown risks, uncertainties and other factors that may cause the actual results, performance or achievements of First Trust High Income Long/Short Fund (the “Fund”) to be materially different from any future results, performance or achievements expressed or implied by the forward-looking statements. When evaluating the information included in this report, you are cautioned not to place undue reliance on these forward-looking statements, which reflect the judgment of the Advisor and/or Sub-Advisor and their respective representatives only as of the date hereof. We undertake no obligation to publicly revise or update these forward-looking statements to reflect events and circumstances that arise after the date hereof.
Performance and Risk Disclosure
There is no assurance that the Fund will achieve its investment objectives. The Fund is subject to market risk, which is the possibility that the market values of securities owned by the Fund will decline and that the value of the Fund’s shares may therefore be less than what you paid for them. Accordingly, you can lose money by investing in the Fund. See “Principal Risks” in the Additional Information section of this report for a discussion of certain other risks of investing in the Fund.
Performance data quoted represents past performance, which is no guarantee of future results, and current performance may be lower or higher than the figures shown. For the most recent month-end performance figures, please visit www.ftportfolios.com or speak with your financial advisor. Investment returns, net asset value and common share price will fluctuate and Fund shares, when sold, may be worth more or less than their original cost.
The Advisor may also periodically provide additional information on Fund performance on the Fund’s web page at www.ftportfolios.com.
How to Read This Report
This report contains information that may help you evaluate your investment in the Fund. It includes details about the Fund and presents data and analysis that provide insight into the Fund’s performance and investment approach.
By reading the portfolio commentary by the portfolio management team of the Fund, you may obtain an understanding of how the market environment affected the Fund’s performance. The statistical information that follows may help you understand the Fund’s performance compared to that of a relevant market benchmark.
It is important to keep in mind that the opinions expressed by personnel of First Trust and MacKay are just that: informed opinions. They should not be considered to be promises or advice. The opinions, like the statistics, cover the period through the date on the cover of this report. The material risks of investing in the Fund are spelled out in the prospectus, the statement of additional information, this report and other Fund regulatory filings.
First Trust High Income Long/Short Fund (FSD)
Semi-Annual Letter from the Chairman and CEO
April 30, 2021
Dear Shareholders,
First Trust is pleased to provide you with the semi-annual report for the First Trust High Income Long/Short Fund (the “Fund”), which contains detailed information about the Fund for the six months ended April 30, 2021.
I would like to begin my remarks by saying that this is a time for all of us to be thankful. It is astounding to me that our scientists and extended health care community successfully discovered, developed, and distributed multiple effective vaccines to treat the coronavirus (“COVID-19”) in the span of just 15 months. Suffice it to say that we are witnessing history in the making. We even received some good news recently with respect to wearing masks in public, a polarizing act for many politicians and Americans. The Centers for Disease Control and Prevention released a new set of guidelines in mid-May for those individuals who have been fully vaccinated. It essentially says fully vaccinated Americans can quit wearing their masks outdoors (even in crowds), in most indoor settings, and can drop social distancing altogether. This is a big step towards expediting the reopening of the U.S. economy.
For those who may not know, we subscribe to the buy-and-hold philosophy of investing here at First Trust Advisors L.P., even though it means enduring lots of tough times. While the notion of being able to time the market is seductive on its face, very few investors are skilled enough to make it work over time. I can think of no better example than the COVID-19 pandemic. The degree of uncertainty surrounding the onset of the virus alone was enough to make the average investor want to run for cover. And if that was not enough, the 33.8% plunge in the S&P 500® Index (the “Index”) from February 19, 2020, through March 23, 2020 (23 trading days) was a real gut check for most of us. But a funny thing happened on the way to another potential collapse of the market − it did not happen. In fact, thanks to the U.S. Federal government stepping up with trillions of dollars of timely fiscal and monetary support, the stock market roared. From March 23, 2020 through May 14, 2021, the Index posted a total return of 90.14%, according to Bloomberg. What a shame for those investors who may have moved some, or all, of their capital out of equities. What looked like a great time to de-risk turned out to be just the opposite.
The overall climate for investing looks bright for a few reasons. First, U.S. real gross domestic product (“GDP”) growth is expected to grow by 6.4% year-over-year in 2021, according to the International Monetary Fund. The last time the U.S. economy grew that fast was in 1984, when real GDP growth reached 7.2%. Second, corporate earnings are expected to recover from their 2020 slide. Bloomberg’s consensus year-over-year earnings growth rate estimates for the Index for 2021 and 2022 were 33.17% and 12.87%, respectively, as of May 14, 2021. That is a significant rebound from the 12.44% decline in earnings in 2020. Third, inflation is rising, and that is exactly what the Federal Reserve has been wanting for some time. Central banks around the world have spent years battling deflationary pressures, so a little bit of inflation is welcome at this stage of the recovery. Lastly, the U.S. labor market is robust despite the talk about the millions of people who lost their jobs in the COVID-19 pandemic and are living off unemployment benefits. As of March 31, 2021, there were 8.12 million job openings in the U.S., the highest total since record-keeping began in December 2000, according to the Bureau of Labor Statistics. We need to get people back to work.
While it seems fashionable to sell fear these days, we choose to follow the data. Remember, the Index has never failed to fully recoup the losses sustained in a market correction or bear market. Stay the course!
Thank you for giving First Trust the opportunity to play a role in your financial future. We value our relationship with you and will report on the Fund again in six months.
Sincerely,
James A. Bowen
Chairman of the Board of Trustees
Chief Executive Officer of First Trust Advisors L.P.
First Trust High Income Long/Short Fund (FSD)
“AT A GLANCE”
As of April 30, 2021 (Unaudited)
| Fund Statistics | |
| Symbol on New York Stock Exchange | FSD |
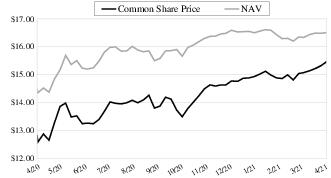
| Common Share Price | $15.46 |
| Common Share Net Asset Value (“NAV”) | $16.51 |
| Premium (Discount) to NAV | (6.36)% |
| Net Assets Applicable to Common Shares | $552,565,622 |
| Current Monthly Distribution per Common Share(1) | $0.1100 |
| Current Annualized Distribution per Common Share | $1.3200 |
| Current Distribution Rate on Common Share Price(2) | 8.54% |
| Current Distribution Rate on NAV(2) | 8.00% |
Common Share Price & NAV (weekly closing price)
| Performance | | | | | |
| | | Average Annual Total Returns |
| | 6 Months Ended
4/30/21 | 1 Year Ended
4/30/21 | 5 Years Ended
4/30/21 | 10 Years Ended
4/30/21 | Inception
(9/27/10)
to 4/30/21 |
| Fund Performance(3) | | | | | |
| NAV | 10.21% | 25.05% | 8.30% | 6.61% | 7.11% |
| Market Value | 19.80% | 32.25% | 9.77% | 6.45% | 5.99% |
| Index Performance | | | | | |
| ICE BofA US High Yield Constrained Index | 8.13% | 20.01% | 7.31% | 6.26% | 6.79% |
| (1) | Most recent distribution paid or declared through 4/30/2021. Subject to change in the future. |
| (2) | Distribution rates are calculated by annualizing the most recent distribution paid or declared through the report date and then dividing by Common Share Price or NAV, as applicable, as of 4/30/2021. Subject to change in the future. |
| (3) | Total return is based on the combination of reinvested dividend, capital gain, and return of capital distributions, if any, at prices obtained by the Dividend Reinvestment Plan and changes in NAV per share for NAV returns and changes in Common Share Price for market value returns. Total returns do not reflect sales load and are not annualized for periods of less than one year. Past performance is not indicative of future results. |
First Trust High Income Long/Short Fund (FSD)
“AT A GLANCE” (Continued)
As of April 30, 2021 (Unaudited)
| Credit Quality(4) | % of Total
Fixed-Income
Investments(5) |
| BBB- and above | 8.8% |
| BB | 48.8 |
| B | 29.4 |
| CCC+ and below | 13.0 |
| Total | 100.0% |
| Industry Classification | % of
Long-Term
Investments(5) |
| Energy | 11.2% |
| Capital Goods | 10.2 |
| Services | 8.7 |
| Telecommunications | 8.5 |
| Healthcare | 8.0 |
| Consumer Goods | 7.9 |
| Basic Industry | 7.0 |
| Media | 6.1 |
| Retail | 6.0 |
| Automotive | 5.3 |
| Leisure | 4.2 |
| Technology & Electronics | 4.1 |
| Financial Services | 3.8 |
| Real Estate | 2.5 |
| Banking | 2.1 |
| Insurance | 2.0 |
| Transportation | 1.6 |
| Commercial Mortgage-Backed Securities | 0.4 |
| Agency | 0.3 |
| Utility | 0.1 |
| Collateralized Mortgage Obligations | 0.0* |
| Total | 100.0% |
| * | Amount is less than 0.1%. |
| Asset Classification | % of
Long-Term
Investments(5) |
| Corporate Bonds and Notes | 73.3% |
| Foreign Corporate Bonds and Notes | 19.6 |
| Capital Preferred Securities | 4.9 |
| Senior Floating-Rate Loan Interests | 1.7 |
| Mortgage-Backed Securities | 0.4 |
| Equity | 0.1 |
| Total | 100.0% |
| Country Exposure | % of
Long-Term
Investments(5) |
| United States | 79.9% |
| Canada | 6.1 |
| Luxembourg | 3.3 |
| Multinational | 3.3 |
| Netherlands | 2.3 |
| United Kingdom | 1.1 |
| Mexico | 0.9 |
| France | 0.8 |
| Germany | 0.6 |
| Finland | 0.6 |
| Austria | 0.4 |
| Ireland | 0.3 |
| Denmark | 0.3 |
| Cayman Islands | 0.1 |
| Total | 100.0% |
| Fund Allocation | % of Net Assets |
| Corporate Bonds and Notes | 98.4% |
| Foreign Corporate Bonds and Notes | 26.3 |
| Capital Preferred Securities | 6.6 |
| Senior Floating-Rate Loan Interests | 2.2 |
| Mortgage-Backed Securities | 0.6 |
| Common Stocks | 0.1 |
| Rights | 0.0 |
| U.S. Government Bonds Sold Short | (10.3) |
| Corporate Bonds Sold Short | (0.9) |
| Foreign Corporate Bonds Sold Short | (0.6) |
| Outstanding Loan | (24.2) |
| Net Other Assets and Liabilities(6) | 1.8 |
| Total | 100.0% |
| (4) | The credit quality and ratings information presented above reflect the ratings assigned by one or more nationally recognized statistical rating organizations (NRSROs), including Standard & Poor’s Ratings Group, a division of the McGraw Hill Companies, Inc., Moody’s Investors Service, Inc., Fitch Ratings or a comparably rated NRSRO. For situations in which a security is rated by more than one NRSRO and the ratings are not equivalent, the highest rating is used. Sub-investment grade ratings are those rated BB+/Ba1 or lower. Investment grade ratings are those rated BBB-/Baa3 or higher. The credit ratings shown relate to the creditworthiness of the issuers of the underlying securities in the Fund, and not to the Fund or its shares. Credit ratings are subject to change. |
| (5) | Percentages are based on long positions only. Short positions are excluded. |
| (6) | Includes forward foreign currency contracts. |
Portfolio Commentary
First Trust High Income Long/Short Fund (FSD)
Semi-Annual Report
April 30, 2021 (Unaudited)
Advisor
First Trust Advisors L.P. (“First Trust” or the “Advisor”) serves as the investment advisor to the First Trust High Income Long/Short Fund (the “Fund”). First Trust is responsible for the ongoing monitoring of the Fund’s investment portfolio, managing the Fund’s business affairs and providing certain administrative services necessary for the management of the Fund.
Sub-Advisor
MacKay Shields LLC, Sub-Advisor to the Fund, was founded in 1938 and became a registered investment advisor in 1969. The Fund trades under the ticker symbol FSD on the New York Stock Exchange. As of April 30, 2021, MacKay had approximately $157.4 billion in assets under management.
FSD Portfolio Management Team
Joseph Cantwell – Senior Managing Director, Co-Head of Global Fixed Income Division and Head of Credit
Matthew Jacob – Managing Director, Global Fixed Income Division
Shu-Yang Tan, CFA – Managing Director, Global Fixed Income Division
Market Recap
This report covers the Fund for the six-month period ended April 30, 2021.
| • | Reflecting over the last six months, the year 2020 closed on an upward trend in both equity and credit markets, recovering strongly from the volatility experienced earlier in 2020 from the coronavirus (“COVID-19”) world health pandemic. Likewise, 2021 opened with the same positive tone in markets with the continued ultra-accommodative policies of the Federal Reserve (the “Fed”), a new U.S. Administration and a Democratic-controlled House and Congress and expanding fiscal support. At the end of March 2021, Congress passed the $1.9 trillion COVID-19 relief package. |
| • | Yields along the front-end of the U.S. treasury curve over the six-month period remained relatively anchored, while the longer end significantly rose. The 10-Year and 30-Year yield increased 75 and 66 basis points (“bps”), respectively. The Fed Funds Rate and asset purchases remained unchanged, as the Fed continued its ultra-accommodative policies. |
| • | U.S. equity markets, as measured by the S&P 500® Index, soared over the last six months returning 28.9%. In commodity markets, oil prices rose significantly over the period, both in the U.S. and globally. According to Markets Insider, both West Texas Intermediate (WTI) and Brent crude oil increased approximately 80% since the end of October 2020. |
| • | These improvements in the labor market reflect the continued resumption of economic activity that had been curtailed due to the COVID-19 pandemic. |
| • | Global manufacturing activity, as measured by IHS Markit’s JPM Global Manufacturing PMI, remains solid keeping up the rate of expansion. Production rose at the fastest pace in over a decade. At 55.8, as of April 30, 2021, it was the best reading since April 2010. However, pressure on capacity remained elevated, with average supplier lead times and the rate of growth in work backlogs increasing. China’s manufacturing companies, as measured by Caixin China PMI, slowed as 2020 ended but picked up in 2021 with recent strong increases in output and sales, although recent delivery times continued to lengthen. In 2021, U.S. business activity, as measured by the IHS Markit U.S. Services PMI, expanded at the fastest pace on record amid a marked uptick in client demand while pressure on capacity remains evident. Private sectors in the Eurozone, as measured by the IHS Markit Eurozone Composite PMI, experienced a return to growth in 2021 on the back of strong manufacturing performance. |
Performance Analysis
During the six-month period ending April 30, 2021, U.S. high yield spreads tightened by 204 bps to 328 bps over Treasuries according to ICE Data. With the overall U.S. high yield index up 8.1% for the same period, all rating categories were higher with performance in the lower quality segment outpacing their higher quality counterparts. BB-rated bonds were up 6.2%, while B’s returned 7.5% and CCC’s and Distressed credits added 19.3% and 55.1%, respectively.
Portfolio Commentary (Continued)
First Trust High Income Long/Short Fund (FSD)
Semi-Annual Report
April 30, 2021 (Unaudited)
Past performance is no guarantee of future results.
Source: BB, ICE BofA BB U.S. High Yield Index
2B, ICE BofA Single-B U.S. High Yield Index3
CCC and Lower, ICE BofA CCC & Lower U.S. High Yield Index4
Distressed, ICE BofA U.S. Distressed High Yield Index5
With a larger percentage of the population vaccinated, the COVID-19 landscape in the U.S. continued to improve. In addition, the Democratic sweep resulted in the signing of a larger than expected stimulus package and the expectation for a more robust stimulus in the future focused on infrastructure, jobs and family support fostered confidence in the durability of the economic recovery. These factors furthered the rally in high yield, resulting in spread levels edging closer to the October 2018 tight of 316 bps. During this semi-annual period, returns for all sectors within the high yield market were positive. This was despite an increase in the 10-Year Treasury yield of 75 bps to 1.63% on expectations of faster economic growth leading to inflationary pressures. The rise in yields largely affected longer duration and higher quality securities leading to the relative underperformance of BB’s. With stronger expectations for the U.S. economy and the continuation of the “reopening” theme, the distressed segment outperformed as investors searched for additional yield. The Energy sector was the top performing sector for the six-month period ended April 30, 2021, gaining 21% as WTI crude rallied close to 80%. Sectors that are more correlated with further economic reopening and improvement posted strong returns, notably the Transportation, Leisure and Capital Goods sectors. Defensive sectors, including Telecom, lagged during the period.

Portfolio Commentary (Continued)
First Trust High Income Long/Short Fund (FSD)
Semi-Annual Report
April 30, 2021 (Unaudited)
Looking at high yield market activity, the asset class experienced net outflows of $7.9 billion year to date, according to JP Morgan. April 2021 was the first monthly inflow since November 2020 with a total of $10.9 billion of outflows since then. Year to date, new issuance continued the torrid pace we have seen over the last year with $208 billion pricing across 317 deals where April 2021 was the eighth highest monthly total on record. Notably, April’s non-refi (net issuance) volume of $18.4 billion is the largest since the $24.5 billion we saw in June 2020. To illustrate the extent of issuance we are seeing in the marketplace, six of the largest 10 months on record have occurred in the last year. Year to date, the pace of defaults has continued to slow; seven companies defaulted impacting $3.6 billion in bonds and loans with four distressed transactions totaling $1 billion. The combined total of $4.6 billion is the lightest start to a year since 2011 when just $1.9 billion had defaulted by this point (JP Morgan).
Turning to performance, the Fund had a net asset value total return** of 10.21% and a market value total return** of 19.80% for the six-month period ended April 30, 2021, outperforming its benchmark, the ICE BofA High Yield Constrained Index6 (the “Benchmark”), which increased by 8.13% for the same period. Given the rally in high yield, the outperformance during the period was driven by the additional high yield exposure from the leverage within the Fund created with the proceeds from short sales, primarily of U.S. Treasuries. These positions are expressed in the belly of the curve7 and are used to reduce the portfolio’s exposure to interest rate risk, while at the same time purchasing additional high yield securities to lever up the portfolio8. Positioning in several higher beta names in the Aerospace & Defense and Energy sectors were the strongest contributors, with a few technology related names also positively contributing. Alternatively, the underweight to the highest beta part of the market, defined as those credits trading with a spread north of 1000 bps, weighed on results. From an industry perspective, positioning within the Consumer Goods sector also negatively impacted results, largely due to the underperformance of the longer duration, higher quality nature of the sector.
Outlook
Our core views for the global economy remain in place, as we continue to expect a robust recovery in growth as a result of waning influences of the pandemic and still-sizeable policy supports. There remain significant differences across countries when it comes to containing the pandemic, vaccine campaigns and policy accommodation. For example, we believe many emerging market economies will lag the global recovery as they continue to face high virus caseloads and restrictions on household and business activities. But these cross-country variations do not meaningfully change our assessment of a post-pandemic recovery coming into view. On the policy front, several central banks are beginning to signal an eventual reduction in policy accommodation. However, we expect the shift to tighter policy to be quite gradual, as policy makers will look through inflation pressures this year and will err on the side of falling behind the curve to ensure a speedy return to full employment.
As for the United States, we continue to expect sustained improvement in the labor market despite a somewhat disappointing April employment situation report, as the ongoing vaccine campaign and unprecedented fiscal stimulus leave consumers well-positioned to increase consumption in the months ahead. We are closely watching the current debate over additional fiscal measures targeting long-standing Democratic priorities such as funding for infrastructure, a transition to clean energy, redressing inequality and a host of measures aimed at supporting families and children. We anticipate this policy thrust to lead to additional fiscal support for the economy in the years ahead, but the measures will also add to deficits. Whether the programs and associated tax increases on corporations and higher-income households meaningfully change underlying trend growth remains to be seen. Spending on infrastructure, education, job training and childcare hold out the potential of increasing the economy’s productive capacity. However, higher corporate tax rates and potentially higher interest rates associated with larger deficits could restrain business investment in the years ahead.
| ** | Total return is based on the combination of reinvested dividend, capital gain and return of capital distributions, if any, at prices obtained by the Dividend Reinvestment Plan and changes in NAV per share for NAV returns and changes in Common Share Price for market value returns. Total returns do not reflect sales load and are not annualized for periods of less than one year. Past performance is not indicative of future results. |
Portfolio Commentary (Continued)
First Trust High Income Long/Short Fund (FSD)
Semi-Annual Report
April 30, 2021 (Unaudited)
Fund Notes:
1 ICE BofA US High Yield Index.
2 The ICE BofA BB U.S. High Yield Index (H0A1) is a subset of ICE BofA U.S. High Yield Index including all securities rated BB1 through BB3, inclusive.
3 ICE BofA Single-B U.S. High Yield Index (H0A2) is a subset of ICE BofA U.S. High Yield Index including all securities rated B1 through B3, inclusive.
4 ICE BofA CCC & Lower U.S. High Yield Index (H0A3) is a subset of ICE BofA U.S. High Yield Index including all securities rated CCC1 or lower.
5 ICE BofA U.S. Distressed High Yield Index (H0DI) is a subset of ICE BofA U.S. High Yield Index including all securities with an option-adjusted spread greater than or equal to 1,000 basis points.
6 ICE BofA U.S. High Yield Constrained Index tracks the performance of US dollar denominated below investment grade corporate debt publicly issued in the US domestic market but caps issuer exposure at 2%. ICE BofA utilizes its own composite scale, similar to those of Moody’s, S&P and Fitch, when publishing a composite rating on an index constituent (e.g. BBB3, BBB2, BBB1). Index constituent composite ratings are the simple averages of numerical equivalent values of the ratings from Moody’s, S&P and Fitch. If only two of the designated agencies rate a bond, the composite rating is based on an average of the two. Likewise, if only one of the designated agencies rates a bond, the composite rating is based on that one rating.
7 Belly of yield curve is the middle of the yield curve; generally considered to be bond maturities from two years up to, but not including, the ten-year bond.
8 Lever up is to use leverage. Leverage is a technique where a fund’s manager borrows assets at one rate and invests the proceeds from the borrowed assets at another rate, seeking to increase yield and total return. Use of leverage can result in additional risk and cost and can magnify the effect of any losses.
SOURCE INFORMATION
ICE Data Indices, LLC (“ICE Data”), is used with permission. ICE® is a registered trademark of ICE Data or its affiliates and BOFA® is a registered trademark of Bank of America Corporation licensed by Bank of America Corporation and its affiliates (“BOFA”) and may not be used without BOFA’s prior written approval. ICE data, its affiliates and their respective third party suppliers disclaim any and all warranties and representations, express and/or implied, including any warranties of merchantability or fitness for a particular purpose or use, including the indices, index data and any data included in, related to, or derived therefrom. Neither ICE Data, its affiliates nor their respective third party suppliers shall be subject to any damages or liability with respect to the adequacy, accuracy, timeliness or completeness of the indices or the index data or any component thereof, and the indices and index data and all components thereof are provided on an “as is” basis and your use is at your own risk. ICE data, its affiliates and their respective third party suppliers do not sponsor, endorse, or recommend MacKay Shields LLC, or any of its products or services.
Copyright ©2021, Markit Economics Limited. All rights reserved and all intellectual property rights retained by Markit Economics Limited.
IMPORTANT DISCLOSURES
Availability of this document and products and services provided by MacKay Shields LLC ( “MacKay Shields”) may be limited by applicable laws and regulations in certain jurisdictions and this document is provided only for persons to whom this document and the products and services of MacKay Shields may otherwise lawfully be issued or made available. None of the products and services provided by MacKay Shields are offered to any person in any jurisdiction where such offering would be contrary to local law or regulation. This document is provided for information purposes only. It does not constitute investment advice and should not be construed as an offer to buy securities. The contents of this document have not been reviewed by any regulatory authority in any jurisdiction.
This material contains the opinions of the Global Fixed Income team but not necessarily those of MacKay Shields. The opinions expressed herein are subject to change without notice. This material is distributed for informational purposes only. Forecasts, estimates, and opinions contained herein should not be considered as investment advice or a recommendation of any particular security, strategy or investment product. Information contained herein has been obtained from sources believed to be reliable, but not guaranteed. Any forward-looking statements speak only as of the date they are made and MacKay Shields assumes no duty and does not undertake to update forward-looking statements. No part of this document may be reproduced in any form, or referred to in any other publication, without express written permission of MacKay Shields LLC. ©2020, MacKay Shields LLC. All Rights Reserved.
Past performance is not indicative of future results.
*On September 23, 2019, Mr. Roberts announced his retirement effective December 31, 2019, at which time his portfolio management responsibilities ceased and he became a Senior Advisor to MacKay’s Global Fixed Income Division.
First Trust High Income Long/Short Fund (FSD)
Portfolio of Investments
April 30, 2021 (Unaudited)
Principal
Value | | Description | | Stated
Coupon | | Stated
Maturity | | Value |
| CORPORATE BONDS AND NOTES – 98.4% |
| | | Automotive – 5.1% | | | | | | |
| $1,930,000 | | Allison Transmission, Inc. (a)
| | 3.75% | | 01/30/31 | | $1,864,863 |
| 2,070,000 | | Ford Motor Co.
| | 8.50% | | 04/21/23 | | 2,320,987 |
| 2,170,000 | | Ford Motor Co. (b)
| | 9.00% | | 04/22/25 | | 2,653,172 |
| 1,400,000 | | Ford Motor Co.
| | 4.35% | | 12/08/26 | | 1,491,770 |
| 1,528,000 | | Ford Motor Co.
| | 7.45% | | 07/16/31 | | 1,968,415 |
| 1,610,000 | | Ford Motor Co.
| | 4.75% | | 01/15/43 | | 1,629,119 |
| 2,222,000 | | Ford Motor Credit Co., LLC
| | 2.98% | | 08/03/22 | | 2,260,496 |
| 3,500,000 | | Ford Motor Credit Co., LLC (b)
| | 4.25% | | 09/20/22 | | 3,621,415 |
| 4,605,000 | | Ford Motor Credit Co., LLC (b)
| | 4.13% | | 08/17/27 | | 4,818,488 |
| 5,000,000 | | Ford Motor Credit Co., LLC (b)
| | 5.11% | | 05/03/29 | | 5,470,300 |
| 275,000 | | Real Hero Merger Sub 2, Inc. (a)
| | 6.25% | | 02/01/29 | | 284,906 |
| | | | | 28,383,931 |
| | | Basic Industry – 6.7% | | | | | | |
| 1,370,000 | | BCPE Ulysses Intermediate, Inc. (a) (c)
| | 7.75% | | 04/01/27 | | 1,413,806 |
| 645,000 | | Brundage-Bone Concrete Pumping Holdings, Inc. (a) (b)
| | 6.00% | | 02/01/26 | | 679,598 |
| 3,495,000 | | Builders FirstSource, Inc. (a) (b)
| | 6.75% | | 06/01/27 | | 3,762,892 |
| 850,000 | | Builders FirstSource, Inc. (a)
| | 5.00% | | 03/01/30 | | 904,336 |
| 1,285,000 | | Coeur Mining, Inc. (a)
| | 5.13% | | 02/15/29 | | 1,247,683 |
| 2,852,000 | | Cornerstone Building Brands, Inc. (a)
| | 6.13% | | 01/15/29 | | 3,055,091 |
| 2,540,000 | | Dycom Industries, Inc. (a)
| | 4.50% | | 04/15/29 | | 2,581,275 |
| 1,675,000 | | Foundation Building Materials, Inc. (a)
| | 6.00% | | 03/01/29 | | 1,664,004 |
| 2,445,000 | | JELD-WEN, Inc. (a) (b)
| | 4.88% | | 12/15/27 | | 2,555,025 |
| 2,979,000 | | KB Home (b)
| | 7.50% | | 09/15/22 | | 3,227,791 |
| 3,500,000 | | LGI Homes, Inc. (a) (b)
| | 6.88% | | 07/15/26 | | 3,648,750 |
| 1,855,000 | | Meritage Homes Corp.
| | 6.00% | | 06/01/25 | | 2,097,309 |
| 2,045,000 | | Olin Corp. (b)
| | 5.13% | | 09/15/27 | | 2,137,580 |
| 1,825,000 | | Park River Holdings, Inc. (a)
| | 5.63% | | 02/01/29 | | 1,779,484 |
| 3,765,000 | | TRI Pointe Group, Inc./TRI Pointe Homes, Inc. (b)
| | 5.88% | | 06/15/24 | | 4,197,504 |
| 770,000 | | Weekley Homes LLC/Weekley Finance Corp. (a)
| | 4.88% | | 09/15/28 | | 797,139 |
| 1,055,000 | | White Cap Parent LLC (a) (d)
| | 8.25% | | 03/15/26 | | 1,097,712 |
| | | | | 36,846,979 |
| | | Capital Goods – 8.1% | | | | | | |
| 1,065,000 | | Amsted Industries, Inc. (a)
| | 5.63% | | 07/01/27 | | 1,132,691 |
| 2,675,000 | | Berry Global, Inc. (a) (b)
| | 4.50% | | 02/15/26 | | 2,744,389 |
| 1,470,000 | | EnerSys (a)
| | 4.38% | | 12/15/27 | | 1,544,433 |
| 2,245,000 | | Graham Packaging Co., Inc. (a)
| | 7.13% | | 08/15/28 | | 2,411,972 |
| 2,600,000 | | Howmet Aerospace, Inc.
| | 6.88% | | 05/01/25 | | 3,019,250 |
| 3,100,000 | | Mauser Packaging Solutions Holding Co. (a) (b)
| | 5.50% | | 04/15/24 | | 3,117,375 |
| 1,700,000 | | Mauser Packaging Solutions Holding Co. (a) (b)
| | 7.25% | | 04/15/25 | | 1,655,375 |
| 1,540,000 | | Navistar International Corp. (a)
| | 9.50% | | 05/01/25 | | 1,672,825 |
| 2,870,000 | | Owens-Brockway Glass Container, Inc. (a) (b)
| | 6.63% | | 05/13/27 | | 3,106,043 |
| 530,000 | | Plastipak Holdings, Inc. (a)
| | 6.25% | | 10/15/25 | | 545,569 |
| 2,462,000 | | Spirit AeroSystems, Inc. (a)
| | 7.50% | | 04/15/25 | | 2,638,612 |
| 625,000 | | TransDigm, Inc. (a)
| | 8.00% | | 12/15/25 | | 679,713 |
| 2,685,000 | | TransDigm, Inc. (a)
| | 6.25% | | 03/15/26 | | 2,846,100 |
| 3,055,000 | | TransDigm, Inc. (b)
| | 5.50% | | 11/15/27 | | 3,183,295 |
| 2,375,000 | | Trident TPI Holdings, Inc. (a)
| | 9.25% | | 08/01/24 | | 2,529,850 |
| 2,660,000 | | Trident TPI Holdings, Inc. (a) (b)
| | 6.63% | | 11/01/25 | | 2,717,602 |
| 2,515,000 | | TriMas Corp. (a)
| | 4.13% | | 04/15/29 | | 2,511,844 |
| 200,000 | | Triumph Group, Inc.
| | 5.25% | | 06/01/22 | | 199,000 |
| 1,230,000 | | Triumph Group, Inc. (a)
| | 8.88% | | 06/01/24 | | 1,369,913 |
| 550,000 | | Triumph Group, Inc. (a)
| | 6.25% | | 09/15/24 | | 556,531 |
Page 8
See Notes to Financial Statements
First Trust High Income Long/Short Fund (FSD)
Portfolio of Investments (Continued)
April 30, 2021 (Unaudited)
Principal
Value | | Description | | Stated
Coupon | | Stated
Maturity | | Value |
| CORPORATE BONDS AND NOTES (Continued) |
| | | Capital Goods (Continued) | | | | | | |
| $4,455,000 | | Triumph Group, Inc. (b)
| | 7.75% | | 08/15/25 | | $4,413,457 |
| | | | | 44,595,839 |
| | | Consumer Goods – 8.9% | | | | | | |
| 1,945,000 | | APX Group, Inc. (a) (b)
| | 6.75% | | 02/15/27 | | 2,093,948 |
| 3,440,000 | | CD&R Smokey Buyer, Inc. (a) (b)
| | 6.75% | | 07/15/25 | | 3,676,500 |
| 750,000 | | Chobani LLC/Chobani Finance Corp., Inc. (a)
| | 7.50% | | 04/15/25 | | 780,469 |
| 600,000 | | Chobani LLC/Chobani Finance Corp., Inc. (a)
| | 4.63% | | 11/15/28 | | 619,500 |
| 3,545,000 | | Darling Ingredients, Inc. (a) (b)
| | 5.25% | | 04/15/27 | | 3,733,328 |
| 2,120,000 | | Edgewell Personal Care Co. (a) (b)
| | 5.50% | | 06/01/28 | | 2,255,150 |
| 1,185,000 | | Energizer Holdings, Inc. (a)
| | 4.38% | | 03/31/29 | | 1,177,665 |
| 3,430,000 | | Kraft Heinz Foods Co.
| | 5.00% | | 07/15/35 | | 4,009,065 |
| 1,855,000 | | Kronos Acquisition Holdings, Inc./KIK Custom Products, Inc. (a)
| | 5.00% | | 12/31/26 | | 1,872,975 |
| 5,560,000 | | Kronos Acquisition Holdings, Inc./KIK Custom Products, Inc. (a) (b)
| | 7.00% | | 12/31/27 | | 5,399,816 |
| 1,275,000 | | Mattel, Inc. (a)
| | 3.38% | | 04/01/26 | | 1,321,219 |
| 1,585,000 | | Mattel, Inc. (a)
| | 5.88% | | 12/15/27 | | 1,744,491 |
| 893,000 | | Newell Brands, Inc.
| | 5.88% | | 04/01/36 | | 1,113,749 |
| 3,965,000 | | Performance Food Group, Inc. (a) (b)
| | 5.50% | | 06/01/24 | | 3,985,142 |
| 1,765,000 | | Post Holdings, Inc. (a) (b)
| | 5.75% | | 03/01/27 | | 1,851,044 |
| 2,760,000 | | Post Holdings, Inc. (a) (b)
| | 4.63% | | 04/15/30 | | 2,792,154 |
| 3,245,000 | | Primo Water Holdings, Inc. (a) (b)
| | 5.50% | | 04/01/25 | | 3,339,008 |
| 3,800,000 | | Primo Water Holdings, Inc. (a)
| | 4.38% | | 04/30/29 | | 3,796,428 |
| 1,100,000 | | Simmons Foods, Inc./Simmons Prepared Foods, Inc./Simmons Pet Food, Inc./Simmons Feed (a)
| | 4.63% | | 03/01/29 | | 1,109,856 |
| 235,000 | | Spectrum Brands, Inc.
| | 5.75% | | 07/15/25 | | 242,203 |
| 2,350,000 | | Triton Water Holdings, Inc. (a)
| | 6.25% | | 04/01/29 | | 2,382,465 |
| | | | | 49,296,175 |
| | | Energy – 13.9% | | | | | | |
| 1,200,000 | | Aethon United BR L.P./Aethon United Finance Corp. (a)
| | 8.25% | | 02/15/26 | | 1,277,250 |
| 1,600,000 | | Antero Midstream Partners L.P./Antero Midstream Finance Corp.
| | 5.38% | | 09/15/24 | | 1,629,000 |
| 1,600,000 | | Apache Corp.
| | 5.10% | | 09/01/40 | | 1,644,000 |
| 2,170,000 | | Archrock Partners L.P./Archrock Partners Finance Corp. (a)
| | 6.25% | | 04/01/28 | | 2,271,547 |
| 1,560,000 | | Ascent Resources Utica Holdings LLC/ARU Finance Corp. (a)
| | 7.00% | | 11/01/26 | | 1,583,751 |
| 970,000 | | Ascent Resources Utica Holdings LLC/ARU Finance Corp. (a) (b)
| | 8.25% | | 12/31/28 | | 1,043,128 |
| 1,919,000 | | Centennial Resource Production LLC (a)
| | 6.88% | | 04/01/27 | | 1,811,037 |
| 1,455,000 | | Cheniere Energy Partners L.P.
| | 4.50% | | 10/01/29 | | 1,521,246 |
| 1,020,000 | | Cheniere Energy, Inc. (a)
| | 4.63% | | 10/15/28 | | 1,064,778 |
| 2,080,000 | | CNX Resources Corp. (a)
| | 7.25% | | 03/14/27 | | 2,249,458 |
| 391,000 | | Continental Resources, Inc./OK
| | 4.38% | | 01/15/28 | | 426,110 |
| 1,960,000 | | Continental Resources, Inc./OK (a)
| | 5.75% | | 01/15/31 | | 2,276,119 |
| 980,000 | | Continental Resources, Inc./OK
| | 4.90% | | 06/01/44 | | 1,022,233 |
| 1,025,000 | | CrownRock L.P./CrownRock Finance, Inc. (a)
| | 5.00% | | 05/01/29 | | 1,050,917 |
| 934,000 | | DCP Midstream Operating L.P.
| | 5.13% | | 05/15/29 | | 999,268 |
| 2,096,000 | | Endeavor Energy Resources L.P./ EER Finance, Inc. (a)
| | 6.63% | | 07/15/25 | | 2,234,860 |
| 610,000 | | EnLink Midstream LLC (a)
| | 5.63% | | 01/15/28 | | 631,350 |
| 5,435,000 | | EnLink Midstream LLC (b)
| | 5.38% | | 06/01/29 | | 5,441,794 |
| 1,825,000 | | EQM Midstream Partners L.P. (a)
| | 6.50% | | 07/01/27 | | 2,017,508 |
| 1,700,000 | | EQM Midstream Partners L.P.
| | 5.50% | | 07/15/28 | | 1,807,865 |
| 1,225,000 | | EQM Midstream Partners L.P. (a)
| | 4.75% | | 01/15/31 | | 1,214,214 |
| 400,000 | | EQT Corp. (b)
| | 3.90% | | 10/01/27 | | 417,536 |
| 390,000 | | EQT Corp.
| | 5.00% | | 01/15/29 | | 426,941 |
| 791,000 | | Hess Midstream Operations L.P. (a)
| | 5.63% | | 02/15/26 | | 821,651 |
| 1,845,000 | | Hilcorp Energy I L.P./Hilcorp Finance Co. (a)
| | 5.75% | | 02/01/29 | | 1,881,632 |
See Notes to Financial Statements
Page 9
First Trust High Income Long/Short Fund (FSD)
Portfolio of Investments (Continued)
April 30, 2021 (Unaudited)
Principal
Value | | Description | | Stated
Coupon | | Stated
Maturity | | Value |
| CORPORATE BONDS AND NOTES (Continued) |
| | | Energy (Continued) | | | | | | |
| $600,000 | | Hilcorp Energy I L.P./Hilcorp Finance Co. (a)
| | 6.00% | | 02/01/31 | | $619,518 |
| 2,665,000 | | Laredo Petroleum, Inc. (b)
| | 9.50% | | 01/15/25 | | 2,747,868 |
| 1,510,000 | | Laredo Petroleum, Inc.
| | 10.13% | | 01/15/28 | | 1,557,135 |
| 4,280,000 | | Occidental Petroleum Corp. (b)
| | 8.50% | | 07/15/27 | | 5,213,575 |
| 3,070,000 | | Occidental Petroleum Corp. (b)
| | 6.63% | | 09/01/30 | | 3,503,837 |
| 747,000 | | Occidental Petroleum Corp.
| | 4.63% | | 06/15/45 | | 678,489 |
| 2,053,000 | | Occidental Petroleum Corp. (b)
| | 4.40% | | 04/15/46 | | 1,812,686 |
| 3,195,000 | | PBF Holding Co., LLC/PBF Finance Corp. (a) (b)
| | 9.25% | | 05/15/25 | | 3,350,756 |
| 1,445,000 | | PBF Logistics LP / PBF Logistics Finance Corp.
| | 6.88% | | 05/15/23 | | 1,445,000 |
| 2,585,000 | | Southwestern Energy Co.
| | 7.50% | | 04/01/26 | | 2,740,113 |
| 730,000 | | Southwestern Energy Co.
| | 8.38% | | 09/15/28 | | 802,989 |
| 770,000 | | Sunoco L.P./Sunoco Finance Corp.
| | 6.00% | | 04/15/27 | | 810,656 |
| 2,240,000 | | Sunoco L.P./Sunoco Finance Corp. (a) (b)
| | 4.50% | | 05/15/29 | | 2,265,200 |
| 2,000,000 | | Targa Resources Partners L.P./Targa Resources Partners Finance Corp.
| | 5.00% | | 01/15/28 | | 2,108,100 |
| 1,645,000 | | Targa Resources Partners L.P./Targa Resources Partners Finance Corp.
| | 6.88% | | 01/15/29 | | 1,845,601 |
| 730,000 | | Targa Resources Partners L.P./Targa Resources Partners Finance Corp. (a)
| | 4.88% | | 02/01/31 | | 764,036 |
| 1,500,000 | | USA Compression Partners L.P./USA Compression Finance Corp.
| | 6.88% | | 04/01/26 | | 1,574,910 |
| 1,830,000 | | USA Compression Partners L.P./USA Compression Finance Corp.
| | 6.88% | | 09/01/27 | | 1,927,914 |
| 909,000 | | Western Midstream Operating L.P.
| | 4.50% | | 03/01/28 | | 970,358 |
| 1,251,000 | | Western Midstream Operating L.P.
| | 5.30% | | 02/01/30 | | 1,366,718 |
| | | | | 76,870,652 |
| | | Financial Services – 3.1% | | | | | | |
| 2,985,000 | | Freedom Mortgage Corp. (a)
| | 7.63% | | 05/01/26 | | 3,116,325 |
| 785,000 | | Home Point Capital, Inc. (a)
| | 5.00% | | 02/01/26 | | 773,971 |
| 1,645,000 | | LD Holdings Group LLC (a)
| | 6.13% | | 04/01/28 | | 1,651,169 |
| 1,395,000 | | LPL Holdings, Inc. (a) (b)
| | 4.63% | | 11/15/27 | | 1,458,647 |
| 1,010,000 | | Midcap Financial Issuer Trust (a)
| | 6.50% | | 05/01/28 | | 1,047,855 |
| 1,540,000 | | OneMain Finance Corp.
| | 6.13% | | 03/15/24 | | 1,665,125 |
| 765,000 | | OneMain Finance Corp.
| | 8.88% | | 06/01/25 | | 847,907 |
| 1,225,000 | | OneMain Finance Corp. (b)
| | 6.63% | | 01/15/28 | | 1,396,108 |
| 1,011,000 | | OneMain Finance Corp.
| | 5.38% | | 11/15/29 | | 1,091,369 |
| 1,225,000 | | PennyMac Financial Services, Inc. (a)
| | 5.38% | | 10/15/25 | | 1,292,375 |
| 2,640,000 | | Quicken Loans, LLC/Quicken Loans Co-Issuer, Inc. (a)
| | 3.63% | | 03/01/29 | | 2,578,950 |
| | | | | 16,919,801 |
| | | Healthcare – 7.0% | | | | | | |
| 1,425,000 | | Bausch Health Americas, Inc. (a)
| | 8.50% | | 01/31/27 | | 1,588,875 |
| 780,000 | | Carriage Services, Inc. (a)
| | 6.63% | | 06/01/26 | | 823,337 |
| 2,775,000 | | Carriage Services, Inc. (a)
| | 4.25% | | 05/15/29 | | 2,771,531 |
| 1,435,000 | | CHS/Community Health Systems, Inc. (a)
| | 8.13% | | 06/30/24 | | 1,501,369 |
| 875,000 | | CHS/Community Health Systems, Inc. (a)
| | 6.63% | | 02/15/25 | | 924,061 |
| 4,765,000 | | CHS/Community Health Systems, Inc. (a) (b)
| | 8.00% | | 03/15/26 | | 5,140,244 |
| 765,000 | | CHS/Community Health Systems, Inc. (a)
| | 5.63% | | 03/15/27 | | 812,266 |
| 1,485,000 | | CHS/Community Health Systems, Inc. (a)
| | 6.00% | | 01/15/29 | | 1,565,190 |
| 1,930,000 | | CHS/Community Health Systems, Inc. (a)
| | 6.88% | | 04/15/29 | | 2,019,658 |
| 750,000 | | Jaguar Holding Co. II/PPD Development L.P. (a)
| | 5.00% | | 06/15/28 | | 818,812 |
| 732,000 | | Ortho-Clinical Diagnostics, Inc./Ortho-Clinical Diagnostics S.A. (a)
| | 7.38% | | 06/01/25 | | 790,102 |
| 2,065,000 | | Par Pharmaceutical, Inc. (a)
| | 7.50% | | 04/01/27 | | 2,175,994 |
| 1,325,000 | | Prestige Brands, Inc. (a) (b)
| | 5.13% | | 01/15/28 | | 1,390,422 |
| 990,000 | | Prestige Brands, Inc. (a)
| | 3.75% | | 04/01/31 | | 951,603 |
| 4,750,000 | | Service Corp International (b)
| | 7.50% | | 04/01/27 | | 5,752,535 |
Page 10
See Notes to Financial Statements
First Trust High Income Long/Short Fund (FSD)
Portfolio of Investments (Continued)
April 30, 2021 (Unaudited)
Principal
Value | | Description | | Stated
Coupon | | Stated
Maturity | | Value |
| CORPORATE BONDS AND NOTES (Continued) |
| | | Healthcare (Continued) | | | | | | |
| $615,000 | | Syneos Health, Inc. (a)
| | 3.63% | | 01/15/29 | | $601,931 |
| 1,730,000 | | Teleflex, Inc. (a)
| | 4.25% | | 06/01/28 | | 1,790,100 |
| 7,000,000 | | Tenet Healthcare Corp. (a) (b)
| | 6.13% | | 10/01/28 | | 7,395,500 |
| | | | | 38,813,530 |
| | | Insurance – 1.0% | | | | | | |
| 990,000 | | AmWINS Group, Inc. (a) (b)
| | 7.75% | | 07/01/26 | | 1,054,162 |
| 2,695,000 | | AssuredPartners, Inc. (a)
| | 5.63% | | 01/15/29 | | 2,735,371 |
| 1,275,000 | | MGIC Investment Corp.
| | 5.25% | | 08/15/28 | | 1,346,719 |
| 505,000 | | NMI Holdings, Inc. (a)
| | 7.38% | | 06/01/25 | | 581,479 |
| | | | | 5,717,731 |
| | | Leisure – 4.5% | | | | | | |
| 1,730,000 | | Affinity Gaming (a)
| | 6.88% | | 12/15/27 | | 1,838,644 |
| 500,000 | | Boyd Gaming Corp. (a)
| | 8.63% | | 06/01/25 | | 554,685 |
| 950,000 | | Boyd Gaming Corp.
| | 6.38% | | 04/01/26 | | 982,063 |
| 1,290,000 | | Caesars Entertainment, Inc. (a)
| | 6.25% | | 07/01/25 | | 1,373,140 |
| 3,280,000 | | Caesars Entertainment, Inc. (a)
| | 8.13% | | 07/01/27 | | 3,648,885 |
| 1,055,000 | | Caesars Resort Collection LLC/CRC Finco, Inc. (a)
| | 5.75% | | 07/01/25 | | 1,112,508 |
| 3,520,000 | | Caesars Resort Collection LLC/CRC Finco, Inc. (a) (b)
| | 5.25% | | 10/15/25 | | 3,553,044 |
| 215,000 | | Constellation Merger Sub, Inc. (a)
| | 8.50% | | 09/15/25 | | 208,259 |
| 2,980,000 | | Mohegan Gaming & Entertainment (a) (b)
| | 8.00% | | 02/01/26 | | 3,028,276 |
| 3,900,000 | | Scientific Games International, Inc. (a) (b)
| | 8.25% | | 03/15/26 | | 4,207,125 |
| 3,175,000 | | Scientific Games International, Inc. (a) (b)
| | 7.00% | | 05/15/28 | | 3,421,507 |
| 775,000 | | Station Casinos LLC (a)
| | 4.50% | | 02/15/28 | | 779,451 |
| | | | | 24,707,587 |
| | | Media – 7.5% | | | | | | |
| 1,235,000 | | Arches Buyer, Inc. (a)
| | 4.25% | | 06/01/28 | | 1,233,697 |
| 2,300,000 | | Arches Buyer, Inc. (a) (b)
| | 6.13% | | 12/01/28 | | 2,360,536 |
| 2,200,000 | | CCO Holdings LLC/CCO Holdings Capital Corp. (a) (b)
| | 5.88% | | 05/01/27 | | 2,273,568 |
| 3,330,000 | | CCO Holdings LLC/CCO Holdings Capital Corp. (a) (b)
| | 4.75% | | 03/01/30 | | 3,479,850 |
| 1,285,000 | | Clear Channel Outdoor Holdings, Inc. (a)
| | 7.75% | | 04/15/28 | | 1,324,874 |
| 820,000 | | Clear Channel Worldwide Holdings, Inc.
| | 9.25% | | 02/15/24 | | 857,503 |
| 3,500,000 | | CSC Holdings LLC (b)
| | 5.25% | | 06/01/24 | | 3,795,942 |
| 2,325,000 | | CSC Holdings LLC (a) (b)
| | 5.50% | | 04/15/27 | | 2,441,550 |
| 1,180,000 | | CSC Holdings LLC (a)
| | 5.75% | | 01/15/30 | | 1,255,962 |
| 900,000 | | DISH DBS Corp.
| | 5.88% | | 11/15/24 | | 975,002 |
| 1,200,000 | | DISH DBS Corp.
| | 7.75% | | 07/01/26 | | 1,384,500 |
| 2,820,000 | | DISH DBS Corp.
| | 7.38% | | 07/01/28 | | 3,041,892 |
| 2,100,000 | | iHeartCommunications, Inc.
| | 8.38% | | 05/01/27 | | 2,255,925 |
| 1,255,000 | | iHeartCommunications, Inc. (a)
| | 5.25% | | 08/15/27 | | 1,301,786 |
| 1,250,000 | | iHeartCommunications, Inc. (a)
| | 4.75% | | 01/15/28 | | 1,291,025 |
| 945,000 | | News Corp. (a)
| | 3.88% | | 05/15/29 | | 964,590 |
| 3,520,000 | | Nexstar Broadcasting, Inc. (a)
| | 5.63% | | 07/15/27 | | 3,723,544 |
| 3,150,000 | | Sirius XM Radio, Inc. (a) (b)
| | 5.38% | | 07/15/26 | | 3,256,942 |
| 2,205,000 | | TEGNA, Inc.
| | 4.63% | | 03/15/28 | | 2,254,701 |
| 655,000 | | TripAdvisor, Inc. (a)
| | 7.00% | | 07/15/25 | | 708,219 |
| 1,235,000 | | Urban One, Inc. (a)
| | 7.38% | | 02/01/28 | | 1,279,985 |
| | | | | 41,461,593 |
| | | Real Estate – 3.3% | | | | | | |
| 1,199,000 | | Iron Mountain, Inc. (a) (b)
| | 4.88% | | 09/15/27 | | 1,249,843 |
| 1,845,000 | | Iron Mountain, Inc. (a) (b)
| | 5.25% | | 03/15/28 | | 1,937,730 |
| 1,575,000 | | Iron Mountain, Inc. (a) (b)
| | 5.25% | | 07/15/30 | | 1,635,952 |
See Notes to Financial Statements
Page 11
First Trust High Income Long/Short Fund (FSD)
Portfolio of Investments (Continued)
April 30, 2021 (Unaudited)
Principal
Value | | Description | | Stated
Coupon | | Stated
Maturity | | Value |
| CORPORATE BONDS AND NOTES (Continued) |
| | | Real Estate (Continued) | | | | | | |
| $1,375,000 | | Iron Mountain, Inc. (a)
| | 4.50% | | 02/15/31 | | $1,373,130 |
| 910,000 | | Iron Mountain, Inc. (a)
| | 5.63% | | 07/15/32 | | 961,884 |
| 1,845,000 | | MGM Growth Properties Operating Partnership L.P./MGP Finance Co-Issuer, Inc.
| | 5.63% | | 05/01/24 | | 1,991,622 |
| 2,820,000 | | QualityTech L.P./QTS Finance Corp. (a) (b)
| | 3.88% | | 10/01/28 | | 2,851,711 |
| 905,000 | | Realogy Group LLC / Realogy Co-Issuer Corp. (a)
| | 5.75% | | 01/15/29 | | 940,404 |
| 1,840,000 | | SBA Communications Corp. (a) (b)
| | 3.13% | | 02/01/29 | | 1,764,969 |
| 3,134,000 | | Service Properties Trust (b)
| | 7.50% | | 09/15/25 | | 3,553,411 |
| | | | | 18,260,656 |
| | | Retail – 7.6% | | | | | | |
| 4,290,000 | | Albertsons Cos, Inc./Safeway Inc/New Albertsons L.P./Albertsons LLC (a) (b)
| | 3.50% | | 03/15/29 | | 4,123,934 |
| 662,000 | | Burlington Coat Factory Warehouse Corp. (a)
| | 6.25% | | 04/15/25 | | 704,203 |
| 1,780,000 | | Carvana Co. (a)
| | 5.50% | | 04/15/27 | | 1,803,674 |
| 770,000 | | CP Atlas Buyer, Inc. (a)
| | 7.00% | | 12/01/28 | | 799,687 |
| 950,000 | | GYP Holdings III Corp. (a)
| | 4.63% | | 05/01/29 | | 952,575 |
| 2,000,000 | | Hanesbrands, Inc. (a)
| | 4.63% | | 05/15/24 | | 2,109,580 |
| 3,300,000 | | KFC Holding Co./Pizza Hut Holdings LLC/Taco Bell of America LLC (a) (b)
| | 5.25% | | 06/01/26 | | 3,398,851 |
| 1,420,000 | | L Brands, Inc. (a)
| | 9.38% | | 07/01/25 | | 1,803,400 |
| 4,100,000 | | L Brands, Inc. (b)
| | 7.50% | | 06/15/29 | | 4,761,904 |
| 1,200,000 | | L Brands, Inc. (a)
| | 6.63% | | 10/01/30 | | 1,384,476 |
| 275,000 | | Macy’s Retail Holdings LLC
| | 2.88% | | 02/15/23 | | 275,718 |
| 2,425,000 | | Macy’s Retail Holdings LLC
| | 3.63% | | 06/01/24 | | 2,455,313 |
| 2,500,000 | | Macy’s Retail Holdings LLC (a)
| | 5.88% | | 04/01/29 | | 2,568,687 |
| 3,770,000 | | Macy’s, Inc. (a) (b)
| | 8.38% | | 06/15/25 | | 4,166,491 |
| 1,900,000 | | Magic Mergeco, Inc. (a)
| | 5.25% | | 05/01/28 | | 1,926,125 |
| 4,655,000 | | Magic Mergeco, Inc. (a) (b)
| | 7.88% | | 05/01/29 | | 4,789,343 |
| 990,000 | | PVH CORP
| | 4.63% | | 07/10/25 | | 1,101,223 |
| 2,680,000 | | QVC, Inc.
| | 4.38% | | 09/01/28 | | 2,746,705 |
| | | | | 41,871,889 |
| | | Services – 8.2% | | | | | | |
| 1,870,000 | | Allied Universal Holdco LLC/Allied Universal Finance Corp. (a) (b)
| | 6.63% | | 07/15/26 | | 1,979,919 |
| 3,505,000 | | Allied Universal Holdco LLC/Allied Universal Finance Corp. (a) (b)
| | 9.75% | | 07/15/27 | | 3,854,501 |
| 390,000 | | Avis Budget Car Rental LLC/Avis Budget Finance, Inc. (a)
| | 5.38% | | 03/01/29 | | 406,575 |
| 1,250,000 | | Brink’s (The) Co. (a) (b)
| | 5.50% | | 07/15/25 | | 1,321,094 |
| 1,900,000 | | Celestial-Saturn Merger Sub, Inc. (a)
| | 4.50% | | 05/01/28 | | 1,899,582 |
| 2,420,000 | | Clean Harbors, Inc. (a) (b)
| | 4.88% | | 07/15/27 | | 2,522,850 |
| 1,100,000 | | Diebold Nixdorf, Inc. (a)
| | 9.38% | | 07/15/25 | | 1,227,187 |
| 3,045,000 | | H&E Equipment Services, Inc. (a)
| | 3.88% | | 12/15/28 | | 2,976,487 |
| 3,605,000 | | Herc Holdings, Inc. (a) (b)
| | 5.50% | | 07/15/27 | | 3,818,524 |
| 2,400,000 | | Imola Merger Corp. (a)
| | 4.75% | | 05/15/29 | | 2,495,304 |
| 650,000 | | LBM Acquisition LLC (a)
| | 6.25% | | 01/15/29 | | 668,155 |
| 1,445,000 | | NESCO Holdings II, Inc. (a)
| | 5.50% | | 04/15/29 | | 1,490,156 |
| 895,000 | | Picasso Finance Sub, Inc. (a)
| | 6.13% | | 06/15/25 | | 953,354 |
| 1,915,000 | | Prime Security Services Borrower, LLC/Prime Finance, Inc. (a)
| | 3.38% | | 08/31/27 | | 1,852,762 |
| 4,835,000 | | Staples, Inc. (a) (b)
| | 7.50% | | 04/15/26 | | 5,010,269 |
| 430,000 | | Stericycle, Inc. (a)
| | 3.88% | | 01/15/29 | | 429,959 |
| 790,000 | | Uber Technologies, Inc. (a)
| | 6.25% | | 01/15/28 | | 859,323 |
| 3,015,000 | | WASH Multifamily Acquisition, Inc. (a)
| | 5.75% | | 04/15/26 | | 3,135,600 |
| 3,650,000 | | Waste Pro USA, Inc. (a) (b)
| | 5.50% | | 02/15/26 | | 3,733,603 |
Page 12
See Notes to Financial Statements
First Trust High Income Long/Short Fund (FSD)
Portfolio of Investments (Continued)
April 30, 2021 (Unaudited)
Principal
Value | | Description | | Stated
Coupon | | Stated
Maturity | | Value |
| CORPORATE BONDS AND NOTES (Continued) |
| | | Services (Continued) | | | | | | |
| $880,000 | | WESCO Distribution, Inc. (a)
| | 7.13% | | 06/15/25 | | $951,500 |
| 1,045,000 | | WESCO Distribution, Inc. (a)
| | 7.25% | | 06/15/28 | | 1,161,256 |
| 1,050,000 | | White Cap Buyer LLC (a)
| | 6.88% | | 10/15/28 | | 1,115,636 |
| 855,000 | | Williams Scotsman International, Inc. (a)
| | 4.63% | | 08/15/28 | | 874,310 |
| 640,000 | | ZoomInfo Technologies LLC/ZoomInfo Finance Corp. (a)
| | 3.88% | | 02/01/29 | | 632,832 |
| | | | | 45,370,738 |
| | | Technology & Electronics – 5.4% | | | | | | |
| 900,000 | | Boxer Parent Co., Inc. (a)
| | 7.13% | | 10/02/25 | | 968,589 |
| 2,380,000 | | CommScope, Inc. (a)
| | 6.00% | | 03/01/26 | | 2,511,995 |
| 3,150,000 | | CommScope, Inc. (a) (b)
| | 8.25% | | 03/01/27 | | 3,378,375 |
| 1,375,000 | | CommScope, Inc. (a) (b)
| | 7.13% | | 07/01/28 | | 1,489,771 |
| 4,996,000 | | Dell International LLC/EMC Corp. (a) (b)
| | 8.35% | | 07/15/46 | | 7,835,258 |
| 1,300,000 | | Endure Digital, Inc. (a)
| | 6.00% | | 02/15/29 | | 1,247,825 |
| 1,900,000 | | Entegris, Inc. (a)
| | 4.38% | | 04/15/28 | | 1,997,422 |
| 2,330,000 | | Go Daddy Operating Co., LLC/GD Finance Co, Inc. (a) (b)
| | 5.25% | | 12/01/27 | | 2,440,675 |
| 2,220,000 | | NCR Corp. (a)
| | 5.13% | | 04/15/29 | | 2,286,600 |
| 900,000 | | NCR Corp. (a)
| | 5.25% | | 10/01/30 | | 932,625 |
| 585,000 | | Presidio Holdings, Inc. (a)
| | 8.25% | | 02/01/28 | | 639,478 |
| 2,435,000 | | Rackspace Technology Global, Inc. (a)
| | 3.50% | | 02/15/28 | | 2,364,994 |
| 1,535,000 | | Veritas US, Inc./Veritas Bermuda Ltd. (a)
| | 7.50% | | 09/01/25 | | 1,590,644 |
| | | | | 29,684,251 |
| | | Telecommunications – 6.4% | | | | | | |
| 1,200,000 | | Cable One, Inc. (a)
| | 4.00% | | 11/15/30 | | 1,187,314 |
| 720,000 | | Embarq Corp.
| | 8.00% | | 06/01/36 | | 839,480 |
| 5,925,000 | | Level 3 Financing, Inc. (b)
| | 5.38% | | 05/01/25 | | 6,047,944 |
| 3,685,000 | | Level 3 Financing, Inc. (a)
| | 3.63% | | 01/15/29 | | 3,574,450 |
| 1,500,000 | | Level 3 Financing, Inc. (a)
| | 3.75% | | 07/15/29 | | 1,464,375 |
| 3,220,000 | | Lumen Technologies, Inc., Series P
| | 7.60% | | 09/15/39 | | 3,700,843 |
| 3,875,000 | | Sprint Capital Corp. (b)
| | 6.88% | | 11/15/28 | | 4,887,449 |
| 2,045,000 | | Sprint Capital Corp.
| | 8.75% | | 03/15/32 | | 3,034,729 |
| 3,685,000 | | Sprint Corp. (b)
| | 7.63% | | 03/01/26 | | 4,523,338 |
| 3,295,000 | | T-Mobile USA, Inc. (b)
| | 6.00% | | 03/01/23 | | 3,326,962 |
| 2,925,000 | | T-Mobile USA, Inc. (b)
| | 6.00% | | 04/15/24 | | 2,944,173 |
| | | | | 35,531,057 |
| | | Transportation – 1.6% | | | | | | |
| 1,496,824 | | American Airlines 2013-2 Class A Pass Through Trust
| | 4.95% | | 01/15/23 | | 1,512,930 |
| 1,540,000 | | American Airlines, Inc. (a)
| | 11.75% | | 07/15/25 | | 1,930,775 |
| 800,000 | | JetBlue 2020-1 Class B Pass Through Trust
| | 7.75% | | 11/15/28 | | 920,498 |
| 1,300,000 | | Mileage Plus Holdings LLC/Mileage Plus Intellectual Property Assets Ltd. (a)
| | 6.50% | | 06/20/27 | | 1,425,515 |
| 685,000 | | United Airlines, Inc. (a)
| | 4.38% | | 04/15/26 | | 711,694 |
| 895,000 | | United Airlines, Inc. (a)
| | 4.63% | | 04/15/29 | | 931,203 |
| 1,289,533 | | US Airways 2000-3C Pass Through Trust
| | 8.39% | | 03/01/22 | | 1,281,135 |
| | | | | 8,713,750 |
| | | Utility – 0.1% | | | | | | |
| 655,000 | | Calpine Corp. (a)
| | 3.75% | | 03/01/31 | | 626,953 |
| | | Total Corporate Bonds and Notes
| | 543,673,112 |
| | | (Cost $513,803,399) | | | | | | |
See Notes to Financial Statements
Page 13
First Trust High Income Long/Short Fund (FSD)
Portfolio of Investments (Continued)
April 30, 2021 (Unaudited)
Principal
Value
(Local
Currency) | | Description | | Stated
Coupon | | Stated
Maturity | | Value
(US Dollars) |
| FOREIGN CORPORATE BONDS AND NOTES – 26.3% |
| | | Agency – 0.4% | | | | | | |
| 2,250,000 | | Petroleos Mexicanos (USD)
| | 6.50% | | 03/13/27 | | $2,382,188 |
| | | Automotive – 0.9% | | | | | | |
| 1,020,000 | | Clarios Global L.P. (USD) (a)
| | 6.75% | | 05/15/25 | | 1,096,826 |
| 675,000 | | Clarios Global L.P./Clarios US Finance Co. (USD) (a)
| | 6.25% | | 05/15/26 | | 716,808 |
| 2,750,000 | | Clarios Global L.P./Clarios US Finance Co. (USD) (a) (b)
| | 8.50% | | 05/15/27 | | 2,973,438 |
| | | | | 4,787,072 |
| | | Basic Industry – 2.7% | | | | | | |
| 2,700,000 | | Alcoa Nederland Holding B.V. (USD) (a) (b)
| | 7.00% | | 09/30/26 | | 2,846,812 |
| 2,500,000 | | Cemex S.A.B. de C.V. (USD) (a)
| | 7.38% | | 06/05/27 | | 2,838,950 |
| 1,900,000 | | James Hardie International Finance DAC (USD) (a) (b)
| | 5.00% | | 01/15/28 | | 2,019,985 |
| 1,325,000 | | NOVA Chemicals, Corp. (USD) (a)
| | 4.25% | | 05/15/29 | | 1,321,317 |
| 1,350,000 | | SpA Holdings 3 Oy (USD) (a)
| | 4.88% | | 02/04/28 | | 1,363,433 |
| 1,625,000 | | SPCM S.A. (USD) (a)
| | 4.88% | | 09/15/25 | | 1,668,192 |
| 2,200,000 | | Stora Enso OYJ (USD) (a)
| | 7.25% | | 04/15/36 | | 2,921,436 |
| | | | | 14,980,125 |
| | | Capital Goods – 5.0% | | | | | | |
| 1,815,000 | | Ardagh Metal Packaging Finance USA LLC/Ardagh Metal Packaging Finance PLC (USD) (a)
| | 3.25% | | 09/01/28 | | 1,792,313 |
| 3,900,000 | | Ardagh Packaging Finance PLC/Ardagh Holdings USA, Inc. (USD) (a)
| | 5.25% | | 08/15/27 | | 3,991,010 |
| 1,100,000 | | Bombardier, Inc. (USD) (a)
| | 6.00% | | 10/15/22 | | 1,101,650 |
| 1,063,000 | | Bombardier, Inc. (USD) (a)
| | 6.13% | | 01/15/23 | | 1,115,650 |
| 3,100,000 | | Bombardier, Inc. (USD) (a)
| | 7.88% | | 04/15/27 | | 3,107,750 |
| 2,240,000 | | CANPACK S.A./Eastern PA Land Investment Holding LLC (USD) (a)
| | 3.13% | | 11/01/25 | | 2,277,800 |
| 1,880,000 | | Cascades, Inc./Cascades USA, Inc. (USD) (a)
| | 5.38% | | 01/15/28 | | 1,961,836 |
| 2,725,000 | | Intertape Polymer Group, Inc. (USD) (a) (b)
| | 7.00% | | 10/15/26 | | 2,867,545 |
| 4,330,000 | | Titan Acquisition Ltd./Titan Co-Borrower LLC (USD) (a) (b)
| | 7.75% | | 04/15/26 | | 4,511,643 |
| 4,425,000 | | Vertical Holdco GmbH (USD) (a) (b)
| | 7.63% | | 07/15/28 | | 4,831,547 |
| | | | | 27,558,744 |
| | | Consumer Goods – 1.7% | | | | | | |
| 2,600,000 | | JBS Investments II GmbH (USD) (a)
| | 7.00% | | 01/15/26 | | 2,766,010 |
| 2,725,000 | | JBS USA LUX S.A./JBS USA Food Co./JBS USA Finance, Inc. (USD) (a) (b)
| | 6.50% | | 04/15/29 | | 3,062,246 |
| 1,000,000 | | JBS USA LUX S.A./JBS USA Food Co./JBS USA Finance, Inc. (USD) (a)
| | 5.50% | | 01/15/30 | | 1,101,260 |
| 2,500,000 | | Minerva Luxembourg S.A. (USD) (a)
| | 4.38% | | 03/18/31 | | 2,438,475 |
| | | | | 9,367,991 |
| | | Energy – 1.1% | | | | | | |
| 2,065,000 | | MEG Energy Corp. (USD) (a) (b)
| | 7.13% | | 02/01/27 | | 2,207,547 |
| 1,100,000 | | Petrobras Global Finance BV (USD)
| | 5.60% | | 01/03/31 | | 1,189,100 |
| 1,000,000 | | Petrobras Global Finance BV (USD)
| | 6.75% | | 06/03/50 | | 1,095,710 |
| 1,555,000 | | TechnipFMC PLC (USD) (a)
| | 6.50% | | 02/01/26 | | 1,660,258 |
| | | | | 6,152,615 |
| | | Financial Services – 0.9% | | | | | | |
| 3,256,000 | | Fairstone Financial, Inc. (USD) (a) (b)
| | 7.88% | | 07/15/24 | | 3,420,493 |
Page 14
See Notes to Financial Statements
First Trust High Income Long/Short Fund (FSD)
Portfolio of Investments (Continued)
April 30, 2021 (Unaudited)
Principal
Value
(Local
Currency) | | Description | | Stated
Coupon | | Stated
Maturity | | Value
(US Dollars) |
| FOREIGN CORPORATE BONDS AND NOTES (Continued) |
| | | Financial Services (Continued) | | | | | | |
| 1,350,000 | | Unifin Financiera SAB de CV (USD) (a)
| | 9.88% | | 01/28/29 | | $1,335,231 |
| | | | | 4,755,724 |
| | | Healthcare – 3.7% | | | | | | |
| 4,130,000 | | Bausch Health Cos., Inc. (USD) (a) (b)
| | 9.00% | | 12/15/25 | | 4,481,050 |
| 4,600,000 | | Bausch Health Cos., Inc. (USD) (a) (b)
| | 5.00% | | 01/30/28 | | 4,674,543 |
| 5,180,000 | | Bausch Health Cos., Inc. (USD) (a)
| | 7.25% | | 05/30/29 | | 5,746,562 |
| 1,250,000 | | Endo Luxembourg Finance Co I Sarl/Endo US, Inc. (USD) (a)
| | 6.13% | | 04/01/29 | | 1,239,063 |
| 3,850,000 | | Teva Pharmaceutical Finance Netherlands III B.V. (USD) (b)
| | 7.13% | | 01/31/25 | | 4,203,988 |
| | | | | 20,345,206 |
| | | Leisure – 1.2% | | | | | | |
| 1,253,000 | | International Game Technology PLC (USD) (a)
| | 5.25% | | 01/15/29 | | 1,330,218 |
| 700,000 | | Melco Resorts Finance Ltd. (USD) (a)
| | 5.75% | | 07/21/28 | | 753,841 |
| 4,385,000 | | Stars Group Holdings B.V./Stars Group U.S. Co-Borrower LLC (USD) (a) (b)
| | 7.00% | | 07/15/26 | | 4,595,918 |
| | | | | 6,679,977 |
| | | Media – 0.6% | | | | | | |
| 1,521,000 | | Clear Channel International B.V. (USD) (a)
| | 6.63% | | 08/01/25 | | 1,595,149 |
| 1,820,000 | | UPC Holding, B.V. (USD) (a)
| | 5.50% | | 01/15/28 | | 1,893,937 |
| | | | | 3,489,086 |
| | | Retail – 0.5% | | | | | | |
| 1,855,000 | | 1011778 BC ULC/New Red Finance, Inc. (USD) (a)
| | 5.75% | | 04/15/25 | | 1,970,168 |
| 1,000,000 | | 1011778 BC ULC/New Red Finance, Inc. (USD) (a) (b)
| | 3.50% | | 02/15/29 | | 976,325 |
| | | | | 2,946,493 |
| | | Services – 2.1% | | | | | | |
| 1,600,000 | | Garda World Security Corp. (USD) (a)
| | 4.63% | | 02/15/27 | | 1,602,000 |
| 1,525,000 | | Garda World Security Corp. (USD) (a)
| | 9.50% | | 11/01/27 | | 1,685,453 |
| 1,407,000 | | GFL Environmental, Inc. (USD) (a)
| | 8.50% | | 05/01/27 | | 1,543,303 |
| 1,050,000 | | GFL Environmental, Inc. (USD) (a)
| | 4.00% | | 08/01/28 | | 1,006,163 |
| 1,500,000 | | Modulaire Global Finance PLC (USD) (a) (b)
| | 8.00% | | 02/15/23 | | 1,534,672 |
| 4,125,000 | | Ritchie Bros. Auctioneers, Inc. (USD) (a) (b)
| | 5.38% | | 01/15/25 | | 4,252,359 |
| | | | | 11,623,950 |
| | | Telecommunications – 5.0% | | | | | | |
| 1,980,000 | | Altice Financing S.A. (USD) (a)
| | 5.00% | | 01/15/28 | | 1,956,903 |
| 6,797,000 | | Altice France Holding S.A. (USD) (a) (b)
| | 10.50% | | 05/15/27 | | 7,665,419 |
| 6,845,000 | | Altice France Holding S.A. (USD) (a) (b)
| | 6.00% | | 02/15/28 | | 6,808,682 |
| 1,840,000 | | Altice France S.A./France (USD) (a)
| | 7.38% | | 05/01/26 | | 1,910,012 |
| 2,535,000 | | Altice France S.A./France (USD) (a)
| | 5.13% | | 07/15/29 | | 2,541,616 |
| 600,000 | | DKT Finance ApS (EUR) (e)
| | 7.00% | | 06/17/23 | | 737,715 |
| 1,116,000 | | DKT Finance ApS (USD) (a)
| | 9.38% | | 06/17/23 | | 1,151,852 |
| 3,540,000 | | Telecom Italia Capital S.A. (USD) (b)
| | 7.72% | | 06/04/38 | | 4,646,250 |
| | | | | 27,418,449 |
| | | Transportation – 0.5% | | | | | | |
| 995,000 | | Air Canada 2020-1 Class C Pass Through Trust (USD) (a)
| | 10.50% | | 07/15/26 | | 1,245,005 |
See Notes to Financial Statements
Page 15
First Trust High Income Long/Short Fund (FSD)
Portfolio of Investments (Continued)
April 30, 2021 (Unaudited)
Principal
Value
(Local
Currency) | | Description | | Stated
Coupon | | Stated
Maturity | | Value
(US Dollars) |
| FOREIGN CORPORATE BONDS AND NOTES (Continued) |
| | | Transportation (Continued) | | | | | | |
| 1,645,000 | | American Airlines, Inc./AAdvantage Loyalty IP Ltd. (USD) (a)
| | 5.50% | | 04/20/26 | | $1,729,306 |
| | | | | 2,974,311 |
| | | Total Foreign Corporate Bonds and Notes
| | 145,461,931 |
| | | (Cost $139,569,033) | | | | | | |
Par
Amount
(Local Currency) | | Description | | Stated
Rate | | Stated
Maturity | | Value
(US Dollars) |
| CAPITAL PREFERRED SECURITIES – 6.6% |
| | | Automotive – 1.2% | | | | | | |
| 5,935,000 | | General Motors Financial Co., Inc., Series A (USD) (b) (f)
| | 5.75% | | (g) | | 6,455,499 |
| | | Banking – 2.8% | | | | | | |
| 2,940,000 | | Bank of America Corp., Series DD (USD) (f)
| | 6.30% | | (g) | | 3,440,717 |
| 3,000,000 | | Barclays Bank PLC, 3 Mo. EUR LIBOR + 0.71% (EUR) (e) (h)
| | 0.17% | | (g) | | 3,467,421 |
| 4,475,000 | | Citigroup, Inc., Series M (USD) (f)
| | 6.30% | | (g) | | 4,825,829 |
| 3,935,000 | | Citigroup, Inc., Series V (USD) (f)
| | 4.70% | | (g) | | 4,015,373 |
| | | | | 15,749,340 |
| | | Financial Services – 1.1% | | | | | | |
| 3,500,000 | | Goldman Sachs Group (The), Inc., Series P (USD) (f)
| | 5.00% | | (g) | | 3,531,500 |
| 3,210,000 | | Textron Financial Corp., 3 Mo. LIBOR + 1.74% (USD) (a) (b) (h)
| | 1.93% | | 02/15/42 | | 2,608,125 |
| | | | | 6,139,625 |
| | | Insurance – 1.5% | | | | | | |
| 5,400,000 | | Hartford Financial Services Group (The), Inc., 3 Mo. LIBOR + 2.13% (USD) (a) (b) (h)
| | 2.32% | | 02/12/47 | | 5,197,654 |
| 3,500,000 | | Lincoln National Corp., 3 Mo. LIBOR + 2.36% (USD) (b) (h)
| | 2.55% | | 05/17/66 | | 3,018,750 |
| | | | | 8,216,404 |
| | | Total Capital Preferred Securities
| | 36,560,868 |
| | | (Cost $35,183,954) | | | | | | |
Principal
Value | | Description | | Rate (i) | | Stated
Maturity (j) | | Value |
| SENIOR FLOATING-RATE LOAN INTERESTS – 2.2% |
| | | Capital Goods – 0.6% | | | | | | |
| $3,000,000 | | ADS Tactical, Inc., Term Loan B, 1 Mo. LIBOR + 5.75%, 1.00% Floor
| | 6.75% | | 03/04/28 | | 2,975,640 |
| 438,750 | | Pretium PKG Holdings, Inc., Initial Term Loan, 5 Mo. LIBOR + 8.25%, 0.75% Floor
| | 9.00% | | 11/06/28 | | 445,331 |
| | | | | 3,420,971 |
| | | Insurance – 0.2% | | | | | | |
| 987,525 | | HUB International Ltd., Term Loan B3, 1 Mo. LIBOR + 3.25%, 0.75% Floor
| | 4.00% | | 04/25/25 | | 985,984 |
| | | Services – 1.3% | | | | | | |
| 7,000,000 | | TruGreen L.P., Initial Term Loan, 1 Mo. LIBOR + 8.50%, 0.75% Floor
| | 9.25% | | 11/02/28 | | 7,210,000 |
Page 16
See Notes to Financial Statements
First Trust High Income Long/Short Fund (FSD)
Portfolio of Investments (Continued)
April 30, 2021 (Unaudited)
Principal
Value | | Description | | Rate (i) | | Stated
Maturity (j) | | Value |
| SENIOR FLOATING-RATE LOAN INTERESTS (Continued) |
| | | Technology & Electronics – 0.1% | | | | | | |
| $600,000 | | Dcert Buyer, Inc., Term Loan, 1 Mo. LIBOR + 7.00%, 0.00% Floor
| | 7.11% | | 02/16/29 | | $602,250 |
| | | Total Senior Floating-Rate Loan Interests
| | 12,219,205 |
| | | (Cost $11,810,471) | | | | | | |
Principal
Value | | Description | | Stated
Coupon | | Stated
Maturity | | Value |
| MORTGAGE-BACKED SECURITIES – 0.6% |
| | | Collateralized Mortgage Obligations – 0.0% | | | | | | |
| | | Washington Mutual Alternative Mortgage Pass-Through Certificates | | | | | | |
| 15,913 | | Series 2007-5, Class A11, 1 Mo. LIBOR x -6 + 39.48% (k)
| | 38.83% | | 06/25/37 | | 30,838 |
| | | Commercial Mortgage-Backed Securities – 0.6% | | | | | | |
| | | Securitized Asset Backed Receivables LLC Trust | | | | | | |
| 7,017,444 | | Series 2006-FR4, Class A2A, 1 Mo. LIBOR + 0.08% (h)
| | 0.19% | | 08/25/36 | | 3,063,850 |
| | | Total Mortgage-Backed Securities
| | 3,094,688 |
| | | (Cost $5,181,454) | | | | | | |
| Shares | | Description | | Value |
| COMMON STOCKS – 0.1% |
| | | Energy – 0.0% | | |
| 7 | | Thunderbird Resources Equity, Inc. (l) (m) (n) (o)
| | 73,622 |
| | | Utility – 0.1% | | |
| 13,918 | | Vistra Corp.
| | 234,797 |
| | | Total Common Stocks
| | 308,419 |
| | | (Cost $997,888) | | |
| RIGHTS – 0.0% |
| | | Utility – 0.0% | | |
| 13,918 | | Vistra Corp., no expiration date (m) (o)
| | 15,421 |
| | | (Cost $22,917) | | |
| | | Total Investments – 134.2%
| | 741,333,644 |
| | | (Cost $706,569,116) (p) | | | | | | |
Principal
Value | | Description | | Stated
Coupon | | Stated
Maturity | | Value |
| U.S. GOVERNMENT BONDS SOLD SHORT - (10.3)% |
| $(30,000,000) | | United States Treasury Note
| | 1.38% | | 09/30/23 | | (30,827,930) |
| (24,000,000) | | United States Treasury Note
| | 2.88% | | 05/31/25 | | (26,187,656) |
| | | Total U.S. Government Bonds Sold Short
| | (57,015,586) |
| | | (Proceeds $52,553,860) | | | | | | |
| CORPORATE BONDS SOLD SHORT – (0.9)% |
| | | Energy – (0.3)% | | | | | | |
| (1,600,000) | | Halliburton Co.
| | 2.92% | | 03/01/30 | | (1,605,601) |
| | | Technology & Electronics – (0.6)% | | | | | | |
| (2,930,000) | | Amkor Technology, Inc. (a)
| | 6.63% | | 09/15/27 | | (3,157,427) |
| | | Total Corporate Bonds Sold Short
| | (4,763,028) |
| | | (Proceeds $4,479,457) | | | | | | |
See Notes to Financial Statements
Page 17
First Trust High Income Long/Short Fund (FSD)
Portfolio of Investments (Continued)
April 30, 2021 (Unaudited)
Principal
Value | | Description | | Stated
Coupon | | Stated
Maturity | | Value |
| FOREIGN CORPORATE BONDS SOLD SHORT – (0.6)% |
| | | Basic Industry – (0.6)% | | | | | | |
| $(2,900,000) | | FMG Resources (August 2006) Pty Ltd. (USD) (a)
| | 5.13% | | 05/15/24 | | $(3,170,222) |
| | | (Proceeds $3,026,975) | | | | | | |
| | | Total Investments Sold Short – (11.8)%
| | (64,948,836) |
| | | (Proceeds $60,060,292) | | | | | | |
| Outstanding Loan – (24.2)%
| | (133,760,967) |
| | Net Other Assets and Liabilities – 1.8%
| | 9,941,781 |
| | Net Assets – 100.0%
| | $552,565,622 |
| Forward Foreign Currency Contracts |
Settlement
Date | | Counterparty | | Amount
Purchased | | Amount
Sold | | Purchase
Value as of
4/30/2021 | | Sale
Value as of
4/30/2021 | | Unrealized
Appreciation/
(Depreciation) |
| 08/02/21 | | JPM | | USD | 4,272,651 | | EUR | 3,531,000 | | $ 4,272,651 | | $ 4,253,374 | | $ 19,277 |
| Counterparty Abbreviations |
| JPM | JPMorgan Chase |
See Note 2D – Forward Foreign Currency Contracts in the Notes to Financial Statements.
|
| (a) | This security, sold within the terms of a private placement memorandum, is exempt from registration upon resale under Rule 144A under the Securities Act of 1933, as amended (the “1933 Act”), and may be resold in transactions exempt from registration, normally to qualified institutional buyers. Pursuant to procedures adopted by the Fund Board of Trustees, this security has been determined to be liquid by MacKay Shields LLC, the Fund’s sub-advisor (the “Sub-Advisor”). Although market instability can result in periods of increased overall market illiquidity, liquidity for each security is determined based on security specific factors and assumptions, which require subjective judgment. At April 30, 2021, securities noted as such amounted to $504,616,896 of total investments and $(6,327,649) of total investments sold short, or 91.3% and (1.1)% of net assets, respectively. |
| (b) | This security or a portion of this security is segregated as collateral for investments sold short. |
| (c) | These notes are Senior Payment-in-kind (“PIK”) Toggle Notes whereby the issuer may, at its option, elect to pay interest on the notes (1) entirely in cash or (2) entirely in PIK interest. Interest paid in cash will accrue on the notes at a rate of 7.75% per annum (“Cash Interest Rate”) and PIK interest will accrue on the notes at a rate per annum equal to the Cash Interest Rate plus 75 basis points. The first interest payment is scheduled for October 1, 2021. |
| (d) | These notes are Senior PIK Toggle Notes whereby the issuer may, at its option, elect to pay interest on the notes (1) entirely in cash or (2) entirely in PIK interest. Interest paid in cash will accrue on the notes at a rate of 8.25% per annum and PIK interest will accrue on the notes at a rate per annum equal to the Cash Interest Rate plus 75 basis points. The first interest payment is scheduled for September 15, 2021. |
| (e) | This security may be resold to qualified foreign investors and foreign institutional buyers under Regulation S of the 1933 Act. |
| (f) | Fixed-to-floating or fixed-to-variable rate security. The interest rate shown reflects the fixed rate in effect at April 30, 2021. At a predetermined date, the fixed rate will change to a floating rate or a variable rate. |
| (g) | Perpetual maturity. |
| (h) | Floating or variable rate security. |
| (i) | Senior Floating-Rate Loan Interests (“Senior Loans”) in which the Fund invests pay interest at rates which are periodically predetermined by reference to a base lending rate plus a premium. These base lending rates are generally (i) the lending rate offered by one or more major European banks, such as the LIBOR, (ii) the prime rate offered by one or more United States banks or (iii) the certificate of deposit rate. Certain Senior Loans are subject to a LIBOR floor that establishes a minimum LIBOR rate. |
| (j) | Senior Loans generally are subject to mandatory and/or optional prepayment. As a result, the actual remaining maturity of Senior Loans may be substantially less than the stated maturities shown. |
| (k) | Inverse floating rate security. |
| (l) | This security is fair valued by the Advisor’s Pricing Committee in accordance with procedures adopted by the Fund’s Board of Trustees, and in accordance with the provisions of the Investment Company Act of 1940, as amended. At April 30, 2021, securities noted as such are valued at $73,622 or 0.0% of net assets. |
| (m) | Pursuant to procedures adopted by the Fund’s Board of Trustees, this security has been determined to be illiquid by the Sub-Advisor. |
Page 18
See Notes to Financial Statements
First Trust High Income Long/Short Fund (FSD)
Portfolio of Investments (Continued)
April 30, 2021 (Unaudited)
| (n) | This security’s value was determined using significant unobservable inputs (see Note 2A – Portfolio Valuation in the Notes to Financial Statements). |
| (o) | Non-income producing security. |
| (p) | Aggregate cost for financial reporting purposes approximates the aggregate cost for federal income tax purposes. As of April 30, 2021, the aggregate gross unrealized appreciation for all investments in which there was an excess of value over tax cost was $39,676,302 and the aggregate gross unrealized depreciation for all investments in which there was an excess of tax cost over value was $9,781,041. The net unrealized appreciation was $29,895,261. The unrealized amounts presented are inclusive of investments sold short and derivative contracts. |
| EUR | Euro |
| LIBOR | London Interbank Offered Rate |
| USD | United States Dollar |
Valuation Inputs
A summary of the inputs used to value the Fund’s investments as of April 30, 2021 is as follows (see Note 2A - Portfolio Valuation in the Notes to Financial Statements):
| ASSETS TABLE |
| | Total
Value at
4/30/2021 | Level 1
Quoted
Prices | Level 2
Significant
Observable
Inputs | Level 3
Significant
Unobservable
Inputs |
Corporate Bonds and Notes*
| $ 543,673,112 | $ — | $ 543,673,112 | $ — |
Foreign Corporate Bonds and Notes*
| 145,461,931 | — | 145,461,931 | — |
Capital Preferred Securities*
| 36,560,868 | — | 36,560,868 | — |
Senior Floating-Rate Loan Interests*
| 12,219,205 | — | 12,219,205 | — |
Mortgage-Backed Securities
| 3,094,688 | — | 3,094,688 | — |
| Common Stocks: | | | | |
Energy
| 73,622 | — | — | 73,622 |
Utility
| 234,797 | 234,797 | — | — |
Rights*
| 15,421 | — | 15,421 | — |
Total Investments
| 741,333,644 | 234,797 | 741,025,225 | 73,622 |
Forward Foreign Currency Contracts
| 19,277 | — | 19,277 | — |
Total
| $ 741,352,921 | $ 234,797 | $ 741,044,502 | $ 73,622 |
LIABILITIES TABLE |
| | Total
Value at
4/30/2021 | Level 1
Quoted
Prices | Level 2
Significant
Observable
Inputs | Level 3
Significant
Unobservable
Inputs |
U.S. Government Bonds Sold Short
| $ (57,015,586) | $ — | $ (57,015,586) | $ — |
Corporate Bonds Sold Short*
| (4,763,028) | — | (4,763,028) | — |
Foreign Corporate Bonds Sold Short*
| (3,170,222) | — | (3,170,222) | — |
Total Investments
| $ (64,948,836) | $— | $ (64,948,836) | $— |
| * | See Portfolio of Investments for industry breakout. |
Level 3 Common Stocks are fair valued by the Advisor’s Pricing Committee. These values are based on unobservable and non-quantitative inputs.
See Notes to Financial Statements
Page 19
First Trust High Income Long/Short Fund (FSD)
Statement of Assets and Liabilities
April 30, 2021 (Unaudited)
| ASSETS: | |
Investments, at value
(Cost $706,569,116)
| $ 741,333,644 |
Cash
| 4,298,869 |
Foreign currency (Cost $36,880)
| 36,534 |
Unrealized appreciation on forward foreign currency contracts
| 19,277 |
Due from broker
| 37,630 |
| Receivables: | |
Interest
| 10,649,063 |
Investment securities sold
| 790,425 |
Prepaid expenses
| 36,129 |
Total Assets
| 757,201,571 |
| LIABILITIES: | |
Borrowings
| 133,760,967 |
Investments sold short, at value (proceeds $60,060,292)
| 64,948,836 |
| Payables: | |
Investment securities purchased
| 4,846,369 |
Investment advisory fees
| 452,185 |
Interest expense on investments sold short
| 425,142 |
Margin interest expense
| 59,260 |
Custodian fees
| 41,414 |
Audit and tax fees
| 40,144 |
Administrative fees
| 33,573 |
Shareholder reporting fees
| 14,730 |
Legal fees
| 8,669 |
Transfer agent fees
| 2,084 |
Trustees’ fees and expenses
| 1,340 |
Financial reporting fees
| 771 |
Other liabilities
| 465 |
Total Liabilities
| 204,635,949 |
NET ASSETS
| $552,565,622 |
| NET ASSETS consist of: | |
Paid-in capital
| $ 635,246,740 |
Par value
| 334,701 |
Accumulated distributable earnings (loss)
| (83,015,819) |
NET ASSETS
| $552,565,622 |
NET ASSET VALUE, per Common Share (par value $0.01 per Common Share)
| $16.51 |
Number of Common Shares outstanding (unlimited number of Common Shares has been authorized)
| 33,470,143 |
Page 20
See Notes to Financial Statements
First Trust High Income Long/Short Fund (FSD)
Statement of Operations
For the Six Months Ended April 30, 2021 (Unaudited)
| INVESTMENT INCOME: | |
Interest
| $ 20,816,952 |
Dividends
| 4,435 |
Other
| 81,596 |
Total investment income
| 20,902,983 |
| EXPENSES: | |
Investment advisory fees
| 2,723,331 |
Margin interest expense
| 967,004 |
Interest expense on investments sold short
| 794,374 |
Administrative fees
| 152,101 |
Shareholder reporting fees
| 76,946 |
Legal fees
| 44,885 |
Audit and tax fees
| 40,165 |
Listing expense
| 21,410 |
Custodian fees
| 16,857 |
Transfer agent fees
| 13,715 |
Trustees’ fees and expenses
| 7,908 |
Financial reporting fees
| 4,625 |
Other
| 31,874 |
Total expenses
| 4,895,195 |
NET INVESTMENT INCOME (LOSS)
| 16,007,788 |
| NET REALIZED AND UNREALIZED GAIN (LOSS): | |
| Net realized gain (loss) on: | |
Investments
| 8,603,495 |
Forward foreign currency contracts
| (71,825) |
Foreign currency transactions
| 893 |
Investments sold short
| (813,426) |
Net realized gain (loss)
| 7,719,137 |
| Net change in unrealized appreciation (depreciation) on: | |
Investments
| 25,507,142 |
Forward foreign currency contracts
| (39,553) |
Foreign currency translation
| (19) |
Investments sold short
| 1,189,420 |
Net change in unrealized appreciation (depreciation)
| 26,656,990 |
NET REALIZED AND UNREALIZED GAIN (LOSS)
| 34,376,127 |
NET INCREASE (DECREASE) IN NET ASSETS RESULTING FROM OPERATIONS
| $ 50,383,915 |
See Notes to Financial Statements
Page 21
First Trust High Income Long/Short Fund (FSD)
Statements of Changes in Net Assets
| | Six Months
Ended
4/30/2021
(Unaudited) | | Year
Ended
10/31/2020 |
| OPERATIONS: | | | |
Net investment income (loss)
| $ 16,007,788 | | $ 31,309,282 |
Net realized gain (loss)
| 7,719,137 | | (26,600,031) |
Net change in unrealized appreciation (depreciation)
| 26,656,990 | | (5,556,401) |
Net increase (decrease) in net assets resulting from operations
| 50,383,915 | | (847,150) |
| DISTRIBUTIONS TO SHAREHOLDERS FROM: | | | |
Investment operations
| (22,130,005) | | (31,244,833) |
Return of capital
| — | | (13,817,545) |
Total distributions to shareholders
| (22,130,005) | | (45,062,378) |
| CAPITAL TRANSACTIONS: | | | |
Repurchase of Common Shares *
| (2,503,784) | | (9,776,932) |
Net increase (decrease) in net assets resulting from capital transactions
| (2,503,784) | | (9,776,932) |
Total increase (decrease) in net assets
| 25,750,126 | | (55,686,460) |
| NET ASSETS: | | | |
Beginning of period
| 526,815,496 | | 582,501,956 |
End of period
| $ 552,565,622 | | $ 526,815,496 |
| CAPITAL TRANSACTIONS were as follows: | | | |
Common Shares at beginning of period
| 33,642,356 | | 34,378,335 |
Common Shares repurchased *
| (172,213) | | (735,979) |
Common Shares at end of period
| 33,470,143 | | 33,642,356 |
| * | On September 15, 2015, the Fund commenced a share repurchase program. The program originally expired on March 15, 2016, but the Board of Trustees of the Fund has subsequently authorized the continuation of the Fund’s share repurchase program until March 15, 2022. For the six months ended April 30, 2021, the Fund repurchased 172,213 of its shares at a weighted-average discount of 11.27% from net asset value per share. For the year ended October 31, 2020, the Fund repurchased 735,979 of its shares at a weighted-average discount of 11.95% from net asset value per share. The Fund expects to continue to repurchase its outstanding shares until the earlier of (i) the repurchase of an additional 1,673,507 common shares (for an aggregate of 1,673,507), or (ii) March 15, 2022. |
Page 22
See Notes to Financial Statements
First Trust High Income Long/Short Fund (FSD)
Statement of Cash Flows
For the Six Months Ended April 30, 2021 (Unaudited)
| Cash flows from operating activities: | | |
Net increase (decrease) in net assets resulting from operations
| $50,383,915 | |
| Adjustments to reconcile net increase (decrease) in net assets resulting from operations to net cash used in operating activities: | | |
Purchases of investments
| (186,704,965) | |
Sales, maturities and paydown of investments
| 159,998,582 | |
Borrowed investments purchased
| (5,869,783) | |
Net amortization/accretion of premiums/discounts on investments
| 31,893 | |
Net realized gain/loss on investments
| (8,603,495) | |
Net realized gain/loss on investments sold short
| 813,426 | |
Net change in unrealized appreciation/depreciation on investments
| (25,507,142) | |
Net change in unrealized appreciation/depreciation on forward foreign currency contracts
| 39,553 | |
Net change in unrealized appreciation/depreciation on investments sold short
| (1,189,420) | |
| Changes in assets and liabilities: | | |
Increase in interest receivable
| (246,409) | |
Increase in due from broker
| (37,630) | |
Increase in prepaid expenses
| (17,552) | |
Decrease in interest payable on investments sold short
| (108,138) | |
Decrease in due to broker
| (99,708) | |
Increase in investment advisory fees payable
| 1,698 | |
Decrease in audit and tax fees payable
| (17,035) | |
Decrease in legal fees payable
| (21,102) | |
Decrease in shareholder reporting fees payable
| (21,160) | |
Increase in administrative fees payable
| 4,394 | |
Increase in custodian fees payable
| 16,856 | |
Decrease in transfer agent fees payable
| (613) | |
Increase in trustees’ fees and expenses payable
| 20 | |
Decrease in margin interest expense payable
| (4,536) | |
Decrease in other liabilities payable
| (554) | |
Cash used in operating activities
| | $(17,158,905) |
| Cash flows from financing activities: | | |
Repurchase of Common Shares
| (2,503,784) | |
Distributions to Common Shareholders from investment operations
| (22,130,005) | |
Net proceeds from borrowing
| 13,350,060 | |
Cash used in financing activities
| | (11,283,729) |
Decrease in cash and foreign currency (a)
| | (28,442,634) |
Cash and foreign currency at beginning of period
| | 32,778,037 |
Cash and foreign currency at end of period
| | $4,335,403 |
| Supplemental disclosure of cash flow information: | | |
Cash paid during the period for interest and fees
| | $1,874,052 |
| (a) | Includes net change in unrealized appreciation (depreciation) on foreign currency of $(19). |
See Notes to Financial Statements
Page 23
First Trust High Income Long/Short Fund (FSD)
Financial Highlights
For a Common Share outstanding throughout each period
| | Six Months
Ended
4/30/2021
(Unaudited) | | Year Ended October 31, |
| 2020 | | 2019 | | 2018 | | 2017 | | 2016 |
Net asset value, beginning of period
| $ 15.66 | | $ 16.94 | | $ 16.57 | | $ 18.23 | | $ 17.71 | | $ 17.28 |
| Income from investment operations: | | | | | | | | | | | |
Net investment income (loss)
| 0.48 | | 0.92 | | 0.93 | | 0.96 | | 1.04 | | 1.00 |
Net realized and unrealized gain (loss)
| 1.02 | | (0.92) | | 0.68 | | (1.32) | | 0.83 | | 0.44 |
Total from investment operations
| 1.50 | | — | | 1.61 | | (0.36) | | 1.87 | | 1.44 |
| Distributions paid to shareholders from: | | | | | | | | | | | |
Net investment income
| (0.66) | | (0.92) | | (0.92) | | (0.98) | | (1.07) | | (1.06) |
Return of capital
| — | | (0.40) | | (0.36) | | (0.37) | | (0.34) | | — |
Total distributions paid to Common Shareholders
| (0.66) | | (1.32) | | (1.28) | | (1.35) | | (1.41) | | (1.06) |
Common Share repurchases
| 0.01 | | 0.04 | | 0.04 | | 0.05 | | 0.00 (a) | | 0.05 |
Tender offer purchases
| — | | — | | — | | — | | 0.06 | | — |
Net asset value, end of period
| $16.51 | | $15.66 | | $16.94 | | $16.57 | | $18.23 | | $17.71 |
Market value, end of period
| $15.46 | | $13.49 | | $15.49 | | $13.91 | | $16.91 | | $15.52 |
Total return based on net asset value (b)
| 10.21% | | 1.53% | | 11.58% | | (0.82)% | | 11.98% | | 10.24% |
Total return based on market value (b)
| 19.80% | | (4.35)% | | 21.54% | | (10.24)% | | 18.52% | | 11.58% |
| Ratios to average net assets/supplemental data: | | | | | | | | | | | |
Net assets, end of period (in 000’s)
| $ 552,566 | | $ 526,815 | | $ 582,502 | | $ 578,360 | | $ 546,047 | | $ 624,109 |
Ratio of total expenses to average net assets
| 1.80% (c) | | 2.13% | | 2.53% | | 2.20% | | 1.86% | | 1.54% |
Ratio of total expenses to average net assets excluding interest expense
| 1.15% (c) | | 1.22% | | 1.16% | | 1.13% | | 1.19% | | 1.16% |
Ratio of net investment income (loss) to average net assets
| 5.88% (c) | | 5.80% | | 5.55% | | 5.48% | | 5.76% | | 5.92% |
Portfolio turnover rate
| 19% | | 63% | | 33% | | 29% | | 39% | | 36% |
| (a) | Amount is less than $0.01. |
| (b) | Total return is based on the combination of reinvested dividend, capital gain and return of capital distributions, if any, at prices obtained by the Dividend Reinvestment Plan, and changes in net asset value per share for net asset value returns and changes in Common Share Price for market value returns. Total returns do not reflect sales load and are not annualized for periods of less than one year. Past performance is not indicative of future results. |
| (c) | Annualized. |
Page 24
See Notes to Financial Statements
Notes to Financial Statements
First Trust High Income Long/Short Fund (FSD)
April 30, 2021 (Unaudited)
1. Organization
First Trust High Income Long/Short Fund (the “Fund”) is a diversified, closed-end management investment company organized as a Massachusetts business trust on June 18, 2010, and is registered with the Securities and Exchange Commission under the Investment Company Act of 1940, as amended (the “1940 Act”). The Fund trades under the ticker symbol “FSD” on the New York Stock Exchange (“NYSE”).
The Fund’s primary investment objective is to provide current income. The Fund’s secondary objective is capital appreciation. The Fund seeks to achieve its investment objectives by investing, under normal market conditions, a majority of its assets in a diversified portfolio of U.S. and foreign (including emerging markets) high-yield corporate fixed-income securities of varying maturities that are rated below-investment grade at the time of purchase. For purposes of this strategy, “corporate fixed-income securities” include corporate bonds, debentures, notes, commercial paper and other similar types of corporate debt instruments, including instruments issued by corporations with direct or indirect government ownership, as well as asset-backed securities, preferred shares, senior floating-rate loan participations, commitments and assignments (“Senior Loans”)(1), payment-in-kind securities, zero-coupon bonds, bank certificates of deposit, fixed time deposits, bankers’ acceptances and derivative instruments that provide the same or similar economic impact as a physical investment in the above securities. Below-investment grade fixed-income securities are commonly referred to as “high-yield” or “junk” bonds and are considered speculative with respect to the issuer’s capacity to pay interest and repay principal. As part of its investment strategy, the Fund intends to maintain both long and short positions in securities under normal market conditions. The Fund will take long positions in securities that MacKay Shields LLC (“MacKay” or the “Sub-Advisor”) believes offer the potential for attractive returns and that it considers in the aggregate to have the potential to outperform the Fund’s benchmark, the ICE BofA US High Yield Constrained Index (the “Index”). The Fund will take short positions in securities that the Sub-Advisor believes in the aggregate will underperform the Index. The Fund’s long positions, either directly or through derivatives, may total up to 130% of the Fund’s Managed Assets. The Fund’s short positions, either directly or through derivatives, may total up to 30% of the Fund’s Managed Assets. “Managed Assets” means the average daily gross asset value of the Fund (which includes the principal amount of any borrowings), minus the sum of the Fund’s liabilities. There can be no assurance that the Fund will achieve its investment objectives. The Fund may not be appropriate for all investors.
2. Significant Accounting Policies
The Fund is considered an investment company and follows accounting and reporting guidance under Financial Accounting Standards Board (“FASB”) Accounting Standards Codification Topic 946, “Financial Services-Investment Companies.” The following is a summary of significant accounting policies consistently followed by the Fund in the preparation of the financial statements. The preparation of the financial statements in accordance with accounting principles generally accepted in the United States of America (“U.S. GAAP”) requires management to make estimates and assumptions that affect the reported amounts and disclosures in the financial statements. Actual results could differ from those estimates.
A. Portfolio Valuation
The net asset value (“NAV”) of the Common Shares of the Fund is determined daily as of the close of regular trading on the NYSE, normally 4:00 p.m. Eastern time, on each day the NYSE is open for trading. If the NYSE closes early on a valuation day, the NAV is determined as of that time. Domestic debt securities and foreign securities are priced using data reflecting the earlier closing of the principal markets for those securities. The Fund’s NAV per Common Share is calculated by dividing the value of all assets of the Fund (including accrued interest and dividends), less all liabilities (including accrued expenses, dividends declared but unpaid and any borrowings of the Fund), by the total number of Common Shares outstanding.
The Fund’s investments are valued daily at market value or, in the absence of market value with respect to any portfolio securities, at fair value. Market value prices represent last sale or official closing prices from a national or foreign exchange (i.e., a regulated market) and are primarily obtained from third-party pricing services. Fair value prices represent any prices not considered market value prices and are either obtained from a third-party pricing service or are determined by the Pricing Committee of the Fund’s investment advisor, First Trust Advisors L.P. (“First Trust” or the “Advisor”), in accordance with valuation procedures adopted by the Fund’s Board of Trustees, and in accordance with provisions of the 1940 Act. Investments valued by the Advisor’s Pricing Committee, if any, are footnoted as such in the footnotes to the Portfolio of Investments. The Fund’s investments are valued as follows:
Corporate bonds, notes, capital preferred securities, U.S. government securities, mortgage-backed securities, asset-backed securities and other debt securities are fair valued on the basis of valuations provided by dealers who make markets in such securities or by a third-party pricing service approved by the Fund’s Board of Trustees, which may use the following valuation inputs when available:
| (1) | The terms “security” and “securities” used throughout the Notes to Financial Statements include Senior Loans. |
Notes to Financial Statements (Continued)
First Trust High Income Long/Short Fund (FSD)
April 30, 2021 (Unaudited)
| 2) | reported trades; |
| 3) | broker/dealer quotes; |
| 4) | issuer spreads; |
| 5) | benchmark securities; |
| 6) | bids and offers; and |
| 7) | reference data including market research publications. |
Common stocks and other equity securities listed on any national or foreign exchange (excluding The Nasdaq Stock Market LLC (“Nasdaq”) and the London Stock Exchange Alternative Investment Market (“AIM”)) are valued at the last sale price on the exchange on which they are principally traded or, for Nasdaq and AIM securities, the official closing price. Securities traded on more than one securities exchange are valued at the last sale price or official closing price, as applicable, at the close of the securities exchange representing the principal market for such securities.
Securities traded in an over-the-counter market are fair valued at the mean of their most recent bid and asked price, if available, and otherwise at their closing bid price.
The Senior Loans held in the Fund are not listed on any securities exchange or board of trade. Senior Loans are typically bought and sold by institutional investors in individually negotiated private transactions that function in many respects like an over-the-counter secondary market, although typically no formal market-makers exist. This market, while having grown substantially since its inception, generally has fewer trades and less liquidity than the secondary market for other types of securities. Some Senior Loans have few or no trades, or trade infrequently, and information regarding a specific Senior Loan may not be widely available or may be incomplete. Accordingly, determinations of the market value of Senior Loans may be based on infrequent and dated information. Because there is less reliable, objective data available, elements of judgment may play a greater role in valuation of Senior Loans than for other types of securities. Typically, Senior Loans are fair valued using information provided by a third-party pricing service. The third-party pricing service primarily uses over-the-counter pricing from dealer runs and broker quotes from indicative sheets to value the Senior Loans.
Forward foreign currency contracts are fair valued at the current day’s interpolated foreign exchange rate, as calculated using the current day’s spot rate, and the thirty, sixty, ninety, and one-hundred eighty day forward rates provided by a third-party pricing service.
Fixed income and other debt securities having a remaining maturity of sixty days or less when purchased are fair valued at cost adjusted for amortization of premiums and accretion of discounts (amortized cost), provided the Advisor’s Pricing Committee has determined that the use of amortized cost is an appropriate reflection of fair value given market and issuer-specific conditions existing at the time of the determination. Factors that may be considered in determining the appropriateness of the use of amortized cost include, but are not limited to, the following:
| 1) | the credit conditions in the relevant market and changes thereto; |
| 2) | the liquidity conditions in the relevant market and changes thereto; |
| 3) | the interest rate conditions in the relevant market and changes thereto (such as significant changes in interest rates); |
| 4) | issuer-specific conditions (such as significant credit deterioration); and |
| 5) | any other market-based data the Advisor’s Pricing Committee considers relevant. In this regard, the Advisor’s Pricing Committee may use last-obtained market-based data to assist it when valuing portfolio securities using amortized cost. |
Certain securities may not be able to be priced by pre-established pricing methods. Such securities may be valued by the Fund’s Board of Trustees or its delegate, the Advisor’s Pricing Committee, at fair value. These securities generally include, but are not limited to, restricted securities (securities which may not be publicly sold without registration under the Securities Act of 1933, as amended (the “1933 Act”)) for which a third-party pricing service is unable to provide a market price; securities whose trading has been formally suspended; a security whose market or fair value price is not available from a pre-established pricing source; a security with respect to which an event has occurred that is likely to materially affect the value of the security after the market has closed but before the calculation of the Fund’s NAV or make it difficult or impossible to obtain a reliable market quotation; and a security whose price, as provided by the third-party pricing service, does not reflect the security’s fair value. As a general principle, the current fair value of a security would appear to be the amount which the owner might reasonably expect to receive for the security upon its current sale. When fair value prices are used, generally they will differ from market quotations or official closing prices on the applicable exchanges. A variety of factors may be considered in determining the fair value of such securities, including, but not limited to, the following:
| 1) | the fundamental business data relating to the borrower/issuer; |
Notes to Financial Statements (Continued)
First Trust High Income Long/Short Fund (FSD)
April 30, 2021 (Unaudited)
| 2) | an evaluation of the forces which influence the market in which these securities are purchased and sold; |
| 3) | the type, size and cost of the security; |
| 4) | the financial statements of the borrower/issuer; |
| 5) | the credit quality and cash flow of the borrower/issuer, based on the Sub-Advisor’s or external analysis; |
| 6) | the information as to any transactions in or offers for the security; |
| 7) | the price and extent of public trading in similar securities (or equity securities) of the borrower/issuer, or comparable companies; |
| 8) | the coupon payments; |
| 9) | the quality, value and salability of collateral, if any, securing the security; |
| 10) | the business prospects of the borrower/issuer, including any ability to obtain money or resources from a parent or affiliate and an assessment of the borrower’s/issuer’s management; |
| 11) | the prospects for the borrower’s/issuer’s industry, and multiples (of earnings and/or cash flows) being paid for similar businesses in that industry; |
| 12) | the borrower’s/issuer’s competitive position within the industry; |
| 13) | the borrower’s/issuer’s ability to access additional liquidity through public and/or private markets; and |
| 14) | other relevant factors. |
The Fund is subject to fair value accounting standards that define fair value, establish the framework for measuring fair value and provide a three-level hierarchy for fair valuation based upon the inputs to the valuation as of the measurement date. The three levels of the fair value hierarchy are as follows:
| • | Level 1 – Level 1 inputs are quoted prices in active markets for identical investments. An active market is a market in which transactions for the investment occur with sufficient frequency and volume to provide pricing information on an ongoing basis. |
| • | Level 2 – Level 2 inputs are observable inputs, either directly or indirectly, and include the following: |
| o | Quoted prices for similar investments in active markets. |
| o | Quoted prices for identical or similar investments in markets that are non-active. A non-active market is a market where there are few transactions for the investment, the prices are not current, or price quotations vary substantially either over time or among market makers, or in which little information is released publicly. |
| o | Inputs other than quoted prices that are observable for the investment (for example, interest rates and yield curves observable at commonly quoted intervals, volatilities, prepayment speeds, loss severities, credit risks, and default rates). |
| o | Inputs that are derived principally from or corroborated by observable market data by correlation or other means. |
| • | Level 3 – Level 3 inputs are unobservable inputs. Unobservable inputs may reflect the reporting entity’s own assumptions about the assumptions that market participants would use in pricing the investment. |
The inputs or methodologies used for valuing investments are not necessarily an indication of the risk associated with investing in those investments. A summary of the inputs used to value the Fund’s investments as of April 30, 2021, is included with the Fund’s Portfolio of Investments.
B. Securities Transactions and Investment Income
Securities transactions are recorded as of the trade date. Realized gains and losses from securities transactions are recorded on the identified cost basis. Dividend income is recorded on the ex-dividend date. Interest income is recorded daily on the accrual basis. Amortization of premiums and accretion of discounts are recorded using the effective interest method.
The United Kingdom’s Financial Conduct Authority, which regulates the London Interbank Offered Rates (“LIBOR”), announced on March 5, 2021 that all non-USD LIBOR reference rates and the 1-week and 2-month USD LIBOR reference rates will cease to be provided or no longer be representative immediately after December 31, 2021 and the remaining USD LIBOR settings will cease to be provided or no longer be representative immediately after June 30, 2023. The International Swaps and Derivatives Association, Inc. (“ISDA”) confirmed that the March 5, 2021 announcement constituted an index cessation event under the Interbank Offered Rates (“IBOR”) Fallbacks Supplement and the ISDA 2020 IBOR Fallbacks Protocol for all 35 LIBOR settings and confirmed that the spread adjustment to be used in ISDA fallbacks was fixed as of the date of the announcement.
In the United States, the Alternative Reference Rates Committee (the “ARRC”), a group of market participants convened by the Board of Governors of the Federal Reserve System and the Federal Reserve Bank of New York in cooperation with other federal and state government agencies, has since 2014 undertaken efforts to identify U.S. dollar reference interest rates as alternatives to LIBOR and to
Notes to Financial Statements (Continued)
First Trust High Income Long/Short Fund (FSD)
April 30, 2021 (Unaudited)
facilitate the mitigation of LIBOR-related risks. In June 2017, the ARRC identified the Secured Overnight Financing Rate (“SOFR”), a broad measure of the cost of cash overnight borrowing collateralized by U.S. Treasury securities, as the preferred alternative for U.S. dollar LIBOR. The Federal Reserve Bank of New York began daily publishing of SOFR in April 2018.
At this time, it is not possible to predict the full impact of the elimination of LIBOR and the establishment of an alternative reference rate on the Fund or its investments.
Securities purchased or sold on a when-issued, delayed-delivery or forward purchase commitment basis may have extended settlement periods. The value of the security so purchased is subject to market fluctuations during this period. The Fund maintains liquid assets with a current value at least equal to the amount of its when-issued, delayed-delivery or forward purchase commitments until payment is made. At April 30, 2021, the Fund had no when-issued, delayed-delivery or forward purchase commitments.
C. Unfunded Loan Commitments
The Fund may enter into certain credit agreements, all or a portion of which may be unfunded. The Fund is obligated to fund these loan commitments at the borrower’s discretion. The Fund had no unfunded loan commitments as of April 30, 2021.
D. Forward Foreign Currency Contracts
The Fund is subject to foreign currency risk in the normal course of pursuing its investment objectives. Forward foreign currency contracts are agreements between two parties (“Counterparties”) to exchange one currency for another at a future date and at a specified price. The Fund uses forward foreign currency contracts to facilitate transactions in foreign securities and to manage the Fund’s foreign currency exposure. These contracts are valued daily, and the Fund’s net equity therein, representing unrealized gain or loss on the contracts as measured by the difference between the forward foreign exchange rates at the dates of entry into the contracts and the forward rates at the reporting date, is included in “Unrealized appreciation on forward foreign currency contracts” and “Unrealized depreciation on forward foreign currency contracts” on the Statement of Assets and Liabilities. The change in unrealized appreciation (depreciation) is included in “Net change in unrealized appreciation (depreciation) on forward foreign currency contracts” on the Statement of Operations. When the forward contract is closed, the Fund records a realized gain or loss equal to the difference between the proceeds from (or the cost of) the closing transaction and the Fund’s basis in the contract. This realized gain or loss is included in “Net realized gain (loss) on forward foreign currency contracts” on the Statement of Operations. Risks arise from the possible inability of Counterparties to meet the terms of their contracts and from movement in currency, securities values and interest rates. Due to the risks, the Fund could incur losses in excess of the net unrealized value shown on the Forward Foreign Currency Contracts table in the Portfolio of Investments. In the event of default by the Counterparty, the Fund will provide notice to the Counterparty of the Fund’s intent to convert the currency held by the Fund into the currency that the Counterparty agreed to exchange with the Fund. If a Counterparty becomes bankrupt or otherwise fails to perform its obligations due to financial difficulties, the Fund may experience significant delays in obtaining any recovery in a bankruptcy or other reorganization proceeding. The Fund may obtain only limited recovery or may obtain no recovery in such circumstances.
E. Foreign Currency
The books and records of the Fund are maintained in U.S. dollars. Foreign currencies, investments and other assets and liabilities are translated into U.S. dollars at the exchange rates prevailing at the end of the period. Purchases and sales of investments and items of income and expense are translated on the respective dates of such transactions. Unrealized gains and losses on assets and liabilities, other than investments in securities, which result from changes in foreign currency exchange rates have been included in “Net change in unrealized appreciation (depreciation) on foreign currency translation” on the Statement of Operations. Unrealized gains and losses on investments in securities which result from changes in foreign exchange rates are included with fluctuations arising from changes in market price and are shown in “Net change in unrealized appreciation (depreciation) on investments” on the Statement of Operations. Net realized foreign currency gains and losses include the effect of changes in exchange rates between trade date and settlement date on investment security transactions, foreign currency transactions and interest and dividends received and are shown in “Net realized gain (loss) on foreign currency transactions” on the Statement of Operations. The portion of foreign currency gains and losses related to fluctuation in exchange rates between the initial purchase settlement date and subsequent sale trade date is included in “Net realized gain (loss) on investments” on the Statement of Operations.
F. Short Sales
Short sales are utilized for investment and risk management purposes and are transactions in which securities or other instruments (such as options, forwards, futures or other derivative contracts) are sold by the Fund, but are not currently owned in the Fund’s portfolio. When the Fund engages in a short sale, the Fund must borrow the security sold short and deliver the security to the counterparty. Short selling allows the Fund to profit from a decline in a market price to the extent such decline exceeds the transaction costs and the costs of borrowing the securities. The Fund will pay a fee or premium to borrow the securities sold short and is obligated to repay the lenders of the securities. Any dividends or interest that accrues on the securities during the period of the loan are due to
Notes to Financial Statements (Continued)
First Trust High Income Long/Short Fund (FSD)
April 30, 2021 (Unaudited)
the lenders. A gain, limited to the price at which the security was sold short, or a loss, unlimited in size, will be recognized upon the termination of the short sale; which is affected by the Fund purchasing the security sold short and delivering the security to the lender. Any such gain or loss may be offset, completely or in part, by the change in the value of the long portion of the Fund’s portfolio. The Fund is subject to the risk that it may be unable to reacquire a security to terminate a short position except at a price substantially in excess of the last quoted price. Also, there is the risk that the counterparty to a short sale may fail to honor its contractual terms, causing a loss to the Fund.
The Fund has established an account with Pershing, LLC for the purpose of purchasing or borrowing securities on margin. At April 30, 2021, the Fund had $133,760,967 in borrowings, which approximates fair value, associated with investments sold short as shown in “Borrowings” on the Statement of Assets and Liabilities. The borrowings are categorized as Level 2 within the fair value hierarchy. At April 30, 2021, the Fund had $64,948,836 of investments sold short as shown in “Investments sold short, at value” on the Statement of Assets and Liabilities. The Fund is charged interest on debit margin balances at a rate equal to the Overnight Bank Funding Rate plus 75 basis points. With regard to securities held short, the Fund is credited a rebate equal to the market value of its short positions at a rate equal to the Overnight Bank Funding Rate less 35 basis points. This rebate rate applies to easy to borrow securities. Securities that are hard to borrow may earn a rebate that is less than the foregoing or may be subject to a premium charge on a security by security basis. The different rebate rate is determined at the time of a short sale request. At April 30, 2021, the Fund had a debit margin balance of $198,688,685 with an interest rate of 0.80%. For six months ended April 30, 2021, the Fund had margin interest expense of $967,004, as shown on the Statement of Operations. For the six months ended April 30, 2021, the average margin balance and interest rate were $193,927,265 and 0.82%, respectively.
G. Dividends and Distributions to Shareholders
Level dividend distributions are declared and paid monthly to Common Shareholders after the payment of interest and/or dividends in connection with leverage. The level dividend rate may be modified by the Board of Trustees from time to time. If, for any monthly distribution, net investment company taxable income, if any (which term includes net short-term capital gain), is less than the amount of the distribution, the difference will generally be a tax-free return of capital distributed from the Fund’s assets. Distributions of any net long-term capital gains earned by the Fund are distributed at least annually. Distributions will automatically be reinvested into additional Common Shares pursuant to the Fund’s Dividend Reinvestment Plan unless cash distributions are elected by the shareholder.
Distributions from net investment income and realized capital gains are determined in accordance with federal income tax regulations, which may differ from U.S. GAAP. Certain capital accounts in the financial statements are periodically adjusted for permanent differences in order to reflect their tax character. These permanent differences are primarily due to the varying treatment of income and gain/loss on portfolio securities held by the Fund and have no impact on net assets or NAV per share. Temporary differences, which arise from recognizing certain items of income, expense and gain/loss in different periods for financial statement and tax purposes, will reverse at some point in the future.
The tax character of distributions paid by the Fund during the fiscal year ended October 31, 2020, was as follows:
| Distributions paid from: | |
Ordinary income
| $31,244,833 |
Capital gains
| — |
Return of capital
| 13,817,545 |
As of October 31, 2020, the components of distributable earnings and net assets on a tax basis were as follows:
Undistributed ordinary income
| $— |
Undistributed capital gains
| — |
Total undistributed earnings
| — |
Accumulated capital and other losses
| (102,938,693) |
Net unrealized appreciation (depreciation)
| (8,331,036) |
Total accumulated earnings (losses)
| (111,269,729) |
Other
| — |
Paid-in capital
| 638,085,225 |
Total net assets
| $526,815,496 |
Notes to Financial Statements (Continued)
First Trust High Income Long/Short Fund (FSD)
April 30, 2021 (Unaudited)
H. Income and Other Taxes
The Fund intends to continue to qualify as a regulated investment company by complying with the requirements under Subchapter M of the Internal Revenue Code of 1986, as amended, which includes distributing substantially all of its net investment income and net realized gains to shareholders. Accordingly, no provision has been made for federal and state income taxes. However, due to the timing and amount of distributions, the Fund may be subject to an excise tax of 4% of the amount by which approximately 98% of the Fund’s taxable income exceeds the distributions from such taxable income for the calendar year.
Under the Regulated Investment Company Modernization Act of 2010 (the “Act”), net capital losses arising in taxable years after December 22, 2010, may be carried forward indefinitely, and their character is retained as short-term and/or long-term losses. Previously, net capital losses were carried forward for up to eight years and treated as short-term losses. As a transition rule, the Act requires that post-enactment net capital losses be used before pre-enactment net capital losses. At October 31, 2020, the Fund had no pre-enactment net capital losses for federal income tax purposes. At October 31, 2020, the Fund had post-enactment net capital losses for federal income tax purposes of $102,938,693 to be carried forward indefinitely.
Of these losses, $27,151,412 is subject to loss limitation resulting from reorganization activity. This limitation generally reduces the utilization of these losses to a maximum of $2,219,032 per year.
The Fund is subject to certain limitations under the U.S. tax rules on the use of capital loss carryforwards and net unrealized built-in losses. These limitations apply when there has been a 50% change in ownership.
Certain losses realized during the current fiscal year may be deferred and treated as occurring on the first day of the following fiscal year for federal income tax purposes. For the fiscal year ended October 31, 2020, the Fund did not incur any net ordinary losses.
The Fund is subject to accounting standards that establish a minimum threshold for recognizing, and a system for measuring, the benefits of a tax position taken or expected to be taken in a tax return. Taxable years ended 2017, 2018, 2019, and 2020 remain open to federal and state audit. As of April 30, 2021, management has evaluated the application of these standards to the Fund and has determined that no provision for income tax is required in the Fund’s financial statements for uncertain tax positions.
I. Expenses
The Fund will pay all expenses directly related to its operations.
3. Investment Advisory Fee, Affiliated Transactions and Other Fee Arrangements
First Trust, the investment advisor to the Fund, is a limited partnership with one limited partner, Grace Partners of DuPage L.P., and one general partner, The Charger Corporation. The Charger Corporation is an Illinois corporation controlled by James A. Bowen, Chief Executive Officer of First Trust. First Trust is responsible for the ongoing monitoring of the Fund’s investment portfolio, managing the Fund’s business affairs and providing certain administrative services necessary for the management of the Fund. For these services, First Trust is entitled to a monthly fee calculated at an annual rate of 1.00% of the Fund’s Managed Assets. First Trust also provides fund reporting services to the Fund for a flat annual fee in the amount of $9,250.
MacKay serves as the Fund’s sub-advisor and manages the Fund’s portfolio subject to First Trust’s supervision. The Sub-Advisor receives a portfolio management fee at an annual rate of 0.50% of Managed Assets that is paid by First Trust from its investment advisory fee.
BNY Mellon Investment Servicing (US) Inc. (“BNYM IS”) serves as the Fund’s transfer agent in accordance with certain fee arrangements. As transfer agent, BNYM IS is responsible for maintaining shareholder records for the Fund. The Bank of New York Mellon (“BNYM”) serves as the Fund’s administrator, fund accountant, and custodian in accordance with certain fee arrangements. As administrator and fund accountant, BNYM is responsible for providing certain administrative and accounting services to the Fund, including maintaining the Fund’s books of account, records of the Fund’s securities transactions, and certain other books and records. As custodian, BNYM is responsible for custody of the Fund’s assets. BNYM IS and BNYM are subsidiaries of The Bank of New York Mellon Corporation, a financial holding company.
Each Trustee who is not an officer or employee of First Trust, any sub-advisor or any of their affiliates (“Independent Trustees”) is paid a fixed annual retainer that is allocated equally among each fund in the First Trust Fund Complex. Each Independent Trustee is also paid an annual per fund fee that varies based on whether the fund is a closed-end or other actively managed fund, a defined-outcome fund or an index fund.
Additionally, the Lead Independent Trustee and the Chairmen of the Audit Committee, Nominating and Governance Committee and Valuation Committee are paid annual fees to serve in such capacities, with such compensation allocated pro rata among each fund in the First Trust Fund Complex based on net assets. Independent Trustees are reimbursed for travel and out-of-pocket expenses in
Notes to Financial Statements (Continued)
First Trust High Income Long/Short Fund (FSD)
April 30, 2021 (Unaudited)
connection with all meetings. The Lead Independent Trustee and Committee Chairmen rotate every three years. The officers and “Interested” Trustee receive no compensation from the Fund for acting in such capacities.
4. Purchases and Sales of Securities
The cost of purchases and proceeds from sales of investments, excluding short-term investments and investments sold short, for the six months ended April 30, 2021, were $177,196,057 and $149,966,326, respectively. The cost of purchases to cover short sales and the proceeds of short sales were $5,869,783 and $0, respectively.
5. Derivative Transactions
The following table presents the types of derivatives held by the Fund at April 30, 2021, the primary underlying risk exposure and the location of these instruments as presented on the Statement of Assets and Liabilities.
| | | | | Asset Derivatives | | Liability Derivatives |
Derivative
Instrument | | Risk
Exposure | | Statement of Assets and
Liabilities Location | | Value | | Statement of Assets and
Liabilities Location | | Value |
Forward foreign
currency
contracts | | Currency Risk | | Unrealized appreciation
on forward foreign
currency contracts | | $ 19,277 | | Unrealized depreciation
on forward foreign
currency contracts | | $ — |
The following table presents the amount of net realized gain (loss) and change in net unrealized appreciation (depreciation) recognized for the six months ended April 30, 2021, on derivative instruments, as well as the primary underlying risk exposure associated with each instrument.
| Statement of Operations Location | |
| Currency Risk Exposure | |
| Net realized gain (loss) on forward foreign currency contracts | $(71,825) |
| Net change in unrealized appreciation (depreciation) on forward foreign currency contracts | (39,553) |
For the six months ended April 30, 2021, the notional values of forward foreign currency contracts opened and closed were $33,699,096 and $31,127,674, respectively.
The Fund does not have the right to offset financial assets and liabilities related to forward foreign currency contracts on the Statement of Assets and Liabilities.
6. Indemnification
The Fund has a variety of indemnification obligations under contracts with its service providers. The Fund’s maximum exposure under these arrangements is unknown. However, the Fund has not had prior claims or losses pursuant to these contracts and expects the risk of loss to be remote.
7. Subsequent Events
Management has evaluated the impact of all subsequent events to the Fund through the date the financial statements were issued, and has determined that there were no subsequent events requiring recognition or disclosure in the financial statements that have not already been disclosed.
Additional Information
First Trust High Income Long/Short Fund (FSD)
April 30, 2021 (Unaudited)
Dividend Reinvestment Plan
If your Common Shares are registered directly with the Fund or if you hold your Common Shares with a brokerage firm that participates in the Fund’s Dividend Reinvestment Plan (the “Plan”), unless you elect, by written notice to the Fund, to receive cash distributions, all dividends, including any capital gain distributions, on your Common Shares will be automatically reinvested by BNY Mellon Investment Servicing (US) Inc. (the “Plan Agent”), in additional Common Shares under the Plan. If you elect to receive cash distributions, you will receive all distributions in cash paid by check mailed directly to you by the Plan Agent, as the dividend paying agent.
If you decide to participate in the Plan, the number of Common Shares you will receive will be determined as follows:
| (1) | If Common Shares are trading at or above net asset value (“NAV”) at the time of valuation, the Fund will issue new shares at a price equal to the greater of (i) NAV per Common Share on that date or (ii) 95% of the market price on that date. |
| (2) | If Common Shares are trading below NAV at the time of valuation, the Plan Agent will receive the dividend or distribution in cash and will purchase Common Shares in the open market, on the NYSE or elsewhere, for the participants’ accounts. It is possible that the market price for the Common Shares may increase before the Plan Agent has completed its purchases. Therefore, the average purchase price per share paid by the Plan Agent may exceed the market price at the time of valuation, resulting in the purchase of fewer shares than if the dividend or distribution had been paid in Common Shares issued by the Fund. The Plan Agent will use all dividends and distributions received in cash to purchase Common Shares in the open market within 30 days of the valuation date except where temporary curtailment or suspension of purchases is necessary to comply with federal securities laws. Interest will not be paid on any uninvested cash payments. |
You may elect to opt-out of or withdraw from the Plan at any time by giving written notice to the Plan Agent, or by telephone at (866) 340-1104, in accordance with such reasonable requirements as the Plan Agent and the Fund may agree upon. If you withdraw or the Plan is terminated, you will receive a certificate for each whole share in your account under the Plan, and you will receive a cash payment for any fraction of a share in your account. If you wish, the Plan Agent will sell your shares and send you the proceeds, minus brokerage commissions.
The Plan Agent maintains all Common Shareholders’ accounts in the Plan and gives written confirmation of all transactions in the accounts, including information you may need for tax records. Common Shares in your account will be held by the Plan Agent in non-certificated form. The Plan Agent will forward to each participant any proxy solicitation material and will vote any shares so held only in accordance with proxies returned to the Fund. Any proxy you receive will include all Common Shares you have received under the Plan.
There is no brokerage charge for reinvestment of your dividends or distributions in Common Shares. However, all participants will pay a pro rata share of brokerage commissions incurred by the Plan Agent when it makes open market purchases.
Automatically reinvesting dividends and distributions does not mean that you do not have to pay income taxes due upon receiving dividends and distributions. Capital gains and income are realized although cash is not received by you. Consult your financial advisor for more information.
If you hold your Common Shares with a brokerage firm that does not participate in the Plan, you will not be able to participate in the Plan and any dividend reinvestment may be effected on different terms than those described above.
The Fund reserves the right to amend or terminate the Plan if in the judgment of the Board of Trustees the change is warranted. There is no direct service charge to participants in the Plan; however, the Fund reserves the right to amend the Plan to include a service charge payable by the participants. Additional information about the Plan may be obtained by writing BNY Mellon Investment Servicing (US) Inc., 301 Bellevue Parkway, Wilmington, Delaware 19809.
Proxy Voting Policies and Procedures
A description of the policies and procedures that the Fund uses to determine how to vote proxies and information on how the Fund voted proxies relating to portfolio investments during the most recent 12-month period ended June 30 is available (1) without charge, upon request, by calling (800) 988-5891; (2) on the Fund’s website at www.ftportfolios.com; and (3) on the Securities and Exchange Commission’s (“SEC”) website at www.sec.gov.
Portfolio Holdings
The Fund files portfolio holdings information for each month in a fiscal quarter within 60 days after the end of the relevant fiscal quarter on Form N-PORT. Portfolio holdings information for the third month of each fiscal quarter will be publicly available on the
Additional Information (Continued)
First Trust High Income Long/Short Fund (FSD)
April 30, 2021 (Unaudited)
SEC’s website at www.sec.gov. The Fund’s complete schedule of portfolio holdings for the second and fourth quarters of each fiscal year is included in the semi-annual and annual reports to shareholders, respectively, and is filed with the SEC on Form N-CSR. The semi-annual and annual report for the Fund is available to investors within 60 days after the period to which it relates. The Fund’s Forms N-PORT and Forms N-CSR are available on the SEC’s website listed above.
Submission of Matters to a Vote of Shareholders
The Fund held its Annual Meeting of Shareholders (the “Annual Meeting”) on April 8, 2021. At the Annual Meeting, Richard E. Erickson and Thomas R. Kadlec were elected by the Common Shareholders of First Trust High Income Long/Short Fund as Class II Trustees for a three-year term expiring at the Fund’s annual meeting of shareholders in 2024. The number of votes cast in favor of Mr. Erickson was 12,065,169 and the number of votes withheld was 17,513,699. The number of votes cast in favor of Mr. Kadlec was 12,069,209 and the number of votes withheld was 17,509,659. James A. Bowen, Robert F. Keith and Niel B. Nielson are the other current and continuing Trustees.
At the Annual Meeting, shareholders of the Fund voted against a shareholder’s proposal that all investment advisory and management agreements pertaining to the Fund between the Fund and First Trust Advisors L.P. shall be terminated, as soon as legally permitted (the “Shareholder Proposal”). 4,915,082 shares of the Fund voted for the Shareholder Proposal, 11,099,638 shares of the Fund voted against the Shareholder Proposal, and 313,378 shares of the Fund abstained. There were 13,250,770 broker nonvotes in connection with the Shareholder Proposal.
Principal Risks
The Fund is a closed-end management investment company designed primarily as a long-term investment and not as a trading vehicle. The Fund is not intended to be a complete investment program and, due to the uncertainty inherent in all investments, there can be no assurance that the Fund will achieve its investment objectives. The following discussion summarizes the principal risks associated with investing in the Fund, which includes the risk that you could lose some or all of your investment in the Fund. The Fund is subject to the informational requirements of the Securities Exchange Act of 1934 and the Investment Company Act of 1940 and, in accordance therewith, files reports, proxy statements and other information that is available for review.
Credit Agency Risk. Credit ratings are determined by credit rating agencies and are only the opinions of such entities. Ratings assigned by a rating agency are not absolute standards of credit quality and do not evaluate market risk or the liquidity of securities. Any shortcomings or inefficiencies in credit rating agencies’ processes for determining credit ratings may adversely affect the credit ratings of securities held by the Fund and, as a result, may adversely affect those securities’ perceived or actual credit risk.
Credit and Below-Investment Grade Securities Risk. Credit risk is the risk that one or more securities in the Fund’s portfolio will decline in price, or the issuer thereof will fail to pay dividends or interest or repay principal when due. Below-investment grade instruments are commonly referred to as high-yield securities or “junk” bonds and are considered speculative with respect to the issuer’s capacity to pay dividends or interest and repay principal and are susceptible to default or decline in market value due to adverse economic and business developments. High-yield securities are often unsecured and subordinated to other creditors of the issuer. The market values for high-yield securities tend to be very volatile, and these securities are generally less liquid than investment grade securities. For these reasons, an investment in the Fund is subject to the following specific risks: (i) increased price sensitivity to changing interest rates and to a deteriorating economic environment; (ii) greater risk of loss due to default or declining credit quality; (iii) adverse company specific events more likely to render the issuer unable to make dividend, interest and/or principal payments; (iv) negative perception of the high-yield market which may depress the price and liquidity of high-yield securities; (v) volatility; and (vi) liquidity.
Currency Risk. The value of securities denominated or quoted in foreign currencies may be adversely affected by fluctuations in the relative currency exchange rates and by exchange control regulations. The Fund’s investment performance may be negatively affected by a devaluation of a currency in which the Fund’s investments are denominated or quoted. Further, the Fund’s investment performance may be significantly affected, either positively or negatively, by currency exchange rates because the U.S. dollar value of securities denominated or quoted in another currency will increase or decrease in response to changes in the value of such currency in relation to the U.S. dollar.
Cyber Security Risk. The Fund is susceptible to potential operational risks through breaches in cyber security. A breach in cyber security refers to both intentional and unintentional events that may cause the Fund to lose proprietary information, suffer data corruption or lose operational capacity. Such events could cause the Fund to incur regulatory penalties, reputational damage, additional compliance costs associated with corrective measures and/or financial loss. Cyber security breaches may involve unauthorized access to the Fund’s digital information systems through “hacking” or malicious software coding, but may also result from outside attacks such as denial-of-service attacks through efforts to make network services unavailable to intended users. In
Additional Information (Continued)
First Trust High Income Long/Short Fund (FSD)
April 30, 2021 (Unaudited)
addition, cyber security breaches of the Fund’s third-party service providers, such as its administrator, transfer agent, custodian, or Sub-Advisor, as applicable, or issuers in which the Fund invests, can also subject the Fund to many of the same risks associated with direct cyber security breaches. The Fund has established risk management systems designed to reduce the risks associated with cyber security. However, there is no guarantee that such efforts will succeed, especially because the Fund does not directly control the cyber security systems of issuers or third party service providers.
Distressed Securities Risk. Distressed securities frequently do not produce income while they are outstanding. The Fund may be required to incur certain extraordinary expenses in order to protect and recover its investment. The Fund also will be subject to significant uncertainty as to when and in what manner and for what value the obligations evidenced by the distressed securities will eventually be satisfied. Distressed securities might be repaid only after lengthy workout, bankruptcy or similar proceedings, during which the issuer may not make any interest or other payments. Because there typically is substantial uncertainty regarding the outcome of such proceedings, there is a high risk of loss, including loss of the entire investment.
Fixed-Income Securities Risk. An investment in fixed-income securities is subject to certain risks, including:
| • | Issuer Risk. The value of fixed-income securities may decline for a number of reasons which directly relate to the issuer, such as management performance, leverage and reduced demand for the issuer’s goods and services. In addition, an issuer of fixed-income securities may default on its obligation to pay interest and repay principal. |
| • | Prepayment Risk. During periods of declining interest rates, the issuer of a security may exercise its option to prepay principal earlier than scheduled, forcing the Fund to reinvest the proceeds from such prepayment in lower yielding securities, which may result in a decline in the Fund’s income and distributions to common shareholders. |
| • | Reinvestment Risk. Reinvestment risk is the risk that income from the Fund’s portfolio will decline if the Fund invests the proceeds from matured, traded or called bonds at market interest rates that are below the Fund portfolio’s current earnings rate. |
Forward Foreign Currency Exchange Contracts Risk. Forward foreign currency exchange contracts involve certain risks, including the risk of failure of the counterparty to perform its obligations under the contract and the risk that the use of forward contracts may not serve as a complete hedge because of an imperfect correlation between movements in the prices of the contracts and the prices of the currencies hedged. While forward foreign currency exchange contracts may limit the risk of loss due to a decline in the value of the hedged currencies, they also may limit any potential gain that might result should the value of the currencies increase. In addition, because forward currency exchange contracts are privately negotiated transactions, there can be no assurance that the Fund will have flexibility to roll-over a forward currency exchange contract upon its expiration if it desires to do so. Hedging against a decline in the value of a currency does not eliminate fluctuations in the value of a portfolio security traded in that currency or prevent a loss if the value of the security declines. Moreover, it may not be possible for the Fund to hedge against a devaluation that is so generally anticipated that the Fund is not able to contract to sell the currency at a price above the devaluation level it anticipates. The cost to the Fund of engaging in currency exchange transactions varies with such factors as the currency involved, the length of the contract period and prevailing market conditions.
Illiquid and Restricted Securities Risk. Investments in restricted securities could have the effect of increasing the amount of the Fund’s assets invested in illiquid securities if qualified institutional buyers are unwilling to purchase these securities. Illiquid and restricted securities may be difficult to dispose of at a fair price at the times when the Fund believes it is desirable to do so. The market price of illiquid and restricted securities generally is more volatile than that of more liquid securities, which may adversely affect the price that the Fund pays for or recovers upon the sale of such securities. Illiquid and restricted securities are also more difficult to value, especially in challenging markets.
Interest Rate Risk. Interest rate risk is the risk that securities will decline in value because of changes in market interest rates. For fixed rate securities, when market interest rates rise, the market value of such securities generally will fall. Investments in fixed rate securities with long-term maturities may experience significant price declines if long-term interest rates increase. During periods of rising interest rates, the average life of certain types of securities may be extended because of slower than expected prepayments. This may lock in a below-market yield, increase the security’s duration and further reduce the value of the security. Fixed rate securities with longer durations tend to be more sensitive to changes in interest rates, usually making them more volatile than securities with shorter durations. The duration of a security will be expected to change over time with changes in market factors and time to maturity.
The interest rates payable on floating rate securities are not fixed and may fluctuate based upon changes in market rates. As short-term interest rates decline, interest payable on floating rate securities typically decreases. Alternatively, during periods of rising interest rates, interest payable on floating rate securities typically increases. Changes in interest rates on floating rate securities may lag behind changes in market rates or may have limits on the maximum increases in interest rates. The value of floating rate securities may decline if their interest rates do not rise as much, or as quickly, as interest rates in general.
Additional Information (Continued)
First Trust High Income Long/Short Fund (FSD)
April 30, 2021 (Unaudited)
Many financial instruments use or may use a floating rate based upon the London Interbank Offered Rate (“LIBOR”). The United Kingdom’s Financial Conduct Authority, which regulates LIBOR, intends to cease making LIBOR available as a reference rate over a phase-out period that is currently expected to begin after the end of 2021. The unavailability or replacement of LIBOR may affect the value, liquidity or return on certain Fund investments and may result in costs incurred in connection with closing out positions and entering into new trades. Any potential effects of the transition away from LIBOR on the Fund or on certain instruments in which the Fund invests can be difficult to ascertain, and they may vary depending on a variety of factors. Any such effects on the transition away from LIBOR, as well as other unforeseen effects, could result in losses to the Fund.
Leverage Risk. The use of leverage by the Fund can magnify the effect of any losses. If the income and gains from the securities and investments purchased with leverage proceeds do not cover the cost of leverage, the return to the common shares will be less than if leverage had not been used. Leverage involves risks and special considerations for common shareholders including: the likelihood of greater volatility of net asset value and market price of the common shares than a comparable portfolio without leverage; the risk that fluctuations in interest rates on borrowings will reduce the return to the common shareholders or will result in fluctuations in the dividends paid on the common shares; in a declining market, the use of leverage is likely to cause a greater decline in the net asset value of the common shares than if the Fund were not leveraged, which may result in a greater decline in the market price of the common shares; and when the Fund uses certain types of leverage, the investment advisory fee payable to the Advisor and by the Advisor to the Sub-Advisor will be higher than if the Fund did not use leverage.
Management Risk and Reliance on Key Personnel. The implementation of the Fund’s investment strategy depends upon the continued contributions of certain key employees of the Advisor and Sub-Advisor, some of whom have unique talents and experience and would be difficult to replace. The loss or interruption of the services of a key member of the portfolio management team could have a negative impact on the Fund.
Market Discount from Net Asset Value. Shares of closed-end investment companies such as the Fund frequently trade at a discount from their net asset value. The Fund cannot predict whether its common shares will trade at, below or above net asset value.
Market Risk. Securities held by a fund, as well as shares of a fund itself, are subject to market fluctuations caused by factors such as general economic conditions, political events, regulatory or market developments, changes in interest rates and perceived trends in securities prices. Shares of a fund could decline in value or underperform other investments as a result of the risk of loss associated with these market fluctuations. In addition, local, regional or global events such as war, acts of terrorism, spread of infectious diseases or other public health issues, recessions, or other events could have a significant negative impact on a fund and its investments. Such events may affect certain geographic regions, countries, sectors and industries more significantly than others. The outbreak of the respiratory disease designated as COVID-19 in December 2019 has caused significant volatility and declines in global financial markets, which have caused losses for investors. The COVID-19 pandemic may last for an extended period of time and will continue to impact the economy for the foreseeable future.
Non-U.S. Securities Risk. Investing in securities of non-U.S. issuers, which are generally denominated in non-U.S. currencies, may involve certain risks not typically associated with investing in securities of U.S. issuers. These risks include: (i) there may be less publicly available information about non-U.S. issuers or markets due to less rigorous disclosure or accounting standards or regulatory practices; (ii) non-U.S. markets may be smaller, less liquid and more volatile than the U.S. market; (iii) potential adverse effects of fluctuations in currency exchange rates or controls on the value of the Fund’s investments; (iv) the economies of non-U.S. countries may grow at slower rates than expected or may experience a downturn or recession; (v) the impact of economic, political, social or diplomatic events; (vi) certain non-U.S. countries may impose restrictions on the ability of non-U.S. issuers to make payments of principal and interest to investors located in the United States due to blockage of non-U.S. currency exchanges or otherwise; and (vii) withholding and other non-U.S. taxes may decrease the Fund’s return. Foreign companies are generally not subject to the same accounting, auditing and financial reporting standards as are U.S. companies. In addition, there may be difficulty in obtaining or enforcing a court judgment abroad, including in the event the issuer of a non-U.S. security defaults or enters bankruptcy, administration or other proceedings. These risks may be more pronounced to the extent that the Fund invests a significant amount of its assets in companies located in one region or in emerging markets.
Potential Conflicts of Interest Risk. First Trust, MacKay and the portfolio managers have interests which may conflict with the interests of the Fund. In particular, First Trust and MacKay currently manage and may in the future manage and/or advise other investment funds or accounts with the same or substantially similar investment objective and strategies as the Fund. In addition, while the Fund is using certain types of leverage, the amount of the fees paid to First Trust (and by First Trust to MacKay) for investment advisory and management services are higher than if the Fund did not use leverage because the fees paid are calculated based on managed assets. Therefore, First Trust and MacKay could have a financial incentive to leverage the Fund.
Preferred Securities Risk. Preferred securities combine some of the characteristics of both common stocks and bonds. Preferred securities are typically subordinated to bonds and other debt securities in a company’s capital structure in terms of priority to corporate
Additional Information (Continued)
First Trust High Income Long/Short Fund (FSD)
April 30, 2021 (Unaudited)
income, subjecting them to greater credit risk than those debt securities. Generally, holders of preferred securities have no voting rights with respect to the issuing company unless preferred dividends have been in arrears for a specified number of periods, at which time the preferred security holders may obtain limited rights. In certain circumstances, an issuer of preferred securities may defer payment on the securities and, in some cases, redeem the securities prior to a specified date. Preferred securities may also be substantially less liquid than other securities, including common stock.
Short Selling Risk. If a security sold short increases in price, the Fund may have to cover its short position at a higher price than the short sale price, resulting in a loss. Because losses on short sales arise from increases in the value of the security sold short, such losses are theoretically unlimited. It is possible that the Fund’s long securities positions will decline in value at the same time that the value of its short securities positions increase, thereby increasing potential losses to the Fund. In addition, the Fund’s short selling strategies will limit its ability to fully benefit from increases in the fixed-income markets.
The Fund may not be able to borrow a security that it needs to deliver or it may not be able to close out a short position at an acceptable price and may have to sell related long positions before it had intended to do so. Thus, the Fund may not be able to successfully implement its short sale strategy due to limited availability of desired securities or for other reasons. Also, there is the risk that the counterparty to a short sale may fail to honor its contractual terms, causing a loss to the Fund.
Valuation Risk. Unlike publicly traded common stock which trades on national exchanges, there is no central place or exchange for fixed-income securities trading. Fixed-income securities generally trade on an “over-the-counter” market which may be anywhere in the world where the buyer and seller can settle on a price. Due to the lack of centralized information and trading, the valuation of fixed-income securities may carry more risk than that of common stock. Uncertainties in the conditions of the financial market, unreliable reference data, lack of transparency and inconsistency of valuation models and processes may lead to inaccurate asset pricing.
INVESTMENT ADVISOR
First Trust Advisors L.P.
120 East Liberty Drive, Suite 400
Wheaton, IL 60187
INVESTMENT SUB-ADVISOR
MacKay Shields LLC
1345 Avenue of the Americas
43rd Floor
New York, NY 10105
TRANSFER AGENT
BNY Mellon Investment Servicing (US) Inc.
301 Bellevue Parkway
Wilmington, DE 19809
ADMINISTRATOR,
FUND ACCOUNTANT,
AND CUSTODIAN
The Bank of New York Mellon
240 Greenwich Street
New York, NY 10286
INDEPENDENT REGISTERED
PUBLIC ACCOUNTING FIRM
Deloitte & Touche LLP
111 S. Wacker Drive
Chicago, IL 60606
LEGAL COUNSEL
Chapman and Cutler LLP
111 W. Monroe Street
Chicago, IL 60603
Item 2. Code of Ethics.
Not applicable.
Item 3. Audit Committee Financial Expert.
Not applicable.
Item 4. Principal Accountant Fees and Services.
Not applicable.
Item 5. Audit Committee of Listed registrants.
Not applicable.
Item 6. Investments.
| (a) | | Schedule of Investments in securities of unaffiliated issuers as of the close of the reporting period is included as part of the report to shareholders filed under Item 1 of this form. |
Item 7. Disclosure of Proxy Voting Policies and Procedures for Closed-End Management Investment Companies.
Not applicable.
Item 8. Portfolio Managers of Closed-End Management Investment Companies.
Item 9. Purchases of Equity Securities by Closed-End Management Investment Company and Affiliated Purchasers.
| Period | (a) Total Number of Shares (or Units) Purchased | (b) Average Price Paid per Share (or Unit) | (c) Total Number of Shares (or Units) Purchased as Part of Publicly Announced Plans or Programs | (d) Maximum Number (or Approximate Dollar Value) of Shares (or Units) that May Yet Be Purchased Under the Plans or Programs |
Month #1 (11/01/2020-11/30/2020) | 32,615 | 14.11 | 2,799,347 | 728,070 |
| Month #2 (12/01/2020-12/31/2020) | 90,403 | 14.61 | 2,889,750 | 637,667 |
| Month #3 (1/01/2021-1/31/2021) | 49,195 | 14.70 | 2,938,945 | 588,487 |
Month #4 (2/01/2021-2/29/2021) | 0 | — | 2,938,945 | 588,487 |
Month #5 (3/01/2021-3/31/2021) | 0 | — | 2,938,945 | 1,673,507 |
| Month #6 (4/01/2021-4/30/2021) | 0 | — | 2,938,945 | 1,673,507 |
| Total | 172,213 | $14.54 | 2,938,945 | 1,673,507 |
On September 15, 2015, the Fund commenced a share repurchase program. The program originally expired on March 15, 2016, but the Board of Trustees of the Fund has subsequently authorized the continuation of the Fund’s share repurchase program until March 15, 2022. For the six months ended April 30, 2021, the Fund repurchased 172,213 of its shares at a weighted-average discount of 11.27% from net asset value per share. For the year ended October 31, 2020, the Fund repurchased 735,979 of its shares at a weighted-average discount of 11.95% from net asset value per share. The Fund expects to continue to repurchase its outstanding shares until the earlier of (i) the repurchase of an additional 1,673,507 common shares (for an aggregate of 1,673,507), or (ii) March 15, 2022.
Item 10. Submission of Matters to a Vote of Security Holders.
There have been no material changes to the procedures by which the shareholders may recommend nominees to the registrant’s board of directors, where those changes were implemented after the registrant last provided disclosure in response to the requirements of Item 407(c)(2)(iv) of Regulation S-K (17 CFR 229.407) (as required by Item 22(b)(15) of Schedule 14A (17 CFR 240.14a-101)), or this Item.
Item 11. Controls and Procedures.
| (a) | | The registrant’s principal executive and principal financial officers, or persons performing similar functions, have concluded that the registrant’s disclosure controls and procedures (as defined in Rule 30a-3(c) under the Investment Company Act of 1940, as amended (the “1940 Act”) (17 CFR 270.30a-3(c))) are effective, as of a date within 90 days of the filing date of the report that includes the disclosure required by this paragraph, based on their evaluation of these controls and procedures required by Rule 30a-3(b) under the 1940 Act (17 CFR 270.30a-3(b)) and Rules 13a-15(b) or 15d-15(b) under the Securities Exchange Act of 1934, as amended (17 CFR 240.13a-15(b) or 240.15d-15(b)). |
| (b) | | There were no changes in the registrant’s internal control over financial reporting (as defined in Rule 30a-3(d) under the 1940 Act (17 CFR 270.30a-3(d)) that occurred during the period covered by this report that has materially affected, or is reasonably likely to materially affect, the registrant’s internal control over financial reporting. |
Item 12. Exhibits.
Item 13. Exhibits.
| (a)(2) | | Certifications pursuant to Rule 30a-2(a) under the 1940 Act and Section 302 of the Sarbanes-Oxley Act of 2002 are attached hereto. |
| (b) | | Certifications pursuant to Rule 30a-2(b) under the 1940 Act and Section 906 of the Sarbanes- Oxley Act of 2002 are attached hereto. |
SIGNATURES
Pursuant to the requirements of the Securities Exchange Act of 1934 and the Investment Company Act of 1940, the registrant has duly caused this report to be signed on its behalf by the undersigned, thereunto duly authorized.
| (registrant) | | First Trust High Income Long/Short Fund |
| By (Signature and Title)* | | /s/ James M. Dykas |
| | | James M. Dykas, President and Chief Executive Officer
(principal executive officer) |
Pursuant to the requirements of the Securities Exchange Act of 1934 and the Investment Company Act of 1940, this report has been signed below by the following persons on behalf of the registrant and in the capacities and on the dates indicated.
| By (Signature and Title)* | | /s/ James M. Dykas |
| | | James M. Dykas, President and Chief Executive Officer
(principal executive officer) |
| By (Signature and Title)* | | /s/ Donald P. Swade |
| | | Donald P. Swade, Treasurer, Chief Financial Officer
and Chief Accounting Officer
(principal financial officer) |
* Print the name and title of each signing officer under his or her signature.