UNITED STATES
SECURITIES AND EXCHANGE COMMISSION
Washington, D.C. 20549
FORM N-CSR
CERTIFIED SHAREHOLDER REPORT OF REGISTERED MANAGEMENT INVESTMENT COMPANIES
Investment Company Act file number 811-22442
First Trust High Income Long/Short Fund
(Exact name of registrant as specified in charter)
120 East Liberty Drive, Suite 400
Wheaton, IL 60187
(Address of principal executive offices) (Zip code)
W. Scott Jardine, Esq.
First Trust Portfolios L.P.
120 East Liberty Drive, Suite 400
Wheaton, IL 60187
(Name and address of agent for service)
Registrant’s telephone number, including area code: 630-765-8000
Date of fiscal year end: October 31
Date of reporting period: April 30, 2023
Form N-CSR is to be used by management investment companies to file reports with the Commission not later than 10 days after the transmission to stockholders of any report that is required to be transmitted to stockholders under Rule 30e-1 under the Investment Company Act of 1940 (17 CFR 270.30e-1). The Commission may use the information provided on Form N-CSR in its regulatory, disclosure review, inspection, and policymaking roles.
A registrant is required to disclose the information specified by Form N-CSR, and the Commission will make this information public. A registrant is not required to respond to the collection of information contained in Form N-CSR unless the Form displays a currently valid Office of Management and Budget (“OMB”) control number. Please direct comments concerning the accuracy of the information collection burden estimate and any suggestions for reducing the burden to Secretary, Securities and Exchange Commission, 100 F Street, NE, Washington, DC 20549. The OMB has reviewed this collection of information under the clearance requirements of 44 U.S.C. § 3507.
Explanatory Note
The Registrant is filing this amendment to its form N-CSRS for the period ended April 30, 2023 originally filed with the Securities and Exchange Commission on July 3, 2023 (Accession Number 0001445546-23-004171). The sole purpose of this fling is to include iXBRL tagging for US-GAAP: SharePrice and US-GAPP: NetAssetValuePerShare.
Item 1. Reports to Stockholders.
| (a) | The Report to Shareholders is attached herewith. |


| 1 | |
| 2 | |
| 4 | |
| 10 | |
| 23 | |
| 24 | |
| 25 | |
| 26 | |
| 27 | |
| 28 | |
| 36 |

| Fund Statistics | |
| Symbol on New York Stock Exchange | FSD |
| Common Share Price | $11.40 |
| Common Share Net Asset Value (“NAV”) | $12.72 |
| Premium (Discount) to NAV | (10.38)% |
| Net Assets Applicable to Common Shares | $423,583,611 |
| Current Monthly Distribution per Common Share(1) | $0.1050 |
| Current Annualized Distribution per Common Share | $1.2600 |
| Current Distribution Rate on Common Share Price(2) | 11.05% |
| Current Distribution Rate on NAV(2) | 9.91% |

| Performance | |||||
| Average Annual Total Returns | |||||
| 6 Months Ended 4/30/23 | 1 Year Ended 4/30/23 | 5 Years Ended 4/30/23 | 10 Years Ended 4/30/23 | Inception (9/27/10) to 4/30/23 | |
| Fund Performance(3) | |||||
| NAV(4) | 6.38% | 0.86% | 3.20% | 4.18% | 5.39% |
| Market Value | 8.87% | -0.94% | 3.68% | 3.48% | 4.10% |
| Index Performance | |||||
| ICE BofA US High Yield Constrained Index | 5.88% | 1.03% | 3.10% | 3.93% | 5.34% |
| (1) | Most recent distribution paid through April 30, 2023. Subject to change in the future. |
| (2) | Distribution rates are calculated by annualizing the most recent distribution paid through the report date and then dividing by Common Share Price or NAV, as applicable, as of April 30, 2023. Subject to change in the future. |
| (3) | Total return is based on the combination of reinvested dividend, capital gain, and return of capital distributions, if any, at prices obtained by the Dividend Reinvestment Plan and changes in NAV per share for NAV returns and changes in Common Share Price for market value returns. Total returns do not reflect sales load and are not annualized for periods of less than one year. Past performance is not indicative of future results. |
| (4) | On January 3, 2023, the fair value methodology used to value the senior loan investments held by the Fund was changed. Prior to that date, the senior loans were valued using the bid side price provided by a pricing service. After such date, the senior loans were valued using the midpoint between the bid and ask price provided by a pricing service. The change in the Fund’s fair value methodology on January 3, 2023, resulted in a one-time increase in the Fund’s net asset value of approximately $0.005 per share on that date, which represented a positive impact on the Fund’s performance of 0.04%. The change to the pricing methodology was negligible to the performance of the Fund on a NAV basis for the periods ended April 30, 2023. |
| Credit Quality(5) | % of Total Fixed-Income Investments(6) |
| BBB- and above | 17.8% |
| BB | 52.4 |
| B | 25.8 |
| CCC+ and below | 4.0 |
| NR | 0.0* |
| Total | 100.0% |
| * | Amount is less than 0.1%. |
| Industry Classification | % of Long-Term Investments(6) |
| Energy | 16.5% |
| Services | 10.1 |
| Media | 9.1 |
| Leisure | 7.0 |
| Capital Goods | 6.9 |
| Basic Industry | 6.5 |
| Healthcare | 5.4 |
| Consumer Goods | 5.0 |
| Automotive | 4.8 |
| Retail | 4.8 |
| Telecommunications | 4.1 |
| Technology & Electronics | 4.0 |
| Real Estate | 3.3 |
| Utility | 3.2 |
| Banking | 3.1 |
| Financial Services | 3.1 |
| Transportation | 2.4 |
| Commercial Mortgage-Backed Securities | 0.4 |
| Insurance | 0.3 |
| Collateralized Mortgage Obligations | 0.0* |
| Total | 100.0% |
| * | Amount is less than 0.1%. |
| Asset Classification | % of Long-Term Investments(6) |
| Corporate Bonds and Notes | 74.9% |
| Foreign Corporate Bonds and Notes | 17.6 |
| Capital Preferred Securities | 5.5 |
| Senior Floating-Rate Loan Interests | 1.6 |
| Mortgage-Backed Securities | 0.3 |
| Equity | 0.1 |
| Total | 100.0% |
| Country Exposure | % of Long-Term Investments(6) |
| United States | 81.9% |
| Canada | 5.5 |
| Multinational | 2.4 |
| United Kingdom | 2.3 |
| Bermuda | 1.8 |
| Netherlands | 1.2 |
| France | 0.8 |
| Liberia | 0.7 |
| Luxembourg | 0.7 |
| Finland | 0.6 |
| Mexico | 0.5 |
| Panama | 0.5 |
| Cayman Islands | 0.4 |
| Switzerland | 0.3 |
| Ireland | 0.3 |
| Italy | 0.1 |
| Total | 100.0% |
| Fund Allocation | % of Net Assets |
| Corporate Bonds and Notes | 100.6% |
| Foreign Corporate Bonds and Notes | 23.7 |
| Capital Preferred Securities | 7.4 |
| Senior Floating-Rate Loan Interests | 2.1 |
| Mortgage-Backed Securities | 0.5 |
| Common Stocks | 0.1 |
| Rights | 0.0* |
| U.S. Government Bonds Sold Short | (12.5) |
| Corporate Bonds Sold Short | (1.0) |
| Outstanding Loan | (33.9) |
| Net Other Assets and Liabilities(7) | 13.0 |
| Total | 100.0% |
| * | Amount is less than 0.1%. |
| (5) | The credit quality and ratings information presented above reflect the ratings assigned by one or more nationally recognized statistical rating organizations (NRSROs), including S&P Global Ratings, Moody’s Investors Service, Inc., Fitch Ratings or a comparably rated NRSRO. For situations in which a security is rated by more than one NRSRO and the ratings are not equivalent, the highest rating is used. Sub-investment grade ratings are those rated BB+/Ba1 or lower. Investment grade ratings are those rated BBB-/Baa3 or higher. The credit ratings shown relate to the creditworthiness of the issuers of the underlying securities in the Fund, and not to the Fund or its shares. Credit ratings are subject to change. |
| (6) | Percentages are based on long positions only. Short positions are excluded. |
| (7) | Includes forward foreign currency contracts. |
| • | Following the rate driven volatility that weighed across credit markets for much of 2022, the year closed on a calmer tone. This sentiment carried into 2023, which opened on a vibrant note and a rally in credit markets in January 2023. Optimism around a possible slowdown in central bank tightening programs along with the hopes of a soft landing drove credit markets higher in the first month of 2023 with strong results. Renewed confidence for a turnaround in global growth with China’s reopening and positive signals from Europe, with their recessionary concerns postponed, also motivated investors. Market enthusiasm however quickly faded in February 2023 with the report of stronger than expected inflation data in both the U.S. and Europe along with somewhat hawkish commentary from the U.S. Federal Reserve (the “Fed”) and European Central Bank (“ECB”) officials. Following this, the Fed raised interest rates in February 2023 by 25 basis points (“bps”), the smallest move since their interest rate hike program began in March 2022. The markets reacted positively in the hopes that this signaled a step closer to the end of the Fed’s tightening cycle; as the month progressed, it was evident that this was not the case. |
| • | In March 2023, chaos within the Banking sector took center stage with the failures of U.S. regional banks, Silicon Valley Bank and Signature Bank, igniting concerns around the solvency of banks and their ability to meet liquidity needs of depositors. Contagion worries escalated, revealing weaknesses within First Republic, another U.S. regional bank, and extended globally leading to the near collapse of Credit Suisse. U.S. Government regulators swiftly stepped in by providing support in the form of liquidity facilities to U.S. banks, guarantees for depositors at smaller banking institutions that demonstrate signs of stress and conveyed statements on the soundness of the U.S. banking system; all measures intended to alleviate fears and reinstitute confidence in banks. Similarly, the Swiss government stepped in, committing to liquidity support for Credit Suisse and eventually acting as the lead negotiator for the agreed acquisition of the troubled bank by UBS. In the midst of the distress within the Banking sector, the Fed stayed the course, raising interest rates by another 25 bps to a range of 4.75% to 5.00%. With inflation still elevated, Fed Chairman Jerome Powell reiterated that there is more work needed to get inflation back toward the Fed’s 2% target. |
| • | Credit markets demonstrated vibrancy, with a calmer tone settling in by late March 2023 and persisting in April. While questions remain about other vulnerable banks and contagion within the Banking sector, concerns were somewhat diminished during the month, particularly given the swift response by government officials and regulatory agencies in both the U.S. and in Europe to address the troubled institutions. In April, market participants turned their attention to corporate earnings, which kicked off. While the start to earnings has been mixed, investors were encouraged by upbeat first quarter 2023 results from technology companies, large oil producers and others that beat expectations. First quarter 2023 results for the large banks, including JP Morgan, Citi and Wells Fargo were favorable, boosted by increased deposits from nervous investors who fled smaller banks and also lifted by higher rates on loans. Results for the smaller and mid-sized banks, on the other hand, remain a concern. |
| • | Turning to economic data in the U.S., first quarter 2023 gross domestic product growth came in at 1.1%, demonstrating a meaningful decline in economic growth from 2.6% in the fourth quarter of 2022, adding to the likelihood of recession in the near future. This deceleration was primarily driven by business activity, while consumer activity, fueled by higher incomes and savings, has been slower to ease. Personal consumption rose to 3.7% in the first quarter of 2023, contributing to elevated inflation in the U.S. As of April, the annualized rate of U.S. inflation was 4.9%, down from 6.5% at the end of 2022, as measured by the Consumer |
| Price Index. While U.S. inflation has declined, the Fed appears to remain committed to bringing inflation down to their ultimate target of 2%. According to the U.S. Bureau of Labor Statistics’ monthly jobs report, U.S. employers added over 250,000 jobs in April 2023 and the unemployment rate decreased to 3.4%. A strong labor market in the midst of high inflation is a major concern of the Fed. | |
| • | Outside the U.S., in Europe, the ECB completed two interest rate hikes of 50 bps year-to-date through April 2023, and also messaged their intent to stay the course to meet their 2% medium-term target. Inflation in the Eurozone remains elevated at 6.9% (as of March 2023). Turning to China, the country continues to make steps forward with a strong rebound in the first quarter of 2023. China’s economy expanded by 4.5% in the first quarter and is expected to grow further this year above 5%. Chinese consumers have enjoyed resuming travel, retail spending and increased activity in restaurants. |
| • | Within this market backdrop, Treasury yields moved lower across the curve year to date through April; the yield curve still remains inverted. The yield on the 2-Year U.S. Treasury declined 37 bps to 4.04%, while the yield on the 10-Year fell 44 bps to close April at 3.44%. Within commodities, oil prices, as measured by WTI Crude, declined during the year and closed April 2023 at $76.78. |
| Average Annual Total Returns | |||||
| 6 Months Ended 4/30/23 | 1 Year Ended 4/30/23 | 5 Years Ended 4/30/23 | 10 Years Ended 4/30/23 | Inception (9/27/10) to 4/30/23 | |
| Fund Performance* | |||||
| NAV** | 6.38% | 0.86% | 3.20% | 4.18% | 5.39% |
| Market Value | 8.87% | -0.94% | 3.68% | 3.48% | 4.10% |
| Index Performance | |||||
| ICE BofA US High Yield Constrained Index | 5.88% | 1.03% | 3.10% | 3.93% | 5.34% |

Performance figures assume reinvestment of all distributions and do not reflect the deduction of taxes that a shareholder would pay on Fund distributions or the redemption or sale of Fund shares. An index is a statistical composite that tracks a specified financial market or sector. Unlike the Fund, the index does not actually hold a portfolio of securities and therefore does not incur the expenses incurred by the Fund. These expenses negatively impact the performance of the Fund. The Fund’s past performance does not predict future performance.
| * | Total return is based on the combination of reinvested dividend, capital gain and return of capital distributions, if any, at prices obtained by the Dividend Reinvestment Plan and changes in NAV per share for NAV returns and changes in Common Share Price for market value returns. Total returns do not reflect sales load and are not annualized for periods of less than one year. Past performance is not indicative of future results.. |
| ** | On January 3, 2023, the fair value methodology used to value the senior loan investments held by the Fund was changed. Prior to that date, the senior loans were valued using the bid side price provided by a pricing service. After such date, the senior loans were valued using the midpoint between the bid and ask price provided by a pricing service. The change in the Fund’s fair value methodology on January 3, 2023, resulted in a one-time increase in the Fund’s net asset value of approximately $0.005 per share on that date, which represented a positive impact on the Fund’s performance of 0.04%.The change to the pricing methodology was negligible to the performance of the Fund on a NAV basis for the periods ended April 30, 2023. |
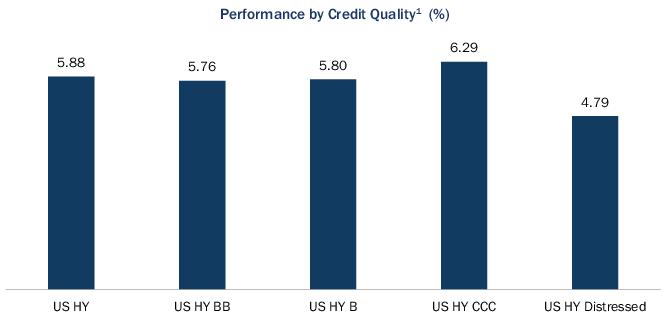
Source: ICE Data
BB, ICE BofA BB U.S. High Yield Index2
Distressed, ICE BofA U.S. Distressed High Yield Index5

| Principal Value | Description | Stated Coupon | Stated Maturity | Value | ||||
| CORPORATE BONDS AND NOTES – 100.6% | ||||||||
| Automotive – 4.7% | ||||||||
| $2,300,000 | Dana, Inc. (a) | 4.50% | 02/15/32 | $1,841,500 | ||||
| 1,185,000 | Energizer Holdings, Inc. (b) | 4.38% | 03/31/29 | 1,037,272 | ||||
| 1,100,000 | Ford Motor Credit Co., LLC | 5.58% | 03/18/24 | 1,094,792 | ||||
| 1,400,000 | Ford Motor Credit Co., LLC (a) | 5.13% | 06/16/25 | 1,364,950 | ||||
| 1,260,000 | Ford Motor Credit Co., LLC | 6.95% | 03/06/26 | 1,272,974 | ||||
| 1,000,000 | Ford Motor Credit Co., LLC | 4.95% | 05/28/27 | 946,977 | ||||
| 2,205,000 | Ford Motor Credit Co., LLC (a) | 4.13% | 08/17/27 | 2,025,985 | ||||
| 5,000,000 | Ford Motor Credit Co., LLC (a) | 5.11% | 05/03/29 | 4,666,930 | ||||
| 2,000,000 | Ford Motor Credit Co., LLC | 7.35% | 03/06/30 | 2,056,361 | ||||
| 1,950,000 | Gates Global LLC/Gates Corp. (b) | 6.25% | 01/15/26 | 1,932,957 | ||||
| 710,000 | Goodyear Tire & Rubber (The) Co. | 4.88% | 03/15/27 | 671,699 | ||||
| 1,135,000 | Thor Industries, Inc. (b) | 4.00% | 10/15/29 | 932,116 | ||||
| 19,844,513 | ||||||||
| Banking – 0.2% | ||||||||
| 335,000 | Fifth Third Bancorp (c) | 4.77% | 07/28/30 | 319,079 | ||||
| 500,000 | Fifth Third Bank NA | 3.85% | 03/15/26 | 471,391 | ||||
| 790,470 | ||||||||
| Basic Industry – 6.5% | ||||||||
| 2,045,000 | Artera Services LLC (b) | 9.03% | 12/04/25 | 1,759,201 | ||||
| 435,000 | Avient Corp. (a) (b) | 7.13% | 08/01/30 | 444,984 | ||||
| 645,000 | Brundage-Bone Concrete Pumping Holdings, Inc. (a) (b) | 6.00% | 02/01/26 | 606,968 | ||||
| 1,450,000 | Camelot Return Merger Sub, Inc. (a) (b) | 8.75% | 08/01/28 | 1,375,673 | ||||
| 320,000 | Carpenter Technology Corp. | 6.38% | 07/15/28 | 317,584 | ||||
| 1,276,000 | Carpenter Technology Corp. (a) | 7.63% | 03/15/30 | 1,306,523 | ||||
| 655,000 | Compass Minerals International, Inc. (b) | 4.88% | 07/15/24 | 648,859 | ||||
| 458,000 | Compass Minerals International, Inc. (b) | 6.75% | 12/01/27 | 439,683 | ||||
| 2,540,000 | Dycom Industries, Inc. (a) (b) | 4.50% | 04/15/29 | 2,321,293 | ||||
| 1,498,000 | Foundation Building Materials, Inc. (b) | 6.00% | 03/01/29 | 1,198,511 | ||||
| 900,000 | Great Lakes Dredge & Dock Corp. (b) | 5.25% | 06/01/29 | 708,808 | ||||
| 2,385,000 | Innophos Holdings, Inc. (a) (b) | 9.38% | 02/15/28 | 2,396,561 | ||||
| 2,445,000 | JELD-WEN, Inc. (a) (b) | 4.88% | 12/15/27 | 2,142,761 | ||||
| 1,820,000 | LGI Homes, Inc. (a) (b) | 4.00% | 07/15/29 | 1,488,501 | ||||
| 800,000 | MIWD Holdco II LLC/MIWD Finance Corp. (b) | 5.50% | 02/01/30 | 672,968 | ||||
| 1,125,000 | Novelis Corp. (b) | 3.25% | 11/15/26 | 1,031,129 | ||||
| 885,000 | Novelis Corp. (b) | 3.88% | 08/15/31 | 742,383 | ||||
| 385,000 | Olympus Water US Holding Corp. (b) | 4.25% | 10/01/28 | 328,790 | ||||
| 925,000 | Rain CII Carbon LLC/CII Carbon Corp. (b) | 7.25% | 04/01/25 | 897,500 | ||||
| 1,145,000 | Standard Industries, Inc./NJ (b) | 4.38% | 07/15/30 | 989,719 | ||||
| 1,390,000 | TopBuild Corp. (a) (b) | 4.13% | 02/15/32 | 1,196,471 | ||||
| 3,765,000 | TRI Pointe Group, Inc./TRI Pointe Homes, Inc. (a) | 5.88% | 06/15/24 | 3,761,762 | ||||
| 770,000 | Weekley Homes LLC/Weekley Finance Corp. (b) | 4.88% | 09/15/28 | 669,403 | ||||
| 27,446,035 | ||||||||
| Capital Goods – 5.0% | ||||||||
| 1,065,000 | Amsted Industries, Inc. (a) (b) | 5.63% | 07/01/27 | 1,045,536 | ||||
| 2,009,000 | Ball Corp. (a) | 6.88% | 03/15/28 | 2,091,237 | ||||
| 1,589,000 | Berry Global, Inc. (a) (b) | 4.50% | 02/15/26 | 1,542,070 | ||||
| 580,000 | Chart Industries, Inc. (b) | 7.50% | 01/01/30 | 598,125 | ||||
| 936,000 | Crown Americas LLC | 5.25% | 04/01/30 | 911,528 | ||||
| 1,470,000 | EnerSys (a) (b) | 4.38% | 12/15/27 | 1,379,051 | ||||
| 985,000 | Graphic Packaging International LLC (a) (b) | 3.75% | 02/01/30 | 881,575 | ||||
| 81,000 | Howmet Aerospace, Inc. | 6.88% | 05/01/25 | 83,531 | ||||
| 450,000 | Mauser Packaging Solutions Holding Co. (b) | 9.25% | 04/15/27 | 427,576 | ||||
| Principal Value | Description | Stated Coupon | Stated Maturity | Value | ||||
| CORPORATE BONDS AND NOTES (Continued) | ||||||||
| Capital Goods (Continued) | ||||||||
| $984,000 | Owens-Brockway Glass Container, Inc. (b) | 6.63% | 05/13/27 | $988,797 | ||||
| 320,000 | Sealed Air Corp. (b) | 6.13% | 02/01/28 | 325,125 | ||||
| 1,600,000 | TK Elevator US Newco, Inc. (a) (b) | 5.25% | 07/15/27 | 1,497,611 | ||||
| 1,085,000 | TransDigm, Inc. (a) (b) | 6.25% | 03/15/26 | 1,091,827 | ||||
| 1,800,000 | TransDigm, Inc. (a) | 6.38% | 06/15/26 | 1,800,068 | ||||
| 2,305,000 | TransDigm, Inc. (a) | 5.50% | 11/15/27 | 2,215,707 | ||||
| 2,000,000 | TransDigm, Inc. (b) | 6.75% | 08/15/28 | 2,033,582 | ||||
| 2,515,000 | TriMas Corp. (a) (b) | 4.13% | 04/15/29 | 2,241,217 | ||||
| 21,154,163 | ||||||||
| Consumer Goods – 6.0% | ||||||||
| 1,370,000 | CD&R Smokey Buyer, Inc. (b) | 6.75% | 07/15/25 | 1,209,025 | ||||
| 3,545,000 | Darling Ingredients, Inc. (a) (b) | 5.25% | 04/15/27 | 3,478,962 | ||||
| 665,000 | Darling Ingredients, Inc. (b) | 6.00% | 06/15/30 | 658,476 | ||||
| 2,120,000 | Edgewell Personal Care Co. (a) (b) | 5.50% | 06/01/28 | 2,031,930 | ||||
| 1,605,000 | Kronos Acquisition Holdings, Inc./KIK Custom Products, Inc. (a) (b) | 5.00% | 12/31/26 | 1,486,888 | ||||
| 3,149,000 | Kronos Acquisition Holdings, Inc./KIK Custom Products, Inc. (a) (b) | 7.00% | 12/31/27 | 2,771,049 | ||||
| 602,000 | Lamb Weston Holdings, Inc. (b) | 4.88% | 05/15/28 | 591,312 | ||||
| 1,585,000 | Mattel, Inc. (a) (b) | 5.88% | 12/15/27 | 1,588,378 | ||||
| 940,000 | Newell Brands, Inc. | 6.38% | 09/15/27 | 928,250 | ||||
| 1,000,000 | Performance Food Group, Inc. (b) | 4.25% | 08/01/29 | 911,254 | ||||
| 625,000 | Post Holdings, Inc. (a) (b) | 5.75% | 03/01/27 | 622,129 | ||||
| 3,510,000 | Post Holdings, Inc. (b) | 4.63% | 04/15/30 | 3,173,444 | ||||
| 3,300,000 | Primo Water Holdings, Inc. (a) (b) | 4.38% | 04/30/29 | 2,913,326 | ||||
| 1,100,000 | Simmons Foods, Inc./Simmons Prepared Foods, Inc./Simmons Pet Food, Inc./Simmons Feed (b) | 4.63% | 03/01/29 | 909,986 | ||||
| 1,017,000 | Spectrum Brands, Inc. | 5.75% | 07/15/25 | 1,009,017 | ||||
| 740,000 | Triton Water Holdings, Inc. (b) | 6.25% | 04/01/29 | 622,266 | ||||
| 670,000 | US Foods, Inc. (b) | 4.63% | 06/01/30 | 613,327 | ||||
| 25,519,019 | ||||||||
| Energy – 20.2% | ||||||||
| 1,200,000 | Aethon United BR L.P./Aethon United Finance Corp. (a) (b) | 8.25% | 02/15/26 | 1,166,552 | ||||
| 1,560,000 | Ascent Resources Utica Holdings LLC/ARU Finance Corp. (a) (b) | 7.00% | 11/01/26 | 1,511,400 | ||||
| 970,000 | Ascent Resources Utica Holdings LLC/ARU Finance Corp. (a) (b) | 8.25% | 12/31/28 | 942,929 | ||||
| 2,624,000 | Ascent Resources Utica Holdings LLC/ARU Finance Corp. (a) (b) | 5.88% | 06/30/29 | 2,359,072 | ||||
| 640,000 | Callon Petroleum Co. (a) | 6.38% | 07/01/26 | 619,150 | ||||
| 1,310,000 | Callon Petroleum Co. (b) | 7.50% | 06/15/30 | 1,245,726 | ||||
| 2,555,000 | Cheniere Energy Partners L.P. (a) | 4.50% | 10/01/29 | 2,406,968 | ||||
| 1,020,000 | Cheniere Energy, Inc. (a) | 4.63% | 10/15/28 | 973,183 | ||||
| 1,100,000 | CNX Midstream Partners L.P. (a) (b) | 4.75% | 04/15/30 | 922,105 | ||||
| 192,000 | CNX Resources Corp. (b) | 7.25% | 03/14/27 | 190,068 | ||||
| 822,000 | CNX Resources Corp. (b) | 6.00% | 01/15/29 | 761,327 | ||||
| 2,050,000 | Comstock Resources, Inc. (a) (b) | 6.75% | 03/01/29 | 1,858,114 | ||||
| 391,000 | Continental Resources, Inc./OK | 4.38% | 01/15/28 | 371,986 | ||||
| 1,025,000 | CrownRock L.P./CrownRock Finance, Inc. (b) | 5.00% | 05/01/29 | 969,374 | ||||
| 934,000 | DCP Midstream Operating L.P. (a) | 5.13% | 05/15/29 | 927,109 | ||||
| 695,000 | DCP Midstream Operating L.P. | 3.25% | 02/15/32 | 594,562 | ||||
| 2,650,000 | Delek Logistics Partners LP/Delek Logistics Finance Corp. (a) (b) | 7.13% | 06/01/28 | 2,416,482 | ||||
| 1,200,000 | DT Midstream, Inc. (b) | 4.13% | 06/15/29 | 1,064,842 | ||||
| 5,140,000 | Endeavor Energy Resources L.P./EER Finance, Inc. (a) (b) | 5.75% | 01/30/28 | 5,120,863 | ||||
| 1,900,000 | EnLink Midstream LLC (a) (b) | 5.63% | 01/15/28 | 1,873,238 | ||||
| 2,335,000 | EnLink Midstream LLC (a) | 5.38% | 06/01/29 | 2,256,950 | ||||
| Principal Value | Description | Stated Coupon | Stated Maturity | Value | ||||
| CORPORATE BONDS AND NOTES (Continued) | ||||||||
| Energy (Continued) | ||||||||
| $150,000 | EnLink Midstream LLC (b) | 6.50% | 09/01/30 | $151,678 | ||||
| 1,825,000 | EQM Midstream Partners L.P. (a) (b) | 6.50% | 07/01/27 | 1,781,818 | ||||
| 1,700,000 | EQM Midstream Partners L.P. (a) | 5.50% | 07/15/28 | 1,551,213 | ||||
| 132,000 | EQM Midstream Partners L.P. (b) | 7.50% | 06/01/30 | 128,265 | ||||
| 3,620,000 | EQM Midstream Partners L.P. (a) (b) | 4.75% | 01/15/31 | 2,971,101 | ||||
| 791,000 | Hess Midstream Operations L.P. (b) | 5.63% | 02/15/26 | 779,633 | ||||
| 1,040,000 | Hess Midstream Operations L.P. (a) (b) | 4.25% | 02/15/30 | 925,850 | ||||
| 1,845,000 | Hilcorp Energy I L.P./Hilcorp Finance Co. (a) (b) | 5.75% | 02/01/29 | 1,725,376 | ||||
| 1,320,000 | Hilcorp Energy I L.P./Hilcorp Finance Co. (a) (b) | 6.00% | 02/01/31 | 1,221,492 | ||||
| 1,145,000 | Holly Energy Partners L.P./Holly Energy Finance Corp. (b) | 6.38% | 04/15/27 | 1,130,214 | ||||
| 1,050,000 | Matador Resources Co. (b) | 6.88% | 04/15/28 | 1,057,833 | ||||
| 1,800,000 | Moss Creek Resources Holdings, Inc. (b) | 7.50% | 01/15/26 | 1,684,914 | ||||
| 1,130,000 | Nabors Industries, Inc. (b) | 7.38% | 05/15/27 | 1,097,445 | ||||
| 314,000 | Noble Finance II LLC (b) | 8.00% | 04/15/30 | 321,903 | ||||
| 4,280,000 | Occidental Petroleum Corp. (a) | 8.50% | 07/15/27 | 4,717,202 | ||||
| 3,070,000 | Occidental Petroleum Corp. (a) | 6.63% | 09/01/30 | 3,280,264 | ||||
| 1,310,000 | PBF Holding Co., LLC/PBF Finance Corp. | 7.25% | 06/15/25 | 1,306,921 | ||||
| 1,250,000 | PBF Holding Co., LLC/PBF Finance Corp. | 6.00% | 02/15/28 | 1,151,469 | ||||
| 2,626,000 | Permian Resources Operating LLC (a) (b) | 6.88% | 04/01/27 | 2,603,128 | ||||
| 725,000 | Rockcliff Energy II LLC (b) | 5.50% | 10/15/29 | 656,332 | ||||
| 1,913,000 | SM Energy Co. (a) | 5.63% | 06/01/25 | 1,871,765 | ||||
| 1,470,000 | SM Energy Co. | 6.50% | 07/15/28 | 1,394,214 | ||||
| 1,100,000 | Southwestern Energy Co. (d) | 5.70% | 01/23/25 | 1,099,136 | ||||
| 730,000 | Southwestern Energy Co. | 8.38% | 09/15/28 | 766,101 | ||||
| 3,265,000 | Southwestern Energy Co. (a) | 5.38% | 03/15/30 | 3,041,839 | ||||
| 1,700,000 | Southwestern Energy Co. (a) | 4.75% | 02/01/32 | 1,501,380 | ||||
| 547,000 | Sunoco L.P./Sunoco Finance Corp. | 4.50% | 05/15/29 | 493,427 | ||||
| 920,000 | Tap Rock Resources LLC (b) | 7.00% | 10/01/26 | 884,861 | ||||
| 2,000,000 | Targa Resources Partners L.P./Targa Resources Partners Finance Corp. | 5.00% | 01/15/28 | 1,958,160 | ||||
| 1,720,000 | Venture Global Calcasieu Pass LLC (a) (b) | 3.88% | 08/15/29 | 1,546,803 | ||||
| 1,875,000 | Venture Global Calcasieu Pass LLC (b) | 6.25% | 01/15/30 | 1,903,082 | ||||
| 2,645,000 | Venture Global Calcasieu Pass LLC (a) (b) | 4.13% | 08/15/31 | 2,346,214 | ||||
| 905,000 | Venture Global Calcasieu Pass LLC (a) (b) | 3.88% | 11/01/33 | 764,081 | ||||
| 1,575,000 | Vital Energy, Inc. (a) | 9.50% | 01/15/25 | 1,585,993 | ||||
| 1,785,000 | Vital Energy, Inc. (a) (b) | 7.75% | 07/31/29 | 1,577,601 | ||||
| 909,000 | Western Midstream Operating L.P. | 4.50% | 03/01/28 | 868,350 | ||||
| 1,251,000 | Western Midstream Operating L.P. (d) | 4.30% | 02/01/30 | 1,143,050 | ||||
| 85,542,108 | ||||||||
| Financial Services – 2.5% | ||||||||
| 1,150,000 | Fortress Transportation and Infrastructure Investors LLC (b) | 6.50% | 10/01/25 | 1,137,187 | ||||
| 2,100,000 | Icahn Enterprises L.P./Icahn Enterprises Finance Corp. (a) | 5.25% | 05/15/27 | 1,982,244 | ||||
| 1,395,000 | LPL Holdings, Inc. (a) (b) | 4.63% | 11/15/27 | 1,319,419 | ||||
| 1,330,000 | MSCI, Inc. (b) | 3.88% | 02/15/31 | 1,166,802 | ||||
| 2,345,000 | OneMain Finance Corp. | 6.13% | 03/15/24 | 2,310,251 | ||||
| 610,000 | OneMain Finance Corp. | 3.50% | 01/15/27 | 521,733 | ||||
| 1,225,000 | PennyMac Financial Services, Inc. (b) | 5.38% | 10/15/25 | 1,157,601 | ||||
| 1,240,000 | Rocket Mortgage LLC/Rocket Mortgage Co-Issuer, Inc. (b) | 3.63% | 03/01/29 | 1,049,672 | ||||
| 10,644,909 | ||||||||
| Healthcare – 7.2% | ||||||||
| 3,065,000 | Avantor Funding, Inc. (a) (b) | 3.88% | 11/01/29 | 2,703,381 | ||||
| 2,000,000 | Carriage Services, Inc. (b) | 4.25% | 05/15/29 | 1,659,517 | ||||
| 1,300,000 | Catalent Pharma Solutions, Inc. (b) | 3.13% | 02/15/29 | 1,107,622 | ||||
| Principal Value | Description | Stated Coupon | Stated Maturity | Value | ||||
| CORPORATE BONDS AND NOTES (Continued) | ||||||||
| Healthcare (Continued) | ||||||||
| $1,365,000 | Catalent Pharma Solutions, Inc. (a) (b) | 3.50% | 04/01/30 | $1,158,679 | ||||
| 4,010,000 | Centene Corp. (a) | 4.63% | 12/15/29 | 3,783,034 | ||||
| 985,000 | CHS/Community Health Systems, Inc. (b) | 6.00% | 01/15/29 | 874,005 | ||||
| 2,250,000 | CHS/Community Health Systems, Inc. (a) (b) | 5.25% | 05/15/30 | 1,877,398 | ||||
| 1,250,000 | Elanco Animal Health, Inc. (a) (e) | 6.65% | 08/28/28 | 1,220,163 | ||||
| 1,405,000 | Encompass Health Corp. | 4.50% | 02/01/28 | 1,326,644 | ||||
| 1,495,000 | HCA, Inc. (a) | 5.88% | 02/15/26 | 1,518,821 | ||||
| 1,495,000 | HCA, Inc. (a) | 5.88% | 02/01/29 | 1,541,872 | ||||
| 1,665,000 | HealthEquity, Inc. (a) (b) | 4.50% | 10/01/29 | 1,490,924 | ||||
| 885,000 | PRA Health Sciences, Inc. (b) | 2.88% | 07/15/26 | 808,791 | ||||
| 1,325,000 | Prestige Brands, Inc. (a) (b) | 5.13% | 01/15/28 | 1,286,820 | ||||
| 990,000 | Prestige Brands, Inc. (b) | 3.75% | 04/01/31 | 839,975 | ||||
| 4,750,000 | Service Corp International (a) | 7.50% | 04/01/27 | 4,966,997 | ||||
| 1,730,000 | Teleflex, Inc. (a) (b) | 4.25% | 06/01/28 | 1,624,108 | ||||
| 175,000 | Tenet Healthcare Corp. | 4.38% | 01/15/30 | 161,009 | ||||
| 778,000 | Tenet Healthcare Corp. (b) | 6.13% | 06/15/30 | 770,229 | ||||
| 30,719,989 | ||||||||
| Insurance – 0.1% | ||||||||
| 505,000 | NMI Holdings, Inc. (b) | 7.38% | 06/01/25 | 514,007 | ||||
| Leisure – 5.3% | ||||||||
| 1,730,000 | Affinity Interactive (a) (b) | 6.88% | 12/15/27 | 1,557,809 | ||||
| 1,790,000 | Boyd Gaming Corp. (a) | 4.75% | 12/01/27 | 1,729,112 | ||||
| 1,290,000 | Caesars Entertainment, Inc. (a) (b) | 6.25% | 07/01/25 | 1,292,735 | ||||
| 1,055,000 | Caesars Resort Collection LLC/CRC Finco, Inc. (a) (b) | 5.75% | 07/01/25 | 1,064,653 | ||||
| 3,775,000 | Carnival Holdings Bermuda Ltd. (b) | 10.38% | 05/01/28 | 4,062,255 | ||||
| 1,470,000 | CDI Escrow Issuer, Inc. (a) (b) | 5.75% | 04/01/30 | 1,418,736 | ||||
| 1,200,000 | Everi Holdings, Inc. (b) | 5.00% | 07/15/29 | 1,070,640 | ||||
| 1,800,000 | Hilton Domestic Operating Co., Inc. (a) | 4.88% | 01/15/30 | 1,710,559 | ||||
| 1,725,000 | Hilton Domestic Operating Co., Inc. (a) (b) | 4.00% | 05/01/31 | 1,527,271 | ||||
| 524,000 | Penn Entertainment, Inc. (b) | 4.13% | 07/01/29 | 441,918 | ||||
| 765,000 | Scientific Games Holdings L.P./Scientific Games US FinCo, Inc. (b) | 6.63% | 03/01/30 | 679,419 | ||||
| 2,700,000 | Scientific Games International, Inc. (a) (b) | 7.00% | 05/15/28 | 2,696,855 | ||||
| 1,550,000 | Station Casinos LLC (b) | 4.50% | 02/15/28 | 1,426,961 | ||||
| 325,000 | Station Casinos LLC (b) | 4.63% | 12/01/31 | 278,585 | ||||
| 1,485,000 | Wynn Resorts Finance LLC/Wynn Resorts Capital Corp. (b) | 5.13% | 10/01/29 | 1,368,649 | ||||
| 22,326,157 | ||||||||
| Media – 11.8% | ||||||||
| 1,235,000 | Arches Buyer, Inc. (a) (b) | 4.25% | 06/01/28 | 1,064,242 | ||||
| 2,300,000 | Arches Buyer, Inc. (a) (b) | 6.13% | 12/01/28 | 1,997,573 | ||||
| 1,850,000 | CCO Holdings LLC/CCO Holdings Capital Corp. (a) (b) | 5.50% | 05/01/26 | 1,818,663 | ||||
| 6,100,000 | CCO Holdings LLC/CCO Holdings Capital Corp. (a) (b) | 5.13% | 05/01/27 | 5,765,047 | ||||
| 2,380,000 | CCO Holdings LLC/CCO Holdings Capital Corp. (a) (b) | 5.38% | 06/01/29 | 2,185,478 | ||||
| 1,605,000 | CCO Holdings LLC/CCO Holdings Capital Corp. (b) | 6.38% | 09/01/29 | 1,526,771 | ||||
| 3,330,000 | CCO Holdings LLC/CCO Holdings Capital Corp. (a) (b) | 4.75% | 03/01/30 | 2,869,681 | ||||
| 3,500,000 | CSC Holdings LLC (a) | 5.25% | 06/01/24 | 3,417,098 | ||||
| 2,325,000 | CSC Holdings LLC (a) (b) | 5.50% | 04/15/27 | 1,991,100 | ||||
| 1,800,000 | CSC Holdings LLC (b) | 5.38% | 02/01/28 | 1,478,750 | ||||
| 1,300,000 | CSC Holdings LLC (b) | 11.25% | 05/15/28 | 1,296,854 | ||||
| 1,350,000 | CSC Holdings LLC (b) | 5.75% | 01/15/30 | 690,179 | ||||
| 2,230,000 | CSC Holdings LLC (a) (b) | 4.63% | 12/01/30 | 1,090,776 | ||||
| 2,655,000 | Directv Financing LLC/Directv Financing Co-Obligor, Inc. (a) (b) | 5.88% | 08/15/27 | 2,332,868 | ||||
| Principal Value | Description | Stated Coupon | Stated Maturity | Value | ||||
| CORPORATE BONDS AND NOTES (Continued) | ||||||||
| Media (Continued) | ||||||||
| $1,140,000 | DISH DBS Corp. (b) | 5.25% | 12/01/26 | $872,906 | ||||
| 1,273,000 | DISH DBS Corp. | 7.38% | 07/01/28 | 639,108 | ||||
| 1,255,000 | iHeartCommunications, Inc. (a) (b) | 5.25% | 08/15/27 | 992,930 | ||||
| 1,250,000 | iHeartCommunications, Inc. (a) (b) | 4.75% | 01/15/28 | 974,859 | ||||
| 2,185,000 | Lamar Media Corp. (a) | 4.00% | 02/15/30 | 1,962,316 | ||||
| 900,000 | Match Group Holdings II LLC (b) | 3.63% | 10/01/31 | 736,263 | ||||
| 3,100,000 | Netflix, Inc. (a) | 4.88% | 04/15/28 | 3,122,118 | ||||
| 945,000 | News Corp. (b) | 3.88% | 05/15/29 | 839,869 | ||||
| 1,480,000 | News Corp. (b) | 5.13% | 02/15/32 | 1,364,320 | ||||
| 920,000 | Nexstar Media, Inc. (b) | 5.63% | 07/15/27 | 864,998 | ||||
| 2,175,000 | Sirius XM Radio, Inc. (a) (b) | 4.13% | 07/01/30 | 1,746,977 | ||||
| 410,000 | TEGNA, Inc. | 4.63% | 03/15/28 | 366,560 | ||||
| 655,000 | TripAdvisor, Inc. (b) | 7.00% | 07/15/25 | 659,854 | ||||
| 880,000 | Univision Communications, Inc. (b) | 4.50% | 05/01/29 | 759,231 | ||||
| 3,370,000 | Warnermedia Holdings, Inc. (b) | 3.76% | 03/15/27 | 3,177,646 | ||||
| 1,490,000 | WMG Acquisition Corp. (b) | 3.75% | 12/01/29 | 1,312,601 | ||||
| 49,917,636 | ||||||||
| Real Estate – 4.4% | ||||||||
| 1,199,000 | Iron Mountain, Inc. (a) (b) | 4.88% | 09/15/27 | 1,144,765 | ||||
| 1,845,000 | Iron Mountain, Inc. (a) (b) | 5.25% | 03/15/28 | 1,777,235 | ||||
| 1,480,000 | Iron Mountain, Inc. (b) | 5.25% | 07/15/30 | 1,365,059 | ||||
| 825,000 | Iron Mountain, Inc. (b) | 4.50% | 02/15/31 | 718,387 | ||||
| 700,000 | Park Intermediate Holdings LLC/PK Domestic Property LLC/PK Finance Co-Issuer (b) | 5.88% | 10/01/28 | 646,380 | ||||
| 2,650,000 | Park Intermediate Holdings LLC/PK Domestic Property LLC/PK Finance Co-Issuer (a) (b) | 4.88% | 05/15/29 | 2,294,635 | ||||
| 1,500,000 | SBA Communications Corp. | 3.88% | 02/15/27 | 1,400,675 | ||||
| 1,840,000 | SBA Communications Corp. (a) | 3.13% | 02/01/29 | 1,576,422 | ||||
| 1,934,000 | Service Properties Trust (a) | 7.50% | 09/15/25 | 1,897,003 | ||||
| 2,040,000 | Uniti Group LP/Uniti Group Finance, Inc./CSL Capital LLC (b) | 10.50% | 02/15/28 | 1,953,905 | ||||
| 2,295,000 | VICI Properties L.P./VICI Note Co., Inc. (b) | 5.63% | 05/01/24 | 2,285,960 | ||||
| 360,000 | VICI Properties L.P./VICI Note Co., Inc. (b) | 3.50% | 02/15/25 | 346,343 | ||||
| 375,000 | VICI Properties L.P./VICI Note Co., Inc. (b) | 4.25% | 12/01/26 | 357,786 | ||||
| 925,000 | XHR L.P. (b) | 4.88% | 06/01/29 | 803,649 | ||||
| 18,568,204 | ||||||||
| Retail – 5.3% | ||||||||
| 1,555,000 | Albertsons Cos, Inc./Safeway, Inc./New Albertsons L.P./Albertsons LLC (a) (b) | 6.50% | 02/15/28 | 1,576,078 | ||||
| 3,490,000 | Albertsons Cos, Inc./Safeway, Inc./New Albertsons L.P./Albertsons LLC (a) (b) | 3.50% | 03/15/29 | 3,095,877 | ||||
| 2,150,000 | Arko Corp. (a) (b) | 5.13% | 11/15/29 | 1,744,080 | ||||
| 1,430,000 | Asbury Automotive Group, Inc. (a) | 4.50% | 03/01/28 | 1,300,709 | ||||
| 817,000 | Bath & Body Works, Inc. (b) | 9.38% | 07/01/25 | 875,279 | ||||
| 1,900,000 | Bath & Body Works, Inc. (a) | 7.50% | 06/15/29 | 1,932,781 | ||||
| 555,000 | Group 1 Automotive, Inc. (b) | 4.00% | 08/15/28 | 493,029 | ||||
| 700,000 | LCM Investments Holdings II LLC (b) | 4.88% | 05/01/29 | 597,459 | ||||
| 870,000 | Lithia Motors, Inc. (b) | 3.88% | 06/01/29 | 754,321 | ||||
| 620,000 | Michaels Cos (The), Inc. (b) | 7.88% | 05/01/29 | 416,181 | ||||
| 875,000 | Nordstrom, Inc. | 4.38% | 04/01/30 | 685,484 | ||||
| 675,000 | QVC, Inc. | 4.38% | 09/01/28 | 333,011 | ||||
| 330,000 | Ritchie Bros Holdings, Inc. (b) | 7.75% | 03/15/31 | 351,037 | ||||
| 2,795,000 | Sonic Automotive, Inc. (a) (b) | 4.63% | 11/15/29 | 2,347,911 | ||||
| 825,000 | Sonic Automotive, Inc. (b) | 4.88% | 11/15/31 | 666,988 | ||||
| Principal Value | Description | Stated Coupon | Stated Maturity | Value | ||||
| CORPORATE BONDS AND NOTES (Continued) | ||||||||
| Retail (Continued) | ||||||||
| $1,415,000 | Victoria’s Secret & Co. (b) | 4.63% | 07/15/29 | $1,145,854 | ||||
| 1,135,000 | Yum! Brands, Inc. (b) | 4.75% | 01/15/30 | 1,098,983 | ||||
| 2,950,000 | Yum! Brands, Inc. (a) | 5.38% | 04/01/32 | 2,880,198 | ||||
| 22,295,260 | ||||||||
| Services – 10.3% | ||||||||
| 3,225,000 | Allied Universal Holdco LLC/Allied Universal Finance Corp. (a) (b) | 6.63% | 07/15/26 | 3,113,082 | ||||
| 1,985,000 | Allied Universal Holdco LLC/Allied Universal Finance Corp. (a) (b) | 9.75% | 07/15/27 | 1,849,103 | ||||
| 685,000 | Allied Universal Holdco LLC/Allied Universal Finance Corp. (b) | 6.00% | 06/01/29 | 537,671 | ||||
| 680,000 | Aramark Services, Inc. (a) (b) | 6.38% | 05/01/25 | 680,884 | ||||
| 1,075,000 | Aramark Services, Inc. (a) (b) | 5.00% | 02/01/28 | 1,025,227 | ||||
| 390,000 | Avis Budget Car Rental LLC/Avis Budget Finance, Inc. (b) | 5.38% | 03/01/29 | 354,157 | ||||
| 1,250,000 | Brink’s (The) Co. (a) (b) | 5.50% | 07/15/25 | 1,239,150 | ||||
| 625,000 | Clarivate Science Holdings Corp. (a) (b) | 3.88% | 07/01/28 | 563,137 | ||||
| 1,520,000 | Clean Harbors, Inc. (a) (b) | 4.88% | 07/15/27 | 1,473,541 | ||||
| 2,175,000 | Covanta Holding Corp. (a) (b) | 4.88% | 12/01/29 | 1,937,707 | ||||
| 950,000 | GYP Holdings III Corp. (a) (b) | 4.63% | 05/01/29 | 839,496 | ||||
| 3,045,000 | H&E Equipment Services, Inc. (a) (b) | 3.88% | 12/15/28 | 2,641,949 | ||||
| 3,605,000 | Herc Holdings, Inc. (a) (b) | 5.50% | 07/15/27 | 3,448,631 | ||||
| 750,000 | Hertz (The) Corp. (b) | 4.63% | 12/01/26 | 676,260 | ||||
| 1,450,000 | Imola Merger Corp. (a) (b) | 4.75% | 05/15/29 | 1,257,232 | ||||
| 1,445,000 | NESCO Holdings II, Inc. (a) (b) | 5.50% | 04/15/29 | 1,306,988 | ||||
| 1,915,000 | Prime Security Services Borrower LLC/Prime Finance, Inc. (a) (b) | 3.38% | 08/31/27 | 1,713,944 | ||||
| 1,800,000 | Sotheby’s (a) (b) | 7.38% | 10/15/27 | 1,690,160 | ||||
| 2,065,000 | Sotheby’s/Bidfair Holdings, Inc. (a) (b) | 5.88% | 06/01/29 | 1,701,766 | ||||
| 3,000,000 | Uber Technologies, Inc. (a) (b) | 7.50% | 05/15/25 | 3,047,865 | ||||
| 1,850,000 | United Rentals North America, Inc. (b) | 6.00% | 12/15/29 | 1,879,210 | ||||
| 2,165,000 | United Rentals North America, Inc. (a) | 3.75% | 01/15/32 | 1,858,460 | ||||
| 3,065,000 | WASH Multifamily Acquisition, Inc. (a) (b) | 5.75% | 04/15/26 | 2,876,631 | ||||
| 2,500,000 | Waste Pro USA, Inc. (a) (b) | 5.50% | 02/15/26 | 2,326,932 | ||||
| 880,000 | WESCO Distribution, Inc. (b) | 7.13% | 06/15/25 | 896,229 | ||||
| 1,045,000 | WESCO Distribution, Inc. (b) | 7.25% | 06/15/28 | 1,074,081 | ||||
| 225,000 | White Cap Buyer LLC (b) | 6.88% | 10/15/28 | 195,342 | ||||
| 805,000 | Williams Scotsman International, Inc. (a) (b) | 6.13% | 06/15/25 | 802,055 | ||||
| 855,000 | Williams Scotsman International, Inc. (b) | 4.63% | 08/15/28 | 785,939 | ||||
| 43,792,829 | ||||||||
| Technology & Electronics – 4.2% | ||||||||
| 900,000 | Boxer Parent Co., Inc. (a) (b) | 7.13% | 10/02/25 | 898,416 | ||||
| 1,760,000 | Central Parent, Inc./CDK Global, Inc. (a) (b) | 7.25% | 06/15/29 | 1,744,440 | ||||
| 850,000 | Cloud Software Group, Inc. (b) | 6.50% | 03/31/29 | 766,473 | ||||
| 2,380,000 | CommScope, Inc. (a) (b) | 6.00% | 03/01/26 | 2,276,586 | ||||
| 820,000 | CommScope, Inc. (b) | 8.25% | 03/01/27 | 634,796 | ||||
| 1,235,000 | Dell International LLC/EMC Corp. (a) | 8.35% | 07/15/46 | 1,523,339 | ||||
| 1,900,000 | Entegris, Inc. (a) (b) | 4.38% | 04/15/28 | 1,741,497 | ||||
| 3,110,000 | Fair Isaac Corp. (a) (b) | 4.00% | 06/15/28 | 2,901,716 | ||||
| 934,000 | NCR Corp. (b) | 5.13% | 04/15/29 | 808,937 | ||||
| 349,000 | Newfold Digital Holdings Group, Inc. (b) | 6.00% | 02/15/29 | 240,019 | ||||
| 585,000 | Presidio Holdings, Inc. (b) | 8.25% | 02/01/28 | 551,453 | ||||
| 580,000 | PTC, Inc. (b) | 3.63% | 02/15/25 | 560,195 | ||||
| 355,000 | PTC, Inc. (b) | 4.00% | 02/15/28 | 330,606 | ||||
| 690,000 | SS&C Technologies, Inc. (b) | 5.50% | 09/30/27 | 668,794 | ||||
| 350,000 | Twilio, Inc. | 3.63% | 03/15/29 | 299,239 | ||||
| Principal Value | Description | Stated Coupon | Stated Maturity | Value | ||||
| CORPORATE BONDS AND NOTES (Continued) | ||||||||
| Technology & Electronics (Continued) | ||||||||
| $2,320,000 | Viavi Solutions, Inc. (a) (b) | 3.75% | 10/01/29 | $1,940,030 | ||||
| 17,886,536 | ||||||||
| Telecommunications – 2.7% | ||||||||
| 1,200,000 | Cable One, Inc. (a) (b) | 4.00% | 11/15/30 | 976,920 | ||||
| 655,000 | Cogent Communications Group, Inc. (a) (b) | 3.50% | 05/01/26 | 609,566 | ||||
| 1,035,000 | Cogent Communications Group, Inc. (b) | 7.00% | 06/15/27 | 1,025,616 | ||||
| 1,765,000 | Level 3 Financing, Inc. (b) | 3.63% | 01/15/29 | 988,708 | ||||
| 900,000 | Level 3 Financing, Inc. (a) (b) | 3.75% | 07/15/29 | 507,311 | ||||
| 3,685,000 | Sprint LLC | 7.63% | 03/01/26 | 3,905,411 | ||||
| 565,000 | T-Mobile USA, Inc. | 2.25% | 02/15/26 | 526,314 | ||||
| 1,515,000 | T-Mobile USA, Inc. | 3.75% | 04/05/27 | 1,459,776 | ||||
| 1,490,000 | T-Mobile USA, Inc. | 5.38% | 04/15/27 | 1,505,365 | ||||
| 11,504,987 | ||||||||
| Transportation – 1.7% | ||||||||
| 555,000 | Allegiant Travel Co. (b) | 7.25% | 08/15/27 | 548,673 | ||||
| 1,540,000 | American Airlines, Inc. (a) (b) | 11.75% | 07/15/25 | 1,695,931 | ||||
| 714,000 | First Student Bidco, Inc./First Transit Parent, Inc. (b) | 4.00% | 07/31/29 | 619,593 | ||||
| 633,058 | JetBlue 2020-1 Class B Pass Through Trust | 7.75% | 11/15/28 | 644,411 | ||||
| 2,282,250 | Mileage Plus Holdings LLC/Mileage Plus Intellectual Property Assets Ltd. (a) (b) | 6.50% | 06/20/27 | 2,281,338 | ||||
| 685,000 | United Airlines, Inc. (b) | 4.38% | 04/15/26 | 655,014 | ||||
| 895,000 | United Airlines, Inc. (a) (b) | 4.63% | 04/15/29 | 810,939 | ||||
| 39,766 | US Airways 2000-3C Pass Through Trust (f) (g) | 8.39% | 09/01/23 | 39,766 | ||||
| 7,295,665 | ||||||||
| Utility – 2.5% | ||||||||
| 1,000,000 | Calpine Corp. (b) | 4.63% | 02/01/29 | 870,087 | ||||
| 2,205,000 | Calpine Corp. (a) (b) | 3.75% | 03/01/31 | 1,883,400 | ||||
| 470,000 | Clearway Energy Operating LLC (b) | 3.75% | 02/15/31 | 402,738 | ||||
| 1,690,000 | Clearway Energy Operating LLC (a) (b) | 3.75% | 01/15/32 | 1,419,382 | ||||
| 1,355,000 | FirstEnergy Corp. (a) (e) | 4.15% | 07/15/27 | 1,319,682 | ||||
| 2,515,000 | PG&E Corp. (a) | 5.00% | 07/01/28 | 2,369,930 | ||||
| 1,060,000 | Vistra Operations Co. LLC (b) | 5.63% | 02/15/27 | 1,035,543 | ||||
| 1,310,000 | Vistra Operations Co. LLC (b) | 4.38% | 05/01/29 | 1,172,395 | ||||
| 10,473,157 | ||||||||
Total Corporate Bonds and Notes | 426,235,644 | |||||||
| (Cost $455,068,313) | ||||||||
| Principal Value (Local Currency) | Description | Stated Coupon | Stated Maturity | Value (US Dollars) | ||||
| FOREIGN CORPORATE BONDS AND NOTES – 23.7% | ||||||||
| Automotive – 0.6% | ||||||||
| 918,000 | Clarios Global L.P. (USD) (b) | 6.75% | 05/15/25 | 920,582 | ||||
| 607,000 | Clarios Global L.P./Clarios US Finance Co. (USD) (b) | 6.25% | 05/15/26 | 604,874 | ||||
| 1,099,000 | Clarios Global L.P./Clarios US Finance Co. (USD) (b) | 8.50% | 05/15/27 | 1,107,486 | ||||
| 2,632,942 | ||||||||
| Banking – 0.8% | ||||||||
| 2,930,000 | Barclays PLC (USD) (a) (c) | 7.33% | 11/02/26 | 3,041,849 | ||||
| Principal Value (Local Currency) | Description | Stated Coupon | Stated Maturity | Value (US Dollars) | ||||
| FOREIGN CORPORATE BONDS AND NOTES (Continued) | ||||||||
| Banking (Continued) | ||||||||
| 500,000 | Intesa Sanpaolo SpA (USD) (b) | 5.02% | 06/26/24 | $485,919 | ||||
| 3,527,768 | ||||||||
| Basic Industry – 2.3% | ||||||||
| 1,350,000 | Ahlstrom Holding 3 Oy (USD) (b) | 4.88% | 02/04/28 | 1,149,847 | ||||
| 2,175,000 | INEOS Finance PLC (USD) (b) | 6.75% | 05/15/28 | 2,151,140 | ||||
| 1,900,000 | James Hardie International Finance DAC (USD) (a) (b) | 5.00% | 01/15/28 | 1,793,119 | ||||
| 475,000 | Nobian Finance BV (EUR) (h) | 3.63% | 07/15/26 | 452,759 | ||||
| 2,250,000 | SPCM S.A. (USD) (a) (b) | 3.38% | 03/15/30 | 1,864,015 | ||||
| 2,200,000 | Stora Enso OYJ (USD) (a) (b) | 7.25% | 04/15/36 | 2,349,665 | ||||
| 9,760,545 | ||||||||
| Capital Goods – 3.6% | ||||||||
| 464,000 | Ardagh Metal Packaging Finance USA LLC/Ardagh Metal Packaging Finance PLC (USD) (b) | 6.00% | 06/15/27 | 462,142 | ||||
| 1,815,000 | Ardagh Metal Packaging Finance USA LLC/Ardagh Metal Packaging Finance PLC (USD) (a) (b) | 3.25% | 09/01/28 | 1,591,322 | ||||
| 1,385,000 | Bombardier, Inc. (USD) (a) (b) | 7.13% | 06/15/26 | 1,382,101 | ||||
| 4,980,000 | Bombardier, Inc. (USD) (a) (b) | 7.88% | 04/15/27 | 4,971,089 | ||||
| 715,000 | Bombardier, Inc. (USD) (b) | 6.00% | 02/15/28 | 678,923 | ||||
| 188,000 | Bombardier, Inc. (USD) (b) | 7.50% | 02/01/29 | 185,111 | ||||
| 2,240,000 | Canpack S.A./Canpack US LLC (USD) (a) (b) | 3.13% | 11/01/25 | 1,989,882 | ||||
| 450,000 | Canpack S.A./Canpack US LLC (USD) (b) | 3.88% | 11/15/29 | 361,417 | ||||
| 1,880,000 | Cascades, Inc./Cascades USA, Inc. (USD) (a) (b) | 5.38% | 01/15/28 | 1,785,991 | ||||
| 875,000 | OI European Group BV (USD) (b) | 4.75% | 02/15/30 | 804,344 | ||||
| 1,380,000 | Titan Acquisition Ltd./Titan Co-Borrower LLC (USD) (b) | 7.75% | 04/15/26 | 1,230,015 | ||||
| 15,442,337 | ||||||||
| Consumer Goods – 0.7% | ||||||||
| 1,000,000 | JBS USA LUX S.A./JBS USA Food Co./JBS USA Finance, Inc. (USD) (a) (b) | 5.50% | 01/15/30 | 955,965 | ||||
| 2,500,000 | Minerva Luxembourg S.A. (USD) (a) (b) | 4.38% | 03/18/31 | 1,967,840 | ||||
| 2,923,805 | ||||||||
| Energy – 2.0% | ||||||||
| 1,775,000 | Baytex Energy Corp. (USD) (b) | 8.50% | 04/30/30 | 1,786,424 | ||||
| 2,065,000 | MEG Energy Corp. (USD) (a) (b) | 7.13% | 02/01/27 | 2,119,376 | ||||
| 2,250,000 | Petroleos Mexicanos (USD) (a) | 6.50% | 03/13/27 | 2,021,464 | ||||
| 650,000 | Transocean Titan Financing Ltd. (USD) (b) | 8.38% | 02/01/28 | 663,156 | ||||
| 662,000 | Transocean, Inc. (USD) (b) | 8.75% | 02/15/30 | 668,620 | ||||
| 1,257,000 | Valaris Ltd. (USD) (b) | 8.38% | 04/30/30 | 1,258,842 | ||||
| 8,517,882 | ||||||||
| Financial Services – 0.5% | ||||||||
| 1,895,000 | Credit Suisse AG/New York NY (USD) | 7.95% | 01/09/25 | 1,931,024 | ||||
| Leisure – 4.1% | ||||||||
| 725,000 | Carnival Corp. (USD) (b) | 5.75% | 03/01/27 | 597,472 | ||||
| 2,885,000 | Carnival Corp. (USD) (a) (b) | 6.00% | 05/01/29 | 2,267,030 | ||||
| 778,000 | International Game Technology PLC (USD) (b) | 5.25% | 01/15/29 | 746,907 | ||||
| 700,000 | Melco Resorts Finance Ltd. (USD) (b) | 5.75% | 07/21/28 | 610,750 | ||||
| 2,890,000 | NCL Corp Ltd. (USD) (a) (b) | 5.88% | 03/15/26 | 2,492,473 | ||||
| 2,220,000 | NCL Corp Ltd. (USD) (a) (b) | 5.88% | 02/15/27 | 2,096,207 | ||||
| 845,000 | NCL Corp Ltd. (USD) (b) | 8.38% | 02/01/28 | 850,929 | ||||
| Principal Value (Local Currency) | Description | Stated Coupon | Stated Maturity | Value (US Dollars) | ||||
| FOREIGN CORPORATE BONDS AND NOTES (Continued) | ||||||||
| Leisure (Continued) | ||||||||
| 765,000 | NCL Corp Ltd. (USD) (b) | 7.75% | 02/15/29 | $648,445 | ||||
| 1,300,000 | NCL Finance Ltd. (USD) (b) | 6.13% | 03/15/28 | 1,050,972 | ||||
| 1,875,000 | Royal Caribbean Cruises Ltd. (USD) (b) | 5.38% | 07/15/27 | 1,666,446 | ||||
| 437,000 | Royal Caribbean Cruises Ltd. (USD) (b) | 8.25% | 01/15/29 | 460,561 | ||||
| 1,708,000 | Royal Caribbean Cruises Ltd. (USD) (b) | 9.25% | 01/15/29 | 1,823,760 | ||||
| 291,000 | Royal Caribbean Cruises Ltd. (USD) (b) | 7.25% | 01/15/30 | 292,080 | ||||
| 859,000 | Viking Cruises Ltd. (USD) (b) | 5.88% | 09/15/27 | 737,954 | ||||
| 1,045,000 | VOC Escrow Ltd. (USD) (b) | 5.00% | 02/15/28 | 930,441 | ||||
| 17,272,427 | ||||||||
| Media – 0.4% | ||||||||
| 1,820,000 | UPC Holding, B.V. (USD) (a) (b) | 5.50% | 01/15/28 | 1,631,093 | ||||
| Retail – 1.0% | ||||||||
| 1,855,000 | 1011778 BC ULC/New Red Finance, Inc. (USD) (a) (b) | 5.75% | 04/15/25 | 1,861,088 | ||||
| 1,000,000 | 1011778 BC ULC/New Red Finance, Inc. (USD) (b) | 3.50% | 02/15/29 | 900,003 | ||||
| 1,425,000 | 1011778 BC ULC/New Red Finance, Inc. (USD) (b) | 4.00% | 10/15/30 | 1,245,281 | ||||
| 4,006,372 | ||||||||
| Services – 2.4% | ||||||||
| 2,330,000 | Garda World Security Corp. (USD) (a) (b) | 4.63% | 02/15/27 | 2,143,501 | ||||
| 3,410,000 | Garda World Security Corp. (USD) (a) (b) | 9.50% | 11/01/27 | 3,272,270 | ||||
| 750,000 | GFL Environmental, Inc. (USD) (b) | 3.75% | 08/01/25 | 725,965 | ||||
| 800,000 | GFL Environmental, Inc. (USD) (b) | 5.13% | 12/15/26 | 788,200 | ||||
| 2,765,000 | GFL Environmental, Inc. (USD) (a) (b) | 4.00% | 08/01/28 | 2,526,438 | ||||
| 655,000 | GFL Environmental, Inc. (USD) (a) (b) | 4.75% | 06/15/29 | 610,257 | ||||
| 10,066,631 | ||||||||
| Technology & Electronics – 1.0% | ||||||||
| 1,650,000 | Broadcom Corp./Broadcom Cayman Finance Ltd. (USD) | 3.50% | 01/15/28 | 1,550,229 | ||||
| 1,760,000 | Open Text Corp. (USD) (a) (b) | 3.88% | 12/01/29 | 1,481,355 | ||||
| 206,000 | Seagate HDD Cayman (USD) | 4.13% | 01/15/31 | 171,181 | ||||
| 291,200 | Seagate HDD Cayman (USD) (b) | 9.63% | 12/01/32 | 319,642 | ||||
| 725,000 | Sensata Technologies BV (USD) (b) | 4.00% | 04/15/29 | 656,034 | ||||
| 244,000 | Sensata Technologies BV (USD) (b) | 5.88% | 09/01/30 | 239,851 | ||||
| 4,418,292 | ||||||||
| Telecommunications – 2.8% | ||||||||
| 1,635,000 | Altice France S.A./France (USD) (a) (b) | 5.13% | 07/15/29 | 1,210,310 | ||||
| 1,350,000 | Iliad Holding SAS (USD) (a) (b) | 6.50% | 10/15/26 | 1,300,199 | ||||
| 1,340,000 | Telecom Italia Capital S.A. (USD) | 7.72% | 06/04/38 | 1,254,361 | ||||
| 1,300,000 | Total Play Telecomunicaciones SA de CV (USD) (a) (b) | 6.38% | 09/20/28 | 857,469 | ||||
| 4,000,000 | Virgin Media Finance PLC (EUR) (h) | 3.75% | 07/15/30 | 3,466,727 | ||||
| 1,000,000 | Vmed O2 UK Financing I PLC (GBP) (b) | 4.50% | 07/15/31 | 985,594 | ||||
| 870,000 | VZ Secured Financing BV (USD) (a) (b) | 5.00% | 01/15/32 | 726,988 | ||||
| 2,700,000 | Ziggo Bond Co. BV (USD) (a) (b) | 5.13% | 02/28/30 | 2,196,444 | ||||
| 11,998,092 | ||||||||
| Transportation – 1.5% | ||||||||
| 850,000 | Air Canada (USD) (a) (b) | 3.88% | 08/15/26 | 787,898 | ||||
| 2,595,000 | Air Canada 2020-1 Class C Pass Through Trust (USD) (b) | 10.50% | 07/15/26 | 2,770,615 | ||||
| 2,095,000 | American Airlines, Inc./AAdvantage Loyalty IP Ltd. (USD) (a) (b) | 5.50% | 04/20/26 | 2,059,686 | ||||
| Principal Value (Local Currency) | Description | Stated Coupon | Stated Maturity | Value (US Dollars) | ||||
| FOREIGN CORPORATE BONDS AND NOTES (Continued) | ||||||||
| Transportation (Continued) | ||||||||
| 575,000 | Stena International S.A. (EUR) (b) | 7.25% | 02/15/28 | $642,304 | ||||
| 6,260,503 | ||||||||
Total Foreign Corporate Bonds and Notes | 100,389,713 | |||||||
| (Cost $107,088,845) | ||||||||
| Par Amount (Local Currency) | Description | Stated Rate | Stated Maturity | Value (US Dollars) | ||||
| CAPITAL PREFERRED SECURITIES – 7.4% | ||||||||
| Automotive – 1.2% | ||||||||
| 5,935,000 | General Motors Financial Co., Inc., Series A (USD) (c) | 5.75% | (i) | 5,052,288 | ||||
| Banking – 3.2% | ||||||||
| 2,940,000 | Bank of America Corp., Series DD (USD) (c) | 6.30% | (i) | 2,975,432 | ||||
| 3,000,000 | Barclays Bank PLC, 3 Mo. EUR LIBOR + 0.71% (EUR) (h) (j) | 3.67% | (i) | 2,750,342 | ||||
| 4,475,000 | Citigroup, Inc., Series M (USD) (c) | 6.30% | (i) | 4,238,049 | ||||
| 3,935,000 | Citigroup, Inc., Series V (USD) (a) (c) | 4.70% | (i) | 3,459,236 | ||||
| 13,423,059 | ||||||||
| Financial Services – 1.2% | ||||||||
| 3,175,000 | American AgCredit Corp., Series QIB (USD) (a) (b) (c) | 5.25% | (i) | 2,774,156 | ||||
| 3,210,000 | Textron Financial Corp., 3 Mo. LIBOR + 1.74% (USD) (a) (b) (j) | 6.60% | 02/15/42 | 2,327,250 | ||||
| 5,101,406 | ||||||||
| Utility – 1.8% | ||||||||
| 1,695,000 | Edison International, Series B (USD) (a) (c) | 5.00% | (i) | 1,453,150 | ||||
| 6,595,000 | Vistra Corp. (USD) (a) (b) (c) | 8.00% | (i) | 6,226,537 | ||||
| 7,679,687 | ||||||||
Total Capital Preferred Securities | 31,256,440 | |||||||
| (Cost $34,765,341) | ||||||||
| Principal Value | Description | Rate (k) | Stated Maturity (l) | Value | ||||
| SENIOR FLOATING-RATE LOAN INTERESTS – 2.1% | ||||||||
| Capital Goods – 0.6% | ||||||||
| $2,700,000 | ADS Tactical, Inc., Initial Term Loan, 1 Mo. LIBOR + 5.75%, 1.00% Floor | 10.78% | 03/19/26 | 2,566,687 | ||||
| Insurance – 0.2% | ||||||||
| 967,725 | HUB International Ltd., Term Loan B3, 3 Mo. LIBOR + 3.25%, 0.75% Floor | 8.51% | 04/25/25 | 967,285 | ||||
| Retail – 0.3% | ||||||||
| 1,071,370 | Michaels Cos (The), Inc., Term Loan B, 3 Mo. LIBOR + 4.25%, 0.75% Floor | 9.41% | 04/15/28 | 984,937 | ||||
| Services – 0.9% | ||||||||
| 5,800,000 | TruGreen L.P., Initial Term Loan (Second Lien), 1 Mo. LIBOR + 8.50%, 0.75% Floor (m) | 13.33% | 11/02/28 | 3,915,000 | ||||
| Principal Value | Description | Rate (k) | Stated Maturity (l) | Value | ||||
| SENIOR FLOATING-RATE LOAN INTERESTS (Continued) | ||||||||
| Technology & Electronics – 0.1% | ||||||||
| $600,000 | Dcert Buyer, Inc., First Amendment Refinancing Loan (Second Lien), 1 Mo. LIBOR + 7.00%, 0.00% Floor | 11.70% | 02/16/29 | $557,061 | ||||
Total Senior Floating-Rate Loan Interests | 8,990,970 | |||||||
| (Cost $10,937,966) | ||||||||
| Principal Value | Description | Stated Coupon | Stated Maturity | Value | ||||
| MORTGAGE-BACKED SECURITIES – 0.5% | ||||||||
| Collateralized Mortgage Obligations – 0.0% | ||||||||
| Washington Mutual Alternative Mortgage Pass-Through Certificates | ||||||||
| 10,950 | Series 2007-5, Class A11, 1 Mo. LIBOR x -6 + 39.48% (n) | 9.36% | 06/25/37 | 12,831 | ||||
| Commercial Mortgage-Backed Securities – 0.5% | ||||||||
| Securitized Asset Backed Receivables LLC Trust | ||||||||
| 6,353,955 | Series 2006-FR4, Class A2A, 1 Mo. LIBOR + 0.16% (j) | 5.18% | 08/25/36 | 2,042,456 | ||||
Total Mortgage-Backed Securities | 2,055,287 | |||||||
| (Cost $5,025,289) | ||||||||
| Shares | Description | Value | ||
| COMMON STOCKS – 0.1% | ||||
| Energy – 0.0% | ||||
| 7 | Thunderbird Resources Equity, Inc. (f) (g) (m) (o) | 35,290 | ||
| Utility – 0.1% | ||||
| 13,918 | Vistra Corp. | 332,083 | ||
Total Common Stocks | 367,373 | |||
| (Cost $960,424) | ||||
| RIGHTS – 0.0% | ||||
| Utility – 0.0% | ||||
| 13,918 | Vistra Corp., no expiration date (m) (o) | 16,006 | ||
| (Cost $22,917) | ||||
Total Investments – 134.4% | 569,311,433 | |||||||
| (Cost $613,869,095) | ||||||||
| Principal Value | Description | Stated Coupon | Stated Maturity | Value | ||||
| U.S. GOVERNMENT BONDS SOLD SHORT – (12.5)% | ||||||||
| $(30,000,000) | United States Treasury Note | 1.38% | 09/30/23 | (29,559,388) | ||||
| (24,000,000) | United States Treasury Note | 2.88% | 05/31/25 | (23,456,250) | ||||
Total U.S. Government Bonds Sold Short | (53,015,638) | |||||||
| (Proceeds $52,553,860) | ||||||||
| CORPORATE BONDS SOLD SHORT – (1.0)% | ||||||||
| Energy – (0.3)% | ||||||||
| (1,600,000) | Halliburton Co. | 2.92% | 03/01/30 | (1,434,365) | ||||
| Principal Value | Description | Stated Coupon | Stated Maturity | Value | ||||
| CORPORATE BONDS SOLD SHORT (Continued) | ||||||||
| Technology & Electronics – (0.7)% | ||||||||
| $(2,930,000) | Amkor Technology, Inc. (b) | 6.63% | 09/15/27 | $(2,937,346) | ||||
Total Corporate Bonds Sold Short | (4,371,711) | |||||||
| (Proceeds $4,479,457) | ||||||||
Total Investments Sold Short – (13.5)% | (57,387,349) | |||||||
| (Proceeds $57,033,317) | ||||||||
Outstanding Loan – (33.9)% | (143,404,360) | ||
Net Other Assets and Liabilities – 13.0% | 55,063,887 | ||
Net Assets – 100.0% | $423,583,611 |
| Forward Foreign Currency Contracts | ||||||||||||||
| Settlement Date | Counterparty | Amount Purchased | Amount Sold | Purchase Value as of 4/30/2023 | Sale Value as of 4/30/2023 | Unrealized Appreciation/ (Depreciation) | ||||||||
| 05/09/23 | JPM | USD | 7,676,684 | EUR | 7,012,000 | $ 7,676,684 | $ 7,731,890 | $ (55,206) | ||||||
| 05/09/23 | JPM | USD | 1,057,955 | GBP | 852,000 | 1,057,955 | 1,071,033 | (13,078) | ||||||
Net Unrealized Appreciation / (Depreciation) | $(68,284) | |||||||||||||
| Counterparty Abbreviations | |
| JPM | JPMorgan Chase |
| (a) | This security or a portion of this security is segregated as collateral for investments sold short and borrowings in the margin account (see Note 2F - Short Sales in the Notes to Financial Statements). At April 30, 2023, the segregated value of these securities amounts to $341,830,678. |
| (b) | This security, sold within the terms of a private placement memorandum, is exempt from registration upon resale under Rule 144A of the Securities Act of 1933, as amended (the “1933 Act”), and may be resold in transactions exempt from registration, normally to qualified institutional buyers. Pursuant to procedures adopted by the Fund Board of Trustees, this security has been determined to be liquid by MacKay Shields LLC, the Fund’s sub-advisor (the “Sub-Advisor”). Although market instability can result in periods of increased overall market illiquidity, liquidity for each security is determined based on security specific factors and assumptions, which require subjective judgment. At April 30, 2023, securities noted as such amounted to $397,287,854 of total investments and $(2,937,346) of total investments sold short, or 93.8% and (0.7)% of net assets, respectively. |
| (c) | Fixed-to-floating or fixed-to-variable rate security. The interest rate shown reflects the fixed rate in effect at April 30, 2023. At a predetermined date, the fixed rate will change to a floating rate or a variable rate. |
| (d) | Multi-Step Coupon Bond - Coupon steps up or down based upon ratings changes. The interest rate shown reflects the rate in effect at April 30, 2023. |
| (e) | Multi-Step Coupon Bond - Coupon steps up or down at a predetermined date. The interest rate shown reflects the rate in effect at April 30, 2023. |
| (f) | This security is fair valued by the Advisor’s Pricing Committee in accordance with procedures approved by the Fund’s Board of Trustees, and in accordance with the provisions of the Investment Company Act of 1940 and rules thereunder, as amended. At April 30, 2023, securities noted as such are valued at $75,056 or 0.0% of net assets. |
| (g) | This security’s value was determined using significant unobservable inputs (see Note 2A – Portfolio Valuation in the Notes to Financial Statements). |
| (h) | This security may be resold to qualified foreign investors and foreign institutional buyers under Regulation S of the 1933 Act. |
| (i) | Perpetual maturity. |
| (j) | Floating or variable rate security. |
| (k) | Senior Floating-Rate Loan Interests (“Senior Loans”) in which the Fund invests pay interest at rates which are periodically predetermined by reference to a base lending rate plus a premium. These base lending rates are generally (i) the lending rate offered by one or more major European banks, such as the LIBOR, (ii) the SOFR obtained from the U.S. Department of the Treasury’s Office of Financial Research, (iii) the prime rate offered by one or more United States banks or (iv) the certificate of deposit rate. Certain Senior Loans are subject to a LIBOR or SOFR floor that establishes a minimum LIBOR or SOFR rate. |
| (l) | Senior Loans generally are subject to mandatory and/or optional prepayment. As a result, the actual remaining maturity of Senior Loans may be substantially less than the stated maturities shown. |
| (m) | Pursuant to procedures adopted by the Fund’s Board of Trustees, this security has been determined to be illiquid by the Sub-Advisor. |
| (n) | Inverse floating rate security. |
| (o) | Non-income producing security. |
| EUR | Euro |
| GBP | British Pound Sterling |
| LIBOR | London Interbank Offered Rate |
| SOFR | Secured Overnight Financing Rate |
| USD | United States Dollar |
| ASSETS TABLE | ||||
| Total Value at 4/30/2023 | Level 1 Quoted Prices | Level 2 Significant Observable Inputs | Level 3 Significant Unobservable Inputs | |
| Corporate Bonds and Notes: | ||||
Transportation | $ 7,295,665 | $ — | $ 7,255,899 | $ 39,766 |
Other Industry Categories* | 418,939,979 | — | 418,939,979 | — |
Foreign Corporate Bonds and Notes* | 100,389,713 | — | 100,389,713 | — |
Capital Preferred Securities* | 31,256,440 | — | 31,256,440 | — |
Senior Floating-Rate Loan Interests* | 8,990,970 | — | 8,990,970 | — |
Mortgage-Backed Securities | 2,055,287 | — | 2,055,287 | — |
| Common Stocks: | ||||
Energy | 35,290 | — | — | 35,290 |
Utility | 332,083 | 332,083 | — | — |
Rights* | 16,006 | — | 16,006 | — |
Total Investments | $ 569,311,433 | $ 332,083 | $ 568,904,294 | $ 75,056 |
| LIABILITIES TABLE | ||||
| Total Value at 4/30/2023 | Level 1 Quoted Prices | Level 2 Significant Observable Inputs | Level 3 Significant Unobservable Inputs | |
U.S. Government Bonds Sold Short | $ (53,015,638) | $ — | $ (53,015,638) | $ — |
Corporate Bonds Sold Short* | (4,371,711) | — | (4,371,711) | — |
Total Investments | (57,387,349) | — | (57,387,349) | — |
Forward Foreign Currency Contracts | (68,284) | — | (68,284) | — |
Total | $ (57,455,633) | $— | $ (57,455,633) | $— |
| * | See Portfolio of Investments for industry breakout. |
| ASSETS: | |
Investments, at value (Cost $613,869,095) | $ 569,311,433 |
Cash | 46,709,562 |
Foreign currency (Cost $403,884) | 415,389 |
Interest receivable | 9,054,553 |
Margin interest rebate | 76,554 |
Prepaid expenses | 32,458 |
Total Assets | 625,599,949 |
| LIABILITIES: | |
Borrowings | 143,404,360 |
Investments sold short, at value (proceeds $57,033,317) | 57,387,349 |
Unrealized depreciation on forward foreign currency contracts | 68,284 |
| Payables: | |
Interest expense on investments sold short | 356,577 |
Investment advisory fees | 346,750 |
Margin interest expense | 341,470 |
Audit and tax fees | 41,454 |
Administrative fees | 37,925 |
Shareholder reporting fees | 15,420 |
Trustees’ fees and expenses | 6,104 |
Legal fees | 4,948 |
Custodian fees | 1,558 |
Transfer agent fees | 1,300 |
Financial reporting fees | 732 |
Other liabilities | 2,107 |
Total Liabilities | 202,016,338 |
NET ASSETS | $423,583,611 |
| NET ASSETS consist of: | |
Paid-in capital | $ 605,108,207 |
Par value | 332,910 |
Accumulated distributable earnings (loss) | (181,857,506) |
NET ASSETS | $423,583,611 |
NET ASSET VALUE, per Common Share (par value $0.01 per Common Share) | $12.72 |
Number of Common Shares outstanding (unlimited number of Common Shares has been authorized) |
| INVESTMENT INCOME: | ||
Interest | $ 17,707,329 | |
Margin interest rebate | 1,121,096 | |
Dividends | 6,359 | |
Other | 4,245 | |
Total investment income | 18,839,029 | |
| EXPENSES: | ||
Margin interest expense | 5,135,724 | |
Investment advisory fees | 2,098,849 | |
Interest expense on investments sold short | 667,606 | |
Administrative fees | 122,784 | |
Shareholder reporting fees | 77,136 | |
Audit and tax fees | 33,923 | |
Legal fees | 33,144 | |
Listing expense | 20,352 | |
Transfer agent fees | 9,254 | |
Trustees’ fees and expenses | 9,189 | |
Financial reporting fees | 4,587 | |
Custodian fees | 2,085 | |
Other | 14,531 | |
Total expenses | 8,229,164 | |
NET INVESTMENT INCOME (LOSS) | 10,609,865 | |
| NET REALIZED AND UNREALIZED GAIN (LOSS): | ||
| Net realized gain (loss) on: | ||
Investments | (8,969,739) | |
Forward foreign currency contracts | (378,418) | |
Foreign currency transactions | 10,520 | |
Investments sold short | — | |
Net realized gain (loss) | (9,337,637) | |
| Net change in unrealized appreciation (depreciation) on: | ||
Investments | 23,832,893 | |
Forward foreign currency contracts | (140,959) | |
Foreign currency translation | 16,932 | |
Investments sold short | (937,179) | |
Net change in unrealized appreciation (depreciation) | 22,771,687 | |
NET REALIZED AND UNREALIZED GAIN (LOSS) | 13,434,050 | |
NET INCREASE (DECREASE) IN NET ASSETS RESULTING FROM OPERATIONS | $ 24,043,915 | |
| Six Months Ended 4/30/2023 (Unaudited) | Year Ended 10/31/2022 | ||
| OPERATIONS: | |||
Net investment income (loss) | $ 10,609,865 | $ 25,447,874 | |
Net realized gain (loss) | (9,337,637) | (16,108,257) | |
Net change in unrealized appreciation (depreciation) | 22,771,687 | (87,694,884) | |
Net increase (decrease) in net assets resulting from operations | 24,043,915 | (78,355,267) | |
| DISTRIBUTIONS TO SHAREHOLDERS FROM: | |||
Investment operations | (21,000,244) | (26,519,418) | |
Return of capital | — | (15,651,193) | |
Total distributions to shareholders | (21,000,244) | (42,170,611) | |
| CAPITAL TRANSACTIONS: | |||
Repurchase of Common Shares * | (1,433,499) | (549,030) | |
Net increase (decrease) in net assets resulting from capital transactions | (1,433,499) | (549,030) | |
Total increase (decrease) in net assets | 1,610,172 | (121,074,908) | |
| NET ASSETS: | |||
Beginning of period | 421,973,439 | 543,048,347 | |
End of period | $ 423,583,611 | $ 421,973,439 | |
| CAPITAL TRANSACTIONS were as follows: | |||
Common Shares at beginning of period | 33,419,132 | 33,470,143 | |
Common Shares repurchased * | (128,117) | (51,011) | |
Common Shares at end of period | 33,291,015 | 33,419,132 |
| * | On September 15, 2015, the Fund commenced a share repurchase program. For the six months ended April 30, 2023, the Fund repurchased 128,117 of its shares at a weighted-average discount of 12.32% from net asset value per share. For the year ended October 31, 2022, the Fund repurchased 51,011 of its shares at a weighted-average discount of 12.68% from net asset value per share. The Fund’s share repurchase program ended on March 15, 2023. |
| Cash flows from operating activities: | ||
Net increase (decrease) in net assets resulting from operations | $24,043,915 | |
| Adjustments to reconcile net increase (decrease) in net assets resulting from operations to net cash used in operating activities: | ||
Purchases of investments | (92,105,633) | |
Sales, maturities and paydown of investments | 64,721,192 | |
Net amortization/accretion of premiums/discounts on investments | (165,845) | |
Net realized gain/loss on investments | 8,969,739 | |
Net change in unrealized appreciation/depreciation on investments | (23,832,893) | |
Net change in unrealized appreciation/depreciation on forward foreign currency contracts | 140,959 | |
Net change in unrealized appreciation/depreciation on investments sold short | 937,179 | |
| Changes in assets and liabilities: | ||
Increase in interest receivable | (484,402) | |
Increase in margin interest rebate receivable | (27,183) | |
Decrease in due from broker | 104,785 | |
Increase in prepaid expenses | (17,734) | |
Decrease in interest payable on investments sold short | (4,061) | |
Decrease in investment advisory fees payable | (5,669) | |
Decrease in audit and tax fees payable | (35,202) | |
Increase in legal fees payable | 4,579 | |
Decrease in shareholder reporting fees payable | (17,386) | |
Increase in administrative fees payable | 3,569 | |
Increase in custodian fees payable | 172 | |
Decrease in transfer agent fees payable | (1,812) | |
Increase in trustees’ fees and expenses payable | 4,552 | |
Decrease in financial reporting fees payable | (39) | |
Increase in margin interest expense payable | 87,868 | |
Increase in other liabilities payable | 1,547 | |
Cash used in operating activities | $(17,677,803) | |
| Cash flows from financing activities: | ||
Repurchase of Common Shares | (1,433,499) | |
Distributions to Common Shareholders from investment operations | (21,000,244) | |
Net proceeds from borrowing | 671,667 | |
Cash used in financing activities | (21,762,076) | |
Decrease in cash and foreign currency (a) | (39,439,879) | |
Cash and foreign currency at beginning of period | 86,564,830 | |
Cash and foreign currency at end of period | $47,124,951 | |
| Supplemental disclosure of cash flow information: | ||
Cash paid during the period for interest and fees | $5,719,523 |
| (a) | Includes net change in unrealized appreciation (depreciation) on foreign currency of $16,932. |
| Six Months Ended 4/30/2023 (Unaudited) | Year Ended October 31, | |||||||||||
| 2022 | 2021 | 2020 | 2019 | 2018 | ||||||||
Net asset value, beginning of period | $ 12.63 | $ 16.22 | $ 15.66 | $ 16.94 | $ 16.57 | $ 18.23 | ||||||
| Income from investment operations: | ||||||||||||
Net investment income (loss) | 0.32 | 0.76 | 0.94 | 0.92 | 0.93 | 0.96 | ||||||
Net realized and unrealized gain (loss) | 0.39 | (3.09) | 0.93 | (0.92) | 0.68 | (1.32) | ||||||
Total from investment operations | 0.71 | (2.33) | 1.87 | — | 1.61 | (0.36) | ||||||
| Distributions paid to shareholders from: | ||||||||||||
Net investment income | (0.63) | (0.79) | (0.95) | (0.92) | (0.92) | (0.98) | ||||||
Return of capital | — | (0.47) | (0.37) | (0.40) | (0.36) | (0.37) | ||||||
Total distributions paid to Common Shareholders | (0.63) | (1.26) | (1.32) | (1.32) | (1.28) | (1.35) | ||||||
Common Share repurchases | 0.01 | 0.00 (a) | 0.01 | 0.04 | 0.04 | 0.05 | ||||||
Net asset value, end of period | $ | $12.63 | $16.22 | $15.66 | $16.94 | $16.57 | ||||||
Market value, end of period | $ | $11.06 | $16.05 | $13.49 | $15.49 | $13.91 | ||||||
Total return based on net asset value (b) | 6.38% | (14.11)% | 12.88% | 1.53% | 11.58% | (0.82)% | ||||||
Total return based on market value (b) | 8.87% | (23.99)% | 29.67% | (4.35)% | 21.54% | (10.24)% | ||||||
| Ratios to average net assets/supplemental data: | ||||||||||||
Net assets, end of period (in 000’s) | $ 423,584 | $ 421,973 | $ 543,048 | $ 526,815 | $ 582,502 | $ 578,360 | ||||||
Ratio of total expenses to average net assets | 3.92% (c) | 2.22% | 1.84% | 2.13% | 2.53% | 2.20% | ||||||
Ratio of total expenses to average net assets excluding interest expense | 1.16% (c) | 1.13% | 1.19% | 1.22% | 1.16% | 1.13% | ||||||
Ratio of net investment income (loss) to average net assets | 5.06% (c) | 5.34% | 5.74% | 5.80% | 5.55% | 5.48% | ||||||
Portfolio turnover rate | 9% | 32% | 43% | 63% | 33% | 29% | ||||||
| (a) | Amount is less than $0.01. |
| (b) | Total return is based on the combination of reinvested dividend, capital gain and return of capital distributions, if any, at prices obtained by the Dividend Reinvestment Plan, and changes in net asset value per share for net asset value returns and changes in Common Share Price for market value returns. Total returns do not reflect sales load and are not annualized for periods of less than one year. Past performance is not indicative of future results. |
| (c) | Annualized. |
| 1) | benchmark yields; |
| (1) | The terms “security” and “securities” used throughout the Notes to Financial Statements include Senior Loans. |
| 2) | reported trades; |
| 3) | broker/dealer quotes; |
| 4) | issuer spreads; |
| 5) | benchmark securities; |
| 6) | bids and offers; and |
| 7) | reference data including market research publications. |
| 1) | the credit conditions in the relevant market and changes thereto; |
| 2) | the liquidity conditions in the relevant market and changes thereto; |
| 3) | the interest rate conditions in the relevant market and changes thereto (such as significant changes in interest rates); |
| 4) | issuer-specific conditions (such as significant credit deterioration); and |
| 5) | any other market-based data the Advisor’s Pricing Committee considers relevant. In this regard, the Advisor’s Pricing Committee may use last-obtained market-based data to assist it when valuing portfolio securities using amortized cost. |
| 1) | the most recent price provided by a pricing service; |
| 2) | the fundamental business data relating to the borrower/issuer; |
| 3) | an evaluation of the forces which influence the market in which these securities are purchased and sold; |
| 4) | the type, size and cost of the security; |
| 5) | the financial statements of the borrower/issuer, or the financial condition of the country of issue; |
| 6) | the credit quality and cash flow of the borrower/issuer, or country of issue, based on the Pricing Committee’s, sub-advisor’s or portfolio manager’s analysis, as applicable, or external analysis; |
| 7) | the information as to any transactions in or offers for the security; |
| 8) | the price and extent of public trading in similar securities (or equity securities) of the borrower/issuer, or comparable companies; |
| 9) | the coupon payments; |
| 10) | the quality, value and salability of collateral, if any, securing the security; |
| 11) | the business prospects of the borrower/issuer, including any ability to obtain money or resources from a parent or affiliate and an assessment of the borrower’s/issuer’s management; |
| 12) | the prospects for the borrower’s/issuer’s industry, and multiples (of earnings and/or cash flows) being paid for similar businesses in that industry; |
| 13) | the borrower’s/issuer’s competitive position within the industry; |
| 14) | the borrower’s/issuer’s ability to access additional liquidity through public and/or private markets; and |
| 15) | other relevant factors. |
| • | Level 1 – Level 1 inputs are quoted prices in active markets for identical investments. An active market is a market in which transactions for the investment occur with sufficient frequency and volume to provide pricing information on an ongoing basis. |
| • | Level 2 – Level 2 inputs are observable inputs, either directly or indirectly, and include the following: |
| o | Quoted prices for similar investments in active markets. |
| o | Quoted prices for identical or similar investments in markets that are non-active. A non-active market is a market where there are few transactions for the investment, the prices are not current, or price quotations vary substantially either over time or among market makers, or in which little information is released publicly. |
| o | Inputs other than quoted prices that are observable for the investment (for example, interest rates and yield curves observable at commonly quoted intervals, volatilities, prepayment speeds, loss severities, credit risks, and default rates). |
| o | Inputs that are derived principally from or corroborated by observable market data by correlation or other means. |
| • | Level 3 – Level 3 inputs are unobservable inputs. Unobservable inputs may reflect the reporting entity’s own assumptions about the assumptions that market participants would use in pricing the investment. |
| Distributions paid from: | |
Ordinary income | $26,519,418 |
Capital gains | — |
Return of capital | 15,651,193 |
Undistributed ordinary income | $— |
Undistributed capital gains | — |
Total undistributed earnings | — |
Accumulated capital and other losses | (105,185,660) |
Net unrealized appreciation (depreciation) | (68,183,419) |
Total accumulated earnings (losses) | (173,369,079) |
Other | (11,532,098) |
Paid-in capital | 606,874,616 |
Total net assets | $421,973,439 |
| Tax Cost | Gross Unrealized Appreciation | Gross Unrealized (Depreciation) | Net Unrealized Appreciation (Depreciation) | |||
| $556,835,778 | $4,958,488 | $(49,938,466) | $(44,979,978) |
| Asset Derivatives | Liability Derivatives | |||||||||
| Derivative Instrument | Risk Exposure | Statement of Assets and Liabilities Location | Value | Statement of Assets and Liabilities Location | Value | |||||
| Forward foreign currency contracts | Currency Risk | Unrealized appreciation on forward foreign currency contracts | $ — | Unrealized depreciation on forward foreign currency contracts | $ 68,284 | |||||
| Statement of Operations Location | |
| Currency Risk Exposure | |
| Net realized gain (loss) on forward foreign currency contracts | $(378,418) |
| Net change in unrealized appreciation (depreciation) on forward foreign currency contracts | (140,959) |
| (1) | If Common Shares are trading at or above net asset value (“NAV”) at the time of valuation, the Fund will issue new shares at a price equal to the greater of (i) NAV per Common Share on that date or (ii) 95% of the market price on that date. |
| (2) | If Common Shares are trading below NAV at the time of valuation, the Plan Agent will receive the dividend or distribution in cash and will purchase Common Shares in the open market, on the NYSE or elsewhere, for the participants’ accounts. It is possible that the market price for the Common Shares may increase before the Plan Agent has completed its purchases. Therefore, the average purchase price per share paid by the Plan Agent may exceed the market price at the time of valuation, resulting in the purchase of fewer shares than if the dividend or distribution had been paid in Common Shares issued by the Fund. The Plan Agent will use all dividends and distributions received in cash to purchase Common Shares in the open market within 30 days of the valuation date except where temporary curtailment or suspension of purchases is necessary to comply with federal securities laws. Interest will not be paid on any uninvested cash payments. |
| • | Issuer Risk. The value of fixed-income securities may decline for a number of reasons which directly relate to the issuer, such as management performance, leverage and reduced demand for the issuer’s goods and services. In addition, an issuer of fixed-income securities may default on its obligation to pay interest and repay principal. |
| • | Prepayment Risk. Prepayment risk is the risk that the issuer of a debt security will repay principal prior to the scheduled maturity date. During periods of declining interest rates, the issuer of a security may exercise its option to prepay principal earlier than scheduled, forcing the Fund to reinvest the proceeds from such prepayment in lower yielding securities, which may result in a decline in the Fund’s income and distributions to common shareholders. |
| • | Reinvestment Risk. Reinvestment risk is the risk that income from the Fund’s portfolio will decline if the Fund invests the proceeds from matured, traded or called bonds at market interest rates that are below the Fund portfolio’s current earnings rate. |
FUND ACCOUNTANT,
AND CUSTODIAN
PUBLIC ACCOUNTING FIRM
| (b) | Not applicable. |
Item 2. Code of Ethics.
Not applicable.
Item 3. Audit Committee Financial Expert.
Not applicable.
Item 4. Principal Accountant Fees and Services.
Not applicable.
Item 5. Audit Committee of Listed Registrants.
Not applicable.
Item 6. Investments.
| (a) | Schedule of Investments in securities of unaffiliated issuers as of the close of the reporting period is included as part of the report to shareholders filed under Item 1 of this form. |
| (b) | Not applicable. |
Item 7. Disclosure of Proxy Voting Policies and Procedures for Closed-End Management Investment Companies.
Not applicable.
Item 8. Portfolio Managers of Closed-End Management Investment Companies.
| (a) | Not applicable. |
| (b) | Not applicable. |
Item 9. Purchases of Equity Securities by Closed-End Management Investment Company and Affiliated Purchasers.
| Period | (a) Total Number of Shares (or Units) Purchased | (b) Average Price Paid per Share (or Unit) | (c) Total Number of Shares (or Units) Purchased as Part of Publicly Announced Plans or Programs | (d) Maximum Number (or Approximate Dollar Value) of Shares (or Units) that May Yet Be Purchased Under the Plans or Programs |
Month #1 (11/01/2022-11/30/2022) | 0 | - | 2,989,956 | 1,673,507 |
| Month #2 (12/01/2022-12/31/2022) | 128,117 | 11.19 | 3,118,073 | 1,545,390 |
| Month #3 (1/01/2023-1/31/2023) | 0 | - | 3,118,073 | 1,545,390 |
Month #4 (2/01/2023-2/28/2023) | 0 | - | 3,118,073 | 1,545,390 |
Month #5 (3/01/2023-3/31/2023) | 0 | - | 3,118,073 | 0 |
| Month #6 (4/01/2023-4/30/2023) | 0 | - | 3,118,073 | 0 |
| Total | 128,117 | 11.19 | 3,118,073 | 0 |
On September 15, 2015, the Fund commenced a share repurchase program. For the six months ended April 30, 2023, the Fund repurchased 128,117 of its shares at a weighted-average discount of 12.32% from net asset value per share. For the year ended October 31, 2022, the Fund repurchased 51,011 of its shares at a weighted-average discount of 12.68% from net asset value per share. The Fund’s share repurchase program ended on March 15, 2023.
Item 10. Submission of Matters to a Vote of Security Holders.
There have been no material changes to the procedures by which the shareholders may recommend nominees to the registrant’s board of directors, where those changes were implemented after the registrant last provided disclosure in response to the requirements of Item 407(c)(2)(iv) of Regulation S-K (17 CFR 229.407) (as required by Item 22(b)(15) of Schedule 14A (17 CFR 240.14a-101)), or this Item.
Item 11. Controls and Procedures.
| (a) | The registrant’s principal executive and principal financial officers, or persons performing similar functions, have concluded that the registrant’s disclosure controls and procedures (as defined in Rule 30a-3(c) under the Investment Company Act of 1940, as amended (the “1940 Act”) (17 CFR 270.30a-3(c))) are effective, as of a date within 90 days of the filing date of the report that includes the disclosure required by this paragraph, based on their evaluation of these controls and procedures required by Rule 30a-3(b) under the 1940 Act (17 CFR 270.30a-3(b)) and Rules 13a-15(b) or 15d-15(b) under the Securities Exchange Act of 1934, as amended (17 CFR 240.13a-15(b) or 240.15d-15(b)). |
| (b) | There were no changes in the registrant’s internal control over financial reporting (as defined in Rule 30a-3(d) under the 1940 Act (17 CFR 270.30a-3(d)) that occurred during the period covered by this report that has materially affected, or is reasonably likely to materially affect, the registrant’s internal control over financial reporting. |
Item 12. Exhibits.
| (a) | Not applicable. |
| (b) | Not applicable |
Item 13. Exhibits.
| (a)(1) | Not applicable. |
| (a)(2) | Certifications pursuant to Rule 30a-2(a) under the 1940 Act and Section 302 of the Sarbanes-Oxley Act of 2002 are attached hereto. |
| (a)(3) | Not applicable. |
| (a)(4) | Not applicable. |
| (b) | Certifications pursuant to Rule 30a-2(b) under the 1940 Act and Section 906 of the Sarbanes-Oxley Act of 2002 are attached hereto. |
SIGNATURES
Pursuant to the requirements of the Securities Exchange Act of 1934 and the Investment Company Act of 1940, the registrant has duly caused this report to be signed on its behalf by the undersigned, thereunto duly authorized.
| (registrant) | First Trust High Income Long/Short Fund |
| By (Signature and Title)* | /s/ James M. Dykas | |
| James M. Dykas, President and Chief Executive Officer (principal executive officer) |
| Date: | July 7, 2023 |
Pursuant to the requirements of the Securities Exchange Act of 1934 and the Investment Company Act of 1940, this report has been signed below by the following persons on behalf of the registrant and in the capacities and on the dates indicated.
| By (Signature and Title)* | /s/ James M. Dykas | |
| James M. Dykas, President and Chief Executive Officer (principal executive officer) |
| Date: | July 7, 2023 |
| By (Signature and Title)* | /s/ Donald P. Swade | |
| Donald P. Swade, Treasurer, Chief Financial Officer and Chief Accounting Officer (principal financial officer) |
| Date: | July 7, 2023 |
* Print the name and title of each signing officer under his or her signature.