CORPORATE CAPITAL TRUST, INC. 8-K
Exhibit 99.2
Quarter Ended September 30, 2017 Corporate Capital Trust, Inc. Quarterly Earnings Presentation

Overview & Listing Update
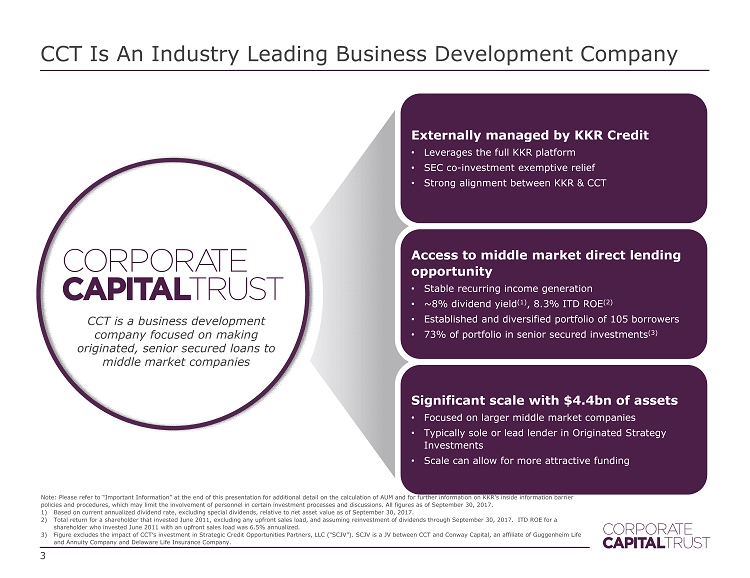
CCT Is An Industry Leading Business Development Company 3 Externally managed by KKR Credit • Leverages the full KKR platform • SEC co - investment exemptive relief • Strong alignment between KKR & CCT Significant scale with $4.4bn of assets • Focused on larger middle market companies • Typically sole or lead lender in Originated Strategy Investments • Scale can allow for more attractive funding Access to middle market direct lending opportunity • Stable recurring income generation • ~8% dividend yield (1) , 8.3% ITD ROE (2) • Established and diversified portfolio of 105 borrowers • 73% of portfolio in senior secured investments (3) CCT is a business development company focused on making originated, senior secured loans to middle market companies Note: Please refer to “Important Information” at the end of this presentation for additional detail on the calculation of AUM and for further information on KKR’s inside information bar rie r policies and procedures, which may limit the involvement of personnel in certain investment processes and discussions . All figures as of September 30, 2017. 1) Based on current annualized dividend rate, excluding special dividends, relative to net asset value as of September 30, 2017. 2) Total return for a shareholder that invested June 2011, excluding any upfront sales load, and assuming reinvestment of divide nds through September 30, 2017 . ITD ROE for a shareholder who invested June 2011 with an upfront sales load was 6.5% annualized. 3) Figure excludes the impact of CCT’s investment in Strategic Credit Opportunities Partners, LLC (“SCJV”). SCJV is a JV between CCT and Conway Capital, an affiliate of Guggenheim Life and Annuity Company and Delaware Life Insurance Company.
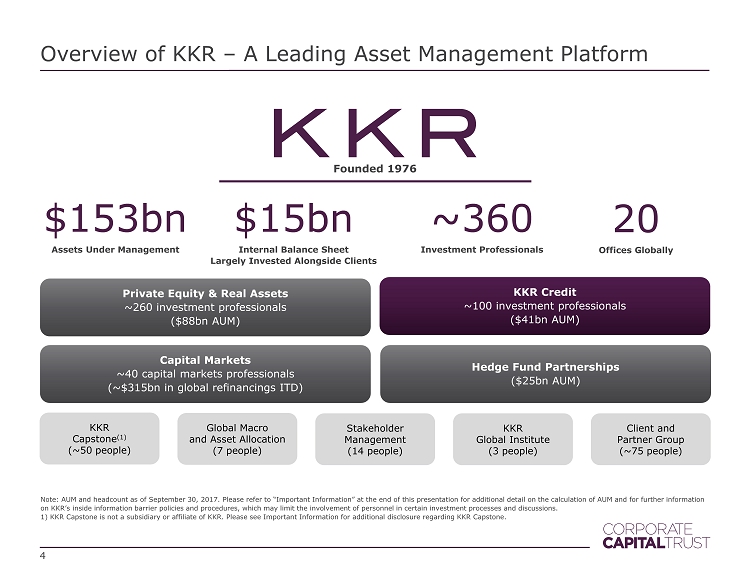
Overview of KKR – A Leading Asset Management Platform Note: AUM and headcount as of September 30 , 2017. Please refer to “Important Information” at the end of this presentation for additional detail on the calculation of AUM and for further information on KKR’s inside information barrier policies and procedures, which may limit the involvement of personnel in certain investme nt processes and discussions. 1) KKR Capstone is not a subsidiary or affiliate of KKR. Please see Important Information for additional disclosure regarding KKR Ca pst one. Founded 1976 4 $ 153bn Assets Under Management Stakeholder Management ( 14 people) Client and Partner Group (~75 people) Global Macro and Asset Allocation (7 people) KKR Global Institute (3 people) KKR Capstone (1) (~50 people) $15bn Internal Balance Sheet Largely Invested Alongside Clients ~ 360 Investment Professionals 20 Offices Globally Private Equity & Real Assets ~ 260 investment professionals ($ 88bn AUM) KKR Credit ~100 investment professionals ($ 41 bn AUM) Capital Markets ~40 capital markets professionals (~$315bn in global refinancings ITD) Hedge Fund Partnerships ($ 25bn AUM)
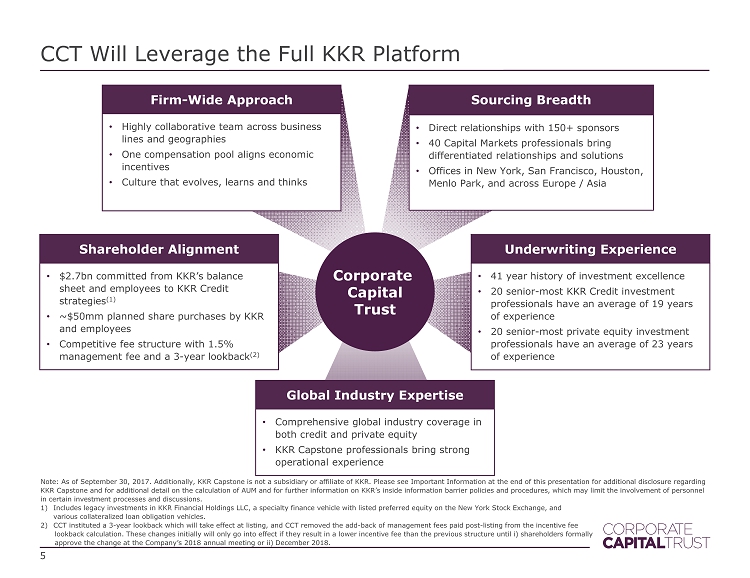
CCT Will Leverage the Full KKR Platform 5 Note: As of September 30 , 2017. Additionally, KKR Capstone is not a subsidiary or affiliate of KKR. Please see Important Information at the end of this presentation for additional disclosure regarding KKR Capstone and for additional detail on the calculation of AUM and for further information on KKR’s inside information barrier policies and pro cedures, which may limit the involvement of personnel in certain investment processes and discussions. 1) Includes legacy investments in KKR Financial Holdings LLC, a specialty finance vehicle with listed preferred equity on the New York St ock Exchange, and various collateralized loan obligation vehicles. 2) CCT instituted a 3 - year lookback which will take effect at listing, and CCT removed the add - back of management fees paid post - listin g from the incentive fee lookback calculation. These changes initially will only go into effect if they result in a lower incentive fee than the previous struc tur e until i) shareholders formally approve the change at the Company’s 2018 annual meeting or ii) December 2018. Global Industry Expertise • Comprehensive global industry coverage in both credit and private equity • KKR Capstone professionals bring strong operational experience Underwriting Experience • 41 year history of investment excellence • 20 senior - most KKR Credit investment professionals have an average of 19 years of experience • 20 senior - most private equity investment professionals have an average of 23 years of experience Sourcing Breadth • Direct relationships with 150+ sponsors • 40 Capital Markets professionals bring differentiated relationships and solutions • Offices in New York, San Francisco, Houston, Menlo Park, and across Europe / Asia Shareholder Alignment • $2.7bn committed from KKR’s balance sheet and employees to KKR Credit strategies (1) • ~$50mm planned share purchases by KKR and employees • Competitive fee structure with 1.5% management fee and a 3 - year lookback (2) Firm - Wide Approach • Highly collaborative team across business lines and geographies • One compensation pool aligns economic incentives • Culture that evolves, learns and thinks Corporate Capital Trust
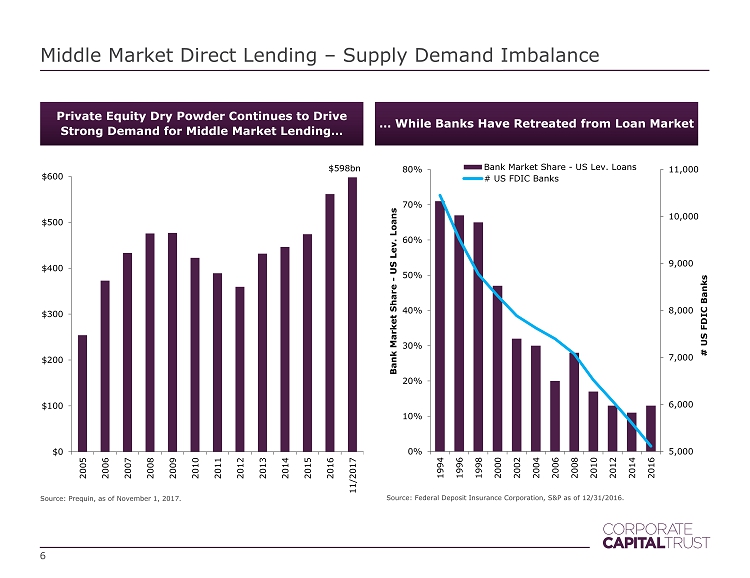
Middle Market Direct Lending – Supply Demand Imbalance Private Equity Dry Powder Continues to Drive Strong Demand for Middle Market Lending… 5,000 6,000 7,000 8,000 9,000 10,000 11,000 0% 10% 20% 30% 40% 50% 60% 70% 80% 1994 1996 1998 2000 2002 2004 2006 2008 2010 2012 2014 2016 # US FDIC Banks Bank Market Share - US Lev. Loans Bank Market Share - US Lev. Loans # US FDIC Banks Source: Federal Deposit Insurance Corporation, S&P as of 12/31/2016 . Source: Prequin , as of November 1 , 2017. $ 598bn $0 $100 $200 $300 $400 $500 $600 2005 2006 2007 2008 2009 2010 2011 2012 2013 2014 2015 2016 11/2017 6 … While Banks Have Retreated from Loan Market
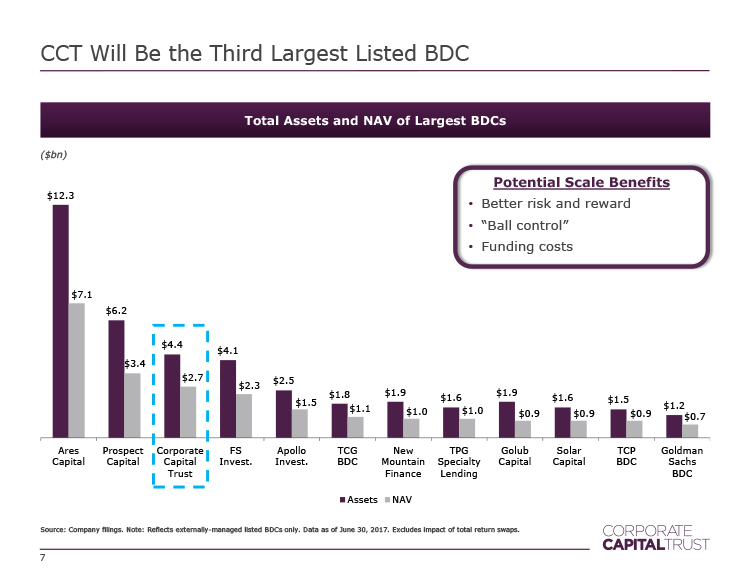
Total Assets and NAV of Largest BDCs ($ bn ) $12.3 $6.2 $4.4 $4.1 $2.5 $1.8 $1.9 $1.6 $1.9 $1.6 $1.5 $1.2 $7.1 $3.4 $2.7 $2.3 $1.5 $1.1 $1.0 $1.0 $0.9 $0.9 $0.9 $0.7 Ares Capital Prospect Capital Corporate Capital Trust FS Invest. Apollo Invest. TCG BDC New Mountain Finance TPG Specialty Lending Golub Capital Solar Capital TCP BDC Goldman Sachs BDC Assets NAV CCT Will Be the Third Largest Listed BDC Source: Company filings. Note: Reflects externally - managed listed BDCs only. Data as of June 30, 2017. Excludes impact of total return swaps. 7 Potential Scale Benefits • “Ball control” • Funding Costs • Better risk and reward
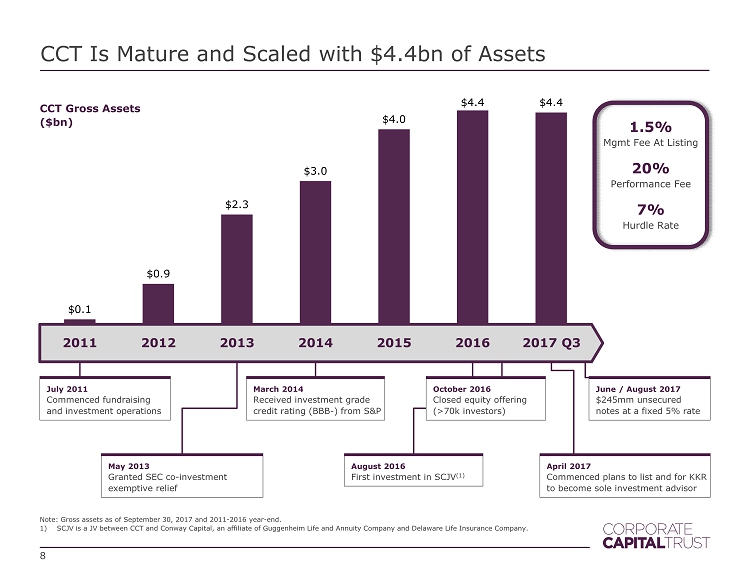
$0.1 $0.9 $2.3 $3.0 $4.0 $4.4 $4.4 CCT Is Mature and Scaled with $4.4bn of Assets Note: Gross assets as of September 30 , 2017 and 2011 - 2016 year - end . 1) SCJV is a JV between CCT and Conway Capital, an affiliate of Guggenheim Life and Annuity Company and Delaware Life Insurance Company. 2011 2012 2013 2014 2015 2016 2017 Q3 CCT Gross Assets ($ bn ) 8 May 2013 Granted SEC co - investment exemptive relief August 2016 First investment in SCJV (1) April 2017 Commenced plans to list and for KKR to become sole investment advisor March 2014 Received investment grade credit rating (BBB - ) from S&P 1.5% Mgmt Fee At Listing 20% Performance Fee 7% Hurdle Rate October 2016 Closed equity offering (>70k investors) July 2011 Commenced fundraising and investment operations June / August 2017 $245mm unsecured notes at a fixed 5% rate
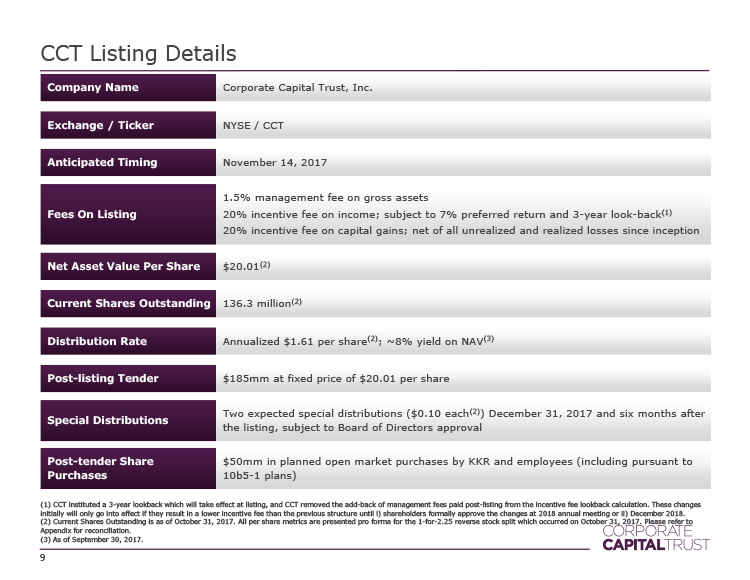
CCT Listing Details Company Name Corporate Capital Trust, Inc. Exchange / Ticker NYSE / CCT Anticipated Timing November 14, 2017 9 Fees On Listing 1.5% management fee on gross assets 20% incentive fee on income; subject to 7% preferred return and 3 - year look - back (1) 20% incentive fee on capital gains; net of all unrealized and realized losses since inception Net Asset Value Per Share $20.01 (2) Current Shares Outstanding 136.3 million (2) Distribution Rate Annualized $1.61 per share (2) ; ~8% yield on NAV (3) Post - listing Tender $ 185mm at fixed price of $20.01 per share Special Distributions Two expected special distributions ($0.10 each (2) ) December 31, 2017 and six months after the listing, subject to Board of Directors approval Post - tender Share Purchases Up to $50mm in planned open market purchases by KKR and employees (pursuant to 10b5 - 1 plans) (1 ) CCT instituted a 3 - year lookback which will take effect at listing, and CCT removed the add - back of management fees paid post - listing from the incentive fee lookback calculation. These changes initially will only go into effect if they result in a lower incentive fee than the previous structure until i) shareholders formally approve the changes or ii) December 2018. (2) Current Shares Outstanding is as of October 31, 2017. All per share metrics are presented pro forma for the 1 - for - 2.25 rever se stock split which occurred on October 31, 2017. Please refer to Appendix for reconciliation. (3) As of September 30, 2017.
Third Quarter Results and Highlights
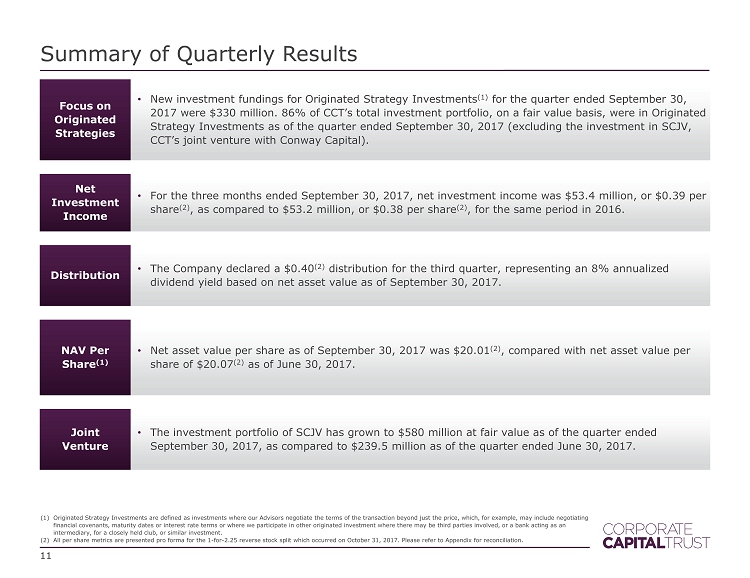
Summary of Quarterly Results 11 Focus on Originated Strategies • New investment fundings for Originated Strategy Investments (1) for the quarter ended September 30, 2017 were $330 million. 86% of CCT’s total investment portfolio, on a fair value basis, were in Originated Strategy Investments as of the quarter ended September 30, 2017 (excluding the investment in SCJV, CCT’s joint venture with Conway Capital). Net Investment Income • For the three months ended September 30, 2017, net investment income was $53.4 million, or $0.39 per share (2) , as compared to $53.2 million, or $0.38 per share (2) , for the same period in 2016. Distribution • The Company declared a $0.40 (2) distribution for the third quarter, representing an 8% annualized dividend yield based on net asset value as of September 30, 2017. NAV Per Share (1) • Net asset value per share as of September 30, 2017 was $20.01 (2) , compared with net asset value per share of $20.07 (2) as of June 30, 2017. Joint Venture • The investment portfolio of SCJV has grown to $580 million at fair value as of the quarter ended September 30, 2017, as compared to $239.5 million as of the quarter ended June 30, 2017. (1) Originated Strategy Investments are defined as investments where our Advisors negotiate the terms of the transaction beyond just the price, which, for example, may include negotiating financial covenants, maturity dates or interest rate terms or where we participate in other originated investment where there ma y be third parties involved, or a bank acting as an intermediary, for a closely held club, or similar investment. (2) All per share metrics are presented pro forma for the 1 - for - 2.25 reverse stock split which occurred on October 31, 2017. Please refer to Appendix for reconciliation.
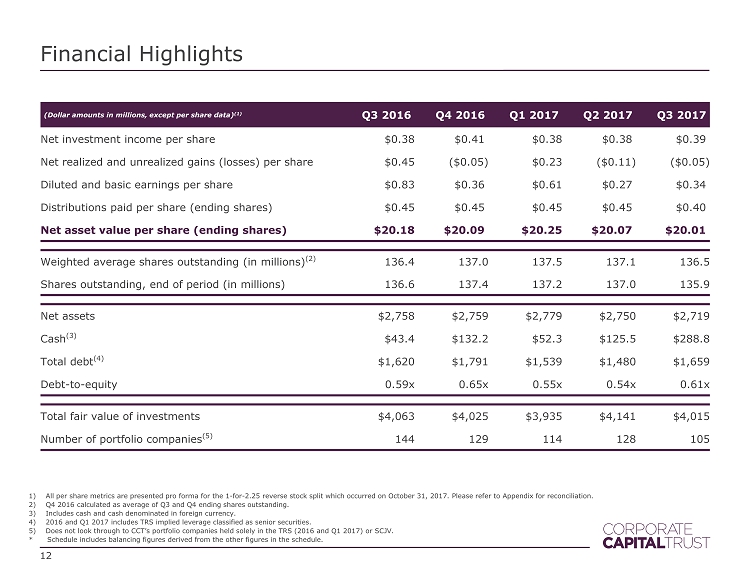
Financial Highlights 12 (Dollar amounts in millions, except per share data) (1) Q3 2016 Q4 2016 Q1 2017 Q2 2017 Q3 2017 Net investment income per share $0.38 $ 0.41 . $0.38 $ 0.38 . $ 0.39 . Net realized and unrealized gains (losses) per share $0.45 ($0.05) $0.23 ($0.11) ($ 0.05) Diluted and basic earnings per share $0.83 $ 0.36 . $0.61 $ 0.27 . $ 0.34 . Distributions paid per share (ending shares) $0.45 $ 0.45 . $0.45 $ 0.45 . $ 0.40 . Net asset value per share (ending shares) $20.18 $ 20.09 . $20.25 $ 20.07 . $ 20.01 . Weighted average shares outstanding (in millions) (2) 136.4 137.0 137.5 137.1 136.5 Shares outstanding, end of period (in millions) 136.6 137.4 137.2 137.0 135.9 Net assets $2,758 $2,759 $2,779 $2,750 $ 2,719 Cash (3) $43.4 $132.2 $52.3 $125.5 $288.8 Total debt (4) $1,620 $1,791 $1,539 $1,480 $1,659 Debt - to - equity 0.59x 0.65x 0.55x 0.54x 0.61x Total fair value of investments $4,063 $4,025 $3,935 $4,141 $ 4,015 Number of portfolio companies (5) 144 129 114 128 105 1) All per share metrics are presented pro forma for the 1 - for - 2.25 reverse stock split which occurred on October 31, 2017. Please refer to Appendix for reconciliation. 2) Q4 2016 calculated as average of Q3 and Q4 ending shares outstanding. 3) Includes cash and cash denominated in foreign currency. 4) 2016 and Q1 2017 includes TRS implied leverage classified as senior securities. 5) Does not look through to CCT’s portfolio companies held solely in the TRS (2016 and Q1 2017) or SCJV. * Schedule includes balancing figures derived from the other figures in the schedule.
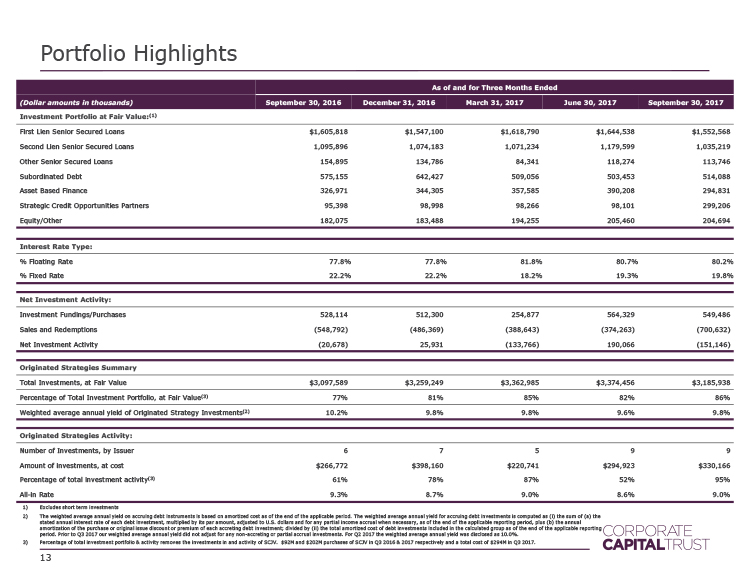
Portfolio Highlights 13 As of and for Three Months Ended (Dollar amounts in thousands) September 30, 2016 December 31, 2016 March 31, 2017 June 30, 2017 September 30, 2017 Investment Portfolio at Fair Value: (1) First Lien Senior Secured Loans $1,605,818 $1,547,100 $1,618,790 $1,644,538 $1,552,568 Second Lien Senior Secured Loans 1,095,896 1,074,183 1,071,234 1,179,599 1,035,219 Other Senior Secured Loans 154,895 134,786 84,341 118,274 113,746 Subordinated Debt 575,155 642,427 509,056 503,453 514,088 Asset Based Finance 326,971 344,305 357,585 390,208 294,831 Strategic Credit Opportunities Partners 95,398 98,998 98,266 98,101 299,206 Equity/Other 182,075 183,488 194,255 205,460 204,694 Interest Rate Type: % Floating Rate 77.8% 77.8% 81.8% 80.7% 80.2% % Fixed Rate 22.2% 22.2% 18.2% 19.3% 19.8% Net Investment Activity: Investment Fundings /Purchases 528,114 512,300 254,877 564,329 549,486 Sales and Redemptions (548,792) (486,369) (388,643) (374,263) (700,632) Net Investment Activity (20,678) 25,931 (133,766) 190,066 (151,146) Originated Strategies Summary Total Investments, at Fair Value $3,097,589 $3,259,249 $3,362,985 $3,374,456 $3,185,938 Percentage of Total Investment Portfolio, at Fair Value (3) 77% 81% 85% 82% 86% Weighted average annual yield of Originated Strategy Investments (2) 10.2% 9.8% 9.8% 9.6% 9.8% Originated Strategies Activity: Number of Investments, by Issuer 6 7 5 9 9 Amount of investments, at cost $266,772 $398,160 $220,741 $294,923 $330,166 Percentage of total investment activity (3) 61% 78% 87% 52% 95% All - in Rate 9.3% 8.7% 9.0% 8.6% 9.0% 1) Excludes short term investments 2) The weighted average annual yield on accruing debt instruments is based on amortized cost as of the end of the applicable period. Th e weighted average annual yield for accruing debt investments is computed as ( i ) the sum of (a) the stated annual interest rate of each debt investment, multiplied by its par amount, adjusted to U.S. dollars and for any parti al income accrual when necessary, as of the end of the applicable reporting period, plus (b) the annual amortization of the purchase or original issue discount or premium of each accreting debt investment; divided by (ii) the tot al amortized cost of debt investments included in the calculated group as of the end of the applicable reporting period. Prior to Q3 2017 our weighted average annual yield did not adjust for any non - accreting or partial accrual investments. For Q2 2017 the weighted average annual yield was disclosed as 10.0%. 3) Percentage of total investment portfolio & activity removes the investments in and activity of SCJV. $93M and $201M purchases of SCJV in Q3 2016 & 2017 respectively and a total cost of $294M in Q3 2017.
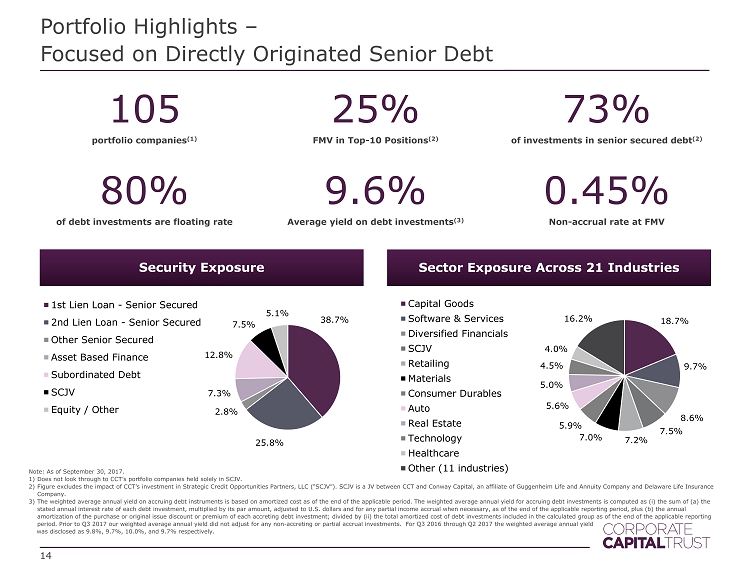
38.7% 25.8% 2.8% 7.3% 12.8% 7.5% 5.1% 1st Lien Loan - Senior Secured 2nd Lien Loan - Senior Secured Other Senior Secured Asset Based Finance Subordinated Debt SCJV Equity / Other Portfolio Highlights – Focused on Directly Originated Senior Debt Security Exposure 105 portfolio companies (1) 25% FMV in Top - 10 Positions (2) 73% of investments in senior secured debt (2) 80% of debt investments are floating rate 9.6% Average yield on debt investments (3) 0.45% Non - accrual rate at FMV 14 Sector Exposure Across 21 Industries 18.7% 9.7% 8.6% 7.5% 7.2% 7.0% 5.9% 5.6% 5.0% 4.5% 4.0% 16.2% Capital Goods Software & Services Diversified Financials SCJV Retailing Materials Consumer Durables Auto Real Estate Technology Healthcare Other (11 industries) Note: As of September 30, 2017. 1) Does not look through to CCT’s portfolio companies held solely in SCJV. 2) Figure excludes the impact of CCT’s investment in Strategic Credit Opportunities Partners, LLC (“SCJV”). SCJV is a JV between CCT and Conway Capital, an affiliate of Guggenheim Life and Annuity Company and Delaware Life Insurance Company. 3) The weighted average annual yield on accruing debt instruments is based on amortized cost as of the end of the applicable period. Th e weighted average annual yield for accruing debt investments is computed as ( i ) the sum of (a) the stated annual interest rate of each debt investment, multiplied by its par amount, adjusted to U.S. dollars and for any parti al income accrual when necessary, as of the end of the applicable reporting period, plus (b) the annual amortization of the purchase or original issue discount or premium of each accreting debt investment; divided by (ii) the tot al amortized cost of debt investments included in the calculated group as of the end of the applicable reporting period. Prior to Q3 2017 our weighted average annual yield did not adjust for any non - accreting or partial accrual investments. For Q3 2016 through Q2 2017 the weighted average annual yield was disclosed as 9.8%, 9.7%, 10.0%, and 9.7% respectively.
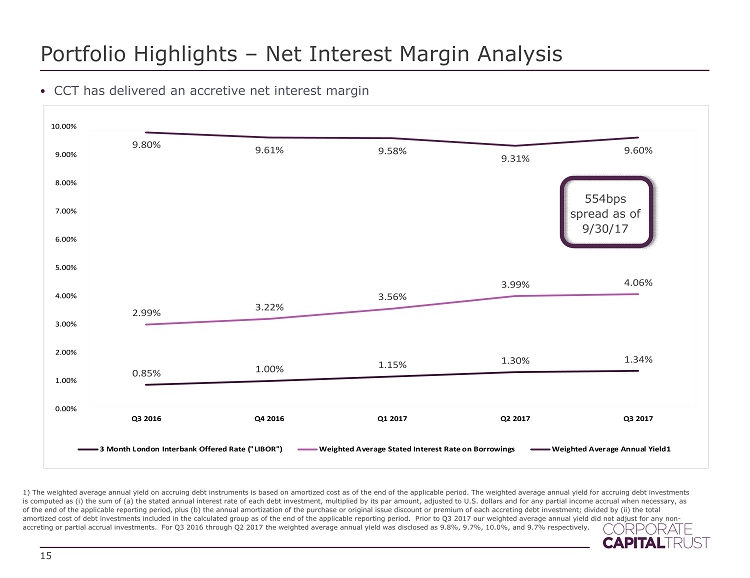
0.85% 1.00% 1.15% 1.30% 1.34% 2.99% 3.22% 3.56% 3.99% 4.06% 9.80% 9.61% 9.58% 9.31% 9.60% 0.00% 1.00% 2.00% 3.00% 4.00% 5.00% 6.00% 7.00% 8.00% 9.00% 10.00% Q3 2016 Q4 2016 Q1 2017 Q2 2017 Q3 2017 3 Month London Interbank Offered Rate ("LIBOR") Weighted Average Stated Interest Rate on Borrowings Weighted Average Annual Yield1 Portfolio Highlights – Net Interest Margin Analysis 15 1) The weighted average annual yield on accruing debt instruments is based on amortized cost as of the end of the applicable period. Th e weighted average annual yield for accruing debt investments is computed as ( i ) the sum of (a) the stated annual interest rate of each debt investment, multiplied by its par amount, adjusted to U.S. doll ars and for any partial income accrual when necessary, as of the end of the applicable reporting period, plus (b) the annual amortization of the purchase or original issue discount or pr emium of each accreting debt investment; divided by (ii) the total amortized cost of debt investments included in the calculated group as of the end of the applicable reporting period. Prior to Q3 2017 our weighted average annual yield did not adjust for any non - accreting or partial accrual investments. For Q3 2016 through Q2 2017 the weighted average annual yield was disclosed as 9.8 %, 9.7%, 10.0%, and 9.7% respectively. • CCT has delivered an accretive net interest margin 554bps spread as of 9/30/17
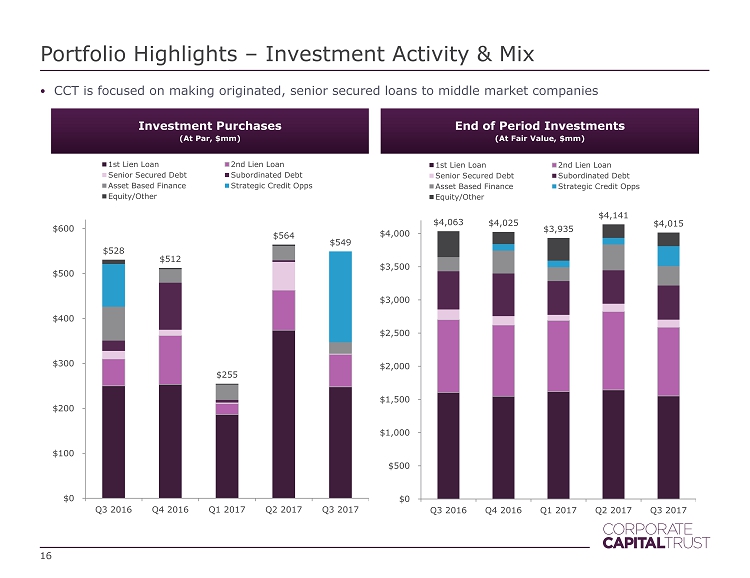
Portfolio Highlights – Investment Activity & Mix 16 $4,063 $4,025 $3,935 $4,141 $4,015 $0 $500 $1,000 $1,500 $2,000 $2,500 $3,000 $3,500 $4,000 Q3 2016 Q4 2016 Q1 2017 Q2 2017 Q3 2017 1st Lien Loan 2nd Lien Loan Senior Secured Debt Subordinated Debt Asset Based Finance Strategic Credit Opps Equity/Other $528 $512 $255 $564 $549 $0 $100 $200 $300 $400 $500 $600 Q3 2016 Q4 2016 Q1 2017 Q2 2017 Q3 2017 1st Lien Loan 2nd Lien Loan Senior Secured Debt Subordinated Debt Asset Based Finance Strategic Credit Opps Equity/Other • CCT is focused on making originated, senior secured loans to middle market companies Investment Purchases (At Par, $mm) End of Period Investments (At Fair Value, $mm)
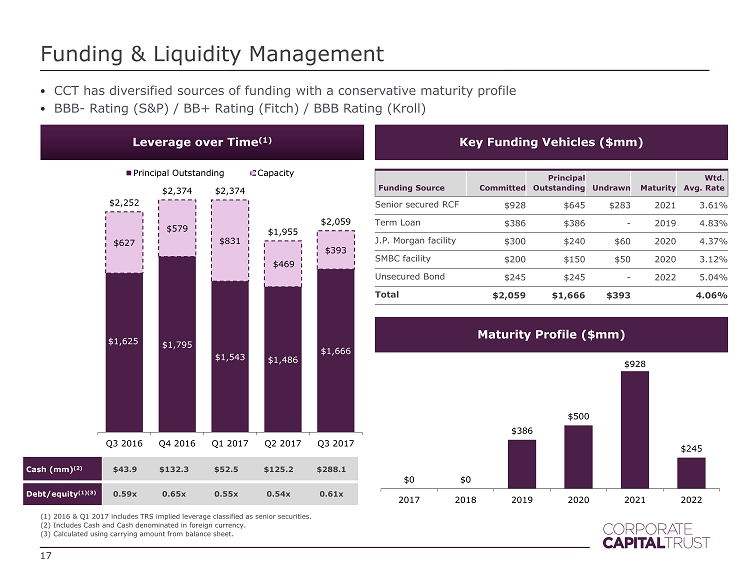
Funding & Liquidity Management Leverage over Time (1) 17 Cash (mm ) (2) $43.9 $132.3 $52.5 $125.2 $288.1 Debt/equity (1)(3) 0.59x 0.65x 0.55x 0.54x 0.61x $0 $0 $386 $500 $928 $245 2017 2018 2019 2020 2021 2022 (1) 2016 & Q1 2017 includes TRS implied leverage classified as senior securities . (2) Includes Cash and Cash denominated in foreign currency . (3) Calculated using carrying amount from balance sheet. $1,625 $1,795 $1,543 $1,486 $1,666 $627 $579 $831 $469 $393 $2,252 $2,374 $2,374 $1,955 $2,059 Q3 2016 Q4 2016 Q1 2017 Q2 2017 Q3 2017 Principal Outstanding Capacity Key Funding Vehicles ($mm) Fundin g Source Committed Principal Outstanding Undrawn Maturity Wtd . Avg. Rate Senior secured RCF $928 $ 645 $283 2021 3.61% Term Loan $386 $386 - 2019 4.83% J.P. Morgan facility $300 $240 $60 2020 4.37% SMBC facility $200 $150 $50 2020 3.12% Unsecured Bond $245 $245 - 2022 5.04% Total $2,059 $ 1,666 $393 4.06% Maturity Profile ($mm) • CCT has diversified sources of funding with a conservative maturity profile • BBB - Rating (S&P) / BB+ Rating (Fitch) / BBB Rating (Kroll)

CCT’s SCJV Offers Key Investor Benefits CCT launched a joint venture with Conway Capital (1) in Q3 2016 • Seeks to invest capital in middle - market loans, broadly syndicated loans, equity, and warrants • Key Portfolio Benefits – Yield enhancing, 13.4% IRR since inception – Access to our partner’s pipeline and due diligence – Primarily senior secured assets As of September 30, 2017, the fair value of CCT’s equity of SCJV was $299.2mm, or 7.5% of CCT’s total portfolio Total portfolio of $580.0mm as of September 30, 2017 In Q3 2017, entered into a $250M revolving credit facility with Goldman Sachs Bank USA (2) Key Terms of the Partnership: • CCT and Conway share voting control 50 % / 50% • Equity ownership 87.5 % CCT / 12.5 % Conway • CCT provides day - to - day administrative oversight Fixed / Floating Sector Exposure Security Exposure 18 82% senior secured 62.4% 15.3% 3.8% 8.3% 10.2% 1st Lien Loan 2nd Lien Loan Senior Secured Bonds Subordinated Debt Asset Based Finance 14.8% 13.1% 11.9% 10.2% 8.6% 8.0% 6.5% 6.2% 5.8% 15.0% Retailing Capital Goods Consumer Services Financials Healthcare Technology Insurance Food & Staples Real Estate Other 86.5% 13.5% Floating rate Fixed rate 1) Conway Capital is an affiliate of Guggenheim Life and Annuity Company and Delaware Life Insurance Company . 2) Credit agreement is with Jersey City Funding LLC, a wholly - owned subsidiary of Strategic Credit Opportunities Partners, LLC (“SCJV ”).
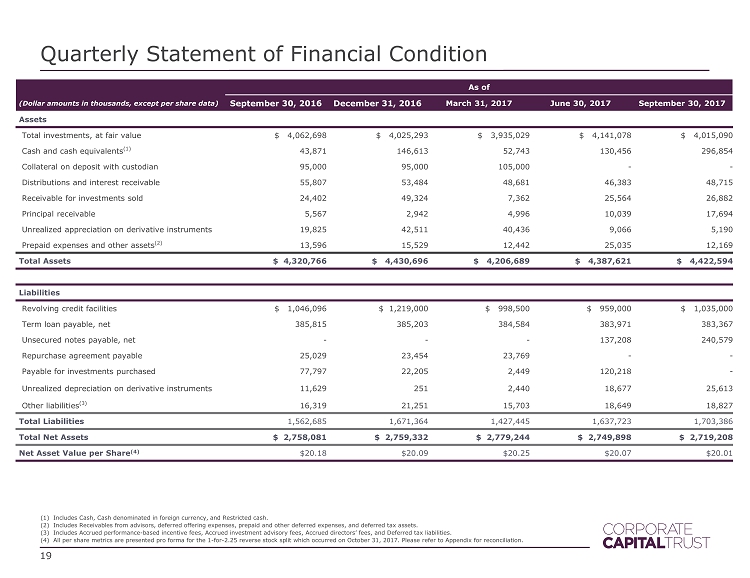
Quarterly Statement of Financial Condition 19 As of (Dollar amounts in thousands, except per share data) Septembe r 30, 2016 December 31, 2016 March 31, 2017 June 30, 2017 September 30, 2017 Assets Total investments, at fair value $ 4,062,698 $ 4,025,293 $ 3,935,029 $ 4,141,078 $ 4,015,090 Cash and cash equivalents (1) 43,871 146,613 52,743 130,456 296,854 Collateral on deposit with custodian 95,000 95,000 105,000 - - Distributions and interest receivable 55,807 53,484 48,681 46,383 48,715 Receivable for investments sold 24,402 49,324 7,362 25,564 26,882 Principal receivable 5,567 2,942 4,996 10,039 17,694 Unrealized appreciation on derivative instruments 19,825 42,511 40,436 9,066 5,190 Prepaid expenses and other assets (2) 13,596 15,529 12,442 25,035 12,169 Total Assets $ 4,320,766 $ 4,430,696 $ 4,206,689 $ 4,387,621 $ 4,422,594 Liabilities Revolving credit facilities $ 1,046,096 $ 1,219,000 $ 998,500 $ 959,000 $ 1,035,000 Term loan payable, net 385,815 385,203 384,584 383,971 383,367 Unsecured notes payable, net - - - 137,208 240,579 Repurchase agreement payable 25,029 23,454 23,769 - - Payable for investments purchased 77,797 22,205 2,449 120,218 - Unrealized depreciation on derivative instruments 11,629 251 2,440 18,677 25,613 Other liabilities (3) 16,319 21,251 15,703 18,649 18,827 Total Liabilities 1,562,685 1,671,364 1,427,445 1,637,723 1,703,386 Total Net Assets $ 2,758,081 $ 2,759,332 $ 2,779,244 $ 2,749,898 $ 2,719,208 Net Asset Value per Share (4) $20.18 $20.09 $20.25 $20.07 $ 20.01 (1) Includes Cash, Cash denominated in foreign currency, and Restricted cash. (2) Includes Receivables from advisors, deferred offering expenses, prepaid and other deferred expenses, and deferred tax assets. (3) Includes Accrued performance - based incentive fees, Accrued investment advisory fees, Accrued directors’ fees, and Deferred tax l iabilities. (4) All per share metrics are presented pro forma for the 1 - for - 2.25 reverse stock split which occurred on October 31, 2017. Please refer to Appendix for reconciliation.
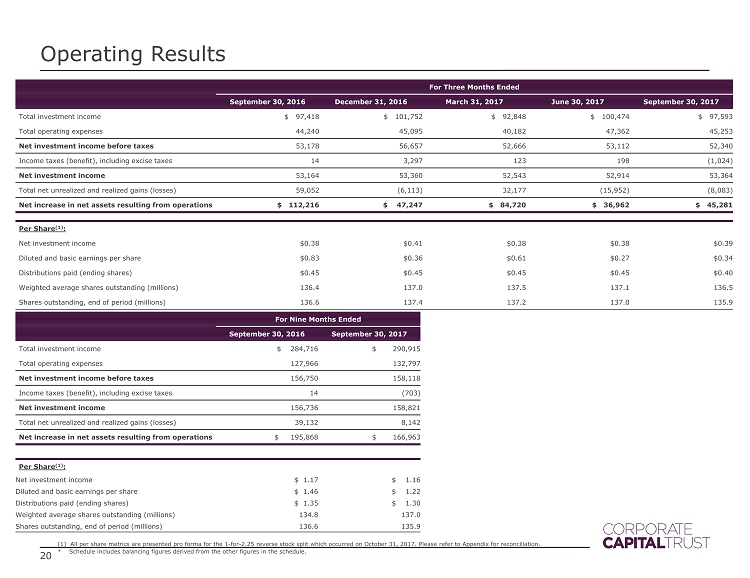
Operating Results 20 For Three Months Ended Septembe r 30, 2016 December 31, 2016 March 31, 2017 June 30, 2017 September 30, 2017 Total investment income $ 97,418 $ 101,752 $ 92,848 $ 100,474 $ 97,593 Total operating expenses 44,240 45,095 40,182 47,362 45,253 Net investment income before taxes 53,178 56,657 52,666 53,112 52,340 Income taxes (benefit), including excise taxes 14 3,297 123 198 (1,024) Net investment income 53,164 53,360 52,543 52,914 53,364 Total net unrealized and realized gains (losses) 59,052 (6,113) 32,177 (15,952) (8,083) Net increase in net assets resulting from operations $ 112,216 $ 47,247 $ 84,720 $ 36,962 $ 45,281 Per Share (1) : Net investment income $0.38 $0.41 $0.38 $0.38 $ 0.39 Diluted and basic earnings per share $0.83 $0.36 $0.61 $0.27 $ 0.34 Distribution s paid (ending shares) $0.45 $0.45 $0.45 $0.45 $ 0.40 Weighted average shares outstanding (millions) 136.4 137.0 137.5 137.1 136.5 Shares outstanding, end of period (millions) 136.6 137.4 137.2 137.0 135.9 For Nine Months Ended September 30, 2016 September 30, 2017 Total investment income $ 284,716 $ 290,915 Total operating expenses 127,966 132,797 Net investment income before taxes 156,750 158,118 Income taxes (benefit), including excise taxes 14 (703) Net investment income 156,736 158,821 Total net unrealized and realized gains (losses) 39,132 8,142 Net increase in net assets resulting from operations $ 195,868 $ 166,963 Per Share (1) : Net investment income $ 1.17 $ 1.16 Diluted and basic earnings per share $ 1.46 $ 1.22 Distributions paid (ending shares) $ 1.35 $ 1.30 Weighted average shares outstanding (millions ) 134.8 137.0 Shares outstanding, end of period (millions ) 136.6 135.9 (1) All per share metrics are presented pro forma for the 1 - for - 2.25 reverse stock split which occurred on October 31, 2017. Please refer to Appendix for reconciliation . * Schedule includes balancing figures derived from the other figures in the schedule .
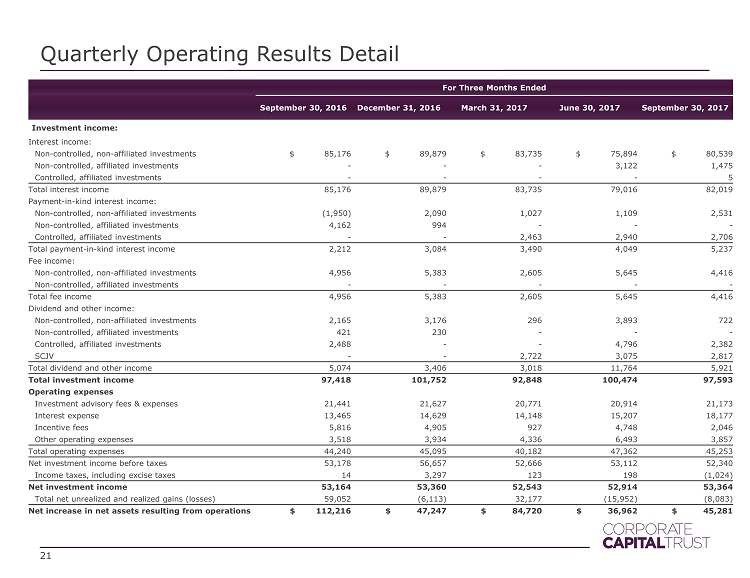
Quarterly Operating Results Detail 21 For Three Months Ended Septembe r 30, 2016 December 31, 2016 March 31, 2017 June 30, 2017 Septembe r 30, 2017 Investment income: Interest income: Non - controlled, non - affiliated investments $ 85,176 $ 89,879 $ 83,735 $ 75,894 $ 80,539 Non - controlled, affiliated investments - - - 3,122 1,475 Controlled, affiliated investments - - - - 5 Total interest income 85,176 89,879 83,735 79,016 82,019 Payment - in - kind interest income: Non - controlled, non - affiliated investments (1,950) 2,090 1,027 1,109 2,531 Non - controlled, affiliated investments 4,162 994 - - - Controlled, affiliated investments - - 2,463 2,940 2,706 Total payment - in - kind interest income 2,212 3,084 3,490 4,049 5,237 Fee income: Non - controlled, non - affiliated investments 4,956 5,383 2,605 5,645 4,416 Non - controlled, affiliated investments - - - - - Total fee income 4,956 5,383 2,605 5,645 4,416 Dividend and other income: Non - controlled, non - affiliated investments 2,165 3,176 296 3,893 722 Non - controlled, affiliated investments 421 230 - - - Controlled, affiliated investments 2,488 - - 4,796 2,382 SCJV - - 2,722 3,075 2,817 Total dividend and other income 5,074 3,406 3,018 11,764 5,921 Total investment income 97,418 101,752 92,848 100,474 97,593 Operating expenses Investment advisory fees & expenses 21,441 21,627 20,771 20,914 21,173 Interest expense 13,465 14,629 14,148 15,207 18,177 Incentive fees 5,816 4,905 927 4,748 2,046 Other operating expenses 3,518 3,934 4,336 6,493 3,857 Total operating expenses 44,240 45,095 40,182 47,362 45,253 Net investment income before taxes 53,178 56,657 52,666 53,112 52,340 Income taxes, including excise taxes 14 3,297 123 198 (1,024) Net investment income 53,164 53,360 52,543 52,914 53,364 Total net unrealized and realized gains (losses) 59,052 (6,113) 32,177 (15,952) (8,083) Net increase in net assets resulting from operations $ 112,216 $ 47,247 $ 84,720 $ 36,962 $ 45,281
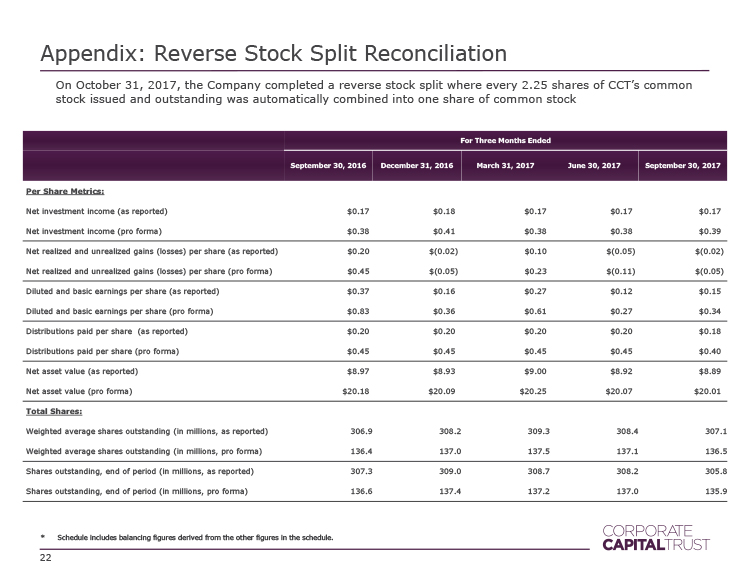
Appendix: Reverse Stock Split Reconciliation 22 On October 31, 2017, the Company completed a reverse stock split where every 2.25 shares of CCT’s common stock issued and outstanding was automatically combined into one share of common stock For Three Months Ended Septembe r 30, 2016 December 31, 2016 March 31, 2017 June 30, 2017 September 30, 2017 Per Share Metrics: Net investment income (as reported) $0.17 $0.18 . $0.17 $0.17 . $0.17 . Net investment income (pro forma) $0.38 $0.41 . $0.38 $0.38 . $0.39 . Net realized and unrealized gains (losses) per share (as reported) $0.20 $(0.02) $0.10 $(0.05) $(0.03) Net realized and unrealized gains (losses) per share (pro forma) $0.45 $(0.04) $0.23 $(0.11) $(0.05) Diluted and basic earnings per share (as reported) $0.37 $0.16 . $0.27 $0.12 . $0.15 . Diluted and basic earnings per share (pro forma) $0.83 $0.36 . $0.61 $0.27 . $0.34 . Distributions paid per share (as reported) $0.20 $0.20 . $0.20 $0.20 . $0.18 . Distributions paid per share (pro forma) $0.45 $0.45 . $0.45 $0.45 . $0.40 . Net asset value (as reported) $8.97 $8.93 . $9.00 $8.92 . $8.89 . Net asset value (pro forma) $20.18 $20.09 . $20.25 $20.07 . $20.01 . Total Shares: Weighted average shares outstanding (in millions, as reported) 306.9 308.2 309.3 308.4 307.1 Weighted average shares outstanding (in millions, pro forma) 136.4 137.0 137.5 137.1 136.5 Shares outstanding, end of period (in millions, as reported) 307.3 309.0 308.7 308.2 305.8 Shares outstanding, end of period (in millions, pro forma) 136.6 137.4 137.2 137.0 135.9 * Schedule includes balancing figures derived from the other figures in the schedule.
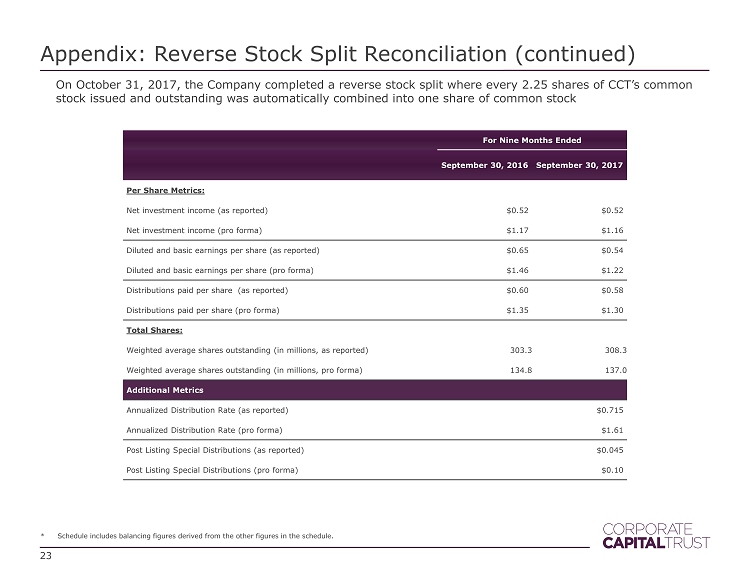
Appendix: Reverse Stock Split Reconciliation (continued) 23 On October 31, 2017, the Company completed a reverse stock split where every 2.25 shares of CCT’s common stock issued and outstanding was automatically combined into one share of common stock For Nine Months Ended Septembe r 30, 2016 September 30, 2017 Per Share Metrics: Net investment income (as reported) $0.52 $0.52 Net investment income (pro forma) $1.17 $1.16 Diluted and basic earnings per share (as reported) $0.65 $0.54 Diluted and basic earnings per share (pro forma) $1.46 $1.22 Distributions paid per share (as reported) $0.60 $0.58 Distributions paid per share (pro forma) $1.35 $1.30 Total Shares: Weighted average shares outstanding (in millions, as reported) 303.3 308.3 Weighted average shares outstanding (in millions, pro forma) 134.8 137.0 Additional Metrics Annualized Distribution Rate (as reported) $0.715 Annualized Distribution Rate (pro forma) $1.61 Post Listing Special Distributions (as reported) $0.045 Post Listing Special Distributions (pro forma) $0.10 * Schedule includes balancing figures derived from the other figures in the schedule.
This presentation is for informational purposes only and is neither an offer to sell nor a solicitation of an offer to buy the securities described herein . Investing in Corporate Capital Trust, Inc . (“We”, “CCT”, or the “Company”) is not suitable for all investors and they should carefully read the information in our Forms 10 - Q and 10 - K filings and in our other public filings before making an investment . Consider the investment objectives, risks, charges and expenses before deciding to invest in our shares of common stock . The information contained herein does not replace or supersede any information contained within the company’s 10 - K, 10 - Qs or other public filings . Corporate Capital Trust closed to new investors who purchase through the independent broker - dealer channel on Feb . 12 , 2016 . Corporate Capital Trust is currently advised by CNL Fund Advisors Company (CNL) and subadvised by KKR Credit Advisors (US) LLC (KKR Credit), affiliates of CNL Financial Group and KKR & Co . L . P . , respectively . The data and information presented are for informational purposes only . KKR Credit conducts its business through KKR Credit Advisors (US) LLC, an investment adviser registered with the U . S . Securities and Exchange Commission (the “SEC”) . KKR Credit Advisors (Ireland), authorized and regulated by the Central Bank of Ireland, and KKR Credit Advisors (UK) LLP which is authorized and regulated by the Financial Conduct Authority in the United Kingdom . References to “KKR Capstone” or “Capstone” are to all or any of KKR Capstone Americas LLC, KKR Capstone EMEA LLP, KKR Capstone EMEA (International) LLP, KKR Capstone Asia Limited, and their affiliates, which are owned and controlled by their senior management . KKR Capstone is not a subsidiary or affiliate of KKR . KKR Capstone operates under several consulting agreements with KKR and uses the “KKR” name under license from KKR . References to operating executives, operating experts, or operating consultants are to employees of KKR Capstone and not to employees of KKR . In this presentation, the impact of initiatives in which KKR Capstone has been involved is based on KKR Capstone’s internal analysis and information provided by the applicable portfolio company . Impacts of such initiatives are estimates that have not been verified by a third party and are not based on any established standards or protocols . They may also reflect the influence of external factors, such as macroeconomic or industry trends, that are unrelated to the initiative presented . Participation of KKR Private Equity, KKR Capital Markets, and KKR Capstone personnel in the public investment process is subject to applicable law and inside information barrier policies and procedures, which may limit the involvement of KKR Private Equity, KKR Capital Markets, and KKR Capstone personnel in certain circumstances and KKR Credit’s ability to leverage such integration with KKR . Discussions with Senior Advisors and employees of KKR’s managed portfolio companies are also subject to the inside information barrier policies and procedures, which may restrict or limit discussions and/or collaborations with KKR Credit . The information contained in this presentation is for informational purposes only and is not an offer to buy or the solicitation of an offer to sell any securities of the Company . The tender offer referenced herein will be made only pursuant to an offer to purchase, letter of transmittal and related materials (the “Tender Materials”) . The full details of the tender offer, including complete instructions on how to tender shares of common stock, will be included in the Tender Materials, which the Company will distribute to shareholders and file with the SEC upon the commencement of the tender offer . Shareholders are urged to carefully read the Tender Materials when they become available because they will contain important information, including the terms and conditions of the tender offer . The Tender Materials (when they become available ), may be obtained free of charge at the SEC’s website (http : //www . sec . gov), at the Company’s website (http : //www . corporatecapitaltrust . com/investor - resources), or by writing to the Company at 450 S . Orange Avenue, Orlando, Florida 32801 (telephone number 866 - 650 - 0650 ) or, after the listing (“Listing”) of the shares of the Company’s common stock on the New York Stock Exchange LLC (“NYSE”), 555 California Street, 50 th Floor, San Francisco, CA 94104 (telephone number 415 - 315 - 3620 ) . 24 Important Information & Forward Looking Statements
25 Some of the statements in this presentation constitute “forward - looking statements” because they relate to future events or the future performance or financial condition of the company . Forward - looking statements generally can be identified by the words “believes,” “expects,” “intends,” “plans,” “estimates” or similar expressions that indicate future events . These statements are based on the beliefs and assumptions of the company’s management and on the information currently available to management at the time of such statements . Although we believe that the expectations reflected in such forward - looking statements are based upon reasonable assumptions, our actual results could differ materially from those set forth in the forward - looking statements . Some factors that might cause such a difference include the following : persistent economic weakness at the global or national level, increased direct competition, changes in government regulations or accounting rules, changes in local, national and global capital market conditions, our ability to obtain or maintain credit lines or credit facilities on satisfactory terms, changes in interest rates, our ability to identify suitable investments, our ability to close on identified investments, our ability to maintain our qualification as a regulated investment company and as a business development company, the ability of our Advisors and their affiliates to attract and retain highly talented professionals, the ability of our Advisors to locate suitable borrowers for our loans, the ability of such borrowers to make payments under their respective loans, our ability to complete the listing of our shares of common stock on the New York Stock Exchange LLC (NYSE), our ability to complete the proposed related tender offer, and the price at which shares of our common stock may trade on the NYSE, which may be higher or lower than the purchase price in the proposed tender offer . Given these uncertainties, we caution you not to place undue reliance on such statements, which apply only as of the date hereof . Important factors that could cause actual results to differ materially from the company’s expectations include those described above and disclosed in the company’s filings with the SEC, including the company’s annual report on Form 10 - K for the year ended December 31 , 2016 , which was filed with the SEC on March 20 , 2017 and the company’s quarterly reports subsequently filed on form 10 - Q . The company undertakes no obligation to update such statements to reflect subsequent events . Important Information & Forward Looking Statements
26 Risk Factors In addition to the other risk factors disclosed in our Forms 10 - K and 10 - Q, risks of investing in Corporate Capital Trust include : • Investing in Corporate Capital Trust may be considered speculative and involves a high degree of risk, including the risk of a substantial loss of investment . Other risks include a limited operating history, reliance on the advisors of the company, conflicts of interest, payment of substantial fees to the advisors of the company and its affiliates, limited liquidity, and liquidation at less than the original amount invested . Corporate Capital Trust is a long - term investment . Investing for short time periods makes losses more likely . See the Risk Factors section in our Forms 10 - K, 10 - Q and other public filings to read about the risks an investor should consider before buying shares of Corporate Capital Trust . There is no assurance the investment objectives will be met . • Corporate Capital Trust may extend loans to those with low credit quality and there may be limited information about those companies, which involves interest rate risk and financial market risk . Leverage can increase expenses and also volatility, which may magnify gains and losses . • Distributions are not guaranteed and subject to change . Future distributions may include a return of principal or borrowed funds, which may lower overall returns to the investor and may not be sustainable . We have borrowed funds to make investments, which increases the risks of investing in our shares . • An investment in Corporate Capital Trust is illiquid, which means that an investor will have limited ability to sell shares and should not expect to be able to sell their holdings until a liquidity event such as the proposed listing described herein . The board of directors must consider a liquidity event on or before Dec . 31 , 2018 , but there is no guarantee that any liquidity event will take place . Information Barrier Disclosure Participation of KKR Private Equity, KKR Capital Markets, and KKR Capstone personnel in the public markets investment process is subject to applicable law and inside information barrier policies and procedures, which may limit the involvement of such personnel in certain circumstances and KKR Credit’s ability to leverage such integration with KKR . Discussions with Senior Advisors and employees of the Firm’s managed portfolio companies are also subject to the inside information barrier policies and procedures, which may restrict or limit discussions and/or collaborations with KKR Credit . Assets Under Management References to “assets under management” or “AUM” represent the assets managed by KKR or its strategic partners as to which KKR is entitled to receive a fee or carried interest (either currently or upon deployment of capital) and general partner capital . KKR calculates the amount of AUM as of any date as the sum of : ( i ) the fair value of the investments of KKR's investment funds ; (ii) uncalled capital commitments from these funds, including uncalled capital commitments from which KKR is currently not earning management fees or carried interest ; (iii) the fair value of investments in KKR's co - investment vehicles ; (iv) the par value of outstanding CLOs (excluding CLOs wholly - owned by KKR) ; (v) KKR's pro - rata portion of the AUM managed by strategic partnerships in which KKR holds a minority ownership interest and (vi) the fair value of other assets managed by KKR . The pro - rata portion of the AUM managed by strategic partnerships is calculated based on KKR’s percentage ownership interest in such entities multiplied by such entity’s respective AUM . KKR’s calculation of AUM may differ from the calculations of other asset managers and, as a result, KKR’s measurements of its AUM may not be comparable to similar measures presented by other asset managers . KKR's definition of AUM is not based on the definitions of AUM that may be set forth in agreements governing the investment funds, vehicles or accounts that it manages and is not calculated pursuant to any regulatory definitions . Important Information