CORPORATE CAPITAL TRUST, INC. 8-K
Exhibit 99.4
CONFIDENTIAL AND PROPRIETARY: For Investment Professionals Only Provided by Request Corporate Capital Trust, Inc. November 2017
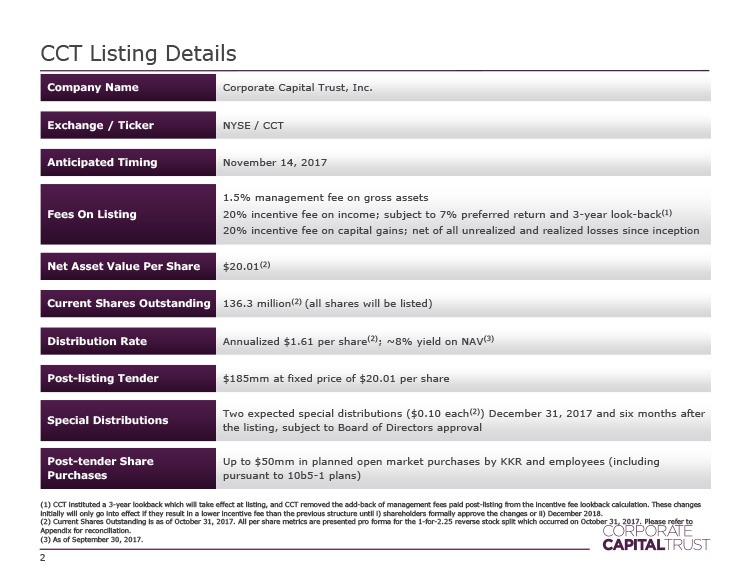
CCT Listing Details Company Name Corporate Capital Trust, Inc. Exchange / Ticker NYSE / CCT Anticipated Timing November 14, 2017 2 Fees On Listing 1.5% management fee on gross assets 20% incentive fee on income; subject to 7% preferred return and 3 - year look - back (1) 20% incentive fee on capital gains; net of all unrealized and realized losses since inception Net Asset Value Per Share $20.01 (2) Current Shares Outstanding 136.3 million (2) (all shares will be listed) Distribution Rate Annualized $1.61 per share (2) ; ~8% yield on NAV (3) Post - listing Tender $ 185mm at fixed price of $20.01 per share Special Distributions Two expected special distributions ($0.10 each (2) ) December 31, 2017 and six months after the listing, subject to Board of Directors approval Post - tender Share Purchases Up to $50mm in planned open market purchases by KKR and employees (pursuant to 10b5 - 1 plans) (1 ) CCT instituted a 3 - year lookback which will take effect at listing, and CCT removed the add - back of management fees paid post - listing from the incentive fee lookback calculation. These changes initially will only go into effect if they result in a lower incentive fee than the previous structure until i) shareholders formally approve the changes or ii) December 2018. (2) Current Shares Outstanding is as of October 31, 2017. All per share metrics are presented pro forma for the 1 - for - 2.25 rever se stock split which occurred on October 31, 2017. Please refer to Appendix for reconciliation. (3) As of September 30, 2017.
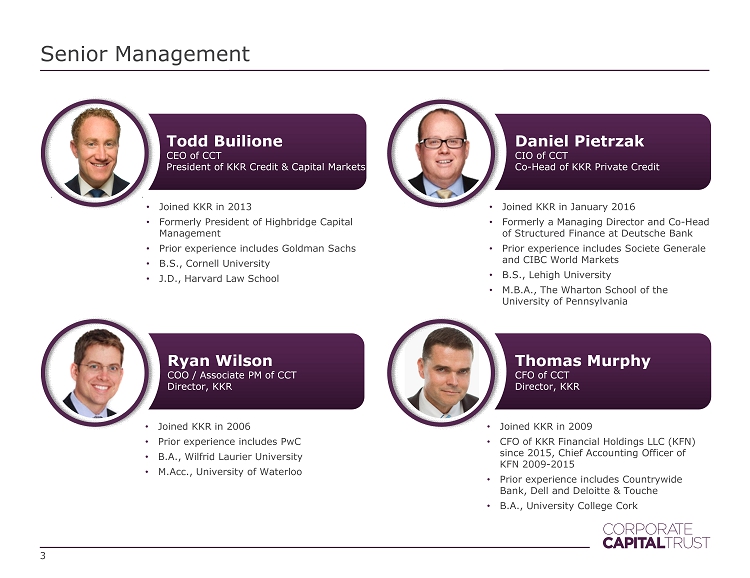
Senior Management 3 Todd Builione CEO of CCT President of KKR Credit & Capital Markets Daniel P i etrzak CIO of CCT Co - Head of KKR Private Credit Ryan Wilson COO / Associate PM of CCT Director , KKR • Joined KKR in January 2016 • Formerly a Managing Director and Co - Head of Structured Finance at Deutsche Bank • Prior experience includes Societe Generale and CIBC World Markets • B.S., Lehigh University • M.B.A., The Wharton School of the University of Pennsylvania • Joined KKR in 2013 • Formerly President of Highbridge Capital Management • Prior experience includes Goldman Sachs • B.S., Cornell University • J.D., Harvard Law School • Joined KKR in 2006 • Prior experience includes PwC • B.A., Wilfrid Laurier University • M.Acc ., University of Waterloo Thomas Murphy CFO of CCT Director , KKR • Joined KKR in 2009 • CFO of KKR Financial Holdings LLC (KFN) since 2015, Chief Accounting Officer of KFN 2009 - 2015 • Prior experience includes Countrywide Bank, Dell and Deloitte & Touche • B.A., University College Cork
Table of Contents 4 Overview of CCT 5 KKR Credit Platform 11 Portfolio 16

Overview of CCT 5

CCT Is An Industry Leading Business Development Company 6 Externally managed by KKR Credit • Leverages the full KKR platform • SEC co - investment exemptive relief • Strong alignment between KKR & CCT Significant scale with $4.4bn of assets • Focused on larger middle market companies • Typically sole or lead lender in Originated Strategy Investments • Scale can allow for more attractive funding Access to middle market direct lending opportunity • Stable recurring income generation • ~8% dividend yield (1) , 8.3% ITD ROE (2) • Established and diversified portfolio of 105 borrowers • 73% of portfolio in senior secured investments (3) CCT is a business development company focused on making originated, senior secured loans to middle market companies Note: Please refer to “Important Information” at the end of this presentation for additional detail on the calculation of AUM and for further information on KKR’s inside information bar rie r policies and procedures, which may limit the involvement of personnel in certain investment processes and discussions . All figures as of September 30, 2017. 1) Based on current annualized dividend rate, excluding special dividends, relative to net asset value as of September 30, 2017. 2) Total return for a shareholder that invested June 2011, excluding any upfront sales load, and assuming reinvestment of divide nds through September 30, 2017. ITD ROE for a shareholder who invested June 2011 with an upfront sale load was 6.5% annualized. 3) Figure excludes the impact of CCT’s investment in Strategic Credit Opportunities Partners, LLC (“SCJV”). SCJV is a JV between CCT and Conway Capital, an affiliate of Guggenheim Life and Annuity Company and Delaware Life Insurance Company.
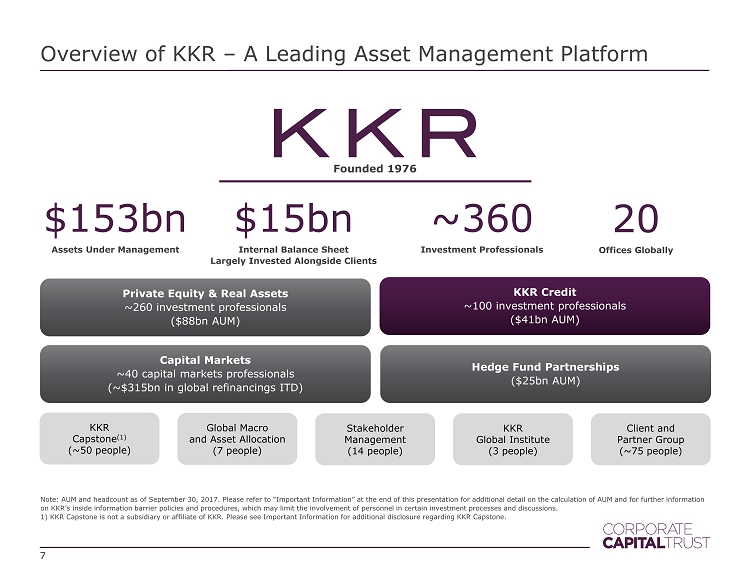
Overview of KKR – A Leading Asset Management Platform Note: AUM and headcount as of September 30 , 2017. Please refer to “Important Information” at the end of this presentation for additional detail on the calculation of AUM and for further information on KKR’s inside information barrier policies and procedures, which may limit the involvement of personnel in certain investme nt processes and discussions. 1) KKR Capstone is not a subsidiary or affiliate of KKR. Please see Important Information for additional disclosure regarding KKR Ca pst one. Founded 1976 7 $ 153bn Assets Under Management Stakeholder Management ( 14 people) Client and Partner Group (~75 people) Global Macro and Asset Allocation (7 people) KKR Global Institute (3 people) KKR Capstone (1) (~50 people) $15bn Internal Balance Sheet Largely Invested Alongside Clients ~ 360 Investment Professionals 20 Offices Globally Private Equity & Real Assets ~ 260 investment professionals ($ 88bn AUM) KKR Credit ~100 investment professionals ($ 41 bn AUM) Capital Markets ~40 capital markets professionals (~$315bn in global refinancings ITD) Hedge Fund Partnerships ($ 25bn AUM)
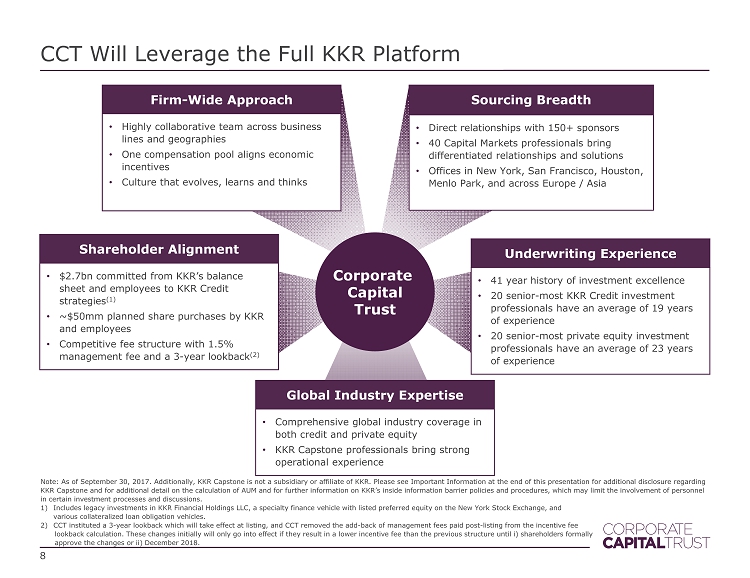
CCT Will Leverage the Full KKR Platform 8 Note: As of September 30 , 2017. Additionally, KKR Capstone is not a subsidiary or affiliate of KKR. Please see Important Information at the end of this presentation for additional disclosure regarding KKR Capstone and for additional detail on the calculation of AUM and for further information on KKR’s inside information barrier policies and pro cedures, which may limit the involvement of personnel in certain investment processes and discussions. 1) Includes legacy investments in KKR Financial Holdings LLC, a specialty finance vehicle with listed preferred equity on the New York St ock Exchange, and various collateralized loan obligation vehicles. 2) CCT instituted a 3 - year lookback which will take effect at listing, and CCT removed the add - back of management fees paid post - listin g from the incentive fee lookback calculation. These changes initially will only go into effect if they result in a lower incentive fee than the previous struc tur e until i) shareholders formally approve the changes or ii) December 2018. Global Industry Expertise • Comprehensive global industry coverage in both credit and private equity • KKR Capstone professionals bring strong operational experience Underwriting Experience • 41 year history of investment excellence • 20 senior - most KKR Credit investment professionals have an average of 19 years of experience • 20 senior - most private equity investment professionals have an average of 23 years of experience Sourcing Breadth • Direct relationships with 150+ sponsors • 40 Capital Markets professionals bring differentiated relationships and solutions • Offices in New York, San Francisco, Houston, Menlo Park, and across Europe / Asia Shareholder Alignment • $2.7bn committed from KKR’s balance sheet and employees to KKR Credit strategies (1) • ~$50mm planned share purchases by KKR and employees • Competitive fee structure with 1.5% management fee and a 3 - year lookback (2) Firm - Wide Approach • Highly collaborative team across business lines and geographies • One compensation pool aligns economic incentives • Culture that evolves, learns and thinks Corporate Capital Trust
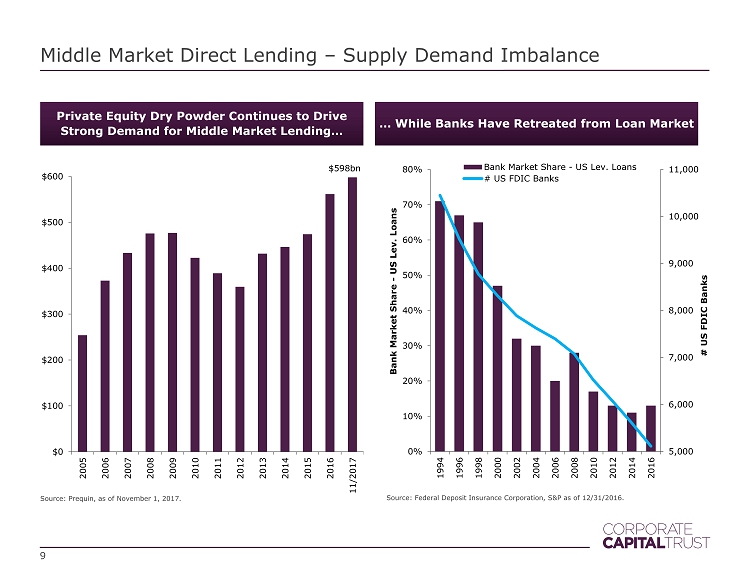
Middle Market Direct Lending – Supply Demand Imbalance Private Equity Dry Powder Continues to Drive Strong Demand for Middle Market Lending… 5,000 6,000 7,000 8,000 9,000 10,000 11,000 0% 10% 20% 30% 40% 50% 60% 70% 80% 1994 1996 1998 2000 2002 2004 2006 2008 2010 2012 2014 2016 # US FDIC Banks Bank Market Share - US Lev. Loans Bank Market Share - US Lev. Loans # US FDIC Banks Source: Federal Deposit Insurance Corporation, S&P as of 12/31/2016 . Source: Prequin , as of November 1 , 2017. $ 598bn $0 $100 $200 $300 $400 $500 $600 2005 2006 2007 2008 2009 2010 2011 2012 2013 2014 2015 2016 11/2017 9 … While Banks Have Retreated from Loan Market
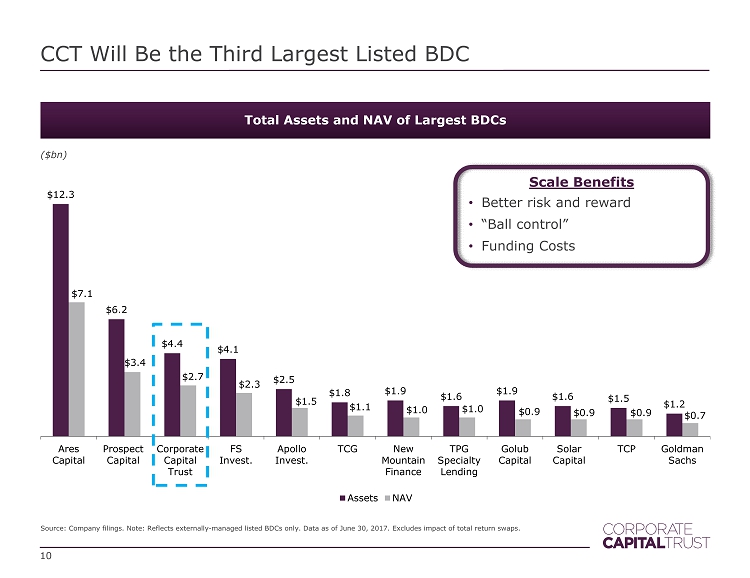
Total Assets and NAV of Largest BDCs ($ bn ) $12.3 $6.2 $4.4 $4.1 $2.5 $1.8 $1.9 $1.6 $1.9 $1.6 $1.5 $1.2 $7.1 $3.4 $2.7 $2.3 $1.5 $1.1 $1.0 $1.0 $0.9 $0.9 $0.9 $0.7 Ares Capital Prospect Capital Corporate Capital Trust FS Invest. Apollo Invest. TCG New Mountain Finance TPG Specialty Lending Golub Capital Solar Capital TCP Goldman Sachs Assets NAV CCT Will Be the Third Largest Listed BDC Source: Company filings. Note: Reflects externally - managed listed BDCs only. Data as of June 30, 2017. Excludes impact of total return swaps. 10 Scale Benefits • “Ball control” • Funding Costs • Better risk and reward

KKR Credit Platform 11
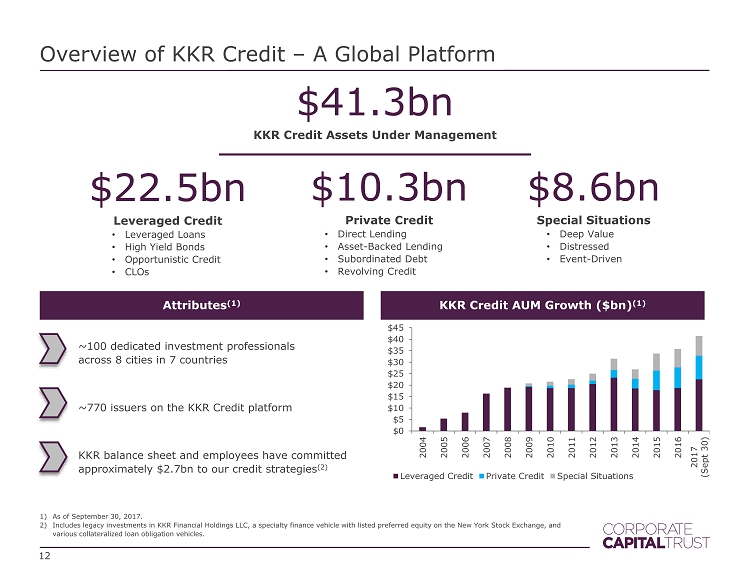
Overview of KKR Credit – A Global Platform 1) As of September 30 , 2017. 2) Includes legacy investments in KKR Financial Holdings LLC, a specialty finance vehicle with listed preferred equity on the Ne w Y ork Stock Exchange, and various collateralized loan obligation vehicles. ~100 dedicated investment professionals across 8 cities in 7 countries ~ 770 issuers on the KKR Credit platform KKR balance sheet and employees have committed approximately $2.7bn to our credit strategies (2) $0 $5 $10 $15 $20 $25 $30 $35 $40 $45 2004 2005 2006 2007 2008 2009 2010 2011 2012 2013 2014 2015 2016 2017 (Sept 30) Leveraged Credit Private Credit Special Situations $41.3bn KKR Credit Assets Under Management $ 22.5bn Leveraged Credit • Leveraged Loans • High Yield Bonds • Opportunistic Credit • CLOs $ 10.3bn Private Credit • Direct Lending • Asset - Backed Lending • Subordinated Debt • Revolving Credit $ 8.6bn Special Situations • Deep Value • Distressed • Event - Driven KKR Credit AUM Growth ($ bn ) (1) Attributes (1) 12
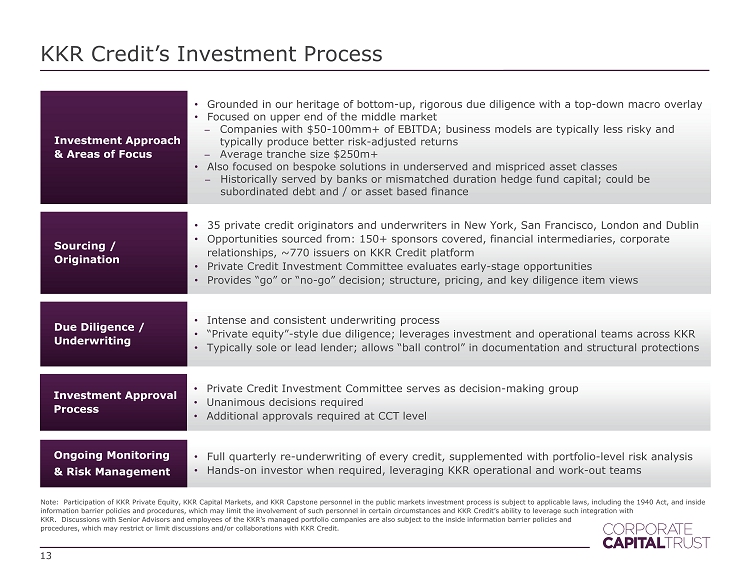
Ongoing Monitoring & Risk Management • Full quarterly re - underwriting of every credit, supplemented with portfolio - level risk analysis • Hands - on investor when required, leveraging KKR operational and work - out teams Investment Approval Process • Private Credit Investment Committee serves as decision - making group • Unanimous decisions required • Additional approvals required at CCT level Due Diligence / Underwriting • Intense and consistent underwriting process • “Private equity” - style due diligence; leverages investment and operational teams across KKR • Typically sole or lead lender; allows “ball control” in documentation and structural protections KKR Credit’s Investment Process Sourcing / Origination • 35 private credit originators and underwriters in New York, San Francisco, London and Dublin • Opportunities sourced from: 150+ sponsors covered, financial intermediaries, corporate relationships, ~ 770 issuers on KKR Credit platform • Private Credit Investment Committee evaluates early - stage opportunities • Provides “go” or “no - go” decision; structure, pricing, and key diligence item views Note: Participation of KKR Private Equity, KKR Capital Markets, and KKR Capstone personnel in the public markets investment pro cess is subject to applicable laws, including the 1940 Act, and inside information barrier policies and procedures, which may limit the involvement of such personnel in certain circumstances and K KR Credit’s ability to leverage such integration with KKR. Discussions with Senior Advisors and employees of the KKR’s managed portfolio companies are also subject to the inside information barrier policies and procedures, which may restrict or limit discussions and/or collaborations with KKR Credit. 13 Investment Approach & Areas of Focus • Grounded in our heritage of bottom - up, rigorous due diligence with a top - down macro overlay • Focused on upper end of the middle market ̶ Companies with $50 - 100mm+ of EBITDA; business model s are typically less risky and typically produce better risk - adjusted returns ̶ Average tranche size $250m+ • Also focused on bespoke solutions in underserved and mispriced asset classes ̶ Historically served by banks or mismatched duration hedge fund capital; could be subordinated debt and / or asset based finance
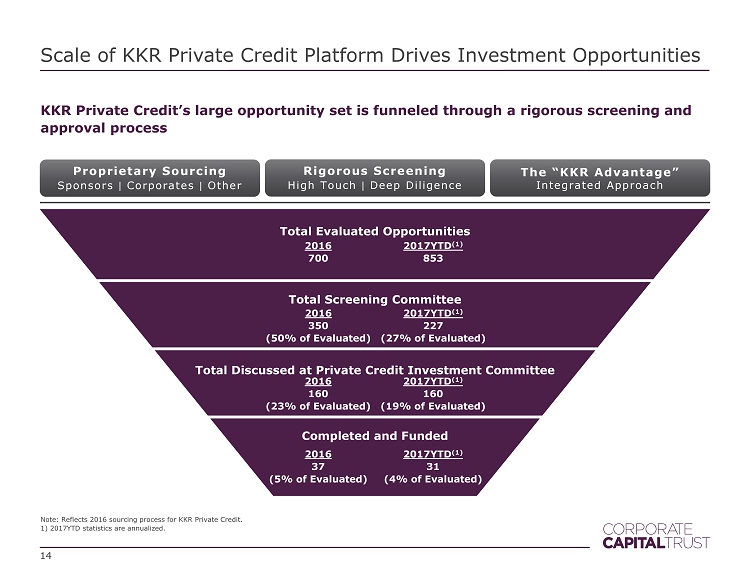
Proprietary Sourcing Sponsors ǀ Corporates ǀ Other Rigorous Screening High Touch ǀ Deep Diligence The “KKR Advantage ” Integrated Approach Scale of KKR Private Credit Platform Drives Investment Opportunities KKR Private Credit’s large opportunity set is funneled through a rigorous screening and approval process Note: Reflects 2016 sourcing process for KKR Private Credit . 1) 2017YTD statistics are annualized. Total Evaluated Opportunities Total Screening Committee Completed and Funded Total Discussed at Private Credit Investment Committee 14 2016 700 2017YTD (1) 853 2016 350 (50% of Evaluated) 2017YTD (1) 227 (27% of Evaluated) 2016 160 (23% of Evaluated) 2017YTD (1) 160 (19% of Evaluated) 2016 37 (5% of Evaluated) 2017YTD (1) 31 (4% of Evaluated)
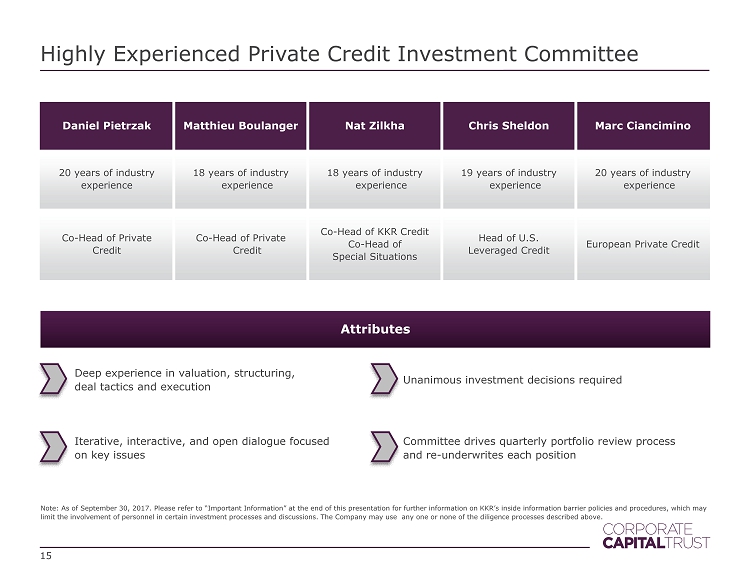
Deep experience in valuation, structuring, deal tactics and execution Unanimous investment decisions required Iterative, interactive, and open dialogue focused on key issues Committee drives quarterly portfolio review process and re - underwrites each position Highly Experienced Private Credit Investment Committee Note: As of September 30, 2017. Please refer to “Important Information” at the end of this presentation for further information on KKR’s inside information barrier policies and procedures , which may limit the involvement of personnel in certain investment processes and discussions. The Company may use any one or none of t he diligence processes described above. Daniel Pietrzak Matthieu Boulanger Nat Zilkha Chris Sheldon Marc Ciancimino 20 years of industry experience 18 years of industry experience 18 years of industry experience 19 years of industry experience 20 years of industry experience Co - Head of Private Credit Co - Head of Private Credit Co - Head of KKR Credit Co - Head of Special Situations Head of U.S. Leveraged Credit European Private Credit 15 Attributes
Portfolio 16
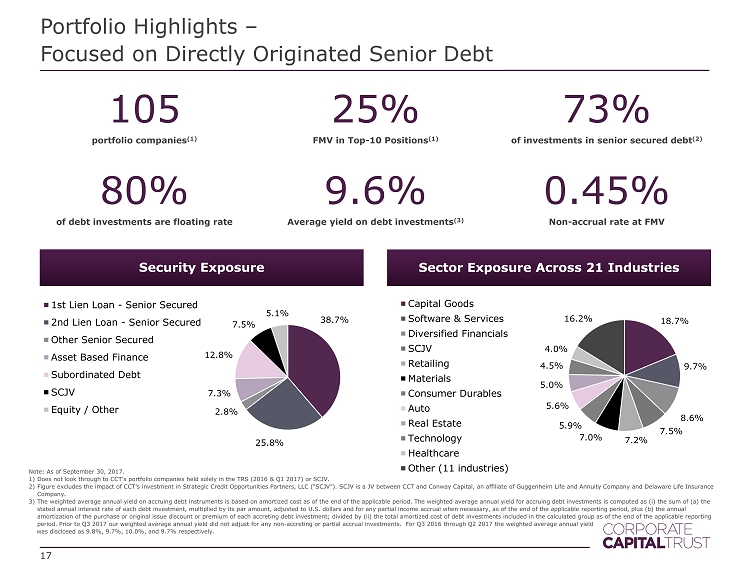
38.7% 25.8% 2.8% 7.3% 12.8% 7.5% 5.1% 1st Lien Loan - Senior Secured 2nd Lien Loan - Senior Secured Other Senior Secured Asset Based Finance Subordinated Debt SCJV Equity / Other Portfolio Highlights – Focused on Directly Originated Senior Debt Security Exposure 105 portfolio companies (1) 25% FMV in Top - 10 Positions (1) 73% of investments in senior secured debt (2) 80% of debt investments are floating rate 9.6% Average yield on debt investments (3) 0.45% Non - accrual rate at FMV 17 Sector Exposure Across 21 Industries 18.7% 9.7% 8.6% 7.5% 7.2% 7.0% 5.9% 5.6% 5.0% 4.5% 4.0% 16.2% Capital Goods Software & Services Diversified Financials SCJV Retailing Materials Consumer Durables Auto Real Estate Technology Healthcare Other (11 industries) Note: As of September 30, 2017. 1) Does not look through to CCT’s portfolio companies held solely in the TRS (2016 & Q1 2017) or SCJV. 2) Figure excludes the impact of CCT’s investment in Strategic Credit Opportunities Partners, LLC (“SCJV”). SCJV is a JV between CCT and Conway Capital, an affiliate of Guggenheim Life and Annuity Company and Delaware Life Insurance Company. 3) The weighted average annual yield on accruing debt instruments is based on amortized cost as of the end of the applicable period. Th e weighted average annual yield for accruing debt investments is computed as ( i ) the sum of (a) the stated annual interest rate of each debt investment, multiplied by its par amount, adjusted to U.S. dollars and for any parti al income accrual when necessary, as of the end of the applicable reporting period, plus (b) the annual amortization of the purchase or original issue discount or premium of each accreting debt investment; divided by (ii) the tot al amortized cost of debt investments included in the calculated group as of the end of the applicable reporting period. Prior to Q3 2017 our weighted average annual yield did not adjust for any non - accreting or partial accrual investments. For Q3 2016 through Q2 2017 the weighted average annual yield was disclosed as 9.8%, 9.7%, 10.0%, and 9.7% respectively.
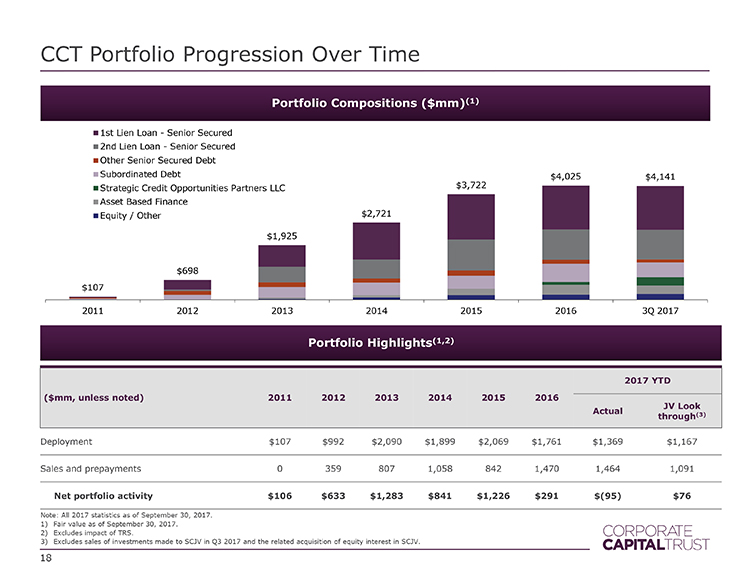
CCT Portfolio Progression Over Time Note: All 2017 statistics as of September 30, 2017. 1) Fair value as of September 30, 2017. 2) Excludes impact of TRS . Includes transfer to SCJV. Portfolio Highlights (1,2) ($mm, unless noted) 2011 2012 2013 2014 2015 2016 2017 YTD Actual JV Lookthrough Deployment $107 $992 $2,090 $1,899 $2,069 $1,669 $1,167 $1,167 Sales and prepayments 0 359 807 1,058 842 1,378 1,262 1,086 Net portfolio activity $106 $633 $1,283 $841 $1,226 $291 $(95) $81 Portfolio Compositions ($mm) (1) 18 $107 $698 $1,925 $2,721 $3,722 $4,025 $4,141 2011 2012 2013 2014 2015 2016 3Q 2017 1st Lien Loan - Senior Secured 2nd Lien Loan - Senior Secured Other Senior Secured Debt Subordinated Debt Strategic Credit Opportunities Partners LLC Asset Based Finance Equity / Other
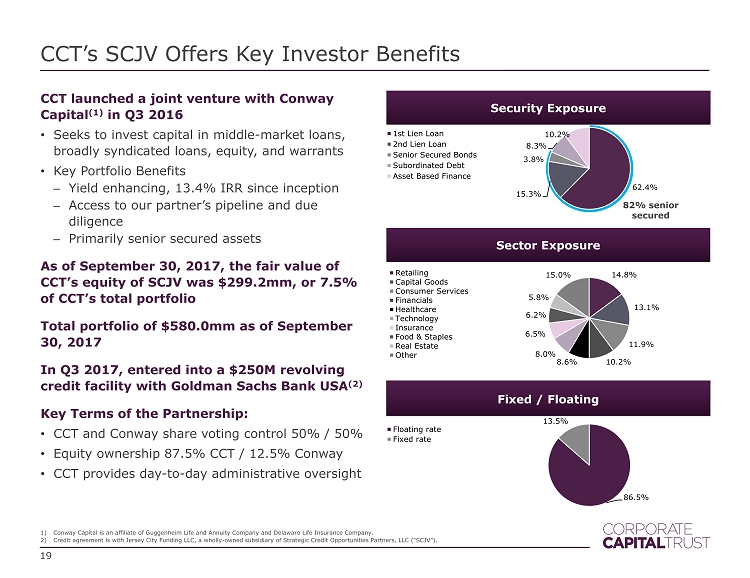
CCT’s SCJV Offers Key Investor Benefits CCT launched a joint venture with Conway Capital (1) in Q3 2016 • Seeks to invest capital in middle - market loans, broadly syndicated loans, equity, and warrants • Key Portfolio Benefits – Yield enhancing, 13.4% IRR since inception – Access to our partner’s pipeline and due diligence – Primarily senior secured assets As of September 30, 2017, the fair value of CCT’s equity of SCJV was $299.2mm, or 7.5% of CCT’s total portfolio Total portfolio of $580.0mm as of September 30, 2017 In Q3 2017, entered into a $250M revolving credit facility with Goldman Sachs Bank USA (2) Key Terms of the Partnership: • CCT and Conway share voting control 50 % / 50% • Equity ownership 87.5 % CCT / 12.5 % Conway • CCT provides day - to - day administrative oversight Fixed / Floating Sector Exposure Security Exposure 19 82% senior secured 62.4% 15.3% 3.8% 8.3% 10.2% 1st Lien Loan 2nd Lien Loan Senior Secured Bonds Subordinated Debt Asset Based Finance 14.8% 13.1% 11.9% 10.2% 8.6% 8.0% 6.5% 6.2% 5.8% 15.0% Retailing Capital Goods Consumer Services Financials Healthcare Technology Insurance Food & Staples Real Estate Other 86.5% 13.5% Floating rate Fixed rate 1) Conway Capital is an affiliate of Guggenheim Life and Annuity Company and Delaware Life Insurance Company . 2) Credit agreement is with Jersey City Funding LLC, a wholly - owned subsidiary of Strategic Credit Opportunities Partners, LLC (“SCJV ”).
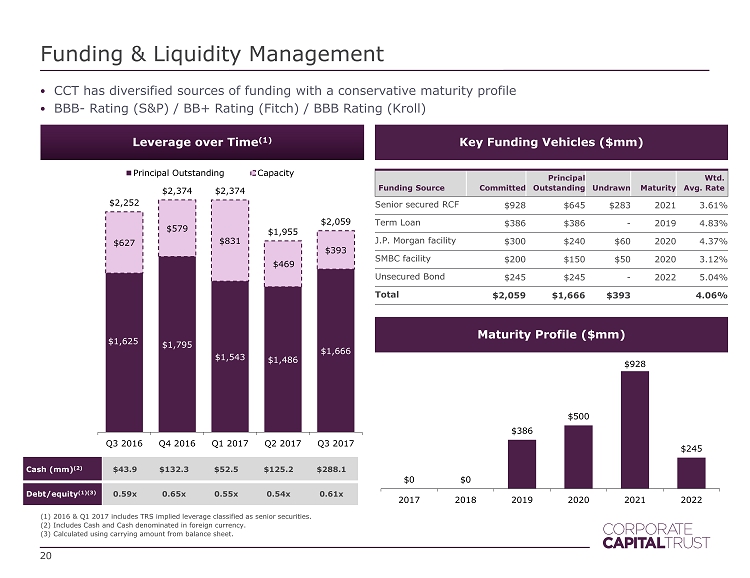
Funding & Liquidity Management Leverage over Time (1) 20 Cash (mm ) (2) $43.9 $132.3 $52.5 $125.2 $288.1 Debt/equity (1)(3) 0.59x 0.65x 0.55x 0.54x 0.61x $0 $0 $386 $500 $928 $245 2017 2018 2019 2020 2021 2022 (1) 2016 & Q1 2017 includes TRS implied leverage classified as senior securities . (2) Includes Cash and Cash denominated in foreign currency . (3) Calculated using carrying amount from balance sheet. $1,625 $1,795 $1,543 $1,486 $1,666 $627 $579 $831 $469 $393 $2,252 $2,374 $2,374 $1,955 $2,059 Q3 2016 Q4 2016 Q1 2017 Q2 2017 Q3 2017 Principal Outstanding Capacity Key Funding Vehicles ($mm) Fundin g Source Committed Principal Outstanding Undrawn Maturity Wtd . Avg. Rate Senior secured RCF $928 $ 645 $283 2021 3.61% Term Loan $386 $386 - 2019 4.83% J.P. Morgan facility $300 $240 $60 2020 4.37% SMBC facility $200 $150 $50 2020 3.12% Unsecured Bond $245 $245 - 2022 5.04% Total $2,059 $ 1,666 $393 4.06% Maturity Profile ($mm) • CCT has diversified sources of funding with a conservative maturity profile • BBB - Rating (S&P) / BB+ Rating (Fitch) / BBB Rating (Kroll)
Closing Remarks 21
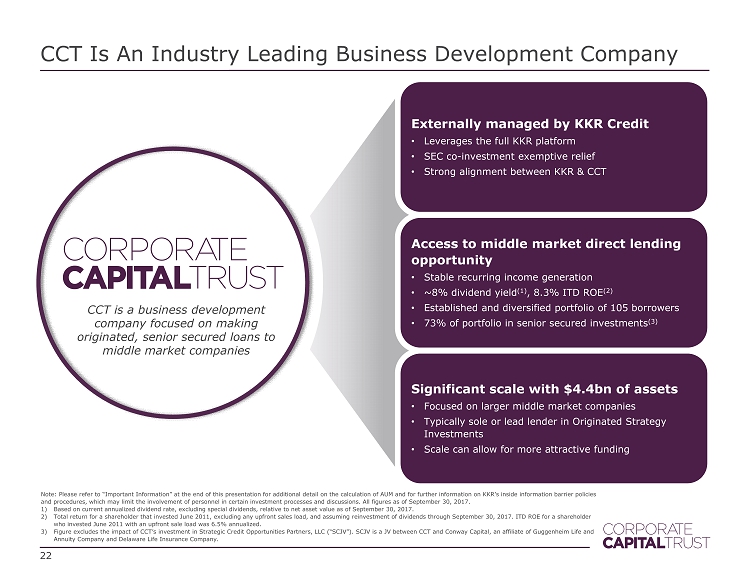
CCT Is An Industry Leading Business Development Company 22 Externally managed by KKR Credit • Leverages the full KKR platform • SEC co - investment exemptive relief • Strong alignment between KKR & CCT Significant scale with $4.4bn of assets • Focused on larger middle market companies • Typically sole or lead lender in Originated Strategy Investments • Scale can allow for more attractive funding Access to middle market direct lending opportunity • Stable recurring income generation • ~8% dividend yield (1) , 8.3% ITD ROE (2) • Established and diversified portfolio of 105 borrowers • 73% of portfolio in senior secured investments (3) CCT is a business development company focused on making originated, senior secured loans to middle market companies Note: Please refer to “Important Information” at the end of this presentation for additional detail on the calculation of AUM and for further information on KKR’s inside information bar rie r policies and procedures, which may limit the involvement of personnel in certain investment processes and discussions . All figures as of September 30, 2017. 1) Based on current annualized dividend rate, excluding special dividends, relative to net asset value as of September 30, 2017. 2) Total return for a shareholder that invested June 2011, excluding any upfront sales load, and assuming reinvestment of divide nds through September 30, 2017. ITD ROE for a shareholder who invested June 2011 with an upfront sale load was 6.5% annualized. 3) Figure excludes the impact of CCT’s investment in Strategic Credit Opportunities Partners, LLC (“SCJV”). SCJV is a JV between CCT and Conway Capital, an affiliate of Guggenheim Life and Annuity Company and Delaware Life Insurance Company.
Appendix – Additional Information 23

$0.1 $0.9 $2.3 $3.0 $4.0 $4.4 $4.4 CCT Is Mature and Scaled with $4.4bn of Assets Note: Gross assets as of September 30 , 2017 and 2011 - 2016 year - end . 1) SCJV is a JV between CCT and Conway Capital, an affiliate of Guggenheim Life and Annuity Company and Delaware Life Insurance Company. 2011 2012 2013 2014 2015 2016 2017 Q3 CCT Gross Assets ($ bn ) 24 May 2013 Granted SEC co - investment exemptive relief August 2016 First investment in SCJV (1) April 2017 Commenced plans to list and for KKR to become sole investment advisor March 2014 Received investment grade credit rating (BBB - ) from S&P 1.5% Mgmt Fee At Listing 20% Performance Fee 7% Hurdle Rate October 2016 Closed equity offering (>70k investors) July 2011 Commenced fundraising and investment operations June / August 2017 $245mm unsecured notes at a fixed 5% rate
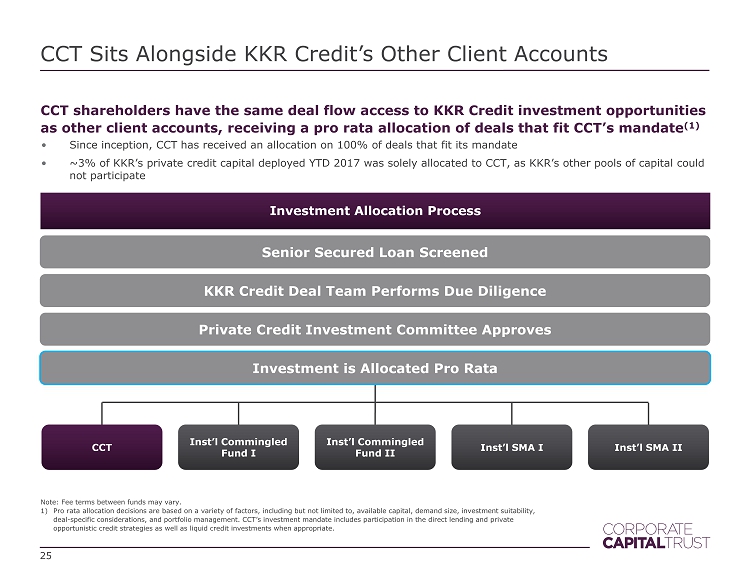
CCT Sits Alongside KKR Credit’s Other Client Accounts CCT shareholders have the same deal flow access to KKR Credit investment opportunities as other client accounts, receiving a pro rata allocation of deals that fit CCT’s mandate (1) 25 Note: Fee terms between funds may vary. 1) Pro rata allocation decisions are based on a variety of factors, including but not limited to, available capital, demand size , i nvestment suitability, deal - specific considerations, and portfolio management . CCT’s investment mandate includes participation in the direct lending and private opportunistic credit strategies as well as liquid credit investments when appropriate. Investment Allocation Process Senior Secured Loan Screened KKR Credit Deal Team Due Diligence • Since inception, CCT has received an allocation on 100 % of deals that fit its mandate • ~ 3% of KKR’s private credit capital deployed YTD 2017 was solely allocated to CCT, as KKR’s other pools of capital could not participate Senior Secured Loan Screened KKR Credit Deal Team Performs Due Diligence CCT Inst’l Commingled Fund I Inst’l Commingled Fund II Inst’l SMA I Inst’l SMA II Private Credit Investment Committee Approves Investment is Allocated Pro Rata
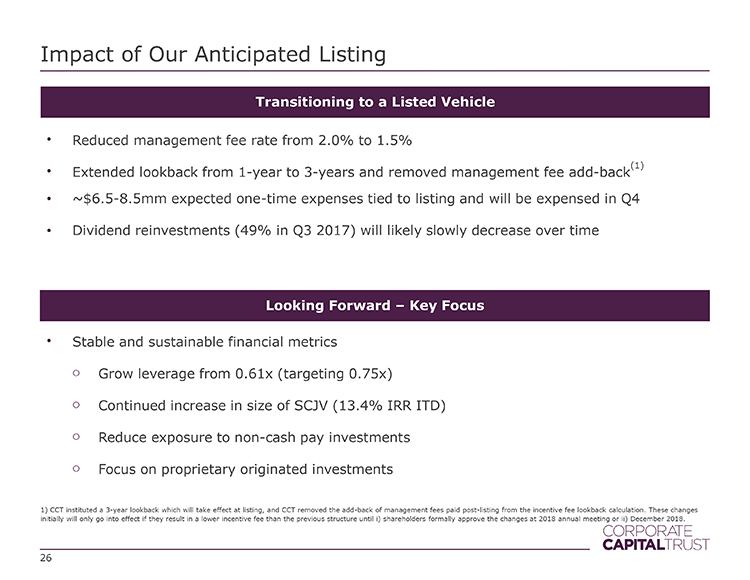
Impact of Our Anticipated Listing 26 Transitioning to a Listed Vehicle Looking Forward – Key Focus • Reduced management fee rate from 2.0% to 1.5% • Extended lookback from 1 - year to 3 - years and removed management fee add - back (1) • ~$6.5 - 8.5mm expected one - time expenses tied to listing and will be expensed in Q4 • Dividend reinvestments (49% in Q3 2017) will likely slowly decrease over time • Stable and sustainable financial metrics o Grow leverage from 0.61x (targeting 0.75x) o Continued increase in size of SCJV ( 13.4% IRR ITD) o Reduce exposure to non - cash pay investments o Focus on proprietary originated investments 1) CCT instituted a 3 - year lookback which will take effect at listing, and CCT removed the add - back of management fees paid post - li sting from the incentive fee lookback calculation. These changes initially will only go into effect if they result in a lower incentive fee than the previous structure until i) shareholders for mally approve the changes or ii) December 2018.
Appendix – Historical Financials 27
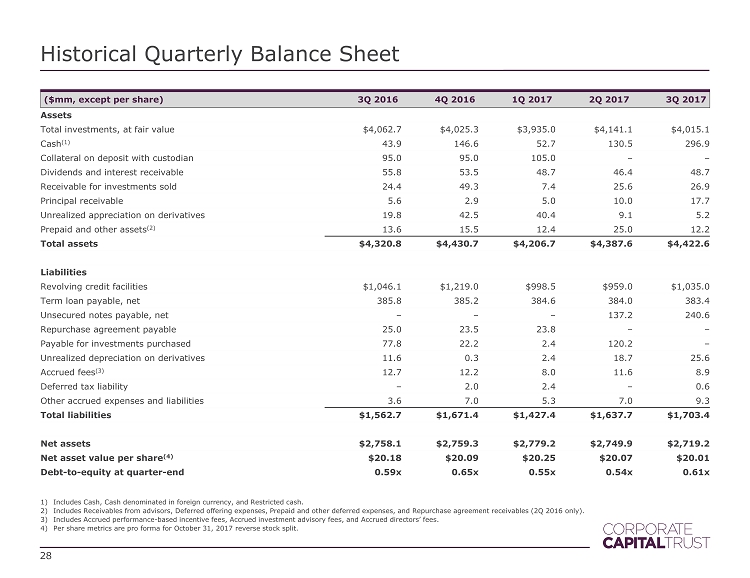
Historical Quarterly Balance Sheet 1) Includes Cash, Cash denominated in foreign currency, and Restricted cash. 2) Includes Receivables from advisors, Deferred offering expenses, Prepaid and other deferred expenses, and Repurchase agreement re ceivables (2Q 2016 only ). 3) Includes Accrued performance - based incentive fees, Accrued investment advisory fees, and Accrued directors’ fees. 4) Per share metrics are pro forma for October 31, 2017 reverse stock split . 28 ($mm, except per share) 3Q 2016 4Q 2016 1Q 2017 2Q 2017 3Q 2017 Assets Total investments, at fair value $4,062.7 $4,025.3 $3,935.0 $4,141.1 $ 4,015.1 Cash (1) 43.9 146.6 52.7 130.5 296.9 Collateral on deposit with custodian 95.0 95.0 105.0 – – Dividends and interest receivable 55.8 53.5 48.7 46.4 48.7 Receivable for investments sold 24.4 49.3 7.4 25.6 26.9 Principal receivable 5.6 2.9 5.0 10.0 17.7 Unrealized appreciation on derivatives 19.8 42.5 40.4 9.1 5.2 Prepaid and other assets (2 ) 13.6 15.5 12.4 25.0 12.2 Total assets $4,320.8 $4,430.7 $4,206.7 $4,387.6 $4,422.6 Liabilities Revolving credit facilities $1,046.1 $1,219.0 $998.5 $959.0 $1,035.0 Term loan payable, net 385.8 385.2 384.6 384.0 383.4 Unsecured notes payable, net – – – 137.2 240.6 Repurchase agreement payable 25.0 23.5 23.8 – – Payable for investments purchased 77.8 22.2 2.4 120.2 – Unrealized depreciation on derivatives 11.6 0.3 2.4 18.7 25.6 Accrued fees (3) 12.7 12.2 8.0 11.6 8.9 Deferred tax liability – 2.0 2.4 – 0.6 Other accrued expenses and liabilities 3.6 7.0 5.3 7.0 9.3 Total liabilities $1,562.7 $1,671.4 $1,427.4 $1,637.7 $ 1,703.4 Net assets $2,758.1 $2,759.3 $2,779.2 $2,749.9 $ 2,719.2 Net asset value per share (4) $20.18 $20.09 $20.25 $20.07 $20.01 Debt - to - equity at quarter - end 0.59x 0.65x 0.55x 0.54x 0.61x
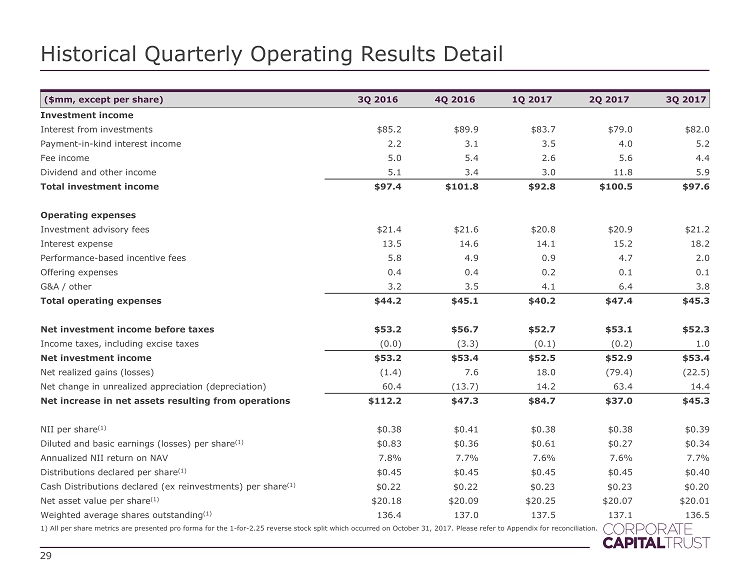
Historical Quarterly Operating Results Detail 29 ($mm, except per share) 3Q 2016 4Q 2016 1Q 2017 2Q 2017 3Q 2017 Investment income Interest from investments $85.2 $89.9 $83.7 $79.0 $82.0 Payment - in - kind interest income 2.2 3.1 3.5 4.0 5.2 Fee income 5.0 5.4 2.6 5.6 4.4 Dividend and other income 5.1 3.4 3.0 11.8 5.9 Total investment income $97.4 $101.8 $92.8 $100.5 $97.6 Operating expenses Investment advisory fees $21.4 $21.6 $20.8 $20.9 $21.2 Interest expense 13.5 14.6 14.1 15.2 18.2 Performance - based incentive fees 5.8 4.9 0.9 4.7 2.0 Offering expenses 0.4 0.4 0.2 0.1 0.1 G&A / other 3.2 3.5 4.1 6.4 3.8 Total operating expenses $44.2 $45.1 $40.2 $47.4 $45.3 Net investment income before taxes $ 53.2 $56.7 $52.7 $53.1 $52.3 Income taxes, including excise taxes (0.0) (3.3) (0.1) (0.2) 1.0 Net investment income $53.2 $53.4 $52.5 $52.9 $53.4 Net realized gains (losses) (1.4) 7.6 18.0 (79.4) (22.5) Net change in unrealized appreciation (depreciation) 60.4 (13.7) 14.2 63.4 14.4 Net increase in net assets resulting from operations $112.2 $47.3 $84.7 $37.0 $45.3 NII per share (1) $0.38 $0.41 $0.38 $0.38 $ 0.39 Diluted and basic earnings (losses) per share (1) $0.83 $0.36 $0.61 $0.27 $ 0.34 Annualized NII return on NAV 7.8% 7.7% 7.6% 7.6% 7.7% Distributions declared per share (1) $0.45 $0.45 $0.45 $0.45 $ 0.40 Cash Distributions declared (ex reinvestments) per share (1) $0.22 $0.22 $0.23 $0.23 $0.20 Net asset value per share (1) $20.18 $20.09 $20.25 $20.07 $ 20.01 Weighted average shares outstanding (1) 136.4 137.0 137.5 137.1 136.5 1) All per share metrics are presented pro forma for the 1 - for - 2.25 reverse stock split which occurred on October 31, 2017. Please refer to Appendix for reconciliation.
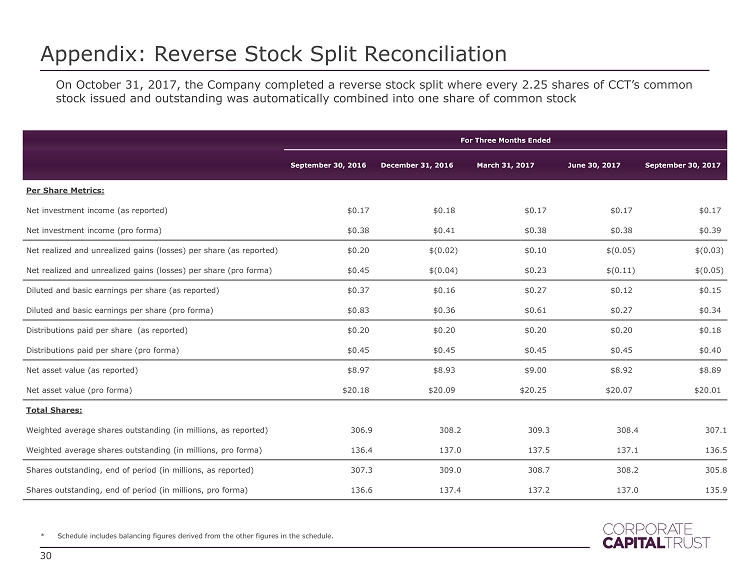
Appendix: Reverse Stock Split Reconciliation 30 On October 31, 2017, the Company completed a reverse stock split where every 2.25 shares of CCT’s common stock issued and outstanding was automatically combined into one share of common stock For Three Months Ended Septembe r 30, 2016 December 31, 2016 March 31, 2017 June 30, 2017 September 30, 2017 Per Share Metrics: Net investment income (as reported) $0.17 $0.18 . $0.17 $0.17 . $0.17 . Net investment income (pro forma) $0.38 $0.41 . $0.38 $0.38 . $0.39 . Net realized and unrealized gains (losses) per share (as reported) $0.20 $(0.02) $0.10 $(0.05) $(0.03) Net realized and unrealized gains (losses) per share (pro forma) $0.45 $(0.04) $0.23 $(0.11) $(0.05) Diluted and basic earnings per share (as reported) $0.37 $0.16 . $0.27 $0.12 . $0.15 . Diluted and basic earnings per share (pro forma) $0.83 $0.36 . $0.61 $0.27 . $0.34 . Distributions paid per share (as reported) $0.20 $0.20 . $0.20 $0.20 . $0.18 . Distributions paid per share (pro forma) $0.45 $0.45 . $0.45 $0.45 . $0.40 . Net asset value (as reported) $8.97 $8.93 . $9.00 $8.92 . $8.89 . Net asset value (pro forma) $20.18 $20.09 . $20.25 $20.07 . $20.01 . Total Shares: Weighted average shares outstanding (in millions, as reported) 306.9 308.2 309.3 308.4 307.1 Weighted average shares outstanding (in millions, pro forma) 136.4 137.0 137.5 137.1 136.5 Shares outstanding, end of period (in millions, as reported) 307.3 309.0 308.7 308.2 305.8 Shares outstanding, end of period (in millions, pro forma) 136.6 137.4 137.2 137.0 135.9 * Schedule includes balancing figures derived from the other figures in the schedule.
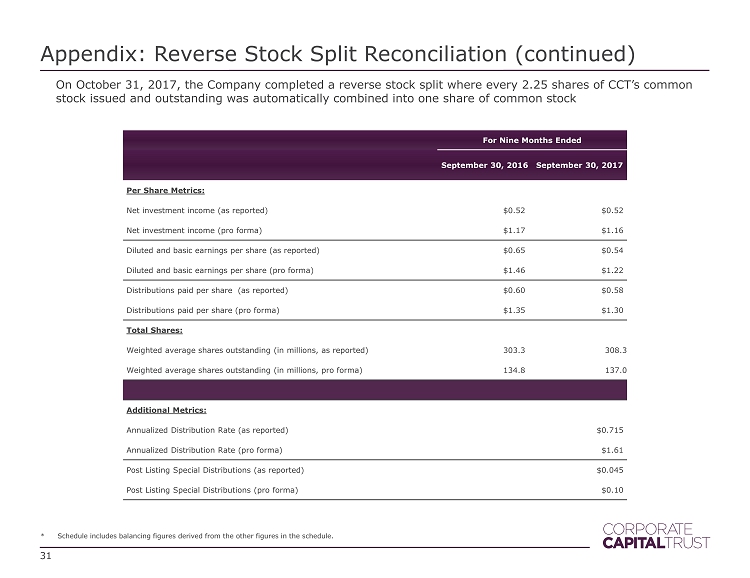
Appendix: Reverse Stock Split Reconciliation (continued) 31 On October 31, 2017, the Company completed a reverse stock split where every 2.25 shares of CCT’s common stock issued and outstanding was automatically combined into one share of common stock For Nine Months Ended Septembe r 30, 2016 September 30, 2017 Per Share Metrics: Net investment income (as reported) $0.52 $0.52 Net investment income (pro forma) $1.17 $1.16 Diluted and basic earnings per share (as reported) $0.65 $0.54 Diluted and basic earnings per share (pro forma) $1.46 $1.22 Distributions paid per share (as reported) $0.60 $0.58 Distributions paid per share (pro forma) $1.35 $1.30 Total Shares: Weighted average shares outstanding (in millions, as reported) 303.3 308.3 Weighted average shares outstanding (in millions, pro forma) 134.8 137.0 Additional Metrics: Annualized Distribution Rate (as reported) $0.715 Annualized Distribution Rate (pro forma) $1.61 Post Listing Special Distributions (as reported) $0.045 Post Listing Special Distributions (pro forma) $0.10 * Schedule includes balancing figures derived from the other figures in the schedule.
Appendix – Case Studies The companies shown on pages 32 - 37 represent a cross - sample of executed transactions in the last 18 months, and CCT would seek to participate in similar transactio ns going forward. The transactions identified are not representative of all of the securities purchased or sold by CCT, and it should not be assume d t hat the investment in the companies identified was or will be profitable. Please refer to “Important Information” for further information on KKR’s inside information barrier policies and procedures, whi ch may limit the involvement of personnel in certain investment processes and discussions. Past performance is no guarantee of future results. 32
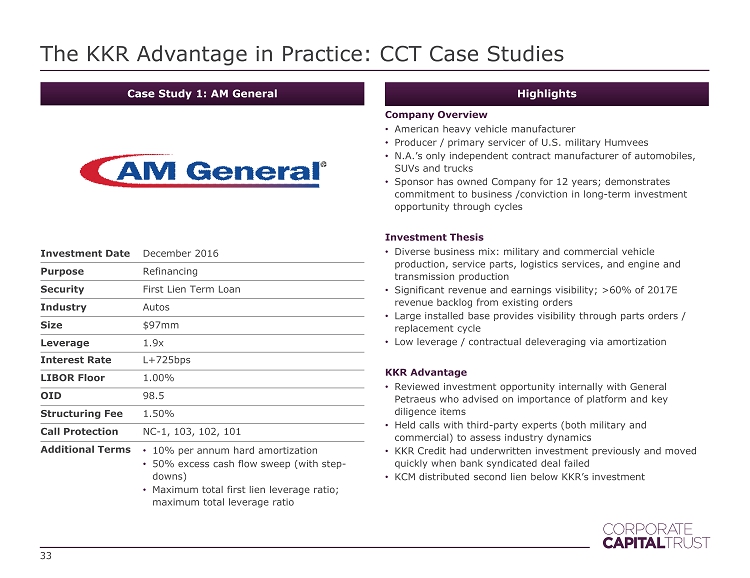
Case Study 1: AM General Investment Date December 2016 Purpose Refinancing Security First Lien Term Loan Industry Autos Size $97mm Leverage 1.9x Interest Rate L+725bps LIBOR Floor 1.00% OID 98.5 Structuring Fee 1.50% Call Protection NC - 1, 103, 102, 101 Additional Terms • 10% per annum hard amortization • 50% excess cash flow sweep (with step - downs) • Maximum total first lien leverage ratio; maximum total leverage ratio The KKR Advantage in Practice: CCT Case Studies 33 Highlights Company Overview • American heavy vehicle manufacturer • Producer / primary servicer of U.S. military Humvees • N.A.’s only independent contract manufacturer of automobiles, SUVs and trucks • Sponsor has owned Company for 12 years; demonstrates commitment to business /conviction in long - term investment opportunity through cycles Investment Thesis • Diverse business mix : military and commercial vehicle production, service parts, logistics services, and engine and transmission production • Significant revenue and earnings visibility; >60% of 2017E revenue backlog from existing orders • Large installed base provides visibility through parts orders / replacement cycle • Low leverage / contractual deleveraging via amortization KKR Advantage • Reviewed investment opportunity internally with General Petraeus who advised on importance of platform and key diligence items • Held calls with third - party experts (both military and commercial) to assess industry dynamics • KKR Credit had underwritten investment previously and moved quickly when bank syndicated deal failed • KCM distributed second lien below KKR’s investment
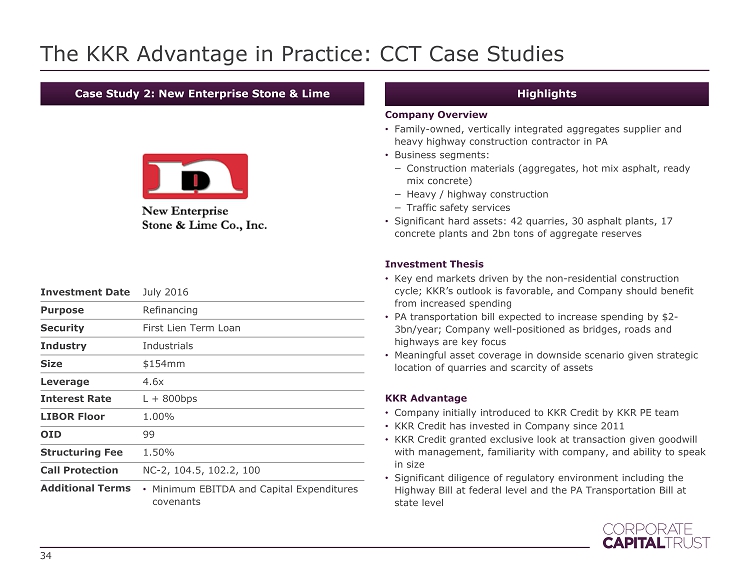
Case Study 2: New Enterprise Stone & Lime Investment Date July 2016 Purpose Refinancing Security First Lien Term Loan Industry Industrials Size $154mm Leverage 4.6x Interest Rate L + 800bps LIBOR Floor 1.00% OID 99 Structuring Fee 1.50% Call Protection NC - 2, 104.5 , 102.2, 100 Additional Terms • Minimum EBITDA and Capital Expenditures covenants The KKR Advantage in Practice: CCT Case Studies 34 Highlights Company Overview • Family - owned, vertically integrated aggregates supplier and heavy highway construction contractor in PA • Business segments: − Construction materials (aggregates, hot mix asphalt, ready mix concrete) − Heavy / highway construction − Traffic safety services • Significant hard assets: 42 quarries, 30 asphalt plants, 17 concrete plants and 2bn tons of aggregate reserves Investment Thesis • Key end markets driven by the non - residential construction cycle; KKR’s outlook is favorable, and Company should benefit from increased spending • PA transportation bill expected to increase spending by $2 - 3bn/year; Company well - positioned as bridges, roads and highways are key focus • Meaningful asset coverage in downside scenario given strategic location of quarries and scarcity of assets KKR Advantage • Company initially introduced to KKR Credit by KKR PE team • KKR Credit has invested in Company since 2011 • KKR Credit granted exclusive look at transaction given goodwill with management, familiarity with company, and ability to speak in size • Significant diligence of regulatory environment including the Highway Bill at federal level and the PA Transportation Bill at state level
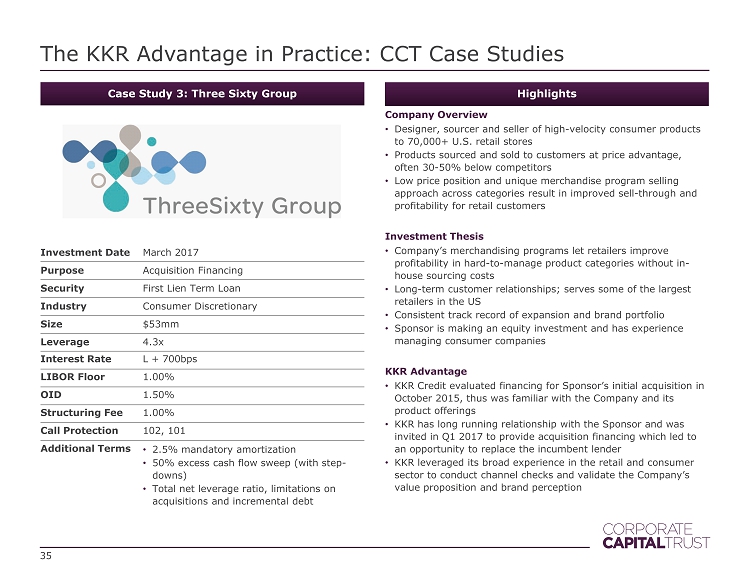
Case Study 3: Three Sixty Group Investment Date March 2017 Purpose Acquisition Financing Security First Lien Term Loan Industry Consumer Discretionary Size $53mm Leverage 4.3x Interest Rate L + 700bps LIBOR Floor 1.00% OID 1.50% Structuring Fee 1.00% Call Protection 102, 101 Additional Terms • 2.5% mandatory amortization • 50% excess cash flow sweep (with step - downs) • Total net leverage ratio, limitations on acquisitions and incremental debt The KKR Advantage in Practice: CCT Case Studies 35 Highlights Company Overview • Designer, sourcer and seller of high - velocity consumer products to 70,000+ U.S. retail stores • Products sourced and sold to customers at price advantage, often 30 - 50% below competitors • Low price position and unique merchandise program selling approach across categories result in improved sell - through and profitability for retail customers Investment Thesis • Company’s merchandising programs let retailers improve profitability in hard - to - manage product categories without in - house sourcing costs • Long - term customer relationships; serves some of the largest retailers in the US • Consistent track record of expansion and brand portfolio • Sponsor is making an equity investment and has experience managing consumer companies KKR Advantage • KKR Credit evaluated financing for Sponsor’s initial acquisition in October 2015, thus was familiar with the Company and its product offerings • KKR has long running relationship with the Sponsor and was invited in Q1 2017 to provide acquisition financing which led to an opportunity to replace the incumbent lender • KKR leveraged its broad experience in the retail and consumer sector to conduct channel checks and validate the Company’s value proposition and brand perception

Case Study 4: NBG Home Investment Date April 2017 Purpose Acquisition Financing Security First Lien Term Loan, Second Lien Term Loan, Equity Co - Invest Industry Home Furnishings Size First Lien: $26mm; Second Lien: $34mm; Equity: $3mm Leverage First Lien: 3.4x; Second Lien: 4.3x Interest Rate First Lien: L+550bps; Second Lien: L+975bps LIBOR Floor 1.00% OID First Lien: 98; Second Lien: 98.5 Structuring Fee Second Lien: 1.50% Call Protection First Lien: 101; Second Lien: 103/102/101 Additional Terms • Covenant - lite first lien and second lien The KKR Advantage in Practice: CCT Case Studies 36 Highlights Company Overview • Designer, manufacturer and distributor of affordable home décor products • Sells through mass market (Target, Walmart), specialty ( HomeGoods , Michael’s), home improvement (Home Depot, Lowe’s) and online (Amazon) distributors Investment Thesis • Diversified customer base; no customer >10% of sales • End markets have been recession resistant • Market driven more by remodel / repairs than new homes due to the low price points and frequent replacement cycles • Affordable home décor is a large / attractive market; $16bn in size • Sponsor specializes in retail investments; extensive experience in retail distribution and sourcing KKR Advantage • Early call from Sycamore to provide complete financing solution • KKR Credit proposed a differentiated solution: covenant - lite first and second lien term loan • KCM acted as Joint Lead Arranger and Joint Bookrunner on the $260mm syndicated first lien term loan while KKR Credit provided the entire second lien term loan
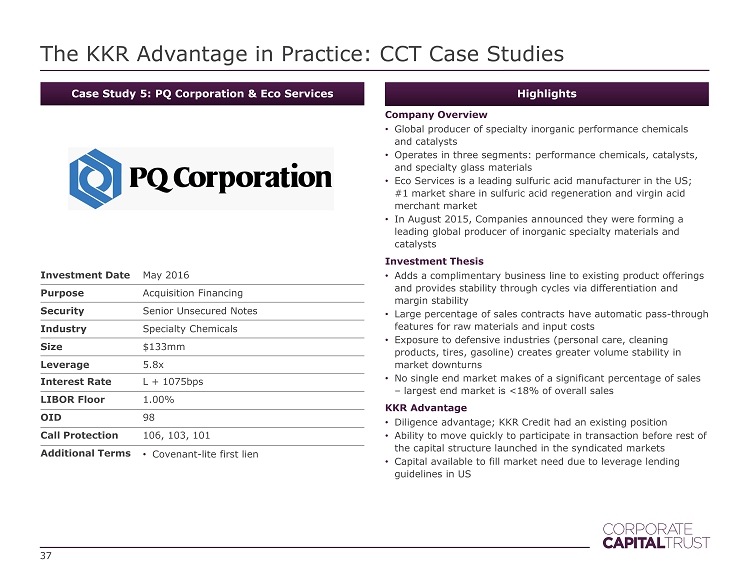
Case Study 5: PQ Corporation & Eco Services Investment Date May 2016 Purpose Acquisition Financing Security Senior Unsecured Notes Industry Specialty Chemicals Size $133mm Leverage 5.8x Interest Rate L + 1075bps LIBOR Floor 1.00% OID 98 Call Protection 106, 103, 101 Additional Terms • Covenant - lite first lien The KKR Advantage in Practice: CCT Case Studies 37 Highlights Company Overview • Global producer of specialty inorganic performance chemicals and catalysts • Operates in three segments: performance chemicals, catalysts, and specialty glass materials • Eco Services is a leading sulfuric acid manufacturer in the US; #1 market share in sulfuric acid regeneration and virgin acid merchant market • In August 2015, Companies announced they were forming a leading global producer of inorganic specialty materials and catalysts Investment Thesis • Adds a complimentary business line to existing product offerings and provides stability through cycles via differentiation and margin stability • Large percentage of sales contracts have automatic pass - through features for raw materials and input costs • Exposure to defensive industries (personal care, cleaning products, tires, gasoline) creates greater volume stability in market downturns • No single end market makes of a significant percentage of sales – largest end market is <18% of overall sales KKR Advantage • Diligence advantage; KKR Credit had an existing position • Ability to move quickly to participate in transaction before rest of the capital structure launched in the syndicated markets • Capital available to fill market need due to leverage lending guidelines in US
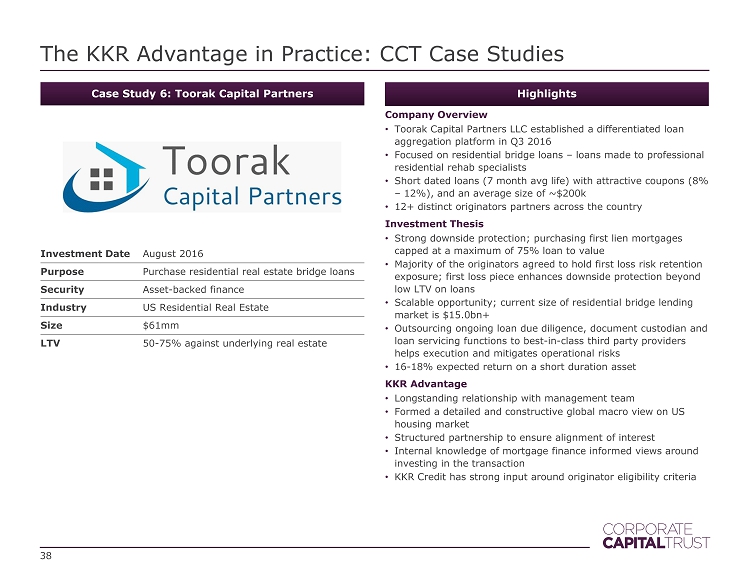
Case Study 6: Toorak Capital Partners Investment Date August 2016 Purpose Purchase residential real estate bridge loans Security Asset - backed finance Industry US Residential Real Estate Size $61mm LTV 50 - 75% against underlying real estate The KKR Advantage in Practice: CCT Case Studies 38 Highlights Company Overview • Toorak Capital Partners LLC established a differentiated loan aggregation platform in Q3 2016 • Focused on residential bridge loans – loans made to professional residential rehab specialists • Short dated loans (7 month avg life) with attractive coupons (8% – 12%), and an average size of ~$200k • 12+ distinct originators partners across the country Investment Thesis • Strong downside protection; purchasing first lien mortgages capped at a maximum of 75% loan to value • Majority of the originators agreed to hold first loss risk retention exposure; first loss piece enhances downside protection beyond low LTV on loans • Scalable opportunity; current size of residential bridge lending market is $15.0bn+ • Outsourcing ongoing loan due diligence, document custodian and loan servicing functions to best - in - class third party providers helps execution and mitigates operational risks • 16 - 18% expected return on a short duration asset KKR Advantage • Longstanding relationship with management team • Formed a detailed and constructive global macro view on US housing market • Structured partnership to ensure alignment of interest • Internal knowledge of mortgage finance informed views around investing in the transaction • KKR Credit has strong input around originator eligibility criteria
Important Information 39
This presentation is for informational purposes only and is neither an offer to sell nor a solicitation of an offer to buy the securities described herein . Investing in Corporate Capital Trust, Inc . (“We”, “CCT”, or the “Company”) is not suitable for all investors and they should carefully read the information in our Forms 10 - Q and 10 - K filings and in our other public filings before making an investment . Consider the investment objectives, risks, charges and expenses before deciding to invest in our shares of common stock . The information contained herein does not replace or supersede any information contained within the company’s 10 - K, 10 - Qs or other public filings . Corporate Capital Trust closed to new investors who purchase through the independent broker - dealer channel on Feb . 12 , 2016 . Corporate Capital Trust is currently advised by CNL Fund Advisors Company (CNL) and subadvised by KKR Credit Advisors (US) LLC (KKR Credit), affiliates of CNL Financial Group and KKR & Co . L . P . , respectively . The data and information presented are for informational purposes only . KKR Credit conducts its business through KKR Credit Advisors (US) LLC, an investment adviser registered with the U . S . Securities and Exchange Commission (the “SEC”) . KKR Credit Advisors (Ireland), authorized and regulated by the Central Bank of Ireland, and KKR Credit Advisors (UK) LLP which is authorized and regulated by the Financial Conduct Authority in the United Kingdom . References to “KKR Capstone” or “Capstone” are to all or any of KKR Capstone Americas LLC, KKR Capstone EMEA LLP, KKR Capstone EMEA (International) LLP, KKR Capstone Asia Limited, and their affiliates, which are owned and controlled by their senior management . KKR Capstone is not a subsidiary or affiliate of KKR . KKR Capstone operates under several consulting agreements with KKR and uses the “KKR” name under license from KKR . References to operating executives, operating experts, or operating consultants are to employees of KKR Capstone and not to employees of KKR . In this presentation, the impact of initiatives in which KKR Capstone has been involved is based on KKR Capstone’s internal analysis and information provided by the applicable portfolio company . Impacts of such initiatives are estimates that have not been verified by a third party and are not based on any established standards or protocols . They may also reflect the influence of external factors, such as macroeconomic or industry trends, that are unrelated to the initiative presented . Participation of KKR Private Equity, KKR Capital Markets, and KKR Capstone personnel in the public investment process is subject to applicable law and inside information barrier policies and procedures, which may limit the involvement of KKR Private Equity, KKR Capital Markets, and KKR Capstone personnel in certain circumstances and KKR Credit’s ability to leverage such integration with KKR . Discussions with Senior Advisors and employees of KKR’s managed portfolio companies are also subject to the inside information barrier policies and procedures, which may restrict or limit discussions and/or collaborations with KKR Credit . The information contained in this presentation is for informational purposes only and is not an offer to buy or the solicitation of an offer to sell any securities of the Company . The tender offer referenced herein will be made only pursuant to an offer to purchase, letter of transmittal and related materials (the “Tender Materials”) . The full details of the tender offer, including complete instructions on how to tender shares of common stock, will be included in the Tender Materials, which the Company will distribute to shareholders and file with the SEC upon the commencement of the tender offer . Shareholders are urged to carefully read the Tender Materials when they become available because they will contain important information, including the terms and conditions of the tender offer . The Tender Materials (when they become available ), may be obtained free of charge at the SEC’s website (http : //www . sec . gov), at the Company’s website (http : //www . corporatecapitaltrust . com/investor - resources), or by writing to the Company at 450 S . Orange Avenue, Orlando, Florida 32801 (telephone number 866 - 650 - 0650 ) or, after the listing (“Listing”) of the shares of the Company’s common stock on the New York Stock Exchange LLC (“NYSE”), 555 California Street, 50 th Floor, San Francisco, CA 94104 (telephone number 415 - 315 - 3620 ) . 40 Important Information & Forward Looking Statements
41 Some of the statements in this presentation constitute “forward - looking statements” because they relate to future events or the future performance or financial condition of the company . Forward - looking statements generally can be identified by the words “believes,” “expects,” “intends,” “plans,” “estimates” or similar expressions that indicate future events . These statements are based on the beliefs and assumptions of the company’s management and on the information currently available to management at the time of such statements . Although we believe that the expectations reflected in such forward - looking statements are based upon reasonable assumptions, our actual results could differ materially from those set forth in the forward - looking statements . Some factors that might cause such a difference include the following : persistent economic weakness at the global or national level, increased direct competition, changes in government regulations or accounting rules, changes in local, national and global capital market conditions, our ability to obtain or maintain credit lines or credit facilities on satisfactory terms, changes in interest rates, our ability to identify suitable investments, our ability to close on identified investments, our ability to maintain our qualification as a regulated investment company and as a business development company, the ability of our Advisors and their affiliates to attract and retain highly talented professionals, the ability of our Advisors to locate suitable borrowers for our loans, the ability of such borrowers to make payments under their respective loans, our ability to complete the listing of our shares of common stock on the New York Stock Exchange LLC (NYSE), our ability to complete the proposed related tender offer, and the price at which shares of our common stock may trade on the NYSE, which may be higher or lower than the purchase price in the proposed tender offer . Given these uncertainties, we caution you not to place undue reliance on such statements, which apply only as of the date hereof . Important factors that could cause actual results to differ materially from the company’s expectations include those described above and disclosed in the company’s filings with the SEC, including the company’s annual report on Form 10 - K for the year ended December 31 , 2016 , which was filed with the SEC on March 20 , 2017 and the company’s quarterly reports subsequently filed on form 10 - Q . The company undertakes no obligation to update such statements to reflect subsequent events . Important Information & Forward Looking Statements
42 Risk Factors In addition to the other risk factors disclosed in our Forms 10 - K and 10 - Q, risks of investing in Corporate Capital Trust include : • Investing in Corporate Capital Trust may be considered speculative and involves a high degree of risk, including the risk of a substantial loss of investment . Other risks include a limited operating history, reliance on the advisors of the company, conflicts of interest, payment of substantial fees to the advisors of the company and its affiliates, limited liquidity, and liquidation at less than the original amount invested . Corporate Capital Trust is a long - term investment . Investing for short time periods makes losses more likely . See the Risk Factors section in our Forms 10 - K, 10 - Q and other public filings to read about the risks an investor should consider before buying shares of Corporate Capital Trust . There is no assurance the investment objectives will be met . • Corporate Capital Trust may extend loans to those with low credit quality and there may be limited information about those companies, which involves interest rate risk and financial market risk . Leverage can increase expenses and also volatility, which may magnify gains and losses . • Distributions are not guaranteed and subject to change . Future distributions may include a return of principal or borrowed funds, which may lower overall returns to the investor and may not be sustainable . We have borrowed funds to make investments, which increases the risks of investing in our shares . • An investment in Corporate Capital Trust is illiquid, which means that an investor will have limited ability to sell shares and should not expect to be able to sell their holdings until a liquidity event such as the proposed listing described herein . The board of directors must consider a liquidity event on or before Dec . 31 , 2018 , but there is no guarantee that any liquidity event will take place . Information Barrier Disclosure Participation of KKR Private Equity, KKR Capital Markets, and KKR Capstone personnel in the public markets investment process is subject to applicable law and inside information barrier policies and procedures, which may limit the involvement of such personnel in certain circumstances and KKR Credit’s ability to leverage such integration with KKR . Discussions with Senior Advisors and employees of the Firm’s managed portfolio companies are also subject to the inside information barrier policies and procedures, which may restrict or limit discussions and/or collaborations with KKR Credit . Assets Under Management References to “assets under management” or “AUM” represent the assets managed by KKR or its strategic partners as to which KKR is entitled to receive a fee or carried interest (either currently or upon deployment of capital) and general partner capital . KKR calculates the amount of AUM as of any date as the sum of : ( i ) the fair value of the investments of KKR's investment funds ; (ii) uncalled capital commitments from these funds, including uncalled capital commitments from which KKR is currently not earning management fees or carried interest ; (iii) the fair value of investments in KKR's co - investment vehicles ; (iv) the par value of outstanding CLOs (excluding CLOs wholly - owned by KKR) ; (v) KKR's pro - rata portion of the AUM managed by strategic partnerships in which KKR holds a minority ownership interest and (vi) the fair value of other assets managed by KKR . The pro - rata portion of the AUM managed by strategic partnerships is calculated based on KKR’s percentage ownership interest in such entities multiplied by such entity’s respective AUM . KKR’s calculation of AUM may differ from the calculations of other asset managers and, as a result, KKR’s measurements of its AUM may not be comparable to similar measures presented by other asset managers . KKR's definition of AUM is not based on the definitions of AUM that may be set forth in agreements governing the investment funds, vehicles or accounts that it manages and is not calculated pursuant to any regulatory definitions . Important Information