|
|

Schedules of Investments | |
RiverPark Large Growth Fund | 1 |
RiverPark/Wedgewood Fund | 2 |
RiverPark Short Term High Yield Fund | 3 |
RiverPark Long/Short Opportunity Fund | 6 |
RiverPark Structural Alpha Fund | 9 |
RiverPark Strategic Income Fund | 11 |
RiverPark Focused Value Fund | 15 |
Statements of Assets and Liabilities | 16 |
Statements of Operations | 18 |
Statements of Changes in Net Assets | 20 |
Financial Highlights | 24 |
Notes to Financial Statements | 32 |
Disclosure of Fund Expenses | 51 |
The RiverPark Funds file their complete schedules of fund holdings with the Securities and Exchange Commission (the “Commission”) for the first and third quarters of each fiscal year on Form N-Q within sixty days after the end of the period. The Funds’ Forms N-Q are available on the Commission’s website at http://www.sec.gov, and may be reviewed and copied at the Commission’s Public Reference Room in Washington, D.C. Information on the operation of the Public Reference Room may be obtained by calling 1-800-SEC-0330.
A description of the policies and procedures that the Funds use to determine how to vote proxies relating to fund securities, as well as information relating to how a Fund voted proxies relating to fund securities during the most recent period ended June 30 is available (i) without charge, upon request, by calling 888-564-4517; and (ii) on the Commission’s website at http://www.sec.gov.
| RiverPark Large Growth Fund |

Description | Shares | Value (000) | ||||||
Schedule of Investments | ||||||||
Common Stock — 99.7%** | ||||||||
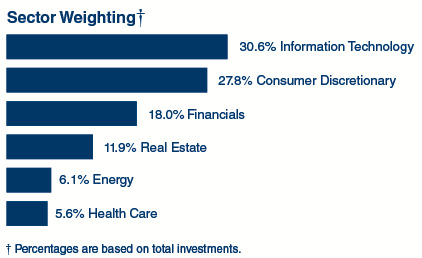
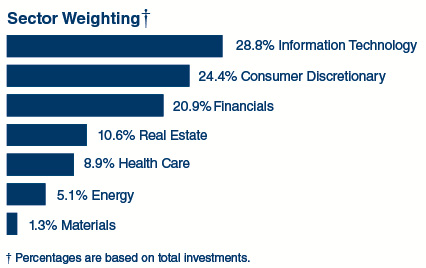
Consumer Discretionary – 27.8% | ||||||||
Amazon.com* | 1,763 | $ | 1,563 | |||||
CarMax* | 20,489 | 1,213 | ||||||
Chipotle Mexican Grill, Cl A* | 1,128 | 502 | ||||||
Dollar Tree* | 23,397 | 1,836 | ||||||
Dollarama^ | 12,726 | 1,055 | ||||||
Las Vegas Sands | 26,508 | 1,513 | ||||||
NIKE, Cl B | 17,189 | 958 | ||||||
Priceline Group* | 1,084 | 1,930 | ||||||
Starbucks | 12,841 | 750 | ||||||
Walt Disney | 16,980 | 1,925 | ||||||
13,245 | ||||||||
Energy – 6.1% | ||||||||
EOG Resources | 11,236 | 1,096 | ||||||
Schlumberger | 15,183 | 1,186 | ||||||
Southwestern Energy* | 77,230 | 631 | ||||||
2,913 | ||||||||
Financials – 17.9% | ||||||||
Affiliated Managers Group | 3,918 | 643 | ||||||
BlackRock, Cl A | 1,534 | 588 | ||||||
Charles Schwab | 42,427 | 1,732 | ||||||
CME Group, Cl A | 11,608 | 1,379 | ||||||
Intercontinental Exchange | 16,689 | 999 | ||||||
TD Ameritrade Holding | 25,920 | 1,007 | ||||||
The Blackstone Group LP (a) | 73,982 | 2,197 | ||||||
8,545 | ||||||||
Health Care – 5.6% | ||||||||
Align Technology* | 10,158 | 1,165 | ||||||
Illumina* | 3,793 | 647 | ||||||
Intuitive Surgical* | 1,113 | 853 | ||||||
2,665 | ||||||||
Information Technology – 30.5% | ||||||||
Adobe Systems* | 12,435 | 1,618 | ||||||
Alliance Data Systems | 5,971 | 1,487 | ||||||
Alphabet, Cl A* | 1,352 | 1,146 | ||||||
Alphabet, Cl C* | 1,383 | 1,147 | ||||||
Apple | 12,719 | 1,827 | ||||||
eBay* | 39,508 | 1,327 | ||||||
Facebook, Cl A* | 17,042 |
| 2,421 | |||||
Mastercard, Cl A | 13,124 | 1,476 | ||||||
Trimble* | 19,605 | 627 | ||||||
Visa, Cl A | 16,371 | 1,455 | ||||||
14,531 | ||||||||
Real Estate – 11.8% | ||||||||
American Tower REIT, Cl A | 14,123 | 1,716 | ||||||
CBRE Group, Cl A* | 34,098 | 1,186 | ||||||
Equinix REIT | 4,336 | 1,736 | ||||||
Realogy Holdings | 34,284 | 1,022 | ||||||
5,660 | ||||||||
Total Common Stock | ||||||||
(Cost $32,967) (000) | 47,559 | |||||||
Total Investments — 99.7% | ||||||||
(Cost $32,967) (000) | $ | 47,559 | ||||||
As of March 31, 2017, all of the Fund’s investments were considered Level 1 in accordance with the authoritative guidance on fair value measurements and disclosure under GAAP.
For the six months ended March 31, 2017, there were no transfers between Level 1 and Level 2 assets and liabilities or between Level 2 and Level 3 assets and liabilities.
Percentages are based on Net Assets of $47,681 (000). |
* | Non-income producing security. |
** | More narrow industries are utilized for compliance purposes, whereas broad sectors are utilized for reporting purposes. |
^ | Traded in Canadian Dollar. |
(a) | Security considered Master Limited Partnership. At March 31, 2017, these securities amounted to $2,197 (000) or 4.6% of Net Assets. |
Cl — Class
LP — Limited Partnership
REIT — Real Estate Investment Trust
The accompanying notes are an integral part of the financial statements. |
1 |
| RiverPark/Wedgewood Fund |
Description | Shares | Value (000) | ||||||
Schedule of Investments | ||||||||
Common Stock — 94.6%** | ||||||||
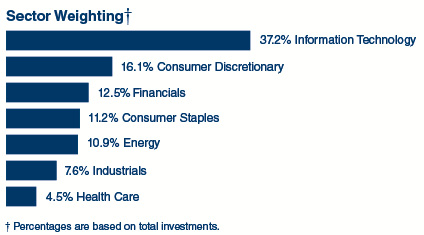
Consumer Discretionary – 15.2% | ||||||||
Priceline Group* | 39,000 | $ | 69,419 | |||||
Ross Stores | 600,000 | 39,522 | ||||||
TJX | 628,000 | 49,662 | ||||||
Tractor Supply | 817,817 | 56,405 | ||||||
215,008 | ||||||||
Consumer Staples – 10.6% | ||||||||
Kraft Heinz | 1,054,000 | 95,714 | ||||||
TreeHouse Foods* | 641,000 | 54,267 | ||||||
149,981 | ||||||||
Energy – 10.3% | ||||||||
Core Laboratories | 592,500 | 68,446 | ||||||
Schlumberger | 999,000 | 78,022 | ||||||
146,468 | ||||||||
Financials – 11.8% | ||||||||
Berkshire Hathaway, Cl B* | 736,000 | 122,677 | ||||||
Charles Schwab | 1,094,200 | 44,654 | ||||||
167,331 | ||||||||
Health Care – 4.3% | ||||||||
Celgene* | 192,000 | 23,891 | ||||||
Edwards Lifesciences* | 392,000 | 36,875 | ||||||
60,766 | ||||||||
Industrials – 7.2% | ||||||||
Fastenal | 824,000 | 42,436 | ||||||
Verisk Analytics, Cl A* | 737,000 | 59,800 | ||||||
102,236 | ||||||||
Information Technology – 35.2% | ||||||||
Alphabet, Cl A* | 116,000 |
| 98,345 | |||||
Apple | 730,000 | 104,872 | ||||||
Cognizant Technology Solutions, Cl A* | 865,000 | 51,485 | ||||||
PayPal Holdings* | 1,737,000 | 74,725 | ||||||
QUALCOMM | 1,454,000 | 83,372 | ||||||
Visa, Cl A | 955,000 | 84,871 | ||||||
497,670 | ||||||||
Total Common Stock | ||||||||
(Cost $999,044) (000) | 1,339,460 | |||||||
Total Investments — 94.6% | ||||||||
(Cost $999,044) (000) | $ | 1,339,460 | ||||||
As of March 31, 2017, all of the Fund’s investments were considered Level 1 in accordance with the authoritative guidance on fair value measurements and disclosure under GAAP.
For the six months ended March 31, 2017, there were no transfers between Level 1 and Level 2 assets and liabilities or between Level 2 and Level 3 assets and liabilities.
Percentages are based on Net Assets of $1,416,035 (000). |
* | Non-income producing security. |
** | More narrow industries are utilized for compliance purposes, whereas broad sectors are utilized for reporting purposes. |
Cl — Class
The accompanying notes are an integral part of the financial statements. |
2 |
| RiverPark Short Term High Yield Fund |
Description | Face | Value (000) | ||||||
Schedule of Investments | ||||||||
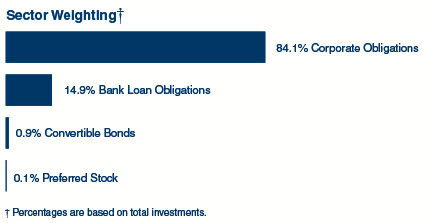
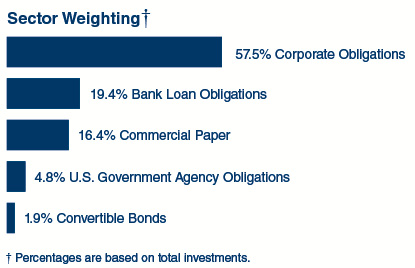
Corporate Obligations — 80.2% | ||||||||
Consumer Discretionary – 22.4% | ||||||||
Beazer Homes USA | ||||||||
7.500%, 09/15/21 | $ | 20,000 | $ | 21,175 | ||||
Cablevision Systems | ||||||||
8.625%, 09/15/17 | 5,544 | 5,703 | ||||||
Caesars Entertainment Resort Properties | ||||||||
8.000%, 10/01/20 | 10,000 | 10,463 | ||||||
DISH DBS | ||||||||
4.625%, 07/15/17 | 7,265 | 7,329 | ||||||
Goodyear Tire & Rubber | ||||||||
7.000%, 05/15/22 | 34,496 | 35,908 | ||||||
International Automotive Components Group | ||||||||
9.125%, 06/01/18 (a) | 23,642 | 23,583 | ||||||
Isle of Capri Casinos | ||||||||
5.875%, 03/15/21 | 2,650 | 2,735 | ||||||
Jo-Ann Stores | ||||||||
8.125%, 03/15/19 (a) | 9,652 | 9,652 | ||||||
MGM Resorts International | ||||||||
11.375%, 03/01/18 | 15,649 | 16,940 | ||||||
MHGE Parent | ||||||||
8.500%, 08/01/19 (a) | 9,094 | 9,139 | ||||||
NAI Entertainment Holdings | ||||||||
5.000%, 08/01/18 (a) | 12,980 | 13,142 | ||||||
Nathan's Famous | ||||||||
10.000%, 03/15/20 (a) | 19,500 | 21,060 | ||||||
NPC International | ||||||||
10.500%, 01/15/20 | 23,045 | 23,788 | ||||||
Radio Systems | ||||||||
8.375%, 11/01/19 (a) | 1,220 | 1,270 | ||||||
TEGNA | ||||||||
5.125%, 10/15/19 | 6,890 | 7,062 | ||||||
208,949 | ||||||||
Consumer Staples – 8.7% | ||||||||
Cott Beverages | ||||||||
6.750%, 01/01/20 | 42,352 | 43,781 | ||||||
Dole Food | ||||||||
7.250%, 05/01/19 (a) |
| 8,005 |
| 8,175 | ||||
DS Services of America | ||||||||
10.000%, 09/01/21 (a) | 17,517 | 18,875 | ||||||
HRG Group | ||||||||
7.875%, 07/15/19 | 9,538 | 9,874 | ||||||
80,705 | ||||||||
Energy – 3.9% | ||||||||
Contura Energy | ||||||||
10.000%, 08/01/21 (a) | 2,450 | 2,642 | ||||||
Globe Luxembourg SCA | ||||||||
9.625%, 05/01/18 (a) | 29,779 | 31,394 | ||||||
SemGroup | ||||||||
7.500%, 06/15/21 | 2,545 | 2,663 | ||||||
36,699 | ||||||||
Financials – 0.7% | ||||||||
Ladder Capital Finance Holding | ||||||||
7.375%, 10/01/17 | 6,210 | 6,210 | ||||||
Health Care – 9.1% | ||||||||
CHS | ||||||||
5.125%, 08/15/18 | 35,769 | 36,175 | ||||||
Wellcare Health Plans | ||||||||
5.750%, 11/15/20 | 46,942 | 48,308 | ||||||
84,483 | ||||||||
Industrials – 11.2% | ||||||||
Albea Beauty Holdings | ||||||||
8.375%, 11/01/19 (a) | 24,316 | 25,441 | ||||||
Cleaver-Brooks | ||||||||
8.750%, 12/15/19 (a) | 4,593 | 4,736 | ||||||
Covanta Holdings | ||||||||
7.250%, 12/01/20 | 41,467 | 42,469 | ||||||
Icahn Enterprises | ||||||||
4.875%, 03/15/19 | 14,395 | 14,611 | ||||||
New Enterprise Stone & Lime | ||||||||
11.000%, 09/01/18 | 250 | 251 | ||||||
Terex | ||||||||
6.500%, 04/01/20 | 16,166 | 16,429 | ||||||
TRAC Intermodal | ||||||||
11.000%, 08/15/19 | 896 | 946 | ||||||
104,883 | ||||||||
Information Technology – 1.8% | ||||||||
Brocade Communications Systems | ||||||||
1.375%, 01/01/20 | 12,000 | 12,165 | ||||||
CDW LLC (CDW Finance) | ||||||||
6.000%, 08/15/22 | 1,458 | 1,548 | ||||||
j2 Cloud Services | ||||||||
8.000%, 08/01/20 | 2,767 | 2,862 | ||||||
16,575 | ||||||||
The accompanying notes are an integral part of the financial statements. |
3 |
| RiverPark Short Term High Yield Fund |
Description | Face | Value (000) | ||||||
Materials – 6.2% | ||||||||
Ardagh Packaging Finance PLC (Ardagh Holding USA) | ||||||||
6.750%, 01/31/21 (a) | $ | 33,990 | $ | 35,329 | ||||
Chemtura | ||||||||
5.750%, 07/15/21 | 2,349 | 2,430 | ||||||
First Quantum Minerals | ||||||||
7.250%, 10/15/19 (a) | 250 | 259 | ||||||
6.750%, 02/15/20 (a) | 14,513 | 15,017 | ||||||
IAMGOLD | ||||||||
6.750%, 10/01/20 (a) | 3,365 | 3,478 | ||||||
Sappi Papier Holding GmbH | ||||||||
7.750%, 07/15/17 (a) | 1,730 | 1,734 | ||||||
58,247 | ||||||||
Real Estate – 3.1% | ||||||||
Homefed | ||||||||
6.500%, 06/30/18 (a) | 28,799 | 28,943 | ||||||
iStar ‡ | ||||||||
9.000%, 06/01/17 | 327 | 331 | ||||||
29,274 | ||||||||
Telecommunication Services – 12.9% | ||||||||
Altice Finco | ||||||||
9.875%, 12/15/20 (a) | 6,252 | 6,599 | ||||||
CenturyLink | ||||||||
6.000%, 04/01/17 | 10,175 | 10,175 | ||||||
Clearwire Communications | ||||||||
8.250%, 12/01/40 (a) | 6,969 | 7,239 | ||||||
Level 3 Financing | ||||||||
4.762%, 01/15/18 (b) | 8,956 | 9,006 | ||||||
Sprint Communications | ||||||||
8.375%, 08/15/17 | 23,420 | 23,965 | ||||||
T-Mobile USA | ||||||||
6.542%, 04/28/20 | 5,976 | 6,103 | ||||||
6.250%, 04/01/21 | 55,960 | 57,709 | ||||||
120,796 | ||||||||
Utilities – 0.2% | ||||||||
AmeriGas Finance | ||||||||
7.000%, 05/20/22 | 1,750 | 1,822 | ||||||
Total Corporate Obligations | ||||||||
(Cost $748,955) (000) | 748,643 | |||||||
Convertible Bond — 0.9% | ||||||||
Alaska Communications Systems Group | ||||||||
6.250%, 05/01/18 | 8,000 | 8,340 | ||||||
Total Convertible Bond | ||||||||
(Cost $8,032) (000) | 8,340 | |||||||
Description | Face | Value (000) | ||||||
Preferred Stock — 0.1% | ||||||||
Digital Realty Trust ‡ | ||||||||
6.625% | $ | 29,849 | $ | 753 | ||||
Total Preferred Stock | ||||||||
(Cost $758) (000) | 753 | |||||||
Bank Loan Obligations — 14.2% | ||||||||
Dell International | ||||||||
2.790%, 12/31/18 | 29,000 | 29,009 | ||||||
Eastman Kodak | ||||||||
7.250%, 09/03/19 | 14,947 | 14,960 | ||||||
Energy Future Intermediate Holding Company | ||||||||
4.304%, 06/30/17 | 16,100 | 16,073 | ||||||
Fairpoint Communications | ||||||||
7.500%, 02/14/19 | 12,578 | 12,629 | ||||||
Internap Network Services | ||||||||
7.000%, 11/26/19 | 11,122 | 11,122 | ||||||
Lee Enterprises | ||||||||
7.250%, 03/31/19 | 5,367 | 5,360 | ||||||
MPG Holdco I | ||||||||
3.750%, 10/20/21 | 9,138 | 9,133 | ||||||
Peabody Energy | ||||||||
4.250%, 09/24/20 | 27,247 | 27,703 | ||||||
Reddy Ice | ||||||||
8.250%, 05/01/19 | 18 | 17 | ||||||
6.750%, 03/28/19 | 1 | 1 | ||||||
6.750%, 03/28/19 | 6,770 | 6,617 | ||||||
Total Bank Loan Obligations | ||||||||
(Cost $132,153) (000) | 132,624 | |||||||
Total Investments — 95.4% | ||||||||
(Cost $889,898) (000) | $ | 890,360 | ||||||
The following is a list of the inputs used as of March 31, 2017 in valuing the Fund’s investments carried at value (000), in accordance with the authoritative guidance on fair value measurements and disclosure under U.S. GAAP:
Investments in Securities | Level 1 | Level 2 | Level 3 | Total | ||||||||||||
Corporate Obligations | $ | — | $ | 748,643 | $ | — | $ | 748,643 | ||||||||
Convertible Bond | — | 8,340 | — | 8,340 | ||||||||||||
Preferred Stock | 753 | — | — | 753 | ||||||||||||
Bank Loan Obligations | — | 132,624 | — | 132,624 | ||||||||||||
Total Investments in Securities | $ | 753 | $ | 889,607 | $ | — | $ | 890,360 | ||||||||
For the six months ended March 31, 2017, there were no transfers between Level 1 and Level 2 assets and liabilities or between Level 2 and Level 3 assets and liabilities.
The accompanying notes are an integral part of the financial statements. |
4 |
| RiverPark Short Term High Yield Fund |
Percentages are based on Net Assets of $932,997 (000). |
(a) | Securities sold within terms of a private placement memorandum, exempt from registration under Section 144A of the Securities Act of 1933, as amended, and may be sold only to dealers in that program or other “accredited investors.” These securities have been determined to be liquid under guidelines established by the Board of Trustees. |
(b) | Variable rate security - Rate disclosed is the rate in effect on March 31, 2017. |
‡ | Real Estate Investment Trust |
LLC — Limited Liability Company
PLC — Public Limited Company
The accompanying notes are an integral part of the financial statements. |
5 |
| RiverPark Long/Short Opportunity Fund |
Description | Shares | Value (000) | ||||||
Schedule of Investments | ||||||||
Common Stock — 98.8%** | ||||||||
Consumer Discretionary – 24.1% | ||||||||
Amazon.com* | 4,989 | $ | 4,423 | |||||
CarMax* | 47,040 | 2,786 | ||||||
Chipotle Mexican Grill, Cl A* | 2,719 | 1,211 | ||||||
Dollar Tree* (a) | 2,794 | 219 | ||||||
Dollarama ‡ | 33,167 | 2,749 | ||||||
Imax* | 46,547 | 1,582 | ||||||
Las Vegas Sands (a) | 14,504 | 828 | ||||||
NIKE, Cl B | 45,686 | 2,546 | ||||||
Priceline Group* (a) (b) | 2,164 | 3,852 | ||||||
Starbucks (b) | 32,832 | 1,917 | ||||||
Walt Disney (a) (b) | 11,827 | 1,341 | ||||||
23,454 | ||||||||
Energy – 5.0% | ||||||||
EOG Resources | 30,215 | 2,948 | ||||||
Schlumberger (a) | 17,870 | 1,396 | ||||||
Southwestern Energy* (a) (b) | 68,956 | 563 | ||||||
4,907 | ||||||||
Financials – 20.7% | ||||||||
Affiliated Managers Group | 9,396 | 1,540 | ||||||
BlackRock, Cl A | 3,932 | 1,508 | ||||||
Charles Schwab | 96,041 | 3,919 | ||||||
CME Group, Cl A (a) | 17,202 | 2,044 | ||||||
Intercontinental Exchange | 39,243 | 2,350 | ||||||
TD Ameritrade Holding | 60,916 | 2,367 | ||||||
The Blackstone Group LP (b) (c) | 215,772 | 6,408 | ||||||
20,136 | ||||||||
Health Care – 8.8% | ||||||||
Align Technology* | 27,004 | 3,098 | ||||||
Illumina* | 8,656 | 1,477 | ||||||
Intuitive Surgical* (b) | 3,235 | 2,479 | ||||||
Pacira Pharmaceuticals* | 32,624 | 1,488 | ||||||
8,542 | ||||||||
Information Technology – 28.4% | ||||||||
Adobe Systems* | 28,604 | 3,722 | ||||||
Alliance Data Systems (a) | 6,396 | 1,593 | ||||||
Alphabet, Cl A* (a) (b) | 3,435 | 2,912 | ||||||
Alphabet, Cl C* (a) (b) | 3,092 |
| 2,565 | |||||
Apple (a) (b) | 19,640 | 2,821 | ||||||
eBay*(a) | 57,952 | 1,946 | ||||||
Facebook, Cl A* | 49,021 | 6,963 | ||||||
Mastercard, Cl A (a) (b) | 7,407 | 833 | ||||||
Trimble* (b) | 53,282 | 1,706 | ||||||
Visa, Cl A (a) (b) | 29,672 | 2,637 | ||||||
27,698 | ||||||||
Materials – 1.3% | ||||||||
Monsanto (b) | 11,155 | 1,263 | ||||||
Real Estate – 10.5% | ||||||||
American Tower REIT, Cl A (a) (b) | 26,866 | 3,265 | ||||||
CBRE Group, Cl A* | 72,622 | 2,527 | ||||||
Equinix REIT (b) | 11,080 | 4,436 | ||||||
10,228 | ||||||||
Total Common Stock | ||||||||
(Cost $66,263) (000) | 96,228 | |||||||
Total Investments — 98.8% | ||||||||
(Cost $66,263) (000) | $ | 96,228 | ||||||
Schedule of Securities Sold Short, Not Yet Purchased | ||||||||
Common Stock — (58.3)% | ||||||||
Consumer Discretionary – (25.1)% | ||||||||
Best Buy | (23,471 | ) | $ | (1,154 | ) | |||
BJ's Restaurants* | (15,311 | ) | (619 | ) | ||||
Coach | (27,523 | ) | (1,138 | ) | ||||
Columbia Sportswear | (9,075 | ) | (533 | ) | ||||
Dick's Sporting Goods | (8,949 | ) | (435 | ) | ||||
Discovery Communications, Cl A* | (35,572 | ) | (1,035 | ) | ||||
Gap | (51,882 | ) | (1,260 | ) | ||||
Garmin | (38,094 | ) | (1,947 | ) | ||||
Harley-Davidson | (13,575 | ) | (821 | ) | ||||
Hibbett Sports* | (17,883 | ) | (528 | ) | ||||
Kohl's | (24,066 | ) | (958 | ) | ||||
Live Nation Entertainment* | (34,561 | ) | (1,050 | ) | ||||
Lululemon Athletica* | (9,317 | ) | (483 | ) | ||||
Macy's | (20,690 | ) | (613 | ) | ||||
Nordstrom | (19,529 | ) | (910 | ) | ||||
Omnicom Group | (17,154 | ) | (1,479 | ) | ||||
Publicis Groupe | (18,249 | ) | (1,275 | ) | ||||
Red Robin Gourmet Burgers* | (16,794 | ) | (982 | ) | ||||
Scripps Networks Interactive, Cl A | (13,803 | ) | (1,082 | ) | ||||
Sonic | (28,055 | ) | (711 | ) | ||||
Sony ADR | (52,671 | ) | (1,776 | ) | ||||
Target | (11,466 | ) | (633 | ) | ||||
TEGNA | (39,631 | ) | (1,015 | ) | ||||
VF | (15,321 | ) | (842 | ) | ||||
WPP | (52,733 | ) | (1,157 | ) | ||||
(24,436 | ) | |||||||
Consumer Staples – (7.2)% | ||||||||
Coca-Cola | (40,567 | ) | (1,722 | ) | ||||
Kroger | (30,348 | ) | (895 | ) | ||||
The accompanying notes are an integral part of the financial statements. |
6 |
| RiverPark Long/Short Opportunity Fund |
Description | Shares | Value (000) | ||||||
Spectrum Brands Holdings | (7,616 | ) | $ | (1,059 | ) | |||
Wal-Mart Stores | (17,635 | ) | (1,271 | ) | ||||
Whole Foods Market | (68,148 | ) | (2,025 | ) | ||||
(6,972 | ) | |||||||
Financials – (2.1)% | ||||||||
Green Dot, Cl A* | (61,397 | ) | (2,048 | ) | ||||
Health Care – (1.7)% | ||||||||
Cerner* | (27,618 | ) | (1,625 | ) | ||||
Industrials – (1.3)% | ||||||||
Nielsen Holdings | (30,976 | ) | (1,280 | ) | ||||
Information Technology – (11.2)% | ||||||||
Cimpress* | (14,761 | ) | (1,272 | ) | ||||
CommScope Holding* | (23,345 | ) | (974 | ) | ||||
Corning | (61,933 | ) | (1,672 | ) | ||||
Flex* | (107,224 | ) | (1,802 | ) | ||||
International Business Machines | (10,144 | ) | (1,766 | ) | ||||
j2 Global | (14,665 | ) | (1,230 | ) | ||||
Western Union | (80,593 | ) | (1,640 | ) | ||||
Zillow Group, Cl A* | (14,926 | ) | (505 | ) | ||||
(10,861 | ) | |||||||
Real Estate – (5.4)% | ||||||||
GGP REIT | (42,861 | ) | (994 | ) | ||||
Iron Mountain REIT | (64,301 | ) | (2,294 | ) | ||||
Macerich REIT | (15,504 | ) | (998 | ) | ||||
Simon Property Group REIT | (5,890 | ) | (1,013 | ) | ||||
(5,299 | ) | |||||||
Telecommunication Services – (4.3)% | ||||||||
AT&T | (41,261 | ) | (1,714 | ) | ||||
Cogent Communications Holdings | (18,976 | ) | (817 | ) | ||||
Verizon Communications | (34,806 | ) | (1,697 | ) | ||||
(4,228 | ) | |||||||
Total Common Stock | ||||||||
(Proceeds $51,390) (000) | (56,749 | ) | ||||||
Total Securities Sold Short, Not Yet Purchased | ||||||||
(Proceeds $51,390) (000) | $ | (56,749 | ) | |||||
The following is a list of the inputs used as of March 31, 2017 in valuing the Fund’s investments, securities sold short, not yet purchased and other financial instruments carried at value (000), in accordance with the authoritative guidance on fair value measurements and disclosure under U.S. GAAP:
Investments in Securities | Level 1 | Level 2 | Level 3 | Total | ||||||||||||
Common Stock | $ | 96,228 | $ | — | $ | — | $ | 96,228 | ||||||||
Total Investments in Securities | $ | 96,228 | $ | — | $ | — | $ | 96,228 | ||||||||
Securities Sold Short, Not Yet Purchased | Level 1 | Level 2 | Level 3 | Total | ||||||||||||
Common Stock | $ | (56,749 | ) | $ | — | $ | — | $ | (56,749 | ) | ||||||
Total Securities Sold Short, Not Yet Purchased | $ | (56,749 | ) | $ | — | $ | — | $ | (56,749 | ) | ||||||
Other Financial Instruments | Level 1 | Level 2 | Level 3 | Total | ||||||||||||
Total Return Swaps^ | $ | — | $ | — | $ | — | $ | — | ||||||||
Total Other Financial Instruments | $ | — | $ | — | $ | — | $ | — | ||||||||
^ | As of March 31, 2017, the swaps are considered Level 2. See Note 2 in Notes to Financial Statements for additional information. |
For the six months ended March 31, 2017, there were no transfers between Level 1 and Level 2 assets and liabilities or between Level 2 and Level 3 assets and liabilities.
The accompanying notes are an integral part of the financial statements. |
7 |
| RiverPark Long/Short Opportunity Fund |
A list of open swap agreements held by the Fund at March 31, 2017 was as follows:
Total Return Swaps | ||||||||||||||||
Counterparty | Reference Entity/Obligation | Fund Pays | Fund | Termination | Contracts | Notional | Net Unrealized Appreciation (Depreciation) (000) | |||||||||
Goldman Sachs International | Alliance Data Systems | Fed Funds 1-Day - 0.45% | Total Return | 09/13/17 | 2,156 | $ | 537 | $ | — | |||||||
Goldman Sachs International | Alliance Data Systems | LIBOR 1-Month - 0.50% | Total Return | 02/06/18 | 5,112 | 1,273 | — | |||||||||
Goldman Sachs International | Alphabet, Cl A | Fed Funds 1-Day - 0.45% | Total Return | 09/11/17 | 379 | 321 | — | |||||||||
Goldman Sachs International | Alphabet, Cl C | Fed Funds 1-Day - 0.45% | Total Return | 09/11/17 | 808 | 670 | — | |||||||||
Goldman Sachs International | American Tower | Fed Funds 1-Day - 0.45% | Total Return | 10/13/17 | 9,923 | 1,206 | — | |||||||||
Goldman Sachs International | Apple | Fed Funds 1-Day - 0.45% | Total Return | 08/22/17 | 4,501 | 647 | — | |||||||||
Goldman Sachs International | Apple | LIBOR 1-Month - 0.50% | Total Return | 02/06/18 | 3,735 | 537 | — | |||||||||
Goldman Sachs International | CME Group | Fed Funds 1-Day - 0.45% | Total Return | 10/13/17 | 14,172 | 1,684 | — | |||||||||
Goldman Sachs International | Dollar Tree | LIBOR 1-Month - 0.50% | Total Return | 08/30/17 | 4,890 | 383 | — | |||||||||
Goldman Sachs International | Dollar Tree | Fed Funds 1-Day - 0.45% | Total Return | 10/12/17 | 28,550 | 2,240 | — | |||||||||
Goldman Sachs International | Dollar Tree | LIBOR 1-Month - 0.50% | Total Return | 02/22/18 | 18,422 | 1,445 | — | |||||||||
Goldman Sachs International | eBay | Fed Funds 1-Day - 0.45% | Total Return | 06/14/17 | 31,411 | 1,054 | — | |||||||||
Goldman Sachs International | Las Vegas Sands | Fed Funds 1-Day - 0.45% | Total Return | 09/11/17 | 17,647 | 1,007 | — | |||||||||
Goldman Sachs International | Las Vegas Sands | LIBOR 1-Month - 0.50% | Total Return | 02/22/18 | 29,011 | 1,656 | — | |||||||||
Goldman Sachs International | Mastercard | Fed Funds 1-Day - 0.45% | Total Return | 09/06/17 | 19,358 | 2,177 | — | |||||||||
Goldman Sachs International | Mastercard | LIBOR 1-Month - 0.50% | Total Return | 02/13/18 | 7,349 | 827 | — | |||||||||
Goldman Sachs International | Priceline Group | Fed Funds 1-Day - 0.45% | Total Return | 06/06/17 | 66 | 117 | — | |||||||||
Goldman Sachs International | Realogy Holdings | LIBOR 1-Month - 0.50% | Total Return | 08/17/17 | 77,412 | 2,306 | — | |||||||||
Goldman Sachs International | Schlumberger | Fed Funds 1-Day - 0.45% | Total Return | 09/06/17 | 19,343 | 1,511 | — | |||||||||
Goldman Sachs International | Southwestern Energy | Fed Funds 1-Day - 0.45% | Total Return | 06/14/17 | 71,196 | 582 | — | |||||||||
Goldman Sachs International | Southwestern Energy | LIBOR 1-Month - 0.50% | Total Return | 08/17/17 | 73,100 | 597 | — | |||||||||
Goldman Sachs International | Southwestern Energy | LIBOR 1-Month - 0.50% | Total Return | 02/23/18 | 28,721 | 235 | — | |||||||||
Goldman Sachs International | Visa | Fed Funds 1-Day - 0.45% | Total Return | 06/06/17 | 8,734 | 776 | — | |||||||||
Goldman Sachs International | Visa | LIBOR 1-Month - 0.50% | Total Return | 02/13/18 | 6,888 | 612 | — | |||||||||
Goldman Sachs International | Walt Disney | Fed Funds 1-Day - 0.45% | Total Return | 08/22/17 | 22,528 | 2,554 | — | |||||||||
Goldman Sachs International | Walt Disney | LIBOR 1-Month - 0.50% | Total Return | 03/30/18 | 2,672 | 303 | — | |||||||||
$ | — | |||||||||||||||
Percentages are based on Net Assets of $97,404 (000). |
* | Non-income producing security. |
** | More narrow industries are utilized for compliance purposes, whereas broad sectors are utilized for reporting purposes. |
‡ | Traded in Canadian Dollar. |
(a) | Underlying security for a total return swap. |
(b) | Some or all is pledged as collateral for securities sold short, not yet purchased in the total amount of $37,081 (000). |
(c) | Security considered Master Limited Partnership. At March 31, 2017, these securities amounted to $6,408 (000) or 6.6% of Net Assets. |
ADR — American Depositary Receipt
Cl — Class
LIBOR — London Interbank Offered Rate
LP — Limited Partnership
REIT — Real Estate Investment Trust
Amounts designated as “— “ are $0 or rounded to $0.
The accompanying notes are an integral part of the financial statements. |
8 |
| RiverPark Structural Alpha Fund |

Description | Face | Value (000) | ||||||
Schedule of Investments | ||||||||
U.S. Treasury Obligations — 61.6% | ||||||||
U.S. Treasury Bills (a) (b) | ||||||||
0.843%, 08/31/17 | $ | 1,000 | $ | 997 | ||||
0.617%, 05/25/17 | 2,000 | 1,998 | ||||||
0.596%, 07/27/17 | 1,500 | 1,496 | ||||||
0.571%, 04/27/17 | 2,000 | 1,999 | ||||||
0.541%, 06/29/17 | 2,000 | 1,996 | ||||||
Total U.S. Treasury Obligations | ||||||||
(Cost $8,488) (000) | 8,486 | |||||||
Total Investments — 61.6% | ||||||||
(Cost $8,488) (000) | $ | 8,486 | ||||||
Schedule of Open Options Purchased | ||||||||
Purchased Options — 13.2% *‡ | ||||||||
CBOE S&P 500 Index, Call Option | ||||||||
Expires 09/29/17, Strike Price $2,150 | 16 | $ | 380 | |||||
Expires 06/30/17, Strike Price $2,100 | 16 | 429 | ||||||
Expires 12/29/17, Strike Price $2,375 | 10 | 95 | ||||||
CBOE S&P 500 Volatility Index, Call Option | ||||||||
Expires 05/17/17, Strike Price $20 | 60 | 3 | ||||||
S&P 500 Index, Call Option | ||||||||
Expires 06/16/17, Strike Price $2,075 | 14 | 405 | ||||||
Expires 09/15/17, Strike Price $2,150 | 16 | 374 | ||||||
Expires 01/19/18, Strike Price $2,275 | 8 | 130 | ||||||
Total Purchased Options | ||||||||
(Cost $988) (000) | $ | 1,816 | ||||||
Schedule of Open Options Written | ||||||||
Written Options — (7.2)% *‡ | ||||||||
C2 S&P 500 Index, Call Option | ||||||||
Expires 04/21/17, Strike Price $2,425 | (1 | ) | $ | — | ||||
C2 S&P 500 Index, Put Option | ||||||||
Expires 04/21/17, Strike Price $2,275 | (1 | ) | (1 | ) | ||||
Description | Contracts | Value (000) | ||||||
CBOE S&P 500 Index, Call Option | ||||||||
Expires 04/07/17, Strike Price $2,425 | (1 | ) | $ | — | ||||
Expires 04/13/17, Strike Price $2,430 | (1 | ) | — | |||||
Expires 09/29/17, Strike Price $2,300 | (16 | ) | (191 | ) | ||||
Expires 12/29/17, Strike Price $2,475 | (10 | ) | (46 | ) | ||||
Expires 06/30/17, Strike Price $2,250 | (16 | ) | (212 | ) | ||||
CBOE S&P 500 Index, Put Option | ||||||||
Expires 06/30/17, Strike Price $1,925 | (8 | ) | (3 | ) | ||||
Expires 12/29/17, Strike Price $2,225 | (5 | ) | (33 | ) | ||||
Expires 04/13/17, Strike Price $2,290 | (1 | ) | (1 | ) | ||||
Expires 09/29/17, Strike Price $2,000 | (8 | ) | (14 | ) | ||||
Expires 04/07/17, Strike Price $2,275 | (1 | ) | — | |||||
CBOE S&P 500 Volatility Index, Call Option | ||||||||
Expires 05/17/17, Strike Price $15 | (30 | ) | (3 | ) | ||||
S&P 500 Index, Call Option | ||||||||
Expires 06/16/17, Strike Price $2,225 | (14 | ) | (209 | ) | ||||
Expires 09/15/17, Strike Price $2,300 | (16 | ) | (183 | ) | ||||
Expires 01/19/18, Strike Price $2,400 | (8 | ) | (68 | ) | ||||
S&P 500 Index, Put Option | ||||||||
Expires 09/15/17, Strike Price $2,000 | (8 | ) | (12 | ) | ||||
Expires 01/19/18, Strike Price $2,100 | (4 | ) | (18 | ) | ||||
Expires 06/16/17, Strike Price $1,900 | (7 | ) | (2 | ) | ||||
Total Written Options | ||||||||
(Premiums Received $824) (000) | $ | (996 | ) | |||||
‡ | See Note 2 in Notes to Financial Statements for additional information. |
The accompanying notes are an integral part of the financial statements. |
9 |
| RiverPark Structural Alpha Fund |
The open futures contracts held by the Fund at March 31, 2017 are as follows:
Counterparty | Type of Contracts | Number Short | Expiration Date | Notional Amount (000) | Unrealized Appreciation (000) | |||||||||
Interactive Brokers LLC | S&P 500 Index EMINI | (32 | ) | Jun-2017 | $ | (3,775 | ) | $ | 4 | |||||
See Note 2 in Notes to Financial Statements for more information regarding futures collateral.
The following is a list of the inputs used as of March 31, 2017 in valuing the Fund’s investments and other financial instruments carried at value (000), in accordance with the authoritative guidance on fair value measurements and disclosure under U.S. GAAP:
Investments in Securities | Level 1 | Level 2 | Level 3 | Total | ||||||||||||
U.S. Treasury Obligations | $ | 8,486 | $ | — | $ | — | $ | 8,486 | ||||||||
Total Investments in Securities | $ | 8,486 | $ | — | $ | — | $ | 8,486 | ||||||||
Other Financial Instruments | Level 1 | Level 2 | Level 3 | Total | ||||||||||||
Purchased Options | $ | — | $ | 1,816 | $ | — | $ | 1,816 | ||||||||
Written Options | — | (996 | ) | — | (996 | ) | ||||||||||
Futures** | ||||||||||||||||
Unrealized Appreciation | 4 | — | — | 4 | ||||||||||||
Total Other Financial Instruments | $ | 4 | $ | 820 | $ | — | $ | 824 | ||||||||
** | Futures contracts are valued at the unrealized appreciation on the instrument. See Note 2 in Notes to Financial Statements for additional information. |
For the six months ended March 31, 2017, there were no transfers between Level 1 and Level 2 assets and liabilities or between Level 2 and Level 3 assets and liabilities.
Percentages are based on Net Assets of $13,782 (000). |
* | Non-income producing security. |
(a) | Zero coupon security. The rate reported on the Schedule of Investments is the effective yield at time of purchase. |
(b) | Pledged as collateral for open options contracts in the total amount of $8,486. |
CBOE — Chicago Board Options Exchange
LLC — Limited Liability Company
S&P — Standard & Poor’s
Amounts designated as “— “ are $0 or rounded to $0.
The accompanying notes are an integral part of the financial statements. |
10 |
| RiverPark Strategic Income Fund |
Description | Face | Value (000) | ||||||
Schedule of Investments | ||||||||
Corporate Obligations — 54.4% | ||||||||
Consumer Discretionary – 20.3% | ||||||||
Brunswick | ||||||||
4.625%, 05/15/21 (a) | $ | 11,192 | $ | 11,477 | ||||
Chester Downs & Marina | ||||||||
9.250%, 02/01/20 (a) | 8,293 | 8,521 | ||||||
Coach | ||||||||
4.250%, 04/01/25 (e) | 8,955 | 9,077 | ||||||
Comcast | ||||||||
3.300%, 02/01/27 | 500 | 497 | ||||||
3.000%, 02/01/24 | 250 | 250 | ||||||
DPH Holdings | ||||||||
6.550%, 06/15/06 (b) | 154,500 | 7,493 | ||||||
Goodyear Tire & Rubber | ||||||||
7.000%, 05/15/22 | 2,605 | 2,712 | ||||||
HT Intermediate Holdings | ||||||||
12.000%, 05/15/19 (a) | 8,062 | 8,062 | ||||||
International Automotive Components Group | ||||||||
9.125%, 06/01/18 (a) | 17,808 | 17,763 | ||||||
Jo-Ann Stores | ||||||||
8.125%, 03/15/19 (a) | 9,136 | 9,136 | ||||||
LBI Media | ||||||||
10.000%, 04/15/19 (a) | 7,383 | 7,364 | ||||||
McGraw-Hill Global Education Holdings | ||||||||
7.875%, 05/15/24 (a) | 2,625 | 2,550 | ||||||
MHGE Parent | ||||||||
8.500%, 08/01/19 (a) | 10,161 | 10,212 | ||||||
Michaels Stores | ||||||||
5.875%, 12/15/20 (a) | 3,280 | 3,376 | ||||||
NPC International | ||||||||
10.500%, 01/15/20 | 16,706 | 17,245 | ||||||
Postmedia Network | ||||||||
8.250%, 07/15/21 (a) | 3,388 | 2,370 | ||||||
Ruby Tuesday | ||||||||
7.625%, 05/15/20 | 4,749 | 4,630 | ||||||
SiTV | ||||||||
10.375%, 07/01/19 (a) |
| 6,535 |
| 3,954 | ||||
Spanish Broadcasting System | ||||||||
12.500%, 04/15/17 (a) | 1,501 | 1,505 | ||||||
TEGNA | ||||||||
5.125%, 10/15/19 | 4,680 | 4,797 | ||||||
132,991 | ||||||||
Consumer Staples – 5.7% | ||||||||
BI-LO | ||||||||
9.250%, 02/15/19 (a) | 9,558 | 8,303 | ||||||
Carolina Beverage Group | ||||||||
10.625%, 08/01/18 (a) | 7,527 | 6,944 | ||||||
Constellation Brands | ||||||||
7.250%, 05/15/17 | 1,500 | 1,508 | ||||||
DS Services of America | ||||||||
10.000%, 09/01/21 (a) | 11,249 | 12,121 | ||||||
Fresh Market | ||||||||
9.750%, 05/01/23 (a) | 2,760 | 2,236 | ||||||
Southern States Cooperative | ||||||||
10.000%, 08/15/21 (a) | 4,338 | 4,132 | ||||||
Whole Foods Market | ||||||||
5.200%, 12/03/25 | 2,000 | 2,129 | ||||||
37,373 | ||||||||
Energy – 0.8% | ||||||||
Express Pipeline | ||||||||
7.390%, 12/31/17 (a) | 221 | 227 | ||||||
Sanjel | ||||||||
7.500%, 06/19/19 (a) (b) | 2,700 | — | ||||||
Westmoreland Coal | ||||||||
8.750%, 01/01/22 (a) | 5,580 | 5,273 | ||||||
5,500 | ||||||||
Financials – 1.3% | ||||||||
Black Knight InfoServ | ||||||||
5.750%, 04/15/23 | 7,191 | 7,533 | ||||||
Toll Road Investors Partnership | ||||||||
3.211%, 02/15/45 (a) (c) | 5,163 | 1,170 | ||||||
8,703 | ||||||||
Health Care – 0.9% | ||||||||
AMAG Pharmaceuticals | ||||||||
7.875%, 09/01/23 (a) | 5,954 | 5,671 | ||||||
Industrials – 12.5% | ||||||||
Albea Beauty Holdings | ||||||||
8.375%, 11/01/19 (a) | 15,938 | 16,675 | ||||||
America West Airlines Pass-Through Trust, Ser 2000-1 | ||||||||
8.057%, 07/02/20 | 432 | 484 | ||||||
Continental Airlines Pass-Through Trust, Ser 2000-2, Cl A1 | ||||||||
7.707%, 04/02/21 | 2,402 | 2,564 | ||||||
The accompanying notes are an integral part of the financial statements. |
11 |
| RiverPark Strategic Income Fund |
Description | Face | Value (000) | ||||||
Continental Airlines Pass-Through Trust, Ser 1999-2, Cl C2 | ||||||||
6.236%, 03/15/20 | $ | 357 | $ | 369 | ||||
Continental Airlines Pass-Through Trust, Ser 2007-1, Cl A | ||||||||
5.983%, 04/19/22 | 1,169 | 1,288 | ||||||
HC2 Holdings | ||||||||
11.000%, 12/01/19 (a) | 18,742 | 19,211 | ||||||
International Wire Group Holdings | ||||||||
10.750%, 08/01/21 (a) | 14,576 | 14,212 | ||||||
Spirit AeroSystems | ||||||||
5.250%, 03/15/22 | 14,860 | 15,474 | ||||||
Techniplas | ||||||||
10.000%, 05/01/20 (a) | 3,122 | 3,005 | ||||||
Waste Italia | ||||||||
10.500%, 11/15/19 (a) (b) | 7,313 | 1,482 | ||||||
Xerium Technologies | ||||||||
9.500%, 08/15/21 | 7,409 | 7,548 | ||||||
82,312 | ||||||||
Information Technology – 1.1% | ||||||||
Apple | ||||||||
1.538%, 02/09/22 (d) | 1,000 | 1,009 | ||||||
j2 Cloud Services | ||||||||
8.000%, 08/01/20 | 2,301 | 2,380 | ||||||
KEMET | ||||||||
10.500%, 05/01/18 | 2,825 | 2,839 | ||||||
ModusLink Global Solutions | ||||||||
5.250%, 03/01/19 | 1,113 | 1,056 | ||||||
7,284 | ||||||||
Materials – 4.0% | ||||||||
Hexion | ||||||||
13.750%, 02/01/22 (a) | 3,374 | 3,247 | ||||||
10.375%, 02/01/22 (a) | 6,748 | 6,765 | ||||||
10.000%, 04/15/20 | 3,010 | 3,018 | ||||||
INVISTA Finance | ||||||||
4.250%, 10/15/19 (a) | 2,920 | 3,015 | ||||||
Kraton Polymers | ||||||||
10.500%, 04/15/23 (a) | 3,399 | 3,917 | ||||||
Real Alloy Holding | ||||||||
10.000%, 01/15/19 (a) | 6,473 | 6,554 | ||||||
26,516 | ||||||||
Real Estate – 5.3% | ||||||||
Avison Young Canada | ||||||||
9.500%, 12/15/21 (a) | 1,857 | 1,838 | ||||||
Crescent Communities | ||||||||
8.875%, 10/15/21 (a) | 3,800 | 3,971 | ||||||
Homefed | ||||||||
6.500%, 06/30/18 (a) | 22,398 | 22,510 | ||||||
Hunt Cos | ||||||||
9.625%, 03/01/21 (a) | 6,420 | 6,749 | ||||||
35,068 | ||||||||
Telecommunication Services – 2.5% | �� | |||||||
SBA Tower Trust | ||||||||
3.598%, 04/15/18 (a) |
| 8,845 |
| 8,850 | ||||
T-Mobile USA | ||||||||
6.542%, 04/28/20 | 4,024 | 4,110 | ||||||
6.250%, 04/01/21 | 2,985 | 3,078 | ||||||
16,038 | ||||||||
Total Corporate Obligations | ||||||||
(Cost $367,073) (000) | 357,456 | |||||||
Commercial Paper (c) — 15.5% | ||||||||
CenterPoint Energy Resources | ||||||||
1.150%, 04/03/17 | 20,000 | 19,998 | ||||||
Ford Motor Credit | ||||||||
1.612%, 09/01/17 | 16,000 | 15,888 | ||||||
ITT | ||||||||
1.301%, 04/10/17 | 7,000 | 6,997 | ||||||
Kraft Heinz Foods | ||||||||
1.312%, 04/25/17 | 6,000 | 5,994 | ||||||
1.051%, 04/03/17 | 9,000 | 8,999 | ||||||
Marriott International | ||||||||
1.152%, 04/21/17 | 6,000 | 5,996 | ||||||
1.081%, 04/14/17 | 9,000 | 8,996 | ||||||
Molex Electronic Technologies | ||||||||
1.120%, 04/03/17 | 15,000 | 14,999 | ||||||
Roche Holdings | ||||||||
0.740%, 04/03/17 | 14,000 | 13,999 | ||||||
Total Commercial Paper | ||||||||
(Cost $101,873) (000) | 101,866 | |||||||
U.S. Government Agency Obligation — 4.6% | ||||||||
FHLB | ||||||||
5.050%, 04/03/17 | 30,000 | 30,000 | ||||||
Total U.S. Government Agency Obligation | ||||||||
(Cost $29,999) (000) | 30,000 | |||||||
Convertible Bonds — 1.8% | ||||||||
Alaska Communications Systems Group | ||||||||
6.250%, 05/01/18 | 1,835 | 1,913 | ||||||
Clearwire Communications | ||||||||
8.250%, 12/01/40 (a) | 4,691 | 4,873 | ||||||
Prospect Capital | ||||||||
5.750%, 03/15/18 | 5,000 | 5,119 | ||||||
Total Convertible Bonds | ||||||||
(Cost $11,742) (000) | 11,905 | |||||||
Bank Loan Obligations — 18.4% | ||||||||
AMC Networks | ||||||||
2.347%, 12/16/19 | 3,047 | 3,047 | ||||||
AMF Bowling Centers | ||||||||
11.000%, 02/16/24 | 13,330 | 13,597 | ||||||
The accompanying notes are an integral part of the financial statements. |
12 |
| RiverPark Strategic Income Fund |
Description | Face | Value (000) | ||||||
Caesars Growth Properties Holdings | ||||||||
6.250%, 05/08/21 | $ | 3,636 | $ | 3,654 | ||||
Consolidated Container | ||||||||
5.000%, 07/03/19 | 7,265 | �� | 7,247 | |||||
Dell | ||||||||
3.350%, 09/07/23 | 14,963 | 15,012 | ||||||
3.240%, 06/02/21 | 5,610 | 5,605 | ||||||
Eastman Kodak | ||||||||
7.250%, 09/03/19 | 8,824 | 8,832 | ||||||
Envigo Holdings | ||||||||
9.530%, 11/03/21 | 5,985 | 5,895 | ||||||
Fram Group Holdings | ||||||||
7.750%, 12/21/21 | 3,392 | 3,390 | ||||||
Hampton Rubber | ||||||||
5.000%, 03/27/21 | 4,488 | 4,106 | ||||||
Lee Enterprises | ||||||||
12.000%, 12/15/22 | 5,560 | 5,852 | ||||||
7.250%, 03/31/19 | 1,180 | 1,179 | ||||||
LSC Communications | ||||||||
7.000%, 09/26/22 | 6,325 | 6,380 | ||||||
Maueser-Werke | ||||||||
8.750%, 07/31/22 | 6,500 | 6,504 | ||||||
Optima Specialty Steel | ||||||||
11.100%, 10/31/17 | 3,389 | 3,389 | ||||||
Peabody Energy | ||||||||
4.250%, 09/24/20 | 18,203 | 18,508 | ||||||
Reddy Ice | ||||||||
8.250%, 05/01/19 | 23 | 22 | ||||||
6.750%, 03/28/19 | 8,715 | 8,519 | ||||||
Total Bank Loan Obligations | ||||||||
(Cost $119,565) (000) | 120,738 | |||||||
Total Investments — 94.7% | ||||||||
(Cost $630,252) (000) | $ | 621,965 | ||||||
Schedule of Securities Sold Short, Not Yet Purchased | ||||||||
Corporate Obligations — (1.6)% | ||||||||
Financials – (0.5)% | ||||||||
Barclays | ||||||||
5.200%, 05/12/26 | (2,000 | ) | $ | (2,061 | ) | |||
CIT Group | ||||||||
5.000%, 08/15/22 | (1,000 | ) | (1,049 | ) | ||||
(3,110 | ) | |||||||
Industrials – (0.9)% | ||||||||
Aircastle | ||||||||
5.125%, 03/15/21 | (2,000 | ) | (2,127 | ) | ||||
Covanta Holding | ||||||||
5.875%, 03/01/24 | (2,000 | ) | (2,035 | ) | ||||
United Rentals North America | ||||||||
4.625%, 07/15/23 | (2,000 | ) | (2,068 | ) | ||||
(6,230 | ) | |||||||
Information Technology – (0.2)% | ||||||||
Lam Research | ||||||||
3.800%, 03/15/25 |
| (1,000 | ) |
| (1,005 | ) | ||
Total Corporate Obligations | ||||||||
(Proceeds $9,901) (000) | (10,345 | ) | ||||||
Total Securities Sold Short, Not Yet Purchased | ||||||||
(Proceeds $9,901) (000) | $ | (10,345 | ) | |||||
A list of the open forward foreign currency contracts held by the Fund at March 31, 2017 is as follows‡:
Counterparty | Settlement Date | Currency to Deliver (000) | Currency to Receive (000) | Unrealized Appreciation (Depreciation) (000) | |||||||||||
Brown Brothers Harriman | 4/3/17 | CAD | 3,284 | USD | 2,449 | $ | (21 | ) | |||||||
Brown Brothers Harriman | 4/3/17 | EUR | 1,475 | USD | 1,560 | (14 | ) | ||||||||
$ | (35 | ) | |||||||||||||
‡ | See Note 2 in Notes to Financial Statements for additional information. |
The following is a list of the inputs used as of March 31, 2017 in valuing the Fund’s investments, securities sold short, not yet purchased and other financial instruments carried at value (000), in accordance with the authoritative guidance on fair value measurements and disclosure under U.S. GAAP:
Investments in Securities | Level 1 | Level 2 | Level 3 | Total | ||||||||||||
Corporate Obligations | $ | — | $ | 357,456 | $ | — | $ | 357,456 | ||||||||
Commercial Paper | — | 101,866 | — | 101,866 | ||||||||||||
U.S. Government Agency Obligation | — | 30,000 | — | 30,000 | ||||||||||||
Convertible Bonds | — | 11,905 | — | 11,905 | ||||||||||||
Bank Loan Obligations | — | 120,738 | — | 120,738 | ||||||||||||
Total Investments in Securities | $ | — | $ | 621,965 | $ | — | $ | 621,965 | ||||||||
Securities Sold Short, Not Yet Purchased | Level 1 | Level 2 | Level 3 | Total | ||||||||||||
Corporate Obligations | $ | — | $ | (10,345 | ) | $ | — | $ | (10,345 | ) | ||||||
Total Securities Sold Short, Not Yet Purchased | $ | — | $ | (10,345 | ) | $ | — | $ | (10,345 | ) | ||||||
The accompanying notes are an integral part of the financial statements. |
13 |
| RiverPark Strategic Income Fund |
Other Financial Instruments | Level 1 | Level 2 | Level 3 | Total | ||||||||||||
Forwards** | ||||||||||||||||
Unrealized Depreciation | $ | — | $ | (35 | ) | $ | — | $ | (35 | ) | ||||||
Total Other Financial Instruments | $ | — | $ | (35 | ) | $ | — | $ | (35 | ) | ||||||
** | Forward contracts are valued at the unrealized depreciation on the instrument. See Note 2 in Notes to Financial Statements for additional information. |
For the six months ended March 31, 2017, there were no transfers between Level 1 and Level 2 assets and liabilities or between Level 2 and Level 3 assets and liabilities.
Percentages are based on Net Assets of $656,565 (000). |
(a) | Securities sold within terms of a private placement memorandum, exempt from registration under Section 144A of the Securities Act of 1933, as amended, and may be sold only to dealers in that program or other “accredited investors.” These securities have been determined to be liquid under guidelines established by the Board of Trustees. |
(b) | Security in default on interest payments. |
(c) | Zero coupon security. The rate reported on the Schedule of Investments is the effective yield at time of purchase. |
(d) | Variable rate security - Rate disclosed is the rate in effect on March 31, 2017. |
(e) | Some or all is pledged as collateral for securities sold short, not yet purchased in the total amount of $9,077 (000). |
CAD — Canadian Dollar
Cl — Class
EUR — Euro
FHLB — Federal Home Loan Bank
Ser — Series
USD — United States Dollar
The accompanying notes are an integral part of the financial statements. |
14 |
| RiverPark Focused Value Fund |
Description | Shares | Value (000) | ||||||
Schedule of Investments | ||||||||
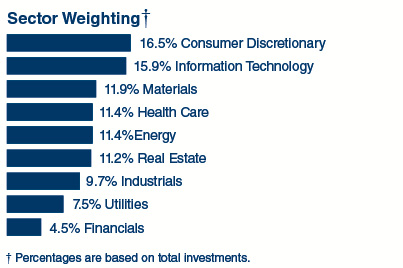
Common Stock — 93.8% | ||||||||
Consumer Discretionary – 15.4% | ||||||||
Las Vegas Sands | 51,700 | $ | 2,950 | |||||
Liberty Global, Cl A* | 48,100 | 1,726 | ||||||
Liberty Global LiLAC, Cl A* | 9,227 | 205 | ||||||
Liberty Interactive QVC Group, Cl A* | 61,200 | 1,225 | ||||||
6,106 | ||||||||
Energy – 10.7% | ||||||||
Magellan Midstream Partners LP (a) | 12,400 | 954 | ||||||
Marathon Petroleum | 65,100 | 3,290 | ||||||
4,244 | ||||||||
Financials – 4.3% | ||||||||
The Blackstone Group LP (a) | 56,700 | 1,684 | ||||||
Health Care – 10.7% | ||||||||
Allergan | 5,800 | 1,386 | ||||||
Anthem | 7,000 | 1,158 | ||||||
Express Scripts Holding* | 25,800 | 1,700 | ||||||
4,244 | ||||||||
Industrials – 9.1% | ||||||||
AerCap Holdings* | 39,900 | 1,834 | ||||||
Macquarie Infrastructure | 22,000 | 1,773 | ||||||
3,607 | ||||||||
Information Technology – 14.9% | ||||||||
Alliance Data Systems | 6,300 | 1,569 | ||||||
Broadcom, Cl A | 5,800 | 1,270 | ||||||
Western Digital | 37,000 | 3,053 | ||||||
5,892 | ||||||||
Materials – 11.1% | ||||||||
CF Industries Holdings | 79,200 | 2,325 | ||||||
LyondellBasell Industries, Cl A | 22,800 | 2,079 | ||||||
4,404 | ||||||||
Real Estate – 10.6% | ||||||||
American Tower REIT, Cl A | 8,500 |
| 1,033 | |||||
Colony NorthStar REIT, Cl A | 107,000 | 1,381 | ||||||
Realogy Holdings | 59,100 | 1,761 | ||||||
4,175 | ||||||||
Utilities – 7.0% | ||||||||
Calpine* | 250,600 | 2,769 | ||||||
Total Common Stock | ||||||||
(Cost $38,188) (000) | 37,125 | |||||||
Total Investments — 93.8% | ||||||||
(Cost $38,188) (000) | $ | 37,125 | ||||||
As of March 31, 2017, all of the Fund’s investments were considered Level 1 in accordance with the authoritative guidance on fair value measurements and disclosure under GAAP.
For the six months ended March 31, 2017, there were no transfers between Level 1 and Level 2 assets and liabilities or between Level 2 and Level 3 assets and liabilities.
Percentages are based on Net Assets of $39,562 (000). |
* | Non-income producing security. |
(a) | Security considered Master Limited Partnership. At March 31, 2017, these securities amounted to $2,638 (000) or 6.7% of Net Assets. |
Cl — Class
LP — Limited Partnership
REIT — Real Estate Investment Trust
The accompanying notes are an integral part of the financial statements. |
15 |
Statements of Assets and Liabilities (000) March 31, 2017 (Unaudited) |
|
RiverPark Large Growth Fund | RiverPark/ Wedgewood Fund | RiverPark Fund | RiverPark Fund | |||||||||||||
Assets: | ||||||||||||||||
Investments in Securities, at Value (Note 2) | $ | 47,559 | $ | 1,339,460 | $ | 890,360 | $ | 96,228 | ||||||||
Deposits with Brokers for Securities Sold Short, Not Yet Purchased | — | — | — | 57,282 | ||||||||||||
Cash | 680 | 46,444 | 40,867 | 501 | ||||||||||||
Foreign Currency | — | — | — | 1 | ||||||||||||
Prepaid Expenses | 16 | 61 | 36 | 29 | ||||||||||||
Receivable for Dividend and Interest Income | 11 | 566 | 14,199 | 54 | ||||||||||||
Receivable for Capital Shares Sold | 1 | 2,065 | 2,312 | 45 | ||||||||||||
Cash Collateral on Swap Contracts | — | — | — | 1,300 | ||||||||||||
Receivable for Investment Securities Sold | — | 61,091 | 29,878 | 433 | ||||||||||||
Receivable for Swap Reset | — | — | — | 791 | ||||||||||||
Total Assets | 48,267 | 1,449,687 | 977,652 | 156,664 | ||||||||||||
Liabilities: | ||||||||||||||||
Payable for Capital Shares Redeemed | 527 | 2,106 | 2,551 | 74 | ||||||||||||
Securities Sold Short, Not Yet Purchased (Note 2) | — | — | — | 56,749 | ||||||||||||
Income Distribution Payable | — | — | 227 | — | ||||||||||||
Dividends Payable on Securities Sold Short | — | — | — | 110 | ||||||||||||
Payable for Investment Securities Purchased | — | 30,316 | 40,937 | 2,171 | ||||||||||||
Payable Due to Adviser (Note 4) | 27 | 798 | 515 | 128 | ||||||||||||
Payable Due to Shareholder Servicing Agent (Note 4) | 14 | 39 | 149 | 2 | ||||||||||||
Payable Due to Administrative Services Plan, Retail Class Shares (Note 4) | 6 | 18 | 17 | — | ||||||||||||
Payable Due to Administrative Services Plan, Institutional Class Shares (Note 4) | 5 | 145 | 112 | 10 | ||||||||||||
Payable Due to Administrator | 2 | 69 | 44 | 5 | ||||||||||||
Payable Due to Trustees | — | 2 | 1 | — | ||||||||||||
Chief Compliance Officer Fees Payable | — | 3 | 2 | — | ||||||||||||
Other Accrued Expenses | 5 | 156 | 100 | 11 | ||||||||||||
Total Liabilities | 586 | 33,652 | 44,655 | 59,260 | ||||||||||||
Net Assets | $ | 47,681 | $ | 1,416,035 | $ | 932,997 | $ | 97,404 | ||||||||
Net Assets Consist of: | ||||||||||||||||
Paid-in Capital | $ | 32,008 | $ | 1,178,243 | $ | 952,094 | $ | 80,420 | ||||||||
Undistributed Net Investment Income (Accumulated Net Investment Loss) | 676 | 442 | 167 | (326 | ) | |||||||||||
Accumulated Net Realized Gain (Loss) on Investments, Securities Sold Short, Not Yet Purchased, Purchased and Written Options and Swap Contracts | 405 | (103,066 | ) | (19,726 | ) | (7,296 | ) | |||||||||
Net Unrealized Appreciation on Investments and Securities Sold Short, Not Yet Purchased | 14,592 | 340,416 | 462 | 24,606 | ||||||||||||
Net Assets | $ | 47,681 | $ | 1,416,035 | $ | 932,997 | $ | 97,404 | ||||||||
Investments in Securities, at Cost | $ | 32,967 | $ | 999,044 | $ | 889,898 | $ | 66,263 | ||||||||
Foreign currency, at Cost | — | — | — | 1 | ||||||||||||
Securities Sold Short, Not Yet Purchased, Proceeds | — | — | — | 51,390 | ||||||||||||
Net Assets - Institutional Class Shares(1) | $ | 17,518,093 | $ | 1,365,865,854 | $ | 686,842,087 | $ | 94,670,390 | ||||||||
Net Assets - Retail Class Shares(1) | $ | 30,163,189 | $ | 50,169,187 | $ | 246,155,266 | $ | 2,733,683 | ||||||||
Institutional Class Shares: | ||||||||||||||||
Outstanding Shares of Beneficial Interest(1) | ||||||||||||||||
(Unlimited Authorization — No Par Value) | 862,240 | 75,130,375 | 70,174,050 | 8,449,916 | ||||||||||||
Retail Class Shares: | ||||||||||||||||
Outstanding Shares of Beneficial Interest(1) | ||||||||||||||||
(Unlimited Authorization — No Par Value) | 1,499,331 | 2,775,679 | 25,231,352 | 246,254 | ||||||||||||
Institutional Class Shares: | ||||||||||||||||
Net Asset Value, Offering and Redemption | ||||||||||||||||
Price Per Share — Institutional Class Shares | $ | 20.32 | $ | 18.18 | $ | 9.79 | $ | 11.20 | ||||||||
Retail Class Shares: | ||||||||||||||||
Net Asset Value, Offering and Redemption | ||||||||||||||||
Price Per Share — Retail Class Shares | $ | 20.12 | $ | 18.07 | $ | 9.76 | $ | 11.10 | ||||||||
(1) | Shares and Net Assets have not been rounded. |
Amounts designated as “—” are either not applicable, $0 or have been rounded to $0.
The accompanying notes are an integral part of the financial statements. |
16 |
Statements of Assets and Liabilities (000) March 31, 2017 (Unaudited) |
|

RiverPark Structural Alpha Fund | RiverPark Strategic Income Fund | RiverPark Focused Value Fund | ||||||||||
Assets: | ||||||||||||
Investments in Securities, at Value (Note 2) | $ | 8,486 | $ | 621,965 | $ | 37,125 | ||||||
Deposits with Brokers for Securities Sold Short, Not Yet Purchased | — | 10,614 | — | |||||||||
Deposits with Brokers for Futures and Options | 2,579 | — | — | |||||||||
Cash | 1,636 | 18,623 | 1,206 | |||||||||
Purchased Options, at Value | 1,816 | — | ��� | |||||||||
Receivable for Investment Securities Sold | 565 | 31,515 | 1,440 | |||||||||
Receivable for Capital Shares Sold | 16 | 2,230 | — | |||||||||
Prepaid Expenses | 14 | 40 | 29 | |||||||||
Receivable for Variation Margin | 8 | — | — | |||||||||
Receivable for Dividend and Interest Income | 1 | 8,299 | 42 | |||||||||
Total Assets | 15,121 | 693,286 | 39,842 | |||||||||
Liabilities: | ||||||||||||
Written Options, at Value (Note 2) | 996 | — | — | |||||||||
Payable for Investment Securities Purchased | 310 | 23,797 | 250 | |||||||||
Payable for Capital Shares Redeemed | 15 | 1,561 | — | |||||||||
Securities Sold Short, Not Yet Purchased (Note 2) | — | 10,345 | — | |||||||||
Income Distribution Payable | — | 183 | — | |||||||||
Unrealized Depreciation on Forward Foreign Currency Contracts | — | 35 | — | |||||||||
Dividends Payable on Securities Sold Short | — | 82 | — | |||||||||
Payable Due to Adviser (Note 4) | 10 | 354 | 22 | |||||||||
Payable Due to Administrative Services Plan, Institutional Class Shares (Note 4) | 4 | 30 | 1 | |||||||||
Payable Due to Administrator | 1 | 31 | 2 | |||||||||
Payable Due to Administrative Services Plan, Retail Class Shares (Note 4) | 1 | 60 | — | |||||||||
Payable Due to Trustees | — | 1 | — | |||||||||
Payable Due to Shareholder Servicing Agent (Note 4) | — | 172 | — | |||||||||
Chief Compliance Officer Fees Payable | — | 1 | — | |||||||||
Other Accrued Expenses | 2 | 69 | 5 | |||||||||
Total Liabilities | 1,339 | 36,721 | 280 | |||||||||
Net Assets | $ | 13,782 | $ | 656,565 | $ | 39,562 | ||||||
Net Assets Consist of: | ||||||||||||
Paid-in Capital | $ | 13,845 | $ | 705,983 | $ | 43,903 | ||||||
Undistributed Net Investment Income (Accumulated Net Investment Loss) | (330 | ) | 835 | 526 | ||||||||
Accumulated Net Realized Loss on Investments, Securities Sold Short, Not Yet Purchased, Purchased and Written Options, Futures Contracts, Forward Currency Contracts and Foreign Currency Transactions | (391 | ) | (41,474 | ) | (3,804 | ) | ||||||
Net Unrealized Depreciation on Investments and Securities Sold Short, Not Yet Purchased | (2 | ) | (8,731 | ) | (1,063 | ) | ||||||
Net Unrealized Appreciation on Purchased and Written Options | 656 | — | — | |||||||||
Net Unrealized Appreciation on Futures Contracts | 4 | — | — | |||||||||
Net Unrealized Depreciation on Forward Foreign Currency Contracts and Foreign Currency Transactions | — | (48 | ) | — | ||||||||
Net Assets | $ | 13,782 | $ | 656,565 | $ | 39,562 | ||||||
Investments in Securities, at Cost | $ | 8,488 | $ | 630,252 | $ | 38,188 | ||||||
Securities Sold Short, Not Yet Purchased, Proceeds | — | 9,901 | — | |||||||||
Purchased Options, at Cost | 988 | — | — | |||||||||
Written Options, Premiums Received | 824 | — | — | |||||||||
Net Assets - Institutional Class Shares(1) | $ | 12,487,722 | $ | 286,548,991 | $ | 38,914,457 | ||||||
Net Assets - Retail Class Shares(1) | $ | 1,293,940 | $ | 370,015,768 | $ | 647,898 | ||||||
Institutional Class Shares: | ||||||||||||
Outstanding Shares of Beneficial Interest(1) | ||||||||||||
(Unlimited Authorization — No Par Value) | 1,234,916 | 30,059,299 | 4,474,480 | |||||||||
Retail Class Shares: | ||||||||||||
Outstanding Shares of Beneficial Interest(1) | ||||||||||||
(Unlimited Authorization — No Par Value) | 129,114 | 38,876,478 | 74,453 | |||||||||
Institutional Class Shares: | ||||||||||||
Net Asset Value, Offering and Redemption | ||||||||||||
Price Per Share — Institutional Class Shares | $ | 10.11 | $ | 9.53 | $ | 8.70 | ||||||
Retail Class Shares: | ||||||||||||
Net Asset Value, Offering and Redemption | ||||||||||||
Price Per Share — Retail Class Shares | $ | 10.02 | $ | 9.52 | $ | 8.70 | ||||||
(1) | Shares and Net Assets have not been rounded. |
Amounts designated as “—” are either not applicable, $0 or have been rounded to $0.
The accompanying notes are an integral part of the financial statements. |
17 |
Statements of Operations (000) For the Six Month Period Ended |
|
RiverPark Large Growth Fund | RiverPark/ Wedgewood Fund | RiverPark Fund | RiverPark Fund | |||||||||||||
Investment Income: | ||||||||||||||||
Dividends | $ | 390 | $ | 7,657 | $ | 121 | $ | 603 | ||||||||
Interest | 1 | 37 | 15,727 | 3 | ||||||||||||
Foreign Taxes Withheld | — | (98 | ) | — | — | |||||||||||
Total Investment Income | 391 | 7,596 | 15,848 | 606 | ||||||||||||
Expenses: | ||||||||||||||||
Investment Advisory Fees (Note 4) | 188 | 4,796 | 2,933 | 775 | ||||||||||||
Shareholder Service Fees(1) (Note 4) | 37 | 64 | 317 | 5 | ||||||||||||
Administrative Services Fee, Retail Class Shares (Note 4) | 18 | 33 | 179 | 3 | ||||||||||||
Administrator Fees (Note 4) | 16 | 414 | 253 | 29 | ||||||||||||
Administrative Services Fee, Institutional Class Shares (Note 4) | 13 | 518 | 305 | 57 | ||||||||||||
Chief Compliance Officer Fees (Note 4) | 1 | 12 | 8 | 1 | ||||||||||||
Trustees’ Fees (Note 4) | 1 | 19 | 11 | 1 | ||||||||||||
Registration Fees | 16 | 29 | 18 | 17 | ||||||||||||
Transfer Agent Fees | 7 | 148 | 99 | 11 | ||||||||||||
Printing Fees | 3 | 69 | 43 | 5 | ||||||||||||
Professional Fees | 2 | 47 | 30 | 3 | ||||||||||||
Custodian Fees | 2 | 13 | 9 | 2 | ||||||||||||
Dividend Expense | — | — | — | 612 | ||||||||||||
Stock Loan Fee | — | — | — | 9 | ||||||||||||
Insurance and Other Fees | 2 | 43 | 30 | 4 | ||||||||||||
Total Expenses | 306 | 6,205 | 4,235 | 1,534 | ||||||||||||
Fees Waived by Adviser (Note 4) | — | — | — | (1 | ) | |||||||||||
Net Expenses | 306 | 6,205 | 4,235 | 1,533 | ||||||||||||
Net Investment Income (Loss) | 85 | 1,391 | 11,613 | (927 | ) | |||||||||||
Net Realized and Unrealized Gain (Loss): | ||||||||||||||||
Net Realized Gain (Loss) From: | ||||||||||||||||
Investments | 2,289 | 47,764 | (82 | ) | 3,299 | |||||||||||
Purchased Options | — | — | — | (282 | ) | |||||||||||
Written Options | — | — | — | 70 | ||||||||||||
Securities Sold Short, Not Yet Purchased | — | — | — | (2,088 | ) | |||||||||||
Swaps Contracts | — | — | — | 1,426 | ||||||||||||
Net Change in Unrealized Appreciation (Depreciation) on: | ||||||||||||||||
Investments | 3,161 | 68,414 | 663 | 7,676 | ||||||||||||
Securities Sold Short, Not Yet Purchased | — | — | — | (548 | ) | |||||||||||
Net Realized and Unrealized Gain | 5,450 | 116,178 | 581 | 9,553 | ||||||||||||
Net Increase in Net Assets Resulting from Operations | $ | 5,535 | $ | 117,569 | $ | 12,194 | $ | 8,626 | ||||||||
(1) | Attributable to Retail Class Shares only. |
Amounts designated as “—” are either not applicable, $0 or have been rounded to $0.
The accompanying notes are an integral part of the financial statements. |
18 |
Statements of Operations (000) For the Six Month Period Ended |
|
RiverPark Structural Alpha Fund | RiverPark Strategic Income Fund | RiverPark Focused Value Fund | ||||||||||
Investment Income: | ||||||||||||
Dividends | $ | — | $ | — | $ | 539 | ||||||
Interest | 25 | 21,543 | 4 | |||||||||
Total Investment Income | 25 | 21,543 | 543 | |||||||||
Expenses: | ||||||||||||
Investment Advisory Fees (Note 4) | 96 | 1,979 | 136 | |||||||||
Administrator Fees (Note 4) | 5 | 171 | 12 | |||||||||
Administrative Services Fee, Institutional Class Shares (Note 4) | 5 | 91 | 2 | |||||||||
Shareholder Service Fees(1) (Note 4) | 2 | 451 | 1 | |||||||||
Administrative Services Fee, Retail Class Shares (Note 4) | 1 | 250 | — | |||||||||
Chief Compliance Officer Fees (Note 4) | — | 5 | 1 | |||||||||
Trustees’ Fees (Note 4) | — | 8 | 1 | |||||||||
Registration Fees | 15 | 30 | 15 | |||||||||
Transfer Agent Fees | 2 | 67 | 5 | |||||||||
Professional Fees | 1 | 20 | 1 | |||||||||
Custodian Fees | 1 | 6 | 1 | |||||||||
Printing Fees | 1 | 29 | 2 | |||||||||
Interest Expense | — | 267 | — | |||||||||
Stock Loan Fee | — | 10 | — | |||||||||
Insurance and Other Fees | 1 | 23 | 1 | |||||||||
Total Expenses | 130 | 3,407 | 178 | |||||||||
Fees Waived by Adviser (Note 4) | (3 | ) | — | — | ||||||||
Advisor Waiver Recapture (Note 4) | — | — | 15 | |||||||||
Net Expenses | 127 | 3,407 | 193 | |||||||||
Net Investment Income (Loss) | (102 | ) | 18,136 | 350 | ||||||||
Net Realized and Unrealized Gain (Loss): | ||||||||||||
Net Realized Gain (Loss) From: | ||||||||||||
Investments | — | (303 | ) | (3,135 | ) | |||||||
Purchased Options | 1,109 | — | — | |||||||||
Written Options | (270 | ) | — | — | ||||||||
Securities Sold Short, Not Yet Purchased | — | (183 | ) | — | ||||||||
Futures Contracts | (573 | ) | — | — | ||||||||
Forward Foreign Currency Contracts | — | 225 | — | |||||||||
Foreign Currency Transactions | — | 31 | — | |||||||||
Net Change in Unrealized Appreciation (Depreciation) on: | ||||||||||||
Investments | (4 | ) | 5,605 | 6,626 | ||||||||
Purchased Options | 387 | (41 | ) | — | ||||||||
Written Options | (365 | ) | — | — | ||||||||
Securities Sold Short, Not Yet Purchased | — | 391 | — | |||||||||
Forward Foreign Currency Contracts | — | (59 | ) | — | ||||||||
Foreign Currency Transactions | — | (12 | ) | — | ||||||||
Net Realized and Unrealized Gain | 284 | 5,654 | 3,491 | |||||||||
Net Increase in Net Assets Resulting from Operations | $ | 182 | $ | 23,790 | $ | 3,841 | ||||||
(1) | Attributable to Retail Class Shares only. |
Amounts designated as “—” are either not applicable, $0 or have been rounded to $0.
The accompanying notes are an integral part of the financial statements. |
19 |
Statements of Changes in Net Assets (000)
|
|
RiverPark Large Growth Fund | RiverPark/Wedgewood Fund | |||||||||||||||
Six Month Period Ended March 31, 2017 (Unaudited) | Year Ended September 30, 2016 | Six Month Period Ended March 31, 2017 (Unaudited) | Year Ended September 30, 2016 | |||||||||||||
Operations: | ||||||||||||||||
Net Investment Income | $ | 85 | $ | 327 | $ | 1,391 | $ | 5,276 | ||||||||
Net Realized Gain (Loss) from Investments | 2,289 | (1,087 | ) | 47,764 | (148,231 | ) | ||||||||||
Net Change in Unrealized Appreciation on Investments | 3,161 | 7,904 | 68,414 | 203,199 | ||||||||||||
Net Increase in Net Assets Resulting from Operations | 5,535 | 7,144 | 117,569 | 60,244 | ||||||||||||
Distributions to Shareholders From: | ||||||||||||||||
Net Investment Income: | ||||||||||||||||
Institutional Class Shares | (167 | ) | (5 | ) | (2,353 | ) | (9,635 | ) | ||||||||
Retail Class Shares | (69 | ) | — | — | (102 | ) | ||||||||||
Net Realized Gains: | ||||||||||||||||
Institutional Class Shares | — | (584 | ) | — | (76,296 | ) | ||||||||||
Retail Class Shares | — | (752 | ) | — | (3,946 | ) | ||||||||||
Total Distributions to Shareholders | (236 | ) | (1,341 | ) | (2,353 | ) | (89,979 | ) | ||||||||
Capital Share Transactions: | ||||||||||||||||
Institutional Class Shares: | ||||||||||||||||
Shares Issued | 492 | 3,725 | 90,855 | 493,266 | ||||||||||||
Shares Issued as Reinvestment of Distributions | 167 | 584 | 2,079 | 73,728 | ||||||||||||
Shares Redeemed | (19,541 | ) | (8,140 | ) | (327,315 | ) | (1,025,151 | ) | ||||||||
Net Decrease in Net Assets from Institutional Class Shares Transactions | (18,882 | ) | (3,831 | ) | (234,381 | ) | (458,157 | ) | ||||||||
Retail Class Shares: | ||||||||||||||||
Shares Issued | 1,835 | 3,318 | 4,180 | 16,920 | ||||||||||||
Shares Issued as Reinvestment of Distributions | 68 | 751 | — | 4,005 | ||||||||||||
Shares Redeemed | (5,488 | ) | (20,789 | ) | (11,779 | ) | (78,105 | ) | ||||||||
Net Decrease in Net Assets from Retail Class Shares Transactions | (3,585 | ) | (16,720 | ) | (7,599 | ) | (57,180 | ) | ||||||||
Net Decrease in Net Assets from Capital Share Transactions | (22,467 | ) | (20,551 | ) | (241,980 | ) | (515,337 | ) | ||||||||
Net Decrease in Net Assets | (17,168 | ) | (14,748 | ) | (126,764 | ) | (545,072 | ) | ||||||||
Net Assets: | ||||||||||||||||
Beginning of Period | 64,849 | 79,597 | 1,542,799 | 2,087,871 | ||||||||||||
End of Period | $ | 47,681 | $ | 64,849 | $ | 1,416,035 | $ | 1,542,799 | ||||||||
Undistributed Net Investment Income | $ | 676 | $ | 827 | $ | 442 | $ | 1,404 | ||||||||
Shares Issued and Redeemed: | ||||||||||||||||
Institutional Class Shares: | ||||||||||||||||
Shares Issued | 26 | 218 | 5,226 | 29,368 | ||||||||||||
Shares Issued as Reinvestment of Distributions | 9 | 33 | 120 | 4,388 | ||||||||||||
Shares Redeemed | (1,023 | ) | (466 | ) | (18,765 | ) | (61,890 | ) | ||||||||
Net Decrease in Institutional Class Shares | (988 | ) | (215 | ) | (13,419 | ) | (28,134 | ) | ||||||||
Retail Class Shares: | ||||||||||||||||
Shares Issued | 96 | 197 | 242 | 1,043 | ||||||||||||
Shares Issued as Reinvestment of Distributions | 4 | 43 | — | 241 | ||||||||||||
Shares Redeemed | (293 | ) | (1,209 | ) | (682 | ) | (4,753 | ) | ||||||||
Net Decrease in Retail Class Shares | (193 | ) | (969 | ) | (440 | ) | (3,469 | ) | ||||||||
Net Decrease in Share Transactions | (1,181 | ) | (1,184 | ) | (13,859 | ) | (31,603 | ) | ||||||||
Amounts designated as “—” are either not applicable, $0 or have been rounded to $0.
The accompanying notes are an integral part of the financial statements. |
20 |
Statements of Changes in Net Assets (000)
|
|
RiverPark Short Term High Yield Fund | RiverPark Long/Short Opportunity Fund | |||||||||||||||
Six Month Period Ended March 31, 2017 (Unaudited) | Year Ended September 30, 2016 | Six Month Period Ended March 31, 2017 (Unaudited) | Year Ended September 30, 2016 | |||||||||||||
Operations: | ||||||||||||||||
Net Investment Income (Loss) | $ | 11,613 | $ | 24,754 | $ | (927 | ) | $ | (1,983 | ) | ||||||
Net Realized Gain (Loss) from Investments, Written and Purchased Options, Securities Sold Short, Not Yet Purchased and Swap Contracts | (82 | ) | (11,595 | ) | 2,425 | (213 | ) | |||||||||
Net Change in Unrealized Appreciation on Investments, Securities Sold Short, Not Yet Purchased and Swap Contracts | 663 | 11,681 | 7,128 | 4,099 | ||||||||||||
Net Increase in Net Assets Resulting from Operations | 12,194 | 24,840 | 8,626 | 1,903 | ||||||||||||
Distributions to Shareholders From: | ||||||||||||||||
Net Investment Income: | ||||||||||||||||
Institutional Class Shares | (8,549 | ) | (18,488 | ) | — | — | ||||||||||
Retail Class Shares | (2,978 | ) | (6,503 | ) | — | — | ||||||||||
Net Realized Gains: | ||||||||||||||||
Institutional Class Shares | — | — | — | — | ||||||||||||
Retail Class Shares | — | — | — | — | ||||||||||||
Total Distributions to Shareholders | (11,527 | ) | (24,991 | ) | — | — | ||||||||||
Capital Share Transactions: | ||||||||||||||||
Institutional Class Shares: | ||||||||||||||||
Shares Issued | 178,888 | 213,842 | 10,789 | 48,516 | ||||||||||||
Shares Issued as Reinvestment of Distributions | 7,351 | 15,151 | — | — | ||||||||||||
Shares Redeemed | (106,399 | ) | (288,318 | ) | (28,479 | ) | (43,655 | ) | ||||||||
Net Increase (Decrease) in Net Assets from Institutional Class Shares Transactions | 79,840 | (59,325 | ) | (17,690 | ) | 4,861 | ||||||||||
Retail Class Shares: | ||||||||||||||||
Shares Issued | 24,170 | 132,007 | 122 | 187 | ||||||||||||
Shares Issued as Reinvestment of Distributions | 2,955 | 6,452 | — | — | ||||||||||||
Shares Redeemed | (56,182 | ) | (67,706 | ) | (1,508 | ) | (9,539 | ) | ||||||||
Net Increase (Decrease) in Net Assets from Retail Class Shares Transactions | (29,057 | ) | 70,753 | (1,386 | ) | (9,352 | ) | |||||||||
Net Increase (Decrease) in Net Assets from Capital Share Transactions | 50,783 | 11,428 | (19,076 | ) | (4,491 | ) | ||||||||||
Net Increase (Decrease) in Net Assets | 51,450 | 11,277 | (10,450 | ) | (2,588 | ) | ||||||||||
Net Assets: | ||||||||||||||||
Beginning of Period | 881,547 | 870,270 | 107,854 | 110,442 | ||||||||||||
End of Period | $ | 932,997 | $ | 881,547 | $ | 97,404 | $ | 107,854 | ||||||||
Undistributed Net Investment Income (Accumulated Net Investment Loss) | $ | 167 | $ | 81 | $ | (326 | ) | $ | 601 | |||||||
Shares Issued and Redeemed: | ||||||||||||||||
Institutional Class Shares: | ||||||||||||||||
Shares Issued | 18,271 | 21,930 | 1,024 | 4,786 | ||||||||||||
Shares Issued as Reinvestment of Distributions | 751 | 1,553 | — | — | ||||||||||||
Shares Redeemed | (10,868 | ) | (29,557 | ) | (2,685 | ) | (4,307 | ) | ||||||||
Net Increase (Decrease) in Institutional Class Shares | 8,154 | (6,074 | ) | (1,661 | ) | 479 | ||||||||||
Retail Class Shares: | ||||||||||||||||
Shares Issued | 2,477 | 13,565 | 11 | 18 | ||||||||||||
Shares Issued as Reinvestment of Distributions | 303 | 664 | — | — | ||||||||||||
Shares Redeemed | (5,757 | ) | (6,965 | ) | (140 | ) | (964 | ) | ||||||||
Net Increase (Decrease) in Retail Class Shares | (2,977 | ) | 7,264 | (129 | ) | (946 | ) | |||||||||
Net Increase (Decrease) in Share Transactions | 5,177 | 1,190 | (1,790 | ) | (467 | ) | ||||||||||
Amounts designated as “—” are either not applicable, $0 or have been rounded to $0.
The accompanying notes are an integral part of the financial statements. |
21 |
Statements of Changes in Net Assets (000)
|
|
RiverPark Structural Alpha Fund | RiverPark Strategic Income Fund | |||||||||||||||
Six Month Period Ended March 31, 2017 (Unaudited) | Year Ended September 30, 2016 | Six Month Period Ended March 31, 2017 (Unaudited) | Year Ended September 30, 2016 | |||||||||||||
Operations: | ||||||||||||||||
Net Investment Income (Loss) | $ | (102 | ) | $ | (322 | ) | $ | 18,136 | $ | 32,341 | ||||||
Net Realized Gain (Loss) from Investments, Written and Purchased Options, Securities Sold Short, Not Yet Purchased, Swap Contracts, Forward Foreign Currency Contracts and Foreign Currency Transactions | 266 | (237 | ) | (230 | ) | (28,879 | ) | |||||||||
Net Change in Unrealized Appreciation on Investments, Written and Purchased Options, Securities Sold Short, Not Yet Purchased, Swap Contracts, Forward Foreign Currency Contracts and Foreign Currency Transactions | 18 | 938 | 5,884 | 26,253 | ||||||||||||
Net Increase in Net Assets Resulting from Operations | 182 | 379 | 23,790 | 29,715 | ||||||||||||
Distributions to Shareholders From: | ||||||||||||||||
Net Investment Income: | ||||||||||||||||
Institutional Class Shares | — | — | (7,305 | ) | (13,264 | ) | ||||||||||
Retail Class Shares | — | — | (10,025 | ) | (20,263 | ) | ||||||||||
Net Realized Gains: | ||||||||||||||||
Institutional Class Shares | (208 | ) | (267 | ) | — | — | ||||||||||
Retail Class Shares | (32 | ) | (51 | ) | — | — | ||||||||||
Total Distributions to Shareholders | (240 | ) | (318 | ) | (17,330 | ) | (33,527 | ) | ||||||||
Capital Share Transactions: | ||||||||||||||||
Institutional Class Shares: | ||||||||||||||||
Shares Issued | 499 | 6,761 | 106,743 | 114,521 | ||||||||||||
Shares Issued as Reinvestment of Distributions | 208 | 266 | 6,271 | 10,798 | ||||||||||||
Shares Redeemed | (5,518 | ) | (4,399 | ) | (75,493 | ) | (125,341 | ) | ||||||||
Net Increase (Decrease) in Net Assets from Institutional Class Shares Transactions | (4,811 | ) | 2,628 | 37,521 | (22 | ) | ||||||||||
Retail Class Shares: | ||||||||||||||||
Shares Issued | 26 | 724 | 46,919 | 82,177 | ||||||||||||
Shares Issued as Reinvestment of Distributions | 32 | 51 | 9,989 | 20,212 | ||||||||||||
Shares Redeemed | (937 | ) | (1,806 | ) | (52,001 | ) | (130,162 | ) | ||||||||
Net Increase (Decrease) in Net Assets from Retail Class Shares Transactions | (879 | ) | (1,031 | ) | 4,907 | (27,773 | ) | |||||||||
Net Increase (Decrease) in Net Assets from Capital Share Transactions | (5,690 | ) | 1,597 | 42,428 | (27,795 | ) | ||||||||||
Net Increase (Decrease) in Net Assets | (5,748 | ) | 1,658 | 48,888 | (31,607 | ) | ||||||||||
Net Assets: | ||||||||||||||||
Beginning of Period | 19,530 | 17,872 | 607,677 | 639,284 | ||||||||||||
End of Period | $ | 13,782 | $ | 19,530 | $ | 656,565 | $ | 607,677 | ||||||||
Undistributed Net Investment Income (Accumulated Net Investment Loss) | $ | (330 | ) | $ | (228 | ) | $ | 835 | $ | 29 | ||||||
Shares Issued and Redeemed: | ||||||||||||||||
Institutional Class Shares: | ||||||||||||||||
Shares Issued | 49 | 674 | 11,226 | 12,490 | ||||||||||||
Shares Issued as Reinvestment of Distributions | 21 | 26 | 661 | 1,174 | ||||||||||||
Shares Redeemed | (543 | ) | (438 | ) | (7,971 | ) | (13,631 | ) | ||||||||
Net Increase (Decrease) in Institutional Class Shares | (473 | ) | 262 | 3,916 | 33 | |||||||||||
Retail Class Shares: | ||||||||||||||||
Shares Issued | 3 | 73 | 4,951 | 8,954 | ||||||||||||
Shares Issued as Reinvestment of Distributions | 3 | 5 | 1,055 | 2,201 | ||||||||||||
Shares Redeemed | (94 | ) | (181 | ) | (5,493 | ) | (14,085 | ) | ||||||||
Net Increase (Decrease) in Retail Class Shares | (88 | ) | (103 | ) | 513 | (2,930 | ) | |||||||||
Net Increase (Decrease) in Share Transactions | (561 | ) | 159 | 4,429 | (2,897 | ) | ||||||||||
Amounts designated as “—” are either not applicable, $0 or have been rounded to $0.
The accompanying notes are an integral part of the financial statements. |
22 |
Statements of Changes in Net Assets (000)
|
|
RiverPark Focused Value Fund | ||||||||
Six Month Period Ended March 31, 2017 (Unaudited) | Year Ended September 30, 2016 | |||||||
Operations: | ||||||||
Net Investment Income | $ | 350 | $ | 663 | ||||
Net Realized Loss from Investments | (3,135 | ) | (615 | ) | ||||
Net Change in Unrealized Appreciation (Depreciation) on Investments | 6,626 | (2,584 | ) | |||||
Net Increase (Decrease) in Net Assets Resulting from Operations | 3,841 | (2,536 | ) | |||||
Distributions to Shareholders From: | ||||||||
Net Investment Income: | ||||||||
Institutional Class Shares | (379 | ) | (256 | ) | ||||
Retail Class Shares | (2 | ) | (1 | ) | ||||
Net Realized Gains: | ||||||||
Institutional Class Shares | — | (18 | ) | |||||
Retail Class Shares | — | — | ||||||
Total Distributions to Shareholders | (381 | ) | (275 | ) | ||||
Capital Share Transactions: | ||||||||
Institutional Class Shares: | ||||||||
Shares Issued | 1,691 | 3,442 | ||||||
Shares Issued as Reinvestment of Distributions | 379 | 274 | ||||||
Shares Redeemed | (8,382 | ) | (2,334 | ) | ||||
Net Increase (Decrease) in Net Assets from Institutional Class Shares Transactions | (6,312 | ) | 1,382 | |||||
Retail Class Shares: | ||||||||
Shares Issued | 273 | 503 | ||||||
Shares Issued as Reinvestment of Distributions | 2 | 2 | ||||||
Shares Redeemed | (75 | ) | (425 | ) | ||||
Net Increase in Net Assets from Retail Class Shares Transactions | 200 | 80 | ||||||
Net Increase (Decrease) in Net Assets from Capital Share Transactions | (6,112 | ) | 1,462 | |||||
Net Decrease in Net Assets | (2,652 | ) | (1,349 | ) | ||||
Net Assets: | ||||||||
Beginning of Period | 42,214 | 43,563 | ||||||
End of Period | $ | 39,562 | $ | 42,214 | ||||
Undistributed Net Investment Income | $ | 526 | $ | 557 | ||||
Shares Issued and Redeemed: | ||||||||
Institutional Class Shares: | ||||||||
Shares Issued | 212 | 442 | ||||||
Shares Issued as Reinvestment of Distributions | 47 | 33 | ||||||
Shares Redeemed | (1,005 | ) | (299 | ) | ||||
Net Increase (Decrease) in Institutional Class Shares | (746 | ) | 176 | |||||
Retail Class Shares: | ||||||||
Shares Issued | 33 | 62 | ||||||
Shares Redeemed | (10 | ) | (53 | ) | ||||
Net Increase in Retail Class Shares | 23 | 9 | ||||||
Net Increase (Decrease) in Share Transactions | (723 | ) | 185 | |||||
Amounts designated as “—” are either not applicable, $0 or have been rounded to $0.
The accompanying notes are an integral part of the financial statements. |
23 |
Financial Highlights For a Share Outstanding Throughout Each Period |
|
| Net Asset | Net | Realized and Unrealized | Total from Investment Operations | Distributions of Dividends from Net Investment Income | Distributions | Total | |||||||||||||||||||||||
RiverPark Large Growth Fund | ||||||||||||||||||||||||||||||
Institutional Class Shares | ||||||||||||||||||||||||||||||
2017* |
| $ | 18.41 | $ | 0.04 | $ | 1.97 | $ | 2.01 | $ | (0.10 | ) | $ | — | $ | (0.10 | ) | |||||||||||||
2016 | 16.93 | 0.09 | 1.69 | 1.78 | — | (2) | (0.30 | ) | (0.30 | ) | ||||||||||||||||||||
2015 | 18.34 | 0.09 | (0.99 | ) | (0.90 | ) | — | (0.51 | ) | (0.51 | ) | |||||||||||||||||||
2014 | 16.28 | 0.02 | 2.21 | 2.23 | (0.04 | ) | (0.13 | ) | (0.17 | ) | ||||||||||||||||||||
2013 | 13.27 | 0.05 | 3.04 | 3.09 | (0.02 | ) | (0.06 | ) | (0.08 | ) | ||||||||||||||||||||
2012 | 10.09 | 0.01 | 3.17 | 3.18 | — | — | — | |||||||||||||||||||||||
Retail Class Shares | ||||||||||||||||||||||||||||||
2017* |
| $ | 18.20 | $ | 0.01 | $ | 1.95 | $ | 1.96 | $ | (0.04 | ) | $ | — | $ | (0.04 | ) | |||||||||||||
2016 | 16.77 | 0.06 | 1.67 | 1.73 | — | (0.30 | ) | (0.30 | ) | |||||||||||||||||||||
2015 | 18.21 | 0.05 | (0.98 | ) | (0.93 | ) | — | (0.51 | ) | (0.51 | ) | |||||||||||||||||||
2014 | 16.18 | (0.03 | ) | 2.19 | 2.16 | — | (2) | (0.13 | ) | (0.13 | ) | |||||||||||||||||||
2013 | 13.21 | 0.01 | 3.03 | 3.04 | (0.01 | ) | (0.06 | ) | (0.07 | ) | ||||||||||||||||||||
2012 | 10.07 | (0.03 | ) | 3.17 | 3.14 | — | — | — | ||||||||||||||||||||||
RiverPark/Wedgewood Fund | ||||||||||||||||||||||||||||||
Institutional Class Shares | ||||||||||||||||||||||||||||||
2017* |
| $ | 16.82 | $ | 0.02 | $ | 1.37 | $ | 1.39 | $ | (0.03 | ) | $ | — | $ | (0.03 | ) | |||||||||||||
2016 | 16.93 | 0.05 | 0.60 | 0.65 | (0.08 | ) | (0.68 | ) | (0.76 | ) | ||||||||||||||||||||
2015 | 18.37 | 0.06 | (0.67 | ) | (0.61 | ) | (0.01 | ) | (0.82 | ) | (0.83 | ) | ||||||||||||||||||
2014 | 16.21 | 0.01 | 2.41 | 2.42 | — | (0.26 | ) | (0.26 | ) | |||||||||||||||||||||
2013 | 13.88 | (0.01 | ) | 2.38 | 2.37 | — | (0.04 | ) | (0.04 | ) | ||||||||||||||||||||
2012 | 10.32 | (0.05 | ) | 3.61 | 3.56 | — | (2) | — | — | |||||||||||||||||||||
Retail Class Shares | ||||||||||||||||||||||||||||||
2017* |
| $ | 16.72 | $ | (0.01 | ) | $ | 1.36 | $ | 1.35 | $ | — | $ | — | $ | — | ||||||||||||||
2016 | 16.73 | 0.10 | (4) | 0.59 | 0.69 | (0.02 | ) | (0.68 | ) | (0.70 | ) | |||||||||||||||||||
2015 | 18.21 | — | (2) | (0.66 | ) | (0.66 | ) | — | (0.82 | ) | (0.82 | ) | ||||||||||||||||||
2014 | 16.09 | (0.03 | ) | 2.41 | 2.38 | — | (0.26 | ) | (0.26 | ) | ||||||||||||||||||||
2013 | 13.82 | (0.05 | ) | 2.36 | 2.31 | — | (0.04 | ) | (0.04 | ) | ||||||||||||||||||||
2012 | 10.30 | (0.08 | ) | 3.60 | 3.52 | — | — | — | ||||||||||||||||||||||
The accompanying notes are an integral part of the financial statements. |
24 |
|

Net Asset | Total Return†† | Net Assets, End of Period (000) | Ratio of Net Expenses to Average Net | Ratio of Total Expenses to Average Net Assets, Excluding Advisor Waiver Recapture | Ratio of Net Investment Income (Loss) to Average Net Assets | Portfolio Turnover Rate | ||||||||||||||||||||
$ | 20.32 | 10.96 | %** | $ | 17,518 | 0.91 | % | 0.91 | % | 0.46 | % | 8 | %** | |||||||||||||
18.41 | 10.58 | 34,056 | 0.98 | (3) | 0.90 | 0.54 | 33 | |||||||||||||||||||
16.93 | (5.03 | ) | 34,963 | 1.00 | (3) | 0.95 | 0.47 | 30 | ||||||||||||||||||
18.34 | 13.75 | † | 13,954 | 1.00 | (3) | 0.98 | 0.13 | 33 | ||||||||||||||||||
16.28 | 23.46 | † | 6,299 | 1.00 | 1.06 | 0.32 | 45 | |||||||||||||||||||
13.27 | 31.52 | † | 3,804 | 1.00 | 2.78 | 0.08 | 24 | |||||||||||||||||||
$ | 20.12 | 10.81 | %** | $ | 30,163 | 1.19 | % | 1.19 | % | 0.14 | % | 8 | %** | |||||||||||||
18.20 | 10.36 | 30,793 | 1.17 | (3) | 1.11 | 0.37 | 33 | |||||||||||||||||||
16.77 | (5.23 | ) | 44,634 | 1.25 | (3) | 1.23 | 0.29 | 30 | ||||||||||||||||||
18.21 | 13.44 | † | 53,293 | 1.25 | 1.26 | (0.14 | ) | 33 | ||||||||||||||||||
16.18 | 23.15 | † | 26,221 | 1.25 | 1.31 | 0.06 | 45 | |||||||||||||||||||
13.21 | 31.18 | † | 15,383 | 1.25 | 1.74 | (0.20 | ) | 24 | ||||||||||||||||||
$ | 18.18 | 8.27 | %** | $ | 1,365,866 | 0.83 | % | 0.83 | % | 0.20 | % | 18 | %** | |||||||||||||
16.82 | 3.88 | 1,489,036 | 0.82 | 0.82 | 0.28 | 24 | ||||||||||||||||||||
16.93 | (3.52 | ) | 1,975,999 | 0.85 | 0.85 | 0.34 | 24 | |||||||||||||||||||
18.37 | 15.04 | 1,700,475 | 0.88 | 0.88 | 0.06 | 24 | ||||||||||||||||||||
16.21 | 17.15 | 834,476 | 0.92 | (3) | 0.89 | (0.06 | ) | 20 | ||||||||||||||||||
13.88 | 34.50 | † | 279,016 | 1.00 | 1.03 | (0.40 | ) | 24 | ||||||||||||||||||
$ | 18.07 | 8.07 | %** | $ | 50,169 | 1.13 | % | 1.13 | % | (0.11 | )% | 18 | %** | |||||||||||||
16.72 | 4.13 | (5) | 53,763 | 0.54 | (6) | 0.54 | (6) | 0.58 | (7) | 24 | ||||||||||||||||
16.73 | (3.83 | ) | 111,872 | 1.16 | 1.16 | (0.02 | ) | 24 | ||||||||||||||||||
18.21 | 14.91 | 209,457 | 1.05 | 1.05 | (0.17 | ) | 24 | |||||||||||||||||||
16.09 | 16.79 | 346,211 | 1.17 | (3) | 1.14 | (0.32 | ) | 20 | ||||||||||||||||||
13.82 | 34.17 | † | 173,582 | 1.25 | 1.27 | (0.64 | ) | 24 | ||||||||||||||||||
* | Unless otherwise indicated, all ratios for the period have been annualized. |
** | Not annualized. |
† | Total return would have been lower had certain fees not been waived and/or expenses assumed by Adviser during the period. |
†† | Returns shown do not reflect the deduction of taxes that a shareholder would pay on Fund distributions or upon the redemption of Fund shares. |
(1) | Per share data was calculated using average shares for the period. |
(2) | Amount represents less than $0.01 per share. |
(3) | Ratio includes previously waived investment advisory fees recovered. |
(4) | The net investment income per share has been increased by a one-time adjustment as a result of a management change in estimate relating to shareholder servicing and administrative servicing fees. Had this change in estimate not occurred, the net investment income per share would have been $0.01 per share. |
(5) | Total return has been increased by a one-time adjustment as a result of a management change in estimate relating to shareholder servicing and administrative servicing fees. Had this change in estimate not occurred, total return would have been 3.63%. |
(6) | The ratio of net expenses to average net assets has been reduced by a one-time adjustment as a result of a management change in estimate relating to shareholder servicing and administrative servicing fees. Had this change in estimate not occurred, the annualized ratio of net expenses to average net assets would have been 1.08%. |
(7) | The ratio of net investment income to average net assets has been increased by a one-time adjustment as a result of a management change in estimate relating to shareholder servicing and administrative servicing fees. Had this change in estimate not occurred, the annualized ratio of net investment income to average net assets would have been 0.04%. |
The accompanying notes are an integral part of the financial statements. |
25 |
Financial Highlights For a Share Outstanding Throughout Each Period |
|
| Net Asset | Net | Realized and Unrealized | Total from Investment Operations | Distributions of Dividends from Net Investment Income | Distributions | Total | |||||||||||||||||||||||
RiverPark Short Term High Yield Fund | ||||||||||||||||||||||||||||||
Institutional Class Shares | ||||||||||||||||||||||||||||||
2017* |
| $ | 9.78 | $ | 0.13 | $ | 0.01 | $ | 0.14 | $ | (0.13 | ) | $ | — | $ | (0.13 | ) | |||||||||||||
2016 | 9.78 | 0.29 | — | (10) | 0.29 | (0.29 | ) | — | (0.29 | ) | ||||||||||||||||||||
2015 | 9.94 | 0.33 | (0.16 | ) | 0.17 | (0.33 | ) | — | (0.33 | ) | ||||||||||||||||||||
2014 | 9.98 | 0.38 | (0.04 | ) | 0.34 | (0.38 | ) | — | (0.38 | ) | ||||||||||||||||||||
2013 | 10.01 | 0.39 | (0.07 | ) | 0.32 | (0.35 | ) | — | (0.35 | ) | ||||||||||||||||||||
2012 | 9.88 | 0.44 | 0.08 | 0.52 | (0.39 | ) | — | (0.39 | ) | |||||||||||||||||||||
Retail Class Shares | ||||||||||||||||||||||||||||||
2017* |
| $ | 9.75 | $ | 0.11 | $ | 0.02 | $ | 0.13 | $ | (0.12 | ) | $ | — | $ | (0.12 | ) | |||||||||||||
2016 | 9.75 | 0.27 | — | (10) | 0.27 | (0.27 | ) | — | (0.27 | ) | ||||||||||||||||||||
2015 | 9.92 | 0.30 | (0.16 | ) | 0.14 | (0.31 | ) | — | (0.31 | ) | ||||||||||||||||||||
2014 | 9.97 | 0.36 | (0.05 | ) | 0.31 | (0.36 | ) | — | (0.36 | ) | ||||||||||||||||||||
2013 | 9.99 | 0.37 | (0.06 | ) | 0.31 | (0.33 | ) | — | (0.33 | ) | ||||||||||||||||||||
2012 | 9.88 | 0.42 | 0.06 | 0.48 | (0.37 | ) | — | (0.37 | ) | |||||||||||||||||||||
RiverPark Long/Short Opportunity Fund | ||||||||||||||||||||||||||||||
Institutional Class Shares | ||||||||||||||||||||||||||||||
2017* |
| $ | 10.29 | $ | (0.09 | ) | $ | 1.00 | $ | 0.91 | $ | — | $ | — | $ | — | ||||||||||||||
2016 | 10.09 | (0.18 | ) | 0.38 | 0.20 | — | — | — | ||||||||||||||||||||||
2015 | 10.51 | (0.15 | ) | (0.27 | ) | (0.42 | ) | — | — | — | ||||||||||||||||||||
2014 | 10.10 | (0.21 | ) | 0.62 | 0.41 | — | — | — | ||||||||||||||||||||||
2013 | 10.14 | (0.22 | ) | 0.27 | 0.05 | — | (0.09 | ) | (0.09 | ) | ||||||||||||||||||||
2012(2) |
| 10.00 | (0.13 | ) | 0.27 | 0.14 | — | — | — | |||||||||||||||||||||
Retail Class Shares | ||||||||||||||||||||||||||||||
2017* |
| $ | 10.21 | $ | (0.11 | ) | $ | 1.00 | $ | 0.89 | $ | — | $ | — | $ | — | ||||||||||||||
2016 | 10.03 | (0.17 | ) | 0.35 | 0.18 | — | — | — | ||||||||||||||||||||||
2015 | 10.46 | (0.16 | ) | (0.27 | ) | (0.43 | ) | — | — | — | ||||||||||||||||||||
2014 | 10.08 | (0.22 | ) | 0.60 | 0.38 | — | — | — | ||||||||||||||||||||||
2013 | 10.13 | (0.23 | ) | 0.27 | 0.04 | — | (0.09 | ) | (0.09 | ) | ||||||||||||||||||||
2012(2) |
| 10.04 | (0.13 | ) | 0.22 | 0.09 | — | — | — | |||||||||||||||||||||
The accompanying notes are an integral part of the financial statements. |
26 |
|
Net Asset | Total Return†† | Net Assets, End of Period (000) | Ratio of Net Expenses to Average Net Assets, Including Dividend Expense and Stock Loan Fee | Ratio of Total Expenses to Average Net Assets, Including Dividend Expense and Stock Loan Fee, Excluding Advisor Waiver Recapture | Ratio of Net Investment Income (Loss) to Average Net Assets | Portfolio Turnover Rate | ||||||||||||||||||||
$ | 9.79 | 1.41 | %** | $ | 686,842 | 0.85 | % | 0.85 | % | 2.65 | % | 103 | %** | |||||||||||||
9.78 | 3.05 | 606,510 | 0.84 | 0.84 | 2.98 | 114 | ||||||||||||||||||||
9.78 | 1.72 | 666,036 | 0.87 | 0.87 | 3.31 | 90 | ||||||||||||||||||||
9.94 | 3.48 | 680,443 | 0.90 | 0.90 | 3.81 | 195 | ||||||||||||||||||||
9.98 | 3.39 | 587,334 | 0.99 | (9) | 0.94 | 3.88 | 390 | |||||||||||||||||||
10.01 | 5.32 | † | 100,224 | 1.00 | 1.12 | 4.42 | 611 | |||||||||||||||||||
$ | 9.76 | 1.29 | %** | $ | 246,155 | 1.15 | % | 1.15 | % | 2.35 | % | 103 | %** | |||||||||||||
9.75 | 2.81 | 275,037 | 1.08 | 1.08 | 2.74 | 114 | ||||||||||||||||||||
9.75 | 1.47 | 204,234 | 1.18 | 1.18 | 3.00 | 90 | ||||||||||||||||||||
9.92 | 3.02 | 225,058 | 1.18 | 1.18 | 3.62 | 195 | ||||||||||||||||||||
9.97 | 3.14 | 285,742 | 1.25 | (9) | 1.21 | 3.75 | 390 | |||||||||||||||||||
9.99 | 4.88 | † | 97,701 | 1.25 | 1.32 | 4.23 | 611 | |||||||||||||||||||
$ | 11.20 | 8.84 | %** | $ | 94,670 | 2.96 | %(8) | 2.96 | % | (1.78 | )% | 10 | %** | |||||||||||||
10.29 | 1.98 | 104,030 | 3.13 | (7)(9) | 3.12 | (1.75 | ) | 40 | ||||||||||||||||||
10.09 | (4.00 | ) | 97,196 | 3.01 | (6)(9) | 3.00 | (1.41 | ) | 35 | |||||||||||||||||
10.51 | 4.06 | 107,276 | 3.22 | (5)(9) | 3.16 | (1.99 | ) | 59 | ||||||||||||||||||
10.10 | 0.55 | † | 26,686 | 3.46 | (4) | 3.60 | (2.22 | ) | 56 | |||||||||||||||||
10.14 | 1.40 | † | 19,994 | 3.49 | (3) | 4.12 | (2.61 | ) | 20 | |||||||||||||||||
$ | 11.10 | 8.72 | %** | $ | 2,734 | 3.20 | %(8) | 3.24 | % | (2.03 | )% | 10 | %** | |||||||||||||
10.21 | 1.79 | 3,824 | 3.33 | (7)(9) | 3.31 | (1.70 | ) | 40 | ||||||||||||||||||
10.03 | (4.11 | ) | 13,246 | 3.16 | (6)(9) | 3.19 | (1.55 | ) | 35 | |||||||||||||||||
10.46 | 3.77 | 16,194 | 3.37 | (5)(9) | 3.29 | (2.03 | ) | 59 | ||||||||||||||||||
10.08 | 0.45 | † | 72,410 | 3.61 | (4) | 3.71 | (2.32 | ) | 56 | |||||||||||||||||
10.13 | 0.90 | † | 4,302 | 3.68 | (3) | 4.18 | (2.78 | ) | 20 | |||||||||||||||||
* | Unless otherwise indicated, all ratios for the period have been annualized. |
** | Not annualized. |
† | Total return would have been lower had certain fees not been waived and/or expenses assumed by Adviser during the period. |
†† | Returns shown do not reflect the deduction of taxes that a shareholder would pay on Fund distributions or upon the redemption of Fund shares. |
(1) | Per share data was calculated using average shares for the period. |
(2) | Institutional Class shares commenced operations on March 30, 2012 and Retail Class Shares commenced operations on April 3, 2012. All ratios for the period have been annualized, except for the Total Return and Portfolio Turnover Rate. |
(3) | Dividend expense and stock loan fee totaled 1.64% of average net assets for the year ended September 30, 2012. Had these expenses not been included the ratios would have been 1.85% and 2.00%, respectively. |
(4) | Dividend expense and stock loan fee totaled 1.61% of average net assets for the year ended September 30, 2013. Had these expenses not been included the ratios would have been 1.85% and 2.00%, respectively. |
(5) | Dividend expense and stock loan fee totaled 1.37% of average net assets for the year ended September 30, 2014. Had these expenses not been included the ratios would have been 1.85% and 2.00%, respectively. |
(6) | Dividend expense and stock loan fee totaled 1.16% of average net assets for the year ended September 30, 2015. Had these expenses not been included the ratios would have been 1.85% and 2.00%, respectively. |
(7) | Dividend expense and stock loan fee totaled 1.35% of average net assets for the year ended September 30, 2016. Had these expenses not been included the ratios would have been 1.78% and 1.98%, respectively. |
(8) | Dividend expense and stock loan fee totaled 1.35% of average net assets for the period ended March 31, 2017. Had these expenses not been included the ratios would have been 1.76% and 2.00%, respectively. |
(9) | Ratios include previously waived investment advisory fees recovered. |
(10) | Amount represents less than $0.01 per share. |
The accompanying notes are an integral part of the financial statements. |
27 |
Financial Highlights For a Share Outstanding Throughout Each Period |
|
| Net Asset | Net | Realized and Unrealized | Total from Investment Operations | Distributions of Dividends from Net Investment Income | Distributions | Total | |||||||||||||||||||||||
RiverPark Structural Alpha Fund | ||||||||||||||||||||||||||||||
Institutional Class Shares | ||||||||||||||||||||||||||||||
2017* |
| $ | 10.15 | $ | (0.06 | ) | $ | 0.17 | $ | 0.11 | $ | — | $ | (0.15 | ) | $ | (0.15 | ) | ||||||||||||
2016(10) |
| 10.13 | (0.16 | ) | 0.35 | 0.19 | — | (0.17 | ) | (0.17 | ) | |||||||||||||||||||
2015 | 10.50 | (0.19 | ) | 0.23 | 0.04 | — | (0.41 | ) | (0.41 | ) | ||||||||||||||||||||
2014 | 10.12 | (0.18 | ) | 0.73 | 0.55 | — | (0.17 | ) | (0.17 | ) | ||||||||||||||||||||
2013(2) |
| 10.00 | (0.05 | ) | 0.17 | 0.12 | — | — | — | |||||||||||||||||||||
Retail Class Shares | ||||||||||||||||||||||||||||||
2017* |
| $ | 10.08 | $ | (0.07 | ) | $ | 0.16 | $ | 0.09 | $ | — | $ | (0.15 | ) | $ | (0.15 | ) | ||||||||||||
2016(10) |
| 10.07 | (0.19 | ) | 0.37 | 0.18 | — | (0.17 | ) | (0.17 | ) | |||||||||||||||||||
2015 | 10.47 | (0.21 | ) | 0.22 | 0.01 | — | (0.41 | ) | (0.41 | ) | ||||||||||||||||||||
2014 | 10.12 | (0.20 | ) | 0.72 | 0.52 | — | (0.17 | ) | (0.17 | ) | ||||||||||||||||||||
2013(2) |
| 10.00 | (0.05 | ) | 0.17 | 0.12 | — | — | — | |||||||||||||||||||||
RiverPark Strategic Income Fund | ||||||||||||||||||||||||||||||
Institutional Class Shares | ||||||||||||||||||||||||||||||
2017* |
| $ | 9.43 | $ | 0.29 | $ | 0.09 | $ | 0.38 | $ | (0.28 | ) | $ | — | $ | (0.28 | ) | |||||||||||||
2016 | 9.49 | 0.52 | (0.04 | ) | 0.48 | (0.54 | ) | — | (0.54 | ) | ||||||||||||||||||||
2015 | 10.26 | 0.56 | (0.72 | ) | (0.16 | ) | (0.60 | ) | (0.01 | ) | (0.61 | ) | ||||||||||||||||||
2014(3) |
| 10.00 | 0.59 | 0.12 | (6) | 0.71 | (0.45 | ) | — | (5) | (0.45 | ) | ||||||||||||||||||
Retail Class Shares | ||||||||||||||||||||||||||||||
2017* |
| $ | 9.42 | $ | 0.27 | $ | 0.09 | $ | 0.36 | $ | (0.26 | ) | $ | — | $ | (0.26 | ) | |||||||||||||
2016 | 9.48 | 0.49 | (0.04 | ) | 0.45 | (0.51 | ) | — | (0.51 | ) | ||||||||||||||||||||
2015 | 10.26 | 0.53 | (0.72 | ) | (0.19 | ) | (0.58 | ) | (0.01 | ) | (0.59 | ) | ||||||||||||||||||
2014(3) |
| 10.00 | 0.55 | 0.14 | (6) | 0.69 | (0.43 | ) | — | (5) | (0.43 | ) | ||||||||||||||||||
The accompanying notes are an integral part of the financial statements. |
28 |
|
Net Asset | Total Return†† | Net Assets, End of Period (000) | Ratio of Net Expenses to Average Net Assets, Including Dividend Expense and Stock Loan Fee | Ratio of Total Expenses to Average Net Assets, Including Dividend Expense and Stock Loan Fee, Excluding Advisor Waiver Recapture | Ratio of Net Investment Income (Loss) to Average Net Assets | Portfolio Turnover Rate | ||||||||||||||||||||
$ | 10.11 | 1.12 | %†** | $ | 12,488 | 1.52 | %(11) | 1.56 | %(11) | (1.22 | )%(11) | 0 | %(7)** | |||||||||||||
10.15 | 1.89 | 17,344 | 1.75 | (4) | 1.74 | (1.59 | ) | 0 | (7) | |||||||||||||||||
10.13 | 0.46 | † | 14,646 | 1.75 | 1.90 | (1.82 | ) | 0 | (7) | |||||||||||||||||
10.50 | 5.46 | † | 8,003 | 1.75 | 2.22 | (1.72 | ) | 0 | (7) | |||||||||||||||||
10.12 | 1.20 | † | 8,118 | 1.75 | 2.99 | (1.73 | ) | 0 | ||||||||||||||||||
$ | 10.02 | 0.93 | %†** | $ | 1,294 | 1.78 | %(11) | 1.88 | %(11) | (1.47 | )%(11) | 0 | %(7)** | |||||||||||||
10.08 | 1.80 | 2,186 | 2.00 | 2.09 | (1.85 | ) | 0 | (7) | ||||||||||||||||||
10.07 | 0.17 | † | 3,226 | 2.00 | 2.24 | (2.07 | ) | 0 | (7) | |||||||||||||||||
10.47 | 5.16 | † | 826 | 2.00 | 2.56 | (1.97 | ) | 0 | (7) | |||||||||||||||||
10.12 | 1.20 | † | 885 | 2.00 | 3.32 | (1.98 | ) | 0 | ||||||||||||||||||
$ | 9.53 | 4.03 | %** | $ | 286,549 | 0.93 | %(9) | 0.93 | % | 6.13 | % | 33 | %** | |||||||||||||
9.43 | 5.34 | 246,474 | 0.93 | (8) | 0.93 | 5.64 | 69 | |||||||||||||||||||
9.49 | (1.63 | ) | 247,726 | 0.90 | 0.90 | 5.57 | 54 | |||||||||||||||||||
10.26 | 7.16 | 205,825 | 0.91 | 0.91 | 5.67 | 61 | ||||||||||||||||||||
$ | 9.52 | 3.91 | %** | $ | 370,016 | 1.25 | %(9) | 1.25 | % | 5.82 | % | 33 | %** | |||||||||||||
9.42 | 5.08 | 361,203 | 1.24 | (8) | 1.24 | 5.32 | 69 | |||||||||||||||||||
9.48 | (1.98 | ) | 391,558 | 1.19 | 1.19 | 5.29 | 54 | |||||||||||||||||||
10.26 | 6.93 | 306,131 | 1.24 | 1.24 | 5.29 | 61 | ||||||||||||||||||||
* | Unless otherwise indicated, all ratios for the period have been annualized. |
** | Not annualized. |
† | Total return would have been lower had certain fees not been waived and/or expenses assumed by Adviser during the period. |
†† | Returns shown do not reflect the deduction of taxes that a shareholder would pay on Fund distributions or upon the redemption of Fund shares. |
(1) | Per share data was calculated using average shares for the period. |
(2) | Commenced operations on June 28, 2013. All ratios for the period have been annualized, except for the Total Return and Portfolio Turnover Rate. |
(3) | Commenced operations on September 30, 2013. All ratios for the period have been annualized, except for the Total Return and Portfolio Turnover Rate. |
(4) | Ratios include previously waived investment advisory fees recovered. |
(5) | Amount represents less than $0.01 per share. |
(6) | Realized and unrealized gains and losses per share in this caption are balancing amounts necessary to reconcile the change in net asset value per share for the period, and may not reconcile with the aggregate gains and losses in the Statement of Operations due to share transactions for the period. |
(7) | Note that the ratio is zero due to not having any long-term securities. |
(8) | Dividend expense and stock loan fee totaled 0.09% of average net assets for the year ended September 30, 2016. Had these expenses not been included the ratios would have been 0.84% and 1.15%, respectively. |
(9) | Dividend expense and stock loan fee totaled 0.09% of average net assets for the period ended March 31, 2017. Had these expenses not been included the ratios would have been 0.84% and 1.16%, respectively. |
(10) | For the year ended September 30, 2016, the Adviser has recovered previously waived investment advisory fees in the Institutional Class while waiving investment advisory fees in the Retail Class. |
(11) | Effective January 1, 2017, the investment advisory fee for the RiverPark Structural Alpha Fund was lowered from 1.40% to 0.90%. |
The accompanying notes are an integral part of the financial statements. |
29 |
Financial Highlights For a Share Outstanding Throughout Each Period |
|
| Net Asset | Net | Realized and Unrealized | Total from Investment Operations | Distributions of Dividends from Net Investment Income | Distributions | Total | |||||||||||||||||||||||
RiverPark Focused Value Fund | ||||||||||||||||||||||||||||||
Institutional Class Shares | ||||||||||||||||||||||||||||||
2017* |
| $ | 8.01 | $ | 0.07 | $ | 0.69 | $ | 0.76 | $ | (0.07 | ) | $ | — | $ | (0.07 | ) | |||||||||||||
2016(5) |
| 8.56 | 0.13 | (0.63 | ) | (0.50 | ) | (0.05 | ) | — | (4) | (0.05 | ) | |||||||||||||||||
2015(2) |
| 10.00 | 0.07 | (1.51 | ) | (1.44 | ) | — | — | — | ||||||||||||||||||||
Retail Class Shares | ||||||||||||||||||||||||||||||
2017* |
| $ | 8.00 | $ | 0.06 | $ | 0.69 | $ | 0.75 | $ | (0.05 | ) | $ | — | $ | (0.05 | ) | |||||||||||||
2016(5) |
| 8.56 | 0.10 | (0.63 | ) | (0.53 | ) | (0.03 | ) | — | (4) | (0.03 | ) | |||||||||||||||||
2015(2) |
| 10.00 | 0.05 | (1.49 | ) | (1.44 | ) | — | — | — | ||||||||||||||||||||
The accompanying notes are an integral part of the financial statements. |
30 |
|
Net Asset | Total Return†† | Net Assets, End of Period (000) | Ratio of Net Expenses to Average Net | Ratio of Total Expenses to Average Net Assets, Excluding Advisor Waiver Recapture | Ratio of Net Investment Income (Loss) to Average Net Assets | Portfolio Turnover Rate | ||||||||||||||||||||
$ | 8.70 | 9.55 | %** | $ | 38,914 | 0.91 | %(3) | 0.84 | % | 1.67 | % | 22 | %** | |||||||||||||
8.01 | (5.83 | ) | 41,803 | 1.00 | (3) | 0.97 | 1.57 | 26 | ||||||||||||||||||
8.56 | (14.40 | )† | 43,200 | 1.00 | 1.25 | 1.35 | 14 | |||||||||||||||||||
$ | 8.70 | 9.38 | %** | $ | 648 | 1.21 | %(3) | 1.18 | % | 1.48 | % | 22 | %** | |||||||||||||
8.00 | (6.14 | ) | 411 | 1.25 | 1.35 | 1.29 | 26 | |||||||||||||||||||
8.56 | (14.40 | )† | 363 | 1.25 | 1.60 | 1.01 | 14 | |||||||||||||||||||
* | Unless otherwise indicated, all ratios for the period have been annualized. |
** | Not annualized. |
† | Total return would have been lower had certain fees not been waived and/or expenses assumed by Adviser during the period. |
†† | Returns shown do not reflect the deduction of taxes that a shareholder would pay on Fund distributions or upon the redemption of Fund shares. |
(1) | Per share data was calculated using average shares for the period. |
(2) | Commenced operations on March 31, 2015. All ratios for the period have been annualized, except for the Total Return and Portfolio Turnover Rate. |
(3) | Ratios include previously waived investment advisory fees recovered. |
(4) | Amount represents less than $0.01 per share. |
(5) | For the year ended September 30, 2016, the Adviser has recovered previously waived investment advisory fees in the Institutional Class while waiving investment advisory fees in the Retail Class. |
The accompanying notes are an integral part of the financial statements. |
31 |
Notes to Financial Statements March 31, 2017 (Unaudited) |
|
1. Organization
RiverPark Funds Trust (the “Trust”), was formed on June 22, 2010 as an open-end registered management investment company under the Investment Act of 1940. As of March 31, 2017, the Trust was comprised of seven funds: the RiverPark Large Growth Fund, RiverPark/Wedgewood Fund, RiverPark Short Term High Yield Fund, RiverPark Long/Short Opportunity Fund, RiverPark Structural Alpha Fund, RiverPark Strategic Income Fund and the RiverPark Focused Value Fund (each a “Fund” and collectively the “Funds”). The investment objective of the RiverPark Large Growth Fund, RiverPark/Wedgewood Fund and RiverPark Focused Value Fund is to seek long term capital appreciation. The investment objective of the RiverPark Short Term High Yield Fund and RiverPark Strategic Income Fund is to seek high current income and capital appreciation consistent with the preservation of capital. The investment objective of the RiverPark Long/Short Opportunity Fund is to seek long-term capital appreciation while managing downside volatility. The investment objective of the RiverPark Structural Alpha Fund is to seek long-term capital appreciation while exposing investors to less risk than broad stock market indices. Each of the Funds is diversified with the exception of the RiverPark/Wedgewood Fund and RiverPark Focused Value Fund which are both non-diversified. Each Fund is registered to offer Institutional Class Shares and Retail Class Shares. Each of the Funds, except the RiverPark Short Term High Yield Fund, has registered Class C Shares but they are not intended to be offered at this time. Each class differs as to ongoing fees. The RiverPark Short Term High Yield Fund was closed to new investors on June 21, 2013.
2. Summary of Significant Accounting Policies
The following is a summary of significant accounting policies followed by the Trust in preparation of its financial statements. These policies are in conformity with accounting principles generally accepted in the United States of America (“GAAP”). The preparation of the financial statements in conformity with GAAP requires management to make estimates and assumptions that affect the reported amounts of assets and liabilities and disclosure of contingent assets and liabilities at the date of the financial statements and the reported amounts of increases and decreases in net assets from operations during the reporting period. Actual results could differ from those estimates. The Funds are investment companies and accordingly follow investment company accounting and reporting guidance of the Financial Accounting Standards Board (FASB) Accounting Standards Codification Topic 946 Financial Services – Investment Companies.
Valuation of Investments — Securities listed on a national securities exchange or traded on the NASDAQ system are valued on their last sale price. Portfolio securities traded on NASDAQ will be valued at the NASDAQ Official Closing Price on each business day for the New York Stock Exchange (“NYSE”). If there is no such reported sale on an exchange or NASDAQ, the portfolio security will be valued at the mean between the most recent quoted bid and asked price. Price information on listed securities is taken from the exchange where the security is primarily traded. Other equity securities and debt securities for which market quotations are readily available are valued at the mean between their bid and asked price, except that debt securities maturing within 60 days are valued on an amortized cost basis which approximates fair value. Debt securities are valued according to the broadest and most representative market, which will ordinarily be over-the-counter. Debt securities may be valued based on prices provided by a pricing service when such prices are believed to reflect the fair value of such securities. Securities for which market quotations are not readily available are valued at fair value as determined in good faith through consideration of other factors in accordance with procedures adopted by, and under the general supervision of, the Board of Trustees (“the Board”).
32 |
Notes to Financial Statements March 31, 2017 (Unaudited) |
|
2. Summary of Significant Accounting Policies (continued)
To the extent that a Fund invests in non-U.S. dollar denominated securities, the value of all assets and liabilities not denominated in United States dollars will be translated into United States dollars on the valuation date. Trading in securities on European and Far Eastern securities exchanges and over-the-counter markets is normally completed well before the close of business on each day the NYSE is open for business (a “business day”). In addition, European or Far Eastern securities trading generally or in a particular country or countries may not take place on all business days in New York. Furthermore, trading takes place in various foreign markets on days which are not business days in New York and on which net asset value is not calculated. Such calculation does not take place contemporaneously with the determination of the prices of the majority of the portfolio securities used in such calculation. Events affecting the values of portfolio securities that occur between the time their prices are determined and the close of the NYSE will not be reflected in a Fund’s calculation of net assets unless the Trustees deem that the particular event would materially affect net asset value, in which case an adjustment will be made.
In accordance with the authoritative guidance on fair value measurement and disclosure under GAAP, the Funds disclose the fair value of their investments in a hierarchy that prioritizes the inputs to valuation techniques used to measure the fair value. The objective of a fair value measurement is to determine the price that would be received to sell an asset or paid to transfer a liability in an orderly transaction between market participants at the measurement date (an exit price). Accordingly, the fair value hierarchy gives the highest priority to quoted prices (unadjusted) in active markets for identical assets or liabilities (Level 1) and the lowest priority to unobservable inputs (Level 3).
The three levels of the fair value hierarchy are described below:
● | Level 1 — | Unadjusted quoted prices in active markets for identical, unrestricted assets or liabilities that the Funds have the ability to access at the measurement date; |
| ● | Level 2 — | Other significant observable inputs (includes quoted prices for similar securities, interest rates, prepayment speeds, credit risk, referenced indices, quoted prices in inactive markets, adjusted quoted prices in active markets, etc.); and |
● | Level 3 — | Prices, inputs or exotic modeling techniques which are both significant to the fair value measurement and unobservable (supported by little or no market activity). |
Investments are classified within the level of the lowest significant input considered in determining fair value. Investments classified within Level 3 whose fair value measurement considers several inputs may include Level 1 or Level 2 inputs as components of the overall fair value measurement.
For details of the investment classification, refer to the Schedules of Investments, Schedules of Securities Sold Short, Not Yet Purchased, Schedules of Open Options Purchased, Schedules of Open Options Written, open forward currency contracts and list of open swap contracts.
It is the Funds’ policy to recognize transfers into and out of Levels at the end of the reporting period. For the six months ended March 31, 2017, there were no significant changes to the Funds’ fair value methodologies.
33 |
Notes to Financial Statements March 31, 2017 (Unaudited) |
|
2. Summary of Significant Accounting Policies (continued)
Securities Sold Short, Not Yet Purchased — As consistent with the RiverPark Long/Short Opportunity Fund’s investment objectives, the Fund intends to sell securities short so long as, as a result of that sale, the current value of securities sold short, not yet purchased by the Fund would not exceed 50% of the value of its gross assets (including the amounts borrowed) and 100% of the value of its net assets. As consistent with the RiverPark Strategic Income Fund’s investment objectives, the Fund intends to sell securities short so long as, as a result of that sale, the current value of securities sold short, not yet purchased by the Fund would not exceed 15% of the value of its net assets. A short sale is the sale by a fund of a security which it does not own in anticipation of purchasing the same security in the future. To complete such a transaction, the Funds must borrow the security to make delivery to the buyer. The Funds are then obligated to replace the security borrowed by purchasing the security at the market price at the time of the replacement. The price at such time may be more or less than the price at which the security was sold by the Funds. Until the security is replaced, the Funds are required to pay the lender amounts equal to any dividends or interest that accrue during the period of the loan. Dividends and interest are shown as an expense for financial reporting purposes. To borrow the security, the Funds also may be required to pay a fee, which is shown as an expense for financial reporting purposes. The proceeds of the short sale are retained by the broker, to the extent necessary to meet margin requirements, until the short position is closed out. A realized gain, limited to the price at which the Funds sold the security short, or a realized loss, unlimited in size on a standalone basis, will be recognized upon the close of a short sale.
Until the Funds close their short position or replace the borrowed security, the Funds will maintain a segregated account with its custodian containing marginable securities. The Funds may be required to add to the segregated account as the market price of a shorted security increases. As a result of maintaining and adding to its segregated account, the Funds may maintain higher levels of marginable assets (for example, long equity positions) for collateral needs thus reducing their overall managed assets available for trading purposes.
Written/Purchased Options — Each of the Funds may purchase call and put options on securities to seek capital growth or for hedging purposes. Each Fund may also write and sell covered call and put options as well as purchase and write options on stock indices (such as the S&P 500 Index) listed on domestic or foreign securities exchanges or traded in the over-the-counter market for hedging purposes. Additionally, RiverPark Long/Short Opportunity Fund, RiverPark Structural Alpha Fund and RiverPark Strategic Income Fund may sell uncovered call and put options on securities and stock indices.
The RiverPark Long/Short Opportunity Fund, RiverPark Structural Alpha Fund and RiverPark Strategic Income Fund may invest up to 50% of the value of their assets, represented by premiums paid, to purchase call and put options on securities and securities indices. The Funds may write covered call and put options on securities and securities indices, so long as the aggregate nominal value does not exceed 200% of the value of its assets. The RiverPark Structural Alpha Fund may purchase or sell options or option spreads, so long as the aggregate net notional value does not exceed 125%, and the gross notional value does not exceed 250% of the value of its assets.
An option on a security provides the purchaser, or “holder,” with the right, but not the obligation, to purchase, in the case of a “call” option, or sell, in the case of a “put” option, the security or securities underlying the option, for a fixed exercise price up to a stated expiration date. The holder pays a nonrefundable purchase price for the option, known as the “premium.” The maximum amount of risk the purchaser of the option assumes is equal to the premium plus related transaction costs, although the entire amount may be lost. The risk of the seller, or “writer,” however, is potentially unlimited, unless the option is “covered,” which is generally accomplished through the writer’s ownership of the underlying security, in the case of a call option, or the writer’s segregation of an amount of cash or securities equal to the exercise price, in the case of a put option. If the writer’s obligation is not covered, it is subject to the risk of the full change in value of the underlying security from the time the option is written until exercise.
34 |
Notes to Financial Statements March 31, 2017 (Unaudited) |
|
2. Summary of Significant Accounting Policies (continued)
Purchased and written equity and index options transactions entered into during the six months ended March 31, 2017 are summarized as follows:
RiverPark Long/Short Opportunity Fund | Purchased Options | Written Options | ||||||||||||||
Number of Contracts | Cost | Number of Contracts | Premiums Received | |||||||||||||
Balance at the beginning of the period | — | $ | — | — | $ | — | ||||||||||
Written | — | — | 1,040 | 69,636 | ||||||||||||
Purchased | 1,040 | 281,882 | — | — | ||||||||||||
Expired | (1,040 | ) | (281,882 | ) | (1,040 | ) | (69,636 | ) | ||||||||
Balance at the end of the period | — | $ | — | — | $ | — | ||||||||||
RiverPark Structural Alpha Fund | Purchased Options | Written Options | ||||||||||||||
Number of Contracts | Cost | Number of Contracts | Premiums Received | |||||||||||||
Balance at the beginning of the period | 136 | $ | 1,426,446 | 236 | $ | 1,218,230 | ||||||||||
Written | — | — | 288 | 553,574 | ||||||||||||
Purchased | 262 | 541,775 | — | — | ||||||||||||
Expired | (78 | ) | (12,151 | ) | (84 | ) | (364,927 | ) | ||||||||
Exercised/Assigned | (84 | ) | (899,568 | ) | (76 | ) | (327,346 | ) | ||||||||
Sold/Covered | (96 | ) | (68,355 | ) | (208 | ) | (255,465 | ) | ||||||||
Balance at the end of the period | 140 | $ | 988,147 | 156 | $ | 824,066 | ||||||||||
RiverPark Strategic Income Fund | Purchased Options | Written Options | ||||||||||||||
Number of Contracts | Cost | Number of Contracts | Premiums Received | |||||||||||||
Balance at the beginning of the period | 500 | $ | 93,020 | — | $ | — | ||||||||||
Exercised | (500 | ) | (93,020 | ) | — | — | ||||||||||
Balance at the end of the period | — | $ | — | — | $ | — | ||||||||||
Purchased and written options held as of March 31, 2017 are disclosed separately on the Statements of Assets and Liabilities. The realized and unrealized gain (loss) from purchased and written options are disclosed separately on the Statements of Operations.
All purchased and written options have equity risk exposure. Additionally, all purchased and written options held as of March 31, 2017 are exchange-traded and therefore no right of offset exists.
Swap Agreements — The Funds may invest in equity-linked securities, including, but not limited to, participation notes, certificates, and equity swaps. Equity-linked securities are privately issued securities whose investment results are designed to correspond generally to the performance of a specified stock index or “basket” of stocks, or a single stock. To the extent that the Funds invest in equity-linked securities whose return corresponds to the performance of a foreign security index or one or more foreign stocks, investing in equity-linked securities will involve risks similar to the risks of investing in foreign securities and subject to each Fund’s restrictions on investments in foreign securities.
35 |
Notes to Financial Statements March 31, 2017 (Unaudited) |
|
2. Summary of Significant Accounting Policies (continued)
Equity swaps allow the parties to a swap agreement to exchange the dividend income or other components of return on an equity investment (for example, a group of equity securities or an index) for a component of return on another non-equity or equity investment. An equity swap may be used by a Fund to invest in a market without owning or taking physical custody of securities in circumstances in which direct investment may be restricted for legal reasons or is otherwise deemed impractical or disadvantageous. Equity swaps may also be used for hedging purposes or to seek to increase exposure and total return. A Fund’s ability to enter into certain swap transactions may be limited by tax considerations. The counterparty to an equity swap contract will typically be a bank, investment banking firm or broker/dealer.
Equity swap contracts may be structured in different ways. For example, a counterparty may agree to pay the Fund the amount, if any, by which the notional amount of the equity swap contract would have increased in value had it been invested in particular stocks (or an index of stocks), plus the dividends that would have been received on those stocks. In these cases, the Fund may agree to pay to the counterparty a floating rate of interest on the notional amount of the equity swap contract plus the amount, if any, by which that notional amount would have decreased in value had it been invested in such stocks. Therefore, the return to the Fund on the equity swap contract should be the gain or loss on the notional amount plus dividends on the stocks less the interest paid by the Fund on the notional amount. In other cases, the counterparty and the Fund may each agree to pay the other the difference between the relative investment performances that would have been achieved if the notional amount of the equity swap contract had been invested in different stocks (or indices of stocks). A Fund will generally enter into equity swaps on a net basis, which means that the two payment streams are netted out, with the Fund receiving or paying, as the case may be, only the net amount of the two payments. Payments may be made at the conclusion of an equity swap contract or monthly during its term.
Equity swaps are derivatives and their value can be very volatile. Equity swaps normally do not involve the delivery of securities or other underlying assets. Accordingly, the risk of loss with respect to equity swaps is normally limited to the net amount of payments that a Fund is contractually obligated to make. If the counterparty to an equity swap defaults, a Fund’s risk of loss consists of the net amount of payments that such Fund is contractually entitled to receive. Because some swap agreements have a leverage component, adverse changes in the value or level of the underlying asset, reference rate, or index can result in a loss substantially greater than the cost of the underlying asset without the use of leverage. In addition, the value of some components of an equity swap (such as the dividends on a common stock) may also be sensitive to changes in interest rates. To the extent that the Adviser does not accurately analyze and predict the potential relative fluctuation of the components swapped with another party, a Fund may suffer a loss. Because equity swaps are normally illiquid, a Fund may be unable to terminate its obligations when desired. When entering into swap contracts, a Fund must “set aside” liquid assets, or engage in other appropriate measures to “cover” its obligation under the swap contract.
All swaps held by the RiverPark Long/Short Opportunity Fund during the six months ended March 31, 2017 had equity risk exposure.
Swaps are marked-to-market daily and are valued at the unrealized appreciation or depreciation on the instrument based upon quotations from market makers and the resulting changes in market values, if any, are recorded as an unrealized gain or loss in the Statements of Operations. Monthly reset payments on the total return swap are inclusive of interest, commissions and dividends which are recorded as part of the net realized gains and losses in the Statement of Operations. Net realized gain on swap contracts was $1,426,148 for the six months ended March 31, 2017. The total return swaps reset monthly, as such there was $0 unrealized appreciation (depreciation) as of March 31, 2017. The total return swaps that the RiverPark Long/Short Opportunity Fund transacts in are subject to a netting arrangement.
36 |
Notes to Financial Statements March 31, 2017 (Unaudited) |
|
2. Summary of Significant Accounting Policies (continued)
Total return swap transactions entered into during the six months ended March 31, 2017 are summarized as follows:
RiverPark Long/Short Opportunity Fund | Total Return Swaps | |||
Number of Contracts | ||||
Swap contracts outstanding at the beginning of the period | 444,287 | |||
Opened | 126,005 | |||
Closed | (62,208 | ) | ||
Swap contracts outstanding at the end of the period | 508,084 | |||
This turnover is inclusive of monthly swap resets, swap expirations and swap transactions with the counterparty. The open swap contracts are collateralized by $1,300,000 in cash.
Futures and Options on Futures on Stock Indices — The RiverPark Structural Alpha Fund intends to use futures and may use options on futures. The use of futures involves the risk that the futures contract may temporarily not correlate with the underlying index on which it is based. Additionally, futures contracts are leveraged vehicles where limited amounts of capital can expose the Fund to significant exposure to changes in the underlying index. Options on futures involve the risks associated with futures as well as the risks associated with using index options. When options are purchased over-the-counter, the Fund will bear the risk that the counterparty that wrote the option will be unable or unwilling to perform its obligations under the option contract. Such options may also be illiquid, and in such cases, the Fund may have difficulty closing out its positions. At March 31, 2017 the options contracts were fully collateralized by $8,485,777 in securities pledged and $1,711,805 in cash.
Futures contracts are valued at the unrealized appreciation (depreciation) on the instrument. Such unrealized is included as a component of the net assets on the Statement of Assets and Liabilities. Variation margin payments are paid or received, depending upon whether unrealized gains or losses are incurred. As of March 31, 2017, the RiverPark Structural Alpha Fund has open futures contracts and during the six months ended, all futures contracts held had equity risk exposure. For the six months ended March 31, 2017, the total amount of all open futures contracts, as presented in the Schedule of Investments, are representative of the volume of activity during the period. The realized and unrealized gain (loss) from futures contracts are disclosed separately on the Statements of Operations. Additionally, all futures contracts held are exchange-traded and therefore no right of offset exists. In addition to the $8,485,777 in collateral noted on the Schedule of Investments for the open option contracts, the futures contracts were also collateralized by $866,925 in cash.
37 |
Notes to Financial Statements March 31, 2017 (Unaudited) |
|
2. Summary of Significant Accounting Policies (continued)
Master Limited Partnerships — The Funds may invest in master limited partnerships (“MLPs”). MLPs are limited partnerships or limited liability companies, whose partnership units or limited liability interests are listed and traded on a U.S. securities exchange, and are treated as publicly traded partnerships for federal income tax purposes. To qualify to be treated as a partnership for tax purposes, an MLP must receive at least 90% of its income from qualifying sources as set forth in Section 7704(d) of the Internal Revenue Code of 1986, as amended (the “Code”). These qualifying sources include interest, dividend, real property rent, gain from sale or other disposition of real property and income from activities such as the exploration, development, mining, production, processing, refining, transportation, storage and marketing of mineral or natural resources. MLPs generally have two classes of owners, the general partner and limited partners. MLPs that are formed as limited liability companies generally have two analogous classes of owners, the managing member and the members. For purposes of this section, references to general partners also apply to managing members and references to limited partners also apply to members. The general partner is typically owned by a major energy company, an investment fund, the direct management of the MLP or is an entity owned by one or more of such parties. The general partner may be structured as a private or publicly traded corporation or other entity. The general partner typically controls the operations and management of the MLP through an equity interest of as much as 2% in the MLP plus, in many cases, ownership of common units and subordinated units. Limited partners own the remainder of the MLP through ownership of common units and have a limited role in the MLP’s operations and management.
An investment in MLP units involves certain risks which differ from an investment in the securities of a corporation. Holders of MLP units have limited control and voting rights on matters affecting the partnership. In addition, there are certain tax risks associated with an investment in MLP units and conflicts of interest exist between common unit holders and the general partner, including those arising from incentive distribution payments. As a partnership, an MLP has no tax liability at the entity level. If, as a result of a change in current law or a change in an MLP’s business, an MLP were treated as a corporation for federal income tax purposes, such MLP would be obligated to pay federal income tax on its income at the corporate tax rate. If an MLP were classified as a corporation for federal income tax purposes, the amount of cash available for distribution by the MLP would be reduced and distributions received by investors would be taxed under federal income tax laws applicable to corporate dividends (as dividend income, return of capital, or capital gain). Therefore, treatment of an MLP as a corporation for federal income tax purposes would result in a reduction in the after-tax return to investors, likely causing a reduction in the value of the Funds’ shares. Dividends from MLPs are recorded on the ex-dividend date.
Investment Transactions — Security transactions are accounted for on the trade date, the date the order to buy or sell is executed. Costs used in determining realized gains and losses on the sales of investment securities are those of the specific securities sold. Discounts or premiums are accreted or amortized to interest income using the effective interest method. Interest income is recognized on the accrual basis from settlement date. Dividend income and expenses and other distributions are recorded on the ex-dividend date, except certain dividends and distributions from foreign securities which are recorded as soon as a Fund is informed after the ex-dividend date. Withholding taxes on foreign dividends have been provided for in accordance with the Funds’ understanding of the applicable country’s tax rules and rates. The ability of issuers of debt securities held by the Funds to meet their obligations may be affected by economic and political developments in a specific country or region.
Defaulted Investments — Debt obligations may be placed on non-accrual status and related interest income may be reduced by ceasing current accruals and writing off interest receivable when the collection of all or a portion of interest has become doubtful based on consistently applied procedures. A debt obligation is removed from non-accrual status when the issuer resumes interest payments or when collectability of interest is reasonably assured.
38 |
Notes to Financial Statements March 31, 2017 (Unaudited) |
|
2. Summary of Significant Accounting Policies (continued)
Expenses — Expenses of the Trust that can be directly attributed to a particular Fund are borne by that Fund. Expenses which cannot be directly attributed to a Fund are apportioned among the Funds of the Trust based on the number of Funds and/or relative net assets.
Classes — Class specific expenses are borne by that class of shares. Income, realized and unrealized gains and losses and non-class specific expenses are allocated to the respective class on the basis of relative daily net assets.
Foreign Currency Translation — The books and records of the Funds are maintained in U.S. dollars. Investment securities and other assets and liabilities denominated in a foreign currency are translated into U.S. dollars on the date of valuation. The Fund’s do not isolate that portion of realized or unrealized gains and losses resulting from changes in the foreign exchange rate from fluctuations arising from changes in the market prices of the securities. These gains and losses are included in net realized and unrealized gains and losses on investments on the Statements of Operations. Net realized and unrealized gains and losses on foreign currency transactions represent net foreign exchange gains or losses from foreign currency exchange contracts, disposition of foreign currencies, currency gains or losses realized between trade and settlement dates on securities transactions and the difference between the amount of the investment income and foreign withholding taxes recorded on the Fund’s books and the U.S. dollar equivalent amounts actually received or paid.
Forward Foreign Currency Exchange Contracts — Each Fund may, but is not obligated to, enter into forward foreign currency exchange contracts (“forward contracts”) in order to protect against uncertainty in the level of future foreign exchange rates in the purchases and sale of securities. A forward contract generally has no deposit requirement, and no commissions are charged at any stage for trades. Although foreign exchange dealers do not charge a fee for commissions, they do realize a profit based on the difference between the price at which they are buying and selling various currencies. Although forward contracts are intended to minimize currency risk — the risk of loss due to a decline in the value of the hedged currencies — at the same time, they tend to limit any potential gain which might result should the value of such currencies increase. As of March 31, 2017, the RiverPark Strategic Income Fund held forward contracts as currency hedges against foreign bonds. It is the Funds’ policy to present the gross unrealized appreciation and gross unrealized depreciation of the forward contracts separately on the Statements of Assets and Liabilities as the Funds do not have a master netting agreement with the counterparty to the forward contracts. In accordance with this policy, unrealized appreciation and depreciation as of March 31, 2017 are presented in unrealized appreciation or unrealized depreciation on forward foreign currency contracts on the Statements of Assets and Liabilities. Realized and unrealized gains (losses) on forward contracts are disclosed separately on the Statements of Operations. For the six months ended March 31, 2017, the total amount of open forward foreign currency contracts, as presented in the RiverPark Strategic Income Fund’s Schedule of Investments, are representative of the volume of activity for this derivative type during the period.
The forward foreign currency contracts held by the RiverPark Strategic Income Fund during the six months ended March 31, 2017 had currency risk exposure.
Dividends and Distributions to Shareholders — Dividends from net investment income are declared and paid to shareholders annually for the RiverPark Large Growth Fund, RiverPark/Wedgewood Fund, RiverPark Long/Short Opportunity Fund, RiverPark Structural Alpha Fund and RiverPark Focused Value Fund and declared and paid monthly for the RiverPark Short Term High Yield Fund and RiverPark Strategic Income Fund. Dividends and distributions are recorded on the ex-dividend date. Any net realized capital gains will be distributed at least annually by the Funds.
39 |
Notes to Financial Statements March 31, 2017 (Unaudited) |
|
2. Summary of Significant Accounting Policies (continued)
Income Taxes — Each Fund intends to qualify or continue to qualify as a “regulated investment company” under Sub-chapter M of the Internal Revenue Code of 1986, as amended. If so qualified, each Fund will not be subject to federal income tax to the extent it distributes substantially all of its net investment income and net capital gains to its shareholders.
The Funds evaluate tax positions taken or expected to be taken in the course of preparing the Funds’ tax returns to determine whether it is “more-likely-than not” (i.e., greater than 50-percent) that each tax position will be sustained upon examination by a taxing authority based on the technical merits of the position. Tax positions not deemed to meet the more-likely-than-not threshold are recorded as a tax benefit or expense in the current year. The Funds did not record any tax provision in the current period. However, management’s conclusions regarding tax positions taken may be subject to review and adjustment at a later date based on factors including, but not limited to, examination by tax authorities (i.e., the last 3 tax year ends, as applicable), on-going analysis of, and changes to, tax laws, regulations and interpretations thereof.
As of and during the six months ended March 31, 2017, the Funds did not have a tax liability for any unrecognized tax benefits. The Funds recognize interest and penalties, if any, related to unrecognized tax benefits as income tax expense in the Statements of Operations. During the year, the Funds did not incur any significant interest or penalties.
3. Derivative Transactions
The fair value of derivative instruments as of March 31, 2017:
Statement of Assets and Liabilities | |||||||||
Fund | Location | Asset Derivatives | Liability Derivatives | ||||||
RiverPark Structural Alpha Fund | |||||||||
Equity contracts (Equity Risk) | |||||||||
Purchased Options | Purchased Options, at value | $ | 1,816 | $ | — | ||||
Written Options | Written Options, at value | — | (996 | ) | |||||
Index Futures Contracts | Receivable for variation margin | 8 | — | ||||||
$ | 1,824 | $ | (996 | ) | |||||
RiverPark Strategic Income Fund | |||||||||
Foreign exchange contracts (Currency Risk) | |||||||||
Forward contracts | Unrealized depreciation on forward foreign currency contracts | $ | — | $ | (35 | ) | |||
$ | — | $ | (35 | ) | |||||
40 |
Notes to Financial Statements March 31, 2017 (Unaudited) |
|
3. Derivative Transactions (continued)
The effect of derivative instruments on the Statements of Operations for the six months ended March 31, 2017 was as follows:
The amount of net realized gain (loss) and change in unrealized appreciation (depreciation) on derivatives:
Fund | Net Realized Gain/(Loss) | Change in Unrealized Appreciation (Depreciation) | Total | |||||||||
RiverPark Long/Short Opportunity Fund | ||||||||||||
Equity contracts (Equity Risk) | ||||||||||||
Purchased Options | $ | (282 | ) | $ | — | $ | (282 | ) | ||||
Written Options | 70 | — | 70 | |||||||||
Swaps Contracts | 1,426 | — | * | 1,426 | ||||||||
$ | 1,214 | $ | — | $ | 1,214 | |||||||
RiverPark Structural Alpha Fund | ||||||||||||
Equity contracts (Equity Risk) | ||||||||||||
Purchased Options | $ | 1,109 | $ | 387 | $ | 1,496 | ||||||
Written Options | (270 | ) | (365 | ) | (635 | ) | ||||||
Futures Contracts | (573 | ) | — | (573 | ) | |||||||
$ | 266 | $ | 22 | $ | 288 | |||||||
RiverPark Strategic Income Fund | ||||||||||||
Equity contracts (Equity Risk) | ||||||||||||
Purchased Options | $ | — | $ | (41 | ) | $ | (41 | ) | ||||
Foreign exchange contracts (Currency Risk) | ||||||||||||
Forward Foreign Currency Contracts | 225 | (59 | ) | 166 | ||||||||
$ | 225 | $ | (100 | ) | $ | 125 | ||||||
* | As of September 30, 2016 and March 31, 2017, due to the nature of the monthly reset, the net unrealized on swap contracts was $0 for the RiverPark Long/Short Opportunity Fund. |
4. Agreements
Investment Advisory Agreement — RiverPark Advisors, LLC (“RiverPark”) serves as the Funds’ investment adviser (the “Adviser”). The Adviser has contractually agreed to waive its fees and to absorb expenses of each Fund through January 31, 2018 to the extent necessary to ensure that ordinary operating expenses of each class (excluding interest, brokerage commissions, dividends on short sales and interest expense on securities sold short, not yet purchased, acquired fund fees and expenses and extraordinary expenses) do not exceed, on an annual basis, certain levels as set forth below.
41 |
Notes to Financial Statements March 31, 2017 (Unaudited) |
|
4. Agreements (continued)
The table below shows the rate of each Fund’s investment advisory fee and the Adviser’s contractual expense limitation for each Fund:
Fund | Advisory Fee Before Contractual Fee Reduction | Expense Limitation (Institutional Class) | Expense Limitation (Retail Class) | Expense Limitation (Class C)** |
RiverPark Large Growth Fund | 0.65% | 1.00% | 1.25% | 2.00% |
RiverPark/Wedgewood Fund | 0.65% | 1.00% | 1.25% | 2.00% |
RiverPark Short Term High Yield Fund | 0.65% | 1.00% | 1.25% | N/A |
RiverPark Long/Short Opportunity Fund | 1.50% | 1.85% | 2.00% | 2.85% |
RiverPark Structural Alpha Fund* | 0.90% | 1.25% | 1.50% | 2.25% |
RiverPark Strategic Income Fund | 0.65% | 1.00% | 1.25% | 2.00% |
RiverPark Focused Value Fund | 0.65% | 1.00% | 1.25% | 2.00% |
* | Effective January 1, 2017, the investment advisory fee for the RiverPark Structural Alpha Fund was lowered from 1.40% to 0.90%. Effective January 1, 2017 the Expense Limitations were lowered from 1.75% to 1.25% for the Institutional Class Shares, 2.00% to 1.50% for the Retail Class Shares and 2.75% to 2.25% for the Class C Shares of the Fund’s average net assets. |
** | Class C Shares are not currently being offered for sale to investors. |
The Funds have each agreed to repay the Adviser in the amount of any fees waived and Fund expenses absorbed, subject to the limitations that: (1) the reimbursement is made only for fees and expenses incurred not more than three years prior to the date of reimbursement; and (2) the reimbursement may not be made if it would cause the expense limitation in effect at the time the fees were waived or Fund expenses were absorbed, to be exceeded. This arrangement will remain in effect until January 31, 2018 unless the Board approves its modification or termination. The Adviser can recapture any fees it has waived within a three-year period subject to the applicable annual rates in the above table.
For the six months ended March 31, 2017, the Adviser fee waiver analysis is as follows:
Fund | Unexpired | Fees Waived for the Period Ended | Fees Recaptured for the Period Ended | Fee Waivers Expired for the Period Ended | Unexpired | |||||||||||||||
RiverPark Long/Short Opportunity Fund | $ | — | $ | 687 | $ | — | $ | — | $ | 687 | ||||||||||
RiverPark Structural Alpha Fund | 73,396 | 3,357 | — | — | 76,753 | |||||||||||||||
RiverPark Focused Value Fund | 15,289 | — | (15,289 | ) | — | — | ||||||||||||||
As of March 31, 2017, the Adviser may in the future seek reimbursement of previously waived fees for the Funds as follows:
Fund | Expiring | Expiring | Expiring | Expiring | Total | |||||||||||||||
RiverPark Long/Short Opportunity Fund | $ | — | $ | — | $ | — | $ | 687 | $ | 687 | ||||||||||
RiverPark Structural Alpha Fund | 49,797 | 21,181 | 2,418 | 3,357 | 76,753 | |||||||||||||||
42 |
Notes to Financial Statements March 31, 2017 (Unaudited) |
|
4. Agreements (continued)
RiverPark provides day-to-day portfolio management services to the RiverPark Large Growth Fund, RiverPark Long/Short Opportunity Fund, RiverPark Structural Alpha Fund and RiverPark Focused Value Fund. The Adviser has discretion to purchase and sell securities in accordance with these Funds’ objectives, policies, and restrictions.
RiverPark oversees the day-to-day portfolio management services provided by the following sub-advisers:
Fund | Investment Sub-Adviser |
RiverPark/Wedgewood Fund | Wedgewood Partners, Inc. |
RiverPark Short Term High Yield Fund | Cohanzick Management, LLC |
RiverPark Strategic Income Fund | Cohanzick Management, LLC |
The discretion to purchase and sell securities in accordance with these Funds’ objectives, policies, and restrictions has been delegated by the Adviser to Wedgewood Partners, Inc. (“Wedgewood”) and Cohanzick Management, LLC with regard to each respective Fund to which such parties serve as sub-adviser. The Adviser pays the sub-advisers a monthly fee based upon the net assets managed by such sub-adviser from the management fee paid to the Adviser pursuant to the Investment Advisory Agreement. The Funds are not responsible for the payment of the sub-advisory fees.
RiverPark (and its affiliated advisers) and Wedgewood may be considered to be affiliates as RiverPark shareholders own approximately 6% of Wedgewood Partners, and Wedgewood owns 2.5% of RiverPark’s holding company. For its services as sub-adviser to the RiverPark/Wedgewood Fund, Wedgewood is entitled to a fee to be paid from RiverPark’s adviser fee, and such fee is calculated daily and paid monthly at an annual rate of 0.325% of RiverPark/Wedgewood Fund’s average net assets in excess of $50,000,000.
Administrator, Custodian and Transfer Agent — SEI Investments Global Funds Services (the “Administrator”) serves as the Funds’ administrator pursuant to an Administration Agreement under which the Administrator provides administrative and accounting services. For these services, the Administrator is paid an asset-based fee, which will vary depending on the number of share classes and average daily net assets of the Fund. For the six months ended March 31, 2017, the Funds were charged $899,625 for these services.
Brown Brothers Harriman & Co. (the “Custodian”) serves as the Funds’ custodian pursuant to a Custodian Agreement. DST Systems, Inc. (the Transfer Agent”) serves as the Funds’ transfer agent pursuant to an Agency Agreement.
Distribution Agreement — SEI Investments Distribution Co., a wholly-owned subsidiary of SEI Investments Company and an affiliate of the Administrator (the “Distributor”) serves as the Funds’ distributor pursuant to a Distribution Agreement.
The Trust has adopted a shareholder services plan under which a shareholder servicing fee may be paid at an annual rate of up to 0.25% of average daily net assets attributable to Retail Class Shares and Institutional Class Shares of the Funds to banks and their affiliates and other institutions, including broker-dealers, as compensation for providing non-distribution related shareholder services. Aggregate compensation for the Institutional Class Shares will not exceed on an annual basis 0.15% of the average daily net assets of such class. As of March 31, 2017, there were no shareholder servicing fees charged to Institutional Class Shares.
The Trust has adopted an administrative services plan under which each Fund may pay a non-distribution related administrative services fee at an annual rate of up to 0.20% and 0.15% of the average daily net assets of the Retail Class Shares and Institutional Class Shares, respectively, to financial institutions, retirement plans, broker-dealers, depository institutions, institutional shareholders of record, registered investment advisers and other financial intermediaries and various brokerage firms or other industry recognized service providers of fund supermarkets or similar programs who provide administrative, recordkeeping and support servicing to their customers.
43 |
Notes to Financial Statements March 31, 2017 (Unaudited) |
|
4. Agreements (continued)
Other — Certain officers and Trustees of the Trust are also officers of the Adviser and the Administrator. Such officers are paid no fees by the Trust for serving as officers of the Trust.
The services provided by the Chief Compliance Officer (“CCO”) and any staff are paid for by the Funds as incurred. The services include regulatory oversight of the Trust’s Adviser, sub-advisers and service providers as required by SEC regulations.
5. Investment Transactions
The cost of security purchases and proceeds from security sales and maturities, other than short-term investments, short sales, purchases to cover, written and purchased options, and short-term securities for the six months ended March 31, 2017, were as follows:
Fund | Purchases (000) | Proceeds from Sales and Maturities (000) | ||||||
RiverPark Large Growth Fund | $ | 4,394 | $ | 26,501 | ||||
RiverPark/Wedgewood Fund | 246,450 | 479,578 | ||||||
RiverPark Short Term High Yield Fund | 1,519,998 | 355,126 | ||||||
RiverPark Long/Short Opportunity Fund | 9,931 | 26,988 | ||||||
RiverPark Structural Alpha Fund | — | — | ||||||
RiverPark Strategic Income Fund | 190,902 | 207,224 | ||||||
RiverPark Focused Value Fund | 8,320 | 11,599 | ||||||
There were no purchases or sales of long-term U.S. Government securities for the six months ended March 31, 2017.
6. Federal Tax Information
The amount and character of income and capital gain distributions to be paid, if any, are determined in accordance with Federal income tax regulations, which may differ from GAAP. As a result, net investment income (loss) and net realized gain (loss) on investment transactions for a reporting period may differ significantly from distributions during the year. The book/tax differences may be temporary or permanent. To the extent these differences are permanent in nature, they are charged or credited to undistributed net investment income (loss), accumulated net realized gain (loss) or paid-in capital as appropriate, in the period that the difference arises.
44 |
Notes to Financial Statements March 31, 2017 (Unaudited) |
|
6. Federal Tax Information (continued)
The tax character of dividends and distributions declared during the last two years ended September 30, 2016 was as follows (000):
Fund | Ordinary Income | Long-Term Capital Gain | Total | |||||||||
RiverPark Large Growth Fund | ||||||||||||
2016 | $ | 1 | $ | 1,340 | $ | 1,341 | ||||||
2015 | 1,093 | 769 | 1,862 | |||||||||
RiverPark/Wedgewood Fund | ||||||||||||
2016 | 11,249 | 78,730 | 89,979 | |||||||||
2015 | 32,481 | 55,333 | 87,814 | |||||||||
RiverPark Short Term High Yield Fund | ||||||||||||
2016 | 24,991 | — | 24,991 | |||||||||
2015 | 29,126 | — | 29,126 | |||||||||
RiverPark Structural Alpha Fund | ||||||||||||
2016 | — | 318 | 318 | |||||||||
2015 | 79 | 297 | 376 | |||||||||
RiverPark Strategic Income Fund | ||||||||||||
2016 | 33,527 | — | 33,527 | |||||||||
2015 | 36,809 | — | 36,809 | |||||||||
RiverPark Focused Value Fund | ||||||||||||
2016 | 275 | — | 275 | |||||||||
There were no distributions declared during the last two years or periods ended September 30 in the RiverPark Long/Short Opportunity Fund.
As of September 30, 2016, the components of distributable earnings/(accumulated losses) on a tax basis were as follows (000):
Fund | Undistributed Ordinary Income | Undistributed Long-Term Capital Gain | Capital Loss Carryforward | Post-October Losses | Unrealized Appreciation (Depreciation) | Other Temporary Differences | Current Year Loss Deferral | Total Distributable Earnings (Accumulated Losses) | ||||||||||||||||||||||||
RiverPark Large Growth Fund | $ | 235 | $ | — | $ | (622 | ) | $ | (705 | ) | $ | 11,466 | $ | — | $ | — | $ | 10,374 | ||||||||||||||
RiverPark/Wedgewood Fund | 1,404 | — | (30,109 | ) | (118,978 | ) | 270,259 | — | — | 122,576 | ||||||||||||||||||||||
RiverPark Short Term High Yield Fund | 81 | — | (11,203 | ) | (8,099 | ) | (543 | ) | — | — | (19,764 | ) | ||||||||||||||||||||
RiverPark Long/Short Opportunity Fund | — | — | (1,860 | ) | (2,394 | ) | 14,646 | (1,251 | ) | (783 | ) | 8,358 | ||||||||||||||||||||
RiverPark Structural Alpha Fund | — | 221 | — | — | 2 | — | (228 | ) | (5 | ) | ||||||||||||||||||||||
RiverPark Strategic Income Fund | 54 | — | (12,819 | ) | (27,420 | ) | (15,670 | ) | (23 | ) | — | (55,878 | ) | |||||||||||||||||||
RiverPark Focused Value Fund | 281 | — | (252 | ) | (246 | ) | (7,584 | ) | — | — | (7,801 | ) | ||||||||||||||||||||
45 |
Notes to Financial Statements March 31, 2017 (Unaudited) |
|
6. Federal Tax Information (continued)
Post-October losses represent losses realized on investment transactions from November 1, 2015 through September 30, 2016, that, in accordance with Federal income tax regulations, the RiverPark Large Growth Fund, the RiverPark/Wedgewood Fund, the RiverPark Short Term High Yield Fund, the RiverPark Long/Short Opportunity Fund, the RiverPark Strategic Income Fund and RiverPark Focused Value Fund elect to defer and treat as having arisen in the following fiscal year.
Deferred late-year losses represent ordinary losses realized on investment transactions from January 1, 2016 through September 30, 2016 and specified losses realized on investment transactions from November 1, 2015 through September 30, 2016. The RiverPark Long/Short Opportunity Fund and the RiverPark Structural Alpha Fund elect to defer the late-year loss and to treat it as having arisen in the following fiscal year.
Under the Regulated Investment Company Modernization Act of 2010, the Funds are permitted to carry forward capital losses incurred in taxable years beginning after December 22, 2010 for an unlimited period. Post-enactment capital losses that are carried forward will retain their character as either short-term or long-term capital losses rather than being considered all short-term as under previous law. Capital loss carryforwards under the new provisions are as follows (000):
Fund | Short Term Loss | Long Term Loss | Total | |||||||||
RiverPark Large Growth Fund | $ | 451 | $ | 171 | $ | 622 | ||||||
RiverPark/Wedgewood Fund | 2,326 | 27,783 | 30,109 | |||||||||
RiverPark Short Term High Yield Fund | 10,598 | 605 | 11,203 | |||||||||
RiverPark Long/Short Opportunity Fund | 1,860 | — | 1,860 | |||||||||
RiverPark Strategic Income Fund | 5,481 | 7,338 | 12,819 | |||||||||
RiverPark Focused Value Fund | 252 | — | 252 | |||||||||
During the year ended September 30, 2016, the following Funds utilized capital loss carryforwards to offset capital gains as follows (000):
Fund | Short Term Loss | Long Term Loss | Total | |||||||||
RiverPark Long/Short Opportunity Fund | $ | 3,524 | $ | — | $ | 3,524 | ||||||
46 |
Notes to Financial Statements March 31, 2017 (Unaudited) |
|
6. Federal Tax Information (continued)
For federal income tax purposes, the cost of investments owned at March 31, 2017 and the net realized gains or losses on securities sold for the period could be different from amounts reported for financial reporting purposes, due to partnership basis adjustments and book versus tax adjustments such as wash sales which cannot be used for federal income tax purposes in the current year and have been deferred for use in future years. The federal tax cost and aggregate gross unrealized appreciation and depreciation on investments held by the Funds, excluding securities sold short, not yet purchased and purchased and written options, at March 31, 2017, were as follows (000):
Fund | Federal Tax Cost | Aggregate Gross Unrealized Appreciation | Aggregate Gross Unrealized Depreciation | Net Unrealized Appreciation (Depreciation) | ||||||||||||
RiverPark Large Growth Fund | $ | 32,967 | $ | 16,174 | $ | (1,582 | ) | $ | 14,592 | |||||||
RiverPark/Wedgewood Fund | 999,044 | 347,872 | (7,456 | ) | 340,416 | |||||||||||
RiverPark Short Term High Yield Fund | 889,898 | 1,895 | (1,433 | ) | 462 | |||||||||||
RiverPark Long/Short Opportunity Fund | 66,263 | 32,190 | (2,225 | ) | 29,965 | |||||||||||
RiverPark Structural Alpha Fund | 8,488 | — | (2 | ) | (2 | ) | ||||||||||
RiverPark Strategic Income Fund | 630,252 | 6,362 | (14,649 | ) | (8,287 | ) | ||||||||||
RiverPark Focused Value Fund | 38,188 | 3,212 | (4,275 | ) | (1,063 | ) | ||||||||||
7. Risks
The RiverPark Short Term High Yield Fund and RiverPark Strategic Income Fund invest in fixed-income instruments that are or are rated below investment grade by Moody’s Investors Service, Inc. and Standard & Poor’s Corporation and accordingly involve greater risk. Such securities are regarded as predominantly speculative with respect to the issuer’s capacity to pay interest and repay principal in accordance with the terms of the obligations and involve major risk to adverse conditions. These securities offer higher returns than bonds with higher ratings as compensation for holding an obligation of an issuer perceived to be less creditworthy. Changes in economic conditions or developments regarding issuers of non-investment grade debt securities are more likely to cause price volatility and weaken the capacity of such issuers to make principal and interest payments than is the case for higher grade debt securities. In addition, the market for lower grade debt securities may be thinner and less active than for higher grade debt securities.
High-yield securities are generally not exchange-traded and, as a result, these instruments trade in a smaller secondary market than exchange-traded bonds. In addition, the Funds invest in bonds of issuers that do not have publicly traded equity securities, making it more difficult to hedge the risks associated with such investments.
The RiverPark Short Term High Yield Fund and RiverPark Strategic Income Fund may invest in securities of companies that are experiencing significant financial or business difficulties, including companies involved in bankruptcy or other reorganization and liquidation proceedings. Although such investments may result in significant returns to the Funds, they involve a substantial degree of risk.
47 |
Notes to Financial Statements March 31, 2017 (Unaudited) |
|
7. Risks (continued)
The RiverPark Long/Short Opportunity Fund and RiverPark Strategic Income Fund are exposed to the risks of using leverage and short sales. The RiverPark Long/Short Opportunity Fund and RiverPark Strategic Income Fund may use leverage. Leverage is the practice of borrowing money to purchase securities. These investment practices involve special risks. Leverage can increase the investment returns of the RiverPark Long/Short Opportunity Fund and RiverPark Strategic Income Fund if the securities purchased increase in value in an amount exceeding the cost of the borrowing. However, if the securities decrease in value, the RiverPark Long/Short Opportunity Fund and RiverPark Strategic Income Fund will suffer a greater loss than would have resulted without the use of leverage. A short sale is the sale by the RiverPark Long/Short Opportunity Fund and RiverPark Strategic Income Fund of a security which it does not own in anticipation of purchasing the same security in the future at a lower price to close the short position. A short sale will be successful if the price of the shorted security decreases. However, if the underlying security goes up in price during the period in which the short position is outstanding, the RiverPark Long/Short Opportunity Fund and RiverPark Strategic Income Fund will recognize a loss. The risk on a standalone or unhedged short sale is unlimited because the RiverPark Long/Short Opportunity Fund and RiverPark Strategic Income Fund must buy the shorted security at the higher price to complete the transaction. Therefore, short sales may be subject to greater risks than investments in long positions. With a long position, the maximum sustainable loss is limited to the amount paid for the security plus the transaction costs, whereas there is no maximum attainable price of the shorted security.
The RiverPark Long/Short Opportunity Fund, RiverPark Structural Alpha Fund and RiverPark Strategic Income Fund are able to invest in options which expose investors to the risks inherent in trading options. These risks include, but are not limited to, volatile movements in the price of the underlying instrument and misjudgments as to the future prices of the options and/or the underlying instrument. Increased option volatility can increase both the profit potential and the risk associated with a fund’s trading. While volatility can be monitored and reacted to, there is no cost-effective means of hedging against market volatility.
Selling options creates additional risks. The seller of a “naked” call option (or the seller of a put option who has a short position in the underlying instrument) is subject to the risk of a rise in the price in the underlying instrument above the strike price, which risk is reduced only by the premium received for selling the option. In exchange for the proceeds received from selling the call option (in lieu of an outright short position), the option seller gives up (or will not participate in) all of the potential gain resulting from a decrease in the price of the underlying instrument below the strike price prior to expiration of the option.
The seller of a “naked” put option (or the seller of a call option who has a long position in the underlying instrument) is subject to the risk of a decline in price of the underlying instrument below the strike price, which risk is reduced only by the proceeds received from selling the option. In exchange for the premium received for selling the put option (in lieu of an outright long position), the option seller gives up (or will not participate in) all of the potential gain resulting from an increase in the price of the underlying instrument above the strike price prior to the expiration of the option. Due to the inherent leveraged nature of options, a relatively small adverse move in the price of the underlying instrument may result in immediate and substantial losses to a Fund.
48 |
Notes to Financial Statements March 31, 2017 (Unaudited) |
|
7. Risks (continued)
The RiverPark Long/Short Opportunity Fund invests in swaps. The use of swaps is a highly specialized activity that involves investment techniques, risk analyses and tax planning different from those associated with ordinary portfolio securities transactions. These transactions can result in sizeable realized and unrealized capital gains and losses relative to the gains and losses from the Fund’s direct investments in the reference assets and short sales. Transactions in swaps can involve greater risks than if the RiverPark Long/Short Opportunity Fund had invested directly in the reference asset because, in addition to general market risks, swaps are also subject to illiquidity risk, counterparty risk, credit risk and valuation risk. Because they are two-party contracts and because they may have terms of greater than seven days, swap transactions may be considered to be illiquid. Moreover, the Fund bears the risk of loss of the amount expected to be received under a swap in the event of the default or bankruptcy of the swap counterparty. Swaps may also be subject to pricing or “basis” risk, which exists when a particular swap becomes extraordinarily expensive relative to historical prices or the price of corresponding cash market instruments. Under certain market conditions it may not be economically feasible to initiate a transaction or liquidate a position in time to avoid a loss or take advantage of an opportunity. As a registered investment company, the Fund must “set aside” liquid assets (often referred to as “asset segregation”), or engage in other approved measures to “cover” open positions with respect to certain kinds of derivatives instruments. The Fund reserves the right to modify its asset segregation policies in the future to comply with any changes in the SEC’s positions regarding asset segregation.
The RiverPark Long/Short Opportunity Fund is exposed to counterparty credit risk through its investment in swap contracts. The RiverPark Long/Short Opportunity Fund bears the risk of loss of the amount expected to be received under a swap agreement in the event of default or bankruptcy of the counterparty, or if the counterparty fails to honor its obligations. The RiverPark Long/Short Opportunity Fund has entered into swap agreements with a single counterparty (Goldman Sachs International), focusing its exposure to the counterparty credit risk of that single counterparty. Furthermore, the swap counterparty’s obligation to the RiverPark Long/Short Opportunity Fund likely will not be collateralized. The RiverPark Long/Short Opportunity Fund settles swap agreements at least monthly.
A more complete description of risks is included in each Fund’s prospectus and SAI.
49 |
Notes to Financial Statements March 31, 2017 (Unaudited) |
|
8. Other
As of March 31, 2017, the Funds had the following concentrations of shareholders holding 10% or more of the outstanding shares of the Funds. These represent omnibus shareholder accounts comprised of one or many individual shareholders.
Fund | |
RiverPark Large Growth Fund | |
Institutional Class Shares | 73% |
Retail Class Shares | 89% |
RiverPark/Wedgewood Fund | |
Institutional Class Shares | 59% |
Retail Class Shares | 72% |
RiverPark Short Term High Yield Fund | |
Institutional Class Shares | 72% |
Retail Class Shares | 93% |
RiverPark Long/Short Opportunity Fund | |
Institutional Class Shares | 79% |
Retail Class Shares | 83% |
RiverPark Structural Alpha Fund | |
Institutional Class Shares | 41% |
Retail Class Shares | 94% |
RiverPark Strategic Income Fund | |
Institutional Class Shares | 70% |
Retail Class Shares | 88% |
RiverPark Focused Value Fund | |
Institutional Class Shares | 84% |
Retail Class Shares | 89% |
In the normal course of business, the Trust enters into contracts that contain a variety of representations which provide general indemnifications. The Trust’s maximum exposure under these arrangements cannot be known; however, the Trust expects any risk of loss to be remote.
9. Subsequent Events
The Funds have evaluated the need for additional disclosures and/or adjustments resulting from subsequent events through the date the financial statements were issued. Based on this evaluation, no adjustments were required to the financial statements.
50 |
Disclosure of Fund Expenses (Unaudited) |
|
All mutual funds have operating expenses. As a shareholder of a mutual fund, your investment is affected by these ongoing costs, which include (among others) costs for portfolio management, administrative services, and shareholder reports like this one. It is important for you to understand the impact of these costs on your investment returns.
Operating expenses such as these are deducted from a mutual fund’s gross income and directly reduce its final investment return. These expenses are expressed as a percentage of a mutual fund’s average net assets; this percentage is known as a mutual fund’s expense ratio.
The following examples use the expense ratio and are intended to help you understand the ongoing costs (in dollars) of investing in your Fund and to compare these costs with those of other mutual funds. The examples are based on an investment of $1,000 made at the beginning of the period shown and held for the entire period.
The table on the following page illustrates your Fund’s costs in two ways.
● Actual Fund Return. This section helps you to estimate the actual expenses after fee waivers that your Fund incurred over the period. The “Expenses Paid During Period” column shows the actual dollar expense incurred by a $1,000 investment in the Fund, and the “Ending Account Value” number is derived from deducting that expense from the Fund’s gross investment return.
You can use this information, together with the actual amount you invested in the Fund, to estimate the expenses you paid over that period. Simply divide your actual account value by $1,000 to arrive at a ratio (for example, an $8,600 account value divided by $1,000 = 8.6), then multiply that ratio by the number shown for your Fund under “Expenses Paid During Period.”
● Hypothetical 5% Return. This section helps you compare your Fund’s costs with those of other mutual funds. It assumes that the Fund had an annual 5% return before expenses during the year, but that the expense ratio (Column 3) for the period is unchanged. This example is useful in making comparisons because the Securities and Exchange Commission requires all mutual funds to make this 5% calculation. You can assess your Fund’s comparative cost by comparing the hypothetical result for your Fund in the “Expenses Paid During Period” column with those that appear in the same charts in the shareholder reports for other mutual funds.
Note: Because the return is set at 5% for comparison purposes — NOT your Fund’s actual return—the account values shown may not apply to your specific investment.
| Beginning Account | Ending | Net | Expenses |
RiverPark Large Growth Fund — Institutional Class Shares | ||||
Actual Fund Return | $1,000.00 | $1,109.60 | 0.91% | $4.79 |
Hypothetical 5% Return | 1,000.00 | 1,020.39 | 0.91 | 4.58 |
RiverPark Large Growth Fund — Retail Class Shares | ||||
Actual Fund Return | 1,000.00 | 1,108.10 | 1.19 | 6.25 |
Hypothetical 5% Return | 1,000.00 | 1,019.00 | 1.19 | 5.99 |
RiverPark/Wedgewood Fund — Institutional Class Shares | ||||
Actual Fund Return | 1,000.00 | 1,082.70 | 0.83 | 4.31 |
Hypothetical 5% Return | 1,000.00 | 1,020.79 | 0.83 | 4.18 |
51 |
Disclosure of Fund Expenses (Unaudited) (Continued) |
|
| Beginning Account | Ending | Net | Expenses |
RiverPark/Wedgewood Fund — Retail Class Shares | ||||
Actual Fund Return | $1,000.00 | $1,080.70 | 1.13% | $5.86 |
Hypothetical 5% Return | 1,000.00 | 1,019.30 | 1.13 | 5.69 |
RiverPark Short Term High Yield Fund — Institutional Class Shares | ||||
Actual Fund Return | 1,000.00 | 1,014.10 | 0.85 | 4.27 |
Hypothetical 5% Return | 1,000.00 | 1,020.69 | 0.85 | 4.28 |
RiverPark Short Term High Yield Fund — Retail Class Shares | ||||
Actual Fund Return | 1,000.00 | 1,012.90 | 1.15 | 5.77 |
Hypothetical 5% Return | 1,000.00 | 1,019.20 | 1.15 | 5.79 |
RiverPark Long/Short Opportunity Fund — Institutional Class Shares | ||||
Actual Fund Return | 1,000.00 | 1,088.40 | 2.96† | 15.41 |
Hypothetical 5% Return | 1,000.00 | 1,010.17 | 2.96 | 14.83 |
RiverPark Long/Short Opportunity Fund — Retail Class Shares | ||||
Actual Fund Return | 1,000.00 | 1,087.20 | 3.20† | 16.65 |
Hypothetical 5% Return | 1,000.00 | 1,008.98 | 3.20 | 16.03 |
RiverPark Structural Alpha Fund — Institutional Class Shares | ||||
Actual Fund Return | 1,000.00 | 1,011.20 | 1.52(1) | 7.62 |
Hypothetical 5% Return | 1,000.00 | 1,017.35 | 1.52 | 7.64 |
RiverPark Structural Alpha Fund — Retail Class Shares | ||||
Actual Fund Return | 1,000.00 | 1,009.30 | 1.78(1) | 8.92 |
Hypothetical 5% Return | 1,000.00 | 1,016.06 | 1.78 | 8.95 |
RiverPark Strategic Income Fund — Institutional Class Shares | ||||
Actual Fund Return | 1,000.00 | 1,040.30 | 0.93†† | 4.73 |
Hypothetical 5% Return | 1,000.00 | 1,020.29 | 0.93 | 4.68 |
RiverPark Strategic Income Fund — Retail Class Shares | ||||
Actual Fund Return | 1,000.00 | 1,039.10 | 1.25†† | 6.35 |
Hypothetical 5% Return | 1,000.00 | 1,018.70 | 1.25 | 6.29 |
52 |
Disclosure of Fund Expenses (Unaudited) (Continued) |
|
| Beginning Account | Ending | Net | Expenses |
RiverPark Focused Value Fund — Institutional Class Shares | ||||
Actual Fund Return | $1,000.00 | $1,095.50 | 0.91% | $4.75 |
Hypothetical 5% Return | 1,000.00 | 1,020.39 | 0.91 | 4.58 |
RiverPark Focused Value Fund — Retail Class Shares | ||||
Actual Fund Return | 1,000.00 | 1,093.80 | 1.21 | 6.32 |
Hypothetical 5% Return | 1,000.00 | 1,018.90 | 1.21 | 6.09 |
* | Expenses are equal to the Fund’s annualized expense ratio multiplied by the average account value over the period, multiplied by 182/365 (to reflect the one-half year period). |
† | The annualized expense ratios include dividend expense and stock loan fees incurred during the six month period. Annualized dividend expense and stock loan fees of average net assets totaled 1.20%. Had these expenses not been included the ratios would have been 1.76% and 2.00%, respectively. |
†† | The annualized expense ratios include dividend expense and stock loan fees incurred during the six month period. Annualized dividend expense and stock loan fees of average net assets totaled 0.09%. Had these expenses not been included the ratios would have been 0.84% and 1.16%, respectively. |
(1) | Effective January 1, 2017, the investment advisory fee for the RiverPark Structural Alpha Fund was lowered from 1.40% to 0.90%. |
53 |
INVESTMENT ADVISER
RiverPark Advisors, LLC
156 West 56th Street, 17th Floor
New York, New York 10019
CUSTODIAN
Brown Brothers Harriman & Co.
40 Wateer Street
Boston, Massachusetts 02109
PRIME BROKERS:
Goldman Sachs & Co.
200 West Street, 3rd Floor
New York, NY 10282
Interactive Brokers LLC
209 South LaSalle Street
Suite 1000
Chicago, IL 60604
TRANSFER AGENT
DST Systems, Inc.
333 West 11th Street, 5th Floor
Kansas City, Missouri 64105
ADMINISTRATOR
SEI Investments Global Funds Services
One Freedom Valley Drive
Oaks, Pennsylvania 19456
INDEPENDENT REGISTERED PUBLIC ACCOUNTING FIRM
Cohen & Company, Ltd.
1350 Euclid Ave., Suite 800
Cleveland, Ohio 44115
DISTRIBUTOR
SEI Investments Distribution Co.
One Freedom Valley Drive
Oaks, Pennsylvania 19456
FUND COUNSEL
Blank Rome LLP
405 Lexington Avenue
New York, New York 10174-0208
This information must be preceded or accompanied by a
current prospectus for the Trust.
RPF-SA-001-0700
| (Registrant) | RiverPark Funds Trust | |
| By (Signature and Title)* | /s/ Morty Schaja | |
| Morty Schaja | ||
| President | ||
| Date: June 9, 2017 |
| By (Signature and Title)* | /s/ Morty Schaja | |
| Morty Schaja | ||
| President | ||
| Date: June 9, 2017 | ||
| By (Signature and Title)* | /s/ Stephen P. Connors | |
| Stephen P. Connors | ||
| Chief Financial Officer and Treasurer | ||
| Date: June 9, 2017 |
| * | Print the name and title of each signing officer under his or her signature. |