UNITED STATES
SECURITIES AND EXCHANGE COMMISSION
Washington, D.C. 20549
FORM N-CSRS
CERTIFIED SHAREHOLDER REPORT OF REGISTERED MANAGEMENT
INVESTMENT COMPANIES
Investment Company Act File Number 811-22431
RiverPark Funds Trust
(Exact name of registrant as specified in charter)
156 West 56th Street, 17th Floor
New York, NY 10019
(Address of principal executive offices) (Zip code)
Morty Schaja
156 West 56th Street, 17th Floor
New York, NY 10019
(Name and address of agent for service)
With copies to:
Thomas R. Westle
Blank Rome LLP
405 Lexington Avenue
New York, NY 10174
Registrant’s telephone number, including area code: 212-484-2100
Date of fiscal year end: September 30, 2019
Date of reporting period: March 31, 2019
| Item 1. | Reports to Stockholders. |
The registrant’s schedules as of the close of the reporting period, as set forth in §§ 210.12-12 through 210.12-14 of Regulation S-X [17 CFR §§ 210-12.12-12.14], are attached hereto.
| | 
|
| | Semi-Annual Report March 31, 2019 (Unaudited) |
Investment Adviser:
RiverPark Advisors, LLC | RiverPark Large Growth Fund Retail Class and Institutional Class Shares RiverPark/Wedgewood Fund Retail Class and Institutional Class Shares RiverPark Short Term High Yield Fund Retail Class and Institutional Class Shares RiverPark Long/Short Opportunity Fund Retail Class and Institutional Class Shares RiverPark Strategic Income Fund Retail Class and Institutional Class Shares RiverPark Floating Rate CMBS Fund Retail Class and Institutional Class Shares Beginning on January 1, 2021, as permitted by regulations adopted by the Securities and Exchange Commission, paper copies of the Funds’ shareholder reports no longer will be sent by mail, unless you specifically request paper copies of the reports from the Funds or from your financial intermediary, such as a broker-dealer or bank. Instead, the reports will be made available on a website, and you will be notified by mail each time a report is posted and provided with a website link to access the report. If you already elected to receive shareholder reports electronically, you will not be affected by this change and you need not take any action. You may elect to receive shareholder reports and other communications from the Funds electronically by contacting your financial intermediary, or, if you are a direct investor, by calling 888-564-4517. You may elect to receive all future reports in paper free of charge. If you invest through a financial intermediary, you can follow the instructions included with this disclosure, if applicable, or you can contact your financial intermediary to inform it that you wish to continue receiving paper copies of your shareholder reports. If you invest directly with the Funds, you can inform the Funds that you wish to continue receiving paper copies of your shareholder reports by calling 888-564-4517. Your election to receive reports in paper will apply to all funds held with your financial intermediary if you invest through a financial intermediary or all Symmetry Panoramic Funds if you invest directly with the Funds. |

| |
Table of Contents
The RiverPark Funds file their complete schedules of fund holdings with the Securities and Exchange Commission (the “Commission”) for the first and third quarters of each fiscal year on Form N-Q or as an exhibit to its reports on Form N-PORT within sixty days after the end of the period. The Funds’ Forms N-Q and Forms N-PORT reports are available on the Commission’s website at http://www.sec.gov, and may be reviewed and copied at the Commission’s Public Reference Room in Washington, D.C. Information on the operation of the Public Reference Room may be obtained by calling 1-800-SEC-0330.
A description of the policies and procedures that the Funds use to determine how to vote proxies relating to fund securities, as well as information relating to how a Fund voted proxies relating to fund securities during the most recent period ended June 30 is available (i) without charge, upon request, by calling 888-564-4517; and (ii) on the Commission’s website at http://www.sec.gov.

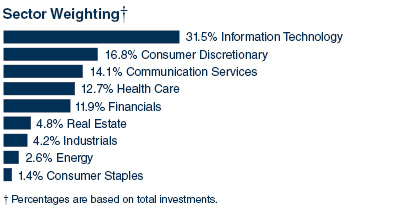
| RiverPark Large Growth Fund March 31, 2019 (Unaudited) |
Description | | Shares | | | Value (000) | |
Schedule of Investments | | | | | | | | |
Common Stock — 97.7%** | | | | | | | | |
Communication Services – 13.8% | | | | | | | | |
Activision Blizzard | | | 12,064 | | | $ | 549 | |
Alphabet, Cl A * | | | 1,069 | | | | 1,258 | |
Alphabet, Cl C * | | | 1,072 | | | | 1,258 | |
Facebook, Cl A * | | | 11,282 | | | | 1,881 | |
Twitter * | | | 31,549 | | | | 1,037 | |
Walt Disney | | | 9,287 | | | | 1,031 | |
| | | | | | | | 7,014 | |
Consumer Discretionary – 16.4% | | | | | | | | |
adidas ADR | | | 7,189 | | | | 876 | |
Amazon.com * | | | 1,486 | | | | 2,646 | |
Booking Holdings * | | | 514 | | | | 897 | |
Dollar General | | | 5,200 | | | | 620 | |
Dollarama ^ | | | 36,178 | | | | 965 | |
NIKE, Cl B | | | 14,608 | | | | 1,230 | |
Ulta Beauty * | | | 3,251 | | | | 1,134 | |
| | | | | | | | 8,368 | |
Consumer Staples – 1.4% | | | | | | | | |
Constellation Brands, Cl A | | | 4,050 | | | | 710 | |
| | | | | | | | | |
Energy – 2.5% | | | | | | | | |
Cabot Oil & Gas, Cl A | | | 25,532 | | | | 666 | |
EOG Resources | | | 6,493 | | | | 618 | |
| | | | | | | | 1,284 | |
Financials – 11.6% | | | | | | | | |
American Express | | | 8,334 | | | | 911 | |
Blackstone Group LP (a) | | | 58,847 | | | | 2,058 | |
Charles Schwab | | | 24,852 | | | | 1,063 | |
CME Group, Cl A | | | 4,947 | | | | 814 | |
TD Ameritrade Holding | | | 21,393 | | | | 1,069 | |
| | | | | | | | 5,915 | |
Health Care – 12.4% | | | | | | | | |
Align Technology * | | | 3,246 | | | | 923 | |
Exact Sciences * | | | 11,291 | | | | 978 | |
Illumina * | | | 2,894 | | | | 899 | |
Intuitive Surgical * | | | 1,482 | | | | 846 | |
IQVIA Holdings * | | | 8,710 | | | | 1,253 | |
UnitedHealth Group | | | 5,852 | | | | 1,447 | |
| | | | | | | | 6,346 | |
Industrials – 4.1% | | | | | | | | |
CoStar Group * | | | 1,894 | | | | 884 | |
Northrop Grumman | | | 4,404 | | | | 1,187 | |
| | | | | | | | 2,071 | |
Information Technology – 30.8% | | | | | | | | |
Adobe * | | | 5,622 | | | | 1,498 | |
Apple | | | 10,889 | | | | 2,068 | |
InterXion Holding * | | | 15,405 | | | | 1,028 | |
Mastercard, Cl A | | | 5,660 | | | | 1,333 | |
Microsoft | | | 21,586 | | | | 2,546 | |
Palo Alto Networks * | | | 5,070 | | | | 1,232 | |
PayPal Holdings * | | | 11,261 | | | | 1,169 | |
salesforce.com * | | | 10,273 | | | | 1,627 | |
ServiceNow * | | | 4,078 | | | | 1,005 | |
Teradata * | | | 21,200 | | | | 925 | |
Visa, Cl A | | | 8,224 | | | | 1,285 | |
| | | | | | | | 15,716 | |
Real Estate – 4.7% | | | | | | | | |
American Tower REIT, Cl A | | | 5,411 | | | | 1,067 | |
Equinix REIT | | | 2,933 | | | | 1,329 | |
| | | | | | | | 2,396 | |
Total Common Stock | | | | | | | | |
(Cost $34,856) (000) | | | | | | | 49,820 | |
| | | | | | | | | |
Total Investments — 97.7% | | | | | | | | |
(Cost $34,856) (000) | | | | | | $ | 49,820 | |
As of March 31, 2019, all of the Fund’s investments were considered Level 1 in accordance with the authoritative guidance on fair value measurements and disclosure under U.S. GAAP.
For the period ended March 31, 2019, there were no transfers between Level 1 and Level 2 assets and liabilities or between Level 2 and Level 3 assets and liabilities.
| Percentages are based on Net Assets of $51,002 (000). |
** | More narrow industries are utilized for compliance purposes, whereas broad sectors are utilized for reporting purposes. |
* | Non-income producing security. |
^ | Traded in Canadian Dollar. |
(a) | Security considered Master Limited Partnership. At March 31, 2019, these securities amounted to $2,058 (000) or 4.0% of Net Assets. |
ADR — American Depositary Receipt
Cl — Class
LP — Limited Partnership
REIT — Real Estate Investment Trust
The accompanying notes are an integral part of the financial statements.
1
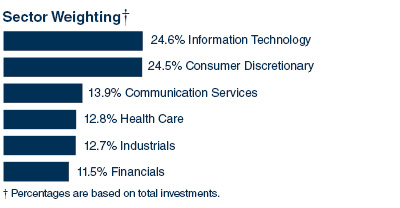
| RiverPark/Wedgewood Fund March 31, 2019 (Unaudited) |
Description | | Shares | | | Value (000) | |
Schedule of Investments | | | | | | | | |
Common Stock — 96.5%** | | | | | | | | |
Communication Services – 13.4% | | | | | | | | |
Alphabet, Cl A * | | | 5,420 | | | $ | 6,379 | |
Facebook, Cl A * | | | 53,802 | | | | 8,968 | |
| | | | | | | | 15,347 | |
Consumer Discretionary – 23.7% | | | | | | | | |
Booking Holdings * | | | 3,656 | | | | 6,380 | |
Ross Stores | | | 29,867 | | | | 2,780 | |
Starbucks | | | 63,050 | | | | 4,687 | |
Tractor Supply | | | 72,665 | | | | 7,104 | |
Ulta Beauty * | | | 17,667 | | | | 6,161 | |
| | | | | | | | 27,112 | |
Financials – 11.1% | | | | | | | | |
Berkshire Hathaway, Cl B * | | | 47,695 | | | | 9,581 | |
Charles Schwab | | | 72,986 | | | | 3,121 | |
| | | | | | | | 12,702 | |
Health Care – 12.3% | | | | | | | | |
Celgene * | | | 43,838 | | | | 4,136 | |
Edwards Lifesciences * | | | 52,346 | | | | 10,015 | |
| | | | | | | | 14,151 | |
Industrials – 12.3% | | | | | | | | |
CH Robinson Worldwide | | | 56,949 | | | | 4,954 | |
Fastenal | | | 98,936 | | | | 6,363 | |
Old Dominion Freight Line | | | 19,150 | | | | 2,765 | |
| | | | | | | | 14,082 | |
Information Technology – 23.7% | | | | | | | | |
Apple | | | 49,786 | | | | 9,457 | |
Cognizant Technology Solutions, Cl A | | | 43,719 | | | | 3,167 | |
PayPal Holdings * | | | 53,871 | | | | 5,594 | |
Visa, Cl A | | | 57,438 | | | | 8,971 | |
| | | | | | | | 27,189 | |
Total Common Stock | | | | | | | | |
(Cost $68,930) (000) | | | | | | | 110,583 | |
| | | | | | | | | |
Total Investments — 96.5% | | | | | | | | |
(Cost $68,930) (000) | | | | | | $ | 110,583 | |
As of March 31, 2019, all of the Fund’s investments were considered Level 1 in accordance with the authoritative guidance on fair value measurements and disclosure under U.S. GAAP.
For the period ended March 31, 2019, there were no transfers between Level 1 and Level 2 assets and liabilities or between Level 2 and Level 3 assets and liabilities.
| Percentages are based on Net Assets of $114,557 (000). |
** | More narrow industries are utilized for compliance purposes, whereas broad sectors are utilized for reporting purposes. |
* | Non-income producing security. |
Cl — Class
The accompanying notes are an integral part of the financial statements.
2
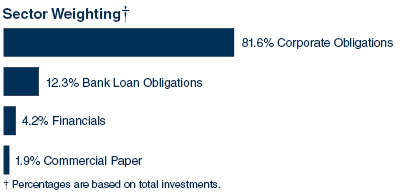
| RiverPark Short Term High Yield Fund March 31, 2019 (Unaudited) |
Description | | Face
Amount
(000) | | | Value (000) | |
Schedule of Investments | | | | | | | | |
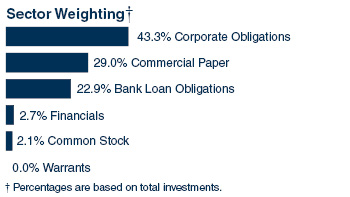
Corporate Obligations — 78.0% | | | | | | | | |
Communication Services – 13.8% | | | | | | | | |
CCO Holdings | | | | | | | | |
5.250%, 03/15/21 | | $ | 12,600 | | | $ | 12,663 | |
Lee Enterprises | | | | | | | | |
9.500%, 03/15/22 (a) | | | 14,292 | | | | 14,667 | |
Level 3 Financing | | | | | | | | |
6.125%, 01/15/21 | | | 24,598 | | | | 24,849 | |
Mediacom Broadband | | | | | | | | |
5.500%, 04/15/21 | | | 22,345 | | | | 22,447 | |
Nokia | | | | | | | | |
5.375%, 05/15/19 | | | 1,100 | | | | 1,106 | |
TEGNA | | | | | | | | |
5.125%, 10/15/19 | | | 6,315 | | | | 6,339 | |
Time Warner Cable | | | | | | | | |
8.250%, 04/01/19 | | | 12,198 | | | | 12,198 | |
Twitter | | | | | | | | |
0.250%, 09/15/19 | | | 25,282 | | | | 24,925 | |
| | | | | | | | 119,194 | |
Consumer Discretionary – 9.6% | | | | | | | | |
AMC Entertainment | | | | | | | | |
5.875%, 02/15/22 | | | 480 | | | | 489 | |
Ashton Woods USA | | | | | | | | |
6.875%, 02/15/21 (a) | | | 6,687 | | | | 6,729 | |
Carmike Cinemas | | | | | | | | |
6.000%, 06/15/23 (a) | | | 6,161 | | | | 6,477 | |
Gamestop | | | | | | | | |
5.500%, 10/01/19 (a) | | | 22,071 | | | | 22,154 | |
Lennar | | | | | | | | |
4.500%, 06/15/19 | | | 9,527 | | | | 9,533 | |
Michaels Stores | | | | | | | | |
5.875%, 12/15/20 (a) | | | 20,745 | | | | 20,797 | |
QVC | | | | | | | | |
3.125%, 04/01/19 | | | 1,987 | | | | 1,987 | |
Schaeffler Finance | | | | | | | | |
4.750%, 05/15/23 (a) | | | 3,790 | | | | 3,841 | |
William Carter | | | | | | | | |
5.250%, 08/15/21 | | | 10,397 | | | | 10,559 | |
| | | | | | | | 82,566 | |
Cosnsumer Staples – 0.8% | | | | | | | | |
Spectrum Brands | | | | | | | | |
6.625%, 11/15/22 | | | 6,366 | | | | 6,528 | |
| | | | | | | | | |
Energy – 5.1% | | | | | | | | |
Kosmos Energy | | | | | | | | |
7.875%, 08/01/21 (a) | | | 19,750 | | | | 20,165 | |
Resolute Energy | | | | | | | | |
8.500%, 05/01/20 | | | 15,519 | | | | 15,519 | |
Ship Finance International | | | | | | | | |
5.750%, 10/15/21 | | | 7,850 | | | | 7,831 | |
| | | | | | | | 43,515 | |
Financials – 0.2% | | | | | | | | |
Springleaf Finance | | | | | | | | |
6.000%, 06/01/20 | | | 2,075 | | | | 2,142 | |
| | | | | | | | | |
Health Care – 2.4% | | | | | | | | |
Teva Pharmaceutical Finance Netherlands III BV | | | | | | | | |
1.700%, 07/19/19 | | | 20,491 | | | | 20,448 | |
| | | | | | | | | |
Industrials – 26.8% | | | | | | | | |
Archrock Partners | | | | | | | | |
6.000%, 04/01/21 | | | 32,185 | | | | 32,171 | |
Arconic | | | | | | | | |
1.625%, 10/15/19 | | | 20,319 | | | | 20,111 | |
Bombardier | | | | | | | | |
7.750%, 03/15/20 (a) | | | 345 | | | | 361 | |
Briggs & Stratton | | | | | | | | |
6.875%, 12/15/20 | | | 8,667 | | | | 9,014 | |
Clean Harbors | | | | | | | | |
5.125%, 06/01/21 | | | 19,435 | | | | 19,532 | |
Greif | | | | | | | | |
7.750%, 08/01/19 | | | 25,580 | | | | 26,027 | |
HC2 Holdings | | | | | | | | |
11.500%, 12/01/21 (a) | | | 9,311 | | | | 8,147 | |
Icahn Enterprises | | | | | | | | |
6.000%, 08/01/20 | | | 22,028 | | | | 22,265 | |
Macquarie Infrastructure | | | | | | | | |
2.875%, 07/15/19 | | | 9,824 | | | | 9,826 | |
Manitowoc | | | | | | | | |
12.750%, 08/15/21 (a) | | | 10,925 | | | | 11,689 | |
Navistar International | | | | | | | | |
4.750%, 04/15/19 | | | 30,939 | | | | 31,016 | |
Nielsen Finance | | | | | | | | |
4.500%, 10/01/20 | | | 28,136 | | | | 28,171 | |
The accompanying notes are an integral part of the financial statements.
3
| RiverPark Short Term High Yield Fund
March 31, 2019 (Unaudited) |
Description | | Face
Amount
(000)/
Shares | | | Value (000) | |
Virgin Australia Holdings | | | | | | | | |
8.500%, 11/15/19 (a) | | $ | 12,142 | | | $ | 12,430 | |
| | | | | | | | 230,760 | |
Information Technology – 10.7% | | | | | | | | |
Amkor Technology | | | | | | | | |
6.375%, 10/01/22 | | | 47,025 | | | | 47,937 | |
Dell | | | | | | | | |
5.875%, 06/15/19 | | | 19,276 | | | | 19,392 | |
Dell International | | | | | | | | |
5.875%, 06/15/21 (a) | | | 3,475 | | | | 3,541 | |
Electronics For Imaging | | | | | | | | |
0.750%, 09/01/19 | | | 6,387 | | | | 6,310 | |
Sanmina | | | | | | | | |
4.375%, 06/01/19 (a) | | | 15,053 | | | | 15,091 | |
| | | | | | | | 92,271 | |
Materials – 5.8% | | | | | | | | |
INVISTA Finance | | | | | | | | |
4.250%, 10/15/19 (a) | | | 14,447 | | | | 14,579 | |
Largo Resources | | | | | | | | |
9.250%, 06/01/21 (a) | | | 5,546 | | | | 5,844 | |
Momentive Performance Materials | | | | | | | | |
3.880%, 10/24/21 | | | 14,950 | | | | 16,165 | |
Reynolds Group Issuer | | | | | | | | |
5.750%, 10/15/20 | | | 13,328 | | | | 13,362 | |
| | | | | | | | 49,950 | |
Telecommunication Services – 2.8% | | | | | | | | |
CenturyLink | | | | | | | | |
6.150%, 09/15/19 | | | 2,869 | | | | 2,902 | |
Sprint Capital | | | | | | | | |
6.900%, 05/01/19 | | | 21,242 | | | | 21,348 | |
| | | | | | | | 24,250 | |
Total Corporate Obligations | | | | | | | | |
(Cost $672,081) (000) | | | | | | | 671,624 | |
| | | | | | | | | |
Common Stock — 4.0% | | | | | | | | |
Financials – 4.0% | | | | | | | | |
Big Rock Partners Acquisition * | | | 222,272 | | | | 2,303 | |
CM Seven Star Acquisition * | | | 285,989 | | | | 2,954 | |
GigCapital * | | | 221,945 | | | | 2,264 | |
Opes Acquisition * | | | 88,000 | | | | 893 | |
Pensare Acquisition * | | | 872,964 | | | | 8,965 | |
Saban Capital Acquisition, Cl A * | | | 669,374 | | | | 6,881 | |
Vantage Energy Acquisition, Cl A * | | | 989,898 | | | | 10,117 | |
| | | | | | | | | |
Total Common Stock | | | | | | | | |
(Cost $34,062) (000) | | | | | | | 34,377 | |
Description | |
Face
Amount
(000)
| | | Value (000) | |
Commercial Paper — 1.8% | | | | | | | | |
Ford Motor Credit | | | | | | | | |
3.347%, 04/03/19 (b) | | $ | 15,583 | | | $ | 15,577 | |
| | | | | | | | | |
Total Commercial Paper | | | | | | | | |
(Cost $15,580) (000) | | | | | | | 15,577 | |
| | | | | | | | | |
Bank Loan Obligations — 11.8% | | | | | | | | |
Berry Plastics Corp. | | | | | | | | |
4.243%, VAR LIBOR USD 1 Month+1.750%, 02/08/20 | | | 22,986 | | | | 22,896 | |
Eastman Kodak | | | | | | | | |
8.749%, VAR LIBOR USD 1 Month+6.250%, 09/03/19 | | | 14,856 | | | | 14,336 | |
First Data Corporation | | | | | | | | |
4.486%, VAR LIBOR USD 1 Month+2.000%, 07/08/22 | | | 15,700 | | | | 15,660 | |
Internap | | | | | | | | |
8.240%, VAR LIBOR USD 1 Month+5.750%, 04/06/22 | | | 4,853 | | | | 4,689 | |
LSC Communications | | | | | | | | |
7.999%, VAR LIBOR USD 1 Month+5.500%, 09/30/22 | | | 9,036 | | | | 8,974 | |
Pacific Gas and Electric | | | | | | | | |
0.000%, 12/31/20 (C) | | | 5,000 | | | | 5,000 | |
Tribune Media Company | | | | | | | | |
0.000%, 01/26/24 (C) | | | 9,777 | | | | 9,757 | |
Windstream Holdings | | | | | | | | |
0.000%, 03/08/21 (C) | | | 20,356 | | | | 20,299 | |
| | | | | | | | | |
Total Bank Loan Obligations | | | | | | | | |
(Cost $102,627) (000) | | | | | | | 101,611 | |
| | | | | | | | | |
Total Investments — 95.6% | | | | | | | | |
(Cost $824,350) (000) | | | | | | $ | 823,189 | |
The accompanying notes are an integral part of the financial statements.
4
| RiverPark Short Term High Yield Fund
March 31, 2019 (Unaudited) |
The following is a list of the inputs used as of March 31, 2019 in valuing the Fund’s investments carried at value (000), in accordance with the authoritative guidance on fair value measurements and disclosure under U.S. GAAP:
Investments in Securities | | Level 1 | | | Level 2 | | | Level 3 | | | Total | |
Corporate Obligations | | $ | — | | | $ | 671,624 | | | $ | — | | | $ | 671,624 | |
Common Stock | | | 34,377 | | | | — | | | | — | | | | 34,377 | |
Commercial Paper | | | — | | | | 15,577 | | | | — | | | | 15,577 | |
Bank Loan Obligations | | | — | | | | 101,611 | | | | — | | | | 101,611 | |
Total Investments in Securities | | $ | 34,377 | | | $ | 788,812 | | | $ | — | | | $ | 823,189 | |
For the period ended March 31, 2019, there were no transfers between Level 1 and Level 2 assets and liabilities or between Level 2 and Level 3 assets and liabilities.
* | Non-income producing security. |
| Percentages are based on Net Assets of $860,981 (000). |
(a) | Securities sold within terms of a private placement memorandum, exempt from registration under Section 144A of the Securities Act of 1933, as amended, and may be sold only to dealers in that program or other “accredited investors.” These securities have been determined to be liquid under guidelines established by the Board of Trustees. |
(b) | Zero coupon security. The rate reported on the Schedule of Investments is the effective yield at time of purchase. |
(c) | Unfunded bank loan. Interest rate not available. |
Cl — Class
LIBOR — London Interbank Offered Rate
USD — United States Dollar
VAR — Variable Rate
The accompanying notes are an integral part of the financial statements.
5
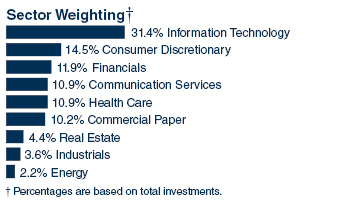
| RiverPark Long/Short Opportunity Fund March 31, 2019 (Unaudited) |
Description | | Shares | | | Value (000) | |
Schedule of Investments | | | | | | | | |
Common Stock — 82.1%** | | | | | | | | |
Communication Services – 10.0% | | | | | | | | |
Alphabet, Cl A * | | | 1,379 | | | $ | 1,623 | |
Alphabet, Cl C * | | | 1,382 | | | | 1,621 | |
Facebook, Cl A * | | | 16,832 | | | | 2,806 | |
Twitter * | | | 40,657 | | | | 1,337 | |
Walt Disney | | | 15,074 | | | | 1,674 | |
| | | | | | | | 9,061 | |
Consumer Discretionary – 13.3% | | | | | | | | |
adidas ADR | | | 10,895 | | | | 1,328 | |
Amazon.com * | | | 2,170 | | | | 3,864 | |
Booking Holdings * | | | 498 | | | | 869 | |
Dollar General | | | 8,737 | | | | 1,042 | |
Dollarama | | | 52,736 | | | | 1,407 | |
NIKE, Cl B | | | 23,865 | | | | 2,010 | |
Ulta Beauty * | | | 4,428 | | | | 1,544 | |
| | | | | | | | 12,064 | |
Energy – 2.0% | | | | | | | | |
Cabot Oil & Gas | | | 36,697 | | | | 958 | |
EOG Resources | | | 9,346 | | | | 889 | |
| | | | | | | | 1,847 | |
Financials – 10.9% | | | | | | | | |
American Express | | | 10,758 | | | | 1,176 | |
Blackstone Group LP (a) | | | 101,633 | | | | 3,554 | |
Charles Schwab | | | 43,441 | | | | 1,858 | |
CME Group, Cl A | | | 8,775 | | | | 1,444 | |
TD Ameritrade Holding | | | 37,395 | | | | 1,869 | |
| | | | | | | | 9,901 | |
Health Care – 10.0% | | | | | | | | |
Align Technology * | | | 3,894 | | | | 1,107 | |
Exact Sciences * | | | 14,764 | | | | 1,279 | |
Illumina * | | | 3,061 | | | | 951 | |
Intuitive Surgical * | | | 1,879 | | | | 1,072 | |
IQVIA Holdings * | | | 15,460 | | | | 2,224 | |
UnitedHealth Group | | | 9,731 | | | | 2,406 | |
| | | | | | | | 9,039 | |
Description | | Shares /
Face
Amount
(000) | | | Value (000) | |
Industrials – 3.2% | | | | | | | | |
CoStar Group * | | | 3,449 | | | $ | 1,609 | |
Northrop Grumman | | | 4,994 | | | | 1,346 | |
| | | | | | | | 2,955 | |
Information Technology – 28.7% | | | | | | | | |
Adobe * | | | 9,594 | | | | 2,557 | |
Apple (a) | | | 17,540 | | | | 3,332 | |
InterXion Holding * | | | 24,123 | | | | 1,610 | |
Mastercard, Cl A | | | 9,992 | | | | 2,352 | |
Microsoft | | | 32,946 | | | | 3,885 | |
Palo Alto Networks * | | | 8,219 | | | | 1,996 | |
PayPal Holdings * | | | 17,149 | | | | 1,781 | |
salesforce.com * | | | 17,389 | | | | 2,754 | |
ServiceNow * | | | 7,583 | | | | 1,869 | |
Teradata * | | | 37,984 | | | | 1,658 | |
Visa, Cl A | | | 14,320 | | | | 2,237 | |
| | | | | | | | 26,031 | |
Real Estate – 4.0% | | | | | | | | |
American Tower REIT, Cl A | | | 7,498 | | | | 1,478 | |
Equinix REIT | | | 4,683 | | | | 2,122 | |
| | | | | | | | 3,600 | |
Total Common Stock | | | | | | | | |
(Cost $56,962) (000) | | | | | | | 74,498 | |
| | | | | | | | | |
Commercial Paper (b) — 9.4% | | | | | | | | |
Apple | | | | | | | | |
2.458%, 04/03/19 | | $ | 3,000 | | | | 2,999 | |
United Parcel Services | | | | | | | | |
2.437%, 05/06/19 | | | 3,000 | | | | 2,992 | |
Wal-Mart | | | | | | | | |
2.481%, 04/08/19 | | | 2,500 | | | | 2,498 | |
| | | | | | | | | |
Total Commercial Paper | | | | | | | | |
(Cost $8,491) (000) | | | | | | | 8,489 | |
| | | | | | | | | |
Total Investments — 91.5% | | | | | | | | |
(Cost $65,453) (000) | | | | | | $ | 82,987 | |
The following is a list of the inputs used as of March 31, 2019 in valuing the Fund’s investments and other financial instruments carried at value (000), in accordance with the authoritative guidance on fair value measurements and disclosure under U.S. GAAP:
Investments in Securities | | Level 1 | | | Level 2 | | | Level 3 | | | Total | |
Common Stock | | $ | 74,498 | | | $ | — | | | $ | — | | | $ | 74,498 | |
Commercial Paper | | | — | | | | 8,489 | | | | — | | | | 8,489 | |
Total Investments in Securities | | $ | 74,498 | | | $ | 8,489 | | | $ | — | | | $ | 82,987 | |
The accompanying notes are an integral part of the financial statements.
6
| RiverPark Long/Short Opportunity Fund
March 31, 2019 (Unaudited) |
Other Financial Instruments | | Level 1 | | | Level 2 | | | Level 3 | | | Total | |
Total Return Swaps‡ | | $ | — | | | $ | — | | | $ | — | | | $ | — | |
Total Other Financial Instruments | | $ | — | | | $ | — | | | $ | — | | | $ | — | |
‡ | Total return swaps are valued at the unrealized appreciation (depreciation) on the instrument. The total return swaps reset monthly, as such there was $0 unrealized appreciation (depreciation) as of March 31, 2019. The swaps are considered Level 2. |
For the period ended March 31, 2019, there were no transfers between Level 1 and Level 2 assets and liabilities or between Level 2 and Level 3 assets and liabilities.
A list of open swap agreements held by the Fund at March 31, 2019 was as follows:
Equity Swap Agreements |
Company Reference | | Counterparty | Receive (Pay) | Payment
Frequency | Termination
Date | | Notional
Amount
(000) | | | Value
(000) | | | Net
Unrealized
Appreciation
(Depreciation)
(000) | |
Centurylink | | Goldman Sachs International | Fed Funds - (0.50)% | Maturity | 05/01/2020 | | $ | (360 | ) | | $ | (352 | ) | | $ | — | |
Cerner Corp | | Goldman Sachs International | Fed Funds - (0.50)% | Maturity | 05/01/2020 | | | (518 | ) | | | (521 | ) | | | — | |
Cimpress Nv | | Goldman Sachs International | Fed Funds - (0.50)% | Maturity | 05/01/2020 | | | (395 | ) | | | (408 | ) | | | — | |
Clorox Company | | Goldman Sachs International | Fed Funds - (0.50)% | Maturity | 05/01/2020 | | | (445 | ) | | | (449 | ) | | | — | |
Coca-Cola Co/The | | Goldman Sachs International | Fed Funds - (0.50)% | Maturity | 05/01/2020 | | | (391 | ) | | | (408 | ) | | | — | |
Colgate-Palmolive Co | | Goldman Sachs International | Fed Funds - (0.50)% | Maturity | 05/01/2020 | | | (502 | ) | | | (522 | ) | | | — | |
Core Laboratories N.V. | | Goldman Sachs International | Fed Funds - (0.535)% | Maturity | 05/01/2020 | | | (391 | ) | | | (399 | ) | | | — | |
Donaldson Co | | Goldman Sachs International | Fed Funds - (0.50)% | Maturity | 05/01/2020 | | | (414 | ) | | | (420 | ) | | | — | |
Edgewell Personal Care Co | | Goldman Sachs International | Fed Funds - (0.50)% | Maturity | 05/01/2020 | | | (235 | ) | | | (238 | ) | | | — | |
F5 Networks | | Goldman Sachs International | Fed Funds - (0.50)% | Maturity | 05/01/2020 | | | (402 | ) | | | (421 | ) | | | — | |
Gap | | Goldman Sachs International | Fed Funds - (0.50)% | Maturity | 05/01/2020 | | | (269 | ) | | | (268 | ) | | | — | |
General Mills | | Goldman Sachs International | Fed Funds - (0.50)% | Maturity | 05/01/2020 | | | (258 | ) | | | (285 | ) | | | — | |
Halliburton Co | | Goldman Sachs International | Fed Funds - (0.50)% | Maturity | 05/01/2020 | | | (423 | ) | | | (445 | ) | | | — | |
Helmerich Payne | | Goldman Sachs International | Fed Funds - (0.50)% | Maturity | 05/01/2020 | | | (215 | ) | | | (223 | ) | | | — | |
Hershey | | Goldman Sachs International | Fed Funds - (0.50)% | Maturity | 05/01/2020 | | | (220 | ) | | | (228 | ) | | | — | |
HP Inc. | | Goldman Sachs International | Fed Funds - (0.50)% | Maturity | 05/01/2020 | | | (539 | ) | | | (559 | ) | | | — | |
Idex Corp | | Goldman Sachs International | Fed Funds - (0.50)% | Maturity | 05/01/2020 | | | (480 | ) | | | (496 | ) | | | — | |
Imax Corp | | Goldman Sachs International | Fed Funds - (0.50)% | Maturity | 05/01/2020 | | | (210 | ) | | | (204 | ) | | | — | |
Interpublic Group Of Cos | | Goldman Sachs International | Fed Funds - (0.50)% | Maturity | 05/01/2020 | | | (438 | ) | | | (409 | ) | | | — | |
Intl Business Machines Corp | | Goldman Sachs International | Fed Funds - (0.50)% | Maturity | 05/01/2020 | | | (450 | ) | | | (461 | ) | | | — | |
Iron Mountain | | Goldman Sachs International | Fed Funds - (0.50)% | Maturity | 05/01/2020 | | | (636 | ) | | | (649 | ) | | | — | |
J2 Global | | Goldman Sachs International | Fed Funds - (0.50)% | Maturity | 05/01/2020 | | | (748 | ) | | | (768 | ) | | | — | |
JM Smucker | | Goldman Sachs International | Fed Funds - (0.50)% | Maturity | 05/01/2020 | | | (212 | ) | | | (240 | ) | | | — | |
Juniper Networks | | Goldman Sachs International | Fed Funds - (0.50)% | Maturity | 05/01/2020 | | | (680 | ) | | | (688 | ) | | | — | |
Kellogg Co | | Goldman Sachs International | Fed Funds - (0.50)% | Maturity | 05/01/2020 | | | (326 | ) | | | (345 | ) | | | — | |
Keurig Dr Pepper | | Goldman Sachs International | Fed Funds - (0.50)% | Maturity | 05/01/2020 | | | (214 | ) | | | (223 | ) | | | — | |
Kimberly-Clark Corp | | Goldman Sachs International | Fed Funds - (0.50)% | Maturity | 05/01/2020 | | | (430 | ) | | | (459 | ) | | | — | |
Kimco Realty Corp | | Goldman Sachs International | Fed Funds - (0.50)% | Maturity | 05/01/2020 | | | (473 | ) | | | (500 | ) | | | — | |
Kroger Co | | Goldman Sachs International | Fed Funds - (0.50)% | Maturity | 05/01/2020 | | | (220 | ) | | | (220 | ) | | | — | |
Leggett Platt | | Goldman Sachs International | Fed Funds - (0.50)% | Maturity | 05/01/2020 | | | (354 | ) | | | (337 | ) | | | — | |
Lowes Cos | | Goldman Sachs International | Fed Funds - (0.50)% | Maturity | 05/01/2020 | | | (564 | ) | | | (616 | ) | | | — | |
Maxim Integrated Products | | Goldman Sachs International | Fed Funds - (0.50)% | Maturity | 05/01/2020 | | | (584 | ) | | | (583 | ) | | | — | |
Monolithic Power Systems | | Goldman Sachs International | Fed Funds - (0.50)% | Maturity | 05/01/2020 | | | (655 | ) | | | (645 | ) | | | — | |
National Oilwell Varco | | Goldman Sachs International | Fed Funds - (0.50)% | Maturity | 05/01/2020 | | | (377 | ) | | | (388 | ) | | | — | |
Nordstrom | | Goldman Sachs International | Fed Funds - (0.50)% | Maturity | 05/01/2020 | | | (294 | ) | | | (292 | ) | | | — | |
Omnicom Group | | Goldman Sachs International | Fed Funds - (0.50)% | Maturity | 05/01/2020 | | | (369 | ) | | | (358 | ) | | | — | |
The accompanying notes are an integral part of the financial statements.
7
| RiverPark Long/Short Opportunity Fund
March 31, 2019 (Unaudited) |
Equity Swap Agreements |
Company Reference | | Counterparty | Receive (Pay) | Payment
Frequency | Termination
Date | | Notional
Amount
(000) | | | Value
(000) | | | Net
Unrealized
Appreciation
(Depreciation)
(000) | |
Patterson-Uti Energy | | Goldman Sachs International | Fed Funds - (0.50)% | Maturity | 05/01/2020 | | $ | (215 | ) | | $ | (236 | ) | | $ | — | |
Pepsico | | Goldman Sachs International | Fed Funds - (0.50)% | Maturity | 05/01/2020 | | | (704 | ) | | | (740 | ) | | | — | |
Power Integrations | | Goldman Sachs International | Fed Funds - (0.50)% | Maturity | 05/01/2020 | | | (748 | ) | | | (739 | ) | | | — | |
Procter Gamble | | Goldman Sachs International | Fed Funds - (0.50)% | Maturity | 05/01/2020 | | | (407 | ) | | | (426 | ) | | | — | |
Re/Max Holdings | | Goldman Sachs International | Fed Funds - (0.50)% | Maturity | 05/01/2020 | | | (446 | ) | | | (429 | ) | | | — | |
Regency Centers Corp | | Goldman Sachs International | Fed Funds - (0.50)% | Maturity | 05/01/2020 | | | (560 | ) | | | (586 | ) | | | — | |
Scotts Miracle-Gro Co | | Goldman Sachs International | Fed Funds - (0.50)% | Maturity | 05/01/2020 | | | (223 | ) | | | (215 | ) | | | — | |
Semtech Corp | | Goldman Sachs International | Fed Funds - (0.50)% | Maturity | 05/01/2020 | | | (677 | ) | | | (631 | ) | | | — | |
Siteone Landscape Supply | | Goldman Sachs International | Fed Funds - (0.50)% | Maturity | 05/01/2020 | | | (644 | ) | | | (685 | ) | | | — | |
SL Green Realty Corp | | Goldman Sachs International | Fed Funds - (0.50)% | Maturity | 05/01/2020 | | | (365 | ) | | | (360 | ) | | | — | |
Snap-On | | Goldman Sachs International | Fed Funds - (0.50)% | Maturity | 05/01/2020 | | | (229 | ) | | | (230 | ) | | | — | |
Sprouts Farmers Market | | Goldman Sachs International | Fed Funds - (0.50)% | Maturity | 05/01/2020 | | | (601 | ) | | | (590 | ) | | | — | |
Tapestry | | Goldman Sachs International | Fed Funds - (0.50)% | Maturity | 05/01/2020 | | | (219 | ) | | | (207 | ) | | | — | |
Tempur Sealy International | | Goldman Sachs International | Fed Funds - (0.50)% | Maturity | 05/01/2020 | | | (417 | ) | | | (418 | ) | | | — | |
Texas Instruments | | Goldman Sachs International | Fed Funds - (0.50)% | Maturity | 05/01/2020 | | | (668 | ) | | | (666 | ) | | | — | |
Toro Co | | Goldman Sachs International | Fed Funds - (0.50)% | Maturity | 05/01/2020 | | | (640 | ) | | | (652 | ) | | | — | |
Transocean Ltd | | Goldman Sachs International | Fed Funds - (0.50)% | Maturity | 05/01/2020 | | | (215 | ) | | | (229 | ) | | | — | |
Trimble | | Goldman Sachs International | Fed Funds - (0.50)% | Maturity | 05/01/2020 | | | (587 | ) | | | (610 | ) | | | — | |
Under Armour | | Goldman Sachs International | Fed Funds - (0.50)% | Maturity | 05/01/2020 | | | (218 | ) | | | (211 | ) | | | — | |
Vornado Realty Trust | | Goldman Sachs International | Fed Funds - (0.50)% | Maturity | 05/01/2020 | | | (451 | ) | | | (444 | ) | | | — | |
Walgreens Boots Alliance | | Goldman Sachs International | Fed Funds - (0.50)% | Maturity | 05/01/2020 | | | (217 | ) | | | (227 | ) | | | — | |
Walmart | | Goldman Sachs International | Fed Funds - (0.50)% | Maturity | 05/01/2020 | | | (554 | ) | | | (554 | ) | | | — | |
Watsco | | Goldman Sachs International | Fed Funds - (0.50)% | Maturity | 05/01/2020 | | | (375 | ) | | | (383 | ) | | | — | |
Williams-Sonoma | | Goldman Sachs International | Fed Funds - (0.74)% | Maturity | 05/01/2020 | | | (228 | ) | | | (223 | ) | | | — | |
Wingstop | | Goldman Sachs International | Fed Funds - (0.50)% | Maturity | 05/01/2020 | | | (219 | ) | | | (256 | ) | | | — | |
Zillow Group | | Goldman Sachs International | Fed Funds - (0.50)% | Maturity | 05/01/2020 | | | (404 | ) | | | (353 | ) | | | — | |
| | | | | | | | | | | | | | | | $ | — | |
* | Non-income producing security. |
| Percentages are based on Net Assets of $90,743 (000). |
** | More narrow industries are utilized for compliance purposes, whereas broad sectors are utilized for reporting purposes. |
(a) | Security considered Master Limited Partnership. At March 31, 2019, these securities amounted to $3,554 (000) or 3.9% of Net Assets. |
(b) | Zero Coupon Security. The rate reported on the Schedule of Investments is the effective yield at time of purchase. |
ADR — American Depositary Receipt
Cl — Class
LP — Limited Partnership
REIT — Real Estate Investment Trust
Amounts designated as “— “ are $0 or rounded to $0.
The accompanying notes are an integral part of the financial statements.
8
| RiverPark Strategic Income Fund March 31, 2019 (Unaudited) |
Description | | Face
Amount
(000)† | | | Value (000) | |
Schedule of Investments | | | | | | | | |
Corporate Obligations — 44.8% | | | | | | | | |
Communication Services – 6.2% | | | | | | | | |
Comcast | | | | | | | | |
3.300%, 10/01/20 | | | 480 | | | $ | 485 | |
3.032%, VAR ICE LIBOR USD 3 Month+0.440%, 10/01/21 | | | 240 | | | | 240 | |
2.922%, VAR ICE LIBOR USD 3 Month+0.330%, 10/01/20 | | | 480 | | | | 481 | |
Inmarsat Finance | | | | | | | | |
6.500%, 10/01/24 (a) | | | 2,749 | | | | 2,893 | |
Lee Enterprises | | | | | | | | |
9.500%, 03/15/22 (a) | | | 8,721 | | | | 8,950 | |
Netflix | | | | | | | | |
6.375%, 05/15/29 (a) | | | 2,895 | | | | 3,138 | |
Salem Media Group | | | | | | | | |
6.750%, 06/01/24 (a) | | | 697 | | | | 634 | |
Sirius XM Radio | | | | | | | | |
5.000%, 08/01/27 (a) | | | 2,077 | | | | 2,086 | |
TEGNA | | | | | | | | |
5.125%, 10/15/19 | | | 2,526 | | | | 2,535 | |
| | | | | | | | 21,442 | |
Consumer Discretionary – 13.0% | | | | | | | | |
Brunswick | | | | | | | | |
4.625%, 05/15/21 (a) | | | 6,298 | | | | 6,298 | |
Carrols Restaurant Group | | | | | | | | |
8.000%, 05/01/22 | | | 4,113 | | | | 4,213 | |
Dollar Tree | | | | | | | | |
3.473%, VAR ICE LIBOR USD 3 Month+0.700%, 04/17/20 | | | 6,500 | | | | 6,501 | |
Ford Motor Credit | | | | | | | | |
3.387%, VAR ICE LIBOR USD 3 Month+0.790%, 06/12/20 (b) | | | 4,828 | | | | 4,790 | |
Georg Jensen | | | | | | | | |
6.000%, VAR Euribor 3 Month+6.000%, 05/15/23 | | EUR | 500 | | | | 556 | |
Jacktel | | | | | | | | |
10.000%, 12/04/23 (a) | | | 1,700 | | | | 1,564 | |
Michaels Stores | | | | | | | | |
5.875%, 12/15/20 (a) | | | 8,297 | | | | 8,318 | |
Nexteer Automotive Group | | | | | | | | |
5.875%, 11/15/21 (a) | | | 2,405 | | | | 2,442 | |
Postmedia Network | | | | | | | | |
8.250%, 07/15/21 (a) | | CAD | 800 | | | | 596 | |
Rivers Pittsburgh Borrower | | | | | | | | |
6.125%, 08/15/21 (a) | | | 3,092 | | | | 3,100 | |
SB Holdco | | | | | | | | |
8.000%, VAR Euribor 3 Month+8.000%, 07/13/22 | | EUR | 1,700 | | | | 1,859 | |
Tapestry | | | | | | | | |
4.250%, 04/01/25 (b) | | | 4,731 | | | | 4,768 | |
| | | | | | | | 45,005 | |
Consumer Staples – 1.4% | | | | | | | | |
Cott Holdings | | | | | | | | |
5.500%, 04/01/25 (a) | | | 3,440 | | | | 3,483 | |
Fresh Market | | | | | | | | |
9.750%, 05/01/23 (a) | | | 2,020 | | | | 1,525 | |
| | | | | | | | 5,008 | |
Energy – 2.3% | | | | | | | | |
Alta Mesa Holdings | | | | | | | | |
7.875%, 12/15/24 | | | 2,006 | | | | 762 | |
Golar LNG Partners | | | | | | | | |
7.063%, VAR ICE LIBOR USD 3 Month+4.400%, 05/22/20 | | | 1,600 | | | | 1,600 | |
Jones Energy Holdings | | | | | | | | |
9.250%, 03/15/23 (c) | | | 1,185 | | | | 42 | |
Sanjel Corporation | | | | | | | | |
7.500%, 06/19/19 (a) (c) (d) | | | 2,700 | | | | — | |
0.000%, 12/31/49 (a) (c) (e) | | | 101 | | | | — | |
0.000%, 12/31/49 (a) (c) (e) | | | 101 | | | | — | |
0.000%, 12/31/49 (a) (c) (e) | | | 101 | | | | — | |
0.000%, 12/31/49 (a) (c) (e) | | | 101 | | | | — | |
0.000%, 12/31/49 (a) (c) (e) | | | 101 | | | | — | |
0.000%, 12/31/49 (a) (c) (e) | | | 101 | | | | — | |
0.000%, 12/31/49 (a) (c) (e) | | | 101 | | | | — | |
Ship Finance International | | | | | | | | |
5.750%, 10/15/21 | | | 3,397 | | | | 3,389 | |
W&T Offshore | | | | | | | | |
9.750%, 11/01/23 (a) | | | 2,273 | | | | 2,276 | |
| | | | | | | | 8,069 | |
Financials – 0.1% | | | | | | | | |
Toll Road Investors Partnership | | | | | | | | |
5.487%, 02/15/45 (a) (e) | | | 704 | | | | 190 | |
The accompanying notes are an integral part of the financial statements.
9
| RiverPark Strategic Income Fund
March 31, 2019 (Unaudited) |
Description | | Face
Amount
(000) | | | Value (000) | |
Health Care – 0.5% | | | | | | | | |
Bayer US Finance II | | | | | | | | |
3.232%, VAR ICE LIBOR USD 3 Month+0.630%, 06/25/21 (a) | | $ | 255 | | | $ | 253 | |
Hadrian Merger Sub | | | | | | | | |
8.500%, 05/01/26 (a) | | | 1,452 | | | | 1,345 | |
| | | | | | | | 1,598 | |
Industrials – 14.5% | | | | | | | | |
America West Airlines Pass-Through Trust, Ser 2000-1 | | | | | | | | |
8.057%, 07/02/20 | | | 222 | | | | 233 | |
Borealis Finance | | | | | | | | |
7.500%, 11/16/22 (a) | | | 5,046 | | | | 4,882 | |
Chembulk Holding | | | | | | | | |
8.000%, 02/02/23 (a) | | | 2,000 | | | | 1,945 | |
Continental Airlines Pass-Through Trust, Ser 2000-2, Cl A1 | | | | | | | | |
7.707%, 04/02/21 | | | 424 | | | | 437 | |
Continental Airlines Pass-Through Trust, Ser 1999-2, Cl C2 | | | | | | | | |
6.236%, 03/15/20 | | | 24 | | | | 24 | |
Continental Airlines Pass-Through Trust, Ser 2007-1, Cl A | | | | | | | | |
5.983%, 04/19/22 | | | 564 | | | | 594 | |
Euronav Luxembourg | | | | | | | | |
7.500%, 05/31/22 (a) | | | 1,600 | | | | 1,568 | |
FXI Holdings | | | | | | | | |
7.875%, 11/01/24 (a) | | | 3,973 | | | | 3,705 | |
HC2 Holdings | | | | | | | | |
11.500%, 12/01/21 (a) | | | 9,230 | | | | 8,076 | |
MAI Holdings | | | | | | | | |
9.500%, 06/01/23 | | | 1,716 | | | | 1,639 | |
MPC Container Ships Invest BV | | | | | | | | |
7.357%, VAR ICE LIBOR USD 3 Month+4.750%, 09/22/22 | | | 2,800 | | | | 2,820 | |
Mueller Industries | | | | | | | | |
6.000%, 03/01/27 | | | 12,404 | | | | 12,218 | |
Stolt-Nielsen | | | | | | | | |
6.375%, 09/21/22 | | | 5,700 | | | | 5,549 | |
Triumph Group | | | | | | | | |
7.750%, 08/15/25 | | | 1,055 | | | | 1,010 | |
Welbilt | | | | | | | | |
9.500%, 02/15/24 | | | 5,203 | | | | 5,632 | |
| | | | | | | | 50,332 | |
Information Technology – 2.9% | | | | | | | | |
DXC Technology | | | | | | | | |
3.576%, VAR ICE LIBOR USD 3 Month+0.950%, 03/01/21 | | | 2,694 | | | | 2,694 | |
Trimble | | | | | | | | |
4.750%, 12/01/24 | | | 4,099 | | | | 4,213 | |
4.150%, 06/15/23 | | | 3,070 | | | | 3,126 | |
| | | | | | | | 10,033 | |
Materials – 2.3% | | | | | | | | |
INVISTA Finance | | | | | | | | |
4.250%, 10/15/19 (a) | | | 6,174 | | | | 6,231 | |
NOVA Chemicals | | | | | | | | |
5.250%, 06/01/27 (a) | | | 1,582 | | | | 1,558 | |
| | | | | | | | 7,789 | |
Real Estate – 0.5% | | | | | | | | |
Five Point Operating | | | | | | | | |
7.875%, 11/15/25 (a) | | | 1,813 | | | | 1,740 | |
| | | | | | | | | |
Utilities – 1.1% | | | | | | | | |
Pacific Gas & Electric | | | | | | | | |
3.500%, 06/15/25 (c) | | | 2,543 | | | | 2,276 | |
2.950%, 03/01/26 (c) | | | 1,661 | | | | 1,462 | |
| | | | | | | | 3,738 | |
Total Corporate Obligations | | | | | | | | |
(Cost $161,675) (000) | | | | | | | 154,944 | |
| | | | | | | | | |
Commercial Paper (e) — 26.5% | | | | | | | | |
AlbeMarle | | | | | | | | |
2.758%, 04/01/19 | | | 7,698 | | | | 7,696 | |
Boston Scientific | | | | | | | | |
2.967%, 06/03/19 | | | 10,436 | | | | 10,382 | |
Constellation Brands | | | | | | | | |
2.858%, 05/01/19 | | | 7,010 | | | | 6,991 | |
General Motors Financial | | | | | | | | |
3.086%, 05/01/19 | | | 8,850 | | | | 8,825 | |
Humana | | | | | | | | |
2.857%, 04/03/19 | | | 4,425 | | | | 4,423 | |
Keurig Dr Pepper | | | | | | | | |
2.813%, 05/20/19 | | | 10,436 | | | | 10,394 | |
Molson Coors Brewing | | | | | | | | |
2.935%, 05/13/19 | | | 9,817 | | | | 9,783 | |
NetApp | | | | | | | | |
2.747%, 04/23/19 | | | 10,019 | | | | 10,000 | |
Rogers Communication | | | | | | | | |
2.740%, 04/25/19 | | | 8,478 | | | | 8,461 | |
Royal Carribean Cruises | | | | | | | | |
3.010%, 04/01/19 | | | 4,880 | | | | 4,879 | |
The accompanying notes are an integral part of the financial statements.
10
| RiverPark Strategic Income Fund
March 31, 2019 (Unaudited) |
Description | | Face
Amount
(000)/
Shares/
Number of
Warrants | | | Value (000) | |
Sherwin Williams | | | | | | | | |
2.912%, 04/29/19 | | $ | 9,817 | | | $ | 9,796 | |
| | | | | | | | | |
Total Commercial Paper | | | | | | | | |
(Cost $91,645) (000) | | | | | | | 91,630 | |
| | | | | | | | | |
Common Stock — 4.4% | | | | | | | | |
Appvion (d) | | | 152,447 | | | | 1,982 | |
Forum Merger II, Cl A * | | | 230,500 | | | | 2,283 | |
Pensare Acquisition * | | | 337,782 | | | | 3,469 | |
RA Parent (d) | | | 56 | | | | 2,211 | |
Tuscan Holdings * | | | 113,631 | | | | 1,184 | |
Vantage Energy Acquisition, Cl A * | | | 381,205 | | | | 3,896 | |
| | | | | | | | | |
Total Common Stock | | | | | | | | |
(Cost $16,365) (000) | | | | | | | 15,025 | |
| | | | | | | | | |
Warrant — 0.0% | | | | | | | | |
Forum Merger II, Expires 09/30/25* | | | 230,500 | | | | 102 | |
| | | | | | | | | |
Total Warrant | | | | | | | | |
(Cost $132) (000) | | | | | | | 102 | |
| | | | | | | | | |
Bank Loan Obligations — 20.9% | | | | | | | | |
Appvion | | | | | | | | |
8.800%, VAR LIBOR USD 1 Month+6.000%, 06/12/26 | | | 1,447 | | | | 1,445 | |
BI-LO | | | | | | | | |
10.783%, VAR LIBOR USD 1 Month+8.000%, 05/15/24 | | | 1,168 | | | | 1,126 | |
10.739%, VAR LIBOR USD 1 Month+8.000%, 05/15/24 | | | 1,168 | | | | 1,126 | |
10.607%, VAR LIBOR USD 1 Month+8.000%, 05/15/24 | | | 1,114 | | | | 1,075 | |
Citgo Petroleum | | | | | | | | |
9.500%, VAR LIBOR USD 1 Month+0.000%, 03/27/24 | | | 4,409 | | | | 4,387 | |
Crestwood Holdings | | | | | | | | |
10.000%, VAR LIBOR USD 1 Month+7.500%, 02/28/23 | | | 6,635 | | | | 6,505 | |
Description | | Face
Amount
(000) | | | Value (000) | |
Eastman Kodak | | | | | | | | |
8.749%, VAR LIBOR USD 1 Month+6.250%, 09/03/19 | | $ | 6,529 | | | $ | 6,300 | |
Envigo Holdings | | | | | | | | |
11.300%, VAR US LIBOR+8.500%, 11/03/21 | | | 3,084 | | | | 2,915 | |
First Data Corporation | | | | | | | | |
4.486%, VAR LIBOR USD 1 Month+2.000%, 07/08/22 | | | 6,279 | | | | 6,263 | |
General Nutrition Centers | | | | | | | | |
9.500%, VAR LIBOR USD 1 Month+7.000%, 12/31/22 | | | 1,701 | | | | 1,717 | |
Infrastructure & Energy | | | | | | | | |
8.851%, VAR LIBOR USD 1 Month+6.250%, 11/14/24 | | | 6,810 | | | | 5,993 | |
Internap | | | | | | | | |
8.240%, VAR LIBOR USD 1 Month+5.750%, 04/06/22 | | | 5,431 | | | | 5,248 | |
Lee Enterprises | | | | | | | | |
12.000%, 12/15/22 | | | 2,065 | | | | 2,065 | |
LSC Communications | | | | | | | | |
7.999%, VAR LIBOR USD 1 Month+5.500%, 09/30/22 | | | 3,744 | | | | 3,719 | |
McDermott International | | | | | | | | |
7.493%, VAR LIBOR USD 1 Month+5.000%, 05/12/25 | | | 3,736 | | | | 3,574 | |
Monitronics International | | | | | | | | |
8.101%, VAR LIBOR USD 3 Month+5.500%, 09/30/22 | | | 1,423 | | | | 1,184 | |
Prince Minerals | | | | | | | | |
10.513%, VAR LIBOR USD 1 Month+7.750%, 03/29/26 | | | 1,096 | | | | 1,019 | |
Production Resource Group | | | | | | | | |
9.650%, VAR LIBOR USD 1 Month+7.000%, 08/21/24 | | | 2,550 | | | | 2,512 | |
Real Alloy Holding | | | | | | | | |
12.800%, 05/31/23 (d)(f) | | | 1,133 | | | | 1,133 | |
Town Sports International | | | | | | | | |
5.999%, VAR LIBOR USD 1 Month+3.500%, 11/15/20 | | | 1,213 | | | | 1,178 | |
The accompanying notes are an integral part of the financial statements.
11
| RiverPark Strategic Income Fund
March 31, 2019 (Unaudited) |
Description | | Face
Amount
(000) | | | Value (000) | |
Trico Group | | | | | | | | |
9.601%, VAR LIBOR USD 1 Month+7.000%, 02/02/24 | | | 3,814 | | | $ | 3,575 | |
WindStream Services | | | | | | | | |
10.500%, 03/29/21 (f) | | | 2,882 | | | | 2,884 | |
Young Innovations | | | | | | | | |
6.601%, VAR LIBOR USD 1 Month+4.000%, 11/06/24 | | | 5,472 | | | | 5,417 | |
| | | | | | | | | |
Total Bank Loan Obligations | | | | | | | | |
(Cost $73,913) (000) | | | | | | | 72,360 | |
| | | | | | | | | |
Total Investments — 96.6% | | | | | | | | |
(Cost $343,730) (000) | | | | | | $ | 334,061 | |
| | | | | | | | | |
Schedule of Securities Sold Short, Not Yet Purchased |
Corporate Obligations — (5.2)% | | | | | | | | |
Communication Services – (0.6)% | | | | | | | | |
AT&T | | | | | | | | |
4.250%, 03/01/27 | | | (2,000 | ) | | $ | (2,058 | ) |
| | | | | | | | | |
Consumer Discretionary – (0.4)% | | | | | | | | |
Harley-Davidson | | | | | | | | |
3.500%, 07/28/25 | | | (1,000 | ) | | | (973 | ) |
Weight Watchers International | | | | | | | | |
8.625%, 12/01/25 (a) | | | (455 | ) | | | (411 | ) |
| | | | | | | | (1,384 | ) |
Consumer Staples – (1.4)% | | | | | | | | |
Conagra Brands | | | | | | | | |
7.125%, 10/01/26 | | | (1,000 | ) | | | (1,163 | ) |
Kraft Heinz Foods | | | | | | | | |
3.000%, 06/01/26 | | | (2,000 | ) | | | (1,866 | ) |
Molson Coors Brewing | | | | | | | | |
5.000%, 05/01/42 | | | (1,000 | ) | | | (982 | ) |
Reckitt Benckiser Treasury Services | | | | | | | | |
3.000%, 06/26/27 (a) | | | (1,000 | ) | | | (967 | ) |
| | | | | | | | (4,978 | ) |
Financials – (0.7)% | | | | | | | | |
General Electric Capital | | | | | | | | |
6.750%, 03/15/32 | | | (2,000 | ) | | | (2,312 | ) |
| | | | | | | | | |
Health Care – (0.7)% | | | | | | | | |
DaVita | | | | | | | | |
5.125%, 07/15/24 | | | (1,182 | ) | | | (1,170 | ) |
McKesson | | | | | | | | |
3.950%, 02/16/28 | | | (660 | ) | | | (661 | ) |
Description | | Face
Amount
(000)† | | | Value (000) | |
Quest Diagnostics | | | | | | | | |
3.450%, 06/01/26 | | | (660 | ) | | $ | (655 | ) |
| | | | | | | | (2,486 | ) |
Industrials – (0.6)% | | | | | | | | |
Trinity Industries | | | | | | | | |
4.550%, 10/01/24 | | | (1,000 | ) | | | (956 | ) |
WW Grainger | | | | | | | | |
4.600%, 06/15/45 | | | (1,000 | ) | | | (1,068 | ) |
| | | | | | | | (2,024 | ) |
Information Technology – (0.3)% | | | | | | | | |
Lam Research | | | | | | | | |
3.800%, 03/15/25 | | | (1,000 | ) | | | (1,028 | ) |
| | | | | | | | | |
Materials – (0.2)% | | | | | | | | |
BASF | | | | | | | | |
0.875%, 11/15/27 | | EUR | | (676) | | | (781 | ) |
| | | | | | | | | |
Real Estate – (0.3)% | | | | | | | | |
SITE Centers | | | | | | | | |
4.700%, 06/01/27 ‡ | | | (1,000 | ) | | | (1,033 | ) |
| | | | | | | | | |
Total Corporate Obligations | | | | | | | | |
(Proceeds $18,321) (000) | | | | | | | (18,084 | ) |
| | | | | | | | | |
Total Securities Sold Short, Not Yet Purchased | | | | | | | | |
(Proceeds $18,321) (000) | | | | | | $ | (18,084 | ) |
A list of the open forward foreign currency contracts held by the Fund at March 31, 2019 is as follows (000):
Counterparty | | Maturity
Date | | | Currency
to Deliver | | | Currency to
Receive | | | Unrealized
Appreciation
(Depreciation) | |
Brown Brothers Harriman | | | 04/05/19 | | | | CAD | | | | 864 | | | | USD | | | | 647 | | | $ | — | |
Brown Brothers Harriman | | | 04/05/19 | | | | EUR | | | | 2,200 | | | | USD | | | | 2,492 | | | | 24 | |
Brown Brothers Harriman | | | 04/05/19 | | | | NOK | | | | 12,171 | | | | USD | | | | 1,404 | | | | (7 | ) |
| | | | | | | | | | | | | | | | | | | | | | | $ | 17 | |
The accompanying notes are an integral part of the financial statements.
12
| RiverPark Strategic Income Fund
March 31, 2019 (Unaudited) |
The following is a list of the inputs used as of March 31, 2019 in valuing the Fund’s investments, securities sold short, not yet purchased, and other financial instruments carried at value (000), in accordance with the authoritative guidance on fair value measurements and disclosure under U.S. GAAP:
Investments in Securities | | Level 1 | | | Level 2 | | | Level 3 | | | Total | |
Corporate Obligations | | $ | — | | | $ | 154,944 | | | $ | — | | | $ | 154,944 | |
Commercial Paper | | | — | | | | 91,630 | | | | — | | | | 91,630 | |
Common Stock | | | 10,832 | | | | — | | | | 4,193 | | | | 15,025 | |
Warrant | | | — | | | | 102 | | | | — | | | | 102 | |
Bank Loan Obligations | | | — | | | | 71,227 | | | | 1,133 | | | | 72,360 | |
Total Investments in Securities | | $ | 10,832 | | | $ | 317,903 | | | $ | 5,326 | | | $ | 334,061 | |
Securities Sold Short, Not Yet Purchased | | Level 1 | | | Level 2 | | | Level 3 | | | Total | |
Corporate Obligations | | $ | — | | | $ | (18,084 | ) | | $ | — | | | $ | (18,084 | ) |
Total Securities Sold Short, Not Yet Purchased | | $ | — | | | $ | (18,084 | ) | | $ | — | | | $ | (18,084 | ) |
Other Financial Instruments | | Level 1 | | | Level 2 | | | Level 3 | | | Total | |
Forwards** | | | | | | | | | | | | | | | | |
Unrealized Appreciation | | $ | — | | | $ | 24 | | | $ | — | | | $ | 24 | |
Unrealized Depreciation | | | — | | | | (7 | ) | | | — | | | | (7 | ) |
Total Other Financial Instruments | | $ | — | | | $ | 17 | | | $ | — | | | $ | 17 | |
** | Forward contracts are valued at the unrealized appreciation (depreciation) on the instrument. See Note 2 in Notes to Financial Statements for additional information. |
The following is a reconciliation of the investments in which significant unobservable inputs (Level 3) were used in determining value (000):
| | Common
Stock | | | Bank Loan
Obligations | | | Total | |
Beginning balance as of October 1, 2018 | | $ | 4,477 | | | $ | 1,246 | | | $ | 5,723 | |
Change in unrealized appreciation/ depreciation) | | | (627 | ) | | | — | | | | (627 | ) |
Purchases | | | 343 | | | | — | | | | 343 | |
Sales | | | — | | | | (113 | ) | | | (113 | ) |
Transfer into Level 3 | | | — | | | | — | | | | — | |
Transfer out of Level 3 | | | — | | | | — | | | | — | |
Ending balance as of March 31, 2019 | | $ | 4,193 | | | $ | 1,133 | | | $ | 5,326 | |
Change in unrealized gains/(losses) included in earnings related to securities still held at reporting date | | $ | (627 | ) | | $ | — | | | $ | (627 | ) |
For the period ended March 31, 2019, there were no transfers between Level 1 and Level 2 assets and liabilities.
The accompanying notes are an integral part of the financial statements.
13
| RiverPark Strategic Income Fund
March 31, 2019 (Unaudited) |
The following table summarizes the quantitative inputs and assumptions used for items categorized as material Level 3 investments as of March 31, 2019. The following disclosures also include qualitative information on the sensitivity of the fair value measurements to changes in the significant unobservable inputs.
Assets | | Fair Value at
March 31,
2019
(000) | | | Valuation
Technique | | Unobservable Inputs | | Range |
Common Stock | | $ | 1,982 | | | | Multiples and Comparables methods | | 4.5x $52mm in EBITDA (total enterprise value) less net debt of $116.6mm on 9mm shares outstanding; 30-50% haircut on comparables; recent emergence from bankruptcy | | $8.83/share - $15.78/share multiple of EBITDA; Net debt $91.9mm EBITDA between $38.1mm and $52mm - $116.6mm (4Q18) |
Common Stock | | | 2,211 | | | | Multiples method | | 5.4x $63mm in EBITDA (total enterprise value) less net debt of $141.2mm on 5mm shares outstanding | | $39,644/share – $57,977/share 4.8x–5.4x multiple of EBITDA; $74mm (4Q18) in EBITDA; $141.2mm (2Q18) – $108.8mm (4Q18) of net debt |
Bank Loan Obligations | | | 1,133 | | | | Multiples method | | Low level of leverage and coupon of LIBOR+10% (totaling approximately 12.5% as of 3/31/19); company evaluating to refinance | | 1.4x-2.2x net leverage; $127.4mm (3Q18) – $108.8 mm (4Q18) of net debt |
The unobservable inputs used to determine fair value of recurring Level 3 assets may have similar or diverging impacts on valuation. Significant increases and decreases in these inputs in isolation and interrelationships between those inputs could result in significantly higher or lower fair value measurement.
| Percentages are based on Net Assets of $345,978 (000). |
* | Non-income producing security. |
† | In U.S. dollars unless otherwise indicated. |
‡ | Real Estate Investment Trust |
(a) | Securities sold within terms of a private placement memorandum, exempt from registration under Section 144A of the Securities Act of 1933, as amended, and may be sold only to dealers in that program or other “accredited investors.” These securities have been determined to be liquid under guidelines established by the Board of Trustees. |
(b) | All or a portion of this security has been committed as collateral for open short positions. The aggregate market value of the collateral at March 31, 2019 was $4,789 (000). |
(c) | Security in default on interest payments. |
(d) | Level 3 security in accordance with fair value hierarchy. |
(e) | Zero coupon security. The rate reported on the Schedule of Investments is the effective yield at time of purchase. |
(f) | Variable or floating rate security, the interest rate of which adjusts periodically based on changes in current interest rates and prepayments on the underlying pool of assets. |
CAD — Canadian Dollar
Cl — Class
EBITDA — Earnings before interest, taxes, depreciation, and amortization
EUR — Euro
EURIBOR — Euro London Interbank Offered Rate
ICE — Intercontinental Exchange
LIBOR — London Interbank Offered Rate
NOK — Norwegian Krone
Ser — Series
USD — United States Dollar
VAR — Variable Rate
The accompanying notes are an integral part of the financial statements.
14
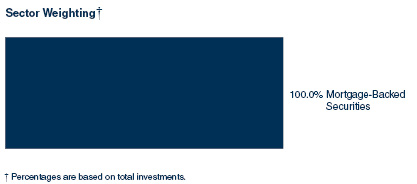
| RiverPark Floating Rate CMBS Fund March 31, 2019 (Unaudited) |
Description | | Face
Amount
(000) | | | Value (000) | |
Schedule of Investments | | | | | | | | |
Commercial Mortgage-Backed Securities (a) — 98.9% |
280 Park Avenue Mortgage Trust, Ser 2017-280P, Cl F | | | | | | | | |
5.311%, VAR LIBOR USD 1 Month+2.827%, 09/15/34 | | $ | 5,000 | | | $ | 5,015 | |
280 Park Avenue Mortgage Trust, Ser 2017-280P, Cl E | | | | | | | | |
4.603%, VAR LIBOR USD 1 Month+2.119%, 09/15/34 | | | 5,000 | | | | 5,016 | |
280 Park Avenue Mortgage Trust, Ser 2017-280P, Cl C | | | | | | | | |
3.734%, VAR LIBOR USD 1 Month+1.250%, 09/15/34 | | | 2,200 | | | | 2,197 | |
BBCMS Mortgage Trust, Ser 2018-TALL, Cl E | | | | | | | | |
4.921%, VAR LIBOR USD 1 Month+2.437%, 03/15/37 | | | 3,000 | | | | 2,987 | |
BBCMS Mortgage Trust, Ser 2018-TALL, Cl C | | | | | | | | |
3.605%, VAR LIBOR USD 1 Month+1.121%, 03/15/37 | | | 6,000 | | | | 5,951 | |
BF Mortgage Trust, Ser 2018-NYT, Cl E | | | | | | | | |
4.984%, VAR LIBOR USD 1 Month+2.500%, 11/15/35 | | | 12,000 | | | | 12,067 | |
BX Commercial Mortgage Trust, Ser 2018-MCSF, Cl E | | | | | | | | |
4.633%, VAR LIBOR USD 1 Month+2.149%, 04/15/35 | | | 5,000 | | | | 4,912 | |
BX Commercial Mortgage Trust, Ser 20108-IND, Cl G | | | | | | | | |
4.534%, VAR LIBOR USD 1 Month+2.050%, 11/15/35 | | | 1,636 | | | | 1,641 | |
BX Commercial Mortgage Trust, Ser 2018-BIOA, Cl E | | | | | | | | |
4.435%, VAR LIBOR USD 1 Month+1.951%, 03/15/37 | | | 4,150 | | | | 4,150 | |
BX Commercial Mortgage Trust, Ser 2018-IND, Cl E | | | | | | | | |
4.184%, VAR LIBOR USD 1 Month+1.700%, 11/15/35 | | | 4,089 | | | | 4,097 | |
CAMB Commercial Mortgage Trust, Ser 2019-LIFE, Cl G | | | | | | | | |
5.734%, VAR LIBOR USD 1 Month+3.250%, 12/15/37 | | | 5,000 | | | | 5,032 | |
CAMB Commercial Mortgage Trust, Ser 2019-LIFE, Cl C | | | | | | | | |
3.934%, VAR LIBOR USD 1 Month+1.450%, 12/15/37 | | | 6,350 | | | | 6,362 | |
CG Commercial Mortgage Trust, Ser 2019-SST2 | | | | | | | | |
4.984%, VAR LIBOR USD 1 Month+2.500%,12/15/36 | | | 2,000 | | | | 1,997 | |
CG Commercial Mortgage Trust, Ser 2018-TBR | | | | | | | | |
4.284%, VAR LIBOR USD 1 Month+1.800%, 12/15/36 | | | 3,500 | | | | 3,502 | |
CHT Mortgage Trust, Ser 2017-CSMO, Cl C | | | | | | | | |
3.984%, VAR LIBOR USD 1 Month+1.500%, 11/15/36 | | | 5,000 | | | | 4,992 | |
CHT Mortgage Trust, Ser 2017-CSMO, Cl D | | | | | | | | |
4.734%, VAR LIBOR USD 1 Month+2.250%, 11/15/36 | | | 2,700 | | | | 2,703 | |
Citigroup Commercial Mortgage Trust, Ser 2018-TBR, Cl B | | | | | | | | |
3.634%, VAR LIBOR USD 1 Month+1.150%, 12/15/36 | | | 3,900 | | | | 3,878 | |
COMM Mortgage Trust, Ser 2014-TWC, Cl E | | | | | | | | |
5.749%, VAR LIBOR USD 1 Month+3.250%, 02/13/32 | | | 2,000 | | | | 2,001 | |
Credit Suisse Mortgage Trust, Ser 2016-MFF, Cl F | | | | | | | | |
9.734%, VAR LIBOR USD 1 Month+7.250%, 11/15/33 | | | 3,750 | | | | 3,742 | |
CSMC Trust, Ser 2017-PFHP, Cl F | | | | | | | | |
6.974%, VAR LIBOR USD 1 Month+4.490%, 12/15/30 | | | 2,658 | | | | 2,649 | |
CSMC Trust, Ser 2017-HD, Cl B | | | | | | | | |
3.834%, VAR LIBOR USD 1 Month+1.350%, 02/15/31 | | | 1,076 | | | | 1,075 | |
DBGS Mortgage Trust, Ser 2018-5BP, Cl D | | | | | | | | |
3.834%, VAR LIBOR USD 1 Month+1.350%, 06/15/33 | | | 5,000 | | | | 4,931 | |
FREMF Mortgage Trust, Ser 2017-KF30, Cl B | | | | | | | | |
5.740%, VAR LIBOR USD 1 Month+3.250%, 03/25/27 | | | 549 | | | | 559 | |
FREMF Mortgage Trust, Ser 2017-KF32, Cl B | | | | | | | | |
5.040%, VAR LIBOR USD 1 Month+2.550%, 05/25/24 | | | 2,512 | | | | 2,528 | |
The accompanying notes are an integral part of the financial statements.
15
| RiverPark Floating Rate CMBS Fund
March 31, 2019 (Unaudited) |
Description | | Face
Amount
(000) | | | Value (000) | |
GS Mortgage Securities Trust, Ser 2018-HULA, Cl D | | | | | | | | |
4.284%, VAR LIBOR USD 1 Month+1.800%, 07/15/25 | | $ | 4,967 | | | $ | 4,970 | |
JPMorgan Chase Commercial Mortgage Securities Trust, Ser 2018-LAQ, Cl C | | | | | | | | |
4.084%, VAR LIBOR USD 1 Month+1.600%, 06/15/32 | | | 4,485 | | | | 4,493 | |
JPMorgan Chase Commercial Mortgage Securities Trust, Ser 2018-PHH, Cl F | | | | | | | | |
5.494%, VAR LIBOR USD 1 Month+3.010%, 06/15/35 | | | 2,000 | | | | 1,965 | |
JPMorgan Chase Commercial Mortgage Securities Trust, Ser 2018-LAQ, Cl D | | | | | | | | |
4.584%, VAR LIBOR USD 1 Month+2.100%, 06/15/32 | | | 996 | | | | 999 | |
Motel 6 Trust, Ser 2017-MTL6, Cl D | | | | | | | | |
4.634%, VAR LIBOR USD 1 Month+2.150%, 08/15/34 | | | 4,510 | | | | 4,519 | |
Natixis Commercial Mortgage Securities Trust, Ser 2018-850T, Cl D | | | | | | | | |
3.937%, VAR LIBOR USD 1 Month+1.454%, 07/15/33 | | | 5,000 | | | | 4,969 | |
Stonemont Portfolio Trust, Ser 2017-MONT, Cl E | | | | | | | | |
5.238%, VAR LIBOR USD 1 Month+2.750%, 08/20/30 | | | 1,954 | | | | 1,959 | |
Waldorf Astoria Boca Raton Trust, Ser 2016-BOCA, Cl C | | | | | | | | |
4.984%, VAR LIBOR USD 1 Month+2.500%, 06/15/29 | | | 1,350 | | | | 1,350 | |
Waldorf Astoria Boca Raton Trust, Ser 2016-BOCA, Cl B | | | | | | | | |
4.534%, VAR LIBOR USD 1 Month+2.050%, 06/15/29 | | | 1,000 | | | | 1,000 | |
Waldorf Astoria Boca Raton Trust, Ser 2016-BOCA, Cl A | | | | | | | | |
3.834%, VAR LIBOR USD 1 Month+1.350%, 06/15/29 | | | 3,000 | | | | 3,000 | |
| | | | | | | | | |
Total Commercial Mortgage-Backed Securities | | | | | | | | |
(Cost $123,530) (000) | | | | | | | 123,208 | |
| | | | | | | | | |
Total Investments — 98.9% | | | | | | | | |
(Cost $123,530) (000) | | | | | | $ | 123,208 | |
As of March 31, 2019, all of the Fund’s investments are Level 2 in accordance with the authoritative guidance on fair value measurements and disclosure under U.S. GAAP.
For the period ended March 31, 2019, there were no transfers between Level 1 and Level 2 assets and liabilities or between Level 2 and Level 3 assets and liabilities.
| Percentages are based on Net Assets of $124,573 (000). |
(a) | Securities sold within terms of a private placement memorandum, exempt from registration under Section 144A of the Securities Act of 1933, as amended, and may be sold only to dealers in that program or other “accredited investors.” These securities have been determined to be liquid under guidelines established by the Board of Trustees. At March 13, 2019, these securities amounted to $123,240 (000) or 98.9% of Net Assets. |
Cl — Class
LIBOR — London Interbank Offered Rate
Ser — Series
USD — United States Dollar
VAR — Variable Rate
The accompanying notes are an integral part of the financial statements.
16
Statements of Assets and Liabilities (000) March 31, 2019 (Unaudited) |
|
| | | RiverPark Large
Growth Fund | | | RiverPark/
Wedgewood Fund | | | RiverPark
Short Term
High Yield Fund | |
Assets: | | | | | | | | | | | | |
Investments in Securities, at Value (Note 2) | | $ | 49,820 | | | $ | 110,583 | | | $ | 823,189 | |
Cash and Cash Equivalent | | | 1,221 | | | | 4,311 | | | | 66,016 | |
Receivable for Capital Shares Sold | | | 24 | | | | 50 | | | | 1,111 | |
Prepaid Expenses | | | 18 | | | | 29 | | | | 50 | |
Receivable for Dividend and Interest Income | | | 10 | | | | 1 | | | | 13,083 | |
Total Assets | | | 51,093 | | | | 114,974 | | | | 903,449 | |
Liabilities: | | | | | | | | | | | | |
Payable for Capital Shares Redeemed | | | 21 | | | | 174 | | | | 2,947 | |
Income Distribution Payable | | | — | | | | — | | | | 148 | |
Payable for Investment Securities Purchased | | | — | | | | — | | | | 38,370 | |
Payable Due to Adviser (Note 3) | | | 28 | | | | 65 | | | | 476 | |
Payable Due to Shareholder Servicing Agent (Note 3) | | | 13 | | | | 9 | | | | 66 | |
Payable Due to Administrative Services, Retail Class Shares (Note 3) | | | 6 | | | | 12 | | | | 10 | |
Payable Due to Administrative Services, Institutional Class Shares (Note 3) | | | 5 | | | | 113 | | | | 119 | |
Payable Due to Administrator | | | 3 | | | | 6 | | | | 44 | |
Chief Compliance Officer Fees Payable | | | — | | | | — | | | | 3 | |
Other Accrued Expenses | | | 15 | | | | 38 | | | | 285 | |
Total Liabilities | | | 91 | | | | 417 | | | | 42,468 | |
Net Assets | | $ | 51,002 | | | $ | 114,557 | | | $ | 860,981 | |
Net Assets Consist of: | | | | | | | | | | | | |
Paid-in Capital | | $ | 32,709 | | | $ | 37,006 | | | $ | 880,581 | |
Total Distributable Earnings/(Loss) | | | 18,293 | | | | 77,551 | | | | (19,600 | ) |
Net Assets | | $ | 51,002 | | | $ | 114,557 | | | $ | 860,981 | |
Investments in Securities, at Cost | | $ | 34,856 | | | $ | 68,930 | | | $ | 824,350 | |
Net Assets - Institutional Class Shares(1) | | $ | 23,321,430 | | | $ | 100,104,329 | | | $ | 821,983,757 | |
Net Assets - Retail Class Shares(1) | | $ | 27,680,785 | | | $ | 14,452,927 | | | $ | 38,997,166 | |
Institutional Class Shares: | | | | | | | | | | | | |
Outstanding Shares of Beneficial Interest(1) | | | | | | | | | | | | |
(Unlimited Authorization — No Par Value) | | | 1,096,311 | | | | 11,535,450 | | | | 84,029,294 | |
Retail Class Shares: | | | | | | | | | | | | |
Outstanding Shares of Beneficial Interest(1) | | | | | | | | | | | | |
(Unlimited Authorization — No Par Value) | | | 1,325,314 | | | | 1,705,701 | | | | 4,005,331 | |
Institutional Class Shares: | | | | | | | | | | | | |
Net Asset Value, Offering and Redemption | | | | | | | | | | | | |
Price Per Share — Institutional Class Shares | | $ | 21.27 | | | $ | 8.68 | | | $ | 9.78 | |
Retail Class Shares: | | | | | | | | | | | | |
Net Asset Value, Offering and Redemption | | | | | | | | | | | | |
Price Per Share — Retail Class Shares | | $ | 20.89 | | | $ | 8.47 | | | $ | 9.74 | |
(1) | Shares and Net Assets have not been rounded. |
Amounts designated as “—” are either not applicable, $0 or have been rounded to $0.
The accompanying notes are an integral part of the financial statements.
17
Statements of Assets and Liabilities (000) March 31, 2019 (Unaudited) |
|
| | | RiverPark
Long/Short
Opportunity Fund | | | RiverPark Strategic
Income Fund | | | RiverPark Floating
Rate CMBS Fund | |
Assets: | | | | | | | | | | | | |
Investments in Securities, at Value (Note 2) | | $ | 82,987 | | | $ | 334,061 | | | $ | 123,208 | |
Deposits with Brokers for Securities Sold Short, Not Yet Purchased | | | 1,113 | | | | 18,515 | | | | — | |
Cash and Cash Equivalent | | | 6,577 | | | | 14,224 | | | | 1,256 | |
Foreign Currency | | | — | | | | 795 | | | | — | |
Cash Collateral on Swap Contracts | | | 650 | | | | — | | | | — | |
Receivable for Capital Shares Sold | | | 81 | | | | 1,237 | | | | 169 | |
Receivable for Dividend and Interest Income | | | 3 | | | | 2,959 | | | | 270 | |
Deferred Offering | | | — | | | | — | | | | 30 | |
Prepaid Expenses | | | 28 | | | | 34 | | | | 25 | |
Receivable for Investment Securities Sold | | | — | | | | 2,709 | | | | 4,829 | |
Unrealized Appreciation on Forward Foreign Currency Contracts | | | — | | | | 24 | | | | — | |
Total Assets | | | 91,439 | | | | 374,558 | | | | 129,787 | |
Liabilities: | | | | | | | | | | | | |
Payable for Swap Reset | | | 404 | | | | — | | | | — | |
Payable for Capital Shares Redeemed | | | 119 | | | | 1,090 | | | | 152 | |
Securities Sold Short, Not Yet Purchased (Note 2) | | | — | | | | 18,084 | | | | — | |
Income Distribution Payable | | | — | | | | 95 | | | | 21 | |
Unrealized Depreciation on Forward Foreign Currency Contracts | | | — | | | | 7 | | | | — | |
Payable for Investment Securities Purchased | | | — | | | | 8,857 | | | | 4,942 | |
Payable Due to Adviser (Note 3) | | | 114 | | | | 190 | | | | 46 | |
Payable Due to Administrative Services, Institutional Class Shares (Note 3) | | | 26 | | | | 80 | | | | — | |
Payable Due to Administrator | | | 5 | | | | 18 | | | | 4 | |
Payable Due to Shareholder Servicing Agent (Note 3) | | | 2 | | | | 36 | | | | — | |
Payable Due to Trustees | | | — | | | | — | | | | 1 | |
Payable Due to Administrative Services, Retail Class Shares (Note 3) | | | — | | | | 7 | | | | — | |
Chief Compliance Officer Fees Payable | | | — | | | | 1 | | | | — | |
Other Accrued Expenses | | | 26 | | | | 115 | | | | 48 | |
Total Liabilities | | | 696 | | | | 28,580 | | | | 5,214 | |
Net Assets | | $ | 90,743 | | | $ | 345,978 | | | $ | 124,573 | |
Net Assets Consist of: | | | | | | | | | | | | |
Paid-in Capital | | $ | 66,032 | | | $ | 408,316 | | | $ | 124,873 | |
Total Distributable Earnings/(Loss) | | | 24,711 | | | | (62,338 | ) | | | (300 | ) |
Net Assets | | $ | 90,743 | | | $ | 345,978 | | | $ | 124,573 | |
Investments in Securities, at Cost | | $ | 65,453 | | | $ | 343,730 | | | $ | 123,530 | |
Securities Sold Short, Not Yet Purchased, Proceeds | | | — | | | | 18,321 | | | | — | |
Net Assets - Institutional Class Shares(1) | | $ | 86,862,266 | | | $ | 316,231,840 | | | $ | 124,480,091 | |
Net Assets - Retail Class Shares(1) | | $ | 3,880,892 | | | $ | 29,746,343 | | | $ | 93,311 | |
Institutional Class Shares: | | | | | | | | | | | | |
Outstanding Shares of Beneficial Interest(1) | | | | | | | | | | | | |
(Unlimited Authorization — No Par Value) | | | 7,193,563 | | | | 34,256,516 | | | | 12,499,681 | |
Retail Class Shares: | | | | | | | | | | | | |
Outstanding Shares of Beneficial Interest(1) | | | | | | | | | | | | |
(Unlimited Authorization — No Par Value) | | | 324,360 | | | | 3,226,538 | | | | 9,373 | |
Institutional Class Shares: | | | | | | | | | | | | |
Net Asset Value, Offering and Redemption | | | | | | | | | | | | |
Price Per Share — Institutional Class Shares | | $ | 12.08 | | | $ | 9.23 | | | $ | 9.96 | |
Retail Class Shares: | | | | | | | | | | | | |
Net Asset Value, Offering and Redemption | | | | | | | | | | | | |
Price Per Share — Retail Class Shares | | $ | 11.96 | | | $ | 9.22 | | | $ | 9.96 | * |
(1) | Shares and Net Assets have not been rounded. |
Amounts designated as “—” are either not applicable, $0 or have been rounded to $0.
* | Commenced operations November 12, 2018. |
The accompanying notes are an integral part of the financial statements.
18
Statements of Operations (000) For the Six Month Period Ended
March 31, 2019 (Unaudited) |
|
| | | RiverPark Large
Growth Fund | | | RiverPark/
Wedgewood Fund | | | RiverPark
Short Term
High Yield Fund | |
Investment Income: | | | | | | | | | | | | |
Dividends | | $ | 179 | | | $ | 668 | | | $ | — | |
Dividends from Master Limited Partnerships | | | 81 | | | | — | | | | — | |
Interest | | | 11 | | | | 17 | | | | 17,278 | |
Foreign Taxes Withheld | | | (2 | ) | | | — | | | | — | |
Total Investment Income | | | 269 | | | | 685 | | | | 17,278 | |
Expenses: | | | | | | | | | | | | |
Investment Advisory Fees (Note 3) | | | 159 | | | | 539 | | | | 2,841 | |
Administrator Fees (Note 3) | | | 15 | | | | 50 | | | | 262 | |
Shareholder Service Fees(1) (Note 3) | | | 34 | | | | 24 | | | | 57 | |
Administrative Services Fee, Retail Class Shares (Note 3) | | | 17 | | | | 7 | | | | 32 | |
Administrative Services Fee, Institutional Class Shares (Note 3) | | | 12 | | | | 40 | | | | 402 | |
Chief Compliance Officer Fees (Note 3) | | | 1 | | | | 3 | | | | 14 | |
Trustees’ Fees (Note 3) | | | 1 | | | | 5 | | | | 24 | |
Registration Fees | | | 16 | | | | 17 | | | | 19 | |
Transfer Agent Fees | | | 8 | | | | 30 | | | | 141 | |
Printing Fees | | | 4 | | | | 8 | | | | 65 | |
Professional Fees | | | 2 | | | | 7 | | | | 45 | |
Custodian Fees | | | 2 | | | | 8 | | | | 9 | |
Insurance and Other Fees | | | 4 | | | | 18 | | | | 65 | |
Total Expenses | | | 275 | | | | 756 | | | | 3,976 | |
Net Expenses | | | 275 | | | | 756 | | | | 3,976 | |
Net Investment Income (Loss) | | | (6 | ) | | | (71 | ) | | | 13,302 | |
Net Realized and Unrealized Gain (Loss): | | | | | | | | | | | | |
Net Realized Gain (Loss) From: | | | | | | | | | | | | |
Investments | | | 5,904 | | | | 41,586 | | | | (62 | ) |
Net Change in Unrealized Appreciation (Depreciation) on: | | | | | | | | | | | | |
Investments | | | (8,358 | ) | | | (62,345 | ) | | | (183 | ) |
Net Realized and Unrealized Gain (Loss) | | | (2,454 | ) | | | (20,759 | ) | | | (245 | ) |
Net Increase (Decrease) in Net Assets Resulting from Operations | | $ | (2,460 | ) | | $ | (20,830 | ) | | $ | 13,057 | |
(1) | Attributable to Retail Class Shares only. |
Amounts designated as “—” are either not applicable, $0 or have been rounded to $0.
The accompanying notes are an integral part of the financial statements.
19
Statements of Operations (000) For the Six Month Period Ended
March 31, 2019 (Unaudited) |
|
| | | RiverPark
Long/Short
Opportunity Fund | | | RiverPark Strategic
Income Fund | | | RiverPark Floating
Rate CMBS Fund | |
Investment Income: | | | | | | | | | | | | |
Dividends | | $ | 293 | | | $ | — | | | $ | — | |
Dividends from Master Limited Partnerships | | | 152 | | | | — | | | | — | |
Interest | | | 370 | | | | 9,950 | | | | 1,404 | |
Foreign Taxes Withheld | | | (5 | ) | | | — | | | | — | |
Total Investment Income | | | 810 | | | | 9,950 | | | | 1,404 | |
Expenses: | | | | | | | | | | | | |
Investment Advisory Fees (Note 3) | | | 677 | | | | 1,171 | | | | 186 | |
Administrator Fees (Note 3) | | | 27 | | | | 108 | | | | 17 | |
Administrative Services Fee, Institutional Class Shares (Note 3) | | | 49 | | | | 174 | | | | 10 | |
Shareholder Service Fees(1) (Note 3) | | | 5 | | | | 42 | | | | — | |
Trustees’ Fees (Note 3) | | | 3 | | | | 10 | | | | 2 | |
Administrative Services Fee, Retail Class Shares (Note 3) | | | 3 | | | | 10 | | | | — | |
Chief Compliance Officer Fees (Note 3) | | | 1 | | | | 6 | | | | 2 | |
Dividend and Interest Expense | | | 346 | | | | 342 | | | | — | |
Registration Fees | | | 21 | | | | 23 | | | | 20 | |
Transfer Agent Fees | | | 15 | | | | 58 | | | | 11 | |
Printing Fees | | | 7 | | | | 26 | | | | 6 | |
Professional Fees | | | 4 | | | | 18 | | | | 9 | |
Stock Loan Fee | | | 2 | | | | — | | | | — | |
Custodian Fees | | | 2 | | | | 6 | | | | 3 | |
Offering Costs | | | — | | | | — | | | | 19 | |
Pricing Fees | | | — | | | | — | | | | 4 | |
Insurance and Other Fees | | | 7 | | | | 34 | | | | 4 | |
Total Expenses | | | 1,169 | | | | 2,028 | | | | 293 | |
Fees Waived by Adviser (Note 3) | | | (2 | ) | | | — | | | | (8 | ) |
Net Expenses | | | 1,167 | | | | 2,028 | | | | 285 | |
Net Investment Income (Loss) | | | (357 | ) | | | 7,922 | | | | 1,119 | |
Net Realized and Unrealized Gain (Loss): | | | | | | | | | | | | |
Net Realized Gain (Loss) From: | | | | | | | | | | | | |
Investments | | | 13,329 | | | | (3,108 | ) | | | (34 | ) |
Purchased Options | | | (202 | ) | | | — | | | | — | |
Securities Sold Short, Not Yet Purchased | | | 2,322 | | | | 149 | | | | — | |
Swaps Contracts | | | (626 | ) | | | — | | | | — | |
Forward Foreign Currency Contracts | | | — | | | | 163 | | | | — | |
Foreign Currency Transactions | | | — | | | | (63 | ) | | | — | |
Net Change in Unrealized Appreciation (Depreciation) on: | | | | | | | | | | | | |
Investments | | | (19,646 | ) | | | (4,350 | ) | | | (486 | ) |
Written Options | | | 84 | | | | — | | | | — | |
Securities Sold Short, Not Yet Purchased | | | 745 | | | | (234 | ) | | | — | |
Forward Foreign Currency Contracts | | | — | | | | 80 | | | | — | |
Foreign Currency Transactions | | | — | | | | (13 | ) | | | — | |
Net Realized and Unrealized Gain (Loss) | | | (3,994 | ) | | | (7,376 | ) | | | (520 | ) |
Net Increase (Decrease) in Net Assets Resulting from Operations | | $ | (4,351 | ) | | $ | 546 | | | $ | 599 | |
(1) | Attributable to Retail Class Shares only. |
Amounts designated as “—” are either not applicable, $0 or have been rounded to $0.
The accompanying notes are an integral part of the financial statements.
20
Statements of Changes in Net Assets (000) |
|
| | | RiverPark Large Growth Fund | | | RiverPark/Wedgewood Fund | |
| | | Six Month Period
Ended March 31,
2019 (Unaudited) | | | Year Ended
September 30,
2018 | | | Six Month Period
Ended March 31,
2019 (Unaudited) | | | Year Ended
September 30,
2018 | |
Operations: | | | | | | | | | | | | | | | | |
Net Investment Income (Loss) | | $ | (6 | ) | | $ | 2 | | | $ | (71 | ) | | $ | (1,760 | ) |
Net Realized Gain from Investments | | | 5,904 | | | | 3,530 | | | | 41,586 | | | | 181,256 | |
Net Change in Unrealized Appreciation on Investments | | | (8,358 | ) | | | 6,761 | | | | (62,345 | ) | | | (87,922 | ) |
Net Increase (Decrease) in Net Assets Resulting from Operations | | | (2,460 | ) | | | 10,293 | | | | (20,830 | ) | | | 91,574 | |
| | | | | | | | | | | | | | | | | |
Distributions:(1) | | | | | | | | | | | | | | | | |
Institutional Class Shares | | | (2,651 | ) | | | (1,599 | ) | | | (86,145 | ) | | | (74,061 | ) |
Retail Class Shares | | | (3,413 | ) | | | (2,526 | ) | | | (11,942 | ) | | | (5,205 | ) |
Total Distributions to Shareholders | | | (6,064 | ) | | | (4,125 | ) | | | (98,087 | ) | | | (79,266 | ) |
Capital Share Transactions: | | | | | | | | | | | | | | | | |
Institutional Class Shares: | | | | | | | | | | | | | | | | |
Shares Issued | | | 728 | | | | 4,268 | | | | 34,873 | | | | 35,161 | |
Shares Issued as Reinvestment of Distributions | | | 2,651 | | | | 1,599 | | | | 77,263 | | | | 66,255 | |
Shares Redeemed | | | (702 | ) | | | (2,746 | ) | | | (139,316 | ) | | | (438,463 | ) |
Net Increase (Decrease) in Net Assets from Institutional Class Shares Transactions | | | 2,677 | | | | 3,121 | | | | (27,180 | ) | | | (337,047 | ) |
Retail Class Shares: | | | | | | | | | | | | | | | | |
Shares Issued | | | 1,212 | | | | 2,425 | | | | 1,996 | | | | 1,844 | |
Shares Issued as Reinvestment of Distributions | | | 3,383 | | | | 2,513 | | | | 11,538 | | | | 5,100 | |
Shares Redeemed | | | (3,400 | ) | | | (5,847 | ) | | | (14,223 | ) | | | (22,294 | ) |
Net Increase (Decrease) in Net Assets from Retail Class Shares Transactions | | | 1,195 | | | | (909 | ) | | | (689 | ) | | | (15,350 | ) |
Net Increase (Decrease) in Net Assets from Capital Share Transactions | | | 3,872 | | | | 2,212 | | | | (27,869 | ) | | | (352,397 | ) |
Net Increase (Decrease) in Net Assets | | | (4,652 | ) | | | 8,380 | | | | (146,786 | ) | | | (340,089 | ) |
Net Assets: | | | | | | | | | | | | | | | | |
Beginning of period | | | 55,654 | | | | 47,274 | | | | 261,343 | | | | 601,432 | |
End of period(2) | | $ | 51,002 | | | $ | 55,654 | | | $ | 114,557 | | | $ | 261,343 | |
Shares Issued and Redeemed: | | | | | | | | | | | | | | | | |
Institutional Class Shares: | | | | | | | | | | | | | | | | |
Shares Issued | | | 38 | | | | 176 | | | | 3,351 | | | | 1,908 | |
Shares Issued as Reinvestment of Distributions | | | 143 | | | | 72 | | | | 10,193 | | | | 3,793 | |
Shares Redeemed | | | (36 | ) | | | (113 | ) | | | (13,667 | ) | | | (23,508 | ) |
Net Increase (Decrease) in Institutional Class Shares | | | 145 | | | | 135 | | | | (123 | ) | | | (17,807 | ) |
Retail Class Shares: | | | | | | | | | | | | | | | | |
Shares Issued | | | 59 | | | | 105 | | | | 226 | | | | 101 | |
Shares Issued as Reinvestment of Distributions | | | 185 | | | | 115 | | | | 1,557 | | | | 294 | |
Shares Redeemed | | | (174 | ) | | | (255 | ) | | | (1,563 | ) | | | (1,191 | ) |
Net Increase (Decrease) in Retail Class Shares | | | 70 | | | | (35 | ) | | | 220 | | | | (796 | ) |
Net Increase (Decrease) in Share Transactions | | | 215 | | | | 100 | | | | 97 | | | | (18,603 | ) |
(1) | Current period presentation of distributions conform with S-X Disclosure Simplification. Prior year distributions have been consolidated to conform with S-X Disclosure Simplification (see Note 8). |
(2) | Includes undistributed (distributed in excess of) net investment income of $741 and $(484), respectively, in 2018. The SEC eliminated the requirement to disclose undistributed net investment income on November 5, 2018. |
The accompanying notes are an integral part of the financial statements.
21
Statements of Changes in Net Assets (000) |
|
| | | RiverPark Short Term High Yield Fund | | | RiverPark Long/Short Opportunity Fund | |
| | | Six Month Period
Ended March 31,
2019 (Unaudited) | | | Year Ended
September 30,
2018 | | | Six Month Period
Ended March 31,
2019 (Unaudited) | | | Year Ended
September 30,
2018 | |
Operations: | | | | | | | | | | | | | | | | |
Net Investment Income (Loss) | | $ | 13,302 | | | $ | 22,992 | | | $ | | (357) | | $ | (1,596 | ) |
Net Realized Gain (Loss) from Investments, Written and Purchased Options and Securities Sold Short, Not Yet Purchased and Swap Contracts | | | (62 | ) | | | 482 | | | | 14,823 | | | | 4,873 | |
Net Change in Unrealized Appreciation (Depreciation) on Investments, Purchased and Written Options and Securities Sold Short, Not Yet Purchased and Swap Contracts | | | (183 | ) | | | 1,273 | | | | (18,817 | ) | | | 9,125 | |
Net Increase (Decrease) in Net Assets Resulting from Operations | | | 13,057 | | | | 24,747 | | | | (4,351 | ) | | | 12,402 | |
| | | | | | | | | | | | | | | | | |
Distributions:(1) | | | | | | | | | | | | | | | | |
Institutional Class Shares | | | (12,499 | ) | | | (21,102 | ) | | | (8,597 | ) | | | (1,043 | ) |
Retail Class Shares | | | (625 | ) | | | (1,891 | ) | | | (375 | ) | | | (34 | ) |
Total Distributions to Shareholders | | | (13,124 | ) | | | (22,993 | ) | | | (8,972 | ) | | | (1,077 | ) |
Capital Share Transactions: | | | | | | | | | | | | | | | | |
Institutional Class Shares: | | | | | | | | | | | | | | | | |
Shares Issued | | | 86,697 | | | | 333,992 | | | | 14,357 | | | | 31,504 | |
Shares Issued as Reinvestment of Distributions | | | 11,601 | | | | 19,438 | | | | 8,387 | | | | 1,043 | |
Shares Redeemed | | | (140,246 | ) | | | (240,223 | ) | | | (25,138 | ) | | | (26,406 | ) |
Net Increase (Decrease) in Net Assets from Institutional Class Shares Transactions | | | (41,948 | ) | | | 113,207 | | | | (2,394 | ) | | | 6,141 | |
Retail Class Shares: | | | | | | | | | | | | | | | | |
Shares Issued | | | 2,798 | | | | 20,008 | | | | 352 | | | | 2,053 | |
Shares Issued as Reinvestment of Distributions | | | 615 | | | | 1,867 | | | | 371 | | | | 33 | |
Shares Redeemed | | | (14,014 | ) | | | (88,387 | ) | | | (614 | ) | | | (1,694 | ) |
Net Increase (Decrease) in Net Assets from Retail Class Shares Transactions | | | (10,601 | ) | | | (66,512 | ) | | | 109 | | | | 392 | |
Net Increase (Decrease) in Net Assets from Capital Share Transactions | | | (52,549 | ) | | | 46,695 | | | | (2,285 | ) | | | 6,533 | |
Net Increase (Decrease) in Net Assets | | | (52,616 | ) | | | 48,449 | | | | (15,608 | ) | | | 17,858 | |
Net Assets: | | | | | | | | | | | | | | | | |
Beginning of period | | | 913,597 | | | | 865,148 | | | | 106,351 | | | | 88,493 | |
End of period(2) | | $ | 860,981 | | | $ | 913,597 | | | $ | 90,743 | | | $ | 106,351 | |
Shares Issued and Redeemed: | | | | | | | | | | | | | | | | |
Institutional Class Shares: | | | | | | | | | | | | | | | | |
Shares Issued | | | 8,875 | | | | 34,157 | | | | 1,168 | | | | 2,370 | |
Shares Issued as Reinvestment of Distributions | | | 1,189 | | | | 1,989 | | | | 757 | | | | 83 | |
Shares Redeemed | | | (14,356 | ) | | | (24,570 | ) | | | (2,047 | ) | | | (2,012 | ) |
Net Increase (Decrease) in Institutional Class Shares | | | (4,292 | ) | | | 11,576 | | | | (122 | ) | | | 441 | |
Retail Class Shares: | | | | | | | | | | | | | | | | |
Shares Issued | | | 288 | | | | 2,055 | | | | 28 | | | | 155 | |
Shares Issued as Reinvestment of Distributions | | | 63 | | | | 192 | | | | 34 | | | | 3 | |
Shares Redeemed | | | (1,440 | ) | | | (9,070 | ) | | | (50 | ) | | | (131 | ) |
Net Increase (Decrease) in Retail Class Shares | | | (1,089 | ) | | | (6,823 | ) | | | 12 | | | | 27 | |
Net Increase (Decrease) in Share Transactions | | | (5,381 | ) | | | 4,753 | | | | (110 | ) | | | 468 | |
(1) | Current period presentation of distributions conform with S-X Disclosure Simplification. Prior year distributions have been consolidated to conform with S-X Disclosure Simplification (see Note 8). |
(2) | Includes undistributed (distributed in excess of) net investment income of $277 and $1,641 respectively, in 2018. The SEC eliminated the requirement to disclose undistributed net investment income on November 5, 2018. |
The accompanying notes are an integral part of the financial statements.
22
Statements of Changes in Net Assets (000) |
|
| | | RiverPark Strategic Income Fund | | | RiverPark Floating Rate CMBS Fund | |
| | | Six Month Period
Ended March 31,
2019 (Unaudited) | | | Year Ended
September 30,
2018 | | | Six Month Period
Ended March 31,
2019 (Unaudited)(2) | | | Year Ended
September 30,
2018 | |
Operations: | | | | | | | | | | | | | | | | |
Net Investment Income | | $ | 7,922 | | | $ | 18,395 | | | $ | 1,119 | | | $ | 2,396 | |
Net Realized Gain (Loss) from Investments, Written Options and Securities Sold Short | | | (2,859 | ) | | | (9,161 | ) | | | (34 | ) | | | 85 | |
Net Change in Unrealized Appreciation on Investments, Written Options and Securities Sold Short | | | (4,517 | ) | | | 4,571 | | | | (486 | ) | | | (267 | ) |
Net Increase in Net Assets Resulting from Operations | | | 546 | | | | 13,805 | | | | 599 | | | | 2,214 | |
| | | | | | | | | | | | | | | | | |
Distributions:(1) | | | | | | | | | | | | | | | | |
Institutional Class Shares | | | (7,589 | ) | | | (14,428 | ) | | | (1,614 | ) | | | (1,934 | ) |
Retail Class Shares(3) | | | (736 | ) | | | (3,910 | ) | | | (1 | ) | | | (382 | ) |
Total Distributions to Shareholders | | | (8,325 | ) | | | (18,338 | ) | | | (1,615 | ) | | | (2,316 | ) |
Capital Share Transactions: | | | | | | | | | | | | | | | | |
Institutional Class Shares: | | | | | | | | | | | | | | | | |
Shares Issued | | | 81,800 | | | | 147,854 | | | | 76,962 | | | | 2,291 | |
Shares Issued as Reinvestment of Distributions | | | 6,954 | | | | 13,142 | | | | 1,085 | | | | 1,830 | |
Shares Redeemed | | | (114,182 | ) | | | (120,413 | ) | | | (760 | ) | | | (14,190 | ) |
Net Increase (Decrease) in Net Assets from Institutional Class Shares Transactions | | | (25,428 | ) | | | 40,583 | | | | 77,287 | | | | (10,069 | ) |
Retail Class Shares: | | | | | | | | | | | | | | | | |
Shares Issued | | | 1,543 | | | | 39,021 | | | | 161 | | | | — | |
Shares Issued as Reinvestment of Distributions | | | 717 | | | | 3,866 | | | | 231 | | | | — | |
Shares Redeemed | | | (10,775 | ) | | | (104,389 | ) | | | (220 | ) | | | — | |
Net Increase (Decrease) in Net Assets from Retail Class Shares Transactions | | | (8,515 | ) | | | (61,502 | ) | | | 172 | | | | — | |
Net Increase (Decrease) in Net Assets from Capital Share Transactions | | | (33,943 | ) | | | (20,919 | ) | | | 77,459 | | | | (10,069 | ) |
Net Increase (Decrease) in Net Assets | | | (41,722 | ) | | | (25,452 | ) | | | 76,443 | | | | (10,171 | ) |
Net Assets: | | | | | | | | | | | | | | | | |
Beginning of period | | | 387,700 | | | | 413,152 | | | | 48,130 | | | | 58,301 | |
End of period(3) | | $ | 345,978 | | | $ | 387,700 | | | $ | 124,573 | | | $ | 48,130 | |
Shares Issued and Redeemed: | | | | | | | | | | | | | | | | |
Institutional Class Shares: | | | | | | | | | | | | | | | | |
Shares Issued | | | 8,808 | | | | 15,631 | | | | 7,711 | | | | 225 | |
Shares Issued as Reinvestment of Distributions | | | 752 | | | | 1,392 | | | | 132 | | | | 181 | |
Shares Redeemed | | | (12,332 | ) | | | (12,726 | ) | | | (91 | ) | | | (1,397 | ) |
Net Increase (Decrease) in Institutional Class Shares | | | (2,772 | ) | | | 4,297 | | | | 7,752 | | | | (991 | ) |
Retail Class Shares:(3) | | | | | | | | | | | | | | | | |
Shares Issued | | | 167 | | | | 4,128 | | | | 16 | | | | — | |
Shares Issued as Reinvestment of Distributions | | | 78 | | | | 410 | | | | — | | | | — | |
Shares Redeemed | | | (1,163 | ) | | | (11,081 | ) | | | (7 | ) | | | — | |
Net Increase (Decrease) in Retail Class Shares | | | (918 | ) | | | (6,543 | ) | | | 9 | | | | — | |
Net Increase (Decrease) in Share Transactions | | | (3,690 | ) | | | (2,246 | ) | | | 7,761 | | | | (991 | ) |
(1) | Current period presentation of distributions conform with S-X Disclosure Simplification. Prior year distributions have been consolidated to conform with S-X Disclosure Simplification (see Note 8). |
(2) | Retail Class commenced operations on November 12, 2018. |
(3) | Includes undistributed (distributed in excess of) net investment income of $22 and $8, respectively, in 2018. The SEC eliminated the requirement to disclose undistributed net investment income on November 5, 2018. |
Amounts designated as “—” are either not applicable, $0 or have been rounded to $0.
The accompanying notes are an integral part of the financial statements.
23
Financial Highlights For a Share Outstanding Throughout Each Period
For the Six Month Period Ended March 31, 2019 (Unaudited)
For the Year or Period Ended September 30, | |
| | Net Asset
Value,
Beginning of
Period | | | Net
Investment
Income
(Loss) (1) | | | Realized and
Unrealized
Gains
(Losses) on
Investments | | | Total from
Investment
Operations | | | Distributions of
Dividends from Net
Investment Income | | | Distributions
from Net
Realized Gains | | | Total
Distributions | |
RiverPark Large Growth Fund | | | | | | | | | | | | | | | | | | | | | | | | | |
Institutional Class Shares | | | | | | | | | | | | | | | | | | | | | | | | | |
2019* | | $ | 25.45 | | | $ | 0.01 | | | $ | (1.40 | ) | | $ | (1.39 | ) | | $ | — | | | $ | (2.79 | ) | | $ | (2.79 | ) |
2018 | | | 22.61 | | | | 0.04 | | | | 4.79 | | | | 4.83 | | | | (0.01 | ) | | | (1.98 | ) | | | (1.99 | ) |
2017 | | | 18.41 | | | | 0.08 | | | | 4.22 | | | | 4.30 | | | | (0.10 | ) | | | — | | | | (0.10 | ) |
2016 | | | 16.93 | | | | 0.09 | | | | 1.69 | | | | 1.78 | | | | — | (2) | | | (0.30 | ) | | | (0.30 | ) |
2015 | | | 18.34 | | | | 0.09 | | | | (0.99 | ) | | | (0.90 | ) | | | — | | | | (0.51 | ) | | | (0.51 | ) |
2014 | | | 16.28 | | | | 0.02 | | | | 2.21 | | | | 2.23 | | | | (0.04 | ) | | | (0.13 | ) | | | (0.17 | ) |
Retail Class Shares | | | | | | | | | | | | | | | | | | | | | | | | | | | | |
2019* | | $ | 25.08 | | | $ | (0.01 | ) | | $ | (1.39 | ) | | $ | (1.40 | ) | | $ | — | | | $ | (2.79 | ) | | $ | (2.79 | ) |
2018 | | | 22.36 | | | | (0.02 | ) | | | 4.72 | | | | 4.70 | | | | — | | | | (1.98 | ) | | | (1.98 | ) |
2017 | | | 18.20 | | | | 0.02 | | | | 4.18 | | | | 4.20 | | | | (0.04 | ) | | | — | | | | (0.04 | ) |
2016 | | | 16.77 | | | | 0.06 | | | | 1.67 | | | | 1.73 | | | | — | | | | (0.30 | ) | | | (0.30 | ) |
2015 | | | 18.21 | | | | 0.05 | | | | (0.98 | ) | | | (0.93 | ) | | | — | | | | (0.51 | ) | | | (0.51 | ) |
2014 | | | 16.18 | | | | (0.03 | ) | | | 2.19 | | | | 2.16 | | | | — | (2) | | | (0.13 | ) | | | (0.13 | ) |
RiverPark/Wedgewood Fund | | | | | | | | | | | | | | | | | | | | | | | | | |
Institutional Class Shares | | | | | | | | | | | | | | | | | | | | | | | | | |
2019* | | $ | 19.91 | | | $ | — | | | $ | (1.83 | ) | | $ | (1.83 | ) | | $ | — | | | $ | (9.40 | ) | | $ | (9.40 | ) |
2018 | | | 18.95 | | | | (0.08 | ) | | | 3.97 | | | | 3.89 | | | | — | | | | (2.93 | ) | | | (2.93 | ) |
2017 | | | 16.82 | | | | (0.01 | ) | | | 2.17 | | | | 2.16 | | | | (0.03 | ) | | | — | | | | (0.03 | ) |
2016 | | | 16.93 | | | | 0.05 | | | | 0.60 | | | | 0.65 | | | | (0.08 | ) | | | (0.68 | ) | | | (0.76 | ) |
2015 | | | 18.37 | | | | 0.06 | | | | (0.67 | ) | | | (0.61 | ) | | | (0.01 | ) | | | (0.82 | ) | | | (0.83 | ) |
2014 | | | 16.21 | | | | 0.01 | | | | 2.41 | | | | 2.42 | | | | — | | | | (0.26 | ) | | | (0.26 | ) |
Retail Class Shares | | | | | | | | | | | | | | | | | | | | | | | | | | | | |
2019* | | $ | 19.71 | | | $ | (0.02 | ) | | $ | (1.82 | ) | | $ | (1.84 | ) | | $ | — | | | $ | (9.40 | ) | | $ | (9.40 | ) |
2018 | | | 18.83 | | | | (0.12 | ) | | | 3.93 | | | | 3.81 | | | | — | | | | (2.93 | ) | | | (2.93 | ) |
2017 | | | 16.72 | | | | (0.04 | ) | | | 2.15 | | | | 2.11 | | | | — | | | | — | | | | — | |
2016 | | | 16.73 | | | | 0.10 | (4) | | | 0.59 | | | | 0.69 | | | | (0.02 | ) | | | (0.68 | ) | | | (0.70 | ) |
2015 | | | 18.21 | | | | — | (2) | | | (0.66 | ) | | | (0.66 | ) | | | — | | | | (0.82 | ) | | | (0.82 | ) |
2014 | | | 16.09 | | | | (0.03 | ) | | | 2.41 | | | | 2.38 | | | | — | | | | (0.26 | ) | | | (0.26 | ) |
The accompanying notes are an integral part of the financial statements.
24
|
|
| | Net Asset
Value, End of
Period | | | Total Return†† | | | Net Assets, End
of Period (000) | | | Ratio of Net
Expenses to
Average Net
Assets, Including
Dividend Expense
and Stock Loan Fee | | | Ratio of Total
Expenses to
Average Net
Assets, Including
Dividend Expense
and Stock Loan
Fee, Excluding
Advisor Waiver
Recapture | | | Ratio of Net
Investment Income
(Loss) to Average
Net Assets | | | Portfolio
Turnover Rate | |
| | | | | | | | | | | | | | | | | | | | | | | | | | | | |
| | | | | | | | | | | | | | | | | | | | | | | | | | | | |
| | $ | 21.27 | | | | (3.87 | )%** | | $ | 23,321 | | | | 0.97 | % | | | 0.97 | % | | | 0.13 | % | | | 43 | %** |
| | | 25.45 | | | | 22.68 | | | | 24,197 | | | | 0.95 | | | | 0.95 | | | | 0.16 | | | | 35 | |
| | | 22.61 | | | | 23.47 | | | | 18,451 | | | | 0.93 | | | | 0.93 | | | | 0.39 | | | | 13 | |
| | | 18.41 | | | | 10.58 | | | | 34,056 | | | | 0.98 | (3) | | | 0.90 | | | | 0.54 | | | | 33 | |
| | | 16.93 | | | | (5.03 | ) | | | 34,963 | | | | 1.00 | (3) | | | 0.95 | | | | 0.47 | | | | 30 | |
| | | 18.34 | | | | 13.75 | † | | | 13,954 | | | | 1.00 | (3) | | | 0.98 | | | | 0.13 | | | | 33 | |
| | | | | | | | | | | | | | | | | | | | | | | | | | | | |
| | $ | 20.89 | | | | (3.98 | )%** | | $ | 27,681 | | | | 1.24 | % | | | 1.24 | % | | | (0.14 | )% | | | 43 | %** |
| | | 25.08 | | | | 22.34 | | | | 31,457 | | | | 1.23 | | | | 1.23 | | | | (0.11 | ) | | | 35 | |
| | | 22.36 | | | | 23.15 | | | | 28,823 | | | | 1.22 | | | | 1.22 | | | | 0.08 | | | | 13 | |
| | | 18.20 | | | | 10.36 | | | | 30,793 | | | | 1.17 | (3) | | | 1.11 | | | | 0.37 | | | | 33 | |
| | | 16.77 | | | | (5.23 | ) | | | 44,634 | | | | 1.25 | (3) | | | 1.23 | | | | 0.29 | | | | 30 | |
| | | 18.21 | | | | 13.44 | † | | | 53,293 | | | | 1.25 | | | | 1.26 | | | | (0.14 | ) | | | 33 | |
| | | | | | | | | | | | | | | | | | | | | | | | | | | | |
| | | | | | | | | | | | | | | | | | | | | | | | | | | | |
| | $ | 8.68 | | | | (2.32 | )%** | | $ | 100,104 | | | | 0.88 | % | | | 0.88 | % | | | (0.05 | )% | | | 11 | %** |
| | | 19.91 | | | | 22.69 | | | | 232,068 | | | | 0.92 | | | | 0.92 | | | | (0.41 | ) | | | 21 | |
| | | 18.95 | | | | 12.85 | | | | 558,476 | | | | 0.85 | | | | 0.85 | | | | (0.03 | ) | | | 31 | |
| | | 16.82 | | | | 3.88 | | | | 1,489,036 | | | | 0.82 | | | | 0.82 | | | | 0.28 | | | | 24 | |
| | | 16.93 | | | | (3.52 | ) | | | 1,975,999 | | | | 0.85 | | | | 0.85 | | | | 0.34 | | | | 24 | |
| | | 18.37 | | | | 15.04 | | | | 1,700,475 | | | | 0.88 | | | | 0.88 | | | | 0.06 | | | | 24 | |
| | | | | | | | | | | | | | | | | | | | | | | | | | | | |
| | $ | 8.47 | | | | (2.50 | )%** | | $ | 14,453 | | | | 1.15 | % | | | 1.15 | % | | | (0.33 | )% | | | 11 | %** |
| | | 19.71 | | | | 22.37 | | | | 29,275 | | | | 1.15 | | | | 1.15 | | | | (0.65 | ) | | | 21 | |
| | | 18.83 | | | | 12.62 | | | | 42,956 | | | | 1.08 | | | | 1.08 | | | | (0.20 | ) | | | 31 | |
| | | 16.72 | | | | 4.13 | (5) | | | 53,763 | | | | 0.54 | (6) | | | 0.54 | (6) | | | 0.58 | (7) | | | 24 | |
| | | 16.73 | | | | (3.83 | ) | | | 111,872 | | | | 1.16 | | | | 1.16 | | | | (0.02 | ) | | | 24 | |
| | | 18.21 | | | | 14.91 | | | | 209,457 | | | | 1.05 | | | | 1.05 | | | | (0.17 | ) | | | 24 | |
* | Unless otherwise indicated, all ratios for the period have been annualized. |
† | Total return would have been lower had certain fees not been waived and/or expenses assumed by Adviser during the period. |
†† | Returns shown do not reflect the deduction of taxes that a shareholder would pay on Fund distributions or upon the redemption of Fund shares. |
(1) | Per share data was calculated using average shares for the period. |
(2) | Amount represents less than $0.01 per share. |
(3) | Ratio includes previously waived investment advisory fees recovered. |
(4) | The net investment income per share has been increased by a one-time adjustment as a result of a management change in estimate relating to shareholder servicing and administrative servicing fees. Had this change in estimate not occurred, the net investment income per share would have been $0.01 per share. |
(5) | Total return has been increased by a one-time adjustment as a result of a management change in estimate relating to shareholder servicing and administrative servicing fees. Had this change in estimate not occurred, total return would have been 3.63%. |
(6) | The ratio of net expenses to average net assets has been reduced by a one-time adjustment as a result of a management change in estimate relating to shareholder servicing and administrative servicing fees. Had this change in estimate not occurred, the annualized ratio of net expenses to average net assets would have been 1.08%. |
(7) | The ratio of net investment income to average net assets has been increased by a one-time adjustment as a result of a management change in estimate relating to shareholder servicing and administrative servicing fees. Had this change in estimate not occurred, the annualized ratio of net investment income to average net assets would have been 0.04%. |
The accompanying notes are an integral part of the financial statements.
25
Financial Highlights For a Share Outstanding Throughout Each Period
For the Six Month Period Ended March 31, 2019 (Unaudited)
For the Year or Period Ended September 30, | |
| | Net Asset
Value,
Beginning of
Period | | | Net
Investment
Income
(Loss) (1) | | | Realized and
Unrealized
Gains
(Losses) on
Investments | | | Total from
Investment
Operations | | | Distributions of
Dividends from Net
Investment Income | | | Distributions
from Net
Realized Gains | | | Total
Distributions | |
RiverPark Short Term High Yield Fund | | | | | | | | | | | | | | | | | | | | | | | | | |
Institutional Class Shares | | | | | | | | | | | | | | | | | | | | | | | | | |
2019* | | $ | 9.78 | | | $ | 0.15 | | | $ | — | | | $ | 0.15 | | | $ | (0.15 | ) | | $ | — | | | $ | (0.15 | ) |
2018 | | | 9.76 | | | | 0.25 | | | | 0.02 | | | | 0.27 | | | | (0.25 | ) | | | — | | | | (0.25 | ) |
2017 | | | 9.78 | | | | 0.28 | | | | (0.02 | ) | | | 0.26 | | | | (0.28 | ) | | | — | | | | (0.28 | ) |
2016 | | | 9.78 | | | | 0.29 | | | | — | (6) | | | 0.29 | | | | (0.29 | ) | | | — | | | | (0.29 | ) |
2015 | | | 9.94 | | | | 0.33 | | | | (0.16 | ) | | | 0.17 | | | | (0.33 | ) | | | — | | | | (0.33 | ) |
2014 | | | 9.98 | | | | 0.38 | | | | (0.04 | ) | | | 0.34 | | | | (0.38 | ) | | | — | | | | (0.38 | ) |
Retail Class Shares | | | | | | | | | | | | | | | | | | | | | | | | | |
2019* | | $ | 9.74 | | | $ | 0.13 | | | $ | 0.01 | (10) | | $ | 0.14 | | | $ | (0.14 | ) | | $ | — | | | $ | (0.14 | ) |
2018 | | | 9.73 | | | | 0.21 | | | | 0.02 | | | | 0.23 | | | | (0.22 | ) | | | — | | | | (0.22 | ) |
2017 | | | 9.75 | | | | 0.25 | | | | (0.02 | ) | | | 0.23 | | | | (0.25 | ) | | | — | | | | (0.25 | ) |
2016 | | | 9.75 | | | | 0.27 | | | | — | (6) | | | 0.27 | | | | (0.27 | ) | | | — | | | | (0.27 | ) |
2015 | | | 9.92 | | | | 0.30 | | | | (0.16 | ) | | | 0.14 | | | | (0.31 | ) | | | — | | | | (0.31 | ) |
2014 | | | 9.97 | | | | 0.36 | | | | (0.05 | ) | | | 0.31 | | | | (0.36 | ) | | | — | | | | (0.36 | ) |
RiverPark Long/Short Opportunity Fund | | | | | | | | | | | | | | | | | | | | | | |
Institutional Class Shares | | | | | | | | | | | | | | | | | | | | | | | | | |
2019* | | $ | 13.95 | | | $ | (0.05 | ) | | $ | (0.54 | ) | | $ | (0.59 | ) | | $ | (0.11 | ) | | $ | (1.17 | ) | | $ | (1.28 | ) |
2018 | | | 12.37 | | | | (0.22 | ) | | | 1.95 | | | | 1.73 | | | | (0.09 | ) | | | (0.06 | ) | | | (0.15 | ) |
2017 | | | 10.29 | | | | (0.20 | ) | | | 2.28 | | | | 2.08 | | | | — | | | | — | | | | — | |
2016 | | | 10.09 | | | | (0.18 | ) | | | 0.38 | | | | 0.20 | | | | — | | | | — | | | | — | |
2015 | | | 10.51 | | | | (0.15 | ) | | | (0.27 | ) | | | (0.42 | ) | | | — | | | | — | | | | — | |
2014 | | | 10.10 | | | | (0.21 | ) | | | 0.62 | | | | 0.41 | | | | — | | | | — | | | | — | |
Retail Class Shares | | | | | | | | | | | | | | | | | | | | | | | | | | | | |
2019* | | $ | 13.81 | | | $ | (0.06 | ) | | $ | (0.54 | ) | | $ | (0.60 | ) | | $ | (0.08 | ) | | $ | (1.17 | ) | | $ | (1.25 | ) |
2018 | | | 12.24 | | | | (0.24 | ) | | | 1.93 | | | | 1.69 | | | | (0.06 | ) | | | (0.06 | ) | | | (0.12 | ) |
2017 | | | 10.21 | | | | (0.22 | ) | | | 2.25 | | | | 2.03 | | | | — | | | | — | | | | — | |
2016 | | | 10.03 | | | | (0.17 | ) | | | 0.35 | | | | 0.18 | | | | — | | | | — | | | | — | |
2015 | | | 10.46 | | | | (0.16 | ) | | | (0.27 | ) | | | (0.43 | ) | | | — | | | | — | | | | — | |
2014 | | | 10.08 | | | | (0.22 | ) | | | 0.60 | | | | 0.38 | | | | — | | | | — | | | | — | |
The accompanying notes are an integral part of the financial statements.
26
|
|
| | Net Asset
Value, End of
Period | | | Total Return†† | | | Net Assets, End
of Period (000) | | | Ratio of Net
Expenses to
Average Net
Assets, Including
Dividend Expense
and Stock Loan Fee | | | Ratio of Total
Expenses to
Average Net
Assets, Including
Dividend Expense
and Stock Loan
Fee, Excluding
Advisor Waiver
Recapture | | | Ratio of Net
Investment Income
(Loss) to Average
Net Assets | | | Portfolio
Turnover Rate | |
| | | | | | | | | | | | | | | | | | | | | | | | | | | | |
| | | | | | | | | | | | | | | | | | | | | | | | | | | | |
| | $ | 9.78 | | | | 1.53 | %** | | $ | 821,984 | | | | 0.89 | % | | | 0.89 | % | | | 3.06 | % | | | 37 | %** |
| | | 9.78 | | | | 2.79 | | | | 863,978 | | | | 0.89 | | | | 0.89 | | | | 2.57 | | | | 193 | |
| | | 9.76 | | | | 2.67 | | | | 749,232 | | | | 0.87 | | | | 0.87 | | | | 2.89 | | | | 194 | |
| | | 9.78 | | | | 3.05 | | | | 606,510 | | | | 0.84 | | | | 0.84 | | | | 2.98 | | | | 114 | |
| | | 9.78 | | | | 1.72 | | | | 666,036 | | | | 0.87 | | | | 0.87 | | | | 3.31 | | | | 90 | |
| | | 9.94 | | | | 3.48 | | | | 680,443 | | | | 0.90 | | | | 0.90 | | | | 3.81 | | | | 195 | |
| | | | | | | | | | | | | | | | | | | | | | | | | | | | |
| | $ | 9.74 | | | | 1.30 | %** | | $ | 38,997 | | | | 1.18 | % | | | 1.18 | % | | | 2.76 | % | | | 37 | %** |
| | | 9.74 | | | | 2.53 | | | | 49,619 | | | | 1.18 | | | | 1.18 | | | | 2.16 | | | | 193 | |
| | | 9.73 | | | | 2.42 | | | | 115,916 | | | | 1.16 | | | | 1.16 | | | | 2.53 | | | | 194 | |
| | | 9.75 | | | | 2.81 | | | | 275,037 | | | | 1.08 | | | | 1.08 | | | | 2.74 | | | | 114 | |
| | | 9.75 | | | | 1.47 | | | | 204,234 | | | | 1.18 | | | | 1.18 | | | | 3.00 | | | | 90 | |
| | | 9.92 | | | | 3.02 | | | | 225,058 | | | | 1.18 | | | | 1.18 | | | | 3.62 | | | | 195 | |
| | | | | | | | | | | | | | | | | | | | | | | | | | | | |
| | | | | | | | | | | | | | | | | | | | | | | | | | | | |
| | $ | 12.08 | | | | (3.33 | )%** | | $ | 86,862 | | | | 2.57 | %(9) | | | 2.57 | % | | | (0.78 | )% | | | 42 | %** |
| | | 13.95 | | | | 14.19 | † | | | 102,042 | | | | 3.28 | (8) | | | 3.28 | | | | (1.67 | ) | | | 59 | |
| | | 12.37 | | | | 20.21 | | | | 85,001 | | | | 3.17 | (7) | | | 3.17 | | | | (1.81 | ) | | | 24 | |
| | | 10.29 | | | | 1.98 | | | | 104,030 | | | | 3.13 | (4)(5) | | | 3.12 | | | | (1.75 | ) | | | 40 | |
| | | 10.09 | | | | (4.00 | ) | | | 97,196 | | | | 3.01 | (3)(5) | | | 3.00 | | | | (1.41 | ) | | | 35 | |
| | | 10.51 | | | | 4.06 | | | | 107,276 | | | | 3.22 | (2)(5) | | | 3.16 | | | | (1.99 | ) | | | 59 | |
| | | | | | | | | | | | | | | | | | | | | | | | | | | | |
| | $ | 11.96 | | | | (3.45 | )%†** | | $ | 3,881 | | | | 2.77 | %(9) | | | 2.86 | % | | | (0.98 | )% | | | 42 | %** |
| | | 13.81 | | | | 14.06 | † | | | 4,309 | | | | 3.48 | (8) | | | 3.58 | | | | (1.86 | ) | | | 59 | |
| | | 12.24 | | | | 19.88 | | | | 3,492 | | | | 3.38 | (7) | | | 3.49 | | | | (2.03 | ) | | | 24 | |
| | | 10.21 | | | | 1.79 | | | | 3,824 | | | | 3.33 | (4)(5) | | | 3.31 | | | | (1.70 | ) | | | 40 | |
| | | 10.03 | | | | (4.11 | ) | | | 13,246 | | | | 3.16 | (3)(5) | | | 3.19 | | | | (1.55 | ) | | | 35 | |
| | | 10.46 | | | | 3.77 | | | | 16,194 | | | | 3.37 | (2)(5) | | | 3.29 | | | | (2.03 | ) | | | 59 | |
* | Unless otherwise indicated, all ratios for the period have been annualized. |
† | Total return would have been lower had certain fees not been waived and/or expenses assumed by Adviser during the period. |
†† | Returns shown do not reflect the deduction of taxes that a shareholder would pay on Fund distributions or upon the redemption of Fund shares. |
(1) | Per share data was calculated using average shares for the period. |
(2) | Dividend expense and stock loan fee totaled 1.37% of average net assets for the year ended September 30, 2014. Had these expenses not been included the ratios would have been 1.85% and 2.00%, respectively. |
(3) | Dividend expense and stock loan fee totaled 1.16% of average net assets for the year ended September 30, 2015. Had these expenses not been included the ratios would have been 1.85% and 2.00%, respectively. |
(4) | Dividend expense and stock loan fee totaled 1.35% of average net assets for the year ended September 30, 2016. Had these expenses not been included the ratios would have been 1.78% and 1.98%, respectively. |
(5) | Ratios include previously waived investment advisory fees recovered. |
(6) | Amount represents less than $0.01 per share. |
(7) | Dividend expense and stock loan fee totaled 1.38% of average net assets for the year ended September 30, 2017. Had these expenses not been included the ratios would have been 1.79% and 2.00%, respectively. |
(8) | Dividend expense and stock loan fee totaled 1.48% of average net assets for the year ended September 30, 2018. Had these expenses not been included the ratios would have been 1.80% and 2.00%, respectively. |
(9) | Dividend expense and stock loan fee totaled 0.77% of average net assets for the period ended March 31, 2019. Had these expenses not been included the ratios would have been 1.80% and 2.00%, respectively. |
(10) | Realized and unrealized gains and losses per share in this caption are balancing amounts necessary to reconcile the change in net asset value per share for the period and may not reconcile with the aggregate gains and losses in the Statements of Operations due to share transactions for the period. |
The accompanying notes are an integral part of the financial statements.
27
Financial Highlights For a Share Outstanding Throughout Each Period
For the Six Month Period Ended March 31, 2019 (Unaudited)
For the Year or Period Ended September 30, | |
| | Net Asset
Value,
Beginning of
Period | | | Net
Investment
Income
(Loss) (1) | | | Realized and
Unrealized
Gains
(Losses) on
Investments | | | Total from
Investment
Operations | | | Distributions of
Dividends from Net
Investment Income | | | Distributions
from Net
Realized Gains | | | Total
Distributions | |
RiverPark Strategic Income Fund | | | | | | | | | | | | | | | | | | | | | | | | | |
Institutional Class Shares | | | | | | | | | | | | | | | | | | | | | | | | | |
2019** | | $ | 9.42 | | | $ | 0.20 | | | $ | (0.17 | ) | | $ | 0.03 | | | $ | (0.22 | ) | | $ | — | | | $ | (0.22 | ) |
2018 | | | 9.52 | | | | 0.42 | | | | (0.10 | ) | | | 0.32 | | | | (0.42 | ) | | | — | | | | (0.42 | ) |
2017 | | | 9.43 | | | | 0.54 | | | | 0.05 | | | | 0.59 | | | | (0.50 | ) | | | — | | | | (0.50 | ) |
2016 | | | 9.49 | | | | 0.52 | | | | (0.04 | ) | | | 0.48 | | | | (0.54 | ) | | | — | | | | (0.54 | ) |
2015 | | | 10.26 | | | | 0.56 | | | | (0.72 | ) | | | (0.16 | ) | | | (0.60 | ) | | | (0.01 | ) | | | (0.61 | ) |
2014(2) | | | 10.00 | | | | 0.59 | | | | 0.12 | (6) | | | 0.71 | | | | (0.45 | ) | | | — | (5) | | | (0.45 | ) |
Retail Class Shares | | | | | | | | | | | | | | | | | | | | | | | | | | | | |
2019** | | $ | 9.40 | | | $ | 0.19 | | | $ | (0.16 | ) | | $ | 0.03 | | | $ | (0.21 | ) | | $ | — | | | $ | (0.21 | ) |
2018 | | | 9.50 | | | | 0.41 | | | | (0.11 | ) | | | 0.30 | | | | (0.40 | ) | | | — | | | | (0.40 | ) |
2017 | | | 9.42 | | | | 0.52 | | | | 0.04 | | | | 0.56 | | | | (0.48 | ) | | | — | | | | (0.48 | ) |
2016 | | | 9.48 | | | | 0.49 | | | | (0.04 | ) | | | 0.45 | | | | (0.51 | ) | | | — | | | | (0.51 | ) |
2015 | | | 10.26 | | | | 0.53 | | | | (0.72 | ) | | | (0.19 | ) | | | (0.58 | ) | | | (0.01 | ) | | | (0.59 | ) |
2014(2) | | | 10.00 | | | | 0.55 | | | | 0.14 | (6) | | | 0.69 | | | | (0.43 | ) | | | — | (5) | | | (0.43 | ) |
RiverPark Floating Rate CMBS Fund | | | | | | | | | | | | | | | | | | | | | | |
Institutional Class Shares | | | | | | | | | | | | | | | | | | | | | | | | | |
2019** | | $ | 10.14 | | | $ | 0.20 | | | $ | (0.10 | ) | | $ | 0.10 | | | $ | (0.17 | ) | | $ | (0.11 | ) | | $ | (0.28 | ) |
2018 | | | 10.16 | | | | 0.42 | | | | (0.03 | ) | | | 0.39 | | | | (0.34 | ) | | | (0.07 | ) | | | (0.41 | ) |
2017(3) | | | 10.00 | | | | 0.41 | | | | 0.09 | | | | 0.50 | | | | (0.34 | ) | | | — | | | | (0.34 | ) |
Retail Class Shares | | | | | | | | | | | | | | | | | | | | | | | | | | | | |
2019*(4) | | $ | 10.14 | | | $ | 0.15 | | | $ | (0.09 | ) | | $ | 0.06 | | | $ | (0.13 | ) | | $ | (0.11 | ) | | $ | (0.24 | ) |
The accompanying notes are an integral part of the financial statements.
28
|
|
| | Net Asset
Value, End of
Period | | | Total Return† | | | Net Assets, End
of Period (000) | | | Ratio of Net
Expenses to
Average Net
Assets, Including
Dividend Expense
and Stock Loan Fee | | | Ratio of Total
Expenses to
Average Net
Assets, Including
Dividend Expense
and Stock Loan
Fee, Excluding
Advisor Waiver
Recapture | | | Ratio of Net
Investment Income
(Loss) to Average
Net Assets | | | Portfolio
Turnover Rate | |
| | | | | | | | | | | | | | | | | | | | | | | | | | | | |
| | | | | | | | | | | | | | | | | | | | | | | | | | | | |
| | $ | 9.23 | | | | 0.33 | %†† | | $ | 316,232 | | | | 1.12 | %(10) | | | 1.12 | % | | | 4.42 | % | | | 42 | %†† |
| | | 9.42 | | | | 3.46 | | | | 348,726 | | | | 1.17 | (9) | | | 1.17 | | | | 4.44 | | | | 55 | |
| | | 9.52 | | | | 6.39 | | | | 311,573 | | | | 1.00 | (8) | | | 1.00 | | | | 5.58 | | | | 62 | |
| | | 9.43 | | | | 5.34 | | | | 246,474 | | | | 0.93 | (7) | | | 0.93 | | | | 5.64 | | | | 69 | |
| | | 9.49 | | | | (1.63 | ) | | | 247,726 | | | | 0.90 | | | | 0.90 | | | | 5.57 | | | | 54 | |
| | | 10.26 | | | | 7.16 | | | | 205,825 | | | | 0.91 | | | | 0.91 | | | | 5.67 | | | | 61 | |
| | | | | | | | | | | | | | | | | | | | | | | | | | | | |
| | $ | 9.22 | | | | 0.31 | %†† | | $ | 29,746 | | | | 1.32 | %(10) | | | 1.32 | % | | | 4.21 | % | | | 42 | %†† |
| | | 9.40 | | | | 3.19 | | | | 38,974 | | | | 1.43 | (9) | | | 1.43 | | | | 4.30 | | | | 55 | |
| | | 9.50 | | | | 6.01 | | | | 101,579 | | | | 1.29 | (8) | | | 1.29 | | | | 5.50 | | | | 62 | |
| | | 9.42 | | | | 5.08 | | | | 361,203 | | | | 1.24 | (7) | | | 1.24 | | | | 5.32 | | | | 69 | |
| | | 9.48 | | | | (1.98 | ) | | | 391,558 | | | | 1.19 | | | | 1.19 | | | | 5.29 | | | | 54 | |
| | | 10.26 | | | | 6.93 | | | | 306,131 | | | | 1.24 | | | | 1.24 | | | | 5.29 | | | | 61 | |
| | | | | | | | | | | | | | | | | | | | | | | | | | | | |
| | | | | | | | | | | | | | | | | | | | | | | | | | | | |
| | $ | 9.96 | | | | 1.15 | %†† | | $ | 124,480 | | | | 0.99 | %(11) | | | 1.02 | % | | | 3.92 | % | | | 27 | %†† |
| | | 10.14 | | | | 3.79 | | | | 48,130 | | | | 1.00 | | | | 1.00 | | | | 4.12 | | | | 84 | |
| | | 10.16 | | | | 5.07 | | | | 58,301 | | | | 1.00 | | | | 1.39 | | | | 4.07 | | | | 10 | * |
| | | | | | | | | | | | | | | | | | | | | | | | | | | | |
| | $ | 9.96 | | | | 0.52 | %†† | | $ | 93 | | | | 1.25 | % | | | 1.37 | % | | | 3.86 | % | | | 27 | %†† |
* | Excludes effect of in-kind transfers. |
** | Unless otherwise indicated, all ratios for the period have been annualized. |
† | Returns shown do not reflect the deduction of taxes that a shareholder would pay on Fund distributions or upon the redemption of Fund shares. |
(1) | Per share data was calculated using average shares for the period. |
(2) | Commenced operations on September 30, 2013. All ratios for the period have been annualized, except for the Total Return and Portfolio Turnover Rate. |
(3) | Commenced operations on October 3, 2016. All ratios for the period have been annualized, except for the Total Return and Portfolio Turnover Rate. |
(4) | Commenced operations on November 12, 2018. All ratios for the period have been annualized, except for the Total Return and Portfolio Turnover Rate. |
(5) | Amount represents less than $0.01 per share. |
(6) | Realized and unrealized gains and losses per share in this caption are balancing amounts necessary to reconcile the change in net asset value per share for the period, and may not reconcile with the aggregate gains and losses in the Statement of Operations due to share transactions for the period. |
(7) | Dividend expense and stock loan fee totaled 0.09% of average net assets for the year ended September 30, 2016. Had these expenses not been included the ratios would have been 0.84% and 1.15%, respectively. |
(8) | Dividend expense and stock loan fee totaled 0.13% of average net assets for the year ended September 30, 2017. Had these expenses not been included the ratios would have been 0.87% and 1.16%, respectively. |
(9) | Dividend expense and stock loan fee totaled 0.26% of average net assets for the year ended September 30, 2018. Had these expenses not been included the ratios would have been 0.91% and 1.17%, respectively. |
(10) | Dividend expense and stock loan fee totaled 0.20% of average net assets for the period ended March 31, 2019. Had these expenses not been included the ratios would have been 0.92% and 1.12%, respectively. |
(11) | Effective March 21, 2019, the Expense Limitation Agreement was amended such that the Total Annual Fund Operating Expenses After Fee Waiver and/or Expense Reimbursement would not exceed, on an annual basis, 0.90% for the Institutional Class Shares. |
Amounts designated as “—” are either not applicable, $0 or have been rounded to $0.
The accompanying notes are an integral part of the financial statements.
29
Notes to Financial Statements March 31, 2019 (Unaudited) |
|
1. Organization
RiverPark Funds Trust (the “Trust”), was formed on June 22, 2010 as an open-end registered management investment company under the Investment Act of 1940. As of March 31, 2019, the Trust was comprised of six funds: the RiverPark Large Growth Fund, RiverPark/Wedgewood Fund, RiverPark Short Term High Yield Fund, RiverPark Long/Short Opportunity Fund, the RiverPark Strategic Income Fund and RiverPark Floating Rate CMBS Fund (each a “Fund” and collectively the “Funds”). The investment objective of the RiverPark Large Growth Fund and RiverPark/Wedgewood Fund is to seek long term capital appreciation. The investment objective of the RiverPark Short Term High Yield Fund and RiverPark Strategic Income Fund is to seek high current income and capital appreciation consistent with the preservation of capital. The investment objective of the RiverPark Long/Short Opportunity Fund is to seek long-term capital appreciation while managing downside volatility. The investment objective of the RiverPark Floating Rate CMBS Fund is to generate current income and capital appreciation consistent with the preservation of capital. Each of the Funds is diversified with the exception of the RiverPark/Wedgewood Fund and RiverPark Floating Rate CMBS Fund which are non-diversified. Each Fund is registered to offer Institutional Class Shares and Retail Class Shares. Each of the Funds, except the RiverPark Short Term High Yield Fund, has registered Class C Shares but they are not intended to be offered at this time. Each class differs as to ongoing fees.
On November 9, 2018, a majority of the shareholders of the RiverPark Floating Rate CMBS Fund (the “Interval Fund”) approved the conversion of the Interval Fund into the New Fund. On November 12, 2018, the conversion of the Interval Fund was completed, and the New Fund commenced operations, assuming all liabilities of the Interval Fund. The net assets and shares on the date of acquisition were $48,994,268 and 4,835,718, respectively. All existing shareholders of the Fund were issued an identical number of in-kind shares, on a one-for-one basis, in a tax-free exchange of the New Fund. The New Fund retained the name of the RiverPark Floating Rate CMBS Fund and there were no changes to its investment objective. The RiverPark Floating Rate CMBS Fund’s Retail Class Shares commenced operations on November 12, 2018.
The RiverPark Short Term High Yield Fund was closed to new investors on June 21, 2013. Effective as of the close of business on April 5, 2017 (the “Re-Opening Date”), the RiverPark Short Term High Yield Fund was made publicly available for sale on a limited basis as set forth below.
The following groups will be permitted to purchase Fund shares after the Re-Opening Date:
| | 1. | Shareholders of record of the Fund as of the Re-Opening Date (although if a shareholder closes all accounts in the Fund, additional investment in the Fund from that shareholder may not be accepted) may continue to purchase additional shares in their existing Fund accounts either directly from the Fund or through a financial intermediary and may continue to reinvest dividends or capital gains distributions from shares owned in the Fund, |
| | 2. | New shareholders may open Fund accounts and purchase directly from the Fund (i.e. not through a financial intermediary), and |
| | 3. | Members of the Fund’s Board of Trustees, persons affiliated with RiverPark Advisors, LLC or Cohanzick Management, LLC and their immediate families will be able to purchase shares of the Fund and establish new accounts. |
The Fund may from time to time, in its sole discretion, limit the types of investors permitted to open new accounts, limit new purchases or otherwise modify the above policy at any time on a case-by-case basis.
2. Summary of Significant Accounting Policies
The following is a summary of significant accounting policies followed by the Trust in preparation of its financial statements. These policies are in conformity with accounting principles generally accepted in the United States of America (“GAAP”). The preparation of the financial statements in conformity with GAAP requires management to make estimates and assumptions that affect the reported amounts of assets and liabilities and disclosure of contingent assets and liabilities at the date of the financial statements and the reported amounts of increases and decreases in net assets from operations during the reporting period. Actual results could differ from those estimates. The Funds are investment companies and accordingly follow investment company accounting and reporting guidance of the Financial Accounting Standards Board (FASB) Accounting Standards Codification Topic 946 Financial Services – Investment Companies.
30
Notes to Financial Statements March 31, 2019 (Unaudited) |
|
2. Summary of Significant Accounting Policies (continued)
Valuation of Investments — Securities listed on a national securities exchange or traded on the NASDAQ system are valued on their last sale price. Portfolio securities traded on NASDAQ will be valued at the NASDAQ Official Closing Price on each business day for the New York Stock Exchange (“NYSE”). If there is no such reported sale on an exchange or NASDAQ, the portfolio security will be valued at the mean between the most recent quoted bid and asked price. Price information on listed securities is taken from the exchange where the security is primarily traded. Other equity securities and debt securities for which market quotations are readily available are valued at the mean between their bid and asked price, except that debt securities maturing within 60 days are valued on an amortized cost basis. Debt securities are valued according to the broadest and most representative market, which will ordinarily be over-the-counter. Debt securities may be valued based on prices provided by a pricing service when such prices are believed to reflect the fair value of such securities. Securities for which market quotations are not readily available are valued at fair value as determined in good faith through consideration of other factors in accordance with procedures adopted by, and under the general supervision of, the Board of Trustees (“the Board”).
To the extent that a Fund invests in non-U.S. dollar denominated securities, the value of all assets and liabilities not denominated in United States dollars will be translated into United States dollars on the valuation date. Trading in securities on European and Far Eastern securities exchanges and over-the-counter markets is normally completed well before the close of business on each day the NYSE is open for business (a “business day”). In addition, European or Far Eastern securities trading generally or in a particular country or countries may not take place on all business days in New York. Furthermore, trading takes place in various foreign markets on days which are not business days in New York and on which net asset value is not calculated. Such calculation does not take place contemporaneously with the determination of the prices of the majority of the portfolio securities used in such calculation. Events affecting the values of portfolio securities that occur between the time their prices are determined and the close of the NYSE will not be reflected in a Fund’s calculation of net assets unless the Trustees deem that the particular event would materially affect net asset value, in which case an adjustment will be made.
In accordance with the authoritative guidance on fair value measurement and disclosure under GAAP, the Funds disclose the fair value of their investments in a hierarchy that prioritizes the inputs to valuation techniques used to measure the fair value. The objective of a fair value measurement is to determine the price that would be received to sell an asset or paid to transfer a liability in an orderly transaction between market participants at the measurement date (an exit price). Accordingly, the fair value hierarchy gives the highest priority to quoted prices (unadjusted) in active markets for identical assets or liabilities (Level 1) and the lowest priority to unobservable inputs (Level 3).
The three levels of the fair value hierarchy are described below:
● | Level 1 — Unadjusted quoted prices in active markets for identical, unrestricted assets or liabilities that the Funds have the ability to access at the measurement date; |
● | Level 2 — Other significant observable inputs (includes quoted prices for similar securities, interest rates, prepayment speeds, credit risk, referenced indices, quoted prices in inactive markets, adjusted quoted prices in active markets, etc.); and |
● | Level 3 — Prices, inputs or exotic modeling techniques which are both significant to the fair value measurement and unobservable (supported by little or no market activity). |
Investments are classified within the level of the lowest significant input considered in determining fair value. Investments classified within Level 3 whose fair value measurement considers several inputs may include Level 1 or Level 2 inputs as components of the overall fair value measurement.
For details of the investment classification, refer to the Schedules of Investments, Schedules of Securities Sold Short, Not Yet Purchased, open forward currency contracts and list of open swap contracts.
31
Notes to Financial Statements March 31, 2019 (Unaudited) |
|
2. Summary of Significant Accounting Policies (continued)
It is the Funds’ policy to recognize transfers into and out of Levels at the end of the reporting period. For the six-month period ended March 31, 2019, there were no significant changes to the Funds’ fair value methodologies.
Securities Sold Short, Not Yet Purchased — As consistent with the RiverPark Long/Short Opportunity Fund’s investment objectives, the Fund intends to sell securities short so long as, as a result of that sale, the current value of securities sold short, not yet purchased by the Fund would not exceed 50% of the value of its gross assets (including the amounts borrowed) and 100% of the value of its net assets. As consistent with the RiverPark Strategic Income Fund’s investment objectives, the Fund intends to sell securities short so long as, as a result of that sale, the current value of securities sold short, not yet purchased by the Fund would not exceed 15% of the value of its net assets. A short sale is the sale by a fund of a security which it does not own in anticipation of purchasing the same security in the future. To complete such a transaction, the Funds must borrow the security to make delivery to the buyer. The Funds are then obligated to replace the security borrowed by purchasing the security at the market price at the time of the replacement. The price at such time may be more or less than the price at which the security was sold by the Funds. Until the security is replaced, the Funds are required to pay the lender amounts equal to any dividends that accrue during the period of the loan. Dividends and interest are shown as an expense for financial reporting purposes. To borrow the security, the Funds also may be required to pay a fee, which is shown as an expense for financial reporting purposes. The proceeds of the short sale are retained by the broker, to the extent necessary to meet margin requirements, until the short position is closed out. A realized gain, limited to the price at which the Funds sold the security short, or a realized loss, unlimited in size on a standalone basis, will be recognized upon the close of a short sale.
Until the Funds close their short position or replace the borrowed security, the Funds will maintain a segregated account with its custodian containing marginable securities. The Funds may be required to add to the segregated account as the market price of a shorted security increases. As a result of maintaining and adding to its segregated account, the Funds may maintain higher levels of marginable assets (for example, long equity positions) for collateral needs thus reducing their overall managed assets available for trading purposes.
Written/Purchased Options — Each of the Funds may purchase call and put options on securities to seek capital growth or for hedging purposes. Each Fund may also write and sell covered call and put options as well as purchase and write options on stock indices (such as the S&P 500 Index) listed on domestic or foreign securities exchanges or traded in the over-the-counter market for hedging purposes. Additionally, the RiverPark Long/Short Opportunity Fund and RiverPark Strategic Income Fund may sell uncovered call and put options on securities and stock indices.
The RiverPark Long/Short Opportunity Fund and RiverPark Strategic Income Fund may invest up to 50% of the value of their assets, represented by premiums paid, to purchase call and put options on securities and securities indices. The Funds may write covered call and put options on securities and securities indices, so long as the aggregate nominal value does not exceed 200% of the value of its assets.
An option on a security provides the purchaser, or “holder,” with the right, but not the obligation, to purchase, in the case of a “call” option, or sell, in the case of a “put” option, the security or securities underlying the option, for a fixed exercise price up to a stated expiration date. The holder pays a nonrefundable purchase price for the option, known as the “premium.” The maximum amount of risk the purchaser of the option assumes is equal to the premium plus related transaction costs, although the entire amount may be lost. The risk of the seller, or “writer,” however, is potentially unlimited, unless the option is “covered,” which is generally accomplished through the writer’s ownership of the underlying security, in the case of a call option, or the writer’s segregation of an amount of cash or securities equal to the exercise price, in the case of a put option. If the writer’s obligation is not covered, it is subject to the risk of the full change in value of the underlying security from the time the option is written until exercise.
The realized and unrealized gain (loss) from purchased and written options, if any, are disclosed separately on the Statements of Operations.
32
Notes to Financial Statements March 31, 2019 (Unaudited) |
|
2. Summary of Significant Accounting Policies (continued)
For the period ended March 31, 2019, the average Delta-Adjusted monthly market value of equity options was as follows:
RiverPark Long/Short Opportunity Fund
Average Market Value for Purchased Options | | $ | 97,474 | |
Swap Agreements — The Funds may invest in equity-linked securities, including, but not limited to, participation notes, certificates, and equity swaps. Equity-linked securities are privately issued securities whose investment results are designed to correspond generally to the performance of a specified stock index or “basket” of stocks, or a single stock. To the extent that the Funds invest in equity-linked securities whose return corresponds to the performance of a foreign security index or one or more foreign stocks, investing in equity-linked securities will involve risks similar to the risks of investing in foreign securities and subject to each Fund’s restrictions on investments in foreign securities.
Equity swaps allow the parties to a swap agreement to exchange the dividend income or other components of return on an equity investment (for example, a group of equity securities or an index) for a component of return on another non-equity or equity investment. An equity swap may be used by a Fund to invest in a market without owning or taking physical custody of securities in circumstances in which direct investment may be restricted for legal reasons or is otherwise deemed impractical or disadvantageous. Equity swaps may also be used for hedging purposes or to seek to increase exposure and total return. A Fund’s ability to enter into certain swap transactions may be limited by tax considerations. The counterparty to an equity swap contract will typically be a bank, investment banking firm or broker/dealer.
Equity swap contracts may be structured in different ways. For example, a counterparty may agree to pay the Fund the amount, if any, by which the notional amount of the equity swap contract would have increased in value had it been invested in particular stocks (or an index of stocks), plus the dividends that would have been received on those stocks. In these cases, the Fund may agree to pay to the counterparty a floating rate of interest on the notional amount of the equity swap contract plus the amount, if any, by which that notional amount would have decreased in value had it been invested in such stocks. Therefore, the return to the Fund on the equity swap contract should be the gain or loss on the notional amount plus dividends on the stocks less the interest paid by the Fund on the notional amount. In other cases, the counterparty and the Fund may each agree to pay the other the difference between the relative investment performances that would have been achieved if the notional amount of the equity swap contract had been invested in different stocks (or indices of stocks). A Fund will generally enter into equity swaps on a net basis, which means that the two payment streams are netted out, with the Fund receiving or paying, as the case may be, only the net amount of the two payments. Payments may be made at the conclusion of an equity swap contract or monthly during its term.
Equity swaps are derivatives and their value can be very volatile. Equity swaps normally do not involve the delivery of securities or other underlying assets. Accordingly, the risk of loss with respect to equity swaps is normally limited to the net amount of payments that a Fund is contractually obligated to make. If the counterparty to an equity swap defaults, a Fund’s risk of loss consists of the net amount of payments that such Fund is contractually entitled to receive. Because some swap agreements have a leverage component, adverse changes in the value or level of the underlying asset, reference rate, or index can result in a loss substantially greater than the cost of the underlying asset without the use of leverage. In addition, the value of some components of an equity swap (such as the dividends on a common stock) may also be sensitive to changes in interest rates. To the extent that the Adviser does not accurately analyze and predict the potential relative fluctuation of the components swapped with another party, a Fund may suffer a loss. Because equity swaps are normally illiquid, a Fund may be unable to terminate its obligations when desired. When entering into swap contracts, a Fund must “set aside” liquid assets, or engage in other appropriate measures to “cover” its obligation under the swap contract. Swaps are marked-to-market daily and are valued at the unrealized appreciation or depreciation on the instrument based upon quotations from market makers and the resulting changes in market values, if any, are recorded as an unrealized gain or loss in the Statements of Operations. Monthly reset payments on the total return swap are inclusive of interest, commissions and dividends which are recorded as part of the net realized gains and losses in the Statement of Operations. Net realized loss on swap contracts was $625,605 for the six month period ended March 31, 2019. The total return swaps reset monthly, as such there was $0 unrealized appreciation (depreciation) as of March 31, 2019. The final monthly reset was on March 31, 2019. The subsequent resets are on a 13 month basis. For the six month period ended March 31, 2019, the average notional value of equity swaps was as follows:
33
Notes to Financial Statements March 31, 2019 (Unaudited) |
|
2. Summary of Significant Accounting Policies (continued)
RiverPark Long/Short Opportunity Fund
Average Monthly Notional Value Long | | $ | 425.204 | |
Average Monthly Notional Value Short | | | (4,320,608 | ) |
There is the risk that the counterparty refuses to continue to enter into swap agreements with the Funds in the future, or requires increased fees, which could impair the Funds’ ability to achieve their investment objective. A counterparty may also increase its collateral requirements, which may limit the Funds’ ability to use leverage and reduce investment returns. In addition, if the Funds cannot locate a counterparty willing to enter into transactions with the Funds, they will not be able to implement their investment strategy. As of March 31, 2019, the RiverPark Long/Short Opportunity Fund entered into swap agreements with one counterparty, Goldman Sachs.
To reduce counterparty risk with respect to Over-the-Counter (“OTC”) transactions, the Funds have entered into master netting arrangements, established within the Funds’ International Swap and Derivatives Association, Inc. (“ISDA”) master agreements, which allow the Funds to make (or to have an entitlement to receive) a single net payment in the event of default (close-out netting) for outstanding payables and receivables with respect to certain OTC positions in purchased equity options and swaps for each individual counterparty. In addition, the Funds may require that certain counterparties post cash and/or securities in collateral accounts to cover their net payment obligations for those derivative contracts subject to ISDA master agreements. If the counterparty fails to perform under these contracts and agreements, the cash and/or securities will be made available to the Funds.
For financial reporting purposes, the Funds do not offset derivative assets and derivative liabilities that are subject to netting arrangements in the Statement of Assets and Liabilities. Bankruptcy or insolvency laws of a particular jurisdiction may impose restrictions on or prohibitions against the right of offset in bankruptcy, insolvency or other events.
Collateral terms are contract specific for OTC derivatives. For derivatives traded under an ISDA master agreement, the collateral requirements are typically calculated by netting the mark to market amount of each transaction under such agreement and comparing that amount to the value of any collateral currently pledged by the Funds or the counterparty.
For financial reporting purposes, cash collateral that has been pledged to cover obligations of the Funds, if any, is reported separately on the Statement of Assets and Liabilities as cash pledged as collateral. Non-cash collateral pledged by the Funds, if any, is noted in the Schedules of Investments. Generally, the amount of collateral due from or to a party must exceed a minimum transfer amount threshold before a transfer has to be made. To the extent amounts due to the Funds from its counterparties are not fully collateralized, contractually or otherwise, the Funds bear the risk of loss from counterparty nonperformance.
As of March 31, 2019, there are no derivative assets (unrealized appreciation) or derivative liabilities (unrealized depreciation) to present within the netting arrangement. For presentation purposes, the Master Netting tables have been omitted.
34
Notes to Financial Statements March 31, 2019 (Unaudited) |
|
2. Summary of Significant Accounting Policies (continued)
Master Limited Partnerships — The Funds may invest in master limited partnerships (“MLPs”). MLPs are limited partnerships or limited liability companies, whose partnership units or limited liability interests are listed and traded on a U.S. securities exchange, and are treated as publicly traded partnerships for federal income tax purposes. To qualify to be treated as a partnership for tax purposes, an MLP must receive at least 90% of its income from qualifying sources as set forth in Section 7704(d) of the Internal Revenue Code of 1986, as amended (the “Code”). These qualifying sources include interest, dividend, real property rent, gain from sale or other disposition of real property and income from activities such as the exploration, development, mining, production, processing, refining, transportation, storage and marketing of mineral or natural resources. MLPs generally have two classes of owners, the general partner and limited partners. MLPs that are formed as limited liability companies generally have two analogous classes of owners, the managing member and the members. For purposes of this section, references to general partners also apply to managing members and references to limited partners also apply to members. The general partner is typically owned by a major energy company, an investment fund, the direct management of the MLP or is an entity owned by one or more of such parties. The general partner may be structured as a private or publicly traded corporation or other entity. The general partner typically controls the operations and management of the MLP through an equity interest of as much as 2% in the MLP plus, in many cases, ownership of common units and subordinated units. Limited partners own the remainder of the MLP through ownership of common units and have a limited role in the MLP’s operations and management.
An investment in MLP units involves certain risks which differ from an investment in the securities of a corporation. Holders of MLP units have limited control and voting rights on matters affecting the partnership. In addition, there are certain tax risks associated with an investment in MLP units and conflicts of interest exist between common unit holders and the general partner, including those arising from incentive distribution payments. As a partnership, an MLP has no tax liability at the entity level. If, as a result of a change in current law or a change in an MLP’s business, an MLP were treated as a corporation for federal income tax purposes, such MLP would be obligated to pay federal income tax on its income at the corporate tax rate. If an MLP were classified as a corporation for federal income tax purposes, the amount of cash available for distribution by the MLP would be reduced and distributions received by investors would be taxed under federal income tax laws applicable to corporate dividends (as dividend income, return of capital, or capital gain). Therefore, treatment of an MLP as a corporation for federal income tax purposes would result in a reduction in the after-tax return to investors, likely causing a reduction in the value of the Funds’ shares. Dividends from MLPs are recorded on the ex-dividend date.
Investment Transactions — Security transactions are accounted for on the trade date, the date the order to buy or sell is executed. Costs used in determining realized gains and losses on the sales of investment securities are those of the specific securities sold. Discounts or premiums are accreted or amortized to interest income using the effective interest method. Interest income is recognized on the accrual basis from settlement date. Dividend income and expenses and other distributions are recorded on the ex-dividend date, except certain dividends and distributions from foreign securities which are recorded as soon as a Fund is informed after the ex-dividend date. Withholding taxes on foreign dividends have been provided for in accordance with the Funds’ understanding of the applicable country’s tax rules and rates. The ability of issuers of debt securities held by the Funds to meet their obligations may be affected by economic and political developments in a specific country or region.
Defaulted Investments — Debt obligations may be placed on non-accrual status and related interest income may be reduced by ceasing current accruals and writing off interest receivable when the collection of all or a portion of interest has become doubtful based on consistently applied procedures. A debt obligation is removed from non-accrual status when the issuer resumes interest payments or when collectability of interest is reasonably assured.
Expenses — Expenses of the Trust that can be directly attributed to a particular Fund are borne by that Fund. Expenses which cannot be directly attributed to a Fund are apportioned among the Funds of the Trust based on the number of Funds and/or relative net assets.
Classes — Class specific expenses are borne by that class of shares. Income, realized and unrealized gains and losses and non-class specific expenses are allocated to the respective class on the basis of relative daily net assets.
35
Notes to Financial Statements March 31, 2019 (Unaudited) |
|
2. Summary of Significant Accounting Policies (continued)
Foreign Currency Translation — The books and records of the Funds are maintained in U.S. dollars. Investment securities and other assets and liabilities denominated in a foreign currency are translated into U.S. dollars on the date of valuation. The Fund’s do not isolate that portion of realized or unrealized gains and losses resulting from changes in the foreign exchange rate from fluctuations arising from changes in the market prices of the securities. These gains and losses are included in net realized and unrealized gains and losses on investments on the Statements of Operations. Net realized and unrealized gains and losses on foreign currency transactions represent net foreign exchange gains or losses from foreign currency exchange contracts, disposition of foreign currencies, currency gains or losses realized between trade and settlement dates on securities transactions and the difference between the amount of the investment income and foreign withholding taxes recorded on the Fund’s books and the U.S. dollar equivalent amounts actually received or paid.
Forward Foreign Currency Exchange Contracts — Each Fund may, but is not obligated to, enter into forward foreign currency exchange contracts (“forward contracts”) in order to protect against uncertainty in the level of future foreign exchange rates in the purchases and sale of securities. A forward contract generally has no deposit requirement, and no commissions are charged at any stage for trades. Although foreign exchange dealers do not charge a fee for commissions, they do realize a profit based on the difference between the price at which they are buying and selling various currencies. Although forward contracts are intended to minimize currency risk — the risk of loss due to a decline in the value of the hedged currencies — at the same time, they tend to limit any potential gain which might result should the value of such currencies increase. As of March 31, 2019, the RiverPark Strategic Income Fund held forward contracts as currency hedges against foreign bonds. It is the Funds’ policy to present the gross unrealized appreciation and gross unrealized depreciation of the forward contracts separately on the Statements of Assets and Liabilities as the Funds do not have a master netting agreement with the counterparty to the forward contracts.
In accordance with this policy, the unrealized appreciation and depreciation as of March 31, 2019 is presented as unrealized appreciation or depreciation on forward foreign currency contracts on the Statements of Assets and Liabilities. Realized and unrealized gains (losses) on forward contracts are disclosed separately on the Statements of Operations. For the six month period ended March 31, 2019, the average balances of forward foreign currency exchange contracts were as follows:
Average Monthly Notional Contracts | | $ | 5,019,434 | |
Dividends and Distributions to Shareholders — Dividends from net investment income are declared and paid to shareholders annually for the RiverPark Large Growth Fund, RiverPark/Wedgewood Fund and RiverPark Long/Short Opportunity Fund, and declared and paid monthly for the RiverPark Short Term High Yield Fund, RiverPark Strategic Income Fund and RiverPark Floating Rate CMBS Fund. Dividends and distributions are recorded on the ex-dividend date. Any net realized capital gains will be distributed at least annually by the Funds.
Income Taxes — Each Fund intends to qualify or continue to qualify as a “regulated investment company” under Sub-chapter M of the Internal Revenue Code of 1986, as amended. If so qualified, each Fund will not be subject to federal income tax to the extent it distributes substantially all of its net investment income and net capital gains to its shareholders.
The Funds evaluate tax positions taken or expected to be taken in the course of preparing the Funds’ tax returns to determine whether it is “more-likely-than not” (i.e., greater than 50-percent) that each tax position will be sustained upon examination by a taxing authority based on the technical merits of the position. Tax positions not deemed to meet the more-likely-than-not threshold are recorded as a tax benefit or expense in the current period. The Funds did not record any tax provision in the current year. However, management’s conclusions regarding tax positions taken may be subject to review and adjustment at a later date based on factors including, but not limited to, examination by tax authorities (i.e., the last 3 tax year ends, as applicable), on-going analysis of, and changes to, tax laws, regulations and interpretations thereof.
As of and during the six month period ended March 31, 2019, the Funds did not have a tax liability for any unrecognized tax benefits. The Funds recognize interest and penalties, if any, related to unrecognized tax benefits as income tax expense in the Statements of Operations. During the period, the Funds did not incur any significant interest or penalties.
36
Notes to Financial Statements March 31, 2019 (Unaudited) |
|
2. Summary of Significant Accounting Policies (continued)
Cash and Cash Equivalents — Cash equivalents include short-term, highly liquid investments with a maturity date at time of purchase of three months or less. The Company maintains cash and cash equivalent balances which, at times during the period, exceeded the $250,000 amount insured by the Federal Deposit Insurance Corporation. The Manager manages the risk of loss by banking with major institutions.
Offering Costs — Offering costs, including costs of printing initial prospectus, legal and registration fees, are amortized over a twelve-month period. As of March 31, 2019, the remaining amount still to be amortized for the RiverPark Floating Rate CMBS Fund was $30,201.
3. Agreements
Investment Advisory Agreement — RiverPark Advisors, LLC (“RiverPark”) serves as the Funds’ investment adviser (the “Adviser”). The Adviser has contractually agreed to waive its fees and to absorb expenses of each Fund through January 31, 2020 to the extent necessary to ensure that ordinary operating expenses of each class (excluding interest, brokerage commissions, dividends on short sales and interest expense on securities sold short, not yet purchased, acquired fund fees and expenses and extraordinary expenses) do not exceed, on an annual basis, certain levels as set forth below.
The table below shows the rate of each Fund’s investment advisory fee and the Adviser’s contractual expense limitation for each Fund:
Fund | Advisory
Fee Before
Contractual
Fee Reduction | Expense
Limitation
(Institutional
Class) | Expense
Limitation
(Retail Class) | Expense
Limitation
(Class C)* |
RiverPark Large Growth Fund | 0.65% | 1.00% | 1.25% | 2.00% |
RiverPark/Wedgewood Fund | 0.65% | 1.00% | 1.25% | 2.00% |
RiverPark Short Term High Yield Fund | 0.65% | 1.00% | 1.25% | N/A |
RiverPark Long/Short Opportunity Fund | 1.50% | 1.85% | 2.00% | 2.85% |
RiverPark Strategic Income Fund | 0.65% | 1.00% | 1.25% | 2.00% |
RiverPark Floating Rate CMBS Fund | 0.65% | 0.90%** | 1.25% | N/A |
* | Class C Shares are not currently being offered for sale to investors. |
** | Prior to March 21, 2019, Expense Limitation Agreement for the Institutional Share Class was 1.00%. After March 21, 2019 the Expense Limitation Agreement for the Institutional Share Class was reduced to 0.90%. |
The Funds have each agreed to repay the Adviser in the amount of any fees waived and Fund expenses absorbed, subject to the limitations that: (1) the reimbursement is made only for fees and expenses incurred not more than three years prior to the date of reimbursement; and (2) the reimbursement may not be made if it would cause the expense limitation in effect at the time the fees were waived or Fund expenses were absorbed, to be exceeded. This arrangement will remain in effect unless and until the Board approves its modification or termination. The Adviser can recapture any fees it has waived within a three-year period subject to the applicable annual rates in the above table.
As of March 31, 2019, the Adviser fee waiver analysis is as follows:
Fund | | Unexpired
Fee Waivers at
September 30,
2018 | | | Fees Waived
for the
Period Ended
March 31,
2019 | | | Fees
Recaptured
for the
Period Ended
March 31,
2019 | | | Fee Waivers
Expired
for the
Period Ended
March 31,
2019 | | | Unexpired
Fee Waivers at
March 31,
2019 | |
RiverPark Long/Short Opportunity Fund | | $ | 6,909 | | | $ | 1,745 | | | $ | — | | | $ | — | | | $ | 8,654 | |
RiverPark Floating Rate CMBS Fund | | | 227,747 | | | | 9,089 | | | | (645 | ) | | | — | | | | 236,191 | |
37
Notes to Financial Statements March 31, 2019 (Unaudited) |
|
3. Agreements (continued)
As of March 31, 2019, the Adviser may in the future seek reimbursement of previously waived fees for the Funds as follows:
| | Expiring
2020 | | | Expiring
2021 | | | Expiring
2022 | | | Total | |
RiverPark Long/Short Opportunity Fund | | $ | 3,714 | | | $ | 3,195 | | | $ | 1,745 | | | $ | 8,654 | |
RiverPark Floating Rate CMBS Fund | | | 219,758 | | | | 7,344 | | | | 9,089 | | | | 236,191 | |
RiverPark provides day-to-day portfolio management services to the RiverPark Large Growth Fund, RiverPark Long/Short Opportunity Fund and RiverPark Floating Rate CMBS Fund. The Adviser has discretion to purchase and sell securities in accordance with these Funds’ objectives, policies, and restrictions.
RiverPark oversees the day-to-day portfolio management services provided by the following sub-advisers:
Fund | Investment Sub-Adviser |
RiverPark/Wedgewood Fund | Wedgewood Partners, Inc. |
RiverPark Short Term High Yield Fund | Cohanzick Management, LLC |
RiverPark Strategic Income Fund | Cohanzick Management, LLC |
The discretion to purchase and sell securities in accordance with these Funds’ objectives, policies, and restrictions has been delegated by the Adviser to Wedgewood Partners, Inc. (“Wedgewood”) and Cohanzick Management, LLC with regard to each respective Fund to which such parties serve as sub-adviser. The
Adviser pays the sub-advisers a monthly fee based upon the net assets managed by such sub-adviser from the management fee paid to the Adviser pursuant to the Investment Advisory Agreement. The Funds are not responsible for the payment of the sub-advisory fees.
RiverPark (and its affiliated advisers) and Wedgewood may be considered to be affiliates as RiverPark shareholders own approximately 6% of Wedgewood Partners, and the owners of Wedgewood own 2.5% of RiverPark’s holding company. For its services as sub-adviser to the RiverPark/Wedgewood Fund, Wedgewood is entitled to a fee to be paid from RiverPark’s adviser fee, and such fee is calculated daily and paid monthly at an annual rate of 0.325% of RiverPark/Wedgewood Fund’s average net assets in excess of $50,000,000.
Administrator, Custodian and Transfer Agent — SEI Investments Global Funds Services (the “Administrator”) serves as the Funds’ administrator pursuant to an Administration Agreement under which the Administrator provides administrative and accounting services. For these services, the Administrator is paid an asset-based fee, which will vary depending on the number of share classes and average daily net assets of the Fund. For the six month period ended March 31, 2019, the Funds were charged $477,771 for these services.
Brown Brothers Harriman & Co. (the “Custodian”) serves as the Funds’ custodian pursuant to a Custodian Agreement.
DST Systems, Inc. (the Transfer Agent”) serves as the Funds’ transfer agent pursuant to an Agency Agreement.
Distribution Agreement — SEI Investments Distribution Co., a wholly-owned subsidiary of SEI Investments Company and an affiliate of the Administrator (the “Distributor”) serves as the Funds’ distributor pursuant to a Distribution Agreement.
The Trust has adopted a shareholder services plan under which a shareholder servicing fee may be paid at an annual rate of up to 0.25% of average daily net assets attributable to Retail Class Shares and Institutional Class Shares of the Funds to banks and their affiliates and other institutions, including broker-dealers, as compensation for providing non-distribution related shareholder services. Aggregate compensation for the Institutional Class Shares will not exceed on an annual basis 0.15% of the average daily net assets of such class. As of March 31, 2019, there were no shareholder servicing fees charged to Institutional Class Shares.
38
Notes to Financial Statements March 31, 2019 (Unaudited) |
|
3. Agreements (continued)
The Trust has adopted an administrative services plan under which each Fund may pay a non-distribution related administrative services fee at an annual rate of up to 0.20% and 0.15% of the average daily net assets of the Retail Class Shares and Institutional Class Shares, respectively, to financial institutions, retirement plans, broker-dealers, depository institutions, institutional shareholders of record, registered investment advisers and other financial intermediaries and various brokerage firms or other industry recognized service providers of fund supermarkets or similar programs who provide administrative, recordkeeping and support servicing to their customers.
Other — Certain officers and Trustees of the Trust are also officers of the Adviser and the Administrator. Such officers are paid no fees by the Trust for serving as officers of the Trust.
The services provided by the Chief Compliance Officer (“CCO”) and any staff are paid for by the Funds as incurred. The services include regulatory oversight of the Trust’s Adviser, sub-advisers and service providers as required by SEC regulations.
4. Investment Transactions
The cost of security purchases and proceeds from security sales and maturities, other than short-term investments, short sales, purchases to cover, written and purchased options, and short-term securities for the six month period ended March 31, 2019, were as follows:
Fund | | Purchases
(000) | | | Proceeds from
Sales and
Maturities
(000) | |
RiverPark Large Growth Fund | | $ | 20,859 | | | $ | 23,261 | |
RiverPark/Wedgewood Fund | | | 18,925 | | | | 147,673 | |
RiverPark Short Term High Yield Fund | | | 587,231 | | | | 136,351 | |
RiverPark Long/Short Opportunity Fund | | | 35,957 | | | | 43,982 | |
RiverPark Strategic Income Fund | | | 66,275 | | | | 62,558 | |
RiverPark Floating Rate CMBS Fund | | | 53,943 | | | | 14,615 | |
There were no purchases or sales of long-term U.S. Government securities for the six month period ended March 31, 2019.
5. Federal Tax Information
The amount and character of income and capital gain distributions to be paid, if any, are determined in accordance with Federal income tax regulations, which may differ from GAAP. As a result, net investment income (loss) and net realized gain (loss) on investment transactions for a reporting period may differ significantly from distributions during the year. The book/tax differences may be temporary or permanent. To the extent these differences are permanent in nature, they are charged or credited to undistributed net investment income (loss), accumulated net realized gain (loss) or paid-in capital as appropriate, in the period that the difference arises.
Accordingly the following permanent differences are primarily attributable to distribution reclassification, equalization, losses on paydowns, investments in swaps, currency transactions, partnership adjustment, short security dividend expense adjustment, net operating loss offset to short term gain and REIT adjustments which have been classified to/from the following components of net assets (000):
Fund | | Distributable
(Earnings/Loss) | | | Paid-in Capital | |
RiverPark/Wedgewood Fund | | $ | (65,436 | ) | | $ | 65,436 | |
39
Notes to Financial Statements March 31, 2019 (Unaudited) |
|
5. Federal Tax Information (continued)
These reclassifications have no impact on net assets or net asset value per share.
The tax character of dividends and distributions declared during the last two years ended September 30, 2018 and 2017 was as follows (000):
Fund | | Ordinary Income | | | Long-Term
Capital Gain | | | Total | |
RiverPark Large Growth Fund | | | | | | | | | | | | |
2018 | | $ | 7 | | | $ | 4,118 | | | $ | 4,125 | |
2017 | | | 206 | | | | 30 | | | | 236 | |
RiverPark/Wedgewood Fund | | | | | | | | | | | | |
2018 | | | — | | | | 79,266 | | | | 79,266 | |
2017 | | | 2,353 | | | | — | | | | 2,353 | |
RiverPark Short Term High Yield Fund | | | | | | | | | | | | |
2018 | | | 22,993 | | | | — | | | | 22,993 | |
2017 | | | 24,418 | | | | — | | | | 24,418 | |
RiverPark Long/Short Opportunity Fund | | | | | | | | | | | | |
2018 | | | — | | | | 1,077 | | | | 1,077 | |
2017 | | | — | | | | — | | | | — | |
RiverPark Strategic Income Fund | | | | | | | | | | | | |
2018 | | | 18,338 | | | | — | | | | 18,338 | |
2017 | | | 27,046 | | | | — | | | | 27,046 | |
RiverPark Floating Rate CMBS Fund | | | | | | | | | | | | |
2018 | | | 2,316 | | | | — | | | | 2,316 | |
2017 | | | 1,841 | | | | — | | | | 1,841 | |
As of September 30, 2018, the components of distributable earnings/(accumulated losses) on a tax basis were as follows (000):
Fund | | Undistributed
Ordinary Income | | | Undistributed
Long-Term
Capital Gain | | | Capital Loss
Carryforward | | | Post-October
Losses | | | Unrealized
Appreciation
(Depreciation) | | | Other
Temporary
Differences | | | Current Year
Loss Deferral | | | Total
Distributable
Earnings
(Accumulated
Losses) | |
RiverPark Large Growth Fund | | $ | — | | | $ | 3,600 | | | $ | — | | | $ | — | | | $ | 23,314 | | | $ | — | | | $ | (97 | ) | | $ | 26,817 | |
RiverPark/Wedgewood Fund | | | — | | | | 96,210 | | | | — | | | | — | | | | 100,744 | | | | — | | | | (486 | ) | | | 196,468 | |
RiverPark Short Term High Yield Fund | | | 278 | | | | — | | | | (18,832 | ) | | | — | | | | (978 | ) | | | (1 | ) | | | — | | | | (19,533 | ) |
RiverPark Long/Short Opportunity Fund | | | — | | | | 3,399 | | | | — | | | | — | | | | 35,888 | | | | (978 | ) | | | (275 | ) | | | 38,034 | |
RiverPark Strategic Income Fund | | | — | | | | — | | | | (49,670 | ) | | | — | | | | (4,849 | ) | | | — | | | | (40 | ) | | | (54,559 | ) |
RiverPark Floating Rate CMBS Fund | | | 21 | | | | 530 | | | | — | | | | — | | | | 164 | | | | — | | | | — | | | | 715 | |
40
Notes to Financial Statements March 31, 2019 (Unaudited) |
|
5. Federal Tax Information (continued)
Deferred late-year losses represent ordinary losses realized on investment transactions from January 1, 2018 through September 30, 2018 and specified losses realized on investment transactions from November 1, 2017 through September 30, 2018. The RiverPark Large Growth Fund, RiverPark/Wedgewood Fund and RiverPark Long/Short Opportunity Fund elect to defer the late-year loss of $96,994, $485,533 and $274,629, respectively, and to treat it as having arisen in the following fiscal year. The RiverPark Strategic Income Fund elects to defer the specified late-year loss of $39,453 and to treat it as having arisen in the following fiscal year.
Funds are permitted to carry forward capital losses indefinitely and such losses will retain their character as either short-term or long-term. As of September 30, 2018, the Funds had capital loss carryforwards as follows (000):
Fund | | Short Term Loss | | | Long Term Loss | | | Total | |
RiverPark Short Term High Yield Fund | | $ | 13,515 | | | $ | 5,317 | | | $ | 18,832 | |
RiverPark Strategic Income Fund | | | 6,192 | | | | 43,478 | | | | 49,670 | |
During the year ended September 30, 2018, the following funds utilized capital loss carryforwards to offset capital gains as follows (000):
Fund | | Short Term Loss | | | Long Term Loss | | | Total | |
RiverPark Short Term High Yield Fund | | $ | 479 | | | $ | — | | | $ | 479 | |
For federal income tax purposes, the cost of investments owned at March 31, 2019 and the net realized gains or losses on securities sold for the period could be different from amounts reported for financial reporting purposes, due to partnership basis adjustments and book versus tax adjustment such as wash sales which cannot be used for federal income tax purposes in the current period and have been deferred for use in future years. The federal tax cost and aggregate gross unrealized appreciation and depreciation on investments held by the Funds were as follows (000):
Fund | | Federal
Tax Cost | | | Aggregate
Gross
Unrealized
Appreciation | | | Aggregate
Gross
Unrealized
Depreciation | | | Net
Unrealized
Appreciation
(Depreciation) | |
RiverPark Large Growth Fund | | $ | 34,856 | | | $ | 15,592 | | | $ | | (628) | | $ | 14,964 | |
RiverPark/Wedgewood Fund | | | 68,930 | | | | 42,191 | | | | (538 | ) | | | 41,653 | |
RiverPark Short Term High Yield Fund | | | 824,350 | | | | 1,998 | | | | (3,159 | ) | | | (1,161 | ) |
RiverPark Long/Short Opportunity Fund | | | 65,453 | | | | 18,215 | | | | (681 | ) | | | 17,534 | |
RiverPark Strategic Income Fund | | | 343,730 | | | | 1,569 | | | | (11,238 | ) | | | (9,669 | ) |
RiverPark Floating Rate CMBS Fund | | | 123,530 | | | | 78 | | | | (400 | ) | | | (322 | ) |
6. Risks
The RiverPark Short Term High Yield Fund and RiverPark Strategic Income Fund invest in fixed-income instruments that are or are rated below investment grade by Moody’s Investors Service, Inc. and Standard & Poor’s Corporation and accordingly involve greater risk. Such securities are regarded as predominantly speculative with respect to the issuer’s capacity to pay interest and repay principal in accordance with the terms of the obligations and involve major risk to adverse conditions. These securities offer higher returns than bonds with higher ratings as compensation for holding an obligation of an issuer perceived to be less creditworthy. Changes in economic conditions or developments regarding issuers of non-investment grade debt securities are more likely to cause price volatility and weaken the capacity of such issuers to make principal and interest payments than is the case for higher grade debt securities. In addition, the market for lower grade debt securities may be thinner and less active than for higher grade debt securities.
41
Notes to Financial Statements March 31, 2019 (Unaudited) |
|
6. Risks (continued)
High-yield securities are generally not exchange-traded and, as a result, these instruments trade in a smaller secondary market than exchange-traded bonds. In addition, the Funds invest in bonds of issuers that do not have publicly traded equity securities, making it more difficult to hedge the risks associated with such investments.
The RiverPark Short Term High Yield Fund and RiverPark Strategic Income Fund may invest in securities of companies that are experiencing significant financial or business difficulties, including companies involved in bankruptcy or other reorganization and liquidation proceedings. Although such investments may result in significant returns to the Funds, they involve a substantial degree of risk.
The RiverPark Long/Short Opportunity Fund and RiverPark Strategic Income Fund are exposed to the risks of using leverage and short sales. The RiverPark Long/Short Opportunity Fund and RiverPark Strategic Income Fund may use leverage. Leverage is the practice of borrowing money to purchase securities. These investment practices involve special risks. Leverage can increase the investment returns of the RiverPark Long/Short Opportunity Fund and RiverPark Strategic Income Fund if the securities purchased increase in value in an amount exceeding the cost of the borrowing. However, if the securities decrease in value, the RiverPark Long/Short Opportunity Fund and RiverPark Strategic Income Fund will suffer a greater loss than would have resulted without the use of leverage. A short sale is the sale by the RiverPark Long/Short Opportunity Fund and RiverPark Strategic Income Fund of a security which it does not own in anticipation of purchasing the same security in the future at a lower price to close the short position. A short sale will be successful if the price of the shorted security decreases. However, if the underlying security goes up in price during the period in which the short position is outstanding, the RiverPark Long/Short Opportunity Fund and RiverPark Strategic Income Fund will recognize a loss. The risk on a standalone or unhedged short sale is unlimited because the RiverPark Long/Short Opportunity Fund and RiverPark Strategic Income Fund must buy the shorted security at the higher price to complete the transaction. Therefore, short sales may be subject to greater risks than investments in long positions. With a long position, the maximum sustainable loss is limited to the amount paid for the security plus the transaction costs, whereas there is no maximum attainable price of the shorted security.
The RiverPark Long/Short Opportunity Fund and RiverPark Strategic Income Fund are able to invest in options which expose investors to the risks inherent in trading options. These risks include, but are not limited to, volatile movements in the price of the underlying instrument and misjudgments as to the future prices of the options and/or the underlying instrument. Increased option volatility can increase both the profit potential and the risk associated with a fund’s trading. While volatility can be monitored and reacted to, there is no cost-effective means of hedging against market volatility.
Selling options creates additional risks. The seller of a “naked” call option (or the seller of a put option who has a short position in the underlying instrument) is subject to the risk of a rise in the price in the underlying instrument above the strike price, which risk is reduced only by the premium received for selling the option. In exchange for the proceeds received from selling the call option (in lieu of an outright short position), the option seller gives up (or will not participate in) all of the potential gain resulting from a decrease in the price of the underlying instrument below the strike price prior to expiration of the option.
The seller of a “naked” put option (or the seller of a call option who has a long position in the underlying instrument) is subject to the risk of a decline in price of the underlying instrument below the strike price, which risk is reduced only by the proceeds received from selling the option. In exchange for the premium received for selling the put option (in lieu of an outright long position), the option seller gives up (or will not participate in) all of the potential gain resulting from an increase in the price of the underlying instrument above the strike price prior to the expiration of the option. Due to the inherent leveraged nature of options, a relatively small adverse move in the price of the underlying instrument may result in immediate and substantial losses to a Fund.
42
Notes to Financial Statements March 31, 2019 (Unaudited) |
|
6. Risks (continued)
The RiverPark Long/Short Opportunity Fund invests in swaps. The use of swaps is a highly specialized activity that involves investment techniques, risk analyses and tax planning different from those associated with ordinary portfolio securities transactions. These transactions can result in sizeable realized and unrealized capital gains and losses relative to the gains and losses from the Fund’s direct investments in the reference assets and short sales. Transactions in swaps can involve greater risks than if the RiverPark Long/Short Opportunity Fund had invested directly in the reference asset because, in addition to general market risks, swaps are also subject to illiquidity risk, counterparty risk, credit risk and valuation risk. Because they are two-party contracts and because they may have terms of greater than seven days, swap transactions may be considered to be illiquid. Moreover, the Fund bears the risk of loss of the amount expected to be received under a swap in the event of the default or bankruptcy of the swap counterparty. Swaps may also be subject to pricing or “basis” risk, which exists when a particular swap becomes extraordinarily expensive relative to historical prices or the price of corresponding cash market instruments. Under certain market conditions it may not be economically feasible to initiate a transaction or liquidate a position in time to avoid a loss or take advantage of an opportunity. As a registered investment company, the Fund must “set aside” liquid assets (often referred to as “asset segregation”), or engage in other approved measures to “cover” open positions with respect to certain kinds of derivatives instruments. The Fund reserves the right to modify its asset segregation policies in the future to comply with any changes in the SEC’s positions regarding asset segregation.
The RiverPark Long/Short Opportunity Fund is exposed to counterparty credit risk through its investment in swap contracts. The RiverPark Long/Short Opportunity Fund bears the risk of loss of the amount expected to be received under a swap agreement in the event of default or bankruptcy of the counterparty, or if the counterparty fails to honor its obligations. The RiverPark Long/Short Opportunity Fund has entered into swap agreements with a single counterparty (Goldman Sachs International), focusing its exposure to the counterparty credit risk of that single counterparty. Furthermore, the swap counterparty’s obligation to the RiverPark Long/Short Opportunity Fund likely will not be collateralized. Through March 31, 2019, the RiverPark Long/Short Opportunity Fund settled its swap agreements at least monthly.
The RiverPark Short Term High Yield Fund and RiverPark Strategic Income Fund may invest in bank loan obligations. The secondary market for loans is a private, unregulated inter-dealer or inter-bank resale market. Purchases and sales of loans are generally subject to contractual restrictions that must be satisfied before a loan can be bought or sold. These restrictions may impede the Fund’s ability to buy or sell loans and may negatively impact the transaction price. It may take longer than seven days for transactions in loans to settle.
The Fund may hold cash, sell investments or temporarily borrow from banks or other lenders to meet short-term liquidity needs due to the extended loan settlement process, such as to satisfy redemption requests from Fund shareholders.
The RiverPark/Wedgewood Fund and RiverPark Floating Rate CMBS Fund are non-diversified, which means that they may hold larger positions in a smaller number of individual securities than if they were diversified. This means that increases or decreases in the value of any of the individual securities owned by the Funds may have a greater impact on the Fund’s net asset value and total return than would be the case in a diversified fund which would likely hold more securities. Therefore, the Fund’s value may fluctuate more, and it could incur greater losses as a result of decreases in the value of any one of its holdings, than if it had invested in a larger number of stocks.
The RiverPark Floating Rate CMBS Fund will invest in commercial real estate debt securities (“CRE Debt”). CRE Debt securities are not backed by the full faith and credit of the U.S. government and are subject to risk of default on the underlying mortgages. CRE Debt may react differently to changes in interest rates than other bonds and the prices of CRE Debt may reflect adverse economic and market conditions. Small movements in interest rates may significantly reduce the value of CRE Debt.
43
Notes to Financial Statements March 31, 2019 (Unaudited) |
|
6. Risks (continued)
The CRE Debt securities in which the Fund is expected to invest are subject to the risks of the underlying mortgage loans. Commercial mortgage loans are secured by commercial property and are subject to risks of delinquency and foreclosure, and risks of loss. The ability of a borrower to repay a loan secured by an income-producing property typically is dependent primarily upon the successful operation of such property rather than upon the existence of independent income or assets of the borrower. If the net operating income of the property is reduced, the borrower’s ability to repay the loan may be impaired. Net operating income of an income-producing property can be affected by, among other things, tenant mix, success of tenant businesses, property management decisions, property location and condition, competition from comparable types of properties, changes in laws that increase operating expense or limit rents that may be charged, any need to address environmental contamination at the property, the occurrence of any uninsured casualty at the property, changes in national, regional or local economic conditions and/or specific industry segments, declines in regional or local real estate values, declines in regional or local rental or occupancy rates, increases in interest rates, real estate tax rates and other operating expenses, changes in governmental rules, regulations and fiscal policies, including environmental legislation, acts of God, terrorism, social unrest and civil disturbances.
Difficult conditions in the markets for CRE Debt securities and mortgage-related assets as well as the broader financial markets have in the past resulted in a temporary but significant contraction in liquidity for CRE Debt securities. Liquidity relates to the ability of the Fund to sell its investments in a timely manner at a price approximately equal to its value on the Fund’s books. To the extent that the market for CRE Debt securities suffers such a contraction, securities that were considered liquid at the time of investment could become temporarily illiquid, and the Sub-Adviser may experience delays or difficulty in selling assets at the prices at which the Fund carries such assets, which may result in a loss to the Fund. There is no way to predict reliably when such market conditions could re-occur or how long such conditions could persist.
CMBS may involve the risks of delinquent payments of interest and principal, early prepayments and potentially unrecoverable principal loss from the sale of foreclosed property. Subordinated classes of CMBS are generally entitled to receive repayment of principal only after all required principal payments have been made to more senior classes and also have subordinated rights as to receipt of interest distributions. Such subordinated classes are subject to a greater risk of non-payment than are senior classes.
CLOs (collateralized loan obligations) and other similarly structured securities are types of asset-backed securities. The cash flows from the CLO trust are split into two or more portions, called tranches, varying in risk and yield. The riskiest portion is the “equity” tranche which bears the bulk of defaults from the loans in the trust and serves to protect the other, more senior tranches from default. Since it is partially protected from defaults, a senior tranche from CLO trust typically has higher ratings and lower yields than the underlying securities, and can be rated investment grade. Despite the protection from the equity tranche, CLO tranches can experience substantial losses due to actual defaults, increased sensitivity to defaults due to collateral default and disappearance of protecting tranches, market anticipation of defaults and aversion to CLO securities as a class. The risks of an investment in a CLO depend largely on the collateral and the class of the CLO in which the Fund invests. Normally, CLOs and other similarly structured securities are privately offered and sold, and thus are not registered under the securities laws.
A more complete description of risks is included in each Fund’s prospectus and SAI.
44
Notes to Financial Statements March 31, 2019 (Unaudited) |
|
7. Other
As of March 31, 2019, the Funds had the following concentrations of shareholders holding 10% or more of the outstanding shares of the Funds. These represent omnibus shareholder accounts comprised of one or many individual shareholders.
Fund | |
RiverPark Large Growth Fund | |
Institutional Class Shares | 77% |
Retail Class Shares | 91% |
RiverPark/Wedgewood Fund | |
Institutional Class Shares | 64% |
Retail Class Shares | 56% |
RiverPark Short Term High Yield Fund | |
Institutional Class Shares | 77% |
Retail Class Shares | 80% |
RiverPark Long/Short Opportunity Fund | |
Institutional Class Shares | 87% |
Retail Class Shares | 87% |
RiverPark Strategic Income Fund | |
Institutional Class Shares | 73% |
Retail Class Shares | 85% |
RiverPark Floating Rate CMBS Fund | |
Institutional Class Shares | 68% |
Retail Class Shares | 99% |
In the normal course of business, the Trust enters into contracts that contain a variety of representations which provide general indemnifications. The Trust’s maximum exposure under these arrangements cannot be known; however, the Trust expects any risk of loss to be remote.
45
Notes to Financial Statements March 31, 2019 (Unaudited) |
|
8. Regulatory Matters
On August 17, 2018, the SEC adopted amendments to Regulation S-X. These changes are effective for periods after November 5, 2018. The updates to Registered Investment Companies were mainly focused on simplifying the presentation of distributable earnings by eliminating the need to present the components of distributable earnings on a book basis in the Statements of Assets and Liabilities. The update also impacted the presentation of undistributed net investment income and distribution to shareholders on the Statements of Changes in Net Assets. The amounts presented in the current Statements of Changes in Net Assets represent the aggregated total distributions of net investment income and realized capital gains, except for distributions classified as return of capital which are still presented separately. The disaggregated amounts from the prior fiscal year are broken out below if there were both distributions from net investment income and realized capital gains. Otherwise, the amount on the current Statements of Changes in Net Assets for the prior fiscal year end represents distributions of net investment income (000):
Fund | | Net Investments
Income | | | Net Realized
Gains | | | Total | |
RiverPark Large Growth Fund | | | | | | | | | | | | |
Institutional Class Shares | | $ | (7 | ) | | $ | (1,592 | ) | | $ | (1,599 | ) |
Retail Class Shares | | | — | | | | (2,526 | ) | | | (2,526 | ) |
RiverPark/Wedgewood Fund | | | | | | | | | | | | |
Institutional Class Shares | | | — | | | | (74,061 | ) | | | (74,061 | ) |
Retail Class Shares | | | — | | | | (5,205 | ) | | | (5,205 | ) |
RiverPark Short Term High Yield Fund | | | | | | | | | | | | |
Institutional Class Shares | | | (21,102 | ) | | | — | | | | (21,102 | ) |
Retail Class Shares | | | (1,891 | ) | | | — | | | | (1,891 | ) |
RiverPark Long/Short Opportunity Fund | | | | | | | | | | | | |
Institutional Class Shares | | | (619 | ) | | | (424 | ) | | | (1,043 | ) |
Retail Class Shares | | | (17 | ) | | | (17 | ) | | | (34 | ) |
RiverPark Strategic Income Fund | | | | | | | | | | | | |
Institutional Class Shares | | | (14,428 | ) | | | — | | | | (14,428 | ) |
Retail Class Shares | | | (3,910 | ) | | | — | | | | (3,910 | ) |
RiverPark Floating Rate CMBS Fund | | | | | | | | | | | | |
Institutional Class Shares | | | (1,934 | ) | | | (382 | ) | | | (2,316 | ) |
Retail Class Shares | | | — | | | | — | | | | — | |
Amounts designated as “—” are either not applicable, $0 or have been rounded to $0.
9. New Accounting Pronouncements
In August 2018, the FASB issued Accounting Standards Update 2018-13, Fair Value Measurement (Topic 820). The new guidance includes additions and modifications to disclosures requirements for fair value measurements. For public entities, the amendments are effective for financial statements issued for fiscal years beginning after December 15, 2019, and interim periods within those fiscal years. At this time, management is currently evaluating the impact of this new guidance on the financial statements and disclosures.
10. Subsequent Events
The Funds have evaluated the need for additional disclosures and/or adjustments resulting from subsequent events through the date the financial statements were issued. Based on this evaluation, no adjustments were required to the financial statements.
46
Disclosure of Fund Expenses (Unaudited) |
|
All mutual funds have operating expenses. As a shareholder of a mutual fund, your investment is affected by these ongoing costs, which include (among others) costs for portfolio management, administrative services, and shareholder reports like this one. It is important for you to understand the impact of these costs on your investment returns.
Operating expenses such as these are deducted from a mutual fund’s gross income and directly reduce its final investment return. These expenses are expressed as a percentage of a mutual fund’s average net assets; this percentage is known as a mutual fund’s expense ratio.
The following examples use the expense ratio and are intended to help you understand the ongoing costs (in dollars) of investing in your Fund and to compare these costs with those of other mutual funds. The examples are based on an investment of $1,000 made at the beginning of the period shown and held for the entire period.
The table on the following page illustrates your Fund’s costs in two ways.
●Actual Fund Return. This section helps you to estimate the actual expenses after fee waivers that your Fund incurred over the period. The “Expenses Paid During Period” column shows the actual dollar expense incurred by a $1,000 investment in the Fund, and the “Ending Account Value” number is derived from deducting that expense from the Fund’s gross investment return.
You can use this information, together with the actual amount you invested in the Fund, to estimate the expenses you paid over that period. Simply divide your actual account value by $1,000 to arrive at a ratio (for example, an $8,600 account value divided by $1,000 = 8.6), then multiply that ratio by the number shown for your Fund under “Expenses Paid During Period.”
● Hypothetical 5% Return. This section helps you compare your Fund’s costs with those of other mutual funds. It assumes that the Fund had an annual 5% return before expenses during the period, but that the expense ratio (Column 3) for the period is unchanged. This example is useful in making comparisons because the Securities and Exchange Commission requires all mutual funds to make this 5% calculation. You can assess your Fund’s comparative cost by comparing the hypothetical result for your Fund in the “Expenses Paid During Period” column with those that appear in the same charts in the shareholder reports for other mutual funds.
Note: Because the return is set at 5% for comparison purposes — NOT your Fund’s actual return—the account values shown may not apply to your specific investment.
| | Beginning
Account
Value
10/1/18 | | | Ending
Account
Value
3/31/19 | | | Net
Annualized
Expense
Ratios | | | Expenses
Paid
During
Period* | |
RiverPark Large Growth Fund — Institutional Class Shares | | | | | | | | | | | | | |
Actual Fund Return | | $ | 1,000.00 | | | $ | 961.30 | | | | 0.97 | % | | $ | 4.74 | |
Hypothetical 5% Return | | | 1,000.00 | | | | 1,020.09 | | | | 0.97 | | | | 4.89 | |
|
RiverPark Large Growth Fund — Retail Class Shares | | | | | | | | | | | | | |
Actual Fund Return | | | 1,000.00 | | | | 960.20 | | | | 1.24 | | | | 6.06 | |
Hypothetical 5% Return | | | 1,000.00 | | | | 1,018.75 | | | | 1.24 | | | | 6.24 | |
|
RiverPark/Wedgewood Fund — Institutional Class Shares | | | | | | | | | | | | | |
Actual Fund Return | | | 1,000.00 | | | | 976.80 | | | | 0.88 | | | | 4.34 | |
Hypothetical 5% Return | | | 1,000.00 | | | | 1,020.54 | | | | 0.88 | | | | 4.43 | |
|
RiverPark/Wedgewood Fund — Retail Class Shares | | | | | | | | | | | | | |
Actual Fund Return | | | 1,000.00 | | | | 975.00 | | | | 1.15 | | | | 5.66 | |
Hypothetical 5% Return | | | 1,000.00 | | | | 1,019.20 | | | | 1.15 | | | | 5.79 | |
47
Disclosure of Fund Expenses (Unaudited) (Concluded) |
|
| | Beginning
Account
Value
10/1/18 | | | Ending
Account
Value
3/31/19 | | | Net
Annualized
Expense
Ratios | | | Expenses
Paid
During
Period* | |
RiverPark Short Term High Yield Fund — Institutional Class Shares | | | | | | | | | | | | | |
Actual Fund Return | | $ | 1,000.00 | | | $ | 1,015.30 | | | | 0.89 | % | | $ | 4.47 | |
Hypothetical 5% Return | | | 1,000.00 | | | | 1,020.49 | | | | 0.89 | | | | 4.48 | |
| | | | | | | | | | | | | | | | | |
RiverPark Short Term High Yield Fund — Retail Class Shares | | | | | | | | | | | | | |
Actual Fund Return | | | 1,000.00 | | | | 1,013.00 | | | | 1.18 | | | | 5.92 | |
Hypothetical 5% Return | | | 1,000.00 | | | | 1,019.05 | | | | 1.18 | | | | 5.94 | |
|
RiverPark Long/Short Opportunity Fund — Institutional Class Shares | | | | | | | | | | | | | |
Actual Fund Return | | | 1,000.00 | | | | 966.70 | | | | 2.57 | † | | | 12.60 | |
Hypothetical 5% Return | | | 1,000.00 | | | | 1,012.12 | | | | 2.57 | | | | 12.89 | |
|
RiverPark Long/Short Opportunity Fund — Retail Class Shares | | | | | | | | | | | | | |
Actual Fund Return | | | 1,000.00 | | | | 965.50 | | | | 2.77 | † | | | 13.57 | |
Hypothetical 5% Return | | | 1,000.00 | | | | 1,011.12 | | | | 2.77 | | | | 13.89 | |
|
RiverPark Strategic Income Fund — Institutional Class Shares | | | | | | | | | | | | | |
Actual Fund Return | | | 1,000.00 | | | | 1,003.30 | | | | 1.12 | †† | | | 5.59 | |
Hypothetical 5% Return | | | 1,000.00 | | | | 1,019.35 | | | | 1.12 | | | | 5.64 | |
|
RiverPark Strategic Income Fund — Retail Class Shares | | | | | | | | | | | | | |
Actual Fund Return | | | 1,000.00 | | | | 1,003.10 | | | | 1.32 | †† | | | 6.59 | |
Hypothetical 5% Return | | | 1,000.00 | | | | 1,018.35 | | | | 1.32 | | | | 6.64 | |
|
RiverPark Floating Rate CMBS Fund — Institutional Class Shares | | | | | | | | | | | | | |
Actual Fund Return | | | 1,000.00 | | | | 1,011.50 | | | | 0.99 | ††† | | | 4.96 | |
Hypothetical 5% Return | | | 1,000.00 | | | | 1,020.00 | | | | 0.99 | | | | 4.99 | |
| |
RiverPark Floating Rate CMBS Fund — Retail Class Shares^ | | | | | | | | | | | | | |
Actual Fund Return | | | 1,000.00 | | | | 1,005.20 | | | | 1.25 | ††† | | | 4.77 | ** |
Hypothetical 5% Return | | | 1,000.00 | | | | 1,018.70 | | | | 1.25 | | | | 6.29 | |
^ | Commenced operations on November 12, 2018. |
* | Expenses are equal to the Fund’s annualized expense ratio multiplied by the average account value over the period, multiplied by 182/365 (to reflect the one-half year period). |
** | Expenses are equal to the Fund’s annualized expense ratio multiplied by the average account value over the period, multiplied by 139/365 (to reflect the period since inception). |
† | The annualized expense ratios include dividend expense and stock loan fees incurred during the six month period. Annualized dividend expense and stock loan fees of average net assets totaled 0.77%. Had these expenses not been included the ratios would have been 1.80% and 2.00%, respectively. |
†† | The annualized expense ratios include dividend expense and stock loan fees incurred during the six month period. Annualized dividend expense and stock loan fees of average net assets totaled 0.20%. Had these expenses not been included the ratios would have been 0.92% and 1.12%, respectively. |
††† | Effective March 21, 2019, the Expense Limitation Agreement was amended such that the Total Annual Fund Operating Expenses After Fee Waiver and/or Expense Reimbursement would not exceed, on an annual basis, 0.90% for the Institutional Class Shares. |
48
(This page intentionally left blank)
INVESTMENT ADVISER
RiverPark Advisors, LLC
156 West 56th Street, 17th Floor
New York, New York 10019
CUSTODIAN
Brown Brothers Harriman & Co.
40 Water Street
Boston, Massachusetts 02109
PRIME BROKER:
Goldman Sachs & Co.
200 West Street, 3rd Floor
New York, NY 10282
TRANSFER AGENT
DST Systems, Inc.
333 West 11th Street, 5th Floor
Kansas City, Missouri 64105
ADMINISTRATOR
SEI Investments Global Funds Services
One Freedom Valley Drive
Oaks, Pennsylvania 19456
INDEPENDENT REGISTERED PUBLIC ACCOUNTING FIRM
Cohen & Company, Ltd.
1350 Euclid Ave., Suite 800
Cleveland, Ohio 44115
DISTRIBUTOR
SEI Investments Distribution Co.
One Freedom Valley Drive
Oaks, Pennsylvania 19456
FUND COUNSEL
Blank Rome LLP
405 Lexington Avenue
New York, New York 10174-0208
This information must be preceded or accompanied by a
current prospectus for the Trust.
RPF-SA-001-0900
Not applicable for semi-annual report.
| Item 3. | Audit Committee Financial Expert. |
Not applicable for semi-annual report.
| Item 4. | Principal Accountant Fees and Services. |
Not applicable for semi-annual report.
| Item 5. | Audit Committee of Listed Registrants. |
Not applicable to open-end management investment companies.
| Item 6. | Schedule of Investments. |
Schedule of Investments is included as part of the Report to Shareholders filed under Item 1 of this form.
| Item 7. | Disclosure of Proxy Voting Policies and Procedures for Closed-End Management Investment Companies. |
Not applicable to open-end management investment companies.
| Item 8. | Portfolio Managers of Closed-End Management Investment Companies. |
Not applicable to open-end management investment companies.
| Item 9. | Purchases of Equity Securities by Closed-End Management Company and Affiliated Purchasers. |
Not applicable to open-end management investment companies.
| Item 10. | Submission of Matters to a Vote of Security Holders. |
None.
| Item 11. | Controls and Procedures. |
(a) The certifying officers, whose certifications are included herewith, have evaluated the registrant’s disclosure controls and procedures within 90 days of the filing date of this report. In their opinion, based on their evaluation, the registrant’s disclosure controls and procedures are adequately designed, and are operating effectively to ensure, that information required to be disclosed by the registrant on Form N-CSR is recorded, processed, summarized and reported within the time periods specified in the Securities and Exchange Commission’s rules and forms.
(b) There were no significant changes in the registrant’s internal control over financial reporting that occurred during the second fiscal quarter of the period covered by this report that have materially affected, or are reasonably likely to materially affect, the registrant’s internal control over financial reporting.
| Items 12. | Disclosure of Securities Lending Activities for Closed-End Management Investment Companies. |
Not applicable.
(a)(1) Not applicable for semi-annual report.
(a)(2) A separate certification for the principal executive officer and the principal financial officer of the registrant as required by Rule 30a-2(a) under the Investment Company Act of 1940, as amended (17 CFR 270.30a-2(a)), are filed herewith.
(b) Officer certifications as required by Rule 30a-2(b) under the Investment Company Act of 1940, as amended (17 CFR 270.30a-2(b)) also accompany this filing as an Exhibit.
SIGNATURES
Pursuant to the requirements of the Securities Exchange Act of 1934 and the Investment Company Act of 1940, the registrant has duly caused this report to be signed on its behalf by the undersigned, thereunto duly authorized.
| (Registrant) | RiverPark Funds Trust | |
| | | |
| By (Signature and Title)* | /s/ Morty Schaja | |
| | Morty Schaja | |
| | President | |
| | | |
| Date: June 7, 2019 | | |
Pursuant to the requirements of the Securities Exchange Act of 1934 and the Investment Company Act of 1940, this report has been signed below by the following persons on behalf of the registrant and in the capacities and on the dates indicated.
| By (Signature and Title)* | /s/ Morty Schaja | |
| | Morty Schaja | |
| | President | |
| | | |
| Date: June 7, 2019 | | |
| | | |
| By (Signature and Title)* | /s/ Stephen P. Connors | |
| | Stephen P. Connors | |
| | Chief Financial Officer and Treasurer | |
| | | |
| Date: June 7, 2019 | | |
| * | Print the name and title of each signing officer under his or her signature. |