UNITED STATES
SECURITIES AND EXCHANGE COMMISSION
Washington, D.C. 20549
________
FORM N-CSR
________
CERTIFIED SHAREHOLDER REPORT OF REGISTERED MANAGEMENT
INVESTMENT COMPANIES
Investment Company Act File Number 811-22431
RiverPark Funds Trust
(Exact name of registrant as specified in charter)
________
156 West 56th Street, 17th Floor
New York, NY 10019
(Address of principal executive offices) (Zip code)
Morty Schaja
156 West 56th Street, 17th Floor
New York, NY 10019
(Name and address of agent for service)
With a copy to:
Thomas R. Westle
Blank Rome LLP
405 Lexington Avenue
New York, NY 10174
Registrant’s telephone number, including area code: 212-484-2100
Date of fiscal year end: September 30, 2022
Date of reporting period: September 30, 2022
Item 1. Reports to Stockholders.
A copy of the report transmitted to stockholders pursuant to Rule 30e-1 under the Investment Company Act of 1940, as amended (the “Act”) (17 CFR § 270.30e-1), is attached hereto.
| |
Annual Report September 30, 2022 | |
RiverPark Large Growth Fund Retail Class Shares and Institutional Class Shares Wedgewood Fund Retail Class Shares and Institutional Class Shares RiverPark Short Term High Yield Fund Retail Class Shares and Institutional Class Shares RiverPark Long/Short Opportunity Fund Retail Class Shares and Institutional Class Shares RiverPark Strategic Income Fund Retail Class Shares and Institutional Class Shares RiverPark Floating Rate CMBS Fund Retail Class Shares and Institutional Class Shares | |
Investment Adviser: |

|
|

Table of Contents
Management’s Discussion of Fund Performance and Analysis | |
RiverPark Large Growth Fund | 1 |
Wedgewood Fund | 3 |
RiverPark Short Term High Yield Fund | 5 |
RiverPark Long/Short Opportunity Fund | 8 |
RiverPark Strategic Income Fund | 12 |
RiverPark Floating Rate CMBS Fund | 15 |
Schedules of Investments | |
RiverPark Large Growth Fund | 17 |
Wedgewood Fund | 18 |
RiverPark Short Term High Yield Fund | 19 |
RiverPark Long/Short Opportunity Fund | 24 |
RiverPark Strategic Income Fund | 27 |
RiverPark Floating Rate CMBS Fund | 35 |
Statements of Assets and Liabilities | 37 |
Statements of Operations | 39 |
Statements of Changes in Net Assets | 41 |
Financial Highlights | 44 |
Notes to Financial Statements | 50 |
Report of Independent Registered Public Accounting Firm | 70 |
Trustees and Officers of the Trust | 71 |
Disclosure of Fund Expenses | 73 |
Approval of the Investment Advisory and Investment Sub-Advisory Agreements | 75 |
Review of Liquidity Risk Management Program | 79 |
Notice to Shareholders | 80 |
The RiverPark Funds file their complete schedules of fund holdings with the Securities and Exchange Commission (the “Commission”) for the first and third quarters of each fiscal year on Form N-Q or as an exhibit to its reports on Form N-PORT within sixty days after the end of the period. The Funds’ Forms N-Q and Form N-PORT reports are available on the Commission’s website at http://www.sec.gov, and may be reviewed and copied at the Commission’s Public Reference Room in Washington, D.C. Information on the operation of the Public Reference Room may be obtained by calling 1-800-SEC-0330.
A description of the policies and procedures that the Funds use to determine how to vote proxies relating to fund securities, as well as information relating to how a Fund voted proxies relating to fund securities during the most recent 12-month period ended June 30 is available (i) without charge, upon request, by calling 888-564-4517; and (ii) on the Commission’s website at http://www.sec.gov.
|
|

Management’s Discussion of Fund Performance and Analysis
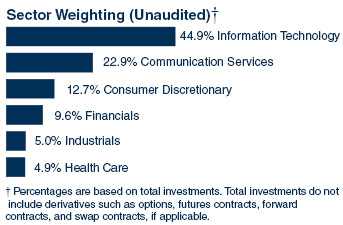
RiverPark Large Growth Fund (Unaudited)
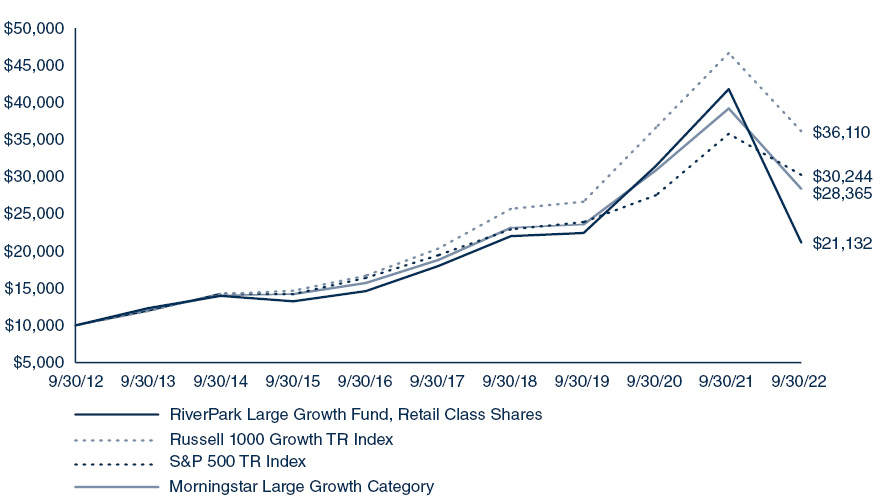
For the fiscal year ended September 30, 2022, the RiverPark Large Growth Fund (the “Fund”) lost 49.30% and 49.44% on its Institutional Class Shares and Retail Class Shares, respectively, while the Russell 1000 Growth Total Return Index lost 22.59% and the S&P 500 Total Return Index lost 15.47%.
Investment results for the fiscal year were not uniform across quarters. The Institutional Class Shares lost 1.35% for the December quarter, 19.58% for the March quarter, 33.91% for the June quarter, and 3.30% in the September quarter.
The Fund lost money from its investments in all sectors, with the worst performing sectors being Communication Services and Information Technology. The Fund’s best performing individual positions were Zoetis Inc, Unitedhealth Group Inc, IQVIA Holdings Inc, Apple Inc, and Charles Schwab Corp. The Fund’s worst performers were Snap Inc, Ringcentral Inc, Twilio Inc, Shopify Inc, and PayPal Holdings Inc.
The RiverPark Large Growth Fund seeks to make investments in securities of large capitalization companies, which it defines as those in excess of $5 billion. The Fund invests in what it believes are exciting growth businesses with significant long-term growth potential, but patiently waits for opportunities to purchase these companies at attractive prices. RiverPark believes the style is best described as a “value orientation toward growth.” RiverPark believes that the current market environment provides it with an opportunity to own a diversified portfolio of growth stocks at attractive valuations.
This represents the manager’s assessment of the market environment at a specific point in time and should not be relied upon by the reader as research or investment advice.
The Russell 1000 Growth Total Return Index measures the performance of those Russell 1000 companies with higher price-to-book ratios and higher forecasted growth values.
The S&P 500 Total Return Index is an unmanaged capitalization-weighted index generally representative of large companies in the U.S. stock market and based on price changes and reinvested dividends.
Morningstar Large Growth portfolios invest primarily in big U.S. companies that are projected to grow faster than other large-cap stocks.
Index returns are for illustrative purposes only and do not reflect any management fees, transaction costs, or expenses. Indexes are unmanaged and one cannot invest directly in an index.
1
|
|

Comparison of Change in the Value of a $10,000 Investment in the RiverPark Large Growth Fund,
Retail Class Shares, versus the Russell 1000 Growth TR Index, the S&P 500 TR Index
and the Morningstar Large Growth Category
AVERAGE ANNUAL TOTAL RETURNS FOR THE | |||||
One Year Return | Annualized | Annualized | Annualized | Annualized | |
Institutional Class Shares | -49.30% | -1.69% | 3.56% | 8.05% | 9.25% |
Retail Class Shares | -49.44% | -1.97% | 3.27% | 7.77% | 8.97% |
Russell 1000 Growth TR Index | -22.59% | 10.67% | 12.17% | 13.70% | 14.04% |
S&P 500 TR Index | -15.47% | 8.16% | 9.24% | 11.70% | 12.20% |
Morningstar Large Growth Category | -27.61% | 6.35% | 8.57% | 10.99% | 11.20% |
* | Fund commenced operations on September 30, 2010. |
Returns shown above are calculated assuming reinvestment of all dividends and distributions. Returns do not reflect the deduction of taxes that a shareholder would pay on dividends or distributions or the redemption of shares from a fund. Returns reflect fee waivers and/or reimbursements in effect for the period; absent fee waivers and reimbursements, performance would have been lower. Effective July 31, 2016, the Fund fully recaptured previously waived investment advisory fees. Results represent past performance and do not indicate future results. The value of an investment in the Fund and the return on investment both will fluctuate and redemption proceeds may be higher or lower than a shareholder’s original cost. Performance of the Institutional Class Shares differs due to the differences in expenses. Current performance may be lower or higher than that shown here. Unlike the Fund’s comparative benchmarks, the Fund’s total returns are reduced by its annual operating expenses. Please note that one cannot invest directly in an unmanaged index.
2
|
|

Management’s Discussion of Fund Performance and Analysis
Wedgewood Fund (Unaudited)
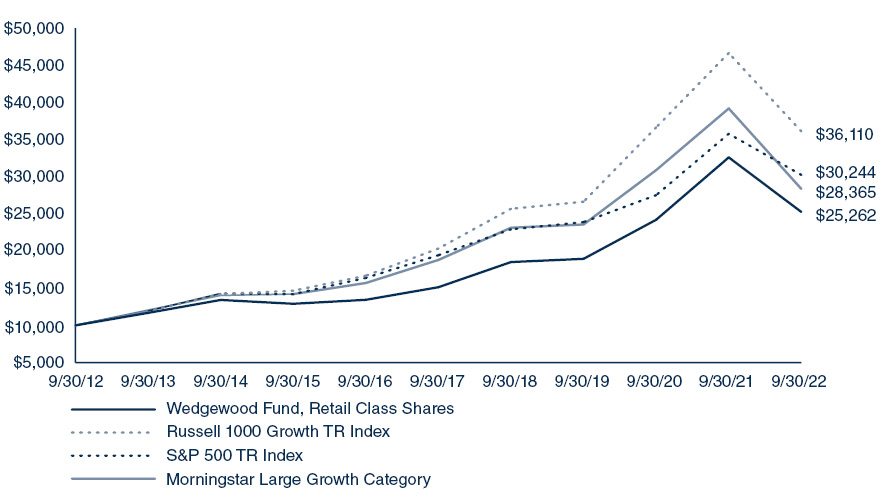
For the fiscal year ended September 30, 2022, the Wedgewood Fund (the “Fund”) lost 22.35% and 22.52% on its Institutional Class Shares and Retail Class Shares, respectively, while the Russell 1000 Growth Total Return Index lost 22.59% and the S&P 500 Total Return Index lost 15.47%.
Investment results for the fiscal year were not uniform across quarters. The Institutional Class Shares gained 10.05% for the December quarter, and lost 10.80% for the March quarter, 17.38% for the June quarter, and 4.26% in the September quarter.
The Fund’s investment results were not uniform across sectors. The Fund’s best performing sector during the period was Energy. The Fund’s worst performing sectors were Information Technology and Communication Services. The Fund’s best performers were Texas Pacific Land Corp, Unitedhealth Group Inc, Progressive Corp, Keysight Technologies Inc, and Motorola Solutions Inc. The Fund’s worst performers were Meta Platforms Inc, PayPal Holdings Inc, Taiwan Semiconductor, Alphabet Inc, and Edwards Lifesciences Corp.
The Wedgewood Fund seeks to make investments in about 19-21 companies, with market capitalizations in excess of $5 billion, which it believes have above-average growth prospects. The Fund invests in businesses that it believes are market leaders with a long-term sustainable competitive advantage. It patiently waits for opportunities to purchase what it believes are great businesses at attractive prices. While the Fund invests in growth it believes that valuation is the key to generating attractive returns over the long-term. Unlike most growth investors, Wedgewood is not a momentum investor but rather a contrarian growth investor. Wedgewood is a firm that believes in investing as opposed to trading and generally experiences an annual portfolio turnover of less than 50%. Wedgewood believes that the current market environment provides it with an opportunity to own a portfolio of growth stocks at attractive valuations.
This represents the manager’s assessment of the market environment at a specific point in time and should not be relied upon by the reader as research or investment advice.
The Russell 1000 Growth Total Return Index measures the performance of those Russell 1000 companies with higher price-to-book ratios and higher forecasted growth values.
The S&P 500 Total Return Index is an unmanaged capitalization-weighted index generally representative of large companies in the U.S. stock market and based on price changes and reinvested dividends.
Morningstar Large Growth portfolios invest primarily in big U.S. companies that are projected to grow faster than other large-cap stocks.
Index returns are for illustrative purposes only and do not reflect any management fees, transaction costs, or expenses. Indexes are unmanaged and one cannot invest directly in an index.
3
|
|

Comparison of Change in the Value of a $10,000 Investment in the Wedgewood Fund,
Retail Class Shares, versus the Russell 1000 Growth TR Index,
the S&P 500 TR Index and the Morningstar Large Growth Category
AVERAGE ANNUAL TOTAL RETURNS FOR THE | |||||
One Year Return | Annualized | Annualized | Annualized | Annualized | |
Institutional Class Shares | -22.35% | 10.32% | 11.07% | 9.93% | 11.21% |
Retail Class Shares | -22.52% | 10.05% | 10.79% | 9.71% | 10.98% |
Russell 1000 Growth TR Index | -22.59% | 10.67% | 12.17% | 13.70% | 14.04% |
S&P 500 TR Index | -15.47% | 8.16% | 9.24% | 11.70% | 12.20% |
Morningstar Large Growth Category | -27.61% | 6.35% | 8.57% | 10.99% | 11.20% |
* | Fund commenced operations on September 30, 2010. |
Returns shown above are calculated assuming reinvestment of all dividends and distributions. Returns do not reflect the deduction of taxes that a shareholder would pay on dividends or distributions or the redemption of shares from a fund. Returns reflect fee waivers and/or reimbursements in effect for the period; absent fee waivers and reimbursements, performance would have been lower. Effective June 30, 2013, the Fund fully recaptured previously waived investment advisory fees. In June 2022 the fund began waiving fees again. Results represent past performance and do not indicate future results. The value of an investment in the Fund and the return on investment both will fluctuate and redemption proceeds may be higher or lower than a shareholder’s original cost. Performance of the Institutional Class Shares differs due to the differences in expenses. Current performance may be lower or higher than that shown here. Unlike the Fund’s comparative benchmarks, the Fund’s total returns are reduced by its annual operating expenses. Please note that one cannot invest directly in an unmanaged index. In June 2022 the fund began waiving fees again.
4
|
|

Management’s Discussion of Fund Performance and Analysis
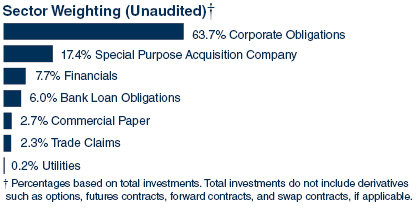
RiverPark Short Term High Yield Fund (Unaudited)
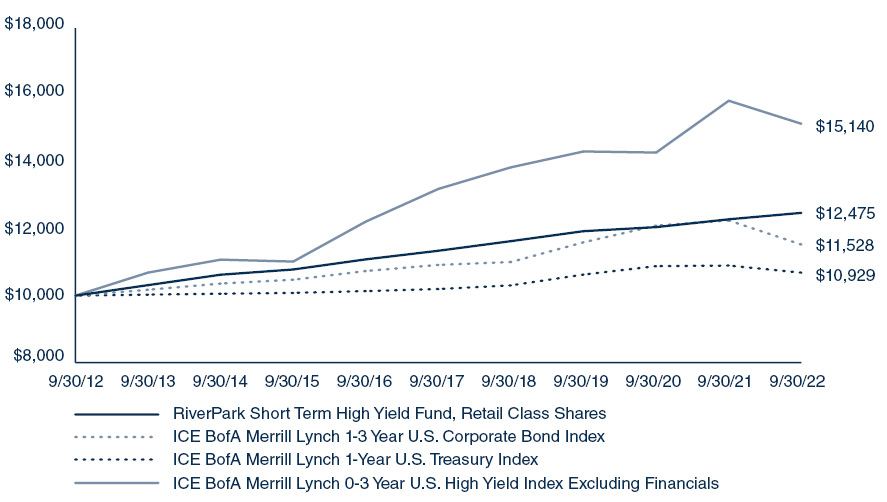
For the fiscal year ended September 30, 2022, the RiverPark Short Term High Yield Fund (the “Fund”) gained 1.82% and 1.56% on its Institutional Class Shares and Retail Class Shares, respectively, while the ICE BofA Merrill Lynch 1-3 Year U.S. Corporate Bond Index lost 5.89%, the ICE BofA Merrill Lynch 1-Year U.S. Treasury Index lost 1.95% and the ICE BofA Merrill Lynch 0-3 Year U.S. High Yield Index Excluding Financials lost 4.35%.
Investment results for the fiscal year were fairly uniform across quarters. The Institutional Class Shares gained 0.63% for the December quarter, 0.10% for the March quarter, 0.19% for the June quarter and 0.90% in the September quarter.
The Fund realized positive contributions from all five of its investment categories. The Fund realized a contribution to its performance of 1.20% in the Short-Term Maturities Category, 0.79% in Event-Driven, 0.49% in Redeemed Debt, 0.18% in Cushion Bonds and 0.03% in Strategic Recap.
The Fund continues to strive for an attractive yield while maintaining a weighted average expected effective maturity of less than one year. As of September 30, 2022, 54% of the Fund’s invested portfolio is expected to mature or be repaid within 90 days, while 91% of the Fund’s invested portfolio is expected to mature or be repaid within 12 months. As of the same date, approximately 48% of the invested portfolio is expected to be repaid as the result of a corporate event (redemption or early retirement due to an acquisition or recapitalization).
The RiverPark Short Term High Yield Fund focuses on short term high yield securities for which they believe credit ratings do not accurately reflect a company’s ability to meet their short term credit obligations. The RiverPark Short Term High Yield Fund seeks to make investments in fixed income securities of companies that have announced or, in Cohanzick’s opinion, will announce a funding event, reorganization or other corporate event that they believe will have a positive impact on a company’s ability to repay their debt. Additionally, the Fund will invest in securities in which it perceives there is limited near term risk of default. In Cohanzick’s view, the risks associated with investing in short term high yield debt are very different from investing in long-dated paper in which operating performance and business sustainability are of primary concern.
5
|
|

This represents the manager’s assessment of the market environment at a specific point in time and should not be relied upon by the reader as research or investment advice.
The ICE BofA Merrill Lynch 1-3 Year U.S. Corporate Index is a subset of the ICE BofA Merrill Lynch U.S. Corporate Master Index tracking the performance of U.S. dollar denominated investment grade rated corporate debt publicly issued in the U.S. domestic market. This subset includes all securities with a remaining term to maturity of less than 3 years.
The ICE BofA Merrill Lynch 1-Year U.S. Treasuries Index is an unmanaged index that tracks the performance of the direct sovereign debt of the U.S. Government having a maturity of at least one year and less than three years.
The ICE BofA Merrill Lynch 0-3 Year U.S. High Yield Index Excluding Financials considers all securities from the ICE BofA Merrill Lynch US High Yield Master II Index and the ICE BofA Merrill Lynch U.S. High Yield 0-1 Year Index, and then applies the following filters: securities greater than or equal to one month but less than 3 years to final maturity, and exclude all securities with Level 2 sector classification = Financial (FNCL).
Index returns are for illustrative purposes only and do not reflect any management fees, transaction costs, or expenses. Indexes are unmanaged and one cannot invest directly in an index.
6
|
|

Comparison of Change in the Value of a $10,000 Investment in the RiverPark Short Term High Yield Fund,
Retail Class Shares, versus the ICE BofA Merrill Lynch 1-3 Year U.S. Corporate Bond Index, the ICE BofA Merrill Lynch 1-Year U.S. Treasury Index and the ICE BofA Merrill Lynch 0-3 Year U.S. High Yield Index Excluding Financials
AVERAGE ANNUAL TOTAL RETURNS FOR THE | |||||
One Year Return | Annualized | Annualized | Annualized | Annualized | |
Institutional Class Shares | 1.82% | 1.76% | 2.17% | 2.52% | 2.80% |
Retail Class Shares | 1.56% | 1.51% | 1.92% | 2.24% | 2.52% |
ICE BofA Merrill Lynch 1-3 Year U.S. Corporate Bond Index | -5.89% | -0.19% | 1.09% | 1.43% | 1.68% |
ICE BofA Merrill Lynch 1-Year U.S. Treasury Index | -1.95% | 0.18% | 0.94% | 0.67% | 0.62% |
ICE BofA Merrill Lynch 0-3 Year U.S. High Yield Index Excluding Financials | -4.35% | 1.89% | 2.79% | 4.23% | 4.57% |
* | Fund commenced operations on September 30, 2010. |
Returns shown above are calculated assuming reinvestment of all dividends and distributions. Returns do not reflect the deduction of taxes that a shareholder would pay on dividends or distributions or the redemption of shares from a fund. Returns reflect fee waivers and/or reimbursements in effect for the period; absent fee waivers and reimbursements, performance would have been lower. Effective September 30, 2013, the Fund fully recaptured previously waived investment advisory fees. Results represent past performance and do not indicate future results. The value of an investment in the Fund and the return on investment both will fluctuate and redemption proceeds may be higher or lower than a shareholder’s original cost. Performance of the Institutional Class Shares differs due to the differences in expenses. Current performance may be lower or higher than that shown here. Unlike the Fund’s comparative benchmarks, the Fund’s total returns are reduced by its annual operating expenses. Please note that one cannot invest directly in an unmanaged index.
7
|
|

Management’s Discussion of Fund Performance and Analysis
RiverPark Long/Short Opportunity Fund (Unaudited)
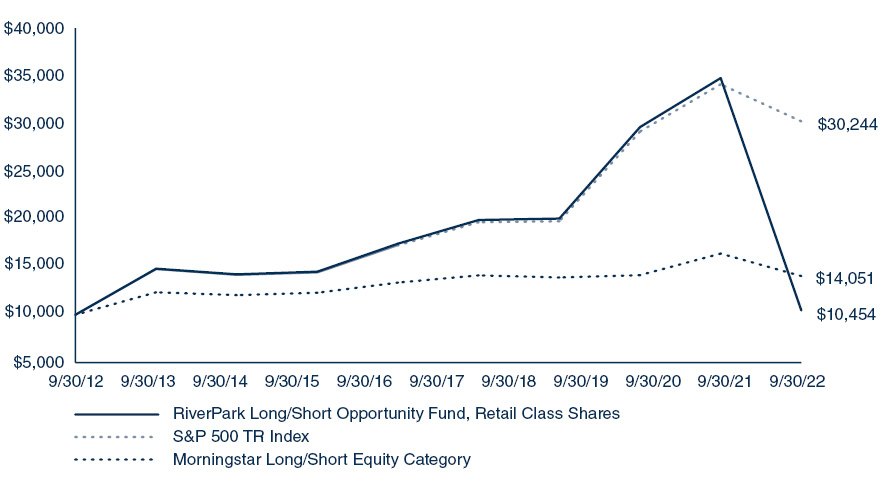
For the fiscal year ended September 30, 2022, the RiverPark Long/Short Opportunity Fund (the “Fund”) lost 56.53% and 56.64% on its Institutional Class Shares and Retail Class Shares respectively, while the S&P 500 Total Return Index lost 15.47% and the Morningstar Long/Short Equity Category lost 8.74%. The average gross and net month-end exposures of the Fund for the fiscal year were 167% and 75% (long 121%, short 46%), respectively.
The Fund’s long positions detracted approximately 59% for the fiscal year, as compared to the performance of the S&P 500 Total Return Index, which lost 15.47%. The Fund’s short positions contributed approximately 5% for the fiscal year.
Investment results for the fiscal year were not uniform across quarters. The Institutional Class Shares lost 4.93% for the December quarter, 25.78% for the March quarter, 35.18% for the June quarter, and 4.94% in the September quarter.
The Fund lost money from its investments in all sectors, with the worst performing sectors being Communication Services and Information Technology. The Fund’s best performing individual positions were Carvana Co (short), Lucid Group Inc (short), Apple Inc, Zoetis Inc, DraftKings Inc (short). The Fund’s worst performers were Snap Inc, Ringcentral Inc, Twilio Inc, PayPal Holdings, and Shopify Inc.
Derivatives, which were used for the Fund’s short positions and to leverage the long positions, detracted approximately 18.56% from the Fund’s performance.
The RiverPark Long/Short Opportunity Fund seeks long-term capital appreciation while managing downside volatility by investing long in equity securities that the Fund’s investment adviser believes have above-average growth prospects and selling short equity securities the Adviser believes are competitively disadvantaged over the long-term. The Fund is an opportunistic long/short investment fund. The Fund’s investment goal is to achieve above average rates of return with less volatility and less downside risk as compared to U.S. equity markets.
8
|
|

This represents the manager’s assessment of the market environment at a specific point in time and should not be relied upon by the reader as research or investment advice.
The S&P 500 Total Return Index is an unmanaged capitalization-weighted index generally representative of large companies in the U.S. stock market and based on price changes and reinvested dividends.
The Morningstar Long/Short Equity Category portfolios hold sizable stakes in both long and short positions. Some funds that fall into this category are market neutral - dividing their exposure equally between long and short positions in an attempt to earn a modest return that is not tied to the market’s fortunes. Other portfolios that are not market neutral will shift their exposure to long and short positions depending upon their macro outlook or the opportunities they uncover through bottom-up research.
Index returns are for illustrative purposes only and do not reflect any management fees, transaction costs, or expenses. Indexes are unmanaged and one cannot invest directly in an index.
9
|
|

Management’s Discussion of Fund Performance and Analysis
RiverPark Long/Short Opportunity Fund
Supplemental Disclosure (Unaudited):
The following represents a reconciliation of accounting principles generally accepted in the United States of America (“GAAP”) to non-GAAP exposure for underlying investments that are held by the Fund through investments in common stock and total return swap transactions as of September 30, 2022. The total non-GAAP exposure is calculated by using the common stock plus the notional swap values divided by the net asset value of the Fund as of September 30, 2022.
Reconciliation of GAAP to Non-GAAP Long/Short Exposure by Underlier
September 30, 2022
Common Stock and Total Return Swaps: | ||
GAAP | Non-GAAP | |
Autodesk | ||
Common Stock | 3.0% | 3.0% |
Total Return Swap | — | 0.1% |
3.0% | 3.1% | |
Charles Schwab | ||
Common Stock | — | — |
Total Return Swap | — | 5.4% |
— | 5.4% | |
Mastercard, Cl A | ||
Common Stock | 3.6% | 3.6% |
Total Return Swap | — | 1.1% |
3.6% | 4.7% | |
Meta Platforms, Cl A | ||
Common Stock | 1.6% | 1.6% |
Total Return Swap | — | 1.0% |
1.6% | 2.6% | |
NVIDIA | ||
Common Stock | 1.1% | 1.1% |
Total Return Swap | — | 1.1% |
1.1% | 2.2% | |
GAAP | Non-GAAP | |
RingCentral, Cl A | ||
Common Stock | 0.2% | 0.2% |
Total Return Swap | — | 2.8% |
0.2% | 3.0% | |
Twilio, Cl A | ||
Common Stock | 2.3% | 2.3% |
Total Return Swap | — | 0.6% |
2.3% | 2.9% | |
Workday, Cl A | ||
Common Stock | 0.9% | 0.9% |
Total Return Swap | — | 1.2% |
0.9% | 2.1% | |
Remaining Underliers Common Stock | 79.7% | 79.7% |
Total Common Stock & Total Return Swaps | 92.4% | 105.7% |
Securities Sold Short, Not Yet Purchased: | ||
Common Stock | — | -23.2% |
Total, Securities Sold Short, Not Yet Purchased | — | -23.2% |
* | See pages 24-26 of the Schedule of Investments, which presents a complete listing of the securities held by the Fund as of September 30, 2022. |
10
|
|

Comparison of Change in the Value of a $10,000 Investment in the RiverPark Long/Short Opportunity Fund,
Retail Class Shares, versus the S&P 500 TR Index and the Morningstar Long/Short Equity Category
AVERAGE ANNUAL TOTAL RETURNS FOR THE | |||||
One Year Return | Annualized | Annualized | Annualized | Annualized | |
Institutional Class Shares | -56.53% | -9.01% | -2.82% | 0.65% | 3.23% |
Retail Class Shares | -56.64% | -9.24% | -3.04% | 0.44% | 3.06% |
S&P 500 TR Index | -15.47% | 8.16% | 9.24% | 11.70% | 12.04% |
Morningstar Long/Short Equity Category | -8.74% | 2.50% | 2.29% | 3.46% | 3.15% |
* | Fund commenced operations on March 30, 2012. The performance data quoted for periods prior to March 30, 2012 is that of the Predecessor Fund. The Predecessor Fund commenced operations on September 30, 2009. The Predecessor Fund was not a registered mutual fund and was not subject to the same investment and tax restrictions as the Fund. If it had been, the Predecessor Fund’s performance might have been lower. Performance shown for periods of one year and greater are annualized. |
For periods after March 30, 2012, the returns shown above are calculated assuming reinvestment of all dividends and distributions. Returns do not reflect the deduction of taxes that a shareholder would pay on dividends or distributions or the redemption of shares from a fund. Returns reflect fee waivers and/or reimbursements in effect for the period; absent fee waivers and reimbursements, performance would have been lower. Results represent past performance and do not indicate future results. The value of an investment in the Fund and the return on investment both will fluctuate and redemption proceeds may be higher or lower than a shareholder’s original cost. Performance of the Institutional Class Shares differs due to the differences in expenses. Current performance may be lower or higher than that shown here. Unlike the Fund’s comparative benchmarks, the Fund’s total returns are reduced by its annual operating expenses. Please note that one cannot invest directly in an unmanaged index.
11
|
|

Management’s Discussion of Fund Performance and Analysis
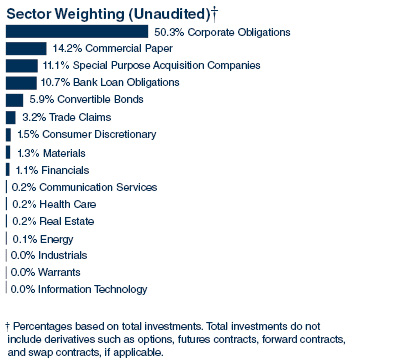
RiverPark Strategic Income Fund (Unaudited)
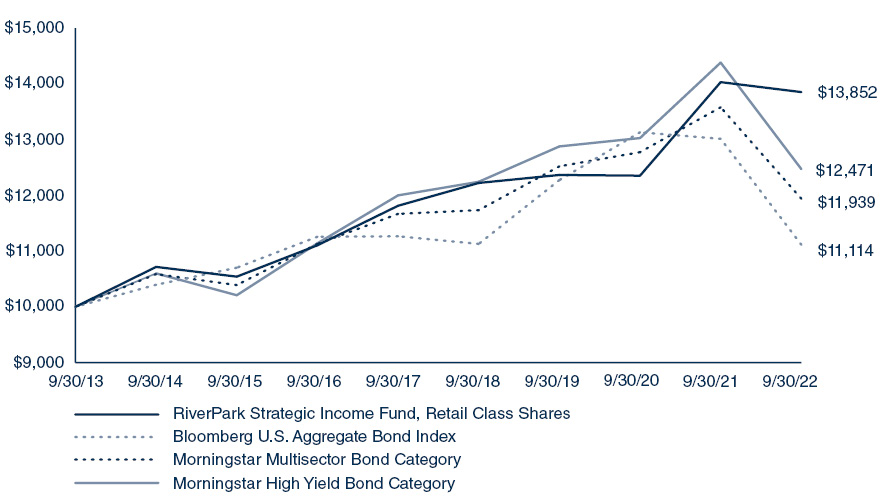
For the fiscal year ended September 30, 2022, the RiverPark Strategic Income Fund (the “Fund”) lost 1.27% and 1.41% on its Institutional Class Shares and Retail Class Shares, respectively, while the Bloomberg U.S. Aggregate Bond Index lost 14.60%, the Morningstar Multisector Bond Category lost 12.08%, and the Morningstar High Yield Bond Category lost 13.29%.
Investment results for the fiscal year were not uniform across quarters. The Institutional Class Shares gained 2.41% for the December quarter, 0.89% for the March quarter, and lost 3.13% for the June quarter, and 1.36% in the September quarter.
The Fund realized positive contributions from three of its seven investment categories. The Fund realized a contribution to its performance of 2.40% in Other (ABS) category, 0.16% in Hedges, and 0.13% in Short Term Securities. Whereas the Fund lost 0.08% in Buy & Hold “Money Good”, 0.37% Interest Rate Resets, 0.92% Priority Based (Above the Fray), and 1.71% in Off the Beaten Path.
As of September 30, 2022, the Fund’s net assets were weighted by category as follows: 31.6% in the Buy & Hold “Money Good” category, 21.6% in Off The Beaten Path, 12.1% in Short Term Securities, 9.8% in Interest Rate Resets (floaters, cushion bonds), 7.9% in Other (ABS), 3.6% in the Priority Based (Above the Fray), -1.3% in Hedges, with the remaining 14.7% in cash and cash equivalents. Across all categories, 73.3% of the net assets were held in high yield securities and 12.0% was held in investment grade securities. The Fund held 119 positions as of this date.
RiverPark Strategic Income Fund seeks high current income and capital appreciation consistent with the preservation of capital by investing in investment grade and non-investment grade debt, preferred stock, convertible bonds, bank loans, high yield bonds and income producing equities that Cohanzick deems appropriate for the Fund’s investment objective. The Fund will primarily invest in both investment grade and non-investment grade “Money Good” securities, for which the enterprise value of the issuing company exceeds the value of the senior and equally ranked debt of the considered investment. The Fund expects to invest in securities that are not widely followed, which Cohanzick believes offer better returns with little or no additional credit risk.
Footnotes:
“Money Good” is a term used by the Adviser to describe debt it believes will be paid off in full under current market conditions and on a strict priority basis.
High yield and investment grade classification of securities was based on Bloomberg Composite Ratings.
12
|
|

This represents the manager’s assessment of the market environment at a specific point in time and should not be relied upon by the reader as research or investment advice.
The Bloomberg U.S. Aggregate Bond Index is a broad-based unmanaged index of investment grade, U.S. dollar-denominated, fixed-rate taxable bond market, including Treasuries, government-related and corporate securities, Mortgage-Backed Securities (agency fixed-rate and hybrid adjustable-rate mortgages pass-throughs), asset backed securities, and commercial backed securities.
The Morningstar Multisector Bond Category portfolios seek income by diversifying their assets among several fixed-income sectors, usually U.S. government obligations, U.S. corporate bonds, foreign bonds, and high-yield U.S. debt securities.
The Morningstar High Yield Bond Category portfolios seek income by diversifying their assets among several fixed-income sectors, usually U.S. government obligations, U.S. corporate bonds, foreign bonds, and high-yield U.S. debt securities.
Index returns are for illustrative purposes only and do not reflect any management fees, transaction costs, or expenses. Indexes are unmanaged and one cannot invest directly in an index.
13
|
|

Comparison of Change in the Value of a $10,000 Investment in the RiverPark Strategic Income Fund,
Retail Class Shares, versus the Bloomberg U.S. Aggregate Bond Index, the Morningstar Multisector Bond
Category and the Morningstar High Yield Bond Category
AVERAGE ANNUAL TOTAL RETURNS FOR THE | ||||
One Year Return | Annualized | Annualized | Annualized | |
Institutional Class Shares | -1.27% | 3.86% | 3.24% | 3.68% |
Retail Class Shares | -1.41% | 3.67% | 3.04% | 3.44% |
Bloomberg U.S. Aggregate Bond Index | -14.60% | -3.26% | -0.27% | 1.18% |
Morningstar Multisector Bond Category | -12.08% | -1.57% | 0.46% | 1.99% |
Morningstar High Yield Bond Category | -13.29% | -1.06% | 0.77% | 2.48% |
* | Fund commenced operations on September 30, 2013. |
Returns shown above are calculated assuming reinvestment of all dividends and distributions. Returns do not reflect the deduction of taxes that a shareholder would pay on dividends or distributions or the redemption of shares from a fund. Returns reflect fee waivers and/or reimbursements in effect for the period; absent fee waivers and reimbursements, performance would have been lower. Effective March 31, 2014, the Fund fully recaptured previously waived investment advisory fees. Results represent past performance and do not indicate future results. The value of an investment in the Fund and the return on investment both will fluctuate and redemption proceeds may be higher or lower than a shareholder’s original cost. Performance of the Institutional Class Shares differs due to the differences in expenses. Current performance may be lower or higher than that shown here. Unlike the Fund’s comparative benchmarks, the Fund’s total returns are reduced by its annual operating expenses. Please note that one cannot invest directly in an unmanaged index.
14
|
|

Management’s Discussion of Fund Performance and Analysis
RiverPark Floating Rate CMBS Fund (Unaudited)
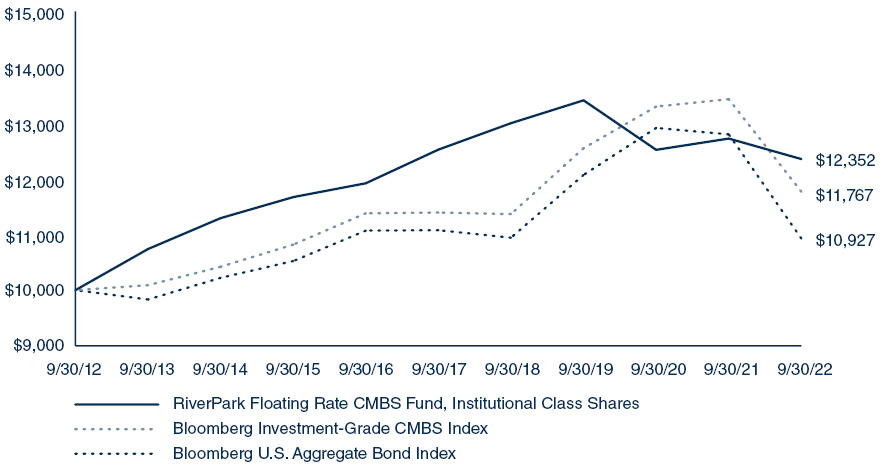
For the fiscal year ended September 30, 2022, the RiverPark Floating Rate CMBS Fund (the “Fund”) lost 2.98% and 3.34% on its Institutional Class Shares and Retail Class Shares respectively, while the Bloomberg U.S. Investment-Grade CMBS Index lost 12.35% and the Bloomberg U.S. Aggregate Bond Index lost 14.60%.
The Fund strives for an attractive yield while maintaining a portfolio that is substantially comprised of floating rate CMBS investments with a weighted average maturity of less than five years. As of September 30, 2022, the weighted average coupon for the Fund was 5.52%, 100% of the Fund’s invested portfolio was in floating rate securities, and the weighted average effective maturity of the portfolio was 1.35 years.
Investment results for the fiscal year were not uniform across quarters. The Institutional Class Shares lost 0.16% for the December quarter, 1.05% for the March quarter, 2.32% for the June quarter, then gained 0.54% in the September quarter.
The RiverPark Floating Rate CMBS Fund emphasizes floating rate Single Asset / Single Borrower (SASB) loans that are structured as Commercial Mortgage Backed Securities (CMBS). The RiverPark Floating Rate CMBS Fund seeks to make investments in larger ($500+ million) securitizations of income producing commercial real estate loans secured by institutional quality assets with well-regarded sponsors. The Fund emphasizes investments that have conservative credit metrics. As of September 30, 2022, all of the Fund’s investments were paying monthly coupons.
This represents the manager’s assessment of the market environment at a specific point in time and should not be relied upon by the reader as research or investment advice.
The Bloomberg U.S. Investment-Grade CMBS Index measures the market of US Agency and US Non-Agency conduit and fusion CMBS deals with a minimum current deal size of $300mn.
The Bloomberg U.S. Aggregate Bond Index is a broad-based flagship benchmark that measures the investment grade, US dollar-denominated, fixed-rate taxable bond market. The index includes Treasuries, government-related and corporate securities, mortgage-backed securities (agency fixed-rate and hybrid ARM pass-throughs), asset-backed securities and commercial back securities (agency and nonagency).
Weighted Average Coupon is used to determine the gross interest rates of multiple mortgages that underline the CMBS. The Weighted Average Coupon represents the average interest rate of different pools of mortgages with varying interest rates.
Index returns are for illustrative purposes only and do not reflect any management fees, transaction costs, or expenses. Indexes are unmanaged and one cannot invest directly in an index.
15
|
|

Comparison of Change in the Value of a $10,000 Investment in the RiverPark Floating Rate CMBS Fund,
Retail Class Shares, versus the Bloomberg U.S. Investment-Grade CMBS Index and Bloomberg
U.S. Aggregate Bond Index
AVERAGE ANNUAL TOTAL RETURNS FOR THE | |||||
One Year Return | Annualized | Annualized | Annualized | Annualized | |
Institutional Class Shares | -2.98% | -2.72% | -0.29% | 2.12% | 3.85% |
Retail Class Shares | -3.34% | -3.08% | -0.61% | 1.93% | 3.70% |
Bloomberg U.S. Investment-Grade CMBS Index | -12.35% | -2.12% | 0.65% | 1.64% | 3.32% |
Bloomberg U.S. Aggregate Bond Index | -14.60% | -3.26% | -0.27% | 0.89% | 1.89% |
* | Fund commenced operations on September 30, 2016. The performance data quoted for period prior to September 30, 2016 is that of the Predecessor Fund. The Predecessor Fund commenced operations on May 31, 2010. The Predecessor Fund was not a registered mutual fund and was not subject to the same investment and tax restrictions as the Fund. If it had been, the Predecessor Fund’s performance might have been lower. Performance shown for periods of one year and greater are annualized. |
Furthermore, on November 12, 2018 the Interval Fund reorganized as an open-end mutual fund with daily liquidity. The performance data for the Retail Class Shares for periods prior to November 12, 2018, but after September 30, 2016 is that of the Institutional Class Shares adjusted to reflect the higher expense ratio applicable to the Retail Class Shares.
For periods after September 30, 2016, the returns shown above are calculated assuming reinvestments of all dividends and distributions. Returns do not reflect the deduction of taxes that a shareholder would pay on dividends or distributions or the redemption of shares from a fund. Returns reflect fee waivers and/or reimbursements in effect for the period; absent fee waivers and reimbursements, performance would have been lower. Results represent past performance and do not indicate future results. The value of an investment in the Fund and the return on investment both will fluctuate and redemption proceeds may be higher or lower than a shareholder’s original cost. Performance of the Institutional Class Shares differs due to the differences in expenses. Current performance may be lower or higher than that shown here. Unlike the Fund’s comparative benchmarks, the Fund’s total returns are reduced by its annual operating expenses. Please note that one cannot invest directly in an unmanaged index.
16
| RiverPark Large Growth Fund September 30, 2022 |

Description | Shares | Value (000) | ||||||
Schedule of Investments | ||||||||
Common Stock — 95.9%** | ||||||||
Communication Services – 20.7% | ||||||||
Alphabet, Cl A * | 9,870 | $ | 944 | |||||
Alphabet, Cl C * | 9,815 | 944 | ||||||
Meta Platforms, Cl A * | 6,251 | 848 | ||||||
Netflix * | 5,252 | 1,237 | ||||||
Pinterest, Cl A * | 53,822 | 1,254 | ||||||
Snap, Cl A * | 102,831 | 1,010 | ||||||
Walt Disney * | 10,849 | 1,023 | ||||||
| 7,260 | ||||||||
Consumer Discretionary – 9.7% | ||||||||
Amazon.com * | 15,247 | 1,723 | ||||||
Booking Holdings * | 519 | 853 | ||||||
Nike, Cl B | 9,976 | 829 | ||||||
| 3,405 | ||||||||
Financials – 12.4% | ||||||||
Blackstone, Cl A | 20,963 | 1,755 | ||||||
Charles Schwab | 26,121 | 1,877 | ||||||
KKR | 16,437 | 707 | ||||||
| 4,339 | ||||||||
Health Care – 4.4% | ||||||||
Illumina * | 3,181 | 607 | ||||||
Intuitive Surgical * | 4,907 | 919 | ||||||
| 1,526 | ||||||||
Industrials – 4.8% | ||||||||
Uber Technologies * | 63,813 | 1,691 | ||||||
Information Technology – 43.9% (Note 7) | ||||||||
Adobe * | 2,141 | 589 | ||||||
Adyen ADR * | 66,133 | 828 | ||||||
Apple | 10,984 | 1,518 | ||||||
Autodesk * | 5,697 | 1,064 | ||||||
Five9 * | 10,093 | 757 | ||||||
Intuit | 2,313 | 896 | ||||||
Mastercard, Cl A | 4,153 | 1,181 | ||||||
Microsoft | 7,463 | 1,738 | ||||||
NVIDIA | 5,702 | 692 | ||||||
PayPal Holdings * | 13,835 | 1,191 | ||||||
RingCentral, Cl A * | 20,899 | 835 | ||||||
ServiceNow * | 2,213 | 836 | ||||||
Shopify, Cl A * | 31,104 | 838 | ||||||
Twilio, Cl A * | 13,168 | 910 | ||||||
Visa, Cl A | 4,230 | 751 | ||||||
Workday, Cl A * | 4,867 | 741 | ||||||
| 15,365 | ||||||||
Total Common Stock | ||||||||
(Cost $28,558) (000) | 33,586 | |||||||
Total Investments — 95.9% | ||||||||
(Cost $28,558) (000) | $ | 33,586 | ||||||
As of September 30, 2022, all of the Fund’s investments were considered Level 1 in accordance with the authoritative guidance on fair value measurements and disclosure under U.S. GAAP.
Percentages are based on Net Assets of $35,005 (000). |
* | Non-income producing security. |
** | More Narrow industries are utilized for compliance purposes, whereas broad sectors are utilized for reporting purposes. |
Cl — Class
ADR — American Depositary Receipt
The accompanying notes are an integral part of the financial statements.
17
| Wedgewood Fund September 30, 2022 |

Description | Shares | Value (000) | ||||||
Schedule of Investments | ||||||||
Common Stock — 99.5%** | ||||||||
Communication Services – 12.8% | ||||||||
Alphabet, Cl A * | 18,645 | $ | 1,783 | |||||
Meta Platforms, Cl A * | 11,974 | 1,625 | ||||||
| 3,408 | ||||||||
Consumer Discretionary – 11.1% | ||||||||
Booking Holdings * | 469 | 771 | ||||||
Pool | 2,011 | 640 | ||||||
Tractor Supply | 8,344 | 1,551 | ||||||
| 2,962 | ||||||||
Energy – 3.9% | ||||||||
Texas Pacific Land | 581 | 1,033 | ||||||
Financials – 10.3% | ||||||||
First Republic Bank | 8,001 | 1,044 | ||||||
Progressive | 9,232 | 1,073 | ||||||
S&P Global | 2,085 | 637 | ||||||
| 2,754 | ||||||||
Health Care – 10.8% | ||||||||
Edwards Lifesciences * | 15,190 | 1,255 | ||||||
UnitedHealth Group | 3,232 | 1,632 | ||||||
| 2,887 | ||||||||
Industrials – 7.9% | ||||||||
Copart * | 10,913 | 1,161 | ||||||
Old Dominion Freight Line | 3,852 | 958 | ||||||
| 2,119 | ||||||||
Information Technology – 42.7% | ||||||||
Apple | 14,430 | 1,994 | ||||||
CDW | 10,766 | 1,680 | ||||||
Microsoft | 6,817 | 1,588 | ||||||
Motorola Solutions | 8,299 | 1,859 | ||||||
PayPal Holdings * | 17,615 | 1,516 | ||||||
Taiwan Semiconductor Manufacturing ADR | 16,679 | 1,144 | ||||||
Visa, Cl A | 9,261 | 1,645 | ||||||
| 11,426 | ||||||||
Total Common Stock | ||||||||
(Cost $22,476) (000) | 26,589 | |||||||
Total Investments — 99.5% | ||||||||
(Cost $22,476) (000) | $ | 26,589 | ||||||
As of September 30, 2022, all of the Fund’s investments were considered Level 1 in accordance with the authoritative guidance on fair value measurements and disclosure under U.S. GAAP.
Percentages are based on Net Assets of $26,735 (000). |
* | Non-income producing security. |
** | More Narrow industries are utilized for compliance purposes, whereas broad sectors are utilized for reporting purposes. |
ADR — American Depositary Receipt
Cl — Class
The accompanying notes are an integral part of the financial statements.
18
| RiverPark Short Term High Yield Fund September 30, 2022 |

Description | Face | Value (000) | ||||||
Schedule of Investments | ||||||||
Corporate Obligations — 62.9% | ||||||||
Communication Services – 9.9% | ||||||||
CCO Holdings | ||||||||
4.000%, 03/01/23 (a) | 30,344 | $ | 30,208 | |||||
Linkem | ||||||||
7.193%, Euribor 3 Month + 6.000%, 11/09/22 (a) (b) | EUR | 31,516 | 30,810 | |||||
Quebecor Media | ||||||||
5.750%, 01/15/23 | 15,429 | 15,298 | ||||||
TEGNA | ||||||||
4.750%, 03/15/26 (a) | 16,239 | 15,695 | ||||||
| 92,011 | ||||||||
Consumer Discretionary – 16.9% | ||||||||
Dollar General | ||||||||
3.250%, 04/15/23 | 35,570 | 35,535 | ||||||
Ford Motor Credit | ||||||||
3.350%, 11/01/22 | 11,301 | 11,287 | ||||||
Mattel | ||||||||
3.150%, 03/15/23 | 10,455 | 10,307 | ||||||
Newell Brands | ||||||||
4.100%, 04/01/23 | 50,635 | 50,641 | ||||||
Royal Caribbean Cruises | ||||||||
10.875%, 06/01/23 (a) | 31,201 | 31,923 | ||||||
9.125%, 06/15/23 (a) | 16,175 | 16,478 | ||||||
| 156,171 | ||||||||
Consumer Staples – 5.0% | ||||||||
Albertsons | ||||||||
3.500%, 02/15/23 (a) | 31,112 | 30,804 | ||||||
Chobani | ||||||||
7.500%, 04/15/25 (a) | 16,705 | 15,349 | ||||||
| 46,153 | ||||||||
Energy – 10.4% | ||||||||
Apache | ||||||||
2.625%, 01/15/23 | 19,625 | 19,592 | ||||||
DCP Midstream Operating | ||||||||
3.875%, 03/15/23 | 19,699 | 19,476 | ||||||
Exterran Energy Solutions | ||||||||
8.125%, 05/01/25 | 34,290 | 34,755 | ||||||
Parsley Energy | ||||||||
5.625%, 10/15/27 (a) | 2,299 | 2,363 | ||||||
PBF Logistics | ||||||||
6.875%, 05/15/23 | 12,777 | 12,765 | ||||||
Schlumberger Holdings | ||||||||
3.625%, 12/21/22 (a) | 4,863 | 4,863 | ||||||
W&T Offshore | ||||||||
9.750%, 11/01/23 (a) | 2,400 | 2,355 | ||||||
| 96,169 | ||||||||
Financials – 3.2% | ||||||||
Navient Solutions | ||||||||
0.000%, 10/03/22 (c) | 28,330 | 28,330 | ||||||
StoneX Group | ||||||||
8.625%, 06/15/25 (a) | 1,590 | 1,609 | ||||||
| 29,939 | ||||||||
Health Care – 4.5% | ||||||||
Columbia Care | ||||||||
13.000%, 05/14/23 | 9,870 | 9,870 | ||||||
9.500%, 02/03/26 | 8,000 | 7,969 | ||||||
Trulieve Cannabis | ||||||||
9.750%, 06/18/24 | 23,842 | 22,829 | ||||||
| 40,668 | ||||||||
Industrials – 2.6% | ||||||||
IEA Energy Services | ||||||||
6.625%, 08/15/29 (a) | 8,025 | 7,873 | ||||||
Nielsen Luxembourg S.A.R.L. | ||||||||
5.000%, 02/01/25 (a) | 11,811 | 11,596 | ||||||
Seaspan | ||||||||
6.500%, 02/05/24 (a) | 4,800 | 4,752 | ||||||
| 24,221 | ||||||||
Information Technology – 5.6% | ||||||||
CentralNic Group | ||||||||
8.160%, Euribor 3 Month + 7.000%, 07/03/23 (b) | EUR | 7,250 | 7,111 | |||||
HP | ||||||||
4.750%, 03/01/29 (a) | 15,375 | 15,476 | ||||||
Sprint Communications | ||||||||
6.000%, 11/15/22 | 29,141 | 29,170 | ||||||
| 51,757 | ||||||||
Materials – 3.3% | ||||||||
GCP Applied Technologies | ||||||||
5.500%, 04/15/26 (a) | 2,555 | 2,591 | ||||||
Graphic Packaging International | ||||||||
4.875%, 11/15/22 | 27,407 | 27,406 | ||||||
| 29,997 | ||||||||
The accompanying notes are an integral part of the financial statements.
19
| RiverPark Short Term High Yield Fund |

Description | Face | Value (000) | ||||||
Real Estate – 1.5% | ||||||||
GEO Group | ||||||||
5.125%, 04/01/23 | 8,470 | $ | 8,472 | |||||
Highwoods Realty | ||||||||
3.625%, 01/15/23 | 5,740 | 5,737 | ||||||
| 14,209 | ||||||||
Total Corporate Obligations | ||||||||
(Cost $592,395) (000) | 581,295 | |||||||
Special Purpose Acquisition Companies — 17.0% | ||||||||
Common Stock– 17.0% | ||||||||
Diversified Financials – 17.0% | ||||||||
10X Capital Venture Acquisition III, Cl A * | 206,666 | 2,087 | ||||||
Aequi Acquisition, Cl A * | 654,104 | 6,534 | ||||||
Alpha Partners Technology Merger, Cl A * | 12,808 | 126 | ||||||
Alpha Partners Technology Merger Founder Shares * (e) | 45,106 | 4 | ||||||
Anzu Special Acquisition I, Cl A * | 98,738 | 971 | ||||||
Apeiron Capital Investment, Cl A * | 114,252 | 1,148 | ||||||
Atlantic Coastal Acquisition, Cl A * | 179,019 | 1,758 | ||||||
Atlantic Coastal Acquisition II, Cl A * | 175,000 | 1,754 | ||||||
Ault Disruptive Technologies * | 255,000 | 2,570 | ||||||
AxonPrime Infrastructure Acquisition Founder Shares * (e) | 22,000 | 3 | ||||||
Banyan Acquisition, Cl A * | 50,000 | 500 | ||||||
BGP Acquisition, Cl A * | 4,100 | 40 | ||||||
Biotech Acquisition, Cl A * | 799,001 | 7,930 | ||||||
Blockchain Moon Acquisition * | 5,100 | 51 | ||||||
Bridgetown Holdings, Cl A * | 281,095 | 2,819 | ||||||
C5 Acquisition, Cl A * | 71,039 | 713 | ||||||
Canna-Global Acquisition, Cl A * | 58,214 | 590 | ||||||
Cartesian Growth, Cl A * | 321,503 | 3,186 | ||||||
Climate Real Impact Solutions II Acquisition, Cl A * | 13,439 | 133 | ||||||
Compute Health Acquisition, Cl A * | 464,655 | 4,586 | ||||||
Conx, Cl A * | 159,942 | 1,599 | ||||||
Corner Growth Acquisition, Cl A * | 183,593 | 1,830 | ||||||
Crown PropTech Acquisitions, Cl A * | 822,131 | 8,156 | ||||||
Direct Selling Acquisition, Cl A * | 300,443 | 3,043 | ||||||
Empowerment & Inclusion Capital I, Cl A * | 574,956 | 5,681 | ||||||
Description | Shares | Value (000) | ||||||
Energem * | 47,546 | $ | 483 | |||||
G Squared Ascend I, Cl A * | 110,000 | 1,092 | ||||||
G&P Acquisition, Cl A * | 58,519 | 585 | ||||||
Global Partner Acquisition II, Cl A * | 504,706 | 5,027 | ||||||
GP Bullhound Acquisition I, Cl A * | EUR | 274,873 | 2,678 | |||||
Hambro Perks Acquisition, Cl A * | GBP | 494,686 | 5,524 | |||||
HCM ACQUISITION CORP, Cl A * | 255,000 | 2,576 | ||||||
HIG Acquisition, Cl A * | 200,000 | 2,006 | ||||||
Highland Transcend Partners I, Cl A * | 451,954 | 4,501 | ||||||
Horizon Acquisition II, Cl A * | 40,351 | 404 | ||||||
Iconic Sports Acquisition, Cl A * | 299,695 | 3,039 | ||||||
InFinT Acquisition, Cl A * | 200,000 | 2,028 | ||||||
Innovative International Acquisition, Cl A * | 142,500 | 1,445 | ||||||
INSU Acquisition III, Cl A * | 707,678 | 7,048 | ||||||
Investcorp Europe Acquisition I, Cl A * | 340,000 | 3,448 | ||||||
Kairous Acquisition ltd * | 100,000 | 1,006 | ||||||
Larkspur Health Acquisition, Cl A * | 700,000 | 7,000 | ||||||
Liberty Resources Acquisition, Cl A * | 50,000 | 506 | ||||||
LMF Acquisition Opportunities, Cl A * | 4,509 | 46 | ||||||
Lux Health Tech Acquisition, Cl A * | 194,879 | 1,951 | ||||||
M3-Brigade Acquisition II, Cl A * | 143,007 | 1,403 | ||||||
M3-Brigade Acquisition III, Cl A * | 358,543 | 3,614 | ||||||
Mercato Partners Acquisition, Cl A * | 400,000 | 4,000 | ||||||
Mountain Crest Acquisition V * | 47,909 | 477 | ||||||
North Atlantic Acquisition, Cl A * | 300,000 | 2,984 | ||||||
Onyx Acquisition I, Cl A * | 70,000 | 708 | ||||||
Oyster Enterprises Acquisition, Cl A * | 200,000 | 1,974 | ||||||
Papaya Growth Opportunity I, Cl A * | 175,000 | 1,755 | ||||||
Pioneer Merger, Cl A * | 50,000 | 498 | ||||||
Pontem, Cl A * | 369,859 | 3,676 | ||||||
Relativity Acquisition, Cl A * | 339,941 | 3,423 | ||||||
RMG Acquisition III, Cl A * | 100,000 | 995 | ||||||
Semper Paratus Acquisition, Cl A * | 175,000 | 1,778 | ||||||
Silver Spike Acquisition II, Cl A * | 80,000 | 794 | ||||||
Sizzle Acquisition * | 75,000 | 761 | ||||||
Spree Acquisition 1 * | 702,000 | 7,097 | ||||||
Talon 1 Acquisition, Cl A * | 57,529 | 586 | ||||||
TPG Pace Beneficial Finance, Cl A * | 200,000 | 2,004 | ||||||
TZP Strategies Acquisition, Cl A * | 200,000 | 1,990 | ||||||
The accompanying notes are an integral part of the financial statements.
20
| RiverPark Short Term High Yield Fund |

Description | Shares | Value (000) | ||||||
Vision Sensing Acquisition, Cl A * | 487,960 | $ | 4,948 | |||||
Western Acquisition Ventures * | 157,143 | 1,570 | ||||||
| 157,240 | ||||||||
Rights – 0.0% | ||||||||
Diversified Financials – 0.0% | ||||||||
AIB Acquisition * | 350,000 | 31 | ||||||
Broad Capital Acquisition * | 350,000 | 52 | ||||||
Kairous Acquisition ltd * | 89,501 | 6 | ||||||
Mountain Crest Acquisition V * | 47,909 | 10 | ||||||
| 99 | ||||||||
Warrants – 0.0% | ||||||||
Diversified Financials – 0.0% | ||||||||
Canna-Global Acquisition | ||||||||
11.500%, 02/12/28 * | 58,214 | 1 | ||||||
GP Bullhound Acquisition I | ||||||||
11.500%, 03/14/27 * | EUR | 137,504 | 54 | |||||
Hambro Perks Acquisition | ||||||||
11.500%, 01/07/26 * | GBP | 309,843 | 36 | |||||
| 91 | ||||||||
Total Special Purpose Acquisition Companies | ||||||||
(Cost $157,028) (000) | 157,430 | |||||||
Preferred Stock — 7.7% | ||||||||
Financials – 7.5% | ||||||||
CoBank ACB | ||||||||
6.250%(b) | 632,897 | 63,290 | ||||||
Reinsurance Group of America | ||||||||
7.663%(b) | 230,423 | 5,811 | ||||||
| 69,101 | ||||||||
Utilities – 0.2% | ||||||||
Alabama Power | ||||||||
5.000% | 82,682 | 2,067 | ||||||
Total Preferred Stock | ||||||||
(Cost $71,877) (000) | 71,168 | |||||||
Description | Face | Value (000) | ||||||
Bank Loan Obligations — 5.9% | ||||||||
Communication Services – 0.9% | ||||||||
Gray Television | ||||||||
4.873%, 02/07/24 (d) | 8,774 | $ | 8,741 | |||||
Industrials – 2.5% | ||||||||
Nielsen Finance | ||||||||
4.705%, 10/04/23 (b) | 22,946 | 22,893 | ||||||
Information Technology – 2.5% | ||||||||
Go Daddy Operating Company | ||||||||
4.865%, 02/15/24 (b) (d) | 18,185 | 17,967 | ||||||
MoneyGram Payment, 1st Lien | ||||||||
6.000%, 07/14/26 | 5,238 | 5,118 | ||||||
| 23,085 | ||||||||
Total Bank Loan Obligations | ||||||||
(Cost $54,929) (000) | 54,719 | |||||||
Commercial Paper — 2.7% | ||||||||
Consumer Discretionary – 1.1% | ||||||||
General Motors Financial | ||||||||
3.777%, 11/28/22 (a) (c) | 9,679 | 9,616 | ||||||
Information Technology – 1.6% | ||||||||
Jabil | ||||||||
3.462%, 10/19/22 (a) (c) | 15,000 | 14,969 | ||||||
Total Commercial Paper | ||||||||
(Cost $24,595) (000) | 24,585 | |||||||
Trade Claims — 2.4% | ||||||||
Energy – 2.4% | ||||||||
Brazos Electric Power * | 25,659 | 22,528 | ||||||
Total Trade Claims | ||||||||
(Cost $23,301) (000) | 22,528 | |||||||
Total Investments — 98.6% | ||||||||
(Cost $924,125) (000) | $ | 911,725 | ||||||
The accompanying notes are an integral part of the financial statements.
21
| RiverPark Short Term High Yield Fund |

A list of the open forward foreign currency contracts held by the Fund at September 30, 2022, is as follows (000):
Counterparty | Maturity | Currency | Currency to | Unrealized | ||||||||||||||||||||
Brown Brothers Harriman | 10/04/22 | USD | 1,439 | GBP | 1,250 | $ | (43 | ) | ||||||||||||||||
Brown Brothers Harriman | 10/04/22 | EUR | 38,211 | USD | 38,358 | 910 | ||||||||||||||||||
Brown Brothers Harriman | 10/04/22 | GBP | 6,166 | USD | 7,143 | 257 | ||||||||||||||||||
Brown Brothers Harriman | 10/04/22 | EUR | 3,651 | USD | 3,514 | (64 | ) | |||||||||||||||||
| $ | 1,060 | |||||||||||||||||||||||
The following is a summary of the inputs used as of September 30, 2022 in valuing the Fund’s investments and other financial instruments carried at value (000), in accordance with the authoritative guidance on fair value measurements and disclosure under U.S. GAAP:
Investments in | Level 1 | Level 2 | Level 3 | Total | ||||||||||||
Corporate Obligations | $ | — | $ | 581,295 | $ | — | $ | 581,295 | ||||||||
Special Purpose Acquisition Companies | 157,237 | 186 | 7 | 157,430 | ||||||||||||
Preferred Stock | 7,878 | 63,290 | — | 71,168 | ||||||||||||
Bank Loan Obligations | — | 54,719 | — | 54,719 | ||||||||||||
Commercial Paper | — | 24,585 | — | 24,585 | ||||||||||||
Trade Claims | — | 22,528 | — | 22,528 | ||||||||||||
Total Investments in Securities | $ | 165,115 | $ | 746,603 | $ | 7 | $ | 911,725 | ||||||||
Other Financial | Level 1 | Level 2 | Level 3 | Total | ||||||||||||
Forwards Contracts* | ||||||||||||||||
Unrealized Appreciation | $ | — | $ | 1,167 | $ | — | $ | 1,167 | ||||||||
Unrealized Depreciation | — | (107 | ) | — | (107 | ) | ||||||||||
Total Other Financial Instruments | $ | — | $ | 1,060 | $ | — | $ | 1,060 | ||||||||
* | Forward contracts are valued at the unrealized appreciation (depreciation) on the instrument. See Note 2 in Notes to Financial Statements for additional information. |
The following is a reconciliation of the investments in which significant unobservable inputs (Level 3) were used in determining value (000):
| Special | Trade Claims | Totals | |||||||||
Beginning balance as of October 1, 2021 | $ | — | $ | 23,093 | $ | 23,093 | ||||||
Change in unrealized appreciation/ (depreciation) | 7 | (613 | ) | (606 | ) | |||||||
Realized gain/(loss) | — | — | — | |||||||||
Purchases (and Short Sales, if applicable) | — | — | — | |||||||||
Other capitalized items | — | 48 | 48 | |||||||||
Sales Proceeds (and Buy to Covers, if applicable) | — | — | — | |||||||||
Transfer into Level 3 | — | — | — | |||||||||
Transfer out of Level 3 | — | (22,528 | )(f) | (22,528 | )(f) | |||||||
Ending balance as of September 30, 2022 | $ | 7 | $ | — | $ | 7 | ||||||
Net change in Unrealized appreciation/ (depreciation) included in the Statements of Operations attributable to Level 3 investments held at September 30, 2022 | $ | 7 | $ | — | $ | 7 | ||||||
‡ | In U.S. Dollar unless otherwise indicated. |
Percentages are based on Net Assets of $924,890 (000). |
* | Non-income producing security. |
(a) | Securities sold within terms of a private placement memorandum, exempt from registration under Section 144A of the Securities Act of 1933, as amended, and may be sold only to dealers in that program or other “accredited investors.” These securities have been determined to be liquid under guidelines established by the Board of Trustees. At September 30, 2022, these securities amounted to $249,329 (000) or 27.0% of Net Assets. |
(b) | Variable or floating rate security. The rate shown is the effective interest rate as of period end. The rates for certain securities are not based on published reference rates and spreads and are either determined by the issuer or agent based on current market conditions; by using a formula based on the rates of underlying loans; or by adjusting periodically based on prevailing interest rates. |
(c) | Zero coupon security. The rate reported on the Schedule of Investments is the effective yield at the time purchase. |
(d) | Unsettled bank loan. Interest rate may not be available. |
(e) | Level 3 security in accordance with fair value hierarchy. |
(f) | Towards the close of the fiscal year-end, an observable settlement price became available on the Brazos Trade Claims position. The transfers out of Level 3 are recorded as of the end of the reporting period. |
Cl — Class
EUR — Euro
EURIBOR — Euro London Interbank Offered Rate
GBP — Great British Pound Sterling
ICE — Intercontinental Exchange
LIBOR — London Interbank Offered Rate
Ltd. — Limited
USD — U.S. Dollar
The accompanying notes are an integral part of the financial statements.
22
| RiverPark Short Term High Yield Fund |

The following table summarizes the quantitative inputs and assumptions used for items categorized as material Level 3 investments as of September 30, 2022. The following disclosures also include qualitative information on the sensitivity of the fair value measurements to changes in the significant unobservable inputs.
Assets | Fair Value at | Valuation Technique | Unobservable Input | Range |
Special Purpose Acquistion | ||||
Alpha Partners Tech Merger Founder Shares | $ 4 | Market Approach | Implied pricing using the underlying warrants | $0.0950 |
Special Purpose Acquistion | ||||
AxonPrime Infrastructure Acquisition Founder Shares | $ 3 | Market Approach | Implied pricing using the underlying warrants | $0.1473 |
The unobservable inputs used to determine fair value of recurring Level 3 assets may have similar or diverging impacts on valuation. Significant increases and decreases in these inputs in isolation and interrelationships between those inputs could result in significantly higher or lower fair value measurement.
Amounts designated as “—’’ are $0 or have been rounded to $0.
The accompanying notes are an integral part of the financial statements.
23
| RiverPark Long/Short Opportunity Fund September 30, 2022 |

Description | Shares | Value (000) | ||||||
Schedule of Investments | ||||||||
Common Stock — 92.4%** | ||||||||
Communication Services – 21.2% | ||||||||
Alphabet, Cl A * | 31,226 | $ | 2,987 | |||||
Alphabet, Cl C * | 31,038 | 2,984 | ||||||
Meta Platforms, Cl A *(a) | 10,923 | 1,482 | ||||||
Netflix * | 13,876 | 3,267 | ||||||
Pinterest, Cl A * | 141,165 | 3,289 | ||||||
Snap, Cl A * | 274,473 | 2,695 | ||||||
Walt Disney * | 29,487 | 2,782 | ||||||
| 19,486 | ||||||||
Consumer Discretionary – 11.7% | ||||||||
Amazon.com * | 51,168 | 5,782 | ||||||
Booking Holdings * | 1,670 | 2,744 | ||||||
Nike, Cl B | 26,856 | 2,232 | ||||||
| 10,758 | ||||||||
Financials – 8.9% | ||||||||
Blackstone, Cl A (b) | 70,216 | 5,877 | ||||||
KKR | 53,425 | 2,297 | ||||||
| 8,174 | ||||||||
Health Care – 4.5% | ||||||||
Illumina * | 9,296 | 1,774 | ||||||
Intuitive Surgical * | 12,660 | 2,373 | ||||||
| 4,147 | ||||||||
Industrials – 4.6% | ||||||||
Uber Technologies * | 160,206 | 4,246 | ||||||
Information Technology – 41.5% (Note 7) | ||||||||
Adobe * | 6,174 | 1,699 | ||||||
Adyen ADR * | 165,670 | 2,074 | ||||||
Apple | 31,759 | 4,389 | ||||||
Autodesk *(a) | 14,998 | 2,802 | ||||||
Five9 * | 26,494 | 1,986 | ||||||
Intuit | 6,029 | 2,335 | ||||||
Mastercard, Cl A (a) | 11,746 | 3,340 | ||||||
Microsoft | 24,279 | 5,655 | ||||||
NVIDIA (a) | 8,692 | 1,055 | ||||||
PayPal Holdings * | 34,941 | 3,007 | ||||||
RingCentral, Cl A *(a) | 3,603 | 144 | ||||||
ServiceNow * | 6,323 | 2,388 | ||||||
Shopify, Cl A * | 86,253 | 2,324 | ||||||
Twilio, Cl A *(a) | 30,780 | 2,128 | ||||||
Visa, Cl A | 11,224 | 1,994 | ||||||
Workday, Cl A *(a) | 5,592 | 851 | ||||||
| 38,171 | ||||||||
Total Common Stock | ||||||||
(Cost $86,519) (000) | 84,982 | |||||||
Total Investments — 92.4% | ||||||||
(Cost $86,519) (000) | $ | 84,982 | ||||||
The accompanying notes are an integral part of the financial statements.
24
| RiverPark Long/Short Opportunity Fund |

A list of open swap agreements held by the Fund at September 30, 2022 was as follows:
Long Exposure | ||||||||||||||||||||||
Company Reference | Counterparty | Fund Pays | Payment | Maturity | Notional | Value | Net | |||||||||||||||
Autodesk | Goldman Sachs International | USD-SOFR + 0.61% | Maturity | 12/29/2022 | $ | 83 | $ | 59 | $ | (24 | ) | |||||||||||
Charles Schwab | Goldman Sachs International | USD-SOFR + 0.61% | Maturity | 03/30/2023 | 5,561 | 4,896 | (665 | ) | ||||||||||||||
MasterCard, Class A | Goldman Sachs International | USD-SOFR + 0.61% | Maturity | 06/07/2023 | 1,252 | 1,000 | (252 | ) | ||||||||||||||
Meta Platforms, Class A | Goldman Sachs International | USD-SOFR + 0.61% | Maturity | 10/30/2023 | 930 | 925 | (5 | ) | ||||||||||||||
NVIDIA | Goldman Sachs International | USD-SOFR + 0.61% | Maturity | 03/28/2023 | 1,834 | 999 | (835 | ) | ||||||||||||||
RingCentral, Class A | Goldman Sachs International | USD-SOFR + 0.61% | Maturity | 01/19/2023 | 11,766 | 2,430 | (9,336 | ) | ||||||||||||||
Twilio, Class A | Goldman Sachs International | USD-SOFR + 0.61% | Maturity | 03/15/2023 | 1,613 | 569 | (1,044 | ) | ||||||||||||||
Workday, Class A | Goldman Sachs International | USD-SOFR + 0.61% | Maturity | 09/28/2023 | 1,197 | 1,089 | (108 | ) | ||||||||||||||
| $ | 24,236 | $ | 11,967 | $ | (12,269 | ) | ||||||||||||||||
Short Exposure | |||||||||||||||||||||||||||||||
Company Reference | Counterparty | Fund | Fund | Payment | Maturity Date | Notional | Value | Net | |||||||||||||||||||||||
American Airlines Group | Goldman Sachs International | USD-SOFR | -0.50% | Maturity | 07/19/2023 | $ | (508 | ) | $ | (460 | ) | $ | 48 | ||||||||||||||||||
Boston Properties | Goldman Sachs International | USD-SOFR | -0.50% | Maturity | 08/15/2023 | (950 | ) | (825 | ) | 125 | |||||||||||||||||||||
Clorox | Goldman Sachs International | USD-SOFR | -0.50% | Maturity | 03/27/2023 | (699 | ) | (615 | ) | 84 | |||||||||||||||||||||
Conagra Brands | Goldman Sachs International | USD-SOFR | -0.50% | Maturity | 02/07/2023 | (650 | ) | (648 | ) | 2 | |||||||||||||||||||||
Delta Air Lines | Goldman Sachs International | USD-SOFR | -0.50% | Maturity | 07/19/2023 | (510 | ) | (462 | ) | 48 | |||||||||||||||||||||
Flex Ltd. | Goldman Sachs International | USD-SOFR | -0.50% | Maturity | 04/12/2023 | (646 | ) | (698 | ) | (52 | ) | ||||||||||||||||||||
Harley-Davidson | Goldman Sachs International | USD-SOFR | -0.50% | Maturity | 09/07/2023 | (729 | ) | (659 | ) | 70 | |||||||||||||||||||||
Industrial Select Sector SPDR | Goldman Sachs International | USD-SOFR | -0.50% | Maturity | 06/22/2023 | (3,164 | ) | (2,780 | ) | 384 | |||||||||||||||||||||
iShares MSCI Eurozone ETF | Goldman Sachs International | USD-SOFR | -0.88% | Maturity | 09/12/2023 | (3,323 | ) | (2,816 | ) | 507 | |||||||||||||||||||||
Kimberly-Clark | Goldman Sachs International | USD-SOFR | -0.50% | Maturity | 06/22/2023 | (631 | ) | (568 | ) | 63 | |||||||||||||||||||||
Match Group | Goldman Sachs International | USD-SOFR | -0.50% | Maturity | 09/27/2023 | (568 | ) | (462 | ) | 106 | |||||||||||||||||||||
MGM Resorts International | Goldman Sachs International | USD-SOFR | -0.50% | Maturity | 06/22/2023 | (525 | ) | (466 | ) | 59 | |||||||||||||||||||||
Mondelez International | Goldman Sachs International | USD-SOFR | -0.50% | Maturity | 01/12/2023 | (671 | ) | (606 | ) | 65 | |||||||||||||||||||||
Paramount Global, Class B | Goldman Sachs International | USD-SOFR | -0.50% | Maturity | 09/07/2023 | (861 | ) | (681 | ) | 180 | |||||||||||||||||||||
RH | Goldman Sachs International | USD-SOFR | -0.50% | Maturity | 10/17/2023 | (740 | ) | (693 | ) | 47 | |||||||||||||||||||||
Roku | Goldman Sachs International | USD-SOFR | -0.50% | Maturity | 10/18/2023 | (506 | ) | (400 | ) | 106 | |||||||||||||||||||||
SPDR S&P Homebuilders ETF | Goldman Sachs International | USD-SOFR | -1.33% | Maturity | 07/17/2023 | (3,137 | ) | (2,827 | ) | 310 | |||||||||||||||||||||
Squarespace | Goldman Sachs International | USD-SOFR | -0.50% | Maturity | 08/16/2023 | (883 | ) | (908 | ) | (25 | ) | ||||||||||||||||||||
Stericycle | Goldman Sachs International | USD-SOFR | -0.50% | Maturity | 09/21/2023 | (864 | ) | (684 | ) | 180 | |||||||||||||||||||||
United Airlines Holdings | Goldman Sachs International | USD-SOFR | -0.50% | Maturity | 07/19/2023 | (499 | ) | (452 | ) | 47 | |||||||||||||||||||||
Vornado Realty Trust | Goldman Sachs International | USD-SOFR | -0.50% | Maturity | 08/15/2023 | (668 | ) | (552 | ) | 116 | |||||||||||||||||||||
Walmart | Goldman Sachs International | USD-SOFR | -0.50% | Maturity | 10/18/2023 | (766 | ) | (752 | ) | 14 | |||||||||||||||||||||
Wynn Resorts, Ltd. | Goldman Sachs International | USD-SOFR | -0.50% | Maturity | 06/22/2023 | (666 | ) | (661 | ) | 5 | |||||||||||||||||||||
Zoom Video Communications, Class A | Goldman Sachs International | USD-SOFR | -0.50% | Maturity | 09/28/2023 | (836 | ) | (759 | ) | 77 | |||||||||||||||||||||
| $ | (24,000 | ) | $ | (21,434 | ) | $ | 2,566 | ||||||||||||||||||||||||
1 | The payment frequency is the maturity date of each swap contract or the settlement date of a closing transaction, whichever comes first. |
† | Inclusive of accrued dividends and interest related to Total Return Swaps. |
The accompanying notes are an integral part of the financial statements.
25
| RiverPark Long/Short Opportunity Fund |

The following is a summary of the inputs used as of September 30, 2022 in valuing the Fund’s investments and other financial instruments carried at value (000), in accordance with the authoritative guidance on fair value measurements and disclosure under U.S. GAAP:
Investments in | Level 1 | Level 2 | Level 3 | Total | ||||||||||||
Common Stock | $ | 84,982 | $ | — | $ | — | $ | 84,982 | ||||||||
Total Investments in Securities | $ | 84,982 | $ | — | $ | — | $ | 84,982 | ||||||||
Other Financial | Level 1 | Level 2 | Level 3 | Total | ||||||||||||
Equity Swaps‡ | ||||||||||||||||
Appreciation | $ | — | $ | 2,643 | $ | — | $ | 2,643 | ||||||||
Depreciation | — | (12,346 | ) | — | (12,346 | ) | ||||||||||
Total Other Financial Instruments | $ | — | $ | (9,703 | ) | $ | — | $ | (9,703 | ) | ||||||
‡ | Equity Swaps are valued at the unrealized appreciation (depreciation) on the instrument. |
Percentages are based on Net Assets of $91,928 (000). |
* | Non-income producing security. |
** | More narrow industries are utilized for compliance purposes, whereas broad sectors are utilized for reporting purposes. |
(a) | Underlying security for a Total Return Swap. |
(b) | This security or a partial position of this security has been committed as collateral for Total Return Swaps. The aggregate market value of the collateral as of September 30, 2022 was $5,269(000). |
Cl — Class
ETF — Exchange Traded Fund
MSCI — Morgan Stanley Capital International
SOFR — Secured Overnight Financing Rate
SPDR — Standard & Poor’s Depositary Receipt
S&P — Standard & Poor’s
USD — United States Dollar
Amounts designated as “— “ are $0 or rounded to $0.
The accompanying notes are an integral part of the financial statements.
26
| RiverPark Strategic Income Fund September 30, 2022 |

Description |
| Face | Value (000) | ||||||
Schedule of Investments | |||||||||
Corporate Obligations — 43.0% | |||||||||
Communication Services – 6.4% | |||||||||
CCO Holdings | |||||||||
4.000%, 03/01/23 (a) | 981 | $ | 977 | ||||||
Clear Channel International BV | |||||||||
6.625%, 08/01/25 (a) | 2,090 | 1,944 | |||||||
Connect Finco SARL | |||||||||
6.750%, 10/01/26 (a) | 2,422 | 2,122 | |||||||
Getty Images | |||||||||
9.750%, 03/01/27 (a) | 2,568 | 2,553 | |||||||
Linkem | |||||||||
7.193%, Euribor 3 Month + 6.000%, 11/09/22 (a) (b) | EUR | 4,657 | 4,553 | ||||||
| 12,149 | |||||||||
Consumer Discretionary – 5.1% | |||||||||
99 Escrow Issuer | |||||||||
7.500%, 01/15/26 (a) | 4,193 | 2,440 | |||||||
Anagram International | |||||||||
15.000%cash/0% PIK, 08/15/25 (a) | 1,592 | 1,618 | |||||||
Georg Jensen | |||||||||
6.321%, Euribor 3 Month + 6.000%, 05/15/23 (b) | EUR | 1,000 | 956 | ||||||
G-III Apparel Group | |||||||||
7.875%, 08/15/25 (a) | 588 | 534 | |||||||
Hercules Achievement | 554 | 526 | |||||||
11.674%, ICE LIBOR USD 3 Month + 8.000%, 12/22/24 (a) (b) | |||||||||
Jacktel | 800 | 680 | |||||||
10.000%, 12/04/23 (a) | 452 | 454 | |||||||
10.000%, 12/04/23 | |||||||||
Lifefit Group Midco GmbH | EUR | 1,160 | 1,134 | ||||||
7.500%, Euribor 3 Month + 7.500%, 07/26/23 (b) | |||||||||
MHH Holding BV | |||||||||
9.912%, ICE LIBOR USD 3 Month + 7.000%, 02/10/25 (b) | 1,292 | 1,308 | |||||||
| 9,650 | |||||||||
Consumer Staples – 1.4% | |||||||||
Chobani | |||||||||
7.500%, 04/15/25 (a) (c) | 2,591 | 2,381 | |||||||
United Natural Foods | |||||||||
6.750%, 10/15/28 (a) | 250 | 229 | |||||||
| 2,610 | |||||||||
Energy – 8.6% | |||||||||
Golar LNG | |||||||||
7.000%, 10/20/25 (a) | 4,817 | 4,595 | |||||||
Greenfire Resources | |||||||||
12.000%, 08/15/25 (a) | 1,615 | 1,718 | |||||||
International Petroleum | |||||||||
7.250%, 02/01/27 (a) | 3,132 | 2,874 | |||||||
Martin Midstream Partners | |||||||||
11.500%, 02/28/25 (a) | 1,838 | 1,797 | |||||||
10.000%, 02/29/24 (a) | 3,457 | 3,476 | |||||||
Mime Petroleum | |||||||||
10.250%, 11/10/26 | 550 | 492 | |||||||
Shelf Drilling North Sea Holdings | |||||||||
10.250%, 10/31/25 (a) | 1,343 | 1,327 | |||||||
| 16,279 | |||||||||
Financials – 3.3% | |||||||||
Aker Horizons | |||||||||
5.530%, NIBOR 3 Month + 3.250%, 08/15/25 (b) | NOK | 8,500 | 705 | ||||||
LR Global Holding GmbH | |||||||||
7.832%, Euribor 3 Month + 7.250%, 02/03/25 (b) | EUR | 2,129 | 1,800 | ||||||
StoneX Group | |||||||||
8.625%, 06/15/25 (a) (c) | 3,653 | 3,697 | |||||||
| 6,202 | |||||||||
The accompanying notes are an integral part of the financial statements.
27
| RiverPark Strategic Income Fund |

Description |
| Face | Value (000) | |||||||||
Health Care – 2.7% | ||||||||||||
Columbia Care | ||||||||||||
9.500%, 02/03/26 | 5,068 | $ | 5,048 | |||||||||
Industrials – 11.0% | ||||||||||||
Altera Shuttle Tankers | ||||||||||||
9.500%, 12/15/25 | 2,700 | 2,376 | ||||||||||
FXI Holdings | ||||||||||||
12.250%, 11/15/26 (a) | 2,331 | 1,853 | ||||||||||
Hawaiian Airlines Pass-Through Certificates, Ser 2013-1, Cl A | ||||||||||||
3.900%, 01/15/26 | 4,196 | 3,486 | ||||||||||
Icahn Enterprises | ||||||||||||
4.750%, 09/15/24 | 191 | 179 | ||||||||||
IEA Energy Services | ||||||||||||
6.625%, 08/15/29 (a) | 5,244 | 5,145 | ||||||||||
Innovate | ||||||||||||
8.500%, 02/01/26 (a) (c) | 5,773 | 4,243 | ||||||||||
Nielsen Finance | ||||||||||||
5.625%, 10/01/28 (a) | 1,096 | 1,090 | ||||||||||
Nielsen Luxembourg S.A.R.L. | ||||||||||||
5.000%, 02/01/25 (a) | 446 | 438 | ||||||||||
StorCentric Peleus Insurance Co | ||||||||||||
5.875%, 02/19/23 (a) (d) | 844 | 838 | ||||||||||
XPO CNW | ||||||||||||
6.700%, 05/01/34 | 1,235 | 1,149 | ||||||||||
| 20,797 | ||||||||||||
Information Technology – 0.8% | ||||||||||||
Azerion Holding BV | ||||||||||||
7.250%, 04/28/24 | EUR | 500 | 484 | |||||||||
Duett Software Group | ||||||||||||
6.720%, NIBOR 3 Month + 5.000%, 04/12/26 (b) | NOK | 4,589 | 409 | |||||||||
LINK Mobility Group Holding | ||||||||||||
3.375%, 12/15/25 | EUR | 800 | 611 | |||||||||
| 1,504 | ||||||||||||
Materials – 3.5% | ||||||||||||
Copper Mountain Mining | ||||||||||||
8.000%, 04/09/26 (a) | 3,902 | 3,411 | ||||||||||
Impala BondCo | ||||||||||||
10.217%, STIBOR SEK 3-Month + 9.000%, 10/20/24 (b) | SEK | 7,500 | 659 | |||||||||
Description |
| Face | Value (000) | |||||||||
Tacora Resources | ||||||||||||
8.250%, 05/15/26 (a) | 2,777 | $ | 2,372 | |||||||||
| 6,442 | ||||||||||||
Utilities – 0.2% | ||||||||||||
WEC Energy Group | ||||||||||||
5.000%, 09/27/25 | 336 | 335 | ||||||||||
Total Corporate Obligations | ||||||||||||
(Cost $90,040) (000) | 81,016 | |||||||||||
Commercial Paper — 12.1% | ||||||||||||
Arrow Electronics | ||||||||||||
10/05/22 (a) (e) | 3,239 | 3,237 | ||||||||||
Constellation Brands | ||||||||||||
10/24/22 (a) (e) | 3,241 | 3,233 | ||||||||||
Crown Castle | ||||||||||||
10/19/22 (a) (e) | 3,340 | 3,334 | ||||||||||
Fortune Brands Home & Security | ||||||||||||
10/03/22 (a) (e) | 2,000 | 1,999 | ||||||||||
General Motors Financial | ||||||||||||
11/15/22 (a) (e) | 3,467 | 3,450 | ||||||||||
Jabil | ||||||||||||
10/28/22 (a) (e) | 3,017 | 3,008 | ||||||||||
Nutrien | ||||||||||||
11/15/22 (a) (e) | 3,017 | 3,003 | ||||||||||
Rogers Communications | ||||||||||||
11/04/22 (a) (e) | 1,593 | 1,587 | ||||||||||
| 22,851 | ||||||||||||
Total Commercial Paper | ||||||||||||
(Cost $22,853) (000) | 22,851 | |||||||||||
Special Purpose Acquisition Companies — 9.5% | ||||||||||||
Common Stock — 9.5% | ||||||||||||
Diversified Financials – 9.5% | ||||||||||||
Alpha Partners Technology Merger Founder Shares * (f) | 8,594 | 1 | ||||||||||
Atlas Crest Investment II, Cl A * | 181,558 | 1,789 | ||||||||||
AxonPrime Infrastructure Acquisition Founder Shares * (f) | 4,000 | 1 | ||||||||||
Berenson Acquisition Founder Shares * (f) | 12,570 | 1 | ||||||||||
BGP Acquisition, Cl A * | 100,793 | 992 | ||||||||||
Biote Founder Shares * | 187,945 | 804 | ||||||||||
Bright Lights Acquisition, Cl A * | 91,491 | 907 | ||||||||||
The accompanying notes are an integral part of the financial statements.
28
| RiverPark Strategic Income Fund |

Description |
| Shares | Value (000) | |||||||||
Carney Technology Acquisition II, Cl A * | 200,449 | $ | 1,994 | |||||||||
Climate Real Impact Solutions II Acquisition, Cl A * | 227,469 | 2,243 | ||||||||||
DHB Capital, Cl A * | 5,295 | 52 | ||||||||||
ESM Acquisition, Cl A * | 53,973 | 535 | ||||||||||
Financials Acquisition, Cl A * | GBP | 64,486 | 718 | |||||||||
Frontier Acquisition, Cl A * | 175,000 | 1,734 | ||||||||||
G&P Acquisition, Cl A * | 14,087 | 141 | ||||||||||
Iconic Sports Acquisition, Cl A * | 91,450 | 927 | ||||||||||
LMF Acquisition Opportunities, Cl A * | 8,731 | 90 | ||||||||||
Mason Industrial Technology, Cl A * | 277,191 | 2,716 | ||||||||||
Parabellum Acquisition Founder Shares * (f) | 19,671 | 1 | ||||||||||
Revelstone Capital Acquisition Founder Shares * (f) | 5,925 | 1 | ||||||||||
Tekkorp Digital Acquisition, Cl A * | 70,000 | 701 | ||||||||||
Trine II Acquisition, Cl A * | 15,733 | 158 | ||||||||||
Vector Acquisition II, Cl A * | 35,637 | 354 | ||||||||||
Williams Rowland Acquisition * | 103,582 | 1,044 | ||||||||||
| 17,904 | ||||||||||||
Warrant – 0.0% | ||||||||||||
Diversified Financials – 0.0% | ||||||||||||
DHB Capital, Cl A | ||||||||||||
11.500%, 03/18/28 * | 1,765 | — | ||||||||||
Financials Acquisition | ||||||||||||
11.500%, 04/07/27 * | GBP | 33,086 | 1 | |||||||||
OmniLit Acquisition, Cl A | ||||||||||||
11.500%, 11/11/26 * | 3,804 | — | ||||||||||
| 1 | ||||||||||||
Total Special Purpose Acquisition Companies | ||||||||||||
(Cost $17,008) (000) | 17,905 | |||||||||||
Description |
| Face | Value (000) | |||||||||
Bank Loan Obligations — 9.1% | ||||||||||||
Consumer Discretionary – 5.2% | ||||||||||||
First Brands Group, LLC, Initial Term Loan, 2nd Lien | ||||||||||||
11.871%, LIBOR + 8.500%, 03/30/28 | 3,393 | $ | 3,232 | |||||||||
Monitronics International, Inc., Loan, 1st Lien | ||||||||||||
10.306%, LIBOR + 0.065%, 03/29/24 | 1,828 | 1,208 | ||||||||||
Mountaineer Merger Corporation, Initial Term Loan, 1st Lien | ||||||||||||
9.788%, 10/26/28 (b) | 3,835 | 3,126 | ||||||||||
Rising Tide, Term Loan, Inital Term Loan, 2nd Lien | ||||||||||||
10.774%, LIBOR + 8.250%, 06/01/29 (b) | 2,786 | 2,173 | ||||||||||
| 9,739 | ||||||||||||
Energy – 0.3% | ||||||||||||
Quaternorth Energy Hold, Term Loan, 2nd Lien | ||||||||||||
11.115%, 08/27/26 | 611 | 607 | ||||||||||
Health Care – 2.6% | ||||||||||||
GemmaCert, Term Loan | ||||||||||||
9.000%, 05/19/24 (f) | 439 | 342 | ||||||||||
Inotiv Inc., Delayed Draw, Term Loan, 1st Lien | ||||||||||||
7.825%, 11/05/26 (g) | 1,258 | 1,207 | ||||||||||
Inotiv Inc., Term Loan, 1st Lien | ||||||||||||
9.320%, 11/05/26 (b) | 3,497 | 3,357 | ||||||||||
| 4,906 | ||||||||||||
Materials – 1.0% | ||||||||||||
Elevate Textiles, Inc., Initial Term Loan, 1st Lien | ||||||||||||
7.277%, 05/01/24 (b) | 1,110 | 855 | ||||||||||
Real Alloy Holding, Term Loan, 1st Lien | ||||||||||||
13.674%, LIBOR + 0.000%, 12/31/49 (f) | 1,098 | 1,098 | ||||||||||
| 1,953 | ||||||||||||
Total Bank Loan Obligations | ||||||||||||
(Cost $19,138) (000) | 17,205 | |||||||||||
The accompanying notes are an integral part of the financial statements.
29
| RiverPark Strategic Income Fund |

Description |
| Face | Value (000) | |||||||||
Convertible Bonds — 5.0% | ||||||||||||
Communication Services – 4.2% | ||||||||||||
BuzzFeed | ||||||||||||
8.500%, 12/03/26 (a) (f) | 5,400 | $ | 4,104 | |||||||||
Leafly Holdings | ||||||||||||
8.000%, 01/31/25 (f) | 4,163 | 3,872 | ||||||||||
| 7,976 | ||||||||||||
Health Care – 0.8% | ||||||||||||
UpHealth | ||||||||||||
6.250%, 06/15/26 (a) | 4,592 | 1,429 | ||||||||||
Total Convertible Bonds | ||||||||||||
(Cost $14,122) (000) | 9,405 | |||||||||||
Trade Claims — 2.7% | ||||||||||||
Energy – 2.7% | ||||||||||||
Brazos Electric Power * | 5,778 | 5,073 | ||||||||||
Total Trade Claims | ||||||||||||
(Cost $5,247) (000) | 5,073 | |||||||||||
Preferred Stock — 2.2% | ||||||||||||
Consumer Discretionary – 1.3% | ||||||||||||
Fossil Group | ||||||||||||
7.000% | 140,113 | 2,312 | ||||||||||
Garrett Motion* | ||||||||||||
11.000%* | 11,292 | 80 | ||||||||||
| 2,392 | ||||||||||||
Financials – 0.9% | ||||||||||||
Argo Blockchain | ||||||||||||
8.750% | 70,802 | 1,125 | ||||||||||
Saratoga Investment | ||||||||||||
6.000% | 25,091 | 604 | ||||||||||
| 1,729 | ||||||||||||
Total Preferred Stock | ||||||||||||
(Cost $5,946) (000) | 4,121 | |||||||||||
Description |
| Shares/ | Value (000) | |||||||||
Common Stock — 1.8% | ||||||||||||
Communication Services – 0.2% | ||||||||||||
KORE Group Holdings * | 32,156 | $ | 61 | |||||||||
Verizon Communications | 8,423 | 320 | ||||||||||
| 381 | ||||||||||||
Energy – 0.1% | ||||||||||||
QuarterNorth Energy * | 1,821 | 219 | ||||||||||
Health Care – 0.2% | ||||||||||||
Biote, Cl A * | 81,291 | 348 | ||||||||||
Industrials – 0.0% | ||||||||||||
Monitronics International * | 208,000 | 52 | ||||||||||
Information Technology – 0.0% | ||||||||||||
MarketWise * | 1,779 | 4 | ||||||||||
Materials – 1.1% | ||||||||||||
RA Parent * (f) | 33 | 2,131 | ||||||||||
Real Estate – 0.2% | ||||||||||||
Alpine Income Property Trust | 15,492 | 251 | ||||||||||
Total Common Stock | ||||||||||||
(Cost $3,931) (000) | 3,386 | |||||||||||
Warrants — 0.0% | ||||||||||||
Communication Services – 0.0% | ||||||||||||
Leafly Holdings * | ||||||||||||
Expires 11/10/2026, Strike Price 11.50 | 21,228 | 4 | ||||||||||
Energy – 0.0% | ||||||||||||
Mcdermott International * | ||||||||||||
Expires 6/30/2027, Strike Price 12.33 | 258,269 | 2 | ||||||||||
Mcdermott International * | ||||||||||||
Expires 6/30/2027, Strike Price 15.98 | 286,965 | 3 | ||||||||||
| 5 | ||||||||||||
Health Care – 0.0% | ||||||||||||
GemmaCert (f) | ||||||||||||
Expires 5/19/2024# | 21,135 | — | ||||||||||
Total Warrants | ||||||||||||
(Cost $153) (000) | 9 | |||||||||||
The accompanying notes are an integral part of the financial statements.
30
| RiverPark Strategic Income Fund |

Description |
| Face | Value (000) | |||||||||
Purchased Option — 0.0% | ||||||||||||
Total Purchased Option | ||||||||||||
(Cost $17) (000) | $ | 21 | ||||||||||
Total Investments — 85.4% | ||||||||||||
(Cost $178,455) (000) | $ | 160,992 | ||||||||||
Securities Sold Short, Not Yet Purchased | ||||||||||||
Corporate Obligations — (1.2)% | ||||||||||||
Consumer Staples – (0.5)% | ||||||||||||
Conagra Brands | ||||||||||||
7.125%, 10/01/26 | (1,000 | ) | $ | (1,046 | ) | |||||||
Financials – (0.6)% | ||||||||||||
FS Energy and Power Fund | ||||||||||||
7.500%, 08/15/23 (a) | (1,060 | ) | (1,060 | ) | ||||||||
Health Care – (0.1)% | ||||||||||||
McKesson | ||||||||||||
3.950%, 02/16/28 | (280 | ) | (263 | ) | ||||||||
Total Corporate Obligations | ||||||||||||
(Proceeds $2,617) (000) | (2,369 | ) | ||||||||||
Total Securities Sold Short, Not Yet Purchased | ||||||||||||
(Proceeds $2,617) (000) | $ | (2,369 | ) | |||||||||
Written Options — (0.2)% | ||||||||||||
Total Written Options | ||||||||||||
(Premiums Received $263) (000) | $ | (347 | ) | |||||||||
A list of the open forward foreign currency contracts held by the Fund at September 30, 2022, is as follows (000):
Counterparty | Maturity | Currency | Currency to | Unrealized | ||||||||||||||||||||
Brown Brothers Harriman | 10/04/22 | SEK | 7,519 | USD | 703 | $ | 25 | |||||||||||||||||
Brown Brothers Harriman | 10/04/22 | EUR | 9,885 | USD | 9,923 | 235 | ||||||||||||||||||
Brown Brothers Harriman | 10/04/22 | GBP | 637 | USD | 738 | 27 | ||||||||||||||||||
Brown Brothers Harriman | 10/04/22 | NOK | 12,596 | USD | 1,265 | 108 | ||||||||||||||||||
| $ | 395 | |||||||||||||||||||||||
A list of the open option contracts held by the Fund at September 30, 2022 was as follows (000):
Description | Number | Notional | Exercise | Expiration | Value | |||||||||||||||
PURCHASED OPTION — 0.0% | ||||||||||||||||||||
Put Options | ||||||||||||||||||||
Diebold Nixdorf* | 531 | $ | 130 | $ | 2.50 | 11/18/22 | $ | 21 | ||||||||||||
Total Purchased Option | ||||||||||||||||||||
(Cost $17) (000) | $ | 130 | $ | 21 | ||||||||||||||||
WRITTEN OPTIONS — (0.2)% | ||||||||||||||||||||
Put Options | ||||||||||||||||||||
iShares iBoxx $ High Yield Corporate Bond ETF* | (168 | ) | $ | (1,199 | ) | $ | 70.00 | 12/16/22 | $ | (35 | ) | |||||||||
iShares iBoxx $ High Yield Corporate Bond ETF* | (332 | ) | (2,370 | ) | 75.00 | 10/21/22 | (133 | ) | ||||||||||||
iShares iBoxx $ High Yield Corporate Bond ETF* | (334 | ) | (2,385 | ) | 75.00 | 11/18/22 | (150 | ) | ||||||||||||
| (5,954 | ) | (318 | ) | |||||||||||||||||
Call Options | ||||||||||||||||||||
Diebold Nixdorf* | (354 | ) | (86 | ) | 5.00 | 11/18/22 | (3 | ) | ||||||||||||
iShares iBoxx $ High Yield Corporate Bond ETF* | (332 | ) | (2,370 | ) | 77.00 | 10/21/22 | (1 | ) | ||||||||||||
iShares iBoxx $ High Yield Corporate Bond ETF* | (334 | ) | (2,384 | ) | 77.00 | 11/18/22 | (3 | ) | ||||||||||||
iShares iBoxx $ High Yield Corporate Bond ETF* | (252 | ) | (1,800 | ) | 73.00 | 11/18/22 | (22 | ) | ||||||||||||
| (6,640 | ) | (29 | ) | |||||||||||||||||
Total Written Options | ||||||||||||||||||||
(Premiums Received $263) (000) | $ | (12,594 | ) | $ | (347 | ) | ||||||||||||||
The accompanying notes are an integral part of the financial statements.
31
| RiverPark Strategic Income Fund |

The following is a summary of the inputs used as of September 30, 2022 in valuing the Fund’s investments, securities sold short, not yet purchased, and other financial instruments carried at value (000), in accordance with the authoritative guidance on fair value measurements and disclosure under U.S. GAAP:
Investments in | Level 1 | Level 2 | Level 3 | Total | ||||||||||||
Corporate Obligations | $ | — | $ | 81,016 | $ | — | $ | 81,016 | ||||||||
Commercial Paper | — | 22,851 | — | 22,851 | ||||||||||||
Special Purpose Acquisition Companies | 17,095 | 805 | 5 | 17,905 | ||||||||||||
Bank Loan Obligations | — | 15,765 | 1,440 | 17,205 | ||||||||||||
Convertible Bonds | — | 1,429 | 7,976 | 9,405 | ||||||||||||
Trade Claims | — | 5,073 | — | 5,073 | ||||||||||||
Preferred Stock | 3,437 | 684 | — | 4,121 | ||||||||||||
Common Stock | 984 | 271 | 2,131 | 3,386 | ||||||||||||
Warrants | — | 9 | — | 9 | ||||||||||||
Purchased Option | 21 | — | — | 21 | ||||||||||||
Total Investments in Securities | $ | 21,537 | $ | 127,903 | $ | 11,552 | $ | 160,992 | ||||||||
Securities Sold | Level 1 | Level 2 | Level 3 | Total | ||||||||||||
Corporate Obligations | $ | — | $ | (2,369 | ) | $ | — | $ | (2,369 | ) | ||||||
Total Securities Sold Short, Not Yet Purchased | $ | — | $ | (2,369 | ) | $ | — | $ | (2,369 | ) | ||||||
Other Financial | Level 1 | Level 2 | Level 3 | Total | ||||||||||||
Written Options | $ | (344 | ) | $ | (3 | ) | $ | — | $ | (347 | ) | |||||
Forwards Contracts* | ||||||||||||||||
Unrealized Appreciation | — | 395 | — | 395 | ||||||||||||
Total Other Financial Instruments | $ | (344 | ) | $ | 392 | $ | — | $ | 48 | |||||||
* | Forward contracts are valued at the unrealized appreciation on the instrument. See Note 2 in Notes to Financial Statements for additional information.The following is a reconciliation of the investments in which significant unobservable inputs (Level 3) were used in determining value (000): |
The following is a reconciliation of the investments in which significant unobservable inputs (Level 3) were used in determining value (000):
Bank Loan | Common | Convertible | Special Purpose | Trade Claims | Warrants | Total | ||||||||||||||||||||||
Beginning balance as of October 1, 2021 | $ | 7,732 | $ | 5,922 | $ | — | $ | — | $ | 5,200 | $ | 3 | $ | 18,857 | ||||||||||||||
Change in unrealized appreciation/ depreciation) | (101 | ) | 1,909 | (291 | ) | 5 | (138 | ) | 3 | 1,387 | ||||||||||||||||||
Realized Gain (Loss) | — | 1,254 | — | — | — | — | 1,254 | |||||||||||||||||||||
Purchases | — | — | 4,163 | — | — | — | 4,163 | |||||||||||||||||||||
Other capitalized items | 105 | — | — | — | 11 | — | 116 | |||||||||||||||||||||
Sales | (6,296 | ) | (6,954 | ) | — | — | — | — | (13,250 | ) | ||||||||||||||||||
Transfer into Level 3 | — | — | 4,104 | (1) | — | — | — | 4,104 | ||||||||||||||||||||
Transfer out of Level 3 | — | — | — | — | (5,073 | )(2) | (6)(3) | (5,079 | ) | |||||||||||||||||||
Ending balance as of September 30, 2022 | $ | 1,440 | $ | 2,131 | $ | 7,976 | $ | 5 | $ | — | $ | — | $ | 11,552 | ||||||||||||||
Net change in unrealized appreciation (depreciation) included in the statement of operations attributable to Level 3 investments held at September 30, 2022 | $ | (101 | ) | $ | 1,250 | $ | (1,587 | ) | $ | 5 | $ | — | $ | — | $ | (433 | ) | |||||||||||
(1) | The basis for the supporting indicative broker quote supplied for Buzzfeed 8.5% 12/3/26 was deemed to be based on unobservable inputs. |
(2) | Towards the close of the fiscal year-end, an observable settlement price became available on the Brazos Trade Claims position. The transfers out of Level 3 are recorded as of the end of the reporting period. |
(3) | An observable bona-fide independent broker quote became available on the McDermott International Warrants with strike prices of $12.33 and $15.98. |
The accompanying notes are an integral part of the financial statements.
32
| RiverPark Strategic Income Fund |

The following table summarizes the quantitative inputs and assumptions used for items categorized as material Level 3 investments as of September 30, 2022. The following disclosures also include qualitative information on the sensitivity of the fair value measurements to changes in the significant unobservable inputs.
Investments | Fair Value at | Valuation Technique | Unobservable Input | Value/Rate (Weighted |
Special Purpose Acquisition Companies | ||||
Alpha Partners Technology Merger Founder Shares | $ 1 | Market Approach | Implied pricing using the underlying warrants | $0.0950 |
Special Purpose Acquisition Companies | ||||
AxonPrime Infrastructure Acquisition Founder Shares | $ 1 | Market Approach | Implied pricing using the underlying warrants | $0.1473 |
Special Purpose Acquisition Companies | ||||
Berenson Acquisition Founder Shares | $ 1 | Market Approach | Implied pricing using the underlying warrants | $0.05075 |
Special Purpose Acquisition Companies | ||||
Parabellum AcquisitionFounder Shares | $ 1 | Market Approach | Implied pricing using the underlying warrants | $0.036 |
Special Purpose Acquisition Companies | ||||
Revelstone Capital Acquisition Founders Shares | $ 1 | Market Approach | Implied pricing using the underlying warrants | $0.1001 |
Bank Loan Obligations | ||||
Real Alloy, Term Loan, 1st Lien 13.674%, LIBOR + 0.000% 12/31/49 | $ 1,098 | Market Approach | Decline in Net Leverage | From 1.1x to 0.8x EBITDA |
Bank Loan Obligations | ||||
GemmaCert, Term Loan 9.000%, 05/19/24 | $ 342 | Discounted Cash Flows Method | 9% rate 3-Yr Loan Secured by Substantially All Assets; Difficulty raising additional capital in current climate | 15% Discount on face amount less cumulative PIK received |
Convertible Bond | ||||
BuzzFeed 8.500%, 12/3/26 | $ 4,104 | Market Approach | Indicative Broker Quote | 76 - 81 |
Convertible Bond | ||||
Leafly Holdings 8% 1/31/25 | $ 3,872 | Market Approach | Broad Decline in Equity and High Yield Markets | 7% Discount reflecting 11.5% YTM |
Note Outstanding | $30 mm | |||
Declining Equity Share Price | ||||
Common Stock | ||||
RA Parent | $ 2,131 | Transactions Method | Recent Sale Price | $65,000 - $67,000 |
Warrants | ||||
GemmaCert Strike of $7.608 expiring 5/19/24 | $ — | Transactions Method | No current market for the Preferred A2 shares, thus warrants deemed to be $0 | N/A |
The unobservable inputs used to determine fair value of recurring Level 3 assets may have similar or diverging impacts on valuation. Significant increases and decreases in these inputs in isolation and interrelationships between those inputs could result in significantly higher or lower fair value measurement.
Percentages are based on Net Assets of $188,466 (000). |
* | Non-income producing security. |
‡ | In U.S. Dollar unless otherwise indicated. |
# | Expiration date or strike price not available. |
The accompanying notes are an integral part of the financial statements.
33
| RiverPark Strategic Income Fund |

(a) | Securities sold within terms of a private placement memorandum, exempt from registration under Section 144A of the Securities Act of 1933, as amended, and may be sold only to dealers in that program or other “accredited investors.” These securities have been determined to be liquid under guidelines established by the Board of Trustees. At September 30, 2022, these securities amounted to $86,755 (000) or 46.0% of Net Assets. |
(b) | Variable or floating rate security. The rate shown is the effective interest rate as of period end. The rates for certain securities are not based on published reference rates and spreads and are either determined by the issuer or agent based on current market conditions; by using a formula based on the rates of underlying loans; or by adjusting periodically based on prevailing interest rates. |
(c) | This security or partial position of this security has been committed as collateral for open short positions and option contracts. The aggregate market value of the collateral as of September 30, 2022 was $10,321 (000). |
(d) | Security in default on interest payments. |
(e) | Zero coupon security. The rate reported on the Schedule of Investments is the effective yield at the time purchase. |
(f) | Level 3 security in accordance with fair value hierarchy. |
(g) | Unsettled bank loan. Interest rate may not be available. |
Cl — Class
ETF — Exchange Traded Fund
EUR — Euro
EURIBOR— Euro London Interbank Offered Rate
GBP—British Pound Sterling
ICE— Intercontinental Exchange
LIBOR— London Interbank Offered Rate
LLC — Limited Liability Company
NIBOR — Norwegian Interbank Offered Rate
NOK — Norway
PIK — Payment-in-Kind
SEK —Swedish Krona
Ser — Series
STIBOR—Stockholm Interbank Offered Rate
USD — U.S. Dollar
The accompanying notes are an integral part of the financial statements.
34
| RiverPark Floating Rate CMBS Fund September 30, 2022 |

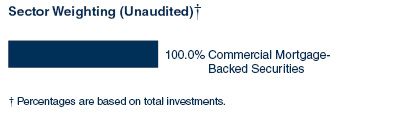
Description | Face | Value (000) | ||||||
Schedule of Investments | ||||||||
Commercial Mortgage-Backed Securities — 92.9% | ||||||||
Non-Agency Mortgage-Backed Obligation – 92.9% | ||||||||
BX Commercial Mortgage Trust, Ser 2022-IND, Cl E | ||||||||
6.909%, TSFR1M + 3.987%, 04/15/37 (a) (b) | $ | 2,000 | $ | 1,870 | ||||
BX Commercial Mortgage Trust, Ser 2021-MFM1, Cl G | ||||||||
6.718%, ICE LIBOR USD 1 Month + 3.900%, 01/15/34 (a) (b) | 250 | 227 | ||||||
BX Commercial Mortgage Trust, Ser 2020-VKNG, Cl G | ||||||||
6.068%, ICE LIBOR USD 1 Month + 3.250%, 10/15/37 (a) (b) | 1,267 | 1,157 | ||||||
BX Commercial Mortgage Trust, Ser 2021-MFM1, Cl F | ||||||||
5.818%, ICE LIBOR USD 1 Month + 3.000%, 01/15/34 (a) (b) | 1,000 | 912 | ||||||
BX Commercial Mortgage Trust, Ser 2021-VOLT, Cl F | ||||||||
5.218%, ICE LIBOR USD 1 Month + 2.400%, 09/15/36 (a) (b) | 1,500 | 1,379 | ||||||
BX Commercial Mortgage Trust, Ser 2021-SOAR, Cl F | ||||||||
5.168%, ICE LIBOR USD 1 Month + 2.350%, 06/15/38 (a) (b) | 1,985 | 1,821 | ||||||
BX Commercial Mortgage Trust, Ser 2019-XL, Cl G | ||||||||
5.118%, ICE LIBOR USD 1 Month + 2.300%, 10/15/36 (a) (b) | 876 | 838 | ||||||
BX Commercial Mortgage Trust, Ser 2021-MFM1, Cl E | ||||||||
5.068%, ICE LIBOR USD 1 Month + 2.250%, 01/15/34 (a) (b) | 1,000 | 925 | ||||||
BX Commercial Mortgage Trust, Ser 2021-XL2, Cl F | ||||||||
5.062%, ICE LIBOR USD 1 Month + 2.244%, 10/15/38 (a) (b) | 1,867 | 1,719 | ||||||
BX Commercial Mortgage Trust, Ser 2021-VINO, Cl E | ||||||||
4.770%, ICE LIBOR USD 1 Month + 1.952%, 05/15/38 (a) (b) | 1,500 | 1,380 | ||||||
BX Trust, Ser 2019-MMP, Cl F | ||||||||
5.610%, ICE LIBOR USD 1 Month + 2.792%, 08/15/36 (a) (b) | 2,985 | 2,801 | ||||||
CAMB Commercial Mortgage Trust, Ser 2019-LIFE, Cl G | ||||||||
6.068%, ICE LIBOR USD 1 Month + 3.250%, 12/15/37 (a) (b) | 2,660 | 2,467 | ||||||
Cold Storage Trust, Ser 2020-ICE5, Cl F | ||||||||
6.310%, ICE LIBOR USD 1 Month + 3.492%, 11/15/37 (a) (b) | 2,949 | 2,787 | ||||||
Credit Suisse Mortgage Capital Certificates, Ser 2019-ICE4, Cl F | ||||||||
5.468%, ICE LIBOR USD 1 Month + 2.650%, 05/15/36 (a) (b) | 3,780 | 3,621 | ||||||
ILPT Commercial Mortgage Trust, Ser 2022-LPF2, Cl C | ||||||||
5.743%, TSFR1M + 3.493%, 10/15/39 (a) (b) | 2,000 | 1,983 | ||||||
JP Morgan Chase Commercial Mortgage Securities, Ser 2021-MHC, Cl E | ||||||||
5.268%, ICE LIBOR USD 1 Month + 2.450%, 04/15/38 (a) (b) | 1,300 | 1,222 | ||||||
KKR Industrial Portfolio Trust, Ser 2021-KDIP, Cl F | ||||||||
4.868%, ICE LIBOR USD 1 Month + 2.050%, 12/15/37 (a) (b) | 975 | 902 | ||||||
MHP, Ser 2021-STOR, Cl F | ||||||||
5.018%, ICE LIBOR USD 1 Month + 2.200%, 07/15/38 (a) (b) | 1,500 | 1,372 | ||||||
Morgan Stanley Capital I Trust, Ser 2017-CLS, Cl F | ||||||||
5.418%, ICE LIBOR USD 1 Month + 2.600%, 11/15/34 (a) (b) | 1,764 | 1,729 | ||||||
MSCG Trust, Ser 2018-SELF, Cl D | ||||||||
4.468%, ICE LIBOR USD 1 Month + 1.650%, 10/15/37 (a) (b) | 2,000 | 1,909 | ||||||
The accompanying notes are an integral part of the financial statements.
35
| RiverPark Floating Rate CMBS Fund |

Description | Face | Value (000) | ||||||
OPG, Ser 2021-PORT F | ||||||||
4.766%, ICE LIBOR USD 1 Month + 1.948%, 10/15/36 (a) (b) | $ | 685 | $ | 614 | ||||
Total Commercial Mortgage-Backed Securities | ||||||||
(Cost $35,610) (000) | $ | 33,635 | ||||||
Total Investments — 92.9% | ||||||||
(Cost $35,610) (000) | $ | 33,635 | ||||||
As of September 30, 2022, all of the Fund’s investments were considered Level 2 in accordance with the authoritative guidance on fair value measurements and disclosure under U.S. GAAP.
Percentages are based on Net Assets of $36,205 (000). |
(a) | Variable or floating rate security. The rate shown is the effective interest rate as of period end. The rates for certain securities are not based on published reference rates and spreads and are either determined by the issuer or agent based on current market conditions; by using a formula based on the rates of underlying loans; or by adjusting periodically based on prevailing interest rates. |
(b) | Securities sold within terms of a private placement memorandum, exempt from registration under Section 144A of the Securities Act of 1933, as amended, and may be sold only to dealers in that program or other “accredited investors.” These securities have been determined to be liquid under guidelines established by the Board of Trustees. At September 30, 2022, these securities amounted to $33,635 (000) or 92.9% of Net Assets. |
Cl — Class
ICE — Intercontinental Exchange
LIBOR — London Interbank Offered Rate
Ser — Series
TSFRIM — 1 Month Term Secured Overweight Financing Rate
USD — United States Dollar
The accompanying notes are an integral part of the financial statements.
36
Statements of Assets and Liabilities (000) September 30, 2022 |
|

RiverPark Large | Wedgewood Fund | RiverPark Short Term | ||||||||||
Assets: | ||||||||||||
Investments in Securities, at Value (Note 2) | $ | 33,586 | $ | 26,589 | $ | 911,725 | ||||||
Deposits with Brokers for Securities Sold Short, Not Yet Purchased | — | — | 66 | |||||||||
Cash and Cash Equivalents | 517 | 145 | 63,202 | |||||||||
Receivable for Investment Securities Sold | 1,210 | — | 18,155 | |||||||||
Receivable for Capital Shares Sold | 54 | 2 | 395 | |||||||||
Receivable for Dividend and Interest Income | 4 | 13 | 11,034 | |||||||||
Unrealized Appreciation on Forward Foreign Currency Contracts | — | — | 1,167 | |||||||||
Prepaid Expenses | 23 | 24 | 163 | |||||||||
Total Assets | 35,394 | 26,773 | 1,005,907 | |||||||||
Liabilities: | ||||||||||||
Payable for Investment Securities Purchased | 316 | — | 78,626 | |||||||||
Payable for Capital Shares Redeemed | 29 | — | 1,061 | |||||||||
Foreign Currency Payable to Custodian (Note 2) | — | — | 39 | |||||||||
Income Distribution Payable | — | — | 220 | |||||||||
Unrealized Depreciation on Forward Foreign Currency Contracts | — | — | 107 | |||||||||
Payable Due to Adviser (Note 4) | 21 | 14 | 507 | |||||||||
Payable Due to Administrative Services, Institutional Class Shares (Note 4) | 5 | 6 | 170 | |||||||||
Payable Due to Shareholder Servicing Agent (Note 4) | 4 | 3 | 15 | |||||||||
Payable Due to Administrative Services, Retail Class Shares (Note 4) | 3 | 2 | 5 | |||||||||
Payable Due to Administrator (Note 4) | 2 | 1 | 45 | |||||||||
Primer Broker Fee | — | — | 5 | |||||||||
Chief Compliance Officer Fees Payable (Note 4) | — | — | 3 | |||||||||
Other Accrued Expenses | 9 | 12 | 214 | |||||||||
Total Liabilities | 389 | 38 | 81,017 | |||||||||
Net Assets | $ | 35,005 | $ | 26,735 | $ | 924,890 | ||||||
Net Assets Consist of: | ||||||||||||
Paid-in Capital | $ | 33,979 | $ | 19,256 | $ | 958,284 | ||||||
Total Distributable Earnings/(Loss) | 1,026 | 7,479 | (33,394 | ) | ||||||||
Net Assets | $ | 35,005 | $ | 26,735 | $ | 924,890 | ||||||
Investments in Securities, at Cost | $ | 28,558 | $ | 22,476 | $ | 924,125 | ||||||
Foreign Currency, at Cost | — | — | 39 | |||||||||
Net Assets - Institutional Class Shares(1) | $ | 20,730,749 | $ | 19,682,542 | $ | 896,698,681 | ||||||
Net Assets - Retail Class Shares(1) | $ | 14,273,873 | $ | 7,052,741 | $ | 28,190,815 | ||||||
Institutional Class Shares: | ||||||||||||
Outstanding Shares of Beneficial Interest(1) | ||||||||||||
(Unlimited Authorization — No Par Value) | 1,309,234 | 4,860,345 | 93,116,047 | |||||||||
Retail Class Shares: | ||||||||||||
Outstanding Shares of Beneficial Interest(1) | ||||||||||||
(Unlimited Authorization — No Par Value) | 935,293 | 1,907,691 | 2,940,002 | |||||||||
Institutional Class Shares: | ||||||||||||
Net Asset Value, Offering and Redemption | ||||||||||||
Price Per Share — Institutional Class Shares | $ | 15.83 | $ | 4.05 | $ | 9.63 | ||||||
Retail Class Shares: | ||||||||||||
Net Asset Value, Offering and Redemption | ||||||||||||
Price Per Share — Retail Class Shares | $ | 15.26 | $ | 3.70 | $ | 9.59 | ||||||
(1) | Shares and Net Assets have not been rounded. |
Amounts designated as “—” are either not applicable, $0 or have been rounded to $0.
The accompanying notes are an integral part of the financial statements.
37
Statements of Assets and Liabilities (000) September 30, 2022 |
|

RiverPark Long/Short | RiverPark Strategic | RiverPark Floating | ||||||||||
Assets: | ||||||||||||
Investments in Securities, at Value (Note 2) | $ | 84,982 | $ | 160,992 | $ | 33,635 | ||||||
Deposits with Brokers for Securities Sold Short, Not Yet Purchased | — | 5,473 | — | |||||||||
Cash and Cash Equivalents | 4,376 | 26,062 | 2,536 | |||||||||
Cash Collateral on Swap Contracts | 10,330 | — | — | |||||||||
Swaps Contracts, at Value (Note 2) | 2,643 | — | — | |||||||||
Receivable for Investment Securities Sold | 2,578 | 247 | — | |||||||||
Receivable for Capital Shares Sold | 305 | 133 | — | |||||||||
Receivable for Dividend and Interest Income | 7 | 2,109 | 92 | |||||||||
Unrealized Appreciation on Forward Foreign Currency Contracts | — | 395 | — | |||||||||
Prepaid Expenses | 32 | 49 | 19 | |||||||||
Total Assets | 105,253 | 195,460 | 36,282 | |||||||||
Liabilities: | ||||||||||||
Swaps Contracts, at value (Note 2) | 12,346 | — | — | |||||||||
Payable for Investment Securities Purchased | 704 | 3,599 | — | |||||||||
Payable for Capital Shares Redeemed | 79 | 455 | 14 | |||||||||
Securities Sold Short, Not Yet Purchased (Note 2) | — | 2,369 | — | |||||||||
Income Distribution Payable | — | 16 | 32 | |||||||||
Written Options, at Value (Note 2) | — | 347 | — | |||||||||
Payable Due to Adviser (Note 4) | 125 | 101 | 16 | |||||||||
Payable Due to Administrative Services, Institutional Class Shares (Note 4) | 14 | 34 | 4 | |||||||||
Payable Due to Administrator (Note 4) | 5 | 9 | 2 | |||||||||
Payable Due to Shareholder Servicing Agent (Note 4) | 5 | 9 | — | |||||||||
Payable Due to Administrative Services, Retail Class Shares (Note 4) | 1 | 2 | — | |||||||||
Payable Due to Custodian | — | 6 | — | |||||||||
Chief Compliance Officer Fees Payable (Note 4) | — | 1 | — | |||||||||
Other Accrued Expenses | 46 | 46 | 9 | |||||||||
Total Liabilities | 13,325 | 6,994 | 77 | |||||||||
Net Assets | $ | 91,928 | $ | 188,466 | $ | 36,205 | ||||||
Net Assets Consist of: | ||||||||||||
Paid-in Capital | $ | 171,527 | $ | 270,751 | $ | 65,008 | ||||||
Total Distributable Loss | (79,599 | ) | (82,285 | ) | (28,803 | ) | ||||||
Net Assets | $ | 91,928 | $ | 188,466 | $ | 36,205 | ||||||
Investments in Securities, at Cost | $ | 86,519 | $ | 178,455 | $ | 35,610 | ||||||
Securities Sold Short, Not Yet Purchased, Proceeds | — | 2,617 | — | |||||||||
Written Options, Premiums Received | — | 263 | — | |||||||||
Net Assets - Institutional Class Shares(1) | $ | 81,622,909 | $ | 168,885,001 | $ | 34,944,847 | ||||||
Net Assets - Retail Class Shares(1) | $ | 10,305,325 | $ | 19,580,626 | $ | 1,260,087 | ||||||
Institutional Class Shares: | ||||||||||||
Outstanding Shares of Beneficial Interest(1) | ||||||||||||
(Unlimited Authorization — No Par Value) | 9,653,193 | 19,393,819 | 4,138,053 | |||||||||
Retail Class Shares: | ||||||||||||
Outstanding Shares of Beneficial Interest(1) | ||||||||||||
(Unlimited Authorization — No Par Value) | 1,238,950 | 2,245,616 | 149,810 | |||||||||
Institutional Class Shares: | ||||||||||||
Net Asset Value, Offering and Redemption | ||||||||||||
Price Per Share — Institutional Class Shares | $ | 8.46 | $ | 8.71 | $ | 8.44 | ||||||
Retail Class Shares: | ||||||||||||
Net Asset Value, Offering and Redemption | ||||||||||||
Price Per Share — Retail Class Shares | $ | 8.32 | $ | 8.72 | $ | 8.41 | ||||||
(1) | Shares and Net Assets have not been rounded. |
Amounts designated as “—” are either not applicable, $0 or have been rounded to $0.
The accompanying notes are an integral part of the financial statements.
38
Statements of Operations (000) For the Year Ended |
|

RiverPark Large | Wedgewood Fund | RiverPark Short Term | ||||||||||
Investment Income: | ||||||||||||
Dividends | $ | 102 | $ | 264 | $ | 1,004 | ||||||
Dividends from Master Limited Partnerships | 88 | — | — | |||||||||
Interest | 3 | 1 | 28,733 | |||||||||
Foreign Taxes Withheld | — | (7 | ) | — | ||||||||
Total Investment Income | 193 | 258 | 29,737 | |||||||||
Expenses: | ||||||||||||
Investment Advisory Fees (Note 4) | 391 | 233 | 6,695 | |||||||||
Shareholder Service Fees(1) (Note 4) | 76 | 23 | 109 | |||||||||
Administrative Services Fee, Retail Class Shares (Note 4) | 41 | 10 | 56 | |||||||||
Administrator Fees (Note 4) | 34 | 20 | 578 | |||||||||
Administrative Services Fee, Institutional Class Shares (Note 4) | 27 | 32 | 1,019 | |||||||||
Trustees’ Fees (Note 4) | 5 | 3 | 72 | |||||||||
Chief Compliance Officer Fees (Note 4) | 2 | 1 | 32 | |||||||||
Registration Fees | 37 | 39 | 57 | |||||||||
Transfer Agent Fees | 17 | 10 | 301 | |||||||||
Professional Fees | 7 | 5 | 133 | |||||||||
Custodian Fees | 4 | 1 | 37 | |||||||||
Printing Fees | 4 | 3 | 67 | |||||||||
Prime Broker Fee | — | — | 60 | |||||||||
Insurance and Other Fees | 13 | 7 | 160 | |||||||||
Total Expenses | 658 | 387 | 9,376 | |||||||||
Fees Waived by Adviser (Note 4) | — | (5 | ) | — | ||||||||
Net Expenses | 658 | 382 | 9,376 | |||||||||
Net Investment Income (Loss) | (465 | ) | (124 | ) | 20,361 | |||||||
Net Realized and Unrealized Gain (Loss): | ||||||||||||
Net Realized Gain (Loss) From: | ||||||||||||
Investments | (2,602 | ) | 4,368 | 1,128 | ||||||||
Purchased options | (109 | ) | — | — | ||||||||
Written Options | — | — | 98 | |||||||||
Forward Foreign Currency Contracts | — | — | 8,529 | |||||||||
Foreign Currency Transactions | — | — | 314 | |||||||||
Net Realized Gain (Loss) | (2,711 | ) | 4,368 | 10,069 | ||||||||
Net Change in Unrealized Appreciation (Depreciation) on: | ||||||||||||
Investments | (35,336 | ) | (12,324 | ) | (12,463 | ) | ||||||
Forward Foreign Currency Contracts | — | — | 327 | |||||||||
Foreign Currency Transactions | — | — | (1 | ) | ||||||||
Net Change in Unrealized Appreciation (Depreciation) | (35,336 | ) | (12,324 | ) | (12,137 | ) | ||||||
Net Realized and Unrealized Loss | (38,047 | ) | (7,956 | ) | (2,068 | ) | ||||||
Net Increase (Decrease) in Net Assets Resulting from Operations | $ | (38,512 | ) | $ | (8,080 | ) | $ | 18,293 | ||||
(1) | Attributable to Retail Class Shares only. |
Amounts designated as “—” are either not applicable, $0 or have been rounded to $0.
The accompanying notes are an integral part of the financial statements.
39
Statements of Operations (000) For the Year Ended |
|

RiverPark Long/Short | RiverPark Strategic | RiverPark Floating | ||||||||||
Investment Income: | ||||||||||||
Dividends from Master Limited Partnerships | $ | 574 | $ | — | $ | — | ||||||
Dividends | 407 | 436 | — | |||||||||
Interest | 28 | 11,910 | 1,399 | |||||||||
Foreign Taxes Withheld | — | (1 | ) | — | ||||||||
Total Investment Income | 1,009 | 12,345 | 1,399 | |||||||||
Expenses: | ||||||||||||
Investment Advisory Fees (Note 4) | 4,416 | 1,329 | 256 | |||||||||
Administrative Services Fee, Institutional Class Shares (Note 4) | 232 | 226 | 22 | |||||||||
Administrator Fees (Note 4) | 164 | 115 | 22 | |||||||||
Shareholder Service Fees(1) (Note 4) | 87 | 40 | 3 | |||||||||
Administrative Services Fee, Retail Class Shares (Note 4) | 49 | 6 | 2 | |||||||||
Trustees’ Fees (Note 4) | 23 | 14 | 3 | |||||||||
Chief Compliance Officer Fees (Note 4) | 9 | 6 | 1 | |||||||||
Transfer Agent Fees | 83 | 60 | 12 | |||||||||
Registration Fees | 57 | 54 | 34 | |||||||||
Professional Fees | 36 | 26 | 5 | |||||||||
Printing Fees | 22 | 17 | 3 | |||||||||
Custodian Fees | 7 | 15 | 1 | |||||||||
Dividend and Interest Expense | — | 326 | — | |||||||||
Insurance and Other Fees | 61 | 42 | 18 | |||||||||
Total Expenses | 5,246 | 2,276 | 382 | |||||||||
Fees Waived by Adviser (Note 4) | (15 | ) | — | (42 | ) | |||||||
Net Expenses | 5,231 | 2,276 | 340 | |||||||||
Net Investment Income (Loss) | (4,222 | ) | 10,069 | 1,059 | ||||||||
Net Realized and Unrealized Gain (Loss): | ||||||||||||
Net Realized Gain (Loss) From: | ||||||||||||
Investments | 2,854 | (4,246 | ) | 8 | ||||||||
Purchased Options | — | (548 | ) | — | ||||||||
Written Options | — | 864 | — | |||||||||
Securities Sold Short, Not Yet Purchased | — | (202 | ) | — | ||||||||
Swap Contracts (Note 7) | (51,291 | ) | — | — | ||||||||
Forward Foreign Currency Contracts | — | 2,842 | — | |||||||||
Foreign Currency Transactions | — | 145 | — | |||||||||
Net Realized Gain (Loss) | (48,437 | ) | (1,145 | ) | 8 | |||||||
Net Change in Unrealized Appreciation (Depreciation) on: | ||||||||||||
Investments | (169,497 | ) | (11,831 | ) | (2,231 | ) | ||||||
Purchased Options | — | 5 | — | |||||||||
Written Options | — | (251 | ) | — | ||||||||
Securities Sold Short, Not Yet Purchased | — | 882 | — | |||||||||
Swap Contracts (Note 7) | (21,898 | ) | — | — | ||||||||
Forward Foreign Currency Contracts | — | 15 | — | |||||||||
Foreign Currency Transactions | — | (1 | ) | — | ||||||||
Net Change in Unrealized Appreciation (Depreciation) | (191,395 | ) | (11,181 | ) | (2,231 | ) | ||||||
Net Realized and Unrealized Loss | (239,832 | ) | (12,326 | ) | (2,223 | ) | ||||||
Net (Decrease) in Net Assets Resulting from Operations | $ | (244,054 | ) | $ | (2,257 | ) | $ | (1,164 | ) | |||
(1) | Attributable to Retail Class Shares only. |
Amounts designated as “—” are either not applicable, $0 or have been rounded to $0.
The accompanying notes are an integral part of the financial statements.
40
Statements of Changes in Net Assets (000)
|
|

RiverPark Large Growth Fund | Wedgewood Fund | |||||||||||||||
Year Ended | Year Ended | Year Ended | Year Ended | |||||||||||||
Operations: | ||||||||||||||||
Net Investment Loss | $ | (465 | ) | $ | (511 | ) | $ | (124 | ) | $ | (142 | ) | ||||
Net Realized Gain (Loss) | (2,711 | ) | 11,076 | 4,368 | 5,570 | |||||||||||
Net Change in Unrealized Appreciation (Depreciation) | (35,336 | ) | 11,013 | (12,324 | ) | 6,841 | ||||||||||
Net Increase (Decrease) in Net Assets Resulting from Operations | (38,512 | ) | 21,578 | (8,080 | ) | 12,269 | ||||||||||
Distributions: | ||||||||||||||||
Institutional Class Shares | (4,467 | ) | (2,175 | ) | (3,622 | ) | (16,497 | ) | ||||||||
Retail Class Shares | (5,783 | ) | (2,740 | ) | (1,315 | ) | (5,068 | ) | ||||||||
Total Distributions to Shareholders | (10,250 | ) | (4,915 | ) | (4,937 | ) | (21,565 | ) | ||||||||
Capital Share Transactions: | ||||||||||||||||
Institutional Class Shares: | ||||||||||||||||
Shares Issued | 5,663 | 2,440 | 1,611 | 6,589 | ||||||||||||
Shares Issued as Reinvestment of Distributions | 4,460 | 2,165 | 3,537 | 15,879 | ||||||||||||
Shares Redeemed | (5,122 | ) | (2,061 | ) | (6,759 | ) | (17,789 | ) | ||||||||
Net Increase (Decrease) in Net Assets from Institutional Class Shares Transactions | 5,001 | 2,544 | (1,611 | ) | 4,679 | |||||||||||
Retail Class Shares: | ||||||||||||||||
Shares Issued | 2,455 | 10,626 | 368 | 1,625 | ||||||||||||
Shares Issued as Reinvestment of Distributions | 5,626 | 2,666 | 1,289 | 4,976 | ||||||||||||
Shares Redeemed | (18,063 | ) | (7,845 | ) | (1,567 | ) | (3,641 | ) | ||||||||
Net Increase (Decrease) in Net Assets from Retail Class Shares Transactions | (9,982 | ) | 5,447 | 90 | 2,960 | |||||||||||
Net Increase (Decrease) in Net Assets from Capital Share Transactions | (4,981 | ) | 7,991 | (1,521 | ) | 7,639 | ||||||||||
Net Increase (Decrease) in Net Assets | (53,743 | ) | 24,654 | (14,538 | ) | (1,657 | ) | |||||||||
Net Assets: | ||||||||||||||||
Beginning of year | 88,748 | 64,094 | 41,273 | 42,930 | ||||||||||||
End of year | $ | 35,005 | $ | 88,748 | $ | 26,735 | $ | 41,273 | ||||||||
Shares Issued and Redeemed: | ||||||||||||||||
Institutional Class Shares: | ||||||||||||||||
Shares Issued | 280 | 75 | 285 | 953 | ||||||||||||
Shares Issued as Reinvestment of Distributions | 147 | 71 | 626 | 3,400 | ||||||||||||
Shares Redeemed | (233 | ) | (61 | ) | (1,319 | ) | (3,087 | ) | ||||||||
Net Increase (Decrease) in Institutional Class Shares | 194 | 85 | (408 | ) | 1,266 | |||||||||||
Retail Class Shares: | ||||||||||||||||
Shares Issued | 101 | 330 | 80 | 278 | ||||||||||||
Shares Issued as Reinvestment of Distributions | 190 | 90 | 249 | 1,149 | ||||||||||||
Shares Redeemed | (790 | ) | (242 | ) | (333 | ) | (714 | ) | ||||||||
Net Increase (Decrease) in Retail Class Shares | (499 | ) | 178 | (4 | ) | 713 | ||||||||||
Net Increase (Decrease) in Share Transactions | (305 | ) | 263 | (412 | ) | 1,979 | ||||||||||
The accompanying notes are an integral part of the financial statements.
41
Statements of Changes in Net Assets (000)
|
|

RiverPark Short Term High Yield Fund | RiverPark Long/Short Opportunity Fund | |||||||||||||||
Year Ended | Year Ended | Year Ended | Year Ended | |||||||||||||
Operations: | ||||||||||||||||
Net Investment Income (Loss) | $ | 20,361 | $ | 18,476 | $ | (4,222 | ) | $ | (6,444 | ) | ||||||
Net Realized Gain (Loss) | 10,069 | (2,877 | ) | (48,437 | ) | (9,978 | ) | |||||||||
Net Change in Unrealized Appreciation (Depreciation) | (12,137 | ) | 3,804 | (191,395 | ) | 85,921 | ||||||||||
Net Increase (Decrease) in Net Assets Resulting from Operations | 18,293 | 19,403 | (244,054 | ) | 69,499 | |||||||||||
Distributions: | ||||||||||||||||
Institutional Class Shares | (21,486 | ) | (16,920 | ) | — | — | ||||||||||
Retail Class Shares | (860 | ) | (1,233 | ) | — | — | ||||||||||
Total Distributions to Shareholders | (22,346 | ) | (18,153 | ) | — | — | ||||||||||
Capital Share Transactions: | ||||||||||||||||
Institutional Class Shares: | ||||||||||||||||
Shares Issued | 342,967 | 807,752 | 102,950 | 254,270 | ||||||||||||
Shares Issued as Reinvestment of Distributions | 19,137 | 15,422 | — | — | ||||||||||||
Shares Redeemed | (580,056 | ) | (359,682 | ) | (257,007 | ) | (165,102 | ) | ||||||||
Net Increase (Decrease) in Net Assets from Institutional Class Shares Transactions | (217,952 | ) | 463,492 | (154,057 | ) | 89,168 | ||||||||||
Retail Class Shares: | ||||||||||||||||
Shares Issued | 5,215 | 30,217 | 6,556 | 55,859 | ||||||||||||
Shares Issued as Reinvestment of Distributions | 838 | 1,204 | — | — | ||||||||||||
Shares Redeemed | (43,672 | ) | (31,530 | ) | (40,742 | ) | (59,484 | ) | ||||||||
Net Decrease in Net Assets from Retail Class Shares Transactions | (37,619 | ) | (109 | ) | (34,186 | ) | (3,625 | ) | ||||||||
Net Increase (Decrease) in Net Assets from Capital Share Transactions | (255,571 | ) | 463,383 | (188,243 | ) | 85,543 | ||||||||||
Net Increase (Decrease) in Net Assets | (259,624 | ) | 464,633 | (432,297 | ) | 155,042 | ||||||||||
Net Assets: | ||||||||||||||||
Beginning of year | 1,184,514 | 719,881 | 524,225 | 369,183 | ||||||||||||
End of year | $ | 924,890 | $ | 1,184,514 | $ | 91,928 | $ | 524,225 | ||||||||
Shares Issued and Redeemed: | ||||||||||||||||
Institutional Class Shares: | ||||||||||||||||
Shares Issued | 35,526 | 83,507 | 7,084 | 13,876 | ||||||||||||
Shares Issued as Reinvestment of Distributions | 1,983 | 1,595 | — | — | ||||||||||||
Shares Redeemed | (60,060 | ) | (37,179 | ) | (20,708 | ) | (8,967 | ) | ||||||||
Net Increase (Decrease) in Institutional Class Shares | (22,551 | ) | 47,923 | (13,624 | ) | 4,909 | ||||||||||
Retail Class Shares: | ||||||||||||||||
Shares Issued | 542 | 3,137 | 430 | 3,115 | ||||||||||||
Shares Issued as Reinvestment of Distributions | 87 | 125 | — | — | ||||||||||||
Shares Redeemed | (4,543 | ) | (3,273 | ) | (2,909 | ) | (3,323 | ) | ||||||||
Net Decrease in Retail Class Shares | (3,914 | ) | (11 | ) | (2,479 | ) | (208 | ) | ||||||||
Net Increase (Decrease) in Share Transactions | (26,465 | ) | 47,912 | (16,103 | ) | 4,701 | ||||||||||
The accompanying notes are an integral part of the financial statements.
42
Statements of Changes in Net Assets (000)
|
|

RiverPark Strategic Income Fund | RiverPark Floating Rate CMBS Fund | |||||||||||||||
Year Ended | Year Ended | Year Ended | Year Ended | |||||||||||||
Operations: | ||||||||||||||||
Net Investment Income | $ | 10,069 | $ | 10,001 | $ | 1,059 | $ | 2,125 | ||||||||
Net Realized Gain (Loss) | (1,145 | ) | 1,644 | 8 | (18,013 | ) | ||||||||||
Net Change in Unrealized Appreciation (Depreciation) | (11,181 | ) | 13,135 | (2,231 | ) | 11,126 | ||||||||||
Net Increase (Decrease) in Net Assets Resulting from Operations | (2,257 | ) | 24,780 | (1,164 | ) | (4,762 | ) | |||||||||
Distributions: | ||||||||||||||||
Institutional Class Shares | (10,697 | ) | (8,645 | ) | (960 | ) | (2,053 | ) | ||||||||
Retail Class Shares | (844 | ) | (496 | ) | (31 | ) | (54 | ) | ||||||||
Total Distributions to Shareholders | (11,541 | ) | (9,141 | ) | (991 | ) | (2,107 | ) | ||||||||
Capital Share Transactions: | ||||||||||||||||
Institutional Class Shares: | ||||||||||||||||
Shares Issued | 79,975 | 68,560 | 1,986 | 5,588 | ||||||||||||
Shares Issued as Reinvestment of Distributions | 10,234 | 8,248 | 726 | 1,810 | ||||||||||||
Shares Redeemed | (104,775 | ) | (73,417 | ) | (10,214 | ) | (289,884 | ) | ||||||||
Net Increase (Decrease) in Net Assets from Institutional Class Shares Transactions | (14,566 | ) | 3,391 | (7,502 | ) | (282,486 | ) | |||||||||
Retail Class Shares: | ||||||||||||||||
Shares Issued | 24,203 | 5,985 | 695 | 1,143 | ||||||||||||
Shares Issued as Reinvestment of Distributions | 817 | 476 | 31 | 54 | ||||||||||||
Shares Redeemed | (17,257 | ) | (4,753 | ) | (957 | ) | (3,490 | ) | ||||||||
Net Increase (Decrease) in Net Assets from Retail Class Shares Transactions | 7,763 | 1,708 | (231 | ) | (2,293 | ) | ||||||||||
Net Increase (Decrease) in Net Assets from Capital Share Transactions | (6,803 | ) | 5,099 | (7,733 | ) | (284,779 | ) | |||||||||
Net Increase (Decrease) in Net Assets | (20,601 | ) | 20,738 | (9,888 | ) | (291,648 | ) | |||||||||
Net Assets: | ||||||||||||||||
Beginning of year | 209,067 | 188,329 | 46,093 | 337,741 | ||||||||||||
End of year | $ | 188,466 | $ | 209,067 | $ | 36,205 | $ | 46,093 | ||||||||
Shares Issued and Redeemed: | ||||||||||||||||
Institutional Class Shares: | ||||||||||||||||
Shares Issued | 8,663 | 7,510 | 231 | 624 | ||||||||||||
Shares Issued as Reinvestment of Distributions | 1,113 | 913 | 84 | 203 | ||||||||||||
Shares Redeemed | (11,386 | ) | (8,097 | ) | (1,164 | ) | (32,851 | ) | ||||||||
Net Increase (Decrease) in Institutional Class Shares | (1,610 | ) | 326 | (849 | ) | (32,024 | ) | |||||||||
Retail Class Shares: | ||||||||||||||||
Shares Issued | 2,631 | 648 | 80 | 129 | ||||||||||||
Shares Issued as Reinvestment of Distributions | 89 | 53 | 3 | 6 | ||||||||||||
Shares Redeemed | (1,874 | ) | (520 | ) | (109 | ) | (390 | ) | ||||||||
Net Increase (Decrease) in Retail Class Shares | 846 | 181 | (26 | ) | (255 | ) | ||||||||||
Net Increase (Decrease) in Share Transactions | (764 | ) | 507 | (875 | ) | (32,279 | ) | |||||||||
Amounts designated as “—” are either not applicable, $0 or have been rounded to $0.
The accompanying notes are an integral part of the financial statements.
43
Financial Highlights For a Share Outstanding Throughout Each Period |
|
| Net Asset | Net | Realized and | Total from | Distributions of | Distributions | Total | |||||||||||||||||||||||||||||||||||||||||
RiverPark Large Growth Fund | ||||||||||||||||||||||||||||||||||||||||||||||||
Institutional Class Shares | ||||||||||||||||||||||||||||||||||||||||||||||||
2022 | $ | 35.40 | $ | (0.16 | ) | $ | (15.33 | ) | $ | (15.49 | ) | $ | — | $ | (4.08 | ) | $ | (4.08 | ) | |||||||||||||||||||||||||||||
2021 | 28.43 | (0.16 | ) | 9.24 | 9.08 | — | (2.11 | ) | (2.11 | ) | ||||||||||||||||||||||||||||||||||||||
2020 | 22.61 | (0.07 | ) | 8.44 | 8.37 | — | (2.55 | ) | (2.55 | ) | ||||||||||||||||||||||||||||||||||||||
2019 | 25.45 | — | (2) | (0.05 | ) | (0.05 | ) | — | (2.79 | ) | (2.79 | ) | ||||||||||||||||||||||||||||||||||||
2018 | 22.61 | 0.04 | 4.79 | 4.83 | (0.01 | ) | (1.98 | ) | (1.99 | ) | ||||||||||||||||||||||||||||||||||||||
Retail Class Shares | ||||||||||||||||||||||||||||||||||||||||||||||||
2022 | $ | 34.36 | $ | (0.23 | ) | $ | (14.79 | ) | $ | (15.02 | ) | $ | — | $ | (4.08 | ) | $ | (4.08 | ) | |||||||||||||||||||||||||||||
2021 | 27.73 | (0.25 | ) | 8.99 | 8.74 | — | (2.11 | ) | (2.11 | ) | ||||||||||||||||||||||||||||||||||||||
2020 | 22.17 | (0.14 | ) | 8.25 | 8.11 | — | (2.55 | ) | (2.55 | ) | ||||||||||||||||||||||||||||||||||||||
2019 | 25.08 | (0.06 | ) | (0.06 | ) | (0.12 | ) | — | (2.79 | ) | (2.79 | ) | ||||||||||||||||||||||||||||||||||||
2018 | 22.36 | (0.02 | ) | 4.72 | 4.70 | — | (1.98 | ) | (1.98 | ) | ||||||||||||||||||||||||||||||||||||||
Wedgewood Fund | ||||||||||||||||||||||||||||||||||||||||||||||||
Institutional Class Shares | ||||||||||||||||||||||||||||||||||||||||||||||||
2022 | $ | 5.86 | $ | (0.01 | ) | $ | (1.10 | ) | $ | (1.11 | ) | $ | — | $ | (0.70 | ) | $ | (0.70 | ) | |||||||||||||||||||||||||||||
2021 | 8.33 | (0.02 | ) | 1.84 | 1.82 | — | (4.29 | ) | (4.29 | ) | ||||||||||||||||||||||||||||||||||||||
2020 | 9.12 | (0.02 | ) | 2.07 | 2.05 | — | (2.84 | ) | (2.84 | ) | ||||||||||||||||||||||||||||||||||||||
2019 | 19.91 | (0.01 | ) | (1.38 | ) | (1.39 | ) | — | (9.40 | ) | (9.40 | ) | ||||||||||||||||||||||||||||||||||||
2018 | 18.95 | (0.08 | ) | 3.97 | 3.89 | — | (2.93 | ) | (2.93 | ) | ||||||||||||||||||||||||||||||||||||||
Retail Class Shares | ||||||||||||||||||||||||||||||||||||||||||||||||
2022 | $ | 5.42 | $ | (0.02 | ) | $ | (1.00 | ) | $ | (1.02 | ) | $ | — | $ | (0.70 | ) | $ | (0.70 | ) | |||||||||||||||||||||||||||||
2021 | 8.01 | (0.03 | ) | 1.73 | 1.70 | — | (4.29 | ) | (4.29 | ) | ||||||||||||||||||||||||||||||||||||||
2020 | 8.89 | (0.04 | ) | 2.00 | 1.96 | — | (2.84 | ) | (2.84 | ) | ||||||||||||||||||||||||||||||||||||||
2019 | 19.71 | (0.04 | ) | (1.38 | ) | (1.42 | ) | — | (9.40 | ) | (9.40 | ) | ||||||||||||||||||||||||||||||||||||
2018 | 18.83 | (0.12 | ) | 3.93 | 3.81 | — | (2.93 | ) | (2.93 | ) | ||||||||||||||||||||||||||||||||||||||
The accompanying notes are an integral part of the financial statements.
44
|

Net Asset | Total Return* | Net Assets, End | Ratio of Net | Ratio of Total | Ratio of Net | Portfolio | |||||||||||||||||||||
| $ | 15.83 | (49.30 | )% | $ | 20,731 | 0.95 | % | 0.95 | % | (0.64 | )% | 89 | % | ||||||||||||||
| 35.40 | 33.14 | 39,489 | 0.91 | 0.91 | (0.46 | ) | 36 | ||||||||||||||||||||
| 28.43 | 40.78 | 29,296 | 0.93 | 0.93 | (0.30 | ) | 53 | ||||||||||||||||||||
| 22.61 | 2.18 | 24,786 | 0.95 | 0.95 | 0.00 | 58 | |||||||||||||||||||||
| 25.45 | 22.68 | 24,197 | 0.95 | 0.95 | 0.16 | 35 | |||||||||||||||||||||
| $ | 15.26 | (49.44 | )% | $ | 14,274 | 1.23 | % | 1.23 | % | (0.90 | )% | 89 | % | ||||||||||||||
| 34.36 | 32.73 | 49,259 | 1.20 | 1.20 | (0.76 | ) | 36 | ||||||||||||||||||||
| 27.73 | 40.38 | 34,798 | 1.23 | 1.23 | (0.59 | ) | 53 | ||||||||||||||||||||
| 22.17 | 1.91 | 29,521 | 1.23 | 1.23 | (0.27 | ) | 58 | ||||||||||||||||||||
| 25.08 | 22.34 | 31,457 | 1.23 | 1.23 | (0.11 | ) | 35 | ||||||||||||||||||||
| $ | 4.05 | (22.35 | )% | $ | 19,682 | 1.00 | % | 1.01 | % | (0.28 | )% | 21 | % | ||||||||||||||
| 5.86 | 34.93 | 30,901 | 0.95 | 0.95 | (0.27 | ) | 16 | ||||||||||||||||||||
| 8.33 | 28.14 | 33,324 | 0.86 | 0.86 | (0.23 | ) | 75 | ||||||||||||||||||||
| 9.12 | 2.63 | 80,209 | 0.86 | 0.86 | (0.07 | ) | 28 | ||||||||||||||||||||
| 19.91 | 22.69 | 232,068 | 0.92 | 0.92 | (0.41 | ) | 21 | ||||||||||||||||||||
| $ | 3.70 | (22.52 | )% | $ | 7,053 | 1.25 | % | 1.26 | % | (0.53 | )% | 21 | % | ||||||||||||||
| 5.42 | 34.66 | 10,372 | 1.24 | 1.24 | (0.56 | ) | 16 | ||||||||||||||||||||
| 8.01 | 27.74 | 9,606 | 1.13 | 1.13 | (0.51 | ) | 75 | ||||||||||||||||||||
| 8.89 | 2.34 | 12,236 | 1.13 | 1.13 | (0.34 | ) | 28 | ||||||||||||||||||||
| 19.71 | 22.37 | 29,275 | 1.15 | 1.15 | (0.65 | ) | 21 | ||||||||||||||||||||
* | Returns shown do not reflect the deduction of taxes that a shareholder would pay on Fund distributions or upon the redemption of Fund shares. |
(1) | Per share data was calculated using average shares for the period. |
(2) | Amount represents less than $0.01 per share. |
The accompanying notes are an integral part of the financial statements.
45
Financial Highlights For a Share Outstanding Throughout Each Period |
|
| Net Asset | Net | Realized and | Total from | Distributions of | Distributions | Total | |||||||||||||||||||||||||||||||||||||||||
RiverPark Short Term High Yield Fund | ||||||||||||||||||||||||||||||||||||||||||||||||
Institutional Class Shares | ||||||||||||||||||||||||||||||||||||||||||||||||
2022 | $ | 9.67 | $ | 0.19 | $ | (0.02 | ) | $ | 0.17 | $ | (0.21 | ) | $ | — | $ | (0.21 | ) | |||||||||||||||||||||||||||||||
2021 | 9.65 | 0.19 | 0.02 | (2) | 0.21 | (0.19 | ) | — | (0.19 | ) | ||||||||||||||||||||||||||||||||||||||
2020 | 9.76 | 0.24 | (0.12 | ) | 0.12 | (0.23 | ) | — | (0.23 | ) | ||||||||||||||||||||||||||||||||||||||
2019 | 9.78 | 0.29 | (0.02 | ) | 0.27 | (0.29 | ) | — | (0.29 | ) | ||||||||||||||||||||||||||||||||||||||
2018 | 9.76 | 0.25 | 0.02 | 0.27 | (0.25 | ) | — | (0.25 | ) | |||||||||||||||||||||||||||||||||||||||
Retail Class Shares | ||||||||||||||||||||||||||||||||||||||||||||||||
2022 | $ | 9.63 | $ | 0.16 | $ | (0.01 | ) | $ | 0.15 | $ | (0.19 | ) | $ | — | $ | (0.19 | ) | |||||||||||||||||||||||||||||||
2021 | 9.61 | 0.17 | 0.02 | (2) | 0.19 | (0.17 | ) | — | (0.17 | ) | ||||||||||||||||||||||||||||||||||||||
2020 | 9.72 | 0.23 | (0.13 | ) | 0.10 | (0.21 | ) | — | (0.21 | ) | ||||||||||||||||||||||||||||||||||||||
2019 | 9.74 | 0.26 | (0.01 | ) | 0.25 | (0.27 | ) | — | (0.27 | ) | ||||||||||||||||||||||||||||||||||||||
2018 | 9.73 | 0.21 | 0.02 | 0.23 | (0.22 | ) | — | (0.22 | ) | |||||||||||||||||||||||||||||||||||||||
RiverPark Long/Short Opportunity Fund | ||||||||||||||||||||||||||||||||||||||||||||||||
Institutional Class Shares | ||||||||||||||||||||||||||||||||||||||||||||||||
2022 | $ | 19.46 | $ | (0.20 | ) | $ | (10.80 | ) | $ | (11.00 | ) | $ | — | $ | — | $ | — | |||||||||||||||||||||||||||||||
2021 | 16.59 | (0.24 | ) | 3.11 | 2.87 | — | — | — | ||||||||||||||||||||||||||||||||||||||||
2020 | 12.59 | (0.16 | ) | 5.56 | 5.40 | (0.11 | ) | (1.29 | ) | (1.40 | ) | |||||||||||||||||||||||||||||||||||||
2019 | 13.95 | (0.10 | ) | 0.02 | (0.08 | ) | (0.11 | ) | (1.17 | ) | (1.28 | ) | ||||||||||||||||||||||||||||||||||||
2018 | 12.37 | (0.22 | ) | 1.95 | 1.73 | (0.09 | ) | (0.06 | ) | (0.15 | ) | |||||||||||||||||||||||||||||||||||||
Retail Class Shares | ||||||||||||||||||||||||||||||||||||||||||||||||
2022 | $ | 19.19 | $ | (0.25 | ) | $ | (10.62 | ) | $ | (10.87 | ) | $ | — | $ | — | $ | — | |||||||||||||||||||||||||||||||
2021 | 16.41 | (0.28 | ) | 3.06 | 2.78 | — | — | — | ||||||||||||||||||||||||||||||||||||||||
2020 | 12.46 | (0.21 | ) | 5.53 | 5.32 | (0.08 | ) | (1.29 | ) | (1.37 | ) | |||||||||||||||||||||||||||||||||||||
2019 | 13.81 | (0.13 | ) | 0.03 | (0.10 | ) | (0.08 | ) | (1.17 | ) | (1.25 | ) | ||||||||||||||||||||||||||||||||||||
2018 | 12.24 | (0.24 | ) | 1.93 | 1.69 | (0.06 | ) | (0.06 | ) | (0.12 | ) | |||||||||||||||||||||||||||||||||||||
The accompanying notes are an integral part of the financial statements.
46
|

Net Asset | Total Return* | Net Assets, End | Ratio of Net | Ratio of Total | Ratio of Net | Portfolio | |||||||||||||||||||||
| $ | 9.63 | 1.82 | % | $ | 896,699 | 0.90 | % | 0.90 | % | 1.99 | % | 164 | % | ||||||||||||||
| 9.67 | 2.19 | 1,118,494 | 0.89 | 0.89 | 1.95 | 158 | |||||||||||||||||||||
| 9.65 | 1.26 | 653,883 | 0.90 | 0.90 | 2.45 | 266 | |||||||||||||||||||||
| 9.76 | 2.81 | 777,925 | 0.88 | 0.88 | 2.96 | 112 | |||||||||||||||||||||
| 9.78 | 2.79 | 863,978 | 0.89 | 0.89 | 2.57 | 193 | |||||||||||||||||||||
| $ | 9.59 | 1.56 | % | $ | 28,191 | 1.17 | % | 1.17 | % | 1.67 | % | 164 | % | ||||||||||||||
| 9.63 | 1.95 | 66,020 | 1.14 | 1.14 | 1.76 | 158 | |||||||||||||||||||||
| 9.61 | 1.01 | 65,998 | 1.05 | 1.05 | 2.35 | 266 | |||||||||||||||||||||
| 9.72 | 2.56 | 31,196 | 1.18 | 1.18 | 2.68 | 112 | |||||||||||||||||||||
| 9.74 | 2.53 | 49,619 | 1.18 | 1.18 | 2.16 | 193 | |||||||||||||||||||||
| $ | 8.46 | (56.53 | )% | $ | 81,623 | 1.75 | % | 1.75 | % | (1.40 | )% | 51 | % | ||||||||||||||
| 19.46 | 17.30 | 452,886 | 1.73 | 1.73 | (1.29 | ) | 33 | ||||||||||||||||||||
| 16.59 | 47.71 | 304,772 | 1.75 | 1.75 | (1.12 | ) | 28 | ||||||||||||||||||||
| 12.59 | 0.75 | 79,984 | 2.18 | (3) | 2.18 | (0.83 | ) | 63 | |||||||||||||||||||
| 13.95 | 14.19 | (4) | 102,042 | 3.28 | (5) | 3.28 | (1.67 | ) | 59 | ||||||||||||||||||
| $ | 8.32 | (56.64 | )% | $ | 10,305 | 2.00 | % | 2.04 | % | (1.67 | )% | 51 | % | ||||||||||||||
| 19.19 | 16.94 | 71,339 | 2.00 | 2.03 | (1.52 | ) | 33 | ||||||||||||||||||||
| 16.41 | 47.47 | 64,411 | 2.00 | 2.03 | (1.41 | ) | 28 | ||||||||||||||||||||
| 12.46 | 0.50 | 4,012 | 2.38 | (3) | 2.48 | (1.04 | ) | 63 | |||||||||||||||||||
| 13.81 | 14.06 | (4) | 4,309 | 3.48 | (5) | 3.58 | (1.86 | ) | 59 | ||||||||||||||||||
* | Returns shown do not reflect the deduction of taxes that a shareholder would pay on Fund distributions or upon the redemption of Fund shares. |
(1) | Per share data was calculated using average shares for the period. |
(2) | Realized and unrealized gains and losses per share in this caption are balancing amounts necessary to reconcile the change in net asset value per share for the period, and may not reconcile with the aggregate gains and losses in the Statement of Operations due to share transactions for the period. |
(3) | Dividend expense and stock loan fee totaled 0.38% of average net assets for the period ended September 30, 2019. Had these expenses not been included the ratios would have been 1.80% and 2.00%, respectively. As of April 1, 2019, dividend expense and stock loan fees on short positions were eliminated. |
(4) | Total return would have been lower had certain fees not been waived and/or expenses assumed by Adviser during the period. |
(5) | Dividend expense and stock loan fee totaled 1.48% of average net assets for the period ended September 30, 2018. Had these expenses not been included the ratios would have been 1.80% and 2.00%, respectively. |
The accompanying notes are an integral part of the financial statements.
47
Financial Highlights For a Share Outstanding Throughout Each Period |
|
| Net Asset | Net | Realized and | Total from | Distributions of | Distributions | Total | |||||||||||||||||||||||||||||||||||||||||
RiverPark Strategic Income Fund | ||||||||||||||||||||||||||||||||||||||||||||||||
Institutional Class Shares | ||||||||||||||||||||||||||||||||||||||||||||||||
2022 | $ | 9.33 | $ | 0.45 | $ | (0.55 | ) | $ | (0.10 | ) | $ | (0.52 | ) | $ | — | $ | (0.52 | ) | ||||||||||||||||||||||||||||||
2021 | 8.60 | 0.45 | 0.70 | 1.15 | (0.42 | ) | — | (0.42 | ) | |||||||||||||||||||||||||||||||||||||||
2020 | 9.10 | 0.49 | (0.51 | ) | (0.02 | ) | (0.48 | ) | — | (0.48 | ) | |||||||||||||||||||||||||||||||||||||
2019 | 9.42 | 0.41 | (0.30 | ) | 0.11 | (0.43 | ) | — | (0.43 | ) | ||||||||||||||||||||||||||||||||||||||
2018 | 9.52 | 0.42 | (0.10 | ) | 0.32 | (0.42 | ) | — | (0.42 | ) | ||||||||||||||||||||||||||||||||||||||
Retail Class Shares | ||||||||||||||||||||||||||||||||||||||||||||||||
2022 | $ | 9.33 | $ | 0.44 | $ | (0.56 | ) | $ | (0.12 | ) | $ | (0.49 | ) | $ | — | $ | (0.49 | ) | ||||||||||||||||||||||||||||||
2021 | 8.60 | 0.44 | 0.68 | 1.12 | (0.39 | ) | — | (0.39 | ) | |||||||||||||||||||||||||||||||||||||||
2020 | 9.09 | 0.47 | (0.50 | ) | (0.03 | ) | (0.46 | ) | — | (0.46 | ) | |||||||||||||||||||||||||||||||||||||
2019 | 9.40 | 0.39 | (0.30 | ) | 0.09 | (0.40 | ) | — | (0.40 | ) | ||||||||||||||||||||||||||||||||||||||
2018 | 9.50 | 0.41 | (0.11 | ) | 0.30 | (0.40 | ) | — | (0.40 | ) | ||||||||||||||||||||||||||||||||||||||
RiverPark Floating Rate CMBS Fund | ||||||||||||||||||||||||||||||||||||||||||||||||
Institutional Class Shares | ||||||||||||||||||||||||||||||||||||||||||||||||
2022 | $ | 8.93 | $ | 0.24 | $ | (0.50 | ) | $ | (0.26 | ) | $ | (0.23 | ) | $ | — | $ | (0.23 | ) | ||||||||||||||||||||||||||||||
2021 | 9.02 | 0.22 | (0.08 | )(7) | 0.14 | (0.23 | ) | — | (0.23 | ) | ||||||||||||||||||||||||||||||||||||||
2020 | 9.98 | 0.31 | (0.97 | ) | (0.66 | ) | (0.30 | )** | — | (8) | (0.30 | ) | ||||||||||||||||||||||||||||||||||||
2019 | 10.14 | 0.36 | (0.06 | ) | 0.30 | (0.35 | ) | (0.11 | ) | (0.46 | ) | |||||||||||||||||||||||||||||||||||||
2018 | 10.16 | 0.42 | (0.03 | ) | 0.39 | (0.34 | ) | (0.07 | ) | (0.41 | ) | |||||||||||||||||||||||||||||||||||||
Retail Class Shares | ||||||||||||||||||||||||||||||||||||||||||||||||
2022 | $ | 8.91 | $ | 0.21 | $ | (0.51 | ) | $ | (0.30 | ) | $ | (0.20 | ) | $ | — | $ | (0.20 | ) | ||||||||||||||||||||||||||||||
2021 | 9.01 | 0.18 | (0.07 | )(7) | 0.11 | (0.21 | ) | — | (0.21 | ) | ||||||||||||||||||||||||||||||||||||||
2020 | 9.98 | 0.28 | (0.97 | ) | (0.69 | ) | (0.28 | )** | — | (8) | (0.28 | ) | ||||||||||||||||||||||||||||||||||||
2019(10) | 10.14 | 0.29 | (0.05 | ) | 0.24 | (0.29 | ) | (0.11 | ) | (0.40 | ) | |||||||||||||||||||||||||||||||||||||
* | Returns shown do not reflect the deduction of taxes that a shareholder would pay on Fund distributions or upon the redemption of Fund shares. |
** | Includes return of capital of $0.0002 per share. |
(1) | Per share data was calculated using average shares for the period. |
(2) | Dividend expense and Interest expense totaled 0.16% of average net assets for the year ended September 30, 2022. Had these expenses not been included the ratios would have been 0.94% and 1.11%, respectively. |
(3) | Dividend expense and Interest expense totaled 0.26% of average net assets for the year ended September 30, 2021. Had these expenses not been included the ratios would have been 0.92% and 1.07%, respectively. |
(4) | Dividend expense and Interest expense totaled 0.14% of average net assets for the year ended September 30, 2020. Had these expenses not been included the ratios would have been 0.91% and 1.08%, respectively. |
(5) | Dividend expense and stock loan fee totaled 0.22% of average net assets for the year ended September 30, 2019. Had these expenses not been included the ratios would have been 0.90% and 1.11%, respectively. |
(6) | Dividend expense and stock loan fee totaled 0.26% of average net assets for the year ended September 30, 2018. Had these expenses not been included the ratios would have been 0.91% and 1.17%, respectively. |
The accompanying notes are an integral part of the financial statements.
48
|

Net Asset | Total Return* | Net Assets, End | Ratio of Net | Ratio of Total | Ratio of Net | Portfolio | |||||||||||||||||||||
| $ | 8.71 | (1.27 | )% | $ | 168,885 | 1.10 | %(2) | 1.10 | % | 4.93 | % | 72 | % | ||||||||||||||
| 9.33 | 13.59 | 195,997 | 1.18 | (3) | 1.18 | 4.94 | 89 | ||||||||||||||||||||
| 8.60 | (0.10 | ) | 177,850 | 1.05 | (4) | 1.05 | 5.58 | 109 | |||||||||||||||||||
| 9.10 | 1.17 | 281,043 | 1.12 | (5) | 1.12 | 4.41 | 39 | ||||||||||||||||||||
| 9.42 | 3.46 | 348,726 | 1.17 | (6) | 1.17 | 4.44 | 55 | ||||||||||||||||||||
| $ | 8.72 | (1.41 | )% | $ | 19,581 | 1.27 | %(2) | 1.27 | % | 4.84 | % | 72 | % | ||||||||||||||
| 9.33 | 13.44 | 13,070 | 1.33 | (3) | 1.33 | 4.80 | 89 | ||||||||||||||||||||
| 8.60 | (0.36 | ) | 10,479 | 1.22 | (4) | 1.22 | 5.40 | 109 | |||||||||||||||||||
| 9.09 | 1.02 | 18,367 | 1.33 | (5) | 1.33 | 4.20 | 39 | ||||||||||||||||||||
| 9.40 | 3.19 | 38,974 | 1.43 | (6) | 1.43 | 4.30 | 55 | ||||||||||||||||||||
| $ | 8.44 | (2.98 | )% | $ | 34,945 | 0.85 | % | 0.96 | % | 2.70 | % | 27 | % | ||||||||||||||
| 8.93 | 1.61 | 44,527 | 0.85 | 0.94 | 2.44 | 45 | |||||||||||||||||||||
| 9.02 | (6.63 | ) | 333,855 | 0.85 | 0.87 | 3.31 | 85 | ||||||||||||||||||||
| 9.98 | 3.15 | 191,548 | 0.90 | (9) | 0.93 | 3.64 | 87 | ||||||||||||||||||||
| 10.14 | 3.79 | 48,130 | 1.00 | 1.00 | 4.12 | 84 | |||||||||||||||||||||
| $ | 8.41 | (3.34 | )% | $ | 1,260 | 1.25 | % | 1.30 | % | 2.39 | % | 27 | % | ||||||||||||||
| 8.91 | 1.24 | 1,566 | 1.25 | 1.29 | 2.04 | 45 | |||||||||||||||||||||
| 9.01 | (6.96 | ) | 3,886 | 1.16 | 1.16 | 3.02 | 85 | ||||||||||||||||||||
| 9.98 | 2.50 | 2,329 | 1.24 | 1.24 | 3.24 | 87 | |||||||||||||||||||||
(7) | Realized and unrealized gains and losses per share in this caption are balancing amounts necessary to reconcile the change in net asset value per share for the period, and may not reconcile with the aggregate gains and losses in the Statement of Operations due to share transactions for the period. |
(8) | Amounts represent less than $.01 per share. |
(9) | During the period, the Expense Limitation Agreement was amended on two separate occasions. The amendments were made effective March, 21, 2019 and July 1, 2019 whereby the Total Annual Fund Operation Expenses After Fee Waiver and Expense Reimbursement would not exceed, on an annual basis 0.90% and 0.85%, respectively for the Institutional Class Shares. |
(10) | Commenced operations on November 12, 2018. All ratios for the period have been annualized, except for the Total Return and Portfolio Turnover Rate. |
The accompanying notes are an integral part of the financial statements.
49
Notes to Financial Statements September 30, 2022 |
|

1. Organization
RiverPark Funds Trust (the “Trust”), was formed on June 22, 2010 as an open-end registered management investment company under the Investment Company Act of 1940, as amended (the “1940 Act”). As of September 30, 2022, the Trust was comprised of six funds: the RiverPark Large Growth Fund, Wedgewood Fund, RiverPark Short Term High Yield Fund, RiverPark Long/Short Opportunity Fund, RiverPark Strategic Income Fund and the RiverPark Floating Rate CMBS Fund (each a “Fund” and collectively the “Funds”). The investment objective of the RiverPark Large Growth Fund and Wedgewood Fund is to seek long term capital appreciation. The investment objective of the RiverPark Short Term High Yield Fund, RiverPark Strategic Income Fund and the RiverPark Floating Rate CMBS Fund is to seek high current income and capital appreciation consistent with the preservation of capital. The investment objective of the RiverPark Long/Short Opportunity Fund is to seek long-term capital appreciation while managing downside volatility. Each of the Funds is diversified with the exception of the Wedgewood Fund and the RiverPark Floating Rate CMBS Fund which are non-diversified. Each Fund is registered to offer Institutional Class Shares and Retail Class Shares. Each of the Funds, except the RiverPark Short Term High Yield Fund and the RiverPark Floating Rate CMBS Fund, have registered Class C Shares but they are not intended to be offered at this time. Each class differs as to ongoing fees.
Sales of Retail and Institutional Class Shares of the RiverPark Short Term High Yield Fund are closed to new investors except as noted below. Existing shareholder of the Fund and certain eligible investors may purchase additional share of the Fund through existing or new accounts and may reinvest dividends and capital gains distributions.
Effective as of the close of business on October 12, 2022, existing shareholders will include shareholders of records and clients of any financial adviser or planner who has client assets invested in the Fund. New shareholders may open Fund accounts and purchase shares directly from the Fund (i.e., not through a financial intermediary). Further, any trustee of RiverPark Funds Trust, or employee of RiverPark Advisors, LLC or Cohanzick Management, LLC, or an investor who is an immediate family member of any if these individuals may also open new accounts and purchase shares of the Fund. The Fund reserves the right, in its sole discretion, to determine the criteria for qualification as an eligible investor and to reject or accept any purchase order. Sales of share of the fund maybe Further restricted or reopened in the future.
2. Summary of Significant Accounting Policies
The following is a summary of significant accounting policies followed by the Trust in preparation of its financial statements. These policies are in conformity with accounting principles generally accepted in the United States of America (“GAAP”). The preparation of the financial statements in conformity with GAAP requires management to make estimates and assumptions that affect the reported amounts of assets and liabilities and disclosure of contingent assets and liabilities at the date of the financial statements and the reported amounts of increases and decreases in net assets from operations during the reporting period. Actual results could differ from those estimates. The Funds are investment companies and accordingly follow investment company accounting and reporting guidance of the Financial Accounting Standards Board (FASB) Accounting Standards Codification Topic 946 Financial Services – Investment Companies.
Valuation of Investments — Securities listed on a national securities exchange or traded on the NASDAQ system are valued on their last sale price. Portfolio securities traded on NASDAQ will be valued at the NASDAQ Official Closing Price on each business day for the New York Stock Exchange (“NYSE”). If there is no such reported sale on an exchange or NASDAQ, the portfolio security will be valued at the mean between the most recent quoted bid and asked price. Price information on listed securities is taken from the exchange where the security is primarily traded. Other equity securities and debt securities for which market quotations are readily available are valued at the mean between their bid and asked price, except that debt securities maturing within 60 days are valued on an amortized cost basis. Debt securities are valued according to the broadest and most representative market, which will ordinarily be over-the-counter. Debt securities may be valued based on prices provided by a pricing service when such prices are believed to reflect the fair value of such securities. Securities for which market quotations are not readily available are required to be fair valued under 1940 Act.
In December 2020, the SEC adopted Rule 2a-5 under the 1940 Act, establishing requirements to determine fair value in good faith for purposes of the 1940 Act. The rule permits fund boards to designate a fund’s investment adviser to perform fair-value determinations, subject to board oversight and certain other conditions. The rule also defines when market
50
Notes to Financial Statements September 30, 2022 |
|

2. Summary of Significant Accounting Policies (continued)
quotations are “readily available” for purposes of the 1940 Act and requires a fund to fair value a portfolio investment when a market quotation is not readily available. The SEC also adopted new Rule 31a-4 under the 1940 Act, which sets forth recordkeeping requirements associated with fair-value determinations. The compliance date for Rule 2a-5 and Rule 31a-4 was September 8, 2022.
RiverPark Advisors, LLC (“RiverPark”) serves as the Funds’ investment adviser (the “Adviser”). Effective September 8, 2022, and pursuant to the requirements of Rule 2a-5, the Trust’s Board of Trustees designated the Adviser as the Board’s valuation designee to perform fair-value determinations for the Funds through a Fair Value Committee established by the Adviser and approved new Adviser Fair Value Procedures for the Funds. Prior to September 8, 2022, fair-value determinations were performed in accordance with the Trust’s Fair Value Procedures established by the Funds’ Board of Trustees and were implemented through a Fair Value Committee designated by the Board.
To the extent that a Fund invests in non-U.S. dollar denominated securities, the value of all assets and liabilities not denominated in United States dollars will be translated into United States dollars on the valuation date. Trading in securities on European and Far Eastern securities exchanges and over-the-counter markets is normally completed well before the close of business on each day the NYSE is open for business (a “business day”). In addition, European or Far Eastern securities trading generally or in a particular country or countries may not take place on all business days in New York. Furthermore, trading takes place in various foreign markets on days, which are not business days in New York, and on which net asset value is not calculated. Such calculation does not take place contemporaneously with the determination of the prices of the majority of the portfolio securities used in such calculation. Events affecting the values of portfolio securities that occur between the time their prices are determined and the close of the NYSE will not be reflected in a Fund’s calculation of net assets unless the Trustees deem that the particular event would materially affect net asset value, in which case an adjustment will be made.
Options are valued at the last quoted sales price. If there is no such reported sale on the valuation date, long positions are valued at the most recent bid price, and short positions are valued at the most recent ask price.
Foreign currency forward contracts are valued at the current day’s interpolated foreign exchange rate, as calculated using forward rates provided by an independent source.
Swaps are marked-to-market daily based upon quotations from market makers and the resulting changes in market values, are recorded as an unrealized gain or loss in the Statements of Operations.
In accordance with the authoritative guidance on fair value measurement and disclosure under GAAP, the Funds disclose the fair value of their investments in a hierarchy that prioritizes the inputs to valuation techniques used to measure the fair value. The objective of a fair value measurement is to determine the price that would be received to sell an asset or paid to transfer a liability in an orderly transaction between market participants at the measurement date (an exit price). Accordingly, the fair value hierarchy gives the highest priority to quoted prices (unadjusted) in active markets for identical assets or liabilities (Level 1) and the lowest priority to unobservable inputs (Level 3).
The three levels of the fair value hierarchy are described below:
● | Level 1 — Unadjusted quoted prices in active markets for identical, unrestricted assets or liabilities that the Funds have the ability to access at the measurement date; |
● | Level 2 — Other significant observable inputs (includes quoted prices for similar securities, interest rates, prepayment speeds, credit risk, referenced indices, quoted prices in inactive markets, adjusted quoted prices in active markets, etc.); and |
● | Level 3 — Prices, inputs or exotic modeling techniques which are both significant to the fair value measurement and unobservable (supported by little or no market activity). |
51
Notes to Financial Statements September 30, 2022 |
|

2. Summary of Significant Accounting Policies (continued)
Investments are classified within the level of the lowest significant input considered in determining fair value. Investments classified within Level 3 whose fair value measurement considers several inputs may include Level 1 or Level 2 inputs as components of the overall fair value measurement.
For details of the investment classification, refer to the Schedules of Investments, Schedule of Securities Sold Short, Not Yet Purchased, lists of open forward currency contracts, lists of open option contracts and list of open swap contracts.
Securities Sold Short, Not Yet Purchased — As consistent with the RiverPark Long/Short Opportunity Fund’s investment objectives, the Fund intends to sell securities short so long as, as a result of that sale, the current value of securities sold short, not yet purchased by the Fund would not exceed 50% of the value of its gross assets (including the amounts borrowed) and 100% of the value of its net assets.
As consistent with the RiverPark Strategic Income Fund’s investment objectives, the Fund intends to sell securities short so long as, as a result of that sale, the current value of securities sold short, not yet purchased by the Fund would not exceed 15% of the value of its net assets. A short sale is the sale by a fund of a security, which it does not own in anticipation of purchasing the same security in the future. To complete such a transaction, the Funds must borrow the security to make delivery to the buyer. The Funds are then obligated to replace the security borrowed by purchasing the security at the market price at the time of the replacement. The price at such time may be more or less than the price at which the security was sold by the Funds. Until the security is replaced, the Funds are required to pay the lender amounts equal to any dividends that accrue during the period of the loan. Dividends and interest are shown as an expense for financial reporting purposes. To borrow the security, the Funds also may be required to pay a fee, which is shown as an expense for financial reporting purposes. The proceeds of the short sale are retained by the broker, to the extent necessary to meet margin requirements, until the short position is closed out. A realized gain, limited to the price at which the Funds sold the security short, or a realized loss, unlimited in size on a standalone basis, will be recognized upon the close of a short sale.
Until the Funds close their short position or replace the borrowed security, the Funds will maintain a segregated account with its custodian containing marginable securities. The Funds may be required to add to the segregated account as the market price of a shorted security increases. As a result of maintaining and adding to its segregated account, the Funds may maintain higher levels of marginable assets (for example, long equity positions) for collateral needs thus reducing their overall managed assets available for trading purposes.
The realized and unrealized gain (loss) from securities sold short, if any, are disclosed separately on the Statements of Operations.
Written/Purchased Options — Each of the Funds may purchase call and put options on securities to seek capital growth or for hedging purposes. Each Fund may also write and sell covered call and put options as well as purchase and write options on stock indices (such as the S&P 500 Index) listed on domestic or foreign securities exchanges or traded in the over-the-counter market for hedging purposes. Additionally, the RiverPark Long/Short Opportunity Fund and RiverPark Strategic Income Fund may sell uncovered call and put options on securities and stock indices.
The RiverPark Long/Short Opportunity Fund and RiverPark Strategic Income Fund may invest up to 50% of the value of their assets, represented by premiums paid, to purchase call and put options on securities and securities indices. The Funds may write covered call and put options on securities and securities indices, so long as the aggregate nominal value does not exceed 200% of the value of its assets.
An option on a security provides the purchaser, or “holder,” with the right, but not the obligation, to purchase, in the case of a “call” option, or sell, in the case of a “put” option, the security or securities underlying the option, for a fixed exercise price up to a stated expiration date. The holder pays a nonrefundable purchase price for the option, known as the “premium.” The maximum amount of risk the purchaser of the option assumes is equal to the premium plus related transaction costs, although the entire amount may be lost. The risk of the seller, or “writer,” however, is potentially unlimited, unless the option is “covered,” which is generally accomplished through the writer’s ownership of the underlying security, in the case of a
52
Notes to Financial Statements September 30, 2022 |
|

2. Summary of Significant Accounting Policies (continued)
call option, or the writer’s segregation of an amount of cash or securities equal to the exercise price, in the case of a put option. If the writer’s obligation is not covered, it is subject to the risk of the full change in value of the underlying security from the time the option is written until exercise.
The realized and unrealized gain (loss) from purchased and written options, if any, are disclosed separately on the Statements of Operations (See Note 3 for risk exposures on the RiverPark Strategic Income Fund).
For the year ended September 30, 2022, the average delta-adjusted monthly market value of equity options was as follows (000):
Purchased Options | ||||
RiverPark Strategic Income Fund | $ | 189 | ||
Written Options | ||||
RiverPark Short Term High Yield Fund | $ | (464 | ) | |
RiverPark Strategic Income Fund | $ | (651 | ) |
Swap Agreements — The Funds may invest in equity-linked securities, including, but not limited to, participation notes, certificates, and equity swaps. Equity-linked securities are privately issued securities whose investment results are designed to correspond generally to the performance of a specified stock index or “basket” of stocks, or a single stock. To the extent that the Funds invest in equity-linked securities whose return corresponds to the performance of a foreign security index or one or more foreign stocks, investing in equity-linked securities will involve risks similar to the risks of investing in foreign securities and subject to each Fund’s restrictions on investments in foreign securities.
Equity swaps allow the parties to a swap agreement to exchange the dividend income or other components of return on an equity investment (for example, a group of equity securities or an index) for a component of return on another non-equity or equity investment. An equity swap may be used by a Fund to invest in a market without owning or taking physical custody of securities in circumstances in which direct investment may be restricted for legal reasons or is otherwise deemed impractical or disadvantageous. Equity swaps may also be used for hedging purposes or to seek to increase exposure and total return. A Fund’s ability to enter into certain swap transactions may be limited by tax considerations. The counterparty to an equity swap contract will typically be a bank, investment banking firm or broker/dealer.
Equity swaps are derivatives and their value can be very volatile. Equity swaps normally do not involve the delivery of securities or other underlying assets. Accordingly, the risk of loss with respect to equity swaps is normally limited to the net amount of payments that a Fund is contractually obligated to make. If the counterparty to an equity swap defaults, a Fund’s risk of loss consists of the net amount of payments that such Fund is contractually entitled to receive (additional information in Note 7 in the Notes to Financial Statements). Because some swap agreements have a leverage component, adverse changes in the value or level of the underlying asset, reference rate, or index can result in a loss substantially greater than the cost of the underlying asset without the use of leverage. In addition, the value of some components of an equity swap (such as the dividends on a common stock) may also be sensitive to changes in interest rates. To the extent that the Adviser does not accurately analyze and predict the potential relative fluctuation of the components swapped with another party, a Fund may suffer a loss. Because equity swaps can be illiquid, a Fund may be unable to terminate its obligations when desired. When entering into swap contracts, a Fund must “set aside” liquid assets, or engage in other appropriate measures to “cover” its obligation under the swap contract.
Swaps are marked-to-market daily and are valued at the unrealized appreciation or depreciation on the instrument based upon quotations from market makers or a pricing service and the resulting changes in market values, if any, are recorded as an unrealized gain or loss in the Statements of Operations. For the Long/Short Opportunity Fund, the net change in unrealized loss on swap contracts was $21,898 (000) for the year ended September 30, 2022. Periodic reset payments on the total return swap are inclusive of interest, commissions and dividends, which are recorded as part of the net realized
53
Notes to Financial Statements September 30, 2022 |
|

2. Summary of Significant Accounting Policies (continued)
gains and losses in the Statements of Operations. For the Long/Short Opportunity Fund, the net realized loss on swap contracts was $51,291 (000) for the year ended September 30, 2022. For the year ended September 30, 2022, (subject to equity risk exposure) the average notional value of equity swaps for the Long/Short Opportunity Fund was as follows (000):
RiverPark Long/Short Opportunity Fund | ||||
Average Monthly Notional Value Long | $ | 95,247 | ||
Average Monthly Notional Value Short | $ | 140,569 |
There is the risk that the counterparty refuses to continue to enter into swap agreements with the Funds in the future, or requires increased fees, which could impair the Funds’ ability to achieve their investment objective. A counterparty may also increase its collateral requirements, which may limit the Funds’ ability to use leverage and reduce investment returns. In addition, if the Funds cannot locate a counterparty willing to enter into transactions with the Funds, they will not be able to implement their investment strategy. For the year ended September 30, 2022, the RiverPark Long/Short Opportunity Fund entered into swap agreements with only one counterparty, Goldman Sachs International.
To reduce counterparty risk with respect to Over-the-Counter (“OTC”) transactions, the Funds have entered into master netting arrangements, established within the Funds’ International Swap and Derivatives Association, Inc. (“ISDA”) master agreements, which allow the Funds to make (or to have an entitlement to receive) a single net payment in the event of default (close-out netting) for outstanding payables and receivables with respect to certain OTC positions in purchased equity options and swaps for each individual counterparty. In addition, the Funds may require that certain counterparties post cash and/or securities in collateral accounts to cover their net payment obligations for those derivative contracts subject to ISDA master agreements. If the counterparty fails to perform under these contracts and agreements, the cash and/or securities will be made available to the Funds.
The following is a summary by counterparty of the market value of swap agreements and collateral (received)/pledged for the RiverPark Long/Short Opportunity Fund as of September 30, 2022 (000)*†:
Gross Amounts not offset in the | ||||||||||||||||||||||||
| Gross | Gross | Net Amounts | Financial | Cash | Net Amount | ||||||||||||||||||
| $ | 2,643 | $ | — | $ | 2,643 | $ | (2,643 | ) | $ | — | $ | — | ||||||||||||
Gross Amounts not offset in the | ||||||||||||||||||||||||
| Gross | Gross | Net Amounts | Financial | Cash | Net Amount | ||||||||||||||||||
| $ | (12,346 | ) | $ | — | $ | (12,346 | ) | $ | 2,643 | $ | 9,703 | $ | — | |||||||||||
† | Net exposures represents the net receivable/(payable) that would be due from/to the counterparty in the event of default. Exposure from swaps can only be netted across transactions governed under the same master agreement with the same legal entity. |
54
Notes to Financial Statements September 30, 2022 |
|

2. Summary of Significant Accounting Policies (continued)
* | Collateral received/pledged is limited to the net outstanding amount due to/from an individual counterparty. The actual collateral amount received/pledged may exceed this amount and may fluctuate in value. |
For financial reporting purposes, the Funds do not offset derivative assets and derivative liabilities that are subject to netting arrangements in the Statements of Assets and Liabilities. Bankruptcy or insolvency laws of a particular jurisdiction may impose restrictions on or prohibitions against the right of offset in bankruptcy, insolvency or other events.
Collateral terms are contract specific for OTC derivatives. For derivatives traded under an ISDA master agreement, the collateral requirements are typically calculated by netting the mark to market amount of each transaction under such agreement and comparing that amount to the value of any collateral currently pledged by the Funds or the counterparty.
For financial reporting purposes, cash collateral that has been pledged to cover obligations of the Funds, if any, is reported separately on the Statements of Assets and Liabilities as cash pledged as collateral. Non-cash collateral pledged by the Funds, if any, is noted in the Schedules of Investments. Generally, the amount of collateral due from or to a party must exceed a minimum transfer amount threshold before a transfer has to be made. To the extent amounts due to the Funds from its counterparties are not fully collateralized, contractually or otherwise, the Funds bear the risk of loss from counterparty nonperformance.
Master Limited Partnerships — The Funds may invest in master limited partnerships (“MLPs”). MLPs are limited partnerships or limited liability companies, whose partnership units or limited liability interests are listed and traded on a U.S. securities exchange, and are treated as publicly traded partnerships for federal income tax purposes. To qualify to be treated as a partnership for tax purposes, an MLP must receive at least 90% of its income from qualifying sources as set forth in Section 7704(d) of the Internal Revenue Code of 1986, as amended (the “Code”). These qualifying sources include interest, dividend, real property rent, gain from sale or other disposition of real property and income from activities such as the exploration, development, mining, production, processing, refining, transportation, storage and marketing of mineral or natural resources. MLPs generally have two classes of owners, the general partner and limited partners. MLPs that are formed as limited liability companies generally have two analogous classes of owners, the managing member and the members. For purposes of this section, references to general partners also apply to managing members and references to limited partners also apply to members. The general partner is typically owned by a major energy company, an investment fund, the direct management of the MLP or is an entity owned by one or more of such parties. The general partner may be structured as a private or publicly traded corporation or other entity. The general partner typically controls the operations and management of the MLP through an equity interest of as much as 2% in the MLP plus, in many cases, ownership of common units and subordinated units. Limited partners own the remainder of the MLP through ownership of common units and have a limited role in the MLP’s operations and management.
An investment in MLP units involves certain risks which differ from an investment in the securities of a corporation. Holders of MLP units have limited control and voting rights on matters affecting the partnership. In addition, there are certain tax risks associated with an investment in MLP units and conflicts of interest exist between common unit holders and the general partner, including those arising from incentive distribution payments. As a partnership, an MLP has no tax liability at the entity level. If, as a result of a change in current law or a change in an MLP’s business, an MLP were treated as a corporation for federal income tax purposes, such MLP would be obligated to pay federal income tax on its income at the corporate tax rate. If an MLP were classified as a corporation for federal income tax purposes, the amount of cash available for distribution by the MLP would be reduced and distributions received by investors would be taxed under federal income tax laws applicable to corporate dividends (as dividend income, return of capital, or capital gain). Therefore, treatment of an MLP as a corporation for federal income tax purposes would result in a reduction in the after-tax return to investors, likely causing a reduction in the value of the Funds’ shares. Dividends from MLPs are recorded on the ex-dividend date.
Investment Transactions — Security transactions are accounted for on the trade date, the date the order to buy or sell is executed. Costs used in determining realized gains and losses on the sales of investment securities are those of the specific securities sold. Discounts or premiums are accreted or amortized to interest income using the effective interest method. Interest income is recognized on the accrual basis from settlement date. Dividend income and expenses and other distributions are recorded on the ex-dividend date, except certain dividends and distributions from foreign securities
55
Notes to Financial Statements September 30, 2022 |
|

2. Summary of Significant Accounting Policies (continued)
which are recorded as soon as a Fund is informed after the ex-dividend date. Withholding taxes on foreign dividends have been provided for in accordance with the Funds’ understanding of the applicable country’s tax rules and rates. The ability of issuers of debt securities held by the Funds to meet their obligations may be affected by economic and political developments in a specific country or region.
Defaulted Investments — Debt obligations may be placed on non-accrual status and related interest income may be reduced by ceasing current accruals and writing off interest receivable when the collection of all or a portion of interest has become doubtful based on consistently applied procedures. A debt obligation is removed from non-accrual status when the issuer resumes interest payments or when collectability of interest is reasonably assured.
Expenses — Expenses of the Trust that can be directly attributed to a particular Fund are borne by that Fund. Expenses which cannot be directly attributed to a Fund are apportioned among the Funds of the Trust based on the number of Funds and/or relative net assets.
Classes — Class specific expenses are borne by that class of shares. Income, realized and unrealized gains and losses and non-class specific expenses are allocated to the respective class on the basis of relative daily net assets.
Foreign Currency Translation — The books and records of the Funds are maintained in U.S. dollars. Investment securities and other assets and liabilities denominated in a foreign currency are translated into U.S. dollars on the date of valuation. The Funds do not isolate that portion of realized or unrealized gains and losses resulting from changes in the foreign exchange rate from fluctuations arising from changes in the market prices of the securities. These gains and losses are included in net realized and unrealized gains and losses on investments on the Statements of Operations. Net realized and unrealized gains and losses on foreign currency transactions represent net foreign exchange gains or losses from foreign currency exchange contracts, disposition of foreign currencies, currency gains or losses realized between trade and settlement dates on securities transactions and the difference between the amount of the investment income and foreign withholding taxes recorded on the Fund’s books and the U.S. dollar equivalent amounts actually received or paid.
Forward Foreign Currency Exchange Contracts — Each Fund may, but is not obligated to, enter into forward foreign currency exchange contracts (“forward contracts”) in order to protect against uncertainty in the level of future foreign exchange rates in the purchases and sale of securities. A forward contract generally has no deposit requirement, and no commissions are charged at any stage for trades. Although foreign exchange dealers do not charge a fee for commissions, they do realize a profit based on the difference between the price at which they are buying and selling various currencies. Although forward contracts are intended to minimize currency risk — the risk of loss due to a decline in the value of the hedged currencies — at the same time, they tend to limit any potential gain which might result should the value of such currencies increase. As of September 30, 2022, the RiverPark Strategic Income Fund and the RiverPark Short Term High Yield Fund held forward contracts as currency hedges against foreign bonds. It is the Funds’ policy to present the gross unrealized appreciation and gross unrealized depreciation of the forward contracts separately on the Statements of Assets and Liabilities, as the Funds do not have a master netting agreement with the counterparty to the forward contracts. As of September 30, 2022, the RiverPark Short Term High Yield Fund and RiverPark Strategic Income Fund entered into one-month forward contracts with one counterparty, Brown Brothers Harriman. In accordance with this policy, the unrealized appreciation and depreciation as of September 30, 2022, is presented as unrealized appreciation or depreciation on forward foreign currency contracts on the Statements of Assets and Liabilities. Realized and change in unrealized gains (losses) on forward foreign currency contracts are disclosed separately on the Statements of Operations.
For the year ended September 30, 2022, subject to currency risk exposure, the average balances of the forward contracts were as follows (000) (See Note 3 for risk exposures on the RiverPark Strategic Income Fund).
Average Monthly Notional Contracts: | ||||
RiverPark Short Term High Yield Fund | $ | 43,755 | ||
RiverPark Strategic Income Fund | $ | 16,562 |
56
Notes to Financial Statements September 30, 2022 |
|

2. Summary of Significant Accounting Policies (continued)
Dividends and Distributions to Shareholders — Dividends from net investment income are declared and paid to shareholders annually for the RiverPark Large Growth Fund, Wedgewood Fund and RiverPark Long/Short Opportunity Fund, and declared and paid monthly for the RiverPark Short Term High Yield Fund, RiverPark Strategic Income Fund and the RiverPark Floating Rate CMBS Fund. Dividends and distributions are recorded on the ex-dividend date. Any net realized capital gains will be distributed at least annually by the Funds.
Income Taxes — Each Fund intends to qualify or continue to qualify as a “regulated investment company” under Sub-chapter M of the Internal Revenue Code of 1986, as amended. If so qualified, each Fund will not be subject to federal income tax to the extent it distributes substantially all of its net investment income and net capital gains to its shareholders.
The Funds evaluate tax positions taken or expected to be taken in the course of preparing the Funds’ tax returns to determine whether it is “more-likely-than not” (i.e., greater than 50-percent) that each tax position will be sustained upon examination by a taxing authority based on the technical merits of the position. Tax positions not deemed to meet the more-likely-than-not threshold are recorded as a tax benefit or expense in the current year. The Funds did not record any tax provision in the current period. However, management’s conclusions regarding tax positions taken may be subject to review and adjustment at a later date based on factors including, but not limited to, examination by tax authorities (i.e., the last 3 tax year ends, as applicable), on-going analysis of, and changes to, tax laws, regulations and interpretations thereof.
As of and during the year ended September 30, 2022, the Funds did not have a tax liability for any unrecognized tax benefits. The Funds recognize interest and penalties, if any, related to unrecognized tax benefits as income tax expense in the Statements of Operations. During the year, the Funds did not incur any significant interest or penalties.
Cash and Cash Equivalents — Cash equivalents include short-term, highly liquid investments with a maturity date at time of purchase of three months or less. The Funds maintain cash and cash equivalent balances which, at times during the period, exceeded the $250,000 amount insured by the Federal Deposit Insurance Corporation. The Manager manages the risk of loss by banking with major institutions.
3. Derivatives Transactions
At September 30, 2022, the Funds are invested in derivative contracts which are reflected in the Statements of Assets and Liabilities as follows:
RiverPark Short Term High Yield Fund
Derivative Assets | Derivative Liabilities | |||||||||
Statement of Assets | Fair Value | Statement of Assets | Fair Value | |||||||
Forward foreign exchange contracts (Currency Risk) | Unrealized appreciation on forward foreign currency contracts | $ | 1,167 | Unrealized depreciation on forward foreign currency contracts | $ | (107 | ) | |||
Total | $ | 1,167 | $ | (107 | ) | |||||
57
Notes to Financial Statements September 30, 2022 |
|

3. Derivatives Transactions (continued)
RiverPark Strategic Income Fund
Derivative Assets | Derivative Liabilities | |||||||||
Statement of Assets | Fair Value | Statement of Assets | Fair Value | |||||||
Forward foreign exchange contracts (Currency Risk) | Unrealized appreciation on forward foreign currency contracts | $ | 395 | Unrealized depreciation on forward foreign currency contracts | $ | — | ||||
Option contracts on equities and exchange-traded funds (Equity Risk) | Investments in securities (1) | 21 | Written options | (347 | ) | |||||
Total | $ | 416 | $ | (347 | ) | |||||
(1) | The Statements of Assets and Liabilities location for Purchased Options is “Investments in Securities”. |
For the year ended September 30, 2022, the effect of derivative instruments on the Funds’ Statements of Operations were as follows:
The amount of realized gain (loss) on derivatives recognized in income (000):
RiverPark Short Term High Yield Fund | Forward | Purchased | Written | Totals | ||||||||||||
Forward foreign exchange contracts (Currency Risk) | $ | 8,529 | $ | — | $ | — | $ | 8,529 | ||||||||
Equity contracts (Equity Risk) | — | — | 98 | 98 | ||||||||||||
Total | $ | 8,529 | — | 98 | 8,627 | |||||||||||
RiverPark Strategic Income Fund | Forward | Purchased | Written | Totals | ||||||||||||
Forward foreign exchange contracts (Currency Risk) | $ | 2,842 | $ | — | $ | — | $ | 2,842 | ||||||||
Option contracts on equities and exchange-traded funds (Equity Risk) | — | (548 | ) | 864 | 316 | |||||||||||
Total | $ | 2,842 | (548 | ) | 864 | 3,158 | ||||||||||
58
Notes to Financial Statements September 30, 2022 |
|

3. Derivatives Transactions (continued)
The change in of unrealized appreciation (depreciation) on derivatives recognized in income (000):
RiverPark Short Term High Yield Fund | Forward | Purchased | Written | Totals | ||||||||||||
Forward foreign exchange contracts (Currency Risk) | $ | 327 | $ | — | $ | — | $ | 327 | ||||||||
Equity contracts (Equity Risk) | — | — | — | — | ||||||||||||
Total | $ | 327 | $ | — | $ | — | $ | 327 | ||||||||
RiverPark Strategic Income Fund | Forward | Purchased | Written | Totals | ||||||||||||
Forward foreign exchange contracts (Currency Risk) | $ | 15 | $ | — | $ | — | $ | 15 | ||||||||
Option contracts on equities and exchange-traded funds (Equity Risk) | — | 5 | (251 | ) | (246 | ) | ||||||||||
Total | $ | 15 | $ | 5 | $ | (251 | ) | $ | (231 | ) | ||||||
4. Agreements
Investment Advisory Agreement — The Adviser has contractually agreed to waive its fees and to absorb expenses of each Fund through January 31, 2023 to the extent necessary to ensure that ordinary operating expenses of each class (excluding interest, brokerage commissions, dividends on short sales and interest expense on securities sold short, not yet purchased, acquired fund fees and expenses and extraordinary expenses) do not exceed, on an annual basis, certain levels as set forth below.
The table below shows the rate of each Funds’ investment advisory fee and the Adviser’s contractual expense limitation for each Fund:
Fund | Advisory | Expense | Expense | Expense |
RiverPark Large Growth Fund | 0.65% | 1.00% | 1.25% | 2.00% |
Wedgewood Fund | 0.65% | 1.00% | 1.25% | 2.00% |
RiverPark Short Term High Yield Fund | 0.65% | 1.00% | 1.25% | N/A |
RiverPark Long/Short Opportunity Fund | 1.50% | 1.85% | 2.00% | 2.85% |
RiverPark Strategic Income Fund | 0.65% | 1.00% | 1.25% | 2.00% |
RiverPark Floating Rate CMBS Fund | 0.65% | 0.85% | 1.25% | N/A |
* | Class C Shares are not currently being offered for sale to investors. |
The Funds have each agreed to repay the Adviser in the amount of any fees waived and Fund expenses absorbed, subject to the limitations that: (1) the reimbursement is made only for fees and expenses incurred not more than three years prior to the date of reimbursement; and (2) the reimbursement will not be made if it would cause the annual expense limitation
59
Notes to Financial Statements September 30, 2022 |
|

4. Agreements (continued)
in effect at the time of the waiver or at the time of the reimbursement to be exceeded. This arrangement will remain in effect unless and until the Board approves its modification or termination. The Adviser can recapture any fees it has waived within a three-year period subject to the applicable annual rates in the above table.
For the year ended September 30, 2022, the Adviser fee waiver analysis is as follows:
| Unexpired | Fees Waived | Fees | Fee Waivers | Unexpired | |||||||||||||||
Wedgewood Fund | $ | — | $ | 6,412 | $ | (1,097 | ) | $ | — | $ | 5,315 | |||||||||
RiverPark Long/Short Opportunity Fund | 33,741 | 14,766 | — | (3,405 | ) | 45,102 | ||||||||||||||
RiverPark Floating Rate CMBS Fund | 172,912 | 41,934 | — | (35,731 | ) | 179,115 | ||||||||||||||
As of September 30, 2022, the amounts of waivers/reimbursements subject to recapture are as follows:
| Expiring | Expiring | Expiring | Total | ||||||||||||
Wedgewood Fund | $ | — | $ | — | $ | 5,315 | $ | 5,315 | ||||||||
RiverPark Long/Short Opportunity Fund | 6,986 | 23,350 | 14,766 | 45,102 | ||||||||||||
RiverPark Floating Rate CMBS Fund | 60,054 | 77,127 | 41,934 | 179,115 | ||||||||||||
RiverPark provides day-to-day portfolio management services to the RiverPark Large Growth Fund, RiverPark Long/Short Opportunity Fund and the RiverPark Floating Rate CMBS Fund. The Adviser has discretion to purchase and sell securities in accordance with these Funds’ objectives, policies, and restrictions.
RiverPark oversees the day-to-day portfolio management services provided by the following sub-advisers:
Fund | Investment Sub-Adviser |
Wedgewood Fund | Wedgewood Partners, Inc. |
RiverPark Short Term High Yield Fund | Cohanzick Management, LLC |
RiverPark Strategic Income Fund | Cohanzick Management, LLC |
The discretion to purchase and sell securities in accordance with these Funds’ objectives, policies, and restrictions has been delegated by the Adviser to Wedgewood Partners, Inc. (“Wedgewood”) and Cohanzick Management, LLC with regard to each respective Fund to which such parties serve as sub-adviser. The Adviser pays the sub-advisers a monthly fee based upon the net assets managed by such sub-adviser from the management fee paid to the Adviser pursuant to the Investment Advisory Agreement. The Funds are not responsible for the payment of the sub-advisory fees.
RiverPark (and its affiliated advisers) and Wedgewood may be considered to be affiliates as RiverPark shareholders own approximately 6% of Wedgewood Partners. For its services as sub-adviser to the Wedgewood Fund, Wedgewood is entitled to a fee to be paid from RiverPark’s adviser fee, and such fee is calculated daily and paid monthly at an annual rate of 0.325% of Wedgewood Fund’s average net assets in excess of $50,000,000.
60
Notes to Financial Statements September 30, 2022 |
|

4. Agreements (continued)
Administrator, Custodian and Transfer Agent — SEI Investments Global Funds Services (the “Administrator”) serves as the Funds’ administrator pursuant to an Administration Agreement under which the Administrator provides administrative and accounting services. For these services, the Administrator is paid an asset-based fee, which will vary depending on the number of share classes and average daily net assets of the Fund. As per the amended administration agreement dated May 13, 2019, the Funds in the Trust were charged fees using a tiered fee structure on their total average net assets.
For the year ended September 30, 2022, the Funds incurred the following fees for these services in the table below:
Fund | Administration | |||
RiverPark Large Growth Fund | $ | 33,607 | ||
Wedgewood Fund | 20,086 | |||
RiverPark Short Term High Yield Fund | 577,838 | |||
RiverPark Long/Short Opportunity Fund | 163,796 | |||
RiverPark Strategic Income Fund | 114,702 | |||
RiverPark Floating Rate CMBS Fund | 22,095 | |||
Brown Brothers Harriman & Co. (the “Custodian”) serves as the Funds’ custodian pursuant to a Custodian Agreement.
DST Systems, Inc. (the “Transfer Agent”) serves as the Funds’ transfer agent pursuant to an Agency Agreement.
Distribution Agreement — SEI Investments Distribution Co., a wholly-owned subsidiary of SEI Investments Company and an affiliate of the Administrator (the “Distributor”) serves as the Funds’ distributor pursuant to a Distribution Agreement.
5. Investment Transactions
The Trust has adopted a shareholder services plan under which a shareholder servicing fee may be paid at an annual rate of up to 0.25% of average daily net assets attributable to Retail Class Shares and Institutional Class Shares of the Funds to banks and their affiliates and other institutions, including broker-dealers, as compensation for providing non-distribution related shareholder services. As of September 30, 2022, there were no shareholder servicing fees charged to Institutional Class Shares.
The Trust has adopted an administrative services plan under which each Fund may pay a non-distribution related administrative services fee at an annual rate of up to 0.20% of the average daily net assets of the Retail Class Shares and 0.15% of the average daily net assets of the Institutional Class Shares, to financial institutions, retirement plans, broker-dealers, depository institutions, institutional shareholders of record, registered investment advisers and other financial intermediaries and various brokerage firms or other industry recognized service providers of fund supermarkets or similar programs who provide administrative, recordkeeping and support servicing to their customers.
For the Retail Class Shares, at no time will the shareholder servicing fees and the administrative servicing fees in the aggregate exceed on an annual basis 0.40% of the average daily net assets until changed by the Board of Trustees.
For the Institutional Class Shares, at no time will the shareholder servicing fees and the administrative servicing fees in the aggregate exceed on an annual basis 0.15% of the average daily net assets until changed by the Board of Trustees.
Other — Certain officers and Trustees of the Trust are also officers of the Adviser and the Administrator. Such officers are paid no fees by the Trust for serving as officers of the Trust.
The services provided by the Chief Compliance Officer (“CCO”) and any staff are paid for by the Funds as incurred. The services include regulatory oversight of the Trust’s Adviser, sub-advisers and service providers as required by SEC regulations.
61
Notes to Financial Statements September 30, 2022 |
|

5. Investment Transactions (continued)
The cost of security purchases and proceeds from security sales and maturities, other than short-term investments, short sales, purchases to cover, written and purchased options, and short-term securities for the year ended September 30, 2022, were as follows:
Fund | Purchases | Proceeds from | ||||||
RiverPark Large Growth Fund | $ | 53,021 | $ | 69,481 | ||||
Wedgewood Fund | 7,260 | 13,849 | ||||||
RiverPark Short Term High Yield Fund | 1,487,569 | 675,514 | ||||||
RiverPark Long/Short Opportunity Fund | 143,865 | 386,405 | ||||||
RiverPark Strategic Income Fund | 135,468 | 163,799 | ||||||
RiverPark Floating Rate CMBS Fund | 10,312 | 20,321 | ||||||
6. Federal Tax Information
The amount and character of income and capital gain distributions to be paid, if any, are determined in accordance with Federal income tax regulations, which may differ from U.S. GAAP. These book/tax differences may be temporary or permanent. To the extent these differences are permanent in nature, they are charged or credited to paid-in capital or distributable earnings, as appropriate, in the period that the differences arise.
Accordingly the following permanent differences are primarily attributable to net operating losses, non-deductible expenses from partnerships, and the utilization of earnings and profits distributed to shareholders on redemption of shares (equalization). Adjustments which have been reclassified to/from the following components of net assets are as follows (000):
Fund | Total | Paid-in Capital | ||||||
RiverPark Large Growth Fund | $ | (359 | ) | $ | 359 | |||
Wedgewood Fund | (868 | ) | 868 | |||||
RiverPark Long/Short Opportunity Fund | 11,059 | (11,059 | ) | |||||
RiverPark Strategic Income Fund | — | * | — | * | ||||
* | Amount shown as “—” rounds to less than $500. |
62
Notes to Financial Statements September 30, 2022 |
|

6. Federal Tax Information (continued)
The tax character of dividends and distributions declared during the last two years ended September 30, 2022 and 2021 was as follows (000):
Fund | Ordinary | Long-Term | Return of | Total | ||||||||||||
RiverPark Large Growth Fund | ||||||||||||||||
2022 | $ | 2,479 | $ | 7,771 | $ | — | $ | 10,250 | ||||||||
2021 | — | 4,915 | — | 4,915 | ||||||||||||
Wedgewood Fund | ||||||||||||||||
2022 | 47 | 4,890 | — | 4,937 | ||||||||||||
2021 | 1,036 | 20,529 | — | 21,565 | ||||||||||||
RiverPark Short Term High Yield Fund | ||||||||||||||||
2022 | 22,346 | — | — | 22,346 | ||||||||||||
2021 | 18,153 | — | — | 18,153 | ||||||||||||
RiverPark Long/Short Opportunity Fund | ||||||||||||||||
2022 | — | — | — | — | ||||||||||||
2021 | — | — | — | — | ||||||||||||
RiverPark Strategic Income Fund | ||||||||||||||||
2022 | 11,541 | — | — | 11,541 | ||||||||||||
2021 | 9,141 | — | — | 9,141 | ||||||||||||
RiverPark Floating Rate CMBS Fund | ||||||||||||||||
2022 | 991 | — | — | 991 | ||||||||||||
2021 | 2,107 | — | — | 2,107 | ||||||||||||
As of September 30, 2022, the components of distributable earnings/(accumulated losses) on a tax basis were as follows (000):
Fund | Undistributed | Undistributed | Capital Loss | Post-October | Unrealized | Other Temporary | Late Year Loss | Total | ||||||||||||||||||||||||
RiverPark Large Growth Fund | $ | — | $ | — | $ | — | $ | (2,210 | ) | $ | 3,539 | $ | 2 | $ | (305 | ) | $ | 1,026 | ||||||||||||||
Wedgewood Fund | 47 | 3,574 | — | — | 3,860 | (2 | ) | — | 7,479 | |||||||||||||||||||||||
RiverPark Short Term High Yield Fund | 9,610 | — | (29,923 | ) | (472 | ) | (12,440 | ) | (169 | ) | — | (33,394 | ) | |||||||||||||||||||
RiverPark Long/Short Opportunity Fund | — | — | (58,342 | ) | — | (20,155 | ) | (1,102 | ) | — | (79,599 | ) | ||||||||||||||||||||
RiverPark Strategic Income Fund | 3,121 | — | (63,832 | ) | (4,158 | ) | (17,414 | ) | (2 | ) | — | (82,285 | ) | |||||||||||||||||||
RiverPark Floating Rate CMBS Fund | 3 | — | (25,718 | ) | (70 | ) | (3,017 | ) | (1 | ) | — | (28,803 | ) | |||||||||||||||||||
Post-October losses represent losses realized on investment transactions from November 1, 2021 through September 30, 2022, that, in accordance with Federal income tax regulations, the Funds elect to defer and treat as having arisen in the following fiscal year.
63
Notes to Financial Statements September 30, 2022 |
|

6. Federal Tax Information (continued)
Deferred late-year losses represent ordinary losses realized on investment transactions from January 1, 2022 through September 30, 2022 and specified losses realized on investment transactions from November 1, 2021 through September 30, 2022. In accordance with Federal income tax regulations, the Funds elect to defer and treat as having arisen in the following fiscal year.
The RiverPark Large Growth Fund, RiverPark Short Term High Yield Fund, RiverPark Strategic Income Fund and RiverPark Floating Rate CMBS Fund had Post-October losses of $2,210,083, $471,856, $4,157,652 and $70,408, respectively. The Funds elect to treat each as having arisen in the following fiscal year.
Funds are permitted to carry forward capital losses indefinitely and such losses will retain their character as either short-term or long-term. As of September 30, 2022, the Funds had capital loss carryforwards as follows (000):
Short-Term Loss | Long-Term Loss | Total* | ||||||||||
RiverPark Short Term High Yield Fund | $ | 14,982 | $ | 14,941 | $ | 29,923 | ||||||
RiverPark Long/Short Opportunity Fund | 58,342 | — | 58,342 | |||||||||
RiverPark Strategic Income Fund | 7,394 | 56,438 | 63,832 | |||||||||
RiverPark Floating Rate CMBS Fund | 15,619 | 10,099 | 25,718 | |||||||||
During the year ended September 30, 2022, the Funds did not utilize capital loss carryforwards to offset capital gains.
For federal income tax purposes, the cost of investments owned at September 30, 2022 and the net realized gains or losses on securities sold for the period could be different from amounts reported for financial reporting purposes, due to partnership basis adjustments and book versus tax adjustments such as interest from perpetual bonds, investments in Passive Foreign Investment Companies adjustments on swaps, mark to market on forward contracts, and wash sales which cannot be used for federal income tax purposes in the current year and have been deferred for use in future years. The federal tax cost and aggregate gross unrealized appreciation and depreciation on investments, foreign currency and derivatives held by the Funds were as follows (000):
Fund | Federal | Aggregate | Aggregate | Net | ||||||||||||
RiverPark Large Growth Fund | $ | 30,047 | $ | 8,520 | $ | (4,981 | ) | $ | 3,539 | |||||||
Wedgewood Fund | 22,729 | 6,347 | (2,487 | ) | 3,860 | |||||||||||
RiverPark Short Term High Yield Fund | 924,159 | 2,284 | (14,724 | ) | (12,440 | ) | ||||||||||
RiverPark Long/Short Opportunity Fund | 93,444 | 20,378 | (40,533 | ) | (20,155 | ) | ||||||||||
RiverPark Strategic Income Fund | 178,567 | 1,865 | (19,279 | ) | (17,414 | ) | ||||||||||
RiverPark Floating Rate CMBS Fund | 36,652 | — | (3,017 | ) | (3,017 | ) | ||||||||||
7. Risks
The RiverPark Short Term High Yield Fund and RiverPark Strategic Income Fund invest in fixed-income instruments that are or are rated below investment grade by Moody’s Investors Service, Inc. and Standard & Poor’s Corporation and accordingly involve greater risk. Such securities are regarded as predominantly speculative with respect to the issuer’s capacity to pay interest and repay principal in accordance with the terms of the obligations and involve major risk to adverse conditions. These securities offer higher returns than bonds with higher ratings as compensation for holding an obligation of an issuer perceived to be less creditworthy. Changes in economic conditions or developments regarding
64
Notes to Financial Statements September 30, 2022 |
|

7. Risks (continued)
issuers of non-investment grade debt securities are more likely to cause price volatility and weaken the capacity of such issuers to make principal and interest payments than is the case for higher grade debt securities. In addition, the market for lower grade debt securities may be thinner and less active than for higher grade debt securities.
High-yield securities are generally not exchange-traded and, as a result, these instruments trade in a smaller secondary market than exchange-traded bonds. In addition, the Funds invest in bonds of issuers that do not have publicly traded equity securities, making it more difficult to hedge the risks associated with such investments.
The RiverPark Short Term High Yield Fund and RiverPark Strategic Income Fund may invest in securities of companies that are experiencing significant financial or business difficulties, including companies involved in bankruptcy or other reorganization and liquidation proceedings. Although such investments may result in significant returns to the Funds, they involve a substantial degree of risk.
The RiverPark Long/Short Opportunity Fund and RiverPark Strategic Income Fund are exposed to the risks of using leverage and short sales. The RiverPark Long/Short Opportunity Fund and RiverPark Strategic Income Fund may use leverage. Leverage is the practice of borrowing money to purchase securities. These investment practices involve special risks. Leverage can increase the investment returns of the RiverPark Long/Short Opportunity Fund and RiverPark Strategic Income Fund if the securities purchased increase in value in an amount exceeding the cost of the borrowing. However, if the securities decrease in value, the RiverPark Long/Short Opportunity Fund and RiverPark Strategic Income Fund will suffer a greater loss than would have resulted without the use of leverage. A short sale is the sale by the RiverPark Long/Short Opportunity Fund and RiverPark Strategic Income Fund of a security which it does not own in anticipation of purchasing the same security in the future at a lower price to close the short position. A short sale will be successful if the price of the shorted security decreases. However, if the underlying security goes up in price during the period in which the short position is outstanding, the RiverPark Long/Short Opportunity Fund and RiverPark Strategic Income Fund will recognize a loss. The risk on a standalone or unhedged short sale is unlimited because the RiverPark Long/Short Opportunity Fund and RiverPark Strategic Income Fund must buy the shorted security at the higher price to complete the transaction. Therefore, short sales may be subject to greater risks than investments in long positions. With a long position, the maximum sustainable loss is limited to the amount paid for the security plus the transaction costs, whereas there is no maximum attainable price of the shorted security.
The RiverPark Long/Short Opportunity Fund and RiverPark Strategic Income Fund are able to invest in options which expose investors to the risks inherent in trading options. These risks include, but are not limited to, volatile movements in the price of the underlying instrument and misjudgments as to the future prices of the options and/or the underlying instrument. Increased option volatility can increase both the profit potential and the risk associated with a fund’s trading. While volatility can be monitored and reacted to, there is no cost-effective means of hedging against market volatility.
Selling options creates additional risks. The seller of a “naked” call option (or the seller of a put option who has a short position in the underlying instrument) is subject to the risk of a rise in the price in the underlying instrument above the strike price, which risk is reduced only by the premium received for selling the option. In exchange for the proceeds received from selling the call option (in lieu of an outright short position), the option seller gives up (or will not participate in) all of the potential gain resulting from a decrease in the price of the underlying instrument below the strike price prior to expiration of the option.
The seller of a “naked” put option (or the seller of a call option who has a long position in the underlying instrument) is subject to the risk of a decline in price of the underlying instrument below the strike price, which risk is reduced only by the proceeds received from selling the option. In exchange for the premium received for selling the put option (in lieu of an outright long position), the option seller gives up (or will not participate in) all of the potential gain resulting from an increase in the price of the underlying instrument above the strike price prior to the expiration of the option. Due to the inherent leveraged nature of options, a relatively small adverse move in the price of the underlying instrument may result in immediate and substantial losses to a Fund.
65
Notes to Financial Statements September 30, 2022 |
|

7. Risks (continued)
The RiverPark Long/Short Opportunity Fund invests in swaps. The use of swaps is a highly specialized activity that involves investment techniques, risk analyses and tax planning different from those associated with ordinary portfolio securities transactions. These transactions can result in sizeable realized and unrealized capital gains and losses relative to the gains and losses from the Fund’s direct investments in the reference assets and short sales. Transactions in swaps can involve greater risks than if the RiverPark Long/Short Opportunity Fund had invested directly in the reference asset because, in addition to general market risks, swaps are also subject to liquidity risk, counterparty risk, credit risk and valuation risk. Because they are two-party contracts and because they may have terms of greater than seven days, swap transactions may be considered to be illiquid. Swaps may also be subject to pricing or “basis” risk, which exists when a particular swap becomes extraordinarily expensive relative to historical prices or the price of corresponding cash market instruments. Under certain market conditions it may not be economically feasible to initiate a transaction or liquidate a position in time to avoid a loss or take advantage of an opportunity. As a registered investment company, the Fund must “set aside” liquid assets (often referred to as “asset segregation”), or engage in other approved measures to “cover” open positions with respect to certain kinds of derivatives instruments. The Fund reserves the right to modify its asset segregation policies in the future to comply with any changes in the SEC’s positions regarding asset segregation.
The RiverPark Long/Short Opportunity Fund is exposed to counterparty credit risk through its investment in swap contracts. The RiverPark Long/Short Opportunity Fund bears the risk of loss of the amount expected to be received under a swap agreement in the event of default or bankruptcy of the counterparty, or if the counterparty fails to honor its obligations. The RiverPark Long/Short Opportunity Fund has entered into swap agreements with a single counterparty (Goldman Sachs International), focusing its exposure to the counterparty credit risk of that single counterparty. Furthermore, the swap counterparty’s obligation to the RiverPark Long/Short Opportunity Fund likely will not be collateralized. The RiverPark Long/Short Opportunity Fund typically resets swap agreements on a rolling 13-month basis.
The RiverPark Short Term High Yield Fund and RiverPark Strategic Income Fund may invest in bank loan obligations. The secondary market for loans is a private, unregulated inter-dealer or inter-bank resale market. Purchases and sales of loans are generally subject to contractual restrictions that must be satisfied before a loan can be bought or sold. These restrictions may impede the Fund’s ability to buy or sell loans and may negatively impact the transaction price. It may take longer than seven days for transactions in loans to settle.
The Fund may hold cash, sell investments or temporarily borrow from banks or other lenders to meet short-term liquidity needs due to the extended loan settlement process, such as to satisfy redemption requests from Fund shareholders.
The Wedgewood Fund and RiverPark Floating Rate CMBS Fund are non-diversified, which means that it may hold larger positions in a smaller number of individual securities than if it were diversified. This means that increases or decreases in the value of any of the individual securities owned by the Funds may have a greater impact on the Fund’s net asset value and total return than a diversified fund which would likely hold more securities. Therefore, the Fund’s value may fluctuate more, and it could incur greater losses as a result of decreases in the value of any one of its holdings, than if it had invested in a larger number of stocks.
The Information Technology sector is an important sector for growth-oriented strategies and thus may represent a large percentage of the investments of RiverPark Large Growth, RiverPark Long/Short and Wedgewood. The sector includes a number of important industries such as software & services, hardware & equipment, and semiconductors. Investments in Information Technology are potentially riskier than investments in more mature industries because the nature of technology is that it is rapidly changing. Therefore, products or services that may initially look promising may subsequently fail or become obsolete and barriers to entry are difficult to determine. Additionally, valuations are often higher, and price movements may be more volatile.
The RiverPark Floating Rate CMBS Fund will invest in commercial real estate debt securities (“CRE Debt”). CRE Debt securities are not backed by the full faith and credit of the U.S. government and are subject to risk of default on the underlying mortgages. CRE Debt may react differently to changes in interest rates than other bonds and the prices of CRE Debt may reflect adverse economic and market conditions. Small movements in interest rates may significantly reduce the value of CRE Debt.
66
Notes to Financial Statements September 30, 2022 |
|

7. Risks (continued)
The CRE Debt securities in which the Fund is expected to invest are subject to the risks of the underlying mortgage loans. Commercial mortgage loans are secured by commercial property and are subject to risks of delinquency and foreclosure, and risks of loss. The ability of a borrower to repay a loan secured by an income-producing property typically is dependent primarily upon the successful operation of such property rather than upon the existence of independent income or assets of the borrower. If the net operating income of the property is reduced, the borrower’s ability to repay the loan may be impaired. Net operating income of an income-producing property can be affected by, among other things, tenant mix, success of tenant businesses, property management decisions, property location and condition, competition from comparable types of properties, changes in laws that increase operating expense or limit rents that may be charged, any need to address environmental contamination at the property, the occurrence of any uninsured casualty at the property, changes in national, regional or local economic conditions and/or specific industry segments, declines in regional or local real estate values, declines in regional or local rental or occupancy rates, increases in interest rates, real estate tax rates and other operating expenses, changes in governmental rules, regulations and fiscal policies, including environmental legislation, acts of God, terrorism, social unrest and civil disturbances.
Difficult conditions in the markets for CRE Debt securities and mortgage-related assets as well as the broader financial markets have in the past resulted in a temporary but significant contraction in liquidity for CRE Debt securities. Liquidity relates to the ability of the Fund to sell its investments in a timely manner at a price approximately equal to its value on the Fund’s books. To the extent that the market for CRE Debt securities suffers such a contraction, securities that were considered liquid at the time of investment could become temporarily illiquid, and the Advisor may experience delays or difficulty in selling assets at the prices at which the Fund carries such assets, which may result in a loss to the Fund. There is no way to predict reliably when such market conditions could re-occur or how long such conditions could persist.
CMBS may involve the risks of delinquent payments of interest and principal, early prepayments and potentially unrecoverable principal loss from the sale of foreclosed property. Subordinated classes of CMBS are generally entitled to receive repayment of principal only after all required principal payments have been made to more senior classes and also have subordinated rights as to receipt of interest distributions. Such subordinated classes are subject to a greater risk of non-payment than are senior classes.
Geopolitical and Health Crisis Risks. Geopolitical events and health crises, including pandemics, war, terrorism, trade disputes, government shutdowns, market closures, natural and environmental disasters, and other public health crises and related events and governments’ reactions to such events have led, and in the future may lead, to economic uncertainty, decreased economic activity, increased market volatility and other disruptive effects on U.S. and global economies and markets. The increasing interconnectedness of markets around the world may result in many markets being affected by such events even if they occur in a single country or region. Such events may have significant adverse direct or indirect effects on the Funds and their investments. A health crisis may also exacerbate other pre-existing risks. The COVID-19 global pandemic and related shutdowns have caused, and could cause in the future, substantial market volatility and exchange trading suspensions and closures, affecting both the liquidity and the volatility of the Funds’ investments.
CLOs (collateralized loan obligations) and other similarly structured securities are types of asset-backed securities. The cash flows from the CLO trust are split into two or more portions, called tranches, varying in risk and yield. The riskiest portion is the “equity” tranche which bears the bulk of defaults from the loans in the trust and serves to protect the other, more senior tranches from default. Since it is partially protected from defaults, a senior tranche from CLO trust typically has higher ratings and lower yields than the underlying securities, and can be rated investment grade. Despite the protection from the equity tranche, CLO tranches can experience substantial losses due to actual defaults, increased sensitivity to defaults due to collateral default and disappearance of protecting tranches, market anticipation of defaults and aversion to CLO securities as a class. The risks of an investment in a CLO depend largely on the collateral and the class of the CLO in which the Fund invests. Normally, CLOs and other similarly structured securities are privately offered and sold, and thus are not registered under the securities laws.
67
Notes to Financial Statements September 30, 2022 |
|

7. Risks (continued)
The RiverPark Short Term High Yield Fund and RiverPark Strategic Income Funds may invest in securities that are purchased in private investment in public equity (“PIPE”) transactions. Securities acquired by the Fund in such transactions are subject to resale restrictions under securities laws. While issuers in PIPE transactions typically agree that they will register the securities for resale by the Fund after the transaction closes (thereby removing resale restrictions), there is no guarantee that the securities will in fact be registered. In addition, a PIPE issuer may require the Fund to agree to other resale restrictions as a condition to the sale of such securities. Thus, the Fund’s ability to resell securities acquired in PIPE transactions may be limited, and even though a public market may exist for such securities, the securities held by the Fund may be deemed illiquid.
The RiverPark Short Term High Yield Fund and RiverPark Strategic Income Funds may invest in stock, warrants, and other securities of special purpose acquisition companies (“SPACs”) or similar special purpose entities that pool funds to seek potential acquisition opportunities. Unless and until an acquisition is completed, a SPAC generally invests its assets (less a portion retained to cover expenses) in U.S. Government securities, money market fund securities and cash; if an acquisition that meets the requirements for the SPAC is not completed within a pre-established period of time, the invested funds are returned to the entity’s shareholders. Because SPACs and similar entities are in essence blank check companies without an operating history or ongoing business other than seeking acquisitions, the value of their securities is particularly dependent on the ability of the entity’s management to identify and complete a profitable acquisition. Some SPACs may pursue acquisitions only within certain industries or regions, which may increase the volatility of their prices. In addition, these securities, which are typically traded in the over-the-counter market, may be considered illiquid and/or be subject to restrictions on resale.
A more complete description of risks is included in each Fund’s prospectus and statement of additional information.
8. Other
As of September 30, 2022, the Funds had the following concentrations of shareholders holding 10% or more of the outstanding shares of the Funds. These represent omnibus shareholder accounts comprised of one or many individual shareholders.
Fund | |
RiverPark Large Growth Fund | |
Institutional Class Shares | 77% |
Retail Class Shares | 84% |
Wedgewood Fund | |
Institutional Class Shares | 50% |
Retail Class Shares | 56% |
RiverPark Short Term High Yield Fund | |
Institutional Class Shares | 70% |
Retail Class Shares | 84% |
RiverPark Long/Short Opportunity Fund | |
Institutional Class Shares | 66% |
Retail Class Shares | 71% |
RiverPark Strategic Income Fund | |
Institutional Class Shares | 69% |
Retail Class Shares | 88% |
RiverPark Floating Rate CMBS Fund | |
Institutional Class Shares | 68% |
Retail Class Shares | 89% |
68
Notes to Financial Statements September 30, 2022 |
|

8. Other (continued)
In the normal course of business, the Trust enters into contracts that contain a variety of representations which provide general indemnifications. The Trust’s maximum exposure under these arrangements cannot be known; however, the Trust expects any risk of loss to be remote.
9. New Accounting Pronouncements
In March 2020, FASB issued ASU 2020-04, Reference Rate Reform: Facilitation of the Effects of Reference Rate Reform on Financial Reporting. The main objective of the new guidance is to provide relief to companies that will be impacted by the expected change in benchmark interest rates at the end of 2021, when participating banks will no longer be required to submit LIBOR quotes by the FCA. The new guidance allows companies to, provided the only change to existing contracts are a change to an approved benchmark interest rate, account for modifications as a continuance of the existing contract without additional analysis.
For new and existing contracts, the Funds may elect to apply the amendments as of March 12, 2020 through December 31, 2022. Management is currently assessing the impact of the ASU’s adoption to the Funds’ financial statements and various filings.
10. Subsequent Events
The Funds have evaluated the need for additional disclosures and/or adjustments resulting from subsequent events through the date the financial statements were issued. Based on this evaluation, no adjustments were required to the financial statements.
69
Report of Independent Registered Public Accounting Firm |
|

To the Shareholders and Board of Trustees of
RiverPark Funds Trust
Opinion on the Financial Statements
We have audited the accompanying statements of assets and liabilities, including the schedules of investments, of RiverPark Funds Trust (the “Trust”), comprising RiverPark Large Growth Fund, Wedgewood Fund, RiverPark Short Term High Yield Fund, RiverPark Long/Short Opportunity Fund, RiverPark Strategic Income Fund, and RiverPark Floating Rate CMBS Fund (the “Funds”) as of September 30, 2022, the related statements of operations for the year then ended, the statements of changes in net assets for each of the two years in the period then ended, the related notes, and the financial highlights for each of the five years in the period then ended (collectively referred to as the “financial statements”). In our opinion, the financial statements present fairly, in all material respects, the financial position of each of the Funds as of September 30, 2022, the results of their operations for the year then ended, the changes in net assets for each of the two years in the period then ended, and the financial highlights for each of the five years in the period then ended, in conformity with accounting principles generally accepted in the United States of America.
Basis for Opinion
These financial statements are the responsibility of the Funds’ management. Our responsibility is to express an opinion on the Funds’ financial statements based on our audits. We are a public accounting firm registered with the Public Company Accounting Oversight Board (United States) (“PCAOB”) and are required to be independent with respect to the Funds in accordance with the U.S. federal securities laws and the applicable rules and regulations of the Securities and Exchange Commission and the PCAOB.
We conducted our audits in accordance with the standards of the PCAOB. Those standards require that we plan and perform the audit to obtain reasonable assurance about whether the financial statements are free of material misstatement whether due to error or fraud.
Our audits included performing procedures to assess the risks of material misstatement of the financial statements, whether due to error or fraud, and performing procedures that respond to those risks. Such procedures included examining, on a test basis, evidence regarding the amounts and disclosures in the financial statements. Our procedures included confirmation of securities owned as of September 30, 2022, by correspondence with the custodian, brokers, and agency banks; when replies were not received from brokers and agency banks, we performed other auditing procedures. Our audits also included evaluating the accounting principles used and significant estimates made by management, as well as evaluating the overall presentation of the financial statements. We believe that our audits provide a reasonable basis for our opinion.
We have served as the Funds’ auditor since 2010.

COHEN & COMPANY, LTD.
Cleveland, Ohio
November 29, 2022
70
Trustees and Officers of the Trust (Unaudited) |
|

Set forth below are the names, addresses, ages, position with the Trust, term of office and length of time served, the principal occupations for the last five years, number of portfolios in the Fund Complex overseen by Trustee, and other directorships outside the Fund Complex of each of the persons currently serving as Trustees and Officers of the Trust. The Trust’s Statement of Additional Information (“SAI”) includes additional information about the trustees and officers. The SAI may be obtained without charge by calling (888) 564-4517. The following chart lists Trustees and Officers as of September 30, 2022:
Name, Address, | Position(s) Held | Term of Office | Principal Occupation(s) | Number of Portfolios | Other Directorships |
Richard Browne, | Independent Trustee | Indefinite; since 2010 | President, Rector Management Corp. (real estate and construction company, since 1986); Partner, Sterling Project Development (real estate and construction); Owners Representative, Queens Ballpark Company, LLC (since 2005). | 6 | None |
David Sachs, | Independent Trustee | Indefinite; since 2016 | Retired (since 2010); Managing Partner, Hocky Capital (1996-2010). | 6 | None |
Ira Balsam, | Independent Trustee | Indefinite; since 2012 | Retired (since Jan. 2012); Chief Financial Officer, Avenue Capital Management II, L.P. (group of unregistered investment companies, 2002-2011). | 6 | None |
Morty Schaja*, | Interested Trustee, President and Chairman of the Board | Indefinite; since 2010 | Chief Executive Officer and Managing Partner, RiverPark Advisors, LLC and RiverPark Capital Management LLC (since 2009). | 6 | None |
Mitch Rubin*, | Interested Trustee | Indefinite; since 2010 | Chief Investment Officer and Managing Partner, RiverPark Advisors, LLC and RiverPark Capital Management LLC (since 2009). | 6 | None |
Paul Genova, | Secretary | Since 2010 | Chief Financial Officer, RiverPark Advisors, LLC and RiverPark Capital Management LLC (since 2009); Chief Financial Officer, RiverPark Capital LLC (since 2008) | N/A | N/A |
71
Trustees and Officers of the Trust (Unaudited) (Concluded) |
|

Name, Address, and Age | Position(s) Held | Term of Office | Principal Occupation | Number of Portfolios | Other Directorships |
Matt Kelly, | Vice President | Since 2010 | Chief Marketing Officer and Partner, RiverPark Advisors, LLC and RiverPark Capital Management LLC (since 2010). | N/A | N/A |
Andrew Metzger, One Freedom Valley | Treasurer and Chief Financial Officer | Since 2021 | Director of Fund Accounting, SEI Investments, since 2020. Senior Director, Embark, from 2019 to 2020. Senior Manager, PricewaterhouseCoopers LLP, from 2002 to 2019. | N/A | N/A |
William Woolverton, 480 East Swedesford Road, Suite 300 Wayne, PA 19087 (71) | Chief Compliance Officer | Since 2021 | Senior Compliance Advisor, Cipperman Compliance Services, 2020 to present; Operating Partner, Altamont Capital Partners, 2020 to present; Chairman of Independent Trustees, Thomas White Mutual Funds, 2016 to present. | N/A | N/A |
* Denotes Trustees who are “interested persons” of the Trust or Fund under the 1940 Act.
** The Fund complex includes each series of the Trust.
72
Disclosure of Fund Expenses (Unaudited) |
|

All mutual funds have operating expenses. As a shareholder of a mutual fund, your investment is affected by these ongoing costs, which include (among others) costs for portfolio management, administrative services, and shareholder reports like this one. It is important for you to understand the impact of these costs on your investment returns.
Operating expenses such as these are deducted from a mutual fund’s gross income and directly reduce its final investment return. These expenses are expressed as a percentage of a mutual fund’s average net assets; this percentage is known as a mutual fund’s expense ratio.
The following examples use the expense ratio and are intended to help you understand the ongoing costs (in dollars) of investing in your Fund and to compare these costs with those of other mutual funds. The examples are based on an investment of $1,000 made at the beginning of the period shown and held for the entire period.
The table on the following page illustrates your Fund’s costs in two ways.
● Actual Fund Return. This section helps you to estimate the actual expenses after fee waivers that your Fund incurred over the period. The “Expenses Paid During Period” column shows the actual dollar expense incurred by a $1,000 investment in the Fund, and the “Ending Account Value” number is derived from deducting that expense from the Fund’s gross investment return.
You can use this information, together with the actual amount you invested in the Fund, to estimate the expenses you paid over that period. Simply divide your actual account value by $1,000 to arrive at a ratio (for example, an $8,600 account value divided by $1,000 = 8.6), then multiply that ratio by the number shown for your Fund under “Expenses Paid During Period”.
● Hypothetical 5% Return. This section helps you compare your Fund’s costs with those of other mutual funds. It assumes that the Fund had an annual 5% return before expenses during the year, but that the expense ratio (Column 3) for the period is unchanged. This example is useful in making comparisons because the Securities and Exchange Commission requires all mutual funds to make this 5% calculation. You can assess your Fund’s comparative cost by comparing the hypothetical result for your Fund in the “Expenses Paid During Period” column with those that appear in the same charts in the shareholder reports for other mutual funds.
Note: Because the return is set at 5% for comparison purposes — NOT your Fund’s actual return—the account values shown may not apply to your specific investment.
| Beginning | Ending | Net | Expenses | ||||||||||||
RiverPark Large Growth Fund — Institutional Class Shares | ||||||||||||||||
Actual Fund Return | $ | 1,000.00 | $ | 639.10 | 1.01 | % | $ | 4.15 | ||||||||
Hypothetical 5% Return | 1,000.00 | 1,020.00 | 1.01 | 5.11 | ||||||||||||
| ||||||||||||||||
RiverPark Large Growth Fund — Retail Class Shares | ||||||||||||||||
Actual Fund Return | 1,000.00 | 638.20 | 1.32 | 5.42 | ||||||||||||
Hypothetical 5% Return | 1,000.00 | 1,018.45 | 1.32 | 6.68 | ||||||||||||
| ||||||||||||||||
Wedgewood Fund — Institutional Class Shares | ||||||||||||||||
Actual Fund Return | 1,000.00 | 791.00 | 1.01 | % | $ | 4.53 | ||||||||||
Hypothetical 5% Return | 1,000.00 | 1,020.00 | 1.01 | 5.11 | ||||||||||||
| ||||||||||||||||
Wedgewood Fund — Retail Class Shares | ||||||||||||||||
Actual Fund Return | 1,000.00 | 790.60 | 1.28 | 5.75 | ||||||||||||
Hypothetical 5% Return | 1,000.00 | 1,018.65 | 1.28 | 6.48 | ||||||||||||
| ||||||||||||||||
73
Disclosure of Fund Expenses (Unaudited) (Concluded) |
|

| Beginning | Ending | Net | Expenses | ||||||||||||
RiverPark Short Term High Yield Fund — Institutional Class Shares | ||||||||||||||||
Actual Fund Return | $ | 1,000.00 | $ | 1,010.90 | 0.92 | % | $ | 4.64 | ||||||||
Hypothetical 5% Return | 1,000.00 | 1,020.46 | 0.92 | 4.66 | ||||||||||||
| ||||||||||||||||
RiverPark Short Term High Yield Fund — Retail Class Shares | ||||||||||||||||
Actual Fund Return | 1,000.00 | 1,009.70 | 1.17 | 5.89 | ||||||||||||
Hypothetical 5% Return | 1,000.00 | 1,019.20 | 1.17 | 5.92 | ||||||||||||
| ||||||||||||||||
RiverPark Long/Short Opportunity Fund — Institutional Class Shares | ||||||||||||||||
Actual Fund Return | 1,000.00 | 616.20 | 1.77 | % | $ | 7.17 | ||||||||||
Hypothetical 5% Return | 1,000.00 | 1,016.19 | 1.77 | 8.95 | ||||||||||||
| ||||||||||||||||
RiverPark Long/Short Opportunity Fund — Retail Class Shares | ||||||||||||||||
Actual Fund Return | 1,000.00 | 615.40 | 2.01 | 8.14 | ||||||||||||
Hypothetical 5% Return | 1,000.00 | 1,014.99 | 2.01 | 10.15 | ||||||||||||
| ||||||||||||||||
RiverPark Strategic Income Fund — Institutional Class Shares | ||||||||||||||||
Actual Fund Return | 1,000.00 | 955.50 | 1.17 | %† | $ | 5.74 | ||||||||||
Hypothetical 5% Return | 1,000.00 | 1,019.20 | 1.17 | 5.92 | ||||||||||||
| ||||||||||||||||
RiverPark Strategic Income Fund — Retail Class Shares | ||||||||||||||||
Actual Fund Return | 1,000.00 | 954.40 | 1.36 | † | 6.66 | |||||||||||
Hypothetical 5% Return | 1,000.00 | 1,018.25 | 1.36 | 6.88 | ||||||||||||
| ||||||||||||||||
RiverPark Floating Rate CMBS Fund — Institutional Class Shares | ||||||||||||||||
Actual Fund Return | 1,000.00 | 982.00 | 0.85 | % | $ | 4.22 | ||||||||||
Hypothetical 5% Return | 1,000.00 | 1,020.81 | 0.85 | 4.31 | ||||||||||||
| ||||||||||||||||
RiverPark Floating Rate CMBS Fund — Retail Class Shares | ||||||||||||||||
Actual Fund Return | 1,000.00 | 980.70 | 1.25 | 6.21 | ||||||||||||
Hypothetical 5% Return | 1,000.00 | 1,018.80 | 1.25 | 6.33 | ||||||||||||
* | Expenses are equal to the Fund’s annualized expense ratio multiplied by the average account value over the account period, multiplied by 183/365 (to reflect the one-half year period). |
† | The annualized expense ratios include dividend expense and interest expense incurred during the six-month period. Annualized dividend expense and interest expense of average net assets totaled 0.20%. Had these expenses not been included the ratios would have been 0.97% and 1.16%, respectively. |
74
Approval of the Investment Advisory and Investment Sub-Advisory Agreements (Unaudited) |
|

At the August 17, 2022 meeting of the Board of Trustees, Fund Counsel reviewed with the Board of Trustees, a memorandum, a copy of which had previously been provided to the Board, that described certain factors that the Board should consider with respect to the continuation of the advisory and sub-advisory agreements, including: (i) the nature, extent, and quality of services to be provided by the investment adviser and the sub-advisers, as appropriate, (ii) the investment performance of the investment adviser and the sub-advisers, as appropriate, with respect to each Fund, (iii) the fees and expenses under the investment advisory and sub-advisory agreements, (iv) the economies of scale expected to be achieved, and (v) the investment adviser’s profitability. Fund Counsel emphasized that the Trustees should also consider any additional factors they deem relevant and should use their own business judgment in determining the material factors to consider in evaluating the investment advisory agreements and the weight to be given to each factor. Fund Counsel also noted that each Trustee may weigh the various factors differently in reaching his conclusions with respect to the investment advisory and sub-advisory agreements. Fund Counsel stated that to assist the Trustees in making a determination, comparative data (particularly as to fees and expenses and performance) for other mutual funds and peer groups was provided to the Trustees by the Adviser as part of the Board materials.
Executive Session of Independent Trustees
The Independent Trustees then met with Fund Counsel in executive session and considered, among other things, the Adviser’s and each sub-adviser’s responses to the 15(c) questionnaires provided to them by Fund Counsel.
The Amended and Restated Investment Advisory Agreement Dated February 14, 2012 Between RiverPark Advisors, LLC and RiverPark Funds Trust
Nature, Extent and Quality of Service. The Trustees noted that the Adviser provided trading, accounting, compliance, and marketing services to each of the Funds within the Trust. They noted that the Adviser also provided portfolio management services to the Large Growth Fund, the Long/Short Opportunity Fund and the Floating Rate CMBS Fund. The Trustees reviewed the background information on the key personnel responsible for advising the Funds, noting that the Adviser’s team has worked together for 20-25 years and has extensive experience and expertise in managing mutual funds and the operations of mutual funds. The Trustees indicated that they were satisfied with the experience of the Adviser’s employees in managing each of the Funds and executing the Funds’ investment strategies. The Trustees reviewed the attention paid to risk management by the Adviser and sub-advisers relating to the investment strategies of the Funds and the steps used to mitigate the risks, including thoroughly researching investments and diversifying each portfolio over many holdings, with specific position limits in place for each Fund. The Trustees noted their comfort with the various steps taken by the Adviser when supervising each sub-advisory relationship. These steps include obtaining an annual (or more frequent) certification from each sub-adviser regarding material compliance matters, description of the sub-adviser’s written annual compliance review, material changes in each sub-adviser’s investment management process, material changes to how brokers are selected, and average commission rate, as well as other additional information. The Trustees also noted that the Adviser’s operations were not disrupted by the COVID-19 pandemic or by any subsequent period of market volatility. The Trustees concluded that the Adviser should continue to provide a high-caliber quality of service to each Fund for the benefit of each Fund’s shareholders.
Performance. The Trustees reviewed the performance of each Fund relative to its peer group, Morningstar category, and benchmark. With respect to the Funds for which the Adviser provided portfolio management services, the Trustees noted that for the year ended June 30, 2022: (i) the Large Growth Fund (Institutional Class) returned -49.26%, as compared to its benchmarks, Russell 1000 Growth Total Return Index and S&P 500 Total Return Index, which returned -18.77% and -10.62%, respectively, in the same period; (ii) the Long/Short Opportunity Fund (Institutional Class) returned -55.52%, as compared to its benchmarks, Morningstar Long/Short Equity Category and S&P 500 Total Return Index, which returned -6.79% and 10.62%, respectively, in the same period; and (iii) the Floating Rate CMBS Fund (Institutional Class) returned -3.06%, as compared to its benchmarks Bloomberg Barclays U.S. Investment-Grade CMBS Index and Bloomberg Barclays U.S. Aggregate Bond Index, which returned -8.90% and -10.29%, respectively, in the same period. The contributions of each of the two sub-advisers to the overall performance was also discussed with respect to the specific Funds that each such sub-adviser managed, and the Trustees noted that for the year ended June 30, 2022: (i) the Wedgewood Fund (Institutional Class) returned -16.77%, as compared to its benchmarks, Russell 1000 Growth Total Return Index and
75
Approval of the Investment Advisory and Investment |
|

S&P 500 Total Return Index, which returned -18.77% and -10.62%, respectively, in the same period; (ii) the Short Term High Yield Fund (Institutional Class) returned 1.14%, as compared to its benchmarks, ICE BofA Merrill Lynch 1-3 Year U.S. Corporate Bond Index, ICE BofA Merrill Lynch 1 Year U.S. Treasury Index and ICE BofA Merrill Lynch 0-3 Year U.S. High Yield Index Excluding Financials, which returned -4.48%, -1.44% and -4.50%, respectively, in the same period; and (iii) the Strategic Income Fund (Institutional Class) returned 1.59%, as compared to its benchmarks Bloomberg Barclays U.S. Aggregate Bond Index, Morningstar Multisector Bond Category and Morningstar High Yield Bond Category, which returned -10.29%, -9.83% and -12.05%, respectively, in the same period. After further discussion, the Trustees concluded that each Fund’s overall performance was satisfactory any underperformance was being monitored and/or addressed.
Fees and Expenses. The Trustees expressed that they had reviewed the advisory fee paid by each Fund and the comparative data provided by the Adviser for each Fund. They agreed that the advisory fee structure was fair and competitive in comparison to other comparable mutual funds as well as other accounts managed by the Adviser. The Trustees also took into account that the Adviser had agreed to reimburse expenses to limit net annual operating expenses (exclusive of any, interest, brokerage commissions, dividends on short sales and interest expense on securities sold short, acquired fund fees and expenses or extraordinary expenses) to varying amounts of average net assets depending on the Fund and share class. After discussion, the Trustees concluded that the advisory fee charged by each Fund was not unreasonable and was within the range of fees charged by other comparable funds.
Economies of Scale. The Trustees considered whether each Fund and the Adviser had reached an asset level that suggested a sharing of certain economies. After discussion, the Trustees agreed that no revision to the existing fee structure was necessary at this time.
Profitability. The Trustees reviewed the Adviser’s financial statements. The Trustees noted that the Adviser was generally profitable for the year ended December 31, 2021. After a brief discussion, the Trustees concluded that the Adviser’s profitability on a Fund by Fund basis was not excessive with respect to each Fund.
Conclusion. Having requested and received such information from the Adviser as the Trustees believed to be reasonably necessary to evaluate the terms of the advisory agreement, and as assisted by Fund Counsel, the Trustees concluded that the fee structure was reasonable and that renewal of the advisory agreement was in the best interests of the shareholders of each Fund. In considering the advisory agreement renewal, the Trustees considered a variety of factors, including those discussed above, and also considered other factors (including conditions and trends prevailing generally in the economy, the securities markets, and the industry). The Trustees did not identify any one factor as determinative, and each Independent Trustee may have weighed each factor differently. The Trustees’ conclusions may be based in part on its consideration of the advisory arrangement in prior years and on the Board’s ongoing regular review of each Fund’s performance and operations throughout the year.
The Sub-Advisory Agreement Dated September 20, 2010 by and among RiverPark Advisors, LLC, Cohanzick Management, LLC (“Cohanzick”) and RiverPark Funds Trust, on behalf of the RiverPark Short Term High Yield Fund and The Sub-Advisory Agreement dated August 1, 2013 by and among RiverPark Advisors, LLC, Cohanzick and RiverPark Funds Trust on behalf of the RiverPark Strategic Income Fund
Nature, Extent, and Quality of Service. The Trustees noted that Cohanzick provided portfolio management and trading services to the Short Term High Yield Fund and the Strategic Income Fund. The Trustees recognized that Cohanzick’s investment approach was bottom up and credit specific. They noted that Cohanzick made buy and sell decisions, credit selection, credit review and analysis, and portfolio construction as part of the services it rendered. The Trustees reviewed the background information on the key investment personnel who are responsible for servicing the Short Term High Yield Fund and the Strategic Income Fund and were comfortable with their credentials. The Trustees discussed Cohanzick’s investment approach as a sub-adviser to the Short Term High Yield Fund and the Strategic Income Fund. The Trustees noted that for the Short Term High Yield Fund, Cohanzick focused on principal preservation with income for an effective short-term holding period of three years or less. Cohanzick has positioned the Strategic Income Fund as a high yield fund that tactically adjusts its exposure between non-investment grade bonds and investment grade bonds based on its
76
Approval of the Investment Advisory and Investment |
|

assessment of risk adjusted returns. The Trustees discussed that they were comfortable with the strategies of each of the Funds and concluded that Cohanzick would continue to deliver high quality service to the Funds and the Adviser for the benefit of each Fund’s shareholders.
Performance. The Trustees reviewed the performance of the Short Term High Yield Fund and the Strategic Income Fund relative to their peer groups, Morningstar category and benchmark. The Trustees noted that for the year ended June 30, 2022: (i) the Short Term High Yield Fund (Institutional Class) returned 1.14%, as compared to its benchmarks, ICE BofA Merrill Lynch 1-3 Year U.S. Corporate Bond Index, ICE BofA Merrill Lynch 1 Year U.S. Treasury Index and ICE BofA Merrill Lynch 0-3 Year U.S. High Yield Index Excluding Financials, which returned -4.48%, -1.44% and -4.50%, respectively, in the same period; and (ii) the Strategic Income Fund (Institutional Class) returned 1.59%, as compared to its benchmarks Bloomberg Barclays U.S. Aggregate Bond Index, Morningstar Multisector Bond Category and Morningstar High Yield Bond Category, which returned -10.29%, -9.83% and -12.05%, respectively, in the same period. The Trustees noted that both Funds outperformed their benchmarks and noted the contributions of Cohanzick to the overall performance of both Funds. After further discussion, the Trustees concluded that each Fund’s performance was consistent with expectations given the investment strategy and was overall reasonable. The Trustees concluded that Cohanzick should be retained as sub-adviser for the benefit of the Adviser, the Short Term High Yield Fund and the Strategic Income Fund and their respective shareholders.
Fees and Expenses. The Trustees discussed the sub-advisory fees paid to Cohanzick and the sub-advisory services provided by Cohanzick to the Short Term High Yield Fund and the Strategic Income Fund. The Trustees noted that such sub-advisory fees were paid by the Adviser and not the Funds. After discussion, the Trustees concluded that the sub-advisory fee was not unreasonable with respect to each of the Short Term High Yield Fund and the Strategic Income Fund.
Economies of Scale. The Trustees considered whether the sub-adviser had realized economies of scale with respect to the management of each of the two Funds. The Trustees agreed that this was primarily an adviser-level issue and should be considered with respect to the overall advisory contract, taking into consideration the impact of the sub-advisory expense. The Trustees noted that the lack of breakpoints at this time was acceptable.
Profitability. The Trustees reviewed Cohanzick’s financial statements. The Trustees recognized that Cohanzick was profitable for the year ended June 30, 2022. The Trustees noted that Cohanzick was profitable in connection with the sub-advisory services provided to each of the Short Term High Yield Fund and the Strategic Income Fund. After a discussion, the Trustees concluded that Cohanzick’s profitability with respect to each Fund was not excessive.
Conclusion. Having requested and received such information from Cohanzick as the Trustees believed to be reasonably necessary to evaluate the terms of each sub-advisory agreement, and as assisted by Fund Counsel, the Trustees concluded that the fee structure was reasonable and that renewal of each sub-advisory agreement was in the best interests of the shareholders of the Short Term High Yield Fund and the Strategic Income Fund. In considering each sub-advisory agreement renewal, the Trustees considered a variety of factors, including those discussed above, and also considered other factors (including conditions and trends prevailing generally in the economy, the securities markets, and the industry). The Trustees did not identify any one factor as determinative, and each Independent Trustee may have weighed each factor differently. The Trustees’ conclusions may be based in part on its consideration of each sub-advisory arrangement in prior years and on the Board’s ongoing regular review of the Funds’ performance and operations throughout the year.
The Sub-Advisory Agreement Dated September 20, 2010 by and among RiverPark Advisors, LLC, Wedgewood Partners, Inc. (“Wedgewood”) and the RiverPark Funds Trust
Nature, Extent, and Quality of Service. The Trustees noted that Wedgewood provided portfolio management services to the Wedgewood Fund. The Trustees reviewed the background information on the key investment personnel who were responsible for servicing the Fund and were comfortable with their credentials. The Trustees discussed Wedgewood’s investment strategy of a focused portfolio of twenty or so carefully researched and studied, best-in-class growth companies, invested at compelling valuations as well as prudently diversified. The Trustees stated that they recognized that Wedgewood’s philosophy and process produced a portfolio that was routinely overweight relative to performance
77
Approval of the Investment Advisory and Investment |
|

benchmark weightings. The Trustees discussed that they remained comfortable with the strategies for the Wedgewood Fund and concluded that Wedgewood should continue to deliver high-quality portfolio management services to the Fund for the benefit of the shareholders of the Fund and the Adviser.
Performance. The Trustees considered the investment performance for the Wedgewood Fund, noting that the Wedgewood Fund (Institutional Class) returned -16.77% for the year ended June 30, 2022, as compared to its benchmarks, Russell 1000 Growth Total Return Index and S&P 500 Total Return Index, which returned -18.77% and -10.62%, respectively, in the same period. The Trustees agreed that the sub-adviser was contributing to the overall returns of the Wedgewood Fund and they concluded that the performance was satisfactory.
Fees and Expenses. The Trustees discussed Wedgewood’s sub-advisory fee and noted that it was paid by the Adviser and not the Fund. They noted that the fee was in line with other investment advisory contracts Wedgewood had with its other clients. The Trustees recognized that the fee was also comparable and similar to other funds with similar investment strategies. After discussion, the Trustees concluded that the sub-advisory fee was not unreasonable with respect to the Wedgewood Fund.
Economies of Scale. The Trustees considered whether it was likely that the sub-adviser had realized economies of scale with respect to the management of the Fund. The Trustees agreed that this was primarily an adviser-level issue and should be considered with respect to the overall advisory contract, taking into consideration the impact of the sub-advisory expense. The Trustees noted that the lack of breakpoints at this time was acceptable.
Profitability. The Trustees reviewed Wedgewood’s financial statements. The Trustees recognized that in the prior year Wedgewood had a slight loss from its relationship with the Wedgewood Fund, but that this slight loss did not impact Wedgewood’s overall profitability. They also noted that providing the sub-advisory services did not add materially to Wedgewood’s overall expenses or overhead which permitted Wedgewood to maintain its financial viability. After a brief discussion, the Trustees concluded that Wedgewood’s profitability was not excessive.
Conclusion. Having requested and received information from Wedgewood as the Trustees believed to be reasonably necessary to evaluate the terms of the sub-advisory agreement, and as assisted by Fund Counsel, the Trustees concluded that the fee structure was reasonable and that renewal of the sub-advisory agreement was in the best interests of the shareholders of the Wedgewood Fund. In considering the sub-advisory agreement renewal, the Trustees considered a variety of factors, including those discussed above, and also considered other factors (including conditions and trends prevailing generally in the economy, the securities markets, and the industry). The Trustees did not identify any one factor as determinative, and each Independent Trustee may have weighed each factor differently. The Trustees’ conclusions may be based in part on its consideration of the sub-advisory arrangement in prior years and on the Board’s ongoing regular review of the Wedgewood Fund’s performance and operations throughout the year.
78
Review of Liquidity Risk |
|

Pursuant to Rule 22e-4 under the 1940 Act, the Funds’ investment adviser has adopted, and the Board has approved, a liquidity risk management program (the “Program”). The Program is overseen by the Funds’ Liquidity Risk Management Program Administrator (the “Program Administrator”), and the Program’s principal objectives include assessing, managing and periodically reviewing each Fund’s liquidity risk, based on factors specific to the circumstances of the Funds.
At a meeting of the Board held on May 12, 2022, the Trustees received a report from the Program Administrator addressing the operations of the Program and assessing its adequacy and effectiveness of implementation. The report covered the period from April 1, 2021 through March 31, 2022.
The Program Administrator’s report noted that the Funds are deemed to be Primarily Highly Liquid and thus are not subject to the requirement to establish a Highly Liquid Investment Minimum (“HLIM”). The report further noted no Fund breached the restriction on holding greater than 15% illiquid assets.
The report stated that, from a liquidity perspective, each Fund’s investment strategy is appropriate for an open-end fund and that no material changes have been made to the Program since its implementation. The report concluded that the Program was adequately designed and effectively implemented.
Further, the Funds did not experience any significant liquidity challenges during the period covered by this Annual Report, and the Funds were able to meet redemption requests without significant dilution to the remaining investors’ interests in the Funds.
There can be no assurance that the Program will achieve its objectives in the future. Please refer to the prospectus for more information regarding a Fund’s exposure to liquidity risk and other principal risks to which an investment in the Funds may be subject.
79
Notice to Shareholders (Unaudited) |
|

For shareholders that do not have a September 30, 2022 tax year end, this notice is for informational purposes only. For shareholders with a September 30, 2022 tax year end, please consult your tax advisor as to the pertinence of this notice. For the fiscal year ended September 30, 2022, the Funds are designating the following items with regard to distributions paid during the year:
Return of | Long Term | Ordinary | Total | Qualifying | |
RiverPark Large Growth Fund | 0.00% | 75.81% | 24.19% | 100.00% | 12.04% |
Wedgewood Fund | 0.00% | 99.05% | 0.95% | 100.00% | 100.00% |
RiverPark Short Term High Yield Fund | 0.00% | 0.00% | 100.00% | 100.00% | 0.00% |
RiverPark Long/Short Opportunity Fund | 0.00% | 0.00% | 0.00% | 0.00% | 0.00% |
RiverPark Strategic Income Fund | 0.00% | 0.00% | 100.00% | 100.00% | 1.65% |
RiverPark Floating Rate CMBS Fund | 0.00% | 0.00% | 100.00% | 100.00% | 0.00% |
Qualifying | U.S. | Qualified | Qualified | |
RiverPark Large Growth Fund | 12.04% | 0.00% | 0.00% | 100.00% |
Wedgewood Fund | 100.00% | 0.00% | 0.19% | 100.00% |
RiverPark Short Term High Yield Fund | 0.00% | 0.00% | 92.86% | 0.00% |
RiverPark Long/Short Opportunity Fund | 0.00% | 0.00% | 0.00% | 0.00% |
RiverPark Strategic Income Fund | 2.25% | 0.00% | 56.24% | 0.00% |
RiverPark Floating Rate CMBS Fund | 0.00% | 0.00% | 100.00% | 0.00% |
(1) | Qualifying dividends represent dividends which qualify for the corporate dividends received deduction and is reflected as a percentage of ordinary income distributions (the total of short term capital gain and net investment income distributions). |
(2) | The percentage in this column represents the amount of “Qualifying Dividend Income” as created by the Jobs and Growth Tax Relief Reconciliation Act of 2003 and is reflected as a percentage of ordinary income distributions (the total of short term capital gain and net investment income distributions). It is the intention of each of the aforementioned funds to designate the maximum amount permitted by law. |
(3) | “U.S. Government Interest” represents the amount of interest that was derived from direct U.S. Government obligations and distributed during the fiscal year. This amount is reflected as a percentage of ordinary income. Generally, interest from direct U.S. Government obligations is exempt from state income tax. However, for shareholders who are residents of California, Connecticut and New York, the statutory threshold requirements were not satisfied to permit exemption of these amounts from state income. |
(4) | The percentage in this column represents the amount of “Interest Related Dividends” as created by the American Jobs Creation Act of 2004 and is reflected as a percentage of net investment income distributions that is exempt from U.S. withholding tax when paid to foreign investors. |
(5) | The percentage in this column represents the amount of “Short-Term Capital Gain Dividends” as created by the American Jobs Creation Act of 2004 and is reflected as a percentage of short-term capital gain distributions that is exempt from U.S. withholding tax when paid to foreign investors. |
80
(This page intentionally left blank)
INVESTMENT ADVISER
RiverPark Advisors, LLC
156 West 56th Street, 17th Floor
New York, New York 10019
CUSTODIAN
Brown Brothers Harriman & Co.
50 Post Office Square
Boston, Massachusetts 02110
PRIME BROKER
Goldman Sachs & Co.
200 West Street, 3rd Floor
New York, New York 10282
TRANSFER AGENT
DST Systems, Inc.
333 West 11th Street, 5th Floor
Kansas City, Missouri 64105
ADMINISTRATOR
SEI Investments Global Funds Services
One Freedom Valley Drive
Oaks, Pennsylvania 19456
INDEPENDENT REGISTERED PUBLIC ACCOUNTING FIRM
Cohen & Company, Ltd.
1350 Euclid Avenue, Suite 800
Cleveland, Ohio 44115
DISTRIBUTOR
SEI Investments Distribution Co.
One Freedom Valley Drive
Oaks, Pennsylvania 19456
FUND COUNSEL
Blank Rome LLP
1271 Avenue if the Americas
New York, New York 10020
This information must be preceded or accompanied by a
current prospectus for the Trust.
RPF-AR-001-1200
Item 2. Code of Ethics.
The Registrant has adopted a code of ethics that applies to the Registrant's principal executive officer, principal financial officer, controller or principal accounting officer or any person who performs a similar function. During the period covered by the report, there were no amendments to the code of ethics, and the Registrant did not grant any waivers from a provision of the code of ethics.
Item 3. Audit Committee Financial Expert.
(a)(1) The Registrant’s Board of Trustees has determined that the Registrant has two audit committee financial experts serving on the audit committee.
(a)(2) The audit committee financial experts, Ira Balsam and David Sachs, are independent trustees as defined in Form N-CSR Item 3(a)(2).
Item 4. Principal Accountant Fees and Services.
(a)-(d) Aggregate fees billed by Cohen & Co., Ltd. (the “Cohen & Co.”), to the Registrant for the fiscal years ended September 30, 2022 and September 30, 2021 for professional services rendered by the Registrant’s principal accountant were as follows:
| 2022 | 2021 | ||
| (a) | Audit Fees | $127,050 | $115,500 |
| (b) | Audit-Related Fees | $750 | $— |
| (c) | Tax Fees | $21,500 | $21,500 |
| (d) | All Other Fees | $— | $— |
Audit Fees include amounts related to the audit of the Registrant’s annual financial statements and services normally provided by the principal accountant in connection with statutory and regulatory filings. Tax Fees include amounts related to the preparation of the Registrant’s tax returns.
All Other Fees include amounts billed for products and services other than those disclosed in paragraphs (a) through (c) of this Item. For the fiscal years ended September 30, 2022 and September 30, 2021, All Other Fees relate to the review of the March 31, 2022 and March 31, 2021 Semi-Annual Reports.
(e)(1) Pursuant to the requirements of the Sarbanes Act, the SEC adopted Rule 2-01 under Regulation S-X, which, among other things, requires a fund’s audit committee to pre-approve certain audit and non-audit services that are provided by its independent auditors in order to ensure the auditors’ independence. The Registrant’s Board of Trustees has established an Audit Committee that has been charged with, among other things, assisting the Board of Trustees in its oversight: the Registrant’s independent auditors; preapproving all audit and non-audit services provided by the Registrant’s independent auditors; the integrity of the Funds’ financial statements; the independent auditors’ qualifications and independence; and the use of appropriate accounting principles.
The Audit Committee has adopted, and the Board of Trustees has ratified, an Audit and Non-Audit Services Pre-Approval Policy (the “Policy”), which requires the Registrant’s Audit Committee to pre-approve all audit and non-audit services provided by the principal accountant to the Registrant. The Policy also requires the Audit Committee to pre-approve any engagement of the principal accountant to provide non-audit services to the Registrant’s investment adviser, if the services relate directly to the Registrant’s operations and financial reporting.
(e)(2) Percentage of fees billed applicable to non-audit services approved pursuant to the “de minimis” exception of Rule 2-01(c)(7)(i)(C) were as follows for Cohen & Co.:
| 2022 | 2021 | |
Audit-Related Fees | 0% | 0% |
| Tax Fees | 0% | 0% |
All Other Fees | 0% | 0% |
(f) Not applicable.
(g) The aggregate fees billed by the Registrant’s principal accountant for non-audit services rendered to the Registrant, for non-audit services rendered to the Registrant’s investment adviser, and for non-audit services rendered to entities controlled by the adviser for the last fiscal year was $0.
(h) During the past fiscal year, all non-audit services provided by the Registrant’s principal accountant to either the Registrant’s investment adviser or to any entity controlling, controlled by, or under common control with Registrant’s investment adviser that provides ongoing services to the Registrant were pre-approved by the Audit Committee of the Registrant’s Board of Trustees. Included in the Audit Committee’s pre-approval was the review and consideration as to whether the provision of these non-audit services is compatible with maintaining the principal accountant’s independence.
(i) Not Applicable. The Registrant has not retained, for the preparation of the audit report on the financial statements included in the Form N-CSR, a registered public accounting firm that has a branch or office that is located in a foreign jurisdiction and that the Public Company Accounting Oversight Board (the “PCAOB”) has determined that the PCAOB is unable to inspect or investigate completely because of a position taken by an authority in the foreign jurisdiction.
(j) Not Applicable. The Registrant is not a “foreign issuer,” as defined in 17 CFR 240.3b-4.
Item 5. Audit Committee of Listed Registrants.
Not applicable to unlisted registrants.
Item 6. Investments.
Schedule of Investments is included as part of the Report to Shareholders filed under Item 1 of this form.
Item 7. Disclosure of Proxy Voting Policies and Procedures for Closed-End Management Investment Companies.
Not applicable to open-end management investment companies.
Item 8. Portfolio Managers of Closed-End Management Investment Companies.
Not applicable to open-end management investment companies.
Item 9. Purchases of Equity Securities by Closed-End Management Company and Affiliated Purchasers.
Not applicable to open-end management investment companies.
Item 10. Submission of Matters to a Vote of Security Holders.
None.
Item 11. Controls and Procedures.
(a) The Registrant’s principal executive and principal financial officers, or persons performing similar functions, have concluded that the Registrant’s disclosure controls and procedures (as defined in Rule 30a-3(c) under the Act (17 CFR § 270.30a-3(c)) as of a date within 90 days of the filing date of the report, are effective based on the evaluation of these controls and procedures required by Rule 30a-3(b) under the Act (17 CFR § 270.30a-3(b)) and Rules 13a-15(b) or 15d-15(b) under the Exchange Act of 1934 (17 CFR § 240.13a-15(b) or § 240.15d-15(b)).
(b) There were no changes in the Registrant’s internal controls over financial reporting (as defined in Rule 30a-3(d) under the Act (17 CFR § 270.30a-3(d)) that occurred during the period covered by this report that has materially affected, or is reasonably likely to materially affect, the Registrant’s internal control over financial reporting.
Item 12. Disclosure of Securities Lending Activities for Closed-End Management Investment Companies.
Not applicable to open-end management investment companies.
.
Items 13. Exhibits.
(a)(1) The Registrant’s Code of Ethics pursuant to Item 2 of Form N-CSR is attached.
SIGNATURES
Pursuant to the requirements of the Securities Exchange Act of 1934 and the Investment Company Act of 1940, the Registrant has duly caused this report to be signed on its behalf by the undersigned, thereunto duly authorized.
| (Registrant) | RiverPark Funds Trust | |
| By (Signature and Title)* | /s/ Morty Schaja | |
| Morty Schaja | ||
| President | ||
| Date: December 9, 2022 |
Pursuant to the requirements of the Securities Exchange Act of 1934 and the Investment Company Act of 1940, this report has been signed below by the following persons on behalf of the registrant and in the capacities and on the dates indicated.
| By (Signature and Title)* | /s/ Morty Schaja | |
| Morty Schaja | ||
| President | ||
| Date: December 9, 2022 | ||
| By (Signature and Title)* | /s/ Andrew Metzger | |
| Andrew Metzger | ||
| Chief Financial Officer and Treasurer | ||
| Date: December 9, 2022 |
* Print the name and title of each signing officer under his or her signature.