UNITED STATES
SECURITIES AND EXCHANGE COMMISSION
Washington, D.C. 20549
FORM N-CSR
CERTIFIED SHAREHOLDER REPORT OF REGISTERED MANAGEMENT
INVESTMENT COMPANIES
Investment Company Act file number 811-22436
EntrepreneurShares Series Trust
(Exact name of registrant as specified in charter)
470 Atlantic Avenue, Suite 400
Boston, MA 02210
(Address of principal executive offices) (Zip code)
Dr. Joel M. Shulman
470 Atlantic Avenue, Suite 400
Boston, MA 02210
(Name and address of agent for service)
800-287-9469
Registrant's telephone number, including area code
Date of fiscal year end: June 30
Date of reporting period: June 30, 2013
Item 1. Reports to Stockholders.
Annual Report
June 30, 2013
EntrepreneurShares Global FundTM
c/o U.S. Bancorp Fund Services, LLC
P.O. Box 701
Milwaukee, WI 53201-0701
EntrepreneurShares Global Fund
July 15, 2013
Dear Shareholders:
As we complete our second full fiscal year, we would like to extend our appreciation for your continuing support for investing in our vision. Our treatise on investments rests upon a conviction that entrepreneurial managers, as defined by our 15 attributes, will outperform non-entrepreneurs over an extended period of time. We diversify our holdings with investments in global capital markets (US, International and Emerging markets) that include different market capitalizations (Small-Cap, Mid-Cap and Large-Cap), both value stocks and growth stocks, high dividend yield stocks, and impact stocks. Our fund invests in all major industry sectors, though includes a higher percentage of technology stocks. Over the history of our mutual fund and extended performance, our fund demonstrates a relatively clear pattern. We tend to strongly outperform our key benchmarks during positive years though underperform during negative periods. The relative benefits in the positive years (known as Up Capture) tend to outweigh the losses in the negative years (Down Capture). This net benefit (known as a risk-adjusted alpha) suggests that we are able to provide our investors with an extra return over a specified benchmark.
In our annual report, we reflect upon our past performance and look ahead to the future. Last year (2012), the markets ended the year higher, though investors experienced considerable volatility due to problems in Europe, Middle East and Asia. Large market cap technology firms were among our strongest performers and emerging market companies were among our weakest.
At the time of this writing, calendar year 2013 has been shaping up as a relatively strong year for investors with less volatility than last year. The first six months of the calendar year 2013 have provided very strong performance for US capital markets. US small cap stocks, in particular, have been our strongest performers.
Over the past 12-month period, our Fund has kept pace with our MSCI World Index benchmark. Consistent with our historical pattern, our Fund generally outperforms our benchmark in stronger months though tends to be weaker in negative ones.
Our enthusiasm and trepidation for future Fund performance rests with the direction of the overall market.
At the time of this writing (July 2013), we are experiencing strong equity appreciation along with global market advances. However, should the financial markets decline our Fund will likely follow this pattern.
We believe that global equities continue to be priced at reasonable levels and we believe are positioned for a nice finish to the remainder of 2013. In particular, we believe that US Small cap stocks still offer opportunity for appreciation.
As an overall commentary, we continue to have confidence that savvy entrepreneurial managers will find a way to make their businesses grow in good conditions and survive in difficult ones. Entrepreneurs have economic incentive to help grow their profits and generate stock appreciation for themselves and other shareholders. This policy has held true in prior years and should remain true in the months and years ahead.
We look forward to sharing more updates with you in the future and assisting you with your portfolio appreciation. Thank you again for your support.
Joel Shulman Ph.D., CFA
Chief Investment Officer
EntrepreneurShares
Must be preceded by or accompanied by a prospectus.
Past performance is no guarantee of future results.
The MSCI World Index is a free float-adjusted market capitalization weighted index that is designed to measure the equity market performance of developed markets.
Fund holdings are subject to change and are not recommendations to buy or sell any security. Investment in the Fund will result in certain risks which are detailed in the Prospectus. These risks include manager risk, market risk, common stock risk, risk of no prior experience of managing a registered mutual fund, small and medium sized companies risk, technology company investing risk, foreign securities risk, emerging markets risk and quantitative investment approach risk.
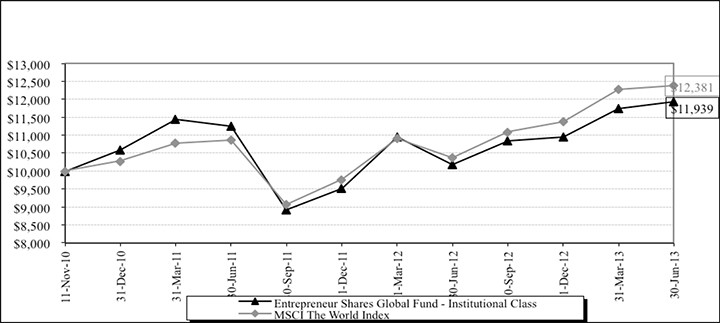
EntrepreneurShares Global Fund
TOTAL RETURN BASED ON A $10,000 INVESTMENT
June 30, 2013 (Unaudited)
This chart assumes an initial gross investment of $10,000 made in the Institutional Class on November 11, 2010 (commencement of operations of the Fund). Returns shown include the reinvestment of all dividends but do not reflect the deduction of taxes that a shareholder would pay on fund distributions or the redemption of fund shares. In the absence of fee waivers and reimbursements, total returns would be reduced. Past performance is not predictive of future performance. Investment return and principal value will fluctuate, so that your shares, when redeemed, may be worth more or less than the original cost.
MSCI The World Index - A free float-adjusted market capitalization weighted index that is designed to measure the equity performance of developed market. Returns assume the reinvestments of all dividends.
Total Annualized Returns for the period ended June 30, 2013
| | | | Since Inception |
| | 1-Year | | (11/11/10) |
| EntrepreneurShares Global Fund – Institutional Class | 17.33% | | 6.96% |
| MSCI The World Index | 19.27% | | 8.45% |
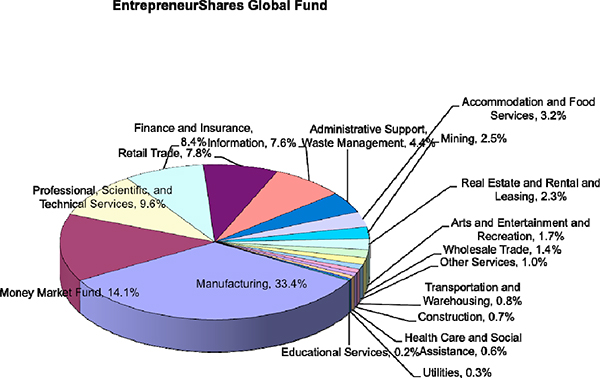
EntrepreneurShares Global Fund
SECTOR ALLOCATION OF PORTFOLIO INVESTMENTS
June 30, 2013 (Unaudited)
EntrepreneurShares Global Fund
EXPENSE EXAMPLE
June 30, 2013 (Unaudited)
As a shareholder of The EntrepreneurShares Global Fund (the “Fund”), you incur ongoing costs, including investment advisory fees, distribution and/or shareholder servicing fees, and other Fund expenses, which are indirectly paid by shareholders. This example is intended to help you understand your ongoing costs (in dollars) of investing in the Fund and to compare these costs with the ongoing costs of investing in other mutual funds.
The example is based on an investment of $1,000 invested at the beginning of the period and held the entire six-month period from January 1, 2013 to June 30, 2013.
ACTUAL EXPENSES
The first line of the table below provides information about actual account values and actual expenses. However, the table does not include shareholder specific fees, such as the $15.00 fee charged for wire redemptions by the Fund’s transfer agent. To the extent that the Fund invests in other investment companies as part of its investment strategy, you will indirectly bear your proportional share of any fees and expenses charged by the underlying funds in which the Fund invests in addition to expenses of the Fund. These expenses are not included in the following example. The table also does not include portfolio trading commissions and related trading costs. You may use the information in this line, together with the amount you invested, to estimate the expenses that you paid over the period. Simply divide your account value by $1,000 (for example, an $8,600 account value divided by $1,000 = 8.6), then multiply the result by the number in the first line under the heading entitled “Expenses Paid During Period” to estimate the expenses you paid on your account during the period.
HYPOTHETICAL EXAMPLE FOR COMPARISON PURPOSES
The second line of the table below provides information about hypothetical account values and hypothetical expense based on the actual expense ratios for each share class of the Fund and an assumed rate of return of 5% per year before expenses, which is not the Fund’s actual return. The hypothetical account values and expenses may not be used to estimate the actual ending account balance or expenses you paid for the period. You may use this information to compare the ongoing costs of investing in the Fund and other funds. To do so, compare this 5% hypothetical example with the 5% hypothetical examples that appear in the shareholder reports of the other fund. Please note that the expenses shown in the table are meant to highlight your ongoing costs only and do not reflect any transactional costs, such as sales charges (loads), redemptions fees, or exchange fees. Therefore, the second line of the table is useful in comparing ongoing costs only, and will not help you determine the relevant total cost of owning different funds.
EntrepreneurShares Global Fund
EXPENSE EXAMPLE (continued)
June 30, 2013 (Unaudited)
EntrepreneurShares Global Fund – Institutional Class
| | | | | | | | | | | |
| | | Beginning Account Value January 1, 2013 | | Ending Account Value June 30, 2013 | | Expenses Paid During Period* January 1, 2013 – June 30, 2013 | |
| Actual | | | | | | | | | | |
| | | | | | | | | | | |
Hypothetical (5% annual return before expenses) | | | 1,000.00 | | | 1,016.36 | | | 8.50 | |
* Expenses are equal to the Fund’s annualized expense ratio (including extraordinary expenses) of 1.70%, multiplied by the average account value over the period, multiplied by 181/365 to reflect the half-year period.
EntrepreneurShares Global Fund
SCHEDULE OF INVESTMENTS
June 30, 2013
| | | | | | | |
| Shares | | | | Fair Value | |
| | | COMMON STOCKS - 84.14% | | | | |
| | | Administrative and Support Services - 4.03% | | | | |
| 933 | | Expedia, Inc. | | $ | 56,120 | |
| 4,100 | | Flight Centre Ltd. (a) | | | 147,474 | |
| 3,000 | | Liquidity Services, Inc. (b) | | | 104,010 | |
| 930 | | ManTech International Corp. | | | 24,292 | |
| 1,299 | | Portfolio Recovery Associates, Inc. (b) | | | 199,565 | |
| 27,000 | | Seek Ltd. (a) | | | 223,965 | |
| 2,854 | | The Geo Group, Inc. | | | 96,893 | |
| 933 | | TripAdvisor, Inc. (a)(b) | | | 56,792 | |
| | | | | | 909,111 | |
| | | Ambulatory Health Care Services - 0.32% | | | | |
| 778 | | MEDNAX, Inc. (b) | | | 71,249 | |
| | | Amusement, Gambling, and Recreation Industries - 1.70% | | | | |
| 5,998 | | Las Vegas Sands Corp. | | | 317,474 | |
| 518 | | Wynn Resorts Ltd. | | | 66,304 | |
| | | | | | 383,778 | |
| | | Apparel Manufacturing - 1.69% | | | | |
| 2,970 | | Guess?, Inc. | | | 92,159 | |
| 1,000 | | Lululemon Athletica, Inc. (b) | | | 65,520 | |
| 2,688 | | Under Armour, Inc. (b) | | | 160,500 | |
| 2,198 | | Zumiez, Inc. (b) | | | 63,193 | |
| | | | | | 381,372 | |
| | | Broadcasting (except Internet) - 1.23% | | | | |
| 25,000 | | CTC Media, Inc. (a) | | | 278,000 | |
| | | Building Material and Garden Equipment and Supplies Dealers - 0.83% | | | | |
| 9,525 | | Titan Machinery, Inc. (b) | | | 186,976 | |
| | | Chemical Manufacturing - 7.62% | | | | |
| 1,656 | | Alexion Pharmaceuticals, Inc. (b) | | | 152,750 | |
| 6,300 | | Galapagos NV (a)(b) | | | 123,005 | |
| 66,000 | | Indorama Ventures PCL (a) | | | 38,091 | |
| 11,183 | | Inter Parfums, Inc. (a) | | | 318,939 | |
| 3,000 | | Jazz Pharmaceuticals PLC (b) | | | 206,190 | |
| 4,558 | | LSB Industries, Inc. (b) | | | 138,609 | |
| 4,105 | | Optimer Pharmaceuticals, Inc. (b) | | | 59,399 | |
| 528 | | Regeneron Pharmaceuticals, Inc. (b) | | | 118,737 | |
| 6,200 | | Rigel Pharmaceuticals, Inc. (b) | | | 20,708 | |
| 3,952 | | Seattle Genetics, Inc. (b) | | | 124,330 | |
| 3,525 | | Theravance, Inc. (b) | | | 135,818 | |
| 4,288 | | United Therapeutics Corp. (b) | | | 282,236 | |
| | | | | | 1,718,812 | |
| | | Clothing and Clothing Accessories Stores - 2.40% | | | | |
| 1,026 | | Blue Nile, Inc. (b) | | | 38,762 | |
| 800 | | LVMH Moet Hennessy Louis Vuitton SA (a) | | | 129,644 | |
| 15,000 | | SuperGroup PLC (a)(b) | | | 163,693 | |
| 2,830 | | The Finish Line, Inc. | | | 61,864 | |
| 3,916 | | The Men’s Wearhouse, Inc. | | | 148,221 | |
| | | | | | 542,184 | |
| | | Computer and Electronic Product Manufacturing - 8.08% | | | | |
| 9,000 | | Axis Communications AB (a) | | | 222,514 | |
See Notes to Financial Statements
EntrepreneurShares Global Fund
SCHEDULE OF INVESTMENTS (continued)
June 30, 2013
| | | | | | | |
| Shares | | | | Fair Value | |
| 1,327 | | Cabot Microelectronics Corp. (a)(b) | | $ | 43,804 | |
| 71 | | CSR PLC - ADR | | | 2,308 | |
| 3,578 | | Cypress Semiconductor Corp. | | | 38,392 | |
| 4,159 | | IPG Photonics Corp. | | | 252,576 | |
| 5,702 | | Ituran Location and Control Ltd. (a) | | | 96,193 | |
| 5,370 | | IXYS Corp. (a) | | | 59,392 | |
| 2,073 | | Microchip Technology, Inc. | | | 77,219 | |
| 5,000 | | Mindray Medical International Ltd. - ADR | | | 187,250 | |
| 1,910 | | National Instruments Corp. | | | 53,366 | |
| 1,000 | | Nidec Corp. (a) | | | 69,772 | |
| 8,000 | | Parrot SA (a)(b) | | | 222,633 | |
| 11,500 | | Spreadtrum Communications, Inc. - ADR | | | 301,875 | |
| 4,074 | | STEC, Inc. (b) | | | 27,377 | |
| 1,991 | | Stratasys Ltd. (b) | | | 166,726 | |
| | | | | | 1,821,397 | |
| | | Construction of Buildings - 0.67% | | | | |
| 25,000 | | Africa Israel Investment Ltd. (a)(b) | | | 54,852 | |
| 16,000 | | Direcional Engenharia SA (a) | | | 95,583 | |
| | | | | | 150,435 | |
| | | Credit Intermediation and Related Activities - 1.56% | | | | |
| 5,084 | | Capital One Financial Corp. | | | 319,326 | |
| 318 | | Credit Acceptance Corp. (b) | | | 33,406 | |
| | | | | | 352,732 | |
| | | Data Processing, Hosting and Related Services - 1.74% | | | | |
| 1,192 | | CoStar Group, Inc. (b) | | | 153,851 | |
| 4,690 | | ExlService Holdings, Inc. (b) | | | 138,636 | |
| 6,442 | | Riverbed Technology, Inc. (a)(b) | | | 100,238 | |
| | | | | | 392,725 | |
| | | Educational Services - 0.24% | | | | |
| 2,063 | | K12, Inc. (b) | | | 54,195 | |
| | | Electrical Equipment, Appliance, and Component Manufacturing - 3.33% | | | | |
| 20,000 | | Alpha & Omega Semiconductor Ltd. (a)(b) | | | 152,800 | |
| 11,193 | | iRobot Corp. (b) | | | 445,145 | |
| 17,884 | | Taser International, Inc. (b) | | | 152,372 | |
| | | | | | 750,317 | |
| | | Fabricated Metal Product Manufacturing - 1.28% | | | | |
| 4,577 | | B/E Aerospace, Inc. (b) | | | 288,717 | |
| | | Food Manufacturing - 3.49% | | | | |
| 150,000 | | Charoen Pokphand Foods PCL (a) | | | 124,536 | |
| 200,000 | | Golden Agri-Resources Ltd. (a) | | | 88,363 | |
| 2,261 | | J&J Snack Foods Corp. | | | 175,906 | |
| 10,000 | | MHP SA (a) | | | 170,000 | |
| 2,664 | | The Hain Celestial Group, Inc. (b) | | | 173,080 | |
| 22,500 | | Wilmar International Ltd. (a) | | | 55,917 | |
| | | | | | 787,802 | |
| | | Food Services and Drinking Places - 3.22% | | | | |
| 364 | | Chipotle Mexican Grill, Inc. (b) | | | 132,623 | |
| 545 | | Panera Bread Co. (b) | | | 101,337 | |
| 3,451 | | Papa John’s International, Inc. (b) | | | 225,592 | |
| 1,659 | | Starbucks Corp. | | | 108,648 | |
See Notes to Financial Statements
EntrepreneurShares Global Fund
SCHEDULE OF INVESTMENTS (continued)
June 30, 2013
| | | | | | | |
| Shares | | | | Fair Value | |
| 6,280 | | Texas Roadhouse, Inc. | | $ | 157,126 | |
| | | | | | 725,326 | |
| | | General Merchandise Stores - 1.10% | | | | |
| 10,000 | | SM Investments Corp. (a) | | | 247,685 | |
| | | Health and Personal Care Stores - 0.54% | | | | |
| 77,000 | | China Shineway Pharmaceutical Group Ltd. (a) | | | 122,508 | |
| | | Hospitals - 0.32% | | | | |
| 1,410 | | IPC The Hospitalist Co., Inc. (b) | | | 72,418 | |
| | | Insurance Carriers and Related Activities - 1.52% | | | | |
| 5,982 | | Meadowbrook Insurance Group, Inc. | | | 48,036 | |
| 1,020 | | Mercury General Corp. | | | 44,839 | |
| 2,923 | | Molina Healthcare, Inc. (b) | | | 108,677 | |
| 2,333 | | National Interstate Corp. | | | 68,240 | |
| 1,265 | | The Navigators Group, Inc. (b) | | | 72,156 | |
| | | | | | 341,948 | |
| | | Internet Publishing and Broadcasting and Web Search Portals - 0.36% | | | | |
| 22,200 | | QSC AG (a) | | | 80,332 | |
| | | Machinery Manufacturing - 1.22% | | | | |
| 13,000 | | Fabrinet (a)(b) | | | 182,000 | |
| 5,696 | | II-VI, Inc. (b) | | | 92,617 | |
| | | | | | 274,617 | |
| | | Merchant Wholesalers, Nondurable Goods - 1.45% | | | | |
| 76,000 | | Chow Sang Sang Holdings International Ltd. (a) | | | 154,233 | |
| 1,200 | | Inditex SA (a) | | | 148,138 | |
| 36,000 | | Ports Design Ltd. (a) | | | 23,486 | |
| | | | | | 325,857 | |
| | | Mining (except Oil and Gas) - 1.44% | | | | |
| 10,000 | | Antofagasta PLC (a) | | | 120,916 | |
| 100,000 | | DMCI Holdings, Inc. (a) | | | 119,445 | |
| 27,000 | | Eurasian Natural Resources Corp. PLC (a) | | | 83,774 | |
| | | | | | 324,135 | |
| | | Miscellaneous Manufacturing - 4.57% | | | | |
| 1,350 | | BioMerieux SA (a) | | | 130,807 | |
| 2,500 | | Cochlear Ltd. (a) | | | 141,093 | |
| 3,750 | | Coloplast A/S (a) | | | 210,271 | |
| 1,441 | | ICU Medical, Inc. (b) | | | 103,839 | |
| 259 | | Intuitive Surgical, Inc. (b) | | | 131,204 | |
| 2,847 | | JAKKS Pacific, Inc. | | | 32,029 | |
| 12,000 | | Renishaw PLC (a) | | | 282,168 | |
| | | | | | 1,031,411 | |
| | | Motion Picture and Sound Recording Industries - 0.50% | | | | |
| 535 | | Netflix, Inc. (b) | | | 112,933 | |
| | | Motor Vehicle and Parts Dealers - 0.53% | | | | |
| 5,702 | | Sonic Automotive, Inc. | | | 120,540 | |
| | | Nonstore Retailers - 2.42% | | | | |
| 3,147 | | eBay, Inc. (a)(b) | | | 162,763 | |
| 1,650 | | MercadoLibre, Inc. (a) | | | 177,804 | |
| 3,318 | | Sohu.com, Inc. (a)(b) | | | 204,455 | |
| | | | | | 545,022 | |
See Notes to Financial Statements
EntrepreneurShares Global Fund
SCHEDULE OF INVESTMENTS (continued)
June 30, 2013
| | | | | | | |
| Shares | | | | Fair Value | |
| | | Oil and Gas Extraction - 0.14% | | | | |
| 954 | | Contango Oil & Gas Co. | | $ | 32,198 | |
| | | Other Information Services - 2.14% | | | | |
| 207 | | Google, Inc. (b) | | | 182,237 | |
| 11,024 | | Travelzoo, Inc. (b) | | | 300,514 | |
| | | | | | 482,751 | |
| | | Personal and Laundry Services - 0.96% | | | | |
| 6,000 | | Natura Cosmeticos SA (a) | | | 131,221 | |
| 4,780 | | Service Corp. International | | | 86,183 | |
| | | | | | 217,404 | |
| | | Pipeline Transportation - 0.21% | | | | |
| 565 | | Kinder Morgan Energy Partners L.P. | | | 48,251 | |
| | | Primary Metal Manufacturing - 1.00% | | | | |
| 25,000 | | Cia Siderurgica Nacional SA (a) | | | 67,560 | |
| 30,000 | | MMX Mineracao e Metalicos SA (a)(b) | | | 19,899 | |
| 7,500 | | Novolipetsk Steel OJSC | | | 98,475 | |
| 2,597 | | Steel Dynamics, Inc. | | | 38,721 | |
| | | | | | 224,655 | |
| | | Professional, Scientific, and Technical Services - 9.60% | | | | |
| 2,986 | | comScore, Inc. (b) | | | 72,828 | |
| 12,000 | | iGATE Corp. (a)(b) | | | 197,040 | |
| 5,000 | | JCDecaux SA (a) | | | 136,380 | |
| 3,328 | | Netscout Systems, Inc. (b) | | | 77,675 | |
| 1,900 | | PAREXEL International Corp. (a)(b) | | | 87,286 | |
| 15,000 | | Park24 Co. Ltd. (a) | | | 272,081 | |
| 1,141 | | Solera Holdings, Inc. (a) | | | 63,497 | |
| 3,105 | | Sourcefire, Inc. (b) | | | 172,483 | |
| 3,888 | | SYKES Enterprises, Inc. (b) | | | 61,275 | |
| 10,447 | | Synchronoss Technologies, Inc. (b) | | | 322,499 | |
| 1,111 | | Syntel, Inc. | | | 69,849 | |
| 3,708 | | VeriSign, Inc. (a)(b) | | | 165,599 | |
| 8,468 | | Virtusa Corp. (b) | | | 187,651 | |
| 5,084 | | VistaPrint NV (a)(b) | | | 250,997 | |
| 2,727 | | Vocus, Inc. (a)(b) | | | 28,688 | |
| | | | | | 2,165,828 | |
| | | Publishing Industries (except Internet) - 1.46% | | | | |
| 1,041 | | Concur Technologies, Inc. (b) | | | 84,717 | |
| 1,971 | | Synopsys, Inc. (a)(b) | | | 70,463 | |
| 1,493 | | Ultimate Software Group, Inc. (b) | | | 175,114 | |
| | | | | | 330,294 | |
| | | Real Estate - 1.08% | | | | |
| 50,000 | | Hopewell Holdings Ltd. (a) | | | 166,644 | |
| 26,000 | | MRV Engenharia e Participacoes SA (a) | | | 76,671 | |
| | | | | | 243,315 | |
| | | Securities, Commodity Contracts, and Other Financial Investments and Related Activities - 4.58% | | | | |
| 3,411 | | Cohen & Steers, Inc. | | | 115,906 | |
| 1,628 | | Evercore Partners, Inc. (a) | | | 63,948 | |
| 1,698 | | Federated Investors, Inc. | | | 46,542 | |
| 3,500 | | Lundbergforetagen AB (a) | | | 133,088 | |
See Notes to Financial Statements
EntrepreneurShares Global Fund
SCHEDULE OF INVESTMENTS (continued)
June 30, 2013
| | | | | | | |
| Shares | | | | Fair Value | |
| 950 | | Morningstar, Inc. | | $ | 73,701 | |
| 750 | | Partners Group Holding AG (a) | | | 203,073 | |
| 15,970 | | The Charles Schwab Corp. | | | 339,043 | |
| 1,358 | | Westwood Holdings Group, Inc. | | | 58,285 | |
| | | | | | 1,033,586 | |
| | | Support Activities for Mining - 0.88% | | | | |
| 13,819 | | W&T Offshore, Inc. | | | 197,474 | |
| | | Telecommunications - 0.20% | | | | |
| 2,581 | | Oplink Communications, Inc. (a)(b) | | | 44,832 | |
| | | Transportation Equipment Manufacturing - 1.24% | | | | |
| 2,592 | | Tesla Motors, Inc. (b) | | | 278,459 | |
| | | Utilities - 0.33% | | | | |
| 818 | | ITC Holdings Corp. | | | 74,683 | |
| | | Waste Management and Remediation Services - 0.37% | | | | |
| 1,636 | | Clean Harbors, Inc. (b) | | | 82,667 | |
| | | Water Transportation - 0.55% | | | | |
| 2,322 | | Hornbeck Offshore Services, Inc. (b) | | | 124,227 | |
| | | TOTAL COMMON STOCKS (Cost $16,011,324) | | | 18,975,158 | |
| | | | | | | |
| | | CLOSED-ENDED MUTUAL FUNDS - 0.71% | | | | |
| | | Funds, Trusts, and Other Financial Vehicles - 0.44% | | | | |
| 2,890 | | Ares Capital Corp. | | | 49,708 | |
| 4,499 | | PennantPark Investment Corp. | | | 49,714 | |
| | | | | | 99,422 | |
| | | Securities, Commodity Contracts, and Other Financial Investments and Related Activities - 0.27% | | | | |
| 4,396 | | Hercules Technology Growth Capital, Inc. | | | 61,280 | |
| | | TOTAL CLOSED-ENDED MUTUAL FUNDS (Cost $144,004) | | | 160,702 | |
| | | | | | | |
| | | REAL ESTATE INVESTMENT TRUSTS (REITs) - 1.25% | | | | |
| | | Real Estate - 1.25% | | | | |
| 9,156 | | DuPont Fabros Technology, Inc. | | | 221,117 | |
| 1,037 | | Equity Residential | | | 60,208 | |
| | | TOTAL REAL ESTATE INVESTMENT TRUSTS (REITs) (Cost $271,150) | | | 281,325 | |
| | | | | | | |
| | | MONEY MARKET FUND - 14.09% | | | | |
| 3,177,267 | | First American Treasury Obligations Fund, 0.01% (c) | | | 3,177,267 | |
| | | TOTAL MONEY MARKET FUND (Cost $3,177,267) | | | 3,177,267 | |
| | | | | | | |
| | | Total Investments (Cost ($19,603,745) - 100.19% | | | 22,594,452 | |
| | | Liabilities in Excess of Other Assets - (0.19)% | | | (42,063 | ) |
| | | TOTAL NET ASSETS - 100.00% | | $ | 22,552,389 | |
| | | | | | | |
| | | Percentages are stated as a percent of net assets. | | | | |
| | | ADR - American Depository Receipt. | | | | |
| | | (a) Global security, as defined in the Fund’s prospectus. | | | | |
| | | (b) Non-income producing security. | | | | |
| | | (c) Variable rate security. The rate listed is as of June 30, 2013. | | | | |
See Notes to Financial Statements
EntrepreneurShares Global Fund
STATEMENT OF ASSETS AND LIABILITIES
June 30, 2013
| ASSETS: | | | | | | |
| | | | | | | |
| | | Investments, at fair value (cost $19,603,745) | | $ | 22,594,452 | |
| | | Income receivable | | | 10,208 | |
| | | Other assets | | | 12,537 | |
| | | Total Assets | | | 22,617,197 | |
| | | | | | | |
| LIABILITIES: | | | | | | |
| | | Payable to Investment Advisor | | | 14,356 | |
| | | Other accrued expenses | | | 50,452 | |
| | | Total Liabilities | | | 64,808 | |
| | | | | | | |
| NET ASSETS | | | | $ | 22,552,389 | |
| | | | | | | |
| NET ASSETS CONSIST OF: | | | | | | |
| | | Capital stock | | $ | 19,515,283 | |
| | | Unrealized appreciation on investments | | | 2,990,584 | |
| | | Accumulated net investment loss | | | (42,232 | ) |
| | | Accumulated net realized gain | | | 88,754 | |
| | | | | | | |
| | | Total Net Assets | | $ | 22,552,389 | |
| | | | | | | |
| NET ASSETS CONSIST OF: | | | | | | |
| Class Institutional Shares: | | | | | | |
| | | Net assets | | $ | 22,552,389 | |
| | | Shares outstanding | | | 1,908,781 | |
| | | | | | | |
| Net Asset Value, Offering and Redemption Price Per Share | | | | | | |
| | | (Unlimited shares of no par value authorized) | | $ | 11.82 | |
See Notes to Financial Statements
EntrepreneurShares Global Fund
STATEMENT OF OPERATIONS
For the year ended June 30, 2013
| | | | | |
| INVESTMENT INCOME: | | | | |
| Dividend income* | | $ | 315,143 | |
| Interest income | | | 7 | |
| | | | 315,150 | |
| EXPENSES: | | | | |
| Investment advisory fees | | | 262,279 | |
| Transfer agent and shareholder service fees | | | 42,243 | |
| Fund accounting fees | | | 46,039 | |
| Federal and state registration fees | | | 28,781 | |
| Administration fees | | | 34,407 | |
| Custody fees | | | 21,571 | |
| Audit fees | | | 20,542 | |
| Legal fees | | | 8,230 | |
| Distribution fees - Retail Shares | | | 2,989 | |
| Reports to shareholders | | | 1,313 | |
| Other | | | 22,897 | |
| Total expenses | | | 491,291 | |
| Expense reimbursement | | | (131,603 | ) |
| Net expenses | | | 359,688 | |
| NET INVESTMENT LOSS | | | (44,538 | ) |
| REALIZED AND UNREALIZED LOSS | | | | |
| ON INVESTMENTS: | | | | |
| Net realized gain on investment transactions | | | 462,407 | |
| Net realized loss on foreign currency transactions | | | (3,899 | ) |
| Change in unrealized appreciation on investments | | | 2,990,109 | |
| Change in unrealized depreciation on foreign currency | | | (145,885 | ) |
| Net gain on investments | | | 3,302,732 | |
| NET INCREASE IN NET ASSETS | | | | |
| RESULTING FROM OPERATIONS | | $ | 3,258,194 | |
* Net of $12,966 in foreign tax withholdings.
See Notes to Financial Statements
EntrepreneurShares Global Fund
STATEMENTS OF CHANGES IN NET ASSETS
| | | | | | | |
| | | YEAR | | | YEAR | |
| | | ENDED | | | ENDED | |
| | | JUNE 30, 2013 | | | JUNE 30,2012 | |
| OPERATIONS: | | | | | | |
| Net investment loss | | $ | (44,538 | ) | | $ | (24,036 | ) |
| Net realized gain(loss) on investment transactions | | | 462,407 | | | | (207,571 | ) |
| Net realized loss on foreign currency transactions | | | (3,899 | ) | | | (32,541 | ) |
| Change in unrealized appreciation(depreciation) on investments | | | 2,990,109 | | | | (908,853 | ) |
| Change in unrealized depreciation on foreign currency | | | (145,885 | ) | | | (407,984 | ) |
| Net increase(decrease) in net assets resulting from operations | | | 3,258,194 | | | | (1,580,985 | ) |
| CAPITAL SHARE TRANSACTIONS: | | | | | | | | |
Proceeds from shares sold - Retail1 | | | 122,008 | | | | 1,345,064 | |
Proceeds from exchange of Retail shares - Institutional1 | | | 1,990,198 | | | | — | |
Proceeds from exchange of Class A shares - Retail2 | | | — | | | | 27,111 | |
| Proceeds from shares sold - Institutional | | | 5,006,248 | | | | 977,110 | |
Proceeds from shares sold - Class A2 | | | — | | | | 9,525 | |
Proceeds from shares issued to holders in reinvestment of dividends - Retail1 | | | 16,726 | | | | 1,294 | |
| Proceeds from shares issued to holders in reinvestment of dividends - Institutional | | | 119,226 | | | | 8,378 | |
Proceeds from shares issued to holders in reinvestment of dividends - Class A2 | | | — | | | | 13 | |
Payment for shares redeemed - Retail1,3 | | | (2,542,321 | ) | | | (415,977 | ) |
Payment for shares redeemed - Institutional3 | | | (1,066,975 | ) | | | (170,388 | ) |
Payment for shares redeemed - Class A2,3 | | | — | | | | — | |
Payment for exchange to Institutional - Retail1 | | | (1,990,198 | ) | | | — | |
Payment for exchange to Retail - Class A2 | | | — | | | | (27,111 | ) |
| Net increase from capital share transactions | | | 1,654,912 | | | | 1,755,019 | |
| DIVIDENDS AND DISTRIBUTIONS TO SHAREHOLDERS: | | | | | | | | |
Distributions from realized gains - Retail1 | | | (17,728 | ) | | | (1,320 | ) |
| Distributions from realized gains - Institutional | | | (147,720 | ) | | | (11,274 | ) |
Distributions from realized gains – Class A2 | | | — | | | | (14 | ) |
| Total dividends and distributions | | | (165,448 | ) | | | (12,608 | ) |
| INCREASE IN NET ASSETS | | | 4,747,658 | | | | 161,426 | |
| NET ASSETS: | | | | | | | | |
| Beginning of Period | | | 17,804,731 | | | | 17,643,305 | |
| End of Period (Including accumulated net investment loss of $42,232, and $357, respectively) | | $ | 22,552,389 | | | $ | 17,804,731 | |
| 1 | Retail shares converted to Institutional shares on January 10, 2013. See Note 1 in the Notes to the Financial Statements. |
| 2 | Class A shares converted to Retail shares on June 29, 2012. See Note 1 in the Notes to the Financial Statements. |
| 3 | Net redemption fees of less then $1 for the period ended June 30, 2011. |
See Notes to Financial Statements
EntrepreneurShares Global Fund
FINANCIAL HIGHLIGHTS
| | | | | | | | | | | |
| Institutional Class | | YEAR ENDED JUNE 30, 2013 | | YEAR ENDED JUNE 30, 2012 | | PERIOD FROM NOV. 11, 2010(1) TO JUNE 30, 2011 | |
| Per Share Data: | | | | | | | | | | |
| Net asset value, beginning of period | | $ | 10.15 | | $ | 11.23 | | $ | 10.00 | |
| | | | | | | | | | | |
| Income (loss) from investment operations: | | | | | | | | | | |
Net investment loss (6) | | | (0.02 | ) | | (0.01 | ) | | (0.04 | ) |
| Net realized and unrealized gains (losses) on investments | | | 1.77 | | | (1.06 | ) | | 1.29 | |
| Total from investment operations | | | 1.75 | | | (1.07 | ) | | 1.25 | |
| Less distributions: | | | | | | | | | | |
| Dividends from net investment income | | | — | | | — | | | (0.02 | ) |
| Distributions from net realized capital gains | | | (0.08 | ) | | (0.01 | ) | | — | |
| Total distributions | | | (0.08 | ) | | (0.01 | ) | | (0.02 | ) |
| Net asset value, end of period | | $ | 11.82 | | $ | 10.15 | | $ | 11.23 | |
| Total return | | | 17.33% | | | -9.55% | | | 12.50% | (2) |
| Supplemental data and ratios: | | | | | | | | | | |
| Net assets, end of period (000’s) | | $ | 22,552 | | $ | 15,606 | | $ | 16,309 | |
| Ratio of expenses to average net assets | | | 1.71% | (5)(7) | | 1.70% | (5) | | 1.70% | (3)(4)(5) |
| Ratio of net investment loss to average net assets | | | -0.21% | (5)(8) | | -0.13% | (5) | | -0.60% | (3)(5) |
| Portfolio turnover rate | | | 13.53% | | | 18.83% | | | 32.87% | (2) |
| (1) | The Fund commenced operations on November 11, 2010. |
| (2) | Not annualized. |
| (3) | Annualized. |
| (4) | Including interest expense increases the ratio by 0.07%. |
| (5) | Net of fees reimbursed or waived of 0.63%, 1.21% and 1.03% for the years ended June 30, 2013 and 2012 and the period ended June 30, 2011, respectively. |
| (6) | Net investment loss per share has been calculated based on average shares outstanding during the period. |
| (7) | Includes expenses related to the Retail Class that was merged into the Institutional Class on January 10, 2013. In the absence of these expenses, the ratio would have been 1.70% |
| (8) | Includes income and expenses attributable to the Retail Class that was merged into the Institutional Class on June 10, 2013. In the absence of these, the ratio would have been -0.20%. |
See Notes to Financial Statements
EntrepreneurShares Global Fund
NOTES TO FINANCIAL STATEMENTS
June 30, 2013
1. ORGANIZATION
EntrepreneurShares™ Series Trust, a Delaware statutory trust (the “Trust”), was formed on July 1, 2010, and has authorized capital of unlimited shares of beneficial interest. The Trust is an open-end management investment company registered under the Investment Company Act of 1940, as amended (the “1940 Act”), and is authorized to issue multiple series and classes of shares. EntrepreneurShares Global Fund (the “Fund”) is currently the sole series of the Trust and is classified as a “diversified” series, as defined in the 1940 Act. The Fund commenced operations on November 11, 2010.
The investment goal of the Fund is to seek long-term capital appreciation. The Fund seeks these investment results through active principles-based securities selection. The Fund mainly invests in equity securities of global companies with market capitalizations that are above $150 million at the time of initial purchase and possess entrepreneurial characteristics, as determined by Weston Capital Advisors, the Fund’s investment advisor.
The Fund currently offers one share class, the Institutional Class. Effective June 29, 2012 the Fund ceased offering its Class A shares to the public. The remaining Class A shares were converted into Retail shares. Effective January 10, 2013 the Fund ceased offering its Retail shares to the public. The remaining Retail shares were converted into Institutional shares. As described in the Fund’s prospectus, the Institutional Class shares do not have a 12b-1 fee.
2. SUMMARY OF SIGNIFICANT ACCOUNT POLICIES
The following is a summary of significant accounting policies consistently followed by the Fund in the preparation of its financial statements. These policies are in conformity with accounting principles generally accepted in the United States of America (GAAP).
Investment Valuations
In determining the net asset value (NAV) of the Fund’s shares, securities that are listed on a national securities exchange (other than The Nasdaq OMX Group, Inc., referred to as NASDAQ) are valued at the last sale price on the day the valuation is made. Securities that are traded on NASDAQ under one of its three listing tiers, NASDAQ Global Select Market, NASDAQ Global Market and NASDAQ Capital Market, are valued at the Nasdaq Official Closing Price. Securities price information on listed stocks is taken from the exchange where the security is primarily traded. Securities which are listed on an exchange but which are not traded on the valuation date are valued at the most recent bid price. Unlisted securities held by the Fund are valued at the average of the quoted bid and ask prices in the OTC market. Securities and other assets for which market quotations are not readily available are valued by appraisal at their fair value as determined in good faith by Weston Capital Advisors, LLC (the “Advisor”) under procedures established by and under the general supervision and responsibility of the Board.
Short-term investments held with a remaining maturity of 60 days or less generally are valued at amortized cost, as the Board believes that this method of valuing short-term investments approximates market value. Short-term investments with 61 days or more to maturity at time of purchase are valued at market value through the 61st day prior to maturity, based on quotations received from market makers or other appropriate sources; thereafter, they are generally valued at amortized cost. There is no definitive set of circumstances under which the Fund may elect to use fair value procedures to value a security. Types of securities that the Fund may hold for which fair value pricing might be required include, but are not limited to: (a) illiquid securities, including restricted securities and private placements for which there is no public market; (b) options not traded on a securities exchange; (c) securities of an issuer that has entered into a restructuring; (d) securities whose trading has been halted or suspended, as permitted by the Securities and Exchange Commission (the SEC); (e) foreign securities, if an event or development has occurred subsequent to the close of the foreign market and prior to the close of regular trading on the New York Stock Exchange that would materially affect the value of the security; and (f) fixed income securities that have gone into default and for which there is not a current market value quotation. Valuing securities at fair value involves greater reliance on judgment than securities that have readily available market quotations. There can be no assurance that the Fund could obtain the fair value assigned to a security if it were to sell the security at approximately the time at which the Fund determines its NAV per share.
Fair-valued securities are valued by the Advisor, under the supervision of the Board. There is no single standard for determining the fair value of a security. Rather, in determining the fair value of a security, the Advisor and the Board shall take into account the relevant factors and surrounding circumstances, which may include: (1) the nature and pricing history (if any) of the security; (2) whether any dealer quotations for the security are available; (3) possible valuation methodologies that could be used to determine the
EntrepreneurShares Global Fund
NOTES TO FINANCIAL STATEMENTS (continued)
June 30, 2013
fair value of the security; (4) the recommendation of the portfolio manager of the Fund with respect to the valuation of the security; (5) whether the same or similar securities are held by other funds managed by the Advisor or other funds and the method used to price the security in those funds; (6) the extent to which the fair value to be determined for the security will result from the use of data or formulae produced by third parties independent of the Advisor; and (7) the liquidity or illiquidity of the market for the security.
Use of Estimates and Indemnifications
The preparation of the financial statements in conformity with GAAP requires management to make estimates and assumptions that affect the reported amounts and disclosures in these financial statements. Actual results could differ from those estimates.
In the normal course of business the Trust, on behalf of the Fund, enters into contracts that contain a variety of representations which provide general indemnifications. The Trust’s maximum exposure under these arrangements is unknown; however, the Trust has not had claims or losses pursuant to these contracts and the Trust expects any risk of loss to be remote.
Federal Income Tax
The Fund intends to continue to qualify as a “regulated investment company” under Subchapter M of the Internal Revenue Code of 1986, as amended. If so qualified, the Fund will not be subject to federal income tax to the extent it distributes substantially all of its net investment income and net realized gains to shareholders.
The Fund has reviewed all open tax years and major jurisdictions and concluded that the Fund did not have any tax positions that did not meet the “more-likely-than-not” threshold of being sustained by the applicable tax authority for the year ended June 30, 2013. The Fund would recognize interest and penalties, if any, related to uncertain tax benefits in the Statement of Operations. During the year ended June 30, 2013, the Fund did not incur any interest or penalties. Open tax years are those that are open for exam by taxing authorities. As of June 30, 2013, open Federal tax years include the tax years ended June 30, 2011, 2012 and 2013. The Fund has no examination in progress.
Fair Value Measurement
The Fund has adopted authoritative fair valuation accounting standards which establish an authoritative definition of fair value and set out a hierarchy for measuring fair value. These standards require additional disclosures about the various inputs and valuation techniques used to develop the measurements of fair value and a discussion of changes in valuation techniques and related inputs during the period. The hierarchy gives the highest priority to unadjusted quoted prices in active markets for identical assets or liabilities (Level 1 measurement) and the lowest priority to unobservable inputs (Level 3 measurements). The three levels of the fair value hierarchy are as follows:
| | | |
| | Level 1: | Inputs that reflect unadjusted quoted prices in active markets for identical assets or liabilities that the Fund has the ability to access at the measurement date; |
| | Level 2: | Significant inputs other than quoted prices that are observable for the asset or liability either directly or indirectly, including inputs in markets that are not considered to be active; |
| | Level 3: | Significant inputs that are unobservable. |
Inputs are used in applying the various valuation techniques and broadly refer to the assumptions that market participants use to make valuation decisions, including assumptions about risk. Inputs may include price information, volatility statistics, specific and broad credit data, liquidity statistics, and other factors. A financial instrument’s level within the fair value hierarchy is based on the lowest level of any input that is significant to the fair value measurement. However, the determination of what constitutes “observable” requires significant judgment by the Fund. The Fund considers observable data to be that market data which is readily available, regularly distributed or updated, reliable and verifiable, not proprietary, and provided by independent sources that are actively involved in the relevant market. The categorization of a financial instrument within the hierarchy is based upon the pricing transparency of the instrument and does not necessarily correspond to the Fund’s perceived risk of that instrument.
EntrepreneurShares Global Fund
NOTES TO FINANCIAL STATEMENTS (continued)
June 30, 2013
Investments whose values are based on quoted market prices in active markets, and are therefore classified within Level 1, include active listed equities and real estate investment trusts, closed-end mutual funds, and certain money market securities. Investments that trade in markets that are not considered to be active, but are valued based on quoted market prices, dealer quotations or alternative pricing sources supported by observable inputs are classified within Level 2. Investments classified within Level 3 have significant unobservable inputs, as they trade infrequently or not at all. The table below is a summary of the inputs used to value the Fund’s investments as of June 30, 2013.
| | | | | | | | | | | | | | |
| Investments at Value | | | Total | | | Level 1 | | | Level 2 | | | Level 3 | |
| Total Common Stock* | | $ | 18,975,158 | | $ | 18,975,158 | | $ | — | | $ | — | |
| Total Real Estate Investment Trusts* | | | 281,325 | | | 281,325 | | | — | | | — | |
| Total Closed-End Mutual Funds* | | | 160,702 | | | 160,702 | | | — | | | — | |
| Total Money Market Funds | | | 3,177,267 | | | 3,177,267 | | | — | | | — | |
| Total Investments | | $ | 22,594,452 | | $ | 22,594,452 | | $ | — | | $ | — | |
* For further information regarding security characteristics, please see the Schedule of Investments.
The Fund did not hold any Level 3 securities during the year ended June 30, 2013. There were no transfers of securities between levels during the year ended June 30, 2013. Transfers between levels are recognized at the end of the reporting period. The Fund did not hold any derivate instruments during the fiscal year ended June 30, 2013.
Distribution to Shareholders
The Fund intends to continue to distribute to its shareholders any net investment income and any net realized long or short-term capital gains, if any, at least annually. Distributions are recorded on ex-dividend date. The Fund may periodically make reclassifications among certain of its capital accounts as a result of the characterization of certain income and realized gains determined annually in accordance with federal tax regulations that may differ from generally accepted accounting principles.
Foreign Currency Transactions
The Fund’s books and records are maintained in U.S. dollars. Foreign currency denominated transactions (i.e. market value of investment securities, assets and liabilities, purchases and sales of investment securities and income and expenses) are translated into U.S. dollars at the current rate of exchange.
Other
Investment transactions are recorded on the trade date. Dividend income, less any foreign tax withheld, is recognized on the ex-dividend date and interest income is recognized on an accrual basis, including amortization/accretion of premiums or discounts.
Net investment income, other than class specific expenses, and realized and unrealized gains and losses are allocated daily to each class of shares based upon the relative net asset value of outstanding shares of each class of shares at the beginning of the day.
3. AGREEMENTS
Investment Advisory Agreement
The Advisor, a related party of the Fund, oversees the performance of the Fund and is responsible for overseeing the management of the investment portfolio of the Fund. These services are provided under the terms of an Investment Advisory Agreement dated September 6, 2012 (the “Investment Advisory Agreement”) between the Trust and the Advisor, pursuant to which the Advisor receives an annual advisory fee equal to 1.25% of the Fund’s average net assets.
Through October 31, 2013, the Advisor has agreed to waive and/or reimburse the Fund for its advisory fee, and to the extent necessary, bear other expenses, to limit the total annualized expenses (excluding borrowing and investment-related costs and fees, taxes, extraordinary expenses and fees and expenses of underlying funds) of Retail Class shares and Institutional Class shares of the Fund to the amounts of 1.95% and 1.70% per annum, respectively, of net assets attributable to such shares of the Fund. The Advisor shall be permitted to recover expenses it has borne subsequent to the effective date of this agreement (whether through reduction of its advisory fee or otherwise) in later periods to the extent that the Fund’s expenses fall below the annual rates set forth above, provided, however, that the Fund is not obligated to pay any such reimbursed fees more than three years after the end of the fiscal year in which
EntrepreneurShares Global Fund
NOTES TO FINANCIAL STATEMENTS (continued)
June 30, 2013
the expense was borne by the Advisor. The Advisor has waived $131,603, which expires on June 30, 2016, $204,253, which expires on June 30, 2015 and $121,768, which expires on June 30, 2014.
Sub-Advisory services are provided to the Fund, pursuant to an agreement between the Advisor and EntrepreneurShares, LLC (the “Sub-Advisor”). Under the terms of this sub-advisory agreement, the Advisor, not the Fund, compensates the Sub-Advisor based on the Fund’s average net assets. Certain officers of the Advisor are also officers of the Sub-Advisor. Mr. Shulman is a majority owner of both the Advisor and Sub-Advisor.
4. DISTRIBUTION PLAN
The Trust has adopted distribution and service (Rule 12b-1) plans (the “Plan”) for the Fund’s Retail Class shares in accordance with Rule 12b-1 under the Investment Company Act of 1940, as amended. The Plan allows the Fund to use up to 0.25% of the average daily net assets attributable to the relevant class of Fund shares, to pay sales, distribution, and other fees for the sale of that share class and for services provided to holders of that class of shares. Because these fees are paid out of the Fund’s assets, over time, these fees will increase the cost of an investment in Retail Class shares and may cost the shareholder more than paying other types of sales charges. The Fund’s Institutional Class shares are not subject to any distribution and service (Rule 12b-1) fees.
5. INCOME TAXES
The tax character of distributions paid during the periods ended June 30, 2013 and 2012 was as follows:
| | | | | | | | | | | | | | |
| | | Ordinary Income | | Long-Term Capital Gain | | Return of Capital | | Total | |
| June 30, 2013 | | $ | — | | $ | 165,448 | | $ | — | | $ | 165,448 | |
| June 30, 2012 | | $ | 9,374 | | $ | 2,597 | | $ | 637 | | $ | 12,608 | |
The tax character of the distributions differs from the financial statements due to adjustments relating to REITs and partnerships.
Additionally, GAAP requires that certain components of net assets be reclassified between financial and tax reporting. These reclassifications have no effect on net assets or net asset value per share. The following table shows the reclassifications made:
| | | | | | | | | | | |
| Period Ended | | Paid in Capital | | Accumulated Net Investment Loss | | Accumulated Realized Gain | |
| June 30, 2013 | | $ | (6,562 | ) | $ | 2,663 | | $ | 3,899 | |
| June 30, 2012 | | $ | (68,879 | ) | $ | 36,944 | | $ | 31,935 | |
The permanent differences relate primarily to foreign currency reclassifications, partnership adjustments and reclassification of net operating losses.
As of June 30, 2013, the cost of investments, gross unrealized appreciation and depreciation of investments and distributable income for tax purposes are:
| | | | | |
| Cost of Investments | | $ | 19,611,904 | |
| Unrealized appreciation | | | 5,118,125 | |
| Unrealized depreciation | | | (2,135,577 | ) |
| Net unrealized appreciation | | | 2,982,548 | |
| Undistributed ordinary income | | | — | |
| Undistributed long-term capital gain | | | 96,913 | |
| Distributable income | | | 96,913 | |
| Other accumulated losses | | | (42,355 | ) |
| Total accumulated losses | | $ | 3,037,106 | |
The table above differs from the financial statements due to timing differences related to the deferral of losses due to wash sales. As of June 30, 2013, the Fund had no capital loss carry forwards which could be used to offset future gains.
At June 30, 2013 the Fund had deferred qualified late year ordinary losses of $ 42,232.
EntrepreneurShares Global Fund
NOTES TO FINANCIAL STATEMENTS (continued)
June 30, 2013
6. CAPITAL SHARE TRANSACTIONS
The Trust has authorized capital of unlimited shares of no par value which may be issued in more than one class or series. Currently the Trust consists of one series, the Fund. Transactions in shares of the Fund were as follows:
| | | | | | | |
| | | Year Ended June 30, 2013 | | Year Ended June 30, 2012 | |
| Retail Class | | | | | | |
| Share sold | | | 11,938 | | 138,448 | |
| Share issued in reinvestment of | | | | | | |
| dividends | | | 1,547 | | 136 | |
| Share exchanged from Class A | | | — | | 2,682 | |
| Share exchanged into | | | | | | |
| Institutional Class | | | (179,287 | ) | — | |
| Shares redeemed | | | (51,668 | ) | (40,941 | ) |
| Net increase | | | (217,470 | ) | 100,325 | |
| Shares outstanding | | | | | | |
| Beginning of period | | | 217,470 | | 117,145 | |
| End of period | | | — | | 217,470 | |
| | | | | | | |
| Institutional Class | | | | | | |
| Share sold | | | 281,076 | | 100,449 | |
| Share issued in reinvestment of | | | | | | |
| dividends | | | 10,978 | | 882 | |
| Shares exchanged from Retail | | | | | | |
| Class | | | 178,347 | | — | |
| Shares redeemed | | | (98,983 | ) | (16,430 | ) |
| Net increase | | | 371,418 | | 84,901 | |
| Shares outstanding | | | | | | |
| Beginning of period | | | 1,537,363 | | 1,452,462 | |
| End of period | | | 1,908,781 | | 1,537,363 | |
| | | | | | | |
| Class A | | | | | | |
| Share sold | | | — | | 858 | |
| Share issue in reinvestment of | | | | | | |
| dividends | | | — | | 2 | |
| Share exchanged into Retail | | | | | | |
| Class | | | — | | (2,679 | ) |
| Shares redeemed | | | — | | — | |
| Net increase | | | — | | (1,819 | ) |
| Shares outstanding | | | | | | |
| Beginning of period | | | — | | 1,819 | |
| End of period | | | — | | — | |
7. RELATED PARTIES
At June 30, 2013, certain officers of the Trust were also employees of the Advisor. However, these officers were not compensated directly by the Fund. In addition, refer to Note 3, agreements.
8. BENEFICIAL OWNERSHIP
The beneficial ownership, either directly or indirectly, of more than 25% of the voting securities of a fund creates a presumption of control of the Fund, under Section 2(a)(9) of the 1940 Act. At June 30, 2013, for the benefit of its shareholders, FP Capital EntrepreneurShares, an affiliate of the Fund, held 69.95% of the total Fund shares outstanding.
EntrepreneurShares Global Fund
NOTES TO FINANCIAL STATEMENTS (continued)
June 30, 2013
9. SUBSEQUENT EVENTS EVALUATION
In preparing the financial statements, the Fund has evaluated events and transactions for potential recognition or disclosure through the date the financial statements were issued. This evaluation did not result in any subsequent events that necessitated disclosure and/or adjustments.
10. INVESTMENT TRANSACTIONS
During the period ended June 30, 2013, the aggregate purchases and sales of securities (excluding short-term) were:
| | Purchases: | $2,465,592 |
| | Sales: | $3,562,299 |
11. FOREIGN INVESTMENT RISK
The Fund generally invests a significant portion of its total assets in securities principally traded in markets outside the U. S. The foreign markets in which the Fund invests in are sometimes open on days when the NYSE is not open and the Fund does not calculate its net asset value (NAV), and sometimes are not open on days when the Fund does calculate it’s NAV. Even on days on which both the foreign market and the NYSE were open, several hours may have passed between the time when trading in the foreign market closed and the time as of which the Fund calculates it’s NAV. That was generally the case for markets in Europe, Asia, Australia and other far eastern markets; the regular closing time of foreign markets in North and South America was generally the same as the closing time of the NYSE and the time as of which the Fund calculate its NAV.
Foreign stocks, as an asset, class may underperform U.S. stocks, and foreign stocks may be more volatile than U.S. stocks. Risks relating to investment in foreign securities (including, but not limited to, depositary receipts and participation certificates) include: currency exchange rate fluctuation; less available public information about the issuers of securities; less stringent regulatory standards; lack of uniform accounting, auditing and financial reporting standards; and country risk including less liquidity, high inflation rates, unfavorable economic practices and political instability. The risks of foreign investments are typically greater in emerging and less developed markets.
12. NEW ACCOUNTING PRONOUNCEMENT
In January, 2013, the FASB issued ASU No. 2013-01 “Clarifying the Scope of Disclosures about Offsetting Assets and Liabilities” in U.S. GAAP and International Reporting Financial Standards (“IFRS”). ASU No. 2013-01 clarifies ASU No. 2011-11, Disclosures about Offsetting Assets and Liabilities to increase comparability and reduce presentation differences between financial statements prepare in accordance differences between financial statements prepare in accordance with U.S. GAAP and financial statements prepared in accordance with IFRS. This requires increased disclosure about derivative instruments that are offset in a reporting entity’s Statement of Assets and Liabilities and derivative instruments that are subject to a master netting agreement (“MNA”). Specifically, the ASU requires reporting entities to present separately for assets and liabilities, a) the gross amounts of those recognized assets and recognized liabilities, b) the amounts offset to determine the net amounts presented in the Statement of Assets and Liabilities, c) the net amount presented in the Statement of Assets and Liabilities, d) the amounts subject to an enforceable MNA not included in (b), and e) the net amount after deducting the amounts from (c) and (d). The effective data of the ASU is for interim and annual periods beginning on or after January 1, 2013. There is no impact of the ASU on the financial statements of the Fund for the year ended June 30, 2013
EntrepreneurShares Global Fund
REPORT OF INDEPENDENT REGISTERED PUBLIC ACCOUNTING FIRM
To the Board of Trustees of EntrepreneurSharesTM Series Trust
and the Shareholders of EntrepreneurSharesTM Global Fund
We have audited the accompanying statement of assets and liabilities, including the schedule of investments, of EntrepreneurSharesTM Global Fund, (the Fund), a separate series of the EntrepreneurSharesTM Series Trust as of June 30, 2013, and the related statements of operations, changes in net assets, and the financial highlights for the year then ended. These financial statements and financial highlights are the responsibility of the Fund’s management. Our responsibility is to express an opinion on these financial statements and financial highlights based on our audit. The accompanying statements of changes in net assets for the year ended June 30, 2012 and the financial highlights for the year ended June 30, 2012 and the period from November 11, 2010 to June 30, 2011 of EntrepreneurSharesTM Global Fund were audited by other auditors whose report, dated August 28, 2012, expressed an unqualified opinion on those statements of changes in net assets and financial highlights.
We conducted our audit in accordance with the standards of the Public Company Accounting Oversight Board (United States). Those standards require that we plan and perform the audit to obtain reasonable assurance about whether the financial statements and financial highlights are free of material misstatement. An audit includes examining, on a test basis, evidence supporting the amounts and disclosures in the financial statements. Our procedures included confirmation of securities owned as of June 30, 2013, by correspondence with the custodian and others or by other appropriate audit procedures where replies from others were not received. An audit also includes assessing the accounting principles used and significant estimates made by management, as well as evaluating the overall financial statement presentation. We believe that our audit provide a reasonable basis for our opinion.
In our opinion, the financial statements and financial highlights referred to above present fairly, in all material respects, the financial position of EntrepreneurSharesTM Global Fund as of June 30, 2013, and the results of its operations, the changes in its net assets, and the financial highlights for the year then ended, in conformity with accounting principles generally accepted in the United States of America.
/s/ McGladrey LLP
Denver, Colorado
August 29, 2013
EntrepreneurShares Global Fund
ADDITIONAL INFORMATION
(Unaudited)
1. ADDITIONAL DISCLOSURE REGARDING FUND TRUSTEES AND OFFICERS
| | | | | Term | | | | | | |
| | | | | of | | | | # of | | |
| | | | | Office(1) | | | | Portfolios in | | Other |
| | | | | and | | | | Fund | | Directorships |
| | | Position(s) | | Length | | Principal | | Complex | | Held by |
| | | Held with | | of Time | | Occupation(s) During | | Overseen by | | Trustee During |
| Name, Address and Birth Year | | Trust | | Served | | Past 5 Years | | Trustee | | Past 5 Years |
| | | | | | | | | | | |
| Dr. Stephen Sohn | | Trustee | | Since | | Chairman – Quantum | | 1 | | None |
| 40 Grove St. Suite 200 | | | | 2010 | | Aesthetic Surgery Inc. | | | | |
| Wellesly Hills, MA 02482 | | | | | | | | | | |
| Birth year: 1944 | | | | | | | | | | |
| | | | | | | | | | | |
| Thomas T. Stallkamp | | Trustee | | Since | | Founder/Principal | | 1 | | Baxter |
| 40 Grove St. Suite 200 | | | | 2010 | | Collaborative | | | | International |
| Wellesly Hills, MA 02482 | | | | | | Management; Former | | | | Inc. and |
| Birth year: 1947 | | | | | | CEO Chairman – MSX | | | | Borg Warner |
| | | | | | | International | | | | Inc. |
| | | | | | | (automotive consulting) | | | | |
| | | | | | | (2003 to 2004). | | | | |
| | | | | | | | | | | |
| George R. Berbeco | | Trustee | | Since | | Chairman – Bay Colony | | 1 | | None |
| 40 Grove St. Suite 200 | | | | 2010 | | Development | | | | |
| Wellesly Hills, MA 02482 | | | | | | Corporation; Former | | | | |
| Birth year: 1944 | | | | | | President – Devon | | | | |
| | | | | | | Group and General | | | | |
| | | | | | | Partner – Devon Capital | | | | |
| | | | | | | Partners, LP. | | | | |
| | | | | | | (information systems | | | | |
| | | | | | | consulting) (2005 to | | | | |
| | | | | | | 2009). | | | | |
| | | | | | | | | | | |
Joel M. Shulman, CFA(2) | | President and | | Since | | Member of the Advisor | | 1 | | None |
| 40 Grove St. Suite 200 | | Trustee | | 2010 | | and the Sub-Advisor | | | | |
| Wellesly Hills, MA 02482 | | | | | | since 2010; Chief | | | | |
| Birth year: 1955 | | | | | | Executive Officer of the | | | | |
| | | | | | | Sub-Advisor since | | | | |
| | | | | | | 2010; Tenured | | | | |
| | | | | | | professor at Babson | | | | |
| | | | | | | College. | | | | |
| | | | | | | | | | | |
| David Cragg | | Secretary, | | Since | | Member and Chief | | N/A | | N/A |
| 40 Grove St. Suite 200 | | Treasurer and | | 2010 | | Compliance Officer the | | | | |
| Wellesly Hills, MA 02482 | | Chief | | | | Advisor since 2010. | | | | |
| Birth year: 1969 | | Compliance | | | | Former Chief Financial | | | | |
| | | Officer | | | | Officer and Chief | | | | |
| | | | | | | Operating Officer of the | | | | |
| | | | | | | Leuthold Group | | | | |
| | | | | | | (institutional research) | | | | |
| | | | | | | (1999 to 2009). | | | | |
| | | | | | | | | | | |
(1) Each Trustee serves an indefinite term until the election of a successor. Each officer serves an indefinite term, renewed annually, until the election of a successor.
(2) Dr. Shulman is considered an interested Trustee within the meaning of the 1940 Act because of his affiliation with the Advisor and the Sub-Advisor.
The Statement of Additional Information includes additional information about the Fund’s Trustees and is available free of charge upon request by call the Fund toll free at (877) 271-8811.
2. SHAREHOLDER NOTIFICATION OF FEDERAL TAX STATUS
For the year ended June 30, 2013, 0% of dividends paid from net ordinary income qualify for the dividends received deduction available to corporate shareholders.
The Fund designates 0% of their ordinary income distributions for the fiscal period as qualified dividend income under the Jobs and Growth Tax Reconciliation Act of 2003.
EntrepreneurShares Global Fund
ADDITIONAL INFORMATION
(Unaudited)
The Fund designates 0% of its ordinary income distributions as short-term capital gain distribution under Internal Revenue Code Section 871(k)(2)(c).
3. AVAILABILITY OF QUARTERLY PORTFOLIO HOLDINGS SCHEDULES
The Fund is required to file their complete schedule of portfolio holdings with the SEC for the first and third quarters of each fiscal year on Form N-Q. Once filed, the Fund’s Form N-Q is available without charge, upon request on the SEC’s website (http://www.sec.gov) and may be available by calling 1.877.271.8811. You may also obtain copies at the SEC’s Public Reference Room in Washington, D.C. Information on the operation of the Public Reference Room may be obtained by calling 1.800.SEC.0330.
4. PROXY VOTING POLICIES AND PROCEDURES AND PROXY VOTING RECORD
A description of the policies and procedures that the Fund uses to determine how to vote proxies relating to portfolio securities is available without charge, upon request, by calling 1.877.271.8811 and on the SEC’s website (http://www.sec.gov). The Fund is required to file how they voted proxies related to portfolio securities during the most recent 12-month period ended June 30.
Once filed, the information is available, without charge, upon request, by calling 1.877.271.8811 and on the SEC’s website (http://www.sec.gov).
5. CHANGE IN INDEPENDENT REGISTERED PUBLIC ACCOUNTING FIRM
On May 9, 2013, the Fund’s Board of Directors engaged the firm McGladrey LLP to serve as the new independent registered public accounting firm to the Fund. During the two most recent fiscal years and through May 9, 2013, the Fund’s management did not consult McGladrey LLP regarding either (i) the application of accounting principles to a specified transaction, either completed or proposed, or the type of audit opinion that might be rendered on the Fund’s financial statements, or (ii) any matter that was either the subject of a disagreement or a reportable event, as such terms are defined in Item 304 of Regulation S-K. The decision to appoint McGladrey LLP was approved by the audit committee of the Fund’s board of directors and by the Fund’s board of directors.
On May 28, 2013, Ernst & Young LLP (“E&Y”) resigned as the independent registered public accounting firm for the
EntrepreneurShares Global Fund (the “Fund”). The reports of E&Y on the Fund’s financial statements for the fiscal years ended June 30, 2011 and 2012 did not contain an adverse opinion or disclaimer of opinion, nor were they qualified or modified as to uncertainty, audit scope or accounting principles.
During the two most recent fiscal years and through May 9, 2013, there were no disagreements with E&Y on any matter of accounting principles or practices, financial statement disclosure, or auditing scope or procedure, which disagreements, if not resolved to the satisfaction of E&Y, would have caused E&Y to make reference to the subject matter of the disagreements in connection with its reports on the financial statements for such years. During the two most recent fiscal years and through May 9, 2013, there were no reportable events of the kind enumerated in paragraphs (1)(v)(A) through (D) of item 304(a) of Regulation S-K.
Investment Advisor
Weston Capital Advisors, LLC
40 Grove Street, Suite 200
Wellesly Square, MA 02482
Investment Sub-Advisor
EntrepreneurShares, LLC
40 Grove Street, Suite 200
Wellesly Square, MA 02482
Independent Public Accounting Firm
McGladrey LLP
555 Seventeenth St., Suite 1000
Denver, CO 80202
Custodian
U.S. Bank, N.A.
1555 N. RiverCenter Drive, Suite 302
Milwaukee, WI 53212
Distributor
Rafferty Capital Markets, LLC
59 Hilton Ave.
Garden City, NY 11530
Administrator, Transfer Agent
And Dividend Disbursing Agent
U.S. Bancorp Fund Services, LLC
615 East Michigan Street
Milwaukee, WI 53202
Item 2. Code of Ethics.
The registrant has adopted a code of ethics that applies to the registrant’s principal executive officer and principal financial officer. The registrant has not made any amendments to its code of ethics during the period covered by this report. The registrant has not granted any waivers from any provisions of the code of ethics during the period covered by this report.
Incorporated by reference to the registrant’s N-CSR filed on September 9, 2011.
Item 3. Audit Committee Financial Expert.
The registrant’s board of trustees has determined that it does not have an audit committee financial expert serving on its audit committee. At this time, the registrant believes that the experience provided by each member of the audit committee together offers the registrant adequate oversight for the registrant’s level of financial complexity.
Item 4. Principal Accountant Fees and Services.
The registrant has engaged its principal accountant to perform audit services, audit-related services, tax services and other services during the past two fiscal years. “Audit services” refer to performing an audit of the registrant's annual financial statements or services that are normally provided by the accountant in connection with statutory and regulatory filings or engagements for those fiscal years. “Audit-related services” refer to the assurance and related services by the principal accountant that are reasonably related to the performance of the audit. “Tax services” refer to professional services rendered by the principal accountant for tax compliance, tax advice, and tax planning. There were no “Other services” provided by the principal accountant. The following table details the aggregate fees billed or expected to be billed for each of the last two fiscal years for audit fees, audit-related fees, tax fees and other fees by the principal accountant.
| | FYE 6/30/2013 McGladrey, LLP | FYE 6/30/2012 Ernst & Young, LLP |
| Audit Fees | $17,500 | $20,000 |
| Audit-Related Fees | $0 | $0 |
| Tax Fees | $2,500 | $2,300 |
| All Other Fees | $0 | $0 |
The audit committee has adopted pre-approval policies and procedures that require the audit committee to pre-approve all audit and non-audit services of the registrant, including services provided to any entity affiliated with the registrant.
The percentage of fees billed by McGladrey, LLP for the fiscal year ended June 30, 2013 and Ernst & Young, LLP for the fiscal year ended June 30, 2012 applicable to non-audit services pursuant to waiver of pre-approval requirement were as follows:
| | FYE 6/30/2013 McGladrey, LLP | FYE 6/30/2012 Ernst & Young, LLP |
| Audit-Related Fees | 0% | 0% |
| Tax Fees | 0% | 0% |
| All Other Fees | 0% | 0% |
All of the principal accountant’s hours spent on auditing the registrant’s financial statements were attributed to work performed by full-time permanent employees of the principal accountant. The following table indicates the non-audit fees billed or expected to be billed by the registrant’s accountant for services to the registrant and to the registrant’s investment adviser (and any other controlling entity, etc.—not sub-adviser) for the last two years. The audit committee of the board of trustees has considered whether the provision of non-audit services that were rendered to the registrant's investment adviser is compatible with maintaining the principal accountant's independence and has concluded that the provision of such non-audit services by the accountant has not compromised the accountant’s independence.
| Non-Audit Related Fees | FYE 6/30/2013 McGladrey, LLP | FYE 6/30/2012 Ernst & Young, LLP |
| Registrant | $2,500 | $2,300 |
| Registrant’s Investment Adviser | $0 | $0 |
Item 5. Audit Committee of Listed Registrants.
Not applicable to registrants who are not listed issuers (as defined in Rule 10A-3 under the Securities Exchange Act of 1934).
Item 6. Investments.
| (a) | Schedule of Investments is included as part of the report to shareholders filed under Item 1 of this Form. |
Item 7. Disclosure of Proxy Voting Policies and Procedures for Closed-End Management Investment Companies.
Not applicable to open-end investment companies.
Item 8. Portfolio Managers of Closed-End Management Investment Companies.
Not applicable to open-end investment companies.
Item 9. Purchases of Equity Securities by Closed-End Management Investment Company and Affiliated Purchasers.
Not applicable to open-end investment companies.
Item 10. Submission of Matters to a Vote of Security Holders.
Not Applicable.
Item 11. Controls and Procedures.
| (a) | The Registrant’s President and Treasurer have reviewed the Registrant's disclosure controls and procedures (as defined in Rule 30a-3(c) under the Investment Company Act of 1940 (the “Act”)) as of a date within 90 days of the filing of this report, as required by Rule 30a-3(b) under the Act and Rules 13a-15(b) or 15d-15(b) under the Securities Exchange Act of 1934. Based on their review, such officers have concluded that the disclosure controls and procedures are effective in ensuring that information required to be disclosed in this report is appropriately recorded, processed, summarized and reported and made known to them by others within the Registrant and by the Registrant’s service provider. |
| (b) | There were no changes in the Registrant's internal control over financial reporting (as defined in Rule 30a-3(d) under the Act) that occurred during the second fiscal quarter of the period covered by this report that has materially affected, or is reasonably likely to materially affect, the Registrant's internal control over financial reporting. |
Item 12. Exhibits.
| (a) | (1) Any code of ethics or amendment thereto, that is the subject of the disclosure required by Item 2, to the extent that the registrant intends to satisfy Item 2 requirements through filing an exhibit. Incorporated by reference to Registrant’s form N-CSR filed September 9, 2011. |
(2) A separate certification for each principal executive and principal financial officer pursuant to Section 302 of the Sarbanes-Oxley Act of 2002. Filed herewith.
(3) Any written solicitation to purchase securities under Rule 23c-1 under the Act sent or given during the period covered by the report by or on behalf of the registrant to 10 or more persons. Not applicable to open-end investment companies.
| (b) | Certifications pursuant to Section 906 of the Sarbanes-Oxley Act of 2002. Furnished herewith. |
SIGNATURES
Pursuant to the requirements of the Securities Exchange Act of 1934 and the Investment Company Act of 1940, the registrant has duly caused this report to be signed on its behalf by the undersigned, thereunto duly authorized.
(Registrant) EntrepreneurShares Series Trust
By (Signature and Title)* /s/ Dr. Joel M. Shulman
Dr. Joel M. Shulman, President
Date 8/29/2013
Pursuant to the requirements of the Securities Exchange Act of 1934 and the Investment Company Act of 1940, this report has been signed below by the following persons on behalf of the registrant and in the capacities and on the dates indicated.
By (Signature and Title)* /s/ Dr. Joel M. Shulman ��
Dr. Joel M. Shulman, President
Date 8/29/2013
By (Signature and Title)* /s/ David Cragg
David Cragg, Treasurer
Date 8/30/2013
* Print the name and title of each signing officer under his or her signature.