UNITED STATES
SECURITIES AND EXCHANGE COMMISSION
Washington, D.C. 20549
FORM N-CSR
CERTIFIED SHAREHOLDER REPORT OF REGISTERED
MANAGEMENT INVESTMENT COMPANIES
Investment Company Act file number 811-22436
EntrepreneurShares Series Trust
(Exact name of registrant as specified in charter)
470 Atlantic Avenue, Suite 400
Boston, MA 02210
(Address of principal executive offices) (Zip code)
Dr. Joel M. Shulman
470 Atlantic Avenue, Suite 400
Boston, MA 02210
(Name and address of agent for service)
800-287-9469
Registrant's telephone number, including area code
Date of fiscal year end: June 30, 2015
Date of reporting period: June 30, 2015
Item 1. Reports to Stockholders.
Annual Report
June 30, 2015
EntrepreneurShares Global Fund
Entrepreneur U.S. All Cap Fund
Entrepreneur U.S. Large Cap Fund
Each a series of EntrepreneurShares Series Trust
c/o U.S. Bancorp Fund Services, LLC
P.O. Box 701
Milwaukee, Wisconsin 53201-0701
EntrepreneurShares Series Trust
August 10, 2015
Dear Shareholders:
We are pleased to report the results for our Fiscal year running July 1, 2014 to June 30, 2015 and share our thoughts for the months ahead. During the past year, equity capital markets generally provided a 5% to 10% appreciation with periodic dips. Global markets experienced a drop off in the Fall of 2014 with another retraction occurring in late Spring 2015. Sharp declines could be directly attributed to unrest in the Middle East, continued debt problems in Greece and a sharp selloff in the overheated markets of China. Volatility was especially acute in the Energy and Material sectors with many companies experiencing significant price reduction. By contrast, the Healthcare (Biotechnology in particular), Consumer Discretionary and Information Technology sectors provided the best returns with double-digit gains in most.
Unlike 2014, in which U.S. Large Capitalization firms dominated performance, U.S. Smaller Cap companies tended to provide the best results during this period. Our U.S. All Cap Fund (benchmarked to the Russell 2000 Total Return Index) generated returns of 7.26% compared to the benchmark returns of 6.49%. Our Global Fund (benchmarked to the MSCI The World Index) produced 3.49% total return compared to its benchmark of 1.97% and our U.S. Large Cap Fund gained 7.77% compared to its S&P 500 Total Return Index benchmark of 7.42%.
In late 2014 and early 2015, we rebalanced our portfolios in order to manage sector risk exposure and showcase our entrepreneurial securities. We continue to invest in data, technology, and operational support in order to manage our portfolios in the most efficient manner possible for our clients.
The EntrepreneurShares Global Fund, the Entrepreneur U.S. All Cap Fund, and the Entrepreneur U.S. Large Cap Fund (each a “Fund”, together the “Funds”) tend to move in a consistent pattern relative to overall markets. Should the financial markets decline, our three Funds will likely follow this pattern. As of the timing of this letter (August 2015), global markets are experiencing tumult, particularly in China. Although these same markets were big winners in the past year, much of the gains have dissipated through a large retail market sell off. It remains to be seen if the strong market correction in China will spill over to other consumer or capital market participants. As with any strong market retraction, our enthusiasm and trepidation for future Fund performance rests with the direction of the overall market. We believe that global equities continue to be priced at reasonable levels and are positioned for a positive finish in the remainder of 2015. In particular, we believe that global equities offer an attractive alternative to fixed income securities and cash equivalent investments.
As an overall commentary, we continue to have confidence that savvy entrepreneurial managers will find a way to grow their businesses in good market conditions and survive in difficult ones. Entrepreneurs have economic and non-economic incentive to grow profits and generate stock appreciation for themselves and other shareholders. This policy has held true in prior years and should remain true in the months and years ahead.
We look forward to sharing more updates with you in the future and assisting you with your portfolio management. Thank you again for your support of our investment strategies.
Joel Shulman Ph.D., CFA
Chief Investment Officer
EntrepreneurShares
EntrepreneurShares Series Trust
Performance data quoted represents past performance; past performance does not guarantee future results. The investment return and principal value of an investment will fluctuate so that an investor’s shares, when redeemed, may be worth more or less than their original cost. Current performance of the fund may be lower or higher than the performance quoted. Performance data current to the most recent month end may be obtained by calling 1-877-271-8811 /or visiting www.ershares.com.
Investors should consider carefully the investment objectives, risks, and charges and expenses before investing. For a full prospectus which contains this and other information about the funds offered by EntrepreneurShares, call 1-877-271-8811.
Please read the full prospectus carefully before investing. Distributed by Rafferty Capital Markets, LLC.
The EntrepreneurShares Global Fund invests in foreign securities which involve greater volatility and political, economic and currency risks and differences in accounting methods. The Entrepreneur U.S. All Cap Fund invests in smaller companies, which involve additional risks such as limited liquidity and greater volatility. The Entrepreneur U.S. Large Cap Fund is exposed to common stock risk. Common stock prices fluctuate based on changes in a company’s financial condition and on overall market and economic conditions. Additional risks are detailed in the prospectus.
The MSCI The World Index is a free float-adjusted market capitalization weighted index that is designed to measure the equity market performance of developed markets. The Russell 3000 Total Return Index measures performance of the largest 3000 U.S. companies representing approximately 98% of the investable U.S. equity market. The Russell 2000 Total Return Index is a subset of the Russell 3000 Total Return Index representing approximately 10% of the total market capitalization of that index. It includes approximately 2000 of the smallest securities based on a combination of their market cap and current index membership. The S&P 500 Total Return Index includes 500 leading companies and captures approximately 80% coverage of available market capitalization. Returns assume the reinvestments of all dividends.
Diversification does not guarantee a profit or assure against a loss.
Opinions expressed are subject to change, are not guaranteed and should not be considered recommendations to buy or sell any security.
EntrepreneurShares Global Fund
PERFORMANCE HIGHLIGHTS
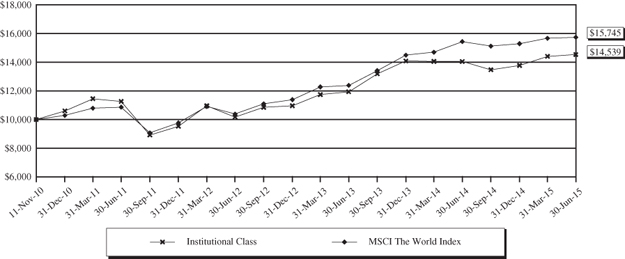
EntrepreneurShares Global Fund vs. MSCI The World Index
Value of $10,000 Investment
This chart assumes an initial gross investment of $10,000 made in the Institutional Class on November 11, 2010 (commencement of operations of the Fund). Returns shown include the reinvestment of all dividends but do not reflect the deduction of taxes that a shareholder would pay on fund distributions or the redemption of fund shares. In the absence of fee waivers and reimbursements, total returns would be reduced. Past performance is not predictive of future performance. Investment return and principal value will fluctuate, so that your shares, when redeemed, may be worth more or less than the original cost. Total returns would have been lower had the Advisor not waived its fees and reimbursed a portion of the Fund’s expenses. The Fund’s total gross operational expenses, including underlying Funds, were 2.42% per the November 1, 2014 Prospectus.
MSCI The World Index – A free float-adjusted market capitalization weighted index that is designed to measure the equity market performance of developed markets. Returns assume the reinvestments of all dividends.
Total Annualized Returns for the period ended June 30, 2015
| | | Since |
| | | Inception |
| | 1-Year | (11/11/10) |
| EntrepreneurShares Global Fund – Institutional Class | 3.49% | 8.41% |
| MSCI The World Index | 1.97% | 10.29% |
Entrepreneur U.S. All Cap Fund
PERFORMANCE HIGHLIGHTS
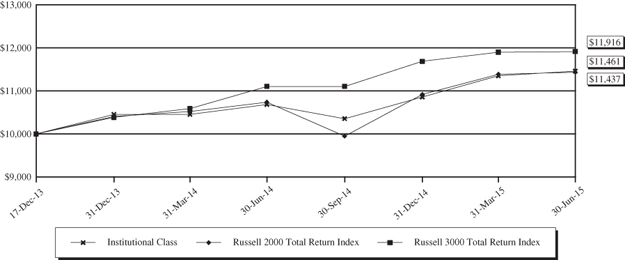
Entrepreneur U.S. All Cap Fund vs. Russell 2000 Total Return Index and Russell 3000 Total Return Index
Value of $10,000 Investment
This chart assumes an initial gross investment of $10,000 made in the Institutional Class on December 17, 2013 (commencement of operations of the Fund). Returns shown include the reinvestment of all dividends but do not reflect the deduction of taxes that a shareholder would pay on fund distributions or the redemption of fund shares. In the absence of fee waivers and reimbursements, total returns would be reduced. Past performance is not predictive of future performance. Investment return and principal value will fluctuate, so that your shares, when redeemed, may be worth more or less than the original cost. Total returns would have been lower had the Advisor not waived its fees and reimbursed a portion of the Fund’s expenses. The Fund’s total gross operational expenses, including underlying Funds, were 1.28% per the October 30, 2014 Prospectus.
Russell 3000 Total Return Index – Measures the performance of the largest 3,000 U.S. companies representing approximately 98% of the investable U.S. equity market.
Russell 2000 Total Return Index – Is a subset of the Russell 3000 Index representing approximately 10% of the total market capitalization of that index. It includes approximately 2000 of the smallest securities based on a combination of their market cap and current index membership.
Returns assume the reinvestments of all dividends.
Total Annualized Returns for the period ended June 30, 2015
| | | Since |
| | | Inception |
| | 1-Year | (12/17/13) |
| Entrepreneur U.S. All Cap Fund – Institutional Class | 7.26% | 9.29% |
| Russell 2000 Total Return Index | 6.49% | 9.14% |
| Russell 3000 Total Return Index* | 7.29% | 12.10% |
| * | The Advisor considers the Russell 2000 Total Return Index a more relevant benchmark, and the Prospectus has been amended to reflect this change. The Russell 3000 Total Return Index will be included until the 2015 Prospectus update. |
Entrepreneur U.S. Large Cap Fund
PERFORMANCE HIGHLIGHTS
Entrepreneur U.S. Large Cap Fund vs. S&P 500 Total Return Index
Value of $10,000 Investment
This chart assumes an initial gross investment of $10,000 made in the Institutional Class on June 30, 2014 (commencement of operations of the Fund). Returns shown include the reinvestment of all dividends but do not reflect the deduction of taxes that a shareholder would pay on fund distributions or the redemption of fund shares. In the absence of fee waivers and reimbursements, total returns would be reduced. Past performance is not predictive of future performance. Investment return and principal value will fluctuate, so that your shares, when redeemed, may be worth more or less than the original cost. Total returns would have been lower had the Advisor not waived its fees and reimbursed a portion of the Fund’s expenses. The Fund’s total gross operational expenses, including underlying Funds, were 0.82% per the June 26, 2014 Prospectus.
S&P 500 Total Return Index – Includes 500 leading companies and captures approximately 80% coverage of available market capitalization. Returns assume the reinvestments of all dividends.
Total Annualized Returns for the period ended June 30, 2015
| | | Since |
| | | Inception |
| | 1-Year | (6/30/14) |
| Entrepreneur U.S. Large Cap Fund – Institutional Class | 7.77% | 7.77% |
| S&P 500 Total Return Index | 7.42% | 7.42% |
EntrepreneurShares Series Trust
ALLOCATION OF PORTFOLIO ASSETS
June 30, 2015 (Unaudited)
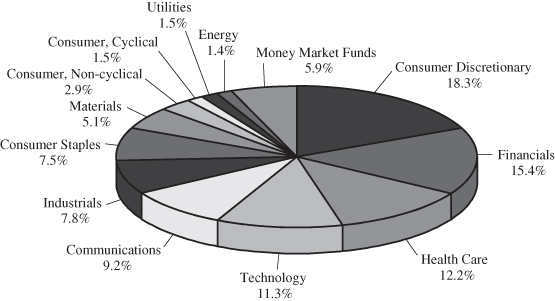
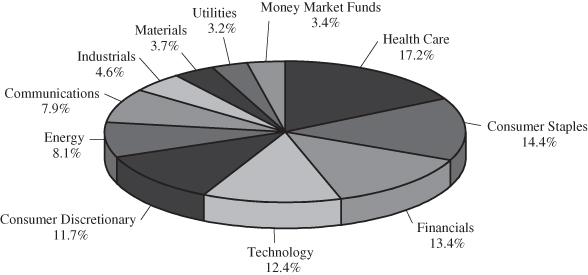
EntrepreneurShares Global Fund
SECTOR ALLOCATION
As a Percentage of Portfolio
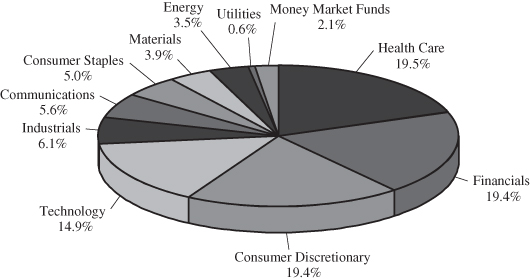
Entrepreneur U.S. All Cap Fund
SECTOR ALLOCATION
As a Percentage of Portfolio
EntrepreneurShares Series Trust
ALLOCATION OF PORTFOLIO ASSETS (Continued)
June 30, 2015 (Unaudited)
Entrepreneur U.S. Large Cap Fund
SECTOR ALLOCATION
As a Percentage of Portfolio
EntrepreneurShares Series Trust
EXPENSE EXAMPLE
June 30, 2015 (Unaudited)
As a shareholder of the EntrepreneurShares Global Fund, the Entrepreneur U.S. All Cap Fund or the Entrepreneur U.S. Large Cap Fund (collectively the “Funds”), you incur two types of costs: (1) transaction costs, including redemption fees on shares held less than 5 business days; and (2) ongoing costs, including investment advisory fees, shareholder servicing fees, and other expenses for the Funds, which are indirectly paid by shareholders. This example is intended to help you understand your ongoing costs (in dollars) of investing in the Funds and to compare these costs with the ongoing costs of investing in other mutual funds.
The example is based on an investment of $1,000 invested at the beginning of the period and held the entire six-month period from January 1, 2015 to June 30, 2015 for the Funds.
ACTUAL EXPENSES
The first line of the table below provides information about actual account values and actual expenses. However, the tables do not include shareholder specific fees, such as the $15.00 fee charged for wire redemptions by the Funds’ transfer agent. To the extent that the Funds invest in other investment companies as part of its investment strategy, you will indirectly bear your proportional share of any fees and expenses charged by the underlying funds in which the Funds invests, in addition to expenses of the Funds. These expenses are not included in the following example. The table also does not include portfolio trading commissions and related trading costs. You may use the information in this line, together with the amount you invested, to estimate the expenses that you paid over the period. Simply divide your account value by $1,000 (for example, an $8,600 account value divided by $1,000 = 8.6), then multiply the result by the number in the first line under the heading entitled “Expenses Paid During Period” to estimate the expenses you paid on your account during the period.
HYPOTHETICAL EXAMPLE FOR COMPARISON PURPOSES
The second line of the table below provides information about hypothetical account values and hypothetical expenses based on the actual expense ratios for each share class of the Funds and an assumed rate of return of 5% per year before expenses, which is not the Funds’ actual return. The hypothetical account values and expenses may not be used to estimate the actual ending account balance or expenses you paid for the period. You may use this information to compare the ongoing costs of investing in the Funds and other funds. To do so, compare this 5% hypothetical example with the 5% hypothetical examples that appear in the shareholder reports of the other fund. Please note that the expenses shown in the table are meant to highlight your ongoing costs only and do not reflect any transactional costs, such as sales charges (loads), redemptions fees, or exchange fees. Therefore, the second line of the table is useful in comparing ongoing costs only, and will not help you determine the relevant total cost of owning different funds.
EntrepreneurShares Series Trust
EXPENSE EXAMPLE (Continued)
June 30, 2015 (Unaudited)
EntrepreneurShares Global Fund – Institutional Class
| | | | Expenses Paid |
| | Beginning | Ending | During Period* |
| | Account Value | Account Value | January 1, 2015 – |
| | January 1, 2015 | June 30, 2015 | June 30, 2015 |
| Actual | $1,000.00 | $1,055.40 | $8.66 |
| Hypothetical (5% return before expenses) | 1,000.00 | 1,016.36 | 8.50 |
| * | Expenses are equal to the Fund’s annualized expense ratio of 1.70%, multiplied by the average account value over the period, multiplied by 181/365 to reflect the one-half year period. |
Entrepreneur U.S. All Cap Fund – Institutional Class
| | | | Expenses Paid |
| | Beginning | Ending | During Period* |
| | Account Value | Account Value | January 1, 2015 – |
| | January 1, 2015 | June 30, 2015 | June 30, 2015 |
| Actual | $1,000.00 | $1,055.30 | $4.33 |
| Hypothetical (5% return before expenses) | 1,000.00 | 1,020.58 | 4.26 |
| * | Expenses are equal to the Fund’s annualized expense ratio of 0.85%, multiplied by the average account value over the period, multiplied by 181/365 to reflect the one-half year period. |
Entrepreneur U.S. Large Cap Fund – Institutional Class
| | | | Expenses Paid |
| | Beginning | Ending | During Period* |
| | Account Value | Account Value | January 1, 2015 – |
| | January 1, 2015 | June 30, 2015 | uuuuuu |
| Actual | $1,000.00 | $1,035.60 | $3.79 |
| Hypothetical (5% return before expenses) | 1,000.00 | 1,021.08 | 3.76 |
| * | Expenses are equal to the Fund’s annualized expense ratio of 0.75%, multiplied by the average account value over the period, multiplied by 181/365 to reflect the one-half year period. |
EntrepreneurShares Global Fund
SCHEDULE OF INVESTMENTS
June 30, 2015
| Shares | | | | Fair Value | |
| | COMMON STOCKS – 94.34% | | | |
| | Apparel & Textile Products – 1.16% | | | |
| | 11 | | Hermes International (b) | | $ | 4,103 | |
| | 218 | | LVMH Moet Hennessy Louis Vuitton SE (b) | | | 38,193 | |
| | 263 | | Under Armour, Inc. – Class A (a) | | | 21,945 | |
| | | | | | | 64,241 | |
| | | | Asset Management – 1.11% | | | | |
| | 205 | | Partners Group Holding AG (b) | | | 61,284 | |
| | | | | | | | |
| | | | Banking – 1.62% | | | | |
| | 2,447 | | Home BancShares, Inc. | | | 89,462 | |
| | | | | | | | |
| | | | Biotechnology & Pharmaceutical – 8.19% | | | | |
| | 90 | | Alexion Pharmaceuticals, Inc. (a) | | | 16,269 | |
| | 1,715 | | Galapagos NV (a)(b) | | | 87,559 | |
| | 661 | | GW Pharmaceuticals plc – ADR (a)(b) | | | 81,197 | |
| | 763 | | Hikma Pharmaceuticals plc (b) | | | 23,174 | |
| | 462 | | Jazz Pharmaceuticals plc (a)(b) | | | 81,345 | |
| | 62 | | Regeneron Pharmaceuticals, Inc. (a) | | | 31,628 | |
| | 251 | | United Therapeutics Corp. (a) | | | 43,661 | |
| | 636 | | USANA Health Sciences, Inc. (a)(b) | | | 86,916 | |
| | | | | | | 451,749 | |
| | | | Chemicals – 1.67% | | | | |
| | 874 | | Airgas, Inc. | | | 92,452 | |
| | | | | | | | |
| | | | Commercial Services – 3.38% | | | | |
| | 1,384 | | Cimpress NV (a)(b) | | | 116,477 | |
| | 4,083 | | Park24 Co. Ltd. (b) | | | 69,960 | |
| | | | | | | 186,437 | |
| | | | Consumer Products – 3.81% | | | | |
| | 870 | | Brown-Forman Corp. – Class B | | | 87,157 | |
| | 535 | | The Hain Celestial Group, Inc. (a) | | | 35,235 | |
| | 531 | | Inter Parfums, Inc. (b) | | | 18,017 | |
| | 494 | | J&J Snack Foods Corp. | | | 54,671 | |
| | 6,125 | | Wilmar International Ltd. (b) | | | 14,916 | |
| | | | | | | 209,996 | |
| | | | Consumer Services – 1.68% | | | | |
| | 3,151 | | Service Corp. International | | | 92,734 | |
| | | | | | | | |
| | | | Electrical Equipment – 2.13% | | | | |
| | 3,267 | | Renishaw plc (b) | | | 117,602 | |
| | | | | | | | |
| | | | Engineering & Construction Services – 0.73% | | | | |
| | 136,094 | | DMCI Holdings, Inc. (b) | | | 39,841 | |
| | 681 | | Hopewell Highway Infrastructure Ltd. (b) | | | 335 | |
| | | | | | | 40,176 | |
The accompanying notes are an integral part of these financial statements.
EntrepreneurShares Global Fund
SCHEDULE OF INVESTMENTS (Continued)
June 30, 2015
| Shares | | | | Fair Value | |
| | Gaming, Lodging & Restaurants – 5.42% | | | |
| | 305 | | Panera Bread Co. – Class A (a) | | $ | 53,305 | |
| | 1,336 | | Papa John’s International, Inc. | | | 101,015 | |
| | 1,612 | | Starbucks Corp. | | | 86,427 | |
| | 1,555 | | Texas Roadhouse, Inc. | | | 58,204 | |
| | | | | | | 298,951 | |
| | | | Hardware – 2.51% | | | | |
| | 545 | | Nidec Corp. (b) | | | 40,813 | |
| | 2,178 | | Parrot SA (a)(b) | | | 97,685 | |
| | | | | | | 138,498 | |
| | | | Health Care Facilities & Services – 2.51% | | | | |
| | 787 | | Molina Healthcare, Inc. (a) | | | 55,326 | |
| | 1,295 | | PAREXEL International Corp. (a) | | | 83,281 | |
| | | | | | | 138,607 | |
| | | | Institutional Financial Services – 1.56% | | | | |
| | 386 | | Intercontinental Exchange, Inc. | | | 86,313 | |
| | | | | | | | |
| | | | Insurance – 2.91% | | | | |
| | 1,328 | | Aflac, Inc. | | | 82,602 | |
| | 571 | | Berkshire Hathaway, Inc. – Class B (a) | | | 77,719 | |
| | | | | | | 160,321 | |
| | | | Iron & Steel – 1.89% | | | | |
| | 12,012 | | Fortescue Metals Group Ltd. (b) | | | 17,702 | |
| | 4,179 | | Steel Dynamics, Inc. | | | 86,568 | |
| | | | | | | 104,270 | |
| | | | Media – 9.27% | | | | |
| | 397 | | Baidu, Inc. – ADR (a)(b) | | | 79,035 | |
| | 1,033 | | Facebook, Inc. – Class A (a) | | | 88,595 | |
| | 165 | | Google, Inc. – Class A (a) | | | 89,107 | |
| | 1,361 | | JCDecaux SA (b) | | | 56,793 | |
| | 7,350 | | Seek Ltd. (b) | | | 79,733 | |
| | 545 | | Teleperformance (b) | | | 38,503 | |
| | 1,291 | | VeriSign, Inc. (a) | | | 79,681 | |
| | | | | | | 511,447 | |
| | | | Medical Equipment & Devices – 4.47% | | | | |
| | 681 | | Cochlear Ltd. (b) | | | 42,113 | |
| | 1,021 | | Coloplast A/S – Class B (b) | | | 66,995 | |
| | 2,278 | | Globus Medical, Inc. – Class A (a) | | | 58,476 | |
| | 2,320 | | Myriad Genetics, Inc. (a) | | | 78,857 | |
| | | | | | | 246,441 | |
| | | | Metals & Mining – 1.53% | | | | |
| | 2,749 | | Hi-Crush Partners LP | | | 84,367 | |
The accompanying notes are an integral part of these financial statements.
EntrepreneurShares Global Fund
SCHEDULE OF INVESTMENTS (Continued)
June 30, 2015
| Shares | | | | Fair Value | |
| | Oil, Gas & Coal – 1.44% | | | |
| | 1,128 | | Helmerich & Payne, Inc. | | $ | 79,434 | |
| | | | | | | | |
| | | | Passenger Transportation – 0.19% | | | | |
| | 490 | | WestJet Airlines Ltd. (b) | | | 10,341 | |
| | | | | | | | |
| | | | Real Estate – 1.77% | | | | |
| | 6,805 | | Africa Israel Investments Ltd. (a)(b) | | | 5,538 | |
| | 13,610 | | Hopewell Holdings Ltd. (b) | | | 49,864 | |
| | 953 | | L E Lundbergforetagen AB – Class B (b) | | | 42,328 | |
| | | | | | | 97,730 | |
| | | | Recreation Facilities & Services – 0.53% | | | | |
| | 1,116 | | Flight Centre Travel Group Ltd. (b) | | | 29,370 | |
| | | | | | | | |
| | | | Retail – Consumer Staples – 3.72% | | | | |
| | 573 | | Costco Wholesale Corp. | | | 77,389 | |
| | 286 | | Dollarama, Inc. (b) | | | 17,334 | |
| | 14,971 | | The Warehouse Group Ltd. (b) | | | 26,580 | |
| | 2,124 | | Whole Foods Market, Inc. | | | 83,771 | |
| | | | | | | 205,074 | |
| | | | Retail – Discretionary – 7.41% | | | | |
| | 1,634 | | Inditex SA (b) | | | 53,111 | |
| | 1,218 | | Luxottica Group S.p.A. – ADR (b) | | | 80,936 | |
| | 450 | | MercadoLibre, Inc. (b) | | | 63,765 | |
| | 13 | | Netflix, Inc. (a) | | | 8,540 | |
| | 3,403 | | SM Investments Corp. (b) | | | 67,547 | |
| | 4,083 | | SuperGroup plc (a)(b) | | | 78,845 | |
| | 1,605 | | Urban Outfitters, Inc. (a) | | | 56,175 | |
| | | | | | | 408,919 | |
| | | | Semiconductors – 5.76% | | | | |
| | 1,563 | | ARM Holdings plc – ADR (b) | | | 77,009 | |
| | 810 | | IPG Photonics Corp. (a) | | | 68,992 | |
| | 3,953 | | NVIDIA Corp. | | | 79,495 | |
| | 1,784 | | Universal Display Corp. (a) | | | 92,286 | |
| | | | | | | 317,782 | |
| | | | Software – 1.93% | | | | |
| | 1,330 | | Cerner Corp. (a) | | | 91,850 | |
| | 360 | | Oracle Corp. | | | 14,508 | |
| | | | | | | 106,358 | |
| | | | Specialty Finance – 6.46% | | | | |
| | 2,393 | | Air Lease Corp. (b) | | | 81,123 | |
| | 278 | | AMERCO | | | 90,881 | |
| | 977 | | Capital One Financial Corp. | | | 85,947 | |
| | 142 | | Credit Acceptance Corp. (a) | | | 34,957 | |
The accompanying notes are an integral part of these financial statements.
EntrepreneurShares Global Fund
SCHEDULE OF INVESTMENTS (Continued)
June 30, 2015
| Shares | | | | Fair Value | |
| | 1,016 | | PRA Group, Inc. (a) | | $ | 63,307 | |
| | | | | | | 356,215 | |
| | | | Technology Services – 1.12% | | | | |
| | 1,301 | | Syntel, Inc. (a) | | | 61,771 | |
| | | | | | | | |
| | | | Transportation & Logistics – 3.41% | | | | |
| | 1,938 | | Expeditors International of Washington, Inc. | | | 89,351 | |
| | 518 | | FedEx Corp. | | | 88,267 | |
| | 458 | | Swift Transportation Co. (a) | | | 10,383 | |
| | | | | | | 188,001 | |
| | | | Transportation Equipment – 1.59% | | | | |
| | 1,379 | | PACCAR, Inc. | | | 87,994 | |
| | | | | | | | |
| | | | Utilities – 1.46% | | | | |
| | 2,506 | | ITC Holdings Corp. | | | 80,643 | |
| | | | TOTAL COMMON STOCKS (Cost $4,003,093) | | | 5,204,980 | |
| | | | | | | | |
| | | | MONEY MARKET FUNDS – 5.91% | | | | |
| | 325,925 | | First American Treasury Obligations Fund – Class Z, 0.00% (c) | | | 325,925 | |
| | | | TOTAL MONEY MARKET FUNDS (Cost $325,925) | | | 325,925 | |
| | | | | | | | |
| | | | Total Investments (Cost $4,329,018) – 100.25% | | | 5,530,905 | |
| | | | Liabilities in Excess of Other Assets – (0.25)% | | | (13,655 | ) |
| | | | TOTAL NET ASSETS – 100.00% | | $ | 5,517,250 | |
Percentages are stated as a percent of net assets.
ADR – American Depository Receipt
| (a) | Non-income producing security. |
| (b) | Global security, as classified by the Fund’s Investment Advisor, in accordance to the definition in the Fund’s prospectus. |
| (c) | The rate quoted is the annualized seven-day yield as of June 30, 2015. |
The accompanying notes are an integral part of these financial statements.
EntrepreneurShares Global Fund
SCHEDULE OF INVESTMENTS (Continued)
June 30, 2015
| | Percent of Net |
| Country of Risk | Assets |
| United States | 70.2% |
| United Kingdom | 6.4% |
| France | 4.3% |
| Australia | 3.1% |
| Japan | 2.0% |
| Philippines | 1.9% |
| Belgium | 1.6% |
| Italy | 1.5% |
| China | 1.4% |
| Denmark | 1.2% |
| Argentina | 1.1% |
| Switzerland | 1.1% |
| Spain | 1.0% |
| Hong Kong | 0.9% |
| Sweden | 0.8% |
| Canada | 0.5% |
| New Zealand | 0.5% |
| Jordan | 0.4% |
| Singapore | 0.3% |
| Israel | 0.1% |
| | 100.3% |
The accompanying notes are an integral part of these financial statements.
Entrepreneur U.S. All Cap Fund
SCHEDULE OF INVESTMENTS (Continued)
June 30, 2015
| Shares | | | | Fair Value | |
| | COMMON STOCKS – 94.12% | | | |
| | Aerospace & Defense – 1.82% | | | |
| | 27,033 | | AAR Corp. | | $ | 861,541 | |
| | 17,421 | | KLX, Inc. (a) | | | 768,789 | |
| | 29,383 | | TASER International, Inc. (a) | | | 978,748 | |
| | | | | | | 2,609,078 | |
| | | | Apparel & Textile Products – 1.40% | | | | |
| | 29,070 | | Iconix Brand Group, Inc. (a) | | | 725,878 | |
| | 11,863 | | Under Armour, Inc. – Class A (a) | | | 989,848 | |
| | 25,614 | | Vera Bradley, Inc. (a) | | | 288,670 | |
| | | | | | | 2,004,396 | |
| | | | Asset Management – 0.76% | | | | |
| | 19,205 | | Cohen & Steers, Inc. | | | 654,506 | |
| | 7,273 | | Westwood Holdings Group, Inc. | | | 433,253 | |
| | | | | | | 1,087,759 | |
| | | | Automotive – 0.58% | | | | |
| | 50,762 | | Gentex Corp. | | | 833,512 | |
| | | | Banking – 1.90% | | | | |
| | 38,469 | | Fidelity Southern Corp. | | | 670,899 | |
| | 14,172 | | First Republic Bank | | | 893,261 | |
| | 31,507 | | Home BancShares, Inc. | | | 1,151,896 | |
| | | | | | | 2,716,056 | |
| | | | Biotechnology & Pharmaceutical – 8.80% | | | | |
| | 2,835 | | Agios Pharmaceuticals, Inc. (a) | | | 315,082 | |
| | 43,944 | | Albany Molecular Research, Inc. (a) | | | 888,548 | |
| | 2,173 | | Alexion Pharmaceuticals, Inc. (a) | | | 392,813 | |
| | 45,105 | | ARIAD Pharmaceuticals, Inc. (a) | | | 373,018 | |
| | 9,231 | | Avalanche Biotechnologies, Inc. (a) | | | 149,912 | |
| | 4,656 | | Clovis Oncology, Inc. (a) | | | 409,169 | |
| | 13,637 | | Emergent Biosolutions, Inc. (a) | | | 449,339 | |
| | 10,345 | | FibroGen, Inc. (a) | | | 243,108 | |
| | 5,987 | | Gilead Sciences, Inc. | | | 700,958 | |
| | 21,518 | | Intra-Cellular Therapies, Inc. (a) | | | 687,500 | |
| | 9,159 | | Intrexon Corp. (a) | | | 446,959 | |
| | 20,646 | | Ironwood Pharmaceuticals, Inc. – Class A (a) | | | 248,991 | |
| | 5,150 | | Isis Pharmaceuticals, Inc. (a) | | | 296,383 | |
| | 11,662 | | Karyopharm Therapeutics, Inc. (a) | | | 317,323 | |
| | 5,053 | | Kite Pharma, Inc. (a) | | | 308,081 | |
| | 7,836 | | KYTHERA Biopharmaceuticals, Inc. (a) | | | 590,129 | |
| | 11,484 | | MacroGenics, Inc. (a) | | | 436,048 | |
| | 48,012 | | MannKind Corp. (a) | | | 273,188 | |
| | 8,927 | | NewLink Genetics Corp. (a) | | | 395,198 | |
| | 1,492 | | Puma Biotechnology, Inc. (a) | | | 174,191 | |
The accompanying notes are an integral part of these financial statements.
Entrepreneur U.S. All Cap Fund
SCHEDULE OF INVESTMENTS (Continued)
June 30, 2015
| Shares | | | | Fair Value | |
| | 2,805 | | Receptos, Inc. (a) | | $ | 533,090 | |
| | 847 | | Regeneron Pharmaceuticals, Inc. (a) | | | 432,080 | |
| | 7,768 | | Sage Therapeutics, Inc. (a) | | | 567,064 | |
| | 28,587 | | Sagent Pharmaceuticals, Inc. (a) | | | 694,950 | |
| | 23,413 | | Sangamo BioSciences, Inc. (a) | | | 259,650 | |
| | 6,820 | | TESARO, Inc. (a) | | | 400,948 | |
| | 2,239 | | United Therapeutics Corp. (a) | | | 389,474 | |
| | 8,754 | | USANA Health Sciences, Inc. (a) | | | 1,196,322 | |
| | 1,486 | | ZIOPHARM Oncology, Inc. (a) | | | 17,827 | |
| | | | | | | 12,587,343 | |
| | | | Chemicals – 2.40% | | | | |
| | 6,544 | | Airgas, Inc. | | | 692,224 | |
| | 33,095 | | Globe Specialty Metals, Inc. | | | 585,782 | |
| | 27,511 | | Huntsman Corp. | | | 607,168 | |
| | 23,723 | | LSB Industries, Inc. (a) | | | 968,847 | |
| | 1,309 | | NewMarket Corp. | | | 581,052 | |
| | | | | | | 3,435,073 | |
| | | | Commercial Services – 1.74% | | | | |
| | 20,650 | | Insperity, Inc. | | | 1,051,085 | |
| | 27,129 | | National Research Corp. – Class A | | | 385,503 | |
| | 65,243 | | Resources Connection, Inc. | | | 1,049,760 | |
| | | | | | | 2,486,348 | |
| | | | Consumer Products – 3.49% | | | | |
| | 2,703 | | The Boston Beer Co., Inc. – Class A (a) | | | 627,069 | |
| | 74,627 | | Boulder Brands, Inc. (a) | | | 517,911 | |
| | 13,659 | | The Hain Celestial Group, Inc. (a) | | | 899,582 | |
| | 38,373 | | Inter Parfums, Inc. | | | 1,301,996 | |
| | 8,426 | | J&J Snack Foods Corp. | | | 932,505 | |
| | 25,923 | | Seneca Foods Corp. – Class A (a) | | | 719,882 | |
| | | | | | | 4,998,945 | |
| | | | Consumer Services – 1.68% | | | | |
| | 35,477 | | Carriage Services, Inc. | | | 847,191 | |
| | 17,458 | | Rent-A-Center, Inc. | | | 494,934 | |
| | 36,174 | | Service Corp. International | | | 1,064,601 | |
| | | | | | | 2,406,726 | |
| | | | Containers & Packaging – 0.49% | | | | |
| | 13,353 | | Silgan Holdings, Inc. | | | 704,504 | |
| | | | | | | | |
| | | | Distributors – Discretionary – 0.22% | | | | |
| | 12,793 | | PC Connection, Inc. | | | 316,499 | |
| | | | | | | | |
| | | | Electrical Equipment – 0.20% | | | | |
| | 4,096 | | OSI Systems, Inc. (a) | | | 289,956 | |
The accompanying notes are an integral part of these financial statements.
Entrepreneur U.S. All Cap Fund
SCHEDULE OF INVESTMENTS (Continued)
June 30, 2015
| Shares | | | | Fair Value | |
| | Engineering & Construction Services – 0.52% | | | |
| | 38,888 | | Mistras Group, Inc. (a) | | $ | 738,094 | |
| | | | | | | | |
| | | | Gaming, Lodging & Restaurants – 3.84% | | | | |
| | 23,516 | | Diamond Resorts International, Inc. (a) | | | 741,930 | |
| | 52,817 | | Extended Stay America, Inc. | | | 991,375 | |
| | 5,691 | | Panera Bread Co. – Class A (a) | | | 994,616 | |
| | 12,226 | | Papa John’s International, Inc. | | | 924,408 | |
| | 19,236 | | Starbucks Corp. | | | 1,031,338 | |
| | 21,528 | | Texas Roadhouse, Inc. | | | 805,793 | |
| | | | | | | 5,489,460 | |
| | | | Hardware – 1.86% | | | | |
| | 25,545 | | Juniper Networks, Inc. | | | 663,404 | |
| | 7,411 | | NetScout Systems, Inc. (a) | | | 271,761 | |
| | 26,214 | | Ruckus Wireless, Inc. (a) | | | 271,053 | |
| | 7,929 | | Super Micro Computer, Inc. (a) | | | 234,540 | |
| | 20,389 | | Ubiquiti Networks, Inc. | | | 650,715 | |
| | 9,482 | | ViaSat, Inc. (a) | | | 571,385 | |
| | | | | | | 2,662,858 | |
| | | | Health Care Facilities & Services – 6.19% | | | | |
| | 22,377 | | Bio-Reference Laboratories, Inc. (a) | | | 923,051 | |
| | 10,012 | | DaVita HealthCare Partners, Inc. (a) | | | 795,654 | |
| | 32,768 | | Diplomat Pharmacy, Inc. (a) | | | 1,466,368 | |
| | 23,320 | | LHC Group, Inc. (a) | | | 891,990 | |
| | 13,496 | | Molina Healthcare, Inc. (a) | | | 948,769 | |
| | 7,566 | | OvaScience, Inc. (a) | | | 218,884 | |
| | 10,981 | | PAREXEL International Corp. (a) | | | 706,188 | |
| | 68,735 | | Select Medical Holdings Corp. | | | 1,113,507 | |
| | 7,160 | | Universal Health Services, Inc. – Class B | | | 1,017,436 | |
| | 14,382 | | VCA, Inc. (a) | | | 782,453 | |
| | | | | | | 8,864,300 | |
| | | | Home & Office Products – 3.33% | | | | |
| | 13,444 | | Mattress Firm Holding Corp. (a) | | | 819,412 | |
| | 23,900 | | Meritage Homes Corp. (a) | | | 1,125,451 | |
| | 63,733 | | PGT, Inc. (a) | | | 924,766 | |
| | 51,547 | | TRI Pointe Homes, Inc. (a) | | | 788,669 | |
| | 43,068 | | William Lyon Homes – Class A (a) | | | 1,105,555 | |
| | | | | | | 4,763,853 | |
| | | | Industrial Services – 0.96% | | | | |
| | 93,157 | | Titan Machinery, Inc. (a) | | | 1,372,203 | |
| | | | | | | | |
| | | | Institutional Financial Services – 1.73% | | | | |
| | 15,366 | | Evercore Partners, Inc. – Class A | | | 829,149 | |
| | 3,365 | | Intercontinental Exchange, Inc. | | | 752,448 | |
The accompanying notes are an integral part of these financial statements.
Entrepreneur U.S. All Cap Fund
SCHEDULE OF INVESTMENTS (Continued)
June 30, 2015
| Shares | | | | Fair Value | |
| | 30,960 | | Moelis & Co. – Class A | | $ | 888,862 | |
| | | | | | | 2,470,459 | |
| | | | Insurance – 5.53% | | | | |
| | 16,140 | | Aflac, Inc. | | | 1,003,908 | |
| | 34,639 | | American Equity Investment Life Holding Co. | | | 934,560 | |
| | 15,801 | | American Financial Group, Inc. | | | 1,027,697 | |
| | 76,740 | | Citizens, Inc. (a) | | | 572,481 | |
| | 9,705 | | HCI Group, Inc. | | | 429,058 | |
| | 10,071 | | Loews Corp. | | | 387,834 | |
| | 17,163 | | National Interstate Corp. | | | 468,893 | |
| | 8,958 | | The Navigators Group, Inc. (a) | | | 694,783 | |
| | 80,257 | | RPX Corp. (a) | | | 1,356,343 | |
| | 19,981 | | W.R. Berkley Corp. | | | 1,037,613 | |
| | | | | | | 7,913,170 | |
| | | | Iron & Steel – 0.60% | | | | |
| | 41,140 | | Steel Dynamics, Inc. | | | 852,215 | |
| | | | | | | | |
| | | | Media – 4.06% | | | | |
| | 42,553 | | Entercom Communications Corp. – Class A (a) | | | 485,955 | |
| | 116,449 | | Entravision Communications Corp. – Class A | | | 958,375 | |
| | 5,134 | | Facebook, Inc. – Class A (a) | | | 440,318 | |
| | 711 | | Google, Inc. – Class A (a) | | | 383,968 | |
| | 26,833 | | HealthStream, Inc. (a) | | | 816,260 | |
| | 8,832 | | IAC/InterActive Corp. | | | 703,557 | |
| | 14,663 | | Nexstar Broadcasting Group, Inc. – Class A | | | 821,128 | |
| | 10,457 | | Shutterstock, Inc. (a) | | | 613,199 | |
| | 9,506 | | VeriSign, Inc. (a) | | | 586,710 | |
| | | | | | | 5,809,470 | |
| | | | Medical Equipment & Devices – 4.50% | | | | |
| | 12,620 | | Abaxis, Inc. | | | 649,678 | |
| | 39,872 | | Bruker Corp. (a) | | | 813,788 | |
| | 5,664 | | Cepheid, Inc. (a) | | | 346,354 | |
| | 879 | | Foundation Medicine, Inc. (a) | | | 29,745 | |
| | 30,809 | | Globus Medical, Inc. – Class A (a) | | | 790,867 | |
| | 14,821 | | LDR Holding Corp. (a) | | | 641,008 | |
| | 27,527 | | Masimo Corp. (a) | | | 1,066,396 | |
| | 20,652 | | Natus Medical, Inc. (a) | | | 878,949 | |
| | 13,211 | | Ocular Therapeutix, Inc. (a) | | | 277,827 | |
| | 27,159 | | Vascular Solutions, Inc. (a) | | | 942,960 | |
| | | | | | | 6,437,572 | |
| | | | Metals & Mining – 0.48% | | | | |
| | 22,321 | | Hi-Crush Partners LP | | | 685,032 | |
The accompanying notes are an integral part of these financial statements.
Entrepreneur U.S. All Cap Fund
SCHEDULE OF INVESTMENTS (Continued)
June 30, 2015
| Shares | | | | Fair Value | |
| | Oil, Gas & Coal – 2.82% | | | |
| | 6,000 | | Clayton Williams Energy, Inc. (a) | | $ | 394,500 | |
| | 9,405 | | Devon Energy Corp. | | | 559,504 | |
| | 98,054 | | FMSA Holdings, Inc. (a) | | | 803,062 | |
| | 14,536 | | Kinder Morgan, Inc. | | | 558,037 | |
| | 76,038 | | Northern Oil and Gas, Inc. (a) | | | 514,777 | |
| | 51,685 | | Sanchez Energy Corp. (a) | | | 506,513 | |
| | 126,690 | | W&T Offshore, Inc. | | | 694,261 | |
| | | | | | | 4,030,654 | |
| | | | Real Estate – 0.69% | | | | |
| | 21,483 | | Marcus & Millichap, Inc. (a) | | | 991,226 | |
| | | | | | | | |
| | | | Renewable Energy – 0.67% | | | | |
| | 125,959 | | Ameresco, Inc. – Class A (a) | | | 963,586 | |
| | | | | | | | |
| | | | Retail – Consumer Staples – 1.50% | | | | |
| | 36,861 | | The Chefs’ Warehouse, Inc. (a) | | | 782,928 | |
| | 5,713 | | Costco Wholesale Corp. | | | 771,598 | |
| | 14,960 | | Whole Foods Market, Inc. | | | 590,022 | |
| | | | | | | 2,144,548 | |
| | | | Retail – Discretionary – 6.62% | | | | |
| | 2,368 | | Amazon.com, Inc. (a) | | | 1,027,925 | |
| | 40,470 | | Barnes & Noble, Inc. (a) | | | 1,050,601 | |
| | 11,753 | | Bed Bath & Beyond, Inc. (a) | | | 810,722 | |
| | 18,737 | | Copart, Inc. (a) | | | 664,789 | |
| | 28,058 | | Guess?, Inc. | | | 537,872 | |
| | 9,830 | | L Brands, Inc. | | | 842,726 | |
| | 1,908 | | Netflix, Inc. (a) | | | 1,253,441 | |
| | 38,520 | | Sonic Automotive, Inc. – Class A | | | 917,932 | |
| | 69,869 | | Tile Shop Holdings, Inc. (a) | | | 991,441 | |
| | 23,352 | | Urban Outfitters, Inc. (a) | | | 817,320 | |
| | 21,125 | | Zumiez, Inc. (a) | | | 562,559 | |
| | | | | | | 9,477,328 | |
| | | | Semiconductors – 3.77% | | | | |
| | 8,982 | | Ambarella, Inc. (a) | | | 922,362 | |
| | 65,885 | | Amkor Technology, Inc. (a) | | | 393,992 | |
| | 9,120 | | Broadcom Corp. – Class A | | | 469,589 | |
| | 8,587 | | Cavium, Inc. (a) | | | 590,871 | |
| | 39,337 | | Cypress Semiconductor Corp. (a) | | | 462,603 | |
| | 4,180 | | IPG Photonics Corp. (a) | | | 356,032 | |
| | 13,101 | | Micrel, Inc. | | | 182,104 | |
| | 8,057 | | Microchip Technology, Inc. | | | 382,103 | |
| | 11,490 | | Monolithic Power Systems, Inc. | | | 582,658 | |
| | 17,492 | | NVIDIA Corp. | | | 351,764 | |
| | 11,186 | | OmniVision Technologies, Inc. (a) | | | 293,017 | |
The accompanying notes are an integral part of these financial statements.
Entrepreneur U.S. All Cap Fund
SCHEDULE OF INVESTMENTS (Continued)
June 30, 2015
| Shares | | | | Fair Value | |
| | 7,976 | | Universal Display Corp. (a) | | $ | 412,599 | |
| | | | | | | 5,399,694 | |
| | | | Software – 5.50% | | | | |
| | 13,601 | | Advent Software, Inc. | | | 601,300 | |
| | 5,754 | | Akamai Technologies, Inc. (a) | | | 401,744 | |
| | 11,202 | | Cerner Corp. (a) | | | 773,610 | |
| | 10,662 | | Cvent, Inc. (a) | | | 274,866 | |
| | 5,795 | | Envestnet, Inc. (a) | | | 234,292 | |
| | 4,150 | | Intuit, Inc. | | | 418,196 | |
| | 5,673 | | LogMeIn, Inc. (a) | | | 365,852 | |
| | 9,555 | | Oracle Corp. | | | 385,067 | |
| | 9,601 | | Paycom Software, Inc. (a) | | | 327,874 | |
| | 11,027 | | PDF Solutions, Inc. (a) | | | 176,432 | |
| | 15,226 | | Pegasystems, Inc. | | | 348,523 | |
| | 11,815 | | Rackspace Hosting, Inc. (a) | | | 439,400 | |
| | 6,246 | | Salesforce.com, Inc. (a) | | | 434,909 | |
| | 9,753 | | SS&C Technologies Holdings, Inc. | | | 609,563 | |
| | 6,947 | | Synchronoss Technologies, Inc. (a) | | | 317,686 | |
| | 6,498 | | Tableau Software, Inc. – Class A (a) | | | 749,219 | |
| | 9,123 | | VASCO Data Security International, Inc. (a) | | | 275,423 | |
| | 26,428 | | Veeva Systems, Inc. – Class A (a) | | | 740,777 | |
| | | | | | | 7,874,733 | |
| | | | Specialty Finance – 5.04% | | | | |
| | 18,671 | | Air Lease Corp. | | | 632,947 | |
| | 2,778 | | AMERCO | | | 908,156 | |
| | 47,494 | | CAI International, Inc. (a) | | | 977,902 | |
| | 8,357 | | Capital One Financial Corp. | | | 735,165 | |
| | 2,435 | | Credit Acceptance Corp. (a) | | | 599,448 | |
| | 5,871 | | Ellie Mae, Inc. (a) | | | 409,737 | |
| | 11,299 | | Euronet Worldwide, Inc. (a) | | | 697,148 | |
| | 28,392 | | Green Dot Corp. – Class A (a) | | | 542,855 | |
| | 12,006 | | Liberty Tax, Inc. | | | 297,149 | |
| | 45,409 | | NewStar Financial, Inc. (a) | | | 499,499 | |
| | 14,741 | | PRA Group, Inc. (a) | | | 918,512 | |
| | | | | | | 7,218,518 | |
| | | | Technology Services – 3.74% | | | | |
| | 3,118 | | CoStar Group, Inc. (a) | | | 627,529 | |
| | 10,046 | | EPAM Systems, Inc. (a) | | | 715,577 | |
| | 8,598 | | ExlService Holdings, Inc. (a) | | | 297,319 | |
| | 6,700 | | Forrester Research, Inc. | | | 241,334 | |
| | 11,522 | | ManTech International Corp. – Class A | | | 334,138 | |
| | 16,905 | | Medidata Solutions, Inc. (a) | | | 918,280 | |
| | 11,695 | | Morningstar, Inc. | | | 930,337 | |
The accompanying notes are an integral part of these financial statements.
Entrepreneur U.S. All Cap Fund
SCHEDULE OF INVESTMENTS (Continued)
June 30, 2015
| Shares | | | | Fair Value | |
| | 17,529 | | NIC, Inc. | | $ | 320,430 | |
| | 12,084 | | Syntel, Inc. (a) | | | 573,748 | |
| | 7,783 | | Virtusa Corp. (a) | | | 400,046 | |
| | | | | | | 5,358,738 | |
| | | | Telecommunications – 1.51% | | | | |
| | 27,893 | | General Communication, Inc. – Class A (a) | | | 474,460 | |
| | 11,813 | | IDT Corp. – Class B | | | 213,579 | |
| | 8,948 | | j2 Global, Inc. | | | 607,927 | |
| | 59,863 | | Premiere Global Services, Inc. (a) | | | 615,990 | |
| | 51,289 | | Vonage Holdings Corp. (a) | | | 251,829 | |
| | | | | | | 2,163,785 | |
| | | | Transportation & Logistics – 2.11% | | | | |
| | 17,425 | | Echo Global Logistics, Inc. (a) | | | 569,100 | |
| | 4,053 | | FedEx Corp. | | | 690,631 | |
| | 32,743 | | Hornbeck Offshore Services, Inc. (a) | | | 672,214 | |
| | 8,958 | | Old Dominion Freight Lines, Inc. (a) | | | 614,564 | |
| | 21,080 | | Swift Transportation Co. (a) | | | 477,884 | |
| | | | | | | 3,024,393 | |
| | | | Utilities – 0.60% | | | | |
| | 26,469 | | ITC Holdings Corp. | | | 851,772 | |
| | | | | | | | |
| | | | Waste & Environmental Services & Equipment – 0.47% | | | | |
| | 12,546 | | Clean Harbors, Inc. (a) | | | 674,222 | |
| | | | TOTAL COMMON STOCKS (Cost $123,369,432) | | | 134,708,078 | |
| | | | | | | | |
| | | | REAL ESTATE INVESTMENT TRUSTS (REITs) – 3.82% | | | | |
| | | | Real Estate – 3.82% | | | | |
| | 23,873 | | American Assets Trust, Inc. | | | 936,060 | |
| | 46,127 | | First Industrial Realty Trust, Inc. | | | 863,959 | |
| | 23,353 | | The GEO Group, Inc. | | | 797,738 | |
| | 34,437 | | Healthcare Realty Trust, Inc. | | | 801,005 | |
| | 64,725 | | Medical Properties Trust, Inc. | | | 848,545 | |
| | 48,914 | | Monmouth Real Estate Investment Corp. | | | 475,444 | |
| | 24,984 | | RLJ Lodging Trust | | | 744,024 | |
| | | | TOTAL REAL ESTATE INVESTMENT TRUSTS (REITs) (Cost $6,108,683) | | | 5,466,775 | |
The accompanying notes are an integral part of these financial statements.
Entrepreneur U.S. All Cap Fund
SCHEDULE OF INVESTMENTS (Continued)
June 30, 2015
| Shares | | | | Fair Value | |
| | MONEY MARKET FUNDS – 2.09% | | | |
| | 2,993,049 | | Fidelity Institutional Money Market Funds – Class I, 0.10% (b) | | $ | 2,993,049 | |
| | | | TOTAL MONEY MARKET FUNDS (Cost $2,993,049) | | | 2,993,049 | |
| | | | | | | | |
| | | | Total Investments (Cost $132,471,164) – 100.03% | | | 143,167,902 | |
| | | | Liabilities in Excess of Other Assets – (0.03)% | | | (45,851 | ) |
| | | | TOTAL NET ASSETS – 100.00% | | $ | 143,122,051 | |
Percentages are stated as a percent of net assets.
| (a) | Non-income producing security. |
| (b) | The rate quoted is the annualized seven-day yield as of June 30, 2015. |
The accompanying notes are an integral part of these financial statements.
Entrepreneur U.S. Large Cap Fund
SCHEDULE OF INVESTMENTS (Continued)
June 30, 2015
| Shares | | | | Fair Value | |
| | COMMON STOCKS – 95.95% | | | |
| | Apparel & Textile Products – 2.54% | | | |
| | 7,164 | | NIKE, Inc. – Class B | | $ | 773,855 | |
| | 3,487 | | Ralph Lauren Corp. | | | 461,540 | |
| | 10,423 | | Under Armour, Inc. – Class A (a) | | | 869,695 | |
| | | | | | | 2,105,090 | |
| | | | Asset Management – 2.23% | | | | |
| | 1,755 | | BlackRock, Inc. | | | 607,195 | |
| | 20,934 | | The Charles Schwab Corp. | | | 683,495 | |
| | 11,342 | | Franklin Resources, Inc. | | | 556,098 | |
| | | | | | | 1,846,788 | |
| | | | Banking – 0.75% | | | | |
| | 4,990 | | M&T Bank Corp. | | | 623,401 | |
| | | | | | | | |
| | | | Biotechnology & Pharmaceutical – 8.16% | | | | |
| | 17,539 | | AbbVie, Inc. | | | 1,178,445 | |
| | 4,967 | | Alexion Pharmaceuticals, Inc. (a) | | | 897,885 | |
| | 16,500 | | Gilead Sciences, Inc. | | | 1,931,820 | |
| | 20,859 | | Mylan NV (a) | | | 1,415,492 | |
| | 2,648 | | Regeneron Pharmaceuticals, Inc. (a) | | | 1,350,824 | |
| | | | | | | 6,774,466 | |
| | | | Chemicals – 2.30% | | | | |
| | 4,367 | | Air Products and Chemicals, Inc. | | | 597,537 | |
| | 12,425 | | Airgas, Inc. | | | 1,314,316 | |
| | | | | | | 1,911,853 | |
| | | | Commercial Services – 1.19% | | | | |
| | 11,700 | | Cintas Corp. | | | 989,703 | |
| | | | | | | | |
| | | | Construction Materials – 0.78% | | | | |
| | 4,600 | | Martin Marietta Materials, Inc. | | | 650,946 | |
| | | | | | | | |
| | | | Consumer Products – 10.77% | | | | |
| | 23,300 | | Brown-Forman Corp. – Class B | | | 2,334,194 | |
| | 13,127 | | Constellation Brands, Inc. – Class A | | | 1,522,995 | |
| | 18,226 | | The Estee Lauder Companies, Inc. – Class A | | | 1,579,465 | |
| | 17,850 | | The JM Smucker Co. | | | 1,935,118 | |
| | 11,657 | | Monster Beverage Corp. (a) | | | 1,562,271 | |
| | | | | | | 8,934,043 | |
| | | | Distributors – Discretionary – 1.02% | | | | |
| | 20,000 | | Fastenal Co. | | | 843,600 | |
| | | | | | | | |
| | | | Engineering & Construction Services – 0.98% | | | | |
| | 7,082 | | SBA Communications Corp. – Class A (a) | | | 814,218 | |
| | | | | | | | |
| | | | Gaming, Lodging & Restaurants – 1.16% | | | | |
| | 17,978 | | Starbucks Corp. | | | 963,890 | |
The accompanying notes are an integral part of these financial statements.
Entrepreneur U.S. Large Cap Fund
SCHEDULE OF INVESTMENTS (Continued)
June 30, 2015
| Shares | | | | Fair Value | |
| | Hardware – 3.54% | | | |
| | 15,241 | | Apple, Inc. | | $ | 1,911,603 | |
| | 39,462 | | Juniper Networks, Inc. | | | 1,024,828 | |
| | | | | | | 2,936,431 | |
| | | | Health Care Facilities & Services – 6.21% | | | | |
| | 20,575 | | DaVita HealthCare Partners, Inc. (a) | | | 1,635,095 | |
| | 14,396 | | UnitedHealth Group, Inc. | | | 1,756,312 | |
| | 12,400 | | Universal Health Services, Inc. – Class B | | | 1,762,040 | |
| | | | | | | 5,153,447 | |
| | | | Home & Office Products – 0.91% | | | | |
| | 3,967 | | Mohawk Industries, Inc. (a) | | | 757,300 | |
| | | | | | | | |
| | | | Industrial Services – 1.03% | | | | |
| | 3,600 | | W.W. Grainger, Inc. | | | 851,940 | |
| | | | | | | | |
| | | | Institutional Financial Services – 1.61% | | | | |
| | 3,340 | | The Goldman Sachs Group, Inc. | | | 697,359 | |
| | 2,854 | | Intercontinental Exchange, Inc. | | | 638,183 | |
| | | | | | | 1,335,542 | |
| | | | Insurance – 5.58% | | | | |
| | 31,809 | | Aflac, Inc. | | | 1,978,520 | |
| | 13,893 | | American Financial Group, Inc. | | | 903,600 | |
| | 4 | | Berkshire Hathaway, Inc. – Class A (a) | | | 819,400 | |
| | 24,027 | | Loews Corp. | | | 925,280 | |
| | | | | | | 4,626,800 | |
| | | | Media – 7.88% | | | | |
| | 3,176 | | Alliance Data Systems Corp. (a) | | | 927,201 | |
| | 10,871 | | Comcast Corp. – Class A | | | 653,782 | |
| | 15,397 | | Facebook, Inc. – Class A (a) | | | 1,320,524 | |
| | 263 | | Google, Inc. – Class A (a) | | | 142,031 | |
| | 1,442 | | Google, Inc. – Class C (a) | | | 750,575 | |
| | 564 | | The Priceline Group, Inc. (a) | | | 649,373 | |
| | 16,807 | | Twenty-First Century Fox, Inc. – Class A | | | 546,984 | |
| | 16,135 | | VeriSign, Inc. (a) | | | 995,852 | |
| | 8,549 | | Viacom, Inc. – Class B | | | 552,607 | |
| | | | | | | 6,538,929 | |
| | | | Medical Equipment & Devices – 2.81% | | | | |
| | 10,750 | | Danaher Corp. | | | 920,092 | |
| | 11,013 | | Waters Corp. (a) | | | 1,413,849 | |
| | | | | | | 2,333,941 | |
| | | | Metals & Mining – 0.61% | | | | |
| | 27,210 | | Freeport-McMoRan, Inc. | | | 506,650 | |
The accompanying notes are an integral part of these financial statements.
Entrepreneur U.S. Large Cap Fund
SCHEDULE OF INVESTMENTS (Continued)
June 30, 2015
| Shares | | | | Fair Value | |
| | Oil, Gas & Coal – 8.07% | | | |
| | 53,327 | | Cabot Oil & Gas Corp. | | $ | 1,681,934 | |
| | 29,103 | | Devon Energy Corp. | | | 1,731,337 | |
| | 23,611 | | Helmerich & Payne, Inc. | | | 1,662,687 | |
| | 42,221 | | Kinder Morgan, Inc. | | | 1,620,864 | |
| | | | | | | 6,696,822 | |
| | | | Retail – Consumer Staples – 3.59% | | | | |
| | 9,570 | | Costco Wholesale Corp. | | | 1,292,524 | |
| | 7,889 | | Family Dollar Stores, Inc. | | | 621,732 | |
| | 27,044 | | Whole Foods Market, Inc. | | | 1,066,616 | |
| | | | | | | 2,980,872 | |
| | | | Retail – Discretionary – 4.93% | | | | |
| | 2,056 | | Amazon.com, Inc. (a) | | | 892,489 | |
| | 7,787 | | Bed Bath & Beyond, Inc. (a) | | | 537,147 | |
| | 7,173 | | L Brands, Inc. | | | 614,941 | |
| | 1,130 | | Netflix, Inc. (a) | | | 742,342 | |
| | 7,759 | | Nordstrom, Inc. | | | 578,046 | |
| | 3,195 | | O’Reilly Automotive, Inc. (a) | | | 722,006 | |
| | | | | | | 4,086,971 | |
| | | | Semiconductors – 1.99% | | | | |
| | 37,490 | | Applied Materials, Inc. | | | 720,558 | |
| | 46,468 | | NVIDIA Corp. | | | 934,471 | |
| | | | | | | 1,655,029 | |
| | | | Software – 5.65% | | | | |
| | 14,754 | | Akamai Technologies, Inc. (a) | | | 1,030,124 | |
| | 20,950 | | Cerner Corp. (a) | | | 1,446,807 | |
| | 10,040 | | Intuit, Inc. | | | 1,011,731 | |
| | 29,798 | | Oracle Corp. | | | 1,200,860 | |
| | | | | | | 4,689,522 | |
| | | | Specialty Finance – 2.54% | | | | |
| | 2,225 | | AMERCO | | | 727,375 | |
| | 15,660 | | Capital One Financial Corp. | | | 1,377,610 | |
| | | | | | | 2,104,985 | |
| | | | Technology Services – 1.25% | | | | |
| | 16,927 | | Cognizant Technology Solutions Corp. – Class A (a) | | | 1,034,070 | |
| | | | | | | | |
| | | | Transportation & Logistics – 1.55% | | | | |
| | 10,300 | | Expeditors International of Washington, Inc. | | | 474,882 | |
| | 4,756 | | FedEx Corp. | | | 810,422 | |
| | | | | | | 1,285,304 | |
| | | | Transportation Equipment – 1.08% | | | | |
| | 14,000 | | PACCAR, Inc. | | | 893,340 | |
The accompanying notes are an integral part of these financial statements.
Entrepreneur U.S. Large Cap Fund
SCHEDULE OF INVESTMENTS (Continued)
June 30, 2015
| Shares | | | | Fair Value | |
| | Utilities – 3.24% | | | |
| | 38,721 | | ITC Holdings Corp. | | $ | 1,246,042 | |
| | 14,730 | | NextEra Energy, Inc. | | | 1,443,982 | |
| | | | | | | 2,690,024 | |
| | | | TOTAL COMMON STOCKS (Cost $73,815,421) | | | 79,615,917 | |
| | | | | | | | |
| | | | REAL ESTATE INVESTMENT TRUSTS (REITs) – 0.69% | | | | |
| | | | Real Estate – 0.69% | | | | |
| | 1,213 | | Boston Properties, Inc. | | | 146,821 | |
| | 2,180 | | Equity Residential | | | 152,971 | |
| | 3,640 | | Prologis, Inc. | | | 135,044 | |
| | 666 | | Urban Edge Properties | | | 13,846 | |
| | 1,332 | | Vornado Realty Trust | | | 126,447 | |
| | | | TOTAL REAL ESTATE INVESTMENT TRUSTS (REITs) (Cost $645,520) | | | 575,129 | |
| | | | | | | | |
| | | | MONEY MARKET FUNDS – 3.40% | | | | |
| | 2,825,632 | | Fidelity Institutional Money Market Funds – Class I, 0.10% (b) | | | 2,825,632 | |
| | | | TOTAL MONEY MARKET FUNDS (Cost $2,825,632) | | | 2,825,632 | |
| | | | | | | | |
| | | | Total Investments (Cost $77,286,573) – 100.04% | | | 83,016,678 | |
| | | | Liabilities in Excess of Other Assets – (0.04)% | | | (36,195 | ) |
| | | | TOTAL NET ASSETS – 100.00% | | $ | 82,980,483 | |
Percentages are stated as a percent of net assets.
| (a) | Non-income producing security. |
| (b) | The rate quoted is the annualized seven-day yield as of June 30, 2015. |
The accompanying notes are an integral part of these financial statements.
EntrepreneurShares Series Trust
STATEMENTS OF ASSETS AND LIABILITIES
June 30, 2015
| | | EntrepreneurShares | | | Entrepreneur | | | Entrepreneur | |
| | | Global | | | U.S. All Cap | | | U.S. Large Cap | |
| | | Fund | | | Fund | | | Fund | |
| ASSETS: | | | | | | | | | |
Investments, at fair value(1) | | $ | 5,530,905 | | | $ | 143,167,902 | | | $ | 83,016,678 | |
| Dividend and interest receivable | | | 7,907 | | | | 80,478 | | | | 33,071 | |
| Cash | | | 47 | | | | — | | | | — | |
| Receivable from Fund shares sold | | | — | | | | — | | | | 2,500 | |
| Other assets | | | 7,567 | | | | 4,746 | | | | 5,163 | |
| Total Assets | | | 5,546,426 | | | | 143,253,126 | | | | 83,057,412 | |
| | | | | | | | | | | | | |
| LIABILITIES: | | | | | | | | | | | | |
| Payable to Investment Advisor | | | 612 | | | | 83,221 | | | | 39,678 | |
| Payable to Trustees | | | 118 | | | | 3,053 | | | | 1,823 | |
| Other accrued expenses | | | 28,446 | | | | 44,801 | | | | 35,428 | |
| Total Liabilities | | | 29,176 | | | | 131,075 | | | | 76,929 | |
| | | | | | | | | | | | | |
| NET ASSETS | | $ | 5,517,250 | | | $ | 143,122,051 | | | $ | 82,980,483 | |
| | | | | | | | | | | | | |
| NET ASSETS CONSIST OF: | | | | | | | | | | | | |
| Capital stock | | $ | 5,260,580 | | | $ | 125,001,783 | | | $ | 77,115,988 | |
| Unrealized appreciation (depreciation) on: | | | | | | | | | | | | |
| Investments | | | 1,201,887 | | | | 10,696,738 | | | | 5,730,105 | |
| Foreign Currency | | | (440 | ) | | | — | | | | — | |
| Accumulated net investment income (loss) | | | (43,924 | ) | | | 19,256 | | | | 216,457 | |
| Accumulated net realized gain (loss) | | | (900,853 | ) | | | 7,404,274 | | | | (82,067 | ) |
| Total Net Assets | | $ | 5,517,250 | | | $ | 143,122,051 | | | $ | 82,980,483 | |
| | | | | | | | | | | | | |
| NET ASSETS CONSIST OF: | | | | | | | | | | | | |
| Institutional Class Shares: | | | | | | | | | | | | |
| Net assets | | $ | 5,517,250 | | | $ | 143,122,051 | | | $ | 82,980,483 | |
| Shares outstanding | | | 452,676 | | | | 12,499,571 | | | | 7,705,673 | |
| Net Asset Value, Offering and | | | | | | | | | | | | |
Redemption Price Per Share(2) | | | | | | | | | | | | |
| (Unlimited shares of no par value authorized) | | $ | 12.19 | | | $ | 11.45 | | | $ | 10.77 | |
| | | | | | | | | | | | | |
| (1) Cost of investments | | $ | 4,329,018 | | | $ | 132,471,164 | | | $ | 77,286,573 | |
| | | | | | | | | | | | | |
| (2) | If applicable, redemption price per share may be reduced by a 2.00% redemption fee for shares redeemed within five days of purchase. |
The accompanying notes are an integral part of these financial statements.
EntrepreneurShares Series Trust
STATEMENTS OF OPERATIONS
For the year ended June 30, 2015
| | | EntrepreneurShares | | | Entrepreneur | | | Entrepreneur | |
| | | Global | | | U.S. All Cap | | | U.S. Large Cap | |
| | | Fund | | | Fund | | | Fund | |
| INVESTMENT INCOME: | | | | | | | | | |
| Dividend income* | | $ | 194,457 | | | $ | 1,104,463 | | | $ | 881,718 | |
| Interest income | | | — | | | | 2,254 | | | | 1,255 | |
| | | | 194,457 | | | | 1,106,717 | | | | 882,973 | |
| | | | | | | | | | | | | |
| EXPENSES: | | | | | | | | | | | | |
| Investment advisory fees | | | 227,392 | | | | 1,018,950 | | | | 515,194 | |
| Custody fees | | | 34,319 | | | | 6,496 | | | | 6,122 | |
| Transfer agent and shareholder service fees | | | 25,334 | | | | 27,538 | | | | 26,675 | |
| Fund accounting fees | | | 22,400 | | | | 54,187 | | | | 28,381 | |
| Professional fees | | | 15,031 | | | | 19,291 | | | | 23,112 | |
| Federal and state registration fees | | | 13,727 | | | | 6,040 | | | | 12,742 | |
| Directors’ fees | | | 11,896 | | | | 9,845 | | | | 8,462 | |
| Administration fees | | | 9,288 | | | | 49,359 | | | | 30,422 | |
| Printing and mailing fees | | | 1,170 | | | | 3,351 | | | | 1,959 | |
| Other fees | | | 8,745 | | | | 18,087 | | | | 7,700 | |
| Total expenses | | | 369,302 | | | | 1,213,144 | | | | 660,769 | |
| Fees waived | | | (60,049 | ) | | | (58,334 | ) | | | (66,315 | ) |
| Net expenses | | | 309,253 | | | | 1,154,810 | | | | 594,454 | |
| NET INVESTMENT INCOME (LOSS) | | | (114,796 | ) | | | (48,093 | ) | | | 288,519 | |
| | | | | | | | | | | | | |
| REALIZED AND UNREALIZED | | | | | | | | | | | | |
| GAIN (LOSS) ON INVESTMENTS: | | | | | | | | | | | | |
| Net realized gain (loss) on investments transactions | | | 2,710,513 | | | | 8,276,600 | | | | (103,676 | ) |
| Net realized loss on foreign currency transactions | | | (3,944 | ) | | | — | | | | — | |
| Change in unrealized appreciation (depreciation) on: | | | | | | | | | | | | |
| Investments | | | (2,162,315 | ) | | | 1,471,680 | | | | 5,742,947 | |
| Foreign Currency | | | (521 | ) | | | — | | | | — | |
| Net gain on investments | | | 543,733 | | | | 9,748,280 | | | | 5,639,271 | |
| NET INCREASE IN NET ASSETS | | | | | | | | | | | | |
| RESULTING FROM OPERATIONS | | $ | 428,937 | | | $ | 9,700,187 | | | $ | 5,927,790 | |
| * Net of foreign tax withheld of: | | $ | 10,294 | | | $ | — | | | $ | — | |
The accompanying notes are an integral part of these financial statements.
EntrepreneurShares Global Fund
STATEMENTS OF CHANGES IN NET ASSETS
| | | Year Ended | | | Year Ended | |
| | | June 30, 2015 | | | June 30, 2014 | |
| OPERATIONS: | | | | | | |
| Net investment loss | | $ | (114,796 | ) | | $ | (60,807 | ) |
| Net realized gain on investment transactions | | | | | | | | |
| and foreign currency | | | 2,706,569 | | | | 3,660,674 | |
| Change in unrealized appreciation (depreciation) | | | | | | | | |
| on investments and foreign currency | | | (2,162,836 | ) | | | 373,699 | |
| Net increase in net assets resulting from operations | | | 428,937 | | | | 3,973,566 | |
| | | | | | | | | |
| CAPITAL SHARE TRANSACTIONS: | | | | | | | | |
| Proceeds from shares sold – Institutional | | | 133,900 | | | | 28,750 | |
| Proceeds from shares issued to holders in | | | | | | | | |
| reinvestment of dividends – Institutional | | | 1,895,169 | | | | 1,030,818 | |
| Payment for shares redeemed – Institutional | | | (6,145,859 | ) | | | (1,863,166 | ) |
Payment for shares redeemed from redemption-in-kind(1) | | | (12,869,830 | ) | | | — | |
| Net decrease in net assets from capital share transactions | | | (16,986,620 | ) | | | (803,598 | ) |
| | | | | | | | | |
| DIVIDENDS AND DISTRIBUTIONS TO SHAREHOLDERS: | | | | | | | | |
| Distributions from realized gains – Institutional | | | (2,327,121 | ) | | | (1,320,303 | ) |
| Total dividends and distributions | | | (2,327,121 | ) | | | (1,320,303 | ) |
| | | | | | | | | |
| INCREASE (DECREASE) IN NET ASSETS | | | (18,884,804 | ) | | | 1,849,665 | |
| | | | | | | | | |
| NET ASSETS: | | | | | | | | |
| Beginning of Year | | | 24,402,054 | | | | 22,552,389 | |
| End of Year* | | $ | 5,517,250 | | | $ | 24,402,054 | |
| * Including undistributed net investment loss of: | | $ | (43,924 | ) | | $ | — | |
(1) See Note 9 of the Financial Statements.
The accompanying notes are an integral part of these financial statements.
Entrepreneur U.S. All Cap Fund
STATEMENTS OF CHANGES IN NET ASSETS (Continued)
| | | | | | Period From | |
| | | | | | December 17, 2013(1) | |
| | | Year Ended | | | to | |
| | | June 30, 2015 | | | June 30, 2014 | |
| OPERATIONS: | | | | | | |
| Net investment income (loss) | | $ | (48,093 | ) | | $ | 64,001 | |
| Net realized gain (loss) on investment transactions | | | 8,276,600 | | | | (743,262 | ) |
| Change in unrealized appreciation on investments | | | 1,471,680 | | | | 9,225,058 | |
| Net increase in net assets resulting from operations | | | 9,700,187 | | | | 8,545,797 | |
| | | | | | | | | |
| CAPITAL SHARE TRANSACTIONS: | | | | | | | | |
| Proceeds from shares sold – Institutional | | | 15,500 | | | | 52,780,598 | |
Proceeds from shares issued in transfer-in-kind(2) | | | — | | | | 72,116,070 | |
| Proceeds from shares issued to holders in | | | | | | | | |
| reinvestment of dividends – Institutional | | | 60,861 | | | | 64,850 | |
| Payment for shares redeemed – Institutional | | | (16,096 | ) | | | (20,000 | ) |
| Net increase in net assets from capital share transactions | | | 60,265 | | | | 124,941,518 | |
| | | | | | | | | |
| DIVIDENDS AND DISTRIBUTIONS TO SHAREHOLDERS: | | | | | | | | |
| Distributions from ordinary income – Institutional | | | (60,866 | ) | | | (64,850 | ) |
| Total dividends and distributions | | | (60,866 | ) | | | (64,850 | ) |
| | | | | | | | | |
| INCREASE IN NET ASSETS | | | 9,699,586 | | | | 133,422,465 | |
| | | | | | | | | |
| NET ASSETS: | | | | | | | | |
| Beginning of Period | | | 133,422,465 | | | | — | |
| End of Period* | | $ | 143,122,051 | | | $ | 133,422,465 | |
| * Including undistributed net investment income (loss) of: | | $ | 19,256 | | | $ | (849 | ) |
| (1) | The U.S. All Cap Fund commenced operations on December 17, 2013. See Note 1 of the Financial Statements. |
| (2) | See Note 9 of the Financial Statements. |
The accompanying notes are an integral part of these financial statements.
Entrepreneur U.S. Large Cap Fund
STATEMENTS OF CHANGES IN NET ASSETS (Continued)
| | | | | | Period From | |
| | | | | | June 30, 2014(1) | |
| | | Year Ended | | | to | |
| | | June 30, 2015 | | | June 30, 2014 | |
| OPERATIONS: | | | | | | |
| Net investment income | | $ | 288,519 | | | $ | — | |
| Net realized loss on investment transactions | | | (103,676 | ) | | | — | |
| Change in unrealized appreciation (depreciation) on investments | | | 5,742,947 | | | | (12,842 | ) |
| Net increase (decrease) in net assets resulting from operations | | | 5,927,790 | | | | (12,842 | ) |
| | | | | | | | | |
| CAPITAL SHARE TRANSACTIONS: | | | | | | | | |
| Proceeds from shares sold – Institutional | | | 2,301,089 | | | | 15,518,169 | |
Proceeds from shares issued in transfer-in-kind(2) | | | — | | | | 59,495,243 | |
| Proceeds from shares issued to holders in | | | | | | | | |
| reinvestment of dividends – Institutional | | | 50,450 | | | | — | |
| Payment for shares redeemed – Institutional | | | (248,963 | ) | | | — | |
| Net increase (decrease) in net assets from capital share transactions | | | 2,102,576 | | | | 75,013,412 | |
| | | | | | | | | |
| DIVIDENDS AND DISTRIBUTIONS TO SHAREHOLDERS: | | | | | | | | |
| Distributions from ordinary income – Institutional | | | (50,453 | ) | | | — | |
| Total dividends and distributions | | | (50,453 | ) | | | — | |
| | | | | | | | | |
| INCREASE IN NET ASSETS | | | 7,979,913 | | | | 75,000,570 | |
| | | | | | | | | |
| NET ASSETS: | | | | | | | | |
| Beginning of Period | | | 75,000,570 | | | | — | |
| End of Period* | | $ | 82,980,483 | | | $ | 75,000,570 | |
| * Including undistributed net investment income of: | | $ | 216,457 | | | $ | — | |
| (1) | The U.S. Large Cap Fund commenced operations on June 30, 2014. See Note 1 of the Financial Statements. |
| (2) | See Note 9 of the Financial Statements. |
The accompanying notes are an integral part of these financial statements.
EntrepreneurShares Global Fund
FINANCIAL HIGHLIGHTS
| | | | | | | | | | | | | | | Period From | |
| | | Year Ended | | | Year Ended | | | Year Ended | | | Year Ended | | | November 11, | |
| | | June 30, | | | June 30, | | | June 30, | | | June 30, | | | 2010(1) to June 30, | |
| | | 2015 | | | 2014 | | | 2013 | | | 2012 | | | 2011 | |
| Per Share Data: | | | | | | | | | | | | | | | |
| Net asset value, beginning of period | | $ | 13.19 | | | $ | 11.82 | | | $ | 10.15 | | | $ | 11.23 | | | $ | 10.00 | |
| | | | | | | | | | | | | | | | | | | | | |
| Income (loss) from | | | | | | | | | | | | | | | | | | | | |
| investment operations: | | | | | | | | | | | | | | | | | | | | |
Net investment loss(2) | | | (0.08 | ) | | | (0.03 | ) | | | (0.02 | ) | | | (0.01 | ) | | | (0.04 | ) |
| Net realized and unrealized | | | | | | | | | | | | | | | | | | | | |
| gain (loss) on investments | | | 0.48 | | | | 2.10 | | | | 1.77 | | | | (1.06 | ) | | | 1.29 | |
| Total from investment operations | | | 0.40 | | | | 2.07 | | | | 1.75 | | | | (1.07 | ) | | | 1.25 | |
| | | | | | | | | | | | | | | | | | | | | |
| Less distributions: | | | | | | | | | | | | | | | | | | | | |
| Dividends from net | | | | | | | | | | | | | | | | | | | | |
| investment income | | | — | | | | — | | | | — | | | | — | | | | (0.02 | ) |
| Distributions from net | | | | | | | | | | | | | | | | | | | | |
| realized capital gains | | | (1.40 | ) | | | (0.70 | ) | | | (0.08 | ) | | | (0.01 | ) | | | — | |
| Return of capital | | | — | | | | — | | | | — | | | | (0.00 | )(3) | | | — | |
| Total distributions | | | (1.40 | ) | | | (0.70 | ) | | | (0.08 | ) | | | (0.01 | ) | | | (0.02 | ) |
| Net asset value, end of period | | $ | 12.19 | | | $ | 13.19 | | | $ | 11.82 | | | $ | 10.15 | | | $ | 11.23 | |
Total return(4) | | | 3.49 | % | | | 17.67 | % | | | 17.33 | % | | | -9.55 | % | | | 12.50 | %(5) |
| | | | | | | | | | | | | | | | | | | | | |
| Supplemental data and ratios: | | | | | | | | | | | | | | | | | | | | |
| Net assets, end of period (000’s) | | $ | 5,517 | | | $ | 24,402 | | | $ | 22,552 | | | $ | 15,606 | | | $ | 16,309 | |
| Ratio of expenses | | | | | | | | | | | | | | | | | | | | |
| to average net assets | | | 1.70 | %(8) | | | 1.70 | %(8) | | | 1.71 | %(8)(9) | | | 1.70 | %(8) | | | 1.70% | %(6)(7)(8) |
| Ratio of net investment | | | | | | | | | | | | | | | | | | | | |
| loss to average net assets | | | (0.63 | )%(8) | | | (0.25 | )%(8) | | | (0.21 | )%(8)(10) | | | (0.13 | )%(8) | | | (0.60 | )%(6)(7)(8) |
| Portfolio turnover rate | | | 69.37 | %(11) | | | 63.88 | % | | | 13.53 | % | | | 18.83 | % | | | 32.87 | %(5) |
| (1) | | The Fund commenced operations on November 11, 2010. |
| (2) | | Net investment loss per share has been calculated based on average shares outstanding during the period. |
| (3) | | Amount is less than $0.01 per share. |
| (4) | | Total returns assumes reinvestment of dividends and would have been lower in the absence of the fees waived. |
| (5) | | Not annualized. |
| (6) | | Annualized. |
| (7) | | Including interest expense increases the ratio by 0.07%. |
| (8) | | Net of fees waived of 0.33%, 0.54%, 0.63%, 1.21% and 1.03% for the years ended June 2015, 2014, 2013 and 2012 and the period ended June 30, 2011, respectively. |
| (9) | | Includes expenses related to the Retail Class that was merged into the Institutional Class on January 10, 2013. In the absence of these expenses, the ratio would have been 1.70%. |
| (10) | | Includes income and expenses attributed to the Retail Class that was merged into the Institutional Class on January 10, 2013. In the absence of these, the ratio would have been (0.20)%. |
| (11) | | Includes the value of portfolio securities delivered as a result of an in-kind redemption. |
The accompanying notes are an integral part of these financial statements.
Entrepreneur U.S. All Cap Fund
FINANCIAL HIGHLIGHTS (Continued)
| | | | | | Period From | |
| | | Year Ended | | | December 17, | |
| | | June 30, | | | 2013(1) to June 30, | |
| | | 2015 | | | 2014 | |
| Per Share Data: | | | | | | |
| Net asset value, beginning of period | | $ | 10.68 | | | $ | 10.00 | |
| | | | | | | | | |
| Income (loss) from investment operations: | | | | | | | | |
Net investment income (loss)(2) | | | (0.00 | )(3) | | | 0.01 | |
| Net realized and unrealized gain on investments | | | 0.77 | | | | 0.68 | |
| Total from investment operations | | | 0.77 | | | | 0.69 | |
| | | | | | | | | |
| Less distributions: | | | | | | | | |
| Dividends from net investment income | | | (0.00 | )(3) | | | (0.01 | ) |
| Total distributions | | | 0.00 | | | | (0.01 | ) |
| Net asset value, end of period | | $ | 11.45 | | | $ | 10.68 | |
Total return(4) | | | 7.26 | % | | | 6.85 | %(5) |
| | | | | | | | | |
| Supplemental data and ratios: | | | | | | | | |
| Net assets, end of period (000’s) | | $ | 143,122 | | | $ | 133,422 | |
| Ratio of expenses to average net assets | | | 0.85 | %(7) | | | 0.85 | %(6)(7) |
| Ratio of net investment income (loss) to average net assets | | | (0.04 | )%(7) | | | 0.09 | %(6)(7) |
| Portfolio turnover rate | | | 107.46 | % | | | 55.16 | %(5)(8) |
| (1) | | The Fund commenced operations on December 17, 2013. |
| (2) | | Net investment income (loss) per share has been calculated based on average shares outstanding during the period. |
| (3) | | Amount is less than $0.01 per share. |
| (4) | | Total returns assumes reinvestment of dividends and would have been lower in the absence of the fees waived. |
| (5) | | Not annualized. |
| (6) | | Annualized. |
| (7) | | Net of fees waived of 0.04% and 0.12% for the year ended June 30, 2015 and the period ended June 30, 2014, respectively. |
| (8) | | Excludes the value of portfolio securities received as a result of in-kind purchases of the Fund’s capital shares. |
The accompanying notes are an integral part of these financial statements.
Entrepreneur U.S. Large Cap Fund
FINANCIAL HIGHLIGHTS (Continued)
| | | | | | Period From | |
| | | Year Ended | | | June 30, | |
| | | June 30, | | | 2014(1) to June 30, | |
| | | 2015 | | | 2014 | |
| Per Share Data: | | | | | | |
| Net asset value, beginning of period | | $ | 10.00 | | | $ | 10.00 | (2) |
| | | | | | | | | |
| Income (loss) from investment operations: | | | | | | | | |
Net investment income(3) | | | 0.04 | | | | — | |
| Net realized and unrealized gain (loss) on investments | | | 0.74 | | | | (0.00 | )(4) |
| Total from investment operations | | | 0.78 | | | | — | |
| | | | | | | | | |
| Less distributions: | | | | | | | | |
| Dividends from net investment income | | | (0.01 | ) | | | — | |
| Total distributions | | | (0.01 | ) | | | — | |
| Net asset value, end of period | | $ | 10.77 | | | $ | 10.00 | |
Total return(5) | | | 7.77 | % | | | 0.00 | %(6) |
| | | | | | | | | |
| Supplemental data and ratios: | | | | | | | | |
| Net assets, end of period (000’s) | | $ | 82,980 | | | $ | 75,001 | |
| Ratio of expenses to average net assets | | | 0.75 | %(7) | | | 0.00 | %(6)(7)(8) |
| Ratio of net investment income to average net assets | | | 0.36 | %(7) | | | 0.00 | %(6)(7)(8) |
| Portfolio turnover rate | | | 89.78 | % | | | 0.00 | %(6)(9) |
| (1) | | The Fund commenced operations on June 30, 2014. |
| (2) | | The initial purchase of shares of the U.S. Large Cap Fund were executed at this price. |
| (3) | | Net investment income per share has been calculated based on average shares outstanding during the period. |
| (4) | | Amount is less than $0.01 per share. |
| (5) | | Total returns assumes reinvestment of dividends and would have been lower in the absence of the fees waived. |
| (6) | | Not annualized. |
| (7) | | Net of fees waived of 0.08% and less than 0.01% for the year ended June 30, 2015 and the period ended June 30, 2014, respectively. |
| (8) | | Amount is based on a one-day fiscal year and is not indicative of future Fund expenses or income. |
| (9) | | Excludes the value of portfolio securities received as a result of in-kind purchases of the Fund’s capital shares. |
The accompanying notes are an integral part of these financial statements.
EntrepreneurShares Series Trust
NOTES TO FINANCIAL STATEMENTS
June 30, 2015
1. ORGANIZATION
EntrepreneurShares™ Series Trust, a Delaware statutory trust (the “Trust”), was formed on July 1, 2010, and has authorized capital of unlimited shares of beneficial interest. The Trust is an open-end management investment company registered under the Investment Company Act of 1940, as amended (the “1940 Act”), and is authorized to issue multiple series and classes of shares. EntrepreneurShares Global Fund (the “Global Fund”), the Entrepreneur U.S. All Cap Fund (the “U.S. All Cap Fund”) and the Entrepreneur U.S. Large Cap Fund (the “U.S. Large Cap Fund”) (each a “Fund”, together, the “Funds”) are classified as a “diversified” series, as defined in the 1940 Act. The Funds are an investment company and, accordingly, follow the investment company accounting and reporting guidance of the Financial Accounting Standards Board Accounting Standards Codification Topic 946 – Investment Companies. The Global Fund commenced operations on November 11, 2010. The U.S. All Cap Fund commenced operations on December 17, 2013. The U.S. Large Cap Fund commenced operations on June 30, 2014.
The investment goal of the Global Fund is to seek long-term capital appreciation. The Global Fund seeks these investment results through active principles-based securities selection. The Global Fund mainly invests in equity securities of global companies with market capitalizations that are above $200 million at the time of initial purchase and possess entrepreneurial characteristics, as determined by Weston Capital Advisors, LLC, the Global Fund’s investment advisor.
The investment goal of the U.S. All Cap Fund is to seek long-term capital appreciation. The U.S. All Cap Fund seeks investment results that exceed the performance, before fees and expenses, of the Russell 2000 Total Return Index. Previously, the Russell 3000 Total Return Index served as the U.S. All Cap Fund’s benchmark. The Advisor considers the Russell 2000 Total Return Index to be a more relevant benchmark. The Russell 3000 Total Return Index will be included until the 2015 Prospectus update. The U.S. All Cap Fund will invest at least 80% of its assets in equity securities of U.S. companies with market capitalizations that are above $200 million at the time of initial purchase and possess entrepreneurial characteristics, as determined by Capital Impact Advisors, LLC, the U.S. All Cap Fund’s investment advisor.
The investment goal of the U.S. Large Cap Fund is to seek long-term capital appreciation. The U.S. Large Cap Fund seeks investment results that exceed the performance, before fees and expenses, of the S&P 500 Total Return Index, through active principles-based securities selection. The U.S. Large Cap Fund mainly invests in equity securities of U.S. companies with market capitalizations that are above $5 billion at the time of initial purchase and possesses entrepreneurial characteristics, as determined by Capital Impact Advisors, LLC, the U.S. Large Cap Fund’s investment advisor. Weston Capital Advisors, LLC and Capital Impact Advisors, LLC (together “Advisors”) are majority owned by Dr. Shulman.
The Funds all currently offer one share class, the Institutional Class. Effective June 29, 2012 the Global Fund ceased offering its Class A shares to the public. The remaining Class A shares were converted into Retail shares. Effective January 10, 2013 the Global Fund ceased offering its Retail shares to the public. The remaining Retail shares were converted into Institutional shares. As described in the Global Fund’s prospectus, the Institutional Class shares do not have a 12b-1 fee.
2. SUMMARY OF SIGNIFICANT ACCOUNTING POLICIES
The following is a summary of significant accounting policies consistently followed by the Funds in the preparation of its financial statements. These policies are in conformity with accounting principles generally accepted in the United States of America (“GAAP”).
Investment Valuations
The following is a summary of the Funds’ pricing procedures. It is intended to be a general discussion and may not necessarily reflect all pricing procedures followed by the Funds.
In determining the net asset value (“NAV”) of the Funds’ shares, securities that are listed on a national securities exchange (other than the National Association of Securities Dealers’ Automated Quotation System (“NASDAQ”)) are valued at the last sale price on the day the valuation is made. Securities that are traded on NASDAQ under one of its three listing tiers, NASDAQ Global Select Market, NASDAQ Global Market and NASDAQ Capital Market, are valued at the NASDAQ
EntrepreneurShares Series Trust
NOTES TO FINANCIAL STATEMENTS (Continued)
June 30, 2015
Official Closing Price. Price information on listed securities is taken from the exchange where the security is primarily traded. Securities which are listed on an exchange but which are not traded on the valuation date are valued at the most recent bid price. Unlisted securities held by the Funds are valued at the average of the quoted bid and ask prices in the over-the-counter (“OTC”) market. Securities and other assets for which market quotations are not readily available are valued at their fair value as determined in good faith under procedures established by and under the general supervision and responsibility of the EntrepreneurShares Series Trust Board of Trustees (the “Board”). Investments in registered open-end investment companies other than exchange-traded funds are valued at the reported NAV.
Short-term investments held with a remaining maturity of 60 days or less generally are valued at amortized cost, as the Board believes that this method of valuing short-term investments approximates fair value. Short-term investments with 61 days or more to maturity at time of purchase are valued at market value through the 61st day prior to maturity, based on quotations received from market makers or other appropriate sources; thereafter, they are generally valued at amortized cost. There is no definitive set of circumstances under which the Funds may elect to use fair value procedures to value a security. Types of securities that the Fund may hold for which fair value pricing might be required include, but are not limited to: (a) illiquid securities, including restricted securities and private placements for which there is no public market; (b) options not traded on a securities exchange; (c) securities of an issuer that has entered into a restructuring; (d) securities whose trading has been halted or suspended, as permitted by the Securities and Exchange Commission (the “SEC”); (e) foreign securities, if an event or development has occurred subsequent to the close of the foreign market and prior to the close of regular trading on the New York Stock Exchange that would materially affect the value of the security; and (f) fixed income securities that have gone into default and for which there is not a current market value quotation.
Valuing securities at fair value involves greater reliance on judgment than valuing securities that have readily available market quotations. There can be no assurance that the Funds could obtain the fair value assigned to a security if it were to sell the security at approximately the time at which the Funds determine its NAV per share.
Securities that are not listed on an exchange are valued by the Fund’s investment advisor, under the supervision of the Board. There is no single standard for determining the fair value of a security. Rather, in determining the fair value of a security, the Fund’s investment advisor and the Board shall take into account the relevant factors and surrounding circumstances, which may include: (1) the nature and pricing history (if any) of the security; (2) whether any dealer quotations for the security are available; (3) possible valuation methodologies that could be used to determine the fair value of the security; (4) the recommendation of the portfolio manager of the Fund with respect to the valuation of the security; (5) whether the same or similar securities are held by other funds managed by the Advisors, or other funds, and the method used to price the security in those funds; (6) the extent to which the fair value to be determined for the security will result from the use of data or formulae produced by third parties independent of the Advisors; and (7) the liquidity or illiquidity of the market for the security.
Use of Estimates and Indemnifications
The preparation of the financial statements in conformity with GAAP requires management to make estimates and assumptions that affect the reported amounts and disclosures in these financial statements. Actual results could differ from those estimates.
In the normal course of business, the Trust, on behalf of the Funds, enters into contracts that contain a variety of representations which provide general indemnifications. The Trust’s maximum exposure under these arrangements is unknown; however, the Trust has not had claims or losses pursuant to these contracts and the Trust expects any risk of loss to be remote.
Federal Income Tax
The Funds intend to continue to qualify as a “regulated investment company” under Subchapter M of the Internal Revenue Code of 1986, as amended. If so qualified, the Funds will not be subject to federal income tax to the extent it distributes substantially all of their net investment income and net realized gains to shareholders.
EntrepreneurShares Series Trust
NOTES TO FINANCIAL STATEMENTS (Continued)
June 30, 2015
The Funds have reviewed all open tax years and major jurisdictions and concluded that the Funds did not have any tax positions that did not meet the “more-likely-than-not” threshold of being sustained by the applicable tax authority for the year ended June 30, 2015. The Funds would recognize interest and penalties, if any, related to uncertain tax benefits in the Statement of Operations. During the year ended June 30, 2015, the Funds did not incur any interest or penalties. Open tax years are those that are open for exam by taxing authorities. As of June 30, 2015, open Federal tax years include the tax years ended June 30, 2013, 2014 and 2015 for the Global Fund and 2014 and 2015 for the U.S. All Cap Fund and U.S. Large Cap Fund. The Funds have no examination in progress.
Fair Value Measurement
The Funds have adopted authoritative fair valuation accounting standards which establish an authoritative definition of fair value and set out a hierarchy for measuring fair value. These standards require additional disclosures about the various inputs and valuation techniques used to develop the measurements of fair value and a discussion of changes in valuation techniques and related inputs during the period. The hierarchy gives the highest priority to unadjusted quoted prices in active markets for identical assets or liabilities (Level 1 measurement) and the lowest priority to unobservable inputs (Level 3 measurements). The three levels of the fair value hierarchy are as follows:
Level 1: Inputs that reflect unadjusted quoted prices in active markets for identical assets that the Fund has the ability to access at the measurement date;
Level 2: Other significant observable inputs, other than quoted prices included in Level 1, that are observable for the asset, either directly or indirectly, these inputs may include quoted prices for the identical instrument on inactive market, quoted prices for similar instruments, interest rates, prepayment spreads, credit risk, yield curves, default rates, and similar data;
Level 3: Unobservable inputs for the assets to the extent that relevant observable inputs are not available, representing the Fund’s own assumptions that a market participant would use in valuing the asset based on the best information available.
Inputs are used in applying the various valuation techniques and broadly refer to the assumptions that market participants use to make valuation decisions, including assumptions about risk. Inputs may include price information, volatility statistics, specific and broad credit data, liquidity statistics, and other factors. A financial instrument’s level within the fair value hierarchy is based on the lowest level of any input that is significant to the fair value measurement. However, the determination of what constitutes “observable” requires significant judgment by the Funds. The Funds consider observable data to be that market data which is readily available, regularly distributed or updated, reliable and verifiable, not proprietary, and provided by independent sources that are actively involved in the relevant market. The categorization of a financial instrument within the hierarchy is based upon the pricing transparency of the instrument and does not necessarily correspond to the Funds’ perceived risk of that instrument.
Investments whose values are based on quoted market prices in active markets, and are therefore classified within Level 1, include active listed equities and real estate investment trusts, closed-end mutual funds, and certain money market securities. Investments that trade in markets that are not considered to be active, but are valued based on quoted market prices, dealer quotations or alternative pricing sources supported by observable inputs are classified within Level 2. Investments classified within Level 3 have significant unobservable inputs, as they trade infrequently or not at all. The tables below are a summary of the inputs used to value the Funds’ investments as of June 30, 2015.
| Global Fund | | | | | | | | | | | | |
Investments at Fair Value* | | Level 1 | | | Level 2 | | | Level 3 | | | Total | |
| Common Stocks | | $ | 5,204,980 | | | $ | — | | | $ | — | | | $ | 5,204,980 | |
| Money Market Funds | | | 325,925 | | | | — | | | | — | | | | 325,925 | |
| Total Investments | | $ | 5,530,905 | | | $ | — | | | $ | — | | | $ | 5,530,905 | |
EntrepreneurShares Series Trust
NOTES TO FINANCIAL STATEMENTS (Continued)
June 30, 2015
| U.S. All Cap Fund | | | | | | | | | | | | |
Investments at Fair Value* | | Level 1 | | | Level 2 | | | Level 3 | | | Total | |
| Common Stocks | | $ | 134,708,078 | | | $ | — | | | $ | — | | | $ | 134,708,078 | |
| Real Estate Investment Trusts | | | 5,466,775 | | | | — | | | | — | | | | 5,466,775 | |
| Money Market Funds | | | 2,993,049 | | | | — | | | | — | | | | 2,993,049 | |
| Total Investments | | $ | 143,167,902 | | | $ | — | | | $ | — | | | $ | 143,167,902 | |
| | | | | | | | | | | | | | | | | |
| U.S. Large Cap Fund | | | | | | | | | | | | | | | | |
Investments at Fair Value* | | Level 1 | | | Level 2 | | | Level 3 | | | Total | |
| Common Stocks | | $ | 79,615,917 | | | $ | — | | | $ | — | | | $ | 79,615,917 | |
| Real Estate Investment Trusts | | | 575,129 | | | | — | | | | — | | | | 575,129 | |
| Money Market Funds | | | 2,825,632 | | | | — | | | | — | | | | 2,825,632 | |
| Total Investments | | $ | 83,016,678 | | | $ | — | | | $ | — | | | $ | 83,016,678 | |
* For further information regarding security characteristics, please see the Schedule of Investments.
For the year ended June 30, 2015, the Funds had no transfers of securities between levels and no investments in derivate instruments. Transfers between levels are recognized at the end of the reporting period. The Funds did not have any Level 3 investments at the beginning or end of the year.
Distribution to Shareholders
The Funds intend to continue to distribute to its shareholders any net investment income and any net realized long or short-term capital gains, if any, at least annually. Distributions are recorded on ex-dividend date. The Fund may periodically make reclassifications among certain of its capital accounts as a result of the characterization of certain income and realized gains determined annually in accordance with federal tax regulations that may differ from GAAP.
Foreign Currency Transactions
The Funds’ books and records are maintained in U.S. dollars. Foreign currency denominated transactions (i.e. fair value of investment securities, assets and liabilities, purchases and sales of investment securities and income and expenses) are translated into U.S. dollars at the current rate of exchange. The Funds isolate portions of the results of operations resulting from changes in foreign exchange rates on investments from the fluctuations arising from changes in market prices of securities held. Such fluctuations are reflected as net realized and unrealized gain or loss on foreign currency.
Investment Transactions and Investment Income
Investment transactions are recorded on the trade date. Dividend income, less any foreign tax withheld, is recognized on the ex-dividend date and interest income is recognized on an accrual basis, including amortization/accretion of premiums or discounts. Net realized gains or losses are determined using the specific identification method.
Net investment income, other than class specific expenses, and realized and unrealized gains and losses are allocated daily to each class of shares based upon the relative net asset value of outstanding shares of each class of shares at the beginning of the day.
3. AGREEMENTS
Global Fund’s Investment Advisory Agreement
Weston Capital Advisors, LLC, a related party of the Global Fund, oversees the performance of the Global Fund and is responsible for overseeing the management of the investment portfolio of the Global Fund. These services are provided under the terms of an investment advisory agreement between the Trust and Weston Capital Advisors, pursuant to which Weston Capital Advisors, LLC receives an annual advisory fee equal to 1.25% of the Global Fund’s average net assets.
EntrepreneurShares Series Trust
NOTES TO FINANCIAL STATEMENTS (Continued)
June 30, 2015
Through November 1, 2015, the Advisor has agreed to waive and/or reimburse the Global Fund for its advisory fee, and to the extent necessary, bear other expenses, to limit the total annualized expenses (excluding borrowing and investment-related costs and fees, taxes, extraordinary expenses and fees and expenses of underlying funds) of the Institutional Class shares of the Global Fund to the amounts of 1.70% per annum of net assets attributable to such shares of the Global Fund. Weston Capital Advisors, LLC shall be permitted to recover expenses it has borne subsequent to the effective date of this agreement (whether through reduction of its advisory fee or otherwise) in later periods to the extent that the Global Fund’s expenses fall below the annual rates set forth above, given that such a rate is not greater than the rate that was in place at the time of the waiver, provided, however, that the Global Fund is not obligated to pay any such waived fees more than three years after the end of the fiscal year in which the expense was borne by Weston Capital Advisors, LLC.
Waived fees subject to recovery by year of expiration are as follows:
| | Year of Expiration | Potential Recovery | |
| | 6/30/18 | $ 60,049 | |
| | 6/30/17 | $133,223 | |
| | 6/30/16 | $131,603 | |
Sub-Advisory services are provided to the Global Fund, pursuant to an agreement between Weston Capital Advisors, LLC and EntrepreneurShares, LLC (the “Sub-Advisor”). Under the terms of this sub-advisory agreement, Weston Capital Advisors, LLC, not the Global Fund, compensates the Sub-Advisor based on the Global Fund’s average net assets. Certain officers of Weston Capital Advisors, LLC are also officers of the Sub-Advisor. Dr. Shulman is a majority owner of both Weston Capital Advisors, LLC and the Sub-Advisor.
U.S. All Cap Fund and U.S. Large Cap Fund Investment Advisory Agreement
Capital Impact Advisors, LLC, a related party of the U.S. All Cap Fund and the U.S. Large Cap Fund, oversees the performance of the U.S. All Cap Fund and the U.S. Large Cap Fund and is responsible for overseeing the management of the investment portfolio of the U.S. All Cap Fund and the U.S. Large Cap Fund. These services are provided under the terms of investment advisory agreements between the Trust and Capital Impact Advisors, LLC, pursuant to which Capital Impact Advisors, LLC receives an annual advisory fee equal to 0.75% of the U.S. All Cap Fund’s average net assets and 0.65% of the U.S. Large Cap Fund’s average net assets.
Through November 1, 2015 for the U.S. All Cap Fund and the U.S. Large Cap Fund, Capital Impact Advisors, LLC has agreed to waive and/or reimburse the U.S. All Cap Fund and the U.S. Large Cap Fund for its advisory fee, and to the extent necessary, bear other expenses, to limit the total annualized expenses (excluding borrowing and investment-related costs and fees, taxes, extraordinary expenses and fees and expenses of underlying funds) of the Institutional Class shares of the U.S. All Cap Fund to the amounts of 0.85% per annum of net assets attributable to such shares of the U.S. All Cap Fund and 0.75% per annum of net assets attributable to shares of the U.S. Large Cap Fund. Capital Impact Advisors, LLC shall be permitted to recover expenses it has borne subsequent to the effective date of this agreement (whether through reduction of its advisory fee or otherwise) in later periods to the extent that the U.S. All Cap Fund’s or the U.S. Large Cap Fund’s expenses fall below the annual rates set forth above, given that such a rate is not greater than the rate that was in place at the time of the waiver, provided, however, that the U.S. All Cap Fund and the U.S. Large Cap Fund are not obligated to pay any such waived fees more than three years after the end of the fiscal year in which the expense was borne by Capital Impact Advisors, LLC.
Waived fees subject to recovery by year of expiration are as follows:
| | Year of Expiration | Potential Recovery | |
| | | U.S. All Cap Fund | U.S. Large Cap Fund | |
| | 6/30/18 | $58,334 | $66,315 | |
| | 6/30/17 | $83,817 | $ 4,000 | |
EntrepreneurShares Series Trust
NOTES TO FINANCIAL STATEMENTS (Continued)
June 30, 2015
4. DISTRIBUTION PLAN
The Trust has adopted distribution and service (Rule 12b-1) plans (the “Plan”) for the Funds’ Retail Class shares (not available for sale at this time) and Class A shares (not available for sale at this time) in accordance with Rule 12b-1 under the Investment Company Act of 1940, as amended. The Plan allows the Funds to use up to 0.25% of the average daily net assets attributable to the relevant classes of Funds’ shares, to pay sales, distribution, and other fees for the sale of that share class and for services provided to holders of that class of shares. Because these fees are paid out of the Funds’ assets, over time, these fees will increase the cost of an investment in Retail Class shares and Class A shares and may cost the shareholder more than paying other types of sales charges. The Funds’ Institutional Class shares are not subject to any distribution and service (Rule 12b-1) fees.
5. INCOME TAXES
The Funds plan to distribute substantially all of the net investment income and net realized gains that it has realized on the sale of securities. These income and gains distributions will generally be paid once each year, on or before December 31. The character of distributions made during the year from net investment income or net realized gains may differ from the characterization for federal income tax purposes due to differences in the recognition of income, expense or gain items for financial reporting and tax reporting purposes.
The tax character of distributions paid during the periods ended June 30, 2014 and 2015 was as follows:
| | Ordinary | Long-Term | |
| Global Fund | Income | Capital Gain | Total |
| June 30, 2015 | $ 96,650 | $2,230,471 | $2,327,121 |
| June 30, 2014 | $174,622 | $1,145,681 | $1,320,303 |
| | | | |
| | Ordinary | Long-Term | |
| U.S. All Cap Fund | Income | Capital Gain | Total |
| June 30, 2015 | $60,866 | $ — | $60,866 |
| June 30, 2014 | $64,850 | $ — | $64,850 |
| | | | |
| | Ordinary | Long-Term | |
| U.S. Large Cap Fund | Income | Capital Gain | Total |
| June 30, 2015 | $50,453 | $ — | $50,453 |
| June 30, 2014 | $ — | $ — | $ — |
The Funds designated as long-term capital gain dividend, pursuant to Internal Revenue Code Section 852(b)(3), the amount necessary to reduce the earnings and profits for the Fund related to net capital gain to zero for the tax year ended June 30, 2015.
Additionally, GAAP requires that certain components of net assets be reclassified between financial and tax reporting. These reclassifications have no effect on net assets or net asset value per share. The following table shows the reclassifications made:
| | | Accumulated | Accumulated |
| Global Fund | Paid in | Net Investment | Realized |
| Year Ended | Capital | Income (Loss) | Gain (Loss) |
| June 30, 2015 | $3,535,515 | $ 70,872 | $(3,606,387) |
| | | | |
| | | Accumulated | Accumulated |
| U.S. All Cap Fund | Paid in | Net Investment | Realized |
| Year Ended | Capital | Income (Loss) | Gain (Loss) |
| June 30, 2015 | $ — | $129,064 | $(129,064) |
EntrepreneurShares Series Trust
NOTES TO FINANCIAL STATEMENTS (Continued)
June 30, 2015
| | | Accumulated | Accumulated |
| U.S. Large Cap Fund | Paid in | Net Investment | Realized |
| Year Ended | Capital | Income (Loss) | Gain (Loss) |
| June 30, 2015 | $ — | $(21,609) | $21,609 |
The permanent differences relate primarily to foreign currency reclassifications, REIT, partnership adjustments, in-kind redemptions and reclassification of net operating losses.
As of June 30, 2015, the cost of investments, gross unrealized appreciation and depreciation of investments and distributable income for tax purposes are:
| | | | | | U.S. All | | | U.S. Large | |
| | | Global Fund | | | Cap Fund | | | Cap Fund | |
| Cost of investments | | $ | 4,335,108 | | | $ | 132,702,827 | | | $ | 77,286,573 | |
| Unrealized appreciation | | | 1,380,340 | | | | 18,454,127 | | | | 7,544,202 | |
| Unrealized depreciation | | | (184,543 | ) | | | (7,989,052 | ) | | | (1,814,097 | ) |
| Net unrealized appreciation | | | 1,195,797 | | | | 10,465,075 | | | | 5,730,105 | |
| Undistributed ordinary income | | | — | | | | 19,256 | | | | 216,457 | |
| Undistributed long-term capital gain | | | — | | | | 7,635,937 | | | | — | |
| Distributable income | | | — | | | | 7,655,193 | | | | 216,457 | |
| Other accumulated loss | | | (939,127 | ) | | | — | | | | (82,067 | ) |
| Total accumulated gain | | $ | 256,670 | | | $ | 18,120,268 | | | $ | 5,864,495 | |
The table above differs from the financial statements due to timing differences related to the deferral of losses due to wash sales, partnership interests and Passive Foreign Investment Companies.
As of June 30, 2015, the Funds had capital loss carry forwards which could be used to offset future gains of:
| | | Capital Loss | | | |
| | | Carryover | | Character | |
| Global Fund | | $ | — | | | |
| U.S. All Cap Fund | | $ | — | | | |
| U.S. Large Cap Fund | | $ | (37,081 | ) | Short-term | |
As of June 30, 2015 the Funds had deferred qualified late year ordinary losses of:
| Global Fund | | $ | (42,288 | ) | |
| U.S. All Cap Fund | | $ | — | | |
| U.S. Large Cap Fund | | $ | — | | |
As of June 30, 2015 the Funds had deferred qualified post October losses of:
| Global Fund | | $ | (896,399 | ) | |
| U.S. All Cap Fund | | $ | — | | |
| U.S. Large Cap Fund | | $ | (44,986 | ) | |
6. CAPITAL SHARE TRANSACTIONS
The Trust has authorized capital of unlimited shares of no par value which may be issued in more than one class or series. Currently, the Trust consists of three series, the Funds. Transactions in shares of the Funds were as follows:
EntrepreneurShares Series Trust
NOTES TO FINANCIAL STATEMENTS (Continued)
June 30, 2015
| | | Year Ended | | | Year Ended | |
| | | June 30, 2015 | | | June 30, 2014 | |
| Global Fund | | | | | | |
| Institutional Class | | | | | | |
| Shares sold | | | 10,867 | | | | 2,220 | |
| Shares issued in reinvestment of dividends | | | 162,397 | | | | 80,533 | |
| Shares redeemed | | | (1,569,976 | ) | | | (142,146 | ) |
| Net decrease | | | (1,396,712 | ) | | | (59,393 | ) |
| Shares outstanding | | | | | | | | |
| Beginning of year | | | 1,849,388 | | | | 1,908,781 | |
| End of year | | | 452,676 | | | | 1,849,388 | |
| | | | | | | | | |
| | | Year Ended | | | Period Ended | |
| | | June 30, 2015 | | | June 30, 2014 | |
| U.S. All Cap Fund | | | | | | | | |
| Institutional Class | | | | | | | | |
| Shares sold | | | 1,467 | | | | 12,489,810 | |
| Shares issued in reinvestment of dividends | | | 5,538 | | | | 6,206 | |
| Shares redeemed | | | (1,499 | ) | | | (1,951 | ) |
| Net increase | | | 5,506 | | | | 12,494,065 | |
| Shares outstanding | | | | | | | | |
| Beginning of period | | | 12,494,065 | | | | — | |
| End of period | | | 12,499,571 | | | | 12,494,065 | |
| | | | | | | | | |
| U.S. Large Cap Fund | | | | | | | | |
| Institutional Class | | | | | | | | |
| Shares sold | | | 223,355 | | | | 7,501,341 | |
| Shares issued in reinvestment of dividends | | | 4,782 | | | | — | |
| Shares redeemed | | | (23,805 | ) | | | — | |
| Net increase | | | 204,332 | | | | 7,501,341 | |
| Shares outstanding | | | | | | | | |
| Beginning of period | | | 7,501,341 | | | | — | |
| End of period | | | 7,705,673 | | | | 7,501,341 | |
7. RELATED PARTIES
As of June 30, 2015, certain officers of the Trust were also employees of the Advisors. However, these officers were not compensated directly by the Funds. Refer to Note 3 for more information.
8. BENEFICIAL OWNERSHIP
The beneficial ownership, either directly or indirectly, of more than 25% of the voting securities of a fund creates a presumption of control of a fund, under Section 2(a)(9) of the 1940 Act. As of June 30, 2015, for the benefit of its shareholders, Pentegra Retirement Services and National Financial Services, LLC respectively held 61.8% and 29.1% of the total Global Fund shares outstanding. As of June 30, 2015, for the benefit of its shareholders, MAC & Co., an affiliate of the U.S. All Cap Fund, held 97.6% of the total U.S. All Cap Fund shares outstanding. As of June 30, 2015, for the benefit of its shareholders, MAC & Co., an affiliate of the U.S. Large Cap Fund, held 97.4% of the total U.S. Large Cap Fund shares outstanding.
EntrepreneurShares Series Trust
NOTES TO FINANCIAL STATEMENTS (Continued)
June 30, 2015
9. INVESTMENT TRANSACTIONS
During the year ended June 30, 2015, the aggregate purchases and sales of securities (including in-kind redemptions and excluding short-term securities) were:
| | | | | | U.S. All | | | U.S. Large | |
| | | Global Fund | | | Cap Fund | | | Cap Fund | |
| Purchases: | | $ | 11,377,679 | | | $ | 142,866,519 | | | $ | 69,853,473 | |
| Sales: | | $ | 28,774,266 | | | $ | 143,581,020 | | | $ | 69,780,722 | |
Global Fund
Effective March 26, 2015, the Fund’s shareholders redeemed assets through an in-kind redemption. In the redemption transaction, the Fund transferred securities with a fair value of $12,869,830 to the redeeming shareholders, which is included in the purchase and sales information above. The Fund recognized a net realized gain in the amount of $3,589,670, which is reflected on the Statement of Operations. The redemption-in-kind is reflected in the Statement of Changes in Net Assets.
U.S. All Cap Fund
On December 17, 2013, the Fund accepted, in accordance with the Rule 17a-7 procedures adopted by the Trust, securities eligible for investment by the Fund as consideration for the Fund shares issued (“transfer in-kind”) for the net transfer in-kind of $72,116,070, which is excluded from the purchase and sales information above.
U.S. Large Cap Fund
On June 30, 2014, the Fund accepted, in accordance with the Rule 17a-7 procedures adopted by the Trust, securities eligible for investment by the Fund as consideration for the Fund shares issued (“transfer in-kind”) for the net transfer in-kind of $59,495,243, which is excluded from the purchase and sales information above. This was comprised of investments with fair value as of June 30, 2014 (the last business day of the period) of $59,495,243, as the transaction was effective and recorded on June 30, 2014 and settled on July 2, 2014.
10. FOREIGN INVESTMENT RISK
The Global Fund generally invests a significant portion of its total assets in securities principally traded in markets outside the U.S. The foreign markets in which the Global Fund invests in are sometimes open on days when the NYSE is not open and the Global Fund does not calculate its NAV, and sometimes are not open on days when the Global Fund does calculate its NAV. Even on days on which both the foreign market and the NYSE were open, several hours may have passed between the time when trading in the foreign market closed and the time as of which the Global Fund calculates its NAV. That is generally the case for markets in Europe, Asia, Australia and other far eastern regions; the regular closing time of foreign markets in North and South America is generally the same as the closing time of the NYSE and the time as of which the Global Fund calculates its NAV.
Foreign stocks, as an asset class, may underperform U.S. stocks, and foreign stocks may be more volatile than U.S. stocks. Risks relating to investment in foreign securities (including, but not limited to, depositary receipts and participation certificates) include: currency exchange rate fluctuation; less available public information about the issuers of securities; less stringent regulatory standards; lack of uniform accounting, auditing and financial reporting standards; and country risk including less liquidity, high inflation rates, unfavorable economic practices and political instability. The risks of foreign investments are typically greater in emerging and less developed markets.
11. SUBSEQUENT EVENTS EVALUATION
In preparing the financial statements, the Funds have evaluated events and transactions for potential recognition or disclosure through the date the financial statements were issued. This evaluation did not result in any subsequent events that necessitated disclosure and/or adjustments.
EntrepreneurShares Series Trust
REPORT OF INDEPENDENT REGISTERED PUBLIC ACCOUNTING FIRM
To the Board of Trustees of EntrepreneurShares Series Trust and the Shareholders of EntrepreneurShares Global Fund, Entrepreneur U.S. All Cap Fund and Entrepreneur U.S. Large Cap Fund
We have audited the accompanying statement of assets and liabilities, including the schedule of investments, of EntrepreneurShares Global Fund, as of June 30, 2015, and the related statement of operations for the year then ended, the statement of changes in net assets for each of the two years in the period then ended, and the financial highlights for each of the four years in the period ended June 30, 2015 and the period November 11, 2010 (commencement of operations) to June 30, 2011. We have also audited the accompanying statement of assets and liabilities, including the schedule of investments, of Entrepreneur U.S. All Cap Fund, as of June 30, 2015, and the related statements of operations for the year then ended and the statement of changes in net assets and the financial highlights for the year then ended and period December 17, 2013 (commencement of operations) to June 30, 2014. We have also audited the accompanying statement of assets and liabilities, including the schedule of investments, of Entrepreneur U.S. Large Cap Fund as of June 30, 2015, and the related statements of operations for the year then ended and statement of changes in net assets and financial highlights for the year then ended and period from June 30, 2014 (commencement of operations) to June 30, 2014. These financial statements and financial highlights are the responsibility of the Funds’ management. Our responsibility is to express an opinion on these financial statements and financial highlights based on our audits.
We conducted our audit in accordance with the standards of the Public Company Accounting Oversight Board (United States). Those standards require that we plan and perform the audits to obtain reasonable assurance about whether the financial statements and financial highlights are free of material misstatement. The Funds are not required to have, nor were we engaged to perform an audit of their internal control over financial reporting. Our audits included consideration of internal control over financial reporting as a basis for designing audit procedures that are appropriate in the circumstances, but not for the purpose of expressing an opinion on the effectiveness of the Funds’ internal control over financial reporting. Accordingly, we express no such opinion. An audit also includes examining, on a test basis, evidence supporting the amounts and disclosures in the financial statements and financial highlights, assessing the accounting principles used and significant estimates made by management, as well as evaluating the overall financial statement presentation. Our procedures included confirmation of securities owned as of June 30, 2015, by correspondence with the custodian. We believe that our audits provide a reasonable basis for our opinion.
In our opinion, the financial statements and financial highlights referred to above present fairly, in all material respects, the financial position of EntrepreneurShares Global Fund, Entrepreneur U.S. All Cap Fund and Entrepreneur U.S. Large Cap Fund as of June 30, 2015, and the results of their operations, the changes in their net assets, and the financial highlights, for each respective periods referred to above, in conformity with accounting principles generally accepted in the United States of America.
/s/ McGladrey LLP
Boston, Massachusetts
August 28, 2015
EntrepreneurShares Series Trust
ADDITIONAL INFORMATION
(Unaudited)
1. ADDITIONAL DISCLOSURE REGARDING FUND TRUSTEES AND OFFICERS
| | | Term of | | # of Portfolios | Other |
| | | Office(1) | | in Fund | Directorships |
| | Position(s) | and | | Complex | Held by Trustee |
| Name, Address | Held | Length of | Principal Occupation(s) | Overseen | During Past |
and Birth Year | with Trust | Time Served | During Past 5 Years | by Trustee | 5 Years |
| | | | | | |
| Dr. Stephen Sohn | Trustee | Since 2010 | Chairman – Quantum | 3 | None |
| 470 Atlantic Ave., Suite #400 | | | Aesthetic Surgery Inc. | | |
| Boston, MA 02210 | | | | | |
| Birth year: 1944 | | | | | |
| | | | | | |
| Thomas T. Stallkamp | Trustee | Since 2010 | Founder/Principal | 3 | None |
| 470 Atlantic Ave., Suite #400 | | | Collaborative | | |
| Boston, MA 02210 | | | Management; Former CEO | | |
| Birth year: 1947 | | | Chairman – MSX International | | |
| | | | (automotive consulting) | | |
| | | | (2003 to 2004). | | |
| | | | | | |
| George R. Berbeco | Trustee | Since 2010 | Chairman – Bay Colony | 3 | None |
| 470 Atlantic Ave., Suite #400 | | | Development Corporation; | | |
| Boston, MA 02210 | | | Former President – Devon | | |
| Birth year: 1944 | | | Group and General | | |
| | | | Partner – Devon Capital | | |
| | | | Partners, LP. | | |
| | | | (information systems | | |
| | | | consulting) (2005 to 2009). | | |
| | | | | | |
Dr. Joel M. Shulman, CFA(2) | President | Since 2010 | Member of the Advisor | 3 | None |
| 470 Atlantic Ave., Suite #400 | and Trustee | | and the Sub-Advisor | | |
| Boston, MA 02210 | | | since 2010; Chief | | |
| Birth year: 1955 | | | Executive Officer of the | | |
| | | | Sub-Advisor since 2010; | | |
| | | | Tenured professor at | | |
| | | | Babson College. | | |
| | | | | | |
| David Cragg | Secretary, | Since 2010 | Member and Chief | N/A | N/A |
| 470 Atlantic Ave., Suite #400 | Treasurer | | Compliance Officer the | | |
| Boston, MA 02210 | and Chief | | Advisor since 2010; | | |
| Birth year: 1969 | Compliance | | Former Chief Financial | | |
| | Officer | | Officer and Chief Operating | | |
| | | | Officer of the Leuthold Group | | |
| | | | (institutional research) | | |
| | | | (1999 to 2009). | | |
| (1) | Each Trustee serves an indefinite term until the election of a successor. Each officer serves an indefinite term, renewed annually, until the election of a successor. |
| (2) | Dr. Shulman is considered an interested Trustee within the meaning of the 1940 Act because of his affiliation with the Advisor and the Sub-Advisor. |
The Statement of Additional Information includes additional information about the Funds’ Trustees and is available free of charge, upon request by calling the Funds toll free at 1.877.271.8811 or by visiting the SEC’s website (http://www.sec.gov).
EntrepreneurShares Series Trust
ADDITIONAL INFORMATION (Continued)
(Unaudited)
2. SHAREHOLDER NOTIFICATION OF FEDERAL TAX STATUS
Global Fund
For the year ended June 30, 2015, 77.09% of dividends paid from net ordinary income qualify for the dividends received deduction available to corporate shareholders.
The Global Fund designates 100.00% of their ordinary income distributions for the fiscal period as qualified dividend income under the Jobs and Growth Tax Reconciliation Act of 2003.
The Global Fund designates 0.00% of its ordinary income distributions as short-term capital gain distribution under Internal Revenue Code Section 871(k)(2)(c).
U.S. All Cap Fund
For the year ended June 30, 2015, 100.00% of dividends paid from net ordinary income qualify for the dividends received deduction available to corporate shareholders.
The U.S. All Cap Fund designates 100.00% of their ordinary income distributions for the fiscal period as qualified dividend income under the Jobs and Growth Tax Reconciliation Act of 2003.
The U.S. All Cap Fund designates 0.00% of its ordinary income distributions as short-term capital gain distribution under Internal Revenue Code Section 871(k)(2)(c).
U.S. Large Cap Fund
For the year ended June 30, 2015, 100.00% of dividends paid from net ordinary income qualify for the dividends received deduction available to corporate shareholders.
The U.S. Large Cap Fund designates 100.00% of their ordinary income distributions for the fiscal period as qualified dividend income under the Jobs and Growth Tax Reconciliation Act of 2003.
The U.S. Large Cap Fund designates 0.00% of its ordinary income distributions as short-term capital gain distribution under Internal Revenue Code Section 871(k)(2)(c).
3. AVAILABILITY OF QUARTERLY PORTFOLIO HOLDINGS SCHEDULES
The Funds are required to file their complete schedule of portfolio holdings with the SEC for the first and third quarters of each fiscal year on Form N-Q. Once filed, the Funds’ Form N-Q is available free of charge, upon request by calling the Funds toll free at 1.877.271.8811 or by visiting the SEC’s website (http://www.sec.gov). You may also obtain copies at the SEC’s Public Reference Room in Washington, D.C. Information on the operation of the Public Reference Room may be obtained by calling 1.800.SEC.0330.
4. PROXY VOTING POLICIES AND PROCEDURES AND PROXY VOTING RECORD
A description of the policies and procedures that the Funds use to determine how to vote proxies relating to portfolio securities is available free of charge, upon request by calling the Funds toll free at 1.877.271.8811 or by visiting the SEC’s website (http://www.sec.gov). The Funds are required to file how they voted proxies related to portfolio securities during the most recent 12-month period ended June 30.
Once filed, the information is available free of charge, upon request by calling the Funds toll free at 1.877.271.8811 or by visiting the SEC’s website (http://www.sec.gov).
EntrepreneurShares Global Fund Investment Advisor
Weston Capital Advisors, LLC
470 Atlantic Avenue, Suite #400
Boston, MA 02210
EntrepreneurShares Global Fund Investment Sub-Advisor
EntrepreneurShares, LLC
470 Atlantic Avenue, Suite #400
Boston, MA 02210
Entrepreneur U.S. All Cap Fund and Entrepreneur U.S. Large Cap Fund Investment Advisor
Capital Impact Advisors, LLC
470 Atlantic Avenue, Suite #400
Boston, MA 02210
Independent Registered Public Accounting Firm
McGladrey LLP
80 City Square
Boston, MA 02129
Custodian
U.S. Bank, N.A.
1555 N. RiverCenter Drive, Suite #302
Milwaukee, WI 53212
Distributor
Rafferty Capital Markets, LLC
59 Hilton Avenue
Garden City, NY 11530
Administrator, Accountant, Transfer Agent
And Dividend Disbursing Agent
U.S. Bancorp Fund Services, LLC
615 East Michigan Street
Milwaukee, WI 53202
The registrant’s board of trustees has determined that it does not have an audit committee financial expert serving on its audit committee. At this time, the registrant believes that the experience provided by each member of the audit committee together offers the registrant adequate oversight for the registrant’s level of financial complexity.
The registrant has engaged its principal accountant to perform audit services, audit-related services, tax services and other services during the past two fiscal years. “Audit services” refer to performing an audit of the registrant's annual financial statements or services that are normally provided by the accountant in connection with statutory and regulatory filings or engagements for those fiscal years. “Audit-related services” refer to the assurance and related services by the principal accountant that are reasonably related to the performance of the audit. “Tax services” refer to professional services rendered by the principal accountant for tax compliance, tax advice, and tax planning, including a review of excise tax calculation and annual distribution requirements. There were no “Other Services” provided by the principal account. The following table details the aggregate fees billed or expected to be billed for each of the last two fiscal years for audit fees, audit-related fees, tax fees and other fees by the principal accountant.
The audit committee has adopted pre-approval policies and procedures that require the audit committee to pre‑approve all audit and non‑audit services of the registrant, including services provided to any entity affiliated with the registrant.
The percentage of fees billed by McGladrey, LLP for the fiscal year ended June 30, 2015 and for the fiscal year ended June 30, 2014 applicable to non-audit services pursuant to waiver of pre-approval requirement were as follows:
All of the principal accountant’s hours spent on auditing the registrant’s financial statements were attributed to work performed by full‑time permanent employees of the principal accountant. The following table indicates the non-audit fees billed or expected to be billed by the registrant’s accountant for services to the registrant and to the registrant’s investment adviser (and any other controlling entity, etc.—not sub-adviser) for the last two years. The audit committee of the board of trustees has considered whether the provision of non-audit services that were rendered to the registrant's investment adviser is compatible with maintaining the principal accountant's independence and has concluded that the provision of such non-audit services by the accountant has not compromised the accountant’s independence.
Not applicable to registrants who are not listed issuers (as defined in Rule 10A-3 under the Securities Exchange Act of 1934).
Not applicable to open-end investment companies.
Not applicable to open-end investment companies.
Not applicable to open-end investment companies.
Not Applicable.
Pursuant to the requirements of the Securities Exchange Act of 1934 and the Investment Company Act of 1940, the registrant has duly caused this report to be signed on its behalf by the undersigned, thereunto duly authorized.
Dr. Joel M. Shulman, President
Pursuant to the requirements of the Securities Exchange Act of 1934 and the Investment Company Act of 1940, this report has been signed below by the following persons on behalf of the registrant and in the capacities and on the dates indicated.
Dr. Joel M. Shulman, President
* Print the name and title of each signing officer under his or her signature.