UNITED STATES
SECURITIES AND EXCHANGE COMMISSION
Washington, D.C. 20549
FORM N-CSR
CERTIFIED SHAREHOLDER REPORT OF REGISTERED
MANAGEMENT INVESTMENT COMPANIES
Investment Company Act file number 811-22436
EntrepreneurShares Series Trust
(Exact name of registrant as specified in charter)
175 Federal Street, Suite #875
Boston, MA 02110
(Address of principal executive offices) (Zip code)
Dr. Joel M. Shulman
175 Federal Street, Suite #875
Boston, MA 02110
(Name and address of agent for service)
(617) 917-2605
Registrant's telephone number, including area code
Date of fiscal year end: June 30, 2016
Date of reporting period: June 30, 2016
Item 1. Reports to Stockholders.
Annual Report
June 30, 2016
EntrepreneurShares Global Fund
Entrepreneur U.S. All Cap Fund
Entrepreneur U.S. Large Cap Fund
Each a series of EntrepreneurShares Series Trust
c/o U.S. Bancorp Fund Services, LLC
P.O. Box 701
Milwaukee, Wisconsin 53201-0701
EntrepreneurShares Series Trust
August 15, 2016
Dear Shareholders:
We are enclosing the report for results covering the fiscal period July 1, 2015 through June 30, 2016.
The global equity landscape proved to be turbulent over the past twelve months. A number of macroeconomic and political factors contributed to above-average volatility resulting in risk-averse investors moving toward historically “safe-haven” asset classes. U.S. Large Capitalized stocks, represented by the S&P 500 Total Return Index, appreciated 3.99%, compared to -2.19% for Global Equity markets as measured by the MSCI The World Index. U.S. Domestic Small-Cap stocks, as measured by the Russell 2000 Total Return Index, were among the worst performers, generating returns of -6.73%.
Not surprisingly, our Entrepreneur Mutual Funds, that traditionally have above average Up-Capture and Down-Capture, under performed their benchmarks during this time period. Several key factors need to be addressed. First, our models work best during periods of market appreciation and low volatility. Our historical above average Up-Capture suggests that when markets rise, our Entrepreneurial stocks tend to rise faster. The corollary also tends to hold true: our above average Down-Capture suggests that during periods of market decline our Entrepreneurial stocks tend to fall faster than peer benchmarks. Except for the U.S. Large Cap Fund, as explained below, this was the case for the most recent fiscal period. Another important distinguishing characteristic is that the majority of our alpha-generating Entrepreneurial stocks tend to fall in the Growth and High Beta classification and reside within the Information Technology, Consumer Discretionary and Health Care sectors. When equity markets favor Value and Low Beta stocks, or reward industries such as Industrials, Materials, Energy or Utilities, our Entrepreneur portfolios will under-perform the markets. Such was the case for much of the recent fiscal period.
During the last fiscal period, our U.S. Large Cap Fund (IMPLX) generated -0.49%, our U.S. All Cap Fund (IMPAX) generated -9.63% and our Global Fund (ENTIX) generated -2.75%. The top performing sectors for the S&P 500 Total Return Index were Utilities (31.5% vs 42.4% for Entrepreneurs), Telecommunications (25.1% vs -6.1% for Entrepreneurs), Staples (18.5% vs 18.6% for Entrepreneurs) and Industrials (6.6% vs 4.2% for Entrepreneurs). Most of the discrepancy between the U.S. Large Cap (IMPLX) and the S&P 500 Total Return Index benchmark can be attributed to weak performance among Energy stocks (-35.2% vs -4.0% for the benchmark) and Biotechnology stocks (-11.7% vs -4.5% for the benchmark). Highlights included Information Technology (9.2% vs 4.7% for the benchmark) and Materials (24.5% vs -2.2% for the benchmark). In the latter case, much of the alpha generated from Materials can be attributed to the acquisition of Airgas (+30.2%).
Among U.S. All Cap stocks, the best performing sectors for the Russell 2000 Total Return Index benchmark included Utilities (30.6% vs 48.4% for Entrepreneurs), Telecommunication (16.9% vs 24.1% for Entrepreneurs), Staples (10.6% vs 3.7% for Entrepreneurs), and Financials (1.8% vs -3.6% for Entrepreneurs). Most of the discrepancy between the U.S. All Cap Fund and the Russell 2000 Total Return Index can be attributed to weak performance among Energy (-65.3% for Entrepreneurs vs -39.2%), Financials, Utilities (due to 3.1% sector under-weight for Entrepreneurs), Materials (-16.5% for Entrepreneurs vs -4.8%) and Industrials (-13.9% for Entrepreneurs vs -7.3%). Bright spots included Health Care (-13.9% for Entrepreneurs vs -21.7%), Consumer Discretionary (-7.6% for Entrepreneurs vs -14.8%) and Information Technology (1.7% for Entrepreneurs vs -3.3%). Each of these traditionally strong areas helped narrow the gap between the U.S. All Cap Fund and its benchmark.
When reviewing Global equity performance, applying MSCI The World Index, we note that the best performing sectors were Utilities (15.6% vs 48.4% for Entrepreneurs), Consumer Staples (13.6% vs 1.0% for Entrepreneurs) and Telecommunication (8.5% vs 14.4% for Entrepreneurs). Interestingly, though the Global Fund outperformed the peer benchmark in the Utilities and Telecommunication sectors, given the paucity of entrepreneurial companies in these sectors, the weights for the Global Fund were -1.7% (1.6% vs 3.3% weight for the benchmark) in Utilities and -3.1% weight (0.4% Entrepreneur weight vs 3.5%) in Telecommunications. Consequently, the strong performance in these two sectors had limited impact on the overall comparative performance. The strongest relative performance, other than the ones mentioned, occurred in the Information Technology space (3.5% vs 2.3% for the benchmark) and Health Care (-0.4% vs -4.3% for the benchmark). In the case of Energy, not unlike the U.S. Large Cap Fund and the U.S. All Cap Fund, the
EntrepreneurShares Series Trust
Global Fund experienced under performance among Energy stocks (-11.6% vs -4.6% for the benchmark). However, the effect on overall returns was relatively modest given the under-weight position of this sector.
We observe consistent behavior across all three portfolios: Utilities, Telecommunications and Consumer Staples were among the top performers and Energy was among the worst. Moreover, we note that the patterns of returns were very uneven during the fiscal period July 1, 2015 to June 30, 2016. Prior to February 11, 2016, U.S. Large Cap stocks appreciably outperformed U.S. Small Cap stocks (by as much as 1,000 basis points), however this pattern has reversed significantly since February 11, 2016 through the time of this writing (900+ basis points).
As a closing summary to this report, we acknowledge the underperformance of our Funds, though we remain encouraged for future success. The behavior of our three mutual funds is not surprising given market conditions favoring value and low beta stocks during this past fiscal year. Though we obviously cannot predict the future or market direction, we remain optimistic that the basic premise of the Entrepreneur model is intact, productive and operating accordingly. The key Entrepreneur sectors of Health Care, Information Technology and Consumer Discretionary, we believe, will continue to offer strong returns to investors over an extended period of time and be rewarded for patience.
We extend our gratitude for your continued support and look forward to sharing more updates to you in the future.
Sincerely,
Joel Shulman Ph.D., CFA
Managing Director
Performance data quoted represents past performance; past performance does not guarantee future results. The investment return and principal value of an investment will fluctuate so that an investor’s shares, when redeemed, may be worth more or less than their original cost. Current performance of the Funds may be lower or higher than the performance quoted. Performance data current to the most recent month end may be obtained by calling 1-877-271-8811 or visiting www.ershares.com.
Investors should consider carefully the investment objectives, risks, and charges and expenses before investing. For a full prospectus which contains this and other information about the Funds offered by EntrepreneurShares, call 1-877-271-8811.
Please read the full prospectus carefully before investing. The full prospectus is distributed by Rafferty Capital Markets, LLC.
The EntrepreneurShares Global Fund invests in foreign securities which involve greater volatility and political, economic and currency risks and differences in accounting methods. The Entrepreneur U.S. All Cap Fund invests in smaller companies, which involve additional risks such as limited liquidity and greater volatility. The Entrepreneur U.S. Large Cap Fund is exposed to common stock risk. Common stock prices fluctuate based on changes in a company’s financial condition and on overall market and economic conditions. Additional risks are detailed in the prospectus.
The MSCI The World Index is a free float-adjusted market capitalization weighted index that is designed to measure the equity market performance of developed markets. The Russell 2000 Total Return Index is a subset of the Russell 3000® Index representing approximately 10% of the total market capitalization of that index. It includes approximately 2000 of the smallest securities based on a combination of their market cap and current index membership. The S&P 500 Total Return Index includes 500 leading companies and captures approximately 80% coverage of available market capitalization. Returns assume the reinvestments of all dividends.
One cannot invest directly in an index.
Diversification does not guarantee a profit or assure against a loss.
Opinions expressed are subject to change, are not guaranteed and should not be considered recommendations to buy or sell any security.
EntrepreneurShares Global Fund
PERFORMANCE HIGHLIGHTS
EntrepreneurShares Global Fund vs. MSCI The World Index
Value of $10,000 Investment
This chart assumes an initial gross investment of $10,000 made in the Institutional Class on November 11, 2010 (commencement of operations of the Fund). Returns shown include the reinvestment of all dividends but do not reflect the deduction of taxes that a shareholder would pay on fund distributions or the redemption of fund shares. In the absence of fee waivers and reimbursements, total returns would be reduced. Past performance is not predictive of future performance. Investment return and principal value will fluctuate, so that your shares, when redeemed, may be worth more or less than the original cost. Total returns would have been lower had the Advisor not waived its fees and reimbursed a portion of the Fund’s expenses. The Fund’s total net operational expenses, including underlying Funds, were 1.77% per the November 1, 2015 prospectus.
MSCI The World Index – A free float-adjusted market capitalization weighted index that is designed to measure the equity performance of developed markets. Returns assume the reinvestments of all dividends.
Total Annualized Returns for the period ended June 30, 2016
| | | | Since |
| | | | Inception |
| | 1-Year | 5-Year | (11/11/10) |
| EntrepreneurShares Global Fund – Institutional Class | -2.75% | 4.66% | 6.34% |
| MSCI The World Index | -2.19% | 7.23% | 7.97% |
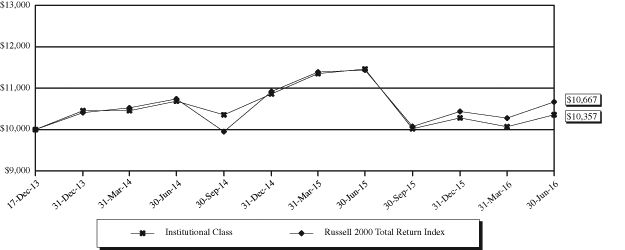
EntrepreneurShares U.S. All Cap Fund
PERFORMANCE HIGHLIGHTS
Entrepreneur U.S. All Cap Fund vs. Russell 2000 Total Return Index
Value of $10,000 Investment
This chart assumes an initial gross investment of $10,000 made in the Institutional Class on December 17, 2013 (commencement of operations of the Fund). Returns shown include the reinvestment of all dividends but do not reflect the deduction of taxes that a shareholder would pay on fund distributions or the redemption of fund shares. In the absence of fee waivers and reimbursements, total returns would be reduced. Past performance is not predictive of future performance. Investment return and principal value will fluctuate, so that your shares, when redeemed, may be worth more or less than the original cost. Total returns would have been lower had the Advisor not waived its fees and reimbursed a portion of the Fund’s expenses. The Fund’s total net operational expenses, including underlying Funds, were 0.92% per the November 1, 2015 prospectus.
Russell 2000 Index – A subset of the Russell 3000® Index representing approximately 10% of the total market capitalization of that index. It includes approximately 2000 of the smallest securities based on a combination of their market cap and current index membership. The Russell 3000® Index was not included as the Russell 2000 Total Return Index best compares the Fund’s performance with the returns of an index reflecting the performance of investments similar to the Fund. The assumed $10,000 investment would have returned, from July 1, 2015 to June 30, 2016, -6.73%, if invested in the Russell 2000 Total Return Index and 2.14%, if invested in the Russell 3000® Index.
Returns assume the reinvestments of all dividends.
Total Annualized Returns for the period ended June 30, 2016
| | | Since |
| | | Inception |
| | 1-Year | (12/17/13) |
| Entrepreneur U.S. All Cap Fund – Institutional Class | -9.63% | 1.39% |
| Russell 2000 Total Return Index | -6.73% | 2.58% |
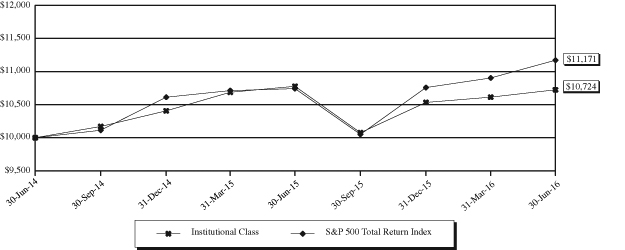
EntrepreneurShares U.S. Large Cap Fund
PERFORMANCE HIGHLIGHTS
Entrepreneur U.S. Large Cap Fund vs. S&P 500 Total Return Index
Value of $10,000 Investment
This chart assumes an initial gross investment of $10,000 made in the Institutional Class on June 30, 2014 (commencement of operations of the Fund). Returns shown include the reinvestment of all dividends but do not reflect the deduction of taxes that a shareholder would pay on fund distributions or the redemption of fund shares. In the absence of fee waivers and reimbursements, total returns would be reduced. Past performance is not predictive of future performance. Investment return and principal value will fluctuate, so that your shares, when redeemed, may be worth more or less than the original cost. Total returns would have been lower had the Advisor not waived its fees and reimbursed a portion of the Fund’s expenses. The Fund’s total net operational expenses, including underlying Funds, were 0.86% per the November 1, 2015 prospectus.
S&P 500 Total Return Index – Includes 500 leading companies and captures approximately 80% coverage of available market capitalization. Returns assume the reinvestments of all dividends.
Total Annualized Returns for the period ended June 30, 2016
| | | Since |
| | | Inception |
| | 1-Year | (6/30/14) |
| Entrepreneur U.S. Large Cap Fund – Institutional Class | -0.49% | 3.56% |
| S&P 500 Total Return Index | 3.99% | 5.69% |
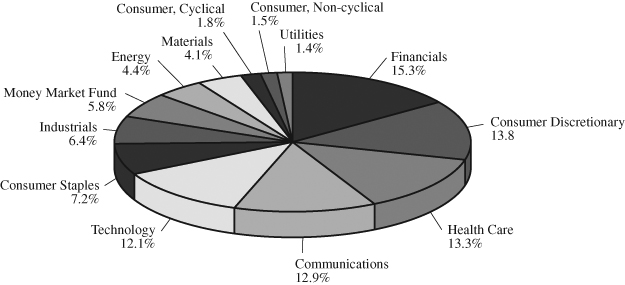
EntrepreneurShares Global Fund
SECTOR ALLOCATION(1)
June 30, 2016 (Unaudited)
As a Percentage of Portfolio
TOP TEN HOLDINGS
as of June 30, 2016 (Unaudited)(1)(2)
Issuer | | % of Net Assets | |
| United Therapeutics Corp. | | | 4.04 | % | |
| Mellanox Technologies Ltd. | | | 2.15 | % | |
| The Hain Celestial Group, Inc. | | | 2.11 | % | |
| Cerner Corp. | | | 2.04 | % | |
| Check Point Software Technologies Ltd | | | 1.90 | % | |
| SoftBank Corp. | | | 1.75 | % | |
| Globus Medical, Inc. – Class A | | | 1.65 | % | |
| USANA Health Sciences, Inc. | | | 1.61 | % | |
| J&J Snack Foods Corp. | | | 1.60 | % | |
| Regus plc | | | 1.58 | % | |
| (1) | Fund holdings and sector allocations are subject to change at any time and are not recommendations to buy or sell any security. |
| (2) | Short-term investments are not included. |
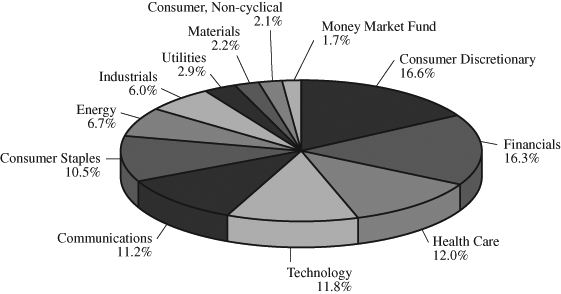
Entrepreneur U.S. All Cap Fund
SECTOR ALLOCATION(1)
June 30, 2016 (Unaudited)
As a Percentage of Portfolio
TOP TEN HOLDINGS
as of June 30, 2016 (Unaudited)(1)(2)
Issuer | | % of Net Assets | |
| United Therapeutics Corp. | | | 1.60 | % | |
| Insperity, Inc. | | | 1.07 | % | |
| National Beverage Corp. | | | 1.05 | % | |
| PRA Group, Inc. | | | 1.01 | % | |
| LGI Homes, Inc. | | | 1.00 | % | |
| MacroGenics, Inc. | | | 0.99 | % | |
| LifeLock, Inc. | | | 0.98 | % | |
| Vascular Solutions, Inc. | | | 0.95 | % | |
| Masimo Corp. | | | 0.94 | % | |
| TASER International, Inc. | | | 0.93 | % | |
| (1) | Fund holdings and sector allocations are subject to change at any time and are not recommendations to buy or sell any security. |
| (2) | Short-term investments are not included. |
Entrepreneur U.S. Large Cap Fund
SECTOR ALLOCATION(1)
June 30, 2016 (Unaudited)
As a Percentage of Portfolio
TOP TEN HOLDINGS
as of June 30, 2016 (Unaudited)(1)
Issuer | | % of Net Assets | |
| Alphabet, Inc. – Class C | | | 3.62 | % | |
| Amazon.com, Inc. | | | 3.18 | % | |
| Facebook, Inc. – Class A | | | 3.14 | % | |
| Apple, Inc. | | | 2.45 | % | |
| Starbucks Corp. | | | 2.01 | % | |
| Exxon Mobil Corp. | | | 1.96 | % | |
| Oracle Corp. | | | 1.79 | % | |
| BlackRock, Inc. | | | 1.71 | % | |
| Cerner Corp. | | | 1.69 | % | |
| Salesforce.com, Inc. | | | 1.69 | % | |
| (1) | Fund holdings and sector allocations are subject to change at any time and are not recommendations to buy or sell any security. |
EntrepreneurShares Series Trust
EXPENSE EXAMPLE
June 30, 2016 (Unaudited)
As a shareholder of the EntrepreneurShares Global Fund, the Entrepreneur U.S. All Cap Fund, or the Entrepreneur U.S. Large Cap Fund (the “Funds”), you incur two types of costs: (1) transaction costs, including redemption fees on shares held less than 5 business days; and (2) ongoing costs, including investment advisory fees, and other expenses for the Funds. This example is intended to help you understand your ongoing costs (in dollars) of investing in the Funds and to compare these costs with the ongoing costs of investing in other mutual funds.
The example is based on an investment of $1,000 invested at the beginning of the period and held the entire period from January 1, 2016 to June 30, 2016.
ACTUAL EXPENSES
The first line of the table below provides information about actual account values and actual expenses. However, the table does not include shareholder specific fees, such as the $15.00 fee charged for wire redemptions by the Funds’ transfer agent. To the extent that the Funds invests in other investment companies as part of its investment strategy, you will indirectly bear your proportional share of any fees and expenses charged by the underlying funds in which the Funds invests in addition to expenses of the Funds. These expenses are not included in the following example. The table also does not include portfolio trading commissions and related trading costs. You may use the information in this line, together with the amount you invested, to estimate the expenses that you paid over the period. Simply divide your account value by $1,000 (for example, an $8,600 account value divided by $1,000 = 8.6), then multiply the result by the number in the first line under the heading entitled “Expenses Paid During Period” to estimate the expenses you paid on your account during the period.
HYPOTHETICAL EXAMPLE FOR COMPARISON PURPOSES
The second line of the table below provides information about hypothetical account values and hypothetical expenses based on the Funds’ actual expense ratios and an assumed rate of return of 5% per year before expenses, which is not the Funds’ actual return. The hypothetical account values and expenses may not be used to estimate the actual ending account balance or expenses you paid for the period. You may use this information to compare the ongoing costs of investing in the Funds and other funds. To do so, compare this 5% hypothetical example with the 5% hypothetical examples that appear in the shareholder reports of the other fund.
Please note that the expenses shown in the table are meant to highlight your ongoing costs only and do not reflect any transactional costs, such as redemptions fees or exchange fees. Therefore, the second line of the table is useful in comparing ongoing costs only, and will not help you determine the relevant total costs of owning different funds. In addition, if these transactional costs were included, your costs would be higher.
EntrepreneurShares Series Trust
EXPENSE EXAMPLE (Continued)
June 30, 2016 (Unaudited)
EntrepreneurShares Global Fund
| | | | Expenses Paid |
| | Beginning | Ending | During Period(1) |
| | Account Value | Account Value | January 1, 2016 – |
| | January 1, 2016 | June 30, 2016 | June 30, 2016 |
Institutional Class – Actual(2) | $1,000.00 | $1,007.70 | $8.49 |
| Institutional Class – Hypothetical | | | |
| (5% return before expenses) | $1,000.00 | $1,016.41 | $8.52 |
| (1) | Expenses are equal to the Fund’s annualized expense ratio of 1.70%, multiplied by the average account value over the period, multiplied by 182/366 to reflect the one-half year period. |
| (2) | Based on actual returns for the six-month period ended June 30, 2016 of 0.77%. |
Entrepreneur U.S. All Cap Fund
| | | | Expenses Paid |
| | Beginning | Ending | During Period(1) |
| | Account Value | Account Value | January 1, 2016 – |
| | January 1, 2016 | June 30, 2016 | June 30, 2016 |
Institutional Class – Actual(2) | $1,000.00 | $1,007.40 | $4.24 |
| Institutional Class – Hypothetical | | | |
| (5% return before expenses) | $1,000.00 | $1,020.64 | $4.27 |
| (1) | Expenses are equal to the Fund’s annualized expense ratio of 0.85%, multiplied by the average account value over the period, multiplied by 182/366 to reflect the one-half year period. |
| (2) | Based on actual returns for the six-month period ended June 30, 2016 of 0.74%. |
Entrepreneur U.S. Large Cap Fund
| | | | Expenses Paid |
| | Beginning | Ending | During Period(1) |
| | Account Value | Account Value | January 1, 2016 – |
| | January 1, 2016 | June 30, 2016 | June 30, 2016 |
Institutional Class – Actual(2) | $1,000.00 | $1,018.20 | $3.76 |
| Institutional Class – Hypothetical | | | |
| (5% return before expenses) | $1,000.00 | $1,021.13 | $3.77 |
| (1) | Expenses are equal to the Fund’s annualized expense ratio of 0.75%, multiplied by the average account value over the period, multiplied by 182/366 to reflect the one-half year period. |
| (2) | Based on actual returns for the six-month period ended June 30, 2016 of 1.82%. |
EntrepreneurShares Global Fund
SCHEDULE OF INVESTMENTS
June 30, 2016
| Shares | | | | Fair Value | |
| | | | | | |
| | | COMMON STOCKS – 94.31% | | | |
| | | | | | |
| | | Asset Management – 2.22% | | | |
| | 37,952 | | Grupo Financiero Interacciones SA de CV (b) | | $ | 185,270 | |
| | 17,972 | | Magellan Financial Group Ltd. (b) | | | 298,229 | |
| | | | | | | 483,499 | |
| | | | | | | | |
| | | | Automotive – 1.15% | | | | |
| | 7,021 | | Linamar Corp. (b) | | | 250,092 | |
| | | | | | | | |
| | | | | | | | |
| | | | Banking – 1.27% | | | | |
| | 13,956 | | Home BancShares, Inc. | | | 276,189 | |
| | | | | | | | |
| | | | | | | | |
| | | | Biotechnology & Pharmaceutical – 7.04% | | | | |
| | 9,250 | | Hikma Pharmaceuticals plc (b) | | | 303,543 | |
| | 8,300 | | United Therapeutics Corp. (a) | | | 879,136 | |
| | 3,143 | | USANA Health Sciences, Inc. (a)(b) | | | 350,225 | |
| | | | | | | 1,532,904 | |
| | | | | | | | |
| | | | Consumer Products – 4.39% | | | | |
| | 9,222 | | The Hain Celestial Group, Inc. (a) | | | 458,794 | |
| | 5,220 | | Inter Parfums, Inc. (b) | | | 149,135 | |
| | 2,915 | | J&J Snack Foods Corp. | | | 347,672 | |
| | 25 | | Wilmar International Ltd. (b) | | | 61 | |
| | | | | | | 955,662 | |
| | | | | | | | |
| | | | Containers & Packaging – 2.85% | | | | |
| | 43,617 | | Cascades, Inc. (b) | | | 308,909 | |
| | 420,000 | | Lee & Man Paper Manufacturing Ltd. (b) | | | 311,288 | |
| | | | | | | 620,197 | |
| | | | | | | | |
| | | | Electrical Equipment – 2.48% | | | | |
| | 12,442 | | Orbotech Ltd. (a)(b) | | | 317,893 | |
| | 7,679 | | Renishaw plc (b) | | | 223,162 | |
| | | | | | | 541,055 | |
| | | | | | | | |
| | | | Gaming, Lodging & Restaurants – 3.57% | | | | |
| | 4,145 | | The Cheesecake Factory, Inc. | | | 199,540 | |
| | 3,726 | | Papa John’s International, Inc. | | | 253,368 | |
| | 5,671 | | Starbucks Corp. | | | 323,928 | |
| | | | | | | 776,836 | |
| | | | | | | | |
| | | | Hardware – 0.87% | | | | |
| | 2,545 | | Nidec Corp. (b) | | | 190,311 | |
| | | | | | | | |
| | | | | | | | |
| | | | Health Care Facilities & Services – 5.40% | | | | |
| | 5,963 | | Molina Healthcare, Inc. (a) | | | 297,554 | |
| | 19,471 | | NMC Health plc (b) | | | 335,675 | |
| | 1,500 | | Universal Health Services, Inc. – Class B | | | 201,150 | |
| | 5,051 | | VCA, Inc. (a) | | | 341,498 | |
| | | | | | | 1,175,877 | |
The accompanying notes are an integral part of these financial statements.
EntrepreneurShares Global Fund
SCHEDULE OF INVESTMENTS (Continued)
June 30, 2016
| Shares | | | | Fair Value | |
| | | | | | |
| | | Institutional Financial Services – 1.46% | | | |
| | 1,246 | | Intercontinental Exchange, Inc. | | $ | 318,926 | |
| | | | | | | | |
| | | | | | | | |
| | | | Iron & Steel – 1.35% | | | | |
| | 11,976 | | Steel Dynamics, Inc. | | | 293,412 | |
| | | | | | | | |
| | | | | | | | |
| | | | Media – 11.35% | | | | |
| | 423 | | Alphabet, Inc. – Class A (a) | | | 297,593 | |
| | 6,985 | | Criteo SA – ADR (a)(b) | | | 320,751 | |
| | 4,100 | | CyberAgent, Inc. (b) | | | 244,972 | |
| | 2,763 | | Facebook, Inc. – Class A (a) | | | 315,756 | |
| | 15,000 | | GMO Internet, Inc. (b) | | | 153,537 | |
| | 23,507 | | Seek Ltd. (b) | | | 266,655 | |
| | 2,955 | | Teleperformance (b) | | | 252,410 | |
| | 3,447 | | VeriSign, Inc. (a) | | | 298,027 | |
| | 14,773 | | Yandex NV – Class A (a)(b) | | | 322,790 | |
| | | | | | | 2,472,491 | |
| | | | | | | | |
| | | | Medical Equipment & Devices – 2.60% | | | | |
| | 2,803 | | Coloplast A/S – Class B (b) | | | 208,156 | |
| | 15,076 | | Globus Medical, Inc. – Class A (a) | | | 359,261 | |
| | | | | | | 567,417 | |
| | | | | | | | |
| | | | Oil, Gas & Coal – 4.43% | | | | |
| | 13,517 | | AltaGas Ltd. (b) | | | 328,522 | |
| | 17,215 | | Kinder Morgan, Inc. | | | 322,265 | |
| | 32,412 | | Subsea 7 SA (a)(b) | | | 314,873 | |
| | | | | | | 965,660 | |
| | | | | | | | |
| | | | Passenger Transportation – 1.34% | | | | |
| | 17,864 | | WestJet Airlines Ltd. (b) | | | 291,477 | |
| | | | | | | | |
| | | | | | | | |
| | | | Real Estate – 4.26% | | | | |
| | 7,846 | | Colliers International Group, Inc. (b) | | | 267,940 | |
| | 30,852 | | Hemfosa Fastigheter AB (b) | | | 315,423 | |
| | 89,633 | | Regus plc (b) | | | 344,848 | |
| | | | | | | 928,211 | |
| | | | | | | | |
| | | | Recreation Facilities & Services – 1.10% | | | | |
| | 10,158 | | Flight Centre Travel Group Ltd. (b) | | | 239,245 | |
| | | | | | | | |
| | | | | | | | |
| | | | Retail – Consumer Staples – 2.95% | | | | |
| | 4,465 | | Dollarama, Inc. (b) | | | 311,733 | |
| | 10,310 | | Whole Foods Market, Inc. | | | 330,126 | |
| | | | | | | 641,859 | |
| | | | | | | | |
| | | | Retail – Discretionary – 8.73% | | | | |
| | 436 | | Amazon.com, Inc. (a) | | | 312,010 | |
| | 3,806 | | L Brands, Inc. | | | 255,497 | |
| | 2,866 | | Luxottica Group S.p.A – ADR (b) | | | 140,033 | |
| | 1,492 | | MercadoLibre, Inc. (b) | | | 209,879 | |
The accompanying notes are an integral part of these financial statements.
EntrepreneurShares Global Fund
SCHEDULE OF INVESTMENTS (Continued)
June 30, 2016
| Shares | | | | Fair Value | |
| | | | | | | | |
| | 2,333 | | Netflix, Inc. (a) | | $ | 213,423 | |
| | 16,800 | | Rakuten, Inc. (b) | | | 179,364 | |
| | 15,133 | | SM Investments Corp. (b) | | | 311,039 | |
| | 109 | | Ted Baker plc (a)(b) | | | 3,514 | |
| | 10,038 | | Urban Outfitters, Inc. (a) | | | 276,045 | |
| | | | | | | 1,900,804 | |
| | | | | | | | |
| | | | Semiconductors – 4.94% | | | | |
| | 7,269 | | ARM Holdings plc – ADR (b) | | | 330,812 | |
| | 3,473 | | IPG Photonics Corp. (a) | | | 277,840 | |
| | 9,761 | | Mellanox Technologies Ltd. (a)(b) | | | 468,138 | |
| | | | | | | 1,076,790 | |
| | | | | | | | |
| | | | Software – 6.45% | | | | |
| | 12,652 | | Atlassian Corp. plc – Class A (a)(b) | | | 327,687 | |
| | 7,580 | | Cerner Corp. (a) | | | 444,188 | |
| | 5,196 | | Check Point Software Technologies Ltd (a)(b) | | | 414,017 | |
| | 5,373 | | Oracle Corp. | | | 219,917 | |
| | | | | | | 1,405,809 | |
| | | | | | | | |
| | | | Specialty Finance – 4.87% | | | | |
| | 9,831 | | Air Lease Corp. (b) | | | 263,274 | |
| | 4,149 | | Capital One Financial Corp. | | | 263,503 | |
| | 3,473 | | LendingTree, Inc. (a) | | | 306,770 | |
| | 9,389 | | PRA Group, Inc. (a) | | | 226,651 | |
| | | | | | | 1,060,198 | |
| | | | | | | | |
| | | | Telecommunications – 1.75% | | | | |
| | 6,800 | | SoftBank Corp. (b) | | | 381,206 | |
| | | | | | | | |
| | | | | | | | |
| | | | Transportation & Logistics – 4.03% | | | | |
| | 2,272 | | FedEx Corp. | | | 344,844 | |
| | 28,276 | | Hornbeck Offshore Services, Inc. (a) | | | 235,822 | |
| | 19,369 | | Swift Transportation Co. (a) | | | 298,476 | |
| | | | | | | 879,142 | |
| | | | | | | | |
| | | | Utilities – 1.46% | | | | |
| | 6,777 | | ITC Holdings Corp. | | | 317,299 | |
| | | | TOTAL COMMON STOCKS (Cost $19,958,427) | | | 20,542,568 | |
| | | | | | | | |
| | | | | | | | |
| | | | REAL ESTATE INVESTMENT TRUSTS (REITs) – 1.47% | | | | |
| | | | | | | | |
| | | | Real Estate – 1.47% | | | | |
| | 9,348 | | The GEO Group, Inc. | | | 319,515 | |
| | | | TOTAL REAL ESTATE INVESTMENT TRUSTS (REITs) (Cost $289,417) | | | 319,515 | |
The accompanying notes are an integral part of these financial statements.
EntrepreneurShares Global Fund
SCHEDULE OF INVESTMENTS (Continued)
June 30, 2016
| Shares | | | | Fair Value | |
| | | | | | |
| | | MONEY MARKET FUNDS – 5.89% | | | |
| | 1,282,587 | | First American Treasury Obligations Fund – Class Z, 0.23% (c) | | $ | 1,282,587 | |
| | | | TOTAL MONEY MARKET FUNDS (Cost $1,282,587) | | | 1,282,587 | |
| | | | | | | | |
| | | | Total Investments (Cost $21,530,431) – 101.67% | | | 22,144,670 | |
| | | | Liabilities in Excess of Other Assets – (1.67)% | | | (363,087 | ) |
| | | | TOTAL NET ASSETS – 100.00% | | $ | 21,781,583 | |
Percentages are stated as a percent of net assets.
ADR – American Depository Receipt
| (a) | Non-income producing security. |
| (b) | Global security, as classified by the Fund’s Investment Advisor, in accordance to the definition in the Fund’s prospectus. |
| (c) | The rate quoted is the annualized seven-day effective yield as of June 30, 2016. |
The accompanying notes are an integral part of these financial statements.
EntrepreneurShares Global Fund
SCHEDULE OF INVESTMENTS (Continued)
June 30, 2016
| | | Percent of Net | |
| Country | | Assets | |
| United States | | | 57.3 | % | |
| Canada | | | 8.1 | % | |
| Israel | | | 5.5 | % | |
| Japan | | | 5.3 | % | |
| Australia | | | 5.2 | % | |
| United Kingdom | | | 4.1 | % | |
| France | | | 2.6 | % | |
| United Arab Emirates | | | 1.5 | % | |
| Russia | | | 1.5 | % | |
| Sweden | | | 1.5 | % | |
| Luxembourg | | | 1.4 | % | |
| Philippines | | | 1.4 | % | |
| Hong Kong | | | 1.4 | % | |
| Jordan | | | 1.4 | % | |
| Argentina | | | 1.0 | % | |
| Denmark | | | 1.0 | % | |
| Mexico | | | 0.9 | % | |
| Italy | | | 0.6 | % | |
| Singapore | | | 0.0 | % | |
| | | | 101.7 | % | |
The accompanying notes are an integral part of these financial statements.
Entrepreneur U.S. All Cap Fund
SCHEDULE OF INVESTMENTS
June 30, 2016
| Shares | | | | Fair Value | |
| | | | | | |
| | | COMMON STOCKS – 90.74% | | | |
| | | | | | |
| | | Aerospace & Defense – 0.93% | | | |
| | 48,883 | | TASER International, Inc. (a) | | $ | 1,216,209 | |
| | | | | | | | |
| | | | | | | | |
| | | | Apparel & Textile Products – 0.60% | | | | |
| | 17,100 | | G-III Apparel Group Ltd. (a) | | | 781,812 | |
| | | | | | | | |
| | | | | | | | |
| | | | Asset Management – 0.79% | | | | |
| | 25,539 | | Cohen & Steers, Inc. | | | 1,032,797 | |
| | | | | | | | |
| | | | | | | | |
| | | | Automotive – 0.68% | | | | |
| | 57,562 | | Gentex Corp. | | | 889,333 | |
| | | | | | | | |
| | | | | | | | |
| | | | Banking – 5.34% | | | | |
| | 22,022 | | Bank of the Ozarks, Inc. | | | 826,265 | |
| | 58,269 | | Fidelity Southern Corp. | | | 913,075 | |
| | 46,412 | | Home BancShares, Inc. | | | 918,494 | |
| | 56,530 | | Live Oak Bancshares, Inc. | | | 797,638 | |
| | 19,100 | | Pinnacle Financial Partners, Inc. | | | 933,035 | |
| | 31,261 | | Preferred Bank | | | 902,661 | |
| | 54,375 | | TriState Capital Holdings, Inc. (a) | | | 746,569 | |
| | 25,158 | | United Bancshares, Inc. | | | 943,677 | |
| | | | | | | 6,981,414 | |
| | | | | | | | |
| | | | Biotechnology & Pharmaceutical – 6.88% | | | | |
| | 9,000 | | Acorda Therapeutics, Inc. (a) | | | 229,545 | |
| | 49,644 | | Albany Molecular Research, Inc. (a) | | | 667,215 | |
| | 24,637 | | Emergent BioSolutions, Inc. (a) | | | 692,792 | |
| | 42,983 | | FibroGen, Inc. (a) | | | 705,351 | |
| | 18,088 | | Intra-Cellular Therapies, Inc. (a) | | | 702,176 | |
| | 20,646 | | Ironwood Pharmaceuticals, Inc. – Class A (a) | | | 269,947 | |
| | 11,662 | | Karyopharm Therapeutics, Inc. (a) | | | 78,252 | |
| | 47,737 | | MacroGenics, Inc. (a) | | | 1,288,422 | |
| | 50,537 | | OPKO Health, Inc. (a) | | | 472,016 | |
| | 7,768 | | Sage Therapeutics, Inc. (a) | | | 234,050 | |
| | 23,413 | | Sangamo BioSciences, Inc. (a) | | | 135,561 | |
| | 6,820 | | TESARO, Inc. (a) | | | 573,221 | |
| | 19,785 | | United Therapeutics Corp. (a) | | | 2,095,627 | |
| | 7,654 | | USANA Health Sciences, Inc. (a) | | | 852,885 | |
| | | | | | | 8,997,060 | |
| | | | | | | | |
| | | | Chemicals – 0.72% | | | | |
| | 69,935 | | Huntsman Corp. | | | 940,626 | |
| | | | | | | | |
| | | | | | | | |
| | | | Commercial Services – 5.16% | | | | |
| | 9,160 | | Cimpress NV (a) | | | 847,117 | |
| | 22,689 | | CorVel Corp. (a) | | | 979,711 | |
| | 56,500 | | The Hackett Group, Inc. | | | 783,655 | |
| | 18,150 | | Insperity, Inc. | | | 1,401,724 | |
| | 81,161 | | LifeLock, Inc. (a) | | | 1,283,155 | |
The accompanying notes are an integral part of these financial statements.
Entrepreneur U.S. All Cap Fund
SCHEDULE OF INVESTMENTS (Continued)
June 30, 2016
| Shares | | | | Fair Value | |
| | | | | | | | |
| | 35,687 | | National Research Corp. – Class A | | $ | 488,912 | |
| | 65,243 | | Resources Connection, Inc. | | | 964,292 | |
| | | | | | | 6,748,566 | |
| | | | | | | | |
| | | | Consumer Products – 4.70% | | | | |
| | 5,103 | | The Boston Beer Co., Inc. – Class A (a) | | | 872,766 | |
| | 22,759 | | The Hain Celestial Group, Inc. (a) | | | 1,132,260 | |
| | 28,373 | | Inter Parfums, Inc. | | | 810,617 | |
| | 8,426 | | J&J Snack Foods Corp. | | | 1,004,969 | |
| | 21,895 | | National Beverage Corp. (a) | | | 1,375,225 | |
| | 26,308 | | Seneca Foods Corp. – Class A (a) | | | 952,613 | |
| | | | | | | 6,148,450 | |
| | | | | | | | |
| | | | Consumer Services – 0.78% | | | | |
| | 42,887 | | Carriage Services, Inc. | | | 1,015,564 | |
| | | | | | | | |
| | | | | | | | |
| | | | Containers & Packaging – 1.52% | | | | |
| | 13,600 | | AEP Industries, Inc. | | | 1,094,256 | |
| | 17,253 | | Silgan Holdings, Inc. | | | 887,839 | |
| | | | | | | 1,982,095 | |
| | | | | | | | |
| | | | Design, Manufacturing & Distribution – 0.75% | | | | |
| | 36,700 | | Sanmina Corp. (a) | | | 983,927 | |
| | | | | | | | |
| | | | | | | | |
| | | | Electrical Equipment – 0.57% | | | | |
| | 12,696 | | OSI Systems, Inc. (a) | | | 738,018 | |
| | | | | | | | |
| | | | | | | | |
| | | | Engineering & Construction Services – 0.71% | | | | |
| | 38,888 | | Mistras Group, Inc. (a) | | | 928,257 | |
| | | | | | | | |
| | | | | | | | |
| | | | Gaming, Lodging & Restaurants – 2.24% | | | | |
| | 17,500 | | The Cheesecake Factory, Inc. | | | 842,450 | |
| | 16,226 | | Papa John’s International, Inc. | | | 1,103,368 | |
| | 21,528 | | Texas Roadhouse, Inc. | | | 981,677 | |
| | | | | | | 2,927,495 | |
| | | | | | | | |
| | | | Hardware – 2.56% | | | | |
| | 19,800 | | Netgear, Inc. (a) | | | 941,292 | |
| | 24,929 | | Super Micro Computer, Inc. (a) | | | 619,486 | |
| | 23,989 | | Ubiquiti Networks, Inc. (a) | | | 927,415 | |
| | 84,688 | | Vicor Corp. (a) | | | 852,808 | |
| | | | | | | 3,341,001 | |
| | | | | | | | |
| | | | Health Care Facilities & Services – 3.75% | | | | |
| | 32,768 | | Diplomat Pharmacy, Inc. (a) | | | 1,146,880 | |
| | 27,120 | | LHC Group, Inc. (a) | | | 1,173,754 | |
| | 13,496 | | Molina Healthcare, Inc. (a) | | | 673,450 | |
| | 15,681 | | PAREXEL International Corp. (a) | | | 986,021 | |
| | 84,935 | | Select Medical Holdings Corp. (a) | | | 923,244 | |
| | | | | | | 4,903,349 | |
The accompanying notes are an integral part of these financial statements.
Entrepreneur U.S. All Cap Fund
SCHEDULE OF INVESTMENTS (Continued)
June 30, 2016
| Shares | | | | Fair Value | |
| | | | | | |
| | | Home & Office Products – 3.83% | | | |
| | 53,995 | | Century Communities, Inc. (a) | | $ | 936,273 | |
| | 41,100 | | LGI Homes, Inc. (a) | | | 1,312,734 | |
| | 25,900 | | Meritage Homes Corp. (a) | | | 972,286 | |
| | 81,048 | | The New Home Co., Inc. (a) | | | 773,198 | |
| | 98,325 | | PGT, Inc. (a) | | | 1,012,748 | |
| | | | | | | 5,007,239 | |
| | | | | | | | |
| | | | Institutional Financial Services – 0.59% | | | | |
| | 34,333 | | Moelis & Co. – Class A | | | 772,492 | |
| | | | | | | | |
| | | | | | | | |
| | | | Insurance – 3.33% | | | | |
| | 61,239 | | American Equity Investment Life Holding Co. | | | 872,656 | |
| | 39,211 | | Citizens, Inc. (a) | | | 298,004 | |
| | 28,897 | | HCI Group, Inc. | | | 788,310 | |
| | 42,308 | | National General Holdings Corp. | | | 906,237 | |
| | 80,257 | | RPX Corp. (a) | | | 735,957 | |
| | 70,700 | | State National Co., Inc. | | | 744,471 | |
| | | | | | | 4,345,635 | |
| | | | | | | | |
| | | | Iron & Steel – 0.80% | | | | |
| | 42,640 | | Steel Dynamics, Inc. | | | 1,044,680 | |
| | | | | | | | |
| | | | | | | | |
| | | | Media – 3.74% | | | | |
| | 116,449 | | Entravision Communications Corp. – Class A | | | 782,537 | |
| | 43,814 | | HealthStream, Inc. (a) | | | 1,161,947 | |
| | 19,263 | | Nexstar Broadcasting Group, Inc. – Class A | | | 916,534 | |
| | 23,957 | | Shutterstock, Inc. (a) | | | 1,097,231 | |
| | 50,800 | | World Wrestling Entertainment, Inc. – Class A | | | 935,228 | |
| | | | | | | 4,893,477 | |
| | | | | | | | |
| | | | Medical Equipment & Devices – 3.35% | | | | |
| | 39,626 | | Globus Medical, Inc. – Class A (a) | | | 944,287 | |
| | 23,427 | | Masimo Corp. (a) | | | 1,230,269 | |
| | 48,600 | | Merit Medical Systems, Inc. (a) | | | 963,738 | |
| | 29,709 | | Vascular Solutions, Inc. (a) | | | 1,237,677 | |
| | | | | | | 4,375,971 | |
| | | | | | | | |
| | | | Metals & Mining – 0.56% | | | | |
| | 55,800 | | Hi-Crush Partners LP | | | 729,306 | |
| | | | | | | | |
| | | | | | | | |
| | | | Oil, Gas & Coal – 1.92% | | | | |
| | 214,671 | | Northern Oil and Gas, Inc. (a) | | | 991,780 | |
| | 31,200 | | Western Refining, Inc. | | | 643,656 | |
| | 18,500 | | World Fuel Services Corp. | | | 878,565 | |
| | | | | | | 2,514,001 | |
| | | | | | | | |
| | | | Renewable Energy – 0.58% | | | | |
| | 174,722 | | Ameresco, Inc. – Class A (a) | | | 763,535 | |
The accompanying notes are an integral part of these financial statements.
Entrepreneur U.S. All Cap Fund
SCHEDULE OF INVESTMENTS (Continued)
June 30, 2016
| Shares | | | | Fair Value | |
| | | | | | |
| | | Retail – Consumer Staples – 1.47% | | | |
| | 42,442 | | Ollie’s Bargain Outlet Holdings, Inc. (a) | | $ | 1,056,382 | |
| | 27,160 | | Whole Foods Market, Inc. | | | 869,663 | |
| | | | | | | 1,926,045 | |
| | | | | | | | |
| | | | Retail – Discretionary – 2.07% | | | | |
| | 115,500 | | 1-800-Flowers.com, Inc. – Class A (a) | | | 1,041,810 | |
| | 18,166 | | Dick’s Sporting Goods, Inc. | | | 818,560 | |
| | 49,420 | | Sonic Automotive, Inc. – Class A | | | 845,576 | |
| | | | | | | 2,705,946 | |
| | | | | | | | |
| | | | Semiconductors – 3.14% | | | | |
| | 20,021 | | Ambarella, Inc. (a) | | | 1,017,267 | |
| | 143,785 | | Amkor Technology, Inc. (a) | | | 826,764 | |
| | 8,580 | | IPG Photonics Corp. (a) | | | 686,400 | |
| | 65,632 | | IXYS Corp. | | | 672,728 | |
| | 13,207 | | Monolithic Power Systems, Inc. | | | 902,302 | |
| | | | | | | 4,105,461 | |
| | | | | | | | |
| | | | Software – 6.97% | | | | |
| | 32,275 | | Envestnet, Inc. (a) | | | 1,075,080 | |
| | 162,997 | | Lionbridge Technologies, Inc. (a) | | | 643,838 | |
| | 15,373 | | LogMeIn, Inc. (a) | | | 975,110 | |
| | 32,300 | | Omnicell, Inc. (a) | | | 1,105,629 | |
| | 23,906 | | Paycom Software, Inc. (a) | | | 1,032,978 | |
| | 58,069 | | PDF Solutions, Inc. (a) | | | 812,385 | |
| | 32,056 | | Pegasystems, Inc. | | | 863,909 | |
| | 38,615 | | Rackspace Hosting, Inc. (a) | | | 805,509 | |
| | 25,854 | | Synchronoss Technologies, Inc. (a) | | | 823,709 | |
| | 53,723 | | VASCO Data Security International, Inc. (a) | | | 880,520 | |
| | 19,825 | | Zedge, Inc. – Class B (a) | | | 90,997 | |
| | | | | | | 9,109,664 | |
| | | | | | | | |
| | | | Specialty Finance – 7.28% | | | | |
| | 27,667 | | Air Lease Corp. | | | 740,922 | |
| | 2,609 | | AMERCO | | | 977,201 | |
| | 4,685 | | Credit Acceptance Corp. (a) | | | 867,100 | |
| | 10,471 | | Ellie Mae, Inc. (a) | | | 959,667 | |
| | 11,299 | | Euronet Worldwide, Inc. (a) | | | 781,778 | |
| | 42,092 | | Green Dot Corp. – Class A (a) | | | 967,695 | |
| | 33,126 | | HFF, Inc. – Class A | | | 956,679 | |
| | 9,950 | | LendingTree, Inc. (a) | | | 878,883 | |
| | 41,490 | | Liberty Tax, Inc. | | | 552,647 | |
| | 60,304 | | NewStar Financial, Inc. (a) | | | 507,760 | |
| | 54,717 | | PRA Group, Inc. (a) | | | 1,320,868 | |
| | | | | | | 9,511,200 | |
The accompanying notes are an integral part of these financial statements.
Entrepreneur U.S. All Cap Fund
SCHEDULE OF INVESTMENTS (Continued)
June 30, 2016
| Shares | | | | Fair Value | |
| | | | | | |
| | | Technology Services – 6.22% | | | |
| | 11,242 | | EPAM Systems, Inc. (a) | | $ | 722,973 | |
| | 16,098 | | ExlService Holdings, Inc. (a) | | | 843,696 | |
| | 24,501 | | Forrester Research, Inc. | | | 903,107 | |
| | 25,422 | | ManTech International Corp. – Class A | | | 961,460 | |
| | 7,300 | | MarketAxess Holdings, Inc. | | | 1,061,420 | |
| | 25,805 | | Medidata Solutions, Inc. (a) | | | 1,209,480 | |
| | 45,029 | | NIC, Inc. | | | 987,936 | |
| | 28,919 | | TeleTech Holdings, Inc. | | | 784,572 | |
| | 22,720 | | Virtusa Corp. (a) | | | 656,154 | |
| | | | | | | 8,130,798 | |
| | | | | | | | |
| | | | Telecommunications – 2.79% | | | | |
| | 24,200 | | Cogent Communications Holdings, Inc. | | | 969,452 | |
| | 51,316 | | General Communication, Inc. – Class A (a) | | | 810,793 | |
| | 59,476 | | IDT Corp. – Class B | | | 843,964 | |
| | 51,588 | | RingCentral, Inc. – Class A (a) | | | 1,017,315 | |
| | | | | | | 3,641,524 | |
| | | | | | | | |
| | | | Transportation & Logistics – 1.87% | | | | |
| | 97,700 | | Hornbeck Offshore Services, Inc. (a) | | | 814,818 | |
| | 55,352 | | Swift Transportation Co. (a) | | | 852,974 | |
| | 33,900 | | Werner Enterprises, Inc. | | | 778,683 | |
| | | | | | | 2,446,475 | |
| | | | | | | | |
| | | | Utilities – 0.79% | | | | |
| | 22,169 | | ITC Holdings Corp. | | | 1,037,953 | |
| | | | | | | | |
| | | | | | | | |
| | | | Waste & Environmental Services & Equipment – 0.76% | | | | |
| | 18,946 | | Clean Harbors, Inc. (a) | | | 987,276 | |
| | | | TOTAL COMMON STOCKS (Cost $115,657,838) | | | 118,604,651 | |
| | | | | | | | |
| | | | REAL ESTATE INVESTMENT TRUSTS (REITs) – 6.10% | | | | |
| | | | | | | | |
| | | | Real Estate – 6.10% | | | | |
| | 23,873 | | American Assets Trust, Inc. | | | 1,013,170 | |
| | 29,153 | | The GEO Group, Inc. | | | 996,450 | |
| | 30,937 | | Healthcare Realty Trust, Inc. | | | 1,082,486 | |
| | 73,125 | | Medical Properties Trust, Inc. | | | 1,112,231 | |
| | 80,038 | | Monmouth Real Estate Investment Corp. | | | 1,061,304 | |
| | 32,100 | | Pebblebrook Hotel Trust | | | 842,625 | |
| | 40,084 | | RLJ Lodging Trust | | | 859,802 | |
| | 38,998 | | Terreno Realty Corp. | | | 1,008,878 | |
| | | | TOTAL REAL ESTATE INVESTMENT TRUSTS (REITs) (Cost $7,739,090) | | | 7,976,946 | |
The accompanying notes are an integral part of these financial statements.
Entrepreneur U.S. All Cap Fund
SCHEDULE OF INVESTMENTS (Continued)
June 30, 2016
| Shares | | | | Fair Value | |
| | | | | | |
| | | MONEY MARKET FUNDS – 3.17% | | | |
| | 4,138,217 | | First American Treasury Obligations Fund – Class Z, 0.23% (b) | | $ | 4,138,217 | |
| | | | TOTAL MONEY MARKET FUNDS (Cost $4,138,217) | | | 4,138,217 | |
| | | | | | | | |
| | | | Total Investments (Cost $127,535,145) – 100.01% | | | 130,719,814 | |
| | | | Liabilities in Excess of Other Assets – (0.01)% | | | (14,427 | ) |
| | | | TOTAL NET ASSETS – 100.00% | | $ | 130,705,387 | |
Percentages are stated as a percent of net assets.
| (a) | Non-income producing security. |
| (b) | The rate quoted is the annualized seven-day effective yield as of June 30, 2016. |
Entrepreneur U.S. Large Cap Fund
SCHEDULE OF INVESTMENTS
June 30, 2016
| Shares | | | | Fair Value | |
| | | | | | |
| | | COMMON STOCKS – 95.91% | | | |
| �� | | | | | |
| | | Aerospace & Defense – 0.69% | | | |
| | 4,697 | | The Boeing Co. | | $ | 609,999 | |
| | | | | | | | |
| | | | Apparel & Textile Products – 2.95% | | | | |
| | 12,863 | | Michael Kors Holdings, Ltd. (a) | | | 636,461 | |
| | 8,501 | | NIKE, Inc. – Class B | | | 469,255 | |
| | 32,530 | | Under Armour, Inc. – Class A (a) | | | 1,305,429 | |
| | 5,608 | | Under Armour, Inc. – Class C (a) | | | 204,114 | |
| | | | | | | 2,615,259 | |
| | | | Asset Management – 1.71% | | | | |
| | 4,429 | | BlackRock, Inc. | | | 1,517,065 | |
| | | | | | | | |
| | | | Banking – 2.95% | | | | |
| | 14,930 | | JPMorgan Chase & Co. | | | 927,750 | |
| | 7,439 | | M&T Bank Corp. | | | 879,513 | |
| | 6,443 | | Signature Bank (a) | | | 804,860 | |
| | | | | | | 2,612,123 | |
| | | | Biotechnology & Pharmaceutical – 7.21% | | | | |
| | 16,498 | | Gilead Sciences, Inc. | | | 1,376,263 | |
| | 5,726 | | Jazz Pharmaceuticals plc (a) | | | 809,141 | |
| | 17,580 | | Medivation, Inc. (a) | | | 1,060,074 | |
| | 20,748 | | Pfizer, Inc. | | | 730,537 | |
| | 3,770 | | Regeneron Pharmaceuticals, Inc. (a) | | | 1,316,597 | |
| | 10,310 | | United Therapeutics Corp. (a) | | | 1,092,035 | |
| | | | | | | 6,384,647 | |
| | | | Chemicals – 2.23% | | | | |
| | 4,298 | | Air Products and Chemicals, Inc. | | | 610,488 | |
| | 8,549 | | The Dow Chemical Co. | | | 424,971 | |
| | 69,462 | | Huntsman Corp. | | | 934,264 | |
| | | | | | | 1,969,723 | |
| | | | Commercial Services – 1.09% | | | | |
| | 9,832 | | Cintas Corp. | | | 964,814 | |
| | | | | | | | |
| | | | Consumer Products – 6.78% | | | | |
| | 10,146 | | Brown-Forman Corp. – Class B | | | 1,012,165 | |
| | 12,583 | | The Coca-Cola Co. | | | 570,387 | |
| | 7,704 | | Constellation Brands, Inc. – Class A | | | 1,274,242 | |
| | 7,533 | | The JM Smucker Co. | | | 1,148,105 | |
| | 6,649 | | Monster Beverage Corp. (a) | | | 1,068,561 | |
| | 10,899 | | The Procter & Gamble Co. | | | 922,818 | |
| | | | | | | 5,996,278 | |
| | | | Electrical Equipment – 2.06% | | | | |
| | 38,640 | | General Electric Co. | | | 1,216,387 | |
The accompanying notes are an integral part of these financial statements.
Entrepreneur U.S. Large Cap Fund
SCHEDULE OF INVESTMENTS (Continued)
June 30, 2016
| Shares | | | | Fair Value | |
| | | | | | | | |
| | 5,202 | | Honeywell International, Inc. | | $ | 605,097 | |
| | | | | | | 1,821,484 | |
| | | | | | | | |
| | | | Gaming, Lodging & Restaurants – 3.41% | | | | |
| | 3,058 | | Chipotle Mexican Grill, Inc. (a) | | | 1,231,640 | |
| | 31,202 | | Starbucks Corp. | | | 1,782,258 | |
| | | | | | | 3,013,898 | |
| | | | | | | | |
| | | | Hardware – 2.96% | | | | |
| | 22,647 | | Apple, Inc. | | | 2,165,053 | |
| | 7,036 | | Arista Networks, Inc. (a) | | | 452,978 | |
| | | | | | | 2,618,031 | |
| | | | | | | | |
| | | | Health Care Facilities & Services – 3.25% | | | | |
| | 10,050 | | UnitedHealth Group, Inc. | | | 1,419,060 | |
| | 10,877 | | Universal Health Services, Inc. – Class B | | | 1,458,606 | |
| | | | | | | 2,877,666 | |
| | | | | | | | |
| | | | Home & Office Products – 0.63% | | | | |
| | 2,950 | | Mohawk Industries, Inc. (a) | | | 559,792 | |
| | | | | | | | |
| | | | | | | | |
| | | | Industrial Services – 0.66% | | | | |
| | 2,565 | | W.W. Grainger, Inc. | | | 582,896 | |
| | | | | | | | |
| | | | | | | | |
| | | | Institutional Financial Services – 2.26% | | | | |
| | 3,494 | | The Goldman Sachs Group, Inc. | | | 519,139 | |
| | 5,795 | | Intercontinental Exchange, Inc. | | | 1,483,288 | |
| | | | | | | 2,002,427 | |
| | | | | | | | |
| | | | Insurance – 4.90% | | | | |
| | 12,724 | | Aflac, Inc. | | | 918,164 | |
| | 12,304 | | American Financial Group, Inc. | | | 909,635 | |
| | 4 | | Berkshire Hathaway, Inc. – Class A (a) | | | 867,900 | |
| | 5,086 | | Berkshire Hathaway, Inc. – Class B (a) | | | 736,402 | |
| | 22,069 | | Loews Corp. | | | 906,815 | |
| | | | | | | 4,338,916 | |
| | | | | | | | |
| | | | Media – 9.37% | | | | |
| | 276 | | Alphabet, Inc. – Class A (a) | | | 194,174 | |
| | 4,627 | | Alphabet, Inc. – Class C (a) | | | 3,202,347 | |
| | 10,104 | | Comcast Corp. – Class A | | | 658,680 | |
| | 24,344 | | Facebook, Inc. – Class A (a) | | | 2,782,032 | |
| | 16,874 | | VeriSign, Inc. (a) | | | 1,458,926 | |
| | | | | | | 8,296,159 | |
| | | | | | | | |
| | | | Medical Equipment & Devices – 3.64% | | | | |
| | 11,243 | | Danaher Corp. | | | 1,135,543 | |
| | 1,719 | | Intuitive Surgical, Inc. (a) | | | 1,136,964 | |
| | 6,717 | | Waters Corp. (a) | | | 944,746 | |
| | | | | | | 3,217,253 | |
The accompanying notes are an integral part of these financial statements.
Entrepreneur U.S. Large Cap Fund
SCHEDULE OF INVESTMENTS (Continued)
June 30, 2016
| Shares | | | | Fair Value | |
| | | | | | |
| | | Oil, Gas & Coal – 6.74% | | | |
| | 8,885 | | Chevron Corp. | | $ | 931,414 | |
| | 14,834 | | Continental Resources, Inc. (a) | | | 671,535 | |
| | 18,463 | | Exxon Mobil Corp. | | | 1,730,722 | |
| | 62,200 | | Kinder Morgan, Inc. | | | 1,164,384 | |
| | 20,980 | | Noble Energy, Inc. | | | 752,553 | |
| | 9,517 | | Tesoro Corp. | | | 713,014 | |
| | | | | | | 5,963,622 | |
| | | | | | | | |
| | | | Retail – Consumer Staples – 3.71% | | | | |
| | 7,808 | | Costco Wholesale Corp. | | | 1,226,168 | |
| | 9,373 | | Walgreens Boots Alliance, Inc. | | | 780,490 | |
| | 39,920 | | Whole Foods Market, Inc. | | | 1,278,238 | |
| | | | | | | 3,284,896 | |
| | | | | | | | |
| | | | Retail – Discretionary – 8.56% | | | | |
| | 3,927 | | Amazon.com, Inc. (a) | | | 2,810,240 | |
| | 21,333 | | L Brands, Inc. | | | 1,432,084 | |
| | 15,076 | | Netflix, Inc. (a) | | | 1,379,152 | |
| | 2,488 | | O’Reilly Automotive, Inc. (a) | | | 674,497 | |
| | 46,457 | | Urban Outfitters, Inc. (a) | | | 1,277,568 | |
| | | | | | | 7,573,541 | |
| | | | | | | | |
| | | | Semiconductors – 2.65% | | | | |
| | 11,506 | | IPG Photonics Corp. (a) | | | 920,480 | |
| | 30,284 | | NVIDIA Corp. | | | 1,423,651 | |
| | | | | | | 2,344,131 | |
| | | | | | | | |
| | | | Software – 6.19% | | | | |
| | 15,994 | | Akamai Technologies, Inc. (a) | | | 894,545 | |
| | 25,596 | | Cerner Corp. (a) | | | 1,499,926 | |
| | 38,694 | | Oracle Corp. | | | 1,583,745 | |
| | 18,871 | | Salesforce.com, Inc. (a) | | | 1,498,546 | |
| | | | | | | 5,476,762 | |
| | | | | | | | |
| | | | Specialty Finance – 2.02% | | | | |
| | 1,282 | | AMERCO | | | 480,173 | |
| | 20,539 | | Capital One Financial Corp. | | | 1,304,432 | |
| | | | | | | 1,784,605 | |
| | | | | | | | |
| | | | Telecommunications – 1.82% | | | | |
| | 19,777 | | AT&T, Inc. | | | 854,564 | |
| | 27,151 | | Zayo Group Holdings, Inc. (a) | | | 758,327 | |
| | | | | | | 1,612,891 | |
| | | | | | | | |
| | | | Transportation & Logistics – 1.59% | | | | |
| | 9,287 | | FedEx Corp. | | | 1,409,581 | |
| | | | | | | | |
| | | | | | | | |
| | | | Transportation Equipment – 1.02% | | | | |
| | 17,320 | | PACCAR, Inc. | | | 898,388 | |
The accompanying notes are an integral part of these financial statements.
Entrepreneur U.S. Large Cap Fund
SCHEDULE OF INVESTMENTS (Continued)
June 30, 2016
| Shares | | | | Fair Value | |
| | | | | | |
| | | Utilities – 2.86% | | | |
| | 11,245 | | Dominion Resources, Inc. | | $ | 876,323 | |
| | 16,350 | | ITC Holdings Corp. | | | 765,507 | |
| | 6,818 | | NextEra Energy, Inc. | | | 889,067 | |
| | | | | | | 2,530,897 | |
| | | | TOTAL COMMON STOCKS (Cost $80,272,442) | | | 84,877,744 | |
| | | | | | | | |
| | | | | | | | |
| | | | REAL ESTATE INVESTMENT TRUSTS (REITs) – 2.46% | | | | |
| | | | | | | | |
| | | | Real Estate – 2.46% | | | | |
| | 7,019 | | Boston Properties, Inc. | | | 925,806 | |
| | 7,746 | | Extra Space Storage, Inc. | | | 716,815 | |
| | 5,368 | | Vornado Realty Trust | | | 537,444 | |
| | | | TOTAL REAL ESTATE INVESTMENT TRUSTS (REITs) (Cost $2,154,684) | | | 2,180,065 | |
| | | | | | | | |
| | | | | | | | |
| | | | MONEY MARKET FUNDS – 1.66% | | | | |
| | 1,464,613 | | First American Treasury Obligations Fund – Class Z, 0.23% (b) | | | 1,464,613 | |
| | | | TOTAL MONEY MARKET FUNDS (Cost $1,464,613) | | | 1,464,613 | |
| | | | | | | | |
| | | | Total Investments (Cost $83,891,739) – 100.03% | | | 88,522,422 | |
| | | | Liabilities in Excess of Other Assets – (0.03)% | | | (27,540 | ) |
| | | | TOTAL NET ASSETS – 100.00% | | $ | 88,494,882 | |
Percentages are stated as a percent of net assets.
| (a) | Non-income producing security. |
| (b) | The rate quoted is the annualized seven-day effective yield as of June 30, 2016. |
The accompanying notes are an integral part of these financial statements.
EntrepreneurShares Series Trust
STATEMENTS OF ASSETS AND LIABILITIES
June 30, 2016
| | | EntrepreneurShares | | | Entrepreneur | | | Entrepreneur | |
| | | Global | | | U.S. All Cap | | | U.S. Large Cap | |
| | | Fund | | | Fund | | | Fund | |
| ASSETS: | | | | | | | | | |
Investments, at fair value(1) | | $ | 22,144,670 | | | $ | 130,719,814 | | | $ | 88,522,422 | |
| Cash | | | 1,633 | | | | — | | | | — | |
| Foreign currency (Cost 126,694) | | | 127,257 | | | | — | | | | — | |
| Dividend and interest receivable | | | 14,800 | | | | 99,926 | | | | 43,604 | |
| Receivable from Fund shares sold | | | — | | | | — | | | | 4,894 | |
| Other assets | | | 7,364 | | | | 9,886 | | | | 8,973 | |
| Total Assets | | | 22,295,724 | | | | 130,829,626 | | | | 88,579,893 | |
| | | | | | | | | | | | | |
| LIABILITIES: | | | | | | | | | | | | |
| Payable for investments purchased | | | 465,780 | | | | — | | | | — | |
| Payable for Fund shares redeemed | | | — | | | | — | | | | 5,237 | |
| Payable to Investment Advisor | | | 15,845 | | | | 78,876 | | | | 40,941 | |
| Payable to Trustees | | | 339 | | | | 2,165 | | | | 1,496 | |
| Other accrued expenses | | | 32,177 | | | | 43,198 | | | | 37,337 | |
| Total Liabilities | | | 514,141 | | | | 124,239 | | | | 85,011 | |
| | | | | | | | | | | | | |
| NET ASSETS | | $ | 21,781,583 | | | $ | 130,705,387 | | | $ | 88,494,882 | |
| | | | | | | | | | | | | |
| NET ASSETS CONSIST OF: | | | | | | | | | | | | |
| Capital stock | | $ | 21,437,000 | | | $ | 133,890,009 | | | $ | 83,294,673 | |
| Accumulated net investment income (loss) | | | (70,663 | ) | | | 219,762 | | | | 268,905 | |
| Accumulated net realized gain (loss) on investments | | | (196,598 | ) | | | (6,589,053 | ) | | | 300,621 | |
| Unrealized appreciation (depreciation) on: | | | | | | | | | | | | |
| Investments | | | 614,239 | | | | 3,184,669 | | | | 4,630,683 | |
| Foreign Currency translations | | | (2,395 | ) | | | — | | | | — | |
| Net Assets | | $ | 21,781,583 | | | $ | 130,705,387 | | | $ | 88,494,882 | |
| | | | | | | | | | | | | |
| NET ASSETS CONSIST OF: | | | | | | | | | | | | |
| Institutional Class | | | | | | | | | | | | |
| Net Assets | | $ | 21,781,583 | | | $ | 130,705,387 | | | $ | 88,494,882 | |
| Shares issued and outstanding | | | 1,844,886 | | | | 13,441,865 | | | | 8,311,301 | |
Net asset value, offering and redemption price per share(2) | | | | | | | | | | | | |
| (Unlimited shares of no par value authorized) | | $ | 11.81 | | | $ | 9.72 | | | $ | 10.65 | |
| | | | | | | | | | | | | |
| (1) Cost of investments | | $ | 21,530,431 | | | $ | 127,535,145 | | | $ | 83,891,739 | |
| (2) | If applicable, redemption price per share may be reduced by a 2.00% redemption fee for shares redeemed within five days of purchase. |
The accompanying notes are an integral part of these financial statements.
EntrepreneurShares Series Trust
STATEMENTS OF OPERATIONS
For the year ended June 30, 2016
| | | EntrepreneurShares | | | Entrepreneur | | | Entrepreneur | |
| | | Global | | | U.S. All Cap | | | U.S. Large Cap | |
| | | Fund | | | Fund | | | Fund | |
| | | | | | | | | | |
| INVESTMENT INCOME: | | | | | | | | | |
| Dividend income* | | $ | 90,571 | | | $ | 1,307,416 | | | $ | 1,180,920 | |
| Interest income | | | 432 | | | | 7,782 | | | | 3,448 | |
| Total investment income | | | 91,003 | | | | 1,315,198 | | | | 1,184,368 | |
| | | | | | | | | | | | | |
| EXPENSES: | | | | | | | | | | | | |
| Investment advisory fees | | | 103,951 | | | | 966,368 | | | | 540,811 | |
| Custody fees | | | 27,244 | | | | 6,413 | | | | 5,755 | |
| Transfer agent fees and expenses | | | 22,606 | | | | 27,312 | | | | 27,915 | |
| Professional fees | | | 18,207 | | | | 30,077 | | | | 22,930 | |
| Federal and state registration fees | | | 15,713 | | | | 6,139 | | | | 9,509 | |
| Fund accounting fees | | | 11,114 | | | | 53,425 | | | | 32,673 | |
| Administration fees | | | 5,736 | | | | 49,359 | | | | 31,995 | |
| Other fees | | | 3,942 | | | | 13,475 | | | | 8,634 | |
| Printing and mailing fees | | | 655 | | | | 5,703 | | | | 4,162 | |
| Trustee fees | | | 650 | | | | 9,350 | | | | 6,005 | |
| Total expenses | | | 209,818 | | | | 1,167,621 | | | | 690,389 | |
| Fees waived | | | (68,444 | ) | | | (72,431 | ) | | | (66,377 | ) |
| Net expenses | | | 141,374 | | | | 1,095,190 | | | | 624,012 | |
| NET INVESTMENT INCOME (LOSS) | | | (50,371 | ) | | | 220,008 | | | | 560,356 | |
| | | | | | | | | | | | | |
| REALIZED AND UNREALIZED GAIN (LOSS) | | | | | | | | | | | | |
| ON INVESTMENTS AND FOREIGN | | | | | | | | | | | | |
| CURRENCY TRANSACTIONS: | | | | | | | | | | | | |
| Net realized gain (loss) on: | | | | | | | | | | | | |
| Investments | | | 643,069 | | | | (6,339,835 | ) | | | 382,688 | |
| Foreign currency transactions | | | 19,755 | | | | — | | | | — | |
| Change in unrealized depreciation on: | | | | | | | | | | | | |
| Investments | | | (587,648 | ) | | | (7,512,069 | ) | | | (1,099,422 | ) |
| Foreign currency translations | | | (1,955 | ) | | | — | | | | — | |
| Net gain (loss) on investments | | | 73,221 | | | | (13,851,904 | ) | | | (716,734 | ) |
| NET INCREASE (DECREASE) IN NET ASSETS | | | | | | | | | | | | |
| RESULTING FROM OPERATIONS | | $ | 22,850 | | | $ | (13,631,896 | ) | | $ | (156,378 | ) |
| * Net of foreign tax withheld of: | | $ | 6,033 | | | $ | — | | | $ | — | |
The accompanying notes are an integral part of these financial statements.
EntrepreneurShares Global Fund
STATEMENTS OF CHANGES IN NET ASSETS
| | | Year Ended | | | Year Ended | |
| | | June 30, 2016 | | | June 30, 2015 | |
| OPERATIONS: | | | | | | |
| Net investment loss | | $ | (50,371 | ) | | $ | (114,796 | ) |
| Net realized gain on investment transactions | | | | | | | | |
| and foreign currency transactions | | | 662,824 | | | | 2,706,569 | |
| Change in unrealized depreciation on investments | | | | | | | | |
| and foreign currency translations | | | (589,603 | ) | | | (2,162,836 | ) |
| Net increase in net assets resulting from operations | | | 22,850 | | | | 428,937 | |
| | | | | | | | | |
| CAPITAL SHARE TRANSACTIONS: | | | | | | | | |
| Institutional Class | | | | | | | | |
| Proceeds from shares sold | | | 16,774,056 | | | | 133,900 | |
| Proceeds from reinvestment of distributions | | | 6,834 | | | | 1,895,169 | |
| Payment for shares redeemed | | | (519,837 | ) | | | (6,145,859 | ) |
Payment for shares redeemed from redemption-in-kind(1) | | | — | | | | (12,869,830 | ) |
| Net increase (decrease) in net assets from capital share transactions | | | 16,261,053 | | | | (16,986,620 | ) |
| | | | | | | | | |
| DISTRIBUTIONS TO SHAREHOLDERS: | | | | | | | | |
| Institutional Class | | | | | | | | |
| From ordinary income | | | (19,570 | ) | | | — | |
| From realized gains | | | — | | | | (2,327,121 | ) |
| Total distributions | | | (19,570 | ) | | | (2,327,121 | ) |
| | | | | | | | | |
| INCREASE (DECREASE) IN NET ASSETS | | | 16,264,333 | | | | (18,884,804 | ) |
| | | | | | | | | |
| NET ASSETS: | | | | | | | | |
| Beginning of Year | | | 5,517,250 | | | | 24,402,054 | |
| End of Year* | | $ | 21,781,583 | | | $ | 5,517,250 | |
| * Including undistributed net investment loss of: | | $ | (70,663 | ) | | $ | (43,924 | ) |
| (1) | See Note 9 of the Financial Statements. |
The accompanying notes are an integral part of these financial statements.
Entrepreneur U.S. All Cap Fund
STATEMENTS OF CHANGES IN NET ASSETS
| | | Year Ended | | | Year Ended | |
| | | June 30, 2016 | | | June 30, 2015 | |
| OPERATIONS: | | | | | | |
| Net investment income (loss) | | $ | 220,008 | | | $ | (48,093 | ) |
| Net realized gain (loss) on investments | | | (6,339,835 | ) | | | 8,276,600 | |
| Change in unrealized appreciation (depreciation) on investments | | | (7,512,069 | ) | | | 1,471,680 | |
| Net increase (decrease) in net assets resulting from operations | | | (13,631,896 | ) | | | 9,700,187 | |
| | | | | | | | | |
| CAPITAL SHARE TRANSACTIONS: | | | | | | | | |
| Institutional Class | | | | | | | | |
| Proceeds from shares sold | | | 1,373,478 | | | | 15,500 | |
| Proceeds from reinvestment of distributions | | | 7,672,249 | | | | 60,861 | |
| Payment for shares redeemed | | | (157,501 | ) | | | (16,096 | ) |
| Net increase in net assets from capital share transactions | | | 8,888,226 | | | | 60,265 | |
| | | | | | | | | |
| DISTRIBUTIONS TO SHAREHOLDERS: | | | | | | | | |
| Institutional Class | | | | | | | | |
| From ordinary income | | | (24,155 | ) | | | (60,866 | ) |
| From realized gains | | | (7,648,839 | ) | | | — | |
| Total distributions | | | (7,672,994 | ) | | | (60,866 | ) |
| | | | | | | | | |
| INCREASE (DECREASE) IN NET ASSETS | | | (12,416,664 | ) | | | 9,699,586 | |
| | | | | | | | | |
| NET ASSETS: | | | | | | | | |
| Beginning of Year | | | 143,122,051 | | | | 133,422,465 | |
| End of Year* | | $ | 130,705,387 | | | $ | 143,122,051 | |
| * Including undistributed net investment income of: | | $ | 219,792 | | | $ | 19,256 | |
The accompanying notes are an integral part of these financial statements.
Entrepreneur U.S. Large Cap Fund
STATEMENTS OF CHANGES IN NET ASSETS
| | | Year Ended | | | Year Ended | |
| | | June 30, 2016 | | | June 30, 2015 | |
| OPERATIONS: | | | | | | |
| Net investment income | | $ | 560,356 | | | $ | 288,519 | |
| Net realized gain (loss) on investments | | | 382,688 | | | | (103,676 | ) |
| Change in unrealized appreciation (depreciation) on investments | | | (1,099,422 | ) | | | 5,742,947 | |
| Net increase (decrease) in net assets resulting from operations | | | (156,378 | ) | | | 5,927,790 | |
| | | | | | | | | |
| CAPITAL SHARE TRANSACTIONS: | | | | | | | | |
| Institutional Class | | | | | | | | |
| Proceeds from shares sold | | | 6,798,752 | | | | 2,301,089 | |
| Proceeds from reinvestment of distributions | | | 505,604 | | | | 50,450 | |
| Payment for shares redeemed | | | (1,125,568 | ) | | | (248,963 | ) |
| Net increase in net assets from capital share transactions | | | 6,178,788 | | | | 2,102,576 | |
| | | | | | | | | |
| DISTRIBUTIONS TO SHAREHOLDERS: | | | | | | | | |
| Institutional Class | | | | | | | | |
| From ordinary income | | | (508,011 | ) | | | (50,453 | ) |
| Total distributions | | | (508,011 | ) | | | (50,453 | ) |
| | | | | | | | | |
| INCREASE IN NET ASSETS | | | 5,514,399 | | | | 7,979,913 | |
| | | | | | | | | |
| NET ASSETS: | | | | | | | | |
| Beginning of Year | | | 82,980,483 | | | | 75,000,570 | |
| End of Year* | | $ | 88,494,882 | | | $ | 82,980,483 | |
| * Including undistributed net investment income of: | | $ | 268,905 | | | $ | 216,457 | |
The accompanying notes are an integral part of these financial statements.
EntrepreneurShares Global Fund
FINANCIAL HIGHLIGHTS
| | | Year Ended | | | Year Ended | | | Year Ended | | | Year Ended | | | Year Ended | |
| | | June 30, | | | June 30, | | | June 30, | | | June 30, | | | June 30, | |
| | | 2016 | | | 2015 | | | 2014 | | | 2013 | | | 2012 | |
| Per Share Data: | | | | | | | | | | | | | | | |
| Net asset value, beginning of year | | $ | 12.19 | | | $ | 13.19 | | | $ | 11.82 | | | $ | 10.15 | | | $ | 11.23 | |
| | | | | | | | | | | | | | | | | | | | | |
| Investment operations: | | | | | | | | | | | | | | | | | | | | |
Net investment loss(1) | | | (0.07 | ) | | | (0.08 | ) | | | (0.03 | ) | | | (0.02 | ) | | | (0.01 | ) |
| Net realized and unrealized | | | | | | | | | | | | | | | | | | | | |
| gain (loss) on investments | | | (0.27 | ) | | | 0.48 | | | | 2.10 | | | | 1.77 | | | | (1.06 | ) |
| Total from investment operations | | | (0.34 | ) | | | 0.40 | | | | 2.07 | | | | 1.75 | | | | (1.07 | ) |
| | | | | | | | | | | | | | | | | | | | | |
| Less distributions from: | | | | | | | | | | | | | | | | | | | | |
| Net investment income | | | (0.04 | ) | | | — | | | | — | | | | — | | | | — | |
| Net realized capital gains | | | — | | | | (1.40 | ) | | | (0.70 | ) | | | (0.08 | ) | | | (0.01 | ) |
| Return of capital | | | — | | | | — | | | | — | | | | — | | | | (0.00 | )(2) |
| Total distributions | | | (0.04 | ) | | | (1.40 | ) | | | (0.70 | ) | | | (0.08 | ) | | | (0.01 | ) |
| Net asset value, end of year | | $ | 11.81 | | | $ | 12.19 | | | $ | 13.19 | | | $ | 11.82 | | | $ | 10.15 | |
Total return(3) | | | -2.75 | % | | | 3.49 | % | | | 17.67 | % | | | 17.33 | % | | | -9.55 | % |
| | | | | | | | | | | | | | | | | | | | | |
| Supplemental data and ratios: | | | | | | | | | | | | | | | | | | | | |
| Net assets, end of year (000’s) | | $ | 21,782 | | | $ | 5,517 | | | $ | 24,402 | | | $ | 22,552 | | | $ | 15,606 | |
| Ratios to average net assets: | | | | | | | | | | | | | | | | | | | | |
Expenses(4) | | | 1.70 | % | | | 1.70 | % | | | 1.70 | % | | | 1.71 | %(5) | | | 1.70 | % |
Net investment loss(4) | | | (0.61 | )% | | | (0.63 | )% | | | (0.25 | )% | | | (0.21 | )%(6) | | | (0.13 | )% |
| Portfolio turnover rate | | | 71 | % | | | 69 | %(7) | | | 64 | % | | | 14 | % | | | 19 | % |
| (1) | Net investment loss per share has been calculated based on average shares outstanding during the year. |
| (2) | Amount is less than $0.01 per share. |
| (3) | Total returns assumes reinvestment of dividends and would have been lower in the absence of fees waived. |
| (4) | Net of fees waived of 0.82%, 0.33%, 0.54%, 0.63%, and 1.21% for the years ended June 30, 2016, June 30, 2015, June 30, 2014, June 30, 2013, and June 30, 2012, respectively. |
| (5) | Includes expenses related to the Retail Class that was merged into the Institutional Class on January 10, 2013. In the absence of these expenses, the ratio would have been 1.70%. |
| (6) | Includes income and expenses attributed to the Retail Class that was merged into the Institutional Class on January 10, 2013. In the absence of these expenses, the ratio would have been (0.20)%. |
| (7) | Includes the value of portfolio securities delivered as a result of an in-kind redemption. |
The accompanying notes are an integral part of these financial statements.
Entrepreneur U.S. All Cap Fund
FINANCIAL HIGHLIGHTS
| | | | | | | | | Period From | |
| | | Year Ended | | | Year Ended | | | December 17, | |
| | | June 30, | | | June 30, | | | 2013(1) to June 30, | |
| | | 2016 | | | 2015 | | | 2014 | |
| Per Share Data: | | | | | | | | | |
| Net asset value, beginning of period | | $ | 11.45 | | | $ | 10.68 | | | $ | 10.00 | |
| | | | | | | | | | | | | |
| Investment operations: | | | | | | | | | | | | |
Net investment income (loss)(2) | | | 0.02 | | | | (0.00 | )(3) | | | 0.01 | |
| Net realized and unrealized gains (losses) on investments | | | (1.14 | ) | | | 0.77 | | | | 0.68 | |
| Total from investment operations | | | (1.12 | ) | | | 0.77 | | | | 0.69 | |
| | | | | | | | | | | | | |
| Less distributions from: | | | | | | | | | | | | |
| Net investment income | | | (0.00 | )(3) | | | (0.00 | )(3) | | | (0.01 | ) |
| Net realized capital gains | | | (0.61 | ) | | | — | | | | — | |
| Total distributions | | | (0.61 | ) | | | (0.00 | )(3) | | | (0.01 | ) |
| Net asset value, end of period | | $ | 9.72 | | | $ | 11.45 | | | $ | 10.68 | |
Total return(4) | | | -9.63 | % | | | 7.26 | % | | | 6.85 | %(5) |
| | | | | | | | | | | | | |
| Supplemental data and ratios: | | | | | | | | | | | | |
| Net assets, end of period (000’s) | | $ | 130,705 | | | $ | 143,122 | | | $ | 133,422 | |
| Ratios to average net assets: | | | | | | | | | | | | |
Expenses(6) | | | 0.85 | % | | | 0.85 | % | | | 0.85 | %(7) |
Net investment income (loss)(6) | | | 0.17 | % | | | (0.04 | )% | | | 0.09 | %(7) |
| Portfolio turnover rate | | | 67 | % | | | 107 | % | | | 55 | %(5)(8) |
| (1) | The Fund commenced operations on December 17, 2013. |
| (2) | Net investment income (loss) per share has been calculated based on average shares outstanding during the period. |
| (3) | Amount is less than $0.01 per share. |
| (4) | Total returns assumes reinvestment of dividends and would have been lower in the absence of fees waived. |
| (5) | Not annualized. |
| (6) | Net of fees waived of 0.06%, 0.04% and 0.12% for the years ended June 30, 2016, June 30, 2015 and the period ended June 30, 2014, respectively. |
| (7) | Annualized. |
| (8) | Excludes the value of portfolio securities received as a result of in-kind purchases of the Fund’s capital shares. |
The accompanying notes are an integral part of these financial statements.
Entrepreneur U.S. Large Cap Fund
FINANCIAL HIGHLIGHTS
| | | | | | | | | Period From | |
| | | Year Ended | | | Year Ended | | | June 30, | |
| | | June 30, | | | June 30, | | | 2014(1) to June 30, | |
| | | 2016 | | | 2015 | | | 2014 | |
| Per Share Data: | | | | | | | | | |
| Net asset value, beginning of period | | $ | 10.77 | | | $ | 10.00 | | | $ | 10.00 | |
| | | | | | | | | | | | | |
| Investment operations: | | | | | | | | | | | | |
Net investment income(2) | | | 0.07 | | | | 0.04 | | | | — | |
| Net realized and unrealized gain (loss) on investments | | | (0.12 | ) | | | 0.74 | | | | (0.00 | )(3) |
| Total from investment operations | | | (0.05 | ) | | | 0.78 | | | | — | |
| | | | | | | | | | | | | |
| Less distributions from: | | | | | | | | | | | | |
| Net investment income | | | (0.07 | ) | | | (0.01 | ) | | | — | |
| Total distributions | | | (0.07 | ) | | | (0.01 | ) | | | — | |
| Net asset value, end of period | | $ | 10.65 | | | $ | 10.77 | | | $ | 10.00 | |
Total return(4) | | | -0.49 | % | | | 7.77 | % | | | 0.00 | %(5) |
| | | | | | | | | | | | | |
| Supplemental data and ratios: | | | | | | | | | | | | |
| Net assets, end of period (000’s) | | $ | 88,495 | | | $ | 82,980 | | | $ | 75,001 | |
| Ratios to average net assets: | | | | | | | | | | | | |
Expenses(6) | | | 0.75 | % | | | 0.75 | % | | | 0.00 | %(5)(7) |
Net investment income(6) | | | 0.67 | % | | | 0.36 | % | | | 0.00 | %(5)(7) |
| Portfolio turnover rate | | | 77 | % | | | 90 | % | | | 0 | %(5)(8) |
| (1) | The Fund commenced operations on June 30, 2014. |
| (2) | Net investment income per share has been calculated based on average shares outstanding during the period. |
| (3) | Amount is less than $0.01 per share. |
| (4) | Total returns assumes reinvestment of dividends and would have been lower in the absence of fees waived. |
| (5) | Not annualized. |
| (6) | Net of fees waived of 0.08%, 0.08% and 0.01% for the years ended June 30, 2016, June 30, 2015 and the period ended June 30, 2014, respectively. |
| (7) | Amount is based on a one-day fiscal year and is not indicative of future Fund expenses or income. |
| (8) | Excludes the value of portfolio securities received as a result of in-kind purchases of the Fund’s capital shares. |
The accompanying notes are an integral part of these financial statements.
EntrepreneurShares Series Trust
NOTES TO FINANCIAL STATEMENTS
June 30, 2016
EntrepreneurShares™ Series Trust, a Delaware statutory trust (the “Trust”), was formed on July 1, 2010, and has authorized capital of unlimited shares of beneficial interest. The Trust is an open-end management investment company registered under the Investment Company Act of 1940, as amended (the “1940 Act”), and is authorized to issue multiple series and classes of shares. The EntrepreneurShares Global Fund (the “Global Fund”), the Entrepreneur U.S. All Cap Fund (the “U.S. All Cap Fund”) and the Entrepreneur U.S. Large Cap Fund (the “U.S. Large Cap Fund”) (each separately a “Fund”, or collectively, “the Funds”) are each classified as a “diversified” series, as defined in the 1940 Act. The Funds are investment companies and, accordingly, follow the investment company accounting and reporting guidance of the Financial Accounting Standards Board Accounting Standards Codification Topic 946 – Investment Companies. The Global Fund commenced operations on November 11, 2010. The U.S. All Cap Fund commenced operations on December 17, 2013. The U.S. Large Cap Fund commenced operations on June 30, 2014.
The investment objective of the Global Fund is long-term capital appreciation. The Global Fund seeks to achieve its objective by investing in equity securities of global companies with market capitalizations that are above $300 million at the time of initial purchase and possess entrepreneurial characteristics, as determined by EntrepreneurShares, LLC, the Global Fund’s Sub-Advisor, and Weston Capital Advisors, LLC, the Global Fund’s investment advisor.
The investment objective of the U.S. All Cap Fund is long-term capital appreciation. The U.S. All Cap Fund seeks to achieve its objective by investing at least 80% of its assets in equity securities of U.S. companies with market capitalization that are above $300 million at the time of initial purchase and possess entrepreneurial characteristics, as determined by Capital Impact Advisors, LLC, the U.S. All Cap Fund’s investment advisor.
The investment objective of the U.S. Large Cap Fund is long-term capital appreciation. The U.S. Large Cap Fund seeks to achieve its objective by investing in equity securities of U.S. companies with market capitalizations that are above $5 billion at the time of initial purchase and possess entrepreneurial characteristics, as determined by Capital Impact Advisors, LLC, the U.S. Large Cap Fund’s investment advisor. Weston Capital Advisors, LLC and Capital Impact Advisors, LLC (together “Advisors”) are majority owned by Dr. Shulman.
Each Fund currently offers one share class, the Institutional Class. Effective June 29, 2012 the Global Fund ceased offering its Class A shares to the public. The remaining Class A shares were converted into Retail shares. Effective January 10, 2013 the Global Fund ceased offering its Retail shares to the public. The remaining Retail shares were converted into Institutional shares. As described in the Prospectus, the Institutional Class shares do not have a 12b-1 fee.
| 2. | SUMMARY OF SIGNIFICANT ACCOUNTING POLICIES |
The following is a summary of significant accounting policies consistently followed by the Funds in the preparation of their financial statements. These policies are in conformity with accounting principles generally accepted in the United States of America (“GAAP”).
Investment Valuations
The following is a summary of the Funds’ pricing procedures. It is intended to be a general discussion and may not necessarily reflect all pricing procedures followed by the Funds.
In determining the net asset value (“NAV”) of the Funds’ shares, securities that are listed on a national securities exchange (other than the National Association of Securities Dealers’ Automatic Quotation System (“NASDAQ”)) are valued at the last sale price on the day the valuation is made. Securities that are traded on NASDAQ under one of its three listing tiers, NASDAQ Global Select Market, NASDAQ Global Market and NASDAQ Capital Market, are valued at the NASDAQ Official Closing Price. Price information on listed securities is taken from the exchange where the security is primarily traded. Securities which are listed on an exchange but which are not traded on the valuation date are valued at the most recent bid price. Unlisted securities held by the Funds are valued at the average of the quoted bid and ask prices in the over-the-counter (“OTC”) market. Securities and other assets for which market quotations are not readily available are
EntrepreneurShares Series Trust
NOTES TO FINANCIAL STATEMENTS (Continued)
June 30, 2016
valued at their fair value as determined in good faith under procedures established by and under the general supervision and responsibility of the EntrepreneurShares Series Trust Board of Trustees (the “Board”). Investments in registered open- end investment companies other than exchange-traded funds are valued at the reported NAV.
Short-term investments held with a remaining maturity of 60 days or less generally are valued at amortized cost, as the Board believes that this method of valuing short-term investments approximates fair value. Short-term investments with 61 days or more to maturity at time of purchase are valued at market value through the 61st day prior to maturity, based on quotations received from market makers or other appropriate sources; thereafter, they are generally valued at amortized cost. There is no definitive set of circumstances under which the Funds may elect to use fair value procedures to value a security. Types of securities that the Funds may hold for which fair value pricing might be required include, but are not limited to: (a) illiquid securities, including restricted securities and private placements for which there is no public market; (b) options not traded on a securities exchange; (c) securities of an issuer that has entered into a restructuring; (d) securities whose trading has been halted or suspended, as permitted by the Securities and Exchange Commission (the “SEC”); (e) foreign securities, if an event or development has occurred subsequent to the close of the foreign market and prior to the close of regular trading on the New York Stock Exchange that would materially affect the value of the security; and (f) fixed income securities that have gone into default and for which there is not a current market value quotation.
Valuing securities at fair value involves greater reliance on judgment than securities that have readily available market quotations. There can be no assurance that the Funds could obtain the fair value price assigned to a security upon sale.
Securities that are not listed on an exchange are valued by a Fund’s investment advisor, under the supervision of the Board. There is no single standard for determining the fair value of a security. Rather, in determining the fair value of a security, the Fund’s investment advisor and the Board take into account the relevant factors and surrounding circumstances, which may include: (1) the nature and pricing history (if any) of the security; (2) whether any dealer quotations for the security are available; (3) possible valuation methodologies that could be used to determine the fair value of the security; (4) the recommendation of the portfolio manager of the Fund with respect to the valuation of the security; (5) whether the same or similar securities are held by other funds managed by the Advisors or other funds and the method used to price the security in those funds; (6) the extent to which the fair value to be determined for the security will result from the use of data or formulae produced by third parties independent of the Advisors; and (7) the liquidity or illiquidity of the market for the security.
Fair Value Measurement
The Funds have adopted authoritative fair valuation accounting standards which establish an authoritative definition of fair value and set out a hierarchy for measuring fair value. These standards require additional disclosures about the various inputs and valuation techniques used to develop the measurements of fair value, a discussion of changes in valuation techniques and related inputs during the period and expanded disclosure of valuation levels for major security types. The hierarchy gives the highest priority to unadjusted quoted prices in active markets for identical assets or liabilities (Level 1 measurement) and the lowest priority to unobservable inputs (Level 3 measurements). The three levels of the fair value hierarchy are as follows:
| | Level 1: | Unadjusted quoted prices in active markets for identical assets that the Fund has the ability to access at the measurement date; |
| | | |
| | Level 2: | Observable inputs other than quoted prices included in Level 1 that are observable for the asset either directly or indirectly. These inputs may include quoted prices for identical instruments on inactive markets, quoted prices for similar instruments, interest rates, prepayment spreads, credit risk, yield curves, default rates, and similar data; |
| | | |
| | Level 3: | Significant unobservable inputs for the asset to the extent that relevant observable inputs are not available, representing the Fund’s own assumptions that a market participant would use in valuing the asset, and would be based on the best information available. |
EntrepreneurShares Series Trust
NOTES TO FNANCIAL STATEMENTS (Continued)
June 30, 2016
Inputs are used in applying the various valuation techniques and broadly refer to the assumptions that market participants use to make valuation decisions, including assumptions about risk. Inputs may include price information, volatility statistics, specific and broad credit data, liquidity statistics, and other factors. A financial instrument’s level within the fair value hierarchy is based on the lowest level of any input that is significant to the fair value measurement. However, the determination of what constitutes “observable” requires significant judgment by the Funds. The Funds consider observable data to be that market data which is readily available, regularly distributed or updated, reliable and verifiable, not proprietary, and provided by independent sources that are actively involved in the relevant market. The categorization of a financial instrument within the hierarchy is based upon the pricing transparency of the instrument and does not necessarily correspond to the Funds’ perceived risk of that instrument.
Investments whose values are based on quoted market prices in active markets, and are therefore classified within Level 1, include active listed equities and real estate investment trusts, closed-end mutual funds, and certain money market securities. Investments that trade in markets that are not considered to be active, but are valued based on quoted market prices, dealer quotations or alternative pricing sources supported by observable inputs are classified within Level 2. Investments classified within Level 3 have significant unobservable inputs, as they trade infrequently or not at all. The tables below are a summary of the inputs used to value the Funds’ investments as of June 30, 2016.
Global Fund | | | | | | | | | | | | |
| Investments at Value* | | Level 1 | | | Level 2 | | | Level 3 | | | Total | |
| Common Stocks | | $ | 20,542,568 | | | $ | — | | | $ | — | | | $ | 20,542,568 | |
| Real Estate Investment Trusts | | | 319,515 | | | | — | | | | — | | | | 319,515 | |
| Money Market Funds | | | 1,282,587 | | | | — | | | | — | | | | 1,282,587 | |
| Total Investments | | $ | 22,144,670 | | | $ | — | | | $ | — | | | $ | 22,144,670 | |
| | | | | | | | | | | | | | | | | |
U.S. All Cap Fund | | | | | | | | | | | | | | | | |
| Investments at Value* | | Level 1 | | | Level 2 | | | Level 3 | | | Total | |
| Common Stocks | | $ | 118,604,651 | | | $ | — | | | $ | — | | | $ | 118,604,651 | |
| Real Estate Investment Trusts | | | 7,976,946 | | | | — | | | | — | | | | 7,976,946 | |
| Money Market Funds | | | 4,138,217 | | | | — | | | | — | | | | 4,138,217 | |
| Total Investments | | $ | 130,719,814 | | | $ | — | | | $ | — | | | $ | 130,719,814 | |
| | | | | | | | | | | | | | | | | |
U.S. Large Cap Fund | | | | | | | | | | | | | | | | |
| Investments at Value* | | Level 1 | | | Level 2 | | | Level 3 | | | Total | |
| Common Stocks | | $ | 84,877,744 | | | $ | — | | | $ | — | | | $ | 84,877,744 | |
| Real Estate Investment Trusts | | | 2,180,065 | | | | — | | | | — | | | | 2,180,065 | |
| Money Market Funds | | | 1,464,613 | | | | — | | | | — | | | | 1,464,613 | |
| Total Investments | | $ | 88,522,422 | | | $ | — | | | $ | — | | | $ | 88,522,422 | |
| * | For further information regarding security characteristics, please see the Schedules of Investments. |
For the year ended June 30, 2016, the Funds had no transfers of securities between levels and no investments in derivate instruments. Transfers between levels are recognized at the end of the reporting period. The Funds did not have any Level 3 instruments during the year.
Use of Estimates and Indemnifications
The preparation of the financial statements in conformity with GAAP requires management to make estimates and assumptions that affect the reported amounts and disclosures in these financial statements. Actual results could differ from those estimates.
EntrepreneurShares Series Trust
NOTES TO FINANCIAL STATEMENTS (Continued)
June 30, 2016
In the normal course of business, the Trust, on behalf of the Funds, enters into contracts that contain a variety of representations which provide general indemnifications. The Trust’s maximum exposure under these arrangements is unknown; however, the Trust has not had claims or losses pursuant to these contracts and the Trust expects any risk of loss to be remote.
Federal Income Taxes
The Funds intend to continue to qualify as a “regulated investment company” under Sub-chapter M of the Internal Revenue Code of 1986, as amended. If so qualified, the Funds will not be subject to federal income tax to the extent it distributes substantially all of their net investment income and net realized gains to shareholders.
The Funds have reviewed all open tax years and major jurisdictions and concluded that the Funds did not have any tax positions that did not meet the “more-likely-than-not” threshold of being sustained by the applicable tax authority for the year ended June 30, 2016. The Funds would recognize interest and penalties, if any, related to uncertain tax benefits in the Statements of Operations. During the year ended June 30, 2016, the Funds did not incur any interest or penalties. As of June 30, 2016, the Funds’ open Federal tax years include the tax years ended June 30, 2014, 2015 and 2016. The Funds have no examination in progress.
Distribution to Shareholders
The Funds intend to continue to distribute to its shareholders any net investment income and any net realized long or short-term capital gains, if any, at least annually. Distributions are recorded on the ex-dividend date. The Funds may periodically make reclassifications among certain of its capital accounts as a result of the characterization of certain income and realized gains determined annually in accordance with federal tax regulations that may differ from GAAP.
Foreign Currency Transactions
The Funds’ books and records are maintained in U.S. dollars. Foreign currency denominated transactions (i.e. fair value of investment securities, assets and liabilities, purchases and sales of investment securities and income and expenses) are translated into U.S. dollars at the current rate of exchange. The Funds isolate portions of the results of operations resulting from changes in foreign exchange rates on investments from the fluctuations arising from changes in market prices of securities held. Such fluctuations are reflected as net realized and unrealized gain or loss on foreign currency.
Investment Transactions and Investment Income
Investment transactions are recorded on the trade date. Dividend income, less any foreign tax withheld, is recognized on the ex-dividend date and interest income is recognized on an accrual basis, including amortization/accretion of premiums or discounts. Net realized gains or losses are determined using the best tax identification method.
Global Fund’s Investment Advisory Agreement
Weston Capital Advisors, LLC, a related party of the Global Fund, oversees the performance of the Global Fund and is responsible for overseeing the management of the investment portfolio of the Global Fund. These services are provided under the terms of an investment advisory agreement between the Trust and Weston Capital Advisors, LLC, pursuant to which Weston Capital Advisors, LLC receives an annual advisory fee equal to 1.25% of the Global Fund’s average net assets.
Through November 1, 2016, the Advisor has agreed to waive and/or reimburse the Global Fund for its advisory fee, and to the extent necessary, bear other expenses, to limit the total annualized expenses (excluding borrowing and investment- related costs and fees, taxes, extraordinary expenses and fees and expenses of underlying funds) of the Institutional Class shares of the Global Fund to the amounts of 1.70% per annum of net assets attributable to such shares of the Global Fund.
Weston Capital Advisors, LLC shall be permitted to recover expenses it has borne subsequent to the effective date of this agreement (whether through reduction of its advisory fee or otherwise) in later periods to the extent that the Global Fund’s
EntrepreneurShares Series Trust
NOTES TO FINANCIAL STATEMENTS (Continued)
June 30, 2016
expenses fall below the annual rates set forth above, given that such a rate is not greater than the rate that was in place at the time of the waiver, provided, however, that the Global Fund is not obligated to pay any such reimbursed fees more than three years after the end of the fiscal year in which the expense was borne by Weston Capital Advisors, LLC.
Waived fees subject to recovery by year of expiration are as follows:
Year of Expiration | Potential Recovery |
| 6/30/2019 | $ 68,444 |
| 6/30/2018 | $ 60,049 |
| 6/30/2017 | $133,223 |
Sub-Advisory services are provided to the Global Fund, pursuant to an agreement between Weston Capital Advisors, LLC and EntrepreneurShares, LLC (the “Sub-Advisor”). Under the terms of this sub-advisory agreement, Weston Capital Advisors, LLC, not the Global Fund, compensates the Sub-Advisor based on the Global Fund’s average net assets. Certain officers of Weston Capital Advisors, LLC are also officers of the Sub-Advisor. Dr. Shulman is a majority owner of both Weston Capital Advisors, LLC and the Sub-Advisor.
U.S. All Cap Fund and U.S. Large Cap Fund Investment Advisory Agreement
Capital Impact Advisors, LLC, a related party of the U.S. All Cap Fund and the U.S. Large Cap Fund, oversees the performance of the U.S. All Cap Fund and the U.S. Large Cap Fund and is responsible for overseeing the management of the investment portfolio of the U.S. All Cap Fund and the U.S. Large Cap Fund. These services are provided under the terms of investment advisory agreements between the Trust and Capital Impact Advisors, LLC, pursuant to which Capital Impact Advisors, LLC receives an annual advisory fee equal to 0.75% of the U.S. All Cap Fund’s average net assets and 0.65% of the U.S. Large Cap Fund’s average net assets.
Through November 1, 2016 for the U.S. All Cap Fund and the U.S. Large Cap Fund, Capital Impact Advisors, LLC has agreed to waive and/or reimburse the U.S. All Cap Fund and the U.S. Large Cap Fund for its advisory fee, and to the extent necessary, bear other expenses, to limit the total annualized expenses (excluding borrowing and investment-related costs and fees, taxes, extraordinary expenses and fees and expenses of underlying funds) of the Institutional Class shares of the U.S. All Cap Fund to the amounts of 0.85% per annum of net assets attributable to such shares of the U.S. All Cap Fund and 0.75% per annum of net assets attributable to shares of the U.S. Large Cap Fund. Capital Impact Advisors, LLC shall be permitted to recover expenses it has borne subsequent to the effective date of this agreement (whether through reduction of its advisory fee or otherwise) in later periods to the extent that the U.S. All Cap Fund or the U.S. Large Cap Fund’s expenses fall below the annual rates set forth above, given that such a rate is not greater than the rate that was in place at the time of the waiver, provided, however, that the U.S. All Cap Fund and the U.S. Large Cap Fund are not obligated to pay any such reimbursed fees more than three years after the end of the fiscal year in which the expense was borne by Capital Impact Advisors, LLC.
Waived fees subject to recovery by year of expiration are as follows:
Year of Expiration | Potential Recovery |
| | U.S. All Cap Fund | U.S. Large Cap Fund |
| 6/30/2019 | $72,431 | $66,377 |
| 6/30/2018 | $58,334 | $66,315 |
| 6/30/2017 | $83,817 | $ 4,000 |
The Trust has adopted distribution and service (Rule 12b-1) plans (the “Plan”) for the Funds’ Retail Class shares (not available for sale at this time) only Global had Class A and per the last paragraph to Note 1, all Class A shares were converted to Retail and those were converted to Institutional, in accordance with Rule 12b-1 under the Investment Company Act of 1940, as amended. The Plan allows the Funds to use up to 0.25% of the average daily net assets
EntrepreneurShares Series Trust
NOTES TO FINANCIAL STATEMENTS (Continued)
June 30, 2016
attributable to the Retail Class shares of the U.S. All Cap Fund and the U.S. Large Cap Fund, to pay sales, distribution, and other fees for the sale of that share class and for services provided to holders of Retail Class shares. Because these fees are paid out of the U.S. All Cap Fund’s and the U.S. Large Cap Fund’s assets, over time, these fees will increase the cost of an investment in Retail Class shares and may cost the shareholder more than paying other types of sales charges. The Funds’ Institutional Class shares are not subject to any distribution and service (Rule 12b-1) fees.
The Funds plan to distribute substantially all of the net investment income and net realized gains that it has realized on the sale of securities. These income and gains distributions will generally be paid once each year, on or before December 31. The character of distributions made during the year from net investment income or net realized gains may differ from the characterization for federal income tax differences in the recognition of income, expense or gain items for financial reporting and tax reporting purposes.
The tax character of distributions paid during the years ended June 30, 2016 and June 30, 2015 was as follows:
| | | | Ordinary | | | Long-Term | | | | |
| | Global Fund | | Income | | | Capital Gain | | | Total | |
| | June 30, 2016 | | $ | 19,570 | | | $ | — | | | $ | 19,570 | |
| | June 30, 2015 | | $ | 96,650 | | | $ | 2,230,471 | | | $ | 2,327,121 | |
| | | | | | | | | | | | |
| | | | Ordinary | | | Long-Term | | | | | |
| | U.S. All Cap Fund | | Income | | | Capital Gain | | | Total | |
| | June 30, 2016 | | $ | 24,155 | | | $ | 7,648,839 | | | $ | 7,672,994 | |
| | June 30, 2015 | | $ | 60,866 | | | $ | — | | | $ | 60,866 | |
| | | | | | | | | | | | |
| | | | Ordinary | | | Long-Term | | | | | |
| | U.S. Large Cap Fund | | Income | | | Capital Gain | | | Total | |
| | June 30, 2016 | | $ | 508,011 | | | $ | — | | | $ | 508,011 | |
| | June 30, 2015 | | $ | 50,453 | | | $ | — | | | $ | 50,453 | |
The Funds designated as long-term capital gain dividend, pursuant to Internal Revenue Code Section 852(b)(3), the amount necessary to reduce the earnings and profits for the Fund related to net capital gains to zero for the tax year ended June 30, 2016.
Additionally, GAAP requires that certain components of net assets be reclassified between financial and tax reporting. These reclassifications have no effect on net assets or net asset value per share. The following table shows the reclassifications made:
| | | | | | | Accumulated | | | Accumulated | |
| | Global Fund | | Paid in | | | Net Investment | | | Realized | |
| | Year Ended | | Capital | | | Income (Loss) | | | Gain (Loss) | |
| | June 30, 2016 | | $ | (84,633 | ) | | $ | 43,202 | | | $ | 41,431 | |
| | | | | | | | | | | | |
| | | | | | | | Accumulated | | | Accumulated | |
| | U.S. All Cap Fund | | Paid in | | | Net Investment | | | Realized | |
| | Year Ended | | Capital | | | Income (Loss) | | | Gain (Loss) | |
| | June 30, 2016 | | $ | — | | | $ | 4,653 | | | $ | (4,653 | ) |
| | | | | | | | | | | | |
| | | | | | | | Accumulated | | | Accumulated | |
| | U.S. Large Cap Fund | | Paid in | | | Net Investment | | | Realized | |
| | Year Ended | | Capital | | | Income (Loss) | | | Gain (Loss) | |
| | June 30, 2016 | | $ | (103 | ) | | $ | 103 | | | $ | — | |
EntrepreneurShares Series Trust
NOTES TO FINANCIAL STATEMENTS (Continued)
June 30, 2016
The permanent differences relate primarily to foreign currency reclassifications, REIT, partnership adjustments, in-kind redemptions and reclassification of net operating losses.
As of June 30, 2016, the cost of investments, gross unrealized appreciation and depreciation of investments and distributable income for tax purposes are:
| | | | | | | U.S. All | | | U.S. Large | |
| | | | Global Fund | | | Cap Fund | | | Cap Fund | |
| | Cost of investments | | $ | 21,565,174 | | | $ | 127,675,284 | | | $ | 84,057,482 | |
| | Unrealized appreciation | | | 1,477,431 | | | | 14,981,640 | | | | 8,302,449 | |
| | Unrealized depreciation | | | (897,935 | ) | | | (11,937,110 | ) | | | (3,837,509 | ) |
| | Net unrealized appreciation | | | 579,496 | | | | 3,044,530 | | | | 4,464,940 | |
| | Undistributed ordinary income | | | — | | | | 256,005 | | | | 475,118 | |
| | Undistributed long-term capital gain | | | — | | | | — | | | | 260,151 | |
| | Distributable income | | | — | | | | 256,005 | | | | 735,269 | |
| | Other accumulated loss | | | (234,913 | ) | | | (6,485,157 | ) | | | — | |
| | Total accumulated gain (loss) | | $ | 344,583 | | | $ | (3,184,622 | ) | | $ | 5,200,209 | |
The table above differs from the financial statements due to timing differences related to the deferral of losses due to wash sales, partnership interests and Passive Foreign Investment Companies.
As of June 30, 2016, the Funds had capital loss carry forwards which could be used to offset future gains of:
| | | | Capital Loss | | | |
| | | | Carryover | | Character | |
| | Global Fund | | $ | (161,855 | ) | Short-term | |
| | U.S. All Cap Fund | | $ | (5,856,615 | ) | Short-term | |
| | | | $ | (628,542 | ) | Long-term | |
| | U.S. Large Cap Fund | | $ | — | | | |
As of June 30, 2016, the Funds had deferred qualified late year ordinary losses of:
| | Global Fund | | $ | 70,663 | |
| | U.S. All Cap Fund | | $ | — | |
| | U.S. Large Cap Fund | | $ | — | |
As of June 30, 2016, the Funds had deferred qualified post October losses of:
| | Global Fund | | $ | — | |
| | U.S. All Cap Fund | | $ | — | |
| | U.S. Large Cap Fund | | $ | — | |
EntrepreneurShares Series Trust
NOTES TO FINANCIAL STATEMENTS (Continued)
June 30, 2016
| 6. | CAPITAL SHARE TRANSACTIONS |
The Trust has authorized capital of unlimited shares of no par value which may be issued in more than one class or series. Currently, the Trust consists of three series, the Funds. Transactions in shares of the Funds were as follows:
| | | Year Ended | | | Year Ended | |
| | | June 30, 2016 | | | June 30, 2015 | |
| Global Fund | | | | | | |
| Institutional Class | | | | | | |
| Shares sold | | | 1,435,238 | | | | 10,867 | |
| Shares issued in reinvestment of distributions | | | 591 | | | | 162,397 | |
| Shares redeemed | | | (43,619 | ) | | | (1,569,976 | ) |
| Net increase (decrease) | | | 1,392,210 | | | | (1,396,712 | ) |
| Shares outstanding | | | | | | | | |
| Beginning of year | | | 452,676 | | | | 1,849,388 | |
| End of year | | | 1,844,886 | | | | 452,676 | |
| | | | | | | | | |
| | | Year Ended | | | Year Ended | |
| | | June 30, 2016 | | | June 30, 2015 | |
| U.S. All Cap Fund | | | | | | | | |
| Institutional Class | | | | | | | | |
| Shares sold | | | 151,902 | | | | 1,467 | |
| Shares issued in reinvestment of distributions | | | 806,785 | | | | 5,538 | |
| Shares redeemed | | | (16,393 | ) | | | (1,499 | ) |
| Net increase | | | 942,294 | | | | 5,506 | |
| Shares outstanding | | | | | | | | |
| Beginning of year | | | 12,499,571 | | | | 12,494,065 | |
| End of year | | | 13,441,865 | | | | 12,499,571 | |
| | | | | | | | | |
| | | Year Ended | | | Year Ended | |
| | | June 30, 2016 | | | June 30, 2015 | |
| U.S. Large Cap Fund | | | | | | | | |
| Institutional Class | | | | | | | | |
| Shares sold | | | 664,321 | | | | 223,355 | |
| Shares issued in reinvestment of distributions | | | 48,945 | | | | 4,782 | |
| Shares redeemed | | | (107,638 | ) | | | (23,805 | ) |
| Net increase | | | 605,628 | | | | 204,332 | |
| Shares outstanding | | | | | | | | |
| Beginning of year | | | 7,705,673 | | | | 7,501,341 | |
| End of year | | | 8,311,301 | | | | 7,705,673 | |
At June 30, 2016, certain officers of the Trust were also employees of the Advisors. However, these officers were not compensated directly by the Funds. Refer to Note 3 for more information.
The beneficial ownership, either directly or indirectly, of more than 25% of the voting securities of a fund creates a presumption of control of a fund, under Section 2(a)(9) of the 1940 Act. As of June 30, 2016, for the benefit of its
EntrepreneurShares Series Trust
NOTES TO FINANCIAL STATEMENTS (Continued)
June 30, 2016
shareholders, National Financial Services, LLC held 73.7% of the total Global Fund shares outstanding. As of June 30, 2016, for the benefit of its shareholders, MAC & Co., an affiliate of the U.S. All Cap Fund, held 96.6% of the total U.S. All Cap Fund shares outstanding. As of June 30, 2016, for the benefit of its shareholders, MAC & Co., an affiliate of the U.S. Large Cap Fund, held 90.9% of the total U.S. Large Cap Fund shares outstanding.
| 9. | INVESTMENT TRANSACTIONS |
During the year ended June 30, 2016, the aggregate purchases and sales of securities (excluding in-kind transactions and short-term securities) were:
| | | | | | | U.S. All | | | U.S. Large | |
| | | | Global Fund | | | Cap Fund | | | Cap Fund | |
| | Purchases: | | $ | 21,337,690 | | | $ | 84,980,770 | | | $ | 71,721,484 | |
| | Sales: | | $ | 5,792,965 | | | $ | 84,632,309 | | | $ | 63,637,434 | |
The Funds did not have any purchases or sales of U.S. Government Securities.
Global Fund
Effective March 26, 2015, the Fund’s shareholders redeemed assets through an in-kind redemption. In the redemption transaction, the Fund transferred securities with a fair value of $12,869,830 to the redeeming shareholders. The redemption-in-kind is reflected in the Global Fund’s Statements of Changes in Net Assets.
| 10. | FOREIGN INVESTMENT RISK |
The Global Fund generally invests a significant portion of its total assets in securities principally traded in markets outside the U.S. The foreign markets in which the Global Fund invests in are sometimes open on days when the New York Stock Exchange (“NYSE”) is not open and the Global Fund does not calculate its net asset value (“NAV”), and sometimes are not open on days when the NYSE is open and the Global Fund does calculate its NAV. Even on days on which both the foreign market and the NYSE are open, several hours may pass between the time when trading in the foreign market closes and the time at which the Global Fund calculates its NAV. That is generally the case for markets in Europe, Asia, Australia and other far eastern markets; the regular closing time of foreign markets in North and South America is generally the same as the closing time of the NYSE and the time at which the Global Fund calculate its NAV.
Foreign stocks, as an asset class, may underperform U.S. stocks, and foreign stocks may be more volatile than U.S. stocks. Risks relating to investment in foreign securities (including, but not limited to, depository receipts and participation certificates) include: currency exchange rate fluctuation; less available public information about the issuers of securities; less stringent regulatory standards; lack of uniform accounting, auditing and financial reporting standards; and country risk including less liquidity, high inflation rates, unfavorable economic practices and political instability. The risks of foreign investments are typically greater in emerging and less developed markets.
| 11. | SUBSEQUENT EVENTS EVALUATION |
In preparing the financial statements, the Funds have evaluated events and transactions for potential recognition or disclosure through the date the financial statements were issued. This evaluation did not result in any subsequent events that necessitated disclosure and/or adjustments.
EntrepreneurShares Series Trust
REPORT OF INDEPENDENT REGISTERED PUBLIC ACCOUNTING FIRM
To the Board of Trustees of EntrepreneurShares Series Trust and the Shareholders of EntrepreneurShares Global Fund, Entrepreneur U.S. All Cap Fund and Entrepreneur U.S. Large Cap Fund
We have audited the accompanying statement of assets and liabilities, including the schedule of investments, of EntrepreneurShares Global Fund, as of June 30, 2016, and the related statement of operations for the year then ended, the statement of changes in net assets for each of the two years in the period then ended, and the financial highlights for each of the four years in the period then ended. The financial highlights for the year ended June 30, 2012 was audited by other auditors. Those auditors expressed an unqualified opinion on those financial statements and financial highlights in their report dated August 28, 2012. We have also audited the accompanying statement of assets and liabilities, including the schedule of investments, of Entrepreneur U.S. All Cap Fund, as of June 30, 2016, and the related statement of operations for the year then ended, the statement of changes in net assets for each of the two years in the period then ended, and the financial highlights for each of the two years in the period ended June 30, 2016 and the period December 17, 2013 (commencement of operations) to June 30, 2014. We have also audited the accompanying statement of assets and liabilities, including the schedule of investments, of Entrepreneur U.S. Large Cap Fund as of June 30, 2016, and the related statement of operations for the year then ended, the statement of changes in net assets for each of the two years in the period then ended, and the financial highlights for each of the two years in the period ended June 30, 2016 and the period June 30, 2014 (commencement of operations) to June 30, 2014. These financial statements and financial highlights are the responsibility of the Funds’ management. Our responsibility is to express an opinion on these financial statements and financial highlights based on our audits.
We conducted our audits in accordance with the standards of the Public Company Accounting Oversight Board (United States). Those standards require that we plan and perform the audit to obtain reasonable assurance about whether the financial statements and financial highlights are free from material misstatement. The Funds are not required to have, nor were we engaged to perform, an audit of their internal control over financial reporting. Our audits included consideration of internal control over financial reporting as a basis for designing audit procedures that are appropriate in the circumstances, but not for the purpose of expressing an opinion on the effectiveness of the Funds’ internal control over financial reporting. Accordingly, we express no such opinion. An audit also includes examining, on a test basis, evidence supporting the amounts and disclosures in the financial statements. Our procedures included confirmation of securities owned as of June 30, 2016, by correspondence with the custodian. An audit also includes assessing the accounting principles used and significant estimates made by management, as well as evaluating the overall financial statement presentation. We believe that our audits provide a reasonable basis for our opinion.
In our opinion, the financial statements and financial highlights referred to above present fairly, in all material respects, the financial position of EntrepreneurShares Global Fund, Entrepreneur U.S. All Cap Fund and Entrepreneur U.S. Large Cap Fund as of June 30, 2016, and the results of their operations, the changes in their net assets for each of the two years in the period then ended, and the financial highlights, for each respective period referred to above, in conformity with U.S. generally accepted accounting principles.
/s/ RSM US LLP
Boston, Massachusetts
August 29, 2016
EntrepreneurShares Series Trust
ADDITIONAL INFORMATION
June 30, 2016 (Unaudited)
| 1. | ADDITIONAL DISCLOSURE REGARDING FUND TRUSTEES AND OFFICERS |
| | | Term of | | # of Portfolios | Other |
| | | Office(1) | | in Fund | Directorships |
| | Position(s) | and | | Complex | Held by Trustee |
| Name, Address | Held | Length of | Principal Occupation(s) | Overseen | During Past |
and Birth Year | with Trust | Time Served | During Past 5 Years | by Trustee | 5 Years |
| | | | | | |
| Dr. Stephen Sohn | Trustee | Since 2010 | Chairman – Quantum | 3 | None |
| 175 Federal Street, Suite #875 | | | Aesthetic Surgery Inc. | | |
| Boston, MA 02210 | | | | | |
| Birth year: 1944 | | | | | |
| | | | | | |
| George R. Berbeco | Trustee | Since 2010 | Chairman – Bay Colony | 3 | None |
| 175 Federal Street, Suite #875 | | | Development Corporation; | | |
| Boston, MA 02210 | | | Former President – Devon | | |
| Birth year: 1944 | | | Group and General Partner – | | |
| | | | Devon Capital Partners, LP. | | |
| | | | (information systems | | |
| | | | consulting) (2005 to 2009). | | |
| | | | | | |
Joel M. Shulman, CFA(2) | President | Since 2010 | Member of the Advisor | 3 | None |
| 175 Federal Street, Suite #875 | and Trustee | | and the Sub-Advisor since | | |
| Boston, MA 02210 | | | 2010; Chief Executive Officer | | |
| Birth year: 1955 | | | of the Sub-Advisor since | | |
| | | | 2010; Tenured professor | | |
| | | | at Babson College. | | |
| | | | | | |
| David Cragg | Secretary, | Since 2010 | Member and Chief | N/A | N/A |
| 175 Federal Street, Suite #875 | Treasurer | | Compliance Officer the | | |
| Boston, MA 02210 | and Chief | | Advisor since 2010. | | |
| Birth year: 1969 | Compliance | | Former Chief Financial | | |
| | Officer | | Officer and Chief Operating | | |
| | | | Officer of the Leuthold Group | | |
| | | | (institutional research) | | |
| | | | (1999 to 2009). | | |
| (1) | Each Trustee serves an indefinite term until the election of a successor. Each officer serves an indefinite term, |
| (2) | Dr. Shulman is considered an interested Trustee within the meaning of the 1940 Act because of his affiliation with the Advisor and Sub-Advisor. |
The Statement of Additional Information includes additional information about the Funds’ Trustees and is available free of charge, upon request, by calling the Funds toll free at 1-877-271-8811 or by visiting the SEC’s website (http://www.sec.gov)
EntrepreneurShares Series Trust
ADDITIONAL INFORMATION (Continued)
June 30, 2016 (Unaudited)
| 2. | SHAREHOLDER NOTIFICATION OF FEDERAL TAX STATUS |
Global Fund
For the year ended June 30, 2016, 0.00% of dividends paid from net ordinary income qualify for the dividends received deduction available to corporate shareholders.
The Global Fund designates 0.00% of their ordinary income distributions for the fiscal period as qualified dividend income under the Jobs and Growth Tax Reconciliation Act of 2003.
The Global Fund designates 0.00% of its ordinary income distributions as short-term capital gain distribution under Internal Revenue Code Section 871(k)(2)(c).
U.S. All Cap Fund
For the year ended June 30, 2016, 100.00% of dividends paid from net ordinary income qualify for the dividends received deduction available to corporate shareholders.
The U.S. All Cap Fund designates 100.00% of their ordinary income distributions for the fiscal period as qualified dividend income under the Jobs and Growth Tax Reconciliation Act of 2003.
The U.S. All Cap Fund designates 0.00% of its ordinary income distributions as short-term capital gain distribution under Internal Revenue Code Section 871(k)(2)(c).
U.S. Large Cap Fund
For the year ended June 30, 2016, 100.00% of dividends paid from net ordinary income qualify for the dividends received deduction available to corporate shareholders.
The U.S. Large Cap Fund designates 100.00% of their ordinary income distributions for the fiscal period as qualified dividend income under the Jobs and Growth Tax Reconciliation Act of 2003.
The U.S. Large Cap Fund designates 0.00% of its ordinary income distributions as short-term capital gain distribution under Internal Revenue Code Section 871(k)(2)(c).
| 3. | AVAILABILITY OF QUARTERLY PORTFOLIO HOLDINGS SCHEDULES |
The Funds file complete schedules of portfolio holdings with the SEC for the first and third quarters of each fiscal year on Form N-Q, which is available on the SEC’s website at www.sec.gov. The Funds’ Form N-Q may be reviewed and copied at the SEC’s Public Reference Room in Washington, D.C. For information on the Public Reference Room call 1-800-SEC-0330. In addition, the Funds’ Form N-Q is available without charge, upon request, by calling 1-877-271-8811.
| 4. | PROXY VOTING POLICIES AND PROCEDURES AND PROXY VOTING RECORD |
A description of the Funds’ proxy voting policies and procedures and information regarding how the Funds voted proxies relating to portfolio securities during the most recent 12 month period ended June 30, is available (1) without charge, upon request, by calling 1-877-271-8811, or (2) on the SEC’s website at www.sec.gov.
EntrepreneurShares Series Trust
PRIVACY POLICY
(Unaudited)
As part of the EntrepreneurShares fund family long tradition of trust, the confidentiality of personal information is paramount. We maintain high standards lo safeguard your personal information. We will remain vigilant and professional in protecting that information and in using it in a fair and lawful manner. As part of this commitment to fulfilling your trust we have formulated this Privacy Policy.
Safeguarding Customer Information and Documents
To conduct regular business, we may collect nonpublic personal information from sources such as:
| | • | Account Applications and other forms, which may include a customer’s name, address, social security number, and information about a customer’s investment goals and risk tolerances; |
| | | |
| | • | Account History, including information about the transactions and balances in a customer’s account; and |
| | | |
| | • | Correspondence, written, telephonic, or electronic between a customer and Weston Capital Advisors, EntrepreneurShares, and/or EntrepreneurShares Global Fund, or service providers to Weston Capital Advisors, EntrepreneurShares, and/or EntrepreneurShares Global Fund. |
To conduct regular business we collect non-public customer data in checklists, forms, in written notations, and in documentation provided to us by our customers for evaluation, registration, licensing or related consulting services. We also create internal lists of such data.
EntrepreneurShares will internally safeguard your nonpublic personal information by restricting access to only those employees who provide products or services Lo you or those who need access to your information to service your account. In addition, we will maintain physical, electronic and procedural safeguards that meet federal and/or state standards to guard your nonpublic personal information. Failure to observe EntrepreneurShares’ procedures regarding customer and consumer privacy will result in discipline and may lead to termination.
Sharing Nonpublic Personal and Financial Information
As the Firm shares nonpublic information solely to service our client accounts, we do not disclose any nonpublic personal information about our customers or former customers to anyone, except as permitted by law or otherwise disclosed herein.
EntrepreneurShares is committed to the privacy and protection of our customers’ personal and financial information. We will not share any such information with any affiliated or nonaffiliated third party except:
| | • | When necessary to complete transactions in a customer account, such as clearing firm. |
| | | |
| | • | When required to service and/or maintain your account. |
| | | |
| | • | In order to resolve a customer dispute or inquiry. |
| | | |
| | • | With persons acting in a fiduciary or representative capacity on behalf of the customer. |
| | | |
| | • | With rating agencies, persons assessing compliance with industry standards, or to the attorneys, accountants and auditors of the firm. |
| | | |
| | • | In connection with any sale and / or merger of EntrepreneurShares’ business. |
| | | |
| | • | To prevent or protect against actual or potential fraud, identity theft, unauthorized transactions, claims or other liability. |
| | | |
| | • | To comply with all federal, state or local laws, rules, statutes and other applicable legal requirements |
| | | |
| | • | In connection with a written agreement to provide advisory services or investment management when the information is released solely for the purpose of providing products or services covered by pursuant to the EntrepreneurShares Wrap Fee Program. |
| | • | Upon the customer’s specific instruction, consent or request. |
Note: When we share your nonpublic information with any third party for the reasons listed above, we make certain that there are written restrictions in place regarding the use and/or disclosure of said information.
Opt-Out Provisions
It is not a policy of EntrepreneurShares to share nonpublic personal and financial information with affiliated or unaffiliated third parties except under the circumstances noted above. Since sharing under the circumstances noted above is necessary to service customer accounts or is mandated by law, there are no allowances made for clients to opt out.
EntrepreneurShares Global Fund Investment Advisor
Weston Capital Advisors, LLC
175 Federal Street, Suite #875
Boston, MA 02110
EntrepreneurShares Global Fund Investment Sub-Advisor
EntrepreneurShares, LLC
175 Federal Street, Suite #875
Boston, MA 02110
Entrepreneur U.S. All Cap Fund and Entrepreneur U.S. Large Cap Fund Investment Advisor
Capital Impact Advisors, LLC
175 Federal Street, Suite #875
Boston, MA 02110
Independent Registered Public Accounting Firm
RSM US LLP
80 City Square
Boston, MA 02129
Custodian
U.S. Bank N.A.
1555 N. Rivercenter Drive, Suite 302
Milwaukee, WI 53212
Distributor
Rafferty Capital Markets, LLC
59 Hilton Avenue
Garden City, NY 11530
Transfer Agent, Fund Accountant and Fund Administrator
U.S. Bancorp Fund Services, LLC
615 East Michigan Street
Milwaukee, WI 53202
This report should be accompanied or preceded by a prospectus.
The Funds’ Statement of Additional Information contains additional information about the
Funds’ trustees and is available without charge upon request by calling 1-877-271-8811.
Item 2. Code of Ethics.
The registrant has adopted a Code of Ethics that applies to the registrant’s principal executive officer and principal financial officer. The registrant has not made any substantive amendments to its Code of Ethics during the period covered by this report. The registrant has not granted any waivers from any provisions of the Code of Ethics during the period covered by this report. A copy of the registrant’s Code of Ethics is filed herewith. You may also receive a copy of the registrant’s Code of Ethics, upon request, by mail, by calling the registrant at 1-877-271-8811.
Item 3. Audit Committee Financial Expert.
The registrant’s board of trustees has determined that it does not have an audit committee financial expert serving on its audit committee. At this time, the registrant believes that the experience provided by each member of the audit committee together offers the registrant adequate oversight for the registrant’s level of financial complexity.
Item 4. Principal Accountant Fees and Services.
The registrant has engaged its principal accountant to perform audit services, audit-related services, tax services and other services during the past two fiscal years. “Audit services” refer to performing an audit of the registrant's annual financial statements or services that are normally provided by the accountant in connection with statutory and regulatory filings or engagements for those fiscal years. “Audit-related services” refer to the assurance and related services by the principal accountant that are reasonably related to the performance of the audit. “Tax services” refer to professional services rendered by the principal accountant for tax compliance, tax advice, and tax planning, including a review of excise tax calculation and annual distribution requirements. There were no “Other Services” provided by the principal account. The following table details the aggregate fees billed or expected to be billed for each of the last two fiscal years for audit fees, audit-related fees, tax fees and other fees by the principal accountant.
| | FYE 6/30/2016 RSM US LLP | FYE 6/30/2015 RSM US LLP |
| Audit Fees | $47,250 | $45,000 |
| Audit-Related Fees | $0 | $0 |
| Tax Fees | $7,875 | $7,500 |
| All Other Fees | $0 | $0 |
The audit committee has adopted pre-approval policies and procedures that require the audit committee to pre‑approve all audit and non‑audit services of the registrant, including services provided to any entity affiliated with the registrant.
The percentage of fees billed by RSM US LLP for the fiscal year ended June 30, 2016 and for the fiscal year ended June 30, 2015 applicable to non-audit services pursuant to waiver of pre-approval requirement were as follows:
| | FYE 6/30/2016 RSM US LLP | FYE 6/30/2015 RSM US LLP |
| Audit-Related Fees | 0% | 0% |
| Tax Fees | 0% | 0% |
| All Other Fees | 0% | 0% |
All of the principal accountant’s hours spent on auditing the registrant’s financial statements were attributed to work performed by full‑time permanent employees of the principal accountant. The following table indicates the non-audit fees billed or expected to be billed by the registrant’s accountant for services to the registrant and to the registrant’s investment adviser (and any other controlling entity, etc.—not sub-adviser) for the last two years. The audit committee of the board of trustees has considered whether the provision of non-audit services that were rendered to the registrant's investment adviser is compatible with maintaining the principal accountant's independence and has concluded that the provision of such non-audit services by the accountant has not compromised the accountant’s independence.
| Non-Audit Related Fees | FYE 6/30/2016 RSM US LLP | FYE 6/30/2015 RSM US LLP |
| Registrant | $0 | $0 |
| Registrant’s Investment Adviser | $0 | $0 |
Item 5. Audit Committee of Listed Registrants.
Not applicable to registrants who are not listed issuers (as defined in Rule 10A-3 under the Securities Exchange Act of 1934).
Item 6. Investments.
| (a) | Schedule of Investments is included as part of the report to shareholders filed under Item 1 of this Form. |
Item 7. Disclosure of Proxy Voting Policies and Procedures for Closed-End Management Investment Companies.
Not applicable to open-end investment companies.
Item 8. Portfolio Managers of Closed-End Management Investment Companies.
Not applicable to open-end investment companies.
Item 9. Purchases of Equity Securities by Closed‑End Management Investment Company and Affiliated Purchasers.
Not applicable to open-end investment companies.
Item 10. Submission of Matters to a Vote of Security Holders.
Not Applicable.
Item 11. Controls and Procedures.
| (a) | The Registrant’s President and Treasurer have reviewed the Registrant's disclosure controls and procedures (as defined in Rule 30a-3(c) under the Investment Company Act of 1940 (the “Act”)) as of a date within 90 days of the filing of this report, as required by Rule 30a-3(b) under the Act and Rules 13a-15(b) or 15d‑15(b) under the Securities Exchange Act of 1934. Based on their review, such officers have concluded that the disclosure controls and procedures are effective in ensuring that information required to be disclosed in this report is appropriately recorded, processed, summarized and reported and made known to them by others within the Registrant and by the Registrant’s service provider. |
| (b) | There were no changes in the Registrant's internal control over financial reporting (as defined in Rule 30a-3(d) under the Act) that occurred during the second fiscal quarter of the period covered by this report that has materially affected, or is reasonably likely to materially affect, the Registrant's internal control over financial reporting. |
Item 12. Exhibits.
| (a) | (1) Any code of ethics or amendment thereto, that is the subject of the disclosure required by Item 2, to the extent that the registrant intends to satisfy Item 2 requirements through filing an exhibit. Filed herewith. |
(2) A separate certification for each principal executive and principal financial officer pursuant to Section 302 of the Sarbanes-Oxley Act of 2002. Filed herewith.
(3) Any written solicitation to purchase securities under Rule 23c‑1 under the Act sent or given during the period covered by the report by or on behalf of the registrant to 10 or more persons. Not applicable to open-end investment companies.
| (b) | Certifications pursuant to Section 906 of the Sarbanes‑Oxley Act of 2002. Filed herewith. |
SIGNATURES
Pursuant to the requirements of the Securities Exchange Act of 1934 and the Investment Company Act of 1940, the registrant has duly caused this report to be signed on its behalf by the undersigned, thereunto duly authorized.
(Registrant) EntrepreneurShares Series Trust
By (Signature and Title)* /s/ Dr. Joel M. Shulman
Dr. Joel M. Shulman, President
Date September 8, 2016
Pursuant to the requirements of the Securities Exchange Act of 1934 and the Investment Company Act of 1940, this report has been signed below by the following persons on behalf of the registrant and in the capacities and on the dates indicated.
By (Signature and Title)* /s/ Dr. Joel M. Shulman
Dr. Joel M. Shulman, President
Date September 8, 2016
By (Signature and Title)* /s/ David Cragg
David Cragg, Treasurer
Date September 8, 2016
* Print the name and title of each signing officer under his or her signature.