UNITED STATES
SECURITIES AND EXCHANGE COMMISSION
Washington, D.C. 20549
FORM N-CSR
CERTIFIED SHAREHOLDER REPORT OF REGISTERED
MANAGEMENT INVESTMENT COMPANIES
Investment Company Act file number : 811-22436
EntrepreneurShares Series Trust
(Exact name of registrant as specified in charter)
175 Federal Street, Suite #875
Boston, MA 02110
(Address of principal executive offices) (Zip code)
Dr. Joel M. Shulman
175 Federal Street, Suite #875
Boston, MA 02110
(Name and address of agent for service)
Registrant’s telephone number, including area code: 1-617-917-2605
Date of fiscal year end: June 30
Date of reporting period: June 30, 2021
Form N-CSR is to be used by management investment companies to file reports with the Commission not later than 10 days after the transmission to stockholders of any report that is required to be transmitted to stockholders under Rule 30e-1 under the Investment Company Act of 1940 (17 CFR 270.30e-1). The Commission may use the information provided on Form N-CSR in its regulatory, disclosure review, inspection and policymaking roles.
A registrant is required to disclose the information specified by Form N-CSR, and the Commission will make this information public. A registrant is not required to respond to the collection of information contained in Form N-CSR unless the Form displays a currently valid Office of Management and Budget ("OMB") control number. Please direct comments concerning the accuracy of the information collection burden estimate and any suggestions for reducing the burden to Secretary, Securities and Exchange Commission, 450 Fifth Street, NW, Washington, DC 20549-0609. The OMB has reviewed this collection of information under the clearance requirements of 44 U.S.C. § 3507.
Item 1. Reports to Stockholders.

Annual Report
EntrepreneurShares Series Trust™
EntrepreneurShares Series Trust (“Trust”) is a registered investment company consisting of separate investment portfolios called “Funds.” This Annual Report relates solely to the following Funds:
| Name | Ticker Symbol |
| ERShares Global Fund | ENTIX |
| ERShares US Small Cap Fund | IMPAX |
| ERShares US Large Cap Fund | IMPLX |
June 30, 2021
175 Federal Street
Suite #875
Boston, MA 02110
Toll Free: 877-271-8811
EntrepreneurShares Series Trust
(Unaudited)
Dear Shareholders:
We are enclosing the report for results covering the fiscal year July 1, 2020 through June 30, 2021. We note that our performance is not symmetrical or consistent through the year with quarters in the past couple of years varying considerably from period to period. We note that the interpretation of results is best measured over an extended period, especially as measured against a consistent benchmark.
The objective of this letter is to provide our shareholders an informative review of our Funds’ performance, present comparison of each fund’s performance vs. appropriate benchmarks, and discuss each fund’s top performing sector. This letter addresses our three mutual funds; ERShares Global Fund, ERShares US Large Cap Fund, and ERShares US Small Cap Fund. The Trust also includes two ETFs; these are separately covered in their own Annual Report. Overall, all funds have positive annual returns, despite the unusual market conditions brought by COVID-19.
Several key factors need to be addressed. First, our models work best during periods of market appreciation and low volatility. Our historical above average Up-Capture suggests that when markets rise, our Entrepreneurial stocks tend to rise faster. The corollary also tends to hold true: our above average Down-Capture suggests that during periods of market decline our Entrepreneurial stocks tend to fall faster than peer benchmarks. The period July 1, 2020 through June 30, 2021 included periods with extreme movements in both directions. Our funds performed as expected during these periods, though with more volatility due to the pandemic and more volatile interest rates. We believe if our funds were evaluated during a Calendar year, investors would have an entirely different interpretation of results.
An important distinguishing characteristic of our strategy is that many of our alpha(1)-generating Entrepreneurial stocks tend to fall in the Growth and High Beta(2) classification. This includes a handful of sectors with most stocks residing within the Information Technology, Consumer Discretionary, Communication Services and Health Care sectors. When equity markets favor these sectors or Growth and High Beta stocks, our Entrepreneur portfolios tend to out-perform the markets over that time period. The opposite also holds true.
ERShares Global Fund
ERShares Global Fund (“ENTIX”) is one of the three mutual funds. ENTIX is benchmarked against the MSCI The World Index (Net)(3). During the last fiscal year, ENTIX performed 42.63% vs. 39.04%, respectively.
The ERShares Global Fund’s top performing sectors for the fiscal year were Financials, Consumer Discretionary, and Communication Services. The Fund’s performance vs. the benchmark in these sectors for the period was 371% vs. 52.87%, 71.70% vs. 48.63% and 56.98% vs. 46.56%, respectively. The ERShares Global Fund’s worst performing sectors were Real Estate, Consumer Staples, and Energy. The Fund’s performance vs the benchmark in these sectors for the fiscal year was -16.39% vs. 30.30%, 2.17% vs. 21.56%, and 20.03% vs. 43.04%, respectively.
| (1) | Alpha compares the risk-adjusted performance of a portfolio to a benchmark index. A positive alpha means the portfolio has outperformed the index on a risk-adjusted basis. |
| (2) | Beta is a measure of the volatility of a portfolio in comparison to a benchmark index. Less than one means the portfolio is less volatile than the index, while greater than one indicates more volatility than the index. Standard deviation measures historical volatility. |
| (3) | Reflects no deduction for fees, expenses or taxes. MSCI publishes two versions of this index reflecting the reinvestment of dividends using two different methodologies: gross dividends and net dividends. The Fund believes that the net dividends version better reflects the returns U.S. investors might expect were they to invest directly in the component securities of the index. |
EntrepreneurShares Series Trust
(Unaudited)
ERShares US Small Cap Fund
ERShares US Small Cap Fund (“IMPAX”) is one of the three mutual funds. IMPAX is benchmarked against the S&P SmallCap 600 and the Russell 2000 Total Return Index. During the last fiscal year, IMPAX performed 42.19% vs. 67.40% vs. 62.03%, respectively.
The ERShares US Small Cap Fund top performing sectors for the period were Consumer Discretionary, Financials, and Real Estate. The Fund’s performance vs. the benchmark in these sectors for the fiscal year was 107.38% vs. 99.41%, 96.66% vs. 56.75%, and 85.59% vs. 45.23%, respectively. The ERShares US Small Cap Fund’s worst performing sectors for the fiscal year were Health Care, Communication Services, and Energy. The Fund’s performance vs. the benchmark for the fiscal year was 31.18% vs. 41.53%, 32.38% vs. 101.76%, and 38.20% vs. 133.20%, respectively.
In this past fiscal year, we note that our relative performance is not consistent across strategies. We had underperformance as measured against our benchmark in the US Large Cap and US Small Cap funds. We do not see this performance as a reflection of our Entrepreneur strategy, but rather, individual stock performance during a specific time period. We note that when our Fund performance is viewed on a calendar year basis or over an extended time period, different interpretations would follow. We believe that we continue to provide evidence that our Entrepreneur Model works over an extended period and extend our gratitude to all of our shareholders for continued support. We look forward to sharing more updates with you in the future.
ERShares US Large Cap Fund
ERShares US Large Cap Fund (“IMPLX”) is one of the three mutual funds. IMPLX is benchmarked against the S&P 500 Total Return Index. During the last fiscal year, IMPLX performed 24.30%% vs. 40.79%, respectively.
The ERShares US Large Cap Fund top performing sectors for the period were Industrials, Information Technology, and Communication Services. The Fund’s performance vs. the benchmark in these sectors for the fiscal year was 68.53% vs. 51.21%, 56.19% vs. 42.48%, and 42.42% vs. 48.39%, respectively. The ERShares US Large Cap Fund’s worst performing sectors for the fiscal year were Real Estate, Health Care, and Consumer Discretionary. The Fund’s performance vs. the benchmark in these sectors for the fiscal year was -23.75% vs. 31.80%, 15.45% vs. 27.86%, 16.59% vs 38.26%, respectively.
Sincerely,
Joel Shulman Ph.D., CFA
Founder and Chief Investment Officer
EntrepreneurShares Series Trust
(Unaudited)
Performance data quoted represents past performance; past performance does not guarantee future results. The investment return and principal value of an investment will fluctuate so that an investor’s shares, when redeemed, may be worth more or less than their original cost. Current performance of the Funds may be lower or higher than the performance quoted. Performance data current to the most recent month end may be obtained by calling 1-877-271-8811 or visiting www.ershares.com.
Investors should consider carefully the investment objectives, risks, and charges and expenses before investing. For a full prospectus which contains this and other information about the Funds offered by EntrepreneurShares, call 1-877-271-8811. Please read the full prospectus carefully before investing. The Mutual Funds and ETFs are distributed by Foreside Fund Services, LLC.
The ERShares Global Fund invests in foreign securities which involve greater volatility and political, economic and currency risks and differences in accounting methods. The ERShares US Small Cap Fund invests in smaller companies, which involve additional risks such as limited liquidity and greater volatility. The funds are exposed to common stock risk. Common stock prices fluctuate based on changes in a company’s financial condition and on overall market and economic conditions. Additional risks are detailed in the prospectus.
The MSCI The World Index (Net) is a free float-adjusted market capitalization weighted index that is designed to measure the equity market performance of developed markets. The Russell 2000 Total Return Index is a subset of the Russell 3000 Total Return Index representing approximately 10% of the total market capitalization of that index. It includes approximately 2000 of the smallest securities based on a combination of their market cap and current index membership. The S&P 500 Total Return Index includes 500 leading companies and captures approximately 80% coverage of available market capitalization. Returns assume the reinvestments of all dividends.
Index performance does not represent actual fund or portfolio performance and such performance does not reflect the actual investment experience of any investor. An investor cannot invest directly in an index.
Diversification does not guarantee a profit or assure against a loss.
Opinions expressed are subject to change, are not guaranteed and should not be considered recommendations to buy or sell any security.
ERShares Global Fund
PERFORMANCE HIGHLIGHTS (Unaudited)
ERShares Global Fund Institutional Class vs. MSCI The World Index (Net)
Value of $10,000 Investment
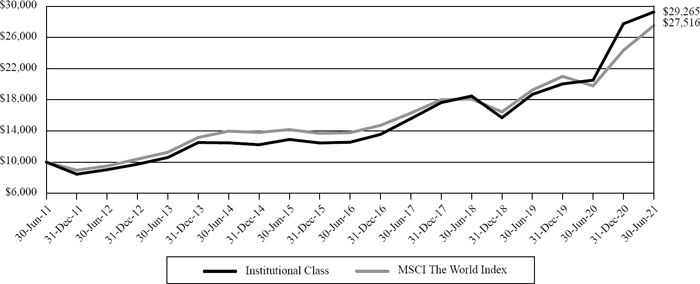
This chart assumes an initial gross investment of $10,000 made in the Institutional Class on June 30, 2011 and held through June 30, 2021. Returns shown include the reinvestment of all dividends but do not reflect the deduction of taxes that a shareholder would pay on ERShares Global Fund (“Global Fund”) distributions or the redemption of Global Fund shares. In the absence of fee waivers and reimbursements, total returns would be reduced. Past performance is not predictive of future performance. Investment return and principal value will fluctuate, so that your shares, when redeemed, may be worth more or less than the original cost. Total returns would have been lower/higher had the expenses not been waived or absorbed/recovered by Seaport Global Advisors, LLC. The Global Fund’s total gross and net operational expenses, including underlying funds, were 1.50% per the October 28, 2020 (as amended February 9, 2021) prospectus.
MSCI The World Index (Net) – A free float-adjusted market capitalization weighted index that is designed to measure the equity performance of developed markets. Returns assume the reinvestments of all dividends. Investors cannot invest directly in an index.
| Total Annualized Returns as of June 30, 2021 |
| | | 1-Year | | 5-Year | | 10-Year |
| ERShares Global Fund – Institutional Class | | 42.63% | | 18.44% | | 11.34% |
| MSCI The World Index (Net) | | 39.04% | | 14.83% | | 10.65% |
ERShares US Small Cap Fund
PERFORMANCE HIGHLIGHTS (Unaudited)
ERShares US Small Cap Fund Institutional Class vs. Russell 2000 Total Return Index vs. S&P SmallCap 600 Index
Value of $10,000 Investment
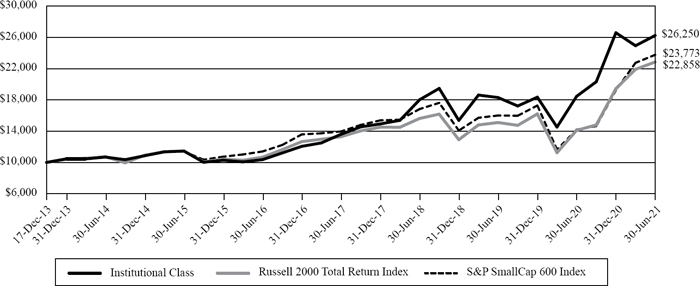
This chart assumes an initial gross investment of $10,000 made in the Institutional Class on December 17, 2013 (commencement of operations of the ERShares US Small Cap Fund (“US Small Cap Fund”)) and held through June 30, 2021. Returns shown include the reinvestment of all dividends but do not reflect the deduction of taxes that a shareholder would pay on US Small Cap Fund distributions or the redemption of US Small Cap Fund shares. In the absence of fee waivers and reimbursements, total returns would be reduced. Past performance is not predictive of future performance. Investment return and principal value will fluctuate, so that your shares, when redeemed, may be worth more or less than the original cost. Total returns would have been lower had Capital Impact Advisors, LLC not waived its fees and reimbursed a portion of the US Small Cap Fund’s expenses. The US Small Cap Fund’s total gross and net operational expenses, including underlying funds, were 0.92% and 0.87%, respectfully, per the October 28, 2020 (as amended February 9, 2021) prospectus.
S&P SmallCap 600 Index – An index that covers roughly the small-cap range of US stocks, using a capitalization-weighted index. Investors cannot invest directly in an index.
Russell 2000 Total Return Index – A subset of the Russell 3000® Total Return Index representing approximately 10% of the total market capitalization of that index. It includes approximately 2000 of the smallest securities based on a combination of their market cap and current index membership. Investors cannot invest directly in an index.
Returns assume the reinvestments of all dividends.
Total Annualized Returns as of June 30, 2021
| | | 1-Year | | 5-Year | | Since Inception (12/17/13) |
| ERShares US Small Cap Fund – Institutional Class | | 42.19% | | 20.44% | | 13.67% |
| Russell 2000 Total Return Index | | 62.03% | | 16.47% | | 11.60% |
| S&P SmallCap 600 Index | | 67.40% | | 15.82% | | 12.18% |
ERShares US Large Cap Fund
PERFORMANCE HIGHLIGHTS (Unaudited)
ERShares US Large Cap Fund Institutional Class vs. S&P 500 Total Return Index
Value of $10,000 Investment
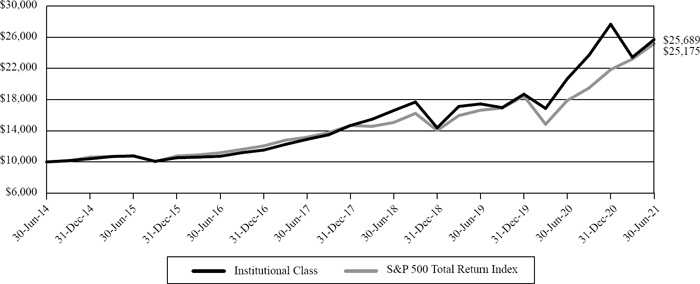
This chart assumes an initial gross investment of $10,000 made in the Institutional Class on June 30, 2014 (commencement of operations of the ERShares US Large Cap Fund (“US Large Cap Fund”)) and held through June 30, 2021. Returns shown include the reinvestment of all dividends but do not reflect the deduction of taxes that a shareholder would pay on US Large Cap Fund distributions or the redemption of US Large Cap Fund shares. In the absence of fee waivers and reimbursements, total returns would be reduced. Past performance is not predictive of future performance. Investment return and principal value will fluctuate, so that your shares, when redeemed, may be worth more or less than the original cost. Total returns would have been lower had Capital Impact Advisors, LLC not waived its fees and reimbursed a portion of the US Large Cap Fund’s expenses. The US Large Cap Fund’s total gross and net operational expenses, including underlying funds, were 0.82% and 0.77%, respectfully, per the October 28, 2020 (as amended February 9, 2021) prospectus.
S&P 500 Total Return Index – Includes 500 leading companies and captures approximately 80% coverage of available market capitalization. Returns assume the reinvestments of all dividends. Investors cannot invest directly in an index.
Total Annualized Returns as of June 30, 2021
| | | | | | | Since |
| | | | | | | Inception |
| | | 1-Year | | 5-Year | | (6/30/14) |
| ERShares US Large Cap Fund – Institutional Class | | 24.30% | | 19.09% | | 14.43% |
| S&P 500 Total Return Index | | 40.79% | | 17.65% | | 14.10% |
| ERShares Global Fund |
| |
| SCHEDULE OF INVESTMENTS SUMMARY TABLE(1) |
| June 30, 2021 (Unaudited) |
| | | % of Net Assets | |
| Communications | | | 29.79 | % |
| Consumer Discretionary | | | 8.34 | % |
| Financials | | | 1.44 | % |
| Health Care | | | 24.98 | % |
| Industrials | | | 1.00 | % |
| Real Estate | | | 1.66 | % |
| Technology | | | 31.93 | % |
| Money Market Funds | | | 5.11 | % |
| Liabilities in Excess of Other Assets | | | (4.25 | )% |
| Total | | | 100.00 | % |
| TOP TEN EQUITY HOLDINGS(1)(2) |
| as of June 30, 2021 (Unaudited) |
| Issuer | | % of Net Assets | |
| Roku, Inc. | | | 4.07 | % |
| Square, Inc., Class A | | | 3.60 | % |
| Teladoc Health, Inc. | | | 3.52 | % |
| Twist Bioscience Corp. | | | 3.05 | % |
| Fiverr International Ltd. | | | 2.93 | % |
| Twilio, Inc., Class A | | | 2.79 | % |
| CRISPR Therapeutics AG | | | 2.78 | % |
| Veeva Systems, Inc., Class A | | | 2.58 | % |
| Zillow Group, Inc., Class A | | | 2.49 | % |
| Spotify Technology S.A. | | | 2.12 | % |
| (1) | Fund holdings and sector allocations are subject to change at any time and are not recommendations to buy or sell any security. |
| (2) | Short-term investments are not included. |
| ERShares US Small Cap Fund |
| |
| SCHEDULE OF INVESTMENTS SUMMARY TABLE(1) |
| June 30, 2021 (Unaudited) |
| | | % of Net Assets | |
| Communications | | | 11.50 | % |
| Consumer Discretionary | | | 10.26 | % |
| Consumer Staples | | | 0.61 | % |
| Energy | | | 3.61 | % |
| Financials | | | 16.50 | % |
| Health Care | | | 27.68 | % |
| Industrials | | | 5.39 | % |
| Materials | | | 0.45 | % |
| Real Estate | | | 2.35 | % |
| Technology | | | 21.32 | % |
| Money Market Funds | | | 11.52 | % |
| Liabilities in Excess of Other Assets | | | (11.19 | )% |
| Total | | | 100.00 | % |
| TOP TEN EQUITY HOLDINGS(1)(2) |
| as of June 30, 2021 (Unaudited) |
| Issuer | | % of Net Assets | |
| Trupanion, Inc. | | | 3.66 | % |
| Futu Holdings Ltd. - ADR | | | 3.36 | % |
| GrowGeneration Corp. | | | 2.93 | % |
| Fiverr International Ltd. | | | 2.72 | % |
| Zynex, Inc. | | | 2.62 | % |
| CRISPR Therapeutics AG | | | 2.51 | % |
| Zscaler, Inc. | | | 2.27 | % |
| Natera, Inc. | | | 2.22 | % |
| Ameresco, Inc., Class A | | | 2.19 | % |
| HubSpot, Inc. | | | 2.02 | % |
| (1) | Fund holdings and sector allocations are subject to change at any time and are not recommendations to buy or sell any security. |
| (2) | Short-term investments are not included. |
| ERShares US Large Cap Fund |
| |
| SCHEDULE OF INVESTMENTS SUMMARY TABLE(1) |
| June 30, 2021 (Unaudited) |
| | | % of Net Assets | |
| Communications | | | 21.09 | % |
| Consumer Discretionary | | | 13.16 | % |
| Energy | | | 1.36 | % |
| Financials | | | 5.68 | % |
| Health Care | | | 20.87 | % |
| Industrials | | | 1.03 | % |
| Materials | | | 0.86 | % |
| Real Estate | | | 2.07 | % |
| Technology | | | 33.23 | % |
| Money Market Funds | | | 2.49 | % |
| Liabilities in Excess of Other Assets | | | (1.84 | )% |
| Total | | | 100.00 | % |
| TOP TEN EQUITY HOLDINGS(1)(2) |
| as of June 30, 2021 (Unaudited) |
| Issuer | | % of Net Assets | |
| Twilio, Inc., Class A | | | 3.62 | % |
| Alphabet, Inc., Class A | | | 3.14 | % |
| Teladoc Health, Inc. | | | 2.93 | % |
| Spotify Technology S.A. | | | 2.88 | % |
| NVIDIA Corp. | | | 2.85 | % |
| Masimo Corp. | | | 2.84 | % |
| Etsy, Inc. | | | 2.46 | % |
| Veeva Systems, Inc., Class A | | | 2.46 | % |
| EPAM Systems, Inc. | | | 2.37 | % |
| Facebook, Inc., Class A | | | 2.34 | % |
| (1) | Fund holdings and sector allocations are subject to change at any time and are not recommendations to buy or sell any security. |
| (2) | Short-term investments are not included. |
| ERShares Global Fund |
| |
| SCHEDULE OF INVESTMENTS |
| June 30, 2021 |
| | | Shares | | | Fair Value | |
| Common Stocks — 99.14% | | | | | | | | |
| Argentina — 1.86% | | | | | | | | |
| Consumer Discretionary — 1.86% | | | | | | | | |
| MercadoLibre, Inc.(a) | | | 1,454 | | | $ | 2,265,027 | |
| | | | | | | | | |
| Total Argentina | | | | | | | 2,265,027 | |
| | | | | | | | | |
| Australia — 3.62% | | | | | | | | |
| Communications — 0.97% | | | | | | | | |
| SEEK Ltd. | | | 47,663 | | | | 1,184,586 | |
| | | | | | | | | |
| Technology — 2.65% | | | | | | | | |
| Technology One Ltd.(a) | | | 263,516 | | | | 1,839,878 | |
| WiseTech Global Ltd. | | | 57,748 | | | | 1,382,829 | |
| | | | | | | | 3,222,707 | |
| Total Australia | | | | | | | 4,407,293 | |
| Canada — 2.44% | | | | | | | | |
| Communications — 2.00% | | | | | | | | |
| Shopify, Inc., Class A(a) | | | 1,665 | | | | 2,432,531 | |
| | | | | | | | | |
| Consumer Discretionary — 0.34% | | | | | | | | |
| Spin Master Corp.(a) | | | 10,652 | | | | 414,359 | |
| | | | | | | | | |
| Technology — 0.10% | | | | | | | | |
| Topicus.com, Inc.(a) | | | 1,714 | | | | 124,513 | |
| | | | | | | | | |
| Total Canada | | | | | | | 2,971,403 | |
| | | | | | | | | |
| Cayman Islands — 8.06% | | | | | | | | |
| Communications — 4.35% | | | | | | | | |
| 51job, Inc. - ADR(a) | | | 14,585 | | | | 1,134,275 | |
| HUYA, Inc. - ADR(a),(b) | | | 130,126 | | | | 2,296,724 | |
| KE Holdings, Inc., Institutional Class - ADR(a) | | | 39,091 | | | | 1,863,859 | |
| | | | | | | | 5,294,858 | |
| Consumer Discretionary — 1.72% | | | | | | | | |
| NagaCorp Ltd. | | | 977,282 | | | | 942,756 | |
| Yadea Group Holdings Ltd. | | | 536,125 | | | | 1,153,136 | |
| | | | | | | | 2,095,892 | |
The accompanying notes are an integral part of these financial statements.
| ERShares Global Fund |
| |
| SCHEDULE OF INVESTMENTS (Continued) |
| June 30, 2021 |
| | | Shares | | | Fair Value | |
| Common Stocks (Continued) | | | | | | | | |
| Cayman Islands (Continued) | | | | | | | | |
| Technology — 1.99% | | | | | | | | |
| Agora, Inc. - ADR(a) | | | 42,861 | | | $ | 1,798,448 | |
| Kingsoft Corp. Ltd. | | | 102,564 | | | | 614,911 | |
| | | | | | | | 2,413,359 | |
| Total Cayman Islands | | | | | | | 9,804,109 | |
| China — 8.10% | | | | | | | | |
| | | | | | | | | |
| Communications — 2.64% | | | | | | | | |
| Bilibili, Inc. - ADR(a) | | | 16,879 | | | | 2,056,537 | |
| Weimob, Inc.(a) | | | 521,703 | | | | 1,150,336 | |
| | | | | | | | 3,206,873 | |
| Consumer Discretionary — 1.09% | | | | | | | | |
| Niu Technologies - ADR(a) | | | 40,435 | | | | 1,320,203 | |
| | | | | | | | | |
| Financials — 1.44% | | | | | | | | |
| Futu Holdings Ltd. - ADR(a) | | | 9,759 | | | | 1,747,739 | |
| | | | | | | | | |
| Health Care — 2.93% | | | | | | | | |
| BeiGene Ltd. - ADR(a) | | | 6,384 | | | | 2,190,925 | |
| Sino Biopharmaceutical Ltd. | | | 1,405,433 | | | | 1,379,313 | |
| | | | | | | | 3,570,238 | |
| Total China | | | | | | | 9,845,053 | |
| | | | | | | | | |
| Denmark — 1.92% | | | | | | | | |
| Health Care — 1.92% | | | | | | | | |
| Genmab A/S(a) | | | 5,693 | | | | 2,329,398 | |
| | | | | | | | | |
| Total Denmark | | | | | | | 2,329,398 | |
| | | | | | | | | |
| France — 2.08% | | | | | | | | |
| Health Care — 0.77% | | | | | | | | |
| Cellectis S.A. - ADR(a) | | | 60,683 | | | | 938,766 | |
| | | | | | | | | |
| Technology — 1.31% | | | | | | | | |
| Teleperformance | | | 3,929 | | | | 1,594,712 | |
| | | | | | | | | |
| Total France | | | | | | | 2,533,478 | |
The accompanying notes are an integral part of these financial statements.
| ERShares Global Fund |
| |
| SCHEDULE OF INVESTMENTS (Continued) |
| June 30, 2021 |
| | | Shares | | | Fair Value | |
| Common Stocks (Continued) | | | | | | | | |
| Israel — 6.14% | | | | | | | | |
| Communications — 4.83% | | | | | | | | |
| Fiverr International Ltd.(a) | | | 14,692 | | | $ | 3,562,664 | |
| Wix.com Ltd.(a) | | | 7,961 | | | | 2,310,919 | |
| | | | | | | | 5,873,583 | |
| Technology — 1.31% | | | | | | | | |
| Check Point Software Technologies Ltd.(a) | | | 13,718 | | | | 1,593,071 | |
| | | | | | | | | |
| Total Israel | | | | | | | 7,466,654 | |
| | | | | | | | | |
| Japan — 1.45% | | | | | | | | |
| Communications — 1.45% | | | | | | | | |
| GMO internet, Inc. | | | 64,534 | | | | 1,760,097 | |
| | | | | | | | | |
| Total Japan | | | | | | | 1,760,097 | |
| | | | | | | | | |
| Luxembourg — 2.12% | | | | | | | | |
| Communications — 2.12% | | | | | | | | |
| Spotify Technology S.A.(a) | | | 9,335 | | | | 2,572,633 | |
| | | | | | | | | |
| Total Luxembourg | | | | | | | 2,572,633 | |
| | | | | | | | | |
| Singapore — 1.38% | | | | | | | | |
| Communications — 1.38% | | | | | | | | |
| Sea Ltd. - ADR(a) | | | 6,128 | | | | 1,682,749 | |
| | | | | | | | | |
| Total Singapore | | | | | | | 1,682,749 | |
| | | | | | | | | |
| Sweden — 3.97% | | | | | | | | |
| Communications — 1.42% | | | | | | | | |
| Embracer Group A.B.(a) | | | 63,968 | | | | 1,730,360 | |
| | | | | | | | | |
| Consumer Discretionary — 1.51% | | | | | | | | |
| Evolution Gaming Group A.B. | | | 11,579 | | | | 1,829,780 | |
| | | | | | | | | |
| Health Care — 1.04% | | | | | | | | |
| CELLINK A.B.(a) | | | 25,538 | | | | 1,265,844 | |
| | | | | | | | | |
| Total Sweden | | | | | | | 4,825,984 | |
The accompanying notes are an integral part of these financial statements.
| ERShares Global Fund |
| |
| SCHEDULE OF INVESTMENTS (Continued) |
| June 30, 2021 |
| | | Shares | | | Fair Value | |
| Common Stocks (Continued) | | | | | | | | |
| Switzerland — 2.78% | | | | | | | | |
| Health Care — 2.78% | | | | | | | | |
| CRISPR Therapeutics AG(a) | | | 20,920 | | | $ | 3,386,739 | |
| | | | | | | | | |
| Total Switzerland | | | | | | | 3,386,739 | |
| | | | | | | | | |
| United Kingdom — 1.00% | | | | | | | | |
| Industrials — 1.00% | | | | | | | | |
| HomeServe PLC | | | 92,246 | | | | 1,219,256 | |
| | | | | | | | | |
| Total United Kingdom | | | | | | | 1,219,256 | |
| | | | | | | | | |
| United States — 52.22% | | | | | | | | |
| Communications — 8.63% | | | | | | | | |
| Roku, Inc.(a) | | | 10,785 | | | | 4,953,012 | |
| Skillz, Inc.(a),(b) | | | 71,122 | | | | 1,544,770 | |
| Trade Desk, Inc. (The), Class A(a) | | | 12,523 | | | | 968,779 | |
| Zillow Group, Inc., Class A(a) | | | 24,714 | | | | 3,028,206 | |
| | | | | | | | 10,494,767 | |
| Consumer Discretionary — 1.82% | | | | | | | | |
| DraftKings, Inc., Class A(a) | | | 42,500 | | | | 2,217,225 | |
| | | | | | | | | |
| Health Care — 15.54% | | | | | | | | |
| 10X Genomics, Inc., Class A(a) | | | 8,220 | | | | 1,609,640 | |
| Beam Therapeutics, Inc.(a) | | | 9,093 | | | | 1,170,360 | |
| Exact Sciences Corp.(a) | | | 17,085 | | | | 2,123,837 | |
| Fate Therapeutics, Inc.(a) | | | 11,195 | | | | 971,614 | |
| Intellia Therapeutics, Inc.(a) | | | 7,290 | | | | 1,180,324 | |
| Invitae Corp.(a) | | | 57,488 | | | | 1,939,070 | |
| Masimo Corp.(a) | | | 7,952 | | | | 1,927,962 | |
| Teladoc Health, Inc.(a) | | | 25,722 | | | | 4,277,311 | |
| Twist Bioscience Corp.(a) | | | 27,871 | | | | 3,713,811 | |
| | | | | | | | 18,913,929 | |
| Real Estate — 1.66% | | | | | | | | |
| eXp World Holdings, Inc.(a) | | | 51,931 | | | | 2,013,365 | |
| | | | | | | | | |
| Technology — 24.57% | | | | | | | | |
| Cloudflare, Inc.(a) | | | 12,603 | | | | 1,333,902 | |
| Crowdstrike Holdings, Inc., Class A(a) | | | 6,713 | | | | 1,687,044 | |
| Datadog, Inc.(a) | | | 22,000 | | | | 2,289,759 | |
| Fortinet, Inc.(a) | | | 4,500 | | | | 1,071,855 | |
| Microchip Technology, Inc. | | | 12,518 | | | | 1,874,445 | |
The accompanying notes are an integral part of these financial statements.
| ERShares Global Fund |
| |
| SCHEDULE OF INVESTMENTS (Continued) |
| June 30, 2021 |
| | | Shares | | | Fair Value | |
| Common Stocks (Continued) | | | | | | | | |
| United States (Continued) | | | | | | | | |
| Technology (Continued) | | | | | | | | |
| NVIDIA Corp. | | | 2,762 | | | $ | 2,209,877 | |
| Ontrak, Inc.(a),(b) | | | 4,385 | | | | 142,425 | |
| Palantir Technologies, Inc., Class A(a) | | | 36,574 | | | | 964,091 | |
| Phreesia, Inc.(a) | | | 19,144 | | | | 1,173,527 | |
| Pure Storage, Inc., Class A(a) | | | 77,621 | | | | 1,515,938 | |
| salesforce.com, Inc.(a) | | | 3,462 | | | | 845,663 | |
| Square, Inc., Class A(a) | | | 17,941 | | | | 4,374,016 | |
| Synopsys, Inc.(a) | | | 6,821 | | | | 1,881,164 | |
| Twilio, Inc., Class A(a) | | | 8,599 | | | | 3,389,381 | |
| Veeva Systems, Inc., Class A(a) | | | 10,106 | | | | 3,142,460 | |
| Zoom Video Communications, Inc., Class A(a) | | | 5,094 | | | | 1,971,531 | |
| | | | | | | | 29,867,078 | |
| Total United States | | | | | | | 63,506,364 | |
| | | | | | | | | |
| Total Common Stocks (Cost $108,056,112) | | | | | | | 120,576,237 | |
| | | | | | | | | |
| Money Market Funds — 5.11% | | | | | | | | |
| BlackRock Liquidity Funds FedFund Portfolio, Institutional Class, 0.03%(c)(d) | | | 4,108,150 | | | | 4,108,150 | |
| Fidelity Investments Money Market Treasury Only Portfolio, Class I, 0.01%(c) | | | 2,108,776 | | | | 2,108,776 | |
| | | | | | | | | |
| Total Money Market Funds (Cost $6,216,926) | | | | | | | 6,216,926 | |
| | | | | | | | | |
| Total Investments — 104.25% (Cost $114,273,038) | | | | | | | 126,793,163 | |
| Liabilities in Excess of Other Assets — (4.25)% | | | | | | | (5,166,212 | ) |
| Net Assets — 100.00% | | | | | | $ | 121,626,951 | |
| (a) | Non-income producing security. |
| (b) | All or a portion of the security was on loan as of June 30, 2021. The total value of securities on loan as of June 30, 2021 was $3,955,547. See Note 2. |
| (c) | Rate disclosed is the seven day effective yield as of June 30, 2021. |
| (d) | All or a portion of this security was purchased with cash proceeds from securities lending. Total collateral had a value of $4,108,150. See Note 2. |
ADR – American Depositary Receipt
The accompanying notes are an integral part of these financial statements.
| ERShares US Small Cap Fund |
| |
| SCHEDULE OF INVESTMENTS |
| June 30, 2021 |
| | | Shares | | | Fair Value | |
| Common Stocks — 99.67% | | | | | | | | |
| Communications — 11.50% | | | | | | | | |
| Cardlytics, Inc.(a) | | | 8,204 | | | $ | 1,041,334 | |
| Cargurus, Inc.(a) | | | 33,464 | | | | 877,761 | |
| Fiverr International Ltd.(a) | | | 17,243 | | | | 4,181,255 | |
| fuboTV, Inc.(a),(b) | | | 78,165 | | | | 2,509,878 | |
| HealthStream, Inc.(a) | | | 46,764 | | | | 1,306,586 | |
| HUYA, Inc. - ADR(a),(b) | | | 173,105 | | | | 3,055,303 | |
| Meredith Corp. | | | 50,000 | | | | 2,172,000 | |
| Score Media and Gaming, Inc.(a) | | | 23,419 | | | | 467,209 | |
| World Wrestling Entertainment, Inc., Class A | | | 35,498 | | | | 2,054,979 | |
| | | | | | | | 17,666,305 | |
| Consumer Discretionary — 10.26% | | | | | | | | |
| Advance Auto Parts, Inc. | | | 5,906 | | | | 1,211,557 | |
| Cheesecake Factory, Inc. (The) | | | 20,000 | | | | 1,083,600 | |
| Freshpet, Inc.(a) | | | 15,944 | | | | 2,598,234 | |
| GrowGeneration Corp.(a) | | | 93,434 | | | | 4,494,176 | |
| Niu Technologies - ADR(a),(b) | | | 47,302 | | | | 1,544,410 | |
| RealReal, Inc. (The)(a) | | | 48,709 | | | | 962,490 | |
| Service Corp. International | | | 39,312 | | | | 2,106,730 | |
| Skechers U.S.A., Inc., Class A(a) | | | 7,046 | | | | 351,102 | |
| Sonic Automotive, Inc., Class A | | | 31,381 | | | | 1,403,986 | |
| | | | | | | | 15,756,285 | |
| Consumer Staples — 0.61% | | | | | | | | |
| AquaBounty Technologies, Inc.(a),(b) | | | 82,097 | | | | 440,040 | |
| Inter Parfums, Inc. | | | 6,905 | | | | 497,160 | |
| | | | | | | | 937,200 | |
| Energy — 3.61% | | | | | | | | |
| Ameresco, Inc., Class A(a) | | | 53,608 | | | | 3,362,294 | |
| Matador Resources Co. | | | 60,742 | | | | 2,187,319 | |
| | | | | | | | 5,549,613 | |
| Financials — 16.50% | | | | | | | | |
| B. Riley Financial, Inc. | | | 13,500 | | | | 1,019,250 | |
| Evercore, Inc., Class A | | | 8,667 | | | | 1,220,054 | |
| Futu Holdings Ltd. - ADR(a) | | | 28,826 | | | | 5,162,449 | |
| HCI Group, Inc. | | | 12,814 | | | | 1,274,096 | |
| Houlihan Lokey, Inc. | | | 11,937 | | | | 976,327 | |
| Live Oak Bancshares, Inc. | | | 49,017 | | | | 2,892,003 | |
| Pinnacle Financial Partners, Inc. | | | 22,242 | | | | 1,963,746 | |
| Preferred Bank | | | 18,390 | | | | 1,163,535 | |
| Stifel Financial Corp. | | | 31,554 | | | | 2,046,592 | |
| Trupanion, Inc.(a) | | | 48,842 | | | | 5,621,715 | |
The accompanying notes are an integral part of these financial statements.
| ERShares US Small Cap Fund |
| |
| SCHEDULE OF INVESTMENTS (Continued) |
| June 30, 2021 |
| | | Shares | | | Fair Value | |
| Common Stocks (Continued) | | | | | | | | |
| Financials (Continued) | | | | | | | | |
| Up Fintech Holding Ltd. - ADR(a),(b) | | | 70,000 | | | $ | 2,028,600 | |
| | | | | | | | 25,368,367 | |
| Health Care — 27.68% | | | | | | | | |
| BeiGene Ltd. - ADR(a) | | | 3,999 | | | | 1,372,417 | |
| Castle Biosciences, Inc.(a) | | | 13,203 | | | | 968,176 | |
| Cellectis S.A. - ADR(a),(b) | | | 113,486 | | | | 1,755,628 | |
| Corcept Therapeutics, Inc.(a) | | | 118,084 | | | | 2,597,848 | |
| CRISPR Therapeutics AG(a) | | | 23,786 | | | | 3,850,715 | |
| Eagle Pharmaceuticals, Inc.(a) | | | 19,276 | | | | 825,013 | |
| Editas Medicine, Inc.(a) | | | 31,480 | | | | 1,783,027 | |
| Ensign Group, Inc. (The) | | | 19,920 | | | | 1,726,466 | |
| Exact Sciences Corp.(a) | | | 12,533 | | | | 1,557,977 | |
| Guardant Health, Inc.(a) | | | 21,202 | | | | 2,633,075 | |
| Invitae Corp.(a),(b) | | | 46,026 | | | | 1,552,457 | |
| Iovance Biotherapeutics, Inc.(a) | | | 40,887 | | | | 1,063,880 | |
| LeMaitre Vascular, Inc. | | | 44,386 | | | | 2,708,434 | |
| Madrigal Pharmaceuticals, Inc.(a) | | | 11,775 | | | | 1,147,003 | |
| Medpace Holdings, Inc.(a) | | | 8,698 | | | | 1,536,328 | |
| Merit Medical Systems, Inc.(a) | | | 47,715 | | | | 3,085,252 | |
| Natera, Inc.(a) | | | 29,978 | | | | 3,403,402 | |
| Neurocrine Biosciences Inc.(a) | | | 24,496 | | | | 2,383,951 | |
| Twist Bioscience Corp.(a) | | | 18,954 | | | | 2,525,621 | |
| Zynex, Inc.(a),(b) | | | 259,139 | | | | 4,024,429 | |
| | | | | | | | 42,501,099 | |
| Industrials — 5.39% | | | | | | | | |
| Clean Harbors, Inc.(a) | | | 25,800 | | | | 2,403,012 | |
| Colfax Corp.(a) | | | 41,718 | | | | 1,911,102 | |
| EHang Holdings Ltd. - ADR(a) | | | 11,459 | | | | 492,737 | |
| Insperity, Inc. | | | 19,844 | | | | 1,793,302 | |
| Titan Machinery, Inc.(a) | | | 54,469 | | | | 1,685,271 | |
| | | | | | | | 8,285,424 | |
| Materials — 0.45% | | | | | | | | |
| Encore Wire Corp. | | | 4,419 | | | | 334,916 | |
| Steel Dynamics, Inc. | | | 6,062 | | | | 361,295 | |
| | | | | | | | 696,211 | |
| Real Estate — 2.35% | | | | | | | | |
| eXp World Holdings, Inc.(a) | | | 58,448 | | | | 2,266,029 | |
| Medical Properties Trust, Inc. | | | 66,638 | | | | 1,339,424 | |
| | | | | | | | 3,605,453 | |
| Technology — 21.32% | | | | | | | | |
| Agora, Inc. - ADR(a),(b) | | | 22,608 | | | | 948,632 | |
The accompanying notes are an integral part of these financial statements.
| ERShares US Small Cap Fund |
| |
| SCHEDULE OF INVESTMENTS (Continued) |
| June 30, 2021 |
| | | Shares | | | Fair Value | |
| Common Stocks (Continued) | | | | | | | | |
| Technology (Continued) | | | | | | | | |
| Appfolio, Inc., Class A(a),(b) | | | 18,658 | | | $ | 2,634,510 | |
| Bumble, Inc., Class A(a),(b) | | | 46,209 | | | | 2,661,638 | |
| ExlService Holdings, Inc.(a) | | | 27,287 | | | | 2,899,516 | |
| HubSpot, Inc.(a) | | | 5,333 | | | | 3,107,646 | |
| Impinj, Inc.(a) | | | 18,625 | | | | 960,864 | |
| MongoDB, Inc.(a) | | | 8,034 | | | | 2,904,452 | |
| Monolithic Power Systems, Inc. | | | 7,135 | | | | 2,664,566 | |
| Ontrak, Inc.(a),(b) | | | 47,735 | | | | 1,550,433 | |
| Phreesia, Inc.(a) | | | 42,046 | | | | 2,577,420 | |
| Super Micro Computer, Inc.(a) | | | 84,273 | | | | 2,964,724 | |
| TTEC Holdings, Inc. | | | 17,328 | | | | 1,786,344 | |
| Vicor Corp.(a) | | | 15,142 | | | | 1,601,115 | |
| Zscaler, Inc.(a) | | | 16,173 | | | | 3,494,337 | |
| | | | | | | | 32,756,197 | |
| Total Common Stocks (Cost $129,156,784) | | | | | | | 153,122,154 | |
| | | | | | | | | |
| Money Market Funds — 11.52% | | | | | | | | |
| BlackRock Liquidity Funds FedFund Portfolio, Institutional Class, 0.03%(c)(d) | | | 16,602,846 | | | | 16,602,846 | |
| Fidelity Investments Money Market Treasury Only Portfolio, Class I, 0.01%(c) | | | 1,102,532 | | | | 1,102,532 | |
| | | | | | | | | |
| Total Money Market Funds (Cost $17,705,378) | | | | | | | 17,705,378 | |
| | | | | | | | | |
| Total Investments — 111.19% (Cost $146,862,162) | | | | | | | 170,827,532 | |
| Liabilities in Excess of Other Assets — (11.19)% | | | | | | | (17,199,058 | ) |
| Net Assets — 100.00% | | | | | | $ | 153,628,474 | |
| (a) | Non-income producing security. |
| (b) | All or a portion of the security was on loan as of June 30, 2021. The total value of securities on loan as of June 30, 2021 was $16,050,431. See Note 2. |
| (c) | Rate disclosed is the seven day effective yield as of June 30, 2021. |
| (d) | All or a portion of this security was purchased with cash proceeds from securities lending. Total collateral had a value of $16,602,846. See Note 2. |
ADR — American Depositary Receipt
The accompanying notes are an integral part of these financial statements.
| ERShares US Large Cap Fund |
| |
| SCHEDULE OF INVESTMENTS |
| June 30, 2021 |
| | | Shares | | | Fair Value | |
| Common Stocks — 99.35% | | | | | | | | |
| Communications — 21.09% | | | | | | | | |
| Alphabet, Inc., Class A(a) | | | 2,056 | | | $ | 5,020,321 | |
| Bilibili, Inc. - ADR(a) | | | 16,879 | | | | 2,056,537 | |
| Facebook, Inc., Class A(a) | | | 10,746 | | | | 3,736,492 | |
| Fiverr International Ltd.(a) | | | 13,223 | | | | 3,206,445 | |
| KE Holdings, Inc., Institutional Class - ADR(a) | | | 19,916 | | | | 949,595 | |
| Roku, Inc.(a) | | | 7,783 | | | | 3,574,343 | |
| Shutterstock, Inc. | | | 14,769 | | | | 1,449,873 | |
| Skillz, Inc.(a),(b) | | | 94,006 | | | | 2,041,810 | |
| Snap, Inc., Class A(a) | | | 40,015 | | | | 2,726,622 | |
| Spotify Technology S.A.(a) | | | 16,717 | | | | 4,607,038 | |
| Trade Desk, Inc. (The), Class A(a) | | | 12,523 | | | | 968,779 | |
| Zillow Group, Inc., Class A(a) | | | 27,399 | | | | 3,357,199 | |
| | | | | | | | 33,695,054 | |
| Consumer Discretionary — 13.16% | | | | | | | | |
| Advance Auto Parts, Inc. | | | 4,626 | | | | 948,978 | |
| Amazon.com, Inc.(a) | | | 383 | | | | 1,317,581 | |
| Copart, Inc.(a) | | | 11,155 | | | | 1,470,564 | |
| DraftKings, Inc., Class A(a) | | | 61,135 | | | | 3,189,413 | |
| Etsy, Inc.(a) | | | 19,069 | | | | 3,925,163 | |
| GrowGeneration Corp.(a) | | | 66,634 | | | | 3,205,094 | |
| L Brands, Inc. | | | 4,277 | | | | 308,201 | |
| MercadoLibre, Inc.(a) | | | 638 | | | | 993,870 | |
| RH(a) | | | 3,887 | | | | 2,639,273 | |
| Service Corp. International | | | 33,503 | | | | 1,795,426 | |
| Wynn Resorts Ltd. | | | 10,070 | | | | 1,231,561 | |
| | | | | | | | 21,025,124 | |
| Energy — 1.36% | | | | | | | | |
| Continental Resources, Inc. | | | 30,829 | | | | 1,172,427 | |
| Enphase Energy, Inc.(a) | | | 5,432 | | | | 997,478 | |
| | | | | | | | 2,169,905 | |
| Financials — 5.68% | | | | | | | | |
| BlackRock, Inc. | | | 2,933 | | | | 2,566,287 | |
| Capital One Financial Corp. | | | 4,093 | | | | 633,146 | |
| Intercontinental Exchange, Inc. | | | 23,931 | | | | 2,840,610 | |
| Stifel Financial Corp. | | | 46,884 | | | | 3,040,896 | |
| | | | | | | | 9,080,939 | |
| Health Care — 20.87% | | | | | | | | |
| 10X Genomics, Inc., Class A(a) | | | 7,717 | | | | 1,511,143 | |
| BeiGene Ltd. - ADR(a) | | | 8,562 | | | | 2,938,393 | |
| Cellectis S.A. - ADR(a) | | | 55,333 | | | | 856,002 | |
| CRISPR Therapeutics AG(a) | | | 21,654 | | | | 3,505,567 | |
The accompanying notes are an integral part of these financial statements.
| ERShares US Large Cap Fund |
| |
| SCHEDULE OF INVESTMENTS (Continued) |
| June 30, 2021 |
| | | Shares | | | Fair Value | |
| Common Stocks (Continued) | | | | | | | | |
| Health Care (Continued) | | | | | | | | |
| Danaher Corp. | | | 3,867 | | | $ | 1,037,748 | |
| Ensign Group, Inc. (The) | | | 17,920 | | | | 1,553,126 | |
| Exact Sciences Corp.(a) | | | 7,568 | | | | 940,778 | |
| Hologic, Inc.(a) | | | 11,760 | | | | 784,627 | |
| Masimo Corp.(a) | | | 18,743 | | | | 4,544,241 | |
| Natera, Inc.(a) | | | 9,165 | | | | 1,040,502 | |
| Regeneron Pharmaceuticals, Inc.(a) | | | 3,223 | | | | 1,800,174 | |
| Supernus Pharmaceuticals, Inc.(a) | | | 48,500 | | | | 1,493,315 | |
| Teladoc Health, Inc.(a) | | | 28,155 | | | | 4,681,895 | |
| Twist Bioscience Corp.(a) | | | 26,200 | | | | 3,491,150 | |
| United Therapeutics Corp.(a) | | | 17,638 | | | | 3,164,434 | |
| | | | | | | | 33,343,095 | |
| Industrials — 1.03% | | | | | | | | |
| Cintas Corp. | | | 2,698 | | | | 1,030,636 | |
| Titan Machinery, Inc.(a) | | | 20,000 | | | | 618,800 | |
| | | | | | | | 1,649,436 | |
| Materials — 0.86% | | | | | | | | |
| Steel Dynamics, Inc. | | | 23,024 | | | | 1,372,230 | |
| | | | | | | | | |
| Real Estate — 2.07% | | | | | | | | |
| Colliers International Group, Inc. | | | 9,644 | | | | 1,079,935 | |
| Kimco Realty Corp. | | | 106,724 | | | | 2,225,195 | |
| | | | | | | | 3,305,130 | |
| Technology — 33.23% | | | | | | | | |
| Bill.com Holdings, Inc.(a) | | | 13,896 | | | | 2,545,469 | |
| Bumble, Inc., Class A(a),(b) | | | 36,351 | | | | 2,093,818 | |
| Cloudflare, Inc.(a) | | | 33,667 | | | | 3,563,315 | |
| Crowdstrike Holdings, Inc., Class A(a) | | | 9,709 | | | | 2,439,969 | |
| Datadog, Inc.(a) | | | 30,470 | | | | 3,171,318 | |
| EPAM Systems, Inc.(a) | | | 7,398 | | | | 3,780,081 | |
| FleetCor Technologies, Inc.(a) | | | 4,509 | | | | 1,154,575 | |
| Fortinet, Inc.(a) | | | 6,266 | | | | 1,492,499 | |
| MongoDB, Inc.(a) | | | 2,562 | | | | 926,214 | |
| NVIDIA Corp. | | | 5,695 | | | | 4,556,570 | |
| Okta, Inc.(a) | | | 11,505 | | | | 2,815,043 | |
| Omnicell, Inc.(a) | | | 19,737 | | | | 2,989,169 | |
| Oracle Corp. | | | 11,563 | | | | 900,064 | |
| salesforce.com, Inc.(a) | | | 10,517 | | | | 2,568,988 | |
| Square, Inc., Class A(a) | | | 14,422 | | | | 3,516,084 | |
| SS&C Technologies Holdings, Inc. | | | 18,341 | | | | 1,321,652 | |
| Synopsys, Inc.(a) | | | 12,845 | | | | 3,542,523 | |
The accompanying notes are an integral part of these financial statements.
| ERShares US Large Cap Fund |
| |
| SCHEDULE OF INVESTMENTS (Continued) |
| June 30, 2021 |
| | | Shares | | | Fair Value | |
| Common Stocks (Continued) | | | | | | | | |
| Technology (Continued) | | | | | | | | |
| Twilio, Inc., Class A(a) | | | 14,683 | | | $ | 5,787,450 | |
| Veeva Systems, Inc., Class A(a) | | | 12,622 | | | | 3,924,811 | |
| | | | | | | | 53,089,612 | |
| Total Common Stocks (Cost $140,737,584) | | | | | | | 158,730,525 | |
| | | | | | | | | |
| Money Market Funds — 2.49% | | | | | | | | |
| BlackRock Liquidity Funds FedFund Portfolio, Institutional Class, 0.03%(c)(d) | | | 3,205,392 | | | | 3,205,392 | |
| Fidelity Investments Money Market Treasury Only Portfolio, Class I, 0.01%(c) | | | 772,946 | | | | 772,946 | |
| | | | | | | | | |
| Total Money Market Funds (Cost $3,978,338) | | | | | | | 3,978,338 | |
| | | | | | | | | |
| Total Investments — 101.84% (Cost $144,715,922) | | | | | | | 162,708,863 | |
| Liabilities in Excess of Other Assets — (1.84)% | | | | | | | (2,936,975 | ) |
| Net Assets — 100.00% | | | | | | $ | 159,771,888 | |
| (a) | Non-income producing security. |
| (b) | All or a portion of the security was on loan as of June 30, 2021. The total value of securities on loan as of June 30, 2021 was $3,141,172. See Note 2. |
| (c) | Rate disclosed is the seven day effective yield as of June 30, 2021. |
| (d) | All or a portion of this security was purchased with cash proceeds from securities lending. Total collateral had a value of $3,205,392. See Note 2. |
ADR — American Depositary Receipt
The accompanying notes are an integral part of these financial statements.
| EntrepreneurShares Series Trust |
| |
| STATEMENTS OF ASSETS AND LIABILITIES |
| June 30, 2021 |
| | | ERShares | | | ERShares | | | ERShares | |
| | | Global | | | US Small | | | US Large | |
| | | Fund | | | Cap Fund | | | Cap Fund | |
| Assets | | | | | | | | | |
| Investments, at cost | | $ | 114,273,038 | | | $ | 146,862,162 | | | $ | 144,715,922 | |
| Investments, at fair value (a) | | | 126,793,163 | | | | 170,827,532 | | | | 162,708,863 | |
| Foreign currency (cost $5,822, $— and $1,802) | | | 5,822 | | | | — | | | | 1,802 | |
| Receivable for fund shares sold | | | — | | | | 750 | | | | 134,170 | |
| Receivable for investments sold | | | 2,327,156 | | | | 481,351 | | | | 234,696 | |
| Dividends and interest receivable | | | 29,259 | | | | 56,879 | | | | 57,896 | |
| Securities lending income receivable | | | 1,138 | | | | 8,156 | | | | 162 | |
| Tax reclaims receivable | | | 24,823 | | | | 496 | | | | 414 | |
| Prepaid expenses | | | 7,800 | | | | 8,329 | | | | 14,283 | |
| Total Assets | | | 129,189,161 | | | | 171,383,493 | | | | 163,152,286 | |
| | | | | | | | | | | | | |
| Liabilities | | | | | | | | | | | | |
| Collateral due to broker for securities loaned | | | 4,108,150 | | | | 16,602,846 | | | | 3,205,392 | |
| Due to custodian | | | 3,293,132 | | | | 1,008,921 | | | | — | |
| Payable for fund shares redeemed | | | — | | | | — | | | | 44,207 | |
| Payable to Adviser | | | 119,724 | | | | 109,462 | | | | 95,598 | |
| Payable to Administrator | | | 6,749 | | | | 5,997 | | | | 5,956 | |
| Accrued expenses and other liabilities | | | 34,455 | | | | 27,793 | | | | 29,245 | |
| Total Liabilities | | | 7,562,210 | | | | 17,755,019 | | | | 3,380,398 | |
| Net Assets | | $ | 121,626,951 | | | $ | 153,628,474 | | | $ | 159,771,888 | |
| | | | | | | | | | | | | |
| Net Assets consist of: | | | | | | | | | | | | |
| Paid-in capital | | | 90,768,545 | | | | 86,657,948 | | | | 103,131,500 | |
| Accumulated earnings | | | 30,858,406 | | | | 66,970,526 | | | | 56,640,388 | |
| Net Assets | | $ | 121,626,951 | | | $ | 153,628,474 | | | $ | 159,771,888 | |
| Institutional Class | | | | | | | | | | | | |
| Net Assets | | $ | 121,626,951 | | | $ | 153,628,474 | | | $ | 159,771,888 | |
| Shares outstanding (unlimited number of shares authorized, $0.01 par value) | | | 5,574,319 | | | | 10,218,557 | | | | 9,136,360 | |
| Net asset value and offering price per share | | $ | 21.82 | | | $ | 15.03 | | | $ | 17.49 | |
| Redemption price per share (NAV * 98%)(b) | | $ | 21.38 | | | $ | 14.73 | | | $ | 17.14 | |
| (a) | Includes securities on loan of $3,955,547, $16,050,431 and $3,141,172, respectively (see Note 2). |
| (b) | The Fund charges a 2% redemption fee on shares redeemed within five business days of purchase. Shares are redeemed at the NAV if held longer than five business days. See Note 8. |
The accompanying notes are an integral part of these financial statements.
| EntrepreneurShares Series Trust |
| |
| STATEMENTS OF OPERATIONS |
| For the year ended June 30, 2021 |
| | | ERShares | | | ERShares | | | ERShares | |
| | | Global | | | US Small | | �� | US Large | |
| | | Fund | | | Cap Fund | | | Cap Fund | |
| Investment Income | | | | | | | | | | | | |
| Dividend income (net of foreign taxes withheld of $13,862, $141 and $1,877) | | $ | 359,157 | | | $ | 471,585 | | | $ | 306,859 | |
| Interest income | | | 227 | | | | 605 | | | | 554 | |
| Securities lending income | | | 237,531 | | | | 402,039 | | | | 86,186 | |
| Total investment income | | | 596,915 | | | | 874,229 | | | | 393,599 | |
| | | | | | | | | | | | | |
| Expenses | | | | | | | | | | | | |
| Advisory fees | | | 968,489 | | | | 1,479,566 | | | | 1,163,422 | |
| Fund accounting and administration fees | | | 40,339 | | | | 85,941 | | | | 78,263 | |
| Custodian fees | | | 22,622 | | | | 14,084 | | | | 13,537 | |
| Auditing fees | | | 18,901 | | | | 18,901 | | | | 18,901 | |
| Registration fees | | | 16,835 | | | | 18,531 | | | | 25,207 | |
| Transfer agent | | | 10,753 | | | | 14,222 | | | | 12,838 | |
| Pricing fees | | | 5,079 | | | | 6,035 | | | | 4,167 | |
| Legal fees | | | 4,196 | | | | 9,050 | | | | 8,849 | |
| Shareholder reporting fees | | | 3,779 | | | | 6,007 | | | | 6,145 | |
| Trustees’ fees and expenses | | | 3,433 | | | | 7,303 | | | | 7,001 | |
| Insurance expense | | | 2,150 | | | | 4,033 | | | | 3,277 | |
| Chief Compliance Officer fees | | | 95 | | | | 405 | | | | 386 | |
| Miscellaneous | | | 17,091 | | | | 15,117 | | | | 15,243 | |
| Total expenses | | | 1,113,762 | | | | 1,679,195 | | | | 1,357,236 | |
| Fees contractually waived by Adviser | | | — | | | | (41,450 | ) | | | (43,400 | ) |
| Fees recouped by Adviser | | | — | | | | 39,183 | | | | 25,673 | |
| Net operating expenses | | | 1,113,762 | | | | 1,676,928 | | | | 1,339,509 | |
| Net investment loss | | | (516,847 | ) | | | (802,699 | ) | | | (945,910 | ) |
| | | | | | | | | | | | | |
| Net Realized and Change in Unrealized Gain (Loss) on Investments | | | | | | | | | | | | |
| Net realized gain (loss) on: | | | | | | | | | | | | |
| Investments | | | 25,484,857 | | | | 64,226,499 | | | | 46,371,557 | |
| Foreign currency transactions | | | (111,914 | ) | | | — | | | | — | |
| Net realized gain | | | 25,372,943 | | | | 64,226,499 | | | | 46,371,557 | |
| | | | | | | | | | | | | |
| Change in unrealized appreciation (depreciation) on: | | | | | | | | | | | | |
| Investments | | | 163,528 | | | | 655,048 | | | | (11,660,329 | ) |
| Foreign currency translations | | | 1,118 | | | | — | | | | 12 | |
| Net change in unrealized appreciation (depreciation) | | | 164,646 | | | | 655,048 | | | | (11,660,317 | ) |
| Net realized and change in unrealized gain on investments | | | 25,537,589 | | | | 64,881,547 | | | | 34,711,240 | |
| Net increase in net assets resulting from operations | | $ | 25,020,742 | | | $ | 64,078,848 | | | $ | 33,765,330 | |
The accompanying notes are an integral part of these financial statements.
| ERShares Global Fund |
| |
| STATEMENTS OF CHANGES IN NET ASSETS |
| | | For the | | | For the | |
| | | Year Ended | | | Year Ended | |
| | | June 30, 2021 | | | June 30, 2020 | |
| Increase (Decrease) in Net Assets from: | | | | | | | | |
| Operations: | | | | | | | | |
| Net investment loss | | $ | (516,847 | ) | | $ | (285,644 | ) |
| Net realized gain on investments and foreign currency transactions | | | 25,372,943 | | | | 413,872 | |
| Net change in unrealized appreciation (depreciation) on investments and foreign currency translations | | | 164,646 | | | | 4,970,093 | |
| Net increase in net assets resulting from operations | | | 25,020,742 | | | | 5,098,321 | |
| | | | | | | | | |
| Distributions to Shareholders from Earnings Institutional Class | | | | | | | | |
| Distributions | | | (6,630,435 | ) | | | (1,788,910 | ) |
| Total distributions to shareholders | | | (6,630,435 | ) | | | (1,788,910 | ) |
| | | | | | | | | |
| Capital Transactions | | | | | | | | |
| Institutional Class | | | | | | | | |
| Proceeds from shares sold | | | 50,836,900 | | | | 483,631 | |
| Proceeds from redemption fees(a) | | | 23 | | | | 77 | |
| Reinvestment of distributions | | | 5,884,564 | | | | 1,436,494 | |
| Cost of shares redeemed | | | (4,718,681 | ) | | | (17,779,977 | ) |
| Net increase (decrease) in net assets resulting from capital transactions | | | 52,002,806 | | | | (15,859,775 | ) |
| Total Increase (Decrease) in Net Assets | | | 70,393,113 | | | | (12,550,364 | ) |
| | | | | | | | | |
| Net Assets | | | | | | | | |
| Beginning of year | | | 51,233,838 | | | | 63,784,202 | |
| End of year | | $ | 121,626,951 | | | $ | 51,233,838 | |
| | | | | | | | | |
| Share Transactions Institutional Class | | | | | | | | |
| Shares sold | | | 2,470,158 | | | | 30,378 | |
| Shares issued in reinvestment of distributions | | | 268,212 | | | | 87,859 | |
| Shares redeemed | | | (210,205 | ) | | | (1,114,539 | ) |
| Net increase (decrease) in shares outstanding | | | 2,528,165 | | | | (996,302 | ) |
| (a) | The Fund charges a 2% redemption fee on shares redeemed within five business days of purchase. Shares are redeemed at the NAV if held longer than five business days. |
The accompanying notes are an integral part of these financial statements.
| ERShares US Small Cap Fund |
| |
| STATEMENTS OF CHANGES IN NET ASSETS |
| | | For the | | | For the | |
| | | Year Ended | | | Year Ended | |
| | | June 30, 2021 | | | June 30, 2020 | |
| Increase (Decrease) in Net Assets from: | | | | | | | | |
| Operations: | | | | | | | | |
| Net investment loss | | $ | (802,699 | ) | | $ | (72,820 | ) |
| Net realized gain on investments and foreign currency transactions | | | 64,226,499 | | | | 11,734,063 | |
| Net change in unrealized appreciation (depreciation) on investments and foreign currency translations | | | 655,048 | | | | (8,945,811 | ) |
| Net increase in net assets resulting from operations | | | 64,078,848 | | | | 2,715,432 | |
| | | | | | | | | |
| Distributions to Shareholders from Earnings Institutional Class | | | | | | | | |
| Distributions | | | (30,803,421 | ) | | | (9,831,600 | ) |
| Total distributions to shareholders | | | (30,803,421 | ) | | | (9,831,600 | ) |
| | | | | | | | | |
| Capital Transactions Institutional Class | | | | | | | | |
| Proceeds from shares sold | | | 5,237,380 | | | | 13,368,391 | |
| Proceeds from redemption fees(a) | | | 228 | | | | 106 | |
| Reinvestment of distributions | | | 30,801,244 | | | | 9,828,304 | |
| Cost of shares redeemed | | | (79,513,650 | ) | | | (12,963,251 | ) |
| Net increase (decrease) in net assets resulting from capital transactions | | | (43,474,798 | ) | | | 10,233,550 | |
| Total Increase (Decrease) in Net Assets | | | (10,199,371 | ) | | | 3,117,382 | |
| | | | | | | | | |
| Net Assets | | | | | | | | |
| Beginning of year | | | 163,827,845 | | | | 160,710,463 | |
| End of year | | $ | 153,628,474 | | | $ | 163,827,845 | |
| | | | | | | | | |
| Share Transactions Institutional Class | | | | | | | | |
| Shares sold | | | 318,094 | | | | 1,289,169 | |
| Shares issued in reinvestment of distributions | | | 1,845,491 | | | | 823,831 | |
| Shares redeemed | | | (5,589,633 | ) | | | (1,115,447 | ) |
| Net increase (decrease) in shares outstanding | | | (3,426,048 | ) | | | 997,553 | |
| (a) | The Fund charges a 2% redemption fee on shares redeemed within five business days of purchase. Shares are redeemed at the NAV if held longer than five business days. |
The accompanying notes are an integral part of these financial statements.
| ERShares US Large Cap Fund |
| |
| STATEMENTS OF CHANGES IN NET ASSETS |
| | | For the | | | For the | |
| | | Year Ended | | | Year Ended | |
| | | June 30, 2021 | | | June 30, 2020 | |
| Increase (Decrease) in Net Assets from: | | | | | | | | |
| Operations: | | | | | | | | |
| Net investment loss | | $ | (945,910 | ) | | $ | (252,655 | ) |
| Net realized gain on investments and foreign currency transactions | | | 46,371,557 | | | | 37,691,888 | |
| Net change in unrealized appreciation (depreciation) on investments and foreign currency translations | | | (11,660,317 | ) | | | (13,899,964 | ) |
| Net increase in net assets resulting from operations | | | 33,765,330 | | | | 23,539,269 | |
| | | | | | | | | |
| Distributions to Shareholders from Earnings Institutional Class | | | | | | | | |
| Distributions | | | (36,057,302 | ) | | | (8,147,630 | ) |
| Total distributions to shareholders | | | (36,057,302 | ) | | | (8,147,630 | ) |
| | | | | | | | | |
| Capital Transactions Institutional Class | | | | | | | | |
| Proceeds from shares sold | | | 4,235,322 | | | | 8,188,540 | |
| Proceeds from redemption fees(a) | | | 392 | | | | 881 | |
| Reinvestment of distributions | | | 36,005,767 | | | | 8,143,889 | |
| Cost of shares redeemed | | | (29,486,084 | ) | | | (13,737,301 | ) |
| Net increase in net assets resulting from capital transactions | | | 10,755,397 | | | | 2,596,009 | |
| Total Increase in Net Assets | | | 8,463,425 | | | | 17,987,648 | |
| | | | | | | | | |
| Net Assets | | | | | | | | |
| Beginning of year | | | 151,308,463 | | | | 133,320,815 | |
| End of year | | $ | 159,771,888 | | | $ | 151,308,463 | |
| | | | | | | | | |
| Share Transactions Institutional Class | | | | | | | | |
| Shares sold | | | 218,367 | | | | 531,797 | |
| Shares issued in reinvestment of distributions | | | 1,794,904 | | | | 534,727 | |
| Shares redeemed | | | (1,831,784 | ) | | | (898,773 | ) |
| Net increase in shares outstanding | | | 181,487 | | | | 167,751 | |
| (a) | The Fund charges a 2% redemption fee on shares redeemed within five business days of purchase. Shares are redeemed at the NAV if held longer than five business days. |
The accompanying notes are an integral part of these financial statements.
| ERShares Global Fund |
| |
| FINANCIAL HIGHLIGHTS – Institutional Class |
| |
| (For a share outstanding during each year) |
| | | For the | | | For the | | | For the | | | For the | | | For the | |
| | | Year Ended | | | Year Ended | | | Year Ended | | | Year Ended | | | Year Ended | |
| | | June 30, | | | June 30, | | | June 30, | | | June 30, | | | June 30, | |
| | | 2021 | | | 2020 | | | 2019 | | | 2018 | | | 2017 | |
| Selected Per Share Data: | | | | | | | | | | | | | | | | | | | | |
| Net asset value, beginning of year | | $ | 16.82 | | | $ | 15.78 | | | $ | 16.07 | | | $ | 14.65 | | | $ | 11.81 | |
| Investment operations: | | | | | | | | | | | | | | | | | | | | |
| Net investment loss(a) | | | (0.14 | ) | | | (0.08 | ) | | | (0.06 | ) | | | (0.10 | ) | | | (0.07 | ) |
| Net realized and unrealized gain | | | 7.32 | | | | 1.61 | | | | 0.16 | | | | 2.77 | | | | 2.91 | |
| Total from investment operations | | | 7.18 | | | | 1.53 | | | | 0.10 | | | | 2.67 | | | | 2.84 | |
| Less distributions to shareholders from: | | | | | | | | | | | | | | | | | | | | |
| Net realized gains | | | (2.18 | ) | | | (0.49 | ) | | | (0.39 | ) | | | (1.25 | ) | | | — | |
| Total distributions | | | (2.18 | ) | | | (0.49 | ) | | | (0.39 | ) | | | (1.25 | ) | | | — | |
| Paid-in capital from redemption fees | | | — | (b) | | | — | (b) | | | — | (b) | | | — | (b) | | | — | |
| Net asset value, end of year | | $ | 21.82 | | | $ | 16.82 | | | $ | 15.78 | | | $ | 16.07 | | | $ | 14.65 | |
| Total Return(c) | | | 42.63 | % | | | 9.80 | % | | | 1.11 | % | | | 18.65 | % | | | 24.05 | % |
| Ratios and Supplemental Data: | | | | | | | | | | | | | | | | | | | | |
| Net assets, end of year (000 omitted) | | $ | 121,627 | | | $ | 51,234 | | | $ | 63,784 | | | $ | 63,082 | | | $ | 26,933 | |
| Ratio of expenses to average net assets: | | | | | | | | | | | | | | | | | | | | |
| Before fees waived/recouped | | | 1.44 | % | | | 1.49 | % | | | 1.47 | % | | | 1.53 | % | | | 1.74 | % |
| After fees waived/recouped | | | 1.44 | % | | | 1.49 | % | | | 1.56 | % | | | 1.70 | % | | | 1.70 | % |
| Ratio of net investment loss to average net assets: | | | | | | | | | | | | | | | | | | | | |
| Before fees waived/recouped | | | (0.67 | )% | | | (0.51 | )% | | | (0.27 | )% | | | (0.47 | )% | | | (0.57 | )% |
| After fees waived/recouped | | | (0.67 | )% | | | (0.51 | )% | | | (0.36 | )% | | | (0.64 | )% | | | (0.53 | )% |
| Portfolio turnover rate | | | 477 | % (d) | | | 61 | % | | | 23 | % | | | 38 | % | | | 65 | % |
| (a) | Based on average shares outstanding during the year. |
| (b) | Rounds to less than $0.005 per share. |
| (c) | Total returns would have been lower/higher had certain expenses not been waived/recovered by the advisor (see Note 3). Returns shown do not reflect the deduction of taxes that a shareholder would pay on Fund distributions or redemptions of Fund shares. |
| (d) | The Fund has experienced an unusual interest rate environment combined with volatile markets resulting from inflationary concerns during the past fiscal year. These two factors posed potential adverse effects to the Fund. Thus, the portfolio manager engaged in temporary defensive positions as well as positioned the Fund to take the best advantage of the environment it was facing. These two actions, combined with a reversion of the defensive positions, resulted in an increased turnover for the Fund. |
The accompanying notes are an integral part of these financial statements.
| ERShares US Small Cap Fund |
| |
| FINANCIAL HIGHLIGHTS – Institutional Class |
| |
| (For a share outstanding during each year) |
| | | For the | | | For the | | | For the | | | For the | | | For the | |
| | | Year Ended | | | Year Ended | | | Year Ended | | | Year Ended | | | Year Ended | |
| | | June 30, | | | June 30, | | | June 30, | | | June 30, | | | June 30, | |
| | | 2021 | | | 2020 | | | 2019 | | | 2018 | | | 2017 | |
| Selected Per Share Data: | | | | | | | | | | | | | | | | | | | | |
| Net asset value, beginning of year | | $ | 12.01 | | | $ | 12.71 | | | $ | 15.27 | | | $ | 12.75 | | | $ | 9.72 | |
| Investment operations: | | | | | | | | | | | | | | | | | | | | |
| Net investment income (loss)(a) | | | (0.06 | ) | | | (0.01 | ) | | | — | (b) | | | (0.02 | ) | | | 0.01 | |
| Net realized and unrealized gain (loss) | | | 5.35 | | | | 0.11 | | | | (0.28 | ) | | | 3.89 | | | | 3.04 | |
| Total from investment operations | | | 5.29 | | | | 0.10 | | | | (0.28 | ) | | | 3.87 | | | | 3.05 | |
| Less distributions to shareholders from: | | | | | | | | | | | | | | | | | | | | |
| Net investment income | | | — | | | | (0.01 | ) | | | — | | | | — | | | | (0.02 | ) |
| Net realized gains | | | (2.27 | ) | | | (0.79 | ) | | | (2.28 | ) | | | (1.35 | ) | | | — | |
| Total distributions | | | (2.27 | ) | | | (0.80 | ) | | | (2.28 | ) | | | (1.35 | ) | | | (0.02 | ) |
| Paid-in capital from redemption fees | | | — | (b) | | | — | (b) | | | — | (b) | | | — | (b) | | | — | |
| Net asset value, end of year | | $ | 15.03 | | | $ | 12.01 | | | $ | 12.71 | | | $ | 15.27 | | | $ | 12.75 | |
| Total Return(c) | | | 42.19 | % | | | 0.86 | % | | | 1.58 | % | | | 32.42 | % | | | 31.39 | % |
| Ratios and Supplemental Data: | | | | | | | | | | | | | | | | | | | | |
| Net assets, end of year (000 omitted) | | $ | 153,628 | | | $ | 163,828 | | | $ | 160,710 | | | $ | 159,435 | | | $ | 120,847 | |
| Ratio of expenses to average net assets: | | | | | | | | | | | | | | | | | | | | |
| Before fees waived/recouped | | | 0.87 | % | | | 0.90 | % | | | 0.89 | % | | | 0.90 | % | | | 0.90 | % |
| After fees waived/recouped | | | 0.85 | % | | | 0.85 | % | | | 0.85 | % | | | 0.85 | % | | | 0.85 | % |
| Ratio of net investment loss to average net assets: | | | | | | | | | | | | | | | | | | | | |
| Before fees waived/recouped | | | (0.43 | )% | | | (0.10 | )% | | | (0.05 | )% | | | (0.16 | )% | | | (0.18 | )% |
| After fees waived/recouped | | | (0.41 | )% | | | (0.05 | )% | | | (0.01 | )% | | | (0.11 | )% | | | (0.13 | )% |
| Portfolio turnover rate | | | 439 | % (d) | | | 139 | % (e) | | | 43 | % | | | 72 | % | | | 53 | % |
| (a) | Based on average shares outstanding during the year. |
| (b) | Rounds to less than $0.005 per share. |
| (c) | Total returns would have been lower/higher had certain expenses not been waived/recovered by the advisor (see Note 3). Returns shown do not reflect the deduction of taxes that a shareholder would pay on Fund distributions or redemptions of Fund shares. |
| (d) | The Fund has experienced an unusual interest rate environment combined with volatile markets resulting from inflationary concerns during the past fiscal year. These two factors posed potential adverse effects to the Fund. Thus, the portfolio manager engaged in temporary defensive positions as well as positioned the Fund to take the best advantage of the environment it was facing. These two actions, combined with a reversion of the defensive positions, resulted in an increased turnover for the Fund. |
| (e) | Given the abnormal market circumstances resulting from the COVID-19 situation, the Fund had taken a temporary defensive position. As the market started to recover, the Fund has been reversing its temporary defensive position. This temporary implementation and reversion of the defensive position increased the Fund’s turnover. |
The accompanying notes are an integral part of these financial statements.
| ERShares US Large Cap Fund |
| |
| FINANCIAL HIGHLIGHTS – Institutional Class |
| |
| (For a share outstanding during each year) |
| | | For the | | | For the | | | For the | | | For the | | | For the | |
| | | Year Ended | | | Year Ended | | | Year Ended | | | Year Ended | | | Year Ended | |
| | | June 30, | | | June 30, | | | June 30, | | | June 30, | | | June 30, | |
| | | 2021 | | | 2020 | | | 2019 | | | 2018 | | | 2017 | |
| Selected Per Share Data: | | | | | | | | | | | | | | | | | | | | |
| Net asset value, beginning of year | | $ | 16.90 | | | $ | 15.17 | | | $ | 14.75 | | | $ | 12.61 | | | $ | 10.65 | |
| Investment operations: | | | | | | | | | | | | | | | | | | | | |
| Net investment income (loss)(a) | | | (0.10 | ) | | | (0.03 | ) | | | — | (b) | | | (0.02 | ) | | | 0.04 | |
| Net realized and unrealized gain | | | 4.72 | | | | 2.73 | | | | 0.69 | | | | 3.48 | | | | 2.10 | |
| Total from investment operations | | | 4.62 | | | | 2.70 | | | | 0.69 | | | | 3.46 | | | | 2.14 | |
| Less distributions to shareholders from: | | | | | | | | | | | | | | | | | | | | |
| Net investment income | | | — | | | | — | | | | — | | | | (0.01 | ) | | | (0.06 | ) |
| Net realized gains | | | (4.03 | ) | | | (0.97 | ) | | | (0.27 | ) | | | (1.31 | ) | | | (0.12 | ) |
| Total distributions | | | (4.03 | ) | | | (0.97 | ) | | | (0.27 | ) | | | (1.32 | ) | | | (0.18 | ) |
| Paid-in capital from redemption fees | | | — | (b) | | | — | (b) | | | — | (b) | | | — | (b) | | | — | |
| Net asset value, end of year | | $ | 17.49 | | | $ | 16.90 | | | $ | 15.17 | | | $ | 14.75 | | | $ | 12.61 | |
| Total Return(c) | | | 24.30 | % | | | 18.50 | % | | | 5.09 | % | | | 28.67 | % | | | 20.26 | % |
| Ratios and Supplemental Data: | | | | | | | | | | | | | | | | | | | | |
| Net assets, end of year (000 omitted) | | $ | 159,772 | | | $ | 151,308 | | | $ | 133,321 | | | $ | 124,392 | | | $ | 107,823 | |
| Ratio of expenses to average net assets: | | | | | | | | | | | | | | | | | | | | |
| Before fees waived/recouped | | | 0.76 | % | | | 0.80 | % | | | 0.79 | % | | | 0.81 | % | | | 0.82 | % |
| After fees waived/recouped | | | 0.75 | % | | | 0.75 | % | | | 0.75 | % | | | 0.75 | % | | | 0.75 | % |
| Ratio of net investment income (loss) to average net assets: | | | | | | | | | | | | | | | | | | | | |
| Before fees waived/recouped | | | (0.54 | )% | | | (0.24 | )% | | | (0.07 | )% | | | (0.18 | )% | | | 0.26 | % |
| After fees waived/recouped | | | (0.53 | )% | | | (0.19 | )% | | | (0.03 | )% | | | (0.12 | )% | | | 0.33 | % |
| Portfolio turnover rate | | | 584 | % (d) | | | 149 | % (e) | | | 0 | % | | | 43 | % | | | 43 | % |
| (a) | Based on average shares outstanding during the year. |
| (b) | Rounds to less than $0.005 per share. |
| (c) | Total returns would have been lower/higher had certain expenses not been waived/recovered by the advisor (see Note 3). Returns shown do not reflect the deduction of taxes that a shareholder would pay on Fund distributions or redemptions of Fund shares. |
| (d) | The Fund has experienced an unusual interest rate environment combined with volatile markets resulting from inflationary concerns during the past fiscal year. These two factors posed potential adverse effects to the Fund. Thus, the portfolio manager engaged in temporary defensive positions as well as positioned the Fund to take the best advantage of the environment it was facing. These two actions, combined with a reversion of the defensive positions, resulted in an increased turnover for the Fund. |
| (e) | Given the abnormal market circumstances resulting from the COVID-19 situation, the Fund had taken a temporary defensive position. As the market started to recover, the Fund has been reversing its temporary defensive position. This temporary implementation and reversion of the defensive position increased the Fund’s turnover. |
The accompanying notes are an integral part of these financial statements.
| EntrepreneurShares Series Trust |
| |
| NOTES TO FINANCIAL STATEMENTS |
| June 30, 2021 |
EntrepreneurShares™ Series Trust, a Delaware statutory trust (the “Trust”), was formed on July 1, 2010, and has authorized capital of unlimited shares of beneficial interest. The Trust is an open-end management investment company registered under the Investment Company Act of 1940, as amended (the “1940 Act”), and is authorized to issue multiple series and classes of shares. The ERShares Global Fund formerly known as the EntrepreneurShares Global Fund (the “Global Fund”), the ERShares US Small Cap Fund formerly known as the Entrepreneur U.S. Small Cap Fund (the “US Small Cap Fund”), and the ERShares US Large Cap Fund formerly known as the Entrepreneur U.S. Large Cap Fund (the “US Large Cap Fund”) (each separately a “Fund”, or collectively, “the Funds”) are each classified as a “diversified” series, as defined in the 1940 Act. The Funds are investment companies and, accordingly, follow the investment company accounting and reporting guidance of the Financial Accounting Standards Board Accounting Standards Codification Topic 946 – Investment Companies including Accounting Standards Update (“ASU”) 2013-08. The Global Fund commenced operations on November 11, 2010. The US Small Cap Fund commenced operations on December 17, 2013. The US Large Cap Fund commenced operations on June 30, 2014.
The investment objective of the Global Fund is long-term capital appreciation. The Global Fund seeks to achieve its objective by investing in equity securities of global companies with market capitalizations that are above $300 million at the time of initial purchase and possess entrepreneurial characteristics, as determined by EntrepreneurShares, LLC, the Global Fund’s sub-advisor (the “Sub-Advisor”), and Seaport Global Advisors, LLC formerly known as Weston Capital Advisors, LLC, the Global Fund’s investment advisor (the “Global Advisor”). Dr. Joel M. Shulman has been the Global Fund’s portfolio manager since November 11, 2010 and Managing Director of the Advisor and President of the Sub-Advisor.
The investment objective of the US Small Cap Fund is long-term capital appreciation. The US Small Cap Fund seeks to achieve its objective by investing at least 80% of its net assets (plus any borrowing for investment purposes) in equity securities of U.S. companies with market capitalization that are above $300 million at the time of initial purchase and possess entrepreneurial characteristics, as determined by Capital Impact Advisors, LLC (the “Advisor”, collectively with the Global Advisor, the “Advisors”), the US Small Cap Fund’s investment advisor. Dr. Joel M. Shulman has been the US Small Cap Fund’s portfolio manager since December 17, 2013 and Chief Executive Officer of the Advisor.
The investment objective of the US Large Cap Fund is long-term capital appreciation. The US Large Cap Fund seeks to achieve its objective by investing in equity securities of U.S. companies with market capitalizations that are above $5 billion at the time of initial purchase and possess entrepreneurial characteristics, as determined by Capital Impact Advisors, LLC, the US Large Cap Fund’s investment advisor. Dr. Joel M. Shulman has been the US Large Cap Fund’s portfolio manager since June 30, 2014 and is Managing Director of the Advisor.
The Global Fund has registered three classes of shares: Class A shares, Retail Class shares and Institutional Class shares. The US Small Cap Fund and US Large Cap Fund each have registered two classes of shares: Institutional Class shares and Retail Class shares. Each share represents an equal proportionate interest in the assets and liabilities belonging to the applicable class and is entitled to such dividends and distributions out of income belonging to the applicable class as are declared by the EntrepreneurShares Series Trust Board of Trustees (the “Board”). On matters that affect the Fund as a whole, each class has the same voting and other rights and preferences as any other class. On matters that affect only one class, only shareholders of that class may vote. Each class votes separately on matters affecting only that class, or on matters expressly required to be voted on separately by state or federal law. Shares of each class of a series have the same voting and other rights and preferences as the other classes and series of the Trust for matters that affect the Trust as a whole. Currently, only Institutional Class shares of each of the Global Fund, US Small Cap Fund and US Large Cap are being offered.
| EntrepreneurShares Series Trust |
| |
| NOTES TO FINANCIAL STATEMENTS (Continued) |
| June 30, 2021 |
| 2. | SUMMARY OF SIGNIFICANT ACCOUNTING POLICIES |
The following is a summary of significant accounting policies consistently followed by the Funds in the preparation of their financial statements. These policies are in conformity with accounting principles generally accepted in the United States of America (“U.S. GAAP”).
Investment Valuation
The following is a summary of the Funds’ pricing procedures. It is intended to be a general discussion and may not necessarily reflect all pricing procedures followed by the Funds.
In determining the net asset value (“NAV”) of the Funds’ shares, securities that are listed on a national securities exchange (other than the National Association of Securities Dealers’ Automatic Quotation System (“NASDAQ”)) are valued at the last sale price on the day the valuation is made. Securities that are traded on NASDAQ under one of its three listing tiers, NASDAQ Global Select Market, NASDAQ Global Market and NASDAQ Capital Market, are valued at the NASDAQ Official Closing Price. Price information on listed securities is taken from the exchange where the security is primarily traded. Securities which are listed on an exchange but which are not traded on the valuation date are valued at the most recent bid price.
Unlisted securities held by the Funds are valued at the average of the quoted bid and ask prices in the over-the-counter market. Securities and other assets for which market quotations are not readily available are valued at their fair value as determined in good faith under procedures established by and under the general supervision and responsibility of the Board. Investments in registered open-end investment companies other than exchange-traded funds are valued at the reported NAV.
Short-term investments with 61 days or more to maturity at time of purchase are valued at fair market value through the 61st day prior to maturity, based on quotations received from market makers or other appropriate sources; thereafter, they are generally valued at amortized cost. There is no definitive set of circumstances under which the Funds may elect to use fair value procedures to value a security. Types of securities that the Funds may hold for which fair value pricing might be required include, but are not limited to: (a) illiquid securities, including restricted securities and private placements for which there is no public market; (b) options not traded on a securities exchange; (c) securities of an issuer that has entered into a restructuring; (d) securities whose trading has been halted or suspended, as permitted by the Securities and Exchange Commission (the “SEC”); (e) foreign securities, if an event or development has occurred subsequent to the close of the foreign market and prior to the close of regular trading on the New York Stock Exchange that would materially affect the value of the security; and (f) fixed income securities that have gone into default and for which there is not a current market value quotation.
Valuing securities at fair value involves greater reliance on judgment than securities that have readily available market quotations. There can be no assurance that the Funds could obtain the fair value price assigned to a security upon sale.
Securities that are not listed on an exchange are valued by the Funds’ Advisors, under the supervision of the Board. There is no single standard for determining the fair value of a security. Rather, in determining the fair value of a security, the Advisors and the Board take into account the relevant factors and surrounding circumstances, which may include: (1) the nature and pricing history (if any) of the security; (2) whether any dealer quotations for the security are available; (3) possible valuation methodologies that could be used to determine the fair value of the security; (4) the recommendation of the portfolio manager of the Funds with respect to the valuation of the security; (5) whether the same or similar securities are held by other funds managed by the Advisors or other funds and the method used to price the security in those funds; (6) the extent to which the fair value to be determined for the security will result from the use of data or formulae produced by third parties independent of the Advisors; and (7) the liquidity or illiquidity of the market for the security.
| EntrepreneurShares Series Trust |
| |
| NOTES TO FINANCIAL STATEMENTS (Continued) |
| June 30, 2021 |
Fair Value Measurement
The Funds have adopted authoritative fair valuation accounting standards which establish an authoritative definition of fair value and set out a hierarchy for measuring fair value. These standards require additional disclosures about the various inputs and valuation techniques used to develop the measurements of fair value, a discussion of changes in valuation techniques and related inputs during the year and expanded disclosure of valuation levels for major security types. The hierarchy gives the highest priority to unadjusted quoted prices in active markets for identical assets or liabilities (Level 1 measurement) and the lowest priority to unobservable inputs (Level 3 measurements). The three levels of the fair value hierarchy are as follows:
| | Level 1: | Unadjusted quoted prices in active markets for identical assets that the Funds have the ability to access at the measurement date; |
| | | |
| | Level 2: | Observable inputs other than quoted prices included in Level 1 that are observable for the asset either directly or indirectly. These inputs may include quoted prices for identical instruments on inactive markets, quoted prices for similar instruments, interest rates, prepayment spreads, credit risk, yield curves, default rates, and similar data; |
| | | |
| | Level 3: | Significant unobservable inputs for the asset to the extent that relevant observable inputs are not available, representing the Funds’ own assumptions that a market participant would use in valuing the asset, and would be based on the best information available. |
Inputs are used in applying the various valuation techniques and broadly refer to the assumptions that market participants use to make valuation decisions, including assumptions about risk. Inputs may include price information, volatility statistics, specific and broad credit data, liquidity statistics, and other factors. A financial instrument’s level within the fair value hierarchy is based on the lowest level of any input that is significant to the fair value measurement. However, the determination of what constitutes “observable” requires significant judgment by the Funds. The Funds consider observable data to be that market data, which is readily available, regularly distributed or updated, reliable and verifiable, not proprietary, and provided by independent sources that are actively involved in the relevant market. The categorization of a financial instrument within the hierarchy is based upon the pricing transparency of the instrument and does not necessarily correspond to the Funds’ perceived risk of that instrument.
Investments whose values are based on quoted market prices in active markets, and are therefore classified within Level 1, include active listed equities and real estate investment trusts, and certain money market securities. Investments that trade in markets that are not considered to be active, but are valued based on quoted market prices, dealer quotations or alternative pricing sources supported by observable inputs are classified within Level 2. Investments classified within Level 3 have significant unobservable inputs, as they trade infrequently or not at all. During the fiscal year ended June 30, 2021, the Funds did not hold any instrument which used significant unobservable inputs (Level 3) in determining fair value. The tables below are a summary of the inputs used to value the Funds’ investments as of June 30, 2021.
| Global Fund* | | Level 1 | | | Level 2 | | | Level 3 | | | Total | |
| Common Stocks | | $ | 120,576,237 | | | $ | — | | | $ | — | | | $ | 120,576,237 | |
| Money Market Funds | | | 6,216,926 | | | | — | | | | — | | | | 6,216,926 | |
| Total Investments | | $ | 126,793,163 | | | $ | — | | | $ | — | | | $ | 126,793,163 | |
| EntrepreneurShares Series Trust |
| |
| NOTES TO FINANCIAL STATEMENTS (Continued) |
| June 30, 2021 |
| US Small Cap Fund* | | Level 1 | | | Level 2 | | | Level 3 | | | Total | |
| Common Stocks | | $ | 153,122,154 | | | $ | — | | | $ | — | | | $ | 153,122,154 | |
| Money Market Funds | | | 17,705,378 | | | | — | | | | — | | | | 17,705,378 | |
| Total Investments | | $ | 170,827,532 | | | $ | — | | | $ | — | | | $ | 170,827,532 | |
| | | | | | | | | | | | | | | | | |
| US Large Cap Fund* | | Level 1 | | | Level 2 | | | Level 3 | | | Total | |
| Common Stocks | | $ | 158,730,525 | | | $ | — | | | $ | — | | | $ | 158,730,525 | |
| Money Market Funds | | | 3,978,338 | | | | — | | | | — | | | | 3,978,338 | |
| Total Investments | | $ | 162,708,863 | | | $ | — | | | $ | — | | | $ | 162,708,863 | |
| * | For further information regarding security characteristic, please see the Schedules of Investments. |
The Funds did not hold any investments at the end of the reporting period for which significant unobservable inputs (Level 3) were used in determining fair value; therefore, no reconciliation of Level 3 securities is included for this reporting period.
Use of Estimates and Indemnifications
The preparation of the financial statements in conformity with U.S. GAAP requires management to make estimates and assumptions that affect the reported amounts and disclosures in these financial statements. Actual results could differ from those estimates.
In the normal course of business, the Trust, on behalf of the Funds, enters into contracts that contain a variety of representations which provide general indemnifications. The Trust’s maximum exposure under these arrangements is unknown; however, the Trust has not had claims or losses pursuant to these contracts and the Trust expects any risk of loss to be remote.
Federal Income Taxes
The Funds intend to continue to qualify as “regulated investment companies” under Sub-chapter M of the Internal Revenue Code of 1986, as amended. If so qualified, the Funds will not be subject to federal income tax to the extent they distribute substantially all of their net investment income and net realized gains to shareholders.
The Funds have reviewed all open tax years and major jurisdictions and concluded that the Funds did not have any tax positions that did not meet the “more-likely-than-not” threshold of being sustained by the applicable tax authority for the year ended June 30, 2021. The Funds would recognize interest and penalties, if any, related to uncertain tax benefits in the Statements of Operations. During the year ended June 30, 2021, the Funds did not incur any interest or penalties. Tax returns filed within the prior three years remain subject to examination by federal and state tax authorities.
Distribution to Shareholders
The Funds intend to continue to distribute to their shareholders any net investment income and any net realized long or short-term capital gains, if any, at least annually. Distributions are recorded on the ex-dividend date. The Funds may periodically make reclassifications among certain of their capital accounts as a result of the characterization of certain income and realized gains determined annually in accordance with federal tax regulations that may differ from U.S. GAAP.
Allocation of Expenses
Expenses incurred by the Trust that do not relate to a specific fund of the Trust are allocated to the individual funds by or under the direction of the Board in such a manner as the Board determine to be fair and equitable.
| EntrepreneurShares Series Trust |
| |
| NOTES TO FINANCIAL STATEMENTS (Continued) |
| June 30, 2021 |
Foreign Currency Transactions
The Funds’ books and records are maintained in U.S. dollars. Foreign currency denominated transactions (i.e., fair value of investment securities, assets and liabilities, purchases and sales of investment securities and income and expenses) are translated into U.S. dollars at the current rate of exchange on the date of valuation. Purchases and sales of securities and income items denominated in foreign currencies are translated into U.S. dollars at the exchange rate in effect on the transaction date. The Funds do not separately report the effect of changes in foreign exchange rates from changes in market prices on securities held. Such fluctuations are included in net realized and unrealized gain or (loss) on investments in the Statements of Operations.
Realized foreign exchange gains or losses arise from sales of foreign currencies, currency gains (losses) realized between the trade and settlement dates on securities transactions and the difference between the recorded amounts of dividends, interest, foreign taxes withheld, and the U.S. dollar equivalent of the amounts actually received or paid. Net unrealized foreign exchange gains (losses) arise from the changes in foreign exchange rates on foreign denominated assets and liabilities other than investments in securities held at the end of the reporting period.
Investment Transactions and Investment Income
Throughout the reporting period, security transactions are accounted for no later than one business day following the trade date. For financial reporting purposes, security transactions are accounted for on trade date on the last business day of the reporting period. The specific identification method is used for determining gains or losses for financial statements and income tax purposes. Dividend income, less any foreign tax withheld, is recognized on the ex-dividend date and interest income is recognized on an accrual basis, including amortization/accretion of premiums or discounts.
Securities Lending
Each Fund may lend portfolio securities constituting up to 33-1/3% of its total assets (as permitted by the 1940 Act) to unaffiliated broker-dealers, banks or other recognized institutional borrowers of securities, provided that the borrower at all times maintains cash, U.S. government securities or equivalent collateral or provides an irrevocable letter of credit in favor of the Fund equal in value to at least 102% of the value of loaned domestic securities and 105% of the value of loaned foreign securities on a daily basis. During the time portfolio securities are on loan, the borrower pays the lending Fund an amount equivalent to any dividends or interest paid on such securities, and such Fund may receive an agreed-upon amount of interest income from the borrower who delivered equivalent collateral or provided a letter of credit. Loans are subject to termination at the option of a Fund or the borrower. A Fund may pay reasonable administrative and custodial fees in connection with a loan of portfolio securities and may pay a negotiated portion of the interest earned on the cash or equivalent collateral to the borrower or placing broker. A Fund does not have the right to vote securities on loan, but could terminate the loan and regain the right to vote if that were considered important with respect to the investment.
The primary risk in securities lending is a default by the borrower during a sharp rise in price of the borrowed security resulting in a deficiency in the collateral posted by the borrower. The Funds will seek to minimize this risk by requiring that the value of the securities loaned be computed each day and additional collateral be furnished each day if required.
At June 30, 2021, the value of securities loaned and cash collateral received are as follows:
| | | Value of | | | Cash | |
| | | Securities | | | Collateral | |
| | | Loaned | | | Received | |
| Global Fund | | $ | 3,955,547 | | | $ | 4,108,150 | |
| US Small Cap Fund | | $ | 16,050,431 | | | $ | 16,602,846 | |
| US Large Cap Fund | | $ | 3,141,172 | | | $ | 3,205,392 | |
| EntrepreneurShares Series Trust |
| |
| NOTES TO FINANCIAL STATEMENTS (Continued) |
| June 30, 2021 |
Securities purchased via reinvestment of cash collateral received as part of the securities lending program consisted of institutional money market funds with overnight and continuous maturities.
It is each Fund’s policy to obtain additional collateral from or return excess collateral to the borrower by the end of the next business day following valuation date of securities loaned. Therefore, the value of the collateral held may be temporarily less than required under the lending contract. As of June 30, 2021, the collateral consisted of BlackRock Liquidity Funds FedFund Portfolio – Institutional Class.
Disclosures about Offsetting Assets and Liabilities
The Funds are required to disclose information about offsetting and related arrangements to enable users of its financial statements to understand the effect of those arrangements on its financial position. As there are no master netting arrangements relating to the Funds’ participation in securities lending, and all amounts related to securities lending are presented gross on the Funds’ Statements of Assets and Liabilities, no additional disclosures have been made on behalf of the Funds. Please refer to the Securities Lending Note for additional disclosures related to securities lending, including collateral related to securities on loan.
Global Fund’s Investment Advisory Agreement
Seaport Global Advisors, LLC, a related party of the Global Fund, oversees the performance of the Global Fund and is responsible for overseeing the management of the investment portfolio of the Global Fund. These services are provided under the terms of an investment advisory agreement between the Trust and Global Advisors, pursuant to which Global Advisors receives an annual advisory fee equal to 1.25% of the Global Fund’s average net assets.
Through November 1, 2021, the Advisor has agreed to waive and/or reimburse the Global Fund for its advisory fee, and to the extent necessary, bear other expenses, to limit the total annualized expenses (excluding borrowing and investment-related costs and fees, taxes, extraordinary expenses and fees and expenses of underlying funds) of the Institutional Class shares of the Global Fund to the amounts of 1.70% per annum of net assets attributable to such shares of the Global Fund.
Global Advisors shall be permitted to recover expenses it has borne subsequent to the effective date of this agreement (whether through reduction of its advisory fee or otherwise) in later periods to the extent that the Global Fund’s expenses fall below the annual rates set forth above, given that such a rate is not greater than the rate that was in place at the time of the waiver, provided, however, that the Global Fund is not obligated to pay any such reimbursed fees more than three years after the expense was incurred by Global Advisors. As of June 30, 2021, Global Fund has no expenses reimbursed available for reimbursement and recoupment.
Sub-Advisory services are provided to the Global Fund, pursuant to an agreement between Global Advisors and EntrepreneurShares, LLC. Under the terms of this sub-advisory agreement, Seaport Global Advisors, LLC, not the Global Fund, compensates the Sub-Advisor based on the Global Fund’s average net assets. Certain officers of Seaport Global Advisors, LLC are also officers of the Sub-Advisor. Dr. Shulman is a majority owner of both Global Advisors and the Sub-Advisor.
US Small Cap Fund and US Large Cap Fund Investment Advisory Agreement
Capital Impact Advisors, LLC, a related party of the US Small Cap Fund and the US Large Cap Fund, oversees the performance of the US Small Cap Fund and the US Large Cap Fund and is responsible for overseeing the management of the investment portfolio of the US Small Cap Fund and the US Large Cap Fund. These services are provided under
| EntrepreneurShares Series Trust |
| |
| NOTES TO FINANCIAL STATEMENTS (Continued) |
| June 30, 2021 |
the terms of investment advisory agreements between the Trust and the Advisor, pursuant to which the Advisor receives an annual advisory fee equal to 0.75% of the US Small Cap Fund’s average net assets and 0.65% of the US Large Cap Fund’s average net assets.
Through November 1, 2021 for the US Small Cap Fund and the US Large Cap Fund, the Advisor has agreed to waive and/or reimburse the US Small Cap Fund and the US Large Cap Fund for its advisory fee, and to the extent necessary, bear other expenses, to limit the total annualized expenses (excluding borrowing and investment-related costs and fees, taxes, extraordinary expenses and fees and expenses of underlying funds) of the Institutional Class shares of the US Small Cap Fund to the amount of 0.85% per annum of net assets attributable to Institutional Class shares of the US Small Cap Fund and 0.75% per annum of net assets attributable to Institutional Class shares of the US Large Cap Fund. The Advisor shall be permitted to recover expenses it has borne subsequent to the effective date of this agreement (whether through reduction of its advisory fee or otherwise) in later periods to the extent that the US Small Cap Fund or the US Large Cap Fund’s expenses fall below the annual rates set forth above, given that such a rate is not greater than the rate that was in place at the time of the waiver, provided, however, that the US Small Cap Fund and the US Large Cap Fund are not obligated to pay any such reimbursed fees more than three years after the expense was incurred by Advisor.
Waived fees subject to recovery by year of expiration are as follows:
| Year of Expiration | | Potential Recovery | |
| | | US Small | | | US Large | |
| | | Cap Fund | | | Cap Fund | |
| 6/30/2022 | | $ | 58,897 | | | $ | 56,945 | |
| 6/30/2023 | | | 75,687 | | | | 75,120 | |
| 6/30/2024 | | | 41,450 | | | | 43,400 | |
| Total | | $ | 176,034 | | | $ | 175,465 | |
The Funds plan to distribute substantially all of their net investment income and net realized gains that they have realized on the sale of securities. These income and gains distributions will generally be paid once each year, on or before December 31. The character of distributions made during the year for financial reporting purposes may differ from the characterization for federal income tax purposes due to differences in the recognition of income, expense or gain items for financial reporting and tax reporting purposes.
The tax character of distributions paid during the year ended June 30, 2021 and the year ended June 30, 2020 was as follows:
| | | Global Fund | | | US Small Cap Fund | | | US Large Cap Fund | |
| | | 2021 | | | 2020 | | | 2021 | | | 2020 | | | 2021 | | | 2020 | |
| Distributions paid from: | | | | | | | | | | | | | | | | | | | | | | | | |
| Ordinary income * | | $ | 1,471,500 | | | $ | — | | | $ | 10,415,747 | | | $ | 93,892 | | | $ | 3,212,143 | | | $ | — | |
| Long-term capital gains | | | 5,158,935 | | | | 1,788,910 | | | | 20,387,674 | | | | 9,737,708 | | | | 32,845,159 | | | | 8,147,630 | |
| Total distributions paid | | $ | 6,630,435 | | | $ | 1,788,910 | | | $ | 30,803,421 | | | $ | 9,831,600 | | | $ | 36,057,302 | | | $ | 8,147,630 | |
| * | For federal income tax purposes, distribution of short-term capital gains are treated as ordinary income distributions. |
| EntrepreneurShares Series Trust |
| |
| NOTES TO FINANCIAL STATEMENTS (Continued) |
| June 30, 2021 |
The Funds designate as long-term capital gain dividends, pursuant to Internal Revenue Code Section 852(b)(3), the amount necessary to reduce the earnings and profits for the Fund related to net capital gains to zero for the tax year ended June 30, 2021.
Additionally, U.S. GAAP requires that certain components of net assets be reclassified between financial and tax reporting. There were no reclassifications between components of net assets for the year ended June 30, 2021.
As of June 30, 2021, the tax cost of securities and the breakdown of unrealized appreciation (depreciation) for each Fund were as follows:
| | | | | | US Small | | | US Large | |
| | | Global Fund | | | Cap Fund | | | Cap Fund | |
| Gross unrealized appreciation | | $ | 9,133,783 | | | $ | 20,585,222 | | | $ | 10,849,660 | |
| Gross unrealized depreciation | | | (1,529,112 | ) | | | (1,749,106 | ) | | | (1,008,144 | ) |
| Net unrealized appreciation (depreciation) on investments | | | 7,604,671 | | | | 18,836,116 | | | | 9,841,516 | |
| Tax cost of investments | | $ | 119,188,492 | | | $ | 151,991,416 | | | $ | 152,867,347 | |
The difference between book basis and tax basis unrealized appreciation (depreciation) is primarily attributable to the mark-to-market adjustments on passive foreign investment companies and the tax deferral of wash sales.
As of June 30, 2021, the components of accumulated earnings/(deficit) on a tax basis were as follows:
| | | | | | US Small | | | US Large | |
| | | Global Fund | | | Cap Fund | | | Cap Fund | |
| Undistributed ordinary income | | $ | 14,374,961 | | | $ | 26,799,714 | | | $ | 15,718,556 | |
| Undistributed long-term capital gains | | | 8,876,408 | | | | 21,334,696 | | | | 31,080,316 | |
| Unrealized appreciation on investments and foreign currency | | | 7,607,037 | | | | 18,836,116 | | | | 9,841,516 | |
| Total accumulated earnings | | $ | 30,858,406 | | | $ | 66,970,526 | | | $ | 56,640,388 | |
At June 30, 2021, certain officers of the Trust were also employees of the Advisors. However, these officers were not compensated directly by the Funds. Refer to Note 1 for more information.
The beneficial ownership, either directly or indirectly, of more than 25% of the voting securities of a fund creates a presumption of control of a fund, under Section 2(a)(9) of the 1940 Act. As of June 30, 2021, for the benefit of its shareholders, MAC & Co., an affiliate of Global Fund, held 92.30% of the total Global Fund shares outstanding. As of June 30, 2021, for the benefit of its shareholders, MAC & Co., an affiliate of the US Small Cap Fund, held 85.31% of the total US Small Cap Fund shares outstanding. As of June 30, 2021, for the benefit of its shareholders, MAC & Co., an affiliate of the US Large Cap Fund, held 90.65% of the total US Large Cap Fund shares outstanding.
| EntrepreneurShares Series Trust |
| |
| NOTES TO FINANCIAL STATEMENTS (Continued) |
| June 30, 2021 |
| 7. | INVESTMENT TRANSACTIONS |
During the year ended June 30, 2021, the aggregate purchases and sales of securities (excluding in-kind transactions and short-term securities) were:
| | | | | | US Small | | | US Large | |
| | | Global Fund | | | Cap Fund | | | Cap Fund | |
| Purchases: | | $ | 415,769,512 | | | $ | 796,210,810 | | | $ | 987,367,406 | |
| Sales: | | $ | 370,408,599 | | | $ | 868,330,772 | | | $ | 1,003,190,672 | |
The Funds did not have any purchases or sales of U.S. Government securities.
Each Fund imposes a redemption fee equal to 2% of the dollar value of the shares redeemed within five business days of the date of purchase. The redemption fee does not apply to shares purchased through reinvested distributions (dividends and capital gains) or through the automatic investment plan, shares held in retirement plans (if the plans request a waiver of the fee), or shares redeemed through designated systematic withdrawal plans.
If a Fund has significant investments in the securities of issuers within a particular sector, any development affecting that sector will have a greater impact on the value of the net assets of the Fund than would be the case if the Fund did not have significant investments in that sector. In addition, this may increase the risk of loss in the Fund and increase the volatility of the Fund’s NAV per share. For instance, economic or market factors, regulatory changes or other developments may negatively impact all companies in a particular sector, and therefore the value of the Fund’s portfolio will be adversely affected. As of June 30, 2021, the Global Fund had 31.93% and 29.79% of the value of its net assets invested in stocks within the Technology and Communications sector, respectively. The US Small Cap Fund had 27.68% invested in the Health Care sector and the US Large Cap Fund had 33.23% invested in the Technology sector.
| 10. | MARKET AND GEOPOLITICAL RISK |
The increasing interconnectivity between global economies and financial markets increases the likelihood that events or conditions in one region or financial market may adversely impact issuers in a different country, region or financial market. Securities in the Funds’ portfolio may underperform due to inflation (or expectations for inflation), interest rates, global demand for particular products or resources, natural disasters, pandemics, epidemics, terrorism, regulatory events and governmental or quasi-governmental actions. The occurrence of global events similar to those in recent years, such as terrorist attacks around the world, natural disasters, social and political discord or debt crises and downgrades, among others, may result in market volatility and may have long term effects on both the U.S. and global financial markets. It is difficult to predict when similar events affecting the U.S. or global financial markets may occur, the effects that such events may have and the duration of those effects. Any such event(s) could have a significant adverse impact on the value and risk profile of the Funds’ portfolio. The current novel coronavirus (COVID-19) global pandemic and the aggressive responses taken by many governments, including closing borders, restricting international and domestic travel, and the imposition of prolonged quarantines or similar restrictions, as well as the forced or voluntary closure of, or operational changes to, many retail and other businesses, has had negative impacts, and in many cases severe negative impacts, on markets worldwide. It is not known how long such impacts, or any future impacts of other significant events described above, will or would last, but there could be a prolonged period of global economic slowdown, which may impact your Fund investment. Therefore, the Funds could lose money over
| EntrepreneurShares Series Trust |
| |
| NOTES TO FINANCIAL STATEMENTS (Continued) |
| June 30, 2021 |
short periods due to short-term market movements and over longer periods during more prolonged market downturns. During a general market downturn, multiple asset classes may be negatively affected. Changes in market conditions and interest rates can have the same impact on all types of securities and instruments. In times of severe market disruptions, you could lose your entire investment.
| 11. | FOREIGN INVESTMENT RISK |
The Global Fund generally invests a significant portion of its total assets in securities principally traded in markets outside the U.S. The foreign markets in which the Global Fund invests in are sometimes open on days when the New York Stock Exchange (“NYSE”) is not open and the Global Fund does not calculate its NAV, and sometimes are not open on days when the NYSE is open and the Global Fund does calculate its NAV. Even on days on which both the foreign market and the NYSE are open, several hours may pass between the time when trading in the foreign market closes and the time at which the Global Fund calculates its NAV. That is generally the case for markets in Europe, Asia, Australia and other far eastern markets; the regular closing time of foreign markets in North and South America is generally the same as the closing time of the NYSE and the time at which the Global Fund calculate its NAV.
Foreign stocks, as an asset class, may underperform U.S. stocks, and foreign stocks may be more volatile than U.S. stocks. Risks relating to investment in foreign securities (including, but not limited to, depository receipts and participation certificates) include: currency exchange rate fluctuation; less available public information about the issuers of securities; less stringent regulatory standards; lack of uniform accounting, auditing and financial reporting standards; and country risk including less liquidity, high inflation rates, unfavorable economic practices and political instability. The risks of foreign investments are typically greater in emerging and less developed markets.
| 12. | SUBSEQUENT EVENTS EVALUATION |
Management has evaluated the Funds’ related events and transactions that occurred through the date of issuance of the Funds’ financial statements. There were no events or transactions that occurred during this period that materially impacted the amounts or disclosures in the Funds’ financial statements.
| EntrepreneurShares Series Trust |
| |
| REPORT OF INDEPENDENT REGISTERED PUBLIC ACCOUNTING FIRM |
To the Board of Trustees of EntrepreneurShares Series Trust
and the Shareholders of ERShares Global Fund, ERShares US Small Cap Fund,
and ERShares US Large Cap Fund
Opinion on the Financial Statements
We have audited the accompanying statements of assets and liabilities of ERShares Global Fund (formerly, EntrepreneurShares Global Fund), ERShares US Small Cap Fund (formerly, Entrepreneur U.S. Small Cap Fund), and ERShares US Large Cap Fund (formerly, Entrepreneur U.S. Large Cap Fund), each a series of shares of beneficial interest in EntrepreneurShares Series Trust (the “Funds”), including the schedules of investments, as of June 30, 2021, and the related statements of operations for the year then ended, and the statements of changes in net assets and financial highlights for each of the years in the two-year period then ended, and the related notes (collectively referred to as the “financial statements”). In our opinion, the financial statements present fairly, in all material respects, the financial position of the Funds as of June 30, 2021, and the results of their operations for the year then ended and the changes in their net assets and their financial highlights for each of the years in the two-year period then ended, in conformity with accounting principles generally accepted in the United States of America. The financial highlights for each of the years in the three-year period ended June 30, 2019 were audited by other auditors, whose report dated August 29, 2019, expressed an unqualified opinion on such financial statements and financial highlights.
Basis for Opinion
These financial statements are the responsibility of the Funds’ management. Our responsibility is to express an opinion on the Funds’ financial statements based on our audits. We are a public accounting firm registered with the Public Company Accounting Oversight Board (United States) (“PCAOB”) and are required to be independent with respect to the Funds in accordance with the U.S. federal securities law and the applicable rules and regulations of the Securities and Exchange Commission and the PCAOB.
We conducted our audits in accordance with the standards of the PCAOB. Those standards require that we plan and perform the audits to obtain reasonable assurance about whether the financial statements are free of material misstatement, whether due to error or fraud. The Funds are not required to have, nor were we engaged to perform, an audit of their internal control over financial reporting. As part of our audits we are required to obtain an understanding of internal control over financial reporting but not for the purpose of expressing an opinion on the effectiveness of the Funds’ internal control over financial reporting. Accordingly, we express no such opinion.
Our audits included performing procedures to assess the risk of material misstatement of the financial statements, whether due to error or fraud, and performing procedures that respond to those risks. Such procedures included examining, on a test basis, evidence regarding the amounts and disclosures in the financial statements. Our procedures included confirmation of securities owned as of June 30, 2021 by correspondence with the custodian, brokers, or by other appropriate auditing procedures where replies from brokers were not received. Our audits also included evaluating the accounting principles used and significant estimates made by management, as well as evaluating the overall presentation of the financial statements. We believe that our audits provide a reasonable basis for our opinion.

BBD, LLP
We have served as the auditor of one or more of the Funds in the EntrepreneurShares Series Trust since 2020.
Philadelphia, Pennsylvania
August 27, 2021
| EntrepreneurShares Series Trust |
| |
| EXPENSE EXAMPLE |
| June 30, 2021 (Unaudited) |
As a Fund shareholder, you may incur two types of costs: (1) transaction costs, including commissions on trading, as applicable; and (2) ongoing costs, including advisory fees and other Fund expenses. These examples are intended to help you understand your ongoing costs (in dollars) of investing in a Fund and to compare these costs with the ongoing costs of investing in other mutual funds.
The expense examples below are based on an investment of $1,000 invested on January 1, 2021 and held through the period ended June 30, 2021.
The Actual Expense figures in the table below provide information about actual account values and actual expenses. You may use this information, together with the amount you invested, to estimate the expenses that you paid over the period. Simply divide your account value by $1,000 (for example, an $8,600 account value divided by $1,000 = 8.6), then multiply the result by the number in the table under the heading entitled “Expenses Paid During Period” to estimate the expenses you paid on your account during this period.
The Hypothetical Expense figures in the table below provide information about hypothetical account values and hypothetical expenses based on each Fund’s actual expense ratio and an assumed rate of return of 5% per year before expenses, which is not each Fund’s actual return. The hypothetical account values and expenses may not be used to estimate the actual ending account balance or expenses you paid for the period. You may use this information to compare the ongoing costs of investing in your Fund and other funds. To do so, compare this 5% hypothetical example with the 5% hypothetical examples that appear in the shareholder reports of the other funds.
Please note that the expenses shown in the table are meant to highlight your ongoing costs only and do not reflect any transactional costs. Further, the expenses do not include any brokerage commissions on investors’ purchases or redemptions of fund shares as described in the fund’s prospectus. Therefore, the examples are useful in comparing ongoing costs only and will not help you determine the relative total cost of owning different funds. In addition, if these transactional costs were included, your costs would have been higher.
| | | | | Beginning | | | | | | |
| | | | | Account | | Ending | | | | |
| | | | | Value | | Account Value | | | | Annualized |
| | | | | January 1, | | June 30, | | Expenses Paid | | Expense |
| | | | | 2021 | | 2021 | | During Period(a) | | Ratio |
| ERShares Global Fund | | Actual | | $1,000.00 | | $1,054.60 | | $7.18 | | 1.41% |
| | | Hypothetical(b) | | $1,000.00 | | $1,017.80 | | $7.05 | | 1.41% |
| ERShares US Small Cap Fund | | Actual | | $1,000.00 | | $986.90 | | $4.19 | | 0.85% |
| | | Hypothetical(b) | | $1,000.00 | | $1,020.58 | | $4.26 | | 0.85% |
| ERShares US Large Cap Fund | | Actual | | $1,000.00 | | $928.80 | | $3.59 | | 0.75% |
| | | Hypothetical(b) | | $1,000.00 | | $1,021.08 | | $3.76 | | 0.75% |
| (a) | Expenses are equal to the average account value over the period multiplied by the Fund’s annualized expense ratio, multiplied by 181/365 (to reflect the one-half year period). |
| (b) | Represents the hypothetical 5% annual return before taxes. |
| EntrepreneurShares Series Trust |
| |
| ADDITIONAL INFORMATION |
| June 30, 2021 (Unaudited) |
| 1. | ADDITIONAL DISCLOSURE REGARDING FUND TRUSTEES AND OFFICERS |
As a Delaware statutory trust, the business and affairs of the Trust are managed by its officers under the direction of its Board of Trustees. The Global Fund, the US Small Cap Fund, the US Large Cap Fund, the ERShares Entrepreneurs ETF and the ERShares NextGen Entrepreneurs ETF are the only funds in the “Fund Complex” as defined in the 1940 Act. The name, birth year and principal occupations during the past five years, and other information with respect to each of the Trustees and officers of the Trust is set forth below. Unless otherwise noted, each Trustee and officer has served in the indicated positions and directorships for at least the last five years. The address of each Trustee and officer is c/o the Trust at 175 Federal Street, Suite #875, Boston, MA 02110.
| Name (Birth Year) | | Position(s)
Held
with Trust | | Term of
Office(1)
and
Length of
Time Served | | Principal Occupation(s)
During Past 5 Years | | # of Portfolios
in Fund
Complex
Overseen by
Trustee | | Other
Directorships
Held by
Trustee During
Past 5 Years |
| Non-Interested Trustees |
Charles Aggouras
(1967) | | Trustee | | Since 2018 | | Real estate investment and development. | | 5 | | None |
George R. Berbeco
(1944) | | Trustee | | Since 2010 | | Former President – Devon Group and General Partner – Devon Capital Partners, LP. (commodity trading) (2005 to 2009). | | 5 | | Director – Bay Colony Development Corporation. |
| Interested Trustees |
Joel M. Shulman, CFA(2)
(1955) | | President and Trustee | | Since 2010 | | Member and principal of EntrepreneurShares, LLC and Seaport Global Advisors, LLC since 2010; Member and founding partner of Capital Impact Advisors, LLC since 2013; Tenured professor at Babson College. | | 5 | | None |
| Officers |
Mihai Prisacariu
(1994) | | Chief Compliance Officer | | Since 2019 | | Began involvement with EntrepreneurShares in 2017. Pursued academic studies prior to 2017. | | N/A | | None |
Eva Adosoglou
(1989) | | Chief Operations Officer | | Since 2019 | | Chief Operating Officer EntrepreneurShares Series Trust since 2019; Innovative Manager – Wirecard from 2018-2019; Portfolio Manager – Cox Automative, Inc. from 2016-2018; Financial Analyst – PWC from 2013-2016. | | N/A | | None |
| (1) | Each Trustee serves an indefinite term until the election of a successor. Each officer serves an indefinite term, renewed annually, until the election of a successor. |
| (2) | Dr. Shulman is considered an interested Trustee within the meaning of the 1940 Act because of his affiliation with the Advisors and Sub-Advisor. |
The Statement of Additional Information includes additional information about the Funds’ Trustees and is available free of charge, upon request by calling the Funds toll free at 1-877-271-8811 or by visiting the SEC’s website (http://www.sec.gov).
| EntrepreneurShares Series Trust |
| |
| ADDITIONAL INFORMATION (Continued) |
| June 30, 2021 (Unaudited) |
| 2. | ADDITIONAL TAX INFORMATION |
Long Term Capital Gains Designation
For the year ended June 30, 2021, the Global, US Small Cap and US Large Cap Funds hereby designate $5,158,935, $20,387,674 and $32,845,159, respectively, as 20% rate gain distributions for purposes of the dividends paid deduction.
Qualified Dividend Income
For the year ended June 30, 2021, 1.79%, 0.94% and 1.51% of the dividends paid from net investment income, including short-term capital gains (if any), is designated as qualified dividend income for the Global Fund, US Small Cap Fund and US Large Cap Fund, respectively.
Corporate Dividends Received Deduction
For the year ended June 30, 2021, 0.56%, 0.35% and 1.39% of the dividends paid from net investment income, including short-term capital gains (if any), qualifies for the dividends received deduction available to corporate shareholders for the Global Fund, US Small Cap Fund and US Large Cap Fund, respectively.
| 3. | AVAILABILITY OF QUARTERLY PORTFOLIO HOLDINGS SCHEDULES |
The Funds file complete schedules of portfolio holdings with the SEC for the first and third quarters of each fiscal year on Form N-PORT (or any predecessor form). These filings are available on the SEC’s website at www.sec.gov. In addition, the Funds’ Form N-PORT is available without charge, upon request, by calling 1-877-271-8811.
| 4. | PROXY VOTING POLICIES AND PROCEDURES AND PROXY VOTING RECORD |
A description of the Funds’ proxy voting policies and procedures and information regarding how the Funds voted proxies relating to portfolio securities during the most recent 12 month period ended June 30, is available without charge, upon request, by (1) calling 1-877-271-8811, or (2) on the SEC’s website at www.sec.gov.
To reduce expenses, each Fund generally mails only one copy of its prospectus and each annual and semi-annual report to those addresses shared by two or more accounts and to shareholders that such Fund reasonably believes are from the same family and household. This is referred to as “householding.” If you wish to discontinue householding and would like to receive individual copies of these documents, please call us at 1-877-271-8811. Once a Fund receives notice to stop householding, the Fund will begin sending individual copies 30 days after receiving requests. This policy does not apply to account statements.
| EntrepreneurShares Series Trust |
| |
| PRIVACY POLICY |
| (Unaudited) |
As part of the EntrepreneurShares fund family’s long tradition of trust, the confidentiality of personal information is paramount. We maintain high standards to safeguard your personal information. We will remain vigilant and professional in protecting that information and in using it in a fair and lawful manner. As part of this commitment to fulfilling your trust we have formulated this Privacy Policy.
Safeguarding Customer Information and Documents
To conduct regular business, we may collect nonpublic personal information from sources such as:
| ● | Account Applications and other forms, which may include a customer’s name, address, social security number, and information about a customer’s investment goals and risk tolerances; |
| ● | Account History, including information about the transactions and balances in a customer’s account; and |
| ● | Correspondence, written, telephonic, or electronic between a customer and Seaport Global Advisors, LLC; Capital Impact Advisors, LLC; EntrepreneurShares, LLC, and/or any EntrepreneurShares Mutual Fund or Exchange-Traded Fund product; such as, ERShares Global Fund, ERShares US Large Cap Fund, ERShares US Small Cap, ERShares Entrepreneurs ETF, ERShares NextGen Entrepreneurs ETF, or service providers to Seaport Global Advisors, Capital Impact, EntrepreneurShares, and/or EntrepreneurShares’ Funds. |
To conduct regular business, we collect non-public customer data in checklists, forms, in written notations, and in documentation provided to us by our customers for evaluation, registration, licensing or related consulting services. We also create internal lists of such data.
EntrepreneurShares will internally safeguard your nonpublic personal information by restricting access to only those employees who provide products or services to you or those who need access to your information to service your account. In addition, we will maintain physical, electronic and procedural safeguards that meet federal and/or state standards to guard your nonpublic personal information. Failure to observe EntrepreneurShares’ procedures regarding customer and consumer privacy will result in discipline and may lead to termination.
Sharing Nonpublic Personal and Financial Information
As EntrepreneurShares shares nonpublic information solely to service our client accounts, we do not disclose any nonpublic personal information about our customers or former customers to anyone, except as permitted by law or otherwise disclosed herein.
EntrepreneurShares is committed to the privacy and protection of our customers’ personal and financial information.
We will not share any such information with any affiliated or nonaffiliated third party except:
| ● | When necessary to complete transactions in a customer account, such as clearing firm. |
| ● | When required to service and/or maintain your account. |
| ● | In order to resolve a customer dispute or inquiry. |
| ● | With persons acting in a fiduciary or representative capacity on behalf of the customer. |
| ● | With rating agencies, persons assessing compliance with industry standards, or to the attorneys, accountants and auditors of the firm. |
| ● | In connection with any sale and / or merger of EntrepreneurShares’ business. |
| ● | To prevent or protect against actual or potential fraud, identity theft, unauthorized transactions, claims or other liability. |
| ● | To comply with all federal, state or local laws, rules, statutes and other applicable legal requirements. |
| EntrepreneurShares Series Trust |
| |
| PRIVACY POLICY (Continued) |
| (Unaudited) |
| ● | In connection with a written agreement to provide advisory services or investment management when the information is released solely for the purpose of providing products or services covered by pursuant to the EntrepreneurShares’ Wrap Fee Program. |
| ● | Upon the customer’s specific instruction, consent or request. |
Note: When we share your nonpublic information with any third party for the reasons listed above, we make certain that there are written restrictions in place regarding the use and/or disclosure of said information.
Opt-Out Provisions
It is not a policy of EntrepreneurShares to share nonpublic personal and financial information with affiliated or unaffiliated third parties except under the circumstances noted above. Since sharing under the circumstances noted above is necessary to service customer accounts or is mandated by law, there are no allowances made for clients to opt out.
This page intentionally left blank.
| |
| |
| ERShares Global Fund Investment Advisor |
| Seaport Global Advisors, LLC |
| 175 Federal Street, Suite #875 |
| Boston, MA 02110 |
| |
| |
| ERShares Global Fund Investment Sub-Advisor |
| EntrepreneurShares, LLC |
| 175 Federal Street, Suite #875 |
| Boston, MA 02110 |
| |
| |
| ERShares US Small Cap Fund and ERShares US Large Cap Fund Investment Advisor |
| Capital Impact Advisors, LLC |
| 175 Federal Street, Suite #875 |
| Boston, MA 02110 |
| |
| |
| Independent Registered Public Accounting Firm |
| BBD, LLP |
| 1835 Market Street, 3rd Floor |
| Philadelphia, PA 19103 |
| |
| |
| Custodian |
| UMB Bank, N.A. |
| 928 Grand Boulevard, 5th Floor |
| Kansas City, MO 64106 |
| |
| |
| Distributor |
| Foreside Fund Services, LLC |
| Three Canal Plaza, Suite 100 |
| Portland, ME 04101 |
| |
| |
| Administrator, Accountant, Transfer Agent and Dividend Disbursing Agent |
| Ultimus Fund Solutions, LLC |
| 225 Pictoria Drive, |
| Cincinnati, OH 45246 |
| |
| |
| Counsel |
| Thompson Hine LLP |
| 41 South High Street, Suite 1700 |
| Columbus, OH 43215 |
| |
| |
| |
| This report should be accompanied or preceded by a prospectus. |
Annual Report
EntrepreneurShares Series Trust™
EntrepreneurShares Series Trust (“Trust”) is a registered investment company consisting of separate investment portfolios called “Funds.” This Annual Report relates solely to the following Funds:
| Name | Ticker Symbol |
ERShares Entrepreneurs ETF
(formerly, ERShares Entrepreneur 30 ETF) | ENTR |
ERShares NextGen Entrepreneurs ETF
(formerly, ERShares Non-US Small Cap ETF) | ERSX |
The Funds are exchange-traded funds. This means that shares of the Funds are listed on NYSE Arca, Inc. (“NYSE Arca”) and trade at market prices. The market price for each Fund’s shares may be different from its net asset value per share (“NAV”).
June 30, 2021
175 Federal Street
Suite #875
Boston, MA 02110
Toll Free: 877-271-8811
EntrepreneurShares Series Trust
(Unaudited)
August 2, 2021
Dear Shareholders:
We are enclosing the report for results covering the fiscal year July 1, 2020 through June 30, 2021. We note that our performance is not symmetrical or consistent through the year with quarters in the past couple of years varying considerably from period to period. We note that the interpretation of results is best measured over an extended period, especially as measured against a consistent benchmark.
The objective of this letter is to provide our shareholders an informative review of our funds’ performance, present comparison of each fund’s performance vs. appropriate benchmarks, and discuss each fund’s top performing sector. This letter addresses our two Exchange Traded Funds (“ETFs”); ERShares Entrepreneurs ETF and ERShares NextGen Entrepreneurs ETF. The Trust also includes three mutual funds; these are separately covered in their own Annual Report. Overall, all funds have positive annual returns, despite the unusual market conditions brought by COVID-19.
Several key factors need to be addressed. First, our models work best during periods of market appreciation and low volatility. Our historical above average Up-Capture suggests that when markets rise, our Entrepreneurial stocks tend to rise faster. The corollary also tends to hold true: our above average Down-Capture suggests that during periods of market decline our Entrepreneurial stocks tend to fall faster than peer benchmarks. The period July 1, 2020 through June 30, 2021 included periods with extreme movements in both directions. Our funds performed as expected during these periods, though with more volatility due to the pandemic and more volatile interest rates. We believe if our funds were evaluated during a Calendar year, investors would have an entirely different interpretation of results.
An important distinguishing characteristic of our strategy is that many of our alpha-generating(1) Entrepreneurial stocks tend to fall in the Growth and High Beta(2) classification. This includes a handful of sectors with most stocks residing within the Information Technology, Consumer Discretionary, Communication Services and Health Care sectors. When equity markets favor these sectors or Growth and High Beta stocks, our Entrepreneur portfolios tend to out-perform the markets over that time period. The opposite also holds true.
ERShares Entrepreneurs ETF
ERShares Entrepreneurs ETF (“ENTR”) is one of the two exchange-traded funds. ENTR is benchmarked against the Russell 1000 Growth Index. During the last fiscal year, ENTR performed 32.01% vs. 42.50%, respectively.
The ERShares Entrepreneurs ETF’s top performing sectors for the period were Information Technology, Communication Services, and Financials. The Fund’s performance vs. the benchmark for the fiscal year was 46.02% vs. 46.48%, 43.51% vs. 57.93%, and 39.66% vs. 29.21%, for the previously referenced sectors respectively. The ERShares Entrepreneurs ETF’s worst performing sectors for the fiscal year were Real Estate, Industrials, and Health Care. The Fund’s performance vs. the benchmark for the fiscal year was -63.57% vs. 23.45%, -26.79% vs. 39.11%, and -4.83% vs. 29.10%, for the previously referenced sectors, respectively.
ERShares NextGen Entrepreneurs ETF
ERShares NextGen Entrepreneurs ETF (“ERSX”) is one of the two exchange-traded funds. ERSX is benchmarked against the FTSE Global ex-US Small Cap Index. During the last fiscal period, ERSX performed 44.58% vs. 44.44%, for the benchmark.
EntrepreneurShares Series Trust
(Unaudited)
The ERShares NextGen Entrepreneurs ETF’s top performing sectors for the fiscal year were Financials, Communication Services, and Industrials. The Fund’s performance vs. the benchmark for the fiscal year was 179.99% vs. 44.60%, 68.22% vs. 43.29%, and 63.15% vs 57.32%, for the previously referenced sectors respectively. The ERShares NextGen Entrepreneurs ETF’s worst performing sectors for the period were Real Estate, Energy, and Consumer Staples. The Fund’s performance vs. the benchmark for the fiscal year was -14.06% vs. 33.21%, -5.11% vs. 62.96%, and -0.07% vs. 22.49%, for the previously referenced sectors, respectively.
In this past fiscal year, we note that our relative performance is not consistent across strategies. We had a slight outperformance as measured against our benchmark in the ERShares NextGen Entrepreneurs ETF and underperformance in the ERShares Entrepreneurs ETF. We do not see this divergence as a reflection of our Entrepreneur strategy, but rather, individual stock performance during a specific time period. We note that when our Fund performance is viewed on a calendar year basis or over an extended time period, different interpretations would follow. We believe that we continue to provide evidence that our Entrepreneur Model works over an extended period and extend our gratitude to all of our shareholders for continued support. We look forward to sharing more updates with you in the future.
Sincerely,
Joel Shulman Ph.D., CFA
Founder and Chief Investment Officer
| (1) | Alpha compares the risk-adjusted performance of a portfolio to a benchmark index. A positive alpha means the portfolio has outperformed the index on a risk-adjusted basis. |
| (2) | Beta is a measure of the volatility of a portfolio in comparison to a benchmark index. Less than one means the portfolio is less volatile than the index, while greater than one indicates more volatility than the index. Standard deviation measures historical volatility. |
EntrepreneurShares Series Trust
(Unaudited)
Performance data quoted represents past performance; past performance does not guarantee future results. The investment return and principal value of an investment will fluctuate so that an investor’s shares, when redeemed, may be worth more or less than their original cost. Current performance of the Funds may be lower or higher than the performance quoted. Performance data current to the most recent month end may be obtained by calling 1-877-271-8811 or visiting www.ershares.com.
Investors should consider carefully the investment objectives, risks, and charges and expenses before investing. For a full prospectus which contains this and other information about the Funds offered by EntrepreneurShares, call 1-877-271-8811. Please read the full prospectus carefully before investing. The Mutual Funds and ETFs are distributed by Foreside Fund Services, LLC.
The ERShares NextGen Entrepreneurs ETF invests in foreign securities which involve greater volatility and political, economic and currency risks and differences in accounting methods. The ERShares NextGen Entrepreneurs ETF invests in smaller companies, which involve additional risks such as limited liquidity and greater volatility. The ETFs are exposed to common stock risk. Common stock prices fluctuate based on changes in a company’s financial condition and on overall market and economic conditions. Additional risks are detailed in the prospectus.
The Russell 1000 Growth Index is comprised of large and mid cap US equities that exhibit growth characteristics. The FTSE Global ex-US Small-Cap Index is a market-capitalization weighted index representing the performance of Small cap stocks in Developed and Emerging markets excluding the US. The index is derived from the FTSE Global Equity Index Series (GEIS), which covers 98% of the world’s investable market capitalization.
Index performance does not represent actual fund or portfolio performance and such performance does not reflect the actual investment experience of any investor. An investor cannot invest directly in an index.
Diversification does not guarantee a profit or assure against a loss.
Opinions expressed are subject to change, are not guaranteed and should not be considered recommendations to buy or sell any security.
ERShares Entrepreneurs ETF
PERFORMANCE HIGHLIGHTS (Unaudited)
ERShares Entrepreneurs ETF vs. Russell 1000 Growth Index
Value of $10,000 Investment
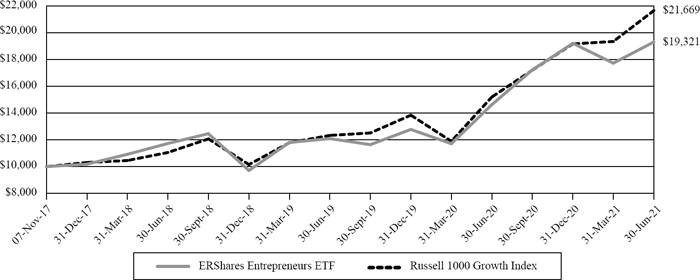
This chart assumes an initial gross investment of $10,000 made in the ERShares Entrepreneurs ETF on November 7, 2017 (commencement of operations of the Fund) and held to June 30, 2021. Returns shown include the reinvestment of all dividends but do not reflect the deduction of taxes that a shareholder would pay on fund distributions or the redemption of fund shares. Past performance is not predictive of future performance. Investment return and principal value will fluctuate, so that your shares, when redeemed, may be worth more or less than the original cost. The Fund’s total gross and net operational expenses, including underlying funds, were 0.49% per the April 1, 2021 prospectus.
Russell 1000 Growth Index – The Russell 1000 Growth Index is an unmanaged index that measures the performance of the large-cap growth segment of the U.S. equity universe. It includes those Russell 1000 companies with higher price-to-book ratios and higher forecasted growth values. An investor cannot invest directly in the index.
Total Annualized Returns as of June 30, 2021
| | | 1-Year | | Since Inception (11/7/2017) |
| ERShares Entrepreneurs ETF – At NAV | | 32.01% | | 19.79% |
| ERShares Entrepreneurs ETF – At Market Value | | 32.06% | | 19.81% |
| Russell 1000 Growth Index | | 42.50% | | 23.62% |
ERShares NextGen Entrepreneurs ETF
PERFORMANCE HIGHLIGHTS (Unaudited)
ERShares NextGen Entrepreneurs ETF vs. FTSE Global ex-US Small Cap Index
Value of $10,000 Investment
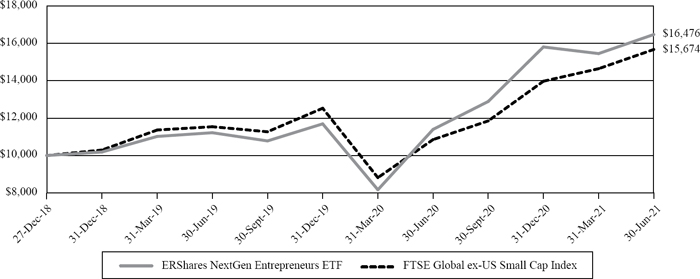
This chart assumes an initial gross investment of $10,000 made in the ERShares NextGen Entrepreneurs ETF on December 27, 2018 (commencement of operations of the Fund) and held to June 30, 2021. Returns shown include the reinvestment of all dividends but do not reflect the deduction of taxes that a shareholder would pay on fund distributions or the redemption of fund shares. Past performance is not predictive of future performance. Investment return and principal value will fluctuate, so that your shares, when redeemed, may be worth more or less than the original cost. The Fund’s total gross and net operational expenses, including underlying funds, were 0.75% per the April 1, 2021 prospectus..
FTSE Global ex-US Small-Cap Index is a market-capitalization weighted index representing the performance of Small cap stocks in Developed and Emerging markets excluding the US. The index is derived from the FTSE Global Equity Index Series (GEIS), which covers 98% of the world’s investable market capitalization.
Total Annualized Returns as of June 30, 2021
| | | 1-Year | | Since Inception (12/27/2018) |
| ERShares NextGen Entrepreneurs ETF – At NAV | | 44.58% | | 22.01% |
| ERShares NextGen Entrepreneurs ETF – At Market Value | | 45.28% | | 22.13% |
| FTSE Global ex-US Small Cap Index | | 44.44% | | 19.57% |
| ERShares Entrepreneurs ETF |
| |
| SCHEDULE OF INVESTMENTS SUMMARY TABLE(1) |
| June 30, 2021 (Unaudited) |
| | | % of Net Assets | |
| Communications | | | 29.37 | % |
| Consumer Discretionary | | | 7.58 | % |
| Health Care | | | 22.41 | % |
| Technology | | | 37.97 | % |
| Other Assets in Excess of Liabilities | | | 2.67 | % |
| | | | 100.00 | % |
| TOP TEN EQUITY HOLDINGS(1)(2) |
| as of June 30, 2021 (Unaudited) |
| Issuer | | % of Net Assets | |
| Roku, Inc. | | | 6.04 | % |
| Spotify Technology S.A. | | | 4.71 | % |
| Twilio, Inc., Class A | | | 4.26 | % |
| Teladoc Health, Inc. | | | 4.04 | % |
| Square, Inc., Class A | | | 3.98 | % |
| Zillow Group, Inc., Class A | | | 3.95 | % |
| Exact Sciences Corp. | | | 3.65 | % |
| Fiverr International Ltd. | | | 3.59 | % |
| Okta, Inc. | | | 3.16 | % |
| MercadoLibre, Inc. | | | 3.08 | % |
| (1) | Fund holdings and sector allocations are subject to change at any time and are not recommendations to buy or sell any security. |
| (2) | Short-term investments are not included. |
| ERShares NextGen Entrepreneurs ETF |
| |
| SCHEDULE OF INVESTMENTS SUMMARY TABLE(1) |
| June 30, 2021 (Unaudited) |
| | | % of Net Assets | |
| Communications | | | 34.18 | % |
| Consumer Discretionary | | | 17.06 | % |
| Energy | | | 5.18 | % |
| Financials | | | 7.13 | % |
| Health Care | | | 12.66 | % |
| Industrials | | | 1.34 | % |
| Real Estate | | | 3.28 | % |
| Technology | | | 15.40 | % |
| Other Assets in Excess of Liabilities | | | 3.77 | % |
| | | | 100.00 | % |
| TOP TEN EQUITY HOLDINGS(1)(2) |
| as of June 30, 2021 (Unaudited) |
| Issuer | | % of Net Assets | |
| CRISPR Therapeutics AG | | | 5.59 | % |
| Fiverr International Ltd. | | | 5.58 | % |
| SolarEdge Technologies, Inc. | | | 4.32 | % |
| Spotify Technology S.A. | | | 4.16 | % |
| Wix.com Ltd. | | | 3.76 | % |
| HUYA, Inc. - ADR | | | 3.71 | % |
| Futu Holdings Ltd. - ADR | | | 3.59 | % |
| SEEK Ltd. | | | 2.98 | % |
| Flight Centre Travel Group Ltd. | | | 2.44 | % |
| Bilibili, Inc. - ADR | | | 2.43 | % |
| (1) | Fund holdings and sector allocations are subject to change at any time and are not recommendations to buy or sell any security. |
| (2) | Short-term investments are not included. |
| ERShares Entrepreneurs ETF |
| |
| SCHEDULE OF INVESTMENTS |
| June 30, 2021 |
| | | Shares | | | Fair Value | |
| Common Stocks — 97.33% | | | | | | | | |
| Communications — 29.37% | | | | | | | | |
| Alphabet, Inc., Class A(a) | | | 917 | | | $ | 2,239,121 | |
| Facebook, Inc., Class A(a) | | | 6,852 | | | | 2,382,509 | |
| Fiverr International Ltd.(a) | | | 21,189 | | | | 5,138,121 | |
| Roku, Inc.(a) | | | 18,798 | | | | 8,632,982 | |
| Sea Ltd. - ADR(a) | | | 7,718 | | | | 2,119,363 | |
| Shutterstock, Inc. | | | 18,183 | | | | 1,785,025 | |
| Skillz, Inc.(a) | | | 92,721 | | | | 2,013,900 | |
| Snap, Inc., Class A(a) | | | 19,735 | | | | 1,344,743 | |
| Spotify Technology S.A.(a) | | | 24,409 | | | | 6,726,876 | |
| Trade Desk, Inc. (The), Class A(a) | | | 51,210 | | | | 3,961,606 | |
| Zillow Group, Inc., Class A(a) | | | 46,093 | | | | 5,647,775 | |
| | | | | | | | 41,992,021 | |
| Consumer Discretionary — 7.58% | | | | | | | | |
| DraftKings, Inc., Class A(a) | | | 28,649 | | | | 1,494,618 | |
| Etsy, Inc.(a) | | | 18,576 | | | | 3,823,684 | |
| MercadoLibre, Inc.(a) | | | 2,831 | | | | 4,410,103 | |
| Tesla, Inc.(a) | | | 1,638 | | | | 1,113,349 | |
| | | | | | | | 10,841,754 | |
| Health Care — 22.41% | | | | | | | | |
| 10X Genomics, Inc., Class A(a) | | | 14,469 | | | | 2,833,320 | |
| Beam Therapeutics, Inc.(a) | | | 9,190 | | | | 1,182,845 | |
| BeiGene Ltd. - ADR(a) | | | 8,248 | | | | 2,830,631 | |
| CRISPR Therapeutics AG(a) | | | 21,805 | | | | 3,530,011 | |
| Exact Sciences Corp.(a) | | | 42,019 | | | | 5,223,381 | |
| Invitae Corp.(a) | | | 57,874 | | | | 1,952,090 | |
| Masimo Corp.(a) | | | 17,898 | | | | 4,339,370 | |
| Teladoc Health, Inc.(a) | | | 34,751 | | | | 5,778,744 | |
| Twist Bioscience Corp.(a) | | | 32,758 | | | | 4,365,004 | |
| | | | | | | | 32,035,396 | |
| Technology — 37.97% | | | | | | | | |
| Bill.com Holdings, Inc.(a) | | | 12,477 | | | | 2,285,537 | |
| Cloudflare, Inc.(a) | | | 41,207 | | | | 4,361,349 | |
| Crowdstrike Holdings, Inc., Class A(a) | | | 13,982 | | | | 3,513,816 | |
| Datadog, Inc.(a) | | | 39,964 | | | | 4,159,453 | |
| EPAM Systems, Inc.(a) | | | 6,458 | | | | 3,299,780 | |
| Fortinet, Inc.(a) | | | 12,208 | | | | 2,907,824 | |
| NVIDIA Corp. | | | 5,127 | | | | 4,102,113 | |
| Okta, Inc.(a) | | | 18,479 | | | | 4,521,442 | |
| Palantir Technologies, Inc., Class A(a) | | | 36,457 | | | | 961,007 | |
| salesforce.com, Inc.(a) | | | 11,081 | | | | 2,706,756 | |
| Square, Inc., Class A(a) | | | 23,367 | | | | 5,696,874 | |
The accompanying notes are an integral part of these financial statements.
| ERShares Entrepreneurs ETF |
| |
| SCHEDULE OF INVESTMENTS (Continued) |
| June 30, 2021 |
| | | Shares | | | Fair Value | |
| Common Stocks (Continued) | | | | | | | | |
| Technology (Continued) | | | | | | | | |
| Synopsys, Inc.(a) | | | 13,517 | | | $ | 3,727,853 | |
| Twilio, Inc., Class A(a) | | | 15,459 | | | | 6,093,320 | |
| Veeva Systems, Inc., Class A(a) | | | 12,673 | | | | 3,940,669 | |
| Zoom Video Communications, Inc., Class A(a) | | | 5,148 | | | | 1,992,430 | |
| | | | | | | | 54,270,223 | |
| TOTAL COMMON STOCKS (Cost $120,701,401) | | | | | | | 139,139,394 | |
| | | | | | | | | |
| Total Investments — 97.33% (Cost $120,701,401) | | | | | | | 139,139,394 | |
| Other Assets in Excess of Liabilities — 2.67% | | | | | | | 3,821,784 | |
| Net Assets — 100.00% | | | | | | $ | 142,961,178 | |
| (a) | Non-income producing security. |
The accompanying notes are an integral part of these financial statements.
| ERShares NextGen Entrepreneurs ETF |
| |
| SCHEDULE OF INVESTMENTS |
| June 30, 2021 |
| | | Shares | | | Fair Value | |
| Common Stocks — 96.23% | | | | | | | | |
| Argentina — 1.92% | | | | | | | | |
| Consumer Discretionary — 1.92% | | | | | | | | |
| MercadoLibre, Inc.(a) | | | 522 | | | $ | 813,166 | |
| | | | | | | | | |
| Total Argentina | | | | | | | 813,166 | |
| | | | | | | | | |
| Australia — 11.72% | | | | | | | | |
| Communications — 3.79% | | | | | | | | |
| carsales.com, Ltd. | | | 23,187 | | | | 343,378 | |
| SEEK Ltd. | | | 50,830 | | | | 1,263,583 | |
| | | | | | | | 1,606,961 | |
| Consumer Discretionary — 4.64% | | | | | | | | |
| Flight Centre Travel Group Ltd.(a) | | | 92,848 | | | | 1,032,787 | |
| Harvey Norman Holdings, Ltd. | | | 226,581 | | | | 931,928 | |
| | | | | | | | 1,964,715 | |
| Financials — 2.34% | | | | | | | | |
| Afterpay, Ltd.(a) | | | 11,193 | | | | 993,494 | |
| | | | | | | | | |
| Technology — 0.95% | | | | | | | | |
| Zip Company Ltd.(a) | | | 70,950 | | | | 402,943 | |
| | | | | | | | | |
| Total Australia | | | | | | | 4,968,113 | |
| | | | | | | | | |
| Canada — 3.81% | | | | | | | | |
| Communications — 2.28% | | | | | | | | |
| Score Media and Gaming, Inc.(a) | | | 48,466 | | | | 966,896 | |
| | | | | | | | | |
| Consumer Discretionary — 0.60% | | | | | | | | |
| Spin Master Corp.(a) | | | 6,498 | | | | 252,770 | |
| | | | | | | | | |
| Real Estate — 0.93% | | | | | | | | |
| Tricon Residential, Inc. | | | 34,406 | | | | 395,797 | |
| | | | | | | | | |
| Total Canada | | | | | | | 1,615,463 | |
| | | | | | | | | |
| Cayman Islands — 13.66% | | | | | | | | |
| Communications — 5.95% | | | | | | | | |
| HUYA, Inc. - ADR(a) | | | 88,945 | | | | 1,569,879 | |
| KE Holdings, Inc., Institutional Class - ADR(a) | | | 19,916 | | | | 949,595 | |
| | | | | | | | 2,519,474 | |
| Consumer Discretionary — 3.13% | | | | | | | | |
| NagaCorp Ltd. | | | 658,472 | | | | 635,034 | |
The accompanying notes are an integral part of these financial statements.
| ERShares NextGen Entrepreneurs ETF |
| |
| SCHEDULE OF INVESTMENTS (Continued) |
| June 30, 2021 |
| | | Shares | | | Fair Value | |
| Common Stocks (Continued) | | | | | | | | |
| Cayman Islands (Continued) | | | | | | | | |
| Consumer Discretionary (Continued) | | | | | | | | |
| Yadea Group Holdings Ltd. | | | 321,707 | | | $ | 690,993 | |
| | | | | | | | 1,326,027 | |
| Financials — 1.19% | | | | | | | | |
| Noah Holdings Ltd. - ADR(a) | | | 10,709 | | | | 505,465 | |
| | | | | | | | | |
| Technology — 3.39% | | | | | | | | |
| Agora, Inc. - ADR(a) | | | 17,904 | | | | 751,252 | |
| Kingsoft Corp. Ltd. | | | 114,424 | | | | 685,274 | |
| | | | | | | | 1,436,526 | |
| Total Cayman Islands | | | | | | | 5,787,492 | |
| | | | | | | | | |
| China — 15.74% | | | | | | | | |
| Communications — 3.54% | | | | | | | | |
| Bilibili, Inc. - ADR(a) | | | 8,459 | | | | 1,030,645 | |
| Weimob, Inc.(a) | | | 213,232 | | | | 470,547 | |
| | | | | | | | 1,501,192 | |
| Consumer Discretionary — 3.25% | | | | | | | | |
| Bosideng International Holdings, Ltd. | | | 673,118 | | | | 480,969 | |
| Niu Technologies - ADR(a) | | | 27,335 | | | | 892,488 | |
| | | | | | | | 1,373,457 | |
| Energy — 0.86% | | | | | | | | |
| Tianneng Power International, Ltd. | | | 208,765 | | | | 364,967 | |
| | | | | | | | | |
| Financials — 3.60% | | | | | | | | |
| Futu Holdings Ltd. - ADR(a) | | | 8,500 | | | | 1,522,264 | |
| | | | | | | | | |
| Health Care — 2.84% | | | | | | | | |
| BeiGene Ltd. - ADR(a) | | | 2,248 | | | | 771,491 | |
| China Medical System Holdings, Ltd. | | | 164,785 | | | | 433,125 | |
| | | | | | | | 1,204,616 | |
| Technology — 1.65% | | | | | | | | |
| Kingdee International Software Group Co., Ltd. | | | 206,354 | | | | 698,893 | |
| | | | | | | | | |
| Total China | | | | | | | 6,665,389 | |
| | | | | | | | | |
| Israel — 9.34% | | | | | | | | |
| Communications — 9.34% | | | | | | | | |
| Fiverr International Ltd.(a) | | | 9,748 | | | | 2,363,793 | |
The accompanying notes are an integral part of these financial statements.
| ERShares NextGen Entrepreneurs ETF |
| |
| SCHEDULE OF INVESTMENTS (Continued) |
| June 30, 2021 |
| | | Shares | | | Fair Value | |
| Common Stocks (Continued) | | | | | | | | |
| Israel (Continued) | | | | | | | | |
| Communications (Continued) | | | | | | | | |
| Wix.com Ltd.(a) | | | 5,486 | | | $ | 1,592,476 | |
| | | | | | | | 3,956,269 | |
| Total Israel | | | | | | | 3,956,269 | |
| | | | | | | | | |
| Japan — 5.96% | | | | | | | | |
| Industrials — 1.34% | | | | | | | | |
| S-Pool, Inc. | | | 63,086 | | | | 568,300 | |
| | | | | | | | | |
| Technology — 4.62% | | | | | | | | |
| GMO Payment Gateway, Inc. | | | 7,197 | | | | 934,701 | |
| SHIFT, Inc.(a) | | | 6,645 | | | | 1,023,193 | |
| | | | | | | | 1,957,894 | |
| Total Japan | | | | | | | 2,526,194 | |
| | | | | | | | | |
| Luxembourg — 4.16% | | | | | | | | |
| Communications — 4.16% | | | | | | | | |
| Spotify Technology S.A.(a) | | | 6,393 | | | | 1,761,847 | |
| | | | | | | | | |
| Total Luxembourg | | | | | | | 1,761,847 | |
| | | | | | | | | |
| New Zealand — 1.63% | | | | | | | | |
| Technology — 1.63% | | | | | | | | |
| Xero Ltd.(a) | | | 6,720 | | | | 691,218 | |
| | | | | | | | | |
| Total New Zealand | | | | | | | 691,218 | |
| | | | | | | | | |
| Singapore — 1.93% | | | | | | | | |
| Communications — 1.62% | | | | | | | | |
| Sea Ltd. - ADR(a) | | | 2,505 | | | | 687,873 | |
| | | | | | | | | |
| Consumer Discretionary — 0.31% | | | | | | | | |
| Best World International, Ltd.(b) | | | 128,500 | | | | 129,962 | |
| | | | | | | | | |
| Total Singapore | | | | | | | 817,835 | |
| | | | | | | | | |
| Sweden — 9.30% | | | | | | | | |
| Communications — 2.12% | | | | | | | | |
| Embracer Group A.B.(a) | | | 33,163 | | | | 896,674 | |
The accompanying notes are an integral part of these financial statements.
| ERShares NextGen Entrepreneurs ETF |
| |
| SCHEDULE OF INVESTMENTS (Continued) |
| June 30, 2021 |
| | | Shares | | | Fair Value | |
| Common Stocks (Continued) | | | | | | | | |
| Sweden (Continued) | | | | | | | | |
| Consumer Discretionary — 0.99% | | | | | | | | |
| Instalco A.B. | | | 10,114 | | | $ | 419,785 | |
| | | | | | | | | |
| Health Care — 4.23% | | | | | | | | |
| Cellavision A.B. | | | 10,644 | | | | 458,361 | |
| CELLINK A.B.(a) | | | 13,424 | | | | 665,456 | |
| Sectra A.B.(a) | | | 8,618 | | | | 667,150 | |
| | | | | | | | 1,790,967 | |
| Technology — 1.96% | | | | | | | | |
| Sinch A.B.(a) | | | 49,470 | | | | 832,442 | |
| | | | | | | | | |
| Total Sweden | | | | | | | 3,939,868 | |
| | | | | | | | | |
| Switzerland — 5.59% | | | | | | | | |
| Health Care — 5.59% | | | | | | | | |
| CRISPR Therapeutics AG(a) | | | 14,630 | | | | 2,368,451 | |
| | | | | | | | | |
| Total Switzerland | | | | | | | 2,368,451 | |
| | | | | | | | | |
| United Kingdom — 4.80% | | | | | | | | |
| Communications — 1.37% | | | | | | | | |
| Frontier Developments plc(a) | | | 18,133 | | | | 580,419 | |
| | | | | | | | | |
| Consumer Discretionary — 2.24% | | | | | | | | |
| Frasers Group plc(a) | | | 113,522 | | | | 946,578 | |
| | | | | | | | | |
| Technology — 1.19% | | | | | | | | |
| Computacenter plc | | | 14,190 | | | | 505,721 | |
| | | | | | | | | |
| Total United Kingdom | | | | | | | 2,032,718 | |
| | | | | | | | | |
| United States — 6.67% | | | | | | | | |
| Energy — 4.33% | | | | | | | | |
| SolarEdge Technologies, Inc.(a) | | | 6,627 | | | | 1,831,504 | |
The accompanying notes are an integral part of these financial statements.
| ERShares NextGen Entrepreneurs ETF |
| |
| SCHEDULE OF INVESTMENTS (Continued) |
| June 30, 2021 |
| | | Shares | | | Fair Value | |
| Common Stocks (Continued) | | | | | | | | |
| United States (Continued) | | | | | | | | |
| Real Estate — 2.34% | | | | | | | | |
| eXp World Holdings, Inc.(a) | | | 25,625 | | | $ | 993,481 | |
| | | | | | | | | |
| Total United States | | | | | | | 2,824,985 | |
| | | | | | | | | |
| TOTAL COMMON STOCKS (Cost $35,197,194) | | | | | | | 40,769,008 | |
| | | | | | | | | |
| Total Investments — 96.23% (Cost $35,197,194) | | | | | | | 40,769,008 | |
| Other Assets in Excess of Liabilities — 3.77% | | | | | | | 1,597,711 | |
| Net Assets — 100.00% | | | | | | $ | 42,366,719 | |
| (a) | Non-income producing security. |
| (b) | Illiquid security. The total fair value of these securities as of June 30, 2021 was $129,962, representing 0.31% of net assets. |
The accompanying notes are an integral part of these financial statements.
| EntrepreneurShares Series Trust |
| |
| STATEMENTS OF ASSETS AND LIABILITIES |
| June 30, 2021 |
| | | | | | ERShares | |
| | | ERShares | | | NextGen | |
| | | Entrepreneurs | | | Entrepreneurs | |
| | | ETF | | | ETF | |
| Assets | | | | | | |
| Investments, at cost | | $ | 120,701,401 | | | $ | 35,197,194 | |
| Investments, at fair value | | | 139,139,394 | | | | 40,769,008 | |
| Cash | | | 3,533,497 | | | | 680,613 | |
| Foreign currencies, at value (cost $— and $240,511) | | | — | | | | 246,035 | |
| Receivable for investments sold | | | 341,861 | | | | 660,639 | |
| Dividends and interest receivable | | | 1,242 | | | | 35,017 | |
| Tax reclaims receivable | | | — | | | | 654 | |
| Total Assets | | | 143,015,994 | | | | 42,391,966 | |
| | | | | | | | | |
| Liabilities | | | | | | | | |
| Unified fee | | | 54,816 | | | | 25,247 | |
| Total Liabilities | | | 54,816 | | | | 25,247 | |
| Net Assets | | $ | 142,961,178 | | | $ | 42,366,719 | |
| | | | | | | | | |
| Net Assets consist of: | | | | | | | | |
| Paid-in capital | | | 89,633,841 | | | | 31,941,982 | |
| Accumulated earnings | | | 53,327,337 | | | | 10,424,737 | |
| Net Assets | | $ | 142,961,178 | | | $ | 42,366,719 | |
| | | | | | | | | |
| Net Assets | | $ | 142,961,178 | | | $ | 42,366,719 | |
| Shares of beneficial interest outstanding (unlimited number of shares authorized, no par value) | | | 5,425,000 | | | | 1,750,000 | |
| Net asset value (offering and redemption price per share) | | $ | 26.35 | | | $ | 24.21 | |
The accompanying notes are an integral part of these financial statements.
| EntrepreneurShares Series Trust |
| |
| STATEMENTS OF OPERATIONS |
| For the year ended June 30, 2021 |
| | | | | | ERShares | |
| | | ERShares | | | NextGen | |
| | | Entrepreneurs | | | Entrepreneurs | |
| | | ETF | | | ETF | |
| Investment Income | | | | | | | | |
| Dividend income (net of foreign taxes withheld of $303 and $59,034) | | $ | 109,974 | | | $ | 270,099 | |
| Interest income | | | 248 | | | | 53 | |
| Total investment income | | | 110,222 | | | | 270,152 | |
| | | | | | | | | |
| Expenses | | | | | | | | |
| Unified fees | | | 703,295 | | | | 284,254 | |
| Total expenses | | | 703,295 | | | | 284,254 | |
| Net investment loss | | | (593,073 | ) | | | (14,102 | ) |
| | | | | | | | | |
| Net Realized and Change in Unrealized Gain (Loss) on Investments | | | | | | | | |
| Net realized gain (loss) on: | | | | | | | | |
| Investments | | | 40,551,553 | | | | 7,487,383 | |
| In-kind redemptions | | | 4,189,348 | | | | 1,326,912 | |
| Foreign currency transactions | | | (14,645 | ) | | | (35,234 | ) |
| Net realized gain | | | 44,726,256 | | | | 8,779,061 | |
| | | | | | | | | |
| Change in unrealized appreciation (depreciation) on: | | | | | | | | |
| Investments | | | (5,872,516 | ) | | | 2,545,733 | |
| Foreign currency translations | | | — | | | | 1,792 | |
| Net change in unrealized appreciation (depreciation) | | | (5,872,516 | ) | | | 2,547,525 | |
| Net realized and change in unrealized gain on investments | | | 38,853,740 | | | | 11,326,586 | |
| Net increase in net assets resulting from operations | | $ | 38,260,667 | | | $ | 11,312,484 | |
The accompanying notes are an integral part of these financial statements.
| EntrepreneurShares Series Trust |
| |
| STATEMENTS OF CHANGES IN NET ASSETS |
| | | | | | ERShares NextGen | |
| | | ERShares Entrepreneurs ETF | | | Entrepreneurs ETF | |
| | | For the | | | For the | | | For the | | | For the | |
| | | Year Ended | | | Year Ended | | | Year Ended | | | Year Ended | |
| | | June 30, 2021 | | | June 30, 2020 | | | June 30, 2021 | | | June 30, 2020 | |
| Increase (Decrease) in Net Assets from: | | | | | | | | | | | | | | | | |
| Operations: | | | | | | | | | | | | | | | | |
| Net investment income (loss) | | $ | (593,073 | ) | | $ | (39,254 | ) | | $ | (14,102 | ) | | $ | 163,266 | |
| Net realized gain (loss) on investments, in-kind redemptions and foreign currency transactions | | | 44,726,256 | | | | 8,359,373 | | | | 8,779,061 | | | | (2,555,322 | ) |
| Net change in unrealized appreciation (depreciation) on investments and foreign currency translations | | | (5,872,516 | ) | | | 11,499,544 | | | | 2,547,525 | | | | 2,810,767 | |
| Net increase in net assets resulting from operations | | | 38,260,667 | | | | 19,819,663 | | | | 11,312,484 | | | | 418,711 | |
| | | | | | | | | | | | | | | | | |
| Distributions to Shareholders | | | | | | | | | | | | | | | | |
| From earnings | | | (9,414,439 | ) | | | (61,004 | ) | | | (183,374 | ) | | | (430,110 | ) |
| Change in net assets from distributions | | | (9,414,439 | ) | | | (61,004 | ) | | | (183,374 | ) | | | (430,110 | ) |
| | | | | | | | | | | | | | | | | |
| Capital Transactions | | | | | | | | | | | | | | | | |
| Proceeds from shares issued | | | 14,151,903 | | | | 22,269,438 | | | | 10,575,696 | | | | 4,215,173 | |
| Cost of shares redeemed | | | (16,378,069 | ) | | | (2,642,935 | ) | | | (6,264,482 | ) | | | — | |
| Net increase (decrease) in net assets resulting from capital transactions | | | (2,226,166 | ) | | | 19,626,503 | | | | 4,311,214 | | | | 4,215,173 | |
| Total Increase in Net Assets | | | 26,620,062 | | | | 39,385,162 | | | | 15,440,324 | | | | 4,203,774 | |
| | | | | | | | | | | | | | | | | |
| Net Assets | | | | | | | | | | | | | | | | |
| Beginning of year | | | 116,341,116 | | | | 76,955,954 | | | | 26,926,395 | | | | 22,722,621 | |
| End of year | | $ | 142,961,178 | | | $ | 116,341,116 | | | $ | 42,366,719 | | | $ | 26,926,395 | |
| | | | | | | | | | | | | | | | | |
| Share Transactions | | | | | | | | | | | | | | | | |
| Issued | | | 550,000 | | | | 1,250,000 | | | | 450,000 | | | | 250,000 | |
| Redeemed | | | (625,000 | ) | | | (150,000 | ) | | | (300,000 | ) | | | — | |
| Net increase (decrease) in shares outstanding | | | (75,000 | ) | | | 1,100,000 | | | | 150,000 | | | | 250,000 | |
The accompanying notes are an integral part of these financial statements.
| ERShares Entrepreneurs ETF Fund |
| |
| FINANCIAL HIGHLIGHTS |
| |
| (For a share outstanding during each period) |
| | | For the | | | For the | | | For the | | | For the | |
| | | Year Ended | | | Year Ended | | | Year Ended | | | Period Ended | |
| | | June 30, | | | June 30, | | | June 30, | | | June 30, | |
| | | 2021 | | | 2020 | | | 2019 | | | 2018(a) | |
| Selected Per Share Data: | | | | | | | | | | | | | | | | |
| Net asset value, beginning of period | | $ | 21.15 | | | $ | 17.49 | | | $ | 17.57 | | | $ | 15.00 | |
| Investment operations: | | | | | | | | | | | | | | | | |
| Net investment income (loss) | | | (0.11 | ) | | | (0.01 | ) | | | 0.02 | | | | 0.03 | |
| Net realized and unrealized gain | | | 6.96 | | | | 3.68 | | | | 0.42 | | | | 2.55 | |
| Total from investment operations | | | 6.85 | | | | 3.67 | | | | 0.44 | | | | 2.58 | |
| Less distributions to shareholders from: | | | | | | | | | | | | | | | | |
| Net investment income | | | — | | | | (0.01 | ) | | | (0.03 | ) | | | (0.01 | ) |
| Net realized gains | | | (1.65 | ) | | | — | | | | (0.49 | ) | | | — | |
| Total distributions | | | (1.65 | ) | | | (0.01 | ) | | | (0.52 | ) | | | (0.01 | ) |
| Net asset value, end of period | | $ | 26.35 | | | $ | 21.15 | | | $ | 17.49 | | | $ | 17.57 | |
| Total Return(b) | | | 32.01 | % | | | 21.03 | % | | | 3.14 | % | | | 17.43 | % (c) |
| Total Return at Market(d) | | | 32.06 | % | | | 21.06 | % | | | 2.78 | % | | | 17.76 | % (c) |
| Ratios and Supplemental Data: | | | | | | | | | | | | | | | | |
| Net assets, end of period (000 omitted) | | $ | 142,961 | | | $ | 116,341 | | | $ | 76,956 | | | $ | 73,814 | |
| Ratio of Net Expenses to Net Assets(e) | | | 0.49 | % | | | 0.49 | % | | | 0.49 | % | | | 0.49 | % (f) |
| Ratio of Net Investment Income (Loss) to Average Net Assets | | | (0.41 | )% | | | (0.05 | )% | | | 0.12 | % | | | 0.25 | % (f) |
| Portfolio turnover rate | | | 714 | % (g) | | | 130 | % (h) | | | 39 | % | | | 32 | % (c) |
| (a) | For the period November 7, 2017 (commencement of operations) to June 30, 2018. |
| (b) | Net asset value total return is calculated assuming an initial investment made at the net asset value at the beginning of the period, reinvestment of all dividends and distributions at net asset value during the period, if any, and redemption on the last day of the period at net asset value. This percentage is not an indication of the performance of a shareholder’s investment in the Fund based on market value due to differences between the market price of the shares and the net asset value per share of the Fund. |
| (d) | Market value total return is calculated assuming an initial investment made at the market value at the beginning of the period, reinvestment of all dividends and distributions at net asset value during the period, if any, and redemption on the last day of the period at market value. Market value is determined by the composite closing price. Composite closing security price is defined as the last reported sale price from any primary listing market (e.g., NYSE Arca) or participating regional exchanges or markets. The composite closing price is the last reported sale price from any of the eligible sources, regardless of volume and not an average price and may have occurred on a date prior to the close of the reporting period. Market value may be greater or less than net asset value, depending on the Fund’s closing price on the listing market. |
| (e) | The Fund operates under a “Unified Fee” structure under which the Advisor pays substantially all of the expenses for the Fund. The Fund pays the Advisor the Unified Fee, an amount based on its average net assets, computed daily and paid monthly. The Fund pays the Advisor 0.49% of its net assets. |
| (g) | The Fund has experienced an unusual interest rate environment combined with volatile markets resulting from inflationary concerns during the past fiscal year. These two factors posed potential adverse effects to the Fund. Thus, the portfolio manager engaged in temporary defensive positions as well as positioned the Fund to take the best advantage of the environment it was facing. These two actions, combined with a reversion of the defensive positions, resulted in an increased turnover for the Fund. |
| (h) | Given the abnormal market circumstances during the quarter ending June 30, 2020, as a result of the COVID-19 situation; the Fund had taken a temporary defensive approach. Implementing the temporary defensive measure resulted in the increase in portfolio turnover for the Fund. The Fund’s exposure to the Entrepreneur 30 Index had been reduced in line with the following guideline of the prospectus “Under normal circumstances, the Fund will invest at least 80% of its net assets, plus any borrowings for investment purposes, in securities of companies included in the Entrepreneur 30 Index.” |
The accompanying notes are an integral part of these financial statements.
| ERShares NextGen Entrepreneurs ETF Fund |
| |
| FINANCIAL HIGHLIGHTS |
| |
| (For a share outstanding during each period) |
| | | For the | | | For the | | | For the | |
| | | Year Ended | | | Year Ended | | | Period Ended | |
| | | June 30, | | | June 30, | | | June 30, | |
| | | 2021 | | | 2020 | | | 2019(a) | |
| Selected Per Share Data: | | | | | | | | | | | | |
| Net asset value, beginning of period | | $ | 16.83 | | | $ | 16.83 | | | $ | 15.00 | |
| Investment operations: | | | | | | | | | | | | |
| Net investment income (loss) | | | (0.01 | ) | | | 0.08 | | | | 0.14 | |
| Net realized and unrealized gain | | | 7.50 | | | | 0.19 | | | | 1.69 | (c) |
| Total from investment operations | | | 7.49 | | | | 0.27 | | | | 1.83 | |
| Less distributions to shareholders from: | | | | | | | | | | | | |
| Net investment income | | | (0.11 | ) | | | (0.27 | ) | | | — | |
| Net realized gains | | | — | | | | — | | | | — | |
| Total distributions | | | (0.11 | ) | | | (0.27 | ) | | | — | |
| Net asset value, end of period | | $ | 24.21 | | | $ | 16.83 | | | $ | 16.83 | |
| Total Return(b) | | | 44.58 | % | | | 1.55 | % | | | 12.22 | % (d) |
| Total Return at Market(e) | | | 45.28 | % | | | 0.96 | % | | | 12.57 | % (d) |
| Ratios and Supplemental Data: | | | | | | | | | | | | |
| Net assets, end of period (000 omitted) | | $ | 42,367 | | | $ | 26,926 | | | $ | 22,723 | |
| Ratio of Net Expenses to Net Assets(f) | | | 0.75 | % | | | 0.75 | % | | | 0.75 | % (g) |
| Ratio of Net Investment Income (Loss) to Average Net Assets | | | (0.04 | )% | | | 0.64 | % | | | 3.99 | % (g) |
| Portfolio turnover rate | | | 316 | % (h) | | | 139 | % | | | 138 | % (d) |
| (a) | For the period December 27, 2018 (commencement of operations) to June 30, 2019. |
| (b) | Net asset value total return is calculated assuming an initial investment made at the net asset value at the beginning of the period, reinvestment of all dividends and distributions at net asset value during the period, if any, and redemption on the last day of the period at net asset value. This percentage is not an indication of the performance of a shareholder’s investment in the Fund based on market value due to differences between the market price of the shares and the net asset value per share of the Fund. |
| (c) | The amount shown for a share outstanding throughout the period does not accord with the change in aggregate gains and losses in the portfolio of securities during the period because of the timing of purchases and sales of Fund shares in relation to fluctuating market values during the period. |
| (e) | Market value total return is calculated assuming an initial investment made at the market value at the beginning of the period, reinvestment of all dividends and distributions at net asset value during the period, if any, and redemption on the last day of the period at market value. Market value is determined by the composite closing price. Composite closing security price is defined as the last reported sale price from any primary listing market (e.g., NYSE Arca) or participating regional exchanges or markets. The composite closing price is the last reported sale price from any of the eligible sources, regardless of volume and not an average price and may have occurred on a date prior to the close of the reporting period. Market value may be greater or less than net asset value, depending on the Fund’s closing price on the listing market. |
| (f) | The Fund operates under a “Unified Fee” structure under which the Advisor pays substantially all of the expenses for the Fund. The Fund pays the Advisor the Unified Fee, an amount based on its average net assets, computed daily and paid monthly. The Fund pays the Advisor 0.75% of its net assets. |
| (h) | The Fund has experienced an unusual interest rate environment combined with volatile markets resulting from inflationary concerns during the past fiscal year. These two factors posed potential adverse effects to the Fund. Thus, the portfolio manager engaged in temporary defensive positions as well as positioned the Fund to take the best advantage of the environment it was facing. These two actions, combined with a reversion of the defensive positions, resulted in an increased turnover for the Fund. |
The accompanying notes are an integral part of these financial statements.
| EntrepreneurShares Series Trust |
| |
| NOTES TO FINANCIAL STATEMENTS |
| June 30, 2021 |
EntrepreneurShares Series Trust™ (the “Trust”) was organized on July 1, 2010 as a Delaware statutory trust. The Trust is registered under the Investment Company Act of 1940 (the “1940 Act”) as an open-end management investment company and thus is determined to be an investment company for accounting purposes. The Trust is comprised of five funds and is authorized to issue an unlimited number of shares of beneficial interest for each fund (“Shares”). The accompanying financial statements are those of the ERShares Entrepreneurs ETF (previously known as ERShares Entrepreneur 30 ETF) and the ERShares NextGen Entrepreneurs ETF (previously known as ERShares Non-US Small Cap ETF) (individually referred to as a “Fund” or collectively as the “Funds”). The Funds are exchange-traded funds. The investment objective of the Funds is to seek long-term capital appreciation. Prior to March 23, 2021, the Funds’ investment objectives were to seek investment results that corresponded (before fees and expenses) generally to the performance of their underlying indices, the Entrepreneur 30 Index and the Entrepreneur Non-US Small Cap Index, respectively. The Funds’ prospectus provides a description of each Fund’s investment objectives, policies, and strategies. The Funds are non-diversified and therefore may invest a greater percentage of their assets in fewer issuers than a diversified Fund. The assets of the Funds are segregated and a shareholder’s interest is limited to the Fund in which shares are held.
Shares of the Funds are listed and traded on the NYSE Arca, Inc. Market prices for the Shares may be different from their NAV. Each Fund issues and redeems Shares on a continuous basis at NAV only in large blocks of Shares, of at least 25,000 Shares for the Entrepreneurs ETF and 10,000 Shares for the NextGen ETF, (“Creation Units”). Creation Units are issued and redeemed principally in-kind for securities included in a specified universe. Once created, Shares generally trade in the secondary market at market prices that change throughout the day in amounts less than a Creation Unit.
Under the Trust’s organizational documents, its officers and Board of Trustees (the “Board”) are indemnified against certain liabilities arising out of the performance of their duties to the Funds. In addition, in the normal course of business, the Trust may enter into contracts with vendors and others that provide for general indemnifications. The Trust’s maximum exposure under these arrangements is unknown, as this would involve future claims that may be made against the Trust. However, based on experience, the Trust expects that risk of loss to be remote.
| (2) | Significant Accounting Policies |
The following is a summary of significant accounting policies consistently followed by each Fund in the preparation of its financial statements. These policies are in conformity with generally accepted accounting principles in the United States of America (“U.S. GAAP”). Each Fund is an investment company and accordingly follows the investment company accounting and reporting guidance of the Financial Accounting Standards Board (“FASB”) Accounting Standard Codification Topic 946 Financial Services – Investment Companies including Accounting Standards Update (“ASU”) 2013-08. The preparation of financial statements in conformity with U.S. GAAP requires management to make estimates and assumptions that affect the amounts of assets, liabilities and disclosure of contingent assets and liabilities at the date of the financial statements and the reported amounts of income and expenses for the period. Actual results could differ from those estimates.
A. Investment Valuations
The Funds hold their investments at fair value. Fair value is defined as the price that would be expected to be received to sell an asset or paid to transfer a liability in an orderly transaction between market participants at the measurement date. The valuation techniques used to determine fair value are further described below.
| EntrepreneurShares Series Trust |
| |
| NOTES TO FINANCIAL STATEMENTS (Continued) |
| June 30, 2021 |
Security values are ordinarily obtained through the use of independent pricing services in accordance with procedures adopted by the Board. Pursuant to these procedures, the Funds may use a pricing service, bank, or broker-dealer experienced in such matters to value the Funds’ securities. When reliable market quotations are not readily available for any security, the fair value of that security will be determined by a committee established by the Board in accordance with procedures adopted by the Board. The fair valuation process is designed to value the subject security at the price the Funds would reasonably expect to receive upon its current sale. Additional consideration is given to securities that have experienced a decrease in the volume or level of activity or to circumstances that indicate that a transaction is not orderly.
Equity securities traded on a securities exchange are valued at the last reported sales price on the principal exchange. Equity securities quoted by NASDAQ are valued at the NASDAQ official closing price. If there is no reported sale on the principal exchange, and in the case of over-the-counter securities, equity securities are valued at a bid price estimated by the security pricing service. In each of these situations, securities are typically categorized as Level 1 and Level 2, respectively in the fair value hierarchy.
In accordance with procedures adopted by the Board, fair value pricing may be used if events materially affecting the value of foreign securities occur between the time the exchange on which they are traded closes and the time the Funds’ net asset values are calculated. The Funds use fair value adjustment factors provided daily by an independent pricing vendor to value certain foreign equity securities in order to adjust for events that may occur between the close of foreign exchanges or markets and the close of the NYSE Arca. These securities are considered as Level 2 in the fair value hierarchy.
Most securities listed on a foreign exchange are valued at the last sale price at the close of the exchange on which the security is primarily traded. In certain countries, market maker prices are used since they are the most representative of the daily trading activity. In the case of certain foreign exchanges, the closing price reported by the exchange (which may sometimes be referred to by the exchange or one or more pricing agents as the “official close” or the “official closing price” or other similar term) will be considered the most recent sale price. Securities not traded on a particular day are valued at the mean between the last reported bid and asked quotes or the last sale price where appropriate; otherwise, fair value will be determined in accordance with fair value procedures approved by the Board.
The accounting records of the Funds are maintained in U.S. dollars. Foreign currency amounts are translated into U.S. dollars at the current rate of exchange to determine the value of investments, assets and liabilities at the close of each business day. Purchases and sales of securities, and income and expenses are translated at the prevailing rate of exchange on the respective dates of such transactions. The Funds do not isolate the portion of the results of operations resulting from changes in foreign exchange rates on investments from fluctuations arising from changes in market prices of securities held. Such fluctuations are included with the net realized and unrealized gain or loss from investments.
The Funds may invest in American Depositary Receipts as well as other “hybrid” forms of depositary receipts, including Global Depositary Receipts. These depositary receipts are certificates evidencing ownership of shares of a foreign issuer, and serve as an alternative to directly purchasing the underlying foreign securities in their national markets and currencies. These certificates are issued by depository banks and generally trade on an established market in the United States or elsewhere. The underlying shares are held in trust by a custodian bank or similar financial institution in the issuer’s home country. Redeemable securities issued by open-end investment companies are valued at the last calculated net asset value, with the exception of securities issued by exchange-traded open-end investment companies, which are priced as equity securities as described above.
Income received by the Funds from sources within foreign countries may be subject to withholding and other income or similar taxes imposed by such countries, a portion of which may be reclaimable. The Funds may be subject to foreign taxes on capital gains on the sale of securities or foreign currency transactions. The Funds accrue foreign capital gains
| EntrepreneurShares Series Trust |
| |
| NOTES TO FINANCIAL STATEMENTS (Continued) |
| June 30, 2021 |
taxes, as applicable, based on their current interpretation of tax rules in the foreign markets in which they invest. Such tax accrual is based in part on actual and estimated realized gains. Estimated realized gains are subject to change and such change could be material. However, management’s conclusions may be subject to future review and change based on changes in, or the interpretation of, the accounting standards or tax laws and regulations.
The Trust has a three-tier fair value hierarchy that is dependent upon the various “inputs” used to determine the value of the Funds’ investments. The valuation techniques described below maximize the use of observable inputs and minimize the use of unobservable inputs in determining fair value. These inputs are summarized in the three broad levels listed below:
| | Level 1 – | Quoted prices in active markets for identical assets. |
| | |
| | Level 2 – | Other observable pricing inputs at the measurement date (including quoted prices for similar securities, interest rates, prepayment speeds, credit risk, etc.). |
| | |
| | Level 3 – | Significant unobservable pricing inputs at the measurement date (including the Fund’s own assumptions in determining the fair value of investments). |
The inputs or methodology used for valuing investments are not necessarily an indication of the risk associated with investing in those investments.
The following table provides the fair value measurement as of June 30, 2021, while the breakdown, by category, of common stocks is disclosed in the Schedule of Investments for each Fund.
| ERShares Entrepreneurs ETF | | Level 1 | | | Level 2 | | | Level 3 | | | Total | |
| Common Stocks* | | $ | 139,139,394 | | | $ | — | | | $ | — | | | $ | 139,139,394 | |
| Total Investments | | $ | 139,139,394 | | | $ | — | | | $ | — | | | $ | 139,139,394 | |
| | | | | | | | | | | | | | | | | |
| ERShares NextGen Entrepreneurs ETF | | | | | | | | | | | | |
| Common Stocks* | | $ | 22,021,133 | | | $ | 18,747,875 | | | $ | — | | | $ | 40,769,008 | |
| Total Investments | | $ | 22,021,133 | | | $ | 18,747,875 | | | $ | — | | | $ | 40,769,008 | |
| * | For further information regarding security characteristic, please see the Schedules of Investments. |
The Funds did not hold any investments at the end of the reporting year for which significant unobservable inputs (Level 3) were used in determining fair value; therefore, no reconciliation of Level 3 securities is included for this reporting period.
B. Security Transactions and Related Income
Investment transactions are accounted for no later than the first calculation of the NAV on the business day following the trade date. For financial reporting purposes, however, security transactions are accounted for on the trade date on the last business day of the reporting period. Securities gains and losses are calculated on the identified cost basis. Interest income and expenses are accrued daily. Dividends, less foreign tax withholding, are recorded on the ex-dividend date. Investment income from non-U.S. sources received by a Fund is generally subject to non-U.S. withholding taxes at rates ranging up to 30%. Such withholding taxes may be reduced or eliminated under the terms of applicable U.S. income tax treaties. The Funds may be subject to foreign taxes on gains in investments or currency repatriation. The Funds accrue such taxes, as applicable, based on their current interpretation of tax rules in the foreign markets in which they invest.
| EntrepreneurShares Series Trust |
| |
| NOTES TO FINANCIAL STATEMENTS (Continued) |
| June 30, 2021 |
C. Cash
Idle cash may be swept into various overnight demand deposits and is classified as cash or foreign currency on the Statements of Assets and Liabilities. The Funds maintain cash in bank deposit accounts which, at times, may exceed United States federally insured limits. Amounts swept overnight are available on the next business day.
D. Dividends and Distributions to Shareholders
The Funds intend to distribute to their shareholders net investment income and net realized long or short-term capital gains, if any, at least annually. Distributions are recorded on the ex-dividend date. The amount of dividends from net investment income and net realized gains is determined in accordance with federal income tax regulations, which may differ from U.S. GAAP. These “book/tax” differences are considered either temporary or permanent in nature. To the extent these differences are permanent in nature (e.g., distributions and income received from pass-through investments), such amounts are reclassified within the capital accounts based on their nature for federal income tax purposes; temporary differences do not require reclassification. Temporary differences are primarily due to return of capital from investments.
E. Allocation of Expenses
Expenses directly attributable to a Fund are charged to that Fund. Expenses not directly attributable to a Fund are allocated proportionally among all Funds within the Trust in relation to the net assets of each Fund or on another reasonable basis.
| (3) | Investment Advisory and Other Contractual Services |
A. Investment Advisory Fees
Capital Impact Advisors, LLC (the “Advisor”) a related party, serves as the Funds’ investment advisor pursuant to an Investment Advisory Agreement. Subject at all times to the supervision and approval of the Board, the Advisor is responsible for the overall management of the Trust. The Advisor has arranged for distribution, custody, fund administration, transfer agency and all other services necessary for the Funds to operate. The Advisor receives a fee for its services, a “Unified Fee”. The ERShares Entrepreneurs ETF pays 0.49% of the Fund’s average daily net assets, computed daily and paid monthly. The ERShares NextGen Entrepreneurs ETF pays 0.75% of the Fund’s average daily net assets, computed daily and paid monthly. Out of the Unified Fee, the Advisor is obligated to pay or arrange for the payment of substantially all expenses of the Funds, including the cost of transfer agency, custody, fund administration, legal, audit, independent trustees and other services, except for interest expenses, distribution fees or expenses, brokerage expenses, acquired fund fees and expenses, taxes and extraordinary expenses such as litigation and other expenses not incurred in the ordinary course of the Funds’ business. The Advisor’s Unified Fee is designed to cause substantially all of the Funds’ expenses to be paid and to compensate the Advisor for providing services for the Funds.
At June 30, 2021, certain officers of the Trust are officers, directors and/or trustees of the Advisor. Certain officers of the Trust were also employees of the Advisor. These officers were not compensated directly by the Funds.
Each non-interested Trustee of the Trust receives compensation of $3,500 for attending each Board meeting, including special meetings, as well as an additional $1,000 for each audit commit meeting. Prior to December 2020, those amounts were $2,500 and $500, respectively. The Funds also reimburse the non-interested Trustees for their reasonable travel expenses incurred in attending meetings of the Board. Trustee fees are allocated to the five funds in the Trust based on each fund’s relative net assets. Trustee fees for the Funds are paid by the Advisor out of the Unified Fee with respect to ERShares Entrepreneurs ETF and ERShares NextGen Entrepreneurs ETF.
| EntrepreneurShares Series Trust |
| |
| NOTES TO FINANCIAL STATEMENTS (Continued) |
| June 30, 2021 |
| (4) | Investment Transactions |
Purchases and sales of investments, excluding in-kind transactions and short-term investments, for the year ended June 30, 2021 were as follows:
| | | | | | ERShares | |
| | | ERShares | | | NextGen | |
| | | Entrepreneurs | | | Entrepreneurs | |
| | | ETF | | | ETF | |
| Purchases: | | $ | 972,033,511 | | | $ | 113,470,371 | |
| Sales: | | $ | 978,660,335 | | | $ | 114,239,434 | |
Purchases and sales of in-kind transactions for the year ended June 31, 2021 were as follows:
| | | | | | ERShares | |
| | | ERShares | | | NextGen | |
| | | Entrepreneurs | | | Entrepreneurs | |
| | | ETF | | | ETF | |
| Purchases: | | $ | 13,672,760 | | | $ | 10,118,348 | |
| Sales: | | $ | 16,201,645 | | | $ | 5,974,607 | |
| (5) | Capital Share Transactions |
Shares are issued and redeemed by each Fund only in aggregations of a specified number of shares or multiples thereof at net asset value. Except when aggregated in Creation Units, shares of each Fund are not redeemable. Transactions in shares for each Fund are disclosed in detail on the Statements of Changes in Net Assets.
The consideration for the purchase of Creation Units of a Fund generally consists of the in-kind deposit of a designated basket of securities, which constitutes an optimized representation of the securities of that Fund’s specified universe, and an amount of cash. Investors purchasing and redeeming Creation Units may be charged a transaction fee to cover the transfer and other transactional costs the Funds incur to issue or redeem Creation Units. The standard transaction fee charge is $250.
From time to time, settlement of securities related to subscriptions-in-kind or redemptions-in-kind may be delayed. In such cases, securities related to in-kind contributions are reflected as “Due from custodian” and securities related to in-kind redemptions are reflected as “Securities payable related to in-kind transactions” on the Statements of Assets and Liabilities.
During the year ended June 30, 2021, the Funds received securities in exchange for subscriptions of capital shares (subscriptions-in-kind) as follows:
| | | | | | ERShares | |
| | | ERShares | | | NextGen | |
| | | Entrepreneurs | | | Entrepreneurs | |
| | | ETF | | | ETF | |
| Shares | | $ | 91,556 | | | $ | 1,770,804 | |
| Fair Value | | $ | 13,672,760 | | | $ | 10,118,348 | |
| EntrepreneurShares Series Trust |
| |
| NOTES TO FINANCIAL STATEMENTS (Continued) |
| June 30, 2021 |
It is the policy of each Fund to qualify as a regulated investment company by complying with the provisions available to certain investment companies, as defined in applicable sections of the Internal Revenue Code of 1986, as amended, and to make distributions of net investment income and net realized capital gains sufficient to relieve it from all, or substantially all, federal income taxes.
The Trust has evaluated tax positions taken or expected to be taken in the course of preparing each Fund’s tax returns to determine whether it is more-likely-than not (i.e., greater than 50-percent chance) that each tax position will be sustained upon examination by a taxing authority based on the technical merits of the position. A tax position that meets the more-likely-than-not recognition threshold is measured to determine the amount of benefit to recognize in the financial statements. Differences between tax positions taken in a tax return and amounts recognized in the financial statements will generally result in an increase in a liability for taxes payable (or a reduction of a tax refund receivable), including the recognition of any related interest and penalties as an operating expense. Tax positions taken in tax years remain subject to examination by tax authorities (generally three years plus the interim tax period since then for federal income tax purposes). The determination has been made that there are not any uncertain tax positions that would require the Funds to record a tax liability and, therefore, there is no impact to the Funds’ financial statements.
As of June 30, 2021, the tax cost of securities and the breakdown of unrealized appreciation (depreciation) for each Fund were as follows:
| | | ERShares | | | ERShares | |
| | | Entrepreneurs | | | Entrepreneurs | |
| | | ETF | | | NextGen ETF | |
| Gross unrealized appreciation | | $ | 11,414,020 | | | $ | 4,620,202 | |
| Gross unrealized depreciation | | | (402,714 | ) | | | (1,293,403 | ) |
| Net unrealized appreciation on investments | | | 11,011,306 | | | | 3,326,799 | |
| Tax cost of investments | | | 128,128,088 | | | | 37,442,209 | |
The differences between book-basis and tax-basis unrealized appreciation/(depreciation) are attributable primarily to: tax deferral of losses on wash sales.
The tax character of distributions paid during the fiscal years ended June 30, 2021 and June 30, 2020 were as follows:
| | | ERShares | | | ERShares Entrepreneurs | |
| | | Entrepreneurs ETF | | | NextGen ETF | |
| | | 2021 | | | 2020 | | | 2021 | | | 2020 | |
| Distributions paid from: | | | | | | | | | | | | | | | | |
| Ordinary income (a) | | $ | 4,217,048 | | | $ | — | | | $ | 183,374 | | | $ | 430,110 | |
| Long-term capital gains | | | 5,197,391 | | | | 61,004 | | | | — | | | | — | |
| Total distributions paid | | $ | 9,414,439 | | | $ | 61,004 | | | $ | 183,374 | | | $ | 430,110 | |
| * | For federal income tax purposes, distribution of short-term capital gains are treated as ordinary income distributions. |
| EntrepreneurShares Series Trust |
| |
| NOTES TO FINANCIAL STATEMENTS (Continued) |
| June 30, 2021 |
As of June 30, 2021, the components of accumulated earnings/(deficit) on a tax basis were as follows:
| | | ERShares | | | ERShares | |
| | | Entrepreneurs | | | Entrepreneurs | |
| | | ETF | | | NextGen ETF | |
| Undistributed ordinary income | | $ | 19,781,750 | | | $ | 3,813,824 | |
| Undistributed long-term capital gains | | | 22,534,281 | | | | 3,278,831 | |
| Unrealized appreciation on investments | | | 11,011,306 | | | | 3,332,082 | |
| Total accumulated earnings | | $ | 53,327,337 | | | $ | 10,424,737 | |
Permanent Tax Differences
As of June 30, 2021, the following reclassifications relating primarily to redemptions in kind, net operating losses, distribution reclasses, and Passive Foreign Investment Companies have been made to increase (decrease) such accounts with offsetting adjustments as indicated:
| | | ERShares | | | ERShares | |
| | | Entrepreneurs | | | Entrepreneurs | |
| | | ETF | | | NextGen ETF | |
| Paid-in Capital | | $ | 3,768,703 | | | $ | 1,106,064 | |
| Accumulated Earnings | | | (3,768,703 | ) | | | (1,106,064 | ) |
ETF Risk
The NAV of a Fund can fluctuate up or down, and you could lose money investing in a Fund if the prices of the securities owned by the Fund decline. In addition, a Fund may be subject to the following risks: (1) the market price of a Fund’s shares may trade above or below its NAV; (2) an active trading market for a Fund’s shares may not develop or be maintained; or (3) trading of a Fund’s shares may be halted if the listing exchange’s officials deem such action appropriate, the shares are delisted from the exchange, or the activation of market-wide “circuit breakers” (which are tied to large decreases in stock prices) halts stock trading generally.
Sector Risk
If a Fund has significant investments in the securities of issuers within a particular sector, any development affecting that sector will have a greater impact on the value of the net assets of the Fund than would be the case if the Fund did not have significant investments in that sector. In addition, this may increase the risk of loss in the Fund and increase the volatility of the Fund’s NAV per share. For instance, economic or market factors, regulatory changes or other developments may negatively impact all companies in a particular sector, and therefore the value of the Fund’s portfolio will be adversely affected. As of June 30, 2021, the ERShares Entrepreneurs ETF had 29.37% and 37.97% of the value of its net assets invested in stocks within the Communications and Technology sectors, respectively. The ERShares NextGen Entrepreneurs ETF had 34.17% of its net assets invested in stocks within the Communications sector.
| EntrepreneurShares Series Trust |
| |
| NOTES TO FINANCIAL STATEMENTS (Continued) |
| June 30, 2021 |
Market and Geopolitical Risk
The increasing interconnectivity between global economies and financial markets increases the likelihood that events or conditions in one region or financial market may adversely impact issuers in a different country, region or financial market. Securities in the Funds’ portfolio may underperform due to inflation (or expectations for inflation), interest rates, global demand for particular products or resources, natural disasters, pandemics, epidemics, terrorism, regulatory events and governmental or quasi-governmental actions. The occurrence of global events similar to those in recent years, such as terrorist attacks around the world, natural disasters, social and political discord or debt crises and downgrades, among others, may result in market volatility and may have long term effects on both the U.S. and global financial markets. It is difficult to predict when similar events affecting the U.S. or global financial markets may occur, the effects that such events may have and the duration of those effects. Any such event(s) could have a significant adverse impact on the value and risk profile of the Funds’ portfolio. The current novel coronavirus (COVID-19) global pandemic and the aggressive responses taken by many governments, including closing borders, restricting international and domestic travel, and the imposition of prolonged quarantines or similar restrictions, as well as the forced or voluntary closure of, or operational changes to, many retail and other businesses, has had negative impacts, and in many cases severe negative impacts, on markets worldwide. It is not known how long such impacts, or any future impacts of other significant events described above, will or would last, but there could be a prolonged period of global economic slowdown, which may impact your Fund investment. Therefore, the Funds could lose money over short periods due to short-term market movements and over longer periods during more prolonged market downturns. During a general market downturn, multiple asset classes may be negatively affected. Changes in market conditions and interest rates can have the same impact on all types of securities and instruments. In times of severe market disruptions, you could lose your entire investment.
Foreign Securities Risk
Foreign securities, foreign currencies, and securities issued by U.S. entities with substantial foreign operations can involve additional risks relating to political, economic, or regulatory conditions in foreign countries. These risks include fluctuations in foreign currencies; imposition of additional taxes; trading, settlement, custodial and other operational risks; and risk arising from the less stringent investor protection and disclosure standards of some foreign markets. All of these factors can make foreign investments more volatile and potentially less liquid than U.S. investments. In addition, foreign markets can perform differently from the U.S. market.
| (8) | Coronavirus (COVID-19) Pandemic |
In early 2020, an outbreak of a novel strain of coronavirus (COVID-19) emerged globally. This coronavirus has resulted in closing international borders, enhanced health screenings, healthcare service preparation and delivery, quarantines, cancellations, disruptions to supply chains and customer activity, as well as general public concern and uncertainty. The impact of this outbreak has negatively affected the worldwide economy, as well as the economies of individual countries, the financial health of individual companies and the market in general in significant and unforeseen ways. The future impact of COVID-19 is currently unknown, and it may exacerbate other risks that apply to the Funds, including political, social and economic risks. Any such impact could adversely affect the Funds’ performance, the performance of the securities in which the Funds invest and may lead to losses on your investment in the Funds. The ultimate impact of COVID-19 on the financial performance of the Funds’ investments is not reasonably estimable at this time.
| EntrepreneurShares Series Trust |
| |
| NOTES TO FINANCIAL STATEMENTS (Continued) |
| June 30, 2021 |
Management has evaluated the Funds’ related events and transactions that occurred through the date of issuance of the Funds’ financial statements. There were no events or transactions that occurred during this period that materially impacted the amounts or disclosures in the Funds’ financial statements.
| EntrepreneurShares Series Trust |
| |
| REPORT OF INDEPENDENT REGISTERED PUBLIC ACCOUNTING FIRM |
To the Board of Trustees of EntrepreneurShares Series Trust
and the Shareholders of ERShares Entrepreneurs ETF
and ERShares NextGen Entrepreneurs ETF
Opinion on the Financial Statements
We have audited the accompanying statements of assets and liabilities of ERShares Entrepreneurs ETF (formerly, ERShares Entrepreneur 30 ETF) and ERShares NextGen Entrepreneurs ETF (formerly, ERShares Non-US Small Cap ETF), each a series of shares of beneficial interest in EntrepreneurShares Series Trust (the “Funds”), including the schedules of investments, as of June 30, 2021, and the related statements of operations for the year then ended, and the statements of changes in net assets and financial highlights for each of the years in the two-year period then ended, and the related notes (collectively referred to as the “financial statements”). In our opinion, the financial statements present fairly, in all material respects, the financial position of the Funds as of June 30, 2021, and the results of their operations for the year then ended, and the changes in their net assets and their financial highlights for each of the years in the two-year period then ended, in conformity with accounting principles generally accepted in the United States of America. The financial highlights noted in the table below, were audited by other auditors, whose report dated August 29, 2019, expressed an unqualified opinion on such financial statements and financial highlights.
| Fund | Financial Highlights Presented |
| ERShares Entrepreneurs ETF | For the year ended June 30, 2019 and the period from November 7, 2017 (commencement of operations) to June 30, 2018 |
| ERShares NextGen Entrepreneurs ETF | For the period from December 27, 2018 (commencement of operations) to June 30, 2019 |
Basis for Opinion
These financial statements are the responsibility of the Funds’ management. Our responsibility is to express an opinion on the Funds’ financial statements based on our audits. We are a public accounting firm registered with the Public Company Accounting Oversight Board (United States) (“PCAOB”) and are required to be independent with respect to the Funds in accordance with the U.S. federal securities law and the applicable rules and regulations of the Securities and Exchange Commission and the PCAOB.
We conducted our audits in accordance with the standards of the PCAOB. Those standards require that we plan and perform the audits to obtain reasonable assurance about whether the financial statements are free of material misstatement, whether due to error or fraud. The Funds are not required to have, nor were we engaged to perform, an audit of their internal control over financial reporting. As part of our audits we are required to obtain an understanding of internal control over financial reporting but not for the purpose of expressing an opinion on the effectiveness of the Funds’ internal control over financial reporting. Accordingly, we express no such opinion.
| EntrepreneurShares Series Trust |
| |
| REPORT OF INDEPENDENT REGISTERED PUBLIC ACCOUNTING FIRM |
Our audits included performing procedures to assess the risk of material misstatement of the financial statements, whether due to error or fraud, and performing procedures that respond to those risks. Such procedures included examining, on a test basis, evidence regarding the amounts and disclosures in the financial statements. Our procedures included confirmation of securities owned as of June 30, 2021 by correspondence with the custodian, brokers, or by other appropriate auditing procedures where replies from brokers were not received. Our audits also included evaluating the accounting principles used and significant estimates made by management, as well as evaluating the overall presentation of the financial statements. We believe that our audits provide a reasonable basis for our opinion.
BBD, LLP
We have served as the auditor of one or more of the Funds in the EntrepreneurShares Series Trust since 2020.
Philadelphia, Pennsylvania
August 27, 2021
| EntrepreneurShares Series Trust |
| |
| EXPENSE EXAMPLE |
| June 30, 2021 (Unaudited) |
As a Fund shareholder, you may incur two types of costs: (1) transaction costs, including commissions on trading, as applicable; and (2) ongoing costs, including advisory fees and other Fund expenses. These examples are intended to help you understand your ongoing costs (in dollars) of investing in a Fund and to compare these costs with the ongoing costs of investing in other funds.
The expense examples below are based on an investment of $1,000 invested on January 1, 2021 and held through the period ended June 30, 2021. Investors may pay brokerage commissions on their purchases and sales of exchange traded fund shares, which are not reflected in the example.
The Actual Expense figures in the table below provide information about actual account values and actual expenses.
You may use this information, together with the amount you invested, to estimate the expenses that you paid over the period. Simply divide your account value by $1,000 (for example, an $8,600 account value divided by $1,000 = 8.6), then multiply the result by the number in the table under the heading entitled “Expense Paid During Period” to estimate the expenses you paid on your account during this period.
The Hypothetical Expense figures in the table below provide information about hypothetical account values and hypothetical expenses based on each Fund’s actual expense ratio and an assumed rate of return of 5% per year before expenses, which is not each Fund’s actual return. The hypothetical account values and expenses may not be used to estimate the actual ending account balance or expenses you paid for the period. You may use this information to compare the ongoing costs of investing in your Fund and other funds. To do so, compare this 5% hypothetical example with the 5% hypothetical examples that appear in the shareholder reports of the other funds.
Please note that the expenses shown in the table are meant to highlight your ongoing costs only and do not reflect any transactional costs. Further, the expenses do not include any brokerage commissions on investors’ purchases or redemptions of Fund shares as described in the applicable Fund’s prospectus. Therefore, the examples are useful in comparing ongoing costs only and will not help you determine the relative total cost of owning different funds. In addition, if these transactional costs were included, your costs would have been higher.
| | | | | Beginning | | Ending | | Expenses | | Annualized |
| | | | | Account Value | | Account Value | | Paid During | | Expense |
| | | | | January 1, 2021 | | June 30, 2021 | | Period(a) | | Ratio |
| ERShares | | | | | | | | | | |
| Entrepreneurs ETF | | Actual | | $1,000.00 | | $1,005.30 | | $2.44 | | 0.49% |
| | | Hypothetical(b) | | $1,000.00 | | $1,022.36 | | $2.46 | | 0.49% |
| ERShares NextGen | | | | | | | | | | |
| Entrepreneurs ETF | | Actual | | $1,000.00 | | $1,042.20 | | $3.80 | | 0.75% |
| | | Hypothetical(b) | | $1,000.00 | | $1,021.08 | | $3.76 | | 0.75% |
| (a) | Expenses are equal to the average account value over the period multiplied by the Fund’s annualized expense ratio, multiplied by 181/365 (to reflect the one-half year period). |
| (b) | Represents the hypothetical 5% annual return before taxes. |
| EntrepreneurShares Series Trust |
| |
| ADDITIONAL INFORMATION |
| June 30, 2021 (Unaudited) |
| 1. | ADDITIONAL DISCLOSURE REGARDING FUND TRUSTEES AND OFFICERS |
As a Delaware statutory trust, the business and affairs of the Trust are managed by its officers under the direction of its Board of Trustees. The Global Fund, the US Small Cap Fund, the US Large Cap Fund, the ERShares Entrepreneurs ETF and the ERShares NextGen Entrepreneurs ETF are the only funds in the “Fund Complex” as defined in the 1940 Act. The name, birth year and principal occupations during the past five years, and other information with respect to each of the Trustees and officers of the Trust is set forth below. Unless otherwise noted, each Trustee and officer has served in the indicated positions and directorships for at least the last five years. The address of each Trustee and officer is c/o the Trust at 175 Federal Street, Suite #875, Boston, MA 02110.
| Name (Birth Year) | | Position(s)
Held
with Trust | | Term of
Office(1)
and
Length of
Time Served | | Principal Occupation(s)
During Past 5 Years | | # of Portfolios
in Fund
Complex
Overseen by
Trustee | | Other
Directorships
Held by
Trustee During
Past 5 Years |
| Non-Interested Trustees |
Charles Aggouras
(1967) | | Trustee | | Since 2018 | | Real estate investment and development. | | 5 | | None |
George R. Berbeco
(1944) | | Trustee | | Since 2010 | | Private Investor; Former President – Devon Group and General Partner – Devon Capital Partners, LP. (commodity trading) (2005 to 2009). | | 5 | | Director – Bay Colony Development Corporation. |
| Interested Trustees |
Joel M. Shulman, CFA(2)
(1955) | | President and Trustee | | Since 2010 | | Member and principal of EntrepreneurShares, LLC and Seaport Global Advisors, LLC since 2010; Member and founding partner of Capital Impact Advisors, LLC since 2013; Tenured professor at Babson College. | | 5 | | None |
| Officers |
Mihai Prisacariu
(1994) | | Chief Compliance Officer | | Since 2019 | | Began involvement with EntrepreneurShares in 2017. Pursued academic studies prior to 2017. | | N/A | | None |
Eva Adosoglou
(1989) | | Chief Operations Officer | | Since 2019 | | Chief Operating Officer EntrepreneurShares Series Trust since 2019; Innovative Manager – Wirecard from 2018-2019; Portfolio Manager – Cox Automative, Inc. from 2016-2018; Financial Analyst – PWC from 2013-2016. | | N/A | | None |
| (1) | Each Trustee serves an indefinite term until the election of a successor. Each officer serves an indefinite term, renewed annually, until the election of a successor. |
| (2) | Dr. Shulman is considered an interested Trustee within the meaning of the 1940 Act because of his affiliation with the Advisors and Sub-Advisor. |
The Statement of Additional Information includes additional information about the Funds’ Trustees and is available free of charge, upon request by calling the Funds toll free at 1-877-271-8811 or by visiting the SEC’s website (http://www.sec.gov).
| EntrepreneurShares Series Trust |
| |
| ADDITIONAL INFORMATION (Continued) |
| June 30, 2021 (Unaudited) |
| 2. | ADDITIONAL TAX INFORMATION |
Long Term Capital Gains Designation
For the year ended June 30, 2021, the Entrepreneur ETF hereby designates $5,197,391, as 20% rate gain distributions for purposes of the dividends paid deduction.
Qualified Dividend Income
For the year ended June 30, 2021, 0.32% and 0.00% of the dividends paid from net investment income, including short-term capital gains (if any), is designated as qualified dividend income for the Entrepreneur ETF and Entrepreneur NextGen ETF, respectively.
Corporate Dividends Received Deduction
For the year ended June 30, 2021, 0.32% and 0.00% of the dividends paid from net investment income, including short-term capital gains (if any), qualifies for the dividends received deduction available to corporate shareholders for the Entrepreneur ETF and Entrepreneur NextGen ETF, respectively.
| 3. | AVAILABILITY OF QUARTERLY PORTFOLIO HOLDINGS SCHEDULES |
The Funds file complete schedules of portfolio holdings with the SEC for the first and third quarters of each fiscal year on Form N-PORT (or any predecessor form). These filings are available on the SEC’s website at www.sec.gov. In addition, the Funds’ Form N-PORT is available without charge, upon request, by calling 1-877-271-8811.
| 4. | PROXY VOTING POLICIES AND PROCEDURES AND PROXY VOTING RECORD |
A description of the Funds’ proxy voting policies and procedures and information regarding how the Funds voted proxies relating to portfolio securities during the most recent 12 month period ended June 30, is available without charge, upon request, by (1) calling 1-877-271-8811, or (2) on the SEC’s website at www.sec.gov.
To reduce expenses, each Fund generally mails only one copy of its prospectus and each annual and semi-annual report to those addresses shared by two or more accounts and to shareholders that such Fund reasonably believes are from the same family and household. This is referred to as “householding.” If you wish to discontinue householding and would like to receive individual copies of these documents, please call us at 1-877-271-8811. Once a Fund receives notice to stop householding, the Fund will begin sending individual copies 30 days after receiving requests. This policy does not apply to account statements.
| EntrepreneurShares Series Trust |
| |
| PRIVACY POLICY |
| (Unaudited) |
As part of the EntrepreneurShares fund family long tradition of trust, the confidentiality of personal information is paramount. We maintain high standards to safeguard your personal information. We will remain vigilant and professional in protecting that information and in using it in a fair and lawful manner. As part of this commitment to fulfilling your trust we have formulated this Privacy Policy.
Safeguarding Customer Information and Documents
To conduct regular business, we may collect nonpublic personal information from sources such as:
| ● | Account Applications and other forms, which may include a customer’s name, address, social security number, and information about a customer’s investment goals and risk tolerances; |
| ● | Account History, including information about the transactions and balances in a customer’s account; and |
| ● | Correspondence, written, telephonic, or electronic between a customer and Seaport Global Advisors, LLC; Capital Impact Advisors, LLC; EntrepreneurShares, LLC, and/or any EntrepreneurShares Mutual Fund or Exchange-Traded Fund product; such as, ERShares Global Fund, ERShares US Large Cap Fund, ERShares US Small Cap, ERShares Entrepreneurs ETF, ERShares NextGen Entrepreneurs ETF, or service providers to Seaport Global Advisors, Capital Impact, EntrepreneurShares, and/or EntrepreneurShares’ Funds. |
To conduct regular business, we collect non-public customer data in checklists, forms, in written notations, and in documentation provided to us by our customers for evaluation, registration, licensing or related consulting services. We also create internal lists of such data.
EntrepreneurShares will internally safeguard your nonpublic personal information by restricting access to only those employees who provide products or services to you or those who need access to your information to service your account. In addition, we will maintain physical, electronic and procedural safeguards that meet federal and/or state standards to guard your nonpublic personal information. Failure to observe EntrepreneurShares’ procedures regarding customer and consumer privacy will result in discipline and may lead to termination.
Sharing Nonpublic Personal and Financial Information
As the Firm shares nonpublic information solely to service our client accounts, we do not disclose any nonpublic personal information about our customers or former customers to anyone, except as permitted by law or otherwise disclosed herein.
EntrepreneurShares is committed to the privacy and protection of our customers’ personal and financial information.
We will not share any such information with any affiliated or nonaffiliated third party except:
| ● | When necessary to complete transactions in a customer account, such as clearing firm. |
| ● | When required to service and/or maintain your account. |
| ● | In order to resolve a customer dispute or inquiry. |
| ● | With persons acting in a fiduciary or representative capacity on behalf of the customer. |
| ● | With rating agencies, persons assessing compliance with industry standards, or to the attorneys, accountants and auditors of the firm. |
| ● | In connection with any sale and / or merger of EntrepreneurShares’ business. |
| ● | To prevent or protect against actual or potential fraud, identity theft, unauthorized transactions, claims or other liability. |
| ● | To comply with all federal, state or local laws, rules, statutes and other applicable legal requirements. |
| EntrepreneurShares Series Trust |
| |
| PRIVACY POLICY (Continued) |
| (Unaudited) |
| ● | In connection with a written agreement to provide advisory services or investment management when the information is released solely for the purpose of providing products or services covered by pursuant to the EntrepreneurShares’ Wrap Fee Program. |
| ● | Upon the customer’s specific instruction, consent or request. |
Note: When we share your nonpublic information with any third party for the reasons listed above, we make certain that there are written restrictions in place regarding the use and/or disclosure of said information.
Opt-Out Provisions
It is not a policy of EntrepreneurShares to share nonpublic personal and financial information with affiliated or unaffiliated third parties except under the circumstances noted above. Since sharing under the circumstances noted above is necessary to service customer accounts or is mandated by law, there are no allowances made for clients to opt out.
This page intentionally left blank.
| |
| |
| |
| |
| |
| |
| |
| |
| Advisor |
| Capital Impact Advisors, LLC |
| 175 Federal Street, Suite #875 |
| Boston, MA 02110 |
| |
| |
| Independent Registered Public Accounting Firm |
| BBD LLP |
| 1835 Market Street, 3rd Floor |
| Philadelphia, PA 19103 |
| |
| Custodian |
| Brown Brothers Harriman & Co. |
| 50 Post Office Square |
| Boston, MA 02110 |
| |
| |
| Distributor |
| Foreside Fund Services, LLC |
| Three Canal Plaza, Suite 100 |
| Portland, ME 04101 |
| |
| |
| Administrator, Accountant, Transfer Agent and Dividend Disbursing Agent |
| Ultimus Fund Solutions, LLC |
| 225 Pictoria Drive, |
| Cincinnati, OH 45246 |
| |
| |
| Counsel |
| Thompson Hine LLP |
| 41 South High Street, Suite 1700 |
| Columbus, OH 43215 |
| |
| |
| |
| This report should be accompanied or preceded by a prospectus. |
| |
| |
| |
Item 2. Code of Ethics.
As of the end of the period covered by this report, the registrant has adopted a code of ethics that applies to the registrant’s principal executive officer, principal financial officer, principal accounting officer or controller, or persons performing similar functions, regardless of whether these individuals are employed by the registrant or a third party. Pursuant to Item 12(a)(1), a copy of registrant’s code of ethics is filed as an exhibit to this Form N-CSR. During the period covered by this report, the code of ethics has not been amended, and the registrant has not granted any waivers, including implicit waivers, from the provisions of the code of ethics.
Item 3. Audit Committee Financial Expert.
(a) The registrant’s board of trustees has determined that the registrant does not have an audit committee financial expert. The committee members and the full Board considered a possibility of adding a member that would qualify as an expert. The audit committee determined that, although none of its members meet the technical definition of an audit committee expert, the committee has sufficient financial expertise to adequately perform its duties under the Audit Committee Charter without the addition of a qualified expert.
Item 4. Principal Accountant Fees and Services.
(a) Audit Fees billed to the registrant by its principal accountants for the two most recent fiscal years:
Fiscal year ended 2021: $56,000
Fiscal year ended 2020: $56,000
(b) Audit-Related Fees billed to the registrant by its principal accountants for the two most recent fiscal years:
Fiscal year ended 2021: $0
Fiscal year ended 2020: $0
Fees for 2021 and 2020 related to the agreed-upon review of items within the Management’s Discussion of Fund Performance sections of the Funds’ Form N-CSR filing. Amount requiring approval of the registrant's audit committee pursuant to paragraph (c)(7)(ii) of Rule 2-01 of Regulation S-X, $0 and $0 respectively.
(c) Tax Fees billed to the registrant by its principal accountants for the two most recent fiscal years:
Fiscal year ended 2021: $15,000
Fiscal year ended 2020: $15,000
Fees for 2021 and 2020 related to the review of the registrant's tax returns. Amount requiring approval of the registrant's audit committee pursuant to paragraph (c)(7)(ii) of Rule 2-01 of Regulation S-X, $0 and $0 respectively.
(d) All other fees billed to the registrant by its principal accountants for the two most recent fiscal years:
Fiscal year ended 2021: $0
Fiscal year ended 2020: $0
Amount requiring approval of the registrant's audit committee pursuant to paragraph (c)(7)(ii) of Rule 2-01 of Regulation S-X, $0 and $0 respectively.
(e)(1) Disclose the audit committee’s pre-approval policies and procedures described in paragraph (c)(7) of Rule 2-01 of Regulation S-X
Pre-Approval of Audit and Permitted Non-Audit Services Provided to the Company
Pre-Approval Requirements. The Committee shall pre-approve all auditing services and permissible non-audit services (e.g., tax services) to be provided to the Company by the Auditor, including the fees
therefor. The Committee may delegate to one or more of its members the authority to grant pre-approvals. In connection with such delegation, the Committee shall establish pre-approval policies and procedures, including the requirement that the decisions of any member to whom authority is delegated under this section (B) shall be presented to the full Committee at each of its scheduled meetings.
De Minimis Exception to Pre-Approval: Pre-approval for a permitted non-audit service shall not be required if:
| | a. | the aggregate amount of all such non-audit services is not more than 5% of the total revenues paid by the Company to the Auditor in the fiscal year in which the non-audit services are provided; |
| | b. | such services were not recognized by the Company at the time of the engagement to be non-audit services; and |
| | c. | such services are promptly brought to the attention of the Committee and approved prior to the completion of the audit by the Committee or by one or more members of the Committee to whom authority to grant such approvals has been delegated by the Committee. |
Additionally, the Committee shall pre-approve the Auditor’s engagements for non-audit services with the Adviser and any affiliate of the Adviser that provides ongoing services to the Company in accordance with the foregoing, if the engagement relates directly to the operations and financial reporting of the Company, unless the aggregate amount of all services provided constitutes no more than 5% of the total amount of revenues paid to the Auditor by the Company, the Adviser and any affiliate of the Adviser that provides ongoing services to the Company during the fiscal year in which the services are provided that would have to be pre-approved by the Committee pursuant to this paragraph (without regard to this exception).
(e)(2) The percentage of services described in each of paragraphs (b) through (d) of this Item that were approved by the audit committee pursuant to paragraph (c)(7)(i)(C) of Rule 2-01 of Regulation S-X are as follows:
(b) 0%
(c) 0%
(d) 0%
(f) The percentage of hours expended on the principal accountant’s engagement to audit the registrant’s financial statements for the most recent fiscal year that were attributed to work performed by persons other than the principal accountant’s full-time, permanent employees was 0%.
(g) The aggregate non-audit fees billed by the registrant’s accountant for services rendered to the registrant, and rendered to the registrant’s investment adviser (not including any sub-adviser whose role is primarily portfolio management and is subcontracted with or overseen by another investment adviser), and any entity controlling, controlled by, or under common control with the adviser that provides ongoing services to the registrant for fiscal years ended June 30, 2020 and June 30, 2021 are $0 and $0, respectively
(h) The registrant’s audit committee of the board of directors has considered whether the provision of non-audit services that were rendered to the registrant’s investment adviser (not including any sub-adviser whose role is primarily portfolio management and is subcontracted with or overseen by another investment adviser), and any entity controlling, controlled by, or under common control with the investment adviser that provides ongoing services to the registrant that were not pre-approved pursuant to paragraph (c)(7)(ii) of Rule 2-01 of Regulation S-X is compatible with maintaining the principal accountant’s independence.
| Item 5. | Audit Committee of Listed Registrants. |
Not applicable.
| Item 6. Schedule of | Investments. |
(a) Not applicable.
(b) Not applicable.
Item 7. Disclosure of Proxy Voting Policies and Procedures for Closed-End Management Investment Companies.
Not applicable.
Item 8. Portfolio Managers of Closed-End Management Investment Companies.
Not applicable.
Item 9. Purchases of Equity Securities by Closed-End Management Investment Company and Affiliated Purchasers.
Not applicable.
Item 10. Submission of Matters to a Vote of Security Holders.
Not applicable.
Item 11. Controls and Procedures.
(a) The registrant’s Principal Executive Officer and Principal Financial Officer have concluded that the registrant's disclosure controls and procedures (as defined in Rule 30a-3(c) under the Act) are effective in design and operation and are sufficient to form the basis of the certifications required by Rule 30a-2 under the Act, based on their evaluation of these disclosure controls and procedures within 90 days of the filing of this report on Form N-CSR.
(b) There were no changes in the registrant’s internal control over financial reporting (as defined in Rule 30a-3(d) under the Act (17 CFR 270.30a-3(d)) that occurred during the period covered by this report that have materially affected or are reasonably likely to materially affect, the registrant’s internal control over financial reporting.
Item 12. Disclosure of Securities Lending Activities for Closed-End Investment Companies.
Not Applicable.
Item 13. Exhibits.
(a)(1) The code of ethics that is the subject of the disclosure required by Item 2 is attached hereto.
(a)(2) Certifications pursuant to Rule 30a-2(a) are attached hereto.
(a)(3) Not applicable.
(b) Certifications pursuant to Rule 30a-2(b) are furnished herewith.
SIGNATURES
Pursuant to the requirements of the Securities Exchange Act of 1934 and the Investment Company Act of 1940, the registrant has duly caused this report to be signed on its behalf by the undersigned, thereunto duly authorized.
(Registrant) EntreprenuerShares Series Trust
By (Signature and Title) /s/ Joel M. Shulman
Dr. Joel M. Shulman, Principal Executive Officer and Principal Financial Officer
Date 9/7/2021
Pursuant to the requirements of the Securities Exchange Act of 1934 and the Investment Company Act of 1940, this report has been signed below by the following persons on behalf of the registrant and in the capacities and on the dates indicated.
By (Signature and Title) /s/ Joel M. Shulman
Dr. Joel M. Shulman, Principal Executive Officer and Principal Financial Officer
Date 9/7/2021