| | OMB APPROVAL |
| | OMB Number: 3235-0570 Expires: August 31, 2020 Estimated average burden hours per response: 20.6 |
UNITED STATES
SECURITIES AND EXCHANGE COMMISSION
Washington, D.C. 20549
FORM N-CSR
CERTIFIED SHAREHOLDER REPORT OF REGISTERED
MANAGEMENT INVESTMENT COMPANIES
| Investment Company Act file number | 811-22445 | |
| Pinnacle Capital Management Funds Trust |
| (Exact name of registrant as specified in charter) |
| 100 Limestone Plaza Fayetteville, NY | 13066 |
| (Address of principal executive offices) | (Zip code) |
| Capital Services, Inc. 615 S. Dupont Hwy. Dover, DE 19901 |
| (Name and address of agent for service) |
With a copy to:
Benjamin V. Mollozzi
Ultimus Fund Solutions, LLC
225 Pictoria Drive, Suite 450
Cincinnati, Ohio 45246
| Registrant's telephone number, including area code: | (315) 234-9716 | |
| Date of fiscal year end: | October 31 | |
| | | |
| Date of reporting period: | October 31, 2019 | |
Form N-CSR is to be used by management investment companies to file reports with the Commission not later than 10 days after the transmission to stockholders of any report that is required to be transmitted to stockholders under Rule 30e-1 under the Investment Company Act of 1940 (17 CFR 270.30e-1). The Commission may use the information provided on Form N-CSR in its regulatory, disclosure review, inspection, and policymaking roles.
A registrant is required to disclose the information specified by Form N-CSR, and the Commission will make this information public. A registrant is not required to respond to the collection of information contained in Form N-CSR unless the Form displays a currently valid Office of Management and Budget ("OMB") control number. Please direct comments concerning the accuracy of the information collection burden estimate and any suggestions for reducing the burden to the Secretary, Securities and Exchange Commission, 450 Fifth Street, NW, Washington, DC 20549-0609. The OMB has reviewed this collection of information under the clearance requirements of 44 U.S.C. § 3507.
| Item 1. | Reports to Stockholders. |
1789 Growth and Income Fund
Class P Shares | (PSEPX) |
Class C Shares | (PSECX) |
ANNUAL REPORT
October 31, 2019
Beginning on January 1, 2021, as permitted by regulations adopted by the U.S. Securities and Exchange Commission, paper copies of the Fund’s shareholder reports like this one will no longer be sent by mail, unless you specifically request paper copies of the reports from the Fund or from your financial intermediary, such as a broker-dealer or bank. Instead, the reports will be made available on a website, and you will be notified by mail each time a report is posted and provided with a website link to access the report.
If you have already elected to receive shareholder reports electronically, you will not be affected by this change and you need not take any action. You may elect to receive shareholder reports and other communications from the Fund electronically by contacting the Fund at 1-888-229-9448 or, if you own these shares through a financial intermediary, by contacting your financial intermediary.
You may elect to receive all future reports in paper free of charge. You can inform the Fund that you wish to continue receiving paper copies of your shareholder reports by contacting the Fund at 1-888-229-9448. If you own shares through a financial intermediary, you may contact your financial intermediary or follow instructions included with this document to elect to continue to receive paper copies of your shareholder reports. Your election to receive reports in paper will apply to all funds held with the fund complex or at your financial intermediary.
1789 GROWTH AND INCOME FUND
LETTER TO SHAREHOLDERS | December 2019 |
Dear Shareholders,
The past year was an exciting and memorable year for our Fund shareholders. I am privileged to finish my second year as Portfolio Manager and excited about the performance over that time. I want to thank everyone at the Fund for their hard work. I review our results for the year below.
The Fund delivered strong absolute returns and notable relative performance compared to indexes measuring the performance of the broad stock market and also within our own peer category.
Several important factors helped to drive stocks higher for the year. We review them below. But it always makes sense to cover the Fund strategy first because we rely on it to deliver value over the long term and through many different markets.
Fund Strategy
The Fund focuses on companies that pay and grow their dividends. Rising dividends send a powerful signal to the market about a firm’s business outlook and its financial strength. The Fund’s portfolio of dividend paying and growing investments are U.S. based equity securities with a market capitalization of over a $1 billion.
Performance(Fund Fiscal Year Ended October 31, 2019)
Most markets ended the year with excellent returns. For example, the S&P 500 Index, a broad measure of the stock market, rose 14.33%. Both results are above the long term averages of the two benchmarks which are slightly below 10% annually.
The Fund rose 17.98% (Class P) and 16.80% (Class C) over the period. In addition to outperforming the S&P, the Fund delivered returns above its peer group. According to Morningstar, a comparable peer group returned approximately 9.6%.
We cover performance in more detail below, but first we want to review the year.
The Fiscal Year in Review
The year got off to a rocky start. The S&P 500 was down 7% in October and one measure of investor anxiety, the CBOE Volatility Index, shot up to some of the highest levels in the last 5 years.
The primary factor was the impact of a protracted trade war between the U.S. and China. Tariffs threatened to lower consumer demand in the world’s biggest markets and to increase costs to the many businesses with supply chain operations in China.
1
Instead of focusing on the risk from a trade war, the Federal Reserve said it would continue to shrink its balance sheet and let rates rise. The stock market reacted quickly and the S&P 500 Index fell over 9% in December, the worst month for the index in nearly ten years. AAII Investor Sentiment Reading investors said less than 1 in 3 investors were positive, down from 60% in the beginning of the year.
Extreme bearishness in a short period of time can often lead to outsized gains. In late January, the end of a long government shutdown and strong profits from consumer-oriented companies helped the stock market recover and bounce back 8% in the month.
Consumer spending proved resilient and the outlook continued to improve. By April, the unemployment rate hit the lowest level since 1969, 3.6%. The Fed also changed its tune. Trade impact and international risks now factored in its outlook and opened the market to rate cuts later in the year. The market climbed up 18% for the year. May was a different story.
One of the well-studied signals of a pending recession, the yield curve, flashed red. The indicator is the difference between long term and short term interest rates and is normally a positive number. However, when investors get nervous about the future they would rather have money today than bet on tomorrow. When that happens, the signal turns negative and the probability of a recession in the next few years rises. The stock market fell 6.5% in the month as the yield curve “inversion” became worse.
In June, the Federal Reserve made it clear that it was closely monitoring the trade disputes and stood ready to act if it threatened the current economic expansion. The ECB was equally firm about their commitment to reigniting growth in the face of a potential recession in Germany. Investors took the central bank’s commitments at face value and the US and international markets soared 7% and 6% respectively.
While trade negotiations, slowing business investments and weak manufacturing dominated the headlines over the coming months, the Fed went farther than the market expected. It lowered rates and stopped shrinking its balance sheet. The balance sheet change was a throwback to the days of quantitative easing and a powerful signal that the Fed might routinely use tools that were once considered extraordinary. Importantly, the yield curve changed to positive.
With the risks of recession falling in the U.S. and abroad, equity markets pushed to new highs.
Investment Highlights
As we said previously, the performance of the Fund was outstanding. The Class P shares rose 17.98% and the Class C shares increased 16.80% for the Fiscal Year. The results were above the S&P 500 Total Return Index and earned a second percentile position in the Morningstar peer group analysis.
The Fund held seventeen equity investments and one money market fund at year end.
2
The top returning positions for the full year were First American Financial, up 44%, NextEra Energy and Fidelity National Financial, up 42%, Mastercard, up 41%, and Home Depot, up 37%. Each investment outperformed the market and their respective industry sectors while raising their annual dividend at an attractive rate. Improvement in the housing market, steady consumer spending and a generally low interest rate environment also contributed to strong returns.
Only two stocks fell in the period. Interpublic Group and UnitedHealth Group each fell 2%. Each company delivered strong profits and raised their dividend well above the market rate, but some unique factors held valuations down. For example, UnitedHealth Group faced significant risk from proposed large changes to the Medicare program. The performance of Interpublic Group was partly due to the consumer staples vertical which has been under pressure by changes in consumer’s tastes and spending.
Conclusion
Corporate profit growth should slow in the beginning of the year partly because it will be compared to very strong, tax-cut fueled, profits from last year. Difficult comps aside, consumer spending should continue to drive profit growth.
Consumers are the largest engine of economic growth in the U.S. and central to sustaining the current economic expansion. Today more people are joining the workforce and also improving their jobs according to the participation rate and underemployment rate. However, consumer confidence can fade quickly. Factors such as higher interest rates, energy and gas prices, bank lending, volatility in homes and stock prices and geopolitical events and could easily upset the current trend in spending.
In the near term, stock prices have soared partly due to outlook for continued low rates and support of the banking system. If the yield curve starts to invert again or technical issues emerge in the repo market, stocks could correct quickly. In the medium term, as the stimulus fades the real economy needs to pick up. If consumer spending is uneven then a trade deal becomes more important because of its potential to stimulate corporate investment.
If the outlook is balanced and stock prices remain in a range, which is our current outlook, then dividends and dividend growth could have a large influence on returns. These factors along with strong stock picking support our goal of generating total return through these types of markets and over the long term business cycles.
3
Past performance is not predictive of future performance. Investment results and principal value will fluctuate so that shares, when redeemed, may be worth more or less than their original cost. Current performance may be higher or lower than the performance data quoted. Performance current through the most recent month end is available by calling 1-888-229-9448.
An investor should consider the investment objectives, risks, charges and expenses of the Fund carefully before investing. The Fund’s prospectus contains this and other important information. To obtain a copy of the Fund’s prospectus please call 1-888- 229-9448 and a copy will be sent to you free of charge. Please read the prospectus carefully before you invest. The Fund is distributed by Pinnacle Investments, LLC.
The Letter to Shareholders seeks to describe some of the Adviser’s current opinions and views of the financial markets. Although the Adviser believes it has a reasonable basis for any opinions or views expressed, actual results may differ, sometimes significantly so, from those expected or expressed.
4
1789 GROWTH AND INCOME FUND - CLASS P
PERFORMANCE INFORMATION
October 31, 2019 (Unaudited)
Comparison of the Change in Value of a $10,000 Investment in
1789 Growth and Income Fund - Class P andStandard & Poor’s 500 Index

Average Annual Total Returns
(for periods ended October 31, 2019) |
| | One
Year | Five
Years | Since
Inception(b) | |
1789 Growth and Income Fund - Class P(a) | 17.98% | 5.88% | 7.72% | |
Standard & Poor’s 500 Index | 14.33% | 10.78% | 12.59% | |
(a) | The total returns shown do not reflect the deduction of taxes that a shareholder would pay on Fund distributions or the redemption of Fund shares. |
(b) | Commencement of operations was August 26, 2013. |
5
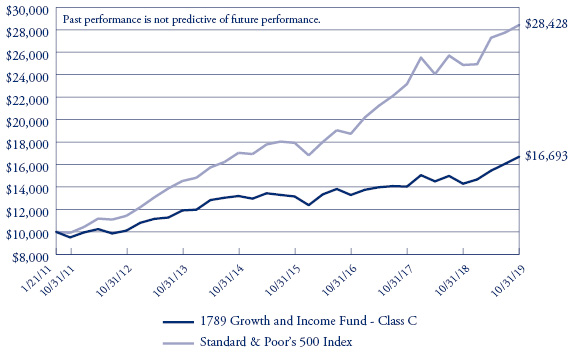
1789 GROWTH AND INCOME FUND - CLASS C
PERFORMANCE INFORMATION
October 31, 2019 (Unaudited)
Comparison of the Change in Value of a $10,000 Investment in
1789 Growth and Income Fund - Class C andStandard & Poor’s 500 Index
Average Annual Total Returns
(for periods ended October 31, 2019) |
| | One
Year | Five
Years | Since
Inception(b) | |
1789 Growth and Income Fund - Class C - Without CDSC(a) | 16.80% | 4.82% | 6.01% | |
1789 Growth and Income Fund - Class C - With CDSC(a) | 15.80% | 4.82% | 6.01% | |
Standard & Poor’s 500 Index | 14.33% | 10.78% | 12.64% | |
(a) | The total returns shown do not reflect the deduction of taxes that a shareholder would pay on Fund distributions or the redemption of Fund shares. |
(b) | Commencement of operations was January 21, 2011. |
6
1789 GROWTH AND INCOME FUND
PORTFOLIO INFORMATION
October 31, 2019 (Unaudited)
Sector Diversification vs. S&P 500 Index (% of Common Stocks)

Top 10 Equity Holdings
Security Description | % of Net Assets |
Crown Castle International Corporation | 6.5% |
Republic Services, Inc. | 5.9% |
ONEOK, Inc. | 5.8% |
Home Depot, Inc. (The) | 4.8% |
Celanese Corporation | 4.7% |
Packaging Corporation of America | 4.6% |
NextEra Energy, Inc. | 4.4% |
Fidelity National Financial, Inc. | 4.3% |
First American Financial Corporation | 4.3% |
Ryman Hospitality Properties, Inc. | 4.3% |
7
1789 GROWTH AND INCOME FUND
SCHEDULE OF INVESTMENTS
October 31, 2019 |
COMMON STOCKS — 74.6% | | Shares | | | Value | |
Communication Services — 4.2% | | | | | | | | |
Media — 4.2% | | | | | | | | |
Interpublic Group of Companies, Inc. (The) | | | 57,450 | | | $ | 1,249,537 | |
| | | | | | | | | |
Consumer Discretionary — 4.8% | | | | | | | | |
Specialty Retail — 4.8% | | | | | | | | |
Home Depot, Inc. (The) | | | 6,100 | | | | 1,430,938 | |
| | | | | | | | | |
Energy — 5.8% | | | | | | | | |
Oil, Gas & Consumable Fuels — 5.8% | | | | | | | | |
ONEOK, Inc. | | | 24,500 | | | | 1,710,835 | |
| | | | | | | | | |
Financials — 13.4% | | | | | | | | |
Banks — 1.8% | | | | | | | | |
JPMorgan Chase & Company | | | 4,250 | | | | 530,910 | |
| | | | | | | | | |
Capital Markets — 3.0% | | | | | | | | |
CME Group, Inc. | | | 4,250 | | | | 874,438 | |
| | | | | | | | | |
Insurance — 8.6% | | | | | | | | |
Fidelity National Financial, Inc. | | | 28,000 | | | | 1,283,520 | |
First American Financial Corporation | | | 20,750 | | | | 1,281,935 | |
| | | | | | | | 2,565,455 | |
Health Care — 4.2% | | | | | | | | |
Health Care Providers & Services — 4.2% | | | | | | | | |
UnitedHealth Group, Inc. | | | 4,975 | | | | 1,257,183 | |
| | | | | | | | | |
Industrials — 10.1% | | | | | | | | |
Aerospace & Defense — 4.2% | | | | | | | | |
Lockheed Martin Corporation | | | 3,300 | | | | 1,243,044 | |
| | | | | | | | | |
Commercial Services & Supplies — 5.9% | | | | | | | | |
Republic Services, Inc. | | | 20,000 | | | | 1,750,200 | |
| | | | | | | | | |
Information Technology — 3.6% | | | | | | | | |
IT Services — 3.6% | | | | | | | | |
Mastercard, Inc. - Class A | | | 3,875 | | | | 1,072,639 | |
See accompanying notes to financial statements. |
8
1789 GROWTH AND INCOME FUND
SCHEDULE OF INVESTMENTS (Continued) |
COMMON STOCKS — 74.6%(Continued) | | Shares | | | Value | |
Materials — 9.3% | | | | | | | | |
Chemicals — 4.7% | | | | | | | | |
Celanese Corporation | | | 11,450 | | | $ | 1,387,167 | |
| | | | | | | | | |
Containers & Packaging — 4.6% | | | | | | | | |
Packaging Corporation of America | | | 12,500 | | | | 1,368,250 | |
| | | | | | | | | |
Real Estate — 14.8% | | | | | | | | |
Equity Real Estate Investment Trusts (REITs) — 14.8% | | | | | | | | |
CoreSite Realty Corporation | | | 10,150 | | | | 1,192,625 | |
Crown Castle International Corporation | | | 14,000 | | | | 1,943,060 | |
Ryman Hospitality Properties, Inc. | | | 15,100 | | | | 1,270,967 | |
| | | | | | | | 4,406,652 | |
Utilities — 4.4% | | | | | | | | |
Electric Utilities — 4.4% | | | | | | | | |
NextEra Energy, Inc. | | | 5,500 | | | | 1,310,870 | |
| | | | | | | | | |
Total Common Stocks (Cost $18,718,232) | | | | | | $ | 22,158,118 | |
|
MONEY MARKET FUNDS — 25.2% | | Shares | | | Value | |
Fidelity Institutional Money Market Government Portfolio - Class I, 1.72%(a) (Cost $7,482,571) | | | 7,482,571 | | | $ | 7,482,571 | |
| | | | | | | | | |
Total Investments at Value — 99.8% (Cost $26,200,803) | | | | | | $ | 29,640,689 | |
| | | | | | | | | |
Other Assets in Excess of Liabilities — 0.2% | | | | | | | 68,380 | |
| | | | | | | | | |
Net Assets — 100.0% | | | | | | $ | 29,709,069 | |
(a) | The rate shown is the 7-day effective yield as of October 31, 2019. |
See accompanying notes to financial statements. |
9
1789 GROWTH AND INCOME FUND
STATEMENT OF ASSETS AND LIABILITIES
October 31, 2019 |
ASSETS | | | | |
Investments in securities: | | | | |
At cost | | $ | 26,200,803 | |
At value (Note 2) | | $ | 29,640,689 | |
Receivable for capital shares sold | | | 123,945 | |
Dividends receivable | | | 18,646 | |
TOTAL ASSETS | | | 29,783,280 | |
| | | | | |
LIABILITIES | | | | |
Accrued investment advisory fees (Note 4) | | | 32,203 | |
Accrued service fees (Note 4) | | | 5,475 | |
Accrued distribution plan fees (Note 4) | | | 36,533 | |
TOTAL LIABILITIES | | | 74,211 | |
| | | | | |
NET ASSETS | | $ | 29,709,069 | |
| | | | | |
Net assets consist of: | | | | |
Paid-in capital | | $ | 26,223,676 | |
Accumulated earnings | | | 3,485,393 | |
NET ASSETS | | $ | 29,709,069 | |
| | | | | |
PRICING OF CLASS P SHARES | | | | |
Net assets applicable to Class P Shares | | $ | 14,030,017 | |
Shares of beneficial interest outstanding (unlimited number of shares authorized, no par value) | | | 1,005,921 | |
Net asset value, offering price and redemption price per share (Note 2) | | $ | 13.95 | |
Short-term redemption price per share (Note 2)(a) | | $ | 13.81 | |
| | | | | |
PRICING OF CLASS C SHARES | | | | |
Net assets applicable to Class C Shares | | $ | 15,679,052 | |
Shares of beneficial interest outstanding (unlimited number of shares authorized, no par value) | | | 1,132,327 | |
Net asset value, offering price and redemption price per share (Note 2) | | $ | 13.85 | |
Short-term redemption price per share (Note 2)(a) | | $ | 13.71 | |
Redemption price per share with CDSC fee (Note 2)(a)(b) | | $ | 13.57 | |
(a) | The Fund imposes a 1.00% redemption fee on shares redeemed within 60 days of purchase. |
(b) | A contingent deferred sales charge (“CDSC”) of 1.00% is charged on Class C shares redeemed within one year of purchase. Redemption price per share is equal to net asset value less any redemption fee or CDSC. |
See accompanying notes to financial statements. |
10
1789 GROWTH AND INCOME FUND
STATEMENT OF OPERATIONS
For the Year Ended October 31, 2019 |
INVESTMENT INCOME | | | | |
Dividends | | $ | 733,735 | |
| | | | | |
EXPENSES | | | | |
Investment advisory fees (Note 4) | | | 195,659 | |
Distribution fees, Class C (Note 4) | | | 119,642 | |
Service fees (Note 4) | | | 62,611 | |
Trustees’ fees (Note 4) | | | 4,000 | |
TOTAL EXPENSES | | | 381,912 | |
| | | | | |
NET INVESTMENT INCOME | | | 351,823 | |
| | | | | |
REALIZED AND UNREALIZED GAINS ON INVESTMENTS | | | | |
Net realized gains from investment transactions | | | 104,617 | |
Net change in unrealized appreciation (depreciation) on investments | | | 3,617,606 | |
NET REALIZED AND UNREALIZED GAINS ON INVESTMENTS | | | 3,722,223 | |
| | | | | |
NET INCREASE IN NET ASSETS RESULTING FROM OPERATIONS | | $ | 4,074,046 | |
See accompanying notes to financial statements. |
11
1789 GROWTH AND INCOME FUND
STATEMENTS OF CHANGES IN NET ASSETS |
| | Year
Ended
October 31,
2019 | | | Year
Ended
October 31,
2018 | |
FROM OPERATIONS | | | | | | | | |
Net investment income | | $ | 351,823 | | | $ | 212,068 | |
Net realized gains from investment transactions | | | 104,617 | | | | 1,919,945 | |
Net change in unrealized appreciation (depreciation) on investments | | | 3,617,606 | | | | (2,111,066 | ) |
Net increase in net assets resulting from operations | | | 4,074,046 | | | | 20,947 | |
| | | | | | | | | |
FROM DISTRIBUTIONS TO SHAREHOLDERS (Note 2) | | | | | | | | |
Class P | | | (1,227,952 | ) | | | (185,804 | ) |
Class C | | | (685,097 | ) | | | (31,025 | ) |
Decrease in net assets from distributions to shareholders | | | (1,913,049 | ) | | | (216,829 | ) |
| | | | | | | | | |
FROM CAPITAL SHARE TRANSACTIONS (Notes 1 and 5) | | | | | | | | |
CLASS P | | | | | | | | |
Proceeds from shares sold | | | 5,449,747 | | | | 15,927,371 | |
Net asset value of shares issued in reinvestment of distributions | | | 1,152,202 | | | | 178,002 | |
Proceeds from redemption fees collected (Note 2) | | | 50 | | | | 1,802 | |
Payments for shares redeemed | | | (11,402,268 | ) | | | (1,684,788 | ) |
Net increase (decrease) in net assets from Class P shares capital share transactions | | | (4,800,269 | ) | | | 14,422,387 | |
| | | | | | | | | |
CLASS C | | | | | | | | |
Proceeds from shares sold | | | 5,103,645 | | | | 3,014,062 | |
Net asset value of shares issued in reinvestment of distributions | | | 634,786 | | | | 27,853 | |
Payments for shares redeemed | | | (1,256,988 | ) | | | (1,478,398 | ) |
Net increase in net assets from Class C shares capital share transactions | | | 4,481,443 | | | | 1,563,517 | |
| | | | | | | | | |
TOTAL INCREASE IN NET ASSETS | | | 1,842,171 | | | | 15,790,022 | |
| | | | | | | | | |
NET ASSETS | | | | | | | | |
Beginning of year | | | 27,866,898 | | | | 12,076,876 | |
End of year | | $ | 29,709,069 | | | $ | 27,866,898 | |
See accompanying notes to financial statements. |
12
1789 GROWTH AND INCOME FUND - CLASS P
FINANCIAL HIGHLIGHTS |
Per share data for a share outstanding throughout each year: |
| | Year
Ended
October 31,
2019 | | | Year
Ended
October 31,
2018 | | | Year
Ended
October 31,
2017 | | | Year
Ended
October 31,
2016 | | | Year
Ended
October 31,
2015 | |
Net asset value at beginning of year | | $ | 12.81 | | | $ | 12.60 | | | $ | 11.99 | | | $ | 12.46 | | | $ | 12.98 | |
| | | | | | | | | | | | | | | | | | | | | |
Income (loss) from investment operations: | | | | | | | | | | | | | | | | | | | | |
Net investment income(a) | | | 0.24 | | | | 0.17 | | | | 0.20 | | | | 0.17 | | | | 0.18 | |
Net realized and unrealized gains (losses) on investments | | | 1.87 | | | | 0.20 | | | | 0.60 | | | | 0.05 | | | | (0.10 | ) |
Total from investment operations | | | 2.11 | | | | 0.37 | | | | 0.80 | | | | 0.22 | | | | 0.08 | |
| | | | | | | | | | | | | | | | | | | | | |
Less distributions: | | | | | | | | | | | | | | | | | | | | |
From net investment income | | | (0.25 | ) | | | (0.16 | ) | | | (0.19 | ) | | | (0.15 | ) | | | (0.32 | ) |
From net realized gains on investments | | | (0.72 | ) | | | — | | | | — | | | | (0.54 | ) | | | (0.28 | ) |
Total distributions | | | (0.97 | ) | | | (0.16 | ) | | | (0.19 | ) | | | (0.69 | ) | | | (0.60 | ) |
| | | | | | | | | | | | | | | | | | | | | |
Proceeds from redemption fees collected (Note 2) | | | 0.00 | (b) | | | 0.00 | (b) | | | — | | | | — | | | | 0.00 | (b) |
| | | | | | | | | | | | | | | | | | | | | |
Net asset value at end of year | | $ | 13.95 | | | $ | 12.81 | | | $ | 12.60 | | | $ | 11.99 | | | $ | 12.46 | |
| | | | | | | | | | | | | | | | | | | | | |
Total return(c) | | | 17.98 | % | | | 2.88 | % | | | 6.73 | % | | | 2.01 | % | | | 0.67 | % |
| | | | | | | | | | | | | | | | | | | | | |
Net assets at end of year (000’s) | | $ | 14,030 | | | $ | 17,886 | | | $ | 3,753 | | | $ | 1,836 | | | $ | 1,531 | |
| | | | | | | | | | | | | | | | | | | | | |
Ratio of total expenses to average net assets | | | 1.01 | % | | | 1.00 | % | | | 1.01 | % | | | 1.01 | % | | | 1.01 | % |
| | | | | | | | | | | | | | | | | | | | | |
Ratio of net investment income to average net assets | | | 1.84 | % | | | 1.29 | % | | | 1.58 | % | | | 1.38 | % | | | 1.41 | % |
| | | | | | | | | | | | | | | | | | | | | |
Portfolio turnover rate | | | 18 | % | | | 120 | % | | | 7 | % | | | 5 | % | | | 23 | % |
(a) | Net investment income per share is based on average shares outstanding during the period. |
(b) | Amount rounds to less than $0.01 per share. |
(c) | Total return is a measure of the change in value of an investment in the Fund over the period covered, which assumes any dividends or capital gains distributions are reinvested in shares of the Fund. Returns shown do not reflect the deduction of taxes a shareholder would pay on Fund distributions or the redemption of Fund shares. |
See accompanying notes to financial statements. |
13
1789 GROWTH AND INCOME FUND - CLASS C
FINANCIAL HIGHLIGHTS |
Per share data for a share outstanding throughout each year: |
| | Year
Ended
October 31,
2019 | | | Year
Ended
October 31,
2018 | | | Year
Ended
October 31,
2017 | | | Year
Ended
October 31,
2016 | | | Year
Ended
October 31,
2015 | |
Net asset value at beginning of year | | $ | 12.73 | | | $ | 12.54 | | | $ | 11.94 | | | $ | 12.42 | | | $ | 12.82 | |
| | | | | | | | | | | | | | | | | | | | | |
Income (loss) from investment operations: | | | | | | | | | | | | | | | | | | | | |
Net investment income(a) | | | 0.10 | | | | 0.04 | | | | 0.07 | | | | 0.05 | | | | 0.05 | |
Net realized and unrealized gains (losses) on investments | | | 1.87 | | | | 0.19 | | | | 0.60 | | | | 0.05 | | | | (0.09 | ) |
Total from investment operations | | | 1.97 | | | | 0.23 | | | | 0.67 | | | | 0.10 | | | | (0.04 | ) |
| | | | | | | | | | | | | | | | | | | | | |
Less distributions: | | | | | | | | | | | | | | | | | | | | |
From net investment income | | | (0.13 | ) | | | (0.04 | ) | | | (0.07 | ) | | | (0.04 | ) | | | (0.08 | ) |
From net realized gains on investments | | | (0.72 | ) | | | — | | | | — | | | | (0.54 | ) | | | (0.28 | ) |
Total distributions | | | (0.85 | ) | | | (0.04 | ) | | | (0.07 | ) | | | (0.58 | ) | | | (0.36 | ) |
| | | | | | | | | | | | | | | | | | | | | |
Proceeds from redemption fees collected (Note 2) | | | — | | | | — | | | | — | | | | 0.00 | (b) | | | 0.00 | (b) |
| | | | | | | | | | | | | | | | | | | | | |
Net asset value at end of year | | $ | 13.85 | | | $ | 12.73 | | | $ | 12.54 | | | $ | 11.94 | | | $ | 12.42 | |
| | | | | | | | | | | | | | | | | | | | | |
Total return(c) | | | 16.80 | % | | | 1.84 | % | | | 5.62 | % | | | 1.02 | % | | | (0.32 | %) |
| | | | | | | | | | | | | | | | | | | | | |
Net assets at end of year (000’s) | | $ | 15,679 | | | $ | 9,981 | | | $ | 8,323 | | | $ | 8,448 | | | $ | 8,553 | |
| | | | | | | | | | | | | | | | | | | | | |
Ratio of total expenses to average net assets | | | 2.01 | % | | | 2.00 | % | | | 2.01 | % | | | 2.01 | % | | | 2.01 | % |
| | | | | | | | | | | | | | | | | | | | | |
Ratio of net investment income to average net assets | | | 0.77 | % | | | 0.32 | % | | | 0.58 | % | | | 0.40 | % | | | 0.39 | % |
| | | | | | | | | | | | | | | | | | | | | |
Portfolio turnover rate | | | 18 | % | | | 120 | % | | | 7 | % | | | 5 | % | | | 23 | % |
(a) | Net investment income per share is based on average shares outstanding during the year. |
(b) | Amount rounds to less than $0.01 per share. |
(c) | Total return is a measure of the change in value of an investment in the Fund over the period covered, which assumes any dividends or capital gains distributions are reinvested in shares of the Fund. Returns shown exclude the effect of applicable sales loads and do not reflect the deduction of taxes a shareholder would pay on Fund distributions or the redemption of Fund shares. |
See accompanying notes to financial statements. |
14
1789 GROWTH AND INCOME FUND
NOTES TO FINANCIAL STATEMENTS
October 31, 2019
1. ORGANIZATION
1789 Growth and Income Fund (the “Fund”) is a diversified series of Pinnacle Capital Management Funds Trust (the “Trust”), an open-end management investment company registered under the Investment Company Act of 1940, as amended (the “1940 Act”), and organized as a statutory trust under the laws of Delaware by the filing of a Certificate of Trust on July 6, 2010.
The Fund seeks total return comprised of current income, growth of income, and capital appreciation.
The Fund currently offers two classes of shares: Class P shares (sold without any sales loads or distribution fees); and Class C shares (sold subject to a contingent deferred sales charge (“CDSC”) of 1.00% if the shares are redeemed within one year after the original purchase of the shares and a distribution fee of up to 1.00% per annum of the Fund’s average daily net assets attributable to Class C shares).
Each class of shares represents an interest in the same assets of the Fund, has the same rights and is identical in all material respects except that (1) the classes bear differing levels of sales loads and distribution fees and (2) each class has exclusive voting rights with respect to matters relating to its own distribution arrangements.
2. SIGNIFICANT ACCOUNTING POLICIES
The following is a summary of the Fund’s significant accounting policies used in the preparation of its financial statements. These policies are in conformity with accounting principles generally accepted in the United States of America (“GAAP”). The Fund follows accounting and reporting guidance under Financial Accounting Standards Board Accounting Standards Codification Topic 946, “Financial Services – Investment Companies.”
SECURITIES VALUATION:The Fund’s portfolio securities are valued as of the close of business of the regular session of the New York Stock Exchange (normally 4:00 p.m., Eastern time). Common stocks and other equity securities generally are valued using market quotations but may be valued on the basis of prices furnished by a pricing service when Pinnacle Capital Management, LLC (the “Adviser”), the investment adviser to the Fund, believes such prices more accurately reflect the fair value of such securities. Securities that are traded on any stock exchange or on the NASDAQ over-the-counter market are generally valued at the last quoted sale price. Lacking a last sale price, an equity security is generally valued at its last bid price. Investments representing shares of other open-end investment companies, including money market funds, are valued at theirnet asset value (“NAV”) as reported by such companies. When using a quoted price and when the market for the security is considered active, the security will be classified as Level 1 within the fair value hierarchy (see below). When quotations are not readily available, when the Adviser
15
1789 GROWTH AND INCOME FUND
NOTES TO FINANCIAL STATEMENTS (Continued)
determines that the market quotation or the price provided by the pricing service does not accurately reflect the current market value, or when restricted or illiquid securities are being valued, such securities are valued at fair value as determined in good faith by the Adviser, in conformity with guidelines adopted by and subject to review of the Board of Trustees of the Trust.
Fixed income securities, if any, typically are valued on the basis of prices furnished by a pricing service when the Adviser believes such prices accurately reflect the market value of such securities. A pricing service utilizes electronic data processing techniques based on yield spreads relating to securities with similar characteristics to determine prices for normal institutional-size trading units of debt securities without regard to sale or bid prices. When the Adviser decides that a price provided by the pricing service does not accurately reflect the market value of the securities, when prices are not readily available from the pricing service, or when restricted or illiquid securities are being valued, securities are valued at fair value as determined in good faith by the Adviser, in conformity with guidelines adopted by and subject to review of the Board of Trustees.
The Fund utilizes various methods to measure the fair value of its investments on a recurring basis. GAAP establishes a single authoritative definition of fair value, sets out a framework for measuring fair value and requires additional disclosures about fair value measurements.
Various inputs are used in determining the value of the Fund’s investments. These inputs are summarized in the three broad levels listed below:
| | ● | Level 1 - Unadjusted quoted prices in active markets for identical assets or liabilities |
| | ● | Level 2 - Observable inputs other than quoted prices included in Level 1 that are observable for the asset or liability, either directly or indirectly; these inputs may include quoted prices for the identical instrument on an inactive market, prices for similar instruments, interest rates, prepayment speeds, credit risk, yield curves, default rates and similar data |
| | ● | Level 3 - Unobservable inputs for the asset or liability, to the extent relevant observable inputs are not available, representing the Fund’s own assumptions about the assumptions a market participant would use in valuing the asset or liability, and based on the best information available |
The inputs or methodology used for valuing securities are not necessarily an indication of the risks associated with investing in those securities. The inputs used to measure fair value may fall into different levels of the fair value hierarchy. In such cases, for disclosure purposes, the level in the fair value hierarchy within which the fair value measurement falls in its entirety is determined based on the lowest level input that is significant to the fair value measurement.
16
1789 GROWTH AND INCOME FUND
NOTES TO FINANCIAL STATEMENTS (Continued)
The following is a summary of the inputs used to value the Fund’s investments measured as of October 31, 2019 by security type:
| | Level 1 | | | Level 2 | | | Level 3 | | | Total | |
Common Stocks | | $ | 22,158,118 | | | $ | — | | | $ | — | | | $ | 22,158,118 | |
Money Market Funds | | | 7,482,571 | | | | — | | | | — | | | | 7,482,571 | |
Total | | $ | 29,640,689 | | | $ | — | | | $ | — | | | $ | 29,640,689 | |
Refer to the Fund’s Schedule of Investments for a listing of the common stocks by sector and industry type. The Fund did not hold derivative instruments or any assets or liabilities that were measured at fair value on a recurring basis using significant unobservable inputs (Level 3) as of or during the year ended October 31, 2019.
SHARE VALUATION:The NAV per share of each class of shares of the Fund is calculated daily by dividing the total value of the assets attributable to that class, less liabilities attributable to that class, by the number of shares of that class outstanding, rounded to the nearest cent. The offering price of Class C shares and Class P shares is equal to the NAV per share. The redemption price per share of each class of shares of the Fund is equal to the NAV per share, except that (i) Class C shares are subject to a CDSC of 1.00% on shares redeemed within one year of purchase and (ii) shares of each class are generally subject to a redemption fee of 1.00%, payable to the applicable class, if redeemed within 60 days or less from the date of purchase. During the years ended October 31, 2019 and 2018, proceeds from redemption fees, recorded in capital, totaled $50 and $1,802, respectively, for Class P Shares. No redemption fees were collected with respect to Class C shares during the years ended October 31, 2019 and 2018.
INVESTMENT INCOME:Interest income is accrued as earned. Dividend income is recorded on the ex-dividend date. Discounts and premiums on fixed income securities are amortized using the interest method. Withholding taxes on foreign dividends, if any, have been recorded in accordance with the Fund’s understanding of the applicable country’s rules and tax rates.
INVESTMENT TRANSACTIONS: Investment transactions are accounted for on trade date for financial reporting purposes. Realized gains and losses on investments sold are determined on a specific identification basis.
ALLOCATIONS BETWEEN CLASSES: Investment income earned, realized capital gains and losses, and unrealized appreciation and depreciation are allocated daily to each class of shares based upon its proportionate share of total net assets of the Fund. Class specific expenses are charged directly to the class incurring the expense. Common expenses which are not attributable to a specific class are allocated daily to each class of shares based upon its proportionate share of total net assets of the Fund.
17
1789 GROWTH AND INCOME FUND
NOTES TO FINANCIAL STATEMENTS (Continued)
DISTRIBUTIONS TO SHAREHOLDERS:Dividends arising from net investment income, if any, are declared and paid quarterly to shareholders. Net realized short-term capital gains, if any, may be distributed throughout the year and net realized long-term capital gains, if any, are distributed at least once each year. The amount of distributions from net investment income and net realized capital gains are determined in accordance with federal income tax regulations, which may differ from GAAP. Dividends and distributions are recorded on the ex-dividend date. The tax character of distributions paid during the years ended October 31, 2019 and 2018 was as follows:
Years Ended | | Ordinary
Income | | | Long-Term
Capital Gains | | | Total
Distributions | |
October 31, 2019 | | $ | 354,558 | | | $ | 1,558,491 | | | $ | 1,913,049 | |
October 31, 2018 | | $ | 216,829 | | | $ | — | | | $ | 216,829 | |
USE OF ESTIMATES:The preparation of financial statements in conformity with GAAP requires management to make estimates and assumptions that affect the reported amounts of assets and liabilities and disclosure of contingent assets and liabilities as of the date of the financial statements and the reported amounts of income and expenses during the reporting period. Actual results could differ from those estimates.
FEDERAL INCOME TAX:The Fund has qualified and intends to continue to qualify as a regulated investment company under the Internal Revenue Code of 1986, as amended (the “Code”). Qualification generally will relieve the Fund of liability for federal income taxes to the extent 100% of its net investment income and net realized capital gains are distributed in accordance with the Code.
In order to avoid imposition of the excise tax applicable to regulated investment companies, it is also the Fund’s intention to declare as dividends in each calendar year at least 98% of its net investment income (earned during the calendar year) and 98.2% of its net realized capital gains (earned during the twelve months ended October 31) plus undistributed amounts from the prior year.
The following information is computed on a tax basis for each item as of October 31, 2019:
Cost of portfolio investments | | $ | 26,229,357 | |
Gross unrealized appreciation | | $ | 3,440,544 | |
Gross unrealized depreciation | | | (29,212 | ) |
Net unrealized appreciation | | | 3,411,332 | |
Undistributed long-term capital gains | | | 74,061 | |
Accumulated earnings | | $ | 3,485,393 | |
18
1789 GROWTH AND INCOME FUND
NOTES TO FINANCIAL STATEMENTS (Continued)
The difference between the federal income tax cost and the financial statement cost of the Fund’s portfolio investments is due to certain timing differences in the recognition of capital gains and losses under income tax regulations and GAAP. These timing differences are temporary in nature and are due to the tax deferral of losses on wash sales.
The Fund recognizes the tax benefits or expenses of uncertain tax positions only where the position is “more likely than not” to be sustained assuming examination by tax authorities. Management has reviewed the tax positions taken on Federal income tax returns for all open tax years (tax years ended October 31, 2016 through October 31, 2019) and has concluded that no provision for unrecognized tax benefits or expenses is required in these financial statements. The Fund identifies its major tax jurisdictions as U.S. Federal and certain State tax authorities. The Fund is not aware of any tax positions for which it is reasonably likely that the total amounts of unrecognized tax benefits or expenses will change materially in the next twelve months.
The Fund recognizes interest and penalties, if any, related to unrecognized tax expenses as income tax expense on the Statement of Operations. During the year ended October 31, 2019, the Fund did not incur any interest or penalties.
3. INVESTMENT TRANSACTIONS
During the year ended October 31, 2019, the cost of purchases and the proceeds from sales and maturities of investment securities, other than U.S. Government securities and short-term securities, totaled $3,958,869 and $5,299,353, respectively.
4. TRANSACTIONS WITH RELATED PARTIES
A Trustee and certain officers of the Trust are affiliated with the Adviser, Ultimus Fund Solutions, LLC (“Ultimus”), the Fund’s administrator, transfer agent and fund accounting agent, or Pinnacle Investments, LLC (the “Distributor”), the principal underwriter of the Fund’s shares.
INVESTMENT MANAGER:Under the terms of an Investment Management Agreement, the Adviser manages the investment portfolio of the Fund, subject to policies adopted by the Board of Trustees. Under the Investment Management Agreement, the Adviser furnishes office space and all necessary office facilities, equipment and executive personnel necessary for managing the assets of the Fund. For its services, the Adviser receives an investment advisory fee at the rate of 0.75% per annum of the Fund’s average daily net assets.
Under a Services Agreement, the Adviser is obligated to pay all of the operating expenses of the Fund, excluding advisory fees, brokerage fees and commissions, distribution fees, taxes, borrowing costs, fees and expenses of non-interested Trustees of the Trust, dividend expense
19
1789 GROWTH AND INCOME FUND
NOTES TO FINANCIAL STATEMENTS (Continued)
on securities sold short, the fees and expenses of acquired funds and extraordinary expenses. Under the Services Agreement, the Adviser receives a service fee at the rate of 0.24% per annum of the Fund’s average daily net assets.
DISTRIBUTOR:The Distributor is an affiliate of the Adviser and serves as the principal underwriter of the Fund’s shares pursuant to an agreement with the Trust. The Distributor promotes and sells shares of the Fund on a continuous basis. During the year ended October 31, 2019, the Distributor collected $3,960 in CDSCs on redemptions of Class C shares of the Fund.
DISTRIBUTION PLAN: The Fund has adopted a distribution plan pursuant to Rule 12b-1 under the 1940 Act (the “Plan”). Pursuant to the Plan, Class C shares may pay brokers for activities primarily intended to result in the sale of shares. The annual limitation for payment of expenses pursuant to the Plan is 1.00% of average daily net assets attributable to Class C shares. During the year ended October 31, 2019, Class C shares incurred distribution fees of $119,642.
TRUSTEE COMPENSATION: Effective January 1, 2019, each Trustee who is not an interested person of the Trust (“Independent Trustee”) receives from the Fund a fee of $500 for each in-person Board meeting attended and $300 for each telephonic Board meeting attended. Prior to January 1, 2019, each Independent Trustee received from the Fund a fee of $250 for each in-person Board meeting attended and $150 for each telephonic Board meeting attended.
OTHER SERVICE PROVIDER:The Trust has entered into mutual fund services agreements with Ultimus, pursuant to which Ultimus provides day-to-day operational services to the Fund including, but not limited to, accounting, administrative, transfer agent, dividend disbursing, and recordkeeping services. The fees payable to Ultimus are paid by the Adviser (not the Fund).
20
1789 GROWTH AND INCOME FUND
NOTES TO FINANCIAL STATEMENTS (Continued)
5. CAPITAL SHARE TRANSACTIONS
Transactions in capital shares were as follows:
| | | Year Ended
October 31, 2019 | | | Year Ended
October 31, 2018 | |
CLASS P SHARES | | Shares | | | Shares | |
Shares sold | | | 412,245 | | | | 1,212,690 | |
Shares issued in reinvestment of dividends | | | 98,144 | | | | 13,443 | |
Shares redeemed | | | (900,263 | ) | | | (128,249 | ) |
Net increase (decrease) in shares outstanding | | | (389,874 | ) | | | 1,097,884 | |
Shares outstanding, beginning of year | | | 1,395,795 | | | | 297,911 | |
Shares outstanding, end of year | | | 1,005,921 | | | | 1,395,795 | |
| | | Year Ended
October 31, 2019 | | | Year Ended
October 31, 2018 | |
CLASS C SHARES | | Shares | | | Shares | |
Shares sold | | | 390,932 | | | | 230,372 | |
Shares issued in reinvestment of dividends | | | 54,470 | | | | 2,121 | |
Shares redeemed | | | (96,892 | ) | | | (112,382 | ) |
Net increase in shares outstanding | | | 348,510 | | | | 120,111 | |
Shares outstanding, beginning of year | | | 783,817 | | | | 663,706 | |
Shares outstanding, end of year | | | 1,132,327 | | | | 783,817 | |
6. PRINCIPAL OWNERS OF FUND SHARES
The beneficial ownership, either directly or indirectly, of 25% or more of the voting securities of the Fund creates a presumption of control of the Fund, under Section 2(a)(9) of the 1940 Act. As of October 31, 2019, the following shareholders owned of record 25% or more of the outstanding shares of each class of the Fund:
NAME OF RECORD OWNER | % Ownership |
Class P Shares | |
First Clearing, LLC (for the benefit of its customers) | 99% |
Class C Shares | |
First Clearing, LLC (for the benefit of its customers) | 81% |
21
1789 GROWTH AND INCOME FUND
NOTES TO FINANCIAL STATEMENTS (Continued)
7. INVESTMENTS IN MONEY MARKET FUNDS
In order to maintain sufficient liquidity to implement investment strategies, or for temporary defensive purposes, the Fund may at times invest a significant portion of its assets in shares of a money market fund. As of October 31, 2019, the Fund had 25.2% of the value of its net assets invested in shares of a money market fund registered under the 1940 Act. The financial statements of the money market fund, the Fidelity Institutional Money Market Government Portfolio – Class I, can be found at www.sec.gov. An investment in a money market fund is not insured or guaranteed by the Federal Deposit Insurance Corporation or any other governmental agency, entity or person. While investor losses in money market funds have been rare, they are possible. The Fund incurs additional indirect expenses due to acquired fund fees and expenses to the extent it invests in shares of money market funds.
8. CONTINGENCIES AND COMMITMENTS
The Fund indemnifies the Trust’s officers and Trustees for certain liabilities that might arise from their performance of their duties to the Fund. Additionally, in the normal course of business, the Fund enters into contracts that contain a variety of representations and warranties and which provide general indemnifications. The Fund’s maximum exposure under these arrangements is unknown, as this would involve future claims that may be made against the Fund that have not yet occurred. However, based on experience, the Trust expects the risk of loss to be remote.
9. SUBSEQUENT EVENTS
The Fund is required to recognize in the financial statements the effects of all subsequent events that provide additional evidence about conditions that existed as of the date of the Statement of Assets and Liabilities. For non-recognized subsequent events that must be disclosed to keep the financial statements from being misleading, the Fund is required to disclose the nature of the event as well as an estimate of its financial effect, or a statement that such an estimate cannot be made. Management has evaluated subsequent events through the issuance of these financial statements and has noted no such events.
22
1789 GROWTH AND INCOME FUND
REPORT OF INDEPENDENT REGISTEREDPUBLIC ACCOUNTING FIRM
To the Shareholders of 1789 Growth and Income Fund and
Board of Trustees of Pinnacle Capital Management Funds Trust
Opinion on the Financial Statements
We have audited the accompanying statement of assets and liabilities, including the schedule of investments, of 1789 Growth and Income Fund (the “Fund”), a series of Pinnacle Capital Management Funds Trust, as of October 31, 2019, and the related statement of operations for the year then ended, the statements of changes in net assets for each of the two years in the period then ended, including the related notes, and the financial highlights for each of the five years in the period then ended (collectively referred to as the “financial statements”). In our opinion, the financial statements present fairly, in all material respects, the financial position of the Fund as of October 31, 2019, the results of its operations for the year then ended, the changes in its net assets for each of the two years in the period then ended, and the financial highlights for each of the five years in the period then ended, in conformity with accounting principles generally accepted in the United States of America.
Basis for Opinion
These financial statements are the responsibility of the Fund’s management. Our responsibility is to express an opinion on the Fund’s financial statements based on our audits. We are a public accounting firm registered with the Public Company Accounting Oversight Board (United States) (“PCAOB”) and are required to be independent with respect to the Fund in accordance with the U.S. federal securities laws and the applicable rules and regulations of the Securities and Exchange Commission and the PCAOB.
We conducted our audits in accordance with the standards of the PCAOB. Those standards require that we plan and perform the audit to obtain reasonable assurance about whether the financial statements are free of material misstatement, whether due to error or fraud.
Our audits included performing procedures to assess the risks of material misstatement of the financial statements, whether due to error or fraud, and performing procedures that respond to those risks. Such procedures included examining, on a test basis, evidence regarding the amounts and disclosures in the financial statements. Our procedures included confirmation of securities owned as of October 31, 2019, by correspondence with the custodian. Our audits also included evaluating the accounting principles used and significant estimates made by management, as well as evaluating the overall presentation of the financial statements. We believe that our audits provide a reasonable basis for our opinion.
We have served as the Fund’s auditor since 2010.
COHEN & COMPANY, LTD.
Chicago, Illinois
December 23, 2019
23
1789 GROWTH AND INCOME FUND
ABOUT YOUR FUND’S EXPENSES (Unaudited) |
We believe it is important for you to understand the impact of costs on your investment. All mutual funds have operating expenses. As a shareholder of the Fund, you incur two types of costs: (1) transaction costs, possibly including contingent deferred sales loads and redemption fees, and (2) ongoing costs, including management fees, Rule 12b-1 distribution fees (if applicable to your class) and other Fund expenses. The following examples are intended to help you understand your ongoing costs (in dollars) of investing in the Fund and to compare these costs with the ongoing costs of investing in other mutual funds.
A mutual fund’s ongoing costs are expressed as a percentage of its average net assets. This figure is known as the expense ratio. The expenses in the tables that follow are based on an investment of $1,000 made at the beginning of the most recent semi-annual period (May 1, 2019) and held until the end of the period (October 31, 2019).
The table that follows illustrates the Fund’s ongoing costs in two ways:
Actual fund return – This section helps you to estimate the actual expenses that you paid over the period. The “Ending Account Value” shown is derived from the Fund’s actual return, and the fourth column shows the dollar amount of operating expenses that would have been paid by an investor who started with $1,000 in the Fund. You may use the information here, together with the amount you invested, to estimate the expenses that you paid over the period.
To do so, simply divide your account value by $1,000 (for example, an $8,600 account value divided by $1,000 = 8.6), then multiply the result by the number given for the Fund under the heading “Expenses Paid During Period.”
Hypothetical 5% return – This section is intended to help you compare the Fund’s ongoing costs with those of other mutual funds. It assumes that the Fund had an annual return of 5% before expenses during the period shown, but that the expense ratio is unchanged. In this case, because the return used is not the Fund’s actual return, the results do not apply to your investment. The example is useful in making comparisons because the U.S. Securities and Exchange Commission (the “SEC”) requires all mutual funds to calculate expenses based on a 5% return. You can assess the Fund’s ongoing costs by comparing this hypothetical example with the hypothetical examples that appear in shareholder reports of other funds.
Note that expenses shown in the table are meant to highlight and help you compare ongoing costs only.
The calculations assume no shares were bought or sold during the period. Your actual costs may have been higher or lower, depending on the amount of your investment and the timing of any purchases or redemptions.
24
1789 GROWTH AND INCOME FUND
ABOUT YOUR FUND’S EXPENSES (Unaudited) (Continued)
More information about the Fund’s expenses, including historical expense ratios, can be found in this report. For additional information on operating expenses and other shareholder costs, please refer to the Fund’s prospectus.
| Beginning
Account Value
May 1,2019 | Ending
Account Value
October 31,
2019 | Expense
Ratio(a) | Expenses
Paid During
Period(b) |
Class P Shares | | | | |
Based on Actual Fund Return | $1,000.00 | $1,085.20 | 1.01% | $5.31 |
Based on Hypothetical 5% Return (before expenses) | $1,000.00 | $1,020.11 | 1.01% | $5.14 |
Class C Shares | | | | |
Based on Actual Fund Return | $1,000.00 | $1,080.00 | 2.01% | $10.54 |
Based on Hypothetical 5% Return (before expenses) | $1,000.00 | $1,015.07 | 2.01% | $10.21 |
(a) | Annualized, based on the most recent one-half year expenses for the Class. |
(b) | Expenses are equal to the annualized expense ratio of the Class, multiplied by the average account value over the period, multiplied by 184/365 (to reflect the one-half year period). |
25
1789 GROWTH AND INCOME FUND
OTHER INFORMATION (Unaudited)
A description of the policies and procedures that the Fund uses to vote proxies relating to portfolio securities is available without charge upon request by calling toll-free 1-888-229-9448, or on the SEC’s website at www.sec.gov. Information regarding how the Fund voted proxies relating to portfolio securities during the most recent 12-month period ended June 30 is available without charge upon request by calling toll-free 1-888-229-9448, or on the SEC’s website at www.sec.gov.
The Trust files a complete listing of portfolio holdings for the Fund with the SEC as of the end of the first and third quarters of each fiscal year on Form N-Q. These filings are available upon request by calling 1-888-229-9448. Furthermore, you may obtain a copy of the filings on the SEC’s website at www.sec.gov.
OTHER FEDERAL TAX INFORMATION (Unaudited)
Qualified Dividend Income – The Fund designates 100%, or up to the maximum amount of such dividends allowable pursuant to the Internal Revenue code, as qualified dividend income eligible for the reduced tax rate of 15%.
Dividends Received Deduction – Corporate shareholders are generally entitled to take the dividends received deduction on the portion of the Fund’s dividend distribution that qualifies under tax law. For the Fund’s fiscal year 2019 ordinary income dividends, 100% qualifies for the corporate dividends received deduction.
Long-Term Capital Gains – For the year ended October 31, 2019, the Fund designates $1,558,491 as long-term capital gain distributions.
26
1789 GROWTH AND INCOME FUND
BOARD OF TRUSTEES AND EXECUTIVE OFFICERS (Unaudited)
The Board of Trustees has overall responsibility for management of the Trust’s affairs. The Trustees serve during the lifetime of the Trust and until its termination, or until death, resignation, retirement, or removal. The Trustees, in turn, elect the officers of the Trust to actively supervise its day-to-day operations. The officers have been elected for an annual term. The following are the Trustees and executive officers of the Trust:
Name,
Address(a),
and Year of Birth | Position(s)
with the
Trust | Length of
Time Served | Principal Occupation(s)
During Past 5 Years | Number of
Portfolios in
Fund Complex
Overseen by
Trustee | Other
Directorships
Held by Trustee
During the Past
5 Years |
Independent Trustees |
Joseph O.
Reagan, MD,
1951 | Trustee
Chairman | Since 2010
Since 2019 | Adjunct Professor, Cornell University’s Sloan School of Management: 2009 to 2015; Practice Consultant, Community General Hospital’s Anesthesia Group: 2008 to present; Professor, New York State Office of Professional Medical Conduct: 2015 to 2016; Anesthesiologist, Anesthesia Group of Onondaga, PC: Retired 2006. | 1 | None |
Mark E. Wadach
1951 | Trustee | Since 2014 | Sales Representative for Upstate Utilities Inc. (utilities, telecom and cellular), 2007 to present. | 1 | NYSA Series Trust (registered investment comapny) |
Christopher Wiles
| Trustee | Since 2019 | Retired, New York State Attorney General’s Office: 2014 – 2018. | 1 | None |
Interested Trustee |
Dalton J. Axenfeld(b)
1988 | Trustee | Since 2019 | CFO, Pinnacle Holding Company, LLC: 2017 – present; Controller, Pinnacle Holding Company, LLC: 2016 – 2017; Senior Auditor, Dannible & McKee, LLP: 2011 – 2016. | 1 | None |
27
1789 GROWTH AND INCOME FUND
BOARD OF TRUSTEES AND EXECUTIVE OFFICERS (Unaudited) (Continued)
Name,
Address(1),
and Year of Birth | Position(s)
with the
Trust | Length of
Time Served | Principal Occupation(s) During Past 5 Years |
Executive Officers |
Dean S. Dellas
1984 | President, Chief Executive Officer and Secretary | Since 2019 | Head Trader, Pinnacle Capital Management, LLC: 2018 to present; Managing Director, Sales & Distribution, Pinnacle Capital Management, LLC: 2017 to present; Financial Advisor/Portfolio Manager, Pinnacle Investments, LLC (Broker Dealer and Registered Investment Advisor): 2013 to present. |
Paul Tryon, CFA
1975 | Treasurer and Chief Financial Officer | Since 2017 | Principal, Senior Portfolio Manager, Pinnacle Capital Management, LLC: 2016 to present; Director of Investments, Emerson Investment Management: 2011 to 2016. |
Kevin McClelland
1986 | Chief Compliance Officer | Since 2012 (CCO Since 2013) | Chief Compliance Officer Chief Operating Officer, Pinnacle Capital Management, LLC: March 2013 to present. |
(a) | The address of each Trustee and officer is c/o Pinnacle Capital Management Funds Trust, 100 Limestone Plaza, Fayetteville, New York 13066. |
(b) | Considered an “interested person” as defined in Section 2(a)(19) of the 1940 Act by virtue of his affiliation with the Adviser. |
Additional information about the Trustees and executive officers is available in the Fund’s Statement of Additional Information (“SAI”). To obtain a free copy of the SAI, please call 1-888-229-9448.
28
1789 GROWTH AND INCOME FUND
APPROVAL OF INVESTMENT ADVISORY AGREEMENT (Unaudited)
Pinnacle Capital Management, LLC (the “Adviser”), 100 Limestone Plaza, Fayetteville, New York 13066, serves as the investment adviser to the 1789 Growth and Income Fund (the “Fund”). The Adviser provides the Fund with a continuous program of investing the Fund’s assets and determining the composition of the Fund’s portfolio. In addition to serving as the investment adviser to the Fund, the Adviser provides investment advisory services to individuals, corporations, pension funds, foundations, endowments, labor unions, insurance companies, healthcare organizations and governments.
The Adviser is subject to the oversight of the Fund and the Fund’s board of trustees (the “Board of Trustees”). The Adviser serves as investment adviser to the Fund pursuant to a written investment management agreement between the Adviser and the Fund dated November 19, 2010 (the “Advisory Agreement”). The Advisory Agreement provides that the Adviser shall not be liable for any loss suffered by the Fund or its shareholders, except by reason of its own willful misfeasance, bad faith or gross negligence, or from its reckless disregard of its duties under the Advisory Agreement. The Advisory Agreement is terminable by the Fund at any time, without penalty, either by action of the Board of Trustees or upon a vote of the holders of a majority of the outstanding voting securities of the Fund upon 60 days’ prior written notice to the Adviser. The Advisory Agreement is also terminable by the Adviser with 60 days’ prior written notice to the Fund, and will terminate automatically in the event of its “assignment,” as defined in the Investment Company Act of 1940 (the “1940 Act”), including in the event of a change of control or sale of the Adviser. The Advisory Agreement continues in force until November 19, 2020, after which it may be continued from year to year thereafter only as long as such continuance is approved annually by (a) the vote of a majority of the Board of Trustees, including a majority of the Trustees who are not “interested persons,” as defined by the 1940 Act, of the Trust (the “Independent Trustees”); or (b) the vote of a majority of the Fund’s outstanding voting securities (as defined in the 1940 Act).
The Board of Trustees, including a majority of the Independent Trustees voting separately, approved the continuance of the Advisory Agreement for an additional term of one year at an in-person meeting held on September 10, 2019. In the course of their deliberations, the Independent Trustees were advised by their independent legal counsel of their obligations in determining to approve the Advisory Agreement. The Trustees received and reviewed a substantial amount of information provided by the Adviser in response to requests of the Trustees and counsel.
In considering whether to approve the Advisory Agreement, the Board of Trustees, including the Independent Trustees, did not identify any single factor as determinative, and each Trustee weighed the various factors independently as he deemed appropriate. The Trustees considered the following matters, among other things, in connection with their approval of the Advisory Agreement.
29
1789 GROWTH AND INCOME FUND
APPROVAL OF INVESTMENT ADVISORY AGREEMENT (Unaudited) (Continued)
Nature, Extent and Quality of Services
The Trustees received and considered information regarding the nature, extent and quality of services provided to the Fund by the Adviser. The Trustees specifically reviewed the qualifications, backgrounds, and responsibilities of the key personnel that oversee the investment management and day-to-day operations of the Fund. The Trustees noted that Mr. Tryon is responsible for the day-to-day management of the Fund and its portfolio. The Trustees considered that the Adviser has a staff of skilled investment professionals that provide research and trading services to the Fund and determined that the Adviser possesses adequate resources to manage the Fund. The Trustees also considered the Adviser’s compliance program and noted the resources it has dedicated towards compliance, including providing a qualified compliance officer to oversee its compliance program. The Trustees also considered the overall investment management capabilities of the Adviser and its ongoing financial commitment to the Fund. The Trustees considered the Adviser’s responsibilities with regards to brokerage selection and best execution and were mindful that the Adviser does not enter into any “soft dollar” arrangements on behalf of the Fund.
Investment Performance of the Fund
The Trustees compared the Fund’s returns to the returns of its benchmark, the S&P 500 Index, as well as to the returns of the Russell 1000 Index. The Trustees also compared the Fund’s performance to other domestic growth and income funds of similar size with similar investment styles, and the Adviser’s separately managed accounts that are managed in a similar investment style (the “Composite Returns”), as included in the Board Materials. In reviewing the comparative performance, the Board considered that the average annual total returns for the Fund’s Class C and P shares were both higher than the average and median returns for the one-year period ended July 31, 2019 of the Fund’s peer group, the 70% to 85% Equity category as derived from Morningstar, Inc. (the “peer group”). The Board also considered the performance of the Fund’s returns (average and median) for the two classes, for the three-year period ended July 31, 2019 as compared to the Fund’s peer group. The Board noted that the returns for both classes for the three-year period ended July 31, 2019 were lower than the Fund’s peer group average and median returns. The Board noted that the average assets for mutual funds in the 70% to 85% Equity category as derived from Morningstar were significantly higher than the average assets of the Fund. The Board also noted that the Fund’s investment objective and strategy had changed in August of 2013 from a balanced fund to a growth and income fund and the impact that this change had on the historical performance of the Fund. The Board further discussed the conversion and closing of the Class A shares in 2017, and the impact of the conversion and closure of that class on the Fund. The Board also noted the impact of a portfolio manager change when Mr. Tryon assumed the role of the Fund’s principal portfolio manager in December 2017.
30
1789 GROWTH AND INCOME FUND
APPROVAL OF INVESTMENT ADVISORY AGREEMENT (Unaudited) (Continued)
Expenses
The Board considered statistical information regarding the Fund’s expense ratio and its various components, including the contractual advisory fee, as compared to its peer group, as defined above. The Trustees noted that the overall expense ratio of the Fund’s Class P shares was lower than the average expense ratio and equal to the median expense ratio for the peer group, according to the Board Materials. The Trustees then noted that the overall expense ratio of the Fund’s Class C shares was higher than the average and median expense ratios for the peer group, according to the Board Materials. The Board considered that, according to the services agreement between the Trust and the Adviser, in return for a service fee paid by the Fund, the Adviser pays all operating expenses of the Fund excluding advisory fees; brokerage fees and commissions; fees paid pursuant to the Fund’s Plan of Distribution Pursuant to Rule 12b-1 (“12b-1 fees”); taxes; borrowing costs; fees and expenses of the Trustees who are not “interested persons” of the Trust (the “Independent Trustees”) as defined by the Investment Company Act of 1940, as amended (the “1940 Act”) , and the fees and expenses of acquired funds and extraordinary expenses. The Board further noted that the average asset size for funds in the peer group was over $7 billion in assets, whereas the Fund has less than $30 million in net assets.
Investment Advisory Fee Rates
The Trustees reviewed and considered the proposed contractual investment advisory fee rate payable by the Fund to the Adviser for investment advisory services. Additionally, the Trustees received and considered information comparing the Fund’s advisory fee rate with those of the other funds in its peer group, as defined above. The Trustees noted that the advisory fee rate for the Fund was higher than the median and average rates for the peer group presented, as included in the Board Materials. The Board again noted the difference in average asset size for funds in the same category as the Fund.
The Trustees reviewed the Adviser’s financial statements and discussed its financial condition. Mr. McClelland noted that the Adviser experienced a profit in 2018, which had been the second year in a row the Adviser has experienced a profit in several years. Mr. McClelland also noted that the Distributor was quite profitable in 2018, and he referred the Trustees to the Distributor’s Statement of Financial Condition for the year ended December 31, 2018 which was included in the Board Materials. Mr. McClelland also referred to the Distributor’s financial information through June 2019, which was also included in the Board Materials. Mr. McClelland explained that the Adviser and the Distributor are both wholly owned subsidiaries of Pinnacle Holding Company, whose management remains fully committed to supporting the Adviser. The Trustees discussed the level of the Fund’s assets, the projected profits of the Adviser and the other ancillary benefits that the Adviser may receive by providing advisory services to the Fund. The Trustees further considered
31
1789 GROWTH AND INCOME FUND
APPROVAL OF INVESTMENT ADVISORY AGREEMENT (Unaudited) (Continued)
the Adviser’s commitment to continue to grow assets in the Fund and the Adviser’s representation that it has adequate financial resources to continue to provide service to the Fund.
Economies of Scale
The Trustees noted that the investment advisory fee schedule for the Fund does not contain breakpoints; however, the Trustees discussed the fact that the Fund’s assets have not grown to an extent that permits it to realize any meaningful economies of scale at this time. The Trustees observed that as the assets of the Fund grow, this factor will become more relevant to their consideration process.
Conclusion
The Trustees determined that the overall arrangement between the Fund and the Adviser, as provided in the Advisory Agreement, was fair and reasonable and that approval of the continuance of the Advisory Agreement was in the best interests of the Fund and its shareholders.
32
1789 GROWTH AND INCOME FUND
Results of Special Meeting of Shareholders (Unaudited)
On August 13, 2019, a Special Meeting of Shareholders of the Trust was held for the purpose of considering the election of four trustees for the Trust. The number of shares of the Trust present and voting at the Special Meeting represented 88.99% of the total shares entitled to vote at the meeting. Each of the four nominees was elected by the shareholders of the Trust.
The results of the voting with respect to the election of the four Trustees were as follows:
| | Number of Shares |
Nominee/Trustee | Affirmative | Withhold |
Joseph O. Reagan, MD | 1,648,405 | 20,917 |
Mark E. Wadach | 1,648,405 | 20,917 |
Christopher Wiles | 1,648,177 | 21,145 |
Dalton J. Axenfeld | 1,648,405 | 20,917 |
33
INVESTMENT ADVISER
Pinnacle Capital Management, LLC
100 Limestone Plaza
Fayetteville, NY 13066
INDEPENDENT REGISTERED PUBLIC ACCOUNTING FIRM
Cohen & Company, Ltd.
101 North Wacker Drive, Suite 605
Chicago, IL 60606
LEGAL COUNSEL
Bond Schoeneck & King PLLC
One Lincoln Center
110 West Fayette Street
Syracuse, NY 13202
CUSTODIAN
U.S. Bank, N.A.
425 Walnut Street
Cincinnati, OH 45202
TRANSFER AGENT
Ultimus Fund Solutions, LLC
225 Pictoria Drive, Suite 450
Cincinnati, OH 45246
DISTRIBUTOR
Pinnacle Investments, LLC
507 Plum Street, Suite 120
Syracuse, NY 13204
This report is intended only for the information of shareholders or those who have received the Fund’s prospectus which contains information about the Fund’s management fee and expenses. Please read the prospectus carefully before investing.
As of the end of the period covered by this report, the registrant has adopted a code of ethics that applies to the registrant’s principal executive officer, principal financial officer, principal accounting officer or controller, or persons performing similar functions, regardless of whether these individuals are employed by the registrant or a third party. Pursuant to Item 13(a)(1), a copy of registrant’s code of ethics is filed as an exhibit to this Form N-CSR. During the period covered by this report, the code of ethics has not been amended, and the registrant has not granted any waivers, including implicit waivers, from the provisions of the code of ethics.
| Item 3. | Audit Committee Financial Expert. |
The registrant’s board of trustees has determined that the registrant does not have an audit committee financial expert serving on its audit committee. The audit committee determined that, although none of its members meet the technical definition of an audit committee financial expert, the members have sufficient financial expertise to address any issues that are likely to come before the committee.
| Item 4. | Principal Accountant Fees and Services. |
| (a) | Audit Fees. The aggregate fees billed for professional services rendered by the principal accountant for the audit of the registrant’s annual financial statements or for services that are normally provided by the accountant in connection with statutory and regulatory filings or engagements were $14,500 and $14,500 with respect to the registrant’s fiscal years ended October 31, 2019 and October 31, 2018, respectively. |
| (b) | Audit-Related Fees. No fees were billed in either of the last two fiscal years for assurance and related services by the principal accountant that are reasonably related to the performance of the audit of the registrant’s financial statements and are not reported under paragraph (a) of this Item. |
| (c) | Tax Fees. The aggregate fees billed for professional services rendered by the principal accountant for tax compliance, tax advice, and tax planning were $2,500 and $2,500 with respect to the registrant’s fiscal years ended October 31, 2019 and October 31, 2018, respectively. The services comprising these fees relate to tax preparation of the registrant’s federal income and excise tax returns. |
| (d) | All Other Fees. With respect to the fiscal year ended October 31, 2019, the aggregate fees billed by the principal accountant for audit services rendered to the registrant’s investment adviser was $42,500. |
No fees were billed in either of the last two fiscal years for products and services provided by the principal accountant, other than the services reported in paragraphs (a) through (c) of this Item.
| (e)(1) | The audit committee approves all audit and non-audit related services and, therefore, has not adopted pre-approval policies and procedures described in paragraph (c)(7) of Rule 2-01 of Regulation S-X. |
| (e)(2) | None of the services described in paragraph (b) through (d) of this Item were approved by the audit committee pursuant to paragraph (c)(7)(i)(C) of Rule 2-01 of Regulation S-X. |
| (f) | Less than 50% of hours expended on the principal accountant’s engagement to audit the registrant’s financial statements for the most recent fiscal year were attributed to work performed by persons other than the principal accountant’s full-time, permanent employees. |
| (g) | With respect to the fiscal years ended October 31, 2019 and October 31, 2018, aggregate non-audit fees of $2,500 and $2,500, respectively, were billed by the registrant’s accountant for services rendered to the registrant. With respect to the fiscal years ended October 31, 2019 and October 31, 2018, aggregate non-audit fees of $11,500 and $11,500, respectively, were billed by the registrant’s accountant for services rendered to the registrant’s investment adviser (not including any sub-adviser whose role is primarily portfolio management and is subcontracted with or overseen by another investment adviser), and any entity controlling, controlled by, or under common control with the adviser that provides ongoing services to the registrant. |
| (h) | The registrant’s audit committee of the board of trustees determined that the provision of non-audit services that were rendered to the registrant’s investment adviser (not including any sub-adviser whose role is primarily portfolio management and is subcontracted with or overseen by another investment adviser), and any entity controlling, controlled by, or under common control with the investment adviser that provides ongoing services to the registrant that were not pre-approved pursuant to paragraph (c)(7)(ii) of Rule 2-01 of Regulation S-X is compatible with maintaining the principal accountant’s independence. |
| Item 5. | Audit Committee of Listed Registrants. |
Not applicable
| Item 6. | Schedule of Investments. |
| (a) | See Schedule I (Investments in securities of unaffiliated issuers) |
| Item 7. | Disclosure of Proxy Voting Policies and Procedures for Closed-End Management Investment Companies. |
Not applicable
| Item 8. | Portfolio Managers of Closed-End Management Investment Companies. |
Not applicable
| Item 9. | Purchases of Equity Securities by Closed-End Management Investment Company and Affiliated Purchasers. |
Not applicable
| Item 10. | Submission of Matters to a Vote of Security Holders. |
The Nominating and Corporate Governance Committee shall, when identifying candidates for the position of Independent Trustee, consider any such candidate recommended by a shareholder if such recommendation contains: (i) sufficient background information concerning the candidate, including evidence the candidate is willing to serve as an Independent Trustee if selected for the position; and (ii) is received in a sufficiently timely manner as determined by the Nominating and Corporate Governance Committee in its discretion. Shareholders shall be directed to address any such recommendations in writing to the attention of the Nominating and Corporate Governance Committee, c/o the Secretary of the Trust. The Secretary shall retain copies of any shareholder recommendations which meet the foregoing requirements for a period of not more than 12 months following receipt. The Secretary shall have no obligation to acknowledge receipt of any shareholder recommendations.
| Item 11. | Controls and Procedures. |
(a) Based on their evaluation of the registrant’s disclosure controls and procedures (as defined in Rule 30a-3(c) under the Investment Company Act of 1940) as of a date within 90 days of the filing date of this report, the registrant’s principal executive officer and principal financial officer have concluded that such disclosure controls and procedures are reasonably designed and are operating effectively to ensure that material information relating to the registrant, including its consolidated subsidiaries, is made known to them by others within those entities, particularly during the period in which this report is being prepared, and that the information required in filings on Form N-CSR is recorded, processed, summarized, and reported on a timely basis.
(b) There were no changes in the registrant’s internal control over financial reporting (as defined in Rule 30a-3(d) under the Investment Company Act of 1940) that occurred during the second fiscal quarter of the period covered by this report that have materially affected, or are reasonably likely to materially affect, the registrant’s internal control over financial reporting.
| Item 12. | Disclosure of Securities Lending Activities for Closed-End Management Investment Companies. |
Not applicable
File the exhibits listed below as part of this Form. Letter or number the exhibits in the sequence indicated.
(a)(1) Any code of ethics, or amendment thereto, that is the subject of the disclosure required by Item 2, to the extent that the registrant intends to satisfy the Item 2 requirements through filing of an exhibit: Attached hereto
(a)(2) A separate certification for each principal executive officer and principal financial officer of the registrant as required by Rule 30a-2(a) under the Act (17 CFR 270.30a-2(a)): Attached hereto
(a)(3) Any written solicitation to purchase securities under Rule 23c-1 under the Act (17 CFR 270.23c-1) sent or given during the period covered by the report by or on behalf of the registrant to 10 or more persons: Not applicable
(a)(4) Change in the registrant’s independent public accountants: Not applicable
(b) Certifications required by Rule 30a-2(b) under the Act (17 CFR 270.30a-2(b)): Attached hereto
| Exhibit 99.CODE ETH | Code of Ethics |
| | |
| Exhibit 99.CERT | Certifications required by Rule 30a-2(a) under the Act |
| | |
| Exhibit 99.906CERT | Certifications required by Rule 30a-2(b) under the Act |
SIGNATURES
Pursuant to the requirements of the Securities Exchange Act of 1934 and the Investment Company Act of 1940, the registrant has duly caused this report to be signed on its behalf by the undersigned, thereunto duly authorized.
| (Registrant) | Pinnacle Capital Management Funds Trust | |
| | | | |
| By (Signature and Title)* | /s/ Dean S. Dellas | |
| | | Dean S. Dellas, President | |
| | | | |
| Date | January 3, 2020 | | |
| | | | |
| Pursuant to the requirements of the Securities Exchange Act of 1934 and the Investment Company Act of 1940, this report has been signed below by the following persons on behalf of the registrant and in the capacities and on the dates indicated. |
| | | | |
| By (Signature and Title)* | /s/ Dean S. Dellas | |
| | | Dean S. Dellas, President | |
| | | | |
| Date | January 3, 2020 | | |
| | | | |
| By (Signature and Title)* | /s/ Paul A. Tryon | |
| | | Paul A. Tryon, Treasurer and Principal Financial Officer | |
| | | | |
| Date | January 3, 2020 | | |
| * | Print the name and title of each signing officer under his or her signature. |