UNITED STATES
SECURITIES AND EXCHANGE COMMISSION
Washington, D.C. 20549
FORM N-CSR
CERTIFIED SHAREHOLDER REPORT OF REGISTERED
MANAGEMENT INVESTMENT COMPANIES
| Investment Company Act file number | 811-22445 | |
| Pinnacle Capital Management Funds Trust |
| (Exact name of registrant as specified in charter) |
| 507 Plum Street, Suite 120 Syracuse, NY | 13204 |
| (Address of principal executive offices) | (Zip code) |
| Capital Services, Inc. 615 S. Dupont Hwy. Dover, DE 19901 |
| (Name and address of agent for service) |
With a copy to:
Jesse D. Hallee, Esq.
Ultimus Fund Solutions, LLC
225 Pictoria Drive, Suite 450
Cincinnati, Ohio 45246
| Registrant's telephone number, including area code: | (315) 234-9716 | |
| Date of fiscal year end: | October 31 | |
| | | |
| Date of reporting period: | October 31, 2022 | |
Form N-CSR is to be used by management investment companies to file reports with the Commission not later than 10 days after the transmission to stockholders of any report that is required to be transmitted to stockholders under Rule 30e-1 under the Investment Company Act of 1940 (17 CFR 270.30e-1). The Commission may use the information provided on Form N-CSR in its regulatory, disclosure review, inspection, and policymaking roles.
A registrant is required to disclose the information specified by Form N-CSR, and the Commission will make this information public. A registrant is not required to respond to the collection of information contained in Form N-CSR unless the Form displays a currently valid Office of Management and Budget ("OMB") control number. Please direct comments concerning the accuracy of the information collection burden estimate and any suggestions for reducing the burden to the Secretary, Securities and Exchange Commission, 450 Fifth Street, NW, Washington, DC 20549-0609. The OMB has reviewed this collection of information under the clearance requirements of 44 U.S.C. § 3507.
| Item 1. | Reports to Stockholders. |

1789 Growth and Income Fund
Class P Shares | (PSEPX) |
Class C Shares | (PSECX) |
ANNUAL REPORT
October 31, 2022
1789 GROWTH AND INCOME FUND
LETTER TO SHAREHOLDERS (Unaudited) | December 2022 |
Dear Shareholders,
2022 was a tough year in the market. Many positive developments, such as a remarkable drop in COVID-related illnesses, were overshadowed by new challenges including broad-based inflation pressure and the war in Ukraine. Still, there are reasons to be optimistic about the potential to meet these challenges and that the turmoil in 2022, will sow the seeds for improved returns in the coming years. We will briefly look at major events of the past few years – the government stimulus, the war and inflation - and then review performance below.
As the years 2020, and 2021, will be remembered for the COVID outbreak, the government’s landmark stimulus response and the ensuing great reopening, 2022, will likely be remembered as the year where inflation took hold of the economy.
As reported by the Bureau of Labor Statistics, the most widely used measure of inflation, the consumer price index (CPI), is up over 7% in the past year (as of November) with the major components of Food and Energy rising over 10% and 13% respectively. The last time CPI registered over 7% was 1982, the end of a 10- year inflation cycle. Since then, CPI has average 2.9%.
Today’s inflation pressure is not a function of any single factor; economic phenomena can take decades to fully manifest. One early contributing factor was the Federal Reserve’s (Fed) adoption of ‘quantitative easing’ amid the recession of 2008. At the time the policy was entirely justified given the risk of deflation. However, the Fed did not stop when the risk subsided – it kept interest rates artificially low for years. Since inflation expectations remained under control and growth remained low for years during the recovery, the Fed continued to create money. In fact, the pressure to keep rates low was so intense that it created negative interest rates in some circumstances.
Financial assets as well as hard assets like real estate and commodities flourished under this scenario. Importantly, the market came to expect that the Fed would come to the rescue when prices declined. When they did, prices went even higher, so investors looked to the riskiest investments to generate returns. Too much money was in the system and underlying inflation pressure was building, but it didn’t truly start to show until after COVID-19 brought the global economy to its knees.
Beyond the truly nefarious health implications, the pandemic-driven unemployment crisis led to two major economic developments. First, most businesses would have to change their processes entirely. Companies needed to revamp their workforce, optimize manufacturing facilities, and restructure relationships with suppliers and partners. Overarching uncertainty in demand led to industry-wide reduction in capacity. Second, the government would have to deliver a substantial stimulus program. The result was landmark legislation including approximately $5 trillion in fiscal spending and unwavering policy support from the Federal
1
Reserve. The plan helped stem the recession and employment snapped back. Like before, investors took clues from the Fed and the market recovered within weeks. Now the central question revolved around a vaccine. How long before we could return to normal?
The stimulus was viewed as a bridge to support the economy until it returned to its pre-COVID level. Since the duration of the pandemic was the greatest unknown, few questioned the potential effects of adding trillions to the money supply. The uneven recovery pushed the question out further, until mid-2021, when businesses started to gain confidence. The long-awaited stimulus-fueled demand had arrived.
Until then many of the structural changes made during the crisis were positive for businesses. They had right sized and lowered costs across the board from real estate to travel and optimized factories and refineries. But as we mentioned before, COVID-related changes led to an industry-wide reduction in capacity and supply. Now every step along the supply chain for finished goods was being pushed to the limit with orders. Turning on the amount of capacity needed simply couldn’t happen overnight. Customers competing for limited supplies has one major risk: higher prices.
Demand-pull inflation is often described as ‘too many dollars chasing too few goods.’ To be fair, few could predict just how many dollars it would take to offset a deflation shock the size of the pandemic or to bridge the economy until it could function on its own. The purpose of unprecedented monetary expansion was to make sure that money was available. However, now that prices were exploding higher, year-over-year CPI was settling in over 5%, GDP estimates predicted a solid rebound, and the economy was reopening - despite a bought with the Delta variant – it was time to reconsider policy risks. In fact, we had plenty of dollars.
The Fed viewed the price increases as more of a supply side disruption limited to a few industries or a rebound from industries which were hurt by COVID. Regardless prices would come down once they put capacity back online and markets normalized. It was temporary. Importantly, despite its rapid decline, they thought it would take some time before unemployment, which was 4.6%, would match the 3.5% pre-COVID measure. Another COVID outbreak could interrupt that path and wages didn’t appear to press on inflation normal range. They did take some action by reducing the pace of quantitative easing, but it amounted to very little in financial terms. They kept rates at zero.
Not everyone agreed. Many companies, across many sectors of the economy, were claiming they could sell anything they could get their hands on. They were also clamoring for workers. Additionally, a key market measure of inflation, the 5-year Forward Inflation Expectation Rate, was moving well beyond the Feds own projections. It made multi-year highs in both the Spring and Fall reflecting an increased skepticism of Fed policy for the first time in years. Inflation was catching on.
The stock market however was very comfortable with the Fed maintaining pandemic-driven super-policy. In the weeks that followed the market would make all-time highs. As it would happen, our most recent Fiscal Year began in October 2021, only 4% from a new market high.
2
By early 2022, the tone was changing in the markets and at the Fed. CPI wasn’t falling, it was accelerating to over 7%. They dropped ‘transitory’ from their language and hinted that it would raise rates in March, for the first time since 2018. However, changes would be small and gradual and projected to end the year between 0.75% and 1%. The market however was moving much faster.
In the first 2 months the S&P fell over 8.5%, the S&P 10-Year treasury bonds index fell 2.5% and inflation expectations came crashing down. The market reaction was partly a function of the Fed shift and slower growth, but it may have also started to factor in a threat that seemed unfathomable to most at the time: a Russian invasion of Ukraine.
The war started February 24th and has continued since. While the devastating humanitarian crisis is well beyond the scope of this letter, we stand with those dedicated to an immediate peace.
A central economic risk of the war is a boost to inflation through higher energy and food prices. Russia is the world’s largest supplier of a wide range of commodities, including natural gas, wheat and fertilizers, while Ukraine is also a heavy exporter of wheat, seed oil and iron. Blockades, sanctions and damaged infrastructure all led to severe reduction in capacity and prices soared. In the 3 months following the war wheat prices increased 60%, natural gas prices 50% and coal prices 75% according to the World Bank.
Europe was set to face the biggest challenge as they import 35% of its natural gas, 20% of crude and 40% of coal from Russia. Russia threatened to cut off supplies of natural gas in the face of sanctions and financial support of Ukraine. In the months that followed the cost of natural gas and electricity in the euro zone increased 115% and 237% respectively according to the Bank of Italy.
Overall global economic implications of the war are clear: growth will slow, and inflation will rise. One estimate from the Fed suggests a peak reduction to global GDP of 1.5% and rise in global inflation of 1.3% in 2023. The impact on Europe is more pronounced where the EU economic forecast is predicting a difficult recession and inflation over 9% to begin 2023.
In the US, consumers now faced spiking higher energy costs on top of food and goods costs while companies who were already strapped with supply chain problems would now have to deal with volatile materials prices and eliminating their businesses in Russia. 40% of non-European companies 50% of consumer goods companies, like automobile manufacturers, sited the war directly in their second quarter conference calls. The energy cost of the war pushed inflation hawks over the edge. Higher prices were here to stay.
The first meeting following the war the Fed recognized inflation would take longer to come under control raising the rates seven times this year, up from three. But with CPI over 8% and gas prices over $5, the market was no longer cooperating. Long term long-term inflation expectations were becoming unhinged.
3
By May the Fed caved. They would hike rates immediately, including by 75 bps per meeting, the largest in 28 years. Expectations for rates which began the year at 0-75 bps by year end were now approaching 4.0%. the new policy was forceful enough to bring inflation expectations back in line, but by mid-June the 10-year UST bond index was already down 15% for the year.
The stock market viewed the drastic measures in a slightly different way. The Fed now seemed willing to move well into ‘restrictive’ mode. That meant they would shrink the economy if it meant stopping inflation. Stocks were down 20% by mid-June, an amount typically associated with upcoming recession.
The market did bounce for the remainder of Summer, but by October it was revisiting the lows on a year-to-date basis. The job market was tight. Wages were starting to pick up which could signal another form of inflation, a wage-price spiral. Growth was slowing for consumers, for housing and for business investment and some measures used to forecast recession, such as the difference between long term and short-term rates, suggest a risk of recession in the next 12 months is now 33%, up from 25%.
As we said at the top of the note, 2022, was a tough year.
In total, from our Fiscal Year October 31st 2021 through October 31st 2022, the S&P 500 Index fell 14.6%.
Outlook
Despite the past year’s turmoil, we think there are reasons to be optimistic about the market.
On the inflation front, the Fed has already moved at an extraordinary pace raising the range from 0.25-0.50% in the beginning of the year to 4.25%-4.50. Many consumer goods are already starting to see inflation abate while another major component of the CPI, housing & rents, is also slowing down due to higher mortgage rates. The more difficult part of CPI the non-housing related components will be the last to hold out but taming that group will likely have more to do with the duration of the existing policy suggesting a ‘pause’ in rate increases. Give the negative outlook for inflation, even small changes and evidence on the margin could drive stocks higher in the year to come.
The war in Ukraine continues to grind on, however the initial energy-driven dire forecasts for the European economy haven’t come to pass. Most outlooks now call for a shallow contraction due to strong fiscal support to households, a large build up in natural gas storage (reducing the risk or rationing this winter) and resiliency to higher energy prices in the manufacturing sector. The European stock index has climbed nearly 12% since October. If Europe gets on a path where it contributes to growth, it would be a positive surprise.
Another opportunity lies in China. Growth has been slowing for the world’s second largest economy for some time due to declines in the real estate market but also more recently from a zero tolerance COVID policy. Like in the US, the government has been providing stimulus to keep the economy afloat, but it finally took the crucial step of lifting the ban including in major cities like Shanghai and Beijing. A full reopening and economic recovery would be a major boost to global growth.
4
All of these trends ultimately contribute to the outlook for corporate profits, one of the largest factor in determining stock returns. Since March the expectations for actual corporate earnings for 2022 and 2023, have declined (11%) and (8%). The outlook for the change in growth from 2023 over 2022 has declined from around positive 10% to positive 8%. If the economy does dip into a recession the forecast for earnings growth would decline and hurt the near-term outlook for stock returns.
We think the upcoming year will see a decline in earnings, however, the market is forward looking and may have already declined with the expectation that profits would be cut. We think that is partly true.
What is likely is that the market will remain volatile over the next year and remain a range suggesting a high probability of recession. In that case, taking a medium-term investment approach of 3 to 5 years would be appropriate because future returns would have good probability to come in above average, especially if the economy has a strong recovery.
Looking through the next years volatility will be hard, but we think it could yield attractive returns. Importantly, the Fund investment strategy focus is focused on dividends and divided growth, which provides investors with income independent of the market. We get paid to wait.
With that we review performance and investment highlights below.
Fund Performance
As we mentioned before, the S&P 500 index declined 14.6% for the previous 12 months ending on October 31, 2022. Class P and C shares declined less that the S&P 500 falling 5.2% and 6.2% respectively.
Part of the Fund investment strategy is to limit losses compared to the index in during times of high market volatile markets. In that regard the Funds performed very well over the past year. However, over the past 5 years, annualized returns for equity indexes have outpace the Fund. One major factor holding back the Fund’s performance is the lower risk characteristic of the investment strategy.
For example, in the case of the S&P 500, annualized returns over the last 5 years have been slightly their above average, but these have come at much higher risk as measured by the standard deviation than the historical average. The market rewarded risk taking. By contrast the Fund has a much lower standard deviation compared to the S&P, 13.8% versus 18.4%, which made it difficult to generate similar returns. However, the market doesn’t always reward risk taking. In fact, over the past year the Funds lower risk helped prevent much larger losses compared to the S&P. If markets continue to be difficult, lower risk strategies should continue to outperform the higher risk strategies.
In addition, the overall volatility of an index or portfolio is partly a function of the percentage dedicated to each sector. For example, a large component of the risk and return in the overall S&P 500 is related to the technology sector as those combined businesses make up over 25% of the total index, the highest concentration of any sector, and one of the most volatile at a 25% standard deviation. Even including the 21% decline in the
5
S&P technology sector last year, it has outpaced the overall index returns over the past 5 years. The Fund does not have as large a position in tech stocks, approximately 5% today, compared to the S&P because few technology companies pay and grow dividends. The lower weighting was very beneficial to the strong relative performance of the Fund, but it made it difficult to keep up with returns over the last 5 years.
The highest risk, most volatile sector in the S&P 500 is energy with a standard deviation 38% over past year and 30% over the past 10 years. Industry profits are leveraged to commodity prices which are highly volatile, but companies can yield outstanding returns in certain economic cycles and market environments.
The energy sector is a small part of the S&P but it can be a large part of some value -oriented dividends, such as the Dow Jones U.S Select Dividend Index which holds over 10% in Oil & Gas companies. Energy returns have been outstanding over the last 3 year of nearly 23% including the past year which delivered an astonishing 75%.
The Fund has invested in the energy sector including refineries and pipelines, which generally pay stable dividends. However, many of these companies have eliminate their dividend when commodities fall or when demand stalls. This was true most recently during the early onset of COVID. This volatility in the dividend makes it difficult to find the investments in this sector with the characteristics we look for such as stable and growing dividends. As a result, the Fund did not have a position as large as the Dow Jones Select index over the last several years so the Fund had trouble keeping up that index return.
Investment Highlights
The Fund’s top returners were Lockheed Martin, up 48%, UnitedHeath Group, up 22% and Kroger Co., up 19.5%. The bottom performers were Celanese Corporation, down 39%, First America Corp down 29% and Crown Castle, down 24%. During the year, the Fund added a position in Cummins, Inc. and it has performed well since, up 11.6%.
Lockheed Martin is a solid investment in the portfolio as still offers an attractive yield of 2.5% even after a 48% gain over the past year. Geopolitical risk has increased around the world, which is leading to increases in many of some of the largest country’s defense budgets. As a leader in defense technology, Lockheed will become an important partner as countries implement increasingly complex defense systems.
UnitedHealth Group is a leading provider of healthcare insurance benefit plans to public and private employers as well as a strong technology business. The healthcare system has strong fundamental growth factors including an aging population and increasing medical needs. There is also a large opportunity to streamline the process between payers and providers which will drive technology sales. Importantly, the company is a fast dividend grower, increasing the growth in its dividend by 16% annually over the last 5 years.
6
Kroger has delivered strong dividend growth over the past 5 years of 14% per year, but also impressing is the acceleration to 24% growth over the past year. The company has a strong position in the market grocery market, and they will improve their market share as they acquire Albertsons. The firm’s investment in digital infrastructure and distribution centers should also all it to compete well again some of its larger competitors like Walmart.
Cummings Inc is a $30 billion market cap. company and a leading global manufacturer of engines and power systems for trucks and equipment. They have a leading technology in major fuel segments such as hydrogen, fuel cells, battery systems, natural gas, diesel and propane which enable the important transition to zero carbon emission vehicles. New legislation is being introduced both domestically and abroad, particularly in China, which creates an urgent need to upgrade trucks and transportation systems. Cumming is well positioned to meet that large market opportunity given is scale and technology.
The poor performers have been effect by challenges such as rising materials costs, higher interest rates and volatility in their core markets. As a specialty chemical company, Celanese faced much higher input costs and took on integration risk when they acquired a business from DuPont. A recovery in the China market and in automobile sales would be a strong driver so a turnaround. First America Corps business is tied to the housing market. Activity in the housing sector has slowed due to higher mortgage rates, however, on the positive side, as a title insurance company, the company is set grow the yield in its large investment portfolio as rates rise which support its attractive yield of over 4%. Additionally, activity in the housing market will improve once rates pause. Like many REITs, Crown Castle is paying more in interest due to its debt balance and business investment in their newer technologies has been uneven. However, the company has a large opportunity and strong barriers to entry which help support an attractive dividend.
Conclusion
Overall, the economy is facing a difficult challenge fighting inflation. If history is somewhat of a guide, then it will be a central focus of investing for several years to come.
We think dividend and dividend growth stocks are well positioned to tackle this challenge especially because the growth in the dividend can help offset the real return that inflation can erode.
Importantly, irrespective of the volatility in the market, many companies can and will pay attractive dividends. We believe solid investments will pay attractive dividends and growth them. Ultimately, we think the top investments will pay attractive dividends, and accelerate the growth of their dividend over many business cycles and through many difficult markets.
Paul A. Tryon, CFA
7
1789 GROWTH AND INCOME FUND - CLASS P
PERFORMANCE INFORMATION
October 31, 2022 (Unaudited)
Comparison of the Change in Value of a $10,000 Investment in
1789 Growth and Income Fund - Class P, S&P 500 Index, S&P High Yield Dividend Aristocrats Index and Dow Jones U.S. Select Dividend Index

Average Annual Total Returns
(for years ended October 31, 2022) |
| | One
Year | Three
Years | Five
Years | Since
Inception(b) | |
1789 Growth and Income Fund - Class P (a) | -5.22% | 5.15% | 7.13% | 6.87% | |
S&P 500 Index | -14.61% | 10.22% | 10.44% | 11.81% | |
S&P High Yield Dividend Aristocrats Index | 2.71% | 9.14% | 9.75% | 11.21% | |
Dow Jones U.S. Select Dividend Index | 3.87% | 9.38% | 8.75% | 10.76% | |
(a) | The total returns shown do not reflect the deduction of taxes that a shareholder would pay on Fund distributions or the redemption of Fund shares. |
(b) | Commencement of operations was August 26, 2013. |
8
1789 GROWTH AND INCOME FUND - CLASS C
PERFORMANCE INFORMATION
October 31, 2022 (Unaudited)
Comparison of the Change in Value of a $10,000 Investment in
1789 Growth and Income Fund - Class C, S&P 500 Index, S&P High Yield Dividend Aristocrats Index and Dow Jones U.S. Select Dividend Index
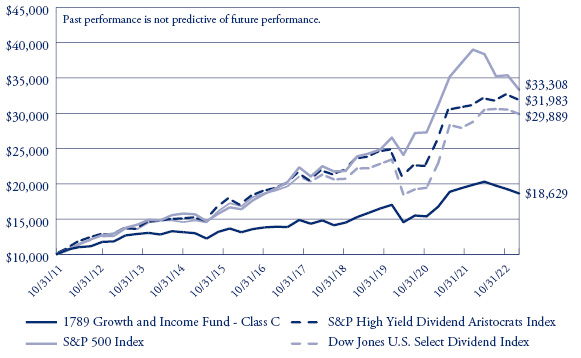
Average Annual Total Returns
(for years ended October 31, 2022) |
| | One
Year | Three
Years | Five
Years | Ten
Years | |
1789 Growth and Income Fund - Class C - Without CDSC (a) | -6.19% | 4.10% | 6.06% | 6.42% | |
1789 Growth and Income Fund - Class C - With CDSC (a) | -7.11% | 4.10% | 6.06% | 6.42% | |
S&P 500 Index | -14.61% | 10.22% | 10.44% | 12.79% | |
S&P High Yield Dividend Aristocrats Index | 2.71% | 9.14% | 9.75% | 12.32% | |
Dow Jones U.S. Select Dividend Index | 3.87% | 9.38% | 8.75% | 11.57% | |
(a) | The total returns shown do not reflect the deduction of taxes that a shareholder would pay on Fund distributions or the redemption of Fund shares. |
9
1789 GROWTH AND INCOME FUND
PORTFOLIO INFORMATION
October 31, 2022 (Unaudited)
Sector Diversification vs. S&P 500 Index (% of Common Stocks)

Top 10 Equity Holdings
Security Description | % of Net Assets |
Kroger Company (The) | 6.3% |
Lockheed Martin Corporation | 6.1% |
UnitedHealth Group, Inc. | 5.9% |
Republic Services, Inc. | 5.0% |
Fidelity National Financial, Inc. | 4.9% |
Cummins, Inc. | 4.9% |
Home Depot, Inc. (The) | 4.9% |
NextEra Energy, Inc. | 4.9% |
JPMorgan Chase & Company | 4.9% |
Interpublic Group of Companies, Inc. (The) | 4.9% |
10
1789 GROWTH AND INCOME FUND
SCHEDULE OF INVESTMENTS
October 31, 2022 |
COMMON STOCKS — 77.7% | | Shares | | | Value | |
Communications — 4.9% | | | | | | | | |
Advertising & Marketing — 4.9% | | | | | | | | |
Interpublic Group of Companies, Inc. (The) | | | 50,700 | | | $ | 1,510,353 | |
| | | | | | | | | |
Consumer Discretionary — 4.9% | | | | | | | | |
Retail - Discretionary — 4.9% | | | | | | | | |
Home Depot, Inc. (The) | | | 5,150 | | | | 1,525,070 | |
| | | | | | | | | |
Consumer Staples — 6.3% | | | | | | | | |
Retail - Consumer Staples — 6.3% | | | | | | | | |
Kroger Company (The) | | | 41,250 | | | | 1,950,713 | |
| | | | | | | | | |
Financials — 18.7% | | | | | | | | |
Banking — 4.9% | | | | | | | | |
JPMorgan Chase & Company | | | 12,000 | | | | 1,510,560 | |
| | | | | | | | | |
Institutional Financial Services — 4.4% | | | | | | | | |
CME Group, Inc. | | | 7,950 | | | | 1,377,735 | |
| | | | | | | | | |
Specialty Finance — 9.4% | | | | | | | | |
Fidelity National Financial, Inc. | | | 38,900 | | | | 1,531,882 | |
First American Financial Corporation | | | 27,200 | | | | 1,370,880 | |
| | | | | | | | 2,902,762 | |
Health Care — 5.9% | | | | | | | | |
Health Care Facilities & Services — 5.9% | | | | | | | | |
UnitedHealth Group, Inc. | | | 3,275 | | | | 1,818,116 | |
| | | | | | | | | |
Industrials — 16.0% | | | | | | | | |
Aerospace & Defense — 6.1% | | | | | | | | |
Lockheed Martin Corporation | | | 3,875 | | | | 1,885,885 | |
| | | | | | | | | |
Commercial Support Services — 5.0% | | | | | | | | |
Republic Services, Inc. | | | 11,700 | | | | 1,551,654 | |
| | | | | | | | | |
Transportation Equipment — 4.9% | | | | | | | | |
Cummins, Inc. | | | 6,250 | | | | 1,528,187 | |
See accompanying notes to financial statements. |
11
1789 GROWTH AND INCOME FUND
SCHEDULE OF INVESTMENTS (CONTINUED) |
COMMON STOCKS — 77.7% (Continued) | | Shares | | | Value | |
Materials — 7.7% | | | | | | | | |
Chemicals — 3.7% | | | | | | | | |
Celanese Corporation | | | 11,950 | | | $ | 1,148,634 | |
| | | | | | | | | |
Containers & Packaging — 4.0% | | | | | | | | |
Packaging Corporation of America | | | 10,350 | | | | 1,244,173 | |
| | | | | | | | | |
Real Estate — 3.8% | | | | | | | | |
REITs — 3.8% | | | | | | | | |
Crown Castle International Corporation | | | 8,750 | | | | 1,166,025 | |
| | | | | | | | | |
Technology — 4.6% | | | | | | | | |
Technology Services — 4.6% | | | | | | | | |
Mastercard, Inc. - Class A | | | 4,390 | | | | 1,440,710 | |
| | | | | | | | | |
Utilities — 4.9% | | | | | | | | |
Electric Utilities — 4.9% | | | | | | | | |
NextEra Energy, Inc. | | | 19,500 | | | | 1,511,250 | |
| | | | | | | | | |
Total Common Stocks (Cost $18,628,552) | | | | | | $ | 24,071,827 | |
|
MONEY MARKET FUNDS — 19.2% | | Shares | | | Value | |
Fidelity Institutional Money Market Government Portfolio - Class I, 2.87% (a) (Cost $5,944,048) | | | 5,944,048 | | | $ | 5,944,048 | |
| | | | | | | | | |
Total Investments at Value — 96.9% (Cost $24,572,600) | | | | | | $ | 30,015,875 | |
| | | | | | | | | |
Other Assets in Excess of Liabilities — 3.1% | | | | | | | 948,043 | |
| | | | | | | | | |
Net Assets — 100.0% | | | | | | $ | 30,963,918 | |
(a) | The rate shown is the 7-day effective yield as of October 31, 2022. |
See accompanying notes to financial statements. |
12
1789 GROWTH AND INCOME FUND
STATEMENT OF ASSETS AND LIABILITIES
October 31, 2022 |
ASSETS | | | | |
Investments in securities: | | | | |
At cost | | $ | 24,572,600 | |
At value (Note 2) | | $ | 30,015,875 | |
Receivable for capital shares sold | | | 75,400 | |
Receivable for investment securities sold | | | 988,993 | |
Dividends receivable | | | 24,880 | |
Other assets | | | 1,500 | |
TOTAL ASSETS | | | 31,106,648 | |
| | | | | |
LIABILITIES | | | | |
Payable for capital shares redeemed | | | 42,619 | |
Accrued investment advisory fees (Note 4) | | | 39,504 | |
Accrued service fees (Note 4) | | | 5,677 | |
Accrued distribution plan fees (Note 4) | | | 54,930 | |
TOTAL LIABILITIES | | | 142,730 | |
| | | | | |
NET ASSETS | | $ | 30,963,918 | |
| | | | | |
Net assets consist of: | | | | |
Paid-in capital | | $ | 24,335,814 | |
Distributable earnings | | | 6,628,104 | |
NET ASSETS | | $ | 30,963,918 | |
| | | | | |
PRICING OF CLASS P SHARES | | | | |
Net assets applicable to Class P Shares | | $ | 13,152,087 | |
Shares of beneficial interest outstanding (unlimited number of shares authorized, no par value) | | | 840,191 | |
Net asset value, offering price and redemption price per share (Note 2) | | $ | 15.65 | |
Short-term redemption price per share (Note 2) (a) | | $ | 15.49 | |
| | | | | |
PRICING OF CLASS C SHARES | | | | |
Net assets applicable to Class C Shares | | $ | 17,811,831 | |
Shares of beneficial interest outstanding (unlimited number of shares authorized, no par value) | | | 1,166,576 | |
Net asset value, offering price and redemption price per share (Note 2) | | $ | 15.27 | |
Redemption price per share with CDSC fee (Note 2) (b) | | $ | 15.12 | |
(a) | Class P shares of the Fund impose a 1.00% redemption fee on shares redeemed within 60 days of purchase. |
(b) | A contingent deferred sales charge (“CDSC”) of 1.00% is charged on Class C shares redeemed within one year of purchase. Redemption price per share is equal to net asset value less any redemption fee or CDSC. |
See accompanying notes to financial statements. |
13
1789 GROWTH AND INCOME FUND
STATEMENT OF OPERATIONS
For the Year Ended October 31, 2022 |
INVESTMENT INCOME | | | | |
Dividends | | $ | 599,285 | |
| | | | | |
EXPENSES | | | | |
Investment advisory fees (Note 4) | | | 246,650 | |
Distribution fees, Class C (Note 4) | | | 191,683 | |
Service fees (Note 4) | | | 78,928 | |
Trustees’ fees (Note 4) | | | 6,000 | |
TOTAL EXPENSES | | | 523,261 | |
| | | | | |
NET INVESTMENT INCOME | | | 76,024 | |
| | | | | |
REALIZED AND UNREALIZED GAINS (LOSSES) ON INVESTMENTS | | | | |
Net realized gains from investment transactions | | | 1,200,547 | |
Net change in unrealized appreciation (depreciation) on investments | | | (3,234,443 | ) |
NET REALIZED AND UNREALIZED LOSSES ON INVESTMENTS | | | (2,033,896 | ) |
| | | | | |
NET DECREASE IN NET ASSETS RESULTING FROM OPERATIONS | | $ | (1,957,872 | ) |
See accompanying notes to financial statements. |
14
1789 GROWTH AND INCOME FUND
STATEMENTS OF CHANGES IN NET ASSETS |
| | Year
Ended
October 31,
2022 | | | Year
Ended
October 31,
2021 | |
FROM OPERATIONS | | | | | | | | |
Net investment income | | $ | 76,024 | | | $ | 105,805 | |
Net realized gains from investment transactions | | | 1,200,547 | | | | 2,049,359 | |
Net change in unrealized appreciation (depreciation) on investments | | | (3,234,443 | ) | | | 5,910,163 | |
Net increase (decrease) in net assets resulting from operations | | | (1,957,872 | ) | | | 8,065,327 | |
| | | | | | | | | |
FROM DISTRIBUTIONS TO SHAREHOLDERS (Note 2) | | | | | | | | |
From distributable earnings | | | | | | | | |
Class P | | | (238,542 | ) | | | (85,307 | ) |
Class C | | | (314,791 | ) | | | (37,202 | ) |
Decrease in net assets from distributions to shareholders | | | (553,333 | ) | | | (122,509 | ) |
| | | | | | | | | |
FROM CAPITAL SHARE TRANSACTIONS (Notes 1 and 5) | | | | | | | | |
Class P | | | | | | | | |
Proceeds from shares sold | | | 1,934,803 | | | | 1,482,952 | |
Net asset value of shares issued in reinvestment of distributions | | | 200,484 | | | | 75,001 | |
Proceeds from redemption fees collected (Note 2) | | | 3,883 | | | | — | |
Payments for shares redeemed | | | (1,813,245 | ) | | | (4,280,494 | ) |
Net increase (decrease) in Class P shares capital share transactions | | | 325,925 | | | | (2,722,541 | ) |
| | | | | | | | | |
Class C | | | | | | | | |
Proceeds from shares sold | | | 2,659,011 | | | | 1,052,919 | |
Net asset value of shares issued in reinvestment of distributions | | | 298,123 | | | | 34,373 | |
Payments for shares redeemed | | | (2,788,733 | ) | | | (2,306,310 | ) |
Net increase (decrease) in Class C shares capital share transactions | | | 168,401 | | | | (1,219,018 | ) |
| | | | | | | | | |
TOTAL INCREASE (DECREASE) IN NET ASSETS | | | (2,016,879 | ) | | | 4,001,259 | |
| | | | | | | | | |
NET ASSETS | | | | | | | | |
Beginning of year | | | 32,980,797 | | | | 28,979,538 | |
End of year | | $ | 30,963,918 | | | $ | 32,980,797 | |
See accompanying notes to financial statements. |
15
1789 GROWTH AND INCOME FUND - CLASS P
FINANCIAL HIGHLIGHTS |
Per share data for a share outstanding throughout each year: |
| | Year
Ended
October 31,
2022 | | | Year
Ended
October 31,
2021 | | | Year
Ended
October 31,
2020 | | | Year
Ended
October 31,
2019 | | | Year
Ended
October 31,
2018 | |
Net asset value at beginning of year | | $ | 16.79 | | | $ | 12.97 | | | $ | 13.95 | | | $ | 12.81 | | | $ | 12.60 | |
| | | | | | | | | | | | | | | | | | | | | |
Income (loss) from investment operations: | | | | | | | | | | | | | | | | | | | | |
Net investment income (a) | | | 0.13 | | | | 0.14 | | | | 0.15 | | | | 0.24 | | | | 0.17 | |
Net realized and unrealized gains (losses) on investments | | | (0.98 | ) | | | 3.77 | | | | (0.96 | ) | | | 1.87 | | | | 0.20 | |
Total from investment operations | | | (0.85 | ) | | | 3.91 | | | | (0.81 | ) | | | 2.11 | | | | 0.37 | |
| | | | | | | | | | | | | | | | | | | | | |
Less distributions from: | | | | | | | | | | | | | | | | | | | | |
Net investment income | | | (0.05 | ) | | | (0.09 | ) | | | (0.13 | ) | | | (0.25 | ) | | | (0.16 | ) |
Net realized gains on investments | | | (0.24 | ) | | | — | | | | (0.03 | ) | | | (0.72 | ) | | | — | |
Return of capital | | | — | | | | — | | | | (0.01 | ) | | | — | | | | — | |
Total distributions | | | (0.29 | ) | | | (0.09 | ) | | | (0.17 | ) | | | (0.97 | ) | | | (0.16 | ) |
| | | | | | | | | | | | | | | | | | | | | |
Proceeds from redemption fees collected (Note 2) | | | 0.00 | (b) | | | — | | | | 0.00 | (b) | | | 0.00 | (b) | | | 0.00 | (b) |
| | | | | | | | | | | | | | | | | | | | | |
Net asset value at end of year | | $ | 15.65 | | | $ | 16.79 | | | $ | 12.97 | | | $ | 13.95 | | | $ | 12.81 | |
| | | | | | | | | | | | | | | | | | | | | |
Total return (c) | | | (5.22 | %) | | | 30.26 | % | | | (5.84 | %) | | | 17.98 | % | | | 2.88 | % |
| | | | | | | | | | | | | | | | | | | | | |
Net assets at end of year (000’s) | | $ | 13,152 | | | $ | 13,779 | | | $ | 13,047 | | | $ | 14,030 | | | $ | 17,886 | |
| | | | | | | | | | | | | | | | | | | | | |
Ratio of total expenses to average net assets | | | 1.01 | % | | | 1.00 | % | | | 1.00 | % | | | 1.01 | % | | | 1.00 | % |
| | | | | | | | | | | | | | | | | | | | | |
Ratio of net investment income to average net assets | | | 0.82 | % | | | 0.91 | % | | | 1.13 | % | | | 1.84 | % | | | 1.29 | % |
| | | | | | | | | | | | | | | | | | | | | |
Portfolio turnover rate | | | 14 | % | | | 10 | % | | | 5 | % | | | 18 | % | | | 120 | % |
(a) | Net investment income per share is based on average shares outstanding during the period. |
(b) | Amount rounds to less than $0.01 per share. |
(c) | Total return is a measure of the change in value of an investment in the Fund over the period covered, which assumes any dividends or capital gains distributions are reinvested in shares of the Fund. Returns shown do not reflect the deduction of taxes a shareholder would pay on Fund distributions or the redemption of Fund shares. |
See accompanying notes to financial statements. |
16
1789 GROWTH AND INCOME FUND - CLASS C
FINANCIAL HIGHLIGHTS |
Per share data for a share outstanding throughout each year: |
| | Year
Ended
October 31,
2022 | | | Year
Ended
October 31,
2021 | | | Year
Ended
October 31,
2020 | | | Year
Ended
October 31,
2019 | | | Year
Ended
October 31,
2018 | |
Net asset value at beginning of year | | $ | 16.53 | | | $ | 12.84 | | | $ | 13.85 | | | $ | 12.73 | | | $ | 12.54 | |
| | | | | | | | | | | | | | | | | | | | | |
Income (loss) from investment operations: | | | | | | | | | | | | | | | | | | | | |
Net investment income (loss) (a) | | | (0.03 | ) | | | (0.02 | ) | | | 0.02 | | | | 0.10 | | | | 0.04 | |
Net realized and unrealized gains (losses) on investments | | | (0.96 | ) | | | 3.74 | | | | (0.96 | ) | | | 1.87 | | | | 0.19 | |
Total from investment operations | | | (0.99 | ) | | | 3.72 | | | | (0.94 | ) | | | 1.97 | | | | 0.23 | |
| | | | | | | | | | | | | | | | | | | | | |
Less distributions from: | | | | | | | | | | | | | | | | | | | | |
Net investment income | | | (0.03 | ) | | | (0.03 | ) | | | (0.04 | ) | | | (0.13 | ) | | | (0.04 | ) |
Net realized gains on investments | | | (0.24 | ) | | | — | | | | (0.03 | ) | | | (0.72 | ) | | | — | |
Return of capital | | | — | | | | — | | | | (0.00 | )(b) | | | — | | | | — | |
Total distributions | | | (0.27 | ) | | | (0.03 | ) | | | (0.07 | ) | | | (0.85 | ) | | | (0.04 | ) |
| | | | | | | | | | | | | | | | | | | | | |
Proceeds from redemption fees collected (Note 2) | | | — | | | | — | | | | — | | | | — | | | | — | |
| | | | | | | | | | | | | | | | | | | | | |
Net asset value at end of year | | $ | 15.27 | | | $ | 16.53 | | | $ | 12.84 | | | $ | 13.85 | | | $ | 12.73 | |
| | | | | | | | | | | | | | | | | | | | | |
Total return (c) | | | (6.19 | %) | | | 29.02 | % | | | (6.79 | %) | | | 16.80 | % | | | 1.84 | % |
| | | | | | | | | | | | | | | | | | | | | |
Net assets at end of year (000’s) | | $ | 17,812 | | | $ | 19,202 | | | $ | 15,932 | | | $ | 15,679 | | | $ | 9,981 | |
| | | | | | | | | | | | | | | | | | | | | |
Ratio of total expenses to average net assets | | | 2.01 | % | | | 2.00 | % | | | 2.00 | % | | | 2.01 | % | | | 2.00 | % |
| | | | | | | | | | | | | | | | | | | | | |
Ratio of net investment income (loss) to average net assets | | | (0.19 | %) | | | (0.10 | %) | | | 0.15 | % | | | 0.77 | % | | | 0.32 | % |
| | | | | | | | | | | | | | | | | | | | | |
Portfolio turnover rate | | | 14 | % | | | 10 | % | | | 5 | % | | | 18 | % | | | 120 | % |
(a) | Net investment income (loss) per share is based on average shares outstanding during the period. |
(b) | Amount rounds to less than $0.01 per share. |
(c) | Total return is a measure of the change in value of an investment in the Fund over the period covered, which assumes any dividends or capital gains distributions are reinvested in shares of the Fund. Returns shown do not reflect the deduction of taxes a shareholder would pay on Fund distributions or the redemption of Fund shares. |
See accompanying notes to financial statements. |
17
1789 GROWTH AND INCOME FUND
NOTES TO FINANCIAL STATEMENTS
October 31, 2022
1. ORGANIZATION
1789 Growth and Income Fund (the “Fund”) is a diversified series of Pinnacle Capital Management Funds Trust (the “Trust”), an open-end management investment company registered under the Investment Company Act of 1940, as amended (the “1940 Act”), and organized as a statutory trust under the laws of Delaware by the filing of a Certificate of Trust on July 6, 2010.
The Fund seeks total return comprised of current income, growth of income, and capital appreciation.
The Fund currently offers two classes of shares: Class P shares (sold without any sales loads or distribution fees); and Class C shares (sold subject to a contingent deferred sales charge (“CDSC”) of 1.00% if the shares are redeemed within one year after the original purchase of the shares and a distribution fee of up to 1.00% per annum of the Fund’s average daily net assets attributable to Class C shares).
Each class of shares represents an interest in the same assets of the Fund, has the same rights and is identical in all material respects except that (1) the classes bear differing levels of sales loads and distribution fees and (2) each class has exclusive voting rights with respect to matters relating to its own distribution arrangements.
2. SIGNIFICANT ACCOUNTING POLICIES
The following is a summary of the Fund’s significant accounting policies used in the preparation of its financial statements. These policies are in conformity with accounting principles generally accepted in the United States of America (“GAAP”). The Fund follows accounting and reporting guidance under Financial Accounting Standards Board Accounting Standards Codification Topic 946, Financial Services – Investment Companies.
SECURITIES VALUATION: The Fund’s portfolio securities are valued as of the close of business of the regular session of the New York Stock Exchange (normally 4:00 p.m., Eastern time). Common stocks generally are valued using market quotations but may be valued on the basis of prices furnished by a pricing service when Pinnacle Capital Management, LLC (the “Adviser”), the investment adviser to the Fund, believes such prices more accurately reflect the fair value of such securities. Securities that are traded on any stock exchange or on the NASDAQ over-the-counter market are generally valued at the last quoted sale price. Lacking a last sale price, an equity security is generally valued at its last bid price. Investments representing shares of other open-end investment companies, including money market funds, are valued at their net asset value (“NAV”) as reported by such companies. When using a quoted price and when the market for the security is considered active, the security will be classified as Level 1 within the fair value hierarchy (see below). When quotations are not readily available, when the Adviser determines that the market quotation
18
1789 GROWTH AND INCOME FUND
NOTES TO FINANCIAL STATEMENTS (Continued)
or the price provided by the pricing service does not accurately reflect the current market value, or when restricted or illiquid securities are being valued, such securities are valued at fair value as determined in good faith by the Adviser, in conformity with guidelines adopted by and subject to review of the Board of Trustees of the Trust.
The Fund utilizes various methods to measure the fair value of its investments on a recurring basis. GAAP establishes a single authoritative definition of fair value, sets out a framework for measuring fair value and requires additional disclosures about fair value measurements.
Various inputs are used in determining the value of the Fund’s investments. These inputs are summarized in the three broad levels listed below:
| | ● | Level 1 - Unadjusted quoted prices in active markets for identical assets or liabilities |
| | ● | Level 2 - Observable inputs other than quoted prices included in Level 1 that are observable for the asset or liability, either directly or indirectly; these inputs may include quoted prices for the identical instrument on an inactive market, prices for similar instruments, interest rates, prepayment speeds, credit risk, yield curves, default rates and similar data |
| | ● | Level 3 - Unobservable inputs for the asset or liability, to the extent relevant observable inputs are not available, representing the Fund’s own assumptions about the assumptions a market participant would use in valuing the asset or liability, and based on the best information available |
The inputs or methodology used for valuing securities are not necessarily an indication of the risks associated with investing in those securities. The inputs used to measure fair value may fall into different levels of the fair value hierarchy. In such cases, for disclosure purposes, the level in the fair value hierarchy within which the fair value measurement falls in its entirety is determined based on the lowest level input that is significant to the fair value measurement.
The following is a summary of the Fund’s investments based on the inputs used to value the investments as of October 31, 2022 by security type:
| | Level 1 | | | Level 2 | | | Level 3 | | | Total | |
Common Stocks | | $ | 24,071,827 | | | $ | — | | | $ | — | | | $ | 24,071,827 | |
Money Market Funds | | | 5,944,048 | | | | — | | | | — | | | | 5,944,048 | |
Total | | $ | 30,015,875 | | | $ | — | | | $ | — | | | $ | 30,015,875 | |
Refer to the Fund’s Schedule of Investments for a listing of the common stocks by sector and industry type. The Fund did not hold derivative instruments or any assets or liabilities that were measured at fair value on a recurring basis using significant unobservable inputs (Level 3) as of or during the year ended October 31, 2022.
19
1789 GROWTH AND INCOME FUND
NOTES TO FINANCIAL STATEMENTS (Continued)
SHARE VALUATION: The NAV per share of each class of shares of the Fund is calculated daily by dividing the total value of the assets attributable to that class, less liabilities attributable to that class, by the number of shares of that class outstanding, rounded to the nearest cent. The offering price of Class C shares and Class P shares is equal to the NAV per share. The redemption price per share of each class of shares of the Fund is equal to the NAV per share, except that (i) Class C shares are subject to a CDSC of 1.00% on shares redeemed within one year of purchase and (ii) Class P shares are generally subject to a redemption fee of 1.00%, payable to the class, if redeemed within 60 days or less from the date of purchase. During the years ended October 31, 2022 and 2021, proceeds from redemption fees, recorded in capital, totaled $3,883 and $0, respectively, for Class P Shares.
INVESTMENT INCOME: Interest income is accrued as earned. Dividend income is recorded on the ex-dividend date. Non-cash dividends included in dividend income, if any, are recorded at the fair market value of the security received. The Fund may invest in real estate investment trusts (“REITs”) that pay distributions to their shareholders based on available funds from operations. It is common for these distributions to exceed the REIT’s taxable earnings and profits resulting in the excess portion of such distribution to be designated as return of capital. Distributions received from REITs are generally recorded as dividend income and, if necessary, are reclassified annually in accordance with tax information provided by the underlying REITs. Discounts and premiums on fixed income securities, if any, are amortized using the interest method.
INVESTMENT TRANSACTIONS: Investment transactions are accounted for on trade date for financial reporting purposes. Realized gains and losses on investments sold are determined on a specific identification basis.
ALLOCATIONS BETWEEN CLASSES: Investment income earned, realized capital gains and losses, and unrealized appreciation and depreciation are allocated daily to each class of shares based upon its proportionate share of total net assets of the Fund. Class specific expenses are charged directly to the class incurring the expense. Common expenses which are not attributable to a specific class are allocated daily to each class of shares based upon its proportionate share of total net assets of the Fund.
DISTRIBUTIONS TO SHAREHOLDERS: Dividends arising from net investment income, if any, are declared and paid quarterly to shareholders. Net realized short-term capital gains, if any, may be distributed throughout the year and net realized long-term capital gains, if any, are distributed at least once each year. The amount of distributions from net investment income and net realized capital gains are determined in accordance
20
1789 GROWTH AND INCOME FUND
NOTES TO FINANCIAL STATEMENTS (Continued)
with federal income tax regulations, which may differ from GAAP. Dividends and distributions are recorded on the ex-dividend date. The tax character of distributions paid during the years ended October 31, 2022 and 2021 was as follows:
Year Ended | | Ordinary
Income | | | Long-Term
Capital Gains | | | Total
Distributions | |
October 31, 2022 | | $ | 101,097 | | | $ | 452,236 | | | $ | 553,333 | |
October 31, 2021 | | $ | 122,509 | | | $ | — | | | $ | 122,509 | |
USE OF ESTIMATES: The preparation of financial statements in conformity with GAAP requires management to make estimates and assumptions that affect the reported amounts of assets and liabilities and disclosure of contingent assets and liabilities as of the date of the financial statements and the reported amounts of increase (decrease) in net assets from operations during the reporting period. Actual results could differ from those estimates.
FEDERAL INCOME TAX: The Fund has qualified and intends to continue to qualify as a regulated investment company under the Internal Revenue Code of 1986, as amended (the “Code”). Qualification generally will relieve the Fund of liability for federal income taxes to the extent 100% of its net investment income and net realized capital gains are distributed in accordance with the Code.
In order to avoid imposition of the excise tax applicable to regulated investment companies, it is also the Fund’s intention to declare as dividends in each calendar year at least 98% of its net investment income (earned during the calendar year) and 98.2% of its net realized capital gains (earned during the twelve months ended October 31) plus undistributed amounts from the prior year.
The following information is computed on a tax basis for each item as of October 31, 2022:
Cost of investments | | $ | 24,591,018 | |
Gross unrealized appreciation | | $ | 6,147,473 | |
Gross unrealized depreciation | | | (722,616 | ) |
Net unrealized appreciation | | | 5,424,857 | |
Undistributed ordinary income | | | 101,486 | |
Undistributed long-term capital gains | | | 1,101,761 | |
Distributable earnings | | $ | 6,628,104 | |
The difference between the federal income tax cost and the financial statement cost of the Fund’s investments is due to certain timing differences in the recognition of capital gains and losses under income tax regulations and GAAP. These timing differences are temporary in nature and are due to the tax deferral of losses on wash sales.
21
1789 GROWTH AND INCOME FUND
NOTES TO FINANCIAL STATEMENTS (Continued)
The Fund recognizes the tax benefits or expenses of uncertain tax positions only where the position is “more likely than not” to be sustained assuming examination by tax authorities. Management has reviewed the tax positions taken on Federal income tax returns for all open tax years (generally, three years) and has concluded that no provision for unrecognized tax benefits or expenses is required in these financial statements. The Fund identifies its major tax jurisdictions as U.S. Federal and certain State tax authorities. The Fund is not aware of any tax positions for which it is reasonably likely that the total amounts of unrecognized tax benefits or expenses will change materially in the next twelve months.
The Fund recognizes interest and penalties, if any, related to unrecognized tax expenses as income tax expense on the Statement of Operations. During the year ended October 31, 2022, the Fund did not incur any interest or penalties.
3. INVESTMENT TRANSACTIONS
During the year ended October 31, 2022, the cost of purchases and the proceeds from sales and maturities of investment securities, other than U.S. Government securities and short-term securities, totaled $3,496,429 and $3,706,492, respectively.
4. TRANSACTIONS WITH RELATED PARTIES
A Trustee and certain officers of the Trust are affiliated with the Adviser, Ultimus Fund Solutions, LLC (“Ultimus”), the Fund’s administrator, transfer agent and fund accounting agent, or Pinnacle Investments, LLC (the “Distributor”), the principal underwriter of the Fund’s shares.
INVESTMENT MANAGER: Under the terms of an Investment Management Agreement, the Adviser manages the investment portfolio of the Fund, subject to policies adopted by the Board of Trustees. Under the Investment Management Agreement, the Adviser furnishes office space and all necessary office facilities, equipment and executive personnel necessary for managing the assets of the Fund. For its services, the Adviser receives an investment advisory fee at the rate of 0.75% per annum, accrued daily and paid monthly, of the Fund’s average daily net assets. For the year ended October 31, 2022, the Adviser earned $246,650 in investment advisory fees.
Under a Services Agreement, the Adviser is obligated to pay all of the operating expenses of the Fund, excluding advisory fees, brokerage fees and commissions, distribution fees, taxes, borrowing costs, fees and expenses of non-interested Trustees of the Trust, dividend expense on securities sold short, the fees and expenses of acquired funds and extraordinary expenses. Under the Services Agreement, the Adviser receives a service fee at the rate of 0.24% per annum of the Fund’s average daily net assets.
22
1789 GROWTH AND INCOME FUND
NOTES TO FINANCIAL STATEMENTS (Continued)
DISTRIBUTOR: The Distributor is an affiliate of the Adviser and serves as the principal underwriter of the Fund’s shares pursuant to an agreement with the Trust. The Distributor promotes and sells shares of the Fund on a continuous basis. During the year ended October 31, 2022, the Distributor collected $7,253 in CDSCs on redemptions of Class C shares of the Fund.
DISTRIBUTION PLAN: The Fund has adopted a distribution plan pursuant to Rule 12b-1 under the 1940 Act (the “Plan”). Pursuant to the Plan, Class C shares may pay brokers for activities primarily intended to result in the sale of shares. The annual limitation for payment of expenses pursuant to the Plan is 1.00% of average daily net assets attributable to Class C shares. During the year ended October 31, 2022, Class C shares incurred distribution fees of $191,683.
TRUSTEE COMPENSATION: Each Trustee who is not an interested person of the Trust (“Independent Trustee”) receives from the Fund a fee of $500 for each Board meeting attended, either in person or by telephone.
OTHER SERVICE PROVIDER: The Trust has entered into mutual fund services agreements with Ultimus, pursuant to which Ultimus provides day-to-day operational services to the Fund including, but not limited to, accounting, administrative, transfer agent, dividend disbursing, and recordkeeping services. The fees payable to Ultimus are paid by the Adviser (not the Fund).
PRINCIPAL HOLDER OF FUND SHARES: As of October 31, 2022, the following shareholder owned of record 25% or more of the outstanding shares of each class of the Fund:
NAME OF RECORD OWNER | | % Ownership | |
Class P Shares | | | | |
Wells Fargo Clearing Services (for the benefit of its customers) | | | 76 | % |
Class C Shares | | | | |
Wells Fargo Clearing Services (for the benefit of its customers) | | | 72 | % |
A beneficial owner of 25% or more of the Fund’s outstanding shares may be considered a controlling person. That shareholder’s vote could have a more significant effect on matters presented at a shareholders’ meeting.
23
1789 GROWTH AND INCOME FUND
NOTES TO FINANCIAL STATEMENTS (Continued)
5. CAPITAL SHARE TRANSACTIONS
Transactions in capital shares were as follows:
| | | Year Ended
October 31, 2022 | | | Year Ended
October 31, 2021 | |
CLASS P SHARES | | Shares | | | Shares | |
Shares sold | | | 116,324 | | | | 95,310 | |
Shares issued in reinvestment of dividends | | | 11,482 | | | | 5,213 | |
Shares redeemed | | | (108,114 | ) | | | (286,114 | ) |
Net increase (decrease) in shares outstanding | | | 19,692 | | | | (185,591 | ) |
Shares outstanding, beginning of year | | | 820,499 | | | | 1,006,090 | |
Shares outstanding, end of year | | | 840,191 | | | | 820,499 | |
| | | Year Ended
October 31, 2022 | | | Year Ended
October 31, 2021 | |
CLASS C SHARES | | Shares | | | Shares | |
Shares sold | | | 160,622 | | | | 69,043 | |
Shares issued in reinvestment of dividends | | | 17,353 | | | | 2,453 | |
Shares redeemed | | | (172,956 | ) | | | (150,533 | ) |
Net increase (decrease) in shares outstanding | | | 5,019 | | | | (79,037 | ) |
Shares outstanding, beginning of year | | | 1,161,557 | | | | 1,240,594 | |
Shares outstanding, end of year | | | 1,166,576 | | | | 1,161,557 | |
6. CONTINGENCIES AND COMMITMENTS
The Fund indemnifies the Trust’s officers and Trustees for certain liabilities that might arise from their performance of their duties to the Fund. Additionally, in the normal course of business, the Fund enters into contracts that contain a variety of representations and warranties and which provide general indemnifications. The Fund’s maximum exposure under these arrangements is unknown, as this would involve future claims that may be made against the Fund that have not yet occurred. However, based on experience, the Trust expects the risk of loss to be remote.
24
1789 GROWTH AND INCOME FUND
NOTES TO FINANCIAL STATEMENTS (Continued)
7. SUBSEQUENT EVENTS
The Fund is required to recognize in the financial statements the effects of all subsequent events that provide additional evidence about conditions that existed as of the date of the Statement of Assets and Liabilities. For non-recognized subsequent events that must be disclosed to keep the financial statements from being misleading, the Fund is required to disclose the nature of the event as well as an estimate of its financial effect, or a statement that such an estimate cannot be made. Management has evaluated subsequent events through the issuance of these financial statements and has noted no such events.
25
1789 GROWTH AND INCOME FUND
REPORT OF INDEPENDENT REGISTERED
PUBLIC ACCOUNTING FIRM
To the Shareholders of 1789 Growth and Income Fund and
Board of Trustees of Pinnacle Capital Management Funds Trust
Opinion on the Financial Statements
We have audited the accompanying statement of assets and liabilities, including the schedule of investments, of 1789 Growth and Income Fund (the “Fund”) as of October 31, 2022, the related statement of operations for the year then ended, the statements of changes in net assets for each of the two years in the period then ended, the related notes, and the financial highlights for each of the five years in the period then ended (collectively referred to as the “financial statements”). In our opinion, the financial statements present fairly, in all material respects, the financial position of the Fund as of October 31, 2022, the results of its operations for the year then ended, the changes in net assets for each of the two years in the period then ended, and the financial highlights for each of the five years in the period then ended, in conformity with accounting principles generally accepted in the United States of America.
Basis for Opinion
These financial statements are the responsibility of the Fund’s management. Our responsibility is to express an opinion on the Fund’s financial statements based on our audits. We are a public accounting firm registered with the Public Company Accounting Oversight Board (United States) (“PCAOB”) and are required to be independent with respect to the Fund in accordance with the U.S. federal securities laws and the applicable rules and regulations of the Securities and Exchange Commission and the PCAOB.
We conducted our audits in accordance with the standards of the PCAOB. Those standards require that we plan and perform the audit to obtain reasonable assurance about whether the financial statements are free of material misstatement whether due to error or fraud.
Our audits included performing procedures to assess the risks of material misstatement of the financial statements, whether due to error or fraud, and performing procedures that respond to those risks. Such procedures included examining, on a test basis, evidence regarding the amounts and disclosures in the financial statements. Our procedures included confirmation of securities owned as of October 31, 2022, by correspondence with the custodian and brokers; when replies were not received from brokers, we performed other auditing procedures. Our audits also included evaluating the accounting principles used and significant estimates made by management, as well as evaluating the overall presentation of the financial statements. We believe that our audits provide a reasonable basis for our opinion.
We have served as the Fund’s auditor since 2010.

COHEN & COMPANY, LTD.
Chicago, Illinois
December 22, 2022
26
1789 GROWTH AND INCOME FUND
ABOUT YOUR FUND’S EXPENSES (Unaudited)
We believe it is important for you to understand the impact of costs on your investment. All mutual funds have operating expenses. As a shareholder of the Fund, you incur two types of costs: (1) transaction costs, possibly including contingent deferred sales loads and redemption fees, and (2) ongoing costs, including management fees, Rule 12b-1 distribution fees (if applicable to your class) and other Fund expenses. The following examples are intended to help you understand your ongoing costs (in dollars) of investing in the Fund and to compare these costs with the ongoing costs of investing in other mutual funds.
A mutual fund’s ongoing costs are expressed as a percentage of its average net assets. This figure is known as the expense ratio. The expenses in the table that follows are based on an investment of $1,000 made at the beginning of the most recent semi-annual period (May 1, 2022) and held until the end of the period (October 31, 2022).
The table that follows illustrates the Fund’s ongoing costs in two ways:
Actual fund return – This section helps you to estimate the actual expenses that you paid over the period. The “Ending Account Value” shown is derived from the Fund’s actual return, and the fourth column shows the dollar amount of operating expenses that would have been paid by an investor who started with $1,000 in the Fund. You may use the information here, together with the amount you invested, to estimate the expenses that you paid over the period.
To do so, simply divide your account value by $1,000 (for example, an $8,600 account value divided by $1,000 = 8.6), then multiply the result by the number given for the Fund under the heading “Expenses Paid During Period.”
Hypothetical 5% return – This section is intended to help you compare the Fund’s ongoing costs with those of other mutual funds. It assumes that the Fund had an annual return of 5% before expenses during the period shown, but that the expense ratio is unchanged. In this case, because the return used is not the Fund’s actual return, the results do not apply to your investment. The example is useful in making comparisons because the U.S. Securities and Exchange Commission (the “SEC”) requires all mutual funds to calculate expenses based on a 5% return. You can assess the Fund’s ongoing costs by comparing this hypothetical example with the hypothetical examples that appear in shareholder reports of other funds.
Note that expenses shown in the table are meant to highlight and help you compare ongoing costs only.
The calculations assume no shares were bought or sold during the period. Your actual costs may have been higher or lower, depending on the amount of your investment and the timing of any purchases or redemptions.
27
1789 GROWTH AND INCOME FUND
ABOUT YOUR FUND’S EXPENSES (Unaudited) (Continued)
More information about the Fund’s expenses, including historical expense ratios, can be found in this report. For additional information on operating expenses and other shareholder costs, please refer to the Fund’s prospectus.
| Beginning
Account Value
May 1,
2022 | Ending
Account Value
October 31,
2022 | Expense
Ratio (a) | Expenses
Paid During
Period (b) |
Class P Shares | | | | |
Based on Actual Fund Return | $ 1,000.00 | $ 947.90 | 1.01% | $ 4.96 |
Based on Hypothetical 5% Return (before expenses) | $ 1,000.00 | $ 1,020.11 | 1.01% | $ 5.14 |
Class C Shares | | | | |
Based on Actual Fund Return | $ 1,000.00 | $ 943.80 | 2.01% | $ 9.85 |
Based on Hypothetical 5% Return (before expenses) | $ 1,000.00 | $ 1,015.07 | 2.01% | $ 10.21 |
(a) | Annualized, based on the most recent one-half year expenses. |
(b) | Expenses are equal to the annualized expense ratio of each Class, multiplied by the average account value over the period, multiplied by 184/365 (to reflect the one-half year period). |
28
1789 GROWTH AND INCOME FUND
OTHER INFORMATION (Unaudited)
A description of the policies and procedures that the Fund uses to vote proxies relating to portfolio securities is available without charge upon request by calling toll-free 1-888-229-9448, or on the SEC’s website at www.sec.gov. Information regarding how the Fund voted proxies relating to portfolio securities during the most recent 12-month period ended June 30 is available without charge upon request by calling toll-free 1-888-229-9448, or on the SEC’s website at www.sec.gov.
The Trust files a complete listing of portfolio holdings for the Fund with the SEC as of the end of the first and third quarters of each fiscal year as an exhibit to its reports on Form N-PORT. The filings are available upon request by calling 1-888-229-9448. Furthermore, you may obtain a copy of the filings on the SEC’s website at www.sec.gov and on the Fund’s website at www.pcm-advisors.com.
FEDERAL TAX INFORMATION (Unaudited)
For the fiscal year ended October 31, 2022, the Fund designated $452,236 as long-term capital gain distributions.
Qualified Dividend Income – The Fund designates 100%, or up to the maximum amount of such dividends allowable pursuant to the Internal Revenue code, as qualified dividend income eligible for the reduced tax rate.
Dividends Received Deduction – Corporate shareholders are generally entitled to take the dividends received deduction on the portion of the Fund’s dividend distribution that qualifies under tax law. For the Fund’s fiscal year 2022 ordinary income dividends, 100% qualifies for the corporate dividends received deduction.
29
1789 GROWTH AND INCOME FUND
BOARD OF TRUSTEES AND EXECUTIVE OFFICERS (Unaudited)
The Board of Trustees has overall responsibility for management of the Trust’s affairs. The Trustees serve during the lifetime of the Trust and until its termination, or until death, resignation, retirement, or removal. The Trustees, in turn, elect the officers of the Trust to actively supervise its day-to-day operations. The officers have been elected for an annual term. The following are the Trustees and executive officers of the Trust:
Name,
Address(a),
and Year of Birth | Position(s)
with the
Trust | Length of
Time Served | Principal Occupation(s)
During Past 5 Years | Number of
Portfolios in
Fund Complex
Overseen by
Trustee | Other
Directorships
Held by Trustee
During the Past
5 Years |
Independent Trustees |
Joseph O.
Reagan, MD,
1951 | Trustee
Chairman | Since 2010
Since 2019 | Retired; Adjunct Professor, Cornell University’s Sloan School of Management: 2009 to 2015; Practice Consultant, Community General Hospital’s Anesthesia Group: 2008 to 2020. | 1 | None |
Mark E. Wadach
1951 | Trustee | Since 2014 | Sales Representative for Upstate Utilities Inc. (utilities, telecom and cellular): 2007 to present. | 1 | NYSA Series Trust (registered investment company) |
Christopher Wiles
1943 | Trustee | Since 2019 | Retired; New York State Attorney General’s Office: 2014 to 2018. | 1 | None |
Interested Trustee |
Dalton J. Axenfeld (b)
1988 | Trustee | Since 2019 | CFO, Pinnacle Holding Company, LLC: 2017 to present; Controller, Pinnacle Holding Company, LLC: 2016 to 2017. | 1 | None |
30
1789 GROWTH AND INCOME FUND
BOARD OF TRUSTEES AND EXECUTIVE OFFICERS (Unaudited) (Continued)
Name,
Address(a),
and Year of Birth | Position(s)
with the
Trust | Length of
Time Served | Principal Occupation(s) During Past 5 Years |
Executive Officers |
Stephen J. Fauer, CFA
1959 | President, Principal Executive Officer | Since 2021 | Chief Investment Officer, Pinnacle Capital Management, LLC: 2006 to present. |
Paul Tryon, CFA
1975 | Treasurer and Chief Financial Officer | Since 2017 | Principal, Senior Portfolio Manager, Pinnacle Capital Management, LLC: 2016 to present. |
Kevin McClelland
1986 | Chief Compliance Officer, Chief Operating Officer | Since 2012 (CCO Since 2013) | Chief Compliance Officer & Chief Operating Officer, Pinnacle Capital Management, LLC: March 2013 to present. |
Jesse D. Hallee
225 Pictoria Drive,
Suite 450,
Cincinnati, Ohio
45246,
1976 | Secretary | Since May 2021 | Senior Vice President and Associate General Counsel, Ultimus Fund Solutions, LLC (2019-present); Vice President and Senior Counsel, State Street Bank and Trust Company (2013-2019). |
(a) | The address of each Trustee and officer is c/o Pinnacle Capital Management Funds Trust, 5845 Widewaters Parkway, Suite 300, East Syracuse, New York, 31057, unless listed otherwise. |
(b) | Considered an “interested person” as defined in Section 2(a)(19) of the 1940 Act by virtue of his affiliation with the Adviser. |
Additional information about the Trustees and executive officers is available in the Fund’s Statement of Additional Information (“SAI”). To obtain a free copy of the SAI, please call 1-888-229-9448.
31
1789 GROWTH AND INCOME FUND
APPROVAL OF INVESTMENT ADVISORY AGREEMENT (Unaudited)
Pinnacle Capital Management, LLC (the “Adviser”), 5845 Widewaters Parkway, Suite 300, East Syracuse, New York 13057, serves as the investment adviser to the 1789 Growth and Income Fund (the “Fund”). The Adviser provides the Fund with a continuous program of investing the Fund’s assets and determining the composition of the Fund’s portfolio. In addition to serving as the investment adviser to the Fund, the Adviser provides investment advisory services to individuals, corporations, pension funds, foundations, endowments, labor unions, insurance companies, healthcare organizations and governments.
The Adviser is subject to the oversight of the Fund and the Fund’s board of trustees (the “Board of Trustees”). The Adviser serves as investment adviser to the Fund pursuant to a written investment management agreement between the Adviser and the Fund dated November 19, 2010 (the “Advisory Agreement”). The Advisory Agreement provides that the Adviser shall not be liable for any loss suffered by the Fund or its shareholders, except by reason of its own willful misfeasance, bad faith or gross negligence, or from its reckless disregard of its duties under the Advisory Agreement. The Advisory Agreement is terminable by the Fund at any time, without penalty, either by action of the Board of Trustees or upon a vote of the holders of a majority of the outstanding voting securities of the Fund upon 60 days’ prior written notice to the Adviser. The Advisory Agreement is also terminable by the Adviser with 60 days’ prior written notice to the Fund, and will terminate automatically in the event of its “assignment,” as defined in the Investment Company Act of 1940, as amended (the “1940 Act”), including in the event of a change of control or sale of the Adviser. The Advisory Agreement continues in force until November 19, 2023, after which it may be continued from year to year thereafter only as long as such continuance is approved annually by (a) the vote of a majority of the Board of Trustees, including a majority of the Trustees who are not “interested persons,” as defined by the 1940 Act, of the Trust (the “Independent Trustees”); or (b) the vote of a majority of the Fund’s outstanding voting securities (as defined in the 1940 Act).
The Board of Trustees, including a majority of the Independent Trustees voting separately, approved the continuance of the Advisory Agreement for an additional term of one year at a telephonic meeting held on October 6, 2022. In the course of their deliberations, the Independent Trustees were advised by their independent legal counsel of their obligations in determining to approve the Advisory Agreement. The Trustees received and reviewed a substantial amount of information provided by the Adviser in response to requests of the Trustees and counsel.
In considering whether to approve the Advisory Agreement, the Board of Trustees, including the Independent Trustees, did not identify any single factor as determinative, and each Trustee weighed the various factors independently as he deemed appropriate. The Trustees considered the following matters, among other things, in connection with their approval of the Advisory Agreement.
32
1789 GROWTH AND INCOME FUND
APPROVAL OF INVESTMENT ADVISORY AGREEMENT (Unaudited) (Continued)
Nature, Extent and Quality of Services
The Trustees received and considered information regarding the nature, extent and quality of services provided to the Fund by the Adviser. The Trustees specifically reviewed the qualifications, backgrounds, and responsibilities of the key personnel that oversee the investment management and day-to-day operations of the Fund. The Trustees noted that Mr. Paul Tryon is responsible for the day-to-day management of the Fund and its portfolio. The Trustees considered that the Adviser has a staff of skilled investment professionals who provide research and trading services to the Fund and determined that the Adviser possesses adequate resources to manage the Fund. The Trustees also considered the Adviser’s compliance program and noted the resources it has dedicated towards compliance, including providing a qualified compliance officer to oversee its compliance program. The Trustees also considered the overall investment management capabilities of the Adviser and its ongoing financial commitment to the Fund. The Trustees considered the Adviser’s responsibilities with regards to brokerage selection and best execution and were mindful that the Adviser does not enter into any “soft dollar” arrangements on behalf of the Fund.
Investment Performance of the Fund
The Trustees compared the Fund’s returns to the returns of its benchmark, the S&P 500 Index. The Trustees also compared the Fund’s performance to other domestic growth and income funds of similar size with similar investment styles, and the Adviser’s separately managed accounts that are managed in a similar investment style (the “Composite Returns”), as included in the Board Materials. In reviewing the comparative performance, the Board considered that the annual returns for the Fund’s Class C and Class P shares for the period ended June 30, 2022 were both higher than the average and median returns for the one-year period ended June 30, 2022 for the Fund’s peer group, the “Large Cap Value Category” with less than $40 million in assets as derived from Morningstar, Inc. (the “peer group”). The Board also considered the returns for the Fund’s Class C and Class P shares for the three-year period ended June 30, 2022 as compared to the Fund’s peer group. The Board noted that the returns for the Fund’s Class C and Class P shares for the three-year period ended June 30, 2022 were both lower than the average returns for the three-year period ended June 30, 2022 for the peer group, that the return for the Fund’s Class C shares was lower than the median return for the three-year period ended June 30, 2022 for the peer group, and that the return for the Fund’s Class P shares was higher than the median return for the three-year period ended June 30, 2022 for the peer group. The Board further discussed the conversion and closing of the Class A shares in 2017, and the impact of the conversion and closure of that class on the Fund. The Board also noted the impact of a portfolio manager change when Mr. Tryon assumed the role of the Fund’s principal portfolio manager in December 2017.
33
1789 GROWTH AND INCOME FUND
APPROVAL OF INVESTMENT ADVISORY AGREEMENT (Unaudited) (Continued)
Expenses
The Board considered statistical information regarding the Fund’s expense ratio and its various components, including the contractual advisory fee, as compared to its peer group, as defined above. The Trustees noted that the overall expense ratio of the Fund’s Class C shares was higher than the average and median expense ratios for the peer group, and that the overall expense ratio of the Fund’s Class P shares was slightly higher than the average and median expense ratios for the peer group, according to the Board Materials. The Board considered that, according to the services agreement between the Trust and the Adviser, in return for a service fee paid by the Fund, the Adviser pays all operating expenses of the Fund excluding advisory fees; brokerage fees and commissions; fees paid pursuant to the Fund’s Plan of Distribution Pursuant to Rule 12b-1 (“12b-1 fees”); taxes; borrowing costs; fees and expenses of the Independent Trustees; and the fees and expenses of acquired funds and extraordinary expenses.
Investment Advisory Fee Rates
The Trustees reviewed and considered the proposed contractual investment advisory fee rate payable by the Fund to the Adviser for investment advisory services. Additionally, the Trustees received and considered information comparing the Fund’s advisory fee rate with those of the other funds in its peer group, as defined above. The Trustees noted that the advisory fee rate for the Fund was higher than the median and average rates for the peer group presented, as included in the Board Materials.
The Trustees reviewed the Adviser’s financial statements and discussed its financial condition. It was noted that the Adviser experienced a profit in 2021 and in the first eight months of 2022. It was also noted that the Distributor was profitable in 2021, and the Trustees reviewed the Distributor’s Income Statement for the year ended December 31, 2021 which was included in the Board Materials. It was noted that the Adviser and the Distributor are both wholly-owned subsidiaries of Pinnacle Holding Company, whose management remains fully committed to supporting the Adviser. The Trustees discussed the level of the Fund’s assets, the projected profits of the Adviser and the other ancillary benefits that the Adviser may receive by providing advisory services to the Fund. The Trustees further considered the Adviser’s commitment to continue to grow assets in the Fund and the Adviser’s representation that it has adequate financial resources to continue to provide service to the Fund.
34
1789 GROWTH AND INCOME FUND
APPROVAL OF INVESTMENT ADVISORY AGREEMENT (Unaudited) (Continued)
Economies of Scale
The Trustees noted that the investment advisory fee schedule for the Fund does not contain breakpoints; however, the Trustees discussed the fact that the Fund’s assets have not grown to an extent that permits it to realize any meaningful economies of scale at this time. The Trustees observed that as the assets of the Fund grow, this factor will become more relevant to their consideration process.
Conclusion
The Trustees determined that the overall arrangement between the Fund and the Adviser, as provided in the Advisory Agreement, was fair and reasonable and that approval of the continuance of the Advisory Agreement was in the best interests of the Fund and its shareholders.
35
1789 GROWTH AND INCOME FUND
LIQUIDITY RISK MANAGEMENT PROGRAM
(Unaudited)
The Fund has adopted and implemented a written liquidity risk management program as required by Rule 22e-4 (the “Liquidity Rule”) under the Investment Company Act. The program is reasonably designed to assess and manage the Fund’s liquidity risk, taking into consideration, among other factors, the Fund’s investment strategy and the liquidity of its portfolio investments during normal and reasonably foreseeable stressed conditions; its short and long-term cash flow projections; and its cash holdings and access to other funding sources. The Funds’ Board of Trustees approved the appointment of a committee to serve as Liquidity Program Administrator (“LPA”), which committee includes representatives from the Fund’s Adviser. The LPA is responsible for the program’s administration and oversight and for reporting to the Board on at least an annual basis regarding the program’s operation and effectiveness. The written Liquidity Assessment Report that was presented to the Board of Trustees at the October 6, 2022 Board meeting covered the period from June 1, 2021 to May 31, 2022 (the “Review Period”).
During the Review Period, the Fund did not experience unusual stress or disruption to its operations related to purchase and redemption activity. Also, during the Review Period, the Fund held adequate levels of cash and highly liquid investments to meet shareholder redemption activities in accordance with applicable requirements. During the Review Period, the Fund did not hold illiquid securities and the Fund was not required to establish a highly liquid investment minimum. The Report concluded that the Fund’s liquidity risk was low during the Review Period.
36
This page intentionally left blank.
This page intentionally left blank.
This page intentionally left blank.
Privacy Notice
FACTS | WHAT DOES THE PINNACLE CAPITAL MANAGEMENT FUNDS TRUST DO WITH YOUR PERSONAL INFORMATION? |
| | | | |
Why? | Financial companies choose how they share your personal information. Federal law gives consumers the right to limit some but not all sharing. Federal law also requires us to tell you how we collect, share, and protect your personal information. Please read this notice carefully to understand what we do. |
| | | | |
What? | The types of personal information we collect and share depend on the product or service you have with us. This information can include: ● Social Security Number ● Assets ● Retirement Assets ● Transaction History ● Checking Account Information ● Purchase History ● Account Balances ● Account Transactions ● Wire Transfer Instructions When you are no longer our customer, we continue to share your information as described in this notice. |
| | | | |
How? | All financial companies need to share your personal information to run their everyday business. In the section below, we list the reasons financial companies can share their customers’ personal information; the reasons the Pinnacle Capital Management Funds Trust chooses to share; and whether you can limit this sharing. |
| | | | |
Reasons we can share your personal information | Does the Pinnacle Capital Management Funds Trust share? | Can you limit this sharing? |
For our everyday business purposes –
such as to process your transactions, maintain your account(s), respond to court orders and legal investigations, or report to credit bureaus | Yes | No |
For our marketing purposes –
to offer our products and services to you | No | We don’t share |
For joint marketing with other financial companies | No | We don’t share |
For our affiliates’ everyday business purposes –
information about your transactions and experiences | No | We don’t share |
For our affiliates’ everyday business purposes –
information about your creditworthiness | No | We don’t share |
For nonaffiliates to market to you | No | We don’t share |
Questions? | Call 1-888-229-9448 |
40
Who we are |
Who is providing this notice? | Pinnacle Capital Management Funds Trust Pinnacle Investments, LLC (Distributor) Ultimus Fund Solutions, LLC (Administrator) |
What we do |
How does the Pinnacle Capital Management Funds Trust protect my personal information? | To protect your personal information from unauthorized access and use, we use security measures that comply with federal law. These measures include computer safeguards and secured files and buildings. Our service providers are held accountable for adhering to strict policies and procedures to prevent any misuse of your nonpublic personal information. |
How does the Pinnacle Capital Management Funds Trust collect my personal information? | We collect your personal information, for example, when you ● Open an account ● Provide account information ● Give us your contact information ● Make deposits or withdrawals from your account ● Make a wire transfer ● Tell us where to send the money ● Tell us who receives the money ● Show your government-issued ID ● Show your driver’s license We also collect your personal information from other companies. |
Why can’t I limit all sharing? | Federal law gives you the right to limit only ● Sharing for affiliates’ everyday business purposes – information about your creditworthiness ● Affiliates from using your information to market to you ● Sharing for nonaffiliates to market to you State laws and individual companies may give you additional rights to limit sharing. |
Definitions |
Affiliates | Companies related by common ownership or control. They can be financial and nonfinancial companies. ● Pinnacle Capital Management, LLC, the investment adviser to the Pinnacle Capital Management Funds Trust, could be deemed to be an affiliate. |
Nonaffiliates | Companies not related by common ownership or control. They can be financial and nonfinancial companies ● Pinnacle Capital Management Funds Trust does not share with nonaffiliates so they can market to you. |
Joint marketing | A formal agreement between nonaffiliated financial companies that together market financial products or services to you. ● Pinnacle Capital Management Funds Trust does not jointly market. |
41
INVESTMENT ADVISER
Pinnacle Capital Management, LLC
5845 Widewaters Parkway,
Suite 300
East Syracuse, NY 13057
INDEPENDENT REGISTERED PUBLIC ACCOUNTING FIRM
Cohen & Company, Ltd.
151 North Franklin Street, Suite 575
Chicago, IL 60606
LEGAL COUNSEL
Bond Schoeneck & King PLLC
One Lincoln Center
110 West Fayette Street
Syracuse, NY 13202
CUSTODIAN
U.S. Bank, N.A.
425 Walnut Street
Cincinnati, OH 45202
TRANSFER AGENT
Ultimus Fund Solutions, LLC
225 Pictoria Drive, Suite 450
Cincinnati, OH 45246
DISTRIBUTOR
Pinnacle Investments, LLC
507 Plum Street, Suite 120
Syracuse, NY 13204
This report is intended only for the information of shareholders or those who have received the Fund’s prospectus which contains information about the Fund’s management fee and expenses. Please read the prospectus carefully before investing.
PCM-AR-22
As of the end of the period covered by this report, the registrant has adopted a code of ethics that applies to the registrant’s principal executive officer, principal financial officer, principal accounting officer or controller, or persons performing similar functions, regardless of whether these individuals are employed by the registrant or a third party. Pursuant to Item 13(a)(1), a copy of registrant’s code of ethics is filed as an exhibit to this Form N-CSR. During the period covered by this report, the code of ethics has not been amended, and the registrant has not granted any waivers, including implicit waivers, from the provisions of the code of ethics.
| Item 3. | Audit Committee Financial Expert. |
The registrant’s board of trustees has determined that the registrant does not have an audit committee financial expert serving on its audit committee. The audit committee determined that, although none of its members meet the technical definition of an audit committee financial expert, the members have sufficient financial expertise to address any issues that are likely to come before the committee.
| Item 4. | Principal Accountant Fees and Services. |
| (a) | Audit Fees. The aggregate fees billed for professional services rendered by the principal accountant for the audit of the registrant’s annual financial statements or for services that are normally provided by the accountant in connection with statutory and regulatory filings or engagements were $15,000 and $14,500 with respect to the registrant’s fiscal years ended October 31, 2022 and October 31, 2021, respectively. |
| (b) | Audit-Related Fees. No fees were billed in either of the last two fiscal years for assurance and related services by the principal accountant that are reasonably related to the performance of the audit of the registrant’s financial statements and are not reported under paragraph (a) of this Item. |
| (c) | Tax Fees. The aggregate fees billed for professional services rendered by the principal accountant for tax compliance, tax advice, and tax planning were $3,500 and $3,000 with respect to the registrant’s fiscal years ended October 31, 2022 and October 31, 2021, respectively. The services comprising these fees relate to tax preparation of the registrant’s federal income and excise tax returns. |
| (d) | All Other Fees. With respect to the fiscal year ended October 31, 2022 and October 31, 2021, the aggregate fees billed by the principal accountant for audit services rendered to the registrant’s investment adviser was $16,000 and $15,000, respectively. |
| | (e)(1) | The audit committee approves all audit and non-audit related services and, therefore, has not adopted pre-approval policies and procedures described in paragraph (c)(7) of Rule 2-01 of Regulation S-X. |
| (e)(2) | None of the services described in paragraph (b) through (d) of this Item were approved by the audit committee pursuant to paragraph (c)(7)(i)(C) of Rule 2-01 of Regulation S-X. |
| (f) | Less than 50% of hours expended on the principal accountant’s engagement to audit the registrant’s financial statements for the most recent fiscal year were attributed to work performed by persons other than the principal accountant’s full-time, permanent employees. |
| (g) | With respect to the fiscal years ended October 31, 2022 and October 31, 2021, aggregate non-audit fees of $3,500 and $3,000, respectively, were billed by the registrant’s accountant for services rendered to the registrant. With respect to the fiscal years ended October 31, 2022 and October 31, 2021, aggregate non-audit fees of $6,000 and $5,000, respectively, were billed by the registrant’s accountant for services rendered to the registrant’s investment adviser (not including any sub-adviser whose role is primarily portfolio management and is subcontracted with or overseen by another investment adviser), and any entity controlling, controlled by, or under common control with the adviser that provides ongoing services to the registrant. |
| (h) | The registrant’s audit committee of the board of trustees determined that the provision of non-audit services that were rendered to the registrant’s investment adviser (not including any sub-adviser whose role is primarily portfolio management and is subcontracted with or overseen by another investment adviser), and any entity controlling, controlled by, or under common control with the investment adviser that provides ongoing services to the registrant that were not pre-approved pursuant to paragraph (c)(7)(ii) of Rule 2-01 of Regulation S-X is compatible with maintaining the principal accountant’s independence. |
| Item 5. | Audit Committee of Listed Registrants. |
Not applicable
| Item 6. | Schedule of Investments. |
| (a) | See Schedule I (Investments in securities of unaffiliated issuers) |
| Item 7. | Disclosure of Proxy Voting Policies and Procedures for Closed-End Management Investment Companies. |
Not applicable
| Item 8. | Portfolio Managers of Closed-End Management Investment Companies. |
Not applicable
| Item 9. | Purchases of Equity Securities by Closed-End Management Investment Company and Affiliated Purchasers. |
Not applicable
| Item 10. | Submission of Matters to a Vote of Security Holders. |
The Nominating and Corporate Governance Committee shall, when identifying candidates for the position of Independent Trustee, consider any such candidate recommended by a shareholder if such recommendation contains: (i) sufficient background information concerning the candidate, including evidence the candidate is willing to serve as an Independent Trustee if selected for the position; and (ii) is received in a sufficiently timely manner as determined by the Nominating and Corporate Governance Committee in its discretion. Shareholders shall be directed to address any such recommendations in writing to the attention of the Nominating and Corporate Governance Committee, c/o the Secretary of the Trust. The Secretary shall retain copies of any shareholder recommendations which meet the foregoing requirements for a period of not more than 12 months following receipt. The Secretary shall have no obligation to acknowledge receipt of any shareholder recommendations.
| Item 11. | Controls and Procedures. |
(a) Based on their evaluation of the registrant’s disclosure controls and procedures (as defined in Rule 30a-3(c) under the Investment Company Act of 1940) as of a date within 90 days of the filing date of this report, the registrant’s principal executive officer and principal financial officer have concluded that such disclosure controls and procedures are reasonably designed and are operating effectively to ensure that material information relating to the registrant, including its consolidated subsidiaries, is made known to them by others within those entities, particularly during the period in which this report is being prepared, and that the information required in filings on Form N-CSR is recorded, processed, summarized, and reported on a timely basis.
(b) There were no changes in the registrant’s internal control over financial reporting (as defined in Rule 30a-3(d) under the Investment Company Act of 1940) that occurred during the period covered by this report that have materially affected, or are reasonably likely to materially affect, the registrant’s internal control over financial reporting.
| Item 12. | Disclosure of Securities Lending Activities for Closed-End Management Investment Companies. |
Not applicable
File the exhibits listed below as part of this Form. Letter or number the exhibits in the sequence indicated.
(a)(1) Any code of ethics, or amendment thereto, that is the subject of the disclosure required by Item 2, to the extent that the registrant intends to satisfy the Item 2 requirements through filing of an exhibit: Attached hereto
(a)(2) A separate certification for each principal executive officer and principal financial officer of the registrant as required by Rule 30a-2(a) under the Act (17 CFR 270.30a-2(a)): Attached hereto
(a)(3) Any written solicitation to purchase securities under Rule 23c-1 under the Act (17 CFR 270.23c-1) sent or given during the period covered by the report by or on behalf of the registrant to 10 or more persons: Not applicable
(a)(4) Change in the registrant’s independent public accountants: Not applicable
(b) Certifications required by Rule 30a-2(b) under the Act (17 CFR 270.30a-2(b)): Attached hereto
SIGNATURES
Pursuant to the requirements of the Securities Exchange Act of 1934 and the Investment Company Act of 1940, the registrant has duly caused this report to be signed on its behalf by the undersigned, thereunto duly authorized.
| (Registrant) | Pinnacle Capital Management Funds Trust | |
| | | | |
| By (Signature and Title)* | | /s/ Stephen Fauer | |
| | | | |
| | | Stephen Fauer, President | |
| | | | |
| Date | December 30, 2022 | | |
| | | | |
| Pursuant to the requirements of the Securities Exchange Act of 1934 and the Investment Company Act of 1940, this report has been signed below by the following persons on behalf of the registrant and in the capacities and on the dates indicated. |
| | | | |
| By (Signature and Title)* | | /s/ Stephen Fauer | |
| | | | |
| | | Stephen Fauer, President | |
| | | | |
| Date | December 30, 2022 | | |
| | | | |
| By (Signature and Title)* | | /s/ Paul A. Tryon | |
| | | | |
| | | Paul A. Tryon, Treasurer and Principal Financial Officer | |
| | | | |
| Date | December 30, 2022 | | |
| * | Print the name and title of each signing officer under his or her signature. |