UNITED STATES
SECURITIES AND EXCHANGE COMMISSION
Washington, D.C. 20549
FORM N-CSR
CERTIFIED SHAREHOLDER REPORT OF REGISTERED
MANAGEMENT INVESTMENT COMPANIES
Investment Company Act file number | 811-22445 | |
Pinnacle Capital Management Funds Trust |
(Exact name of registrant as specified in charter) |
507 Plum Street, Suite 120, Syracuse, NY | 13204 |
(Address of principal executive offices) | (Zip code) |
Capital Services, Inc. 615 S. Dupont Hwy. Dover, DE 19901 |
(Name and address of agent for service) |
With a copy to:
Jesse D. Hallee, Esq.
Ultimus Fund Solutions, LLC
225 Pictoria Drive, Suite 450
Cincinnati, Ohio 45246
Registrant's telephone number, including area code: | (315) 234-9716 | |
Date of fiscal year end: | October 31 | |
| | | |
Date of reporting period: | October 31, 2024 | |
Form N-CSR is to be used by management investment companies to file reports with the Commission not later than 10 days after the transmission to stockholders of any report that is required to be transmitted to stockholders under Rule 30e-1 under the Investment Company Act of 1940 (17 CFR 270.30e-1). The Commission may use the information provided on Form N-CSR in its regulatory, disclosure review, inspection, and policymaking roles.
A registrant is required to disclose the information specified by Form N-CSR, and the Commission will make this information public. A registrant is not required to respond to the collection of information contained in Form N-CSR unless the Form displays a currently valid Office of Management and Budget ("OMB") control number. Please direct comments concerning the accuracy of the information collection burden estimate and any suggestions for reducing the burden to Secretary, Securities and Exchange Commission, 450 Fifth Street, NW, Washington, DC 20549-0609. The OMB has reviewed this collection of information under the clearance requirements of 44 U.S.C. § 3507.
Item 1. Reports to Stockholders.
1789 Growth and Income Fund
Annual Shareholder Report - October 31, 2024
This annual shareholder report contains important information about 1789 Growth and Income Fund (the "Fund") for the period of November 1, 2023 to October 31, 2024. You can find additional information about the Fund at https://pcm-advisors.com/1789-growth-income-fund/. You can also request this information by contacting us at (888) 229-9448.
What were the Fund’s costs for the last year?
(based on a hypothetical $10,000 investment)
| Class Name | Costs of a $10,000 investment | Costs paid as a percentage of a $10,000 investment |
|---|
| Class P Shares | $115 | 1.01% |
How did the Fund perform during the reporting period?
The 1789 Growth and Income Fund (the “Fund”) generated positive returns for the fiscal year ended October 31, 2024. However, the Fund underperformed its primary benchmark, the S&P 500, which returned 38.02%. Negatively impacting returns for the Fund was the decision by the Fund’s former portfolio manager to maintain significant cash balances that, though generating positive returns, provided a return less than the broad equity markets. The greatest impact was in the first half of the fiscal year. Money market fund holdings as a percentage of the market value of the Fund’s investments totaled 15.64%, 10.43%, 3.52%, and 1.56% at the end of the three-month periods ended January 31, 2004, April 30, 2024, July 31, 2024, and October 31, 2024, respectively.
The Fund’s investment strategy focuses on identifying companies with growing dividends. Utilizing this strategy, the Fund began the year with sector weightings in Technology that differed from that of the S&P 500. That sector represented 31.7% of the S&P 500 holdings as of October 31, 2024 and 14.5% of the Fund. This is significant because Technology stocks contributed significantly to the positive returns of the S&P 500. The lack of significant holdings within the Fund was a major factor explaining why the Fund did not match that of the S&P 500.
At an individual security level, the top 5 performing equities, with performance from either the prior fiscal year end or date of first purchase into the Fund were Republic Services, Inc., Kroger Company (The), JPMorgan Chase & Company, Fidelity National Financial, Inc., and Cummins, Inc. The worst 5 performing equities, with performance from either the prior fiscal year end or date of first purchase into the Fund were Merck & Company, Inc., Microsoft Corporation, UnitedHealth Group, Inc., Interpublic Group of Companies, Inc. (The), and Stryker Corporation.
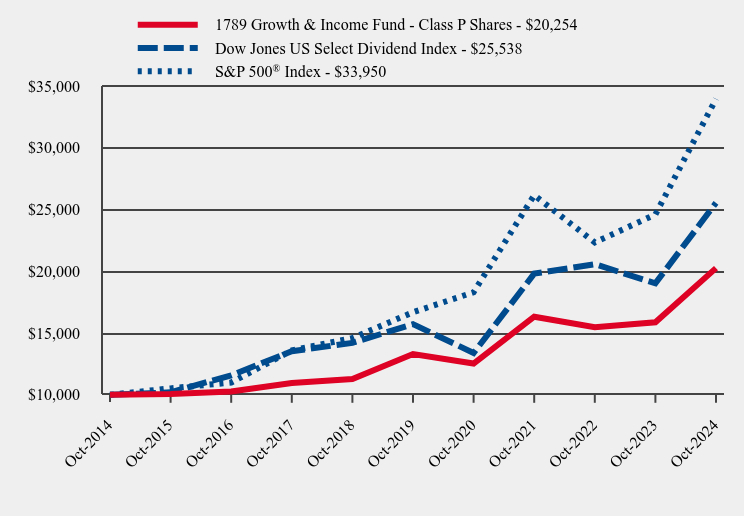
How has the Fund performed over the last ten years?
Total Return Based on $10,000 Investment
| 1789 Growth & Income Fund - Class P Shares | Dow Jones US Select Dividend Index | S&P 500® Index |
|---|
| Oct-2014 | $10,000 | $10,000 | $10,000 |
| Oct-2015 | $10,067 | $10,203 | $10,520 |
| Oct-2016 | $10,270 | $11,579 | $10,994 |
| Oct-2017 | $10,961 | $13,527 | $13,593 |
| Oct-2018 | $11,277 | $14,203 | $14,591 |
| Oct-2019 | $13,304 | $15,719 | $16,681 |
| Oct-2020 | $12,527 | $13,383 | $18,301 |
| Oct-2021 | $16,317 | $19,806 | $26,155 |
| Oct-2022 | $15,465 | $20,573 | $22,334 |
| Oct-2023 | $15,868 | $19,023 | $24,599 |
| Oct-2024 | $20,254 | $25,538 | $33,950 |
Average Annual Total Returns
| 1 Year | 5 Years | 10 Years |
|---|
| 1789 Growth & Income Fund - Class P Shares | 27.65% | 8.77% | 7.31% |
S&P 500® Index | 38.02% | 15.27% | 13.00% |
| Dow Jones US Select Dividend Index | 34.25% | 10.19% | 9.83% |
The Fund's past performance is not a good predictor of how the Fund will perform in the future. The graph and table do not reflect the deduction of taxes that a shareholder would pay on fund distributions or redemption of fund shares.
| Net Assets | $30,935,809 |
| Number of Portfolio Holdings | 20 |
| Advisory Fee | $231,010 |
| Portfolio Turnover | 20% |
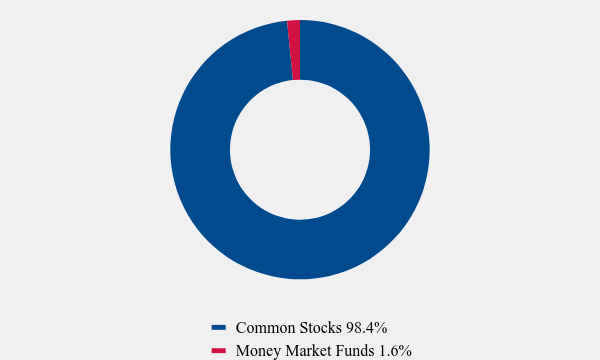
Asset Weighting (% of total investments)
| Value | Value |
|---|
| Common Stocks | 98.4% |
| Money Market Funds | 1.6% |
What did the Fund invest in?
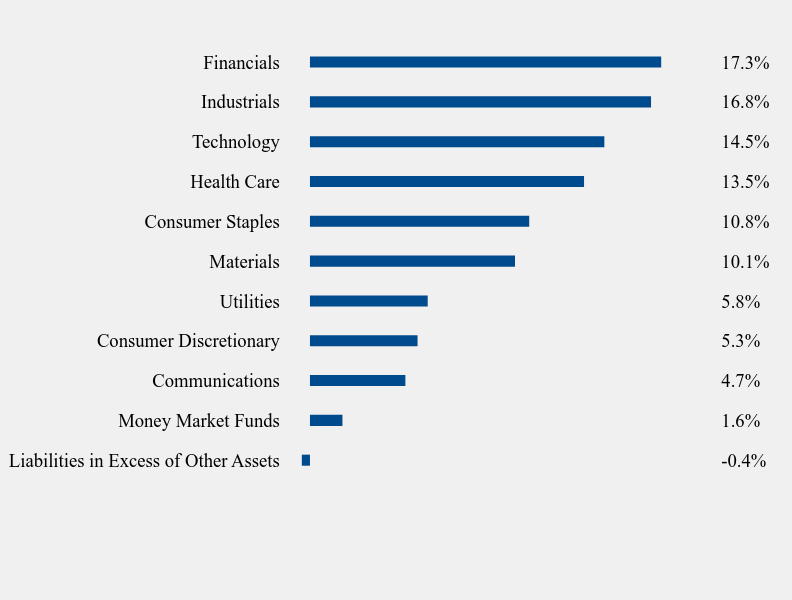
Sector Weighting (% of net assets)
| Value | Value |
|---|
| Liabilities in Excess of Other Assets | -0.4% |
| Money Market Funds | 1.6% |
| Communications | 4.7% |
| Consumer Discretionary | 5.3% |
| Utilities | 5.8% |
| Materials | 10.1% |
| Consumer Staples | 10.8% |
| Health Care | 13.5% |
| Technology | 14.5% |
| Industrials | 16.8% |
| Financials | 17.3% |
Top 10 Holdings (% of net assets)
| Holding Name | % of Net Assets |
| Packaging Corporation of America | 6.3% |
| Fidelity National Financial, Inc. | 6.1% |
| UnitedHealth Group, Inc. | 5.9% |
| Ingredion, Inc. | 5.8% |
| NextEra Energy, Inc. | 5.8% |
| JPMorgan Chase & Company | 5.8% |
| Cummins, Inc. | 5.8% |
| Lockheed Martin Corporation | 5.6% |
| CME Group, Inc. | 5.4% |
| Republic Services, Inc. | 5.4% |
No material changes occurred during the year ended October 31, 2024.
1789 Growth and Income Fund - Class P Shares (PSEPX)
Annual Shareholder Report - October 31, 2024
Where can I find additional information about the Fund?
Additional information is available on the Fund's website (https://pcm-advisors.com/1789-growth-income-fund/), including its:
Prospectus
Financial information
Holdings
Proxy voting information
1789 Growth and Income Fund
Annual Shareholder Report - October 31, 2024
This annual shareholder report contains important information about 1789 Growth and Income Fund (the "Fund") for the period of November 1, 2023 to October 31, 2024. You can find additional information about the Fund at https://pcm-advisors.com/1789-growth-income-fund/. You can also request this information by contacting us at (888) 229-9448.
What were the Fund’s costs for the last year?
(based on a hypothetical $10,000 investment)
| Class Name | Costs of a $10,000 investment | Costs paid as a percentage of a $10,000 investment |
|---|
| Class C Shares | $227 | 2.01% |
How did the Fund perform during the reporting period?
The 1789 Growth and Income Fund (the “Fund”) generated positive returns for the fiscal year ended October 31, 2024. However, the Fund underperformed its primary benchmark, the S&P 500, which returned 38.02%. Negatively impacting returns for the Fund was the decision by the Fund’s former portfolio manager to maintain significant cash balances that, though generating positive returns, provided a return less than the broad equity markets. The greatest impact was in the first half of the fiscal year. Money market fund holdings as a percentage of the market value of the Fund’s investments totaled 15.64%, 10.43%, 3.52%, and 1.56% at the end of the three-month periods ended January 31, 2004, April 30, 2024, July 31, 2024, and October 31, 2024, respectively.
The Fund’s investment strategy focuses on identifying companies with growing dividends. Utilizing this strategy, the Fund began the year with sector weightings in Technology that differed from that of the S&P 500. That sector represented 31.7% of the S&P 500 holdings as of October 31, 2024 and 14.5% of the Fund. This is significant because Technology stocks contributed significantly to the positive returns of the S&P 500. The lack of significant holdings within the Fund was a major factor explaining why the Fund did not match that of the S&P 500.
At an individual security level, the top 5 performing equities, with performance from either the prior fiscal year end or date of first purchase into the Fund were Republic Services, Inc., Kroger Company (The), JPMorgan Chase & Company, Fidelity National Financial, Inc., and Cummins, Inc. The worst 5 performing equities, with performance from either the prior fiscal year end or date of first purchase into the Fund were Merck & Company, Inc., Microsoft Corporation, UnitedHealth Group, Inc., Interpublic Group of Companies, Inc. (The), and Stryker Corporation.
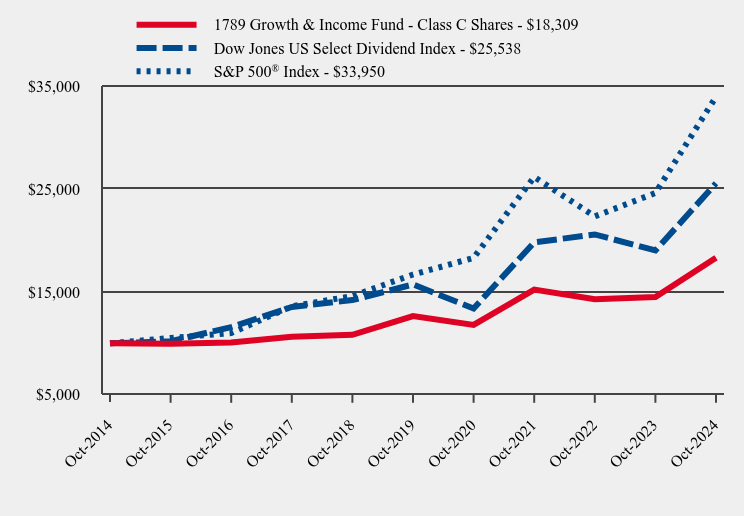
How has the Fund performed over the last ten years?
Total Return Based on $10,000 Investment
| 1789 Growth & Income Fund - Class C Shares | Dow Jones US Select Dividend Index | S&P 500® Index |
|---|
| Oct-2014 | $10,000 | $10,000 | $10,000 |
| Oct-2015 | $9,968 | $10,203 | $10,520 |
| Oct-2016 | $10,070 | $11,579 | $10,994 |
| Oct-2017 | $10,635 | $13,527 | $13,593 |
| Oct-2018 | $10,831 | $14,203 | $14,591 |
| Oct-2019 | $12,651 | $15,719 | $16,681 |
| Oct-2020 | $11,793 | $13,383 | $18,301 |
| Oct-2021 | $15,214 | $19,806 | $26,155 |
| Oct-2022 | $14,273 | $20,573 | $22,334 |
| Oct-2023 | $14,493 | $19,023 | $24,599 |
| Oct-2024 | $18,309 | $25,538 | $33,950 |
Average Annual Total Returns
| 1 Year | 5 Years | 10 Years |
|---|
| 1789 Growth & Income Fund - Class C Shares | | | |
| Without CDSC | 26.33% | 7.67% | 6.23% |
| With CDSC | 25.33% | 7.67% | 6.23% |
| Dow Jones US Select Dividend Index | 34.25% | 10.19% | 9.83% |
S&P 500® Index | 38.02% | 15.27% | 13.00% |
The Fund's past performance is not a good predictor of how the Fund will perform in the future. The graph and table do not reflect the deduction of taxes that a shareholder would pay on fund distributions or redemption of fund shares.
| Net Assets | $30,935,809 |
| Number of Portfolio Holdings | 20 |
| Advisory Fee | $231,010 |
| Portfolio Turnover | 20% |
Asset Weighting (% of total investments)
| Value | Value |
|---|
| Common Stocks | 98.4% |
| Money Market Funds | 1.6% |
What did the Fund invest in?
Sector Weighting (% of net assets)
| Value | Value |
|---|
| Liabilities in Excess of Other Assets | -0.4% |
| Money Market Funds | 1.6% |
| Communications | 4.7% |
| Consumer Discretionary | 5.3% |
| Utilities | 5.8% |
| Materials | 10.1% |
| Consumer Staples | 10.8% |
| Health Care | 13.5% |
| Technology | 14.5% |
| Industrials | 16.8% |
| Financials | 17.3% |
Top 10 Holdings (% of net assets)
| Holding Name | % of Net Assets |
| Packaging Corporation of America | 6.3% |
| Fidelity National Financial, Inc. | 6.1% |
| UnitedHealth Group, Inc. | 5.9% |
| Ingredion, Inc. | 5.8% |
| NextEra Energy, Inc. | 5.8% |
| JPMorgan Chase & Company | 5.8% |
| Cummins, Inc. | 5.8% |
| Lockheed Martin Corporation | 5.6% |
| CME Group, Inc. | 5.4% |
| Republic Services, Inc. | 5.4% |
No material changes occurred during the year ended October 31, 2024.
1789 Growth and Income Fund - Class C Shares (PSECX)
Annual Shareholder Report - October 31, 2024
Where can I find additional information about the Fund?
Additional information is available on the Fund's website (https://pcm-advisors.com/1789-growth-income-fund/), including its:
Prospectus
Financial information
Holdings
Proxy voting information
Item 2. Code of Ethics.
As of the end of the period covered by this report, the registrant has adopted a code of ethics that applies to the registrant's principal executive officer, principal financial officer, principal accounting officer or controller, or persons performing similar functions, regardless of whether these individuals are employed by the registrant or a third party. Pursuant to Item 13(a)(1), a copy of registrant's code of ethics is filed as an exhibit to this Form N-CSR. During the period covered by this report, the code of ethics has not been amended, and the registrant has not granted any waivers, including implicit waivers, from the provisions of the code of ethics.
Item 3. Audit Committee Financial Expert.
The registrant's board of trustees has determined that the registrant does not have an audit committee financial expert serving on its audit committee. The audit committee determined that, although none of its members meet the technical definition of an audit committee financial expert, the members have sufficient financial expertise to address any issues that are likely to come before the committee. After evaluation of the accounting environment within which the registrant operates, it was the consensus of the audit committee members that it is not necessary at the present time for the committee to seek to recruit an additional trustee who would qualify as an audit committee financial expert. It was the view of the committee that, if novel issues ever arise, it will hire an expert to assist it as needed.
Item 4. Principal Accountant Fees and Services.
| (a) | Audit Fees. The aggregate fees billed for professional services rendered by the principal accountant for the audit of the registrant's annual financial statements or for services that are normally provided by the accountant in connection with statutory and regulatory filings or engagements were $15,500 and $15,000 with respect to the registrant's fiscal years ended October 31, 2024 and 2023, respectively. |
| (b) | Audit-Related Fees. No fees were billed during the fiscal years ended October 31, 2024 and 2023 for assurance and related services by the principal accountant that are reasonably related to the performance of the audit of the registrant's financial statements and are not reported under paragraph (a) of this Item. |
| (c) | Tax Fees. The aggregate fees billed for professional services rendered by the principal accountant for tax compliance, tax advice, and tax planning were $3,500 and $3,500 with respect to the registrant's fiscal years ended October 31, 2024 and 2023, respectively. The services comprising these fees include the preparation of the registrant's federal income tax returns and the preparation of the registrant's excise tax returns (which includes review of the Funds' required distributions). |
| (d) | All Other Fees. With respect to the fiscal year ended October 31, 2024 and October 31, 2023, the aggregate fees billed by the principal accountant for audit services rendered to the registrant's investment adviser was $16,000 and $16,000, respectively. |
| (e)(1) | The audit committee approves all audit and non-audit related services and, therefore, has not adopted pre-approval policies and procedures described in paragraph (c)(7) of Rule 2-01 of Regulation S-X. |
| (e)(2) | None of the services described in paragraph (b) through (d) of this Item were approved by the audit committee pursuant to paragraph (c)(7)(i)(C) of Rule 2-01 of Regulation S-X. |
| (f) | Less than 50% of hours expended on the principal accountant's engagement to audit the registrant's financial statements for the most recent fiscal year were attributed to work performed by persons other than the principal accountant's full-time, permanent employees. |
| (g) | With respect to the fiscal years ended October 31, 2024 and October 31, 2023, aggregate non-audit fees of $3,500 and $3,500, respectively, were billed by the registrant's accountant for services rendered to the registrant. With respect to the fiscal years ended October 31, 2024 and October 31, 2023, aggregate non-audit fees of $6,000 and $6,000, respectively, were billed by the registrant's accountant for services rendered to the registrant's investment adviser (not including any sub-adviser whose role is primarily portfolio management and is subcontracted with or overseen by another investment adviser), and any entity controlling, controlled by, or under common control with the adviser that provides ongoing services to the registrant. |
| (h) | The principal accountant has not provided any non-audit services to the registrant's investment adviser (not including any sub-adviser whose role is primarily portfolio management and is subcontracted with or overseen by another investment adviser), and any entity controlling, controlled by, or under common control with the investment adviser that provides ongoing services to the registrant. |
Item 5. Audit Committee of Listed Registrants.
Not applicable
Item 6. Investments.
| (a) | The Registrant(s) schedule(s) of investments is included in the Financial Statements under Item 7 of this form. |
Item 7. Financial Statements and Financial Highlights for Open-End Management Investment Companies
(a)

1789 Growth and Income Fund
Class P Shares | (PSEPX) |
Class C Shares | (PSECX) |
FINANCIAL STATEMENTS
October 31, 2024
1789 GROWTH AND INCOME FUND SCHEDULE OF INVESTMENTS
October 31, 2024 |
COMMON STOCKS — 98.8% | | Shares | | | Value | |
Communications — 4.7% | | | | | | | | |
Advertising & Marketing — 4.7% | | | | | | | | |
Interpublic Group of Companies, Inc. (The) | | | 49,350 | | | $ | 1,450,890 | |
| | | | | | | | | |
Consumer Discretionary — 5.3% | | | | | | | | |
Retail - Discretionary — 5.3% | | | | | | | | |
Home Depot, Inc. (The) | | | 4,175 | | | | 1,643,906 | |
| | | | | | | | | |
Consumer Staples — 10.8% | | | | | | | | |
Food — 5.8% | | | | | | | | |
Ingredion, Inc. | | | 13,600 | | | | 1,805,536 | |
| | | | | | | | | |
Retail - Consumer Staples — 5.0% | | | | | | | | |
Kroger Company (The) | | | 27,460 | | | | 1,531,444 | |
| | | | | | | | | |
Financials — 17.3% | | | | | | | | |
Banking — 5.8% | | | | | | | | |
JPMorgan Chase & Company | | | 8,100 | | | | 1,797,552 | |
| | | | | | | | | |
Institutional Financial Services — 5.4% | | | | | | | | |
CME Group, Inc. | | | 7,450 | | | | 1,678,932 | |
| | | | | | | | | |
Specialty Finance — 6.1% | | | | | | | | |
Fidelity National Financial, Inc. | | | 31,000 | | | | 1,865,270 | |
| | | | | | | | | |
Health Care — 13.5% | | | | | | | | |
Biotech & Pharma — 3.2% | | | | | | | | |
Merck & Company, Inc. | | | 9,880 | | | | 1,010,922 | |
| | | | | | | | | |
Health Care Facilities & Services — 5.9% | | | | | | | | |
UnitedHealth Group, Inc. | | | 3,225 | | | | 1,820,512 | |
| | | | | | | | | |
Medical Equipment & Devices — 4.4% | | | | | | | | |
Stryker Corporation | | | 3,810 | | | | 1,357,427 | |
See accompanying notes to financial statements. |
1
1789 GROWTH AND INCOME FUND
SCHEDULE OF INVESTMENTS (CONTINUED) |
COMMON STOCKS — 98.8% (Continued) | | Shares | | | Value | |
Industrials — 16.8% | | | | | | | | |
Aerospace & Defense — 5.6% | | | | | | | | |
Lockheed Martin Corporation | | | 3,195 | | | $ | 1,744,630 | |
| | | | | | | | | |
Commercial Support Services — 5.4% | | | | | | | | |
Republic Services, Inc. | | | 8,400 | | | | 1,663,200 | |
| | | | | | | | | |
Transportation Equipment — 5.8% | | | | | | | | |
Cummins, Inc. | | | 5,400 | | | | 1,776,492 | |
| | | | | | | | | |
Materials — 10.1% | | | | | | | | |
Chemicals — 3.8% | | | | | | | | |
Celanese Corporation | | | 9,450 | | | | 1,190,417 | |
| | | | | | | | | |
Containers & Packaging — 6.3% | | | | | | | | |
Packaging Corporation of America | | | 8,500 | | | | 1,945,990 | |
| | | | | | | | | |
Technology — 14.5% | | | | | | | | |
Semiconductors — 5.2% | | | | | | | | |
Broadcom, Inc. | | | 9,420 | | | | 1,599,233 | |
| | | | | | | | | |
Software — 3.9% | | | | | | | | |
Microsoft Corporation | | | 3,000 | | | | 1,219,050 | |
| | | | | | | | | |
Technology Services — 5.4% | | | | | | | | |
Mastercard, Inc. - Class A | | | 3,320 | | | | 1,658,639 | |
| | | | | | | | | |
Utilities — 5.8% | | | | | | | | |
Electric Utilities — 5.8% | | | | | | | | |
NextEra Energy, Inc. | | | 22,704 | | | | 1,799,292 | |
| | | | | | | | | |
Total Common Stocks (Cost $19,568,768) | | | | | | $ | 30,559,334 | |
See accompanying notes to financial statements. |
2
1789 GROWTH AND INCOME FUND
SCHEDULE OF INVESTMENTS (CONTINUED) | |
MONEY MARKET FUNDS — 1.6% | | Shares | | | Value | |
Fidelity Institutional Money Market Government Portfolio - Class I, 4.70% (a) (Cost $483,743) | | | 483,743 | | | $ | 483,743 | |
| | | | | | | | | |
| Total Investments at Value — 100.4% (Cost $20,052,511) | | | | | | $ | 31,043,077 | |
| | | | | | | | | |
Liabilities in Excess of Other Assets — (0.4%) | | | | | | | (107,268 | ) |
| | | | | | | | | |
Net Assets — 100.0% | | | | | | $ | 30,935,809 | |
(a) | The rate shown is the 7-day effective yield as of October 31, 2024. |
See accompanying notes to financial statements. |
3
1789 GROWTH AND INCOME FUND
STATEMENT OF ASSETS AND LIABILITIES
October 31, 2024 |
ASSETS | | | | |
Investments in securities: | | | | |
At cost | | $ | 20,052,511 | |
At value (Note 2) | | $ | 31,043,077 | |
Receivable for capital shares sold | | | 34,206 | |
Dividends receivable | | | 11,133 | |
Other assets | | | 1,500 | |
TOTAL ASSETS | | | 31,089,916 | |
| | | | | |
LIABILITIES | | | | |
Payable to Adviser (Note 4) | | | 56,382 | |
Accrued service fees (Note 4) | | | 11,824 | |
Accrued distribution plan fees (Note 4) | | | 85,901 | |
TOTAL LIABILITIES | | | 154,107 | |
| | | | | |
NET ASSETS | | $ | 30,935,809 | |
| | | | | |
Net assets consist of: | | | | |
Paid-in capital | | $ | 18,976,727 | |
Distributable earnings | | | 11,959,082 | |
NET ASSETS | | $ | 30,935,809 | |
| | | | | |
PRICING OF CLASS P SHARES | | | | |
Net assets applicable to Class P Shares | | $ | 11,785,027 | |
Shares of beneficial interest outstanding (unlimited number of shares authorized, no par value) | | | 630,376 | |
Net asset value, offering price and redemption price per share (Note 2) | | $ | 18.70 | |
Short-term redemption price per share (Note 2) (a) | | $ | 18.51 | |
| | | | | |
PRICING OF CLASS C SHARES | | | | |
Net assets applicable to Class C Shares | | $ | 19,150,782 | |
Shares of beneficial interest outstanding (unlimited number of shares authorized, no par value) | | | 1,054,430 | |
Net asset value, offering price and redemption price per share (Note 2) | | $ | 18.16 | |
Redemption price per share with CDSC fee (Note 2) (b) | | $ | 17.98 | |
(a) | Class P shares of the Fund impose a 1.00% redemption fee on shares redeemed within 60 days of purchase. |
(b) | A contingent deferred sales charge (“CDSC”) of 1.00% is charged on Class C shares redeemed within one year of purchase. Redemption price per share is equal to net asset value less any redemption fee or CDSC. |
See accompanying notes to financial statements. |
4
1789 GROWTH AND INCOME FUND
STATEMENT OF OPERATIONS
For the Year Ended October 31, 2024 |
INVESTMENT INCOME | | | | |
Dividends | | $ | 838,140 | |
| | | | | |
EXPENSES | | | | |
Investment advisory fees (Note 4) | | | 231,010 | |
Distribution fees, Class C (Note 4) | | | 185,477 | |
Service fees (Note 4) | | | 73,923 | |
Trustees’ fees (Note 4) | | | 6,000 | |
TOTAL EXPENSES | | | 496,410 | |
| | | | | |
NET INVESTMENT INCOME | | | 341,730 | |
| | | | | |
REALIZED AND UNREALIZED GAINS ON INVESTMENTS | | | | |
Net realized gains from investment transactions | | | 990,901 | |
Net change in unrealized appreciation (depreciation) on investments | | | 5,892,550 | |
NET REALIZED AND UNREALIZED GAINS ON INVESTMENTS | | | 6,883,451 | |
| | | | | |
NET INCREASE IN NET ASSETS RESULTING FROM OPERATIONS | | $ | 7,225,181 | |
See accompanying notes to financial statements. |
5
1789 GROWTH AND INCOME FUND
STATEMENTS OF CHANGES IN NET ASSETS |
| | Year
Ended
October 31,
2024 | | | Year
Ended
October 31,
2023 | |
FROM OPERATIONS | | | | | | | | |
Net investment income | | $ | 341,730 | | | $ | 534,154 | |
Net realized gains from investment transactions | | | 990,901 | | | | 458,148 | |
Net change in unrealized appreciation (depreciation) on investments | | | 5,892,550 | | | | (345,259 | ) |
Net increase in net assets resulting from operations | | | 7,225,181 | | | | 647,043 | |
| | | | | | | | | |
FROM DISTRIBUTIONS TO SHAREHOLDERS (Note 2) | | | | | | | | |
From distributable earnings | | | | | | | | |
Class P | | | (395,319 | ) | | | (777,969 | ) |
Class C | | | (426,654 | ) | | | (941,304 | ) |
Decrease in net assets from distributions to shareholders | | | (821,973 | ) | | | (1,719,273 | ) |
| | | | | | | | | |
FROM CAPITAL SHARE TRANSACTIONS (Notes 1 and 5) | | | | | | | | |
Class P | | | | | | | | |
Proceeds from shares sold | | | 481,363 | | | | 785,886 | |
Net asset value of shares issued in reinvestment of distributions | | | 323,338 | | | | 640,290 | |
Proceeds from redemption fees collected (Note 2) | | | 650 | | | | — | |
Payments for shares redeemed | | | (3,274,592 | ) | | | (2,451,183 | ) |
Net decrease in Class P shares capital share transactions | | | (2,469,241 | ) | | | (1,025,007 | ) |
| | | | | | | | | |
Class C | | | | | | | | |
Proceeds from shares sold | | | 189,726 | | | | 670,935 | |
Net asset value of shares issued in reinvestment of distributions | | | 406,351 | | | | 890,850 | |
Payments for shares redeemed | | | (2,183,300 | ) | | | (1,839,401 | ) |
Net decrease in Class C shares capital share transactions | | | (1,587,223 | ) | | | (277,616 | ) |
| | | | | | | | | |
TOTAL INCREASE (DECREASE) IN NET ASSETS | | | 2,346,744 | | | | (2,374,853 | ) |
| | | | | | | | | |
NET ASSETS | | | | | | | | |
Beginning of year | | | 28,589,065 | | | | 30,963,918 | |
End of year | | $ | 30,935,809 | | | $ | 28,589,065 | |
See accompanying notes to financial statements. |
6
1789 GROWTH AND INCOME FUND - CLASS P
FINANCIAL HIGHLIGHTS |
Per share data for a share outstanding throughout each year: |
| | Year
Ended
October 31,
2024 | | | Year
Ended
October 31,
2023 | | | Year
Ended
October 31,
2022 | | | Year
Ended
October 31,
2021 | | | Year
Ended
October 31,
2020 | |
Net asset value at beginning of year | | $ | 15.12 | | | $ | 15.65 | | | $ | 16.79 | | | $ | 12.97 | | | $ | 13.95 | |
| | | | | | | | | | | | | | | | | | | | | |
Income (loss) from investment operations: | | | | | | | | | | | | | | | | | | | | |
Net investment income (a) | | | 0.30 | | | | 0.36 | | | | 0.13 | | | | 0.14 | | | | 0.15 | |
Net realized and unrealized gains (losses) on investments | | | 3.82 | | | | 0.05 | | | | (0.98 | ) | | | 3.77 | | | | (0.96 | ) |
Total from investment operations | | | 4.12 | | | | 0.41 | | | | (0.85 | ) | | | 3.91 | | | | (0.81 | ) |
| | | | | | | | | | | | | | | | | | | | | |
Less distributions from: | | | | | | | | | | | | | | | | | | | | |
Net investment income | | | (0.30 | ) | | | (0.34 | ) | | | (0.05 | ) | | | (0.09 | ) | | | (0.13 | ) |
Net realized gains on investments | | | (0.24 | ) | | | (0.60 | ) | | | (0.24 | ) | | | — | | | | (0.03 | ) |
Return of capital | | | — | | | | — | | | | — | | | | — | | | | (0.01 | ) |
Total distributions | | | (0.54 | ) | | | (0.94 | ) | | | (0.29 | ) | | | (0.09 | ) | | | (0.17 | ) |
| | | | | | | | | | | | | | | | | | | | | |
Proceeds from redemption fees collected (Note 2) | | | 0.00 | (b) | | | — | | | | 0.00 | (b) | | | — | | | | 0.00 | (b) |
| | | | | | | | | | | | | | | | | | | | | |
Net asset value at end of year | | $ | 18.70 | | | $ | 15.12 | | | $ | 15.65 | | | $ | 16.79 | | | $ | 12.97 | |
| | | | | | | | | | | | | | | | | | | | | |
Total return (c) | | | 27.65 | % | | | 2.60 | % | | | (5.22 | %) | | | 30.26 | % | | | (5.84 | %) |
| | | | | | | | | | | | | | | | | | | | | |
Net assets at end of year (000’s) | | $ | 11,785 | | | $ | 11,700 | | | $ | 13,152 | | | $ | 13,779 | | | $ | 13,047 | |
| | | | | | | | | | | | | | | | | | | | | |
Ratio of total expenses to average net assets | | | 1.01 | % | | | 1.01 | % | | | 1.01 | % | | | 1.00 | % | | | 1.00 | % |
| | | | | | | | | | | | | | | | | | | | | |
Ratio of net investment income to average net assets | | | 1.72 | % | | | 2.32 | % | | | 0.82 | % | | | 0.91 | % | | | 1.13 | % |
| | | | | | | | | | | | | | | | | | | | | |
Portfolio turnover rate | | | 20 | % | | | 9 | % | | | 14 | % | | | 10 | % | | | 5 | % |
(a) | Net investment income per share is based on average shares outstanding during the period. |
(b) | Amount rounds to less than $0.01 per share. |
(c) | Total return is a measure of the change in value of an investment in the Fund over the period covered, which assumes any dividends or capital gains distributions are reinvested in shares of the Fund. Returns shown do not reflect the deduction of taxes a shareholder would pay on Fund distributions or the redemption of Fund shares. |
See accompanying notes to financial statements. |
7
1789 GROWTH AND INCOME FUND - CLASS C
FINANCIAL HIGHLIGHTS |
Per share data for a share outstanding throughout each year: |
| | Year
Ended
October 31,
2024 | | | Year
Ended
October 31,
2023 | | | Year
Ended
October 31,
2022 | | | Year
Ended
October 31,
2021 | | | Year
Ended
October 31,
2020 | |
Net asset value at beginning of year | | $ | 14.71 | | | $ | 15.27 | | | $ | 16.53 | | | $ | 12.84 | | | $ | 13.85 | |
| | | | | | | | | | | | | | | | | | | | | |
Income (loss) from investment operations: | | | | | | | | | | | | | | | | | | | | |
Net investment income (loss) (a) | | | 0.12 | | | | 0.20 | | | | (0.03 | ) | | | (0.02 | ) | | | 0.02 | |
Net realized and unrealized gains (losses) on investments | | | 3.71 | | | | 0.04 | | | | (0.96 | ) | | | 3.74 | | | | (0.96 | ) |
Total from investment operations | | | 3.83 | | | | 0.24 | | | | (0.99 | ) | | | 3.72 | | | | (0.94 | ) |
| | | | | | | | | | | | | | | | | | | | | |
Less distributions from: | | | | | | | | | | | | | | | | | | | | |
Net investment income | | | (0.14 | ) | | | (0.20 | ) | | | (0.03 | ) | | | (0.03 | ) | | | (0.04 | ) |
Net realized gains on investments | | | (0.24 | ) | | | (0.60 | ) | | | (0.24 | ) | | | — | | | | (0.03 | ) |
Return of capital | | | — | | | | — | | | | — | | | | — | | | | (0.00 | )(b) |
Total distributions | | | (0.38 | ) | | | (0.80 | ) | | | (0.27 | ) | | | (0.03 | ) | | | (0.07 | ) |
| | | | | | | | | | | | | | | | | | | | | |
Net asset value at end of year | | $ | 18.16 | | | $ | 14.71 | | | $ | 15.27 | | | $ | 16.53 | | | $ | 12.84 | |
| | | | | | | | | | | | | | | | | | | | | |
Total return (c) | | | 26.33 | % | | | 1.54 | % | | | (6.19 | %) | | | 29.02 | % | | | (6.79 | %) |
| | | | | | | | | | | | | | | | | | | | | |
Net assets at end of year (000’s) | | $ | 19,151 | | | $ | 16,889 | | | $ | 17,812 | | | $ | 19,202 | | | $ | 15,932 | |
| | | | | | | | | | | | | | | | | | | | | |
Ratio of total expenses to average net assets | | | 2.01 | % | | | 2.01 | % | | | 2.01 | % | | | 2.00 | % | | | 2.00 | % |
| | | | | | | | | | | | | | | | | | | | | |
Ratio of net investment income (loss) to average net assets | | | 0.71 | % | | | 1.31 | % | | | (0.19 | %) | | | (0.10 | %) | | | 0.15 | % |
| | | | | | | | | | | | | | | | | | | | | |
Portfolio turnover rate | | | 20 | % | | | 9 | % | | | 14 | % | | | 10 | % | | | 5 | % |
(a) | Net investment income per share is based on average shares outstanding during the period. |
(b) | Amount rounds to less than $0.01 per share. |
(c) | Total return is a measure of the change in value of an investment in the Fund over the period covered, which assumes any dividends or capital gains distributions are reinvested in shares of the Fund. Returns shown do not reflect the deduction of taxes a shareholder would pay on Fund distributions or the redemption of Fund shares. |
See accompanying notes to financial statements. |
8
1789 GROWTH AND INCOME FUND NOTES TO FINANCIAL STATEMENTS October 31, 2024
1. ORGANIZATION
1789 Growth and Income Fund (the “Fund”) is a diversified series of Pinnacle Capital Management Funds Trust (the “Trust”), an open-end management investment company registered under the Investment Company Act of 1940, as amended (the “1940 Act”), and organized as a statutory trust under the laws of Delaware by the filing of a Certificate of Trust on July 6, 2010.
The Fund seeks total return comprised of current income, growth of income, and capital appreciation.
The Fund currently offers two classes of shares: Class P shares (sold without any sales loads or distribution fees); and Class C shares (sold subject to a contingent deferred sales charge (“CDSC”) of 1.00% if the shares are redeemed within one year after the original purchase of the shares and a distribution fee of up to 1.00% per annum of the Fund’s average daily net assets attributable to Class C shares).
Each class of shares represents an interest in the same assets of the Fund, has the same rights and is identical in all material respects except that (1) the classes bear differing levels of sales loads and distribution fees and (2) each class has exclusive voting rights with respect to matters relating to its own distribution arrangements.
2. SIGNIFICANT ACCOUNTING POLICIES
The following is a summary of the Fund’s significant accounting policies used in the preparation of its financial statements. These policies are in conformity with accounting principles generally accepted in the United States of America (“GAAP”). The Fund follows accounting and reporting guidance under Financial Accounting Standards Board Accounting Standards Codification Topic 946, Financial Services – Investment Companies.
Regulatory update - Tailored Shareholder Reports for Mutual Funds and Exchange-Traded Funds (“ETFs”) – Effective January 24, 2023, the Securities and Exchange Commission (the “SEC”) adopted rule and form amendments to require mutual funds and ETFs to transmit concise and visually engaging streamlined annual and semiannual reports to shareholders that highlight key information. Other information, including financial statements, will no longer appear in a streamlined shareholder report but must be available online, delivered free of charge upon request, and filed on a semiannual basis on Form N-CSR. The rule and form amendments have a compliance date of July 24, 2024. The Fund has implemented the rule and form requirements, as applicable, and is currently adhering to the requirements.
SECURITIES VALUATION: The Fund’s portfolio securities are valued as of the close of business of the regular session of the New York Stock Exchange (normally 4:00 p.m., Eastern time). Common stocks generally are valued using market quotations but may
9
1789 GROWTH AND INCOME FUND NOTES TO FINANCIAL STATEMENTS (Continued)
be valued on the basis of prices furnished by a pricing service when Pinnacle Capital Management, LLC (the “Adviser”), and (‘valuation designee’), believes such prices more accurately reflect the fair value of such securities. Securities that are traded on any stock exchange or on the NASDAQ over-the-counter market are generally valued at the last quoted sale price. Lacking a last sale price, an equity security is generally valued at its last bid price. Investments representing shares of other open-end investment companies, including money market funds, are valued at their net asset value (“NAV”) as reported by such companies. When using a quoted price and when the market for the security is considered active, the security will be classified as Level 1 within the fair value hierarchy (see below). When quotations are not readily available, when the valuation designee determines that the market quotation or the price provided by the pricing service does not accurately reflect the current market value, or when restricted or illiquid securities are being valued, such securities are valued at fair value as determined in good faith by the valuation designee, in conformity with guidelines adopted by and subject to review of the Board of Trustees of the Trust, pursuant to Rule 2a-5 under the 1940 Act. Under these procedures, the securities will be classified as Level 2 or 3 within the fair value hierarchy, depending on the inputs used. Such methods of fair valuation may include, but are not limited to: multiple of earnings, multiple of book value, discount from market of a similar freely traded security, purchase price of the security, subsequent private transactions in the security or related securities, or a combination of these and other factors.
The Fund utilizes various methods to measure the fair value of its investments on a recurring basis. GAAP establishes a single authoritative definition of fair value, sets out a framework for measuring fair value and requires additional disclosures about fair value measurements.
Various inputs are used in determining the value of the Fund’s investments. These inputs are summarized in the three broad levels listed below:
| | ● | Level 1 - Unadjusted quoted prices in active markets for identical assets or liabilities |
| | ● | Level 2 - Observable inputs other than quoted prices included in Level 1 that are observable for the asset or liability, either directly or indirectly; these inputs may include quoted prices for the identical instrument on an inactive market, prices for similar instruments, interest rates, prepayment speeds, credit risk, yield curves, default rates and similar data |
| | ● | Level 3 - Unobservable inputs for the asset or liability, to the extent relevant observable inputs are not available, representing the Fund’s own assumptions about the assumptions a market participant would use in valuing the asset or liability, and based on the best information available |
The inputs or methodology used for valuing securities are not necessarily an indication of the risks associated with investing in those securities. The inputs used to measure fair value may fall into different levels of the fair value hierarchy. In such cases, for disclosure
10
1789 GROWTH AND INCOME FUND NOTES TO FINANCIAL STATEMENTS (Continued)
purposes, the level in the fair value hierarchy within which the fair value measurement falls in its entirety is determined based on the lowest level input that is significant to the fair value measurement.
The following is a summary of the Fund’s investments based on the inputs used to value the investments as of October 31, 2024 by security type:
| | Level 1 | | | Level 2 | | | Level 3 | | | Total | |
Common Stocks | | $ | 30,559,334 | | | $ | — | | | $ | — | | | $ | 30,559,334 | |
Money Market Funds | | | 483,743 | | | | — | | | | — | | | | 483,743 | |
Total | | $ | 31,043,077 | | | $ | — | | | $ | — | | | $ | 31,043,077 | |
Refer to the Fund’s Schedule of Investments for a listing of the common stocks by sector and industry type. The Fund did not hold derivative instruments or any assets or liabilities that were measured at fair value on a recurring basis using significant unobservable inputs (Level 3) as of or during the year ended October 31, 2024.
SHARE VALUATION: The NAV per share of each class of shares of the Fund is calculated daily by dividing the total value of the assets attributable to that class, less liabilities attributable to that class, by the number of shares of that class outstanding, rounded to the nearest cent. The offering price of Class C shares and Class P shares is equal to the NAV per share. The redemption price per share of each class of shares of the Fund is equal to the NAV per share, except that (i) Class C shares are subject to a CDSC of 1.00% on shares redeemed within one year of purchase and (ii) Class P shares are generally subject to a redemption fee of 1.00%, payable to the class, if redeemed within 60 days or less from the date of purchase. During the years ending October 31, 2024 and 2023, proceeds from redemption fees, recorded in capital, totaled $650 and $0, respectively, for Class P Shares.
INVESTMENT INCOME: Interest income is accrued as earned. Dividend income is recorded on the ex-dividend date. Non-cash dividends included in dividend income, if any, are recorded at the fair market value of the security received on the date of distribution. The Fund may invest in real estate investment trusts (“REITs”) that pay distributions to their shareholders based on available funds from operations. It is common for these distributions to exceed the REIT’s taxable earnings and profits resulting in the excess portion of such distribution to be designated as return of capital. Distributions received from REITs are generally recorded as dividend income and, if necessary, are reclassified annually in accordance with tax information provided by the underlying REITs. Discounts and premiums on fixed income securities, if any, are amortized using the interest method.
INVESTMENT TRANSACTIONS: Investment transactions are accounted for on trade date for financial reporting purposes. Realized gains and losses on investments sold are determined on a specific identification basis.
11
1789 GROWTH AND INCOME FUND NOTES TO FINANCIAL STATEMENTS (Continued)
ALLOCATIONS BETWEEN CLASSES: Investment income earned, realized capital gains and losses, and unrealized appreciation and depreciation are allocated daily to each class of shares based upon its proportionate share of total net assets of the Fund. Class specific expenses are charged directly to the class incurring the expense. Common expenses which are not attributable to a specific class are allocated daily to each class of shares based upon its proportionate share of total net assets of the Fund.
DISTRIBUTIONS TO SHAREHOLDERS: Dividends arising from net investment income, if any, are declared and paid quarterly to shareholders. Net realized short-term capital gains, if any, may be distributed throughout the year and net realized long-term capital gains, if any, are distributed at least once each year. The amount of distributions from net investment income and net realized capital gains are determined in accordance with federal income tax regulations, which may differ from GAAP. Dividends and distributions are recorded on the ex-dividend date. The tax character of distributions paid during the years ended October 31, 2024 and 2023 was as follows:
Year Ended | | Ordinary Income | | | Long-Term Capital Gains | | | Total Distributions* | |
October 31, 2024 | | $ | 382,938 | | | $ | 439,035 | | | $ | 821,973 | |
October 31, 2023 | | $ | 617,402 | | | $ | 1,101,871 | | | $ | 1,719,273 | |
| * | Total Distributions may not tie to the amounts listed on the Statements of Changes in Net Assets due to reclassifications of the character of the distributions as a result of permanent differences between financial statements and income tax reporting. |
USE OF ESTIMATES: The preparation of financial statements in conformity with GAAP requires management to make estimates and assumptions that affect the reported amounts of assets and liabilities and disclosure of contingent assets and liabilities as of the date of the financial statements and the reported amounts of increase (decrease) in net assets from operations during the reporting period. Actual results could differ from those estimates.
FEDERAL INCOME TAX: The Fund has qualified and intends to continue to qualify as a regulated investment company under the Internal Revenue Code of 1986, as amended (the “Code”). Qualification generally will relieve the Fund of liability for federal income taxes to the extent 100% of its net investment income and net realized capital gains are distributed in accordance with the Code.
In order to avoid imposition of the excise tax applicable to regulated investment companies, it is also the Fund’s intention to declare as dividends in each calendar year at least 98% of its net investment income (earned during the calendar year) and 98.2% of its net realized capital gains (earned during the twelve months ended October 31) plus undistributed amounts from the prior year.
12
1789 GROWTH AND INCOME FUND NOTES TO FINANCIAL STATEMENTS (Continued)
The following information is computed on a tax basis for each item as of October 31, 2024:
Cost of investments | | $ | 20,070,929 | |
Gross unrealized appreciation | | $ | 11,210,550 | |
Gross unrealized depreciation | | | (238,402 | ) |
Net unrealized appreciation | | | 10,972,148 | |
Undistributed ordinary income | | | 25,336 | |
Undistributed long-term capital gains | | | 961,598 | |
Distributable earnings | | $ | 11,959,082 | |
The difference between the federal income tax cost and the financial statement cost of the Fund’s investments is due to certain timing differences in the recognition of capital gains and losses under income tax regulations and GAAP. These timing differences are temporary in nature and are due to the tax deferral of losses on wash sales.
The Fund recognizes the tax benefits or expenses of uncertain tax positions only where the position is “more likely than not” to be sustained assuming examination by tax authorities. Management has reviewed the tax positions taken on Federal income tax returns for all open tax years (generally, three years) and has concluded that no provision for unrecognized tax benefits or expenses is required in these financial statements. The Fund identifies its major tax jurisdictions as U.S. Federal and certain State tax authorities. The Fund is not aware of any tax positions for which it is reasonably likely that the total amounts of unrecognized tax benefits or expenses will change materially in the next twelve months.
The Fund recognizes interest and penalties, if any, related to unrecognized tax expenses as income tax expense on the Statement of Operations. During the year ended October 31, 2024, the Fund did not incur any interest or penalties.
3. INVESTMENT TRANSACTIONS
During the year ended October 31, 2024, the cost of purchases and the proceeds from sales and maturities of investment securities, other than U.S. Government securities and short-term securities, totaled $5,747,265 and $5,454,375 respectively.
4. TRANSACTIONS WITH RELATED PARTIES
A Trustee and certain officers of the Trust are affiliated with the Adviser, Ultimus Fund Solutions, LLC (“Ultimus”), the Fund’s administrator, transfer agent and fund accounting agent, or Pinnacle Investments, LLC (the “Distributor”), the principal underwriter of the Fund’s shares.
13
1789 GROWTH AND INCOME FUND NOTES TO FINANCIAL STATEMENTS (Continued)
INVESTMENT MANAGER: Under the terms of an Investment Management Agreement, the Adviser manages the investment portfolio of the Fund, subject to policies adopted by the Board of Trustees. Under the Investment Management Agreement, the Adviser furnishes office space and all necessary office facilities, equipment and executive personnel necessary for managing the assets of the Fund. For its services, the Adviser receives an investment advisory fee at the rate of 0.75% per annum, accrued daily and paid monthly, of the Fund’s average daily net assets. For the year ended October 31, 2024, the Adviser earned $231,010 in investment advisory fees.
Under a Services Agreement, the Adviser is obligated to pay all of the operating expenses of the Fund, excluding advisory fees, brokerage fees and commissions, distribution fees, taxes, borrowing costs, fees and expenses of non-interested Trustees of the Trust, dividend expense on securities sold short, the fees and expenses of acquired funds and extraordinary expenses. Under the Services Agreement, the Adviser receives a service fee at the rate of 0.24% per annum of the Fund’s average daily net assets. For the year ended October 31, 2024, the Adviser earned $73,923 in service fees.
DISTRIBUTOR: The Distributor is an affiliate of the Adviser and serves as the principal underwriter of the Fund’s shares pursuant to an agreement with the Trust. The Distributor promotes and sells shares of the Fund on a continuous basis. During the year ended October 31, 2024, the Distributor collected $530 in CDSCs on redemptions of Class C shares of the Fund.
DISTRIBUTION PLAN: The Fund has adopted a distribution plan pursuant to Rule 12b-1 under the 1940 Act (the “Plan”). Pursuant to the Plan, Class C shares may pay brokers for activities primarily intended to result in the sale of shares. The annual limitation for payment of expenses pursuant to the Plan is 1.00% of average daily net assets attributable to Class C shares. During the year ended October 31, 2024, Class C shares incurred distribution fees of $185,477.
TRUSTEE COMPENSATION: Each Trustee who is not an interested person of the Trust (“Independent Trustee”) receives from the Fund a fee of $500 for each Board meeting attended, either in person or by telephone.
OTHER SERVICE PROVIDER: The Trust has entered into mutual fund services agreements with Ultimus, pursuant to which Ultimus provides day-to-day operational services to the Fund including, but not limited to, accounting, administrative, transfer agent, dividend disbursing, and recordkeeping services. The fees payable to Ultimus are paid by the Adviser (not the Fund).
14
1789 GROWTH AND INCOME FUND NOTES TO FINANCIAL STATEMENTS (Continued)
PRINCIPAL HOLDER OF FUND SHARES: As of October 31, 2024, the following shareholder owned of record 25% or more of the outstanding shares of the Fund:
NAME OF RECORD OWNER | | % Ownership | |
Wells Fargo Clearing Services (for the benefit of its customers) | | | 76 | % |
A beneficial owner of 25% or more of the Fund’s outstanding shares may be considered a controlling person. That shareholder’s vote could have a more significant effect on matters presented at a shareholders’ meeting.
5. CAPITAL SHARE TRANSACTIONS
Transactions in capital shares were as follows:
| | | Year Ended
October 31, 2024 | | | Year Ended
October 31, 2023 | |
CLASS P SHARES | | Shares | | | Shares | |
Shares sold | | | 27,384 | | | | 50,073 | |
Shares issued in reinvestment of dividends | | | 19,132 | | | | 41,646 | |
Shares redeemed | | | (190,093 | ) | | | (157,957 | ) |
Net decrease in shares outstanding | | | (143,577 | ) | | | (66,238 | ) |
Shares outstanding, beginning of year | | | 773,953 | | | | 840,191 | |
Shares outstanding, end of year | | | 630,376 | | | | 773,953 | |
| | | Year Ended
October 31, 2024 | | | Year Ended
October 31, 2023 | |
CLASS C SHARES | | Shares | | | Shares | |
Shares sold | | | 11,534 | | | | 44,036 | |
Shares issued in reinvestment of dividends | | | 25,060 | | | | 59,534 | |
Shares redeemed | | | (130,540 | ) | | | (121,770 | ) |
Net decrease in shares outstanding | | | (93,946 | ) | | | (18,200 | ) |
Shares outstanding, beginning of year | | | 1,148,376 | | | | 1,166,576 | |
Shares outstanding, end of year | | | 1,054,430 | | | | 1,148,376 | |
15
1789 GROWTH AND INCOME FUND NOTES TO FINANCIAL STATEMENTS (Continued)
6. CONTINGENCIES AND COMMITMENTS
The Fund indemnifies the Trust’s officers and Trustees for certain liabilities that might arise from their performance of their duties to the Fund. Additionally, in the normal course of business, the Fund enters into contracts that contain a variety of representations and warranties and which provide general indemnifications. The Fund’s maximum exposure under these arrangements is unknown, as this would involve future claims that may be made against the Fund that have not yet occurred. However, based on experience, the Trust expects the risk of loss to be remote.
7. SUBSEQUENT EVENTS
The Fund is required to recognize in the financial statements the effects of all subsequent events that provide additional evidence about conditions that existed as of the date of the Statement of Assets and Liabilities. For non-recognized subsequent events that must be disclosed to keep the financial statements from being misleading, the Fund is required to disclose the nature of the event as well as an estimate of its financial effect, or a statement that such an estimate cannot be made. Management has evaluated subsequent events through the issuance of these financial statements and has noted no such events.
16
1789 GROWTH AND INCOME FUND REPORT OF INDEPENDENT REGISTERED PUBLIC ACCOUNTING FIRM
To the Shareholders of 1789 Growth and Income Fund and Board of Trustees of Pinnacle Capital Management Funds Trust
Opinion on the Financial Statements
We have audited the accompanying statement of assets and liabilities, including the schedule of investments, of 1789 Growth and Income Fund (the “Fund”) as of October 31, 2024, the related statement of operations for the year then ended, the statements of changes in net assets for each of the two years in the period then ended, the financial highlights for each of the five years in the period then ended, and the related notes (collectively referred to as the “financial statements”). In our opinion, the financial statements present fairly, in all material respects, the financial position of the Fund as of October 31, 2024, the results of its operations for the year then ended, the changes in net assets for each of the two years in the period then ended, and the financial highlights for each of the five years in the period then ended, in conformity with accounting principles generally accepted in the United States of America.
Basis for Opinion
These financial statements are the responsibility of the Fund’s management. Our responsibility is to express an opinion on the Fund’s financial statements based on our audits. We are a public accounting firm registered with the Public Company Accounting Oversight Board (United States) (“PCAOB”) and are required to be independent with respect to the Fund in accordance with the U.S. federal securities laws and the applicable rules and regulations of the Securities and Exchange Commission and the PCAOB.
We conducted our audits in accordance with the standards of the PCAOB. Those standards require that we plan and perform the audit to obtain reasonable assurance about whether the financial statements are free of material misstatement whether due to error or fraud.
Our audits included performing procedures to assess the risks of material misstatement of the financial statements, whether due to error or fraud, and performing procedures that respond to those risks. Such procedures included examining, on a test basis, evidence regarding the amounts and disclosures in the financial statements. Our procedures included confirmation of securities owned as of October 31, 2024, by correspondence with the custodian. Our audits also included evaluating the accounting principles used and
17
1789 GROWTH AND INCOME FUND REPORT OF INDEPENDENT REGISTERED PUBLIC ACCOUNTING FIRM (Continued)
significant estimates made by management, as well as evaluating the overall presentation of the financial statements. We believe that our audits provide a reasonable basis for our opinion.
We have served as the Fund’s auditor since 2010.

COHEN & COMPANY, LTD. Philadelphia, Pennsylvania December 20, 2024
18
1789 GROWTH AND INCOME FUND OTHER INFORMATION (Unaudited)
A description of the policies and procedures that the Fund uses to vote proxies relating to portfolio securities is available without charge upon request by calling toll-free 1-888-229-9448, or on the SEC’s website at www.sec.gov. Information regarding how the Fund voted proxies relating to portfolio securities during the most recent 12-month period ended June 30 is available without charge upon request by calling toll-free 1-888-229-9448, or on the SEC’s website at www.sec.gov.
The Trust files a complete listing of portfolio holdings for the Fund with the SEC as of the end of the first and third quarters of each fiscal year as an exhibit to its reports on Form N-PORT. The filings are available upon request by calling 1-888-229-9448. Furthermore, you may obtain a copy of the filings on the SEC’s website at www.sec.gov and on the Fund’s website at www.pcm-advisors.com.
FEDERAL TAX INFORMATION (Unaudited)
For the fiscal year ended October 31, 2024, the Fund designated $439,035 as long-term capital gain distributions.
Qualified Dividend – The Fund designates 100%, or up to the maximum amount of such dividends allowable pursuant to the Internal Revenue code, as qualified dividend income eligible for the reduced tax rate.
Dividends Received Deduction – Corporate shareholders are generally entitled to take the dividends received deduction on the portion of the Fund’s dividend distribution that qualifies under tax law. For the Fund’s fiscal year 2024 ordinary income dividends, 100% qualifies for the corporate dividends received deduction.
19
1789 GROWTH AND INCOME FUND APPROVAL OF INVESTMENT ADVISORY AGREEMENT (Unaudited)
Pinnacle Capital Management, LLC (the “Adviser”), 5845 Widewaters Parkway, Suite 300, East Syracuse, New York 13057, serves as the investment adviser to the 1789 Growth and Income Fund (the “Fund”). The Adviser provides the Fund with a continuous program of investing the Fund’s assets and determining the composition of the Fund’s portfolio. In addition to serving as the investment adviser to the Fund, the Adviser provides investment advisory services to individuals, corporations, pension funds, foundations, endowments, labor unions, insurance companies, healthcare organizations and governments.
The Adviser is subject to the oversight of the Fund and the Fund’s board of trustees (the “Board of Trustees”). The Adviser serves as investment adviser to the Fund pursuant to a written investment management agreement between the Adviser and the Fund dated November 19, 2010 (the “Advisory Agreement”). The Advisory Agreement provides that the Adviser shall not be liable for any loss suffered by the Fund or its shareholders, except by reason of its own willful misfeasance, bad faith or gross negligence, or from its reckless disregard of its duties under the Advisory Agreement. The Advisory Agreement is terminable by the Fund at any time, without penalty, either by action of the Board of Trustees or upon a vote of the holders of a majority of the outstanding voting securities of the Fund upon 60 days’ prior written notice to the Adviser. The Advisory Agreement is also terminable by the Adviser with 60 days’ prior written notice to the Fund, and will terminate automatically in the event of its “assignment,” as defined in the Investment Company Act of 1940, as amended (the “1940 Act”), including in the event of a change of control or sale of the Adviser. The Advisory Agreement continues in force until November 19, 2024, after which it may be continued from year to year thereafter only as long as such continuance is approved annually by (a) the vote of a majority of the Board of Trustees, including a majority of the Trustees who are not “interested persons,” as defined by the 1940 Act, of the Trust (the “Independent Trustees”); or (b) the vote of a majority of the Fund’s outstanding voting securities (as defined in the 1940 Act).
The Board of Trustees, including a majority of the Independent Trustees voting separately, approved the continuance of the Advisory Agreement for an additional term of one year at a telephonic meeting held on September 12, 2024. In the course of their deliberations, the Independent Trustees were advised by their independent legal counsel of their obligations in determining to approve the Advisory Agreement. The Trustees received and reviewed a substantial amount of information provided by the Adviser in response to requests of the Trustees and counsel.
In considering whether to approve the Advisory Agreement, the Board of Trustees, including the Independent Trustees, did not identify any single factor as determinative, and each Trustee weighed the various factors independently as he deemed appropriate. The Trustees considered the following matters, among other things, in connection with their approval of the Advisory Agreement.
20
1789 GROWTH AND INCOME FUND APPROVAL OF INVESTMENT ADVISORY AGREEMENT (Unaudited) (Continued)
Nature, Extent and Quality of Services
The Trustees received and considered information regarding the nature, extent and quality of services provided to the Fund by the Adviser. The Trustees specifically reviewed the qualifications, backgrounds, and responsibilities of the key personnel that oversee the investment management and day-to-day operations of the Fund. The Trustees noted that Mr. Fauer is responsible for the day-to-day management of the Fund and its portfolio. The Trustees considered that the Adviser has a staff of skilled investment professionals who provide research and trading services to the Fund and determined that the Adviser possesses adequate resources to manage the Fund. The Trustees also considered the Adviser’s compliance program and noted the resources it has dedicated towards compliance, including providing a qualified compliance officer to oversee its compliance program. The Trustees also considered the overall investment management capabilities of the Adviser and its ongoing financial commitment to the Fund. The Trustees considered the Adviser’s responsibilities with regards to brokerage selection and best execution and were mindful that the Adviser does not enter into any “soft dollar” arrangements on behalf of the Fund.
Investment Performance of the Fund
The Trustees compared the Fund’s returns to the returns of its benchmark, the S&P 500 Index. The Trustees also compared the Fund’s performance to other domestic growth and income funds of similar size with similar investment styles, and the Adviser’s separately managed accounts that are managed in a similar investment style (the “Composite Returns”), as included in the Board Materials. In reviewing the comparative performance, the Board considered that the returns for the Fund’s Class C and Class P shares for the one-year period ended August 31, 2024 were both lower than the average and median returns for the one-year period ended August 31, 2024 for the Fund’s peer group, the “Large Cap Value Category” with less than $40 million in assets as derived from Morningstar, Inc. (the “peer group”). The Board also considered the returns for the Fund’s Class C and Class P shares for the three-year period ended August 31, 2024 as compared to the Fund’s peer group. The Board noted that the returns for the Fund’s Class C and Class P shares for the three-year period ended August 31, 2024 were both lower than the average and median returns for the three-year period ended August 31, 2024 for the peer group.
Expenses
The Board considered statistical information regarding the Fund’s expense ratio and its various components, including the contractual advisory fee, as compared to its peer group, as defined above. The Trustees noted that the overall expense ratio of the Fund’s Class C shares was higher than the average and median expense ratios for the peer group, and that the overall expense ratio of the Class P shares was higher than the average and median expense ratios for the peer group, according to the Board Materials. The Board considered that, according to the services agreement between the Trust and the Adviser, in return
21
1789 GROWTH AND INCOME FUND APPROVAL OF INVESTMENT ADVISORY AGREEMENT (Unaudited) (Continued)
for a service fee paid by the Fund, the Adviser pays all operating expenses of the Fund excluding advisory fees; brokerage fees and commissions; fees paid pursuant to the Fund’s Plan of Distribution Pursuant to Rule 12b-1 (“12b-1 fees”); taxes; borrowing costs; fees and expenses of the Independent Trustees, and the fees and expenses of acquired funds and extraordinary expenses.
Investment Advisory Fee Rates
The Trustees reviewed and considered the proposed contractual investment advisory fee rate payable by the Fund to the Adviser for investment advisory services. Additionally, the Trustees received and considered information comparing the Fund’s advisory fee rate with those of the other funds in its peer group, as defined above. The Trustees noted that the advisory fee rate for the Fund was higher than the median and average rates for the peer group presented, as included in the Board Materials.
The Trustees reviewed the Adviser’s financial statements and discussed its financial condition. Mr. McClelland noted that the Adviser experienced a profit in 2023. Mr. McClelland also noted that the Distributor was profitable in 2023, and he referred the Trustees to the Distributor’s Income Statement for the year ended December 31, 2023 which was included in the Board Materials. Mr. McClelland explained that the Adviser and the Distributor are both wholly-owned subsidiaries of Pinnacle Holding Company, whose management remains fully committed to supporting the Adviser. The Trustees discussed the level of the Fund’s assets, the projected profits of the Adviser and the other ancillary benefits that the Adviser may receive by providing advisory services to the Fund. The Trustees further considered the Adviser’s commitment to continue to grow assets in the Fund and the Adviser’s representation that it has adequate financial resources to continue to provide service to the Fund.
Economies of Scale
The Trustees noted that the investment advisory fee schedule for the Fund does not contain breakpoints; however, the Trustees discussed the fact that the Fund’s assets have not grown to an extent that permits it to realize any meaningful economies of scale at this time. The Trustees observed that as the assets of the Fund grow, this factor will become more relevant to their consideration process.
Conclusion
The Trustees determined that the overall arrangement between the Fund and the Adviser, as provided in the Advisory Agreement, was fair and reasonable and that approval of the continuance of the Advisory Agreement was in the best interests of the Fund and its shareholders.
22
This page intentionally left blank.
This page intentionally left blank.
This page intentionally left blank.
INVESTMENT ADVISER
Pinnacle Capital Management, LLC
5845 Widewaters Parkway,
Suite 300
East Syracuse, NY 13057
INDEPENDENT REGISTERED PUBLIC ACCOUNTING FIRM
Cohen & Company, Ltd.
1835 Market Street, Suite 310
Philadelphia, PA 19103
LEGAL COUNSEL
Bond Schoeneck & King PLLC
One Lincoln Center
110 West Fayette Street
Syracuse, NY 13202
CUSTODIAN
U.S. Bank, N.A.
425 Walnut Street
Cincinnati, OH 45202
TRANSFER AGENT
Ultimus Fund Solutions, LLC
225 Pictoria Drive, Suite 450
Cincinnati, OH 45246
DISTRIBUTOR
Pinnacle Investments, LLC
507 Plum Street, Suite 120
Syracuse, NY 13204
This report is intended only for the information of shareholders or those who have received the Fund’s prospectus which contains information about the Fund’s management fee and expenses. Please read the prospectus carefully before investing.
(b) Included in (a)
Item 8. Changes in and Disagreements with Accountants for Open-End Management Investment Companies.
Not applicable
Item 9. Proxy Disclosures for Open-End Management Investment Companies.
Not applicable
Item 10. Remuneration Paid to Directors, Officers, and Others of Open-End Management Investment Companies.
Included under Item 7
Item 11. Statement Regarding Basis for Approval of Investment Advisory Contract.
Included under Item 7
Item 12. Disclosure of Proxy Voting Policies and Procedures for Closed-End Management Investment Companies.
Not applicable
Item 13. Portfolio Managers of Closed-End Management Investment Companies.
Not applicable
Item 14. Purchases of Equity Securities by Closed-End Management Investment Company and Affiliated Purchasers.
Not applicable
Item 15. Submission of Matters to a Vote of Security Holders.
The registrant has not adopted procedures by which shareholders may recommend nominees to the registrant's board of trustees.
Item 16. Controls and Procedures.
(a) Based on their evaluation of the registrant's disclosure controls and procedures (as defined in Rule 30a-3(c) under the Investment Company Act of 1940) as of a date within 90 days of the filing date of this report, the registrant's principal executive officer and principal financial officer have concluded that such disclosure controls and procedures are reasonably designed and are operating effectively to ensure that material information relating to the registrant, including its consolidated subsidiaries, is made known to them by others within those entities, particularly during the period in which this report is being prepared, and that the information required in filings on Form N-CSR is recorded, processed, summarized, and reported on a timely basis.
(b) There were no changes in the registrant's internal control over financial reporting (as defined in Rule 30a-3(d) under the Investment Company Act of 1940) that occurred during the period covered by this report that have materially affected, or are reasonably likely to materially affect, the registrant's internal control over financial reporting.
Item 17. Disclosure of Securities Lending Activities for Closed-End Management Investment Companies.
Not applicable
Item 18. Recovery of Erroneously Awarded Compensation.
(a) Not applicable
(b) Not applicable
Item 19. Exhibits.
File the exhibits listed below as part of this Form. Letter or number the exhibits in the sequence indicated.
(a)(1) Any code of ethics, or amendment thereto, that is the subject of the disclosure required by Item 2, to the extent that the registrant intends to satisfy the Item 2 requirements through filing of an exhibit: Attached hereto
(a)(2) A separate certification for each principal executive officer and principal financial officer of the registrant as required by Rule 30a-2(a) under the Act (17 CFR 270.30a-2(a)): Attached hereto
(1) Not applicable
(2) Change in the registrant's independent public accountant: Not applicable
(b) Certifications required by Rule 30a-2(b) under the Act (17 CFR 270.30a-2(b)): Attached hereto
Exhibit 99.CODE ETH Code of Ethics
Exhibit 99.CERT Certifications required by Rule 30a-2(a) under the Act
Exhibit 99.906CERT Certifications required by Rule 30a-2(b) under the Act
SIGNATURES
Pursuant to the requirements of the Securities Exchange Act of 1934 and the Investment Company Act of 1940, the registrant has duly caused this report to be signed on its behalf by the undersigned, thereunto duly authorized.
(Registrant) | Pinnacle Capital Management Funds Trust | |
| | | | |
By (Signature and Title)* | | /s/ Stephen J. Fauer | |
| | | Stephen J. Fauer, President and Principal Executive Officer | |
| | | | |
Date | January 7, 2025 | | |
| | | | |
| Pursuant to the requirements of the Securities Exchange Act of 1934 and the Investment Company Act of 1940, this report has been signed below by the following persons on behalf of the registrant and in the capacities and on the dates indicated. |
| | | | |
By (Signature and Title)* | | /s/ Stephen J. Fauer | |
| | | Stephen J. Fauer, President and Principal Executive Officer | |
| | | | |
Date | January 7, 2025 | | |
| | | | |
By (Signature and Title)* | | /s/ Dalton J. Axenfeld | |
| | | Dalton J. Axenfeld, Treasurer and Principal Financial Officer | |
| | | | |
Date | January 7, 2025 | | |
* Print the name and title of each signing officer under his or her signature.