                                 UNITED STATES
                       SECURITIES AND EXCHANGE COMMISSION
                             Washington, D.C. 20549

                                   FORM N-CSR

        CERTIFIED SHAREHOLDER REPORT OF REGISTERED MANAGEMENT INVESTMENT
                                   COMPANIES

                  Investment Company Act file number 811-22452
                                                    -----------

                            First Trust Series Fund
            -------------------------------------------------------
               (Exact name of registrant as specified in charter)

                       120 East Liberty Drive, Suite 400
                               Wheaton, IL 60187
            -------------------------------------------------------
              (Address of principal executive offices) (Zip code)

                             W. Scott Jardine, Esq.

                          First Trust Portfolios L.P.
                       120 East Liberty Drive, Suite 400
                               Wheaton, IL 60187
            -------------------------------------------------------
                    (Name and address of agent for service)

       Registrant's telephone number, including area code: (630) 765-8000
                                                          ----------------

                      Date of fiscal year end: October 31
                                              ------------

                   Date of reporting period: October 31, 2017
                                            ------------------

Form N-CSR is to be used by management investment companies to file reports with
the Commission not later than 10 days after the transmission to stockholders of
any report that is required to be transmitted to stockholders under Rule 30e-1
under the Investment Company Act of 1940 (17 CFR 270.30e-1). The Commission may
use the information provided on Form N-CSR in its regulatory, disclosure review,
inspection, and policymaking roles.

A registrant is required to disclose the information specified by Form N-CSR,
and the Commission will make this information public. A registrant is not
required to respond to the collection of information contained in Form N-CSR
unless the Form displays a currently valid Office of Management and Budget
("OMB") control number. Please direct comments concerning the accuracy of the
information collection burden estimate and any suggestions for reducing the
burden to Secretary, Securities and Exchange Commission, 100 F Street, NE,
Washington, DC 20549. The OMB has reviewed this collection of information under
the clearance requirements of 44 U.S.C. ss. 3507.


<PAGE>


ITEM 1. REPORTS TO STOCKHOLDERS.

The Report to Shareholders is attached herewith.
FIRST TRUST
First Trust Preferred
Securities and Income Fund
-----------------------------------------
Annual Report
For the Year Ended
October 31, 2017
STONEBRIDGE
Advisors LLC
<PAGE>
--------------------------------------------------------------------------------
TABLE OF CONTENTS
--------------------------------------------------------------------------------
FIRST TRUST PREFERRED SECURITIES AND INCOME FUND
ANNUAL REPORT
OCTOBER 31, 2017
Shareholder Letter........................................................... 1
At a Glance.................................................................. 2
Portfolio Commentary......................................................... 4
Understanding Your Fund Expenses............................................. 6
Portfolio of Investments..................................................... 7
Statement of Assets and Liabilities.......................................... 13
Statement of Operations...................................................... 14
Statements of Changes in Net Assets.......................................... 15
Financial Highlights......................................................... 16
Notes to Financial Statements................................................ 21
Report of Independent Registered Public Accounting Firm...................... 28
Additional Information....................................................... 29
Board of Trustees and Officers............................................... 33
Privacy Policy............................................................... 35
CAUTION REGARDING FORWARD-LOOKING STATEMENTS
This report contains certain forward-looking statements within the meaning of
the Securities Act of 1933, as amended, and the Securities Exchange Act of 1934,
as amended. Forward-looking statements include statements regarding the goals,
beliefs, plans or current expectations of First Trust Advisors L.P. ("First
Trust" or the "Advisor") and/or Stonebridge Advisors LLC ("Stonebridge" or the
"Sub-Advisor") and their respective representatives, taking into account the
information currently available to them. Forward-looking statements include all
statements that do not relate solely to current or historical fact. For example,
forward-looking statements include the use of words such as "anticipate,"
"estimate," "intend," "expect," "believe," "plan," "may," "should," "would" or
other words that convey uncertainty of future events or outcomes.
Forward-looking statements involve known and unknown risks, uncertainties and
other factors that may cause the actual results, performance or achievements of
First Trust Preferred Securities and Income Fund (the "Fund") to be materially
different from any future results, performance or achievements expressed or
implied by the forward-looking statements. When evaluating the information
included in this report, you are cautioned not to place undue reliance on these
forward-looking statements, which reflect the judgment of the Advisor and/or
Sub-Advisor and their respective representatives only as of the date hereof. We
undertake no obligation to publicly revise or update these forward-looking
statements to reflect events and circumstances that arise after the date hereof.
PERFORMANCE AND RISK DISCLOSURE
There is no assurance that the Fund will achieve its investment objective. The
Fund is subject to market risk, which is the possibility that the market values
of securities owned by the Fund will decline and that the value of Fund shares
may therefore be less than what you paid for them. Accordingly, you can lose
money by investing in the Fund. See "Risk Considerations" in the Additional
Information section of this report for a discussion of certain other risks of
investing in the Fund.
Performance data quoted represents past performance, which is no guarantee of
future results, and current performance may be lower or higher than the figures
shown. For the most recent month-end performance figures, please visit
http://www.ftportfolios.com or speak with your financial advisor. Investment
returns and net asset value will fluctuate and Fund shares, when sold, may be
worth more or less than their original cost.
The Advisor may also periodically provide additional information on Fund
performance on the Fund's webpage at http://www.ftportfolios.com.
HOW TO READ THIS REPORT
This report contains information that may help you evaluate your investment in
the Fund. It includes details about the Fund and presents data and analysis that
provide insight into the Fund's performance and investment approach.
By reading the portfolio commentary from the Sub-Advisor of the Fund, you may
obtain an understanding of how the market environment affected the Fund's
performance. The statistical information that follows may help you understand
the Fund's performance compared to that of relevant market benchmarks.
It is important to keep in mind that the opinions expressed by the Sub-Advisor
are just that, informed opinions. They should not be considered to be promises
or advice. The opinions, like the statistics, cover the period through the date
on the cover of this report. The material risks of investing in the Fund are
spelled out in the prospectus, the statement of additional information, this
report and other Fund regulatory filings.
<PAGE>
--------------------------------------------------------------------------------
SHAREHOLDER LETTER
--------------------------------------------------------------------------------
FIRST TRUST PREFERRED SECURITIES AND INCOME FUND
ANNUAL LETTER FROM THE CHAIRMAN AND CEO
OCTOBER 31, 2017
Dear Shareholders:
Thank you for your investment in First Trust Preferred Securities and Income
Fund.
First Trust is pleased to provide you with the annual report which contains
detailed information about your investment for the 12 months ended October 31,
2017, including a market overview and a performance analysis for the period. We
encourage you to read this report carefully and discuss it with your financial
advisor.
The U.S. bull market continued through the November 2016 election and the first
nine months of the Trump presidency. During that period, November 8, 2016
(Election Day 2016) through October 31, 2017, the S&P 500(R) Index (the "Index")
posted a total return of 22.73%, according to Bloomberg. Ten of the eleven Index
sectors were up on a total return basis as well. Since the beginning of 2017
through October 31, 2017, the Index has closed its trading sessions at all-time
highs on 50 occasions. Finally, as of October 31, 2017, the Index has spent the
entire year in positive territory. This has only happened in 10 different years
over the past seven decades.
The current bull market, as measured from March 9, 2009 through October 31,
2017, is the second longest in history. While we are optimistic about the U.S.
economy, we are also aware that no one can predict the future or know how
markets will perform in different economic environments. We believe that one
should invest for the long term and be prepared for market volatility by keeping
current on your portfolio and investing goals by speaking regularly with your
investment professional. It is also important to keep in mind that past
performance can never guarantee future results.
Thank you for giving First Trust the opportunity to be a part of your investment
plan. We value our relationship with you and will continue to focus on bringing
the types of investments that we believe can help you reach your financial
goals.
Sincerely,
/s/ James A. Bowen
James A. Bowen
Chairman of the Board of Trustees
Chief Executive Officer of First Trust Advisors L.P.
Page 1
<PAGE>
FIRST TRUST PREFERRED SECURITIES AND INCOME FUND
"AT A GLANCE"
AS OF OCTOBER 31, 2017 (UNAUDITED)
-----------------------------------------------------------
FUND STATISTICS
-----------------------------------------------------------
FIRST TRUST PREFERRED SECURITIES NET ASSET
AND INCOME FUND VALUE (NAV)
-----------------------------------------------------------
Class A (FPEAX) $22.39
Class C (FPECX) $22.44
Class F (FPEFX) $22.62
Class I (FPEIX) $22.49
Class R3 (FPERX) $22.35
-----------------------------------------------------------
-----------------------------------------------------------
% OF TOTAL
TOP TEN HOLDINGS INVESTMENTS
-----------------------------------------------------------
Liberty Mutual Group, Inc. 2.2%
Bank of America Corp., Series DD 2.0
Enel S.p.A. 1.9
Farm Credit Bank of Texas, Series 1 1.9
Wells Fargo & Co., Series K 1.8
Zions Bancorporation, Series J 1.8
Barclays PLC 1.8
Aquarius & Investments PLC for Swiss
Reinsurance Co., Ltd. 1.7
Enbridge Energy Partners 1.7
Credit Agricole S.A. 1.7
------
Total 18.5%
======
-----------------------------------------------------------
% OF TOTAL
SECTOR ALLOCATION INVESTMENTS
-----------------------------------------------------------
Financials 77.3%
Utilities 6.1
Energy 5.3
Consumer Staples 4.0
Real Estate 3.9
Industrials 2.5
Materials 0.5
Telecommunication Services 0.4
------
Total 100.0%
======
-----------------------------------------------------------
% OF TOTAL
CREDIT QUALITY(1) INVESTMENTS
-----------------------------------------------------------
A+ 0.4%
A 2.3
A- 2.3
BBB+ 12.0
BBB 16.5
BBB- 20.9
BB+ 23.3
BB 9.6
BB- 6.3
B+ 2.5
B 0.1
Not Rated 3.8
------
Total 100.0%
======
<TABLE>
<CAPTION>
------------------------------------------------------------------------------------------------------------------------
CLASS CLASS CLASS CLASS CLASS
DIVIDEND DISTRIBUTIONS A SHARES C SHARES F SHARES I SHARES R3 SHARES
------------------------------------------------------------------------------------------------------------------------
<S> <C> <C> <C> <C> <C>
Current Monthly Distribution per Share(2) $0.0954 $0.0814 $0.0972 $0.1000 $0.0908
Current Distribution Rate on NAV(3) 5.11% 4.35% 5.16% 5.34% 4.88%
</TABLE>
(1) The credit quality and ratings information presented above reflects the
ratings assigned by one or more nationally recognized statistical rating
organizations (NRSROs), including Standard & Poor's Ratings Group, a
division of The McGraw-Hill Companies, Inc., Moody's Investors Service,
Inc., Fitch Ratings or a comparably rated NRSRO. For situations in which a
security is rated by more than one NRSRO and the ratings are not
equivalent, the highest rating is used. Sub-investment grade ratings are
those rated BB+/Ba1 or lower. Investment grade ratings are those rated
BBB-/Baa3 or higher. The credit ratings shown relate to the
creditworthiness of the issuer of the underlying securities in the Fund
and not the Fund or its shares. Credit ratings are subject to change.
(2) Most recent distribution paid or declared through 10/31/17. Subject to
change in the future.
(3) Distribution rates are calculated by annualizing the most recent
distribution paid or declared through the report date and then dividing by
NAV as of 10/31/2017. Subject to change in the future.
Page 2
<PAGE>
FIRST TRUST PREFERRED SECURITIES AND INCOME FUND
"AT A GLANCE" (CONTINUED)
AS OF OCTOBER 31, 2017 (UNAUDITED)
-----------------------------------------------------------
PERFORMANCE OF A $10,000 INVESTMENT
-----------------------------------------------------------
This chart compares your Fund's Class I performance to that
of the ICE BofAML Fixed Rate Preferred Securities Index,
the ICE BofAML U.S. Capital Securities Index and the Blended
Index(a) from 1/11/2011 through 10/31/2017.
<TABLE>
<CAPTION>
First Trust Preferred ICE BofAML Fixed Rate ICE BofAML U.S.
Securities and Income Preferred Securities Capital Securities Blended
Fund - Class I Shares Index ("POP1") Index ("C0CS") Index (a)
<S> <C> <C> <C> <C>
1/11/11 $10,000 $10,000 $10,000 $10,000
4/30/11 10,393 10,454 10,484 10,469
10/31/11 10,521 10,521 10,138 10,330
4/30/12 11,475 11,142 10,861 11,002
10/31/12 12,398 11,847 11,958 11,903
4/30/13 12,931 12,288 12,651 12,470
10/31/13 11,894 11,553 12,711 12,132
4/30/14 12,715 12,485 13,445 12,965
10/31/14 13,163 12,992 13,899 13,446
4/30/15 13,693 13,573 14,391 13,987
10/31/15 13,862 13,965 14,123 14,056
4/30/16 14,101 14,480 14,365 14,436
10/31/16 15,009 14,975 15,157 15,080
4/30/17 15,572 15,421 15,451 15,451
10/31/17 16,409 15,959 16,152 16,072
</TABLE>
(a) The Blended Index return is 50/50 split between the ICE BofAML Fixed Rate
Preferred Securities Index and ICE BofAML U.S. Capital Securities Index.
<TABLE>
<CAPTION>
------------------------------------------------------------------------------------------------------------------------------------
PERFORMANCE AS OF OCTOBER 31, 2017
------------------------------------------------------------------------------------------------------------------------------------
A SHARES C SHARES F SHARES I SHARES R3 SHARES BLENDED P0P1* C0CS*
Inception Inception Inception Inception Inception INDEX* ICE BofAML ICE BofAML
2/25/2011 2/25/2011 3/2/2011 1/11/2011 3/2/2011 Fixed Rate U.S. Capital
Preferred Securities
Securities Index(1) Index(2)
------------------------------------------------------------------------------------------------------------------------------------
W/MAX
1.00%
W/MAX CONTINGENT
W/O 4.50% W/O DEFERRED W/O W/O W/O W/O W/O W/O
CUMULATIVE SALES SALES SALES SALES SALES SALES SALES SALES SALES SALES
TOTAL RETURNS CHARGES CHARGE CHARGES CHARGE CHARGES CHARGES CHARGES CHARGES CHARGES CHARGES
<S> <C> <C> <C> <C> <C> <C> <C> <C>
1 Year 9.05% 4.15% 8.27% 7.27% 9.27% 9.39% 8.70% 6.58% 6.58% 6.57%
AVERAGE ANNUAL
TOTAL RETURNS
5 Year 5.50% 4.53% 4.72% 4.72% 5.61% 5.79% 5.21% 6.18% 6.14% 6.19%
Since Inception 7.19% 6.45% 6.41% 6.41% 7.36% 7.57% 6.81% 7.22% 7.11% 7.30%
30-Day SEC Yield(3) 4.14% 3.36% 4.45% 4.36% 3.14% N/A N/A N/A
------------------------------------------------------------------------------------------------------------------------------------
</TABLE>
* Since inception return is based on the Class I Shares inception date.
Performance figures assume reinvestment of all distributions and do not reflect
the deduction of taxes that the shareholder would pay on Fund distributions or
the redemption of Fund shares. The total returns would have been lower if
certain fees had not been waived and expenses reimbursed by the Advisor and
Sub-Advisor. An index is a statistical composite that tracks a specific
financial market or sector. Unlike the Fund, these indices do not actually hold
a portfolio of securities and therefore do not incur the expenses incurred by
the Fund. These expenses negatively impact the performance of the Fund. The
Fund's past performance does not predict future performance.
Performance of share classes will vary due to differences in sales charges and
expenses. Total return with sales charges includes payment of the maximum sales
charge of 4.50% for Class A Shares, a contingent deferred sales charge ("CDSC")
of 1.00% for Class C Shares in year one and 12b-1 service fees of 0.25% per year
of average daily net assets for Class A Shares and combined Rule 12b-1
distribution and service fees of 1.00% per year of average daily net assets for
Class C Shares. Class F, Class I and Class R3 Shares do not have a front-end
sales charge or a CDSC; therefore, performance is at net asset value. The Rule
12b-1 service fees are 0.15% of average daily net assets for Class F Shares and
combined Rule 12b-1 distribution and service fees are 0.50% of average daily net
assets for Class R3 Shares, while Class I Shares do not have these fees. Prior
to December 15, 2011, the combined Rule 12b-1 distribution and service fees for
Class R3 Shares were 0.75% of average daily net assets.
(1) Effective October 22, 2017, the index name changed from BofA Merrill Lynch
Fixed Rate Preferred Securities Index to ICE BofAML Fixed Rate Preferred
Securities Index.
(2) Effective October 22, 2017, the index name changed from BofA Merrill Lynch
U.S. Capital Securities Index to ICE BofAML U.S. Capital Securities Index.
(3) 30-day SEC yield is calculated by dividing the net investment income per
share earned during the most recent 30-day period by the maximum offering
price per share on the last day of the period. The reported SEC yields are
subsidized. The subsidized yields reflect the fee waiver and/or
reimbursement of Fund expenses, which has the effect of lowering the
Fund's expense ratio and generating a higher yield.
Page 3
<PAGE>
--------------------------------------------------------------------------------
PORTFOLIO COMMENTARY
--------------------------------------------------------------------------------
FIRST TRUST PREFERRED SECURITIES AND INCOME FUND
ANNUAL REPORT
OCTOBER 31, 2017 (UNAUDITED)
ADVISOR
First Trust Advisors L.P. ("First Trust") is the investment advisor to the First
Trust Preferred Securities and Income Fund (the "Fund"). First Trust is
responsible for the ongoing monitoring of the Fund's investment portfolio,
managing the Fund's business affairs and providing certain administrative
services necessary for the management of the Fund.
SUB-ADVISOR
Stonebridge Advisors LLC ("Stonebridge" or the "Sub-Advisor") is the sub-advisor
to the Fund and is a registered investment advisor based in Wilton, Connecticut.
Stonebridge specializes in the management of preferred and hybrid securities.
PORTFOLIO MANAGEMENT TEAM
SCOTT T. FLEMING - PRESIDENT AND CHIEF INVESTMENT OFFICER OF STONEBRIDGE
ADVISORS LLC
ROBERT WOLF - SENIOR VICE PRESIDENT AND SENIOR PORTFOLIO MANAGER
DANIELLE SALTERS, CFA - VICE PRESIDENT, PORTFOLIO MANAGER AND CREDIT ANALYST
ANNUAL REPORT COMMENTARY
MARKET RECAP
The fiscal year ended October 31, 2017 was a period of solid returns for the
preferred and hybrid securities markets. The period began with substantial
volatility following an increase in interest rates in the fourth quarter of 2016
from the unexpected victory of Donald Trump in the U.S. Presidential election
and continued Republican control of the U.S. Congress. Higher rates were also
supported by improving economic and employment data, which allowed the Federal
Reserve (the "Fed") to increase short-term interest rates by 0.25% twice during
the period. However, risk assets recovered and performed well throughout the
last three quarters of the period due to stabilizing long-term interest rates, a
flattening yield curve, and significant spread tightening. Contingent capital
securities ("CoCos") were the best performing part of the preferred and hybrid
securities markets during the period, returning 16.78%. We believe this was due
to the improvement in credit quality of European banks (largest issuers of
CoCos), attractive yields and structures compared to U.S. bank tier 1 capital
securities, and the increasing investor comfort with the securities and more
stable investor base. After initial weakness during the period, the retail
preferred securities market was pushed higher by inflows into passive preferred
exchange-traded funds ("ETFs"), limited new issuance, and stable rates, which
were positive for the fixed for life structures that make up the majority of the
retail market. For the fiscal year, the retail market earned 6.58% while the
institutional market earned 6.57%, according to the ICE BofAML Fixed Rate
Preferred Securities Index ("P0P1") and the ICE BofAML U.S. Capital Securities
Index ("C0CS"), respectively.
PERFORMANCE ANALYSIS
The Fund continues to strive to provide comparable income to peer funds while
focusing on limiting the downside risks. The Fund experienced strong performance
during the fiscal year despite more defensive positioning, driven by active
management with a focus on security selection. The Fund's Class I Shares
produced a total return of 9.39% for the fiscal year ended October 31, 2017,
compared to the benchmark's (a 50/50 blend of P0P1 and C0CS) total return of
6.58%. Outperformance was primarily driven by security selection within
fixed-to-float securities and an overweight of floating-rate securities and
CoCos, both of which are not held in the benchmark.
The Fund continues to maintain its core strategy of overweighting fixed-to-float
securities and securities with high coupons and relatively short call dates. The
Fund's exposure to floating-rate securities, in particular, was a substantial
contributor to performance with those securities experiencing substantial
capital appreciation driven by increases in the London Interbank Offered Rate
("LIBOR") throughout the period. The Fund also benefitted from its allocation to
CoCos, not held in the benchmark. The Fund has continued to increase exposure to
the space given the reasons stated above. This allocation was a substantial
contributor to the Fund's outperformance. These positive impacts were partially
offset by the Fund's bias toward lower duration securities in the environment in
which longer duration securities outperformed.
Page 4
<PAGE>
--------------------------------------------------------------------------------
PORTFOLIO COMMENTARY (CONTINUED)
--------------------------------------------------------------------------------
FIRST TRUST PREFERRED SECURITIES AND INCOME FUND
ANNUAL REPORT
OCTOBER 31, 2017 (UNAUDITED)
We will continue deploying the strategy of mitigating risk to the downside by
remaining overweight in less interest-rate-sensitive securities, limiting
exposure to risky issuers and industries, and limiting overlap with passive
ETFs. We believe this strategy will also allow the Fund to show more resilience
in a market downturn and potentially outperform in a rising rate environment.
MARKET AND FUND OUTLOOK
The strong macro-economic backdrop, strong corporate earnings and solid
creditworthiness, particularly within financials, continue to support a risk-on
environment, in our opinion. Stable to gradually increasing rates, moderate
issuance, and the continued demand for yield continue to be positive for the
preferred and hybrid securities markets. However, we believe strong performance
across equity and credit markets and increased economic optimism has stretched
valuations of new issuance in some cases, which could become problematic if
interest rates or supply increases. Recently, weaker security structures have
come to market, but the deals were many times oversubscribed, supported by
investor demand for yield and some buyers that are indiscriminate about pricing,
in the form of passive ETFs, taking up a larger share of markets and deals. We
believe this could put pressure on distributions if higher yielding legacy
securities continue to be redeemed and replaced by lower yielding securities.
Stonebridge continues to believe that the yield curve is likely to remain flat,
as short-term rates are likely to increase and may push long term rates higher.
We have long anticipated, and positioned for, a rising rate environment, and we
continue to hold the view that this process will be gradual. We believe U.S.
fiscal policy and potential tax and regulatory changes have the potential to
boost economic growth but we also believe this impact is likely to be muted and
slow given political uncertainty and the likelihood that any changes will likely
be phased in over time. Stonebridge continues to focus on protecting the
principal of our investors and, as such, we believe it is prudent to protect
investors against a potential rise in interest rates through actively managing
interest rate risk.
Page 5
<PAGE>
FIRST TRUST PREFERRED SECURITIES AND INCOME FUND
UNDERSTANDING YOUR FUND EXPENSES
OCTOBER 31, 2017 (UNAUDITED)
As a shareholder of the First Trust Preferred Securities and Income Fund, you
incur two types of costs: (1) transaction costs, including sales charges (loads)
on purchases of Class A Shares and contingent deferred sales charges on the
lesser of purchase price or redemption proceeds of Class C Shares; and (2)
ongoing costs, including management fees, distribution and/or service (12b-1)
fees, if any, and other Fund expenses. This Example is intended to help you
understand your ongoing costs (in U.S. dollars) of investing in the Fund and to
compare these costs with the ongoing costs of investing in other mutual funds.
The Example is based on an investment of $1,000 invested at the beginning of the
period and held through the six-month period ended October 31, 2017.
ACTUAL EXPENSES
The first three columns of the table below provide information about actual
account values and actual expenses. You may use the information in these
columns, together with the amount you invested, to estimate the expenses that
you paid over the period. Simply divide your account value by $1,000 (for
example, an $8,600 account value divided by $1,000 = 8.6), then multiply the
result by the number in the third column under the heading entitled "Expenses
Paid During Period" to estimate the expenses you paid on your account during the
period.
HYPOTHETICAL EXAMPLE FOR COMPARISON PURPOSES
The next three columns of the table below provide information about hypothetical
account values and hypothetical expenses based on the Fund's actual expense
ratio and an assumed rate of return of 5% per year before expenses, which is not
the Fund's actual return. The hypothetical account values and expenses may not
be used to estimate the actual ending account balance or expenses you paid for
the period. You may use this information to compare the ongoing cost of
investing in the Fund and other funds. To do so, compare this 5% hypothetical
example with the 5% hypothetical examples that appear in the shareholder reports
of the other funds.
Please note that the expenses shown in the table are meant to highlight your
ongoing costs only and do not reflect any transactional costs, such as sales
charges (loads) or contingent deferred sales charges. Therefore, the
hypothetical section of the table is useful in comparing ongoing costs only, and
will not help you determine the relative total costs of owning different funds.
In addition, if these transactional costs were included, your costs would have
been higher.
<TABLE>
<CAPTION>
---------------------------------------------------------------------------------------------------
HYPOTHETICAL
ACTUAL EXPENSES (5% RETURN BEFORE EXPENSES)
------------------------------------------- ---------------------------------------
ENDING EXPENSES PAID BEGINNING ENDING EXPENSES PAID
BEGINNING ACCOUNT DURING PERIOD ACCOUNT ACCOUNT DURING PERIOD ANNUALIZED
ACCOUNT VALUE VALUE 5/1/2017 - VALUE VALUE 5/1/2017 - EXPENSE
5/1/2017 10/31/2017 10/31/2017 (a) 5/1/2017 10/31/2017 10/31/2017 (a) RATIOS (b)
----------------------------------------------------------------------------------------------------------------
<S> <C> <C> <C> <C> <C> <C> <C>
Class A $ 1,000.00 $ 1,051.50 $ 6.83 $1,000.00 $ 1,018.55 $ 6.72 1.32%
Class C 1,000.00 1,048.00 10.27 1,000.00 1,015.17 10.11 1.99
Class F 1,000.00 1,053.40 6.73 1,000.00 1,018.65 6.61 1.30
Class I 1,000.00 1,054.00 4.97 1,000.00 1,020.37 4.89 0.96
Class R3 1,000.00 1,049.80 8.47 1,000.00 1,016.94 8.34 1.64
</TABLE>
(a) Expenses are equal to the annualized expense ratios, multiplied by the
average account value over the period May 1, 2017 through October 31,
2017, multiplied by 184/365 (to reflect the six-month period).
(b) These expense ratios reflect expense caps.
Page 6
<PAGE>
FIRST TRUST PREFERRED SECURITIES AND INCOME FUND
PORTFOLIO OF INVESTMENTS
OCTOBER 31, 2017
<TABLE>
<CAPTION>
STATED STATED
SHARES DESCRIPTION RATE MATURITY VALUE
------------- --------------------------------------------------- --------- ------------ --------------
<S> <C> <C> <C> <C>
$25 PAR PREFERRED SECURITIES - 17.9%
BANKS - 5.3%
40,000 Bank of America Corp., Series CC................... 6.20% (a) $ 1,072,000
30,000 Citigroup Capital XIII, 3 Mo. LIBOR + 6.37% (b).... 7.75% 10/30/40 816,600
6,799 Citigroup, Inc., Series J (c)...................... 7.13% (a) 195,811
50,000 Citigroup, Inc., Series K (c)...................... 6.88% (a) 1,444,500
13,996 Citigroup, Inc., Series S.......................... 6.30% (a) 378,872
15,456 FNB Corp. (c)...................................... 7.25% (a) 448,070
87,100 GMAC Capital Trust I, Series 2, 3Mo. LIBOR +
5.79% (b)....................................... 7.10% 02/15/40 2,287,246
107,491 People's United Financial, Inc., Series A (c)...... 5.63% (a) 2,897,957
10,700 Regions Financial Corp., Series B (c).............. 6.38% (a) 303,345
16,288 Valley National Bancorp, Series B (c).............. 5.50% (a) 430,003
57,531 Wells Fargo & Co., Series Q (c).................... 5.85% (a) 1,567,145
54,369 Wintrust Financial Corp., Series D (c)............. 6.50% (a) 1,521,788
--------------
13,363,337
--------------
CAPITAL MARKETS - 3.6%
3,157 Charles Schwab Corp., Series D..................... 5.95% (a) 86,502
16,487 Goldman Sachs Group, Inc., Series J (c)............ 5.50% (a) 442,676
71,083 Morgan Stanley, Series E (c)....................... 7.13% (a) 2,057,853
35,100 Morgan Stanley, Series F (c)....................... 6.88% (a) 1,002,105
25,102 Morgan Stanley, Series I (c)....................... 6.38% (a) 702,856
105,359 Morgan Stanley, Series K (c)....................... 5.85% (a) 2,844,693
60,000 State Street Corp., Series D (c)................... 5.90% (a) 1,662,600
12,599 Stifel Financial Corp., Series A................... 6.25% (a) 337,023
--------------
9,136,308
--------------
DIVERSIFIED FINANCIAL SERVICES - 0.8%
78,513 KKR Financial Holdings LLC, Series A............... 7.38% (a) 1,991,875
--------------
EQUITY REAL ESTATE INVESTMENT TRUSTS - 3.8%
8,509 American Homes 4 Rent, Series C (d)................ 5.50% (a) 241,400
23,626 American Homes 4 Rent, Series E.................... 6.35% (a) 623,963
1,061 Colony NorthStar, Inc., Series D................... 8.50% (a) 27,619
49,976 Colony NorthStar, Inc., Series E................... 8.75% (a) 1,349,352
12,305 Colony NorthStar, Inc., Series H................... 7.13% (a) 315,623
74,323 EPR Properties, Series F........................... 6.63% (a) 1,878,142
25,000 Equity Commonwealth................................ 5.75% 08/01/42 627,500
25,000 Farmland Partners, Inc., Series B (d).............. 6.00% (a) 674,563
23,490 Global Net Lease, Inc., Series A................... 7.25% (a) 588,894
15,927 Taubman Centers, Inc., Series J.................... 6.50% (a) 401,361
15,000 Urstadt Biddle Properties, Inc., Series H.......... 6.25% (a) 398,850
102,470 VEREIT, Inc., Series F............................. 6.70% (a) 2,620,158
--------------
9,747,425
--------------
FOOD PRODUCTS - 0.1%
13,791 CHS, Inc., Series 2 (c)............................ 7.10% (a) 381,597
--------------
INSURANCE - 2.0%
7,100 AmTrust Financial Services, Inc.................... 7.50% 09/15/55 191,274
33,556 Aspen Insurance Holdings Ltd....................... 5.63% (a) 849,973
26,151 Aspen Insurance Holdings Ltd. (c).................. 5.95% (a) 704,508
50,000 Delphi Financial Group, Inc., 3Mo. LIBOR +
3.19% (b) (e)................................... 4.51% 05/15/37 1,065,625
</TABLE>
See Notes to Financial Statements Page 7
<PAGE>
FIRST TRUST PREFERRED SECURITIES AND INCOME FUND
PORTFOLIO OF INVESTMENTS (CONTINUED)
OCTOBER 31, 2017
<TABLE>
<CAPTION>
STATED STATED
SHARES DESCRIPTION RATE MATURITY VALUE
------------- --------------------------------------------------- --------- ------------ --------------
<S> <C> <C> <C> <C>
$25 PAR PREFERRED SECURITIES (CONTINUED)
INSURANCE (CONTINUED)
14,443 National General Holdings Corp..................... 7.63% 09/15/55 $ 371,457
21,000 Phoenix Cos., Inc.................................. 7.45% 01/15/32 393,095
31,725 Reinsurance Group of America, Inc. (c)............. 5.75% 06/15/56 881,955
19,927 Validus Holdings, Ltd., Series B................... 5.80% (a) 503,555
--------------
4,961,442
--------------
MORTGAGE REAL ESTATE INVESTMENT TRUSTS - 1.0%
25,000 AGNC Investment Corp., Series C (c)................ 7.00% (a) 668,750
38,824 Annaly Capital Management, Inc., Series F (c)...... 6.95% (a) 1,024,953
13,200 Invesco Mortgage Capital, Inc., Series B (c)....... 7.75% (a) 348,084
23,000 Two Harbors Investment, Corp., Series B (c)........ 7.63% (a) 610,880
--------------
2,652,667
--------------
MULTI-UTILITIES - 0.8%
40,000 Integrys Holding, Inc. (c)......................... 6.00% 08/01/73 1,132,500
30,000 Just Energy Group, Inc., Series A (c).............. 8.50% (a) 780,000
--------------
1,912,500
--------------
THRIFTS & MORTGAGE FINANCE - 0.5%
46,302 New York Community Bancorp, Inc., Series A (c)..... 6.38% (a) 1,293,215
--------------
TOTAL $25 PAR PREFERRED SECURITIES............................................ 45,440,366
(Cost $44,135,158) --------------
$100 PAR PREFERRED SECURITIES - 2.8%
BANKS - 2.7%
32,500 CoBank ACB, Series F (c) (f)....................... 6.25% (a) 3,510,000
27,000 CoBank ACB, Series G............................... 6.13% (a) 2,761,085
5,500 Farm Credit Bank Of Texas (c) (g).................. 6.75% (a) 606,375
--------------
6,877,460
--------------
CONSUMER FINANCE - 0.1%
5,130 SLM Corp., Series B, 3Mo. LIBOR + 1.7% (b)......... 3.02% (a) 345,351
--------------
TOTAL $100 PAR PREFERRED SECURITIES........................................... 7,222,811
(Cost $6,634,735) --------------
$1,000 PAR PREFERRED SECURITIES - 4.1%
BANKS - 2.6%
4,000 Farm Credit Bank Of Texas, Series 1 (g)............ 10.00% (a) 4,890,000
1,261 Sovereign Real Estate Investment Trust (g)......... 12.00% (a) 1,580,979
--------------
6,470,979
--------------
CONSUMER FINANCE - 0.2%
500 Compeer Financial ACA (c) (g)...................... 6.75% (a) 534,562
--------------
DIVERSIFIED FINANCIAL SERVICES - 0.2%
500 Kinder Morgan GP, Inc., 3Mo. LIBOR +
3.90% (b) (g)................................... 5.21% 08/18/57 469,719
--------------
INSURANCE - 1.1%
3,000 XLIT Ltd., Series D, 3Mo. LIBOR + 3.12% (b)........ 4.48% (a) 2,863,125
--------------
TOTAL $1,000 PAR PREFERRED SECURITIES......................................... 10,338,385
(Cost $10,172,874) --------------
</TABLE>
Page 8 See Notes to Financial Statements
<PAGE>
FIRST TRUST PREFERRED SECURITIES AND INCOME FUND
PORTFOLIO OF INVESTMENTS (CONTINUED)
OCTOBER 31, 2017
<TABLE>
<CAPTION>
PAR STATED STATED
AMOUNT DESCRIPTION RATE MATURITY VALUE
------------- --------------------------------------------------- --------- ------------ --------------
<S> <C> <C> <C> <C>
CAPITAL PREFERRED SECURITIES - 73.5%
AUTOMOBILES - 1.0%
$ 2,400,000 General Motors Financial Co., Inc., Series A (c)... 5.75% (a) $ 2,514,000
--------------
BANKS - 33.1%
1,500,000 Australia & New Zealand Banking Group
Ltd. (c) (f) (h)................................ 6.75% (a) 1,727,100
2,600,000 Banco Bilbao Vizcaya Argentaria S.A. (c) (h)....... 9.00% (a) 2,691,429
500,000 Banco Mercantil del Norte S.A. (c) (f) (h)......... 6.88% (a) 526,250
1,000,000 Banco Mercantil del Norte S.A. (c) (f) (h)......... 7.63% (a) 1,090,000
4,500,000 Bank of America Corp., Series DD (c)............... 6.30% (a) 5,138,010
200,000 Bank of America Corp., Series K (c)................ 8.00% (a) 202,750
1,000,000 Bank of America Corp., Series M (c)................ 8.13% (a) 1,032,850
1,500,000 Bank of America Corp., Series Z (c)................ 6.50% (a) 1,717,500
4,000,000 Barclays PLC (c) (h)............................... 7.88% (a) 4,468,344
1,100,000 Barclays PLC (c) (h)............................... 8.25% (a) 1,171,043
1,500,000 BNP Paribas S.A. (c) (f) (h)....................... 7.63% (a) 1,685,625
1,000,000 BPCE S.A. (c) (f).................................. 12.50% (a) 1,181,880
1,500,000 Citigroup, Inc., Series O (c)...................... 5.88% (a) 1,572,225
680,000 Citigroup, Inc., Series P (c)...................... 5.95% (a) 744,845
1,250,000 Citigroup, Inc., Series R (c)...................... 6.13% (a) 1,342,187
500,000 Citizens Financial Group, Inc. (c)................. 5.50% (a) 525,000
2,500,000 CoBank ACB, Series I (c)........................... 6.25% (a) 2,753,205
1,000,000 Commerzbank AG..................................... 8.13% 09/19/23 1,217,030
753,000 Cooperatieve Rabobank UA (c)....................... 11.00% (a) 857,479
1,000,000 Cooperatieve Rabobank UA (c) (f)................... 11.00% (a) 1,138,750
2,000,000 Credit Agricole S.A. (c) (f) (h)................... 7.88% (a) 2,281,378
3,485,000 Credit Agricole S.A. (c) (f) (h)................... 8.13% (a) 4,201,471
2,000,000 Credit Agricole S.A. (c)........................... 8.38% (a) 2,220,000
1,000,000 Danske Bank A/S (c) (h)............................ 6.13% (a) 1,087,227
500,000 Fifth Third Bancorp (c)............................ 5.10% (a) 512,500
1,000,000 HSBC Holdings PLC (c) (h).......................... 6.38% (a) 1,096,250
3,000,000 ING Groep N.V. (c) (h)............................. 6.88% (a) 3,349,626
2,954,000 Intesa Sanpaolo S.p.A. (c) (f) (h)................. 7.70% (a) 3,242,015
1,000,000 JPMorgan Chase & Co., Series 1 (c)................. 7.90% (a) 1,026,750
1,500,000 JPMorgan Chase & Co., Series S (c)................. 6.75% (a) 1,721,250
1,000,000 Lloyds Bank PLC (c) (f)............................ 12.00% (a) 1,354,416
1,000,000 Lloyds Banking Group PLC (c) (h)................... 7.50% (a) 1,143,750
1,046,000 Royal Bank Of Scotland Group PLC (c) (h)........... 7.50% (a) 1,123,404
1,000,000 Royal Bank Of Scotland Group PLC (c) (h)........... 8.00% (a) 1,145,700
3,250,000 Royal Bank Of Scotland Group PLC (c) (h)........... 8.63% (a) 3,688,425
1,500,000 Societe Generale S.A. (c) (f) (h).................. 7.38% (a) 1,657,500
2,250,000 Societe Generale S.A. (c) (f) (h).................. 7.88% (a) 2,556,562
2,250,000 Standard Chartered PLC (c) (f) (h)................. 7.75% (a) 2,500,650
2,000,000 UniCredit S.p.A. (c) (f)........................... 5.86% 06/19/32 2,140,440
1,900,000 UniCredit S.p.A. (c) (h)........................... 8.00% (a) 2,107,659
4,500,000 Wells Fargo & Co., Series K (c).................... 7.98% (a) 4,596,975
1,500,000 Wells Fargo & Co., Series U (c).................... 5.88% (a) 1,678,875
4,000,000 Zions Bancorporation, Series J (c)................. 7.20% (a) 4,570,000
--------------
83,786,325
--------------
CAPITAL MARKETS - 3.5%
500,000 Charles Schwab Corp. (c)........................... 5.00% (a) 506,250
2,750,000 Credit Suisse Group AG (c) (f) (h)................. 7.50% (a) 3,203,404
2,000,000 E*Trade Financial Corp., Series A (c).............. 5.88% (a) 2,140,000
</TABLE>
See Notes to Financial Statements Page 9
<PAGE>
FIRST TRUST PREFERRED SECURITIES AND INCOME FUND
PORTFOLIO OF INVESTMENTS (CONTINUED)
OCTOBER 31, 2017
<TABLE>
<CAPTION>
PAR STATED STATED
AMOUNT DESCRIPTION RATE MATURITY VALUE
------------- --------------------------------------------------- --------- ------------ --------------
<S> <C> <C> <C> <C>
CAPITAL PREFERRED SECURITIES (CONTINUED)
CAPITAL MARKETS (CONTINUED)
$ 500,000 Goldman Sachs Group, Inc., Series L (c)............ 5.70% (a) $ 516,875
1,298,000 Natixis S.A. (c)................................... 10.00% (a) 1,346,675
1,000,000 UBS Group AG (c) (h)............................... 7.13% (a) 1,079,390
--------------
8,792,594
--------------
CONSUMER FINANCE - 0.6%
1,610,000 Discover Financial Services, Series C (c).......... 5.50% (a) 1,644,213
--------------
DIVERSIFIED FINANCIAL SERVICES - 0.4%
1,000,000 Voya Financial, Inc. (c)........................... 5.65% 05/15/53 1,057,500
--------------
DIVERSIFIED TELECOMMUNICATION SERVICES - 0.4%
1,000,000 Koninklijke KPN N.V. (c)........................... 7.00% 03/28/73 1,137,450
--------------
ELECTRIC UTILITIES - 4.6%
3,500,000 Emera, Inc., Series 16-A (c)....................... 6.75% 06/15/76 4,025,350
4,000,000 Enel S.p.A. (c) (f)................................ 8.75% 09/24/73 4,950,000
1,000,000 Nextera Energy Capital Holdings, Inc., Series D,
3Mo. LIBOR + 3.35% (b).......................... 4.66% 09/01/67 1,001,301
1,000,000 Southern (The) Co., Series B (c)................... 5.50% 03/15/57 1,064,862
500,000 Southern California Edison Co., Series E (c)....... 6.25% (a) 564,375
--------------
11,605,888
--------------
FOOD PRODUCTS - 3.8%
1,300,000 Dairy Farmers of America, Inc. (g)................. 7.13% (a) 1,454,375
3,000,000 Land O'Lakes Capital Trust I (g)................... 7.45% 03/15/28 3,525,000
1,200,000 Land O'Lakes, Inc. (f)............................. 7.25% (a) 1,299,000
3,000,000 Land O'Lakes, Inc. (f)............................. 8.00% (a) 3,345,000
--------------
9,623,375
--------------
INDEPENDENT POWER AND RENEWABLE ELECTRICITY PRODUCERS - 0.7%
1,575,000 AES Gener S.A. (c)................................. 8.38% 12/18/73 1,672,918
--------------
INDUSTRIAL CONGLOMERATES - 0.9%
966,000 General Electric Co. (c)........................... 6.38% 11/15/67 969,671
1,250,000 General Electric Co., Series D (c)................. 5.00% (a) 1,306,250
--------------
2,275,921
--------------
INSURANCE - 17.2%
1,000,000 AG Insurance S.A. (c).............................. 6.75% (a) 1,060,000
4,200,000 Aquarius & Investments PLC for Swiss Reinsurance
Co., Ltd. (c)................................... 8.25% (a) 4,402,822
1,215,000 Assured Guaranty Municipal Holdings, Inc. (c) (f).. 6.40% 12/15/66 1,190,700
4,100,000 Catlin Insurance Co., Ltd., 3 Mo. LIBOR +
2.98% (b) (f)................................... 4.33% (a) 3,895,000
1,000,000 CNP Assurances (c)................................. 6.88% (a) 1,072,500
2,500,000 CNP Assurances (c)................................. 7.50% (a) 2,630,625
1,000,000 Fortegra Financial Corp. (c) (g)................... 8.50% 10/15/57 1,005,000
3,300,000 Friends Life Holdings PLC (c)...................... 7.88% (a) 3,494,050
1,000,000 Fukoku Mutual Life Insurance Co. (c)............... 6.50% (a) 1,132,130
2,500,000 La Mondiale SAM (c)................................ 7.63% (a) 2,670,283
2,663,000 Liberty Mutual Group, Inc. (f)..................... 7.80% 03/15/37 3,382,010
3,285,000 Liberty Mutual Group, Inc. (c)..................... 10.75% 06/15/58 5,461,312
1,830,000 MetLife, Inc. (f).................................. 9.25% 04/08/38 2,724,413
1,250,000 Metlife, Inc....................................... 10.75% 08/01/39 2,090,625
977,000 Mitsui Sumitomo Insurance Co., Ltd. (c) (f)........ 7.00% 03/15/72 1,123,452
</TABLE>
Page 10 See Notes to Financial Statements
<PAGE>
FIRST TRUST PREFERRED SECURITIES AND INCOME FUND
PORTFOLIO OF INVESTMENTS (CONTINUED)
OCTOBER 31, 2017
<TABLE>
<CAPTION>
PAR STATED STATED
AMOUNT DESCRIPTION RATE MATURITY VALUE
------------- --------------------------------------------------- --------- ------------ --------------
<S> <C> <C> <C> <C>
CAPITAL PREFERRED SECURITIES (CONTINUED)
INSURANCE (CONTINUED)
$ 1,000,000 Prudential Financial, Inc. (c)..................... 5.63% 06/15/43 $ 1,087,750
2,000,000 QBE Insurance Group, Ltd. (c) (f).................. 7.50% 11/24/43 2,319,000
2,500,000 QBE Insurance Group, Ltd. (c)...................... 6.75% 12/02/44 2,840,625
--------------
43,852,297
--------------
METALS & MINING - 0.5%
500,000 BHP Billiton Finance USA Ltd. (c) (f).............. 6.25% 10/19/75 549,000
500,000 BHP Billiton Finance USA Ltd. (c) (f).............. 6.75% 10/19/75 590,000
--------------
1,139,000
--------------
OIL, GAS & CONSUMABLE FUELS - 5.2%
4,231,400 Enbridge Energy Partners L.P., 3Mo. LIBOR +
3.80% (b)....................................... 5.13% 10/01/37 4,231,400
600,000 Enbridge, Inc. (c)................................. 5.50% 07/15/77 619,500
500,000 Enbridge, Inc., Series 16-A (c).................... 6.00% 01/15/77 536,320
2,661,000 Energy Transfer LP, 3Mo. LIBOR + 3.02% (b)......... 4.39% 11/01/66 2,414,857
1,500,000 Enterprise Products Operating LLC, Series A,
3Mo. LIBOR + 3.71% (b).......................... 5.08% 08/01/66 1,500,000
1,155,000 Enterprise Products Operating LLC, Series B (c).... 7.03% 01/15/68 1,160,775
2,500,000 Transcanada Trust, Series 16-A (c)................. 5.88% 08/15/76 2,737,500
--------------
13,200,352
--------------
TRANSPORTATION INFRASTRUCTURE - 1.6%
3,720,000 AerCap Global Aviation Trust (c) (f)............... 6.50% 06/15/45 4,073,400
--------------
TOTAL CAPITAL PREFERRED SECURITIES............................................ 186,105,233
(Cost $178,262,832) --------------
PRINCIPAL STATED STATED
VALUE DESCRIPTION RATE MATURITY VALUE
------------- --------------------------------------------------- --------- ------------ --------------
CORPORATE BONDS AND NOTES - 0.4%
INSURANCE - 0.4%
1,000,000 AmTrust Financial Services, Inc.................... 6.13% 08/15/23 995,000
(Cost $995,207) --------------
TOTAL INVESTMENTS - 98.7%..................................................... 250,101,795
(Cost $240,200,806) (i)
NET OTHER ASSETS AND LIABILITIES - 1.3%....................................... 3,179,135
--------------
NET ASSETS - 100.0%........................................................... $ 253,280,930
==============
</TABLE>
(a) Perpetual maturity.
(b) Floating rate security.
(c) Fixed-to-floating or fixed-to-variable rate security. The interest rate
shown reflects the fixed rate in effect at October 31, 2017. At a
predetermined date, the fixed rate will change to a floating rate or a
variable rate.
(d) Step-up security. A security where the coupon increases or steps up at a
predetermined date.
(e) Pursuant to procedures adopted by the First Trust Series Fund's (the
"Trust") Board of Trustees, this security has been determined to be
illiquid by Stonebridge Advisors LLC, the Fund's sub-advisor
(the "Sub-Advisor").
(f) This security, sold within the terms of a private placement memorandum, is
exempt from registration upon resale under Rule 144A under the Securities
Act of 1933, as amended (the "1933 Act"), and may be resold in
transactions exempt from registration, normally to qualified institutional
buyers. Pursuant to procedures adopted by the Trust's Board of Trustees,
this security has been determined to be liquid by the Sub-Advisor.
Although market instability can result in periods of increased overall
market illiquidity, liquidity for each security is determined based on
security specific factors and assumptions, which require subjective
judgment. At October 31, 2017, securities noted as such amounted to
$63,438,416 or 25.0% of net assets.
See Notes to Financial Statements Page 11
<PAGE>
FIRST TRUST PREFERRED SECURITIES AND INCOME FUND
PORTFOLIO OF INVESTMENTS (CONTINUED)
OCTOBER 31, 2017
(g) This security, sold within the terms of a private placement memorandum, is
exempt from registration upon resale under Rule 144A under the 1933 Act,
as amended, and may be resold in transactions exempt from registration,
normally to qualified institutional buyers (see Note 2C - Restricted
Securities in the Notes to Financial Statements).
(h) This security is a contingent convertible capital security, which may be
subject to conversion into common stock of the issuer under certain
circumstances. At October 31, 2017, securities noted as such amounted to
$48,824,202 or 19.3% of net assets. Of these securities, 3.3% originated
in emerging markets and 96.7% originated in foreign markets.
(i) Aggregate cost for federal income tax purposes is $240,187,134. As of
October 31, 2017, the aggregate gross unrealized appreciation for all
investments in which there was an excess value over tax cost was
$12,023,917 and the aggregate gross unrealized depreciation for all
investments in which there was an excess of tax cost over value was
$2,109,256. The net unrealized appreciation was $9,914,661.
LIBOR - London Interbank Offered Rate
-----------------------------
VALUATION INPUTS
A summary of the inputs used to value the Fund's investments as of October 31,
2017 is as follows (see Note 2A - Portfolio Valuation in the Notes to Financial
Statements):
<TABLE>
<CAPTION>
LEVEL 2 LEVEL 3
TOTAL LEVEL 1 SIGNIFICANT SIGNIFICANT
VALUE AT QUOTED OBSERVABLE UNOBSERVABLE
10/31/2017 PRICES INPUTS INPUTS
------------- ------------- ------------- -------------
<S> <C> <C> <C> <C>
$25 Par Preferred Securities:
Insurance......................................... $ 4,961,442 $ 3,502,722 $ 1,458,720 $ --
Multi-Utilities................................... 1,912,500 780,000 1,132,500 --
Other industry categories*........................ 38,566,424 38,566,424 -- --
------------- ------------- ------------- -------------
Total $25 Par Preferred Securities................... 45,440,366 42,849,146 2,591,220 --
$100 Par Preferred Securities:
Banks............................................. 6,877,460 -- 6,877,460 --
Consumer Finance.................................. 345,351 345,351 -- --
------------- ------------- ------------- -------------
Total $100 Par Preferred Securities.................. 7,222,811 345,351 6,877,460 --
$1,000 Par Preferred Securities*..................... 10,338,385 -- 10,338,385 --
Capital Preferred Securities*........................ 186,105,233 -- 186,105,233 --
Corporate Bonds and Notes*........................... 995,000 -- 995,000 --
------------- ------------- ------------- -------------
Total Investments.................................... $ 250,101,795 $ 43,194,497 $ 206,907,298 $ --
============= ============= ============= =============
</TABLE>
* See the Portfolio of Investments for industry breakout.
All transfers in and out of the Levels during the period are assumed to occur on
the last day of the period at their current value. There were no transfers
between Levels at October 31, 2017.
Page 12 See Notes to Financial Statements
<PAGE>
FIRST TRUST PREFERRED SECURITIES AND INCOME FUND
STATEMENT OF ASSETS AND LIABILITIES
OCTOBER 31, 2017
<TABLE>
<CAPTION>
ASSETS:
<S> <C>
Investments, at value
(Cost $240,200,806)................................................................................. $ 250,101,795
Cash................................................................................................ 3,214,257
Prepaid expenses.................................................................................... 48,416
Receivables:
Investment securities sold....................................................................... 5,482,981
Interest......................................................................................... 2,399,410
Fund shares sold................................................................................. 638,203
Dividends........................................................................................ 50,960
-------------
Total Assets..................................................................................... 261,936,022
-------------
LIABILITIES:
Payables:
Investment securities purchased.................................................................. 7,212,470
Fund shares repurchased.......................................................................... 931,889
Investment advisory fees......................................................................... 169,221
Distributions payable............................................................................ 77,346
12b-1 distribution and service fees.............................................................. 64,002
Transfer agent fees.............................................................................. 59,790
Administrative fees.............................................................................. 42,834
Audit and tax fees............................................................................... 33,202
Registration fees................................................................................ 22,720
Printing fees.................................................................................... 18,312
Custodian fees................................................................................... 12,756
Commitment and administrative agency fees........................................................ 4,645
Trustees' fees and expenses...................................................................... 2,949
Legal fees....................................................................................... 1,842
Financial reporting fees......................................................................... 770
Other liabilities................................................................................... 344
-------------
Total Liabilities................................................................................ 8,655,092
-------------
NET ASSETS.......................................................................................... $ 253,280,930
=============
NET ASSETS CONSIST OF:
Paid-in capital..................................................................................... $ 252,425,442
Par value........................................................................................... 112,736
Accumulated net investment income (loss)............................................................ 557,195
Accumulated net realized gain (loss) on investments................................................. (9,715,432)
Net unrealized appreciation (depreciation) on investments........................................... 9,900,989
-------------
NET ASSETS.......................................................................................... $ 253,280,930
=============
MAXIMUM OFFERING PRICE PER SHARE:
CLASS A SHARES:
Net asset value and redemption price per share (Based on net assets of $39,063,437 and 1,744,911
shares of beneficial interest issued and outstanding).......................................... $ 22.39
Maximum sales charge (4.50% of offering price)................................................... 1.05
-------------
Maximum offering price to public................................................................... $ 23.44
=============
CLASS C SHARES:
Net asset value and redemption price per share (Based on net assets of $64,462,350 and 2,872,480
shares of beneficial interest issued and outstanding)......................................... $ 22.44
=============
CLASS F SHARES:
Net asset value and redemption price per share (Based on net assets of $7,338,706 and 324,427
shares of beneficial interest issued and outstanding)......................................... $ 22.62
=============
CLASS I SHARES:
Net asset value and redemption price per share (Based on net assets of $141,660,626 and 6,297,920
shares of beneficial interest issued and outstanding)......................................... $ 22.49
=============
CLASS R3 SHARES:
Net asset value and redemption price per share (Based on net assets of $755,811 and 33,820
shares of beneficial interest issued and outstanding)......................................... $ 22.35
=============
</TABLE>
See Notes to Financial Statements Page 13
<PAGE>
FIRST TRUST PREFERRED SECURITIES AND INCOME FUND
STATEMENT OF OPERATIONS
FOR THE YEAR ENDED OCTOBER 31, 2017
<TABLE>
<CAPTION>
INVESTMENT INCOME:
<S> <C>
Interest ........................................................................................... $ 9,964,416
Dividends .......................................................................................... 4,261,117
Other............................................................................................... 30,801
-------------
Total investment income.......................................................................... 14,256,334
-------------
EXPENSES:
12b-1 distribution and/or service fees:
Class A.......................................................................................... 96,278
Class C.......................................................................................... 550,278
Class F.......................................................................................... 11,544
Class R3......................................................................................... 3,409
Investment advisory fees............................................................................ 1,765,175
Transfer agent fees................................................................................. 151,570
Administrative fees................................................................................. 93,775
Registration fees................................................................................... 77,871
Commitment and administrative agency fees........................................................... 59,594
Audit and tax fees.................................................................................. 34,126
Custodian fees...................................................................................... 33,760
Printing fees....................................................................................... 32,945
Trustees' fees and expenses......................................................................... 18,424
Financial reporting fees............................................................................ 9,250
Excise tax expense.................................................................................. 6,995
Legal fees.......................................................................................... 4,390
Listing expense..................................................................................... 2,993
Expenses previously waived or reimbursed............................................................ 2,494
Other............................................................................................... 11,460
-------------
Total expenses................................................................................... 2,966,331
Fees waived or expenses reimbursed by the investment advisor..................................... (25,178)
-------------
Net expenses..................................................................................... 2,941,153
-------------
NET INVESTMENT INCOME (LOSS)........................................................................ 11,315,181
-------------
NET REALIZED AND UNREALIZED GAIN (LOSS):
Net realized gain (loss) on:
Net realized gain (loss) on investments.......................................................... 2,374,196
Net change in unrealized appreciation (depreciation) on investments.............................. 5,842,618
-------------
NET REALIZED AND UNREALIZED GAIN (LOSS)............................................................. 8,216,814
-------------
NET INCREASE (DECREASE) IN NET ASSETS RESULTING FROM OPERATIONS..................................... $ 19,531,995
=============
</TABLE>
Page 14 See Notes to Financial Statements
<PAGE>
FIRST TRUST PREFERRED SECURITIES AND INCOME FUND
STATEMENTS OF CHANGES IN NET ASSETS
<TABLE>
<CAPTION>
YEAR ENDED YEAR ENDED
10/31/2017 10/31/2016
------------- -------------
<S> <C> <C>
OPERATIONS:
Net investment income (loss)........................................................ $ 11,315,181 $ 9,267,054
Net realized gain (loss)............................................................ 2,374,196 (1,017,162)
Net change in unrealized appreciation (depreciation)................................ 5,842,618 4,709,234
------------- -------------
Net increase (decrease) in net assets resulting from operations..................... 19,531,995 12,959,126
------------- -------------
DISTRIBUTIONS TO SHAREHOLDERS FROM NET INVESTMENT INCOME:
Class A Shares...................................................................... (2,021,236) (1,636,847)
Class C Shares...................................................................... (2,466,076) (2,206,079)
Class F Shares...................................................................... (405,856) (242,014)
Class I Shares...................................................................... (6,495,243) (5,104,605)
Class R3 Shares..................................................................... (34,204) (17,199)
------------- -------------
(11,422,615) (9,206,744)
------------- -------------
CAPITAL TRANSACTIONS:
Proceeds from shares sold........................................................... 120,198,101 91,244,153
Proceeds from shares reinvested..................................................... 10,184,046 8,118,073
Cost of shares redeemed............................................................. (83,818,787) (67,454,788)
------------- -------------
Net increase (decrease) in net assets resulting from capital transactions........... 46,563,360 31,907,438
------------- -------------
Total increase (decrease) in net assets............................................. 54,672,740 35,659,820
NET ASSETS:
Beginning of period................................................................. 198,608,190 162,948,370
------------- -------------
End of period....................................................................... $ 253,280,930 $ 198,608,190
============= =============
Accumulated net investment income (loss) at end of period........................... $ 557,195 $ 763,275
============= =============
</TABLE>
See Notes to Financial Statements Page 15
<PAGE>
FIRST TRUST PREFERRED SECURITIES AND INCOME FUND
FINANCIAL HIGHLIGHTS
FOR A SHARE OUTSTANDING THROUGHOUT EACH PERIOD
<TABLE>
<CAPTION>
YEAR ENDED OCTOBER 31,
---------------------------------------------------------------
CLASS A SHARES 2017 2016 2015 2014 2013
----------- ----------- ----------- ----------- -----------
<S> <C> <C> <C> <C> <C>
Net asset value, beginning of period.......... $ 21.63 $ 21.13 $ 21.20 $ 20.27 $ 22.42
------- ------- ------- ------- -------
INCOME FROM INVESTMENT OPERATIONS:
Net investment income (loss).................. 1.11 (a) 1.16 (a) 1.18 (a) 1.14 (a) 0.98 (a)
Net realized and unrealized gain (loss)....... 0.80 0.49 (0.13) 0.91 (1.91)
------- ------- ------- ------- -------
Total from investment operations.............. 1.91 1.65 1.05 2.05 (0.93)
------- ------- ------- ------- -------
DISTRIBUTIONS PAID TO SHAREHOLDERS FROM:
Net investment income......................... (1.15) (1.15) (1.12) (1.09) (0.98)
Net realized gain............................. -- -- -- -- (0.09)
Return of capital............................. -- -- -- (0.03) (0.15)
------- ------- ------- ------- -------
Total distributions........................... (1.15) (1.15) (1.12) (1.12) (1.22)
------- ------- ------- ------- -------
Net asset value, end of period................ $ 22.39 $ 21.63 $ 21.13 $ 21.20 $ 20.27
======= ======= ======= ======= =======
TOTAL RETURN (b).............................. 9.05% 8.09% 5.05% 10.35% (4.36)%
======= ======= ======= ======= =======
RATIOS TO AVERAGE NET ASSETS/SUPPLEMENTAL DATA:
Net assets, end of period (in 000's).......... $39,063 $35,468 $28,585 $32,874 $90,286
Ratio of total expenses to average net assets. 1.36% 1.51% (c) 1.50% (c) 1.40% 1.44%
Ratio of net expenses to average net assets... 1.36% 1.41% (c) 1.41% (c) 1.40% 1.40%
Ratio of net investment income (loss) to
average net assets......................... 5.11% 5.50% 5.55% 5.47% 4.52%
Portfolio turnover rate....................... 44% 71% 123% 170% 60%
</TABLE>
(a) Based on average shares outstanding.
(b) Assumes reinvestment of all distributions for the period and does not
include payment of the maximum sales charge of 4.50% or contingent
deferred sales charge (CDSC). On purchases of $1 million or more, a CDSC
of 1% may be imposed on certain redemptions made within twelve months of
purchase. If the sales charges were included, total returns would be
lower. These returns include Rule 12b-1 service fees of 0.25% and do not
reflect the deduction of taxes that a shareholder would pay on Fund
distributions or the redemption of Fund shares. The total returns would
have been lower if certain fees had not been waived and expenses
reimbursed by the investment advisor. Total return is calculated for the
time period presented and is not annualized for periods of less than one
year.
(c) For the years ended October 31, 2016 and 2015, ratios reflect excise tax
of 0.01% and 0.01%, respectively, which are not included in the expense
cap.
Page 16 See Notes to Financial Statements
<PAGE>
FIRST TRUST PREFERRED SECURITIES AND INCOME FUND
FINANCIAL HIGHLIGHTS
FOR A SHARE OUTSTANDING THROUGHOUT EACH PERIOD
<TABLE>
<CAPTION>
YEAR ENDED OCTOBER 31,
---------------------------------------------------------------
CLASS C SHARES 2017 2016 2015 2014 2013
----------- ----------- ----------- ----------- -----------
<S> <C> <C> <C> <C> <C>
Net asset value, beginning of period............ $ 21.67 $ 21.17 $ 21.24 $ 20.30 $ 22.45
------- ------- ------- ------- -------
INCOME FROM INVESTMENT OPERATIONS:
Net investment income (loss).................... 0.96 (a) 1.01 (a) 1.02 (a) 0.99 (a) 0.83 (a)
Net realized and unrealized gain (loss)......... 0.79 0.48 (0.13) 0.91 (1.93)
------- ------- ------- ------- -------
Total from investment operations................ 1.75 1.49 0.89 1.90 (1.10)
------- ------- ------- ------- -------
DISTRIBUTIONS PAID TO SHAREHOLDERS FROM:
Net investment income........................... (0.98) (0.99) (0.96) (0.94) (0.84)
Net realized gain............................... -- -- -- -- (0.08)
Return of capital............................... -- -- -- (0.02) (0.13)
------- ------- ------- ------- -------
Total distributions............................. (0.98) (0.99) (0.96) (0.96) (1.05)
------- ------- ------- ------- -------
Net asset value, end of period.................. $ 22.44 $ 21.67 $ 21.17 $ 21.24 $ 20.30
======= ======= ======= ======= =======
TOTAL RETURN (b)................................ 8.27% 7.27% 4.26% 9.56% (5.03)%
======= ======= ======= ======= =======
RATIOS TO AVERAGE NET ASSETS/SUPPLEMENTAL DATA:
Net assets, end of period (in 000's)............ $64,462 $51,004 $45,093 $45,248 $55,376
Ratio of total expenses to average net assets... 2.06% 2.17% (c) 2.16% (c) 2.18% 2.17%
Ratio of net expenses to average net assets..... 2.06% 2.16% (c) 2.16% (c) 2.15% 2.15%
Ratio of net investment income (loss) to
average net assets........................... 4.41% 4.76% 4.79% 4.75% 3.81%
Portfolio turnover rate......................... 44% 71% 123% 170% 60%
</TABLE>
(a) Based on average shares outstanding.
(b) Assumes reinvestment of all distributions for the period and does not
include payment of the maximum CDSC of 1%, charged on certain redemptions
made within one year of purchase. If the sales charge was included, total
returns would be lower. These returns include combined Rule 12b-1
distribution and service fees of 1% and do not reflect the deduction of
taxes that a shareholder would pay on Fund distributions or the redemption
of Fund shares. The total returns would have been lower if certain fees
had not been waived and expenses reimbursed by the investment advisor.
Total return is calculated for the time period presented and is not
annualized for periods of less than one year.
(c) For the years ended October 31, 2016 and 2015, ratios reflect excise tax
of 0.01% and 0.01%, respectively, which are not included in the expense
cap.
See Notes to Financial Statements Page 17
<PAGE>
FIRST TRUST PREFERRED SECURITIES AND INCOME FUND
FINANCIAL HIGHLIGHTS
FOR A SHARE OUTSTANDING THROUGHOUT EACH PERIOD
<TABLE>
<CAPTION>
YEAR ENDED OCTOBER 31,
---------------------------------------------------------------
CLASS F SHARES 2017 2016 2015 2014 2013
----------- ----------- ----------- ----------- -----------
<S> <C> <C> <C> <C> <C>
Net asset value, beginning of period............ $ 21.82 $ 21.31 $ 21.37 $ 20.42 $ 22.59
------- ------- ------- ------- -------
INCOME FROM INVESTMENT OPERATIONS:
Net investment income (loss).................... 1.13 (a) 1.18 (a) 1.23 (a) 1.18 (a) 1.02 (a)
Net realized and unrealized gain (loss)......... 0.84 0.50 (0.15) 0.91 (1.95)
------- ------- ------- ------- -------
Total from investment operations................ 1.97 1.68 1.08 2.09 (0.93)
------- ------- ------- ------- -------
DISTRIBUTIONS PAID TO SHAREHOLDERS FROM:
Net investment income........................... (1.17) (1.17) (1.14) (1.11) (1.01)
Net realized gain............................... -- -- -- -- (0.08)
Return of capital............................... -- -- -- (0.03) (0.15)
------- ------- ------- ------- -------
Total distributions............................. (1.17) (1.17) (1.14) (1.14) (1.24)
------- ------- ------- ------- -------
Net asset value, end of period.................. $ 22.62 $ 21.82 $ 21.31 $ 21.37 $ 20.42
======= ======= ======= ======= =======
TOTAL RETURN (b)................................ 9.27% 8.18% 5.16% 10.48% (4.32)%
======= ======= ======= ======= =======
RATIOS TO AVERAGE NET ASSETS/SUPPLEMENTAL DATA:
Net assets, end of period (in 000's)............ $ 7,339 $ 5,025 $ 2,501 $ 2,617 $ 3,735
Ratio of total expenses to average net assets... 1.39% 1.70% (c) 1.92% 1.81% 1.58%
Ratio of net expenses to average net assets..... 1.30% 1.31% (c) 1.30% 1.30% 1.30%
Ratio of net investment income (loss) to
average net assets........................... 5.11% 5.55% 5.70% 5.64% 4.63%
Portfolio turnover rate......................... 44% 71% 123% 170% 60%
</TABLE>
(a) Based on average shares outstanding.
(b) Assumes reinvestment of all distributions for the period. These returns
include Rule 12b-1 service fees of 0.15% and do not reflect the deduction
of taxes that a shareholder would pay on Fund distributions or the
redemption of Fund shares. The total returns would have been lower if
certain fees had not been waived and expenses reimbursed by the investment
advisor. Total return is calculated for the time period presented and is
not annualized for periods of less than one year.
(c) For the year ended October 31, 2016, ratios reflect excise tax of 0.01%,
which is not included in the expense cap.
Page 18 See Notes to Financial Statements
<PAGE>
FIRST TRUST PREFERRED SECURITIES AND INCOME FUND
FINANCIAL HIGHLIGHTS
FOR A SHARE OUTSTANDING THROUGHOUT EACH PERIOD
<TABLE>
<CAPTION>
YEAR ENDED OCTOBER 31,
---------------------------------------------------------------
CLASS I SHARES 2017 2016 2015 2014 2013
----------- ----------- ----------- ----------- -----------
<S> <C> <C> <C> <C> <C>
Net asset value, beginning of period............ $ 21.71 $ 21.21 $ 21.27 $ 20.33 $ 22.47
------- ------- ------- ------- -------
INCOME FROM INVESTMENT OPERATIONS:
Net investment income (loss).................... 1.20 (a) 1.22 (a) 1.23 (a) 1.20 (a) 1.04 (a)
Net realized and unrealized gain (loss)......... 0.78 0.48 (0.12) 0.91 (1.91)
------- ------- ------- ------- -------
Total from investment operations................ 1.98 1.70 1.11 2.11 (0.87)
------- ------- ------- ------- -------
DISTRIBUTIONS PAID TO SHAREHOLDERS FROM:
Net investment income........................... (1.20) (1.20) (1.17) (1.14) (1.03)
Net realized gain............................... -- -- -- -- (0.09)
Return of capital............................... -- -- -- (0.03) (0.15)
------- ------- ------- ------- -------
Total distributions............................. (1.20) (1.20) (1.17) (1.17) (1.27)
------- ------- ------- ------- -------
Net asset value, end of period.................. $ 22.49 $ 21.71 $ 21.21 $ 21.27 $ 20.33
======= ======= ======= ======= =======
TOTAL RETURN (b)................................ 9.39% 8.33% 5.35% 10.65% (4.06)%
======= ======= ======= ======= =======
RATIOS TO AVERAGE NET ASSETS/SUPPLEMENTAL DATA:
Net assets, end of period (in 000's)............ $141,661 $106,393 $86,412 $71,094 $58,700
Ratio of total expenses to average net assets... 0.99% 1.16% (c) 1.16% (c) 1.15% 1.23%
Ratio of net expenses to average net assets..... 0.99% 1.16% (c) 1.16% (c) 1.15% 1.15%
Ratio of net investment income (loss) to
average net assets........................... 5.49% 5.74% 5.80% 5.74% 4.79%
Portfolio turnover rate......................... 44% 71% 123% 170% 60%
</TABLE>
(a) Based on average shares outstanding.
(b) Assumes reinvestment of all distributions for the period. These returns do
not reflect the deduction of taxes that a shareholder would pay on Fund
distributions or the redemption of Fund shares. The total return would
have been lower if certain fees had not been waived and expenses
reimbursed by the investment advisor. Total return is calculated for the
time period presented and is not annualized for periods of less than one
year.
(c) For the years ended October 31, 2016 and 2015, ratios reflect excise tax
of 0.01% and 0.01%, respectively, which are not included in the expense
cap.
See Notes to Financial Statements Page 19
<PAGE>
FIRST TRUST PREFERRED SECURITIES AND INCOME FUND
FINANCIAL HIGHLIGHTS
FOR A SHARE OUTSTANDING THROUGHOUT EACH PERIOD
<TABLE>
<CAPTION>
YEAR ENDED OCTOBER 31,
---------------------------------------------------------------
CLASS R3 SHARES 2017 2016 2015 2014 2013
----------- ----------- ----------- ----------- -----------
<S> <C> <C> <C> <C> <C>
Net asset value, beginning of period............ $ 21.61 $ 21.13 $ 21.20 $ 20.26 $ 22.41
------- ------- ------- ------- -------
INCOME FROM INVESTMENT OPERATIONS:
Net investment income (loss).................... 1.05 (a) 1.11 (a) 1.13 (a) 1.09 (a) 0.93 (a)
Net realized and unrealized gain (loss)......... 0.78 0.47 (0.14) 0.92 (1.92)
------- ------- ------- ------- -------
Total from investment operations................ 1.83 1.58 0.99 2.01 (0.99)
------- ------- ------- ------- -------
DISTRIBUTIONS PAID TO SHAREHOLDERS FROM:
Net investment income........................... (1.09) (1.10) (1.06) (1.04) (0.92)
Net realized gain............................... -- -- -- -- (0.10)
Return of capital............................... -- -- -- (0.03) (0.14)
------- ------- ------- ------- -------
Total distributions............................. (1.09) (1.10) (1.06) (1.07) (1.16)
------- ------- ------- ------- -------
Net asset value, end of period.................. $ 22.35 $ 21.61 $ 21.13 $ 21.20 $ 20.26
======= ======= ======= ======= =======
TOTAL RETURN (b)................................ 8.70% 7.73% 4.79% 10.14% (4.61)%
======= ======= ======= ======= =======
RATIOS TO AVERAGE NET ASSETS/SUPPLEMENTAL DATA:
Net assets, end of period (in 000's)............ $ 756 $ 717 $ 357 $ 401 $ 478
Ratio of total expenses to average net assets... 4.29% 7.42% (c) 6.56% (c) 5.74% 4.87%
Ratio of net expenses to average net assets..... 1.65% 1.66% (c) 1.66% (c) 1.65% 1.65%
Ratio of net investment income (loss) to
average net assets........................... 4.83% 5.25% 5.30% 5.25% 4.25%
Portfolio turnover rate......................... 44% 71% 123% 170% 60%
</TABLE>
(a) Based on average shares outstanding.
(b) Assumes reinvestment of all distributions for the period. These returns
include combined Rule 12b-1 distribution and service fees of 0.50%, and do
not reflect the deduction of taxes that a shareholder would pay on Fund
distributions or the redemption of Fund shares. The total returns would
have been lower if certain fees had not been waived and expenses
reimbursed by the investment advisor. Total return is calculated for the
time period presented and is not annualized for periods of less than one
year.
(c) For years ended October 31, 2016 and 2015, ratios reflect excise tax of
0.01% and 0.01%, respectively, which are not included in the expense cap.
Page 20 See Notes to Financial Statements
<PAGE>
--------------------------------------------------------------------------------
NOTES TO FINANCIAL STATEMENTS
--------------------------------------------------------------------------------
FIRST TRUST PREFERRED SECURITIES AND INCOME FUND
OCTOBER 31, 2017
1. ORGANIZATION
First Trust Preferred Securities and Income Fund (the "Fund") is a series of the
First Trust Series Fund (the "Trust"), a Massachusetts business trust organized
on July 9, 2010, and is registered as a diversified, open-end management
investment company with the Securities and Exchange Commission ("SEC") under the
Investment Company Act of 1940, as amended (the "1940 Act"). The Fund offers
five classes of shares: Class A, Class C, Class F, Class I and Class R3. Each
class represents an interest in the same portfolio of investments but with a
different combination of sales charges, distribution and service (12b-1) fees,
eligibility requirements and other features.
The Fund's investment objective is to seek to provide current income and total
return. The Fund seeks to achieve its objective by investing, under normal
market conditions, at least 80% of its net assets (including investment
borrowings, if any) in preferred securities and other securities with similar
economic characteristics. There can be no assurance that the Fund will achieve
its investment objective. The Fund may not be appropriate for all investors.
2. SIGNIFICANT ACCOUNTING POLICIES
The Fund is considered an investment company and follows accounting and
reporting guidance under Financial Accounting Standards Board ("FASB")
Accounting Standards Codification ("ASC") Topic 946, "Financial
Services-Investment Companies." The following is a summary of significant
accounting policies consistently followed by the Fund in the preparation of its
financial statements. The preparation of financial statements in accordance with
accounting principles generally accepted in the United States of America ("U.S.
GAAP") requires management to make estimates and assumptions that affect the
reported amounts and disclosures in the financial statements. Actual results
could differ from those estimates.
A. PORTFOLIO VALUATION
The net asset value ("NAV") for each class of shares of the Fund is determined
daily as of the close of trading on the New York Stock Exchange ("NYSE"),
normally 4:00 p.m. Eastern time, on each day the NYSE is open for trading. If
the NYSE closes early on a valuation day, the NAV is determined as of that time.
Domestic debt securities and foreign securities are priced using data reflecting
the earlier closing at the principal markets for those securities. The NAV for
each class is calculated by dividing the value of the Fund's total assets
attributable to such class (including accrued interest and dividends), less all
liabilities attributable to such class (including accrued expenses, dividends
declared but unpaid and any borrowings of the Fund), by the total number of
shares of the class outstanding. Differences in NAV of each class of the Fund's
shares are generally expected to be due to the daily expense accruals of the
specified distribution and service (12b-1) fees and transfer agency costs
applicable to such class of shares and the resulting differential in the
dividends that may be paid on each class of shares.
The Fund's investments are valued daily at market value or, in the absence of
market value with respect to any portfolio securities, at fair value. Market
value prices represent last sale or official closing prices from a national or
foreign exchange (i.e., a regulated market) and are primarily obtained from
third-party pricing services. Fair value prices represent any prices not
considered market value prices and are either obtained from a third-party
pricing service, or are determined by the Pricing Committee of the Trust's
investment advisor, First Trust Advisors L.P. ("First Trust" or the "Advisor")
in accordance with valuation procedures adopted by the Trust's Board of
Trustees, and in accordance with provisions of the 1940 Act. Investments valued
by the Advisor's Pricing Committee, if any, are footnoted as such in the
footnotes to the Portfolio of Investments. The Fund's investments are valued as
follows:
Preferred stocks and other equity securities listed on any national or
foreign exchange (excluding the Nasdaq Stock Market LLC ("Nasdaq") and the
London Stock Exchange Alternative Investment Market ("AIM")), are valued
at the last sale price on the exchange on which they are principally
traded or, for Nasdaq and AIM securities, the official closing price.
Securities traded on more than one securities exchange are valued at the
last sale price or official closing price, as applicable, at the close of
the securities exchange representing the principal market for such
securities.
Bonds, notes, capital preferred securities, and other debt securities are
fair valued on the basis of valuations provided by dealers who make
markets in such securities or by an independent pricing service approved
by the Trust's Board of Trustees, which may use the following valuation
inputs when available:
1) benchmark yields;
2) reported trades;
3) broker/dealer quotes;
4) issuer spreads;
5) benchmark securities;
6) bids and offers; and
7) reference data including market research publications.
Page 21
<PAGE>
--------------------------------------------------------------------------------
NOTES TO FINANCIAL STATEMENTS (CONTINUED)
--------------------------------------------------------------------------------
FIRST TRUST PREFERRED SECURITIES AND INCOME FUND
OCTOBER 31, 2017
Securities traded in an over-the-counter market are fair valued at the
mean of their most recent bid and asked price, if available, and otherwise
at their closing bid price.
Fixed income and other debt securities having a remaining maturity of 60
days or less when purchased are fair valued at cost adjusted for
amortization of premiums and accretion of discounts (amortized cost),
provided the Advisor's Pricing Committee has determined that the use of
amortized cost is an appropriate reflection of fair value given market and
issuer-specific conditions existing at the time of the determination.
Factors that may be considered in determining the appropriateness of the
use of amortized cost include, but are not limited to, the following:
1) the credit conditions in the relevant market and changes
thereto;
2) the liquidity conditions in the relevant market and changes
thereto;
3) the interest rate conditions in the relevant market and
changes thereto (such as significant changes in interest
rates);
4) issuer-specific conditions (such as significant credit
deterioration); and
5) any other market-based data the Advisor's Pricing Committee
considers relevant. In this regard, the Advisor's Pricing
Committee may use last-obtained market-based data to assist it
when valuing portfolio securities using amortized cost.
Certain securities may not be able to be priced by pre-established pricing
methods. Such securities may be valued by the Trust's Board of Trustees or its
delegate, the Advisor's Pricing Committee, at fair value. These securities
generally include, but are not limited to, restricted securities (securities
which may not be publicly sold without registration under the Securities Act of
1933, as amended (the "1933 Act")) for which a third-party pricing service is
unable to provide a market price; securities whose trading has been formally
suspended; a security whose market or fair value price is not available from a
pre-established pricing source; a security with respect to which an event has
occurred that is likely to materially affect the value of the security after the
market has closed but before the calculation of the Fund's NAV or make it
difficult or impossible to obtain a reliable market quotation; and a security
whose price, as provided by the third-party pricing service, does not reflect
the security's fair value. As a general principle, the current fair value of a
security would appear to be the amount which the owner might reasonably expect
to receive for the security upon its current sale. When fair value prices are
used, generally they will differ from market quotations or official closing
prices on the applicable exchanges. A variety of factors may be considered in
determining the fair value of such securities, including, but not limited to,
the following:
1) the type of security;
2) the size of the holding;
3) the initial cost of the security;
4) transactions in comparable securities;
5) price quotes from dealers and/or third-party pricing services;
6) relationships among various securities;
7) information obtained by contacting the issuer, analysts, or the
appropriate stock exchange;
8) an analysis of the issuer's financial statements; and
9) the existence of merger proposals or tender offers that might affect
the value of the security.
If the securities in question are foreign securities, the following additional
information may be considered:
1) the value of similar foreign securities traded on other foreign
markets;
2) ADR trading of similar securities;
3) closed-end fund trading of similar securities;
4) foreign currency exchange activity;
5) the trading prices of financial products that are tied to baskets of
foreign securities;
6) factors relating to the event that precipitated the pricing problem;
7) whether the event is likely to recur; and
8) whether the effects of the event are isolated or whether they affect
entire markets, countries or regions.
The Fund is subject to fair value accounting standards that define fair value,
establish the framework for measuring fair value and provide a three-level
hierarchy for fair valuation based upon the inputs to the valuation as of the
measurement date. The three levels of the fair value hierarchy are as follows:
o Level 1 - Level 1 inputs are quoted prices in active markets for
identical investments. An active market is a market in which
transactions for the investment occur with sufficient frequency and
volume to provide pricing information on an ongoing basis.
o Level 2 - Level 2 inputs are observable inputs, either directly or
indirectly, and include the following:
o Quoted prices for similar investments in active markets.
o Quoted prices for identical or similar investments in markets
that are non-active. A non-active market is a market where
there are few transactions for the investment, the prices are
not current, or price quotations vary substantially either
over time or among market makers, or in which little
information is released publicly.
Page 22
<PAGE>
--------------------------------------------------------------------------------
NOTES TO FINANCIAL STATEMENTS (CONTINUED)
--------------------------------------------------------------------------------
FIRST TRUST PREFERRED SECURITIES AND INCOME FUND
OCTOBER 31, 2017
o Inputs other than quoted prices that are observable for the
investment (for example, interest rates and yield curves
observable at commonly quoted intervals, volatilities,
prepayment speeds, loss severities, credit risks, and default
rates).
o Inputs that are derived principally from or corroborated by
observable market data by correlation or other means.
o Level 3 - Level 3 inputs are unobservable inputs. Unobservable
inputs may reflect the reporting entity's own assumptions about the
assumptions that market participants would use in pricing the
investment.
The inputs or methodologies used for valuing investments are not necessarily an
indication of the risk associated with investing in those investments. A summary
of the inputs used to value the Fund's investments as of October 31, 2017, is
included with the Fund's Portfolio of Investments.
B. SECURITIES TRANSACTIONS AND INVESTMENT INCOME
Securities transactions are recorded as of the trade date. Realized gains and
losses from securities transactions are recorded on the identified cost basis.
Dividend income is recorded on the ex-dividend date. Interest income is recorded
daily on the accrual basis, including the amortization of premiums and accretion
of discounts. Income is allocated on a pro rata basis to each class of shares.
The Fund may hold the securities of real estate investment trusts ("REITs").
Distributions from such investments may include income, capital gains and return
of capital. The actual character of amounts received during the year is not
known until after the REITs' fiscal year end. The Fund records the character of
distributions received from the REITs during the year based on estimates
available. The characterization of distributions received by the Fund may be
subsequently revised based on information received from the REITs after their
tax reporting periods conclude.
C. RESTRICTED SECURITIES
The Fund invests in restricted securities, which are securities that may not be
offered for public sale without first being registered under the 1933 Act. Prior
to registration, restricted securities may only be resold in transactions exempt
from registration under Rule 144A under the 1933 Act, normally to qualified
institutional buyers. As of October 31, 2017, the Fund held restricted
securities as shown in the following table that Stonebridge Advisors LLC
("Stonebridge" or the "Sub-Advisor") has deemed illiquid pursuant to procedures
adopted by the Trust's Board of Trustees. Although market instability can result
in periods of increased overall market illiquidity, liquidity for each security
is determined based on security-specific factors and assumptions, which require
subjective judgment. The Fund does not have the right to demand that such
securities be registered. These securities are valued according to the valuation
procedures as stated in the Portfolio Valuation note (Note 2A) and are not
expressed as a discount to the carrying value of a comparable unrestricted
security. There are no unrestricted securities with the same maturity date and
yield for these issuers.
<TABLE>
<CAPTION>
ACQUISITION SHARES/ CURRENT CARRYING % OF
SECURITY DATE PAR AMOUNT PRICE COST VALUE NET ASSETS
---------------------------------------------------------------------------------------------------------------------
<S> <C> <C> <C> <C> <C> <C>
Compeer Financial ACA, 6.75% 7/31/15 500 $ 1,069.12 $ 526,520 $ 534,562 0.21%
Dairy Farmers of America, Inc.,
7.13% 9/15/16-10/4/16 $1,300,000 111.88 1,316,875 1,454,375 0.57
Farm Credit Bank Of Texas, 6.75% 12/8/15-12/18/15 5,500 110.25 568,000 606,375 0.24
Farm Credit Bank Of Texas,
Series 1, 10.00% 3/24/14-4/7/16 4,000 1,222.50 4,978,560 4,890,000 1.93
Fortegra Financial Corp., 8.50%,
10/15/57 10/12/17 $1,000,000 100.50 1,000,000 1,005,000 0.40
Kinder Morgan GP, Inc., 5.21%,
08/18/57 6/21/17 500 939.44 457,500 469,719 0.19
Land O'Lakes Capital Trust I,
7.45%, 03/15/28 6/6/14-3/20/15 $3,000,000 117.50 3,078,707 3,525,000 1.39
Sovereign Real Estate Investment
Trust, 12.00% 2/5/15-3/22/16 1,261 1,253.75 1,657,802 1,580,979 0.62
---------------------------------------
$ 13,583,964 $ 14,066,010 5.55%
---------------------------------------
</TABLE>
D. DIVIDENDS AND DISTRIBUTIONS TO SHAREHOLDERS
The Fund will declare daily and pay monthly distributions of all or a portion of
its net income to holders of each class of shares. Distributions of any net
capital gains earned by the Fund will be distributed at least annually.
Distributions will automatically be reinvested into additional Fund shares
unless cash distributions are elected by the shareholder.
Page 23
<PAGE>
--------------------------------------------------------------------------------
NOTES TO FINANCIAL STATEMENTS (CONTINUED)
--------------------------------------------------------------------------------
FIRST TRUST PREFERRED SECURITIES AND INCOME FUND
OCTOBER 31, 2017
Distributions from net investment income and realized capital gains are
determined in accordance with income tax regulations, which may differ from U.S.
GAAP. Certain capital accounts in the financial statements are periodically
adjusted for permanent differences in order to reflect their tax character.
These permanent differences are primarily due to the varying treatment of income
and gain/loss on portfolio securities held by the Fund and have no impact on net
assets or NAV per share. Temporary differences, which arise from recognizing
certain items of income, expense and gain/loss in different periods for
financial statement and tax purposes, will reverse at some time in the future.
Permanent differences incurred during the year ended October 31, 2017, resulting
in book and tax accounting differences, have been reclassified at year end to
reflect a decrease in accumulated net investment income (loss) of $98,646, an
increase in accumulated net realized gain (loss) on investments of $105,641 and
a decrease to paid-in capital of $6,995. Net assets were not affected by these
reclassifications.
The tax character of distributions paid during the fiscal years ended October
31, 2017 and 2016 was as follows:
Distributions paid from: 2017 2016
Ordinary income.............................. $ 11,422,615 $ 9,206,744
Capital gain................................. -- --
Return of capital............................ -- --
As of October 31, 2017, the distributable earnings and net assets on a tax basis
were as follows:
Undistributed ordinary income................ $ 314,507
Undistributed capital gains.................. --
------------
Total undistributed earnings................. 314,507
Accumulated capital and other losses......... (9,486,416)
Net unrealized appreciation (depreciation)... 9,914,661
------------
Total accumulated earnings (losses).......... 742,752
Other........................................ --
Paid-in capital.............................. 252,538,178
------------
Net assets................................... $253,280,930
============
E. INCOME TAXES
The Fund intends to continue to qualify as a regulated investment company by
complying with the requirements under Subchapter M of the Internal Revenue Code
of 1986, as amended, which includes distributing substantially all of its net
investment income and net realized gains to shareholders. Accordingly, no
provision has been made for federal and state income taxes. However, due to the
timing and amount of distributions, the Fund may be subject to an excise tax of
4% of the amount by which approximately 98% of the Fund's taxable income exceeds
the distributions from such taxable income for the calendar year.
The Fund intends to utilize provisions of the federal income tax laws which
allow it to carry a realized capital loss forward indefinitely following the
year of the loss and offset such loss against any future realized capital gains.
The Fund is subject to certain limitations under U.S. tax rules on the use of
capital loss carryforwards and net unrealized built-in losses. These limitations
apply when there has been a 50% change in ownership. At October 31, 2017, for
federal income tax purposes, the Fund had a capital loss carryforward of
$9,486,416 available, to the extent provided by regulations, to offset future
capital gains.
The Fund is subject to accounting standards that establish a minimum threshold
for recognizing, and a system for measuring, the benefits of a tax position
taken or expected to be taken in a tax return. Taxable years ended 2014, 2015,
2016 and 2017 remain open to federal and state audit. As of October 31, 2017,
management has evaluated the application of these standards to the Fund, and has
determined that no provision for income tax is required in the Fund's financial
statements for uncertain tax positions.
F. EXPENSES
The Fund pays all expenses directly related to its operations. Expenses of the
Fund are allocated on a pro rata basis to each class of shares, except for
distribution and service (12b-1) fees and incremental transfer agency costs
which are unique to each class of shares.
G. NEW AND AMENDED FINANCIAL REPORTING RULES AND FORMS
On October 13, 2016, the SEC adopted new rules and forms, and amended existing
rules and forms. The new and amended rules and forms are intended to modernize
the reporting of information provided by funds and to improve the quality and
type of information that funds provide to the SEC and investors. In part, the
new and amended rules and forms amend Regulation S-X and require standardized,
enhanced disclosure about derivatives in a Fund's financial statements, as well
as other amendments. The compliance date for the amendments of Regulation S-X
was August 1, 2017 and resulted in additional disclosure for variable interest
Page 24
<PAGE>
--------------------------------------------------------------------------------
NOTES TO FINANCIAL STATEMENTS (CONTINUED)
--------------------------------------------------------------------------------
FIRST TRUST PREFERRED SECURITIES AND INCOME FUND
OCTOBER 31, 2017
rate securities within the Portfolio of Investments. The new form types and
other rule amendments will be effective for the First Trust funds, including the
Fund, for reporting periods beginning on and after June 1, 2018. Management is
evaluating the new form types and other rule amendments that are effective on
and after June 1, 2018 to determine the impact to the Fund.
H. NEW ACCOUNTING PRONOUNCEMENT
In December 2016, FASB released Accounting Standards Update ("ASU") 2016-19 that
makes technical changes to various sections of the ASC, including Topic 820,
Fair Value Measurement. The changes to Topic 820 are intended to clarify the
difference between a valuation approach and a valuation technique. The changes
to ASC 820-10-50-2 require a reporting entity to disclose, for Level 2 and Level
3 fair value measurements, a change in either or both a valuation approach and a
valuation technique and the reason(s) for the change. The changes to Topic 820
are effective for fiscal years, and interim periods within those fiscal years,
beginning after December 15, 2016. At this time, management is evaluating the
implications of the ASU and has not yet determined its impact on the financial
statements and disclosures.
3. INVESTMENT ADVISORY FEE, AFFILIATED TRANSACTIONS AND OTHER FEE ARRANGEMENTS
First Trust, the investment advisor to the Fund, is a limited partnership with
one limited partner, Grace Partners of DuPage L.P., and one general partner, The
Charger Corporation. The Charger Corporation is an Illinois corporation
controlled by James A. Bowen, Chief Executive Officer of First Trust. First
Trust is responsible for supervising the selection and ongoing monitoring of the
Fund's investment portfolio, managing the Fund's business affairs and providing
certain administrative services necessary for the management of the Fund. For
these services, First Trust is entitled to a monthly fee calculated at an annual
rate of 0.80% of the Fund's average daily net assets. First Trust also provides
fund reporting services to the Fund for a flat annual fee in the amount of
$9,250.
Stonebridge, a majority-owned affiliate of First Trust, serves as the Fund's
sub-advisor and manages the Fund's portfolio subject to First Trust's
supervision. The Sub-Advisor receives a monthly portfolio management fee
calculated at an annual rate of 0.40% of average daily net assets that is paid
by First Trust out of its investment advisory fee.
First Trust Capital Partners, LLC, an affiliate of First Trust, owns, through a
wholly-owned subsidiary, a 51% ownership interest in Stonebridge.
First Trust and Stonebridge have agreed to waive fees and reimburse Fund
expenses to the extent necessary to prevent the total annual operating expenses
of the Fund (excluding 12b-1 distribution and service fees, interest expenses,
taxes, fees incurred in acquiring and disposing of portfolio securities and
extraordinary expenses) from exceeding 1.15% of average daily net assets of any
class of shares of the Fund (the "Expense Cap") until February 28, 2019 and then
from exceeding 1.50% from March 1, 2019 to February 28, 2028 (the "Expense Cap
Termination Date"). Expenses borne and fees waived by First Trust and
Stonebridge are subject to recovery on a Fund class level by First Trust and
Stonebridge for up to three years from the date the fee or expense was incurred,
but no reimbursement payment will be made by the Fund at any time if it would
result in the Fund's expenses exceeding the applicable Expense Cap in place for
the most recent fiscal year for which such expense limitation was in place.
Class A and C amounts are included as "Expenses previously waived or reimbursed"
on the Statement of Operations. The advisory fee waivers and expense
reimbursement for the year ended October 31, 2017 and the expenses borne by
First Trust and Stonebridge subject to recovery for the periods indicated were
as follows:
<TABLE>
<CAPTION>
EXPENSES SUBJECT TO RECOVERY
----------------------------------------------------------------------
YEAR ENDED YEAR ENDED YEAR ENDED
ADVISORY EXPENSE OCTOBER 31, OCTOBER 31, OCTOBER 31,
FEE WAIVER REIMBURSEMENT 2015 2016 2017 TOTAL
------------- ------------- ------------- ------------- ------------- -------------
<S> <C> <C> <C> <C> <C>
$25,178 $ -- $67,919 $70,141 $25,178 $163,238
</TABLE>
During the year ended October 31, 2017, First Trust recovered $2,494 of fees
that were previously waived.
Brown Brothers Harriman & Co. ("BBH") serves as the Fund's administrator, fund
accountant and custodian in accordance with certain fee arrangements. As
administrator and fund accountant, BBH is responsible for providing certain
administrative and accounting services to the Fund, including maintaining the
Fund's books of account, records of the Fund's securities transactions, and
certain other books and records. As custodian, BBH is responsible for custody of
the Fund's assets.
BNY Mellon Investment Servicing (US) Inc. ("BNYM IS") serves as the Fund's
transfer agent in accordance with certain fee arrangements. As transfer agent,
BNYM IS is responsible for maintaining shareholder records for the Fund. BNYM IS
is a subsidiary of The Bank of New York Mellon Corporation, a financial holding
company.
Each Trustee who is not an officer or employee of First Trust, any sub-advisor
or any of their affiliates ("Independent Trustees") is paid a fixed annual
retainer that is allocated equally among each fund in the First Trust Fund
Complex. Each Independent Trustee is also paid an annual per fund fee that
varies based on whether the fund is a closed-end or other actively managed fund,
or is an index fund.
Page 25
<PAGE>
--------------------------------------------------------------------------------
NOTES TO FINANCIAL STATEMENTS (CONTINUED)
--------------------------------------------------------------------------------
FIRST TRUST PREFERRED SECURITIES AND INCOME FUND
OCTOBER 31, 2017
Additionally, the Lead Independent Trustee and the Chairmen of the Audit
Committee, Nominating and Governance Committee and Valuation Committee are paid
annual fees to serve in such capacities, with such compensation allocated pro
rata among each fund in the First Trust Fund Complex based on net assets.
Independent trustees are reimbursed for travel and out-of-pocket expenses in
connection with all meetings. The Lead Independent Trustee and Committee
Chairmen rotate every three years. The officers and "Interested" Trustee receive
no compensation from the Trust for acting in such capacities.
4. CAPITAL SHARE TRANSACTIONS
Capital transactions were as follows:
<TABLE>
<CAPTION>
YEAR ENDED YEAR ENDED
OCTOBER 31, 2017 OCTOBER 31, 2016
SHARES VALUE SHARES VALUE
---------- ------------- ---------- -------------
<S> <C> <C> <C> <C>
Sales:
Class A 808,030 $ 17,542,282 591,247 $ 12,534,279
Class C 861,323 18,937,718 661,312 14,050,042
Class F 763,726 16,970,043 399,627 8,541,027
Class I 3,048,690 66,600,847 2,620,498 55,678,827
Class R3 6,624 147,211 20,424 439,978
---------- ------------- ---------- -------------
Total Sales: 5,488,393 $120,198,101 4,293,108 $ 91,244,153
========== ============= ========== =============
Dividend Reinvestment:
Class A 66,513 $ 1,454,350 52,224 $ 1,104,127
Class C 102,559 2,247,327 92,326 1,954,563
Class F 16,322 361,622 9,174 195,634
Class I 277,790 6,100,484 229,195 4,862,092
Class R3 931 20,263 77 1,657
---------- ------------- ---------- -------------
Total Dividend Reinvestment: 464,115 $ 10,184,046 382,996 $ 8,118,073
========== ============= ========== =============
Redemptions:
Class A (769,383) $ (16,786,204) (356,446) $ (7,531,465)
Class C (444,954) (9,686,681) (530,054) (11,218,663)
Class F (685,918) (15,315,364) (295,868) (6,275,621)
Class I (1,929,595) (41,878,505) (2,023,609) (42,340,985)
Class R3 (6,941) (152,033) (4,206) (88,054)
---------- ------------- ---------- -------------
Total Redemptions: (3,836,791) $ (83,818,787) (3,210,183) $ (67,454,788)
========== ============= ========== =============
</TABLE>
5. PURCHASES AND SALES OF SECURITIES
Cost of purchases and proceeds from sales of securities, other than short-term
investments, for the year ended October 31, 2017, were $141,887,470 and
$96,075,729, respectively.
6. BORROWINGS
The Trust, on behalf of the Fund, along with First Trust Exchange-Traded Fund
III and First Trust Exchange-Traded Fund IV, entered into a $220 million Credit
Agreement with The Bank of Nova Scotia ("Scotia") as administrative agent for a
group of lenders. Scotia charges a commitment fee of 0.25% of the daily amount
of the excess of the commitment amount over the outstanding principal balance of
the loans and an agency fee. Prior to March 9, 2017, the commitment amount was
$180,000,000. Prior to December 16, 2016, the commitment amount was
$140,000,000. First Trust allocates the commitment fee and agency fee amongst
the funds that have access to the credit line. To the extent that the Fund
accesses the credit line, there would also be an interest fee charged.
The Fund did not have any borrowings outstanding during the year ended October
31, 2017.
Page 26
<PAGE>
--------------------------------------------------------------------------------
NOTES TO FINANCIAL STATEMENTS (CONTINUED)
--------------------------------------------------------------------------------
FIRST TRUST PREFERRED SECURITIES AND INCOME FUND
OCTOBER 31, 2017
7. DISTRIBUTION AND SERVICE PLAN
The Board of Trustees adopted a Distribution and Service Plan pursuant to Rule
12b-1 under the 1940 Act. In accordance with the Rule 12b-1 plan, the share
classes of the Fund are authorized to pay an amount up to 0.25%, 1.00%, 0.15%
and 0.50% of their average daily net assets each year for Class A, Class C,
Class F and Class R3, respectively, to reimburse and compensate First Trust
Portfolios L.P. ("FTP"), the distributor of the Fund, for amounts expended to
finance activities primarily intended to result in the sale of Fund shares or
the provision of investor services. FTP may also use this amount to compensate
securities dealers or other persons for providing distribution assistance,
including broker-dealer and shareholder support and educational and promotional
services.
8. INDEMNIFICATION
The Fund has a variety of indemnification obligations under contracts with its
service providers. The Fund's maximum exposure under these arrangements is
unknown. However, the Fund has not had prior claims or losses pursuant to these
contracts and expects the risk of loss to be remote.
9. SUBSEQUENT EVENTS
Management has evaluated the impact of all subsequent events to the Fund through
the date the financial statements were issued and has determined that there were
no subsequent events requiring recognition of disclosures in the financial
statements that have not already been disclosed.
Page 27
<PAGE>
--------------------------------------------------------------------------------
REPORT OF INDEPENDENT REGISTERED PUBLIC ACCOUNTING FIRM
--------------------------------------------------------------------------------
TO THE SHAREHOLDERS AND THE BOARD OF TRUSTEES OF FIRST TRUST PREFERRED
SECURITIES AND INCOME FUND:
We have audited the accompanying statement of assets and liabilities of First
Trust Preferred Securities and Income Fund (the "Fund"), a series of the First
Trust Series Fund, including the portfolio of investments, as of October 31,
2017, and the related statement of operations for the year then ended, the
statements of changes in net assets for each of the two years in the period then
ended, and the financial highlights for each of the five years in the period
then ended. These financial statements and financial highlights are the
responsibility of the Fund's management. Our responsibility is to express an
opinion on these financial statements and financial highlights based on our
audits.
We conducted our audits in accordance with the standards of the Public Company
Accounting Oversight Board (United States). Those standards require that we plan
and perform the audit to obtain reasonable assurance about whether the financial
statements and financial highlights are free of material misstatement. The Fund
is not required to have, nor were we engaged to perform, an audit of its
internal control over financial reporting. Our audits included consideration of
internal control over financial reporting as a basis for designing audit
procedures that are appropriate in the circumstances, but not for the purpose of
expressing an opinion on the effectiveness of the Fund's internal control over
financial reporting. Accordingly, we express no such opinion. An audit also
includes examining, on a test basis, evidence supporting the amounts and
disclosures in the financial statements, assessing the accounting principles
used and significant estimates made by management, as well as evaluating the
overall financial statement presentation. Our procedures included confirmation
of securities owned as of October 31, 2017, by correspondence with the Fund's
custodian and brokers; when replies were not received from brokers, we performed
other auditing procedures. We believe that our audits provide a reasonable basis
for our opinion.
In our opinion, the financial statements and financial highlights referred to
above present fairly, in all material respects, the financial position of First
Trust Preferred Securities and Income Fund as of October 31, 2017, the results
of its operations for the year then ended, the changes in its net assets for
each of the two years in the period then ended, and the financial highlights for
each of the five years in the period then ended, in conformity with accounting
principles generally accepted in the United States of America.
/s/ Deloitte & Touche LLP
Chicago, Illinois
December 20, 2017
Page 28
<PAGE>
--------------------------------------------------------------------------------
ADDITIONAL INFORMATION
--------------------------------------------------------------------------------
FIRST TRUST PREFERRED SECURITIES AND INCOME FUND
OCTOBER 31, 2017 (UNAUDITED)
PROXY VOTING POLICIES AND PROCEDURES
A description of the policies and procedures that the Trust uses to determine
how to vote proxies and information on how the Fund voted proxies relating to
portfolio securities during the most recent 12-month period ended June 30 is
available (1) without charge, upon request, by calling (800) 988-5891; (2) on
the Fund's website located at http://www.ftportfolios.com; and (3) on the
Securities and Exchange Commission's ("SEC") website at http://www.sec.gov.
PORTFOLIO HOLDINGS
The Trust files its complete schedule of portfolio holdings with the SEC for the
first and third quarters of each fiscal year on Form N-Q. The Fund's Form N-Qs
are available (1) by calling (800) 988-5891; (2) on the Fund's website located
at http://www.ftportfolios.com; (3) on the SEC's website at http://www.sec.gov;
and (4) for review and copying at the SEC's Public Reference Room ("PRR") in
Washington, DC. Information regarding the operation of the PRR may be obtained
by calling (800) SEC-0330.
TAX INFORMATION
The Fund hereby designates as qualified dividend income 66.97% of its ordinary
income distributions (including short-term capital gains, if applicable) for the
period ended October 31, 2017. 33.79% of the ordinary income (including
short-term capital gain, if applicable) distributions made by the Fund during
the period ended October 31, 2017, qualify for corporate dividends received
deduction available to corporate shareholders.
RISK CONSIDERATIONS
Risks are inherent in all investing. The following summarizes some of the risks
that should be considered for the Fund. For additional information about the
risks associated with investing in the Fund, please see the Fund's prospectus
and statement of additional information, as well as other Fund regulatory
filings.
MARKET RISK: Market risk is the risk that a particular security owned by the
Fund or shares of the Fund in general may fall in value. Securities are subject
to market fluctuations caused by such factors as economic, political, regulatory
or market developments, changes in interest rates and perceived trends in stock
prices. Overall stock values could decline generally or could underperform other
investments. Companies with smaller market capitalizations are generally subject
to additional market risk.
INTEREST RATE RISK: If interest rates rise, the prices of fixed-rate preferred
securities and other fixed-rate debt securities held by the Fund will fall.
PREFERRED SECURITIES RISK: Preferred securities combine some of the
characteristics of both common stocks and bonds. Preferred securities are
typically subordinated to bonds and other debt instruments in a company's
capital structure, in terms of priority to corporate income, and therefore will
be subject to greater credit risk than those debt instruments. Preferred
securities are also subject to credit risk, interest rate risk and income risk.
CONCENTRATION RISK: A fund concentrated in a single industry or sector is likely
to present more risks than a fund that is broadly diversified over several
industries or sectors. Compared to the broad market, an individual industry or
sector may be more strongly affected by changes in the economic climate, broad
market shifts, moves in a particular dominant stock, or regulatory changes.
CONTINGENT CONVERTIBLE SECURITIES RISK: Contingent convertible securities
("CoCos") may provide for mandatory conversion into common stock of the issuer
under certain circumstances. Since the common stock of the issuer may not pay a
dividend, investors in these instruments could experience a reduced income rate,
potentially to zero; and conversion would deepen the subordination of the
investor, hence worsening standing in a bankruptcy. In addition, some such
instruments have a set stock conversion rate that would cause a reduction in
value of the security if the price of the stock is below the conversion price on
the conversion date. CoCos may be considered to be high-yield securities (a.k.a.
"junk" bonds) and, to the extent a CoCo held by the Fund undergoes a write down,
the Fund may lose some or all of its original investment in the CoCo.
Performance of a CoCo issuer may, in general, be correlated with the performance
of other CoCo issuers. As a result, negative information regarding one CoCo
issuer may cause a decline in value of other CoCo issuers. Subordinate
securities such as CoCos are more likely to experience credit loss than
non-subordinate securities of the same issuer - even if the CoCos do not convert
to equity securities. Any losses incurred by subordinate securities, such as
CoCos, are likely to be proportionately greater than non-subordinate securities
and any recovery of principal and interest of subordinate securities may take
more time. As a result, any perceived decline in creditworthiness of a CoCo
issuer is likely to have a greater impact on the CoCo, as a subordinate
security.
CREDIT RISK: Credit risk is the risk that an issuer of a security may be unable
or unwilling to make dividend, interest and principal payments when due and the
related risk that the value of a security may decline because of concerns about
the issuer's ability or willingness to make such payments. In addition, parties
to other financial contracts with the Fund could default on their obligations.
Page 29
<PAGE>
--------------------------------------------------------------------------------
ADDITIONAL INFORMATION (CONTINUED)
--------------------------------------------------------------------------------
FIRST TRUST PREFERRED SECURITIES AND INCOME FUND
OCTOBER 31, 2017 (UNAUDITED)
CURRENCY RISK: Although the Fund's net asset value is determined on the basis of
U.S. dollars, because the Fund invests in foreign securities, you may lose money
if the local currency of a foreign market depreciates against the U.S. dollar,
even if the local currency value of the Fund's holdings goes up.
DEPOSITARY RECEIPTS RISK: Depositary receipts may be less liquid than the
underlying shares in their primary trading market. Any distributions paid to the
holders of depositary receipts are usually subject to a fee charged by the
depositary. Holders of depositary receipts may have limited voting rights, and
investment restrictions in certain countries may adversely impact the value of
depositary receipts because such restrictions may limit the ability to convert
equity share into depositary receipts and vice versa. Such restrictions may
cause equity shares of the underlying issuer to trade at a discount or premium
to the market price of the depositary receipts.
FINANCIAL COMPANIES RISK: The Fund invests in the securities of financial
companies, which may include banks, thrifts, brokerage firms, broker-dealers,
investment banks, finance companies, REITs and companies involved in the
insurance industry. Banks, thrifts and their holding companies are especially
subject to the adverse effects of economic recession; government regulation;
decreases in the availability of capital; volatile interest rates; portfolio
concentrations in geographic markets and in commercial and residential real
estate loans; and competition from new entrants in their fields of business.
ILLIQUID SECURITIES RISK: Illiquid securities involve the risk that the
securities will not be able to be sold at the time desired by the Fund or at
prices approximately the value at which the Fund is carrying the securities on
its books.
INCOME RISK: If interest rates fall, the income from the Fund's portfolio will
decline as the Fund invests the proceeds from new share sales, or from matured
or called debt securities, at interest rates that are below the portfolio's
current earnings rate.
REIT INVESTMENT RISK: Investing in REITs involves risks related to their
structure and focus, which include, but are not limited to, dependency upon
management skills, limited diversification, the risks of locating and managing
financing for projects, heavy cash flow dependency, possible default by
borrowers, the costs and potential losses of self-liquidation of one or more
holdings, the risk of a possible lack of mortgage funds and associated interest
rate risks, overbuilding, property vacancies, increases in property taxes and
operating expenses, changes in zoning laws, losses due to environmental damages,
changes in neighborhood values and appeal to purchasers, the possibility of
failing to maintain exemptions from registration under the 1940 Act and, in many
cases, relatively small market capitalization, which may result in less market
liquidity and greater price volatility. Fund shareholders indirectly pay REIT
fees and expenses.
NON-U.S. SECURITIES RISK: The Fund may invest in securities of non-U.S. issuers.
Such securities are subject to higher volatility than securities of domestic
issuers due to possible adverse political, social or economic developments;
restrictions on foreign investment or exchange of securities; lack of liquidity;
currency exchange rates; excessive taxation; government seizure of assets;
different legal or accounting standards; and less government supervision and
regulation of exchanges in foreign countries.
ADVISORY AND SUB-ADVISORY AGREEMENTS
BOARD CONSIDERATIONS REGARDING APPROVAL OF CONTINUATION OF INVESTMENT MANAGEMENT
AND INVESTMENT SUB-ADVISORY AGREEMENTS
The Board of Trustees of First Trust Series Fund (the "Trust"), including the
Independent Trustees, unanimously approved the continuation of the Investment
Management Agreement (the "Advisory Agreement") between the Trust, on behalf of
the First Trust Preferred Securities and Income Fund (the "Fund"), and First
Trust Advisors L.P. (the "Advisor" or "First Trust") and the Investment
Sub-Advisory Agreement (the "Sub-Advisory Agreement" and together with the
Advisory Agreement, the "Agreements") among the Trust, on behalf of the Fund,
the Advisor and Stonebridge Advisors LLC (the "Sub-Advisor") for a one-year
period ending June 30, 2018 at a meeting held on June 12, 2017. The Board
determined that the continuation of the Agreements is in the best interests of
the Fund in light of the extent and quality of the services provided and such
other matters as the Board considered to be relevant in the exercise of its
reasonable business judgment.
To reach this determination, the Board considered its duties under the
Investment Company Act of 1940, as amended (the "1940 Act"), as well as under
the general principles of state law in reviewing and approving advisory
contracts; the requirements of the 1940 Act in such matters; the fiduciary duty
of investment advisors with respect to advisory agreements and compensation; the
standards used by courts in determining whether investment company boards have
fulfilled their duties; and the factors to be considered by the Board in voting
on such agreements. At meetings held on April 24, 2017 and June 12, 2017, the
Board, including the Independent Trustees, reviewed materials provided by the
Advisor and the Sub-Advisor responding to requests for information from counsel
to the Independent Trustees that, among other things, outlined the services
provided by the Advisor and the Sub-Advisor to the Fund (including the relevant
personnel responsible for these services and their experience); the advisory fee
rate payable by the Fund and the sub-advisory fee rate as compared to fees
charged to a peer group of funds compiled by Management Practice, Inc. ("MPI"),
an independent source (the "MPI Peer Group"), and as compared to fees charged to
other clients of the Advisor and the Sub-Advisor; expenses of the Fund as
compared to expense ratios of the funds in the MPI Peer Group; performance
information for the Fund; the nature of expenses incurred in providing services
to the Fund and the potential for economies of scale, if any; financial data on
the Advisor and the Sub-Advisor; any fall-out benefits to the Advisor and its
Page 30
<PAGE>
--------------------------------------------------------------------------------
ADDITIONAL INFORMATION (CONTINUED)
--------------------------------------------------------------------------------
FIRST TRUST PREFERRED SECURITIES AND INCOME FUND
OCTOBER 31, 2017 (UNAUDITED)
affiliates, First Trust Portfolios L.P. ("FTP") and First Trust Capital
Partners, LLC ("FTCP"), and the Sub-Advisor; and information on the Advisor's
and the Sub-Advisor's compliance programs. The Board reviewed initial materials
with the Advisor at the meeting held on April 24, 2017, prior to which the
Independent Trustees and their counsel met separately to discuss the information
provided by the Advisor and the Sub-Advisor. Following the April meeting,
independent legal counsel on behalf of the Independent Trustees requested
certain clarifications and supplements to the materials provided, and the
information provided in response to those requests was considered at an
executive session of the Independent Trustees and independent legal counsel held
prior to the June 12, 2017 meeting, as well as at the meeting held that day. The
Board applied its business judgment to determine whether the arrangements
between the Trust and the Advisor and among the Trust, the Advisor and the
Sub-Advisor continue to be reasonable business arrangements from the Fund's
perspective as well as from the perspective of the Fund's shareholders. The
Board determined that, given the totality of the information provided with
respect to the Agreements, the Board had received sufficient information to
renew the Agreements. The Board considered that shareholders chose to invest or
remain invested in the Fund knowing that the Advisor and the Sub-Advisor manage
the Fund and knowing the Fund's advisory fee.
In reviewing the Agreements, the Board considered the nature, extent and quality
of the services provided by the Advisor and the Sub-Advisor under the
Agreements. With respect to the Advisory Agreement, the Board considered that
the Advisor is responsible for the overall management and administration of the
Trust and the Fund and reviewed all of the services provided by the Advisor to
the Fund, including the oversight of the Sub-Advisor, as well as the background
and experience of the persons responsible for such services. The Board noted
that the Advisor oversees the Sub-Advisor's day-to-day management of the Fund's
investments, including portfolio risk monitoring and performance review. In
reviewing the services provided, the Board noted the compliance program that had
been developed by the Advisor and considered that it includes a robust program
for monitoring the Advisor's, the Sub-Advisor's and the Fund's compliance with
the 1940 Act, as well as the Fund's compliance with its investment objective and
policies. The Board also considered a report from the Advisor with respect to
its risk management functions related to the operation of the Fund. Finally, as
part of the Board's consideration of the Advisor's services, the Advisor, in its
written materials and at the April 24, 2017 meeting, described to the Board the
scope of its ongoing investment in additional infrastructure and personnel to
maintain and improve the quality of services provided to the Fund and the other
funds in the First Trust Fund Complex. With respect to the Sub-Advisory
Agreement, the Board reviewed the materials provided by the Sub-Advisor and
considered the services that the Sub-Advisor provides to the Fund, including the
Sub-Advisor's day-to-day management of the Fund's investments. In considering
the Sub-Advisor's management of the Fund, the Board noted the background and
experience of the Sub-Advisor's portfolio management team and the Board's prior
meetings with members of the portfolio management team. In light of the
information presented and the considerations made, the Board concluded that the
nature, extent and quality of the services provided to the Fund by the Advisor
and the Sub-Advisor under the Agreements have been and are expected to remain
satisfactory and that the Sub-Advisor, under the oversight of the Advisor, has
managed the Fund consistent with its investment objective and policies.
The Board considered the advisory and sub-advisory fee rates payable under the
Agreements for the services provided. The Board noted that the sub-advisory fee
is paid by the Advisor from its advisory fee. The Board considered that the
Advisor and Sub-Advisor agreed to extend the current expense caps for each share
class through February 28, 2019 and agreed to keep the long-term expense cap in
place from March 1, 2019 through February 28, 2028. The Board noted that fees
waived or expenses borne by the Advisor and Sub-Advisor are subject to
reimbursement by the Fund for up to three years from the date the expense was
incurred or fees were waived, but no reimbursement payment would be made by the
Fund if it would result in the Fund exceeding an expense ratio equal to the
expense cap in place at the time of the reimbursement or at the time the
expenses were borne or the fees were waived by the Advisor and Sub-Advisor. The
Board received and reviewed information showing the advisory fee rates and
expense ratios of the peer funds in the MPI Peer Group, as well as advisory fee
rates charged by the Advisor and the Sub-Advisor to other fund and non-fund
clients, as applicable. With respect to the MPI Peer Group, the Board discussed
with representatives of the Advisor how the MPI Peer Group was assembled, as
well as the limitations in creating a relevant peer group for the Fund,
including that (i) some of the peer funds are larger than the Fund, which causes
the Fund's fixed expenses to be higher on a percentage basis as compared to the
larger peer funds, and some of the peer funds are part of a larger fund complex
that may allow for additional economies of scale and (ii) only one of the peer
funds employs an advisor/sub-advisor management structure with an unaffiliated
sub-advisor. The Board took these limitations into account in considering the
peer data. Based on the information provided, the Board noted that the advisory
fee rate payable by the Fund was above the median advisory fee of the peer funds
in the MPI Peer Group. The Board noted that the Fund's total (net) expense ratio
(Class A shares) was above the median of the MPI Peer Group. With respect to
fees charged to other clients, the Board considered differences between the Fund
and other clients that limited their comparability. In considering the advisory
fee rate overall, the Board also considered the Advisor's statement that it
seeks to meet investor needs through innovative and value-added investment
solutions and the Advisor's description of its long-term commitment to the Fund.
The Board considered performance information for the Fund. The Board noted the
process it has established for monitoring the Fund's performance and portfolio
risk on an ongoing basis, which includes quarterly performance reporting from
the Advisor and Sub-Advisor for the Fund. The Board determined that this process
continues to be effective for reviewing the Fund's performance. The Board
received and reviewed information comparing the Fund's performance for periods
ended December 31, 2016 to the performance of the MPI Peer Group and to two
benchmark indexes and a blended benchmark index. Based on the information
provided, the Board noted that the Fund (Class A shares) outperformed the MPI
Peer Group average for the one- and three-year periods and underperformed the
Page 31
<PAGE>
--------------------------------------------------------------------------------
ADDITIONAL INFORMATION (CONTINUED)
--------------------------------------------------------------------------------
FIRST TRUST PREFERRED SECURITIES AND INCOME FUND
OCTOBER 31, 2017 (UNAUDITED)
MPI Peer Group average for the five year period ended December 31, 2016. The
Board also noted that the Fund (Class A shares) outperformed the blended
benchmark index for the one- and three-year periods and underperformed the
blended benchmark index for the five-year period ended December 31, 2016.
On the basis of all the information provided on the fees, expenses and
performance of the Fund and the ongoing oversight by the Board, the Board
concluded that the advisory and sub-advisory fees for the Fund continue to be
reasonable and appropriate in light of the nature, extent and quality of the
services provided by the Advisor and the Sub-Advisor to the Fund under the
Agreements.
The Board considered information and discussed with the Advisor whether there
were any economies of scale in connection with providing advisory services to
the Fund and noted the Advisor's statement that it expects its expenses to
increase over the next twelve months as the Advisor continues to make
investments in personnel and infrastructure. The Board considered the revenues
and allocated costs (including the allocation methodology) of the Advisor in
serving as investment advisor to the Fund for the twelve months ended December
31, 2016 and the estimated profitability level for the Fund calculated by the
Advisor based on such data, as well as complex-wide and product-line
profitability data for the same period. The Board noted the inherent limitations
in the profitability analysis and concluded that, based on the information
provided, the Advisor's profitability level for the Fund was not unreasonable.
In addition, the Board considered fall-out benefits described by the Advisor
that may be realized from its relationship with the Fund. The Board considered
that the Advisor had identified as a fall out benefit to the Advisor and FTP
their exposure to investors and brokers who, absent their exposure to the Fund,
may have had no dealings with the Advisor or FTP. The Board considered the
ownership interest of FTCP in the Sub-Advisor and potential fall-out benefits to
the Advisor from such ownership interest. The Board noted that in addition to
the advisory fees paid by the Fund, FTP is compensated for services provided to
the Fund through 12b-1 distribution and service fees and that First Trust
receives compensation from the Fund for providing fund reporting services
pursuant to a separate Fund Reporting Services Agreement. The Board concluded
that the character and amount of potential fall-out benefits to the Advisor were
not unreasonable.
The Board considered the Sub-Advisor's expenses in providing investment services
to the Fund and noted the Sub-Advisor's recent hiring of additional personnel to
work on the Fund and commitment to add additional resources if assets increase.
The Board did not review the profitability of the Sub-Advisor with respect to
the Fund. The Board noted that the Advisor pays the Sub-Advisor from its
advisory fee, and its understanding that the Fund's sub-advisory fee rate was
the product of an arm's length negotiation. The Board concluded that the
profitability analysis for the Advisor was more relevant. The Board considered
fall-out benefits that may be realized by the Sub-Advisor from its relationship
with the Fund, including potential fall-out benefits to the Sub-Advisor from the
ownership interest of FTCP in the Sub-Advisor. The Board noted that the
Sub-Advisor does not maintain any soft-dollar arrangements. The Board concluded
that the character and amount of potential fall-out benefits to the Sub-Advisor
were not unreasonable.
Based on all of the information considered and the conclusions reached, the
Board, including the Independent Trustees, unanimously determined that the terms
of the Agreements continue to be fair and reasonable and that the continuation
of the Agreements is in the best interests of the Fund. No single factor was
determinative in the Board's analysis.
Page 32
<PAGE>
--------------------------------------------------------------------------------
BOARD OF TRUSTEES AND OFFICERS
--------------------------------------------------------------------------------
FIRST TRUST PREFERRED SECURITIES AND INCOME FUND
OCTOBER 31, 2017 (UNAUDITED)
The Trust's statement of additional information includes additional information
about the Trustees and is available, without charge, upon request, by calling
(800) 988-5891.
<TABLE>
<CAPTION>
NUMBER OF OTHER
PORTFOLIOS IN TRUSTEESHIPS OR
THE FIRST TRUST DIRECTORSHIPS
NAME, ADDRESS, TERM OF OFFICE FUND COMPLEX HELD BY TRUSTEE
DATE OF BIRTH AND AND LENGTH OF PRINCIPAL OCCUPATIONS OVERSEEN BY DURING PAST
POSITION WITH THE TRUST SERVICE DURING PAST 5 YEARS TRUSTEE 5 YEARS
------------------------------------------------------------------------------------------------------------------------------------
INDEPENDENT TRUSTEES
------------------------------------------------------------------------------------------------------------------------------------
<S> <C> <C> <C> <C>
Richard E. Erickson, Trustee o Indefinite Term Physician, Officer, Wheaton Orthopedics; 151 None
c/o First Trust Advisors L.P. Limited Partner, Gundersen Real Estate
120 E. Liberty Drive, o Since Trust Limited Partnership (June 1992 to
Suite 400 Inception December 2016); Member, Sportsmed
Wheaton, IL 60187 LLC (April 2007 to November 2015)
D.O.B.: 04/51
Thomas R. Kadlec, Trustee o Indefinite Term President, ADM Investor Services, Inc. 151 Director of ADM
c/o First Trust Advisors L.P. (Futures Commission Merchant) Investor Services,
120 E. Liberty Drive, o Since Trust Inc., ADM
Suite 400 Inception Investor Services
Wheaton, IL 60187 International,
D.O.B.: 11/57 Futures Industry
Association, and
National Futures
Association
Robert F. Keith, Trustee o Indefinite Term President, Hibs Enterprises (Financial 151 Director of Trust
c/o First Trust Advisors L.P. and Management Consulting) Company of
120 E. Liberty Drive, o Since Trust Illinois
Suite 400 Inception
Wheaton, IL 60187
D.O.B.: 11/56
Niel B. Nielson, Trustee o Indefinite Term Managing Director and Chief Operating 151 Director of
c/o First Trust Advisors L.P. Officer (January 2015 to Present), Pelita Covenant
120 E. Liberty Drive, o Since Trust Harapan Educational Foundation Transport, Inc.
Suite 400 Inception (Educational Products and Services); (May 2003 to
Wheaton, IL 60187 President and Chief Executive Officer May 2014)
D.O.B.: 03/54 (June 2012 to September 2014), Servant
Interactive LLC (Educational Products and
Services); President and Chief Executive
Officer (June 2012 to September 2014),
Dew Learning LLC (Educational Products
and Services); President (June 2002 to
June 2012), Covenant College
------------------------------------------------------------------------------------------------------------------------------------
INTERESTED TRUSTEE
------------------------------------------------------------------------------------------------------------------------------------
James A. Bowen(1), Trustee, o Three Year Term Chief Executive Officer, First Trust 151 None
Chairman of the Board Advisors L.P. and First Trust Portfolios
120 E. Liberty Drive, o Since Trust L.P.; Chairman of the Board of Directors,
Suite 400 Inception BondWave LLC (Software Development
Wheaton, IL 60187 Company) and Stonebridge Advisors LLC
D.O.B.: 09/55 (Investment Advisor)
</TABLE>
-----------------------------
(1) Mr. Bowen is deemed an "interested person" of the Trust due to his
position of Chief Executive Officer of First Trust Advisors L.P.,
investment advisor of the Trust.
Page 33
<PAGE>
--------------------------------------------------------------------------------
BOARD OF TRUSTEES AND OFFICERS (CONTINUED)
--------------------------------------------------------------------------------
FIRST TRUST PREFERRED SECURITIES AND INCOME FUND
OCTOBER 31, 2017 (UNAUDITED)
<TABLE>
<CAPTION>
POSITION AND TERM OF OFFICE
NAME, ADDRESS OFFICES AND LENGTH OF PRINCIPAL OCCUPATIONS
AND DATE OF BIRTH WITH TRUST SERVICE DURING PAST 5 YEARS
------------------------------------------------------------------------------------------------------------------------------------
OFFICERS(2)
------------------------------------------------------------------------------------------------------------------------------------
<S> <C> <C> <C>
James M. Dykas President and Chief o Indefinite Term Managing Director and Chief Financial Officer
120 E. Liberty Drive, Executive Officer (January 2016 to Present), Controller (January 2011
Suite 400 o Since January 2016 to January 2016), Senior Vice President (April 2007
Wheaton, IL 60187 to January 2016), First Trust Advisors L.P. and First
D.O.B.: 01/66 Trust Portfolios L.P.; Chief Financial Officer
(January 2016 to Present), BondWave LLC (Software
Development Company); and Stonebridge Advisors
LLC (Investment Advisor)
Donald P. Swade Treasurer, Chief o Indefinite Term Senior Vice President (July 2016 to Present), Vice
120 E. Liberty Drive, Financial Officer and President (April 2012 to July 2016), First Trust
Suite 400 Chief Accounting Officer o Since January 2016 Advisors L.P. and First Trust Portfolios L.P.
Wheaton, IL 60187
D.O.B.: 08/72
W. Scott Jardine Secretary and Chief o Indefinite Term General Counsel, First Trust Advisors L.P. and
120 E. Liberty Drive, Legal Officer First Trust Portfolios L.P.; Secretary and General
Suite 400 o Since Trust Counsel, BondWave LLC; Secretary, Stonebridge
Wheaton, IL 60187 Inception Advisors LLC
D.O.B.: 05/60
Daniel J. Lindquist Vice President o Indefinite Term Managing Director, First Trust Advisors L.P. and
120 E. Liberty Drive, First Trust Portfolios L.P.
Suite 400 o Since Trust
Wheaton, IL 60187 Inception
D.O.B: 02/70
Kristi A. Maher Chief Compliance o Indefinite Term Deputy General Counsel, First Trust Advisors L.P.
120 E. Liberty Drive, Officer and and First Trust Portfolios L.P.
Suite 400 Assistant Secretary o Chief Compliance
Wheaton, IL 60187 Officer since
D.O.B.: 12/66 January 2011
o Assistant Secretary
since January 2011
</TABLE>
-----------------------------
(2) The term "officer" means the president, vice president, secretary,
treasurer, controller or any other officer who performs a policy making
function.
Page 34
<PAGE>
--------------------------------------------------------------------------------
PRIVACY POLICY
--------------------------------------------------------------------------------
FIRST TRUST PREFERRED SECURITIES AND INCOME FUND
OCTOBER 31, 2017 (UNAUDITED)
PRIVACY POLICY
First Trust values our relationship with you and considers your privacy an
important priority in maintaining that relationship. We are committed to
protecting the security and confidentiality of your personal information.
SOURCES OF INFORMATION
We collect nonpublic personal information about you from the following sources:
o Information we receive from you and your broker-dealer, investment
advisor or financial representative through interviews,
applications, agreements or other forms;
o Information about your transactions with us, our affiliates or
others;
o Information we receive from your inquiries by mail, e-mail or
telephone; and
o Information we collect on our website through the use of "cookies".
For example, we may identify the pages on our website that your
browser requests or visits.
INFORMATION COLLECTED
The type of data we collect may include your name, address, social security
number, age, financial status, assets, income, tax information, retirement and
estate plan information, transaction history, account balance, payment history,
investment objectives, marital status, family relationships and other personal
information.
DISCLOSURE OF INFORMATION
We do not disclose any nonpublic personal information about our customers or
former customers to anyone, except as permitted by law. In addition to using
this information to verify your identity (as required under law), the permitted
uses may also include the disclosure of such information to unaffiliated
companies for the following reasons:
o In order to provide you with products and services and to effect
transactions that you request or authorize, we may disclose your
personal information as described above to unaffiliated financial
service providers and other companies that perform administrative or
other services on our behalf, such as transfer agents, custodians
and trustees, or that assist us in the distribution of investor
materials such as trustees, banks, financial representatives, proxy
services, solicitors and printers.
o We may release information we have about you if you direct us to do
so, if we are compelled by law to do so, or in other legally limited
circumstances (for example to protect your account from fraud).
In addition, in order to alert you to our other financial products and services,
we may share your personal information within First Trust.
USE OF WEB ANALYTICS
We currently use third party analytics tools, Google Analytics and AddThis, to
gather information for purposes of improving First Trust's website and marketing
our products and services to you. These tools employ cookies, which are small
pieces of text stored in a file by your web browser and sent to websites that
you visit, to collect information, track website usage and viewing trends such
as the number of hits, pages visited, videos and PDFs viewed and the length of
user sessions in order to evaluate website performance and enhance navigation of
the website. We may also collect other anonymous information, which is generally
limited to technical and web navigation information such as the IP address of
your device, internet browser type and operating system for purposes of
analyzing the data to make First Trust's website better and more useful to our
users. The information collected does not include any personal identifiable
information such as your name, address, phone number or email address unless you
provide that information through the website for us to contact you in order to
answer your questions or respond to your requests. To find out how to opt-out of
these services click on: Google Analytics and AddThis.
CONFIDENTIALITY AND SECURITY
With regard to our internal security procedures, First Trust restricts access to
your nonpublic personal information to those First Trust employees who need to
know that information to provide products or services to you. We maintain
physical, electronic and procedural safeguards to protect your nonpublic
personal information.
POLICY UPDATES AND INQUIRIES
As required by federal law, we will notify you of our privacy policy annually.
We reserve the right to modify this policy at any time, however, if we do change
it, we will tell you promptly. For questions about our policy, or for additional
copies of this notice, please go to www.ftportfolios.com, or contact us at
1-800-621-1675 (First Trust Portfolios) or 1-800-222-6822 (First Trust
Advisors).
May 2017
Page 35
<PAGE>
This Page Left Blank Intentionally.
<PAGE>
FIRST TRUST
INVESTMENT ADVISOR
First Trust Advisors L.P.
120 E. Liberty Drive, Suite 400
Wheaton, IL 60187
INVESTMENT SUB-ADVISOR
Stonebridge Advisors, LLC
10 Westport Road
Suite C101
Wilton, CT 06897
ADMINISTRATOR,
FUND ACCOUNTANT &
CUSTODIAN
Brown Brothers Harriman & Co.
50 Post Office Square
Boston, MA 02110
TRANSFER AGENT
BNY Mellon Investment Servicing (US) Inc.
301 Bellevue Parkway
Wilmington, DE 19810
INDEPENDENT REGISTERED
PUBLIC ACCOUNTING FIRM
Deloitte & Touche LLP
111 S. Wacker Drive
Chicago, IL 60606
LEGAL COUNSEL
Chapman and Cutler LLP
111 W. Monroe Street
Chicago, IL 60603
<PAGE>
[BLANK BACK COVER]
<PAGE>
FIRST TRUST
First Trust/Confluence
Small Cap Value Fund
-----------------------------------------
Annual Report
For the Year Ended
October 31, 2017
CONFLUENCE INVESTMENT MANAGEMENT
<PAGE>
--------------------------------------------------------------------------------
TABLE OF CONTENTS
--------------------------------------------------------------------------------
FIRST TRUST/CONFLUENCE SMALL CAP VALUE FUND
ANNUAL REPORT
OCTOBER 31, 2017
Shareholder Letter........................................................... 1
At a Glance.................................................................. 2
Portfolio Commentary......................................................... 4
Understanding Your Fund Expenses............................................. 6
Portfolio of Investments..................................................... 7
Statement of Assets and Liabilities.......................................... 9
Statement of Operations...................................................... 10
Statements of Changes in Net Assets.......................................... 11
Financial Highlights......................................................... 12
Notes to Financial Statements................................................ 15
Report of Independent Registered Public Accounting Firm...................... 21
Additional Information....................................................... 22
Board of Trustees and Officers............................................... 26
Privacy Policy............................................................... 28
CAUTION REGARDING FORWARD-LOOKING STATEMENTS
This report contains certain forward-looking statements within the meaning of
the Securities Act of 1933, as amended, and the Securities Exchange Act of 1934,
as amended. Forward-looking statements include statements regarding the goals,
beliefs, plans or current expectations of First Trust Advisors L.P. ("First
Trust" or the "Advisor") and/or Confluence Investment Management LLC
("Confluence" or the "Sub-Advisor") and their respective representatives, taking
into account the information currently available to them. Forward-looking
statements include all statements that do not relate solely to current or
historical fact. For example, forward-looking statements include the use of
words such as "anticipate," "estimate," "intend," "expect," "believe," "plan,"
"may," "should," "would" or other words that convey uncertainty of future events
or outcomes.
Forward-looking statements involve known and unknown risks, uncertainties and
other factors that may cause the actual results, performance or achievements of
First Trust/Confluence Small Cap Value Fund (the "Fund") to be materially
different from any future results, performance or achievements expressed or
implied by the forward-looking statements. When evaluating the information
included in this report, you are cautioned not to place undue reliance on these
forward-looking statements, which reflect the judgment of the Advisor and/or
Sub-Advisor and their respective representatives only as of the date hereof. We
undertake no obligation to publicly revise or update these forward-looking
statements to reflect events and circumstances that arise after the date hereof.
PERFORMANCE AND RISK DISCLOSURE
There is no assurance that the Fund will achieve its investment objective. The
Fund is subject to market risk, which is the possibility that the market values
of securities owned by the Fund will decline and that the value of Fund shares
may therefore be less than what you paid for them. Accordingly, you can lose
money by investing in the Fund. See "Risk Considerations" in the Additional
Information section of this report for a discussion of certain other risks of
investing in the Fund.
Performance data quoted represents past performance, which is no guarantee of
future results, and current performance may be lower or higher than the figures
shown. For the most recent month-end performance figures, please visit
http://www.ftportfolios.com or speak with your financial advisor. Investment
returns and net asset value will fluctuate and Fund shares, when sold, may be
worth more or less than their original cost.
The Advisor may also periodically provide additional information on Fund
performance on the Fund's web page at http://www.ftportfolios.com.
HOW TO READ THIS REPORT
This report contains information that may help you evaluate your investment in
the Fund. It includes details about the Fund and presents data and analysis that
provide insight into the Fund's performance and investment approach.
By reading the portfolio commentary by the portfolio management team of the
Fund, you may obtain an understanding of how the market environment affected the
Fund's performance. The statistical information that follows may help you
understand the Fund's performance compared to that of relevant market
benchmarks.
It is important to keep in mind that the opinions expressed by personnel of
Confluence are just that: informed opinions. They should not be considered to be
promises or advice. The opinions, like the statistics, cover the period through
the date on the cover of this report. The material risks of investing in the
Fund are spelled out in the prospectus, the statement of additional information,
this report and other Fund regulatory filings.
<PAGE>
--------------------------------------------------------------------------------
SHAREHOLDER LETTER
--------------------------------------------------------------------------------
FIRST TRUST/CONFLUENCE SMALL CAP VALUE FUND
ANNUAL LETTER FROM THE CHAIRMAN AND CEO
OCTOBER 31, 2017
Dear Shareholders:
Thank you for your investment in First Trust/Confluence Small Cap Value Fund.
First Trust is pleased to provide you with the annual report which contains
detailed information about your investment for the 12 months ended October 31,
2017, including a market overview and a performance analysis for the period. We
encourage you to read this report carefully and discuss it with your financial
advisor.
The U.S. bull market continued through the November 2016 election and the first
nine months of the Trump presidency. During that period, November 8, 2016
(Election Day 2016) through October 31, 2017, the S&P 500(R) Index (the "Index")
posted a total return of 22.73%, according to Bloomberg. Ten of the eleven Index
sectors were up on a total return basis as well. Since the beginning of 2017
through October 31, 2017, the Index has closed its trading sessions at all-time
highs on 50 occasions. Finally, as of October 31, 2017, the Index has spent the
entire year in positive territory. This has only happened in 10 different years
over the past seven decades.
The current bull market, as measured from March 9, 2009 through October 31,
2017, is the second longest in history. While we are optimistic about the U.S.
economy, we are also aware that no one can predict the future or know how
markets will perform in different economic environments. We believe that one
should invest for the long term and be prepared for market volatility by keeping
current on your portfolio and investing goals by speaking regularly with your
investment professional. It is also important to keep in mind that past
performance can never guarantee future results.
Thank you for giving First Trust the opportunity to be a part of your investment
plan. We value our relationship with you and will continue to focus on bringing
the types of investments that we believe can help you reach your financial
goals.
Sincerely,
/s/ James A. Bowen
James A. Bowen
Chairman of the Board of Trustees
Chief Executive Officer of First Trust Advisors L.P.
Page 1
<PAGE>
FIRST TRUST/CONFLUENCE SMALL CAP VALUE FUND
"AT A GLANCE"
AS OF OCTOBER 31, 2017 (UNAUDITED)
-----------------------------------------------------------
FUND STATISTICS
-----------------------------------------------------------
NET ASSET
FIRST TRUST/CONFLUENCE SMALL CAP VALUE FUND VALUE (NAV)
-----------------------------------------------------------
Class A (FOVAX) $34.48
Class C (FOVCX) $31.47
Class I (FOVIX) $35.07
-----------------------------------------------------------
-----------------------------------------------------------
% OF TOTAL
TOP TEN HOLDINGS INVESTMENTS
-----------------------------------------------------------
Boston Beer (The) Co., Inc., Class A 5.1%
Natus Medical, Inc. 4.4
Innophos Holdings, Inc. 4.3
Thermon Group Holdings, Inc. 4.3
Monotype Imaging Holdings, Inc. 4.2
Morningstar, Inc. 4.0
MTS Systems Corp. 3.9
Rayonier, Inc. 3.9
Advisory Board (The) Co. 3.9
Forward Air Corp. 3.9
-----------------------------------------------------------
Total 41.9%
======
-----------------------------------------------------------
% OF TOTAL
SECTOR ALLOCATION INVESTMENTS
-----------------------------------------------------------
Industrials 27.3%
Health Care 15.9
Financials 14.1
Information Technology 12.9
Consumer Discretionary 10.6
Consumer Staples 8.4
Real Estate 6.5
Materials 4.3
-----------------------------------------------------------
Total 100.0%
======
Page 2
<PAGE>
FIRST TRUST/CONFLUENCE SMALL CAP VALUE FUND
"AT A GLANCE" (CONTINUED)
AS OF OCTOBER 31, 2017 (UNAUDITED)
-----------------------------------------------------------
PERFORMANCE OF A $10,000 INVESTMENT
-----------------------------------------------------------
This chart compares your Fund's Class I performance to that
of the Russell 2000(R) Value Index and the Russell 2000(R)
Index from 1/11/2011 through 10/31/2017.
First Trust/Confluence
Small Cap Value Fund - Russell 2000(R) Russell 2000(R)
Class I Shares Value Index ("R2000V") Index ("R2000")
1/11/11 $10,000 $10,000 $10,000
4/30/11 10,730 10,966 10,716
10/31/11 9,790 9,457 9,261
4/30/12 10,554 10,499 10,323
10/31/12 10,951 10,599 10,601
4/30/13 12,260 12,309 12,307
10/31/13 13,892 14,023 14,389
4/30/14 14,285 14,720 14,832
10/31/14 15,214 15,129 15,548
4/30/15 15,626 15,439 16,271
10/31/15 15,403 14,693 15,601
4/30/16 15,847 14,866 15,305
10/31/16 16,552 15,987 16,243
4/30/17 19,113 18,906 19,227
10/31/17 20,684 19,957 20,766
<TABLE>
<CAPTION>
------------------------------------------------------------------------------------------------------------------
PERFORMANCE AS OF OCTOBER 31, 2017
------------------------------------------------------------------------------------------------------------------
A SHARES C SHARES I SHARES
Inception 2/24/2011 Inception 3/2/2011 Inception 1/11/2011 R2000V* R2000*
------------------------------------------------------------------------------------------------------------------
W/MAX
1.00%
W/MAX CONTINGENT
W/O 5.50% W/O DEFERRED W/O W/O W/O
CUMULATIVE SALES SALES SALES SALES SALES SALES SALES
TOTAL RETURNS CHARGES CHARGE CHARGES CHARGE CHARGES CHARGES CHARGES
<S> <C> <C> <C> <C> <C> <C> <C>
1 Year 25.53% 18.66% 24.58% 23.58% 24.99% 24.81% 27.85%
AVERAGE ANNUAL
TOTAL RETURNS
5 Years 13.43% 12.16% 12.49% 12.49% 13.57% 13.58% 14.49%
Since Inception 11.09% 10.15% 9.62% 9.62% 11.28% 10.69% 11.34%
------------------------------------------------------------------------------------------------------------------
</TABLE>
* Since inception return is based on the Class I Shares inception date.
Performance figures assume reinvestment of all distributions and do not reflect
the deduction of taxes that a shareholder would pay on Fund distributions or the
redemption of Fund shares. The total returns would have been lower if certain
fees had not been waived and expenses reimbursed by the Advisor. An index is a
statistical composite that tracks a specified financial market or sector. Unlike
the Fund, the indices do not actually hold a portfolio of securities and
therefore do not incur the expenses incurred by the Fund. These expenses
negatively impact the performance of the Fund. The Fund's past performance does
not predict future performance.
Performance of share classes will vary due to differences in sales charges and
expenses. Average annual total return with sales charges includes payment of the
maximum sales charge of 5.50% for Class A Shares, a contingent deferred sales
charge ("CDSC") of 1.00% for Class C Shares in year one and 12b-1 service fees
of 0.25% per year of average daily net assets for Class A Shares and combined
Rule 12b-1 distribution and service fees of 1.00% per year of average daily net
assets for Class C Shares. Class I Shares do not have a front-end sales charge
or a CDSC, nor do they pay distribution or service fees.
Page 3
<PAGE>
--------------------------------------------------------------------------------
PORTFOLIO COMMENTARY
--------------------------------------------------------------------------------
FIRST TRUST/CONFLUENCE SMALL CAP VALUE FUND
ANNUAL REPORT
OCTOBER 31, 2017 (UNAUDITED)
ADVISOR
First Trust Advisors L.P. ("First Trust") is the investment advisor to the First
Trust/Confluence Small Cap Value Fund (the "Fund"). First Trust is responsible
for the ongoing monitoring of the Fund's investment portfolio, managing the
Fund's business affairs and providing certain administrative services necessary
for the management of the Fund.
SUB-ADVISOR
Confluence Investment Management LLC, a registered investment advisor
("Confluence" or the "Sub-Advisor"), located in St. Louis, Missouri, serves as
the sub-advisor to the Fund. The investment professionals at Confluence have
over 80 years of aggregate portfolio management experience. Confluence
professionals have invested in a wide range of specialty finance and other
financial company securities during various market cycles, working to provide
attractive risk-adjusted returns to clients.
PORTFOLIO MANAGEMENT TEAM
MARK KELLER, CFA - CHIEF EXECUTIVE OFFICER AND CHIEF INVESTMENT OFFICER,
CONFLUENCE
DANIEL WINTER, CFA - SENIOR VICE PRESIDENT AND PORTFOLIO MANAGER, CONFLUENCE
CHRIS STEIN - VICE PRESIDENT AND PORTFOLIO MANAGER, CONFLUENCE
THOMAS DUGAN, CFA - ASSOCIATE VICE PRESIDENT AND PORTFOLIO MANAGER, CONFLUENCE
COMMENTARY
MARKET RECAP
For the Fund's fiscal year ended October 31, 2017, the small capitalization
equity markets performed extremely well reacting favorably following the
November 2016 U.S. presidential election with the Russell 2000(R) Index and
Russell 2000(R) Value Index up 11.15% and 13.27%, respectively, in November of
2016. The strength carried throughout the Fund's fiscal year ending October 31,
2017 with the Russell 2000(R) Index and Russell 2000(R) Value Index posting
annual gains of 27.85% and 24.81%, respectively.
The equity market's strength can be tied to the continued economic growth but
clearly received a boost post-election, in our opinion. We believe this to be
driven by optimistic views that the new administration will be successful in
pushing its agenda on tax reform, deregulation, infrastructure and trade, which
are expected to enhance economic and earnings growth and outweigh the Federal
Reserve's (the "Fed") more recent monetary policy movements toward
normalization, i.e., raising rates and tapering its balance sheet.
While we anticipate continued economic growth with little risk of recession, we
are also mindful that the risk profile of the market changes over the course of
bull markets and this time is no different. In the early stages of bull markets,
investors are typically fearful as their near-term experience of the bear market
is still seared in their minds. But, as time progresses and the bull market
ages, investors typically shift to the grander opportunities that they may
achieve as the market advances. Said differently, in the early stages of bull
markets investors are generally more concerned about preserving capital, but the
focus shifts to the prospect of returns in the later stages. This generally
results in undervalued businesses being sought in the early stages of a bull
market and high growth/momentum businesses attracting investors in the later
stages. We believe this is reflected in the current market with strong returns
from high-growth stocks (e.g., Facebook, Amazon, Netflix and Google, or better
known as the FANG stocks) driving a wide divergence between the growth and value
indexes with the Russell 2000(R) Growth Index up 18.62% versus the Russell
2000(R) Value Index up 5.81% year-to-date.
The Class I Shares of the Fund generated a total return of 24.99% during the
fiscal year ended October 31, 2017, slightly outperforming the benchmark Russell
2000(R) Value Index while underperforming the Russell 2000(R) Index. Since the
Fund' inception on January 11, 2011 through the end of October 2017, the Class I
Shares of the Fund are up 11.28% (on an annualized basis), slightly ahead of the
performance of the Russell 2000(R) Value Index and in-line with Russell 2000(R)
Index which posted annualized gains of 10.69% and 11.34%, respectively, for the
same period.
PERFORMANCE ANALYSIS
During the Fund's fiscal year ended October 31, 2017, all sectors exhibited
generally strong performance with the exception of the Energy and Consumer
Staples sectors. For the Fund, the relative weightings and performance of the
Energy, Industrials and Real Estate sectors were positive contributors to
relative performance. The Financial Services, Health Care, and Information
Technology sectors were the main detractors to relative performance (see Fund
Attribution table). The large cash position was also a detractor to relative
performance.
Our investment approach is focused on understanding and valuing individual
businesses with the emphasis of owning great businesses at bargain prices. This
is a fundamental approach that views risk as the probability of a permanent loss
of capital as opposed to tracking error of a benchmark. Businesses that exhibit
the attributes we seek (e.g., substantial competitive advantages and pricing
power, free cash flow generation, high returns on invested capital) are often
difficult to find in commodity-oriented or highly regulated businesses in which
pricing is contingent on factors outside management's control. This will often
Page 4
<PAGE>
--------------------------------------------------------------------------------
PORTFOLIO COMMENTARY (CONTINUED)
--------------------------------------------------------------------------------
FIRST TRUST/CONFLUENCE SMALL CAP VALUE FUND
ANNUAL REPORT
OCTOBER 31, 2017 (UNAUDITED)
<TABLE>
<CAPTION>
--------------------------------------------------------------------------------------------------------------------
RUSSELL 2000 RUSSELL 2000 VALUE SMALL CAP VALUE ATTRIBUTION
-------------------- ------------------ ------------------ -------------------
VS. RSL VS. RSL
SECTOR WGT RTN WGT RTN WGT RTN 2000V 2000
--------------------------------------------------------------------------------------------------------------------
<S> <C> <C> <C> <C> <C> <C> <C> <C>
Consumer Discretionary 12.17 20.34 10.05 18.70 6.54 3.27 (0.68) (0.78)
Consumer Staples 2.89 4.08 2.78 (1.87) 6.17 12.88 (0.24) (0.01)
Energy 3.44 (5.15) 5.63 (2.02) 0.00 0.00 1.14 1.54
Financial Services 18.76 31.48 31.46 30.22 14.91 25.75 (0.99) (1.49)
Health Care 13.69 37.67 5.07 41.40 15.96 22.75 (2.16) (1.22)
Industrials 14.63 35.45 12.58 38.73 27.49 52.98 5.77 5.93
Information Technology 17.40 32.11 9.99 31.09 7.70 15.11 (1.70) (1.36)
Materials 4.78 33.34 4.53 28.20 1.74 3.47 (0.68) (0.51)
Real Estate 7.75 14.46 10.70 11.36 6.83 35.35 1.55 2.18
Telecom 0.79 23.74 0.66 (11.83) 0.00 0.00 0.03 0.25
Utilities 3.70 23.70 6.54 23.39 0.00 0.00 0.16 0.12
Cash 0.00 0.00 0.00 0.00 12.66 0.46 (3.49) (3.14)
--------------------------------------------------------------------------------------------------------------------
</TABLE>
Sources: Factset and Confluence Investment Management. Index Data is based on
the respective Exchange Traded Fund (iShares Russell 2000 and Russell 2000
Value).
result in over/underweighting certain areas of the market that either offer more
attractive valuations or have superior underlying attributes. Subsequently,
performance in any given time frame will be impacted by the market's perception
of the value of these individual businesses compared to the benchmarks. It is
with this approach that we would expect to outperform in down markets as the
focus is on managing risk. Our objective is to beat the broad markets on average
and over long periods, but in order to accomplish this goal we will differ from
the benchmarks which will ultimately result in tracking error, good and bad,
from time to time.
This approach is research intensive and deployed with a bottom-up focus of
investing in businesses in a relatively concentrated manner; therefore,
performance is ultimately driven by the underlying strength of the holdings of
the Fund and less influenced by macro or top-down sector weightings. The
emphasis is on owning a diversified portfolio of undervalued businesses with the
sector weightings (over/under) considered more of a byproduct of what the market
is presenting.
During the Fund's fiscal year ended October 31, 2017, the small capitalization
markets experienced a relatively subdued market in terms of volatility but with
a strong upside bias. Overall, the Fund performed relatively well.
In the Industrials sector, the Fund benefited from solid returns from Corporate
Executive Board (CEB), which was acquired, Graco, Inc. (GGG) and Raven
Industries, Inc. (RAVN). In the Real Estate sector, the Fund benefited from
RE/MAX Holdings, Inc. (RMAX) and Gladstone Commercial (GOOD).
The Fund's relative weakness in the Information Technology sector was driven by
the performance of Luxoft Holdings (LXFT) and sector underweighting relative to
the benchmarks. In the Healthcare sector, relative weakness was driven by the
performance of Patterson Cos., Inc. (PDCO). In the Financial Services sector,
relative weakness was driven by the performance of Veritex Holdings, Inc.
(VBTX).
Regarding the high cash levels, the Fund has had three holdings acquired during
the fiscal year - Corporate Executive Board (CEB), VCA Antech (WOOF) and One
Beacon (OB) - and one pending acquisition - The Advisory Board Co. (ABCO).
Having a business holding acquired generally generates an upward short-term
price movement, but it also requires finding a compelling replacement for the
acquired businesses. As always, we will do so in a prudent fashion.
MARKET AND FUND OUTLOOK
Looking forward, we expect continued economic expansion as monetary policy
remains accommodative and fiscal policy is leaning toward a friendlier business
climate. This has resulted in a more optimistic business outlook. We also expect
inflation and inflation expectations to remain in check near current levels
which supports the markets valuations. We continue to work diligently to put
cash to work in a prudent fashion and acknowledge high cash levels, as discussed
above. As always, we remain focused on company-specific fundamentals and growth
prospects, and believe the current market will continue to provide us with
opportunities to buy quality companies at reasonable prices.
Page 5
<PAGE>
FIRST TRUST/CONFLUENCE SMALL CAP VALUE FUND
UNDERSTANDING YOUR FUND EXPENSES
AS OF OCTOBER 31, 2017 (UNAUDITED)
As a shareholder of First Trust/Confluence Small Cap Value Fund, you incur two
types of costs: (1) transaction costs, including sales charges (loads) on
purchases of Class A Shares and contingent deferred sales charges on the lesser
of purchase price or redemption proceeds of Class C Shares; and (2) ongoing
costs, including management fees, distribution and/or service (12b-1) fees, and
other Fund expenses. This Example is intended to help you understand your
ongoing costs of investing in the Fund and to compare these costs with the
ongoing costs of investing in other mutual funds.
The Example is based on an investment of $1,000 invested at the beginning of the
period and held through the six-month period ended October 31, 2017.
ACTUAL EXPENSES
The first three columns of the table below provide information about actual
account values and actual expenses. You may use the information in these
columns, together with the amount you invested, to estimate the expenses that
you paid over the period. Simply divide your account value by $1,000 (for
example, an $8,600 account value divided by $1,000 = 8.6), then multiply the
result by the number in the third column under the heading entitled "Expenses
Paid During Period" to estimate the expenses you paid on your account during the
period.
HYPOTHETICAL EXAMPLE FOR COMPARISON PURPOSES
The next three columns of the table below provide information about hypothetical
account values and hypothetical expenses based on the Fund's actual expense
ratio and an assumed rate of return of 5% per year before expenses, which is not
the Fund's actual return. The hypothetical account values and expenses may not
be used to estimate the actual ending account balance or expenses you paid for
the period. You may use this information to compare the ongoing cost of
investing in the Fund and other funds. To do so, compare this 5% hypothetical
example with the 5% hypothetical examples that appear in the shareholder reports
of the other funds.
Please note that the expenses shown in the table are meant to highlight your
ongoing costs only and do not reflect any transactional costs, such as sales
charges (loads) or contingent deferred sales charges. Therefore, the
hypothetical section of the table is useful in comparing ongoing costs only, and
will not help you determine the relative total costs of owning different funds.
In addition, if these transactional costs were included, your costs would have
been higher.
<TABLE>
<CAPTION>
---------------------------------------------------------------------------------------------------
HYPOTHETICAL
ACTUAL EXPENSES (5% RETURN BEFORE EXPENSES)
------------------------------------------- ---------------------------------------
ENDING EXPENSES PAID BEGINNING ENDING EXPENSES PAID
BEGINNING ACCOUNT DURING PERIOD ACCOUNT ACCOUNT DURING PERIOD ANNUALIZED
ACCOUNT VALUE VALUE 5/01/2017 - VALUE VALUE 5/01/2017 - EXPENSE
5/01/2017 10/31/2017 10/31/2017 (a) 5/01/2017 10/31/2017 10/31/2017 (a) RATIOS (b)
---------------------------------------------------------------------------------------------------
<S> <C> <C> <C> <C> <C> <C> <C>
Class A $1,000.00 $1,086.00 $ 8.41 $1,000.00 $1,017.14 $ 8.13 1.60%
Class C 1,000.00 1,082.90 12.34 1,000.00 1,013.36 11.93 2.35
Class I 1,000.00 1,082.40 7.09 1,000.00 1,018.40 6.87 1.35
</TABLE>
(a) Expenses are equal to the annualized expense ratios, multiplied by the
average account value over the period (May 1, 2017 through October 31,
2017), multiplied by 184/365 (to reflect the six-month period).
(b) These expense ratios reflect expense caps.
Page 6
<PAGE>
FIRST TRUST/CONFLUENCE SMALL CAP VALUE FUND
PORTFOLIO OF INVESTMENTS
OCTOBER 31, 2017
<TABLE>
<CAPTION>
SHARES DESCRIPTION VALUE
------------- ---------------------------------------------------------------------------- --------------
<S> <C> <C>
COMMON STOCKS - 84.6%
AIR FREIGHT & LOGISTICS - 3.4%
10,022 Forward Air Corp............................................................ $ 575,664
--------------
BANKS - 6.2%
7,734 Bank of Marin Bancorp....................................................... 523,978
19,669 Veritex Holdings, Inc. (a).................................................. 518,475
--------------
1,042,453
--------------
BEVERAGES - 4.5%
4,272 Boston Beer (The) Co., Inc., Class A (a).................................... 760,630
--------------
CAPITAL MARKETS - 3.5%
6,892 Morningstar, Inc............................................................ 587,267
--------------
CHEMICALS - 3.8%
13,140 Innophos Holdings, Inc...................................................... 642,940
--------------
ELECTRICAL EQUIPMENT - 3.8%
29,638 Thermon Group Holdings, Inc. (a)............................................ 637,513
--------------
ELECTRONIC EQUIPMENT, INSTRUMENTS & COMPONENTS - 3.4%
11,204 MTS Systems Corp............................................................ 583,168
--------------
FOOD PRODUCTS - 2.9%
13,091 Snyder's-Lance, Inc......................................................... 492,614
--------------
HEALTH CARE EQUIPMENT & SUPPLIES - 8.8%
12,864 Halyard Health, Inc. (a).................................................... 542,218
15,269 Natus Medical, Inc. (a)..................................................... 647,405
8,421 Varex Imaging Corp. (a)..................................................... 289,430
--------------
1,479,053
--------------
HEALTH CARE PROVIDERS & SERVICES - 2.5%
11,555 Patterson Cos., Inc......................................................... 427,535
--------------
HOTELS, RESTAURANTS & LEISURE - 3.2%
45,153 Potbelly Corp. (a).......................................................... 544,094
--------------
INDUSTRIAL CONGLOMERATES - 2.7%
13,405 Raven Industries, Inc....................................................... 451,078
--------------
INSURANCE - 2.7%
9,245 Brown & Brown, Inc.......................................................... 460,771
--------------
IT SERVICES - 4.2%
1,272 Gartner, Inc. (a)........................................................... 159,394
11,676 Luxoft Holding, Inc. (a).................................................... 543,518
--------------
702,912
--------------
LIFE SCIENCES TOOLS & SERVICES - 2.7%
3,427 Bio-Techne Corp............................................................. 449,006
--------------
MACHINERY - 9.8%
7,697 Franklin Electric Co., Inc.................................................. 350,214
3,750 Graco, Inc.................................................................. 494,212
3,286 John Bean Technologies Corp................................................. 351,273
3,736 RBC Bearings, Inc. (a)...................................................... 462,592
--------------
1,658,291
--------------
</TABLE>
See Notes to Financial Statements Page 7
<PAGE>
FIRST TRUST/CONFLUENCE SMALL CAP VALUE FUND
PORTFOLIO OF INVESTMENTS (CONTINUED)
OCTOBER 31, 2017
<TABLE>
<CAPTION>
SHARES DESCRIPTION VALUE
------------- ---------------------------------------------------------------------------- --------------
<S> <C> <C>
COMMON STOCKS (CONTINUED)
PROFESSIONAL SERVICES - 4.4%
10,706 Advisory Board (The) Co. (a)................................................ $ 577,321
2,198 Exponent, Inc............................................................... 162,322
--------------
739,643
--------------
REAL ESTATE MANAGEMENT & DEVELOPMENT - 2.3%
5,868 RE/MAX Holdings, Inc., Class A.............................................. 390,222
--------------
SOFTWARE - 3.7%
26,964 Monotype Imaging Holdings, Inc.............................................. 621,520
--------------
TEXTILES, APPAREL & LUXURY GOODS - 6.1%
15,898 Culp, Inc................................................................... 503,967
19,174 Movado Group, Inc........................................................... 531,120
--------------
1,035,087
--------------
TOTAL COMMON STOCKS......................................................... 14,281,461
(Cost $11,854,478) --------------
REAL ESTATE INVESTMENT TRUSTS - 3.4%
EQUITY REAL ESTATE INVESTMENT TRUSTS - 3.4%
19,288 Rayonier, Inc............................................................... 578,254
(Cost $532,935) --------------
TOTAL INVESTMENTS - 88.0%................................................... 14,859,715
(Cost $12,387,413) (b)
NET OTHER ASSETS AND LIABILITIES - 12.0%.................................... 2,031,104
--------------
NET ASSETS - 100.0%......................................................... $ 16,890,819
==============
</TABLE>
-----------------------------
(a) Non-income producing security.
(b) Aggregate cost for federal income tax purposes is $12,384,050. As of
October 31, 2017, the aggregate gross unrealized appreciation for all
investments in which there was an excess of value over tax cost was
$2,630,518 and the aggregate gross unrealized depreciation for all
investments in which there was an excess of tax cost over value was
$154,853. The net unrealized appreciation was $2,475,665.
-----------------------------
VALUATION INPUTS
A summary of the inputs used to value the Fund's investments as of October 31,
2017 is as follows (see Note 2A - Portfolio Valuation in the Notes to Financial
Statements):
<TABLE>
<CAPTION>
LEVEL 2 LEVEL 3
TOTAL LEVEL 1 SIGNIFICANT SIGNIFICANT
VALUE AT QUOTED OBSERVABLE UNOBSERVABLE
10/31/2017 PRICES INPUTS INPUTS
------------- ------------- ------------- -------------
<S> <C> <C> <C> <C>
Common Stocks*....................................... $ 14,281,461 $ 14,281,461 $ -- $ --
Real Estate Investment Trusts*....................... 578,254 578,254 -- --
------------- ------------- ------------- -------------
Total Investments.................................... $ 14,859,715 $ 14,859,715 $ -- $ --
============= ============= ============= =============
</TABLE>
* See Portfolio of Investments for industry breakout.
All transfers in and out of the Levels during the period are assumed to occur on
the last day of the period at their current value. There were no transfers
between Levels at October 31, 2017.
Page 8 See Notes to Financial Statements
<PAGE>
FIRST TRUST/CONFLUENCE SMALL CAP VALUE FUND
STATEMENT OF ASSETS AND LIABILITIES
OCTOBER 31, 2017
<TABLE>
<CAPTION>
ASSETS:
<S> <C>
Investments, at value
(Cost $12,387,413).............................................................................. $ 14,859,715
Cash............................................................................................ 2,130,523
Prepaid expenses................................................................................ 24,816
Receivables:
Fund shares sold............................................................................. 13,230
Dividends.................................................................................... 2,662
From Investment Advisor...................................................................... 1,772
---------------
Total Assets................................................................................. 17,032,718
---------------
LIABILITIES:
Payables:
Audit and tax fees........................................................................... 33,960
Fund shares repurchased...................................................................... 33,129
Transfer agent fees.......................................................................... 28,330
Administrative fees.......................................................................... 21,875
Printing fees................................................................................ 7,652
12b-1 distribution and service fees.......................................................... 4,568
Commitment and administrative agency fees.................................................... 3,991
Custodian fees............................................................................... 2,310
Registration fees............................................................................ 1,665
Trustees' fees and expenses.................................................................. 1,649
Legal fees................................................................................... 1,122
Financial reporting fees..................................................................... 770
Other liabilities............................................................................... 878
---------------
Total Liabilities............................................................................ 141,899
---------------
NET ASSETS...................................................................................... $ 16,890,819
===============
NET ASSETS CONSIST OF:
Paid-in capital................................................................................. $ 13,440,643
Par value....................................................................................... 4,973
Accumulated net investment income (loss)........................................................ 3,363
Accumulated net realized gain (loss) on investments............................................. 969,538
Net unrealized appreciation (depreciation) on investments....................................... 2,472,302
---------------
NET ASSETS...................................................................................... $ 16,890,819
===============
MAXIMUM OFFERING PRICE PER SHARE:
CLASS A SHARES:
Net asset value and redemption price per share (Based on net assets of $5,655,594 and 164,042
shares of beneficial interest issued and outstanding)........................................ $ 34.48
Maximum sales charge (5.50% of offering price).................................................. 2.01
---------------
Maximum offering price to public................................................................ $ 36.49
===============
CLASS C SHARES:
Net asset value and redemption price per share (Based on net assets of $3,962,245 and 125,896
shares of beneficial interest issued and outstanding)........................................ $ 31.47
===============
CLASS I SHARES:
Net asset value and redemption price per share (Based on net assets of $7,272,980 and 207,409
shares of beneficial interest issued and outstanding)........................................ $ 35.07
===============
</TABLE>
See Notes to Financial Statements Page 9
<PAGE>
FIRST TRUST/CONFLUENCE SMALL CAP VALUE FUND
STATEMENT OF OPERATIONS
FOR THE YEAR ENDED OCTOBER 31, 2017
<TABLE>
<CAPTION>
INVESTMENT INCOME:
<S> <C>
Dividends....................................................................................... $ 137,598
Interest........................................................................................ 7,552
Other........................................................................................... 46
---------------
Total investment income...................................................................... 145,196
---------------
EXPENSES:
Investment advisory fees........................................................................ 133,381
Transfer agent fees............................................................................. 68,837
Administrative fees............................................................................. 52,500
Commitment and administrative agency fees....................................................... 51,487
12b-1 distribution and/or service fees:
Class A...................................................................................... 12,190
Class C...................................................................................... 37,872
Registration fees............................................................................... 48,128
Audit and tax fees.............................................................................. 34,885
Printing fees................................................................................... 17,681
Trustees' fees and expenses..................................................................... 16,784
Financial reporting fees........................................................................ 9,250
Custodian fees.................................................................................. 5,125
Legal fees...................................................................................... 2,309
Listing expense................................................................................. 1,804
Other........................................................................................... 337
---------------
Total expenses............................................................................... 492,570
Fees waived and expenses reimbursed by the investment advisor................................ (262,436)
---------------
Net expenses.................................................................................... 230,134
---------------
NET INVESTMENT INCOME (LOSS).................................................................... (84,938)
---------------
NET REALIZED AND UNREALIZED GAIN (LOSS):
Net realized gain (loss) on investments...................................................... 1,061,171
Net change in unrealized appreciation (depreciation) on investments.......................... 1,828,856
---------------
NET REALIZED AND UNREALIZED GAIN (LOSS)......................................................... 2,890,027
---------------
NET INCREASE (DECREASE) IN NET ASSETS RESULTING FROM OPERATIONS................................. $ 2,805,089
===============
</TABLE>
Page 10 See Notes to Financial Statements
<PAGE>
FIRST TRUST/CONFLUENCE SMALL CAP VALUE FUND
STATEMENTS OF CHANGES IN NET ASSETS
<TABLE>
<CAPTION>
YEAR YEAR
ENDED ENDED
10/31/2017 10/31/2016
--------------- ---------------
<S> <C> <C>
OPERATIONS:
Net investment income (loss)................................................... $ (84,938) $ (40,173)
Net realized gain (loss)....................................................... 1,061,171 186,076
Net change in unrealized appreciation (depreciation)........................... 1,828,856 193,900
--------------- ---------------
Net increase (decrease) in net assets resulting from operations................ 2,805,089 339,803
--------------- ---------------
DISTRIBUTIONS TO SHAREHOLDERS FROM NET REALIZED GAIN:
Class A Shares................................................................. (58,496) (25,931)
Class C Shares................................................................. (47,722) (38,306)
Class I Shares................................................................. (34,235) (12,475)
--------------- ---------------
Total distributions to shareholders............................................ (140,453) (76,712)
--------------- ---------------
CAPITAL TRANSACTIONS:
Proceeds from shares sold ..................................................... 8,490,868 5,824,877
Proceeds from shares reinvested................................................ 123,849 67,615
Cost of shares redeemed........................................................ (3,494,346) (1,522,634)
--------------- ---------------
Net increase (decrease) in net assets resulting from capital transactions...... 5,120,371 4,369,858
--------------- ---------------
Total increase (decrease) in net assets........................................ 7,785,007 4,632,949
NET ASSETS:
Beginning of period............................................................ 9,105,812 4,472,863
--------------- ---------------
End of period.................................................................. $ 16,890,819 $ 9,105,812
=============== ===============
Accumulated net investment income (loss) at end of period...................... $ 3,363 $ 3,363
=============== ===============
</TABLE>
See Notes to Financial Statements Page 11
<PAGE>
FIRST TRUST/CONFLUENCE SMALL CAP VALUE FUND
FINANCIAL HIGHLIGHTS
FOR A SHARE OUTSTANDING THROUGHOUT EACH PERIOD
<TABLE>
<CAPTION>
YEAR ENDED OCTOBER 31,
-------------------------------------------------------------
CLASS A SHARES 2017 2016 2015 2014 2013
--------- --------- --------- --------- ---------
<S> <C> <C> <C> <C> <C>
Net asset value, beginning of period............ $ 27.81 $ 26.34 $ 28.03 $ 26.77 $ 21.58
------- ------- ------- ------- -------
INCOME FROM INVESTMENT OPERATIONS:
Net investment income (loss) (a)................ (0.16) (0.10) 0.04 0.00 (b) 0.10
Net realized and unrealized gain (loss)......... 7.20 1.97 0.31 2.39 5.46
------- ------- ------- ------- -------
Total from investment operations................ 7.04 1.87 0.35 2.39 5.56
------- ------- ------- ------- -------
DISTRIBUTIONS PAID TO SHAREHOLDERS FROM:
Net investment income........................... -- -- -- -- (0.27)
Net realized gain............................... (0.37) (0.40) (2.04) (1.13) (0.10)
------- ------- ------- ------- -------
Total distributions............................. (0.37) (0.40) (2.04) (1.13) (0.37)
------- ------- ------- ------- -------
Net asset value, end of period.................. $ 34.48 $ 27.81 $ 26.34 $ 28.03 $ 26.77
======= ======= ======= ======= =======
TOTAL RETURN (c)................................ 25.53% 7.22% 1.22% 9.23% 26.16%
======= ======= ======= ======= =======
RATIOS TO AVERAGE NET ASSETS/SUPPLEMENTAL DATA:
Net assets, end of period (in 000's)............ $ 5,656 $ 3,767 $ 1,413 $ 1,144 $ 1,288
Ratio of total expenses to average net assets... 3.56% 5.69% 7.61% 8.65% 11.29%
Ratio of net expenses to average net assets..... 1.60% 1.61% (d) 1.60% 1.60% 1.60%
Ratio of net investment income (loss) to
average net assets........................... (0.50)% (0.38)% 0.16% 0.00% (e) 0.42%
Portfolio turnover rate......................... 28% 15% 17% 39% 31%
</TABLE>
(a) Per share amounts have been calculated using the average shares method.
(b) Amount is less than $0.01.
(c) Assumes reinvestment of all distributions for the period and does not
include payment of the maximum sales charge of 5.50% or contingent
deferred sales charge (CDSC). On purchases of $1 million or more, a CDSC
of 1% may be imposed on certain redemptions made within twelve months of
purchase. If the sales charges were included, total returns would be
lower. These returns include Rule 12b-1 service fees of 0.25% and do not
reflect the deduction of taxes that a shareholder would pay on Fund
distributions or the redemption of Fund shares. The total returns would
have been lower if certain fees had not been waived and expenses
reimbursed by the investment advisor. Total return is calculated for the
time period presented and is not annualized for periods of less than one
year.
(d) Includes excise tax. If this excise tax was not included, the net expense
would have been 1.60%.
(e) Amount is less than 0.01%.
Page 12 See Notes to Financial Statements
<PAGE>
FIRST TRUST/CONFLUENCE SMALL CAP VALUE FUND
FINANCIAL HIGHLIGHTS (CONTINUED)
FOR A SHARE OUTSTANDING THROUGHOUT EACH PERIOD
<TABLE>
<CAPTION>
YEAR ENDED OCTOBER 31,
-------------------------------------------------------------
CLASS C SHARES 2017 2016 2015 2014 2013
--------- --------- --------- --------- ---------
<S> <C> <C> <C> <C> <C>
Net asset value, beginning of period............ $ 25.61 $ 24.51 $ 26.44 $ 25.51 $ 20.59
------- ------- ------- ------- -------
INCOME FROM INVESTMENT OPERATIONS:
Net investment income (loss) (a)................ (0.36) (0.28) (0.14) (0.19) (0.10)
Net realized and unrealized gain (loss)......... 6.59 1.78 0.25 2.25 5.23
------- ------- ------- ------- -------
Total from investment operations................ 6.23 1.50 0.11 2.06 5.13
------- ------- ------- ------- -------
DISTRIBUTIONS PAID TO SHAREHOLDERS FROM:
Net investment income........................... -- -- -- -- (0.11)
Net realized gain............................... (0.37) (0.40) (2.04) (1.13) (0.10)
------- ------- ------- ------- -------
Total distributions............................. (0.37) (0.40) (2.04) (1.13) (0.21)
------- ------- ------- ------- -------
Net asset value, end of period.................. $ 31.47 $ 25.61 $ 24.51 $ 26.44 $ 25.51
======= ======= ======= ======= =======
TOTAL RETURN (b)................................ 24.58% 6.28% 0.33% 8.36% 25.11%
======= ======= ======= ======= =======
RATIOS TO AVERAGE NET ASSETS/SUPPLEMENTAL DATA:
Net assets, end of period (in 000's)............ $ 3,962 $ 3,237 $ 2,247 $ 1,977 $ 1,956
Ratio of total expenses to average net assets... 4.45% 6.28% 7.93% 8.81% 10.45%
Ratio of net expenses to average net assets..... 2.35% 2.36% (c) 2.35% 2.35% 2.35%
Ratio of net investment income (loss) to
average net assets........................... (1.25)% (1.12)% (0.57)% (0.73)% (0.43)%
Portfolio turnover rate......................... 28% 15% 17% 39% 31%
</TABLE>
(a) Per share amounts have been calculated using the average shares method.
(b) Assumes reinvestment of all distributions for the period and does not
include payment of the maximum CDSC of 1%, charged on certain redemptions
made within one year of purchase. If the sales charge was included, total
returns would be lower. These returns include combined Rule 12b-1
distribution and service fees of 1% and do not reflect the deduction of
taxes that a shareholder would pay on Fund distributions or the redemption
of Fund shares. The total returns would have been lower if certain fees
had not been waived and expenses reimbursed by the investment advisor.
Total return is calculated for the time period presented and is not
annualized for periods of less than one year.
(c) Includes excise tax. If this excise tax was not included, the net expense
would have been 2.35%.
See Notes to Financial Statements Page 13
<PAGE>
FIRST TRUST/CONFLUENCE SMALL CAP VALUE FUND
FINANCIAL HIGHLIGHTS (CONTINUED)
FOR A SHARE OUTSTANDING THROUGHOUT EACH PERIOD
<TABLE>
<CAPTION>
YEAR ENDED OCTOBER 31,
-------------------------------------------------------------
CLASS I SHARES 2017 2016 2015 2014 2013
--------- --------- --------- --------- ---------
<S> <C> <C> <C> <C> <C>
Net asset value, beginning of period............ $ 28.40 $ 26.84 $ 28.52 $ 27.15 $ 21.81
------- ------- ------- ------- -------
INCOME FROM INVESTMENT OPERATIONS:
Net investment income (loss) (a)................ (0.09) (0.05) 0.10 0.08 0.16
Net realized and unrealized gain (loss)......... 7.13 2.01 0.26 2.42 5.60
------- ------- ------- ------- -------
Total from investment operations................ 7.04 1.96 0.36 2.50 5.76
------- ------- ------- ------- -------
DISTRIBUTIONS PAID TO SHAREHOLDERS FROM:
Net investment income........................... -- -- -- -- (0.32)
Net realized gain............................... (0.37) (0.40) (2.04) (1.13) (0.10)
------- ------- ------- ------- -------
Total distributions............................. (0.37) (0.40) (2.04) (1.13) (0.42)
------- ------- ------- ------- -------
Net asset value, end of period.................. $ 35.07 $ 28.40 $ 26.84 $ 28.52 $ 27.15
======= ======= ======= ======= =======
TOTAL RETURN (b)................................ 24.99% 7.46% 1.23% 9.51% 26.85%
======= ======= ======= ======= =======
RATIOS TO AVERAGE NET ASSETS/SUPPLEMENTAL DATA:
Net assets, end of period (in 000's)............ $ 7,273 $ 2,101 $ 813 $ 592 $ 276
Ratio of total expenses to average net assets... 3.22% 5.63% 8.46% 11.05% 17.52%
Ratio of net expenses to average net assets..... 1.35% 1.35% 1.35% 1.35% 1.35%
Ratio of net investment income (loss) to
average net assets........................... (0.28)% (0.16)% 0.38% 0.28% 0.66%
Portfolio turnover rate......................... 28% 15% 17% 39% 31%
</TABLE>
(a) Per share amounts have been calculated using the average shares method.
(b) Assumes reinvestment of all distributions for the period. These returns do
not reflect the deduction of taxes that a shareholder would pay on Fund
distributions or the redemption of Fund shares. The total return would
have been lower if certain fees had not been waived and expenses
reimbursed by the investment advisor. Total return is calculated for the
time period presented and is not annualized for periods of less than one
year.
Page 14 See Notes to Financial Statements
<PAGE>
--------------------------------------------------------------------------------
NOTES TO FINANCIAL STATEMENTS
--------------------------------------------------------------------------------
FIRST TRUST/CONFLUENCE SMALL CAP VALUE FUND
OCTOBER 31, 2017
1. ORGANIZATION
First Trust/Confluence Small Cap Value Fund (the "Fund") is a series of the
First Trust Series Fund (the "Trust"), a Massachusetts business trust organized
on July 9, 2010, and is registered as a diversified, open-end management
investment company with the Securities and Exchange Commission ("SEC") under the
Investment Company Act of 1940, as amended (the "1940 Act"). The Fund offers
three classes of shares: Class A, Class C and Class I. Each class represents an
interest in the same portfolio of investments but with a different combination
of sales charges, distribution and service (12b-1) fees, eligibility
requirements and other features.
The Fund's investment objective is to seek to provide long-term capital
appreciation. The Fund seeks to achieve its investment objective by investing,
under normal market conditions, at least 80% of its net assets (including
investment borrowings, if any) in equity securities of U.S. listed companies
with small market capitalizations ("Small-Cap Companies") at the time of
investment that Confluence Investment Management LLC ("Confluence" or the
"Sub-Advisor") believes have produced solid returns over extended periods of
time. There can be no assurance that the Fund will achieve its investment
objective. The Fund may not be appropriate for all investors.
2. SIGNIFICANT ACCOUNTING POLICIES
The Fund is considered an investment company and follows accounting and
reporting guidance under Financial Accounting Standards Board ("FASB")
Accounting Standards Codification ("ASC") Topic 946, "Financial
Services-Investment Companies." The following is a summary of significant
accounting policies consistently followed by the Fund in the preparation of its
financial statements. The preparation of financial statements in accordance with
accounting principles generally accepted in the United States of America ("U.S.
GAAP") requires management to make estimates and assumptions that affect the
reported amounts and disclosures in the financial statements. Actual results
could differ from those estimates.
A. PORTFOLIO VALUATION
The net asset value ("NAV") of each class of shares of the Fund is determined
daily as of the close of regular trading on the New York Stock Exchange
("NYSE"), normally 4:00 p.m. Eastern time, on each day the NYSE is open for
trading. If the NYSE closes early on a valuation day, the NAV is determined as
of that time. The NAV for each class is calculated by dividing the value of the
Fund's total assets attributable to such class (including accrued interest and
dividends), less all liabilities attributable to such class (including accrued
expenses, dividends declared but unpaid and any borrowings of the Fund), by the
total number of shares of the class outstanding. Differences in NAV of each
class of the Fund's shares are generally expected to be due to the daily expense
accruals of the specified distribution and service (12b-1) fees and transfer
agency costs applicable to such class of shares and the resulting differential
in the dividends that may be paid on each class of shares.
The Fund's investments are valued daily at market value or, in the absence of
market value with respect to any portfolio securities, at fair value. Market
value prices represent last sale or official closing prices from a national or
foreign exchange (i.e., a regulated market) and are primarily obtained from
third-party pricing services. Fair value prices represent any prices not
considered market value prices and are either obtained from a third-party
pricing service or are determined by the Pricing Committee of the Trust's
investment advisor, First Trust Advisors L.P. ("First Trust" or the "Advisor"),
in accordance with valuation procedures adopted by the Trust's Board of
Trustees, and in accordance with provisions of the 1940 Act. Investments valued
by the Advisor's Pricing Committee, if any, are footnoted as such in the
footnotes to the Portfolio of Investments. The Fund's investments are valued as
follows:
Common stocks, real estate investment trusts ("REITs") and other
securities listed on any national or foreign exchange (excluding The
Nasdaq Stock Market LLC ("Nasdaq") and the London Stock Exchange
Alternative Investment Market ("AIM")) are valued at the last sale price
on the exchange on which they are principally traded or, for Nasdaq and
AIM securities, the official closing price. Securities traded on more than
one securities exchange are valued at the last sale price or official
closing price, as applicable, at the close of the securities exchange
representing the principal market for such securities.
Securities traded in an over-the-counter market are fair valued at the
mean of their most recent bid and asked price, if available, and otherwise
at their closing bid price.
Certain securities may not be able to be priced by pre-established pricing
methods. Such securities may be valued by the Trust's Board of Trustees or its
delegate, the Advisor's Pricing Committee, at fair value. These securities
generally include, but are not limited to, restricted securities (securities
which may not be publicly sold without registration under the Securities Act of
1933, as amended) for which a third-party pricing service is unable to provide a
market price; securities whose trading has been formally suspended; a security
whose market or fair value price is not available from a pre-established pricing
source; a security with respect to which an event has occurred that is likely to
materially affect the value of the security after the market has closed but
before the calculation of the Fund's NAV or make it difficult or impossible to
obtain a reliable market quotation; and a security whose price, as provided by
the third-party pricing service, does not reflect the security's fair value. As
a general principle, the current fair value of a security would appear to be the
amount which the owner might reasonably expect to receive for the security upon
its current sale. When fair value prices are used, generally they will differ
from market quotations or official closing prices on the applicable exchanges. A
variety of factors may be considered in determining the fair value of such
securities, including, but not limited to, the following:
Page 15
<PAGE>
--------------------------------------------------------------------------------
NOTES TO FINANCIAL STATEMENTS (CONTINUED)
--------------------------------------------------------------------------------
FIRST TRUST/CONFLUENCE SMALL CAP VALUE FUND
OCTOBER 31, 2017
1) the type of security;
2) the size of the holding;
3) the initial cost of the security;
4) transactions in comparable securities;
5) price quotes from dealers and/or third-party pricing services;
6) relationships among various securities;
7) information obtained by contacting the issuer, analysts, or the
appropriate stock exchange;
8) an analysis of the issuer's financial statements; and
9) the existence of merger proposals or tender offers that might affect
the value of the security.
The Fund is subject to fair value accounting standards that define fair value,
establish the framework for measuring fair value and provide a three-level
hierarchy for fair valuation based upon the inputs to the valuation as of the
measurement date. The three levels of the fair value hierarchy are as follows:
o Level 1 - Level 1 inputs are quoted prices in active markets for
identical investments. An active market is a market in which
transactions for the investment occur with sufficient frequency and
volume to provide pricing information on an ongoing basis.
o Level 2 - Level 2 inputs are observable inputs, either directly or
indirectly, and include the following:
o Quoted prices for similar investments in active markets.
o Quoted prices for identical or similar investments in markets
that are non-active. A non-active market is a market where
there are few transactions for the investment, the prices are
not current, or price quotations vary substantially either
over time or among market makers, or in which little
information is released publicly.
o Inputs other than quoted prices that are observable for the
investment (for example, interest rates and yield curves
observable at commonly quoted intervals, volatilities,
prepayment speeds, loss severities, credit risks, and default
rates).
o Inputs that are derived principally from or corroborated by
observable market data by correlation or other means.
o Level 3 - Level 3 inputs are unobservable inputs. Unobservable
inputs may reflect the reporting entity's own assumptions about the
assumptions that market participants would use in pricing the
investment.
The inputs or methodologies used for valuing investments are not necessarily an
indication of the risk associated with investing in those investments. A summary
of the inputs used to value the Fund's investments as of October 31, 2017, is
included with the Fund's Portfolio of Investments.
B. SECURITIES TRANSACTIONS AND INVESTMENT INCOME
Securities transactions are recorded as of the trade date. Realized gains and
losses from securities transactions are recorded on the identified cost basis.
Dividend income is recorded on the ex-dividend date. Interest income, if any, is
recorded daily on the accrual basis, including the amortization of premiums and
the accretion of discounts. Income is allocated on a pro rata basis to each
class of shares.
The Fund may hold shares of business development companies ("BDCs"). The tax
character of distributions received from these securities may vary when reported
by the issuer after its tax reporting period concludes.
The Fund may hold REITs. Distributions from such investments may be comprised of
return of capital, capital gains and income. The actual character of amounts
received during the year is not known until after the REIT's fiscal year end.
The Fund records the character of distributions received from REITs during the
year based on estimates available. The characterization of distributions
received by the Fund may be subsequently revised based on information received
from the REITs after their tax reporting periods conclude.
C. DIVIDENDS AND DISTRIBUTIONS TO SHAREHOLDERS
The Fund will distribute to holders of its shares semi-annual dividends of all
or a portion of its net income. Distributions of any net capital gains earned by
the Fund will be distributed at least annually. Distributions will automatically
be reinvested into additional Fund shares unless cash distributions are elected
by the shareholder.
Distributions from net investment income and realized capital gains are
determined in accordance with income tax regulations, which may differ from U.S.
GAAP. Certain capital accounts in the financial statements are periodically
adjusted for permanent differences in order to reflect their tax character.
These permanent differences are primarily due to the varying treatment of income
and gain/loss on portfolio securities held by the Fund and have no impact on net
assets or NAV per share. Temporary differences, which arise from recognizing
certain items of income, expense and gain/loss in different periods for
financial statement and tax purposes, will reverse at some point in the future.
Permanent differences incurred during the year ended October 31, 2017, resulting
in book and tax accounting differences, have been reclassified at year end to
reflect an increase in accumulated net investment income (loss) of $84,938, a
decrease in accumulated net realized gain (loss) on investments of $86,357, and
an increase in paid-in capital of $1,419. Net assets were not affected by this
reclassification.
Page 16
<PAGE>
--------------------------------------------------------------------------------
NOTES TO FINANCIAL STATEMENTS (CONTINUED)
--------------------------------------------------------------------------------
FIRST TRUST/CONFLUENCE SMALL CAP VALUE FUND
OCTOBER 31, 2017
The tax character of distributions paid during the fiscal years ended October
31, 2017 and 2016 was as follows:
Distributions paid from: 2017 2016
Ordinary income.............................. $ 38,034 $ --
Capital gain................................. 102,419 76,712
Return of capital............................ -- --
As of October 31, 2017, the distributable earnings and net assets on a tax basis
were as follows:
Undistributed ordinary income................ $ 247,428
Undistributed capital gains ................. 722,110
------------
Total undistributed earnings................. 969,538
Accumulated capital and other losses......... --
Net unrealized appreciation (depreciation)... 2,475,665
------------
Total accumulated earnings (losses).......... 3,445,203
Other........................................ --
Paid-in capital.............................. 13,445,616
------------
Net assets................................... $ 16,890,819
============
D. INCOME TAXES
The Fund intends to continue to qualify as a regulated investment company by
complying with the requirements under Subchapter M of the Internal Revenue Code
of 1986, as amended, which includes distributing substantially all of its net
investment income and net realized gains to shareholders. Accordingly, no
provision has been made for federal and state income taxes. However, due to the
timing and amount of distributions, the Fund may be subject to an excise tax of
4% of the amount by which approximately 98% of the Fund's taxable income exceeds
the distributions from such taxable income for the calendar year.
The Fund intends to utilize provisions of the federal income tax laws, which
allows it to carry realized capital loss forward indefinitely following the year
of the loss and offset such loss against any future realized capital gains. The
Fund is subject to certain limitations under U.S. tax rules on the use of
capital loss carryforwards and net unrealized built-in losses. These limitations
apply when there has been a 50% change in ownership. At October 31, 2017, the
Fund had no non-expiring capital loss carryforwards for federal income tax
purposes.
The Fund is subject to accounting standards that establish a minimum threshold
for recognizing, and a system for measuring, the benefits of a tax position
taken or expected to be taken in a tax return. Taxable years ended 2014, 2015,
2016, and 2017 remain open to federal and state audit. As of October 31, 2017,
management has evaluated the application of these standards to the Fund and has
determined that no provision for income tax is required in the Fund's financial
statements for uncertain tax positions.
E. EXPENSES
The Fund pays all expenses directly related to its operations. Expenses of the
Fund are allocated on a pro rata basis to each class of shares, except for
distribution and service (12b-1) fees and incremental transfer agency costs
which are unique to each class of shares.
F. NEW AND AMENDED FINANCIAL REPORTING RULES AND FORMS
On October 13, 2016, the SEC adopted new rules and forms, and amended existing
rules and forms. The new and amended rules and forms are intended to modernize
the reporting of information provided by funds and to improve the quality and
type of information that funds provide to the SEC and investors. In part, the
new and amended rules and forms amend Regulation S-X and require standardized,
enhanced disclosures about derivatives in a fund's financial statements, as well
as other amendments. The compliance date for the amendments of Regulation S-X
was August 1, 2017, which resulted in no change to the financial statements. The
new form types and other rule amendments will be effective for the First Trust
funds, including the Fund, for reporting periods beginning on and after June 1,
2018. Management is evaluating the new form types and other rule amendments that
are effective on and after June 1, 2018 to determine the impact to the Fund.
G. NEW ACCOUNTING PRONOUNCEMENT
In December 2016, FASB released Accounting Standards Update ("ASU") 2016-19 that
makes technical changes to various sections of the ASC, including Topic 820,
Fair Value Measurement. The changes to Topic 820 are intended to clarify the
difference between a valuation approach and a valuation technique. The changes
to ASC 820-10-50-2 require a reporting entity to disclose, for Level 2 and Level
3 fair value measurements, a change in either or both a valuation approach and a
valuation technique and the reason(s) for the change. The changes to Topic 820
are effective for fiscal years, and interim periods within those fiscal years,
beginning after December 15, 2016. At this time, management is evaluating the
implications of the ASU and has not yet determined its impact on the financial
statements and disclosures.
Page 17
<PAGE>
--------------------------------------------------------------------------------
NOTES TO FINANCIAL STATEMENTS (CONTINUED)
--------------------------------------------------------------------------------
FIRST TRUST/CONFLUENCE SMALL CAP VALUE FUND
OCTOBER 31, 2017
3. INVESTMENT ADVISORY FEE, AFFILIATED TRANSACTIONS AND OTHER FEE ARRANGEMENTS
First Trust, the investment advisor to the Fund, is a limited partnership with
one limited partner, Grace Partners of DuPage L.P., and one general partner, The
Charger Corporation. The Charger Corporation is an Illinois corporation
controlled by James A. Bowen, Chief Executive Officer of First Trust. First
Trust is responsible for the ongoing monitoring of the Fund's investment
portfolio, managing the Fund's business affairs and providing certain
administrative services necessary for the management of the Fund. For these
investment management services, First Trust is entitled to a monthly fee
calculated at an annual rate of 1.00% of the Fund's average daily net assets.
First Trust also provides fund reporting services to the Fund for a flat annual
fee in the amount of $9,250.
Confluence serves as the Fund's sub-advisor and manages the Fund's portfolio
subject to First Trust's supervision. The Sub-Advisor receives a portfolio
management fee at an annual rate of 0.50% of the Fund's average daily net assets
that is paid by First Trust from its investment advisory fee.
First Trust and Confluence have agreed to waive fees and reimburse Fund expenses
to the extent necessary to prevent the total annual operating expenses of the
Fund (excluding 12b-1 distribution and service fees, interest expenses, taxes,
acquired fund fees and expenses, fees incurred in acquiring and disposing of
portfolio securities and extraordinary expenses) from exceeding 1.35% of average
daily net assets of any class of shares of the Fund (the "Expense Cap") until
February 28, 2019 and then from exceeding 1.70% from March 1, 2019 to February
28, 2028 (the "Expense Cap Termination Date"). Expenses borne and fees waived by
First Trust and Confluence are subject to recovery on a Fund class level, if
applicable, by First Trust and Confluence for up to three years from the date
the fee or expense was incurred, but no reimbursement payment will be made by
the Fund at any time if it would result in the Fund's expenses exceeding the
Expense Cap in place for the most recent fiscal year for which such expense
limitation was in place. These amounts would be included in "Expenses previously
waived or reimbursed" on the Statement of Operations. The advisory fee waivers
and expense reimbursement for the year ended October 31, 2017, and the expenses
borne by First Trust and Confluence subject to recovery were as follows:
<TABLE>
<CAPTION>
EXPENSES SUBJECT TO RECOVERY
------------------------------------------------------
ADVISORY FEE EXPENSE YEAR ENDED YEAR ENDED YEAR ENDED
WAIVER REIMBURSEMENT OCTOBER 31, 2015 OCTOBER 31, 2016 OCTOBER 31, 2017 TOTAL
------------ ------------- ---------------- ---------------- ---------------- -------------
<S> <C> <C> <C> <C> <C>
$ 133,381 $ 129,055 $ 267,934 $ 247,943 $ 262,436 $ 778,313
</TABLE>
Brown Brothers Harriman & Co. ("BBH") serves as the Fund's administrator, fund
accountant and custodian in accordance with certain fee arrangements. As
administrator and fund accountant, BBH is responsible for providing certain
administrative and accounting services to the Fund, including maintaining the
Fund's books of account, records of the Fund's securities transactions, and
certain other books and records. As custodian, BBH is responsible for custody of
the Fund's assets.
BNY Mellon Investment Servicing (US) Inc. ("BNYM IS") serves as the Fund's
transfer agent in accordance with certain fee arrangements. As transfer agent,
BNYM IS is responsible for maintaining shareholder records for the Fund. BNYM IS
is a subsidiary of The Bank of New York Mellon Corporation, a financial holding
company.
Each Trustee who is not an officer or employee of First Trust, any sub-advisor
or any of their affiliates ("Independent Trustees") is paid a fixed annual
retainer that is allocated equally among each fund in the First Trust Fund
Complex. Each Independent Trustee is also paid an annual per fund fee that
varies based on whether the fund is a closed-end or other actively managed fund,
or is an index fund.
Additionally, the Lead Independent Trustee and the Chairmen of the Audit
Committee, Nominating and Governance Committee and Valuation Committee are paid
annual fees to serve in such capacities, with such compensation allocated pro
rata among each fund in the First Trust Fund Complex based on net assets.
Independent Trustees are reimbursed for travel and out-of-pocket expenses in
connection with all meetings. The Lead Independent Trustee and Committee
Chairmen rotate every three years. The officers and "Interested" Trustee receive
no compensation from the Trust for acting in such capacities.
Page 18
<PAGE>
--------------------------------------------------------------------------------
NOTES TO FINANCIAL STATEMENTS (CONTINUED)
--------------------------------------------------------------------------------
FIRST TRUST/CONFLUENCE SMALL CAP VALUE FUND
OCTOBER 31, 2017
4. CAPITAL SHARE TRANSACTIONS
Capital transactions were as follows:
<TABLE>
<CAPTION>
YEAR ENDED YEAR ENDED
OCTOBER 31, 2017 OCTOBER 31, 2016
SHARES VALUE SHARES VALUES
---------- ------------- ---------- -------------
<S> <C> <C> <C> <C>
Sales:
Class A 83,953 $ 2,640,636 101,204 $ 2,795,429
Class C 27,393 779,701 58,513 1,482,383
Class I 158,422 5,070,531 55,851 1,547,065
---------- ------------- ---------- -------------
Total Sales: 269,768 $ 8,490,868 215,568 $ 5,824,877
========== ============= ========== =============
Dividend Reinvestment:
Class A 1,525 $ 45,810 752 $ 19,256
Class C 1,621 44,739 1,533 36,400
Class I 1,086 33,300 457 11,959
---------- ------------- ---------- -------------
Total Dividend Reinvestment: 4,232 $ 123,849 2,742 $ 67,615
========== ============= ========== =============
Redemptions:
Class A (56,930) $ (1,779,700) (20,115) $ (511,985)
Class C (29,546) (854,770) (25,290) (649,466)
Class I (26,091) (859,876) (12,603) (361,183)
---------- ------------- ---------- -------------
Total Redemptions: (112,567) $ (3,494,346) (58,008) $ (1,522,634)
========== ============= ========== =============
</TABLE>
5. PURCHASES AND SALES OF SECURITIES
The cost of purchases and proceeds from sales of investments, excluding
short-term investments, for the year ended October 31, 2017, were $7,485,675 and
$3,259,486, respectively.
6. BORROWINGS
The Trust, on behalf of the Fund, along with First Trust Exchange-Traded Fund
III and First Trust Exchange-Traded Fund IV have a $220 million Credit Agreement
with The Bank of Nova Scotia ("Scotia") as administrative agent for a group of
lenders. Scotia charges a commitment fee of 0.25% of the daily amount of the
excess of the commitment amount over the outstanding principal balance of the
loans. Prior to March 9, 2017, the commitment amount was $180 million. Prior to
December 16, 2016, the commitment amount was $140 million. First Trust allocates
the commitment fee and agency fee amongst the funds that have access to the
credit line. To the extent that the Fund accesses the credit line, there would
also be an interest fee charged. The Fund did not have any borrowings
outstanding during the year ended October 31, 2017.
7. DISTRIBUTION AND SERVICE PLAN
The Board of Trustees adopted a Distribution and Service Plan pursuant to Rule
12b-1 under the 1940 Act. In accordance with the Rule 12b-1 plan, the share
classes of the Fund are authorized to pay an amount up to 0.25% and 1.00% of
their average daily net assets each year for Class A and Class C, respectively,
to reimburse First Trust Portfolios L.P. ("FTP"), the distributor of the Fund,
for amounts expended to finance activities primarily intended to result in the
sale of Fund shares or the provision of investor services. FTP may also use this
amount to compensate securities dealers or other persons for providing
distribution assistance, including broker-dealer and shareholder support and
educational and promotional services. Class I shares have no 12b-1 fees.
Page 19
<PAGE>
--------------------------------------------------------------------------------
NOTES TO FINANCIAL STATEMENTS (CONTINUED)
--------------------------------------------------------------------------------
FIRST TRUST/CONFLUENCE SMALL CAP VALUE FUND
OCTOBER 31, 2017
8. INDEMNIFICATION
The Fund has a variety of indemnification obligations under contracts with its
service providers. The Fund's maximum exposure under these arrangements is
unknown. However, the Fund has not had prior claims or losses pursuant to these
contracts and expects the risk of loss to be remote.
9. SUBSEQUENT EVENTS
Management has evaluated the impact of all subsequent events to the Fund through
the date the financial statements were issued, and has determined that there
were no subsequent events requiring recognition or disclosure in the financial
statements that have not already been disclosed.
Page 20
<PAGE>
--------------------------------------------------------------------------------
REPORT OF INDEPENDENT REGISTERED PUBLIC ACCOUNTING FIRM
--------------------------------------------------------------------------------
TO THE BOARD OF TRUSTEES AND SHAREHOLDERS OF FIRST TRUST/CONFLUENCE SMALL CAP
VALUE FUND:
We have audited the accompanying statement of assets and liabilities of First
Trust/Confluence Small Cap Value Fund (the "Fund"), a series of the First Trust
Series Fund, including the portfolio of investments, as of October 31, 2017, and
the related statement of operations for the year then ended, the statements of
changes in net assets for each of the two years in the period then ended, and
the financial highlights for each of the five years in the period then ended.
These financial statements and financial highlights are the responsibility of
the Fund's management. Our responsibility is to express an opinion on these
financial statements and financial highlights based on our audits.
We conducted our audits in accordance with the standards of the Public Company
Accounting Oversight Board (United States). Those standards require that we plan
and perform the audit to obtain reasonable assurance about whether the financial
statements and financial highlights are free of material misstatement. The Fund
is not required to have, nor were we engaged to perform, an audit of its
internal control over financial reporting. Our audits included consideration of
internal control over financial reporting as a basis for designing audit
procedures that are appropriate in the circumstances, but not for the purpose of
expressing an opinion on the effectiveness of the Fund's internal control over
financial reporting. Accordingly, we express no such opinion. An audit also
includes examining, on a test basis, evidence supporting the amounts and
disclosures in the financial statements, assessing the accounting principles
used and significant estimates made by management, as well as evaluating the
overall financial statement presentation. Our procedures included confirmation
of securities owned as of October 31, 2017, by correspondence with the Fund's
custodian and brokers; when replies were not received from brokers, we performed
other auditing procedures. We believe that our audits provide a reasonable basis
for our opinion.
In our opinion, the financial statements and financial highlights referred to
above present fairly, in all material respects, the financial position of First
Trust/Confluence Small Cap Value Fund as of October 31, 2017, the results of its
operations for the year then ended, the changes in its net assets for each of
the two years in the period then ended, and the financial highlights for each of
the five years in the period then ended, in conformity with accounting
principles generally accepted in the United States of America.
/s/ Deloitte & Touche LLP
Chicago, Illinois
December 20, 2017
Page 21
<PAGE>
--------------------------------------------------------------------------------
ADDITIONAL INFORMATION
--------------------------------------------------------------------------------
FIRST TRUST/CONFLUENCE SMALL CAP VALUE FUND
OCTOBER 31, 2017 (UNAUDITED)
PROXY VOTING POLICIES AND PROCEDURES
A description of the policies and procedures that the Trust uses to determine
how to vote proxies and information on how the Fund voted proxies relating to
portfolio securities during the most recent 12-month period ended June 30 is
available (1) without charge, upon request, by calling (800) 988-5891; (2) on
the Fund's website located at http://www.ftportfolios.com; and (3) on the
Securities and Exchange Commission's ("SEC") website at http://www.sec.gov.
PORTFOLIO HOLDINGS
The Trust files its complete schedule of portfolio holdings with the SEC for the
first and third quarters of each fiscal year on Form N-Q. The Fund's Form N-Qs
are available (1) by calling (800) 988-5891; (2) on the Fund's website located
at http://www.ftportfolios.com; (3) on the SEC's website at http://www.sec.gov;
and (4) for review and copying at the SEC's Public Reference Room ("PRR") in
Washington, DC. Information regarding the operation of the PRR may be obtained
by calling (800) SEC-0330.
TAX INFORMATION
The Fund hereby designates as qualified dividend income 100.00% of its ordinary
income distributions (including short-term capital gains, if applicable) for the
period ended October 31, 2017. 100.00% of the ordinary income (including
short-term capital gain, if applicable) distributions made by the Fund during
the period ended October 31, 2017, qualify for corporate dividends received
deduction available to corporate shareholders.
RISK CONSIDERATIONS
Risks are inherent in all investing. The following summarizes some of the risks
that should be considered for the Fund. For additional information about the
risks associated with investing in the Fund, please see the Fund's prospectus
and statement of additional information, as well as other Fund regulatory
filings.
BDC RISK: The Fund may invest in BDCs which may carry risks similar to those of
a private equity or venture capital fund. BDCs are not redeemable at the option
of the shareholder and they may trade in the market at a discount to their net
asset value. The BDCs held by the Fund may employ the use of leverage through
borrowings or the issuance of preferred stock. While leverage often serves to
increase the yield of a BDC, this leverage also subjects a BDC to increased
risks, including the likelihood of increased volatility and the possibility that
a BDC's common share income will fall if the dividend rate of the preferred
shares or the interest rate on any borrowings rises.
CONCENTRATION RISK: A fund concentrated in a single industry or sector is likely
to present more risks than a fund that is broadly diversified over several
industries or sectors. Compared to the broad market, an individual industry or
sector may be more strongly affected by changes in the economic climate, broad
market shifts, moves in a particular dominant stock, or regulatory changes.
EQUITY SECURITIES RISK: Because the Fund invests in equity securities, the value
of Fund shares will fluctuate with changes in the value of these equity
securities. Equity securities prices fluctuate for several reasons, including
changes in investors' perceptions of the financial condition of an issuer or the
general condition of the relevant stock market, such as the current market
volatility, or when political or economic events affecting the issuers occur. In
addition, common stock prices may be particularly sensitive to rising interest
rates, as the cost of capital rises and borrowing costs increase.
FINANCIAL COMPANIES RISK: Financial companies are especially subject to the
adverse effects of economic recession, currency exchange rates, government
regulation, decreases in the availability of capital, volatile interest rates,
portfolio concentrations in geographic markets and in commercial and residential
real estate loans, and competition from new entrants in their fields of
business.
HEALTH CARE COMPANIES RISK: Health care companies are companies involved in
medical services or health care, including biotechnology research and
production, drugs and pharmaceuticals and health care facilities and services.
These companies are subject to extensive competition, generic drug sales or the
loss of patent protection, product liability litigation and increased government
regulation. Research and development costs of bringing new drugs to market are
substantial, and there is no guarantee that the product will ever come to
market. Health care facility operators may be affected by the demand for
services, efforts by government or insurers to limit rates, restriction of
government financial assistance and competition from other providers.
INDUSTRIALS AND PRODUCER DURABLES COMPANIES RISK: The Fund invests in the
securities of industrials and producer durables companies, which convert
unfinished goods into finished durables used to manufacture other goods or
provide services. These companies produce electrical equipment and components,
industrial products, manufactured housing and telecommunications equipment.
General risks of these companies include the general state of the economy,
intense competition, consolidation, domestic and international politics, excess
capacity and consumer demand and spending trends. In addition, they may also be
significantly affected by overall capital spending levels, economic cycles,
technical obsolescence, delays in modernization, labor relations, government
regulations and e-commerce initiatives.
Page 22
<PAGE>
--------------------------------------------------------------------------------
ADDITIONAL INFORMATION (CONTINUED)
--------------------------------------------------------------------------------
FIRST TRUST/CONFLUENCE SMALL CAP VALUE FUND
OCTOBER 31, 2017 (UNAUDITED)
INVESTMENT COMPANIES RISK: If the Fund invests in investment companies, Fund
shareholders bear both their proportionate share of Fund expenses and,
indirectly, the expenses of the investment companies. Also, the investment
companies are subject to the risks of the underlying securities that they hold.
In addition, the Fund will incur brokerage costs when purchasing and selling
shares of ETFs and closed-end investment companies. Closed-end investment
companies may be leveraged, in which case the value and/or yield of their shares
will tend to be more volatile than shares of unleveraged funds. In addition, for
index-based ETFs, the performance of an ETF may diverge from the performance of
such index (commonly known as tracking error). Moreover, shares of closed-end
investment companies and ETFs may be sold at a discount from their net asset
value.
MARKET CAPITALIZATION RISK: The Fund normally invests at least 80% of its assets
in Small-Cap Companies. Because the market capitalization is measured at the
time of its initial purchase, the Fund will not be forced to sell a stock
because the stock has exceeded or fallen below the market capitalization range.
Because of market movement, there can be no assurance that the securities held
by the Fund will stay within the given market capitalization range. As a result,
the Fund may be exposed to additional risk or investors may not be given the
opportunity to invest fully in a certain market capitalization range.
MARKET RISK: Market risk is the risk that a particular security owned by the
Fund or shares of the Fund in general may fall in value. Securities are subject
to market fluctuations caused by such factors as economic, political, regulatory
or market developments, changes in interest rates and perceived trends in
securities prices. Shares of the Fund could decline in value or underperform
other investments.
REAL ESTATE INVESTMENT RISK: The Fund invests in companies in the real estate
industry, including REITs. Therefore, the Fund is subject to the risks
associated with investing in real estate, which may include, but are not limited
to, fluctuations in the value of underlying properties; defaults by borrowers or
tenants; market saturation; changes in general and local economic conditions;
decreases in market rates for rents; increases in competition, property taxes,
capital expenditures or operating expenses; and other economic, political or
regulatory occurrences affecting companies in the real estate industry.
REIT INVESTMENT RISK: Because the Fund invests in REITs, the Fund is subject to
the risks associated with investing in real estate, which may include, but are
not limited to, fluctuations in the value of underlying properties; defaults by
borrowers or tenants; market saturation; changes in general and local operating
expenses; and other economic, political or regulatory occurrences affecting
companies in the real estate industry. In addition to risks related to
investments in real estate generally, investing in REITs involves certain other
risks related to their structure and focus, which include, but are not limited
to, dependency upon management skills, limited diversification, the risks of
locating and managing financing for projects, heavy cash flow dependency,
possible default by borrowers, the costs and potential losses of
self-liquidation of one or more holdings, the risk of a possible lack of
mortgage funds and associated interest rate risks, overbuilding, property
vacancies, increases in property taxes and operating expenses, changes in zoning
laws, losses due to environmental damages, changes in neighborhood values and
appeal to purchasers, the possibility of failing to maintain exemptions from
registration under the 1940 Act and, in many cases, relatively small market
capitalization, which may result in less market liquidity and greater price
volatility. REITs are also subject to the risk that the real estate market may
experience an economic downturn generally, which may have a material effect on
the real estate in which the REITs invest and their underlying portfolio
securities.
SMALL CAP RISK: The Fund invests in Small-Cap Companies. Such companies may be
more vulnerable to adverse general market or economic developments, and their
securities may be less liquid and may experience greater price volatility than
larger, more established companies as a result of several factors, including
limited trading volumes, products or financial resources, management
inexperience and dependence on a few key people, and less publicly available
information. Accordingly, such companies are generally subject to greater market
risk than larger, more established companies. The market movements of equity
securities issued by issuers with smaller capitalizations may be more abrupt or
erratic than the market movements of equity securities of larger, more
established companies or the stock market in general. Historically, smaller
capitalization companies have sometimes gone through extended periods when they
did not perform as well as larger companies. In addition, equity securities of
Small-Cap Companies may be less liquid than those of larger companies.
SMALL FUND RISK: The Fund currently has fewer assets than larger funds, and like
other relatively smaller funds, large inflows and outflows may impact the Fund's
market exposure for limited periods of time. This impact may be positive or
negative, depending on the direction of market movement during the period
affected.
VALUE INVESTING RISK: The Fund focuses its investments on securities that the
portfolio managers believe are undervalued or inexpensive relative to other
investments. These types of securities may present risks in addition to the
general risks associated with investing in them. These securities generally are
selected on the basis of an issuer's business and economic fundamentals or the
securities' current and projected credit profiles, relative to current market
price. Such securities are subject to the risk of misestimating certain
fundamental factors. Disciplined adherence to a "value" investment mandate
during periods in which that style is "out of favor" can result in significant
underperformance relative to overall market indices and other managed investment
vehicles that pursue growth style investments and/or flexible style mandates.
Page 23
<PAGE>
--------------------------------------------------------------------------------
ADDITIONAL INFORMATION (CONTINUED)
--------------------------------------------------------------------------------
FIRST TRUST/CONFLUENCE SMALL CAP VALUE FUND
OCTOBER 31, 2017 (UNAUDITED)
ADVISORY AND SUB-ADVISORY AGREEMENTS
BOARD CONSIDERATIONS REGARDING APPROVAL OF CONTINUATION OF INVESTMENT MANAGEMENT
AGREEMENT AND SUB-ADVISORY AGREEMENT
The Board of Trustees (the "Board") of First Trust Series Fund (the "Trust"),
including the Independent Trustees, unanimously approved the continuation of the
Investment Management Agreement (the "Advisory Agreement") between the Trust, on
behalf of the First Trust/Confluence Small Cap Value Fund (the "Fund"), and
First Trust Advisors L.P. (the "Advisor" or "First Trust") and the Investment
Sub Advisory Agreement (the "Sub Advisory Agreement" and together with the
Advisory Agreement, the "Agreements") among the Trust, on behalf of the Fund,
the Advisor and Confluence Investment Management LLC (the "Sub-Advisor") for a
one-year period ending June 30, 2018 at a meeting held on June 12, 2017. The
Board determined that the continuation of the Agreements is in the best
interests of the Fund in light of the extent and quality of the services
provided and such other matters as the Board considered to be relevant in the
exercise of its reasonable business judgment.
To reach this determination, the Board considered its duties under the
Investment Company Act of 1940, as amended (the "1940 Act"), as well as under
the general principles of state law in reviewing and approving advisory
contracts; the requirements of the 1940 Act in such matters; the fiduciary duty
of investment advisors with respect to advisory agreements and compensation; the
standards used by courts in determining whether investment company boards have
fulfilled their duties; and the factors to be considered by the Board in voting
on such agreements. At meetings held on April 24, 2017 and June 12, 2017, the
Board, including the Independent Trustees, reviewed materials provided by the
Advisor and the Sub-Advisor responding to requests for information from counsel
to the Independent Trustees that, among other things, outlined the services
provided by the Advisor and the Sub-Advisor to the Fund (including the relevant
personnel responsible for these services and their experience); the advisory fee
rate payable by the Fund and the sub-advisory fee rate as compared to fees
charged to a peer group of funds compiled by Management Practice, Inc. ("MPI"),
an independent source (the "MPI Peer Group"), and as compared to fees charged to
other clients of the Advisor and the Sub-Advisor; expenses of the Fund as
compared to expense ratios of the funds in the MPI Peer Group; performance
information for the Fund; the nature of expenses incurred in providing services
to the Fund and the potential for economies of scale, if any; financial data on
the Advisor and the Sub-Advisor; any fall out benefits to the Advisor and its
affiliate, First Trust Portfolios L.P. ("FTP"), and the Sub-Advisor; and
information on the Advisor's and the Sub-Advisor's compliance programs. The
Board reviewed initial materials with the Advisor at the meeting held on April
24, 2017, prior to which the Independent Trustees and their counsel met
separately to discuss the information provided by the Advisor and the
Sub-Advisor. Following the April meeting, independent legal counsel on behalf of
the Independent Trustees requested certain clarifications and supplements to the
materials provided, and the information provided in response to those requests
was considered at an executive session of the Independent Trustees and
independent legal counsel held prior to the June 12, 2017 meeting, as well as at
the meeting held that day. The Board applied its business judgment to determine
whether the arrangements between the Trust and the Advisor and among the Trust,
the Advisor and the Sub-Advisor continue to be reasonable business arrangements
from the Fund's perspective as well as from the perspective of the Fund's
shareholders. The Board determined that, given the totality of the information
provided with respect to the Agreements, the Board had received sufficient
information to renew the Agreements. The Board considered that shareholders
chose to invest or remain invested in the Fund knowing that the Advisor and the
Sub-Advisor manage the Fund and knowing the Fund's advisory fee.
In reviewing the Agreements, the Board considered the nature, extent and quality
of the services provided by the Advisor and the Sub-Advisor under the
Agreements. With respect to the Advisory Agreement, the Board considered that
the Advisor is responsible for the overall management and administration of the
Trust and the Fund and reviewed all of the services provided by the Advisor to
the Fund, including the oversight of the Sub-Advisor, as well as the background
and experience of the persons responsible for such services. The Board noted
that the Advisor oversees the Sub-Advisor's day-to-day management of the Fund's
investments, including portfolio risk monitoring and performance review. In
reviewing the services provided, the Board noted the compliance program that had
been developed by the Advisor and considered that it includes a robust program
for monitoring the Advisor's, the Sub-Advisor's and the Fund's compliance with
the 1940 Act, as well as the Fund's compliance with its investment objective and
policies. The Board also considered a report from the Advisor with respect to
its risk management functions related to the operation of the Fund. Finally, as
part of the Board's consideration of the Advisor's services, the Advisor, in its
written materials and at the April 24, 2017 meeting, described to the Board the
scope of its ongoing investment in additional infrastructure and personnel to
maintain and improve the quality of services provided to the Fund and the other
funds in the First Trust Fund Complex. With respect to the Sub-Advisory
Agreement, the Board reviewed the materials provided by the Sub-Advisor and
considered the services that the Sub-Advisor provides to the Fund, including the
Sub-Advisor's day-to-day management of the Fund's investments. In considering
the Sub-Advisor's management of the Fund, the Board noted the background and
experience of the Sub-Advisor's portfolio management team and the Board's prior
meetings with members of the portfolio management team. In light of the
information presented and the considerations made, the Board concluded that the
nature, extent and quality of the services provided to the Fund by the Advisor
and the Sub-Advisor under the Agreements have been and are expected to remain
satisfactory and that the Sub-Advisor, under the oversight of the Advisor, has
managed the Fund consistent with its investment objective and policies.
The Board considered the advisory and sub-advisory fee rates payable under the
Agreements for the services provided. The Board noted that the sub-advisory fee
is paid by the Advisor from its advisory fee. The Board considered that the
Advisor and Sub-Advisor agreed to extend the current expense caps for each share
class through February 28, 2019 and agreed to keep the long-term expense cap in
place from March 1, 2019 through February 28, 2028. The Board noted that fees
waived or expenses borne by the Advisor and Sub-Advisor are subject to
Page 24
<PAGE>
--------------------------------------------------------------------------------
ADDITIONAL INFORMATION (CONTINUED)
--------------------------------------------------------------------------------
FIRST TRUST/CONFLUENCE SMALL CAP VALUE FUND
OCTOBER 31, 2017 (UNAUDITED)
reimbursement by the Fund for up to three years from the date the expense was
incurred or fees were waived, but no reimbursement payment would be made by the
Fund if it would result in the Fund exceeding an expense ratio equal to the
expense cap in place at the time of the reimbursement or at the time the
expenses were borne or the fees were waived by the Advisor and Sub-Advisor. The
Board received and reviewed information showing the advisory fee rates and
expense ratios of the peer funds in the MPI Peer Group, as well as advisory fee
rates charged by the Advisor and the Sub-Advisor to other fund and non-fund
clients, as applicable. With respect to the MPI Peer Group, the Board discussed
with representatives of the Advisor how the MPI Peer Group was assembled, as
well as the limitations in creating a relevant peer group for the Fund,
including that (i) all of the peer funds are larger than the Fund, which causes
the Fund's fixed expenses to be higher on a percentage basis as compared to the
larger peer funds, and some of the peer funds are part of a larger fund complex
that may allow for additional economies of scale and (ii) most of the peer funds
do not employ an unaffiliated advisor/sub-advisor management structure. The
Board took these limitations into account in considering the peer data. Based on
the information provided, the Board noted that the advisory fee rate payable by
the Fund was above the median advisory fee of the peer funds in the MPI Peer
Group. The Board noted that the Fund's total (net) expense ratio (Class A
shares) was above the median of the MPI Peer Group. With respect to fees charged
to other clients, the Board considered differences between the Fund and other
clients that limited their comparability. In considering the advisory fee rate
overall, the Board also considered the Advisor's statement that it seeks to meet
investor needs through innovative and value-added investment solutions and the
Advisor's description of its long-term commitment to the Fund.
The Board considered performance information for the Fund. The Board noted the
process it has established for monitoring the Fund's performance and portfolio
risk on an ongoing basis, which includes quarterly performance reporting from
the Advisor and Sub-Advisor for the Fund. The Board determined that this process
continues to be effective for reviewing the Fund's performance. The Board
received and reviewed information comparing the Fund's performance for periods
ended December 31, 2016 to the performance of the MPI Peer Group and to two
benchmark indexes. Based on the information provided, the Board noted that the
Fund (Class A shares) underperformed the MPI Peer Group average and both
benchmark indexes for the one-and five-year periods ended December 31, 2016, and
outperformed the MPI Peer Group average and one of the benchmark indexes, but
underperformed the other benchmark index for the three-year period ended
December 31, 2016. The Board noted information provided by the Advisor on
reasons for the Fund's recent underperformance.
On the basis of all the information provided on the fees, expenses and
performance of the Fund and the ongoing oversight by the Board, the Board
concluded that the advisory and sub-advisory fees for the Fund continue to be
reasonable and appropriate in light of the nature, extent and quality of the
services provided by the Advisor and the Sub-Advisor to the Fund under the
Agreements.
The Board considered information and discussed with the Advisor whether there
were any economies of scale in connection with providing advisory services to
the Fund and noted the Advisor's statement that it expects its expenses to
increase over the next twelve months as the Advisor continues to make
investments in personnel and infrastructure. The Board considered the revenues
and allocated costs (including the allocation methodology) of the Advisor in
serving as investment advisor to the Fund for the twelve months ended December
31, 2016 and the estimated profitability level for the Fund calculated by the
Advisor based on such data, as well as complex-wide and product-line
profitability data for the same period. The Board noted the inherent limitations
in the profitability analysis and concluded that, based on the information
provided, the Advisor's profitability level for the Fund was not unreasonable.
In addition, the Board considered fall-out benefits described by the Advisor
that may be realized from its relationship with the Fund. The Board considered
that the Advisor had identified as a fall out benefit to the Advisor and FTP
their exposure to investors and brokers who, absent their exposure to the Fund,
may have had no dealings with the Advisor or FTP. The Board noted that in
addition to the advisory fees paid by the Fund, FTP is compensated for services
provided to the Fund through 12b-1 distribution and service fees and that First
Trust receives compensation from the Fund for providing fund reporting services
pursuant to a separate Fund Reporting Services Agreement. The Board concluded
that the character and amount of potential fall-out benefits to the Advisor were
not unreasonable.
The Board considered that many of the Sub Advisor's costs are fixed, allowing
for economies of scale with regard to certain costs. The Board did not review
the profitability of the Sub-Advisor with respect to the Fund. The Board noted
that the Advisor pays the Sub-Advisor from its advisory fee and its
understanding that the Fund's sub-advisory fee rate was the product of an arm's
length negotiation. The Board concluded that the profitability analysis for the
Advisor was more relevant. The Board considered fall-out benefits that may be
realized by the Sub-Advisor and one of its affiliates from their relationship
with the Fund, including that the Sub-Advisor may enter into soft dollar and
commission sharing arrangements, and considered a summary of such arrangements.
The Board concluded that the character and amount of potential fall-out benefits
to the Sub-Advisor were not unreasonable.
Based on all of the information considered and the conclusions reached, the
Board, including the Independent Trustees, unanimously determined that the terms
of the Agreements continue to be fair and reasonable and that the continuation
of the Agreements is in the best interests of the Fund. No single factor was
determinative in the Board's analysis.
Page 25
<PAGE>
--------------------------------------------------------------------------------
BOARD OF TRUSTEES AND OFFICERS
--------------------------------------------------------------------------------
FIRST TRUST/CONFLUENCE SMALL CAP VALUE FUND
OCTOBER 31, 2017 (UNAUDITED)
The Trust's statement of additional information includes additional information
about the Trustees and is available, without charge, upon request, by calling
(800) 988-5891.
<TABLE>
<CAPTION>
NUMBER OF OTHER
PORTFOLIOS IN TRUSTEESHIPS OR
THE FIRST TRUST DIRECTORSHIPS
NAME, ADDRESS, TERM OF OFFICE FUND COMPLEX HELD BY TRUSTEE
DATE OF BIRTH AND AND LENGTH OF PRINCIPAL OCCUPATIONS OVERSEEN BY DURING PAST
POSITION WITH THE TRUST SERVICE DURING PAST 5 YEARS TRUSTEE 5 YEARS
------------------------------------------------------------------------------------------------------------------------------------
INDEPENDENT TRUSTEES
------------------------------------------------------------------------------------------------------------------------------------
<S> <C> <C> <C> <C>
Richard E. Erickson, Trustee o Indefinite Term Physician, Officer, Wheaton Orthopedics; 151 None
c/o First Trust Advisors L.P. Limited Partner, Gundersen Real Estate
120 E. Liberty Drive, o Since Trust Limited Partnership (June 1992 to
Suite 400 Inception December 2016); Member, Sportsmed
Wheaton, IL 60187 LLC (April 2007 to November 2015)
D.O.B.: 04/51
Thomas R. Kadlec, Trustee o Indefinite Term President, ADM Investor Services, Inc. 151 Director of ADM
c/o First Trust Advisors L.P. (Futures Commission Merchant) Investor Services,
120 E. Liberty Drive, o Since Trust Inc., ADM
Suite 400 Inception Investor Services
Wheaton, IL 60187 International,
D.O.B.: 11/57 Futures Industry
Association, and
National Futures
Association
Robert F. Keith, Trustee o Indefinite Term President, Hibs Enterprises (Financial 151 Director of Trust
c/o First Trust Advisors L.P. and Management Consulting) Company of
120 E. Liberty Drive, o Since Trust Illinois
Suite 400 Inception
Wheaton, IL 60187
D.O.B.: 11/56
Niel B. Nielson, Trustee o Indefinite Term Managing Director and Chief Operating 151 Director of
c/o First Trust Advisors L.P. Officer (January 2015 to Present), Pelita Covenant
120 E. Liberty Drive, o Since Trust Harapan Educational Foundation Transport, Inc.
Suite 400 Inception (Educational Products and Services); (May 2003 to
Wheaton, IL 60187 President and Chief Executive Officer May 2014)
D.O.B.: 03/54 (June 2012 to September 2014), Servant
Interactive LLC (Educational Products and
Services); President and Chief Executive
Officer (June 2012 to September 2014),
Dew Learning LLC (Educational Products
and Services); President (June 2002 to
June 2012), Covenant College
------------------------------------------------------------------------------------------------------------------------------------
INTERESTED TRUSTEE
------------------------------------------------------------------------------------------------------------------------------------
James A. Bowen(1), Trustee, o Indefinite Term Chief Executive Officer, First Trust 151 None
Chairman of the Board Advisors L.P. and First Trust Portfolios
120 E. Liberty Drive, o Since Trust L.P.; Chairman of the Board of Directors,
Suite 400 Inception BondWave LLC (Software Development
Wheaton, IL 60187 Company) and Stonebridge Advisors LLC
D.O.B.: 09/55 (Investment Advisor)
</TABLE>
-----------------------------
(1) Mr. Bowen is deemed an "interested person" of the Trust due to his
position of Chief Executive Officer of First Trust Advisors L.P.,
investment advisor of the Trust.
Page 26
<PAGE>
--------------------------------------------------------------------------------
BOARD OF TRUSTEES AND OFFICERS (CONTINUED)
--------------------------------------------------------------------------------
FIRST TRUST/CONFLUENCE SMALL CAP VALUE FUND
OCTOBER 31, 2017 (UNAUDITED)
<TABLE>
<CAPTION>
POSITION AND TERM OF OFFICE
NAME, ADDRESS OFFICES AND LENGTH OF PRINCIPAL OCCUPATIONS
AND DATE OF BIRTH WITH TRUST SERVICE DURING PAST 5 YEARS
------------------------------------------------------------------------------------------------------------------------------------
OFFICERS(2)
------------------------------------------------------------------------------------------------------------------------------------
<S> <C> <C> <C>
James M. Dykas President and Chief o Indefinite Term Managing Director and Chief Financial Officer
120 E. Liberty Drive, Executive Officer (January 2016 to Present), Controller (January 2011
Suite 400 o Since January 2016 to January 2016), Senior Vice President (April 2007
Wheaton, IL 60187 to January 2016), First Trust Advisors L.P. and First
D.O.B.: 01/66 Trust Portfolios L.P.; Chief Financial Officer
(January 2016 to Present), BondWave LLC
(Software Development Company); and Stonebridge
Advisors LLC (Investment Advisor)
Donald P. Swade Treasurer, Chief o Indefinite Term Senior Vice President (July 2016 to Present), Vice
120 E. Liberty Drive, Financial Officer and President (April 2012 to July 2016), First Trust
Suite 400 Chief Accounting Officer o Since January 2016 Advisors L.P. and First Trust Portfolios L.P.
Wheaton, IL 60187
D.O.B.: 08/72
W. Scott Jardine Secretary and Chief o Indefinite Term General Counsel, First Trust Advisors L.P. and
120 E. Liberty Drive, Legal Officer First Trust Portfolios L.P.; Secretary and General
Suite 400 o Since Trust Counsel, BondWave LLC; Secretary, Stonebridge
Wheaton, IL 60187 Inception Advisors LLC
D.O.B.: 05/60
Daniel J. Lindquist Vice President o Indefinite Term Managing Director, First Trust Advisors L.P. and
120 E. Liberty Drive, First Trust Portfolios L.P.
Suite 400 o Since Trust
Wheaton, IL 60187 Inception
D.O.B: 02/70
Kristi A. Maher Chief Compliance o Indefinite Term Deputy General Counsel, First Trust Advisors L.P.
120 E. Liberty Drive, Officer and and First Trust Portfolios L.P.
Suite 400 Assistant Secretary o Chief Compliance
Wheaton, IL 60187 Officer since
D.O.B.: 12/66 January 2011
o Assistant Secretary
since Trust Inception
</TABLE>
-----------------------------
(2) The term "officer" means the president, vice president, secretary,
treasurer, controller or any other officer who performs a policy making
function.
Page 27
<PAGE>
--------------------------------------------------------------------------------
PRIVACY POLICY
--------------------------------------------------------------------------------
FIRST TRUST/CONFLUENCE SMALL CAP VALUE FUND
OCTOBER 31, 2017 (UNAUDITED)
PRIVACY POLICY
First Trust values our relationship with you and considers your privacy an
important priority in maintaining that relationship. We are committed to
protecting the security and confidentiality of your personal information.
SOURCES OF INFORMATION
We collect nonpublic personal information about you from the following sources:
o Information we receive from you and your broker-dealer, investment
advisor or financial representative through interviews,
applications, agreements or other forms;
o Information about your transactions with us, our affiliates or
others;
o Information we receive from your inquiries by mail, e-mail or
telephone; and
o Information we collect on our website through the use of "cookies".
For example, we may identify the pages on our website that your
browser requests or visits.
INFORMATION COLLECTED
The type of data we collect may include your name, address, social security
number, age, financial status, assets, income, tax information, retirement and
estate plan information, transaction history, account balance, payment history,
investment objectives, marital status, family relationships and other personal
information.
DISCLOSURE OF INFORMATION
We do not disclose any nonpublic personal information about our customers or
former customers to anyone, except as permitted by law. In addition to using
this information to verify your identity (as required under law), the permitted
uses may also include the disclosure of such information to unaffiliated
companies for the following reasons:
o In order to provide you with products and services and to effect
transactions that you request or authorize, we may disclose your
personal information as described above to unaffiliated financial
service providers and other companies that perform administrative or
other services on our behalf, such as transfer agents, custodians
and trustees, or that assist us in the distribution of investor
materials such as trustees, banks, financial representatives, proxy
services, solicitors and printers.
o We may release information we have about you if you direct us to do
so, if we are compelled by law to do so, or in other legally limited
circumstances (for example to protect your account from fraud).
In addition, in order to alert you to our other financial products and services,
we may share your personal information within First Trust.
USE OF WEB ANALYTICS
We currently use third party analytics tools, Google Analytics and AddThis, to
gather information for purposes of improving First Trust's website and marketing
our products and services to you. These tools employ cookies, which are small
pieces of text stored in a file by your web browser and sent to websites that
you visit, to collect information, track website usage and viewing trends such
as the number of hits, pages visited, videos and PDFs viewed and the length of
user sessions in order to evaluate website performance and enhance navigation of
the website. We may also collect other anonymous information, which is generally
limited to technical and web navigation information such as the IP address of
your device, internet browser type and operating system for purposes of
analyzing the data to make First Trust's website better and more useful to our
users. The information collected does not include any personal identifiable
information such as your name, address, phone number or email address unless you
provide that information through the website for us to contact you in order to
answer your questions or respond to your requests. To find out how to opt-out of
these services click on: Google Analytics and AddThis.
CONFIDENTIALITY AND SECURITY
With regard to our internal security procedures, First Trust restricts access to
your nonpublic personal information to those First Trust employees who need to
know that information to provide products or services to you. We maintain
physical, electronic and procedural safeguards to protect your nonpublic
personal information.
POLICY UPDATES AND INQUIRIES
As required by federal law, we will notify you of our privacy policy annually.
We reserve the right to modify this policy at any time, however, if we do change
it, we will tell you promptly. For questions about our policy, or for additional
copies of this notice, please go to www.ftportfolios.com, or contact us at
1-800-621-1675 (First Trust Portfolios) or 1-800-222-6822 (First Trust
Advisors).
May 2017
Page 28
<PAGE>
FIRST TRUST
INVESTMENT ADVISOR
First Trust Advisors L.P.
120 E. Liberty Drive, Suite 400
Wheaton, IL 60187
INVESTMENT SUB-ADVISOR
Confluence Investment Management LLC
20 Allen Avenue, Suite 300
Saint Louis, MO 63119
ADMINISTRATOR,
FUND ACCOUNTANT &
CUSTODIAN
Brown Brothers Harriman & Co.
50 Post Office Square
Boston, MA 02110
TRANSFER AGENT
BNY Mellon Investment Servicing (US) Inc.
301 Bellevue Parkway
Wilmington, DE 19810
INDEPENDENT REGISTERED
PUBLIC ACCOUNTING FIRM
Deloitte & Touche LLP
111 S. Wacker Drive
Chicago, IL 60606
LEGAL COUNSEL
Chapman and Cutler LLP
111 W. Monroe Street
Chicago, IL 60603
<PAGE>
[BLANK BACK COVER]
<PAGE>
FIRST TRUST
First Trust Short Duration
High Income Fund
-----------------------------------------
Annual Report
For the Year Ended October 31, 2017
<PAGE>
--------------------------------------------------------------------------------
TABLE OF CONTENTS
--------------------------------------------------------------------------------
FIRST TRUST SHORT DURATION HIGH INCOME FUND
ANNUAL REPORT
OCTOBER 31, 2017
Shareholder Letter........................................................... 1
At a Glance.................................................................. 2
Portfolio Commentary......................................................... 4
Understanding Your Fund Expenses............................................. 7
Portfolio of Investments..................................................... 8
Statement of Assets and Liabilities.......................................... 25
Statement of Operations...................................................... 26
Statements of Changes in Net Assets.......................................... 27
Financial Highlights......................................................... 28
Notes to Financial Statements................................................ 31
Report of Independent Registered Public Accounting Firm...................... 37
Additional Information....................................................... 38
Board of Trustees and Officers............................................... 42
Privacy Policy............................................................... 44
CAUTION REGARDING FORWARD-LOOKING STATEMENTS
This report contains certain forward-looking statements within the meaning of
the Securities Act of 1933, as amended, and the Securities Exchange Act of 1934,
as amended. Forward-looking statements include statements regarding the goals,
beliefs, plans or current expectations of First Trust Advisors L.P. ("First
Trust" or the "Advisor") and its representatives, taking into account the
information currently available to them. Forward-looking statements include all
statements that do not relate solely to current or historical fact. For example,
forward-looking statements include the use of words such as "anticipate,"
"estimate," "intend," "expect," "believe," "plan," "may," "should," "would" or
other words that convey uncertainty of future events or outcomes.
Forward-looking statements involve known and unknown risks, uncertainties and
other factors that may cause the actual results, performance or achievements of
First Trust Short Duration High Income Fund (the "Fund") to be materially
different from any future results, performance or achievements expressed or
implied by the forward-looking statements. When evaluating the information
included in this report, you are cautioned not to place undue reliance on these
forward-looking statements, which reflect the judgment of the Advisor and its
representatives only as of the date hereof. We undertake no obligation to
publicly revise or update these forward-looking statements to reflect events and
circumstances that arise after the date hereof.
PERFORMANCE AND RISK DISCLOSURE
There is no assurance that the Fund will achieve its investment objectives. The
Fund is subject to market risk, which is the possibility that the market values
of securities owned by the Fund will decline and that the value of Fund shares
may therefore be less than what you paid for them. Accordingly, you can lose
money by investing in the Fund. See "Risk Considerations" in the Additional
Information section of this report for a discussion of certain other risks of
investing in the Fund.
Performance data quoted represents past performance, which is no guarantee of
future results, and current performance may be lower or higher than the figures
shown. For the most recent month-end performance figures, please visit
http://www.ftportfolios.com or speak with your financial advisor. Investment
returns and net asset value will fluctuate and Fund shares, when sold, may be
worth more or less than their original cost.
The Advisors may also periodically provide additional information on Fund
performance on the Fund's webpage at http://www.ftportfolios.com.
HOW TO READ THIS REPORT
This report contains information that may help you evaluate your investment in
the Fund. It includes details about the Fund and presents data and analysis that
provide insight into the Fund's performance.
By reading the portfolio commentary by the portfolio management team of the
Fund, you may obtain an understanding of how the market environment affected the
Fund's performance. The statistical information that follows may help you
understand the Fund's performance compared to that of relevant market
benchmarks.
It is important to keep in mind that the opinions expressed by personnel of
First Trust are just that: informed opinions. They should not be considered to
be promises or advice. The opinions, like the statistics, cover the period
through the date on the cover of this report. The material risks of investing in
the Fund are spelled out in the prospectus, the statement of additional
information, this report and other Fund regulatory filings.
<PAGE>
--------------------------------------------------------------------------------
SHAREHOLDER LETTER
--------------------------------------------------------------------------------
FIRST TRUST SHORT DURATION HIGH INCOME FUND
ANNUAL LETTER FROM THE CHAIRMAN AND CEO
OCTOBER 31, 2017
Dear Shareholders:
Thank you for your investment in First Trust Short Duration High Income Fund
(the "Fund").
First Trust is pleased to provide you with the annual report which contains
detailed information about your investment for the 12 months ended October 31,
2017, including a market overview and a performance analysis for the period. We
encourage you to read this report carefully and discuss it with your financial
advisor.
The U.S. bull market continued through the November 2016 election and the first
nine months of the Trump presidency. During that period, November 8, 2016
(Election Day 2016) through October 31, 2017, the S&P 500(R) Index (the "Index")
posted a total return of 22.73%, according to Bloomberg. Ten of the eleven Index
sectors were up on a total return basis as well. Since the beginning of 2017
through October 31, 2017, the Index has closed its trading sessions at all-time
highs on 50 occasions. Finally, as of October 31, 2017, the Index has spent the
entire year in positive territory. This has only happened in 10 different years
over the past seven decades.
The current bull market, as measured from March 9, 2009 through October 31, 2017
is the second longest in history. While we are optimistic about the U.S.
economy, we are aware that no one can know how markets will perform in different
economic environments. We are also upbeat about the potential for world economic
growth turning higher. While no one can predict the future, the International
Monetary Fund sees world real gross domestic product rising by an estimated 0.5
percentage points from the 3.2% posted in 2016 to the 3.7% it is projecting for
2018.
We believe that one should invest for the long term and be prepared for market
volatility by keeping current on your portfolio and investing goals by speaking
regularly with your investment professional. It is also important to keep in
mind that past performance can never guarantee future results.
Thank you for giving First Trust the opportunity to be a part of your investment
plan. We value our relationship with you and will continue to focus on bringing
the types of investments that we believe can help you reach your financial
goals.
Sincerely,
/s/ James A. Bowen
James A. Bowen
Chairman of the Board of Trustees
Chief Executive Officer of First Trust Advisors L.P.
Page 1
<PAGE>
FIRST TRUST SHORT DURATION HIGH INCOME FUND
"AT A GLANCE"
AS OF OCTOBER 31, 2017 (UNAUDITED)
-----------------------------------------------------------
FUND STATISTICS
-----------------------------------------------------------
FIRST TRUST SHORT DURATION HIGH NET ASSET
INCOME FUND VALUE (NAV)
-----------------------------------------------------------
Class A (FDHAX) $20.00
Class C (FDHCX) $19.98
Class I (FDHIX) $20.00
-----------------------------------------------------------
-----------------------------------------------------------
% OF SENIOR LOANS
AND OTHER
CREDIT QUALITY(1) DEBT SECURITIES(2)
-----------------------------------------------------------
BBB- 4.4%
BB+ 1.8
BB 8.5
BB- 16.4
B+ 17.7
B 20.8
B- 12.8
CCC+ 7.1
CCC 4.8
CCC- 0.6
D 1.0
Not Rated 4.0
Private 0.1
------
Total 100.0%
======
-----------------------------------------------------------
% OF SENIOR LOANS
AND OTHER
TOP TEN ISSUERS SECURITIES(2)
-----------------------------------------------------------
Caesars Growth Partners LLC 3.8%
Valeant Pharmaceuticals International, Inc. 3.2
Caesers Entertainment Reports Properies LLC 3.1
Energy Future Intermediate Holding Co. 2.9
CHS/Community Health Systems, Inc. 2.7
BMC Software Finance, Inc. 2.6
Tenet Healthcare Corp. 2.3
ClubCorp Club Operations, Inc. 2.1
Amaya Holdings B.V. 2.1
MPH Acquisition Holdings LLC 2.0
------
Total 26.8%
======
-----------------------------------------------------------
% OF SENIOR LOANS
AND OTHER
INDUSTRY CLASSIFICATION SECURITIES(2)
-----------------------------------------------------------
Hotels, Restaurants & Leisure 19.8%
Health Care Providers & Services 16.4
Software 8.7
Pharmaceuticals 8.6
Media 6.0
Diversified Telecommunication Services 3.9
Containers & Packaging 3.4
Electric Utilities 3.3
Food & Staples Retailing 3.0
Life Sciences Tools & Services 3.0
Professional Services 2.0
Food Products 1.9
Insurance 1.7
Commercial Services & Supplies 1.6
Oil, Gas & Consumable Fuels 1.6
Building Products 1.4
Health Care Equipment & Supplies 1.4
Real Estate Management & Development 1.3
Diversified Financial Services 1.2
Capital Markets 1.2
Trading Companies & Distributors 1.2
Specialty Retail 1.0
Diversified Consumer Services 1.0
Wireless Telecommunication Services 0.9
Metals & Mining 0.8
Diversified Business Services 0.6
Equity Real Estate Investment Trusts (REITs) 0.5
Chemicals 0.4
Independent Power and Renewable
Electricity Producers 0.4
Auto Components 0.4
Road & Rail 0.3
Semiconductors & Semiconductor Equipment 0.3
Technology Hardware, Storage & Peripherals 0.2
Automobiles 0.2
Aerospace & Defense 0.2
Machinery 0.1
IT Services 0.1
Consumer Finance 0.0*
Construction Materials 0.0*
Communications Equipment 0.0*
------
Total 100.0%
======
--------------------------------------------------------------------------------
CLASS CLASS CLASS
DIVIDEND DISTRIBUTIONS A SHARES C SHARES I SHARES
--------------------------------------------------------------------------------
Current Monthly Distribution per Share (3) $0.0758 $0.0633 $0.0800
Current Distribution Rate on NAV (4) 4.55% 3.80% 4.80%
* Amount represents less than 0.1%.
(1) The ratings are by Standard & Poor's. A credit rating is an assessment
provided by a nationally recognized statistical rating organization
(NRSRO) of the creditworthiness of an issuer with respect to its debt
obligations. Ratings are measured on a scale that generally ranges from
AAA (highest) to D (lowest). Investment grade is defined as those issuers
that have a long-term credit rating of BBB- or higher. The credit ratings
shown relate to the creditworthiness of the issuers of the underlying
securities in the Fund, and not the Fund or its shares. Credit ratings are
subject to change.
(2) Percentages are based on long-term positions. Money market funds are
excluded.
(3) Most recent distribution paid or declared through 10/31/2017. Subject to
change in the future.
(4) Distribution rates are calculated by annualizing the most recent
distribution paid or declared through the report date and then dividing by
NAV as of 10/31/2017. Subject to change in the future.
Page 2
<PAGE>
FIRST TRUST SHORT DURATION HIGH INCOME FUND
"AT A GLANCE" (CONTINUED)
AS OF OCTOBER 31, 2017 (UNAUDITED)
-----------------------------------------------------------
PERFORMANCE OF A $10,000 INVESTMENT
-----------------------------------------------------------
This chart compares your Fund's Class I performance to that
of the ICE BofAML US High Yield Constrained Index(a),
the S&P/LSTA Leveraged Loan Index and the Blended Index(b)
from 11/1/2012 through 10/31/2017.
<TABLE>
<CAPTION>
First Trust Short ICE BofAML US
Duration High Income Blended High Yield Constrained S&P/LSTA Leveraged
Fund - Class I Shares Index (a) Index ("HUC0") Loan Index ("SPBDAL")
<S> <C> <C> <C> <C>
1/11/12 $10,000 $10,000 $10,000 $10,000
4/30/13 10,613 10,548 10,713 10,384
10/31/13 10,811 10,705 10,869 10,542
4/30/14 11,037 11,082 11,386 10,783
10/31/14 11,178 11,198 11,504 10,896
4/30/15 11,460 11,411 11,679 11,144
10/31/15 11,282 11,112 11,270 10,947
4/30/16 11,511 11,326 11,524 11,120
10/31/16 11,929 12,042 12,418 11,664
4/30/17 12,292 12,551 13,096 12,015
10/31/17 12,533 12,895 13,553 12,255
</TABLE>
(a) Effective October 22, 2017, the index name changed from BofA Merrill Lynch
US High Yield Constrained Index to ICE BofAML US High Yield Constrained
Index.
(b) The Blended Index return is a 50/50 split between the ICE BofAML US High
Yield Constrained Index and the S&P/LSTA Leveraged Loan Index returns.
<TABLE>
<CAPTION>
-----------------------------------------------------------------------------------------------------------------------------
PERFORMANCE AS OF OCTOBER 31, 2017
-----------------------------------------------------------------------------------------------------------------------------
A SHARES C SHARES I SHARES BLENDED
Inception 11/1/2012 Inception 11/1/2012 Inception 11/1/2012 INDEX* HUC0* SPBDAL*
-----------------------------------------------------------------------------------------------------------------------------
W/MAX
1.00%
W/MAX CONTINGENT
W/O 3.50% W/O DEFERRED W/O W/O W/O W/O
CUMULATIVE TOTAL SALES SALES SALES SALES SALES SALES SALES SALES
RETURNS CHARGES CHARGE CHARGES CHARGE CHARGES CHARGES CHARGES CHARGES
<S> <C> <C> <C> <C> <C> <C> <C> <C>
1 Year 4.79% 1.14% 4.01% 3.01% 5.06% 7.09% 9.14% 5.06%
AVERAGE ANNUAL TOTAL
RETURNS
Since Inception 4.35% 3.61% 3.57% 3.57% 4.61% 5.22% 6.27% 4.15%
30-Day SEC Yield(1) 3.58% 2.95% 3.95% N/A N/A N/A
-----------------------------------------------------------------------------------------------------------------------------
</TABLE>
* Since inception return is based on inception date of the Fund.
Performance figures assume reinvestment of all distributions and do not reflect
the deduction of taxes that the shareholder would pay on Fund distributions or
the redemption of Fund shares. The total returns would have been lower if
certain fees had not been waived and expenses reimbursed by the Advisor. An
index is a statistical composite that tracks a specific financial market or
sector. Unlike the Fund, the indices do not actually hold a portfolio of
securities and therefore do not incur the expenses incurred by the Fund. These
expenses negatively impact the performance of the Fund. The Fund's past
performance does not predict future performance.
Performance of share classes will vary due to differences in sales charges and
expenses. Total returns with sales charges include payment of the maximum sales
charge of 3.50% for Class A Shares, a contingent deferred sales charge ("CDSC")
of 1.00% for Class C Shares in year one and 12b-1 service fees of 0.25% per year
of average daily net assets for Class A Shares and combined Rule 12b-1
distribution and service fees of 1.00% per year of average daily net assets for
Class C Shares. Class I Shares do not have a front-end sales charge or a CDSC,
nor do they pay distribution or service fees.
(1) 30-day SEC yield is calculated by dividing the net investment income per
share earned during the most recent 30-day period by the maximum offering
price per share on the last day of the period. The reported SEC yields are
subsidized. The subsidized yields reflect the waiver and/or a
reimbursement of Fund expenses, which has the effect of lowering the
Fund's expense ratio and generating a higher yield.
Page 3
<PAGE>
--------------------------------------------------------------------------------
PORTFOLIO COMMENTARY
--------------------------------------------------------------------------------
FIRST TRUST SHORT DURATION HIGH INCOME FUND
ANNUAL REPORT
OCTOBER 31, 2017 (UNAUDITED)
ADVISOR
The First Trust Advisors L.P. ("First Trust" or the "Advisors") Leveraged
Finance Team is comprised of 15 experienced investment professionals
specializing in below investment grade securities. The team is comprised of
portfolio management, research, trading and operations personnel. As of October
31, 2017, the First Trust Leveraged Finance Team managed or supervised
approximately $4.06 billion in senior secured bank loans and high-yield bonds.
These assets are managed across various strategies, including two closed-end
funds, an open-end fund, four exchange-traded funds, one UCITS fund and a series
of unit investment trusts on behalf of retail and institutional clients.
PORTFOLIO MANAGEMENT TEAM
WILLIAM HOUSEY, CFA - SENIOR VICE PRESIDENT, SENIOR PORTFOLIO MANAGER
SCOTT D. FRIES, CFA - SENIOR VICE PRESIDENT, PORTFOLIO MANAGER
PETER FASONE, CFA, CPA - VICE PRESIDENT, PORTFOLIO MANAGER
COMMENTARY
MARKET RECAP
For the 12-months ending October 31, 2017, equities posted a strong return with
the S&P 500(R) Index up 23.63%. Interest rates, as measured by the 10-year U.S.
Treasury bond, finished the fiscal year at 2.38% as of October 31, 2017, up from
1.83% at the start of the fiscal year. Overall, positive equity market returns,
generally positive risk sentiment supported by relatively benign volatility,
recent optimism surrounding the release of the GOP tax plan, and a stabilization
in commodity prices have provided a firm backdrop for credit markets, in our
view. Senior loans, as measured by the S&P/LSTA Leveraged Loan Index, were up
5.06% in the period while high-yield bonds, as measured by the ICE BofAML US
High Yield Constrained Index, were up 9.14%.
High-Yield Bond Market
The ICE BofAML US High Yield Constrained Index returned 9.14% for the 12-month
period ending October 31, 2017, which compares to 10.18% for the prior fiscal
year period. Additionally, the high-yield bond market experienced positive total
returns in nine of the 12 months in the period.
High-yield bond spreads over U.S. Treasuries tightened 140 basis points ("bps")
to end the period at T+351 bps as of October 31, 2017. The long-term average
spread over U.S. Treasuries is T+584 bps (December 1997 - October 2017).
Lower quality high-yield bonds outperformed higher quality high-yield bonds in
the period, which was a continuation of the trend in the prior year period.
Lower quality CCC rated issues and below returned 14.62%, significantly
outperforming higher quality B rated issues' return of 9.12% and BB rated
issues' return of 7.69% in the fiscal period. The average price of high-yield
bonds in the market entered the period at $99.10 and increased steadily for the
better part of the year to end the period with an average price of $101.58.
Senior Loan Market
The S&P/LSTA Leveraged Loan Index returned 5.06% for the 12-month period ending
October 31, 2017, which compares to 6.54% for the prior fiscal year period. The
senior loan market experienced positive total returns in 10 of the 12 months in
the period.
Senior loan spreads over 3-month London Interbank Offered Rate ("LIBOR")
declined 85 bps during the period to L+407 bps. This compares favorably to the
pre-credit crisis average spread of L+372 (December 1997 - June 2007) but is
inside the long-term average spread of L+522 (December 1997 - October 2017).
Lower quality senior loans outperformed higher quality senior loans in the
period, which was a continuation of the trend in the prior year period. Lower
quality CCC rated issues returned 15.22%, significantly outperforming higher
quality B rated issues' return of 5.13% and BB rated issues' return of 3.97% in
the fiscal period ending October 31, 2017. The average price of senior loans in
the market began the period at $97.17 and increased to end the period with an
average price of $98.16.
Page 4
<PAGE>
--------------------------------------------------------------------------------
PORTFOLIO COMMENTARY (CONTINUED)
--------------------------------------------------------------------------------
FIRST TRUST SHORT DURATION HIGH INCOME FUND
ANNUAL REPORT
OCTOBER 31, 2017 (UNAUDITED)
Default Rates
During the 12-month period ending October 31, 2017, default rates decreased
within both the JP Morgan High-Yield Bond Universe and the S&P/LSTA Leveraged
Loan Index. The LTM ("Last Twelve Months") default rate within the high-yield
bond market ended the period at 1.18% compared to the 3.59% default rate one
year ago. Default activity declined during the period driven by the
stabilization in commodity prices. The senior loan LTM default rate ended the
period at 1.51% compared to the 1.95% default rate one year ago. We continue to
believe the low default rates in both high-yield bonds and senior loans are
reflective of the relatively sound financial condition of most companies, the
lack of near-term debt maturities, and the strong backdrop of a healthy
macroeconomic environment.
FUND PERFORMANCE
The Fund's I share class returned 5.06% over the last 12 months, which
underperformed the Blended Benchmark return of 7.09% (comprised of 50% S&P/LSTA
Leveraged Loan Index and 50% ICE BofAML US High Yield Constrained Index) over
the same time period.
The Fund's most recent monthly distribution, on October 31, 2017, of $0.08 per
share remained unchanged from the monthly distribution paid to Class I
shareholders in October 2016. At the end of the period, the effective yield
based on the Class I distributions for the trailing 12 months was 4.80% based on
NAV.
The Fund was generally underweight the highest credit quality issues, mainly
issues rated BB- and above. This was beneficial to the Fund as the highest
credit quality issues lagged in performance relative to the rest of the senior
loan and high-yield bond markets. At the end of October 2016, the Fund held
34.47% in issues rated BB- or above compared to 48.62% for the Blended
Benchmark. One year later, those weightings moved to 31.34% and 45.71% for the
Fund and the Blended Benchmark, respectively, as of October 31, 2017. More than
offsetting this tailwind was the Fund's underweight position to the energy (oil
& gas) and metals/mining industries, the Fund's overweight position to the
healthcare industry, and the Fund's overweight allocation to senior loans
relative to high-yield bonds. The Fund's underweight position to the energy (oil
& gas) industry detracted from performance as this industry was one of the best
performing industries over the period with a 10.69% return in the high-yield
portion of the Blended Benchmark and a 12.59% return within the senior loan
portion of the Blended Benchmark.
If part of an issuer's investment premise relies on a commodity price, we
believe this can create a high hurdle for inclusion in the portfolio. In times
of strong commodity returns, like we have seen over the last year, our credit
process can lead to periods of underperformance, however, over time, we believe
the Fund will benefit from lower volatility and better risk adjusted returns.
This rigorous process also tends to lead to an overweight position to the
healthcare industry, which tends to be a more defensive industry. The healthcare
industry typically lags during a period of market tightening due to the
defensive non-cyclical nature of the industry, and this cycle has been no
different. As a result, the healthcare industry returned 7.93% within the
high-yield portion of the Blended Benchmark and returned 5.95% within the senior
loan portion of the Blended Benchmark, respectively, over the period.
Finally, the Fund's senior loan allocation was a headwind to performance as
senior loans underperformed high-yield bonds over the period. However, the Fund
did decrease its allocation to senior loans by 442 bps during the fiscal year to
end October 2017 at 61.74%. This compares to the 50/50 split between senior
loans and high-yield bonds within the Blended Benchmark. That said, we continue
to find value in certain parts of the senior loan market as the difference in
yield-to-maturity between senior loans and high-yield bonds remains tight
relative to historic levels (bonds yield 0.88% more than loans today vs the
long-term average of 2.28% since January 31, 1999) and senior loans offer the
Fund some protection in a rising rate environment by shortening duration given
the floating rate characteristic of senior loans.
MARKET AND FUND OUTLOOK
While spreads within the high-yield bond market are tight relative to historical
norms, we believe there is room for further tightening throughout the cycle
given that spreads remain wide of the tight spreads experienced at the top of
the last cycle of T+245 in May 2007. Moreover, the default rate within the
high-yield bond market has been declining. We believe the low default rate is
reflective of the relatively sound financial condition of most companies and the
strong backdrop of a healthy macroeconomic environment.
Page 5
<PAGE>
--------------------------------------------------------------------------------
PORTFOLIO COMMENTARY (CONTINUED)
--------------------------------------------------------------------------------
FIRST TRUST SHORT DURATION HIGH INCOME FUND
ANNUAL REPORT
OCTOBER 31, 2017 (UNAUDITED)
We believe that with the potential for additional interest rate hikes on the
horizon, LIBOR should continue to migrate higher during the rest of 2017 and
into 2018. Importantly, the default rate for senior loans remains low, at 1.51%
and we believe it is likely to remain low given the overall health of the U.S.
economy. This is below the long-term average default rate of 3.04% (March 1999 -
October 2017).
We believe that the favorable backdrop for the macro economy will persist for
the near to intermediate term and that we are in a healthy part of the economic
cycle to own high-yield bonds and senior loans. We also believe that the current
cycle continues to have a long runway. Specifically, we believe senior loans,
given their senior secured position in the capital structure, floating interest
rate, attractive income and low default rate are well positioned as we move
through 2017 and into 2018. We also believe that high-yield bonds should
continue to perform well given their mid-cycle valuations and declining default
rate. As we evaluate new investment opportunities, decisions will continue to be
rooted in our rigorous bottom-up credit analysis and our focus will remain on
identifying the opportunities that we believe offer the best risk and reward
balance.
Page 6
<PAGE>
FIRST TRUST SHORT DURATION HIGH INCOME FUND
UNDERSTANDING YOUR FUND EXPENSES
OCTOBER 31, 2017 (UNAUDITED)
As a shareholder of the First Trust Short Duration High Income Fund, you incur
two types of costs: (1) transaction costs, including sales charges (loads) on
purchases of Class A Shares and contingent deferred sales charges on the lesser
of purchase price or redemption proceeds of Class C Shares; and (2) ongoing
costs, including management fees; distribution and/or service (12b-1) fees; and
other Fund expenses. This Example is intended to help you understand your
ongoing costs (in U.S. dollars) of investing in the Fund and to compare these
costs with the ongoing costs of investing in other mutual funds.
The Example is based on an investment of $1,000 invested at the beginning of the
period and held through the six-month period ended October 31, 2017.
ACTUAL EXPENSES
The first three columns of the table below provide information about actual
account values and actual expenses. You may use the information in these
columns, together with the amount you invested, to estimate the expenses that
you paid over the period. Simply divide your account value by $1,000 (for
example, an $8,600 account value divided by $1,000 = 8.6), then multiply the
result by the number in the third column under the heading entitled "Expenses
Paid During Period" to estimate the expenses you paid on your account during the
period.
HYPOTHETICAL EXAMPLE FOR COMPARISON PURPOSES
The next three columns of the table below provide information about hypothetical
account values and hypothetical expenses based on the Fund's actual expense
ratio and an assumed rate of return of 5% per year before expenses, which is not
the Fund's actual return. The hypothetical account values and expenses may not
be used to estimate the actual ending account balance or expenses you paid for
the period. You may use this information to compare the ongoing cost of
investing in the Fund and other funds. To do so, compare this 5% hypothetical
example with the 5% hypothetical examples that appear in the shareholder reports
of the other funds.
Please note that the expenses shown in the table are meant to highlight your
ongoing costs only and do not reflect any transactional costs, such as sales
charges (loads) or contingent deferred sales charges. Therefore, the
hypothetical section of the table is useful in comparing ongoing costs only, and
will not help you determine the relative total costs of owning different funds.
In addition, if these transactional costs were included, your costs would have
been higher.
<TABLE>
<CAPTION>
-----------------------------------------------------------------------------------------------------------
HYPOTHETICAL
ACTUAL EXPENSES (5% RETURN BEFORE EXPENSES)
-------------------------------------------- --------------------------------------------
BEGINNING ENDING EXPENSES PAID BEGINNING ENDING EXPENSES PAID
ACCOUNT ACCOUNT DURING PERIOD ACCOUNT ACCOUNT DURING PERIOD ANNUALIZED
VALUE VALUE 5/1/2017 - VALUE VALUE 5/1/2017 - EXPENSE
5/1/2017 10/31/2017 10/31/2017 (a) 5/1/2017 10/31/2017 10/31/2017 (a) RATIOS (b)
-----------------------------------------------------------------------------------------------------------
<S> <C> <C> <C> <C> <C> <C> <C>
Class A $1,000.00 $ 1,018.30 $ 6.51 $1,000.00 $ 1,018.75 $ 6.51 1.28%
Class C 1,000.00 1,014.50 10.31 1,000.00 1,014.97 10.31 2.03
Class I 1,000.00 1,019.60 5.24 1,000.00 1,020.01 5.24 1.03
</TABLE>
(a) Expenses are equal to the annualized expense ratios as indicated in the
table, multiplied by the average account value over the period (May 1,
2017 through October 31, 2017), multiplied by 184/365 (to reflect the
six-month period).
(b) These expense ratios reflect expense caps.
Page 7
<PAGE>
FIRST TRUST SHORT DURATION HIGH INCOME FUND
PORTFOLIO OF INVESTMENTS
OCTOBER 31, 2017
<TABLE>
<CAPTION>
PRINCIPAL STATED
VALUE DESCRIPTION RATE (a) MATURITY (b) VALUE
------------- --------------------------------------------------- ---------- -------------- --------------
<S> <C> <C> <C> <C>
SENIOR FLOATING-RATE LOAN INTERESTS - 59.3%
AEROSPACE & DEFENSE - 0.2%
$ 331,548 Transdigm, Inc., Term Loan F - Extended, 1 Mo.
LIBOR + 3.00%, 0.75% Floor...................... 4.24% 06/09/23 $ 332,834
178,538 Transdigm, Inc., Term Loan F - Extended, 3 Mo.
LIBOR + 3.00%, 0.75% Floor...................... 4.33% 06/09/23 179,231
--------------
512,065
--------------
AGRICULTURAL PRODUCTS - 0.0%
28,421 Dole Foods Co., Term Loan B, 1 Mo. LIBOR
+ 2.75%, 1.00% Floor............................ 3.99% 04/06/24 28,528
56,842 Dole Foods Co., Term Loan B, 2 Mo. LIBOR
+ 2.75%, 1.00% Floor............................ 4.02% 04/06/24 57,055
4,169 Dole Foods Co., Term Loan B, 3 Mo. LIBOR
+ 2.75%, 1.00% Floor............................ 4.08% 04/06/24 4,184
6 Dole Foods Co., Term Loan B, 3 Mo. PRIME
+ 1.75%, 1.00% Floor............................ 6.00% 04/06/24 6
--------------
89,773
--------------
ALTERNATIVE CARRIERS - 0.4%
1,000,000 Level 3 Financing, Inc., Tranche B 2024 Term Loan,
1 Mo. LIBOR + 2.25%, 0.00% Floor................ 3.49% 02/22/24 1,003,390
--------------
APPLICATION SOFTWARE - 2.9%
729,600 CCC Information Resources, Inc., Term Loan B,
1 Mo. LIBOR + 3.00%, 1.00% Floor................ 4.25% 03/31/24 732,336
367,078 Hyland Software, Term 3 Loan, 1 Mo. LIBOR
+ 3.25%, 0.75% Floor............................ 4.49% 07/01/22 370,444
693,809 Informatica Corp. (Ithacalux S.A.R.L), Dollar Term
Loan, 3 Mo. LIBOR + 3.50%, 1.00% Floor.......... 4.83% 08/05/22 694,968
2,061,659 JDA Software Group (RP Crown Parent, Inc.), Term
Loan B, 1 Mo. LIBOR + 3.00%, 1.00% Floor........ 4.24% 10/12/23 2,070,256
905,171 Kronos, Inc., Term Loan B, 3 Mo. LIBOR + 3.50%,
1.00% Floor..................................... 4.81% 11/01/23 911,218
188,927 LANDesk Software, Inc., Term Loan B, 1 Mo.
LIBOR + 4.25%, 1.00% Floor...................... 5.50% 01/18/24 184,204
60,190 Micro Focus International (MA Finance LLC),
MA Finance TLB3, 1 Mo. LIBOR + 2.75%,
0.00% Floor..................................... 3.99% 06/21/24 60,378
406,477 Micro Focus International (MA Finance LLC),
Seattle Spinco TLB, 1 Mo. LIBOR + 2.75%,
0.00% Floor..................................... 3.99% 06/21/24 407,749
2,626 Mitchell International, Inc., Initial Term Loan,
2 Mo. LIBOR + 3.50%, 1.00% Floor................ 4.81% 10/13/20 2,650
1,037,577 Mitchell International, Inc., Initial Term Loan,
3 Mo. LIBOR + 3.50%, 1.00% Floor................ 4.88% 10/13/20 1,047,092
342,000 Qlik Technologies (Project Alpha Intermediate
Holdings, Inc.), Term Loan B, 6 Mo. LIBOR
+ 3.50%, 1.00% Floor............................ 5.04% 04/26/24 334,093
--------------
6,815,388
--------------
ASSET MANAGEMENT & CUSTODY BANKS - 0.7%
359,100 First Eagle Investment Management, Term Loan B,
2 Mo. LIBOR + 3.00%, 0.75% Floor................ 4.36% 12/01/22 361,904
</TABLE>
Page 8 See Notes to Financial Statements
<PAGE>
FIRST TRUST SHORT DURATION HIGH INCOME FUND
PORTFOLIO OF INVESTMENTS (CONTINUED)
OCTOBER 31, 2017
<TABLE>
<CAPTION>
PRINCIPAL STATED
VALUE DESCRIPTION RATE (a) MATURITY (b) VALUE
------------- --------------------------------------------------- ---------- -------------- --------------
<S> <C> <C> <C> <C>
SENIOR FLOATING-RATE LOAN INTERESTS (CONTINUED)
ASSET MANAGEMENT & CUSTODY BANKS (CONTINUED)
$ 120,037 Guggenheim Partners Investment Management
Holdings LLC, Term Loan B, 1 Mo. LIBOR
+ 2.75%, 0.75% Floor............................ 3.99% 07/22/23 $ 120,638
1,097,292 Victory Capital Holdings (VCH Holdings LLC),
Initial Term Loan, 3 Mo. LIBOR + 5.25%,
1.00% Floor..................................... 6.58% 10/31/21 1,115,123
--------------
1,597,665
--------------
AUTO PARTS & EQUIPMENT - 0.3%
399,759 Gates Global LLC, Term Loan B, 3 Mo. LIBOR
+ 3.25%, 1.00% Floor............................ 4.58% 03/30/24 402,309
390,711 Tower Automotive Holdings USA LLC, Term Loan B,
1 Mo. LIBOR + 2.75%, 0.00% Floor................ 4.00% 03/06/24 392,012
--------------
794,321
--------------
BROADCASTING - 0.1%
44,109 Cumulus Media Holdings, Inc., Term Loan, 1 Mo.
LIBOR + 3.25%, 1.00% Floor...................... 4.50% 12/23/20 38,264
251,256 Tribune Media Co., Extended Term Loan C, 1 Mo.
LIBOR + 3.00%, 0.75% Floor...................... 4.24% 01/27/24 251,648
20,159 Tribune Media Co., Term B Loan, 1 Mo. LIBOR
+ 3.00%, 0.75% Floor............................ 4.24% 12/27/20 20,178
--------------
310,090
--------------
BUILDING PRODUCTS - 1.0%
86,913 Beacon Roofing Supply, Term Loan B, 1 Mo. LIBOR
+ 2.25%, 0.00% Floor............................ 3.49% 01/02/25 87,456
2,323,352 Quikrete Holdings, Inc., Term Loan B, 1 Mo. LIBOR
+ 2.75%, 0.00% Floor............................ 3.99% 11/15/23 2,333,668
--------------
2,421,124
--------------
CABLE & SATELLITE - 0.3%
553,846 UPC Financing Partnership, Term Loan AR, 1 Mo.
LIBOR + 2.50%, 0.00% Floor...................... 3.73% 01/15/26 555,463
130,000 Virgin Media Finance PLC, Term Loan I, 1 Mo.
LIBOR + 2.75%, 0.00% Floor...................... 3.99% 01/31/25 130,488
--------------
685,951
--------------
CASINOS & GAMING - 9.1%
89,063 Amaya Holdings B.V., 2nd Lien TL, 3 Mo. LIBOR
+ 7.00%, 1.00% Floor............................ 8.33% 07/31/22 90,398
4,640,577 Amaya Holdings B.V., Term Loan B, 3 Mo. LIBOR
+ 3.50%, 1.00% Floor............................ 4.83% 08/01/21 4,671,159
134,400 Aristocrat Technologies, Incremental 2024 Term Loan,
3 Mo. LIBOR + 2.00%, 0.00% Floor................ 3.36% 09/30/24 135,005
5,103,286 Caesars Entertainment Resort Properties LLC, Term
Loan B, 1 Mo. LIBOR + 3.50%, 1.00% Floor........ 4.74% 10/04/20 5,106,042
3,738,980 Caesars Growth Partners LLC, 2017 Term Loan,
1 Mo. LIBOR + 3.00%, 1.00% Floor................ 4.24% 05/08/21 3,739,765
4,400,000 Caesars Resort Collection, Term Loan B,
1 Mo. LIBOR + 2.75%, 0.00% Floor................ 3.99% 09/28/24 4,426,708
319,897 Golden Nugget, Term Loan B, 1 Mo. LIBOR
+ 3.25%, 0.75% Floor............................ 4.49% 10/04/23 323,051
</TABLE>
See Notes to Financial Statements Page 9
<PAGE>
FIRST TRUST SHORT DURATION HIGH INCOME FUND
PORTFOLIO OF INVESTMENTS (CONTINUED)
OCTOBER 31, 2017
<TABLE>
<CAPTION>
PRINCIPAL STATED
VALUE DESCRIPTION RATE (a) MATURITY (b) VALUE
------------- --------------------------------------------------- ---------- -------------- --------------
<S> <C> <C> <C> <C>
SENIOR FLOATING-RATE LOAN INTERESTS (CONTINUED)
CASINOS & GAMING (CONTINUED)
$ 422,228 Golden Nugget, Term Loan B, 2 Mo. LIBOR + 3.25%,
0.75% Floor..................................... 4.55% 10/04/23 $ 426,391
2,543,240 VICI Properties (Caesars), Term Loan B, 1 Mo.
LIBOR + 3.50%, 0.00% Floor...................... 4.75% 10/15/22 2,545,046
--------------
21,463,565
--------------
COAL & CONSUMABLE FUELS - 0.2%
232,478 Arch Coal, Inc., Initial Term Loan, 1 Mo. LIBOR +
3.25%, 1.00% Floor.............................. 4.49% 03/07/24 234,658
183,602 Peabody Energy Corp., Term Loan, 1 Mo. LIBOR
+ 3.50%, 1.00% Floor............................ 4.74% 03/31/22 184,806
--------------
419,464
--------------
COMMERCIAL PRINTING - 0.0%
85,500 Multi-Color Corp., Term Loan B, 1 Mo. LIBOR
+ 2.25%, 0.00% Floor............................ 3.49% 11/01/24 86,034
--------------
DIVERSIFIED CHEMICALS - 0.1%
184,211 Ineos US Finance LLC, Term Loan B, 1 Mo. LIBOR
+ 2.00%, 0.00% Floor............................ 3.24% 03/31/24 184,327
--------------
DIVERSIFIED SUPPORT SERVICES - 0.8%
325,276 Brickman Group Holdings, Inc., Initial Term Loan
(First Lien), 1 Mo. LIBOR + 3.00%, 1.00% Floor.. 4.24% 12/18/20 776,616
1,915 Brickman Group Holdings, Inc., Initial Term Loan
(First Lien), 2 Mo. LIBOR + 3.00%, 1.00% Floor.. 4.31% 12/18/20 4,572
398,843 Brickman Group Holdings, Inc., Initial Term Loan
(First Lien), 3 Mo. LIBOR + 3.00%, 1.00% Floor.. 4.38% 12/18/20 952,263
179,640 Brickman Group Holdings, Inc., Second Lien Term
Loan, 1 Mo. LIBOR + 6.50%, 1.00% Floor.......... 7.74% 12/17/21 180,186
--------------
1,913,637
--------------
ELECTRIC UTILITIES - 3.1%
752,646 Dayton Power & Light Co., Term Loan B, 1 Mo.
LIBOR + 3.25%, 0.75% Floor...................... 4.50% 08/24/22 761,587
6,433,623 Energy Future Intermediate Holding Co., DIP Term
Loan, 1 Mo. LIBOR + 3.00%, 1.00% Floor.......... 4.24% 06/28/18 6,473,834
--------------
7,235,421
--------------
ENVIRONMENTAL & FACILITIES SERVICES - 0.5%
387,828 PSSI (Packers Holdings LLC), PCKHLD TL B 1L
USD, 1 Mo. LIBOR + 3.50%, 1.00% Floor........... 4.73% 12/02/21 391,706
770,040 WTG Holdings III Corp. (EWT Holdings III Corp.),
Term Loan (First Lien), 3 Mo. LIBOR + 3.75%,
1.00% Floor..................................... 5.08% 01/15/21 775,815
--------------
1,167,521
--------------
FOOD DISTRIBUTORS - 0.2%
248,750 TKC Holdings, Inc., Term Loan B, 2 Mo. LIBOR
+ 4.25%, 1.00% Floor............................ 5.52% 01/31/23 251,238
296,250 US Foods, Inc., Term Loan B, 1 Mo. LIBOR + 2.75%,
0.75% Floor..................................... 4.00% 06/27/23 298,534
--------------
549,772
--------------
</TABLE>
Page 10 See Notes to Financial Statements
<PAGE>
FIRST TRUST SHORT DURATION HIGH INCOME FUND
PORTFOLIO OF INVESTMENTS (CONTINUED)
OCTOBER 31, 2017
<TABLE>
<CAPTION>
PRINCIPAL STATED
VALUE DESCRIPTION RATE (a) MATURITY (b) VALUE
------------- --------------------------------------------------- ---------- -------------- --------------
<S> <C> <C> <C> <C>
SENIOR FLOATING-RATE LOAN INTERESTS (CONTINUED)
FOOD RETAIL - 1.2%
$ 954,391 Albertsons LLC, Term Loan B5, 3 Mo. LIBOR
+ 3.00%, 0.75% Floor............................ 4.33% 12/21/22 $ 923,269
1,881,617 Albertsons LLC, Term Loan B6, 3 Mo. LIBOR
+ 3.00%, 0.75% Floor............................ 4.32% 06/22/23 1,821,255
--------------
2,744,524
--------------
HEALTH CARE EQUIPMENT - 0.3%
318,841 DJO Finance LLC (ReAble Therapeutics Finance
LLC), Initial Term Loan, 1 Mo. LIBOR + 3.25%,
1.00% Floor..................................... 4.49% 06/08/20 318,908
326,309 DJO Finance LLC (ReAble Therapeutics Finance
LLC), Initial Term Loan, 3 Mo. LIBOR + 3.25%,
1.00% Floor..................................... 4.59% 06/08/20 326,378
99,750 Kinetic Concepts, Inc. (Acelity L.P., Inc.), Term
Loan B, 3 Mo. LIBOR + 3.25%, 1.00% Floor........ 4.58% 01/31/24 99,600
--------------
744,886
--------------
HEALTH CARE FACILITIES - 1.3%
201,207 Acadia Healthcare Co., Inc., Term Loan B1, 1 Mo.
LIBOR + 2.75%, 0.75% Floor...................... 3.99% 02/11/22 202,340
122,813 Acadia Healthcare Co., Inc., Term Loan B2, 1 Mo.
LIBOR + 2.75%, 0.75% Floor...................... 3.99% 02/16/23 123,388
1,422,116 CHS/Community Health Systems, Inc., Incremental
2021 Term H Loan, 3 Mo. LIBOR + 3.00%,
1.00% Floor..................................... 4.32% 01/27/21 1,374,447
355,908 Concentra, Inc. (MJ Acquisition Corp.), Term Loan B,
3 Mo. LIBOR + 3.00%, 1.00% Floor................ 4.32% 06/01/22 357,022
101 Concentra, Inc. (MJ Acquisition Corp.), Term Loan B,
3 Mo. PRIME + 2.00%, 1.00% Floor................ 6.25% 06/01/22 101
868,837 Kindred Healthcare, Inc., New Term Loan,
3 Mo. LIBOR + 3.50%, 1.00% Floor................ 4.88% 04/09/21 871,009
237,891 National Veterinary Associates (NVA Holdings, Inc.),
Term Loan B2, 3 Mo. LIBOR + 3.50%, 1.00%
Floor........................................... 4.83% 08/14/21 239,973
--------------
3,168,280
--------------
HEALTH CARE SERVICES - 4.6%
944,072 21st Century Oncology, Inc., Tranche B Term Loan,
3 Mo. LIBOR + 6.13%, 1.00% Floor (c)............ 7.47% 04/30/22 887,427
62,400 Air Medical Group Holdings, Inc., New Term Loan B,
1 Mo. LIBOR + 4.25%, 1.00% Floor................ 5.49% 09/30/24 62,673
98,751 Air Medical Group Holdings, Inc., Term Loan B1,
1 Mo. LIBOR + 4.00%, 1.00% Floor................ 5.24% 04/28/22 99,121
820,619 Air Methods Corp. (ASP AMC Intermediate
Holdings, Inc.), Term Loan B, 3 Mo. LIBOR
+ 3.50%, 1.00% Floor............................ 4.83% 04/13/24 818,567
709,697 CareCore National LLC, Term Loan B, 1 Mo. LIBOR
+ 4.00%, 1.00% Floor............................ 5.24% 03/06/21 710,584
907 CHG Healthcare Services, Inc., Term Loan B, 2 Mo.
LIBOR + 3.25%, 1.00% Floor...................... 4.56% 06/07/23 915
</TABLE>
See Notes to Financial Statements Page 11
<PAGE>
FIRST TRUST SHORT DURATION HIGH INCOME FUND
PORTFOLIO OF INVESTMENTS (CONTINUED)
OCTOBER 31, 2017
<TABLE>
<CAPTION>
PRINCIPAL STATED
VALUE DESCRIPTION RATE (a) MATURITY (b) VALUE
------------- --------------------------------------------------- ---------- -------------- --------------
<S> <C> <C> <C> <C>
SENIOR FLOATING-RATE LOAN INTERESTS (CONTINUED)
HEALTH CARE SERVICES (CONTINUED)
$ 356,465 CHG Healthcare Services, Inc., Term Loan B, 3 Mo.
LIBOR + 3.25%, 1.00% Floor...................... 4.63% 06/07/23 $ 359,584
1,107,270 Curo Health Services Holdings, Inc., Term Loan B,
3 Mo. LIBOR + 4.00%, 1.00% Floor................ 5.31% 02/05/22 1,107,967
1,127,280 DuPage Medical Group, Initial Term Loan, 3 Mo.
LIBOR + 3.00%, 0.75% Floor...................... 4.32% 08/15/24 1,131,508
170,569 Envision Healthcare Corp. (Emergency Medical
Services Corp.), Term Loan B, 1 Mo. LIBOR
+ 3.00%, 0.75% Floor............................ 4.25% 12/01/23 171,209
198,004 ExamWorks Group, Inc., Term Loan B, 1 Mo. LIBOR
+ 3.25%, 1.00% Floor............................ 4.49% 07/27/23 199,572
1,293,941 Healogics, Inc. (CDRH Parent, Inc.), Initial Term
Loan (First Lien), 3 Mo. LIBOR + 4.25%, 1.00%
Floor........................................... 5.57% 07/01/21 1,080,441
857,143 Surgery Centers Holdings, Inc., Term Loan B, 1 Mo.
LIBOR + 3.25%, 1.00% Floor...................... 4.50% 06/30/24 849,214
1,970,100 Team Health, Inc., Term Loan B, 1 Mo. LIBOR
+ 2.75%, 1.00% Floor............................ 3.99% 02/06/24 1,952,862
1,521,016 U.S. Renal Care, Inc., Term Loan B, 3 Mo. LIBOR
+ 4.25%, 1.00% Floor............................ 5.58% 12/30/22 1,468,055
--------------
10,899,699
--------------
HOUSEHOLD APPLIANCES - 0.2%
54,237 Traeger Grills, Delayed Draw Term Loan, 3 Mo.
LIBOR + 5.00%, 1.00% Floor (d).................. 2.50% (e) 09/25/24 54,780
345,763 Traeger Grills, Closing Date Term Loan, 3 Mo.
LIBOR + 5.00%, 1.00% Floor...................... 6.33% 09/30/24 349,220
--------------
404,000
--------------
HUMAN RESOURCE & EMPLOYMENT SERVICES - 0.2%
427,500 Tempo Acquisition, Term Loan B, 1 Mo. LIBOR
+ 3.00%, 0.00% Floor............................ 4.24% 05/01/24 428,748
--------------
HYPERMARKETS & SUPER CENTERS - 1.4%
3,060,065 BJ's Wholesale Club, Inc., 1st Lien Term Loan, 1 Mo.
LIBOR + 3.75%, 1.00% Floor...................... 4.99% 01/31/24 2,979,738
363,261 BJ's Wholesale Club, Inc., 2nd Lien Term Loan, 1 Mo.
LIBOR + 7.50%, 1.00% Floor...................... 8.74% 01/26/25 350,547
--------------
3,330,285
--------------
INSURANCE BROKERS - 1.4%
125,712 Confie Seguros Holding II Co., Term Loan B, 1 Mo.
LIBOR + 5.75%, 1.00% Floor...................... 6.99% 04/19/22 124,534
1,270,276 HUB International Ltd., Initial Term Loan (New),
3 Mo. LIBOR + 3.00%, 1.00% Floor................ 4.31% 10/02/20 1,279,701
753,905 National Financial Partners Corp., Term Loan B,
1 Mo. LIBOR + 3.50%, 1.00% Floor................ 4.74% 01/08/24 761,210
1,068,571 USI, Inc. (Compass Investors, Inc.), Term Loan B,
3 Mo. LIBOR + 3.00%, 0.00% Floor................ 4.31% 05/15/24 1,070,794
--------------
3,236,239
--------------
</TABLE>
Page 12 See Notes to Financial Statements
<PAGE>
FIRST TRUST SHORT DURATION HIGH INCOME FUND
PORTFOLIO OF INVESTMENTS (CONTINUED)
OCTOBER 31, 2017
<TABLE>
<CAPTION>
PRINCIPAL STATED
VALUE DESCRIPTION RATE (a) MATURITY (b) VALUE
------------- --------------------------------------------------- ---------- -------------- --------------
<S> <C> <C> <C> <C>
SENIOR FLOATING-RATE LOAN INTERESTS (CONTINUED)
INTEGRATED TELECOMMUNICATION SERVICES - 2.3%
$ 3,672,788 Century Link (Qwest), Term Loan B, 1 Mo. LIBOR
+ 2.75%, 0.00% Floor............................ 2.75% 01/31/25 $ 3,623,830
1,675,317 Numericable U.S. LLC (Altice France S.A.), Term
Loan B12, 3 Mo. LIBOR + 3.00%, 0.00% Floor...... 4.35% 01/06/26 1,675,702
--------------
5,299,532
--------------
LEISURE FACILITIES - 1.7%
2,508,000 ClubCorp Club Operations, Inc., Term Loan B, 3 Mo.
LIBOR + 3.25%, 0.00% Floor...................... 4.59% 08/31/24 2,517,405
1,036,682 Planet Fitness Holdings LLC, Term Loan B, 1 Mo.
LIBOR + 3.00%, 0.75% Floor...................... 4.24% 03/31/21 1,044,457
338,301 Planet Fitness Holdings LLC, Term Loan B, 3 Mo.
LIBOR + 3.00%, 0.75% Floor...................... 4.33% 03/31/21 340,839
--------------
3,902,701
--------------
LIFE SCIENCES TOOLS & SERVICES - 1.7%
255,154 Immucor, Inc., Term Loan B (First Lien), 2 Mo.
LIBOR + 5.00%, 1.00% Floor...................... 6.31% 06/25/21 259,859
672,000 IMS Health, Inc. (Quintiles Transnational), Term B-2
Loan, 3 Mo. LIBOR + 2.00%, 0.00% Floor.......... 3.32% 01/17/25 676,442
1,048,125 Ortho-Clinical Diagnostics, Inc. (Crimson Merger
Sub, Inc.), Initial Term Loan, 3 Mo. LIBOR
+ 3.75%, 1.00% Floor............................ 5.08% 06/30/21 1,052,936
84,000 Parexel (West Street Merger), Term Loan B, 1 Mo.
LIBOR + 3.00%, 0.00% Floor...................... 4.24% 09/27/24 84,750
458,929 Pharmaceutical Product Development, Inc., Term
Loan B, 1 Mo. LIBOR + 2.75%, 1.00% Floor........ 3.99% 08/18/22 461,366
510,751 Pharmaceutical Product Development, Inc., Term
Loan B, 3 Mo. LIBOR + 2.75%, 1.00% Floor........ 4.08% 08/18/22 513,463
930,692 Sterigenics International (STHI Intermediate Holding
Corp.), Term Loan B, 1 Mo. LIBOR + 3.00%,
1.00% Floor..................................... 4.24% 05/15/22 930,692
--------------
3,979,508
--------------
MANAGED HEALTH CARE - 0.6%
1,464,292 MultiPlan, Inc. (MPH Acquisition Holdings LLC),
Term Loan B, 3 Mo. LIBOR + 3.00%, 1.00%
Floor........................................... 4.33% 06/07/23 1,477,895
--------------
METAL & GLASS CONTAINERS - 0.4%
461,244 Berlin Packaging LLC, Term Loan B, 1 Mo. LIBOR
+ 3.25%, 1.00% Floor............................ 4.49% 10/01/21 464,418
149,755 Berlin Packaging LLC, Term Loan B, 1 Mo. LIBOR
+ 3.25%, 1.00% Floor............................ 4.50% 10/01/21 150,785
365,402 Berlin Packaging LLC, Term Loan B, 3 Mo. LIBOR
+ 3.25%, 1.00% Floor............................ 4.59% 10/01/21 367,915
--------------
983,118
--------------
MOVIES & ENTERTAINMENT - 0.7%
446,625 Creative Artists Agency LLC (CAA Holdings LLC),
Term Loan B, 1 Mo. LIBOR + 3.50%, 1.00%
Floor........................................... 4.74% 02/15/24 451,091
</TABLE>
See Notes to Financial Statements Page 13
<PAGE>
FIRST TRUST SHORT DURATION HIGH INCOME FUND
PORTFOLIO OF INVESTMENTS (CONTINUED)
OCTOBER 31, 2017
<TABLE>
<CAPTION>
PRINCIPAL STATED
VALUE DESCRIPTION RATE (a) MATURITY (b) VALUE
------------- --------------------------------------------------- ---------- -------------- --------------
<S> <C> <C> <C> <C>
SENIOR FLOATING-RATE LOAN INTERESTS (CONTINUED)
MOVIES & ENTERTAINMENT (CONTINUED)
$ 1,166,346 Formula One (Delta 2 Lux S.A.R.L.), Facility B3
(USD) Loan, 1 Mo. LIBOR + 3.00%, 1.00%
Floor........................................... 4.24% 02/01/24 $ 1,174,849
--------------
1,625,940
--------------
OIL & GAS EXPLORATION & PRODUCTION - 0.1%
377,825 American Energy Marcellus Holdings LLC (Ascent
Resources - Marcellus LLC), Initial Loan (First
Lien), 2 Mo. LIBOR + 4.25%, 1.00% Floor (g)..... 5.49% 08/04/20 277,891
472,222 American Energy Marcellus Holdings LLC (Ascent
Resources - Marcellus LLC), Initial Loan (Second
Lien), 1 Mo. LIBOR + 7.50%, 1.00% Floor (g)..... 8.74% 08/04/21 29,221
--------------
307,112
--------------
OTHER DIVERSIFIED FINANCIAL SERVICES - 0.4%
179,550 iPayment, Inc., Term Loan B, 3 Mo. LIBOR + 6.00%,
1.00% Floor..................................... 7.35% 04/11/23 181,345
790,000 Wex, Inc., Term Loan B, 1 Mo. LIBOR + 2.75%,
0.00% Floor..................................... 3.99% 07/01/23 798,327
--------------
979,672
--------------
PACKAGED FOODS & MEATS - 1.0%
1,485,000 Amplify Snack Brands, Inc., Term Loan B, 1 Mo.
LIBOR + 5.50%, 1.00% Floor...................... 6.74% 08/31/23 1,475,259
762,712 Post Holdings, Inc., Series A Incremental Term Loan,
1 Mo. LIBOR + 2.25%, 0.00% Floor................ 3.60% 05/30/24 766,388
--------------
2,241,647
--------------
PAPER PACKAGING - 1.5%
3,470,056 Reynolds Group Holdings, Inc., 2017 Incremental US
Term Loan, 1 Mo. LIBOR + 2.75%, 0.00% Floor..... 3.99% 02/05/23 3,489,558
--------------
PHARMACEUTICALS - 4.7%
330,206 Akorn, Inc., Loan, 1 Mo. LIBOR + 4.25%, 1.00%
Floor........................................... 5.50% 04/16/21 331,444
1,636,747 Amneal Pharmaceuticals LLC, Term Loan B, 3 Mo.
LIBOR + 3.50%, 1.00% Floor...................... 4.83% 11/01/19 1,644,930
1,122,764 Catalent Pharma Solutions, Inc., Term Loan B, 1 Mo.
LIBOR + 2.25%, 1.00% Floor...................... 3.49% 05/20/24 1,132,588
1,362,564 Concordia Healthcare Corp., Initial Dollar Term Loan,
1 Mo. LIBOR + 4.25%, 1.00% Floor (c)............ 5.49% 10/21/21 1,134,525
1,984,029 Endo Pharmaceuticals Holdings, Inc., Term Loan B,
1 Mo. LIBOR + 4.25%, 0.75% Floor................ 5.50% 04/29/24 2,009,822
2,178,079 Horizon Pharma, Inc., Term Loan B, 1 Mo. LIBOR
+ 3.25%, 1.00% Floor............................ 4.50% 03/29/24 2,182,849
2,542,910 Valeant Pharmaceuticals International, Inc.,
Series F-1 Tranche B Term Loan, 1 Mo. LIBOR
+ 4.75%, 0.75% Floor............................ 5.99% 04/01/22 2,598,549
--------------
11,034,707
--------------
</TABLE>
Page 14 See Notes to Financial Statements
<PAGE>
FIRST TRUST SHORT DURATION HIGH INCOME FUND
PORTFOLIO OF INVESTMENTS (CONTINUED)
OCTOBER 31, 2017
<TABLE>
<CAPTION>
PRINCIPAL STATED
VALUE DESCRIPTION RATE (a) MATURITY (b) VALUE
------------- --------------------------------------------------- ---------- -------------- --------------
<S> <C> <C> <C> <C>
SENIOR FLOATING-RATE LOAN INTERESTS (CONTINUED)
PROPERTY & CASUALTY INSURANCE - 0.5%
$ 561,144 Cunningham Lindsey U.S., Inc., Initial Term Loan
(First Lien), 3 Mo. LIBOR + 3.75%, 1.25% Floor.. 5.08% 12/10/19 $ 550,387
600,000 Sedgwick Claims Management Services, Inc., Initial
Loan (Second Lien), 1 Mo. LIBOR + 5.75%,
1.00% Floor..................................... 6.99% 02/28/22 605,250
--------------
1,155,637
--------------
REAL ESTATE SERVICES - 0.3%
509,339 DTZ Worldwide LTD., 2015-1 Additional Term Loan,
3 Mo. LIBOR + 3.25%, 1.00% Floor................ 4.57% 11/04/21 512,125
31,450 DTZ Worldwide LTD., 2015-1 Additional Term Loan,
3 Mo. LIBOR + 3.25%, 1.00% Floor................ 4.58% 11/04/21 31,622
228,883 DTZ Worldwide LTD., 2015-1 Additional Term Loan,
3 Mo. LIBOR + 3.25%, 1.00% Floor................ 4.63% 11/04/21 230,135
--------------
773,882
--------------
RESEARCH & CONSULTING SERVICES - 1.7%
1,484,119 Acosta, Inc., Term Loan B, 1 Mo. LIBOR + 3.25%,
1.00% Floor..................................... 4.49% 09/26/21 1,306,025
2,878 Advantage Sales & Marketing, Inc., Initial Term Loan
(First Lien), 2 Mo. LIBOR + 3.25%, 1.00% Floor.. 4.56% 07/23/21 2,721
1,113,913 Advantage Sales & Marketing, Inc., Initial Term Loan
(First Lien), 3 Mo. LIBOR + 3.25%, 1.00% Floor.. 4.63% 07/23/21 1,052,993
1,691,500 Information Resources, Inc., Term Loan B, 3 Mo.
LIBOR + 4.25%, 1.00% Floor...................... 5.62% 01/18/24 1,709,125
--------------
4,070,864
--------------
RESTAURANTS - 1.7%
1,000,000 Portillo's Holdings LLC, Second Lien Term Loan,
3 Mo. LIBOR + 8.00%, 1.00% Floor................ 9.33% 08/15/22 1,000,000
2,575,175 Portillo's Holdings LLC, Term B Loan (First Lien),
3 Mo. LIBOR + 4.50%, 1.00% Floor................ 5.83% 08/02/21 2,588,051
415,714 Red Lobster Management LLC, Initial Term Loan
(First Lien), 1 Mo. LIBOR + 5.25%, 1.00% Floor.. 6.49% 07/28/21 421,950
--------------
4,010,001
--------------
RETAIL REITS - 0.5%
1,134,594 Capital Automotive LLC, 2nd Lien Term Loan, 1 Mo.
LIBOR + 6.00%, 1.00% Floor...................... 7.25% 03/15/25 1,162,959
--------------
SECURITY & ALARM SERVICES - 0.2%
538,670 Garda World Security Corp., Term Loan B, 3 Mo.
LIBOR + 4.00%, 1.00% Floor...................... 5.31% 05/15/24 542,844
--------------
SEMICONDUCTORS - 0.3%
711,027 Western Digital Corp., Term Loan B, 1 Mo. LIBOR
+ 2.75%, 0.75% Floor............................ 3.99% 04/29/23 713,160
--------------
SPECIALIZED CONSUMER SERVICES - 0.7%
1,079,429 Asurion LLC, Replacement TL B-5, 1 Mo. LIBOR
+ 3.00%, 0.00% Floor............................ 4.24% 11/03/23 1,088,205
</TABLE>
See Notes to Financial Statements Page 15
<PAGE>
FIRST TRUST SHORT DURATION HIGH INCOME FUND
PORTFOLIO OF INVESTMENTS (CONTINUED)
OCTOBER 31, 2017
<TABLE>
<CAPTION>
PRINCIPAL STATED
VALUE DESCRIPTION RATE (a) MATURITY (b) VALUE
------------- --------------------------------------------------- ---------- -------------- --------------
<S> <C> <C> <C> <C>
SENIOR FLOATING-RATE LOAN INTERESTS (CONTINUED)
SPECIALIZED CONSUMER SERVICES (CONTINUED)
$ 250,000 Asurion LLC, Term Loan (Second Lien) 2017, 1 Mo.
LIBOR + 6.00%, 0.00% Floor...................... 7.24% 07/31/25 $ 257,970
274,744 Asurion LLC, Term Loan B4, 1 Mo. LIBOR + 2.75%,
1.00% Floor..................................... 3.99% 08/04/22 276,760
--------------
1,622,935
--------------
SPECIALIZED FINANCE - 1.4%
1,791,000 AlixPartners LLP, Term Loan B, 3 Mo. LIBOR
+ 2.75%, 0.00% Floor............................ 4.08% 04/04/24 1,798,845
1,358,281 Duff & Phelps Corp., Restatement Term Loan, 3 Mo.
LIBOR + 3.25%, 1.00% Floor...................... 4.61% 10/12/24 1,371,021
--------------
3,169,866
--------------
SPECIALTY CHEMICALS - 0.2%
434,000 H.B. Fuller, Term Loan B, 1 Mo. LIBOR + 2.25%,
0.00% Floor..................................... 3.49% 10/20/24 436,352
81,382 Platform Specialty Products Corp. (fka: Macdermid,
Inc.), Term Loan B6, 1 Mo. LIBOR + 3.00%,
1.00% Floor..................................... 4.24% 06/07/23 81,841
--------------
518,193
--------------
SPECIALTY STORES - 0.7%
44,186 Party City Holdings, Inc., Term Loan B, 3 Mo.
LIBOR + 3.00%, 0.75% Floor...................... 4.34% 08/19/22 44,297
449,301 Party City Holdings, Inc., Term Loan B, 3 Mo.
LIBOR + 3.00%, 0.75% Floor...................... 4.38% 08/19/22 450,423
189,589 Party City Holdings, Inc., Term Loan B, 6 Mo.
LIBOR + 3.00%, 0.75% Floor...................... 4.58% 08/19/22 190,063
1,298,178 Toys "R" US-Delaware, Inc., Term B-2 Loan, 3 Mo.
LIBOR + 3.75%, 1.50% Floor (c).................. 5.25% 05/25/18 480,326
166,667 Toys "R" US-Delaware, Inc., Term B-3 Loan, 3 Mo.
LIBOR + 3.75%, 1.50% Floor (c).................. 5.25% 05/25/18 61,667
745,923 Toys "R" US-Delaware, Inc., Term B-4 Loan, 3 Mo.
LIBOR + 8.75%, 1.00% Floor (c).................. 10.07% 04/25/20 426,340
--------------
1,653,116
--------------
SYSTEMS SOFTWARE - 4.5%
342,400 Applied Systems, Inc., 1st Lien Term Loan, 3 Mo.
LIBOR + 3.25%, 1.00% Floor...................... 4.57% 09/13/24 346,584
234,945 Applied Systems, Inc., 2nd Lien Term Loan, 3 Mo.
LIBOR + 7.00%, 1.00% Floor...................... 8.32% 09/13/25 241,993
850,704 Avast Software B.V. (Sybil Software LLC), Initial
Refinancing Dollar Term Loan, 3 Mo. LIBOR +
3.25%, 1.00% Floor.............................. 4.58% 09/30/23 854,958
4,760,264 BMC Software Finance, Inc., Term Loan B, 1 Mo.
LIBOR + 4.00%, 1.00% Floor...................... 5.24% 09/10/22 4,792,062
2,059,092 Compuware Corp., Term Loan B3, 3 Mo. LIBOR
+ 4.25%, 1.00% Floor............................ 5.63% 12/15/21 2,087,404
772,267 Misys Financial Software Ltd. (Almonde, Inc.), Term
Loan B, 3 Mo. LIBOR + 3.50%, 1.00% Floor........ 4.82% 06/13/24 769,147
</TABLE>
Page 16 See Notes to Financial Statements
<PAGE>
FIRST TRUST SHORT DURATION HIGH INCOME FUND
PORTFOLIO OF INVESTMENTS (CONTINUED)
OCTOBER 31, 2017
<TABLE>
<CAPTION>
PRINCIPAL STATED
VALUE DESCRIPTION RATE (a) MATURITY (b) VALUE
------------- --------------------------------------------------- ---------- -------------- --------------
<S> <C> <C> <C> <C>
SENIOR FLOATING-RATE LOAN INTERESTS (CONTINUED)
SYSTEMS SOFTWARE (CONTINUED)
$ 247,584 Riverbed Technology, Inc., Term Loan B, 1 Mo.
LIBOR + 3.25%, 1.00% Floor...................... 4.50% 04/24/22 $ 236,908
1,269,750 Vertafore, Inc., Term Loan B, 1 Mo. LIBOR + 3.25%,
1.00% Floor..................................... 4.49% 06/30/23 1,277,686
--------------
10,606,742
--------------
TRADING COMPANIES & DISTRIBUTORS - 1.0%
2,324,175 Avolon Holding LTD., Term Loan B2, 1 Mo. LIBOR
+ 2.25%, 0.75% Floor............................ 3.49% 04/03/22 2,341,467
--------------
TOTAL SENIOR FLOATING-RATE LOAN INTERESTS........................................ 139,869,225
(Cost $141,746,113) --------------
PRINCIPAL STATED STATED
VALUE DESCRIPTION COUPON MATURITY VALUE
------------- --------------------------------------------------- ---------- -------------- --------------
CORPORATE BONDS AND NOTES - 30.4%
AGRICULTURAL PRODUCTS - 0.1%
150,000 Lamb Weston Holdings, Inc. (f)..................... 4.63% 11/01/24 157,500
--------------
APPLICATION SOFTWARE - 0.5%
1,000,000 Infor (US), Inc.................................... 6.50% 05/15/22 1,047,500
198,000 RP Crown Parent LLC (f)............................ 7.38% 10/15/24 206,415
--------------
1,253,915
--------------
AUTOMOTIVE RETAIL - 0.1%
155,000 KAR Auction Services, Inc. (f)..................... 5.13% 06/01/25 160,813
--------------
BROADCASTING - 1.6%
375,000 LIN Television Corp................................ 5.88% 11/15/22 392,343
100,000 Nexstar Broadcasting, Inc. (f)..................... 6.13% 02/15/22 104,250
2,000,000 Nexstar Broadcasting, Inc. (f)..................... 5.63% 08/01/24 2,055,000
1,000,000 Sinclair Television Group, Inc. (f)................ 5.63% 08/01/24 1,017,500
264,000 Sinclair Television Group, Inc. (f)................ 5.88% 03/15/26 267,630
51,000 Sinclair Television Group, Inc. (f)................ 5.13% 02/15/27 48,769
--------------
3,885,492
--------------
BUILDING PRODUCTS - 0.3%
500,000 Cemex Finance LLC (f).............................. 6.00% 04/01/24 530,000
176,000 Standard Industries, Inc. (f)...................... 5.00% 02/15/27 183,867
--------------
713,867
--------------
CABLE & SATELLITE - 1.7%
972,000 Altice US Finance I Corp. (f)...................... 5.50% 05/15/26 1,013,310
1,500,000 CCO Holdings LLC/CCO Holdings Capital Corp......... 5.75% 01/15/24 1,561,875
200,000 CCO Holdings LLC/CCO Holdings Capital
Corp. (f)....................................... 5.88% 04/01/24 213,500
1,000,000 Cequel Communications Holdings I LLC/Cequel
Capital Corp. (f)............................... 5.13% 12/15/21 1,022,500
131,000 CSC Holdings LLC (f)............................... 5.50% 04/15/27 135,257
--------------
3,946,442
--------------
</TABLE>
See Notes to Financial Statements Page 17
<PAGE>
FIRST TRUST SHORT DURATION HIGH INCOME FUND
PORTFOLIO OF INVESTMENTS (CONTINUED)
OCTOBER 31, 2017
<TABLE>
<CAPTION>
PRINCIPAL STATED STATED
VALUE DESCRIPTION COUPON MATURITY VALUE
------------- --------------------------------------------------- ---------- -------------- --------------
<S> <C> <C> <C> <C>
CORPORATE BONDS AND NOTES (CONTINUED)
CASINOS & GAMING - 4.1%
$ 287,000 Caesars Entertainment Resort Properties LLC/Caesars
Entertainment Resort Properties Finance, Inc.... 8.00% 10/01/20 $ 294,175
1,482,000 Caesars Entertainment Resort Properties LLC/Caesars
Entertainment Resort Properties Finance, Inc.... 11.00% 10/01/21 1,574,625
4,533,000 Caesars Growth Properties Holdings LLC/Caesars
Growth Properties Finance, Inc.................. 9.38% 05/01/22 4,886,574
387,000 Eldorado Resorts, Inc.............................. 6.00% 04/01/25 410,220
1,850,000 MGM Resorts International.......................... 7.75% 03/15/22 2,151,883
459,000 Penn National Gaming, Inc. (f)..................... 5.63% 01/15/27 476,212
--------------
9,793,689
--------------
COMMUNICATIONS EQUIPMENT - 0.0%
15,000 CommScope Technologies LLC (f)..................... 5.00% 03/15/27 14,644
--------------
COMPUTER & ELECTRONICS RETAIL - 0.0%
100,000 Energizer Holdings, Inc. (f)....................... 5.50% 06/15/25 105,250
--------------
CONSTRUCTION MATERIALS - 0.0%
16,000 Summit Materials LLC/Summit Materials Finance
Corp. (f)....................................... 5.13% 06/01/25 16,240
--------------
CONSUMER FINANCE - 0.0%
79,000 FirstCash, Inc. (f)................................ 5.38% 06/01/24 82,926
--------------
DIVERSIFIED METALS & MINING - 0.2%
500,000 Freeport-McMoRan, Inc.............................. 6.88% 02/15/23 549,435
--------------
DIVERSIFIED REAL ESTATE ACTIVITIES - 0.4%
500,000 Meritage Homes Corp................................ 7.00% 04/01/22 572,500
355,000 TRI Pointe Group, Inc./TRI Pointe Homes, Inc....... 5.88% 06/15/24 386,063
--------------
958,563
--------------
ENVIRONMENTAL & FACILITIES SERVICES - 0.0%
30,000 Wrangler Buyer Corp. (f)........................... 6.00% 10/01/25 30,825
--------------
FOOD RETAIL - 0.1%
270,000 Albertsons Cos., LLC/Safeway, Inc./New Albertson's,
Inc./Albertson's LLC............................ 5.75% 03/15/25 238,950
--------------
HEALTH CARE EQUIPMENT - 1.0%
2,050,000 DJO Finco, Inc./DJO Finance LLC/DJO Finance
Corp. (f)....................................... 8.13% 06/15/21 1,968,000
300,000 Hill-Rom Holdings, Inc. (f)........................ 5.75% 09/01/23 317,250
39,000 Hologic, Inc. (f).................................. 4.38% 10/15/25 39,721
--------------
2,324,971
--------------
HEALTH CARE FACILITIES - 6.1%
3,978,000 CHS/Community Health Systems, Inc.................. 8.00% 11/15/19 3,803,962
1,100,000 CHS/Community Health Systems, Inc.................. 6.88% 02/01/22 800,250
160,000 CHS/Community Health Systems, Inc.................. 6.25% 03/31/23 154,600
375,000 HCA, Inc........................................... 5.38% 02/01/25 387,656
750,000 HealthSouth Corp................................... 5.75% 11/01/24 769,219
1,250,000 Kindred Healthcare, Inc............................ 8.00% 01/15/20 1,268,750
500,000 Kindred Healthcare, Inc............................ 6.38% 04/15/22 465,250
1,500,000 Select Medical Corp................................ 6.38% 06/01/21 1,548,750
</TABLE>
Page 18 See Notes to Financial Statements
<PAGE>
FIRST TRUST SHORT DURATION HIGH INCOME FUND
PORTFOLIO OF INVESTMENTS (CONTINUED)
OCTOBER 31, 2017
<TABLE>
<CAPTION>
PRINCIPAL STATED STATED
VALUE DESCRIPTION COUPON MATURITY VALUE
------------- --------------------------------------------------- ---------- -------------- --------------
<S> <C> <C> <C> <C>
CORPORATE BONDS AND NOTES (CONTINUED)
HEALTH CARE FACILITIES (CONTINUED)
$ 500,000 Tenet Healthcare Corp.............................. 6.75% 02/01/20 $ 510,625
1,231,000 Tenet Healthcare Corp. (f)......................... 7.50% 01/01/22 1,300,244
3,339,000 Tenet Healthcare Corp.............................. 8.13% 04/01/22 3,368,216
--------------
14,377,522
--------------
HEALTH CARE SERVICES - 0.5%
487,000 DaVita, Inc........................................ 5.00% 05/01/25 480,913
600,000 Envision Healthcare Corp........................... 5.63% 07/15/22 612,750
--------------
1,093,663
--------------
HEALTH CARE TECHNOLOGY - 0.5%
1,170,000 Change Healthcare Holdings LLC/Change Healthcare
Finance, Inc. (f)............................... 5.75% 03/01/25 1,200,713
--------------
HOTELS, RESORTS & CRUISE LINES - 0.1%
160,000 Hilton Worldwide Finance LLC/Hilton Worldwide
Finance Corp.................................... 4.63% 04/01/25 165,400
--------------
INDEPENDENT POWER PRODUCERS & ENERGY TRADERS - 0.4%
62,000 Calpine Corp....................................... 5.50% 02/01/24 59,598
800,000 NRG Energy, Inc.................................... 6.25% 07/15/22 844,000
--------------
903,598
--------------
INDUSTRIAL MACHINERY - 0.1%
142,000 SPX Flow, Inc. (f)................................. 5.63% 08/15/24 150,875
142,000 SPX Flow, Inc. (f)................................. 5.88% 08/15/26 151,585
--------------
302,460
--------------
INTEGRATED TELECOMMUNICATION SERVICES - 0.7%
1,000,000 Frontier Communications Corp....................... 8.13% 10/01/18 1,021,000
498,000 Zayo Group LLC/Zayo Capital, Inc. (f).............. 5.75% 01/15/27 526,013
--------------
1,547,013
--------------
INVESTMENT BANKING & BROKERAGE - 0.5%
1,050,000 LPL Holdings, Inc. (f)............................. 5.75% 09/15/25 1,094,625
--------------
IT CONSULTING & OTHER SERVICES - 0.1%
176,000 Gartner, Inc. (f).................................. 5.13% 04/01/25 186,560
--------------
LEISURE FACILITIES - 2.0%
2,250,000 Constellation Merger Sub, Inc. (f)................. 8.50% 09/15/25 2,244,375
2,325,000 Six Flags Entertainment Corp. (f).................. 4.88% 07/31/24 2,397,656
--------------
4,642,031
--------------
LIFE SCIENCES TOOLS & SERVICES - 1.1%
151,000 inVentiv Group Holdings, Inc./inVentiv Health, Inc./
inVentiv Health Clinical, Inc. (f).............. 7.50% 10/01/24 167,233
900,000 Jaguar Holding Co. II/Pharmaceutical Product
Development LLC (f)............................. 6.38% 08/01/23 941,625
1,150,000 Ortho-Clinical Diagnostics, Inc. / Ortho-Clinical
Diagnostics S.A. (f)............................ 6.63% 05/15/22 1,157,187
200,000 Quintiles IMS, Inc. (f)............................ 5.00% 10/15/26 213,000
75,000 West Street Merger Sub, Inc. (f)................... 6.38% 09/01/25 76,406
--------------
2,555,451
--------------
</TABLE>
See Notes to Financial Statements Page 19
<PAGE>
FIRST TRUST SHORT DURATION HIGH INCOME FUND
PORTFOLIO OF INVESTMENTS (CONTINUED)
OCTOBER 31, 2017
<TABLE>
<CAPTION>
PRINCIPAL STATED STATED
VALUE DESCRIPTION COUPON MATURITY VALUE
------------- --------------------------------------------------- ---------- -------------- --------------
<S> <C> <C> <C> <C>
CORPORATE BONDS AND NOTES (CONTINUED)
MANAGED HEALTH CARE - 2.1%
$ 100,000 Centene Corp....................................... 5.63% 02/15/21 $ 104,000
100,000 Centene Corp....................................... 6.13% 02/15/24 107,750
2,750,000 MPH Acquisition Holdings LLC (f)................... 7.13% 06/01/24 2,966,562
1,600,000 Wellcare Health Plans, Inc......................... 5.25% 04/01/25 1,688,000
--------------
4,866,312
--------------
METAL & GLASS CONTAINERS - 0.0%
100,000 Owens-Brockway Glass Container, Inc. (f)........... 5.88% 08/15/23 109,938
--------------
MOVIES & ENTERTAINMENT - 0.6%
1,355,000 AMC Entertainment Holdings, Inc.................... 5.75% 06/15/25 1,324,512
125,000 Cinemark USA, Inc.................................. 4.88% 06/01/23 127,969
--------------
1,452,481
--------------
OIL & GAS EXPLORATION & PRODUCTION - 0.9%
200,000 Murphy Oil Corp.................................... 6.88% 08/15/24 215,500
625,000 Sanchez Energy Corp................................ 6.13% 01/15/23 525,000
1,379,000 Tallgrass Energy Partners LP/Tallgrass Energy
Finance Corp. (f)............................... 5.50% 09/15/24 1,432,436
--------------
2,172,936
--------------
OIL & GAS REFINING & MARKETING - 0.0%
75,000 Murphy Oil USA, Inc................................ 5.63% 05/01/27 79,781
--------------
OIL & GAS STORAGE & TRANSPORTATION - 0.3%
500,000 Crestwood Midstream Partners L.P./Crestwood
Midstream Finance Corp.......................... 5.75% 04/01/25 515,000
151,000 Holly Energy Partners L.P./Holly Energy Finance
Corp. (f)........................................ 6.00% 08/01/24 158,928
--------------
673,928
--------------
PACKAGED FOODS & MEATS - 0.5%
390,000 B&G Foods, Inc..................................... 5.25% 04/01/25 399,263
640,000 Post Holdings, Inc. (f)............................ 5.50% 03/01/25 668,800
--------------
1,068,063
--------------
PAPER PACKAGING - 0.4%
789,000 Reynolds Group Issuer, Inc./Reynolds Group Issuer
LLC/Reynolds Group Issuer Lu. (f)............... 7.00% 07/15/24 843,737
--------------
PHARMACEUTICALS - 1.0%
152,000 Eagle Holdings Co. II LLC (f) (h).................. 7.63% 05/15/22 157,130
2,335,000 Endo Finance LLC & Endo Finco, Inc. (f)............ 7.25% 01/15/22 2,159,875
--------------
2,317,005
--------------
REAL ESTATE SERVICES - 0.5%
1,061,000 Realogy Group LLC/Realogy Co-Issuer Corp. (f)...... 4.88% 06/01/23 1,097,817
--------------
SECURITY & ALARM SERVICES - 0.0%
15,000 Brink's (The) Co. (f).............................. 4.63% 10/15/27 14,964
--------------
SPECIALTY CHEMICALS - 0.0%
100,000 Valvoline, Inc. (f)................................ 5.50% 07/15/24 106,250
--------------
SYSTEMS SOFTWARE - 0.4%
625,000 BMC Software Finance, Inc. (f)..................... 8.13% 07/15/21 642,969
345,000 BMC Software, Inc.................................. 7.25% 06/01/18 353,625
</TABLE>
Page 20 See Notes to Financial Statements
<PAGE>
FIRST TRUST SHORT DURATION HIGH INCOME FUND
PORTFOLIO OF INVESTMENTS (CONTINUED)
OCTOBER 31, 2017
<TABLE>
<CAPTION>
PRINCIPAL STATED STATED
VALUE DESCRIPTION COUPON MATURITY VALUE
------------- --------------------------------------------------- ---------- -------------- --------------
<S> <C> <C> <C> <C>
CORPORATE BONDS AND NOTES (CONTINUED)
SYSTEMS SOFTWARE (CONTINUED)
$ 16,000 Symantec Corp. (f)................................. 5.00% 04/15/25 $ 16,760
--------------
1,013,354
--------------
TECHNOLOGY HARDWARE, STORAGE & PERIPHERALS - 0.2%
500,000 Dell International LLC/EMC Corp. (f)............... 7.13% 06/15/24 552,087
--------------
TRADING COMPANIES & DISTRIBUTORS - 0.1%
250,000 Ashtead Capital, Inc. (f).......................... 4.13% 08/15/25 252,188
--------------
TRUCKING - 0.3%
600,000 Avis Budget Car Rental LLC/Avis Budget Finance,
Inc. (f)........................................ 5.13% 06/01/22 605,250
125,000 Avis Budget Car Rental LLC/Avis Budget Finance,
Inc............................................. 5.50% 04/01/23 127,031
--------------
732,281
--------------
WIRELESS TELECOMMUNICATION SERVICES - 0.9%
38,000 SBA Communications Corp. (f)....................... 4.00% 10/01/22 38,760
320,000 SBA Communications Corp............................ 4.88% 09/01/24 329,600
501,000 Sprint Communications, Inc. (f).................... 9.00% 11/15/18 532,312
500,000 Sprint Communications, Inc......................... 7.00% 08/15/20 539,850
200,000 T-Mobile USA, Inc.................................. 6.00% 03/01/23 211,250
200,000 T-Mobile USA, Inc.................................. 6.63% 04/01/23 210,500
170,000 T-Mobile USA, Inc.................................. 5.13% 04/15/25 178,449
--------------
2,040,721
--------------
TOTAL CORPORATE BONDS AND NOTES.................................................. 71,696,401
(Cost $70,808,652) --------------
FOREIGN CORPORATE BONDS AND NOTES - 6.0%
ALUMINUM - 0.5%
780,000 Alcoa Nederland Holding B.V. (f)................... 7.00% 09/30/26 893,100
250,000 Alcoa Nederland Holding B.V. (f)................... 6.75% 09/30/24 279,130
--------------
1,172,230
--------------
AUTOMOBILE MANUFACTURERS - 0.2%
500,000 Fiat Chrysler Automobiles N.V...................... 5.25% 04/15/23 532,500
--------------
CABLE & SATELLITE - 0.6%
1,000,000 Virgin Media Finance PLC (f)....................... 6.00% 10/15/24 1,051,250
351,000 Ziggo Secured Finance B.V. (f)..................... 5.50% 01/15/27 358,897
--------------
1,410,147
--------------
CASINOS & GAMING - 0.1%
327,000 Melco Resorts Finance Ltd. (f)..................... 4.88% 06/06/25 330,797
--------------
INTEGRATED TELECOMMUNICATION SERVICES - 0.4%
1,000,000 SFR Group S.A. (f)................................. 6.00% 05/15/22 1,043,750
--------------
METAL & GLASS CONTAINERS - 0.9%
2,020,000 Ardagh Packaging Finance PLC/Ardagh Holdings
USA, Inc. (f)................................... 6.00% 02/15/25 2,148,775
--------------
PACKAGED FOODS & MEATS - 0.3%
410,000 JBS USA LUX S.A./JBS USA Finance, Inc. (f)......... 8.25% 02/01/20 415,637
224,000 JBS USA LUX S.A./JBS USA Finance, Inc. (f)......... 5.88% 07/15/24 221,200
--------------
636,837
--------------
</TABLE>
See Notes to Financial Statements Page 21
<PAGE>
FIRST TRUST SHORT DURATION HIGH INCOME FUND
PORTFOLIO OF INVESTMENTS (CONTINUED)
OCTOBER 31, 2017
<TABLE>
<CAPTION>
PRINCIPAL STATED STATED
VALUE DESCRIPTION COUPON MATURITY VALUE
------------- --------------------------------------------------- ---------- -------------- --------------
<S> <C> <C> <C> <C>
FOREIGN CORPORATE BONDS AND NOTES (CONTINUED)
PHARMACEUTICALS - 2.7%
$ 180,000 Concordia International Corp. (c) (f).............. 9.00% 04/01/22 $ 158,850
1,000,000 Mallinckrodt International Finance S.A./Mallinckrodt
CB LLC (f)...................................... 5.75% 08/01/22 983,750
250,000 Mallinckrodt International Finance S.A./Mallinckrodt
CB LLC (f)...................................... 5.63% 10/15/23 234,688
250,000 Mallinckrodt International Finance S.A./Mallinckrodt
CB LLC (f)...................................... 5.50% 04/15/25 225,625
4,729,000 Valeant Pharmaceuticals International, Inc. (f).... 5.38% 03/15/20 4,669,887
--------------
6,272,800
--------------
RESEARCH & CONSULTING SERVICES - 0.1%
80,000 IHS Markit, Inc. (f)............................... 4.75% 02/15/25 84,800
157,000 Nielsen Co. Luxembourg (The) SARL (f).............. 5.00% 02/01/25 162,888
--------------
247,688
--------------
RESTAURANTS - 0.2%
415,000 1011778 BC ULC/New Red Finance, Inc. (f)........... 5.00% 10/15/25 424,856
--------------
TOTAL FOREIGN CORPORATE BONDS AND NOTES.......................................... 14,220,380
(Cost $13,861,756) --------------
</TABLE>
<TABLE>
<CAPTION>
SHARES DESCRIPTION VALUE
------------- --------------------------------------------------------------------------------- --------------
<S> <C> <C>
COMMON STOCKS - 0.1%
ELECTRIC UTILITIES - 0.1%
14,134 Vistra Energy Corp. (i).......................................................... 274,765
(Cost $218,370) --------------
RIGHTS - 0.0%
ELECTRIC UTILITIES - 0.0%
22,964 Vistra Energy Corp. Claim (i) (j) (k)............................................ 0
14,134 Vistra Energy Corp. (i).......................................................... 13,187
--------------
13,187
--------------
LIFE SCIENCES TOOLS & SERVICES - 0.0%
1 New Millennium Holdco, Inc., Lender Claim Trust (i) (j) (k) (l).................. 0
1 New Millennium Holdco, Inc., Corporate Claim Trust (i) (j) (k) (l)............... 0
--------------
0
--------------
TOTAL RIGHTS..................................................................... 13,187
(Cost $24,558) --------------
MONEY MARKET FUNDS - 9.4%
22,079,552 Morgan Stanley Institutional Liquidity Fund - Treasury Portfolio - Institutional
Class - 0.93% (m)............................................................. 22,079,552
(Cost $22,079,552) --------------
TOTAL INVESTMENTS - 105.2%....................................................... 248,153,510
(Cost $248,739,001) (n)
NET OTHER ASSETS AND LIABILITIES - (5.2%)........................................ (12,282,741)
--------------
NET ASSETS - 100.0%.............................................................. $ 235,870,769
==============
</TABLE>
Page 22 See Notes to Financial Statements
<PAGE>
FIRST TRUST SHORT DURATION HIGH INCOME FUND
PORTFOLIO OF INVESTMENTS (CONTINUED)
OCTOBER 31, 2017
-----------------------------
(a) Senior Floating-Rate Loan Interests ("Senior Loans") in which the Fund
invests pay interest at rates which are periodically predetermined by
reference to a base lending rate plus a premium. These base lending rates
are generally (i) the lending rate offered by one or more major European
banks, such as the London Inter-Bank Offered Rate ("LIBOR"), (ii) the
prime rate offered by one or more United States banks or (iii) the
certificate of deposit rate. Certain Senior Loans are subject to a LIBOR
floor that establishes a minimum LIBOR rate.
(b) Senior Loans generally are subject to mandatory and/or optional
prepayment. As a result, the actual remaining maturity of Senior Loans may
be substantially less than the stated maturities shown.
(c) This issuer has filed for protection in federal bankruptcy court.
(d) Delayed Draw Loan (all or a portion of which is unfunded). See Note 2C -
Unfunded Loan Commitments in the Notes to Financial Statements.
(e) Represents commitment fee rate on unfunded loan commitment. The commitment
fee rate steps up at predetermined time intervals.
(f) This security, sold within the terms of a private placement memorandum, is
exempt from registration upon resale under Rule 144A under the Securities
Act of 1933, as amended (the "1933 Act"), and may be resold in
transactions exempt from registration, normally to qualified institutional
buyers. Pursuant to procedures adopted by First Trust Series Fund's (the
"Trust") Board of Trustees, this security has been determined to be liquid
by First Trust Advisors L.P. ("First Trust" or the "Advisor"). Although
market instability can result in periods of increased overall market
illiquidity, liquidity for each security is determined based on security
specific factors and assumptions, which require subjective judgment. At
October 31, 2017, securities noted as such amounted to $48,020,119 or
20.4% of net assets.
(g) This issuer is in default and interest is not being accrued by the Fund
nor paid by the issuer.
(h) These notes are Senior Payment-in-kind ("PIK") Toggle Notes whereby the
issuer may, at its option, elect to pay interest on the notes (1) entirely
in cash or (2) entirely in PIK interest. Interest paid in cash will accrue
on the notes at a rate of 7.63% per annum ("Cash Interest Rate") and PIK
interest will accrue on the notes at a rate per annum equal to the Cash
Interest Rate plus 75 basis points. The first payment is scheduled for
November 15, 2017.
(i) Non-income producing security.
(j) This security is fair valued by the Advisor's Pricing Committee in
accordance with procedures adopted by the Trust's Board of Trustees and in
accordance with provisions of the Investment Company Act of 1940, as
amended. At October 31, 2017, securities noted as such are valued at $0 or
0.0% of net assets.
(k) This security's value was determined using significant unobservable inputs
(see Note 2A - Portfolio Valuation in the Notes to Financial Statements).
(l) Pursuant to procedures adopted by the Trust's Board of Trustees, this
security has been determined to be illiquid by First Trust, the Fund's
Advisor.
(m) Rate shown reflects yield as of October 31, 2017.
(n) Aggregate cost for federal income tax purposes is $249,178,712. As of
October 31, 2017, the aggregate gross unrealized appreciation for all
investments in which there was an excess of value over tax cost was
$2,655,976 and the aggregate gross unrealized depreciation for all
investments in which there was an excess of tax cost over value was
$3,681,178. The net unrealized depreciation was $1,025,202.
See Notes to Financial Statements Page 23
<PAGE>
FIRST TRUST SHORT DURATION HIGH INCOME FUND
PORTFOLIO OF INVESTMENTS (CONTINUED)
OCTOBER 31, 2017
-----------------------------
VALUATION INPUTS
A summary of the inputs used to value the Fund's investments as of October 31,
2017 is as follows (see Note 2A - Portfolio Valuation in the Notes to Financial
Statements):
<TABLE>
<CAPTION>
LEVEL 2 LEVEL 3
TOTAL LEVEL 1 SIGNIFICANT SIGNIFICANT
VALUE AT QUOTED OBSERVABLE UNOBSERVABLE
10/31/2017 PRICES INPUTS INPUTS
------------- ------------- ------------- -------------
<S> <C> <C> <C> <C>
Senior Floating-Rate Loan Interests*............... $ 139,869,225 $ -- $ 139,869,225 $ --
Corporate Bonds and Notes*......................... 71,696,401 -- 71,696,401 --
Foreign Corporate Bonds and Notes*................. 14,220,380 -- 14,220,380 --
Common Stocks*..................................... 274,765 274,765 -- --
Rights:*
Electric Utilities.............................. 13,187 -- 13,187 --**
Life Science Tools & Services................... --** -- -- --**
Money Market Funds................................. 22,079,552 22,079,552 -- --
------------- ------------- ------------- -------------
Total Investments.................................. $ 248,153,510 $ 22,354,317 $ 225,799,193 $ --**
============= ============= ============= =============
</TABLE>
* See Portfolio of Investments for industry breakout. Industry categories
are only shown separately if they include holdings in two or more levels
or have holdings in only Level 3.
** Investment is valued at $0.
All transfers in and out of the Levels during the period are assumed to occur on
the last day of the period at their current value. There were no transfers
between Levels at October 31, 2017.
Level 3 Rights that are fair valued by the Advisor's Pricing Committee are
footnoted in the Portfolio of Investments. The Level 3 Rights are based on
unobservable and non-quantitative inputs. The Trust's Board of Trustees has
adopted valuation procedures that are utilized by the Advisor's Pricing
Committee to oversee day-to-day valuation of the Fund's investments. The
Advisor's Pricing Committee, through the Fund's fund accounting agent, monitors
daily pricing via tolerance checks and stale and unchanged price reviews. The
Advisor's Pricing Committee also reviews monthly back testing of third-party
pricing service prices by comparing sales prices of the Fund's investments to
prior day third-party pricing service prices. Additionally, the Advisor's
Pricing Committee reviews periodic information from the Fund's third-party
pricing service that compares secondary market trade prices to their daily
valuations.
The following table presents the activity of the Fund's investments measured at
fair value on a recurring basis using significant unobservable inputs (Level 3)
for the period presented.
BEGINNING BALANCE AT OCTOBER 31, 2016
Rights $ --**
Net Realized Gain (Loss) --
Net Change in Unrealized Appreciation/Depreciation --
Purchases --
Sales --
Transfers In --
Transfers Out --
-------------
ENDING BALANCE AT OCTOBER 31, 2017
Rights --**
--------------
Total Level 3 holdings $ --**
=============
** Investment is valued at $0.
There was no net change in unrealized appreciation (depreciation) from Level 3
investments held as of October 31, 2017.
Page 24 See Notes to Financial Statements
<PAGE>
FIRST TRUST SHORT DURATION HIGH INCOME FUND
STATEMENT OF ASSETS AND LIABILITIES
OCTOBER 31, 2017
<TABLE>
<CAPTION>
ASSETS:
<S> <C>
Investments, at value
(Cost $248,739,001)............................................................................ $248,153,510
Cash........................................................................................... 32,248
Receivables:
Investment securities sold.................................................................. 2,958,108
Interest.................................................................................... 1,838,593
Fund shares sold............................................................................ 1,480,953
Prepaid expenses............................................................................... 3,458
------------
Total Assets................................................................................ 254,466,870
------------
LIABILITIES:
Payables:
Investment securities purchased............................................................. 16,924,703
Fund shares repurchased..................................................................... 1,076,401
Distributions payable....................................................................... 148,009
Investment advisory fees.................................................................... 133,423
Transfer agent fees......................................................................... 61,673
Audit and tax fees.......................................................................... 58,201
Unfunded loan commitments................................................................... 54,780
Administrative fees......................................................................... 53,048
12b-1 distributions and service fees........................................................ 36,728
Printing fees............................................................................... 18,287
Custodian fees.............................................................................. 12,527
Registration fees........................................................................... 6,610
Commitment fees............................................................................. 5,399
Trustees' fees and expenses................................................................. 1,356
Financial reporting fees.................................................................... 771
Legal fees.................................................................................. 747
Other liabilities.............................................................................. 3,438
------------
18,596,101
------------
NET ASSETS..................................................................................... $235,870,769
============
NET ASSETS CONSIST OF:
Paid-in capital................................................................................ $241,402,041
Par value...................................................................................... 117,943
Accumulated net investment income (loss)....................................................... (249,390)
Accumulated net realized gain (loss) on investments............................................ (4,814,334)
Net unrealized appreciation (depreciation) on investments...................................... (585,491)
------------
NET ASSETS..................................................................................... $235,870,769
============
MAXIMUM OFFERING PRICE PER SHARE:
(Net assets are rounded to the nearest whole dollar and shares are rounded to the nearest full share)
CLASS A SHARES:
Net asset value and redemption price per share (Based on net assets of $72,462,466 and
3,623,073 shares of beneficial interest issued and outstanding)............................. $ 20.00
Maximum sales charge (3.50% of offering price)................................................. 0.73
------------
Maximum offering price to public............................................................... $ 20.73
============
CLASS C SHARES:
Net asset value and redemption price per share (Based on net assets of $24,393,394 and
1,220,931 shares of beneficial interest issued and outstanding)............................. $ 19.98
============
CLASS I SHARES:
Net asset value and redemption price per share (Based on net assets of
$139,014,909 and 6,950,334 shares
of beneficial interest issued and outstanding).............................................. $ 20.00
============
</TABLE>
See Notes to Financial Statements Page 25
<PAGE>
FIRST TRUST SHORT DURATION HIGH INCOME FUND
STATEMENT OF OPERATIONS
FOR THE YEAR ENDED OCTOBER 31, 2017
<TABLE>
<CAPTION>
INVESTMENT INCOME:
<S> <C>
Interest....................................................................................... $ 11,762,078
Dividends...................................................................................... 32,791
Other.......................................................................................... 64,897
------------
Total investment income..................................................................... 11,859,766
------------
EXPENSES:
Investment advisory fees....................................................................... 1,476,443
12b-1 distribution and/or service fees
Class A..................................................................................... 183,273
Class C..................................................................................... 232,667
Administrative fees............................................................................ 177,431
Transfer agent fees............................................................................ 149,489
Expenses previously waived or reimbursed....................................................... 128,520
Registration fees.............................................................................. 64,575
Audit and tax fees............................................................................. 59,125
Custodian fees................................................................................. 52,344
Printing fees.................................................................................. 49,648
Commitment fees................................................................................ 43,093
Excise tax expense............................................................................. 33,131
Legal fees..................................................................................... 28,643
Trustees' fees and expenses.................................................................... 16,784
Financial reporting fees....................................................................... 9,250
Other.......................................................................................... 15,879
------------
Total expenses.............................................................................. 2,720,295
------------
NET INVESTMENT INCOME (LOSS)................................................................... 9,139,471
------------
NET REALIZED AND UNREALIZED GAIN (LOSS):
Net realized gain (loss) on investments..................................................... (886,874)
Net change in unrealized appreciation (depreciation) on investments......................... 2,626,918
------------
NET REALIZED AND UNREALIZED GAIN (LOSS)........................................................ 1,740,044
------------
NET INCREASE (DECREASE) IN NET ASSETS RESULTING FROM OPERATIONS............................... $ 10,879,515
============
</TABLE>
Page 26 See Notes to Financial Statements
<PAGE>
FIRST TRUST SHORT DURATION HIGH INCOME FUND
STATEMENTS OF CHANGES IN NET ASSETS
<TABLE>
<CAPTION>
YEAR YEAR
ENDED ENDED
10/31/2017 10/31/2016
------------- -------------
<S> <C> <C>
OPERATIONS:
Net investment income (loss).................................................. $ 9,139,471 $ 7,709,061
Net realized gain (loss)...................................................... (886,874) (3,197,036)
Net change in unrealized appreciation (depreciation).......................... 2,626,918 3,902,696
------------- -------------
Net increase (decrease) in net assets resulting from operations............... 10,879,515 8,414,721
------------- -------------
DISTRIBUTIONS TO SHAREHOLDERS FROM NET INVESTMENT INCOME:
Class A Shares................................................................ (3,326,443) (2,261,813)
Class C Shares................................................................ (883,245) (935,313)
Class I Shares................................................................ (6,255,088) (4,827,752)
------------- -------------
Total distributions to shareholders........................................... (10,464,776) (8,024,878)
------------- -------------
CAPITAL TRANSACTIONS:
Proceeds from Shares sold..................................................... 132,141,172 82,990,512
Proceeds from Shares reinvested............................................... 8,836,368 6,913,108
Cost of Shares redeemed....................................................... (97,646,017) (80,469,500)
------------- -------------
Net increase (decrease) in net assets resulting from capital transactions..... 43,331,523 9,434,120
------------- -------------
Total increase (decrease) in net assets....................................... 43,746,262 9,823,963
NET ASSETS:
Beginning of period........................................................... 192,124,507 182,300,544
------------- -------------
End of period................................................................. $ 235,870,769 $ 192,124,507
============= =============
Accumulated net investment income (loss) at end of period..................... $ (249,390) $ 705,239
============= =============
</TABLE>
See Notes to Financial Statements Page 27
<PAGE>
FIRST TRUST SHORT DURATION HIGH INCOME FUND
FINANCIAL HIGHLIGHTS
FOR A SHARE OUTSTANDING THROUGHOUT EACH PERIOD
<TABLE>
<CAPTION>
YEAR ENDED OCTOBER 31, PERIOD
------------------------------------------------------------ ENDED
CLASS A SHARES 2017 2016 2015 2014 10/31/2013 (a)
------------ ------------ ------------ ------------ --------------
<S> <C> <C> <C> <C> <C>
Net asset value, beginning of period...... $ 19.97 $ 19.83 $ 20.54 $ 20.68 $ 20.00
-------- -------- -------- -------- --------
INCOME FROM INVESTMENT OPERATIONS:
Net investment income (loss) (b).......... 0.79 0.87 0.90 0.76 0.65
Net realized and unrealized gain (loss)... 0.15 0.18 (0.77) (0.12) 0.90
-------- -------- -------- -------- --------
Total from investment operations.......... 0.94 1.05 0.13 0.64 1.55
-------- -------- -------- -------- --------
DISTRIBUTIONS PAID TO SHAREHOLDERS FROM:
Net investment income..................... (0.91) (0.91) (0.80) (0.78) (0.70)
Net realized gain......................... -- -- (0.04) -- --
Return of capital......................... -- -- -- -- (0.17)
-------- -------- -------- -------- --------
Total from distributions.................. (0.91) (0.91) (0.84) (0.78) (0.87)
-------- -------- -------- -------- --------
Net asset value, end of period............ $ 20.00 $ 19.97 $ 19.83 $ 20.54 $ 20.68
======== ======== ======== ======== ========
TOTAL RETURN (c).......................... 4.79% 5.47% 0.63% 3.14% 7.87% (d)
======== ======== ======== ======== ========
RATIOS TO AVERAGE NET ASSETS/SUPPLEMENTAL DATA:
Net assets, end of period (in 000's)...... $ 72,462 $ 55,640 $ 53,433 $ 53,304 $ 44,819
Ratio of total expenses to average
net assets............................. 1.21% 1.27% 1.26% 1.38% 1.54% (f)
Ratio of net expenses to average
net assets............................. 1.26% (e) 1.27% (e) 1.25% 1.25% 1.25% (f)
Ratio of net investment income (loss) to
average net assets..................... 3.96% 4.44% 4.43% 3.68% 3.20% (f)
Portfolio turnover rate................... 100% 62% 58% 109% 89%
</TABLE>
(a) Class A Shares were initially seeded and commenced operations on November
1, 2012.
(b) Per share amounts have been calculated using the average shares method.
(c) Assumes reinvestment of all distributions for the period and does not
include payment of the maximum sales charge of 3.50% or contingent
deferred sales charge (CDSC). On purchases of $1 million or more, a CDSC
of 1% may be imposed on certain redemptions made within twelve months of
purchase. If the sales charges were included, total returns would be
lower. These returns include Rule 12b-1 service fees of 0.25% and do not
reflect the deduction of taxes that a shareholder would pay on Fund
distributions or the redemption of Fund shares. The total returns would
have been lower if certain fees had not been waived and expenses
reimbursed by the investment advisor. Total return is calculated for the
time period presented and is not annualized for periods of less than one
year.
(d) The Fund received a payment from First Trust Advisors L.P. (the "Advisor")
in the amount of $1,079 in connection with a trade error. The payment from
the Advisor represents less than $0.01 per share and had no effect on the
total return of the Class A Shares.
(e) Includes excise tax. If this excise tax expense was not included, the net
expense ratio would have been 1.25%.
(f) Annualized.
Page 28 See Notes to Financial Statements
<PAGE>
FIRST TRUST SHORT DURATION HIGH INCOME FUND
FINANCIAL HIGHLIGHTS (CONTINUED)
FOR A SHARE OUTSTANDING THROUGHOUT EACH PERIOD
<TABLE>
<CAPTION>
YEAR ENDED OCTOBER 31, PERIOD
------------------------------------------------------------ ENDED
CLASS C SHARES 2017 2016 2015 2014 10/31/2013 (a)
------------ ------------ ------------ ------------ --------------
<S> <C> <C> <C> <C> <C>
Net asset value, beginning of period...... $ 19.95 $ 19.81 $ 20.52 $ 20.66 $ 20.00
-------- -------- -------- -------- --------
INCOME FROM INVESTMENT OPERATIONS:
Net investment income (loss) (b).......... 0.64 0.72 0.75 0.60 0.50
Net realized and unrealized gain (loss)... 0.15 0.18 (0.77) (0.11) 0.89
-------- -------- -------- -------- --------
Total from investment operations.......... 0.79 0.90 (0.02) 0.49 1.39
-------- -------- -------- -------- --------
DISTRIBUTIONS PAID TO SHAREHOLDERS FROM:
Net investment income..................... (0.76) (0.76) (0.65) (0.63) (0.59)
Net realized gain......................... -- -- (0.04) -- --
Return of capital......................... -- -- -- -- (0.14)
-------- -------- -------- -------- --------
Total from distributions.................. (0.76) (0.76) (0.69) (0.63) (0.73)
-------- -------- -------- -------- --------
Net asset value, end of period............ $ 19.98 $ 19.95 $ 19.81 $ 20.52 $ 20.66
======== ======== ======== ======== ========
TOTAL RETURN (c).......................... 4.01% 4.69% (0.12)% 2.38% 7.04% (d)
======== ======== ======== ======== ========
RATIOS TO AVERAGE NET ASSETS/SUPPLEMENTAL DATA:
Net assets, end of period (in 000's)...... $ 24,393 $ 23,841 $ 25,213 $ 24,531 $ 13,522
Ratio of total expenses to average
net assets............................. 1.96% 2.02% 2.01% 2.13% 2.29% (f)
Ratio of net expenses to average
net assets............................. 2.01% (e) 2.02% (e) 2.00% 2.00% 2.00% (f)
Ratio of net investment income (loss) to
average net assets..................... 3.20% 3.70% 3.68% 2.93% 2.45% (f)
Portfolio turnover rate................... 100% 62% 58% 109% 89%
</TABLE>
(a) Class C Shares were initially seeded and commenced operations on November
1, 2012.
(b) Per share amounts have been calculated using the average shares method.
(c) Assumes reinvestment of all distributions for the period and does not
include payment of the maximum CDSC of 1% charged on certain redemptions
made within one year of purchase. If the sales charges were included,
total returns would be lower. These returns include combined Rule 12b-1
distribution and service fees of 1% and do not reflect the deduction of
taxes that a shareholder would pay on Fund distributions or the redemption
of Fund shares. The total returns would have been lower if certain fees
had not been waived and expenses reimbursed by the investment advisor.
Total return is calculated for the time period presented and is not
annualized for periods less than one year.
(d) The Fund received a payment from First Trust Advisors L.P. (the "Advisor")
in the amount of $1,079 in connection with a trade error. The payment from
the Advisor represents less than $0.01 per share and had no effect on the
total return of the Class C Shares.
(e) Includes excise tax. If this excise tax expense was not included, the net
expense ratio would have been 2.00%.
(f) Annualized.
See Notes to Financial Statements Page 29
<PAGE>
FIRST TRUST SHORT DURATION HIGH INCOME FUND
FINANCIAL HIGHLIGHTS (CONTINUED)
FOR A SHARE OUTSTANDING THROUGHOUT EACH PERIOD
<TABLE>
<CAPTION>
YEAR ENDED OCTOBER 31, PERIOD
------------------------------------------------------------ ENDED
CLASS I SHARES 2017 2016 2015 2014 10/31/2013 (a)
------------ ------------ ------------ ------------ --------------
<S> <C> <C> <C> <C> <C>
Net asset value, beginning of period...... $ 19.97 $ 19.83 $ 20.54 $ 20.68 $ 20.00
-------- -------- -------- -------- --------
INCOME FROM INVESTMENT OPERATIONS:
Net investment income (loss) (b).......... 0.85 0.92 0.95 0.81 0.70
Net realized and unrealized gain (loss)... 0.14 0.18 (0.77) (0.12) 0.90
-------- -------- -------- -------- --------
Total from investment operations.......... 0.99 1.10 0.18 0.69 1.60
-------- -------- -------- -------- --------
DISTRIBUTIONS PAID TO SHAREHOLDERS FROM:
Net investment income..................... (0.96) (0.96) (0.85) (0.83) (0.74)
Net realized gain......................... -- -- (0.04) -- --
Return of capital......................... -- -- -- -- (0.18)
-------- -------- -------- -------- --------
Total from distributions.................. (0.96) (0.96) (0.89) (0.83) (0.92)
-------- -------- -------- -------- --------
Net asset value, end of period............ $ 20.00 $ 19.97 $ 19.83 $ 20.54 $ 20.68
======== ======== ======== ======== ========
TOTAL RETURN (c).......................... 5.06% 5.74% 0.88% 3.40% 8.11% (d)
======== ======== ======== ======== ========
RATIOS TO AVERAGE NET ASSETS/SUPPLEMENTAL DATA:
Net assets, end of period (in 000's)...... $139,015 $112,644 $103,655 $103,033 $ 43,395
Ratio of total expenses to average
net assets............................. 0.96% 1.02% 1.01% 1.13% 1.29% (f)
Ratio of net expenses to average
net assets............................. 1.01% (e) 1.02% (e) 1.00% 1.00% 1.00% (f)
Ratio of net investment income (loss) to
average net assets..................... 4.21% 4.69% 4.68% 3.93% 3.45% (f)
Portfolio turnover rate................... 100% 62% 58% 109% 89%
</TABLE>
(a) Class I Shares were initially seeded and commenced operations on November
1, 2012.
(b) Per share amounts have been calculated using the average shares method.
(c) Assumes reinvestment of all distributions for the period. These returns do
not reflect the deduction of taxes that a shareholder would pay on Fund
distributions or the redemption of Fund shares. The total returns would
have been lower if certain fees had not been waived and expenses
reimbursed by the investment advisor. Total return is calculated for the
time period presented and is not annualized for periods less than one
year.
(d) The Fund received a payment from First Trust Advisors L.P. (the "Advisor")
in the amount of $1,079 in connection with a trade error. The payment from
the Advisor represents less than $0.01 per share and had no effect on the
total return of the Class I Shares.
(e) Includes excise tax. If this excise tax expense was not included, the net
expense ratio would have been 1.00%.
(f) Annualized.
Page 30 See Notes to Financial Statements
<PAGE>
--------------------------------------------------------------------------------
NOTES TO FINANCIAL STATEMENTS
--------------------------------------------------------------------------------
FIRST TRUST SHORT DURATION HIGH INCOME FUND
OCTOBER 31, 2017
1. ORGANIZATION
First Trust Short Duration High Income Fund (the "Fund") is a series of the
First Trust Series Fund (the "Trust"), a Massachusetts business trust organized
on July 9, 2010, and is registered as a diversified open-end management
investment company with the Securities and Exchange Commission (the "SEC") under
the Investment Company Act of 1940, as amended (the "1940 Act"). The Fund offers
three classes of shares: Class A, Class C and Class I. Each class represents an
interest in the same portfolio of investments but with a different combination
of sales charges, distribution and service (12b-1) fees, eligibility
requirements and other features.
The Fund's primary investment objective is to seek to provide a high level of
current income. As a secondary objective, the Fund seeks capital appreciation.
The Fund seeks to achieve its investment objectives by investing, under normal
market conditions, at least 80% of its net assets (including investment
borrowings) in high-yield debt securities and bank loans that are rated
below-investment grade or unrated. High-yield debt securities are
below-investment grade debt securities, commonly known as "junk bonds." For
purposes of determining whether a security is below-investment grade, the lowest
available rating is used. There can be no assurance that the Fund will achieve
its investment objectives. The Fund may not be appropriate for all investors.
2. SIGNIFICANT ACCOUNTING POLICIES
The Fund is considered an investment company and follows accounting and
reporting guidance under Financial Accounting and Standards Board ("FASB")
Accounting Standards Codification ("ASC") Topic 946, "Financial
Services-Investment Companies." The following is a summary of significant
accounting policies consistently followed by the Fund in the preparation of its
financial statements. The preparation of financial statements in accordance with
accounting principles generally accepted in the United States of America ("U.S.
GAAP") requires management to make estimates and assumptions that affect the
reported amounts and disclosures in the financial statements. Actual results
could differ from those estimates.
A. PORTFOLIO VALUATION
The net asset value ("NAV") for each class of shares of the Fund is determined
daily as of the close of regular trading on the New York Stock Exchange
("NYSE"), normally 4:00 p.m. Eastern time, on each day the NYSE is open for
trading. If the NYSE closes early on a valuation day, the NAV is determined as
of that time. Domestic debt securities and foreign securities are priced using
data reflecting the earlier closing of the principal markets for those
securities. The NAV for each class is calculated by dividing the value of the
Fund's total assets attributable to such class (including accrued interest and
dividends), less all liabilities attributable to such class (including accrued
expenses, dividends declared but unpaid and any borrowings of the Fund), by the
total number of shares of the class outstanding. Differences in NAV of each
class of the Fund's shares are generally expected to be due to the daily expense
accruals of the specified distribution and service (12b-1) fees, if any, and
transfer agency costs applicable to such class of shares and the resulting
differential in the dividends that may be paid on each class of shares.
The Fund's investments are valued daily at market value or, in the absence of
market value with respect to any portfolio securities, at fair value. Market
value prices represent last sale or official closing prices from a national or
foreign exchange (i.e., a regulated market) and are primarily obtained from
third-party pricing services. Fair value prices represent any prices not
considered market value prices and are either obtained from a third-party
pricing service or are determined by the Pricing Committee of the Trust's
investment advisor, First Trust Advisors L.P. ("First Trust" or the "Advisor"),
in accordance with valuation procedures adopted by the Trust's Board of
Trustees, and in accordance with provisions of the 1940 Act. Investments valued
by the Advisor's Pricing Committee, if any, are footnoted as such in the
footnotes to the Portfolio of Investments. The Fund's investments are valued as
follows:
The Senior Floating-Rate Loan Interests ("Senior Loans")(1) in which the
Fund invests are not listed on any securities exchange or board of trade.
Senior Loans are typically bought and sold by institutional investors in
individually negotiated private transactions that function in many
respects like an over-the-counter secondary market, although typically no
formal market makers exist. This market, while having grown substantially
since its inception, generally has fewer trades and less liquidity than
the secondary market for other types of securities. Some Senior Loans have
few or no trades, or trade infrequently, and information regarding a
specific Senior Loan may not be widely available or may be incomplete.
Accordingly, determinations of the market value of Senior Loans may be
based on infrequent and dated information. Because there is less reliable,
objective data available, elements of judgment may play a greater role in
valuation of Senior Loans than for other types of securities. Typically,
Senior Loans are fair valued using information provided by a third-party
pricing service. The third-party pricing service primarily uses
over-the-counter pricing from dealer runs and broker quotes from
indicative sheets to value the Senior Loans.
-----------------------------
(1) The terms "security" and "securities" used throughout the Notes to
Financial Statements include Senior Loans.
Page 31
<PAGE>
--------------------------------------------------------------------------------
NOTES TO FINANCIAL STATEMENTS (CONTINUED)
--------------------------------------------------------------------------------
FIRST TRUST SHORT DURATION HIGH INCOME FUND
OCTOBER 31, 2017
Common stocks and other equity securities listed on any national or
foreign exchange (excluding The Nasdaq Stock Market LLC ("Nasdaq") and the
London Stock Exchange Alternative Investment Market ("AIM")) are valued at
the last price on the exchange on which they are principally traded or,
for Nasdaq and AIM securities, the official closing price. Securities
traded on more than one securities exchange are valued at the last sale
price or official closing price, as applicable, at the close of the
securities exchange representing the principal market for such securities.
Fixed income and other debt securities having a remaining maturity of
sixty days or less when purchased are fair valued at cost adjusted for
amortization of premiums and accretion of discounts (amortized cost),
provided the Advisor's Pricing Committee has determined that the use of
amortized cost is an appropriate reflection of fair value given market and
issuer-specific conditions existing at the time of the determination.
Factors that may be considered in determining the appropriateness of the
use of amortized cost include, but are not limited to, the following:
1) the credit conditions in the relevant market and changes thereto;
2) the liquidity conditions in the relevant market and changes thereto;
3) the interest rate conditions in the relevant market and changes
thereto (such as significant changes in interest rates);
4) issuer-specific conditions (such as significant credit
deterioration); and
5) any other market-based data the Advisor's Pricing Committee
considers relevant. In this regard, the Advisor's Pricing Committee
may use last-obtained market-based data to assist it when valuing
portfolio securities using amortized cost.
Corporate bonds, corporate notes and other debt securities are fair valued
on the basis of valuations provided by dealers who make markets in such
securities or by a third-party pricing service approved by the Trust's
Board of Trustees, which may use the following valuation inputs when
available:
1) benchmark yields;
2) reported trades;
3) broker/dealer quotes;
4) issuer spreads;
5) benchmark securities;
6) bids and offers; and
7) reference data including market research publications.
Securities traded in an over-the-counter market are fair valued at the
mean of their most recent bid and asked price, if available, and otherwise
at their closing bid price.
Certain securities may not be able to be priced by pre-established pricing
methods. Such securities may be valued by the Trust's Board of Trustees or its
delegate, the Advisor's Pricing Committee, at fair value. These securities
generally include, but are not limited to, restricted securities (securities
which may not be publicly sold without registration under the Securities Act of
1933, as amended) for which a third-party pricing service is unable to provide a
market price; securities whose trading has been formally suspended; a security
whose market or fair value price is not available from a pre-established pricing
source; a security with respect to which an event has occurred that is likely to
materially affect the value of the security after the market has closed but
before the calculation of the Fund's NAV or make it difficult or impossible to
obtain a reliable market quotation; and a security whose price, as provided by
the third-party pricing service, does not reflect the security's fair value. As
a general principle, the current fair value of a security would appear to be the
amount which the owner might reasonably expect to receive for the security upon
its current sale. When fair value prices are used, generally they will differ
from market quotations or official closing prices on the applicable exchanges. A
variety of factors may be considered in determining the fair value of such
securities, including, but not limited to, the following:
1) the fundamental business data relating to the borrower/issuer;
2) an evaluation of the forces which influence the market in which
these securities are purchased and sold;
3) the type, size and cost of a security;
4) the financial statements of the borrower/issuer;
5) the credit quality and cash flow of the borrower/issuer, based on
the Advisor's or external analysis;
6) the information as to any transactions in or offers for the
security;
7) the price and extent of public trading in similar securities (or
equity securities) of the issuer/borrower, or comparable companies;
8) the coupon payments;
9) the quality, value and salability of collateral, if any, securing
the security;
10) the business prospects of the borrower/issuer, including any ability
to obtain money or resources from a parent or affiliate and an
assessment of the borrower's/issuer's management;
11) the prospects for the borrower's/issuer's industry, and multiples
(of earnings and/or cash flows) being paid for similar businesses in
that industry;
12) borrower's/issuer's competitive position within the industry;
13) borrower's/issuer's ability to access additional liquidity through
public and/or private markets; and
14) other relevant factors.
Page 32
<PAGE>
--------------------------------------------------------------------------------
NOTES TO FINANCIAL STATEMENTS (CONTINUED)
--------------------------------------------------------------------------------
FIRST TRUST SHORT DURATION HIGH INCOME FUND
OCTOBER 31, 2017
The Fund is subject to fair value accounting standards that define fair value,
establish the framework for measuring fair value and provide a three-level
hierarchy for fair valuation based upon the inputs to the valuation as of the
measurement date. The three levels of the fair value hierarchy are as follows:
o Level 1 - Level 1 inputs are quoted prices in active markets for
identical investments. An active market is a market in which
transactions for the investment occur with sufficient frequency and
volume to provide pricing information on an ongoing basis.
o Level 2 - Level 2 inputs are observable inputs, either directly or
indirectly, and include the following:
o Quoted prices for similar investments in active markets.
o Quoted prices for identical or similar investments in markets
that are non-active. A non-active market is a market where
there are few transactions for the investment, the prices are
not current, or price quotations vary substantially either
over time or among market makers, or in which little
information is released publicly.
o Inputs other than quoted prices that are observable for the
investment (for example, interest rates and yield curves
observable at commonly quoted intervals, volatilities,
prepayment speeds, loss severities, credit risks, and default
rates).
o Inputs that are derived principally from or corroborated by
observable market data by correlation or other means.
o Level 3 - Level 3 inputs are unobservable inputs. Unobservable
inputs may reflect the reporting entity's own assumptions about the
assumptions that market participants would use in pricing the
investment.
The inputs or methodologies used for valuing investments are not necessarily an
indication of the risk associated with investing in those investments. A summary
of the inputs used to value the Fund's investments as of October 31, 2017, is
included with the Fund's Portfolio of Investments.
B. SECURITIES TRANSACTIONS AND INVESTMENT INCOME
Securities transactions are recorded as of the trade date. Realized gains and
losses from securities transactions are recorded on the identified cost basis.
Dividend income is recorded on the ex-dividend date. Interest income is recorded
daily on the accrual basis. Market premiums and discounts are amortized over the
expected life of each respective borrowing. Amortization of premiums and the
accretion of discounts are recorded using the effective interest method.
Securities purchased or sold on a when-issued, delayed-delivery or forward
purchase commitment basis may have extended settlement periods. The value of the
security so purchased is subject to market fluctuations during this period. Due
to the nature of the Senior Loan market, the actual settlement date may not be
certain at the time of the purchase or sale for some of the Senior Loans.
Interest income on such Senior Loans is not accrued until settlement date. The
Fund maintains liquid assets with a current value at least equal to the amount
of its when-issued, delayed-delivery or forward purchase commitments. The Fund
had no when-issued, delayed-delivery or forward purchase commitments (other than
unfunded commitments discussed below) as of October 31, 2017.
C. UNFUNDED LOAN COMMITMENTS
The Fund may enter into certain credit agreements, all or a portion of which may
be unfunded. The Fund is obligated to fund these loan commitments at the
borrower's discretion. The Fund had unfunded delayed draw loan commitments,
which are marked to market daily, of $54,780 as of October 31, 2017.
D. DIVIDENDS AND DISTRIBUTIONS TO SHAREHOLDERS
The Fund will declare daily and pay monthly distributions of all or a portion of
its net income to holders of each class of shares. Distributions of any net
capital gains earned by the Fund will be distributed at least annually.
Distributions will automatically be reinvested into additional Fund shares
unless cash distributions are elected by the shareholder.
Distributions from net investment income and realized capital gains are
determined in accordance with income tax regulations, which may differ from U.S.
GAAP. Certain capital accounts in the financial statements are periodically
adjusted for permanent differences in order to reflect their tax character.
These permanent differences are primarily due to the varying treatment of income
and gain/loss on portfolio securities held by the Fund and have no impact on net
assets or net asset value per share. Temporary differences, which arise from
recognizing certain items of income, expense and gain/loss in different periods
for financial statement and tax purposes, will reverse at some point in the
future. Permanent differences incurred during the fiscal year ended October 31,
2017, primarily as a result of differing book/tax treatment on recognition of
amortization/accretion on portfolio holdings, have been reclassified at year end
to reflect an increase in accumulated net investment income (loss) by $370,676,
a decrease in accumulated net realized gain (loss) on investments by $360,971
and a decrease to paid-in capital of $9,705. Net assets were not affected by
this reclassification.
Page 33
<PAGE>
--------------------------------------------------------------------------------
NOTES TO FINANCIAL STATEMENTS (CONTINUED)
--------------------------------------------------------------------------------
FIRST TRUST SHORT DURATION HIGH INCOME FUND
OCTOBER 31, 2017
The tax character of distributions paid during the fiscal years ended October
31, 2017 and 2016, was as follows:
Distributions paid from: 2017 2016
Ordinary income.............................. $ 10,464,776 $ 8,024,878
Capital gain................................. -- --
Return of capital............................ -- --
As of October 31, 2017, the distributable earnings and net assets on a tax basis
were as follows:
Undistributed ordinary income................ $ 270,341
Undistributed capital gains.................. --
------------
Total undistributed earnings................. 270,341
Accumulated capital and other losses......... (4,814,306)
Net unrealized appreciation (depreciation)... (1,025,202)
------------
Total accumulated earnings (losses).......... (5,569,167)
Other........................................ (80,048)
Paid-in capital.............................. 241,519,984
------------
Net assets................................... $235,870,769
============
E. INCOME TAXES
The Fund intends to continue to qualify as a regulated investment company by
complying with the requirements under Subchapter M of the Internal Revenue Code
of 1986, as amended, which includes distributing substantially all of its net
investment income and net realized gains to shareholders. Accordingly, no
provision has been made for federal and state income taxes. However, due to the
timing and amount of distributions, the Fund may be subject to an excise tax of
4% of the amount by which approximately 98% of the Fund's taxable income exceeds
the distributions from such taxable income for the calendar year.
The Fund intends to utilize provisions of the federal income tax laws, which
allow it to carry a realized capital loss forward indefinitely following the
year of the loss and offset such loss against any future realized capital gains.
The Fund is subject to certain limitations under U.S. tax rules on the use of
capital loss carryforwards and net unrealized built-in losses. These limitations
apply when there has been a 50% change in ownership. At October 31, 2017, the
Fund had non-expiring capital loss carryforwards of $4,814,306 for federal
income tax purposes.
Certain losses realized during the current fiscal year may be deferred and
treated as occurring the first day of the following fiscal year for federal
income tax purposes. For the fiscal year ended October 31, 2017, the Fund did
not incur any net ordinary losses.
The Fund is subject to accounting standards that establish a minimum threshold
for recognizing, and a system for measuring, the benefits of a tax position
taken or expected to be taken in a tax return. Taxable years ended 2014, 2015,
2016 and 2017 remain open to federal and state audit. As of October 31, 2017,
management has evaluated the application of these standards to the Fund and has
determined that no provision for income tax is required in the Fund's financial
statements for uncertain tax positions.
F. EXPENSES
The Fund pays all expenses directly related to its operations. Expenses of the
Fund are allocated on a pro rata basis to each class of shares, except for
distribution and service (12b-1) fees and incremental transfer agency costs
which are unique to each class of shares.
G. NEW AND AMENDED FINANCIAL REPORTING RULES AND FORMS
On October 13, 2016, the SEC adopted new rules and forms, and amended existing
rules and forms. The new and amended rules and forms are intended to modernize
the reporting of information provided by funds and to improve the quality and
type of information that funds provide to the SEC and investors. In part, the
new and amended rules and forms amend Regulation S-X and require standardized,
enhanced disclosures about derivatives in a fund's financial statements, as well
as other amendments. The compliance date for the amendments of Regulation S-X
was August 1, 2017, and resulted in additional disclosure for variable interest
rate securities within the Portfolio of Investments. The new form types and
other rule amendments will be effective for the First Trust funds, including the
Fund, for reporting periods beginning on and after June 1, 2018. Management is
evaluating the new form types and other rule amendments that are effective on
and after June 1, 2018 to determine the impact to the Fund.
Page 34
<PAGE>
--------------------------------------------------------------------------------
NOTES TO FINANCIAL STATEMENTS (CONTINUED)
--------------------------------------------------------------------------------
FIRST TRUST SHORT DURATION HIGH INCOME FUND
OCTOBER 31, 2017
H. NEW ACCOUNTING PRONOUNCEMENT
In December 2016, FASB released Accounting Standards Update ("ASU") 2016-19 that
makes technical changes to various sections of the ASC, including Topic 820,
Fair Value Measurement. The changes to Topic 820 are intended to clarify the
difference between a valuation approach and a valuation technique. The changes
to ASC 820-10-50-2 require a reporting entity to disclose, for Level 2 and Level
3 fair value measurements, a change in either or both a valuation approach and a
valuation technique and the reason(s) for the change. The changes to Topic 820
are effective for fiscal years, and interim periods within those fiscal years,
beginning after December 15, 2016. At this time, management is evaluating the
implications of the ASU and has not yet determined its impact on the financial
statements and disclosures.
3. INVESTMENT ADVISORY FEE, AFFILIATED TRANSACTIONS AND OTHER FEE ARRANGEMENTS
First Trust, the investment advisor to the Fund, is a limited partnership with
one limited partner, Grace Partners of DuPage L.P., and one general partner, The
Charger Corporation. The Charger Corporation is an Illinois corporation
controlled by James A. Bowen, Chief Executive Officer of First Trust. First
Trust is responsible for the ongoing monitoring of the Fund's investment
portfolio, managing the Fund's business affairs and providing certain
administrative services necessary for the management of the Fund. For these
investment management services, First Trust is entitled to a monthly fee
calculated at an annual rate of 0.65% of the Fund's average daily net assets.
First Trust also provides fund reporting services to the Fund for a flat annual
fee in the amount of $9,250.
First Trust has agreed to waive fees and reimburse Fund expenses to the extent
necessary to prevent the total annual operating expenses of the Fund (excluding
12b-1 distribution and service fees, interest expenses, taxes, fees incurred in
acquiring and disposing of portfolio securities and extraordinary expenses) from
exceeding 1.00% of average daily net assets of any class of shares of the Fund
until February 28, 2018, and then from exceeding 1.35% from March 1, 2018,
through February 28, 2027. Expenses borne and fees waived by First Trust are
subject to recovery on a Fund class level, if applicable, by First Trust for up
to three years from the date the fee was waived or expense was incurred, but no
reimbursement payment will be made by the Fund at any time if it would result in
the Fund's expenses exceeding the applicable expense limitation in place for the
most recent fiscal year for which such expense limitation was in place. These
amounts are included in "Expenses previously waived or reimbursed" on the
Statement of Operations. The advisory fee waivers and expense reimbursements for
the year ended October 31, 2017, and the expenses borne by First Trust subject
to recovery were as follows:
<TABLE>
<CAPTION>
EXPENSES SUBJECT TO RECOVERY
-------------------------------------------------------------------------
ADVISORY FEE EXPENSE PERIOD ENDED YEAR ENDED YEAR ENDED
WAIVER REIMBURSEMENTS OCTOBER 31, 2015 OCTOBER 31, 2016 OCTOBER 31, 2017 TOTAL
------------ -------------- ---------------- ---------------- ---------------- --------------
<S> <C> <C> <C> <C> <C>
$ -- $ -- $11,894 $ -- $ -- $11,894
</TABLE>
BNY Mellon Investment Servicing (US) Inc. ("BNYM IS") serves as the Fund's
transfer agent in accordance with certain fee arrangements. As transfer agent,
BNYM IS is responsible for maintaining shareholder records for the Fund. The
Bank of New York Mellon ("BNYM") serves as the Fund's administrator, fund
accountant and custodian in accordance with certain fee arrangements. As
administrator and fund accountant, BNYM is responsible for providing certain
administrative and accounting services to the Fund, including maintaining the
Fund's books of account, records of the Fund's securities transactions, and
certain other books and records. As custodian, BNYM is responsible for custody
of the Fund's assets. BNYM IS and BNYM are subsidiaries of The Bank of New York
Mellon Corporation, a financial holding company.
Each Trustee who is not an officer or employee of First Trust, any sub-advisor
or any of their affiliates ("Independent Trustees") is paid a fixed annual
retainer that is allocated equally among each fund in the First Trust Fund
Complex. Each Independent Trustee is also paid an annual per fund fee that
varies based on whether the fund is a closed-end or other actively managed fund,
or is an index fund.
Additionally, the Lead Independent Trustee and the Chairmen of the Audit
Committee, Nominating and Governance Committee and Valuation Committee are paid
annual fees to serve in such capacities, with such compensation allocated pro
rata among each fund in the First Trust Fund Complex based on net assets.
Independent Trustees are reimbursed for travel and out-of-pocket expenses in
connection with all meetings. The Lead Independent Trustee and Committee
Chairmen rotate every three years. The officers and "Interested" Trustee receive
no compensation from the Trust for acting in such capacities.
Page 35
<PAGE>
--------------------------------------------------------------------------------
NOTES TO FINANCIAL STATEMENTS (CONTINUED)
--------------------------------------------------------------------------------
FIRST TRUST SHORT DURATION HIGH INCOME FUND
OCTOBER 31, 2017
4. CAPITAL SHARE TRANSACTIONS
Capital transactions were as follows:
<TABLE>
<CAPTION>
YEAR ENDED YEAR ENDED
OCTOBER 31, 2017 OCTOBER 31, 2016
SHARES VALUE SHARES VALUE
---------- ------------- ---------- -------------
<S> <C> <C> <C> <C>
Sales:
Class A 2,166,955 $ 43,330,998 1,404,733 $ 27,590,019
Class C 319,712 6,399,722 281,113 5,492,853
Class I 4,110,531 82,410,452 2,547,774 49,907,640
---------- ------------- ---------- -------------
Total Sales: 6,597,198 $ 132,141,172 4,233,620 $ 82,990,512
========== ============= ========== =============
Dividend Reinvestment:
Class A 131,419 $ 2,634,908 97,760 $ 1,914,417
Class C 38,599 772,980 41,163 805,286
Class I 270,729 5,428,480 214,036 4,193,405
---------- ------------- ---------- -------------
Total Dividend Reinvestment: 440,747 $ 8,836,368 352,959 $ 6,913,108
========== ============= ========== =============
Redemptions:
Class A (1,461,890) $ (29,289,205) (1,410,230) $ (27,208,886)
Class C (332,438) (6,639,313) (399,642) (7,806,593)
Class I (3,071,873) (61,717,499) (2,347,504) (45,454,021)
---------- ------------- ---------- -------------
Total Redemptions: (4,866,201) $ (97,646,017) (4,157,376) $ (80,469,500)
========== ============= ========== =============
</TABLE>
5. PURCHASES AND SALES OF SECURITIES
Cost of purchases and proceeds from sales of investments, excluding short-term
investments, for the year ended October 31, 2017, were $255,159,446 and
$216,129,067, respectively.
6. BORROWINGS
The Trust, on behalf of the Fund, along with First Trust Variable Insurance
Trust and First Trust Exchange-Traded Fund IV, has a $200 million Credit
Agreement (the "BNYM Line of Credit") with BNYM to be a liquidity backstop
during periods of high redemption volume. Prior to February 3, 2017, the BNYM
Line of Credit was $135 million. A commitment fee of 0.15% of the daily amount
of the excess of the commitment amount over the outstanding principal balance of
the loans will be charged by BNYM, which First Trust allocates amongst the funds
that have access to the BNYM Line of Credit. These fees are reflected on the
Statement of Operations in the Commitment fees line item. To the extent that the
Fund accesses the BNYM Line of Credit, there would also be an interest fee
charged. As of October 31, 2017, the Fund did not have any outstanding
borrowings under the BNYM Line of Credit.
7. DISTRIBUTION AND SERVICE PLAN
The Board of Trustees adopted a Distribution and Service Plan pursuant to Rule
12b-1 under the 1940 Act. In accordance with the Rule 12b-1 plan, the share
classes of the Fund are authorized to pay an amount up to 0.25% and 1.00% of
their average daily net assets each year for Class A and Class C, respectively,
to reimburse and compensate First Trust Portfolios L.P. ("FTP"), the distributor
of the Fund, for amounts expended to finance activities primarily intended to
result in the sale of Fund shares or the provision of investor services. FTP may
also use this amount to compensate securities dealers or other persons for
providing distribution assistance, including broker-dealer and shareholder
support and educational and promotional services. Class I shares have no 12b-1
fees.
8. INDEMNIFICATION
The Fund has a variety of indemnification obligations under contracts with its
service providers. The Fund's maximum exposure under these arrangements is
unknown. However, the Fund has not had prior claims or losses pursuant to these
contracts and expects the risk of loss to be remote.
9. SUBSEQUENT EVENTS
Management has evaluated the impact of all subsequent events to the Fund through
the date the financial statements were issued, and has determined that there
were no subsequent events requiring recognition or disclosure in the financial
statements that have not already been disclosed.
Page 36
<PAGE>
--------------------------------------------------------------------------------
REPORT OF INDEPENDENT REGISTERED PUBLIC ACCOUNTING FIRM
--------------------------------------------------------------------------------
TO THE BOARD OF TRUSTEES AND SHAREHOLDERS OF FIRST TRUST SHORT DURATION HIGH
INCOME FUND:
We have audited the accompanying statement of assets and liabilities of First
Trust Short Duration High Income Fund (the "Fund"), a series of the First Trust
Series Fund, including the portfolio of investments, as of October 31, 2017, and
the related statement of operations for the year then ended, the statements of
changes in net assets for each of the two years in the period then ended, and
the financial highlights for each of the periods presented. These financial
statements and financial highlights are the responsibility of the Fund's
management. Our responsibility is to express an opinion on these financial
statements and financial highlights based on our audits.
We conducted our audits in accordance with the standards of the Public Company
Accounting Oversight Board (United States). Those standards require that we plan
and perform the audit to obtain reasonable assurance about whether the financial
statements and financial highlights are free of material misstatement. The Fund
is not required to have, nor were we engaged to perform, an audit of its
internal control over financial reporting. Our audits included consideration of
internal control over financial reporting as a basis for designing audit
procedures that are appropriate in the circumstances, but not for the purpose of
expressing an opinion on the effectiveness of the Fund's internal control over
financial reporting. Accordingly, we express no such opinion. An audit also
includes examining, on a test basis, evidence supporting the amounts and
disclosures in the financial statements, assessing the accounting principles
used and significant estimates made by management, as well as evaluating the
overall financial statement presentation. Our procedures included confirmation
of securities owned as of October 31, 2017, by correspondence with the Fund's
custodian, brokers, and agent banks; when replies were not received from brokers
or agent banks, we performed other auditing procedures. We believe that our
audits provide a reasonable basis for our opinion.
In our opinion, the financial statements and financial highlights referred to
above present fairly, in all material respects, the financial position of First
Trust Short Duration High Income Fund as of October 31, 2017, the results of its
operations for the year then ended, the changes in its net assets for each of
the two years in the period then ended, and the financial highlights for each of
the periods presented, in conformity with accounting principles generally
accepted in the United States of America.
/s/ Deloitte & Touche LLP
Chicago, Illinois
December 20, 2017
Page 37
<PAGE>
--------------------------------------------------------------------------------
ADDITIONAL INFORMATION
--------------------------------------------------------------------------------
FIRST TRUST SHORT DURATION HIGH INCOME FUND
OCTOBER 31, 2017 (UNAUDITED)
PROXY VOTING POLICIES AND PROCEDURES
A description of the policies and procedures that the Fund uses to determine how
to vote proxies and information on how the Fund voted proxies relating to
portfolio securities during the most recent 12-month period ended June 30 is
available (1) without charge, upon request, by calling (800) 988-5891; (2) on
the Fund's website located at http://www.ftportfolios.com; and (3) on the
Securities and Exchange Commission's ("SEC") website at http://www.sec.gov.
PORTFOLIO HOLDINGS
The Trust files its complete schedule of portfolio holdings with the SEC for the
first and third quarters of each fiscal year on Form N-Q. The Trust's Forms N-Q
are available (1) by calling (800) 988-5891; (2) on the Fund's website located
at http://www.ftportfolios.com; (3) on the SEC's website at http://www.sec.gov;
and (4) for review and copying at the SEC's Public Reference Room ("PRR") in
Washington, DC. Information regarding the operation of the PRR may be obtained
by calling (800) SEC-0330.
TAX INFORMATION
Distributions paid to foreign shareholders during the Fund's fiscal year ended
October 31, 2017, that were properly designated by the Fund as "interest-related
dividends" or "short-term capital gain dividends," may not be subject to federal
income tax provided that the income was earned directly by such foreign
shareholders.
Of the ordinary income (including short-term capital gain, if applicable)
distributions made by the Fund during the period ended October 31, 2017, none
qualify for the corporate dividends received deduction available to corporate
shareholders or as qualified dividend income.
RISK CONSIDERATIONS
RISKS ARE INHERENT IN ALL INVESTING. THE FOLLOWING SUMMARIZES SOME, BUT NOT ALL,
OF THE RISKS THAT SHOULD BE CONSIDERED FOR THE FUND. FOR ADDITIONAL INFORMATION
ABOUT THE RISKS ASSOCIATED WITH INVESTING IN THE FUND, PLEASE SEE THE FUND'S
PROSPECTUS AND STATEMENT OF ADDITIONAL INFORMATION, AS WELL AS OTHER FUND
REGULATORY FILINGS.
BANK LOANS RISK: An investment in bank loans subjects the Fund to credit risk,
which is heightened for loans in which the Fund invests because companies that
issue such loans tend to be highly leveraged and thus are more susceptible to
the risks of interest deferral, default and/or bankruptcy. Senior floating rate
loans, in which the Fund invests, are usually rated below-investment grade but
may also be unrated. As a result, the risks associated with these loans are
similar to the risks of below-investment grade fixed income instruments. An
economic downturn would generally lead to a higher non-payment rate, and a
senior floating rate loan may lose significant market value before a default
occurs. Moreover, any specific collateral used to secure a senior floating rate
loan may decline in value or become illiquid, which would adversely affect the
loan's value. Unlike the securities markets, there is no central clearinghouse
for loan trades, and the loan market has not established enforceable settlement
standards or remedies for failure to settle. Therefore, portfolio transactions
in loans may have uncertain settlement time periods. Senior floating rate loans
are subject to a number of risks in this report, including liquidity risk and
the risk of investing in below-investment grade fixed income instruments.
CALL RISK: If an issuer calls higher-yielding debt instruments held by the Fund,
performance could be adversely impacted.
CONVERTIBLE BONDS RISK: The market values of convertible bonds tend to decline
as interest rates increase and, conversely, to increase as interest rates
decline. A convertible bond's market value also tends to reflect the market
price of the common stock of the issuing company.
CREDIT RISK: Credit risk is the risk that an issuer of a security may be unable
or unwilling to make dividend, interest and principal payments when due and the
related risk that the value of a security may decline because of concerns about
the issuer's ability or willingness to make such payments. Credit risk may be
heightened for the Fund because it invests a substantial portion of its net
assets in high-yield or "junk" debt. Such securities, while generally offering
higher yields than investment grade debt with similar maturities, involve
greater risks, including the possibility of dividend or interest deferral,
default or bankruptcy, and are regarded as predominantly speculative with
respect to the issuer's capacity to pay dividends or interest and repay
principal. Credit risk is heightened for loans in which the Fund invests because
companies that issue such loans tend to be highly leveraged and thus are more
susceptible to the risks of interest deferral, default and/or bankruptcy.
CURRENCY RISK: Because the Fund's net asset value ("NAV") is determined on the
basis of U.S. dollars and the Fund invests in foreign securities, you may lose
money if the local currency of a foreign market depreciates against the U.S.
dollar, even if the local currency value of the Fund's holdings goes up.
CYBER SECURITY RISK: As the use of Internet technology has become more prevalent
in the course of business, the Fund has become more susceptible to potential
operational risks through breaches in cyber security. A breach in cyber security
refers to both intentional and unintentional events that may cause the Fund to
lose proprietary information, suffer data corruption or lose operational
Page 38
<PAGE>
--------------------------------------------------------------------------------
ADDITIONAL INFORMATION (CONTINUED)
--------------------------------------------------------------------------------
FIRST TRUST SHORT DURATION HIGH INCOME FUND
OCTOBER 31, 2017 (UNAUDITED)
capacity. Such events could cause the Fund to incur regulatory penalties,
reputational damage, additional compliance costs associated with corrective
measures and/or financial loss. Cyber security breaches may involve unauthorized
access to the Fund's digital information systems through "hacking" or malicious
software coding, but may also result from outside attacks such as
denial-of-service attacks through efforts to make network services unavailable
to intended users. In addition, cyber security breaches of the Fund's third
party service providers, such as its administrator, transfer agent, custodian,
or sub-advisor, as applicable, or issuers in which the Fund invests, can also
subject the Fund to many of the same risks associated with direct cyber security
breaches. The Fund has established risk management systems designed to reduce
the risks associated with cyber security. However, there is no guarantee that
such efforts will succeed, especially because the Fund does not directly control
the cyber security systems of issuers or third party service providers.
HIGH-YIELD SECURITIES RISK: High-yield securities, or "junk bonds," are subject
to greater market fluctuations and risk of loss than securities with higher
investment ratings. These securities are issued by companies that may have
limited operating history, narrowly focused operations, and/or other impediments
to the timely payment of periodic interest and principal at maturity. If the
economy slows down or dips into recession, the issuers of high-yield securities
may not have sufficient resources to continue making timely payment of periodic
interest and principal at maturity. The market for high-yield securities is
smaller and less liquid than that for investment grade securities. High-yield
securities are generally not listed on a national securities exchange but trade
in the over-the-counter markets. Due to the smaller, less liquid market for
high-yield securities, the bid-offer spread on such securities is generally
greater than it is for investment grade securities and the purchase or sale of
such securities may take longer to complete.
ILLIQUID SECURITIES RISK: Illiquid securities involve the risk that the
securities will not be able to be sold at the time desired by the Fund or at
prices approximately the value at which the Fund is carrying the securities on
its books.
INCOME RISK: If interest rates fall, the income from the Fund's portfolio may
decline as the Fund generally holds floating rate debt that will adjust lower
with falling interest rates. For loans, interest rates typically reset every 30
to 90 days.
INTEREST RATE RISK: Interest rate risk is the risk that the value of the debt
securities held by the Fund will decline because of rising market interest
rates. Interest rate risk is generally lower for shorter term investments and
higher for longer term investments. Duration is a common measure of interest
rate risk, which measures a bond's expected life on a present value basis,
taking into account the bond's yield, interest payments and final maturity.
Duration is a reasonably accurate measure of a bond's price sensitivity to
changes in interest rates. The longer the duration of a bond, the greater the
bond's price sensitivity is to changes in interest rates.
LIQUIDITY RISK: The Fund invests a substantial portion of its assets in
lower-quality debt issued by companies that are highly leveraged. Lower-quality
debt tends to be less liquid than higher-quality debt. Moreover, smaller debt
issues tend to be less liquid than larger debt issues. If the economy
experiences a sudden downturn, or if the debt markets for such companies become
distressed, the Fund may have particular difficulty selling its assets in
sufficient amounts, at reasonable prices and in a sufficiently timely manner to
raise the cash necessary to meet any potentially heavy redemption requests by
Fund shareholders.
MANAGEMENT RISK: The Fund is subject to management risk because it is an
actively managed portfolio. In managing the Fund's investment portfolio, the
Advisor will apply investment techniques and risk analyses that may not have the
desired result. There can be no guarantee that the Fund will meet its investment
objectives.
MARKET RISK: Market risk is the risk that a particular security owned by the
Fund or shares of the Fund in general may fall in value. Securities are subject
to market fluctuations caused by such factors as economic, political, regulatory
or market developments, changes in interest rates and perceived trends in stock
prices. Overall stock values could decline generally or could underperform other
investments.
NON-U.S. SECURITIES RISK: Non-U.S. securities are subject to higher volatility
than securities of domestic issuers due to possible adverse political, social or
economic developments; restrictions on foreign investment or exchange of
securities; lack of liquidity; currency exchange rates; excessive taxation;
government seizure of assets; different legal or accounting standards; and less
government supervision and regulation of exchanges in foreign countries.
OTHER DEBT SECURITIES RISK: Secured loans that are not first lien loans,
unsecured loans and other debt securities are subject to many of the same risks
that affect Senior Loans; however they are often unsecured and/or lower in the
issuer's capital structure than Senior Loans, and thus may be exposed to greater
risk of default and lower recoveries in the event of a default. This risk can be
further heightened in the case of below investment grade instruments.
Additionally, most fixed income securities are fixed-rate and thus are generally
more susceptible than floating rate loans to price volatility related to changes
in prevailing interest rates.
PREPAYMENT RISK: Loans and other fixed income investments are subject to
prepayment risk. The degree to which borrowers prepay loans, whether as a
contractual requirement or at their election, may be affected by general
business conditions, the financial condition of the borrower and competitive
conditions among loan investors, among others. As such, prepayments cannot be
predicted with accuracy. Upon a prepayment, either in part or in full, the
actual outstanding debt on which the Fund derives interest income will be
reduced. The Fund may not be able to reinvest the proceeds received on terms as
favorable as the prepaid loan.
Page 39
<PAGE>
--------------------------------------------------------------------------------
ADDITIONAL INFORMATION (CONTINUED)
--------------------------------------------------------------------------------
FIRST TRUST SHORT DURATION HIGH INCOME FUND
OCTOBER 31, 2017 (UNAUDITED)
ADVISORY AND SUB-ADVISORY AGREEMENTS
BOARD CONSIDERATIONS REGARDING CONTINUATION OF INVESTMENT MANAGEMENT AGREEMENT
The Board of Trustees (the "Board") of First Trust Series Fund (the "Trust"),
including the Independent Trustees, unanimously approved the continuation of the
Investment Management Agreement (the "Agreement") between the Trust, on behalf
of the First Trust Short Duration High Income Fund (the "Fund"), and First Trust
Advisors L.P. (the "Advisor" or "First Trust") for a one-year period ending June
30, 2018 at a meeting held on June 12, 2017. The Board determined that the
continuation of the Agreement is in the best interests of the Fund in light of
the extent and quality of the services provided and such other matters as the
Board considered to be relevant in the exercise of its reasonable business
judgment.
To reach this determination, the Board considered its duties under the
Investment Company Act of 1940, as amended (the "1940 Act"), as well as under
the general principles of state law in reviewing and approving advisory
contracts; the requirements of the 1940 Act in such matters; the fiduciary duty
of investment advisors with respect to advisory agreements and compensation; the
standards used by courts in determining whether investment company boards have
fulfilled their duties; and the factors to be considered by the Board in voting
on such agreements. At meetings held on April 24, 2017 and June 12, 2017, the
Board, including the Independent Trustees, reviewed materials provided by the
Advisor responding to requests for information from counsel to the Independent
Trustees that, among other things, outlined the services provided by the Advisor
to the Fund (including the relevant personnel responsible for these services and
their experience); the advisory fee rate payable by the Fund as compared to fees
charged to a peer group of funds compiled by Management Practice, Inc. ("MPI"),
an independent source (the "MPI Peer Group"), and as compared to fees charged to
other clients of the Advisor; expenses of the Fund as compared to expense ratios
of the funds in the MPI Peer Group; performance information for the Fund; the
nature of expenses incurred in providing services to the Fund and the potential
for economies of scale, if any; financial data on the Advisor; any fall out
benefits to the Advisor and its affiliate, First Trust Portfolios L.P. ("FTP");
and information on the Advisor's compliance program. The Board reviewed initial
materials with the Advisor at the meeting held on April 24, 2017, prior to which
the Independent Trustees and their counsel met separately to discuss the
information provided by the Advisor. Following the April meeting, independent
legal counsel on behalf of the Independent Trustees requested certain
clarifications and supplements to the materials provided, and the information
provided in response to those requests was considered at an executive session of
the Independent Trustees and independent legal counsel held prior to the June
12, 2017 meeting, as well as at the meeting held that day. The Board applied its
business judgment to determine whether the arrangement between the Trust and the
Advisor continues to be a reasonable business arrangement from the Fund's
perspective as well as from the perspective of the Fund's shareholders. The
Board determined that, given the totality of the information provided with
respect to the Agreement, the Board had received sufficient information to renew
the Agreement. The Board considered that shareholders chose to invest or remain
invested in the Fund knowing that the Advisor manages the Fund and knowing the
Fund's advisory fee.
In reviewing the Agreement, the Board considered the nature, extent and quality
of the services provided by the Advisor under the Agreement. The Board
considered that the Advisor is responsible for the overall management and
administration of the Trust and the Fund, and reviewed all of the services
provided by the Advisor to the Fund, as well as the background and experience of
the persons responsible for such services. The Board noted that the Advisor's
Leveraged Finance Investment Team is responsible for the day-to-day management
of the Fund's investments and considered the background and experience of the
members of the Leveraged Finance Investment Team and noted the Board's prior
meetings with members of the Team. The Board considered the Advisor's statement
that it applies the same oversight model internally with its Leveraged Finance
Investment Team as it uses for overseeing external sub-advisors, including
portfolio risk monitoring and performance review. In reviewing the services
provided, the Board noted the compliance program that had been developed by the
Advisor and considered that it includes a robust program for monitoring the
Advisor's and the Fund's compliance with the 1940 Act, as well as the Fund's
compliance with its investment objectives and policies. The Board also
considered a report from the Advisor with respect to its risk management
functions related to the operation of the Fund. Finally, as part of the Board's
consideration of the Advisor's services, the Advisor, in its written materials
and at the April 24, 2017 meeting, described to the Board the scope of its
ongoing investment in additional infrastructure and personnel to maintain and
improve the quality of services provided to the Fund and the other funds in the
First Trust Fund Complex. In light of the information presented and the
considerations made, the Board concluded that the nature, extent and quality of
the services provided to the Fund by the Advisor under the Agreement have been
and are expected to remain satisfactory and that the Advisor has managed the
Fund consistent with its investment objectives and policies.
The Board considered the advisory fee rate payable by the Fund under the
Agreement for the services provided. The Board considered that the Advisor
agreed to extend the current expense caps for each share class through February
28, 2019 and agreed to keep the long-term expense cap in place from March 1,
2019 through February 28, 2028. The Board noted that fees waived or expenses
borne by the Advisor are subject to reimbursement by the Fund for up to three
years from the date the expense was incurred or fees were waived, but no
reimbursement payment would be made by the Fund if it would result in the Fund
exceeding an expense ratio equal to the expense cap in place at the time of the
reimbursement or at the time the expenses were borne or the fees were waived by
the Advisor. The Board received and reviewed information showing the advisory
fee rates and expense ratios of the peer funds in the MPI Peer Group, as well as
advisory fee rates charged by the Advisor to other fund and non-fund clients, as
applicable. Based on the information provided, the Board noted that the advisory
fee rate payable by the Fund was above the median advisory fee of the peer funds
Page 40
<PAGE>
--------------------------------------------------------------------------------
ADDITIONAL INFORMATION (CONTINUED)
--------------------------------------------------------------------------------
FIRST TRUST SHORT DURATION HIGH INCOME FUND
OCTOBER 31, 2017 (UNAUDITED)
in the MPI Peer Group. The Board noted that the Fund's total (net) expense ratio
(Class A shares) was above the median of the MPI Peer Group. With respect to the
MPI Peer Group, the Board discussed with representatives of the Advisor how the
MPI Peer Group was assembled, and limitations in creating a relevant peer group
for the Fund. The Board took these limitations into account in considering the
peer data. With respect to fees charged to other clients, the Board considered
differences between the Fund and other clients that limited their comparability.
In considering the advisory fee rate overall, the Board also considered the
Advisor's statement that it seeks to meet investor needs through innovative and
value-added investment solutions and the Advisor's description of its long-term
commitment to the Fund.
The Board considered performance information for the Fund. The Board noted the
process it has established for monitoring the Fund's performance and portfolio
risk on an ongoing basis, which includes quarterly performance reporting from
the Advisor for the Fund. The Board determined that this process continues to be
effective for reviewing the Fund's performance. The Board received and reviewed
information comparing the Fund's performance for periods ended December 31, 2016
to the performance of the MPI Peer Group and to two benchmark indexes and a
blended benchmark index. Based on the information provided, the Board noted that
the Fund (Class A shares) underperformed the MPI Peer Group average, the
benchmark indexes and the blended benchmark index for the one- and three-year
periods ended December 31, 2016. The Board noted information provided by the
Advisor on reasons for the Fund's underperformance.
On the basis of all the information provided on the fees, expenses and
performance of the Fund and the ongoing oversight by the Board, the Board
concluded that the advisory fee for the Fund continues to be reasonable and
appropriate in light of the nature, extent and quality of the services provided
by the Advisor to the Fund under the Agreement.
The Board considered information and discussed with the Advisor whether there
were any economies of scale in connection with providing advisory services to
the Fund and noted the Advisor's statement that it expects its expenses to
increase over the next twelve months as the Advisor continues to make
investments in personnel and infrastructure. The Board considered the revenues
and allocated costs (including the allocation methodology) of the Advisor in
serving as investment advisor to the Fund for the twelve months ended December
31, 2016 and the estimated profitability level for the Fund calculated by the
Advisor based on such data, as well as complex-wide and product-line
profitability data for the same period. The Board noted the inherent limitations
in the profitability analysis and concluded that, based on the information
provided, the Advisor's profitability level for the Fund was not unreasonable.
In addition, the Board considered fall-out benefits described by the Advisor
that may be realized from its relationship with the Fund. The Board considered
that the Advisor had identified as a fall out benefit to the Advisor and FTP
their exposure to investors and brokers who, absent their exposure to the Fund,
may have had no dealings with the Advisor or FTP. The Board noted that in
addition to the advisory fees paid by the Fund, FTP is compensated for services
provided to the Fund through 12b-1 distribution and service fees and that First
Trust receives compensation from the Fund for providing fund reporting services
pursuant to a separate Fund Reporting Services Agreement. The Board also noted
that the Advisor does not utilize soft dollars in connection with its management
of the Fund's portfolio. The Board concluded that the character and amount of
potential fall-out benefits to the Advisor were not unreasonable.
Based on all of the information considered and the conclusions reached, the
Board, including the Independent Trustees, unanimously determined that the terms
of the Agreement continue to be fair and reasonable and that the continuation of
the Agreement is in the best interests of the Fund. No single factor was
determinative in the Board's analysis.
Page 41
<PAGE>
--------------------------------------------------------------------------------
BOARD OF TRUSTEES AND OFFICERS
--------------------------------------------------------------------------------
FIRST TRUST SHORT DURATION HIGH INCOME FUND
OCTOBER 31, 2017 (UNAUDITED)
The Trust's statement of additional information includes additional information
about the Trustees and is available, without charge, upon request, by calling
(800) 988-5891.
<TABLE>
<CAPTION>
NUMBER OF OTHER
PORTFOLIOS IN TRUSTEESHIPS OR
THE FIRST TRUST DIRECTORSHIPS
NAME, ADDRESS, TERM OF OFFICE FUND COMPLEX HELD BY TRUSTEE
DATE OF BIRTH AND AND LENGTH OF PRINCIPAL OCCUPATIONS OVERSEEN BY DURING PAST
POSITION WITH THE TRUST SERVICE DURING PAST 5 YEARS TRUSTEE 5 YEARS
------------------------------------------------------------------------------------------------------------------------------------
INDEPENDENT TRUSTEES
------------------------------------------------------------------------------------------------------------------------------------
<S> <C> <C> <C> <C>
Richard E. Erickson, Trustee o Indefinite Term Physician, Officer, Wheaton Orthopedics; 151 None
c/o First Trust Advisors L.P. Limited Partner, Gundersen Real Estate
120 E. Liberty Drive, o Since Trust Limited Partnership (June 1992 to
Suite 400 Inception December 2016); Member, Sportsmed
Wheaton, IL 60187 LLC (April 2007 to November 2015)
D.O.B.: 04/51
Thomas R. Kadlec, Trustee o Indefinite Term President, ADM Investor Services, Inc. 151 Director of ADM
c/o First Trust Advisors L.P. (Futures Commission Merchant) Investor Services,
120 E. Liberty Drive, o Since Trust Inc., ADM
Suite 400 Inception Investor Services
Wheaton, IL 60187 International,
D.O.B.: 11/57 Futures Industry
Association, and
National Futures
Association
Robert F. Keith, Trustee o Indefinite Term President, Hibs Enterprises (Financial 151 Director of Trust
c/o First Trust Advisors L.P. and Management Consulting) Company of
120 E. Liberty Drive, o Since Trust Illinois
Suite 400 Inception
Wheaton, IL 60187
D.O.B.: 11/56
Niel B. Nielson, Trustee o Indefinite Term Managing Director and Chief Operating 151 Director of
c/o First Trust Advisors L.P. Officer (January 2015 to Present), Pelita Covenant
120 E. Liberty Drive, o Since Trust Harapan Educational Foundation Transport, Inc.
Suite 400 Inception (Educational Products and Services); (May 2003 to
Wheaton, IL 60187 President and Chief Executive Officer May 2014)
D.O.B.: 03/54 (June 2012 to September 2014), Servant
Interactive LLC (Educational Products and
Services); President and Chief Executive
Officer (June 2012 to September 2014),
Dew Learning LLC (Educational Products
and Services); President (June 2002 to
June 2012), Covenant College
------------------------------------------------------------------------------------------------------------------------------------
INTERESTED TRUSTEE
------------------------------------------------------------------------------------------------------------------------------------
James A. Bowen(1), Trustee, o Indefinite Term Chief Executive Officer, First Trust 151 None
Chairman of the Board Advisors L.P. and First Trust Portfolios
120 E. Liberty Drive, o Since Trust Chairman of the Board of Directors,
Suite 400 Inception L.P.; BondWave LLC (Software Development
Wheaton, IL 60187 Company) and Stonebridge Advisors LLC
D.O.B.: 09/55 (Investment Advisor)
</TABLE>
-----------------------------
(1) Mr. Bowen is deemed an "interested person" of the Trust due to his
position as Chief Executive Officer of First Trust Advisors L.P.,
investment advisor of the Trust.
Page 42
<PAGE>
--------------------------------------------------------------------------------
BOARD OF TRUSTEES AND OFFICERS (CONTINUED)
--------------------------------------------------------------------------------
FIRST TRUST SHORT DURATION HIGH INCOME FUND
OCTOBER 31, 2017 (UNAUDITED)
<TABLE>
<CAPTION>
POSITION AND TERM OF OFFICE
NAME, ADDRESS OFFICES AND LENGTH OF PRINCIPAL OCCUPATIONS
AND DATE OF BIRTH WITH TRUST SERVICE DURING PAST 5 YEARS
------------------------------------------------------------------------------------------------------------------------------------
OFFICERS(2)
------------------------------------------------------------------------------------------------------------------------------------
<S> <C> <C> <C>
James M. Dykas President and Chief o Indefinite Term Managing Director and Chief Financial Officer
120 E. Liberty Drive, Executive Officer (January 2016 to Present), Controller (January 2011
Suite 400 o Since January 2016 to January 2016), Senior Vice President (April 2007
Wheaton, IL 60187 to January 2016), First Trust Advisors L.P. and First
D.O.B.: 01/66 Trust Portfolios L.P. Chief Financial Officer
(January 2016 to Present), BondWave LLC (Software
Development Company) and Stonebridge Advisors LLC
(Investment Advisor)
Donald P. Swade Treasurer, Chief o Indefinite Term Senior Vice President (July 2016 to Present), Vice
120 E. Liberty Drive, Financial Officer and President (April 2012 to July 2016), First Trust
Suite 400 Chief Accounting Officer o Since January 2016 Advisors L.P. and First Trust Portfolios L.P.
Wheaton, IL 60187
D.O.B.: 08/72
W. Scott Jardine Secretary and Chief o Indefinite Term General Counsel, First Trust Advisors L.P., First
120 E. Liberty Drive, Legal Officer Trust Portfolios L.P.; Secretary and General Counsel,
Suite 400 o Since Trust BondWave LLC; Secretary of Stonebridge Advisors LLC
Wheaton, IL 60187 Inception
D.O.B.: 05/60
Daniel J. Lindquist Vice President o Indefinite Term Managing Director, First Trust Advisors L.P. and
120 E. Liberty Drive, First Trust Portfolios L.P.
Suite 400 o Since Trust
Wheaton, IL 60187 Inception
D.O.B.: 02/70
Kristi A. Maher Chief Compliance o Indefinite Term Deputy General Counsel, First Trust Advisors L.P.
120 E. Liberty Drive, Officer and and First Trust Portfolios L.P.
Suite 400 Assistant Secretary o Since Trust
Wheaton, IL 60187 Inception
D.O.B.: 12/66
</TABLE>
-----------------------------
(2) The term "officer" means the president, vice president, secretary,
treasurer, controller or any other officer who performs a policy making
function.
Page 43
<PAGE>
--------------------------------------------------------------------------------
PRIVACY POLICY
--------------------------------------------------------------------------------
FIRST TRUST SHORT DURATION HIGH INCOME FUND
OCTOBER 31, 2017 (UNAUDITED)
PRIVACY POLICY
First Trust values our relationship with you and considers your privacy an
important priority in maintaining that relationship. We are committed to
protecting the security and confidentiality of your personal information.
SOURCES OF INFORMATION
We collect nonpublic personal information about you from the following sources:
o Information we receive from you and your broker-dealer, investment
advisor or financial representative through interviews,
applications, agreements or other forms;
o Information about your transactions with us, our affiliates or
others;
o Information we receive from your inquiries by mail, e-mail or
telephone; and
o Information we collect on our website through the use of "cookies".
For example, we may identify the pages on our website that your
browser requests or visits.
INFORMATION COLLECTED
The type of data we collect may include your name, address, social security
number, age, financial status, assets, income, tax information, retirement and
estate plan information, transaction history, account balance, payment history,
investment objectives, marital status, family relationships and other personal
information.
DISCLOSURE OF INFORMATION
We do not disclose any nonpublic personal information about our customers or
former customers to anyone, except as permitted by law. In addition to using
this information to verify your identity (as required under law), the permitted
uses may also include the disclosure of such information to unaffiliated
companies for the following reasons:
o In order to provide you with products and services and to effect
transactions that you request or authorize, we may disclose your
personal information as described above to unaffiliated financial
service providers and other companies that perform administrative or
other services on our behalf, such as transfer agents, custodians
and trustees, or that assist us in the distribution of investor
materials such as trustees, banks, financial representatives, proxy
services, solicitors and printers.
o We may release information we have about you if you direct us to do
so, if we are compelled by law to do so, or in other legally limited
circumstances (for example to protect your account from fraud).
In addition, in order to alert you to our other financial products and services,
we may share your personal information within First Trust.
USE OF WEB ANALYTICS
We currently use third party analytics tools, Google Analytics and AddThis, to
gather information for purposes of improving First Trust's website and marketing
our products and services to you. These tools employ cookies, which are small
pieces of text stored in a file by your web browser and sent to websites that
you visit, to collect information, track website usage and viewing trends such
as the number of hits, pages visited, videos and PDFs viewed and the length of
user sessions in order to evaluate website performance and enhance navigation of
the website. We may also collect other anonymous information, which is generally
limited to technical and web navigation information such as the IP address of
your device, internet browser type and operating system for purposes of
analyzing the data to make First Trust's website better and more useful to our
users. The information collected does not include any personal identifiable
information such as your name, address, phone number or email address unless you
provide that information through the website for us to contact you in order to
answer your questions or respond to your requests. To find out how to opt-out of
these services click on: Google Analytics and AddThis.
CONFIDENTIALITY AND SECURITY
With regard to our internal security procedures, First Trust restricts access to
your nonpublic personal information to those First Trust employees who need to
know that information to provide products or services to you. We maintain
physical, electronic and procedural safeguards to protect your nonpublic
personal information.
POLICY UPDATES AND INQUIRIES
As required by federal law, we will notify you of our privacy policy annually.
We reserve the right to modify this policy at any time, however, if we do change
it, we will tell you promptly. For questions about our policy, or for additional
copies of this notice, please go to www.ftportfolios.com, or contact us at
1-800-621-1675 (First Trust Portfolios) or 1-800-222-6822 (First Trust
Advisors).
May 2017
Page 44
<PAGE>
FIRST TRUST
INVESTMENT ADVISOR
First Trust Advisors L.P.
120 E. Liberty Drive, Suite 400
Wheaton, IL 60187
TRANSFER AGENT
BNY Mellon Investment Servicing (US) Inc.
301 Bellevue Parkway
Wilmington, DE 19809
ADMINISTRATOR,
FUND ACCOUNTANT,
AND CUSTODIAN
The Bank of New York Mellon
101 Barclay Street, 20th Floor
New York, NY 10286
INDEPENDENT REGISTERED
PUBLIC ACCOUNTING FIRM
Deloitte & Touche LLP
111 S. Wacker Drive
Chicago, IL 60606
LEGAL COUNSEL
Chapman and Cutler LLP
111 W. Monroe Street
Chicago, IL 60603
<PAGE>
[BLANK BACK COVER]
<PAGE>
Table of Contents
First Trust AQA® Equity Fund
Annual Report
October 31, 2017
Caution Regarding Forward-Looking Statements
This report contains certain forward-looking statements within the meaning of the Securities Act of 1933, as amended, and the Securities Exchange Act of 1934, as amended. Forward-looking statements include statements regarding the goals, beliefs, plans or current expectations of First Trust Advisors L.P. (“First Trust” or the “Advisor”) and/or J.J.B. Hilliard, W.L. Lyons, LLC (“Hilliard Lyons” or the “Sub-Advisor”) and their respective representatives, taking into account the information currently available to them. Forward-looking statements include all statements that do not relate solely to current or historical fact. For example, forward-looking statements include the use of words such as “anticipate,” “estimate,” “intend,” “expect,” “believe,” “plan,” “may,” “should,” “would” or other words that convey uncertainty of future events or outcomes.
Forward-looking statements involve known and unknown risks, uncertainties and other factors that may cause the actual results, performance or achievements of First Trust AQA® Equity Fund (the “Fund”) to be materially different from any future results, performance or achievements expressed or implied by the forward-looking statements. When evaluating the information included in this report, you are cautioned not to place undue reliance on these forward-looking statements, which reflect the judgment of the Advisor and/or Sub-Advisor and their respective representatives only as of the date hereof. We undertake no obligation to publicly revise or update these forward-looking statements to reflect events and circumstances that arise after the date hereof.
Performance and Risk Disclosure
There is no assurance that the Fund will achieve its investment objective. The Fund is subject to market risk, which is the possibility that the market values of securities owned by the Fund will decline and that the value of the Fund shares may therefore be less than what you paid for them. Accordingly, you can lose money by investing in the Fund. See “Risk Considerations” in the Additional Information section of this report for a discussion of certain other risks of investing in the Fund.
Performance data quoted represents past performance, which is no guarantee of future results, and current performance may be lower or higher than the figures shown. For the most recent month-end performance figures, please visit http://www.ftportfolios.com or speak with your financial advisor. Investment returns and net asset value will fluctuate and Fund shares, when sold, may be worth more or less than their original cost.
The Advisor may also periodically provide additional information on Fund performance on the Fund’s web page at http://www.ftportfolios.com.
How to Read This Report
This report contains information that may help you evaluate your investment in the Fund. It includes details about the Fund and presents data and analysis that provide insight into the Fund’s performance and investment approach.
By reading the portfolio commentary by the portfolio management team of the Fund, you may obtain an understanding of how the market environment affected the Fund’s performance. The statistical information that follows may help you understand the Fund’s performance compared to that of relevant market benchmarks.
It is important to keep in mind that the opinions expressed by personnel of Hilliard Lyons are just that: informed opinions. They should not be considered to be promises or advice. The opinions, like the statistics, cover the period through the date on the cover of this report. The material risks of investing in the Fund are spelled out in the prospectus, the statement of additional information, this report and other Fund regulatory filings.
Shareholder Letter
First Trust AQA® Equity Fund
Annual Letter from the Chairman and CEO
October 31, 2017
Dear Shareholders:
Thank you for your investment in First Trust AQA® Equity Fund.
First Trust is pleased to provide you with the annual report which contains detailed information about your investment for the 12 months ended October 31, 2017, including a market overview and a performance analysis for the period. We encourage you to read this report carefully and discuss it with your financial advisor.
The U.S. bull market continued through the November 2016 election and the first nine months of the Trump presidency. During that period, November 8, 2016 (Election Day 2016) through October 31, 2017, the S&P 500® Index (the “Index”) posted a total return of 22.73%, according to Bloomberg. Ten of the eleven Index sectors were up on a total return basis as well. Since the beginning of 2017 through October 31, 2017, the Index has closed its trading sessions at all-time highs on 50 occasions. Finally, as of October 31, 2017, the Index has spent the entire year in positive territory. This has only happened in 10 different years over the past seven decades.
The current bull market, as measured from March 9, 2009 through October 31, 2017, is the second longest in history. While we are optimistic about the U.S. economy, we are also aware that no one can predict the future or know how markets will perform in different economic environments. We believe that one should invest for the long term and be prepared for market volatility by keeping current on your portfolio and investing goals by speaking regularly with your investment professional. It is also important to keep in mind that past performance can never guarantee future results.
Thank you for giving First Trust the opportunity to be a part of your investment plan. We value our relationship with you and will continue to focus on bringing the types of investments that we believe can help you reach your financial goals.
Sincerely,

James A. Bowen
Chairman of the Board of Trustees
Chief Executive Officer of First Trust Advisors L.P.
Page 1
First Trust AQA® Equity Fund
“AT A GLANCE”
As of October 31, 2017 (Unaudited)
Fund Statistics
| | | | |
First Trust AQA® Equity Fund | | Net Asset
Value (NAV) | |
Class A (AQAAX) | | $ | 27.51 | |
Class C (AQACX) | | $ | 27.13 | |
Class I (AQAIX) | | $ | 27.42 | |
| |
Sector Allocation | | % of Total
Investments |
Information Technology | | | 26.6 | % |
Consumer Discretionary | | | 24.7 | |
Industrials | | | 24.2 | |
Health Care | | | 9.7 | |
Financials | | | 9.3 | |
Consumer Staples | | | 3.1 | |
Energy | | | 2.4 | |
| | | | |
Total | | | 100.0 | % |
| | | | |
| | | | |
Top Ten Holdings | | % of Total
Investments |
Cognex Corp. | | | 5.3 | % |
ABIOMED, Inc. | | | 4.4 | |
Trex Co., Inc. | | | 4.3 | |
Monolithic Power Systems, Inc. | | | 4.3 | |
Saia, Inc. | | | 3.8 | |
MSCI, Inc. | | | 3.8 | |
Dana, Inc. | | | 3.7 | |
Wabash National Corp. | | | 3.7 | |
KB Home | | | 3.7 | |
Old Dominion Freight Line, Inc. | | | 3.4 | |
| | | | |
Total | | | 40.4 | % |
| | | | |
Page 2
First Trust AQA® Equity Fund
“AT A GLANCE” (Continued)
As of October 31, 2017 (Unaudited)
Performance of a $10,000 Investment
This chart compares your Fund’s Class I performance to that of the Russell 3000® Value Index and the Russell 3000® Index from 11/10/2015 through 10/31/2017.
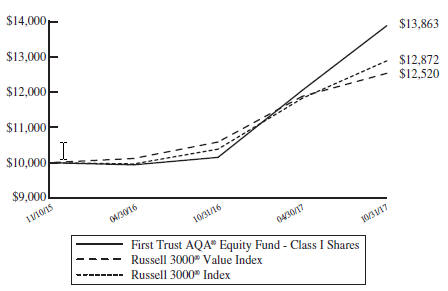
Performance as of October 31, 2017
| | | | | | | | | | | | | | | | | | | | | | | | | | | | |
| | | Class A
Inception 11/10/2015 | | | Class C
Inception 11/10/2015 | | | Class I
Inception 11/10/2015 | | | Russell
3000® Value
Index* | | | Russell
3000®
Index* | |
| | | w/o sales charge | | | w/ max 5.50% sales charge | | | w/o sales charge | | | w/ max 1.00% contingent deferred sales charge | | | w/o sales charge | | | w/o sales charges | | | w/o sales charges | |
Cumulative Total Returns | | | | | | | | | | | | | | | | | | | | | | | | | | | | |
1 Year | | | 36.26% | | | | 28.77% | | | | 35.25% | | | | 34.25% | | | | 36.58% | | | | 18.30% | | | | 23.98% | |
Average Annual Total Returns | | | | | | | | | | | | | | | | | | | | | | | | | | | | |
Since Inception | | | 18.22% | | | | 14.88% | | | | 17.40% | | | | 17.40% | | | | 18.01% | | | | 12.07% | | | | 13.65% | |
| * | Since inception return is based on the Class I Shares inception date. |
Performance figures assume reinvestment of all distributions and do not reflect the deduction of taxes that the shareholder would pay on Fund distributions or the redemption of Fund shares. The total returns would have been lower if certain fees had not been waived and expenses reimbursed by the Advisor. An index is a statistical composite that tracks a specific financial market or sector. Unlike the Fund, these indices do not actually hold a portfolio of securities and therefore do not incur the expenses incurred by the Fund. These expenses negatively impact the performance of the Fund. The Fund’s past performance does not predict future performance.
Performance of share classes will vary due to differences in sales charges and expenses. Total return with sales charges includes payment of the maximum sales charge of 5.50% for Class A Shares, a contingent deferred sales charge (“CDSC”) of 1.00% for Class C Shares in year one and 12b-1 service fees of 0.25% per year of average daily net assets for Class A Shares and combined Rule 12b-1 distribution and service fees of 1.00% per year of average daily net assets for Class C Shares. Class I Shares do not have a front-end sales charge or a CDSC, nor do they pay distribution or service fees.
Page 3
Portfolio Commentary
First Trust AQA® Equity Fund
Annual Report
October 31, 2017 (Unaudited)
Advisor
First Trust Advisors L.P. (“First Trust”) is the investment advisor to the First Trust AQA® Equity Fund (the “Fund”). First Trust is responsible for the ongoing monitoring of the Fund’s investment portfolio, managing the Fund’s business affairs and providing certain administrative services necessary for the management of the Fund.
Sub-Advisor
J.J.B. Hilliard, W.L. Lyons, LLC (“Hilliard Lyons” or the “Sub-Advisor”) is the sub-advisor to the Fund and is a registered investment adviser located in Louisville, Kentucky. Hilliard Lyons manages the Fund using its proprietary quantitative methodology called the Automated Quantitative Analysis (“AQA®”) program.
Portfolio Management Team
Alan Morel – Senior Vice President, Senior Portfolio Manager of Hilliard Lyons
Cory Gerkin, CFA – Portfolio Manager of Hilliard Lyons
Commentary
Market Recap
The 12-month period ended October 31, 2017 was anchored by the U.S. Presidential election in 2016, from which time the broader S&P 500® Index rose by 24.5%. Without too much legislation to warrant this upward valuation, we believe the new administration’s promise of less Federal legislation and lower corporate and personal taxes has emboldened businesses to invest and hire. Higher household net worth generated by lower unemployment, rising housing prices and increased stock prices have increased consumer spending. The underlying net worth of stocks (increase in net retained earnings) in the Fund rose 15.5% in 2016, and through the second quarter of 2017, rose another 12.5%.
Performance Analysis
Class I shares of the Fund generated a total return of 36.58% during the 12-month period ended October 31, 2017, versus the Russell 3000® Value Index (the “Benchmark”) and the Russell 3000® Index appreciation of 18.30% and 23.98%, respectively. The Fund was most heavily weighted toward the Information Technology (26.58%), Consumer Discretionary (24.71%), and Industrials (24.21%) sectors.
The Fund’s top 10 holdings represented 40.4% of the portfolio, and our bottom ten performers were 14.91% of the portfolio. Allocation of resources within the portfolio are set at the median of the portfolio for the initial purchase of a stock; thereafter, stock price movement alone determines the percentage of the portfolio represented by each stock in the portfolio. Within our best performing sector, Industrials, transportation-related companies contributed the majority of the gain. In the Industrial sector, Cognex Corp (CGNX), a major supplier of recognition software to Apple (AAPL), was the best performer for the last 12 months (138.8%) and represents the Fund’s largest holding at 5.34% of the portfolio. At the other end of the scale, Bed, Bath and Beyond (BBBY) fell 50.23%, and at 0.85% of the portfolio is the Fund’s smallest holding. BBBY has been a major casualty of the ‘Amazon effect’ on retailers.
The AQA investment process is driven only by financial performance and price. Net worth generated by financial performance is the dependent variable, and price is the independent variable. Discrepancies between the two indicate a level of under or over-valuation for a stock relative to all other stocks in our universe of S&P 500® Indexed companies. Undervalued stocks eligible for inclusion in the Fund are not selected on the basis of product, industry, or sector. If there are well managed companies that are out of favor in an industry or in a sector itself out of favor with investors, then those sectors and industries will, by default, be more heavily weighted in the portfolio at that time.
There are statistical techniques that allow quantification of the comparative effect of sector weighting for the portfolio and its benchmark. In the last 12 months, the coincidence of Fund performance with Benchmark performance determined largely by matching weightings (the sector allocation effect), has been negligible. By contrast, the Fund’s performance by sector has corresponded well with the individual performance of stocks within that sector (the sector interaction effect): portfolio return (+63.65%) for stocks in the industrial sector (representing 24.20% of the portfolio), and portfolio return (+51.17%) for stocks in the Information Technology sector (representing 26.60% of the portfolio, indicate the advantage gained by the Fund. Superior performing stocks (the stock selection effect) are additionally benefitted by recognition in the marketplace of a previously undervalued sector.
Statistically, value added by the AQA investment process through the allocation effect (0.06 percentage points), the interaction effect (10.58 percentage points), and the selection effect (10.38 percentage points), indicate a total value added to the main benchmark performance by the AQA investment process, of 21.02 percentage points over the last twelve months. These figures reflect comparisons between the Fund and the Benchmark.
Page 4
Portfolio Commentary (Continued)
First Trust AQA® Equity Fund
Annual Report
October 31, 2017 (Unaudited)
Market and Fund Outlook
We did not foresee the onset of the ‘Trump rally’, and we cannot predict its inevitable end. The market exists as a trading place. The day to day movement of stock prices is a mystery to us; to suppose that our view over a longer term would be any less of a mystery would be a mistake.
For the Fund and its ever-changing portfolio of stocks, we are confident that the selection process in place ensures that each stock entering the portfolio is equally undervalued at the point of its inclusion. We are equally sanguine that the recognition process of the value that exists in each of these stocks will be recognized over time, if that value and its rate of growth is maintained. A portfolio turnover rate of 57% in fiscal year 2016 and 38% in fiscal year 2017 indicates that there is a gradual replenishment of undervalued stocks into the portfolio and stocks, whose value has been recognized, are sold. This encourages us to believe that the current portfolio is close to the average level of undervaluation present in the portfolio of one year ago, even after an appreciation of 36.58%.
Page 5
First Trust AQA® Equity Fund
Understanding Your Fund Expenses
October 31, 2017 (Unaudited)
As a shareholder of the First Trust AQA® Equity Fund, you incur two types of costs: (1) transaction costs, including sales charges (loads) on purchases of Class A Shares and contingent deferred sales charges on the lesser of purchase price or redemption proceeds of Class C Shares; and (2) ongoing costs, including management fees, distribution and/or service (12b-1) fees, if any, and other Fund expenses. This Example is intended to help you understand your ongoing costs of investing in the Fund and to compare these costs with the ongoing costs of investing in other funds.
The Example is based on an investment of $1,000 invested at the beginning of the period and held through the six-month period ended October 31, 2017.
Actual Expenses
The first three columns of the table below provide information about actual account values and actual expenses. You may use the information in these columns, together with the amount you invested, to estimate the expenses that you paid over the period. Simply divide your account value by $1,000 (for example, an $8,600 account value divided by $1,000 = 8.6), then multiply the result by the number in the third column under the heading entitled “Expenses Paid During Period” to estimate the expenses you paid on your account during this period.
Hypothetical Example for Comparison Purposes
The next three columns of the table below provide information about hypothetical account values and hypothetical expenses based on the Fund’s actual expense ratio and an assumed rate of return of 5% per year before expenses, which is not the Fund’s actual return. The hypothetical account values and expenses may not be used to estimate the actual ending account balance or expenses you paid for the period. You may use this information to compare the ongoing costs of investing in the Fund and other funds. To do so, compare this 5% hypothetical example with the 5% hypothetical examples that appear in the shareholder reports of the other funds.
Please note that the expenses shown in the table are meant to highlight your ongoing costs only and do not reflect any transactional costs such as sales charges (loads) or contingent deferred sales charges. Therefore, the hypothetical section of the table is useful in comparing ongoing costs only, and will not help you determine the relative total costs of owning different funds. In addition, if these transactional costs were included, your costs would have been higher.
| | | | | | | | | | | | | | | | | | | | | | | | | | | | |
| | | Actual Expenses | | | Hypothetical
(5% Return Before Expenses) | | | | |
| | | Beginning
Account Value
5/1/2017 | | | Ending Account
Value
10/31/2017 | | | Expenses Paid
During Period
5/1/2017 -
10/31/2017 (a) | | | Beginning
Account Value
5/1/2017 | | | Ending Account
Value
10/31/2017 | | | Expenses Paid
During Period
5/1/2017 -
10/31/2017 (a) | | | Annualized
Expense Ratios (b) | |
Class A | | $ | 1,000.00 | | | $ | 1,150.10 | | | $ | 8.67 | | | $ | 1,000.00 | | | $ | 1,017.14 | | | $ | 8.13 | | | | 1.60 | % |
Class C | | | 1,000.00 | | | | 1,145.70 | | | | 12.71 | | | | 1,000.00 | | | | 1,013.36 | | | | 11.93 | | | | 2.35 | |
Class I | | | 1,000.00 | | | | 1,151.20 | | | | 7.32 | | | | 1,000.00 | | | | 1,018.40 | | | | 6.87 | | | | 1.35 | |
| (a) | Expenses are equal to the annualized expense ratios, multiplied by the average account value over the period (May 1, 2017 through October 31, 2017), multiplied by 184/365 (to reflect the one-half year period). |
| (b) | These expense ratios reflect expense caps. |
Page 6
First Trust AQA® Equity Fund
Portfolio of Investments
October 31, 2017
| | | | | | | | |
Shares | | | Description | | Value | |
| | COMMON STOCKS – 100.2% | | | | |
| | |
| | | | Airlines – 4.2% | | | | |
| | 16,469 | | | Delta Air Lines, Inc. | | $ | 823,944 | |
| | 18,839 | | | Southwest Airlines Co. | | | 1,014,669 | |
| | | | | | | | |
| | | | | | | 1,838,613 | |
| | | | | | | | |
| | | | Auto Components – 3.7% | | | | |
| | 53,039 | | | Dana, Inc. | | | 1,617,159 | |
| | | | | | | | |
| | | | Biotechnology – 1.6% | | | | |
| | 9,485 | | | Gilead Sciences, Inc. | | | 710,996 | |
| | | | | | | | |
| | | | Building Products – 4.3% | | | | |
| | 17,030 | | | Trex Co., Inc. (a) | | | 1,863,933 | |
| | | | | | | | |
| | | | Capital Markets – 9.3% | | | | |
| | 6,739 | | | Affiliated Managers Group, Inc. | | | 1,256,824 | |
| | 14,039 | | | MSCI, Inc. | | | 1,647,617 | |
| | 104,380 | | | WisdomTree Investments, Inc. | | | 1,157,574 | |
| | | | | | | | |
| | | | | | | 4,062,015 | |
| | | | | | | | |
| | | | Communications Equipment – 1.1% | | | | |
| | 11,386 | | | Applied Optoelectronics, Inc. (a) | | | 463,866 | |
| | | | | | | | |
| | | | Construction & Engineering – 2.4% | | | | |
| | 18,024 | | | Jacobs Engineering Group, Inc. | | | 1,049,177 | |
| | | | | | | | |
| | | | Electronic Equipment, Instruments & Components – 8.5% | | | | |
| | 18,917 | | | Cognex Corp. | | | 2,329,628 | |
| | 10,203 | | | SYNNEX Corp. | | | 1,376,181 | |
| | | | | | | | |
| | | | | | | 3,705,809 | |
| | | | | | | | |
| | | | Food Products – 1.9% | | | | |
| | 18,680 | | | Cal-Maine Foods, Inc. (a) | | | 840,600 | |
| | | | | | | | |
| | | | Health Care Equipment & Supplies – 6.3% | | | | |
| | 9,867 | | | ABIOMED, Inc. (a) | | | 1,903,542 | |
| | 9,687 | | | Masimo Corp. (a) | | | 850,131 | |
| | | | | | | | |
| | | | | | | 2,753,673 | |
| | | | | | | | |
| | | | Hotels, Restaurants & Leisure – 3.1% | | | | |
| | 46,796 | | | Boyd Gaming Corp. | | | 1,367,847 | |
| | | | | | | | |
| | | | Household Durables – 7.0% | | | | |
| | 58,101 | | | KB Home | | | 1,593,710 | |
| | 31,244 | | | Toll Brothers, Inc. | | | 1,438,474 | |
| | | | | | | | |
| | | | | | | 3,032,184 | |
| | | | | | | | |
| | | | Internet Software & Services – 1.8% | | | | |
| | 4,230 | | | Facebook, Inc., Class A (a) | | | 761,654 | |
| | | | | | | | |
| | | | IT Services – 5.1% | | | | |
| | 4,277 | | | Alliance Data Systems Corp. | | | 956,893 | |
| | | | | | | | |
Shares | | | Description | | Value | |
| | | | IT Services (Continued) | | | | |
| | 16,827 | | | Cognizant Technology Solutions Corp., Class A | | $ | 1,273,299 | |
| | | | | | | | |
| | | | | | | 2,230,192 | |
| | | | | | | | |
| | | | Leisure Products – 4.0% | | | | |
| | 84,657 | | | Callaway Golf Co. | | | 1,221,601 | |
| | 39,355 | | | Nautilus, Inc. (a) | | | 511,615 | |
| | | | | | | | |
| | | | | | | 1,733,216 | |
| | | | | | | | |
| | | | Machinery – 6.1% | | | | |
| | 32,449 | | | Trinity Industries, Inc. | | | 1,055,241 | |
| | 71,352 | | | Wabash National Corp. | | | 1,605,420 | |
| | | | | | | | |
| | | | | | | 2,660,661 | |
| | | | | | | | |
| | | | Media – 1.8% | | | | |
| | 29,388 | | | Twenty-First Century Fox, Inc., Class A | | | 768,496 | |
| | | | | | | | |
| | | | Multiline Retail – 2.1% | | | | |
| | 11,468 | | | Dollar General Corp. | | | 927,073 | |
| | | | | | | | |
| | | | Oil, Gas & Consumable Fuels – 2.5% | | | | |
| | 13,482 | | | Valero Energy Corp. | | | 1,063,595 | |
| | | | | | | | |
| | | | Pharmaceuticals – 1.7% | | | | |
| | 4,223 | | | Allergan PLC | | | 748,442 | |
| | | | | | | | |
| | | | Road & Rail – 7.2% | | | | |
| | 12,179 | | | Old Dominion Freight Line, Inc. | | | 1,475,242 | |
| | 25,664 | | | Saia, Inc. (a) | | | 1,663,027 | |
| | | | | | | | |
| | | | | | | 3,138,269 | |
| | | | | | | | |
| | | | Semiconductors & Semiconductor Equipment – 4.3% | | | | |
| | 15,206 | | | Monolithic Power Systems, Inc. | | | 1,850,114 | |
| | | | | | | | |
| | | | Software – 5.9% | | | | |
| | 34,806 | | | Progress Software Corp. | | | 1,473,338 | |
| | 60,685 | | | TiVo Corp. | | | 1,101,433 | |
| | | | | | | | |
| | | | | | | 2,574,771 | |
| | | | | | | | |
| | | | Specialty Retail – 0.9% | | | | |
| | 18,686 | | | Bed Bath & Beyond, Inc. | | | 371,851 | |
| | | | | | | | |
| | | | Textiles, Apparel & Luxury Goods – 2.2% | | | | |
| | 29,863 | | | Skechers U.S.A., Inc., Class A (a) | | | 953,227 | |
| | | | | | | | |
| | | | Tobacco – 1.2% | | | | |
| | 7,767 | | | Altria Group, Inc. | | | 498,797 | |
| | | | | | | | |
| | | | Total Investments – 100.2%
(Cost $33,519,386) (b) | | | 43,586,230 | |
| | | | Net Other Assets and Liabilities – (0.2)% | | | (89,698 | ) |
| | | | | | | | |
| | | | Net Assets – 100.0% | | $ | 43,496,532 | |
| | | | | | | | |
| | | | |
| | See Notes to Financial Statements | | Page 7 |
First Trust AQA® Equity Fund
Portfolio of Investments (Continued)
October 31, 2017
| (a) | Non-income producing security. |
| (b) | Aggregate cost for federal income tax purposes was $33,533,484. As of October 31, 2017, the aggregate gross unrealized appreciation for all investments in which there as an excess of value over tax cost was $11,343,167 and the aggregate gross unrealized depreciation for all investments in which there was an excess of tax cost over value was $1,290,421. The net unrealized appreciation was $10,052,746. |
Valuation Inputs
A summary of the inputs used to value the Fund’s investments as of October 31, 2017 is as follows (see Note 2A - Portfolio Valuation in the Notes to Financial Statements):
| | | | | | | | | | | | |
| | | Total Value at 10/31/2017 | | Level 1 Quoted Prices | | Level 2
Significant
Observable
Inputs | | | Level 3
Significant
Unobservable
Inputs | |
Common Stocks* | | $43,586,230 | | $43,586,230 | | $ | — | | | $ | — | |
| | | | | | | | | | | | |
| * | See Portfolio of Investments for industry breakout. |
All transfers in and out of the Levels during the period are assumed to occur on the last day of the period at their current value. There were no transfers between Levels at October 31, 2017.
| | | | |
| Page 8 | | See Notes to Financial Statements | | |
First Trust AQA® Equity Fund
Statement of Assets and Liabilities
October 31, 2017
| | | | |
ASSETS: | | | | |
Investments, at value
(Cost $33,519,386) | | $ | 43,586,230 | |
Cash | | | 432,020 | |
Receivables: | | | | |
Fund shares sold | | | 112,540 | |
Dividends | | | 2,704 | |
Prepaid expenses | | | 33,099 | |
| | | | |
Total Assets | | | 44,166,593 | |
| | | | |
LIABILITIES: | | | | |
Payables: | | | | |
Fund shares redeemed | | | 520,324 | |
Transfer agent fees | | | 39,137 | |
Audit and tax fees | | | 28,001 | |
Administrative fees | | | 22,056 | |
12b-1 distribution and service fees | | | 20,108 | |
Investment advisory fees | | | 15,321 | |
Printing fees | | | 12,236 | |
Custodian fees | | | 3,727 | |
Registration fees | | | 3,457 | |
Interest and fees on loan | | | 3,076 | |
Trustees’ fees and expenses | | | 1,610 | |
Financial reporting fees | | | 770 | |
Legal fees | | | 238 | |
| | | | |
Total Liabilities | | | 670,061 | |
| | | | |
NET ASSETS. | | $ | 43,496,532 | |
| | | | |
NET ASSETS consist of: | | | | |
Paid-in capital | | $ | 32,239,868 | |
Par value | | | 15,908 | |
Accumulated net investment income (loss) | | | — | |
Accumulated net realized gain (loss) on investments | | | 1,173,912 | |
Net unrealized appreciation (depreciation) on investments | | | 10,066,844 | |
| | | | |
NET ASSETS | | $ | 43,496,532 | |
| | | | |
Maximum Offering Price Per Share: | | | | |
| |
Class A Shares: | | | | |
Net asset value and redemption price per share (Based on net assets of $22,116,794 and 803,929 shares of beneficial interest issued and outstanding) | | $ | 27.51 | |
Maximum sales charge (5.50% of offering price) | | | 1.60 | |
| | | | |
Maximum offering price to public | | $ | 29.11 | |
| | | | |
Class C Shares: | | | | |
Net asset value and redemption price per share (Based on net assets of $18,369,909 and 677,066 shares of beneficial interest issued and outstanding) | | $ | 27.13 | |
| | | | |
Class I Shares: | | | | |
Net asset value and redemption price per share (Based on net assets of $3,009,829 and 109,783 shares of beneficial interest issued and outstanding) | | $ | 27.42 | |
| | | | |
| | | | |
| | See Notes to Financial Statements | | Page 9 |
First Trust AQA® Equity Fund
Statement of Operations
For the Year Ended October 31, 2017
| | | | |
INVESTMENT INCOME: | | | | |
Dividends | | $ | 360,863 | |
Interest | | | 6,353 | |
| | | | |
Total investment income | | | 367,216 | |
| | | | |
EXPENSES: | | | | |
Investment advisory fees | | | 355,980 | |
12b-1 distribution and/or service fees: | | | | |
Class A | | | 39,002 | |
Class C | | | 171,838 | |
Transfer agent fees | | | 95,013 | |
Administrative fees | | | 54,258 | |
Audit and tax fees | | | 28,925 | |
Custodian fees | | | 24,469 | |
Printing fees | | | 23,311 | |
Trustees’ fees and expenses | | | 16,783 | |
Financial reporting fees | | | 9,250 | |
Registration fees | | | 8,216 | |
Commitment fees | | | 3,076 | |
Listing expense | | | 1,801 | |
Legal fees | | | 398 | |
Other | | | (4,572 | ) |
| | | | |
Total expenses | | | 827,748 | |
Fees waived by the investment advisor | | | (136,315 | ) |
| | | | |
Net expenses | | | 691,433 | |
| | | | |
NET INVESTMENT INCOME (LOSS) | | | (324,217 | ) |
| | | | |
NET REALIZED AND UNREALIZED GAIN (LOSS): | | | | |
Net realized gain (loss) on investments | | | 1,500,421 | |
Net change in unrealized appreciation (depreciation) on investments | | | 9,308,457 | |
| | | | |
NET REALIZED AND UNREALIZED GAIN (LOSS) | | | 10,808,878 | |
| | | | |
NET INCREASE (DECREASE) IN NET ASSETS RESULTING FROM OPERATIONS | | $ | 10,484,661 | |
| | | | |
| | | | |
| Page 10 | | See Notes to Financial Statements | | |
First Trust AQA® Equity Fund
Statements of Changes in Net Assets
| | | | | | | | |
| | | Year
Ended
10/31/2017 | | | Period
Ended
10/31/2016 (a) | |
OPERATIONS: | | | | | | | | |
Net investment income (loss) | | $ | (324,217 | ) | | $ | (118,406 | ) |
Net realized gain (loss) | | | 1,500,421 | | | | 462,605 | |
Net change in unrealized appreciation (depreciation) | | | 9,308,457 | | | | 758,387 | |
| | | | | | | | |
Net increase (decrease) in net assets resulting from operations | | | 10,484,661 | | | | 1,102,586 | |
| | | | | | | | |
DISTRIBUTIONS TO SHAREHOLDERS FROM NET REALIZED GAIN: | | | | | | | | |
Class A Shares | | | (136,704 | ) | | | — | |
Class C Shares | | | (175,390 | ) | | | — | |
Class I Shares | | | (34,397 | ) | | | — | |
| | | | | | | | |
Total distributions to shareholders | | | (346,491 | ) | | | — | |
| | | | | | | | |
CAPITAL TRANSACTIONS: | | | | | | | | |
Proceeds from shares sold | | | 17,450,833 | | | | 25,528,862 | |
Proceeds from shares reinvested | | | 335,557 | | | | — | |
Redemptions of shares | | | (9,871,258 | ) | | | (1,188,218 | ) |
| | | | | | | | |
Net increase (decrease) in net assets resulting from capital transactions | | | 7,915,132 | | | | 24,340,644 | |
| | | | | | | | |
Total increase (decrease) in net assets | | | 18,053,302 | | | | 25,443,230 | |
| | |
NET ASSETS: | | | | | | | | |
Beginning of period | | | 25,443,230 | | | | — | |
| | | | | | | | |
End of period | | $ | 43,496,532 | | | $ | 25,443,230 | |
| | | | | | | | |
Accumulated net investment income (loss) at end of period | | $ | — | | | $ | — | |
| | | | | | | | |
| (a) | The Fund was initially seeded on November 9, 2015 and commenced operations on November 10, 2015. |
| | | | |
| | See Notes to Financial Statements | | Page 11 |
First Trust AQA® Equity Fund
Financial Highlights
For a share outstanding throughout each period
| | | | | | | | |
| | | Year Ended
10/31/2017 | | | Period
Ended
10/31/2016 (a) | |
Class A Shares | | | | | | | | |
Net asset value, beginning of period | | $ | 20.42 | | | $ | 20.00 | |
| | | | | | | | |
Income from investment operations: | | | | | | | | |
Net investment income (loss) (b) | | | (0.14 | ) | | | (0.08 | ) |
Net realized and unrealized gain (loss) | | | 7.50 | | | | 0.50 | |
| | | | | | | | |
Total from investment operations | | | 7.36 | | | | 0.42 | |
| | | | | | | | |
Distributions paid to shareholders from: | | | | | | | | |
Net realized gain | | | (0.27 | ) | | | — | |
| | | | | | | | |
Net asset value, end of period | | $ | 27.51 | | | $ | 20.42 | |
| | | | | | | | |
Total return (c) | | | 36.26 | % | | | 2.10 | % |
| | |
Ratios to average net assets/supplemental data: | | | | | | | | |
Net assets, end of period (in 000’s) | | $ | 22,117 | | | $ | 10,527 | |
Ratio of total expenses to average net assets | | | 1.91 | % | | | 2.65 | % (d) |
Ratio of net expenses to average net assets | | | 1.60 | % | | | 1.60 | % (d) |
Ratio of net investment income (loss) to average net assets | | | (0.58 | )% | | | (0.42 | )% (d) |
Portfolio turnover rate | | | 38 | % | | | 57 | % |
| (a) | Class A Shares were initially seeded on November 9, 2015 and commenced operations on November 10, 2015. |
| (b) | Per share amounts have been calculated using the average shares method. |
| (c) | Assumes reinvestment of all distributions for the period and does not include payment of the maximum sales charge of 5.50% or contingent deferred sales charge (CDSC). On purchases of $1 million or more, a CDSC of 1% may be imposed on certain redemptions made within twelve months of purchase. If the sales charges were included, total returns would be lower. These returns include Rule 12b-1 service fees of 0.25% and do not reflect the deduction of taxes that a shareholder would pay on Fund distributions or the redemption of Fund shares. The total returns would have been lower if certain fees had not been waived and expenses reimbursed by the investment advisor. Total return is calculated for the time period presented and is not annualized for periods of less than one year. |
| | | | |
| Page 12 | | See Notes to Financial Statements | | |
First Trust AQA® Equity Fund
Financial Highlights (Continued)
For a share outstanding throughout each period
| | | | | | | | |
| | | Year Ended
10/31/2017 | | | Period
Ended
10/31/2016 (a) | |
Class C Shares | | | | | | | | |
Net asset value, beginning of period | | $ | 20.29 | | | $ | 20.00 | |
| | | | | | | | |
Income from investment operations: | | | | | | | | |
Net investment income (loss) (b) | | | (0.31 | ) | | | (0.23 | ) |
Net realized and unrealized gain (loss) | | | 7.42 | | | | 0.52 | |
| | | | | | | | |
Total from investment operations | | | 7.11 | | | | 0.29 | |
| | | | | | | | |
Distributions paid to shareholders from: | | | | | | | | |
Net realized gain | | | (0.27 | ) | | | — | |
| | | | | | | | |
Net asset value, end of period | | $ | 27.13 | | | $ | 20.29 | |
| | | | | | | | |
Total return (c) | | | 35.25 | % | | | 1.45 | % |
| | |
Ratios to average net assets/supplemental data: | | | | | | | | |
Net assets, end of period (in 000’s) | | $ | 18,370 | | | $ | 12,416 | |
Ratio of total expenses to average net assets | | | 2.72 | % | | | 3.48 | % (d) |
Ratio of net expenses to average net assets | | | 2.35 | % | | | 2.35 | % (d) |
Ratio of net investment income (loss) to average net assets | | | (1.31 | )% | | | (1.17 | )% (d) |
Portfolio turnover rate | | | 38 | % | | | 57 | % |
| (a) | Class C Shares were initially seeded on November 9, 2015 and commenced operations on November 10, 2015. |
| (b) | Per share amounts have been calculated using the average shares method. |
| (c) | Assumes reinvestment of all distributions for the period and does not include payment of the maximum CDSC of 1%, charged on certain redemptions made within one year of purchase. If the sales charge was included, total returns would be lower. These returns include combined Rule 12b-1 distribution and service fees of 1% and do not reflect the deduction of taxes that a shareholder would pay on Fund distributions or the redemption of Fund shares. The total returns would have been lower if certain fees had not been waived and expenses reimbursed by the investment advisor. Total return is calculated for the time period presented and is not annualized for periods of less than one year. |
| | | | |
| | See Notes to Financial Statements | | Page 13 |
First Trust AQA® Equity Fund
Financial Highlights (Continued)
For a share outstanding throughout each period
| | | | | | | | |
| | | Year Ended
10/31/2017 | | | Period
Ended
10/31/2016 (a) | |
| Class I Shares | | | | | | | | |
Net asset value, beginning of period | | $ | 20.30 | | | $ | 20.00 | |
| | | | | | | | |
Income from investment operations: | | | | | | | | |
Net investment income (loss) (b) | | | (0.07 | ) | | | (0.03 | ) |
Net realized and unrealized gain (loss) | | | 7.46 | | | | 0.33 | |
| | | | | | | | |
Total from investment operations | | | 7.39 | | | | 0.30 | |
| | | | | | | | |
Distributions paid to shareholders from: | | | | | | | | |
Net realized gain | | | (0.27 | ) | | | — | |
| | | | | | | | |
Net asset value, end of period | | $ | 27.42 | | | $ | 20.30 | |
| | | | | | | | |
Total return (c) | | | 36.58 | % | | | 1.50 | % |
| | |
Ratios to average net assets/supplemental data: | | | | | | | | |
Net assets, end of period (in 000’s) | | $ | 3,010 | | | $ | 2,500 | |
Ratio of total expenses to average net assets | | | 2.22 | % | | | 3.08 | % (d) |
Ratio of net expenses to average net assets | | | 1.35 | % | | | 1.35 | % (d) |
Ratio of net investment income (loss) to average net assets | | | (0.31 | )% | | | (0.15 | )% (d) |
Portfolio turnover rate | | | 38 | % | | | 57 | % |
| (a) | Class I Shares were initially seeded on November 9, 2015 and commenced operations on November 10, 2015. |
| (b) | Per share amounts have been calculated using the average shares method. |
| (c) | Assumes reinvestment of all distributions for the period. These returns do not reflect the deduction of taxes that a shareholder would pay on Fund distributions or the redemption of Fund shares. The total returns would have been lower if certain fees had not been waived and expenses reimbursed by the investment advisor. Total return is calculated for the time period presented and is not annualized for periods of less than one year. |
| | | | |
| Page 14 | | See Notes to Financial Statements | | |
Notes to Financial Statements
First Trust AQA® Equity Fund
October 31, 2017
1. Organization
First Trust AQA® Equity Fund (the “Fund”) is a series of the First Trust Series Fund (the “Trust”), a Massachusetts business trust organized on July 9, 2010, and is registered as a diversified open-end management investment company with the Securities and Exchange Commission (“SEC”) under the Investment Company Act of 1940, as amended (the “1940 Act”). The Fund offers three classes of shares: Class A, Class C and Class I. Each class represents an interest in the same portfolio of investments but with a different combination of sales charges, distribution and service (12b-1) fees, eligibility requirements and other features.
The Fund’s investment objective is to seek capital appreciation. Under normal market conditions, the Fund invests at least 80% of its net assets (including investment borrowings) in equity securities (specifically, common stocks) of U.S. companies. First Trust Advisors L.P. (“First Trust” or the “Advisor”) typically selects common stocks for investment by the Fund using information produced by a proprietary quantitative methodology developed by the Fund’s sub-advisor called the Automated Quantitative Analysis (“AQA®”) program. In general, the stocks chosen for investment by the Fund are those considered by AQA® to be the most undervalued at the time the portfolio was selected based on a set of pre-determined proprietary screens and evaluations.
2. Significant Accounting Policies
The Fund is considered an investment company and follows accounting and reporting guidance under Financial Accounting Standards Board (“FASB”) Accounting Standards Codification (“ASC”) Topic 946, “Financial Services-Investment Companies.” The following is a summary of significant accounting policies consistently followed by the Fund in the preparation of the financial statements. The preparation of the financial statements in accordance with accounting principles generally accepted in the United States of America (“U.S. GAAP”) requires management to make estimates and assumptions that affect the reported amounts and disclosures in the financial statements. Actual results could differ from those estimates.
A. Portfolio Valuation
The net asset value (“NAV”) of each class of shares of the Fund is determined daily as of the close of regular trading on the New York Stock Exchange (“NYSE”), normally 4:00 p.m. Eastern time, on each day the NYSE is open for trading. If the NYSE closes early on a valuation day, the NAV is determined as of that time.The NAV for each class is calculated by dividing the value of the Fund’s total assets attributable to such class (including accrued interest and dividends), less all liabilities attributable to such class (including accrued expenses, dividends declared but unpaid and any borrowings of the Fund), by the total number of shares of the class outstanding. Differences in NAV of each class of the Fund’s shares are generally expected to be due to the daily expense accruals of the specified distribution and service (12b-1) fees and transfer agency costs applicable to such class of shares and the resulting differential in the dividends that may be paid on each class of shares.
The Fund’s investments are valued daily at market value or, in the absence of market value with respect to any portfolio securities, at fair value. Market value prices represent last sale or official closing prices from a national or foreign exchange (i.e., a regulated market) and are primarily obtained from third-party pricing services. Fair value prices represent any prices not considered market value prices and are either obtained from a third-party pricing service or are determined by the Pricing Committee of the Fund’s investment advisor, First Trust, in accordance with valuation procedures adopted by the Trust’s Board of Trustees, and in accordance with provisions of the 1940 Act. Investments valued by the Advisor’s Pricing Committee, if any, are footnoted as such in the footnotes to the Portfolio of Investments. The Fund’s investments are valued as follows:
Common stocks and other equity securities listed on any national or foreign exchange (excluding The Nasdaq Stock Market LLC (“Nasdaq”) and the London Stock Exchange Alternative Investment Market (“AIM”)) are valued at the last sale price on the exchange on which they are principally traded or, for Nasdaq and AIM securities, the official closing price. Securities traded on more than one securities exchange are valued at the last sale price or official closing price, as applicable, at the close of the securities exchange representing the principal market for such securities.
Securities traded in an over-the-counter market are fair valued at the mean of their most recent bid and asked price, if available, and otherwise at their closing bid price.
Certain securities may not be able to be priced by pre-established pricing methods. Such securities may be valued by the Trust’s Board of Trustees or its delegate, the Advisor’s Pricing Committee, at fair value. These securities generally include, but are not limited to, restricted securities (securities which may not be publicly sold without registration under the Securities Act of 1933, as amended) for which a third-party pricing service is unable to provide a market price; securities whose trading has been formally suspended; a security whose market or fair value price is not available from a pre-established pricing source; a security with respect to which an event has occurred that is likely to materially affect the value of the security after the market has closed but before the calculation of the Fund’s NAV or make it difficult or impossible to obtain a reliable market quotation; and a security whose price, as provided by the third-party pricing service, does not reflect the security’s fair value. As a general principle, the current fair value of a security would
Page 15
Notes to Financial Statements (Continued)
First Trust AQA® Equity Fund
October 31, 2017
appear to be the amount which the owner might reasonably expect to receive for the security upon its current sale. When fair value prices are used, generally they will differ from market quotations or official closing prices on the applicable exchanges. A variety of factors may be considered in determining the fair value of such securities, including, but not limited to, the following:
| | 2) | the size of the holding; |
| | 3) | the initial cost of the security; |
| | 4) | transactions in comparable securities; |
| | 5) | price quotes from dealers and/or third-party pricing services; |
| | 6) | relationships among various securities; |
| | 7) | information obtained by contacting the issuer, analysts, or the appropriate stock exchange; |
| | 8) | an analysis of the issuer’s financial statements; and |
| | 9) | the existence of merger proposals or tender offers that might affect the value of the security. |
The Fund is subject to fair value accounting standards that define fair value, establish the framework for measuring fair value and provide a three-level hierarchy for fair valuation based upon the inputs to the valuation as of the measurement date. The three levels of the fair value hierarchy are as follows:
| | • | | Level 1 – Level 1 inputs are quoted prices in active markets for identical investments. An active market is a market in which transactions for the investment occur with sufficient frequency and volume to provide pricing information on an ongoing basis. |
| | • | | Level 2 – Level 2 inputs are observable inputs, either directly or indirectly, and include the following: |
| | • | | Quoted prices for similar investments in active markets. |
| | • | | Quoted prices for identical or similar investments in markets that are non-active. A non-active market is a market where there are few transactions for the investment, the prices are not current, or price quotations vary substantially either over time or among market makers, or in which little information is released publicly. |
| | • | | Inputs other than quoted prices that are observable for the investment (for example, interest rates and yield curves observable at commonly quoted intervals, volatilities, prepayment speeds, loss severities, credit risks, and default rates). |
| | • | | Inputs that are derived principally from or corroborated by observable market data by correlation or other means. |
| | • | | Level 3 – Level 3 inputs are unobservable inputs. Unobservable inputs may reflect the reporting entity’s own assumptions about the assumptions that market participants would use in pricing the investment. |
The inputs or methodologies used for valuing investments are not necessarily an indication of the risk associated with investing in those investments. A summary of the inputs used to value the Fund’s investments as of October 31, 2017, is included with the Fund’s Portfolio of Investments.
B. Securities Transactions and Investment Income
Securities transactions are recorded as of the trade date. Realized gains and losses from securities transactions are recorded on the identified cost basis. Dividend income is recorded on the ex-dividend date. Interest income, if any, is recorded daily on the accrual basis, including the amortization of premiums and the accretion of discounts. Income is allocated on a pro rata basis to each class of shares.
C. Dividends and Distributions to Shareholders
Dividends from net investment income, if any, are declared and paid annually by the Fund, or as the Board of Trustees may determine from time to time. Distributions of net realized capital gains earned by the Fund, if any, are distributed at least annually.
Distributions from income and capital gains are determined in accordance with income tax regulations, which may differ from U.S. GAAP. Certain capital accounts in the financial statements are periodically adjusted for permanent differences in order to reflect their tax character. These permanent differences are primarily due to the varying treatment of income and gain/loss on portfolio securities held by the Fund and have no impact on net assets or NAV per share. Temporary differences, which arise from recognizing certain items of income, expense and gain/loss in different periods for financial statement and tax purposes, will reverse at some time in the future. Permanent differences incurred during the fiscal year ended October 31, 2017, resulting in book and tax accounting differences, have been reclassified at year end to reflect an increase in accumulated net investment income (loss) of $324,217 and a decrease in accumulated net realized gain (loss) on investments of $324,217. Net assets were not affected by this reclassification.
Page 16
Notes to Financial Statements (Continued)
First Trust AQA® Equity Fund
October 31, 2017
The tax character of distributions paid by the Fund during the fiscal year ended October 31, 2017, and the fiscal period ended October 31, 2016, was as follows:
| | | | | | | | |
Distributions paid from: | | 2017 | | | 2016 | |
Ordinary income | | $ | 346,491 | | | $ | — | |
Capital gain | | | — | | | | — | |
Return of capital | | | — | | | | — | |
As of October 31, 2017, the distributable earnings and net assets on a tax basis were as follows:
| | | | |
Undistributed ordinary income | | $ | 187,157 | |
Undistributed capital gains | | | 1,000,853 | |
| | | | |
Total Undistributed Earnings | | | 1,188,010 | |
Accumulated capital and other losses | | | — | |
Net unrealized appreciation (depreciation) | | | 10,052,746 | |
| | | | |
Total accumulated earnings | | | 11,240,756 | |
Other | | | — | |
Paid-in capital | | | 32,255,776 | |
| | | | |
Total net assets | | $ | 43,496,532 | |
| | | | |
D. Income Taxes
The Fund intends to continue to qualify as a regulated investment company by complying with the requirements under Subchapter M of the Internal Revenue Code of 1986, as amended, which includes distributing substantially all of its net investment income and net realized gains to shareholders. Accordingly, no provision has been made for federal and state income taxes. However, due to the timing and amount of distributions, the Fund may be subject to an excise tax of 4% of the amount by which approximately 98% of the Fund’s taxable income exceeds the distributions from such taxable income for the calendar year.
The Fund intends to utilize provisions of the federal income tax laws, which allow it to carry a realized capital loss forward indefinitely following the year of the loss and offset such loss against any future realized capital gains. The Fund is subject to certain limitations under U.S. tax rules on the use of capital loss carryforwards and net unrealized built-in losses. These limitations apply when there has been a 50% change in ownership. At October 31, 2017, the Fund had no non-expiring capital loss carryforwards for federal income tax purposes.
Certain losses realized during the current fiscal year may be deferred and treated as occurring on the first day of the following fiscal year for federal income tax purposes. For the year ended October 31, 2017, the Fund did not defer any net ordinary losses.
The Fund is subject to accounting standards that establish a minimum threshold for recognizing, and a system for measuring, the benefits of a tax position taken or expected to be taken in a tax return. Taxable years ending 2016 and 2017 remain open to federal and state audit. As of October 31, 2017, management has evaluated the application of these standards to the Fund and has determined that no provision for income tax is required in the Fund’s financial statements for uncertain tax positions.
E. Expenses
The Fund will pay all expenses directly related to its operations. Expenses of the Fund are allocated on a pro rata basis to each class of shares, except for distribution and service (12b-1) fees and incremental transfer agency costs which are unique to each class of shares.
F. New and Amended Financial Reporting Rules and Forms
On October 13, 2016, the SEC adopted new rules and forms, and amended existing rules and forms. The new and amended rules and forms are intended to modernize the reporting of information provided by funds and to improve the quality and type of information that funds provide to the SEC and investors. In part, the new and amended rules and forms amend Regulation S-X and require standardized, enhanced disclosures about derivatives in a fund’s financial statements, as well as other amendments. The compliance date for the amendments of Regulation S-X was August 1, 2017, which resulted in no change to the financial statements. The new form types and other rule amendments will be effective for the First Trust funds, including the Fund, for reporting periods beginning on and after June 1, 2018. Management is evaluating the new form types and other rule amendments that are effective on and after June 1, 2018 to determine the impact to the Fund.
Page 17
Notes to Financial Statements (Continued)
First Trust AQA® Equity Fund
October 31, 2017
G. New Accounting Pronouncement
In December 2016, FASB released Accounting Standards Update (“ASU”) 2016-19 that makes technical changes to various sections of the ASC, including Topic 820, Fair Value Measurement. The changes to Topic 820 are intended to clarify the difference between a valuation approach and a valuation technique. The changes to ASC 820-10-50-2 require a reporting entity to disclose, for Level 2 and Level 3 fair value measurements, a change in either or both a valuation approach and a valuation technique and the reason(s) for the change. The changes to Topic 820 are effective for fiscal years, and interim periods within those fiscal years, beginning after December 15, 2016. At this time, management is evaluating the implications of the ASU and has not yet determined its impact on the financial statements and disclosures.
3. Investment Advisory Fee, Affiliated Transactions and Other Fee Arrangements
First Trust, the investment advisor to the Fund, is a limited partnership with one limited partner, Grace Partners of DuPage L.P., and one general partner, The Charger Corporation. The Charger Corporation is an Illinois corporation controlled by James A. Bowen, Chief Executive Officer of First Trust. First Trust is responsible for the ongoing monitoring of the Fund’s investment portfolio, managing the Fund’s business affairs and providing certain administrative services necessary for the management of the Fund. For these investment management services, First Trust is entitled to a monthly fee calculated at an annual rate of 1.00% of the Fund’s average daily net assets. First Trust also provides fund reporting services to the Fund for a flat annual fee in the amount of $9,250.
J.J.B. Hilliard, W.L. Lyons, LLC (“Hilliard Lyons” or the “Sub-Advisor”) serves as the Fund’s sub-advisor and manages the Fund’s portfolio subject to First Trust’s supervision. The Sub-Advisor receives a monthly sub-advisory fee calculated at an annual rate of 0.50% of the Fund’s average daily net assets that is paid by First Trust out of its investment advisory fee.
First Trust and Hilliard Lyons have agreed to waive fees and reimburse Fund expenses to the extent necessary to prevent the total annual operating expenses of the Fund (excluding 12b-1 distribution and service fees, interest expenses, taxes, acquired fund fees and expenses, fees incurred in acquiring and disposing of portfolio securities and extraordinary expenses) from exceeding 1.35% of average daily net assets of any class of shares of the Fund (the “Expense Cap”) until February 28, 2019, and then from exceeding 1.70% from March 1, 2019 to February 28, 2028 (the “Expense Cap Termination Date”) . Expenses borne and fees waived by First Trust and Hilliard Lyons are subject to recovery on a Fund class level, if applicable, by First Trust and Hilliard Lyons for up to three years from the date the fee or expense was incurred, but no reimbursement payment will be made by the Fund at any time if it would result in the Fund’s expenses exceeding the Expense Cap in place for the most recent fiscal year for which such expense limitation was in place. These amounts would be included in “Expenses previously waived or reimbursed” on the Statement of Operations. The advisory fee waivers and expense reimbursement for the year ended October 31, 2017, and the expenses borne by First Trust and Hilliard Lyons subject to recovery were as follows:
| | | | | | | | | | | | | | | | |
| | | | | | Expenses Subject to Recovery | |
Advisory Fee Waiver | | Expense
Reimbursement | | | Period Ended
October 31, 2016 | | | Year Ended
October 31, 2017 | | | Total | |
$ 136,315 | | $ — | | | $ 183,866 | | | $ 136,315 | | | $ 320,181 | |
Brown Brothers Harriman & Co. (“BBH”) serves as the Fund’s administrator, fund accountant and custodian in accordance with certain fee arrangements. As administrator and fund accountant, BBH is responsible for providing certain administrative and accounting services to the Fund, including maintaining the Fund’s books of account, records of the Fund’s securities transactions, and certain other books and records. As custodian, BBH is responsible for custody of the Fund’s assets.
BNY Mellon Investment Servicing (US) Inc. (“BNYM IS”) serves as the Fund’s transfer agent in accordance with certain fee arrangements. As transfer agent, BNYM IS is responsible for maintaining shareholder records for the Fund.
Each Trustee who is not an officer or employee of First Trust, any sub-advisor or any of their affiliates (“Independent Trustees”) is paid a fixed annual retainer that is allocated equally among each fund in the First Trust Fund Complex. Each Independent Trustee is also paid an annual per fund fee that varies based on whether the fund is a closed-end or other actively managed fund, or is an index fund.
Additionally, the Lead Independent Trustee and the Chairmen of the Audit Committee, Nominating and Governance Committee and Valuation Committee are paid annual fees to serve in such capacities, with such compensation allocated pro rata among each fund in the First Trust Fund Complex based on net assets. Independent Trustees are reimbursed for travel and out-of-pocket expenses in connection with all meetings. The Lead Independent Trustee and Committee Chairmen rotate every three years. The officers and “Interested” Trustee receive no compensation from the Trust for acting in such capacities.
Page 18
Notes to Financial Statements (Continued)
First Trust AQA® Equity Fund
October 31, 2017
4. Capital Share Transactions
Capital transactions were as follows:
| | | | | | | | | | | | | | | | |
| | | Year Ended | | | Period Ended | |
| | | October 31, 2017 | | | October 31, 2016 | |
| | | Shares | | | Value | | | Shares | | | Value | |
Sales: | | | | | | | | | | | | | | | | |
Class A | | | 462,184 | | | $ | 11,181,772 | | | | 531,588 | | | $ | 10,344,389 | |
Class C | | | 251,766 | | | | 5,835,596 | | | | 628,518 | | | | 12,270,092 | |
Class I | | | 18,828 | | | | 433,465 | | | | 149,057 | | | | 2,914,381 | |
| | | | | | | | | | | | | | | | |
Total Sales | | | 732,778 | | | $ | 17,450,833 | | | | 1,309,163 | | | $ | 25,528,862 | |
| | | | | | | | | | | | | | | | |
Dividend Reinvestment: | | | | | | | | | | | | | | | | |
Class A | | | 5,645 | | | $ | 132,534 | | | | — | | | $ | — | |
Class C | | | 7,273 | | | | 169,472 | | | | — | | | | — | |
Class I | | | 1,437 | | | | 33,551 | | | | — | | | | — | |
| | | | | | | | | | | | | | | | |
Total Dividend Reinvestment | | | 14,355 | | | $ | 335,557 | | | | — | | | $ | — | |
| | | | | | | | | | | | | | | | |
Redemptions: | | | | | | | | | | | | | | | | |
Class A | | | (179,401 | ) | | $ | (4,388,385 | ) | | | (16,087 | ) | | $ | (313,316 | ) |
Class C | | | (193,883 | ) | | | (4,691,632 | ) | | | (16,608 | ) | | | (338,194 | ) |
Class I | | | (33,649 | ) | | | (791,241 | ) | | | (25,890 | ) | | | (536,708 | ) |
| | | | | | | | | | | | | | | | |
Total Redemptions | | | (406,933 | ) | | $ | (9,871,258 | ) | | | (58,585 | ) | | $ | (1,188,218 | ) |
| | | | | | | | | | | | | | | | |
5. Purchases and Sales of Securities
The cost of purchases and proceeds from sales of securities, excluding short-term investments, for the year ended October 31, 2017, were $21,248,408 and $13,109,640, respectively.
6. Distribution and Service Plan
The Board of Trustees adopted a Distribution and Service Plan pursuant to Rule 12b-1 under the 1940 Act. In accordance with the Rule 12b-1 plan, the share classes of the Fund are authorized to pay an amount up to 0.25% and 1.00% of their average daily net assets each year for Class A and Class C, respectively, to reimburse First Trust Portfolios L.P. (“FTP”), the distributor of the Fund, for amounts expended to finance activities primarily intended to result in the sale of Fund shares or the provision of investor services. FTP may also use this amount to compensate securities dealers or other persons for providing distribution assistance, including broker-dealer and shareholder support and educational and promotional services. Class I shares have no 12b-1 fees.
7. Borrowings
Effective October 17, 2017, the Fund was added to a $220 million Credit Agreement with The Bank of Nova Scotia (“Scotia”) as administrative agent for a group of lenders. Scotia charges a commitment fee of 0.25% of the daily amount of the excess of the commitment amount over the outstanding principal balance of the loans. First Trust allocates the commitment fee and agency fee amongst the funds that have access to the credit line. To the extent that the Fund accesses the credit line, there would also be an interest fee charged. The Fund did not have any borrowings outstanding during the period ended October 31, 2017.
8. Indemnification
The Fund has a variety of indemnification obligations under contracts with its service providers. The Fund’s maximum exposure under these arrangements is unknown. However, the Fund has not had prior claims or losses pursuant to these contracts and expects the risk of loss to be remote.
9. Subsequent Events
Management has evaluated the impact of all subsequent events to the Fund through the date the financial statements were issued, and has determined that there were no subsequent events requiring recognition or disclosure in the financial statements that have not already been disclosed.
Page 19
Report of Independent Registered Public Accounting Firm
To the Shareholders and the Board of Trustees of First Trust AQA® Equity Fund:
We have audited the accompanying statement of assets and liabilities of First Trust AQA® Equity Fund (the “Fund”), a series of the First Trust Series Fund, including the portfolio of investments, as of October 31, 2017, and the related statement of operations for the year then ended and the statements of changes in net assets and the financial highlights for each of the periods presented. These financial statements and financial highlights are the responsibility of the Fund’s management. Our responsibility is to express an opinion on these financial statements and financial highlights based on our audits.
We conducted our audits in accordance with the standards of the Public Company Accounting Oversight Board (United States). Those standards require that we plan and perform the audit to obtain reasonable assurance about whether the financial statements and financial highlights are free of material misstatement. The Fund is not required to have, nor were we engaged to perform, an audit of its internal control over financial reporting. Our audits included consideration of internal control over financial reporting as a basis for designing audit procedures that are appropriate in the circumstances, but not for the purpose of expressing an opinion on the effectiveness of the Fund’s internal control over financial reporting. Accordingly, we express no such opinion. An audit also includes examining, on a test basis, evidence supporting the amounts and disclosures in the financial statements, assessing the accounting principles used and significant estimates made by management, as well as evaluating the overall financial statement presentation. Our procedures included confirmation of securities owned as of October 31, 2017, by correspondence with the Fund’s custodian and brokers; when replies were not received from brokers, we performed other auditing procedures. We believe that our audits provide a reasonable basis for our opinion.
In our opinion, the financial statements and financial highlights referred to above present fairly, in all material respects, the financial position of First Trust AQA® Equity Fund as of October 31, 2017, the results of its operations for the year then ended and the changes in its net assets and the financial highlights for each of the periods presented, in conformity with accounting principles generally accepted in the United States of America.

Chicago, Illinois
December 20, 2017
Page 20
Additional Information
First Trust AQA® Equity Fund
October 31, 2017 (Unaudited)
Proxy Voting Policies and Procedures
A description of the policies and procedures that the Trust uses to determine how to vote proxies and information on how the Fund voted proxies relating to portfolio securities during the most recent 12-month period ended June 30 is available (1) without charge, upon request, by calling (800) 988-5891; (2) on the Fund’s website located at http://www.ftportfolios.com; and (3) on the Securities and Exchange Commission’s (“SEC”) website at http://www.sec.gov.
Portfolio Holdings
The Trust files its complete schedule of portfolio holdings with the SEC for the first and third quarters of each fiscal year on Form N-Q. The Fund’s Form N-Qs are available (1) by calling (800) 988-5891; (2) on the Fund’s website located at http://www.ftportfolios.com; (3) on the SEC’s website at http://www.sec.gov; and (4) for review and copying at the SEC’s Public Reference Room (“PRR”) in Washington, DC. Information regarding the operation of the PRR may be obtained by calling (800) SEC-0330.
Tax Information
The Fund hereby designates as qualified dividend income 52.82% of its ordinary income distributions (including short-term capital gains, if applicable) for the period ended October 31, 2017. 52.82% of the ordinary income (including short-term capital gain, if applicable) distributions made by the Fund during the period ended October 31, 2017, qualify for corporate dividends received deduction available to corporate shareholders.
Risk Considerations
Risks are inherent in all investing. The following summarizes some of the risks that should be considered for the Fund. For additional information about the risks associated with investing in the Fund, please see the Fund’s prospectus and statement of additional information, as well as other Fund regulatory filings.
CONSUMER DISCRETIONARY COMPANIES RISK. Consumer discretionary companies are companies that provide non-essential goods and services, such as retailers, media companies and consumer services. These companies manufacture products and provide discretionary services directly to the consumer, and the success of these companies is tied closely to the performance of the overall domestic and international economy, interest rates, competition and consumer confidence. Success depends heavily on disposable household income and consumer spending. Changes in demographics and consumer tastes can also affect the demand for, and success of, consumer discretionary products in the marketplace.
EQUITY SECURITIES RISK. Because the Fund invests in equity securities, the value of the Fund’s shares will fluctuate with changes in the value of these equity securities. Equity securities prices fluctuate for several reasons, including changes in investors’ perceptions of the financial condition of an issuer or the general condition of the relevant stock market, such as market volatility, or when political or economic events affecting the issuers occur. In addition, common stock prices may be particularly sensitive to rising interest rates, as the cost of capital rises and borrowing costs increase.
INFORMATION TECHNOLOGY COMPANIES RISK. Information technology companies are generally subject to the following risks: rapidly changing technologies; short product life cycles; fierce competition; aggressive pricing and reduced profit margins; the loss of patent, copyright and trademark protections; cyclical market patterns; evolving industry standards; and frequent new product introductions. Information technology companies may be smaller and less experienced companies, with limited product lines, markets or financial resources and fewer experienced management or marketing personnel. Information technology company stocks, particularly those that are Internet related, have experienced extreme price and volume fluctuations that are often unrelated to their operating performance.
LIQUIDITY RISK. The Fund invests in equity securities that may have limited liquidity despite being listed on a securities exchange. Equity securities that are less liquid or that trade less can be more difficult or more costly to buy, or to sell, compared to other more liquid or active investments. This liquidity risk is a factor of the trading volume of a particular security, as well as the size and liquidity of the market for such security. The prices at which the equity securities are held in the Fund will be adversely affected if trading markets for the equity securities are limited or absent.
MARKET RISK. Market risk is the risk that a particular security owned by the Fund or shares of the Fund in general may fall in value. Securities are subject to market fluctuations caused by such factors as economic, political, regulatory or market developments, changes in interest rates and perceived trends in securities prices. Shares of the Fund could decline in value or underperform other investments.
Page 21
Additional Information (Continued)
First Trust AQA® Equity Fund
October 31, 2017 (Unaudited)
MODEL RISK. The Fund relies heavily on a proprietary quantitative model that uses information and data supplied by third parties. When the model and data prove to be incorrect or incomplete, any decisions made in reliance thereon expose the Fund to potential risks.
SMALL FUND RISK. The Fund currently has fewer assets than larger funds, and like other relatively smaller funds, large inflows and outflows may impact the Fund’s market exposure for limited periods of time. This impact may be positive or negative, depending on the direction of market movement during the period affected.
SMALLER COMPANIES RISK. The Fund invests in small and/or mid capitalization companies. Such companies may be more vulnerable to adverse general market or economic developments, and their securities may be less liquid and may experience greater price volatility than larger, more established companies as a result of several factors, including limited trading volumes, products or financial resources, management inexperience and less publicly available information. Accordingly, such companies are generally subject to greater market risk than larger, more established companies.
VALUE INVESTING RISK. The Fund focuses its investments on securities that the proprietary quantitative model on which the Fund is based considers to be undervalued or inexpensive relative to other investments. These types of securities may present risks in addition to the general risks associated with investing in them. These securities are selected on the basis of an issuer’s business and economic fundamentals or a security’s current credit profile, relative to current market practice. Disciplined adherence to a “value” investment mandate during period in which that style is “out of favor” can result in significant underperformance relative to overall market indices and other managed investment vehicles that pursue growth style investments and/or flexible style mandates.
Advisory and Sub-Advisory Agreements
Board Considerations Regarding Approval of Investment Management and Investment Sub-Advisory Agreements
The Board of Trustees of First Trust Series Fund (the “Trust”), including the Independent Trustees, unanimously approved the continuation of the Investment Management Agreement (the “Advisory Agreement”) between the Trust, on behalf of the First Trust AQA® Equity Fund (the “Fund”), and First Trust Advisors L.P. (the “Advisor” or “First Trust”) and the Investment Sub-Advisory Agreement (the “Sub-Advisory Agreement” and together with the Advisory Agreement, the “Agreements”) among the Trust, on behalf of the Fund, the Advisor and J.J.B. Hilliard, W.L. Lyons, LLC (the “Sub-Advisor”) for a one-year period ending June 30, 2018 at a meeting held on June 12, 2017. The Board determined that the continuation of the Agreements is in the best interests of the Fund in light of the extent and quality of the services provided and such other matters as the Board considered to be relevant in the exercise of its reasonable business judgment.
To reach this determination, the Board considered its duties under the Investment Company Act of 1940, as amended (the “1940 Act”), as well as under the general principles of state law in reviewing and approving advisory contracts; the requirements of the 1940 Act in such matters; the fiduciary duty of investment advisors with respect to advisory agreements and compensation; the standards used by courts in determining whether investment company boards have fulfilled their duties; and the factors to be considered by the Board in voting on such agreements. At meetings held on April 24, 2017 and June 12, 2017, the Board, including the Independent Trustees, reviewed materials provided by the Advisor and the Sub-Advisor responding to requests for information from counsel to the Independent Trustees that, among other things, outlined the services provided by the Advisor and the Sub-Advisor to the Fund (including the relevant personnel responsible for these services and their experience); the advisory fee rate payable by the Fund and the sub-advisory fee rate as compared to fees charged to a peer group of funds compiled by Management Practice, Inc. (“MPI”), an independent source (the “MPI Peer Group”), and as compared to fees charged to other clients of the Advisor and the Sub-Advisor; expenses of the Fund as compared to expense ratios of the funds in the MPI Peer Group; performance information for the Fund; the nature of expenses incurred in providing services to the Fund and the potential for economies of scale, if any; financial data on the Advisor and the Sub-Advisor; any fall-out benefits to the Advisor and its affiliate, First Trust Portfolios L.P. (“FTP”), and the Sub-Advisor; and information on the Advisor’s and the Sub-Advisor’s compliance programs. The Board reviewed initial materials with the Advisor at the meeting held on April 24, 2017, prior to which the Independent Trustees and their counsel met separately to discuss the information provided by the Advisor and the Sub-Advisor. Following the April meeting, independent legal counsel on behalf of the Independent Trustees requested certain clarifications and supplements to the materials provided, and the information provided in response to those requests was considered at an executive session of the Independent Trustees and independent legal counsel held prior to the June 12, 2017 meeting, as well as at the meeting held that day. The Board applied its business judgment to determine whether the arrangements between the Trust and the Advisor and among the Trust, the Advisor and the Sub-Advisor continue to be reasonable business arrangements from the Fund’s perspective as well as the perspective of the Fund’s shareholders. The Board determined that, given the totality of the information provided with respect to the Agreements, the Board had received sufficient information to renew the Agreements. The Board considered that shareholders chose to invest or remain invested in the Fund knowing that the Advisor and the Sub-Advisor manage the Fund and knowing the Fund’s advisory fee.
Page 22
Additional Information (Continued)
First Trust AQA® Equity Fund
October 31, 2017 (Unaudited)
In reviewing the Agreements, the Board considered the nature, extent and quality of the services provided by the Advisor and the Sub-Advisor under the Agreements. With respect to the Advisory Agreement, the Board considered that the Advisor is responsible for the overall management and administration of the Trust and the Fund and reviewed all of the services provided by the Advisor to the Fund, including the oversight of the Sub-Advisor, as well as the background and experience of the persons responsible for such services. The Board noted that the Advisor oversees the Sub-Advisor’s day-to-day management of the Fund’s investments, including portfolio risk monitoring and performance review. In reviewing the services provided, the Board noted the compliance program that had been developed by the Advisor and considered that it includes a robust program for monitoring the Advisor’s, the Sub-Advisor’s and the Fund’s compliance with the 1940 Act, as well as the Fund’s compliance with its investment objective and policies. The Board also considered a report from the Advisor with respect to its risk management functions related to the operation of the Fund. Finally, as part of the Board’s consideration of the Advisor’s services, the Advisor, in its written materials and at the April 24, 2017 meeting, described to the Board the scope of its ongoing investment in additional infrastructure and personnel to maintain and improve the quality of services provided to the Fund and the other funds in the First Trust Fund Complex. With respect to the Sub-Advisory Agreement, in addition to the written materials provided by the Sub-Advisor, at the April 24, 2017 meeting, the Board also received a presentation from representatives of the Sub-Advisor, including the portfolio managers, discussing the services that the Sub-Advisor provides to the Fund and how the Sub-Advisor manages the Fund’s investments. In considering the Sub-Advisor’s management of the Fund, the Board noted the background and experience of the Sub-Advisor’s portfolio management team. In light of the information presented and the considerations made, the Board concluded that the nature, extent and quality of the services provided to the Fund by the Advisor and the Sub-Advisor under the Agreements have been and are expected to remain satisfactory and that the Sub-Advisor, under the oversight of the Advisor, has managed the Fund consistent with its investment objective and policies.
The Board considered the advisory and sub-advisory fee rates payable under the Agreements for the services provided. The Board noted that the sub-advisory fee is paid by the Advisor from its advisory fee. The Board considered that the Advisor and Sub-Advisor agreed to extend the current expense caps for each share class through February 28, 2019 and agreed to keep the long-term expense cap in place from March 1, 2019 through February 28, 2028. The Board noted that fees waived or expenses borne by the Advisor and Sub-Advisor are subject to reimbursement by the Fund for up to three years from the date the expense was incurred or fees were waived, but no reimbursement payment would be made by the Fund if it would result in the Fund exceeding an expense ratio equal to the expense cap in place at the time of the reimbursement or at the time the expenses were borne or the fees were waived by the Advisor and Sub-Advisor. The Board received and reviewed information showing the advisory fee rates and expense ratios of the peer funds in the MPI Peer Group, as well as advisory fee rates charged by the Advisor and the Sub-Advisor to other fund and non-fund clients, as applicable. With respect to the MPI Peer Group, the Board discussed with representatives of the Advisor how the MPI Peer Group was assembled, as well as limitations in creating a relevant peer group for the Fund, including that (i) all but one of the peer funds are larger than the Fund, which causes the Fund’s fixed expenses to be higher on a percentage basis as compared to the larger peer funds, and some of the peer funds are part of a larger fund complex that may allow for additional economies of scale, and (ii) most of the peer funds do not employ an advisor/sub-advisor management structure with an unaffiliated sub-advisor. The Board took these limitations into account in considering the peer data. Based on the information provided, the Board noted that the advisory fee rate payable by the Fund was above the median advisory fee of the peer funds in the MPI Peer Group. The Board noted that the Fund’s total (net) expense ratio (Class A shares) was above the median of the MPI Peer Group. With respect to fees charged to other clients, the Board considered differences between the Fund and other clients that limited their comparability. In considering the advisory fee rate overall, the Board also considered the Advisor’s statement that it seeks to meet investor needs through innovative and value-added investment solutions and the Advisor’s description of its long-term commitment to the Fund.
The Board considered performance information for the Fund. The Board noted the process it has established for monitoring the Fund’s performance and portfolio risk on an ongoing basis, which includes quarterly performance reporting from the Advisor and Sub-Advisor for the Fund. The Board determined that this process continues to be effective for reviewing the Fund’s performance. The Board received and reviewed information comparing the Fund’s performance for the one-year period ended December 31, 2016 to the performance of the MPI Peer Group and to that of two benchmark indexes. Based on the information provided, the Board noted that the Fund (Class A shares) outperformed the MPI Peer Group average and both benchmark indexes for the one-year period ended December 31, 2016.
On the basis of all the information provided on the fees, expenses and performance of the Fund and the ongoing oversight by the Board, the Board concluded that the advisory and sub-advisory fees for the Fund continue to be reasonable and appropriate in light of the nature, extent and quality of the services provided by the Advisor and the Sub-Advisor to the Fund under the Agreements.
The Board considered information and discussed with the Advisor whether there were any economies of scale in connection with providing advisory services to the Fund and noted the Advisor’s statement that it expects its expenses to increase over the next twelve months as the Advisor continues to make investments in personnel and infrastructure. The Board considered the revenues and allocated costs (including the allocation methodology) of the Advisor in serving as investment advisor to the Fund for the twelve months ended December 31, 2016 and the estimated profitability level for the Fund calculated by the Advisor based on such data, as well as
Page 23
Additional Information (Continued)
First Trust AQA® Equity Fund
October 31, 2017
complex-wide and product-line profitability data for the same period. The Board noted the inherent limitations in the profitability analysis and concluded that, based on the information provided, the Advisor’s profitability level for the Fund was not unreasonable. In addition, the Board considered fall-out benefits described by the Advisor that may be realized from its relationship with the Fund. The Board considered that the Advisor had identified as a fall out benefit to the Advisor and FTP their exposure to investors and brokers who, absent their exposure to the Fund, may have had no dealings with the Advisor or FTP. The Board noted that in addition to the advisory fees paid by the Fund, FTP is compensated for services provided to the Fund through 12b-1 distribution and service fees and that First Trust receives compensation from the Fund for providing fund reporting services pursuant to a separate Fund Reporting Services Agreement. The Board concluded that the character and amount of potential fall-out benefits to the Advisor were not unreasonable.
The Board considered that many of the Sub-Advisor’s costs are fixed, but that the Sub-Advisor does not believe it is currently experiencing any economies of scale with respect to the Fund. The Board did not review the profitability of the Sub-Advisor with respect to the Fund. The Board noted that the Advisor pays the Sub-Advisor from its advisory fee and its understanding that the Fund’s sub-advisory fee rate was the product of an arm’s length negotiation. The Board concluded that the profitability analysis for the Advisor was more relevant. The Board considered fall-out benefits that may be realized by the Sub-Advisor from its relationship with the Fund. The Board noted the Sub-Advisor’s statements that portfolio trades for the Fund have been and would continue to be done at no commission charge to the Fund and that the Sub-Advisor does not utilize soft dollars in connection with the Fund. The Board concluded that the character and amount of potential fall-out benefits to the Sub-Advisor were not unreasonable.
Based on all of the information considered and the conclusions reached, the Board, including the Independent Trustees, unanimously determined that the terms of the Agreements continue to be fair and reasonable and that the continuation of the Agreements is in the best interests of the Fund. No single factor was determinative in the Board’s analysis.
Page 24
Board of Trustees and Officers
First Trust AQA® Equity Fund
October 31, 2017 (Unaudited)
The Trust’s statement of additional information includes additional information about the Trustees and is available, without charge,
upon request, by calling (800) 988-5891.
| | | | | | | | |
Name, Address, Date of Birth and Position with the Trust | | Term of Office and Year First Elected or Appointed | | Principal Occupations During Past 5 Years | | Number of
Portfolios in
the First Trust
Fund Complex
Overseen by
Trustee | | Other Trusteeships or
Directorships Held by Trustee During Past 5 Years |
| INDEPENDENT TRUSTEES |
| | | | |
Richard E. Erickson, Trustee c/o First Trust Advisors L.P. 120 E. Liberty Drive, Suite 400 Wheaton, IL 60187 D.O.B.: 04/51 | | • Indefinite Term • Since Trust Inception | | Physician; Officer, Wheaton Orthopedics; Limited Partner, Gundersen Real Estate Limited Partnership (June 1992 to December 2016); Member, Sportsmed LLC (April 2007 to November 2015) | | 151 | | None |
| | | | |
Thomas R. Kadlec, Trustee c/o First Trust Advisors L.P. 120 E. Liberty Drive, Suite 400 Wheaton, IL 60187 D.O.B.: 11/57 | | • Indefinite Term • Since Trust Inception | | President, ADM Investor Services, Inc. (Futures Commission Merchant) | | 151 | | Director of ADM Investor Services, Inc., ADM Investor Services International, Futures Industry Association, and National Futures Association |
| | | | |
Robert F. Keith, Trustee c/o First Trust Advisors L.P. 120 E. Liberty Drive, Suite 400 Wheaton, IL 60187 D.O.B.: 11/56 | | • Indefinite Term • Since Trust Inception | | President, Hibs Enterprises (Financial and Management Consulting) | | 151 | | Director of Trust Company of Illinois |
| | | | |
Niel B. Nielson, Trustee c/o First Trust Advisors L.P. 120 E. Liberty Drive, Suite 400 Wheaton, IL 60187 D.O.B.: 03/54 | | • Indefinite Term • Since Trust Inception | | Managing Director and Chief Operating Officer (January 2015 to Present), Pelita Harapan Educational Foundation (Educational Products and Services); President and Chief Executive Officer (June 2012 to September 2014), Servant Interactive LLC (Educational Products and Services); President and Chief Executive Officer (June 2012 to September 2014), Dew Learning LLC (Educational Products and Services); President (June 2002 to June 2012), Covenant College | | 151 | | Director of Covenant Transport, Inc. (May 2003 to May 2014) |
|
| INTERESTED TRUSTEE |
| | | | |
James A. Bowen(1), Trustee and Chairman of the Board 120 E. Liberty Drive, Suite 400 Wheaton, IL 60187 D.O.B.: 09/55 | | • Indefinite Term • Since Trust Inception | | Chief Executive Officer, First Trust Advisors L.P. and First Trust Portfolios L.P.; Chairman of the Board of Directors, BondWave LLC (Software Development Company) and Stonebridge Advisors LLC (Investment Advisor) | | 151 | | None |
| (1) | Mr. Bowen is deemed an “interested person” of the Trust due to his position as CEO of First Trust Advisors, L.P., investment advisor of the Trust. |
Page 25
Board of Trustees and Officers (Continued)
First Trust AQA® Equity Fund
October 31, 2017 (Unaudited)
| | | | | | |
Name, Address and Date of Birth | | Position and Offices with Trust | | Term of Office and Length of Service | | Principal Occupations During Past 5 Years |
| OFFICERS(2) |
| | | |
James M. Dykas 120 E. Liberty Drive, Suite 400 Wheaton, IL 60187 D.O.B.: 01/66 | | President and Chief Executive Officer | | • Indefinite Term • Since January 2016 | | Managing Director and Chief Financial Officer (January 2016 to Present), Controller (January 2011 to January 2016), Senior Vice President (April 2007 to January 2016), First Trust Advisors L.P. and First Trust Portfolios L.P.; Chief Financial Officer, BondWave LLC (Software Development Company) (January 2016 to Present) and Stonebridge Advisors LLC (Investment Advisor) (January 2016 to Present) |
| | | |
Donald P. Swade 120 E. Liberty Drive, Suite 400 Wheaton, IL 60187 D.O.B.: 08/72 | | Treasurer, Chief Financial Officer and Chief Accounting Officer | | • Indefinite Term • Since January 2016 | | Senior Vice President (July 2016 to Present), Vice President (April 2012 to July 2016), First Trust Advisors L.P. and First Trust Portfolios L.P. |
| | | |
W. Scott Jardine 120 E. Liberty Drive, Suite 400 Wheaton, IL 60187 D.O.B.: 05/60 | | Secretary and Chief Legal Officer | | • Indefinite Term • Since Trust Inception | | General Counsel, First Trust Advisors L.P. and First Trust Portfolios L.P.; Secretary and General Counsel, BondWave LLC; and Secretary, Stonebridge Advisors LLC |
| | | |
Daniel J. Lindquist 120 E. Liberty Drive, Suite 400 Wheaton, IL 60187 D.O.B: 02/70 | | Vice President | | • Indefinite Term • Since Trust Inception | | Managing Director, First Trust Advisors L.P. and First Trust Portfolios L.P. |
| | | |
Kristi A. Maher 120 E. Liberty Drive, Suite 400 Wheaton, IL 60187 D.O.B.: 12/66 | | Chief Compliance Officer and Assistant Secretary | | • Indefinite Term • Chief Compliance Officer Since January 2011 • Assistant Secretary Since Trust Inception | | Deputy General Counsel, First Trust Advisors L.P. and First Trust Portfolios L.P. |
| (2) | The term “officer” means the president, vice president, secretary, treasurer, controller or any other officer who performs a policy making function. |
Page 26
Privacy Policy
First Trust AQA® Equity Fund
October 31, 2017 (Unaudited)
Privacy Policy
First Trust values our relationship with you and considers your privacy an important priority in maintaining that relationship. We are committed to protecting the security and confidentiality of your personal information.
Sources of Information
We collect nonpublic personal information about you from the following sources:
| | • | | Information we receive from you and your broker-dealer, investment advisor or financial representative through interviews, applications, agreements or other forms; |
| | • | | Information about your transactions with us, our affiliates or others; |
| | • | | Information we receive from your inquiries by mail, e-mail or telephone; and |
| | • | | Information we collect on our website through the use of “cookies”. For example, we may identify the pages on our website that your browser requests or visits. |
Information Collected
The type of data we collect may include your name, address, social security number, age, financial status, assets, income, tax information, retirement and estate plan information, transaction history, account balance, payment history, investment objectives, marital status, family relationships and other personal information.
Disclosure of Information
We do not disclose any nonpublic personal information about our customers or former customers to anyone, except as permitted by law. In addition to using this information to verify your identity (as required under law), the permitted uses may also include the disclosure of such information to unaffiliated companies for the following reasons:
| | • | | In order to provide you with products and services and to effect transactions that you request or authorize, we may disclose your personal information as described above to unaffiliated financial service providers and other companies that perform administrative or other services on our behalf, such as transfer agents, custodians and trustees, or that assist us in the distribution of investor materials such as trustees, banks, financial representatives, proxy services, solicitors and printers. |
| | • | | We may release information we have about you if you direct us to do so, if we are compelled by law to do so, or in other legally limited circumstances (for example to protect your account from fraud). |
In addition, in order to alert you to our other financial products and services, we may share your personal information within First Trust.
Use of Web Analytics
We currently use third party analytics tools, Google Analytics and AddThis, to gather information for purposes of improving First Trust’s website and marketing our products and services to you. These tools employ cookies, which are small pieces of text stored in a file by your web browser and sent to websites that you visit, to collect information, track website usage and viewing trends such as the number of hits, pages visited, videos and PDFs viewed and the length of user sessions in order to evaluate website performance and enhance navigation of the website. We may also collect other anonymous information, which is generally limited to technical and web navigation information such as the IP address of your device, internet browser type and operating system for purposes of analyzing the data to make First Trust’s website better and more useful to our users. The information collected does not include any personal identifiable information such as your name, address, phone number or email address unless you provide that information through the website for us to contact you in order to answer your questions or respond to your requests. To find out how to opt-out of these services click on: Google Analytics and Add This.
Confidentiality and Security
With regard to our internal security procedures, First Trust restricts access to your nonpublic personal information to those First Trust employees who need to know that information to provide products or services to you. We maintain physical, electronic and procedural safeguards to protect your nonpublic personal information.
Policy Updates and Inquiries
As required by federal law, we will notify you of our privacy policy annually. We reserve the right to modify this policy at any time, however, if we do change it, we will tell you promptly. For questions about our policy, or for additional copies of this notice, please go to www.ftportfolios.com, or contact us at 1-800-621-1675 (First Trust Portfolios) or 1-800-222-6822 (First Trust Advisors).
May 2017
Page 27
This page intentionally left blank

INVESTMENT ADVISOR
First Trust Advisors L.P.
120 E. Liberty Drive, Suite 400
Wheaton, IL 60187
INVESTMENT SUB-ADVISOR
J.J.B. Hilliard, W.L. Lyons, LLC
500 West Jefferson Street
Louisville, KY 40202
ADMINISTRATOR, FUND ACCOUNTANT & CUSTODIAN
Brown Brothers Harriman & Co.
50 Post Office Square
Boston, MA 02110
TRANSFER AGENT
BNY Mellon Investment Servicing (US) Inc.
301 Bellevue Parkway
Wilmington, DE 19810
INDEPENDENT REGISTERED PUBLIC ACCOUNTING FIRM
Deloitte & Touche LLP
111 S. Wacker Drive
Chicago, IL 60606
LEGAL COUNSEL
Chapman and Cutler LLP
111 W. Monroe Street
Chicago, IL 60603
ITEM 2. CODE OF ETHICS.

(a)   The registrant, as of the end of the period covered by this report, has
      adopted a code of ethics that applies to the registrant's principal
      executive officer, principal financial officer, principal accounting
      officer or controller, or persons performing similar functions, regardless
      of whether these individuals are employed by the registrant or a third
      party.

(c)   There have been no amendments, during the period covered by this report,
      to a provision of the code of ethics that applies to the registrant's
      principal executive officer, principal financial officer, principal
      accounting officer or controller, or persons performing similar functions,
      regardless of whether these individuals are employed by the registrant or
      a third party, and that relates to any element of the code of ethics
      description.

(d)   The registrant has not granted any waivers, including an implicit waiver,
      from a provision of the code of ethics that applies to the registrant's
      principal executive officer, principal financial officer, principal
      accounting officer or controller, or persons performing similar functions,
      regardless of whether these individuals are employed by the registrant or
      a third party, that relates to one or more of the items set forth in
      paragraph (b) of this item's instructions.

ITEM 3. AUDIT COMMITTEE FINANCIAL EXPERT.

As of the end of the period covered by the report, the Registrant's Board of
Trustees has determined that Thomas R. Kadlec and Robert F. Keith are qualified
to serve as audit committee financial experts serving on its audit committee and
that each of them is "independent," as defined by Item 3 of Form N-CSR.

ITEM 4. PRINCIPAL ACCOUNTANT FEES AND SERVICES.

      (a) Audit Fees (Registrant) -- The aggregate fees billed for professional
services rendered by the principal accountant for the audit of the registrant's
annual financial statements or services that are normally provided by the
accountant in connection with statutory and regulatory filings or engagements
were $133,000 for the fiscal year ended October 31, 2016 and $133,000 for the
fiscal year ended October 31, 2017.

      Audit Fees (Investment Advisor and Distributor) -- The aggregate fees
billed for professional services rendered by the principal accountant for the
audit of the registrant's annual financial statements or services that are
normally provided by the accountant in connection with statutory and regulatory
filings or engagements were $0 for the fiscal year ended October 31, 2016 and $0
for the fiscal year ended October 31, 2017.

      (b) Audit-Related Fees (Registrant) -- The aggregate fees billed in each
of the last two fiscal years for assurance and related services by the principal
accountant that are reasonably related to the performance of the audit of the
registrant's financial statements and are not reported under paragraph (a) of
this Item were $3,000 for the fiscal year ended October 31, 2016 and $0 for the
fiscal year ended October 31, 2017. The 2016 audit-related fees reflect fees for
auditing data after migration to new fund accounting software.

      Audit-Related Fees (Investment Adviser and Distributor) -- The aggregate
fees billed for assurance and related services by the principal accountant that
are reasonably related to the performance of the audit of the registrant's
financial statements, including conducting the seed audit and preparation of the
seed audit consent, and are not reported under paragraph (a) of this Item were
$0 for the Investment Adviser and $0 for the Distributor for the fiscal year
ended October 31, 2016 and $0 for the Investment Adviser and $0 for the
Distributor for the fiscal year ended October 31, 2017.

      (c) Tax Fees (Registrant) -- The aggregate fees billed for professional
services rendered by the principal accountant for tax compliance, tax advice,
and tax planning to the registrant were $15,200 for the fiscal year ended
October 31, 2016 and $19,200 for the fiscal year ended October 31, 2017.

      Tax Fees (Investment Adviser and Distributor) -- The aggregate fees billed
for professional services rendered by the principal accountant for tax
compliance, tax advice, and tax planning to the registrant's adviser and
distributor were $0 for the Investment Adviser and $0 for the Distributor for
the fiscal year ended October 31, 2016 and $0 for the Investment Adviser and $0
for the Distributor for the fiscal year ended October 31, 2017.

      (d) All Other Fees (Registrant) -- The aggregate fees billed for products
and services provided by the principal accountant to the registrant, other than
the services reported in paragraphs (a) through (c) of this Item were $0 for the
fiscal year ended October 31, 2016 and $0 for the fiscal year ended October 31,
2017.

      All Other Fees (Investment Adviser and Distributor) -- The aggregate fees
billed for products and services provided by the principal accountant to the
registrant's investment adviser and distributor, other than the services
reported in paragraphs (a) through (c) of this Item were $0 for the Investment
Adviser and $0 for the Distributor for the fiscal year ended October 31, 2016
and $0 for the Investment Adviser and $0 for the Distributor for the fiscal year
ended October 31, 2017.

      (e)(1) Disclose the audit committee's pre-approval policies and procedures
described in paragraph (c) (7) of Rule 2-01 of Regulation S-X.

      Pursuant to its charter and its Audit and Non-Audit Services Pre-Approval
Policy, the Audit Committee (the "Committee") is responsible for the
pre-approval of all audit services and permitted non-audit services (including
the fees and terms thereof) to be performed for the registrant by its
independent auditors. The Chairman of the Committee is authorized to give such
pre-approvals on behalf of the Committee up to $25,000 and report any such
pre-approval to the full Committee.

      The Committee is also responsible for the pre-approval of the independent
auditor's engagements for non-audit services with the registrant's adviser (not
including a sub-adviser whose role is primarily portfolio management and is
sub-contracted or overseen by another investment adviser) and any entity
controlling, controlled by or under common control with the investment adviser
that provides ongoing services to the registrant, if the engagement relates
directly to the operations and financial reporting of the registrant, subject to
the de minimis exceptions for non-audit services described in Rule 2-01 of
Regulation S-X. If the independent auditor has provided non-audit services to
the registrant's adviser (other than any sub-adviser whose role is primarily
portfolio management and is sub-contracted with or overseen by another
investment adviser) and any entity controlling, controlled by or under common
control with the investment adviser that provides ongoing services to the
registrant that were not pre-approved pursuant to its policies, the Committee
will consider whether the provision of such non-audit services is compatible
with the auditor's independence.

      (e)(2) The percentage of services described in each of paragraphs (b)
through (d) for the registrant and the registrant's investment adviser and
distributor of this Item that were approved by the audit committee pursuant to
the pre-approval exceptions included in paragraph (c)(7)(i)(C) or
paragraph(C)(7)(ii) of Rule 2-01 of Regulation S-X are as follows:

           Registrant:             Adviser and Distributor:
           -----------             ------------------------
             (b) 0%                         (b) 0%
             (c) 0%                         (c) 0%
             (d) 0%                         (d) 0%

      (f) The percentage of hours expended on the principal accountant's
engagement to audit the registrant's financial statements for the most recent
fiscal year that were attributed to work performed by persons other than the
principal accountant's full-time, permanent employees was less than fifty
percent.

      (g) The aggregate non-audit fees billed by the registrant's accountant for
services rendered to the registrant, and rendered to the registrant's investment
adviser (not including any sub-adviser whose role is primarily portfolio
management and is subcontracted with or overseen by another investment adviser),
and any entity controlling, controlled by, or under common control with the
adviser that provides ongoing services to the registrant for the fiscal year
ended October 31, 2016 were $15,950 for the registrant, $13,000 for the
registrant's investment adviser, $31,500 for the registrant's distributor and
$3,000 for Stonebridge Advisors LLC, which is under common control with the
registrant's investment adviser and serves as the registrant's sub-advisor for
the First Trust Preferred Securities and Income Fund ("Stonebridge"); and for
the fiscal year ended October 31, 2017 were $19,200 for the registrant, $44,000
for the registrant's investment adviser, $63,900 for the registrant's
distributor and $3,000 for Stonebridge.


      (h) The registrant's audit committee of its Board of Trustees has
determined that the provision of non-audit services that were rendered to the
registrant's investment adviser (not including any sub-adviser whose role is
primarily portfolio management and is subcontracted with or overseen by another
investment adviser), and any entity controlling, controlled by, or under common
control with the investment adviser that provides ongoing services to the
registrant that were not pre-approved pursuant to paragraph (c)(7)(ii) of Rule
2-01 of Regulation S-X is compatible with maintaining the principal accountant's
independence.

ITEM 5. AUDIT COMMITTEE OF LISTED REGISTRANTS.

(a)   The Registrant has a separately designated audit committee consisting of
      all the independent directors of the Registrant. The members of the audit
      committee are: Thomas R. Kadlec, Niel B. Nielson, Richard E. Erickson and
      Robert F. Keith.

ITEM 6. INVESTMENTS.

(a)   Schedule of Investments in securities of unaffiliated issuers as of the
      close of the reporting period is included as part of the report to
      shareholders filed under Item 1 of this form.

(b)   Not applicable.

ITEM 7. DISCLOSURE OF PROXY VOTING POLICIES AND PROCEDURES FOR CLOSED-END
MANAGEMENT INVESTMENT COMPANIES.

Not applicable.

ITEM 8. PORTFOLIO MANAGERS OF CLOSED-END MANAGEMENT INVESTMENT COMPANIES.

Not applicable.

ITEM 9. PURCHASES OF EQUITY SECURITIES BY CLOSED-END MANAGEMENT INVESTMENT
COMPANY AND AFFILIATED PURCHASERS.

Not applicable.

ITEM 10. SUBMISSION OF MATTERS TO A VOTE OF SECURITY HOLDERS.

There have been no material changes to the procedures by which the shareholders
may recommend nominees to the registrant's board of directors, where those
changes were implemented after the registrant last provided disclosure in
response to the requirements of Item 407(c)(2)(iv) of Regulation S-K (17 CFR
229.407) (as required by Item 22(b)(15) of Schedule 14A (17 CFR 240.14a-101)),
or this Item.

ITEM 11. CONTROLS AND PROCEDURES.

(a)   The registrant's principal executive and principal financial officers, or
      persons performing similar functions, have concluded that the registrant's
      disclosure controls and procedures (as defined in Rule 30a-3(c) under the
      Investment Company Act of 1940, as amended (the "1940 Act") (17 CFR
      270.30a-3(c))) are effective, as of a date within 90 days of the filing
      date of the report that includes the disclosure required by this
      paragraph, based on their evaluation of these controls and procedures
      required by Rule 30a-3(b) under the 1940 Act (17 CFR 270.30a-3(b)) and
      Rules 13a-15(b) or 15d-15(b) under the Securities Exchange Act of 1934, as
      amended (17 CFR 240.13a-15(b) or 240.15d-15(b)).

(b)   There were no changes in the registrant's internal control over financial
      reporting (as defined in Rule 30a-3(d) under the 1940 Act (17 CFR
      270.30a-3(d)) that occurred during the period covered by this report that
      has materially affected, or is reasonably likely to materially affect, the
      registrant's internal control over financial reporting.

ITEM 12. EXHIBITS.

(a)(1) Code of ethics, or any amendment thereto, that is the subject of
       disclosure required by Item 2 is attached hereto.

(a)(2) Certifications pursuant to Rule 30a-2(a) under the 1940 Act and Section
       302 of the Sarbanes-Oxley Act of 2002 are attached hereto.

(a)(3) Not applicable.

(b)    Certifications pursuant to Rule 30a-2(b) under the 1940 Act and Section
       906 of the Sarbanes- Oxley Act of 2002 are attached hereto.


<PAGE>


                                   SIGNATURES

Pursuant to the requirements of the Securities Exchange Act of 1934 and the
Investment Company Act of 1940, the registrant has duly caused this report to be
signed on its behalf by the undersigned, thereunto duly authorized.

(Registrant)                First Trust Series Fund
                   ------------------------------------------

By (Signature and Title)*               /s/ James M. Dykas
                                        ----------------------------------------
                                        James M. Dykas, President and
                                        Chief Executive Officer
                                        (principal executive officer)

Date: December 21, 2017
     -------------------

Pursuant to the requirements of the Securities Exchange Act of 1934 and the
Investment Company Act of 1940, this report has been signed below by the
following persons on behalf of the registrant and in the capacities and on the
dates indicated.

By (Signature and Title)*               /s/ James M. Dykas
                                        ----------------------------------------
                                        James M. Dykas, President and
                                        Chief Executive Officer
                                        (principal executive officer)

Date: December 21, 2017
     -------------------

By (Signature and Title)*               /s/ Donald P. Swade
                                        ----------------------------------------
                                        Donald P. Swade, Treasurer,
                                        Chief Financial Officer and
                                        Chief Accounting Officer
                                        (principal financial officer)

Date: December 21, 2017
     -------------------

* Print the name and title of each signing officer under his or her signature.