W. Scott Jardine, Esq.
First Trust Portfolios L.P.
120 East Liberty Drive, Suite 400
Wheaton, IL 60187
(Name and address of agent for service)
Form N-CSR is to be used by management investment companies to file reports with the Commission not later than 10 days after the transmission to stockholders of any report that is required to be transmitted to stockholders under Rule 30e-1 under the Investment Company Act of 1940 (17 CFR 270.30e-1). The Commission may use the information provided on Form N-CSR in its regulatory, disclosure review, inspection, and policymaking roles.
A registrant is required to disclose the information specified by Form N-CSR, and the Commission will make this information public. A registrant is not required to respond to the collection of information contained in Form N-CSR unless the Form displays a currently valid Office of Management and Budget (“OMB”) control number. Please direct comments concerning the accuracy of the information collection burden estimate and any suggestions for reducing the burden to Secretary, Securities and Exchange Commission, 100 F Street, NE, Washington, DC 20549. The OMB has reviewed this collection of information under the clearance requirements of 44 U.S.C. § 3507.
Item 1. Reports to Stockholders.
The Report to Shareholders is attached herewith.
Portfolio Commentary
First Trust Preferred Securities and Income Fund
Annual Report
October 31, 2018 (Unaudited)
Advisor
First Trust Advisors L.P. (“First Trust” or the “Advisor”) is the investment advisor to the First Trust Preferred Securities and Income Fund (the “Fund”). First Trust is responsible for the ongoing monitoring of the Fund’s investment portfolio, managing the Fund’s business affairs and providing certain administrative services necessary for the management of the Fund.
Sub-Advisor
Stonebridge Advisors LLC (“Stonebridge” or the “Sub-Advisor”) is the investment sub-advisor to the Fund and is a registered investment advisor based in Wilton, Connecticut. Stonebridge specializes in the management of preferred and hybrid securities.
Stonebridge Advisors LLC Portfolio Management Team
Scott T. Fleming - Chief Executive Officer and President
Robert Wolf - Chief Investment Officer, Senior Vice President and Senior Portfolio Manager
Annual Report Commentary
Market Recap
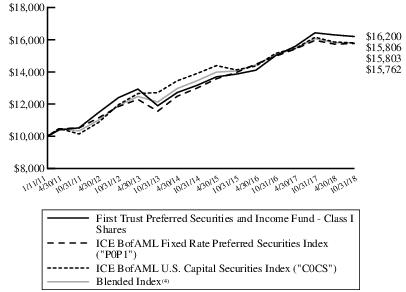
The fiscal year ended October 31, 2018 was a volatile period for the preferred and hybrid securities market with all parts of the market experiencing negative performance. This was largely driven by rising interest rates as well as economic and political headlines across the globe. The Federal Reserve (the “Fed”) guided short-term interest rates higher by 0.25% four times during the period as improving economic and employment data in the United States supported further rate hikes. Longer term interest rates also moved higher, but the curve flattened substantially as short-term rates increased at a faster pace. Credit spreads also managed to tighten within the preferred and hybrid securities market amid continued improvement in credit fundamentals, despite political uncertainty in Turkey, BREXIT negotiations, and trade tensions between China and the United States weighing on fixed income markets overall. These headlines pressured contingent capital securities (“CoCos”) which are largely issued by European banks. As a result, CoCos, as measured by the ICE BofAML USD Investment Grade Contingent Capital Index (“COCU”), were the worst performing part of the preferred and hybrid market during the period, as COCU was down 2.52%. Finally, the retail $25 par preferred securities market outperformed the institutional $1000 par preferred securities market during the period, as limited new issuance and net negative supply supported that part of the market. For the fiscal year, the retail market fell 1.23% while the institutional market lost 2.14% according to The ICE BofAML Fixed Rate Preferred Securities Index (“P0P1”) and The ICE BofAML U.S. Capital Securities Index (“C0CS”), respectively.
Performance Analysis
For the fiscal year ended October 31, 2018, the Fund’s I-shares produced a total return of -1.38% compared to the benchmark’s (a 50/50 blend of P0P1 and C0CS) total return of -1.67%. The Fund’s negative performance for the period was due to an overweight to contingent convertible capital securities (CoCos). However, the Fund was able to outperform the benchmark through security selection within $25 par preferred securities and non-CoCo institutional securities and an overweight to floating rate securities.
CoCos issued by European banks were the primary reason for the Fund’s negative performance during the period. Political volatility in Italy, BREXIT negotiations, and tariffs from the United States all weighed on CoCos throughout the period, despite improvements in European bank capitalization. CoCos continue to offer some of the most attractive yields and structures in the preferred and hybrid market and the Fund’s CoCo holdings are issued by well capitalized multinational banks with stable credit fundamentals that we believe will outperform longer term.
The Fund’s outperformance relative to the benchmark was driven by superior security selection within $25 par preferred securities and non-CoCo institutional securities. The Fund’s focus on variable rate securities with both wide back-end reset spreads and shorter durations contributed positively to relative performance.
The Fund also benefited from overweighting floating rate securities, which appreciated with rising short-term interest rates, spread tightening and a flattening yield curve. In the current rising interest rate environment, we believe it is prudent to maintain a conservative stance in regard to interest rates relative to the benchmark and peers.
Market and Fund Outlook
As we approach 2019, we believe the preferred and hybrid securities market will be positively supported by strong issuer credit fundamentals, attractive yields compared to other fixed income asset classes and a positive market technical from limited net new issue supply into 2019. Although headline risks of global trade wars and other geopolitical events will likely persist for the next 6 to 12
Notes to Financial Statements
First Trust Preferred Securities and Income Fund
October 31, 2018
1. Organization
First Trust Preferred Securities and Income Fund (the “Fund”) is a series of the First Trust Series Fund (the “Trust”), a Massachusetts business trust organized on July 9, 2010, and is registered as a diversified open-end management investment company with the Securities and Exchange Commission (“SEC”) under the Investment Company Act of 1940, as amended (the “1940 Act”). The Fund offers five classes of shares: Class A, Class C, Class F, Class I and Class R3. Each class represents an interest in the same portfolio of investments but with a different combination of sales charges, distribution and service (12b-1) fees, eligibility requirements and other features.
The Fund’s investment objective is to seek to provide current income and total return. The Fund seeks to achieve its objective by investing, under normal market conditions, at least 80% of its net assets (including investment borrowings, if any) in preferred securities and other securities with similar economic characteristics. There can be no assurance that the Fund will achieve its investment objective. The Fund may not be appropriate for all investors.
2. Significant Accounting Policies
The Fund is considered an investment company and follows accounting and reporting guidance under Financial Accounting Standards Board (“FASB”) Accounting Standards Codification (“ASC”) Topic 946, “Financial Services-Investment Companies.” The following is a summary of significant accounting policies consistently followed by the Fund in the preparation of the financial statements. The preparation of the financial statements in accordance with accounting principles generally accepted in the United States of America (“U.S. GAAP”) requires management to make estimates and assumptions that affect the reported amounts and disclosures in the financial statements. Actual results could differ from those estimates.
A. Portfolio Valuation
The net asset value (“NAV”) of each class of shares of the Fund is determined daily as of the close of regular trading on the New York Stock Exchange (“NYSE”), normally 4:00 p.m. Eastern time, on each day the NYSE is open for trading. If the NYSE closes early on a valuation day, the NAV is determined as of that time. Domestic debt securities and foreign securities are priced using data reflecting the earlier closing at the principal markets for those securities. The NAV for each class is calculated by dividing the value of the Fund’s total assets attributable to such class (including accrued interest and dividends), less all liabilities attributable to such class (including accrued expenses, dividends declared but unpaid and any borrowings of the Fund), by the total number of shares of the class outstanding. Differences in NAV of each class of the Fund’s shares are generally expected to be due to the daily expense accruals of the specified distribution and service (12b-1) fees and transfer agency costs applicable to such class of shares and the resulting differential in the dividends that may be paid on each class of shares.
The Fund’s investments are valued daily at market value or, in the absence of market value with respect to any portfolio securities, at fair value. Market value prices represent last sale or official closing prices from a national or foreign exchange (i.e., a regulated market) and are primarily obtained from third-party pricing services. Fair value prices represent any prices not considered market value prices and are either obtained from a third-party pricing service or are determined by the Pricing Committee of the Trust’s investment advisor, First Trust Advisors L.P. (“First Trust” or the “Advisor”), in accordance with valuation procedures adopted by the Trust’s Board of Trustees, and in accordance with provisions of the 1940 Act. Investments valued by the Advisor’s Pricing Committee, if any, are footnoted as such in the footnotes to the Portfolio of Investments. The Fund’s investments are valued as follows:
Preferred stocks and other equity securities listed on any national or foreign exchange (excluding The Nasdaq Stock Market LLC (“Nasdaq”) and the London Stock Exchange Alternative Investment Market (“AIM”)) are valued at the last sale price on the exchange on which they are principally traded or, for Nasdaq and AIM securities, the official closing price. Securities traded on more than one securities exchange are valued at the last sale price or official closing price, as applicable, at the close of the securities exchange representing the principal market for such securities.
Bonds, notes, capital preferred securities, and other debt securities are fair valued on the basis of valuations provided by dealers who make markets in such securities or by a third-party pricing service approved by the Trust’s Board of Trustees, which may use the following valuation inputs when available:
| 1) | benchmark yields; |
| 2) | reported trades; |
| 3) | broker/dealer quotes; |
| 4) | issuer spreads; |
| 5) | benchmark securities; |
| 6) | bids and offers; and |
| 7) | reference data including market research publications. |
Notes to Financial Statements (Continued)
First Trust Preferred Securities and Income Fund
October 31, 2018
F. Expenses
The Fund pays all expenses directly related to its operations. Expenses of the Fund are allocated on a pro rata basis to each class of shares, except for distribution and service (12b-1) fees and incremental transfer agency costs which are unique to each class of shares.
G. New Accounting Pronouncements
On March 30, 2017, the FASB issued Accounting Standards Update (“ASU”) 2017-08 “Premium Amortization on Purchased Callable Debt Securities”, which amends the amortization period for certain purchased callable debt securities held at a premium by shortening such period to the earliest call date. The new guidance requires an entity to amortize the premium on a callable debt security within its scope to the earliest call date, unless the guidance for considering estimated prepayments is applied. If the call option is not exercised at the earliest call date, the yield is reset to the effective yield using the payment terms of the security. If the security has more than one call date and the premium was amortized to a call price greater than the next call price, any excess of the amortized cost basis over the amount repayable at the next call date will be amortized to that date. If there are no other call dates, any excess of the amortized cost basis over the par amount will be amortized to maturity. Discounts on purchased callable debt securities will continue to be amortized to the security’s maturity date. The ASU 2017-08 is effective for public business entities for fiscal years, and interim periods within those fiscal years, beginning after December 15, 2018. Earlier application is permitted for all entities, including adoption in an interim period. If an entity early adopts the ASU in an interim period, any adjustments must be reflected as of the beginning of the fiscal year that includes that interim period. Management is still assessing the impact of the adoption of ASU 2017-08 on the financial statements but does not expect it to have a material impact.
On August 28, 2018, the FASB issued ASU 2018-13, “Disclosure Framework – Changes to the Disclosure Requirements for Fair Value Measurement,” which amends the fair value measurement disclosure requirements of ASC 820. The amendments of ASU 2018-13 include new, eliminated, and modified disclosure requirements of ASC 820. In addition, the amendments clarify that materiality is an appropriate consideration of entities when evaluating disclosure requirements. The ASU is effective for fiscal years beginning after December 15, 2019, including interim periods therein. Early adoption is permitted for any eliminated or modified disclosures upon issuance of this ASU. The Fund has early adopted ASU 2018-13 for these financial statements, which did not result in a material impact.
3. Investment Advisory Fee, Affiliated Transactions and Other Fee Arrangements
First Trust, the investment advisor to the Fund, is a limited partnership with one limited partner, Grace Partners of DuPage L.P., and one general partner, The Charger Corporation. The Charger Corporation is an Illinois corporation controlled by James A. Bowen, Chief Executive Officer of First Trust. First Trust is responsible for the ongoing monitoring of the Fund’s investment portfolio, managing the Fund’s business affairs and providing certain administrative services necessary for the management of the Fund. For these investment management services, First Trust is entitled to a monthly fee calculated at an annual rate of 0.80% of the Fund’s average daily net assets. First Trust also provides fund reporting services to the Fund for a flat annual fee in the amount of $9,250.
Stonebridge, a majority-owned affiliate of First Trust, serves as the Fund’s sub-advisor and manages the Fund’s portfolio subject to First Trust’s supervision. The Sub-Advisor receives a monthly portfolio management fee calculated at an annual rate of 0.40% of the Fund’s average daily net assets that is paid by First Trust out of its investment advisory fee.
First Trust Capital Partners, LLC, an affiliate of First Trust, owns a 51% ownership interest in Stonebridge.
First Trust and Stonebridge have agreed to waive fees and/or reimburse Fund expenses to the extent necessary to prevent the total annual operating expenses of the Fund (excluding 12b-1 distribution and service fees, interest expenses, taxes, acquired fund fees and expenses, fees incurred in acquiring and disposing of portfolio securities and extraordinary expenses) from exceeding 1.15% of average daily net assets of any class of shares of the Fund (the “Expense Cap”) until February 28, 2020 and then from exceeding 1.50% from March 1, 2020 to February 28, 2029 (the “Expense Cap Termination Date”). Expenses borne and fees waived by First Trust and Stonebridge are subject to recovery on a Fund class level, if applicable, by First Trust and Stonebridge for up to three years from the date the fee or expense was incurred, but no reimbursement payment will be made by the Fund at any time if it would result in the Fund’s expenses exceeding (i) the Expense Cap in place for the most recent fiscal year for which such expense limitation was in place, (ii) the Expense Cap in place at the time the fees were waived, or (iii) the currenct Expense Cap. These amounts would be included in “Expenses previously waived or reimbursed” on the Statement of Operations. The advisory fee waiver and expense
Additional Information
First Trust Preferred Securities and Income Fund
October 31, 2018 (Unaudited)
Proxy Voting Policies and Procedures
A description of the policies and procedures that the Trust uses to determine how to vote proxies and information on how the Fund voted proxies relating to portfolio securities during the most recent 12-month period ended June 30 is available (1) without charge, upon request, by calling (800) 988-5891; (2) on the Fund’s website at www.ftportfolios.com; and (3) on the Securities and Exchange Commission’s (“SEC”) website at www.sec.gov.
Portfolio Holdings
The Trust files its complete schedule of the Fund’s portfolio holdings with the SEC for the first and third quarters of each fiscal year on Form N-Q. The Trust’s Form N-Qs are available (1) by calling (800) 988-5891; (2) on the Fund’s website at www.ftportfolios.com; and (3) on the SEC’s website at www.sec.gov.
Beginning in April 2019, the Trust will cease to disclose the Fund’s holdings on Form N-Q and will file Form N-PORT with the SEC on a monthly basis. Part F of Form N-PORT, which contains the complete schedule of the Fund’s portfolio holdings, will be made available in the same manner as Form N-Q discussed above.
Federal Tax Information
The Fund hereby designates as qualified dividend income 67.83% of its ordinary income distributions (including short-term capital gains, if applicable) for the fiscal year ended October 31, 2018. In addition, 30.88% of the ordinary income distributions (including short-term capital gains, if applicable) made by the Fund for the fiscal year ended October 31, 2018, qualify for the corporate dividends received deduction available to corporate shareholders.
Risk Considerations
Risks are inherent in all investing. You should consider the Fund’s investment objective, risks, charges and expenses carefully before investing. You can download the Fund’s prospectus at www.ftportfolios.com or contact First Trust Portfolios L.P. at (800) 621-1675 to request a prospectus, which contains this and other information about the Fund. For additional information about the risks associated with investing in the Fund, please see the Fund’s statement of additional information, as well as other regulatory filings. Read these documents carefully before you invest.
CONCENTRATION RISK. A fund concentrated in one or more industries or sectors is likely to present more risks than a fund that is broadly diversified over several industries or sectors. Compared to the broad market, an individual industry or sector may be more strongly affected by changes in the economic climate, broad market shifts, moves in a particular dominant stock, or regulatory changes.
CONTINGENT CONVERTIBLE SECURITIES RISK. Contingent convertible securities (“CoCos”) may provide for mandatory conversion into common stock of the issuer under certain circumstances. Since the common stock of the issuer may not pay a dividend, investors in these instruments could experience a reduced income rate, potentially to zero; and conversion would deepen the subordination of the investor, hence worsening standing in a bankruptcy. In addition, some such instruments have a set stock conversion rate that would cause a reduction in value of the security if the price of the stock is below the conversion price on the conversion date. CoCos may be considered to be high-yield securities (a.k.a. “junk” bonds) and, to the extent a CoCo held by the Fund undergo a write down, the Fund may lose some or all of its original investment in the CoCo. Subordinate securities such as CoCos are more likely to experience credit loss than non-subordinate securities of the same issuer - even if the CoCos do not convert to equity securities. Any losses incurred by subordinate securities, such as CoCos, are likely to be proportionately greater than non-subordinate securities and any recovery of principal and interest of subordinate securities may take more time. As a result, any perceived decline in creditworthiness of a CoCo issuer is likely to have a greater impact on the CoCo, as a subordinate security.
CREDIT RISK. Credit risk is the risk that an issuer of a security will be unable or unwilling to make dividend, interest and/or principal payments when due and the related risk that the value of a security may decline because of concerns about the issuer’s ability to make such payments. Credit risk may be heightened if the Fund invests in “high yield” or “junk” securities; such securities, while generally offering higher yields than investment grade debt with similar maturities, involve greater risks, including the possibility of dividend or interest deferral, default or bankruptcy, and are regarded as predominantly speculative with respect to the issuer’s capacity to pay dividends or interest and repay principal.
CURRENCY EXCHANGE RATE RISK. Changes in currency exchange rates and the relative value of non-U.S. currencies will affect the value of the Fund’s investment and the value of Fund shares. Currency exchange rates can be very volatile and can change quickly and unpredictably. As a result, the value of an investment in the Fund may change quickly and without warning and you may lose money.
Additional Information (Continued)
First Trust Preferred Securities and Income Fund
October 31, 2018 (Unaudited)
CYBER SECURITY RISK. As the use of Internet technology has become more prevalent in the course of business, the Fund has become more susceptible to potential operational risks through breaches in cyber security. A breach in cyber security refers to both intentional and unintentional events that may cause the Fund to lose proprietary information, suffer data corruption or lose operational capacity. Such events could cause the Fund to incur regulatory penalties, reputational damage, additional compliance costs associated with corrective measures and/or financial loss. Cyber security breaches may involve unauthorized access to the Fund’s digital information systems through “hacking” or malicious software coding, but may also result from outside attacks such as denial-of-service attacks through efforts to make network services unavailable to intended users. In addition, cyber security breaches of the Fund’s third-party service providers, such as its administrator, transfer agent, custodian, or sub-advisor, as applicable, or issuers in which the Fund invests, can also subject the Fund to many of the same risks associated with direct cyber security breaches. The Fund has established risk management systems designed to reduce the risks associated with cyber security. However, there is no guarantee that such efforts will succeed, especially because the Fund does not directly control the cyber security systems of issuers or third-party service providers.
DEPOSITARY RECEIPTS RISK. Depositary receipts may be less liquid than the underlying shares in their primary trading market. Any distributions paid to the holders of depositary receipts are usually subject to a fee charged by the depositary. Holders of depositary receipts may have limited voting rights, and investment restrictions in certain countries may adversely impact the value of depositary receipts because such restrictions may limit the ability to convert the equity shares into depositary receipts and vice versa. Such restrictions may cause the equity shares of the underlying issuer to trade at a discount or premium to the market price of the depositary receipts.
EXTENSION RISK. Extension risk is the risk that, when interest rates rise, certain obligations will be paid off by the issuer (or obligor) more slowly than anticipated, causing the value of these securities to fall. Rising interest rates tend to extend the duration of securities, making them more sensitive to changes in interest rates. The value of longer-term securities generally changes more in response to changes in interest rates than shorter-term securities. As a result, in a period of rising interest rates, securities may exhibit additional volatility and may lose value.
FINANCIAL COMPANIES RISK. Financial companies are especially subject to the adverse effects of economic recession, currency exchange rates, government regulation, decreases in the availability of capital, volatile interest rates, portfolio concentrations in geographic markets and in commercial and residential real estate loans, and competition from new entrants in their fields of business.
HIGH YIELD SECURITIES RISK. High yield securities, or “junk” bonds, are subject to greater market fluctuations and risk of loss than securities with higher ratings, and therefore, are considered to be highly speculative. These securities are issued by companies that may have limited operating history, narrowly focused operations and/or other impediments to the timely payment of periodic interest and principal at maturity. If the economy slows down or dips into recession, the issuers of high yield securities may not have sufficient resources to continue making timely payment of periodic interest and principal at maturity. The market for high yield securities is smaller and less liquid than that for investment grade securities. High yield securities are generally not listed on a national securities exchange but trade in the over-the-counter markets. Due to the smaller, less liquid market for high yield securities, the bid-offer spread on such securities is generally greater than it is for investment grade securities and the purchase or sale of such securities may take longer to complete. In general, high yield securities may have a greater risk of default than other types of securities.
ILLIQUID SECURITIES RISK. Illiquid securities involve the risk that the securities will not be able to be sold at the time desired by the Fund or at prices approximately the value at which the Fund values the securities.
INCOME RISK. Income from the Fund’s fixed income investments could decline during periods of falling interest rates.
INTEREST RATE RISK. Interest rate risk is the risk that the value of the fixed-income securities will decline because of rising market interest rates. Interest rate risk is generally lower for shorter term investments, which generally have shorter durations, and higher for longer term investments. Duration is a measure of the expected price volatility of a fixed-income instrument as a result of changes in market rates of interest, based on, among other factors, the weighted average timing of the instrument’s expected principal and interest payments. In general, duration represents the expected percentage change in the value of a security for an immediate 1% change in interest rates. Therefore, prices of fixed-income securities with shorter durations tend to be less sensitive to interest rate changes than fixed-income securities with longer durations. As the value of a fixed-income security changes over time, so will its duration.
MARKET RISK. Market risk is the risk that a particular security owned by the Fund or shares of the Fund in general may fall in value. Securities are subject to market fluctuations caused by such factors as economic, political, regulatory or market developments, changes in interest rates and perceived trends in securities prices. Shares of the Fund could decline in value or underperform other investments.
Additional Information (Continued)
First Trust Preferred Securities and Income Fund
October 31, 2018 (Unaudited)
NON·U.S. SECURITIES RISK. Non-U.S. securities are subject to higher volatility than securities of domestic issuers due to possible adverse political, social or economic developments, restrictions on foreign investment or exchange of securities, lack of liquidity, currency exchange rates, excessive taxation, government seizure of assets, different legal or accounting standards, and less government supervision and regulation of exchanges in foreign countries.
PREFERRED SECURITIES RISK. Preferred securities combine some of the characteristics of both common stocks and bonds. Preferred securities are typically subordinated to bonds and other debt instruments in a company’s capital structure, in terms of priority to corporate income, and therefore will be subject to greater credit risk than those debt instruments. Preferred securities are also subject to credit risk, interest rate risk and income risk.
REAL ESTATE INVESTMENT RISK. The Fund invests in companies in the real estate industry, including real estate investment trusts (“REITs”). Therefore, the Fund is subject to the risks associated with investing in real estate, which may include, but are not limited to, fluctuations in the value of underlying properties; defaults by borrowers or tenants; market saturation; changes in general and local economic conditions; decreases in market rates for rents; increases in competition, property taxes, capital expenditures or operating expenses; and other economic, political or regulatory occurrences affecting companies in the real estate industry.
REIT INVESTMENT RISK. Investing in REITs involves certain other risks related to their structure and focus, which include, but are not limited to, dependency upon management skills, limited diversification, the risks of locating and managing financing for projects, heavy cash flow dependency, possible default by borrowers, the costs and potential losses of self-liquidation of one or more holdings, the risk of a possible lack of mortgage funds and associated interest rate risks, overbuilding, property vacancies, increases in property taxes and operating expenses, changes in zoning laws, losses due to environmental damages, changes in neighborhood values and appeal to purchasers, the possibility of failing to maintain exemptions from registration under the Investment Company Act of 1940, as amended and, in many cases, relatively small market capitalization, which may result in less market liquidity and greater price volatility. REITs are also subject to the risk that the real estate market may experience an economic downturn generally, which may have a material effect on the real estate in which the REITs invest and their underlying portfolio securities.
Advisory and Sub-Advisory Agreements
Board Considerations Regarding Approval of Investment Management and Investment Sub-Advisory Agreements
The Board of Trustees of First Trust Series Fund (the “Trust”), including the Independent Trustees, unanimously approved the continuation of the Investment Management Agreement (the “Advisory Agreement”) between the Trust, on behalf of the First Trust Preferred Securities and Income Fund (the “Fund”), and First Trust Advisors L.P. (the “Advisor” or “First Trust”) and the Investment Sub-Advisory Agreement (the “Sub-Advisory Agreement” and together with the Advisory Agreement, the “Agreements”) among the Trust, on behalf of the Fund, the Advisor and Stonebridge Advisors LLC (the “Sub-Advisor”) for a one-year period ending June 30, 2019 at a meeting held on June 11, 2018. The Board determined that the continuation of the Agreements is in the best interests of the Fund in light of the nature, extent and quality of the services provided and such other matters as the Board considered to be relevant in the exercise of its reasonable business judgment.
To reach this determination, the Board considered its duties under the Investment Company Act of 1940, as amended (the “1940 Act”), as well as under the general principles of state law, in reviewing and approving advisory contracts; the requirements of the 1940 Act in such matters; the fiduciary duty of investment advisors with respect to advisory agreements and compensation; the standards used by courts in determining whether investment company boards have fulfilled their duties; and the factors to be considered by the Board in voting on such agreements. At meetings held on April 23, 2018 and June 11, 2018, the Board, including the Independent Trustees, reviewed materials provided by the Advisor and the Sub-Advisor responding to requests for information from counsel to the Independent Trustees that, among other things, outlined the services provided by the Advisor and the Sub-Advisor to the Fund (including the relevant personnel responsible for these services and their experience); the advisory fee rate payable by the Fund and the sub-advisory fee rate as compared to fees charged to a peer group of funds compiled by Management Practice, Inc. (“MPI”), an independent source (the “Peer Group”), and as compared to fees charged to other clients of the Advisor and the Sub-Advisor; expenses of the Fund as compared to expense ratios of the funds in the Peer Group; performance information for the Fund; the nature of expenses incurred in providing services to the Fund and the potential for economies of scale, if any; financial data on the Advisor and the Sub-Advisor; any fall out benefits to the Advisor and its affiliates, First Trust Portfolios L.P. (“FTP”) and First Trust Capital Partners, LLC (“FTCP”), and the Sub-Advisor; and information on the Advisor’s and the Sub-Advisor’s compliance programs. The Board reviewed initial materials with the Advisor at the meeting held on April 23, 2018, prior to which the Independent Trustees and their counsel met separately to discuss the information provided by the Advisor and the Sub-Advisor. Following the April meeting, independent legal counsel on behalf of the Independent Trustees requested certain clarifications and supplements to the materials provided, and the information provided in response to those requests was considered at an executive session of the Independent Trustees and independent legal counsel held prior to the June 11, 2018 meeting, as well as at the meeting held that day. The Board applied its business judgment to determine whether the arrangements between the Trust and the Advisor and among the Trust, the
Additional Information (Continued)
First Trust Preferred Securities and Income Fund
October 31, 2018 (Unaudited)
Advisor and the Sub-Advisor continue to be reasonable business arrangements from the Fund’s perspective. The Board determined that, given the totality of the information provided with respect to the Agreements, the Board had received sufficient information to renew the Agreements. The Board considered that shareholders chose to invest or remain invested in the Fund knowing that the Advisor and the Sub-Advisor manage the Fund and knowing the Fund’s advisory fee.
In reviewing the Agreements, the Board considered the nature, extent and quality of the services provided by the Advisor and the Sub-Advisor under the Agreements. With respect to the Advisory Agreement, the Board considered that the Advisor is responsible for the overall management and administration of the Trust and the Fund and reviewed all of the services provided by the Advisor to the Fund, including the oversight of the Sub-Advisor, as well as the background and experience of the persons responsible for such services. The Board noted that the Advisor oversees the Sub-Advisor’s day-to-day management of the Fund’s investments, including portfolio risk monitoring and performance review. In reviewing the services provided, the Board noted the compliance program that had been developed by the Advisor and considered that it includes a robust program for monitoring the Advisor’s, the Sub-Advisor’s and the Fund’s compliance with the 1940 Act, as well as the Fund’s compliance with its investment objective, policies and restrictions. The Board also considered a report from the Advisor with respect to its risk management functions related to the operation of the Fund. Finally, as part of the Board’s consideration of the Advisor’s services, the Advisor, in its written materials and at the April 23, 2018 meeting, described to the Board the scope of its ongoing investment in additional infrastructure and personnel to maintain and improve the quality of services provided to the Fund and the other funds in the First Trust Fund Complex. With respect to the Sub-Advisory Agreement, the Board reviewed the materials provided by the Sub-Advisor and considered the services that the Sub-Advisor provides to the Fund, including the Sub-Advisor’s day-to-day management of the Fund’s investments. In considering the Sub-Advisor’s management of the Fund, the Board noted the background and experience of the Sub-Advisor’s portfolio management team and the Board’s prior meetings with members of the portfolio management team. In light of the information presented and the considerations made, the Board concluded that the nature, extent and quality of the services provided to the Trust and the Fund by the Advisor and the Sub-Advisor under the Agreements have been and are expected to remain satisfactory and that the Sub-Advisor, under the oversight of the Advisor, has managed the Fund consistent with its investment objective, policies and restrictions.
The Board considered the advisory and sub-advisory fee rates payable under the Agreements for the services provided. The Board noted that the sub-advisory fee is paid by the Advisor from its advisory fee. The Board considered that the Advisor and Sub-Advisor agreed to extend the current expense caps for each share class through February 29, 2020 and agreed to keep the long-term expense cap in place from March 1, 2020 through February 28, 2029. The Board noted that fees waived or expenses borne by the Advisor and Sub-Advisor are subject to reimbursement by the Fund for up to three years from the date the expense was incurred or fees were waived, but no reimbursement payment would be made by the Fund if it would result in the Fund exceeding an expense ratio equal to the expense cap in place at the time of the reimbursement or at the time the expenses were borne or the fees were waived by the Advisor and Sub-Advisor. The Board received and reviewed information showing the advisory fee rates and expense ratios of the peer funds in the Peer Group, as well as advisory and unitary fee rates charged by the Advisor and the Sub-Advisor to other fund and non-fund clients, as applicable. With respect to the Peer Group, the Board noted its prior discussions with the Advisor and MPI regarding the assembly of the Peer Group and, at the April 23, 2018 meeting, discussed with the Advisor limitations in creating a relevant peer group for the Fund, including that only one of the peer funds employs an advisor/sub advisor management structure with an unaffiliated sub-advisor. Based on the information provided, the Board noted that the advisory fee rate payable by the Fund was above the median advisory fee of the peer funds in the Peer Group. The Board noted that the Fund’s total (net) expense ratio (Class A shares) was above the median of the Peer Group. With respect to fees charged to other clients, the Board considered differences between the Fund and other clients that limited their comparability. In considering the advisory fee rate overall, the Board also considered the Advisor’s statement that it seeks to meet investor needs through innovative and value-added investment solutions and the Advisor’s description of its long-term commitment to the Fund.
The Board considered performance information for the Fund. The Board noted the process it has established for monitoring the Fund’s performance and portfolio risk on an ongoing basis, which includes quarterly performance reporting from the Advisor and Sub-Advisor for the Fund. The Board determined that this process continues to be effective for reviewing the Fund’s performance. The Board received and reviewed information comparing the Fund’s performance for periods ended December 31, 2017 to the performance of the peer funds in the Peer Group and to two benchmark indexes and a blended benchmark index. Based on the information provided, the Board noted that the Fund (Class A shares) outperformed the Peer Group average for the one- and three-year periods, but underperformed the Peer Group average for the five year period ended December 31, 2017. The Board also noted that the Fund (Class A shares) outperformed both benchmark indexes and the blended benchmark index for the one- and three-year periods, but underperformed both benchmark indexes and the blended benchmark index for the five-year period ended December 31, 2017.
On the basis of all the information provided on the fees, expenses and performance of the Fund and the ongoing oversight by the Board, the Board concluded that the advisory and sub-advisory fees for the Fund continue to be reasonable and appropriate in light of the nature, extent and quality of the services provided by the Advisor and the Sub-Advisor to the Fund under the Agreements.
Privacy Policy
First Trust Preferred Securities and Income Fund
October 31, 2018 (Unaudited)
Privacy Policy
First Trust values our relationship with you and considers your privacy an important priority in maintaining that relationship. We are committed to protecting the security and confidentiality of your personal information.
Sources of Information
We collect nonpublic personal information about you from the following sources:
| • | Information we receive from you and your broker-dealer, investment advisor or financial representative through interviews, applications, agreements or other forms; |
| • | Information about your transactions with us, our affiliates or others; |
| • | Information we receive from your inquiries by mail, e-mail or telephone; and |
| • | Information we collect on our website through the use of “cookies”. For example, we may identify the pages on our website that your browser requests or visits. |
Information Collected
The type of data we collect may include your name, address, social security number, age, financial status, assets, income, tax information, retirement and estate plan information, transaction history, account balance, payment history, investment objectives, marital status, family relationships and other personal information.
Disclosure of Information
We do not disclose any nonpublic personal information about our customers or former customers to anyone, except as permitted by law. In addition to using this information to verify your identity (as required under law), the permitted uses may also include the disclosure of such information to unaffiliated companies for the following reasons:
| • | In order to provide you with products and services and to effect transactions that you request or authorize, we may disclose your personal information as described above to unaffiliated financial service providers and other companies that perform administrative or other services on our behalf, such as transfer agents, custodians and trustees, or that assist us in the distribution of investor materials such as trustees, banks, financial representatives, proxy services, solicitors and printers. |
| • | We may release information we have about you if you direct us to do so, if we are compelled by law to do so, or in other legally limited circumstances (for example to protect your account from fraud). |
In addition, in order to alert you to our other financial products and services, we may share your personal information within First Trust.
Use of Website Analytics
We currently use third party analytics tools, Google Analytics and AddThis, to gather information for purposes of improving First Trust’s website and marketing our products and services to you. These tools employ cookies, which are small pieces of text stored in a file by your web browser and sent to websites that you visit, to collect information, track website usage and viewing trends such as the number of hits, pages visited, videos and PDFs viewed and the length of user sessions in order to evaluate website performance and enhance navigation of the website. We may also collect other anonymous information, which is generally limited to technical and web navigation information such as the IP address of your device, internet browser type and operating system for purposes of analyzing the data to make First Trust’s website better and more useful to our users. The information collected does not include any personal identifiable information such as your name, address, phone number or email address unless you provide that information through the website for us to contact you in order to answer your questions or respond to your requests. To find out how to opt-out of these services click on: Google Analytics and AddThis.
Confidentiality and Security
With regard to our internal security procedures, First Trust restricts access to your nonpublic personal information to those First Trust employees who need to know that information to provide products or services to you. We maintain physical, electronic and procedural safeguards to protect your nonpublic personal information.
Policy Updates and Inquiries
As required by federal law, we will notify you of our privacy policy annually. We reserve the right to modify this policy at any time, however, if we do change it, we will tell you promptly. For questions about our policy, or for additional copies of this notice, please go to www.ftportfolios.com, or contact us at 1-800-621-1675 (First Trust Portfolios) or 1-800-222-6822 (First Trust Advisors).
May 2017
Portfolio Commentary
First Trust/Confluence Small Cap Value Fund
Annual Report
October 31, 2018 (Unaudited)
Advisor
First Trust Advisors L.P. (“First Trust” or the “Advisor”) serves as the investment advisor to the First Trust/Confluence Small Cap Value Fund (the “Fund”). First Trust is responsible for the ongoing monitoring of the Fund’s investment portfolio, managing the Fund’s business affairs and providing certain administrative services necessary for the management of the Fund.
Sub-Advisor
Confluence Investment Management LLC, a registered investment advisor (“Confluence” or the “Sub-Advisor”), located in St. Louis, Missouri, serves as the sub-advisor to the Fund. The investment professionals at Confluence have over 80 years of aggregate portfolio management experience. Confluence professionals have invested in a wide range of specialty finance and other financial company securities during various market cycles, working to provide attractive risk-adjusted returns to clients.
Portfolio Management Team
Mark Keller, CFA - Chief Executive Officer and Chief Investment Officer, Confluence
Daniel Winter, CFA - Senior Vice President and Portfolio Manager, Confluence
Chris Stein - Vice President and Portfolio Manager, Confluence
Thomas Dugan, CFA - Associate Vice President and Portfolio Manager, Confluence
Commentary
Market Recap
For the Fund’s fiscal year ended October 31, 2018, the small capitalization equity markets posted rather mundane results with the Russell 2000® Index and Russell 2000® Value Index up 1.85% and down 0.59%, respectively. While an observer late to the game might conclude it must have been a rather boring environment, they would be very wrong as the markets were up solidly going into October 2018. In fact, from November 1, 2017 through September 30, 2018, the Russell 2000® Index and Russell 2000® Value Index were up 11.51% and 7.14%, respectively, before the broad October selloff in equities.
The domestic equity markets, both large and small capitalization, were quite strong the past 18-24 months going into October 2018 as the economic backdrop, aided by tax reform and regulatory relief, provided a nice tailwind for investors. While economic strength has been relatively broad based, equity returns have not. Investors were increasingly leaning toward businesses that exhibit above-average growth/momentum while paying less attention to valuations. In fact, the Russell Growth Indices have been outperforming their Value counterparts rather handily the past couple of years (see table below). This broad sentiment changed rather abruptly with the pullback in October 2018.
| Index | CY 2017 | CY 2018 (through Sept) | Oct 2018 |
| Russell 2000 | 14.70% | 11.51% | (10.86%) |
| Russell 2000 Value | 7.84% | 7.14% | (8.95%) |
| Russell 2000 Growth | 22.17% | 15.76% | (12.65%) |
The October retreat in sentiment appears to have been driven primarily by the ongoing trade negotiations with China that have led to some tariffs as well as concerns that the Federal Reserve’s (the “Fed”) normalization of monetary policy will put the economic expansion at risk. From our perspective, the recent pullback is simply a healthy correction as the economy remains on solid footing. Regarding the Fed, we don’t see their recent actions as a cause for concern, but we will be monitoring their future moves and guidance as they approach a more neutral level. From a fundamental perspective, businesses are reporting solid progress on the revenue and earnings front, and both consumer and business optimism remains high.
The Class I shares of the Fund generated gains of 4.30% during the fiscal year ended October 31, 2018, outperforming the Russell 2000® Value Index and Russell 2000® Index benchmarks. From the Fund’s inception on January 11, 2011 through the end of October 2018, the Class I shares of the Fund were up 10.36%, ahead of the performance of the Russell 2000® Value Index and in line with the Russell 2000® Index, which posted gains of 9.18% and 10.08%, respectively, for the same period (returns are annualized for periods greater than a year).
Performance Analysis
During the Fund’s fiscal year ended October 31, 2018, the market’s narrowness led to bifurcations which were also apparent in the wide variance of sector performance in the benchmarks as well as the Fund. For the market, the Consumer Services, Consumer
First Trust/Confluence Small Cap Value Fund
Understanding Your Fund Expenses
October 31, 2018 (Unaudited)
As a shareholder of the First Trust/Confluence Small Cap Value Fund (the “Fund”), you incur two types of costs: (1) transaction costs, including sales charges (loads) on purchases of Class A Shares and contingent deferred sales charges on the lesser of purchase price or redemption proceeds of Class C Shares; and (2) ongoing costs, including management fees, distribution and/or service (12b-1) fees, if any, and other Fund expenses. This Example is intended to help you understand your ongoing costs of investing in the Fund and to compare these costs with the ongoing costs of investing in other funds.
The Example is based on an investment of $1,000 invested at the beginning of the period and held through the six-month period ended October 31, 2018.
Actual Expenses
The first three columns of the table below provide information about actual account values and actual expenses. You may use the information in these columns, together with the amount you invested, to estimate the expenses that you paid over the period. Simply divide your account value by $1,000 (for example, an $8,600 account value divided by $1,000 = 8.6), then multiply the result by the number in the third column under the heading entitled “Expenses Paid During Period” to estimate the expenses you paid on your account during this period.
Hypothetical Example for Comparison Purposes
The next three columns of the table below provide information about hypothetical account values and hypothetical expenses based on the Fund’s actual expense ratio and an assumed rate of return of 5% per year before expenses, which is not the Fund’s actual return. The hypothetical account values and expenses may not be used to estimate the actual ending account balance or expenses you paid for the period. You may use this information to compare the ongoing costs of investing in the Fund and other funds. To do so, compare this 5% hypothetical example with the 5% hypothetical examples that appear in the shareholder reports of the other funds.
Please note that the expenses shown in the table are meant to highlight your ongoing costs only and do not reflect any transactional costs such as sales charges (loads) or contingent deferred sales charges. Therefore, the hypothetical section of the table is useful in comparing ongoing costs only, and will not help you determine the relative total costs of owning different funds. In addition, if these transactional costs were included, your costs would have been higher.
| | | Actual Expenses | | Hypothetical
(5% Return Before Expenses) | | |
| | | Beginning
Account
Value
5/1/2018 | | Ending
Account
Value
10/31/2018 | | Expenses Paid
During Period
5/1/2018 - 10/31/2018 (a) | | Beginning
Account
Value
5/1/2018 | | Ending
Account
Value
10/31/2018 | | Expenses Paid
During Period
5/1/2018 - 10/31/2018 (a) | | Annualized
Expense
Ratios (b) |
| Class A | | $ 1,000.00 | | $ 1,002.40 | | $ 8.08 | | $ 1,000.00 | | $ 1,017.14 | | $ 8.13 | | 1.60% |
| Class C | | 1,000.00 | | 998.70 | | 11.84 | | 1,000.00 | | 1,013.36 | | 11.93 | | 2.35 |
| Class I | | 1,000.00 | | 1,003.50 | | 6.82 | | 1,000.00 | | 1,018.40 | | 6.87 | | 1.35 |
| (a) | Expenses are equal to the annualized expense ratios as indicated in the table multiplied by the average account value over the period (May 1, 2018 through October 31, 2018), multiplied by 184/365 (to reflect the six-month period). |
| (b) | These expense ratios reflect expense caps. |
First Trust/Confluence Small Cap Value Fund
Portfolio of Investments
October 31, 2018
| Shares | | Description | | Value |
| COMMON STOCKS – 91.6% |
| | | Air Freight & Logistics – 2.8% | | |
| 10,022 | | Forward Air Corp. | | $601,220 |
| | | Banks – 5.6% | | |
| 7,934 | | Bank of Marin Bancorp. | | 674,311 |
| 22,769 | | Veritex Holdings, Inc. (a) | | 536,437 |
| | | | | 1,210,748 |
| | | Capital Markets – 4.0% | | |
| 6,892 | | Morningstar, Inc. | | 860,122 |
| | | Chemicals – 2.2% | | |
| 16,190 | | Innophos Holdings, Inc. | | 474,367 |
| | | Diversified Financial Services – 3.2% | | |
| 37,180 | | Cannae Holdings, Inc. (a) | | 686,715 |
| | | Electrical Equipment – 5.9% | | |
| 14,655 | | Allied Motion Technologies, Inc. | | 639,837 |
| 29,638 | | Thermon Group Holdings, Inc. (a) | | 639,588 |
| | | | | 1,279,425 |
| | | Electronic Equipment,
Instruments & Components – 2.8% | | |
| 12,704 | | MTS Systems Corp. | | 601,534 |
| | | Gas Utilities – 3.3% | | |
| 10,980 | | Northwest Natural Holding Co. | | 711,394 |
| | | Health Care Equipment &
Supplies – 4.6% | | |
| 18,269 | | Natus Medical, Inc. (a) | | 545,878 |
| 17,141 | | Varex Imaging Corp. (a) | | 444,980 |
| | | | | 990,858 |
| | | Health Care Providers &
Services – 2.6% | | |
| 24,555 | | Patterson Cos., Inc. | | 554,452 |
| | | Hotels, Restaurants &
Leisure – 3.9% | | |
| 2,909 | | Nathan’s Famous, Inc. | | 217,855 |
| 53,653 | | Potbelly Corp. (a) | | 626,667 |
| | | | | 844,522 |
| | | Industrial Conglomerates – 2.7% | | |
| 13,405 | | Raven Industries, Inc. | | 582,849 |
| | | Insurance – 2.8% | | |
| 21,190 | | Brown & Brown, Inc. | | 597,134 |
| | | IT Services – 4.8% | | |
| 17,757 | | I3 Verticals, Inc., Class A (a) | | 381,598 |
| 15,976 | | Luxoft Holding, Inc. (a) | | 658,690 |
| | | | | 1,040,288 |
| Shares | | Description | | Value |
|
| | | Life Sciences Tools &
Services – 3.1% | | |
| 12,419 | | Cambrex Corp. (a) | | $661,809 |
| | | Machinery – 11.4% | | |
| 10,144 | | Astec Industries, Inc. | | 381,516 |
| 6,691 | | John Bean Technologies Corp. | | 695,663 |
| 7,034 | | Kadant, Inc. | | 694,256 |
| 4,746 | | RBC Bearings, Inc. (a) | | 700,889 |
| | | | | 2,472,324 |
| | | Paper & Forest Products – 3.0% | | |
| 8,010 | | Neenah, Inc. | | 644,485 |
| | | Personal Products – 2.6% | | |
| 53,436 | | elf Beauty, Inc. (a) | | 566,956 |
| | | Pharmaceuticals – 2.8% | | |
| 14,245 | | Phibro Animal Health Corp., Class A | | 611,395 |
| | | Professional Services – 3.1% | | |
| 40,904 | | Resources Connection, Inc. | | 667,553 |
| | | Real Estate Management &
Development – 3.0% | | |
| 17,355 | | RE/MAX Holdings, Inc., Class A | | 648,904 |
| | | Software – 2.5% | | |
| 31,183 | | Monotype Imaging Holdings, Inc. | | 546,638 |
| | | Textiles, Apparel & Luxury
Goods – 5.5% | | |
| 19,398 | | Culp, Inc. | | 449,064 |
| 19,174 | | Movado Group, Inc. | | 738,391 |
| | | | | 1,187,455 |
| | | Water Utilities – 3.4% | | |
| 12,263 | | SJW Group | | 744,732 |
| | | Total Common Stocks | | 19,787,879 |
| | | (Cost $19,355,390) | | |
| REAL ESTATE INVESTMENT TRUSTS – 6.1% |
| | | Equity Real Estate Investment
Trusts – 6.1% | | |
| 36,508 | | Gladstone Commercial Corp. | | 693,287 |
| 20,888 | | Rayonier, Inc. | | 630,818 |
| | | Total Real Estate Investment Trusts | | 1,324,105 |
| | | (Cost $1,223,910) | | |
| | | Total Investments – 97.7% | | 21,111,984 |
| | | (Cost $20,579,300) (b) | | |
| | | Net Other Assets and Liabilities – 2.3% | | 503,824 |
| | | Net Assets – 100.0% | | $21,615,808 |
Page 8
See Notes to Financial Statements
First Trust/Confluence Small Cap Value Fund
Portfolio of Investments (Continued)
October 31, 2018
|
| (a) | Non-income producing security. |
| (b) | Aggregate cost for federal income tax purposes was $20,575,937. As of October 31, 2018, the aggregate gross unrealized appreciation for all investments in which there was an excess of value over tax cost was $2,543,762 and the aggregate gross unrealized depreciation for all investments in which there was an excess of tax cost over value was $2,007,715. The net unrealized appreciation was $536,047. |
Valuation Inputs
A summary of the inputs used to value the Fund’s investments as of October 31, 2018 is as follows (see Note 2A - Portfolio Valuation in the Notes to Financial Statements):
| | Total
Value at
10/31/2018 | Level 1
Quoted
Prices | Level 2
Significant
Observable
Inputs | Level 3
Significant
Unobservable
Inputs |
| Common Stocks* | $ 19,787,879 | $ 19,787,879 | $ — | $ — |
| Real Estate Investment Trusts* | 1,324,105 | 1,324,105 | — | — |
| Total Investments | $ 21,111,984 | $ 21,111,984 | $— | $— |
| * | See Portfolio of Investments for industry breakout. |
See Notes to Financial Statements
Page 9
First Trust/Confluence Small Cap Value Fund
Statement of Assets and Liabilities
October 31, 2018
| ASSETS: | |
Investments, at value
(Cost $20,579,300)
| $ 21,111,984 |
Cash
| 502,044 |
| Receivables: | |
Fund shares sold
| 62,420 |
Dividends
| 11,235 |
Prepaid expenses
| 25,346 |
Total Assets
| 21,713,029 |
| LIABILITIES: | |
| Payables: | |
Audit and tax fees
| 33,280 |
Administrative fees
| 17,502 |
Fund shares redeemed
| 14,813 |
Shareholder reporting fees
| 7,610 |
Transfer agent fees
| 7,493 |
12b-1 distribution and service fees
| 4,754 |
Commitment and administrative agency fees
| 4,009 |
Custodian fees
| 2,039 |
Investment advisory fees
| 1,933 |
Trustees’ fees and expenses
| 1,329 |
Registration fees
| 1,133 |
Financial reporting fees
| 770 |
Legal fees
| 457 |
Other liabilities
| 99 |
Total Liabilities
| 97,221 |
NET ASSETS
| $21,615,808 |
| NET ASSETS consist of: | |
Paid-in capital
| $ 18,562,124 |
Par value
| 6,415 |
Accumulated distributable earnings (loss)
| 3,047,269 |
NET ASSETS
| $21,615,808 |
| Maximum Offering Price Per Share: | |
| Class A Shares: | |
Net asset value and redemption price per share (Based on net assets of $6,692,146 and 196,954 shares of beneficial interest issued and outstanding)
| $33.98 |
Maximum sales charge (5.50% of offering price)
| 1.98 |
Maximum offering price to public
| $35.96 |
| Class C Shares: | |
Net asset value and redemption price per share (Based on net assets of $3,621,443 and 118,319 shares of beneficial interest issued and outstanding)
| $30.61 |
| Class I Shares: | |
Net asset value and redemption price per share (Based on net assets of $11,302,219 and 326,222 shares of beneficial interest issued and outstanding)
| $34.65 |
Page 10
See Notes to Financial Statements
First Trust/Confluence Small Cap Value Fund
Statement of Operations
For the Year Ended October 31, 2018
| INVESTMENT INCOME: | |
Dividends
| $ 191,780 |
Interest
| 17,248 |
Total investment income
| 209,028 |
| EXPENSES: | |
Investment advisory fees
| 199,111 |
| 12b-1 distribution and/or service fees: | |
Class A
| 16,121 |
Class C
| 40,291 |
Transfer agent fees
| 68,378 |
Administrative fees
| 52,502 |
Registration fees
| 45,309 |
Audit and tax fees
| 32,524 |
Shareholder reporting fees
| 27,078 |
Commitment and administrative agency fees
| 26,633 |
Trustees’ fees and expenses
| 15,699 |
Financial reporting fees
| 9,250 |
Custodian fees
| 4,441 |
Legal fees
| 4,032 |
Listing expense
| 1,800 |
Other
| 245 |
Total expenses
| 543,414 |
Fees waived and expenses reimbursed by the investment advisor
| (218,185) |
Net expenses
| 325,229 |
NET INVESTMENT INCOME (LOSS)
| (116,201) |
| NET REALIZED AND UNREALIZED GAIN (LOSS): | |
Net realized gain (loss) on investments
| 2,628,572 |
Net change in unrealized appreciation (depreciation) on investments
| (1,939,618) |
NET REALIZED AND UNREALIZED GAIN (LOSS)
| 688,954 |
NET INCREASE (DECREASE) IN NET ASSETS RESULTING FROM OPERATIONS
| $ 572,753 |
See Notes to Financial Statements
Page 11
First Trust/Confluence Small Cap Value Fund
Statements of Changes in Net Assets
| | Year
Ended
10/31/2018 | | Year
Ended
10/31/2017 |
| OPERATIONS: | | | |
Net investment income (loss)
| $ (116,201) | | $ (84,938) |
Net realized gain (loss)
| 2,628,572 | | 1,061,171 |
Net change in unrealized appreciation (depreciation)
| (1,939,618) | | 1,828,856 |
Net increase (decrease) in net assets resulting from operations
| 572,753 | | 2,805,089 |
| DISTRIBUTIONS TO SHAREHOLDERS FROM INVESTMENT OPERATIONS: | | | |
Class A Shares
| (328,598) | | |
Class C Shares
| (234,993) | | |
Class I Shares
| (407,096) | | |
Total distributions to shareholders from investment operations
| (970,687) | | |
| DISTRIBUTIONS TO SHAREHOLDERS FROM NET REALIZED GAIN: | | | |
Class A Shares
| | | (58,496) |
Class C Shares
| | | (47,722) |
Class I Shares
| | | (34,235) |
Total distributions to shareholders from net realized gain
| | | (140,453) |
| CAPITAL TRANSACTIONS: | | | |
Proceeds from shares sold
| 9,965,431 | | 8,490,868 |
Proceeds from shares reinvested
| 912,306 | | 123,849 |
Cost of shares redeemed
| (5,754,814) | | (3,494,346) |
Net increase (decrease) in net assets resulting from capital transactions
| 5,122,923 | | 5,120,371 |
Total increase (decrease) in net assets
| 4,724,989 | | 7,785,007 |
| NET ASSETS: | | | |
Beginning of period
| 16,890,819 | | 9,105,812 |
End of period
| $21,615,808 | | $16,890,819 |
Accumulated net investment income (loss) at end of period
| | | $3,363 |
Page 12
See Notes to Financial Statements
First Trust/Confluence Small Cap Value Fund
Financial Highlights
For a Share outstanding throughout each period
| Class A Shares | Year Ended October 31, |
| 2018 | | 2017 | | 2016 | | 2015 | | 2014 |
Net asset value, beginning of period
| $ 34.48 | | $ 27.81 | | $ 26.34 | | $ 28.03 | | $ 26.77 |
| Income from investment operations: | | | | | | | | | |
Net investment income (loss) (a)
| (0.20) | | (0.16) | | (0.10) | | 0.04 | | 0.00 (b) |
Net realized and unrealized gain (loss)
| 1.63 | | 7.20 | | 1.97 | | 0.31 | | 2.39 |
Total from investment operations
| 1.43 | | 7.04 | | 1.87 | | 0.35 | | 2.39 |
| Distributions paid to shareholders from: | | | | | | | | | |
Net realized gain
| (1.93) | | (0.37) | | (0.40) | | (2.04) | | (1.13) |
Net asset value, end of period
| $33.98 | | $34.48 | | $27.81 | | $26.34 | | $28.03 |
Total return (c)
| 4.16% | | 25.53% | | 7.22% | | 1.22% | | 9.23% |
| Ratios to average net assets/supplemental data: | | | | | | | | | |
Net assets, end of period (in 000’s)
| $ 6,692 | | $ 5,656 | | $ 3,767 | | $ 1,413 | | $ 1,144 |
Ratio of total expenses to average net assets
| 2.71% | | 3.56% | | 5.69% | | 7.61% | | 8.65% |
Ratio of net expenses to average net assets
| 1.60% | | 1.60% | | 1.61% (d) | | 1.60% | | 1.60% |
Ratio of net investment income (loss) to average net assets
| (0.56)% | | (0.50)% | | (0.38)% | | 0.16% | | 0.00% (e) |
Portfolio turnover rate
| 35% | | 28% | | 15% | | 17% | | 39% |
| (a) | Based on average shares outstanding. |
| (b) | Amount represents less than $0.01 per share. |
| (c) | Assumes reinvestment of all distributions for the period and does not include payment of the maximum sales charge of 5.50% or contingent deferred sales charge (CDSC). On purchases of $1 million or more, a CDSC of 1% may be imposed on certain redemptions made within twelve months of purchase. If the sales charges were included, total returns would be lower. These returns include Rule 12b-1 service fees of 0.25% and do not reflect the deduction of taxes that a shareholder would pay on Fund distributions or the redemption of Fund shares. The total returns would have been lower if certain fees had not been waived and expenses reimbursed by the investment advisor. Total return is calculated for the time period presented and is not annualized for periods of less than one year. |
| (d) | Includes excise tax. If this excise tax expense was not included, the net expense ratio would have been 1.60%. |
| (e) | Amount is less than 0.01%. |
See Notes to Financial Statements
Page 13
First Trust/Confluence Small Cap Value Fund
Financial Highlights (Continued)
For a Share outstanding throughout each period
| Class C Shares | Year Ended October 31, |
| 2018 | | 2017 | | 2016 | | 2015 | | 2014 |
Net asset value, beginning of period
| $ 31.47 | | $ 25.61 | | $ 24.51 | | $ 26.44 | | $ 25.51 |
| Income from investment operations: | | | | | | | | | |
Net investment income (loss) (a)
| (0.42) | | (0.36) | | (0.28) | | (0.14) | | (0.19) |
Net realized and unrealized gain (loss)
| 1.49 | | 6.59 | | 1.78 | | 0.25 | | 2.25 |
Total from investment operations
| 1.07 | | 6.23 | | 1.50 | | 0.11 | | 2.06 |
| Distributions paid to shareholders from: | | | | | | | | | |
Net realized gain
| (1.93) | | (0.37) | | (0.40) | | (2.04) | | (1.13) |
Net asset value, end of period
| $30.61 | | $31.47 | | $25.61 | | $24.51 | | $26.44 |
Total return (b)
| 3.34% | | 24.58% | | 6.28% | | 0.33% | | 8.36% |
| Ratios to average net assets/supplemental data: | | | | | | | | | |
Net assets, end of period (in 000’s)
| $ 3,621 | | $ 3,962 | | $ 3,237 | | $ 2,247 | | $ 1,977 |
Ratio of total expenses to average net assets
| 3.69% | | 4.45% | | 6.28% | | 7.93% | | 8.81% |
Ratio of net expenses to average net assets
| 2.35% | | 2.35% | | 2.36% (c) | | 2.35% | | 2.35% |
Ratio of net investment income (loss) to average net assets
| (1.31)% | | (1.25)% | | (1.12)% | | (0.57)% | | (0.73)% |
Portfolio turnover rate
| 35% | | 28% | | 15% | | 17% | | 39% |
| (a) | Based on average shares outstanding. |
| (b) | Assumes reinvestment of all distributions for the period and does not include payment of the maximum CDSC of 1%, charged on certain redemptions made within one year of purchase. If the sales charge was included, total returns would be lower. These returns include combined Rule 12b-1 distribution and service fees of 1% and do not reflect the deduction of taxes that a shareholder would pay on Fund distributions or the redemption of Fund shares. The total returns would have been lower if certain fees had not been waived and expenses reimbursed by the investment advisor. Total return is calculated for the time period presented and is not annualized for periods of less than one year. |
| (c) | Includes excise tax. If this excise tax expense was not included, the net expense ratio would have been 2.35%. |
Page 14
See Notes to Financial Statements
First Trust/Confluence Small Cap Value Fund
Financial Highlights (Continued)
For a Share outstanding throughout each period
| Class I Shares | Year Ended October 31, |
| 2018 | | 2017 | | 2016 | | 2015 | | 2014 |
Net asset value, beginning of period
| $ 35.07 | | $ 28.40 | | $ 26.84 | | $ 28.52 | | $ 27.15 |
| Income from investment operations: | | | | | | | | | |
Net investment income (loss) (a)
| (0.11) | | (0.09) | | (0.05) | | 0.10 | | 0.08 |
Net realized and unrealized gain (loss)
| 1.62 | | 7.13 | | 2.01 | | 0.26 | | 2.42 |
Total from investment operations
| 1.51 | | 7.04 | | 1.96 | | 0.36 | | 2.50 |
| Distributions paid to shareholders from: | | | | | | | | | |
Net realized gain
| (1.93) | | (0.37) | | (0.40) | | (2.04) | | (1.13) |
Net asset value, end of period
| $34.65 | | $35.07 | | $28.40 | | $26.84 | | $28.52 |
Total return (b)
| 4.30% | | 24.99% | | 7.46% | | 1.23% | | 9.51% |
| Ratios to average net assets/supplemental data: | | | | | | | | | |
Net assets, end of period (in 000’s)
| $ 11,302 | | $ 7,273 | | $ 2,101 | | $ 813 | | $ 592 |
Ratio of total expenses to average net assets
| 2.33% | | 3.22% | | 5.63% | | 8.46% | | 11.05% |
Ratio of net expenses to average net assets
| 1.35% | | 1.35% | | 1.35% | | 1.35% | | 1.35% |
Ratio of net investment income (loss) to average net assets
| (0.29)% | | (0.28)% | | (0.16)% | | 0.38% | | 0.28% |
Portfolio turnover rate
| 35% | | 28% | | 15% | | 17% | | 39% |
| (a) | Based on average shares outstanding. |
| (b) | Assumes reinvestment of all distributions for the period. These returns do not reflect the deduction of taxes that a shareholder would pay on Fund distributions or the redemption of Fund shares. The total returns would have been lower if certain fees had not been waived and expenses reimbursed by the investment advisor. Total return is calculated for the time period presented and is not annualized for periods of less than one year. |
See Notes to Financial Statements
Page 15
Notes to Financial Statements
First Trust/Confluence Small Cap Value Fund
October 31, 2018
1. Organization
First Trust/Confluence Small Cap Value Fund (the “Fund”) is a series of the First Trust Series Fund (the “Trust”), a Massachusetts business trust organized on July 9, 2010, and is registered as a diversified open-end management investment company with the Securities and Exchange Commission (“SEC”) under the Investment Company Act of 1940, as amended (the “1940 Act”). The Fund offers three classes of shares: Class A, Class C and Class I. Each class represents an interest in the same portfolio of investments but with a different combination of sales charges, distribution and service (12b-1) fees, eligibility requirements and other features.
The Fund’s investment objective is to seek to provide long-term capital appreciation. The Fund seeks to achieve its investment objective by investing, under normal market conditions, at least 80% of its net assets (including investment borrowings, if any) in equity securities of U.S. listed companies with small market capitalizations (“Small-Cap Companies”) at the time of investment that Confluence Investment Management LLC (“Confluence” or the “Sub-Advisor”) believes have produced solid returns over extended periods of time. There can be no assurance that the Fund will achieve its investment objective. The Fund may not be appropriate for all investors.
2. Significant Accounting Policies
The Fund is considered an investment company and follows accounting and reporting guidance under Financial Accounting Standards Board (“FASB”) Accounting Standards Codification (“ASC”) Topic 946, “Financial Services-Investment Companies.” The following is a summary of significant accounting policies consistently followed by the Fund in the preparation of the financial statements. The preparation of the financial statements in accordance with accounting principles generally accepted in the United States of America (“U.S. GAAP”) requires management to make estimates and assumptions that affect the reported amounts and disclosures in the financial statements. Actual results could differ from those estimates.
A. Portfolio Valuation
The net asset value (“NAV”) of each class of shares of the Fund is determined daily as of the close of regular trading on the New York Stock Exchange (“NYSE”), normally 4:00 p.m. Eastern time, on each day the NYSE is open for trading. If the NYSE closes early on a valuation day, the NAV is determined as of that time. The NAV for each class is calculated by dividing the value of the Fund’s total assets attributable to such class (including accrued interest and dividends), less all liabilities attributable to such class (including accrued expenses, dividends declared but unpaid and any borrowings of the Fund), by the total number of shares of the class outstanding. Differences in NAV of each class of the Fund’s shares are generally expected to be due to the daily expense accruals of the specified distribution and service (12b-1) fees and transfer agency costs applicable to such class of shares and the resulting differential in the dividends that may be paid on each class of shares.
The Fund’s investments are valued daily at market value or, in the absence of market value with respect to any portfolio securities, at fair value. Market value prices represent last sale or official closing prices from a national or foreign exchange (i.e., a regulated market) and are primarily obtained from third-party pricing services. Fair value prices represent any prices not considered market value prices and are either obtained from a third-party pricing service or are determined by the Pricing Committee of the Fund’s investment advisor, First Trust Advisors L.P. (“First Trust” or the “Advisor”), in accordance with valuation procedures adopted by the Trust’s Board of Trustees, and in accordance with provisions of the 1940 Act. Investments valued by the Advisor’s Pricing Committee, if any, are footnoted as such in the footnotes to the Portfolio of Investments. The Fund’s investments are valued as follows:
Common stocks, real estate investment trusts (“REITs”) and other equity securities listed on any national or foreign exchange (excluding The Nasdaq Stock Market LLC (“Nasdaq”) and the London Stock Exchange Alternative Investment Market (“AIM”)) are valued at the last sale price on the exchange on which they are principally traded or, for Nasdaq and AIM securities, the official closing price. Securities traded on more than one securities exchange are valued at the last sale price or official closing price, as applicable, at the close of the securities exchange representing the principal market for such securities.
Securities traded in an over-the-counter market are fair valued at the mean of their most recent bid and asked price, if available, and otherwise at their closing bid price.
Certain securities may not be able to be priced by pre-established pricing methods. Such securities may be valued by the Trust’s Board of Trustees or its delegate, the Advisor’s Pricing Committee, at fair value. These securities generally include, but are not limited to, restricted securities (securities which may not be publicly sold without registration under the Securities Act of 1933, as amended) for which a third-party pricing service is unable to provide a market price; securities whose trading has been formally suspended; a security whose market or fair value price is not available from a pre-established pricing source; a security with respect to which an event has occurred that is likely to materially affect the value of the security after the market has closed but before the calculation of the Fund’s NAV or make it difficult or impossible to obtain a reliable market quotation; and a security whose price, as provided by the third-party pricing service, does not reflect the security’s fair value. As a general principle, the current fair value of a security would
Notes to Financial Statements (Continued)
First Trust/Confluence Small Cap Value Fund
October 31, 2018
appear to be the amount which the owner might reasonably expect to receive for the security upon its current sale. When fair value prices are used, generally they will differ from market quotations or official closing prices on the applicable exchanges. A variety of factors may be considered in determining the fair value of such securities, including, but not limited to, the following:
| 1) | the type of security; |
| 2) | the size of the holding; |
| 3) | the initial cost of the security; |
| 4) | transactions in comparable securities; |
| 5) | price quotes from dealers and/or third-party pricing services; |
| 6) | relationships among various securities; |
| 7) | information obtained by contacting the issuer, analysts, or the appropriate stock exchange; |
| 8) | an analysis of the issuer’s financial statements; and |
| 9) | the existence of merger proposals or tender offers that might affect the value of the security. |
The Fund is subject to fair value accounting standards that define fair value, establish the framework for measuring fair value and provide a three-level hierarchy for fair valuation based upon the inputs to the valuation as of the measurement date. The three levels of the fair value hierarchy are as follows:
| • | Level 1 – Level 1 inputs are quoted prices in active markets for identical investments. An active market is a market in which transactions for the investment occur with sufficient frequency and volume to provide pricing information on an ongoing basis. |
| • | Level 2 – Level 2 inputs are observable inputs, either directly or indirectly, and include the following: |
| o | Quoted prices for similar investments in active markets. |
| o | Quoted prices for identical or similar investments in markets that are non-active. A non-active market is a market where there are few transactions for the investment, the prices are not current, or price quotations vary substantially either over time or among market makers, or in which little information is released publicly. |
| o | Inputs other than quoted prices that are observable for the investment (for example, interest rates and yield curves observable at commonly quoted intervals, volatilities, prepayment speeds, loss severities, credit risks, and default rates). |
| o | Inputs that are derived principally from or corroborated by observable market data by correlation or other means. |
| • | Level 3 – Level 3 inputs are unobservable inputs. Unobservable inputs may reflect the reporting entity’s own assumptions about the assumptions that market participants would use in pricing the investment. |
The inputs or methodologies used for valuing investments are not necessarily an indication of the risk associated with investing in those investments. A summary of the inputs used to value the Fund’s investments as of October 31, 2018, is included with the Fund’s Portfolio of Investments.
B. Securities Transactions and Investment Income
Securities transactions are recorded as of the trade date. Realized gains and losses from securities transactions are recorded on the identified cost basis. Dividend income is recorded on the ex-dividend date. Interest income, if any, is recorded daily on the accrual basis, including the amortization of premiums and the accretion of discounts. Income is allocated on a pro rata basis to each class of shares.
The Fund may hold REITs. Distributions from such investments may be comprised of return of capital, capital gains and income. The actual character of amounts received during the year is not known until after the REIT’s fiscal year end. The Fund records the character of distributions received from REITs during the year based on estimates available. The characterization of distributions received by the Fund may be subsequently revised based on information received from the REITs after their tax reporting periods conclude.
C. Dividends and Distributions to Shareholders
The Fund will distribute to holders of its shares semi-annual dividends of all or a portion of its net income. Distributions of any net capital gains earned by the Fund will be distributed at least annually. Distributions will automatically be reinvested into additional Fund shares unless cash distributions are elected by the shareholder.
Distributions from net investment income and realized capital gains are determined in accordance with federal income tax regulations, which may differ from U.S. GAAP. Certain capital accounts in the financial statements are periodically adjusted for permanent differences in order to reflect their tax character. These permanent differences are primarily due to the varying treatment of income and
Notes to Financial Statements (Continued)
First Trust/Confluence Small Cap Value Fund
October 31, 2018
gain/loss on portfolio securities held by the Fund and have no impact on net assets or NAV per share. Temporary differences, which arise from recognizing certain items of income, expense and gain/loss in different periods for financial statement and tax purposes, will reverse at some point in the future. Permanent differences incurred during the fiscal year ended October 31, 2018, resulting in book and tax accounting differences, have been reclassified at year end to reflect an increase in accumulated net investment income (loss) of $116,201 and a decrease in accumulated net realized gain (loss) of $116,201. Accumulated distributable earnings (loss) consists of accumulated net investment income (loss), accumulated net realized gain (loss) on investments, and unrealized appreciation (depreciation) on investments. Net assets were not affected by this reclassification.
The tax character of distributions paid by the Fund during the fiscal years ended October 31, 2018 and 2017, was as follows:
| Distributions paid from: | 2018 | 2017 |
Ordinary income
| $247,923 | $38,034 |
Capital gains
| 722,764 | 102,419 |
Return of capital
| — | — |
As of October 31, 2018, the distributable earnings and net assets on a tax basis were as follows:
Undistributed ordinary income
| $400,889 |
Undistributed capital gains
| 2,110,333 |
Total undistributed earnings
| 2,511,222 |
Accumulated capital and other losses
| — |
Net unrealized appreciation (depreciation)
| 536,047 |
Total accumulated earnings (losses)
| 3,047,269 |
Other
| — |
Paid-in capital
| 18,568,539 |
Total net assets
| $21,615,808 |
D. Income Taxes
The Fund intends to continue to qualify as a regulated investment company by complying with the requirements under Subchapter M of the Internal Revenue Code of 1986, as amended, which includes distributing substantially all of its net investment income and net realized gains to shareholders. Accordingly, no provision has been made for federal and state income taxes. However, due to the timing and amount of distributions, the Fund may be subject to an excise tax of 4% of the amount by which approximately 98% of the Fund’s taxable income exceeds the distributions from such taxable income for the calendar year.
The Fund intends to utilize provisions of the federal income tax laws, which allow it to carry a realized capital loss forward indefinitely following the year of the loss and offset such loss against any future realized capital gains. The Fund is subject to certain limitations under U.S. tax rules on the use of capital loss carryforwards and net unrealized built-in losses. These limitations apply when there has been a 50% change in ownership. At October 31, 2018, the Fund had no non-expiring capital loss carryforward for federal income tax purposes.
The Fund is subject to accounting standards that establish a minimum threshold for recognizing, and a system for measuring, the benefits of a tax position taken or expected to be taken in a tax return. Taxable years ended 2015, 2016, 2017, and 2018 remain open to federal and state audit. As of October 31, 2018, management has evaluated the application of these standards to the Fund and has determined that no provision for income tax is required in the Fund’s financial statements for uncertain tax positions.
E. Expenses
The Fund will pay all expenses directly related to its operations. Expenses of the Fund are allocated on a pro rata basis to each class of shares, except for distribution and service (12b-1) fees and incremental transfer agency costs which are unique to each class of shares.
F. New Accounting Pronouncement
On August 28, 2018, the FASB issued Accounting Standards Update (“ASU”) 2018-13, “Disclosure Framework – Changes to the Disclosure Requirements for Fair Value Measurement,” which amends the fair value measurement disclosure requirements of ASC 820. The amendments of ASU 2018-13 include new, eliminated, and modified disclosure requirements of ASC 820. In addition, the amendments clarify that materiality is an appropriate consideration of entities when evaluating disclosure requirements. The ASU is effective for fiscal years beginning after December 15, 2019, including interim periods therein. Early adoption is permitted for any
Notes to Financial Statements (Continued)
First Trust/Confluence Small Cap Value Fund
October 31, 2018
eliminated or modified disclosures upon issuance of this ASU. The Fund has early adopted ASU 2018-13 for these financial statements, which did not result in a material impact.
3. Investment Advisory Fee, Affiliated Transactions and Other Fee Arrangements
First Trust, the investment advisor to the Fund, is a limited partnership with one limited partner, Grace Partners of DuPage L.P., and one general partner, The Charger Corporation. The Charger Corporation is an Illinois corporation controlled by James A. Bowen, Chief Executive Officer of First Trust. First Trust is responsible for the ongoing monitoring of the Fund’s investment portfolio, managing the Fund’s business affairs and providing certain administrative services necessary for the management of the Fund. For these investment management services, First Trust is entitled to a monthly fee calculated at an annual rate of 1.00% of the Fund’s average daily net assets. First Trust also provides fund reporting services to the Fund for a flat annual fee in the amount of $9,250.
Confluence serves as the Fund’s sub-advisor and manages the Fund’s portfolio subject to First Trust’s supervision. The Sub-Advisor receives a monthly sub-advisory fee calculated at an annual rate of 0.50% of the Fund’s average daily net assets that is paid by First Trust out of its investment advisory fee.
First Trust and Confluence have agreed to waive fees and/or reimburse Fund expenses to the extent necessary to prevent the total annual fund operating expenses (excluding 12b-1 distribution and service fees, interest expenses, taxes, fees incurred in acquiring and disposing of portfolio securities and extraordinary expenses) from exceeding 1.35% of average daily net assets of any class of shares of the Fund (the “Expense Cap”) until February 28, 2020 and then from exceeding 1.70% from March 1, 2020 to February 28, 2029 (the “Expense Cap Termination Date”). Expenses borne and fees waived by First Trust and Confluence are subject to recovery on a Fund class level, if applicable, by First Trust and Confluence for up to three years from the date the fee or expense was incurred, but no reimbursement payment will be made by the Fund at any time if it would result in the Fund’s expenses exceeding (i) the Expense Cap in place for the most recent fiscal year for which such expense limitation was in place; (ii) the Expense Cap in place at the time the fees were waived; or (iii) the current Expense Cap. Expense limitations may be terminated or modified prior to their expiration only with the approval of the Board of Trustees of the Trust. These amounts would be included in “Expenses previously waived or reimbursed” on the Statement of Operations. The advisory fee waiver and expense reimbursement for the fiscal year ended October 31, 2018 and the expenses borne by First Trust and Confluence subject to recovery were as follows:
| | | | | Expenses Subject to Recovery |
Advisory Fee
Waiver | | Expense
Reimbursement | | Year Ended
October 31, 2016 | | Year Ended
October 31, 2017 | | Year Ended
October 31, 2018 | | Total |
| $ 199,111 | | $ 19,074 | | $ 247,943 | | $ 262,436 | | $ 218,185 | | $ 728,564 |
Brown Brothers Harriman & Co. (“BBH”) serves as the Fund’s administrator, fund accountant and custodian in accordance with certain fee arrangements. As administrator and fund accountant, BBH is responsible for providing certain administrative and accounting services to the Fund, including maintaining the Fund’s books of account, records of the Fund’s securities transactions, and certain other books and records. As custodian, BBH is responsible for custody of the Fund’s assets.
BNY Mellon Investment Servicing (US) Inc. (“BNYM IS”) serves as the Fund’s transfer agent in accordance with certain fee arrangements. As transfer agent, BNYM IS is responsible for maintaining shareholder records for the Fund. BNYM IS is a subsidiary of The Bank of New York Mellon Corporation, a financial holding company.
Each Trustee who is not an officer or employee of First Trust, any sub-advisor or any of their affiliates (“Independent Trustees”) is paid a fixed annual retainer that is allocated equally among each fund in the First Trust Fund Complex. Each Independent Trustee is also paid an annual per fund fee that varies based on whether the fund is a closed-end or other actively managed fund, or is an index fund.
Additionally, the Lead Independent Trustee and the Chairmen of the Audit Committee, Nominating and Governance Committee and Valuation Committee are paid annual fees to serve in such capacities, with such compensation allocated pro rata among each fund in the First Trust Fund Complex based on net assets. Independent Trustees are reimbursed for travel and out-of-pocket expenses in connection with all meetings. The Lead Independent Trustee and Committee Chairmen rotate every three years. The officers and “Interested” Trustee receive no compensation from the Trust for acting in such capacities.
Notes to Financial Statements (Continued)
First Trust/Confluence Small Cap Value Fund
October 31, 2018
4. Capital Share Transactions
Capital transactions were as follows:
| | Year Ended
October 31, 2018 | | Year Ended
October 31, 2017 |
| | Shares | | Value | | Shares | | Value |
| Sales: | | | | | | | |
| Class A | 62,108 | | $ 2,190,325 | | 83,953 | | $ 2,640,636 |
| Class C | 34,840 | | 1,080,006 | | 27,393 | | 779,701 |
| Class I | 187,274 | | 6,695,100 | | 158,422 | | 5,070,531 |
| Total Sales | 284,222 | | $ 9,965,431 | | 269,768 | | $ 8,490,868 |
| Dividend Reinvestment: | | | | | | | |
| Class A | 8,807 | | $ 299,176 | | 1,525 | | $ 45,810 |
| Class C | 7,113 | | 219,210 | | 1,621 | | 44,739 |
| Class I | 11,385 | | 393,920 | | 1,086 | | 33,300 |
| Total Dividend Reinvestment | 27,305 | | $ 912,306 | | 4,232 | | $ 123,849 |
| Redemptions: | | | | | | | |
| Class A | (38,003) | | $ (1,336,253) | | (56,930) | | $ (1,779,700) |
| Class C | (49,530) | | (1,564,657) | | (29,546) | | (854,770) |
| Class I | (79,846) | | (2,853,904) | | (26,091) | | (859,876) |
| Total Redemptions | (167,379) | | $ (5,754,814) | | (112,567) | | $ (3,494,346) |
5. Purchases and Sales of Securities
The cost of purchases and proceeds from sales of securities, excluding short-term investments, for the fiscal year ended October 31, 2018, were $11,940,043 and $6,335,386, respectively.
6. Distribution and Service Plan
The Board of Trustees adopted a Distribution and Service Plan pursuant to Rule 12b-1 under the 1940 Act. In accordance with the Rule 12b-1 plan, the share classes of the Fund are authorized to pay an amount up to 0.25% and 1.00% of their average daily net assets each year for Class A and Class C, respectively, to reimburse First Trust Portfolios L.P. (“FTP”), the distributor of the Fund, for amounts expended to finance activities primarily intended to result in the sale of Fund shares or the provision of investor services. FTP may also use this amount to compensate securities dealers or other persons for providing distribution assistance, including broker-dealer and shareholder support and educational and promotional services. Class I shares have no 12b-1 fees.
7. Borrowings
The Trust, on behalf of the Fund, along with First Trust Exchange-Traded Fund III and First Trust Exchange-Traded Fund IV have a $360 million Credit Agreement with The Bank of Nova Scotia (“Scotia”) as administrative agent for a group of lenders. Prior to August 28, 2018 and March 7, 2018, the commitment amount was $320 million and $220 million, respectively. Scotia charges a commitment fee of 0.25% of the daily amount of the excess of the commitment amount over the outstanding principal balance of the loans. First Trust allocates the commitment fee and agency fee amongst the funds that have access to the credit line. To the extent that the Fund accesses the credit line, there would also be an interest fee charged. The Fund did not have any borrowings outstanding during the fiscal year ended October 31, 2018.
8. Indemnification
The Fund has a variety of indemnification obligations under contracts with its service providers. The Fund’s maximum exposure under these arrangements is unknown. However, the Fund has not had prior claims or losses pursuant to these contracts and expects the risk of loss to be remote.
Notes to Financial Statements (Continued)
First Trust/Confluence Small Cap Value Fund
October 31, 2018
9. Subsequent Events
Management has evaluated the impact of all subsequent events to the Fund through the date the financial statements were issued, and has determined that there were no subsequent events requiring recognition or disclosure in the financial statements that have not already been disclosed.
Report of Independent Registered Public Accounting Firm
To the Shareholders and the Board of Trustees of First Trust Series Fund:
Opinion on the Financial Statements and Financial Highlights
We have audited the accompanying statement of assets and liabilities, including the portfolio of investments, of First Trust/Confluence Small Cap Value Fund (the “Fund”), one of the funds constituting First Trust Series Fund, as of October 31, 2018, the related statement of operations for the year then ended, the statements of changes in net assets for each of the two years in the period then ended, the financial highlights for each of the five years in the period then ended, and the related notes. In our opinion, the financial statements and financial highlights present fairly, in all material respects, the financial position of the Fund as of October 31, 2018, the results of its operations for the year then ended, the changes in its net assets for each of the two years in the period then ended, and the financial highlights for each of the five years in the period then ended, in conformity with accounting principles generally accepted in the United States of America.
Basis for Opinion
These financial statements and financial highlights are the responsibility of the Fund’s management. Our responsibility is to express an opinion on the Fund’s financial statements and financial highlights based on our audits. We are a public accounting firm registered with the Public Company Accounting Oversight Board (United States) (PCAOB) and are required to be independent with respect to the Fund in accordance with the U.S. federal securities laws and the applicable rules and regulations of the Securities and Exchange Commission and the PCAOB.
We conducted our audits in accordance with the standards of the PCAOB. Those standards require that we plan and perform the audit to obtain reasonable assurance about whether the financial statements and financial highlights are free of material misstatement, whether due to error or fraud. The Fund is not required to have, nor were we engaged to perform, an audit of its internal control over financial reporting. As part of our audits we are required to obtain an understanding of internal control over financial reporting but not for the purpose of expressing an opinion on the effectiveness of the Fund’s internal control over financial reporting. Accordingly, we express no such opinion.
Our audits included performing procedures to assess the risks of material misstatement of the financial statements and financial highlights, whether due to error or fraud, and performing procedures that respond to those risks. Such procedures included examining, on a test basis, evidence regarding the amounts and disclosures in the financial statements and financial highlights. Our audits also included evaluating the accounting principles used and significant estimates made by management, as well as evaluating the overall presentation of the financial statements and financial highlights. Our procedures included confirmation of securities owned as of October 31, 2018, by correspondence with the custodian and brokers. We believe that our audits provide a reasonable basis for our opinion.
Chicago, Illinois
December 20, 2018
We have served as the auditor of one or more First Trust investment companies since 2001.
Additional Information
First Trust/Confluence Small Cap Value Fund
October 31, 2018 (Unaudited)
Proxy Voting Policies and Procedures
A description of the policies and procedures that the Trust uses to determine how to vote proxies and information on how the Fund voted proxies relating to portfolio securities during the most recent 12-month period ended June 30 is available (1) without charge, upon request, by calling (800) 988-5891; (2) on the Fund’s website at www.ftportfolios.com; and (3) on the Securities and Exchange Commission’s (“SEC”) website at www.sec.gov.
Portfolio Holdings
The Trust files its complete schedule of the Fund’s portfolio holdings with the SEC for the first and third quarters of each fiscal year on Form N-Q. The Trust’s Form N-Qs are available (1) by calling (800) 988-5891; (2) on the Fund’s website at www.ftportfolios.com; and (3) on the SEC’s website at www.sec.gov.
Beginning in April 2019, the Trust will cease to disclose the Fund’s holdings on Form N-Q and will file Form N-PORT with the SEC on a monthly basis. Part F of Form N-PORT, which contains the complete schedule of the Fund’s portfolio holdings, will be made available in the same manner as Form N-Q discussed above.
Federal Tax Information
The Fund hereby designates as qualified dividend income 46.5% of its ordinary income distributions (including short-term capital gains, if applicable) for the period ended October 31, 2018. 46.5% of the ordinary income distributions (including short-term capital gain, if applicable) made by the Fund during the period ended October 31, 2018, qualify for corporate dividends received deduction available to corporate shareholders.
For the fiscal year ended October 31, 2018, the amount of long-term capital gain distributions by the Fund was $722,764 which is taxable at the maximum rate of 20% for federal income tax purposes.
Risk Considerations
Risks are inherent in all investing. You should consider the Fund’s investment objective, risks, charges and expenses carefully before investing. You can download the Fund’s prospectus at www.ftportfolios.com or contact First Trust Portfolios L.P. at (800) 621-1675 to request a prospectus, which contains this and other information about the Fund. For additional information about the risks associated with investing in the Fund, please see the Fund’s statement of additional information, as well as other regulatory filings. Read these documents carefully before you invest.
BDC RISK. The Fund may invest in business development companies (“BDCs”) which may carry risks similar to those of a private equity or venture capital fund. BDCs are not redeemable at the option of the shareholder and they may trade in the market at a discount to their net asset value. The BDCs held by the Fund may employ the use of leverage to their portfolios through borrowings or the issuance of preferred stock. While leverage often serves to increase the yield of a BDC, this leverage also subjects a BDC to increased risks, including the likelihood of increased volatility and the possibility that a BDC’s common share income will fall if the dividend rate of the preferred shares or the interest rate on any borrowings rises.
CONCENTRATION RISK. A fund concentrated in one or more industries or sectors is likely to present more risks than a fund that is broadly diversified over several industries or sectors. Compared to the broad market, an individual industry or sector may be more strongly affected by changes in the economic climate, broad market shifts, moves in a particular dominant stock, or regulatory changes.
CYBER SECURITY RISK. As the use of Internet technology has become more prevalent in the course of business, the Fund has become more susceptible to potential operational risks through breaches in cyber security. A breach in cyber security refers to both intentional and unintentional events that may cause the Fund to lose proprietary information, suffer data corruption or lose operational capacity. Such events could cause the Fund to incur regulatory penalties, reputational damage, additional compliance costs associated with corrective measures and/or financial loss. Cyber security breaches may involve unauthorized access to the Fund’s digital information systems through “hacking” or malicious software coding, but may also result from outside attacks such as denial-of-service attacks through efforts to make network services unavailable to intended users. In addition, cyber security breaches of the Fund’s third-party service providers, such as its administrator, transfer agent, custodian, or sub-advisor, as applicable, or issuers in which the Fund invests, can also subject the Fund to many of the same risks associated with direct cyber security breaches. The Fund has established risk management systems designed to reduce the risks associated with cyber security. However, there is no guarantee that such efforts will succeed, especially because the Fund does not directly control the cyber security systems of issuers or third-party service providers.
Additional Information (Continued)
First Trust/Confluence Small Cap Value Fund
October 31, 2018 (Unaudited)
EQUITY SECURITIES RISK. Because the Fund invests in equity securities, the value of the Fund’s shares will fluctuate with changes in the value of these equity securities. Equity securities prices fluctuate for several reasons, including changes in investors’ perceptions of the financial condition of an issuer or the general condition of the relevant stock market, such as market volatility, or when political or economic events affecting the issuers occur. In addition, common stock prices may be particularly sensitive to rising interest rates, as the cost of capital rises and borrowing costs increase.
INDUSTRIALS AND PRODUCER DURABLES COMPANIES RISK. The Fund invests in the securities of industrials and producer durables companies, which convert unfinished goods into finished durables used to manufacture other goods or provide services. Some industrials companies are involved in electrical equipment and components, industrial products, manufactured housing and telecommunications equipment. General risks of industrials companies include the general state of the economy, intense competition, consolidation, domestic and international politics, excess capacity and consumer demand and spending trends. In addition, they may also be significantly affected by overall capital spending levels, economic cycles, technical obsolescence, delays in modernization, labor relations, government regulations and e-commerce initiatives.
INVESTMENT COMPANIES RISK. If the Fund invests in investment companies, Fund shareholders bear both their proportionate share of Fund expenses and, indirectly, the expenses of the investment companies. Also, the investment companies are subject to the risks of the underlying securities that they hold. In addition, the Fund will incur brokerage costs when purchasing and selling shares of ETFs and closed-end investment companies. Closed-end investment companies may be leveraged, in which case the value and/or yield of their shares will tend to be more volatile than shares of unleveraged funds. In addition, for index-based ETFs, the performance of an ETF may diverge from the performance of such index (commonly known as tracking error). Moreover, shares of closed-end investment companies and ETFs may be sold at a discount from their net asset value.
MARKET CAPITALIZATION RISK. The Fund normally invests at least 80% of its assets in Small-Cap Companies. Because the market capitalization is measured at the time of its initial purchase, the Fund will not be forced to sell a stock because the stock has exceeded or fallen below the market capitalization range. Because of market movement, there can be no assurance that the securities held by the Fund will stay within the given market capitalization range. As a result, the Fund may be exposed to additional risk or investors may not be given the opportunity to invest fully in a certain market capitalization range.
MARKET RISK. Market risk is the risk that a particular security owned or shares of the Fund in general may fall in value. Securities are subject to market fluctuations caused by such factors as economic, political, regulatory or market developments, changes in interest rates and perceived trends in securities prices. Shares of the Fund could decline in value or underperform other investments.
REAL ESTATE INVESTMENT RISK. The Fund invests in companies in the real estate industry, including real estate investment trusts (“REITs”). Therefore, the Fund is subject to the risks associated with investing in real estate, which may include, but are not limited to, fluctuations in the value of underlying properties; defaults by borrowers or tenants; market saturation; changes in general and local economic conditions; decreases in market rates for rents; increases in competition, property taxes, capital expenditures or operating expenses; and other economic, political or regulatory occurrences affecting companies in the real estate industry.
REIT INVESTMENT RISK. Investing in REITs involves certain other risks related to their structure and focus, which include, but are not limited to, dependency upon management skills, limited diversification, the risks of locating and managing financing for projects, heavy cash flow dependency, possible default by borrowers, the costs and potential losses of self-liquidation of one or more holdings, the risk of a possible lack of mortgage funds and associated interest rate risks, overbuilding, property vacancies, increases in property taxes and operating expenses, changes in zoning laws, losses due to environmental damages, changes in neighborhood values and appeal to purchasers, the possibility of failing to maintain exemptions from registration under the Investment Company Act of 1940, as amended and, in many cases, relatively small market capitalization, which may result in less market liquidity and greater price volatility. REITs are also subject to the risk that the real estate market may experience an economic downturn generally, which may have a material effect on the real estate in which the REITs invest and their underlying portfolio securities.
SMALL CAP RISK. The Fund invests in Small-Cap Companies. Such companies may be more vulnerable to adverse general market or economic developments, and their securities may be less liquid and may experience greater price volatility than larger, more established companies as a result of several factors, including limited trading volumes, products or financial resources, management inexperience and dependence on a few key people, and less publicly available information. Accordingly, such companies are generally subject to greater market risk than larger, more established companies. The market movements of equity securities issued by issuers with smaller capitalizations may be more abrupt or erratic than the market movements of equity securities of larger, more established companies or the stock market in general. Historically, smaller capitalization companies have sometimes gone through extended periods when they did not perform as well as larger companies.
Additional Information (Continued)
First Trust/Confluence Small Cap Value Fund
October 31, 2018 (Unaudited)
SMALL FUND RISK. The Fund currently has fewer assets than larger funds, and like other smaller funds, large inflows and outflows may impact the Fund’s market exposure for limited periods of time. This impact may be positive or negative, depending on the direction of market movement during the period affected.
VALUE INVESTING RISK. The Fund focuses its investments on securities that the portfolio managers believe are undervalued or inexpensive relative to other investments. These types of securities may present risks in addition to the general risks associated with investing in them. These securities generally are selected on the basis of an issuer’s business and economic fundamentals or the securities’ current and projected credit profiles, relative to current market price. Such securities are subject to the risk of misestimating certain fundamental factors. Disciplined adherence to a “value” investment mandate during periods in which that style is “out of favor” can result in significant underperformance relative to overall market indices and other managed investment vehicles that pursue growth style investments and/or flexible style mandates.
Advisory and Sub-Advisory Agreements
Board Considerations Regarding Continuation of Investment Management and Investment Sub-Advisory Agreements
The Board of Trustees of First Trust Series Fund (the “Trust”), including the Independent Trustees, unanimously approved the continuation of the Investment Management Agreement (the “Advisory Agreement”) between the Trust, on behalf of the First Trust/Confluence Small Cap Value Fund (the “Fund”), and First Trust Advisors L.P. (the “Advisor” or “First Trust”) and the Investment Sub-Advisory Agreement (the “Sub-Advisory Agreement” and together with the Advisory Agreement, the “Agreements”) among the Trust, on behalf of the Fund, the Advisor and Confluence Investment Management LLC (the “Sub-Advisor”) for a one-year period ending June 30, 2019 at a meeting held on June 11, 2018. The Board determined that the continuation of the Agreements is in the best interests of the Fund in light of the nature, extent and quality of the services provided and such other matters as the Board considered to be relevant in the exercise of its reasonable business judgment.
To reach this determination, the Board considered its duties under the Investment Company Act of 1940, as amended (the “1940 Act”), as well as under the general principles of state law, in reviewing and approving advisory contracts; the requirements of the 1940 Act in such matters; the fiduciary duty of investment advisors with respect to advisory agreements and compensation; the standards used by courts in determining whether investment company boards have fulfilled their duties; and the factors to be considered by the Board in voting on such agreements. At meetings held on April 23, 2018 and June 11, 2018, the Board, including the Independent Trustees, reviewed materials provided by the Advisor and the Sub-Advisor responding to requests for information from counsel to the Independent Trustees that, among other things, outlined the services provided by the Advisor and the Sub-Advisor to the Fund (including the relevant personnel responsible for these services and their experience); the advisory fee rate payable by the Fund and the sub-advisory fee rate as compared to fees charged to a peer group of funds compiled by Management Practice, Inc. (“MPI”), an independent source (the “Peer Group”), and as compared to fees charged to other clients of the Advisor and the Sub-Advisor; expenses of the Fund as compared to expense ratios of the funds in the Peer Group; performance information for the Fund; the nature of expenses incurred in providing services to the Fund and the potential for economies of scale, if any; financial data on the Advisor and the Sub-Advisor; any fall-out benefits to the Advisor and its affiliate, First Trust Portfolios L.P. (“FTP”), and the Sub-Advisor; and information on the Advisor’s and the Sub-Advisor’s compliance programs. The Board reviewed initial materials with the Advisor at the meeting held on April 23, 2018, prior to which the Independent Trustees and their counsel met separately to discuss the information provided by the Advisor and the Sub-Advisor. Following the April meeting, independent legal counsel on behalf of the Independent Trustees requested certain clarifications and supplements to the materials provided, and the information provided in response to those requests was considered at an executive session of the Independent Trustees and independent legal counsel held prior to the June 11, 2018 meeting, as well as at the meeting held that day. The Board applied its business judgment to determine whether the arrangements between the Trust and the Advisor and among the Trust, the Advisor and the Sub-Advisor continue to be reasonable business arrangements from the Fund’s perspective. The Board determined that, given the totality of the information provided with respect to the Agreements, the Board had received sufficient information to renew the Agreements. The Board considered that shareholders chose to invest or remain invested in the Fund knowing that the Advisor and the Sub-Advisor manage the Fund and knowing the Fund’s advisory fee.
In reviewing the Agreements, the Board considered the nature, extent and quality of the services provided by the Advisor and the Sub-Advisor under the Agreements. With respect to the Advisory Agreement, the Board considered that the Advisor is responsible for the overall management and administration of the Trust and the Fund and reviewed all of the services provided by the Advisor to the Fund, including the oversight of the Sub-Advisor, as well as the background and experience of the persons responsible for such services. The Board noted that the Advisor oversees the Sub-Advisor’s day-to-day management of the Fund’s investments, including portfolio risk monitoring and performance review. In reviewing the services provided, the Board noted the compliance program that had been developed by the Advisor and considered that it includes a robust program for monitoring the Advisor’s, the Sub-Advisor’s and the Fund’s compliance with the 1940 Act, as well as the Fund’s compliance with its investment objective, policies and restrictions. The Board also considered a report from the Advisor with respect to its risk management functions related to the operation of the
Additional Information (Continued)
First Trust/Confluence Small Cap Value Fund
October 31, 2018 (Unaudited)
Fund. Finally, as part of the Board’s consideration of the Advisor’s services, the Advisor, in its written materials and at the April 23, 2018 meeting, described to the Board the scope of its ongoing investment in additional infrastructure and personnel to maintain and improve the quality of services provided to the Fund and the other funds in the First Trust Fund Complex. With respect to the Sub-Advisory Agreement, the Board reviewed the materials provided by the Sub-Advisor and considered the services that the Sub-Advisor provides to the Fund, including the Sub-Advisor’s day-to-day management of the Fund’s investments. In considering the Sub-Advisor’s management of the Fund, the Board noted the background and experience of the Sub-Advisor’s portfolio management team and the Board’s prior meetings with members of the portfolio management team. In light of the information presented and the considerations made, the Board concluded that the nature, extent and quality of the services provided to the Trust and the Fund by the Advisor and the Sub-Advisor under the Agreements have been and are expected to remain satisfactory and that the Sub-Advisor, under the oversight of the Advisor, has managed the Fund consistent with its investment objective, policies and restrictions.
The Board considered the advisory and sub-advisory fee rates payable under the Agreements for the services provided. The Board noted that the sub-advisory fee is paid by the Advisor from its advisory fee. The Board considered that the Advisor and Sub-Advisor agreed to extend the current expense caps for each share class through February 29, 2020 and agreed to keep the long-term expense cap in place from March 1, 2020 through February 28, 2029. The Board noted that fees waived or expenses borne by the Advisor and Sub-Advisor are subject to reimbursement by the Fund for up to three years from the date the expense was incurred or fees were waived, but no reimbursement payment would be made by the Fund if it would result in the Fund exceeding an expense ratio equal to the expense cap in place at the time of the reimbursement or at the time the expenses were borne or the fees were waived by the Advisor and Sub-Advisor. The Board received and reviewed information showing the advisory fee rates and expense ratios of the peer funds in the Peer Group, as well as advisory and unitary fee rates charged by the Advisor and the Sub-Advisor to other fund and non-fund clients, as applicable. With respect to the Peer Group, the Board noted its prior discussions with the Advisor and MPI regarding the assembly of the Peer Group and, at the April 23, 2018 meeting, discussed with the Advisor limitations in creating a relevant peer group for the Fund, including that most of the peer funds do not employ an unaffiliated advisor/sub-advisor management structure. Based on the information provided, the Board noted that the advisory fee rate payable by the Fund was above the median advisory fee of the peer funds in the Peer Group. The Board noted that the Fund’s total (net) expense ratio (Class A shares) was above the median of the Peer Group. With respect to fees charged to other clients, the Board considered differences between the Fund and other clients that limited their comparability. In considering the advisory fee rate overall, the Board also considered the Advisor’s statement that it seeks to meet investor needs through innovative and value-added investment solutions and the Advisor’s description of its long-term commitment to the Fund.
The Board considered performance information for the Fund. The Board noted the process it has established for monitoring the Fund’s performance and portfolio risk on an ongoing basis, which includes quarterly performance reporting from the Advisor and Sub-Advisor for the Fund. The Board determined that this process continues to be effective for reviewing the Fund’s performance. The Board received and reviewed information comparing the Fund’s performance for periods ended December 31, 2017 to the performance of the peer funds in the Peer Group and to two benchmark indexes. Based on the information provided, the Board noted that the Fund (Class A shares) outperformed the Peer Group average and both benchmark indexes for the one-and three-year periods ended December 31, 2017, and outperformed the Peer Group average and one of the benchmark indexes, but underperformed the other benchmark index, for the five-year period ended December 31, 2017.
On the basis of all the information provided on the fees, expenses and performance of the Fund and the ongoing oversight by the Board, the Board concluded that the advisory and sub-advisory fees for the Fund continue to be reasonable and appropriate in light of the nature, extent and quality of the services provided by the Advisor and the Sub-Advisor to the Fund under the Agreements.
The Board considered information and discussed with the Advisor whether there were any economies of scale in connection with providing advisory services to the Fund and noted the Advisor’s statement that it believes its expenses will likely increase over the next twelve months as the Advisor continues to make investments in infrastructure and personnel. The Board considered the revenues and allocated costs (including the allocation methodology) of the Advisor in serving as investment advisor to the Fund for the twelve months ended December 31, 2017 and the estimated profitability level for the Fund calculated by the Advisor based on such data, as well as complex-wide and product-line profitability data, for the same period. The Board noted the inherent limitations in the profitability analysis and concluded that, based on the information provided, the Advisor’s profitability level for the Fund was not unreasonable. In addition, the Board considered fall-out benefits described by the Advisor that may be realized from its relationship with the Fund. The Board considered that the Advisor had identified as a fall out benefit to the Advisor and FTP their exposure to investors and brokers who, absent their exposure to the Fund, may have had no dealings with the Advisor or FTP. The Board noted that in addition to the advisory fees paid by the Fund, FTP is compensated for services provided to the Fund through 12b-1 distribution and service fees and that First Trust receives compensation from the Fund for providing fund reporting services pursuant to a separate Fund Reporting Services Agreement. The Board concluded that the character and amount of potential fall-out benefits to the Advisor were not unreasonable.
Additional Information (Continued)
First Trust/Confluence Small Cap Value Fund
October 31, 2018 (Unaudited)
The Board considered that many of the Sub Advisor’s costs are fixed, allowing for economies of scale with regard to certain costs. The Board did not review the profitability of the Sub-Advisor with respect to the Fund. The Board noted that the Advisor pays the Sub-Advisor from its advisory fee and its understanding that the Fund’s sub-advisory fee rate was the product of an arm’s length negotiation. The Board concluded that the profitability analysis for the Advisor was more relevant. The Board considered fall-out benefits that may be realized by the Sub-Advisor and one of its affiliates from their relationship with the Fund, including that the Sub-Advisor may enter into soft dollar and commission sharing arrangements, and considered a summary of such arrangements. The Board noted certain additional fall-out benefits identified by the Sub-Advisor deriving from the exposure provided by its relationship with Fund shareholders and the Advisor. The Board concluded that the character and amount of potential fall-out benefits to the Sub-Advisor were not unreasonable.
Based on all of the information considered and the conclusions reached, the Board, including the Independent Trustees, unanimously determined that the terms of the Agreements continue to be fair and reasonable and that the continuation of the Agreements is in the best interests of the Fund. No single factor was determinative in the Board’s analysis.
Board of Trustees and Officers
First Trust/Confluence Small Cap Value Fund
October 31, 2018 (Unaudited)
The following tables identify the Trustees and Officers of the Trust. Unless otherwise indicated, the address of all persons is 120 E. Liberty Drive, Suite 400, Wheaton, IL 60187.
The Trust’s statement of additional information includes additional information about the Trustees and is available, without charge, upon request, by calling (800) 988-5891.
| Name, Year of Birth and Position with the Trust | Term of Office and Year First Elected or Appointed | Principal Occupations
During Past 5 Years | Number of Portfolios in the First Trust Fund Complex Overseen by Trustee | Other Trusteeships or Directorships Held by Trustee During Past 5 Years |
| INDEPENDENT TRUSTEES |
Richard E. Erickson, Trustee
(1951) | • Indefinite Term
• Since Trust Inception | Physician; Officer, Wheaton Orthopedics; Limited Partner, Gundersen Real Estate Limited Partnership (June 1992 to December 2016); Member, Sportsmed LLC (April 2007 to November 2015) | 159 | None |
Thomas R. Kadlec, Trustee
(1957) | • Indefinite Term
• Since Trust Inception | President, ADM Investor Services, Inc. (Futures Commission Merchant) | 159 | Director of ADM Investor Services, Inc., ADM Investor Services International, Futures Industry Association, and National Futures Association |
Robert F. Keith, Trustee
(1956) | • Indefinite Term
• Since Trust Inception | President, Hibs Enterprises (Financial and Management Consulting) | 159 | Director of Trust Company of Illinois |
Niel B. Nielson, Trustee
(1954) | • Indefinite Term
• Since Trust Inception | Senior Advisor (August 2018 to Present), Managing Director and Chief Operating Officer (January 2015 to August 2018), Pelita Harapan Educational Foundation (Educational Products and Services); President and Chief Executive Officer (June 2012 to September 2014), Servant Interactive LLC (Educational Products and Services); President and Chief Executive Officer (June 2012 to September 2014), Dew Learning LLC (Educational Products and Services) | 159 | Director of Covenant Transport, Inc. (May 2003 to May 2014) |
| INTERESTED TRUSTEE |
James A. Bowen(1), Trustee and
Chairman of the Board
(1955) | • Indefinite Term
• Since Trust Inception | Chief Executive Officer, First Trust Advisors L.P. and First Trust Portfolios L.P.; Chairman of the Board of Directors, BondWave LLC (Software Development Company) and Stonebridge Advisors LLC (Investment Advisor) | 159 | None |
| (1) | Mr. Bowen is deemed an “interested person” of the Trust due to his position as CEO of First Trust Advisors L.P., investment advisor of the Trust. |
Board of Trustees and Officers (Continued)
First Trust/Confluence Small Cap Value Fund
October 31, 2018 (Unaudited)
| Name and Year of Birth | Position and Offices with Trust | Term of Office and Length of Service | Principal Occupations
During Past 5 Years |
| OFFICERS(2) |
James M. Dykas
(1966) | President and Chief Executive Officer | • Indefinite Term
• Since January 2016 | Managing Director and Chief Financial Officer (January 2016 to Present), Controller (January 2011 to January 2016), Senior Vice President (April 2007 to January 2016), First Trust Advisors L.P. and First Trust Portfolios L.P.; Chief Financial Officer (January 2016 to Present), BondWave LLC (Software Development Company) and Stonebridge Advisors LLC (Investment Advisor) |
Donald P. Swade
(1972) | Treasurer, Chief Financial Officer and Chief Accounting Officer | • Indefinite Term
• Since January 2016 | Senior Vice President (July 2016 to Present), Vice President (April 2012 to July 2016), First Trust Advisors L.P. and First Trust Portfolios L.P. |
W. Scott Jardine
(1960) | Secretary and Chief Legal Officer | • Indefinite Term
• Since Trust Inception | General Counsel, First Trust Advisors L.P. and First Trust Portfolios L.P.; Secretary and General Counsel, BondWave LLC; Secretary, Stonebridge Advisors LLC |
Daniel J. Lindquist
(1970) | Vice President | • Indefinite Term
• Since Trust Inception | Managing Director, First Trust Advisors L.P. and First Trust Portfolios L.P. |
Kristi A. Maher
(1966) | Chief Compliance Officer and Assistant Secretary | • Indefinite Term
• Chief Compliance Officer Since January 2011 • Assistant Secretary Since Trust Inception | Deputy General Counsel, First Trust Advisors L.P. and First Trust Portfolios L.P. |
| (2) | The term “officer” means the president, vice president, secretary, treasurer, controller or any other officer who performs a policy making function. |
Privacy Policy
First Trust/Confluence Small Cap Value Fund
October 31, 2018 (Unaudited)
Privacy Policy
First Trust values our relationship with you and considers your privacy an important priority in maintaining that relationship. We are committed to protecting the security and confidentiality of your personal information.
Sources of Information
We collect nonpublic personal information about you from the following sources:
| • | Information we receive from you and your broker-dealer, investment advisor or financial representative through interviews, applications, agreements or other forms; |
| • | Information about your transactions with us, our affiliates or others; |
| • | Information we receive from your inquiries by mail, e-mail or telephone; and |
| • | Information we collect on our website through the use of “cookies”. For example, we may identify the pages on our website that your browser requests or visits. |
Information Collected
The type of data we collect may include your name, address, social security number, age, financial status, assets, income, tax information, retirement and estate plan information, transaction history, account balance, payment history, investment objectives, marital status, family relationships and other personal information.
Disclosure of Information
We do not disclose any nonpublic personal information about our customers or former customers to anyone, except as permitted by law. In addition to using this information to verify your identity (as required under law), the permitted uses may also include the disclosure of such information to unaffiliated companies for the following reasons:
| • | In order to provide you with products and services and to effect transactions that you request or authorize, we may disclose your personal information as described above to unaffiliated financial service providers and other companies that perform administrative or other services on our behalf, such as transfer agents, custodians and trustees, or that assist us in the distribution of investor materials such as trustees, banks, financial representatives, proxy services, solicitors and printers. |
| • | We may release information we have about you if you direct us to do so, if we are compelled by law to do so, or in other legally limited circumstances (for example to protect your account from fraud). |
In addition, in order to alert you to our other financial products and services, we may share your personal information within First Trust.
Use of Web Analytics
We currently use third party analytics tools, Google Analytics and AddThis, to gather information for purposes of improving First Trust’s website and marketing our products and services to you. These tools employ cookies, which are small pieces of text stored in a file by your web browser and sent to websites that you visit, to collect information, track website usage and viewing trends such as the number of hits, pages visited, videos and PDFs viewed and the length of user sessions in order to evaluate website performance and enhance navigation of the website. We may also collect other anonymous information, which is generally limited to technical and web navigation information such as the IP address of your device, internet browser type and operating system for purposes of analyzing the data to make First Trust’s website better and more useful to our users. The information collected does not include any personal identifiable information such as your name, address, phone number or email address unless you provide that information through the website for us to contact you in order to answer your questions or respond to your requests. To find out how to opt-out of these services click on: Google Analytics and AddThis.
Confidentiality and Security
With regard to our internal security procedures, First Trust restricts access to your nonpublic personal information to those First Trust employees who need to know that information to provide products or services to you. We maintain physical, electronic and procedural safeguards to protect your nonpublic personal information.
Policy Updates and Inquiries
As required by federal law, we will notify you of our privacy policy annually. We reserve the right to modify this policy at any time, however, if we do change it, we will tell you promptly. For questions about our policy, or for additional copies of this notice, please go to www.ftportfolios.com, or contact us at 1-800-621-1675 (First Trust Portfolios) or 1-800-222-6822 (First Trust Advisors).
May 2017
This page intentionally left blank
This page intentionally left blank
INVESTMENT ADVISOR
First Trust Advisors L.P.
120 E. Liberty Drive, Suite 400
Wheaton, IL 60187
INVESTMENT SUB-ADVISOR
Confluence Investment Management LLC
20 Allen Avenue, Suite 300
Saint Louis, MO 63119
ADMINISTRATOR,
FUND ACCOUNTANT &
CUSTODIAN
Brown Brothers Harriman & Co.
50 Post Office Square
Boston, MA 02110
TRANSFER AGENT
BNY Mellon Investment Servicing (US) Inc.
301 Bellevue Parkway
Wilmington, DE 19809
INDEPENDENT REGISTERED
PUBLIC ACCOUNTING FIRM
Deloitte & Touche LLP
111 S. Wacker Drive
Chicago, IL 60606
LEGAL COUNSEL
Chapman and Cutler LLP
111 W. Monroe Street
Chicago, IL 60603

First Trust Short Duration
High Income Fund
Annual Report
For the Year Ended
October 31, 2018
First Trust Short Duration High Income Fund
Annual Report
October 31, 2018
Caution Regarding Forward-Looking Statements
This report contains certain forward-looking statements within the meaning of the Securities Act of 1933, as amended, and the Securities Exchange Act of 1934, as amended. Forward-looking statements include statements regarding the goals, beliefs, plans or current expectations of First Trust Advisors L.P. (“First Trust” or the “Advisor”) and its representatives, taking into account the information currently available to them. Forward-looking statements include all statements that do not relate solely to current or historical fact. For example, forward-looking statements include the use of words such as “anticipate,” “estimate,” “intend,” “expect,” “believe,” “plan,” “may,” “should,” “would” or other words that convey uncertainty of future events or outcomes.
Forward-looking statements involve known and unknown risks, uncertainties and other factors that may cause the actual results, performance or achievements of First Trust Short Duration High Income Fund (the “Fund”) to be materially different from any future results, performance or achievements expressed or implied by the forward-looking statements. When evaluating the information included in this report, you are cautioned not to place undue reliance on these forward-looking statements, which reflect the judgment of the Advisor and its representatives only as of the date hereof. We undertake no obligation to publicly revise or update these forward-looking statements to reflect events and circumstances that arise after the date hereof.
Performance and Risk Disclosure
There is no assurance that the Fund will achieve its investment objectives. The Fund is subject to market risk, which is the possibility that the market values of securities owned by the Fund will decline and that the value of the Fund shares may therefore be less than what you paid for them. Accordingly, you can lose money by investing in the Fund. See “Risk Considerations” in the Additional Information section of this report for a discussion of certain other risks of investing in the Fund.
Performance data quoted represents past performance, which is no guarantee of future results, and current performance may be lower or higher than the figures shown. For the most recent month-end performance figures, please visit www.ftportfolios.com or speak with your financial advisor. Investment returns and net asset value will fluctuate and Fund shares, when sold, may be worth more or less than their original cost.
The Advisor may also periodically provide additional information on Fund performance on the Fund’s web page at www.ftportfolios.com.
How to Read This Report
This report contains information that may help you evaluate your investment in the Fund. It includes details about the Fund and presents data and analysis that provide insight into the Fund’s performance and investment approach.
By reading the portfolio commentary by the portfolio management team of the Fund, you may obtain an understanding of how the market environment affected the Fund’s performance. The statistical information that follows may help you understand the Fund’s performance compared to that of relevant market benchmarks.
It is important to keep in mind that the opinions expressed by personnel of the Advisor are just that: informed opinions. They should not be considered to be promises or advice. The opinions, like the statistics, cover the period through the date on the cover of this report. The material risks of investing in the Fund are spelled out in the prospectus, the statement of additional information, and other Fund regulatory filings.
First Trust Short Duration High Income Fund
Annual Letter from the Chairman and CEO
October 31, 2018
Dear Shareholders,
First Trust is pleased to provide you with the annual report for the First Trust Short Duration High Income Fund (the “Fund”), which contains detailed information about the Fund for the twelve months ended October 31, 2018, including a market overview and a performance analysis. We encourage you to read this report carefully and discuss it with your financial advisor.
As I mentioned in my April 2018 letter, 2017 was a very strong year for U.S. and global markets. Investors were rewarded with rising markets and very little volatility. As 2018 began, investors were hoping for another strong year in the markets. For the entire first quarter, however, increased market volatility was the norm for U.S. and global markets. The markets continued their volatility throughout the second quarter. During April and May, the Dow Jones Industrial Average (“DJIA”) closed out each month slightly down, but ended both June and July slightly up. August was a strong month for stocks, and the DJIA finished August just under its previous high in January of 2018. At the close of the third quarter in September, the markets had moved higher into positive territory. In fact, all three major U.S. indices (the Nasdaq Composite Index, the DJIA and the S& P 500® Index) hit record levels during the third quarter. In October, markets were again very volatile, surprising analysts and investors alike. Both global and U.S. markets fell on fears of slowing growth, trade wars and higher interest rates. The DJIA was down 5% for October and the MSCI EAFE Index, an index of stocks in 21 developed markets (excluding the U.S. and Canada), was down 9% for the same period.
Based on continued strong job growth and the economic outlook in the U.S., the Federal Reserve (the “Fed”) raised interest rates in March, June and September. At their September meeting, the Fed also indicated the possibility of one more rate hike in 2018 as well as three more rate hikes in 2019.
Trade tensions have had an impact on markets around the world and could continue to do so in the future. However, our economists believe that the long-term impact of U.S. tariffs will be to encourage countries to come back to the table and talk about more equal trade. Despite market volatility, we continue to believe that the combination of low interest rates, low inflation and strong corporate earnings still point to a positive economic environment and further growth, though we understand that past performance can never guarantee future performance.
We continue to believe that you should invest for the long term and be prepared for market movements, which can happen at any time. You can do this by keeping current on your portfolio and by speaking regularly with your investment professional. Markets go up and they also go down, but savvy investors are prepared for either through careful attention to investment goals.
Thank you for giving First Trust the opportunity to be a part of your financial plan. We value our relationship with you and will report on the Fund again in six months.
Sincerely,
James A. Bowen
Chairman of the Board of Trustees
Chief Executive Officer of First Trust Advisors L.P.
First Trust Short Duration High Income Fund
“AT A GLANCE”
As of October 31, 2018 (Unaudited)
| Fund Statistics | |
| First Trust Short Duration High Income Fund | Net Asset
Value (NAV) |
| Class A (FDHAX) | $19.62 |
| Class C (FDHCX) | $19.60 |
| Class I (FDHIX) | $19.63 |
| Credit Quality(1) | % of Senior
Loans and Other
Debt Securities(2) |
| BBB+ | 0.4% |
| BBB- | 6.9 |
| BB+ | 5.4 |
| BB | 7.8 |
| BB- | 15.5 |
| B+ | 23.2 |
| B | 20.6 |
| B- | 13.3 |
| CCC+ | 5.0 |
| CCC | 1.5 |
| D | 0.4 |
| Not Rated | 0.0* |
| Total | 100.0% |
| * | Amount is less than 0.1%. |
| Top 10 Issuers | % of Senior
Loans and Other
Securities(2) |
| Bausch Health Companies, Inc. (Valeant) | 3.7% |
| Vistra Operations Company LLC (TEX/TXU) | 2.6% |
| Tenet Healthcare Corp. | 2.4% |
| Stars Group Holdings B.V. (Amaya) | 2.3% |
| ClubCorp Club Operations, Inc. | 2.1% |
| Caesars Resort Collection, LLC | 2.0% |
| Endo LLC | 1.8% |
| DJO Finance LLC (ReAble Therapeutics Finance LLC) | 1.8% |
| Parexel International Corp. | 1.8% |
| Reynolds Group Holdings, Inc. | 1.7% |
| Total | 22.2% |
| Industry Classification | % of Senior
Loans and Other
Securities(2) |
| Health Care Providers & Services | 14.0% |
| Hotels, Restaurants & Leisure | 13.3 |
| Software | 11.1 |
| Pharmaceuticals | 8.8 |
| Media | 5.5 |
| Life Sciences Tools & Services | 4.5 |
| Diversified Financial Services | 3.7 |
| Insurance | 3.2 |
| Electric Utilities | 2.9 |
| Professional Services | 2.3 |
| Auto Components | 2.1 |
| Containers & Packaging | 2.1 |
| Food & Staples Retailing | 2.1 |
| Commercial Services & Supplies | 1.9 |
| Health Care Equipment & Supplies | 1.9 |
| Building Products | 1.8 |
| Diversified Consumer Services | 1.6 |
| Diversified Telecommunication Services | 1.5 |
| Technology Hardware, Storage & Peripherals | 1.3 |
| Industrial Conglomerates | 1.2 |
| Health Care Technology | 1.2 |
| Wireless Telecommunication Services | 1.1 |
| Oil, Gas & Consumable Fuels | 1.0 |
| Capital Markets | 1.0 |
| Entertainment | 1.0 |
| Household Products | 1.0 |
| Food Products | 0.9 |
| Real Estate Management & Development | 0.8 |
| Chemicals | 0.7 |
| Metals & Mining | 0.7 |
| Aerospace & Defense | 0.6 |
| Specialty Retail | 0.6 |
| Equity Real Estate Investment Trusts | 0.5 |
| Household Durables | 0.5 |
| Automobiles | 0.4 |
| Semiconductors & Semiconductor Equipment | 0.4 |
| Machinery | 0.3 |
| Construction & Engineering | 0.3 |
| Trading Companies & Distributors | 0.1 |
| Personal Products | 0.1 |
| Energy Equipment & Services | 0.0* |
| Consumer Finance | 0.0* |
| Total | 100.0% |
| * | Amount is less than 0.1%. |
Dividend
Distributions | A Shares | C Shares | I Shares |
| Current Monthly Distribution per Share(3) | $0.0709 | $0.0585 | $0.0750 |
| Current Distribution Rate on NAV(4) | 4.34% | 3.58% | 4.58% |
| (1) | The ratings are by Standard & Poor’s. A credit rating is an assessment provided by a nationally recognized statistical rating organization (NRSRO) of the creditworthiness of an issuer with respect to its debt obligations. Ratings are measured on a scale that generally ranges from AAA (highest) to D (lowest). Investment grade is defined as those issuers that have a long-term credit rating of BBB- or higher. The credit ratings shown relate to the creditworthiness of the issuers of the underlying securities in the Fund, and not the Fund or its shares. Credit ratings are subject to change. |
| (2) | Percentages are based on long-term positions. Money market funds are excluded. |
| (3) | Most recent distribution paid or declared through 10/31/2018. Subject to change in the future. |
| (4) | Distribution rates are calculated by annualizing the most recent distribution paid or declared through the report date and then dividing by NAV as of 10/31/2018. Subject to change in the future. |
First Trust Short Duration High Income Fund
“AT A GLANCE” (Continued)
As of October 31, 2018 (Unaudited)
Performance of a $10,000 Investment
This chart compares your Fund’s Class I performance to that of the ICE BofAML US High Yield Constrained Index, the S&P/LSTA Leveraged Loan Index and the Blended Index(5).
| Performance as of October 31, 2018 |
| | | | A Shares
Inception
11/1/2012 | | | C Shares
Inception
11/1/2012 | | | I Shares
Inception
11/1/2012 | | | Blended Index* | | | HUC0* | | | SPBDAL* |
Cumulative
Total Returns | | | w/o
sales
charge | | w/max
3.50%
sales
charge | | | w/o
sales
charge | | w/max 1.00% contingent deferred sales charge | | | w/o
sales
charge | | | w/o
sales
charges | | | w/o
sales
charges | | | w/o sales charges |
| 1 Year | | | 2.61% | | (1.00)% | | | 1.85% | | 0.87% | | | 2.92% | | | 2.69% | | | 0.86% | | | 4.54% |
Average Annual
Total Returns | | | | | | | | | | | | | | | | | | | | | | |
| 5 Years | | | 3.32% | | 2.58% | | | 2.55% | | 2.55% | | | 3.58% | | | 4.35% | | | 4.69% | | | 3976% |
| Since Inception | | | 4.06% | | 3.44% | | | 3.28% | | 3.28% | | | 4.33% | | | 4.80% | | | 5.35% | | | 4.22% |
| 30-Day SEC Yield(6) | | | 3.90% | | | 3.23% | | | 4.30% | | | N/A | | | N/A | | | N/A |
* Since inception return is based on inception date of the Fund.
Performance figures assume reinvestment of all distributions and do not reflect the deduction of taxes that a shareholder would pay on Fund distributions or the redemption or sale of Fund shares. The total returns would have been lower if certain fees had not been waived and expenses reimbursed by the Advisor. An index is a statistical composite that tracks a specified financial market or sector. Unlike the Fund, the indices do not actually hold a portfolio of securities and therefore do not incur the expenses incurred by the Fund. These expenses negatively impact the performance of the Fund. The Fund’s past performance does not predict future performance.
Performance of share classes will vary due to differences in sales charges and expenses. Total returns with sales charges include payment of the maximum sales charge of 3.50% for Class A Shares, a contingent deferred sales charge (“CDSC”) of 1.00% for Class C Shares in year one and 12b-1 service fees of 0.25% per year of average daily net assets for Class A Shares and combined Rule 12b-1 distribution and service fees of 1.00% per year of average daily net assets for Class C Shares. Class I Shares do not have a front-end sales charge or a CDSC, nor do they pay distribution or service fees.
| (5) | The Blended Index return is a 50/50 split between the ICE BofAML US High Yield Constrained Index and the S&P/LSTA Leveraged Loan Index returns. |
| (6) | 30-day SEC yield is calculated by dividing the net investment income per share earned during the most recent 30-day period by the maximum offering price per share on the last day of the period. The reported SEC yields are subsidized. The subsidized yields reflect the waiver and/or a reimbursement of Fund expenses, which has the effect of lowering the Fund’s expense ratio and generating a higher yield. |
Portfolio Commentary
First Trust Short Duration High Income Fund
Annual Report
October 31, 2018 (Unaudited)
Advisor
The First Trust Advisors L.P. (“First Trust”) Leveraged Finance Team is comprised of 15 experienced investment professionals specializing in below investment grade securities. The team is comprised of portfolio management, research, trading and operations personnel. As of October 31, 2018, the First Trust Leveraged Finance Team managed or supervised approximately $4.47 billion in senior secured bank loans and high-yield bonds. These assets are managed across various strategies, including two closed-end funds, an open-end fund, four exchange-traded funds, one UCITS fund and a series of unit investment trusts on behalf of retail and institutional clients.
Portfolio Management Team
William Housey, CFA – Senior Vice President, Senior Portfolio Manager
Scott D. Fries, CFA – Senior Vice President, Portfolio Manager
Peter Fasone, CFA, CPA - Vice President, Portfolio Manager
Annual Report Commentary
First Trust Short Duration High Income Fund
The primary investment objective of the First Trust Short Duration High Income Fund (the “Fund”) is to seek to provide a high level of current income. As a secondary objective, the Fund seeks capital appreciation.
Market Recap
Economic growth, low unemployment, and strong consumer sentiment have led to asset prices increasing throughout the year. However, the effects of these positive developments were dampened by fears surrounding increasing interest rates. Meanwhile, global economic growth concerns were fueled by fears of a trade war. For the 12 months ending October 31, 2018, equities posted a solid return with the S&P 500® Index up 7.35%. Interest rates, as measured by the 10-year U.S. Treasury bond finished the fiscal year at 3.14% as of October 31, 2018, up from 2.38% at the start of the fiscal year. High-yield bonds, as measured by the ICE BofAML US High Yield Constrained Index, were up 0.86%, and senior loans, as measured by the S&P/LSTA Leveraged Loan Index, were up 4.54% in the period.
High-Yield Bond Market
High-yield bond spreads over U.S. Treasuries widened 30 basis points (“bps”) to end the period at T+381 bps, as of October 31, 2018. The spread is inside the long-term average spread over U.S. Treasuries of T+573 bps (December 1997 – October 2018).
Lower quality high-yield bonds outperformed higher quality high-yield bonds in the period, which was a continuation of the trend in the prior year period. Issues rated CCC and below returned 4.57%, outperforming the 1.67% return of B rated issues, and outperforming the -0.82% return of issues rated BB and above in the period. The average price of high-yield bonds in the market entered the period at $101.58 and decreased steadily for the better part of the year to end the period with an average price of $96.40.
Senior Loan Market
The senior loan market experienced positive total returns in 11 of the 12 months in the period. As a result, senior loan spreads over 3-month London Interbank Offered Rate (“LIBOR”) declined 18 bps during the prior year period to L+389 bps. This is slightly favorable compared to the pre-credit crisis average spread of L+372 (December 1997 – June 2007) but is inside the long-term average spread of L+515 (December 1997 – October 2018).
Lower quality senior loans outperformed higher quality senior loans in the period, which was a continuation of the trend in the prior year period. CCC rated issues returned 8.82%, outperforming the 4.85% return of B rated issues, and outperforming the 3.68% return of BB rated issues in the period. The average price of senior loans in the market were relatively flat as prices began the period at $98.16 and ended the period at $98.14.
Default Rates
During the12-month period ending October 31, 2018, default rates increased within both the JP Morgan High-Yield Bond Universe and the S&P/LSTA Leveraged Loan Index. The last twelve months (“LTM”) default rate within the high-yield bond market ended the period at 2.02% compared to the 1.18% default rate one year ago. The senior loan market ended the period at 1.92% compared to the 1.51% default rate one year ago. Default activity increased during the period due to the February 2018 default of iHeartMedia, the largest default by par amount outstanding since 2014. Despite the increase in default rates, defaults remain low by historical standards.
Portfolio Commentary (Continued)
First Trust Short Duration High Income Fund
Annual Report
October 31, 2018 (Unaudited)
We believe the low default rate is reflective of the relatively sound financial condition of most companies, the lack of near-term debt maturities, and the strong backdrop of a healthy macroeconomic environment.
Fund Performance
The Fund’s Class I shares returned 2.92% over the last 12 months, which outperformed the Blended Index (the “Benchmark”) return of 2.69% (comprised of 50% S&P/LSTA Leveraged Loan Index and 50% ICE BofAML US High Yield Constrained Index) over the same period.
The Fund held 238 individual positions diversified across 42 industries at the end of the reporting period. Health Care Providers & Services (14.0%), Hotels, Restaurants & Leisure (13.3%), and Software (11.1%) were the Fund’s top three industry exposures at the end of the period. By comparison, the Fund held 257 individual positions across 40 industries as of October 31, 2017. The Fund greatly reduced its allocation to high-yield bonds from 38.14% to 22.03% during the period. The Fund’s duration remained low throughout the period and declined from 1.36 years to 0.94 years.
During the reporting period, the Fund benefitted from its overweight position and asset selection in the healthcare industry as the Fund’s healthcare holdings performed better than the healthcare sector. The healthcare sector also outperformed the Benchmark during the period. Another benefit to the Fund’s performance during the period was its asset selection within the pharmaceuticals industry. Certain drug manufacturers held by the Fund reported improved operating results and improved balance sheets. The Fund’s performance also benefitted from its asset selection within the retail industry. The Fund’s position in food retailers experienced solid gains during the period as business sentiment grew more positive on the back of better financial results.
Partially offsetting these tailwinds was the Fund’s underweight position to the energy (oil & gas) industry, the Fund’s higher than normal cash balance, and the Fund’s asset selection within the cable & satellite television industry. The Fund’s underweight position to the energy (oil & gas) industry detracted from performance as this industry was one of the best performing industries during the period with a 2.25% return in the high-yield portion of the Benchmark and a 7.13% return within the senior loan portion of the Benchmark.
If part of an issuer’s investment premise relies on a commodity price, we believe this can create a high hurdle for inclusion in the portfolio. In times of strong commodity returns, our credit process can lead to periods of underperformance, however, over time we believe the Fund will benefit from lower volatility and better risk adjusted returns. The Fund’s strategic decision to hold a higher than normal level of cash to take advantage of opportunities arising from market volatility also detracted from its returns during the period.
Finally, the Fund’s asset selection within the cable & satellite television industry was a headwind during the period. The Fund’s holdings in certain European cable operators experienced weakness due to increasing competition and poor operating results.
The Fund’s most recent monthly distribution of $0.075 per share for Class I shares declined $0.005 from the $0.080 monthly distribution paid in October 2017. At the end of the period, the effective yield based on the distributions for the trailing twelve months was 4.79% based on NAV.
Market and Fund Outlook
We believe that with the potential for additional interest rate hikes on the horizon, short term interest rates, notably LIBOR, should continue to increase during the remainder of 2018 and into 2019. Importantly, the default rate for senior loan and high-yield issuers remains low and we believe they are likely to remain low given the overall health of the U.S. economy.
We remain confident that the favorable backdrop for the macro economy will persist for the near to intermediate term and that we are in a healthy part of the economic cycle to own high-yield bonds and senior loans. As we evaluate new investment opportunities, decisions will continue to be rooted in our rigorous bottom-up credit analysis and our focus will remain on identifying the opportunities that we believe offer the best risk and reward balance.
First Trust Short Duration High Income Fund
Understanding Your Fund Expenses
October 31, 2018 (Unaudited)
As a shareholder of the First Trust Short Duration High Income Fund (the “Fund”), you incur two types of costs: (1) transaction costs, including sales charges (loads) on purchases of Class A Shares and contingent deferred sales charges on the lesser of purchase price or redemption proceeds of Class C Shares; and (2) ongoing costs, including management fees, distribution and/or service (12b-1) fees, if any, and other Fund expenses. This Example is intended to help you understand your ongoing costs of investing in the Fund and to compare these costs with the ongoing costs of investing in other funds.
The Example is based on an investment of $1,000 invested at the beginning of the period and held through the six-month period ended October 31, 2018.
Actual Expenses
The first three columns of the table below provide information about actual account values and actual expenses. You may use the information in these columns, together with the amount you invested, to estimate the expenses that you paid over the period. Simply divide your account value by $1,000 (for example, an $8,600 account value divided by $1,000 = 8.6), then multiply the result by the number in the third column under the heading entitled “Expenses Paid During Period” to estimate the expenses you paid on your account during this period.
Hypothetical Example for Comparison Purposes
The next three columns of the table below provide information about hypothetical account values and hypothetical expenses based on the Fund’s actual expense ratio and an assumed rate of return of 5% per year before expenses, which is not the Fund’s actual return. The hypothetical account values and expenses may not be used to estimate the actual ending account balance or expenses you paid for the period. You may use this information to compare the ongoing costs of investing in the Fund and other funds. To do so, compare this 5% hypothetical example with the 5% hypothetical examples that appear in the shareholder reports of the other funds.
Please note that the expenses shown in the table are meant to highlight your ongoing costs only and do not reflect any transactional costs such as sales charges (loads) or contingent deferred sales charges. Therefore, the hypothetical section of the table is useful in comparing ongoing costs only, and will not help you determine the relative total costs of owning different funds. In addition, if these transactional costs were included, your costs would have been higher.
| | Actual Expenses | | Hypothetical
(5% Return Before Expenses) | | |
| | Beginning
Account
Value
5/1/2018 | Ending
Account
Value
10/31/2018 | Expenses Paid
During Period
5/1/2018 - 10/31/2018 (a) | | Beginning
Account
Value
5/1/2018 | Ending
Account
Value
10/31/2018 | Expenses Paid
During Period
5/1/2018 - 10/31/2018 (a) | | Annualized
Expense
Ratios (b) |
| Class A | $ 1,000.00 | $ 1,014.60 | $ 6.09 | | $ 1,000.00 | $ 1,019.16 | $ 6.11 | | 1.20% |
| Class C | 1,000.00 | 1,010.80 | 9.88 | | 1,000.00 | 1,015.38 | 9.91 | | 1.95 |
| Class I | 1,000.00 | 1,015.80 | 4.83 | | 1,000.00 | 1,020.42 | 4.84 | | 0.95 |
| (a) | Expenses are equal to the annualized expense ratios as indicated in the table multiplied by the average account value over the period (May 1, 2018 through October 31, 2018) multiplied by 184/365 (to reflect the six-month period). |
| (b) | These expense ratios reflect expense caps. |
First Trust Short Duration High Income Fund
Portfolio of Investments
October 31, 2018
Principal
Value | | Description | | Rate (a) | | Stated
Maturity (b) | | Value |
| SENIOR FLOATING-RATE LOAN INTERESTS – 73.9% |
| | | Aerospace & Defense – 0.6% | | | | | | |
| $296,677 | | Science Applications International Corp, Term Loan B, 1 Mo. LIBOR + 1.75%, 0.00% Floor
| | 4.06% | | 10/31/25 | | $295,935 |
| 601,776 | | Transdigm Inc., Tranche E Term Loan, 1 Mo. LIBOR + 2.50%, 0.00% Floor
| | 4.80% | | 05/30/25 | | 598,177 |
| 504,998 | | Transdigm, Inc., Term Loan F, 1 Mo. LIBOR + 2.50%, 0.00% Floor
| | 4.80% | | 06/09/23 | | 502,291 |
| | | | | 1,396,403 |
| | | Alternative Carriers – 0.4% | | | | | | |
| 1,000,000 | | Level 3 Financing, Inc., Tranche B 2024 Term Loan, 1 Mo. LIBOR + 2.25%, 0.00% Floor
| | 4.53% | | 02/22/24 | | 1,000,470 |
| | | Application Software – 4.3% | | | | | | |
| 918,849 | | CCC Information Services Inc., Term Loan B, 1 Mo. LIBOR + 3.00%, 1.00% Floor
| | 5.31% | | 04/26/24 | | 919,015 |
| 447,193 | | Hyland Software, Inc., Term Loan B, 1 Mo. LIBOR + 3.25%, 0.75% Floor
| | 5.55% | | 07/01/24 | | 449,335 |
| 1,266,517 | | Informatica Corporation, Term Loan B, 1 Mo. LIBOR + 3.25%, 0.00% Floor
| | 5.55% | | 08/06/22 | | 1,270,874 |
| 898,382 | | Kronos, Inc., Term Loan B, 3 Mo. LIBOR + 3.00%, 0.00% Floor
| | 5.31% | | 11/01/23 | | 899,083 |
| 238,749 | | Micro Focus International (MA Financeco, LLC), Miami Escrow TL B3, 1 Mo. LIBOR + 2.50%, 0.00% Floor
| | 4.80% | | 06/21/24 | | 237,928 |
| 1,612,332 | | Micro Focus International (MA Financeco, LLC), Seattle Spinco TLB, 1 Mo. LIBOR + 2.50%, 0.00% Floor
| | 4.80% | | 06/21/24 | | 1,606,785 |
| 2,016,078 | | Mitchell International, Inc., 1st Lien Term Loan, 1 Mo. LIBOR + 3.25%, 0.00% Floor
| | 5.55% | | 11/30/24 | | 2,005,997 |
| 487,816 | | Qlik Technologies (Project Alpha Intermediate Holdings, Inc.), Term Loan B, 3 Mo. LIBOR + 3.50%, 1.00% Floor
| | 5.94% | | 04/26/24 | | 485,377 |
| 2,040,887 | | RP Crown Parent, Inc. (JDA Software Group), Term Loan B, 1 Mo. LIBOR + 2.75%, 1.00% Floor
| | 5.05% | | 10/12/23 | | 2,035,274 |
| | | | | 9,909,668 |
| | | Asset Management & Custody Banks – 0.5% | | | | | | |
| 360,000 | | First Eagle Investment Management, Term Loan B, 3 Mo. LIBOR + 2.75%, 0.00% Floor
| | 5.14% | | 12/01/24 | | 360,450 |
| 376,785 | | Harbourvest Partners L.P., Term Loan B, 1 Mo. LIBOR + 2.25%, 0.00% Floor
| | 4.53% | | 03/01/25 | | 376,315 |
| 434,497 | | Victory Capital Holdings, Term Loan B, 3 Mo. LIBOR + 2.75%, 0.00% Floor
| | 5.14% | | 02/15/25 | | 435,040 |
| | | | | 1,171,805 |
| | | Auto Parts & Equipment – 1.8% | | | | | | |
| 2,768,827 | | Gates Global LLC, Initial B-2 Dollar Term Loans, 1 Mo. LIBOR + 2.75%, 1.00% Floor
| | 5.05% | | 03/31/24 | | 2,770,073 |
| 369,256 | | Lumileds (Bright Bidco B.V.), Term Loan B, 1 Mo. LIBOR + 3.50%, 1.00% Floor
| | 5.89% | | 06/30/24 | | 360,641 |
| 773,508 | | Lumileds (Bright Bidco B.V.), Term Loan B, 3 Mo. LIBOR + 3.50%, 1.00% Floor
| | 5.89% | | 06/30/24 | | 755,462 |
| 332,326 | | Tower Automotive Holdings USA LLC, Term Loan B, 1 Mo. LIBOR + 2.75%, 0.00% Floor
| | 5.06% | | 03/07/24 | | 331,495 |
| | | | | 4,217,671 |
| | | Broadcasting – 1.3% | | | | | | |
| 326,701 | | Cumulus Media Holdings Inc., Exit Term Loan, 1 Mo. LIBOR + 4.50%, 1.00% Floor
| | 6.81% | | 05/15/22 | | 322,415 |
See Notes to Financial Statements
Page 7
First Trust Short Duration High Income Fund
Portfolio of Investments (Continued)
October 31, 2018
Principal
Value | | Description | | Rate (a) | | Stated
Maturity (b) | | Value |
| SENIOR FLOATING-RATE LOAN INTERESTS (Continued) |
| | | Broadcasting (Continued) | | | | | | |
| $2,764,366 | | Tribune Media Co. (fka Tribune Co.), Extended Term Loan C, 1 Mo. LIBOR + 3.00%, 0.75% Floor
| | 5.30% | | 01/27/24 | | $2,769,564 |
| 20,159 | | Tribune Media Co. (fka Tribune Co.), Term B Loan, 1 Mo. LIBOR + 3.00%, 0.75% Floor
| | 5.30% | | 12/27/20 | | 20,190 |
| | | | | 3,112,169 |
| | | Building Products – 1.5% | | | | | | |
| 86,478 | | Beacon Roofing Supply, Inc., Term Loan B, 1 Mo. LIBOR + 2.25%, 0.00% Floor
| | 4.53% | | 01/02/25 | | 85,570 |
| 3,207,918 | | Quikrete Holdings, Inc., Term Loan B, 1 Mo. LIBOR + 2.75%, 0.00% Floor
| | 5.05% | | 11/15/23 | | 3,193,097 |
| 112,721 | | Resideo Technologies Inc., Term Loan B, 3 Mo. LIBOR + 2.00%, 0.00% Floor
| | 4.49% | | 10/24/25 | | 112,933 |
| | | | | 3,391,600 |
| | | Cable & Satellite – 1.1% | | | | | | |
| 378,455 | | Cablevision (CSC Holdings, Inc.), January 2018 Term Loans, 1 Mo. LIBOR + 2.50%, 0.00% Floor
| | 4.78% | | 01/25/26 | | 377,626 |
| 1,561,000 | | Cablevision (CSC Holdings, Inc.), New Additional Term Loan B3, 2 Mo. LIBOR + 2.25%, 0.00% Floor
| | 4.75% | | 01/10/26 | | 1,556,614 |
| 579,000 | | Virgin Media Investment Holdings Ltd., Term Loan K, 1 Mo. LIBOR + 2.50%, 0.00% Floor
| | 4.78% | | 01/15/26 | | 578,334 |
| | | | | 2,512,574 |
| | | Casinos & Gaming – 7.6% | | | | | | |
| 124,503 | | Aristocrat Technologies, Term B-3 Loan, 3 Mo. LIBOR + 1.75%, 0.00% Floor
| | 4.22% | | 10/19/24 | | 123,993 |
| 4,367,000 | | Caesars Resort Collection, LLC., Term Loan B, 1 Mo. LIBOR + 2.75%, 0.00% Floor
| | 5.05% | | 12/22/24 | | 4,366,389 |
| 1,843,740 | | CityCenter Holdings LLC, Term Loan B, 1 Mo. LIBOR + 2.25%, 0.75% Floor
| | 4.55% | | 04/18/24 | | 1,838,559 |
| 39,679 | | Golden Nugget, Inc., Term Loan B, 1 Mo. LIBOR + 2.75%, 0.75% Floor
| | 5.05% | | 10/04/23 | | 39,697 |
| 1,071,536 | | Golden Nugget, Inc., Term Loan B, 3 Mo. LIBOR + 2.75%, 0.75% Floor
| | 5.19%-5.28% | | 10/04/23 | | 1,072,040 |
| 1,243,899 | | Las Vegas Sands LLC, Term Loan B, 1 Mo. LIBOR + 1.75%, 0.00% Floor
| | 4.05% | | 03/27/25 | | 1,238,675 |
| 513,010 | | MGM Growth Properties Operating Partnership LP, Term Loan B, 1 Mo. LIBOR + 2.00%, 0.00% Floor
| | 4.30% | | 03/23/25 | | 511,179 |
| 552,022 | | Penn National Gaming, Inc., Term Loan B, 2 Mo. LIBOR + 2.25%, 0.00% Floor
| | 4.58% | | 10/01/25 | | 553,402 |
| 127,666 | | Scientific Games International, Inc., Term Loan B5, 1 Mo. LIBOR + 2.75%, 0.00% Floor
| | 5.05% | | 08/14/24 | | 126,343 |
| 535,189 | | Scientific Games International, Inc., Term Loan B5, 2 Mo. LIBOR + 2.75%, 0.00% Floor
| | 5.04% | | 08/14/24 | | 529,644 |
| 4,997,623 | | Stars Group Holdings B.V. (Amaya), Term Loan B, 3 Mo. LIBOR + 3.50%, 0.00% Floor
| | 5.89% | | 07/28/25 | | 5,015,665 |
| 760,288 | | Station Casinos, Inc (Red Rock), Term Loan B, 1 Mo. LIBOR + 2.50%, 0.75% Floor
| | 4.81% | | 06/08/23 | | 759,262 |
| 1,486,119 | | VICI Properties (Caesars), Term Loan B, 1 Mo. LIBOR + 2.00%, 0.00% Floor
| | 4.28% | | 12/20/24 | | 1,481,631 |
| | | | | 17,656,479 |
| | | Coal & Consumable Fuels – 0.2% | | | | | | |
| 230,141 | | Arch Coal, Inc., Term Loan B, 1 Mo. LIBOR + 2.75%, 1.00% Floor
| | 5.05% | | 03/07/24 | | 229,799 |
Page 8
See Notes to Financial Statements
First Trust Short Duration High Income Fund
Portfolio of Investments (Continued)
October 31, 2018
Principal
Value | | Description | | Rate (a) | | Stated
Maturity (b) | | Value |
| SENIOR FLOATING-RATE LOAN INTERESTS (Continued) |
| | | Coal & Consumable Fuels (Continued) | | | | | | |
| $126,126 | | Peabody Energy, Term Loan B, 1 Mo. LIBOR + 2.75%, 0.00% Floor
| | 5.05% | | 03/31/25 | | $125,770 |
| | | | | 355,569 |
| | | Commercial Printing – 0.2% | | | | | | |
| 376,771 | | Multi-Color Corp., Term Loan B, 1 Mo. LIBOR + 2.00%, 0.00% Floor
| | 4.30% | | 10/31/24 | | 377,479 |
| | | Construction & Engineering – 0.3% | | | | | | |
| 69,823 | | Pike Electric, Inc., Term Loan B, 1 Mo. LIBOR + 3.50%, 1.00% Floor
| | 5.81% | | 03/23/25 | | 70,172 |
| 554,597 | | Westinghouse Electric (Brookfield WEC Holdings Inc.), Term Loan B, 1 Mo. LIBOR + 3.75%, 0.75% Floor
| | 6.05% | | 07/31/25 | | 557,525 |
| | | | | 627,697 |
| | | Diversified Chemicals – 0.1% | | | | | | |
| 182,829 | | Ineos US Finance LLC, 2024 Dollar Term Loan, 1 Mo. LIBOR + 2.00%, 0.00% Floor
| | 4.30% | | 03/31/24 | | 182,401 |
| | | Diversified Support Services – 0.6% | | | | | | |
| 1,321,488 | | Brightview Landscapes (FKA - Brickman), Term Loan B, 1 Mo. LIBOR + 2.50%, 0.00% Floor
| | 4.81% | | 08/15/25 | | 1,321,078 |
| | | Electric Utilities – 2.6% | | | | | | |
| 745,062 | | Dayton Power & Light Co., Term Loan B, 1 Mo. LIBOR + 2.00%, 0.75% Floor
| | 4.31% | | 08/24/22 | | 744,601 |
| 1,861,375 | | Vistra Operations Co. LLC (TEX/TXU), 2016 Incremental Term Loan B2, 1 Mo. LIBOR + 2.25%, 0.00% Floor
| | 4.55% | | 12/14/23 | | 1,862,082 |
| 2,062,943 | | Vistra Operations Co. LLC (TEX/TXU), 2018 Incremental Term Loan B3, 1 Mo. LIBOR + 2.00%, 0.00% Floor
| | 4.29% | | 12/31/25 | | 2,055,434 |
| 1,433,035 | | Vistra Operations Co. LLC (TEX/TXU), Initial Term Loan B1, 1 Mo. LIBOR + 2.00%, 0.00% Floor
| | 4.30% | | 08/04/23 | | 1,429,051 |
| | | | | 6,091,168 |
| | | Environmental & Facilities Services – 0.8% | | | | | | |
| 680,416 | | GFL Environmental Inc., Term Loan B, 2 Mo. LIBOR + 3.00%, 1.00% Floor
| | 5.39% | | 05/31/25 | | 669,359 |
| 319,512 | | GFL Environmental Inc., Term Loan B, 3 Mo. LIBOR + 3.00%, 1.00% Floor
| | 5.39% | | 05/31/25 | | 314,320 |
| 601,318 | | Packers Holding LLC, Term Loan B, 1 Mo. LIBOR + 3.00%, 1.00% Floor
| | 5.28% | | 12/04/24 | | 600,314 |
| 233,698 | | Servicemaster Company, LLC, The, Tranche C Term Loan, 1 Mo. LIBOR + 2.50%, 0.00% Floor
| | 4.80% | | 11/08/23 | | 234,516 |
| | | | | 1,818,509 |
| | | Food Retail – 0.6% | | | | | | |
| 455,458 | | Albertsons LLC, Term Loan B5, 3 Mo. LIBOR + 3.00%, 0.75% Floor
| | 5.38% | | 12/21/22 | | 454,064 |
| 1,016,587 | | Albertsons LLC, Term Loan B6, 3 Mo. LIBOR + 3.00%, 0.75% Floor
| | 5.31% | | 06/22/23 | | 1,011,504 |
| | | | | 1,465,568 |
| | | Health Care Equipment – 0.8% | | | | | | |
| 98,750 | | Acelity L.P., Inc. (Kinetic Concepts, Inc.), Term Loan B, 3 Mo. LIBOR + 3.25%, 1.00% Floor
| | 5.64% | | 01/31/24 | | 99,018 |
| 898,602 | | DJO Finance LLC (ReAble Therapeutics Finance LLC), Initial Term Loan, 1 Mo. LIBOR + 3.25%, 1.00% Floor
| | 5.65% | | 06/08/20 | | 896,544 |
See Notes to Financial Statements
Page 9
First Trust Short Duration High Income Fund
Portfolio of Investments (Continued)
October 31, 2018
Principal
Value | | Description | | Rate (a) | | Stated
Maturity (b) | | Value |
| SENIOR FLOATING-RATE LOAN INTERESTS (Continued) |
| | | Health Care Equipment (Continued) | | | | | | |
| $901,050 | | DJO Finance LLC (ReAble Therapeutics Finance LLC), Initial Term Loan, 3 Mo. LIBOR + 3.25%, 1.00% Floor
| | 5.65% | | 06/08/20 | | $898,987 |
| | | | | 1,894,549 |
| | | Health Care Facilities – 0.5% | | | | | | |
| 194,406 | | Acadia Healthcare Co., Inc., Term Loan B3, 1 Mo. LIBOR + 2.50%, 0.00% Floor
| | 4.80% | | 02/11/22 | | 194,649 |
| 118,664 | | Acadia Healthcare Co., Inc., Term Loan B4, 1 Mo. LIBOR + 2.50%, 0.00% Floor
| | 4.80% | | 02/16/23 | | 118,812 |
| 508,777 | | Concentra, Inc. (fka MJ Acquisitions), Term Loan B, 1 Mo. LIBOR + 2.75%, 0.00% Floor
| | 5.03% | | 06/01/22 | | 509,413 |
| 364,353 | | Gentiva Health Services, Inc., Term Loan B, 1 Mo. LIBOR + 3.75%, 0.00% Floor
| | 6.06% | | 06/30/25 | | 365,719 |
| | | | | 1,188,593 |
| | | Health Care Services – 6.2% | | | | | | |
| 936,991 | | 21st Century Oncology Holdings, Inc. (21st Century Oncology, Inc.), Tranche B Term Loan, 3 Mo. LIBOR + 6.13%, 1.00% Floor | | 8.57% | | 01/16/23 | | 871,992 |
| 160,674 | | Agiliti Health, Inc. (Universal Hospital Services), Term Loan, 1 Mo. LIBOR + 3.00%, 0.00% Floor
| | 5.31% | | 10/31/25 | | 161,477 |
| 385,053 | | Air Medical Group Holdings, Inc. (Global Medical Responses), 2018 New Term Loan, 1 Mo. LIBOR + 4.25%, 1.00% Floor
| | 6.53% | | 03/14/25 | | 377,351 |
| 404,253 | | Air Medical Group Holdings, Inc. (Global Medical Responses), Term Loan B, 1 Mo. LIBOR + 3.25%, 1.00% Floor
| | 5.53% | | 04/28/22 | | 391,923 |
| 1,212,619 | | Air Methods Corp. (a/k/a ASP AMC Intermediate Holdings, Inc.), Term Loan B, 3 Mo. LIBOR + 3.50%, 1.00% Floor
| | 5.89% | | 04/21/24 | | 1,092,873 |
| 1,280,601 | | CDRH Parent, Inc. (Healogics, Inc.), Initial Term Loan (First Lien), 3 Mo. LIBOR + 4.25%, 1.00% Floor
| | 6.58% | | 07/01/21 | | 1,198,643 |
| 458,142 | | CHG Healthcare Services, Inc. (fka CHG Buyer Corp.), Term Loan, 1 Mo. LIBOR + 3.00%, 1.00% Floor
| | 5.30% | | 06/07/23 | | 459,287 |
| 816,205 | | CHG Healthcare Services, Inc. (fka CHG Buyer Corp.), Term Loan, 3 Mo. LIBOR + 3.00%, 1.00% Floor
| | 5.30% | | 06/07/23 | | 818,245 |
| 1,621,651 | | DuPage Medical Group (Midwest Physician), Term Loan B, 1 Mo. LIBOR + 2.75%, 0.75% Floor
| | 5.05% | | 08/15/24 | | 1,607,964 |
| 1,912,109 | | Envision Healthcare Corporation, Term Loan B, 1 Mo. LIBOR + 3.75%, 0.00% Floor
| | 6.05% | | 10/10/25 | | 1,870,884 |
| 243,217 | | ExamWorks (Gold Merger Co., Inc.), Term Loan B, 1 Mo. LIBOR + 3.25%, 1.00% Floor
| | 5.55% | | 07/27/23 | | 243,825 |
| 1,180,597 | | Surgery Centers Holdings, Inc., Term Loan B, 3 Mo. LIBOR + 3.25%, 1.00% Floor
| | 5.57% | | 08/31/24 | | 1,177,351 |
| 2,020,801 | | Team Health, Inc., Term Loan B, 1 Mo. LIBOR + 2.75%, 1.00% Floor
| | 5.05% | | 02/06/24 | | 1,907,131 |
| 2,004,253 | | U.S. Renal Care, Inc., Term Loan B, 3 Mo. LIBOR + 4.25%, 1.00% Floor
| | 6.64% | | 12/30/22 | | 1,939,115 |
| 368,768 | | Verscend Technologies, Term Loan B, 1 Mo. LIBOR + 4.50%, 0.00% Floor
| | 6.80% | | 08/27/25 | | 371,420 |
| | | | | 14,489,481 |
| | | Health Care Technology – 0.6% | | | | | | |
| 1,470,431 | | Change Healthcare Holdings, Inc., Term Loan B, 1 Mo. LIBOR + 2.75%, 1.00% Floor
| | 5.05% | | 03/01/24 | | 1,468,049 |
| | | Hotels, Resorts & Cruise Lines – 0.0% | | | | | | |
| 80,732 | | Wyndham Hotels & Resorts, Term Loan B, 1 Mo. LIBOR + 1.75%, 0.00% Floor
| | 4.05% | | 03/28/25 | | 80,648 |
Page 10
See Notes to Financial Statements
First Trust Short Duration High Income Fund
Portfolio of Investments (Continued)
October 31, 2018
Principal
Value | | Description | | Rate (a) | | Stated
Maturity (b) | | Value |
| SENIOR FLOATING-RATE LOAN INTERESTS (Continued) |
| | | Household Appliances – 0.4% | | | | | | |
| $1,029,703 | | Traeger Grills (TGP Holdings III LLC), Term Loan B, 3 Mo. LIBOR + 4.25%, 1.00% Floor
| | 6.64% | | 09/25/24 | | $1,010,396 |
| | | Household Products – 0.9% | | | | | | |
| 249,037 | | Energizer Holding, Inc., Term Loan B, 1 Mo. LIBOR + 2.25%, 0.00% Floor
| | 4.56% | | 06/30/25 | | 249,194 |
| 575,347 | | Spectrum Brands, Inc., Term Loan B, 1 Mo. LIBOR + 2.00%, 0.00% Floor
| | 4.31% | | 06/23/22 | | 575,140 |
| 764,739 | | Spectrum Brands, Inc., Term Loan B, 2 Mo. LIBOR + 2.00%, 0.00% Floor
| | 4.33%-4.40% | | 06/23/22 | | 764,464 |
| 431,511 | | Spectrum Brands, Inc., Term Loan B, 3 Mo. LIBOR + 2.00%, 0.00% Floor
| | 4.35% | | 06/23/22 | | 431,355 |
| | | | | 2,020,153 |
| | | Human Resource & Employment Services – 0.4% | | | | | | |
| 912,461 | | Tempo Acquisition, Term Loan B, 1 Mo. LIBOR + 3.00%, 0.00% Floor
| | 5.30% | | 05/01/24 | | 912,232 |
| | | Hypermarkets & Super Centers – 1.3% | | | | | | |
| 3,077,792 | | BJ’s Wholesale Club, Inc., Term Loan B, 1 Mo. LIBOR + 3.00%, 0.00% Floor
| | 5.28% | | 02/03/24 | | 3,083,086 |
| | | Industrial Conglomerates – 1.2% | | | | | | |
| 706,358 | | Accudyne Industries, Term Loan B, 1 Mo. LIBOR + 3.00%, 1.00% Floor
| | 5.30% | | 08/18/24 | | 702,826 |
| 1,638,119 | | Gardner Denver, Inc., Term Loan B, 1 Mo. LIBOR + 2.75%, 0.00% Floor
| | 5.05% | | 07/30/24 | | 1,640,380 |
| 367,725 | | Messer Industries USA, Inc., Initial Term B-1, 1 Mo. LIBOR + 2.50%, 0.00% Floor
| | 4.81% | | 09/30/25 | | 367,633 |
| | | | | 2,710,839 |
| | | Insurance Brokers – 2.6% | | | | | | |
| 2,636,760 | | Amwins Group, Inc., Term Loan B (First Lien), 1 Mo. LIBOR + 2.75%, 1.00% Floor
| | 5.03% | | 01/25/24 | | 2,639,397 |
| 2,061 | | HUB International Ltd., Term Loan B, 2 Mo. LIBOR + 3.00%, 0.00% Floor
| | 5.36% | | 04/25/25 | | 2,054 |
| 820,253 | | HUB International Ltd., Term Loan B, 3 Mo. LIBOR + 3.00%, 0.00% Floor
| | 5.49% | | 04/25/25 | | 817,432 |
| 854,274 | | National Financial Partners Corp. (NFP), Term Loan B, 1 Mo. LIBOR + 3.00%, 0.00% Floor
| | 5.30% | | 01/06/24 | | 850,643 |
| 1,610,854 | | USI, Inc. (fka Compass Investors, Inc.), Term Loan B, 3 Mo. LIBOR + 3.00%, 0.00% Floor
| | 5.39% | | 05/15/24 | | 1,600,786 |
| | | | | 5,910,312 |
| | | Integrated Telecommunication Services – 1.0% | | | | | | |
| 2,231,316 | | Century Link (Qwest), Term Loan B, 1 Mo. LIBOR + 2.75%, 0.00% Floor
| | 5.05% | | 01/31/25 | | 2,206,214 |
| | | Leisure Facilities – 1.0% | | | | | | |
| 2,456,004 | | ClubCorp Club Operations, Term Loan B, 3 Mo. LIBOR + 2.75%, 0.00% Floor
| | 5.14% | | 09/18/24 | | 2,413,908 |
| | | Life Sciences Tools & Services – 3.7% | | | | | | |
| 501,964 | | Immucor, Inc., Term Loan B-3, 3 Mo. LIBOR + 5.00%, 1.00% Floor
| | 7.39% | | 06/15/21 | | 509,494 |
| 920,346 | | Ortho-Clinical Diagnostics Holdings Luxembourg, Term Loan B, 1 Mo. LIBOR + 3.25%, 0.00% Floor
| | 5.54% | | 05/31/25 | | 916,894 |
See Notes to Financial Statements
Page 11
First Trust Short Duration High Income Fund
Portfolio of Investments (Continued)
October 31, 2018
Principal
Value | | Description | | Rate (a) | | Stated
Maturity (b) | | Value |
| SENIOR FLOATING-RATE LOAN INTERESTS (Continued) |
| | | Life Sciences Tools & Services (Continued) | | | | | | |
| $3,855,267 | | Parexel International Corp., Term Loan B, 1 Mo. LIBOR + 2.75%, 0.00% Floor
| | 5.05% | | 09/27/24 | | $3,795,048 |
| 816,249 | | Pharmaceutical Product Development, Inc. (PPDI), Term Loan B, 1 Mo. LIBOR + 2.50%, 1.00% Floor
| | 4.80% | | 08/18/22 | | 813,188 |
| 965,427 | | Quintiles IMS, Inc. (IQVIA), Term Loan B3, 3 Mo. LIBOR + 1.75%, 0.00% Floor
| | 4.14% | | 06/15/25 | | 961,806 |
| 1,696,350 | | Sotera Health Holdings, LLC (Sterigenics), Term Loan B, 1 Mo. LIBOR + 3.00%, 1.00% Floor
| | 5.30% | | 05/15/22 | | 1,697,758 |
| | | | | 8,694,188 |
| | | Managed Health Care – 1.1% | | | | | | |
| 1,180,808 | | Davis Vision (Wink Holdco, Inc.), Initial Term Loan, 1 Mo. LIBOR + 3.00%, 1.00% Floor
| | 5.30% | | 12/02/24 | | 1,176,675 |
| 1,304,171 | | MultiPlan, Inc. (MPH), Term Loan B, 3 Mo. LIBOR + 2.75%, 1.00% Floor
| | 5.14% | | 06/07/23 | | 1,299,829 |
| | | | | 2,476,504 |
| | | Metal & Glass Containers – 0.3% | | | | | | |
| 546,009 | | Berlin Packaging LLC, Term Loan B, 1 Mo. LIBOR + 3.00%, 0.00% Floor
| | 5.26%-5.30% | | 11/07/25 | | 545,021 |
| 62,053 | | Berlin Packaging LLC, Term Loan B, 3 Mo. LIBOR + 3.00%, 0.00% Floor
| | 5.39% | | 11/07/25 | | 61,940 |
| 71,846 | | Crown Holdings, Term Loan B, 1 Mo. LIBOR + 2.00%, 0.00% Floor
| | 4.28% | | 04/03/25 | | 71,885 |
| | | | | 678,846 |
| | | Movies & Entertainment – 0.5% | | | | | | |
| 756,200 | | Cineworld Group PLC (Crown), Term Loan B, 1 Mo. LIBOR + 2.50%, 0.00% Floor
| | 4.80% | | 02/05/25 | | 752,495 |
| 442,159 | | Creative Artists Agency LLC (CAA Holdings LLC), Term Loan B, 1 Mo. LIBOR + 3.00%, 0.00% Floor
| | 5.29% | | 02/15/24 | | 442,711 |
| | | | | 1,195,206 |
| | | Oil & Gas Equipment & Services – 0.1% | | | | | | |
| 105,534 | | NorthRiver Midsteam Finance LP (Grizzly/Enbridge), Term Loan B, 3 Mo. LIBOR + 3.25%, 0.00% Floor
| | 5.65% | | 09/30/25 | | 105,974 |
| | | Oil & Gas Exploration & Production – 0.0% | | | | | | |
| 66,667 | | Ascent Resources - Marcellus LLC, EXIT Term Loan B, 1 Mo. LIBOR + 6.50%, 1.00% Floor (c)
| | 8.78% | | 03/30/23 | | 66,750 |
| | | Oil & Gas Storage & Transportation – 0.3% | | | | | | |
| 588,429 | | Lotus Midstream (Centurion Pipeline Company LLC), Term Loan B, 3 Mo. LIBOR + 3.25%, 0.00% Floor
| | 5.64% | | 09/30/25 | | 591,007 |
| | | Other Diversified Financial Services – 3.1% | | | | | | |
| 3,269,986 | | AlixPartners LLP, Term Loan B, 1 Mo. LIBOR + 2.75%, 0.00% Floor
| | 5.05% | | 04/04/24 | | 3,269,986 |
| 2,524,150 | | Duff & Phelps Corp. (Deerfield Dakota), Initial Term Loan, 1 Mo. LIBOR + 3.25%, 1.00% Floor
| | 5.55% | | 02/13/25 | | 2,518,899 |
| 723,136 | | Financial & Risk US Holdings, Inc. (Refinitiv), Initial Dollar Term Loan, 1 Mo. LIBOR + 3.75%, 0.00% Floor
| | 6.05% | | 10/01/25 | | 715,305 |
| 782,000 | | Wex, Inc., Term Loan B, 1 Mo. LIBOR + 2.25%, 0.00% Floor
| | 4.55% | | 07/01/23 | | 782,649 |
| | | | | 7,286,839 |
Page 12
See Notes to Financial Statements
First Trust Short Duration High Income Fund
Portfolio of Investments (Continued)
October 31, 2018
Principal
Value | | Description | | Rate (a) | | Stated
Maturity (b) | | Value |
| SENIOR FLOATING-RATE LOAN INTERESTS (Continued) |
| | | Packaged Foods & Meats – 0.6% | | | | | | |
| $146,678 | | Hostess Brands, LLC, Term Loan B, 1 Mo. LIBOR + 2.25%, 0.75% Floor
| | 4.55% | | 08/03/22 | | $145,807 |
| 911 | | Hostess Brands, LLC, Term Loan B, 2 Mo. LIBOR + 2.25%, 0.75% Floor
| | 4.55% | | 08/03/22 | | 906 |
| 214,086 | | Hostess Brands, LLC, Term Loan B, 3 Mo. LIBOR + 2.25%, 0.75% Floor
| | 4.55% | | 08/03/22 | | 212,814 |
| 1,140,689 | | Post Holdings, Inc., Term Loan B, 1 Mo. LIBOR + 2.00%, 0.00% Floor
| | 4.29% | | 05/24/24 | | 1,138,852 |
| | | | | 1,498,379 |
| | | Paper Packaging – 1.5% | | | | | | |
| 3,435,094 | | Reynolds Group Holdings, Inc., U.S. Term Loan, 1 Mo. LIBOR + 2.75%, 0.00% Floor
| | 5.05% | | 02/05/23 | | 3,435,094 |
| | | Personal Products – 0.1% | | | | | | |
| 214,306 | | Rodan & Fields, Term Loan B, 1 Mo. LIBOR + 4.00%, 0.00% Floor
| | 6.28% | | 06/15/25 | | 215,377 |
| | | Pharmaceuticals – 6.2% | | | | | | |
| 330,206 | | Akorn, Inc., Loan, 3 Mo. LIBOR + 5.50%, 1.00% Floor
| | 7.18% | | 04/16/21 | | 304,734 |
| 6,830,581 | | Bausch Health Companies, Inc. (Valeant), Term Loan B, 1 Mo. LIBOR + 3.00%, 0.00% Floor
| | 5.27% | | 06/01/25 | | 6,829,010 |
| 705,596 | | Catalent Pharma Solutions, Inc., Term Loan B, 1 Mo. LIBOR + 2.25%, 1.00% Floor
| | 4.55% | | 05/20/24 | | 708,023 |
| 852,000 | | Concordia Healthcare, Dollar Term Loan, 1 Mo. LIBOR + 5.50%, 1.00% Floor
| | 7.78% | | 09/06/24 | | 832,830 |
| 1,824,959 | | Endo LLC, Term Loan B, 1 Mo. LIBOR + 4.25%, 0.75% Floor
| | 6.56% | | 04/29/24 | | 1,831,420 |
| 730,358 | | GoodRX, Inc., Term Loan B, 1 Mo. LIBOR + 3.00%, 0.00% Floor
| | 5.28% | | 10/15/25 | | 733,403 |
| 496,222 | | Grifols Worldwide Operations Limited, Tranche B Term Loan, 1 Mo. LIBOR + 2.25%, 0.00% Floor
| | 4.47% | | 01/31/25 | | 496,445 |
| 2,106,681 | | Horizon Pharma, Inc., Term Loan B, 1 Mo. LIBOR + 3.00%, 1.00% Floor
| | 5.31% | | 03/29/24 | | 2,106,681 |
| 241,492 | | Mallinckrodt International Finance S.A., 2017 Term Loan B, 3 Mo. LIBOR + 2.75%, 0.75% Floor
| | 5.14% | | 09/24/24 | | 238,133 |
| 241,505 | | Mallinckrodt International Finance S.A., 2018 Incremental Term Loan, 3 Mo. LIBOR + 3.00%, 0.75% Floor
| | 5.52% | | 02/24/25 | | 239,655 |
| | | | | 14,320,334 |
| | | Real Estate Services – 0.4% | | | | | | |
| 997,487 | | Realogy Corp., Term Loan B, 1 Mo. LIBOR + 2.25%, 0.75% Floor
| | 4.53% | | 02/08/25 | | 994,056 |
| | | Research & Consulting Services – 1.8% | | | | | | |
| 1,555,514 | | Advantage Sales & Marketing, Inc., Initial Term Loan (First Lien), 1 Mo. LIBOR + 3.25%, 1.00% Floor
| | 5.55% | | 07/23/21 | | 1,411,629 |
| 952,764 | | Advantage Sales & Marketing, Inc., Term Loan B2, 1 Mo. LIBOR + 3.25%, 1.00% Floor
| | 5.55% | | 07/25/21 | | 863,842 |
| 1,674,500 | | Information Resources, Inc. (fka Symphonyiri Group, Inc.), Term Loan B, 3 Mo. LIBOR + 4.25%, 1.00% Floor
| | 6.57% | | 01/18/24 | | 1,673,110 |
| 214,503 | | TransUnion LLC, Term Loan B4, 1 Mo. LIBOR + 2.00%, 0.00% Floor
| | 4.30% | | 06/30/25 | | 213,928 |
| | | | | 4,162,509 |
| | | Restaurants – 1.6% | | | | | | |
| 262,027 | | IRB Holding Corp. (Arby’s/Inspire Brands), Term Loan B, 2 Mo. LIBOR + 3.25%, 1.00% Floor
| | 5.46% | | 01/18/25 | | 261,262 |
| 1,000,000 | | Portillo’s Holdings LLC, Second Lien Term Loan, 3 Mo. LIBOR + 8.00%, 1.00% Floor
| | 10.39% | | 08/15/22 | | 1,000,000 |
See Notes to Financial Statements
Page 13
First Trust Short Duration High Income Fund
Portfolio of Investments (Continued)
October 31, 2018
Principal
Value | | Description | | Rate (a) | | Stated
Maturity (b) | | Value |
| SENIOR FLOATING-RATE LOAN INTERESTS (Continued) |
| | | Restaurants (Continued) | | | | | | |
| $2,428,114 | | Portillo’s Holdings LLC, Term B Loan (First Lien), 3 Mo. LIBOR + 4.50%, 1.00% Floor
| | 6.89% | | 08/02/21 | | $2,423,573 |
| | | | | 3,684,835 |
| | | Retail REITs – 0.5% | | | | | | |
| 1,078,056 | | Capital Automotive LP, 2nd Lien Term Loan, 1 Mo. LIBOR + 6.00%, 1.00% Floor
| | 8.30% | | 03/15/25 | | 1,092,879 |
| | | Security & Alarm Services – 0.3% | | | | | | |
| 184,292 | | Frontdoor, Inc., Term Loan B, 1 Mo. LIBOR + 2.50%, 0.00% Floor
| | 4.81% | | 08/16/25 | | 184,293 |
| 533,256 | | Garda World Security Corp., Term Loan B, 3 Mo. LIBOR + 3.50%, 1.00% Floor
| | 5.82% | | 05/26/24 | | 534,813 |
| | | | | 719,106 |
| | | Semiconductors – 0.3% | | | | | | |
| 783,514 | | Microchip Technology, Initial Term Loan, 1 Mo. LIBOR + 2.00%, 0.00% Floor
| | 4.31% | | 05/29/25 | | 780,380 |
| | | Specialized Consumer Services – 1.5% | | | | | | |
| 1,114,000 | | Asurion LLC (fka Assurion Corp.), Second Lien Replacement B-2 Term Loan, 1 Mo. LIBOR + 6.50%, 0.00% Floor
| | 8.80% | | 07/31/25 | | 1,142,685 |
| 997,500 | | Asurion LLC (fka Assurion Corp.), Term Loan B7, 1 Mo. LIBOR + 3.00%, 0.00% Floor
| | 5.30% | | 11/03/24 | | 998,039 |
| 264,020 | | Asurion LLC (fka Assurion Corp.), Term Loan B4, 1 Mo. LIBOR + 3.00%, 0.00% Floor
| | 5.30% | | 08/04/22 | | 264,255 |
| 1,037,330 | | Asurion LLC (fka Assurion Corp.), Term Loan B6, 1 Mo. LIBOR + 3.00%, 0.00% Floor
| | 5.30% | | 11/03/23 | | 1,037,766 |
| | | | | 3,442,745 |
| | | Specialized Finance – 0.4% | | | | | | |
| 921,108 | | Alliant Holdings I, LLC, Initial Term Loan, 1 Mo. LIBOR + 3.00%, 0.00% Floor
| | 5.28% | | 05/09/25 | | 919,828 |
| | | Specialty Chemicals – 0.6% | | | | | | |
| 517,333 | | Akzonobel Specialty Chemicals (Starfruit), Term Loan B, 1 Mo. LIBOR + 3.25%, 0.00% Floor
| | 5.51% | | 10/01/25 | | 515,394 |
| 871,629 | | H.B. Fuller Company, Term Loan B, 1 Mo. LIBOR + 2.00%, 0.00% Floor
| | 4.28% | | 10/20/24 | | 867,994 |
| 75,432 | | Macdermid, Inc. (Platform Specialty Products Corp.), Term Loan B6, 1 Mo. LIBOR + 3.00%, 1.00% Floor
| | 5.30% | | 06/07/23 | | 75,448 |
| | | | | 1,458,836 |
| | | Specialty Stores – 0.5% | | | | | | |
| 451,172 | | Party City Holdings, Inc. (Party City Corp.), Term Loan B, 1 Mo. LIBOR + 2.75%, 0.75% Floor
| | 5.06% | | 08/19/22 | | 452,219 |
| 813,872 | | Toys “R” US, Term B-2 Loan, 3 Mo. PRIME + 2.75%, 1.50% Floor (d) (e)
| | 8.00% | | 05/25/18 | | 403,681 |
| 721,690 | | Toys “R” US, Term B4 Loan, 3 Mo. PRIME + 7.75%, 1.00% Floor (d) (e)
| | 13.00% | | 04/25/20 | | 366,560 |
| | | | | 1,222,460 |
| | | Systems Software – 6.0% | | | | | | |
| 1,331,351 | | Applied Systems, Inc., 1st Lien Term Loan, 3 Mo. LIBOR + 3.00%, 1.00% Floor
| | 5.39% | | 09/13/24 | | 1,335,519 |
| 234,945 | | Applied Systems, Inc., 2nd Lien Term Loan, 3 Mo. LIBOR + 7.00%, 1.00% Floor
| | 9.39% | | 09/13/25 | | 238,352 |
Page 14
See Notes to Financial Statements
First Trust Short Duration High Income Fund
Portfolio of Investments (Continued)
October 31, 2018
Principal
Value | | Description | | Rate (a) | | Stated
Maturity (b) | | Value |
| SENIOR FLOATING-RATE LOAN INTERESTS (Continued) |
| | | Systems Software (Continued) | | | | | | |
| $1,445,495 | | Avast Software B.V. (Sybil), Term Loan B, 3 Mo. LIBOR + 2.50%, 1.00% Floor
| | 4.89% | | 09/30/23 | | $1,449,889 |
| 1,962,040 | | BMC Software Finance, Inc. (Boxer Parent), Term Loan B, 3 Mo. LIBOR + 4.25%, 0.00% Floor
| | 6.65% | | 10/02/25 | | 1,966,748 |
| 1,251,451 | | Dynatrace LLC, Term Loan B, 1 Mo. LIBOR + 3.25%, 0.00% Floor
| | 5.55% | | 08/22/25 | | 1,258,234 |
| 1,329,455 | | Misys Financial Software Ltd. (Almonde, Inc.)(Finastra), Term Loan B, 3 Mo. LIBOR + 3.50%, 1.00% Floor
| | 5.89% | | 06/13/24 | | 1,320,960 |
| 1,815,616 | | Riverbed Technology, Inc., Term Loan B, 1 Mo. LIBOR + 3.25%, 1.00% Floor
| | 5.56% | | 04/24/22 | | 1,803,143 |
| 2,171,737 | | SS&C European Holdings, S.a.r.l, Term Loan B-3, 1 Mo. LIBOR + 2.25%, 0.00% Floor
| | 4.55% | | 04/16/25 | | 2,159,662 |
| 841,765 | | SS&C European Holdings, S.a.r.l, Term Loan B-4, 1 Mo. LIBOR + 2.25%, 0.00% Floor
| | 4.55% | | 04/16/25 | | 837,085 |
| 479,180 | | SS&C European Holdings, S.a.r.l, Term Loan B-5, 1 Mo. LIBOR + 2.25%, 0.00% Floor
| | 4.55% | | 04/16/25 | | 476,271 |
| 368,268 | | SUSE (Marcel Lux IV SARL), Facility B1 USD, 1 Mo. LIBOR + 3.25%, 0.00% Floor
| | 5.56% | | 09/30/25 | | 368,268 |
| 749,204 | | Vertafore, Inc., Term Loan B, 1 Mo. LIBOR + 3.25%, 0.00% Floor
| | 5.55% | | 06/15/25 | | 746,237 |
| | | | | 13,960,368 |
| | | Technology Hardware, Storage & Peripherals – 1.0% | | | | | | |
| 2,420,141 | | Dell International LLC, Term Loan B, 1 Mo. LIBOR + 2.00%, 0.75% Floor
| | 4.31% | | 09/07/23 | | 2,416,511 |
| | | Trading Companies & Distributors – 0.1% | | | | | | |
| 121,291 | | Reece International Pty Ltd. (Hamilton), Term Loan B, 3 Mo. LIBOR + 2.00%, 0.00% Floor
| | 4.40% | | 07/02/25 | | 121,443 |
| | | Total Senior Floating-Rate Loan Interests
| | 171,537,222 |
| | | (Cost $173,141,492) | | | | | | |
Principal
Value | | Description | | Stated
Coupon | | Stated
Maturity | | Value |
| CORPORATE BONDS AND NOTES – 18.0% |
| | | Application Software – 0.3% | | | | | | |
| 629,000 | | RP Crown Parent LLC (f)
| | 7.38% | | 10/15/24 | | 646,298 |
| | | Auto Parts & Equipment – 0.2% | | | | | | |
| 411,000 | | American Axle & Manufacturing, Inc.
| | 6.63% | | 10/15/22 | | 417,679 |
| | | Automotive Retail – 0.1% | | | | | | |
| 155,000 | | KAR Auction Services, Inc. (f)
| | 5.13% | | 06/01/25 | | 146,088 |
| | | Broadcasting – 2.8% | | | | | | |
| 986,000 | | Gray Television, Inc. (f)
| | 5.13% | | 10/15/24 | | 937,932 |
| 2,478,000 | | Nexstar Broadcasting, Inc. (f)
| | 5.63% | | 08/01/24 | | 2,372,685 |
| 880,000 | | Sinclair Television Group, Inc.
| | 6.13% | | 10/01/22 | | 891,000 |
| 1,998,000 | | Sinclair Television Group, Inc. (f)
| | 5.63% | | 08/01/24 | | 1,918,080 |
| 264,000 | | Sinclair Television Group, Inc. (f)
| | 5.88% | | 03/15/26 | | 252,450 |
| | | | | 6,372,147 |
| | | Building Products – 0.3% | | | | | | |
| 500,000 | | CEMEX Finance LLC (f)
| | 6.00% | | 04/01/24 | | 500,125 |
| 70,000 | | Standard Industries, Inc. (f)
| | 5.38% | | 11/15/24 | | 67,463 |
| | | | | 567,588 |
See Notes to Financial Statements
Page 15
First Trust Short Duration High Income Fund
Portfolio of Investments (Continued)
October 31, 2018
Principal
Value | | Description | | Stated
Coupon | | Stated
Maturity | | Value |
| CORPORATE BONDS AND NOTES (Continued) |
| | | Casinos & Gaming – 0.7% | | | | | | |
| $68,000 | | Caesars Resort Collection LLC/CRC Finco, Inc. (f)
| | 5.25% | | 10/15/25 | | $63,453 |
| 74,000 | | Eldorado Resorts (f)
| | 6.00% | | 09/15/26 | | 72,661 |
| 387,000 | | Eldorado Resorts, Inc.
| | 6.00% | | 04/01/25 | | 384,097 |
| 1,000,000 | | MGM Resorts International
| | 6.00% | | 03/15/23 | | 1,017,500 |
| | | | | 1,537,711 |
| | | Consumer Finance – 0.0% | | | | | | |
| 79,000 | | FirstCash, Inc. (f)
| | 5.38% | | 06/01/24 | | 78,210 |
| | | Diversified Real Estate Activities – 0.1% | | | | | | |
| 355,000 | | TRI Pointe Group, Inc./TRI Pointe Homes, Inc.
| | 5.88% | | 06/15/24 | | 332,813 |
| | | Environmental & Facilities Services – 0.0% | | | | | | |
| 52,000 | | Wrangler Buyer Corp. (f)
| | 6.00% | | 10/01/25 | | 55,900 |
| | | Health Care Equipment – 1.0% | | | | | | |
| 2,050,000 | | DJO Finance LLC/DJO Finance Corp. (f)
| | 8.13% | | 06/15/21 | | 2,073,985 |
| 136,000 | | Kinetic Concepts, Inc./KCI USA, Inc. (f)
| | 7.88% | | 02/15/21 | | 139,230 |
| | | | | 2,213,215 |
| | | Health Care Facilities – 4.3% | | | | | | |
| 1,130,000 | | Encompass Health Corp.
| | 5.75% | | 11/01/24 | | 1,131,413 |
| 100,000 | | HCA, Inc.
| | 5.88% | | 05/01/23 | | 104,125 |
| 375,000 | | HCA, Inc.
| | 5.38% | | 02/01/25 | | 378,281 |
| 2,935,000 | | Select Medical Corp.
| | 6.38% | | 06/01/21 | | 2,971,687 |
| 500,000 | | Tenet Healthcare Corp.
| | 6.75% | | 02/01/20 | | 515,625 |
| 1,266,000 | | Tenet Healthcare Corp. (f)
| | 7.50% | | 01/01/22 | | 1,323,761 |
| 3,339,000 | | Tenet Healthcare Corp.
| | 8.13% | | 04/01/22 | | 3,489,255 |
| | | | | 9,914,147 |
| | | Health Care Services – 0.4% | | | | | | |
| 490,000 | | DaVita, Inc.
| | 5.13% | | 07/15/24 | | 469,175 |
| 487,000 | | DaVita, Inc.
| | 5.00% | | 05/01/25 | | 462,041 |
| 83,000 | | MEDNAX, Inc. (f)
| | 5.25% | | 12/01/23 | | 83,104 |
| | | | | 1,014,320 |
| | | Health Care Technology – 0.5% | | | | | | |
| 1,222,000 | | Change Healthcare Holdings LLC/Change Healthcare Finance, Inc. (f)
| | 5.75% | | 03/01/25 | | 1,199,087 |
| | | Household Products – 0.0% | | | | | | |
| 100,000 | | Energizer Holdings, Inc. (f)
| | 5.50% | | 06/15/25 | | 97,500 |
| | | Industrial Machinery – 0.3% | | | | | | |
| 629,000 | | SPX FLOW, Inc. (f)
| | 5.63% | | 08/15/24 | | 613,275 |
| 142,000 | | SPX FLOW, Inc. (f)
| | 5.88% | | 08/15/26 | | 137,030 |
| | | | | 750,305 |
| | | Insurance Brokers – 0.5% | | | | | | |
| 727,000 | | Amwins Group, Inc. (f)
| | 7.75% | | 07/01/26 | | 748,810 |
| 462,000 | | HUB International Ltd. (f)
| | 7.00% | | 05/01/26 | | 452,067 |
| | | | | 1,200,877 |
| | | Investment Banking & Brokerage – 0.4% | | | | | | |
| 1,050,000 | | LPL Holdings, Inc. (f)
| | 5.75% | | 09/15/25 | | 1,022,437 |
| | | Leisure Facilities – 0.9% | | | | | | |
| 2,250,000 | | Constellation Merger Sub, Inc. (f)
| | 8.50% | | 09/15/25 | | 2,174,062 |
Page 16
See Notes to Financial Statements
First Trust Short Duration High Income Fund
Portfolio of Investments (Continued)
October 31, 2018
Principal
Value | | Description | | Stated
Coupon | | Stated
Maturity | | Value |
| CORPORATE BONDS AND NOTES (Continued) |
| | | Life Sciences Tools & Services – 0.5% | | | | | | |
| $914,000 | | Jaguar Holding Co. II/Pharmaceutical Product Development LLC (f)
| | 6.38% | | 08/01/23 | | $916,011 |
| 151,000 | | Syneos Health, Inc./inVentiv Health, Inc./inVentiv Health Clinical, Inc. (f)
| | 7.50% | | 10/01/24 | | 159,682 |
| 75,000 | | West Street Merger Sub, Inc. (f)
| | 6.38% | | 09/01/25 | | 70,688 |
| | | | | 1,146,381 |
| | | Managed Health Care – 0.8% | | | | | | |
| 170,000 | | Centene Corp.
| | 6.13% | | 02/15/24 | | 178,075 |
| 1,000,000 | | MPH Acquisition Holdings LLC (f)
| | 7.13% | | 06/01/24 | | 1,018,320 |
| 672,000 | | Polaris Intermediate Corp. (f) (g)
| | 8.50% | | 12/01/22 | | 691,320 |
| | | | | 1,887,715 |
| | | Metal & Glass Containers – 0.0% | | | | | | |
| 100,000 | | Owens-Brockway Glass Container, Inc. (f)
| | 5.88% | | 08/15/23 | | 100,000 |
| | | Movies & Entertainment – 0.4% | | | | | | |
| 831,000 | | AMC Entertainment Holdings, Inc.
| | 5.75% | | 06/15/25 | | 771,791 |
| 227,000 | | Cinemark USA, Inc.
| | 4.88% | | 06/01/23 | | 222,744 |
| | | | | 994,535 |
| | | Oil & Gas Exploration & Production – 0.2% | | | | | | |
| 200,000 | | Murphy Oil Corp.
| | 6.88% | | 08/15/24 | | 208,226 |
| 625,000 | | Sanchez Energy Corp.
| | 6.13% | | 01/15/23 | | 234,375 |
| | | | | 442,601 |
| | | Oil & Gas Storage & Transportation – 0.3% | | | | | | |
| 500,000 | | Crestwood Midstream Partners L.P./Crestwood Midstream Finance Corp.
| | 5.75% | | 04/01/25 | | 501,250 |
| 151,000 | | Holly Energy Partners L.P./Holly Energy Finance Corp. (f)
| | 6.00% | | 08/01/24 | | 152,132 |
| | | | | 653,382 |
| | | Packaged Foods & Meats – 0.2% | | | | | | |
| 390,000 | | B&G Foods, Inc.
| | 5.25% | | 04/01/25 | | 372,938 |
| | | Paper Packaging – 0.2% | | | | | | |
| 399,000 | | Reynolds Group Issuer, Inc./Reynolds Group Issuer LLC/Reynolds Group Issuer Lu. (f)
| | 7.00% | | 07/15/24 | | 399,998 |
| | | Pharmaceuticals – 1.0% | | | | | | |
| 152,000 | | Eagle Holdings Co. II LLC (f) (h)
| | 7.63% | | 05/15/22 | | 153,140 |
| 2,335,000 | | Endo Finance LLC & Endo Finco, Inc. (f)
| | 7.25% | | 01/15/22 | | 2,224,087 |
| | | | | 2,377,227 |
| | | Real Estate Services – 0.2% | | | | | | |
| 370,000 | | Realogy Group LLC/Realogy Co-Issuer Corp. (f)
| | 4.88% | | 06/01/23 | | 336,700 |
| | | Restaurants – 0.1% | | | | | | |
| 216,000 | | IRB Holding Corp. (f)
| | 6.75% | | 02/15/26 | | 207,360 |
| | | Technology Hardware, Storage & Peripherals – 0.2% | | | | | | |
| 500,000 | | Dell International LLC/EMC Corp. (f)
| | 7.13% | | 06/15/24 | | 529,578 |
| | | Trading Companies & Distributors – 0.1% | | | | | | |
| 137,000 | | United Rentals North America, Inc.
| | 6.50% | | 12/15/26 | | 138,848 |
| | | Wireless Telecommunication Services – 1.0% | | | | | | |
| 38,000 | | SBA Communications Corp.
| | 4.00% | | 10/01/22 | | 36,575 |
| 990,000 | | SBA Communications Corp.
| | 4.88% | | 09/01/24 | | 959,063 |
See Notes to Financial Statements
Page 17
First Trust Short Duration High Income Fund
Portfolio of Investments (Continued)
October 31, 2018
Principal
Value | | Description | | Stated
Coupon | | Stated
Maturity | | Value |
| CORPORATE BONDS AND NOTES (Continued) |
| | | Wireless Telecommunication Services (Continued) | | | | | | |
| $501,000 | | Sprint Communications, Inc. (f)
| | 9.00% | | 11/15/18 | | $502,628 |
| 500,000 | | Sprint Communications, Inc.
| | 7.00% | | 08/15/20 | | 518,750 |
| 200,000 | | T-Mobile USA, Inc.
| | 6.00% | | 03/01/23 | | 205,568 |
| 170,000 | | T-Mobile USA, Inc.
| | 5.13% | | 04/15/25 | | 167,875 |
| | | | | 2,390,459 |
| | | Total Corporate Bonds and Notes
| | 41,718,106 |
| | | (Cost $42,662,028) | | | | | | |
| FOREIGN CORPORATE BONDS AND NOTES – 3.0% |
| | | Aluminum – 0.6% | | | | | | |
| 250,000 | | Alcoa Nederland Holding B.V. (f)
| | 6.75% | | 09/30/24 | | 263,750 |
| 1,121,000 | | Alcoa Nederland Holding B.V. (f)
| | 7.00% | | 09/30/26 | | 1,188,260 |
| | | | | 1,452,010 |
| | | Automobile Manufacturers – 0.4% | | | | | | |
| 799,000 | | Fiat Chrysler Automobiles N.V.
| | 5.25% | | 04/15/23 | | 797,002 |
| | | Cable & Satellite – 0.1% | | | | | | |
| 250,000 | | Virgin Media Finance PLC (f)
| | 6.00% | | 10/15/24 | | 245,388 |
| | | Casinos & Gaming – 0.1% | | | | | | |
| 327,000 | | Melco Resorts Finance Ltd. (f)
| | 4.88% | | 06/06/25 | | 300,583 |
| | | Packaged Foods & Meats – 0.1% | | | | | | |
| 224,000 | | JBS USA LUX S.A./JBS USA Finance, Inc. (f)
| | 5.88% | | 07/15/24 | | 220,696 |
| | | Pharmaceuticals – 1.2% | | | | | | |
| 1,334,000 | | Bausch Health Companies, Inc. (Valeant) (f)
| | 5.63% | | 12/01/21 | | 1,317,325 |
| 116,000 | | Concordia Healthcare Corp.
| | 8.00% | | 09/06/24 | | 113,970 |
| 1,000,000 | | Mallinckrodt International Finance S.A./Mallinckrodt CB LLC (f)
| | 5.75% | | 08/01/22 | | 897,500 |
| 250,000 | | Mallinckrodt International Finance S.A./Mallinckrodt CB LLC (f)
| | 5.63% | | 10/15/23 | | 215,625 |
| 250,000 | | Mallinckrodt International Finance S.A./Mallinckrodt CB LLC (f)
| | 5.50% | | 04/15/25 | | 202,500 |
| | | | | 2,746,920 |
| | | Restaurants – 0.5% | | | | | | |
| 1,303,000 | | 1011778 BC ULC/New Red Finance, Inc. (f)
| | 5.00% | | 10/15/25 | | 1,224,820 |
| | | Total Foreign Corporate Bonds and Notes
| | 6,987,419 |
| | | (Cost $7,277,413) | | | | | | |
| Shares | | Description | | Value |
| COMMON STOCKS – 0.2% |
| | | Broadcasting – 0.0% | | |
| 426 | | Cumulus Media New Holdings (i)
| | 6,816 |
| | | Electric Utilities – 0.1% | | |
| 14,134 | | Vistra Energy Corp. (i)
| | 319,852 |
| | | Oil & Gas Exploration & Production – 0.1% | | |
| 47,894 | | Ascent Resources - Marcellus LLC Class A Common Shares (c) (i)
| | 153,668 |
| | | Total Common Stocks
| | 480,336 |
| | | (Cost $377,488) | | |
| RIGHTS – 0.0% |
| | | Electric Utilities – 0.0% | | |
| 14,134 | | Vistra Energy Corp. (i)
| | 11,420 |
Page 18
See Notes to Financial Statements
First Trust Short Duration High Income Fund
Portfolio of Investments (Continued)
October 31, 2018
| Shares | | Description | | Value |
| RIGHTS (Continued) |
| | | Electric Utilities (Continued) | | |
| 22,964 | | Vistra Energy Corp. Claim (i) (j) (k)
| | $0 |
| | | | | 11,420 |
| | | Life Sciences Tools & Services – 0.0% | | |
| 1 | | New Millennium Holdco, Inc., Corporate Claim Trust (i) (j) (k) (l)
| | 0 |
| 1 | | New Millennium Holdco, Inc., Lender Claim Trust (i) (j) (k) (l)
| | 0 |
| | | | | 0 |
| | | Total Rights
| | 11,420 |
| | | (Cost $23,701) | | |
| WARRANTS – 0.0% |
| | | Oil & Gas Exploration & Production – 0.0% | | |
| 12,400 | | Ascent Resources - Marcellus LLC First Lien Warrants (c) (i)
| | 372 |
| | | (Cost $1,240) | | |
| MONEY MARKET FUNDS – 7.2% |
| 16,798,983 | | Morgan Stanley Institutional Liquidity Funds - Treasury Portfolio - Institutional Class - 2.07% (m)
| | 16,798,983 |
| | | (Cost $16,798,983) | | |
| | | Total Investments – 102.3%
| | 237,533,858 |
| | | (Cost $240,282,345) (n) | | |
| | | Net Other Assets and Liabilities – (2.3)%
| | (5,362,498) |
| | | Net Assets – 100.0%
| | $232,171,360 |
|
| (a) | Senior Floating-Rate Loan Interests (“Senior Loans”) in which the Fund invests pay interest at rates which are periodically predetermined by reference to a base lending rate plus a premium. These base lending rates are generally (i) the lending rate offered by one or more major European banks, such as the LIBOR, (ii) the prime rate offered by one or more United States banks or (iii) the certificate of deposit rate. Certain Senior Loans are subject to a LIBOR floor that establishes a minimum LIBOR rate. When a range of rates is disclosed, the Fund holds more than one contract within the same tranche with identical LIBOR period, spread and floor, but different LIBOR reset dates. |
| (b) | Senior Loans generally are subject to mandatory and/or optional prepayment. As a result, the actual remaining maturity of Senior Loans may be substantially less than the stated maturities shown. |
| (c) | On March 30, 2018, American Energy Marcellus Holdings LLC, also known as Ascent Resources - Marcellus LLC, completed a Bankruptcy Plan of Reorganization. In connection with the Plan of Reorganization, the Fund received a portion of a new exit term loan and a share of the newly issued common equity shares in the re-organized company. The Fund also received equity warrants entitling it to purchase additional common equity shares. |
| (d) | This issuer has filed for protection in bankruptcy court. |
| (e) | This issuer is in default and interest is not being accrued by the Fund nor paid by the issuer. |
| (f) | This security, sold within the terms of a private placement memorandum, is exempt from registration upon resale under Rule 144A under the Securities Act of 1933, as amended (the “1933 Act”), and may be resold in transactions exempt from registration, normally to qualified institutional buyers. Pursuant to procedures adopted by the Trust’s Board of Trustees, this security has been determined to be liquid by First Trust Advisors L.P. (the “Advisor”). Although market instability can result in periods of increased overall market illiquidity, liquidity for each security is determined based on security specific factors and assumptions, which require subjective judgment. At October 31, 2018, securities noted as such amounted to $30,713,784 or 13.2% of net assets. |
| (g) | These notes are Senior Payment-in-kind (“PIK”) Toggle Notes whereby the issuer may, at its option, elect to pay interest on the notes (1) entirely in cash or (2) entirely in PIK interest. Interest paid in cash will accrue on the notes at a rate of 8.50% per annum (“Cash Interest Rate”) and PIK interest will accrue on the notes at a rate per annum equal to the Cash Interest Rate plus 75 basis points. For the fiscal year ended October 31, 2018, this security paid all of its interest in cash. |
| (h) | These notes are Senior PIK Toggle Notes whereby the issuer may, at its option, elect to pay interest on the notes (1) entirely in cash or (2) entirely in PIK interest. Interest paid in cash will accrue on the notes at a rate of 7.63% per annum (“Cash Interest Rate”) and PIK interest will accrue on the notes at a rate per annum equal to the Cash Interest Rate plus 75 basis points. For the fiscal year ended October 31, 2018, this security paid all of its interest in cash. |
| (i) | Non-income producing security. |
| (j) | This security is fair valued by the Advisor’s Pricing Committee in accordance with procedures adopted by the Trust’s Board of Trustees, and in accordance with the provisions of the Investment Company Act of 1940, as amended. At October 31, 2018, securities noted as such are valued at $0 or 0.0% of net assets. |
See Notes to Financial Statements
Page 19
First Trust Short Duration High Income Fund
Portfolio of Investments (Continued)
October 31, 2018
| (k) | This security’s value was determined using significant unobservable inputs (see Note 2A-Portfolio Valuation in the Notes to Financial Statements). |
| (l) | Pursuant to procedures adopted by the Trust’s Board of Trustees, this security has been determined to be illiquid by the Advisor. |
| (m) | Rate shown reflects yield as of October 31, 2018. |
| (n) | Aggregate cost for federal income tax purposes was $240,433,718. As of October 31, 2018, the aggregate gross unrealized appreciation for all investments in which there was an excess of value over tax cost was $496,017 and the aggregate gross unrealized depreciation for all investments in which there was an excess of tax cost over value was $3,395,877. The net unrealized depreciation was $2,899,860. |
| LIBOR | London Interbank Offered Rate |
| USD | United States Dollar |
Valuation Inputs
A summary of the inputs used to value the Fund’s investments as of October 31, 2018 is as follows (see Note 2A - Portfolio Valuation in the Notes to Financial Statements):
| | Total
Value at
10/31/2018 | Level 1
Quoted
Prices | Level 2
Significant
Observable
Inputs | Level 3
Significant
Unobservable
Inputs |
Senior Floating-Rate Loan Interests*
| $ 171,537,222 | $ — | $ 171,537,222 | $ — |
Corporate Bonds and Notes*
| 41,718,106 | — | 41,718,106 | — |
Foreign Corporate Bonds and Notes*
| 6,987,419 | — | 6,987,419 | — |
| Common Stocks: | | | | |
Electric Utilities
| 319,852 | 319,852 | — | — |
Other industry categories*
| 160,484 | — | 160,484 | — |
| Rights: | | | | |
Electric Utilities
| 11,420 | — | 11,420 | —** |
Life Sciences Tools & Services
| —** | — | — | —** |
Warrants*
| 372 | — | 372 | — |
Money Market Funds
| 16,798,983 | 16,798,983 | — | — |
Total Investments
| $ 237,533,858 | $ 17,118,835 | $ 220,415,023 | $—** |
| * | See Portfolio of Investments for industry breakout. |
| ** | Investment is valued at $0. |
Level 3 Rights are fair valued by the Advisor’s Pricing Committee and are footnoted in the Portfolio of Investments. These values are based on unobservable and non-quantitative inputs.
Page 20
See Notes to Financial Statements
First Trust Short Duration High Income Fund
Statement of Assets and Liabilities
October 31, 2018
| ASSETS: | |
Investments, at value
(Cost $240,282,345)
| $ 237,533,858 |
Cash
| 47,444 |
| Receivables: | |
Investment securities sold
| 5,271,164 |
Interest
| 1,143,172 |
Fund shares sold
| 239,497 |
Total Assets
| 244,235,135 |
| LIABILITIES: | |
| Payables: | |
Investment securities purchased
| 8,026,937 |
Fund shares redeemed
| 3,591,270 |
Distributions
| 141,479 |
Investment advisory fees
| 128,438 |
Audit and tax fees
| 58,927 |
12b-1 distribution and service fees
| 32,951 |
Shareholder reporting fees
| 25,045 |
Transfer agent fees
| 17,120 |
Administrative fees
| 17,051 |
Custodian fees
| 13,060 |
Commitment fees
| 4,269 |
Legal fees
| 1,449 |
Trustees’ fees and expenses
| 1,371 |
Financial reporting fees
| 771 |
Registration fees
| 452 |
Other liabilities
| 3,185 |
Total Liabilities
| 12,063,775 |
NET ASSETS
| $232,171,360 |
| NET ASSETS consist of: | |
Paid-in capital
| $ 241,605,364 |
Par value
| 118,326 |
Accumulated distributable earnings (loss)
| (9,552,330) |
NET ASSETS
| $232,171,360 |
| Class A Shares: | |
Net asset value and redemption price per share (Based on net assets of $57,982,113 and 2,955,273 shares of beneficial interest issued and outstanding)
| $19.62 |
Maximum sales charge (3.50% of offering price)
| 0.71 |
Maximum offering price to public
| $20.33 |
| Class C Shares: | |
Net asset value and redemption price per share (Based on net assets of $23,624,947 and 1,205,195 shares of beneficial interest issued and outstanding)
| $19.60 |
| Class I Shares: | |
Net asset value and redemption price per share (Based on net assets of $150,564,300 and 7,672,092 shares of beneficial interest issued and outstanding)
| $19.63 |
See Notes to Financial Statements
Page 21
First Trust Short Duration High Income Fund
Statement of Operations
For the Year Ended October 31, 2018
| INVESTMENT INCOME: | |
Interest
| $ 11,284,963 |
Other
| 206,752 |
Total investment income
| 11,491,715 |
| EXPENSES: | |
Investment advisory fees
| 1,382,410 |
| 12b-1 distribution and/or service fees: | |
Class A
| 127,579 |
Class C
| 236,442 |
Transfer agent fees
| 125,865 |
Administrative fees
| 98,758 |
Shareholder reporting fees
| 62,171 |
Registration fees
| 61,707 |
Audit and tax fees
| 60,350 |
Commitment fees
| 49,255 |
Custodian fees
| 48,280 |
Legal fees
| 40,029 |
Trustees’ fees and expenses
| 16,276 |
Expenses previously waived or reimbursed
| 11,894 |
Financial reporting fees
| 9,250 |
Excise tax expense
| 3,486 |
Other
| 24,152 |
Total expenses
| 2,357,904 |
NET INVESTMENT INCOME (LOSS)
| 9,133,811 |
| NET REALIZED AND UNREALIZED GAIN (LOSS): | |
Net realized gain (loss) on investments
| (1,400,521) |
Net change in unrealized appreciation (depreciation) on investments
| (2,162,996) |
NET REALIZED AND UNREALIZED GAIN (LOSS)
| (3,563,517) |
NET INCREASE (DECREASE) IN NET ASSETS RESULTING FROM OPERATIONS
| $ 5,570,294 |
Page 22
See Notes to Financial Statements
First Trust Short Duration High Income Fund
Statements of Changes in Net Assets
| | Year
Ended
10/31/2018 | | Year
Ended
10/31/2017 |
| OPERATIONS: | | | |
Net investment income (loss)
| $ 9,133,811 | | $ 9,139,471 |
Net realized gain (loss)
| (1,400,521) | | (886,874) |
Net change in unrealized appreciation (depreciation)
| (2,162,996) | | 2,626,918 |
Net increase (decrease) in net assets resulting from operations
| 5,570,294 | | 10,879,515 |
| DISTRIBUTIONS TO SHAREHOLDERS FROM INVESTMENT OPERATIONS: | | | |
Class A Shares
| (2,228,545) | | |
Class C Shares
| (864,672) | | |
Class I Shares
| (6,381,697) | | |
Total distributions to shareholders from investment operations
| (9,474,914) | | |
| DISTRIBUTIONS TO SHAREHOLDERS FROM NET INVESTMENT INCOME: | | | |
Class A Shares
| | | (3,326,443) |
Class C Shares
| | | (883,245) |
Class I Shares
| | | (6,255,088) |
Total distributions to shareholders from net investment income
| | | (10,464,776) |
| DISTRIBUTIONS TO SHAREHOLDERS FROM RETURN OF CAPITAL: | | | |
Class A shares
| (58,171) | | — |
Class C shares
| (22,506) | | — |
Class I shares
| (166,998) | | — |
Total distributions to shareholders from return of capital
| (247,675) | | — |
| CAPITAL TRANSACTIONS: | | | |
Proceeds from shares sold
| 105,690,417 | | 132,141,172 |
Proceeds from shares reinvested
| 8,196,603 | | 8,836,368 |
Cost of shares redeemed
| (113,434,134) | | (97,646,017) |
Net increase (decrease) in net assets resulting from capital transactions
| 452,886 | | 43,331,523 |
Total increase (decrease) in net assets
| (3,699,409) | | 43,746,262 |
| NET ASSETS: | | | |
Beginning of period
| 235,870,769 | | 192,124,507 |
End of period
| $232,171,360 | | $235,870,769 |
Accumulated net investment income (loss) at end of period
| | | $(249,390) |
See Notes to Financial Statements
Page 23
First Trust Short Duration High Income Fund
Financial Highlights
For a Share outstanding throughout each period
| Class A Shares | Year Ended October 31, |
| 2018 | | 2017 | | 2016 | | 2015 | | 2014 |
Net asset value, beginning of period
| $ 20.00 | | $ 19.97 | | $ 19.83 | | $ 20.54 | | $ 20.68 |
| Income from investment operations: | | | | | | | | | |
Net investment income (loss) (a)
| 0.84 | | 0.79 | | 0.87 | | 0.90 | | 0.76 |
Net realized and unrealized gain (loss)
| (0.33) | | 0.15 | | 0.18 | | (0.77) | | (0.12) |
Total from investment operations
| 0.51 | | 0.94 | | 1.05 | | 0.13 | | 0.64 |
| Distributions paid to shareholders from: | | | | | | | | | |
Net investment income
| (0.87) | | (0.91) | | (0.91) | | (0.80) | | (0.78) |
Net realized gain
| — | | — | | — | | (0.04) | | — |
Net return of capital
| (0.02) | | — | | — | | — | | — |
Total distributions
| (0.89) | | (0.91) | | (0.91) | | (0.84) | | (0.78) |
Net asset value, end of period
| $19.62 | | $20.00 | | $19.97 | | $19.83 | | $20.54 |
Total return (b)
| 2.61% | | 4.79% | | 5.47% | | 0.63% | | 3.14% |
| Ratios to average net assets/supplemental data: | | | | | | | | | |
Net assets, end of period (in 000’s)
| $ 57,982 | | $ 72,462 | | $ 55,640 | | $ 53,433 | | $ 53,304 |
Ratio of total expenses to average net assets
| 1.19% | | 1.21% | | 1.27% | | 1.26% | | 1.38% |
Ratio of net expenses to average net assets
| 1.19% | | 1.26% (c) | | 1.27% (c) | | 1.25% | | 1.25% |
Ratio of net investment income (loss) to average net assets
| 4.22% | | 3.96% | | 4.44% | | 4.43% | | 3.68% |
Portfolio turnover rate
| 97% | | 100% | | 62% | | 58% | | 109% |
| (a) | Based on average shares outstanding. |
| (b) | Assumes reinvestment of all distributions for the period and does not include payment of the maximum sales charge of 3.50% or contingent deferred sales charge (CDSC). On purchases of $1 million or more, a CDSC of 1% may be imposed on certain redemptions made within twelve months of purchase. If the sales charges were included, total returns would be lower. These returns include Rule 12b-1 service fees of 0.25% and do not reflect the deduction of taxes that a shareholder would pay on Fund distributions or the redemption of Fund shares. The total returns would have been lower if certain fees had not been waived and expenses reimbursed by the investment advisor. Total return is calculated for the time period presented and is not annualized for periods of less than one year. |
| (c) | Includes excise tax. If this excise tax expense was not included, the net expense ratio would have been 1.25%. |
Page 24
See Notes to Financial Statements
First Trust Short Duration High Income Fund
Financial Highlights (Continued)
For a Share outstanding throughout each period
| Class C Shares | Year Ended October 31, |
| 2018 | | 2017 | | 2016 | | 2015 | | 2014 |
Net asset value, beginning of period
| $ 19.98 | | $ 19.95 | | $ 19.81 | | $ 20.52 | | $ 20.66 |
| Income from investment operations: | | | | | | | | | |
Net investment income (loss) (a)
| 0.69 | | 0.64 | | 0.72 | | 0.75 | | 0.60 |
Net realized and unrealized gain (loss)
| (0.33) | | 0.15 | | 0.18 | | (0.77) | | (0.11) |
Total from investment operations
| 0.36 | | 0.79 | | 0.90 | | (0.02) | | 0.49 |
| Distributions paid to shareholders from: | | | | | | | | | |
Net investment income
| (0.73) | | (0.76) | | (0.76) | | (0.65) | | (0.63) |
Net realized gain
| — | | — | | — | | (0.04) | | — |
Net return of capital
| (0.01) | | — | | — | | — | | — |
Total distributions
| (0.74) | | (0.76) | | (0.76) | | (0.69) | | (0.63) |
Net asset value, end of period
| $19.60 | | $19.98 | | $19.95 | | $19.81 | | $20.52 |
Total return (b)
| 1.85% | | 4.01% | | 4.69% | | (0.12)% | | 2.38% |
| Ratios to average net assets/supplemental data: | | | | | | | | | |
Net assets, end of period (in 000’s)
| $ 23,625 | | $ 24,393 | | $ 23,841 | | $ 25,213 | | $ 24,531 |
Ratio of total expenses to average net assets
| 1.94% | | 1.96% | | 2.02% | | 2.01% | | 2.13% |
Ratio of net expenses to average net assets
| 1.94% | | 2.01% (c) | | 2.02% (c) | | 2.00% | | 2.00% |
Ratio of net investment income (loss) to average net assets
| 3.47% | | 3.20% | | 3.70% | | 3.68% | | 2.93% |
Portfolio turnover rate
| 97% | | 100% | | 62% | | 58% | | 109% |
| (a) | Based on average shares outstanding. |
| (b) | Assumes reinvestment of all distributions for the period and does not include payment of the maximum CDSC of 1%, charged on certain redemptions made within one year of purchase. If the sales charge was included, total returns would be lower. These returns include combined Rule 12b-1 distribution and service fees of 1% and do not reflect the deduction of taxes that a shareholder would pay on Fund distributions or the redemption of Fund shares. The total returns would have been lower if certain fees had not been waived and expenses reimbursed by the investment advisor. Total return is calculated for the time period presented and is not annualized for periods of less than one year. |
| (c) | Includes excise tax. If this excise tax expense was not included, the net expense ratio would have been 2.00%. |
See Notes to Financial Statements
Page 25
First Trust Short Duration High Income Fund
Financial Highlights (Continued)
For a Share outstanding throughout each period
| Class I Shares | Year Ended October 31, |
| 2018 | | 2017 | | 2016 | | 2015 | | 2014 |
Net asset value, beginning of period
| $ 20.00 | | $ 19.97 | | $ 19.83 | | $ 20.54 | | $ 20.68 |
| Income from investment operations: | | | | | | | | | |
Net investment income (loss) (a)
| 0.89 | | 0.85 | | 0.92 | | 0.95 | | 0.81 |
Net realized and unrealized gain (loss)
| (0.32) | | 0.14 | | 0.18 | | (0.77) | | (0.12) |
Total from investment operations
| 0.57 | | 0.99 | | 1.10 | | 0.18 | | 0.69 |
| Distributions paid to shareholders from: | | | | | | | | | |
Net investment income
| (0.92) | | (0.96) | | (0.96) | | (0.85) | | (0.83) |
Net realized gain
| — | | — | | — | | (0.04) | | — |
Net return of capital
| (0.02) | | — | | — | | — | | — |
Total distributions
| (0.94) | | (0.96) | | (0.96) | | (0.89) | | (0.83) |
Net asset value, end of period
| $19.63 | | $20.00 | | $19.97 | | $19.83 | | $20.54 |
Total return (b)
| 2.92% | | 5.06% | | 5.74% | | 0.88% | | 3.40% |
| Ratios to average net assets/supplemental data: | | | | | | | | | |
Net assets, end of period (in 000’s)
| $ 150,564 | | $ 139,015 | | $ 112,644 | | $ 103,655 | | $ 103,033 |
Ratio of total expenses to average net assets
| 0.94% | | 0.96% | | 1.02% | | 1.01% | | 1.13% |
Ratio of net expenses to average net assets
| 0.94% | | 1.01% (c) | | 1.02% (c) | | 1.00% | | 1.00% |
Ratio of net investment income (loss) to average net assets
| 4.47% | | 4.21% | | 4.69% | | 4.68% | | 3.93% |
Portfolio turnover rate
| 97% | | 100% | | 62% | | 58% | | 109% |
| (a) | Based on average shares outstanding. |
| (b) | Assumes reinvestment of all distributions for the period. These returns do not reflect the deduction of taxes that a shareholder would pay on Fund distributions or the redemption of Fund shares. The total returns would have been lower if certain fees had not been waived and expenses reimbursed by the investment advisor. Total return is calculated for the time period presented and is not annualized for periods of less than one year. |
| (c) | Includes excise tax. If this excise tax expense was not included, the net expense ratio would have been 1.00%. |
Page 26
See Notes to Financial Statements
Notes to Financial Statements
First Trust Short Duration High Income Fund
October 31, 2018
1. Organization
First Trust Short Duration High Income Fund (the “Fund”) is a series of the First Trust Series Fund (the “Trust”), a Massachusetts business trust organized on July 9, 2010, and is registered as a diversified open-end management investment company with the Securities and Exchange Commission (“SEC”) under the Investment Company Act of 1940, as amended (the “1940 Act”). The Fund offers three classes of shares: Class A, Class C and Class I. Each class represents an interest in the same portfolio of investments but with a different combination of sales charges, distribution and service (12b-1) fees, eligibility requirements and other features.
The Fund’s primary investment objective is to seek to provide a high level of current income. As a secondary objective, the Fund seeks capital appreciation. The Fund seeks to achieve its investment objectives by investing, under normal market conditions, at least 80% of its net assets (including investment borrowings) in high-yield debt securities and bank loans that are rated below-investment grade or unrated. High-yield debt securities are below-investment grade debt securities, commonly known as “junk bonds.” For purposes of determining whether a security is below-investment grade, the lowest available rating is used. There can be no assurance that the Fund will achieve its investment objectives. The Fund may not be appropriate for all investors.
2. Significant Accounting Policies
The Fund is considered an investment company and follows accounting and reporting guidance under Financial Accounting Standards Board (“FASB”) Accounting Standards Codification (“ASC”) Topic 946, “Financial Services-Investment Companies.” The following is a summary of significant accounting policies consistently followed by the Fund in the preparation of the financial statements. The preparation of the financial statements in accordance with accounting principles generally accepted in the United States of America (“U.S. GAAP”) requires management to make estimates and assumptions that affect the reported amounts and disclosures in the financial statements. Actual results could differ from those estimates.
A. Portfolio Valuation
The net asset value (“NAV”) of each class of shares of the Fund is determined daily as of the close of regular trading on the New York Stock Exchange (“NYSE”), normally 4:00 p.m. Eastern time, on each day the NYSE is open for trading. If the NYSE closes early on a valuation day, the NAV is determined as of that time. The NAV for each class is calculated by dividing the value of the Fund’s total assets attributable to such class (including accrued interest and dividends), less all liabilities attributable to such class (including accrued expenses, dividends declared but unpaid and any borrowings of the Fund), by the total number of shares of the class outstanding. Differences in NAV of each class of the Fund’s shares are generally expected to be due to the daily expense accruals of the specified distribution and service (12b-1) fees and transfer agency costs applicable to such class of shares and the resulting differential in the dividends that may be paid on each class of shares.
The Fund’s investments are valued daily at market value or, in the absence of market value with respect to any portfolio securities, at fair value. Market value prices represent last sale or official closing prices from a national or foreign exchange (i.e., a regulated market) and are primarily obtained from third-party pricing services. Fair value prices represent any prices not considered market value prices and are either obtained from a third-party pricing service or are determined by the Pricing Committee of the Trust’s investment advisor, First Trust Advisors L.P. (“First Trust” or the “Advisor”), in accordance with valuation procedures adopted by the Trust’s Board of Trustees, and in accordance with provisions of the 1940 Act. Investments valued by the Advisor’s Pricing Committee, if any, are footnoted as such in the footnotes to the Portfolio of Investments. The Fund’s investments are valued as follows:
Senior Floating-Rate Loan interests (“Senior Loans”)(1) are not listed on any securities exchange or board of trade. Senior Loans are typically bought and sold by institutional investors in individually negotiated private transactions that function in many respects like an over-the-counter secondary market, although typically no formal market-makers exist. This market, while having grown substantially since its inception, generally has fewer trades and less liquidity than the secondary market for other types of securities. Some Senior Loans have few or no trades, or trade infrequently, and information regarding a specific Senior Loan may not be widely available or may be incomplete. Accordingly, determinations of the market value of Senior Loans may be based on infrequent and dated information. Because there is less reliable, objective data available, elements of judgment may play a greater role in valuation of Senior Loans than for other types of securities. Typically, Senior Loans are fair valued using information provided by a third-party pricing service. The third-party pricing service primarily uses over-the-counter pricing from dealer runs and broker quotes from indicative sheets to value the Senior Loans.
Common stocks and other equity securities listed on any national or foreign exchange (excluding The Nasdaq Stock Market LLC (“Nasdaq”) and the London Stock Exchange Alternative Investment Market (“AIM”)) are valued at the last sale price on the exchange on which they are principally traded or, for Nasdaq and AIM securities, the official closing price. Securities traded on more than one securities exchange are valued at the last sale price or official closing price, as applicable, at the close of the securities exchange representing the principal market for such securities.
| (1) | The terms “security” and “securities” used throughout the Notes to Financial Statements include Senior Loans. |
Notes to Financial Statements (Continued)
First Trust Short Duration High Income Fund
October 31, 2018
Shares of open-end funds are valued at fair value which is based on NAV per share.
Fixed income and other debt securities having a remaining maturity of sixty days or less when purchased are fair valued at cost adjusted for amortization of premiums and accretion of discounts (amortized cost), provided the Advisor’s Pricing Committee has determined that the use of amortized cost is an appropriate reflection of fair value given market and issuer-specific conditions existing at the time of the determination. Factors that may be considered in determining the appropriateness of the use of amortized cost include, but are not limited to, the following:
| 1) | the credit conditions in the relevant market and changes thereto; |
| 2) | the liquidity conditions in the relevant market and changes thereto; |
| 3) | the interest rate conditions in the relevant market and changes thereto (such as significant changes in interest rates); |
| 4) | issuer-specific conditions (such as significant credit deterioration); and |
| 5) | any other market-based data the Advisor’s Pricing Committee considers relevant. In this regard, the Advisor’s Pricing Committee may use last-obtained market-based data to assist it when valuing portfolio securities using amortized cost. |
Corporate bonds, corporate notes and other debt securities are fair valued on the basis of valuations provided by dealers who make markets in such securities or by a third-party pricing service approved by the Fund’s Board of Trustees, which may use the following valuation inputs when available:
| 1) | benchmark yields; |
| 2) | reported trades; |
| 3) | broker/dealer quotes; |
| 4) | issuer spreads; |
| 5) | benchmark securities; |
| 6) | bids and offers; and |
| 7) | reference data including market research publications. |
Securities traded in an over-the-counter market are fair valued at the mean of their most recent bid and asked price, if available, and otherwise at their closing bid price.
Certain securities may not be able to be priced by pre-established pricing methods. Such securities may be valued by the Trust’s Board of Trustees or its delegate, the Advisor’s Pricing Committee, at fair value. These securities generally include, but are not limited to, restricted securities (securities which may not be publicly sold without registration under the Securities Act of 1933, as amended) for which a third-party pricing service is unable to provide a market price; securities whose trading has been formally suspended; a security whose market or fair value price is not available from a pre-established pricing source; a security with respect to which an event has occurred that is likely to materially affect the value of the security after the market has closed but before the calculation of the Fund’s NAV or make it difficult or impossible to obtain a reliable market quotation; and a security whose price, as provided by the third-party pricing service, does not reflect the security’s fair value. As a general principle, the current fair value of a security would appear to be the amount which the owner might reasonably expect to receive for the security upon its current sale. When fair value prices are used, generally they will differ from market quotations or official closing prices on the applicable exchanges. A variety of factors may be considered in determining the fair value of such securities, including, but not limited to, the following:
| 1) | the fundamental business data relating to the borrower/issuer; |
| 2) | an evaluation of the forces which influence the market in which these securities are purchased and sold; |
| 3) | the type, size and cost of the security; |
| 4) | the financial statements of the borrower/issuer; |
| 5) | the credit quality and cash flow of the borrower/issuer, based on the Advisor’s or external analysis; |
| 6) | the information as to any transactions in or offers for the security; |
| 7) | the price and extent of public trading in similar securities (or equity securities) of the issuer/borrower, or comparable companies; |
| 8) | the coupon payments; |
| 9) | the quality, value and salability of collateral, if any, securing the security; |
| 10) | the business prospects of the borrower/issuer, including any ability to obtain money or resources from a parent or affiliate and an assessment of the borrower’s/issuer’s management; |
| 11) | the prospects for the borrower’s/issuer’s industry, and multiples (of earnings and/or cash flows) being paid for similar businesses in that industry; |
| 12) | the borrower’s/issuer’s competitive position within the industry; |
Notes to Financial Statements (Continued)
First Trust Short Duration High Income Fund
October 31, 2018
| 13) | the borrower’s/issuer’s ability to access additional liquidity through public and/or private markets; and |
| 14) | other relevant factors. |
The Fund is subject to fair value accounting standards that define fair value, establish the framework for measuring fair value and provide a three-level hierarchy for fair valuation based upon the inputs to the valuation as of the measurement date. The three levels of the fair value hierarchy are as follows:
| • | Level 1 – Level 1 inputs are quoted prices in active markets for identical investments. An active market is a market in which transactions for the investment occur with sufficient frequency and volume to provide pricing information on an ongoing basis. |
| • | Level 2 – Level 2 inputs are observable inputs, either directly or indirectly, and include the following: |
| o | Quoted prices for similar investments in active markets. |
| o | Quoted prices for identical or similar investments in markets that are non-active. A non-active market is a market where there are few transactions for the investment, the prices are not current, or price quotations vary substantially either over time or among market makers, or in which little information is released publicly. |
| o | Inputs other than quoted prices that are observable for the investment (for example, interest rates and yield curves observable at commonly quoted intervals, volatilities, prepayment speeds, loss severities, credit risks, and default rates). |
| o | Inputs that are derived principally from or corroborated by observable market data by correlation or other means. |
| • | Level 3 – Level 3 inputs are unobservable inputs. Unobservable inputs may reflect the reporting entity’s own assumptions about the assumptions that market participants would use in pricing the investment. |
The inputs or methodologies used for valuing investments are not necessarily an indication of the risk associated with investing in those investments. A summary of the inputs used to value the Fund’s investments as of October 31, 2018, is included with the Fund’s Portfolio of Investments.
B. Securities Transactions and Investment Income
Securities transactions are recorded as of the trade date. Realized gains and losses from securities transactions are recorded on the identified cost basis. Dividend income is recorded on the ex-dividend date. Interest income is recorded daily on the accrual basis. Market premiums and discounts are amortized over the expected life of each respective borrowing. Amortization of premiums and accretion of discounts are recorded using the effective interest method.
Securities purchased or sold on a when-issued, delayed-delivery or forward purchase commitment basis may have extended settlement periods. The value of the security so purchased is subject to market fluctuations during this period. Due to the nature of the Senior Loan market, the actual settlement date may not be certain at the time of the purchase or sale for some of the Senior Loans. Interest income on such Senior Loans is not accrued until settlement date. The Fund maintains liquid assets with a current value at least equal to the amount of its when-issued, delayed-delivery or forward purchase commitments. At October 31, 2018, the Fund had no when-issued, delayed-delivery or forward purchase commitments.
C. Unfunded Loan Commitments
The Fund may enter into certain credit agreements, all or a portion of which may be unfunded. The Fund is obligated to fund these loan commitments at the borrower’s discretion. The Fund had no unfunded delayed draw term loan commitments as of October 31, 2018.
D. Dividends and Distributions to Shareholders
The Fund will declare daily and pay monthly distributions of all or a portion of its net income to holders of each class of shares. Distributions of any net capital gains earned by the Fund will be distributed at least annually. Distributions will automatically be reinvested into additional Fund shares unless cash distributions are elected by the shareholder.
Distributions from net investment income and realized capital gains are determined in accordance with federal income tax regulations, which may differ from U.S. GAAP. Certain capital accounts in the financial statements are periodically adjusted for permanent differences in order to reflect their tax character. These permanent differences are primarily due to the varying treatment of income and gain/loss on portfolio securities held by the Fund and have no impact on net assets or NAV per share. Temporary differences, which arise from recognizing certain items of income, expense and gain/loss in different periods for financial statement and tax purposes, will reverse at some point in the future. Permanent differences incurred during the fiscal year ended October 31, 2018, resulting in book and tax accounting differences, have been reclassified at year end to reflect an increase in accumulated net investment income
Notes to Financial Statements (Continued)
First Trust Short Duration High Income Fund
October 31, 2018
(loss) of $441,583, a decrease in accumulated net realized gain (loss) of $440,078 and a decrease to paid-in capital of $1,505. Accumulated distributable earnings (loss) consists of accumulated net investment income (loss), acccumulated net realized gain (loss) on investments, and unrealized appreciation (depreciation) on investments. Net assets were not affected by this reclassification.
The tax character of distributions paid by the Fund during the fiscal years ended October 31, 2018 and 2017, was as follows:
| Distributions paid from: | 2018 | 2017 |
Ordinary income
| $9,474,914 | $10,464,776 |
Capital gains
| — | — |
Return of capital
| 247,675 | — |
As of October 31, 2018, the distributable earnings and net assets on a tax basis were as follows:
Undistributed ordinary income
| $— | |
Undistributed capital gains
| — | |
Total undistributed earnings
| — | |
Accumulated capital and other losses
| (6,652,470) | |
Net unrealized appreciation (depreciation)
| (2,899,860) | |
Total accumulated earnings (losses)
| (9,552,330) | |
Other
| — | |
Paid-in capital
| 241,723,690 | |
Total net assets
| $232,171,360 | |
E. Income Taxes
The Fund intends to continue to qualify as a regulated investment company by complying with the requirements under Subchapter M of the Internal Revenue Code of 1986, as amended, which includes distributing substantially all of its net investment income and net realized gains to shareholders. Accordingly, no provision has been made for federal and state income taxes. However, due to the timing and amount of distributions, the Fund may be subject to an excise tax of 4% of the amount by which approximately 98% of the Fund’s taxable income exceeds the distributions from such taxable income for the calendar year.
The Fund intends to utilize provisions of the federal income tax laws, which allow it to carry a realized capital loss forward indefinitely following the year of the loss and offset such loss against any future realized capital gains. The Fund is subject to certain limitations under U.S. tax rules on the use of capital loss carryforwards and net unrealized built-in losses. These limitations apply when there has been a 50% change in ownership. At October 31, 2018, the Fund had $6,652,470 of non-expiring capital loss carryforwards for federal income tax purposes.
Certain losses realized during the current fiscal year may be deferred and treated as occurring on the first day of the following fiscal year for federal income tax purposes. For the fiscal year ended October 31, 2018, the Fund did not defer any net ordinary losses.
The Fund is subject to accounting standards that establish a minimum threshold for recognizing, and a system for measuring, the benefits of a tax position taken or expected to be taken in a tax return. Taxable years ended 2015, 2016, 2017, and 2018 remain open to federal and state audit. As of October 31, 2018, management has evaluated the application of these standards to the Fund and has determined that no provision for income tax is required in the Fund’s financial statements for uncertain tax positions.
F. Expenses
The Fund will pay all expenses directly related to its operations. Expenses of the Fund are allocated on a pro rata basis to each class of shares, except for distribution and service (12b-1) fees and incremental transfer agency costs which are unique to each class of shares.
G. New Accounting Pronouncements
On March 30, 2017, the FASB issued Accounting Standards Update (“ASU”) 2017-08 “Premium Amortization on Purchased Callable Debt Securities,” which amends the amortization period for certain purchased callable debt securities held at a premium by shortening such period to the earliest call date. The new guidance requires an entity to amortize the premium on a callable debt security within its scope to the earliest call date, unless the guidance for considering estimated prepayments is applied. If the call option is not exercised at the earliest call date, the yield is reset to the effective yield using the payment terms of the security. If the security has more than one call date and the premium was amortized to a call price greater than the next call price, any excess of the amortized cost basis over the amount repayable at the next call date will be amortized to that date. If there are no other call dates, any excess of the amortized cost
Notes to Financial Statements (Continued)
First Trust Short Duration High Income Fund
October 31, 2018
basis over the par amount will be amortized to maturity. Discounts on purchased callable debt securities will continue to be amortized to the security’s maturity date. ASU 2017-08 is effective for public business entities for fiscal years, and interim periods within those fiscal years, beginning after December 15, 2018. Earlier adoption is permitted for all entities, including adoption in an interim period. If an entity early adopts the ASU in an interim period, any adjustments must be reflected as of the beginning of the fiscal year that includes that interim period. Management is still assessing the impact of the adoption of ASU 2017-08 on the financial statements but does not expect it to have a material impact.
On August 28, 2018, the FASB issued ASU 2018-13, “Disclosure Framework – Changes to the Disclosure Requirements for Fair Value Measurement,” which amends the fair value measurement disclosure requirements of ASC 820. The amendments of ASU 2018-13 include new, eliminated, and modified disclosure requirements of ASC 820. In addition, the amendments clarify that materiality is an appropriate consideration of entities when evaluating disclosure requirements. The ASU is effective for fiscal years beginning after December 15, 2019, including interim periods therein. Early adoption is permitted for any eliminated or modified disclosures upon issuance of this ASU. The Fund has early adopted ASU 2018-13 for these financial statements, which did not result in a material impact.
3. Investment Advisory Fee, Affiliated Transactions and Other Fee Arrangements
First Trust, the investment advisor to the Fund, is a limited partnership with one limited partner, Grace Partners of DuPage L.P., and one general partner, The Charger Corporation. The Charger Corporation is an Illinois corporation controlled by James A. Bowen, Chief Executive Officer of First Trust. First Trust is responsible for the selection and ongoing monitoring of the Fund’s investment portfolio, managing the Fund’s business affairs and providing certain administrative services necessary for the management of the Fund. For these investment management services, First Trust is entitled to a monthly fee calculated at an annual rate of 0.65% of the Fund’s . First Trust also provides fund reporting services to the Fund for a flat annual fee in the amount of $9,250.
First Trust has agreed to waive fees and/or reimburse Fund expenses to the extent necessary to prevent the total annual fund operating expenses (excluding 12b-1 distribution and service fees, interest expenses, taxes, fees incurred in acquiring and disposing of portfolio securities and extraordinary expenses) from exceeding 1.00% of average daily net assets of any class of shares of the Fund (the “Expense Cap”) until February 29, 2020 and then from exceeding 1.35% from March 1, 2020 to February 28, 2029 (the “Expense Cap Termination Date”). Expenses borne and fees waived by First Trust are subject to recovery on a Fund class level, if applicable, by First Trust for up to three years from the date the fee or expense was incurred, but no reimbursement payment will be made by the Fund at any time if it would result in the Fund’s expenses exceeding (i) the Expense Cap in place for the most recent fiscal year for which such expense limitation was in place; (ii) the Expense Cap in place at the time the fees were waived; or (iii) the current Expense Cap. Expense limitations may be terminated or modified prior to their expiration only with the approval of the Board of Trustees of the First Trust Series Fund. These amounts would be included in “Expenses previously waived or reimbursed” on the Statement of Operations. There were no advisory fee waivers or expense reimbursements for the fiscal year ended October 31, 2018.
BNY Mellon Investment Servicing (US) Inc. (“BNYM IS”) serves as the Fund’s transfer agent in accordance with certain fee arrangements. As transfer agent, BNYM IS is responsible for maintaining shareholder records for the Fund. The Bank of New York Mellon (“BNYM”) serves as the Fund’s administrator, fund accountant, and custodian in accordance with certain fee arrangements. As administrator and fund accountant, BNYM is responsible for providing certain administrative and accounting services to the Fund, including maintaining the Fund’s books of account, records of the Fund’s securities transactions, and certain other books and records. As custodian, BNYM is responsible for custody of the Fund’s assets. BNYM IS and BNYM are subsidiaries of The Bank of New York Mellon Corporation, a financial holding company.
Each Trustee who is not an officer or employee of First Trust, any sub-advisor or any of their affiliates (“Independent Trustees”) is paid a fixed annual retainer that is allocated equally among each fund in the First Trust Fund Complex. Each Independent Trustee is also paid an annual per fund fee that varies based on whether the fund is a closed-end or other actively managed fund, or is an index fund.
Additionally, the Lead Independent Trustee and the Chairmen of the Audit Committee, Nominating and Governance Committee and Valuation Committee are paid annual fees to serve in such capacities, with such compensation allocated pro rata among each fund in the First Trust Fund Complex based on net assets. Independent Trustees are reimbursed for travel and out-of-pocket expenses in connection with all meetings. The Lead Independent Trustee and Committee Chairmen rotate every three years. The officers and “Interested” Trustee receive no compensation from the Trust for acting in such capacities.
Notes to Financial Statements (Continued)
First Trust Short Duration High Income Fund
October 31, 2018
4. Capital Share Transactions
Capital transactions were as follows:
| | Year Ended
October 31, 2018 | | Year Ended
October 31, 2017 |
| | Shares | | Value | | Shares | | Value |
| Sales: | | | | | | | |
| Class A | 1,447,958 | | $ 28,558,091 | | 2,166,955 | | $ 43,330,998 |
| Class C | 274,033 | | 5,419,138 | | 319,712 | | 6,399,722 |
| Class I | 3,625,462 | | 71,713,188 | | 4,110,531 | | 82,410,452 |
| Total Sales | 5,347,453 | | $ 105,690,417 | | 6,597,198 | | $ 132,141,172 |
| Dividend Reinvestment: | | | | | | | |
| Class A | 102,051 | | $ 2,017,636 | | 131,419 | | $ 2,634,908 |
| Class C | 39,118 | | 772,841 | | 38,599 | | 772,980 |
| Class I | 273,318 | | 5,406,126 | | 270,729 | | 5,428,480 |
| Total Dividend Reinvestment | 414,487 | | $ 8,196,603 | | 440,747 | | $ 8,836,368 |
| Redemptions: | | | | | | | |
| Class A | (2,217,809) | | $ (44,002,444) | | (1,461,890) | | $ (29,289,205) |
| Class C | (328,886) | | (6,510,642) | | (332,438) | | (6,639,313) |
| Class I | (3,177,024) | | (62,921,048) | | (3,071,873) | | (61,717,499) |
| Total Redemptions | (5,723,719) | | $ (113,434,134) | | (4,866,201) | | $ (97,646,017) |
5. Purchases and Sales of Securities
The cost of purchases and proceeds from sales of securities, excluding short-term investments, for the fiscal year ended October 31, 2018, were $197,628,562 and $196,885,141, respectively.
6. Distribution and Service Plan
The Board of Trustees adopted a Distribution and Service Plan pursuant to Rule 12b-1 under the 1940 Act. In accordance with the Rule 12b-1 plan, the share classes of the Fund are authorized to pay an amount up to 0.25% and 1.00% of their average daily net assets each year for Class A and Class C, respectively, to reimburse First Trust Portfolios L.P. (“FTP”), the distributor of the Fund, for amounts expended to finance activities primarily intended to result in the sale of Fund shares or the provision of investor services. FTP may also use this amount to compensate securities dealers or other persons for providing distribution assistance, including broker-dealer and shareholder support and educational and promotional services. Class I shares have no 12b-1 fees.
7. Borrowings
The Trust, on behalf of the Fund, along with First Trust Variable Insurance Trust and First Trust Exchange-Traded Fund IV, has a $200 million Credit Agreement (the “BNYM Line of Credit”) with BNYM to be a liquidity backstop during periods of high redemption volume. A commitment fee of 0.15% of the daily amount of the excess of the commitment amount over the outstanding principal balance of the loans will be charged by BNYM, which First Trust allocates amongst the funds that have access to the BNYM Line of Credit. These fees are reflected on the Statement of Operations in the Commitment fees line item. To the extent that the Fund accesses the BNYM Line of Credit, there would also be an interest fee charged. The Fund did not have any borrowings outstanding during the fiscal year ended October 31, 2018.
8. Indemnification
The Fund has a variety of indemnification obligations under contracts with its service providers. The Fund’s maximum exposure under these arrangements is unknown. However, the Fund has not had prior claims or losses pursuant to these contracts and expects the risk of loss to be remote.
Notes to Financial Statements (Continued)
First Trust Short Duration High Income Fund
October 31, 2018
9. Subsequent Events
Management has evaluated the impact of all subsequent events to the Fund through the date the financial statements were issued, and has determined that there were no subsequent events requiring recognition or disclosure in the financial statements that have not already been disclosed.
Report of Independent Registered Public Accounting Firm
To the Shareholders and the Board of Trustees of First Trust Series Fund:
Opinion on the Financial Statements and Financial Highlights
We have audited the accompanying statement of assets and liabilities, including the portfolio of investments, of First Trust Short Duration High Income Fund (the “Fund”), one of the funds constituting First Trust Series Fund, including the portfolio of investments, as of October 31, 2018, the related statement of operations for the year then ended, the statements of changes in net assets for each of the two years in the period then ended, the financial highlights for each of the five years in the period then ended, and the related notes. In our opinion, the financial statements and financial highlights present fairly, in all material respects, the financial position of the Fund as of October 31, 2018, the results of its operations for the year then ended, the changes in its net assets for each of the two years in the period then ended, and the financial highlights for each of the five years in the period then ended, in conformity with accounting principles generally accepted in the United States of America.
Basis for Opinion
These financial statements and financial highlights are the responsibility of the Fund’s management. Our responsibility is to express an opinion on the Fund’s financial statements and financial highlights based on our audits. We are a public accounting firm registered with the Public Company Accounting Oversight Board (United States) (PCAOB) and are required to be independent with respect to the Fund in accordance with the U.S. federal securities laws and the applicable rules and regulations of the Securities and Exchange Commission and the PCAOB.
We conducted our audits in accordance with the standards of the PCAOB. Those standards require that we plan and perform the audit to obtain reasonable assurance about whether the financial statements and financial highlights are free of material misstatement, whether due to error or fraud. The Fund is not required to have, nor were we engaged to perform, an audit of its internal control over financial reporting. As part of our audits we are required to obtain an understanding of internal control over financial reporting but not for the purpose of expressing an opinion on the effectiveness of the Fund’s internal control over financial reporting. Accordingly, we express no such opinion.
Our audits included performing procedures to assess the risks of material misstatement of the financial statements and financial highlights, whether due to error or fraud, and performing procedures that respond to those risks. Such procedures included examining, on a test basis, evidence regarding the amounts and disclosures in the financial statements and financial highlights. Our audits also included evaluating the accounting principles used and significant estimates made by management, as well as evaluating the overall presentation of the financial statements and financial highlights. Our procedures included confirmation of securities owned as of October 31, 2018, by correspondence with the custodian, agent banks and brokers; when replies were not received from agent banks and brokers, we performed other auditing procedures. We believe that our audits provide a reasonable basis for our opinion.
Chicago, Illinois
December 20, 2018
We have served as the auditor of one or more First Trust investment companies since 2001.
Additional Information
First Trust Short Duration High Income Fund
October 31, 2018 (Unaudited)
Proxy Voting Policies and Procedures
A description of the policies and procedures that the Trust uses to determine how to vote proxies and information on how the Fund voted proxies relating to portfolio securities during the most recent 12-month period ended June 30 is available (1) without charge, upon request, by calling (800) 988-5891; (2) on the Fund’s website at www.ftportfolios.com; and (3) on the Securities and Exchange Commission’s (“SEC”) website at www.sec.gov.
Portfolio Holdings
The Trust files its complete schedule of the Fund’s portfolio holdings with the SEC for the first and third quarters of each fiscal year on Form N-Q. The Trust’s Form N-Qs are available (1) by calling (800) 988-5891; (2) on the Fund’s website at www.ftportfolios.com; and (3) on the SEC’s website at www.sec.gov.
Beginning in April 2019, the Trust will cease to disclose the Fund’s holdings on Form N-Q and will file Form N-PORT with the SEC on a monthly basis. Part F of Form N-PORT, which contains the complete schedule of the Fund’s portfolio holdings, will be made available in the same manner as Form N-Q discussed above.
Tax Information
Distributions paid to foreign shareholders during the Fund’s fiscal year ended October 31, 2018, that were properly designated by the Fund as “interest-related dividends” or “short-term capital gain dividends,” may not be subject to federal income tax provided that the income was earned by such foreign shareholders.
Of the ordinary income (including short-term capital gain, if applicable) distributions made by the Fund during the period ended October 31, 2018, none qualify for the corporate dividends received deduction available to corporate shareholders or as qualified dividend income.
Risk Considerations
Risks are inherent in all investing. You should consider the Fund’s investment objectives, risks, charges and expenses carefully before investing. You can download the Fund’s prospectus at www.ftportfolios.com or contact First Trust Portfolios L.P. at (800) 621-1675 to request a prospectus, which contains this and other information about the Fund. For additional information about the risks associated with investing in the Fund, please see the Fund’s statement of additional information, as well as other regulatory filings. Read these documents carefully before you invest.
The following summarizes some of the risks that should be considered for the Fund.
BANK LOANS RISK. An investment in bank loans subjects the Fund to credit risk, which is heightened for bank loans in which the Fund invests because companies that issue such loans tend to be highly leveraged and thus are more susceptible to the risks of interest deferral, default and/or bankruptcy. Senior floating rate loans, in which the Fund may invest, are usually rated below investment grade but may also be unrated. As a result, the risks associated with these senior floating rate loans are similar to the risks of high yield fixed income instruments. An economic downturn would generally lead to a higher non-payment rate, and a senior floating rate loan may lose significant market value before a default occurs. Moreover, any specific collateral used to secure a senior floating rate loan may decline in value or become illiquid, which would adversely affect the senior floating rate loan’s value. Unlike the securities markets, there is no central clearinghouse for loan trades, and the loan market has not established enforceable settlement standards or remedies for failure to settle. Therefore, portfolio transactions in senior floating rate loans may have uncertain settlement time periods. Senior floating rate loans are subject to a number of risks described elsewhere in this prospectus, including liquidity risk and the risk of investing in below investment grade fixed income instruments.
CALL RISK. If an issuer calls higher-yielding securities held by the Fund, performance could be adversely impacted. During periods of falling interest rates, issuers of callable securities may call (redeem) securities with higher coupon rates or interest rates before their maturity dates. The Fund would then lose any price appreciation above the bond’s call price and would be forced to reinvest the unanticipated proceeds at lower interest rates, resulting in a decline in the Fund’s income. Such redemptions and subsequent reinvestments would also increase the Fund’s portfolio turnover rate.
CONVERTIBLE BONDS RISK. The market values of convertible bonds tend to decline as interest rates increase and, conversely, to increase as interest rates decline. A convertible bond’s market value also tends to reflect the market price of the common stock of the issuing company.
CREDIT RISK. Credit risk is the risk that an issuer of a security may be unable or unwilling to make dividend, interest and principal payments when due and the related risk that the value of a security may decline because of concerns about the issuer’s ability or
Additional Information (Continued)
First Trust Short Duration High Income Fund
October 31, 2018 (Unaudited)
willingness to make such payments. Credit risk may be heightened for the Fund because it invests a substantial portion of its net assets in high yield or “junk” debt. Such securities, while generally offering higher yields than investment grade debt with similar maturities, involve greater risks, including the possibility of dividend or interest deferral, default or bankruptcy, and are regarded as predominantly speculative with respect to the issuer’s capacity to pay dividends or interest and repay principal. Credit risk is heightened for loans in which the Fund invests because companies that issue such loans tend to be highly leveraged and thus are more susceptible to the risks of interest deferral, default and/or bankruptcy.
CURRENCY RISK. Because the Fund’s net asset value is determined on the basis of U.S. dollars and the Fund invests in non-U.S. dollar-denominated securities, you may lose money if the local currency of a foreign market depreciates against the U.S. dollar, even if the local currency value of the Fund’s holdings goes up. The Fund may hedge certain of its non-U.S. dollar holdings.
CYBER SECURITY RISK. As the use of Internet technology has become more prevalent in the course of business, the Fund has become more susceptible to potential operational risks through breaches in cyber security. A breach in cyber security refers to both intentional and unintentional events that may cause the Fund to lose proprietary information, suffer data corruption or lose operational capacity. Such events could cause the Fund to incur regulatory penalties, reputational damage, additional compliance costs associated with corrective measures and/or financial loss. Cyber security breaches may involve unauthorized access to the Fund’s digital information systems through “hacking” or malicious software coding, but may also result from outside attacks such as denial-of-service attacks through efforts to make network services unavailable to intended users. In addition, cyber security breaches of the Fund’s third-party service providers, such as its administrator, transfer agent, custodian, or sub-advisor, as applicable, or issuers in which the Fund invests, can also subject the Fund to many of the same risks associated with direct cyber security breaches. The Fund has established risk management systems designed to reduce the risks associated with cyber security. However, there is no guarantee that such efforts will succeed, especially because the Fund does not directly control the cyber security systems of issuers or third-party service providers.
EXTENSION RISK. Extension risk is the risk that, when interest rates rise, certain obligations will be paid off by the issuer (or obligor) more slowly than anticipated, causing the value of these securities to fall. Rising interest rates tend to extend the duration of securities, making them more sensitive to changes in interest rates. The value of longer-term securities generally changes more in response to changes in interest rates than shorter-term securities. As a result, in a period of rising interest rates, securities may exhibit additional volatility and may lose value.
HIGH YIELD SECURITIES RISK. High yield securities, or “junk” bonds, are subject to greater market fluctuations and risk of loss than securities with higher ratings, and therefore, are considered to be highly speculative. These securities are issued by companies that may have limited operating history, narrowly focused operations and/or other impediments to the timely payment of periodic interest and principal at maturity. If the economy slows down or dips into recession, the issuers of high yield securities may not have sufficient resources to continue making timely payment of periodic interest and principal at maturity. The market for high yield securities is smaller and less liquid than that for investment grade securities. High yield securities are generally not listed on a national securities exchange but trade in the over-the-counter markets. Due to the smaller, less liquid market for high yield securities, the bid-offer spread on such securities is generally greater than it is for investment grade securities and the purchase or sale of such securities may take longer to complete. In general, high yield securities may have a greater risk of default than other types of securities.
ILLIQUID SECURITIES RISK. Illiquid securities involve the risk that the securities will not be able to be sold at the time desired by the Fund or at prices approximately the value at which the Fund values the securities.
INCOME RISK. If interest rates fall, the income from the Fund’s portfolio will likely decline if the Fund holds floating rate debt that will adjust lower with falling interest rates. For loans, interest rates typically reset periodically.
INTEREST RATE RISK. Interest rate risk is the risk that the value of the debt securities in the Fund will decline because of rising market interest rates. Interest rate risk is generally lower for shorter-term investments and higher for longer-term investments. Duration is a measure of the expected price volatility of a debt instrument as a result of changes in market rates of interest, based on, among other factors, the weighted average timing of the instrument’s expected principal and interest payments. In general, duration represents the expected percentage change in the value of a security for an immediate 1% change in interest rates. Therefore, prices of debt securities with shorter durations tend to be less sensitive to interest rate changes than debt securities with longer durations. As the value of a debt security changes over time, so will its duration.
LIQUIDITY RISK. The Fund invests a substantial portion of its assets in lower-quality debt issued by companies that are highly leveraged. Lower-quality debt tends to be less liquid than higher-quality debt. Moreover, smaller debt issues tend to be less liquid than larger debt issues. If the economy experiences a sudden downturn, or if the debt markets for such companies become distressed, the Fund may have particular difficulty selling its assets in sufficient amounts, at reasonable prices and in a sufficiently timely manner to raise the cash necessary to meet any potentially heavy redemption requests by Fund shareholders.
Additional Information (Continued)
First Trust Short Duration High Income Fund
October 31, 2018 (Unaudited)
MARKET RISK. Market risk is the risk that a particular security owned by the Fund or shares of the Fund in general may fall in value. Securities are subject to market fluctuations caused by such factors as economic, political, regulatory or market developments, changes in interest rates and perceived trends in securities prices. Shares of the Fund could decline in value or underperform other investments.
NON-U.S. SECURITIES RISK. Non-U.S. securities are subject to higher volatility than securities of domestic issuers due to possible adverse political, social or economic developments, restrictions on foreign investment or exchange of securities, lack of liquidity, currency exchange rates, excessive taxation, government seizure of assets, different legal or accounting standards, and less government supervision and regulation of exchanges in foreign countries.
OTHER DEBT SECURITIES RISK. Secured loans that are not first lien loans, unsecured loans and other debt securities are subject to many of the same risks that affect Senior Loans; however, they are often unsecured and/or lower in the issuer’s capital structure than Senior Loans, and thus may be exposed to greater risk of default and lower recoveries in the event of a default. This risk can be further heightened in the case of below investment grade instruments. Additionally, most fixed income securities are fixed-rate and thus are generally more susceptible than floating rate loans to price volatility related to changes in prevailing interest rates.
PORTFOLIO TURNOVER RISK. The Fund’s strategy may frequently involve buying and selling portfolio securities to rebalance the Fund’s exposure to various market sectors. High portfolio turnover may result in the Fund paying higher levels of transaction costs and generating greater tax liabilities for shareholders. Portfolio turnover risk may cause the Fund’s performance to be less than you expect.
PREPAYMENT RISK. Loans and other fixed income investments are subject to prepayment risk. The degree to which borrowers prepay loans, whether as a contractual requirement or at their election, may be affected by general business conditions, the financial condition of the borrower and competitive conditions among loan investors, among others. As such, prepayments cannot be predicted with accuracy. Upon a prepayment, either in part or in full, the actual outstanding debt on which the Fund derives interest income will be reduced. The Fund may not be able to reinvest the proceeds received on terms as favorable as the prepaid loan.
Advisory Agreement
Board Considerations Regarding Continuation of Investment Management Agreement
The Board of Trustees of First Trust Series Fund (the “Trust”), including the Independent Trustees, unanimously approved the continuation of the Investment Management Agreement (the “Agreement”) between the Trust, on behalf of the First Trust Short Duration High Income Fund (the “Fund”), and First Trust Advisors L.P. (the “Advisor”) for a one-year period ending June 30, 2019 at a meeting held on June 11, 2018. The Board determined that the continuation of the Agreement is in the best interests of the Fund in light of the nature, extent and quality of the services provided and such other matters as the Board considered to be relevant in the exercise of its reasonable business judgment.
To reach this determination, the Board considered its duties under the Investment Company Act of 1940, as amended (the “1940 Act”), as well as under the general principles of state law, in reviewing and approving advisory contracts; the requirements of the 1940 Act in such matters; the fiduciary duty of investment advisors with respect to advisory agreements and compensation; the standards used by courts in determining whether investment company boards have fulfilled their duties; and the factors to be considered by the Board in voting on such agreements. At meetings held on April 23, 2018 and June 11, 2018, the Board, including the Independent Trustees, reviewed materials provided by the Advisor responding to requests for information from counsel to the Independent Trustees that, among other things, outlined the services provided by the Advisor to the Fund (including the relevant personnel responsible for these services and their experience); the advisory fee rate payable by the Fund as compared to fees charged to a peer group of funds compiled by Management Practice, Inc. (“MPI”), an independent source (the “Peer Group”), and as compared to fees charged to other clients of the Advisor; expenses of the Fund as compared to expense ratios of the funds in the Peer Group; performance information for the Fund; the nature of expenses incurred in providing services to the Fund and the potential for economies of scale, if any; financial data on the Advisor; any fall-out benefits to the Advisor and its affiliate, First Trust Portfolios L.P. (“FTP”); and information on the Advisor’s compliance program. The Board reviewed initial materials with the Advisor at the meeting held on April 23, 2018, prior to which the Independent Trustees and their counsel met separately to discuss the information provided by the Advisor. Following the April meeting, independent legal counsel on behalf of the Independent Trustees requested certain clarifications and supplements to the materials provided, and the information provided in response to those requests was considered at an executive session of the Independent Trustees and independent legal counsel held prior to the June 11, 2018 meeting, as well as at the meeting held that day. The Board applied its business judgment to determine whether the arrangement between the Trust and the Advisor continues to be a reasonable business arrangement from the Fund’s perspective. The Board determined that, given the totality of the information
Additional Information (Continued)
First Trust Short Duration High Income Fund
October 31, 2018 (Unaudited)
provided with respect to the Agreement, the Board had received sufficient information to renew the Agreement. The Board considered that shareholders chose to invest or remain invested in the Fund knowing that the Advisor manages the Fund and knowing the Fund’s advisory fee.
In reviewing the Agreement, the Board considered the nature, extent and quality of the services provided by the Advisor under the Agreement. The Board considered that the Advisor is responsible for the overall management and administration of the Trust and the Fund, and reviewed all of the services provided by the Advisor to the Fund, as well as the background and experience of the persons responsible for such services. The Board noted that the Advisor’s Leveraged Finance Investment Team is responsible for the day-to-day management of the Fund’s investments and considered the background and experience of the members of the Leveraged Finance Investment Team and noted the Board’s prior meetings with members of the Team. The Board considered the Advisor’s statement that it applies the same oversight model internally with its Leveraged Finance Investment Team as it uses for overseeing external sub-advisors, including portfolio risk monitoring and performance review. In reviewing the services provided, the Board noted the compliance program that had been developed by the Advisor and considered that it includes a robust program for monitoring the Advisor’s and the Fund’s compliance with the 1940 Act, as well as the Fund’s compliance with its investment objectives, policies, and restrictions. The Board also considered a report from the Advisor with respect to its risk management functions related to the operation of the Fund. Finally, as part of the Board’s consideration of the Advisor’s services, the Advisor, in its written materials and at the April 23, 2018 meeting, described to the Board the scope of its ongoing investment in additional infrastructure and personnel to maintain and improve the quality of services provided to the Fund and the other funds in the First Trust Fund Complex. In light of the information presented and the considerations made, the Board concluded that the nature, extent and quality of the services provided to the Trust and the Fund by the Advisor under the Agreement have been and are expected to remain satisfactory and that the Advisor has managed the Fund consistent with its investment objectives, policies and restrictions.
The Board considered the advisory fee rate payable by the Fund under the Agreement for the services provided. The Board considered that the Advisor agreed to extend the current expense caps for each share class through February 29, 2020 and agreed to keep the long-term expense cap in place from March 1, 2020 through February 28, 2029. The Board noted that fees waived or expenses borne by the Advisor are subject to reimbursement by the Fund for up to three years from the date the expense was incurred or fees were waived, but no reimbursement payment would be made by the Fund if it would result in the Fund exceeding an expense ratio equal to the expense cap in place at the time of the reimbursement or at the time the expenses were borne or the fees were waived by the Advisor. The Board received and reviewed information showing the advisory fee rates and expense ratios of the peer funds in the Peer Group, as well as advisory and unitary fee rates charged by the Advisor to other fund and non-fund clients, as applicable. Based on the information provided, the Board noted that the advisory fee rate payable by the Fund was above the median advisory fee of the peer funds in the Peer Group. The Board noted that the Fund’s total (net) expense ratio (Class A shares) was above the median of the Peer Group. With respect to the Peer Group, the Board noted its prior discussions with the Advisor and MPI regarding the assembly of the Peer Group and, at the April 23, 2018 meeting, discussed with the Advisor limitations in creating a relevant peer group for the Fund. The Board took these limitations into account in considering the peer data. With respect to fees charged to other non-ETF clients, the Board considered differences between the Fund and other non-ETF clients that limited their comparability. In considering the advisory fee rate overall, the Board also considered the Advisor’s statement that it seeks to meet investor needs through innovative and value-added investment solutions and the Advisor’s description of its long-term commitment to the Fund.
The Board considered performance information for the Fund. The Board noted the process it has established for monitoring the Fund’s performance and portfolio risk on an ongoing basis, which includes quarterly performance reporting from the Advisor for the Fund. The Board determined that this process continues to be effective for reviewing the Fund’s performance. The Board received and reviewed information comparing the Fund’s performance for periods ended December 31, 2017 to the performance of the peer funds in the Peer Group and to two benchmark indexes and a blended benchmark index. Based on the information provided, the Board noted that the Fund (Class A shares) underperformed the Peer Group average, the ICE BofAML US High Yield Constrained Index and the blended benchmark index for the one-, three- and five-year periods ended December 31, 2017 and the S&P/LSTA Leveraged Loan Index for the one- and three-year periods ended December 31, 2017 but outperformed the S&P/LSTA Leveraged Loan Index for the five-year period ended December 31, 2017. The Board noted the information provided by the Advisor on reasons for the Fund’s relative underperformance.
On the basis of all the information provided on the fees, expenses and performance of the Fund and the ongoing oversight by the Board, the Board concluded that the advisory fee for the Fund continues to be reasonable and appropriate in light of the nature, extent and quality of the services provided by the Advisor to the Fund under the Agreement.
The Board considered information and discussed with the Advisor whether there were any economies of scale in connection with providing advisory services to the Fund and noted the Advisor’s statement that it believes its expenses will likely increase over the next twelve months as the Advisor continues to make investments in infrastructure and personnel. The Board considered the revenues and allocated costs (including the allocation methodology) of the Advisor in serving as investment advisor to the Fund for the twelve
Additional Information (Continued)
First Trust Short Duration High Income Fund
October 31, 2018 (Unaudited)
months ended December 31, 2017 and the estimated profitability level for the Fund calculated by the Advisor based on such data, as well as complex-wide and product-line profitability data, for the same period. The Board noted the inherent limitations in the profitability analysis and concluded that, based on the information provided, the Advisor’s profitability level for the Fund was not unreasonable. In addition, the Board considered fall-out benefits described by the Advisor that may be realized from its relationship with the Fund. The Board considered that the Advisor had identified as a fall out benefit to the Advisor and FTP their exposure to investors and brokers who, absent their exposure to the Fund, may have had no dealings with the Advisor or FTP. The Board noted that in addition to the advisory fees paid by the Fund, FTP is compensated for services provided to the Fund through 12b-1 distribution and service fees and that First Trust receives compensation from the Fund for providing fund reporting services pursuant to a separate Fund Reporting Services Agreement. The Board also noted that the Advisor does not utilize soft dollars in connection with its management of the Fund’s portfolio. The Board concluded that the character and amount of potential fall-out benefits to the Advisor were not unreasonable.
Based on all of the information considered and the conclusions reached, the Board, including the Independent Trustees, unanimously determined that the terms of the Agreement continue to be fair and reasonable and that the continuation of the Agreement is in the best interests of the Fund. No single factor was determinative in the Board’s analysis.
Board of Trustees and Officers
First Trust Short Duration High Income Fund
October 31, 2018 (Unaudited)
The following tables identify the Trustees and Officers of the Trust. Unless otherwise indicated, the address of all persons is 120 E. Liberty Drive, Suite 400, Wheaton, IL 60187.
The Trust’s statement of additional information includes additional information about the Trustees and is available, without charge, upon request, by calling (800) 988-5891.
| Name, Year of Birth and Position with the Trust | Term of Office and Year First Elected or Appointed | Principal Occupations
During Past 5 Years | Number of Portfolios in the First Trust Fund Complex Overseen by Trustee | Other Trusteeships or Directorships Held by Trustee During Past 5 Years |
| INDEPENDENT TRUSTEES |
Richard E. Erickson, Trustee
(1951) | • Indefinite Term
• Since Trust Inception | Physician; Officer, Wheaton Orthopedics; Limited Partner, Gundersen Real Estate Limited Partnership (June 1992 to December 2016); Member, Sportsmed LLC (April 2007 to November 2015) | 159 | None |
Thomas R. Kadlec, Trustee
(1957) | • Indefinite Term
• Since Trust Inception | President, ADM Investor Services, Inc. (Futures Commission Merchant) | 159 | Director of ADM Investor Services, Inc., ADM Investor Services International, Futures Industry Association, and National Futures Association |
Robert F. Keith, Trustee
(1956) | • Indefinite Term
• Since Trust Inception | President, Hibs Enterprises (Financial and Management Consulting) | 159 | Director of Trust Company of Illinois |
Niel B. Nielson, Trustee
(1954) | • Indefinite Term
• Since Trust Inception | Senior Advisor (August 2018 to Present), Managing Director and Chief Operating Officer (January 2015 to August 2018), Pelita Harapan Educational Foundation (Educational Products and Services); President and Chief Executive Officer (June 2012 to September 2014), Servant Interactive LLC (Educational Products and Services); President and Chief Executive Officer (June 2012 to September 2014), Dew Learning LLC (Educational Products and Services) | 159 | Director of Covenant Transport, Inc. (May 2003 to May 2014) |
| INTERESTED TRUSTEE |
James A. Bowen(1), Trustee and
Chairman of the Board
(1955) | • Indefinite Term
• Since Trust Inception | Chief Executive Officer, First Trust Advisors L.P. and First Trust Portfolios L.P.; Chairman of the Board of Directors, BondWave LLC (Software Development Company) and Stonebridge Advisors LLC (Investment Advisor) | 159 | None |
| (1) | Mr. Bowen is deemed an “interested person” of the Trust due to his position as CEO of First Trust Advisors L.P., investment advisor of the Trust. |
Board of Trustees and Officers (Continued)
First Trust Short Duration High Income Fund
October 31, 2018 (Unaudited)
| Name and Year of Birth | Position and Offices with Trust | Term of Office and Length of Service | Principal Occupations
During Past 5 Years |
| OFFICERS(2) |
James M. Dykas
(1966) | President and Chief Executive Officer | • Indefinite Term
• Since January 2016 | Managing Director and Chief Financial Officer (January 2016 to Present), Controller (January 2011 to January 2016), Senior Vice President (April 2007 to January 2016), First Trust Advisors L.P. and First Trust Portfolios L.P.; Chief Financial Officer (January 2016 to Present), BondWave LLC (Software Development Company) and Stonebridge Advisors LLC (Investment Advisor) |
Donald P. Swade
(1972) | Treasurer, Chief Financial Officer and Chief Accounting Officer | • Indefinite Term
• Since January 2016 | Senior Vice President (July 2016 to Present), Vice President (April 2012 to July 2016), First Trust Advisors L.P. and First Trust Portfolios L.P. |
W. Scott Jardine
(1960) | Secretary and Chief Legal Officer | • Indefinite Term
• Since Trust Inception | General Counsel, First Trust Advisors L.P. and First Trust Portfolios L.P.; Secretary and General Counsel, BondWave LLC; Secretary, Stonebridge Advisors LLC |
Daniel J. Lindquist
(1970) | Vice President | • Indefinite Term
• Since Trust Inception | Managing Director, First Trust Advisors L.P. and First Trust Portfolios L.P. |
Kristi A. Maher
(1966) | Chief Compliance Officer and Assistant Secretary | • Indefinite Term
• Chief Compliance Officer Since January 2011 • Assistant Secretary Since Trust Inception | Deputy General Counsel, First Trust Advisors L.P. and First Trust Portfolios L.P. |
| (2) | The term “officer” means the president, vice president, secretary, treasurer, controller or any other officer who performs a policy making function. |
Privacy Policy
First Trust Short Duration High Income Fund
October 31, 2018 (Unaudited)
Privacy Policy
First Trust values our relationship with you and considers your privacy an important priority in maintaining that relationship. We are committed to protecting the security and confidentiality of your personal information.
Sources of Information
We collect nonpublic personal information about you from the following sources:
| • | Information we receive from you and your broker-dealer, investment advisor or financial representative through interviews, applications, agreements or other forms; |
| • | Information about your transactions with us, our affiliates or others; |
| • | Information we receive from your inquiries by mail, e-mail or telephone; and |
| • | Information we collect on our website through the use of “cookies”. For example, we may identify the pages on our website that your browser requests or visits. |
Information Collected
The type of data we collect may include your name, address, social security number, age, financial status, assets, income, tax information, retirement and estate plan information, transaction history, account balance, payment history, investment objectives, marital status, family relationships and other personal information.
Disclosure of Information
We do not disclose any nonpublic personal information about our customers or former customers to anyone, except as permitted by law. In addition to using this information to verify your identity (as required under law), the permitted uses may also include the disclosure of such information to unaffiliated companies for the following reasons:
| • | In order to provide you with products and services and to effect transactions that you request or authorize, we may disclose your personal information as described above to unaffiliated financial service providers and other companies that perform administrative or other services on our behalf, such as transfer agents, custodians and trustees, or that assist us in the distribution of investor materials such as trustees, banks, financial representatives, proxy services, solicitors and printers. |
| • | We may release information we have about you if you direct us to do so, if we are compelled by law to do so, or in other legally limited circumstances (for example to protect your account from fraud). |
In addition, in order to alert you to our other financial products and services, we may share your personal information within First Trust.
Use of Website Analytics
We currently use third party analytics tools, Google Analytics and AddThis, to gather information for purposes of improving First Trust’s website and marketing our products and services to you. These tools employ cookies, which are small pieces of text stored in a file by your web browser and sent to websites that you visit, to collect information, track website usage and viewing trends such as the number of hits, pages visited, videos and PDFs viewed and the length of user sessions in order to evaluate website performance and enhance navigation of the website. We may also collect other anonymous information, which is generally limited to technical and web navigation information such as the IP address of your device, internet browser type and operating system for purposes of analyzing the data to make First Trust’s website better and more useful to our users. The information collected does not include any personal identifiable information such as your name, address, phone number or email address unless you provide that information through the website for us to contact you in order to answer your questions or respond to your requests. To find out how to opt-out of these services click on: Google Analytics and AddThis.
Confidentiality and Security
With regard to our internal security procedures, First Trust restricts access to your nonpublic personal information to those First Trust employees who need to know that information to provide products or services to you. We maintain physical, electronic and procedural safeguards to protect your nonpublic personal information.
Policy Updates and Inquiries
As required by federal law, we will notify you of our privacy policy annually. We reserve the right to modify this policy at any time, however, if we do change it, we will tell you promptly. For questions about our policy, or for additional copies of this notice, please go to www.ftportfolios.com, or contact us at 1-800-621-1675 (First Trust Portfolios) or 1-800-222-6822 (First Trust Advisors).
May 2017
This page intentionally left blank
This page intentionally left blank
INVESTMENT ADVISOR
First Trust Advisors L.P.
120 E. Liberty Drive, Suite 400
Wheaton, IL 60187
ADMINISTRATOR,
FUND ACCOUNTANT, AND
CUSTODIAN
The Bank of New York Mellon
240 Greenwich Street
New York, NY 10286
TRANSFER AGENT
BNY Mellon Investment Servicing (US) Inc.
301 Bellevue Parkway
Wilmington, DE 19809
INDEPENDENT REGISTERED
PUBLIC ACCOUNTING FIRM
Deloitte & Touche LLP
111 S. Wacker Drive
Chicago, IL 60606
LEGAL COUNSEL
Chapman and Cutler LLP
111 W. Monroe Street
Chicago, IL 60603

First Trust AQA® Equity
Fund
Annual Report
For the Year Ended
October 31, 2018
First Trust AQA® Equity Fund
Annual Report
October 31, 2018
Caution Regarding Forward-Looking Statements
This report contains certain forward-looking statements within the meaning of the Securities Act of 1933, as amended, and the Securities Exchange Act of 1934, as amended. Forward-looking statements include statements regarding the goals, beliefs, plans or current expectations of First Trust Advisors L.P. (“First Trust” or the “Advisor”) and/or J.J.B. Hilliard, W.L. Lyons, LLC (“Hilliard Lyons” or the “Sub-Advisor”) and their respective representatives, taking into account the information currently available to them. Forward-looking statements include all statements that do not relate solely to current or historical fact. For example, forward-looking statements include the use of words such as “anticipate,” “estimate,” “intend,” “expect,” “believe,” “plan,” “may,” “should,” “would” or other words that convey uncertainty of future events or outcomes.
Forward-looking statements involve known and unknown risks, uncertainties and other factors that may cause the actual results, performance or achievements of First Trust AQA® Equity Fund (the “Fund”) to be materially different from any future results, performance or achievements expressed or implied by the forward-looking statements. When evaluating the information included in this report, you are cautioned not to place undue reliance on these forward-looking statements, which reflect the judgment of the Advisor and/or Sub-Advisor and their respective representatives only as of the date hereof. We undertake no obligation to publicly revise or update these forward-looking statements to reflect events and circumstances that arise after the date hereof.
Performance and Risk Disclosure
There is no assurance that the Fund will achieve its investment objective. The Fund is subject to market risk, which is the possibility that the market values of securities owned by the Fund will decline and that the value of the Fund shares may therefore be less than what you paid for them. Accordingly, you can lose money by investing in the Fund. See “Risk Considerations” in the Additional Information section of this report for a discussion of certain other risks of investing in the Fund.
Performance data quoted represents past performance, which is no guarantee of future results, and current performance may be lower or higher than the figures shown. For the most recent month-end performance figures, please visit www.ftportfolios.com or speak with your financial advisor. Investment returns and net asset value will fluctuate and Fund shares, when sold, may be worth more or less than their original cost.
The Advisor may also periodically provide additional information on Fund performance on the Fund’s web page at www.ftportfolios.com.
How to Read This Report
This report contains information that may help you evaluate your investment in the Fund. It includes details about the Fund and presents data and analysis that provide insight into the Fund’s performance and investment approach.
By reading the portfolio commentary by the portfolio management team of the Fund, you may obtain an understanding of how the market environment affected the Fund’s performance. The statistical information that follows may help you understand the Fund’s performance compared to that of relevant market benchmarks.
It is important to keep in mind that the opinions expressed by personnel of First Trust and Hilliard Lyons are just that: informed opinions. They should not be considered to be promises or advice. The opinions, like the statistics, cover the period through the date on the cover of this report. The material risks of investing in the Fund are spelled out in the prospectus, the statement of additional information, this report and other Fund regulatory filings.
First Trust AQA® Equity Fund
Annual Letter from the Chairman and CEO
October 31, 2018
Dear Shareholders,
First Trust is pleased to provide you with the annual report for the First Trust AQA® Equity Fund (the “Fund”), which contains detailed information about the Fund for the twelve months ended October 31, 2018, including a market overview and a performance analysis. We encourage you to read this report carefully and discuss it with your financial advisor.
As I mentioned in my April 2018 letter, 2017 was a very strong year for U.S. and global markets. Investors were rewarded with rising markets and very little volatility. As 2018 began, investors were hoping for another strong year in the markets. For the entire first quarter, however, increased market volatility was the norm for U.S. and global markets. The markets continued their volatility throughout the second quarter. During April and May, the Dow Jones Industrial Average (“DJIA”) closed out each month slightly down, but ended both June and July slightly up. August was a strong month for stocks, and the DJIA finished August just under its previous high in January of 2018. At the close of the third quarter in September, the markets had moved higher into positive territory. In fact, all three major U.S. indices (the Nasdaq Composite Index, the DJIA and the S& P 500® Index) hit record levels during the third quarter. In October, markets were again very volatile, surprising analysts and investors alike. Both global and U.S. markets fell on fears of slowing growth, trade wars and higher interest rates. The DJIA was down 5% for October and the MSCI EAFE Index, an index of stocks in 21 developed markets (excluding the U.S. and Canada), was down 9% for the same period.
Based on continued strong job growth and the economic outlook in the U.S., the Federal Reserve (the “Fed”) raised interest rates in March, June and September. At their September meeting, the Fed also indicated the possibility of one more rate hike in 2018 as well as three more rate hikes in 2019.
Trade tensions have had an impact on markets around the world and could continue to do so in the future. However, our economists believe that the long-term impact of U.S. tariffs will be to encourage countries to come back to the table and talk about more equal trade. Despite market volatility, we continue to believe that the combination of low interest rates, low inflation and strong corporate earnings still point to a positive economic environment and further growth, though we understand that past performance can never guarantee future performance.
We continue to believe that you should invest for the long term and be prepared for market movements, which can happen at any time. You can do this by keeping current on your portfolio and by speaking regularly with your investment professional. Markets go up and they also go down, but savvy investors are prepared for either through careful attention to investment goals.
Thank you for giving First Trust the opportunity to be a part of your financial plan. We value our relationship with you and will report on the Fund again in six months.
Sincerely,
James A. Bowen
Chairman of the Board of Trustees
Chief Executive Officer of First Trust Advisors L.P.
First Trust AQA® Equity Fund
“AT A GLANCE”
As of October 31, 2018 (Unaudited)
| Fund Statistics | |
| First Trust AQA® Equity Fund | Net Asset
Value (NAV) |
| Class A (AQAAX) | $26.42 |
| Class C (AQACX) | $25.84 |
| Class I (AQAIX) | $26.39 |
| Sector Allocation | % of Total
Investments |
| Information Technology | 24.1% |
| Consumer Discretionary | 21.1 |
| Health Care | 19.4 |
| Industrials | 14.9 |
| Financials | 10.3 |
| Communication Services | 4.7 |
| Materials | 3.2 |
| Consumer Staples | 2.3 |
| Total | 100.0% |
| Top Ten Holdings | % of Total
Investments |
| ABIOMED, Inc. | 6.3% |
| BJ’s Restaurants, Inc. | 5.0 |
| Callaway Golf Co. | 4.3 |
| MSCI, Inc. | 4.2 |
| Trex Co., Inc. | 4.1 |
| Cognex Corp. | 3.6 |
| Monolithic Power Systems, Inc. | 3.4 |
| Dave & Buster’s Entertainment, Inc. | 3.3 |
| HCA Healthcare, Inc. | 3.2 |
| Masimo Corp. | 3.2 |
| Total | 40.6% |
First Trust AQA® Equity Fund
“AT A GLANCE” (Continued)
As of October 31, 2018 (Unaudited)
Performance of a $10,000 Investment
This chart compares your Fund’s Class I performance to that of the Russell 3000® Value Index and the Russell 3000® Index from 11/10/2015 through 10/31/2018.
| Performance as of October 31, 2018 |
| | | | Class A
Inception 11/10/2015 | | | Class C
Inception 11/10/2015 | | | Class I
Inception 11/10/2015 | | | Russell
3000® Value
Index* | | | Russell 3000® Index* |
Cumulative
Total Returns | | | w/o
sales
charge | | w/max
5.50%
sales
charge | | | w/o
sales
charge | | w/max 1.00% contingent deferred sales charge | | | w/o
sales
charge | | | w/o
sales
charges | | | w/o
sales
charges |
| 1 Year | | | -1.38% | | -6.84% | | | -2.16% | | -3.11% | | | -1.16% | | | 2.78% | | | 6.60% |
Average Annual
Total Returns | | | | | | | | | | | | | | | | | | | |
| Since Inception | | | 11.21% | | 9.12% | | | 10.42% | | 10.42% | | | 11.17% | | | 8.86% | | | 11.23% |
* Since inception return is based on the Class I Shares inception date.
Performance figures assume reinvestment of all distributions and do not reflect the deduction of taxes that the shareholder would pay on Fund distributions or the redemption of Fund shares. The total returns would have been lower if certain fees had not been waived and expenses reimbursed by the Advisor. An index is a statistical composite that tracks a specific financial market or sector. Unlike the Fund, these indices do not actually hold a portfolio of securities and therefore do not incur the expenses incurred by the Fund. These expenses negatively impact the performance of the Fund. The Fund’s past performance does not predict future performance.
Performance of share classes will vary due to differences in sales charges and expenses. Total return with sales charges includes payment of the maximum sales charge of 5.50% for Class A Shares, a contingent deferred sales charge (“CDSC”) of 1.00% for Class C Shares in year one and 12b-1 service fees of 0.25% per year of average daily net assets for Class A Shares and combined Rule 12b-1 distribution and service fees of 1.00% per year of average daily net assets for Class C Shares. Class I Shares do not have a front-end sales charge or a CDSC, nor do they pay distribution or service fees.
Portfolio Commentary
First Trust AQA® Equity Fund
Annual Report
October 31, 2018 (Unaudited)
Advisor
First Trust Advisors L.P. (“First Trust” or the “Advisor”) serves as the investment advisor to the First Trust AQA® Equity Fund (the “Fund”). First Trust is responsible for the ongoing monitoring of the Fund’s investment portfolio, managing the Fund’s business affairs and providing certain administrative services necessary for the management of the Fund.
Sub-Advisor
J.J.B. Hilliard, W.L. Lyons, LLC (“Hilliard Lyons” or the “Sub-Advisor”) is the sub-advisor to the Fund and is a registered investment adviser located in Louisville, Kentucky. Hilliard Lyons manages the Fund using its proprietary quantitative methodology called the Automated Quantitative Analysis (“AQA®”) program.
Portfolio Management Team
Alan Morel – Senior Vice President, Senior Portfolio Manager of Hilliard Lyons
Cory Gerkin, CFA – Vice President, Portfolio Manager of Hilliard Lyons
Commentary
Market Recap
The 12-month period ended October 31, 2018 was marked with turmoil in the markets as we came into the new year in reaction to sweeping tax changes and the onset of trade negotiations with our North American neighbors and with China and Europe. More market dislocation preceded the November 2018 mid-term elections.
We believe there is a connection here. Uncertainty is anathema to investors, and major uncertainty introduces an element of panic, in our view. Through all the increased volatility, the S&P 500® Index ended up 7.35% for the fiscal year. That index was up 15.22% in September 2018 before a -6.84% drop through the end of October 2018.
The Trump Administration’s economic agenda appears to be taking hold, in our view. Job creation by business, not by government, has significantly reduced the unemployment rate to the point that the Federal Reserve (the “Fed”) fears a tight labor market will lead to inflation. The labor participation rate, still in the low 60%, argues against this, but the Fed has still to rein in excess liquidity in the form of undistributed stimulus money, and a tighter money supply may be the only available recourse.
Meanwhile, third quarter 2018 profits are being reported at a healthy 22% gain from the third quarter of 2017, capital investment is increasing, and tax revenue to government is starting to grow at a rate faster than government spending. Depending on the outcome of the next Presidential election, we believe that potentially two or six more years of sustained corporate stimulus will bring a decision point that has long term ramifications for the economy: to reduce the National Debt or to use its leverage for a) additional spending or, b) additional stimulus. We may not see the market worry too much about this until after the 2020 Presidential election, so with economic growth and less political uncertainty we expect stock prices to rise in pursuit of increased valuations.
Stockholders’ equity of companies in the Fund’s portfolio rose 17.98% in the last twelve months. This year, through the end of October 2018, the pace of change in the portfolio’s price was matched by the pace of change in its net worth. When this happens then the portfolio, despite its appreciation, is as undervalued as it was before the increase in price. If appreciation of the portfolio is below the rate of change of value, then the portfolio is more significantly undervalued.
Performance Analysis
The Fund’s Class I shares generated a return of -1.16% for the 12-month period ended October 31, 2018, versus the Russell 3000® Value Index (the “Benchmark”) appreciation of 2.78%. The Fund was most heavily weighted toward the Consumer Discretionary (21.73%), Industrials (21.57%), and Information Technology (19.81%) sectors. Compared with the Benchmark, only the Healthcare sector was a similar weighting match with the Fund’s portfolio (12.09% versus 13.75%). The most positive performance in the Fund’s portfolio took place in sectors that were the least heavily weighted, with the exception of the Healthcare sector. The Communication Services, Consumer Staples, and Energy sectors each experienced double-digit gains, but each were weighted in the low single figures. The exception was the Healthcare sector, with a gain of 47.95%. The Information Technology sector, weighted 19.79% in the portfolio, suffered a loss of -19.65%, almost entirely in the fourth fiscal quarter when this sector was badly hit in the market.
The Fund’s top ten holdings represent 40.6% of the portfolio, and the bottom ten performers are 12.1% of the portfolio. Allocation of resources for an addition to the portfolio is set at the median of the portfolio’s value per stock; thereafter, stock price movement alone determines the percentage of the portfolio represented by each stock in the portfolio. Within our best performing sector, Healthcare, equipment companies contributed the majority of the gain. Abiomed (ABMD), a manufacturer of heart impeller pumps, was one of the
Portfolio Commentary (Continued)
First Trust AQA® Equity Fund
Annual Report
October 31, 2018 (Unaudited)
Fund’s best performers for the last twelve months (+81%), and at fiscal year-end, is the Fund’s largest holding at 6.3% of the portfolio. In Consumer Discretionary stocks, BJ’s Restaurants (BJRI) rose 102%. At the other end of the scale, TiVo Corporation (TIVO) fell 36%, and at 1.37%, is one of the Fund’s smaller holdings. The growth of streaming television has reduced the growth of set top boxes. Another of our holdings, Applied Optoelectronics, Inc. (AAOI) fell -50% over the period. AAOI was beset by problems both with its capacity utilization, and more specifically, with its 25G lasers that caused a delay in transceiver shipments to a large customer.
The AQA® investment process is driven only by financial performance and price. Net worth generated by financial performance is the dependent variable, and price is the independent variable. Discrepancies between the two indicate a level of under- or over-valuation for a stock relative to all other stocks in our universe of S&P Indexed companies. Undervalued stocks eligible for inclusion in the Fund’s portfolio are not selected on the basis of product, industry, or sector. Well-managed companies that are out of favor in an industry, or in a sector out of favor with investors, will, by default, be more heavily weighted in the portfolio at that time.
There are statistical techniques that allow quantification of the comparative effect of sector weighting for the portfolio and its benchmark. The last twelve months were marked by a lack of coincidence of the Fund’s portfolio performance with portfolio weightings. Performance determined by matching weightings (the sector allocation effect), has been negative. Performance by sector has a negative correlation with the individual performance of stocks within that sector (the sector interaction effect): portfolio return for stocks (the stock selection effect) has been the bright spot in a tough market.
Approximately six stocks in the portfolio accounted for the positive performance, offset by the losses in Information Technology. But the sectors under pricing pressure, throughout the reporting period, have reported gains in revenues and earnings equal to, and, in many cases, superior to those companies recognized by the market over the same period. The difference is not in value or the rate of growth of value of individual stocks, but the difference in perception of these stocks and of their respective sectors, in our view. We are satisfied that the original basis for any stock entering the Fund’s portfolio, an unrecognized, sustained superior growth in value over time, has been enhanced over the reporting period, even as stock prices in some cases have retreated.
Market and Fund Outlook
For the Fund and its ever-changing portfolio of stocks, we are confident that the selection process in place ensures that each stock entering the portfolio is equally undervalued at the point of its inclusion. We are equally sanguine that the recognition process of the value that exists in each of these stocks will be recognized over time, if that value and its rate of growth is maintained. In our opinion, a portfolio turnover rate of 38% in 2017 and 45% in 2018 indicates that there has been a gradual replenishment of undervalued stocks into the portfolio and stocks whose value has been recognized, are sold.
We believe the strong internal rate of growth of these companies indicates a level of undervaluation of the Fund’s portfolio against that measured at the beginning of the fiscal year.
First Trust AQA® Equity Fund
Understanding Your Fund Expenses
October 31, 2018 (Unaudited)
As a shareholder of the First Trust AQA® Equity Fund (the “Fund”), you incur two types of costs: (1) transaction costs, including sales charges (loads) on purchases of Class A Shares and contingent deferred sales charges on the lesser of purchase price or redemption proceeds of Class C Shares; and (2) ongoing costs, including management fees, distribution and/or service (12b-1) fees, if any, and other Fund expenses. This Example is intended to help you understand your ongoing costs of investing in the Fund and to compare these costs with the ongoing costs of investing in other funds.
The Example is based on an investment of $1,000 invested at the beginning of the period and held through the six-month period ended October 31, 2018.
Actual Expenses
The first three columns of the table below provide information about actual account values and actual expenses. You may use the information in these columns, together with the amount you invested, to estimate the expenses that you paid over the period. Simply divide your account value by $1,000 (for example, an $8,600 account value divided by $1,000 = 8.6), then multiply the result by the number in the third column under the heading entitled “Expenses Paid During Period” to estimate the expenses you paid on your account during this period.
Hypothetical Example for Comparison Purposes
The next three columns of the table below provide information about hypothetical account values and hypothetical expenses based on the Fund’s actual expense ratio and an assumed rate of return of 5% per year before expenses, which is not the Fund’s actual return. The hypothetical account values and expenses may not be used to estimate the actual ending account balance or expenses you paid for the period. You may use this information to compare the ongoing costs of investing in the Fund and other funds. To do so, compare this 5% hypothetical example with the 5% hypothetical examples that appear in the shareholder reports of the other funds.
Please note that the expenses shown in the table are meant to highlight your ongoing costs only and do not reflect any transactional costs such as sales charges (loads) or contingent deferred sales charges. Therefore, the hypothetical section of the table is useful in comparing ongoing costs only, and will not help you determine the relative total costs of owning different funds. In addition, if these transactional costs were included, your costs would have been higher.
| | | Actual Expenses | | Hypothetical
(5% Return Before Expenses) | | |
| | | Beginning
Account
Value
5/1/2018 | | Ending
Account
Value
10/31/2018 | | Expenses Paid
During Period
5/1/2018 - 10/31/2018 (a) | | Beginning
Account
Value
5/1/2018 | | Ending
Account
Value
10/31/2018 | | Expenses Paid
During Period
5/1/2018 - 10/31/2018 (a) | | Annualized
Expense
Ratios (b) |
| Class A | | $ 1,000.00 | | $ 959.00 | | $ 7.90 | | $ 1,000.00 | | $ 1,017.14 | | $ 8.13 | | 1.60% |
| Class C | | 1,000.00 | | 955.60 | | 11.58 | | 1,000.00 | | 1,013.36 | | 11.93 | | 2.35 |
| Class I | | 1,000.00 | | 960.30 | | 6.67 | | 1,000.00 | | 1,018.40 | | 6.87 | | 1.35 |
| (a) | Expenses are equal to the annualized expense ratios as indicated in the table multiplied by the average account value over the period (May 1, 2018 through October 31, 2018), multiplied by 184/365 (to reflect the six-month period). |
| (b) | These expense ratios reflect expense caps. |
First Trust AQA® Equity Fund
Portfolio of Investments
October 31, 2018
| Shares | | Description | | Value |
| COMMON STOCKS – 93.7% |
| | | Airlines – 5.2% | | |
| 8,469 | | Delta Air Lines, Inc. | | $463,508 |
| 32,341 | | Hawaiian Holdings, Inc. | | 1,119,322 |
| 15,839 | | Southwest Airlines Co. | | 777,695 |
| | | | | 2,360,525 |
| | | Biotechnology – 2.1% | | |
| 12,339 | | Enanta Pharmaceuticals, Inc. (a) | | 952,077 |
| | | Building Products – 3.8% | | |
| 28,060 | | Trex Co., Inc. (a) | | 1,720,078 |
| | | Capital Markets – 8.4% | | |
| 4,639 | | Affiliated Managers Group, Inc. | | 527,269 |
| 29,900 | | Janus Henderson Group PLC | | 734,643 |
| 11,739 | | MSCI, Inc. | | 1,765,311 |
| 96,380 | | WisdomTree Investments, Inc. | | 748,872 |
| | | | | 3,776,095 |
| | | Communications Equipment – 3.4% | | |
| 15,486 | | Applied Optoelectronics, Inc. (a) | | 303,990 |
| 39,791 | | Ciena Corp. (a) | | 1,243,867 |
| | | | | 1,547,857 |
| | | Diversified Telecommunication
Services – 2.6% | | |
| 20,347 | | Verizon Communications, Inc. | | 1,161,610 |
| | | Electronic Equipment,
Instruments & Components – 3.3% | | |
| 35,234 | | Cognex Corp. | | 1,509,425 |
| | | Health Care Equipment &
Supplies – 11.4% | | |
| 7,767 | | ABIOMED, Inc. (a) | | 2,650,100 |
| 28,844 | | Hologic, Inc. (a) | | 1,124,628 |
| 11,687 | | Masimo Corp. (a) | | 1,351,017 |
| | | | | 5,125,745 |
| | | Health Care Providers &
Services – 3.0% | | |
| 10,282 | | HCA Healthcare, Inc. | | 1,372,955 |
| | | Hotels, Restaurants &
Leisure – 10.6% | | |
| 34,473 | | BJ’s Restaurants, Inc. | | 2,109,058 |
| 46,796 | | Boyd Gaming Corp. | | 1,242,902 |
| 23,723 | | Dave & Buster’s Entertainment, Inc. | | 1,412,705 |
| | | | | 4,764,665 |
| | | Household Durables – 1.4% | | |
| 18,244 | | Toll Brothers, Inc. | | 614,093 |
| | | Interactive Media & Services – 1.9% | | |
| 5,530 | | Facebook, Inc., Class A (a) | | 839,399 |
| Shares | | Description | | Value |
|
| | | IT Services – 3.7% | | |
| 2,477 | | Alliance Data Systems Corp. | | $510,708 |
| 16,827 | | Cognizant Technology Solutions Corp., Class A | | 1,161,568 |
| | | | | 1,672,276 |
| | | Leisure Products – 4.0% | | |
| 84,657 | | Callaway Golf Co. | | 1,811,660 |
| | | Machinery – 2.2% | | |
| 66,352 | | Wabash National Corp. | | 1,001,915 |
| | | Paper & Forest Products – 3.0% | | |
| 16,088 | | Boise Cascade Co. | | 495,350 |
| 39,498 | | Louisiana-Pacific Corp. | | 859,871 |
| | | | | 1,355,221 |
| | | Pharmaceuticals – 1.7% | | |
| 63,956 | | Corcept Therapeutics, Inc. (a) | | 751,483 |
| | | Road & Rail – 2.6% | | |
| 9,179 | | Old Dominion Freight Line, Inc. | | 1,197,125 |
| | | Semiconductors &
Semiconductor Equipment – 8.3% | | |
| 3,307 | | Broadcom, Inc. | | 739,081 |
| 47,393 | | Kulicke & Soffa Industries, Inc. | | 963,500 |
| 8,133 | | MKS Instruments, Inc. | | 599,321 |
| 12,206 | | Monolithic Power Systems, Inc. | | 1,441,773 |
| | | | | 3,743,675 |
| | | Software – 3.8% | | |
| 10,920 | | Citrix Systems, Inc. (a) | | 1,118,972 |
| 52,685 | | TiVo Corp. | | 579,535 |
| | | | | 1,698,507 |
| | | Textiles, Apparel & Luxury
Goods – 3.8% | | |
| 16,363 | | Skechers U.S.A., Inc., Class A (a) | | 467,491 |
| 40,715 | | Steven Madden Ltd. | | 1,273,158 |
| | | | | 1,740,649 |
| | | Thrifts & Mortgage Finance – 1.3% | | |
| 13,562 | | Walker & Dunlop, Inc. | | 569,061 |
| | | Tobacco – 2.2% | | |
| 15,267 | | Altria Group, Inc. | | 992,966 |
| | | Total Investments – 93.7% | | 42,279,062 |
| | | (Cost $37,730,330) (b) | | |
| | | Net Other Assets and Liabilities – 6.3% | | 2,826,159 |
| | | Net Assets – 100.0% | | $45,105,221 |
See Notes to Financial Statements
Page 7
First Trust AQA® Equity Fund
Portfolio of Investments (Continued)
October 31, 2018
|
| (a) | Non-income producing security. |
| (b) | Aggregate cost for federal income tax purposes was $37,722,612. As of October 31, 2018, the aggregate gross unrealized appreciation for all investments in which there was an excess of value over tax cost was $8,020,429 and the aggregate gross unrealized depreciation for all investments in which there was an excess of tax cost over value was $3,463,979. The net unrealized appreciation was $4,556,450. |
Valuation Inputs
A summary of the inputs used to value the Fund’s investments as of October 31, 2018 is as follows (see Note 2A - Portfolio Valuation in the Notes to Financial Statements):
| | Total
Value at
10/31/2018 | Level 1
Quoted
Prices | Level 2
Significant
Observable
Inputs | Level 3
Significant
Unobservable
Inputs |
| Common Stocks* | $ 42,279,062 | $ 42,279,062 | $ — | $ — |
| * | See Portfolio of Investments for industry breakout. |
Page 8
See Notes to Financial Statements
First Trust AQA® Equity Fund
Statement of Assets and Liabilities
October 31, 2018
| ASSETS: | |
Investments, at value
(Cost $37,730,330)
| $ 42,279,062 |
Cash
| 2,787,601 |
| Receivables: | |
Fund shares sold
| 140,240 |
Dividends
| 11,838 |
Prepaid expenses
| 27,160 |
Total Assets
| 45,245,901 |
| LIABILITIES: | |
| Payables: | |
Investment advisory fees
| 42,372 |
Audit and tax fees
| 28,751 |
12b-1 distribution and service fees
| 20,583 |
Administrative fees
| 17,682 |
Shareholder reporting fees
| 7,914 |
Transfer agent fees
| 7,749 |
Fund shares redeemed
| 7,396 |
Commitment fees
| 2,736 |
Custodian fees
| 1,498 |
Trustees’ fees and expenses
| 1,454 |
Registration fees
| 861 |
Financial reporting fees
| 770 |
Legal fees
| 567 |
Other liabilities
| 347 |
Total Liabilities
| 140,680 |
NET ASSETS
| $45,105,221 |
| NET ASSETS consist of: | |
Paid-in capital
| $ 36,199,905 |
Par value
| 17,220 |
Accumulated distributable earnings (loss)
| 8,888,096 |
NET ASSETS
| $45,105,221 |
| Maximum Offering Price Per Share: | |
| Class A Shares: | |
Net asset value and redemption price per share (Based on net assets of $24,484,490 and 926,887 shares of beneficial interest issued and outstanding)
| $26.42 |
Maximum sales charge (5.50% of offering price)
| 1.54 |
Maximum offering price to public
| $27.96 |
| Class C Shares: | |
Net asset value and redemption price per share (Based on net assets of $17,120,867 and 662,484 shares of beneficial interest issued and outstanding)
| $25.84 |
| Class I Shares: | |
Net asset value and redemption price per share (Based on net assets of $3,499,864 and 132,639 shares of beneficial interest issued and outstanding)
| $26.39 |
See Notes to Financial Statements
Page 9
First Trust AQA® Equity Fund
Statement of Operations
For the Year Ended October 31, 2018
| INVESTMENT INCOME: | |
Dividends
| $ 456,270 |
Interest
| 20,021 |
Total investment income
| 476,291 |
| EXPENSES: | |
Investment advisory fees
| 460,183 |
| 12b-1 distribution and/or service fees: | |
Class A
| 62,487 |
Class C
| 182,303 |
Transfer agent fees
| 92,314 |
Administrative fees
| 52,502 |
Registration fees
| 50,003 |
Shareholder reporting fees
| 31,934 |
Audit and tax fees
| 29,154 |
Commitment and agency fees
| 27,932 |
Legal fees
| 16,367 |
Trustees’ fees and expenses
| 15,898 |
Financial reporting fees
| 9,250 |
Custodian fees
| 7,141 |
Listing expense
| 1,800 |
Other
| 1,965 |
Total expenses
| 1,041,233 |
Fees waived by the investment advisor
| (175,140) |
Net expenses
| 866,093 |
NET INVESTMENT INCOME (LOSS)
| (389,802) |
| NET REALIZED AND UNREALIZED GAIN (LOSS): | |
Net realized gain (loss) on investments
| 4,738,819 |
Net change in unrealized appreciation (depreciation) on investments
| (5,518,112) |
NET REALIZED AND UNREALIZED GAIN (LOSS)
| (779,293) |
NET INCREASE (DECREASE) IN NET ASSETS RESULTING FROM OPERATIONS
| $(1,169,095) |
Page 10
See Notes to Financial Statements
First Trust AQA® Equity Fund
Statements of Changes in Net Assets
| | Year
Ended
10/31/2018 | | Year
Ended
10/31/2017 |
| OPERATIONS: | | | |
Net investment income (loss)
| $ (389,802) | | $ (324,217) |
Net realized gain (loss)
| 4,738,819 | | 1,500,421 |
Net change in unrealized appreciation (depreciation)
| (5,518,112) | | 9,308,457 |
Net increase (decrease) in net assets resulting from operations
| (1,169,095) | | 10,484,661 |
| DISTRIBUTIONS TO SHAREHOLDERS FROM INVESTMENT OPERATIONS: | | | |
Class A Shares
| (598,812) | | |
Class C Shares
| (501,248) | | |
Class I Shares
| (81,020) | | |
Total distributions to shareholders from investment operations
| (1,181,080) | | |
| DISTRIBUTIONS TO SHAREHOLDERS FROM NET REALIZED GAIN: | | | |
Class A Shares
| | | (136,704) |
Class C Shares
| | | (175,390) |
Class I Shares
| | | (34,397) |
Total distributions to shareholders from net realized gain
| | | (346,491) |
| CAPITAL TRANSACTIONS: | | | |
Proceeds from shares sold
| 15,119,698 | | 17,450,833 |
Proceeds from shares reinvested
| 1,133,188 | | 335,557 |
Cost of shares redeemed
| (12,294,022) | | (9,871,258) |
Net increase (decrease) in net assets resulting from capital transactions
| 3,958,864 | | 7,915,132 |
Total increase (decrease) in net assets
| 1,608,689 | | 18,053,302 |
| NET ASSETS: | | | |
Beginning of period
| 43,496,532 | | 25,443,230 |
End of period
| $45,105,221 | | $43,496,532 |
Accumulated net investment income (loss) at end of period
| | | $— |
See Notes to Financial Statements
Page 11
First Trust AQA® Equity Fund
Financial Highlights
For a share outstanding throughout each period
| Class A Shares | Year Ended October 31, | | Period
Ended
10/31/2016 (a) |
| 2018 | | 2017 | |
Net asset value, beginning of period
| $ 27.51 | | $ 20.42 | | $ 20.00 |
| Income from investment operations: | | | | | |
Net investment income (loss) (b)
| (0.16) | | (0.14) | | (0.08) |
Net realized and unrealized gain (loss)
| (0.17) | | 7.50 | | 0.50 |
Total from investment operations
| (0.33) | | 7.36 | | 0.42 |
| Distributions paid to shareholders from: | | | | | |
Net realized gain
| (0.76) | | (0.27) | | — |
Net asset value, end of period
| $26.42 | | $27.51 | | $20.42 |
Total return (c)
| (1.38)% | | 36.26% | | 2.10% |
| Ratios to average net assets/supplemental data: | | | | | |
Net assets, end of period (in 000’s)
| $ 24,484 | | $ 22,117 | | $ 10,527 |
Ratio of total expenses to average net assets
| 1.94% | | 1.91% | | 2.65% (d) |
Ratio of net expenses to average net assets
| 1.60% | | 1.60% | | 1.60% (d) |
Ratio of net investment income (loss) to average net assets
| (0.56)% | | (0.58)% | | (0.42)% (d) |
Portfolio turnover rate
| 45% | | 38% | | 57% |
| (a) | Class A Shares were initially seeded on November 9, 2015 and commenced operations on November 10, 2015. |
| (b) | Based on average shares outstanding. |
| (c) | Assumes reinvestment of all distributions for the period and does not include payment of the maximum sales charge of 5.50% or contingent deferred sales charge (CDSC). On purchases of $1 million or more, a CDSC of 1% may be imposed on certain redemptions made within twelve months of purchase. If the sales charges were included, total returns would be lower. These returns include Rule 12b-1 service fees of 0.25% and do not reflect the deduction of taxes that a shareholder would pay on Fund distributions or the redemption of Fund shares. The total returns would have been lower if certain fees had not been waived and expenses reimbursed by the investment advisor. Total return is calculated for the time period presented and is not annualized for periods of less than one year. |
| (d) | Annualized. |
Page 12
See Notes to Financial Statements
First Trust AQA® Equity Fund
Financial Highlights (Continued)
For a share outstanding throughout each period
| Class C Shares | Year Ended October 31, | | Period
Ended
10/31/2016 (a) |
| 2018 | | 2017 | |
Net asset value, beginning of period
| $ 27.13 | | $ 20.29 | | $ 20.00 |
| Income from investment operations: | | | | | |
Net investment income (loss) (b)
| (0.37) | | (0.31) | | (0.23) |
Net realized and unrealized gain (loss)
| (0.16) | | 7.42 | | 0.52 |
Total from investment operations
| (0.53) | | 7.11 | | 0.29 |
| Distributions paid to shareholders from: | | | | | |
Net realized gain
| (0.76) | | (0.27) | | — |
Net asset value, end of period
| $25.84 | | $27.13 | | $20.29 |
Total return (c)
| (2.16)% | | 35.25% | | 1.45% |
| Ratios to average net assets/supplemental data: | | | | | |
Net assets, end of period (in 000’s)
| $ 17,121 | | $ 18,370 | | $ 12,416 |
Ratio of total expenses to average net assets
| 2.71% | | 2.72% | | 3.48% (d) |
Ratio of net expenses to average net assets
| 2.35% | | 2.35% | | 2.35% (d) |
Ratio of net investment income (loss) to average net assets
| (1.32)% | | (1.31)% | | (1.17)% (d) |
Portfolio turnover rate
| 45% | | 38% | | 57% |
| (a) | Class C Shares were initially seeded on November 9, 2015 and commenced operations on November 10, 2015. |
| (b) | Based on average shares outstanding. |
| (c) | Assumes reinvestment of all distributions for the period and does not include payment of the maximum CDSC of 1%, charged on certain redemptions made within one year of purchase. If the sales charge was included, total returns would be lower. These returns include combined Rule 12b-1 distribution and service fees of 1% and do not reflect the deduction of taxes that a shareholder would pay on Fund distributions or the redemption of Fund shares. The total returns would have been lower if certain fees had not been waived and expenses reimbursed by the investment advisor. Total return is calculated for the time period presented and is not annualized for periods of less than one year. |
| (d) | Annualized. |
See Notes to Financial Statements
Page 13
First Trust AQA® Equity Fund
Financial Highlights (Continued)
For a share outstanding throughout each period
| Class I Shares | Year Ended October 31, | | Period
Ended
10/31/2016 (a) |
| 2018 | | 2017 | |
Net asset value, beginning of period
| $ 27.42 | | $ 20.30 | | $ 20.00 |
| Income from investment operations: | | | | | |
Net investment income (loss) (b)
| (0.09) | | (0.07) | | (0.03) |
Net realized and unrealized gain (loss)
| (0.18) | | 7.46 | | 0.33 |
Total from investment operations
| (0.27) | | 7.39 | | 0.30 |
| Distributions paid to shareholders from: | | | | | |
Net realized gain
| (0.76) | | (0.27) | | — |
Net asset value, end of period
| $26.39 | | $27.42 | | $20.30 |
Total return (c)
| (1.16)% | | 36.58% | | 1.50% |
| Ratios to average net assets/supplemental data: | | | | | |
Net assets, end of period (in 000’s)
| $ 3,500 | | $ 3,010 | | $ 2,500 |
Ratio of total expenses to average net assets
| 2.23% | | 2.22% | | 3.08% (d) |
Ratio of net expenses to average net assets
| 1.35% | | 1.35% | | 1.35% (d) |
Ratio of net investment income (loss) to average net assets
| (0.32)% | | (0.31)% | | (0.15)% (d) |
Portfolio turnover rate
| 45% | | 38% | | 57% |
| (a) | Class I Shares were initially seeded on November 9, 2015 and commenced operations on November 10, 2015. |
| (b) | Based on average shares outstanding. |
| (c) | Assumes reinvestment of all distributions for the period. These returns do not reflect the deduction of taxes that a shareholder would pay on Fund distributions or the redemption of Fund shares. The total returns would have been lower if certain fees had not been waived and expenses reimbursed by the investment advisor. Total return is calculated for the time period presented and is not annualized for periods of less than one year. |
| (d) | Annualized. |
Page 14
See Notes to Financial Statements
Notes to Financial Statements
First Trust AQA® Equity Fund
October 31, 2018
1. Organization
First Trust AQA® Equity Fund (the “Fund”) is a series of the First Trust Series Fund (the “Trust”), a Massachusetts business trust organized on July 9, 2010, and is registered as a diversified open-end management investment company with the Securities and Exchange Commission (“SEC”) under the Investment Company Act of 1940, as amended (the “1940 Act”). The Fund offers three classes of shares: Class A, Class C and Class I. Each class represents an interest in the same portfolio of investments but with a different combination of sales charges, distribution and service (12b-1) fees, eligibility requirements and other features.
The Fund’s investment objective is to seek capital appreciation. Under normal market conditions, the Fund invests at least 80% of its net assets (including investment borrowings) in equity securities (specifically, common stocks) of U.S. companies. First Trust Advisors L.P. (“First Trust” or the “Advisor”) typically selects common stocks for investment by the Fund using information produced by a proprietary quantitative methodology developed by the Fund’s sub-advisor called the Automated Quantitative Analysis (“AQA®”) program. In general, the stocks chosen for investment by the Fund are those considered by AQA® to be the most undervalued at the time the portfolio was selected based on a set of pre-determined proprietary screens and evaluations. There can be no assurance that the Fund will achieve its investment objective. The Fund may not be appropriate for all investors.
2. Significant Accounting Policies
The Fund is considered an investment company and follows accounting and reporting guidance under Financial Accounting Standards Board (“FASB”) Accounting Standards Codification (“ASC”) Topic 946, “Financial Services-Investment Companies.” The following is a summary of significant accounting policies consistently followed by the Fund in the preparation of the financial statements. The preparation of the financial statements in accordance with accounting principles generally accepted in the United States of America (“U.S. GAAP”) requires management to make estimates and assumptions that affect the reported amounts and disclosures in the financial statements. Actual results could differ from those estimates.
A. Portfolio Valuation
The net asset value (“NAV”) of each class of shares of the Fund is determined daily as of the close of regular trading on the New York Stock Exchange (“NYSE”), normally 4:00 p.m. Eastern time, on each day the NYSE is open for trading. If the NYSE closes early on a valuation day, the NAV is determined as of that time. The NAV for each class is calculated by dividing the value of the Fund’s total assets attributable to such class (including accrued interest and dividends), less all liabilities attributable to such class (including accrued expenses, dividends declared but unpaid and any borrowings of the Fund), by the total number of shares of the class outstanding. Differences in NAV of each class of the Fund’s shares are generally expected to be due to the daily expense accruals of the specified distribution and service (12b-1) fees and transfer agency costs applicable to such class of shares and the resulting differential in the dividends that may be paid on each class of shares.
The Fund’s investments are valued daily at market value or, in the absence of market value with respect to any portfolio securities, at fair value. Market value prices represent last sale or official closing prices from a national or foreign exchange (i.e., a regulated market) and are primarily obtained from third-party pricing services. Fair value prices represent any prices not considered market value prices and are either obtained from a third-party pricing service or are determined by the Pricing Committee of the Fund’s investment advisor, First Trust, in accordance with valuation procedures adopted by the Trust’s Board of Trustees, and in accordance with provisions of the 1940 Act. Investments valued by the Advisor’s Pricing Committee, if any, are footnoted as such in the footnotes to the Portfolio of Investments. The Fund’s investments are valued as follows:
Common stocks and other equity securities listed on any national or foreign exchange (excluding The Nasdaq Stock Market LLC (“Nasdaq”) and the London Stock Exchange Alternative Investment Market (“AIM”)) are valued at the last sale price on the exchange on which they are principally traded or, for Nasdaq and AIM securities, the official closing price. Securities traded on more than one securities exchange are valued at the last sale price or official closing price, as applicable, at the close of the securities exchange representing the principal market for such securities.
Securities traded in an over-the-counter market are fair valued at the mean of their most recent bid and asked price, if available, and otherwise at their closing bid price.
Certain securities may not be able to be priced by pre-established pricing methods. Such securities may be valued by the Trust’s Board of Trustees or its delegate, the Advisor’s Pricing Committee, at fair value. These securities generally include, but are not limited to, restricted securities (securities which may not be publicly sold without registration under the Securities Act of 1933, as amended) for which a third-party pricing service is unable to provide a market price; securities whose trading has been formally suspended; a security whose market or fair value price is not available from a pre-established pricing source; a security with respect to which an event has occurred that is likely to materially affect the value of the security after the market has closed but before the calculation of the Fund’s NAV or make it difficult or impossible to obtain a reliable market quotation; and a security whose price, as provided by the
Notes to Financial Statements (Continued)
First Trust AQA® Equity Fund
October 31, 2018
third-party pricing service, does not reflect the security’s fair value. As a general principle, the current fair value of a security would appear to be the amount which the owner might reasonably expect to receive for the security upon its current sale. When fair value prices are used, generally they will differ from market quotations or official closing prices on the applicable exchanges. A variety of factors may be considered in determining the fair value of such securities, including, but not limited to, the following:
| 1) | the type of security; |
| 2) | the size of the holding; |
| 3) | the initial cost of the security; |
| 4) | transactions in comparable securities; |
| 5) | price quotes from dealers and/or third-party pricing services; |
| 6) | relationships among various securities; |
| 7) | information obtained by contacting the issuer, analysts, or the appropriate stock exchange; |
| 8) | an analysis of the issuer’s financial statements; and |
| 9) | the existence of merger proposals or tender offers that might affect the value of the security. |
The Fund is subject to fair value accounting standards that define fair value, establish the framework for measuring fair value and provide a three-level hierarchy for fair valuation based upon the inputs to the valuation as of the measurement date. The three levels of the fair value hierarchy are as follows:
| • | Level 1 – Level 1 inputs are quoted prices in active markets for identical investments. An active market is a market in which transactions for the investment occur with sufficient frequency and volume to provide pricing information on an ongoing basis. |
| • | Level 2 – Level 2 inputs are observable inputs, either directly or indirectly, and include the following: |
| o | Quoted prices for similar investments in active markets. |
| o | Quoted prices for identical or similar investments in markets that are non-active. A non-active market is a market where there are few transactions for the investment, the prices are not current, or price quotations vary substantially either over time or among market makers, or in which little information is released publicly. |
| o | Inputs other than quoted prices that are observable for the investment (for example, interest rates and yield curves observable at commonly quoted intervals, volatilities, prepayment speeds, loss severities, credit risks, and default rates). |
| o | Inputs that are derived principally from or corroborated by observable market data by correlation or other means. |
| • | Level 3 – Level 3 inputs are unobservable inputs. Unobservable inputs may reflect the reporting entity’s own assumptions about the assumptions that market participants would use in pricing the investment. |
The inputs or methodologies used for valuing investments are not necessarily an indication of the risk associated with investing in those investments. A summary of the inputs used to value the Fund’s investments as of October 31, 2018, is included with the Fund’s Portfolio of Investments.
B. Securities Transactions and Investment Income
Securities transactions are recorded as of the trade date. Realized gains and losses from securities transactions are recorded on the identified cost basis. Dividend income is recorded on the ex-dividend date. Interest income, if any, is recorded daily on the accrual basis, including the amortization of premiums and the accretion of discounts. Income is allocated on a pro rata basis to each class of shares.
C. Dividends and Distributions to Shareholders
Dividends from net investment income, if any, are declared and paid annually by the Fund, or as the Board of Trustees may determine from time to time. Distributions of net realized capital gains earned by the Fund, if any, are distributed at least annually.
Distributions from income and capital gains are determined in accordance with federal income tax regulations, which may differ from U.S. GAAP. Certain capital accounts in the financial statements are periodically adjusted for permanent differences in order to reflect their tax character. These permanent differences are primarily due to the varying treatment of income and gain/loss on portfolio securities held by the Fund and have no impact on net assets or NAV per share. Temporary differences, which arise from recognizing certain items of income, expense and gain/loss in different periods for financial statement and tax purposes, will reverse at some time in the future. Permanent differences incurred during the fiscal year ended October 31, 2018, resulting in book and tax accounting differences, have been reclassified at fiscal year end to reflect an increase in accumulated net investment income (loss) of $175,883, a decrease in accumulated net realized gain (loss) on investments of $178,368 and an increase to paid-in-capital of $2,485. Accumulated
Notes to Financial Statements (Continued)
First Trust AQA® Equity Fund
October 31, 2018
distributable earnings (loss) consists of accumulated net investment income (loss), accumulated net realized gain (loss) on investments, and unrealized appreciation (depreciation) on investments. Net assets were not affected by this reclassification.
The tax character of distributions paid by the Fund during the fiscal years ended October 31, 2018 and 2017, was as follows:
| Distributions paid from: | 2018 | 2017 |
Ordinary income
| $180,224 | $346,491 |
Capital gains
| 1,000,856 | — |
Return of capital
| — | — |
As of October 31, 2018, the distributable earnings and net assets on a tax basis were as follows:
Undistributed ordinary income
| $— |
Undistributed capital gains
| 4,545,565 |
Total undistributed earnings
| 4,545,565 |
Accumulated capital and other losses
| (213,919) |
Net unrealized appreciation (depreciation)
| 4,556,450 |
Total accumulated earnings (losses)
| 8,888,096 |
Other
| — |
Paid-in capital
| 36,217,125 |
Total net assets
| $45,105,221 |
D. Income Taxes
The Fund intends to continue to qualify as a regulated investment company by complying with the requirements under Subchapter M of the Internal Revenue Code of 1986, as amended, which includes distributing substantially all of its net investment income and net realized gains to shareholders. Accordingly, no provision has been made for federal and state income taxes. However, due to the timing and amount of distributions, the Fund may be subject to an excise tax of 4% of the amount by which approximately 98% of the Fund’s taxable income exceeds the distributions from such taxable income for the calendar year.
The Fund intends to utilize provisions of the federal income tax laws, which allow it to carry a realized capital loss forward indefinitely following the year of the loss and offset such loss against any future realized capital gains. The Fund is subject to certain limitations under U.S. tax rules on the use of capital loss carryforwards and net unrealized built-in losses. These limitations apply when there has been a 50% change in ownership. At October 31, 2018, the Fund had no non-expiring capital loss carryforwards for federal income tax purposes.
Certain losses realized during the current fiscal year may be deferred and treated as occurring on the first day of the following fiscal year for federal income tax purposes. For the fiscal year ended October 31, 2018, the Fund incurred and elected to defer qualified late year ordinary losses of $213,919.
The Fund is subject to accounting standards that establish a minimum threshold for recognizing, and a system for measuring, the benefits of a tax position taken or expected to be taken in a tax return. Taxable years ended 2016, 2017, and 2018 remain open to federal and state audit. As of October 31, 2018, management has evaluated the application of these standards to the Fund and has determined that no provision for income tax is required in the Fund’s financial statements for uncertain tax positions.
E. Expenses
The Fund will pay all expenses directly related to its operations. Expenses of the Fund are allocated on a pro rata basis to each class of shares, except for distribution and service (12b-1) fees and incremental transfer agency costs which are unique to each class of shares.
F. New Accounting Pronouncement
On August 28, 2018, the FASB issued Accounting Standards Update (“ASU”) 2018-13, “Disclosure Framework – Changes to the Disclosure Requirements for Fair Value Measurement,” which amends the fair value measurement disclosure requirements of ASC 820. The amendments of ASU 2018-13 include new, eliminated, and modified disclosure requirements of ASC 820. In addition, the amendments clarify that materiality is an appropriate consideration of entities when evaluating disclosure requirements. The ASU is effective for fiscal years beginning after December 15, 2019, including interim periods therein. Early adoption is permitted for any eliminated or modified disclosures upon issuance of this ASU. The Fund has early adopted ASU 2018-13 for these financial statements, which did not result in a material impact.
Notes to Financial Statements (Continued)
First Trust AQA® Equity Fund
October 31, 2018
3. Investment Advisory Fee, Affiliated Transactions and Other Fee Arrangements
First Trust, the investment advisor to the Fund, is a limited partnership with one limited partner, Grace Partners of DuPage L.P., and one general partner, The Charger Corporation. The Charger Corporation is an Illinois corporation controlled by James A. Bowen, Chief Executive Officer of First Trust. First Trust is responsible for the ongoing monitoring of the Fund’s investment portfolio, managing the Fund’s business affairs and providing certain administrative services necessary for the management of the Fund. For these investment management services, First Trust is entitled to a monthly fee calculated at an annual rate of 1.00% of the Fund’s average daily net assets. First Trust also provides fund reporting services to the Fund for a flat annual fee in the amount of $9,250.
J.J.B. Hilliard, W.L. Lyons, LLC (“Hilliard Lyons” or the “Sub-Advisor”) serves as the Fund’s sub-advisor and manages the Fund’s portfolio subject to First Trust’s supervision. The Sub-Advisor receives a monthly sub-advisory fee calculated at an annual rate of 0.50% of the Fund’s average daily net assets that is paid by First Trust out of its investment advisory fee.
First Trust and Hilliard Lyons have agreed to waive fees and/or reimburse Fund expenses to the extent necessary to prevent the total annual fund operating expenses (excluding 12b-1 distribution and service fees, interest expenses, taxes, fees incurred in acquiring and disposing of portfolio securities and extraordinary expenses) from exceeding 1.35% of average daily net assets of any class of shares of the Fund (the “Expense Cap”) until February 28, 2020 and then from exceeding 1.70% from March 1, 2020 to February 28, 2029 (the “Expense Cap Termination Date”). Expenses borne and fees waived by First Trust and Hilliard Lyons are subject to recovery on a Fund class level, if applicable, by First Trust and Hilliard Lyons for up to three years from the date the fee or expense was incurred, but no reimbursement payment will be made by the Fund at any time if it would result in the Fund’s expenses exceeding (i) the Expense Cap in place for the most recent fiscal year for which such expense limitation was in place; (ii) the Expense Cap in place at the time the fees were waived; or (iii) the current Expense Cap. Expense limitations may be terminated or modified prior to their expiration only with the approval of the Board of Trustees of the Trust. These amounts would be included in “Expenses previously waived or reimbursed” on the Statement of Operations. The advisory fee waiver and expense reimbursement for the fiscal year ended October 31, 2018 and the expenses borne by First Trust and Hilliard Lyons subject to recovery were as follows:
| | | | | Expenses Subject to Recovery |
Advisory Fee
Waiver | | Expense
Reimbursement | | Period Ended
October 31, 2016 | | Year Ended
October 31, 2017 | | Year Ended
October 31, 2018 | | Total |
| $ 175,140 | | $ — | | $ 183,866 | | $ 136,315 | | $ 175,140 | | $ 495,321 |
Brown Brothers Harriman & Co. (“BBH”) serves as the Fund’s administrator, fund accountant and custodian in accordance with certain fee arrangements. As administrator and fund accountant, BBH is responsible for providing certain administrative and accounting services to the Fund, including maintaining the Fund’s books of account, records of the Fund’s securities transactions, and certain other books and records. As custodian, BBH is responsible for custody of the Fund’s assets.
BNY Mellon Investment Servicing (US) Inc. (“BNYM IS”) serves as the Fund’s transfer agent in accordance with certain fee arrangements. As transfer agent, BNYM IS is responsible for maintaining shareholder records for the Fund.
Each Trustee who is not an officer or employee of First Trust, any sub-advisor or any of their affiliates (“Independent Trustees”) is paid a fixed annual retainer that is allocated equally among each fund in the First Trust Fund Complex. Each Independent Trustee is also paid an annual per fund fee that varies based on whether the fund is a closed-end or other actively managed fund, or is an index fund.
Additionally, the Lead Independent Trustee and the Chairmen of the Audit Committee, Nominating and Governance Committee and Valuation Committee are paid annual fees to serve in such capacities, with such compensation allocated pro rata among each fund in the First Trust Fund Complex based on net assets. Independent Trustees are reimbursed for travel and out-of-pocket expenses in connection with all meetings. The Lead Independent Trustee and Committee Chairmen rotate every three years. The officers and “Interested” Trustee receive no compensation from the Trust for acting in such capacities.
Notes to Financial Statements (Continued)
First Trust AQA® Equity Fund
October 31, 2018
4. Capital Share Transactions
Capital transactions were as follows:
| | Year Ended
October 31, 2018 | | Year Ended
October 31, 2017 |
| | Shares | | Value | | Shares | | Value |
| Sales: | | | | | | | |
| Class A | 302,353 | | $ 8,681,663 | | 462,184 | | $ 11,181,772 |
| Class C | 156,203 | | 4,475,242 | | 251,766 | | 5,835,596 |
| Class I | 65,542 | | 1,962,793 | | 18,828 | | 433,465 |
| Total Sales | 524,098 | | $ 15,119,698 | | 732,778 | | $ 17,450,833 |
| Dividend Reinvestment: | | | | | | | |
| Class A | 20,407 | | $ 576,285 | | 5,645 | | $ 132,534 |
| Class C | 17,168 | | 477,449 | | 7,273 | | 169,472 |
| Class I | 2,822 | | 79,454 | | 1,437 | | 33,551 |
| Total Dividend Reinvestment | 40,397 | | $ 1,133,188 | | 14,355 | | $ 335,557 |
| Redemptions: | | | | | | | |
| Class A | (199,802) | | $ (5,683,348) | | (179,401) | | $ (4,388,385) |
| Class C | (187,953) | | (5,288,146) | | (193,883) | | (4,691,632) |
| Class I | (45,508) | | (1,322,528) | | (33,649) | | (791,241) |
| Total Redemptions | (433,263) | | $ (12,294,022) | | (406,933) | | $ (9,871,258) |
5. Purchases and Sales of Securities
The cost of purchases and proceeds from sales of securities, excluding short-term investments, for the fiscal year ended October 31, 2018, were $20,115,718 and $20,643,594, respectively.
6. Distribution and Service Plan
The Board of Trustees adopted a Distribution and Service Plan pursuant to Rule 12b-1 under the 1940 Act. In accordance with the Rule 12b-1 plan, the share classes of the Fund are authorized to pay an amount up to 0.25% and 1.00% of their average daily net assets each year for Class A and Class C, respectively, to reimburse First Trust Portfolios L.P. (“FTP”), the distributor of the Fund, for amounts expended to finance activities primarily intended to result in the sale of Fund shares or the provision of investor services. FTP may also use this amount to compensate securities dealers or other persons for providing distribution assistance, including broker-dealer and shareholder support and educational and promotional services. Class I shares have no 12b-1 fees.
7. Borrowings
The Trust, on behalf of the Fund, along with First Trust Exchange-Traded Fund III and First Trust Exchange Traded Fund IV have a $360 million Credit Agreement with The Bank of Nova Scotia (“Scotia”) as administrative agent for a group of lenders. Prior to August 28, 2018 and March 7, 2018, the commitment amount was $320 million and $220 million, respectively. Scotia charges a commitment fee of 0.25% of the daily amount of the excess of the commitment amount over the outstanding principal balance of the loans. First Trust allocates the commitment fee and agency fee amongst the funds that have access to the credit line. To the extent that the Fund accesses the credit line, there would also be an interest fee charged. The Fund did not have any borrowings outstanding during the fiscal year ended October 31, 2018.
8. Indemnification
The Fund has a variety of indemnification obligations under contracts with its service providers. The Fund’s maximum exposure under these arrangements is unknown. However, the Fund has not had prior claims or losses pursuant to these contracts and expects the risk of loss to be remote.
Notes to Financial Statements (Continued)
First Trust AQA® Equity Fund
October 31, 2018
9. Subsequent Events
Management has evaluated the impact of all subsequent events to the Fund through the date the financial statements were issued, and has determined that there was the following subsequent event:
On November 27, 2018, HL Financial Services, LLC, the parent of Hilliard Lyons, announced it had entered into an agreement with Baird Financial Corporation, the parent of Robert W. Baird & Co. Incorporated, a broker-dealer and investment adviser headquartered in Milwaukee, Wisconsin, pursuant to which Baird Financial Corporation will acquire Hilliard Lyons. As a result of the transaction Hilliard Lyons will be affiliated with Robert W. Baird & Co. Incorporated, as both firms will be under common control. The transaction, which is subject to regulatory approvals and other conditions, is expected to close in the first half of 2019.
Report of Independent Registered Public Accounting Firm
To the Shareholders and the Board of Trustees of First Trust Series Fund:
Opinion on the Financial Statements and Financial Highlights
We have audited the accompanying statement of assets and liabilities, including the portfolio of investments, of First Trust AQA® Equity Fund (the “Fund”), one of the funds constituting First Trust Series Fund, as of October 31, 2018, the related statement of operations for the year then ended, the statements of changes in net assets for each of the two years in the period then ended, the financial highlights for the years ended October 31, 2018 , 2017, and the period from November 10, 2015 (commencement of operations) through October 31, 2016, and the related notes. In our opinion, the financial statements and financial highlights present fairly, in all material respects, the financial position of the Fund as of October 31, 2018, the results of its operations for the year then ended, the changes in its net assets for each of the two years in the period then ended, and the financial highlights for the years ended October 31, 2018, 2017, and for the period from November 10, 2015 (commencement of operations) through October 31, 2016, in conformity with accounting principles generally accepted in the United States of America.
Basis for Opinion
These financial statements and financial highlights are the responsibility of the Fund’s management. Our responsibility is to express an opinion on the Fund’s financial statements and financial highlights based on our audits. We are a public accounting firm registered with the Public Company Accounting Oversight Board (United States) (PCAOB) and are required to be independent with respect to the Fund in accordance with the U.S. federal securities laws and the applicable rules and regulations of the Securities and Exchange Commission and the PCAOB.
We conducted our audits in accordance with the standards of the PCAOB. Those standards require that we plan and perform the audit to obtain reasonable assurance about whether the financial statements and financial highlights are free of material misstatement, whether due to error or fraud. The Fund is not required to have, nor were we engaged to perform, an audit of its internal control over financial reporting. As part of our audits we are required to obtain an understanding of internal control over financial reporting but not for the purpose of expressing an opinion on the effectiveness of the Fund’s internal control over financial reporting. Accordingly, we express no such opinion.
Our audits included performing procedures to assess the risks of material misstatement of the financial statements and financial highlights, whether due to error or fraud, and performing procedures that respond to those risks. Such procedures included examining, on a test basis, evidence regarding the amounts and disclosures in the financial statements and financial highlights. Our audits also included evaluating the accounting principles used and significant estimates made by management, as well as evaluating the overall presentation of the financial statements and financial highlights. Our procedures included confirmation of securities owned as of October 31, 2018, by correspondence with the custodian and brokers. We believe that our audits provide a reasonable basis for our opinion.
Chicago, Illinois
December 20, 2018
We have served as the auditor of one or more First Trust investment companies since 2001.
Additional Information
First Trust AQA® Equity Fund
October 31, 2018 (Unaudited)
Proxy Voting Policies and Procedures
A description of the policies and procedures that the Trust uses to determine how to vote proxies and information on how the Fund voted proxies relating to portfolio securities during the most recent 12-month period ended June 30 is available (1) without charge, upon request, by calling (800) 988-5891; (2) on the Fund’s website at www.ftportfolios.com; and (3) on the Securities and Exchange Commission’s (“SEC”) website at www.sec.gov.
Portfolio Holdings
The Trust files its complete schedule of the Fund’s portfolio holdings with the SEC for the first and third quarters of each fiscal year on Form N-Q. The Trust’s Form NQs are available (1) by calling (800) 988-5891; (2) on the Fund’s website at www.ftportfolios.com; and (3) on the SEC’s website at www.sec.gov.
Beginning in April 2019, the Trust will cease to disclose the Fund’s holdings on Form N-Q and will file Form N-PORT with the SEC on a monthly basis. Part F of Form N-PORT, which contains the complete schedule of the Fund’s portfolio holdings, will be made available in the same manner as Form N-Q discussed above.
Federal Tax Information
The Fund hereby designates as qualified dividend income 100% of its ordinary income distributions (including short-term capital gains, if applicable) for the period ended October 31, 2018. 100% of the ordinary income distributions (including short-term capital gain, if applicable) made by the Fund during the period ended October 31, 2018, qualify for corporate dividends received deduction available to corporate shareholders.
For the fiscal year ended October 31, 2018, the amount of long-term capital gain distributions by the Fund was $1,000,856 which is taxable at the maximum rate of 20% for federal income tax purposes.
Risk Considerations
Risks are inherent in all investing. You should consider the Fund’s investment objective, risks, charges and expenses carefully before investing. You can download the Fund’s prospectus at www.ftportfolios.com or contact First Trust Portfolios L.P. at (800) 621-1675 to request a prospectus, which contains this and other information about the Fund. For additional information about the risks associated with investing in the Fund, please see the Fund’s statement of additional information, as well as other regulatory filings. Read these documents carefully before you invest.
The following summarizes some of the risks that should be considered for the Fund.
CONCENTRATION RISK. A fund concentrated in one or more industries or sectors is likely to present more risks than a fund that is broadly diversified over several industries or sectors. Compared to the broad market, an individual industry or sector may be more strongly affected by changes in the economic climate, broad market shifts, moves in a particular dominant stock, or regulatory changes.
CONSUMER DISCRETIONARY COMPANIES RISK. Consumer discretionary companies provide non-essential goods and services, such as retailers, media companies and consumer services. These companies manufacture products and provide discretionary services directly to the consumer, and the success of these companies is tied closely to the performance of the overall domestic and international economy, interest rates, competition and consumer confidence. Success depends heavily on disposable household income and consumer spending. Changes in demographics and consumer tastes can also affect the demand for, and success of, consumer discretionary products in the marketplace.
CYBERSECURITY RISK. As the use of Internet technology has become more prevalent in the course of business, the Fund has become more susceptible to potential operational risks through breaches in cyber security. A breach in cyber security refers to both intentional and unintentional events that may cause the Fund to lose proprietary information, suffer data corruption or lose operational capacity. Such events could cause the Fund to incur regulatory penalties, reputational damage, additional compliance costs associated with corrective measures and/or financial loss. Cyber security breaches may involve unauthorized access to the Fund’s digital information systems through “hacking” or malicious software coding, but may also result from outside attacks such as denial-of-service attacks through efforts to make network services unavailable to intended users. In addition, cyber security breaches of the Fund’s third-party service providers, such as its administrator, transfer agent, custodian, or sub-advisor, as applicable, or issuers in which the Fund invests, can also subject the Fund to many of the same risks associated with direct cyber security breaches. The Fund has established risk management systems designed to reduce the risks associated with cyber security. However, there is no guarantee that such efforts will succeed, especially because the Fund does not directly control the cyber security systems of issuers or third-party service providers.
Additional Information (Continued)
First Trust AQA® Equity Fund
October 31, 2018 (Unaudited)
EQUITY SECURITIES RISK. Because the Fund invests in equity securities, the value of the Fund’s shares will fluctuate with changes in the value of these equity securities. Equity securities prices fluctuate for several reasons, including changes in investors’ perceptions of the financial condition of an issuer or the general condition of the relevant stock market, such as market volatility, or when political or economic events affecting the issuers occur. In addition, common stock prices may be particularly sensitive to rising interest rates, as the cost of capital rises and borrowing costs increase.
INDUSTRIALS AND PRODUCER DURABLES COMPANIES RISK. Industrials companies convert unfinished goods into finished durables used to manufacture other goods or provide services. Some industrials companies are involved in electrical equipment and components, industrial products, manufactured housing and telecommunications equipment. General risks of industrials companies include the general state of the economy, intense competition, consolidation, domestic and international politics, excess capacity and consumer demand and spending trends. In addition, they may also be significantly affected by overall capital spending levels, economic cycles, technical obsolescence, delays in modernization, labor relations, government regulations and e-commerce initiatives.
INFORMATION TECHNOLOGY COMPANIES RISK. Information technology companies are generally subject to the following risks: rapidly changing technologies; short product life cycles; fierce competition; aggressive pricing and reduced profit margins; the loss of patent, copyright and trademark protections; cyclical market patterns; evolving industry standards; and frequent new product introductions. Information technology companies may be smaller and less experienced companies, with limited product lines, markets or financial resources and fewer experienced management or marketing personnel. Information technology company stocks, particularly those that are Internet related, have experienced extreme price and volume fluctuations that are often unrelated to their operating performance.
INVESTMENT STRATEGY RISK. In selecting securities for the Fund’s portfolio, the Fund’s portfolio managers employ a quantitative strategy that utilizes screens in an attempt to identify undervalued securities. There is no guarantee that this strategy will be successful in identifying such securities or that the intrinsic value of such securities will ever be recognized by the market. Companies that may be perceived as undervalued may fail to appreciate for long periods of time and may never realize their full potential value. Additionally, the screens utilized by the strategy may limit the number of investment opportunities available to the Fund and could cause the Fund to invest a relatively high percentage of its assets in a limited number of issuers. Such screens may cause the Fund to underperform funds with broader investable universes, or the market as a whole, and could make the Fund more susceptible to a single adverse economic or regulatory occurrence than other more diversified funds.
LIQUIDITY RISK. The Fund invests in equity securities that may have limited liquidity despite being listed on a securities exchange. Equity securities that are less liquid or that trade less can be more difficult or more costly to buy, or to sell, compared to other more liquid or active investments. This liquidity risk is a factor of the trading volume of a particular security, as well as the size and liquidity of the market for such security. The prices at which the equity securities are held in the Fund will be adversely affected if trading markets for the equity securities are limited or absent.
MARKET RISK. Market risk is the risk that a particular security owned by the Fund or shares of the Fund in general may fall in value. Securities are subject to market fluctuations caused by such factors as economic, political, regulatory or market developments, changes in interest rates and perceived trends in securities prices. Shares of the Fund could decline in value or underperform other investments.
MODEL RISK. The Fund relies heavily on a proprietary quantitative model that uses information and data supplied by third parties. When the model and data prove to be incorrect or incomplete, any decisions made in reliance thereon expose the Fund to potential risks.
SMALL FUND RISK. The Fund currently has fewer assets than larger funds, and like other smaller funds, large inflows and outflows may impact the Fund’s market exposure for limited periods of time. This impact may be positive or negative, depending on the direction of market movement during the period affected.
SMALLER COMPANIES RISK. The Fund invests in small and/or mid-capitalization companies. Such companies may be more vulnerable to adverse general market or economic developments, and their securities may be less liquid and may experience greater price volatility than larger, more established companies as a result of several factors, including limited trading volumes, products or financial resources, management inexperience and less publicly available information. Accordingly, such companies are generally subject to greater market risk than larger, more established companies.
Additional Information (Continued)
First Trust AQA® Equity Fund
October 31, 2018 (Unaudited)
Advisory and Sub-Advisory Agreements
Board Considerations Regarding Approval of Investment Management and Investment Sub-Advisory Agreements
The Board of Trustees of First Trust Series Fund (the “Trust”), including the Independent Trustees, unanimously approved the continuation of the Investment Management Agreement (the “Advisory Agreement”) between the Trust, on behalf of the First Trust AQA® Equity Fund (the “Fund”), and First Trust Advisors L.P. (the “Advisor”) and the Investment Sub-Advisory Agreement (the “Sub-Advisory Agreement” and together with the Advisory Agreement, the “Agreements”) among the Trust, on behalf of the Fund, the Advisor and J.J.B. Hilliard, W.L. Lyons, LLC (the “Sub-Advisor”) for a one-year period ending June 30, 2019 at a meeting held on June 11, 2018. The Board determined that the continuation of the Agreements is in the best interests of the Fund in light of the nature, extent and quality of the services provided and such other matters as the Board considered to be relevant in the exercise of its reasonable business judgment.
To reach this determination, the Board considered its duties under the Investment Company Act of 1940, as amended (the “1940 Act”), as well as under the general principles of state law, in reviewing and approving advisory contracts; the requirements of the 1940 Act in such matters; the fiduciary duty of investment advisors with respect to advisory agreements and compensation; the standards used by courts in determining whether investment company boards have fulfilled their duties; and the factors to be considered by the Board in voting on such agreements. At meetings held on April 23, 2018 and June 11, 2018, the Board, including the Independent Trustees, reviewed materials provided by the Advisor and the Sub-Advisor responding to requests for information from counsel to the Independent Trustees that, among other things, outlined the services provided by the Advisor and the Sub-Advisor to the Fund (including the relevant personnel responsible for these services and their experience); the advisory fee rate payable by the Fund and the sub-advisory fee rate as compared to fees charged to a peer group of funds compiled by Management Practice, Inc. (“MPI”), an independent source (the “Peer Group”), and as compared to fees charged to other clients of the Advisor and the Sub-Advisor; expenses of the Fund as compared to expense ratios of the funds in the Peer Group; performance information for the Fund; the nature of expenses incurred in providing services to the Fund and the potential for economies of scale, if any; financial data on the Advisor and the Sub-Advisor; any fall-out benefits to the Advisor and its affiliate, First Trust Portfolios L.P. (“FTP”), and the Sub-Advisor; and information on the Advisor’s and the Sub-Advisor’s compliance programs. The Board reviewed initial materials with the Advisor at the meeting held on April 23, 2018, prior to which the Independent Trustees and their counsel met separately to discuss the information provided by the Advisor and the Sub-Advisor. Following the April meeting, independent legal counsel on behalf of the Independent Trustees requested certain clarifications and supplements to the materials provided, and the information provided in response to those requests was considered at an executive session of the Independent Trustees and independent legal counsel held prior to the June 11, 2018 meeting, as well as at the meeting held that day. The Board applied its business judgment to determine whether the arrangements between the Trust and the Advisor and among the Trust, the Advisor and the Sub-Advisor continue to be reasonable business arrangements from the Fund’s perspective. The Board determined that, given the totality of the information provided with respect to the Agreements, the Board had received sufficient information to renew the Agreements. The Board considered that shareholders chose to invest or remain invested in the Fund knowing that the Advisor and the Sub-Advisor manage the Fund and knowing the Fund’s advisory fee.
In reviewing the Agreements, the Board considered the nature, extent and quality of the services provided by the Advisor and the Sub-Advisor under the Agreements. With respect to the Advisory Agreement, the Board considered that the Advisor is responsible for the overall management and administration of the Trust and the Fund and reviewed all of the services provided by the Advisor to the Fund, including the oversight of the Sub-Advisor, as well as the background and experience of the persons responsible for such services. The Board noted that the Advisor oversees the Sub-Advisor’s day-to-day management of the Fund’s investments, including portfolio risk monitoring and performance review. In reviewing the services provided, the Board noted the compliance program that had been developed by the Advisor and considered that it includes a robust program for monitoring the Advisor’s, the Sub-Advisor’s and the Fund’s compliance with the 1940 Act, as well as the Fund’s compliance with its investment objective, policies and restrictions. The Board also considered a report from the Advisor with respect to its risk management functions related to the operation of the Fund. Finally, as part of the Board’s consideration of the Advisor’s services, the Advisor, in its written materials and at the April 23, 2018 meeting, described to the Board the scope of its ongoing investment in additional infrastructure and personnel to maintain and improve the quality of services provided to the Fund and the other funds in the First Trust Fund Complex. With respect to the Sub-Advisory Agreement, the Board reviewed the materials provided by the Sub-Advisor and considered the services that the Sub-Advisor provides to the Fund, including the Sub-Advisor’s day-to-day management of the Fund’s investments. In considering the Sub-Advisor’s management of the Fund, the Board noted the background and experience of the Sub-Advisor’s portfolio management team and the Board’s prior meetings with members of the portfolio management team. In light of the information presented and the considerations made, the Board concluded that the nature, extent and quality of the services provided to the Trust and the Fund by the Advisor and the Sub-Advisor under the Agreements have been and are expected to remain satisfactory and that the Sub-Advisor, under the oversight of the Advisor, has managed the Fund consistent with its investment objective, policies and restrictions.
Additional Information (Continued)
First Trust AQA® Equity Fund
October 31, 2018 (Unaudited)
The Board considered the advisory and sub-advisory fee rates payable under the Agreements for the services provided. The Board noted that the sub-advisory fee is paid by the Advisor from its advisory fee. The Board considered that the Advisor and Sub-Advisor agreed to extend the current expense caps for each share class through February 29, 2020 and agreed to keep the long-term expense cap in place from March 1, 2020 through February 28, 2029. The Board noted that fees waived or expenses borne by the Advisor and Sub-Advisor are subject to reimbursement by the Fund for up to three years from the date the expense was incurred or fees were waived, but no reimbursement payment would be made by the Fund if it would result in the Fund exceeding an expense ratio equal to the expense cap in place at the time of the reimbursement or at the time the expenses were borne or the fees were waived by the Advisor and Sub-Advisor. The Board received and reviewed information showing the advisory fee rates and expense ratios of the peer funds in the Peer Group, as well as advisory and unitary fee rates charged by the Advisor and the Sub-Advisor to other fund and non-fund clients, as applicable. With respect to the Peer Group, the Board noted its prior discussions with the Advisor and MPI regarding the assembly of the Peer Group and, at the April 23, 2018 meeting, discussed limitations in creating a relevant peer group for the Fund, including that only one of the peer funds employs an advisor/sub-advisor management structure with an unaffiliated sub-advisor. Based on the information provided, the Board noted that the advisory fee rate payable by the Fund was above the median advisory fee of the peer funds in the Peer Group. The Board noted that the Fund’s total (net) expense ratio (Class A shares) was above the median of the Peer Group. With respect to fees charged to other clients, the Board considered differences between the Fund and other clients that limited their comparability. In considering the advisory fee rate overall, the Board also considered the Advisor’s statement that it seeks to meet investor needs through innovative and value-added investment solutions and the Advisor’s description of its long-term commitment to the Fund.
The Board considered performance information for the Fund. The Board noted the process it has established for monitoring the Fund’s performance and portfolio risk on an ongoing basis, which includes quarterly performance reporting from the Advisor and Sub-Advisor for the Fund. The Board determined that this process continues to be effective for reviewing the Fund’s performance. The Board received and reviewed information comparing the Fund’s performance for the one-year period ended December 31, 2017 to the performance of the peer funds in the Peer Group and to that of two benchmark indexes. Based on the information provided, the Board noted that the Fund (Class A shares) outperformed the Peer Group average and both benchmark indexes for the one-year period ended December 31, 2017.
On the basis of all the information provided on the fees, expenses and performance of the Fund and the ongoing oversight by the Board, the Board concluded that the advisory and sub-advisory fees for the Fund continue to be reasonable and appropriate in light of the nature, extent and quality of the services provided by the Advisor and the Sub-Advisor to the Fund under the Agreements.
The Board considered information and discussed with the Advisor whether there were any economies of scale in connection with providing advisory services to the Fund and noted the Advisor’s statement that it believes its expenses will likely increase over the next twelve months as the Advisor continues to make investments in additional infrastructure and personnel. The Board considered the revenues and allocated costs (including the allocation methodology) of the Advisor in serving as investment advisor to the Fund for the twelve months ended December 31, 2017 and the estimated profitability level for the Fund calculated by the Advisor based on such data, as well as complex-wide and product-line profitability data, for the same period. The Board noted the inherent limitations in the profitability analysis and concluded that, based on the information provided, the Advisor’s profitability level for the Fund was not unreasonable. In addition, the Board considered fall-out benefits described by the Advisor that may be realized from its relationship with the Fund. The Board considered that the Advisor had identified as a fall out benefit to the Advisor and FTP their exposure to investors and brokers who, absent their exposure to the Fund, may have had no dealings with the Advisor or FTP. The Board noted that in addition to the advisory fees paid by the Fund, FTP is compensated for services provided to the Fund through 12b-1 distribution and service fees and that the Advisor receives compensation from the Fund for providing fund reporting services pursuant to a separate Fund Reporting Services Agreement. The Board concluded that the character and amount of potential fall-out benefits to the Advisor were not unreasonable.
The Board considered that the Sub Advisor’s expenses with regard to the Fund are generally fixed, but that the Sub-Advisor does not believe it is benefitting from economies of scale as related to the Fund. The Board did not review the profitability of the Sub-Advisor with respect to the Fund. The Board noted that the Advisor pays the Sub-Advisor from its advisory fee and its understanding that the Fund’s sub-advisory fee rate was the product of an arm’s length negotiation. The Board concluded that the profitability analysis for the Advisor was more relevant. The Board considered fall-out benefits that may be realized by the Sub-Advisor from its relationship with the Fund. The Board noted the Sub-Advisor’s statements that portfolio trades for the Fund have been and would continue to be done at no commission charge to the Fund and that the Sub-Advisor had no soft dollar payments in connection with the Fund. The Board concluded that the character and amount of potential fall-out benefits to the Sub-Advisor were not unreasonable.
Based on all of the information considered and the conclusions reached, the Board, including the Independent Trustees, unanimously determined that the terms of the Agreements continue to be fair and reasonable and that the continuation of the Agreements is in the best interests of the Fund. No single factor was determinative in the Board’s analysis.
Board of Trustees and Officers
First Trust AQA® Equity Fund
October 31, 2018 (Unaudited)
The following tables identify the Trustees and Officers of the Trust. Unless otherwise indicated, the address of all persons is 120 E. Liberty Drive, Suite 400, Wheaton, IL 60187.
The Trust’s statement of additional information includes additional information about the Trustees and is available, without charge, upon request, by calling (800) 988-5891.
| Name, Year of Birth and Position with the Trust | Term of Office and Year First Elected or Appointed | Principal Occupations
During Past 5 Years | Number of Portfolios in the First Trust Fund Complex Overseen by Trustee | Other Trusteeships or Directorships Held by Trustee During Past 5 Years |
| INDEPENDENT TRUSTEES |
Richard E. Erickson, Trustee
(1951) | • Indefinite Term
• Since Trust Inception | Physician; Officer, Wheaton Orthopedics; Limited Partner, Gundersen Real Estate Limited Partnership (June 1992 to December 2016); Member, Sportsmed LLC (April 2007 to November 2015) | 159 | None |
Thomas R. Kadlec, Trustee
(1957) | • Indefinite Term
• Since Trust Inception | President, ADM Investor Services, Inc. (Futures Commission Merchant) | 159 | Director of ADM Investor Services, Inc., ADM Investor Services International, Futures Industry Association, and National Futures Association |
Robert F. Keith, Trustee
(1956) | • Indefinite Term
• Since Trust Inception | President, Hibs Enterprises (Financial and Management Consulting) | 159 | Director of Trust Company of Illinois |
Niel B. Nielson, Trustee
(1954) | • Indefinite Term
• Since Trust Inception | Senior Advisor (August 2018 to Present), Managing Director and Chief Operating Officer (January 2015 to August 2018), Pelita Harapan Educational Foundation (Educational Products and Services); President and Chief Executive Officer (June 2012 to September 2014), Servant Interactive LLC (Educational Products and Services); President and Chief Executive Officer (June 2012 to September 2014), Dew Learning LLC (Educational Products and Services) | 159 | Director of Covenant Transport, Inc. (May 2003 to May 2014) |
| INTERESTED TRUSTEE |
James A. Bowen(1), Trustee and
Chairman of the Board
(1955) | • Indefinite Term
• Since Trust Inception | Chief Executive Officer, First Trust Advisors L.P. and First Trust Portfolios L.P.; Chairman of the Board of Directors, BondWave LLC (Software Development Company) and Stonebridge Advisors LLC (Investment Advisor) | 159 | None |
| (1) | Mr. Bowen is deemed an “interested person” of the Trust due to his position as CEO of First Trust Advisors L.P., investment advisor of the Trust. |
Board of Trustees and Officers (Continued)
First Trust AQA® Equity Fund
October 31, 2018 (Unaudited)
| Name and Year of Birth | Position and Offices with Trust | Term of Office and Length of Service | Principal Occupations
During Past 5 Years |
| OFFICERS(2) |
James M. Dykas
(1966) | President and Chief Executive Officer | • Indefinite Term
• Since January 2016 | Managing Director and Chief Financial Officer (January 2016 to Present), Controller (January 2011 to January 2016), Senior Vice President (April 2007 to January 2016), First Trust Advisors L.P. and First Trust Portfolios L.P.; Chief Financial Officer (January 2016 to Present), BondWave LLC (Software Development Company) and Stonebridge Advisors LLC (Investment Advisor) |
Donald P. Swade
(1972) | Treasurer, Chief Financial Officer and Chief Accounting Officer | • Indefinite Term
• Since January 2016 | Senior Vice President (July 2016 to Present), Vice President (April 2012 to July 2016), First Trust Advisors L.P. and First Trust Portfolios L.P. |
W. Scott Jardine
(1960) | Secretary and Chief Legal Officer | • Indefinite Term
• Since Trust Inception | General Counsel, First Trust Advisors L.P. and First Trust Portfolios L.P.; Secretary and General Counsel, BondWave LLC; Secretary, Stonebridge Advisors LLC |
Daniel J. Lindquist
(1970) | Vice President | • Indefinite Term
• Since Trust Inception | Managing Director, First Trust Advisors L.P. and First Trust Portfolios L.P. |
Kristi A. Maher
(1966) | Chief Compliance Officer and Assistant Secretary | • Indefinite Term
• Chief Compliance Officer Since January 2011 • Assistant Secretary Since Trust Inception | Deputy General Counsel, First Trust Advisors L.P. and First Trust Portfolios L.P. |
| (2) | The term “officer” means the president, vice president, secretary, treasurer, controller or any other officer who performs a policy making function. |
Privacy Policy
First Trust AQA® Equity Fund
October 31, 2018 (Unaudited)
Privacy Policy
First Trust values our relationship with you and considers your privacy an important priority in maintaining that relationship. We are committed to protecting the security and confidentiality of your personal information.
Sources of Information
We collect nonpublic personal information about you from the following sources:
| • | Information we receive from you and your broker-dealer, investment advisor or financial representative through interviews, applications, agreements or other forms; |
| • | Information about your transactions with us, our affiliates or others; |
| • | Information we receive from your inquiries by mail, e-mail or telephone; and |
| • | Information we collect on our website through the use of “cookies”. For example, we may identify the pages on our website that your browser requests or visits. |
Information Collected
The type of data we collect may include your name, address, social security number, age, financial status, assets, income, tax information, retirement and estate plan information, transaction history, account balance, payment history, investment objectives, marital status, family relationships and other personal information.
Disclosure of Information
We do not disclose any nonpublic personal information about our customers or former customers to anyone, except as permitted by law. In addition to using this information to verify your identity (as required under law), the permitted uses may also include the disclosure of such information to unaffiliated companies for the following reasons:
| • | In order to provide you with products and services and to effect transactions that you request or authorize, we may disclose your personal information as described above to unaffiliated financial service providers and other companies that perform administrative or other services on our behalf, such as transfer agents, custodians and trustees, or that assist us in the distribution of investor materials such as trustees, banks, financial representatives, proxy services, solicitors and printers. |
| • | We may release information we have about you if you direct us to do so, if we are compelled by law to do so, or in other legally limited circumstances (for example to protect your account from fraud). |
In addition, in order to alert you to our other financial products and services, we may share your personal information within First Trust.
Use of Website Analytics
We currently use third party analytics tools, Google Analytics and AddThis, to gather information for purposes of improving First Trust’s website and marketing our products and services to you. These tools employ cookies, which are small pieces of text stored in a file by your web browser and sent to websites that you visit, to collect information, track website usage and viewing trends such as the number of hits, pages visited, videos and PDFs viewed and the length of user sessions in order to evaluate website performance and enhance navigation of the website. We may also collect other anonymous information, which is generally limited to technical and web navigation information such as the IP address of your device, internet browser type and operating system for purposes of analyzing the data to make First Trust’s website better and more useful to our users. The information collected does not include any personal identifiable information such as your name, address, phone number or email address unless you provide that information through the website for us to contact you in order to answer your questions or respond to your requests. To find out how to opt-out of these services click on: Google Analytics and AddThis.
Confidentiality and Security
With regard to our internal security procedures, First Trust restricts access to your nonpublic personal information to those First Trust employees who need to know that information to provide products or services to you. We maintain physical, electronic and procedural safeguards to protect your nonpublic personal information.
Policy Updates and Inquiries
As required by federal law, we will notify you of our privacy policy annually. We reserve the right to modify this policy at any time, however, if we do change it, we will tell you promptly. For questions about our policy, or for additional copies of this notice, please go to www.ftportfolios.com, or contact us at 1-800-621-1675 (First Trust Portfolios) or 1-800-222-6822 (First Trust Advisors).
May 2017
INVESTMENT ADVISOR
First Trust Advisors L.P.
120 E. Liberty Drive, Suite 400
Wheaton, IL 60187
INVESTMENT SUB-ADVISOR
J.J.B. Hilliard, W.L. Lyons, LLC
500 West Jefferson Street
Louisville, KY 40202
ADMINISTRATOR,
FUND ACCOUNTANT &
CUSTODIAN
Brown Brothers Harriman & Co.
50 Post Office Square
Boston, MA 02110
TRANSFER AGENT
BNY Mellon Investment Servicing (US) Inc.
301 Bellevue Parkway
Wilmington, DE 19809
INDEPENDENT REGISTERED
PUBLIC ACCOUNTING FIRM
Deloitte & Touche LLP
111 S. Wacker Drive
Chicago, IL 60606
LEGAL COUNSEL
Chapman and Cutler LLP
111 W. Monroe Street
Chicago, IL 60603
Item 2. Code of Ethics.
| (a) | The registrant, as of the end of the period covered by this report, has adopted a code of ethics that applies to the registrant’s principal executive officer, principal financial officer, principal accounting officer or controller, or persons performing similar functions, regardless of whether these individuals are employed by the registrant or a third party. |
| (c) | There have been no amendments, during the period covered by this report, to a provision of the code of ethics that applies to the registrant's principal executive officer, principal financial officer, principal accounting officer or controller, or persons performing similar functions, regardless of whether these individuals are employed by the registrant or a third party, and that relates to any element of the code of ethics description. |
| (d) | The registrant has not granted any waivers, including an implicit waiver, from a provision of the code of ethics that applies to the registrant’s principal executive officer, principal financial officer, principal accounting officer or controller, or persons performing similar functions, regardless of whether these individuals are employed by the registrant or a third party, that relates to one or more of the items set forth in paragraph (b) of this item’s instructions. |
Item 3. Audit Committee Financial Expert.
As of the end of the period covered by the report, the Registrant’s Board of Trustees has determined that Thomas R. Kadlec and Robert F. Keith are qualified to serve as audit committee financial experts serving on its audit committee and that each of them is “independent,” as defined by Item 3 of Form N-CSR.
Item 4. Principal Accountant Fees and Services.
(a) Audit Fees (Registrant) -- The aggregate fees billed for professional services rendered by the principal accountant for the audit of the registrant's annual financial statements or services that are normally provided by the accountant in connection with statutory and regulatory filings or engagements were $133,000 for the fiscal year ended October 31, 2017 and $136,500 for the fiscal year ended October 31, 2018.
Audit Fees (Investment Advisor and Distributor) -- The aggregate fees billed for professional services rendered by the principal accountant for the audit of the registrant's annual financial statements or services that are normally provided by the accountant in connection with statutory and regulatory filings or engagements were $0 for the fiscal year ended October 31, 2017 and $0 for the fiscal year ended October 31, 2018.
(b) Audit-Related Fees (Registrant) -- The aggregate fees billed in each of the last two fiscal years for assurance and related services by the principal accountant that are reasonably related to the performance of the audit of the registrant's financial statements and are not reported under paragraph (a) of this Item were $0 for the fiscal year ended October 31, 2017 and $0 for the fiscal year ended October 31, 2018.
Audit-Related Fees (Investment Adviser and Distributor) -- The aggregate fees billed for assurance and related services by the principal accountant that are reasonably related to the performance of the audit of the registrant's financial statements, including conducting the seed audit and preparation of the seed audit consent, and are not reported under paragraph (a) of this Item were $0 for the Investment Adviser and $0 for the Distributor for the fiscal year ended October 31, 2017 and $0 for the Investment Adviser and $0 for the Distributor for the fiscal year ended October 31, 2018.
(c) Tax Fees (Registrant) -- The aggregate fees billed for professional services rendered by the principal accountant for tax compliance, tax advice, and tax planning to the registrant were $19,200 for the fiscal year ended October 31, 2017 and $16,150 for the fiscal year ended October 31, 2018.
Tax Fees (Investment Adviser and Distributor) -- The aggregate fees billed for professional services rendered by the principal accountant for tax compliance, tax advice, and tax planning to the registrant's adviser and distributor were $0 for the Investment Adviser and $0 for the Distributor for the fiscal year ended October 31, 2017 and $0 for the Investment Adviser and $0 for the Distributor for the fiscal year ended October 31, 2018.
(d) All Other Fees (Registrant) -- The aggregate fees billed for products and services provided by the principal accountant to the registrant, other than the services reported in paragraphs (a) through (c) of this Item were $0 for the fiscal year ended October 31, 2017 and $0 for the fiscal year ended October 31, 2018.
All Other Fees (Investment Adviser and Distributor) -- The aggregate fees billed for products and services provided by the principal accountant to the registrant’s investment adviser and distributor, other than the services reported in paragraphs (a) through (c) of this Item were $0 for the Investment Adviser and $0 for the Distributor for the fiscal year ended October 31, 2017 and $0 for the Investment Adviser and $0 for the Distributor for the fiscal year ended October 31, 2018.
(e)(1) Disclose the audit committee's pre-approval policies and procedures described in paragraph (c) (7) of Rule 2-01 of Regulation S-X.
Pursuant to its charter and its Audit and Non-Audit Services Pre-Approval Policy, the Audit Committee (the "Committee") is responsible for the pre-approval of all audit services and permitted non-audit services (including the fees and terms thereof) to be performed for the registrant by its independent auditors. The Chairman of the Committee is authorized to give such pre-approvals on behalf of the Committee up to $25,000 and report any such pre-approval to the full Committee.
The Committee is also responsible for the pre-approval of the independent auditor's engagements for non-audit services with the registrant's adviser (not including a sub-adviser whose role is primarily portfolio management and is sub-contracted or overseen by another investment adviser) and any entity controlling, controlled by or under common control with the investment adviser that provides ongoing services to the registrant, if the engagement relates directly to the operations and financial reporting of the registrant, subject to the de minimis exceptions for non-audit services described in Rule 2-01 of Regulation S-X. If the independent auditor has provided non-audit services to the registrant's adviser (other than any sub-adviser whose role is primarily portfolio management and is sub-contracted with or overseen by another investment adviser) and any entity controlling, controlled by or under common control with the investment adviser that provides ongoing services to the registrant that were not pre-approved pursuant to its policies, the Committee will consider whether the provision of such non-audit services is compatible with the auditor's independence.
(e)(2) The percentage of services described in each of paragraphs (b) through (d) for the registrant and the registrant's investment adviser and distributor of this Item that were approved by the audit committee pursuant to the pre-approval exceptions included in paragraph (c)(7)(i)(C) or paragraph(C)(7)(ii) of Rule 2-01 of Regulation S-X are as follows:
Registrant: Adviser and Distributor:
(b) 0% (b) 0%
(c) 0% (c) 0%
(d) 0% (d) 0%
(f) The percentage of hours expended on the principal accountant's engagement to audit the registrant's financial statements for the most recent fiscal year that were attributed to work performed by persons other than the principal accountant's full-time, permanent employees was less than fifty
percent.
(g) The aggregate non-audit fees billed by the registrant's accountant for services rendered to the registrant, and rendered to the registrant's investment adviser (not including any sub-adviser whose role is primarily portfolio management and is subcontracted with or overseen by another investment adviser), and any entity controlling, controlled by, or under common control with the adviser that provides ongoing services to the registrant for the fiscal year ended October 31, 2017 were $19,200 for the registrant, $44,000 for the registrant’s investment adviser, $63,900 for the registrant’s distributor and $3,000 for Stonebridge Advisors LLC, which is under common control with the registrant’s investment adviser and serves as the registrant’s sub-advisor for the First Trust Preferred Securities and Income Fund (“Stonebridge”); and for the fiscal year ended October 31, 2018 were $16,150 for the registrant, $48,190 for the registrant’s investment adviser, $80,310 for the registrant’s distributor and $3,000 for Stonebridge.
(h) The registrant’s audit committee of its Board of Trustees has determined that the provision of non-audit services that were rendered to the registrant’s investment adviser (not including any sub-adviser whose role is primarily portfolio management and is subcontracted with or overseen by another investment adviser), and any entity controlling, controlled by, or under common control with the investment adviser that provides ongoing services to the registrant that were not pre-approved pursuant to paragraph (c)(7)(ii) of Rule 2-01 of Regulation S-X is compatible with maintaining the principal accountant’s independence.
Item 5. Audit Committee of Listed registrants.
| (a) | The Registrant has a separately designated audit committee consisting of all the independent directors of the Registrant. The members of the audit committee are: Thomas R. Kadlec, Niel B. Nielson, Richard E. Erickson and Robert F. Keith. |
Item 6. Investments.
| (a) | Schedule of Investments in securities of unaffiliated issuers as of the close of the reporting period is included as part of the report to shareholders filed under Item 1 of this form. |
Item 7. Disclosure of Proxy Voting Policies and Procedures for Closed-End Management Investment Companies.
Not applicable.
Item 8. Portfolio Managers of Closed-End Management Investment Companies.
Not applicable.
Item 9. Purchases of Equity Securities by Closed-End Management Investment Company and Affiliated Purchasers.
Not applicable.
Item 10. Submission of Matters to a Vote of Security Holders.
There have been no material changes to the procedures by which the shareholders may recommend nominees to the registrant’s board of directors, where those changes were implemented after the registrant last provided disclosure in response to the requirements of Item 407(c)(2)(iv) of Regulation S-K (17 CFR 229.407) (as required by Item 22(b)(15) of Schedule 14A (17 CFR 240.14a-101)), or this Item.
Item 11. Controls and Procedures.
| (a) | The registrant’s principal executive and principal financial officers, or persons performing similar functions, have concluded that the registrant’s disclosure controls and procedures (as defined in Rule 30a-3(c) under the Investment Company Act of 1940, as amended (the “1940 Act”) (17 CFR 270.30a-3(c))) are effective, as of a date within 90 days of the filing date of the report that includes the disclosure required by this paragraph, based on their evaluation of these controls and procedures required by Rule 30a-3(b) under the 1940 Act (17 CFR 270.30a-3(b)) and Rules 13a-15(b) or 15d-15(b) under the Securities Exchange Act of 1934, as amended (17 CFR 240.13a-15(b) or 240.15d-15(b)). |
| (b) | There were no changes in the registrant’s internal control over financial reporting (as defined in Rule 30a-3(d) under the 1940 Act (17 CFR 270.30a-3(d)) that occurred during the period covered by this report that has materially affected, or is reasonably likely to materially affect, the registrant’s internal control over financial reporting. |
Item 12. Disclosure of Securities Lending Activities for Closed-End Management Investment Companies.
Not applicable.
Item 13. Exhibits.
| (a)(2) | | Certifications pursuant to Rule 30a-2(a) under the 1940 Act and Section 302 of the Sarbanes-Oxley Act of 2002 are attached hereto. |
| (b) | | Certifications pursuant to Rule 30a-2(b) under the 1940 Act and Section 906 of the Sarbanes-Oxley Act of 2002 are attached hereto. |
SIGNATURES
Pursuant to the requirements of the Securities Exchange Act of 1934 and the Investment Company Act of 1940, the registrant has duly caused this report to be signed on its behalf by the undersigned, thereunto duly authorized.
| (Registrant) | | First Trust Series Fund |
S
| By (Signature and Title)* | | /s/ James M. Dykas |
| | | James M. Dykas, President and Chief Executive Officer
(principal executive officer) |
Pursuant to the requirements of the Securities Exchange Act of 1934 and the Investment Company Act of 1940, this report has been signed below by the following persons on behalf of the registrant and in the capacities and on the dates indicated.
| By (Signature and Title)* | | /s/ James M. Dykas |
| | | James M. Dykas, President and Chief Executive Officer
(principal executive officer) |
| By (Signature and Title)* | | /s/ Donald P. Swade |
| | | Donald P. Swade, Treasurer, Chief Financial Officer
and Chief Accounting Officer
(principal financial officer) |
* Print the name and title of each signing officer under his or her signature.