UNITED STATES
SECURITIES AND EXCHANGE COMMISSION
Washington, D.C. 20549
FORM N-CSR
CERTIFIED SHAREHOLDER REPORT OF REGISTERED MANAGEMENT INVESTMENT COMPANIES
| Investment Company Act file number 811-22452 |
First Trust Series Fund
(Exact name of registrant as specified in charter) |
120 East Liberty Drive, Suite 400
Wheaton, IL 60187
(Address of principal executive offices) (Zip code) |
| |
W. Scott Jardine, Esq.
First Trust Portfolios L.P.
120 East Liberty Drive, Suite 400
Wheaton, IL 60187
(Name and address of agent for service) |
Registrant’s telephone number, including area code: (630) 765-8000
Date of fiscal year end: October 31
Date of reporting period: October 31, 2021
Form N-CSR is to be used by management investment companies to file reports with the Commission not later than 10 days after the transmission to stockholders of any report that is required to be transmitted to stockholders under Rule 30e-1 under the Investment Company Act of 1940 (17 CFR 270.30e-1). The Commission may use the information provided on Form N-CSR in its regulatory, disclosure review, inspection, and policymaking roles.
A registrant is required to disclose the information specified by Form N-CSR, and the Commission will make this information public. A registrant is not required to respond to the collection of information contained in Form N-CSR unless the Form displays a currently valid Office of Management and Budget (“OMB”) control number. Please direct comments concerning the accuracy of the information collection burden estimate and any suggestions for reducing the burden to Secretary, Securities and Exchange Commission, 100 F Street, NE, Washington, DC 20549. The OMB has reviewed this collection of information under the clearance requirements of 44 U.S.C. § 3507.
Item 1. Reports to Stockholders.
The Report to Shareholders is attached herewith.

First Trust Preferred
Securities and Income Fund
Annual Report
For the Year Ended
October 31, 2021
First Trust Preferred Securities and Income Fund
Annual Report
October 31, 2021
Caution Regarding Forward-Looking Statements
This report contains certain forward-looking statements within the meaning of the Securities Act of 1933, as amended, and the Securities Exchange Act of 1934, as amended. Forward-looking statements include statements regarding the goals, beliefs, plans or current expectations of First Trust Advisors L.P. (“First Trust” or the “Advisor”) and/or Stonebridge Advisors LLC (“Stonebridge” or the “Sub-Advisor”) and their respective representatives, taking into account the information currently available to them. Forward-looking statements include all statements that do not relate solely to current or historical fact. For example, forward-looking statements include the use of words such as “anticipate,” “estimate,” “intend,” “expect,” “believe,” “plan,” “may,” “should,” “would” or other words that convey uncertainty of future events or outcomes.
Forward-looking statements involve known and unknown risks, uncertainties and other factors that may cause the actual results, performance or achievements of First Trust Preferred Securities and Income Fund (the “Fund”) to be materially different from any future results, performance or achievements expressed or implied by the forward-looking statements. When evaluating the information included in this report, you are cautioned not to place undue reliance on these forward-looking statements, which reflect the judgment of the Advisor and/or Sub-Advisor and their respective representatives only as of the date hereof. We undertake no obligation to publicly revise or update these forward-looking statements to reflect events and circumstances that arise after the date hereof.
Performance and Risk Disclosure
There is no assurance that the Fund will achieve its investment objective. The Fund is subject to market risk, which is the possibility that the market values of securities owned by the Fund will decline and that the value of the Fund’s shares may therefore be less than what you paid for them. Accordingly, you can lose money by investing in the Fund. See “Risk Considerations” in the Additional Information section of this report for a discussion of certain other risks of investing in the Fund.
Performance data quoted represents past performance, which is no guarantee of future results, and current performance may be lower or higher than the figures shown. For the most recent month-end performance figures, please visit www.ftportfolios.com or speak with your financial advisor. Investment returns and net asset value will fluctuate and Fund shares, when sold, may be worth more or less than their original cost.
The Advisor may also periodically provide additional information on Fund performance on the Fund’s web page at www.ftportfolios.com.
How to Read This Report
This report contains information that may help you evaluate your investment in the Fund. It includes details about the Fund and presents data and analysis that provide insight into the Fund’s performance and investment approach.
By reading the portfolio commentary by the portfolio management team of the Fund, you may obtain an understanding of how the market environment affected the Fund’s performance. The statistical information that follows may help you understand the Fund’s performance compared to that of relevant market benchmarks.
It is important to keep in mind that the opinions expressed by personnel of First Trust and Stonebridge are just that: informed opinions. They should not be considered to be promises or advice. The opinions, like the statistics, cover the period through the date on the cover of this report. The material risks of investing in the Fund are spelled out in the prospectus, the statement of additional information, this report and other Fund regulatory filings.
First Trust Preferred Securities and Income Fund
Annual Letter from the Chairman and CEO
October 31, 2021
Dear Shareholders,
First Trust is pleased to provide you with the annual report for the First Trust Preferred Securities and Income Fund (the “Fund”), which contains detailed information about the Fund for the twelve months ended October 31, 2021.
Inflation has arrived, and its entrance was grand, to say the least. The Consumer Price Index came in at 6.2% year-over-year in October 2021, according to data from the U.S. Bureau of Labor Statistics. The last time it topped the 6.0% mark was in December 1990 (6.1%), over 30 years ago. As is often the case with major shifts in the economy and markets, there is debate over what is truly behind them. For many months, as inflation was trending higher, Federal Reserve (the “Fed”) Chairman Jerome Powell held the view that the rising inflationary pressures largely stemmed from global supply chain bottlenecks induced by the coronavirus (“COVID-19”) pandemic. Perhaps the best example of this is the unprecedented backlog of container ships that have dropped anchor outside the California ports of Los Angeles and Long Beach. Together, these ports service 40% of all the container ships bound for the U.S. In normal times, no ships are anchored waiting to unload their goods. Shortages of trucks and drivers have also contributed to the slowdown at the ports.
The takeaway is that goods are not being delivered to warehouses and store shelves in a timely fashion and that is helping to drive prices higher for consumers. Simply put, inflation is the byproduct of too much money chasing too few goods. We’ll return to this axiom shortly. Chairman Powell originally believed the bottlenecks would be remedied relatively quickly as the global economy reopened and people went back to work. That, in turn, would allow inflationary pressures to dissipate, which has not happened. Around the end of October, Chairman Powell finally acknowledged that inflation will likely remain elevated through mid-2022. This realization is what motivated the Fed to announce that it would begin to taper its monthly bond buying program (quantitative easing) starting in November 2021. It has been purchasing roughly $80 billion of Treasuries and $40 billion of mortgage-backed securities in the open market every month since June 2020. The Fed will shave $15 billion off that combined total every month until the buying has ceased, which should be around mid-2022. If all goes to plan, the next stage in the evolution of the Fed’s monetary policy would involve initiating interest rate hikes.
While the supply chain bottlenecks have clearly played a role in the spike in inflation by limiting the amount of goods available to consume, the biggest contributing factor is likely the surge in the U.S. money supply, according to Brian Wesbury, Chief Economist at First Trust. M2 is a measure of the money supply that includes cash, checking deposits and liquid assets easily convertible to cash. The M2 measure of money has exploded by 36% since February 2020, well above the 6% pre-COVID-19 annualized norm. The trillions of dollars of stimulus distributed by the U.S. government to help backstop the economy during the pandemic has contributed to higher inflation. On Wednesday, November 10, 2021, President Joe Biden admitted that his $1.9 trillion COVID-19 stimulus package has done just that. Remember, too much money chasing too few goods leads to inflation. Keep in mind, President Biden has recently successfully navigated a $1.2 trillion bipartisan infrastructure bill through Congress and has another roughly $1.75 trillion Build Back Better Act (social spending) piece of legislation pending. That means there is at least another $1.2 trillion dollars flowing into the economy over the next few years, and maybe more.
Data from FactSet indicates that the number of S&P 500® Index companies mentioning inflation on their 2021 third quarter earnings call hit a 10-year high, according to Business Insider. To date, 285 of the 461 companies that have reported their results have cited concerns over rising inflation. The Materials, Consumer Staples and Energy sectors had the highest percentage of companies mentioned on these earnings calls at 90%, 88% and 86%, respectively. Suffice it to say, investors should add inflation to the list of criteria to assist them in positioning their portfolios moving forward.
Thank you for giving First Trust the opportunity to play a role in your financial future. We value our relationship with you and will report on the Fund again in six months.
Sincerely,
James A. Bowen
Chairman of the Board of Trustees
Chief Executive Officer of First Trust Advisors L.P.
First Trust Preferred Securities and Income Fund
“AT A GLANCE”
As of October 31, 2021 (Unaudited)
| Fund Statistics | |
| First Trust Preferred Securities and Income Fund | Net Asset
Value (NAV) |
| Class A (FPEAX) | $22.58 |
| Class C (FPECX) | $22.72 |
| Class F (FPEFX) | $22.87 |
| Class I (FPEIX) | $22.72 |
| Class R3 (FPERX) | $22.51 |
| Sector Allocation | % of Total
Investments |
| Financials | 74.6% |
| Energy | 8.3 |
| Utilities | 6.7 |
| Industrials | 4.2 |
| Consumer Staples | 3.3 |
| Real Estate | 2.1 |
| Communication Services | 0.8 |
| Total | 100.0% |
| Country Allocation | % of Total
Investments |
| United States | 52.1% |
| United Kingdom | 9.1 |
| Canada | 7.0 |
| France | 6.8 |
| Switzerland | 4.7 |
| Bermuda | 3.9 |
| Netherlands | 3.5 |
| Australia | 2.6 |
| Italy | 2.2 |
| Spain | 2.0 |
| Multinational | 1.2 |
| Mexico | 1.2 |
| Finland | 1.0 |
| Denmark | 1.0 |
| Japan | 0.8 |
| Germany | 0.4 |
| Sweden | 0.3 |
| Chile | 0.2 |
| Total | 100.0% |
| Credit Quality(1) | % of Total
Fixed-Income
Investments |
| A | 0.5% |
| A- | 0.4 |
| BBB+ | 10.5 |
| BBB | 22.5 |
| BBB- | 27.8 |
| BB+ | 22.4 |
| BB | 9.3 |
| BB- | 1.8 |
| B+ | 1.2 |
| B | 0.9 |
| Not Rated | 2.7 |
| Total | 100.0% |
| Top Ten Holdings | % of Total
Investments |
| Barclays PLC | 2.5% |
| AerCap Holdings N.V. | 2.1 |
| Emera, Inc., Series 16-A | 1.7 |
| Enbridge, Inc., Series 16-A | 1.6 |
| Wells Fargo & Co., Series L | 1.6 |
| Credit Suisse Group AG | 1.4 |
| Societe Generale S.A. | 1.3 |
| Credit Agricole S.A. | 1.2 |
| Highlands Holdings Bond Issuer Ltd./Highlands Holdings Bond Co-Issuer, Inc. | 1.2 |
| Lloyds Banking Group PLC | 1.2 |
| Total | 15.8% |
Dividend
Distributions | Class A Shares | Class C Shares | Class F
Shares | Class I Shares | Class R3
Shares |
| Current Monthly Distribution per Share(2) | $0.0853 | $0.0709 | $0.0871 | $0.0900 | $0.0805 |
| Current Distribution Rate on NAV(3) | 4.53% | 3.74% | 4.57% | 4.75% | 4.29% |
| (1) | The credit quality and ratings information presented above reflect the ratings assigned by one or more nationally recognized statistical rating organizations (NRSROs), including Standard & Poor’s Ratings Group, a division of the McGraw Hill Companies, Inc., Moody’s Investors Service, Inc., Fitch Ratings or a comparably rated NRSRO. For situations in which a security is rated by more than one NRSRO and the ratings are not equivalent, the highest rating is used. Sub-investment grade ratings are those rated BB+/Ba1 or lower. Investment grade ratings are those rated BBB-/Baa3 or higher. The credit ratings shown relate to the creditworthiness of the issuers of the underlying securities in the Fund, and not to the Fund or its shares. Credit ratings are subject to change. |
| (2) | Most recent distribution paid or declared through October 31, 2021. Subject to change in the future. |
| (3) | Distribution rates are calculated by annualizing the most recent distribution paid or declared through the report date and then dividing by NAV as of October 31, 2021. Subject to change in the future. |
First Trust Preferred Securities and Income Fund
“AT A GLANCE” (Continued)
As of October 31, 2021 (Unaudited)
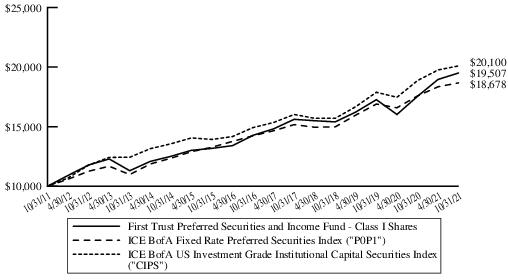
Performance of a $10,000 investment
This chart compares your Fund’s Class I performance to that of the ICE BofA Fixed Rate Preferred Securities Index and the ICE BofA US Investment Grade Institutional Capital Securities Index from 10/31/2011 through 10/31/2021.
First Trust Preferred Securities and Income Fund
“AT A GLANCE” (Continued)
As of October 31, 2021 (Unaudited)
| Performance as of October 31, 2021 |
| | A Shares
Inception
2/25/2011 | | | C Shares
Inception
2/25/2011 | | | F Shares
Inception
3/2/2011 | | | I Shares
Inception
1/11/2011 | | | R3 Shares
Inception
3/2/2011 |
Cumulative
Total Returns | w/o
sales
charge | | w/max
4.50%
sales
charge | | | w/o
sales
charge | | w/max 1.00% contingent deferred sales charge | | | w/o
sales
charge | | | w/o
sales
charge | | | w/o
sales
charge |
| 1 Year | 10.89% | | 5.92% | | | 10.11% | | 9.11% | | | 10.91% | | | 11.21% | | | 10.56% |
Average Annual
Total Returns | | | | | | | | | | | | | | | | | |
| 5 Years | 6.16% | | 5.19% | | | 5.44% | | 5.44% | | | 6.29% | | | 6.45% | | | 5.86% |
| 10 Years | 6.63% | | 6.14% | | | 5.87% | | 5.87% | | | 6.81% | | | 6.91% | | | 6.33% |
| Since Inception | 6.53% | | 6.07% | | | 5.78% | | 5.78% | | | 6.68% | | | 6.88% | | | 6.19% |
| 30-Day SEC Yield(4) | 3.29% | | | 2.71% | | | 3.60% | | | 3.73% | | | 3.25% |
| Performance as of October 31, 2021 (Continued) |
| | Blended
Index*(5)(6)(7) | P0P1*
ICE BofA
Fixed Rate
Preferred
Securities Index | CIPS*
ICE BofA
US Investment
Grade
Institutional
Capital
Securities
Index | Prior
Blended
Index*(8) |
Cumulative
Total Returns | w/o
sales
charge | w/o
sales
charge | w/o
sales
charge | w/o
sales
charge |
| 1 Year | 8.18% | 6.27% | 6.56% | 6.10% |
Average Annual
Total Returns | | | | |
| 5 Years | 6.76% | 5.59% | 6.14% | 5.87% |
| 10 Years | N/A | 6.45% | 7.23% | 6.86% |
| Since Inception | N/A | 6.45% | 6.85% | 6.66% |
* Since inception return is based on the Class I Shares inception date.
Performance figures assume reinvestment of all distributions and do not reflect the deduction of taxes that the shareholder would pay on Fund distributions or the redemption of Fund shares. The total returns would have been lower if certain fees had not been waived and expenses reimbursed by the Advisor and Sub-Advisor. An index is a statistical composite that tracks a specific financial market or sector. Unlike the Fund, these indices do not actually hold a portfolio of securities and therefore do not incur the expenses incurred by the Fund. These expenses negatively impact the performance of the Fund. The Fund’s past performance does not predict future performance.
Performance of share classes will vary due to differences in sales charges and expenses. Total return with sales charges includes payment of the maximum sales charge of 4.50% for Class A Shares, a contingent deferred sales charge (“CDSC”) of 1.00% for Class C Shares in year one and Rule 12b-1 service fees of 0.25% per year of average daily net assets for Class A Shares and combined Rule 12b-1 distribution and service fees of 1.00% per year of average daily net assets for Class C Shares. Class F, Class I and Class R3 Shares do not have a front-end sales charge or a CDSC; therefore, performance is at net asset value. The Rule 12b-1 service fees are 0.15% of average daily net assets for Class F Shares and combined Rule 12b-1 distribution and service fees are 0.50% of average daily net assets for Class R3 Shares, while Class I Shares do not have these fees. Prior to December 15, 2011, the combined Rule 12b-1 distribution and service fees for Class R3 Shares were 0.75% of average daily net assets.
| (4) | 30-day SEC yield is calculated by dividing the net investment income per share earned during the most recent 30-day period by the maximum offering price per share on the last day of the period. The reported SEC yields are subsidized. The subsidized yields reflect the waiver and/or a reimbursement of Fund expenses, which has the effect of lowering the Fund’s expense ratio and generating a higher yield. |
| (5) | On July 6, 2021, the Fund’s benchmark changed from the Prior Blended Index to the Blended Index, because the Advisor believes that the Blended Index better reflects the investment strategies of the Fund. |
| (6) | The Blended Index consists of a 30/30/30/10 blend of the ICE BofA Core Plus Fixed Rate Preferred Securities Index, the ICE BofA US Investment Grade Institutional Capital Securities Index, the ICE USD Contingent Capital Index and the ICE BofA US High Yield Institutional Capital Securities Index. The Blended Index is intended to reflect the proportional market cap of each segment of the preferred and hybrid securities market. The indices do not charge management fees or brokerage expenses, and no such fees or expenses were deducted from the performance shown. Indices are unmanaged and an investor cannot invest directly in an index. The Blended Index returns are calculated by using the monthly returns of the four indices during each period shown above. At the beginning of each month the four indices are rebalanced to a 30/30/30/10 ratio to account for divergence from that ratio that occurred during the course of each month. The monthly returns are then compounded for each period shown above, giving the performance for the Blended Index for each period shown above. |
| (7) | Since the ICE BofA Core Plus Fixed Rate Preferred Securities Index had an inception date March 31, 2012, and the ICE USD Contingent Capital Index had an inception date of December 31, 2013, the performance of the Blended Index is not available for all of the periods disclosed. |
| (8) | The Prior Blended Index consists of a 50/50 blend of the ICE BofA Fixed Rate Preferred Securities Index and the ICE BofA U.S. Capital Securities Index. The indices do not charge management fees or brokerage expenses, and no such fees or expenses were deducted from the performance shown. Indices are unmanaged and an investor cannot invest directly in an index. The Prior Blended Index returns are calculated by using the monthly returns of the two indices during each period shown above. At the beginning of each month the two indices are rebalanced to a 50/50 ratio to account for divergence from that ratio that occurred during the course of each month. The monthly returns are then compounded for each period shown above, giving the performance for the Prior Blended Index for each period shown above. |
Portfolio Commentary
First Trust Preferred Securities and Income Fund
Annual Report
October 31, 2021 (Unaudited)
Advisor
First Trust Advisors L.P. (“First Trust” or the “Advisor”) serves as the investment advisor to the First Trust Preferred Securities and Income Fund (the “Fund”). First Trust is responsible for the ongoing monitoring of the Fund’s investment portfolio, managing the Fund’s business affairs and providing certain administrative services necessary for the management of the Fund.
Sub-Advisor
Stonebridge Advisors LLC (“Stonebridge” or the “Sub-Advisor”) is the investment sub-advisor to the Fund and is a registered investment advisor based in Wilton, Connecticut. Stonebridge specializes in the management of preferred and hybrid securities.
Stonebridge Advisors LLC Portfolio Management Team
Scott T. Fleming - Chief Executive Officer and President
Robert Wolf - Chief Investment Officer, Senior Vice President and Senior Portfolio Manager
Eric Weaver - Senior Vice President, Chief Strategist and Portfolio Manager
Annual Report Commentary
Market Recap
The 12-month period ended October 31, 2021 was a far less volatile period for the preferred and hybrid securities market relative to the prior year. The beginning of the period was marked by another major leg of the market rebound following the volatility in the spring of 2020 driven by the coronavirus (“COVID-19”) pandemic. A second major leg of the rebound largely concluded by the end of the 2020 calendar year and provided over 450 basis points (“bps”) of total return in the Fund’s Benchmark in the first two months of the period. The Benchmark (the “Benchmark”) is a 30%/30%/30%/10% blend of the ICE BofA US Investment Grade Institutional Capital Securities Index (“CIPS”), the ICE USD Contingent Capital Index (“CDLR”), the ICE BofA Core Plus Fixed Rate Preferred Securities Index (“P0P4”), and the ICE BofA US High Yield Institutional Capital Securities Index (“HIPS”), respectively. This time period coincided with President Joe Biden’s U.S. presidential election win, along with an anticipated increase in consumer spending and ending of the COVID-19 pandemic.
As the 2021 calendar year began, a number of headwinds surfaced, most notably a jump in Treasury yields. The 10-Year U.S. Treasury yield increased by over 80 bps in the first quarter of 2021. This led to some volatility in the preferred and hybrid securities market, with a larger pullback in the $25 par retail market compared to the $1,000 par institutional market.
U.S. Treasury yields rallied and consolidated over the following seven months of the 12-month period ended October 31, 2021. This rate environment was supportive of the preferred and hybrid market in general, leading to further yield spread tightening. From a credit perspective, U.S. and European banks reported very strong results over the course of the period, leading equity analysts to lift the 2021 fiscal year consensus earnings estimates by approximately 75% for U.S. banks and over 50% for European banks compared to beginning of year estimates. In addition to strong earnings, loan quality and capital trended well. Both the Federal Reserve (the “Fed”) and the European Central Bank echoed this strong performance by lifting restrictions on common equity distributions. Away from banks, other major sectors within preferreds, including insurance, utilities and real estate investment trusts demonstrated stable credit metrics and positive earnings trends, while rising oil prices provided a nice tail wind for the energy sector.
During the period, non-investment grade (“non-IG”) $1,000 par securities outperformed all other parts of the preferred and hybrid securities market, returning 13.13% (HIPS). European contingent convertible capital securities (“CoCos”) also performed well during the period, returning 8.61% (CDLR). The investment-grade (“IG”) $1,000 par market significantly underperformed their non-IG counterparts during the risk-on period, returning 6.58% (CIPS). The $25 par retail market was the most volatile market segment for the period, but still managed to return 7.73% (P0P4).
Performance Analysis
For the 12-month period ended October 31, 2021, the Fund’s I-shares produced a total return of 11.21%. This compares to a total return of 8.18% for the Fund’s Benchmark. The Fund’s outperformance compared to its Benchmark during the period was primarily a result of its overweight allocation and security selection to non-IG securities, security selection within non-U.S. bank contingent CoCos and security selection within IG securities. The Fund also benefited from its security selection within newly issued securities and $25 par retail securities.
After the announcement of multiple vaccines with proven efficacy against COVID-19 early in the period and the subsequent reopening of the U.S. economy, non-IG securities outperformed all other parts of the preferred and hybrid market. As a result, the yield between
Portfolio Commentary (Continued)
First Trust Preferred Securities and Income Fund
Annual Report
October 31, 2021 (Unaudited)
IG and non-IG securities compressed significantly. The Fund benefited from its better security selection and overweight allocation to non-IG securities relative to the Benchmark during the period. Specifically, the Fund’s holdings within U.S. pipelines, aircraft lessors and food and dairy issuers all added a substantial amount of alpha relative to the Benchmark.
Returns within the IG institutional segment of the market were also strong during the period, although they trailed all other segments of the $1,000 par institutional market. The Fund benefited from its superior security selection within its IG institutional holdings versus the Benchmark during the period. This was due to a combination of factors, including security selection within $1,000 par insurers, allocation to institutional floaters, which are not held in the Benchmark, and the Fund’s overweight allocation to higher reset variable rate securities. In general, the Fund has focused on remaining overweight to lower duration sensitive securities, such as shorter call securities and defensive variable rate securities, in order to offset the potential impact of rising interest rates.
With the reopening economy and increased inflation expectations, the 10-Year Treasury yield moved significantly higher during the period. This contributed to the elevated volatility within the $25 par retail market, which has a longer duration profile than the $1,000 par institutional market due to their overweight to fixed-for-life coupon structures. The Fund took advantage of the volatility during the period and outperformed significantly across both IG and non-IG retail holdings while still maintaining an underweight allocation relative to the Benchmark.
Another area of outperformance for the Fund was its superior security selection within non-U.S. bank CoCos. Similar to U.S. banks, non-U.S. banks benefited from improved economic conditions, generally resulting in better-than-expected earnings and lower loan loss provisions than previously forecasted. The Fund’s holdings in United Kingdom, French, Swiss and Italian banks drove the outperformance in this market segment.
Finally, the new issuance market in fiscal year 2021 proved to be significantly more competitive than during the second or third quarter of 2020, as the demand for yield drove down coupons and spreads on new deals. However, the Fund managed to outperform versus the Benchmark within the primary market over the same time period. The Fund selectively focused on newly issued securities with the best combination of credit, relative valuation and structure.
Market and Fund Outlook
Looking ahead, we believe preferreds offer better relative value than most other fixed income due to the high yields, combined with the high credit quality of the issuers and intermediate to low duration profile. At the same time, with investor demand for yield leading to a tightening to near fair value for preferreds, in our opinion, we expect income to be the biggest driver of returns over the next 12 months.
With credit fundamentals stable, and the market fairly valued, in our view, we believe that interest rate volatility is the biggest potential risk heading into 2022. In our opinion, active management is beneficial in the current environment where a number of potential catalysts exist that could lead to higher interest rates including uncertainty over the composition of the Fed’s board. We believe that a dovish tilt to the makeup of the Fed leadership could result in steepening of the yield curve. Other catalysts for rate volatility also persist, such as tapering of the Fed’s bond purchase program, inflationary pressures and potential increases in federal spending and taxation. Given the confluence of factors potentially affecting interest rates, we have selectively sought out value in preferreds across the entire yield curve but maintain a bias towards the shorter end along with securities that contain a component of rate protection, such as variable rate securities. We will also focus on improving the composition of the Fund by reducing exposure to higher risk security structures and targeting relative value swaps in favor of improving security structure combined with improved valuation.
First Trust Preferred Securities and Income Fund
Understanding Your Fund Expenses
October 31, 2021 (Unaudited)
As a shareholder of the First Trust Preferred Securities and Income Fund (the “Fund”), you incur two types of costs: (1) transaction costs, including sales charges (loads) on purchases of Class A Shares and contingent deferred sales charges on the lesser of purchase price or redemption proceeds of Class C Shares; and (2) ongoing costs, including management fees, distribution and/or service (12b-1) fees, if any, and other Fund expenses. This Example is intended to help you understand your ongoing costs of investing in the Fund and to compare these costs with the ongoing costs of investing in other funds.
The Example is based on an investment of $1,000 invested at the beginning of the period and held through the six-month period ended October 31, 2021.
Actual Expenses
The first three columns of the table below provide information about actual account values and actual expenses. You may use the information in these columns, together with the amount you invested, to estimate the expenses that you paid over the period. Simply divide your account value by $1,000 (for example, an $8,600 account value divided by $1,000 = 8.6), then multiply the result by the number in the third column under the heading entitled “Expenses Paid During Period” to estimate the expenses you paid on your account during this six-month period.
Hypothetical Example for Comparison Purposes
The next three columns of the table below provide information about hypothetical account values and hypothetical expenses based on the Fund’s actual expense ratio and an assumed rate of return of 5% per year before expenses, which is not the Fund’s actual return. The hypothetical account values and expenses may not be used to estimate the actual ending account balance or expenses you paid for the period. You may use this information to compare the ongoing costs of investing in the Fund and other funds. To do so, compare this 5% hypothetical example with the 5% hypothetical examples that appear in the shareholder reports of the other funds.
Please note that the expenses shown in the table are meant to highlight your ongoing costs only and do not reflect any transactional costs such as sales charges (loads) or contingent deferred sales charges. Therefore, the hypothetical section of the table is useful in comparing ongoing costs only, and will not help you determine the relative total costs of owning different funds. In addition, if these transactional costs were included, your costs would have been higher.
| | Actual Expenses | | Hypothetical
(5% Return Before Expenses) | |
| | Beginning
Account
Value
5/1/2021 | Ending
Account
Value
10/31/2021 | Expenses Paid
During Period
5/1/2021 -
10/31/2021 (a) | Beginning
Account
Value
5/1/2021 | | Ending
Account
Value
10/31/2021 | Expenses Paid
During Period
5/1/2021 -
10/31/2021 (a) | Annualized
Expense
Ratios (b) |
Class A
| $ 1,000.00 | $ 1,027.80 | $ 6.75 | $ 1,000.00 | | $ 1,018.55 | $ 6.72 | 1.32% |
Class C
| $ 1,000.00 | $ 1,024.30 | $ 10.41 | $ 1,000.00 | | $ 1,014.92 | $ 10.36 | 2.04% |
Class F
| $ 1,000.00 | $ 1,027.50 | $ 6.64 | $ 1,000.00 | | $ 1,018.65 | $ 6.61 | 1.30% |
Class I
| $ 1,000.00 | $ 1,028.90 | $ 5.27 | $ 1,000.00 | | $ 1,020.01 | $ 5.24 | 1.03% |
Class R3
| $ 1,000.00 | $ 1,026.20 | $ 8.43 | $ 1,000.00 | | $ 1,016.89 | $ 8.39 | 1.65% |
| (a) | Expenses are equal to the annualized expense ratios as indicated in the table multiplied by the average account value over the period (May 1, 2021 through October 31, 2021), multiplied by 184/365 (to reflect the six-month period). |
| (b) | These expense ratios reflect expense caps. |
First Trust Preferred Securities and Income Fund
Portfolio of Investments
October 31, 2021
| Shares | | Description | | Stated
Rate | | Stated
Maturity | | Value |
| $25 PAR PREFERRED SECURITIES – 16.0% |
| | | Banks – 2.6% | | | | | | |
| 147 | | Atlantic Union Bankshares Corp., Series A
| | 6.88% | | (a) | | $4,125 |
| 17,250 | | Fifth Third Bancorp, Series A
| | 6.00% | | (a) | | 460,230 |
| 8,764 | | First Midwest Bancorp, Inc., Series A
| | 7.00% | | (a) | | 247,145 |
| 39,734 | | First Republic Bank, Series M
| | 4.00% | | (a) | | 968,715 |
| 21,018 | | JPMorgan Chase & Co., Series LL
| | 4.63% | | (a) | | 549,410 |
| 40,177 | | Pinnacle Financial Partners, Inc., Series B
| | 6.75% | | (a) | | 1,132,590 |
| 62,765 | | Signature Bank, Series A
| | 5.00% | | (a) | | 1,625,613 |
| 4,971 | | Texas Capital Bancshares, Inc., Series B
| | 5.75% | | (a) | | 132,030 |
| 27,348 | | Valley National Bancorp, Series B (b)
| | 5.50% | | (a) | | 707,766 |
| 10,424 | | Wells Fargo & Co., Series DD
| | 4.25% | | (a) | | 260,183 |
| 30,000 | | WesBanco, Inc., Series A (b)
| | 6.75% | | (a) | | 861,600 |
| 9,104 | | Western Alliance Bancorp, Series A (b)
| | 4.25% | | (a) | | 239,071 |
| 42,690 | | Wintrust Financial Corp., Series E (b)
| | 6.88% | | (a) | | 1,205,566 |
| | | | | 8,394,044 |
| | | Capital Markets – 1.1% | | | | | | |
| 25,553 | | Affiliated Managers Group, Inc.
| | 4.20% | | 09/30/61 | | 632,820 |
| 20,766 | | Apollo Global Management, Inc., Series B
| | 6.38% | | (a) | | 560,474 |
| 53,733 | | Carlyle Finance LLC
| | 4.63% | | 05/15/61 | | 1,396,252 |
| 39,115 | | KKR Group Finance Co., IX LLC
| | 4.63% | | 04/01/61 | | 1,026,182 |
| 3,597 | | Oaktree Capital Group LLC, Series A
| | 6.63% | | (a) | | 96,436 |
| | | | | 3,712,164 |
| | | Diversified Financial Services – 0.3% | | | | | | |
| 34,751 | | Equitable Holdings, Inc., Series A
| | 5.25% | | (a) | | 923,682 |
| | | Diversified Telecommunication Services – 0.4% | | | | | | |
| 38,862 | | Qwest Corp.
| | 6.50% | | 09/01/56 | | 997,587 |
| 5,477 | | Qwest Corp.
| | 6.75% | | 06/15/57 | | 144,100 |
| | | | | 1,141,687 |
| | | Electric Utilities – 0.9% | | | | | | |
| 35,878 | | Brookfield BRP Holdings Canada, Inc.
| | 4.63% | | (a) | | 898,923 |
| 28,651 | | Brookfield Infrastructure Finance ULC
| | 5.00% | | 05/24/81 | | 739,482 |
| 2,694 | | SCE Trust III, Series H (b)
| | 5.75% | | (a) | | 69,424 |
| 18,460 | | SCE Trust IV, Series J (b)
| | 5.38% | | (a) | | 462,608 |
| 7,414 | | SCE Trust V, Series K (b)
| | 5.45% | | (a) | | 191,874 |
| 27,160 | | Southern (The) Co.
| | 4.95% | | 01/30/80 | | 722,185 |
| | | | | 3,084,496 |
| | | Equity Real Estate Investment Trusts – 0.8% | | | | | | |
| 20,431 | | Agree Realty Corp., Series A
| | 4.25% | | (a) | | 501,581 |
| 272 | | DigitalBridge Group, Inc., Series I
| | 7.15% | | (a) | | 7,072 |
| 87 | | DigitalBridge Group, Inc., Series J
| | 7.13% | | (a) | | 2,286 |
| 27,351 | | Global Net Lease, Inc., Series A
| | 7.25% | | (a) | | 724,254 |
| 2,712 | | National Storage Affiliates Trust, Series A
| | 6.00% | | (a) | | 71,841 |
| 48,401 | | Public Storage, Series P
| | 4.00% | | (a) | | 1,226,481 |
| | | | | 2,533,515 |
| | | Food Products – 0.2% | | | | | | |
| 11,637 | | CHS, Inc., Series 2 (b)
| | 7.10% | | (a) | | 324,207 |
| 5,901 | | CHS, Inc., Series 3 (b)
| | 6.75% | | (a) | | 165,936 |
| 6,575 | | CHS, Inc., Series 4
| | 7.50% | | (a) | | 190,609 |
| | | | | 680,752 |
Page 8
See Notes to Financial Statements
First Trust Preferred Securities and Income Fund
Portfolio of Investments (Continued)
October 31, 2021
| Shares | | Description | | Stated
Rate | | Stated
Maturity | | Value |
| $25 PAR PREFERRED SECURITIES (Continued) |
| | | Gas Utilities – 0.2% | | | | | | |
| 24,497 | | South Jersey Industries, Inc.
| | 5.63% | | 09/16/79 | | $655,050 |
| | | Independent Power & Renewable Electricity Producers – 0.2% | | | | | | |
| 21,958 | | Brookfield Renewable Partners L.P., Series 17
| | 5.25% | | (a) | | 581,228 |
| | | Insurance – 4.1% | | | | | | |
| 71,983 | | Aegon Funding Co., LLC
| | 5.10% | | 12/15/49 | | 1,939,222 |
| 83,465 | | American Equity Investment Life Holding Co., Series A (b)
| | 5.95% | | (a) | | 2,328,673 |
| 36,665 | | American Equity Investment Life Holding Co., Series B (b)
| | 6.63% | | (a) | | 1,049,719 |
| 4,822 | | AmTrust Financial Services, Inc.
| | 7.25% | | 06/15/55 | | 95,958 |
| 5,383 | | AmTrust Financial Services, Inc.
| | 7.50% | | 09/15/55 | | 107,660 |
| 28,000 | | Arch Capital Group Ltd., Series G
| | 4.55% | | (a) | | 726,600 |
| 10,593 | | Aspen Insurance Holdings Ltd.
| | 5.63% | | (a) | | 292,791 |
| 48,048 | | Aspen Insurance Holdings Ltd.
| | 5.63% | | (a) | | 1,271,350 |
| 32,729 | | Athene Holding Ltd., Series A (b)
| | 6.35% | | (a) | | 978,270 |
| 9,582 | | Axis Capital Holdings Ltd., Series E
| | 5.50% | | (a) | | 241,658 |
| 24,466 | | CNO Financial Group, Inc.
| | 5.13% | | 11/25/60 | | 660,582 |
| 73,827 | | Delphi Financial Group, Inc., 3 Mo. LIBOR + 3.19% (c)
| | 3.31% | | 05/15/37 | | 1,775,539 |
| 4,275 | | Global Indemnity Group LLC
| | 7.88% | | 04/15/47 | | 110,295 |
| 27,470 | | Globe Life, Inc.
| | 4.25% | | 06/15/61 | | 715,731 |
| 10,700 | | Phoenix Cos. (The), Inc.
| | 7.45% | | 01/15/32 | | 198,619 |
| 27,762 | | RenaissanceRe Holdings Ltd., Series G
| | 4.20% | | (a) | | 699,047 |
| | | | | 13,191,714 |
| | | Mortgage Real Estate Investment Trusts – 0.8% | | | | | | |
| 16,372 | | AGNC Investment Corp., Series C (b)
| | 7.00% | | (a) | | 415,522 |
| 30,561 | | AGNC Investment Corp., Series F (b)
| | 6.13% | | (a) | | 774,110 |
| 47,332 | | Annaly Capital Management, Inc., Series F (b)
| | 6.95% | | (a) | | 1,199,866 |
| 7,000 | | Annaly Capital Management, Inc., Series I (b)
| | 6.75% | | (a) | | 184,030 |
| | | | | 2,573,528 |
| | | Multi-Utilities – 0.8% | | | | | | |
| 19,117 | | Algonquin Power & Utilities Corp. (b)
| | 6.88% | | 10/17/78 | | 527,438 |
| 11,270 | | Algonquin Power & Utilities Corp., Series 19-A (b)
| | 6.20% | | 07/01/79 | | 314,771 |
| 29,776 | | Brookfield Infrastructure Partners L.P., Series 13
| | 5.13% | | (a) | | 753,035 |
| 35,444 | | Integrys Holding, Inc. (b)
| | 6.00% | | 08/01/73 | | 971,166 |
| | | | | 2,566,410 |
| | | Oil, Gas & Consumable Fuels – 1.3% | | | | | | |
| 3,965 | | Energy Transfer L.P., Series C (b)
| | 7.38% | | (a) | | 100,077 |
| 274 | | Energy Transfer L.P., Series D (b)
| | 7.63% | | (a) | | 6,861 |
| 98,078 | | Energy Transfer L.P., Series E (b)
| | 7.60% | | (a) | | 2,502,950 |
| 28,176 | | NuStar Energy L.P., Series A (b)
| | 8.50% | | (a) | | 690,594 |
| 1,283 | | NuStar Energy L.P., Series C (b)
| | 9.00% | | (a) | | 33,371 |
| 39,987 | | NuStar Logistics L.P., 3 Mo. LIBOR + 6.73% (c)
| | 6.86% | | 01/15/43 | | 1,008,872 |
| | | | | 4,342,725 |
| | | Real Estate Management & Development – 1.3% | | | | | | |
| 53,333 | | Brookfield Property Partners L.P., Series A
| | 5.75% | | (a) | | 1,301,859 |
| 10,209 | | Brookfield Property Partners L.P., Series A-1
| | 6.50% | | (a) | | 262,371 |
| 53,680 | | Brookfield Property Partners L.P., Series A2
| | 6.38% | | (a) | | 1,392,459 |
| 56,275 | | Brookfield Property Preferred L.P.
| | 6.25% | | 07/26/81 | | 1,397,308 |
| | | | | 4,353,997 |
| | | Trading Companies & Distributors – 0.6% | | | | | | |
| 26,662 | | Air Lease Corp., Series A (b)
| | 6.15% | | (a) | | 720,941 |
See Notes to Financial Statements
Page 9
First Trust Preferred Securities and Income Fund
Portfolio of Investments (Continued)
October 31, 2021
| Shares | | Description | | Stated
Rate | | Stated
Maturity | | Value |
| $25 PAR PREFERRED SECURITIES (Continued) |
| | | Trading Companies & Distributors (Continued) | | | | | | |
| 42,181 | | WESCO International, Inc., Series A (b)
| | 10.63% | | (a) | | $1,324,483 |
| | | | | 2,045,424 |
| | | Wireless Telecommunication Services – 0.4% | | | | | | |
| 11,017 | | United States Cellular Corp.
| | 6.25% | | 09/01/69 | | 302,527 |
| 43,583 | | United States Cellular Corp.
| | 5.50% | | 06/01/70 | | 1,158,436 |
| | | | | 1,460,963 |
| | | Total $25 Par Preferred Securities
| | 52,241,379 |
| | | (Cost $49,046,403) | | | | | | |
| $100 PAR PREFERRED SECURITIES – 2.5% |
| | | Banks – 2.5% | | | | | | |
| 9,400 | | AgriBank FCB (b)
| | 6.88% | | (a) | | 1,022,250 |
| 32,500 | | CoBank ACB, Series F (b)
| | 6.25% | | (a) | | 3,388,125 |
| 27,000 | | CoBank ACB, Series G
| | 6.13% | | (a) | | 2,774,790 |
| 10,500 | | Farm Credit Bank of Texas (b) (d)
| | 6.75% | | (a) | | 1,139,250 |
| | | Total $100 Par Preferred Securities
| | 8,324,415 |
| | | (Cost $7,977,200) | | | | | | |
| $1,000 PAR PREFERRED SECURITIES – 2.2% |
| | | Banks – 2.0% | | | | | | |
| 1,127 | | Bank of America Corp., Series L
| | 7.25% | | (a) | | 1,614,112 |
| 3,353 | | Wells Fargo & Co., Series L
| | 7.50% | | (a) | | 5,096,459 |
| | | | | 6,710,571 |
| | | Diversified Financial Services – 0.2% | | | | | | |
| 500 | | Compeer Financial ACA (b) (d)
| | 6.75% | | (a) | | 531,250 |
| | | Total $1,000 Par Preferred Securities
| | 7,241,821 |
| | | (Cost $6,618,059) | | | | | | |
Par
Amount | | Description | | Stated
Rate | | Stated
Maturity | | Value |
| CAPITAL PREFERRED SECURITIES – 76.0% |
| | | Banks – 34.9% | | | | | | |
| $1,400,000 | | Australia & New Zealand Banking Group Ltd. (b) (d) (e)
| | 6.75% | | (a) | | 1,611,323 |
| 600,000 | | Australia & New Zealand Banking Group Ltd. (b) (e) (f)
| | 6.75% | | (a) | | 690,567 |
| 2,300,000 | | Banco Bilbao Vizcaya Argentaria S.A., Series 9 (b) (e)
| | 6.50% | | (a) | | 2,472,500 |
| 600,000 | | Banco Mercantil del Norte S.A. (b) (d) (e)
| | 7.50% | | (a) | | 659,448 |
| 1,000,000 | | Banco Mercantil del Norte S.A. (b) (d) (e)
| | 7.63% | | (a) | | 1,099,520 |
| 1,100,000 | | Banco Mercantil del Norte S.A. (b) (d) (e)
| | 8.38% | | (a) | | 1,287,396 |
| 1,600,000 | | Banco Santander S.A. (b) (e)
| | 4.75% | | (a) | | 1,612,272 |
| 2,200,000 | | Banco Santander S.A. (b) (e) (f)
| | 7.50% | | (a) | | 2,384,881 |
| 2,200,000 | | Bank of Nova Scotia (The) (b)
| | 4.90% | | (a) | | 2,353,296 |
| 1,100,000 | | Barclays PLC (b) (e)
| | 4.38% | | (a) | | 1,084,930 |
| 1,700,000 | | Barclays PLC (b) (e)
| | 6.13% | | (a) | | 1,869,473 |
| 2,650,000 | | Barclays PLC (b) (e) (f)
| | 7.88% | | (a) | | 2,710,778 |
| 7,200,000 | | Barclays PLC (b) (e)
| | 8.00% | | (a) | | 8,032,500 |
| 650,000 | | BBVA Bancomer S.A. (b) (d) (e)
| | 5.88% | | 09/13/34 | | 707,840 |
| 1,500,000 | | BNP Paribas S.A. (b) (d) (e)
| | 6.63% | | (a) | | 1,625,625 |
| 1,700,000 | | BNP Paribas S.A. (b) (d) (e)
| | 7.38% | | (a) | | 1,951,932 |
| 1,921,000 | | Citigroup, Inc. (b)
| | 3.88% | | (a) | | 1,942,611 |
| 99,000 | | Citigroup, Inc. (b)
| | 5.90% | | (a) | | 102,713 |
| 725,000 | | Citigroup, Inc. (b)
| | 5.95% | | (a) | | 750,375 |
| 431,000 | | Citigroup, Inc., Series D (b)
| | 5.35% | | (a) | | 443,068 |
Page 10
See Notes to Financial Statements
First Trust Preferred Securities and Income Fund
Portfolio of Investments (Continued)
October 31, 2021
Par
Amount | | Description | | Stated
Rate | | Stated
Maturity | | Value |
| CAPITAL PREFERRED SECURITIES (Continued) |
| | | Banks (Continued) | | | | | | |
| $1,780,000 | | Citigroup, Inc., Series P (b)
| | 5.95% | | (a) | | $1,922,400 |
| 262,000 | | Citigroup, Inc., Series T (b)
| | 6.25% | | (a) | | 302,269 |
| 1,072,000 | | Citigroup, Inc., Series W (b)
| | 4.00% | | (a) | | 1,097,460 |
| 1,140,000 | | Citigroup, Inc., Series Y (b)
| | 4.15% | | (a) | | 1,146,840 |
| 1,120,000 | | Citizens Financial Group, Inc., Series F (b)
| | 5.65% | | (a) | | 1,230,600 |
| 1,000,000 | | Citizens Financial Group, Inc., Series G (b)
| | 4.00% | | (a) | | 1,010,000 |
| 2,500,000 | | CoBank ACB, Series I (b)
| | 6.25% | | (a) | | 2,809,375 |
| 700,000 | | Comerica, Inc. (b)
| | 5.63% | | (a) | | 774,375 |
| 600,000 | | Commerzbank AG (b) (e) (f)
| | 7.00% | | (a) | | 646,992 |
| 2,600,000 | | Credit Agricole S.A. (b) (d) (e)
| | 6.88% | | (a) | | 2,871,050 |
| 2,800,000 | | Credit Agricole S.A. (b) (d) (e)
| | 7.88% | | (a) | | 3,103,030 |
| 3,285,000 | | Credit Agricole S.A. (b) (d) (e)
| | 8.13% | | (a) | | 3,943,409 |
| 400,000 | | Danske Bank A.S. (b) (e) (f)
| | 4.38% | | (a) | | 404,032 |
| 1,500,000 | | Danske Bank A.S. (b) (e) (f)
| | 6.13% | | (a) | | 1,592,813 |
| 1,050,000 | | Danske Bank A.S. (b) (e) (f)
| | 7.00% | | (a) | | 1,171,732 |
| 600,000 | | Farm Credit Bank of Texas, Series 3 (b) (d)
| | 6.20% | | (a) | | 660,000 |
| 1,100,000 | | Farm Credit Bank of Texas, Series 4 (b) (d)
| | 5.70% | | (a) | | 1,204,500 |
| 901,000 | | Fifth Third Bancorp, Series H (b)
| | 5.10% | | (a) | | 922,399 |
| 2,644,000 | | HSBC Holdings PLC (b) (e)
| | 6.38% | | (a) | | 2,879,832 |
| 470,000 | | Huntington Bancshares, Inc., Series G (b)
| | 4.45% | | (a) | | 503,488 |
| 1,930,000 | | ING Groep N.V. (b) (e)
| | 5.75% | | (a) | | 2,096,858 |
| 1,400,000 | | ING Groep N.V. (b) (e)
| | 6.50% | | (a) | | 1,538,257 |
| 900,000 | | ING Groep N.V. (b) (e) (f)
| | 6.88% | | (a) | | 922,500 |
| 1,954,000 | | Intesa Sanpaolo S.p.A. (b) (d) (e)
| | 7.70% | | (a) | | 2,186,037 |
| 1,749,000 | | JPMorgan Chase & Co., Series Q (b)
| | 5.15% | | (a) | | 1,800,123 |
| 594,000 | | JPMorgan Chase & Co., Series R (b)
| | 6.00% | | (a) | | 621,250 |
| 1,138,000 | | JPMorgan Chase & Co., Series V, 3 Mo. LIBOR + 3.32% (c)
| | 3.45% | | (a) | | 1,138,576 |
| 1,600,000 | | Lloyds Banking Group PLC (b) (e)
| | 6.75% | | (a) | | 1,829,736 |
| 3,400,000 | | Lloyds Banking Group PLC (b) (e)
| | 7.50% | | (a) | | 3,765,500 |
| 800,000 | | M&T Bank Corp. (b)
| | 3.50% | | (a) | | 788,000 |
| 500,000 | | Natwest Group PLC (b) (e)
| | 6.00% | | (a) | | 553,965 |
| 1,600,000 | | Natwest Group PLC (b) (e)
| | 8.00% | | (a) | | 1,878,024 |
| 2,800,000 | | Nordea Bank Abp (b) (d) (e)
| | 6.63% | | (a) | | 3,204,236 |
| 950,000 | | PNC Financial Services Group (The), Inc., Series T (b)
| | 3.40% | | (a) | | 939,313 |
| 1,000,000 | | Regions Financial Corp., Series D (b)
| | 5.75% | | (a) | | 1,106,250 |
| 200,000 | | Skandinaviska Enskilda Banken AB (b) (e) (f)
| | 5.13% | | (a) | | 212,371 |
| 3,900,000 | | Societe Generale S.A. (b) (d) (e)
| | 5.38% | | (a) | | 4,153,500 |
| 3,090,000 | | Societe Generale S.A. (b) (d) (e)
| | 7.88% | | (a) | | 3,412,287 |
| 200,000 | | Societe Generale S.A. (b) (d) (e)
| | 8.00% | | (a) | | 233,201 |
| 2,800,000 | | Standard Chartered PLC (b) (d) (e)
| | 4.30% | | (a) | | 2,695,756 |
| 1,500,000 | | Standard Chartered PLC (b) (d) (e)
| | 6.00% | | (a) | | 1,634,250 |
| 2,128,000 | | SVB Financial Group, Series D (b)
| | 4.25% | | (a) | | 2,138,374 |
| 800,000 | | Swedbank AB, Series NC5 (b) (e) (f)
| | 5.63% | | (a) | | 862,484 |
| 408,000 | | Texas Capital Bancshares, Inc. (b)
| | 4.00% | | 05/06/31 | | 425,240 |
| 828,000 | | Truist Financial Corp., Series P (b)
| | 4.95% | | (a) | | 900,657 |
| 3,100,000 | | UniCredit S.p.A. (b) (e) (f)
| | 8.00% | | (a) | | 3,393,089 |
| 750,000 | | UniCredit S.p.A. (b) (d)
| | 5.46% | | 06/30/35 | | 821,456 |
| 799,000 | | US Bancorp (b)
| | 3.70% | | (a) | | 797,841 |
| 2,112,000 | | Wells Fargo & Co., Series BB (b)
| | 3.90% | | (a) | | 2,152,920 |
| | | | | 113,791,695 |
| | | Capital Markets – 9.6% | | | | | | |
| 1,568,000 | | Apollo Management Holdings L.P. (b) (d)
| | 4.95% | | 01/14/50 | | 1,624,427 |
| 1,300,000 | | Bank of New York Mellon (The) Corp., Series G (b)
| | 4.70% | | (a) | | 1,417,910 |
| 2,260,000 | | Charles Schwab (The) Corp., Series G (b)
| | 5.38% | | (a) | | 2,488,825 |
See Notes to Financial Statements
Page 11
First Trust Preferred Securities and Income Fund
Portfolio of Investments (Continued)
October 31, 2021
Par
Amount | | Description | | Stated
Rate | | Stated
Maturity | | Value |
| CAPITAL PREFERRED SECURITIES (Continued) |
| | | Capital Markets (Continued) | | | | | | |
| $3,150,000 | | Charles Schwab (The) Corp., Series I (b)
| | 4.00% | | (a) | | $3,245,760 |
| 2,430,000 | | Credit Suisse Group AG (b) (d) (e)
| | 5.25% | | (a) | | 2,530,237 |
| 500,000 | | Credit Suisse Group AG (b) (d) (e)
| | 6.25% | | (a) | | 539,005 |
| 2,300,000 | | Credit Suisse Group AG (b) (d) (e)
| | 6.38% | | (a) | | 2,509,875 |
| 250,000 | | Credit Suisse Group AG (b) (d) (e)
| | 7.50% | | (a) | | 273,125 |
| 4,100,000 | | Credit Suisse Group AG (b) (d) (e)
| | 7.50% | | (a) | | 4,368,550 |
| 1,028,000 | | EFG International AG (b) (e) (f)
| | 5.50% | | (a) | | 1,082,433 |
| 3,000,000 | | Goldman Sachs Group (The), Inc., Series Q (b)
| | 5.50% | | (a) | | 3,225,900 |
| 200,000 | | Goldman Sachs Group (The), Inc., Series R (b)
| | 4.95% | | (a) | | 211,000 |
| 685,000 | | Goldman Sachs Group (The), Inc., Series T (b)
| | 3.80% | | (a) | | 686,712 |
| 800,000 | | Goldman Sachs Group (The), Inc., Series U (b)
| | 3.65% | | (a) | | 796,000 |
| 1,064,000 | | Goldman Sachs Group (The), Inc., Series V (b)
| | 4.13% | | (a) | | 1,068,203 |
| 500,000 | | Morgan Stanley, Series H, 3 Mo. LIBOR + 3.61% (c)
| | 3.73% | | (a) | | 502,581 |
| 700,000 | | Morgan Stanley, Series M (b)
| | 5.88% | | (a) | | 800,739 |
| 2,400,000 | | UBS Group AG (b) (e) (f)
| | 6.88% | | (a) | | 2,713,500 |
| 960,000 | | UBS Group AG (b) (d) (e)
| | 7.00% | | (a) | | 1,038,667 |
| | | | | 31,123,449 |
| | | Consumer Finance – 1.1% | | | | | | |
| 1,963,000 | | American Express Co. (b)
| | 3.55% | | (a) | | 1,976,005 |
| 1,652,000 | | Capital One Financial Corp., Series M (b)
| | 3.95% | | (a) | | 1,682,975 |
| | | | | 3,658,980 |
| | | Diversified Financial Services – 3.1% | | | | | | |
| 2,500,000 | | American AgCredit Corp. (b) (d)
| | 5.25% | | (a) | | 2,556,250 |
| 1,500,000 | | Ares Finance Co., III LLC (b) (d)
| | 4.13% | | 06/30/51 | | 1,542,288 |
| 1,500,000 | | Capital Farm Credit ACA, Series 1 (b) (d)
| | 5.00% | | (a) | | 1,556,250 |
| 600,000 | | Compeer Financial ACA (b) (d)
| | 4.88% | | (a) | | 609,000 |
| 450,000 | | Depository Trust & Clearing (The) Corp., Series D (b) (d)
| | 3.38% | | (a) | | 455,344 |
| 2,265,000 | | Voya Financial, Inc. (b)
| | 5.65% | | 05/15/53 | | 2,375,215 |
| 843,000 | | Voya Financial, Inc., Series A (b)
| | 6.13% | | (a) | | 897,795 |
| | | | | 9,992,142 |
| | | Electric Utilities – 3.0% | | | | | | |
| 840,000 | | Duke Energy Corp. (b)
| | 4.88% | | (a) | | 893,760 |
| 4,756,000 | | Emera, Inc., Series 16-A (b)
| | 6.75% | | 06/15/76 | | 5,600,808 |
| 600,000 | | Enel S.p.A. (b) (d)
| | 8.75% | | 09/24/73 | | 678,870 |
| 1,260,000 | | Southern (The) Co., Series 21-A (b)
| | 3.75% | | 09/15/51 | | 1,283,260 |
| 1,302,000 | | Southern California Edison Co., Series E (b)
| | 6.25% | | (a) | | 1,310,421 |
| | | | | 9,767,119 |
| | | Energy Equipment & Services – 0.6% | | | | | | |
| 1,600,000 | | Transcanada Trust (b)
| | 5.50% | | 09/15/79 | | 1,750,000 |
| | | Food Products – 3.0% | | | | | | |
| 300,000 | | Dairy Farmers of America, Inc. (g)
| | 7.13% | | (a) | | 304,500 |
| 3,000,000 | | Land O’Lakes Capital Trust I (g)
| | 7.45% | | 03/15/28 | | 3,468,450 |
| 1,400,000 | | Land O’Lakes, Inc. (d)
| | 7.00% | | (a) | | 1,477,560 |
| 1,200,000 | | Land O’Lakes, Inc. (d)
| | 7.25% | | (a) | | 1,302,414 |
| 3,000,000 | | Land O’Lakes, Inc. (d)
| | 8.00% | | (a) | | 3,255,360 |
| | | | | 9,808,284 |
| | | Independent Power & Renewable Electricity Producers – 0.2% | | | | | | |
| 700,000 | | AES Andes S.A. (b) (d)
| | 6.35% | | 10/07/79 | | 726,404 |
Page 12
See Notes to Financial Statements
First Trust Preferred Securities and Income Fund
Portfolio of Investments (Continued)
October 31, 2021
Par
Amount | | Description | | Stated
Rate | | Stated
Maturity | | Value |
| CAPITAL PREFERRED SECURITIES (Continued) |
| | | Insurance – 9.5% | | | | | | |
| $700,000 | | Allianz SE (b) (d)
| | 3.50% | | (a) | | $707,000 |
| 1,900,000 | | Asahi Mutual Life Insurance Co. (b) (f)
| | 6.50% | | (a) | | 2,036,819 |
| 600,000 | | Asahi Mutual Life Insurance Co. (b) (f)
| | 7.25% | | (a) | | 607,678 |
| 1,822,000 | | Assurant, Inc. (b)
| | 7.00% | | 03/27/48 | | 2,126,948 |
| 850,000 | | Assured Guaranty Municipal Holdings, Inc. (b) (d)
| | 6.40% | | 12/15/66 | | 944,323 |
| 2,900,000 | | AXIS Specialty Finance LLC (b)
| | 4.90% | | 01/15/40 | | 3,067,141 |
| 1,276,000 | | Enstar Finance LLC (b)
| | 5.75% | | 09/01/40 | | 1,347,775 |
| 1,000,000 | | Fortegra Financial Corp. (b) (g)
| | 8.50% | | 10/15/57 | | 1,262,962 |
| 3,200,000 | | Global Atlantic Fin Co. (b) (d)
| | 4.70% | | 10/15/51 | | 3,299,016 |
| 820,000 | | Hartford Financial Services Group (The), Inc., 3 Mo. LIBOR + 2.13% (c) (d)
| | 2.25% | | 02/12/47 | | 797,450 |
| 1,174,000 | | Kuvare US Holdings, Inc. (b) (d)
| | 7.00% | | 02/17/51 | | 1,255,986 |
| 300,000 | | La Mondiale SAM (b) (f)
| | 5.88% | | 01/26/47 | | 340,906 |
| 1,120,000 | | Lancashire Holdings Ltd. (b) (f)
| | 5.63% | | 09/18/41 | | 1,217,322 |
| 900,000 | | Liberty Mutual Group, Inc. (b) (d)
| | 4.13% | | 12/15/51 | | 923,661 |
| 2,700,000 | | Markel Corp. (b)
| | 6.00% | | (a) | | 2,973,375 |
| 1,400,000 | | Principal Financial Group, Inc., 3 Mo. LIBOR + 3.04% (c)
| | 3.17% | | 05/15/55 | | 1,393,725 |
| 2,000,000 | | QBE Insurance Group Ltd. (b) (d)
| | 5.88% | | (a) | | 2,190,000 |
| 1,100,000 | | QBE Insurance Group Ltd. (b) (d)
| | 7.50% | | 11/24/43 | | 1,218,250 |
| 2,100,000 | | QBE Insurance Group Ltd. (b) (f)
| | 6.75% | | 12/02/44 | | 2,350,583 |
| 301,000 | | QBE Insurance Group Ltd. (b) (f)
| | 5.88% | | 06/17/46 | | 337,403 |
| 646,000 | | Reinsurance Group of America, Inc., 3 Mo. LIBOR + 2.67% (c)
| | 2.78% | | 12/15/65 | | 628,430 |
| | | | | 31,026,753 |
| | | Multi-Utilities – 1.2% | | | | | | |
| 2,043,000 | | CenterPoint Energy, Inc., Series A (b)
| | 6.13% | | (a) | | 2,159,809 |
| 735,000 | | NiSource, Inc. (b)
| | 5.65% | | (a) | | 779,100 |
| 1,000,000 | | Sempra Energy (b)
| | 4.88% | | (a) | | 1,081,410 |
| | | | | 4,020,319 |
| | | Oil, Gas & Consumable Fuels – 6.3% | | | | | | |
| 300,000 | | Buckeye Partners L.P. (b)
| | 6.38% | | 01/22/78 | | 274,769 |
| 2,850,000 | | DCP Midstream L.P., Series A (b)
| | 7.38% | | (a) | | 2,864,250 |
| 1,552,000 | | DCP Midstream Operating L.P. (b) (d)
| | 5.85% | | 05/21/43 | | 1,450,173 |
| 2,132,000 | | Enbridge, Inc. (b)
| | 6.25% | | 03/01/78 | | 2,355,071 |
| 4,638,000 | | Enbridge, Inc., Series 16-A (b)
| | 6.00% | | 01/15/77 | | 5,130,463 |
| 2,276,000 | | Enbridge, Inc., Series 20-A (b)
| | 5.75% | | 07/15/80 | | 2,563,914 |
| 1,786,000 | | Energy Transfer L.P., 3 Mo. LIBOR + 3.02% (c)
| | 3.14% | | 11/01/66 | | 1,477,736 |
| 916,000 | | Energy Transfer L.P., Series F (b)
| | 6.75% | | (a) | | 942,335 |
| 271,000 | | Energy Transfer L.P., Series H (b)
| | 6.50% | | (a) | | 281,162 |
| 2,204,000 | | Enterprise Products Operating LLC, 3 Mo. LIBOR + 2.78% (c)
| | 2.90% | | 06/01/67 | | 2,052,839 |
| 1,196,000 | | Enterprise Products Operating LLC, Series D (b)
| | 4.88% | | 08/16/77 | | 1,181,566 |
| | | | | 20,574,278 |
| | | Trading Companies & Distributors – 2.7% | | | | | | |
| 6,410,000 | | AerCap Holdings N.V. (b)
| | 5.88% | | 10/10/79 | | 6,696,783 |
| 700,000 | | Air Lease Corp., Series B (b)
| | 4.65% | | (a) | | 725,375 |
| 1,330,000 | | Aircastle Ltd. (b) (d)
| | 5.25% | | (a) | | 1,369,900 |
| | | | | 8,792,058 |
| | | Transportation Infrastructure – 0.8% | | | | | | |
| 1,860,000 | | AerCap Global Aviation Trust (b) (d)
| | 6.50% | | 06/15/45 | | 1,997,649 |
See Notes to Financial Statements
Page 13
First Trust Preferred Securities and Income Fund
Portfolio of Investments (Continued)
October 31, 2021
Par
Amount | | Description | | Stated
Rate | | Stated
Maturity | | Value |
| CAPITAL PREFERRED SECURITIES (Continued) |
| | | Transportation Infrastructure (Continued) | | | | | | |
| $500,000 | | BNSF Funding Trust I (b)
| | 6.61% | | 12/15/55 | | $572,025 |
| | | | | 2,569,674 |
| | | Total Capital Preferred Securities
| | 247,601,155 |
| | | (Cost $234,815,297) | | | | | | |
Principal
Value | | Description | | Stated
Coupon | | Stated
Maturity | | Value |
| FOREIGN CORPORATE BONDS AND NOTES – 1.2% |
| | | Insurance – 1.2% | | | | | | |
| 3,597,666 | | Highlands Holdings Bond Issuer Ltd./Highlands Holdings Bond Co-Issuer, Inc. (d) (h)
| | 7.63% | | 10/15/25 | | 3,815,577 |
| | | (Cost $3,806,455) | | | | | | |
| CORPORATE BONDS AND NOTES – 0.3% |
| | | Insurance – 0.3% | | | | | | |
| 900,000 | | AmTrust Financial Services, Inc.
| | 6.13% | | 08/15/23 | | 909,487 |
| | | (Cost $908,810) | | | | | | |
| Total Investments – 98.2%
| | 320,133,834 |
| | (Cost $303,172,224) (i) | | |
| | Net Other Assets and Liabilities – 1.8%
| | 5,715,611 |
| | Net Assets – 100.0%
| | $325,849,445 |
|
| (a) | Perpetual maturity. |
| (b) | Fixed-to-floating or fixed-to-variable rate security. The interest rate shown reflects the fixed rate in effect at October 31, 2021. At a predetermined date, the fixed rate will change to a floating rate or a variable rate. |
| (c) | Floating or variable rate security. |
| (d) | This security, sold within the terms of a private placement memorandum, is exempt from registration upon resale under Rule 144A under the Securities Act of 1933, as amended (the “1933 Act”), and may be resold in transactions exempt from registration, normally to qualified institutional buyers. Pursuant to procedures adopted by the First Trust Series Fund’s (the “Trust”) Board of Trustees, this security has been determined to be liquid by First Trust Advisors L.P., (the “Advisor”). Although market instability can result in periods of increased overall market illiquidity, liquidity for each security is determined based on security specific factors and assumptions, which require subjective judgment. At October 31, 2021, securities noted as such amounted to $87,748,907 or 26.9% of net assets. |
| (e) | This security is a contingent convertible capital security which may be subject to conversion into common stock of the issuer under certain circumstances. At October 31, 2021, securities noted as such amounted to $96,041,318 or 29.5% of net assets. Of these securities, 3.9% originated in emerging markets, and 96.1% originated in foreign markets. |
| (f) | This security may be resold to qualified foreign investors and foreign institutional buyers under Regulation S of the 1933 Act. |
| (g) | This security, sold within the terms of a private placement memorandum, is exempt from registration upon resale under Rule 144A under the 1933 Act, and may be resold in transactions exempt from registration, normally to qualified institutional buyers (see Note 2C - Restricted Securities in the Notes to Financial Statements). |
| (h) | These notes are Senior Payment-in-kind (“PIK”) Toggle Notes whereby the issuer may, at its option, elect to pay interest on the notes (1) entirely in cash or (2) entirely in PIK interest. Interest paid in cash will accrue on the notes at a rate of 7.63% per annum (“Cash Interest Rate”) and PIK interest will accrue on the notes at a rate per annum equal to the Cash Interest Rate plus 75 basis points. For the fiscal year ended October 31, 2021, the Fund received $125,666 PIK interest distributions from Highlands Holdings Bond Issuer Ltd. |
| (i) | Aggregate cost for federal income tax purposes was $301,929,745. As of October 31, 2021, the aggregate gross unrealized appreciation for all investments in which there was an excess of value over tax cost was $18,782,419 and the aggregate gross unrealized depreciation for all investments in which there was an excess of tax cost over value was $578,330. The net unrealized appreciation was $18,204,089. |
Page 14
See Notes to Financial Statements
First Trust Preferred Securities and Income Fund
Portfolio of Investments (Continued)
October 31, 2021
Valuation Inputs
A summary of the inputs used to value the Fund’s investments as of October 31, 2021 is as follows (see Note 2A - Portfolio Valuation in the Notes to Financial Statements):
| | Total
Value at
10/31/2021 | Level 1
Quoted
Prices | Level 2
Significant
Observable
Inputs | Level 3
Significant
Unobservable
Inputs |
| $25 Par Preferred Securities: | | | | |
Insurance
| $ 13,191,714 | $ 11,013,938 | $ 2,177,776 | $ — |
Multi-Utilities
| 2,566,410 | 1,595,244 | 971,166 | — |
Other industry categories*
| 36,483,255 | 36,483,255 | — | — |
$100 Par Preferred Securities*
| 8,324,415 | — | 8,324,415 | — |
| $1,000 Par Preferred Securities: | | | | |
Banks
| 6,710,571 | 6,710,571 | — | — |
Diversified Financial Services
| 531,250 | — | 531,250 | — |
Capital Preferred Securities*
| 247,601,155 | — | 247,601,155 | — |
Foreign Corporate Bonds and Notes*
| 3,815,577 | — | 3,815,577 | — |
Corporate Bonds and Notes*
| 909,487 | — | 909,487 | — |
Total Investments
| $ 320,133,834 | $ 55,803,008 | $ 264,330,826 | $— |
| * | See Portfolio of Investments for industry breakout. |
See Notes to Financial Statements
Page 15
First Trust Preferred Securities and Income Fund
Statement of Assets and Liabilities
October 31, 2021
| ASSETS: | |
Investments, at value
(Cost $303,172,224)
| $ 320,133,834 |
Cash
| 1,919,728 |
| Receivables: | |
Interest
| 2,978,100 |
Fund shares sold
| 1,516,567 |
Investment securities sold
| 1,114,136 |
Dividends
| 144,571 |
Dividend reclaims
| 1,037 |
Total Assets
| 327,807,973 |
| LIABILITIES: | |
| Payables: | |
Fund shares redeemed
| 728,493 |
Investment securities purchased
| 604,846 |
Investment advisory fees
| 219,233 |
Distributions
| 116,004 |
Transfer agent fees
| 63,513 |
Administrative fees
| 62,507 |
12b-1 distribution and service fees
| 56,248 |
Audit and tax fees
| 42,181 |
Legal fees
| 24,933 |
Shareholder reporting fees
| 15,851 |
Registration fees
| 10,355 |
Custodian fees
| 7,525 |
Commitment and administrative agency fees
| 3,025 |
Financial reporting fees
| 771 |
Other liabilities
| 3,043 |
Total Liabilities
| 1,958,528 |
NET ASSETS
| $325,849,445 |
| NET ASSETS consist of: | |
Paid-in capital
| $ 318,967,628 |
Par value
| 143,562 |
Accumulated distributable earnings (loss)
| 6,738,255 |
NET ASSETS
| $325,849,445 |
| Maximum Offering Price Per Share: | |
| Class A Shares: | |
Net asset value and redemption price per share (Based on net assets of $56,364,533 and 2,496,442 shares of beneficial interest issued and outstanding)
| $22.58 |
Maximum sales charge (4.50% of offering price)
| 1.06 |
Maximum offering price to public
| $23.64 |
| Class C Shares: | |
Net asset value and redemption price per share (Based on net assets of $51,755,831 and 2,277,980 shares of beneficial interest issued and outstanding)
| $22.72 |
| Class F Shares: | |
Net asset value and redemption price per share (Based on net assets of $968,758 and 42,352 shares of beneficial interest issued and outstanding)
| $22.87 |
| Class I Shares: | |
Net asset value and redemption price per share (Based on net assets of $216,022,309 and 9,506,668 shares of beneficial interest issued and outstanding)
| $22.72 |
| Class R3 Shares: | |
Net asset value and redemption price per share (Based on net assets of $738,014 and 32,786 shares of beneficial interest issued and outstanding)
| $22.51 |
Page 16
See Notes to Financial Statements
First Trust Preferred Securities and Income Fund
Statement of Operations
For the Year Ended October 31, 2021
| INVESTMENT INCOME: | |
Interest
| $ 13,525,917 |
Dividends
| 3,904,703 |
Total investment income
| 17,430,620 |
| EXPENSES: | |
Investment advisory fees
| 2,513,218 |
| 12b-1 distribution and/or service fees: | |
Class A
| 123,368 |
Class C
| 555,371 |
Class F
| 1,492 |
Class R3
| 3,576 |
Transfer agent fees
| 261,465 |
Registration fees
| 137,754 |
Administrative fees
| 133,515 |
Shareholder reporting fees
| 63,875 |
Audit and tax fees
| 63,105 |
Custodian fees
| 46,936 |
Commitment and administrative agency fees
| 45,106 |
Legal fees
| 16,911 |
Trustees’ fees and expenses
| 15,208 |
Financial reporting fees
| 9,250 |
Expenses previously waived or reimbursed
| 4,014 |
Listing expense
| 3,508 |
Other
| 4,175 |
Total expenses
| 4,001,847 |
Fees waived and expenses reimbursed by the investment advisor
| (38,675) |
Net expenses
| 3,963,172 |
NET INVESTMENT INCOME (LOSS)
| 13,467,448 |
| NET REALIZED AND UNREALIZED GAIN (LOSS): | |
Net realized gain (loss) on investments
| 5,098,120 |
Net change in unrealized appreciation (depreciation) on investments
| 13,312,730 |
NET REALIZED AND UNREALIZED GAIN (LOSS)
| 18,410,850 |
NET INCREASE (DECREASE) IN NET ASSETS RESULTING FROM OPERATIONS
| $ 31,878,298 |
See Notes to Financial Statements
Page 17
First Trust Preferred Securities and Income Fund
Statements of Changes in Net Assets
| | Year
Ended
10/31/2021 | | Year
Ended
10/31/2020 |
| OPERATIONS: | | | |
Net investment income (loss)
| $ 13,467,448 | | $ 13,480,783 |
Net realized gain (loss)
| 5,098,120 | | (6,794,753) |
Net change in unrealized appreciation (depreciation)
| 13,312,730 | | (4,571,180) |
Net increase (decrease) in net assets resulting from operations
| 31,878,298 | | 2,114,850 |
| DISTRIBUTIONS TO SHAREHOLDERS FROM INVESTMENT OPERATIONS: | | | |
Class A Shares
| (2,027,973) | | (1,900,896) |
Class C Shares
| (1,899,342) | | (2,196,229) |
Class F Shares
| (41,330) | | (93,664) |
Class I Shares
| (8,947,567) | | (8,585,113) |
Class R3 Shares
| (27,927) | | (33,529) |
Total distributions to shareholders from investment operations
| (12,944,139) | | (12,809,431) |
| DISTRIBUTIONS TO SHAREHOLDERS FROM RETURN OF CAPITAL: | | | |
Class A shares
| (221,139) | | (183,435) |
Class C shares
| (202,730) | | (209,421) |
Class F shares
| (4,407) | | (6,702) |
Class I shares
| (970,230) | | (827,127) |
Class R3 shares
| (2,998) | | (3,200) |
Total distributions to shareholders from return of capital
| (1,401,504) | | (1,229,885) |
| CAPITAL TRANSACTIONS: | | | |
Proceeds from shares sold
| 71,079,673 | | 110,162,679 |
Proceeds from shares reinvested
| 12,962,840 | | 12,278,896 |
Cost of shares redeemed
| (65,560,931) | | (99,832,324) |
Net increase (decrease) in net assets resulting from capital transactions
| 18,481,582 | | 22,609,251 |
Total increase (decrease) in net assets
| 36,014,237 | | 10,684,785 |
| NET ASSETS: | | | |
Beginning of period
| 289,835,208 | | 279,150,423 |
End of period
| $325,849,445 | | $289,835,208 |
Page 18
See Notes to Financial Statements
First Trust Preferred Securities and Income Fund
Financial Highlights
For a Share outstanding throughout each period
| Class A Shares | Year Ended October 31, |
| 2021 | | 2020 | | 2019 | | 2018 | | 2017 |
Net asset value, beginning of period
| $ 21.31 | | $ 22.07 | | $ 20.85 | | $ 22.39 | | $ 21.63 |
| Income from investment operations: | | | | | | | | | |
Net investment income (loss)
| 0.95 (a) | | 1.01 (a) | | 1.12 (a) | | 1.11 (a) | | 1.11 (a) |
Net realized and unrealized gain (loss)
| 1.34 | | (0.70) | | 1.25 | | (1.50) | | 0.80 |
Total from investment operations
| 2.29 | | 0.31 | | 2.37 | | (0.39) | | 1.91 |
| Distributions paid to shareholders from: | | | | | | | | | |
Net investment income
| (0.92) | | (0.98) | | (1.12) | | (1.13) | | (1.15) |
Return of capital
| (0.10) | | (0.09) | | (0.03) | | (0.02) | | — |
Total distributions
| (1.02) | | (1.07) | | (1.15) | | (1.15) | | (1.15) |
Net asset value, end of period
| $22.58 | | $21.31 | | $22.07 | | $20.85 | | $22.39 |
Total return (b)
| 10.89% | | 1.53% | | 11.75% | | (1.77)% | | 9.05% |
| Ratios to average net assets/supplemental data: | | | | | | | | | |
Net assets, end of period (in 000’s)
| $ 56,365 | | $ 43,802 | | $ 39,719 | | $ 36,262 | | $ 39,063 |
Ratio of total expenses to average net assets
| 1.33% | | 1.36% | | 1.41% | | 1.37% | | 1.36% |
Ratio of net expenses to average net assets
| 1.33% | | 1.36% | | 1.40% | | 1.37% | | 1.36% |
Ratio of net investment income (loss) to average net assets
| 4.22% | | 4.78% | | 5.27% | | 5.15% | | 5.11% |
Portfolio turnover rate
| 38% | | 46% | | 41% | | 33% | | 44% |
| (a) | Based on average shares outstanding. |
| (b) | Assumes reinvestment of all distributions for the period and does not include payment of the maximum sales charge of 4.50% or contingent deferred sales charge (CDSC). On purchases of $1 million or more, a CDSC of 1% may be imposed on certain redemptions made within twelve months of purchase. If the sales charges were included, total returns would be lower. These returns include Rule 12b-1 service fees of 0.25% and do not reflect the deduction of taxes that a shareholder would pay on Fund distributions or the redemption of Fund shares. The total returns would have been lower if certain fees had not been waived and expenses reimbursed by the investment advisor. Total return is calculated for the time period presented and is not annualized for periods of less than one year. |
See Notes to Financial Statements
Page 19
First Trust Preferred Securities and Income Fund
Financial Highlights (Continued)
For a Share outstanding throughout each period
| Class C Shares | Year Ended October 31, |
| 2021 | | 2020 | | 2019 | | 2018 | | 2017 |
Net asset value, beginning of period
| $ 21.43 | | $ 22.18 | | $ 20.93 | | $ 22.44 | | $ 21.67 |
| Income from investment operations: | | | | | | | | | |
Net investment income (loss)
| 0.79 (a) | | 0.87 (a) | | 0.98 (a) | | 0.97 (a) | | 0.96 (a) |
Net realized and unrealized gain (loss)
| 1.35 | | (0.71) | | 1.26 | | (1.50) | | 0.79 |
Total from investment operations
| 2.14 | | 0.16 | | 2.24 | | (0.53) | | 1.75 |
| Distributions paid to shareholders from: | | | | | | | | | |
Net investment income
| (0.77) | | (0.83) | | (0.96) | | (0.96) | | (0.98) |
Return of capital
| (0.08) | | (0.08) | | (0.03) | | (0.02) | | — |
Total distributions
| (0.85) | | (0.91) | | (0.99) | | (0.98) | | (0.98) |
Net asset value, end of period
| $22.72 | | $21.43 | | $22.18 | | $20.93 | | $22.44 |
Total return (b)
| 10.11% | | 0.84% | | 11.01% | | (2.37)% | | 8.27% |
| Ratios to average net assets/supplemental data: | | | | | | | | | |
Net assets, end of period (in 000’s)
| $ 51,756 | | $ 54,264 | | $ 57,898 | | $ 59,610 | | $ 64,462 |
Ratio of total expenses to average net assets
| 2.04% | | 2.07% | | 2.06% | | 2.02% | | 2.06% |
Ratio of net expenses to average net assets
| 2.04% | | 2.07% | | 2.06% | | 2.02% | | 2.06% |
Ratio of net investment income (loss) to average net assets
| 3.51% | | 4.09% | | 4.61% | | 4.50% | | 4.41% |
Portfolio turnover rate
| 38% | | 46% | | 41% | | 33% | | 44% |
| (a) | Based on average shares outstanding. |
| (b) | Assumes reinvestment of all distributions for the period and does not include payment of the maximum CDSC of 1%, charged on certain redemptions made within one year of purchase. If the sales charge was included, total returns would be lower. These returns include combined Rule 12b-1 distribution and service fees of 1% and do not reflect the deduction of taxes that a shareholder would pay on Fund distributions or the redemption of Fund shares. Total return is calculated for the time period presented and is not annualized for periods of less than one year. |
Page 20
See Notes to Financial Statements
First Trust Preferred Securities and Income Fund
Financial Highlights (Continued)
For a Share outstanding throughout each period
| Class F Shares | Year Ended October 31, |
| 2021 | | 2020 | | 2019 | | 2018 | | 2017 |
Net asset value, beginning of period
| $ 21.59 | | $ 22.32 | | $ 21.07 | | $ 22.62 | | $ 21.82 |
| Income from investment operations: | | | | | | | | | |
Net investment income (loss)
| 0.97 (a) | | 1.06 (a) | | 1.16 (a) | | 1.14 (a) | | 1.13 (a) |
Net realized and unrealized gain (loss)
| 1.36 | | (0.70) | | 1.26 | | (1.52) | | 0.84 |
Total from investment operations:
| 2.33 | | 0.36 | | 2.42 | | (0.38) | | 1.97 |
| Distributions paid to shareholders from: | | | | | | | | | |
Net investment income
| (0.95) | | (1.02) | | (1.14) | | (1.15) | | (1.17) |
Return of capital
| (0.10) | | (0.07) | | (0.03) | | (0.02) | | — |
Total distributions
| (1.05) | | (1.09) | | (1.17) | | (1.17) | | (1.17) |
Net asset value, end of period
| $22.87 | | $21.59 | | $22.32 | | $21.07 | | $22.62 |
Total return (b)
| 10.91% | | 1.79% | | 11.87% | | (1.70)% | | 9.27% |
| Ratios to average net assets/supplemental data: | | | | | | | | | |
Net assets, end of period (in 000’s)
| $ 969 | | $ 993 | | $ 4,238 | | $ 7,431 | | $ 7,339 |
Ratio of total expenses to average net assets
| 3.17% | | 2.36% | | 1.65% | | 1.42% | | 1.39% |
Ratio of net expenses to average net assets
| 1.30% | | 1.30% | | 1.30% | | 1.30% | | 1.30% |
Ratio of net investment income (loss) to average net assets
| 4.25% | | 4.83% | | 5.43% | | 5.21% | | 5.11% |
Portfolio turnover rate
| 38% | | 46% | | 41% | | 33% | | 44% |
| (a) | Based on average shares outstanding. |
| (b) | Assumes reinvestment of all distributions for the period. These returns include Rule 12b-1 service fees of 0.15% and do not reflect the deduction of taxes that a shareholder would pay on Fund distributions or the redemption of Fund shares. The total returns would have been lower if certain fees had not been waived and expenses reimbursed by the investment advisor. Total return is calculated for the time period presented and is not annualized for periods of less than one year. |
See Notes to Financial Statements
Page 21
First Trust Preferred Securities and Income Fund
Financial Highlights (Continued)
For a Share outstanding throughout each period
| Class I Shares | Year Ended October 31, |
| 2021 | | 2020 | | 2019 | | 2018 | | 2017 |
Net asset value, beginning of period
| $ 21.43 | | $ 22.23 | | $ 20.98 | | $ 22.49 | | $ 21.71 |
| Income from investment operations: | | | | | | | | | |
Net investment income (loss)
| 1.02 (a) | | 1.08 (a) | | 1.19 (a) | | 1.20 (a) | | 1.20 (a) |
Net realized and unrealized gain (loss)
| 1.35 | | (0.76) | | 1.26 | | (1.51) | | 0.78 |
Total from investment operations
| 2.37 | | 0.32 | | 2.45 | | (0.31) | | 1.98 |
| Distributions paid to shareholders from: | | | | | | | | | |
Net investment income
| (0.97) | | (1.02) | | (1.17) | | (1.17) | | (1.20) |
Return of capital
| (0.11) | | (0.10) | | (0.03) | | (0.03) | | — |
Total distributions
| (1.08) | | (1.12) | | (1.20) | | (1.20) | | (1.20) |
Net asset value, end of period
| $22.72 | | $21.43 | | $22.23 | | $20.98 | | $22.49 |
Total return (b)
| 11.21% | | 1.63% | | 12.09% | | (1.38)% | | 9.39% |
| Ratios to average net assets/supplemental data: | | | | | | | | | |
Net assets, end of period (in 000’s)
| $ 216,022 | | $ 190,093 | | $ 176,503 | | $ 142,161 | | $ 141,661 |
Ratio of total expenses to average net assets
| 1.03% | | 1.05% | | 1.04% | | 1.02% | | 0.99% |
Ratio of net expenses to average net assets
| 1.03% | | 1.05% | | 1.04% | | 1.02% | | 0.99% |
Ratio of net investment income (loss) to average net assets
| 4.51% | | 5.09% | | 5.60% | | 5.51% | | 5.49% |
Portfolio turnover rate
| 38% | | 46% | | 41% | | 33% | | 44% |
| (a) | Based on average shares outstanding. |
| (b) | Assumes reinvestment of all distributions for the period. These returns do not reflect the deduction of taxes that a shareholder would pay on Fund distributions or the redemption of Fund shares. Total return is calculated for the time period presented and is not annualized for periods of less than one year. |
Page 22
See Notes to Financial Statements
First Trust Preferred Securities and Income Fund
Financial Highlights (Continued)
For a Share outstanding throughout each period
| Class R3 Shares | Year Ended October 31, |
| 2021 | | 2020 | | 2019 | | 2018 | | 2017 |
Net asset value, beginning of period
| $ 21.26 | | $ 22.02 | | $ 20.81 | | $ 22.35 | | $ 21.61 |
| Income from investment operations: | | | | | | | | | |
Net investment income (loss)
| 0.87 (a) | | 0.95 (a) | | 1.06 (a) | | 1.05 (a) | | 1.05 (a) |
Net realized and unrealized gain (loss)
| 1.35 | | (0.70) | | 1.24 | | (1.50) | | 0.78 |
Total from investment operations:
| 2.22 | | 0.25 | | 2.30 | | (0.45) | | 1.83 |
| Distributions paid to shareholders from: | | | | | | | | | |
Net investment income
| (0.88) | | (0.92) | | (1.06) | | (1.07) | | (1.09) |
Return of capital
| (0.09) | | (0.09) | | (0.03) | | (0.02) | | — |
Total distributions
| (0.97) | | (1.01) | | (1.09) | | (1.09) | | (1.09) |
Net asset value, end of period
| $22.51 | | $21.26 | | $22.02 | | $20.81 | | $22.35 |
Total return (b)
| 10.56% | | 1.32% | | 11.44% | | (2.02)% | | 8.70% |
| Ratios to average net assets/supplemental data: | | | | | | | | | |
Net assets, end of period (in 000’s)
| $ 738 | | $ 683 | | $ 792 | | $ 724 | | $ 756 |
Ratio of total expenses to average net assets
| 4.45% | | 4.20% | | 4.46% | | 4.01% | | 4.29% |
Ratio of net expenses to average net assets
| 1.65% | | 1.65% | | 1.65% | | 1.65% | | 1.65% |
Ratio of net investment income (loss) to average net assets
| 3.90% | | 4.51% | | 5.02% | | 4.87% | | 4.83% |
Portfolio turnover rate
| 38% | | 46% | | 41% | | 33% | | 44% |
| (a) | Based on average shares outstanding. |
| (b) | Assumes reinvestment of all distributions for the period. These returns include combined Rule 12b-1 distribution and service fees of 0.50%, and do not reflect the deduction of taxes that a shareholder would pay on Fund distributions or the redemption of Fund shares. The total returns would have been lower if certain fees had not been waived and expenses reimbursed by the investment advisor. Total return is calculated for the time period presented and is not annualized for periods of less than one year. |
See Notes to Financial Statements
Page 23
Notes to Financial Statements
First Trust Preferred Securities and Income Fund
October 31, 2021
1. Organization
First Trust Preferred Securities and Income Fund (the “Fund”) is a series of the First Trust Series Fund (the “Trust”), a Massachusetts business trust organized on July 9, 2010, and is registered as a diversified open-end management investment company with the Securities and Exchange Commission under the Investment Company Act of 1940, as amended (the “1940 Act”). The Fund offers five classes of shares: Class A, Class C, Class F, Class I and Class R3. Each class represents an interest in the same portfolio of investments but with a different combination of sales charges, distribution and service (12b-1) fees, eligibility requirements and other features.
The Fund’s investment objective seeks to provide current income and total return. The Fund seeks to achieve its objective by investing, under normal market conditions, at least 80% of its net assets (including investment borrowings, if any) in preferred securities and other securities with similar economic characteristics. There can be no assurance that the Fund will achieve its investment objective. The Fund may not be appropriate for all investors.
2. Significant Accounting Policies
The Fund is considered an investment company and follows accounting and reporting guidance under Financial Accounting Standards Board Accounting Standards Codification Topic 946, “Financial Services-Investment Companies.” The following is a summary of significant accounting policies consistently followed by the Fund in the preparation of the financial statements. The preparation of the financial statements in accordance with accounting principles generally accepted in the United States of America (“U.S. GAAP”) requires management to make estimates and assumptions that affect the reported amounts and disclosures in the financial statements. Actual results could differ from those estimates.
A. Portfolio Valuation
The net asset value (“NAV”) of each class of shares of the Fund is determined daily as of the close of regular trading on the New York Stock Exchange (“NYSE”), normally 4:00 p.m. Eastern time, on each day the NYSE is open for trading. If the NYSE closes early on a valuation day, the NAV is determined as of that time. Domestic debt securities and foreign securities are priced using data reflecting the earlier closing at the principal markets for those securities. The NAV for each class is calculated by dividing the value of the Fund’s total assets attributable to such class (including accrued interest and dividends), less all liabilities attributable to such class (including accrued expenses, dividends declared but unpaid and any borrowings of the Fund), by the total number of shares of the class outstanding. Differences in NAV of each class of the Fund’s shares are generally expected to be due to the daily expense accruals of the specified distribution and service (12b-1) fees and transfer agency costs applicable to such class of shares and the resulting differential in the dividends that may be paid on each class of shares.
The Fund’s investments are valued daily at market value or, in the absence of market value with respect to any portfolio securities, at fair value. Market value prices represent last sale or official closing prices from a national or foreign exchange (i.e., a regulated market) and are primarily obtained from third-party pricing services. Fair value prices represent any prices not considered market value prices and are either obtained from a third-party pricing service or are determined by the Pricing Committee of the Trust’s investment advisor, First Trust Advisors L.P. (“First Trust” or the “Advisor”), in accordance with valuation procedures adopted by the Trust’s Board of Trustees, and in accordance with provisions of the 1940 Act. Investments valued by the Advisor’s Pricing Committee, if any, are footnoted as such in the footnotes to the Portfolio of Investments. The Fund’s investments are valued as follows:
Preferred stocks and other equity securities listed on any national or foreign exchange (excluding The Nasdaq Stock Market LLC (“Nasdaq”) and the London Stock Exchange Alternative Investment Market (“AIM”)) are valued at the last sale price on the exchange on which they are principally traded or, for Nasdaq and AIM securities, the official closing price. Securities traded on more than one securities exchange are valued at the last sale price or official closing price, as applicable, at the close of the securities exchange representing the principal market for such securities.
Bonds, notes, capital preferred securities, and other debt securities are fair valued on the basis of valuations provided by dealers who make markets in such securities or by a third-party pricing service approved by the Trust’s Board of Trustees, which may use the following valuation inputs when available:
| 1) | benchmark yields; |
| 2) | reported trades; |
| 3) | broker/dealer quotes; |
| 4) | issuer spreads; |
| 5) | benchmark securities; |
| 6) | bids and offers; and |
| 7) | reference data including market research publications. |
Notes to Financial Statements (Continued)
First Trust Preferred Securities and Income Fund
October 31, 2021
Securities traded in an over-the-counter market are fair valued at the mean of their most recent bid and asked price, if available, and otherwise at their closing bid price.
Fixed income and other debt securities having a remaining maturity of sixty days or less when purchased are fair valued at cost adjusted for amortization of premiums and accretion of discounts (amortized cost), provided the Advisor’s Pricing Committee has determined that the use of amortized cost is an appropriate reflection of fair value given market and issuer-specific conditions existing at the time of the determination. Factors that may be considered in determining the appropriateness of the use of amortized cost include, but are not limited to, the following:
| 1) | the credit conditions in the relevant market and changes thereto; |
| 2) | the liquidity conditions in the relevant market and changes thereto; |
| 3) | the interest rate conditions in the relevant market and changes thereto (such as significant changes in interest rates); |
| 4) | issuer-specific conditions (such as significant credit deterioration); and |
| 5) | any other market-based data the Advisor’s Pricing Committee considers relevant. In this regard, the Advisor’s Pricing Committee may use last-obtained market-based data to assist it when valuing portfolio securities using amortized cost. |
Certain securities may not be able to be priced by pre-established pricing methods. Such securities may be valued by the Trust’s Board of Trustees or its delegate, the Advisor’s Pricing Committee, at fair value. These securities generally include, but are not limited to, restricted securities (securities which may not be publicly sold without registration under the Securities Act of 1933, as amended (the “1933 Act”)) for which a third-party pricing service is unable to provide a market price; securities whose trading has been formally suspended; a security whose market or fair value price is not available from a pre-established pricing source; a security with respect to which an event has occurred that is likely to materially affect the value of the security after the market has closed but before the calculation of the Fund’s NAV or make it difficult or impossible to obtain a reliable market quotation; and a security whose price, as provided by the third-party pricing service, does not reflect the security’s fair value. As a general principle, the current fair value of a security would appear to be the amount which the owner might reasonably expect to receive for the security upon its current sale. When fair value prices are used, generally they will differ from market quotations or official closing prices on the applicable exchanges. A variety of factors may be considered in determining the fair value of such securities, including, but not limited to, the following:
| 1) | the type of security; |
| 2) | the size of the holding; |
| 3) | the initial cost of the security; |
| 4) | transactions in comparable securities; |
| 5) | price quotes from dealers and/or third-party pricing services; |
| 6) | relationships among various securities; |
| 7) | information obtained by contacting the issuer, analysts, or the appropriate stock exchange; |
| 8) | an analysis of the issuer’s financial statements; and |
| 9) | the existence of merger proposals or tender offers that might affect the value of the security. |
If the securities in question are foreign securities, the following additional information may be considered:
| 1) | the value of similar foreign securities traded on other foreign markets; |
| 2) | ADR trading of similar securities; |
| 3) | closed-end fund or exchange-traded fund trading of similar securities; |
| 4) | foreign currency exchange activity; |
| 5) | the trading prices of financial products that are tied to baskets of foreign securities; |
| 6) | factors relating to the event that precipitated the pricing problem; |
| 7) | whether the event is likely to recur; and |
| 8) | whether the effects of the event are isolated or whether they affect entire markets, countries or regions. |
The Fund is subject to fair value accounting standards that define fair value, establish the framework for measuring fair value and provide a three-level hierarchy for fair valuation based upon the inputs to the valuation as of the measurement date. The three levels of the fair value hierarchy are as follows:
| • | Level 1 – Level 1 inputs are quoted prices in active markets for identical investments. An active market is a market in which transactions for the investment occur with sufficient frequency and volume to provide pricing information on an ongoing basis. |
Notes to Financial Statements (Continued)
First Trust Preferred Securities and Income Fund
October 31, 2021
| • | Level 2 – Level 2 inputs are observable inputs, either directly or indirectly, and include the following: |
| o | Quoted prices for similar investments in active markets. |
| o | Quoted prices for identical or similar investments in markets that are non-active. A non-active market is a market where there are few transactions for the investment, the prices are not current, or price quotations vary substantially either over time or among market makers, or in which little information is released publicly. |
| o | Inputs other than quoted prices that are observable for the investment (for example, interest rates and yield curves observable at commonly quoted intervals, volatilities, prepayment speeds, loss severities, credit risks, and default rates). |
| o | Inputs that are derived principally from or corroborated by observable market data by correlation or other means. |
| • | Level 3 – Level 3 inputs are unobservable inputs. Unobservable inputs may reflect the reporting entity’s own assumptions about the assumptions that market participants would use in pricing the investment. |
The inputs or methodologies used for valuing investments are not necessarily an indication of the risk associated with investing in those investments. A summary of the inputs used to value the Fund’s investments as of October 31, 2021, is included with the Fund’s Portfolio of Investments.
B. Securities Transactions and Investment Income
Securities transactions are recorded as of the trade date. Realized gains and losses from securities transactions are recorded on the identified cost basis. Dividend income is recorded on the ex-dividend date. Interest income is recorded daily on the accrual basis, including the amortization of premiums and accretion of discounts. Income is allocated on a pro rata basis to each class of shares.
The Fund may hold the securities of real estate investment trusts (“REITs”). Distributions from such investments may include income, capital gains and return of capital. The actual character of amounts received during the year is not known until after the REITs’ fiscal year end. The Fund records the character of distributions received from the REITs during the year based on estimates available. The characterization of distributions received by the Fund may be subsequently revised based on information received from the REITs after their tax reporting periods conclude.
The United Kingdom’s Financial Conduct Authority, which regulates the London Interbank Offered Rates (“LIBOR”), announced on March 5, 2021 that all non-USD LIBOR reference rates and the 1-week and 2-month USD LIBOR reference rates will cease to be provided or no longer be representative immediately after December 31, 2021 and the remaining USD LIBOR settings will cease to be provided or no longer be representative immediately after June 30, 2023. The International Swaps and Derivatives Association, Inc. (“ISDA”) confirmed that the March 5, 2021 announcement constituted an index cessation event under the Interbank Offered Rates (“IBOR”) Fallbacks Supplement and the ISDA 2020 IBOR Fallbacks Protocol for all 35 LIBOR settings and confirmed that the spread adjustment to be used in ISDA fallbacks was fixed as of the date of the announcement.
In the United States, the Alternative Reference Rates Committee (the “ARRC”), a group of market participants convened by the Board of Governors of the Federal Reserve System and the Federal Reserve Bank of New York in cooperation with other federal and state government agencies, has since 2014 undertaken efforts to identify U.S. dollar reference interest rates as alternatives to LIBOR and to facilitate the mitigation of LIBOR-related risks. In June 2017, the ARRC identified the Secured Overnight Financing Rate (“SOFR”), a broad measure of the cost of cash overnight borrowing collateralized by U.S. Treasury securities, as the preferred alternative for U.S. dollar LIBOR. The Federal Reserve Bank of New York began daily publishing of SOFR in April 2018.
At this time, it is not possible to predict the full impact of the elimination of LIBOR and the establishment of an alternative reference rate on the Fund or its investments.
C. Restricted Securities
The Fund invests in restricted securities, which are securities that may not be offered for public sale without first being registered under the 1933 Act. Prior to registration, restricted securities may only be resold in transactions exempt from registration under Rule 144A under the 1933 Act, normally to qualified institutional buyers. As of October 31, 2021, the Fund held restricted securities as shown in the following table that the Advisor has deemed illiquid pursuant to procedures adopted by the Trust’s Board of Trustees. Although market instability can result in periods of increased overall market illiquidity, liquidity for each security is determined based on security-specific factors and assumptions, which require subjective judgment. The Fund does not have the right to demand that such securities be registered. These securities are valued according to the valuation procedures as stated in the Portfolio Valuation note (Note 2A) and are not expressed as a discount to the carrying value of a comparable unrestricted security. There are no unrestricted securities with the same maturity dates and yields for these issuers.
Notes to Financial Statements (Continued)
First Trust Preferred Securities and Income Fund
October 31, 2021
| Security | Acquisition
Date | Principal
Value | Current Price | Carrying
Cost | | Value | | % of
Net
Assets |
| Dairy Farmers of America, Inc., 7.13% | 09/15/16-10/04/16 | $300,000 | $101.50 | $310,125 | | $304,500 | | 0.09% |
| Fortegra Financial Corp., 8.50%, 10/15/57 | 10/12/17 | 1,000,000 | 126.30 | 1,000,000 | | 1,262,962 | | 0.39 |
| Land O’Lakes Capital Trust I, 7.45%, 03/15/28 | 06/06/14-03/20/15 | 3,000,000 | 115.61 | 3,054,607 | | 3,468,450 | | 1.06 |
| | | | | $4,364,732 | | $5,035,912 | | 1.54% |
D. Dividends and Distributions to Shareholders
The Fund will declare daily and pay monthly distributions of all or a portion of its net income to holders of each class of shares. Distributions of any net capital gains earned by the Fund will be distributed at least annually. Distributions will automatically be reinvested into additional Fund shares unless cash distributions are elected by the shareholder.
Distributions from net investment income and realized capital gains are determined in accordance with federal income tax regulations, which may differ from U.S. GAAP. Certain capital accounts in the financial statements are periodically adjusted for permanent differences in order to reflect their tax character. These permanent differences are primarily due to the varying treatment of income and gain/loss on portfolio securities held by the Fund and have no impact on net assets or NAV per share. Temporary differences, which arise from recognizing certain items of income, expense and gain/loss in different periods for financial statement and tax purposes, will reverse at some point in the future. Permanent differences incurred during the fiscal year ended October 31, 2021, resulting in book and tax accounting differences, have been reclassified at year end to reflect a decrease in accumulated net investment income (loss) of $90,206, an increase in accumulated net realized gain (loss) on investments of $193,106, and a decrease to paid-in-capital of $102,900. Accumulated distributable earnings (loss) consists of accumulated net investment income (loss), accumulated net realized gain (loss) on investments, and unrealized appreciation (depreciation) on investments. Net assets were not affected by these reclassifications.
The tax character of distributions paid by the Fund during the fiscal years ended October 31, 2021 and 2020, was as follows:
| Distributions paid from: | 2021 | 2020 |
Ordinary income
| $12,944,139 | $12,809,431 |
Capital gains
| — | — |
Return of capital
| 1,401,504 | 1,229,885 |
As of October 31, 2021, the components of distributable earnings and net assets on a tax basis were as follows:
Undistributed ordinary income
| $— |
Undistributed capital gains
| — |
Total undistributed earnings
| — |
Accumulated capital and other losses
| (11,465,834) |
Net unrealized appreciation (depreciation)
| 18,204,089 |
Total accumulated earnings (losses)
| 6,738,255 |
Other
| — |
Paid-in capital
| 319,111,190 |
Total net assets
| $325,849,445 |
E. Income Taxes
The Fund intends to continue to qualify as a regulated investment company by complying with the requirements under Subchapter M of the Internal Revenue Code of 1986, as amended, which includes distributing substantially all of its net investment income and net realized gains to shareholders. Accordingly, no provision has been made for federal and state income taxes. However, due to the timing and amount of distributions, the Fund may be subject to an excise tax of 4% of the amount by which approximately 98% of the Fund’s taxable income exceeds the distributions from such taxable income for the calendar year.
Notes to Financial Statements (Continued)
First Trust Preferred Securities and Income Fund
October 31, 2021
The Fund intends to utilize provisions of the federal income tax laws, which allow it to carry a realized capital loss forward indefinitely following the year of the loss and offset such loss against any future realized capital gains. The Fund is subject to certain limitations under U.S. tax rules on the use of capital loss carryforwards and net unrealized built-in losses. These limitations apply when there has been a 50% change in ownership. At October 31, 2021, for federal income tax purposes, the Fund had $11,465,834 of non-expiring capital loss carryforwards available to the extent provided by regulations to offset future capital gains.
The Fund is subject to accounting standards that establish a minimum threshold for recognizing, and a system for measuring, the benefits of a tax position taken or expected to be taken in a tax return. Taxable years ended 2018, 2019, 2020, and 2021 remain open to federal and state audit. As of October 31, 2021, management has evaluated the application of these standards to the Fund and has determined that no provision for income tax is required in the Fund’s financial statements for uncertain tax positions.
F. Expenses
The Fund pays all expenses directly related to its operations. Expenses of the Fund are allocated on a pro rata basis to each class of shares, except for distribution and service (12b-1) fees and incremental transfer agency costs which are unique to each class of shares.
3. Investment Advisory Fee, Affiliated Transactions and Other Fee Arrangements
First Trust, the investment advisor to the Fund, is a limited partnership with one limited partner, Grace Partners of DuPage L.P., and one general partner, The Charger Corporation. The Charger Corporation is an Illinois corporation controlled by James A. Bowen, Chief Executive Officer of First Trust. First Trust is responsible for the ongoing monitoring of the Fund’s investment portfolio, managing the Fund’s business affairs and providing certain administrative services necessary for the management of the Fund. For these investment management services, First Trust is entitled to a monthly fee calculated at an annual rate of 0.80% of the Fund’s average daily net assets. First Trust also provides fund reporting services to the Fund for a flat annual fee in the amount of $9,250.
Stonebridge, a majority-owned affiliate of First Trust, serves as the Fund’s sub-advisor and manages the Fund’s portfolio subject to First Trust’s supervision. The Sub-Advisor receives a monthly portfolio management fee calculated at an annual rate of 0.40% of the Fund’s average daily net assets that is paid by First Trust out of its investment advisory fee.
First Trust Capital Partners, LLC, an affiliate of First Trust, owns a 51% ownership interest in Stonebridge.
First Trust and Stonebridge have agreed to waive fees and/or reimburse Fund expenses to the extent necessary to prevent the total annual fund operating expenses (excluding 12b-1 distribution and service fees, interest expenses, taxes, acquired fund fees and expenses, fees incurred in acquiring and disposing of portfolio securities and extraordinary expenses) from exceeding 1.15% of average daily net assets of any class of shares of the Fund (the “Expense Cap”) until February 28, 2023 and then from exceeding 1.50% from March 1, 2023 to February 28, 2032 (the “Expense Cap Termination Date”). Expenses borne and fees waived by First Trust and Stonebridge are subject to recovery on the Fund’s class level, if applicable, by First Trust and Stonebridge for up to three years from the date the fee or expense was incurred, but no reimbursement payment will be made by the Fund at any time if it would result in the Fund’s expenses exceeding (i) the Expense Cap in place for the most recent fiscal year for which such expense limitation was in place; (ii) the Expense Cap in place at the time the fees were waived; or (iii) the current Expense Cap. Expense limitations may be terminated or modified prior to their expiration only with the approval of the Board of Trustees of the Trust. These amounts would be included in “Expenses previously waived or reimbursed” on the Statement of Operations. The advisory fee waiver and expense reimbursement for the fiscal year ended October 31, 2021 and the expenses borne by First Trust and Stonebridge subject to recovery were as follows:
| | | | | Expenses Subject to Recovery |
Advisory Fee
Waiver | | Expense
Reimbursement | | Year Ended
October 31, 2019 | | Year Ended
October 31, 2020 | | Year Ended
October 31, 2021 | | Total |
| $ 38,675 | | $ — | | $ 38,436 | | $ 40,267 | | $ 38,675 | | $ 117,378 |
During the fiscal year ended October 31, 2021, First Trust recovered $4,014 of fees that were previously waived.
Brown Brothers Harriman & Co. (“BBH”) serves as the Fund’s administrator, fund accountant and custodian in accordance with certain fee arrangements. As administrator and fund accountant, BBH is responsible for providing certain administrative and accounting services to the Fund, including maintaining the Fund’s books of account, records of the Fund’s securities transactions, and certain other books and records. As custodian, BBH is responsible for custody of the Fund’s assets.
Notes to Financial Statements (Continued)
First Trust Preferred Securities and Income Fund
October 31, 2021
BNY Mellon Investment Servicing (US) Inc. (“BNYM IS”) serves as the Fund’s transfer agent in accordance with certain fee arrangements. As transfer agent, BNYM IS is responsible for maintaining shareholder records for the Fund. BNYM IS is a subsidiary of The Bank of New York Mellon Corporation, a financial holding company.
Each Trustee who is not an officer or employee of First Trust, any sub-advisor or any of their affiliates (“Independent Trustees”) is paid a fixed annual retainer that is allocated equally among each fund in the First Trust Fund Complex. Each Independent Trustee is also paid an annual per fund fee that varies based on whether the fund is a closed-end or other actively managed fund, a defined-outcome fund or an index fund.
Additionally, the Lead Independent Trustee and the Chairs of the Audit Committee, Nominating and Governance Committee and Valuation Committee are paid annual fees to serve in such capacities, with such compensation allocated pro rata among each fund in the First Trust Fund Complex based on net assets. Independent Trustees are reimbursed for travel and out-of-pocket expenses in connection with all meetings. The Lead Independent Trustee and Committee Chairs rotate every three years. The officers and “Interested” Trustee receive no compensation from the Trust for acting in such capacities.
4. Capital Share Transactions
Capital transactions were as follows:
| | Year Ended
October 31, 2021 | | Year Ended
October 31, 2020 |
| | Shares | | Value | | Shares | | Value |
| Sales: | | | | | | | |
| Class A | 732,198 | | $ 16,484,863 | | 526,639 | | $ 11,289,438 |
| Class C | 194,429 | | 4,395,572 | | 363,301 | | 7,911,541 |
| Class F | 1,475 | | 33,532 | | 9,644 | | 210,674 |
| Class I | 2,218,685 | | 50,136,059 | | 4,387,405 | | 90,703,453 |
| Class R3 | 1,314 | | 29,647 | | 2,232 | | 47,573 |
| Total Sales | 3,148,101 | | $ 71,079,673 | | 5,289,221 | | $ 110,162,679 |
| Dividend Reinvestment: | | | | | | | |
| Class A | 80,966 | | $ 1,820,859 | | 79,864 | | $ 1,680,903 |
| Class C | 81,561 | | 1,843,949 | | 101,234 | | 2,142,115 |
| Class F | 1,472 | | 33,510 | | 3,459 | | 75,202 |
| Class I | 408,796 | | 9,247,640 | | 394,745 | | 8,357,010 |
| Class R3 | 753 | | 16,882 | | 1,127 | | 23,666 |
| Total Dividend Reinvestment | 573,548 | | $ 12,962,840 | | 580,429 | | $ 12,278,896 |
| Redemptions: | | | | | | | |
| Class A | (372,651) | | $ (8,363,254) | | (350,333) | | $ (7,234,990) |
| Class C | (530,533) | | (12,017,995) | | (542,882) | | (11,115,275) |
| Class F | (6,591) | | (149,965) | | (157,024) | | (3,549,887) |
| Class I | (1,992,635) | | (44,998,460) | | (3,848,875) | | (77,779,990) |
| Class R3 | (1,388) | | (31,257) | | (7,200) | | (152,182) |
| Total Redemptions | (2,903,798) | | $ (65,560,931) | | (4,906,314) | | $ (99,832,324) |
5. Purchases and Sales of Securities
The cost of purchases and proceeds from sales of securities, excluding short-term investments, for the fiscal year ended October 31, 2021, were $138,554,272 and $118,136,150, respectively.
6. Distribution and Service Plan
The Board of Trustees adopted a Distribution and Service Plan pursuant to Rule 12b-1 under the 1940 Act. In accordance with the Rule 12b-1 plan, the share classes of the Fund are authorized to pay an amount up to 0.25%, 1.00%, 0.15% and 0.50% of their average daily net assets each year for Class A, Class C, Class F and Class R3, respectively, to reimburse First Trust Portfolios L.P. (“FTP”), the distributor of the Fund, for amounts expended to finance activities primarily intended to result in the sale of Fund shares or the
Notes to Financial Statements (Continued)
First Trust Preferred Securities and Income Fund
October 31, 2021
provision of investor services. FTP may also use this amount to compensate securities dealers or other persons for providing distribution assistance, including broker-dealer and shareholder support and educational and promotional services. Class I shares have no 12b-1 fees.
7. Borrowings
The Trust, on behalf of the Fund, along with First Trust Exchange-Traded Fund III and First Trust Exchange-Traded Fund IV have a $355 million Credit Agreement with The Bank of Nova Scotia (“Scotia”) as administrative agent for a group of lenders. Between March 3, 2021 and October 28, 2021 the commitment amount was $330 million, and prior to March 3, 2021, the commitment amount was $410 million. Scotia charges a commitment fee of 0.25% of the daily amount of the excess of the commitment amount over the outstanding principal balance of the loans, and an agency fee. First Trust allocates the commitment fee and agency fee amongst the funds that have access to the credit line. To the extent that the Fund accesses the credit line, there would also be an interest fee charged. The Fund did not have any borrowings outstanding during the fiscal year ended October 31, 2021.
8. Indemnification
The Fund has a variety of indemnification obligations under contracts with its service providers. The Fund’s maximum exposure under these arrangements is unknown. However, the Fund has not had prior claims or losses pursuant to these contracts and expects the risk of loss to be remote.
9. Subsequent Events
Management has evaluated the impact of all subsequent events to the Fund through the date the financial statements were issued, and has determined that there were no subsequent events requiring recognition or disclosure in the financial statements that have not already been disclosed.
Report of Independent Registered Public Accounting Firm
To the Shareholders and the Board of Trustees of First Trust Series Fund:
Opinion on the Financial Statements and Financial Highlights
We have audited the accompanying statement of assets and liabilities of First Trust Preferred Securities and Income Fund (the “Fund”), a series of the First Trust Series Fund, including the portfolio of investments, as of October 31, 2021, the related statement of operations for the year then ended, the statements of changes in net assets for each of the two years in the period then ended, the financial highlights for each of the five years in the period then ended, and the related notes. In our opinion, the financial statements and financial highlights present fairly, in all material respects, the financial position of the Fund as of October 31, 2021, the results of its operations for the year then ended, the changes in its net assets for each of the two years in the period then ended, and the financial highlights for each of the five years in the period then ended in conformity with accounting principles generally accepted in the United States of America.
Basis for Opinion
These financial statements and financial highlights are the responsibility of the Fund’s management. Our responsibility is to express an opinion on the Fund’s financial statements and financial highlights based on our audits. We are a public accounting firm registered with the Public Company Accounting Oversight Board (United States) (PCAOB) and are required to be independent with respect to the Fund in accordance with the U.S. federal securities laws and the applicable rules and regulations of the Securities and Exchange Commission and the PCAOB.
We conducted our audits in accordance with the standards of the PCAOB. Those standards require that we plan and perform the audit to obtain reasonable assurance about whether the financial statements and financial highlights are free of material misstatement, whether due to error or fraud. The Fund is not required to have, nor were we engaged to perform, an audit of its internal control over financial reporting. As part of our audits we are required to obtain an understanding of internal control over financial reporting but not for the purpose of expressing an opinion on the effectiveness of the Fund’s internal control over financial reporting. Accordingly, we express no such opinion.
Our audits included performing procedures to assess the risks of material misstatement of the financial statements and financial highlights, whether due to error or fraud, and performing procedures that respond to those risks. Such procedures included examining, on a test basis, evidence regarding the amounts and disclosures in the financial statements and financial highlights. Our audits also included evaluating the accounting principles used and significant estimates made by management, as well as evaluating the overall presentation of the financial statements and financial highlights. Our procedures included confirmation of securities owned as of October 31, 2021, by correspondence with the custodian and brokers; when replies were not received from brokers, we performed other auditing procedures. We believe that our audits provide a reasonable basis for our opinion.
Chicago, Illinois
December 17, 2021
We have served as the auditor of one or more First Trust investment companies since 2001.
Additional Information
First Trust Preferred Securities and Income Fund
October 31, 2021 (Unaudited)
Proxy Voting Policies and Procedures
A description of the policies and procedures that the Trust uses to determine how to vote proxies and information on how the Fund voted proxies relating to portfolio securities during the most recent 12-month period ended June 30 is available (1) without charge, upon request, by calling (800) 988-5891; (2) on the Fund’s website at www.ftportfolios.com; and (3) on the Securities and Exchange Commission’s (“SEC”) website at www.sec.gov.
Portfolio Holdings
The Fund files portfolio holdings information for each month in a fiscal quarter within 60 days after the end of the relevant fiscal quarter on Form N-PORT. Portfolio holdings information for the third month of each fiscal quarter will be publicly available on the SEC’s website at www.sec.gov. The Fund’s complete schedule of portfolio holdings for the second and fourth quarters of each fiscal year is included in the semi-annual and annual reports to shareholders, respectively, and is filed with the SEC on Form N-CSR. The semi-annual and annual report for the Fund is available to investors within 60 days after the period to which it relates. The Fund’s Forms N-PORT and Forms N-CSR are available on the SEC’s website listed above.
Federal Tax Information
The Fund hereby designates as qualified dividend income 81.37% of its ordinary income distributions (including short-term capital gains, if applicable) for the year ended October 31, 2021. In addition, 32.49% of the ordinary income distributions (including short-term capital gain, if applicable) made by the Fund during the fiscal year ended October 31, 2021, qualify for corporate dividends received deduction available to corporate shareholders.
A portion of the ordinary dividends (including short-term capital gains) paid to shareholders during the taxable year ended October 31, 2021, may be eligible for the Qualified Business Income (QBI) Deduction under the Internal Revenue Code of 1986, as amended, section 199A for the aggregate dividends the Fund received from the underlying Real Estate Investment Trusts (REITs) it invests in.
Risk Considerations
Risks are inherent in all investing. Certain general risks that may be applicable to a Fund are identified below, but not all of the material risks relevant to each Fund are included in this report and not all of the risks below apply to each Fund. The material risks of investing in each Fund are spelled out in its prospectus, statement of additional information and other regulatory filings. Before investing, you should consider each Fund’s investment objective, risks, charges and expenses, and read each Fund’s prospectus and statement of additional information carefully. You can download each Fund’s prospectus at www.ftportfolios.com or contact First Trust Portfolios L.P. at (800) 621-1675 to request a prospectus, which contains this and other information about each Fund.
Concentration Risk. To the extent that a fund is able to invest a significant percentage of its assets in a single asset class or the securities of issuers within the same country, state, region, industry or sector, an adverse economic, business or political development may affect the value of the fund’s investments more than if the fund were more broadly diversified. A fund that tracks an index will be concentrated to the extent the fund’s corresponding index is concentrated. A concentration makes a fund more susceptible to any single occurrence and may subject the fund to greater market risk than a fund that is more broadly diversified.
Credit Risk. Credit risk is the risk that an issuer of a security will be unable or unwilling to make dividend, interest and/or principal payments when due and the related risk that the value of a security may decline because of concerns about the issuer’s ability to make such payments.
Cyber Security Risk. The funds are susceptible to potential operational risks through breaches in cyber security. A breach in cyber security refers to both intentional and unintentional events that may cause a fund to lose proprietary information, suffer data corruption or lose operational capacity. Such events could cause a fund to incur regulatory penalties, reputational damage, additional compliance costs associated with corrective measures and/or financial loss. In addition, cyber security breaches of a fund’s third-party service providers, such as its administrator, transfer agent, custodian, or sub-advisor, as applicable, or issuers in which the fund invests, can also subject a fund to many of the same risks associated with direct cyber security breaches.
Derivatives Risk. To the extent a fund uses derivative instruments such as futures contracts, options contracts and swaps, the fund may experience losses because of adverse movements in the price or value of the underlying asset, index or rate, which may be magnified by certain features of the derivative. These risks are heightened when a fund’s portfolio managers use derivatives to enhance the fund’s return or as a substitute for a position or security, rather than solely to hedge (or offset) the risk of a position or security held by the fund.
Additional Information (Continued)
First Trust Preferred Securities and Income Fund
October 31, 2021 (Unaudited)
Equity Securities Risk. To the extent a fund invests in equity securities, the value of the fund’s shares will fluctuate with changes in the value of the equity securities. Equity securities prices fluctuate for several reasons, including changes in investors’ perceptions of the financial condition of an issuer or the general condition of the relevant stock market, such as market volatility, or when political or economic events affecting the issuers occur. In addition, common stock prices may be particularly sensitive to rising interest rates, as the cost of capital rises and borrowing costs increase. Equity securities may decline significantly in price over short or extended periods of time, and such declines may occur in the equity market as a whole, or they may occur in only a particular country, company, industry or sector of the market.
ETF Risk. The shares of an ETF trade like common stock and represent an interest in a portfolio of securities. The risks of owning an ETF generally reflect the risks of owning the underlying securities, although lack of liquidity in an ETF could result in it being more volatile and ETFs have management fees that increase their costs. Shares of an ETF trade on an exchange at market prices rather than net asset value, which may cause the shares to trade at a price greater than net asset value (premium) or less than net asset value (discount). In times of market stress, decisions by market makers to reduce or step away from their role of providing a market for an ETF’s shares, or decisions by an ETF’s authorized participants that they are unable or unwilling to proceed with creation and/or redemption orders of an ETF’s shares, could result in shares of the ETF trading at a discount to net asset value and in greater than normal intraday bid-ask spreads.
Fixed Income Securities Risk. To the extent a fund invests in fixed income securities, the fund will be subject to credit risk, income risk, interest rate risk, liquidity risk and prepayment risk. Income risk is the risk that income from a fund’s fixed income investments could decline during periods of falling interest rates. Interest rate risk is the risk that the value of a fund’s fixed income securities will decline because of rising interest rates. Liquidity risk is the risk that a security cannot be purchased or sold at the time desired, or cannot be purchased or sold without adversely affecting the price. Prepayment risk is the risk that the securities will be redeemed or prepaid by the issuer, resulting in lower interest payments received by the fund. In addition to these risks, high yield securities, or “junk” bonds, are subject to greater market fluctuations and risk of loss than securities with higher ratings, and the market for high yield securities is generally smaller and less liquid than that for investment grade securities.
Investment Companies Risk. To the extent a fund invests in the securities of other investment vehicles, the fund will incur additional fees and expenses that would not be present in a direct investment in those investment vehicles. Furthermore, the fund’s investment performance and risks are directly related to the investment performance and risks of the investment vehicles in which the fund invests.
LIBOR Risk. To the extent a fund invests in floating or variable rate obligations that use the London Interbank Offered Rate (“LIBOR”) as a reference interest rate, it is subject to LIBOR Risk. The United Kingdom’s Financial Conduct Authority, which regulates LIBOR, will cease making LIBOR available as a reference rate over a phase-out period that will begin immediately after December 31, 2021. The unavailability or replacement of LIBOR may affect the value, liquidity or return on certain fund investments and may result in costs incurred in connection with closing out positions and entering into new trades. Any potential effects of the transition away from LIBOR on the fund or on certain instruments in which the fund invests can be difficult to ascertain, and they may vary depending on a variety of factors, and they could result in losses to the fund.
Management Risk. To the extent that a fund is actively managed, it is subject to management risk. In managing an actively-managed fund’s investment portfolio, the fund’s portfolio managers will apply investment techniques and risk analyses that may not have the desired result. There can be no guarantee that a fund will meet its investment objective.
Market Risk. Securities held by a fund, as well as shares of a fund itself, are subject to market fluctuations caused by factors such as general economic conditions, political events, regulatory or market developments, changes in interest rates and perceived trends in securities prices. Shares of a fund could decline in value or underperform other investments as a result of the risk of loss associated with these market fluctuations. In addition, local, regional or global events such as war, acts of terrorism, spread of infectious diseases or other public health issues, recessions, or other events could have a significant negative impact on a fund and its investments. Such events may affect certain geographic regions, countries, sectors and industries more significantly than others. The outbreak of the respiratory disease designated as COVID-19 in December 2019 has caused significant volatility and declines in global financial markets, which have caused losses for investors. While the development of vaccines has slowed the spread of the virus and allowed for the resumption of “reasonably” normal business activity in the United States, many countries continue to impose lockdown measures in an attempt to slow the spread. Additionally, there is no guarantee that vaccines will be effective against emerging variants of the disease.
Non-U.S. Securities Risk. To the extent a fund invests in non-U.S. securities, it is subject to additional risks not associated with securities of domestic issuers. Non-U.S. securities are subject to higher volatility than securities of domestic issuers due to: possible adverse political, social or economic developments; restrictions on foreign investment or exchange of securities; capital controls; lack of liquidity; currency exchange rates; excessive taxation; government seizure of assets; the imposition of sanctions by foreign governments; different legal or accounting standards; and less government supervision and regulation of exchanges in foreign
Additional Information (Continued)
First Trust Preferred Securities and Income Fund
October 31, 2021 (Unaudited)
countries. Investments in non-U.S. securities may involve higher costs than investments in U.S. securities, including higher transaction and custody costs, as well as additional taxes imposed by non-U.S. governments. These risks may be heightened for securities of companies located, or with significant operations, in emerging market countries.
Operational Risk. Each fund is subject to risks arising from various operational factors, including, but not limited to, human error, processing and communication errors, errors of a fund’s service providers, counterparties or other third-parties, failed or inadequate processes and technology or systems failures. Each fund relies on third-parties for a range of services, including custody. Any delay or failure relating to engaging or maintaining such service providers may affect a fund’s ability to meet its investment objective. Although the funds and the funds’ investment advisor seek to reduce these operational risks through controls and procedures, there is no way to completely protect against such risks.
| NOT FDIC INSURED | NOT BANK GUARANTEED | MAY LOSE VALUE |
Advisory and Sub-Advisory Agreements
Board Considerations Regarding Approval of Continuation of Investment Management and Investment Sub-Advisory Agreements
The Board of Trustees of First Trust Series Fund (the “Trust”), including the Independent Trustees, unanimously approved the continuation of the Investment Management Agreement (the “Advisory Agreement”) between the Trust, on behalf of the First Trust Preferred Securities and Income Fund (the “Fund”), and First Trust Advisors L.P. (the “Advisor”) and the Investment Sub Advisory Agreement (the “Sub Advisory Agreement” and together with the Advisory Agreement, the “Agreements”) among the Trust, on behalf of the Fund, the Advisor and Stonebridge Advisors LLC (the “Sub-Advisor”). The Board approved the continuation of the Agreements for a one-year period ending June 30, 2022 at a meeting held on June 6–7, 2021. The Board determined that the continuation of the Agreements is in the best interests of the Fund in light of the nature, extent and quality of the services provided and such other matters as the Board considered to be relevant in the exercise of its business judgment.
To reach this determination, the Board considered its duties under the Investment Company Act of 1940, as amended (the “1940 Act”), as well as under the general principles of state law, in reviewing and approving advisory contracts; the requirements of the 1940 Act in such matters; the fiduciary duty of investment advisors with respect to advisory agreements and compensation; the standards used by courts in determining whether investment company boards have fulfilled their duties; and the factors to be considered by the Board in voting on such agreements. At meetings held on April 26, 2021 and June 6–7, 2021, the Board, including the Independent Trustees, reviewed materials provided by the Advisor and the Sub-Advisor responding to requests for information from counsel to the Independent Trustees, submitted on behalf of the Independent Trustees, that, among other things, outlined: the services provided by the Advisor and the Sub-Advisor to the Fund (including the relevant personnel responsible for these services and their experience); the advisory fee rate payable by the Fund and the sub-advisory fee rate as compared to fees charged to a peer group of funds (the “Expense Group”) and a broad peer universe of funds (the “Expense Universe”), each assembled by Broadridge Financial Solutions, Inc. (“Broadridge”), an independent source, and as compared to fees charged to other clients of the Advisor and the Sub-Advisor; the expense ratio of the Fund as compared to expense ratios of the funds in the Fund’s Expense Group and Expense Universe; performance information for the Fund, including comparisons of the Fund’s performance to that of one or more relevant benchmark indexes and to that of a performance group of funds and a broad performance universe of funds (the “Performance Universe”), each assembled by Broadridge; the nature of expenses incurred in providing services to the Fund and the potential for the Advisor and the Sub-Advisor to realize economies of scale, if any; profitability and other financial data for the Advisor; financial data for the Sub-Advisor; any fall out benefits to the Advisor and its affiliates, First Trust Portfolios L.P. (“FTP”) and First Trust Capital Partners, LLC (“FTCP”), and the Sub-Advisor; and information on the Advisor’s and the Sub-Advisor’s compliance programs. The Board reviewed initial materials with the Advisor at the meeting held on April 26, 2021, prior to which the Independent Trustees and their counsel met separately to discuss the information provided by the Advisor and the Sub-Advisor. Following the April meeting, counsel to the Independent Trustees, on behalf of the Independent Trustees, requested certain clarifications and supplements to the materials provided, and the information provided in response to those requests was considered at an executive session of the Independent Trustees and their counsel held prior to the June 6–7, 2021 meeting, as well as at the June meeting. The Board applied its business judgment to determine whether the arrangements between the Trust and the Advisor and among the Trust, the Advisor and the Sub-Advisor continue to be reasonable business arrangements from the Fund’s perspective. The Board determined that, given the totality of the information provided with respect to the Agreements, the Board had received sufficient information to renew the Agreements. The Board considered that shareholders chose to invest or remain invested in the Fund knowing that the Advisor and the Sub-Advisor manage the Fund and knowing the Fund’s advisory fee.
In reviewing the Agreements, the Board considered the nature, extent and quality of the services provided by the Advisor and the Sub-Advisor under the Agreements. With respect to the Advisory Agreement, the Board considered that the Advisor is responsible for the overall management and administration of the Trust and the Fund and reviewed all of the services provided by the Advisor to the Fund, including the oversight of the Sub-Advisor, as well as the background and experience of the persons responsible for such
Additional Information (Continued)
First Trust Preferred Securities and Income Fund
October 31, 2021 (Unaudited)
services. The Board noted that the Advisor oversees the Sub-Advisor’s day-to-day management of the Fund’s investments, including portfolio risk monitoring and performance review. In reviewing the services provided, the Board noted the compliance program that had been developed by the Advisor and considered that it includes a robust program for monitoring the Advisor’s, the Sub-Advisor’s and the Fund’s compliance with the 1940 Act, as well as the Fund’s compliance with its investment objective, policies and restrictions. The Board also considered a report from the Advisor with respect to its risk management functions related to the operation of the Fund. Finally, as part of the Board’s consideration of the Advisor’s services, the Advisor, in its written materials and at the April 26, 2021 meeting, described to the Board the scope of its ongoing investment in additional personnel and infrastructure to maintain and improve the quality of services provided to the Fund and the other funds in the First Trust Fund Complex. With respect to the Sub-Advisory Agreement, the Board reviewed the materials provided by the Sub-Advisor and considered the services that the Sub-Advisor provides to the Fund, including the Sub-Advisor’s day-to-day management of the Fund’s investments. In considering the Sub-Advisor’s management of the Fund, the Board noted the background and experience of the Sub-Advisor’s portfolio management team, including the Board’s prior meetings with members of the portfolio management team. In light of the information presented and the considerations made, the Board concluded that the nature, extent and quality of the services provided to the Trust and the Fund by the Advisor and the Sub-Advisor under the Agreements have been and are expected to remain satisfactory and that the Sub-Advisor, under the oversight of the Advisor, has managed the Fund consistent with its investment objective, policies and restrictions.
The Board considered the advisory and sub-advisory fee rates payable under the Agreements for the services provided. The Board noted that the sub-advisory fee is paid by the Advisor from its advisory fee. The Board considered that the Advisor and the Sub-Advisor agreed to extend the current expense caps for each share class through February 28, 2023 and agreed to keep the long-term expense cap in place from March 1, 2023 through February 28, 2032. The Board noted that fees waived or expenses borne by the Advisor and the Sub-Advisor are subject to reimbursement by the Fund for up to three years from the date the fee was waived or expense was incurred, but no reimbursement payment would be made by the Fund at any time if it would result in the Fund’s expenses exceeding (i) the applicable expense limitation in place for the most recent fiscal year for which such expense limitation was in place, (ii) the applicable expense limitation in place at the time the fees were waived, or (iii) the current expense limitation. The Board received and reviewed information showing the advisory or unitary fee rates and expense ratios of the peer funds in the Expense Group, as well as advisory and unitary fee rates charged by the Advisor and the Sub-Advisor to other fund and non-fund clients, as applicable. With respect to the Expense Group, the Board, at the April 26, 2021 meeting, discussed with the Advisor limitations in creating a relevant peer group for the Fund, including that (i) the Fund is unique in its composition, which makes assembling peers with the same strategy and asset mix difficult; (ii) certain peer group fund assets are larger than those of the Fund, in which case the comparison causes the fixed expenses of the Fund to be larger on a percentage basis; and (iii) not all peer funds employ an advisor/sub advisor management structure. The Board took these limitations into account in considering the peer data. Based on the information provided, the Board noted that the contractual advisory fee rate payable by the Fund was above the median contractual advisory fee of the peer funds in the Expense Group. The Board also noted that the Fund’s total (net) expense ratio (Class A shares) was above the median total (net) expense ratio of the peer funds in the Expense Group. With respect to fees charged to other clients, the Board considered differences between the Fund and other clients that limited their comparability. In considering the advisory fee rate overall, the Board also considered the Advisor’s statement that it seeks to meet investor needs through innovative and value-added investment solutions and the Advisor’s demonstrated long-term commitment to the Fund and the other funds in the First Trust Fund Complex.
The Board considered performance information for the Fund. The Board noted the process it has established for monitoring the Fund’s performance and portfolio risk on an ongoing basis, which includes quarterly performance reporting from the Advisor and the Sub-Advisor for the Fund. The Board determined that this process continues to be effective for reviewing the Fund’s performance. The Board received and reviewed information comparing the Fund’s performance for periods ended December 31, 2020 to the performance of the funds in the Performance Universe and to that of a blended benchmark index. Based on the information provided, the Board noted that the Fund (Class A shares) outperformed the Performance Universe median for the one-, three- and five-year periods ended December 31, 2020. The Board also noted that the Fund (Class A shares) underperformed the blended benchmark index for the one-, three- and five-year periods ended December 31, 2020.
On the basis of all the information provided on the fees, expenses and performance of the Fund and the ongoing oversight by the Board, the Board concluded that the advisory and sub-advisory fees for the Fund continue to be reasonable and appropriate in light of the nature, extent and quality of the services provided by the Advisor and the Sub-Advisor to the Fund under the Agreements.
The Board considered information and discussed with the Advisor whether there were any economies of scale in connection with providing advisory services to the Fund and noted the Advisor’s statement that it believes its expenses will likely increase during the next twelve months as the Advisor continues to hire personnel and build infrastructure, including technology, to improve the services to the Fund. The Board considered the revenues and allocated costs (including the allocation methodology) of the Advisor in serving as investment advisor to the Fund for the twelve months ended December 31, 2020 and the estimated profitability level for the Fund calculated by the Advisor based on such data, as well as complex-wide and product-line profitability data, for the same period. The Board noted the inherent limitations in the profitability analysis and concluded that, based on the information provided, the Advisor’s
Additional Information (Continued)
First Trust Preferred Securities and Income Fund
October 31, 2021 (Unaudited)
profitability level for the Fund was not unreasonable. In addition, the Board considered fall-out benefits described by the Advisor that may be realized from its relationship with the Fund. The Board considered that the Advisor had identified as a fall-out benefit to the Advisor and FTP their exposure to investors and brokers who, absent their exposure to the Fund, may have had no dealings with the Advisor or FTP. The Board considered the ownership interest of FTCP in the Sub-Advisor and potential fall-out benefits to the Advisor from such ownership interest. The Board noted that in addition to the advisory fees paid by the Fund, FTP is compensated for services provided to the Fund through 12b 1 distribution and service fees and that the Advisor receives compensation from the Fund for providing fund reporting services pursuant to a separate Fund Reporting Services Agreement. The Board concluded that the character and amount of potential fall-out benefits to the Advisor were not unreasonable.
The Board considered the Sub-Advisor’s expenses in providing sub-advisory services to the Fund and noted the Sub-Advisor’s hiring of additional personnel and commitment to add additional resources if assets increase. The Board did not review the profitability of the Sub-Advisor with respect to the Fund. The Board noted that the Advisor pays the Sub-Advisor from its advisory fee and its understanding that the Fund’s sub-advisory fee rate was the product of an arm’s length negotiation. The Board concluded that the profitability analysis for the Advisor was more relevant. The Board considered fall-out benefits that may be realized by the Sub-Advisor from its relationship with the Fund, including potential fall-out benefits to the Sub-Advisor from the ownership interest of FTCP in the Sub-Advisor. The Board noted the Sub-Advisor’s statements that its relationship with the Advisor has helped it build relationships with Wall Street firms that have preferred and hybrid securities trading desks, which may lead to access to those firms’ research reports and analysts, but that the Sub-Advisor does not utilize soft-dollar arrangements. The Board concluded that the character and amount of potential fall-out benefits to the Sub-Advisor were not unreasonable.
Based on all of the information considered and the conclusions reached, the Board, including the Independent Trustees, unanimously determined that the terms of the Agreements continue to be fair and reasonable and that the continuation of the Agreements is in the best interests of the Fund. No single factor was determinative in the Board’s analysis.
Board of Trustees
Effective November 1, 2021, Denise M. Keefe was appointed as a Trustee of the Trust. Ms. Keefe is Executive Vice President of Advocate Aurora Health and President of Advocate Aurora Continuing Health Division (together, “Advocate”), one of the largest integrated healthcare systems in the U.S. serving Illinois and Wisconsin. Ms. Keefe has been employed by Advocate since 1993 and is responsible for the Continuing Health Division’s strategic direction, fiscal management, business development, revenue enhancement, operational efficiencies, and human resource management of 4,000 employees. Ms. Keefe also currently serves on the boards of several organizations within the Advocate Aurora Continuing Health Division and other health care organizations, including RML Long Term Acute Care Hospitals (since 2014) and Senior Helpers (since 2021). Prior thereto, Ms. Keefe was Corporate Vice President, Marketing and Business Development for the Visiting Nurse Association of Chicago (1989 – 1992) and a former Board Member of Sherman West Court Skilled Nursing Facility.
Board of Trustees and Officers
First Trust Preferred Securities and Income Fund
October 31, 2021 (Unaudited)
The following tables identify the Trustees and Officers of the Trust. Unless otherwise indicated, the address of all persons is 120 East Liberty Drive, Suite 400, Wheaton, IL 60187.
The Trust’s statement of additional information includes additional information about the Trustees and is available, without charge, upon request, by calling (800) 988-5891.
| Name, Year of Birth and Position with the Trust | Term of Office and Year First Elected or Appointed | Principal Occupations
During Past 5 Years | Number of Portfolios in the First Trust Fund Complex Overseen by Trustee | Other Trusteeships or Directorships Held by Trustee During Past 5 Years |
| INDEPENDENT TRUSTEES |
Richard E. Erickson, Trustee
(1951) | • Indefinite Term
• Since Trust Inception | Physician; Officer, Wheaton Orthopedics; Limited Partner, Gundersen Real Estate Limited Partnership (June 1992 to December 2016) | 215 | None |
Thomas R. Kadlec, Trustee
(1957) | • Indefinite Term
• Since Trust Inception | President, ADM Investor Services, Inc. (Futures Commission Merchant) | 215 | Director of ADM Investor Services, Inc., ADM Investor Services International, Futures Industry Association, and National Futures Association |
Robert F. Keith, Trustee
(1956) | • Indefinite Term
• Since Trust Inception | President, Hibs Enterprises (Financial and Management Consulting) | 215 | Director of Trust Company of Illinois |
Niel B. Nielson, Trustee
(1954) | • Indefinite Term
• Since Trust Inception | Senior Advisor (August 2018 to Present), Managing Director and Chief Operating Officer (January 2015 to August 2018), Pelita Harapan Educational Foundation (Educational Products and Services) | 215 | None |
| INTERESTED TRUSTEE |
James A. Bowen(1), Trustee and
Chairman of the Board
(1955) | • Indefinite Term
• Since Trust Inception | Chief Executive Officer, First Trust Advisors L.P. and First Trust Portfolios L.P.; Chairman of the Board of Directors, BondWave LLC (Software Development Company) and Stonebridge Advisors LLC (Investment Advisor) | 215 | None |
| (1) | Mr. Bowen is deemed an “interested person” of the Trust due to his position as CEO of First Trust Advisors L.P., investment advisor of the Trust. |
Board of Trustees and Officers (Continued)
First Trust Preferred Securities and Income Fund
October 31, 2021 (Unaudited)
| Name and Year of Birth | Position and Offices with Trust | Term of Office and Length of Service | Principal Occupations
During Past 5 Years |
| OFFICERS(2) |
James M. Dykas
(1966) | President and Chief Executive Officer | • Indefinite Term
• Since January 2016 | Managing Director and Chief Financial Officer (January 2016 to Present), Controller (January 2011 to January 2016), Senior Vice President (April 2007 to January 2016), First Trust Advisors L.P. and First Trust Portfolios L.P.; Chief Financial Officer (January 2016 to Present), BondWave LLC (Software Development Company) and Stonebridge Advisors LLC (Investment Advisor) |
Donald P. Swade
(1972) | Treasurer, Chief Financial Officer and Chief Accounting Officer | • Indefinite Term
• Since January 2016 | Senior Vice President (July 2016 to Present), Vice President (April 2012 to July 2016), First Trust Advisors L.P. and First Trust Portfolios L.P. |
W. Scott Jardine
(1960) | Secretary and Chief Legal Officer | • Indefinite Term
• Since Trust Inception | General Counsel, First Trust Advisors L.P. and First Trust Portfolios L.P.; Secretary and General Counsel, BondWave LLC; Secretary, Stonebridge Advisors LLC |
Daniel J. Lindquist
(1970) | Vice President | • Indefinite Term
• Since Trust Inception | Managing Director, First Trust Advisors L.P. and First Trust Portfolios L.P. |
Kristi A. Maher
(1966) | Chief Compliance Officer and Assistant Secretary | • Indefinite Term
• Chief Compliance Officer Since January 2011 • Assistant Secretary Since Trust Inception | Deputy General Counsel, First Trust Advisors L.P. and First Trust Portfolios L.P. |
| (2) | The term “officer” means the president, vice president, secretary, treasurer, controller or any other officer who performs a policy making function. |
Privacy Policy
First Trust Preferred Securities and Income Fund
October 31, 2021 (Unaudited)
Privacy Policy
First Trust values our relationship with you and considers your privacy an important priority in maintaining that relationship. We are committed to protecting the security and confidentiality of your personal information.
Sources of Information
We collect nonpublic personal information about you from the following sources:
| • | Information we receive from you and your broker-dealer, investment professional or financial representative through interviews, applications, agreements or other forms; |
| • | Information about your transactions with us, our affiliates or others; |
| • | Information we receive from your inquiries by mail, e-mail or telephone; and |
| • | Information we collect on our website through the use of “cookies”. For example, we may identify the pages on our website that your browser requests or visits. |
Information Collected
The type of data we collect may include your name, address, social security number, age, financial status, assets, income, tax information, retirement and estate plan information, transaction history, account balance, payment history, investment objectives, marital status, family relationships and other personal information.
Disclosure of Information
We do not disclose any nonpublic personal information about our customers or former customers to anyone, except as permitted by law. In addition to using this information to verify your identity (as required under law), the permitted uses may also include the disclosure of such information to unaffiliated companies for the following reasons:
| • | In order to provide you with products and services and to effect transactions that you request or authorize, we may disclose your personal information as described above to unaffiliated financial service providers and other companies that perform administrative or other services on our behalf, such as transfer agents, custodians and trustees, or that assist us in the distribution of investor materials such as trustees, banks, financial representatives, proxy services, solicitors and printers. |
| • | We may release information we have about you if you direct us to do so, if we are compelled by law to do so, or in other legally limited circumstances (for example to protect your account from fraud). |
In addition, in order to alert you to our other financial products and services, we may share your personal information within First Trust.
Use of Website Analytics
We currently use third party analytics tools, Google Analytics and AddThis, to gather information for purposes of improving First Trust’s website and marketing our products and services to you. These tools employ cookies, which are small pieces of text stored in a file by your web browser and sent to websites that you visit, to collect information, track website usage and viewing trends such as the number of hits, pages visited, videos and PDFs viewed and the length of user sessions in order to evaluate website performance and enhance navigation of the website. We may also collect other anonymous information, which is generally limited to technical and web navigation information such as the IP address of your device, internet browser type and operating system for purposes of analyzing the data to make First Trust’s website better and more useful to our users. The information collected does not include any personal identifiable information such as your name, address, phone number or email address unless you provide that information through the website for us to contact you in order to answer your questions or respond to your requests. To find out how to opt-out of these services click on: Google Analytics and AddThis.
Confidentiality and Security
With regard to our internal security procedures, First Trust restricts access to your nonpublic personal information to those First Trust employees who need to know that information to provide products or services to you. We maintain physical, electronic and procedural safeguards to protect your nonpublic personal information.
Policy Updates and Inquiries
As required by federal law, we will notify you of our privacy policy annually. We reserve the right to modify this policy at any time, however, if we do change it, we will tell you promptly. For questions about our policy, or for additional copies of this notice, please go to www.ftportfolios.com, or contact us at 1-800-621-1675 (First Trust Portfolios) or 1-800-222-6822 (First Trust Advisors).
March 2021
This page intentionally left blank
INVESTMENT ADVISOR
First Trust Advisors L.P.
120 East Liberty Drive, Suite 400
Wheaton, IL 60187
INVESTMENT SUB-ADVISOR
Stonebridge Advisors LLC
10 Westport Road, Suite C101
Wilton, CT 06897
ADMINISTRATOR,
FUND ACCOUNTANT &
CUSTODIAN
Brown Brothers Harriman & Co.
50 Post Office Square
Boston, MA 02110
TRANSFER AGENT
BNY Mellon Investment Servicing (US) Inc.
301 Bellevue Parkway
Wilmington, DE 19809
INDEPENDENT REGISTERED
PUBLIC ACCOUNTING FIRM
Deloitte & Touche LLP
111 S. Wacker Drive
Chicago, IL 60606
LEGAL COUNSEL
Chapman and Cutler LLP
111 W. Monroe Street
Chicago, IL 60603

First Trust/Confluence
Small Cap Value Fund
Annual Report
For the Year Ended
October 31, 2021
First Trust/Confluence Small Cap Value Fund
Annual Report
October 31, 2021
Caution Regarding Forward-Looking Statements
This report contains certain forward-looking statements within the meaning of the Securities Act of 1933, as amended, and the Securities Exchange Act of 1934, as amended. Forward-looking statements include statements regarding the goals, beliefs, plans or current expectations of First Trust Advisors L.P. (“First Trust” or the “Advisor”) and/or Confluence Investment Management LLC (“Confluence” or the “Sub-Advisor”) and their respective representatives, taking into account the information currently available to them. Forward-looking statements include all statements that do not relate solely to current or historical fact. For example, forward-looking statements include the use of words such as “anticipate,” “estimate,” “intend,” “expect,” “believe,” “plan,” “may,” “should,” “would” or other words that convey uncertainty of future events or outcomes.
Forward-looking statements involve known and unknown risks, uncertainties and other factors that may cause the actual results, performance or achievements of First Trust/Confluence Small Cap Value Fund (the “Fund”) to be materially different from any future results, performance or achievements expressed or implied by the forward-looking statements. When evaluating the information included in this report, you are cautioned not to place undue reliance on these forward-looking statements, which reflect the judgment of the Advisor and/or Sub-Advisor and their respective representatives only as of the date hereof. We undertake no obligation to publicly revise or update these forward-looking statements to reflect events and circumstances that arise after the date hereof.
Performance and Risk Disclosure
There is no assurance that the Fund will achieve its investment objective. The Fund is subject to market risk, which is the possibility that the market values of securities owned by the Fund will decline and that the value of the Fund’s shares may therefore be less than what you paid for them. Accordingly, you can lose money by investing in the Fund. See “Risk Considerations” in the Additional Information section of this report for a discussion of certain other risks of investing in the Fund.
Performance data quoted represents past performance, which is no guarantee of future results, and current performance may be lower or higher than the figures shown. For the most recent month-end performance figures, please visit www.ftportfolios.com or speak with your financial advisor. Investment returns and net asset value will fluctuate and Fund shares, when sold, may be worth more or less than their original cost.
The Advisor may also periodically provide additional information on Fund performance on the Fund’s web page at www.ftportfolios.com.
How to Read This Report
This report contains information that may help you evaluate your investment in the Fund. It includes details about the Fund and presents data and analysis that provide insight into the Fund’s performance and investment approach.
By reading the portfolio commentary by the portfolio management team of the Fund, you may obtain an understanding of how the market environment affected the Fund’s performance. The statistical information that follows may help you understand the Fund’s performance compared to that of relevant market benchmarks.
It is important to keep in mind that the opinions expressed by personnel of First Trust and Confluence are just that: informed opinions. They should not be considered to be promises or advice. The opinions, like the statistics, cover the period through the date on the cover of this report. The material risks of investing in the Fund are spelled out in the prospectus, the statement of additional information, this report and other Fund regulatory filings.
First Trust/Confluence Small Cap Value Fund
Annual Letter from the Chairman and CEO
October 31, 2021
Dear Shareholders,
First Trust is pleased to provide you with the annual report for the First Trust/Confluence Small Cap Value Fund (the “Fund”), which contains detailed information about the Fund for the twelve months ended October 31, 2021.
Inflation has arrived, and its entrance was grand, to say the least. The Consumer Price Index came in at 6.2% year-over-year in October 2021, according to data from the U.S. Bureau of Labor Statistics. The last time it topped the 6.0% mark was in December 1990 (6.1%), over 30 years ago. As is often the case with major shifts in the economy and markets, there is debate over what is truly behind them. For many months, as inflation was trending higher, Federal Reserve (the “Fed”) Chairman Jerome Powell held the view that the rising inflationary pressures largely stemmed from global supply chain bottlenecks induced by the coronavirus (“COVID-19”) pandemic. Perhaps the best example of this is the unprecedented backlog of container ships that have dropped anchor outside the California ports of Los Angeles and Long Beach. Together, these ports service 40% of all the container ships bound for the U.S. In normal times, no ships are anchored waiting to unload their goods. Shortages of trucks and drivers have also contributed to the slowdown at the ports.
The takeaway is that goods are not being delivered to warehouses and store shelves in a timely fashion and that is helping to drive prices higher for consumers. Simply put, inflation is the byproduct of too much money chasing too few goods. We’ll return to this axiom shortly. Chairman Powell originally believed the bottlenecks would be remedied relatively quickly as the global economy reopened and people went back to work. That, in turn, would allow inflationary pressures to dissipate, which has not happened. Around the end of October, Chairman Powell finally acknowledged that inflation will likely remain elevated through mid-2022. This realization is what motivated the Fed to announce that it would begin to taper its monthly bond buying program (quantitative easing) starting in November 2021. It has been purchasing roughly $80 billion of Treasuries and $40 billion of mortgage-backed securities in the open market every month since June 2020. The Fed will shave $15 billion off that combined total every month until the buying has ceased, which should be around mid-2022. If all goes to plan, the next stage in the evolution of the Fed’s monetary policy would involve initiating interest rate hikes.
While the supply chain bottlenecks have clearly played a role in the spike in inflation by limiting the amount of goods available to consume, the biggest contributing factor is likely the surge in the U.S. money supply, according to Brian Wesbury, Chief Economist at First Trust. M2 is a measure of the money supply that includes cash, checking deposits and liquid assets easily convertible to cash. The M2 measure of money has exploded by 36% since February 2020, well above the 6% pre-COVID-19 annualized norm. The trillions of dollars of stimulus distributed by the U.S. government to help backstop the economy during the pandemic has contributed to higher inflation. On Wednesday, November 10, 2021, President Joe Biden admitted that his $1.9 trillion COVID-19 stimulus package has done just that. Remember, too much money chasing too few goods leads to inflation. Keep in mind, President Biden has recently successfully navigated a $1.2 trillion bipartisan infrastructure bill through Congress and has another roughly $1.75 trillion Build Back Better Act (social spending) piece of legislation pending. That means there is at least another $1.2 trillion dollars flowing into the economy over the next few years, and maybe more.
Data from FactSet indicates that the number of S&P 500® Index companies mentioning inflation on their 2021 third quarter earnings call hit a 10-year high, according to Business Insider. To date, 285 of the 461 companies that have reported their results have cited concerns over rising inflation. The Materials, Consumer Staples and Energy sectors had the highest percentage of companies mentioned on these earnings calls at 90%, 88% and 86%, respectively. Suffice it to say, investors should add inflation to the list of criteria to assist them in positioning their portfolios moving forward.
Thank you for giving First Trust the opportunity to play a role in your financial future. We value our relationship with you and will report on the Fund again in six months.
Sincerely,
James A. Bowen
Chairman of the Board of Trustees
Chief Executive Officer of First Trust Advisors L.P.
First Trust/Confluence Small Cap Value Fund
“AT A GLANCE”
As of October 31, 2021 (Unaudited)
| Fund Statistics | |
| First Trust/Confluence Small Cap Value Fund | Net Asset
Value (NAV) |
| Class A (FOVAX) | $37.10 |
| Class C (FOVCX) | $32.19 |
| Class I (FOVIX) | $38.47 |
| Sector Allocation | % of Total
Investments |
| Industrials | 26.1% |
| Financials | 24.2 |
| Consumer Discretionary | 13.7 |
| Real Estate | 9.5 |
| Information Technology | 8.2 |
| Consumer Staples | 5.8 |
| Utilities | 5.4 |
| Energy | 3.1 |
| Materials | 2.5 |
| Health Care | 1.5 |
| Total | 100.0% |
| Top Ten Holdings | % of Total
Investments |
| BRP Group, Inc., Class A | 5.0% |
| Kadant, Inc. | 4.8 |
| Movado Group, Inc. | 4.5 |
| Veritex Holdings, Inc. | 4.2 |
| John Bean Technologies Corp. | 3.8 |
| RBC Bearings, Inc. | 3.6 |
| Morningstar, Inc. | 3.5 |
| Brown & Brown, Inc. | 3.5 |
| Gladstone Commercial Corp. | 3.5 |
| Cannae Holdings, Inc. | 3.3 |
| Total | 39.7% |
First Trust/Confluence Small Cap Value Fund
“AT A GLANCE” (Continued)
As of October 31, 2021 (Unaudited)
Performance of a $10,000 Investment
This chart compares your Fund’s Class I performance to that of the Russell 2000® Value Index and the Russell 2000® Index from 10/31/2011 through 10/31/2021.
| Performance as of October 31, 2021 |
| | Class A
Inception 2/24/2011 | | | Class C
Inception 3/2/2011 | | | Class I
Inception 1/11/2011 | | | R2000V* | | | R2000* |
| Cumulative Total Returns | w/o
sales
charge | | w/max
5.50%
sales
charge | | | w/o
sales
charge | | w/max 1.00% contingent deferred sales charge | | | w/o
sales
charge | | | w/o
sales
charges | | | w/o
sales
charges |
| 1 Year | 38.69% | | 31.06% | | | 38.21% | | 37.21% | | | 39.23% | | | 64.30% | | | 50.80% |
| Average Annual Total Returns | | | | | | | | | | | | | | | | | |
| 5 Years | 10.43% | | 9.19% | | | 9.63% | | 9.63% | | | 10.67% | | | 12.61% | | | 15.52% |
| 10 Years | 10.51% | | 9.89% | | | 9.62% | | 9.62% | | | 10.87% | | | 12.12% | | | 13.50% |
| Since Inception | 9.52% | | 8.94% | | | 8.32% | | 8.32% | | | 9.81% | | | 10.34% | | | 11.81% |
* Since inception return is based on the Class I Shares inception date.
Performance figures assume reinvestment of all distributions and do not reflect the deduction of taxes that the shareholder would pay on Fund distributions or the redemption of Fund shares. The total returns would have been lower if certain fees had not been waived and expenses reimbursed by the Advisor. An index is a statistical composite that tracks a specific financial market or sector. Unlike the Fund, these indices do not actually hold a portfolio of securities and therefore do not incur the expenses incurred by the Fund. These expenses negatively impact the performance of the Fund. The Fund’s past performance does not predict future performance.
Performance of share classes will vary due to differences in sales charges and expenses. Total return with sales charges includes payment of the maximum sales charge of 5.50% for Class A Shares, a contingent deferred sales charge (“CDSC”) of 1.00% for Class C Shares in year one and 12b-1 service fees of 0.25% per year of average daily net assets for Class A Shares and combined Rule 12b-1 distribution and service fees of 1.00% per year of average daily net assets for Class C Shares. Class I Shares do not have a front-end sales charge or a CDSC, nor do they pay distribution or service fees.
Portfolio Commentary
First Trust/Confluence Small Cap Value Fund
Annual Report
October 31, 2021 (Unaudited)
Advisor
First Trust Advisors L.P. (“First Trust” or the “Advisor”) serves as the investment advisor to the First Trust/Confluence Small Cap Value Fund (the “Fund”). First Trust is responsible for the ongoing monitoring of the Fund’s investment portfolio, managing the Fund’s business affairs and providing certain administrative services necessary for the management of the Fund.
Sub-Advisor
Confluence Investment Management LLC, a registered investment advisor (“Confluence” or the “Sub-Advisor”), located in St. Louis, Missouri, serves as the sub-advisor to the Fund. The investment professionals at Confluence have an average of over 20 years of portfolio management experience each. Confluence professionals have invested in a wide range of specialty finance and other financial company securities during various market cycles, working to provide attractive risk-adjusted returns to clients.
Portfolio Management Team
Mark Keller, CFA - Chief Executive Officer and Chief Investment Officer, Confluence
Daniel Winter, CFA - Senior Vice President and Chief Investment Officer - Value Equity, Confluence
Thomas Dugan, CFA - Vice President and Portfolio Manager, Confluence
Commentary
Market Recap
The small capitalization (“cap”) equity markets began the 12-month period ended October 31, 2021 on the heels of an economic recovery following the dramatic coronavirus pandemic-induced shutdowns in the spring of 2020. These shutdowns prompted unprecedented injections of liquidity in the form of monetary and fiscal policy. The start of the period also brought broad optimism that a vaccine would accelerate herd immunity and the return to normal activities. And while this scenario has broadly played out, there have been a few bumps in the road, many related to the strength of demand, have presented challenges in the supply channels, as well as in finding employees. These are generally good problems to have and supply chain disruptions are not atypical coming out of a recession, especially a severe one. These underlying trends provided the tailwind for improving investor sentiment and helped propel the equity markets and, more specifically, the small cap markets to outsized returns as the Russell 2000® Index was up 50.80%, well ahead of its large cap counterpart, the Russell 1000® Index, which was up 43.51% for the same period.
The period was certainly a strong one, but it was also heavily skewed toward the first half of 2021, specifically the first quarter. It was truly a tale of two halves. The first half benefited from the economic recovery, which aided smaller businesses, especially the highly levered and deep cyclical entities, that suffered the most during the shutdowns. There was also a decent-sized component of speculation attributed to the Reddit forum, WallStreetBets, and meme stocks which drove dramatic gains in certain stocks, specifically in retail brick and mortar businesses, such as GameStop Corp. and AMC Entertainment Holding, Inc. The second half of the year was marked by near-term concerns surrounding when the Federal Reserve (the “Fed”) would begin tapering and the legislative challenges over the debt ceiling and ensuing infrastructure and spending bills being debated in Congress. This ultimately stalled investor sentiment.
| | FY’Q1 | FY’Q2 | FY’Q3 | FY’Q4 | Full Fiscal Year |
| Small-Cap Indices | Nov’20-Jan’21 | Feb’21-April’21 | May’21-July’21 | Aug’21-Oct’21 | Nov’20-Oct’21 |
| Russell 2000® Index | 35.15% | 9.55% | (1.53%) | 3.44% | 50.79% |
| Russell 2000® Value Index | 35.53 | 17.44 | (1.19) | 4.46 | 64.29 |
| Russell 2000® Growth Index | 34.83 | 2.23 | (2.01) | 2.50 | 38.45 |
Despite the headwinds in the second half, the 12-month period ended October 31, 2021 still produced exceptional returns for small caps. In fact, it was the best fiscal year on record for the Russell 2000® Value Index over the past 42 years, dating back to 1980 (the data is based on the Fund’s fiscal year of November 1 – October 31).
The strength of the Russell 2000® Value Index, and the large disparity relative to the Russell 2000® Growth Index, was a reversal of the previous fiscal year as sentiment shifted from concerns of shutdowns to notions of grandeur of economic expansion. An economic recovery and expansion benefited the Russell 2000® Value Index as it is far more exposed to the cyclical and commodity-oriented entities that faced severe pressure during the shutdowns, which resulted in a loss of -13.92% for the 2020 fiscal year. Meanwhile, the Russell 2000® Growth Index posted returns of 13.37% for the 2020 fiscal year as it benefited from exposure to the Information Technology and Health Care sectors.
Portfolio Commentary (Continued)
First Trust/Confluence Small Cap Value Fund
Annual Report
October 31, 2021 (Unaudited)
It is also worth noting that smaller businesses generally have less financial flexibility and struggle more going into recessions, which tends to pressure returns relative to their larger cap brethren. As the economy bottoms and begins to recover, the rebound coming out of the recession is generally stronger for small caps. The current cycle is typical; however, the excess liquidity appears to be inducing pockets of excess exuberance, as evidenced by data from the research firm Strategas which reflected that 43% of businesses in the Russell 2000® Index were not generating earnings.
The gravitation toward unprofitable businesses is an indication that investor sentiment remains very optimistic. When investors are optimistic, the focus gets skewed toward upside potential as they base equity values on stories, narratives, and memes, which is an approach that typically favors quantitative, passive, or thematic approaches. On the flip side, during pessimistic times, investors focus on downside protection and value equities based on cash flow, earnings, and assets, which typically favor fundamental and value-based approaches.
The Fund also had a strong fiscal year, up 39.23% (Class I shares), which was also skewed to the first half of the year. In a typical one-year period, such returns would be well regarded, but this is an atypical period as discussed previously and brings into focus our investment philosophy as well as the construction methodology of the indexes.
Performance Analysis
There was an extremely wide dispersion in sector performance as the Energy and Consumer Services sectors posted very strong returns, while the Utilities and Health Care sectors lagged despite positive returns.
The Fund also saw wide dispersion among sector performance with the Information Technology and Industrials sectors leading, while the Energy and Utilities sectors were the laggards (see Portfolio Attribution table).
| | Russell 2000 | Russell 2000 Value | Small Cap Value | Attribution |
| Sector | Wgt | Rtn | Wgt | Rtn | Wgt | GrossRtn | vs. Rsl2000 | vs. Rsl2000V |
| Communication Services | 2.99 | 79.69 | 3.16 | 116.94 | 0.00 | 0.00 | (0.77) | (1.57) |
| Consumer Discretionary | 13.15 | 63.19 | 11.67 | 76.61 | 13.05 | 54.34 | (1.16) | (2.78) |
| Consumer Staples | 3.25 | 37.98 | 3.23 | 43.29 | 6.12 | 22.41 | (1.41) | (1.97) |
| Energy | 3.06 | 180.81 | 5.34 | 180.95 | 2.01 | (1.62) | (4.99) | (7.45) |
| Financial Services | 15.46 | 58.00 | 26.71 | 59.58 | 22.32 | 33.83 | (5.11) | (5.41) |
| Health Care | 20.08 | 18.02 | 8.06 | 37.22 | 5.39 | 33.16 | 6.08 | 0.58 |
| Industrials | 15.33 | 60.39 | 16.39 | 59.92 | 22.93 | 59.65 | 0.33 | (0.55) |
| Information Technology | 13.30 | 57.57 | 5.72 | 68.67 | 8.55 | 70.38 | 0.92 | 0.18 |
| Materials | 4.22 | 62.35 | 5.72 | 74.26 | 2.53 | 39.24 | (0.73) | (1.11) |
| Real Estate | 6.44 | 57.03 | 9.62 | 61.01 | 9.11 | 30.80 | (2.30) | (2.72) |
| Utilities | 2.74 | 20.94 | 4.38 | 20.07 | 5.50 | 8.78 | (1.58) | (1.15) |
| Cash | 0.00 | 0.00 | 0.00 | 0.00 | 2.50 | 0.01 | (1.34) | (1.68) |
Sources: FactSet and Confluence Investment Management. Index Data is based on the respective Exchange-Traded Fund (iShares Russell 2000® and Russell 2000® Value).
While the small cap equity markets cooled in the second half of the 12-month period ended October 31, 2021, the exuberant sentiment of past quarters remains elevated as illustrated by the large percentage of unprofitable businesses. This has resulted in lagging relative returns for the period as our investment philosophy focuses on competitively advantaged, high-quality businesses that generate free cash flow. Hence, we are less exposed to the deep cyclical, commodity-sensitive sectors such as Energy, which has produced outsized returns of 180% year-to-date in the Russell 2000® Index and Russell 2000® Value Index. The Fund was also underweight Financials relative to the Russell 2000® Value Index, primarily banks, which also generated solid returns over the 12-month period ended October 31, 2021, such as the S&P Regional Bank ETF that was up 76%. These two sectors are highly commoditized and/or highly regulated, which, in our opinion, hinders their long-term returns on invested capital and often results in our decision to underweight them in the Fund.
Portfolio Commentary (Continued)
First Trust/Confluence Small Cap Value Fund
Annual Report
October 31, 2021 (Unaudited)
Our philosophy has always been to take a fundamental approach which is focused on understanding a business and what it is worth with the specific goal of identifying competitively advantaged businesses trading at sizable discounts to intrinsic value. The belief is that these types of businesses can not only survive tough economic environments but often enhance their competitive positions. In our opinion, owning a small but diversified collection of these types of businesses and allowing them to compound at above-average rates over long periods provides the highest probability of generating above-average returns. This will result in our portfolios over/under-weighting certain areas of the market that, in our view, either offer more attractive valuations or have superior underlying attributes. Subsequently, our performance in any given time frame will be affected by the market’s perception of the value of these individual businesses compared to the broad market.
This approach is research-intensive and deployed with a bottom-up focus of investing in businesses in a relatively concentrated manner; therefore, performance is ultimately driven by the underlying strength of the holdings of the Fund and less influenced by macro or top-down sector weightings. The emphasis is on owning a diversified portfolio of undervalued businesses with the sector weightings (over/under) considered more of a by-product of what the market is presenting as good investment opportunities.
Market and Fund Outlook
Going forward, the partisan banter in Washington is not new and we would expect a compromise on infrastructure and a spending bill. After all, the debate is about how much to spend, not whether to spend, with infrastructure north of $1.0 trillion and a proposed budget spend of $1.5-$3.5 trillion. These large proposed spending programs combined with the accommodative stance of the Fed have and should continue to provide ample liquidity as the economy transitions from recovery into the current expansion. While we have witnessed a few bumps in the reopening with supply chain disruptions, and would not be surprised to see some additional obstacles, the trend remains positive and investors have responded accordingly with large inflows into the global equity markets over the course of 2021.
We expect fiscal and monetary policy to remain accommodative which will benefit the economy. While the near-term inflationary pressures have drawn a lot of attention, these pressures have historically been present in the recovery stage as supply chains adjust to the added demand. This was even more evident in the most recent recovery as the pandemic and subsequent lockdowns exasperated the recession, while the aggressive fiscal and monetary policies shortened the recovery. We would expect some added volatility as monetary policy begins to revert to “normal,” which introduces the risk of a mistake. Meanwhile, the sizeable equity flows in 2021 reflect investor optimism and the upside potential with less focus on valuations. These types of environments create opportunities for long-term fundamental investors to uncover some great businesses trading at attractive valuations. Of course, we remain focused on our core strength which is analyzing and valuing businesses.
Our task is to construct a portfolio of businesses that have the wherewithal to survive the downside, while providing ample opportunity to participate when the recovery occurs. The current environment has created quite the bifurcation, but rest assured we remain committed to implementing our philosophy and sustaining a consistent risk profile that is aligned with investor objectives and risk tolerance.
First Trust/Confluence Small Cap Value Fund
Understanding Your Fund Expenses
October 31, 2021 (Unaudited)
As a shareholder of the First Trust/Confluence Small Cap Value Fund (the “Fund”), you incur two types of costs: (1) transaction costs, including sales charges (loads) on purchases of Class A Shares and contingent deferred sales charges on the lesser of purchase price or redemption proceeds of Class C Shares; and (2) ongoing costs, including management fees, distribution and/or service (12b-1) fees, if any, and other Fund expenses. This Example is intended to help you understand your ongoing costs of investing in the Fund and to compare these costs with the ongoing costs of investing in other funds.
The Example is based on an investment of $1,000 invested at the beginning of the period and held through the six-month period ended October 31, 2021.
Actual Expenses
The first three columns of the table below provide information about actual account values and actual expenses. You may use the information in these columns, together with the amount you invested, to estimate the expenses that you paid over the period. Simply divide your account value by $1,000 (for example, an $8,600 account value divided by $1,000 = 8.6), then multiply the result by the number in the third column under the heading entitled “Expenses Paid During Period” to estimate the expenses you paid on your account during this six-month period.
Hypothetical Example for Comparison Purposes
The next three columns of the table below provide information about hypothetical account values and hypothetical expenses based on the Fund’s actual expense ratio and an assumed rate of return of 5% per year before expenses, which is not the Fund’s actual return. The hypothetical account values and expenses may not be used to estimate the actual ending account balance or expenses you paid for the period. You may use this information to compare the ongoing costs of investing in the Fund and other funds. To do so, compare this 5% hypothetical example with the 5% hypothetical examples that appear in the shareholder reports of the other funds.
Please note that the expenses shown in the table are meant to highlight your ongoing costs only and do not reflect any transactional costs such as sales charges (loads) or contingent deferred sales charges. Therefore, the hypothetical section of the table is useful in comparing ongoing costs only, and will not help you determine the relative total costs of owning different funds. In addition, if these transactional costs were included, your costs would have been higher.
| | Actual Expenses | | Hypothetical
(5% Return Before Expenses) | |
| | Beginning
Account
Value
5/1/2021 | Ending
Account
Value
10/31/2021 | Expenses Paid
During Period
5/1/2021 -
10/31/2021 (a) | Beginning
Account
Value
5/1/2021 | | Ending
Account
Value
10/31/2021 | Expenses Paid
During Period
5/1/2021 -
10/31/2021 (a) | Annualized
Expense
Ratios (b) |
Class A
| $ 1,000.00 | $ 994.60 | $ 8.04 | $ 1,000.00 | | $ 1,017.14 | $ 8.13 | 1.60% |
Class C
| $ 1,000.00 | $ 991.40 | $ 11.80 | $ 1,000.00 | | $ 1,013.36 | $ 11.93 | 2.35% |
Class I
| $ 1,000.00 | $ 996.40 | $ 6.79 | $ 1,000.00 | | $ 1,018.40 | $ 6.87 | 1.35% |
| (a) | Expenses are equal to the annualized expense ratios as indicated in the table multiplied by the average account value over the period (May 1, 2021 through October 31, 2021), multiplied by 184/365 (to reflect the six-month period). |
| (b) | These expense ratios reflect expense caps. |
First Trust/Confluence Small Cap Value Fund
Portfolio of Investments
October 31, 2021
| Shares | | Description | | Value |
| COMMON STOCKS – 89.7% |
| | | Air Freight & Logistics – 2.4% | | |
| 12,422 | | Forward Air Corp. | | $1,249,156 |
| | | Automobiles – 2.9% | | |
| 22,109 | | Winnebago Industries, Inc. | | 1,496,558 |
| | | Banks – 6.7% | | |
| 35,968 | | Bank of Marin Bancorp. | | 1,370,740 |
| 50,340 | | Veritex Holdings, Inc. | | 2,061,423 |
| | | | | 3,432,163 |
| | | Capital Markets – 3.4% | | |
| 5,506 | | Morningstar, Inc. | | 1,744,026 |
| | | Commercial Services &
Supplies – 2.0% | | |
| 54,292 | | Healthcare Services Group, Inc. | | 1,041,863 |
| | | Diversified Consumer
Services – 2.8% | | |
| 38,100 | | Frontdoor, Inc. (a) | | 1,420,368 |
| | | Diversified Financial Services – 3.2% | | |
| 48,376 | | Cannae Holdings, Inc. (a) | | 1,649,622 |
| | | Electrical Equipment – 5.7% | | |
| 45,757 | | Allied Motion Technologies, Inc. | | 1,608,359 |
| 77,011 | | Thermon Group Holdings, Inc. (a) | | 1,330,750 |
| | | | | 2,939,109 |
| | | Electronic Equipment,
Instruments & Components – 2.9% | | |
| 20,345 | | FARO Technologies, Inc. (a) | | 1,496,782 |
| | | Energy Equipment &
Services – 3.0% | | |
| 59,507 | | Core Laboratories N.V. | | 1,547,777 |
| | | Food Products – 2.7% | | |
| 9,458 | | J&J Snack Foods Corp. | | 1,395,528 |
| | | Gas Utilities – 2.5% | | |
| 28,090 | | Northwest Natural Holding Co. | | 1,266,578 |
| | | Health Care Equipment &
Supplies – 1.5% | | |
| 30,319 | | Natus Medical, Inc. (a) | | 759,491 |
| | | Hotels, Restaurants &
Leisure – 1.0% | | |
| 8,459 | | Nathan’s Famous, Inc. | | 528,688 |
| | | Insurance – 10.0% | | |
| 27,440 | | Brown & Brown, Inc. | | 1,731,738 |
| 67,384 | | BRP Group, Inc., Class A (a) | | 2,459,516 |
| Shares | | Description | | Value |
|
| | | Insurance (Continued) | | |
| 31,019 | | James River Group Holdings Ltd. | | $991,057 |
| | | | | 5,182,311 |
| | | IT Services – 5.0% | | |
| 43,680 | | I3 Verticals, Inc., Class A (a) | | 977,995 |
| 12,865 | | Perficient, Inc. (a) | | 1,590,114 |
| | | | | 2,568,109 |
| | | Leisure Products – 2.2% | | |
| 50,705 | | American Outdoor Brands, Inc. (a) | | 1,155,060 |
| | | Machinery – 11.8% | | |
| 12,781 | | John Bean Technologies Corp. | | 1,888,393 |
| 10,730 | | Kadant, Inc. | | 2,383,347 |
| 7,701 | | RBC Bearings, Inc. (a) | | 1,801,495 |
| | | | | 6,073,235 |
| | | Paper & Forest Products – 2.4% | | |
| 24,710 | | Neenah, Inc. | | 1,248,843 |
| | | Personal Products – 2.8% | | |
| 41,700 | | Edgewell Personal Care Co. | | 1,459,083 |
| | | Real Estate Management &
Development – 2.6% | | |
| 42,955 | | RE/MAX Holdings, Inc., Class A | | 1,366,399 |
| | | Road & Rail – 3.2% | | |
| 97,970 | | Marten Transport Ltd. | | 1,629,241 |
| | | Textiles, Apparel & Luxury
Goods – 4.3% | | |
| 66,441 | | Movado Group, Inc. | | 2,212,485 |
| | | Water Utilities – 2.7% | | |
| 21,513 | | SJW Group | | 1,418,137 |
| | | Total Common Stocks | | 46,280,612 |
| | | (Cost $34,649,358) | | |
| REAL ESTATE INVESTMENT TRUSTS – 6.5% |
| | | Equity Real Estate Investment
Trusts – 6.5% | | |
| 78,908 | | Gladstone Commercial Corp. | | 1,724,929 |
| 43,088 | | Rayonier, Inc. | | 1,608,475 |
| | | Total Real Estate Investment Trusts | | 3,333,404 |
| | | (Cost $2,373,021) | | |
| | | Total Investments – 96.2% | | 49,614,016 |
| | | (Cost $37,022,379) (b) | | |
| | | Net Other Assets and Liabilities – 3.8% | | 1,973,662 |
| | | Net Assets – 100.0% | | $51,587,678 |
Page 8
See Notes to Financial Statements
First Trust/Confluence Small Cap Value Fund
Portfolio of Investments (Continued)
October 31, 2021
|
| (a) | Non-income producing security. |
| (b) | Aggregate cost for federal income tax purposes was $37,049,671. As of October 31, 2021, the aggregate gross unrealized appreciation for all investments in which there was an excess of value over tax cost was $14,640,236 and the aggregate gross unrealized depreciation for all investments in which there was an excess of tax cost over value was $2,075,891. The net unrealized appreciation was $12,564,345. |
Valuation Inputs
A summary of the inputs used to value the Fund’s investments as of October 31, 2021 is as follows (see Note 2A - Portfolio Valuation in the Notes to Financial Statements):
| | Total
Value at
10/31/2021 | Level 1
Quoted
Prices | Level 2
Significant
Observable
Inputs | Level 3
Significant
Unobservable
Inputs |
| Common Stocks* | $ 46,280,612 | $ 46,280,612 | $ — | $ — |
| Real Estate Investment Trusts* | 3,333,404 | 3,333,404 | — | — |
| Total Investments | $ 49,614,016 | $ 49,614,016 | $— | $— |
| * | See Portfolio of Investments for industry breakout. |
See Notes to Financial Statements
Page 9
First Trust/Confluence Small Cap Value Fund
Statement of Assets and Liabilities
October 31, 2021
| ASSETS: | |
Investments, at value
(Cost $37,022,379)
| $ 49,614,016 |
Cash
| 1,851,970 |
| Receivables: | |
Fund shares sold
| 209,167 |
Dividends
| 16,236 |
Prepaid expenses
| 39,210 |
Total Assets
| 51,730,599 |
| LIABILITIES: | |
| Payables: | |
Audit and tax fees
| 42,000 |
Investment advisory fees
| 30,821 |
Transfer agent fees
| 22,009 |
Registration fees
| 11,449 |
Shareholder reporting fees
| 9,138 |
Administrative fees
| 8,901 |
Fund shares redeemed
| 8,635 |
Commitment and administrative agency fees
| 2,369 |
12b-1 distribution and service fees
| 2,206 |
Legal fees
| 1,969 |
Trustees’ fees and expenses
| 1,480 |
Custodian fees
| 1,037 |
Financial reporting fees
| 771 |
Other liabilities
| 136 |
Total Liabilities
| 142,921 |
NET ASSETS
| $51,587,678 |
| NET ASSETS consist of: | |
Paid-in capital
| $ 38,705,163 |
Par value
| 13,529 |
Accumulated distributable earnings (loss)
| 12,868,986 |
NET ASSETS
| $51,587,678 |
| Maximum Offering Price Per Share: | |
| Class A Shares: | |
Net asset value and redemption price per share (Based on net assets of $4,381,465 and 118,102 shares of beneficial interest issued and outstanding)
| $37.10 |
Maximum sales charge (5.50% of offering price)
| 2.16 |
Maximum offering price to public
| $39.26 |
| Class C Shares: | |
Net asset value and redemption price per share (Based on net assets of $1,487,651 and 46,213 shares of beneficial interest issued and outstanding)
| $32.19 |
| Class I Shares: | |
Net asset value and redemption price per share (Based on net assets of $45,718,562 and 1,188,567 shares of beneficial interest issued and outstanding)
| $38.47 |
Page 10
See Notes to Financial Statements
First Trust/Confluence Small Cap Value Fund
Statement of Operations
For the Year Ended October 31, 2021
| INVESTMENT INCOME: | |
Dividends (net of foreign withholding tax of $178)
| $ 565,634 |
Interest
| 78 |
Other
| 17 |
Total investment income
| 565,729 |
| EXPENSES: | |
Investment advisory fees
| 495,514 |
Transfer agent fees
| 86,241 |
Registration fees
| 60,634 |
Administrative fees
| 52,502 |
Audit and tax fees
| 52,155 |
Shareholder reporting fees
| 37,055 |
Commitment and administrative agency fees
| 35,256 |
| 12b-1 distribution and/or service fees: | |
Class A
| 10,578 |
Class C
| 19,166 |
Trustees’ fees and expenses
| 15,206 |
Financial reporting fees
| 9,250 |
Custodian fees
| 8,898 |
Legal fees
| 6,206 |
Listing expense
| 2,100 |
Other
| 1,600 |
Total expenses
| 892,361 |
Fees waived and expenses reimbursed by the investment advisor
| (193,717) |
Net expenses
| 698,644 |
NET INVESTMENT INCOME (LOSS)
| (132,915) |
| NET REALIZED AND UNREALIZED GAIN (LOSS): | |
Net realized gain (loss) on investments
| 1,634,783 |
Net change in unrealized appreciation (depreciation) on investments
| 12,511,394 |
NET REALIZED AND UNREALIZED GAIN (LOSS)
| 14,146,177 |
NET INCREASE (DECREASE) IN NET ASSETS RESULTING FROM OPERATIONS
| $ 14,013,262 |
See Notes to Financial Statements
Page 11
First Trust/Confluence Small Cap Value Fund
Statements of Changes in Net Assets
| | Year
Ended
10/31/2021 | | Year
Ended
10/31/2020 |
| OPERATIONS: | | | |
Net investment income (loss)
| $ (132,915) | | $ (64,512) |
Net realized gain (loss)
| 1,634,783 | | (1,090,820) |
Net change in unrealized appreciation (depreciation)
| 12,511,394 | | (1,923,083) |
Net increase (decrease) in net assets resulting from operations
| 14,013,262 | | (3,078,415) |
| CAPITAL TRANSACTIONS: | | | |
Proceeds from shares sold
| 14,320,289 | | 24,850,336 |
Cost of shares redeemed
| (11,369,746) | | (14,178,172) |
Net increase (decrease) in net assets resulting from capital transactions
| 2,950,543 | | 10,672,164 |
Total increase (decrease) in net assets
| 16,963,805 | | 7,593,749 |
| NET ASSETS: | | | |
Beginning of period
| 34,623,873 | | 27,030,124 |
End of period
| $51,587,678 | | $34,623,873 |
Page 12
See Notes to Financial Statements
First Trust/Confluence Small Cap Value Fund
Financial Highlights
For a Share outstanding throughout each period
| Class A Shares | Year Ended October 31, |
| 2021 | | 2020 | | 2019 | | 2018 | | 2017 |
Net asset value, beginning of period
| $ 26.75 | | $ 30.95 | | $ 33.98 | | $ 34.48 | | $ 27.81 |
| Income from investment operations: | | | | | | | | | |
Net investment income (loss) (a)
| (0.16) | | (0.10) | | (0.08) | | (0.20) | | (0.16) |
Net realized and unrealized gain (loss)
| 10.51 | | (4.10) | | 0.83 | | 1.63 | | 7.20 |
Total from investment operations
| 10.35 | | (4.20) | | 0.75 | | 1.43 | | 7.04 |
| Distributions paid to shareholders from: | | | | | | | | | |
Net realized gain
| — | | — | | (3.78) | | (1.93) | | (0.37) |
Net asset value, end of period
| $37.10 | | $26.75 | | $30.95 | | $33.98 | | $34.48 |
Total return (b)
| 38.69% | | (13.57)% | | 4.77% | | 4.16% | | 25.53% |
| Ratios to average net assets/supplemental data: | | | | | | | | | |
Net assets, end of period (in 000’s)
| $ 4,381 | | $ 3,326 | | $ 8,612 | | $ 6,692 | | $ 5,656 |
Ratio of total expenses to average net assets
| 2.41% | | 2.69% | | 2.66% | | 2.71% | | 3.56% |
Ratio of net expenses to average net assets
| 1.60% | | 1.60% | | 1.60% | | 1.60% | | 1.60% |
Ratio of net investment income (loss) to average net assets
| (0.45)% | | (0.34)% | | (0.28)% | | (0.56)% | | (0.50)% |
Portfolio turnover rate
| 16% | | 18% | | 25% | | 35% | | 28% |
| (a) | Based on average shares outstanding. |
| (b) | Assumes reinvestment of all distributions for the period and does not include payment of the maximum sales charge of 5.50% or contingent deferred sales charge (CDSC). On purchases of $1 million or more, a CDSC of 1% may be imposed on certain redemptions made within twelve months of purchase. If the sales charges were included, total returns would be lower. These returns include Rule 12b-1 service fees of 0.25% and do not reflect the deduction of taxes that a shareholder would pay on Fund distributions or the redemption of Fund shares. The total returns would have been lower if certain fees had not been waived and expenses reimbursed by the investment advisor. Total return is calculated for the time period presented and is not annualized for periods of less than one year. |
See Notes to Financial Statements
Page 13
First Trust/Confluence Small Cap Value Fund
Financial Highlights (Continued)
For a Share outstanding throughout each period
| Class C Shares | Year Ended October 31, |
| 2021 | | 2020 | | 2019 | | 2018 | | 2017 |
Net asset value, beginning of period
| $ 23.29 | | $ 27.30 | | $ 30.61 | | $ 31.47 | | $ 25.61 |
| Income from investment operations: | | | | | | | | | |
Net investment income (loss) (a)
| (0.37) | | (0.26) | | (0.27) | | (0.42) | | (0.36) |
Net realized and unrealized gain (loss)
| 9.27 | | (3.75) | | 0.74 | | 1.49 | | 6.59 |
Total from investment operations
| 8.90 | | (4.01) | | 0.47 | | 1.07 | | 6.23 |
| Distributions paid to shareholders from: | | | | | | | | | |
Net realized gain
| — | | — | | (3.78) | | (1.93) | | (0.37) |
Net asset value, end of period
| $32.19 | | $23.29 | | $27.30 | | $30.61 | | $31.47 |
Total return (b)
| 38.21% | | (14.65)% | | 4.33% | | 3.34% | | 24.58% |
| Ratios to average net assets/supplemental data: | | | | | | | | | |
Net assets, end of period (in 000’s)
| $ 1,488 | | $ 1,811 | | $ 2,671 | | $ 3,621 | | $ 3,962 |
Ratio of total expenses to average net assets
| 3.76% | | 4.06% | | 3.87% | | 3.69% | | 4.45% |
Ratio of net expenses to average net assets
| 2.35% | | 2.35% | | 2.35% | | 2.35% | | 2.35% |
Ratio of net investment income (loss) to average net assets
| (1.19)% | | (1.05)% | | (1.03)% | | (1.31)% | | (1.25)% |
Portfolio turnover rate
| 16% | | 18% | | 25% | | 35% | | 28% |
| (a) | Based on average shares outstanding. |
| (b) | Assumes reinvestment of all distributions for the period and does not include payment of the maximum CDSC of 1%, charged on certain redemptions made within one year of purchase. If the sales charge was included, total returns would be lower. These returns include combined Rule 12b-1 distribution and service fees of 1% and do not reflect the deduction of taxes that a shareholder would pay on Fund distributions or the redemption of Fund shares. The total returns would have been lower if certain fees had not been waived and expenses reimbursed by the investment advisor. Total return is calculated for the time period presented and is not annualized for periods of less than one year. |
Page 14
See Notes to Financial Statements
First Trust/Confluence Small Cap Value Fund
Financial Highlights (Continued)
For a Share outstanding throughout each period
| Class I Shares | Year Ended October 31, |
| 2021 | | 2020 | | 2019 | | 2018 | | 2017 |
Net asset value, beginning of period
| $ 27.63 | | $ 31.76 | | $ 34.65 | | $ 35.07 | | $ 28.40 |
| Income from investment operations: | | | | | | | | | |
Net investment income (loss) (a)
| (0.08) | | (0.03) | | (0.01) | | (0.11) | | (0.09) |
Net realized and unrealized gain (loss)
| 10.92 | | (4.10) | | 0.90 | | 1.62 | | 7.13 |
Total from investment operations
| 10.84 | | (4.13) | | 0.89 | | 1.51 | | 7.04 |
| Distributions paid to shareholders from: | | | | | | | | | |
Net realized gain
| — | | — | | (3.78) | | (1.93) | | (0.37) |
Net asset value, end of period
| $38.47 | | $27.63 | | $31.76 | | $34.65 | | $35.07 |
Total return (b)
| 39.23% | | (13.00)% | | 5.14% | | 4.30% | | 24.99% |
| Ratios to average net assets/supplemental data: | | | | | | | | | |
Net assets, end of period (in 000’s)
| $ 45,719 | | $ 29,487 | | $ 15,747 | | $ 11,302 | | $ 7,273 |
Ratio of total expenses to average net assets
| 1.65% | | 1.96% | | 2.22% | | 2.33% | | 3.22% |
Ratio of net expenses to average net assets
| 1.35% | | 1.35% | | 1.35% | | 1.35% | | 1.35% |
Ratio of net investment income (loss) to average net assets
| (0.21)% | | (0.11)% | | (0.02)% | | (0.29)% | | (0.28)% |
Portfolio turnover rate
| 16% | | 18% | | 25% | | 35% | | 28% |
| (a) | Based on average shares outstanding. |
| (b) | Assumes reinvestment of all distributions for the period. These returns do not reflect the deduction of taxes that a shareholder would pay on Fund distributions or the redemption of Fund shares. The total returns would have been lower if certain fees had not been waived and expenses reimbursed by the investment advisor. Total return is calculated for the time period presented and is not annualized for periods of less than one year. |
See Notes to Financial Statements
Page 15
Notes to Financial Statements
First Trust/Confluence Small Cap Value Fund
October 31, 2021
1. Organization
First Trust/Confluence Small Cap Value Fund (the “Fund”) is a series of the First Trust Series Fund (the “Trust”), a Massachusetts business trust organized on July 9, 2010, and is registered as a diversified open-end management investment company with the Securities and Exchange Commission under the Investment Company Act of 1940, as amended (the “1940 Act”). The Fund offers three classes of shares: Class A, Class C and Class I. Each class represents an interest in the same portfolio of investments but with a different combination of sales charges, distribution and service (12b-1) fees, eligibility requirements and other features.
The Fund’s investment objective seeks to provide long-term capital appreciation. The Fund seeks to achieve its investment objective by investing, under normal market conditions, at least 80% of its net assets (including investment borrowings) in equity securities of U.S. listed companies with small market capitalizations at the time of investment that Confluence Investment Management LLC (“Confluence” or the “Sub-Advisor”) believes have produced solid returns over extended periods of time. There can be no assurance that the Fund will achieve its investment objective. The Fund may not be appropriate for all investors.
2. Significant Accounting Policies
The Fund is considered an investment company and follows accounting and reporting guidance under Financial Accounting Standards Board Accounting Standards Codification Topic 946, “Financial Services-Investment Companies.” The following is a summary of significant accounting policies consistently followed by the Fund in the preparation of the financial statements. The preparation of the financial statements in accordance with accounting principles generally accepted in the United States of America (“U.S. GAAP”) requires management to make estimates and assumptions that affect the reported amounts and disclosures in the financial statements. Actual results could differ from those estimates.
A. Portfolio Valuation
The net asset value (“NAV”) of each class of shares of the Fund is determined daily as of the close of regular trading on the New York Stock Exchange (“NYSE”), normally 4:00 p.m. Eastern time, on each day the NYSE is open for trading. If the NYSE closes early on a valuation day, the NAV is determined as of that time. The NAV for each class is calculated by dividing the value of the Fund’s total assets attributable to such class (including accrued interest and dividends), less all liabilities attributable to such class (including accrued expenses, dividends declared but unpaid and any borrowings of the Fund), by the total number of shares of the class outstanding. Differences in NAV of each class of the Fund’s shares are generally expected to be due to the daily expense accruals of the specified distribution and service (12b-1) fees and transfer agency costs applicable to such class of shares and the resulting differential in the dividends that may be paid on each class of shares.
The Fund’s investments are valued daily at market value or, in the absence of market value with respect to any portfolio securities, at fair value. Market value prices represent last sale or official closing prices from a national or foreign exchange (i.e., a regulated market) and are primarily obtained from third-party pricing services. Fair value prices represent any prices not considered market value prices and are either obtained from a third-party pricing service or are determined by the Pricing Committee of the Trust’s investment advisor, First Trust Advisors L.P. (“First Trust” or the “Advisor”), in accordance with valuation procedures adopted by the Trust’s Board of Trustees, and in accordance with provisions of the 1940 Act. Investments valued by the Advisor’s Pricing Committee, if any, are footnoted as such in the footnotes to the Portfolio of Investments. The Fund’s investments are valued as follows:
Common stocks, real estate investment trusts (“REITs”), and other equity securities listed on any national or foreign exchange (excluding The Nasdaq Stock Market LLC (“Nasdaq”) and the London Stock Exchange Alternative Investment Market (“AIM”)) are valued at the last sale price on the exchange on which they are principally traded or, for Nasdaq and AIM securities, the official closing price. Securities traded on more than one securities exchange are valued at the last sale price or official closing price, as applicable, at the close of the securities exchange representing the principal market for such securities.
Securities traded in an over-the-counter market are fair valued at the mean of their most recent bid and asked price, if available, and otherwise at their closing bid price.
Certain securities may not be able to be priced by pre-established pricing methods. Such securities may be valued by the Trust’s Board of Trustees or its delegate, the Advisor’s Pricing Committee, at fair value. These securities generally include, but are not limited to, restricted securities (securities which may not be publicly sold without registration under the Securities Act of 1933, as amended) for which a third-party pricing service is unable to provide a market price; securities whose trading has been formally suspended; a security whose market or fair value price is not available from a pre-established pricing source; a security with respect to which an event has occurred that is likely to materially affect the value of the security after the market has closed but before the calculation of the Fund’s NAV or make it difficult or impossible to obtain a reliable market quotation; and a security whose price, as provided by the third-party pricing service, does not reflect the security’s fair value. As a general principle, the current fair value of a security would appear to be the amount which the owner might reasonably expect to receive for the security upon its current sale. When fair value
Notes to Financial Statements (Continued)
First Trust/Confluence Small Cap Value Fund
October 31, 2021
prices are used, generally they will differ from market quotations or official closing prices on the applicable exchanges. A variety of factors may be considered in determining the fair value of such securities, including, but not limited to, the following:
| 1) | the type of security; |
| 2) | the size of the holding; |
| 3) | the initial cost of the security; |
| 4) | transactions in comparable securities; |
| 5) | price quotes from dealers and/or third-party pricing services; |
| 6) | relationships among various securities; |
| 7) | information obtained by contacting the issuer, analysts, or the appropriate stock exchange; |
| 8) | an analysis of the issuer’s financial statements; and |
| 9) | the existence of merger proposals or tender offers that might affect the value of the security. |
The Fund is subject to fair value accounting standards that define fair value, establish the framework for measuring fair value and provide a three-level hierarchy for fair valuation based upon the inputs to the valuation as of the measurement date. The three levels of the fair value hierarchy are as follows:
| • | Level 1 – Level 1 inputs are quoted prices in active markets for identical investments. An active market is a market in which transactions for the investment occur with sufficient frequency and volume to provide pricing information on an ongoing basis. |
| • | Level 2 – Level 2 inputs are observable inputs, either directly or indirectly, and include the following: |
| o | Quoted prices for similar investments in active markets. |
| o | Quoted prices for identical or similar investments in markets that are non-active. A non-active market is a market where there are few transactions for the investment, the prices are not current, or price quotations vary substantially either over time or among market makers, or in which little information is released publicly. |
| o | Inputs other than quoted prices that are observable for the investment (for example, interest rates and yield curves observable at commonly quoted intervals, volatilities, prepayment speeds, loss severities, credit risks, and default rates). |
| o | Inputs that are derived principally from or corroborated by observable market data by correlation or other means. |
| • | Level 3 – Level 3 inputs are unobservable inputs. Unobservable inputs may reflect the reporting entity’s own assumptions about the assumptions that market participants would use in pricing the investment. |
The inputs or methodologies used for valuing investments are not necessarily an indication of the risk associated with investing in those investments. A summary of the inputs used to value the Fund’s investments as of October 31, 2021, is included with the Fund’s Portfolio of Investments.
B. Securities Transactions and Investment Income
Securities transactions are recorded as of the trade date. Realized gains and losses from securities transactions are recorded on the identified cost basis. Dividend income is recorded on the ex-dividend date. Interest income, if any, is recorded daily on the accrual basis, including the amortization of premiums and the accretion of discounts. Income is allocated on a pro rata basis to each class of shares.
The Fund may hold REITs. Distributions from such investments may be comprised of return of capital, capital gains and income. The actual character of amounts received during the year is not known until after the REITs’ fiscal year end. The Fund records the character of distributions received from REITs during the year based on estimates available. The characterization of distributions received by the Fund may be subsequently revised based on information received from the REITs after their tax reporting periods conclude.
C. Dividends and Distributions to Shareholders
The Fund will distribute to holders of its shares semi-annual dividends of all or a portion of its net income. Distributions of any net capital gains earned by the Fund will be distributed at least annually. Distributions will automatically be reinvested into additional Fund shares unless cash distributions are elected by the shareholder.
Distributions from net investment income and realized capital gains are determined in accordance with federal income tax regulations, which may differ from U.S. GAAP. Certain capital accounts in the financial statements are periodically adjusted for permanent differences in order to reflect their tax character. These permanent differences are primarily due to the varying treatment of income and
Notes to Financial Statements (Continued)
First Trust/Confluence Small Cap Value Fund
October 31, 2021
gain/loss on portfolio securities held by the Fund and have no impact on net assets or NAV per share. Temporary differences, which arise from recognizing certain items of income, expense and gain/loss in different periods for financial statement and tax purposes, will reverse at some point in the future. Permanent differences incurred during the fiscal year ended October 31, 2021, resulting in book and tax accounting differences, have been reclassified at year end to reflect an increase in accumulated net investment income (loss) of $87,707 and a decrease in accumulated net realized gain (loss) of $87,707. Accumulated distributable earnings (loss) consists of accumulated net investment income (loss), accumulated net realized gain (loss) on investments, and unrealized appreciation (depreciation) on investments. Net assets were not affected by these reclassifications.
The tax character of distributions paid by the Fund during the fiscal years ended October 31, 2021 and 2020, was as follows:
| Distributions paid from: | 2021 | 2020 |
Ordinary income
| $— | $— |
Capital gains
| — | — |
Return of capital
| — | — |
As of October 31, 2021, the components of distributable earnings and net assets on a tax basis were as follows:
Undistributed ordinary income
| $— |
Undistributed capital gains
| 407,103 |
Total undistributed earnings
| 407,103 |
Accumulated capital and other losses
| (102,462) |
Net unrealized appreciation (depreciation)
| 12,591,637 |
Total accumulated earnings (losses)
| 12,896,278 |
Other
| (27,292) |
Paid-in capital
| 38,718,692 |
Total net assets
| $51,587,678 |
D. Income Taxes
The Fund intends to continue to qualify as a regulated investment company by complying with the requirements under Subchapter M of the Internal Revenue Code of 1986, as amended, which includes distributing substantially all of its net investment income and net realized gains to shareholders. Accordingly, no provision has been made for federal and state income taxes. However, due to the timing and amount of distributions, the Fund may be subject to an excise tax of 4% of the amount by which approximately 98% of the Fund’s taxable income exceeds the distributions from such taxable income for the calendar year.
The Fund intends to utilize provisions of the federal income tax laws, which allow it to carry a realized capital loss forward indefinitely following the year of the loss and offset such loss against any future realized capital gains. The Fund is subject to certain limitations under U.S. tax rules on the use of capital loss carryforwards and net unrealized built-in losses. These limitations apply when there has been a 50% change in ownership. At October 31, 2021, the Fund had no non-expiring net capital loss carryforwards for federal income tax purposes.
Certain losses realized during the current fiscal year may be deferred and treated as occurring the first day of the following fiscal year for federal income tax purposes. For the fiscal year ended October 31, 2021, the Fund incurred and elected to defer net ordinary losses of $102,462.
The Fund is subject to accounting standards that establish a minimum threshold for recognizing, and a system for measuring, the benefits of a tax position taken or expected to be taken in a tax return. Taxable years ended 2018, 2019, 2020, and 2021 remain open to federal and state audit. As of October 31, 2021, management has evaluated the application of these standards to the Fund and has determined that no provision for income tax is required in the Fund’s financial statements for uncertain tax positions.
E. Expenses
The Fund will pay all expenses directly related to its operations. Expenses of the Fund are allocated on a pro rata basis to each class of shares, except for distribution and service (12b-1) fees and incremental transfer agency costs which are unique to each class of shares.
Notes to Financial Statements (Continued)
First Trust/Confluence Small Cap Value Fund
October 31, 2021
3. Investment Advisory Fee, Affiliated Transactions and Other Fee Arrangements
First Trust, the investment advisor to the Fund, is a limited partnership with one limited partner, Grace Partners of DuPage L.P., and one general partner, The Charger Corporation. The Charger Corporation is an Illinois corporation controlled by James A. Bowen, Chief Executive Officer of First Trust. First Trust is responsible for the ongoing monitoring of the Fund’s investment portfolio, managing the Fund’s business affairs and providing certain administrative services necessary for the management of the Fund. For these services, First Trust is entitled to a monthly fee calculated at an annual rate of 1.00% of the Fund’s average daily net assets. First Trust also provides fund reporting services to the Fund for a flat annual fee in the amount of $9,250.
Confluence serves as the Fund’s sub-advisor and manages the Fund’s portfolio subject to First Trust’s supervision. The Sub-Advisor receives a monthly sub-advisory fee calculated at an annual rate of 0.50% of the Fund’s average daily net assets that is paid by First Trust out of its investment advisory fee.
First Trust and Confluence have agreed to waive fees and/or reimburse Fund expenses to the extent necessary to prevent the total annual fund operating expenses (excluding 12b-1 distribution and service fees, interest expenses, taxes, acquired fund fees and expenses, fees incurred in acquiring and disposing of portfolio securities and extraordinary expenses) from exceeding 1.35% of average daily net assets of any class of shares of the Fund (the “Expense Cap”) until February 28, 2023 and then from exceeding 1.70% from March 1, 2023 to February 28, 2032 (the “Expense Cap Termination Date”). Expenses borne and fees waived by First Trust and Confluence are subject to recovery on the Fund’s class level, if applicable, by First Trust and Confluence for up to three years from the date the fee or expense was incurred, but no reimbursement payment will be made by the Fund at any time if it would result in the Fund’s expenses exceeding (i) the Expense Cap in place for the most recent fiscal year for which such expense limitation was in place; (ii) the Expense Cap in place at the time the fees were waived; or (iii) the current Expense Cap. Expense limitations may be terminated or modified prior to their expiration only with the approval of the Board of Trustees of the Trust. These amounts would be included in “Expenses previously waived or reimbursed” on the Statement of Operations. The advisory fee waiver and expense reimbursement for the fiscal year ended October 31, 2021 and the expenses borne by First Trust and Confluence subject to recovery were as follows:
| | | | | Expenses Subject to Recovery | | |
Advisory Fee
Waiver | | Expense
Reimbursement | | Year Ended
October 31, 2019 | | Year Ended
October 31, 2020 | | Year Ended
October 31, 2021 | | Total |
| $ 193,717 | | $ — | | $ 253,404 | | $ 234,495 | | $ 193,717 | | $ 681,616 |
Brown Brothers Harriman & Co. (“BBH”) serves as the Fund’s administrator, fund accountant and custodian in accordance with certain fee arrangements. As administrator and fund accountant, BBH is responsible for providing certain administrative and accounting services to the Fund, including maintaining the Fund’s books of account, records of the Fund’s securities transactions, and certain other books and records. As custodian, BBH is responsible for custody of the Fund’s assets.
BNY Mellon Investment Servicing (US) Inc. (“BNYM IS”) serves as the Fund’s transfer agent in accordance with certain fee arrangements. As transfer agent, BNYM IS is responsible for maintaining shareholder records for the Fund. BNYM IS is a subsidiary of The Bank of New York Mellon Corporation, a financial holding company.
Each Trustee who is not an officer or employee of First Trust, any sub-advisor or any of their affiliates (“Independent Trustees”) is paid a fixed annual retainer that is allocated equally among each fund in the First Trust Fund Complex. Each Independent Trustee is also paid an annual per fund fee that varies based on whether the fund is a closed-end or other actively managed fund, a defined-outcome fund or an index fund.
Additionally, the Lead Independent Trustee and the Chairs of the Audit Committee, Nominating and Governance Committee and Valuation Committee are paid annual fees to serve in such capacities, with such compensation allocated pro rata among each fund in the First Trust Fund Complex based on net assets. Independent Trustees are reimbursed for travel and out-of-pocket expenses in connection with all meetings. The Lead Independent Trustee and Committee Chairs rotate every three years. The officers and “Interested” Trustee receive no compensation from the Trust for acting in such capacities.
Notes to Financial Statements (Continued)
First Trust/Confluence Small Cap Value Fund
October 31, 2021
4. Capital Share Transactions
Capital transactions were as follows:
| | Year Ended
October 31, 2021 | | Year Ended
October 31, 2020 |
| | Shares | | Value | | Shares | | Value |
| Sales: | | | | | | | |
| Class A | 41,119 | | $ 1,465,200 | | 26,001 | | $ 761,076 |
| Class C | 10,247 | | 299,799 | | 23,357 | | 553,787 |
| Class I | 347,663 | | 12,555,290 | | 839,947 | | 23,535,473 |
| Total Sales | 399,029 | | $ 14,320,289 | | 889,305 | | $ 24,850,336 |
| Dividend Reinvestment: | | | | | | | |
| Class A | — | | $ — | | — | | $ — |
| Class C | — | | — | | — | | — |
| Class I | — | | — | | — | | — |
| Total Dividend Reinvestment | — | | $ — | | — | | $ — |
| Redemptions: | | | | | | | |
| Class A | (47,385) | | $ (1,629,744) | | (179,871) | | $ (5,399,489) |
| Class C | (41,768) | | (1,280,146) | | (43,480) | | (1,082,702) |
| Class I | (226,380) | | (8,459,856) | | (268,391) | | (7,695,981) |
| Total Redemptions | (315,533) | | $ (11,369,746) | | (491,742) | | $ (14,178,172) |
5. Purchases and Sales of Securities
The cost of purchases and proceeds from sales of securities, excluding short-term investments, for the fiscal year ended October 31, 2021, were $8,748,044 and $7,632,733, respectively.
6. Distribution and Service Plan
The Board of Trustees adopted a Distribution and Service Plan pursuant to Rule 12b-1 under the 1940 Act. In accordance with the Rule 12b-1 plan, the share classes of the Fund are authorized to pay an amount up to 0.25% and 1.00% of their average daily net assets each year for Class A and Class C, respectively, to reimburse First Trust Portfolios L.P. (“FTP”), the distributor of the Fund, for amounts expended to finance activities primarily intended to result in the sale of Fund shares or the provision of investor services. FTP may also use this amount to compensate securities dealers or other persons for providing distribution assistance, including broker-dealer and shareholder support and educational and promotional services. Class I shares have no 12b-1 fees.
7. Borrowings
The Trust, on behalf of the Fund, along with First Trust Exchange-Traded Fund III and First Trust Exchange-Traded Fund IV have a $355 million Credit Agreement with The Bank of Nova Scotia (“Scotia”) as administrative agent for a group of lenders. Between March 3, 2021 and October 28, 2021 the commitment amount was $330 million, and prior to March 3, 2021, the commitment amount was $410 million. Scotia charges a commitment fee of 0.25% of the daily amount of the excess of the commitment amount over the outstanding principal balance of the loans, and an agency fee. First Trust allocates the commitment fee and agency fee amongst the funds that have access to the credit line. To the extent that the Fund accesses the credit line, there would also be an interest fee charged. The Fund did not have any borrowings outstanding during the fiscal year ended October 31, 2021.
8. Indemnification
The Fund has a variety of indemnification obligations under contracts with its service providers. The Fund’s maximum exposure under these arrangements is unknown. However, the Fund has not had prior claims or losses pursuant to these contracts and expects the risk of loss to be remote.
Notes to Financial Statements (Continued)
First Trust/Confluence Small Cap Value Fund
October 31, 2021
9. Subsequent Events
Management has evaluated the impact of all subsequent events to the Fund through the date the financial statements were issued, and has determined that there were no subsequent events requiring recognition or disclosure in the financial statements that have not already been disclosed.
Report of Independent Registered Public Accounting Firm
To the Shareholders and the Board of Trustees of First Trust Series Fund:
Opinion on the Financial Statements and Financial Highlights
We have audited the accompanying statement of assets and liabilities of First Trust/Confluence Small Cap Value Fund (the “Fund”), a series of the First Trust Series Fund, including the portfolio of investments, as of October 31, 2021, the related statement of operations for the year then ended, the statements of changes in net assets for each of the two years in the period then ended, the financial highlights for each of the five years in the period then ended, and the related notes. In our opinion, the financial statements and financial highlights present fairly, in all material respects, the financial position of the Fund as of October 31, 2021, the results of its operations for the year then ended, the changes in its net assets for each of the two years in the period then ended, and the financial highlights for each of the five years in the period then ended in conformity with accounting principles generally accepted in the United States of America.
Basis for Opinion
These financial statements and financial highlights are the responsibility of the Fund’s management. Our responsibility is to express an opinion on the Fund’s financial statements and financial highlights based on our audits. We are a public accounting firm registered with the Public Company Accounting Oversight Board (United States) (PCAOB) and are required to be independent with respect to the Fund in accordance with the U.S. federal securities laws and the applicable rules and regulations of the Securities and Exchange Commission and the PCAOB.
We conducted our audits in accordance with the standards of the PCAOB. Those standards require that we plan and perform the audit to obtain reasonable assurance about whether the financial statements and financial highlights are free of material misstatement, whether due to error or fraud. The Fund is not required to have, nor were we engaged to perform, an audit of its internal control over financial reporting. As part of our audits we are required to obtain an understanding of internal control over financial reporting but not for the purpose of expressing an opinion on the effectiveness of the Fund’s internal control over financial reporting. Accordingly, we express no such opinion.
Our audits included performing procedures to assess the risks of material misstatement of the financial statements and financial highlights, whether due to error or fraud, and performing procedures that respond to those risks. Such procedures included examining, on a test basis, evidence regarding the amounts and disclosures in the financial statements and financial highlights. Our audits also included evaluating the accounting principles used and significant estimates made by management, as well as evaluating the overall presentation of the financial statements and financial highlights. Our procedures included confirmation of securities owned as of October 31, 2021, by correspondence with the custodian and brokers. We believe that our audits provide a reasonable basis for our opinion.
Chicago, Illinois
December 17, 2021
We have served as the auditor of one or more First Trust investment companies since 2001.
Additional Information
First Trust/Confluence Small Cap Value Fund
October 31, 2021 (Unaudited)
Proxy Voting Policies and Procedures
A description of the policies and procedures that the Trust uses to determine how to vote proxies and information on how the Fund voted proxies relating to portfolio securities during the most recent 12-month period ended June 30 is available (1) without charge, upon request, by calling (800) 988-5891; (2) on the Fund’s website at www.ftportfolios.com; and (3) on the Securities and Exchange Commission’s (“SEC”) website at www.sec.gov.
Portfolio Holdings
The Fund files portfolio holdings information for each month in a fiscal quarter within 60 days after the end of the relevant fiscal quarter on Form N-PORT. Portfolio holdings information for the third month of each fiscal quarter will be publicly available on the SEC’s website at www.sec.gov. The Fund’s complete schedule of portfolio holdings for the second and fourth quarters of each fiscal year is included in the semi-annual and annual reports to shareholders, respectively, and is filed with the SEC on Form N-CSR. The semi-annual and annual report for the Fund is available to investors within 60 days after the period to which it relates. The Fund’s Forms N-PORT and Forms N-CSR are available on the SEC’s website listed above.
Risk Considerations
Risks are inherent in all investing. Certain general risks that may be applicable to a Fund are identified below, but not all of the material risks relevant to each Fund are included in this report and not all of the risks below apply to each Fund. The material risks of investing in each Fund are spelled out in its prospectus, statement of additional information and other regulatory filings. Before investing, you should consider each Fund’s investment objective, risks, charges and expenses, and read each Fund’s prospectus and statement of additional information carefully. You can download each Fund’s prospectus at www.ftportfolios.com or contact First Trust Portfolios L.P. at (800) 621-1675 to request a prospectus, which contains this and other information about each Fund.
Concentration Risk. To the extent that a fund is able to invest a significant percentage of its assets in a single asset class or the securities of issuers within the same country, state, region, industry or sector, an adverse economic, business or political development may affect the value of the fund’s investments more than if the fund were more broadly diversified. A fund that tracks an index will be concentrated to the extent the fund’s corresponding index is concentrated. A concentration makes a fund more susceptible to any single occurrence and may subject the fund to greater market risk than a fund that is more broadly diversified.
Credit Risk. Credit risk is the risk that an issuer of a security will be unable or unwilling to make dividend, interest and/or principal payments when due and the related risk that the value of a security may decline because of concerns about the issuer’s ability to make such payments.
Cyber Security Risk. The funds are susceptible to potential operational risks through breaches in cyber security. A breach in cyber security refers to both intentional and unintentional events that may cause a fund to lose proprietary information, suffer data corruption or lose operational capacity. Such events could cause a fund to incur regulatory penalties, reputational damage, additional compliance costs associated with corrective measures and/or financial loss. In addition, cyber security breaches of a fund’s third-party service providers, such as its administrator, transfer agent, custodian, or sub-advisor, as applicable, or issuers in which the fund invests, can also subject a fund to many of the same risks associated with direct cyber security breaches.
Derivatives Risk. To the extent a fund uses derivative instruments such as futures contracts, options contracts and swaps, the fund may experience losses because of adverse movements in the price or value of the underlying asset, index or rate, which may be magnified by certain features of the derivative. These risks are heightened when a fund’s portfolio managers use derivatives to enhance the fund’s return or as a substitute for a position or security, rather than solely to hedge (or offset) the risk of a position or security held by the fund.
Equity Securities Risk. To the extent a fund invests in equity securities, the value of the fund’s shares will fluctuate with changes in the value of the equity securities. Equity securities prices fluctuate for several reasons, including changes in investors’ perceptions of the financial condition of an issuer or the general condition of the relevant stock market, such as market volatility, or when political or economic events affecting the issuers occur. In addition, common stock prices may be particularly sensitive to rising interest rates, as the cost of capital rises and borrowing costs increase. Equity securities may decline significantly in price over short or extended periods of time, and such declines may occur in the equity market as a whole, or they may occur in only a particular country, company, industry or sector of the market.
ETF Risk. The shares of an ETF trade like common stock and represent an interest in a portfolio of securities. The risks of owning an ETF generally reflect the risks of owning the underlying securities, although lack of liquidity in an ETF could result in it being more volatile and ETFs have management fees that increase their costs. Shares of an ETF trade on an exchange at market prices rather than
Additional Information (Continued)
First Trust/Confluence Small Cap Value Fund
October 31, 2021 (Unaudited)
net asset value, which may cause the shares to trade at a price greater than net asset value (premium) or less than net asset value (discount). In times of market stress, decisions by market makers to reduce or step away from their role of providing a market for an ETF’s shares, or decisions by an ETF’s authorized participants that they are unable or unwilling to proceed with creation and/or redemption orders of an ETF’s shares, could result in shares of the ETF trading at a discount to net asset value and in greater than normal intraday bid-ask spreads.
Fixed Income Securities Risk. To the extent a fund invests in fixed income securities, the fund will be subject to credit risk, income risk, interest rate risk, liquidity risk and prepayment risk. Income risk is the risk that income from a fund’s fixed income investments could decline during periods of falling interest rates. Interest rate risk is the risk that the value of a fund’s fixed income securities will decline because of rising interest rates. Liquidity risk is the risk that a security cannot be purchased or sold at the time desired, or cannot be purchased or sold without adversely affecting the price. Prepayment risk is the risk that the securities will be redeemed or prepaid by the issuer, resulting in lower interest payments received by the fund. In addition to these risks, high yield securities, or “junk” bonds, are subject to greater market fluctuations and risk of loss than securities with higher ratings, and the market for high yield securities is generally smaller and less liquid than that for investment grade securities.
Investment Companies Risk. To the extent a fund invests in the securities of other investment vehicles, the fund will incur additional fees and expenses that would not be present in a direct investment in those investment vehicles. Furthermore, the fund’s investment performance and risks are directly related to the investment performance and risks of the investment vehicles in which the fund invests.
LIBOR Risk. To the extent a fund invests in floating or variable rate obligations that use the London Interbank Offered Rate (“LIBOR”) as a reference interest rate, it is subject to LIBOR Risk. The United Kingdom’s Financial Conduct Authority, which regulates LIBOR, will cease making LIBOR available as a reference rate over a phase-out period that will begin immediately after December 31, 2021. The unavailability or replacement of LIBOR may affect the value, liquidity or return on certain fund investments and may result in costs incurred in connection with closing out positions and entering into new trades. Any potential effects of the transition away from LIBOR on the fund or on certain instruments in which the fund invests can be difficult to ascertain, and they may vary depending on a variety of factors, and they could result in losses to the fund.
Management Risk. To the extent that a fund is actively managed, it is subject to management risk. In managing an actively-managed fund’s investment portfolio, the fund’s portfolio managers will apply investment techniques and risk analyses that may not have the desired result. There can be no guarantee that a fund will meet its investment objective.
Market Risk. Securities held by a fund, as well as shares of a fund itself, are subject to market fluctuations caused by factors such as general economic conditions, political events, regulatory or market developments, changes in interest rates and perceived trends in securities prices. Shares of a fund could decline in value or underperform other investments as a result of the risk of loss associated with these market fluctuations. In addition, local, regional or global events such as war, acts of terrorism, spread of infectious diseases or other public health issues, recessions, or other events could have a significant negative impact on a fund and its investments. Such events may affect certain geographic regions, countries, sectors and industries more significantly than others. The outbreak of the respiratory disease designated as COVID-19 in December 2019 has caused significant volatility and declines in global financial markets, which have caused losses for investors. While the development of vaccines has slowed the spread of the virus and allowed for the resumption of “reasonably” normal business activity in the United States, many countries continue to impose lockdown measures in an attempt to slow the spread. Additionally, there is no guarantee that vaccines will be effective against emerging variants of the disease.
Non-U.S. Securities Risk. To the extent a fund invests in non-U.S. securities, it is subject to additional risks not associated with securities of domestic issuers. Non-U.S. securities are subject to higher volatility than securities of domestic issuers due to: possible adverse political, social or economic developments; restrictions on foreign investment or exchange of securities; capital controls; lack of liquidity; currency exchange rates; excessive taxation; government seizure of assets; the imposition of sanctions by foreign governments; different legal or accounting standards; and less government supervision and regulation of exchanges in foreign countries. Investments in non-U.S. securities may involve higher costs than investments in U.S. securities, including higher transaction and custody costs, as well as additional taxes imposed by non-U.S. governments. These risks may be heightened for securities of companies located, or with significant operations, in emerging market countries.
Operational Risk. Each fund is subject to risks arising from various operational factors, including, but not limited to, human error, processing and communication errors, errors of a fund’s service providers, counterparties or other third-parties, failed or inadequate processes and technology or systems failures. Each fund relies on third-parties for a range of services, including custody. Any delay or failure relating to engaging or maintaining such service providers may affect a fund’s ability to meet its investment objective. Although
Additional Information (Continued)
First Trust/Confluence Small Cap Value Fund
October 31, 2021 (Unaudited)
the funds and the funds’ investment advisor seek to reduce these operational risks through controls and procedures, there is no way to completely protect against such risks.
| NOT FDIC INSURED | NOT BANK GUARANTEED | MAY LOSE VALUE |
Advisory and Sub-Advisory Agreements
Board Considerations Regarding Approval of Continuation of Investment Management and Investment Sub-Advisory Agreements
The Board of Trustees of First Trust Series Fund (the “Trust”), including the Independent Trustees, unanimously approved the continuation of the Investment Management Agreement (the “Advisory Agreement”) between the Trust, on behalf of the First Trust/Confluence Small Cap Value Fund (the “Fund”), and First Trust Advisors L.P. (the “Advisor”) and the Investment Sub Advisory Agreement (the “Sub Advisory Agreement” and together with the Advisory Agreement, the “Agreements”) among the Trust, on behalf of the Fund, the Advisor and Confluence Investment Management LLC (the “Sub-Advisor”). The Board approved the continuation of the Agreements for a one-year period ending June 30, 2022 at a meeting held on June 6–7, 2021. The Board determined that the continuation of the Agreements is in the best interests of the Fund in light of the nature, extent and quality of the services provided and such other matters as the Board considered to be relevant in the exercise of its business judgment.
To reach this determination, the Board considered its duties under the Investment Company Act of 1940, as amended (the “1940 Act”), as well as under the general principles of state law, in reviewing and approving advisory contracts; the requirements of the 1940 Act in such matters; the fiduciary duty of investment advisors with respect to advisory agreements and compensation; the standards used by courts in determining whether investment company boards have fulfilled their duties; and the factors to be considered by the Board in voting on such agreements. At meetings held on April 26, 2021 and June 6–7, 2021, the Board, including the Independent Trustees, reviewed materials provided by the Advisor and the Sub-Advisor responding to requests for information from counsel to the Independent Trustees, submitted on behalf of the Independent Trustees, that, among other things, outlined: the services provided by the Advisor and the Sub-Advisor to the Fund (including the relevant personnel responsible for these services and their experience); the advisory fee rate payable by the Fund and the sub-advisory fee rate as compared to fees charged to a peer group of funds (the “Expense Group”) and a broad peer universe of funds (the “Expense Universe”), each assembled by Broadridge Financial Solutions, Inc. (“Broadridge”), an independent source, and as compared to fees charged to other clients of the Advisor and the Sub-Advisor; the expense ratio of the Fund as compared to expense ratios of the funds in the Fund’s Expense Group and Expense Universe; performance information for the Fund, including comparisons of the Fund’s performance to that of one or more relevant benchmark indexes and to that of a performance group of funds and a broad performance universe of funds (the “Performance Universe”), each assembled by Broadridge; the nature of expenses incurred in providing services to the Fund and the potential for the Advisor and the Sub-Advisor to realize economies of scale, if any; profitability and other financial data for the Advisor; financial data for the Sub-Advisor; any fall out benefits to the Advisor and its affiliate, First Trust Portfolios L.P. (“FTP”), and the Sub-Advisor; and information on the Advisor’s and the Sub-Advisor’s compliance programs. The Board reviewed initial materials with the Advisor at the meeting held on April 26, 2021, prior to which the Independent Trustees and their counsel met separately to discuss the information provided by the Advisor and the Sub-Advisor. Following the April meeting, counsel to the Independent Trustees, on behalf of the Independent Trustees, requested certain clarifications and supplements to the materials provided, and the information provided in response to those requests was considered at an executive session of the Independent Trustees and their counsel held prior to the June 6–7, 2021 meeting, as well as at the June meeting. The Board applied its business judgment to determine whether the arrangements between the Trust and the Advisor and among the Trust, the Advisor and the Sub-Advisor continue to be reasonable business arrangements from the Fund’s perspective. The Board determined that, given the totality of the information provided with respect to the Agreements, the Board had received sufficient information to renew the Agreements. The Board considered that shareholders chose to invest or remain invested in the Fund knowing that the Advisor and the Sub-Advisor manage the Fund and knowing the Fund’s advisory fee.
In reviewing the Agreements, the Board considered the nature, extent and quality of the services provided by the Advisor and the Sub-Advisor under the Agreements. With respect to the Advisory Agreement, the Board considered that the Advisor is responsible for the overall management and administration of the Trust and the Fund and reviewed all of the services provided by the Advisor to the Fund, including the oversight of the Sub-Advisor, as well as the background and experience of the persons responsible for such services. The Board noted that the Advisor oversees the Sub-Advisor’s day-to-day management of the Fund’s investments, including portfolio risk monitoring and performance review. In reviewing the services provided, the Board noted the compliance program that had been developed by the Advisor and considered that it includes a robust program for monitoring the Advisor’s, the Sub-Advisor’s and the Fund’s compliance with the 1940 Act, as well as the Fund’s compliance with its investment objective, policies and restrictions. The Board also considered a report from the Advisor with respect to its risk management functions related to the operation of the Fund. Finally, as part of the Board’s consideration of the Advisor’s services, the Advisor, in its written materials and at the April 26, 2021 meeting, described to the Board the scope of its ongoing investment in additional personnel and infrastructure to maintain and improve the quality of services provided to the Fund and the other funds in the First Trust Fund Complex. With respect to the
Additional Information (Continued)
First Trust/Confluence Small Cap Value Fund
October 31, 2021 (Unaudited)
Sub-Advisory Agreement, the Board reviewed the materials provided by the Sub-Advisor and considered the services that the Sub-Advisor provides to the Fund, including the Sub-Advisor’s day-to-day management of the Fund’s investments. In considering the Sub-Advisor’s management of the Fund, the Board noted the background and experience of the Sub-Advisor’s portfolio management team, including the Board’s prior meetings with members of the portfolio management team. In light of the information presented and the considerations made, the Board concluded that the nature, extent and quality of the services provided to the Trust and the Fund by the Advisor and the Sub-Advisor under the Agreements have been and are expected to remain satisfactory and that the Sub-Advisor, under the oversight of the Advisor, has managed the Fund consistent with its investment objective, policies and restrictions.
The Board considered the advisory and sub-advisory fee rates payable under the Agreements for the services provided. The Board noted that the sub-advisory fee is paid by the Advisor from its advisory fee. The Board considered that the Advisor and the Sub-Advisor agreed to extend the current expense caps for each share class through February 28, 2023 and agreed to keep the long-term expense cap in place from March 1, 2023 through February 28, 2032. The Board noted that fees waived or expenses borne by the Advisor and the Sub-Advisor are subject to reimbursement by the Fund for up to three years from the date the fee was waived or expense was incurred, but no reimbursement payment would be made by the Fund at any time if it would result in the Fund’s expenses exceeding (i) the applicable expense limitation in place for the most recent fiscal year for which such expense limitation was in place, (ii) the applicable expense limitation in place at the time the fees were waived, or (iii) the current expense limitation. The Board received and reviewed information showing the advisory fee rates and expense ratios of the peer funds in the Expense Group, as well as advisory and unitary fee rates charged by the Advisor and the Sub-Advisor to other fund and non-fund clients, as applicable. With respect to the Expense Group, the Board, at the April 26, 2021 meeting, discussed with the Advisor limitations in creating a relevant peer group for the Fund, including that not all peer funds employ an advisor/sub-advisor management structure. The Board took these limitations into account in considering the peer data. Based on the information provided, the Board noted that the contractual advisory fee rate payable by the Fund was above the median contractual advisory fee of the peer funds in the Expense Group. The Board also noted that the Fund’s total (net) expense ratio (Class A shares) was above the median total (net) expense ratio of the peer funds in the Expense Group. With respect to fees charged to other clients, the Board considered differences between the Fund and other clients that limited their comparability. In considering the advisory fee rate overall, the Board also considered the Advisor’s statement that it seeks to meet investor needs through innovative and value-added investment solutions and the Advisor’s demonstrated long-term commitment to the Fund and the other funds in the First Trust Fund Complex.
The Board considered performance information for the Fund. The Board noted the process it has established for monitoring the Fund’s performance and portfolio risk on an ongoing basis, which includes quarterly performance reporting from the Advisor and the Sub-Advisor for the Fund. The Board determined that this process continues to be effective for reviewing the Fund’s performance. The Board received and reviewed information comparing the Fund’s performance for periods ended December 31, 2020 to the performance of the funds in the Performance Universe and to that of a benchmark index. Based on the information provided, the Board noted that the Fund (Class A shares) outperformed its Performance Universe median for the five-year period ended December 31, 2020 and underperformed its Performance Universe median for the one- and three-year periods ended December 31, 2020. The Board also noted that the Fund (Class A shares) outperformed its benchmark index for the three- and five-year periods ended December 31, 2020 and underperformed its benchmark index for the one-year period ended December 31, 2020.
On the basis of all the information provided on the fees, expenses and performance of the Fund and the ongoing oversight by the Board, the Board concluded that the advisory and sub-advisory fees for the Fund continue to be reasonable and appropriate in light of the nature, extent and quality of the services provided by the Advisor and the Sub-Advisor to the Fund under the Agreements.
The Board considered information and discussed with the Advisor whether there were any economies of scale in connection with providing advisory services to the Fund and noted the Advisor’s statement that it believes its expenses will likely increase during the next twelve months as the Advisor continues to hire personnel and build infrastructure, including technology, to improve the services to the Fund. The Board considered the revenues and allocated costs (including the allocation methodology) of the Advisor in serving as investment advisor to the Fund for the twelve months ended December 31, 2020 and the estimated profitability level for the Fund calculated by the Advisor based on such data, as well as complex-wide and product-line profitability data, for the same period. The Board noted the inherent limitations in the profitability analysis and concluded that, based on the information provided, the Advisor’s profitability level for the Fund was not unreasonable. In addition, the Board considered fall-out benefits described by the Advisor that may be realized from its relationship with the Fund. The Board considered that the Advisor had identified as a fall-out benefit to the Advisor and FTP their exposure to investors and brokers who, absent their exposure to the Fund, may have had no dealings with the Advisor or FTP. The Board noted that in addition to the advisory fees paid by the Fund, FTP is compensated for services provided to the Fund through 12b-1 distribution and service fees and that the Advisor receives compensation from the Fund for providing fund reporting services pursuant to a separate Fund Reporting Services Agreement. The Board concluded that the character and amount of potential fall-out benefits to the Advisor were not unreasonable.
Additional Information (Continued)
First Trust/Confluence Small Cap Value Fund
October 31, 2021 (Unaudited)
The Board considered the Sub-Advisor’s statement that many of its costs are fixed, allowing for economies of scale. The Board did not review the profitability of the Sub-Advisor with respect to the Fund. The Board noted that the Advisor pays the Sub-Advisor from its advisory fee and its understanding that the Fund’s sub-advisory fee rate was the product of an arm’s length negotiation. The Board concluded that the profitability analysis for the Advisor was more relevant. The Board considered fall-out benefits that may be realized by the Sub-Advisor and one of its affiliates from the Sub-Advisor’s relationship with the Fund, including that the Sub-Advisor may enter into soft dollar and commission sharing arrangements, and considered a summary of such arrangements. The Board noted certain additional fall-out benefits identified by the Sub-Advisor deriving from the exposure provided by its relationship with the Fund and the Advisor. The Board concluded that the character and amount of potential fall-out benefits to the Sub-Advisor were not unreasonable.
Based on all of the information considered and the conclusions reached, the Board, including the Independent Trustees, unanimously determined that the terms of the Agreements continue to be fair and reasonable and that the continuation of the Agreements is in the best interests of the Fund. No single factor was determinative in the Board’s analysis.
Board of Trustees
Effective November 1, 2021, Denise M. Keefe was appointed as a Trustee of the Trust. Ms. Keefe is Executive Vice President of Advocate Aurora Health and President of Advocate Aurora Continuing Health Division (together, “Advocate”), one of the largest integrated healthcare systems in the U.S. serving Illinois and Wisconsin. Ms. Keefe has been employed by Advocate since 1993 and is responsible for the Continuing Health Division’s strategic direction, fiscal management, business development, revenue enhancement, operational efficiencies, and human resource management of 4,000 employees. Ms. Keefe also currently serves on the boards of several organizations within the Advocate Aurora Continuing Health Division and other health care organizations, including RML Long Term Acute Care Hospitals (since 2014) and Senior Helpers (since 2021). Prior thereto, Ms. Keefe was Corporate Vice President, Marketing and Business Development for the Visiting Nurse Association of Chicago (1989 – 1992) and a former Board Member of Sherman West Court Skilled Nursing Facility.
Board of Trustees and Officers
First Trust/Confluence Small Cap Value Fund
October 31, 2021 (Unaudited)
The following tables identify the Trustees and Officers of the Trust. Unless otherwise indicated, the address of all persons is 120 East Liberty Drive, Suite 400, Wheaton, IL 60187.
The Trust’s statement of additional information includes additional information about the Trustees and is available, without charge, upon request, by calling (800) 988-5891.
| Name, Year of Birth and Position with the Trust | Term of Office and Year First Elected or Appointed | Principal Occupations
During Past 5 Years | Number of Portfolios in the First Trust Fund Complex Overseen by Trustee | Other Trusteeships or Directorships Held by Trustee During Past 5 Years |
| INDEPENDENT TRUSTEES |
Richard E. Erickson, Trustee
(1951) | • Indefinite Term
• Since Trust Inception | Physician; Officer, Wheaton Orthopedics; Limited Partner, Gundersen Real Estate Limited Partnership (June 1992 to December 2016) | 215 | None |
Thomas R. Kadlec, Trustee
(1957) | • Indefinite Term
• Since Trust Inception | President, ADM Investor Services, Inc. (Futures Commission Merchant) | 215 | Director of ADM Investor Services, Inc., ADM Investor Services International, Futures Industry Association, and National Futures Association |
Robert F. Keith, Trustee
(1956) | • Indefinite Term
• Since Trust Inception | President, Hibs Enterprises (Financial and Management Consulting) | 215 | Director of Trust Company of Illinois |
Niel B. Nielson, Trustee
(1954) | • Indefinite Term
• Since Trust Inception | Senior Advisor (August 2018 to Present), Managing Director and Chief Operating Officer (January 2015 to August 2018), Pelita Harapan Educational Foundation (Educational Products and Services) | 215 | None |
| INTERESTED TRUSTEE |
James A. Bowen(1), Trustee and
Chairman of the Board
(1955) | • Indefinite Term
• Since Trust Inception | Chief Executive Officer, First Trust Advisors L.P. and First Trust Portfolios L.P.; Chairman of the Board of Directors, BondWave LLC (Software Development Company) and Stonebridge Advisors LLC (Investment Advisor) | 215 | None |
| (1) | Mr. Bowen is deemed an “interested person” of the Trust due to his position as CEO of First Trust Advisors L.P., investment advisor of the Trust. |
Board of Trustees and Officers (Continued)
First Trust/Confluence Small Cap Value Fund
October 31, 2021 (Unaudited)
| Name and Year of Birth | Position and Offices with Trust | Term of Office and Length of Service | Principal Occupations
During Past 5 Years |
| OFFICERS(2) |
James M. Dykas
(1966) | President and Chief Executive Officer | • Indefinite Term
• Since January 2016 | Managing Director and Chief Financial Officer (January 2016 to Present), Controller (January 2011 to January 2016), Senior Vice President (April 2007 to January 2016), First Trust Advisors L.P. and First Trust Portfolios L.P.; Chief Financial Officer (January 2016 to Present), BondWave LLC (Software Development Company) and Stonebridge Advisors LLC (Investment Advisor) |
Donald P. Swade
(1972) | Treasurer, Chief Financial Officer and Chief Accounting Officer | • Indefinite Term
• Since January 2016 | Senior Vice President (July 2016 to Present), Vice President (April 2012 to July 2016), First Trust Advisors L.P. and First Trust Portfolios L.P. |
W. Scott Jardine
(1960) | Secretary and Chief Legal Officer | • Indefinite Term
• Since Trust Inception | General Counsel, First Trust Advisors L.P. and First Trust Portfolios L.P.; Secretary and General Counsel, BondWave LLC; Secretary, Stonebridge Advisors LLC |
Daniel J. Lindquist
(1970) | Vice President | • Indefinite Term
• Since Trust Inception | Managing Director, First Trust Advisors L.P. and First Trust Portfolios L.P. |
Kristi A. Maher
(1966) | Chief Compliance Officer and Assistant Secretary | • Indefinite Term
• Chief Compliance Officer Since January 2011 • Assistant Secretary Since Trust Inception | Deputy General Counsel, First Trust Advisors L.P. and First Trust Portfolios L.P. |
| (2) | The term “officer” means the president, vice president, secretary, treasurer, controller or any other officer who performs a policy making function. |
Privacy Policy
First Trust/Confluence Small Cap Value Fund
October 31, 2021 (Unaudited)
Privacy Policy
First Trust values our relationship with you and considers your privacy an important priority in maintaining that relationship. We are committed to protecting the security and confidentiality of your personal information.
Sources of Information
We collect nonpublic personal information about you from the following sources:
| • | Information we receive from you and your broker-dealer, investment professional or financial representative through interviews, applications, agreements or other forms; |
| • | Information about your transactions with us, our affiliates or others; |
| • | Information we receive from your inquiries by mail, e-mail or telephone; and |
| • | Information we collect on our website through the use of “cookies”. For example, we may identify the pages on our website that your browser requests or visits. |
Information Collected
The type of data we collect may include your name, address, social security number, age, financial status, assets, income, tax information, retirement and estate plan information, transaction history, account balance, payment history, investment objectives, marital status, family relationships and other personal information.
Disclosure of Information
We do not disclose any nonpublic personal information about our customers or former customers to anyone, except as permitted by law. In addition to using this information to verify your identity (as required under law), the permitted uses may also include the disclosure of such information to unaffiliated companies for the following reasons:
| • | In order to provide you with products and services and to effect transactions that you request or authorize, we may disclose your personal information as described above to unaffiliated financial service providers and other companies that perform administrative or other services on our behalf, such as transfer agents, custodians and trustees, or that assist us in the distribution of investor materials such as trustees, banks, financial representatives, proxy services, solicitors and printers. |
| • | We may release information we have about you if you direct us to do so, if we are compelled by law to do so, or in other legally limited circumstances (for example to protect your account from fraud). |
In addition, in order to alert you to our other financial products and services, we may share your personal information within First Trust.
Use of Website Analytics
We currently use third party analytics tools, Google Analytics and AddThis, to gather information for purposes of improving First Trust’s website and marketing our products and services to you. These tools employ cookies, which are small pieces of text stored in a file by your web browser and sent to websites that you visit, to collect information, track website usage and viewing trends such as the number of hits, pages visited, videos and PDFs viewed and the length of user sessions in order to evaluate website performance and enhance navigation of the website. We may also collect other anonymous information, which is generally limited to technical and web navigation information such as the IP address of your device, internet browser type and operating system for purposes of analyzing the data to make First Trust’s website better and more useful to our users. The information collected does not include any personal identifiable information such as your name, address, phone number or email address unless you provide that information through the website for us to contact you in order to answer your questions or respond to your requests. To find out how to opt-out of these services click on: Google Analytics and AddThis.
Confidentiality and Security
With regard to our internal security procedures, First Trust restricts access to your nonpublic personal information to those First Trust employees who need to know that information to provide products or services to you. We maintain physical, electronic and procedural safeguards to protect your nonpublic personal information.
Policy Updates and Inquiries
As required by federal law, we will notify you of our privacy policy annually. We reserve the right to modify this policy at any time, however, if we do change it, we will tell you promptly. For questions about our policy, or for additional copies of this notice, please go to www.ftportfolios.com, or contact us at 1-800-621-1675 (First Trust Portfolios) or 1-800-222-6822 (First Trust Advisors).
March 2021
This page intentionally left blank
This page intentionally left blank
INVESTMENT ADVISOR
First Trust Advisors L.P.
120 East Liberty Drive, Suite 400
Wheaton, IL 60187
INVESTMENT SUB-ADVISOR
Confluence Investment Management LLC
20 Allen Avenue, Suite 300
Saint Louis, MO 63119
ADMINISTRATOR,
FUND ACCOUNTANT &
CUSTODIAN
Brown Brothers Harriman & Co.
50 Post Office Square
Boston, MA 02110
TRANSFER AGENT
BNY Mellon Investment Servicing (US) Inc.
301 Bellevue Parkway
Wilmington, DE 19809
INDEPENDENT REGISTERED
PUBLIC ACCOUNTING FIRM
Deloitte & Touche LLP
111 S. Wacker Drive
Chicago, IL 60606
LEGAL COUNSEL
Chapman and Cutler LLP
111 W. Monroe Street
Chicago, IL 60603

First Trust Short Duration
High Income Fund
Annual Report
For the Year Ended
October 31, 2021
First Trust Short Duration High Income Fund
Annual Report
October 31, 2021
Caution Regarding Forward-Looking Statements
This report contains certain forward-looking statements within the meaning of the Securities Act of 1933, as amended, and the Securities Exchange Act of 1934, as amended. Forward-looking statements include statements regarding the goals, beliefs, plans or current expectations of First Trust Advisors L.P. (“First Trust” or the “Advisor”) and its representatives, taking into account the information currently available to them. Forward-looking statements include all statements that do not relate solely to current or historical fact. For example, forward-looking statements include the use of words such as “anticipate,” “estimate,” “intend,” “expect,” “believe,” “plan,” “may,” “should,” “would” or other words that convey uncertainty of future events or outcomes.
Forward-looking statements involve known and unknown risks, uncertainties and other factors that may cause the actual results, performance or achievements of First Trust Short Duration High Income Fund (the “Fund”) to be materially different from any future results, performance or achievements expressed or implied by the forward-looking statements. When evaluating the information included in this report, you are cautioned not to place undue reliance on these forward-looking statements, which reflect the judgment of the Advisor and its representatives only as of the date hereof. We undertake no obligation to publicly revise or update these forward-looking statements to reflect events and circumstances that arise after the date hereof.
Performance and Risk Disclosure
There is no assurance that the Fund will achieve its investment objectives. The Fund is subject to market risk, which is the possibility that the market values of securities owned by the Fund will decline and that the value of the Fund’s shares may therefore be less than what you paid for them. Accordingly, you can lose money by investing in the Fund. See “Risk Considerations” in the Additional Information section of this report for a discussion of certain other risks of investing in the Fund.
Performance data quoted represents past performance, which is no guarantee of future results, and current performance may be lower or higher than the figures shown. For the most recent month-end performance figures, please visit www.ftportfolios.com or speak with your financial advisor. Investment returns and net asset value will fluctuate and Fund shares, when sold, may be worth more or less than their original cost.
The Advisor may also periodically provide additional information on Fund performance on the Fund’s web page at www.ftportfolios.com.
How to Read This Report
This report contains information that may help you evaluate your investment in the Fund. It includes details about the Fund and presents data and analysis that provide insight into the Fund’s performance and investment approach.
By reading the portfolio commentary by the portfolio management team of the Fund, you may obtain an understanding of how the market environment affected the Fund’s performance. The statistical information that follows may help you understand the Fund’s performance compared to that of relevant market benchmarks.
It is important to keep in mind that the opinions expressed by personnel of the Advisor are just that: informed opinions. They should not be considered to be promises or advice. The opinions, like the statistics, cover the period through the date on the cover of this report. The material risks of investing in the Fund are spelled out in the prospectus, the statement of additional information, this report and other Fund regulatory filings.
First Trust Short Duration High Income Fund
Annual Letter from the Chairman and CEO
October 31, 2021
Dear Shareholders,
First Trust is pleased to provide you with the annual report for the First Trust Short Duration High Income Fund (the “Fund”), which contains detailed information about the Fund for the twelve months ended October 31, 2021.
Inflation has arrived, and its entrance was grand, to say the least. The Consumer Price Index came in at 6.2% year-over-year in October 2021, according to data from the U.S. Bureau of Labor Statistics. The last time it topped the 6.0% mark was in December 1990 (6.1%), over 30 years ago. As is often the case with major shifts in the economy and markets, there is debate over what is truly behind them. For many months, as inflation was trending higher, Federal Reserve (the “Fed”) Chairman Jerome Powell held the view that the rising inflationary pressures largely stemmed from global supply chain bottlenecks induced by the coronavirus (“COVID-19”) pandemic. Perhaps the best example of this is the unprecedented backlog of container ships that have dropped anchor outside the California ports of Los Angeles and Long Beach. Together, these ports service 40% of all the container ships bound for the U.S. In normal times, no ships are anchored waiting to unload their goods. Shortages of trucks and drivers have also contributed to the slowdown at the ports.
The takeaway is that goods are not being delivered to warehouses and store shelves in a timely fashion and that is helping to drive prices higher for consumers. Simply put, inflation is the byproduct of too much money chasing too few goods. We’ll return to this axiom shortly. Chairman Powell originally believed the bottlenecks would be remedied relatively quickly as the global economy reopened and people went back to work. That, in turn, would allow inflationary pressures to dissipate, which has not happened. Around the end of October, Chairman Powell finally acknowledged that inflation will likely remain elevated through mid-2022. This realization is what motivated the Fed to announce that it would begin to taper its monthly bond buying program (quantitative easing) starting in November 2021. It has been purchasing roughly $80 billion of Treasuries and $40 billion of mortgage-backed securities in the open market every month since June 2020. The Fed will shave $15 billion off that combined total every month until the buying has ceased, which should be around mid-2022. If all goes to plan, the next stage in the evolution of the Fed’s monetary policy would involve initiating interest rate hikes.
While the supply chain bottlenecks have clearly played a role in the spike in inflation by limiting the amount of goods available to consume, the biggest contributing factor is likely the surge in the U.S. money supply, according to Brian Wesbury, Chief Economist at First Trust. M2 is a measure of the money supply that includes cash, checking deposits and liquid assets easily convertible to cash. The M2 measure of money has exploded by 36% since February 2020, well above the 6% pre-COVID-19 annualized norm. The trillions of dollars of stimulus distributed by the U.S. government to help backstop the economy during the pandemic has contributed to higher inflation. On Wednesday, November 10, 2021, President Joe Biden admitted that his $1.9 trillion COVID-19 stimulus package has done just that. Remember, too much money chasing too few goods leads to inflation. Keep in mind, President Biden has recently successfully navigated a $1.2 trillion bipartisan infrastructure bill through Congress and has another roughly $1.75 trillion Build Back Better Act (social spending) piece of legislation pending. That means there is at least another $1.2 trillion dollars flowing into the economy over the next few years, and maybe more.
Data from FactSet indicates that the number of S&P 500® Index companies mentioning inflation on their 2021 third quarter earnings call hit a 10-year high, according to Business Insider. To date, 285 of the 461 companies that have reported their results have cited concerns over rising inflation. The Materials, Consumer Staples and Energy sectors had the highest percentage of companies mentioned on these earnings calls at 90%, 88% and 86%, respectively. Suffice it to say, investors should add inflation to the list of criteria to assist them in positioning their portfolios moving forward.
Thank you for giving First Trust the opportunity to play a role in your financial future. We value our relationship with you and will report on the Fund again in six months.
Sincerely,
James A. Bowen
Chairman of the Board of Trustees
Chief Executive Officer of First Trust Advisors L.P.
First Trust Short Duration High Income Fund
“AT A GLANCE”
As of October 31, 2021 (Unaudited)
| Fund Statistics | |
| First Trust Short Duration High Income Fund | Net Asset
Value (NAV) |
| Class A (FDHAX) | $19.57 |
| Class C (FDHCX) | $19.56 |
| Class I (FDHIX) | $19.59 |
| Credit Quality(1) | % of Senior
Loans and other
Debt Securities(2) |
| BB+ | 0.3% |
| BB | 2.4 |
| BB- | 5.4 |
| B+ | 15.9 |
| B | 40.4 |
| B- | 21.5 |
| CCC+ | 7.5 |
| CCC | 1.5 |
| CCC- | 2.4 |
| CC | 0.2 |
| D | 2.1 |
| Not Rated | 0.4 |
| Total | 100.0% |
| Top 10 Issuers | % of Senior
Loans and other
Securities(2) |
| Internet Brands, Inc. (Web MD/MH Sub I, LLC) | 2.9% |
| Alliant Holdings I, LLC | 2.4 |
| Endo, LLC | 2.4 |
| Hyland Software, Inc. | 2.4 |
| Verscend Technologies, Inc. (Cotiviti) | 2.3 |
| athenahealth, Inc. (VVC Holding Corp.) | 2.2 |
| Applied Systems, Inc. | 2.2 |
| SolarWinds Holdings, Inc. | 2.1 |
| HUB International Ltd. | 2.0 |
| Mallinckrodt International Finance S.A. | 1.9 |
| Total | 22.8% |
| Industry Classification | % of Senior
Loans and Other
Securities(2) |
| Software | 21.2% |
| Health Care Providers & Services | 17.0 |
| Pharmaceuticals | 10.6 |
| Insurance | 7.3 |
| Hotels, Restaurants & Leisure | 6.9 |
| Health Care Technology | 6.8 |
| Media | 6.4 |
| Diversified Telecommunication Services | 3.8 |
| Specialty Retail | 1.9 |
| Health Care Equipment & Supplies | 1.8 |
| Entertainment | 1.8 |
| Professional Services | 1.8 |
| Diversified Consumer Services | 1.7 |
| Commercial Services & Supplies | 1.5 |
| Electric Utilities | 1.4 |
| Containers & Packaging | 1.4 |
| Machinery | 1.1 |
| Building Products | 1.1 |
| Road & Rail | 0.7 |
| Aerospace & Defense | 0.7 |
| Auto Components | 0.6 |
| Trading Companies & Distributors | 0.5 |
| Construction & Engineering | 0.3 |
| Oil, Gas & Consumable Fuels | 0.3 |
| Automobiles | 0.3 |
| Diversified Financial Services | 0.2 |
| Electronic Equipment, Instruments & Components | 0.2 |
| IT Services | 0.2 |
| Food Products | 0.2 |
| Communications Equipment | 0.1 |
| Airlines | 0.1 |
| Textiles, Apparel & Luxury Goods | 0.1 |
| Life Sciences Tools & Services | 0.0* |
| Total | 100.0% |
| * | Amount is less than 0.1%. |
| Dividend Distributions | A Shares | C Shares | I Shares |
| Current Monthly Distribution per Share(3) | $0.0544 | $0.0421 | $0.0585 |
| Current Distribution Rate on NAV(4) | 3.34% | 2.58% | 3.58% |
| (1) | The ratings are by Standard & Poor’s. A credit rating is an assessment provided by a nationally recognized statistical rating organization (NRSRO) of the creditworthiness of an issuer with respect to debt obligations except for those debt obligations that are only privately rated. Ratings are measured on a scale that generally ranges from AAA (highest) to D (lowest). Investment grade is defined as those issuers that have a long-term credit rating of BBB- or higher. “NR” indicates no rating. The credit ratings shown relate to the creditworthiness of the issuers of the underlying securities in the Fund, and not to the Fund or its shares. Credit ratings are subject to change. |
| (2) | Percentages are based on long-term positions. Money market funds are excluded. |
| (3) | Most recent distribution paid or declared through October 31, 2021. Subject to change in the future. |
| (4) | Distribution rates are calculated by annualizing the most recent distribution paid or declared through the report date and then dividing by NAV as of October 31, 2021. Subject to change in the future. |
First Trust Short Duration High Income Fund
“AT A GLANCE” (Continued)
As of October 31, 2021 (Unaudited)
Performance of a $10,000 Investment
This chart compares your Fund’s Class I performance to that of the ICE BofA US High Yield Constrained Index, the S&P/LSTA Leveraged Loan Index and the Blended Index(5).
| Performance as of October 31, 2021 |
| | A Shares
Inception
11/1/2012 | | | C Shares
Inception
11/1/2012 | | | I Shares
Inception
11/1/2012 | | | Blended Index* | | | HUC0* | | | SPBDAL* |
Cumulative
Total Returns | w/o
sales
charge | | w/max
3.50%
sales
charge | | | w/o
sales
charge | | w/max 1.00% contingent deferred sales charge | | | w/o
sales
charge | | | w/o
sales
charges | | | w/o
sales
charges | | | w/o
sales
charges |
| 1 Year | 6.83% | | 3.07% | | | 6.04% | | 5.04% | | | 7.09% | | | 9.60% | | | 10.74% | | | 8.46% |
Average Annual
Total Returns | | | | | | | | | | | | | | | | | | | | |
| 5 Years | 3.82% | | 3.09% | | | 3.06% | | 3.06% | | | 4.10% | | | 5.35% | | | 6.23% | | | 4.46% |
| Since Inception | 4.01% | | 3.60% | | | 3.24% | | 3.24% | | | 4.28% | | | 5.09% | | | 5.93% | | | 4.22% |
| 30-Day SEC Yield(6) | 3.23% | | | 2.60% | | | 3.60% | | | N/A | | | N/A | | | N/A |
* Since inception return is based on inception date of the Fund.
Performance figures assume reinvestment of all distributions and do not reflect the deduction of taxes that a shareholder would pay on Fund distributions or the redemption or sale of Fund shares. The total returns would have been lower if certain fees had not been waived and expenses reimbursed by the Advisor. An index is a statistical composite that tracks a specified financial market or sector. Unlike the Fund, the indices do not actually hold a portfolio of securities and therefore do not incur the expenses incurred by the Fund. These expenses negatively impact the performance of the Fund. The Fund’s past performance does not predict future performance.
Performance of share classes will vary due to differences in sales charges and expenses. Total returns with sales charges include payment of the maximum sales charge of 3.50% for Class A Shares, a contingent deferred sales charge (“CDSC”) of 1.00% for Class C Shares in year one and Rule 12b-1 service fees of 0.25% per year of average daily net assets for Class A Shares and combined Rule 12b-1 distribution and service fees of 1.00% per year of average daily net assets for Class C Shares. Class I Shares do not have a front-end sales charge or a CDSC, nor do they pay distribution or service fees.
| (5) | The Blended Index return is a 50/50 split between the ICE BofA US High Yield Constrained Index and the S&P/LSTA Leveraged Loan Index returns. The Blended Index returns are calculated by using the monthly return of the two indices during each period shown above. At the beginning of each month the two indices are rebalanced to a 50-50 ratio to account for divergence from that ratio that occurred during the course of each month. The monthly returns are then compounded for each period shown above, giving the performance for the Blended Index for each period shown above. |
| (6) | 30-day SEC yield is calculated by dividing the net investment income per share earned during the most recent 30-day period by the maximum offering price per share on the last day of the period. The reported SEC yields are subsidized. The subsidized yields reflect the waiver and/or a reimbursement of Fund expenses, which has the effect of lowering the Fund’s expense ratio and generating a higher yield. |
Portfolio Commentary
First Trust Short Duration High Income Fund
Annual Report
October 31, 2021 (Unaudited)
Advisor
The First Trust Advisors L.P. (“First Trust”) Leveraged Finance Team is comprised of 17 experienced investment professionals specializing in below investment grade securities. The team is comprised of portfolio management, research, trading and operations personnel. As of October 31, 2021, the First Trust Leveraged Finance Team managed or supervised approximately $7.21 billion in senior secured bank loans and high-yield bonds. These assets are managed across various strategies, including three closed-end funds, an open-end fund, three exchange-traded funds, and a series of unit investment trusts on behalf of retail and institutional clients.
Portfolio Management Team
William Housey, CFA – Managing Director of Fixed Income and Senior Portfolio Manager
Jeffrey Scott, CFA – Senior Vice President and Portfolio Manager
Annual Report Commentary
First Trust Short Duration High Income Fund
The First Trust Short Duration High Income Fund (the “Fund”) seeks to provide a high level of current income. As a secondary objective, the Fund seeks capital appreciation.
Market Recap
As we ended 2020, the coronavirus (“COVID-19”) vaccine rollout was underway, and a $900 billion stimulus package was signed into law supporting equity markets into year-end. At the beginning of 2021, investor optimism around stronger economic growth expectations, an additional $2.0 trillion dollars of federal stimulus, a strong uptake in the vaccination rate, and higher inflation expectations resulted in a significant move higher in interest rates. The 10-Year U.S. Treasury yield increased 83 basis points (“bps”) during the first quarter of 2021 to a peak of 1.74% on March 31, 2021, after which rates temporally consolidated before finishing the 12-month period ended October 31, 2021 at 1.55%. In October 2021, despite significantly higher inflation given strong global demand, supply chain bottlenecks and labor shortages, the Federal Reserve (the “Fed”) has maintained its quantitative easing program and has kept the target range for the Federal Funds rate at 0.00 – 0.25%. U.S. Equities reached all-time highs in October 2021 as strong earnings outweighed concerns over higher inflation. The S&P 500® Index returned 42.91% during the last twelve-month (“LTM”) period ended October 31, 2021.
Senior Loan Market
Senior loan spreads over the 3-month London Interbank Offered Rate (“LIBOR”) decreased 169 bps during the 12-month period ended October 31, 2021, to L+416 bps. The current spread is 99 bps below the senior loan market’s long-term average spread of L+515 bps (December 1997 – October 2021). Retail senior loan funds experienced their 11th consecutive monthly inflow in October 2021, and inflows for loan funds totaled $38.1 billion over the LTM period. We believe the strong demand for senior loans was driven by rising U.S. Treasury rates and an increasing possibility of interest rate hikes late next year.
During the LTM period, lower quality CCC rated senior loans returned 21.83%, outperforming single-B rated senior loans return of 8.33% and BB rated senior loans return of 5.52%. The average price of senior loans in the market increased from $93.17 in the beginning of the period to $98.55 at the end of the period.
High-Yield Bond Market
High-yield bond spreads over U.S. Treasuries decreased 217 bps during the 12-month period ended October 31, 2021, to T+317 bps. The current spread is 240 bps below the high-yield bond market’s long-term average spread over U.S. Treasuries of T+557 bps (December 1997 – October 2021). High-yield bond funds reported their third consecutive monthly inflow in October 2021, the fifth inflow in the LTM period. High-yield bond outflows totaled $6.8 billion during the LTM period.
During the LTM period, lower quality CCC rated high-yield bonds returned 22.86%, outperforming single-B rated bonds return of 9.40% and BB rated bonds return of 8.56%. The average price of high-yield bonds in the market increased from $99.29 in the beginning of the period to $103.67 at the end of the period.
Default Rates
During the 12-month period ended October 31, 2021, default rates decreased within the high-yield bond and senior loan markets, as measured by the JP Morgan High-Yield Bond Universe and the S&P/LSTA Leveraged Loan Index, respectively. The LTM default rate within the high-yield bond market declined from a peak of 6.34% at the beginning of the period, to 0.36% at end of the period. The
Portfolio Commentary (Continued)
First Trust Short Duration High Income Fund
Annual Report
October 31, 2021 (Unaudited)
senior loan market LTM default rate ended the period at 0.20% compared to the 4.11% rate at the beginning of the period. The default rates in both the high-yield bond market and the senior loan market are below the long-term average default rates of 3.18% and 2.86%, respectively.
Fund Performance
The Fund’s Class I shares returned 7.09% over the 12-month period ended October 31, 2021. The Blended Benchmark (the “Benchmark”) (comprised of 50% S&P/LSTA Leveraged Loan Index and 50% ICE BofA US High Yield Constrained Index) returned 9.60% over the same period.
The Fund held 218 individual positions diversified across 32 industries at the end of the reporting period. Software (21.20%), Health Care Providers & Services (16.96%), and Pharmaceuticals (10.54%) were the Fund’s top three industry exposures at the end of the period. By comparison, the Fund held 176 individual positions across 30 industries on October 31, 2020. The Fund slightly decreased its allocation to high-yield bonds from 22.69% to 20.43% during the period. The Fund’s duration remained low throughout the period and was relatively unchanged from 0.81 years to 0.78 years.
During the LTM period, the Fund benefitted from strong security selection within the leisure, nonferrous metals/minerals, and broadcasting industries. Within leisure, the Fund benefitted from its overweight position in theaters as positive vaccine news drove a strong recovery in prices during the LTM period. Within nonferrous metals/mining, the Fund’s overweight position in a company that mines and produces coal significantly outperformed during the LTM period as the company’s securities prices benefitted from an increase in metallurgical and thermal coal prices. Within the broadcasting industry, the Fund’s overweight positions in media and sports broadcasters outperformed during the LTM period as broadcasters benefitted from the recovery in advertising spend.
During the LTM, the Fund’s higher allocation to senior loans was the primary headwind to performance relative to the Benchmark. Senior loans returned 8.46%, which lagged high-yield bonds impressive 10.74% return during the LTM period. An additional headwind was the Fund’s cash as risk asset prices generated positive returns during the LTM period. The Fund’s de minimis exposure to the oil & gas industry, which was the best performing industry during the LTM period as crude oil prices increased 133.50% to $83.57, also detracted from performance. Oil and gas comprised 7.96% of the Benchmark and only 0.02% of the Fund.
The Fund’s most recent monthly distribution of $0.0585 per share is above the $0.0550 per share distribution paid in October 2020. At the end of the period, the effective yield based on the distributions for the trailing twelve months was 3.42% based on net asset value.
The Fund experienced zero defaults during the last twelve-month period. This compared to 12 defaults in the LTM period within the JP Morgan High-Yield Bond Universe and the S&P/LSTA Leveraged Loan Index, combined. Since inception, the Fund has experienced 11 defaults, which compares to 401 within the JP Morgan High-Yield Bond Universe and the S&P/LSTA Leveraged Loan Index, combined, over the same period. The JP Morgan US High-Yield Bond Universe LTM default rate was 0.36% and the S&P/LSTA Leveraged Loan Index LTM default rate was 0.20%.
Market and Fund Outlook
We believe that continued economic growth and persistently high inflation are likely to result in higher interest rates across the U.S. Treasury yield curve. As such, we expect long-duration fixed income asset class returns to be pressured as rates increase. We believe senior loans, given their senior secured position in the capital structure, floating rate coupon and strong fundamental tailwinds, as evidenced by the low corporate default rate, continue to offer an attractive solution to generate income and avoid interest rate risk in this environment. As we evaluate existing and new investment opportunities in this environment, our decisions will continue to be rooted in our rigorous bottom-up credit analysis process and our focus will remain on identifying the opportunities that we believe offer the best risk and reward balance.
First Trust Short Duration High Income Fund
Understanding Your Fund Expenses
October 31, 2021 (Unaudited)
As a shareholder of the First Trust Short Duration High Income Fund (the “Fund”), you incur two types of costs: (1) transaction costs, including sales charges (loads) on purchases of Class A Shares and contingent deferred sales charges on the lesser of purchase price or redemption proceeds of Class C Shares; and (2) ongoing costs, including management fees, distribution and/or service (12b-1) fees, if any, and other Fund expenses. This Example is intended to help you understand your ongoing costs of investing in the Fund and to compare these costs with the ongoing costs of investing in other funds.
The Example is based on an investment of $1,000 invested at the beginning of the period and held through the six-month period ended October 31, 2021.
Actual Expenses
The first three columns of the table below provide information about actual account values and actual expenses. You may use the information in these columns, together with the amount you invested, to estimate the expenses that you paid over the period. Simply divide your account value by $1,000 (for example, an $8,600 account value divided by $1,000 = 8.6), then multiply the result by the number in the third column under the heading entitled “Expenses Paid During Period” to estimate the expenses you paid on your account during this six-month period.
Hypothetical Example for Comparison Purposes
The next three columns of the table below provide information about hypothetical account values and hypothetical expenses based on the Fund’s actual expense ratio and an assumed rate of return of 5% per year before expenses, which is not the Fund’s actual return. The hypothetical account values and expenses may not be used to estimate the actual ending account balance or expenses you paid for the period. You may use this information to compare the ongoing costs of investing in the Fund and other funds. To do so, compare this 5% hypothetical example with the 5% hypothetical examples that appear in the shareholder reports of the other funds.
Please note that the expenses shown in the table are meant to highlight your ongoing costs only and do not reflect any transactional costs such as sales charges (loads) or contingent deferred sales charges. Therefore, the hypothetical section of the table is useful in comparing ongoing costs only, and will not help you determine the relative total costs of owning different funds. In addition, if these transactional costs were included, your costs would have been higher.
| | Actual Expenses | | Hypothetical
(5% Return Before Expenses) | |
| | Beginning
Account
Value
5/1/2021 | Ending
Account
Value
10/31/2021 | Expenses Paid
During Period
5/1/2021 -
10/31/2021 (a) | Beginning
Account
Value
5/1/2021 | | Ending
Account
Value
10/31/2021 | Expenses Paid
During Period
5/1/2021 -
10/31/2021 (a) | Annualized
Expense
Ratios (b) |
Class A
| $ 1,000.00 | $ 1,011.70 | $ 6.03 | $ 1,000.00 | | $ 1,019.21 | $ 6.06 | 1.19% |
Class C
| $ 1,000.00 | $ 1,008.00 | $ 9.82 | $ 1,000.00 | | $ 1,015.43 | $ 9.86 | 1.94% |
Class I
| $ 1,000.00 | $ 1,013.50 | $ 4.77 | $ 1,000.00 | | $ 1,020.47 | $ 4.79 | 0.94% |
| (a) | Expenses are equal to the annualized expense ratios as indicated in the table multiplied by the average account value over the period (May 1, 2021 through October 31, 2021), multiplied by 184/365 (to reflect the six-month period). |
| (b) | These expense ratios reflect expense caps. |
First Trust Short Duration High Income Fund
Portfolio of Investments
October 31, 2021
Principal
Value | | Description | | Rate (a) | | Stated
Maturity (b) | | Value |
| SENIOR FLOATING-RATE LOAN INTERESTS – 75.4% |
| | | Aerospace & Defense – 0.7% | | | | | | |
| $284,853 | | Atlantic Aviation FBO, Inc. (KKR Apple Bidco, LLC), 1st Lien Term Loan, 1 Mo. LIBOR + 3.00%, 0.50% Floor
| | 3.50% | | 07/31/28 | | $284,141 |
| 468,236 | | Peraton Corp., Term Loan B, 1 Mo. LIBOR + 3.75%, 0.75% Floor
| | 4.50% | | 02/01/28 | | 468,746 |
| 403,208 | | Spirit Aerosystems, Inc., New Term Loan B, 1 Mo. LIBOR + 3.75%, 0.50% Floor
| | 4.25% | | 01/15/25 | | 404,216 |
| | | | | 1,157,103 |
| | | Apparel, Accessories & Luxury Goods – 0.1% | | | | | | |
| 155,926 | | Careismatic Brands/New Trojan, Inc. (fka Strategic Partners), Term Loan B, 3 Mo. LIBOR + 3.25%, 0.50% Floor
| | 3.75% | | 01/06/28 | | 155,341 |
| | | Application Software – 15.3% | | | | | | |
| 495,187 | | AppLovin Corp., Amendment No. 6 New Term Loan, 1 Mo. LIBOR + 3.00%, 0.50% Floor
| | 3.50% | | 10/25/28 | | 493,949 |
| 184,685 | | CCC Intelligent Solutions, Inc., Term Loan B, 3 Mo. LIBOR + 2.50%, 0.50% Floor
| | 3.00% | | 09/21/28 | | 184,085 |
| 208,990 | | ConnectWise, LLC, Term Loan B, 3 Mo. LIBOR + 3.50%, 0.50% Floor
| | 4.00% | | 09/30/28 | | 208,691 |
| 1,503,758 | | Epicor Software Corp., First Lien Term Loan C, 1 Mo. LIBOR + 3.25%, 0.75% Floor
| | 4.00% | | 07/30/27 | | 1,501,758 |
| 167,779 | | Flexera Software, LLC, 2020 Term Loan B, 3 Mo. LIBOR + 3.75%, 0.75% Floor
| | 4.50% | | 01/26/28 | | 167,870 |
| 1,568,543 | | Gainwell Acquisition Corp. (fka Milano), Term Loan B, 3 Mo. LIBOR + 4.00%, 0.75% Floor
| | 4.75% | | 10/01/27 | | 1,571,210 |
| 2,387,513 | | Greeneden U.S. Holdings II, LLC (Genesys Telecommunications Laboratories, Inc.), Initial Dollar Term Loan, 1 Mo. LIBOR + 4.00%, 0.75% Floor
| | 4.75% | | 12/01/27 | | 2,392,360 |
| 3,834,212 | | Hyland Software, Inc., 2018 Refinancing Term Loan, 1 Mo. LIBOR + 3.50%, 0.75% Floor
| | 4.25% | | 07/01/24 | | 3,835,401 |
| 697,754 | | Imprivata, Inc., Term Loan B, 1 Mo. LIBOR + 3.50%, 0.50% Floor
| | 4.00% | | 11/30/27 | | 697,970 |
| 287,140 | | Inmar, Inc., Initial Term Loan, 3 Mo. LIBOR + 4.00%, 1.00% Floor
| | 5.00% | | 05/01/24 | | 286,063 |
| 1,625,765 | | Internet Brands, Inc. (Web MD/MH Sub I, LLC), 2020 June New Term Loan, 1 Mo. LIBOR + 3.75%, 1.00% Floor
| | 4.75% | | 09/15/24 | | 1,628,480 |
| 1,893,131 | | Internet Brands, Inc. (Web MD/MH Sub I, LLC), 2nd Amendment Initial Term Loan, 1 Mo. LIBOR + 3.50%, 0.00% Floor
| | 3.59% | | 09/13/24 | | 1,885,483 |
| 1,102,775 | | Internet Brands, Inc. (Web MD/MH Sub I, LLC), 2nd Lien Term Loan, 1 Mo. LIBOR + 6.25%, 0.00% Floor
| | 6.35% | | 02/23/29 | | 1,116,902 |
| 95,511 | | ION Trading Technologies, Term Loan B, 1 Mo. LIBOR + 4.75%, 0.00% Floor
| | 4.84% | | 04/01/28 | | 95,690 |
| 1,593,349 | | LogMeIn, Inc. (Logan), Term Loan B, 1 Mo. LIBOR + 4.75%, 0.00% Floor
| | 4.83% | | 08/31/27 | | 1,590,736 |
| 1,727,013 | | McAfee, LLC, Term Loan B, 1 Mo. LIBOR + 3.75%, 0.00% Floor
| | 3.84% | | 09/30/24 | | 1,728,101 |
| 122,644 | | MeridianLink, Inc., Term Loan B, 1 Mo. LIBOR + 3.00%, 0.50% Floor
| | 3.50% | | 11/09/28 | | 122,490 |
| 1,393,206 | | Micro Focus International (MA Financeco, LLC), Term Loan B4, 3 Mo. LIBOR + 4.25%, 1.00% Floor
| | 5.25% | | 06/05/25 | | 1,403,223 |
| 271,658 | | N-Able, Inc., Term Loan B, 3 Mo. LIBOR + 3.00%, 0.50% Floor
| | 3.50% | | 07/19/28 | | 271,318 |
| 239,933 | | RealPage, Inc., Second Lien Term Loan, 1 Mo. LIBOR + 6.50%, 0.75% Floor
| | 7.25% | | 04/22/29 | | 244,732 |
| 599,332 | | RealPage, Inc., Term Loan B, 1 Mo. LIBOR + 3.25%, 0.50% Floor
| | 3.75% | | 04/24/28 | | 597,893 |
See Notes to Financial Statements
Page 7
First Trust Short Duration High Income Fund
Portfolio of Investments (Continued)
October 31, 2021
Principal
Value | | Description | | Rate (a) | | Stated
Maturity (b) | | Value |
| SENIOR FLOATING-RATE LOAN INTERESTS (Continued) |
| | | Application Software (Continued) | | | | | | |
| $3,494,084 | | SolarWinds Holdings, Inc., 2018 Refinancing Term Loan, 1 Mo. LIBOR + 2.75%, 0.00% Floor
| | 2.84% | | 02/05/24 | | $3,444,747 |
| 262,790 | | Solera Holdings, Inc. (Polaris Newco), Term Loan B, 6 Mo. LIBOR + 4.00%, 0.50% Floor
| | 4.50% | | 06/04/28 | | 263,295 |
| 117,289 | | Tenable, Inc., Term Loan B, 6 Mo. LIBOR + 2.75%, 0.50% Floor
| | 3.25% | | 07/07/28 | | 116,996 |
| 68,829 | | Ultimate Kronos Group (UKG, Inc.), 2021 Incremental Term Loan, 3 Mo. LIBOR + 3.25%, 0.75% Floor
| | 4.00% | | 05/03/26 | | 68,907 |
| | | | | 25,918,350 |
| | | Auto Parts & Equipment – 0.5% | | | | | | |
| 204,701 | | Clarios Global L.P. (Power Solutions), Term Loan B, 1 Mo. LIBOR + 3.25%, 0.00% Floor
| | 3.34% | | 04/30/26 | | 203,336 |
| 87,967 | | Dexko Global (Dornoch Debt Merger Sub, Inc.), Initial Dollar Term Loan, 3 Mo. LIBOR + 3.75%, 0.50% Floor
| | 4.25% | | 10/04/28 | | 87,873 |
| 599,523 | | Truck Hero, Inc., Term Loan B, 1 Mo. LIBOR + 3.25%, 0.75% Floor
| | 4.00% | | 01/31/28 | | 596,663 |
| | | | | 887,872 |
| | | Broadcasting – 1.1% | | | | | | |
| 130,125 | | E.W. Scripps Company, B-3 Term Loan, 1 Mo. LIBOR + 3.00%, 0.75% Floor
| | 3.75% | | 01/07/28 | | 130,186 |
| 664,788 | | iHeartCommunications, Inc., Second Amendment Incremental Term Loan B, 1 Mo. LIBOR + 3.25%, 0.50% Floor
| | 3.75% | | 05/01/26 | | 665,825 |
| 721,280 | | iHeartCommunications, Inc., Term Loan B, 1 Mo. LIBOR + 3.00%, 0.00% Floor
| | 3.09% | | 05/01/26 | | 715,740 |
| 303,000 | | Univision Communications, Inc., 2017 Replacement Repriced First Lien Term Loan C-5, 1 Mo. LIBOR + 2.75%, 1.00% Floor
| | 3.75% | | 03/15/24 | | 302,685 |
| 89,966 | | Univision Communications, Inc., 2021 Replacement New First Lien Term Loan, 1 Mo. LIBOR + 3.25%, 0.75% Floor
| | 4.00% | | 03/24/26 | | 89,899 |
| | | | | 1,904,335 |
| | | Cable & Satellite – 1.0% | | | | | | |
| 395,675 | | DIRECTV Holdings, LLC, Closing Date Term Loan, 3 Mo. LIBOR + 5.00%, 0.75% Floor
| | 5.75% | | 07/31/27 | | 395,865 |
| 994,366 | | Radiate Holdco, LLC (RCN), Inc. Amendment No. 6 Term Loan, 1 Mo. LIBOR + 3.25%, 0.75% Floor
| | 4.00% | | 09/25/26 | | 991,432 |
| 353,102 | | WideOpenWest Finance, LLC, Term Loan B, 1 Mo. LIBOR + 3.25%, 1.00% Floor
| | 4.25% | | 08/19/23 | | 352,534 |
| | | | | 1,739,831 |
| | | Casinos & Gaming – 3.6% | | | | | | |
| 214,905 | | Caesars Resort Collection, LLC, New Term Loan B, 1 Mo. LIBOR + 3.50%, 0.00% Floor
| | 3.59% | | 07/20/25 | | 215,029 |
| 1,568,999 | | Caesars Resort Collection, LLC, Term Loan B, 1 Mo. LIBOR + 2.75%, 0.00% Floor
| | 2.84% | | 12/22/24 | | 1,560,998 |
| 2,797,580 | | Golden Nugget, Inc., Term Loan B, 3 Mo. LIBOR + 2.50%, 0.75% Floor
| | 3.25% | | 10/04/23 | | 2,782,081 |
| 1,595,948 | | Scientific Games International, Inc., Term Loan B5, 1 Mo. LIBOR + 2.75%, 0.00% Floor
| | 2.84% | | 08/14/24 | | 1,588,511 |
| | | | | 6,146,619 |
| | | Construction & Engineering – 0.3% | | | | | | |
| 388,553 | | USIC, Inc., 1st Lien Term Loan, 1 Mo. LIBOR + 3.50%, 0.75% Floor
| | 4.25% | | 05/15/28 | | 387,946 |
Page 8
See Notes to Financial Statements
First Trust Short Duration High Income Fund
Portfolio of Investments (Continued)
October 31, 2021
Principal
Value | | Description | | Rate (a) | | Stated
Maturity (b) | | Value |
| SENIOR FLOATING-RATE LOAN INTERESTS (Continued) |
| | | Construction & Engineering (Continued) | | | | | | |
| $130,321 | | Westinghouse Electric (Brookfield WEC Holdings, Inc.), Refinancing No. 2 Term Loan, 1 Mo. LIBOR + 2.75%, 0.50% Floor
| | 3.25% | | 08/01/25 | | $129,344 |
| | | | | 517,290 |
| | | Data Processing & Outsourced Services – 0.0% | | | | | | |
| 78,156 | | Paysafe Holdings (US) Corp., New Term Loan B, 1 Mo. LIBOR + 2.75%, 0.50% Floor
| | 3.25% | | 06/24/28 | | 77,692 |
| | | Electric Utilities – 1.2% | | | | | | |
| 2,032,522 | | PG&E Corp., Term Loan B, 3 Mo. LIBOR + 3.00%, 0.50% Floor
| | 3.50% | | 06/23/25 | | 2,009,026 |
| | | Electronic Equipment & Instruments – 0.2% | | | | | | |
| 332,822 | | Verifone Systems, Inc., Initial Term Loan, 3 Mo. LIBOR + 4.00%, 0.00% Floor
| | 4.13% | | 08/20/25 | | 325,750 |
| | | Environmental & Facilities Services – 1.3% | | | | | | |
| 261,079 | | Allied Universal Holdco, LLC, Initial US Dollar Term Loan, 3 Mo. LIBOR + 3.75%, 0.50% Floor
| | 4.25% | | 05/14/28 | | 260,917 |
| 1,594,625 | | Packers Holdings, LLC (PSSI), Term Loan B, 6 Mo. LIBOR + 3.25%, 0.75% Floor
| | 4.00% | | 03/15/28 | | 1,587,656 |
| 382,642 | | TruGreen L.P., Second Refinancing Term Loan B, 1 Mo. LIBOR + 4.00%, 0.75% Floor
| | 4.75% | | 11/02/27 | | 382,642 |
| | | | | 2,231,215 |
| | | Health Care Distributors – 0.3% | | | | | | |
| 522,253 | | Radiology Partners, Inc., Term Loan B, 1 Mo. LIBOR + 4.25%, 0.00% Floor
| | 4.33%-4.34% | | 07/09/25 | | 521,381 |
| | | Health Care Equipment – 0.5% | | | | | | |
| 916,187 | | Chamberlain Group, Inc. (Chariot), Term Loan B, 1 Mo. LIBOR + 3.50%, 0.50% Floor
| | 4.00% | | 11/03/28 | | 914,282 |
| | | Health Care Facilities – 0.1% | | | | | | |
| 191,239 | | Ardent Health Services, Inc. (AHP Health Partners, Inc.), Term Loan B, 1 Mo. LIBOR + 3.50%, 0.50% Floor
| | 4.00% | | 08/24/28 | | 191,776 |
| | | Health Care Services – 13.6% | | | | | | |
| 324,985 | | AccentCare (Pluto Acquisition I, Inc.), New Term Loan B, 3 Mo. LIBOR + 4.00%, 0.00% Floor
| | 4.12% | | 06/20/26 | | 324,715 |
| 1,386,771 | | ADMI Corp. (Aspen Dental), 2020 Incremental Term Loan B2, 1 Mo. LIBOR + 3.13%, 0.50% Floor
| | 3.63% | | 12/23/27 | | 1,375,940 |
| 385,498 | | ADMI Corp. (Aspen Dental), 2021 Incremental Term Loan B3, 1 Mo. LIBOR + 3.50%, 0.50% Floor
| | 4.00% | | 12/23/27 | | 385,086 |
| 1,030,364 | | Air Methods Corp., Term Loan B, 3 Mo. LIBOR + 3.50%, 1.00% Floor
| | 4.50% | | 04/21/24 | | 981,422 |
| 3,519,448 | | athenahealth, Inc. (VVC Holding Corp.), Term Loan B-1, 3 Mo. LIBOR + 4.25%, 0.00% Floor
| | 4.38% | | 02/11/26 | | 3,528,246 |
| 244,788 | | Aveanna Healthcare, LLC, Delayed Draw Term Loan, 1 Mo. LIBOR + 3.75%, 0.50% Floor
| | 4.25% | | 07/15/28 | | 244,137 |
| 1,052,587 | | Aveanna Healthcare, LLC, New Term Loan B, 1 Mo. LIBOR + 3.75%, 0.50% Floor
| | 4.25% | | 07/15/28 | | 1,049,787 |
| 679,793 | | Brightspring Health (Phoenix Guarantor, Inc.), Incremental Term Loan B-3, 1 Mo. LIBOR + 3.50%, 0.00% Floor
| | 3.59% | | 03/05/26 | | 676,822 |
| 1,377,204 | | CHG Healthcare Services, Inc., Term Loan B, 3 Mo. LIBOR + 3.50%, 0.50% Floor
| | 4.00% | | 09/30/28 | | 1,377,204 |
See Notes to Financial Statements
Page 9
First Trust Short Duration High Income Fund
Portfolio of Investments (Continued)
October 31, 2021
Principal
Value | | Description | | Rate (a) | | Stated
Maturity (b) | | Value |
| SENIOR FLOATING-RATE LOAN INTERESTS (Continued) |
| | | Health Care Services (Continued) | | | | | | |
| $381,802 | | Civitas Solutions (National Mentor Holdings, Inc.), Term Loan B, 1 Mo. LIBOR + 3.75%, 0.75% Floor
| | 4.50% | | 03/01/28 | | $379,256 |
| 385,451 | | Civitas Solutions (National Mentor Holdings, Inc.), Term Loan B, 3 Mo. LIBOR + 3.75%, 0.75% Floor
| | 4.50% | | 03/01/28 | | 382,880 |
| 25,704 | | Civitas Solutions (National Mentor Holdings, Inc.), Term Loan C, 3 Mo. LIBOR + 3.75%, 0.75% Floor
| | 4.50% | | 03/01/28 | | 25,532 |
| 246,801 | | DuPage Medical Group (Midwest Physician Admin. Services, LLC), Initial Term Loan, 3 Mo. LIBOR + 3.25%, 0.75% Floor
| | 4.00% | | 03/15/28 | | 245,567 |
| 2,416,633 | | Envision Healthcare Corporation, Initial Term Loan, 1 Mo. LIBOR + 3.75%, 0.00% Floor
| | 3.84% | | 10/10/25 | | 1,994,737 |
| 2,070,742 | | ExamWorks Group, Inc. (Electron Bidco), Initial Term Loan, 3 Mo. LIBOR + 3.25%, 0.50% Floor
| | 3.75% | | 10/29/28 | | 2,068,154 |
| 114,474 | | Global Medical Response, Inc. (fka Air Medical), 2021 Refinancing Term Loan, 1 Mo. LIBOR + 4.25%, 1.00% Floor
| | 5.25% | | 10/02/25 | | 113,923 |
| 94,594 | | Help at Home (HAH Group Holding Company, LLC), Delayed Draw Term Loan, 3 Mo. LIBOR + 5.00%, 1.00% Floor
| | 6.00% | | 10/29/27 | | 94,594 |
| 745,728 | | Help at Home (HAH Group Holding Company, LLC), Initial Term Loan, 3 Mo. LIBOR + 5.00%, 1.00% Floor
| | 6.00% | | 10/29/27 | | 745,728 |
| 1,065,226 | | Packaging Coordinators, Inc. (PCI Pharma), Term Loan B, 3 Mo. LIBOR + 3.50%, 0.75% Floor
| | 4.25% | | 11/30/27 | | 1,066,334 |
| 1,357 | | Radnet Management, Inc., Term Loan B, 2 Mo. PRIME + 2.00%, 3.25% Floor
| | 5.25% | | 04/22/28 | | 1,354 |
| 540,191 | | Radnet Management, Inc., Term Loan B, 3 Mo. LIBOR + 3.00%, 0.75% Floor
| | 3.75% | | 04/22/28 | | 538,954 |
| 131,967 | | SCP Health (Onex TSG Intermediate Corp.), Initial Term Loan, 3 Mo. LIBOR + 4.75%, 0.75% Floor
| | 5.50% | | 02/28/28 | | 131,761 |
| 596,527 | | Surgery Centers Holdings, Inc., 2021 Term Loan B, 1 Mo. LIBOR + 3.75%, 0.75% Floor
| | 4.50% | | 08/31/26 | | 597,606 |
| 1,369,001 | | Team Health, Inc., Term Loan B, 1 Mo. LIBOR + 2.75%, 1.00% Floor
| | 3.75% | | 02/06/24 | | 1,303,974 |
| 1,043,941 | | U.S. Anesthesia Partners Intermediate Holdings, Inc., New Term Loan B, 6 Mo. LIBOR + 4.25%, 0.50% Floor
| | 4.75% | | 09/30/28 | | 1,042,772 |
| 2,329,839 | | U.S. Renal Care, Inc., Term Loan B, 1 Mo. LIBOR + 5.00%, 0.00% Floor
| | 5.13% | | 06/28/26 | | 2,312,948 |
| 86,989 | | US Radiology Specialists, Inc., Closing Date Term Loan, 3 Mo. LIBOR + 5.50%, 0.75% Floor
| | 6.25% | | 12/15/27 | | 87,206 |
| | | | | 23,076,639 |
| | | Health Care Supplies – 1.2% | | | | | | |
| 2,077,069 | | Medline Borrower, LP (Mozart), Initial Dollar Term Loan, 1 Mo. LIBOR + 3.25%, 0.50% Floor
| | 3.75% | | 10/21/28 | | 2,079,126 |
| | | Health Care Technology – 5.1% | | | | | | |
| 945,428 | | Ciox Health (Healthport/CT Technologies Intermediate Holdings, Inc.), Term Loan 2021 Reprice, 1 Mo. LIBOR + 4.25%, 0.75% Floor
| | 5.00% | | 12/16/25 | | 947,281 |
| 789,749 | | Ensemble RCM, LLC (Ensemble Health), Term Loan B, 3 Mo. LIBOR + 3.75%, 0.00% Floor
| | 3.88% | | 08/01/26 | | 790,452 |
| 56,688 | | eResearch Technology, Inc. (ERT), Incremental Term Loan B, 1 Mo. LIBOR + 4.50%, 1.00% Floor
| | 5.50% | | 02/04/27 | | 56,917 |
| 859,230 | | Mediware (Wellsky/Project Ruby Ultimate Parent Corp.), Term Loan B, 1 Mo. LIBOR + 3.25%, 0.75% Floor
| | 4.00% | | 03/10/28 | | 857,915 |
| 148,325 | | Navicure, Inc. (Waystar Technologies, Inc.), Term Loan B, 1 Mo. LIBOR + 4.00%, 0.00% Floor
| | 4.09% | | 10/23/26 | | 148,418 |
Page 10
See Notes to Financial Statements
First Trust Short Duration High Income Fund
Portfolio of Investments (Continued)
October 31, 2021
Principal
Value | | Description | | Rate (a) | | Stated
Maturity (b) | | Value |
| SENIOR FLOATING-RATE LOAN INTERESTS (Continued) |
| | | Health Care Technology (Continued) | | | | | | |
| $88,344 | | Press Ganey (Azalea TopCo, Inc.), 2021 Term Loan, 1 Mo. LIBOR + 3.75%, 0.75% Floor
| | 4.50% | | 07/25/26 | | $88,454 |
| 252,155 | | Press Ganey (Azalea TopCo, Inc.), Term Loan B, 3 Mo. LIBOR + 3.50%, 0.00% Floor
| | 3.59% | | 07/25/26 | | 250,201 |
| 3,161,476 | | Verscend Technologies, Inc. (Cotiviti), New Term Loan B-1, 1 Mo. LIBOR + 4.00%, 0.00% Floor
| | 4.09% | | 08/27/25 | | 3,165,428 |
| 650,704 | | Zelis Payments Buyer, Inc., New Term Loan B, 1 Mo. LIBOR + 3.50%, 0.00% Floor
| | 3.58% | | 09/30/26 | | 645,283 |
| 1,785,643 | | Zelis Payments Buyer, Inc., Term Loan B, 1 Mo. LIBOR + 3.50%, 0.00% Floor
| | 3.58% | | 09/30/26 | | 1,777,126 |
| | | | | 8,727,475 |
| | | Homefurnishing Retail – 0.5% | | | | | | |
| 467,605 | | At Home Holding III, Inc. (Ambience), Term Loan B, 3 Mo. LIBOR + 4.25%, 0.50% Floor
| | 4.75% | | 07/23/28 | | 465,463 |
| 462,504 | | Rent-A-Center, Inc., New Term Loan B, 1 Mo. LIBOR + 3.25%, 0.50% Floor
| | 3.75% | | 02/15/28 | | 463,374 |
| | | | | 928,837 |
| | | Hotels, Resorts & Cruise Lines – 0.2% | | | | | | |
| 277,592 | | Alterra Mountain Company, Term Loan B-2, 1 Mo. LIBOR + 3.50%, 0.50% Floor
| | 4.00% | | 08/17/28 | | 276,829 |
| | | Industrial Machinery – 1.1% | | | | | | |
| 99,861 | | Filtration Group Corporation, 2021 Incremental Term Loan B, 1 Mo. LIBOR + 3.50%, 0.50% Floor
| | 4.00% | | 10/21/28 | | 99,686 |
| 1,693,534 | | TK Elevator Newco GMBH (Vertical U.S. Newco, Inc.), New Term Loan B1 (USD), 6 Mo. LIBOR + 3.50%, 0.50% Floor
| | 4.00% | | 07/31/27 | | 1,695,651 |
| | | | | 1,795,337 |
| | | Insurance Brokers – 4.6% | | | | | | |
| 2,869,438 | | Alliant Holdings I, LLC, Initial Term Loan, 1 Mo. LIBOR + 3.25%, 0.00% Floor
| | 3.34% | | 05/09/25 | | 2,843,441 |
| 336,612 | | AssuredPartners, Inc., 2021 Term Loan B, 1 Mo. LIBOR + 3.50%, 0.50% Floor
| | 4.00% | | 02/13/27 | | 335,434 |
| 867,890 | | BroadStreet Partners, Inc., Term Loan B, 1 Mo. LIBOR + 3.00%, 0.00% Floor
| | 3.08% | | 01/27/27 | | 856,407 |
| 358,977 | | Cross Financial Corp., Term Loan B, 1 Mo. LIBOR + 4.00%, 0.75% Floor
| | 4.75% | | 09/15/27 | | 360,621 |
| 6,255 | | Hub International Limited, New Term Loan B-3, 2 Mo. LIBOR + 3.25%, 0.75% Floor
| | 4.00% | | 04/25/25 | | 6,247 |
| 2,476,835 | | HUB International Limited, New Term Loan B-3, 3 Mo. LIBOR + 3.25%, 0.75% Floor
| | 4.00% | | 04/25/25 | | 2,473,739 |
| 132,499 | | Ryan Specialty Group, LLC, Term Loan B, 1 Mo. LIBOR + 3.00%, 0.75% Floor
| | 3.75% | | 09/01/27 | | 132,532 |
| 849,585 | | USI, Inc. (fka Compass Investors, Inc.), Term Loan B, 3 Mo. LIBOR + 3.00%, 0.00% Floor
| | 3.13% | | 05/15/24 | | 842,755 |
| | | | | 7,851,176 |
| | | Integrated Telecommunication Services – 2.6% | | | | | | |
| 1,496,358 | | Frontier Communications Corp., Term Loan B, 3 Mo. LIBOR + 3.75%, 0.75% Floor
| | 4.50% | | 05/01/28 | | 1,493,366 |
| 2,622,010 | | Numericable (Altice France S.A. or SFR), Term Loan B-12, 3 Mo. LIBOR + 3.69%, 0.00% Floor
| | 3.81% | | 01/31/26 | | 2,591,857 |
See Notes to Financial Statements
Page 11
First Trust Short Duration High Income Fund
Portfolio of Investments (Continued)
October 31, 2021
Principal
Value | | Description | | Rate (a) | | Stated
Maturity (b) | | Value |
| SENIOR FLOATING-RATE LOAN INTERESTS (Continued) |
| | | Integrated Telecommunication Services (Continued) | | | | | | |
| $267,002 | | Numericable (Altice France S.A. or SFR), Term Loan B-13, 3 Mo. LIBOR + 4.00%, 0.00% Floor
| | 4.12% | | 08/14/26 | | $265,554 |
| | | | | 4,350,777 |
| | | Leisure Facilities – 0.2% | | | | | | |
| 405,711 | | SeaWorld Parks and Entertainment, Term Loan B, 1 Mo. LIBOR + 3.00%, 0.50% Floor
| | 3.50% | | 08/25/28 | | 404,189 |
| | | Managed Health Care – 0.5% | | | | | | |
| 863,539 | | Multiplan, Inc. (MPH), Term Loan B, 3 Mo. LIBOR + 4.25%, 0.50% Floor
| | 4.75% | | 09/01/28 | | 841,233 |
| | | Metal & Glass Containers – 0.3% | | | | | | |
| 108,991 | | Altium Packaging (fka Consolidated Container), Term Loan B, 1 Mo. LIBOR + 2.75%, 0.50% Floor
| | 3.25% | | 02/03/28 | | 107,878 |
| 358,056 | | PODS, LLC, Term Loan B, 1 Mo. LIBOR + 3.00%, 0.75% Floor
| | 3.75% | | 03/31/28 | | 357,387 |
| | | | | 465,265 |
| | | Movies & Entertainment – 1.7% | | | | | | |
| 185,611 | | Cineworld Group PLC (Crown), New Priority Term Loan, 3 Mo. LIBOR + 8.25%, 1.00% Floor
| | 9.25% | | 05/23/24 | | 199,067 |
| 327,316 | | Cineworld Group PLC (Crown), Priority Term Loan B-1, Fixed Rate at 15.25% (c)
| | 15.25% | | 05/23/24 | | 394,744 |
| 2,294,216 | | Cineworld Group PLC (Crown), Term Loan B, 6 Mo. LIBOR + 2.50%, 1.00% Floor
| | 3.50% | | 02/28/25 | | 1,888,140 |
| 153,416 | | PUG, LLC (Stubhub/Viagogo), Incremental Term Loan B-2, 1 Mo. LIBOR + 4.25%, 0.50% Floor
| | 4.75% | | 02/13/27 | | 153,416 |
| 224,095 | | PUG, LLC (Stubhub/Viagogo), Term Loan B, 1 Mo. LIBOR + 3.50%, 0.00% Floor
| | 3.59% | | 02/12/27 | | 220,079 |
| | | | | 2,855,446 |
| | | Packaged Foods & Meats – 0.2% | | | | | | |
| 112,639 | | BellRing Brands, LLC, 2021 Refinancing Term Loan, 1 Mo. LIBOR + 4.00%, 0.75% Floor
| | 4.75% | | 10/21/24 | | 113,005 |
| 189,294 | | Simply Good Foods (Atkins Nutritionals, Inc.), Term Loan B, 1 Mo. LIBOR + 3.75%, 1.00% Floor
| | 4.75% | | 07/07/24 | | 190,123 |
| | | | | 303,128 |
| | | Paper Packaging – 0.9% | | | | | | |
| 1,450,048 | | Pactiv LLC/Evergreen Packaging, LLC (fka Reynolds Group Holdings), Tranche B-3 U.S. Term Loan, 1 Mo. LIBOR + 3.50%, 0.50% Floor
| | 4.00% | | 09/20/28 | | 1,446,829 |
| | | Pharmaceuticals – 4.6% | | | | | | |
| 313,568 | | Akorn, Inc., Exit Take Back Term Loan, 3 Mo. LIBOR + 7.50%, 1.00% Floor (d)
| | 8.50% | | 09/30/25 | | 315,449 |
| 1,201,239 | | Jazz Pharmaceuticals, Inc., Term Loan B, 1 Mo. LIBOR + 3.50%, 0.50% Floor
| | 4.00% | | 05/05/28 | | 1,202,741 |
| 1,938,301 | | Mallinckrodt International Finance S.A., 2017 Term Loan B, 6 Mo. LIBOR + 5.25%, 0.75% Floor (e)
| | 6.00% | | 09/24/24 | | 1,800,739 |
| 287,816 | | Mallinckrodt International Finance S.A., 2018 Incremental Term Loan, 3 Mo. LIBOR + 5.50%, 0.75% Floor (e)
| | 6.25% | | 02/24/25 | | 267,370 |
| 1,692,710 | | Nestle Skin Health (Sunshine Lux VII SARL/Galderma), Facility B3 (USD), 3 Mo. LIBOR + 3.75%, 0.75% Floor
| | 4.50% | | 10/02/26 | | 1,695,469 |
| 2,418,067 | | Parexel International Corp. (Phoenix Newco), First Lien Term Loan, 1 Mo. LIBOR + 3.50%, 0.50% Floor
| | 4.00% | | 11/15/28 | | 2,419,735 |
Page 12
See Notes to Financial Statements
First Trust Short Duration High Income Fund
Portfolio of Investments (Continued)
October 31, 2021
Principal
Value | | Description | | Rate (a) | | Stated
Maturity (b) | | Value |
| SENIOR FLOATING-RATE LOAN INTERESTS (Continued) |
| | | Pharmaceuticals (Continued) | | | | | | |
| $102,750 | | Perrigo Rx (Padagis, LLC), Term Loan B, 3 Mo. LIBOR + 4.75%, 0.50% Floor
| | 5.25% | | 07/06/28 | | $102,879 |
| | | | | 7,804,382 |
| | | Publishing – 0.1% | | | | | | |
| 174,161 | | Meredith Corp., Tranche B-3 Term Loan, 3 Mo. LIBOR + 4.25%, 1.00% Floor
| | 5.25% | | 01/31/25 | | 177,608 |
| | | Research & Consulting Services – 1.6% | | | | | | |
| 1,417,602 | | Clarivate Analytics PLC (Camelot), Amendment No. 2 Incremental Term Loan, 1 Mo. LIBOR + 3.00%, 1.00% Floor
| | 4.00% | | 10/31/26 | | 1,419,728 |
| 341,981 | | Corelogic, Inc., Term Loan B, 1 Mo. LIBOR + 3.50%, 0.50% Floor
| | 4.00% | | 06/02/28 | | 341,725 |
| 147,477 | | J.D. Power (Project Boost Purchaser, LLC), 2021 Incremental Term Loan B, 1 Mo. LIBOR + 3.50%, 0.50% Floor
| | 4.00% | | 05/26/26 | | 147,323 |
| 666,132 | | Nielsen Consumer, Inc. (Indy US Holdco, LLC), Term Loan B-1, 1 Mo. LIBOR + 4.00%, 0.00% Floor
| | 4.08% | | 03/05/28 | | 667,385 |
| 129,927 | | Veritext Corporation (VT TopCo, Inc.), Non-Fungible 1st Lien Term Loan, 1 Mo. LIBOR + 3.75%, 0.75% Floor
| | 4.50% | | 08/10/25 | | 129,765 |
| | | | | 2,705,926 |
| | | Restaurants – 1.3% | | | | | | |
| 148,875 | | IRB Holding Corp. (Arby’s/Inspire Brands), Fourth Amendment Incremental Term Loan B, 3 Mo. LIBOR + 3.25%, 1.00% Floor
| | 4.25% | | 12/15/27 | | 148,769 |
| 1,875,305 | | IRB Holding Corp. (Arby’s/Inspire Brands), Term Loan B, 3 Mo. LIBOR + 2.75%, 1.00% Floor
| | 3.75% | | 02/05/25 | | 1,869,829 |
| 152,208 | | Whatabrands, LLC, Term Loan B, 1 Mo. LIBOR + 3.25%, 0.50% Floor
| | 3.75% | | 07/31/28 | | 152,047 |
| | | | | 2,170,645 |
| | | Specialized Consumer Services – 1.6% | | | | | | |
| 629,238 | | Asurion, LLC, 2nd Lien Term Loan B-4, 1 Mo. LIBOR + 5.25%, 0.00% Floor
| | 5.34% | | 01/20/29 | | 626,224 |
| 1,262,056 | | Asurion, LLC, Second Lien Term Loan B-3, 1 Mo. LIBOR + 5.25%, 0.00% Floor
| | 5.34% | | 01/31/28 | | 1,256,869 |
| 900,700 | | Asurion, LLC, Term Loan B6, 1 Mo. LIBOR + 3.13%, 0.00% Floor
| | 3.21% | | 11/03/23 | | 898,259 |
| | | | | 2,781,352 |
| | | Specialized Finance – 0.2% | | | | | | |
| 359,894 | | WCG Purchaser Corp. (WIRB-Copernicus Group), Term Loan B, 2 Mo. LIBOR + 4.00%, 1.00% Floor
| | 5.00% | | 01/08/27 | | 361,471 |
| | | Specialty Stores – 1.2% | | | | | | |
| 728,113 | | Bass Pro Group, LLC (Great Outdoors Group, LLC), Term Loan B-1, 3 Mo. LIBOR + 4.25%, 0.75% Floor
| | 5.00% | | 03/05/28 | | 729,780 |
| 936,047 | | Petco Animal Supplies, Inc., Initial Term Loan B, 3 Mo. LIBOR + 3.25%, 0.75% Floor
| | 4.00% | | 03/03/28 | | 935,382 |
| 381,294 | | Petsmart, Inc., Initial Term Loan B, 1 Mo. LIBOR + 3.75%, 0.75% Floor
| | 4.50% | | 02/12/28 | | 381,432 |
| | | | | 2,046,594 |
| | | Systems Software – 4.7% | | | | | | |
| 3,266,180 | | Applied Systems, Inc., 1st Lien Term Loan, 3 Mo. LIBOR + 3.25%, 0.50% Floor
| | 3.75% | | 09/19/24 | | 3,261,346 |
See Notes to Financial Statements
Page 13
First Trust Short Duration High Income Fund
Portfolio of Investments (Continued)
October 31, 2021
Principal
Value | | Description | | Rate (a) | | Stated
Maturity (b) | | Value |
| SENIOR FLOATING-RATE LOAN INTERESTS (Continued) |
| | | Systems Software (Continued) | | | | | | |
| $230,570 | | Applied Systems, Inc., 2nd Lien Term Loan, 3 Mo. LIBOR + 5.50%, 0.75% Floor
| | 6.25% | | 09/19/25 | | $233,205 |
| 297,375 | | BeyondTrust (Brave Parent Holdings, Inc.), Term Loan B, 1 Mo. LIBOR + 4.00%, 0.00% Floor
| | 4.09% | | 04/19/25 | | 297,268 |
| 861,811 | | BMC Software Finance, Inc. (Boxer Parent), 2021 Replacement Dollar Term Loan, 3 Mo. LIBOR + 3.75%, 0.00% Floor
| | 3.88% | | 10/02/25 | | 855,416 |
| 465,139 | | Idera, Inc., Initial Term Loan, 6 Mo. LIBOR + 3.75%, 0.75% Floor
| | 4.50% | | 02/15/28 | | 464,172 |
| 677,669 | | Misys Financial Software Ltd. (Almonde, Inc.) (Finastra), Term Loan B, 6 Mo. LIBOR + 3.50%, 1.00% Floor
| | 4.50% | | 06/13/24 | | 673,773 |
| 603,891 | | Proofpoint, Inc., Term Loan B, 3 Mo. LIBOR + 3.25%, 0.50% Floor
| | 3.75% | | 08/31/28 | | 601,143 |
| 968,446 | | Sophos Group PLC (Surf), Term Loan B, 3 Mo. LIBOR + 3.50%, 0.00% Floor
| | 3.62% | | 03/05/27 | | 961,735 |
| 592,412 | | SUSE (Marcel Lux IV SARL), Facility B1 USD, 1 Mo. LIBOR + 3.25%, 0.00% Floor
| | 3.34% | | 03/15/26 | | 592,412 |
| | | | | 7,940,470 |
| | | Trading Companies & Distributors – 0.5% | | | | | | |
| 849,089 | | SRS Distribution, Inc., 2021 Refinancing Term Loan, 1 Mo. LIBOR + 3.75%, 0.50% Floor
| | 4.25% | | 06/04/28 | | 848,851 |
| | | Trucking – 0.7% | | | | | | |
| 1,007,123 | | Hertz (The) Corporation, Exit Term Loan B, 1 Mo. LIBOR + 3.50%, 0.50% Floor
| | 4.00% | | 06/30/28 | | 1,008,050 |
| 190,280 | | Hertz (The) Corporation, Exit Term Loan C, 1 Mo. LIBOR + 3.50%, 0.50% Floor
| | 4.00% | | 06/30/28 | | 190,454 |
| | | | | 1,198,504 |
| | | Total Senior Floating-Rate Loan Interests
| | 128,135,952 |
| | | (Cost $128,551,408) | | | | | | |
Principal
Value | | Description | | Stated
Coupon | | Stated
Maturity | | Value |
| CORPORATE BONDS AND NOTES – 13.7% |
| | | Airlines – 0.1% | | | | | | |
| 176,000 | | Mileage Plus Holdings, LLC/Mileage Plus Intellectual Property Assets Ltd. (f)
| | 6.50% | | 06/20/27 | | 191,771 |
| | | Application Software – 0.2% | | | | | | |
| 291,000 | | LogMeIn, Inc. (f)
| | 5.50% | | 09/01/27 | | 291,623 |
| | | Automobile Manufacturers – 0.2% | | | | | | |
| 342,000 | | Ford Motor Co.
| | 9.00% | | 04/22/25 | | 411,683 |
| | | Automotive Retail – 0.1% | | | | | | |
| 155,000 | | KAR Auction Services, Inc. (f)
| | 5.13% | | 06/01/25 | | 155,581 |
| | | Broadcasting – 2.1% | | | | | | |
| 572,000 | | Cumulus Media New Holdings, Inc. (f)
| | 6.75% | | 07/01/26 | | 595,595 |
| 454,000 | | Diamond Sports Group, LLC/Diamond Sports Finance Co. (f)
| | 5.38% | | 08/15/26 | | 257,420 |
| 1,097,000 | | Diamond Sports Group, LLC/Diamond Sports Finance Co. (f)
| | 6.63% | | 08/15/27 | | 329,100 |
| 500,000 | | Gray Television, Inc. (f)
| | 7.00% | | 05/15/27 | | 535,625 |
| 675,000 | | iHeartCommunications, Inc.
| | 8.38% | | 05/01/27 | | 719,719 |
| 625,000 | | iHeartCommunications, Inc. (f)
| | 4.75% | | 01/15/28 | | 629,737 |
| 83,000 | | Sinclair Television Group, Inc. (f)
| | 5.88% | | 03/15/26 | | 85,179 |
| 12,000 | | Sinclair Television Group, Inc. (f)
| | 5.13% | | 02/15/27 | | 11,550 |
Page 14
See Notes to Financial Statements
First Trust Short Duration High Income Fund
Portfolio of Investments (Continued)
October 31, 2021
Principal
Value | | Description | | Stated
Coupon | | Stated
Maturity | | Value |
| CORPORATE BONDS AND NOTES (Continued) |
| | | Broadcasting (Continued) | | | | | | |
| $397,000 | | Univision Communications, Inc. (f)
| | 6.63% | | 06/01/27 | | $429,975 |
| | | | | 3,593,900 |
| | | Cable & Satellite – 1.8% | | | | | | |
| 3,001,000 | | CSC Holdings, LLC (f)
| | 5.75% | | 01/15/30 | | 2,964,838 |
| | | Casinos & Gaming – 0.6% | | | | | | |
| 51,000 | | Boyd Gaming Corp. (f)
| | 8.63% | | 06/01/25 | | 55,181 |
| 924,000 | | Caesars Entertainment, Inc. (f)
| | 6.25% | | 07/01/25 | | 973,064 |
| 65,000 | | Golden Nugget, Inc. (f)
| | 6.75% | | 10/15/24 | | 65,244 |
| | | | | 1,093,489 |
| | | Coal & Consumable Fuels – 0.3% | | | | | | |
| 217,254 | | Peabody Energy Corp. (f) (g)
| | 8.50% | | 12/31/24 | | 204,559 |
| 243,000 | | PIC AU Holdings, LLC/PIC AU Holdings Corp. (f)
| | 10.00% | | 12/31/24 | | 248,858 |
| | | | | 453,417 |
| | | Communications Equipment – 0.1% | | | | | | |
| 200,000 | | CommScope Technologies, LLC (f)
| | 6.00% | | 06/15/25 | | 198,323 |
| | | Health Care Facilities – 0.7% | | | | | | |
| 173,000 | | Tenet Healthcare Corp. (f)
| | 4.63% | | 06/15/28 | | 180,352 |
| 1,005,000 | | Tenet Healthcare Corp. (f)
| | 6.13% | | 10/01/28 | | 1,056,456 |
| | | | | 1,236,808 |
| | | Health Care Services – 1.0% | | | | | | |
| 1,468,000 | | Global Medical Response, Inc. (f)
| | 6.50% | | 10/01/25 | | 1,455,992 |
| 144,000 | | ModivCare, Inc. (f)
| | 5.88% | | 11/15/25 | | 151,380 |
| 69,000 | | Team Health Holdings, Inc. (f)
| | 6.38% | | 02/01/25 | | 61,180 |
| | | | | 1,668,552 |
| | | Health Care Technology – 1.3% | | | | | | |
| 1,687,000 | | Change Healthcare Holdings, LLC/Change Healthcare Finance, Inc. (f)
| | 5.75% | | 03/01/25 | | 1,701,761 |
| 480,000 | | Verscend Escrow Corp. (f)
| | 9.75% | | 08/15/26 | | 509,069 |
| | | | | 2,210,830 |
| | | Insurance Brokers – 2.3% | | | | | | |
| 1,069,000 | | Alliant Holdings Intermediate, LLC/Alliant Holdings Co-Issuer (f)
| | 6.75% | | 10/15/27 | | 1,105,078 |
| 85,000 | | AmWINS Group, Inc. (f)
| | 4.88% | | 06/30/29 | | 84,962 |
| 1,991,000 | | AssuredPartners, Inc. (f)
| | 7.00% | | 08/15/25 | | 2,020,865 |
| 676,000 | | HUB International Ltd. (f)
| | 7.00% | | 05/01/26 | | 697,970 |
| | | | | 3,908,875 |
| | | Integrated Telecommunication Services – 1.1% | | | | | | |
| 215,000 | | Frontier Communications Holdings, LLC (f)
| | 5.88% | | 10/15/27 | | 225,481 |
| 316,000 | | Frontier Communications Holdings, LLC (f)
| | 5.00% | | 05/01/28 | | 321,530 |
| 500,000 | | Frontier Communications Holdings, LLC (f)
| | 6.75% | | 05/01/29 | | 518,125 |
| 748,000 | | Zayo Group Holdings, Inc. (f)
| | 6.13% | | 03/01/28 | | 731,170 |
| | | | | 1,796,306 |
| | | Managed Health Care – 0.6% | | | | | | |
| 1,093,000 | | MPH Acquisition Holdings, LLC (f)
| | 5.75% | | 11/01/28 | | 995,237 |
| | | Movies & Entertainment – 0.0% | | | | | | |
| 43,000 | | Live Nation Entertainment, Inc. (f)
| | 6.50% | | 05/15/27 | | 47,139 |
See Notes to Financial Statements
Page 15
First Trust Short Duration High Income Fund
Portfolio of Investments (Continued)
October 31, 2021
Principal
Value | | Description | | Stated
Coupon | | Stated
Maturity | | Value |
| CORPORATE BONDS AND NOTES (Continued) |
| | | Paper Packaging – 0.2% | | | | | | |
| $348,000 | | Graham Packaging Co., Inc. (f)
| | 7.13% | | 08/15/28 | | $358,551 |
| | | Pharmaceuticals – 0.1% | | | | | | |
| 135,000 | | Organon & Co./Organon Foreign Debt Co-Issuer B.V. (f)
| | 5.13% | | 04/30/31 | | 139,412 |
| | | Research & Consulting Services – 0.1% | | | | | | |
| 44,000 | | Clarivate Science Holdings Corp. (f)
| | 4.88% | | 07/01/29 | | 43,866 |
| 118,000 | | Nielsen Finance, LLC/Nielsen Finance Co. (f)
| | 5.63% | | 10/01/28 | | 122,836 |
| | | | | 166,702 |
| | | Restaurants – 0.6% | | | | | | |
| 922,000 | | IRB Holding Corp. (f)
| | 7.00% | | 06/15/25 | | 975,015 |
| 78,000 | | IRB Holding Corp. (f)
| | 6.75% | | 02/15/26 | | 79,853 |
| | | | | 1,054,868 |
| | | Systems Software – 0.2% | | | | | | |
| 258,000 | | Boxer Parent Co., Inc. (f)
| | 9.13% | | 03/01/26 | | 269,996 |
| | | Total Corporate Bonds and Notes
| | 23,207,901 |
| | | (Cost $23,281,270) | | | | | | |
| FOREIGN CORPORATE BONDS AND NOTES – 5.9% |
| | | Building Products – 1.0% | | | | | | |
| 1,455,000 | | Cemex S.A.B. de C.V. (f)
| | 7.38% | | 06/05/27 | | 1,610,515 |
| 100,000 | | Cemex S.A.B. de C.V. (f)
| | 5.45% | | 11/19/29 | | 108,445 |
| | | | | 1,718,960 |
| | | Data Processing & Outsourced Services – 0.2% | | | | | | |
| 254,000 | | Paysafe Finance PLC/Paysafe Holdings US Corp. (f)
| | 4.00% | | 06/15/29 | | 240,982 |
| | | Environmental & Facilities Services – 0.1% | | | | | | |
| 114,000 | | Allied Universal Holdco, LLC/Allied Universal Finance Corp./Atlas Luxco 4 S.A.R.L. (f)
| | 4.63% | | 06/01/28 | | 113,222 |
| 76,000 | | Allied Universal Holdco, LLC/Allied Universal Finance Corp./Atlas Luxco 4 S.A.R.L. (f)
| | 4.63% | | 06/01/28 | | 75,407 |
| | | | | 188,629 |
| | | Pharmaceuticals – 4.6% | | | | | | |
| 2,820,000 | | Bausch Health Cos., Inc. (f)
| | 6.13% | | 04/15/25 | | 2,875,751 |
| 3,926,000 | | Endo DAC/Endo Finance, LLC/Endo Finco, Inc. (f)
| | 9.50% | | 03/27/28 | | 3,902,778 |
| 250,000 | | Mallinckrodt International Finance S.A./Mallinckrodt CB, LLC (e) (f) (h)
| | 5.63% | | 10/15/23 | | 112,813 |
| 250,000 | | Mallinckrodt International Finance S.A./Mallinckrodt CB, LLC (e) (f) (h)
| | 5.50% | | 04/15/25 | | 112,813 |
| 774,000 | | Mallinckrodt International Finance S.A./Mallinckrodt CB, LLC (e) (f)
| | 10.00% | | 04/15/25 | | 821,407 |
| | | | | 7,825,562 |
| | | Total Foreign Corporate Bonds and Notes
| | 9,974,133 |
| | | (Cost $10,475,647) | | | | | | |
| Shares | | Description | | Value |
| COMMON STOCKS – 0.4% |
| | | Broadcasting – 0.0% | | |
| 426 | | Cumulus Media Holdings (i)
| | 5,291 |
Page 16
See Notes to Financial Statements
First Trust Short Duration High Income Fund
Portfolio of Investments (Continued)
October 31, 2021
| Shares | | Description | | Value |
| COMMON STOCKS (Continued) |
| | | Electric Utilities – 0.2% | | |
| 14,134 | | Vistra Corp.
| | $276,885 |
| | | Oil & Gas Exploration & Production – 0.0% | | |
| 47,894 | | Ascent Resources - Marcellus LLC Class A Common Shares (i) (j)
| | 59,867 |
| | | Pharmaceuticals – 0.2% | | |
| 26,696 | | Akorn, Inc. (i) (j)
| | 288,664 |
| | | Total Common Stocks
| | 630,707 |
| | | (Cost $683,527) | | |
| WARRANTS – 0.0% |
| | | Movies & Entertainment – 0.0% | | |
| 97,523 | | Cineworld Group PLC (Crown), expiring 12/10/25 (i) (k)
| | 58,057 |
| | | Oil & Gas Exploration & Production – 0.0% | | |
| 12,400 | | Ascent Resources - Marcellus, LLC First Lien Warrants, expiring 3/20/23 (i) (k)
| | 310 |
| | | Total Warrants
| | 58,367 |
| | | (Cost $1,240) | | |
| RIGHTS – 0.0% |
| | | Electric Utilities – 0.0% | | |
| 14,134 | | Vistra Energy Corp., no expiration date (i) (k)
| | 19,646 |
| | | Life Sciences Tools & Services – 0.0% | | |
| 1 | | New Millennium Holdco, Inc., Corporate Claim Trust, no expiration date (i) (k) (l) (m)
| | 0 |
| 1 | | New Millennium Holdco, Inc., Lender Claim Trust, no expiration date (i) (k) (l) (m)
| | 0 |
| | | | | 0 |
| | | Total Rights
| | 19,646 |
| | | (Cost $23,096) | | |
| MONEY MARKET FUNDS – 2.0% |
| 3,407,643 | | Morgan Stanley Institutional Liquidity Funds - Treasury Portfolio - Institutional Class - 0.01% (n)
| | 3,407,643 |
| | | (Cost $3,407,643) | | |
| | | Total Investments – 97.4%
| | 165,434,349 |
| | | (Cost $166,423,831) (o) | | |
| | | Net Other Assets and Liabilities – 2.6%
| | 4,367,473 |
| | | Net Assets – 100.0%
| | $169,801,822 |
|
| (a) | Senior Floating-Rate Loan Interests (“Senior Loans”) in which the Fund invests pay interest at rates which are periodically predetermined by reference to a base lending rate plus a premium. These base lending rates are generally (i) the lending rate offered by one or more major European banks, such as the LIBOR, (ii) the prime rate offered by one or more United States banks or (iii) the certificate of deposit rate. Certain Senior Loans are subject to a LIBOR floor that establishes a minimum LIBOR rate. When a range of rates is disclosed, the Fund holds more than one contract within the same tranche with identical LIBOR period, spread and floor, but different LIBOR reset dates. |
| (b) | Senior Loans generally are subject to mandatory and/or optional prepayment. As a result, the actual remaining maturity of Senior Loans may be substantially less than the stated maturities shown. |
| (c) | The issuer may pay interest on the loans in cash and in Payment-In-Kind (“PIK”) interest. Interest paid in cash will accrue at the rate of 7.00% per annum (“Cash Interest Rate”) and PIK interest will accrue on the loan at the rate of 8.25% per annum. For the fiscal year ended October 31, 2021, the Fund received a portion of the interest in cash and PIK interest with a principal value of $22,309 for Cineworld Group PLC (Crown). |
| (d) | The issuer may pay interest on the loans (1) entirely in cash or (2) in the event that both the PIK Toggle Condition has been satisfied and the issuer elects to exercise the PIK interest, 2.50% payable in cash and 7.00% payable as PIK interest. For the fiscal year ended October 31, 2021, this security paid all of its interest in cash. |
| (e) | This issuer has filed for protection in bankruptcy court. |
See Notes to Financial Statements
Page 17
First Trust Short Duration High Income Fund
Portfolio of Investments (Continued)
October 31, 2021
| (f) | This security, sold within the terms of a private placement memorandum, is exempt from registration upon resale under Rule 144A under the Securities Act of 1933, as amended (the “1933 Act”), and may be resold in transactions exempt from registration, normally to qualified institutional buyers. Pursuant to procedures adopted by the Trust’s Board of Trustees, this security has been determined to be liquid by First Trust Advisors L.P. (the “Advisor”). Although market instability can result in periods of increased overall market illiquidity, liquidity for each security is determined based on security specific factors and assumptions, which require subjective judgment. At October 31, 2021, securities noted as such amounted to $32,050,632 or 18.9% of net assets. |
| (g) | The issuer will pay interest on the bonds in cash and in PIK interest. Interest paid in cash will accrue at the rate of 6.00% per annum (“Cash Interest Rate”) and PIK interest will accrue on the bond at the rate of 2.50% per annum. For the fiscal year ended October 31, 2021, the Fund received a portion of the interest in cash and PIK interest with a principal value of $2,254 for Peabody Energy Corp. |
| (h) | This issuer is in default and interest is not being accrued by the Fund nor paid by the issuer. |
| (i) | Non-income producing security. |
| (j) | Security received in a transaction exempt from registration under the 1933 Act. The security may be resold pursuant to an exemption from registration under the 1933 Act, typically to qualified institutional buyers. Pursuant to procedures adopted by the Trust’s Board of Trustees, this security has been determined to be illiquid by the Advisor. Although market instability can result in periods of increased overall market illiquidity, liquidity for the security is determined based on security-specific factors and assumptions, which require subjective judgment. At October 31, 2021, securities noted as such amounted to $348,531 or 0.2% of net assets. |
| (k) | Pursuant to procedures adopted by the Trust’s Board of Trustees, this security has been determined to be illiquid by the Advisor. |
| (l) | This security is fair valued by the Advisor’s Pricing Committee in accordance with procedures adopted by the Trust’s Board of Trustees, and in accordance with the provisions of the Investment Company Act of 1940, as amended. At October 31, 2021, securities noted as such are valued at $0 or 0.0% of net assets. |
| (m) | This security’s value was determined using significant unobservable inputs. (see Note 2A- Portfolio Valuation in the Notes to Financial Statements). |
| (n) | Rate shown reflects yield as of October 31, 2021. |
| (o) | Aggregate cost for federal income tax purposes was $166,595,524. As of October 31, 2021, the aggregate gross unrealized appreciation for all investments in which there was an excess of value over tax cost was $1,318,902 and the aggregate gross unrealized depreciation for all investments in which there was an excess of tax cost over value was $2,480,077. The net unrealized depreciation was $1,161,175. |
| LIBOR | London Interbank Offered Rate |
Valuation Inputs
A summary of the inputs used to value the Fund’s investments as of October 31, 2021 is as follows (see Note 2A - Portfolio Valuation in the Notes to Financial Statements):
| | Total
Value at
10/31/2021 | Level 1
Quoted
Prices | Level 2
Significant
Observable
Inputs | Level 3
Significant
Unobservable
Inputs |
Senior Floating-Rate Loan Interests*
| $ 128,135,952 | $ — | $ 128,135,952 | $ — |
Corporate Bonds and Notes*
| 23,207,901 | — | 23,207,901 | — |
Foreign Corporate Bonds and Notes*
| 9,974,133 | — | 9,974,133 | — |
| Common Stocks: | | | | |
Oil & Gas Exploration & Production
| 59,867 | — | 59,867 | — |
Pharmaceuticals
| 288,664 | — | 288,664 | — |
Other industry categories*
| 282,176 | 282,176 | — | — |
Warrants*
| 58,367 | — | 58,367 | — |
| Rights: | | | | |
Electric Utilities
| 19,646 | — | 19,646 | — |
Life Sciences Tools & Services
| —** | — | — | —** |
Money Market Funds
| 3,407,643 | 3,407,643 | — | — |
Total Investments
| $ 165,434,349 | $ 3,689,819 | $ 161,744,530 | $—** |
| * | See Portfolio of Investments for industry breakout. |
| ** | Investment is valued at $0. |
Level 3 Investments that are fair valued by the Advisor’s Pricing Committee are footnoted in the Portfolio of Investments. All Level 3 values are based on unobservable inputs.
Page 18
See Notes to Financial Statements
First Trust Short Duration High Income Fund
Statement of Assets and Liabilities
October 31, 2021
| ASSETS: | |
Investments, at value
(Cost $166,423,831)
| $ 165,434,349 |
Cash
| 8,426 |
| Receivables: | |
Investment securities sold
| 12,827,069 |
Interest
| 824,775 |
Fund shares sold
| 145,120 |
Prepaid expenses
| 1,399 |
Total Assets
| 179,241,138 |
| LIABILITIES: | |
| Payables: | |
Investment securities purchased
| 8,856,505 |
Fund shares redeemed
| 297,279 |
Investment advisory fees
| 94,168 |
Audit and tax fees
| 70,007 |
Transfer agent fees
| 30,018 |
12b-1 distribution and service fees
| 17,781 |
Shareholder reporting fees
| 16,332 |
Distributions
| 15,370 |
Administrative fees
| 15,111 |
Custodian fees
| 7,208 |
Legal fees
| 5,788 |
Commitment fees
| 4,677 |
Trustees’ fees and expenses
| 1,462 |
Financial reporting fees
| 771 |
Registration fees
| 446 |
Unrealized depreciation on unfunded loan commitments
| 2,694 |
Other liabilities
| 3,699 |
Total Liabilities
| 9,439,316 |
NET ASSETS
| $169,801,822 |
| NET ASSETS consist of: | |
Paid-in capital
| $ 182,098,640 |
Par value
| 86,715 |
Accumulated distributable earnings (loss)
| (12,383,533) |
NET ASSETS
| $169,801,822 |
| Maximum Offering Price Per Share: | |
| Class A Shares: | |
Net asset value and redemption price per share (Based on net assets of $17,823,144 and 910,710 shares of beneficial interest issued and outstanding)
| $19.57 |
Maximum sales charge (3.50% of offering price)
| 0.71 |
Maximum offering price to public
| $20.28 |
| Class C Shares: | |
Net asset value and redemption price per share (Based on net assets of $16,375,091 and 837,127 shares of beneficial interest issued and outstanding)
| $19.56 |
| Class I Shares: | |
Net asset value and redemption price per share (Based on net assets of $135,603,587 and 6,923,616 shares of beneficial interest issued and outstanding)
| $19.59 |
See Notes to Financial Statements
Page 19
First Trust Short Duration High Income Fund
Statement of Operations
For the Year Ended October 31, 2021
| INVESTMENT INCOME: | |
Interest
| $ 7,561,578 |
Dividends
| 8,294 |
Other
| 189,824 |
Total investment income
| 7,759,696 |
| EXPENSES: | |
Investment advisory fees
| 1,093,537 |
| 12b-1 distribution and/or service fees: | |
Class A
| 45,178 |
Class C
| 164,378 |
Transfer agent fees
| 126,016 |
Administrative fees
| 109,675 |
Audit and tax fees
| 68,755 |
Registration fees
| 68,126 |
Commitment fees
| 49,828 |
Shareholder reporting fees
| 42,604 |
Trustees’ fees and expenses
| 15,399 |
Financial reporting fees
| 9,250 |
Legal fees
| 6,247 |
Custodian fees
| 3,434 |
Excise tax expense
| 2,431 |
Other
| 20,114 |
Total expenses
| 1,824,972 |
NET INVESTMENT INCOME (LOSS)
| 5,934,724 |
| NET REALIZED AND UNREALIZED GAIN (LOSS): | |
Net realized gain (loss) on investments
| (294,668) |
| Net change in unrealized appreciation (depreciation) on: | |
Investments
| 5,329,986 |
Unfunded loan commitments
| (2,559) |
Net change in unrealized appreciation (depreciation)
| 5,327,427 |
NET REALIZED AND UNREALIZED GAIN (LOSS)
| 5,032,759 |
NET INCREASE (DECREASE) IN NET ASSETS RESULTING FROM OPERATIONS
| $ 10,967,483 |
Page 20
See Notes to Financial Statements
First Trust Short Duration High Income Fund
Statements of Changes in Net Assets
| | Year
Ended
10/31/2021 | | Year
Ended
10/31/2020 |
| OPERATIONS: | | | |
Net investment income (loss)
| $ 5,934,724 | | $ 5,352,014 |
Net realized gain (loss)
| (294,668) | | (3,100,216) |
Net change in unrealized appreciation (depreciation)
| 5,327,427 | | (786,502) |
Net increase (decrease) in net assets resulting from operations
| 10,967,483 | | 1,465,296 |
| DISTRIBUTIONS TO SHAREHOLDERS FROM INVESTMENT OPERATIONS: | | | |
Class A Shares
| (573,609) | | (1,180,172) |
Class C Shares
| (401,074) | | (563,189) |
Class I Shares
| (4,592,855) | | (3,886,213) |
Total distributions to shareholders from investment operations
| (5,567,538) | | (5,629,574) |
| DISTRIBUTIONS TO SHAREHOLDERS FROM RETURN OF CAPITAL: | | | |
Class A shares
| — | | (130,180) |
Class C shares
| — | | (63,524) |
Class I shares
| — | | (450,129) |
Total distributions to shareholders from return of capital
| — | | (643,833) |
| CAPITAL TRANSACTIONS: | | | |
Proceeds from shares sold
| 78,047,699 | | 77,756,904 |
Proceeds from shares reinvested
| 5,173,454 | | 4,909,562 |
Cost of shares redeemed
| (87,756,321) | | (68,721,478) |
Net increase (decrease) in net assets resulting from capital transactions
| (4,535,168) | | 13,944,988 |
Total increase (decrease) in net assets
| 864,777 | | 9,136,877 |
| NET ASSETS: | | | |
Beginning of period
| 168,937,045 | | 159,800,168 |
End of period
| $169,801,822 | | $168,937,045 |
See Notes to Financial Statements
Page 21
First Trust Short Duration High Income Fund
Financial Highlights
For a Share outstanding throughout each period
| Class A Shares | Year Ended October 31, |
| 2021 | | 2020 | | 2019 | | 2018 | | 2017 |
Net asset value, beginning of period
| $ 18.91 | | $ 19.31 | | $ 19.62 | | $ 20.00 | | $ 19.97 |
| Income from investment operations: | | | | | | | | | |
Net investment income (loss) (a)
| 0.67 | | 0.67 | | 0.86 | | 0.84 | | 0.79 |
Net realized and unrealized gain (loss)
| 0.62 | | (0.28) | | (0.32) | | (0.33) | | 0.15 |
Total from investment operations
| 1.29 | | 0.39 | | 0.54 | | 0.51 | | 0.94 |
| Distributions paid to shareholders from: | | | | | | | | | |
Net investment income
| (0.63) | | (0.71) | | (0.85) | | (0.87) | | (0.91) |
Return of capital
| — | | (0.08) | | — | | (0.02) | | — |
Total distributions
| (0.63) | | (0.79) | | (0.85) | | (0.89) | | (0.91) |
Net asset value, end of period
| $19.57 | | $18.91 | | $19.31 | | $19.62 | | $20.00 |
Total return (b)
| 6.83% | | 2.11% | | 2.82% | | 2.61% | | 4.79% |
| Ratios to average net assets/supplemental data: | | | | | | | | | |
Net assets, end of period (in 000’s)
| $ 17,823 | | $ 22,510 | | $ 37,836 | | $ 57,982 | | $ 72,462 |
Ratio of total expenses to average net assets
| 1.21% | | 1.25% | | 1.23% | | 1.19% | | 1.21% |
Ratio of net expenses to average net assets
| 1.21% | | 1.25% | | 1.23% | | 1.19% | | 1.26% (c) |
Ratio of net investment income (loss) to average net assets
| 3.40% | | 3.56% | | 4.39% | | 4.22% | | 3.96% |
Portfolio turnover rate
| 90% | | 88% | | 37% | | 97% | | 100% |
| (a) | Based on average shares outstanding. |
| (b) | Assumes reinvestment of all distributions for the period and does not include payment of the maximum sales charge of 3.50% or contingent deferred sales charge (CDSC). On purchases of $250,000 or more, a CDSC of 1% may be imposed on certain redemptions made within twelve months of purchase. If the sales charges were included, total returns would be lower. These returns include Rule 12b-1 service fees of 0.25% and do not reflect the deduction of taxes that a shareholder would pay on Fund distributions or the redemption of Fund shares. The total returns would have been lower if certain fees had not been waived and expenses reimbursed by the investment advisor. Total return is calculated for the time period presented and is not annualized for periods of less than one year. |
| (c) | Includes excise tax. If this excise tax expense was not included, the net expense ratio would have been 1.25%. |
Page 22
See Notes to Financial Statements
First Trust Short Duration High Income Fund
Financial Highlights (Continued)
For a Share outstanding throughout each period
| Class C Shares | Year Ended October 31, |
| 2021 | | 2020 | | 2019 | | 2018 | | 2017 |
Net asset value, beginning of period
| $ 18.90 | | $ 19.30 | | $ 19.60 | | $ 19.98 | | $ 19.95 |
| Income from investment operations: | | | | | | | | | |
Net investment income (loss) (a)
| 0.52 | | 0.53 | | 0.71 | | 0.69 | | 0.64 |
Net realized and unrealized gain (loss)
| 0.62 | | (0.28) | | (0.31) | | (0.33) | | 0.15 |
Total from investment operations
| 1.14 | | 0.25 | | 0.40 | | 0.36 | | 0.79 |
| Distributions paid to shareholders from: | | | | | | | | | |
Net investment income
| (0.48) | | (0.58) | | (0.70) | | (0.73) | | (0.76) |
Return of capital
| — | | (0.07) | | — | | (0.01) | | — |
Total distributions
| (0.48) | | (0.65) | | (0.70) | | (0.74) | | (0.76) |
Net asset value, end of period
| $19.56 | | $18.90 | | $19.30 | | $19.60 | | $19.98 |
Total return (b)
| 6.04% | | 1.35% | | 2.11% | | 1.85% | | 4.01% |
| Ratios to average net assets/supplemental data: | | | | | | | | | |
Net assets, end of period (in 000’s)
| $ 16,375 | | $ 15,629 | | $ 20,802 | | $ 23,625 | | $ 24,393 |
Ratio of total expenses to average net assets
| 1.96% | | 2.00% | | 1.98% | | 1.94% | | 1.96% |
Ratio of net expenses to average net assets
| 1.96% | | 2.00% | | 1.98% | | 1.94% | | 2.01% (c) |
Ratio of net investment income (loss) to average net assets
| 2.65% | | 2.79% | | 3.68% | | 3.47% | | 3.20% |
Portfolio turnover rate
| 90% | | 88% | | 37% | | 97% | | 100% |
| (a) | Based on average shares outstanding. |
| (b) | Assumes reinvestment of all distributions for the period and does not include payment of the maximum CDSC of 1%, charged on certain redemptions made within one year of purchase. If the sales charge was included, total returns would be lower. These returns include combined Rule 12b-1 distribution and service fees of 1% and do not reflect the deduction of taxes that a shareholder would pay on Fund distributions or the redemption of Fund shares. The total returns would have been lower if certain fees had not been waived and expenses reimbursed by the investment advisor. Total return is calculated for the time period presented and is not annualized for periods of less than one year. |
| (c) | Includes excise tax. If this excise tax expense was not included, the net expense ratio would have been 2.00%. |
See Notes to Financial Statements
Page 23
First Trust Short Duration High Income Fund
Financial Highlights (Continued)
For a Share outstanding throughout each period
| Class I Shares | Year Ended October 31, |
| 2021 | | 2020 | | 2019 | | 2018 | | 2017 |
Net asset value, beginning of period
| $ 18.93 | | $ 19.33 | | $ 19.63 | | $ 20.00 | | $ 19.97 |
| Income from investment operations: | | | | | | | | | |
Net investment income (loss) (a)
| 0.72 | | 0.72 | | 0.91 | | 0.89 | | 0.85 |
Net realized and unrealized gain (loss)
| 0.61 | | (0.28) | | (0.31) | | (0.32) | | 0.14 |
Total from investment operations
| 1.33 | | 0.44 | | 0.60 | | 0.57 | | 0.99 |
| Distributions paid to shareholders from: | | | | | | | | | |
Net investment income
| (0.67) | | (0.75) | | (0.90) | | (0.92) | | (0.96) |
Return of capital
| — | | (0.09) | | — | | (0.02) | | — |
Total distributions
| (0.67) | | (0.84) | | (0.90) | | (0.94) | | (0.96) |
Net asset value, end of period
| $19.59 | | $18.93 | | $19.33 | | $19.63 | | $20.00 |
Total return (b)
| 7.09% | | 2.37% | | 3.13% | | 2.92% | | 5.06% |
| Ratios to average net assets/supplemental data: | | | | | | | | | |
Net assets, end of period (in 000’s)
| $ 135,604 | | $ 130,798 | | $ 101,163 | | $ 150,564 | | $ 139,015 |
Ratio of total expenses to average net assets
| 0.96% | | 1.00% | | 0.98% | | 0.94% | | 0.96% |
Ratio of net expenses to average net assets
| 0.96% | | 1.00% | | 0.98% | | 0.94% | | 1.01% (c) |
Ratio of net investment income (loss) to average net assets
| 3.65% | | 3.78% | | 4.67% | | 4.47% | | 4.21% |
Portfolio turnover rate
| 90% | | 88% | | 37% | | 97% | | 100% |
| (a) | Based on average shares outstanding. |
| (b) | Assumes reinvestment of all distributions for the period. These returns do not reflect the deduction of taxes that a shareholder would pay on Fund distributions or the redemption of Fund shares. The total returns would have been lower if certain fees had not been waived and expenses reimbursed by the investment advisor. Total return is calculated for the time period presented and is not annualized for periods of less than one year. |
| (c) | Includes excise tax. If this excise tax expense was not included, the net expense ratio would have been 1.00%. |
Page 24
See Notes to Financial Statements
Notes to Financial Statements
First Trust Short Duration High Income Fund
October 31, 2021
1. Organization
First Trust Short Duration High Income Fund (the “Fund”) is a series of the First Trust Series Fund (the “Trust”), a Massachusetts business trust organized on July 9, 2010, and is registered as a diversified open-end management investment company with the Securities and Exchange Commission under the Investment Company Act of 1940, as amended (the “1940 Act”). The Fund offers three classes of shares: Class A, Class C and Class I. Each class represents an interest in the same portfolio of investments but with a different combination of sales charges, distribution and service (12b-1) fees, eligibility requirements and other features.
The Fund seeks to provide a high level of current income. As a secondary objective, the Fund seeks capital appreciation. The Fund seeks to achieve its investment objectives by investing, under normal market conditions, at least 80% of its net assets (including investment borrowings) in high yield debt securities and bank loans that are rated below-investment grade or unrated. High yield debt securities are below-investment grade debt securities, commonly known as “junk bonds.” For purposes of determining whether a security is below-investment grade, the lowest available rating is used. There can be no assurance that the Fund will achieve its investment objectives. The Fund may not be appropriate for all investors.
2. Significant Accounting Policies
The Fund is considered an investment company and follows accounting and reporting guidance under Financial Accounting Standards Board (“FASB”) Accounting Standards Codification Topic 946, “Financial Services-Investment Companies.” The following is a summary of significant accounting policies consistently followed by the Fund in the preparation of the financial statements. The preparation of the financial statements in accordance with accounting principles generally accepted in the United States of America (“U.S. GAAP”) requires management to make estimates and assumptions that affect the reported amounts and disclosures in the financial statements. Actual results could differ from those estimates.
A. Portfolio Valuation
The net asset value (“NAV”) of each class of shares of the Fund is determined daily as of the close of regular trading on the New York Stock Exchange (“NYSE”), normally 4:00 p.m. Eastern time, on each day the NYSE is open for trading. If the NYSE closes early on a valuation day, the NAV is determined as of that time. The NAV for each class is calculated by dividing the value of the Fund’s total assets attributable to such class (including accrued interest and dividends), less all liabilities attributable to such class (including accrued expenses, dividends declared but unpaid and any borrowings of the Fund), by the total number of shares of the class outstanding. Differences in NAV of each class of the Fund’s shares are generally expected to be due to the daily expense accruals of the specified distribution and service (12b-1) fees and transfer agency costs applicable to such class of shares and the resulting differential in the dividends that may be paid on each class of shares.
The Fund’s investments are valued daily at market value or, in the absence of market value with respect to any portfolio securities, at fair value. Market value prices represent last sale or official closing prices from a national or foreign exchange (i.e., a regulated market) and are primarily obtained from third-party pricing services. Fair value prices represent any prices not considered market value prices and are either obtained from a third-party pricing service or are determined by the Pricing Committee of the Trust’s investment advisor, First Trust Advisors L.P. (“First Trust” or the “Advisor”), in accordance with valuation procedures adopted by the Trust’s Board of Trustees, and in accordance with provisions of the 1940 Act. Investments valued by the Advisor’s Pricing Committee, if any, are footnoted as such in the footnotes to the Portfolio of Investments. The Fund’s investments are valued as follows:
Senior Floating-Rate Loan interests (“Senior Loans”)(1) are not listed on any securities exchange or board of trade. Senior Loans are typically bought and sold by institutional investors in individually negotiated private transactions that function in many respects like an over-the-counter secondary market, although typically no formal market-makers exist. This market, while having grown substantially since its inception, generally has fewer trades and less liquidity than the secondary market for other types of securities. Some Senior Loans have few or no trades, or trade infrequently, and information regarding a specific Senior Loan may not be widely available or may be incomplete. Accordingly, determinations of the market value of Senior Loans may be based on infrequent and dated information. Because there is less reliable, objective data available, elements of judgment may play a greater role in valuation of Senior Loans than for other types of securities. Typically, Senior Loans are fair valued using information provided by a third-party pricing service. The third-party pricing service primarily uses over-the-counter pricing from dealer runs and broker quotes from indicative sheets to value the Senior Loans.
Common stocks and other equity securities listed on any national or foreign exchange (excluding The Nasdaq Stock Market LLC (“Nasdaq”) and the London Stock Exchange Alternative Investment Market (“AIM”)) are valued at the last sale price on the exchange on which they are principally traded or, for Nasdaq and AIM securities, the official closing price. Securities traded on more than one securities exchange are valued at the last sale price or official closing price, as applicable, at the close of the securities exchange representing the principal market for such securities.
| (1) | The terms “security” and “securities” used throughout the Notes to Financial Statements include Senior Loans. |
Notes to Financial Statements (Continued)
First Trust Short Duration High Income Fund
October 31, 2021
Shares of open-end funds are valued at fair value which is based on NAV per share.
Fixed income and other debt securities having a remaining maturity of sixty days or less when purchased are fair valued at cost adjusted for amortization of premiums and accretion of discounts (amortized cost), provided the Advisor’s Pricing Committee has determined that the use of amortized cost is an appropriate reflection of fair value given market and issuer-specific conditions existing at the time of the determination. Factors that may be considered in determining the appropriateness of the use of amortized cost include, but are not limited to, the following:
| 1) | the credit conditions in the relevant market and changes thereto; |
| 2) | the liquidity conditions in the relevant market and changes thereto; |
| 3) | the interest rate conditions in the relevant market and changes thereto (such as significant changes in interest rates); |
| 4) | issuer-specific conditions (such as significant credit deterioration); and |
| 5) | any other market-based data the Advisor’s Pricing Committee considers relevant. In this regard, the Advisor’s Pricing Committee may use last-obtained market-based data to assist it when valuing portfolio securities using amortized cost. |
Corporate bonds, corporate notes and other debt securities are fair valued on the basis of valuations provided by dealers who make markets in such securities or by a third-party pricing service approved by the Fund’s Board of Trustees, which may use the following valuation inputs when available:
| 1) | benchmark yields; |
| 2) | reported trades; |
| 3) | broker/dealer quotes; |
| 4) | issuer spreads; |
| 5) | benchmark securities; |
| 6) | bids and offers; and |
| 7) | reference data including market research publications. |
Securities traded in an over-the-counter market are fair valued at the mean of their most recent bid and asked price, if available, and otherwise at their closing bid price.
Certain securities may not be able to be priced by pre-established pricing methods. Such securities may be valued by the Trust’s Board of Trustees or its delegate, the Advisor’s Pricing Committee, at fair value. These securities generally include, but are not limited to, restricted securities (securities which may not be publicly sold without registration under the Securities Act of 1933, as amended) for which a third-party pricing service is unable to provide a market price; securities whose trading has been formally suspended; a security whose market or fair value price is not available from a pre-established pricing source; a security with respect to which an event has occurred that is likely to materially affect the value of the security after the market has closed but before the calculation of the Fund’s NAV or make it difficult or impossible to obtain a reliable market quotation; and a security whose price, as provided by the third-party pricing service, does not reflect the security’s fair value. As a general principle, the current fair value of a security would appear to be the amount which the owner might reasonably expect to receive for the security upon its current sale. When fair value prices are used, generally they will differ from market quotations or official closing prices on the applicable exchanges. A variety of factors may be considered in determining the fair value of such securities, including, but not limited to, the following:
| 1) | the fundamental business data relating to the borrower/issuer; |
| 2) | an evaluation of the forces which influence the market in which these securities are purchased and sold; |
| 3) | the type, size and cost of the security; |
| 4) | the financial statements of the borrower/issuer; |
| 5) | the credit quality and cash flow of the borrower/issuer, based on the Advisor’s or external analysis; |
| 6) | the information as to any transactions in or offers for the security; |
| 7) | the price and extent of public trading in similar securities (or equity securities) of the borrower/issuer, or comparable companies; |
| 8) | the coupon payments; |
| 9) | the quality, value and salability of collateral, if any, securing the security; |
| 10) | the business prospects of the borrower/issuer, including any ability to obtain money or resources from a parent or affiliate and an assessment of the borrower’s/issuer’s management; |
| 11) | the prospects for the borrower’s/issuer’s industry, and multiples (of earnings and/or cash flows) being paid for similar businesses in that industry; |
| 12) | the borrower’s/issuer’s competitive position within the industry; |
Notes to Financial Statements (Continued)
First Trust Short Duration High Income Fund
October 31, 2021
| 13) | the borrower’s/issuer’s ability to access additional liquidity through public and/or private markets; and |
| 14) | other relevant factors. |
The Fund is subject to fair value accounting standards that define fair value, establish the framework for measuring fair value and provide a three-level hierarchy for fair valuation based upon the inputs to the valuation as of the measurement date. The three levels of the fair value hierarchy are as follows:
| • | Level 1 – Level 1 inputs are quoted prices in active markets for identical investments. An active market is a market in which transactions for the investment occur with sufficient frequency and volume to provide pricing information on an ongoing basis. |
| • | Level 2 – Level 2 inputs are observable inputs, either directly or indirectly, and include the following: |
| o | Quoted prices for similar investments in active markets. |
| o | Quoted prices for identical or similar investments in markets that are non-active. A non-active market is a market where there are few transactions for the investment, the prices are not current, or price quotations vary substantially either over time or among market makers, or in which little information is released publicly. |
| o | Inputs other than quoted prices that are observable for the investment (for example, interest rates and yield curves observable at commonly quoted intervals, volatilities, prepayment speeds, loss severities, credit risks, and default rates). |
| o | Inputs that are derived principally from or corroborated by observable market data by correlation or other means. |
| • | Level 3 – Level 3 inputs are unobservable inputs. Unobservable inputs may reflect the reporting entity’s own assumptions about the assumptions that market participants would use in pricing the investment. |
The inputs or methodologies used for valuing investments are not necessarily an indication of the risk associated with investing in those investments. A summary of the inputs used to value the Fund’s investments as of October 31, 2021, is included with the Fund’s Portfolio of Investments.
B. Securities Transactions and Investment Income
Securities transactions are recorded as of the trade date. Realized gains and losses from securities transactions are recorded on the identified cost basis. Dividend income is recorded on the ex-dividend date. Interest income is recorded daily on the accrual basis. Market premiums and discounts are amortized over the expected life of each respective borrowing. Amortization of premiums and accretion of discounts are recorded using the effective interest method.
The United Kingdom’s Financial Conduct Authority, which regulates the London Interbank Offered Rates (“LIBOR”), announced on March 5, 2021 that all non-USD LIBOR reference rates and the 1-week and 2-month USD LIBOR reference rates will cease to be provided or no longer be representative immediately after December 31, 2021 and the remaining USD LIBOR settings will cease to be provided or no longer be representative immediately after June 30, 2023. The International Swaps and Derivatives Association, Inc. (“ISDA”) confirmed that the March 5, 2021 announcement constituted an index cessation event under the Interbank Offered Rates (“IBOR”) Fallbacks Supplement and the ISDA 2020 IBOR Fallbacks Protocol for all 35 LIBOR settings and confirmed that the spread adjustment to be used in ISDA fallbacks was fixed as of the date of the announcement.
In the United States, the Alternative Reference Rates Committee (the “ARRC”), a group of market participants convened by the Board of Governors of the Federal Reserve System and the Federal Reserve Bank of New York in cooperation with other federal and state government agencies, has since 2014 undertaken efforts to identify U.S. dollar reference interest rates as alternatives to LIBOR and to facilitate the mitigation of LIBOR-related risks. In June 2017, the ARRC identified the Secured Overnight Financing Rate (“SOFR”), a broad measure of the cost of cash overnight borrowing collateralized by U.S. Treasury securities, as the preferred alternative for U.S. dollar LIBOR. The Federal Reserve Bank of New York began daily publishing of SOFR in April 2018.
At this time, it is not possible to predict the full impact of the elimination of LIBOR and the establishment of an alternative reference rate on the Fund or its investments.
Securities purchased or sold on a when-issued, delayed-delivery or forward purchase commitment basis may have extended settlement periods. The value of the security so purchased is subject to market fluctuations during this period. Due to the nature of the Senior Loan market, the actual settlement date may not be certain at the time of the purchase or sale for some of the Senior Loans. Interest income on such Senior Loans is not accrued until settlement date. The Fund maintains liquid assets with a current value at least equal to the amount of its when-issued, delayed-delivery or forward purchase commitments. At October 31, 2021, the Fund had no when-issued, delayed-delivery or forward purchase commitments (other than the unfunded commitments discussed below).
Notes to Financial Statements (Continued)
First Trust Short Duration High Income Fund
October 31, 2021
C. Unfunded Loan Commitments
The Fund may enter into certain credit agreements, all or a portion of which may be unfunded. The Fund is obligated to fund these loan commitments at the borrower’s discretion. Unfunded loan commitments are marked-to-market daily, and any unrealized appreciation (depreciation) is included in the Statement of Assets and Liabilities and Statement of Operations. In connection with these commitments, the Fund earns a commitment fee typically set as a percentage of the commitment amount. The commitment fees are included in “Other” under Investment Income on the Statement of Operations. As of October 31, 2021, the Fund had the following unfunded loan commitments:
| Borrower | | Principal
Value | | Commitment
Amount | | Value | | Unrealized
Appreciation
(Depreciation) |
| Civitas Solutions (National Mentor Holdings, Inc.), Term Loan | | $ 84,822 | | $ 84,933 | | $ 84,256 | | $ (677) |
| Dexko Global (Dornoch Debt Merger Sub, Inc.), Term Loan | | 16,756 | | 16,756 | | 16,738 | | (18) |
| Veritext Corporation (VT TopCo, Inc.), Term Loan | | 22,737 | | 22,737 | | 22,709 | | (28) |
| Zelis Payments Buyer, Inc., Term Loan | | 236,619 | | 236,619 | | 234,648 | | (1,971) |
| | | | | $361,045 | | $358,351 | | $(2,694) |
D. Dividends and Distributions to Shareholders
The Fund will declare daily and pay monthly distributions of all or a portion of its net income to holders of each class of shares. Distributions of any net capital gains earned by the Fund will be distributed at least annually. Distributions will automatically be reinvested into additional Fund shares unless cash distributions are elected by the shareholder.
Distributions from net investment income and realized capital gains are determined in accordance with federal income tax regulations, which may differ from U.S. GAAP. Certain capital accounts in the financial statements are periodically adjusted for permanent differences in order to reflect their tax character. These permanent differences are primarily due to the varying treatment of income and gain/loss on portfolio securities held by the Fund and have no impact on net assets or NAV per share. Temporary differences, which arise from recognizing certain items of income, expense and gain/loss in different periods for financial statement and tax purposes, will reverse at some point in the future. Permanent differences incurred during the fiscal year ended October 31, 2021, resulting in book and tax accounting differences, have been reclassified at year end to reflect an increase in accumulated net investment income (loss) of $72,572, a decrease in accumulated net realized gain (loss) of $45,072, and a decrease to paid-in capital of $27,500. Accumulated distributable earnings (loss) consists of accumulated net investment income (loss), accumulated net realized gain (loss) on investments, and unrealized appreciation (depreciation) on investments. Net assets were not affected by these reclassifications.
The tax character of distributions paid by the Fund during the fiscal years ended October 31, 2021 and 2020, was as follows:
| Distributions paid from: | 2021 | 2020 |
Ordinary income
| $5,567,538 | $5,629,574 |
Capital gains
| — | — |
Return of capital
| — | 643,833 |
As of October 31, 2021, the distributable earnings and net assets on a tax basis were as follows:
Undistributed ordinary income
| $570,533 |
Undistributed capital gains
| — |
Total undistributed earnings
| 570,533 |
Accumulated capital and other losses
| (11,790,197) |
Net unrealized appreciation (depreciation)
| (1,163,869) |
Total accumulated earnings (losses)
| (12,383,533) |
Other
| — |
Paid-in capital
| 182,185,355 |
Total net assets
| $169,801,822 |
Notes to Financial Statements (Continued)
First Trust Short Duration High Income Fund
October 31, 2021
E. Income Taxes
The Fund intends to continue to qualify as a regulated investment company by complying with the requirements under Subchapter M of the Internal Revenue Code of 1986, as amended, which includes distributing substantially all of its net investment income and net realized gains to shareholders. Accordingly, no provision has been made for federal and state income taxes. However, due to the timing and amount of distributions, the Fund may be subject to an excise tax of 4% of the amount by which approximately 98% of the Fund’s taxable income exceeds the distributions from such taxable income for the calendar year. For the fiscal year ended October 31, 2021, the Fund incurred $2,431 of excise tax expense.
The Fund intends to utilize provisions of the federal income tax laws, which allow it to carry a realized capital loss forward indefinitely following the year of the loss and offset such loss against any future realized capital gains. The Fund is subject to certain limitations under U.S. tax rules on the use of capital loss carryforwards and net unrealized built-in losses. These limitations apply when there has been a 50% change in ownership. At October 31, 2021, the Fund had non-expiring net capital loss carryforwards for federal income tax purposes of $11,790,197.
Certain losses realized during the current fiscal year may be deferred and treated as occurring the first day of the following fiscal year for federal income tax purposes. For the fiscal year ended October 31, 2021, the Fund did not incur any net late year ordinary losses.
The Fund is subject to accounting standards that establish a minimum threshold for recognizing, and a system for measuring, the benefits of a tax position taken or expected to be taken in a tax return. Taxable years ended 2018, 2019, 2020, and 2021 remain open to federal and state audit. As of October 31, 2021, management has evaluated the application of these standards to the Fund and has determined that no provision for income tax is required in the Fund’s financial statements for uncertain tax positions.
F. Expenses
The Fund will pay all expenses directly related to its operations. Expenses of the Fund are allocated on a pro rata basis to each class of shares, except for distribution and service (12b-1) fees and incremental transfer agency costs which are unique to each class of shares.
3. Investment Advisory Fee, Affiliated Transactions and Other Fee Arrangements
First Trust, the investment advisor to the Fund, is a limited partnership with one limited partner, Grace Partners of DuPage L.P., and one general partner, The Charger Corporation. The Charger Corporation is an Illinois corporation controlled by James A. Bowen, Chief Executive Officer of First Trust. First Trust is responsible for the selection and ongoing monitoring of the Fund’s investment portfolio, managing the Fund’s business affairs and providing certain administrative services necessary for the management of the Fund. For these investment management services, First Trust is entitled to a monthly fee calculated at an annual rate of 0.65% of the Fund’s average daily net assets. First Trust also provides fund reporting services to the Fund for a flat annual fee in the amount of $9,250.
First Trust has agreed to waive fees and/or reimburse Fund expenses to the extent necessary to prevent the total annual fund operating expenses (excluding 12b-1 distribution and service fees, interest expenses, taxes, fees incurred in acquiring and disposing of portfolio securities and extraordinary expenses) from exceeding 1.00% of average daily net assets of any class of shares of the Fund (the “Expense Cap”) until February 28, 2023 and then from exceeding 1.35% from March 1, 2023 to February 28, 2032 (the “Expense Cap Termination Date”). Expenses borne and fees waived by First Trust are subject to recovery on the Fund’s class level, if applicable, by First Trust for up to three years from the date the fee or expense was incurred, but no reimbursement payment will be made by the Fund at any time if it would result in the Fund’s expenses exceeding (i) the Expense Cap in place for the most recent fiscal year for which such expense limitation was in place; (ii) the Expense Cap in place at the time the fees were waived; or (iii) the current Expense Cap. Expense limitations may be terminated or modified prior to their expiration only with the approval of the Board of Trustees of the Trust. These amounts would be included in “Expenses previously waived or reimbursed” on the Statement of Operations. There were no advisory fee waivers or expense reimbursements for the fiscal year ended October 31, 2021.
BNY Mellon Investment Servicing (US) Inc. (“BNYM IS”) serves as the Fund’s transfer agent in accordance with certain fee arrangements. As transfer agent, BNYM IS is responsible for maintaining shareholder records for the Fund. The Bank of New York Mellon (“BNYM”) serves as the Fund’s administrator, fund accountant, and custodian in accordance with certain fee arrangements. As administrator and fund accountant, BNYM is responsible for providing certain administrative and accounting services to the Fund, including maintaining the Fund’s books of account, records of the Fund’s securities transactions, and certain other books and records. As custodian, BNYM is responsible for custody of the Fund’s assets. BNYM IS and BNYM are subsidiaries of The Bank of New York Mellon Corporation, a financial holding company.
Each Trustee who is not an officer or employee of First Trust, any sub-advisor or any of their affiliates (“Independent Trustees”) is paid a fixed annual retainer that is allocated equally among each fund in the First Trust Fund Complex. Each Independent Trustee is
Notes to Financial Statements (Continued)
First Trust Short Duration High Income Fund
October 31, 2021
also paid an annual per fund fee that varies based on whether the fund is a closed-end or other actively managed fund, a defined-outcome fund or an index fund.
Additionally, the Lead Independent Trustee and the Chairs of the Audit Committee, Nominating and Governance Committee and Valuation Committee are paid annual fees to serve in such capacities, with such compensation allocated pro rata among each fund in the First Trust Fund Complex based on net assets. Independent Trustees are reimbursed for travel and out-of-pocket expenses in connection with all meetings. The Lead Independent Trustee and Committee Chairs rotate every three years. The officers and “Interested” Trustee receive no compensation from the Trust for acting in such capacities.
4. Capital Share Transactions
Capital transactions were as follows:
| | Year Ended
October 31, 2021 | | Year Ended
October 31, 2020 |
| | Shares | | Value | | Shares | | Value |
| Sales: | | | | | | | |
| Class A | 363,016 | | $ 7,141,720 | | 192,900 | | $ 3,651,650 |
| Class C | 202,080 | | 3,962,298 | | 67,559 | | 1,298,226 |
| Class I | 3,414,919 | | 66,943,681 | | 3,815,091 | | 72,807,028 |
| Total Sales | 3,980,015 | | $ 78,047,699 | | 4,075,550 | | $ 77,756,904 |
| Dividend Reinvestment: | | | | | | | |
| Class A | 25,504 | | $ 500,641 | | 59,808 | | $ 1,133,017 |
| Class C | 18,316 | | 359,363 | | 27,666 | | 522,965 |
| Class I | 219,557 | | 4,313,450 | | 171,826 | | 3,253,580 |
| Total Dividend Reinvestment | 263,377 | | $ 5,173,454 | | 259,300 | | $ 4,909,562 |
| Redemptions: | | | | | | | |
| Class A | (668,102) | | $ (12,991,552) | | (1,021,329) | | $ (18,968,740) |
| Class C | (209,997) | | (4,114,157) | | (346,122) | | (6,514,798) |
| Class I | (3,620,625) | | (70,650,612) | | (2,311,909) | | (43,237,940) |
| Total Redemptions | (4,498,724) | | $ (87,756,321) | | (3,679,360) | | $ (68,721,478) |
5. Purchases and Sales of Securities
The cost of purchases and proceeds from sales of securities, excluding short-term investments, for the fiscal year ended October 31, 2021, were $145,137,699 and $150,271,776, respectively.
6. Distribution and Service Plan
The Board of Trustees adopted a Distribution and Service Plan pursuant to Rule 12b-1 under the 1940 Act. In accordance with the Rule 12b-1 plan, the share classes of the Fund are authorized to pay an amount up to 0.25% and 1.00% of their average daily net assets each year for Class A and Class C, respectively, to reimburse First Trust Portfolios L.P. (“FTP”), the distributor of the Fund, for amounts expended to finance activities primarily intended to result in the sale of Fund shares or the provision of investor services. FTP may also use this amount to compensate securities dealers or other persons for providing distribution assistance, including broker-dealer and shareholder support and educational and promotional services. Class I shares have no 12b-1 fees.
7. Borrowings
The Trust, on behalf of the Fund, along with First Trust Variable Insurance Trust and First Trust Exchange-Traded Fund IV, has a $200 million Credit Agreement (the “BNYM Line of Credit”) with BNYM to be a liquidity backstop during periods of high redemption volume. A commitment fee of 0.25% of the daily amount of the excess of the commitment amount over the outstanding principal balance of the loans will be charged by BNYM, which First Trust allocates amongst the funds that have access to the BNYM Line of Credit. Prior to January 29, 2021 the commitment fee was 0.15%. These fees are reflected on the Statement of Operations in the “Commitment fees” line item. To the extent that the Fund accesses the BNYM Line of Credit, there would also be an interest fee charged. The Fund did not have any borrowings outstanding during the fiscal year ended October 31, 2021.
Notes to Financial Statements (Continued)
First Trust Short Duration High Income Fund
October 31, 2021
8. Indemnification
The Fund has a variety of indemnification obligations under contracts with its service providers. The Fund’s maximum exposure under these arrangements is unknown. However, the Fund has not had prior claims or losses pursuant to these contracts and expects the risk of loss to be remote.
9. Subsequent Events
Management has evaluated the impact of all subsequent events to the Fund through the date the financial statements were issued, and has determined that there were no subsequent events requiring recognition or disclosure in the financial statements that have not already been disclosed.
Report of Independent Registered Public Accounting Firm
To the Shareholders and the Board of Trustees of First Trust Series Fund:
Opinion on the Financial Statements and Financial Highlights
We have audited the accompanying statement of assets and liabilities of First Trust Short Duration High Income Fund (the “Fund”), a series of the First Trust Series Fund, including the portfolio of investments, as of October 31, 2021, the related statement of operations for the year then ended, the statements of changes in net assets for each of the two years in the period then ended, the financial highlights for each of the five years in the period then ended, and the related notes. In our opinion, the financial statements and financial highlights present fairly, in all material respects, the financial position of the Fund as of October 31, 2021, the results of its operations for the year then ended, the changes in its net assets for each of the two years in the period then ended, and the financial highlights for each of the five years in the period then ended in conformity with accounting principles generally accepted in the United States of America.
Basis for Opinion
These financial statements and financial highlights are the responsibility of the Fund’s management. Our responsibility is to express an opinion on the Fund’s financial statements and financial highlights based on our audits. We are a public accounting firm registered with the Public Company Accounting Oversight Board (United States) (PCAOB) and are required to be independent with respect to the Fund in accordance with the U.S. federal securities laws and the applicable rules and regulations of the Securities and Exchange Commission and the PCAOB.
We conducted our audits in accordance with the standards of the PCAOB. Those standards require that we plan and perform the audit to obtain reasonable assurance about whether the financial statements and financial highlights are free of material misstatement, whether due to error or fraud. The Fund is not required to have, nor were we engaged to perform, an audit of its internal control over financial reporting. As part of our audits we are required to obtain an understanding of internal control over financial reporting but not for the purpose of expressing an opinion on the effectiveness of the Fund’s internal control over financial reporting. Accordingly, we express no such opinion.
Our audits included performing procedures to assess the risks of material misstatement of the financial statements and financial highlights, whether due to error or fraud, and performing procedures that respond to those risks. Such procedures included examining, on a test basis, evidence regarding the amounts and disclosures in the financial statements and financial highlights. Our audits also included evaluating the accounting principles used and significant estimates made by management, as well as evaluating the overall presentation of the financial statements and financial highlights. Our procedures included confirmation of securities owned as of October 31, 2021, by correspondence with the custodian, agent banks and brokers; when replies were not received from agent banks and brokers, we performed other auditing procedures. We believe that our audits provide a reasonable basis for our opinion.
Chicago, Illinois
December 17, 2021
We have served as the auditor of one or more First Trust investment companies since 2001.
Additional Information
First Trust Short Duration High Income Fund
October 31, 2021 (Unaudited)
Proxy Voting Policies and Procedures
A description of the policies and procedures that the Trust uses to determine how to vote proxies and information on how the Fund voted proxies relating to portfolio securities during the most recent 12-month period ended June 30 is available (1) without charge, upon request, by calling (800) 988-5891; (2) on the Fund’s website at www.ftportfolios.com; and (3) on the Securities and Exchange Commission’s (“SEC”) website at www.sec.gov.
Portfolio Holdings
The Fund files portfolio holdings information for each month in a fiscal quarter within 60 days after the end of the relevant fiscal quarter on Form N-PORT. Portfolio holdings information for the third month of each fiscal quarter will be publicly available on the SEC’s website at www.sec.gov. The Fund’s complete schedule of portfolio holdings for the second and fourth quarters of each fiscal year is included in the semi-annual and annual reports to shareholders, respectively, and is filed with the SEC on Form N-CSR. The semi-annual and annual report for the Fund is available to investors within 60 days after the period to which it relates. The Fund’s Forms N-PORT and Forms N-CSR are available on the SEC’s website listed above.
Tax Information
Distributions paid to foreign shareholders during the Fund’s fiscal year ended October 31, 2021, that were properly designated by the Fund as “interest-related dividends” or “short-term capital gain dividends,” may not be subject to federal income tax provided that the income was earned by such foreign shareholders.
Of the ordinary income (including short-term capital gain, if applicable) distributions made by the Fund during the period ended October 31, 2021, none qualify for the corporate dividends received deduction available to corporate shareholders or as qualified dividend income.
Risk Considerations
Risks are inherent in all investing. Certain general risks that may be applicable to a Fund are identified below, but not all of the material risks relevant to each Fund are included in this report and not all of the risks below apply to each Fund. The material risks of investing in each Fund are spelled out in its prospectus, statement of additional information and other regulatory filings. Before investing, you should consider each Fund’s investment objective, risks, charges and expenses, and read each Fund’s prospectus and statement of additional information carefully. You can download each Fund’s prospectus at www.ftportfolios.com or contact First Trust Portfolios L.P. at (800) 621-1675 to request a prospectus, which contains this and other information about each Fund.
Concentration Risk. To the extent that a fund is able to invest a significant percentage of its assets in a single asset class or the securities of issuers within the same country, state, region, industry or sector, an adverse economic, business or political development may affect the value of the fund’s investments more than if the fund were more broadly diversified. A fund that tracks an index will be concentrated to the extent the fund’s corresponding index is concentrated. A concentration makes a fund more susceptible to any single occurrence and may subject the fund to greater market risk than a fund that is more broadly diversified.
Credit Risk. Credit risk is the risk that an issuer of a security will be unable or unwilling to make dividend, interest and/or principal payments when due and the related risk that the value of a security may decline because of concerns about the issuer’s ability to make such payments.
Cyber Security Risk. The funds are susceptible to potential operational risks through breaches in cyber security. A breach in cyber security refers to both intentional and unintentional events that may cause a fund to lose proprietary information, suffer data corruption or lose operational capacity. Such events could cause a fund to incur regulatory penalties, reputational damage, additional compliance costs associated with corrective measures and/or financial loss. In addition, cyber security breaches of a fund’s third-party service providers, such as its administrator, transfer agent, custodian, or sub-advisor, as applicable, or issuers in which the fund invests, can also subject a fund to many of the same risks associated with direct cyber security breaches.
Derivatives Risk. To the extent a fund uses derivative instruments such as futures contracts, options contracts and swaps, the fund may experience losses because of adverse movements in the price or value of the underlying asset, index or rate, which may be magnified by certain features of the derivative. These risks are heightened when a fund’s portfolio managers use derivatives to enhance the fund’s return or as a substitute for a position or security, rather than solely to hedge (or offset) the risk of a position or security held by the fund.
Equity Securities Risk. To the extent a fund invests in equity securities, the value of the fund’s shares will fluctuate with changes in the value of the equity securities. Equity securities prices fluctuate for several reasons, including changes in investors’ perceptions of
Additional Information (Continued)
First Trust Short Duration High Income Fund
October 31, 2021 (Unaudited)
the financial condition of an issuer or the general condition of the relevant stock market, such as market volatility, or when political or economic events affecting the issuers occur. In addition, common stock prices may be particularly sensitive to rising interest rates, as the cost of capital rises and borrowing costs increase. Equity securities may decline significantly in price over short or extended periods of time, and such declines may occur in the equity market as a whole, or they may occur in only a particular country, company, industry or sector of the market.
ETF Risk. The shares of an ETF trade like common stock and represent an interest in a portfolio of securities. The risks of owning an ETF generally reflect the risks of owning the underlying securities, although lack of liquidity in an ETF could result in it being more volatile and ETFs have management fees that increase their costs. Shares of an ETF trade on an exchange at market prices rather than net asset value, which may cause the shares to trade at a price greater than net asset value (premium) or less than net asset value (discount). In times of market stress, decisions by market makers to reduce or step away from their role of providing a market for an ETF’s shares, or decisions by an ETF’s authorized participants that they are unable or unwilling to proceed with creation and/or redemption orders of an ETF’s shares, could result in shares of the ETF trading at a discount to net asset value and in greater than normal intraday bid-ask spreads.
Fixed Income Securities Risk. To the extent a fund invests in fixed income securities, the fund will be subject to credit risk, income risk, interest rate risk, liquidity risk and prepayment risk. Income risk is the risk that income from a fund’s fixed income investments could decline during periods of falling interest rates. Interest rate risk is the risk that the value of a fund’s fixed income securities will decline because of rising interest rates. Liquidity risk is the risk that a security cannot be purchased or sold at the time desired, or cannot be purchased or sold without adversely affecting the price. Prepayment risk is the risk that the securities will be redeemed or prepaid by the issuer, resulting in lower interest payments received by the fund. In addition to these risks, high yield securities, or “junk” bonds, are subject to greater market fluctuations and risk of loss than securities with higher ratings, and the market for high yield securities is generally smaller and less liquid than that for investment grade securities.
Investment Companies Risk. To the extent a fund invests in the securities of other investment vehicles, the fund will incur additional fees and expenses that would not be present in a direct investment in those investment vehicles. Furthermore, the fund’s investment performance and risks are directly related to the investment performance and risks of the investment vehicles in which the fund invests.
LIBOR Risk. To the extent a fund invests in floating or variable rate obligations that use the London Interbank Offered Rate (“LIBOR”) as a reference interest rate, it is subject to LIBOR Risk. The United Kingdom’s Financial Conduct Authority, which regulates LIBOR, will cease making LIBOR available as a reference rate over a phase-out period that will begin immediately after December 31, 2021. The unavailability or replacement of LIBOR may affect the value, liquidity or return on certain fund investments and may result in costs incurred in connection with closing out positions and entering into new trades. Any potential effects of the transition away from LIBOR on the fund or on certain instruments in which the fund invests can be difficult to ascertain, and they may vary depending on a variety of factors, and they could result in losses to the fund.
Management Risk. To the extent that a fund is actively managed, it is subject to management risk. In managing an actively-managed fund’s investment portfolio, the fund’s portfolio managers will apply investment techniques and risk analyses that may not have the desired result. There can be no guarantee that a fund will meet its investment objective.
Market Risk. Securities held by a fund, as well as shares of a fund itself, are subject to market fluctuations caused by factors such as general economic conditions, political events, regulatory or market developments, changes in interest rates and perceived trends in securities prices. Shares of a fund could decline in value or underperform other investments as a result of the risk of loss associated with these market fluctuations. In addition, local, regional or global events such as war, acts of terrorism, spread of infectious diseases or other public health issues, recessions, or other events could have a significant negative impact on a fund and its investments. Such events may affect certain geographic regions, countries, sectors and industries more significantly than others. The outbreak of the respiratory disease designated as COVID-19 in December 2019 has caused significant volatility and declines in global financial markets, which have caused losses for investors. While the development of vaccines has slowed the spread of the virus and allowed for the resumption of “reasonably” normal business activity in the United States, many countries continue to impose lockdown measures in an attempt to slow the spread. Additionally, there is no guarantee that vaccines will be effective against emerging variants of the disease.
Non-U.S. Securities Risk. To the extent a fund invests in non-U.S. securities, it is subject to additional risks not associated with securities of domestic issuers. Non-U.S. securities are subject to higher volatility than securities of domestic issuers due to: possible adverse political, social or economic developments; restrictions on foreign investment or exchange of securities; capital controls; lack of liquidity; currency exchange rates; excessive taxation; government seizure of assets; the imposition of sanctions by foreign governments; different legal or accounting standards; and less government supervision and regulation of exchanges in foreign countries. Investments in non-U.S. securities may involve higher costs than investments in U.S. securities, including higher transaction
Additional Information (Continued)
First Trust Short Duration High Income Fund
October 31, 2021 (Unaudited)
and custody costs, as well as additional taxes imposed by non-U.S. governments. These risks may be heightened for securities of companies located, or with significant operations, in emerging market countries.
Operational Risk. Each fund is subject to risks arising from various operational factors, including, but not limited to, human error, processing and communication errors, errors of a fund’s service providers, counterparties or other third-parties, failed or inadequate processes and technology or systems failures. Each fund relies on third-parties for a range of services, including custody. Any delay or failure relating to engaging or maintaining such service providers may affect a fund’s ability to meet its investment objective. Although the funds and the funds’ investment advisor seek to reduce these operational risks through controls and procedures, there is no way to completely protect against such risks.
| NOT FDIC INSURED | NOT BANK GUARANTEED | MAY LOSE VALUE |
Advisory Agreement
Board Considerations Regarding Approval of Continuation of Investment Management Agreement
The Board of Trustees of First Trust Series Fund (the “Trust”), including the Independent Trustees, unanimously approved the continuation of the Investment Management Agreement (the “Agreement”) between the Trust, on behalf of the First Trust Short Duration High Income Fund (the “Fund”), and First Trust Advisors L.P. (the “Advisor”). The Board approved the continuation of the Agreement for a one-year period ending June 30, 2022 at a meeting held on June 6–7, 2021. The Board determined that the continuation of the Agreement is in the best interests of the Fund in light of the nature, extent and quality of the services provided and such other matters as the Board considered to be relevant in the exercise of its business judgment.
To reach this determination, the Board considered its duties under the Investment Company Act of 1940, as amended (the “1940 Act”), as well as under the general principles of state law, in reviewing and approving advisory contracts; the requirements of the 1940 Act in such matters; the fiduciary duty of investment advisors with respect to advisory agreements and compensation; the standards used by courts in determining whether investment company boards have fulfilled their duties; and the factors to be considered by the Board in voting on such agreements. At meetings held on April 26, 2021 and June 6–7, 2021, the Board, including the Independent Trustees, reviewed materials provided by the Advisor responding to requests for information from counsel to the Independent Trustees, submitted on behalf of the Independent Trustees, that, among other things, outlined: the services provided by the Advisor to the Fund (including the relevant personnel responsible for these services and their experience); the advisory fee rate payable by the Fund as compared to fees charged to a peer group of funds (the “Expense Group”) and a broad peer universe of funds (the “Expense Universe”), each assembled by Broadridge Financial Solutions, Inc. (“Broadridge”), an independent source, and as compared to fees charged to other clients of the Advisor; the expense ratio of the Fund as compared to expense ratios of the funds in the Fund’s Expense Group and Expense Universe; performance information for the Fund, including comparisons of the Fund’s performance to that of one or more relevant benchmark indexes and to that of a performance group of funds and a broad performance universe of funds (the “Performance Universe”), each assembled by Broadridge; the nature of expenses incurred in providing services to the Fund and the potential for the Advisor to realize economies of scale, if any; profitability and other financial data for the Advisor; any fall out benefits to the Advisor and its affiliate, First Trust Portfolios L.P. (“FTP”); and information on the Advisor’s compliance program. The Board reviewed initial materials with the Advisor at the meeting held on April 26, 2021, prior to which the Independent Trustees and their counsel met separately to discuss the information provided by the Advisor. Following the April meeting, counsel to the Independent Trustees, on behalf of the Independent Trustees, requested certain clarifications and supplements to the materials provided, and the information provided in response to those requests was considered at an executive session of the Independent Trustees and their counsel held prior to the June 6–7, 2021 meeting, as well as at the June meeting. The Board applied its business judgment to determine whether the arrangement between the Trust and the Advisor continues to be a reasonable business arrangement from the Fund’s perspective. The Board determined that, given the totality of the information provided with respect to the Agreement, the Board had received sufficient information to renew the Agreement. The Board considered that shareholders chose to invest or remain invested in the Fund knowing that the Advisor manages the Fund and knowing the Fund’s advisory fee.
In reviewing the Agreement, the Board considered the nature, extent and quality of the services provided by the Advisor under the Agreement. The Board considered that the Advisor is responsible for the overall management and administration of the Trust and the Fund and reviewed all of the services provided by the Advisor to the Fund, as well as the background and experience of the persons responsible for such services. The Board noted that the Advisor’s Leveraged Finance Investment Team is responsible for the day-to-day management of the Fund’s investments. The Board considered the background and experience of the members of the Leveraged Finance Investment Team. The Board considered the Advisor’s statement that it applies the same oversight model internally with its Leveraged Finance Investment Team as it uses for overseeing external sub-advisors, including portfolio risk monitoring and performance review. In reviewing the services provided, the Board noted the compliance program that had been developed by the Advisor and considered that it includes a robust program for monitoring the Advisor’s and the Fund’s compliance with the 1940 Act, as well as the Fund’s compliance with its investment objectives, policies and restrictions. The Board also considered a report from the
Additional Information (Continued)
First Trust Short Duration High Income Fund
October 31, 2021 (Unaudited)
Advisor with respect to its risk management functions related to the operation of the Fund. Finally, as part of the Board’s consideration of the Advisor’s services, the Advisor, in its written materials and at the April 26, 2021 meeting, described to the Board the scope of its ongoing investment in additional personnel and infrastructure to maintain and improve the quality of services provided to the Fund and the other funds in the First Trust Fund Complex. In addition to the written materials provided by the Advisor, at the April 26, 2021 meeting, the Board also received a presentation from representatives of the Advisor’s Leveraged Finance Investment Team discussing the services that the Team provides to the Fund, including the Team’s day-to-day management of the Fund’s investments. In light of the information presented and the considerations made, the Board concluded that the nature, extent and quality of the services provided to the Trust and the Fund by the Advisor under the Agreement have been and are expected to remain satisfactory and that the Advisor has managed the Fund consistent with its investment objectives, policies and restrictions.
The Board considered the advisory fee rate payable by the Fund under the Agreement for the services provided. The Board considered that the Advisor agreed to extend the current expense caps for each share class through February 28, 2023 and agreed to keep the long-term expense cap in place from March 1, 2023 through February 28, 2032. The Board noted that fees waived or expenses borne by the Advisor are subject to reimbursement by the Fund for up to three years from the date the fee was waived or expense was incurred, but no reimbursement payment would be made by the Fund at any time if it would result in the Fund’s expenses exceeding (i) the applicable expense limitation in place for the most recent fiscal year for which such expense limitation was in place, (ii) the applicable expense limitation in place at the time the fees were waived, or (iii) the current expense limitation. The Board received and reviewed information showing the advisory fee rates and expense ratios of the peer funds in the Expense Group, as well as advisory and unitary fee rates charged by the Advisor to other fund and non-fund clients, as applicable. With respect to the Expense Group, the Board, at the April 26, 2021 meeting, discussed with the Advisor limitations in creating a relevant peer group for the Fund. The Board took these limitations into account in considering the peer data. Based on the information provided, the Board noted that the contractual advisory fee rate payable by the Fund was above the median contractual advisory fee of the peer funds in the Expense Group. The Board also noted that the Fund’s total (net) expense ratio (Class A shares) was above the median total (net) expense ratio of the peer funds in the Expense Group. With respect to fees charged to other clients, the Board considered differences between the Fund and other clients that limited their comparability. In considering the advisory fee rate overall, the Board also considered the Advisor’s statement that it seeks to meet investor needs through innovative and value-added investment solutions and the Advisor’s demonstrated long-term commitment to the Fund and the other funds in the First Trust Fund Complex.
The Board considered performance information for the Fund. The Board noted the process it has established for monitoring the Fund’s performance and portfolio risk on an ongoing basis, which includes quarterly performance reporting from the Advisor for the Fund. The Board determined that this process continues to be effective for reviewing the Fund’s performance. The Board received and reviewed information comparing the Fund’s performance for periods ended December 31, 2020 to the performance of the funds in the Performance Universe and to that of a blended benchmark index. Based on the information provided, the Board noted that the Fund (Class A shares) underperformed its Performance Universe median and blended benchmark index for the one-, three- and five-year periods ended December 31, 2020. The Board noted the Leveraged Finance Investment Team’s discussion of the Fund’s performance at the April 26, 2021 meeting.
On the basis of all the information provided on the fees, expenses and performance of the Fund and the ongoing oversight by the Board, the Board concluded that the advisory fee for the Fund continues to be reasonable and appropriate in light of the nature, extent and quality of the services provided by the Advisor to the Fund under the Agreement.
The Board considered information and discussed with the Advisor whether there were any economies of scale in connection with providing advisory services to the Fund and noted the Advisor’s statement that it believes its expenses will likely increase during the next twelve months as the Advisor continues to hire personnel and build infrastructure, including technology, to improve the services to the Fund. The Board considered the revenues and allocated costs (including the allocation methodology) of the Advisor in serving as investment advisor to the Fund for the twelve months ended December 31, 2020 and the estimated profitability level for the Fund calculated by the Advisor based on such data, as well as complex-wide and product-line profitability data, for the same period. The Board noted the inherent limitations in the profitability analysis and concluded that, based on the information provided, the Advisor’s profitability level for the Fund was not unreasonable. In addition, the Board considered fall-out benefits described by the Advisor that may be realized from its relationship with the Fund. The Board considered that the Advisor had identified as a fall-out benefit to the Advisor and FTP their exposure to investors and brokers who, absent their exposure to the Fund, may have had no dealings with the Advisor or FTP. The Board noted that in addition to the advisory fees paid by the Fund, FTP is compensated for services provided to the Fund through 12b-1 distribution and service fees and that the Advisor receives compensation from the Fund for providing fund reporting services pursuant to a separate Fund Reporting Services Agreement. The Board also noted that the Advisor does not utilize soft dollars in connection with the Fund. The Board concluded that the character and amount of potential fall-out benefits to the Advisor were not unreasonable.
Additional Information (Continued)
First Trust Short Duration High Income Fund
October 31, 2021 (Unaudited)
Based on all of the information considered and the conclusions reached, the Board, including the Independent Trustees, unanimously determined that the terms of the Agreement continue to be fair and reasonable and that the continuation of the Agreement is in the best interests of the Fund. No single factor was determinative in the Board’s analysis.
Board of Trustees
Effective November 1, 2021, Denise M. Keefe was appointed as a Trustee of the Trust. Ms. Keefe is Executive Vice President of Advocate Aurora Health and President of Advocate Aurora Continuing Health Division (together, “Advocate”), one of the largest integrated healthcare systems in the U.S. serving Illinois and Wisconsin. Ms. Keefe has been employed by Advocate since 1993 and is responsible for the Continuing Health Division’s strategic direction, fiscal management, business development, revenue enhancement, operational efficiencies, and human resource management of 4,000 employees. Ms. Keefe also currently serves on the boards of several organizations within the Advocate Aurora Continuing Health Division and other health care organizations, including RML Long Term Acute Care Hospitals (since 2014) and Senior Helpers (since 2021). Prior thereto, Ms. Keefe was Corporate Vice President, Marketing and Business Development for the Visiting Nurse Association of Chicago (1989 – 1992) and a former Board Member of Sherman West Court Skilled Nursing Facility.
Board of Trustees and Officers
First Trust Short Duration High Income Fund
October 31, 2021 (Unaudited)
The following tables identify the Trustees and Officers of the Trust. Unless otherwise indicated, the address of all persons is 120 East Liberty Drive, Suite 400, Wheaton, IL 60187.
The Trust’s statement of additional information includes additional information about the Trustees and is available, without charge, upon request, by calling (800) 988-5891.
| Name, Year of Birth and Position with the Trust | Term of Office and Year First Elected or Appointed | Principal Occupations
During Past 5 Years | Number of Portfolios in the First Trust Fund Complex Overseen by Trustee | Other Trusteeships or Directorships Held by Trustee During Past 5 Years |
| INDEPENDENT TRUSTEES |
Richard E. Erickson, Trustee
(1951) | • Indefinite Term
• Since Trust Inception | Physician; Officer, Wheaton Orthopedics; Limited Partner, Gundersen Real Estate Limited Partnership (June 1992 to December 2016) | 215 | None |
Thomas R. Kadlec, Trustee
(1957) | • Indefinite Term
• Since Trust Inception | President, ADM Investor Services, Inc. (Futures Commission Merchant) | 215 | Director of ADM Investor Services, Inc., ADM Investor Services International, Futures Industry Association, and National Futures Association |
Robert F. Keith, Trustee
(1956) | • Indefinite Term
• Since Trust Inception | President, Hibs Enterprises (Financial and Management Consulting) | 215 | Director of Trust Company of Illinois |
Niel B. Nielson, Trustee
(1954) | • Indefinite Term
• Since Trust Inception | Senior Advisor (August 2018 to Present), Managing Director and Chief Operating Officer (January 2015 to August 2018), Pelita Harapan Educational Foundation (Educational Products and Services) | 215 | None |
| INTERESTED TRUSTEE |
James A. Bowen(1), Trustee and
Chairman of the Board
(1955) | • Indefinite Term
• Since Trust Inception | Chief Executive Officer, First Trust Advisors L.P. and First Trust Portfolios L.P.; Chairman of the Board of Directors, BondWave LLC (Software Development Company) and Stonebridge Advisors LLC (Investment Advisor) | 215 | None |
| (1) | Mr. Bowen is deemed an “interested person” of the Trust due to his position as CEO of First Trust Advisors L.P., investment advisor of the Trust. |
Board of Trustees and Officers (Continued)
First Trust Short Duration High Income Fund
October 31, 2021 (Unaudited)
| Name and Year of Birth | Position and Offices with Trust | Term of Office and Length of Service | Principal Occupations
During Past 5 Years |
| OFFICERS(2) |
James M. Dykas
(1966) | President and Chief Executive Officer | • Indefinite Term
• Since January 2016 | Managing Director and Chief Financial Officer (January 2016 to Present), Controller (January 2011 to January 2016), Senior Vice President (April 2007 to January 2016), First Trust Advisors L.P. and First Trust Portfolios L.P.; Chief Financial Officer (January 2016 to Present), BondWave LLC (Software Development Company) and Stonebridge Advisors LLC (Investment Advisor) |
Donald P. Swade
(1972) | Treasurer, Chief Financial Officer and Chief Accounting Officer | • Indefinite Term
• Since January 2016 | Senior Vice President (July 2016 to Present), Vice President (April 2012 to July 2016), First Trust Advisors L.P. and First Trust Portfolios L.P. |
W. Scott Jardine
(1960) | Secretary and Chief Legal Officer | • Indefinite Term
• Since Trust Inception | General Counsel, First Trust Advisors L.P. and First Trust Portfolios L.P.; Secretary and General Counsel, BondWave LLC; Secretary, Stonebridge Advisors LLC |
Daniel J. Lindquist
(1970) | Vice President | • Indefinite Term
• Since Trust Inception | Managing Director, First Trust Advisors L.P. and First Trust Portfolios L.P. |
Kristi A. Maher
(1966) | Chief Compliance Officer and Assistant Secretary | • Indefinite Term
• Chief Compliance Officer Since January 2011 • Assistant Secretary Since Trust Inception | Deputy General Counsel, First Trust Advisors L.P. and First Trust Portfolios L.P. |
| (2) | The term “officer” means the president, vice president, secretary, treasurer, controller or any other officer who performs a policy making function. |
Privacy Policy
First Trust Short Duration High Income Fund
October 31, 2021 (Unaudited)
Privacy Policy
First Trust values our relationship with you and considers your privacy an important priority in maintaining that relationship. We are committed to protecting the security and confidentiality of your personal information.
Sources of Information
We collect nonpublic personal information about you from the following sources:
| • | Information we receive from you and your broker-dealer, investment professional or financial representative through interviews, applications, agreements or other forms; |
| • | Information about your transactions with us, our affiliates or others; |
| • | Information we receive from your inquiries by mail, e-mail or telephone; and |
| • | Information we collect on our website through the use of “cookies”. For example, we may identify the pages on our website that your browser requests or visits. |
Information Collected
The type of data we collect may include your name, address, social security number, age, financial status, assets, income, tax information, retirement and estate plan information, transaction history, account balance, payment history, investment objectives, marital status, family relationships and other personal information.
Disclosure of Information
We do not disclose any nonpublic personal information about our customers or former customers to anyone, except as permitted by law. In addition to using this information to verify your identity (as required under law), the permitted uses may also include the disclosure of such information to unaffiliated companies for the following reasons:
| • | In order to provide you with products and services and to effect transactions that you request or authorize, we may disclose your personal information as described above to unaffiliated financial service providers and other companies that perform administrative or other services on our behalf, such as transfer agents, custodians and trustees, or that assist us in the distribution of investor materials such as trustees, banks, financial representatives, proxy services, solicitors and printers. |
| • | We may release information we have about you if you direct us to do so, if we are compelled by law to do so, or in other legally limited circumstances (for example to protect your account from fraud). |
In addition, in order to alert you to our other financial products and services, we may share your personal information within First Trust.
Use of Website Analytics
We currently use third party analytics tools, Google Analytics and AddThis, to gather information for purposes of improving First Trust’s website and marketing our products and services to you. These tools employ cookies, which are small pieces of text stored in a file by your web browser and sent to websites that you visit, to collect information, track website usage and viewing trends such as the number of hits, pages visited, videos and PDFs viewed and the length of user sessions in order to evaluate website performance and enhance navigation of the website. We may also collect other anonymous information, which is generally limited to technical and web navigation information such as the IP address of your device, internet browser type and operating system for purposes of analyzing the data to make First Trust’s website better and more useful to our users. The information collected does not include any personal identifiable information such as your name, address, phone number or email address unless you provide that information through the website for us to contact you in order to answer your questions or respond to your requests. To find out how to opt-out of these services click on: Google Analytics and AddThis.
Confidentiality and Security
With regard to our internal security procedures, First Trust restricts access to your nonpublic personal information to those First Trust employees who need to know that information to provide products or services to you. We maintain physical, electronic and procedural safeguards to protect your nonpublic personal information.
Policy Updates and Inquiries
As required by federal law, we will notify you of our privacy policy annually. We reserve the right to modify this policy at any time, however, if we do change it, we will tell you promptly. For questions about our policy, or for additional copies of this notice, please go to www.ftportfolios.com, or contact us at 1-800-621-1675 (First Trust Portfolios) or 1-800-222-6822 (First Trust Advisors).
March 2021
INVESTMENT ADVISOR
First Trust Advisors L.P.
120 East Liberty Drive, Suite 400
Wheaton, IL 60187
ADMINISTRATOR,
FUND ACCOUNTANT, AND
CUSTODIAN
The Bank of New York Mellon
240 Greenwich Street
New York, NY 10286
TRANSFER AGENT
BNY Mellon Investment Servicing (US) Inc.
301 Bellevue Parkway
Wilmington, DE 19809
INDEPENDENT REGISTERED
PUBLIC ACCOUNTING FIRM
Deloitte & Touche LLP
111 S. Wacker Drive
Chicago, IL 60606
LEGAL COUNSEL
Chapman and Cutler LLP
111 W. Monroe Street
Chicago, IL 60603
Item 2. Code of Ethics.
| (a) | | The registrant, as of the end of the period covered by this report, has adopted a code of ethics that applies to the registrant’s principal executive officer, principal financial officer, principal accounting officer or controller, or persons performing similar functions, regardless of whether these individuals are employed by the registrant or a third party. |
| (c) | | There have been no amendments, during the period covered by this report, to a provision of the code of ethics that applies to the registrant's principal executive officer, principal financial officer, principal accounting officer or controller, or persons performing similar functions, regardless of whether these individuals are employed by the registrant or a third party, and that relates to any element of the code of ethics description. |
| (d) | | The registrant has not granted any waivers, including an implicit waiver, from a provision of the code of ethics that applies to the registrant’s principal executive officer, principal financial officer, principal accounting officer or controller, or persons performing similar functions, regardless of whether these individuals are employed by the registrant or a third party, that relates to one or more of the items set forth in paragraph (b) of this item’s instructions. |
Item 3. Audit Committee Financial Expert.
As of the end of the period covered by the report, the Registrant’s Board of Trustees has determined that Thomas R. Kadlec and Robert F. Keith are qualified to serve as audit committee financial experts serving on its audit committee and that each of them is “independent,” as defined by Item 3 of Form N-CSR.
Item 4. Principal Accountant Fees and Services.
(a) Audit Fees (Registrant) -- The aggregate fees billed for professional services rendered by the principal accountant for the audit of the registrant's annual financial statements or services that are normally provided by the accountant in connection with statutory and regulatory filings or engagements were $109,000 for the fiscal year ended October 31, 2020 and $109,000 for the fiscal year ended October 31, 2021.
Audit Fees (Investment Advisor and Distributor) -- The aggregate fees billed for professional services rendered by the principal accountant for the audit of the registrant's annual financial statements or services that are normally provided by the accountant in connection with statutory and regulatory filings or engagements were $0 for the fiscal year ended October 31, 2020 and $0 for the fiscal year ended October 31, 2021.
(b) Audit-Related Fees (Registrant) -- The aggregate fees billed in each of the last two fiscal years for assurance and related services by the principal accountant that are reasonably related to the performance of the audit of the registrant's financial statements and are not reported under paragraph (a) of this Item were $0 for the fiscal year ended October 31, 2020 and $0 for the fiscal year ended October 31, 2021.
Audit-Related Fees (Investment Advisor and Distributor) -- The aggregate fees billed for assurance and related services by the principal accountant that are reasonably related to the performance of the audit of the registrant's financial statements, including conducting the seed audit and preparation of the seed audit consent, and are not reported under paragraph (a) of this Item were $0 for the Investment Advisor and $0 for the Distributor for the fiscal year ended October 31, 2020 and $0 for the Investment Advisor and $0 for the Distributor for the fiscal year ended October 31, 2021.
(c) Tax Fees (Registrant) -- The aggregate fees billed for professional services rendered by the principal accountant for tax compliance, tax advice, and tax planning to the registrant were $37,047 for the fiscal year ended October 31, 2020; and for tax compliance, tax advice, tax planning and professional services rendered for PFIC (Passive Foreign Investment Company) identification services to the registrant were $33,550 for the fiscal year ended October 31, 2021. These fees were for tax consultation and/or tax return preparation and professional services rendered for PFIC (Passive Foreign Investment Company) Identification Services.
Tax Fees (Investment Advisor and Distributor) -- The aggregate fees billed for professional services rendered by the principal accountant for tax compliance, tax advice, and tax planning to the registrant's advisor and distributor were $0 for the Investment Advisor and $0 for the Distributor for the fiscal year ended October 31, 2020 and $0 for the Investment Advisor and $0 for the Distributor for the fiscal year ended October 31, 2021.
(d) All Other Fees (Registrant) -- The aggregate fees billed for products and services provided by the principal accountant to the registrant, other than the services reported in paragraphs (a) through (c) of this Item were $0 for the fiscal year ended October 31, 2020 and $0 for the fiscal year ended October 31, 2021.
All Other Fees (Investment Advisor and Distributor) -- The aggregate fees billed for products and services provided by the principal accountant to the registrant’s investment advisor and distributor, other than the services reported in paragraphs (a) through (c) of this Item were $0 for the Investment Advisor and $0 for the Distributor for the fiscal year ended October 31, 2020 and $0 for the Investment Advisor and $0 for the Distributor for the fiscal year ended October 31, 2021.
(e)(1) Disclose the audit committee's pre-approval policies and procedures described in paragraph (c) (7) of Rule 2-01 of Regulation S-X.
Pursuant to its charter and its Audit and Non-Audit Services Pre-Approval Policy, the Audit Committee (the "Committee") is responsible for the pre-approval of all audit services and permitted non-audit services (including the fees and terms thereof) to be performed for the registrant by its independent auditors. The Chairman of the Committee is authorized to give such pre-approvals on behalf of the Committee up to $25,000 and report any such pre-approval to the full Committee.
The Committee is also responsible for the pre-approval of the independent auditor's engagements for non-audit services with the registrant's advisor (not including a sub-advisor whose role is primarily portfolio management and is sub-contracted or overseen by another investment advisor) and any entity controlling, controlled by or under common control with the investment advisor that provides ongoing services to the registrant, if the engagement relates directly to the operations and financial reporting of the registrant, subject to the de minimis exceptions for non-audit services described in Rule 2-01 of Regulation S-X. If the independent auditor has provided non-audit services to the registrant's advisor (other than any sub-advisor whose role is primarily portfolio management and is sub-contracted with or overseen by another investment advisor) and any entity controlling, controlled by or under common control with the investment advisor that provides ongoing services to the registrant that were not pre-approved pursuant to its policies, the Committee will consider whether the provision of such non-audit services is compatible with the auditor's independence.
(e)(2) The percentage of services described in each of paragraphs (b) through (d) for the registrant and the registrant's investment advisor and distributor of this Item that were approved by the audit committee pursuant to the pre-approval exceptions included in paragraph (c)(7)(i)(C) or paragraph(C)(7)(ii) of Rule 2-01 of Regulation S-X are as follows:
Registrant: Adviser and Distributor:
(b) 0% (b) 0%
(c) 0% (c) 0%
(d) 0% (d) 0%
(f) The percentage of hours expended on the principal accountant's engagement to audit the registrant's financial statements for the most recent fiscal year that were attributed to work performed by persons other than the principal accountant's full-time, permanent employees was less than fifty percent.
(g) The aggregate non-audit fees billed by the registrant's accountant for services rendered to the registrant, and rendered to the registrant's investment advisor (not including any sub-advisor whose role is primarily portfolio management and is subcontracted with or overseen by another investment advisor), and any entity controlling, controlled by, or under common control with the advisor that provides ongoing services to the registrant for the fiscal year ended October 31, 2020 were $37,047 for the registrant, $70,370 for the registrant’s investment advisor, $99,830 for the registrant’s distributor and $18,000 for Stonebridge Advisors LLC, which is under common control with the registrant’s investment advisor and serves as the registrant’s sub-advisor for the First Trust Preferred Securities and Income Fund (“Stonebridge”); and for the fiscal year ended October 31, 2021 were $33,550 for the registrant, $16,500 for the registrant’s investment advisor, $29,500 for the registrant’s distributor and $4,000 for Stonebridge.
(h) The registrant’s audit committee of its Board of Trustees has determined that the provision of non-audit services that were rendered to the registrant’s investment advisor (not including any sub-advisor whose role is primarily portfolio management and is subcontracted with or overseen by another investment advisor), and any entity controlling, controlled by, or under common control with the investment advisor that provides ongoing services to the registrant that were not pre-approved pursuant to paragraph (c)(7)(ii) of Rule 2-01 of Regulation S-X is compatible with maintaining the principal accountant’s independence.
(i) Not applicable.
(j) Not applicable.
Item 5. Audit Committee of Listed registrants.
| (a) | | The registrant has a separately designated audit committee consisting of all the independent directors of the registrant. The members of the audit committee are: Thomas R. Kadlec, Niel B. Nielson, Richard E. Erickson and Robert F. Keith. |
Item 6. Investments.
| (a) | | Schedule of Investments in securities of unaffiliated issuers as of the close of the reporting period is included as part of the report to shareholders filed under Item 1 of this form. |
Item 7. Disclosure of Proxy Voting Policies and Procedures for Closed-End Management Investment Companies.
Not applicable.
Item 8. Portfolio Managers of Closed-End Management Investment Companies.
Not applicable.
Item 9. Purchases of Equity Securities by Closed-End Management Investment Company and Affiliated Purchasers.
Not applicable.
Item 10. Submission of Matters to a Vote of Security Holders.
There have been no material changes to the procedures by which the shareholders may recommend nominees to the registrant’s board of directors, where those changes were implemented after the registrant last provided disclosure in response to the requirements of Item 407(c)(2)(iv) of Regulation S-K (17 CFR 229.407) (as required by Item 22(b)(15) of Schedule 14A (17 CFR 240.14a-101)), or this Item.
Item 11. Controls and Procedures.
| (a) | | The registrant’s principal executive and principal financial officers, or persons performing similar functions, have concluded that the registrant’s disclosure controls and procedures (as defined in Rule 30a-3(c) under the Investment Company Act of 1940, as amended (the “1940 Act”) (17 CFR 270.30a-3(c))) are effective, as of a date within 90 days of the filing date of the report that includes the disclosure required by this paragraph, based on their evaluation of these controls and procedures required by Rule 30a-3(b) under the 1940 Act (17 CFR 270.30a-3(b)) and Rules 13a-15(b) or 15d-15(b) under the Securities Exchange Act of 1934, as amended (17 CFR 240.13a-15(b) or 240.15d-15(b)). |
| (b) | | There were no changes in the registrant’s internal control over financial reporting (as defined in Rule 30a-3(d) under the 1940 Act (17 CFR 270.30a-3(d)) that occurred during the period covered by this report that has materially affected, or is reasonably likely to materially affect, the registrant’s internal control over financial reporting. |
Item 12. Disclosure of Securities Lending Activities for Closed-End Management Investment Companies.
Not applicable.
Item 13. Exhibits.
SIGNATURES
Pursuant to the requirements of the Securities Exchange Act of 1934 and the Investment Company Act of 1940, the registrant has duly caused this report to be signed on its behalf by the undersigned, thereunto duly authorized.
| (Registrant) | | First Trust Series Fund |
| By (Signature and Title)* | | /s/ James M. Dykas |
| | | James M. Dykas, President and Chief Executive Officer
(principal executive officer) |
Pursuant to the requirements of the Securities Exchange Act of 1934 and the Investment Company Act of 1940, this report has been signed below by the following persons on behalf of the registrant and in the capacities and on the dates indicated.
| By (Signature and Title)* | | /s/ James M. Dykas |
| | | James M. Dykas, President and Chief Executive Officer
(principal executive officer) |
| By (Signature and Title)* | | /s/ Donald P. Swade |
| | | Donald P. Swade, Treasurer, Chief Financial Officer
and Chief Accounting Officer
(principal financial officer) |
* Print the name and title of each signing officer under his or her signature.