UNITED STATES
SECURITIES AND EXCHANGE COMMISSION
Washington, D.C. 20549
FORM N-CSR
CERTIFIED SHAREHOLDER REPORT OF REGISTERED MANAGEMENT INVESTMENT COMPANIES
| Investment Company Act file number 811-22452 |
First Trust Series Fund
(Exact name of registrant as specified in charter) |
120 East Liberty Drive, Suite 400
Wheaton, IL 60187
(Address of principal executive offices) (Zip code) |
| |
W. Scott Jardine, Esq.
First Trust Portfolios L.P.
120 East Liberty Drive, Suite 400
Wheaton, IL 60187
(Name and address of agent for service) |
Registrant’s telephone number, including area code: (630) 765-8000
Date of fiscal year end: October 31
Date of reporting period: October 31, 2022
Form N-CSR is to be used by management investment companies to file reports with the Commission not later than 10 days after the transmission to stockholders of any report that is required to be transmitted to stockholders under Rule 30e-1 under the Investment Company Act of 1940 (17 CFR 270.30e-1). The Commission may use the information provided on Form N-CSR in its regulatory, disclosure review, inspection, and policymaking roles.
A registrant is required to disclose the information specified by Form N-CSR, and the Commission will make this information public. A registrant is not required to respond to the collection of information contained in Form N-CSR unless the Form displays a currently valid Office of Management and Budget (“OMB”) control number. Please direct comments concerning the accuracy of the information collection burden estimate and any suggestions for reducing the burden to Secretary, Securities and Exchange Commission, 450 Fifth Street, NW, Washington, DC 20549-0609. The OMB has reviewed this collection of information under the clearance requirements of 44 U.S.C. § 3507.
Item 1. Reports to Stockholders.
The Report to Shareholders is attached herewith.

First Trust Preferred
Securities and Income Fund
Annual Report
For the Year Ended
October 31, 2022
First Trust Preferred Securities and Income Fund
Annual Report
October 31, 2022
Caution Regarding Forward-Looking Statements
This report contains certain forward-looking statements within the meaning of the Securities Act of 1933, as amended, and the Securities Exchange Act of 1934, as amended. Forward-looking statements include statements regarding the goals, beliefs, plans or current expectations of First Trust Advisors L.P. (“First Trust” or the “Advisor”) and/or Stonebridge Advisors LLC (“Stonebridge” or the “Sub-Advisor”) and their respective representatives, taking into account the information currently available to them. Forward-looking statements include all statements that do not relate solely to current or historical fact. For example, forward-looking statements include the use of words such as “anticipate,” “estimate,” “intend,” “expect,” “believe,” “plan,” “may,” “should,” “would” or other words that convey uncertainty of future events or outcomes.
Forward-looking statements involve known and unknown risks, uncertainties and other factors that may cause the actual results, performance or achievements of First Trust Preferred Securities and Income Fund (the “Fund”) to be materially different from any future results, performance or achievements expressed or implied by the forward-looking statements. When evaluating the information included in this report, you are cautioned not to place undue reliance on these forward-looking statements, which reflect the judgment of the Advisor and/or Sub-Advisor and their respective representatives only as of the date hereof. We undertake no obligation to publicly revise or update these forward-looking statements to reflect events and circumstances that arise after the date hereof.
Performance and Risk Disclosure
There is no assurance that the Fund will achieve its investment objective. The Fund is subject to market risk, which is the possibility that the market values of securities owned by the Fund will decline and that the value of the Fund’s shares may therefore be less than what you paid for them. Accordingly, you can lose money by investing in the Fund. See “Risk Considerations” in the Additional Information section of this report for a discussion of certain other risks of investing in the Fund.
Performance data quoted represents past performance, which is no guarantee of future results, and current performance may be lower or higher than the figures shown. For the most recent month-end performance figures, please visit www.ftportfolios.com or speak with your financial advisor. Investment returns and net asset value will fluctuate and Fund shares, when sold, may be worth more or less than their original cost.
The Advisor may also periodically provide additional information on Fund performance on the Fund’s web page at www.ftportfolios.com.
How to Read This Report
This report contains information that may help you evaluate your investment in the Fund. It includes details about the Fund and presents data and analysis that provide insight into the Fund’s performance and investment approach.
By reading the portfolio commentary by the portfolio management team of the Fund, you may obtain an understanding of how the market environment affected the Fund’s performance. The statistical information that follows may help you understand the Fund’s performance compared to that of relevant market benchmarks.
It is important to keep in mind that the opinions expressed by personnel of First Trust and Stonebridge are just that: informed opinions. They should not be considered to be promises or advice. The opinions, like the statistics, cover the period through the date on the cover of this report. The material risks of investing in the Fund are spelled out in the prospectus, the statement of additional information, this report and other Fund regulatory filings.
First Trust Preferred Securities and Income Fund
Annual Letter from the Chairman and CEO
October 31, 2022
Dear Shareholders,
First Trust is pleased to provide you with the annual report for the First Trust Preferred Securities and Income Fund (the “Fund”), which contains detailed information about the Fund for the twelve months ended October 31, 2022.
As I’m writing this letter in mid-November, it strikes me that things appear to be a little more chaotic in the current climate than normal. One of the things that may have contributed to the chaotic nature of the news flow of late was the November mid-term election. For the most part, except for a few seats in Congress, the election is behind us. We learned there would be no “red wave” (Republicans gaining a strong majority in Congress) but likely gridlock ahead. Gridlock has been good for stock market investors in the past few decades, particularly when there’s been a Democratic president and the Republicans have control of at least one house of Congress, according to Brian Wesbury, Chief Economist at First Trust.
The Federal Reserve (the “Fed”) has kept its promise to aggressively hike interest rates to combat robust inflation. As of November 13, 2022, the Fed has increased the Federal Funds target rate (upper bound) six times, from 0.25% to 4.00%. The Fed’s actions have some investors and pundits looking for evidence linking the interest rate hikes to a downturn in the economy. In short, the hope is that a pullback in economic activity might deter the Fed from executing further interest rate hikes. Fed Chairman Jerome Powell, however, recently said that the terminal rate (the ultimate rate the Fed is targeting) will likely need to be higher than previously estimated in order to curb stubbornly high inflation. The Consumer Price Index (“CPI”) is a commonly used measure of inflation. The CPI stood at 7.7% on a trailing 12-month basis as of October 31, 2022, according to the U.S. Bureau of Labor Statistics. That is down from its recent high of 9.1% in June 2022. Prior to this year, the last time the CPI was higher than 7.0% was over 40 years ago. While monetary policy is an ongoing process subject to change, the Fed does appear to be steadfast in its mission to bring the rate of inflation back to its preferred level of 2.0%, and that will take some time, in my opinion. Stay tuned!
Equity and fixed income markets have contended with numerous headwinds this year, such as the war between Russia and Ukraine. Since setting its all-time high of 4,796.56 on January 3, 2022, the S&P 500® Index has been in a bear market (a price decline of 20% or more from the most recent high) for the better part of 310 days. Suffice it to say, we are all looking forward to the end of this bear market. With respect to corrections and bear markets, the silver lining is that the S&P 500® Index has never failed to fully recover the losses sustained in any previous downturn. Where might we see demand for stocks moving forward? One such source could be stock buybacks. As of the last week of October 2022, U.S. companies had announced stock buybacks totaling $1 trillion so far this year, according to Birinyi Associates. The fixed income market has not been immune to selling pressure either. Year-to-date through November 10, 2022, yields on the 10-Year Treasury Note increased by 258 basis points. As you may be aware, bond yields and bond prices are inversely related, particularly with respect to investment-grade bonds. As yields rise, prices fall and vice versa. As noted above, the Fed has more work to do, so bond investors should not be surprised to see interest rates and bond yields trend at least a bit higher in the months ahead.
Thank you for giving First Trust the opportunity to play a role in your financial future. We value our relationship with you and will report on the Fund again in six months.
Sincerely,
James A. Bowen
Chairman of the Board of Trustees
Chief Executive Officer of First Trust Advisors L.P.
First Trust Preferred Securities and Income Fund
“AT A GLANCE”
As of October 31, 2022 (Unaudited)
| Fund Statistics | |
| First Trust Preferred Securities and Income Fund | Net Asset
Value (NAV) |
| Class A (FPEAX) | $18.47 |
| Class C (FPECX) | $18.60 |
| Class F (FPEFX) | $18.71 |
| Class I (FPEIX) | $18.60 |
| Class R3 (FPERX) | $18.40 |
| Sector Allocation | % of Total
Investments |
| Financials | 74.1% |
| Energy | 9.2 |
| Utilities | 7.6 |
| Consumer Staples | 3.8 |
| Industrials | 2.8 |
| Real Estate | 1.5 |
| Communication Services | 0.7 |
| Consumer Discretionary | 0.3 |
| Total | 100.0% |
| Country Allocation | % of Total
Investments |
| United States | 53.3% |
| United Kingdom | 9.2 |
| Canada | 7.4 |
| Switzerland | 6.4 |
| France | 5.4 |
| Bermuda | 3.6 |
| Netherlands | 3.1 |
| Italy | 2.3 |
| Spain | 1.8 |
| Australia | 1.8 |
| Multinational | 1.6 |
| Denmark | 1.4 |
| Germany | 1.3 |
| Mexico | 1.2 |
| Finland | 0.2 |
| Total | 100.0% |
| Credit Quality(1) | % of Total
Fixed-Income
Investments |
| A | 0.1% |
| BBB+ | 10.3 |
| BBB | 22.5 |
| BBB- | 30.6 |
| BB+ | 16.1 |
| BB | 10.7 |
| BB- | 6.2 |
| B+ | 0.8 |
| B | 0.3 |
| Not Rated | 2.4 |
| Total | 100.0% |
| Top Ten Holdings | % of Total
Investments |
| Barclays PLC | 2.6% |
| AerCap Holdings N.V. | 1.9 |
| Enbridge, Inc., Series 16-A | 1.8 |
| Wells Fargo & Co., Series L | 1.8 |
| Highlands Holdings Bond Issuer Ltd./Highlands Holdings Bond Co-Issuer, Inc. | 1.6 |
| Bank of America Corp., Series TT | 1.6 |
| Credit Suisse Group AG | 1.6 |
| Credit Agricole S.A. | 1.4 |
| Land O’Lakes Capital Trust I | 1.3 |
| Land O’Lakes, Inc. | 1.3 |
| Total | 16.9% |
Dividend
Distributions | Class A Shares | Class C Shares | Class F Shares | Class I Shares | Class R3 Shares |
| Current Monthly Distribution per Share(2) | $0.0834 | $0.0711 | $0.0850 | $0.0875 | $0.0794 |
| Current Distribution Rate on NAV(3) | 5.42% | 4.59% | 5.45% | 5.65% | 5.18% |
| (1) | The credit quality and ratings information presented above reflect the ratings assigned by one or more nationally recognized statistical rating organizations (NRSROs), including S&P Global Ratings, Moody’s Investors Service, Inc., Fitch Ratings or a comparably rated NRSRO. For situations in which a security is rated by more than one NRSRO and the ratings are not equivalent, the highest rating is used. Sub-investment grade ratings are those rated BB+/Ba1 or lower. Investment grade ratings are those rated BBB-/Baa3 or higher. The credit ratings shown relate to the creditworthiness of the issuers of the underlying securities in the Fund, and not to the Fund or its shares. Credit ratings are subject to change. |
| (2) | Most recent distribution paid through October 31, 2022. Subject to change in the future. |
| (3) | Distribution rates are calculated by annualizing the most recent distribution paid through the report date and then dividing by NAV as of October 31, 2022. Subject to change in the future. |
First Trust Preferred Securities and Income Fund
“AT A GLANCE” (Continued)
As of October 31, 2022 (Unaudited)
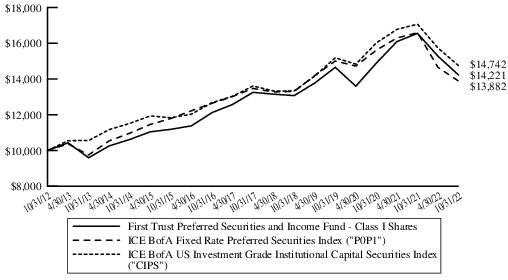
Performance of a $10,000 investment
This chart compares your Fund’s Class I performance to that of the ICE BofA Fixed Rate Preferred Securities Index and the ICE BofA US Investment Grade Institutional Capital Securities Index from 10/31/2012 through 10/31/2022.
First Trust Preferred Securities and Income Fund
“AT A GLANCE” (Continued)
As of October 31, 2022 (Unaudited)
| Performance as of October 31, 2022 |
| | | A Shares
Inception
2/25/2011 | | C Shares
Inception
2/25/2011 | | F Shares
Inception
3/2/2011 | | I Shares
Inception
1/11/2011 | | R3 Shares
Inception
3/2/2011 | | Blended
Index*(4)(5)(6) | | P0P1*
ICE BofA
Fixed Rate
Preferred
Securities Index | | CIPS*
ICE BofA
US Investment
Grade
Institutional
Capital
Securities
Index | | Prior
Blended
Index*(7) |
Cumulative
Total Returns | | w/o
sales
charge | | w/max
4.50%
sales
charge | | w/o
sales
charge | | w/max 1.00% contingent deferred sales charge | | w/o
sales
charge | | w/o
sales
charge | | w/o
sales
charge | | w/o sales charge | | w/o sales charge | | w/o sales charge | | w/o sales charge |
| 1 Year | | (14.36)% | | (18.22)% | | (14.97)% | | (15.79)% | | (14.36)% | | (14.09)% | | (14.67)% | | (16.71)% | | (16.32)% | | (13.64)% | | (15.84)% |
Average Annual
Total Returns | | | | | | | | | | | | | | | | | | | | | | |
| 5 Years | | 1.15% | | 0.22% | | 0.46% | | 0.46% | | 1.23% | | 1.43% | | 0.86% | | 1.06% | | 0.60% | | 1.61% | | 0.99% |
| 10 Years | | 3.30% | | 2.83% | | 2.57% | | 2.57% | | 3.40% | | 3.58% | | 3.01% | | N/A | | 3.33% | | 3.96% | | 3.55% |
| Since Inception | | 4.56% | | 4.15% | | 3.82% | | 3.82% | | 4.69% | | 4.92% | | 4.22% | | N/A | | 4.30% | | 4.95% | | 4.54% |
| 30-Day SEC Yield(8) | | 5.59% | | 5.19% | | 5.90% | | 6.21% | | 5.54% | | N/A | | N/A | | N/A | | N/A |
* Since inception return is based on the Class I Shares inception date.
Performance figures assume reinvestment of all distributions and do not reflect the deduction of taxes that the shareholder would pay on Fund distributions or the redemption of Fund shares. The total returns would have been lower if certain fees had not been waived and expenses reimbursed by the Advisor and Sub-Advisor. An index is a statistical composite that tracks a specific financial market or sector. Unlike the Fund, these indices do not actually hold a portfolio of securities and therefore do not incur the expenses incurred by the Fund. These expenses negatively impact the performance of the Fund. The Fund’s past performance does not predict future performance.
Performance of share classes will vary due to differences in sales charges and expenses. Total return with sales charges includes payment of the maximum sales charge of 4.50% for Class A Shares, a contingent deferred sales charge (“CDSC”) of 1.00% for Class C Shares in year one and Rule 12b-1 service fees of 0.25% per year of average daily net assets for Class A Shares and combined Rule 12b-1 distribution and service fees of 1.00% per year of average daily net assets for Class C Shares. Class F, Class I and Class R3 Shares do not have a front-end sales charge or a CDSC; therefore, performance is at net asset value. The Rule 12b-1 service fees are 0.15% of average daily net assets for Class F Shares and combined Rule 12b-1 distribution and service fees are 0.50% of average daily net assets for Class R3 Shares, while Class I Shares do not have these fees. Prior to December 15, 2011, the combined Rule 12b-1 distribution and service fees for Class R3 Shares were 0.75% of average daily net assets.
| (4) | On July 6, 2021, the Fund’s benchmark changed from the Prior Blended Index to the Blended Index, because the Advisor believes that the Blended Index better reflects the investment strategies of the Fund. |
| (5) | The Blended Index consists of a 30/30/30/10 blend of the ICE BofA Core Plus Fixed Rate Preferred Securities Index, the ICE BofA US Investment Grade Institutional Capital Securities Index, the ICE USD Contingent Capital Index and the ICE BofA US High Yield Institutional Capital Securities Index. The Blended Index is intended to reflect the proportional market cap of each segment of the preferred and hybrid securities market. The indices do not charge management fees or brokerage expenses, and no such fees or expenses were deducted from the performance shown. Indices are unmanaged and an investor cannot invest directly in an index. The Blended Index returns are calculated by using the monthly returns of the four indices during each period shown above. At the beginning of each month the four indices are rebalanced to a 30/30/30/10 ratio to account for divergence from that ratio that occurred during the course of each month. The monthly returns are then compounded for each period shown above, giving the performance for the Blended Index for each period shown above. |
| (6) | Since the ICE USD Contingent Capital Index had an inception date of December 31, 2013, the performance of the Blended Index is not available for all of the periods disclosed. |
| (7) | The Prior Blended Index consists of a 50/50 blend of the ICE BofA Fixed Rate Preferred Securities Index and the ICE BofA U.S. Capital Securities Index. The indices do not charge management fees or brokerage expenses, and no such fees or expenses were deducted from the performance shown. Indices are unmanaged and an investor cannot invest directly in an index. The Prior Blended Index returns are calculated by using the monthly returns of the two indices during each period shown above. At the beginning of each month the two indices are rebalanced to a 50/50 ratio to account for divergence from that ratio that occurred during the course of each month. The monthly returns are then compounded for each period shown above, giving the performance for the Prior Blended Index for each period shown above. |
| (8) | 30-day SEC yield is calculated by dividing the net investment income per share earned during the most recent 30-day period by the maximum offering price per share on the last day of the period. The reported SEC yields are subsidized. The subsidized yields reflect the waiver and/or a reimbursement of Fund expenses, which has the effect of lowering the Fund’s expense ratio and generating a higher yield. |
Portfolio Commentary
First Trust Preferred Securities and Income Fund
Annual Report
October 31, 2022 (Unaudited)
Advisor
First Trust Advisors L.P. (“First Trust” or the “Advisor”) serves as the investment advisor to the First Trust Preferred Securities and Income Fund (the “Fund”). First Trust is responsible for the ongoing monitoring of the Fund’s investment portfolio, managing the Fund’s business affairs and providing certain administrative services necessary for the management of the Fund.
Sub-Advisor
Stonebridge Advisors LLC (“Stonebridge” or the “Sub-Advisor”) is the investment sub-advisor to the Fund and is a registered investment advisor based in Wilton, Connecticut. Stonebridge specializes in the management of preferred and hybrid securities.
Stonebridge Advisors LLC Portfolio Management Team
Scott T. Fleming - Chief Executive Officer and President
Robert Wolf - Chief Investment Officer, Executive Vice President and Senior Portfolio Manager
Eric Weaver - Executive Vice President, Chief Strategist and Portfolio Manager
Angelo Graci, CFA - Executive Vice President, Head of Credit Research and Portfolio Manager
Annual Report Commentary
Market Recap
The 12-month period ended October 31, 2022, was negative for all segments of the preferred and hybrid securities market as interest rates moved sharply higher across the Treasury curve. In the face of stubbornly high inflation throughout 2021, the Federal Reserve (the “Fed”) pivoted to a hawkish monetary policy stance in early 2022. The Fed proceeded to increase the Federal Funds target rate to 3.00-3.25% by the end of the period, including an unprecedented series of three separate 75 basis point (“bps”) hikes with the market expecting a fourth in early November 2022. In response to the Fed’s pivot, 2-Year Treasury yields moved higher by around 400 bps and 10-Year Treasury yields moved higher by about 250 bps during the period. Meanwhile, the Treasury 2-Year/10-Year yield curve inverted by nearly 50 bps, reflecting the market’s expectation for a potential economic slowdown in response to tighter monetary policy. Long duration and fixed rate securities suffered the deepest losses during the period, while variable rate and floating rate securities outperformed. During the 12-month period ended October 31, 2022, investment grade (“IG”) $1,000 par institutional securities were the top performing segment of the preferred and hybrid securities market, returning -13.64% (the ICE BofA US Investment Grade Institutional Capital Securities Index (“CIPS”)), non-IG $1,000 par institutional securities returned -16.00% (the ICE BofA US High Yield Institutional Capital Securities Index (“HIPS”)), while the non-U.S. bank contingent convertible capital securities (“CoCos”) returned -15.94% (the ICE USD Contingent Capital Index (“CDLR”)). Finally, the $25 par exchange-traded market was by far the worst performer due to its longer duration profile and heavy outflows from passive exchange-traded funds (“ETFs”) that focus on the $25 par exchange-traded market. The $25 par exchange-traded securities returned -20.94% (the ICE BofA Core Plus Fixed Rate Preferred Securities Index (“P0P4”)) during the period.
Performance Analysis
For the 12-month period ended October 31, 2022, the Fund I-shares produced a total return of -14.09%. This compares to a total return of -16.71% for the Fund’s benchmark (the “Benchmark”), which is a 30/30/30/10 blend of P0P4, CIPS, CDLR and HIPS, respectively. The main contributors to the Fund’s outperformance relative to the Benchmark were the Fund’s defensive positioning in regard to rising interest rates, security selection within CoCos and security selection within investment grade (“IG”) securities. The Fund also benefited from its security selection within the pipeline sector and $25 par exchange-traded holdings.
The Fund began repositioning for potentially higher interest rates as early as the fourth quarter of 2020, which paid off on a relative basis during the fiscal year 2022. Short duration (<3 year) securities significantly outperformed during the period while long duration securities (5+ years) significantly underperformed. The Fund benefited from its significant underweight to longer duration securities and overweight to short duration securities, including floaters, which are not held in the Benchmark. The Fund outperformed versus the Benchmark across every duration segment of the curve.
Another area of outperformance for the Fund was its superior security selection within non-U.S. bank CoCos, including its superior security selection within European banks. The Fund also benefitted from its underweight allocation to emerging market banks, which it is comfortable maintaining going forward. Russian bank CoCos, which were not held by the Fund, suffered complete losses during the period.
Portfolio Commentary (Continued)
First Trust Preferred Securities and Income Fund
Annual Report
October 31, 2022 (Unaudited)
Within non-IG securities, the Fund benefited from its superior security selection, particularly within the pipeline sector. The Fund’s pipeline holdings outperformed the Benchmark’s by over 7% for the period. The Fund continues to maintain an overweight allocation to this sector given its favorable outlook.
Turning to the $25 par exchange-traded market, the Fund benefited from its underweight to fixed rate securities and its security selection within variable rate holdings. This was partially offset by the Fund’s security selection within the Equity Real Estate Investment Trusts (“REITs”) and Utilities sectors, and the relative underweight to $25 par variable rate securities.
Finally, the Fund added to its relative performance through the new issuance markets. Given the volatility and exchange-traded fund outflows during the period, the Fund was very selective within this market segment.
Market and Fund Outlook
As we look ahead, we believe the risk reward balance has improved in regard to interest rate risk, creating opportunities in the preferred and hybrid securities market. We believe our base case for the next 12 months is for the market to perform positively with some capital appreciation in addition to income. We believe risks from inflationary pressures, rising rates and geopolitical conflicts are elevated, but are largely priced into the market. Valuation metrics for preferred securities are at attractive levels with high yields relative to other fixed income asset classes coupled with market prices trading at historically deep discounts to par. We especially favor select longer duration variable rate securities and securities trading at deep discounts. We believe in a “pull to par” effect for many of the deeply discounted securities that have a high likelihood of trading closer to par as they approach their first call dates. The primary driver of this “pull to par” effect are variable rate securities with high resets that project much higher coupons after their first call dates.
In addition, we believe the high quality credit fundamentals and sector concentrations in highly regulated industries could help to insulate the asset class in a recessionary environment and against current geopolitical risks. U.S. and European banks are well capitalized and entering the new fiscal year from a position of strength in the face of economic headwinds, while other major sectors like Insurance, Utilities, and REITs offer lower sensitivity to inflation, in our opinion.
We foresee the risk-reward dynamic progressively improving as we approach 2023 and think that the preferred and hybrid securities market is set up to outperform longer term. As active fund managers, we have the advantage of repositioning the portfolio as market conditions change. As a result, we believe the Fund is positioned for outperformance over the next twelve months due to an overweight in discounted securities that we think have the greatest upside potential, defensive credit exposure and capacity to take advantage of market dislocations as they arise.
First Trust Preferred Securities and Income Fund
Understanding Your Fund Expenses
October 31, 2022 (Unaudited)
As a shareholder of the First Trust Preferred Securities and Income Fund (the “Fund”), you incur two types of costs: (1) transaction costs, including sales charges (loads) on purchases of Class A Shares and contingent deferred sales charges on the lesser of purchase price or redemption proceeds of Class C Shares; and (2) ongoing costs, including management fees, distribution and/or service (12b-1) fees, if any, and other Fund expenses. This Example is intended to help you understand your ongoing costs of investing in the Fund and to compare these costs with the ongoing costs of investing in other funds.
The Example is based on an investment of $1,000 invested at the beginning of the period and held through the six-month period ended October 31, 2022.
Actual Expenses
The first three columns of the table below provide information about actual account values and actual expenses. You may use the information in these columns, together with the amount you invested, to estimate the expenses that you paid over the period. Simply divide your account value by $1,000 (for example, an $8,600 account value divided by $1,000 = 8.6), then multiply the result by the number in the third column under the heading entitled “Expenses Paid During Period” to estimate the expenses you paid on your account during this six-month period.
Hypothetical Example for Comparison Purposes
The next three columns of the table below provide information about hypothetical account values and hypothetical expenses based on the Fund’s actual expense ratio and an assumed rate of return of 5% per year before expenses, which is not the Fund’s actual return. The hypothetical account values and expenses may not be used to estimate the actual ending account balance or expenses you paid for the period. You may use this information to compare the ongoing costs of investing in the Fund and other funds. To do so, compare this 5% hypothetical example with the 5% hypothetical examples that appear in the shareholder reports of the other funds.
Please note that the expenses shown in the table are meant to highlight your ongoing costs only and do not reflect any transactional costs such as sales charges (loads) or contingent deferred sales charges. Therefore, the hypothetical section of the table is useful in comparing ongoing costs only, and will not help you determine the relative total costs of owning different funds. In addition, if these transactional costs were included, your costs would have been higher.
| | Actual Expenses | | Hypothetical
(5% Return Before Expenses) | |
| | Beginning
Account
Value
5/1/2022 | Ending
Account
Value
10/31/2022 | Expenses Paid
During Period
5/1/2022 -
10/31/2022 (a) | | Beginning
Account
Value
5/1/2022 | Ending
Account
Value
10/31/2022 | Expenses Paid
During Period
5/1/2022 -
10/31/2022 (a) | Annualized
Expense
Ratios (b) |
Class A
| $ 1,000.00 | $ 930.20 | $ 6.37 | | $ 1,000.00 | $ 1,018.60 | $ 6.67 | 1.31% |
Class C
| $ 1,000.00 | $ 927.10 | $ 9.71 | | $ 1,000.00 | $ 1,015.12 | $ 10.16 | 2.00% |
Class F
| $ 1,000.00 | $ 930.10 | $ 6.32 | | $ 1,000.00 | $ 1,018.65 | $ 6.61 | 1.30% |
Class I
| $ 1,000.00 | $ 931.40 | $ 4.82 | | $ 1,000.00 | $ 1,020.21 | $ 5.04 | 0.99% |
Class R3
| $ 1,000.00 | $ 928.30 | $ 8.02 | | $ 1,000.00 | $ 1,016.89 | $ 8.39 | 1.65% |
| (a) | Expenses are equal to the annualized expense ratios as indicated in the table multiplied by the average account value over the period (May 1, 2022 through October 31, 2022), multiplied by 184/365 (to reflect the six-month period). |
| (b) | These expense ratios reflect expense caps. |
First Trust Preferred Securities and Income Fund
Portfolio of Investments
October 31, 2022
| Shares | | Description | | Stated
Rate | | Stated
Maturity | | Value |
| $25 PAR PREFERRED SECURITIES – 13.1% |
| | | Automobiles – 0.3% | | | | | | |
| 27,582 | | Ford Motor Co.
| | 6.50% | | 08/15/62 | | $628,870 |
| | | Banks – 2.0% | | | | | | |
| 444 | | Atlantic Union Bankshares Corp., Series A
| | 6.88% | | (a) | | 10,563 |
| 5,775 | | Citizens Financial Group, Inc., Series D (b)
| | 6.35% | | (a) | | 135,424 |
| 6,000 | | JPMorgan Chase & Co., Series LL
| | 4.63% | | (a) | | 111,240 |
| 8,764 | | Old National Bancorp, Series A
| | 7.00% | | (a) | | 225,673 |
| 28,696 | | PacWest Bancorp, Series A (b)
| | 7.75% | | (a) | | 712,235 |
| 40,177 | | Pinnacle Financial Partners, Inc., Series B
| | 6.75% | | (a) | | 978,310 |
| 62,765 | | Signature Bank, Series A
| | 5.00% | | (a) | | 1,105,919 |
| 4,155 | | Texas Capital Bancshares, Inc., Series B
| | 5.75% | | (a) | | 82,393 |
| 27,348 | | Valley National Bancorp, Series B, 3 Mo. LIBOR + 3.58% (c)
| | 7.25% | | (a) | | 659,634 |
| 4,496 | | Wells Fargo & Co., Series Q (b)
| | 5.85% | | (a) | | 102,284 |
| 24,363 | | WesBanco, Inc., Series A (b)
| | 6.75% | | (a) | | 610,537 |
| | | | | 4,734,212 |
| | | Capital Markets – 0.9% | | | | | | |
| 25,553 | | Affiliated Managers Group, Inc.
| | 4.20% | | 09/30/61 | | 379,207 |
| 53,733 | | Carlyle Finance LLC
| | 4.63% | | 05/15/61 | | 853,817 |
| 39,115 | | KKR Group Finance Co., IX LLC
| | 4.63% | | 04/01/61 | | 681,775 |
| 4,858 | | Morgan Stanley, Series P
| | 6.50% | | (a) | | 120,478 |
| | | | | 2,035,277 |
| | | Diversified Financial Services – 0.4% | | | | | | |
| 11,369 | | Apollo Asset Management, Inc., Series B
| | 6.38% | | (a) | | 247,844 |
| 38,132 | | Equitable Holdings, Inc., Series A
| | 5.25% | | (a) | | 710,018 |
| | | | | 957,862 |
| | | Diversified Telecommunication Services – 0.3% | | | | | | |
| 39,135 | | Qwest Corp.
| | 6.50% | | 09/01/56 | | 671,165 |
| | | Electric Utilities – 0.9% | | | | | | |
| 35,878 | | Brookfield BRP Holdings Canada, Inc.
| | 4.63% | | (a) | | 519,643 |
| 28,651 | | Brookfield Infrastructure Finance ULC
| | 5.00% | | 05/24/81 | | 456,124 |
| 18,460 | | SCE Trust IV, Series J (b)
| | 5.38% | | (a) | | 331,172 |
| 12,068 | | SCE Trust V, Series K (b)
| | 5.45% | | (a) | | 231,464 |
| 27,160 | | Southern (The) Co., Series 2020A
| | 4.95% | | 01/30/80 | | 519,299 |
| | | | | 2,057,702 |
| | | Equity Real Estate Investment Trusts – 0.3% | | | | | | |
| 27,478 | | Global Net Lease, Inc., Series A
| | 7.25% | | (a) | | 586,380 |
| 2,712 | | National Storage Affiliates Trust, Series A
| | 6.00% | | (a) | | 58,688 |
| | | | | 645,068 |
| | | Gas Utilities – 0.2% | | | | | | |
| 24,497 | | South Jersey Industries, Inc.
| | 5.63% | | 09/16/79 | | 428,942 |
| | | Independent Power & Renewable Electricity Producers – 0.2% | | | | | | |
| 21,958 | | Brookfield Renewable Partners L.P., Series 17
| | 5.25% | | (a) | | 359,892 |
| | | Insurance – 3.9% | | | | | | |
| 61,062 | | Aegon Funding Co., LLC
| | 5.10% | | 12/15/49 | | 1,190,709 |
| 74,883 | | American Equity Investment Life Holding Co., Series A (b)
| | 5.95% | | (a) | | 1,687,114 |
| 36,659 | | American Equity Investment Life Holding Co., Series B (b)
| | 6.63% | | (a) | | 849,022 |
| 4,822 | | AmTrust Financial Services, Inc.
| | 7.25% | | 06/15/55 | | 82,529 |
| 5,383 | | AmTrust Financial Services, Inc.
| | 7.50% | | 09/15/55 | | 94,203 |
| 28,000 | | Arch Capital Group Ltd., Series G
| | 4.55% | | (a) | | 491,680 |
Page 8
See Notes to Financial Statements
First Trust Preferred Securities and Income Fund
Portfolio of Investments (Continued)
October 31, 2022
| Shares | | Description | | Stated
Rate | | Stated
Maturity | | Value |
| $25 PAR PREFERRED SECURITIES (Continued) |
| | | Insurance (Continued) | | | | | | |
| 5,235 | | Aspen Insurance Holdings Ltd.
| | 5.63% | | (a) | | $101,035 |
| 48,607 | | Aspen Insurance Holdings Ltd.
| | 5.63% | | (a) | | 923,047 |
| 1,504 | | Aspen Insurance Holdings Ltd. (b)
| | 5.95% | | (a) | | 34,306 |
| 28,847 | | Athene Holding Ltd., Series A (b)
| | 6.35% | | (a) | | 686,847 |
| 23,160 | | CNO Financial Group, Inc.
| | 5.13% | | 11/25/60 | | 421,512 |
| 73,827 | | Delphi Financial Group, Inc., 3 Mo. LIBOR + 3.19% (c)
| | 6.10% | | 05/15/37 | | 1,633,422 |
| 10,700 | | Phoenix Cos. (The), Inc.
| | 7.45% | | 01/15/32 | | 164,071 |
| 29,001 | | Reinsurance Group of America, Inc. (b)
| | 7.13% | | 10/15/52 | | 734,305 |
| 3,531 | | RenaissanceRe Holdings Ltd., Series G
| | 4.20% | | (a) | | 58,862 |
| | | | | 9,152,664 |
| | | Mortgage Real Estate Investment Trusts – 0.7% | | | | | | |
| 11,701 | | AGNC Investment Corp., Series C, 3 Mo. LIBOR + 5.11% (c)
| | 9.19% | | (a) | | 276,144 |
| 30,561 | | AGNC Investment Corp., Series F (b)
| | 6.13% | | (a) | | 568,435 |
| 28,195 | | Annaly Capital Management, Inc., Series F, 3 Mo. LIBOR + 4.99% (c)
| | 8.67% | | (a) | | 679,217 |
| 7,000 | | Annaly Capital Management, Inc., Series I (b)
| | 6.75% | | (a) | | 145,740 |
| | | | | 1,669,536 |
| | | Multi-Utilities – 0.6% | | | | | | |
| 29,230 | | Brookfield Infrastructure Partners L.P., Series 13
| | 5.13% | | (a) | | 467,095 |
| 35,444 | | Integrys Holding, Inc. (b)
| | 6.00% | | 08/01/73 | | 820,529 |
| 10,513 | | Sempra Energy
| | 5.75% | | 07/01/79 | | 228,342 |
| | | | | 1,515,966 |
| | | Oil, Gas & Consumable Fuels – 0.8% | | | | | | |
| 3,965 | | Energy Transfer L.P., Series C (b)
| | 7.38% | | (a) | | 88,816 |
| 274 | | Energy Transfer L.P., Series D (b)
| | 7.63% | | (a) | | 6,264 |
| 51,341 | | Energy Transfer L.P., Series E (b)
| | 7.60% | | (a) | | 1,182,383 |
| 25,320 | | NuStar Energy L.P., Series A, 3 Mo. LIBOR + 6.77% (c)
| | 10.25% | | (a) | | 586,411 |
| | | | | 1,863,874 |
| | | Real Estate Management & Development – 1.2% | | | | | | |
| 53,333 | | Brookfield Property Partners L.P., Series A
| | 5.75% | | (a) | | 806,928 |
| 10,209 | | Brookfield Property Partners L.P., Series A-1
| | 6.50% | | (a) | | 169,980 |
| 53,680 | | Brookfield Property Partners L.P., Series A2
| | 6.38% | | (a) | | 874,984 |
| 57,982 | | Brookfield Property Preferred L.P.
| | 6.25% | | 07/26/81 | | 905,679 |
| 3,074 | | DigitalBridge Group, Inc., Series I
| | 7.15% | | (a) | | 58,437 |
| 115 | | DigitalBridge Group, Inc., Series J
| | 7.13% | | (a) | | 2,139 |
| | | | | 2,818,147 |
| | | Trading Companies & Distributors – 0.0% | | | | | | |
| 2,023 | | WESCO International, Inc., Series A (b)
| | 10.63% | | (a) | | 54,621 |
| | | Wireless Telecommunication Services – 0.4% | | | | | | |
| 11,017 | | United States Cellular Corp.
| | 6.25% | | 09/01/69 | | 214,391 |
| 43,583 | | United States Cellular Corp.
| | 5.50% | | 06/01/70 | | 754,640 |
| | | | | 969,031 |
| | | Total $25 Par Preferred Securities
| | 30,562,829 |
| | | (Cost $37,950,792) | | | | | | |
| $100 PAR PREFERRED SECURITIES – 0.9% |
| | | Banks – 0.9% | | | | | | |
| 9,400 | | AgriBank FCB (b)
| | 6.88% | | (a) | | 934,125 |
See Notes to Financial Statements
Page 9
First Trust Preferred Securities and Income Fund
Portfolio of Investments (Continued)
October 31, 2022
| Shares | | Description | | Stated
Rate | | Stated
Maturity | | Value |
| $100 PAR PREFERRED SECURITIES (Continued) |
| | | Banks (Continued) | | | | | | |
| 10,500 | | Farm Credit Bank of Texas (b) (d)
| | 6.75% | | (a) | | $1,047,375 |
| | | Total $100 Par Preferred Securities
| | 1,981,500 |
| | | (Cost $2,100,275) | | | | | | |
| $1,000 PAR PREFERRED SECURITIES – 2.5% |
| | | Banks – 2.3% | | | | | | |
| 1,004 | | Bank of America Corp., Series L
| | 7.25% | | (a) | | 1,165,102 |
| 3,504 | | Wells Fargo & Co., Series L
| | 7.50% | | (a) | | 4,084,017 |
| | | | | 5,249,119 |
| | | Diversified Financial Services – 0.2% | | | | | | |
| 500 | | Compeer Financial ACA (b) (d)
| | 6.75% | | (a) | | 497,500 |
| | | Total $1,000 Par Preferred Securities
| | 5,746,619 |
| | | (Cost $6,627,956) | | | | | | |
Par
Amount | | Description | | Stated
Rate | | Stated
Maturity | | Value |
| CAPITAL PREFERRED SECURITIES – 80.7% |
| | | Banks – 35.3% | | | | | | |
| $1,400,000 | | Australia & New Zealand Banking Group Ltd. (b) (d) (e)
| | 6.75% | | (a) | | 1,341,959 |
| 1,300,000 | | Banco Bilbao Vizcaya Argentaria S.A., Series 9 (b) (e)
| | 6.50% | | (a) | | 1,164,488 |
| 600,000 | | Banco Mercantil del Norte S.A. (b) (d) (e)
| | 7.50% | | (a) | | 468,909 |
| 1,000,000 | | Banco Mercantil del Norte S.A. (b) (d) (e)
| | 7.63% | | (a) | | 821,433 |
| 1,100,000 | | Banco Mercantil del Norte S.A. (b) (d) (e)
| | 8.38% | | (a) | | 958,171 |
| 1,600,000 | | Banco Santander S.A. (b) (e)
| | 4.75% | | (a) | | 1,130,125 |
| 2,000,000 | | Banco Santander S.A. (b) (e) (f)
| | 7.50% | | (a) | | 1,898,750 |
| 1,269,000 | | Bank of America Corp., Series RR (b)
| | 4.38% | | (a) | | 1,021,545 |
| 3,900,000 | | Bank of America Corp., Series TT (b)
| | 6.13% | | (a) | | 3,695,250 |
| 450,000 | | Bank of Nova Scotia (The) (b)
| | 4.90% | | (a) | | 418,384 |
| 300,000 | | Bank of Nova Scotia (The) (b)
| | 8.63% | | 10/27/82 | | 301,750 |
| 1,100,000 | | Barclays PLC (b) (e)
| | 4.38% | | (a) | | 732,830 |
| 1,900,000 | | Barclays PLC (b) (e)
| | 6.13% | | (a) | | 1,650,625 |
| 6,345,000 | | Barclays PLC (b) (e)
| | 8.00% | | (a) | | 5,986,177 |
| 2,355,000 | | Barclays PLC (b) (e)
| | 8.00% | | (a) | | 2,115,752 |
| 650,000 | | BBVA Bancomer S.A. (b) (d) (e)
| | 5.88% | | 09/13/34 | | 544,603 |
| 2,600,000 | | BNP Paribas S.A. (b) (d) (e)
| | 4.63% | | (a) | | 1,996,791 |
| 400,000 | | BNP Paribas S.A. (b) (d) (e)
| | 4.63% | | (a) | | 280,500 |
| 1,084,000 | | BNP Paribas S.A. (b) (d) (e)
| | 6.63% | | (a) | | 1,018,572 |
| 1,440,000 | | BNP Paribas S.A. (b) (d) (e)
| | 7.75% | | (a) | | 1,361,283 |
| 1,921,000 | | Citigroup, Inc. (b)
| | 3.88% | | (a) | | 1,581,943 |
| 725,000 | | Citigroup, Inc. (b)
| | 5.95% | | (a) | | 719,563 |
| 1,077,000 | | Citigroup, Inc., Series D (b)
| | 5.35% | | (a) | | 1,039,305 |
| 649,000 | | Citigroup, Inc., Series M (b)
| | 6.30% | | (a) | | 607,626 |
| 1,000,000 | | Citigroup, Inc., Series P (b)
| | 5.95% | | (a) | | 906,423 |
| 1,072,000 | | Citigroup, Inc., Series W (b)
| | 4.00% | | (a) | | 906,912 |
| 1,140,000 | | Citigroup, Inc., Series Y (b)
| | 4.15% | | (a) | | 892,332 |
| 250,000 | | Citizens Financial Group, Inc., Series B (b)
| | 6.00% | | (a) | | 230,035 |
| 1,000,000 | | Citizens Financial Group, Inc., Series G (b)
| | 4.00% | | (a) | | 794,759 |
| 2,500,000 | | CoBank ACB, Series I (b)
| | 6.25% | | (a) | | 2,393,750 |
| 1,465,000 | | CoBank ACB, Series K (b)
| | 6.45% | | (a) | | 1,424,723 |
| 600,000 | | Commerzbank AG (b) (e) (f)
| | 7.00% | | (a) | | 515,935 |
| 1,100,000 | | Credit Agricole S.A. (b) (d) (e)
| | 6.88% | | (a) | | 1,029,028 |
| 3,285,000 | | Credit Agricole S.A. (b) (d) (e)
| | 8.13% | | (a) | | 3,279,409 |
| 1,000,000 | | Danske Bank A.S. (b) (e) (f)
| | 4.38% | | (a) | | 801,250 |
Page 10
See Notes to Financial Statements
First Trust Preferred Securities and Income Fund
Portfolio of Investments (Continued)
October 31, 2022
Par
Amount | | Description | | Stated
Rate | | Stated
Maturity | | Value |
| CAPITAL PREFERRED SECURITIES (Continued) |
| | | Banks (Continued) | | | | | | |
| $1,500,000 | | Danske Bank A.S. (b) (e) (f)
| | 6.13% | | (a) | | $1,395,853 |
| 1,050,000 | | Danske Bank A.S. (b) (e) (f)
| | 7.00% | | (a) | | 972,683 |
| 600,000 | | Farm Credit Bank of Texas, Series 3 (b) (d)
| | 6.20% | | (a) | | 531,970 |
| 1,100,000 | | Farm Credit Bank of Texas, Series 4 (b) (d)
| | 5.70% | | (a) | | 994,286 |
| 1,930,000 | | ING Groep N.V. (b) (e)
| | 5.75% | | (a) | | 1,650,351 |
| 1,200,000 | | ING Groep N.V. (b) (e)
| | 6.50% | | (a) | | 1,094,761 |
| 1,954,000 | | Intesa Sanpaolo S.p.A. (b) (d) (e)
| | 7.70% | | (a) | | 1,696,376 |
| 594,000 | | JPMorgan Chase & Co., Series R (b)
| | 6.00% | | (a) | | 586,575 |
| 1,600,000 | | Lloyds Banking Group PLC (b) (e)
| | 6.75% | | (a) | | 1,458,416 |
| 2,668,406 | | Lloyds Banking Group PLC (b) (e)
| | 7.50% | | (a) | | 2,550,366 |
| 731,000 | | Lloyds Banking Group PLC (b) (e)
| | 7.50% | | (a) | | 679,830 |
| 684,997 | | M&T Bank Corp. (b)
| | 3.50% | | (a) | | 509,669 |
| 500,000 | | NatWest Group PLC (b) (e)
| | 6.00% | | (a) | | 446,200 |
| 1,600,000 | | NatWest Group PLC (b) (e)
| | 8.00% | | (a) | | 1,511,800 |
| 400,000 | | Nordea Bank Abp (b) (d) (e)
| | 6.63% | | (a) | | 378,790 |
| 2,490,000 | | PNC Financial Services Group (The), Inc., Series V (b)
| | 6.20% | | (a) | | 2,364,753 |
| 3,500,000 | | Societe Generale S.A. (b) (d) (e)
| | 5.38% | | (a) | | 2,543,980 |
| 490,000 | | Societe Generale S.A. (b) (d) (e)
| | 7.88% | | (a) | | 478,295 |
| 200,000 | | Societe Generale S.A. (b) (d) (e)
| | 8.00% | | (a) | | 197,079 |
| 2,800,000 | | Standard Chartered PLC (b) (d) (e)
| | 4.30% | | (a) | | 1,847,797 |
| 1,000,000 | | Standard Chartered PLC (b) (d) (e)
| | 6.00% | | (a) | | 913,467 |
| 1,240,000 | | Standard Chartered PLC (b) (d) (e)
| | 7.75% | | (a) | | 1,136,150 |
| 1,877,003 | | SVB Financial Group, Series C (b)
| | 4.00% | | (a) | | 1,315,301 |
| 2,128,000 | | SVB Financial Group, Series D (b)
| | 4.25% | | (a) | | 1,425,289 |
| 1,000,000 | | Toronto-Dominion Bank (The) (b)
| | 8.13% | | 10/31/82 | | 1,014,450 |
| 3,100,000 | | UniCredit S.p.A. (b) (e) (f)
| | 8.00% | | (a) | | 2,908,187 |
| 750,000 | | UniCredit S.p.A. (b) (d)
| | 5.46% | | 06/30/35 | | 558,657 |
| 3,312,000 | | Wells Fargo & Co., Series BB (b)
| | 3.90% | | (a) | | 2,813,958 |
| | | | | 82,006,179 |
| | | Capital Markets – 10.0% | | | | | | |
| 1,568,000 | | Apollo Management Holdings L.P. (b) (d)
| | 4.95% | | 01/14/50 | | 1,317,734 |
| 1,075,000 | | Bank of New York Mellon (The) Corp., Series I (b)
| | 3.75% | | (a) | | 830,491 |
| 400,000 | | Charles Schwab (The) Corp. (b)
| | 5.00% | | (a) | | 356,000 |
| 2,114,000 | | Charles Schwab (The) Corp., Series I (b)
| | 4.00% | | (a) | | 1,740,668 |
| 3,155,000 | | Credit Suisse Group AG (b) (d) (e)
| | 5.25% | | (a) | | 2,242,796 |
| 2,425,000 | | Credit Suisse Group AG (b) (d) (e)
| | 6.38% | | (a) | | 1,815,062 |
| 4,100,000 | | Credit Suisse Group AG (b) (d) (e)
| | 7.50% | | (a) | | 3,643,875 |
| 1,400,000 | | Credit Suisse Group AG (b) (d) (e)
| | 9.75% | | (a) | | 1,332,936 |
| 2,800,000 | | Deutsche Bank AG, Series 2020 (b) (e)
| | 6.00% | | (a) | | 2,204,649 |
| 1,428,000 | | EFG International AG (b) (e) (f)
| | 5.50% | | (a) | | 1,137,009 |
| 200,000 | | Goldman Sachs Group (The), Inc., Series R (b)
| | 4.95% | | (a) | | 180,816 |
| 685,000 | | Goldman Sachs Group (The), Inc., Series T (b)
| | 3.80% | | (a) | | 527,519 |
| 1,718,000 | | Goldman Sachs Group (The), Inc., Series U (b)
| | 3.65% | | (a) | | 1,309,605 |
| 1,500,000 | | UBS Group AG (b) (d) (e)
| | 4.88% | | (a) | | 1,200,752 |
| 200,000 | | UBS Group AG (b) (e) (f)
| | 5.13% | | (a) | | 174,000 |
| 2,400,000 | | UBS Group AG (b) (e) (f)
| | 6.88% | | (a) | | 2,283,298 |
| 960,000 | | UBS Group AG (b) (d) (e)
| | 7.00% | | (a) | | 930,925 |
| | | | | 23,228,135 |
| | | Consumer Finance – 1.9% | | | | | | |
| 2,317,000 | | Ally Financial, Inc., Series B (b)
| | 4.70% | | (a) | | 1,687,066 |
| 123,000 | | Ally Financial, Inc., Series C (b)
| | 4.70% | | (a) | | 83,025 |
| 1,963,000 | | American Express Co. (b)
| | 3.55% | | (a) | | 1,518,871 |
See Notes to Financial Statements
Page 11
First Trust Preferred Securities and Income Fund
Portfolio of Investments (Continued)
October 31, 2022
Par
Amount | | Description | | Stated
Rate | | Stated
Maturity | | Value |
| CAPITAL PREFERRED SECURITIES (Continued) |
| | | Consumer Finance (Continued) | | | | | | |
| $1,652,000 | | Capital One Financial Corp., Series M (b)
| | 3.95% | | (a) | | $1,237,315 |
| | | | | 4,526,277 |
| | | Diversified Financial Services – 3.4% | | | | | | |
| 2,500,000 | | American AgCredit Corp. (b) (d)
| | 5.25% | | (a) | | 2,296,875 |
| 1,500,000 | | Ares Finance Co. III LLC (b) (d)
| | 4.13% | | 06/30/51 | | 1,142,270 |
| 1,500,000 | | Capital Farm Credit ACA, Series 1 (b) (d)
| | 5.00% | | (a) | | 1,278,750 |
| 600,000 | | Compeer Financial ACA (b) (d)
| | 4.88% | | (a) | | 531,750 |
| 1,920,000 | | Corebridge Financial, Inc. (b) (d)
| | 6.88% | | 12/15/52 | | 1,722,643 |
| 843,000 | | Voya Financial, Inc., Series A (b)
| | 6.13% | | (a) | | 824,033 |
| | | | | 7,796,321 |
| | | Electric Utilities – 2.6% | | | | | | |
| 893,000 | | Duke Energy Corp. (b)
| | 4.88% | | (a) | | 797,002 |
| 761,000 | | Edison International, Series B (b)
| | 5.00% | | (a) | | 610,703 |
| 1,500,000 | | Emera, Inc., Series 16-A (b)
| | 6.75% | | 06/15/76 | | 1,403,808 |
| 630,000 | | Southern (The) Co., Series 21-A (b)
| | 3.75% | | 09/15/51 | | 498,920 |
| 1,000,000 | | Southern (The) Co., Series B (b)
| | 4.00% | | 01/15/51 | | 871,450 |
| 1,802,000 | | Southern California Edison Co., Series E, 3 Mo. LIBOR + 4.20% (c)
| | 6.98% | | (a) | | 1,761,858 |
| | | | | 5,943,741 |
| | | Energy Equipment & Services – 1.0% | | | | | | |
| 1,500,000 | | Transcanada Trust (b)
| | 5.50% | | 09/15/79 | | 1,261,875 |
| 1,200,000 | | Transcanada Trust (b)
| | 5.60% | | 03/07/82 | | 1,028,088 |
| | | | | 2,289,963 |
| | | Food Products – 3.7% | | | | | | |
| 300,000 | | Dairy Farmers of America, Inc. (g)
| | 7.13% | | (a) | | 279,375 |
| 3,000,000 | | Land O’Lakes Capital Trust I (g)
| | 7.45% | | 03/15/28 | | 2,988,915 |
| 1,400,000 | | Land O’Lakes, Inc. (d)
| | 7.00% | | (a) | | 1,298,318 |
| 1,200,000 | | Land O’Lakes, Inc. (d)
| | 7.25% | | (a) | | 1,122,066 |
| 3,000,000 | | Land O’Lakes, Inc. (d)
| | 8.00% | | (a) | | 2,978,145 |
| | | | | 8,666,819 |
| | | Insurance – 9.6% | | | | | | |
| 400,000 | | Allianz SE (b) (d)
| | 3.50% | | (a) | | 316,839 |
| 1,822,000 | | Assurant, Inc. (b)
| | 7.00% | | 03/27/48 | | 1,737,040 |
| 850,000 | | Assured Guaranty Municipal Holdings, Inc. (b) (d)
| | 6.40% | | 12/15/66 | | 773,500 |
| 2,100,000 | | AXIS Specialty Finance LLC (b)
| | 4.90% | | 01/15/40 | | 1,706,103 |
| 1,276,000 | | Enstar Finance LLC (b)
| | 5.75% | | 09/01/40 | | 1,136,606 |
| 2,585,000 | | Enstar Finance LLC (b)
| | 5.50% | | 01/15/42 | | 2,035,171 |
| 1,000,000 | | Fortegra Financial Corp. (b) (g)
| | 8.50% | | 10/15/57 | | 1,016,783 |
| 4,027,000 | | Global Atlantic Fin Co. (b) (d)
| | 4.70% | | 10/15/51 | | 2,977,625 |
| 820,000 | | Hartford Financial Services Group (The), Inc., 3 Mo. LIBOR + 2.13% (c) (d)
| | 5.03% | | 02/12/47 | | 680,591 |
| 1,174,000 | | Kuvare US Holdings, Inc. (b) (d)
| | 7.00% | | 02/17/51 | | 1,182,805 |
| 300,000 | | La Mondiale SAM (b) (f)
| | 5.88% | | 01/26/47 | | 268,818 |
| 1,920,000 | | Lancashire Holdings Ltd. (b) (f)
| | 5.63% | | 09/18/41 | | 1,432,320 |
| 1,000,000 | | Liberty Mutual Group, Inc. (b) (d)
| | 4.13% | | 12/15/51 | | 758,655 |
| 1,400,000 | | Principal Financial Group, Inc., 3 Mo. LIBOR + 3.04% (c)
| | 5.95% | | 05/15/55 | | 1,352,750 |
| 2,061,000 | | Prudential Financial, Inc. (b)
| | 6.00% | | 09/01/52 | | 1,881,292 |
| 1,500,000 | | QBE Insurance Group Ltd. (b) (d)
| | 5.88% | | (a) | | 1,369,584 |
| 1,000,000 | | QBE Insurance Group Ltd. (b) (f)
| | 6.75% | | 12/02/44 | | 964,245 |
| 301,000 | | QBE Insurance Group Ltd. (b) (f)
| | 5.88% | | 06/17/46 | | 272,426 |
Page 12
See Notes to Financial Statements
First Trust Preferred Securities and Income Fund
Portfolio of Investments (Continued)
October 31, 2022
Par
Amount | | Description | | Stated
Rate | | Stated
Maturity | | Value |
| CAPITAL PREFERRED SECURITIES (Continued) |
| | | Insurance (Continued) | | | | | | |
| $646,000 | | Reinsurance Group of America, Inc., 3 Mo. LIBOR + 2.67% (c)
| | 5.96% | | 12/15/65 | | $545,870 |
| | | | | 22,409,023 |
| | | Mortgage Real Estate Investment Trusts – 0.1% | | | | | | |
| 300,000 | | Scentre Group Trust 2 (b) (d)
| | 5.13% | | 09/24/80 | | 229,635 |
| | | Multi-Utilities – 3.0% | | | | | | |
| 2,526,000 | | Algonquin Power & Utilities Corp. (b)
| | 4.75% | | 01/18/82 | | 2,021,595 |
| 2,043,000 | | CenterPoint Energy, Inc., Series A (b)
| | 6.13% | | (a) | | 1,919,864 |
| 1,235,000 | | NiSource, Inc. (b)
| | 5.65% | | (a) | | 1,142,375 |
| 2,620,000 | | Sempra Energy (b)
| | 4.13% | | 04/01/52 | | 1,976,433 |
| | | | | 7,060,267 |
| | | Oil, Gas & Consumable Fuels – 7.3% | | | | | | |
| 1,308,000 | | Buckeye Partners L.P. (b)
| | 6.38% | | 01/22/78 | | 1,054,555 |
| 1,500,000 | | DCP Midstream Operating L.P. (b) (d)
| | 5.85% | | 05/21/43 | | 1,453,398 |
| 2,132,000 | | Enbridge, Inc. (b)
| | 6.25% | | 03/01/78 | | 1,886,098 |
| 1,600,000 | | Enbridge, Inc. (b)
| | 7.63% | | 01/15/83 | | 1,532,138 |
| 4,638,000 | | Enbridge, Inc., Series 16-A (b)
| | 6.00% | | 01/15/77 | | 4,178,370 |
| 1,000,000 | | Enbridge, Inc., Series 20-A (b)
| | 5.75% | | 07/15/80 | | 886,110 |
| 1,786,000 | | Energy Transfer L.P., 3 Mo. LIBOR + 3.02% (c)
| | 5.80% | | 11/01/66 | | 1,333,071 |
| 657,000 | | Energy Transfer L.P., Series A (b)
| | 6.25% | | (a) | | 547,796 |
| 1,065,000 | | Energy Transfer L.P., Series F (b)
| | 6.75% | | (a) | | 914,494 |
| 1,075,000 | | Energy Transfer L.P., Series G (b)
| | 7.13% | | (a) | | 894,260 |
| 2,204,000 | | Enterprise Products Operating LLC, 3 Mo. LIBOR + 2.78% (c)
| | 5.86% | | 06/01/67 | | 1,844,651 |
| 596,000 | | Enterprise Products Operating LLC, Series D, 3 Mo. LIBOR + 2.99% (c)
| | 5.91% | | 08/16/77 | | 525,481 |
| | | | | 17,050,422 |
| | | Trading Companies & Distributors – 2.6% | | | | | | |
| 4,910,000 | | AerCap Holdings N.V. (b)
| | 5.88% | | 10/10/79 | | 4,424,695 |
| 700,000 | | Air Lease Corp., Series B (b)
| | 4.65% | | (a) | | 585,131 |
| 1,330,000 | | Aircastle Ltd. (b) (d)
| | 5.25% | | (a) | | 1,001,289 |
| | | | | 6,011,115 |
| | | Transportation Infrastructure – 0.2% | | | | | | |
| 400,000 | | AerCap Global Aviation Trust (b) (d)
| | 6.50% | | 06/15/45 | | 365,900 |
| | | Total Capital Preferred Securities
| | 187,583,797 |
| | | (Cost $216,193,481) | | | | | | |
Principal
Value | | Description | | Stated
Coupon | | Stated
Maturity | | Value |
| FOREIGN CORPORATE BONDS AND NOTES – 1.6% |
| | | Insurance – 1.6% | | | | | | |
| 3,925,666 | | Highlands Holdings Bond Issuer Ltd./Highlands Holdings Bond Co-Issuer, Inc. (d) (h)
| | 7.63% | | 10/15/25 | | 3,704,527 |
| | | (Cost $4,100,655) | | | | | | |
| Total Investments – 98.8%
| | 229,579,272 |
| | (Cost $266,973,159) | | |
| | Net Other Assets and Liabilities – 1.2%
| | 2,857,225 |
| | Net Assets – 100.0%
| | $232,436,497 |
See Notes to Financial Statements
Page 13
First Trust Preferred Securities and Income Fund
Portfolio of Investments (Continued)
October 31, 2022
| (b) | Fixed-to-floating or fixed-to-variable rate security. The interest rate shown reflects the fixed rate in effect at October 31, 2022. At a predetermined date, the fixed rate will change to a floating rate or a variable rate. |
| (c) | Floating or variable rate security. |
| (d) | This security, sold within the terms of a private placement memorandum, is exempt from registration upon resale under Rule 144A of the Securities Act of 1933, as amended (the “1933 Act”), and may be resold in transactions exempt from registration, normally to qualified institutional buyers. Pursuant to procedures adopted by the First Trust Series Fund’s (the “Trust”) Board of Trustees, this security has been determined to be liquid by First Trust Advisors L.P., (the “Advisor”). Although market instability can result in periods of increased overall market illiquidity, liquidity for each security is determined based on security specific factors and assumptions, which require subjective judgment. At October 31, 2022, securities noted as such amounted to $65,591,625 or 28.2% of net assets. |
| (e) | This security is a contingent convertible capital security which may be subject to conversion into common stock of the issuer under certain circumstances. At October 31, 2022, securities noted as such amounted to $69,922,273 or 30.1% of net assets. Of these securities, 4.0% originated in emerging markets, and 96.0% originated in foreign markets. |
| (f) | This security may be resold to qualified foreign investors and foreign institutional buyers under Regulation S of the 1933 Act. |
| (g) | This security, sold within the terms of a private placement memorandum, is exempt from registration upon resale under Rule 144A of the 1933 Act, and may be resold in transactions exempt from registration, normally to qualified institutional buyers (see Note 2C - Restricted Securities in the Notes to Financial Statements). |
| (h) | These notes are Senior Payment-in-kind (“PIK”) Toggle Notes whereby the issuer may, at its option, elect to pay interest on the notes (1) entirely in cash or (2) entirely in PIK interest. Interest paid in cash will accrue on the notes at a rate of 7.63% per annum (“Cash Interest Rate”) and PIK interest will accrue on the notes at a rate per annum equal to the Cash Interest Rate plus 75 basis points. For the fiscal year ended October 31, 2022, this security paid all of its interest in cash. |
Valuation Inputs
A summary of the inputs used to value the Fund’s investments as of October 31, 2022 is as follows (see Note 2A - Portfolio Valuation in the Notes to Financial Statements):
| | Total
Value at
10/31/2022 | Level 1
Quoted
Prices | Level 2
Significant
Observable
Inputs | Level 3
Significant
Unobservable
Inputs |
| $25 Par Preferred Securities: | | | | |
Electric Utilities
| $ 2,057,702 | $ 1,538,059 | $ 519,643 | $ — |
Insurance
| 9,152,664 | 6,444,134 | 2,708,530 | — |
Multi-Utilities
| 1,515,966 | 695,437 | 820,529 | — |
Wireless Telecommunication Services
| 969,031 | 214,391 | 754,640 | — |
Other Industry Categories*
| 16,867,466 | 16,867,466 | — | — |
$100 Par Preferred Securities*
| 1,981,500 | — | 1,981,500 | — |
| $1,000 Par Preferred Securities: | | | | |
Banks
| 5,249,119 | 5,249,119 | — | — |
Diversified Financial Services
| 497,500 | — | 497,500 | — |
Capital Preferred Securities*
| 187,583,797 | — | 187,583,797 | — |
Foreign Corporate Bonds and Notes*
| 3,704,527 | — | 3,704,527 | — |
Total Investments
| $ 229,579,272 | $ 31,008,606 | $ 198,570,666 | $— |
| * | See Portfolio of Investments for industry breakout. |
Page 14
See Notes to Financial Statements
First Trust Preferred Securities and Income Fund
Statement of Assets and Liabilities
October 31, 2022
| ASSETS: | |
Investments, at value
(Cost $266,973,159)
| $ 229,579,272 |
Cash
| 1,344,836 |
| Receivables: | |
Interest
| 2,751,635 |
Fund shares sold
| 763,067 |
Dividends
| 78,387 |
Dividend reclaims
| 1,036 |
Prepaid expenses
| 59,661 |
Total Assets
| 234,577,894 |
| LIABILITIES: | |
| Payables: | |
Fund shares redeemed
| 1,445,751 |
Investment securities purchased
| 175,315 |
Investment advisory fees
| 153,931 |
Distributions
| 102,901 |
Administrative fees
| 80,342 |
Transfer agent fees
| 50,330 |
Audit and tax fees
| 49,756 |
12b-1 distribution and service fees
| 40,439 |
Shareholder reporting fees
| 16,671 |
Commitment and administrative agency fees
| 9,557 |
Legal fees
| 5,885 |
Custodian fees
| 5,531 |
Registration fees
| 2,625 |
Trustees’ fees and expenses
| 1,592 |
Financial reporting fees
| 771 |
Total Liabilities
| 2,141,397 |
NET ASSETS
| $232,436,497 |
| NET ASSETS consist of: | |
Paid-in capital
| $ 281,745,002 |
Par value
| 125,114 |
Accumulated distributable earnings (loss)
| (49,433,619) |
NET ASSETS
| $232,436,497 |
| Maximum Offering Price Per Share: | |
| Class A Shares: | |
Net asset value and redemption price per share (Based on net assets of $44,712,634 and 2,420,737 shares of beneficial interest issued and outstanding)
| $18.47 |
Maximum sales charge (4.50% of offering price)
| 0.87 |
Maximum offering price to public
| $19.34 |
| Class C Shares: | |
Net asset value and redemption price per share (Based on net assets of $36,112,000 and 1,941,212 shares of beneficial interest issued and outstanding)
| $18.60 |
| Class F Shares: | |
Net asset value and redemption price per share (Based on net assets of $688,399 and 36,802 shares of beneficial interest issued and outstanding)
| $18.71 |
| Class I Shares: | |
Net asset value and redemption price per share (Based on net assets of $150,233,656 and 8,075,171 shares of beneficial interest issued and outstanding)
| $18.60 |
| Class R3 Shares: | |
Net asset value and redemption price per share (Based on net assets of $689,808 and 37,497 shares of beneficial interest issued and outstanding)
| $18.40 |
See Notes to Financial Statements
Page 15
First Trust Preferred Securities and Income Fund
Statement of Operations
For the Year Ended October 31, 2022
| INVESTMENT INCOME: | |
Interest
| $ 13,890,734 |
Dividends (net of foreign withholding tax of $14,785)
| 3,024,634 |
Total investment income
| 16,915,368 |
| EXPENSES: | |
Investment advisory fees
| 2,291,396 |
| 12b-1 distribution and/or service fees: | |
Class A
| 124,608 |
Class C
| 443,048 |
Class F
| 1,272 |
Class R3
| 3,569 |
Transfer agent fees
| 268,063 |
Administrative fees
| 130,083 |
Shareholder reporting fees
| 55,276 |
Audit and tax fees
| 43,092 |
Custodian fees
| 35,258 |
Commitment and administrative agency fees
| 34,944 |
Registration fees
| 34,011 |
Trustees’ fees and expenses
| 20,148 |
Legal fees
| 18,667 |
Financial reporting fees
| 9,250 |
Listing expense
| 3,991 |
Other
| 1,796 |
Total expenses
| 3,518,472 |
Fees waived and expenses reimbursed by the investment advisor
| (41,224) |
Net expenses
| 3,477,248 |
NET INVESTMENT INCOME (LOSS)
| 13,438,120 |
| NET REALIZED AND UNREALIZED GAIN (LOSS): | |
Net realized gain (loss) on investments
| (2,277,777) |
Net change in unrealized appreciation (depreciation) on investments
| (54,355,497) |
NET REALIZED AND UNREALIZED GAIN (LOSS)
| (56,633,274) |
NET INCREASE (DECREASE) IN NET ASSETS RESULTING FROM OPERATIONS
| $(43,195,154) |
Page 16
See Notes to Financial Statements
First Trust Preferred Securities and Income Fund
Statements of Changes in Net Assets
| | Year
Ended
10/31/2022 | | Year
Ended
10/31/2021 |
| OPERATIONS: | | | |
Net investment income (loss)
| $ 13,438,120 | | $ 13,467,448 |
Net realized gain (loss)
| (2,277,777) | | 5,098,120 |
Net change in unrealized appreciation (depreciation)
| (54,355,497) | | 13,312,730 |
Net increase (decrease) in net assets resulting from operations
| (43,195,154) | | 31,878,298 |
| DISTRIBUTIONS TO SHAREHOLDERS FROM INVESTMENT OPERATIONS: | | | |
Class A Shares
| (2,255,861) | | (2,027,973) |
Class C Shares
| (1,647,844) | | (1,899,342) |
Class F Shares
| (38,661) | | (41,330) |
Class I Shares
| (9,035,354) | | (8,947,567) |
Class R3 Shares
| (30,813) | | (27,927) |
Total distributions to shareholders from investment operations
| (13,008,533) | | (12,944,139) |
| DISTRIBUTIONS TO SHAREHOLDERS FROM RETURN OF CAPITAL: | | | |
Class A shares
| (11,498) | | (221,139) |
Class C shares
| (8,398) | | (202,730) |
Class F shares
| (197) | | (4,407) |
Class I shares
| (45,884) | | (970,230) |
Class R3 shares
| (161) | | (2,998) |
Total distributions to shareholders from return of capital
| (66,138) | | (1,401,504) |
| CAPITAL TRANSACTIONS: | | | |
Proceeds from shares sold
| 83,021,009 | | 71,079,673 |
Proceeds from shares reinvested
| 11,660,379 | | 12,962,840 |
Cost of shares redeemed
| (131,824,511) | | (65,560,931) |
Net increase (decrease) in net assets resulting from capital transactions
| (37,143,123) | | 18,481,582 |
Total increase (decrease) in net assets
| (93,412,948) | | 36,014,237 |
| NET ASSETS: | | | |
Beginning of period
| 325,849,445 | | 289,835,208 |
End of period
| $232,436,497 | | $325,849,445 |
See Notes to Financial Statements
Page 17
First Trust Preferred Securities and Income Fund
Financial Highlights
For a Share outstanding throughout each period
| Class A Shares | Year Ended October 31, |
| 2022 | | 2021 | | 2020 | | 2019 | | 2018 |
Net asset value, beginning of period
| $ 22.58 | | $ 21.31 | | $ 22.07 | | $ 20.85 | | $ 22.39 |
| Income from investment operations: | | | | | | | | | |
Net investment income (loss)
| 0.95 (a) | | 0.95 (a) | | 1.01 (a) | | 1.12 (a) | | 1.11 (a) |
Net realized and unrealized gain (loss)
| (4.12) | | 1.34 | | (0.70) | | 1.25 | | (1.50) |
Total from investment operations
| (3.17) | | 2.29 | | 0.31 | | 2.37 | | (0.39) |
| Distributions paid to shareholders from: | | | | | | | | | |
Net investment income
| (0.94) | | (0.92) | | (0.98) | | (1.12) | | (1.13) |
Return of capital
| (0.00) (b) | | (0.10) | | (0.09) | | (0.03) | | (0.02) |
Total distributions
| (0.94) | | (1.02) | | (1.07) | | (1.15) | | (1.15) |
Net asset value, end of period
| $18.47 | | $22.58 | | $21.31 | | $22.07 | | $20.85 |
Total return (c)
| (14.36)% | | 10.89% | | 1.53% | | 11.75% | | (1.77)% |
| Ratios to average net assets/supplemental data: | | | | | | | | | |
Net assets, end of period (in 000’s)
| $ 44,713 | | $ 56,365 | | $ 43,802 | | $ 39,719 | | $ 36,262 |
Ratio of total expenses to average net assets
| 1.30% | | 1.33% | | 1.36% | | 1.41% | | 1.37% |
Ratio of net expenses to average net assets
| 1.30% | | 1.33% | | 1.36% | | 1.40% | | 1.37% |
Ratio of net investment income (loss) to average net assets
| 4.61% | | 4.22% | | 4.78% | | 5.27% | | 5.15% |
Portfolio turnover rate
| 30% | | 38% | | 46% | | 41% | | 33% |
| (a) | Based on average shares outstanding. |
| (b) | Amount is less than $0.01. |
| (c) | Assumes reinvestment of all distributions for the period and does not include payment of the maximum sales charge of 4.50% or contingent deferred sales charge (CDSC). On purchases of $1 million or more, a CDSC of 1% may be imposed on certain redemptions made within twelve months of purchase. If the sales charges were included, total returns would be lower. These returns include Rule 12b-1 service fees of 0.25% and do not reflect the deduction of taxes that a shareholder would pay on Fund distributions or the redemption of Fund shares. The total returns would have been lower if certain fees had not been waived and expenses reimbursed by the investment advisor. Total return is calculated for the time period presented and is not annualized for periods of less than one year. |
Page 18
See Notes to Financial Statements
First Trust Preferred Securities and Income Fund
Financial Highlights (Continued)
For a Share outstanding throughout each period
| Class C Shares | Year Ended October 31, |
| 2022 | | 2021 | | 2020 | | 2019 | | 2018 |
Net asset value, beginning of period
| $ 22.72 | | $ 21.43 | | $ 22.18 | | $ 20.93 | | $ 22.44 |
| Income from investment operations: | | | | | | | | | |
Net investment income (loss)
| 0.81 (a) | | 0.79 (a) | | 0.87 (a) | | 0.98 (a) | | 0.97 (a) |
Net realized and unrealized gain (loss)
| (4.15) | | 1.35 | | (0.71) | | 1.26 | | (1.50) |
Total from investment operations
| (3.34) | | 2.14 | | 0.16 | | 2.24 | | (0.53) |
| Distributions paid to shareholders from: | | | | | | | | | |
Net investment income
| (0.78) | | (0.77) | | (0.83) | | (0.96) | | (0.96) |
Return of capital
| (0.00) (b) | | (0.08) | | (0.08) | | (0.03) | | (0.02) |
Total distributions
| (0.78) | | (0.85) | | (0.91) | | (0.99) | | (0.98) |
Net asset value, end of period
| $18.60 | | $22.72 | | $21.43 | | $22.18 | | $20.93 |
Total return (c)
| (14.97)% | | 10.11% | | 0.84% | | 11.01% | | (2.37)% |
| Ratios to average net assets/supplemental data: | | | | | | | | | |
Net assets, end of period (in 000’s)
| $ 36,112 | | $ 51,756 | | $ 54,264 | | $ 57,898 | | $ 59,610 |
Ratio of total expenses to average net assets
| 2.02% | | 2.04% | | 2.07% | | 2.06% | | 2.02% |
Ratio of net expenses to average net assets
| 2.02% | | 2.04% | | 2.07% | | 2.06% | | 2.02% |
Ratio of net investment income (loss) to average net assets
| 3.89% | | 3.51% | | 4.09% | | 4.61% | | 4.50% |
Portfolio turnover rate
| 30% | | 38% | | 46% | | 41% | | 33% |
| (a) | Based on average shares outstanding. |
| (b) | Amount is less than $0.01. |
| (c) | Assumes reinvestment of all distributions for the period and does not include payment of the maximum CDSC of 1%, charged on certain redemptions made within one year of purchase. If the sales charge was included, total returns would be lower. These returns include combined Rule 12b-1 distribution and service fees of 1% and do not reflect the deduction of taxes that a shareholder would pay on Fund distributions or the redemption of Fund shares. Total return is calculated for the time period presented and is not annualized for periods of less than one year. |
See Notes to Financial Statements
Page 19
First Trust Preferred Securities and Income Fund
Financial Highlights (Continued)
For a Share outstanding throughout each period
| Class F Shares | Year Ended October 31, |
| 2022 | | 2021 | | 2020 | | 2019 | | 2018 |
Net asset value, beginning of period
| $ 22.87 | | $ 21.59 | | $ 22.32 | | $ 21.07 | | $ 22.62 |
| Income from investment operations: | | | | | | | | | |
Net investment income (loss)
| 0.96 (a) | | 0.97 (a) | | 1.06 (a) | | 1.16 (a) | | 1.14 (a) |
Net realized and unrealized gain (loss)
| (4.16) | | 1.36 | | (0.70) | | 1.26 | | (1.52) |
Total from investment operations:
| (3.20) | | 2.33 | | 0.36 | | 2.42 | | (0.38) |
| Distributions paid to shareholders from: | | | | | | | | | |
Net investment income
| (0.96) | | (0.95) | | (1.02) | | (1.14) | | (1.15) |
Return of capital
| (0.00) (b) | | (0.10) | | (0.07) | | (0.03) | | (0.02) |
Total distributions
| (0.96) | | (1.05) | | (1.09) | | (1.17) | | (1.17) |
Net asset value, end of period
| $18.71 | | $22.87 | | $21.59 | | $22.32 | | $21.07 |
Total return (c)
| (14.36)% | | 10.91% | | 1.79% | | 11.87% | | (1.70)% |
| Ratios to average net assets/supplemental data: | | | | | | | | | |
Net assets, end of period (in 000’s)
| $ 688 | | $ 969 | | $ 993 | | $ 4,238 | | $ 7,431 |
Ratio of total expenses to average net assets
| 3.73% | | 3.17% | | 2.36% | | 1.65% | | 1.42% |
Ratio of net expenses to average net assets
| 1.30% | | 1.30% | | 1.30% | | 1.30% | | 1.30% |
Ratio of net investment income (loss) to average net assets
| 4.61% | | 4.25% | | 4.83% | | 5.43% | | 5.21% |
Portfolio turnover rate
| 30% | | 38% | | 46% | | 41% | | 33% |
| (a) | Based on average shares outstanding. |
| (b) | Amount is less than $0.01. |
| (c) | Assumes reinvestment of all distributions for the period. These returns include Rule 12b-1 service fees of 0.15% and do not reflect the deduction of taxes that a shareholder would pay on Fund distributions or the redemption of Fund shares. The total returns would have been lower if certain fees had not been waived and expenses reimbursed by the investment advisor. Total return is calculated for the time period presented and is not annualized for periods of less than one year. |
Page 20
See Notes to Financial Statements
First Trust Preferred Securities and Income Fund
Financial Highlights (Continued)
For a Share outstanding throughout each period
| Class I Shares | Year Ended October 31, |
| 2022 | | 2021 | | 2020 | | 2019 | | 2018 |
Net asset value, beginning of period
| $ 22.72 | | $ 21.43 | | $ 22.23 | | $ 20.98 | | $ 22.49 |
| Income from investment operations: | | | | | | | | | |
Net investment income (loss)
| 1.02 (a) | | 1.02 (a) | | 1.08 (a) | | 1.19 (a) | | 1.20 (a) |
Net realized and unrealized gain (loss)
| (4.15) | | 1.35 | | (0.76) | | 1.26 | | (1.51) |
Total from investment operations
| (3.13) | | 2.37 | | 0.32 | | 2.45 | | (0.31) |
| Distributions paid to shareholders from: | | | | | | | | | |
Net investment income
| (0.98) | | (0.97) | | (1.02) | | (1.17) | | (1.17) |
Return of capital
| (0.01) | | (0.11) | | (0.10) | | (0.03) | | (0.03) |
Total distributions
| (0.99) | | (1.08) | | (1.12) | | (1.20) | | (1.20) |
Net asset value, end of period
| $18.60 | | $22.72 | | $21.43 | | $22.23 | | $20.98 |
Total return (b)
| (14.09)% | | 11.21% | | 1.63% | | 12.09% | | (1.38)% |
| Ratios to average net assets/supplemental data: | | | | | | | | | |
Net assets, end of period (in 000’s)
| $ 150,234 | | $ 216,022 | | $ 190,093 | | $ 176,503 | | $ 142,161 |
Ratio of total expenses to average net assets
| 1.00% | | 1.03% | | 1.05% | | 1.04% | | 1.02% |
Ratio of net expenses to average net assets
| 1.00% | | 1.03% | | 1.05% | | 1.04% | | 1.02% |
Ratio of net investment income (loss) to average net assets
| 4.90% | | 4.51% | | 5.09% | | 5.60% | | 5.51% |
Portfolio turnover rate
| 30% | | 38% | | 46% | | 41% | | 33% |
| (a) | Based on average shares outstanding. |
| (b) | Assumes reinvestment of all distributions for the period. These returns do not reflect the deduction of taxes that a shareholder would pay on Fund distributions or the redemption of Fund shares. Total return is calculated for the time period presented and is not annualized for periods of less than one year. |
See Notes to Financial Statements
Page 21
First Trust Preferred Securities and Income Fund
Financial Highlights (Continued)
For a Share outstanding throughout each period
| Class R3 Shares | Year Ended October 31, |
| 2022 | | 2021 | | 2020 | | 2019 | | 2018 |
Net asset value, beginning of period
| $ 22.51 | | $ 21.26 | | $ 22.02 | | $ 20.81 | | $ 22.35 |
| Income from investment operations: | | | | | | | | | |
Net investment income (loss)
| 0.88 (a) | | 0.87 (a) | | 0.95 (a) | | 1.06 (a) | | 1.05 (a) |
Net realized and unrealized gain (loss)
| (4.10) | | 1.35 | | (0.70) | | 1.24 | | (1.50) |
Total from investment operations:
| (3.22) | | 2.22 | | 0.25 | | 2.30 | | (0.45) |
| Distributions paid to shareholders from: | | | | | | | | | |
Net investment income
| (0.89) | | (0.88) | | (0.92) | | (1.06) | | (1.07) |
Return of capital
| (0.00) (b) | | (0.09) | | (0.09) | | (0.03) | | (0.02) |
Total distributions
| (0.89) | | (0.97) | | (1.01) | | (1.09) | | (1.09) |
Net asset value, end of period
| $18.40 | | $22.51 | | $21.26 | | $22.02 | | $20.81 |
Total return (c)
| (14.67)% | | 10.56% | | 1.32% | | 11.44% | | (2.02)% |
| Ratios to average net assets/supplemental data: | | | | | | | | | |
Net assets, end of period (in 000’s)
| $ 690 | | $ 738 | | $ 683 | | $ 792 | | $ 724 |
Ratio of total expenses to average net assets
| 4.53% | | 4.45% | | 4.20% | | 4.46% | | 4.01% |
Ratio of net expenses to average net assets
| 1.65% | | 1.65% | | 1.65% | | 1.65% | | 1.65% |
Ratio of net investment income (loss) to average net assets
| 4.29% | | 3.90% | | 4.51% | | 5.02% | | 4.87% |
Portfolio turnover rate
| 30% | | 38% | | 46% | | 41% | | 33% |
| (a) | Based on average shares outstanding. |
| (b) | Amount is less than $0.01. |
| (c) | Assumes reinvestment of all distributions for the period. These returns include combined Rule 12b-1 distribution and service fees of 0.50%, and do not reflect the deduction of taxes that a shareholder would pay on Fund distributions or the redemption of Fund shares. The total returns would have been lower if certain fees had not been waived and expenses reimbursed by the investment advisor. Total return is calculated for the time period presented and is not annualized for periods of less than one year. |
Page 22
See Notes to Financial Statements
Notes to Financial Statements
First Trust Preferred Securities and Income Fund
October 31, 2022
1. Organization
First Trust Preferred Securities and Income Fund (the “Fund”) is a series of the First Trust Series Fund (the “Trust”), a Massachusetts business trust organized on July 9, 2010, and is registered as a diversified open-end management investment company with the Securities and Exchange Commission (“SEC”) under the Investment Company Act of 1940, as amended (the “1940 Act”). The Fund offers five classes of shares: Class A, Class C, Class F, Class I and Class R3. Each class represents an interest in the same portfolio of investments but with a different combination of sales charges, distribution and service (12b-1) fees, eligibility requirements and other features.
The Fund’s investment objective seeks to provide current income and total return. The Fund seeks to achieve its objective by investing, under normal market conditions, at least 80% of its net assets (including investment borrowings, if any) in preferred securities and other securities with similar economic characteristics. There can be no assurance that the Fund will achieve its investment objective. The Fund may not be appropriate for all investors.
2. Significant Accounting Policies
The Fund is considered an investment company and follows accounting and reporting guidance under Financial Accounting Standards Board Accounting Standards Codification Topic 946, “Financial Services-Investment Companies.” The following is a summary of significant accounting policies consistently followed by the Fund in the preparation of the financial statements. The preparation of the financial statements in accordance with accounting principles generally accepted in the United States of America (“U.S. GAAP”) requires management to make estimates and assumptions that affect the reported amounts and disclosures in the financial statements. Actual results could differ from those estimates.
A. Portfolio Valuation
The net asset value (“NAV”) of each class of shares of the Fund is determined daily as of the close of regular trading on the New York Stock Exchange (“NYSE”), normally 4:00 p.m. Eastern time, on each day the NYSE is open for trading. If the NYSE closes early on a valuation day, the NAV is determined as of that time. Domestic debt securities and foreign securities are priced using data reflecting the earlier closing at the principal markets for those securities. The NAV for each class is calculated by dividing the value of the Fund’s total assets attributable to such class (including accrued interest and dividends), less all liabilities attributable to such class (including accrued expenses, dividends declared but unpaid and any borrowings of the Fund), by the total number of shares of the class outstanding. Differences in NAV of each class of the Fund’s shares are generally expected to be due to the daily expense accruals of the specified distribution and service (12b-1) fees and transfer agency costs applicable to such class of shares and the resulting differential in the dividends that may be paid on each class of shares.
The Fund’s investments are valued daily at market value or, in the absence of market value with respect to any portfolio securities, at fair value. Market value prices represent readily available market quotations such as last sale or official closing prices from a national or foreign exchange (i.e., a regulated market) and are primarily obtained from third-party pricing services. Fair value prices represent any prices not considered market value prices and are either obtained from a third-party pricing service or are determined by the Pricing Committee of the Trust’s investment advisor, First Trust Advisors L.P. (“First Trust” or the “Advisor”), in accordance with valuation procedures approved by the Trust’s Board of Trustees, and in accordance with provisions of the 1940 Act and rules thereunder. Investments valued by the Advisor’s Pricing Committee, if any, are footnoted as such in the footnotes to the Portfolio of Investments. The Fund’s investments are valued as follows:
Preferred stocks, exchange-traded funds, and other equity securities listed on any national or foreign exchange (excluding The Nasdaq Stock Market LLC (“Nasdaq”) and the London Stock Exchange Alternative Investment Market (“AIM”)) are valued at the last sale price on the exchange on which they are principally traded or, for Nasdaq and AIM securities, the official closing price. Securities traded on more than one securities exchange are valued at the last sale price or official closing price, as applicable, at the close of the securities exchange representing the primary exchange for such securities.
Bonds, notes, capital preferred securities, and other debt securities are fair valued on the basis of valuations provided by a third-party pricing service approved by the Advisor’s Pricing Committee, which may use the following valuation inputs when available:
| 1) | benchmark yields; |
| 2) | reported trades; |
| 3) | broker/dealer quotes; |
| 4) | issuer spreads; |
| 5) | benchmark securities; |
| 6) | bids and offers; and |
Notes to Financial Statements (Continued)
First Trust Preferred Securities and Income Fund
October 31, 2022
| 7) | reference data including market research publications. |
Securities traded in an over-the-counter market are valued at the mean of their most recent bid and asked price, if available, and otherwise at their last trade price.
Fixed income and other debt securities having a remaining maturity of sixty days or less when purchased are fair valued at cost adjusted for amortization of premiums and accretion of discounts (amortized cost), provided the Advisor’s Pricing Committee has determined that the use of amortized cost is an appropriate reflection of fair value given market and issuer-specific conditions existing at the time of the determination. Factors that may be considered in determining the appropriateness of the use of amortized cost include, but are not limited to, the following:
| 1) | the credit conditions in the relevant market and changes thereto; |
| 2) | the liquidity conditions in the relevant market and changes thereto; |
| 3) | the interest rate conditions in the relevant market and changes thereto (such as significant changes in interest rates); |
| 4) | issuer-specific conditions (such as significant credit deterioration); and |
| 5) | any other market-based data the Advisor’s Pricing Committee considers relevant. In this regard, the Advisor’s Pricing Committee may use last-obtained market-based data to assist it when valuing portfolio securities using amortized cost. |
Certain securities may not be able to be priced by pre-established pricing methods. Such securities may be valued by the Advisor’s Pricing Committee at fair value. These securities generally include, but are not limited to, restricted securities (securities which may not be publicly sold without registration under the Securities Act of 1933, as amended (the “1933 Act”)) for which a third-party pricing service is unable to provide a market price; securities whose trading has been formally suspended; a security whose market or fair value price is not available from a pre-established pricing source; a security with respect to which an event has occurred that is likely to materially affect the value of the security after the market has closed but before the calculation of the Fund’s NAV or make it difficult or impossible to obtain a reliable market quotation; and a security whose price, as provided by the third-party pricing service, does not reflect the security’s fair value. As a general principle, the current fair value of a security would appear to be the amount which the owner might reasonably expect to receive for the security upon its current sale. When fair value prices are used, generally they will differ from market quotations or official closing prices on the applicable exchanges. A variety of factors may be considered in determining the fair value of such securities, including, but not limited to, the following:
| 1) | the last sale price on the exchange on which they are principally traded or, for Nasdaq and AIM securities, the official closing price; |
| 2) | the type of security; |
| 3) | the size of the holding; |
| 4) | the initial cost of the security; |
| 5) | transactions in comparable securities; |
| 6) | price quotes from dealers and/or third-party pricing services; |
| 7) | relationships among various securities; |
| 8) | information obtained by contacting the issuer, analysts, or the appropriate stock exchange; |
| 9) | an analysis of the issuer’s financial statements; |
| 10) | the existence of merger proposals or tender offers that might affect the value of the security; and |
| 11) | other relevant factors. |
If the securities in question are foreign securities, the following additional information may be considered:
| 1) | the value of similar foreign securities traded on other foreign markets; |
| 2) | ADR trading of similar securities; |
| 3) | closed-end fund or exchange-traded fund trading of similar securities; |
| 4) | foreign currency exchange activity; |
| 5) | the trading prices of financial products that are tied to baskets of foreign securities; |
| 6) | factors relating to the event that precipitated the pricing problem; |
| 7) | whether the event is likely to recur; |
| 8) | whether the effects of the event are isolated or whether they affect entire markets, countries or regions; and |
| 9) | other relevant factors. |
Notes to Financial Statements (Continued)
First Trust Preferred Securities and Income Fund
October 31, 2022
The Fund is subject to fair value accounting standards that define fair value, establish the framework for measuring fair value and provide a three-level hierarchy for fair valuation based upon the inputs to the valuation as of the measurement date. The three levels of the fair value hierarchy are as follows:
| • | Level 1 – Level 1 inputs are quoted prices in active markets for identical investments. An active market is a market in which transactions for the investment occur with sufficient frequency and volume to provide pricing information on an ongoing basis. |
| • | Level 2 – Level 2 inputs are observable inputs, either directly or indirectly, and include the following: |
| o | Quoted prices for similar investments in active markets. |
| o | Quoted prices for identical or similar investments in markets that are non-active. A non-active market is a market where there are few transactions for the investment, the prices are not current, or price quotations vary substantially either over time or among market makers, or in which little information is released publicly. |
| o | Inputs other than quoted prices that are observable for the investment (for example, interest rates and yield curves observable at commonly quoted intervals, volatilities, prepayment speeds, loss severities, credit risks, and default rates). |
| o | Inputs that are derived principally from or corroborated by observable market data by correlation or other means. |
| • | Level 3 – Level 3 inputs are unobservable inputs. Unobservable inputs may reflect the reporting entity’s own assumptions about the assumptions that market participants would use in pricing the investment. |
The inputs or methodologies used for valuing investments are not necessarily an indication of the risk associated with investing in those investments. A summary of the inputs used to value the Fund’s investments as of October 31, 2022, is included with the Fund’s Portfolio of Investments.
In December 2020, the SEC adopted Rule 2a-5 under the 1940 Act, establishing requirements to determine fair value in good faith for purposes of the 1940 Act. The rule permits fund boards to designate a fund’s investment adviser to perform fair value determinations, subject to board oversight and certain other conditions. The rule also defines when market quotations are “readily available” for purposes of the 1940 Act and requires a fund to fair value a portfolio investment when a market quotation is not readily available. The SEC also adopted new Rule 31a-4 under the 1940 Act, which sets forth recordkeeping requirements associated with fair value determinations. The compliance date for Rule 2a-5 and Rule 31a-4 was September 8, 2022.
Effective September 8, 2022 and pursuant to the requirements of Rule 2a-5, the Trust’s Board of Trustees designated the Advisor as its valuation designee to perform fair value determinations and approved new Advisor Valuation Procedures for the Trust.
B. Securities Transactions and Investment Income
Securities transactions are recorded as of the trade date. Realized gains and losses from securities transactions are recorded on the identified cost basis. Dividend income is recorded on the ex-dividend date. Interest income is recorded daily on the accrual basis, including the amortization of premiums and accretion of discounts. Income is allocated on a pro rata basis to each class of shares.
The Fund may hold the securities of real estate investment trusts (“REITs”). Distributions from such investments may include income, capital gains and return of capital. The actual character of amounts received during the year is not known until after the REITs’ fiscal year end. The Fund records the character of distributions received from the REITs during the year based on estimates available. The characterization of distributions received by the Fund may be subsequently revised based on information received from the REITs after their tax reporting periods conclude.
The United Kingdom’s Financial Conduct Authority (the “FCA”), which regulates the London Interbank Offered Rates (“LIBOR”), announced on March 5, 2021 that it intended to phase-out all LIBOR reference rates, beginning December 31, 2021. Since that announcement, the FCA has ceased publication of all non-USD LIBOR reference rates and the 1-week and 2-month USD LIBOR reference rates as of December 31, 2021. The remaining USD LIBOR settings will cease to be published or no longer be representative immediately after June 30, 2023. The International Swaps and Derivatives Association, Inc. (“ISDA”) confirmed that the FCA’s March 5, 2021 announcement of its intention to cease providing LIBOR reference rates, constituted an index cessation event under the Interbank Offered Rates (“IBOR”) Fallbacks Supplement and the ISDA 2020 IBOR Fallbacks Protocol for all 35 LIBOR settings and confirmed that the spread adjustment to be used in ISDA fallbacks was fixed as of the date of the announcement.
In the United States, the Alternative Reference Rates Committee (the “ARRC”), a group of market participants convened by the Board of Governors of the Federal Reserve System and the Federal Reserve Bank of New York in cooperation with other federal and state government agencies, has since 2014 undertaken efforts to identify U.S. dollar reference interest rates as alternatives to LIBOR and to facilitate the mitigation of LIBOR-related risks. In June 2017, the ARRC identified the Secured Overnight Financing Rate (“SOFR”),
Notes to Financial Statements (Continued)
First Trust Preferred Securities and Income Fund
October 31, 2022
a broad measure of the cost of cash overnight borrowing collateralized by U.S. Treasury securities, as the preferred alternative for U.S. dollar LIBOR. The Federal Reserve Bank of New York began daily publishing of SOFR in April 2018. There is no assurance that any alternative reference rate, including SOFR, will be similar to or produce the same value or economic equivalence as LIBOR or that instruments using an alternative rate will have the same volume or liquidity.
At this time, it is not possible to predict the full impact of the elimination of LIBOR and the establishment of an alternative reference rate on the Fund or its investments.
C. Restricted Securities
The Fund invests in restricted securities, which are securities that may not be offered for public sale without first being registered under the 1933 Act. Prior to registration, restricted securities may only be resold in transactions exempt from registration under Rule 144A under the 1933 Act, normally to qualified institutional buyers. As of October 31, 2022, the Fund held restricted securities as shown in the following table that the Advisor has deemed illiquid pursuant to procedures adopted by the Trust’s Board of Trustees. Although market instability can result in periods of increased overall market illiquidity, liquidity for each security is determined based on security-specific factors and assumptions, which require subjective judgment. The Fund does not have the right to demand that such securities be registered. These securities are valued according to the valuation procedures as stated in the Portfolio Valuation note (Note 2A) and are not expressed as a discount to the carrying value of a comparable unrestricted security. There are no unrestricted securities with the same maturity dates and yields for these issuers.
| Security | Acquisition
Date | Principal
Value | Current Price | Carrying
Cost | | Value | | % of
Net
Assets |
| Dairy Farmers of America, Inc., 7.13% | 10/04/16 | $300,000 | $93.13 | $310,125 | | $279,375 | | 0.12% |
| Fortegra Financial Corp., 8.50%, 10/15/57 | 10/12/17 | 1,000,000 | 101.68 | 1,000,000 | | 1,016,783 | | 0.44 |
| Land O’Lakes Capital Trust I, 7.45%, 03/15/28 | 06/06/14-03/20/15 | 3,000,000 | 99.63 | 3,047,500 | | 2,988,915 | | 1.28 |
| | | | | $4,357,625 | | $4,285,073 | | 1.84% |
D. Dividends and Distributions to Shareholders
The Fund will declare daily and pay monthly distributions of all or a portion of its net income to holders of each class of shares. Distributions of any net capital gains earned by the Fund will be distributed at least annually. Distributions will automatically be reinvested into additional Fund shares unless cash distributions are elected by the shareholder. The Fund may also designate a portion of the amount paid to redeeming shareholders as a distribution for tax purposes.
Distributions from net investment income and realized capital gains are determined in accordance with federal income tax regulations, which may differ from U.S. GAAP. Certain capital accounts in the financial statements are periodically adjusted for permanent differences in order to reflect their tax character. These permanent differences are primarily due to the varying treatment of income and gain/loss on portfolio securities held by the Fund and have no impact on net assets or NAV per share. Temporary differences, which arise from recognizing certain items of income, expense and gain/loss in different periods for financial statement and tax purposes, will reverse at some point in the future. Permanent differences incurred during the fiscal year ended October 31, 2022, resulting in book and tax accounting differences, have been reclassified at year end to reflect a decrease in accumulated net investment income (loss) of $652,903, an increase in accumulated net realized gain (loss) on investments of $684,716, and a decrease to paid-in-capital of $31,813. Accumulated distributable earnings (loss) consists of accumulated net investment income (loss), accumulated net realized gain (loss) on investments, and unrealized appreciation (depreciation) on investments. Net assets were not affected by these reclassifications.
The tax character of distributions paid by the Fund during the fiscal years ended October 31, 2022 and 2021, was as follows:
| Distributions paid from: | 2022 | 2021 |
Ordinary income
| $13,008,533 | $12,944,139 |
Capital gains
| — | — |
Return of capital
| 66,138 | 1,401,504 |
Notes to Financial Statements (Continued)
First Trust Preferred Securities and Income Fund
October 31, 2022
As of October 31, 2022, the components of distributable earnings and net assets on a tax basis were as follows:
Undistributed ordinary income
| $— |
Undistributed capital gains
| — |
Total undistributed earnings
| — |
Accumulated capital and other losses
| (12,950,587) |
Net unrealized appreciation (depreciation)
| (36,483,032) |
Total accumulated earnings (losses)
| (49,433,619) |
Other
| — |
Paid-in capital
| 281,870,116 |
Total net assets
| $232,436,497 |
E. Income Taxes
The Fund intends to continue to qualify as a regulated investment company by complying with the requirements under Subchapter M of the Internal Revenue Code of 1986, as amended, which includes distributing substantially all of its net investment income and net realized gains to shareholders. Accordingly, no provision has been made for federal and state income taxes. However, due to the timing and amount of distributions, the Fund may be subject to an excise tax of 4% of the amount by which approximately 98% of the Fund’s taxable income exceeds the distributions from such taxable income for the calendar year.
The Fund intends to utilize provisions of the federal income tax laws, which allow it to carry a realized capital loss forward indefinitely following the year of the loss and offset such loss against any future realized capital gains. The Fund is subject to certain limitations under U.S. tax rules on the use of capital loss carryforwards and net unrealized built-in losses. These limitations apply when there has been a 50% change in ownership. At October 31, 2022, for federal income tax purposes, the Fund had $12,950,587 of non-expiring capital loss carryforwards available, to the extent provided by regulations, to offset future capital gains.
The Fund is subject to accounting standards that establish a minimum threshold for recognizing, and a system for measuring, the benefits of a tax position taken or expected to be taken in a tax return. Taxable years ended 2019, 2020, 2021, and 2022 remain open to federal and state audit. As of October 31, 2022, management has evaluated the application of these standards to the Fund and has determined that no provision for income tax is required in the Fund’s financial statements for uncertain tax positions.
As of October 31, 2022, the aggregate cost, gross unrealized appreciation, gross unrealized depreciation, and net unrealized appreciation/(depreciation) on investments (including short positions and derivatives, if any) for federal income tax purposes were as follows:
| Tax Cost | | Gross
Unrealized
Appreciation | | Gross
Unrealized
(Depreciation) | | Net Unrealized
Appreciation
(Depreciation) |
| $266,062,304 | | $609,740 | | $(37,092,772) | | $(36,483,032) |
F. Expenses
The Fund pays all expenses directly related to its operations. Expenses of the Fund are allocated on a pro rata basis to each class of shares, except for distribution and service (12b-1) fees and incremental transfer agency costs which are unique to each class of shares.
3. Investment Advisory Fee, Affiliated Transactions and Other Fee Arrangements
First Trust, the investment advisor to the Fund, is a limited partnership with one limited partner, Grace Partners of DuPage L.P., and one general partner, The Charger Corporation. The Charger Corporation is an Illinois corporation controlled by James A. Bowen, Chief Executive Officer of First Trust. First Trust is responsible for the ongoing monitoring of the Fund’s investment portfolio, managing the Fund’s business affairs and providing certain administrative services necessary for the management of the Fund. For these investment management services, First Trust is entitled to a monthly fee calculated at an annual rate of 0.80% of the Fund’s average daily net assets. First Trust also provides fund reporting services to the Fund for a flat annual fee in the amount of $9,250.
Stonebridge, a majority-owned affiliate of First Trust, serves as the Fund’s sub-advisor and manages the Fund’s portfolio subject to First Trust’s supervision. The Sub-Advisor receives a monthly portfolio management fee calculated at an annual rate of 0.40% of the Fund’s average daily net assets that is paid by First Trust out of its investment advisory fee.
Notes to Financial Statements (Continued)
First Trust Preferred Securities and Income Fund
October 31, 2022
First Trust Capital Partners, LLC, an affiliate of First Trust, owns a 51% ownership interest in Stonebridge.
First Trust and Stonebridge have agreed to waive fees and/or reimburse Fund expenses to the extent necessary to prevent the total annual fund operating expenses (excluding 12b-1 distribution and service fees, interest expenses, taxes, acquired fund fees and expenses, fees incurred in acquiring and disposing of portfolio securities and extraordinary expenses) from exceeding 1.15% of average daily net assets of any class of shares of the Fund (the “Expense Cap”) until February 28, 2024 and then from exceeding 1.50% from March 1, 2024 to February 28, 2033 (the “Expense Cap Termination Date”). Expenses borne and fees waived by First Trust and Stonebridge are subject to recovery on the Fund’s class level, if applicable, by First Trust and Stonebridge for up to three years from the date the fee or expense was incurred, but no reimbursement payment will be made by the Fund at any time if it would result in the Fund’s expenses exceeding (i) the Expense Cap in place for the most recent fiscal year for which such expense limitation was in place; (ii) the Expense Cap in place at the time the fees were waived; or (iii) the current Expense Cap. Expense limitations may be terminated or modified prior to their expiration only with the approval of the Board of Trustees of the Trust. These amounts would be included in “Expenses previously waived or reimbursed” on the Statement of Operations. The advisory fee waiver and expense reimbursement for the fiscal year ended October 31, 2022 and the expenses borne by First Trust and Stonebridge subject to recovery were as follows:
| | | | | Expenses Subject to Recovery |
Advisory Fee
Waiver | | Expense
Reimbursement | | Year Ended
October 31, 2020 | | Year Ended
October 31, 2021 | | Year Ended
October 31, 2022 | | Total |
| $ 41,224 | | $ — | | $ 40,267 | | $ 38,675 | | $ 41,224 | | $ 120,166 |
Brown Brothers Harriman & Co. (“BBH”) serves as the Fund’s administrator, fund accountant and custodian in accordance with certain fee arrangements. As administrator and fund accountant, BBH is responsible for providing certain administrative and accounting services to the Fund, including maintaining the Fund’s books of account, records of the Fund’s securities transactions, and certain other books and records. As custodian, BBH is responsible for custody of the Fund’s assets.
BNY Mellon Investment Servicing (US) Inc. (“BNYM IS”) serves as the Fund’s transfer agent in accordance with certain fee arrangements. As transfer agent, BNYM IS is responsible for maintaining shareholder records for the Fund. BNYM IS is a subsidiary of The Bank of New York Mellon Corporation, a financial holding company.
Each Trustee who is not an officer or employee of First Trust, any sub-advisor or any of their affiliates (“Independent Trustees”) is paid a fixed annual retainer that is allocated equally among each fund in the First Trust Fund Complex. Each Independent Trustee is also paid an annual per fund fee that varies based on whether the fund is a closed-end or other actively managed fund, a target outcome fund or an index fund.
Additionally, the Lead Independent Trustee and the Chairs of the Audit Committee, Nominating and Governance Committee and Valuation Committee are paid annual fees to serve in such capacities, with such compensation allocated pro rata among each fund in the First Trust Fund Complex based on net assets. Independent Trustees are reimbursed for travel and out-of-pocket expenses in connection with all meetings. The Lead Independent Trustee and Committee Chairs rotate every three years. The officers and “Interested” Trustee receive no compensation from the Trust for acting in such capacities.
4. Capital Share Transactions
Capital transactions were as follows:
| | Year Ended
October 31, 2022 | | Year Ended
October 31, 2021 |
| | Shares | | Value | | Shares | | Value |
| Sales: | | | | | | | |
| Class A | 652,681 | | $ 13,057,774 | | 732,198 | | $ 16,484,863 |
| Class C | 126,015 | | 2,655,985 | | 194,429 | | 4,395,572 |
| Class F | 1,457 | | 29,653 | | 1,475 | | 33,532 |
| Class I | 3,262,960 | | 67,174,343 | | 2,218,685 | | 50,136,059 |
| Class R3 | 5,008 | | 103,254 | | 1,314 | | 29,647 |
| Total Sales | 4,048,121 | | $ 83,021,009 | | 3,148,101 | | $ 71,079,673 |
Notes to Financial Statements (Continued)
First Trust Preferred Securities and Income Fund
October 31, 2022
| | Year Ended
October 31, 2022 | | Year Ended
October 31, 2021 |
| | Shares | | Value | | Shares | | Value |
| Dividend Reinvestment: | | | | | | | |
| Class A | 91,894 | | $ 1,868,039 | | 80,966 | | $ 1,820,859 |
| Class C | 70,762 | | 1,448,469 | | 81,561 | | 1,843,949 |
| Class F | 1,106 | | 22,811 | | 1,472 | | 33,510 |
| Class I | 405,366 | | 8,302,927 | | 408,796 | | 9,247,640 |
| Class R3 | 901 | | 18,133 | | 753 | | 16,882 |
| Total Dividend Reinvestment | 570,029 | | $ 11,660,379 | | 573,548 | | $ 12,962,840 |
| Redemptions: | | | | | | | |
| Class A | (820,280) | | $ (16,722,017) | | (372,651) | | $ (8,363,254) |
| Class C | (533,545) | | (10,987,572) | | (530,533) | | (12,017,995) |
| Class F | (8,113) | | (162,559) | | (6,591) | | (149,965) |
| Class I | (5,099,823) | | (103,927,524) | | (1,992,635) | | (44,998,460) |
| Class R3 | (1,198) | | (24,839) | | (1,388) | | (31,257) |
| Total Redemptions | (6,462,959) | | $ (131,824,511) | | (2,903,798) | | $ (65,560,931) |
5. Purchases and Sales of Securities
The cost of purchases and proceeds from sales of securities, excluding short-term investments, for the fiscal year ended October 31, 2022, were $84,639,911 and $118,304,548, respectively.
6. Distribution and Service Plan
The Board of Trustees adopted a Distribution and Service Plan pursuant to Rule 12b-1 under the 1940 Act. In accordance with the Rule 12b-1 plan, the share classes of the Fund are authorized to pay an amount up to 0.25%, 1.00%, 0.15% and 0.50% of their average daily net assets each year for Class A, Class C, Class F and Class R3, respectively, to reimburse First Trust Portfolios L.P. (“FTP”), the distributor of the Fund, for amounts expended to finance activities primarily intended to result in the sale of Fund shares or the provision of investor services. FTP may also use this amount to compensate securities dealers or other persons for providing distribution assistance, including broker-dealer and shareholder support and educational and promotional services. Class I shares have no 12b-1 fees.
7. Borrowings
The Trust, on behalf of the Fund, along with First Trust Exchange-Traded Fund III and First Trust Exchange-Traded Fund IV have a $305 million Credit Agreement with The Bank of Nova Scotia (“Scotia”) as administrative agent for a group of lenders. Between March 2, 2022 and October 30, 2022, the commitment amount was $280 million, and prior to March 2, 2022, the commitment amount was $355 million. Scotia charges a commitment fee of 0.25% of the daily amount of the excess of the commitment amount over the outstanding principal balance of the loans, and an agency fee. First Trust allocates the commitment fee and agency fee amongst the funds that have access to the credit line. To the extent that the Fund accesses the credit line, there would also be an interest fee charged. The Fund did not have any borrowings outstanding during the fiscal year ended October 31, 2022.
8. Indemnification
The Fund has a variety of indemnification obligations under contracts with its service providers. The Fund’s maximum exposure under these arrangements is unknown. However, the Fund has not had prior claims or losses pursuant to these contracts and expects the risk of loss to be remote.
9. Subsequent Events
Management has evaluated the impact of all subsequent events to the Fund through the date the financial statements were issued and has determined that there were no subsequent events requiring recognition or disclosure in the financial statements that have not already been disclosed.
Report of Independent Registered Public Accounting Firm
To the Shareholders and the Board of Trustees of First Trust Series Fund:
Opinion on the Financial Statements and Financial Highlights
We have audited the accompanying statement of assets and liabilities of First Trust Preferred Securities and Income Fund (the “Fund”), a series of the First Trust Series Fund, including the portfolio of investments, as of October 31, 2022, the related statement of operations for the year then ended, the statements of changes in net assets for each of the two years in the period then ended, the financial highlights for each of the five years in the period then ended, and the related notes. In our opinion, the financial statements and financial highlights present fairly, in all material respects, the financial position of the Fund as of October 31, 2022, the results of its operations for the year then ended, the changes in its net assets for each of the two years in the period then ended, and the financial highlights for each of the five years in the period then ended in conformity with accounting principles generally accepted in the United States of America.
Basis for Opinion
These financial statements and financial highlights are the responsibility of the Fund’s management. Our responsibility is to express an opinion on the Fund’s financial statements and financial highlights based on our audits. We are a public accounting firm registered with the Public Company Accounting Oversight Board (United States) (PCAOB) and are required to be independent with respect to the Fund in accordance with the U.S. federal securities laws and the applicable rules and regulations of the Securities and Exchange Commission and the PCAOB.
We conducted our audits in accordance with the standards of the PCAOB. Those standards require that we plan and perform the audit to obtain reasonable assurance about whether the financial statements and financial highlights are free of material misstatement, whether due to error or fraud. The Fund is not required to have, nor were we engaged to perform, an audit of its internal control over financial reporting. As part of our audits we are required to obtain an understanding of internal control over financial reporting but not for the purpose of expressing an opinion on the effectiveness of the Fund’s internal control over financial reporting. Accordingly, we express no such opinion.
Our audits included performing procedures to assess the risks of material misstatement of the financial statements and financial highlights, whether due to error or fraud, and performing procedures that respond to those risks. Such procedures included examining, on a test basis, evidence regarding the amounts and disclosures in the financial statements and financial highlights. Our audits also included evaluating the accounting principles used and significant estimates made by management, as well as evaluating the overall presentation of the financial statements and financial highlights. Our procedures included confirmation of securities owned as of October 31, 2022, by correspondence with the custodian and brokers; when replies were not received from brokers, we performed other auditing procedures. We believe that our audits provide a reasonable basis for our opinion.
Chicago, Illinois
December 21, 2022
We have served as the auditor of one or more First Trust investment companies since 2001.
Additional Information
First Trust Preferred Securities and Income Fund
October 31, 2022 (Unaudited)
Proxy Voting Policies and Procedures
A description of the policies and procedures that the Trust uses to determine how to vote proxies and information on how the Fund voted proxies relating to portfolio securities during the most recent 12-month period ended June 30 is available (1) without charge, upon request, by calling (800) 988-5891; (2) on the Fund’s website at www.ftportfolios.com; and (3) on the Securities and Exchange Commission’s (“SEC”) website at www.sec.gov.
Portfolio Holdings
The Fund files portfolio holdings information for each month in a fiscal quarter within 60 days after the end of the relevant fiscal quarter on Form N-PORT. Portfolio holdings information for the third month of each fiscal quarter will be publicly available on the SEC’s website at www.sec.gov. The Fund’s complete schedule of portfolio holdings for the second and fourth quarters of each fiscal year is included in the semi-annual and annual reports to shareholders, respectively, and is filed with the SEC on Form N-CSR. The semi-annual and annual report for the Fund is available to investors within 60 days after the period to which it relates. The Fund’s Forms N-PORT and Forms N-CSR are available on the SEC’s website listed above.
Federal Tax Information
The Fund hereby designates as qualified dividend income 69.41% of its ordinary income distributions (including short-term capital gains, if applicable) for the year ended October 31, 2022. In addition, 28.86% of the ordinary income distributions (including short-term capital gain, if applicable) made by the Fund during the fiscal year ended October 31, 2022, qualify for corporate dividends received deduction available to corporate shareholders.
A portion of the ordinary dividends (including short-term capital gains) paid to shareholders during the taxable year ended October 31, 2022, may be eligible for the Qualified Business Income (QBI) Deduction under the Internal Revenue Code of 1986, as amended, section 199A for the aggregate dividends the Fund received from the underlying Real Estate Investment Trusts (REITs) it invests in.
Risk Considerations
Risks are inherent in all investing. Certain general risks that may be applicable to a Fund are identified below, but not all of the material risks relevant to each Fund are included in this report and not all of the risks below apply to each Fund. The material risks of investing in each Fund are spelled out in its prospectus, statement of additional information and other regulatory filings. Before investing, you should consider each Fund’s investment objective, risks, charges and expenses, and read each Fund’s prospectus and statement of additional information carefully. You can download each Fund’s prospectus at www.ftportfolios.com or contact First Trust Portfolios L.P. at (800) 621-1675 to request a prospectus, which contains this and other information about each Fund.
Concentration Risk. To the extent that a fund is able to invest a significant percentage of its assets in a single asset class or the securities of issuers within the same country, state, region, industry or sector, an adverse economic, business or political development may affect the value of the fund’s investments more than if the fund were more broadly diversified. A fund that tracks an index will be concentrated to the extent the fund’s corresponding index is concentrated. A concentration makes a fund more susceptible to any single occurrence and may subject the fund to greater market risk than a fund that is more broadly diversified.
Credit Risk. Credit risk is the risk that an issuer of a security will be unable or unwilling to make dividend, interest and/or principal payments when due and the related risk that the value of a security may decline because of concerns about the issuer’s ability to make such payments.
Cyber Security Risk. The funds are susceptible to potential operational risks through breaches in cyber security. A breach in cyber security refers to both intentional and unintentional events that may cause a fund to lose proprietary information, suffer data corruption or lose operational capacity. Such events could cause a fund to incur regulatory penalties, reputational damage, additional compliance costs associated with corrective measures and/or financial loss. In addition, cyber security breaches of a fund’s third-party service providers, such as its administrator, transfer agent, custodian, or sub-advisor, as applicable, or issuers in which the fund invests, can also subject a fund to many of the same risks associated with direct cyber security breaches.
Derivatives Risk. To the extent a fund uses derivative instruments such as futures contracts, options contracts and swaps, the fund may experience losses because of adverse movements in the price or value of the underlying asset, index or rate, which may be magnified by certain features of the derivative. These risks are heightened when a fund’s portfolio managers use derivatives to enhance the fund’s return or as a substitute for a position or security, rather than solely to hedge (or offset) the risk of a position or security held by the fund.
Additional Information (Continued)
First Trust Preferred Securities and Income Fund
October 31, 2022 (Unaudited)
Equity Securities Risk. To the extent a fund invests in equity securities, the value of the fund’s shares will fluctuate with changes in the value of the equity securities. Equity securities prices fluctuate for several reasons, including changes in investors’ perceptions of the financial condition of an issuer or the general condition of the relevant stock market, such as market volatility, or when political or economic events affecting the issuers occur. In addition, common stock prices may be particularly sensitive to rising interest rates, as the cost of capital rises and borrowing costs increase. Equity securities may decline significantly in price over short or extended periods of time, and such declines may occur in the equity market as a whole, or they may occur in only a particular country, company, industry or sector of the market.
Fixed Income Securities Risk. To the extent a fund invests in fixed income securities, the fund will be subject to credit risk, income risk, interest rate risk, liquidity risk and prepayment risk. Income risk is the risk that income from a fund’s fixed income investments could decline during periods of falling interest rates. Interest rate risk is the risk that the value of a fund’s fixed income securities will decline because of rising interest rates. Liquidity risk is the risk that a security cannot be purchased or sold at the time desired, or cannot be purchased or sold without adversely affecting the price. Prepayment risk is the risk that the securities will be redeemed or prepaid by the issuer, resulting in lower interest payments received by the fund. In addition to these risks, high yield securities, or “junk” bonds, are subject to greater market fluctuations and risk of loss than securities with higher ratings, and the market for high yield securities is generally smaller and less liquid than that for investment grade securities.
Investment Companies Risk. To the extent a fund invests in the securities of other investment vehicles, the fund will incur additional fees and expenses that would not be present in a direct investment in those investment vehicles. Furthermore, the fund’s investment performance and risks are directly related to the investment performance and risks of the investment vehicles in which the fund invests.
LIBOR Risk. To the extent a fund invests in floating or variable rate obligations that use the London Interbank Offered Rate (“LIBOR”) as a reference interest rate, it is subject to LIBOR Risk. The United Kingdom’s Financial Conduct Authority, which regulates LIBOR has ceased making LIBOR available as a reference rate over a phase-out period that began December 31, 2021. There is no assurance that any alternative reference rate, including the Secured Overnight Financing Rate (“SOFR”) will be similar to or produce the same value or economic equivalence as LIBOR or that instruments using an alternative rate will have the same volume or liquidity. The unavailability or replacement of LIBOR may affect the value, liquidity or return on certain fund investments and may result in costs incurred in connection with closing out positions and entering into new trades. Any potential effects of the transition away from LIBOR on the fund or on certain instruments in which the fund invests can be difficult to ascertain, and they may vary depending on a variety of factors, and they could result in losses to the fund.
Management Risk. To the extent that a fund is actively managed, it is subject to management risk. In managing an actively-managed fund’s investment portfolio, the fund’s portfolio managers will apply investment techniques and risk analyses that may not have the desired result. There can be no guarantee that a fund will meet its investment objective.
Market Risk. Market risk is the risk that a particular security, or shares of a fund in general, may fall in value. Securities held by a fund, as well as shares of a fund itself, are subject to market fluctuations caused by factors such as general economic conditions, political events, regulatory or market developments, changes in interest rates and perceived trends in securities prices. Shares of a fund could decline in value or underperform other investments as a result of the risk of loss associated with these market fluctuations. In addition, local, regional or global events such as war, acts of terrorism, spread of infectious diseases or other public health issues, recessions, or other events could have a significant negative impact on a fund and its investments. Such events may affect certain geographic regions, countries, sectors and industries more significantly than others. In February 2022, Russia invaded Ukraine which has caused and could continue to cause significant market disruptions and volatility within the markets in Russia, Europe, and the United States. The hostilities and sanctions resulting from those hostilities could have a significant impact on certain fund investments as well as fund performance. The COVID-19 global pandemic and the ensuing policies enacted by governments and central banks have caused and may continue to cause significant volatility and uncertainty in global financial markets. While the U.S. has resumed “reasonably” normal business activity, many countries continue to impose lockdown measures. Additionally, there is no guarantee that vaccines will be effective against emerging variants of the disease. These events also adversely affect the prices and liquidity of a fund’s portfolio securities or other instruments and could result in disruptions in the trading markets. Any of such circumstances could have a materially negative impact on the value of a fund’s shares and result in increased market volatility. During any such events, a fund’s shares may trade at increased premiums or discounts to their net asset value and the bid/ask spread on a fund’s shares may widen.
Non-U.S. Securities Risk. To the extent a fund invests in non-U.S. securities, it is subject to additional risks not associated with securities of domestic issuers. Non-U.S. securities are subject to higher volatility than securities of domestic issuers due to: possible adverse political, social or economic developments; restrictions on foreign investment or exchange of securities; capital controls; lack of liquidity; currency exchange rates; excessive taxation; government seizure of assets; the imposition of sanctions by foreign governments; different legal or accounting standards; and less government supervision and regulation of exchanges in foreign countries. Investments in non-U.S. securities may involve higher costs than investments in U.S. securities, including higher transaction
Additional Information (Continued)
First Trust Preferred Securities and Income Fund
October 31, 2022 (Unaudited)
and custody costs, as well as additional taxes imposed by non-U.S. governments. These risks may be heightened for securities of companies located, or with significant operations, in emerging market countries.
Operational Risk. Each fund is subject to risks arising from various operational factors, including, but not limited to, human error, processing and communication errors, errors of a fund’s service providers, counterparties or other third-parties, failed or inadequate processes and technology or systems failures. Each fund relies on third-parties for a range of services, including custody. Any delay or failure relating to engaging or maintaining such service providers may affect a fund’s ability to meet its investment objective. Although the funds and the funds’ investment advisor seek to reduce these operational risks through controls and procedures, there is no way to completely protect against such risks.
Preferred Securities Risk. Preferred securities combine some of the characteristics of both common stocks and bonds. Preferred securities are typically subordinated to bonds and other debt securities in a company’s capital structure in terms of priority to corporate income, subjecting them to greater credit risk than those debt securities. Generally, holders of preferred securities have no voting rights with respect to the issuing company unless preferred dividends have been in arrears for a specified number of periods, at which time the preferred security holders may obtain limited rights. In certain circumstances, an issuer of preferred securities may defer payment on the securities and, in some cases, redeem the securities prior to a specified date. Preferred securities may also be substantially less liquid than other securities, including common stock.
Valuation Risk. The valuation of certain securities may carry more risk than that of common stock. Uncertainties in the conditions of the financial markets, unreliable reference data, lack of transparency and inconsistency of valuation models and processes may lead to inaccurate asset pricing. A fund may hold investments in sizes smaller than institutionally sized round lot positions (sometimes referred to as odd lots). However, third-party pricing services generally provide evaluations on the basis of institutionally-sized round lots. If a fund sells certain of its investments in an odd lot transaction, the sale price may be less than the value at which such securities have been held by the fund. Odd lots often trade at lower prices than institutional round lots. There is no assurance that the fund will be able to sell a portfolio security at the price established by the pricing service, which could result in a loss to the fund.
| NOT FDIC INSURED | NOT BANK GUARANTEED | MAY LOSE VALUE |
Advisory and Sub-Advisory Agreements
Board Considerations Regarding Approval of Continuation of Investment Management and Investment Sub-Advisory Agreements
The Board of Trustees of First Trust Series Fund (the “Trust”), including the Independent Trustees, unanimously approved the continuation of the Investment Management Agreement (the “Advisory Agreement”) between the Trust, on behalf of the First Trust Preferred Securities and Income Fund (the “Fund”), and First Trust Advisors L.P. (the “Advisor”) and the Investment Sub-Advisory Agreement (the “Sub-Advisory Agreement” and together with the Advisory Agreement, the “Agreements”) among the Trust, on behalf of the Fund, the Advisor and Stonebridge Advisors LLC (the “Sub-Advisor”). The Board approved the continuation of the Agreements for a one-year period ending June 30, 2023 at a meeting held on June 12–13, 2022. The Board determined that the continuation of the Agreements is in the best interests of the Fund in light of the nature, extent and quality of the services provided and such other matters as the Board considered to be relevant in the exercise of its business judgment.
To reach this determination, the Board considered its duties under the Investment Company Act of 1940, as amended (the “1940 Act”), as well as under the general principles of state law, in reviewing and approving advisory contracts; the requirements of the 1940 Act in such matters; the fiduciary duty of investment advisors with respect to advisory agreements and compensation; the standards used by courts in determining whether investment company boards have fulfilled their duties; and the factors to be considered by the Board in voting on such agreements. At meetings held on April 18, 2022 and June 12–13, 2022, the Board, including the Independent Trustees, reviewed materials provided by the Advisor and the Sub-Advisor responding to requests for information from counsel to the Independent Trustees, submitted on behalf of the Independent Trustees, that, among other things, outlined: the services provided by the Advisor and the Sub-Advisor to the Fund (including the relevant personnel responsible for these services and their experience); the advisory fee rate payable by the Fund and the sub-advisory fee rate as compared to fees charged to a peer group of funds (the “Expense Group”) and a broad peer universe of funds (the “Expense Universe”), each assembled by Broadridge Financial Solutions, Inc. (“Broadridge”), an independent source, and as compared to fees charged to other clients of the Advisor and the Sub-Advisor; the expense ratio of the Fund as compared to expense ratios of the funds in the Fund’s Expense Group and Expense Universe; performance information for the Fund, including comparisons of the Fund’s performance to that of one or more relevant benchmark indexes and to that of a performance group of funds and a broad performance universe of funds (the “Performance Universe”), each assembled by Broadridge; the nature of expenses incurred in providing services to the Fund and the potential for the Advisor and the Sub-Advisor to realize economies of scale, if any; profitability and other financial data for the Advisor; financial data for the Sub-Advisor; any indirect benefits to the Advisor and its affiliates, First Trust Portfolios L.P. (“FTP”) and First Trust Capital Partners, LLC (“FTCP”), and the Sub-Advisor; and information on the Advisor’s and the Sub-Advisor’s compliance programs. The Board reviewed initial
Additional Information (Continued)
First Trust Preferred Securities and Income Fund
October 31, 2022 (Unaudited)
materials with the Advisor at the meeting held on April 18, 2022, prior to which the Independent Trustees and their counsel met separately to discuss the information provided by the Advisor and the Sub-Advisor. Following the April meeting, counsel to the Independent Trustees, on behalf of the Independent Trustees, requested certain clarifications and supplements to the materials provided, and the information provided in response to those requests was considered at an executive session of the Independent Trustees and their counsel held prior to the June 12–13, 2022 meeting, as well as at the June meeting. The Board applied its business judgment to determine whether the arrangements between the Trust and the Advisor and among the Trust, the Advisor and the Sub-Advisor continue to be reasonable business arrangements from the Fund’s perspective. The Board determined that, given the totality of the information provided with respect to the Agreements, the Board had received sufficient information to renew the Agreements. The Board considered that shareholders chose to invest or remain invested in the Fund knowing that the Advisor and the Sub-Advisor manage the Fund and knowing the Fund’s advisory fee.
In reviewing the Agreements, the Board considered the nature, extent and quality of the services provided by the Advisor and the Sub-Advisor under the Agreements. With respect to the Advisory Agreement, the Board considered that the Advisor is responsible for the overall management and administration of the Trust and the Fund and reviewed all of the services provided by the Advisor to the Fund, including the oversight of the Sub-Advisor, as well as the background and experience of the persons responsible for such services. The Board noted that the Advisor oversees the Sub-Advisor’s day-to-day management of the Fund’s investments, including portfolio risk monitoring and performance review. In reviewing the services provided, the Board noted the compliance program that had been developed by the Advisor and considered that it includes a robust program for monitoring the Advisor’s, the Sub-Advisor’s and the Fund’s compliance with the 1940 Act, as well as the Fund’s compliance with its investment objective, policies and restrictions. The Board also considered a report from the Advisor with respect to its risk management functions related to the operation of the Fund. Finally, as part of the Board’s consideration of the Advisor’s services, the Advisor, in its written materials and at the April 18, 2022 meeting, described to the Board the scope of its ongoing investment in additional personnel and infrastructure to maintain and improve the quality of services provided to the Fund and the other funds in the First Trust Fund Complex. With respect to the Sub-Advisory Agreement, in addition to the written materials provided by the Sub-Advisor, at the June 12–13, 2022 meeting, the Board also received a presentation from representatives of the Sub-Advisor, who discussed the services that the Sub-Advisor provides to the Fund, including the Sub-Advisor’s day-to-day management of the Fund’s investments. In considering the Sub-Advisor’s management of the Fund, the Board noted the background and experience of the Sub-Advisor’s portfolio management team. In light of the information presented and the considerations made, the Board concluded that the nature, extent and quality of the services provided to the Trust and the Fund by the Advisor and the Sub-Advisor under the Agreements have been and are expected to remain satisfactory and that the Sub-Advisor, under the oversight of the Advisor, has managed the Fund consistent with its investment objective, policies and restrictions.
The Board considered the advisory and sub-advisory fee rates payable under the Agreements for the services provided. The Board noted that the sub-advisory fee is paid by the Advisor from its advisory fee. The Board considered that the Advisor and the Sub-Advisor agreed to extend the current expense caps for each share class through February 28, 2024 and agreed to keep the long-term expense cap in place from March 1, 2024 through February 28, 2033. The Board noted that fees waived or expenses borne by the Advisor and the Sub-Advisor are subject to reimbursement by the Fund for up to three years from the date the fee was waived or expense was incurred, but no reimbursement payment would be made by the Fund at any time if it would result in the Fund’s expenses exceeding (i) the applicable expense limitation in place for the most recent fiscal year for which such expense limitation was in place, (ii) the applicable expense limitation in place at the time the fees were waived, or (iii) the current expense limitation. The Board received and reviewed information showing the fee rates and expense ratios of the peer funds in the Expense Group, as well as advisory and unitary fee rates charged by the Advisor and the Sub-Advisor to other fund and non-fund clients, as applicable. With respect to the Expense Group, the Board, at the April 18, 2022 meeting, discussed with Broadridge its methodology for assembling peer groups and discussed with the Advisor limitations in creating a relevant peer group for the Fund, including that (i) the Fund is unique in its composition, which makes assembling peers with the same strategy and asset mix difficult; (ii) certain peer group fund assets are larger than those of the Fund, in which case the comparison causes the fixed expenses of the Fund to be larger on a percentage basis; and (iii) not all peer funds employ an advisor/sub-advisor management structure. The Board took these limitations into account in considering the peer data. Based on the information provided, the Board noted that the contractual advisory fee rate payable by the Fund was above the median contractual advisory fee of the peer funds in the Expense Group. The Board also noted that the Fund’s total (net) expense ratio (Class A shares) was above the median total (net) expense ratio of the peer funds in the Expense Group. With respect to fees charged to other clients, the Board considered differences between the Fund and other clients that limited their comparability. In considering the advisory fee rate overall, the Board also considered the Advisor’s statement that it seeks to meet investor needs through innovative and value-added investment solutions and the Advisor’s demonstrated long-term commitment to the Fund and the other funds in the First Trust Fund Complex.
The Board considered performance information for the Fund. The Board noted the process it has established for monitoring the Fund’s performance and portfolio risk on an ongoing basis, which includes quarterly performance reporting from the Advisor and the Sub-Advisor for the Fund. The Board determined that this process continues to be effective for reviewing the Fund’s performance. The
Additional Information (Continued)
First Trust Preferred Securities and Income Fund
October 31, 2022 (Unaudited)
Board received and reviewed information comparing the Fund’s performance for periods ended December 31, 2021 to the performance of the funds in the Performance Universe and to that of a blended benchmark index. Based on the information provided, the Board noted that the Fund (Class A shares) outperformed the Performance Universe median for the one-, three-, five- and ten-year periods ended December 31, 2021. The Board also noted that the Fund (Class A shares) outperformed the blended benchmark index for the one-year period ended December 31, 2021 and underperformed the blended benchmark index for the three- and five-year periods ended December 31, 2021.
On the basis of all the information provided on the fees, expenses and performance of the Fund and the ongoing oversight by the Board, the Board concluded that the advisory and sub-advisory fees for the Fund continue to be reasonable and appropriate in light of the nature, extent and quality of the services provided by the Advisor and the Sub-Advisor to the Fund under the Agreements.
The Board considered information and discussed with the Advisor whether there were any economies of scale in connection with providing advisory services to the Fund and noted the Advisor’s statement that it believes that its expenses relating to providing advisory services to the Fund will likely increase during the next twelve months as the Advisor continues to build infrastructure and add new staff. The Board considered the revenues and allocated costs (including the allocation methodology) of the Advisor in serving as investment advisor to the Fund for the twelve months ended December 31, 2021 and the estimated profitability level for the Fund calculated by the Advisor based on such data, as well as complex-wide and product-line profitability data, for the same period. The Board noted the inherent limitations in the profitability analysis and concluded that, based on the information provided, the Advisor’s profitability level for the Fund was not unreasonable. In addition, the Board considered indirect benefits described by the Advisor that may be realized from its relationship with the Fund. The Board considered that the Advisor had identified as an indirect benefit to the Advisor and FTP their exposure to investors and brokers who, absent their exposure to the Fund, may have had no dealings with the Advisor or FTP. The Board considered the ownership interest of FTCP in the Sub-Advisor and potential indirect benefits to the Advisor from such ownership interest. The Board noted that in addition to the advisory fees paid by the Fund, FTP is compensated for services provided to the Fund through 12b-1 distribution and service fees and that the Advisor receives compensation from the Fund for providing fund reporting services pursuant to a separate Fund Reporting Services Agreement. The Board concluded that the character and amount of potential indirect benefits to the Advisor were not unreasonable.
The Board considered the Sub-Advisor’s expenses in providing sub-advisory services to the Fund and noted the Sub-Advisor’s hiring of additional personnel and the Sub-Advisor’s statement that it would add resources as needed if it experiences enough asset growth. The Board did not review the profitability of the Sub-Advisor with respect to the Fund. The Board noted that the Advisor pays the Sub-Advisor from its advisory fee and its understanding that the Fund’s sub-advisory fee rate was the product of an arm’s length negotiation. The Board concluded that the profitability analysis for the Advisor was more relevant. The Board considered indirect benefits that may be realized by the Sub-Advisor from its relationship with the Fund, including potential indirect benefits to the Sub-Advisor from the ownership interest of FTCP in the Sub-Advisor. The Board noted the Sub-Advisor’s statements that its relationship with the Advisor has helped it build relationships with Wall Street firms that have preferred and hybrid securities trading desks, which may lead to access to those firms’ research reports and analysts, but that the Sub-Advisor does not utilize soft-dollar arrangements. The Board concluded that the character and amount of potential indirect benefits to the Sub-Advisor were not unreasonable.
Based on all of the information considered and the conclusions reached, the Board, including the Independent Trustees, unanimously determined that the terms of the Agreements continue to be fair and reasonable and that the continuation of the Agreements is in the best interests of the Fund. No single factor was determinative in the Board’s analysis.
Board of Trustees and Officers
First Trust Preferred Securities and Income Fund
October 31, 2022 (Unaudited)
The following tables identify the Trustees and Officers of the Trust. Unless otherwise indicated, the address of all persons is 120 East Liberty Drive, Suite 400, Wheaton, IL 60187.
The Trust’s statement of additional information includes additional information about the Trustees and is available, without charge, upon request, by calling (800) 988-5891.
| Name, Year of Birth and Position with the Trust | Term of Office and Year First Elected or Appointed | Principal Occupations
During Past 5 Years | Number of Portfolios in the First Trust Fund Complex Overseen by Trustee | Other Trusteeships or Directorships Held by Trustee During Past 5 Years |
| INDEPENDENT TRUSTEES |
Richard E. Erickson, Trustee
(1951) | • Indefinite Term
• Since Trust Inception | Physician, Edward-Elmhurst Medical Group; Physician and Officer, Wheaton Orthopedics (1990 to 2021) | 223 | None |
Thomas R. Kadlec, Trustee
(1957) | • Indefinite Term
• Since Trust Inception | Retired; President, ADM Investor Services, Inc. (Futures Commission Merchant) (2010 to July 2022) | 223 | Director, National Futures Association and ADMIS Singapore Ltd.; Formerly, Director of ADM Investor Services, Inc., ADM Investor Services International, ADMIS Hong Kong Ltd., and Futures Industry Association |
Denise M. Keefe, Trustee
(1964) | • Indefinite Term
• Since 2021 | Executive Vice President, Advocate Aurora Health and President, Advocate Aurora Continuing Health Division (Integrated Healthcare System) | 223 | Director and Board Chair of Advocate Home Health Services, Advocate Home Care Products and Advocate Hospice; Director and Board Chair of Aurora At Home (since 2018); Director of Advocate Physician Partners Accountable Care Organization; Director and Board Chair of RML Long Term Acute Care Hospitals; and Director of Senior Helpers (since 2021) |
Robert F. Keith, Trustee
(1956) | • Indefinite Term
• Since Trust Inception | President, Hibs Enterprises (Financial and Management Consulting) | 223 | Formerly, Director of Trust Company of Illinois |
Niel B. Nielson, Trustee
(1954) | • Indefinite Term
• Since Trust Inception | Senior Advisor (2018 to Present), Managing Director and Chief Operating Officer (2015 to 2018), Pelita Harapan Educational Foundation (Educational Products and Services) | 223 | None |
| INTERESTED TRUSTEE |
James A. Bowen(1), Trustee and
Chairman of the Board
(1955) | • Indefinite Term
• Since Trust Inception | Chief Executive Officer, First Trust Advisors L.P. and First Trust Portfolios L.P.; Chairman of the Board of Directors, BondWave LLC (Software Development Company) and Stonebridge Advisors LLC (Investment Advisor) | 223 | None |
| (1) | Mr. Bowen is deemed an “interested person” of the Trust due to his position as CEO of First Trust Advisors L.P., investment advisor of the Trust. |
Board of Trustees and Officers (Continued)
First Trust Preferred Securities and Income Fund
October 31, 2022 (Unaudited)
| Name and Year of Birth | Position and Offices with Trust | Term of Office and Length of Service | Principal Occupations
During Past 5 Years |
| OFFICERS(2) |
James M. Dykas
(1966) | President and Chief Executive Officer | • Indefinite Term
• Since 2016 | Managing Director and Chief Financial Officer, First Trust Advisors L.P. and First Trust Portfolios L.P.; Chief Financial Officer, BondWave LLC (Software Development Company) and Stonebridge Advisors LLC (Investment Advisor) |
Donald P. Swade
(1972) | Treasurer, Chief Financial Officer and Chief Accounting Officer | • Indefinite Term
• Since 2016 | Senior Vice President, First Trust Advisors L.P. and First Trust Portfolios L.P. |
W. Scott Jardine
(1960) | Secretary and Chief Legal Officer | • Indefinite Term
• Since Trust Inception | General Counsel, First Trust Advisors L.P. and First Trust Portfolios L.P.; Secretary and General Counsel, BondWave LLC; Secretary, Stonebridge Advisors LLC |
Daniel J. Lindquist
(1970) | Vice President | • Indefinite Term
• Since Trust Inception | Managing Director, First Trust Advisors L.P. and First Trust Portfolios L.P. |
Kristi A. Maher
(1966) | Chief Compliance Officer and Assistant Secretary | • Indefinite Term
• Chief Compliance Officer Since January 2011 • Assistant Secretary Since Trust Inception | Deputy General Counsel, First Trust Advisors L.P. and First Trust Portfolios L.P. |
| (2) | The term “officer” means the president, vice president, secretary, treasurer, controller or any other officer who performs a policy making function. |
Privacy Policy
First Trust Preferred Securities and Income Fund
October 31, 2022 (Unaudited)
Privacy Policy
First Trust values our relationship with you and considers your privacy an important priority in maintaining that relationship. We are committed to protecting the security and confidentiality of your personal information.
Sources of Information
We collect nonpublic personal information about you from the following sources:
| • | Information we receive from you and your broker-dealer, investment professional or financial representative through interviews, applications, agreements or other forms; |
| • | Information about your transactions with us, our affiliates or others; |
| • | Information we receive from your inquiries by mail, e-mail or telephone; and |
| • | Information we collect on our website through the use of “cookies.” For example, we may identify the pages on our website that your browser requests or visits. |
Information Collected
The type of data we collect may include your name, address, social security number, age, financial status, assets, income, tax information, retirement and estate plan information, transaction history, account balance, payment history, investment objectives, marital status, family relationships and other personal information.
Disclosure of Information
We do not disclose any nonpublic personal information about our customers or former customers to anyone, except as permitted by law. In addition to using this information to verify your identity (as required under law), the permitted uses may also include the disclosure of such information to unaffiliated companies for the following reasons:
| • | In order to provide you with products and services and to effect transactions that you request or authorize, we may disclose your personal information as described above to unaffiliated financial service providers and other companies that perform administrative or other services on our behalf, such as transfer agents, custodians and trustees, or that assist us in the distribution of investor materials such as trustees, banks, financial representatives, proxy services, solicitors and printers. |
| • | We may release information we have about you if you direct us to do so, if we are compelled by law to do so, or in other legally limited circumstances (for example to protect your account from fraud). |
In addition, in order to alert you to our other financial products and services, we may share your personal information within First Trust.
Use of Website Analytics
We currently use third party analytics tools, Google Analytics and AddThis, to gather information for purposes of improving First Trust’s website and marketing our products and services to you. These tools employ cookies, which are small pieces of text stored in a file by your web browser and sent to websites that you visit, to collect information, track website usage and viewing trends such as the number of hits, pages visited, videos and PDFs viewed and the length of user sessions in order to evaluate website performance and enhance navigation of the website. We may also collect other anonymous information, which is generally limited to technical and web navigation information such as the IP address of your device, internet browser type and operating system for purposes of analyzing the data to make First Trust’s website better and more useful to our users. The information collected does not include any personal identifiable information such as your name, address, phone number or email address unless you provide that information through the website for us to contact you in order to answer your questions or respond to your requests. To find out how to opt-out of these services click on: Google Analytics and AddThis.
Confidentiality and Security
With regard to our internal security procedures, First Trust restricts access to your nonpublic personal information to those First Trust employees who need to know that information to provide products or services to you. We maintain physical, electronic and procedural safeguards to protect your nonpublic personal information.
Policy Updates and Inquiries
As required by federal law, we will notify you of our privacy policy annually. We reserve the right to modify this policy at any time, however, if we do change it, we will tell you promptly. For questions about our policy, or for additional copies of this notice, please go to www.ftportfolios.com, or contact us at 1-800-621-1675 (First Trust Portfolios) or 1-800-222-6822 (First Trust Advisors).
March 2022
This page intentionally left blank
This page intentionally left blank
INVESTMENT ADVISOR
First Trust Advisors L.P.
120 East Liberty Drive, Suite 400
Wheaton, IL 60187
INVESTMENT SUB-ADVISOR
Stonebridge Advisors LLC
10 Westport Road, Suite C101
Wilton, CT 06897
ADMINISTRATOR,
FUND ACCOUNTANT &
CUSTODIAN
Brown Brothers Harriman & Co.
50 Post Office Square
Boston, MA 02110
TRANSFER AGENT
BNY Mellon Investment Servicing (US) Inc.
301 Bellevue Parkway
Wilmington, DE 19809
INDEPENDENT REGISTERED
PUBLIC ACCOUNTING FIRM
Deloitte & Touche LLP
111 S. Wacker Drive
Chicago, IL 60606
LEGAL COUNSEL
Chapman and Cutler LLP
320 South Canal Street
Chicago, IL 60606

First Trust/Confluence
Small Cap Value Fund
Annual Report
For the Year Ended
October 31, 2022
First Trust/Confluence Small Cap Value Fund
Annual Report
October 31, 2022
Caution Regarding Forward-Looking Statements
This report contains certain forward-looking statements within the meaning of the Securities Act of 1933, as amended, and the Securities Exchange Act of 1934, as amended. Forward-looking statements include statements regarding the goals, beliefs, plans or current expectations of First Trust Advisors L.P. (“First Trust” or the “Advisor”) and/or Confluence Investment Management LLC (“Confluence” or the “Sub-Advisor”) and their respective representatives, taking into account the information currently available to them. Forward-looking statements include all statements that do not relate solely to current or historical fact. For example, forward-looking statements include the use of words such as “anticipate,” “estimate,” “intend,” “expect,” “believe,” “plan,” “may,” “should,” “would” or other words that convey uncertainty of future events or outcomes.
Forward-looking statements involve known and unknown risks, uncertainties and other factors that may cause the actual results, performance or achievements of First Trust/Confluence Small Cap Value Fund (the “Fund”) to be materially different from any future results, performance or achievements expressed or implied by the forward-looking statements. When evaluating the information included in this report, you are cautioned not to place undue reliance on these forward-looking statements, which reflect the judgment of the Advisor and/or Sub-Advisor and their respective representatives only as of the date hereof. We undertake no obligation to publicly revise or update these forward-looking statements to reflect events and circumstances that arise after the date hereof.
Performance and Risk Disclosure
There is no assurance that the Fund will achieve its investment objective. The Fund is subject to market risk, which is the possibility that the market values of securities owned by the Fund will decline and that the value of the Fund’s shares may therefore be less than what you paid for them. Accordingly, you can lose money by investing in the Fund. See “Risk Considerations” in the Additional Information section of this report for a discussion of certain other risks of investing in the Fund.
Performance data quoted represents past performance, which is no guarantee of future results, and current performance may be lower or higher than the figures shown. For the most recent month-end performance figures, please visit www.ftportfolios.com or speak with your financial advisor. Investment returns and net asset value will fluctuate and Fund shares, when sold, may be worth more or less than their original cost.
The Advisor may also periodically provide additional information on Fund performance on the Fund’s web page at www.ftportfolios.com.
How to Read This Report
This report contains information that may help you evaluate your investment in the Fund. It includes details about the Fund and presents data and analysis that provide insight into the Fund’s performance and investment approach.
By reading the portfolio commentary by the portfolio management team of the Fund, you may obtain an understanding of how the market environment affected the Fund’s performance. The statistical information that follows may help you understand the Fund’s performance compared to that of relevant market benchmarks.
It is important to keep in mind that the opinions expressed by personnel of First Trust and Confluence are just that: informed opinions. They should not be considered to be promises or advice. The opinions, like the statistics, cover the period through the date on the cover of this report. The material risks of investing in the Fund are spelled out in the prospectus, the statement of additional information, this report and other Fund regulatory filings.
First Trust/Confluence Small Cap Value Fund
Annual Letter from the Chairman and CEO
October 31, 2022
Dear Shareholders,
First Trust is pleased to provide you with the annual report for the First Trust/Confluence Small Cap Value Fund (the “Fund”), which contains detailed information about the Fund for the twelve months ended October 31, 2022.
As I’m writing this letter in mid-November, it strikes me that things appear to be a little more chaotic in the current climate than normal. One of the things that may have contributed to the chaotic nature of the news flow of late was the November mid-term election. For the most part, except for a few seats in Congress, the election is behind us. We learned there would be no “red wave” (Republicans gaining a strong majority in Congress) but likely gridlock ahead. Gridlock has been good for stock market investors in the past few decades, particularly when there’s been a Democratic president and the Republicans have control of at least one house of Congress, according to Brian Wesbury, Chief Economist at First Trust.
The Federal Reserve (the “Fed”) has kept its promise to aggressively hike interest rates to combat robust inflation. As of November 13, 2022, the Fed has increased the Federal Funds target rate (upper bound) six times, from 0.25% to 4.00%. The Fed’s actions have some investors and pundits looking for evidence linking the interest rate hikes to a downturn in the economy. In short, the hope is that a pullback in economic activity might deter the Fed from executing further interest rate hikes. Fed Chairman Jerome Powell, however, recently said that the terminal rate (the ultimate rate the Fed is targeting) will likely need to be higher than previously estimated in order to curb stubbornly high inflation. The Consumer Price Index (“CPI”) is a commonly used measure of inflation. The CPI stood at 7.7% on a trailing 12-month basis as of October 31, 2022, according to the U.S. Bureau of Labor Statistics. That is down from its recent high of 9.1% in June 2022. Prior to this year, the last time the CPI was higher than 7.0% was over 40 years ago. While monetary policy is an ongoing process subject to change, the Fed does appear to be steadfast in its mission to bring the rate of inflation back to its preferred level of 2.0%, and that will take some time, in my opinion. Stay tuned!
Equity and fixed income markets have contended with numerous headwinds this year, such as the war between Russia and Ukraine. Since setting its all-time high of 4,796.56 on January 3, 2022, the S&P 500® Index has been in a bear market (a price decline of 20% or more from the most recent high) for the better part of 310 days. Suffice it to say, we are all looking forward to the end of this bear market. With respect to corrections and bear markets, the silver lining is that the S&P 500® Index has never failed to fully recover the losses sustained in any previous downturn. Where might we see demand for stocks moving forward? One such source could be stock buybacks. As of the last week of October 2022, U.S. companies had announced stock buybacks totaling $1 trillion so far this year, according to Birinyi Associates. The fixed income market has not been immune to selling pressure either. Year-to-date through November 10, 2022, yields on the 10-Year Treasury Note increased by 258 basis points. As you may be aware, bond yields and bond prices are inversely related, particularly with respect to investment-grade bonds. As yields rise, prices fall and vice versa. As noted above, the Fed has more work to do, so bond investors should not be surprised to see interest rates and bond yields trend at least a bit higher in the months ahead.
Thank you for giving First Trust the opportunity to play a role in your financial future. We value our relationship with you and will report on the Fund again in six months.
Sincerely,
James A. Bowen
Chairman of the Board of Trustees
Chief Executive Officer of First Trust Advisors L.P.
First Trust/Confluence Small Cap Value Fund
“AT A GLANCE”
As of October 31, 2022 (Unaudited)
| Fund Statistics | |
| First Trust/Confluence Small Cap Value Fund | Net Asset
Value (NAV) |
| Class A (FOVAX) | $30.64 |
| Class C (FOVCX) | $26.34 |
| Class I (FOVIX) | $31.85 |
| Sector Allocation | % of Total
Investments |
| Industrials | 28.2% |
| Financials | 22.9 |
| Consumer Staples | 13.8 |
| Consumer Discretionary | 9.4 |
| Information Technology | 7.2 |
| Utilities | 6.7 |
| Real Estate | 6.2 |
| Energy | 3.9 |
| Materials | 1.7 |
| Total | 100.0% |
| Top Ten Holdings | % of Total
Investments |
| BRP Group, Inc., Class A | 4.0% |
| J&J Snack Foods Corp. | 3.9 |
| Core Laboratories N.V. | 3.9 |
| Kadant, Inc. | 3.8 |
| Spectrum Brands Holdings, Inc. | 3.6 |
| Brown & Brown, Inc. | 3.6 |
| Hayward Holdings, Inc. | 3.6 |
| SJW Group | 3.4 |
| Bank of Marin Bancorp. | 3.4 |
| RBC Bearings, Inc. | 3.4 |
| Total | 36.6% |
First Trust/Confluence Small Cap Value Fund
“AT A GLANCE” (Continued)
As of October 31, 2022 (Unaudited)
Performance of a $10,000 Investment
This chart compares your Fund’s Class I performance to that of the Russell 2000® Value Index and the Russell 2000® Index from 10/31/2012 through 10/31/2022.
| Performance as of October 31, 2022 |
| | Class A
Inception 2/24/2011 | Class C
Inception 3/2/2011 | Class I
Inception 1/11/2011 | R2000V* | R2000* |
| Cumulative Total Returns | w/o
sales
charge | w/max
5.50%
sales
charge | w/o
sales
charge | w/max 1.00% contingent deferred sales charge | w/o
sales
charge | w/o
sales
charges | w/o
sales
charges |
| 1 Year | -16.65% | -21.24% | -17.27% | -18.09% | -16.45% | -16.45% | (10.73)% | (18.54)% |
| Average Annual Total Returns | | | | | | | |
| 5 Years | 1.74% | 0.60% | 1.01% | 1.01% | 2.11% | 2.11% | 5.31% | 5.56% |
| 10 Years | 7.43% | 6.82% | 6.59% | 6.59% | 7.68% | 7.68% | 9.37% | 9.93% |
| Since Inception | 6.99% | 6.47% | 5.85% | 5.85% | 7.29% | 7.29% | 8.38% | 8.85% |
* Since inception return is based on the Class I Shares inception date.
Performance figures assume reinvestment of all distributions and do not reflect the deduction of taxes that the shareholder would pay on Fund distributions or the redemption of Fund shares. The total returns would have been lower if certain fees had not been waived and expenses reimbursed by the Advisor. An index is a statistical composite that tracks a specific financial market or sector. Unlike the Fund, these indices do not actually hold a portfolio of securities and therefore do not incur the expenses incurred by the Fund. These expenses negatively impact the performance of the Fund. The Fund’s past performance does not predict future performance.
Performance of share classes will vary due to differences in sales charges and expenses. Total return with sales charges includes payment of the maximum sales charge of 5.50% for Class A Shares, a contingent deferred sales charge (“CDSC”) of 1.00% for Class C Shares in year one and 12b-1 service fees of 0.25% per year of average daily net assets for Class A Shares and combined Rule 12b-1 distribution and service fees of 1.00% per year of average daily net assets for Class C Shares. Class I Shares do not have a front-end sales charge or a CDSC, nor do they pay distribution or service fees.
Portfolio Commentary
First Trust/Confluence Small Cap Value Fund
Annual Report
October 31, 2022 (Unaudited)
Advisor
First Trust Advisors L.P. (“First Trust” or the “Advisor”) serves as the investment advisor to the First Trust/Confluence Small Cap Value Fund (the “Fund”). First Trust is responsible for the ongoing monitoring of the Fund’s investment portfolio, managing the Fund’s business affairs and providing certain administrative services necessary for the management of the Fund.
Sub-Advisor
Confluence Investment Management LLC, a registered investment advisor (“Confluence” or the “Sub-Advisor”), located in St. Louis, Missouri, serves as the sub-advisor to the Fund. The investment professionals at Confluence have an average of over 20 years of portfolio management experience each. Confluence professionals have invested in a wide range of specialty finance and other financial company securities during various market cycles, working to provide attractive risk-adjusted returns to clients.
Portfolio Management Team
Mark Keller, CFA - Chief Executive Officer and Chief Investment Officer of Confluence
Daniel Winter, CFA - Senior Vice President and Chief Investment Officer - Value Equity of Confluence
Thomas Dugan, CFA - Vice President and Portfolio Manager of Confluence
The portfolio managers are primarily and jointly responsible for the day-to-day management of the Fund. Mark Keller and Daniel Winter have served as a part of the portfolio management team of the Fund since 2011. Thomas Dugan has served as a part of the portfolio management team of the Fund since 2015.
Commentary
Market Recap
The past few years have not been for the faint of heart for small capitalization equity investors as overly accommodative monetary and fiscal policy overlaid with COVID-19 pandemic-induced lockdowns and the reopening of the economy have produced extremely volatile markets. As the chart below illustrates, the start of the 12-month period ended October 31, 2022, came on the heels of outsized returns and with consumers anxious to return to normal activities and flush with liquidity, which provided a nice backdrop to start the fiscal year. This positive sentiment and added liquidity also helped fuel an abundance of new stock issuance. Despite these strong tailwinds, the optimism for equities was hindered by stubbornly high inflation, which forced more aggressive monetary tightening by the Federal Reserve (the “Fed”), and geopolitical concerns surrounding Russia’s invasion of Ukraine and China’s overtures toward Taiwan. This led to a difficult fiscal year for small capitalization indexes, with the Russell 2000® posting a down year of -18.54%, and the Russell 2000® Value and Growth returning -10.73% and -26.02%, respectively, for the 12-month period ended October 31, 2022.
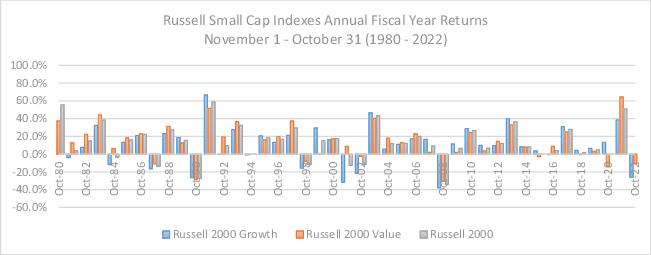
The pressure on equity markets continues to be caused by stubbornly high inflation which has forced the Fed to tighten more aggressively than expected. This was evident again in September 2022 when the Fed raised the Federal Funds target rate to 3.00-3.25%, marking the third consecutive increase of 75 basis points (“bps”) since mid-June 2022. Despite the Fed’s hawkishness, the broad market, as measured by the Russell 2000® Index, rallied over 21% between mid-June 2022 and mid-August 2022, as investors
Portfolio Commentary (Continued)
First Trust/Confluence Small Cap Value Fund
Annual Report
October 31, 2022 (Unaudited)
displayed their eagerness for a pivot. Unfortunately, the persistence of inflation did not allow for a pivot and many of the same trends continued through the end of the 12-month period ended October 31, 2022.
Delving further into the small capitalization indexes, they have witnessed an increasing number of unprofitable businesses embracing the public markets given the excess liquidity flowing from the adoption of the Fed’s Zero Interest Rate Policy and Quantitative Easing following the Great Financial Crisis of 2008-09 (“GFC”). Kailash Capital’s analysis of the Russell 2500 shows that non-earners topped out at over 40% in the past couple of years, up from less than 20% prior to the GFC. Not only have non-earners become a large percentage of the indexes, but they have also had a manic run over the past couple of years. The worm is now turning, but it may take some time before fundamentals become the focus again. When looking back at prior surges in optimism surrounding non-earners, specifically the dot.com surge of the late 1990s, data reveals that it can take a few years for the excess optimism to subside as the non-earners began to outperform in mid-1998 and peaked in early 2000 before reverting back below trend in late 2001.
Thus far in 2022, selling has been rather indiscriminate outside of the Energy sector, but we subscribe to the belief that fundamentals and valuations have historically been the driver of long-term returns. When they become the focus again, we believe active managers that seek companies with free cash flow generation at attractive valuations will likely be rewarded as they have been in the past. Lastly, the sharp drawdown in small capitalization stocks puts them at attractive valuations. According to data from BofA U.S. Equity & Quant Strategy, valuation levels have not been this attractive since 1990.
The Fund also had a difficult fiscal year, down 16.45%, experiencing many of the same headwinds as fundamentals and valuations remain out of favor.
Performance Analysis
There was an extremely wide dispersion in sector performance as the Energy sector posted outsized returns, while most of the sectors were deeply negative except for the Utilities and Consumer Staples sector, which tend to be defensive.
The Fund also saw wide dispersion among sector performance with the Health Care, Consumer Staples, and Utilities sectors posting positive absolute and relative results, while the Energy and Financial Services sectors were the relative laggards.
For the Fund, the underweighting and underperformance in the Energy sector holdings, specifically Core Laboratories (“CLB”), has been a detractor to relative performance. Core Labs is a leading provider of critical reservoir description services in testing rocks and fluids from oil and natural gas wells for Exploration & Production companies. It has an extensive and unparalleled lab network by placing science and geology experts in regions all over the world to study hydrocarbon deposits and become experts on a particular field. With this market-leading position and field expertise, CLB enjoys network effects with a vast proprietary and growing library of field geology and well flow information. The company aggregates well data and uses this information to learn more about a basin in order to hone its knowledge and provide greater reservoir insights for its customers. This virtuous circle strengthens its competitive advantages, which is an asset-light model serving a capital-intensive industry. The company’s business is especially valuable for offshore and international drilling, with approximately 80% of its revenue coming from outside the U.S. The international drilling rig count, a good proxy for future business, has increased 5% year-to-date versus North American drilling that has increased 30% year-to-date. Despite all the press to the contrary, the U.S. has significantly increased its hydrocarbon production relative to international producers. CLB also services the North American market through its perforating guns used in the fracking process, and that market remains competitive. Although the international rig count was down slightly through June 30, 2022, it has subsequently increased 7% through September 2022. Along with greater worldwide recession concerns that would dampen hydrocarbon demand, CLB has had to negotiate covenant waivers with its lenders for the short term, which has put pressure on its stock price. Nevertheless, CLB is a leader in its industry, and its near-term prospects should follow the international rig count as it continues to slowly rebound. We have confidence in the company’s market position and ability to execute.
Importantly, our investment approach is focused on understanding and valuing individual businesses with the emphasis on owning great businesses at bargain prices. This is a fundamental approach that views risk as the probability of a permanent loss of capital as opposed to tracking error of a benchmark. Companies that exhibit the attributes of great businesses that we look for (substantial competitive advantages, pricing power, free cash flow generation, high returns on invested capital) are often difficult to find in commodity-oriented or highly regulated industries in which pricing is contingent on factors outside their control. This will often result in over/underweighting certain areas of the market that either offer more attractive valuations or have superior underlying attributes. Subsequently, performance in any given time frame will be impacted by the market’s perception of the value of these individual businesses compared to the broad market.
This approach is research-intensive and deployed with a bottom-up focus of investing in businesses in a relatively concentrated manner; therefore, performance is ultimately driven by the underlying strength of the holdings of the Fund and less influenced by
Portfolio Commentary (Continued)
First Trust/Confluence Small Cap Value Fund
Annual Report
October 31, 2022 (Unaudited)
macro or top-down sector weightings. The emphasis is on owning a diversified portfolio of undervalued businesses, with sector weightings (over/under) considered more of a by-product of what the market is presenting as good investment opportunities.
Market and Fund Outlook
After decades of subdued inflation, the Fed is now witnessing elevated levels and has been forced to act accordingly. The Fed’s actions have naturally generated additional uncertainty around the impact these moves will have on the economy, which is weighing on investor sentiment. In our view, this uncertainty will likely continue as the market grapples with the pace and magnitude of future tightening, resulting in a continuation of the recent volatility. If anything, we believe the past few years have reinforced the fallacy of prognostication and highlight the importance of adhering to a disciplined process. At current levels, we believe the markets are providing attractive valuations for long-term fundamental investors, and we intend to take advantage of opportunities as they present themselves. As always, we remain focused on our core strength, which is analyzing and valuing businesses.
First Trust/Confluence Small Cap Value Fund
Understanding Your Fund Expenses
October 31, 2022 (Unaudited)
As a shareholder of the First Trust/Confluence Small Cap Value Fund (the “Fund”), you incur two types of costs: (1) transaction costs, including sales charges (loads) on purchases of Class A Shares and contingent deferred sales charges on the lesser of purchase price or redemption proceeds of Class C Shares; and (2) ongoing costs, including management fees, distribution and/or service (12b-1) fees, if any, and other Fund expenses. This Example is intended to help you understand your ongoing costs of investing in the Fund and to compare these costs with the ongoing costs of investing in other funds.
The Example is based on an investment of $1,000 invested at the beginning of the period and held through the six-month period ended October 31, 2022.
Actual Expenses
The first three columns of the table below provide information about actual account values and actual expenses. You may use the information in these columns, together with the amount you invested, to estimate the expenses that you paid over the period. Simply divide your account value by $1,000 (for example, an $8,600 account value divided by $1,000 = 8.6), then multiply the result by the number in the third column under the heading entitled “Expenses Paid During Period” to estimate the expenses you paid on your account during this six-month period.
Hypothetical Example for Comparison Purposes
The next three columns of the table below provide information about hypothetical account values and hypothetical expenses based on the Fund’s actual expense ratio and an assumed rate of return of 5% per year before expenses, which is not the Fund’s actual return. The hypothetical account values and expenses may not be used to estimate the actual ending account balance or expenses you paid for the period. You may use this information to compare the ongoing costs of investing in the Fund and other funds. To do so, compare this 5% hypothetical example with the 5% hypothetical examples that appear in the shareholder reports of the other funds.
Please note that the expenses shown in the table are meant to highlight your ongoing costs only and do not reflect any transactional costs such as sales charges (loads) or contingent deferred sales charges. Therefore, the hypothetical section of the table is useful in comparing ongoing costs only, and will not help you determine the relative total costs of owning different funds. In addition, if these transactional costs were included, your costs would have been higher.
| | Actual Expenses | | Hypothetical
(5% Return Before Expenses) | |
| | Beginning
Account
Value
5/1/2022 | Ending
Account
Value
10/31/2022 | Expenses Paid
During Period
5/1/2022 -
10/31/2022 (a) | | Beginning
Account
Value
5/1/2022 | Ending
Account
Value
10/31/2022 | Expenses Paid
During Period
5/1/2022 -
10/31/2022 (a) | Annualized
Expense
Ratios (b) |
Class A
| $ 1,000.00 | $ 956.30 | $ 7.89 | | $ 1,000.00 | $ 1,017.14 | $ 8.13 | 1.60% |
Class C
| $ 1,000.00 | $ 952.60 | $ 11.57 | | $ 1,000.00 | $ 1,013.36 | $ 11.93 | 2.35% |
Class I
| $ 1,000.00 | $ 957.60 | $ 6.66 | | $ 1,000.00 | $ 1,018.40 | $ 6.87 | 1.35% |
| (a) | Expenses are equal to the annualized expense ratios as indicated in the table multiplied by the average account value over the period (May 1, 2022 through October 31, 2022), multiplied by 184/365 (to reflect the six-month period). |
| (b) | These expense ratios reflect expense caps. |
First Trust/Confluence Small Cap Value Fund
Portfolio of Investments
October 31, 2022
| Shares | | Description | | Value |
| COMMON STOCKS – 90.2% |
| | | Air Freight & Logistics – 3.1% | | |
| 8,022 | | Forward Air Corp. | | $849,289 |
| | | Automobiles – 3.1% | | |
| 14,208 | | Winnebago Industries, Inc. | | 848,075 |
| | | Banks – 6.4% | | |
| 24,918 | | Bank of Marin Bancorp. | | 899,540 |
| 27,772 | | Veritex Holdings, Inc. | | 877,040 |
| | | | | 1,776,580 |
| | | Beverages – 3.1% | | |
| 7,750 | | MGP Ingredients, Inc. | | 868,387 |
| | | Building Products – 6.5% | | |
| 48,986 | | AZEK (The) Co., Inc. (a) | | 857,745 |
| 101,935 | | Hayward Holdings, Inc. (a) | | 942,899 |
| | | | | 1,800,644 |
| | | Capital Markets – 3.0% | | |
| 3,560 | | Morningstar, Inc. | | 826,561 |
| | | Chemicals – 1.6% | | |
| 18,934 | | Mativ, Inc. | | 449,493 |
| | | Diversified Consumer
Services – 2.1% | | |
| 26,579 | | Frontdoor, Inc. (a) | | 586,333 |
| | | Diversified Financial Services – 2.3% | | |
| 27,876 | | Cannae Holdings, Inc. (a) | | 645,608 |
| | | Electrical Equipment – 3.2% | | |
| 25,902 | | Allied Motion Technologies, Inc. | | 876,006 |
| | | Electronic Equipment,
Instruments & Components – 1.2% | | |
| 11,454 | | FARO Technologies, Inc. (a) | | 334,571 |
| | | Energy Equipment &
Services – 3.7% | | |
| 52,837 | | Core Laboratories N.V. | | 1,028,208 |
| | | Food Products – 3.8% | | |
| 7,058 | | J&J Snack Foods Corp. | | 1,041,831 |
| | | Gas Utilities – 3.2% | | |
| 18,320 | | Northwest Natural Holding Co. | | 881,009 |
| | | Household Products – 3.5% | | |
| 20,798 | | Spectrum Brands Holdings, Inc. | | 959,620 |
| | | Insurance – 10.3% | | |
| 16,043 | | Brown & Brown, Inc. | | 943,168 |
| 37,401 | | BRP Group, Inc., Class A (a) | | 1,060,319 |
| 91,625 | | Hagerty Inc., Class A (a) | | 832,871 |
| | | | | 2,836,358 |
| Shares | | Description | | Value |
|
| | | IT Services – 5.7% | | |
| 35,380 | | I3 Verticals, Inc., Class A (a) | | $769,869 |
| 12,009 | | Perficient, Inc. (a) | | 804,243 |
| | | | | 1,574,112 |
| | | Leisure Products – 0.8% | | |
| 25,162 | | American Outdoor Brands, Inc. (a) | | 224,445 |
| | | Machinery – 11.7% | | |
| 52,963 | | Gates Industrial Corp, PLC (a) | | 590,537 |
| 8,181 | | John Bean Technologies Corp. | | 746,107 |
| 5,630 | | Kadant, Inc. | | 1,001,859 |
| 3,527 | | RBC Bearings, Inc. (a) | | 894,200 |
| | | | | 3,232,703 |
| | | Personal Products – 2.8% | | |
| 20,080 | | Edgewell Personal Care Co. | | 786,935 |
| | | Real Estate Management &
Development – 0.2% | | |
| 3,000 | | RE/MAX Holdings, Inc., Class A | | 58,380 |
| | | Road & Rail – 2.6% | | |
| 38,555 | | Marten Transport Ltd. | | 723,677 |
| | | Textiles, Apparel & Luxury
Goods – 3.0% | | |
| 25,152 | | Movado Group, Inc. | | 831,777 |
| | | Water Utilities – 3.3% | | |
| 12,800 | | SJW Group | | 904,704 |
| | | Total Common Stocks | | 24,945,306 |
| | | (Cost $22,375,248) | | |
| REAL ESTATE INVESTMENT TRUSTS – 5.8% |
| | | Equity Real Estate Investment
Trusts – 5.8% | | |
| 43,760 | | Gladstone Commercial Corp. | | 769,738 |
| 24,653 | | Rayonier, Inc. | | 830,806 |
| | | Total Real Estate Investment Trusts | | 1,600,544 |
| | | (Cost $1,266,522) | | |
| | | Total Investments – 96.0% | | 26,545,850 |
| | | (Cost $23,641,770) | | |
| | | Net Other Assets and Liabilities – 4.0% | | 1,119,738 |
| | | Net Assets – 100.0% | | $27,665,588 |
| (a) | Non-income producing security. |
Page 8
See Notes to Financial Statements
First Trust/Confluence Small Cap Value Fund
Portfolio of Investments (Continued)
October 31, 2022
Valuation Inputs
A summary of the inputs used to value the Fund’s investments as of October 31, 2022 is as follows (see Note 2A - Portfolio Valuation in the Notes to Financial Statements):
| | Total
Value at
10/31/2022 | Level 1
Quoted
Prices | Level 2
Significant
Observable
Inputs | Level 3
Significant
Unobservable
Inputs |
| Common Stocks* | $ 24,945,306 | $ 24,945,306 | — | — |
| Real Estate Investment Trusts* | $ 1,600,544 | $ 1,600,544 | — | — |
| Total Investments | $ 26,545,850 | $ 26,545,850 | $— | $— |
| * | See Portfolio of Investments for industry breakout. |
See Notes to Financial Statements
Page 9
First Trust/Confluence Small Cap Value Fund
Statement of Assets and Liabilities
October 31, 2022
| ASSETS: | |
Investments, at value
(Cost $23,641,770)
| $ 26,545,850 |
Cash
| 1,643,452 |
| Receivables: | |
Fund shares sold
| 15,546 |
Dividends
| 10,349 |
From investment advisor
| 3,176 |
Prepaid expenses
| 49,791 |
Total Assets
| 28,268,164 |
| LIABILITIES: | |
| Payables: | |
Investment securities purchased
| 477,539 |
Audit and tax fees
| 48,940 |
Transfer agent fees
| 18,059 |
Custodian fees
| 14,125 |
Registration fees
| 11,041 |
Administrative fees
| 8,910 |
Interest and fees on loan
| 7,880 |
Shareholder reporting fees
| 7,658 |
Fund shares redeemed
| 3,543 |
Legal fees
| 2,621 |
12b-1 distribution and service fees
| 1,172 |
Financial reporting fees
| 771 |
Trustees’ fees and expenses
| 216 |
Other liabilities
| 101 |
Total Liabilities
| 602,576 |
NET ASSETS
| $27,665,588 |
| NET ASSETS consist of: | |
Paid-in capital
| $ 21,670,920 |
Par value
| 8,769 |
Accumulated distributable earnings (loss)
| 5,985,899 |
NET ASSETS
| $27,665,588 |
| Maximum Offering Price Per Share: | |
| Class A Shares: | |
Net asset value and redemption price per share (Based on net assets of $3,164,003 and 103,281 shares of beneficial interest issued and outstanding)
| $30.64 |
Maximum sales charge (5.50% of offering price)
| 1.78 |
Maximum offering price to public
| $32.42 |
| Class C Shares: | |
Net asset value and redemption price per share (Based on net assets of $664,070 and 25,208 shares of beneficial interest issued and outstanding)
| $26.34 |
| Class I Shares: | |
Net asset value and redemption price per share (Based on net assets of $23,837,515 and 748,395 shares of beneficial interest issued and outstanding)
| $31.85 |
Page 10
See Notes to Financial Statements
First Trust/Confluence Small Cap Value Fund
Statement of Operations
For the Year Ended October 31, 2022
| INVESTMENT INCOME: | |
Dividends (net of foreign withholding tax of $337)
| $ 437,966 |
Interest
| 3,176 |
Other
| 4 |
Total investment income
| 441,146 |
| EXPENSES: | |
Investment advisory fees
| 372,194 |
Transfer agent fees
| 92,301 |
Administrative fees
| 52,894 |
Audit and tax fees
| 42,000 |
Registration fees
| 40,158 |
Commitment and administrative agency fees
| 28,415 |
Shareholder reporting fees
| 22,120 |
| 12b-1 distribution and/or service fees: | |
Class A
| 9,455 |
Class C
| 10,563 |
Custodian fees
| 19,324 |
Trustees’ fees and expenses
| 17,152 |
Financial reporting fees
| 9,250 |
Legal fees
| 9,207 |
Listing expense
| 2,400 |
Other
| 1,309 |
Total expenses
| 728,742 |
Fees waived and expenses reimbursed by the investment advisor
| (206,310) |
Net expenses
| 522,432 |
NET INVESTMENT INCOME (LOSS)
| (81,286) |
| NET REALIZED AND UNREALIZED GAIN (LOSS): | |
Net realized gain (loss) on investments
| 3,196,030 |
Net change in unrealized appreciation (depreciation) on investments
| (9,687,557) |
NET REALIZED AND UNREALIZED GAIN (LOSS)
| (6,491,527) |
NET INCREASE (DECREASE) IN NET ASSETS RESULTING FROM OPERATIONS
| $(6,572,813) |
See Notes to Financial Statements
Page 11
First Trust/Confluence Small Cap Value Fund
Statements of Changes in Net Assets
| | Year
Ended
10/31/2022 | | Year
Ended
10/31/2021 |
| OPERATIONS: | | | |
Net investment income (loss)
| $ (81,286) | | $ (132,915) |
Net realized gain (loss)
| 3,196,030 | | 1,634,783 |
Net change in unrealized appreciation (depreciation)
| (9,687,557) | | 12,511,394 |
Net increase (decrease) in net assets resulting from operations
| (6,572,813) | | 14,013,262 |
| DISTRIBUTIONS TO SHAREHOLDERS FROM INVESTMENT OPERATIONS: | | | |
Class A Shares
| (38,305) | | — |
Class C Shares
| (15,999) | | — |
Class I Shares
| (348,176) | | — |
Total distributions to shareholders from investment operations
| (402,480) | | — |
| CAPITAL TRANSACTIONS: | | | |
Proceeds from shares sold
| 4,875,411 | | 14,320,289 |
Proceeds from shares reinvested
| 399,634 | | — |
Cost of shares redeemed
| (22,221,842) | | (11,369,746) |
Net increase (decrease) in net assets resulting from capital transactions
| (16,946,797) | | 2,950,543 |
Total increase (decrease) in net assets
| (23,922,090) | | 16,963,805 |
| NET ASSETS: | | | |
Beginning of period
| 51,587,678 | | 34,623,873 |
End of period
| $27,665,588 | | $51,587,678 |
Page 12
See Notes to Financial Statements
First Trust/Confluence Small Cap Value Fund
Financial Highlights
For a Share outstanding throughout each period
| Class A Shares | Year Ended October 31, |
| 2022 | | 2021 | | 2020 | | 2019 | | 2018 |
Net asset value, beginning of period
| $ 37.10 | | $ 26.75 | | $ 30.95 | | $ 33.98 | | $ 34.48 |
| Income from investment operations: | | | | | | | | | |
Net investment income (loss) (a)
| (0.14) | | (0.16) | | (0.10) | | (0.08) | | (0.20) |
Net realized and unrealized gain (loss)
| (5.97) | | 10.51 | | (4.10) | | 0.83 | | 1.63 |
Total from investment operations
| (6.11) | | 10.35 | | (4.20) | | 0.75 | | 1.43 |
| Distributions paid to shareholders from: | | | | | | | | | |
Net realized gain
| (0.35) | | — | | — | | (3.78) | | (1.93) |
Net asset value, end of period
| $30.64 | | $37.10 | | $26.75 | | $30.95 | | $33.98 |
Total return (b)
| (16.65)% | | 38.69% | | (13.57)% | | 4.77% | | 4.16% |
| Ratios to average net assets/supplemental data: | | | | | | | | | |
Net assets, end of period (in 000’s)
| $ 3,164 | | $ 4,381 | | $ 3,326 | | $ 8,612 | | $ 6,692 |
Ratio of total expenses to average net assets
| 2.61% | | 2.41% | | 2.69% | | 2.66% | | 2.71% |
Ratio of net expenses to average net assets
| 1.60% | | 1.60% | | 1.60% | | 1.60% | | 1.60% |
Ratio of net investment income (loss) to average net assets
| (0.42)% | | (0.45)% | | (0.34)% | | (0.28)% | | (0.56)% |
Portfolio turnover rate
| 17% | | 16% | | 18% | | 25% | | 35% |
| (a) | Based on average shares outstanding. |
| (b) | Assumes reinvestment of all distributions for the period and does not include payment of the maximum sales charge of 5.50% or contingent deferred sales charge (CDSC). On purchases of $1 million or more, a CDSC of 1% may be imposed on certain redemptions made within twelve months of purchase. If the sales charges were included, total returns would be lower. These returns include Rule 12b-1 service fees of 0.25% and do not reflect the deduction of taxes that a shareholder would pay on Fund distributions or the redemption of Fund shares. The total returns would have been lower if certain fees had not been waived and expenses reimbursed by the investment advisor. Total return is calculated for the time period presented and is not annualized for periods of less than one year. |
See Notes to Financial Statements
Page 13
First Trust/Confluence Small Cap Value Fund
Financial Highlights (Continued)
For a Share outstanding throughout each period
| Class C Shares | Year Ended October 31, |
| 2022 | | 2021 | | 2020 | | 2019 | | 2018 |
Net asset value, beginning of period
| $ 32.19 | | $ 23.29 | | $ 27.30 | | $ 30.61 | | $ 31.47 |
| Income from investment operations: | | | | | | | | | |
Net investment income (loss) (a)
| (0.35) | | (0.37) | | (0.26) | | (0.27) | | (0.42) |
Net realized and unrealized gain (loss)
| (5.15) | | 9.27 | | (3.75) | | 0.74 | | 1.49 |
Total from investment operations
| (5.50) | | 8.90 | | (4.01) | | 0.47 | | 1.07 |
| Distributions paid to shareholders from: | | | | | | | | | |
Net realized gain
| (0.35) | | — | | — | | (3.78) | | (1.93) |
Net asset value, end of period
| $26.34 | | $32.19 | | $23.29 | | $27.30 | | $30.61 |
Total return (b)
| (17.27)% | | 38.21% | | (14.65)% | | 4.33% | | 3.34% |
| Ratios to average net assets/supplemental data: | | | | | | | | | |
Net assets, end of period (in 000’s)
| $ 664 | | $ 1,488 | | $ 1,811 | | $ 2,671 | | $ 3,621 |
Ratio of total expenses to average net assets
| 4.76% | | 3.76% | | 4.06% | | 3.87% | | 3.69% |
Ratio of net expenses to average net assets
| 2.35% | | 2.35% | | 2.35% | | 2.35% | | 2.35% |
Ratio of net investment income (loss) to average net assets
| (1.18)% | | (1.19)% | | (1.05)% | | (1.03)% | | (1.31)% |
Portfolio turnover rate
| 17% | | 16% | | 18% | | 25% | | 35% |
| (a) | Based on average shares outstanding. |
| (b) | Assumes reinvestment of all distributions for the period and does not include payment of the maximum CDSC of 1%, charged on certain redemptions made within one year of purchase. If the sales charge was included, total returns would be lower. These returns include combined Rule 12b-1 distribution and service fees of 1% and do not reflect the deduction of taxes that a shareholder would pay on Fund distributions or the redemption of Fund shares. The total returns would have been lower if certain fees had not been waived and expenses reimbursed by the investment advisor. Total return is calculated for the time period presented and is not annualized for periods of less than one year. |
Page 14
See Notes to Financial Statements
First Trust/Confluence Small Cap Value Fund
Financial Highlights (Continued)
For a Share outstanding throughout each period
| Class I Shares | Year Ended October 31, |
| 2022 | | 2021 | | 2020 | | 2019 | | 2018 |
Net asset value, beginning of period
| $ 38.47 | | $ 27.63 | | $ 31.76 | | $ 34.65 | | $ 35.07 |
| Income from investment operations: | | | | | | | | | |
Net investment income (loss) (a)
| (0.06) | | (0.08) | | (0.03) | | (0.01) | | (0.11) |
Net realized and unrealized gain (loss)
| (6.21) | | 10.92 | | (4.10) | | 0.90 | | 1.62 |
Total from investment operations
| (6.27) | | 10.84 | | (4.13) | | 0.89 | | 1.51 |
| Distributions paid to shareholders from: | | | | | | | | | |
Net realized gain
| (0.35) | | — | | — | | (3.78) | | (1.93) |
Net asset value, end of period
| $31.85 | | $38.47 | | $27.63 | | $31.76 | | $34.65 |
Total return (b)
| (16.45)% | | 39.23% | | (13.00)% | | 5.14% | | 4.30% |
| Ratios to average net assets/supplemental data: | | | | | | | | | |
Net assets, end of period (in 000’s)
| $ 23,838 | | $ 45,719 | | $ 29,487 | | $ 15,747 | | $ 11,302 |
Ratio of total expenses to average net assets
| 1.79% | | 1.65% | | 1.96% | | 2.22% | | 2.33% |
Ratio of net expenses to average net assets
| 1.35% | | 1.35% | | 1.35% | | 1.35% | | 1.35% |
Ratio of net investment income (loss) to average net assets
| (0.16)% | | (0.21)% | | (0.11)% | | (0.02)% | | (0.29)% |
Portfolio turnover rate
| 17% | | 16% | | 18% | | 25% | | 35% |
| (a) | Based on average shares outstanding. |
| (b) | Assumes reinvestment of all distributions for the period. These returns do not reflect the deduction of taxes that a shareholder would pay on Fund distributions or the redemption of Fund shares. The total returns would have been lower if certain fees had not been waived and expenses reimbursed by the investment advisor. Total return is calculated for the time period presented and is not annualized for periods of less than one year. |
See Notes to Financial Statements
Page 15
Notes to Financial Statements
First Trust/Confluence Small Cap Value Fund
October 31, 2022
1. Organization
First Trust/Confluence Small Cap Value Fund (the “Fund”) is a series of the First Trust Series Fund (the “Trust”), a Massachusetts business trust organized on July 9, 2010, and is registered as a diversified open-end management investment company with the Securities and Exchange Commission (“SEC”) under the Investment Company Act of 1940, as amended (the “1940 Act”). The Fund offers three classes of shares: Class A, Class C and Class I. Each class represents an interest in the same portfolio of investments but with a different combination of sales charges, distribution and service (12b-1) fees, eligibility requirements and other features.
The Fund’s investment objective seeks to provide long-term capital appreciation. The Fund seeks to achieve its investment objective by investing, under normal market conditions, at least 80% of its net assets (including investment borrowings) in equity securities of U.S. listed companies with small market capitalizations (“Small-Cap Companies”) at the time of investment that Confluence Investment Management LLC (“Confluence” or the “Sub-Advisor”) believes have produced solid returns over extended periods of time. There can be no assurance that the Fund will achieve its investment objective. The Fund may not be appropriate for all investors.
2. Significant Accounting Policies
The Fund is considered an investment company and follows accounting and reporting guidance under Financial Accounting Standards Board Accounting Standards Codification Topic 946, “Financial Services-Investment Companies.” The following is a summary of significant accounting policies consistently followed by the Fund in the preparation of the financial statements. The preparation of the financial statements in accordance with accounting principles generally accepted in the United States of America (“U.S. GAAP”) requires management to make estimates and assumptions that affect the reported amounts and disclosures in the financial statements. Actual results could differ from those estimates.
A. Portfolio Valuation
The net asset value (“NAV”) of each class of shares of the Fund is determined daily as of the close of regular trading on the New York Stock Exchange (“NYSE”), normally 4:00 p.m. Eastern time, on each day the NYSE is open for trading. If the NYSE closes early on a valuation day, the NAV is determined as of that time. The NAV for each class is calculated by dividing the value of the Fund’s total assets attributable to such class (including accrued interest and dividends), less all liabilities attributable to such class (including accrued expenses, dividends declared but unpaid and any borrowings of the Fund), by the total number of shares of the class outstanding. Differences in NAV of each class of the Fund’s shares are generally expected to be due to the daily expense accruals of the specified distribution and service (12b-1) fees and transfer agency costs applicable to such class of shares and the resulting differential in the dividends that may be paid on each class of shares.
The Fund’s investments are valued daily at market value or, in the absence of market value with respect to any portfolio securities, at fair value. Market value prices represent readily available market quotations such as last sale or official closing prices from a national or foreign exchange (i.e., a regulated market) and are primarily obtained from third-party pricing services. Fair value prices represent any prices not considered market value prices and are either obtained from a third-party pricing service or are determined by the Pricing Committee of the Fund’s investment advisor, First Trust Advisors L.P. (“First Trust” or the “Advisor”), in accordance with valuation procedures approved by the Trust’s Board of Trustees, and in accordance with provisions of the 1940 Act and rules thereunder. Investments valued by the Advisor’s Pricing Committee, if any, are footnoted as such in the footnotes to the Portfolio of Investments. The Fund’s investments are valued as follows:
Common stocks, real estate investment trusts (“REITs”), and other equity securities listed on any national or foreign exchange (excluding The Nasdaq Stock Market LLC (“Nasdaq”) and the London Stock Exchange Alternative Investment Market (“AIM”)) are valued at the last sale price on the exchange on which they are principally traded or, for Nasdaq and AIM securities, the official closing price. Securities traded on more than one securities exchange are valued at the last sale price or official closing price, as applicable, at the close of the securities exchange representing the primary exchange for such securities.
Securities traded in an over-the-counter market are valued at the mean of their most recent bid and asked price, if available, and otherwise at their last trade price.
Certain securities may not be able to be priced by pre-established pricing methods. Such securities may be valued by the Advisor’s Pricing Committee at fair value. These securities generally include, but are not limited to, restricted securities (securities which may not be publicly sold without registration under the Securities Act of 1933, as amended) for which a third-party pricing service is unable to provide a market price; securities whose trading has been formally suspended; a security whose market or fair value price is not available from a pre-established pricing source; a security with respect to which an event has occurred that is likely to materially affect the value of the security after the market has closed but before the calculation of the Fund’s NAV or make it difficult or impossible to obtain a reliable market quotation; and a security whose price, as provided by the third-party pricing service, does not reflect the security’s fair value. As a general principle, the current fair value of a security would appear to be the amount which the owner might
Notes to Financial Statements (Continued)
First Trust/Confluence Small Cap Value Fund
October 31, 2022
reasonably expect to receive for the security upon its current sale. When fair value prices are used, generally they will differ from market quotations or official closing prices on the applicable exchanges. A variety of factors may be considered in determining the fair value of such securities, including, but not limited to, the following:
| 1) | the last sale price on the exchange on which they are principally traded or, for Nasdaq and AIM securities, the official closing price; |
| 2) | the type of security; |
| 3) | the size of the holding; |
| 4) | the initial cost of the security; |
| 5) | transactions in comparable securities; |
| 6) | price quotes from dealers and/or third-party pricing services; |
| 7) | relationships among various securities; |
| 8) | information obtained by contacting the issuer, analysts, or the appropriate stock exchange; |
| 9) | an analysis of the issuer’s financial statements; |
| 10) | the existence of merger proposals or tender offers that might affect the value of the security; and |
| 11) | other relevant factors. |
The Fund is subject to fair value accounting standards that define fair value, establish the framework for measuring fair value and provide a three-level hierarchy for fair valuation based upon the inputs to the valuation as of the measurement date. The three levels of the fair value hierarchy are as follows:
| • | Level 1 – Level 1 inputs are quoted prices in active markets for identical investments. An active market is a market in which transactions for the investment occur with sufficient frequency and volume to provide pricing information on an ongoing basis. |
| • | Level 2 – Level 2 inputs are observable inputs, either directly or indirectly, and include the following: |
| o | Quoted prices for similar investments in active markets. |
| o | Quoted prices for identical or similar investments in markets that are non-active. A non-active market is a market where there are few transactions for the investment, the prices are not current, or price quotations vary substantially either over time or among market makers, or in which little information is released publicly. |
| o | Inputs other than quoted prices that are observable for the investment (for example, interest rates and yield curves observable at commonly quoted intervals, volatilities, prepayment speeds, loss severities, credit risks, and default rates). |
| o | Inputs that are derived principally from or corroborated by observable market data by correlation or other means. |
| • | Level 3 – Level 3 inputs are unobservable inputs. Unobservable inputs may reflect the reporting entity’s own assumptions about the assumptions that market participants would use in pricing the investment. |
The inputs or methodologies used for valuing investments are not necessarily an indication of the risk associated with investing in those investments. A summary of the inputs used to value the Fund’s investments as of October 31, 2022, is included with the Fund’s Portfolio of Investments.
In December 2020, the SEC adopted Rule 2a-5 under the 1940 Act, establishing requirements to determine fair value in good faith for purposes of the 1940 Act. The rule permits fund boards to designate a fund’s investment adviser to perform fair value determinations, subject to board oversight and certain other conditions. The rule also defines when market quotations are “readily available” for purposes of the 1940 Act and requires a fund to fair value a portfolio investment when a market quotation is not readily available. The SEC also adopted new Rule 31a-4 under the 1940 Act, which sets forth recordkeeping requirements associated with fair value determinations. The compliance date for Rule 2a-5 and Rule 31a-4 was September 8, 2022.
Effective September 8, 2022 and pursuant to the requirements of Rule 2a-5, the Trust’s Board of Trustees designated the Advisor as its valuation designee to perform fair value determinations and approved new Advisor Valuation Procedures for the Trust.
B. Securities Transactions and Investment Income
Securities transactions are recorded as of the trade date. Realized gains and losses from securities transactions are recorded on the identified cost basis. Dividend income is recorded on the ex-dividend date. Interest income, if any, is recorded daily on the accrual basis, including the amortization of premiums and the accretion of discounts. Income is allocated on a pro rata basis to each class of shares.
Notes to Financial Statements (Continued)
First Trust/Confluence Small Cap Value Fund
October 31, 2022
The Fund may hold REITs. Distributions from such investments may be comprised of return of capital, capital gains and income. The actual character of amounts received during the year is not known until after the REITs’ fiscal year end. The Fund records the character of distributions received from REITs during the year based on estimates available. The characterization of distributions received by the Fund may be subsequently revised based on information received from the REITs after their tax reporting periods conclude.
C. Dividends and Distributions to Shareholders
The Fund will distribute to holders of its shares semi-annual dividends of all or a portion of its net income. Distributions of any net capital gains earned by the Fund will be distributed at least annually. Distributions will automatically be reinvested into additional Fund shares unless cash distributions are elected by the shareholder. The fund may also designate a portion of the amount paid to redeeming shareholders as a distribution for tax purposes.
Distributions from net investment income and realized capital gains are determined in accordance with federal income tax regulations, which may differ from U.S. GAAP. Certain capital accounts in the financial statements are periodically adjusted for permanent differences in order to reflect their tax character. These permanent differences are primarily due to the varying treatment of income and gain/loss on portfolio securities held by the Fund and have no impact on net assets or NAV per share. Temporary differences, which arise from recognizing certain items of income, expense and gain/loss in different periods for financial statement and tax purposes, will reverse at some point in the future. Permanent differences incurred during the fiscal year ended October 31, 2022, resulting in book and tax accounting differences, have been reclassified at year end to reflect an increase in accumulated net investment income (loss) of $150,528, a decrease in accumulated net realized gain (loss) of $58,322 and a decrease in paid-in capital of $92,206. Accumulated distributable earnings (loss) consists of accumulated net investment income (loss), accumulated net realized gain (loss) on investments, and unrealized appreciation (depreciation) on investments. Net assets were not affected by these reclassifications.
The tax character of distributions paid by the Fund during the fiscal years ended October 31, 2022 and 2021, was as follows:
| Distributions paid from: | 2022 | 2021 |
Ordinary income
| $— | $— |
Capital gains
| 402,480 | — |
Return of capital
| — | — |
As of October 31, 2022, the components of distributable earnings and net assets on a tax basis were as follows:
Undistributed ordinary income
| $— |
Undistributed capital gains
| 3,117,098 |
Total undistributed earnings
| 3,117,098 |
Accumulated capital and other losses
| (33,220) |
Net unrealized appreciation (depreciation)
| 2,904,080 |
Total accumulated earnings (losses)
| 5,987,958 |
Other
| (2,059) |
Paid-in capital
| 21,679,689 |
Total net assets
| $27,665,588 |
D. Income Taxes
The Fund intends to continue to qualify as a regulated investment company by complying with the requirements under Subchapter M of the Internal Revenue Code of 1986, as amended, which includes distributing substantially all of its net investment income and net realized gains to shareholders. Accordingly, no provision has been made for federal and state income taxes. However, due to the timing and amount of distributions, the Fund may be subject to an excise tax of 4% of the amount by which approximately 98% of the Fund’s taxable income exceeds the distributions from such taxable income for the calendar year.
The Fund intends to utilize provisions of the federal income tax laws, which allow it to carry a realized capital loss forward indefinitely following the year of the loss and offset such loss against any future realized capital gains. The Fund is subject to certain limitations under U.S. tax rules on the use of capital loss carryforwards and net unrealized built-in losses. These limitations apply when there has been a 50% change in ownership. At October 31, 2022, the Fund had no non-expiring net capital loss carryforwards for federal income tax purposes.
Notes to Financial Statements (Continued)
First Trust/Confluence Small Cap Value Fund
October 31, 2022
Certain losses realized during the current fiscal year may be deferred and treated as occurring on the first day of the following fiscal year for federal income tax purposes. For the fiscal year ended October 31, 2022, the Fund incurred and elected to defer net ordinary losses of $33,220.
The Fund is subject to accounting standards that establish a minimum threshold for recognizing, and a system for measuring, the benefits of a tax position taken or expected to be taken in a tax return. Taxable years ended 2019, 2020, 2021, and 2022 remain open to federal and state audit. As of October 31, 2022, management has evaluated the application of these standards to the Fund and has determined that no provision for income tax is required in the Fund’s financial statements for uncertain tax positions.
As of October 31, 2022, the aggregate cost, gross unrealized appreciation, gross unrealized depreciation, and net unrealized appreciation/(depreciation) on investments (including short positions and derivatives, if any) for federal income tax purposes were as follows:
| Tax Cost | | Gross
Unrealized
Appreciation | | Gross
Unrealized
(Depreciation) | | Net Unrealized
Appreciation
(Depreciation) |
| $23,643,829 | | $5,237,221 | | $(2,335,200) | | $2,902,021 |
E. Expenses
The Fund will pay all expenses directly related to its operations. Expenses of the Fund are allocated on a pro rata basis to each class of shares, except for distribution and service (12b-1) fees and incremental transfer agency costs which are unique to each class of shares.
3. Investment Advisory Fee, Affiliated Transactions and Other Fee Arrangements
First Trust, the investment advisor to the Fund, is a limited partnership with one limited partner, Grace Partners of DuPage L.P., and one general partner, The Charger Corporation. The Charger Corporation is an Illinois corporation controlled by James A. Bowen, Chief Executive Officer of First Trust. First Trust is responsible for the ongoing monitoring of the Fund’s investment portfolio, managing the Fund’s business affairs and providing certain administrative services necessary for the management of the Fund. For these services, First Trust is entitled to a monthly fee calculated at an annual rate of 1.00% of the Fund’s average daily net assets. First Trust also provides fund reporting services to the Fund for a flat annual fee in the amount of $9,250.
Confluence serves as the Fund’s sub-advisor and manages the Fund’s portfolio subject to First Trust’s supervision. The Sub-Advisor receives a monthly sub-advisory fee calculated at an annual rate of 0.50% of the Fund’s average daily net assets that is paid by First Trust out of its investment advisory fee.
First Trust and Confluence have agreed to waive fees and/or reimburse Fund expenses to the extent necessary to prevent the total annual fund operating expenses (excluding 12b-1 distribution and service fees, interest expenses, taxes, acquired fund fees and expenses, fees incurred in acquiring and disposing of portfolio securities and extraordinary expenses) from exceeding 1.35% of average daily net assets of any class of shares of the Fund (the “Expense Cap”) until February 28, 2024 and then from exceeding 1.70% from March 1, 2024 to February 28, 2033 (the “Expense Cap Termination Date”). Expenses borne and fees waived by First Trust and Confluence are subject to recovery on the Fund’s class level, if applicable, by First Trust and Confluence for up to three years from the date the fee or expense was incurred, but no reimbursement payment will be made by the Fund at any time if it would result in the Fund’s expenses exceeding (i) the Expense Cap in place for the most recent fiscal year for which such expense limitation was in place; (ii) the Expense Cap in place at the time the fees were waived; or (iii) the current Expense Cap. Expense limitations may be terminated or modified prior to their expiration only with the approval of the Board of Trustees of the Trust. These amounts would be included in “Expenses previously waived or reimbursed” on the Statement of Operations. The advisory fee waiver and expense reimbursement for the fiscal year ended October 31, 2022 and the expenses borne by First Trust and Confluence subject to recovery were as follows:
| | | | | Expenses Subject to Recovery | | |
Advisory Fee
Waiver | | Expense
Reimbursement | | Year Ended
October 31, 2020 | | Year Ended
October 31, 2021 | | Year Ended
October 31, 2022 | | Total |
| $ 206,310 | | $ — | | $ 234,495 | | $ 193,717 | | $ 206,310 | | $ 634,522 |
Brown Brothers Harriman & Co. (“BBH”) serves as the Fund’s administrator, fund accountant and custodian in accordance with certain fee arrangements. As administrator and fund accountant, BBH is responsible for providing certain administrative and
Notes to Financial Statements (Continued)
First Trust/Confluence Small Cap Value Fund
October 31, 2022
accounting services to the Fund, including maintaining the Fund’s books of account, records of the Fund’s securities transactions, and certain other books and records. As custodian, BBH is responsible for custody of the Fund’s assets.
BNY Mellon Investment Servicing (US) Inc. (“BNYM IS”) serves as the Fund’s transfer agent in accordance with certain fee arrangements. As transfer agent, BNYM IS is responsible for maintaining shareholder records for the Fund. BNYM IS is a subsidiary of The Bank of New York Mellon Corporation, a financial holding company.
Each Trustee who is not an officer or employee of First Trust, any sub-advisor or any of their affiliates (“Independent Trustees”) is paid a fixed annual retainer that is allocated equally among each fund in the First Trust Fund Complex. Each Independent Trustee is also paid an annual per fund fee that varies based on whether the fund is a closed-end or other actively managed fund, a target outcome fund or an index fund.
Additionally, the Lead Independent Trustee and the Chairs of the Audit Committee, Nominating and Governance Committee and Valuation Committee are paid annual fees to serve in such capacities, with such compensation allocated pro rata among each fund in the First Trust Fund Complex based on net assets. Independent Trustees are reimbursed for travel and out-of-pocket expenses in connection with all meetings. The Lead Independent Trustee and Committee Chairs rotate every three years. The officers and “Interested” Trustee receive no compensation from the Trust for acting in such capacities.
4. Capital Share Transactions
Capital transactions were as follows:
| | Year Ended
October 31, 2022 | | Year Ended
October 31, 2021 |
| | Shares | | Value | | Shares | | Value |
| Sales: | | | | | | | |
| Class A | 27,684 | | $ 918,435 | | 41,119 | | $ 1,465,200 |
| Class C | 3,140 | | 97,104 | | 10,247 | | 299,799 |
| Class I | 110,509 | | 3,859,872 | | 347,663 | | 12,555,290 |
| Total Sales | 141,333 | | $ 4,875,411 | | 399,029 | | $ 14,320,289 |
| Dividend Reinvestment: | | | | | | | |
| Class A | 1,021 | | $ 37,512 | | — | | $— |
| Class C | 486 | | $ 15,466 | | — | | $— |
| Class I | 9,089 | | $ 346,656 | | — | | $— |
| Total Dividend Reinvestment | 10,596 | | $ 399,634 | | — | | $ — |
| Redemptions: | | | | | | | |
| Class A | (43,526) | | $ (1,452,775) | | (47,385) | | $ (1,629,744) |
| Class C | (24,631) | | (696,835) | | (41,768) | | (1,280,146) |
| Class I | (559,770) | | (20,072,232) | | (226,380) | | (8,459,856) |
| Total Redemptions | (627,927) | | $ (22,221,842) | | (315,533) | | $ (11,369,746) |
5. Purchases and Sales of Securities
The cost of purchases and proceeds from sales of securities, excluding short-term investments, for the fiscal year ended October 31, 2022, were $6,112,251 and $22,558,104, respectively.
6. Distribution and Service Plan
The Board of Trustees adopted a Distribution and Service Plan pursuant to Rule 12b-1 under the 1940 Act. In accordance with the Rule 12b-1 plan, the share classes of the Fund are authorized to pay an amount up to 0.25% and 1.00% of their average daily net assets each year for Class A and Class C, respectively, to reimburse First Trust Portfolios L.P. (“FTP”), the distributor of the Fund, for amounts expended to finance activities primarily intended to result in the sale of Fund shares or the provision of investor services. FTP may also use this amount to compensate securities dealers or other persons for providing distribution assistance, including broker-dealer and shareholder support and educational and promotional services. Class I shares have no 12b-1 fees.
Notes to Financial Statements (Continued)
First Trust/Confluence Small Cap Value Fund
October 31, 2022
7. Borrowings
The Trust, on behalf of the Fund, along with First Trust Exchange-Traded Fund III and First Trust Exchange-Traded Fund IV have a $305 million Credit Agreement with The Bank of Nova Scotia (“Scotia”) as administrative agent for a group of lenders. Between March 2, 2022 and October 30, 2022, the commitment amount was $280 million, and prior to March 2, 2022, the commitment amount was $355 million. Scotia charges a commitment fee of 0.25% of the daily amount of the excess of the commitment amount over the outstanding principal balance of the loans, and an agency fee. First Trust allocates the commitment fee and agency fee amongst the funds that have access to the credit line. To the extent that the Fund accesses the credit line, there would also be an interest fee charged. The Fund did not have any borrowings outstanding during the fiscal year ended October 31, 2022.
8. Indemnification
The Fund has a variety of indemnification obligations under contracts with its service providers. The Fund’s maximum exposure under these arrangements is unknown. However, the Fund has not had prior claims or losses pursuant to these contracts and expects the risk of loss to be remote.
9. Subsequent Events
Management has evaluated the impact of all subsequent events to the Fund through the date the financial statements were issued and has determined that there were no subsequent events requiring recognition or disclosure in the financial statements that have not already been disclosed.
Report of Independent Registered Public Accounting Firm
To the Shareholders and the Board of Trustees of First Trust Series Fund:
Opinion on the Financial Statements and Financial Highlights
We have audited the accompanying statement of assets and liabilities of First Trust/Confluence Small Cap Value Fund (the “Fund”), a series of the First Trust Series Fund, including the portfolio of investments, as of October 31, 2022, the related statement of operations for the year then ended, the statements of changes in net assets for each of the two years in the period then ended, the financial highlights for each of the five years in the period then ended, and the related notes. In our opinion, the financial statements and financial highlights present fairly, in all material respects, the financial position of the Fund as of October 31, 2022, the results of its operations for the year then ended, the changes in its net assets for each of the two years in the period then ended, and the financial highlights for each of the five years in the period then ended in conformity with accounting principles generally accepted in the United States of America.
Basis for Opinion
These financial statements and financial highlights are the responsibility of the Fund’s management. Our responsibility is to express an opinion on the Fund’s financial statements and financial highlights based on our audits. We are a public accounting firm registered with the Public Company Accounting Oversight Board (United States) (PCAOB) and are required to be independent with respect to the Fund in accordance with the U.S. federal securities laws and the applicable rules and regulations of the Securities and Exchange Commission and the PCAOB.
We conducted our audits in accordance with the standards of the PCAOB. Those standards require that we plan and perform the audit to obtain reasonable assurance about whether the financial statements and financial highlights are free of material misstatement, whether due to error or fraud. The Fund is not required to have, nor were we engaged to perform, an audit of its internal control over financial reporting. As part of our audits we are required to obtain an understanding of internal control over financial reporting but not for the purpose of expressing an opinion on the effectiveness of the Fund’s internal control over financial reporting. Accordingly, we express no such opinion.
Our audits included performing procedures to assess the risks of material misstatement of the financial statements and financial highlights, whether due to error or fraud, and performing procedures that respond to those risks. Such procedures included examining, on a test basis, evidence regarding the amounts and disclosures in the financial statements and financial highlights. Our audits also included evaluating the accounting principles used and significant estimates made by management, as well as evaluating the overall presentation of the financial statements and financial highlights. Our procedures included confirmation of securities owned as of October 31, 2022, by correspondence with the custodian and brokers; when replies were not received from brokers, we performed other auditing procedures. We believe that our audits provide a reasonable basis for our opinion.
Chicago, Illinois
December 21, 2022
We have served as the auditor of one or more First Trust investment companies since 2001.
Additional Information
First Trust/Confluence Small Cap Value Fund
October 31, 2022 (Unaudited)
Proxy Voting Policies and Procedures
A description of the policies and procedures that the Trust uses to determine how to vote proxies and information on how the Fund voted proxies relating to portfolio securities during the most recent 12-month period ended June 30 is available (1) without charge, upon request, by calling (800) 988-5891; (2) on the Fund’s website at www.ftportfolios.com; and (3) on the Securities and Exchange Commission’s (“SEC”) website at www.sec.gov.
Portfolio Holdings
The Fund files portfolio holdings information for each month in a fiscal quarter within 60 days after the end of the relevant fiscal quarter on Form N-PORT. Portfolio holdings information for the third month of each fiscal quarter will be publicly available on the SEC’s website at www.sec.gov. The Fund’s complete schedule of portfolio holdings for the second and fourth quarters of each fiscal year is included in the semi-annual and annual reports to shareholders, respectively, and is filed with the SEC on Form N-CSR. The semi-annual and annual report for the Fund is available to investors within 60 days after the period to which it relates. The Fund’s Forms N-PORT and Forms N-CSR are available on the SEC’s website listed above.
Federal Tax Information
For the year ended October 31, 2022, the amount of long-term capital gain distributions designated by the Fund was $402,480, which is taxable at the applicable capital gain tax rates for federal income tax purposes.
Risk Considerations
Risks are inherent in all investing. Certain general risks that may be applicable to a Fund are identified below, but not all of the material risks relevant to each Fund are included in this report and not all of the risks below apply to each Fund. The material risks of investing in each Fund are spelled out in its prospectus, statement of additional information and other regulatory filings. Before investing, you should consider each Fund’s investment objective, risks, charges and expenses, and read each Fund’s prospectus and statement of additional information carefully. You can download each Fund’s prospectus at www.ftportfolios.com or contact First Trust Portfolios L.P. at (800) 621-1675 to request a prospectus, which contains this and other information about each Fund.
Concentration Risk. To the extent that a fund is able to invest a significant percentage of its assets in a single asset class or the securities of issuers within the same country, state, region, industry or sector, an adverse economic, business or political development may affect the value of the fund’s investments more than if the fund were more broadly diversified. A fund that tracks an index will be concentrated to the extent the fund’s corresponding index is concentrated. A concentration makes a fund more susceptible to any single occurrence and may subject the fund to greater market risk than a fund that is more broadly diversified.
Credit Risk. Credit risk is the risk that an issuer of a security will be unable or unwilling to make dividend, interest and/or principal payments when due and the related risk that the value of a security may decline because of concerns about the issuer’s ability to make such payments.
Cyber Security Risk. The funds are susceptible to potential operational risks through breaches in cyber security. A breach in cyber security refers to both intentional and unintentional events that may cause a fund to lose proprietary information, suffer data corruption or lose operational capacity. Such events could cause a fund to incur regulatory penalties, reputational damage, additional compliance costs associated with corrective measures and/or financial loss. In addition, cyber security breaches of a fund’s third-party service providers, such as its administrator, transfer agent, custodian, or sub-advisor, as applicable, or issuers in which the fund invests, can also subject a fund to many of the same risks associated with direct cyber security breaches.
Derivatives Risk. To the extent a fund uses derivative instruments such as futures contracts, options contracts and swaps, the fund may experience losses because of adverse movements in the price or value of the underlying asset, index or rate, which may be magnified by certain features of the derivative. These risks are heightened when a fund’s portfolio managers use derivatives to enhance the fund’s return or as a substitute for a position or security, rather than solely to hedge (or offset) the risk of a position or security held by the fund.
Equity Securities Risk. To the extent a fund invests in equity securities, the value of the fund’s shares will fluctuate with changes in the value of the equity securities. Equity securities prices fluctuate for several reasons, including changes in investors’ perceptions of the financial condition of an issuer or the general condition of the relevant stock market, such as market volatility, or when political or economic events affecting the issuers occur. In addition, common stock prices may be particularly sensitive to rising interest rates, as the cost of capital rises and borrowing costs increase. Equity securities may decline significantly in price over short or extended periods of time, and such declines may occur in the equity market as a whole, or they may occur in only a particular country, company, industry or sector of the market.
Additional Information (Continued)
First Trust/Confluence Small Cap Value Fund
October 31, 2022 (Unaudited)
ETF Risk. The shares of an ETF trade like common stock and represent an interest in a portfolio of securities. The risks of owning an ETF generally reflect the risks of owning the underlying securities, although lack of liquidity in an ETF could result in it being more volatile and ETFs have management fees that increase their costs. Shares of an ETF trade on an exchange at market prices rather than net asset value, which may cause the shares to trade at a price greater than net asset value (premium) or less than net asset value (discount). In times of market stress, decisions by market makers to reduce or step away from their role of providing a market for an ETF’s shares, or decisions by an ETF’s authorized participants that they are unable or unwilling to proceed with creation and/or redemption orders of an ETF’s shares, could result in shares of the ETF trading at a discount to net asset value and in greater than normal intraday bid-ask spreads.
Fixed Income Securities Risk. To the extent a fund invests in fixed income securities, the fund will be subject to credit risk, income risk, interest rate risk, liquidity risk and prepayment risk. Income risk is the risk that income from a fund’s fixed income investments could decline during periods of falling interest rates. Interest rate risk is the risk that the value of a fund’s fixed income securities will decline because of rising interest rates. Liquidity risk is the risk that a security cannot be purchased or sold at the time desired, or cannot be purchased or sold without adversely affecting the price. Prepayment risk is the risk that the securities will be redeemed or prepaid by the issuer, resulting in lower interest payments received by the fund. In addition to these risks, high yield securities, or “junk” bonds, are subject to greater market fluctuations and risk of loss than securities with higher ratings, and the market for high yield securities is generally smaller and less liquid than that for investment grade securities.
Investment Companies Risk. To the extent a fund invests in the securities of other investment vehicles, the fund will incur additional fees and expenses that would not be present in a direct investment in those investment vehicles. Furthermore, the fund’s investment performance and risks are directly related to the investment performance and risks of the investment vehicles in which the fund invests.
LIBOR Risk. To the extent a fund invests in floating or variable rate obligations that use the London Interbank Offered Rate (“LIBOR”) as a reference interest rate, it is subject to LIBOR Risk. The United Kingdom’s Financial Conduct Authority, which regulates LIBOR, will cease making LIBOR available as a reference rate over a phase-out period that will begin immediately after December 31, 2021. The unavailability or replacement of LIBOR may affect the value, liquidity or return on certain fund investments and may result in costs incurred in connection with closing out positions and entering into new trades. Any potential effects of the transition away from LIBOR on the fund or on certain instruments in which the fund invests can be difficult to ascertain, and they may vary depending on a variety of factors, and they could result in losses to the fund.
Management Risk. To the extent that a fund is actively managed, it is subject to management risk. In managing an actively-managed fund’s investment portfolio, the fund’s portfolio managers will apply investment techniques and risk analyses that may not have the desired result. There can be no guarantee that a fund will meet its investment objective.
Market Risk. Securities held by a fund, as well as shares of a fund itself, are subject to market fluctuations caused by factors such as general economic conditions, political events, regulatory or market developments, changes in interest rates and perceived trends in securities prices. Shares of a fund could decline in value or underperform other investments as a result of the risk of loss associated with these market fluctuations. In addition, local, regional or global events such as war, acts of terrorism, spread of infectious diseases or other public health issues, recessions, or other events could have a significant negative impact on a fund and its investments. Such events may affect certain geographic regions, countries, sectors and industries more significantly than others. The outbreak of the respiratory disease designated as COVID-19 in December 2019 has caused significant volatility and declines in global financial markets, which have caused losses for investors. While the development of vaccines has slowed the spread of the virus and allowed for the resumption of “reasonably” normal business activity in the United States, many countries continue to impose lockdown measures in an attempt to slow the spread. Additionally, there is no guarantee that vaccines will be effective against emerging variants of the disease.
Non-U.S. Securities Risk. To the extent a fund invests in non-U.S. securities, it is subject to additional risks not associated with securities of domestic issuers. Non-U.S. securities are subject to higher volatility than securities of domestic issuers due to: possible adverse political, social or economic developments; restrictions on foreign investment or exchange of securities; capital controls; lack of liquidity; currency exchange rates; excessive taxation; government seizure of assets; the imposition of sanctions by foreign governments; different legal or accounting standards; and less government supervision and regulation of exchanges in foreign countries. Investments in non-U.S. securities may involve higher costs than investments in U.S. securities, including higher transaction and custody costs, as well as additional taxes imposed by non-U.S. governments. These risks may be heightened for securities of companies located, or with significant operations, in emerging market countries.
Operational Risk. Each fund is subject to risks arising from various operational factors, including, but not limited to, human error, processing and communication errors, errors of a fund’s service providers, counterparties or other third-parties, failed or inadequate processes and technology or systems failures. Each fund relies on third-parties for a range of services, including custody. Any delay or failure relating to engaging or maintaining such service providers may affect a fund’s ability to meet its investment objective. Although
Additional Information (Continued)
First Trust/Confluence Small Cap Value Fund
October 31, 2022 (Unaudited)
the funds and the funds’ investment advisor seek to reduce these operational risks through controls and procedures, there is no way to completely protect against such risks.
| NOT FDIC INSURED | NOT BANK GUARANTEED | MAY LOSE VALUE |
Advisory and Sub-Advisory Agreements
Board Considerations Regarding Approval of Continuation of Investment Management and Investment Sub-Advisory Agreements
The Board of Trustees of First Trust Series Fund (the “Trust”), including the Independent Trustees, unanimously approved the continuation of the Investment Management Agreement (the “Advisory Agreement”) between the Trust, on behalf of the First Trust/Confluence Small Cap Value Fund (the “Fund”), and First Trust Advisors L.P. (the “Advisor”) and the Investment Sub-Advisory Agreement (the “Sub-Advisory Agreement” and together with the Advisory Agreement, the “Agreements”) among the Trust, on behalf of the Fund, the Advisor and Confluence Investment Management LLC (the “Sub-Advisor”). The Board approved the continuation of the Agreements for a one-year period ending June 30, 2023 at a meeting held on June 12–13, 2022. The Board determined that the continuation of the Agreements is in the best interests of the Fund in light of the nature, extent and quality of the services provided and such other matters as the Board considered to be relevant in the exercise of its business judgment.
To reach this determination, the Board considered its duties under the Investment Company Act of 1940, as amended (the “1940 Act”), as well as under the general principles of state law, in reviewing and approving advisory contracts; the requirements of the 1940 Act in such matters; the fiduciary duty of investment advisors with respect to advisory agreements and compensation; the standards used by courts in determining whether investment company boards have fulfilled their duties; and the factors to be considered by the Board in voting on such agreements. At meetings held on April 18, 2022 and June 12–13, 2022, the Board, including the Independent Trustees, reviewed materials provided by the Advisor and the Sub-Advisor responding to requests for information from counsel to the Independent Trustees, submitted on behalf of the Independent Trustees, that, among other things, outlined: the services provided by the Advisor and the Sub-Advisor to the Fund (including the relevant personnel responsible for these services and their experience); the advisory fee rate payable by the Fund and the sub-advisory fee rate as compared to fees charged to a peer group of funds (the “Expense Group”) and a broad peer universe of funds (the “Expense Universe”), each assembled by Broadridge Financial Solutions, Inc. (“Broadridge”), an independent source, and as compared to fees charged to other clients of the Advisor and the Sub-Advisor; the expense ratio of the Fund as compared to expense ratios of the funds in the Fund’s Expense Group and Expense Universe; performance information for the Fund, including comparisons of the Fund’s performance to that of one or more relevant benchmark indexes and to that of a performance group of funds and a broad performance universe of funds (the “Performance Universe”), each assembled by Broadridge; the nature of expenses incurred in providing services to the Fund and the potential for the Advisor and the Sub-Advisor to realize economies of scale, if any; profitability and other financial data for the Advisor; financial data for the Sub-Advisor; any indirect benefits to the Advisor and its affiliate, First Trust Portfolios L.P. (“FTP”), and the Sub-Advisor; and information on the Advisor’s and the Sub-Advisor’s compliance programs. The Board reviewed initial materials with the Advisor at the meeting held on April 18, 2022, prior to which the Independent Trustees and their counsel met separately to discuss the information provided by the Advisor and the Sub-Advisor. Following the April meeting, counsel to the Independent Trustees, on behalf of the Independent Trustees, requested certain clarifications and supplements to the materials provided, and the information provided in response to those requests was considered at an executive session of the Independent Trustees and their counsel held prior to the June 12–13, 2022 meeting, as well as at the June meeting. The Board applied its business judgment to determine whether the arrangements between the Trust and the Advisor and among the Trust, the Advisor and the Sub-Advisor continue to be reasonable business arrangements from the Fund’s perspective. The Board determined that, given the totality of the information provided with respect to the Agreements, the Board had received sufficient information to renew the Agreements. The Board considered that shareholders chose to invest or remain invested in the Fund knowing that the Advisor and the Sub-Advisor manage the Fund and knowing the Fund’s advisory fee.
In reviewing the Agreements, the Board considered the nature, extent and quality of the services provided by the Advisor and the Sub-Advisor under the Agreements. With respect to the Advisory Agreement, the Board considered that the Advisor is responsible for the overall management and administration of the Trust and the Fund and reviewed all of the services provided by the Advisor to the Fund, including the oversight of the Sub-Advisor, as well as the background and experience of the persons responsible for such services. The Board noted that the Advisor oversees the Sub-Advisor’s day-to-day management of the Fund’s investments, including portfolio risk monitoring and performance review. In reviewing the services provided, the Board noted the compliance program that had been developed by the Advisor and considered that it includes a robust program for monitoring the Advisor’s, the Sub-Advisor’s and the Fund’s compliance with the 1940 Act, as well as the Fund’s compliance with its investment objective, policies and restrictions. The Board also considered a report from the Advisor with respect to its risk management functions related to the operation of the Fund. Finally, as part of the Board’s consideration of the Advisor’s services, the Advisor, in its written materials and at the April 18, 2022 meeting, described to the Board the scope of its ongoing investment in additional personnel and infrastructure to maintain and improve the quality of services provided to the Fund and the other funds in the First Trust Fund Complex. With respect to the
Additional Information (Continued)
First Trust/Confluence Small Cap Value Fund
October 31, 2022 (Unaudited)
Sub-Advisory Agreement, the Board reviewed the materials provided by the Sub-Advisor and considered the services that the Sub-Advisor provides to the Fund, including the Sub-Advisor’s day-to-day management of the Fund’s investments. In considering the Sub-Advisor’s management of the Fund, the Board noted the background and experience of the Sub-Advisor’s portfolio management team, including the Board’s prior meetings with members of the portfolio management team. In light of the information presented and the considerations made, the Board concluded that the nature, extent and quality of the services provided to the Trust and the Fund by the Advisor and the Sub-Advisor under the Agreements have been and are expected to remain satisfactory and that the Sub-Advisor, under the oversight of the Advisor, has managed the Fund consistent with its investment objective, policies and restrictions.
The Board considered the advisory and sub-advisory fee rates payable under the Agreements for the services provided. The Board noted that the sub-advisory fee is paid by the Advisor from its advisory fee. The Board considered that the Advisor and the Sub-Advisor agreed to extend the current expense caps for each share class through February 28, 2024 and agreed to keep the long-term expense cap in place from March 1, 2024 through February 28, 2033. The Board noted that fees waived or expenses borne by the Advisor and the Sub-Advisor are subject to reimbursement by the Fund for up to three years from the date the fee was waived or expense was incurred, but no reimbursement payment would be made by the Fund at any time if it would result in the Fund’s expenses exceeding (i) the applicable expense limitation in place for the most recent fiscal year for which such expense limitation was in place, (ii) the applicable expense limitation in place at the time the fees were waived, or (iii) the current expense limitation. The Board received and reviewed information showing the fee rates and expense ratios of the peer funds in the Expense Group, as well as advisory and unitary fee rates charged by the Advisor and the Sub-Advisor to other fund and non-fund clients, as applicable. With respect to the Expense Group, the Board, at the April 18, 2022 meeting, discussed with Broadridge its methodology for assembling peer groups and discussed with the Advisor limitations in creating a relevant peer group for the Fund, including that not all peer funds employ an advisor/sub-advisor management structure. The Board took these limitations into account in considering the peer data. Based on the information provided, the Board noted that the contractual advisory fee rate payable by the Fund was above the median contractual advisory fee of the peer funds in the Expense Group. The Board also noted that the Fund’s total (net) expense ratio (Class A shares) was above the median total (net) expense ratio of the peer funds in the Expense Group. With respect to fees charged to other clients, the Board considered differences between the Fund and other clients that limited their comparability. In considering the advisory fee rate overall, the Board also considered the Advisor’s statement that it seeks to meet investor needs through innovative and value-added investment solutions and the Advisor’s demonstrated long-term commitment to the Fund and the other funds in the First Trust Fund Complex.
The Board considered performance information for the Fund. The Board noted the process it has established for monitoring the Fund’s performance and portfolio risk on an ongoing basis, which includes quarterly performance reporting from the Advisor and the Sub-Advisor for the Fund. The Board determined that this process continues to be effective for reviewing the Fund’s performance. The Board received and reviewed information comparing the Fund’s performance for periods ended December 31, 2021 to the performance of the funds in the Performance Universe and to that of a benchmark index. Based on the information provided, the Board noted that the Fund (Class A shares) underperformed the Performance Universe median for the one-, three-, five- and ten-year periods ended December 31, 2021. The Board also noted that the Fund (Class A shares) underperformed the benchmark index for the one-, three- and ten-year periods ended December 31, 2021 and outperformed the benchmark index for the five-year period ended December 31, 2021.
On the basis of all the information provided on the fees, expenses and performance of the Fund and the ongoing oversight by the Board, the Board concluded that the advisory and sub-advisory fees for the Fund continue to be reasonable and appropriate in light of the nature, extent and quality of the services provided by the Advisor and the Sub-Advisor to the Fund under the Agreements.
The Board considered information and discussed with the Advisor whether there were any economies of scale in connection with providing advisory services to the Fund and noted the Advisor’s statement that it believes that its expenses relating to providing advisory services to the Fund will likely increase during the next twelve months as the Advisor continues to build infrastructure and add new staff. The Board considered the revenues and allocated costs (including the allocation methodology) of the Advisor in serving as investment advisor to the Fund for the twelve months ended December 31, 2021 and the estimated profitability level for the Fund calculated by the Advisor based on such data, as well as complex-wide and product-line profitability data, for the same period. The Board noted the inherent limitations in the profitability analysis and concluded that, based on the information provided, the Advisor’s profitability level for the Fund was not unreasonable. In addition, the Board considered indirect benefits described by the Advisor that may be realized from its relationship with the Fund. The Board considered that the Advisor had identified as an indirect benefit to the Advisor and FTP their exposure to investors and brokers who, absent their exposure to the Fund, may have had no dealings with the Advisor or FTP. The Board noted that in addition to the advisory fees paid by the Fund, FTP is compensated for services provided to the Fund through 12b-1 distribution and service fees and that the Advisor receives compensation from the Fund for providing fund reporting services pursuant to a separate Fund Reporting Services Agreement. The Board concluded that the character and amount of potential indirect benefits to the Advisor were not unreasonable.
Additional Information (Continued)
First Trust/Confluence Small Cap Value Fund
October 31, 2022 (Unaudited)
The Board considered the Sub-Advisor’s statement that many of its costs are fixed, allowing for economies of scale. The Board did not review the profitability of the Sub-Advisor with respect to the Fund. The Board noted that the Advisor pays the Sub-Advisor from its advisory fee and its understanding that the Fund’s sub-advisory fee rate was the product of an arm’s length negotiation. The Board concluded that the profitability analysis for the Advisor was more relevant. The Board considered indirect benefits that may be realized by the Sub-Advisor and one of its affiliates from the Sub-Advisor’s relationship with the Fund, including that the Sub-Advisor may enter into soft dollar and commission sharing arrangements, and considered a summary of such arrangements. The Board noted certain additional indirect benefits identified by the Sub-Advisor deriving from the exposure provided by its relationship with the Fund and the Advisor. The Board concluded that the character and amount of potential indirect benefits to the Sub-Advisor were not unreasonable.
Based on all of the information considered and the conclusions reached, the Board, including the Independent Trustees, unanimously determined that the terms of the Agreements continue to be fair and reasonable and that the continuation of the Agreements is in the best interests of the Fund. No single factor was determinative in the Board’s analysis.
Board of Trustees and Officers
First Trust/Confluence Small Cap Value Fund
October 31, 2022 (Unaudited)
The following tables identify the Trustees and Officers of the Trust. Unless otherwise indicated, the address of all persons is 120 East Liberty Drive, Suite 400, Wheaton, IL 60187.
The Trust’s statement of additional information includes additional information about the Trustees and is available, without charge, upon request, by calling (800) 988-5891.
| Name, Year of Birth and Position with the Trust | Term of Office and Year First Elected or Appointed | Principal Occupations
During Past 5 Years | Number of Portfolios in the First Trust Fund Complex Overseen by Trustee | Other Trusteeships or Directorships Held by Trustee During Past 5 Years |
| INDEPENDENT TRUSTEES |
Richard E. Erickson, Trustee
(1951) | • Indefinite Term
• Since Trust Inception | Physician, Edward-Elmhurst Medical Group; Physician and Officer, Wheaton Orthopedics (1990 to 2021) | 223 | None |
Thomas R. Kadlec, Trustee
(1957) | • Indefinite Term
• Since Trust Inception | Retired; President, ADM Investor Services, Inc. (Futures Commission Merchant) (2010 to July 2022) | 223 | Director, National Futures Association and ADMIS Singapore Ltd.; Formerly, Director of ADM Investor Services, Inc., ADM Investor Services International, ADMIS Hong Kong Ltd., and Futures Industry Association |
Denise M. Keefe, Trustee
(1964) | • Indefinite Term
• Since 2021 | Executive Vice President, Advocate Aurora Health and President, Advocate Aurora Continuing Health Division (Integrated Healthcare System) | 223 | Director and Board Chair of Advocate Home Health Services, Advocate Home Care Products and Advocate Hospice; Director and Board Chair of Aurora At Home (since 2018); Director of Advocate Physician Partners Accountable Care Organization; Director and Board Chair of RML Long Term Acute Care Hospitals; and Director of Senior Helpers (since 2021) |
Robert F. Keith, Trustee
(1956) | • Indefinite Term
• Since Trust Inception | President, Hibs Enterprises (Financial and Management Consulting) | 223 | Formerly, Director of Trust Company of Illinois |
Niel B. Nielson, Trustee
(1954) | • Indefinite Term
• Since Trust Inception | Senior Advisor (2018 to Present), Managing Director and Chief Operating Officer (2015 to 2018), Pelita Harapan Educational Foundation (Educational Products and Services) | 223 | None |
| INTERESTED TRUSTEE |
James A. Bowen(1), Trustee and
Chairman of the Board
(1955) | • Indefinite Term
• Since Trust Inception | Chief Executive Officer, First Trust Advisors L.P. and First Trust Portfolios L.P.; Chairman of the Board of Directors, BondWave LLC (Software Development Company) and Stonebridge Advisors LLC (Investment Advisor) | 223 | None |
| (1) | Mr. Bowen is deemed an “interested person” of the Trust due to his position as CEO of First Trust Advisors L.P., investment advisor of the Trust. |
Board of Trustees and Officers (Continued)
First Trust/Confluence Small Cap Value Fund
October 31, 2022 (Unaudited)
| Name and Year of Birth | Position and Offices with Trust | Term of Office and Length of Service | Principal Occupations
During Past 5 Years |
| OFFICERS(2) |
James M. Dykas
(1966) | President and Chief Executive Officer | • Indefinite Term
• Since 2016 | Managing Director and Chief Financial Officer, First Trust Advisors L.P. and First Trust Portfolios L.P.; Chief Financial Officer, BondWave LLC (Software Development Company) and Stonebridge Advisors LLC (Investment Advisor) |
Donald P. Swade
(1972) | Treasurer, Chief Financial Officer and Chief Accounting Officer | • Indefinite Term
• Since 2016 | Senior Vice President, First Trust Advisors L.P. and First Trust Portfolios L.P. |
W. Scott Jardine
(1960) | Secretary and Chief Legal Officer | • Indefinite Term
• Since Trust Inception | General Counsel, First Trust Advisors L.P. and First Trust Portfolios L.P.; Secretary and General Counsel, BondWave LLC; Secretary, Stonebridge Advisors LLC |
Daniel J. Lindquist
(1970) | Vice President | • Indefinite Term
• Since Trust Inception | Managing Director, First Trust Advisors L.P. and First Trust Portfolios L.P. |
Kristi A. Maher
(1966) | Chief Compliance Officer and Assistant Secretary | • Indefinite Term
• Chief Compliance Officer Since January 2011 • Assistant Secretary Since Trust Inception | Deputy General Counsel, First Trust Advisors L.P. and First Trust Portfolios L.P. |
| (2) | The term “officer” means the president, vice president, secretary, treasurer, controller or any other officer who performs a policy making function. |
Privacy Policy
First Trust/Confluence Small Cap Value Fund
October 31, 2022 (Unaudited)
Privacy Policy
First Trust values our relationship with you and considers your privacy an important priority in maintaining that relationship. We are committed to protecting the security and confidentiality of your personal information.
Sources of Information
We collect nonpublic personal information about you from the following sources:
| • | Information we receive from you and your broker-dealer, investment professional or financial representative through interviews, applications, agreements or other forms; |
| • | Information about your transactions with us, our affiliates or others; |
| • | Information we receive from your inquiries by mail, e-mail or telephone; and |
| • | Information we collect on our website through the use of “cookies.” For example, we may identify the pages on our website that your browser requests or visits. |
Information Collected
The type of data we collect may include your name, address, social security number, age, financial status, assets, income, tax information, retirement and estate plan information, transaction history, account balance, payment history, investment objectives, marital status, family relationships and other personal information.
Disclosure of Information
We do not disclose any nonpublic personal information about our customers or former customers to anyone, except as permitted by law. In addition to using this information to verify your identity (as required under law), the permitted uses may also include the disclosure of such information to unaffiliated companies for the following reasons:
| • | In order to provide you with products and services and to effect transactions that you request or authorize, we may disclose your personal information as described above to unaffiliated financial service providers and other companies that perform administrative or other services on our behalf, such as transfer agents, custodians and trustees, or that assist us in the distribution of investor materials such as trustees, banks, financial representatives, proxy services, solicitors and printers. |
| • | We may release information we have about you if you direct us to do so, if we are compelled by law to do so, or in other legally limited circumstances (for example to protect your account from fraud). |
In addition, in order to alert you to our other financial products and services, we may share your personal information within First Trust.
Use of Website Analytics
We currently use third party analytics tools, Google Analytics and AddThis, to gather information for purposes of improving First Trust’s website and marketing our products and services to you. These tools employ cookies, which are small pieces of text stored in a file by your web browser and sent to websites that you visit, to collect information, track website usage and viewing trends such as the number of hits, pages visited, videos and PDFs viewed and the length of user sessions in order to evaluate website performance and enhance navigation of the website. We may also collect other anonymous information, which is generally limited to technical and web navigation information such as the IP address of your device, internet browser type and operating system for purposes of analyzing the data to make First Trust’s website better and more useful to our users. The information collected does not include any personal identifiable information such as your name, address, phone number or email address unless you provide that information through the website for us to contact you in order to answer your questions or respond to your requests. To find out how to opt-out of these services click on: Google Analytics and AddThis.
Confidentiality and Security
With regard to our internal security procedures, First Trust restricts access to your nonpublic personal information to those First Trust employees who need to know that information to provide products or services to you. We maintain physical, electronic and procedural safeguards to protect your nonpublic personal information.
Policy Updates and Inquiries
As required by federal law, we will notify you of our privacy policy annually. We reserve the right to modify this policy at any time, however, if we do change it, we will tell you promptly. For questions about our policy, or for additional copies of this notice, please go to www.ftportfolios.com, or contact us at 1-800-621-1675 (First Trust Portfolios) or 1-800-222-6822 (First Trust Advisors).
March 2022
This page intentionally left blank
This page intentionally left blank
INVESTMENT ADVISOR
First Trust Advisors L.P.
120 East Liberty Drive, Suite 400
Wheaton, IL 60187
INVESTMENT SUB-ADVISOR
Confluence Investment Management LLC
20 Allen Avenue, Suite 300
Saint Louis, MO 63119
ADMINISTRATOR,
FUND ACCOUNTANT &
CUSTODIAN
Brown Brothers Harriman & Co.
50 Post Office Square
Boston, MA 02110
TRANSFER AGENT
BNY Mellon Investment Servicing (US) Inc.
301 Bellevue Parkway
Wilmington, DE 19809
INDEPENDENT REGISTERED
PUBLIC ACCOUNTING FIRM
Deloitte & Touche LLP
111 S. Wacker Drive
Chicago, IL 60606
LEGAL COUNSEL
Chapman and Cutler LLP
320 South Canal Street
Chicago, IL 60606

First Trust Short Duration
High Income Fund
Annual Report
For the Year Ended
October 31, 2022
First Trust Short Duration High Income Fund
Annual Report
October 31, 2022
Caution Regarding Forward-Looking Statements
This report contains certain forward-looking statements within the meaning of the Securities Act of 1933, as amended, and the Securities Exchange Act of 1934, as amended. Forward-looking statements include statements regarding the goals, beliefs, plans or current expectations of First Trust Advisors L.P. (“First Trust” or the “Advisor”) and its representatives, taking into account the information currently available to them. Forward-looking statements include all statements that do not relate solely to current or historical fact. For example, forward-looking statements include the use of words such as “anticipate,” “estimate,” “intend,” “expect,” “believe,” “plan,” “may,” “should,” “would” or other words that convey uncertainty of future events or outcomes.
Forward-looking statements involve known and unknown risks, uncertainties and other factors that may cause the actual results, performance or achievements of First Trust Short Duration High Income Fund (the “Fund”) to be materially different from any future results, performance or achievements expressed or implied by the forward-looking statements. When evaluating the information included in this report, you are cautioned not to place undue reliance on these forward-looking statements, which reflect the judgment of the Advisor and its representatives only as of the date hereof. We undertake no obligation to publicly revise or update these forward-looking statements to reflect events and circumstances that arise after the date hereof.
Performance and Risk Disclosure
There is no assurance that the Fund will achieve its investment objectives. The Fund is subject to market risk, which is the possibility that the market values of securities owned by the Fund will decline and that the value of the Fund’s shares may therefore be less than what you paid for them. Accordingly, you can lose money by investing in the Fund. See “Risk Considerations” in the Additional Information section of this report for a discussion of certain other risks of investing in the Fund.
Performance data quoted represents past performance, which is no guarantee of future results, and current performance may be lower or higher than the figures shown. For the most recent month-end performance figures, please visit www.ftportfolios.com or speak with your financial advisor. Investment returns and net asset value will fluctuate and Fund shares, when sold, may be worth more or less than their original cost.
The Advisor may also periodically provide additional information on Fund performance on the Fund’s web page at www.ftportfolios.com.
How to Read This Report
This report contains information that may help you evaluate your investment in the Fund. It includes details about the Fund and presents data and analysis that provide insight into the Fund’s performance and investment approach.
By reading the portfolio commentary by the portfolio management team of the Fund, you may obtain an understanding of how the market environment affected the Fund’s performance. The statistical information that follows may help you understand the Fund’s performance compared to that of relevant market benchmarks.
It is important to keep in mind that the opinions expressed by personnel of the Advisor are just that: informed opinions. They should not be considered to be promises or advice. The opinions, like the statistics, cover the period through the date on the cover of this report. The material risks of investing in the Fund are spelled out in the prospectus, the statement of additional information, this report and other Fund regulatory filings.
First Trust Short Duration High Income Fund
Annual Letter from the Chairman and CEO
October 31, 2022
Dear Shareholders,
First Trust is pleased to provide you with the annual report for the First Trust Short Duration High Income Fund (the “Fund”), which contains detailed information about the Fund for the twelve months ended October 31, 2022.
As I’m writing this letter in mid-November, it strikes me that things appear to be a little more chaotic in the current climate than normal. One of the things that may have contributed to the chaotic nature of the news flow of late was the November mid-term election. For the most part, except for a few seats in Congress, the election is behind us. We learned there would be no “red wave” (Republicans gaining a strong majority in Congress) but likely gridlock ahead. Gridlock has been good for stock market investors in the past few decades, particularly when there’s been a Democratic president and the Republicans have control of at least one house of Congress, according to Brian Wesbury, Chief Economist at First Trust.
The Federal Reserve (the “Fed”) has kept its promise to aggressively hike interest rates to combat robust inflation. As of November 13, 2022, the Fed has increased the Federal Funds target rate (upper bound) six times, from 0.25% to 4.00%. The Fed’s actions have some investors and pundits looking for evidence linking the interest rate hikes to a downturn in the economy. In short, the hope is that a pullback in economic activity might deter the Fed from executing further interest rate hikes. Fed Chairman Jerome Powell, however, recently said that the terminal rate (the ultimate rate the Fed is targeting) will likely need to be higher than previously estimated in order to curb stubbornly high inflation. The Consumer Price Index (“CPI”) is a commonly used measure of inflation. The CPI stood at 7.7% on a trailing 12-month basis as of October 31, 2022, according to the U.S. Bureau of Labor Statistics. That is down from its recent high of 9.1% in June 2022. Prior to this year, the last time the CPI was higher than 7.0% was over 40 years ago. While monetary policy is an ongoing process subject to change, the Fed does appear to be steadfast in its mission to bring the rate of inflation back to its preferred level of 2.0%, and that will take some time, in my opinion. Stay tuned!
Equity and fixed income markets have contended with numerous headwinds this year, such as the war between Russia and Ukraine. Since setting its all-time high of 4,796.56 on January 3, 2022, the S&P 500® Index has been in a bear market (a price decline of 20% or more from the most recent high) for the better part of 310 days. Suffice it to say, we are all looking forward to the end of this bear market. With respect to corrections and bear markets, the silver lining is that the S&P 500® Index has never failed to fully recover the losses sustained in any previous downturn. Where might we see demand for stocks moving forward? One such source could be stock buybacks. As of the last week of October 2022, U.S. companies had announced stock buybacks totaling $1 trillion so far this year, according to Birinyi Associates. The fixed income market has not been immune to selling pressure either. Year-to-date through November 10, 2022, yields on the 10-Year Treasury Note increased by 258 basis points. As you may be aware, bond yields and bond prices are inversely related, particularly with respect to investment-grade bonds. As yields rise, prices fall and vice versa. As noted above, the Fed has more work to do, so bond investors should not be surprised to see interest rates and bond yields trend at least a bit higher in the months ahead.
Thank you for giving First Trust the opportunity to play a role in your financial future. We value our relationship with you and will report on the Fund again in six months.
Sincerely,
James A. Bowen
Chairman of the Board of Trustees
Chief Executive Officer of First Trust Advisors L.P.
First Trust Short Duration High Income Fund
“AT A GLANCE”
As of October 31, 2022 (Unaudited)
| Fund Statistics | |
| First Trust Short Duration High Income Fund | Net Asset
Value (NAV) |
| Class A (FDHAX) | $17.70 |
| Class C (FDHCX) | $17.69 |
| Class I (FDHIX) | $17.71 |
| Credit Quality(1) | % of Senior
Loans and other
Debt Securities(2) |
| BBB- | 3.3% |
| BB+ | 3.3 |
| BB | 4.8 |
| BB- | 10.9 |
| B+ | 15.9 |
| B | 36.8 |
| B- | 16.5 |
| CCC+ | 7.9 |
| CCC | 0.2 |
| CCC- | 0.0* |
| Not Rated | 0.4 |
| Total | 100.0% |
| Top 10 Issuers | % of Senior
Loans and other
Securities(2) |
| Internet Brands, Inc. (Web MD/MH Sub I, LLC) | 3.5% |
| HUB International Ltd. | 3.3 |
| Alliant Holdings I, LLC | 3.2 |
| Verscend Technologies, Inc. (Cotiviti) | 3.2 |
| SS&C Technologies Holdings, Inc. | 2.9 |
| IRB Holding Corp. (Arby’s/Inspire Brands) | 2.9 |
| Charter Communications Operating, LLC | 2.8 |
| Hyland Software, Inc. | 2.7 |
| AssuredPartners, Inc. | 2.7 |
| Cablevision (aka CSC Holdings, LLC) | 2.4 |
| Total | 29.6% |
| Industry Classification | % of Senior
Loans and Other
Securities(2) |
| Software | 23.1% |
| Insurance | 12.3 |
| Media | 10.7 |
| Health Care Providers & Services | 9.8 |
| Health Care Technology | 8.9 |
| Hotels, Restaurants & Leisure | 7.0 |
| Diversified Telecommunication Services | 3.2 |
| Containers & Packaging | 2.4 |
| Electric Utilities | 2.4 |
| Pharmaceuticals | 1.9 |
| Food Products | 1.9 |
| Wireless Telecommunication Services | 1.7 |
| Professional Services | 1.7 |
| Capital Markets | 1.5 |
| Aerospace & Defense | 1.3 |
| Diversified Consumer Services | 1.2 |
| Specialty Retail | 1.2 |
| Building Products | 1.2 |
| Commercial Services & Supplies | 1.2 |
| Diversified Financial Services | 1.1 |
| IT Services | 0.8 |
| Electronic Equipment, Instruments & Components | 0.8 |
| Health Care Equipment & Supplies | 0.7 |
| Trading Companies & Distributors | 0.6 |
| Machinery | 0.4 |
| Beverages | 0.3 |
| Auto Components | 0.2 |
| Entertainment | 0.2 |
| Road & Rail | 0.2 |
| Communications Equipment | 0.1 |
| Life Sciences Tools & Services | 0.0* |
| Total | 100.0% |
| * | Amount is less than 0.1%. |
| Dividend Distributions | A Shares | C Shares | I Shares |
| Current Monthly Distribution per Share(3) | $0.0762 | $0.0650 | $0.0800 |
| Current Distribution Rate on NAV(4) | 5.17% | 4.41% | 5.42% |
| (1) | The ratings are by S&P Global Ratings. A credit rating is an assessment provided by a nationally recognized statistical rating organization (NRSRO) of the creditworthiness of an issuer with respect to debt obligations except for those debt obligations that are only privately rated. Ratings are measured on a scale that generally ranges from AAA (highest) to D (lowest). Investment grade is defined as those issuers that have a long-term credit rating of BBB- or higher. “NR” indicates no rating. The credit ratings shown relate to the creditworthiness of the issuers of the underlying securities in the Fund, and not to the Fund or its shares. Credit ratings are subject to change. |
| (2) | Percentages are based on long-term positions. Money market funds are excluded. |
| (3) | Most recent distribution paid through October 31, 2022. Subject to change in the future. |
| (4) | Distribution rates are calculated by annualizing the most recent distribution paid through the report date and then dividing by NAV as of October 31, 2022. Subject to change in the future. |
First Trust Short Duration High Income Fund
“AT A GLANCE” (Continued)
As of October 31, 2022 (Unaudited)
Performance of a $10,000 Investment
This chart compares your Fund’s Class I performance to that of the ICE BofA US High Yield Constrained Index, the Morningstar® LSTA® US Leveraged Loan Index and the Blended Index(5).
| Performance as of October 31, 2022 |
| | | A Shares
Inception
11/1/2012 | C Shares
Inception
11/1/2012 | I Shares
Inception
11/1/2012 | Blended Index* | HUC0* | SPBDAL* |
Cumulative
Total Returns | | w/o
sales
charge | | w/max
3.50%
sales
charge | w/o
sales
charge | | w/max 1.00% contingent deferred sales charge | w/o
sales
charge | w/o
sales
charge | w/o
sales
charge | w/o
sales
charge |
| 1 Year | | (5.78)% | | (9.07)% | (6.49)% | | (7.40)% | (5.58)% | (6.61)% | (11.44)% | (1.76)% |
Average Annual
Total Returns | | | | | | | | | | | |
| 5 Years | | 1.64% | | 0.91% | 0.89% | | 0.89% | 1.90% | 2.51% | 1.88% | 3.07% |
| Since Inception | | 2.99% | | 2.62% | 2.22% | | 2.22% | 3.24% | 3.86% | 4.05% | 3.61% |
| 30-Day SEC Yield(6) | | 6.90% | 6.40% | 7.41% | N/A | N/A | N/A |
* Since inception return is based on inception date of the Fund.
Performance figures assume reinvestment of all distributions and do not reflect the deduction of taxes that a shareholder would pay on Fund distributions or the redemption or sale of Fund shares. The total returns would have been lower if certain fees had not been waived and expenses reimbursed by the Advisor. An index is a statistical composite that tracks a specified financial market or sector. Unlike the Fund, the indices do not actually hold a portfolio of securities and therefore do not incur the expenses incurred by the Fund. These expenses negatively impact the performance of the Fund. The Fund’s past performance does not predict future performance.
Performance of share classes will vary due to differences in sales charges and expenses. Total returns with sales charges include payment of the maximum sales charge of 3.50% for Class A Shares, a contingent deferred sales charge (“CDSC”) of 1.00% for Class C Shares in year one and Rule 12b-1 service fees of 0.25% per year of average daily net assets for Class A Shares and combined Rule 12b-1 distribution and service fees of 1.00% per year of average daily net assets for Class C Shares. Class I Shares do not have a front-end sales charge or a CDSC, nor do they pay distribution or service fees.
| (5) | The Blended Index return is a 50/50 split between the ICE BofA US High Yield Constrained Index and the Morningstar® LSTA® US Leveraged Loan Index (formerly, S&P/LSTA Leveraged Loan Index) returns. The Blended Index returns are calculated by using the monthly return of the two indices during each period shown above. At the beginning of each month the two indices are rebalanced to a 50-50 ratio to account for divergence from that ratio that occurred during the course of each month. The monthly returns are then compounded for each period shown above, giving the performance for the Blended Index for each period shown above. |
| (6) | 30-day SEC yield is calculated by dividing the net investment income per share earned during the most recent 30-day period by the maximum offering price per share on the last day of the period. The reported SEC yields are subsidized. The subsidized yields reflect the waiver and/or a reimbursement of Fund expenses, which has the effect of lowering the Fund’s expense ratio and generating a higher yield. |
Portfolio Commentary
First Trust Short Duration High Income Fund
Annual Report
October 31, 2022 (Unaudited)
Advisor
The First Trust Advisors L.P. (“First Trust”) Leveraged Finance Team is comprised of 17 experienced investment professionals specializing in below investment grade securities. The team is comprised of portfolio management, research, trading and operations personnel. As of October 31, 2022, the First Trust Leveraged Finance Team managed or supervised approximately $5.8 billion in senior secured bank loans and high-yield bonds. These assets are managed across various strategies, including two closed-end funds, an open-end fund, four exchange-traded funds, and a series of unit investment trusts on behalf of retail and institutional clients.
Portfolio Management Team
William Housey, CFA – Managing Director of Fixed Income and Senior Portfolio Manager
Jeffrey Scott, CFA – Senior Vice President and Portfolio Manager
The portfolio managers are primarily and jointly responsible for the day-to-day management of the First Trust Short Duration High Income Fund (the “Fund”). Mr. Housey has served as a part of the portfolio management team of the Fund since 2012, while Mr. Scott has served as part of the portfolio management team of the Fund since 2020.
Annual Report Commentary
First Trust Short Duration High Income Fund
The primary investment objective of the Fund is to seek to provide a high level of current income. As a secondary objective, the Fund seeks capital appreciation.
Market Recap
In the last 12-month (“LTM”) period ended October 31, 2022, inflation remained stubbornly elevated with the October 2022 Consumer Price Index printing 7.7% on a year-over-year basis; meanwhile, the Federal Reserve (the “Fed”) continues to reiterate its commitment to a 2.0% inflation target. The Fed increased the Federal Funds target rate by 300 basis points (“bps”) in the LTM period, moving the upper bound from 0.25% to 3.25% over the course of five meetings. In each of the last three meetings, the Fed increased the Federal Funds target rate by a full 75 bps. Due to the persistence of the inflation data and how far it is from the target, we do not believe the Fed can “pivot” to a more accommodative posture until either (1) inflation has tamed, or (2) a recession is near or already underway, absent any major financial market calamity. The 10-Year U.S. Treasury yield finished the period at 4.05%, after trading from lows of 1.34% to highs of 4.24% over the LTM period. While U.S. Equities reached all-time highs in January 2022, investor concerns over geopolitical risks, elevated inflation, and rapidly increasing interest rates soon dampened market euphoria and tipped U.S. Equities into a bear market. The S&P 500® Index returned -14.61% during the LTM period ended October 31, 2022.
Senior Loan Market
Senior loan spreads over the 3-month London Interbank Offered Rate (“LIBOR”) increased by 238 bps to L+654 bps during the LTM period ended October 31, 2022. The current spread is 139 bps above the long-term average spread of L+515 bps (December 1997 – October 2022). After experiencing six consecutive monthly inflows, retail senior loan funds realized their sixth consecutive monthly outflow in October 2022, bringing net inflows to $2.8 billion over the LTM period. The market’s expectation for rate hikes drove strong demand for the senior loan asset class in the first half of the period; however, as market volatility escalated, demand slowed.
During the LTM period, BB rated senior loans (+1.36%) outperformed both B rated (-2.42%) and CCC rated senior loans (-10.66%). The average senior loan price decreased from $98.55 at the beginning of the period to $92.19 at the end of the period.
High-Yield Bond Market
High-yield bond spreads over U.S. Treasuries increased 148 bps during the LTM period ended October 31, 2022 to T+465 bps. The current spread is 87 bps below the long-term average spread of T+552 bps (December 1997 – October 2022). High-yield bond funds reported their third monthly inflow of the period in October 2022, bringing net LTM outflows to $51.8 billion.
In the LTM period, B rated bonds (-10.46%) outperformed both BB rated (-11.13%) and CCC rated bonds (-15.89%). The average high-yield bond price decreased from $103.67 at the beginning of the period to $85.67 at the end of the period.
Default Rates
Both high-yield bond and senior loan default rates increased in the LTM period ended October 31, 2022, as measured by the JP Morgan High-Yield Bond Universe and the Morningstar® LSTA® US Leveraged Loan Index, respectively. The LTM default rate of the
Portfolio Commentary (Continued)
First Trust Short Duration High Income Fund
Annual Report
October 31, 2022 (Unaudited)
high-yield bond market rose from 0.36% at the beginning of the period to 0.84% at the end of the period. The LTM default rate of the senior loan market rose from 0.20% at the beginning of the period to 0.83% at the end of the period. Both high-yield and senior loan default rates remain below their long-term average default rates of 3.07% and 2.76%, respectively.
Fund Performance
The Fund’s Class I shares returned -5.58% over the LTM period ended October 31, 2022, outperforming the Blended Index (the “Benchmark”) (comprised of 50% Morningstar® LSTA® US Leveraged Loan Index and 50% ICE BofA US High Yield Constrained Index) return of -6.61% over the same period.
The Fund held 185 individual positions diversified across 30 industries at the end of the reporting period. Software (23.1%), Insurance (12.3%), and Media (10.7%) were the Fund’s top three industry exposures at the end of the period. By comparison, the Fund held 219 individual positions across 32 industries on October 31, 2021. The Fund increased its allocation to high-yield bonds from 20.48% to 26.71% during the same period. The Fund’s duration remained low throughout the period and changed from 0.78 years to 1.12 years.
The Fund’s allocation to senior loans enhanced performance as senior loans outperformed high-yield bonds throughout the period. Strong security selection within both the Technology and Electronics industries, in addition to defensive overweight positions in the insurance industry, further drove outperformance.
The Fund’s overweight to the Healthcare Providers & Services industry detracted from performance. Healthcare providers across the industry continue to recover from the lingering negative impacts of the COVID-19 pandemic. Further, the Fund’s de minimis exposure to the Oil, Gas & Consumable Fuels industry also detracted from performance as the industry outperformed the overall Benchmark throughout the LTM period as crude oil prices remained elevated.
The Fund’s Class I shares’ most recent monthly distribution of $0.0800 per share is above the $0.0585 per share distribution paid in October 2021. At the end of the LTM period, the effective yield based on the distributions for the trailing twelve months was 4.54% based on net asset value.
The Fund experienced one default during the LTM period. This compared to 18 defaults in the LTM period within the JP Morgan High-Yield Bond Universe (9) and the Morningstar® LSTA® US Leveraged Loan Index (9), combined. Since inception, the Fund has experienced 12 defaults, which compares to 419 within the JP Morgan High-Yield Bond Universe (260) and the Morningstar® LSTA® US Leveraged Loan Index (159), combined, over the same period. The Fund’s LTM default rate of 1.31% was above both the JP Morgan High-Yield Bond Universe LTM default rate of 0.84% and the Morningstar® LSTA® US Leveraged Loan Index LTM default rate of 0.83% at the end of the period.
Market and Fund Outlook
Our market framework centers on our view that the Fed will stay the course, ultimately holding rates at such a restrictive level that it tilts the economy into recession, most likely in the second half of 2023, in our opinion. We therefore expect market volatility to continue as investors attempt to gauge the ultimate Federal Funds target rate as well as the likelihood, and timing of, a recession. Consequently, we favor increasing credit quality while defensively positioning in sectors with limited cyclicality. Further, we believe improved valuations have created attractive opportunities in the corporate credit landscape. As we assess such market opportunities, we continue to employ our bottom-up credit underwriting process and rigorous approach to risk management.
First Trust Short Duration High Income Fund
Understanding Your Fund Expenses
October 31, 2022 (Unaudited)
As a shareholder of the First Trust Short Duration High Income Fund (the “Fund”), you incur two types of costs: (1) transaction costs, including sales charges (loads) on purchases of Class A Shares and contingent deferred sales charges on the lesser of purchase price or redemption proceeds of Class C Shares; and (2) ongoing costs, including management fees, distribution and/or service (12b-1) fees, if any, and other Fund expenses. This Example is intended to help you understand your ongoing costs of investing in the Fund and to compare these costs with the ongoing costs of investing in other funds.
The Example is based on an investment of $1,000 invested at the beginning of the period and held through the six-month period ended October 31, 2022.
Actual Expenses
The first three columns of the table below provide information about actual account values and actual expenses. You may use the information in these columns, together with the amount you invested, to estimate the expenses that you paid over the period. Simply divide your account value by $1,000 (for example, an $8,600 account value divided by $1,000 = 8.6), then multiply the result by the number in the third column under the heading entitled “Expenses Paid During Period” to estimate the expenses you paid on your account during this six-month period.
Hypothetical Example for Comparison Purposes
The next three columns of the table below provide information about hypothetical account values and hypothetical expenses based on the Fund’s actual expense ratio and an assumed rate of return of 5% per year before expenses, which is not the Fund’s actual return. The hypothetical account values and expenses may not be used to estimate the actual ending account balance or expenses you paid for the period. You may use this information to compare the ongoing costs of investing in the Fund and other funds. To do so, compare this 5% hypothetical example with the 5% hypothetical examples that appear in the shareholder reports of the other funds.
Please note that the expenses shown in the table are meant to highlight your ongoing costs only and do not reflect any transactional costs such as sales charges (loads) or contingent deferred sales charges. Therefore, the hypothetical section of the table is useful in comparing ongoing costs only, and will not help you determine the relative total costs of owning different funds. In addition, if these transactional costs were included, your costs would have been higher.
| | Actual Expenses | | Hypothetical
(5% Return Before Expenses) | |
| | Beginning
Account
Value
5/1/2022 | Ending
Account
Value
10/31/2022 | Expenses Paid
During Period
5/1/2022 -
10/31/2022 (a) | | Beginning
Account
Value
5/1/2022 | Ending
Account
Value
10/31/2022 | Expenses Paid
During Period
5/1/2022 -
10/31/2022 (a) | Annualized
Expense
Ratios (b) |
Class A
| $ 1,000.00 | $ 954.90 | $ 6.21 | | $ 1,000.00 | $ 1,018.85 | $ 6.41 | 1.26% |
Class C
| $ 1,000.00 | $ 951.20 | $ 9.89 | | $ 1,000.00 | $ 1,015.07 | $ 10.21 | 2.01% |
Class I
| $ 1,000.00 | $ 956.10 | $ 4.98 | | $ 1,000.00 | $ 1,020.11 | $ 5.14 | 1.01% |
| (a) | Expenses are equal to the annualized expense ratios as indicated in the table multiplied by the average account value over the period (May 1, 2022 through October 31, 2022), multiplied by 184/365 (to reflect the six-month period). |
| (b) | These expense ratios reflect expense caps. |
First Trust Short Duration High Income Fund
Portfolio of Investments
October 31, 2022
Principal
Value | | Description | | Rate (a) | | Stated
Maturity (b) | | Value |
| SENIOR FLOATING-RATE LOAN INTERESTS – 67.9% |
| | | Aerospace & Defense – 1.2% | | | | | | |
| $1,631,140 | | Transdigm, Inc., Tranche G Refinancing TL, 3 Mo. LIBOR + 2.25%, 1.00% Floor
| | 5.92% | | 08/22/24 | | $1,602,970 |
| | | Application Software – 15.3% | | | | | | |
| 207,423 | | ConnectWise, LLC, Term Loan B, 3 Mo. SOFR + 3.50%, 0.00% Floor
| | 7.17% | | 09/30/28 | | 195,409 |
| 1,488,568 | | Epicor Software Corp., First Lien Term Loan C, 1 Mo. LIBOR + 3.25%, 0.00% Floor
| | 7.00% | | 07/30/27 | | 1,415,628 |
| 1,632,288 | | Gainwell Acquisition Corp. (fka Milano), Term Loan B, 3 Mo. LIBOR + 4.00%, 1.00% Floor
| | 7.67% | | 10/01/27 | | 1,547,948 |
| 3,004,582 | | Greeneden U.S. Holdings II, LLC (Genesys Telecommunications Laboratories, Inc.), Initial Dollar Term Loan, 1 Mo. LIBOR + 4.00%, 0.00% Floor
| | 7.75% | | 12/01/27 | | 2,923,848 |
| 3,597,438 | | Hyland Software, Inc., Term Loan B, 1 Mo. LIBOR + 3.50%, 1.00% Floor
| | 7.25% | | 07/01/24 | | 3,504,516 |
| 152,204 | | Imprivata, Inc., Term Loan B, 1 Mo. LIBOR + 3.75%, 0.00% Floor
| | 7.50% | | 11/30/27 | | 148,542 |
| 119,854 | | Informatica Corporation, Term Loan B, 1 Mo. LIBOR + 2.75%, 0.00% Floor
| | 6.56% | | 10/29/28 | | 116,507 |
| 1,235,930 | | Internet Brands, Inc. (Web MD/MH Sub I, LLC), 2020 June New Term Loan, 1 Mo. LIBOR + 3.75%, 0.00% Floor
| | 7.50% | | 09/15/24 | | 1,188,298 |
| 1,102,775 | | Internet Brands, Inc. (Web MD/MH Sub I, LLC), 2nd Lien Term Loan, 1 Mo. LIBOR + 6.25%, 0.00% Floor
| | 9.98% | | 02/23/29 | | 1,007,661 |
| 2,452,723 | | Internet Brands, Inc. (Web MD/MH Sub I, LLC), Initial Term Loan, 1 Mo. LIBOR + 3.75%, 0.00% Floor
| | 7.50% | | 09/13/24 | | 2,357,680 |
| 94,553 | | ION Trading Technologies Limited, Term Loan B, 3 Mo. SOFR + 4.75%, 0.00% Floor
| | 8.42% | | 04/01/28 | | 87,718 |
| 1,413,263 | | LogMeIn, Inc. (GoTo Group, Inc.), Term Loan B, 1 Mo. LIBOR + 4.75%, 0.00% Floor
| | 8.32% | | 08/31/27 | | 887,996 |
| 830,445 | | McAfee Corp. (Condor Merger Sub, Inc.), Term Loan B, 1 Mo. LIBOR + 3.75%, 0.00% Floor
| | 6.87% | | 02/28/29 | | 758,304 |
| 133,795 | | N-Able, Inc., Term Loan B, 1 Mo. LIBOR + 3.00%, 0.75% Floor
| | 6.07% | | 07/19/28 | | 128,945 |
| 38,673 | | Open Text Corporation (GXS), Term Loan B, 1 Mo. LIBOR + 1.75%, 0.00% Floor
| | 5.50% | | 05/30/25 | | 38,033 |
| 353,983 | | RealPage, Inc., Second Lien Term Loan, 1 Mo. LIBOR + 6.50%, 0.00% Floor
| | 10.25% | | 04/22/29 | | 339,824 |
| 1,457,355 | | RealPage, Inc., Term Loan B, 1 Mo. LIBOR + 3.00%, 0.00% Floor
| | 6.75% | | 04/24/28 | | 1,367,189 |
| 2,910,193 | | SolarWinds Holdings, Inc., Initial Term Loan, 1 Mo. LIBOR + 2.75%, 0.00% Floor
| | 6.50% | | 02/05/24 | | 2,878,442 |
| 183,259 | | Solera Holdings, Inc. (Polaris Newco), Term Loan B, 3 Mo. LIBOR + 4.00%, 0.00% Floor
| | 7.67% | | 06/04/28 | | 167,021 |
| 68,313 | | Ultimate Kronos Group (UKG, Inc.), 2021 Term Loan, 3 Mo. LIBOR + 3.25%, 0.75% Floor
| | 7.00% | | 05/03/26 | | 65,817 |
| | | | | 21,125,326 |
| | | Asset Management & Custody Banks – 1.4% | | | | | | |
| 1,528,886 | | Edelman Financial Engines Center, LLC, Term Loan B, 1 Mo. LIBOR + 3.50%, 0.00% Floor
| | 7.25% | | 04/07/28 | | 1,423,209 |
| 494,486 | | Edelman Financial Engines Center, LLC, Term Loan Second Lien, 1 Mo. LIBOR + 6.75%, 0.00% Floor
| | 10.50% | | 07/20/26 | | 445,656 |
| | | | | 1,868,865 |
| | | Auto Parts & Equipment – 0.1% | | | | | | |
| 204,701 | | Clarios Global L.P. (Power Solutions), Term Loan B, 1 Mo. LIBOR + 3.25%, 0.00% Floor
| | 7.00% | | 04/30/26 | | 198,656 |
See Notes to Financial Statements
Page 7
First Trust Short Duration High Income Fund
Portfolio of Investments (Continued)
October 31, 2022
Principal
Value | | Description | | Rate (a) | | Stated
Maturity (b) | | Value |
| SENIOR FLOATING-RATE LOAN INTERESTS (Continued) |
| | | Broadcasting – 2.1% | | | | | | |
| $114,562 | | E.W. Scripps Company, Tranche B-3 Term Loan, 1 Mo. LIBOR + 2.75%, 0.00% Floor
| | 6.50% | | 01/07/28 | | $112,606 |
| 911,103 | | Gray Television, Inc., Term C Loan, 1 Mo. LIBOR + 2.50%, 0.00% Floor
| | 5.63% | | 01/02/26 | | 894,530 |
| 1,007,682 | | Gray Television, Inc., Term Loan B2, 1 Mo. LIBOR + 2.50%, 0.00% Floor
| | 5.62%-5.63% | | 02/07/24 | | 1,006,422 |
| 478,873 | | iHeartCommunications, Inc., Second Amendment Incremental Term Loan B, 1 Mo. SOFR + 3.25%, 0.00% Floor
| | 7.00% | | 05/01/26 | | 451,486 |
| 447,770 | | Nexstar Broadcasting, Inc., Incremental Term Loan B-4, 1 Mo. LIBOR + 2.50%, 0.00% Floor
| | 6.25% | | 09/19/26 | | 442,607 |
| 48,481 | | Univision Communications, Inc., 2017 Replacement Repriced First Lien Term Loan C-5, 1 Mo. LIBOR + 2.75%, 1.00% Floor
| | 6.50% | | 03/15/24 | | 48,152 |
| | | | | 2,955,803 |
| | | Building Products – 0.1% | | | | | | |
| 101,491 | | Hunter Douglas, Inc. (Solis), Term Loan B, 3 Mo. SOFR+ 3.50%, 0.00% Floor
| | 6.34% | | 02/28/29 | | 83,962 |
| | | Cable & Satellite – 0.9% | | | | | | |
| 841,329 | | Cablevision (aka CSC Holdings, LLC), March 2017 Term Loan B-1, 1 Mo. LIBOR + 2.25%, 0.00% Floor
| | 5.66% | | 07/17/25 | | 812,412 |
| 407,270 | | Charter Communications Operating, LLC, Term Loan B1, 1 Mo. LIBOR + 1.75%, 0.00% Floor
| | 5.51% | | 04/30/25 | | 401,817 |
| | | | | 1,214,229 |
| | | Casinos & Gaming – 0.4% | | | | | | |
| 472,518 | | Golden Nugget, Inc. (Fertitta Entertainment, LLC), Initial Term Loan B, 1 Mo. SOFR + 4.00%, 0.00% Floor
| | 7.73% | | 01/27/29 | | 442,277 |
| 82,912 | | Scientific Games Holdings L.P. (Scientific Games Lottery), Initial Dollar Term Loan, 3 Mo. SOFR + 3.50%, 0.00% Floor
| | 7.10% | | 04/04/29 | | 77,969 |
| | | | | 520,246 |
| | | Data Processing & Outsourced Services – 0.5% | | | | | | |
| 595,638 | | Go Daddy Operating Company, LLC, Term Loan B2, 1 Mo. LIBOR + 1.75%, 1.00% Floor
| | 5.50% | | 02/15/24 | | 591,171 |
| 77,413 | | Paysafe Holdings (US) Corp., Facility B1 Loan, 1 Mo. LIBOR + 2.75%, 0.00% Floor
| | 6.50% | | 06/24/28 | | 69,768 |
| | | | | 660,939 |
| | | Education Services – 0.4% | | | | | | |
| 565,615 | | Ascensus Holdings, Inc. (Mercury), First Lien Term Loan, 3 Mo. LIBOR + 3.50%, 0.75% Floor
| | 7.19% | | 08/02/28 | | 528,850 |
| | | Electric Utilities – 2.2% | | | | | | |
| 3,137,273 | | PG&E Corp., Term Loan B, 1 Mo. LIBOR + 3.00%, 1.00% Floor
| | 6.81% | | 06/23/25 | | 3,081,587 |
| | | Electronic Equipment & Instruments – 0.7% | | | | | | |
| 528,502 | | Chamberlain Group, Inc. (Chariot), Term Loan B, 1 Mo. LIBOR + 3.50%, 0.75% Floor
| | 7.25% | | 11/03/28 | | 478,860 |
| 576,814 | | Verifone Systems, Inc., Term Loan B, 3 Mo. LIBOR + 4.00%, 0.75% Floor
| | 7.00% | | 08/20/25 | | 511,778 |
| | | | | 990,638 |
| | | Environmental & Facilities Services – 0.6% | | | | | | |
| 678,207 | | GFL Environmental, Inc., Term Loan B, 3 Mo. LIBOR + 3.00%, 0.50% Floor
| | 7.41% | | 05/31/25 | | 673,859 |
Page 8
See Notes to Financial Statements
First Trust Short Duration High Income Fund
Portfolio of Investments (Continued)
October 31, 2022
Principal
Value | | Description | | Rate (a) | | Stated
Maturity (b) | | Value |
| SENIOR FLOATING-RATE LOAN INTERESTS (Continued) |
| | | Environmental & Facilities Services (Continued) | | | | | | |
| $188,058 | | Packers Holdings, LLC (PSSI), Term Loan B, 1 Mo. LIBOR + 3.25%, 0.75% Floor
| | 6.56% | | 03/15/28 | | $171,885 |
| | | | | 845,744 |
| | | Health Care Equipment – 0.0% | | | | | | |
| 33,105 | | Embecta Corp., Initial Term Loan, 3 Mo. LIBOR + 3.00%, 0.00% Floor
| | 6.55% | | 03/31/29 | | 32,216 |
| | | Health Care Facilities – 0.3% | | | | | | |
| 189,327 | | Ardent Health Services, Inc. (AHP Health Partners, Inc.), Term Loan B, 1 Mo. LIBOR + 3.50%, 0.50% Floor
| | 7.25% | | 08/24/28 | | 179,624 |
| 235,258 | | Select Medical Corporation, Term Loan B, 1 Mo. LIBOR + 2.50%, 0.75% Floor
| | 6.26% | | 03/06/25 | | 228,421 |
| | | | | 408,045 |
| | | Health Care Services – 4.3% | | | | | | |
| 1,474,073 | | ADMI Corp. (Aspen Dental), 2020 Incremental Term Loan B2, 1 Mo. LIBOR + 3.38%, 0.75% Floor
| | 7.13% | | 12/23/27 | | 1,311,188 |
| 528,521 | | ADMI Corp. (Aspen Dental), 2021 Incremental Term Loan B3, 1 Mo. LIBOR + 3.75%, 0.50% Floor
| | 7.50% | | 12/23/27 | | 471,705 |
| 319,485 | | Aveanna Healthcare, LLC, 2021 Term Loan B, 1 Mo. LIBOR + 3.75%, 0.50% Floor
| | 7.32% | | 07/15/28 | | 255,268 |
| 22,458 | | Aveanna Healthcare, LLC, Delayed Draw Term Loan, 1 Mo. LIBOR + 3.75%, 0.50% Floor
| | 7.32% | | 07/15/28 | | 17,944 |
| 672,961 | | Brightspring Health (Phoenix Guarantor, Inc.), Incremental Term Loan B-3, 1 Mo. LIBOR + 3.50%, 0.50% Floor
| | 7.25% | | 03/05/26 | | 645,094 |
| 1,280,151 | | CHG Healthcare Services, Inc., Term Loan B, 1 Mo. LIBOR + 3.25%, 0.75% Floor
| | 7.00% | | 09/30/28 | | 1,240,377 |
| 201,803 | | DaVita, Inc., Term Loan B, 1 Mo. LIBOR + 1.75%, 0.00% Floor
| | 5.50% | | 08/12/26 | | 194,782 |
| 721,168 | | ExamWorks Group, Inc. (Electron Bidco), Term Loan B, 1 Mo. LIBOR + 3.00%, 0.75% Floor
| | 6.75% | | 10/29/28 | | 696,150 |
| 115,924 | | Packaging Coordinators, Inc. (PCI Pharma), Term Loan B, 3 Mo. LIBOR + 3.75%, 0.00% Floor
| | 7.42% | | 11/30/27 | | 111,830 |
| 536,119 | | Radnet Management, Inc., Term Loan B, 1 Mo. LIBOR + 3.00%, 0.00% Floor
| | 6.75% | | 04/22/28 | | 519,365 |
| 73,280 | | SCP Health (Onex TSG Intermediate Corp.), Term Loan B, 3 Mo. LIBOR + 4.75%, 0.00% Floor
| | 9.16% | | 02/28/28 | | 65,036 |
| 113,130 | | Sevita (National Mentor Holdings, Inc.), Term Loan B, 1 Mo. LIBOR + 3.75%, 0.50% Floor
| | 7.51% | | 03/01/28 | | 80,220 |
| 314,822 | | Sevita (National Mentor Holdings, Inc.), Term Loan B, 3 Mo. LIBOR + 3.75%, 0.50% Floor
| | 7.43% | | 03/01/28 | | 223,237 |
| 13,098 | | Sevita (National Mentor Holdings, Inc.), Term Loan C, 3 Mo. LIBOR + 3.75%, 0.75% Floor
| | 7.43% | | 03/01/28 | | 9,288 |
| 149,968 | | U.S. Anesthesia Partners Intermediate Holdings, Inc., New Term Loan B, 1 Mo. LIBOR + 4.25%, 0.75% Floor
| | 8.02% | | 09/30/28 | | 142,095 |
| | | | | 5,983,579 |
| | | Health Care Supplies – 0.7% | | | | | | |
| 995,000 | | Medline Borrower, L.P. (Mozart), Initial Dollar Term Loan, 1 Mo. LIBOR + 3.25%, 0.75% Floor
| | 7.00% | | 10/21/28 | | 913,738 |
| | | Health Care Technology – 7.8% | | | | | | |
| 1,681,536 | | athenahealth, Inc. (Minerva Merger Sub, Inc.), Term Loan B, 1 Mo. LIBOR + 3.50%, 0.75% Floor
| | 6.97% | | 02/15/29 | | 1,533,006 |
| 1,400,948 | | Ciox Health (Healthport/CT Technologies Intermediate Holdings, Inc.), New Term Loan B, 1 Mo. LIBOR + 4.25%, 0.75% Floor
| | 8.00% | | 12/16/25 | | 1,281,868 |
See Notes to Financial Statements
Page 9
First Trust Short Duration High Income Fund
Portfolio of Investments (Continued)
October 31, 2022
Principal
Value | | Description | | Rate (a) | | Stated
Maturity (b) | | Value |
| SENIOR FLOATING-RATE LOAN INTERESTS (Continued) |
| | | Health Care Technology (Continued) | | | | | | |
| $570,954 | | Ensemble RCM, LLC (Ensemble Health), Term Loan B, 3 Mo. LIBOR + 3.85%, 0.00% Floor
| | 7.94% | | 08/01/26 | | $562,150 |
| 850,594 | | Mediware (Wellsky/Project Ruby Ultimate Parent Corp.), Term Loan B, 1 Mo. LIBOR + 3.25%, 0.75% Floor
| | 7.00% | | 03/10/28 | | 799,159 |
| 344,719 | | Navicure, Inc. (Waystar Technologies, Inc.), Term Loan B, 1 Mo. LIBOR + 4.00%, 0.75% Floor
| | 7.75% | | 10/23/26 | | 334,595 |
| 87,678 | | Press Ganey (Azalea TopCo, Inc.), 2021 Term Loan, 1 Mo. LIBOR + 3.75%, 0.75% Floor
| | 7.50% | | 07/25/26 | | 81,540 |
| 249,582 | | Press Ganey (Azalea TopCo, Inc.), Term Loan B, 1 Mo. LIBOR + 3.50%, 0.75% Floor
| | 7.25% | | 07/25/26 | | 232,658 |
| 3,405,949 | | Verscend Technologies, Inc. (Cotiviti), New Term Loan B-1, 1 Mo. LIBOR + 4.00%, 0.75% Floor
| | 7.75% | | 08/27/25 | | 3,359,117 |
| 2,629,245 | | Zelis Payments Buyer, Inc., New Term Loan B-1, 1 Mo. LIBOR + 3.50%, 0.75% Floor
| | 7.25% | | 09/30/26 | | 2,585,967 |
| | | | | 10,770,060 |
| | | Hotels, Resorts & Cruise Lines – 0.5% | | | | | | |
| 176,829 | | Alterra Mountain Company, Term Loan B-2, 1 Mo. LIBOR + 3.50%, 0.00% Floor
| | 7.25% | | 08/17/28 | | 172,519 |
| 516,316 | | Four Seasons Holdings, Inc., Term Loan B, 1 Mo. LIBOR + 2.00%, 0.00% Floor
| | 5.75% | | 11/30/23 | | 515,118 |
| | | | | 687,637 |
| | | Industrial Machinery – 0.4% | | | | | | |
| 98,862 | | Filtration Group Corporation, 2021 Incremental Term Loan B, 1 Mo. LIBOR + 3.50%, 0.75% Floor
| | 7.25% | | 10/21/28 | | 95,279 |
| 438,086 | | TK Elevator Newco GMBH (Vertical U.S. Newco, Inc.), New Term Loan B1 (USD), 6 Mo. LIBOR + 3.50%, 0.50% Floor
| | 6.87% | | 07/31/27 | | 415,362 |
| | | | | 510,641 |
| | | Insurance Brokers – 7.8% | | | | | | |
| 3,066,285 | | Alliant Holdings I, LLC, Initial Term Loan, 1 Mo. LIBOR + 3.25%, 0.50% Floor
| | 7.00% | | 05/09/25 | | 2,974,787 |
| 333,238 | | AssuredPartners, Inc., 2021 Term Loan B, 1 Mo. LIBOR + 3.50%, 0.50% Floor
| | 7.25% | | 02/13/27 | | 317,326 |
| 348,209 | | AssuredPartners, Inc., Incremental Term Loan 2022, 1 Mo. SOFR + 3.50%, 0.50% Floor
| | 7.23% | | 02/13/27 | | 331,669 |
| 496,173 | | AssuredPartners, Inc., Term Loan B, 1 Mo. LIBOR + 3.50%, 0.00% Floor
| | 7.25% | | 02/12/27 | | 472,605 |
| 859,079 | | BroadStreet Partners, Inc., Term Loan B, 1 Mo. LIBOR + 3.00%, 0.50% Floor
| | 6.75% | | 01/27/27 | | 820,283 |
| 1,260,423 | | HUB International Limited, Initial Term Loan B, 3 Mo. LIBOR + 3.00%, 0.50% Floor
| | 6.98%-7.33% | | 04/25/25 | | 1,234,559 |
| 3,687 | | HUB International Limited, New Term Loan B-3, 2 Mo. LIBOR + 3.25%, 0.75% Floor
| | 7.23% | | 04/25/25 | | 3,617 |
| 1,445,325 | | HUB International Limited, New Term Loan B-3, 3 Mo. LIBOR + 3.25%, 0.75% Floor
| | 7.53% | | 04/25/25 | | 1,417,893 |
| 207,692 | | HUB International Limited, Term Loan B4, 1 Mo. LIBOR + 4.00%, 1.00% Floor
| | 8.22% | | 11/10/29 | | 201,981 |
| 131,161 | | Ryan Specialty Group, LLC, Term Loan B, 1 Mo. SOFR + 3.00%, 0.50% Floor
| | 6.83% | | 09/01/27 | | 129,070 |
| 2,930,154 | | USI, Inc. (fka Compass Investors, Inc.), Term Loan B, 3 Mo. LIBOR + 2.75%, 0.50% Floor
| | 6.42% | | 05/15/24 | | 2,891,710 |
| | | | | 10,795,500 |
Page 10
See Notes to Financial Statements
First Trust Short Duration High Income Fund
Portfolio of Investments (Continued)
October 31, 2022
Principal
Value | | Description | | Rate (a) | | Stated
Maturity (b) | | Value |
| SENIOR FLOATING-RATE LOAN INTERESTS (Continued) |
| | | Integrated Telecommunication Services – 2.5% | | | | | | |
| $2,594,698 | | Numericable (Altice France S.A. or SFR), Term Loan B-12, 3 Mo. LIBOR + 3.69%, 0.75% Floor
| | 7.77% | | 01/31/26 | | $2,327,132 |
| 264,249 | | Numericable (Altice France S.A. or SFR), Term Loan B-13, 3 Mo. LIBOR + 4.00%, 0.50% Floor
| | 6.91% | | 08/14/26 | | 241,568 |
| 263,972 | | Radiate Holdco, LLC (Astound), Amendment No. 6 Term Loan, 1 Mo. LIBOR + 3.25%, 0.50% Floor
| | 7.00% | | 09/25/26 | | 241,139 |
| 281,758 | | Zayo Group Holdings, Inc., Incremental Term Loan B-2, 1 Mo. SOFR + 4.25%, 0.75% Floor
| | 7.98% | | 03/09/27 | | 233,428 |
| 531,240 | | Zayo Group Holdings, Inc., Initial Dollar Term Loan, 1 Mo. LIBOR + 3.00%, 0.50% Floor
| | 6.75% | | 03/09/27 | | 429,242 |
| | | | | 3,472,509 |
| | | Managed Health Care – 0.3% | | | | | | |
| 463,804 | | Multiplan, Inc. (MPH), Term Loan B, 3 Mo. LIBOR + 4.25%, 0.50% Floor
| | 7.32% | | 08/31/28 | | 430,104 |
| | | Metal & Glass Containers – 0.4% | | | | | | |
| 107,895 | | Altium Packaging, LLC (fka Consolidated Container), Term Loan B, 1 Mo. LIBOR + 2.75%, 0.50% Floor
| | 6.51% | | 02/03/28 | | 101,518 |
| 518,020 | | Berry Global, Inc., Term Loan Z, 1 Mo. LIBOR + 1.75%, 0.00% Floor
| | 5.05% | | 07/01/26 | | 510,062 |
| | | | | 611,580 |
| | | Movies & Entertainment – 0.1% | | | | | | |
| 199,363 | | Delta 2 (Lux) S.a.r.l. (Formula One), New Facility B3, 1 Mo. LIBOR + 2.50%, 1.00% Floor
| | 6.25% | | 02/01/24 | | 198,781 |
| | | Packaged Foods & Meats – 1.7% | | | | | | |
| 6,233 | | Hostess Brands, LLC (HB Holdings), Term Loan B, 1 Mo. LIBOR + 2.25%, 0.50% Floor
| | 6.00% | | 08/03/25 | | 6,127 |
| 2,412,151 | | Hostess Brands, LLC (HB Holdings), Term Loan B, 3 Mo. LIBOR + 2.25%, 0.50% Floor
| | 6.66% | | 08/03/25 | | 2,371,145 |
| | | | | 2,377,272 |
| | | Paper Packaging – 1.3% | | | | | | |
| 72,833 | | Graham Packaging Company, L.P., Term Loan B, 1 Mo. LIBOR + 3.00%, 0.50% Floor
| | 6.75% | | 08/04/27 | | 70,901 |
| 333,484 | | Pactiv LLC/Evergreen Packaging, LLC (fka Reynolds Group Holdings), Term Loan B-2, 1 Mo. LIBOR + 3.25%, 0.50% Floor
| | 7.00% | | 02/05/26 | | 323,836 |
| 1,298,594 | | Pactiv LLC/Evergreen Packaging, LLC (fka Reynolds Group Holdings), Tranche B-3 U.S. Term Loan, 1 Mo. LIBOR + 3.50%, 0.50% Floor
| | 7.25% | | 09/20/28 | | 1,258,247 |
| 131,173 | | Reynolds Consumer Products, LLC, Initial Term Loan, 1 Mo. LIBOR + 1.75%, 0.50% Floor
| | 5.50% | | 02/04/27 | | 128,513 |
| | | | | 1,781,497 |
| | | Pharmaceuticals – 1.6% | | | | | | |
| 87,449 | | IQVIA, Inc. (Quintiles), Term Loan B3, 3 Mo. LIBOR + 1.75%, 0.00% Floor
| | 5.42% | | 06/11/25 | | 86,957 |
| 749,326 | | Nestle Skin Health (Sunshine Lux VII SARL/Galderma), 2021 Term Loan B-3, 3 Mo. LIBOR + 3.75%, 0.00% Floor
| | 7.42% | | 10/02/26 | | 712,332 |
| 1,481,478 | | Parexel International Corp. (Phoenix Newco), First Lien Term Loan, 1 Mo. LIBOR + 3.25%, 0.50% Floor
| | 7.00% | | 11/15/28 | | 1,424,634 |
| | | | | 2,223,923 |
See Notes to Financial Statements
Page 11
First Trust Short Duration High Income Fund
Portfolio of Investments (Continued)
October 31, 2022
Principal
Value | | Description | | Rate (a) | | Stated
Maturity (b) | | Value |
| SENIOR FLOATING-RATE LOAN INTERESTS (Continued) |
| | | Research & Consulting Services – 1.6% | | | | | | |
| $1,650,751 | | Clarivate Analytics PLC (Camelot), Amendment No. 2 Incremental Term Loan, 1 Mo. LIBOR + 3.00%, 0.50% Floor
| | 6.75% | | 10/31/26 | | $1,622,556 |
| 362,184 | | Corelogic, Inc., Term Loan B, 1 Mo. LIBOR + 3.50%, 0.75% Floor
| | 7.31% | | 06/02/28 | | 266,104 |
| 145,998 | | J.D. Power (Project Boost Purchaser, LLC), 2021 Incremental Term Loan B, 1 Mo. LIBOR + 3.50%, 0.50% Floor
| | 7.25% | | 05/26/26 | | 139,976 |
| 128,222 | | Veritext Corporation (VT TopCo, Inc.), Non-Fungible 1st Lien Term Loan, 1 Mo. LIBOR + 3.75%, 0.75% Floor
| | 7.50% | | 08/10/25 | | 124,054 |
| | | | | 2,152,690 |
| | | Restaurants – 2.4% | | | | | | |
| 482,756 | | 1011778 B.C. Unlimited Liability Company (Restaurant Brands) (aka Burger King/Tim Horton’s), Term Loan B-4, 1 Mo. LIBOR + 1.75%, 0.00% Floor
| | 5.50% | | 11/14/26 | | 469,118 |
| 143,081 | | 1011778 B.C. Unlimited Liability Company (Restaurant Brands) (aka Burger King/Tim Horton’s), Term Loan B-4, 3 Mo. LIBOR + 1.75%, 0.00% Floor
| | 6.16% | | 11/14/26 | | 139,039 |
| 147,375 | | IRB Holding Corp. (Arby’s/Inspire Brands), New Term Loan B 2022, 1 Mo. SOFR + 3.10%, 0.75% Floor
| | 6.21% | | 12/15/27 | | 143,359 |
| 2,680,851 | | IRB Holding Corp. (Arby’s/Inspire Brands), Term Loan B, 1 Mo. LIBOR + 2.75%, 0.50% Floor
| | 6.50% | | 02/05/25 | | 2,637,663 |
| | | | | 3,389,179 |
| | | Soft Drinks – 0.3% | | | | | | |
| 488,875 | | Tropicana (Naked Juice LLC/Bengal Debt Merger Sub, LLC), 1st Lien Term Loan, 3 Mo. SOFR + 3.25%, 0.50% Floor
| | 6.90% | | 01/24/29 | | 445,394 |
| | | Specialized Consumer Services – 0.8% | | | | | | |
| 159,911 | | Aramark Services, Inc., Term Loan B-3, 1 Mo. LIBOR + 1.75%, 0.50% Floor
| | 5.50% | | 03/11/25 | | 155,046 |
| 1,262,057 | | Asurion, LLC, Second Lien Term Loan B-3, 1 Mo. LIBOR + 5.25%, 0.50% Floor
| | 9.00% | | 01/31/28 | | 884,235 |
| | | | | 1,039,281 |
| | | Specialized Finance – 1.0% | | | | | | |
| 537,408 | | WCG Purchaser Corp. (WIRB-Copernicus Group), Term Loan B, 1 Mo. LIBOR + 4.00%, 0.50% Floor
| | 7.75% | | 01/08/27 | | 508,189 |
| 890,955 | | WCG Purchaser Corp. (WIRB-Copernicus Group), Term Loan B, 3 Mo. LIBOR + 4.00%, 0.50% Floor
| | 7.67% | | 01/08/27 | | 842,514 |
| | | | | 1,350,703 |
| | | Specialty Stores – 1.1% | | | | | | |
| 1,195,679 | | Petco Health and Wellness Company, Inc., Initial Term Loan B, 3 Mo. LIBOR + 3.25%, 0.75% Floor
| | 6.92% | | 03/03/28 | | 1,144,731 |
| 377,472 | | Petsmart, Inc., Initial Term Loan B, 1 Mo. LIBOR + 3.75%, 0.75% Floor
| | 7.50% | | 02/12/28 | | 362,532 |
| | | | | 1,507,263 |
| | | Systems Software – 2.9% | | | | | | |
| 227,409 | | Applied Systems, Inc., 2nd Lien Term Loan, 3 Mo. LIBOR + 5.50%, 0.50% Floor
| | 9.17% | | 09/19/25 | | 222,673 |
| 851,864 | | BMC Software Finance, Inc. (Boxer Parent), 2021 Replacement Dollar Term Loan, 1 Mo. LIBOR + 3.75%, 0.50% Floor
| | 7.50% | | 10/02/25 | | 817,577 |
| 306,205 | | Idera, Inc., Initial Term Loan, 3 Mo. LIBOR + 3.75%, 0.50% Floor
| | 7.50% | | 02/15/28 | | 279,259 |
Page 12
See Notes to Financial Statements
First Trust Short Duration High Income Fund
Portfolio of Investments (Continued)
October 31, 2022
Principal
Value | | Description | | Rate (a) | | Stated
Maturity (b) | | Value |
| SENIOR FLOATING-RATE LOAN INTERESTS (Continued) |
| | | Systems Software (Continued) | | | | | | |
| $670,231 | | Misys Financial Software Ltd. (Almonde, Inc.) (Finastra), Term Loan B, 3 Mo. LIBOR + 3.50%, 0.50% Floor
| | 6.87% | | 06/13/24 | | $604,508 |
| 347,788 | | Proofpoint, Inc., Term Loan B, 3 Mo. LIBOR + 3.25%, 0.00% Floor
| | 6.32% | | 08/31/28 | | 330,398 |
| 533,721 | | Sophos Group PLC (Surf), Term Loan B, 3 Mo. LIBOR + 3.50%, 0.00% Floor
| | 6.67% | | 03/05/27 | | 521,462 |
| 410,951 | | SS&C Technologies Holdings, Inc., Term Loan B-3, 1 Mo. LIBOR + 1.75%, 0.50% Floor
| | 5.50% | | 04/16/25 | | 401,823 |
| 315,162 | | SS&C Technologies Holdings, Inc., Term Loan B-4, 1 Mo. LIBOR + 1.75%, 0.00% Floor
| | 5.50% | | 04/16/25 | | 308,162 |
| 586,336 | | SUSE (Marcel Lux IV SARL), Facility B1 USD, 1 Mo. SOFR + 3.25%, 0.00% Floor
| | 6.37% | | 03/15/26 | | 573,144 |
| | | | | 4,059,006 |
| | | Trading Companies & Distributors – 0.6% | | | | | | |
| 840,576 | | SRS Distribution, Inc., 2021 Refinancing Term Loan, 1 Mo. LIBOR + 3.50%, 0.00% Floor
| | 7.25% | | 06/04/28 | | 779,635 |
| 43,060 | | SRS Distribution, Inc., 2022 Refinancing Term Loan, 1 Mo. SOFR + 3.60%, 0.00% Floor
| | 7.33% | | 06/04/28 | | 39,911 |
| | | | | 819,546 |
| | | Wireless Telecommunication Services – 1.6% | | | | | | |
| 2,261,862 | | SBA Senior Finance II, LLC, Term Loan B, 1 Mo. LIBOR + 1.75%, 0.75% Floor
| | 5.51% | | 04/11/25 | | 2,240,058 |
| | | Total Senior Floating-Rate Loan Interests
| | 93,878,017 |
| | | (Cost $98,234,010) | | | | | | |
Principal
Value | | Description | | Stated
Coupon | | Stated
Maturity | | Value |
| CORPORATE BONDS AND NOTES – 22.2% |
| | | Application Software – 0.2% | | | | | | |
| 456,000 | | GoTo Group, Inc. (c)
| | 5.50% | | 09/01/27 | | 265,629 |
| | | Broadcasting – 3.0% | | | | | | |
| 1,097,000 | | Diamond Sports Group, LLC/Diamond Sports Finance Co. (c)
| | 6.63% | | 08/15/27 | | 57,593 |
| 533,000 | | Gray Television, Inc. (c)
| | 7.00% | | 05/15/27 | | 512,565 |
| 785,000 | | iHeartCommunications, Inc.
| | 8.38% | | 05/01/27 | | 706,514 |
| 23,000 | | iHeartCommunications, Inc. (c)
| | 5.25% | | 08/15/27 | | 20,994 |
| 625,000 | | iHeartCommunications, Inc. (c)
| | 4.75% | | 01/15/28 | | 542,084 |
| 758,000 | | Nexstar Media, Inc. (c)
| | 5.63% | | 07/15/27 | | 721,264 |
| 63,000 | | Sinclair Television Group, Inc. (c)
| | 5.13% | | 02/15/27 | | 53,032 |
| 1,407,000 | | Sirius XM Radio, Inc. (c)
| | 3.13% | | 09/01/26 | | 1,260,313 |
| 272,000 | | Univision Communications, Inc. (c)
| | 6.63% | | 06/01/27 | | 269,155 |
| | | | | 4,143,514 |
| | | Cable & Satellite – 4.0% | | | | | | |
| 2,962,000 | | CCO Holdings, LLC/CCO Holdings Capital Corp. (c)
| | 5.13% | | 05/01/27 | | 2,748,603 |
| 433,000 | | CCO Holdings, LLC/CCO Holdings Capital Corp. (c)
| | 6.38% | | 09/01/29 | | 400,094 |
| 3,001,000 | | CSC Holdings, LLC (c)
| | 5.75% | | 01/15/30 | | 2,326,780 |
| | | | | 5,475,477 |
| | | Casinos & Gaming – 2.3% | | | | | | |
| 50,000 | | Fertitta Entertainment, LLC/Fertitta Entertainment Finance Co., Inc. (c)
| | 4.63% | | 01/15/29 | | 43,578 |
See Notes to Financial Statements
Page 13
First Trust Short Duration High Income Fund
Portfolio of Investments (Continued)
October 31, 2022
Principal
Value | | Description | | Stated
Coupon | | Stated
Maturity | | Value |
| CORPORATE BONDS AND NOTES (Continued) |
| | | Casinos & Gaming (Continued) | | | | | | |
| $1,443,000 | | Fertitta Entertainment, LLC/Fertitta Entertainment Finance Co., Inc. (c)
| | 6.75% | | 01/15/30 | | $1,135,879 |
| 2,203,000 | | VICI Properties L.P./VICI Note Co., Inc. (c)
| | 4.25% | | 12/01/26 | | 1,987,845 |
| | | | | 3,167,302 |
| | | Communications Equipment – 0.1% | | | | | | |
| 200,000 | | CommScope Technologies, LLC (c)
| | 6.00% | | 06/15/25 | | 186,972 |
| | | Health Care Facilities – 2.8% | | | | | | |
| 342,000 | | HCA, Inc.
| | 5.88% | | 02/15/26 | | 338,908 |
| 107,000 | | HCA, Inc.
| | 5.38% | | 09/01/26 | | 104,133 |
| 676,000 | | Select Medical Corp. (c)
| | 6.25% | | 08/15/26 | | 642,271 |
| 85,000 | | Tenet Healthcare Corp. (c)
| | 4.88% | | 01/01/26 | | 80,275 |
| 1,085,000 | | Tenet Healthcare Corp. (c)
| | 6.25% | | 02/01/27 | | 1,037,455 |
| 358,000 | | Tenet Healthcare Corp. (c)
| | 5.13% | | 11/01/27 | | 330,624 |
| 341,000 | | Tenet Healthcare Corp. (c)
| | 4.63% | | 06/15/28 | | 300,685 |
| 1,135,000 | | Tenet Healthcare Corp. (c)
| | 6.13% | | 10/01/28 | | 986,457 |
| | | | | 3,820,808 |
| | | Health Care Services – 1.2% | | | | | | |
| 150,000 | | DaVita, Inc. (c)
| | 4.63% | | 06/01/30 | | 117,190 |
| 90,000 | | DaVita, Inc. (c)
| | 3.75% | | 02/15/31 | | 65,586 |
| 1,816,000 | | Global Medical Response, Inc. (c)
| | 6.50% | | 10/01/25 | | 1,447,833 |
| | | | | 1,630,609 |
| | | Health Care Technology – 0.5% | | | | | | |
| 692,000 | | Verscend Escrow Corp. (c)
| | 9.75% | | 08/15/26 | | 694,872 |
| | | Insurance Brokers – 3.6% | | | | | | |
| 151,000 | | Alliant Holdings Intermediate, LLC/Alliant Holdings Co-Issuer (c)
| | 4.25% | | 10/15/27 | | 136,286 |
| 1,109,000 | | Alliant Holdings Intermediate, LLC/Alliant Holdings Co-Issuer (c)
| | 6.75% | | 10/15/27 | | 1,013,177 |
| 223,000 | | AmWINS Group, Inc. (c)
| | 4.88% | | 06/30/29 | | 191,304 |
| 2,419,000 | | AssuredPartners, Inc. (c)
| | 7.00% | | 08/15/25 | | 2,320,984 |
| 1,348,000 | | HUB International Ltd. (c)
| | 7.00% | | 05/01/26 | | 1,333,637 |
| | | | | 4,995,388 |
| | | Integrated Telecommunication Services – 0.4% | | | | | | |
| 118,000 | | Radiate HoldCo, LLC/Radiate Finance, Inc. (c)
| | 4.50% | | 09/15/26 | | 99,948 |
| 10,000 | | Zayo Group Holdings, Inc. (c)
| | 4.00% | | 03/01/27 | | 7,639 |
| 748,000 | | Zayo Group Holdings, Inc. (c)
| | 6.13% | | 03/01/28 | | 498,916 |
| | | | | 606,503 |
| | | Managed Health Care – 0.3% | | | | | | |
| 522,000 | | MPH Acquisition Holdings, LLC (c)
| | 5.75% | | 11/01/28 | | 404,710 |
| | | Movies & Entertainment – 0.0% | | | | | | |
| 43,000 | | Live Nation Entertainment, Inc. (c)
| | 6.50% | | 05/15/27 | | 42,990 |
| | | Paper Packaging – 0.5% | | | | | | |
| 586,000 | | Graham Packaging Co., Inc. (c)
| | 7.13% | | 08/15/28 | | 481,222 |
| 282,000 | | Pactiv Evergreen Group Issuer, Inc./Pactiv Evergreen Group Issuer, LLC (c)
| | 4.00% | | 10/15/27 | | 252,418 |
| | | | | 733,640 |
| | | Restaurants – 0.7% | | | | | | |
| 977,000 | | IRB Holding Corp. (c)
| | 7.00% | | 06/15/25 | | 977,576 |
Page 14
See Notes to Financial Statements
First Trust Short Duration High Income Fund
Portfolio of Investments (Continued)
October 31, 2022
Principal
Value | | Description | | Stated
Coupon | | Stated
Maturity | | Value |
| CORPORATE BONDS AND NOTES (Continued) |
| | | Systems Software – 2.4% | | | | | | |
| $258,000 | | Boxer Parent Co., Inc. (c)
| | 9.13% | | 03/01/26 | | $246,805 |
| 3,286,000 | | SS&C Technologies, Inc. (c)
| | 5.50% | | 09/30/27 | | 3,065,069 |
| | | | | 3,311,874 |
| | | Trucking – 0.2% | | | | | | |
| 272,000 | | Hertz (The) Corp. (c)
| | 4.63% | | 12/01/26 | | 232,285 |
| | | Total Corporate Bonds and Notes
| | 30,690,149 |
| | | (Cost $34,513,415) | | | | | | |
| FOREIGN CORPORATE BONDS AND NOTES – 2.6% |
| | | Application Software – 0.6% | | | | | | |
| 1,019,000 | | Open Text Corp. (c)
| | 3.88% | | 02/15/28 | | 874,271 |
| | | Auto Parts & Equipment – 0.1% | | | | | | |
| 110,000 | | Clarios Global L.P./Clarios US Finance Co. (c)
| | 8.50% | | 05/15/27 | | 108,489 |
| | | Building Products – 1.0% | | | | | | |
| 1,398,000 | | Cemex S.A.B. de C.V. (c)
| | 7.38% | | 06/05/27 | | 1,387,306 |
| 28,000 | | Cemex S.A.B. de C.V. (c)
| | 5.45% | | 11/19/29 | | 24,489 |
| | | | | 1,411,795 |
| | | Data Processing & Outsourced Services – 0.2% | | | | | | |
| 485,000 | | Paysafe Finance PLC/Paysafe Holdings US Corp. (c)
| | 4.00% | | 06/15/29 | | 347,481 |
| | | Environmental & Facilities Services – 0.5% | | | | | | |
| 572,000 | | GFL Environmental, Inc. (c)
| | 3.75% | | 08/01/25 | | 542,651 |
| 114,000 | | GFL Environmental, Inc. (c)
| | 4.00% | | 08/01/28 | | 98,914 |
| | | | | 641,565 |
| | | Restaurants – 0.2% | | | | | | |
| 186,000 | | 1011778 BC ULC/New Red Finance, Inc. (c)
| | 4.38% | | 01/15/28 | | 164,336 |
| 121,000 | | 1011778 BC ULC/New Red Finance, Inc. (c)
| | 4.00% | | 10/15/30 | | 98,204 |
| | | | | 262,540 |
| | | Total Foreign Corporate Bonds and Notes
| | 3,646,141 |
| | | (Cost $3,834,868) | | | | | | |
| Shares | | Description | | Value |
| COMMON STOCKS – 0.1% |
| | | Pharmaceuticals – 0.1% | | |
| 26,696 | | Akorn, Inc. (d) (e)
| | 160,176 |
| | | (Cost $306,038) | | |
| RIGHTS – 0.0% |
| | | Electric Utilities – 0.0% | | |
| 14,134 | | Vistra Energy Corp., no expiration date (e) (f)
| | 16,961 |
| | | Life Sciences Tools & Services – 0.0% | | |
| 1 | | New Millennium Holdco, Inc., Corporate Claim Trust, no expiration date (e) (f) (g) (h)
| | 0 |
| 1 | | New Millennium Holdco, Inc., Lender Claim Trust, no expiration date (e) (f) (g) (h)
| | 0 |
| | | | | 0 |
| | | Total Rights
| | 16,961 |
| | | (Cost $23,096) | | |
See Notes to Financial Statements
Page 15
First Trust Short Duration High Income Fund
Portfolio of Investments (Continued)
October 31, 2022
| Shares | | Description | | Value |
| WARRANTS – 0.0% |
| | | Movies & Entertainment – 0.0% | | |
| 97,523 | | Cineworld Group PLC (Crown), expiring 11/23/25 (e) (f)
| | $5,592 |
| | | (Cost $0) | | |
| MONEY MARKET FUNDS – 6.9% |
| 9,525,272 | | Morgan Stanley Institutional Liquidity Funds - Treasury Portfolio - Institutional Class - 2.85% (i)
| | 9,525,272 |
| | | (Cost $9,525,272) | | |
| | | Total Investments – 99.7%
| | 137,922,308 |
| | | (Cost $146,436,699) | | |
| | | Net Other Assets and Liabilities – 0.3%
| | 451,073 |
| | | Net Assets – 100.0%
| | $138,373,381 |
| (a) | Senior Floating-Rate Loan Interests (“Senior Loans”) in which the Fund invests pay interest at rates which are periodically predetermined by reference to a base lending rate plus a premium. These base lending rates are generally (i) the lending rate offered by one or more major European banks, such as the LIBOR, (ii) the SOFR obtained from the U.S. Department of the Treasury’s Office of Financial Research, (iii) the prime rate offered by one or more United States banks or (iv) the certificate of deposit rate. Certain Senior Loans are subject to a LIBOR or SOFR floor that establishes a minimum LIBOR or SOFR rate. When a range of rates is disclosed, the Fund holds more than one contract within the same tranche with identical LIBOR or SOFR period, spread and floor, but different LIBOR or SOFR reset dates. |
| (b) | Senior Loans generally are subject to mandatory and/or optional prepayment. As a result, the actual remaining maturity of Senior Loans may be substantially less than the stated maturities shown. |
| (c) | This security, sold within the terms of a private placement memorandum, is exempt from registration upon resale under Rule 144A of the Securities Act of 1933, as amended (the “1933 Act”), and may be resold in transactions exempt from registration, normally to qualified institutional buyers. Pursuant to procedures adopted by the Trust’s Board of Trustees, this security has been determined to be liquid by First Trust Advisors L.P. (the “Advisor”). Although market instability can result in periods of increased overall market illiquidity, liquidity for each security is determined based on security specific factors and assumptions, which require subjective judgment. At October 31, 2022, securities noted as such amounted to $33,186,735 or 24.0% of net assets. |
| (d) | Security received in a transaction exempt from registration under the 1933 Act. The security may be resold pursuant to an exemption from registration under the 1933 Act, typically to qualified institutional buyers (see Note 2D - Restricted Securities in the Notes to Financial Statements). |
| (e) | Non-income producing security. |
| (f) | Pursuant to procedures adopted by the Trust’s Board of Trustees, this security has been determined to be illiquid by the Advisor. |
| (g) | This security is fair valued by the Advisor’s Pricing Committee in accordance with procedures approved by the Trust’s Board of Trustees, and in accordance with the provisions of the Investment Company Act of 1940 and rules thereunder, as amended. At October 31, 2022, securities noted as such are valued at $0 or 0.0% of net assets. |
| (h) | This security’s value was determined using significant unobservable inputs. (see Note 2A - Portfolio Valuation in the Notes to Financial Statements). |
| (i) | Rate shown reflects yield as of October 31, 2022. |
| LIBOR | London Interbank Offered Rate |
| SOFR | Secured Overnight Financing Rate |
Page 16
See Notes to Financial Statements
First Trust Short Duration High Income Fund
Portfolio of Investments (Continued)
October 31, 2022
Valuation Inputs
A summary of the inputs used to value the Fund’s investments as of October 31, 2022 is as follows (see Note 2A - Portfolio Valuation in the Notes to Financial Statements):
| | Total
Value at
10/31/2022 | Level 1
Quoted
Prices | Level 2
Significant
Observable
Inputs | Level 3
Significant
Unobservable
Inputs |
Senior Floating-Rate Loan Interests*
| $93,878,017 | $— | $ 93,878,017 | $ — |
Corporate Bonds and Notes*
| 30,690,149 | — | 30,690,149 | — |
Foreign Corporate Bonds and Notes*
| 3,646,141 | — | 3,646,141 | — |
Common Stocks*
| 160,176 | — | 160,176 | — |
| Rights: | | | | |
Electric Utilities
| 16,961 | — | 16,961 | — |
Life Sciences Tools & Services
| —** | — | — | —** |
Warrants*
| 5,592 | — | 5,592 | — |
Money Market Funds
| 9,525,272 | 9,525,272 | — | — |
Total Investments
| $ 137,922,308 | $ 9,525,272 | $ 128,397,036 | $—** |
| * | See Portfolio of Investments for industry breakout. |
| ** | Investment is valued at $0. |
Level 3 Investments that are fair valued by the Advisor’s Pricing Committee are footnoted in the Portfolio of Investments. All Level 3 values are based on unobservable inputs.
See Notes to Financial Statements
Page 17
First Trust Short Duration High Income Fund
Statement of Assets and Liabilities
October 31, 2022
| ASSETS: | |
Investments, at value
(Cost $146,436,699)
| $ 137,922,308 |
Cash
| 55,290 |
| Receivables: | |
Investment securities sold
| 5,383,173 |
Interest
| 880,908 |
Fund shares sold
| 23,847 |
Prepaid expenses
| 18,837 |
Total Assets
| 144,284,363 |
| LIABILITIES: | |
| Payables: | |
Investment securities purchased
| 5,104,371 |
Fund shares redeemed
| 512,904 |
Audit and tax fees
| 77,882 |
Investment advisory fees
| 74,684 |
Transfer agent fees
| 27,870 |
Distributions
| 19,405 |
Administrative fees
| 16,958 |
Shareholder reporting fees
| 12,728 |
12b-1 distribution and service fees
| 12,616 |
Commitment fees
| 4,968 |
Custodian fees
| 3,866 |
Legal fees
| 1,898 |
Trustees’ fees and expenses
| 1,533 |
Financial reporting fees
| 771 |
Registration fees
| 445 |
Unrealized depreciation on unfunded loan commitments
| 35,155 |
Other liabilities
| 2,928 |
Total Liabilities
| 5,910,982 |
NET ASSETS
| $138,373,381 |
| NET ASSETS consist of: | |
Paid-in capital
| $ 167,065,210 |
Par value
| 78,154 |
Accumulated distributable earnings (loss)
| (28,769,983) |
NET ASSETS
| $138,373,381 |
| Class A Shares: | |
Net asset value and redemption price per share (Based on net assets of $15,995,778 and 903,914 shares of beneficial interest issued and outstanding)
| $17.70 |
Maximum sales charge (3.50% of offering price)
| 0.64 |
Maximum offering price to public
| $18.34 |
| Class C Shares: | |
Net asset value and redemption price per share (Based on net assets of $10,962,499 and 619,797 shares of beneficial interest issued and outstanding)
| $17.69 |
| Class I Shares: | |
Net asset value and redemption price per share (Based on net assets of $111,415,104 and 6,291,643 shares of beneficial interest issued and outstanding)
| $17.71 |
Page 18
See Notes to Financial Statements
First Trust Short Duration High Income Fund
Statement of Operations
For the Year Ended October 31, 2022
| INVESTMENT INCOME: | |
Interest
| $ 8,560,021 |
Dividends
| 17,106 |
Other
| 67,774 |
Total investment income
| 8,644,901 |
| EXPENSES: | |
Investment advisory fees
| 1,015,675 |
| 12b-1 distribution and/or service fees: | |
Class A
| 43,783 |
Class C
| 132,313 |
Transfer agent fees
| 141,501 |
Administrative fees
| 119,040 |
Audit and tax fees
| 69,182 |
Commitment fees
| 57,385 |
Registration fees
| 46,181 |
Shareholder reporting fees
| 44,739 |
Custodian fees
| 22,398 |
Legal fees
| 21,379 |
Trustees’ fees and expenses
| 18,553 |
Excise tax expense
| 18,500 |
Financial reporting fees
| 9,250 |
Other
| 13,674 |
Total expenses
| 1,773,553 |
Fees waived by the investment advisor
| (16,381) |
Net expenses
| 1,757,172 |
NET INVESTMENT INCOME (LOSS)
| 6,887,729 |
| NET REALIZED AND UNREALIZED GAIN (LOSS): | |
Net realized gain (loss) on investments
| (9,198,257) |
| Net change in unrealized appreciation (depreciation) on: | |
Investments
| (7,524,909) |
Unfunded loan commitments
| (32,461) |
Net change in unrealized appreciation (depreciation)
| (7,557,370) |
NET REALIZED AND UNREALIZED GAIN (LOSS)
| (16,755,627) |
NET INCREASE (DECREASE) IN NET ASSETS RESULTING FROM OPERATIONS
| $(9,867,898) |
See Notes to Financial Statements
Page 19
First Trust Short Duration High Income Fund
Statements of Changes in Net Assets
| | Year
Ended
10/31/2022 | | Year
Ended
10/31/2021 |
| OPERATIONS: | | | |
Net investment income (loss)
| $ 6,887,729 | | $ 5,934,724 |
Net realized gain (loss)
| (9,198,257) | | (294,668) |
Net change in unrealized appreciation (depreciation)
| (7,557,370) | | 5,327,427 |
Net increase (decrease) in net assets resulting from operations
| (9,867,898) | | 10,967,483 |
| DISTRIBUTIONS TO SHAREHOLDERS FROM INVESTMENT OPERATIONS: | | | |
Class A Shares
| (709,509) | | (573,609) |
Class C Shares
| (431,527) | | (401,074) |
Class I Shares
| (5,379,706) | | (4,592,855) |
Total distributions to shareholders from investment operations
| (6,520,742) | | (5,567,538) |
| CAPITAL TRANSACTIONS: | | | |
Proceeds from shares sold
| 59,292,753 | | 78,047,699 |
Proceeds from shares reinvested
| 6,302,421 | | 5,173,454 |
Cost of shares redeemed
| (80,634,975) | | (87,756,321) |
Net increase (decrease) in net assets resulting from capital transactions
| (15,039,801) | | (4,535,168) |
Total increase (decrease) in net assets
| (31,428,441) | | 864,777 |
| NET ASSETS: | | | |
Beginning of period
| 169,801,822 | | 168,937,045 |
End of period
| $138,373,381 | | $169,801,822 |
Page 20
See Notes to Financial Statements
First Trust Short Duration High Income Fund
Financial Highlights
For a Share outstanding throughout each period
| Class A Shares | Year Ended October 31, |
| 2022 | | 2021 | | 2020 | | 2019 | | 2018 |
Net asset value, beginning of period
| $ 19.57 | | $ 18.91 | | $ 19.31 | | $ 19.62 | | $ 20.00 |
| Income from investment operations: | | | | | | | | | |
Net investment income (loss) (a)
| 0.80 | | 0.67 | | 0.67 | | 0.86 | | 0.84 |
Net realized and unrealized gain (loss)
| (1.91) | | 0.62 | | (0.28) | | (0.32) | | (0.33) |
Total from investment operations
| (1.11) | | 1.29 | | 0.39 | | 0.54 | | 0.51 |
| Distributions paid to shareholders from: | | | | | | | | | |
Net investment income
| (0.76) | | (0.63) | | (0.71) | | (0.85) | | (0.87) |
Return of capital
| — | | — | | (0.08) | | — | | (0.02) |
Total distributions
| (0.76) | | (0.63) | | (0.79) | | (0.85) | | (0.89) |
Net asset value, end of period
| $17.70 | | $19.57 | | $18.91 | | $19.31 | | $19.62 |
Total return (b)
| (5.78)% | | 6.83% | | 2.11% | | 2.82% | | 2.61% |
| Ratios to average net assets/supplemental data: | | | | | | | | | |
Net assets, end of period (in 000’s)
| $ 15,996 | | $ 17,823 | | $ 22,510 | | $ 37,836 | | $ 57,982 |
Ratio of total expenses to average net assets
| 1.27% | | 1.21% | | 1.25% | | 1.23% | | 1.19% |
Ratio of net expenses to average net assets
| 1.26% (c) | | 1.21% | | 1.25% | | 1.23% | | 1.19% |
Ratio of net investment income (loss) to average net assets
| 4.30% | | 3.40% | | 3.56% | | 4.39% | | 4.22% |
Portfolio turnover rate
| 54% | | 90% | | 88% | | 37% | | 97% |
| (a) | Based on average shares outstanding. |
| (b) | Assumes reinvestment of all distributions for the period and does not include payment of the maximum sales charge of 3.50% or contingent deferred sales charge (CDSC). On purchases of $250,000 or more, a CDSC of 1% may be imposed on certain redemptions made within twelve months of purchase. If the sales charges were included, total returns would be lower. These returns include Rule 12b-1 service fees of 0.25% and do not reflect the deduction of taxes that a shareholder would pay on Fund distributions or the redemption of Fund shares. The total returns would have been lower if certain fees had not been waived and expenses reimbursed by the investment advisor. Total return is calculated for the time period presented and is not annualized for periods of less than one year. |
| (c) | Includes excise tax. If this excise tax expense was not included, the net expense ratio would have been 1.25%. |
See Notes to Financial Statements
Page 21
First Trust Short Duration High Income Fund
Financial Highlights (Continued)
For a Share outstanding throughout each period
| Class C Shares | Year Ended October 31, |
| 2022 | | 2021 | | 2020 | | 2019 | | 2018 |
Net asset value, beginning of period
| $ 19.56 | | $ 18.90 | | $ 19.30 | | $ 19.60 | | $ 19.98 |
| Income from investment operations: | | | | | | | | | |
Net investment income (loss) (a)
| 0.65 | | 0.52 | | 0.53 | | 0.71 | | 0.69 |
Net realized and unrealized gain (loss)
| (1.90) | | 0.62 | | (0.28) | | (0.31) | | (0.33) |
Total from investment operations
| (1.25) | | 1.14 | | 0.25 | | 0.40 | | 0.36 |
| Distributions paid to shareholders from: | | | | | | | | | |
Net investment income
| (0.62) | | (0.48) | | (0.58) | | (0.70) | | (0.73) |
Return of capital
| — | | — | | (0.07) | | — | | (0.01) |
Total distributions
| (0.62) | | (0.48) | | (0.65) | | (0.70) | | (0.74) |
Net asset value, end of period
| $17.69 | | $19.56 | | $18.90 | | $19.30 | | $19.60 |
Total return (b)
| (6.49)% | | 6.04% | | 1.35% | | 2.11% | | 1.85% |
| Ratios to average net assets/supplemental data: | | | | | | | | | |
Net assets, end of period (in 000’s)
| $ 10,962 | | $ 16,375 | | $ 15,629 | | $ 20,802 | | $ 23,625 |
Ratio of total expenses to average net assets
| 2.02% | | 1.96% | | 2.00% | | 1.98% | | 1.94% |
Ratio of net expenses to average net assets
| 2.01% (c) | | 1.96% | | 2.00% | | 1.98% | | 1.94% |
Ratio of net investment income (loss) to average net assets
| 3.49% | | 2.65% | | 2.79% | | 3.68% | | 3.47% |
Portfolio turnover rate
| 54% | | 90% | | 88% | | 37% | | 97% |
| (a) | Based on average shares outstanding. |
| (b) | Assumes reinvestment of all distributions for the period and does not include payment of the maximum CDSC of 1%, charged on certain redemptions made within one year of purchase. If the sales charge was included, total returns would be lower. These returns include combined Rule 12b-1 distribution and service fees of 1% and do not reflect the deduction of taxes that a shareholder would pay on Fund distributions or the redemption of Fund shares. The total returns would have been lower if certain fees had not been waived and expenses reimbursed by the investment advisor. Total return is calculated for the time period presented and is not annualized for periods of less than one year. |
| (c) | Includes excise tax. If this excise tax expense was not included, the net expense ratio would have been 2.00%. |
Page 22
See Notes to Financial Statements
First Trust Short Duration High Income Fund
Financial Highlights (Continued)
For a Share outstanding throughout each period
| Class I Shares | Year Ended October 31, |
| 2022 | | 2021 | | 2020 | | 2019 | | 2018 |
Net asset value, beginning of period
| $ 19.59 | | $ 18.93 | | $ 19.33 | | $ 19.63 | | $ 20.00 |
| Income from investment operations: | | | | | | | | | |
Net investment income (loss) (a)
| 0.84 | | 0.72 | | 0.72 | | 0.91 | | 0.89 |
Net realized and unrealized gain (loss)
| (1.92) | | 0.61 | | (0.28) | | (0.31) | | (0.32) |
Total from investment operations
| (1.08) | | 1.33 | | 0.44 | | 0.60 | | 0.57 |
| Distributions paid to shareholders from: | | | | | | | | | |
Net investment income
| (0.80) | | (0.67) | | (0.75) | | (0.90) | | (0.92) |
Return of capital
| — | | — | | (0.09) | | — | | (0.02) |
Total distributions
| (0.80) | | (0.67) | | (0.84) | | (0.90) | | (0.94) |
Net asset value, end of period
| $17.71 | | $19.59 | | $18.93 | | $19.33 | | $19.63 |
Total return (b)
| (5.58)% | | 7.09% | | 2.37% | | 3.13% | | 2.92% |
| Ratios to average net assets/supplemental data: | | | | | | | | | |
Net assets, end of period (in 000’s)
| $ 111,415 | | $ 135,604 | | $ 130,798 | | $ 101,163 | | $ 150,564 |
Ratio of total expenses to average net assets
| 1.02% | | 0.96% | | 1.00% | | 0.98% | | 0.94% |
Ratio of net expenses to average net assets
| 1.01% (c) | | 0.96% | | 1.00% | | 0.98% | | 0.94% |
Ratio of net investment income (loss) to average net assets
| 4.52% | | 3.65% | | 3.78% | | 4.67% | | 4.47% |
Portfolio turnover rate
| 54% | | 90% | | 88% | | 37% | | 97% |
| (a) | Based on average shares outstanding. |
| (b) | Assumes reinvestment of all distributions for the period. These returns do not reflect the deduction of taxes that a shareholder would pay on Fund distributions or the redemption of Fund shares. The total returns would have been lower if certain fees had not been waived and expenses reimbursed by the investment advisor. Total return is calculated for the time period presented and is not annualized for periods of less than one year. |
| (c) | Includes excise tax. If this excise tax expense was not included, the net expense ratio would have been 1.00%. |
See Notes to Financial Statements
Page 23
Notes to Financial Statements
First Trust Short Duration High Income Fund
October 31, 2022
1. Organization
First Trust Short Duration High Income Fund (the “Fund”) is a series of the First Trust Series Fund (the “Trust”), a Massachusetts business trust organized on July 9, 2010, and is registered as a diversified open-end management investment company with the Securities and Exchange Commission (“SEC”) under the Investment Company Act of 1940, as amended (the “1940 Act”). The Fund offers three classes of shares: Class A, Class C and Class I. Each class represents an interest in the same portfolio of investments but with a different combination of sales charges, distribution and service (12b-1) fees, eligibility requirements and other features.
The Fund seeks to provide a high level of current income. As a secondary objective, the Fund seeks capital appreciation. The Fund seeks to achieve its investment objectives by investing, under normal market conditions, at least 80% of its net assets (including investment borrowings) in high yield debt securities and bank loans that are rated below-investment grade or unrated. High yield debt securities are below-investment grade debt securities, commonly known as “junk bonds.” For purposes of determining whether a security is below-investment grade, the lowest available rating is used. There can be no assurance that the Fund will achieve its investment objectives. The Fund may not be appropriate for all investors.
2. Significant Accounting Policies
The Fund is considered an investment company and follows accounting and reporting guidance under Financial Accounting Standards Board (“FASB”) Accounting Standards Codification Topic 946, “Financial Services-Investment Companies.” The following is a summary of significant accounting policies consistently followed by the Fund in the preparation of the financial statements. The preparation of the financial statements in accordance with accounting principles generally accepted in the United States of America (“U.S. GAAP”) requires management to make estimates and assumptions that affect the reported amounts and disclosures in the financial statements. Actual results could differ from those estimates.
A. Portfolio Valuation
The net asset value (“NAV”) of each class of shares of the Fund is determined daily as of the close of regular trading on the New York Stock Exchange (“NYSE”), normally 4:00 p.m. Eastern time, on each day the NYSE is open for trading. If the NYSE closes early on a valuation day, the NAV is determined as of that time. The NAV for each class is calculated by dividing the value of the Fund’s total assets attributable to such class (including accrued interest and dividends), less all liabilities attributable to such class (including accrued expenses, dividends declared but unpaid and any borrowings of the Fund), by the total number of shares of the class outstanding. Differences in NAV of each class of the Fund’s shares are generally expected to be due to the daily expense accruals of the specified distribution and service (12b-1) fees and transfer agency costs applicable to such class of shares and the resulting differential in the dividends that may be paid on each class of shares.
The Fund’s investments are valued daily at market value or, in the absence of market value with respect to any portfolio securities, at fair value. Market value prices represent readily available market quotations such as last sale or official closing prices from a national or foreign exchange (i.e., a regulated market) and are primarily obtained from third-party pricing services. Fair value prices represent any prices not considered market value prices and are either obtained from a third-party pricing service or are determined by the Pricing Committee of the Trust’s investment advisor, First Trust Advisors L.P. (“First Trust” or the “Advisor”), in accordance with valuation procedures approved by the Trust’s Board of Trustees, and in accordance with provisions of the 1940 Act and rules thereunder. Investments valued by the Advisor’s Pricing Committee, if any, are footnoted as such in the footnotes to the Portfolio of Investments. The Fund’s investments are valued as follows:
Senior Floating-Rate Loan interests (“Senior Loans”)(1) are not listed on any securities exchange or board of trade. Senior Loans are typically bought and sold by institutional investors in individually negotiated private transactions that function in many respects like an over-the-counter secondary market, although typically no formal market-makers exist. This market, while having grown substantially since its inception, generally has fewer trades and less liquidity than the secondary market for other types of securities. Some Senior Loans have few or no trades, or trade infrequently, and information regarding a specific Senior Loan may not be widely available or may be incomplete. Accordingly, determinations of the market value of Senior Loans may be based on infrequent and dated information. Because there is less reliable, objective data available, elements of judgment may play a greater role in valuation of Senior Loans than for other types of securities. Typically, Senior Loans are fair valued using information provided by a third-party pricing service. The third-party pricing service primarily uses over-the-counter pricing from dealer runs and broker quotes from indicative sheets to value the Senior Loans.
Common stocks and other equity securities listed on any national or foreign exchange (excluding The Nasdaq Stock Market LLC (“Nasdaq”) and the London Stock Exchange Alternative Investment Market (“AIM”)) are valued at the last sale price on the exchange on which they are principally traded or, for Nasdaq and AIM securities, the official closing price. Securities traded on
| (1) | The terms “security” and “securities” used throughout the Notes to Financial Statements include Senior Loans. |
Notes to Financial Statements (Continued)
First Trust Short Duration High Income Fund
October 31, 2022
more than one securities exchange are valued at the last sale price or official closing price, as applicable, at the close of the securities exchange representing the primary exchange for such securities.
Shares of open-end funds are valued based on NAV per share.
Fixed income and other debt securities having a remaining maturity of sixty days or less when purchased are fair valued at cost adjusted for amortization of premiums and accretion of discounts (amortized cost), provided the Advisor’s Pricing Committee has determined that the use of amortized cost is an appropriate reflection of fair value given market and issuer-specific conditions existing at the time of the determination. Factors that may be considered in determining the appropriateness of the use of amortized cost include, but are not limited to, the following:
| 1) | the credit conditions in the relevant market and changes thereto; |
| 2) | the liquidity conditions in the relevant market and changes thereto; |
| 3) | the interest rate conditions in the relevant market and changes thereto (such as significant changes in interest rates); |
| 4) | issuer-specific conditions (such as significant credit deterioration); and |
| 5) | any other market-based data the Advisor’s Pricing Committee considers relevant. In this regard, the Advisor’s Pricing Committee may use last-obtained market-based data to assist it when valuing portfolio securities using amortized cost. |
Corporate bonds, corporate notes and other debt securities are fair valued on the basis of valuations provided by a third-party pricing service approved by the Advisor’s Pricing Committee, which may use the following valuation inputs when available:
| 1) | benchmark yields; |
| 2) | reported trades; |
| 3) | broker/dealer quotes; |
| 4) | issuer spreads; |
| 5) | benchmark securities; |
| 6) | bids and offers; and |
| 7) | reference data including market research publications. |
Securities traded in an over-the-counter market are valued at the mean of their most recent bid and asked price, if available, and otherwise at their last trade price.
Certain securities may not be able to be priced by pre-established pricing methods. Such securities may be valued by the Advisor’s Pricing Committee at fair value. These securities generally include, but are not limited to, restricted securities (securities which may not be publicly sold without registration under the Securities Act of 1933, as amended) for which a third-party pricing service is unable to provide a market price; securities whose trading has been formally suspended; a security whose market or fair value price is not available from a pre-established pricing source; a security with respect to which an event has occurred that is likely to materially affect the value of the security after the market has closed but before the calculation of the Fund’s NAV or make it difficult or impossible to obtain a reliable market quotation; and a security whose price, as provided by the third-party pricing service, does not reflect the security’s fair value. As a general principle, the current fair value of a security would appear to be the amount which the owner might reasonably expect to receive for the security upon its current sale. When fair value prices are used, generally they will differ from market quotations or official closing prices on the applicable exchanges. A variety of factors may be considered in determining the fair value of such securities, including, but not limited to, the following:
| 1) | the most recent price provided by a pricing service; |
| 2) | the fundamental business data relating to the borrower/issuer; |
| 3) | an evaluation of the forces which influence the market in which these securities are purchased and sold; |
| 4) | the type, size and cost of the security; |
| 5) | the financial statements of the borrower/issuer, or the financial condition of the country of issue; |
| 6) | the credit quality and cash flow of the issuer; |
| 7) | the information as to any transactions in or offers for the security; |
| 8) | the price and extent of public trading in similar securities (or equity securities) of the issuer, or comparable companies; |
| 9) | the coupon payments; |
| 10) | the quality, value and salability of collateral, if any, securing the security; |
| 11) | the business prospects of the issuer, including any ability to obtain money or resources from a parent or affiliate and an assessment of the borrower’s/issuer’s management; |
Notes to Financial Statements (Continued)
First Trust Short Duration High Income Fund
October 31, 2022
| 12) | the prospects for the borrower’s/issuer’s industry, and multiples (of earnings and/or cash flows) being paid for similar businesses in that industry; |
| 13) | the borrower’s/issuer’s competitive position within the industry; |
| 14) | the borrower’s/issuer’s ability to access additional liquidity through public and/or private markets; and |
| 15) | other relevant factors. |
The Fund is subject to fair value accounting standards that define fair value, establish the framework for measuring fair value and provide a three-level hierarchy for fair valuation based upon the inputs to the valuation as of the measurement date. The three levels of the fair value hierarchy are as follows:
| • | Level 1 – Level 1 inputs are quoted prices in active markets for identical investments. An active market is a market in which transactions for the investment occur with sufficient frequency and volume to provide pricing information on an ongoing basis. |
| • | Level 2 – Level 2 inputs are observable inputs, either directly or indirectly, and include the following: |
| o | Quoted prices for similar investments in active markets. |
| o | Quoted prices for identical or similar investments in markets that are non-active. A non-active market is a market where there are few transactions for the investment, the prices are not current, or price quotations vary substantially either over time or among market makers, or in which little information is released publicly. |
| o | Inputs other than quoted prices that are observable for the investment (for example, interest rates and yield curves observable at commonly quoted intervals, volatilities, prepayment speeds, loss severities, credit risks, and default rates). |
| o | Inputs that are derived principally from or corroborated by observable market data by correlation or other means. |
| • | Level 3 – Level 3 inputs are unobservable inputs. Unobservable inputs may reflect the reporting entity’s own assumptions about the assumptions that market participants would use in pricing the investment. |
The inputs or methodologies used for valuing investments are not necessarily an indication of the risk associated with investing in those investments. A summary of the inputs used to value the Fund’s investments as of October 31, 2022, is included with the Fund’s Portfolio of Investments.
In December 2020, the SEC adopted Rule 2a-5 under the 1940 Act, establishing requirements to determine fair value in good faith for purposes of the 1940 Act. The rule permits fund boards to designate a fund’s investment adviser to perform fair value determinations, subject to board oversight and certain other conditions. The rule also defines when market quotations are “readily available” for purposes of the 1940 Act and requires a fund to fair value a portfolio investment when a market quotation is not readily available. The SEC also adopted new Rule 31a-4 under the 1940 Act, which sets forth recordkeeping requirements associated with fair value determinations. The compliance date for Rule 2a-5 and Rule 31a-4 was September 8, 2022.
Effective September 8, 2022 and pursuant to the requirements of Rule 2a-5, the Trust’s Board of Trustees designated the Advisor as its valuation designee to perform fair value determinations and approved new Advisor Valuation Procedures for the Trust.
B. Securities Transactions and Investment Income
Securities transactions are recorded as of the trade date. Realized gains and losses from securities transactions are recorded on the identified cost basis. Dividend income is recorded on the ex-dividend date. Interest income is recorded daily on the accrual basis. Market premiums and discounts are amortized over the expected life of each respective borrowing. Amortization of premiums and accretion of discounts are recorded using the effective interest method.
The United Kingdom’s Financial Conduct Authority (the “FCA”), which regulates the London Interbank Offered Rates (“LIBOR”), announced on March 5, 2021 that it intended to phase-out all LIBOR reference rates, beginning December 31, 2021. Since that announcement, the FCA has ceased publication of all non-USD LIBOR reference rates and the 1-week and 2-month USD LIBOR reference rates as of December 31, 2021. The remaining USD LIBOR settings will cease to be published or no longer be representative immediately after June 30, 2023. The International Swaps and Derivatives Association, Inc. (“ISDA”) confirmed that the FCA’s March 5, 2021 announcement of its intention to cease providing LIBOR reference rates, constituted an index cessation event under the Interbank Offered Rates (“IBOR”) Fallbacks Supplement and the ISDA 2020 IBOR Fallbacks Protocol for all 35 LIBOR settings and confirmed that the spread adjustment to be used in ISDA fallbacks was fixed as of the date of the announcement.
In the United States, the Alternative Reference Rates Committee (the “ARRC”), a group of market participants convened by the Board of Governors of the Federal Reserve System and the Federal Reserve Bank of New York in cooperation with other federal and state government agencies, has since 2014 undertaken efforts to identify U.S. dollar reference interest rates as alternatives to LIBOR and to
Notes to Financial Statements (Continued)
First Trust Short Duration High Income Fund
October 31, 2022
facilitate the mitigation of LIBOR-related risks. In June 2017, the ARRC identified the Secured Overnight Financing Rate (“SOFR”), a broad measure of the cost of cash overnight borrowing collateralized by U.S. Treasury securities, as the preferred alternative for U.S. dollar LIBOR. The Federal Reserve Bank of New York began daily publishing of SOFR in April 2018. There is no assurance that any alternative reference rate, including SOFR, will be similar to or produce the same value or economic equivalence as LIBOR or that instruments using an alternative rate will have the same volume or liquidity.
At this time, it is not possible to predict the full impact of the elimination of LIBOR and the establishment of an alternative reference rate on the Fund or its investments.
Securities purchased or sold on a when-issued, delayed-delivery or forward purchase commitment basis may have extended settlement periods. The value of the security so purchased is subject to market fluctuations during this period. Due to the nature of the Senior Loan market, the actual settlement date may not be certain at the time of the purchase or sale for some of the Senior Loans. Interest income on such Senior Loans is not accrued until settlement date. The Fund maintains liquid assets with a current value at least equal to the amount of its when-issued, delayed-delivery or forward purchase commitments. At October 31, 2022, the Fund had no when-issued, delayed-delivery or forward purchase commitments (other than the unfunded commitments discussed below).
C. Unfunded Loan Commitments
The Fund may enter into certain credit agreements, all or a portion of which may be unfunded. The Fund is obligated to fund these loan commitments at the borrower’s discretion. Unfunded loan commitments are marked-to-market daily, and any unrealized appreciation (depreciation) is included in the Statement of Assets and Liabilities and Statement of Operations. In connection with these commitments, the Fund earns a commitment fee typically set as a percentage of the commitment amount. The commitment fees are included in “Other” under Investment Income on the Statement of Operations. As of October 31, 2022, the Fund had the following unfunded loan commitments:
| Borrower | | Principal
Value | | Commitment
Amount | | Value | | Unrealized
Appreciation
(Depreciation) |
| athenahealth, Inc. (Minerva Merger Sub, Inc.), Term Loan | | $ 285,720 | | $ 285,118 | | $ 260,483 | | $ (24,635) |
| Aveanna Healthcare, LLC, Term Loan | | 52,535 | | 52,216 | | 41,975 | | (10,241) |
| Veritext Corporation (VT TopCo, Inc.), Term Loan | | 8,563 | | 8,564 | | 8,285 | | (279) |
| | | | | $345,898 | | $310,743 | | $(35,155) |
D. Restricted Securities
The Fund invests in restricted securities, which are securities that may not be offered for public sale without first being registered under the 1933 Act. Prior to registration, restricted securities may only be resold in transactions exempt from registration under Rule 144A under the 1933 Act, normally to qualified institutional buyers. As of October 31, 2022, the Fund held restricted securities as shown in the following table that the Advisor has deemed illiquid pursuant to procedures adopted by the Trust’s Board of Trustees. Although market instability can result in periods of increased overall market illiquidity, liquidity for each security is determined based on security-specific factors and assumptions, which require subjective judgment. The Fund does not have the right to demand that such securities be registered. These securities are valued according to the valuation procedures as stated in the Portfolio Valuation note (Note 2A) and are not expressed as a discount to the carrying value of a comparable unrestricted security. There are no unrestricted securities with the same maturity dates and yields for these issuers.
| Security | Acquisition
Date | Principal
Value/Shares | Current Price | Carrying
Cost | Value | % of
Net
Assets |
| Akorn, Inc. | 10/15/20 | 26,696 | $6.00 | $306,038 | $160,176 | 0.12% |
E. Dividends and Distributions to Shareholders
The Fund will declare daily and pay monthly distributions of all or a portion of its net income to holders of each class of shares. Distributions of any net capital gains earned by the Fund will be distributed at least annually. Distributions will automatically be reinvested into additional Fund shares unless cash distributions are elected by the shareholder. The Fund may also designate a portion of the amount paid to redeeming shareholder as a distribution for tax purposes.
Notes to Financial Statements (Continued)
First Trust Short Duration High Income Fund
October 31, 2022
Distributions from net investment income and realized capital gains are determined in accordance with federal income tax regulations, which may differ from U.S. GAAP. Certain capital accounts in the financial statements are periodically adjusted for permanent differences in order to reflect their tax character. These permanent differences are primarily due to the varying treatment of income and gain/loss on portfolio securities held by the Fund and have no impact on net assets or NAV per share. Temporary differences, which arise from recognizing certain items of income, expense and gain/loss in different periods for financial statement and tax purposes, will reverse at some point in the future. Permanent differences incurred during the fiscal year ended October 31, 2022, resulting in book and tax accounting differences, have been reclassified at year end to reflect an increase in accumulated net investment income (loss) of $196,784, a decrease in accumulated net realized gain (loss) of $194,594, and a decrease to paid-in capital of $2,190. Accumulated distributable earnings (loss) consists of accumulated net investment income (loss), accumulated net realized gain (loss) on investments, and unrealized appreciation (depreciation) on investments. Net assets were not affected by this reclassification.
The tax character of distributions paid by the Fund during the fiscal years ended October 31, 2022 and 2021, was as follows:
| Distributions paid from: | 2022 | 2021 |
Ordinary income
| $6,520,742 | $5,567,538 |
Capital gains
| — | — |
Return of capital
| — | — |
As of October 31, 2022, the distributable earnings and net assets on a tax basis were as follows:
Undistributed ordinary income
| $1,161,365 |
Undistributed capital gains
| — |
Total undistributed earnings
| 1,161,365 |
Accumulated capital and other losses
| (21,166,414) |
Net unrealized appreciation (depreciation)
| (8,764,934) |
Total accumulated earnings (losses)
| (28,769,983) |
Other
| — |
Paid-in capital
| 167,143,364 |
Total net assets
| $138,373,381 |
F. Income Taxes
The Fund intends to continue to qualify as a regulated investment company by complying with the requirements under Subchapter M of the Internal Revenue Code of 1986, as amended, which includes distributing substantially all of its net investment income and net realized gains to shareholders. Accordingly, no provision has been made for federal and state income taxes. However, due to the timing and amount of distributions, the Fund may be subject to an excise tax of 4% of the amount by which approximately 98% of the Fund’s taxable income exceeds the distributions from such taxable income for the calendar year. For the fiscal year ended October 31, 2022, the Fund incurred $18,500 of excise tax expense.
The Fund intends to utilize provisions of the federal income tax laws, which allow it to carry a realized capital loss forward indefinitely following the year of the loss and offset such loss against any future realized capital gains. The Fund is subject to certain limitations under U.S. tax rules on the use of capital loss carryforwards and net unrealized built-in losses. These limitations apply when there has been a 50% change in ownership. At October 31, 2022, the Fund had non-expiring net capital loss carryforwards for federal income tax purposes of $21,166,414.
Certain losses realized during the current fiscal year may be deferred and treated as occurring the first day of the following fiscal year for federal income tax purposes. For the fiscal year ended October 31, 2022, the Fund did not incur any net late year ordinary losses.
The Fund is subject to accounting standards that establish a minimum threshold for recognizing, and a system for measuring, the benefits of a tax position taken or expected to be taken in a tax return. Taxable years ended 2019, 2020, 2021, and 2022 remain open to federal and state audit. As of October 31, 2022, management has evaluated the application of these standards to the Fund and has determined that no provision for income tax is required in the Fund’s financial statements for uncertain tax positions.
Notes to Financial Statements (Continued)
First Trust Short Duration High Income Fund
October 31, 2022
As of October 31, 2022, the aggregate cost, gross unrealized appreciation, gross unrealized depreciation, and net unrealized appreciation/(depreciation) on investments (including short positions and derivatives, if any) for federal income tax purposes were as follows:
| Tax Cost | | Gross
Unrealized
Appreciation | | Gross
Unrealized
(Depreciation) | | Net Unrealized
Appreciation
(Depreciation) |
| $146,652,087 | | $64,322 | | $(8,794,101) | | $(8,729,779) |
G. Expenses
The Fund will pay all expenses directly related to its operations. Expenses of the Fund are allocated on a pro rata basis to each class of shares, except for distribution and service (12b-1) fees and incremental transfer agency costs which are unique to each class of shares.
3. Investment Advisory Fee, Affiliated Transactions and Other Fee Arrangements
First Trust, the investment advisor to the Fund, is a limited partnership with one limited partner, Grace Partners of DuPage L.P., and one general partner, The Charger Corporation. The Charger Corporation is an Illinois corporation controlled by James A. Bowen, Chief Executive Officer of First Trust. First Trust is responsible for the selection and ongoing monitoring of the Fund’s investment portfolio, managing the Fund’s business affairs and providing certain administrative services necessary for the management of the Fund. For these investment management services, First Trust is entitled to a monthly fee calculated at an annual rate of 0.65% of the Fund’s average daily net assets. First Trust also provides fund reporting services to the Fund for a flat annual fee in the amount of $9,250.
First Trust has agreed to waive fees and/or reimburse Fund expenses to the extent necessary to prevent the total annual fund operating expenses (excluding 12b-1 distribution and service fees, interest expenses, taxes, fees incurred in acquiring and disposing of portfolio securities and extraordinary expenses) from exceeding 1.00% of average daily net assets of any class of shares of the Fund (the “Expense Cap”) until February 28, 2024 and then from exceeding 1.35% from March 1, 2024 to February 28, 2033 (the “Expense Cap Termination Date”). Expenses borne and fees waived by First Trust are subject to recovery on the Fund’s class level, if applicable, by First Trust for up to three years from the date the fee or expense was incurred, but no reimbursement payment will be made by the Fund at any time if it would result in the Fund’s expenses exceeding (i) the Expense Cap in place for the most recent fiscal year for which such expense limitation was in place; (ii) the Expense Cap in place at the time the fees were waived; or (iii) the current Expense Cap. Expense limitations may be terminated or modified prior to their expiration only with the approval of the Board of Trustees of the Trust. These amounts would be included in “Expenses previously waived or reimbursed” on the Statement of Operations. The advisory fee waivers and expense reimbursement for the fiscal year ended October 31, 2022 and the expenses borne by First Trust subject to recovery were as follows:
| Advisory Fee Waivers | | Expense Reimbursements | | Expenses Subject
to Recovery |
| $ 16,381 | | $ — | | $ 16,381 |
BNY Mellon Investment Servicing (US) Inc. (“BNYM IS”) serves as the Fund’s transfer agent in accordance with certain fee arrangements. As transfer agent, BNYM IS is responsible for maintaining shareholder records for the Fund. The Bank of New York Mellon (“BNYM”) serves as the Fund’s administrator, fund accountant, and custodian in accordance with certain fee arrangements. As administrator and fund accountant, BNYM is responsible for providing certain administrative and accounting services to the Fund, including maintaining the Fund’s books of account, records of the Fund’s securities transactions, and certain other books and records. As custodian, BNYM is responsible for custody of the Fund’s assets. BNYM IS and BNYM are subsidiaries of The Bank of New York Mellon Corporation, a financial holding company.
Each Trustee who is not an officer or employee of First Trust, any sub-advisor or any of their affiliates (“Independent Trustees”) is paid a fixed annual retainer that is allocated equally among each fund in the First Trust Fund Complex. Each Independent Trustee is also paid an annual per fund fee that varies based on whether the fund is a closed-end or other actively managed fund, a target outcome fund or an index fund.
Additionally, the Lead Independent Trustee and the Chairs of the Audit Committee, Nominating and Governance Committee and Valuation Committee are paid annual fees to serve in such capacities, with such compensation allocated pro rata among each fund in the First Trust Fund Complex based on net assets. Independent Trustees are reimbursed for travel and out-of-pocket expenses in
Notes to Financial Statements (Continued)
First Trust Short Duration High Income Fund
October 31, 2022
connection with all meetings. The Lead Independent Trustee and Committee Chairs rotate every three years. The officers and “Interested” Trustee receive no compensation from the Trust for acting in such capacities.
4. Capital Share Transactions
Capital transactions were as follows:
| | Year Ended
October 31, 2022 | | Year Ended
October 31, 2021 |
| | Shares | | Value | | Shares | | Value |
| Sales: | | | | | | | |
| Class A | 181,529 | | $ 3,449,363 | | 363,016 | | $ 7,141,720 |
| Class C | 36,404 | | 674,587 | | 202,080 | | 3,962,298 |
| Class I | 2,924,228 | | 55,168,803 | | 3,414,919 | | 66,943,681 |
| Total Sales | 3,142,161 | | $ 59,292,753 | | 3,980,015 | | $ 78,047,699 |
| Dividend Reinvestment: | | | | | | | |
| Class A | 35,812 | | $ 661,490 | | 25,504 | | $ 500,641 |
| Class C | 20,945 | | 387,094 | | 18,316 | | 359,363 |
| Class I | 283,864 | | 5,253,837 | | 219,557 | | 4,313,450 |
| Total Dividend Reinvestment | 340,621 | | $ 6,302,421 | | 263,377 | | $ 5,173,454 |
| Redemptions: | | | | | | | |
| Class A | (224,137) | | $ (4,179,869) | | (668,102) | | $ (12,991,552) |
| Class C | (274,679) | | (5,140,699) | | (209,997) | | (4,114,157) |
| Class I | (3,840,065) | | (71,314,407) | | (3,620,625) | | (70,650,612) |
| Total Redemptions | (4,338,881) | | $ (80,634,975) | | (4,498,724) | | $ (87,756,321) |
5. Purchases and Sales of Securities
The cost of purchases and proceeds from sales of securities, excluding short-term investments, for the fiscal year ended October 31, 2022, were $79,044,417 and $96,324,675, respectively.
6. Distribution and Service Plan
The Board of Trustees adopted a Distribution and Service Plan pursuant to Rule 12b-1 under the 1940 Act. In accordance with the Rule 12b-1 plan, the share classes of the Fund are authorized to pay an amount up to 0.25% and 1.00% of their average daily net assets each year for Class A and Class C, respectively, to reimburse First Trust Portfolios L.P. (“FTP”), the distributor of the Fund, for amounts expended to finance activities primarily intended to result in the sale of Fund shares or the provision of investor services. FTP may also use this amount to compensate securities dealers or other persons for providing distribution assistance, including broker-dealer and shareholder support and educational and promotional services. Class I shares have no 12b-1 fees.
7. Borrowings
The Trust, on behalf of the Fund, along with First Trust Variable Insurance Trust and First Trust Exchange-Traded Fund IV, has a $200 million Credit Agreement with BNYM (the “BNYM Line of Credit”) to be a liquidity backstop during periods of high redemption volume. A commitment fee of 0.25% of the daily amount of the excess of the commitment amount over the outstanding principal balance of the loans will be charged by BNYM, which First Trust allocates amongst the funds that have access to the BNYM Line of Credit. These fees are reflected on the Statement of Operations in the “Commitment fees” line item. To the extent that the Fund accesses the BNYM Line of Credit, there would also be an interest fee charged. The Fund did not have any borrowings outstanding during the fiscal year ended October 31, 2022.
8. Indemnification
The Fund has a variety of indemnification obligations under contracts with its service providers. The Fund’s maximum exposure under these arrangements is unknown. However, the Fund has not had prior claims or losses pursuant to these contracts and expects the risk of loss to be remote.
Notes to Financial Statements (Continued)
First Trust Short Duration High Income Fund
October 31, 2022
9. Subsequent Events
Management has evaluated the impact of all subsequent events to the Fund through the date the financial statements were issued and has determined that there were no subsequent events requiring recognition or disclosure in the financial statements that have not already been disclosed.
Report of Independent Registered Public Accounting Firm
To the Shareholders and the Board of Trustees of First Trust Series Fund:
Opinion on the Financial Statements and Financial Highlights
We have audited the accompanying statement of assets and liabilities of First Trust Short Duration High Income Fund (the “Fund”), a series of the First Trust Series Fund, including the portfolio of investments, as of October 31, 2022, the related statement of operations for the year then ended, the statements of changes in net assets for each of the two years in the period then ended, the financial highlights for each of the five years in the period then ended, and the related notes. In our opinion, the financial statements and financial highlights present fairly, in all material respects, the financial position of the Fund as of October 31, 2022, the results of its operations for the year then ended, the changes in its net assets for each of the two years in the period then ended, and the financial highlights for each of the five years in the period then ended in conformity with accounting principles generally accepted in the United States of America.
Basis for Opinion
These financial statements and financial highlights are the responsibility of the Fund’s management. Our responsibility is to express an opinion on the Fund’s financial statements and financial highlights based on our audits. We are a public accounting firm registered with the Public Company Accounting Oversight Board (United States) (PCAOB) and are required to be independent with respect to the Fund in accordance with the U.S. federal securities laws and the applicable rules and regulations of the Securities and Exchange Commission and the PCAOB.
We conducted our audits in accordance with the standards of the PCAOB. Those standards require that we plan and perform the audit to obtain reasonable assurance about whether the financial statements and financial highlights are free of material misstatement, whether due to error or fraud. The Fund is not required to have, nor were we engaged to perform, an audit of its internal control over financial reporting. As part of our audits we are required to obtain an understanding of internal control over financial reporting but not for the purpose of expressing an opinion on the effectiveness of the Fund’s internal control over financial reporting. Accordingly, we express no such opinion.
Our audits included performing procedures to assess the risks of material misstatement of the financial statements and financial highlights, whether due to error or fraud, and performing procedures that respond to those risks. Such procedures included examining, on a test basis, evidence regarding the amounts and disclosures in the financial statements and financial highlights. Our audits also included evaluating the accounting principles used and significant estimates made by management, as well as evaluating the overall presentation of the financial statements and financial highlights. Our procedures included confirmation of securities owned as of October 31, 2022, by correspondence with the custodian, agent banks and brokers; when replies were not received from agent banks and brokers, we performed other auditing procedures. We believe that our audits provide a reasonable basis for our opinion.
Chicago, Illinois
December 21, 2022
We have served as the auditor of one or more First Trust investment companies since 2001.
Additional Information
First Trust Short Duration High Income Fund
October 31, 2022 (Unaudited)
Proxy Voting Policies and Procedures
A description of the policies and procedures that the Trust uses to determine how to vote proxies and information on how the Fund voted proxies relating to portfolio securities during the most recent 12-month period ended June 30 is available (1) without charge, upon request, by calling (800) 988-5891; (2) on the Fund’s website at www.ftportfolios.com; and (3) on the Securities and Exchange Commission’s (“SEC”) website at www.sec.gov.
Portfolio Holdings
The Fund files portfolio holdings information for each month in a fiscal quarter within 60 days after the end of the relevant fiscal quarter on Form N-PORT. Portfolio holdings information for the third month of each fiscal quarter will be publicly available on the SEC’s website at www.sec.gov. The Fund’s complete schedule of portfolio holdings for the second and fourth quarters of each fiscal year is included in the semi-annual and annual reports to shareholders, respectively, and is filed with the SEC on Form N-CSR. The semi-annual and annual report for the Fund is available to investors within 60 days after the period to which it relates. The Fund’s Forms N-PORT and Forms N-CSR are available on the SEC’s website listed above.
Tax Information
Distributions paid to foreign shareholders during the Fund’s fiscal year ended October 31, 2022, that were properly designated by the Fund as “interest-related dividends” or “short-term capital gain dividends,” may not be subject to federal income tax provided that the income was earned by such foreign shareholders.
Of the ordinary income (including short-term capital gain, if applicable) distributions made by the Fund during the period ended October 31, 2022, none qualify for the corporate dividends received deduction available to corporate shareholders or as qualified dividend income.
Risk Considerations
Risks are inherent in all investing. Certain general risks that may be applicable to a Fund are identified below, but not all of the material risks relevant to each Fund are included in this report and not all of the risks below apply to each Fund. The material risks of investing in each Fund are spelled out in its prospectus, statement of additional information and other regulatory filings. Before investing, you should consider each Fund’s investment objective, risks, charges and expenses, and read each Fund’s prospectus and statement of additional information carefully. You can download each Fund’s prospectus at www.ftportfolios.com or contact First Trust Portfolios L.P. at (800) 621-1675 to request a prospectus, which contains this and other information about each Fund.
Concentration Risk. To the extent that a fund is able to invest a significant percentage of its assets in a single asset class or the securities of issuers within the same country, state, region, industry or sector, an adverse economic, business or political development may affect the value of the fund’s investments more than if the fund were more broadly diversified. A fund that tracks an index will be concentrated to the extent the fund’s corresponding index is concentrated. A concentration makes a fund more susceptible to any single occurrence and may subject the fund to greater market risk than a fund that is more broadly diversified.
Credit Risk. Credit risk is the risk that an issuer of a security will be unable or unwilling to make dividend, interest and/or principal payments when due and the related risk that the value of a security may decline because of concerns about the issuer’s ability to make such payments.
Cyber Security Risk. The funds are susceptible to potential operational risks through breaches in cyber security. A breach in cyber security refers to both intentional and unintentional events that may cause a fund to lose proprietary information, suffer data corruption or lose operational capacity. Such events could cause a fund to incur regulatory penalties, reputational damage, additional compliance costs associated with corrective measures and/or financial loss. In addition, cyber security breaches of a fund’s third-party service providers, such as its administrator, transfer agent, custodian, or sub-advisor, as applicable, or issuers in which the fund invests, can also subject a fund to many of the same risks associated with direct cyber security breaches.
Derivatives Risk. To the extent a fund uses derivative instruments such as futures contracts, options contracts and swaps, the fund may experience losses because of adverse movements in the price or value of the underlying asset, index or rate, which may be magnified by certain features of the derivative. These risks are heightened when a fund’s portfolio managers use derivatives to enhance the fund’s return or as a substitute for a position or security, rather than solely to hedge (or offset) the risk of a position or security held by the fund.
Equity Securities Risk. To the extent a fund invests in equity securities, the value of the fund’s shares will fluctuate with changes in the value of the equity securities. Equity securities prices fluctuate for several reasons, including changes in investors’ perceptions of
Additional Information (Continued)
First Trust Short Duration High Income Fund
October 31, 2022 (Unaudited)
the financial condition of an issuer or the general condition of the relevant stock market, such as market volatility, or when political or economic events affecting the issuers occur. In addition, common stock prices may be particularly sensitive to rising interest rates, as the cost of capital rises and borrowing costs increase. Equity securities may decline significantly in price over short or extended periods of time, and such declines may occur in the equity market as a whole, or they may occur in only a particular country, company, industry or sector of the market.
Fixed Income Securities Risk. To the extent a fund invests in fixed income securities, the fund will be subject to credit risk, income risk, interest rate risk, liquidity risk and prepayment risk. Income risk is the risk that income from a fund’s fixed income investments could decline during periods of falling interest rates. Interest rate risk is the risk that the value of a fund’s fixed income securities will decline because of rising interest rates. Liquidity risk is the risk that a security cannot be purchased or sold at the time desired, or cannot be purchased or sold without adversely affecting the price. Prepayment risk is the risk that the securities will be redeemed or prepaid by the issuer, resulting in lower interest payments received by the fund. In addition to these risks, high yield securities, or “junk” bonds, are subject to greater market fluctuations and risk of loss than securities with higher ratings, and the market for high yield securities is generally smaller and less liquid than that for investment grade securities.
Investment Companies Risk. To the extent a fund invests in the securities of other investment vehicles, the fund will incur additional fees and expenses that would not be present in a direct investment in those investment vehicles. Furthermore, the fund’s investment performance and risks are directly related to the investment performance and risks of the investment vehicles in which the fund invests.
LIBOR Risk. To the extent a fund invests in floating or variable rate obligations that use the London Interbank Offered Rate (“LIBOR”) as a reference interest rate, it is subject to LIBOR Risk. The United Kingdom’s Financial Conduct Authority, which regulates LIBOR has ceased making LIBOR available as a reference rate over a phase-out period that began December 31, 2021. There is no assurance that any alternative reference rate, including the Secured Overnight Financing Rate (“SOFR”) will be similar to or produce the same value or economic equivalence as LIBOR or that instruments using an alternative rate will have the same volume or liquidity. The unavailability or replacement of LIBOR may affect the value, liquidity or return on certain fund investments and may result in costs incurred in connection with closing out positions and entering into new trades. Any potential effects of the transition away from LIBOR on the fund or on certain instruments in which the fund invests can be difficult to ascertain, and they may vary depending on a variety of factors, and they could result in losses to the fund.
Management Risk. To the extent that a fund is actively managed, it is subject to management risk. In managing an actively-managed fund’s investment portfolio, the fund’s portfolio managers will apply investment techniques and risk analyses that may not have the desired result. There can be no guarantee that a fund will meet its investment objective.
Market Risk. Market risk is the risk that a particular security, or shares of a fund in general, may fall in value. Securities held by a fund, as well as shares of a fund itself, are subject to market fluctuations caused by factors such as general economic conditions, political events, regulatory or market developments, changes in interest rates and perceived trends in securities prices. Shares of a fund could decline in value or underperform other investments as a result of the risk of loss associated with these market fluctuations. In addition, local, regional or global events such as war, acts of terrorism, spread of infectious diseases or other public health issues, recessions, or other events could have a significant negative impact on a fund and its investments. Such events may affect certain geographic regions, countries, sectors and industries more significantly than others. In February 2022, Russia invaded Ukraine which has caused and could continue to cause significant market disruptions and volatility within the markets in Russia, Europe, and the United States. The hostilities and sanctions resulting from those hostilities could have a significant impact on certain fund investments as well as fund performance. The COVID-19 global pandemic and the ensuing policies enacted by governments and central banks have caused and may continue to cause significant volatility and uncertainty in global financial markets. While the U.S. has resumed “reasonably” normal business activity, many countries continue to impose lockdown measures. Additionally, there is no guarantee that vaccines will be effective against emerging variants of the disease. These events also adversely affect the prices and liquidity of a fund’s portfolio securities or other instruments and could result in disruptions in the trading markets. Any of such circumstances could have a materially negative impact on the value of a fund’s shares and result in increased market volatility. During any such events, a fund’s shares may trade at increased premiums or discounts to their net asset value and the bid/ask spread on a fund’s shares may widen.
Non-U.S. Securities Risk. To the extent a fund invests in non-U.S. securities, it is subject to additional risks not associated with securities of domestic issuers. Non-U.S. securities are subject to higher volatility than securities of domestic issuers due to: possible adverse political, social or economic developments; restrictions on foreign investment or exchange of securities; capital controls; lack of liquidity; currency exchange rates; excessive taxation; government seizure of assets; the imposition of sanctions by foreign governments; different legal or accounting standards; and less government supervision and regulation of exchanges in foreign countries. Investments in non-U.S. securities may involve higher costs than investments in U.S. securities, including higher transaction and custody costs, as well as additional taxes imposed by non-U.S. governments. These risks may be heightened for securities of companies located, or with significant operations, in emerging market countries.
Additional Information (Continued)
First Trust Short Duration High Income Fund
October 31, 2022 (Unaudited)
Operational Risk. Each fund is subject to risks arising from various operational factors, including, but not limited to, human error, processing and communication errors, errors of a fund’s service providers, counterparties or other third-parties, failed or inadequate processes and technology or systems failures. Each fund relies on third-parties for a range of services, including custody. Any delay or failure relating to engaging or maintaining such service providers may affect a fund’s ability to meet its investment objective. Although the funds and the funds’ investment advisor seek to reduce these operational risks through controls and procedures, there is no way to completely protect against such risks.
Preferred Securities Risk. Preferred securities combine some of the characteristics of both common stocks and bonds. Preferred securities are typically subordinated to bonds and other debt securities in a company’s capital structure in terms of priority to corporate income, subjecting them to greater credit risk than those debt securities. Generally, holders of preferred securities have no voting rights with respect to the issuing company unless preferred dividends have been in arrears for a specified number of periods, at which time the preferred security holders may obtain limited rights. In certain circumstances, an issuer of preferred securities may defer payment on the securities and, in some cases, redeem the securities prior to a specified date. Preferred securities may also be substantially less liquid than other securities, including common stock.
Valuation Risk. The valuation of certain securities may carry more risk than that of common stock. Uncertainties in the conditions of the financial markets, unreliable reference data, lack of transparency and inconsistency of valuation models and processes may lead to inaccurate asset pricing. A fund may hold investments in sizes smaller than institutionally sized round lot positions (sometimes referred to as odd lots). However, third-party pricing services generally provide evaluations on the basis of institutionally-sized round lots. If a fund sells certain of its investments in an odd lot transaction, the sale price may be less than the value at which such securities have been held by the fund. Odd lots often trade at lower prices than institutional round lots. There is no assurance that the fund will be able to sell a portfolio security at the price established by the pricing service, which could result in a loss to the fund.
| NOT FDIC INSURED | NOT BANK GUARANTEED | MAY LOSE VALUE |
Advisory Agreement
Board Considerations Regarding Approval of Continuation of Investment Management Agreement
The Board of Trustees of First Trust Series Fund (the “Trust”), including the Independent Trustees, unanimously approved the continuation of the Investment Management Agreement (the “Agreement”) between the Trust, on behalf of the First Trust Short Duration High Income Fund (the “Fund”), and First Trust Advisors L.P. (the “Advisor”). The Board approved the continuation of the Agreement for a one-year period ending June 30, 2023 at a meeting held on June 12–13, 2022. The Board determined that the continuation of the Agreement is in the best interests of the Fund in light of the nature, extent and quality of the services provided and such other matters as the Board considered to be relevant in the exercise of its business judgment.
To reach this determination, the Board considered its duties under the Investment Company Act of 1940, as amended (the “1940 Act”), as well as under the general principles of state law, in reviewing and approving advisory contracts; the requirements of the 1940 Act in such matters; the fiduciary duty of investment advisors with respect to advisory agreements and compensation; the standards used by courts in determining whether investment company boards have fulfilled their duties; and the factors to be considered by the Board in voting on such agreements. At meetings held on April 18, 2022 and June 12–13, 2022, the Board, including the Independent Trustees, reviewed materials provided by the Advisor responding to requests for information from counsel to the Independent Trustees, submitted on behalf of the Independent Trustees, that, among other things, outlined: the services provided by the Advisor to the Fund (including the relevant personnel responsible for these services and their experience); the advisory fee rate payable by the Fund as compared to fees charged to a peer group of funds (the “Expense Group”) and a broad peer universe of funds (the “Expense Universe”), each assembled by Broadridge Financial Solutions, Inc. (“Broadridge”), an independent source, and as compared to fees charged to other clients of the Advisor; the expense ratio of the Fund as compared to expense ratios of the funds in the Fund’s Expense Group and Expense Universe; performance information for the Fund, including comparisons of the Fund’s performance to that of one or more relevant benchmark indexes and to that of a performance group of funds and a broad performance universe of funds (the “Performance Universe”), each assembled by Broadridge; the nature of expenses incurred in providing services to the Fund and the potential for the Advisor to realize economies of scale, if any; profitability and other financial data for the Advisor; any indirect benefits to the Advisor and its affiliate, First Trust Portfolios L.P. (“FTP”); and information on the Advisor’s compliance program. The Board reviewed initial materials with the Advisor at the meeting held on April 18, 2022, prior to which the Independent Trustees and their counsel met separately to discuss the information provided by the Advisor. Following the April meeting, counsel to the Independent Trustees, on behalf of the Independent Trustees, requested certain clarifications and supplements to the materials provided, and the information provided in response to those requests was considered at an executive session of the Independent Trustees and their counsel held prior to the June 12–13, 2022 meeting, as well as at the June meeting. The Board applied its business judgment to determine whether the arrangement between the Trust and the Advisor continues to be a reasonable business arrangement from the Fund’s perspective. The Board determined that, given the totality of the information provided with respect to the Agreement,
Additional Information (Continued)
First Trust Short Duration High Income Fund
October 31, 2022 (Unaudited)
the Board had received sufficient information to renew the Agreement. The Board considered that shareholders chose to invest or remain invested in the Fund knowing that the Advisor manages the Fund and knowing the Fund’s advisory fee.
In reviewing the Agreement, the Board considered the nature, extent and quality of the services provided by the Advisor under the Agreement. The Board considered that the Advisor is responsible for the overall management and administration of the Trust and the Fund and reviewed all of the services provided by the Advisor to the Fund, as well as the background and experience of the persons responsible for such services. The Board noted that the Advisor’s Leveraged Finance Investment Team is responsible for the day-to-day management of the Fund’s investments. The Board considered the background and experience of the members of the Leveraged Finance Investment Team and noted the Board’s prior meetings with members of the Team. The Board considered the Advisor’s statement that it applies the same oversight model internally with its Leveraged Finance Investment Team as it uses for overseeing external sub-advisors, including portfolio risk monitoring and performance review. In reviewing the services provided, the Board noted the compliance program that had been developed by the Advisor and considered that it includes a robust program for monitoring the Advisor’s and the Fund’s compliance with the 1940 Act, as well as the Fund’s compliance with its investment objectives, policies and restrictions. The Board also considered a report from the Advisor with respect to its risk management functions related to the operation of the Fund. Finally, as part of the Board’s consideration of the Advisor’s services, the Advisor, in its written materials and at the April 18, 2022 meeting, described to the Board the scope of its ongoing investment in additional personnel and infrastructure to maintain and improve the quality of services provided to the Fund and the other funds in the First Trust Fund Complex. In light of the information presented and the considerations made, the Board concluded that the nature, extent and quality of the services provided to the Trust and the Fund by the Advisor under the Agreement have been and are expected to remain satisfactory and that the Advisor has managed the Fund consistent with its investment objectives, policies and restrictions.
The Board considered the advisory fee rate payable by the Fund under the Agreement for the services provided. The Board considered that the Advisor agreed to extend the current expense caps for each share class through February 28, 2024 and agreed to keep the long-term expense cap in place from March 1, 2024 through February 28, 2033. The Board noted that fees waived or expenses borne by the Advisor are subject to reimbursement by the Fund for up to three years from the date the fee was waived or expense was incurred, but no reimbursement payment would be made by the Fund at any time if it would result in the Fund’s expenses exceeding (i) the applicable expense limitation in place for the most recent fiscal year for which such expense limitation was in place, (ii) the applicable expense limitation in place at the time the fees were waived, or (iii) the current expense limitation. The Board received and reviewed information showing the fee rates and expense ratios of the peer funds in the Expense Group, as well as advisory and unitary fee rates charged by the Advisor to other fund and non-fund clients, as applicable. With respect to the Expense Group, the Board, at the April 18, 2022 meeting, discussed with Broadridge its methodology for assembling peer groups and discussed with the Advisor limitations in creating a relevant peer group for the Fund. The Board took these limitations into account in considering the peer data. Based on the information provided, the Board noted that the contractual advisory fee rate payable by the Fund was above the median contractual advisory fee of the peer funds in the Expense Group. The Board also noted that the Fund’s total (net) expense ratio (Class A shares) was above the median total (net) expense ratio of the peer funds in the Expense Group. With respect to fees charged to other clients, the Board considered differences between the Fund and other clients that limited their comparability. In considering the advisory fee rate overall, the Board also considered the Advisor’s statement that it seeks to meet investor needs through innovative and value-added investment solutions and the Advisor’s demonstrated long-term commitment to the Fund and the other funds in the First Trust Fund Complex.
The Board considered performance information for the Fund. The Board noted the process it has established for monitoring the Fund’s performance and portfolio risk on an ongoing basis, which includes quarterly performance reporting from the Advisor for the Fund. The Board determined that this process continues to be effective for reviewing the Fund’s performance. The Board received and reviewed information comparing the Fund’s performance for periods ended December 31, 2021 to the performance of the funds in the Performance Universe and to that of a blended benchmark index. Based on the information provided, the Board noted that the Fund (Class A shares) underperformed the Performance Universe median and the blended benchmark index for the one-, three- and five-year periods ended December 31, 2021.
On the basis of all the information provided on the fees, expenses and performance of the Fund and the ongoing oversight by the Board, the Board concluded that the advisory fee for the Fund continues to be reasonable and appropriate in light of the nature, extent and quality of the services provided by the Advisor to the Fund under the Agreement.
The Board considered information and discussed with the Advisor whether there were any economies of scale in connection with providing advisory services to the Fund and noted the Advisor’s statement that it believes that its expenses relating to providing advisory services to the Fund will likely increase during the next twelve months as the Advisor continues to build infrastructure and add new staff. The Board considered the revenues and allocated costs (including the allocation methodology) of the Advisor in serving as investment advisor to the Fund for the twelve months ended December 31, 2021 and the estimated profitability level for the Fund calculated by the Advisor based on such data, as well as complex-wide and product-line profitability data, for the same period. The
Additional Information (Continued)
First Trust Short Duration High Income Fund
October 31, 2022 (Unaudited)
Board noted the inherent limitations in the profitability analysis and concluded that, based on the information provided, the Advisor’s profitability level for the Fund was not unreasonable. In addition, the Board considered indirect benefits described by the Advisor that may be realized from its relationship with the Fund. The Board considered that the Advisor had identified as an indirect benefit to the Advisor and FTP their exposure to investors and brokers who, absent their exposure to the Fund, may have had no dealings with the Advisor or FTP. The Board noted that in addition to the advisory fees paid by the Fund, FTP is compensated for services provided to the Fund through 12b-1 distribution and service fees and that the Advisor receives compensation from the Fund for providing fund reporting services pursuant to a separate Fund Reporting Services Agreement. The Board also noted that the Advisor does not utilize soft dollars in connection with the Fund. The Board concluded that the character and amount of potential indirect benefits to the Advisor were not unreasonable.
Based on all of the information considered and the conclusions reached, the Board, including the Independent Trustees, unanimously determined that the terms of the Agreement continue to be fair and reasonable and that the continuation of the Agreement is in the best interests of the Fund. No single factor was determinative in the Board’s analysis.
Board of Trustees and Officers
First Trust Short Duration High Income Fund
October 31, 2022 (Unaudited)
The following tables identify the Trustees and Officers of the Trust. Unless otherwise indicated, the address of all persons is 120 East Liberty Drive, Suite 400, Wheaton, IL 60187.
The Trust’s statement of additional information includes additional information about the Trustees and is available, without charge, upon request, by calling (800) 988-5891.
| Name, Year of Birth and Position with the Trust | Term of Office and Year First Elected or Appointed | Principal Occupations
During Past 5 Years | Number of Portfolios in the First Trust Fund Complex Overseen by Trustee | Other Trusteeships or Directorships Held by Trustee During Past 5 Years |
| INDEPENDENT TRUSTEES |
Richard E. Erickson, Trustee
(1951) | • Indefinite Term
• Since Trust Inception | Physician, Edward-Elmhurst Medical Group; Physician and Officer, Wheaton Orthopedics (1990 to 2021) | 223 | None |
Thomas R. Kadlec, Trustee
(1957) | • Indefinite Term
• Since Trust Inception | Retired; President, ADM Investor Services, Inc. (Futures Commission Merchant) (2010 to July 2022) | 223 | Director, National Futures Association and ADMIS Singapore Ltd.; Formerly, Director of ADM Investor Services, Inc., ADM Investor Services International, ADMIS Hong Kong Ltd., and Futures Industry Association |
Denise M. Keefe, Trustee
(1964) | • Indefinite Term
• Since 2021 | Executive Vice President, Advocate Aurora Health and President, Advocate Aurora Continuing Health Division (Integrated Healthcare System) | 223 | Director and Board Chair of Advocate Home Health Services, Advocate Home Care Products and Advocate Hospice; Director and Board Chair of Aurora At Home (since 2018); Director of Advocate Physician Partners Accountable Care Organization; Director and Board Chair of RML Long Term Acute Care Hospitals; and Director of Senior Helpers (since 2021) |
Robert F. Keith, Trustee
(1956) | • Indefinite Term
• Since Trust Inception | President, Hibs Enterprises (Financial and Management Consulting) | 223 | Formerly, Director of Trust Company of Illinois |
Niel B. Nielson, Trustee
(1954) | • Indefinite Term
• Since Trust Inception | Senior Advisor (2018 to Present), Managing Director and Chief Operating Officer (2015 to 2018), Pelita Harapan Educational Foundation (Educational Products and Services) | 223 | None |
| INTERESTED TRUSTEE |
James A. Bowen(1), Trustee and
Chairman of the Board
(1955) | • Indefinite Term
• Since Trust Inception | Chief Executive Officer, First Trust Advisors L.P. and First Trust Portfolios L.P.; Chairman of the Board of Directors, BondWave LLC (Software Development Company) and Stonebridge Advisors LLC (Investment Advisor) | 223 | None |
| (1) | Mr. Bowen is deemed an “interested person” of the Trust due to his position as CEO of First Trust Advisors L.P., investment advisor of the Trust. |
Board of Trustees and Officers (Continued)
First Trust Short Duration High Income Fund
October 31, 2022 (Unaudited)
| Name and Year of Birth | Position and Offices with Trust | Term of Office and Length of Service | Principal Occupations
During Past 5 Years |
| OFFICERS(2) |
James M. Dykas
(1966) | President and Chief Executive Officer | • Indefinite Term
• Since 2016 | Managing Director and Chief Financial Officer, First Trust Advisors L.P. and First Trust Portfolios L.P.; Chief Financial Officer, BondWave LLC (Software Development Company) and Stonebridge Advisors LLC (Investment Advisor) |
Donald P. Swade
(1972) | Treasurer, Chief Financial Officer and Chief Accounting Officer | • Indefinite Term
• Since 2016 | Senior Vice President, First Trust Advisors L.P. and First Trust Portfolios L.P. |
W. Scott Jardine
(1960) | Secretary and Chief Legal Officer | • Indefinite Term
• Since Trust Inception | General Counsel, First Trust Advisors L.P. and First Trust Portfolios L.P.; Secretary and General Counsel, BondWave LLC; Secretary, Stonebridge Advisors LLC |
Daniel J. Lindquist
(1970) | Vice President | • Indefinite Term
• Since Trust Inception | Managing Director, First Trust Advisors L.P. and First Trust Portfolios L.P. |
Kristi A. Maher
(1966) | Chief Compliance Officer and Assistant Secretary | • Indefinite Term
• Chief Compliance Officer Since January 2011 • Assistant Secretary Since Trust Inception | Deputy General Counsel, First Trust Advisors L.P. and First Trust Portfolios L.P. |
| (2) | The term “officer” means the president, vice president, secretary, treasurer, controller or any other officer who performs a policy making function. |
Privacy Policy
First Trust Short Duration High Income Fund
October 31, 2022 (Unaudited)
Privacy Policy
First Trust values our relationship with you and considers your privacy an important priority in maintaining that relationship. We are committed to protecting the security and confidentiality of your personal information.
Sources of Information
We collect nonpublic personal information about you from the following sources:
| • | Information we receive from you and your broker-dealer, investment professional or financial representative through interviews, applications, agreements or other forms; |
| • | Information about your transactions with us, our affiliates or others; |
| • | Information we receive from your inquiries by mail, e-mail or telephone; and |
| • | Information we collect on our website through the use of “cookies.” For example, we may identify the pages on our website that your browser requests or visits. |
Information Collected
The type of data we collect may include your name, address, social security number, age, financial status, assets, income, tax information, retirement and estate plan information, transaction history, account balance, payment history, investment objectives, marital status, family relationships and other personal information.
Disclosure of Information
We do not disclose any nonpublic personal information about our customers or former customers to anyone, except as permitted by law. In addition to using this information to verify your identity (as required under law), the permitted uses may also include the disclosure of such information to unaffiliated companies for the following reasons:
| • | In order to provide you with products and services and to effect transactions that you request or authorize, we may disclose your personal information as described above to unaffiliated financial service providers and other companies that perform administrative or other services on our behalf, such as transfer agents, custodians and trustees, or that assist us in the distribution of investor materials such as trustees, banks, financial representatives, proxy services, solicitors and printers. |
| • | We may release information we have about you if you direct us to do so, if we are compelled by law to do so, or in other legally limited circumstances (for example to protect your account from fraud). |
In addition, in order to alert you to our other financial products and services, we may share your personal information within First Trust.
Use of Website Analytics
We currently use third party analytics tools, Google Analytics and AddThis, to gather information for purposes of improving First Trust’s website and marketing our products and services to you. These tools employ cookies, which are small pieces of text stored in a file by your web browser and sent to websites that you visit, to collect information, track website usage and viewing trends such as the number of hits, pages visited, videos and PDFs viewed and the length of user sessions in order to evaluate website performance and enhance navigation of the website. We may also collect other anonymous information, which is generally limited to technical and web navigation information such as the IP address of your device, internet browser type and operating system for purposes of analyzing the data to make First Trust’s website better and more useful to our users. The information collected does not include any personal identifiable information such as your name, address, phone number or email address unless you provide that information through the website for us to contact you in order to answer your questions or respond to your requests. To find out how to opt-out of these services click on: Google Analytics and AddThis.
Confidentiality and Security
With regard to our internal security procedures, First Trust restricts access to your nonpublic personal information to those First Trust employees who need to know that information to provide products or services to you. We maintain physical, electronic and procedural safeguards to protect your nonpublic personal information.
Policy Updates and Inquiries
As required by federal law, we will notify you of our privacy policy annually. We reserve the right to modify this policy at any time, however, if we do change it, we will tell you promptly. For questions about our policy, or for additional copies of this notice, please go to www.ftportfolios.com, or contact us at 1-800-621-1675 (First Trust Portfolios) or 1-800-222-6822 (First Trust Advisors).
March 2022
INVESTMENT ADVISOR
First Trust Advisors L.P.
120 East Liberty Drive, Suite 400
Wheaton, IL 60187
ADMINISTRATOR,
FUND ACCOUNTANT, AND
CUSTODIAN
The Bank of New York Mellon
240 Greenwich Street
New York, NY 10286
TRANSFER AGENT
BNY Mellon Investment Servicing (US) Inc.
301 Bellevue Parkway
Wilmington, DE 19809
INDEPENDENT REGISTERED
PUBLIC ACCOUNTING FIRM
Deloitte & Touche LLP
111 S. Wacker Drive
Chicago, IL 60606
LEGAL COUNSEL
Chapman and Cutler LLP
320 South Canal Street
Chicago, IL 60606

First Trust Managed
Municipal Fund
Annual Report
For the Period June 15, 2022
(Commencement of Operations)
through October 31, 2022
First Trust Managed Municipal Fund
Annual Report
October 31, 2022
Caution Regarding Forward-Looking Statements
This report contains certain forward-looking statements within the meaning of the Securities Act of 1933, as amended, and the Securities Exchange Act of 1934, as amended. Forward-looking statements include statements regarding the goals, beliefs, plans or current expectations of First Trust Advisors L.P. (“First Trust” or the “Advisor”) and its representatives, taking into account the information currently available to them. Forward-looking statements include all statements that do not relate solely to current or historical fact. For example, forward-looking statements include the use of words such as “anticipate,” “estimate,” “intend,” “expect,” “believe,” “plan,” “may,” “should,” “would” or other words that convey uncertainty of future events or outcomes.
Forward-looking statements involve known and unknown risks, uncertainties and other factors that may cause the actual results, performance or achievements of First Trust Managed Municipal Fund (the “Fund”) to be materially different from any future results, performance or achievements expressed or implied by the forward-looking statements. When evaluating the information included in this report, you are cautioned not to place undue reliance on these forward-looking statements, which reflect the judgment of the Advisor and its representatives only as of the date hereof. We undertake no obligation to publicly revise or update these forward-looking statements to reflect events and circumstances that arise after the date hereof.
Performance and Risk Disclosure
There is no assurance that the Fund will achieve its investment objectives. The Fund is subject to market risk, which is the possibility that the market values of securities owned by the Fund will decline and that the value of the Fund’s shares may therefore be less than what you paid for them. Accordingly, you can lose money by investing in the Fund. See “Risk Considerations” in the Additional Information section of this report for a discussion of certain other risks of investing in the Fund.
Performance data quoted represents past performance, which is no guarantee of future results, and current performance may be lower or higher than the figures shown. For the most recent month-end performance figures, please visit www.ftportfolios.com or speak with your financial advisor. Investment returns and net asset value will fluctuate and Fund shares, when sold, may be worth more or less than their original cost.
The Advisor may also periodically provide additional information on Fund performance on the Fund’s web page at www.ftportfolios.com.
How to Read This Report
This report contains information that may help you evaluate your investment in the Fund. It includes details about the Fund and presents data and analysis that provide insight into the Fund’s performance and investment approach.
By reading the portfolio commentary by the portfolio management team of the Fund, you may obtain an understanding of how the market environment affected the Fund’s performance. The statistical information that follows may help you understand the Fund’s performance compared to that of relevant market benchmark.
It is important to keep in mind that the opinions expressed by personnel of the Advisor are just that: informed opinions. They should not be considered to be promises or advice. The opinions, like the statistics, cover the period through the date on the cover of this report. The material risks of investing in the Fund are spelled out in the prospectus, the statement of additional information, this report and other Fund regulatory filings.
First Trust Managed Municipal Fund
Annual Letter from the Chairman and CEO
October 31, 2022
Dear Shareholders,
First Trust is pleased to provide you with the annual report for the First Trust Managed Municipal Fund (the “Fund”), which contains detailed information about the Fund since its inception on June 15, 2022 through October 31, 2022. Please note that information contained in this letter and the annual report prior to the Fund’s inception date does not apply to this Fund.
As I’m writing this letter in mid-November, it strikes me that things appear to be a little more chaotic in the current climate than normal. One of the things that may have contributed to the chaotic nature of the news flow of late was the November mid-term election. For the most part, except for a few seats in Congress, the election is behind us. We learned there would be no “red wave” (Republicans gaining a strong majority in Congress) but likely gridlock ahead. Gridlock has been good for stock market investors in the past few decades, particularly when there’s been a Democratic president and the Republicans have control of at least one house of Congress, according to Brian Wesbury, Chief Economist at First Trust.
The Federal Reserve (the “Fed”) has kept its promise to aggressively hike interest rates to combat robust inflation. As of November 13, 2022, the Fed has increased the Federal Funds target rate (upper bound) six times, from 0.25% to 4.00%. The Fed’s actions have some investors and pundits looking for evidence linking the interest rate hikes to a downturn in the economy. In short, the hope is that a pullback in economic activity might deter the Fed from executing further interest rate hikes. Fed Chairman Jerome Powell, however, recently said that the terminal rate (the ultimate rate the Fed is targeting) will likely need to be higher than previously estimated in order to curb stubbornly high inflation. The Consumer Price Index (“CPI”) is a commonly used measure of inflation. The CPI stood at 7.7% on a trailing 12-month basis as of October 31, 2022, according to the U.S. Bureau of Labor Statistics. That is down from its recent high of 9.1% in June 2022. Prior to this year, the last time the CPI was higher than 7.0% was over 40 years ago. While monetary policy is an ongoing process subject to change, the Fed does appear to be steadfast in its mission to bring the rate of inflation back to its preferred level of 2.0%, and that will take some time, in my opinion. Stay tuned!
Equity and fixed income markets have contended with numerous headwinds this year, such as the war between Russia and Ukraine. Since setting its all-time high of 4,796.56 on January 3, 2022, the S&P 500® Index has been in a bear market (a price decline of 20% or more from the most recent high) for the better part of 310 days. Suffice it to say, we are all looking forward to the end of this bear market. With respect to corrections and bear markets, the silver lining is that the S&P 500® Index has never failed to fully recover the losses sustained in any previous downturn. Where might we see demand for stocks moving forward? One such source could be stock buybacks. As of the last week of October 2022, U.S. companies had announced stock buybacks totaling $1 trillion so far this year, according to Birinyi Associates. The fixed income market has not been immune to selling pressure either. Year-to-date through November 10, 2022, yields on the 10-Year Treasury Note increased by 258 basis points. As you may be aware, bond yields and bond prices are inversely related, particularly with respect to investment-grade bonds. As yields rise, prices fall and vice versa. As noted above, the Fed has more work to do, so bond investors should not be surprised to see interest rates and bond yields trend at least a bit higher in the months ahead.
Thank you for giving First Trust the opportunity to play a role in your financial future. We value our relationship with you and will report on the Fund again in six months.
Sincerely,
James A. Bowen
Chairman of the Board of Trustees
Chief Executive Officer of First Trust Advisors L.P.
First Trust Managed Municipal Fund
“AT A GLANCE”
As of October 31, 2022 (Unaudited)
| Fund Statistics | |
| First Trust Managed Municipal Fund | Net Asset
Value (NAV) |
| Class I (CWAIX) | $19.33 |
| Credit Quality(1) | % of Total
Investments
(including cash) |
| AAA | 7.3% |
| AA | 27.6 |
| A | 26.5 |
| BBB | 13.3 |
| BB | 3.0 |
| Not Rated | 12.9 |
| Short Rated Only | 0.8 |
| Cash | 8.6 |
| Total | 100.0% |
| Sector Allocation | % of Total
Investments
(including cash) |
| Insured | 9.7% |
| Utility | 8.9 |
| Industrial Development Bond | 8.0 |
| Hospital | 7.9 |
| Government Obligation Bond - Unlimited Tax | 7.1 |
| Airport | 5.4 |
| Toll Road | 5.3 |
| Continuing Care Retirement Communities | 5.2 |
| Dedicated Tax | 4.5 |
| Gas | 4.4 |
| Pre-refunded/Escrowed-to-maturity | 3.6 |
| Water & Sewer | 3.3 |
| Special Assessment | 3.3 |
| Higher Education | 3.3 |
| Government Obligation Bond - Limited Tax | 2.9 |
| Education | 2.5 |
| Tax Increment | 1.6 |
| Certificates of Participation | 1.1 |
| Tobacco | 1.0 |
| Mass Transit | 1.0 |
| Port | 0.7 |
| Student Loan | 0.7 |
| Cash | 8.6 |
| Total | 100.0% |
| Dividend Distributions | I Shares |
| Current Monthly Distribution per Share(2) | $0.0375 |
| Current Distribution Rate on NAV(3) | 2.33% |
| (1) | The credit quality and ratings information presented above reflect the ratings assigned by one or more nationally recognized statistical rating organizations (NRSROs), including S&P Global Ratings, Moody’s Investors Service, Inc., Fitch Ratings or a comparably rated NRSRO. For situations in which a security is rated by more than one NRSRO and the ratings are not equivalent, the highest rating is used. Sub-investment grade ratings are those rated BB+/Ba1 or lower. Investment grade ratings are those rated BBB-/Baa3 or higher. The credit ratings shown relate to the creditworthiness of the issuers of the underlying securities in the Fund, and not to the Fund or its shares. Credit ratings are subject to change. |
| (2) | Most recent distribution paid through October 31, 2022. Subject to change in the future. |
| (3) | Distribution rates are calculated by annualizing the most recent distribution paid through the report date and then dividing by NAV as of October 31, 2022. Subject to change in the future. |
First Trust Managed Municipal Fund
“AT A GLANCE” (Continued)
As of October 31, 2022 (Unaudited)
Performance of a $10,000 Investment
This chart compares your Fund’s Class I performance to that of the Bloomberg Municipal Bond 5-15 Year Index from 6/15/2022 through 10/31/2022.
| Performance as of October 31, 2022 |
| | I Shares
Inception
6/15/2022 | Bloomberg
Municipal
Bond 5-15
Year Index* |
Cumulative
Total Returns | w/o
sales
charge | w/o
sales
charge |
| Since Inception | -2.84% | -2.35% |
| 30-Day SEC Yield(4) | 3.43% | N/A |
* Since inception return is based on the Class I Shares inception date.
Performance figures assume reinvestment of all distributions and do not reflect the deduction of taxes that the shareholder would pay on Fund distributions or the redemption of Fund shares. The total returns would have been lower if certain fees had not been waived and expenses reimbursed by the Advisor. An index is a statistical composite that tracks a specific financial market or sector. Unlike the Fund, the index does not actually hold a portfolio of securities and therefore does not incur the expenses incurred by the Fund. These expenses negatively impact the performance of the Fund. The Fund’s past performance does not predict future performance. Performance in municipal bond investment strategies can be impacted from the benefits of purchasing odd lot positions. The impact of these investments can be particulary meaningful when funds have limited assets under management and may not be a sustainable source of performance as a fund grows in size.
| (4) | 30-day SEC yield is calculated by dividing the net investment income per share earned during the most recent 30-day period by the maximum offering price per share on the last day of the period. The reported SEC yields are subsidized. The subsidized yields reflect the waiver and/or a reimbursement of Fund expenses, which has the effect of lowering the Fund’s expense ratio and generating a higher yield. |
Portfolio Commentary
First Trust Managed Municipal Fund
Annual Report
October 31, 2022 (Unaudited)
Advisor
First Trust Advisors L.P. (“First Trust” or the “Advisor”) serves as the investment advisor to the First Trust Managed Municipal Fund (the “Fund”). First Trust is responsible for the ongoing monitoring of the Fund’s investment portfolio, managing the Fund’s business affairs and providing certain administrative services necessary for the management of the Fund.
Portfolio Management Team
Johnathan N. Wilhelm, Senior Vice President, Senior Portfolio Manager
Tom Byron, Senior Vice President, Portfolio Manager
The portfolio managers are primarily and jointly responsible for the day-to-day management of the Fund. Each portfolio manager has served as a part of the portfolio management team of the Fund since June 14, 2022.
Commentary
The Fund is an actively managed municipal bond fund. The Fund’s primary investment objective is to generate current income that is exempt from federal income taxes and its secondary objective is long term capital appreciation. Under normal market conditions, the Fund seeks to achieve its investment objectives by investing at least 80% of its net assets (plus any borrowings for investment purposes) in municipal debt securities that pay interest that is exempt from federal income taxes. The Fund invests at least 65% of its net assets in investment grade securities. This commentary discusses market performance and the Fund’s performance from the Fund’s inception on June 15, 2022 through October 31, 2022.
Market Recap
For the period from the Fund’s inception on June 15, 2022 through October 31, 2022, municipal bonds generated a total return of -3.07% as measured by the Bloomberg Municipal Bond Index. During the same period, the Bloomberg Municipal Bond 5-15 Year Index and Bloomberg High Yield Municipal Index produced returns of -2.35% and -5.47%, respectively. By comparison, the Bloomberg U.S. Treasury Index generated a -4.04% return during the reporting period. The following have been major factors in explaining the municipal bond market’s performance:
| • | During the period, U.S. Treasury rates increased all along the yield curve and municipal interest rates followed U.S. Treasury yields higher. During the period, 10-Year and 30-Year U.S. Treasury yields increased by approximately 76 basis points (“bps”) and 84 bps, respectively, to 4.05% and 4.17%. |
| • | Large industry-wide mutual fund and exchange-traded fund (ETFs) outflows resulted in funds selling municipal bonds to meet redemptions which put additional pressure on municipal bond prices. From June 1, 2022 thru October 31, 2022, municipal fund outflows totaled approximately $42.3 billion. |
| • | New issue municipal bond supply has been lower compared to one-year ago figures. From June 1, 2022 thru October 31, 2022, primary market issuance was approximately $155.3 billion, down approximately 29% compared to the same period a year ago. |
| • | According to data from Municipal Market Analytics, Inc., the number of municipal bond defaults was lower year-to-date compared to a year ago while the par value of defaulted bonds rose modestly. Through October 26, 2022, the number and par value of municipal bond defaults totaled 42 and $3.14 billion, respectively, compared with 61 defaults and $2.80 billion for the same period a year ago. |
As a result of these factors, municipal bond yields rose, credit spreads widened, and municipal bond prices declined.
Performance Analysis
The Fund’s net asset value return since the Fund’s inception date of June 15, 2022 through October 31, 2022, was -2.84% versus the Bloomberg Municipal Bond 5-15 Year Index (the “Benchmark”) return of -2.35% during the same time period. The Fund’s monthly distribution of $0.0375 on October 31, 2022, represented a tax-exempt annualized distribution rate of 2.33% based on the Fund’s closing market price of $19.33. The Fund’s distribution rate is not constant and is subject to change over time based on the performance of the Fund and general market conditions.
From a portfolio construction perspective, the Fund maintains an underweight position in the highest quality issuers (“AA” and “AAA” rated) versus its Benchmark and is overweight the Benchmark in terms of “A”, “BBB”, as well as below investment grade and non-rated bonds. The Fund may allocate up to 35% of its net assets to credits that are either rated below investment grade or are
Portfolio Commentary (Continued)
First Trust Managed Municipal Fund
Annual Report
October 31, 2022 (Unaudited)
non-rated and deemed to be of comparable quality at the time of purchase. The Fund’s overweight in investments in non-rated high yield municipal securities relative to the Benchmark was a significant negative detractor to the Fund’s performance during the period, and its overweight relative to the Benchmark in “BBB” rated municipal securities was also a negative contributor to Fund performance. The Fund’s selection of bonds in the “AAA” and “AA” rating categories was a positive contributor to the Fund’s performance during the period.
The Fund’s modified duration on October 31, 2022 was approximately 5.73 years compared to the modified duration of its Benchmark of 5.66 years. The Fund’s effective duration on October 31, 2022 was approximately 6.15 years versus 5.90 years of the Benchmark. The Fund’s overweight allocation to municipal securities with effective durations of 7 to 10 years was a significant negative contributor to the Fund’s performance over the reporting period. The underweight exposure to 1 to 5 years effective duration was also a negative contributor. Conversely, the Fund’s overweight exposure to municipal securities with effective durations between 0 to 1 years was a significant positive contributor to Fund performance.
Regarding yield curve positioning, the Fund’s overweight allocation to municipal securities maturing 18 years and longer also was a significant negative contributor to the Fund’s performance over the reporting period, while bonds with a 16-18-year maturity date were also a negative contributor to performance relative to the Benchmark. The Fund did not use interest rate hedges during the reporting period.
Over the reporting period, municipal sectors that were the primary outperformers relative to the Fund’s Benchmark included Education, Industrial Development, and Housing. Sectors that detracted from the Fund’s performance over the reporting period included State-General Obligation, Special Tax, Local General Obligation, and Health Care.
Market Outlook
According to Fed Funds Futures (Bloomberg WIRP function), as of October 18, 2022, approximately 7 to 8 25-basis point interest rate hikes are expected from November 2, 2022, through March 22, 2023. During the remainder of 2022 and first quarter of 2023, we expect longer U.S. Treasury rates to become range-bound. For example, regarding the 10-Year U.S. Treasury, we expect the bond to trade within a range of 3.75%-4.25% and would not be surprised if the yield curve inverts significantly more whereby 2-Year yields are significantly higher than 10-Year yields. The Federal Reserve raised interest rates by 75 bps at their November 2, 2022 meeting, and we expect another 50 bps at their December 2022 meeting, plus additional 25-50 bps of interest rate hikes in early 2023. If these rate increases occur, the Federal Funds target rate will end the year at approximately 4.25%-4.50%. Thus, we expect short term U.S. Treasury rates to be significantly higher than 10-Year Treasury rates by year-end. During 2023, given our expectation for slower U.S. economic growth and declining inflation, we would expect U.S. Treasury rates in the longer portion of the yield curve to decline.
Regarding municipal bonds, rates have also increased dramatically during the first ten months of 2022. As of October 31, 2022, AAA 5-Year, 10-Year, and 30-Year municipal rates have increased by approximately 264 bps, 235 bps, and 262 bps, respectively, to 3.24%, 3.39% and 4.12%, respectively. During the remainder of 2022, we believe municipal rates will become range-bound or even rally if two key events occur: (1) U.S. Treasury rates do in fact stabilize within a reasonably tight range; and (2) mutual fund/ETF outflows moderate. We believe that municipal rates and taxable equivalent yields are now attractive for high wage earners. If we see rates stabilize, we believe retail investors will begin purchasing municipal bonds more aggressively and fund outflows will moderate. For the fourth quarter of 2022 and first half of 2023, we do expect the municipal market to produce positive total returns, as we expect interest rates to become broadly stable or range-bound, and the additional coupon income generated from higher interest rates and coupon payments to offset any relatively small declines in municipal bond prices. We especially like “A” rated municipal bonds in certain sectors which have seen distinct credit spread widening, including hospitals, airports, and gas bonds.
Credit quality remains healthy in the municipal bond market. Defaults and credit rating downgrades remain favorable. Therefore, we believe credits spreads widening or narrowing should be primarily driven by the direction of U.S. Treasury rates and municipal mutual fund/ETF fund flows. However, given an expected slowdown in the U.S. economy, we will focus on municipal credits with leading market positions, growing utilization statistics, and healthy balance sheets. Within the high yield municipal universe, we will focus on higher credit quality securities and reduce exposure to lower rated high yield borrowers.
With this in mind, we continue to practice the discipline of our investment process where we perform fundamental credit analysis and quantitative total return scenario analysis on individual bonds and the portfolio as a whole, looking for bonds we believe that can provide both high income and attractive total return potential over time.
First Trust Managed Municipal Fund
Understanding Your Fund Expenses
October 31, 2022 (Unaudited)
As a shareholder of the First Trust Managed Municipal Fund (the “Fund”), you incur two types of costs: (1) transaction costs and (2) ongoing costs, including management fees, distribution and/or service (12b-1) fees, if any, and other Fund expenses. This Example is intended to help you understand your ongoing costs of investing in the Fund and to compare these costs with the ongoing costs of investing in other funds.
The Example is based on an investment of $1,000 invested at the beginning of the period (or since inception) and held through the six-month (or shorter) period ended October 31, 2022.
Actual Expenses
The first three columns of the table below provide information about actual account values and actual expenses. You may use the information in these columns, together with the amount you invested, to estimate the expenses that you paid over the period. Simply divide your account value by $1,000 (for example, an $8,600 account value divided by $1,000 = 8.6), then multiply the result by the number in the third column under the heading entitled “Expenses Paid During Period” to estimate the expenses you paid on your account during this six-month (or shorter) period.
Hypothetical Example for Comparison Purposes
The next three columns of the table below provide information about hypothetical account values and hypothetical expenses based on the Fund’s actual expense ratio and an assumed rate of return of 5% per year before expenses, which is not the Fund’s actual return. The hypothetical account values and expenses may not be used to estimate the actual ending account balance or expenses you paid for the period. You may use this information to compare the ongoing costs of investing in the Fund and other funds. To do so, compare this 5% hypothetical example with the 5% hypothetical examples that appear in the shareholder reports of the other funds.
Please note that the expenses shown in the table are meant to highlight your ongoing costs only and do not reflect any transactional costs such as sales charges (loads) or contingent deferred sales charges. Therefore, the hypothetical section of the table is useful in comparing ongoing costs only, and will not help you determine the relative total costs of owning different funds. In addition, if these transactional costs were included, your costs would have been higher.
| | Actual Expenses | | Hypothetical
(5% Return Before Expenses) | |
| | Beginning
Account
Value
6/15/2022 (a) | Ending
Account
Value
10/31/2022 | Expenses Paid
During Period
6/15/2022 (a) -
10/31/2022 (b) | | Beginning
Account
Value
6/15/2022 (a) | Ending
Account
Value
10/31/2022 | Expenses Paid
During Period
6/15/2022 (a) -
10/31/2022 (b) | Annualized
Expense
Ratios (c) |
Class I
| $ 1,000.00 | $ 971.60 | $ 1.88 | | $ 1,000.00 | $ 1,022.68 | $ 2.55 | 0.50% |
| (a) | Inception date. |
| (b) | Actual expenses are equal to the annualized expense ratio as indicated in the table multiplied by the average account value over the period (June 15, 2022 through October 31, 2022), multiplied by 139/365. Hypothetical expenses are assumed for the most recent six-month period. |
| (c) | The expense ratio reflects an expense cap. The Fund’s expense ratio reflects an additional waiver. See Note 3 in the Notes to Financial Statements. |
First Trust Managed Municipal Fund
Portfolio of Investments
October 31, 2022
Principal
Value | | Description | | Stated
Coupon | | Stated
Maturity | | Value |
| MUNICIPAL BONDS – 87.4% |
| | | Alabama – 1.0% | | | | | | |
| $500,000 | | Black Belt Energy Gas Dist AL Gas Proj Rev Gas Proj Rev Bonds, Proj No. 7, Ser C-1 (Mandatory put 12/01/26)
| | 4.00% | | 10/01/52 | | $481,480 |
| | | Arizona – 2.6% | | | | | | |
| 465,000 | | AZ Brd of Rgts, Ser A
| | 5.00% | | 07/01/39 | | 487,131 |
| 750,000 | | Pima Cnty AZ Indl Dev Auth Sr Living Rev La Posada At Pusch Ridge Proj, Ser A (a)
| | 6.25% | | 11/15/35 | | 745,359 |
| | | | | 1,232,490 |
| | | Arkansas – 0.5% | | | | | | |
| 250,000 | | AR Dev Fin Auth Envrnmntl Rev Green Bond United States Steel Corp Proj, AMT (a)
| | 5.45% | | 09/01/52 | | 226,193 |
| | | California – 10.4% | | | | | | |
| 600,000 | | CA Cmnty Choice Fing Auth Clean Energy Proj Rev Green Bond, Ser A-1 (Mandatory put 08/01/28)
| | 4.00% | | 05/01/53 | | 576,567 |
| 500,000 | | CA St Hlth Facs Fing Auth Rev Stanford Hlth Care, Ser A
| | 5.00% | | 08/15/54 | | 483,428 |
| 250,000 | | CA St Muni Fin Auth Chrt Sch Rev Palmdale Aerospace Acdmy Proj, Ser A (a)
| | 5.00% | | 07/01/38 | | 230,547 |
| 375,000 | | CA St Muni Fin Auth Rev Ref HumanGood Oblig Grp, Ser A
| | 4.00% | | 10/01/34 | | 347,858 |
| 500,000 | | CA St Poll Control Fin Auth Sol Wst Disp Rev Ref Wst Mgmt Inc, Ser A3, AMT
| | 4.30% | | 07/01/40 | | 471,560 |
| 500,000 | | CA St Poll Control Fin Auth Wtr Furnishing Rev Plant Bonds, AMT (a)
| | 5.00% | | 07/01/37 | | 469,273 |
| 250,000 | | Los Angeles CA Dept of Arpts Arpt Rev Sub Los Angeles Intl Arpt, Ser A, AMT
| | 5.25% | | 05/15/48 | | 250,370 |
| 675,000 | | River Islands CA Pub Fing Auth Spl Tax Ref Cmnty Facs Dist #2003-1, Ser A-1, AGM
| | 5.00% | | 09/01/35 | | 710,987 |
| 275,000 | | San Diego Cnty Ca Regl Arpt Auth Arpt Rev Ref Subord Arpt Rev Bonds, Ser B
| | 5.00% | | 07/01/37 | | 278,715 |
| 500,000 | | San Francisco CA City & Cnty Arpts Commn Intl Arpt Rev, Ser E, AMT
| | 5.00% | | 05/01/50 | | 480,092 |
| 605,000 | | Tustin CA Cmnty Facs Dist Spltax Ref #06-1 Legacy Columbus Vlgs, Ser A
| | 5.00% | | 09/01/37 | | 615,875 |
| | | | | 4,915,272 |
| | | Colorado – 4.2% | | | | | | |
| 500,000 | | Copperleaf CO Met Dist #6, Ser A (Pre-refunded maturity 12/01/23)
| | 5.25% | | 12/01/48 | | 524,266 |
| 500,000 | | Mirabelle Met Dist #2 CO Sr, Ser A
| | 5.00% | | 12/01/49 | | 412,999 |
| 500,000 | | Murphy Creek Met Dist #5 CO Sr Bonds, Ser A
| | 6.00% | | 12/01/52 | | 446,683 |
| 600,000 | | Sheridan Station W Metro Dist Co (Pre-refunded maturity 12/01/22)
| | 6.00% | | 12/01/47 | | 619,224 |
| | | | | 2,003,172 |
| | | Connecticut – 1.5% | | | | | | |
| 250,000 | | CT St Spl Tax Oblig Rev Transprtn Infra Purp, Ser A (b)
| | 5.00% | | 07/01/36 | | 268,932 |
| 500,000 | | Harbor Point CT Infra Impt Dist Spl Oblig Rev Ref Harbor Point Proj Ltd (a)
| | 5.00% | | 04/01/39 | | 465,149 |
| | | | | 734,081 |
| | | Florida – 5.6% | | | | | | |
| 500,000 | | Broward Cnty FL Arpt Sys Rev, Ser A, AMT
| | 5.00% | | 10/01/38 | | 493,017 |
| 320,000 | | Broward Cnty FL Port Facs Rev, AMT
| | 5.00% | | 09/01/38 | | 325,223 |
| 500,000 | | FL St Dev Fin Corp Var Brightline Passngr Rail Expan Proj Remk, Ser A, AMT (Mandatory put 04/04/23)
| | 2.90% | | 12/01/56 | | 496,042 |
See Notes to Financial Statements
Page 7
First Trust Managed Municipal Fund
Portfolio of Investments (Continued)
October 31, 2022
Principal
Value | | Description | | Stated
Coupon | | Stated
Maturity | | Value |
| MUNICIPAL BONDS (Continued) |
| | | Florida (Continued) | | | | | | |
| $500,000 | | Forest Lake Cmnty Dev Dist FL Spl Assmnt Assmnt Area 1 Proj (a)
| | 4.00% | | 05/01/40 | | $413,481 |
| 400,000 | | Lee Cnty FL Loc Optional Gas Tax Rev
| | 5.00% | | 08/01/40 | | 409,560 |
| 250,000 | | Palm Beach Cnty Fl Hlth Facs Auth Hosp Rev Jupiter Med Ctr Proj, Ser A
| | 5.00% | | 11/01/34 | | 246,163 |
| 250,000 | | SE Overtown Park W Cmnty Redev Agy FL Tax, Ser A-1 (a)
| | 5.00% | | 03/01/30 | | 252,259 |
| | | | | 2,635,745 |
| | | Georgia – 3.8% | | | | | | |
| 1,000,000 | | Burke Cnty GA Dev Auth Poll Control Rev Var GA Pwr Co Vogtle, Ser 1 (c)
| | 1.79% | | 07/01/49 | | 1,000,000 |
| 500,000 | | Main Street Nat Gas Inc GA Gas Sply Rev, Ser A (Mandatory put 12/01/29)
| | 4.00% | | 09/01/52 | | 461,072 |
| 335,000 | | Muni Elec Auth of GA Plant Vogtle Units 3&4 Proj J, Ser A, AGM
| | 5.00% | | 07/01/29 | | 353,234 |
| | | | | 1,814,306 |
| | | Hawaii – 0.8% | | | | | | |
| 500,000 | | Honolulu City & Cnty HI Brd of Wtr Sply Sys Rev, Ser A
| | 3.00% | | 07/01/41 | | 384,606 |
| | | Illinois – 3.4% | | | | | | |
| 415,000 | | Chicago IL O’Hare Intl Arpt Rev Ref Gen Sr Lien, Ser C
| | 5.00% | | 01/01/38 | | 418,242 |
| 500,000 | | IL St
| | 5.50% | | 05/01/39 | | 502,654 |
| 250,000 | | IL St, Ser A
| | 5.50% | | 03/01/47 | | 242,047 |
| 410,000 | | Madison Bond Etc Cntys Il Cmnty Unit Sch Dist #5, Ser B, AGM
| | 5.50% | | 02/01/35 | | 440,577 |
| | | | | 1,603,520 |
| | | Indiana – 4.2% | | | | | | |
| 525,000 | | IN St Fin Auth Envrnmntl Rev Ref Var Duke Energy IN Inc Proj Remk, Ser A-1, AMT (Mandatory put 06/01/32) (b)
| | 4.50% | | 05/01/35 | | 506,980 |
| 500,000 | | IN St Fin Auth Envrnmntl Rev Var Ref Fulcrum Centerpoint LLC Proj, AMT (Mandatory put 11/15/23)
| | 4.50% | | 12/15/46 | | 500,060 |
| 500,000 | | Rockport IN Poll Control Rev Ref Aep Generating Comp Proj Remk, Ser A
| | 3.13% | | 07/01/25 | | 485,990 |
| 500,000 | | Rockport IN Poll Control Rev Ref Aep Generating Company Proj Remk, Ser B
| | 3.13% | | 07/01/25 | | 485,990 |
| | | | | 1,979,020 |
| | | Iowa – 0.9% | | | | | | |
| 500,000 | | IA St Fin Auth Midwstrn Disaster Area Rev Ref IA Fertilizer Company Proj (Mandatory put 12/01/42)
| | 5.00% | | 12/01/50 | | 445,814 |
| | | Kentucky – 2.3% | | | | | | |
| 500,000 | | KY St Econ Dev Fin Auth Sol Wst Disp Rev Ref Rep Svcs Inc Pj Remk, Ser B (Mandatory put 12/01/22)
| | 2.75% | | 04/01/31 | | 499,775 |
| 580,000 | | KY St Property & Bldgs Commn Revs Proj #124, Ser A, AGM
| | 5.00% | | 11/01/37 | | 611,391 |
| | | | | 1,111,166 |
| | | Maryland – 0.7% | | | | | | |
| 335,000 | | MD St Dept Of Transprtn Consol Transprtn 2nd Issue
| | 5.00% | | 10/01/29 | | 354,565 |
| | | Massachusetts – 1.1% | | | | | | |
| 500,000 | | MA St Dev Fin Agy Rev Fltg Ref Clg Holy Cross A Remk (c)
| | 1.64% | | 09/01/37 | | 500,000 |
| | | Michigan – 2.0% | | | | | | |
| 580,000 | | Great Lakes Wtr Auth Mich Wtr Rev Ref Bds C Rev Re
| | 5.25% | | 07/01/33 | | 607,400 |
Page 8
See Notes to Financial Statements
First Trust Managed Municipal Fund
Portfolio of Investments (Continued)
October 31, 2022
Principal
Value | | Description | | Stated
Coupon | | Stated
Maturity | | Value |
| MUNICIPAL BONDS (Continued) |
| | | Michigan (Continued) | | | | | | |
| $355,000 | | MI St Fin Auth Rev Multi Modal Mclaren Hlth Care, Ser A
| | 5.00% | | 02/15/37 | | $361,798 |
| | | | | 969,198 |
| | | Minnesota – 1.4% | | | | | | |
| 650,000 | | Alexandria MN Indep Sch Dist #206 Ref Sch Bldg, Ser B
| | 5.00% | | 02/01/24 | | 663,184 |
| | | Mississippi – 1.0% | | | | | | |
| 500,000 | | MS St Hosp Equipment & Facs Auth Ref Adj Baptist Memorial Hlth Care Corp Remk, Ser A-2 (Mandatory put 08/30/23)
| | 3.15% | | 09/01/36 | | 496,627 |
| | | Missouri – 1.1% | | | | | | |
| 500,000 | | MO St Hlth & Eductnl Facs Auth Var St Louis Univ, Ser B-1 (c)
| | 1.69% | | 10/01/35 | | 500,000 |
| | | New Jersey – 3.8% | | | | | | |
| 500,000 | | NJ St Econ Dev Auth Mtr Vehcl Surcharge Rev Ref, Subser A, BAM
| | 5.00% | | 07/01/23 | | 504,688 |
| 310,000 | | NJ St Hgr Edu Asst Auth Stdt Loan Rev, Ser 1A, AMT
| | 4.00% | | 12/01/30 | | 305,691 |
| 500,000 | | NJ St Transprtn Trust Fund Auth Ref Transprtn Sys Bonds, Ser A
| | 5.00% | | 12/15/39 | | 491,810 |
| 500,000 | | NJ St Turnpike Auth Turnpike Rev, Ser A
| | 5.00% | | 01/01/32 | | 511,016 |
| | | | | 1,813,205 |
| | | New York – 7.6% | | | | | | |
| 475,000 | | Build NYC Res Corp NY Rev Global Cmnty Chrt Sch Proj, Ser A
| | 5.00% | | 06/15/42 | | 430,792 |
| 400,000 | | Long Beach NY, Ser B, BAM
| | 5.25% | | 07/15/42 | | 405,920 |
| 435,000 | | Met Transprtn Auth NY Rev Ref, Ser F
| | 5.00% | | 11/15/22 | | 435,257 |
| 500,000 | | New York City NY Muni Wtr Fin Auth Wtr & Swr Sys Rev 2nd Gen Resolution, Ser BB-1
| | 5.00% | | 06/15/49 | | 506,629 |
| 500,000 | | New York City NY Transitional Fin Auth Rev Sub, Ser B-1
| | 4.00% | | 11/01/38 | | 459,412 |
| 500,000 | | New York NY Subser B-1, Ser B
| | 5.25% | | 10/01/40 | | 535,460 |
| 460,000 | | Westchester NY Tobacco Asset Securitization Ref Sr, Ser B
| | 5.00% | | 06/01/41 | | 462,035 |
| 375,000 | | Westhill NY Centrl Sch Dist, BANS
| | 4.00% | | 06/28/23 | | 376,396 |
| | | | | 3,611,901 |
| | | North Carolina – 3.2% | | | | | | |
| 1,000,000 | | Charlotte Mecklenburg NC Hosp Auth Hlth Care Sys Rev Var Atrium Hlth, Ser C (Mandatory put 03/01/23)
| | 5.00% | | 01/15/48 | | 1,005,255 |
| 500,000 | | NC St Turnpike Auth, BANS
| | 5.00% | | 02/01/24 | �� | 506,102 |
| | | | | 1,511,357 |
| | | Ohio – 0.9% | | | | | | |
| 500,000 | | OH St Air Quality Dev Auth Ref OH Vly Elec Corp Proj, Ser A
| | 3.25% | | 09/01/29 | | 445,541 |
| | | Oregon – 1.9% | | | | | | |
| 500,000 | | Clackamas Cnty OR Hosp Fac Auth Rev Ref Rose Villa Proj, Ser A
| | 5.38% | | 11/15/55 | | 423,313 |
| 500,000 | | Union Cnty OR Hosp Fac Auth Grande Ronde Hosp
| | 5.00% | | 07/01/41 | | 466,633 |
| | | | | 889,946 |
| | | Pennsylvania – 3.8% | | | | | | |
| 515,000 | | Lancaster Cnty PA Hosp Auth Penn St Hlth
| | 5.00% | | 11/01/37 | | 525,775 |
| 500,000 | | Lehigh Cnty PA Indl Dev Auth Ref Ppl Elec Util Corp Proj Remk, Ser A
| | 3.00% | | 09/01/29 | | 460,938 |
| 500,000 | | Maxatawny Twp PA Muni Auth Rev Diakon Lutheran Social Ministries Proj, Ser A
| | 5.00% | | 01/01/41 | | 473,121 |
| 340,000 | | PA St Turnpike Commn Oil Franchise Tax Rev Ref, Ser A
| | 5.00% | | 12/01/46 | | 338,515 |
| | | | | 1,798,349 |
See Notes to Financial Statements
Page 9
First Trust Managed Municipal Fund
Portfolio of Investments (Continued)
October 31, 2022
Principal
Value | | Description | | Stated
Coupon | | Stated
Maturity | | Value |
| MUNICIPAL BONDS (Continued) |
| | | Puerto Rico – 1.0% | | | | | | |
| $500,000 | | Puerto Rico Cmwlth Restructured, Ser A1
| | 4.00% | | 07/01/33 | | $424,145 |
| 77,000 | | Puerto Rico Sales Tax Fing Corp Sales Tax Rev Restructured, Ser A-1
| | 4.50% | | 07/01/34 | | 70,004 |
| | | | | 494,149 |
| | | South Carolina – 0.8% | | | | | | |
| 410,000 | | SC St Jobs Econ Dev Auth Econ Dev Rev Ref The Woodlands at Furman
| | 4.00% | | 11/15/27 | | 387,743 |
| | | Tennessee – 2.1% | | | | | | |
| 500,000 | | Met Govt Nashville & Davidson Cnty TN, Ser A
| | 4.00% | | 01/01/37 | | 475,031 |
| 500,000 | | TN St Energy Acq Corp Gas Rev Proj, Ser A (Mandatory put 05/01/23)
| | 4.00% | | 05/01/48 | | 498,932 |
| | | | | 973,963 |
| | | Texas – 11.8% | | | | | | |
| 500,000 | | Arlington TX Hgr Edu Fin Corp Edu Rev Ref Harmony Pub Schs, Ser A
| | 4.00% | | 02/15/36 | | 467,950 |
| 550,000 | | Austin TX Arpt Sys Rev, Ser B, AMT
| | 5.00% | | 11/15/37 | | 542,767 |
| 400,000 | | Centrl TX Regl Mobility Auth Rev Ref Sr Lien, Ser B
| | 5.00% | | 01/01/33 | | 416,615 |
| 400,000 | | Centrl TX Regl Mobility Auth Rev, Ser B
| | 5.00% | | 01/01/39 | | 403,052 |
| 410,000 | | Corpus Christi TX Util Sys Rev Junior Lien, Ser B
| | 5.00% | | 07/15/35 | | 435,760 |
| 300,000 | | Cotulla TX Indep Sch Dist
| | 5.00% | | 02/15/34 | | 324,080 |
| 500,000 | | Dallas TX Area Rapid Transit Sales Tax Rev Ref, Ser A
| | 4.00% | | 12/01/34 | | 488,468 |
| 500,000 | | Fort Bend Cnty TX Muni Util Dist #182, BAM (b)
| | 5.00% | | 09/01/33 | | 521,019 |
| 545,000 | | Fulshear Muni Util Dist No 3A TX, BAM
| | 5.00% | | 09/01/39 | | 548,915 |
| 500,000 | | Lower Colorado River TX Auth Trans Contract Rev Ref Lcra Trans Svcs Corp Proj
| | 5.00% | | 05/15/40 | | 514,508 |
| 190,000 | | Lower Colorado River TX Auth Trans Contract Rev Ref LCRA Trans Svcs Corp Proj
| | 5.00% | | 05/15/39 | | 196,580 |
| 250,000 | | N TX Tollway Auth Rev Ref 2nd Tier, Ser B
| | 5.00% | | 01/01/39 | | 252,748 |
| 500,000 | | Princeton TX Spl Assmnt Rev Winchester Pub Impr Dt #2 Proj (a)
| | 5.13% | | 09/01/42 | | 465,788 |
| | | | | 5,578,250 |
| | | Utah – 1.0% | | | | | | |
| 500,000 | | Downtown E Streetcar Swr Pub Infra Dist Sr Lien, Ser A (a)
| | 5.75% | | 03/01/42 | | 457,576 |
| | | West Virginia – 1.0% | | | | | | |
| 500,000 | | WV St Econ Dev Auth Sol Wst Disp Facs Var Sr Arch Res Proj, AMT (Mandatory put 07/01/25)
| | 5.00% | | 07/01/45 | | 494,088 |
| Total Investments – 87.4%
| | 41,506,507 |
| | (Cost $43,521,797) | | |
| | Net Other Assets and Liabilities – 12.6%
| | 5,962,177 |
| | Net Assets – 100.0%
| | $47,468,684 |
| (a) | This security, sold within the terms of a private placement memorandum, is exempt from registration upon resale under Rule 144A of the Securities Act of 1933, as amended, and may be resold in transactions exempt from registration, normally to qualified institutional buyers. Pursuant to procedures adopted by the Trust’s Board of Trustees, this security has been determined to be liquid by First Trust Advisors L.P. (the “Advisor”). Although market instability can result in periods of increased overall market illiquidity, liquidity for each security is determined based on security specific factors and assumptions, which require subjective judgment. At October 31, 2022, securities noted as such amounted to $3,725,625 or 7.8% of net assets. |
| (b) | When-issued security. The interest rate shown reflects the rate in effect at October 31, 2022. Interest will begin accruing on the security’s first settlement date. |
| (c) | Variable Rate Demand bond. Interest rate is reset periodically by the agent based on current market conditions. |
Page 10
See Notes to Financial Statements
First Trust Managed Municipal Fund
Portfolio of Investments (Continued)
October 31, 2022
| AGM | Assured Guaranty Municipal Corp. |
| AMT | Alternative Minimum Tax |
| BAM | Build America Mutual |
| BANS | Bond Anticipation Notes |
Valuation Inputs
A summary of the inputs used to value the Fund’s investments as of October 31, 2022 is as follows (see Note 2A - Portfolio Valuation in the Notes to Financial Statements):
| | Total
Value at
10/31/2022 | Level 1
Quoted
Prices | Level 2
Significant
Observable
Inputs | Level 3
Significant
Unobservable
Inputs |
Municipal Bonds*
| $ 41,506,507 | $ — | $ 41,506,507 | $ — |
| * | See Portfolio of Investments for state and territory breakout. |
See Notes to Financial Statements
Page 11
First Trust Managed Municipal Fund
Statement of Assets and Liabilities
October 31, 2022
| ASSETS: | |
Investments, at value
(Cost $43,521,797)
| $ 41,506,507 |
Cash
| 3,888,448 |
| Receivables: | |
Fund shares sold
| 2,619,300 |
Interest
| 573,458 |
Common Shares issued under the Dividend Reinvestment Plan
| 3,166 |
Prepaid expenses
| 54 |
Total Assets
| 48,590,933 |
| LIABILITIES: | |
| Payables: | |
Investment securities purchased
| 774,173 |
Fund shares redeemed
| 259,959 |
Audit and tax fees
| 44,000 |
Registration fees
| 10,776 |
Shareholder reporting fees
| 9,550 |
Transfer agent fees
| 5,666 |
Legal fees
| 4,970 |
Investment advisory fees
| 4,705 |
Trustees’ fees and expenses
| 1,529 |
Administrative fees
| 1,197 |
Financial reporting fees
| 771 |
Custodian fees
| 650 |
Other liabilities
| 4,303 |
Total Liabilities
| 1,122,249 |
NET ASSETS
| $47,468,684 |
| NET ASSETS consist of: | |
Paid-in capital
| $ 49,354,109 |
Par value
| 24,563 |
Accumulated distributable earnings (loss)
| (1,909,988) |
NET ASSETS
| $47,468,684 |
| Maximum Offering Price Per Share: | |
| Class I Shares: | |
Net asset value and redemption price per share (Based on net assets of $47,468,684 and 2,456,278 shares of beneficial interest issued and outstanding)
| $19.33 |
Page 12
See Notes to Financial Statements
First Trust Managed Municipal Fund
Statement of Operations
For the Period Ended October 31, 2022 (a)
| INVESTMENT INCOME: | |
Interest
| $ 422,682 |
Total investment income
| 422,682 |
| EXPENSES: | |
Investment advisory fees
| 64,439 |
Audit and tax fees
| 44,000 |
Registration fees
| 26,087 |
Shareholder reporting fees
| 15,485 |
Transfer agent fees
| 11,131 |
Trustees’ fees and expenses
| 6,115 |
Legal fees
| 5,218 |
Financial reporting fees
| 3,464 |
Administrative fees
| 2,741 |
Custodian fees
| 1,696 |
Other
| 2,121 |
Total expenses
| 182,497 |
Fees waived by the investment advisor
| (118,058) |
Net expenses
| 64,439 |
NET INVESTMENT INCOME (LOSS)
| 358,243 |
| NET REALIZED AND UNREALIZED GAIN (LOSS): | |
Net realized gain (loss) on investments
| (41,548) |
Net change in unrealized appreciation (depreciation) on investments
| (2,015,290) |
NET REALIZED AND UNREALIZED GAIN (LOSS)
| (2,056,838) |
NET INCREASE (DECREASE) IN NET ASSETS RESULTING FROM OPERATIONS
| $(1,698,595) |
| (a) | The Fund was initially seeded and commenced operations on June 15, 2022. |
See Notes to Financial Statements
Page 13
First Trust Managed Municipal Fund
Statement of Changes in Net Assets
| | Period
Ended
10/31/2022 (a) |
| OPERATIONS: | |
Net investment income (loss)
| $ 358,243 |
Net realized gain (loss)
| (41,548) |
Net change in unrealized appreciation (depreciation)
| (2,015,290) |
Net increase (decrease) in net assets resulting from operations
| (1,698,595) |
| DISTRIBUTIONS TO SHAREHOLDERS FROM INVESTMENT OPERATIONS: | |
Class I Shares
| (211,393) |
Total distributions to shareholders from investment operations
| (211,393) |
| CAPITAL TRANSACTIONS: | |
Proceeds from shares sold
| 50,683,853 |
Proceeds from shares reinvested
| 214,555 |
Cost of shares redeemed
| (1,519,736) |
Net increase (decrease) in net assets resulting from capital transactions
| 49,378,672 |
Total increase (decrease) in net assets
| 47,468,684 |
| NET ASSETS: | |
Beginning of period
| — |
End of period
| $47,468,684 |
| (a) | The Fund was initially seeded and commenced operations on June 15, 2022. |
Page 14
See Notes to Financial Statements
First Trust Managed Municipal Fund
Financial Highlights
For a Share outstanding throughout the period
| Class I Shares | Period
Ended
10/31/2022 (a) |
Net asset value, beginning of period
| $ 20.00 |
| Income from investment operations: | |
Net investment income (loss) (b)
| 0.21 |
Net realized and unrealized gain (loss)
| (0.78) |
Total from investment operations
| (0.57) |
| Distributions paid to shareholders from: | |
Net investment income
| (0.10) |
Net asset value, end of period
| $19.33 |
Total return (c)
| (2.84)% |
| Ratios to average net assets/supplemental data: | |
Net assets, end of period (in 000’s)
| $ 47,469 |
Ratio of total expenses to average net assets
| 1.41% (d) |
Ratio of net expenses to average net assets
| 0.50% (d) |
Ratio of net investment income (loss) to average net assets
| 2.76% (d) |
Portfolio turnover rate
| 10% |
| (a) | Class I Shares were initially seeded and commenced operations on June 15, 2022. |
| (b) | Based on average shares outstanding. |
| (c) | Assumes reinvestment of all distributions for the period. This return does not reflect the deduction of taxes that a shareholder would pay on Fund distributions or the redemption of Fund shares. Total return is calculated for the time period presented and is not annualized for periods of less than one year. |
| (d) | Annualized. |
See Notes to Financial Statements
Page 15
Notes to Financial Statements
First Trust Managed Municipal Fund
October 31, 2022
1. Organization
First Trust Managed Municipal Fund (the “Fund”) is a series of the First Trust Series Fund (the “Trust”), a Massachusetts business trust organized on July 9, 2010, and is registered as an open-end management investment company with the Securities and Exchange Commission (“SEC”) under the Investment Company Act of 1940, as amended (the “1940 Act”). The Fund offers one class of shares: Class I.
The Fund’s primary investment objective is to generate current income that is exempt from federal income taxes and its secondary objective is long term capital appreciation. The Fund seeks to achieve its objectives by investing, under normal market conditions, at least 80% of its net assets (plus any borrowings for investment purposes) in municipal debt securities that pay interest that is exempt from federal income taxes. There can be no assurance that the Fund will achieve its investment objectives. The Fund may not be appropriate for all investors.
2. Significant Accounting Policies
The Fund is considered an investment company and follows accounting and reporting guidance under Financial Accounting Standards Board Accounting Standards Codification Topic 946, “Financial Services-Investment Companies.” The following is a summary of significant accounting policies consistently followed by the Fund in the preparation of the financial statements. The preparation of the financial statements in accordance with accounting principles generally accepted in the United States of America (“U.S. GAAP”) requires management to make estimates and assumptions that affect the reported amounts and disclosures in the financial statements. Actual results could differ from those estimates.
A. Portfolio Valuation
The Fund’s net asset value (“NAV”) is determined daily as of the close of regular trading on the New York Stock Exchange (“NYSE”), normally 4:00 p.m. Eastern time, on each day the NYSE is open for trading. If the NYSE closes early on a valuation day, the NAV is determined as of that time. Domestic debt securities are priced using data reflecting the earlier closing of the principal markets for those securities. The Fund’s NAV is calculated by dividing the value of all assets of the Fund (including accrued interest and dividends), less all liabilities (including accrued expenses and dividends declared but unpaid), by the total number of shares outstanding.
The Fund’s investments are valued daily at market value or, in the absence of market value with respect to any portfolio securities, at fair value. Market value prices represent readily available market quotations such as last sale or official closing prices from a national or foreign exchange (i.e., a regulated market) and are primarily obtained from third-party pricing services. Fair value prices represent any prices not considered market value prices and are either obtained from a third-party pricing service or are determined by the Pricing Committee of the Trust’s investment advisor, First Trust Advisors L.P. (“First Trust” or the “Advisor”), in accordance with valuation procedures approved by the Trust’s Board of Trustees, and in accordance with provisions of the 1940 Act and rules thereunder. Investments valued by the Advisor’s Pricing Committee, if any, are footnoted as such in the footnotes to the Portfolio of Investments. The Fund’s investments are valued as follows:
Municipal securities are fair valued on the basis of valuations provided by a third-party pricing service approved by the Advisor’s Pricing Committee, which may use the following valuation inputs when available:
| 1) | benchmark yields; |
| 2) | reported trades; |
| 3) | broker/dealer quotes; |
| 4) | issuer spreads; |
| 5) | benchmark securities; |
| 6) | bids and offers; and |
| 7) | reference data including market research publications. |
Pricing services generally value fixed-income securities assuming orderly transactions of an institutional round lot size, but a Fund may hold or transact in such securities in smaller, odd lot sizes. Odd lots may trade at lower prices than institutional round lots.
Fixed income and other debt securities having a remaining maturity of sixty days or less when purchased are fair valued at cost adjusted for amortization of premiums and accretion of discounts (amortized cost), provided the Advisor’s Pricing Committee has determined that the use of amortized cost is an appropriate reflection of fair value given market and issuer-specific
Notes to Financial Statements (Continued)
First Trust Managed Municipal Fund
October 31, 2022
conditions existing at the time of the determination. Factors that may be considered in determining the appropriateness of the use of amortized cost include, but are not limited to, the following:
| 1) | the credit conditions in the relevant market and changes thereto; |
| 2) | the liquidity conditions in the relevant market and changes thereto; |
| 3) | the interest rate conditions in the relevant market and changes thereto (such as significant changes in interest rates); |
| 4) | issuer-specific conditions (such as significant credit deterioration); and |
| 5) | any other market-based data the Advisor’s Pricing Committee considers relevant. In this regard, the Advisor’s Pricing Committee may use last-obtained market-based data to assist it when valuing portfolio securities using amortized cost. |
Securities traded in an over-the-counter market are valued at the mean of their most recent bid and asked price, if available, and otherwise at their last trade price.
Certain securities may not be able to be priced by pre-established pricing methods. Such securities may be valued by the Advisor’s Pricing Committee at fair value. These securities generally include, but are not limited to, restricted securities (securities which may not be publicly sold without registration under the Securities Act of 1933, as amended (the “1933 Act”)) for which a third-party pricing service is unable to provide a market price; securities whose trading has been formally suspended; a security whose market or fair value price is not available from a pre-established pricing source; a security with respect to which an event has occurred that is likely to materially affect the value of the security after the market has closed but before the calculation of the Fund’s NAV or make it difficult or impossible to obtain a reliable market quotation; and a security whose price, as provided by the third-party pricing service, does not reflect the security’s fair value. As a general principle, the current fair value of a security would appear to be the amount which the owner might reasonably expect to receive for the security upon its current sale. When fair value prices are used, generally they will differ from market quotations or official closing prices on the applicable exchanges. A variety of factors may be considered in determining the fair value of such securities, including, but not limited to, the following:
| 1) | the fundamental business data relating to the issuer; |
| 2) | an evaluation of the forces which influence the market in which these securities are purchased and sold; |
| 3) | the type, size and cost of the security; |
| 4) | the financial statements of the issuer; |
| 5) | the credit quality and cash flow of the issuer, based on the Advisor’s or external analysis; |
| 6) | the information as to any transactions in or offers for the security; |
| 7) | the price and extent of public trading in similar securities (or equity securities) of the issuer, or comparable companies; |
| 8) | the coupon payments; |
| 9) | the quality, value and salability of collateral, if any, securing the security; and |
| 10) | other relevant factors. |
The Fund is subject to fair value accounting standards that define fair value, establish the framework for measuring fair value and provide a three-level hierarchy for fair valuation based upon the inputs to the valuation as of the measurement date. The three levels of the fair value hierarchy are as follows:
| • | Level 1 – Level 1 inputs are quoted prices in active markets for identical investments. An active market is a market in which transactions for the investment occur with sufficient frequency and volume to provide pricing information on an ongoing basis. |
| • | Level 2 – Level 2 inputs are observable inputs, either directly or indirectly, and include the following: |
| o | Quoted prices for similar investments in active markets. |
| o | Quoted prices for identical or similar investments in markets that are non-active. A non-active market is a market where there are few transactions for the investment, the prices are not current, or price quotations vary substantially either over time or among market makers, or in which little information is released publicly. |
| o | Inputs other than quoted prices that are observable for the investment (for example, interest rates and yield curves observable at commonly quoted intervals, volatilities, prepayment speeds, loss severities, credit risks, and default rates). |
| o | Inputs that are derived principally from or corroborated by observable market data by correlation or other means. |
| • | Level 3 – Level 3 inputs are unobservable inputs. Unobservable inputs may reflect the reporting entity’s own assumptions about the assumptions that market participants would use in pricing the investment. |
Notes to Financial Statements (Continued)
First Trust Managed Municipal Fund
October 31, 2022
The inputs or methodologies used for valuing investments are not necessarily an indication of the risk associated with investing in those investments. A summary of the inputs used to value the Fund’s investments as of October 31, 2022, is included with the Fund’s Portfolio of Investments.
In December 2020, the SEC adopted Rule 2a-5 under the 1940 Act, establishing requirements to determine fair value in good faith for purposes of the 1940 Act. The rule permits fund boards to designate a fund’s investment adviser to perform fair value determinations, subject to board oversight and certain other conditions. The rule also defines when market quotations are “readily available” for purposes of the 1940 Act and requires a fund to fair value a portfolio investment when a market quotation is not readily available. The SEC also adopted new Rule 31a-4 under the 1940 Act, which sets forth recordkeeping requirements associated with fair value determinations. The compliance date for Rule 2a-5 and Rule 31a-4 was September 8, 2022.
Effective September 8, 2022 and pursuant to the requirements of Rule 2a-5, the Trust’s Board of Trustees designated the Advisor as its valuation designee to perform fair value determinations and approved new Advisor Valuation Procedures for the Trust.
B. Securities Transactions and Investment Income
Securities transactions are recorded as of the trade date. Realized gains and losses from securities transactions are recorded on the identified cost basis. Dividend income is recorded on the ex-dividend date. Interest income is recorded daily on the accrual basis. Amortization of premiums and accretion of discounts are recorded using the effective interest method.
Securities purchased or sold on a when-issued, delayed-delivery or forward purchase commitment basis may have extended settlement periods. The value of the security so purchased is subject to market fluctuations during this period. The Fund maintains liquid assets with a current value at least equal to the amount of its when-issued, delayed-delivery or forward purchace commitments until payment is made. At October 31, 2022, the Fund held $268,932 of when-issued or delay delivery securities.
C. Dividends and Distributions to Shareholders
The Fund will declare daily and pay monthly distributions of all or a portion of its net income to holders of each class of shares. Distributions of any net capital gains earned by the Fund are distributed at least annually. Distributions will automatically be reinvested into additional Fund shares unless cash distributions are elected by the shareholder. The Fund may also designate a portion of the amount paid to redeeming shareholder as a distribution for tax purposes.
Distributions from net investment income and realized capital gains are determined in accordance with federal income tax regulations, which may differ from U.S. GAAP. Certain capital accounts in the financial statements are periodically adjusted for permanent differences in order to reflect their tax character. These permanent differences are primarily due to the varying treatment of income and gain/loss on portfolio securities held by the Fund and have no impact on net assets or NAV per share. Temporary differences, which arise from recognizing certain items of income, expense and gain/loss in different periods for financial statement and tax purposes, will reverse at some point in the future. For the fiscal period ended October 31, 2022, there were no tax adjustments made to the accumulated distributable earnings (loss) accounts due to differences between book and tax treatments. Accumulated distributable earnings (loss) consists of accumulated net investment income (loss), accumulated net realized gain (loss) on investments, and unrealized appreciation (depreciation) on investments. Net assets were not affected by these reclassifications.
The tax character of distributions paid by the Fund during the fiscal period ended October 31, 2022, was as follows:
| Distributions paid from: | |
Ordinary income
| $— |
Capital gains
| — |
Tax-exempt income
| 211,393 |
Return of capital
| — |
Notes to Financial Statements (Continued)
First Trust Managed Municipal Fund
October 31, 2022
As of October 31, 2022, the distributable earnings and net assets on a tax basis were as follows:
Undistributed ordinary income
| $141,811 |
Undistributed capital gains
| — |
Total undistributed earnings
| 141,811 |
Accumulated capital and other losses
| (41,548) |
Net unrealized appreciation (depreciation)
| (2,010,251) |
Total accumulated earnings (losses)
| (1,909,988) |
Other
| — |
Paid-in capital
| 49,378,672 |
Total net assets
| $47,468,684 |
D. Income Taxes
The Fund intends to qualify as a regulated investment company by complying with the requirements under Subchapter M of the Internal Revenue Code of 1986, as amended, which includes distributing substantially all of its net investment income and net realized gains to shareholders. Accordingly, no provision has been made for federal and state income taxes. However, due to the timing and amount of distributions, the Fund may be subject to an excise tax of 4% of the amount by which approximately 98% of the Fund’s taxable income exceeds the distributions from such taxable income for the calendar year.
In addition, the Fund intends to invest in municipal securities to allow it to pay shareholders “exempt dividends” as defined in the Code.
The Fund intends to utilize provisions of the federal income tax laws, which allow it to carry a realized capital loss forward indefinitely following the year of the loss and offset such loss against any future realized capital gains. The Fund is subject to certain limitations under U.S. tax rules on the use of capital loss carryforwards and net unrealized built-in losses. These limitations apply when there has been a 50% change in ownership. At October 31, 2022, the Fund had non-expiring net capital loss carryforwards for federal income tax purposes of $41,548.
Certain losses realized during the current fiscal year may be deferred and treated as occurring on the first day of the following fiscal year for federal income tax purposes. For the fiscal period ended October 31, 2022, the Fund did not incur any net late year ordinary losses.
The Fund is subject to accounting standards that establish a minimum threshold for recognizing, and a system for measuring, the benefits of a tax position taken or expected to be taken in a tax return. The taxable year ended 2022 remains open to federal and state audit. As of October 31, 2022, management has evaluated the application of these standards to the Fund and has determined that no provision for income tax is required in the Fund’s financial statements for uncertain tax positions.
As of October 31, 2022, the aggregate cost, gross unrealized appreciation, gross unrealized depreciation, and net unrealized appreciation/(depreciation) on investments (including short positions and derivatives, if any) for federal income tax purposes were as follows:
| Tax Cost | | Gross
Unrealized
Appreciation | | Gross
Unrealized
(Depreciation) | | Net Unrealized
Appreciation
(Depreciation) |
| $43,516,758 | | $622 | | $(2,010,873) | | $(2,010,251) |
E. Expenses
The Fund pays all expenses directly related to its operations.
3. Investment Advisory Fee, Affiliated Transactions and Other Fee Arrangements
First Trust, the investment advisor to the Fund, is a limited partnership with one limited partner, Grace Partners of DuPage L.P., and one general partner, The Charger Corporation. The Charger Corporation is an Illinois corporation controlled by James A. Bowen, Chief Executive Officer of First Trust. First Trust is responsible for the selection and ongoing monitoring of the Fund’s investment portfolio, managing the Fund’s business affairs and providing certain administrative services necessary for the management of the
Notes to Financial Statements (Continued)
First Trust Managed Municipal Fund
October 31, 2022
Fund. For these investment management services, First Trust is entitled to a monthly fee calculated at an annual rate of 0.50% of the Fund’s average net assets. First Trust also provides fund reporting services to the Fund for a flat annual fee in the amount of $9,250.
First Trust has agreed to waive fees and/or reimburse expenses to the extent necessary through June 14, 2024, to prevent the Fund’s Total Annual Operating Expenses (excluding interest expenses, taxes, fees incurred in acquiring and disposing of portfolio securities, acquired fund fees and expenses, and extraordinary expenses) from exceeding 0.65% of the average daily net assets of Class I shares of the Fund (the “Expense Cap”). Expenses borne and fees waived by First Trust are subject to reimbursement by the Fund for up to three years from the date the fee or expense was incurred, but no reimbursement payment will be made by the Fund at any time if it would result in the Fund’s expenses exceeding (i) the Expense Cap in place for the most recent fiscal year for which such expense limitation was in place, (ii) the Expense Cap in place at the time the fees were waived, or (iii) the current Expense Cap. Additionally, pursuant to a contractual agreement, First Trust has agreed to waive management fees of 0.15% of average daily net assets through June 14, 2024. The waiver agreement may be terminated by action of the Board of Trustees at any time upon 60 days’ written notice by the Trust, on behalf of the Fund, or by First Trust only after June 14, 2024. These amounts would be included in “Expenses previously waived or reimbursed” on the Statement of Operations. The advisory fee waiver and expense reimbursement for the fiscal period ended October 31, 2022 and the expenses borne by First Trust and subject to recovery were as follows:
| | | | | Expenses Subject to Recovery | | |
Advisory Fee
Waiver | | Expense
Reimbursement | | Period Ended
October 31, 2022 | | Total |
| $ 64,439 | | $ 53,619 | | $ 118,058 | | $ 118,058 |
BNY Mellon Investment Servicing (US) Inc. (“BNYM IS”) serves as the Fund’s transfer agent in accordance with certain fee arrangements. As transfer agent, BNYM IS is responsible for maintaining shareholder records for the Fund. The Bank of New York Mellon (“BNYM”) serves as the Fund’s administrator, fund accountant, and custodian in accordance with certain fee arrangements. As administrator and fund accountant, BNYM is responsible for providing certain administrative and accounting services to the Fund, including maintaining the Fund’s books of account, records of the Fund’s securities transactions, and certain other books and records. As custodian, BNYM is responsible for custody of the Fund’s assets. BNYM IS and BNYM are subsidiaries of The Bank of New York Mellon Corporation, a financial holding company.
Each Trustee who is not an officer or employee of First Trust, any sub-advisor or any of their affiliates (“Independent Trustees”) is paid a fixed annual retainer that is allocated equally among each fund in the First Trust Fund Complex. Each Independent Trustee is also paid an annual per fund fee that varies based on whether the fund is a closed-end or other actively managed fund, a target outcome fund or an index fund.
Additionally, the Lead Independent Trustee and the Chairs of the Audit Committee, Nominating and Governance Committee and Valuation Committee are paid annual fees to serve in such capacities, with such compensation allocated pro rata among each fund in the First Trust Fund Complex based on net assets. Independent Trustees are reimbursed for travel and out-of-pocket expenses in connection with all meetings. The Lead Independent Trustee and Committee Chairs rotate every three years. The officers and “Interested” Trustee receive no compensation from the Trust for acting in such capacities.
Notes to Financial Statements (Continued)
First Trust Managed Municipal Fund
October 31, 2022
4. Capital Share Transactions
Capital transactions were as follows:
| | Period Ended
October 31, 2022 |
| | Shares | | Value |
| Sales: | | | |
| Class I | 2,521,332 | | $ 50,683,853 |
| Total Sales | 2,521,332 | | $ 50,683,853 |
| Dividend Reinvestment: | | | |
| Class I | 10,939 | | $ 214,555 |
| Total Dividend Reinvestment | 10,939 | | $ 214,555 |
| Redemptions: | | | |
| Class I | (75,993) | | $ (1,519,736) |
| Total Redemptions | (75,993) | | $ (1,519,736) |
5. Purchases and Sales of Securities
The cost of purchases and proceeds from sales of securities, excluding short-term investments, for the fiscal period ended October 31, 2022, were $45,582,811 and $3,277,929, respectively.
6. Indemnification
The Fund has a variety of indemnification obligations under contracts with its service providers. The Fund’s maximum exposure under these arrangements is unknown. However, the Fund has not had prior claims or losses pursuant to these contracts and expects the risk of loss to be remote.
7. Subsequent Events
Management has evaluated the impact of all subsequent events to the Fund through the date the financial statements were issued and has determined that there were no subsequent events requiring recognition or disclosure in the financial statements that have not already been disclosed.
(1)The terms “security” and “securities” used throughout the Notes to Financial Statements include Senior Loans.
Report of Independent Registered Public Accounting Firm
To the Shareholders and the Board of Trustees of First Trust Series Fund:
Opinion on the Financial Statements and Financial Highlights
We have audited the accompanying statement of assets and liabilities of First Trust Managed Municipal Fund (the “Fund”), a series of the First Trust Series Fund, including the portfolio of investments, as of October 31, 2022, and the related statements of operations, changes in net assets, and the financial highlights for the period from June 15, 2022 (commencement of operations) through October 31, 2022, and the related notes. In our opinion, the financial statements and financial highlights present fairly, in all material respects, the financial position of the Fund as of October 31, 2022, and the results of its operations, the changes in its net assets, and the financial highlights for the period from June 15, 2022 (commencement of operations) through October 31, 2022 in conformity with accounting principles generally accepted in the United States of America.
Basis for Opinion
These financial statements and financial highlights are the responsibility of the Fund’s management. Our responsibility is to express an opinion on the Fund’s financial statements and financial highlights based on our audit. We are a public accounting firm registered with the Public Company Accounting Oversight Board (United States) (PCAOB) and are required to be independent with respect to the Fund in accordance with the U.S. federal securities laws and the applicable rules and regulations of the Securities and Exchange Commission and the PCAOB.
We conducted our audit in accordance with the standards of the PCAOB. Those standards require that we plan and perform the audit to obtain reasonable assurance about whether the financial statements and financial highlights are free of material misstatement, whether due to error or fraud. The Fund is not required to have, nor were we engaged to perform, an audit of its internal control over financial reporting. As part of our audit we are required to obtain an understanding of internal control over financial reporting but not for the purpose of expressing an opinion on the effectiveness of the Fund’s internal control over financial reporting. Accordingly, we express no such opinion.
Our audit included performing procedures to assess the risks of material misstatement of the financial statements and financial highlights, whether due to error or fraud, and performing procedures that respond to those risks. Such procedures included examining, on a test basis, evidence regarding the amounts and disclosures in the financial statements and financial highlights. Our audit also included evaluating the accounting principles used and significant estimates made by management, as well as evaluating the overall presentation of the financial statements and financial highlights. Our procedures included confirmation of securities owned as of October 31, 2022, by correspondence with the custodian and brokers; when replies were not received from brokers, we performed other auditing procedures. We believe that our audit provides a reasonable basis for our opinion.
Chicago, Illinois
December 21, 2022
We have served as the auditor of one or more First Trust investment companies since 2001.
Additional Information
First Trust Managed Municipal Fund
October 31, 2022 (Unaudited)
Proxy Voting Policies and Procedures
A description of the policies and procedures that the Trust uses to determine how to vote proxies and information on how the Fund voted proxies relating to portfolio securities during the most recent 12-month period ended June 30 is available (1) without charge, upon request, by calling (800) 988-5891; (2) on the Fund’s website at www.ftportfolios.com; and (3) on the Securities and Exchange Commission’s (“SEC”) website at www.sec.gov.
Portfolio Holdings
The Fund files portfolio holdings information for each month in a fiscal quarter within 60 days after the end of the relevant fiscal quarter on Form N-PORT. Portfolio holdings information for the third month of each fiscal quarter will be publicly available on the SEC’s website at www.sec.gov. The Fund’s complete schedule of portfolio holdings for the second and fourth quarters of each fiscal year is included in the semi-annual and annual reports to shareholders, respectively, and is filed with the SEC on Form N-CSR. The semi-annual and annual report for the Fund is available to investors within 60 days after the period to which it relates. The Fund’s Forms N-PORT and Forms N-CSR are available on the SEC’s website listed above.
Federal Tax Information
For the taxable year ended October 31, 2022, the following distribution information is being provided as required by the Internal Revenue Code of 1986, as amended, or to meet a specific state’s requirement. The Fund designates the following percentages or, if subsequently determined to be different, the maximum amount allowable for its fiscal period ended October 31, 2022:
| Federal and State Income Tax | | Percentages |
| Tax-Exempt Interest Dividends | | 100.00% |
| Alternative Minimum Tax (AMT) | | 15.42% |
Risk Considerations
Risks are inherent in all investing. Certain general risks that may be applicable to a Fund are identified below, but not all of the material risks relevant to each Fund are included in this report and not all of the risks below apply to each Fund. The material risks of investing in each Fund are spelled out in its prospectus, statement of additional information and other regulatory filings. Before investing, you should consider each Fund’s investment objective, risks, charges and expenses, and read each Fund’s prospectus and statement of additional information carefully. You can download each Fund’s prospectus at www.ftportfolios.com or contact First Trust Portfolios L.P. at (800) 621-1675 to request a prospectus, which contains this and other information about each Fund.
Concentration Risk. To the extent that a fund is able to invest a significant percentage of its assets in a single asset class or the securities of issuers within the same country, state, region, industry or sector, an adverse economic, business or political development may affect the value of the fund’s investments more than if the fund were more broadly diversified. A fund that tracks an index will be concentrated to the extent the fund’s corresponding index is concentrated. A concentration makes a fund more susceptible to any single occurrence and may subject the fund to greater market risk than a fund that is more broadly diversified.
Credit Risk. Credit risk is the risk that an issuer of a security will be unable or unwilling to make dividend, interest and/or principal payments when due and the related risk that the value of a security may decline because of concerns about the issuer’s ability to make such payments.
Cyber Security Risk. The funds are susceptible to potential operational risks through breaches in cyber security. A breach in cyber security refers to both intentional and unintentional events that may cause a fund to lose proprietary information, suffer data corruption or lose operational capacity. Such events could cause a fund to incur regulatory penalties, reputational damage, additional compliance costs associated with corrective measures and/or financial loss. In addition, cyber security breaches of a fund’s third-party service providers, such as its administrator, transfer agent, custodian, or sub-advisor, as applicable, or issuers in which the fund invests, can also subject a fund to many of the same risks associated with direct cyber security breaches.
Derivatives Risk. To the extent a fund uses derivative instruments such as futures contracts, options contracts and swaps, the fund may experience losses because of adverse movements in the price or value of the underlying asset, index or rate, which may be magnified by certain features of the derivative. These risks are heightened when a fund’s portfolio managers use derivatives to enhance the fund’s return or as a substitute for a position or security, rather than solely to hedge (or offset) the risk of a position or security held by the fund.
Additional Information (Continued)
First Trust Managed Municipal Fund
October 31, 2022 (Unaudited)
Equity Securities Risk. To the extent a fund invests in equity securities, the value of the fund’s shares will fluctuate with changes in the value of the equity securities. Equity securities prices fluctuate for several reasons, including changes in investors’ perceptions of the financial condition of an issuer or the general condition of the relevant stock market, such as market volatility, or when political or economic events affecting the issuers occur. In addition, common stock prices may be particularly sensitive to rising interest rates, as the cost of capital rises and borrowing costs increase. Equity securities may decline significantly in price over short or extended periods of time, and such declines may occur in the equity market as a whole, or they may occur in only a particular country, company, industry or sector of the market.
Fixed Income Securities Risk. To the extent a fund invests in fixed income securities, the fund will be subject to credit risk, income risk, interest rate risk, liquidity risk and prepayment risk. Income risk is the risk that income from a fund’s fixed income investments could decline during periods of falling interest rates. Interest rate risk is the risk that the value of a fund’s fixed income securities will decline because of rising interest rates. Liquidity risk is the risk that a security cannot be purchased or sold at the time desired, or cannot be purchased or sold without adversely affecting the price. Prepayment risk is the risk that the securities will be redeemed or prepaid by the issuer, resulting in lower interest payments received by the fund. In addition to these risks, high yield securities, or “junk” bonds, are subject to greater market fluctuations and risk of loss than securities with higher ratings, and the market for high yield securities is generally smaller and less liquid than that for investment grade securities.
Investment Companies Risk. To the extent a fund invests in the securities of other investment vehicles, the fund will incur additional fees and expenses that would not be present in a direct investment in those investment vehicles. Furthermore, the fund’s investment performance and risks are directly related to the investment performance and risks of the investment vehicles in which the fund invests.
LIBOR Risk. To the extent a fund invests in floating or variable rate obligations that use the London Interbank Offered Rate (“LIBOR”) as a reference interest rate, it is subject to LIBOR Risk. The United Kingdom’s Financial Conduct Authority, which regulates LIBOR has ceased making LIBOR available as a reference rate over a phase-out period that began December 31, 2021. There is no assurance that any alternative reference rate, including the Secured Overnight Financing Rate (“SOFR”) will be similar to or produce the same value or economic equivalence as LIBOR or that instruments using an alternative rate will have the same volume or liquidity. The unavailability or replacement of LIBOR may affect the value, liquidity or return on certain fund investments and may result in costs incurred in connection with closing out positions and entering into new trades. Any potential effects of the transition away from LIBOR on the fund or on certain instruments in which the fund invests can be difficult to ascertain, and they may vary depending on a variety of factors, and they could result in losses to the fund.
Management Risk. To the extent that a fund is actively managed, it is subject to management risk. In managing an actively-managed fund’s investment portfolio, the fund’s portfolio managers will apply investment techniques and risk analyses that may not have the desired result. There can be no guarantee that a fund will meet its investment objective.
Market Risk. Market risk is the risk that a particular security, or shares of a fund in general, may fall in value. Securities held by a fund, as well as shares of a fund itself, are subject to market fluctuations caused by factors such as general economic conditions, political events, regulatory or market developments, changes in interest rates and perceived trends in securities prices. Shares of a fund could decline in value or underperform other investments as a result of the risk of loss associated with these market fluctuations. In addition, local, regional or global events such as war, acts of terrorism, spread of infectious diseases or other public health issues, recessions, or other events could have a significant negative impact on a fund and its investments. Such events may affect certain geographic regions, countries, sectors and industries more significantly than others. In February 2022, Russia invaded Ukraine which has caused and could continue to cause significant market disruptions and volatility within the markets in Russia, Europe, and the United States. The hostilities and sanctions resulting from those hostilities could have a significant impact on certain fund investments as well as fund performance. The COVID-19 global pandemic and the ensuing policies enacted by governments and central banks have caused and may continue to cause significant volatility and uncertainty in global financial markets. While the U.S. has resumed “reasonably” normal business activity, many countries continue to impose lockdown measures. Additionally, there is no guarantee that vaccines will be effective against emerging variants of the disease. These events also adversely affect the prices and liquidity of a fund’s portfolio securities or other instruments and could result in disruptions in the trading markets. Any of such circumstances could have a materially negative impact on the value of a fund’s shares and result in increased market volatility. During any such events, a fund’s shares may trade at increased premiums or discounts to their net asset value and the bid/ask spread on a fund’s shares may widen.
Non-U.S. Securities Risk. To the extent a fund invests in non-U.S. securities, it is subject to additional risks not associated with securities of domestic issuers. Non-U.S. securities are subject to higher volatility than securities of domestic issuers due to: possible adverse political, social or economic developments; restrictions on foreign investment or exchange of securities; capital controls; lack of liquidity; currency exchange rates; excessive taxation; government seizure of assets; the imposition of sanctions by foreign governments; different legal or accounting standards; and less government supervision and regulation of exchanges in foreign countries. Investments in non-U.S. securities may involve higher costs than investments in U.S. securities, including higher transaction
Additional Information (Continued)
First Trust Managed Municipal Fund
October 31, 2022 (Unaudited)
and custody costs, as well as additional taxes imposed by non-U.S. governments. These risks may be heightened for securities of companies located, or with significant operations, in emerging market countries.
Operational Risk. Each fund is subject to risks arising from various operational factors, including, but not limited to, human error, processing and communication errors, errors of a fund’s service providers, counterparties or other third-parties, failed or inadequate processes and technology or systems failures. Each fund relies on third-parties for a range of services, including custody. Any delay or failure relating to engaging or maintaining such service providers may affect a fund’s ability to meet its investment objective. Although the funds and the funds’ investment advisor seek to reduce these operational risks through controls and procedures, there is no way to completely protect against such risks.
Preferred Securities Risk. Preferred securities combine some of the characteristics of both common stocks and bonds. Preferred securities are typically subordinated to bonds and other debt securities in a company’s capital structure in terms of priority to corporate income, subjecting them to greater credit risk than those debt securities. Generally, holders of preferred securities have no voting rights with respect to the issuing company unless preferred dividends have been in arrears for a specified number of periods, at which time the preferred security holders may obtain limited rights. In certain circumstances, an issuer of preferred securities may defer payment on the securities and, in some cases, redeem the securities prior to a specified date. Preferred securities may also be substantially less liquid than other securities, including common stock.
Valuation Risk. The valuation of certain securities may carry more risk than that of common stock. Uncertainties in the conditions of the financial markets, unreliable reference data, lack of transparency and inconsistency of valuation models and processes may lead to inaccurate asset pricing. A fund may hold investments in sizes smaller than institutionally sized round lot positions (sometimes referred to as odd lots). However, third-party pricing services generally provide evaluations on the basis of institutionally-sized round lots. If a fund sells certain of its investments in an odd lot transaction, the sale price may be less than the value at which such securities have been held by the fund. Odd lots often trade at lower prices than institutional round lots. There is no assurance that the fund will be able to sell a portfolio security at the price established by the pricing service, which could result in a loss to the fund.
| NOT FDIC INSURED | NOT BANK GUARANTEED | MAY LOSE VALUE |
Advisory Agreement
Board Considerations Regarding Approval of Investment Management Agreement
The Board of Trustees of First Trust Series Fund (the “Trust”), including the Independent Trustees, approved the Investment Management Agreement (the “Agreement”) with First Trust Advisors L.P. (the “Advisor”), on behalf of First Trust Managed Municipal Fund (the “Fund”), for an initial two-year term at a meeting held on January 24, 2022. The Board determined that the Agreement is in the best interests of the Fund in light of the nature, extent and quality of the services expected to be provided and such other matters as the Board considered to be relevant in the exercise of its business judgment.
To reach this determination, the Board considered its duties under the Investment Company Act of 1940, as amended (the “1940 Act”), as well as under the general principles of state law, in reviewing and approving advisory contracts; the requirements of the 1940 Act in such matters; the fiduciary duty of investment advisors with respect to advisory agreements and compensation; the standards used by courts in determining whether investment company boards have fulfilled their duties; and the factors to be considered by the Board in voting on such agreements. To assist the Board in its evaluation of the Agreement for the Fund, the Independent Trustees received a report from the Advisor in advance of the Board meeting responding to a request for information from counsel to the Independent Trustees, submitted on behalf of the Independent Trustees, that, among other things, outlined: the services to be provided by the Advisor to the Fund (including the relevant personnel responsible for these services and their experience); the proposed advisory fee rate payable by the Fund as compared to fees charged to a peer group of funds (the “Expense Group”) and a broad peer universe of funds (the “Expense Universe”), each assembled by Broadridge Financial Solutions, Inc. (“Broadridge”), an independent source, and as compared to fees charged to other clients of the Advisor; the estimated expense ratio of the Fund’s Class I shares as compared to expense ratios of comparable share classes of the funds in the Fund’s Expense Group and Expense Universe; the nature of expenses to be incurred in providing services to the Fund and the potential for the Advisor to realize economies of scale, if any; profitability and other financial data for the Advisor; any fall-out benefits to the Advisor and its affiliate, First Trust Portfolios L.P. (“FTP”); and information on the Advisor’s compliance program. The Independent Trustees and their counsel also met separately to discuss the information provided by the Advisor. The Board applied its business judgment to determine whether the arrangement between the Trust and the Advisor is a reasonable business arrangement from the Fund’s perspective.
In evaluating whether to approve the Agreement for the Fund, the Board considered the nature, extent and quality of the services to be provided by the Advisor under the Agreement and considered that employees of the Advisor provide management services to three other series of the Trust as well as other funds in the First Trust Fund Complex with diligence and care. The Board considered that the
Additional Information (Continued)
First Trust Managed Municipal Fund
October 31, 2022 (Unaudited)
Advisor will be responsible for the overall management and administration of the Fund and reviewed all of the services to be provided by the Advisor to the Fund, as well as the background and experience of the persons responsible for such services. The Board noted that the Advisor’s Municipal Securities Team will be responsible for the day-to-day management of the Fund’s investments and considered the background and experience of the members of the Municipal Securities Team. The Board considered that the Advisor applies the same oversight model internally with the Municipal Securities Team as it uses for overseeing external sub-advisors, including portfolio risk monitoring and performance review. In reviewing the services to be provided, the Board noted the compliance program that had been developed by the Advisor and considered that it includes a robust program for monitoring the Advisor’s and the Fund’s compliance with the 1940 Act, as well as the Fund’s compliance with its investment objectives, policies and restrictions. At the meeting, the Trustees received a presentation from representatives of the Municipal Securities Team and were able to ask questions about the team and the proposed investment strategy for the Fund. Because the Fund had yet to commence investment operations, the Board could not consider the historical investment performance of the Fund. In light of the information presented and the considerations made, the Board concluded that the nature, extent and quality of the services to be provided to the Fund by the Advisor under the Agreement are expected to be satisfactory.
The Board considered the proposed advisory fee rate payable by the Fund under the Agreement for the services to be provided. The Board noted that, under the Agreement, the Fund would pay the Advisor an advisory fee equal to an annual rate of 0.50% of its average daily net assets. The Board also considered that, pursuant to an Expense Reimbursement, Fee Waiver and Recovery Agreement, the Advisor would contractually agree for at least a two-year period beginning upon the effectiveness of the Fund’s registration statement to waive fees and/or reimburse Fund expenses to the extent necessary to prevent the total annual operating expenses of the Fund (excluding taxes, interest, all brokerage commissions, other normal charges incident to the purchase and sale of portfolio securities, distribution and service fees payable pursuant to a Rule 12b-1 plan, if any, and extraordinary expenses) from exceeding 0.65% of the average daily net assets of the Fund. The Board noted that fees waived or expenses borne by the Advisor pursuant to the Expense Reimbursement, Fee Waiver and Recovery Agreement are proposed to be subject to reimbursement by the Fund for up to three years from the date the fee was waived or expense was incurred, but no reimbursement payment would be made by the Fund at any time if it would result in the total annual operating expenses of the Fund (excluding taxes, interest, all brokerage commissions, other normal charges incident to the purchase and sale of portfolio securities, distribution and service fees payable pursuant to a Rule 12b-1 plan, if any, and extraordinary expenses) exceeding: (i) the applicable expense limitation in place for the most recent fiscal year for which such expense limitation was in place, (ii) the applicable expense limitation in place at the time the fees were waived, or (iii) the current expense limitation. The Board also noted that the Advisor would contractually agree to waive a portion of its advisory fee in an amount equal to 0.15% of the Fund’s average daily net assets for at least a two-year period beginning upon the effectiveness of the Fund’s registration statement and that the Advisor would agree to waive an additional portion of its advisory fee in an amount equal to 0.15% of the Fund’s average daily net assets for at least a two-year period beginning upon the effectiveness of the Fund’s registration statement. The Board received and reviewed information showing the fee rates and expense ratios of the peer funds in the Expense Group, as well as advisory and unitary fee rates charged by the Advisor to other clients. With respect to the Expense Group, the Board discussed with representatives of the Advisor how the Expense Group was assembled and how the Fund compared and differed from the peer funds. The Board took this information into account in considering the peer data. Based on the information provided, the Board noted that the total (net) advisory fee rate payable by the Fund, after taking into account the fee waivers, was below the median total (net) advisory fee of the peer funds in the Expense Group. The Board also noted that the Fund’s total (net) expense ratio (Class I shares), after taking into account the fee waivers, was below the median total (net) expense ratio of the peer funds in the Expense Group. With respect to fees charged to other clients, the Board considered differences between the Fund and other clients that limited their comparability; however, the Board considered the Advisor’s statement that the Fund’s investment objective and policies are similar to those of an actively-managed exchange-traded fund in the First Trust Fund Complex managed by the Advisor that pays a unitary fee equal to an annual rate of 0.65% of its average daily net assets and for which the Advisor has contractually agreed to waive fees in the amount of 0.15% of the fund’s average daily net assets for at least a one-year period from the date of the fund’s currently effective registration statement. In light of the information considered and the nature, extent and quality of the services expected to be provided to the Fund under the Agreement, the Board determined that the proposed advisory fee was fair and reasonable.
The Board considered whether there are any potential economies of scale to be achieved in connection with the Advisor providing investment advisory services to the Fund. The Board noted that the Advisor has continued to hire personnel and build infrastructure, including technology, to improve the services to the funds in the First Trust Fund Complex. The Board took into consideration the types of costs to be borne by the Advisor in connection with its services to be performed for the Fund under the Agreement. The Board considered the Advisor’s estimate of the asset level for the Fund at which the Advisor expects the Agreement to be profitable to the Advisor and the Advisor’s estimate of the profitability of the Agreement if the Fund’s assets reach $100 million. The Board noted the inherent limitations in the profitability analysis and concluded that, based on the information provided, the Advisor’s estimated profitability level for the Fund was not unreasonable. In addition, the Board considered fall-out benefits described by the Advisor that may be realized from its relationship with the Fund. The Board considered that the Advisor had identified as a fall-out benefit to the
Additional Information (Continued)
First Trust Managed Municipal Fund
October 31, 2022 (Unaudited)
Advisor and FTP their exposure to investors and brokers who, absent their exposure to the Fund, may have had no dealings with the Advisor or FTP. The Board also considered FTP’s compensation for services to be provided to the Fund through Rule 12b-1 distribution and service fees payable by Class A and Class C shares, noting that although the Fund intended to launch with Class I shares only, Class A and Class C shares could be offered in the future. In addition, the Board considered the Advisor’s compensation for fund reporting services to be provided to the Fund pursuant to a separate Fund Reporting Services Agreement. The Board noted that the Advisor will not utilize soft dollars in connection with the Fund. The Board concluded that the character and amount of potential fall-out benefits to the Advisor were not unreasonable.
Based on all of the information considered and the conclusions reached, the Board, including the Independent Trustees, determined that the terms of the Agreement are fair and reasonable and that the approval of the Agreement is in the best interests of the Fund. No single factor was determinative in the Board’s analysis.
Board of Trustees and Officers
First Trust Managed Municipal Fund
October 31, 2022 (Unaudited)
The following tables identify the Trustees and Officers of the Trust. Unless otherwise indicated, the address of all persons is 120 East Liberty Drive, Suite 400, Wheaton, IL 60187.
The Trust’s statement of additional information includes additional information about the Trustees and is available, without charge, upon request, by calling (800) 988-5891.
| Name, Year of Birth and Position with the Trust | Term of Office and Year First Elected or Appointed | Principal Occupations
During Past 5 Years | Number of Portfolios in the First Trust Fund Complex Overseen by Trustee | Other Trusteeships or Directorships Held by Trustee During Past 5 Years |
| INDEPENDENT TRUSTEES |
Richard E. Erickson, Trustee
(1951) | • Indefinite Term
• Since Trust Inception | Physician, Edward-Elmhurst Medical Group; Physician and Officer, Wheaton Orthopedics (1990 to 2021) | 223 | None |
Thomas R. Kadlec, Trustee
(1957) | • Indefinite Term
• Since Trust Inception | Retired; President, ADM Investor Services, Inc. (Futures Commission Merchant) (2010 to July 2022) | 223 | Director, National Futures Association and ADMIS Singapore Ltd.; Formerly, Director of ADM Investor Services, Inc., ADM Investor Services International, ADMIS Hong Kong Ltd., and Futures Industry Association |
Denise M. Keefe, Trustee
(1964) | • Indefinite Term
• Since 2021 | Executive Vice President, Advocate Aurora Health and President, Advocate Aurora Continuing Health Division (Integrated Healthcare System) | 223 | Director and Board Chair of Advocate Home Health Services, Advocate Home Care Products and Advocate Hospice; Director and Board Chair of Aurora At Home (since 2018); Director of Advocate Physician Partners Accountable Care Organization; Director and Board Chair of RML Long Term Acute Care Hospitals; and Director of Senior Helpers (since 2021) |
Robert F. Keith, Trustee
(1956) | • Indefinite Term
• Since Trust Inception | President, Hibs Enterprises (Financial and Management Consulting) | 223 | Formerly, Director of Trust Company of Illinois |
Niel B. Nielson, Trustee
(1954) | • Indefinite Term
• Since Trust Inception | Senior Advisor (2018 to Present), Managing Director and Chief Operating Officer (2015 to 2018), Pelita Harapan Educational Foundation (Educational Products and Services) | 223 | None |
| INTERESTED TRUSTEE |
James A. Bowen(1), Trustee and
Chairman of the Board
(1955) | • Indefinite Term
• Since Trust Inception | Chief Executive Officer, First Trust Advisors L.P. and First Trust Portfolios L.P.; Chairman of the Board of Directors, BondWave LLC (Software Development Company) and Stonebridge Advisors LLC (Investment Advisor) | 223 | None |
| (1) | Mr. Bowen is deemed an “interested person” of the Trust due to his position as CEO of First Trust Advisors L.P., investment advisor of the Trust. |
Board of Trustees and Officers (Continued)
First Trust Managed Municipal Fund
October 31, 2022 (Unaudited)
| Name and Year of Birth | Position and Offices with Trust | Term of Office and Length of Service | Principal Occupations
During Past 5 Years |
| OFFICERS(2) |
James M. Dykas
(1966) | President and Chief Executive Officer | • Indefinite Term
• Since 2016 | Managing Director and Chief Financial Officer, First Trust Advisors L.P. and First Trust Portfolios L.P.; Chief Financial Officer, BondWave LLC (Software Development Company) and Stonebridge Advisors LLC (Investment Advisor) |
Donald P. Swade
(1972) | Treasurer, Chief Financial Officer and Chief Accounting Officer | • Indefinite Term
• Since 2016 | Senior Vice President, First Trust Advisors L.P. and First Trust Portfolios L.P. |
W. Scott Jardine
(1960) | Secretary and Chief Legal Officer | • Indefinite Term
• Since Trust Inception | General Counsel, First Trust Advisors L.P. and First Trust Portfolios L.P.; Secretary and General Counsel, BondWave LLC; Secretary, Stonebridge Advisors LLC |
Daniel J. Lindquist
(1970) | Vice President | • Indefinite Term
• Since Trust Inception | Managing Director, First Trust Advisors L.P. and First Trust Portfolios L.P. |
Kristi A. Maher
(1966) | Chief Compliance Officer and Assistant Secretary | • Indefinite Term
• Chief Compliance Officer Since January 2011 • Assistant Secretary Since Trust Inception | Deputy General Counsel, First Trust Advisors L.P. and First Trust Portfolios L.P. |
| (2) | The term “officer” means the president, vice president, secretary, treasurer, controller or any other officer who performs a policy making function. |
Privacy Policy
First Trust Managed Municipal Fund
October 31, 2022 (Unaudited)
Privacy Policy
First Trust values our relationship with you and considers your privacy an important priority in maintaining that relationship. We are committed to protecting the security and confidentiality of your personal information.
Sources of Information
We collect nonpublic personal information about you from the following sources:
| • | Information we receive from you and your broker-dealer, investment professional or financial representative through interviews, applications, agreements or other forms; |
| • | Information about your transactions with us, our affiliates or others; |
| • | Information we receive from your inquiries by mail, e-mail or telephone; and |
| • | Information we collect on our website through the use of “cookies.” For example, we may identify the pages on our website that your browser requests or visits. |
Information Collected
The type of data we collect may include your name, address, social security number, age, financial status, assets, income, tax information, retirement and estate plan information, transaction history, account balance, payment history, investment objectives, marital status, family relationships and other personal information.
Disclosure of Information
We do not disclose any nonpublic personal information about our customers or former customers to anyone, except as permitted by law. In addition to using this information to verify your identity (as required under law), the permitted uses may also include the disclosure of such information to unaffiliated companies for the following reasons:
| • | In order to provide you with products and services and to effect transactions that you request or authorize, we may disclose your personal information as described above to unaffiliated financial service providers and other companies that perform administrative or other services on our behalf, such as transfer agents, custodians and trustees, or that assist us in the distribution of investor materials such as trustees, banks, financial representatives, proxy services, solicitors and printers. |
| • | We may release information we have about you if you direct us to do so, if we are compelled by law to do so, or in other legally limited circumstances (for example to protect your account from fraud). |
In addition, in order to alert you to our other financial products and services, we may share your personal information within First Trust.
Use of Website Analytics
We currently use third party analytics tools, Google Analytics and AddThis, to gather information for purposes of improving First Trust’s website and marketing our products and services to you. These tools employ cookies, which are small pieces of text stored in a file by your web browser and sent to websites that you visit, to collect information, track website usage and viewing trends such as the number of hits, pages visited, videos and PDFs viewed and the length of user sessions in order to evaluate website performance and enhance navigation of the website. We may also collect other anonymous information, which is generally limited to technical and web navigation information such as the IP address of your device, internet browser type and operating system for purposes of analyzing the data to make First Trust’s website better and more useful to our users. The information collected does not include any personal identifiable information such as your name, address, phone number or email address unless you provide that information through the website for us to contact you in order to answer your questions or respond to your requests. To find out how to opt-out of these services click on: Google Analytics and AddThis.
Confidentiality and Security
With regard to our internal security procedures, First Trust restricts access to your nonpublic personal information to those First Trust employees who need to know that information to provide products or services to you. We maintain physical, electronic and procedural safeguards to protect your nonpublic personal information.
Policy Updates and Inquiries
As required by federal law, we will notify you of our privacy policy annually. We reserve the right to modify this policy at any time, however, if we do change it, we will tell you promptly. For questions about our policy, or for additional copies of this notice, please go to www.ftportfolios.com, or contact us at 1-800-621-1675 (First Trust Portfolios) or 1-800-222-6822 (First Trust Advisors).
March 2022
This page intentionally left blank
This page intentionally left blank
INVESTMENT ADVISOR
First Trust Advisors L.P.
120 East Liberty Drive, Suite 400
Wheaton, IL 60187
ADMINISTRATOR,
FUND ACCOUNTANT, AND
CUSTODIAN
The Bank of New York Mellon
240 Greenwich Street
New York, NY 10286
TRANSFER AGENT
BNY Mellon Investment Servicing (US) Inc.
301 Bellevue Parkway
Wilmington, DE 19809
INDEPENDENT REGISTERED
PUBLIC ACCOUNTING FIRM
Deloitte & Touche LLP
111 S. Wacker Drive
Chicago, IL 60606
LEGAL COUNSEL
Chapman and Cutler LLP
320 South Canal Street
Chicago, IL 60606
Item 2. Code of Ethics.
| (a) | | The registrant, as of the end of the period covered by this report, has adopted a code of ethics that applies to the registrant’s principal executive officer, principal financial officer, principal accounting officer or controller, or persons performing similar functions, regardless of whether these individuals are employed by the registrant or a third party. |
| (c) | | There have been no amendments, during the period covered by this report, to a provision of the code of ethics that applies to the registrant's principal executive officer, principal financial officer, principal accounting officer or controller, or persons performing similar functions, regardless of whether these individuals are employed by the registrant or a third party, and that relates to any element of the code of ethics description. |
| (d) | | The registrant has not granted any waivers, including an implicit waiver, from a provision of the code of ethics that applies to the registrant’s principal executive officer, principal financial officer, principal accounting officer or controller, or persons performing similar functions, regardless of whether these individuals are employed by the registrant or a third party, that relates to one or more of the items set forth in paragraph (b) of this item’s instructions. |
| (f) | | A copy of the code of ethics that applies to the registrant’s principal executive officer, principal financial officer, principal accounting officer or controller is filed as an exhibit pursuant to Item 13(a)(1). |
Item 3. Audit Committee Financial Expert.
As of the end of the period covered by the report, the Registrant’s Board of Trustees has determined that Thomas R. Kadlec and Robert F. Keith are qualified to serve as audit committee financial experts serving on its audit committee and that each of them is “independent,” as defined by Item 3 of Form N-CSR.
Item 4. Principal Accountant Fees and Services.
(a) Audit Fees (Registrant) -- The aggregate fees billed for professional services rendered by the principal accountant for the audit of the registrant's annual financial statements or services that are normally provided by the accountant in connection with statutory and regulatory filings or engagements were $109,000 for the fiscal year ended October 31, 2021 and $143,000 for the fiscal year ended October 31, 2022.
Audit Fees (Investment Advisor and Distributor) -- The aggregate fees billed for professional services rendered by the principal accountant for the audit of the registrant's annual financial statements or services that are normally provided by the accountant in connection with statutory and regulatory filings or engagements were $0 for the fiscal year ended October 31, 2021 and $0 for the fiscal year ended October 31, 2022.
(b) Audit-Related Fees (Registrant) -- The aggregate fees billed in each of the last two fiscal years for assurance and related services by the principal accountant that are reasonably related to the performance of the audit of the registrant's financial statements and are not reported under paragraph (a) of this Item were $0 for the fiscal year ended October 31, 2021 and $0 for the fiscal year ended October 31, 2022.
Audit-Related Fees (Investment Advisor and Distributor) -- The aggregate fees billed for assurance and related services by the principal accountant that are reasonably related to the performance of the audit of the registrant's financial statements, including conducting the seed audit and preparation of the seed audit consent, and are not reported under paragraph (a) of this Item were $0 for the Investment Advisor and $0 for the Distributor for the fiscal year ended October 31, 2021 and $0 for the Investment Advisor and $0 for the Distributor for the fiscal year ended October 31, 2022.
(c) Tax Fees (Registrant) -- The aggregate fees billed for professional services rendered by the principal accountant for tax compliance, tax advice, and tax planning to the registrant were $33,550 for the fiscal year ended October 31, 2021; and for tax compliance, tax advice, tax planning to the registrant were $44,250 for the fiscal year ended October 31, 2022. The above fees were also for tax consultation and/or tax return preparation and professional services rendered for PFIC (Passive Foreign Investment Company) Identification Services.
Tax Fees (Investment Advisor and Distributor) -- The aggregate fees billed for professional services rendered by the principal accountant for tax compliance, tax advice, and tax planning to the registrant's advisor and distributor were $0 for the Investment Advisor and $0 for the Distributor for the fiscal year ended October 31, 2021 and $0 for the Investment Advisor and $0 for the Distributor for the fiscal year ended October 31, 2022.
(d) All Other Fees (Registrant) -- The aggregate fees billed for products and services provided by the principal accountant to the registrant, other than the services reported in paragraphs (a) through (c) of this Item were $0 for the fiscal year ended October 31, 2021 and $0 for the fiscal year ended October 31, 2022.
All Other Fees (Investment Advisor and Distributor) -- The aggregate fees billed for products and services provided by the principal accountant to the registrant’s investment advisor and distributor, other than the services reported in paragraphs (a) through (c) of this Item were $0 for the Investment Advisor and $0 for the Distributor for the fiscal year ended October 31, 2021 and $0 for the Investment Advisor and $0 for the Distributor for the fiscal year ended October 31, 2022.
(e)(1) Disclose the audit committee's pre-approval policies and procedures described in paragraph (c) (7) of Rule 2-01 of Regulation S-X.
Pursuant to its charter and its Audit and Non-Audit Services Pre-Approval Policy, the Audit Committee (the "Committee") is responsible for the pre-approval of all audit services and permitted non-audit services (including the fees and terms thereof) to be performed for the registrant by its independent auditors. The Chairman of the Committee is authorized to give such pre-approvals on behalf of the Committee up to $25,000 and report any such pre-approval to the full Committee.
The Committee is also responsible for the pre-approval of the independent auditor's engagements for non-audit services with the registrant's advisor (not including a sub-advisor whose role is primarily portfolio management and is sub-contracted or overseen by another investment advisor) and any entity controlling, controlled by or under common control with the investment advisor that provides ongoing services to the registrant, if the engagement relates directly to the operations and financial reporting of the registrant, subject to the de minimis exceptions for non-audit services described in Rule 2-01 of Regulation S-X. If the independent auditor has provided non-audit services to the registrant's advisor (other than any sub-advisor whose role is primarily portfolio management and is sub-contracted with or overseen by another investment advisor) and any entity controlling, controlled by or under common control with the investment advisor that provides ongoing services to the registrant that were not pre-approved pursuant to its policies, the Committee will consider whether the provision of such non-audit services is compatible with the auditor's independence.
(e)(2) The percentage of services described in each of paragraphs (b) through (d) for the registrant and the registrant's investment advisor and distributor of this Item that were approved by the audit committee pursuant to the pre-approval exceptions included in paragraph (c)(7)(i)(C) or paragraph(C)(7)(ii) of Rule 2-01 of Regulation S-X are as follows:
| | Registrant: | | Advisor and Distributor: | |
| | (b) 0% | | (b) 0% | |
| | (c) 0% | | (c) 0% | |
| | (d) 0% | | (d) 0% | |
(f) The percentage of hours expended on the principal accountant's engagement to audit the registrant's financial statements for the most recent fiscal year that were attributed to work performed by persons other than the principal accountant's full-time, permanent employees was less than fifty percent.
(g) The aggregate non-audit fees billed by the registrant's accountant for services rendered to the registrant, and rendered to the registrant's investment advisor (not including any sub-advisor whose role is primarily portfolio management and is subcontracted with or overseen by another investment advisor), and any entity controlling, controlled by, or under common control with the advisor that provides ongoing services to the registrant for the fiscal year ended October 31, 2021 were $33,550 for the registrant, $16,500 for the registrant’s investment advisor, $29,500 for the registrant’s distributor and $4,000 for Stonebridge Advisors LLC, which is under common control with the registrant’s investment advisor and serves as the registrant’s sub-advisor for the First Trust Preferred Securities and Income Fund (“Stonebridge”); and for the fiscal year ended October 31, 2022 were $44,250 for the registrant, $0 for the registrant’s investment advisor, $0 for the registrant’s distributor and $0 for Stonebridge.
(h) The registrant’s audit committee of its Board of Trustees has determined that the provision of non-audit services that were rendered to the registrant’s investment advisor (not including any sub-advisor whose role is primarily portfolio management and is subcontracted with or overseen by another investment advisor), and any entity controlling, controlled by, or under common control with the investment advisor that provides ongoing services to the registrant that were not pre-approved pursuant to paragraph (c)(7)(ii) of Rule 2-01 of Regulation S-X is compatible with maintaining the principal accountant’s independence.
(i) Not applicable.
(j) Not applicable.
Item 5. Audit Committee of Listed registrants.
| (a) | | The registrant has a separately designated standing audit committee established in accordance with Section 3(a)(58)(A) of the Securities Exchange Act of 1934 consisting of all the independent directors of the registrant. The audit committee of the registrant is comprised of: Richard E. Erickson, Thomas R. Kadlec, Denise M. Keefe, Robert F. Keith and Niel B. Nielson. |
Item 6. Investments.
| (a) | | Schedule of Investments in securities of unaffiliated issuers as of the close of the reporting period is included as part of the report to shareholders filed under Item 1 of this form. |
Item 7. Disclosure of Proxy Voting Policies and Procedures for Closed-End Management Investment Companies.
Not applicable.
Item 8. Portfolio Managers of Closed-End Management Investment Companies.
Not applicable.
Item 9. Purchases of Equity Securities by Closed-End Management Investment Company and Affiliated Purchasers.
Not applicable.
Item 10. Submission of Matters to a Vote of Security Holders.
There have been no material changes to the procedures by which the shareholders may recommend nominees to the registrant’s board of directors, where those changes were implemented after the registrant last provided disclosure in response to the requirements of Item 407(c)(2)(iv) of Regulation S-K (17 CFR 229.407) (as required by Item 22(b)(15) of Schedule 14A (17 CFR 240.14a-101)), or this Item.
Item 11. Controls and Procedures.
| (a) | | The registrant’s principal executive and principal financial officers, or persons performing similar functions, have concluded that the registrant’s disclosure controls and procedures (as defined in Rule 30a-3(c) under the Investment Company Act of 1940, as amended (the “1940 Act”) (17 CFR 270.30a-3(c))) are effective, as of a date within 90 days of the filing date of the report that includes the disclosure required by this paragraph, based on their evaluation of these controls and procedures required by Rule 30a-3(b) under the 1940 Act (17 CFR 270.30a-3(b)) and Rules 13a-15(b) or 15d-15(b) under the Securities Exchange Act of 1934, as amended (17 CFR 240.13a-15(b) or 240.15d-15(b)). |
| (b) | | There were no changes in the registrant’s internal control over financial reporting (as defined in Rule 30a-3(d) under the 1940 Act (17 CFR 270.30a-3(d)) that occurred during the period covered by this report that has materially affected, or is reasonably likely to materially affect, the registrant’s internal control over financial reporting. |
Item 12. Disclosure of Securities Lending Activities for Closed-End Management Investment Companies.
Not applicable.
Item 13. Exhibits.
SIGNATURES
Pursuant to the requirements of the Securities Exchange Act of 1934 and the Investment Company Act of 1940, the registrant has duly caused this report to be signed on its behalf by the undersigned, thereunto duly authorized.
| (Registrant) | | First Trust Series Fund |
| By (Signature and Title)* | | /s/ James M. Dykas |
| | | James M. Dykas, President and Chief Executive Officer
(principal executive officer) |
Pursuant to the requirements of the Securities Exchange Act of 1934 and the Investment Company Act of 1940, this report has been signed below by the following persons on behalf of the registrant and in the capacities and on the dates indicated.
| By (Signature and Title)* | | /s/ James M. Dykas |
| | | James M. Dykas, President and Chief Executive Officer
(principal executive officer) |
| By (Signature and Title)* | | /s/ Donald P. Swade |
| | | Donald P. Swade, Treasurer, Chief Financial Officer
and Chief Accounting Officer
(principal financial officer) |
* Print the name and title of each signing officer under his or her signature.