UNITED STATES
SECURITIES AND EXCHANGE COMMISSION
Washington, D.C. 20549
FORM N-CSR
CERTIFIED SHAREHOLDER REPORT OF REGISTERED MANAGEMENT INVESTMENT COMPANIES
Investment Company Act file number
(Exact name of registrant as specified in charter)
120 East Liberty Drive, Suite 400
Wheaton, IL 60187
(Address of principal executive offices) (Zip code)
W. Scott Jardine, Esq.
First Trust Portfolios L.P.
120 East Liberty Drive, Suite 400
Wheaton, IL 60187
(Name and address of agent for service)
Registrant's telephone number, including area code:
Date of reporting period:
Form N-CSR is to be used by management investment companies to file reports with the Commission not later than 10 days after the transmission to stockholders of any report that is required to be transmitted to stockholders under Rule 30e-1 under the Investment Company Act of 1940 (17 CFR 270.30e-1). The Commission may use the information provided on Form N-CSR in its regulatory, disclosure review, inspection, and policymaking roles.
A registrant is required to disclose the information specified by Form N-CSR, and the Commission will make this information public. A registrant is not required to respond to the collection of information contained in Form N-CSR unless the Form displays a currently valid Office of Management and Budget (“OMB”) control number. Please direct comments concerning the accuracy of the information collection burden estimate and any suggestions for reducing the burden to Secretary, Securities and Exchange Commission, 100 F Street, NE, Washington, DC 20549. The OMB has reviewed this collection of information under the clearance requirements of 44 U.S.C. § 3507.
First Trust/Confluence Small Cap Value Fund
FOVAX | Class A
ANNUAL SHAREHOLDER REPORT | OCTOBER 31, 2024
This annual shareholder report contains important information about the First Trust/Confluence Small Cap Value Fund (the “Fund”) for the year of November 1, 2023 to October 31, 2024 (the “Period”). You can find additional information about the Fund at www.ftportfolios.com/fund-documents/MF/FOVAX. You can also request this information by contacting us at 1-800-621-1675 or info@ftportfolios.com.
WHAT WERE THE FUND COSTS FOR THE LAST YEAR?
(Based on a hypothetical $10,000 investment)
| Fund | Costs of a $10,000 investment | Costs paid as a percentage
of a $10,000 investment |
| First Trust/Confluence Small Cap Value Fund - Class A | $176 | 1.60% |
HOW DID THE FUND PERFORM LAST YEAR? WHAT AFFECTED THE FUND’S PERFORMANCE?
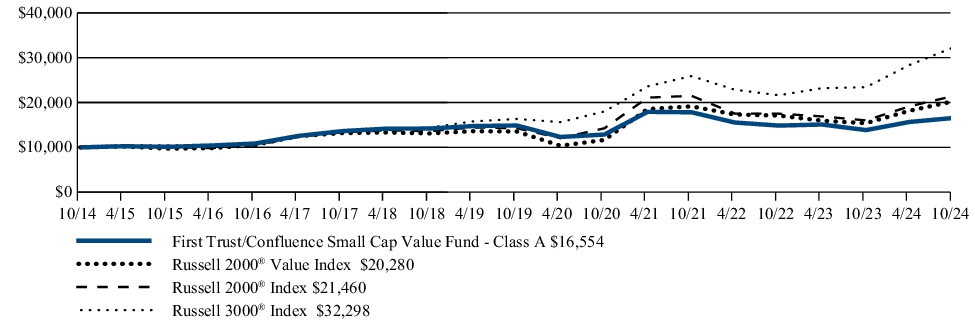
The Fund’s Class A returned 19.54% (without sales charge) for the 12 months ended October 31, 2024. The Fund’s Class A underperformed its benchmark, the Russell 2000® Index, which returned 34.07% for the same Period.
The Period began on the heels of the last interest rate hike by the Federal Reserve (the “Fed”) and the signal that rate cuts were probable over the ensuing year. The Fed did not disappoint as the rate of inflation continued to decline and provided the Fed the cover to begin cutting the Federal Funds target rate, which commenced in September 2024 with a 50 basis points cut. By the end of the Period, the Fed had swung to a more accommodative policy following very aggressive interest rate hikes that started in mid-2022. The policy shift and avoidance of a recession while employment remained solid provided a nice tailwind for equities following a couple of tough years for small caps. The Fund benefited from the backdrop and produced strong results for the Period.
The relative underperformance was impacted by the strong beta-driven rally, which tends to benefit the highly cyclical and/or leveraged businesses, as well as declines from a few of the Fund’s holdings, primarily in the Consumer Staples and Consumer Discretionary sectors. Recall that our philosophy is focused on quality businesses that are conservatively financed trading at attractive valuations and does so in a concentrated manner. This will result in some differences from time to time based on the sentiment of the market and/or the performance of a few underlying names in the Fund’s portfolio. The philosophy has historically provided less volatility and good downside protection albeit with the expected tracking error. Tracking error can be good or bad over the short run but over the long run it has been additive. We remain committed to our philosophy and process as our focus on fundamental research has shown to be successful over the long term.
FUND PERFORMANCE (October 31, 2014 to October 31, 2024)
The performance line graph below shows the performance of a hypothetical $10,000 initial investment in the Fund over a ten-year period (or for the life of the Fund, if shorter). The subsequent account value as of the end of the Period is listed next to the name of the Fund or index, as applicable. The performance table below shows the average annual total returns of the Fund for the past one-, five-, and ten-year periods, as applicable (or for the life of the Fund, if shorter), as of the end of the Period. Both the line graph and performance table compare the Fund’s performance to an appropriate broad-based index and may compare to additional indices reflecting the market segment(s) in which the Fund invests over the same periods.
INVESTMENT PERFORMANCE OF $10,000
| Average Annual Total Returns (as of October 31, 2024) | 1 Year | 5 Year | 10 Year |
| First Trust/Confluence Small Cap Value Fund - Class A (w/max 5.50% sales charge) | 12.98% | 1.02% | 4.58% |
| First Trust/Confluence Small Cap Value Fund - Class A (without sales charge) | 19.54% | 2.17% | 5.17% |
| Russell 2000® Value Index | 31.77% | 8.42% | 7.33% |
| Russell 2000® Index | 34.07% | 8.50% | 7.94% |
| Russell 3000® Index | 37.86% | 14.60% | 12.44% |
Visit www.ftportfolios.com/MF/FOVAX for more recent performance information.
The Fund’s past performance is not a good predictor of the Fund’s future performance. The graph and table do not reflect the deduction of taxes that a shareholder would pay on Fund distributions or redemption of Fund shares. The Fund’s total returns would have been lower if certain fees had not been waived and expenses reimbursed by the investment advisor.
KEY FUND STATISTICS (As of October 31, 2024)
| Fund net assets | $21,692,431 |
| Total number of portfolio holdings | 31 |
| Total advisory fee paid | $5,067 |
| Portfolio turnover rate | 17% |
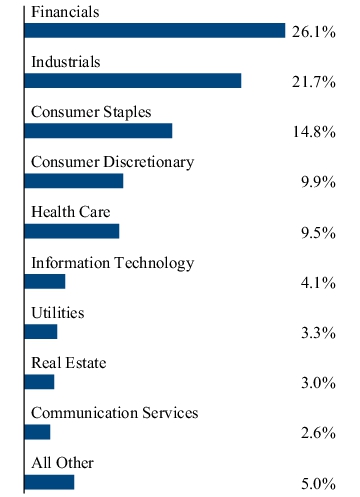
WHAT DID THE FUND INVEST IN? (As of October 31, 2024)
The tables below show the investment makeup of the Fund, representing the percentage of total investments of the Fund.
| Baldwin Insurance (The) Group, Inc. | 5.3% |
| Hagerty, Inc., Class A | 4.7% |
| Sapiens International Corp., N.V. | 4.1% |
| RBC Bearings, Inc. | 3.9% |
| Gates Industrial Corp. PLC | 3.9% |
| J&J Snack Foods Corp. | 3.9% |
| I3 Verticals, Inc., Class A | 3.9% |
| Hayward Holdings, Inc. | 3.9% |
| Brown & Brown, Inc. | 3.8% |
| John Bean Technologies Corp. | 3.7% |
WHERE CAN I FIND ADDITIONAL INFORMATION ABOUT THE FUND?
Visit www.ftportfolios.com/fund-documents/MF/FOVAX to view additional information about the Fund such as the prospectus, financial information, Fund holdings and proxy voting information. You may also request this information by contacting us at 1-800-621-1675 or info@ftportfolios.com.
First Trust/Confluence Small Cap Value Fund
FOVCX | Class C
ANNUAL SHAREHOLDER REPORT | OCTOBER 31, 2024
This annual shareholder report contains important information about the First Trust/Confluence Small Cap Value Fund (the “Fund”) for the year of November 1, 2023 to October 31, 2024 (the “Period”). You can find additional information about the Fund at www.ftportfolios.com/fund-documents/MF/FOVCX. You can also request this information by contacting us at 1-800-621-1675 or info@ftportfolios.com.
WHAT WERE THE FUND COSTS FOR THE LAST YEAR?
(Based on a hypothetical $10,000 investment)
| Fund | Costs of a $10,000 investment | Costs paid as a percentage
of a $10,000 investment |
| First Trust/Confluence Small Cap Value Fund - Class C | $257 | 2.35% |
HOW DID THE FUND PERFORM LAST YEAR? WHAT AFFECTED THE FUND’S PERFORMANCE?
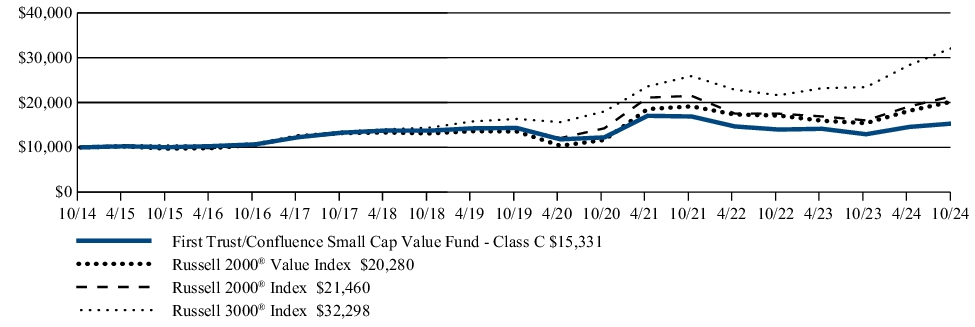
The Fund’s Class C returned 18.64% (without sales charge) for the 12 months ended October 31, 2024. The Fund’s Class C underperformed its benchmark, the Russell 2000® Index, which returned 34.07% for the same Period.
The Period began on the heels of the last interest rate hike by the Federal Reserve (the “Fed”) and the signal that rate cuts were probable over the ensuing year. The Fed did not disappoint as the rate of inflation continued to decline and provided the Fed the cover to begin cutting the Federal Funds target rate, which commenced in September 2024 with a 50 basis points cut. By the end of the Period, the Fed had swung to a more accommodative policy following very aggressive interest rate hikes that started in mid-2022. The policy shift and avoidance of a recession while employment remained solid provided a nice tailwind for equities following a couple of tough years for small caps. The Fund benefited from the backdrop and produced strong results for the Period.
The relative underperformance was impacted by the strong beta-driven rally, which tends to benefit the highly cyclical and/or leveraged businesses, as well as declines from a few of the Fund’s holdings, primarily in the Consumer Staples and Consumer Discretionary sectors. Recall that our philosophy is focused on quality businesses that are conservatively financed trading at attractive valuations and does so in a concentrated manner. This will result in some differences from time to time based on the sentiment of the market and/or the performance of a few underlying names in the Fund’s portfolio. The philosophy has historically provided less volatility and good downside protection albeit with the expected tracking error. Tracking error can be good or bad over the short run but over the long run it has been additive. We remain committed to our philosophy and process as our focus on fundamental research has shown to be successful over the long term.
FUND PERFORMANCE (October 31, 2014 to October 31, 2024)
The performance line graph below shows the performance of a hypothetical $10,000 initial investment in the Fund over a ten-year period (or for the life of the Fund, if shorter). The subsequent account value as of the end of the Period is listed next to the name of the Fund or index, as applicable. The performance table below shows the average annual total returns of the Fund for the past one-, five-, and ten-year periods, as applicable (or for the life of the Fund, if shorter), as of the end of the Period. Both the line graph and performance table compare the Fund’s performance to an appropriate broad-based index and may compare to additional indices reflecting the market segment(s) in which the Fund invests over the same periods.
INVESTMENT PERFORMANCE OF $10,000
| Average Annual Total Returns (as of October 31, 2024) | 1 Year | 5 Year | 10 Year |
| First Trust/Confluence Small Cap Value Fund - Class C (w/max 1.00% contingent deferred sales charge) | 17.64% | 1.38% | 4.37% |
| First Trust/Confluence Small Cap Value Fund - Class C (without sales charge) | 18.64% | 1.38% | 4.37% |
| Russell 2000® Value Index | 31.77% | 8.42% | 7.33% |
| Russell 2000® Index | 34.07% | 8.50% | 7.94% |
| Russell 3000® Index | 37.86% | 14.60% | 12.44% |
Visit www.ftportfolios.com/MF/FOVCX for more recent performance information.
The Fund’s past performance is not a good predictor of the Fund’s future performance. The graph and table do not reflect the deduction of taxes that a shareholder would pay on Fund distributions or redemption of Fund shares. The Fund’s total returns would have been lower if certain fees had not been waived and expenses reimbursed by the investment advisor.
KEY FUND STATISTICS (As of October 31, 2024)
| Fund net assets | $21,692,431 |
| Total number of portfolio holdings | 31 |
| Total advisory fee paid | $5,067 |
| Portfolio turnover rate | 17% |
WHAT DID THE FUND INVEST IN? (As of October 31, 2024)
The tables below show the investment makeup of the Fund, representing the percentage of total investments of the Fund.
| Baldwin Insurance (The) Group, Inc. | 5.3% |
| Hagerty, Inc., Class A | 4.7% |
| Sapiens International Corp., N.V. | 4.1% |
| RBC Bearings, Inc. | 3.9% |
| Gates Industrial Corp. PLC | 3.9% |
| J&J Snack Foods Corp. | 3.9% |
| I3 Verticals, Inc., Class A | 3.9% |
| Hayward Holdings, Inc. | 3.9% |
| Brown & Brown, Inc. | 3.8% |
| John Bean Technologies Corp. | 3.7% |
WHERE CAN I FIND ADDITIONAL INFORMATION ABOUT THE FUND?
Visit www.ftportfolios.com/fund-documents/MF/FOVCX to view additional information about the Fund such as the prospectus, financial information, Fund holdings and proxy voting information. You may also request this information by contacting us at 1-800-621-1675 or info@ftportfolios.com.
First Trust/Confluence Small Cap Value Fund
FOVIX | Class I
ANNUAL SHAREHOLDER REPORT | OCTOBER 31, 2024
This annual shareholder report contains important information about the First Trust/Confluence Small Cap Value Fund (the “Fund”) for the year of November 1, 2023 to October 31, 2024 (the “Period”). You can find additional information about the Fund at www.ftportfolios.com/fund-documents/MF/FOVIX. You can also request this information by contacting us at 1-800-621-1675 or info@ftportfolios.com.
WHAT WERE THE FUND COSTS FOR THE LAST YEAR?
(Based on a hypothetical $10,000 investment)
| Fund | Costs of a $10,000 investment | Costs paid as a percentage
of a $10,000 investment |
| First Trust/Confluence Small Cap Value Fund - Class I | $148 | 1.35% |
HOW DID THE FUND PERFORM LAST YEAR? WHAT AFFECTED THE FUND’S PERFORMANCE?
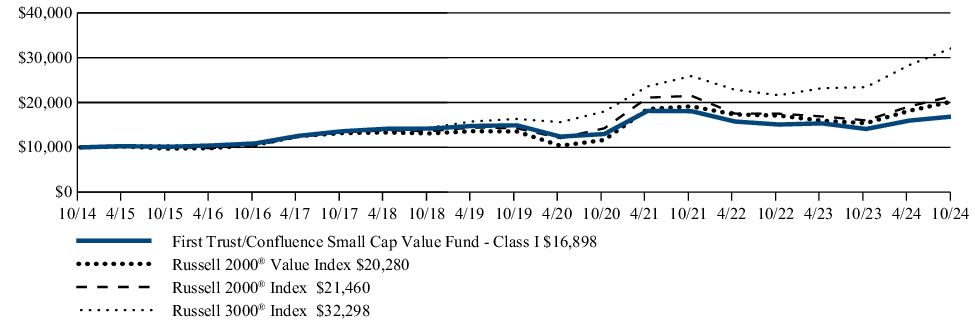
The Fund’s Class I returned 19.87% for the 12 months ended October 31, 2024. The Fund’s Class I underperformed its benchmark, the Russell 2000® Index, which returned 34.07% for the same Period.
The Period began on the heels of the last interest rate hike by the Federal Reserve (the “Fed”) and the signal that rate cuts were probable over the ensuing year. The Fed did not disappoint as the rate of inflation continued to decline and provided the Fed the cover to begin cutting the Federal Funds target rate, which commenced in September 2024 with a 50 basis points cut. By the end of the Period, the Fed had swung to a more accommodative policy following very aggressive interest rate hikes that started in mid-2022. The policy shift and avoidance of a recession while employment remained solid provided a nice tailwind for equities following a couple of tough years for small caps. The Fund benefited from the backdrop and produced strong results for the Period.
The relative underperformance was impacted by the strong beta-driven rally, which tends to benefit the highly cyclical and/or leveraged businesses, as well as declines from a few of the Fund’s holdings, primarily in the Consumer Staples and Consumer Discretionary sectors. Recall that our philosophy is focused on quality businesses that are conservatively financed trading at attractive valuations and does so in a concentrated manner. This will result in some differences from time to time based on the sentiment of the market and/or the performance of a few underlying names in the Fund’s portfolio. The philosophy has historically provided less volatility and good downside protection albeit with the expected tracking error. Tracking error can be good or bad over the short run but over the long run it has been additive. We remain committed to our philosophy and process as our focus on fundamental research has shown to be successful over the long term.
FUND PERFORMANCE (October 31, 2014 to October 31, 2024)
The performance line graph below shows the performance of a hypothetical $10,000 initial investment in the Fund over a ten-year period (or for the life of the Fund, if shorter). The subsequent account value as of the end of the Period is listed next to the name of the Fund or index, as applicable. The performance table below shows the average annual total returns of the Fund for the past one-, five-, and ten-year periods, as applicable (or for the life of the Fund, if shorter), as of the end of the Period. Both the line graph and performance table compare the Fund’s performance to an appropriate broad-based index and may compare to additional indices reflecting the market segment(s) in which the Fund invests over the same periods.
INVESTMENT PERFORMANCE OF $10,000
| Average Annual Total Returns (as of October 31, 2024) | 1 Year | 5 Year | 10 Year |
| First Trust/Confluence Small Cap Value Fund - Class I | 19.87% | 2.54% | 5.39% |
| Russell 2000® Value Index | 31.77% | 8.42% | 7.33% |
| Russell 2000® Index | 34.07% | 8.50% | 7.94% |
| Russell 3000® Index | 37.86% | 14.60% | 12.44% |
Visit www.ftportfolios.com/MF/FOVIX for more recent performance information.
The Fund’s past performance is not a good predictor of the Fund’s future performance. The graph and table do not reflect the deduction of taxes that a shareholder would pay on Fund distributions or redemption of Fund shares. The Fund’s total returns would have been lower if certain fees had not been waived and expenses reimbursed by the investment advisor.
KEY FUND STATISTICS (As of October 31, 2024)
| Fund net assets | $21,692,431 |
| Total number of portfolio holdings | 31 |
| Total advisory fee paid | $5,067 |
| Portfolio turnover rate | 17% |
WHAT DID THE FUND INVEST IN? (As of October 31, 2024)
The tables below show the investment makeup of the Fund, representing the percentage of total investments of the Fund.
| Baldwin Insurance (The) Group, Inc. | 5.3% |
| Hagerty, Inc., Class A | 4.7% |
| Sapiens International Corp., N.V. | 4.1% |
| RBC Bearings, Inc. | 3.9% |
| Gates Industrial Corp. PLC | 3.9% |
| J&J Snack Foods Corp. | 3.9% |
| I3 Verticals, Inc., Class A | 3.9% |
| Hayward Holdings, Inc. | 3.9% |
| Brown & Brown, Inc. | 3.8% |
| John Bean Technologies Corp. | 3.7% |
WHERE CAN I FIND ADDITIONAL INFORMATION ABOUT THE FUND?
Visit www.ftportfolios.com/fund-documents/MF/FOVIX to view additional information about the Fund such as the prospectus, financial information, Fund holdings and proxy voting information. You may also request this information by contacting us at 1-800-621-1675 or info@ftportfolios.com.
First Trust Short Duration High Income Fund
FDHAX | Class A
ANNUAL SHAREHOLDER REPORT | OCTOBER 31, 2024
This annual shareholder report contains important information about the First Trust Short Duration High Income Fund (the “Fund”) for the year of November 1, 2023 to October 31, 2024 (the “Period”). You can find additional information about the Fund at www.ftportfolios.com/fund-documents/MF/FDHAX. You can also request this information by contacting us at 1-800-621-1675 or info@ftportfolios.com.
WHAT WERE THE FUND COSTS FOR THE LAST YEAR?
(Based on a hypothetical $10,000 investment)
| Fund | Costs of a $10,000 investment | Costs paid as a percentage
of a $10,000 investment |
| First Trust Short Duration High Income Fund - Class A | $131 | 1.25% |
HOW DID THE FUND PERFORM LAST YEAR? WHAT AFFECTED THE FUND’S PERFORMANCE?
The Fund’s Class A returned 10.31% (without sales charge) for the 12 months ended October 31, 2024. The Fund’s Class A underperformed its blended benchmark, which consists of the following two indexes: 50% of the Morningstar® LSTA® US Leveraged Loan Index and 50% of the ICE BofA US High Yield Constrained Index. The blended benchmark returned 13.52% for the same Period (10.56% for the Morningstar® LSTA® US Leveraged Loan Index and 16.49% for the ICE BofA US High Yield Constrained Index).
The following key factors impacted Fund performance relative to the blended benchmark during the Period:
Credit Quality: Performance across the credit quality spectrum was mixed during the Period but lower quality assets generally outperformed. The Fund benefited from an overweight allocation to higher-quality assets rated BBB. Conversely, the Fund’s overweight allocation to assets rated B, its underweight allocation to assets rated BB, and its overweight allocation to assets rated CCC and below were detractors to Fund performance.
Asset Type: The Fund’s senior loan allocation detracted from performance relative to the blended benchmark as loans underperformed bonds during the Period. The Fund began the Period with a 63.69% allocation to loans and ended the Period with a 32.92% allocation to loans. Additionally, the Fund’s net cash position was a headwind to performance.
Sector/Industry: Relative to the blended benchmark, the primary contributors to the Fund’s performance were its selection within the Materials sector, its underweight allocation to, and selection in, the Telecommunication Services sector, and its underweight allocation to the Energy sector. Conversely, the Fund’s overweight allocation to, and selection in, the Software & Services, Insurance, Pharmaceuticals, Biotechnology and Life Sciences Tools & Services sectors were the primary detractors to the Fund’s performance.
U.S. Treasury Rates: 10-Year U.S. Treasury yields declined by 65 basis points (“bps”) to 4.28% after entering the Period at a high of 4.93% and bouncing off a low of 3.62%. Falling Treasury rates are generally a tailwind to fixed income assets.
Spreads, Yields and Prices: Loan spreads over the Secured Overnight Financing Rate compressed by 100 bps to S+444 bps. While loan spreads ended the Period below the long-term average of S+516 bps (December 1997 – October 2024), yields of 9.09% remain well above the long-term average of 6.99% (January 1999 – October 2024) driven by elevated base rates. Loan prices increased by $2.14 to $96.90 and remain at a discount to par ($100). High-yield bond spreads over treasuries compressed by 157 bps to T+288 bps. While high-yield bond spreads ended the Period below the long-term average of T+530 bps (December 1996 – October 2024), a yield-to-worst of 7.33% remains compelling. High-yield bond prices increased by $9.41 to $95.72 and remain at a discount to par ($100).
Defaults: The Fund experienced zero defaults during the Period, compared to 15 defaults in the Morningstar® LSTA® US Leveraged Loan Index and 7 defaults in the JP Morgan High-Yield Bond Universe. Since the Fund’s inception, the Fund experienced 12 defaults, compared to 484 combined in both indexes over the same timeframe. The loan and high-yield bond market default rates fell from 1.43% and 1.76%, respectively, at the beginning of the Period to 0.73% and 0.55%, respectively, at the end of the Period, remaining below the long-term averages of 2.63% and 2.93%, respectively, dating back to 1999. The avoidance of defaults generally benefits performance.
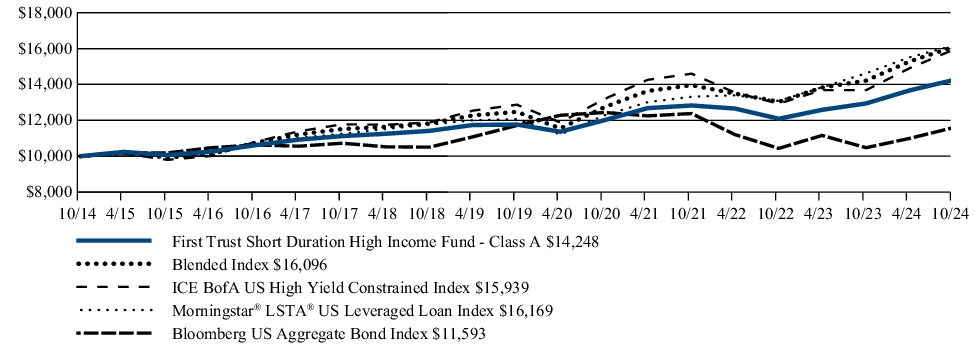
FUND PERFORMANCE (October 31, 2014 to October 31, 2024)
The performance line graph below shows the performance of a hypothetical $10,000 initial investment in the Fund over a ten-year period (or for the life of the Fund, if shorter). The subsequent account value as of the end of the Period is listed next to the name of the Fund or index, as applicable. The performance table below shows the average annual total returns of the Fund for the past one-, five-, and ten-year periods, as applicable (or for the life of the Fund, if shorter), as of the end of the Period. Both the line graph and performance table compare the Fund’s performance to an appropriate broad-based index and may compare to additional indices reflecting the market segment(s) in which the Fund invests over the same periods.
INVESTMENT PERFORMANCE OF $10,000
| Average Annual Total Returns (as of October 31, 2024) | 1 Year | 5 Year | 10 Year |
| First Trust Short Duration High Income Fund - Class A (w/max 3.50% sales charge) | 6.47% | 3.22% | 3.24% |
| First Trust Short Duration High Income Fund - Class A (without sales charge) | 10.31% | 3.96% | 3.60% |
| Blended Index(1) | 13.52% | 5.23% | 4.87% |
| ICE BofA US High Yield Constrained Index | 16.49% | 4.37% | 4.77% |
| Morningstar® LSTA® US Leveraged Loan Index | 10.56% | 6.02% | 4.92% |
| Bloomberg US Aggregate Bond Index | 10.55% | (0.23)% | 1.49% |
| (1) | The Blended Index return is a 50/50 split between the ICE BofA US High Yield Constrained Index and the Morningstar® LSTA® US Leveraged Loan Index returns. |
Visit www.ftportfolios.com/MF/FDHAX for more recent performance information.
The Fund’s past performance is not a good predictor of the Fund’s future performance. The graph and table do not reflect the deduction of taxes that a shareholder would pay on Fund distributions or redemption of Fund shares.
KEY FUND STATISTICS (As of October 31, 2024)
| Fund net assets | $73,890,945 |
| Total number of portfolio holdings | 175 |
| Total advisory fee paid | $393,401 |
| Portfolio turnover rate | 64% |
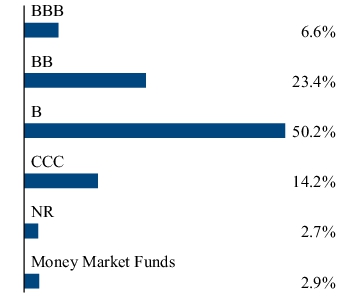
WHAT DID THE FUND INVEST IN? (As of October 31, 2024)
The tables below show the investment makeup of the Fund, representing the percentage of net assets and total investments, respectively, of the Fund.
| Corporate Bonds and Notes | 51.9% |
| Senior Floating-Rate Loan Interests | 31.3% |
| Foreign Corporate Bonds and Notes | 11.2% |
| Money Market Funds | 2.8% |
| Common Stocks | 0.0% |
| Rights | 0.0% |
| Net Other Assets and Liabilities | 2.8% |
Any amount shown as 0.0% represents less than 0.1%
(1) The ratings are by S&P Global Ratings. A credit rating is an assessment provided by a nationally recognized statistical rating organization (NRSRO) of the creditworthiness of an issuer with respect to debt obligations except for those debt obligations that are only privately rated. Ratings are measured on a scale that generally ranges from AAA (highest) to D (lowest). Investment grade is defined as those issuers that have a long-term credit rating of BBB- or higher. "NR" indicates no rating. The credit ratings shown relate to the creditworthiness of the issuers of the underlying securities in the Fund, and not to the Fund or its shares. Credit ratings are subject to change.
WHERE CAN I FIND ADDITIONAL INFORMATION ABOUT THE FUND?
Visit www.ftportfolios.com/fund-documents/MF/FDHAX to view additional information about the Fund such as the prospectus, financial information, Fund holdings and proxy voting information. You may also request this information by contacting us at 1-800-621-1675 or info@ftportfolios.com.
First Trust Short Duration High Income Fund
FDHCX | Class C
ANNUAL SHAREHOLDER REPORT | OCTOBER 31, 2024
This annual shareholder report contains important information about the First Trust Short Duration High Income Fund (the “Fund”) for the year of November 1, 2023 to October 31, 2024 (the “Period”). You can find additional information about the Fund at www.ftportfolios.com/fund-documents/MF/FDHCX. You can also request this information by contacting us at 1-800-621-1675 or info@ftportfolios.com.
WHAT WERE THE FUND COSTS FOR THE LAST YEAR?
(Based on a hypothetical $10,000 investment)
| Fund | Costs of a $10,000 investment | Costs paid as a percentage
of a $10,000 investment |
| First Trust Short Duration High Income Fund - Class C | $209 | 2.00% |
HOW DID THE FUND PERFORM LAST YEAR? WHAT AFFECTED THE FUND’S PERFORMANCE?
The Fund’s Class C returned 9.45% (without sales charge) for the 12 months ended October 31, 2024. The Fund’s Class C underperformed its blended benchmark, which consists of the following two indexes: 50% of the Morningstar® LSTA® US Leveraged Loan Index and 50% of the ICE BofA US High Yield Constrained Index. The blended benchmark returned 13.52% for the same Period (10.56% for the Morningstar® LSTA® US Leveraged Loan Index and 16.49% for the ICE BofA US High Yield Constrained Index).
The following key factors impacted Fund performance relative to the blended benchmark during the Period:
Credit Quality: Performance across the credit quality spectrum was mixed during the Period but lower quality assets generally outperformed. The Fund benefited from an overweight allocation to higher-quality assets rated BBB. Conversely, the Fund’s overweight allocation to assets rated B, its underweight allocation to assets rated BB, and its overweight allocation to assets rated CCC and below were detractors to Fund performance.
Asset Type: The Fund’s senior loan allocation detracted from performance relative to the blended benchmark as loans underperformed bonds during the Period. The Fund began the Period with a 63.69% allocation to loans and ended the Period with a 32.92% allocation to loans. Additionally, the Fund’s net cash position was a headwind to performance.
Sector/Industry: Relative to the blended benchmark, the primary contributors to the Fund’s performance were its selection within the Materials sector, its underweight allocation to, and selection in, the Telecommunication Services sector, and its underweight allocation to the Energy sector. Conversely, the Fund’s overweight allocation to, and selection in, the Software & Services, Insurance, Pharmaceuticals, Biotechnology and Life Sciences Tools & Services sectors were the primary detractors to the Fund’s performance.
U.S. Treasury Rates: 10-Year U.S. Treasury yields declined by 65 basis points (“bps”) to 4.28% after entering the Period at a high of 4.93% and bouncing off a low of 3.62%. Falling Treasury rates are generally a tailwind to fixed income assets.
Spreads, Yields and Prices: Loan spreads over the Secured Overnight Financing Rate compressed by 100 bps to S+444 bps. While loan spreads ended the Period below the long-term average of S+516 bps (December 1997 – October 2024), yields of 9.09% remain well above the long-term average of 6.99% (January 1999 – October 2024) driven by elevated base rates. Loan prices increased by $2.14 to $96.90 and remain at a discount to par ($100). High-yield bond spreads over treasuries compressed by 157 bps to T+288 bps. While high-yield bond spreads ended the Period below the long-term average of T+530 bps (December 1996 – October 2024), a yield-to-worst of 7.33% remains compelling. High-yield bond prices increased by $9.41 to $95.72 and remain at a discount to par ($100).
Defaults: The Fund experienced zero defaults during the Period, compared to 15 defaults in the Morningstar® LSTA® US Leveraged Loan Index and 7 defaults in the JP Morgan High-Yield Bond Universe. Since the Fund’s inception, the Fund experienced 12 defaults, compared to 484 combined in both indexes over the same timeframe. The loan and high-yield bond market default rates fell from 1.43% and 1.76%, respectively, at the beginning of the Period to 0.73% and 0.55%, respectively, at the end of the Period, remaining below the long-term averages of 2.63% and 2.93%, respectively, dating back to 1999. The avoidance of defaults generally benefits performance.
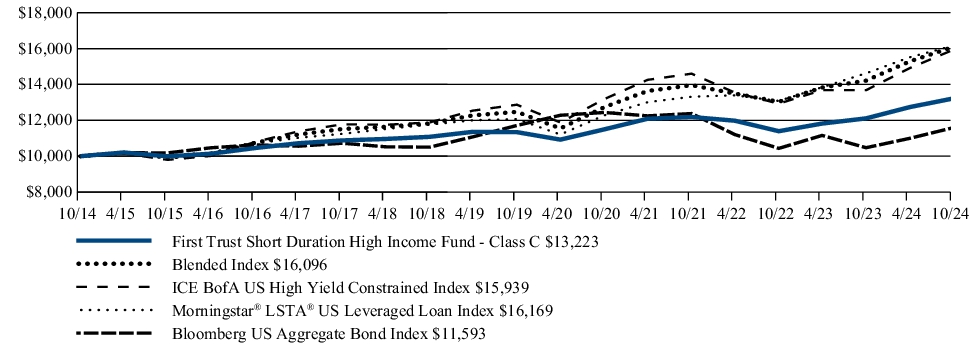
FUND PERFORMANCE (October 31, 2014 to October 31, 2024)
The performance line graph below shows the performance of a hypothetical $10,000 initial investment in the Fund over a ten-year period (or for the life of the Fund, if shorter). The subsequent account value as of the end of the Period is listed next to the name of the Fund or index, as applicable. The performance table below shows the average annual total returns of the Fund for the past one-, five-, and ten-year periods, as applicable (or for the life of the Fund, if shorter), as of the end of the Period. Both the line graph and performance table compare the Fund’s performance to an appropriate broad-based index and may compare to additional indices reflecting the market segment(s) in which the Fund invests over the same periods.
INVESTMENT PERFORMANCE OF $10,000
| Average Annual Total Returns (as of October 31, 2024) | 1 Year | 5 Year | 10 Year |
| First Trust Short Duration High Income Fund - Class C (w/max 1.00% contingent deferred sales charge) | 8.45% | 3.17% | 2.83% |
| First Trust Short Duration High Income Fund - Class C (without sales charge) | 9.45% | 3.17% | 2.83% |
| Blended Index(1) | 13.52% | 5.23% | 4.87% |
| ICE BofA US High Yield Constrained Index | 16.49% | 4.37% | 4.77% |
| Morningstar® LSTA® US Leveraged Loan Index | 10.56% | 6.02% | 4.92% |
| Bloomberg US Aggregate Bond Index | 10.55% | (0.23)% | 1.49% |
| (1) | The Blended Index return is a 50/50 split between the ICE BofA US High Yield Constrained Index and the Morningstar® LSTA® US Leveraged Loan Index returns. |
Visit www.ftportfolios.com/MF/FDHCX for more recent performance information.
The Fund’s past performance is not a good predictor of the Fund’s future performance. The graph and table do not reflect the deduction of taxes that a shareholder would pay on Fund distributions or redemption of Fund shares.
KEY FUND STATISTICS (As of October 31, 2024)
| Fund net assets | $73,890,945 |
| Total number of portfolio holdings | 175 |
| Total advisory fee paid | $393,401 |
| Portfolio turnover rate | 64% |
WHAT DID THE FUND INVEST IN? (As of October 31, 2024)
The tables below show the investment makeup of the Fund, representing the percentage of net assets and total investments, respectively, of the Fund.
| Corporate Bonds and Notes | 51.9% |
| Senior Floating-Rate Loan Interests | 31.3% |
| Foreign Corporate Bonds and Notes | 11.2% |
| Money Market Funds | 2.8% |
| Common Stocks | 0.0% |
| Rights | 0.0% |
| Net Other Assets and Liabilities | 2.8% |
Any amount shown as 0.0% represents less than 0.1%
(1) The ratings are by S&P Global Ratings. A credit rating is an assessment provided by a nationally recognized statistical rating organization (NRSRO) of the creditworthiness of an issuer with respect to debt obligations except for those debt obligations that are only privately rated. Ratings are measured on a scale that generally ranges from AAA (highest) to D (lowest). Investment grade is defined as those issuers that have a long-term credit rating of BBB- or higher. "NR" indicates no rating. The credit ratings shown relate to the creditworthiness of the issuers of the underlying securities in the Fund, and not to the Fund or its shares. Credit ratings are subject to change.
WHERE CAN I FIND ADDITIONAL INFORMATION ABOUT THE FUND?
Visit www.ftportfolios.com/fund-documents/MF/FDHCX to view additional information about the Fund such as the prospectus, financial information, Fund holdings and proxy voting information. You may also request this information by contacting us at 1-800-621-1675 or info@ftportfolios.com.
First Trust Short Duration High Income Fund
FDHIX | Class I
ANNUAL SHAREHOLDER REPORT | OCTOBER 31, 2024
This annual shareholder report contains important information about the First Trust Short Duration High Income Fund (the “Fund”) for the year of November 1, 2023 to October 31, 2024 (the “Period”). You can find additional information about the Fund at www.ftportfolios.com/fund-documents/MF/FDHIX. You can also request this information by contacting us at 1-800-621-1675 or info@ftportfolios.com.
WHAT WERE THE FUND COSTS FOR THE LAST YEAR?
(Based on a hypothetical $10,000 investment)
| Fund | Costs of a $10,000 investment | Costs paid as a percentage
of a $10,000 investment |
| First Trust Short Duration High Income Fund - Class I | $105 | 1.00% |
HOW DID THE FUND PERFORM LAST YEAR? WHAT AFFECTED THE FUND’S PERFORMANCE?
The Fund’s Class I returned 10.58% for the 12 months ended October 31, 2024. The Fund’s Class I underperformed its blended benchmark, which consists of the following two indexes: 50% of the Morningstar® LSTA® US Leveraged Loan Index and 50% of the ICE BofA US High Yield Constrained Index. The blended benchmark returned 13.52% for the same Period (10.56% for the Morningstar® LSTA® US Leveraged Loan Index and 16.49% for the ICE BofA US High Yield Constrained Index, respectively).
The following key factors impacted Fund performance relative to the blended benchmark during the Period:
Credit Quality: Performance across the credit quality spectrum was mixed during the Period but lower quality assets generally outperformed. The Fund benefited from an overweight allocation to higher-quality assets rated BBB. Conversely, the Fund’s overweight allocation to assets rated B, its underweight allocation to assets rated BB, and its overweight allocation to assets rated CCC and below were detractors to Fund performance.
Asset Type: The Fund’s senior loan allocation detracted from performance relative to the blended benchmark as loans underperformed bonds during the Period. The Fund began the Period with a 63.69% allocation to loans and ended the Period with a 32.92% allocation to loans. Additionally, the Fund’s net cash position was a headwind to performance.
Sector/Industry: Relative to the blended benchmark, the primary contributors to the Fund’s performance were its selection within the Materials sector, its underweight allocation to, and selection in, the Telecommunication Services sector, and its underweight allocation to the Energy sector. Conversely, the Fund’s overweight allocation to, and selection in, the Software & Services, Insurance, Pharmaceuticals, Biotechnology and Life Sciences Tools & Services sectors were the primary detractors to the Fund’s performance.
U.S. Treasury Rates: 10-Year U.S. Treasury yields declined by 65 basis points (“bps”) to 4.28% after entering the Period at a high of 4.93% and bouncing off a low of 3.62%. Falling Treasury rates are generally a tailwind to fixed income assets.
Spreads, Yields and Prices: Loan spreads over the Secured Overnight Financing Rate compressed by 100 bps to S+444 bps. While loan spreads ended the Period below the long-term average of S+516 bps (December 1997 – October 2024), yields of 9.09% remain well above the long-term average of 6.99% (January 1999 – October 2024) driven by elevated base rates. Loan prices increased by $2.14 to $96.90 and remain at a discount to par ($100). High-yield bond spreads over treasuries compressed by 157 bps to T+288 bps. While high-yield bond spreads ended the Period below the long-term average of T+530 bps (December 1996 – October 2024), a yield-to-worst of 7.33% remains compelling. High-yield bond prices increased by $9.41 to $95.72 and remain at a discount to par ($100).
Defaults: The Fund experienced zero defaults during the Period, compared to 15 defaults in the Morningstar® LSTA® US Leveraged Loan Index and 7 defaults in the JP Morgan High-Yield Bond Universe. Since the Fund’s inception, the Fund experienced 12 defaults, compared to 484 combined in both indexes over the same timeframe. The loan and high-yield bond market default rates fell from 1.43% and 1.76%, respectively, at the beginning of the Period to 0.73% and 0.55%, respectively, at the end of the Period, remaining below the long-term averages of 2.63% and 2.93%, respectively, dating back to 1999. The avoidance of defaults generally benefits performance.
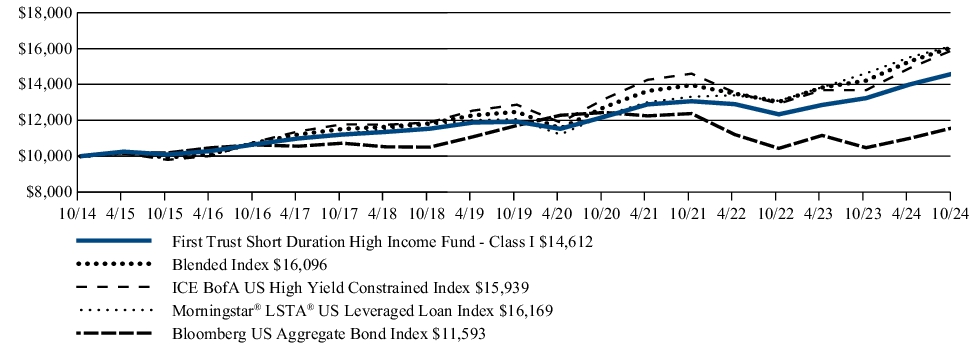
FUND PERFORMANCE (October 31, 2014 to October 31, 2024)
The performance line graph below shows the performance of a hypothetical $10,000 initial investment in the Fund over a ten-year period (or for the life of the Fund, if shorter). The subsequent account value as of the end of the Period is listed next to the name of the Fund or index, as applicable. The performance table below shows the average annual total returns of the Fund for the past one-, five-, and ten-year periods, as applicable (or for the life of the Fund, if shorter), as of the end of the Period. Both the line graph and performance table compare the Fund’s performance to an appropriate broad-based index and may compare to additional indices reflecting the market segment(s) in which the Fund invests over the same periods.
INVESTMENT PERFORMANCE OF $10,000
| Average Annual Total Returns (as of October 31, 2024) | 1 Year | 5 Year | 10 Year |
| First Trust Short Duration High Income Fund - Class I | 10.58% | 4.20% | 3.87% |
| Blended Index(1) | 13.52% | 5.23% | 4.87% |
| ICE BofA US High Yield Constrained Index | 16.49% | 4.37% | 4.77% |
| Morningstar® LSTA® US Leveraged Loan Index | 10.56% | 6.02% | 4.92% |
| Bloomberg US Aggregate Bond Index | 10.55% | (0.23)% | 1.49% |
| (1) | The Blended Index return is a 50/50 split between the ICE BofA US High Yield Constrained Index and the Morningstar® LSTA® US Leveraged Loan Index returns. |
Visit www.ftportfolios.com/MF/FDHIX for more recent performance information.
The Fund’s past performance is not a good predictor of the Fund’s future performance. The graph and table do not reflect the deduction of taxes that a shareholder would pay on Fund distributions or redemption of Fund shares.
KEY FUND STATISTICS (As of October 31, 2024)
| Fund net assets | $73,890,945 |
| Total number of portfolio holdings | 175 |
| Total advisory fee paid | $393,401 |
| Portfolio turnover rate | 64% |
WHAT DID THE FUND INVEST IN? (As of October 31, 2024)
The tables below show the investment makeup of the Fund, representing the percentage of net assets and total investments, respectively, of the Fund.
| Corporate Bonds and Notes | 51.9% |
| Senior Floating-Rate Loan Interests | 31.3% |
| Foreign Corporate Bonds and Notes | 11.2% |
| Money Market Funds | 2.8% |
| Common Stocks | 0.0% |
| Rights | 0.0% |
| Net Other Assets and Liabilities | 2.8% |
Any amount shown as 0.0% represents less than 0.1%
(1) The ratings are by S&P Global Ratings. A credit rating is an assessment provided by a nationally recognized statistical rating organization (NRSRO) of the creditworthiness of an issuer with respect to debt obligations except for those debt obligations that are only privately rated. Ratings are measured on a scale that generally ranges from AAA (highest) to D (lowest). Investment grade is defined as those issuers that have a long-term credit rating of BBB- or higher. "NR" indicates no rating. The credit ratings shown relate to the creditworthiness of the issuers of the underlying securities in the Fund, and not to the Fund or its shares. Credit ratings are subject to change.
WHERE CAN I FIND ADDITIONAL INFORMATION ABOUT THE FUND?
Visit www.ftportfolios.com/fund-documents/MF/FDHIX to view additional information about the Fund such as the prospectus, financial information, Fund holdings and proxy voting information. You may also request this information by contacting us at 1-800-621-1675 or info@ftportfolios.com.
First Trust Managed Municipal Fund
CWAIX | Class I
ANNUAL SHAREHOLDER REPORT | OCTOBER 31, 2024
This annual shareholder report contains important information about the First Trust Managed Municipal Fund (the “Fund”) for the year of November 1, 2023 to October 31, 2024 (the “Period”). You can find additional information about the Fund at www.ftportfolios.com/fund-documents/MF/CWAIX. You can also request this information by contacting us at 1-800-621-1675 or info@ftportfolios.com.
This report describes changes to the Fund that occurred during the Period.
WHAT WERE THE FUND COSTS FOR THE LAST YEAR?
(Based on a hypothetical $10,000 investment)
| Fund | Costs of a $10,000 investment | Costs paid as a percentage
of a $10,000 investment |
| First Trust Managed Municipal Fund - Class I | $59 | 0.56% |
HOW DID THE FUND PERFORM LAST YEAR? WHAT AFFECTED THE FUND’S PERFORMANCE?
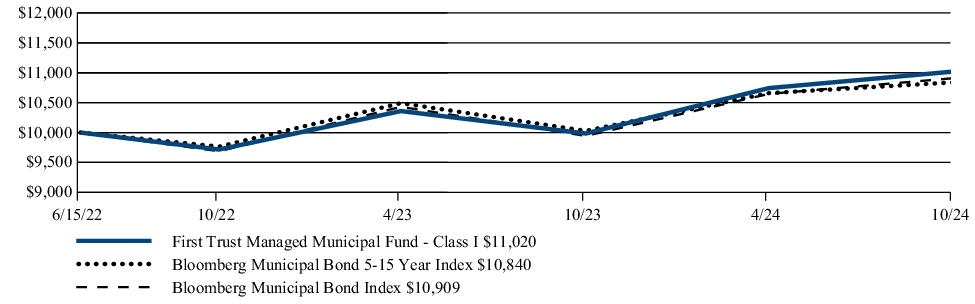
The Fund’s Class I returned 10.38% for the 12 months ended October 31, 2024. The Fund’s Class I outperformed its benchmark, the Bloomberg Municipal Bond 5-15 Year Index, which returned 8.10% for the same Period.
The following key factors impacted the Fund’s performance relative to the benchmark during the Period:
Credit Rating: The Fund’s selection of non-rated municipal bonds and selection and allocation of AA and A rated bonds were the primary contributors to the Fund’s outperformance relative to the benchmark. No credit rating category was a material negative contributor to the Fund’s performance during the Period.
Yield Curve Positioning/Duration: Relative to the benchmark, the Fund’s allocation to bonds in the 18+ years to maturity and 16-18 years to maturity were the primary contributors to the Fund’s outperformance. The allocation and selection in 8-10 years to maturity, 6-8 years to maturity and 4-6 years to maturity were secondary contributors. The allocation and selection to bonds with maturities of 12-14 years and the selection of bonds with maturities 0-2 years were the primary detractors to the Fund’s performance. The allocation to bonds 2-4 years to maturity was a secondary negative detractor to the Fund’s performance. Examining effective duration, the Fund’s allocation and selection of bonds with an effective duration of 7-10 years and 3-5 years were the primary contributors to the Fund’s outperformance while the selection of bonds with an effective duration of 5-7 years was a secondary contributor to the Fund’s outperformance. Bond selection with an effective duration in 0-2 years and the allocation to bonds with an effective duration of 2-4 years were the primary detractors to the Fund’s performance.
Interest Rate Hedge: The use of U.S. Treasury futures to hedge interest rate risk was a moderately negative contributor to the Fund’s performance.
Sector/Industry: The selection of Special Tax bonds, Local General Obligation, Education and the allocation and selection in Health Care and State General Obligation sectors were the leading contributors to the Fund’s outperformance. The Fund’s allocation and selection of housing bonds was a modest detractor to the Fund’s performance.
These key factors impacted the Fund’s performance during the Period:
U.S. Treasury Rate Trends: U.S. Treasury rates declined all along the yield curve. During the Period, 10-Year and 30-Year U.S. Treasury yields decreased by approximately 65 basis points (“bps”) and 62 bps, respectively, to 4.28% and 4.47%. As a reminder, the price of a bond moves inversely to a given change in yield, so lower yields resulted in higher U.S. Treasury bond prices.
Industry Fund Inflows/Outflows: Industry-wide mutual fund and exchange-traded fund flows have been distinctly positive year-to-date. According to data collected by LSEG Lipper and JP Morgan, year-to-date inflows were tracking approximately $33.8 billion with approximately $19.7 billion inflows into investment grade funds and $14.2 billion of inflows into high yield funds. In general, fund inflows would indicate more demand for municipal securities which could support bond prices while fund outflows would signal less demand for municipal securities which could reduce bond prices.
Primary Market Supply: New issue municipal bond supply has been significantly higher year-to-date, as of October 31, 2024, compared to the same period of 2023. Through October 31, 2024, year-to-date issuance increased approximately 38% to $442 billion. Historically speaking, larger than historical average municipal bond supply could require higher yields to increase or support municipal bond demand while less supply might result in lower yields given a consistent level of demand. Actual market experience could vary from historical norms.
Credits Spreads and Trends: According to data analyzed from Bloomberg, municipal credit spreads declined year-over-year. From, October 31, 2023 to October 31, 2024, municipal bond credit spreads for bonds rated AA, A, BBB, and high yield decreased by approximately 4 bps, 19 bps, 26 bps, and 26 bps, respectively.
Changes in Municipal Bond Yields: Looking at the Refinitiv/TM3 AAA municipal yield curve over the past year, municipal yields have declined significantly, with 10-Year and 30-Year AAA municipal yields declining by 60 bps and 70 bps, respectively, to 3.01% and 3.87% as of October 31, 2024.
FUND PERFORMANCE (June 15, 2022 to October 31, 2024)
The performance line graph below shows the performance of a hypothetical $10,000 initial investment in the Fund over a ten-year period (or for the life of the Fund, if shorter). The subsequent account value as of the end of the Period is listed next to the name of the Fund or index, as applicable. The performance table below shows the average annual total returns of the Fund for the past one-, five-, and ten-year periods, as applicable (or for the life of the Fund, if shorter), as of the end of the Period. Both the line graph and performance table compare the Fund’s performance to an appropriate broad-based index and may compare to additional indices reflecting the market segment(s) in which the Fund invests over the same periods.
INVESTMENT PERFORMANCE OF $10,000
| Average Annual Total Returns (as of October 31, 2024) | 1 Year | Since
Inception
(6/15/22) |
| First Trust Managed Municipal Fund - Class I | 10.38% | 4.17% |
| Bloomberg Municipal Bond 5-15 Year Index | 8.10% | 3.45% |
| Bloomberg Municipal Bond Index | 9.70% | 3.73% |
Visit www.ftportfolios.com/MF/CWAIX for more recent performance information.
The Fund’s past performance is not a good predictor of the Fund’s future performance. The graph and table do not reflect the deduction of taxes that a shareholder would pay on Fund distributions or redemption of Fund shares. The Fund’s total returns would have been lower if certain fees had not been waived and expenses reimbursed by the investment advisor.
Performance in municipal bond investment strategies can be impacted from the benefits of purchasing odd lot positions. The impact of these investments can be particularly meaningful when funds have limited assets under management and may not be a sustainable source of performance as a fund grows in size.
KEY FUND STATISTICS (As of October 31, 2024)
| Fund net assets | $75,310,420 |
| Total number of portfolio holdings | 141 |
| Total advisory fee paid | $150,489 |
| Portfolio turnover rate | 28% |
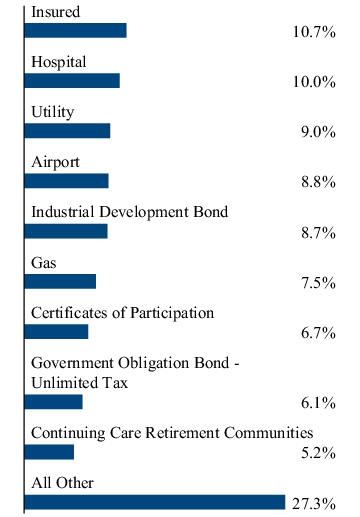
WHAT DID THE FUND INVEST IN? (As of October 31, 2024)
The tables below show the investment makeup of the Fund, representing the percentage of total investments of the Fund.
| AAA | 5.1 |
| AA | 34.6 |
| A | 29.4 |
| BBB | 15.5 |
| BB | 2.4 |
| B | 0.7 |
| Not Rated | 12.3 |
(1) The credit quality and ratings information presented above reflect the ratings assigned by one or more nationally recognized statistical rating organizations (NRSROs), including S&P Global Ratings, Moody’s Investors Service, Inc., Fitch Ratings or a comparably rated NRSRO. For situations in which a security is rated by more than one NRSRO and the ratings are not equivalent, the highest rating is used. Sub-investment grade ratings are those rated BB+/Ba1 or lower. Investment grade ratings are those rated BBB-/Baa3 or higher. The credit ratings shown relate to the creditworthiness of the issuers of the underlying securities in the Fund, and not to the Fund or its shares. Credit ratings are subject to change.
HOW HAS THE FUND MATERIALLY CHANGED?
This is a summary of certain changes to the Fund since November 1, 2023. For more complete information, you may review the Fund’s prospectus, and any applicable supplements at www.ftportfolios.com/fund-documents/MF/CWAIX or upon request at 1-800-621-1675 or info@ftportfolios.com.
Effective June 14, 2024, the investment advisor’s agreement to waive management fees in the amount of 0.15% of the Fund’s average daily net assets was terminated.
WHERE CAN I FIND ADDITIONAL INFORMATION ABOUT THE FUND?
Visit www.ftportfolios.com/fund-documents/MF/CWAIX to view additional information about the Fund such as the prospectus, financial information, Fund holdings and proxy voting information. You may also request this information by contacting us at 1-800-621-1675 or info@ftportfolios.com.
First Trust Preferred Securities
and Income Fund
FPEAX | Class A
ANNUAL SHAREHOLDER REPORT | OCTOBER 31, 2024
This annual shareholder report contains important information about the First Trust Preferred Securities and Income Fund (the “Fund”) for the year of November 1, 2023 to October 31, 2024 (the “Period”). You can find additional information about the Fund at www.ftportfolios.com/fund-documents/MF/FPEAX. You can also request this information by contacting us at 1-800-621-1675 or info@ftportfolios.com.
WHAT WERE THE FUND COSTS FOR THE LAST YEAR?
(Based on a hypothetical $10,000 investment)
| Fund | Costs of a $10,000 investment | Costs paid as a percentage
of a $10,000 investment |
| First Trust Preferred Securities and Income Fund - Class A | $155 | 1.41%(1) |
| (1) | The ratio reflects extraordinary legal expenses of 0.01%, which are not included in the expense cap. |
HOW DID THE FUND PERFORM LAST YEAR? WHAT AFFECTED THE FUND’S PERFORMANCE?
The Fund’s Class A returned 20.44% (without sales charge) for the 12 months ended October 31, 2024. The Fund’s Class A underperformed its benchmark, a blended benchmark consisting of a 30/30/30/10 blend of the ICE BofA Core Plus Fixed Rate Preferred Securities Index, the ICE BofA US Investment Grade Institutional Capital Securities Index, the ICE USD Contingent Capital Index and the ICE BofA US High Yield Institutional Capital Securities Index, which returned 20.56% for the same Period.
The performance of the Fund was primarily driven by security selection within variable rate securities during the bullish Period. Many of these securities were trading at deep discounts to par to start the Period but pulled towards par during the Period as resilient economic data and disinflation drove spreads tighter across the market. This was most pronounced within shorter duration securities that are approaching their first call dates. Other factors that contributed to the Fund’s performance were as follows:
Better security selection and overweight allocation to newly issued securities in 2024;
Security selection within global banks including U.S. Global Systematically Important Banks, European banks and high-quality Emerging Market Banks;
Security selection in insurance, utilities and energy pipelines.
There were a few factors that detracted from relative performance compared to the benchmark. This included the Fund’s underweight to longer duration (10+ year) securities, including fixed rate coupon security structures. These securities outperformed as rates moved lower during the Period. Other factors that detracted from relative performance were as follows:
Underweight allocation and security selection within regional and super regional banks;
Overweight allocation to Federal Farm Credit Banks;
Underweight allocation to consumer finance.
Despite the economic resilience experienced through the tightening cycle to date, the Fund maintains a conservative stance as it relates to credit. Specifically, this includes underweighting potentially higher beta parts of the market, including consumer finance, regional banks and real estate investment trusts.
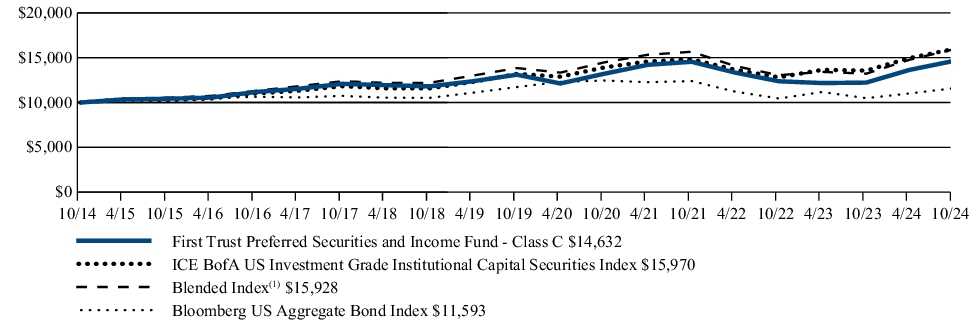
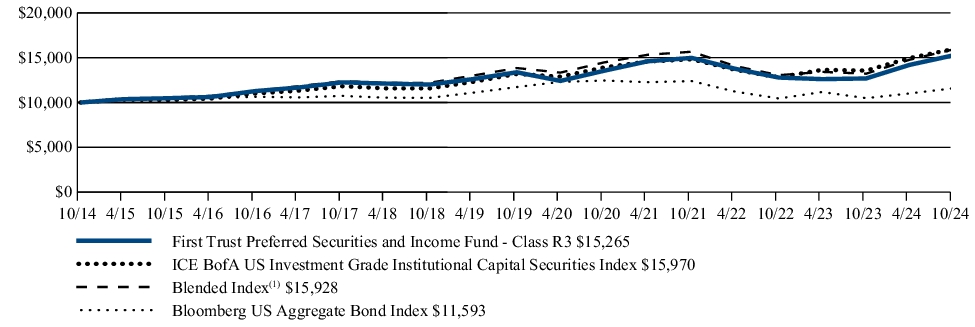
FUND PERFORMANCE (October 31, 2014 to October 31, 2024)
The performance line graph below shows the performance of a hypothetical $10,000 initial investment in the Fund over a ten-year period (or for the life of the Fund, if shorter). The subsequent account value as of the end of the Period is listed next to the name of the Fund or index, as applicable. The performance table below shows the average annual total returns of the Fund for the past one-, five-, and ten-year periods, as applicable (or for the life of the Fund, if shorter), as of the end of the Period. Both the line graph and performance table compare the Fund’s performance to an appropriate broad-based index and may compare to additional indices reflecting the market segment(s) in which the Fund invests over the same periods.
INVESTMENT PERFORMANCE OF $10,000
| Average Annual Total Returns (as of October 31, 2024) | 1 Year | 5 Year | 10 Year |
| First Trust Preferred Securities and Income Fund - Class A (w/max 4.50% sales charge) | 15.02% | 2.00% | 4.14% |
| First Trust Preferred Securities and Income Fund - Class A (without sales charge) | 20.44% | 2.94% | 4.62% |
| ICE BofA US Investment Grade Institutional Capital Securities Index | 17.82% | 3.90% | 4.79% |
| Blended Index(1) | 20.56% | 2.84% | 4.76% |
| Bloomberg US Aggregate Bond Index | 10.55% | (0.23)% | 1.49% |
| (1) | The Blended Index consists of a 30/30/30/10 blend of the ICE BofA Core Plus Fixed Rate Preferred Securities Index, the ICE BofA US Investment Grade Institutional Capital Securities Index, the ICE USD Contingent Capital Index and the ICE BofA US High Yield Institutional Capital Securities Index. |
Visit www.ftportfolios.com/MF/FPEAX for more recent performance information.
The Fund’s past performance is not a good predictor of the Fund’s future performance. The graph and table do not reflect the deduction of taxes that a shareholder would pay on Fund distributions or redemption of Fund shares. The Fund’s total returns would have been lower if certain fees had not been waived and expenses reimbursed by the investment advisor.
KEY FUND STATISTICS (As of October 31, 2024)
| Fund net assets | $234,020,431 |
| Total number of portfolio holdings | 185 |
| Total advisory fee paid | $1,732,894 |
| Portfolio turnover rate | 43% |
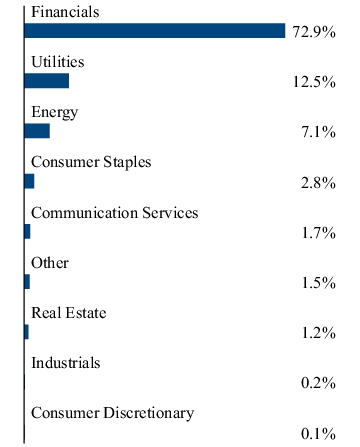
WHAT DID THE FUND INVEST IN? (As of October 31, 2024)
The tables below show the investment makeup of the Fund, representing the percentage of total investments of the Fund.
| Bank of America Corp., Series TT | 2.6% |
| Wells Fargo & Co., Series L | 2.1% |
| Barclays PLC | 1.8% |
| JPMorgan Chase & Co., Series NN | 1.8% |
| Energy Transfer, L.P., Series G | 1.7% |
| Intesa Sanpaolo S.p.A. | 1.7% |
| Lloyds Banking Group PLC | 1.5% |
| Toronto-Dominion Bank (The) | 1.5% |
| Bank of Montreal | 1.5% |
| Global Atlantic Fin Co. | 1.4% |
WHERE CAN I FIND ADDITIONAL INFORMATION ABOUT THE FUND?
Visit www.ftportfolios.com/fund-documents/MF/FPEAX to view additional information about the Fund such as the prospectus, financial information, Fund holdings and proxy voting information. You may also request this information by contacting us at 1-800-621-1675 or info@ftportfolios.com.
First Trust Preferred Securities
and Income Fund
FPECX | Class C
ANNUAL SHAREHOLDER REPORT | OCTOBER 31, 2024
This annual shareholder report contains important information about the First Trust Preferred Securities and Income Fund (the “Fund”) for the year of November 1, 2023 to October 31, 2024 (the “Period”). You can find additional information about the Fund at www.ftportfolios.com/fund-documents/MF/FPECX. You can also request this information by contacting us at 1-800-621-1675 or info@ftportfolios.com.
WHAT WERE THE FUND COSTS FOR THE LAST YEAR?
(Based on a hypothetical $10,000 investment)
| Fund | Costs of a $10,000 investment | Costs paid as a percentage
of a $10,000 investment |
| First Trust Preferred Securities and Income Fund - Class C | $237 | 2.16%(1) |
| (1) | The ratio reflects extraordinary legal expenses of 0.01%, which are not included in the expense cap. |
HOW DID THE FUND PERFORM LAST YEAR? WHAT AFFECTED THE FUND’S PERFORMANCE?
The Fund’s Class C returned 19.57% (without sales charge) for the 12 months ended October 31, 2024. The Fund’s Class C underperformed its benchmark, a blended benchmark consisting of a 30/30/30/10 blend of the ICE BofA Core Plus Fixed Rate Preferred Securities Index, the ICE BofA US Investment Grade Institutional Capital Securities Index, the ICE USD Contingent Capital Index and the ICE BofA US High Yield Institutional Capital Securities Index, which returned 20.56% for the same Period.
The performance of the Fund was primarily driven by security selection within variable rate securities during the bullish Period. Many of these securities were trading at deep discounts to par to start the Period but pulled towards par during the Period as resilient economic data and disinflation drove spreads tighter across the market. This was most pronounced within shorter duration securities that are approaching their first call dates. Other factors that contributed to the Fund’s performance were as follows:
Better security selection and overweight allocation to newly issued securities in 2024;
Security selection within global banks including U.S. Global Systematically Important Banks, European banks and high-quality Emerging Market Banks;
Security selection in insurance, utilities and energy pipelines.
There were a few factors that detracted from relative performance compared to the benchmark. This included the Fund’s underweight to longer duration (10+ year) securities, including fixed rate coupon security structures. These securities outperformed as rates moved lower during the Period. Other factors that detracted from relative performance were as follows:
Underweight allocation and security selection within regional and super regional banks;
Overweight allocation to Federal Farm Credit Banks;
Underweight allocation to consumer finance.
Despite the economic resilience experienced through the tightening cycle to date, the Fund maintains a conservative stance as it relates to credit. Specifically, this includes underweighting potentially higher beta parts of the market, including consumer finance, regional banks and real estate investment trusts.
FUND PERFORMANCE (October 31, 2014 to October 31, 2024)
The performance line graph below shows the performance of a hypothetical $10,000 initial investment in the Fund over a ten-year period (or for the life of the Fund, if shorter). The subsequent account value as of the end of the Period is listed next to the name of the Fund or index, as applicable. The performance table below shows the average annual total returns of the Fund for the past one-, five-, and ten-year periods, as applicable (or for the life of the Fund, if shorter), as of the end of the Period. Both the line graph and performance table compare the Fund’s performance to an appropriate broad-based index and may compare to additional indices reflecting the market segment(s) in which the Fund invests over the same periods.
INVESTMENT PERFORMANCE OF $10,000
| Average Annual Total Returns (as of October 31, 2024) | 1 Year | 5 Year | 10 Year |
| First Trust Preferred Securities and Income Fund - Class C (w/max 1.00% contingent deferred sales charge) | 18.57% | 2.21% | 3.88% |
| First Trust Preferred Securities and Income Fund - Class C (without sales charge) | 19.57% | 2.21% | 3.88% |
| ICE BofA US Investment Grade Institutional Capital Securities Index | 17.82% | 3.90% | 4.79% |
| Blended Index(1) | 20.56% | 2.84% | 4.76% |
| Bloomberg US Aggregate Bond Index | 10.55% | (0.23)% | 1.49% |
| (1) | The Blended Index consists of a 30/30/30/10 blend of the ICE BofA Core Plus Fixed Rate Preferred Securities Index, the ICE BofA US Investment Grade Institutional Capital Securities Index, the ICE USD Contingent Capital Index and the ICE BofA US High Yield Institutional Capital Securities Index. |
Visit www.ftportfolios.com/MF/FPECX for more recent performance information.
The Fund’s past performance is not a good predictor of the Fund’s future performance. The graph and table do not reflect the deduction of taxes that a shareholder would pay on Fund distributions or redemption of Fund shares. The Fund’s total returns would have been lower if certain fees had not been waived and expenses reimbursed by the investment advisor.
KEY FUND STATISTICS (As of October 31, 2024)
| Fund net assets | $234,020,431 |
| Total number of portfolio holdings | 185 |
| Total advisory fee paid | $1,732,894 |
| Portfolio turnover rate | 43% |
WHAT DID THE FUND INVEST IN? (As of October 31, 2024)
The tables below show the investment makeup of the Fund, representing the percentage of total investments of the Fund.
| Bank of America Corp., Series TT | 2.6% |
| Wells Fargo & Co., Series L | 2.1% |
| Barclays PLC | 1.8% |
| JPMorgan Chase & Co., Series NN | 1.8% |
| Energy Transfer, L.P., Series G | 1.7% |
| Intesa Sanpaolo S.p.A. | 1.7% |
| Lloyds Banking Group PLC | 1.5% |
| Toronto-Dominion Bank (The) | 1.5% |
| Bank of Montreal | 1.5% |
| Global Atlantic Fin Co. | 1.4% |
WHERE CAN I FIND ADDITIONAL INFORMATION ABOUT THE FUND?
Visit www.ftportfolios.com/fund-documents/MF/FPECX to view additional information about the Fund such as the prospectus, financial information, Fund holdings and proxy voting information. You may also request this information by contacting us at 1-800-621-1675 or info@ftportfolios.com.
First Trust Preferred Securities
and Income Fund
FPEFX | Class F
ANNUAL SHAREHOLDER REPORT | OCTOBER 31, 2024
This annual shareholder report contains important information about the First Trust Preferred Securities and Income Fund (the “Fund”) for the year of November 1, 2023 to October 31, 2024 (the “Period”). You can find additional information about the Fund at www.ftportfolios.com/fund-documents/MF/FPEFX. You can also request this information by contacting us at 1-800-621-1675 or info@ftportfolios.com.
WHAT WERE THE FUND COSTS FOR THE LAST YEAR?
(Based on a hypothetical $10,000 investment)
| Fund | Costs of a $10,000 investment | Costs paid as a percentage
of a $10,000 investment |
| First Trust Preferred Securities and Income Fund - Class F | $145 | 1.31%(1) |
| (1) | The ratio reflects extraordinary legal expenses of 0.01%, which are not included in the expense cap. |
HOW DID THE FUND PERFORM LAST YEAR? WHAT AFFECTED THE FUND’S PERFORMANCE?
The Fund’s Class F returned 20.63% for the 12 months ended October 31, 2024. The Fund’s Class F outperformed its benchmark, a blended benchmark consisting of a 30/30/30/10 blend of the ICE BofA Core Plus Fixed Rate Preferred Securities Index, the ICE BofA US Investment Grade Institutional Capital Securities Index, the ICE USD Contingent Capital Index and the ICE BofA US High Yield Institutional Capital Securities Index, which returned 20.56% for the same Period.
The performance of the Fund was primarily driven by security selection within variable rate securities during the bullish Period. Many of these securities were trading at deep discounts to par to start the Period but pulled towards par during the Period as resilient economic data and disinflation drove spreads tighter across the market. This was most pronounced within shorter duration securities that are approaching their first call dates. Other factors that contributed to the Fund’s performance were as follows:
Better security selection and overweight allocation to newly issued securities in 2024;
Security selection within global banks including U.S. Global Systematically Important Banks, European banks and high-quality Emerging Market Banks;
Security selection in insurance, utilities and energy pipelines.
There were a few factors that detracted from relative performance compared to the benchmark. This included the Fund’s underweight to longer duration (10+ year) securities, including fixed rate coupon security structures. These securities outperformed as rates moved lower during the Period. Other factors that detracted from relative performance were as follows:
Underweight allocation and security selection within regional and super regional banks;
Overweight allocation to Federal Farm Credit Banks;
Underweight allocation to consumer finance.
Despite the economic resilience experienced through the tightening cycle to date, the Fund maintains a conservative stance as it relates to credit. Specifically, this includes underweighting potentially higher beta parts of the market, including consumer finance, regional banks and real estate investment trusts.
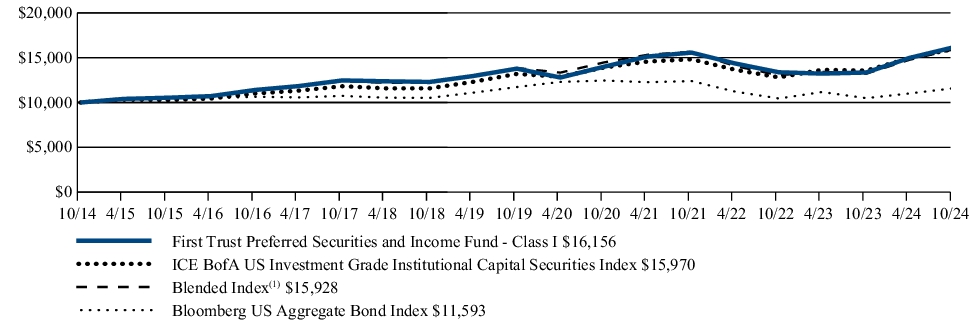
FUND PERFORMANCE (October 31, 2014 to October 31, 2024)
The performance line graph below shows the performance of a hypothetical $10,000 initial investment in the Fund over a ten-year period (or for the life of the Fund, if shorter). The subsequent account value as of the end of the Period is listed next to the name of the Fund or index, as applicable. The performance table below shows the average annual total returns of the Fund for the past one-, five-, and ten-year periods, as applicable (or for the life of the Fund, if shorter), as of the end of the Period. Both the line graph and performance table compare the Fund’s performance to an appropriate broad-based index and may compare to additional indices reflecting the market segment(s) in which the Fund invests over the same periods.
INVESTMENT PERFORMANCE OF $10,000
| Average Annual Total Returns (as of October 31, 2024) | 1 Year | 5 Year | 10 Year |
| First Trust Preferred Securities and Income Fund - Class F | 20.63% | 3.04% | 4.73% |
| ICE BofA US Investment Grade Institutional Capital Securities Index | 17.82% | 3.90% | 4.79% |
| Blended Index(1) | 20.56% | 2.84% | 4.76% |
| Bloomberg US Aggregate Bond Index | 10.55% | (0.23)% | 1.49% |
| (1) | The Blended Index consists of a 30/30/30/10 blend of the ICE BofA Core Plus Fixed Rate Preferred Securities Index, the ICE BofA US Investment Grade Institutional Capital Securities Index, the ICE USD Contingent Capital Index and the ICE BofA US High Yield Institutional Capital Securities Index. |
Visit www.ftportfolios.com/MF/FPEFX for more recent performance information.
The Fund’s past performance is not a good predictor of the Fund’s future performance. The graph and table do not reflect the deduction of taxes that a shareholder would pay on Fund distributions or redemption of Fund shares. The Fund’s total returns would have been lower if certain fees had not been waived and expenses reimbursed by the investment advisor.
KEY FUND STATISTICS (As of October 31, 2024)
| Fund net assets | $234,020,431 |
| Total number of portfolio holdings | 185 |
| Total advisory fee paid | $1,732,894 |
| Portfolio turnover rate | 43% |
WHAT DID THE FUND INVEST IN? (As of October 31, 2024)
The tables below show the investment makeup of the Fund, representing the percentage of total investments of the Fund.
| Bank of America Corp., Series TT | 2.6% |
| Wells Fargo & Co., Series L | 2.1% |
| Barclays PLC | 1.8% |
| JPMorgan Chase & Co., Series NN | 1.8% |
| Energy Transfer, L.P., Series G | 1.7% |
| Intesa Sanpaolo S.p.A. | 1.7% |
| Lloyds Banking Group PLC | 1.5% |
| Toronto-Dominion Bank (The) | 1.5% |
| Bank of Montreal | 1.5% |
| Global Atlantic Fin Co. | 1.4% |
WHERE CAN I FIND ADDITIONAL INFORMATION ABOUT THE FUND?
Visit www.ftportfolios.com/fund-documents/MF/FPEFX to view additional information about the Fund such as the prospectus, financial information, Fund holdings and proxy voting information. You may also request this information by contacting us at 1-800-621-1675 or info@ftportfolios.com.
First Trust Preferred Securities
and Income Fund
FPEIX | Class I
ANNUAL SHAREHOLDER REPORT | OCTOBER 31, 2024
This annual shareholder report contains important information about the First Trust Preferred Securities and Income Fund (the “Fund”) for the year of November 1, 2023 to October 31, 2024 (the “Period”). You can find additional information about the Fund at www.ftportfolios.com/fund-documents/MF/FPEIX. You can also request this information by contacting us at 1-800-621-1675 or info@ftportfolios.com.
WHAT WERE THE FUND COSTS FOR THE LAST YEAR?
(Based on a hypothetical $10,000 investment)
| Fund | Costs of a $10,000 investment | Costs paid as a percentage
of a $10,000 investment |
| First Trust Preferred Securities and Income Fund - Class I | $117 | 1.06%(1) |
| (1) | The ratio reflects extraordinary legal expenses of 0.01%, which are not included in the expense cap. |
HOW DID THE FUND PERFORM LAST YEAR? WHAT AFFECTED THE FUND’S PERFORMANCE?
The Fund’s Class I returned 20.92% for the 12 months ended October 31, 2024. The Fund’s Class I outperformed its benchmark, a blended benchmark consisting of a 30/30/30/10 blend of the ICE BofA Core Plus Fixed Rate Preferred Securities Index, the ICE BofA US Investment Grade Institutional Capital Securities Index, the ICE USD Contingent Capital Index and the ICE BofA US High Yield Institutional Capital Securities Index, which returned 20.56% for the same Period.
The performance of the Fund was primarily driven by security selection within variable rate securities during the bullish Period. Many of these securities were trading at deep discounts to par to start the Period but pulled towards par during the Period as resilient economic data and disinflation drove spreads tighter across the market. This was most pronounced within shorter duration securities that are approaching their first call dates. Other factors that contributed to the Fund’s performance were as follows:
Better security selection and overweight allocation to newly issued securities in 2024;
Security selection within global banks including U.S. Global Systematically Important Banks, European banks and high-quality Emerging Market Banks;
Security selection in insurance, utilities and energy pipelines.
There were a few factors that detracted from relative performance compared to the benchmark. This included the Fund’s underweight to longer duration (10+ year) securities, including fixed rate coupon security structures. These securities outperformed as rates moved lower during the Period. Other factors that detracted from relative performance were as follows:
Underweight allocation and security selection within regional and super regional banks;
Overweight allocation to Federal Farm Credit Banks;
Underweight allocation to consumer finance.
Despite the economic resilience experienced through the tightening cycle to date, the Fund maintains a conservative stance as it relates to credit. Specifically, this includes underweighting potentially higher beta parts of the market, including consumer finance, regional banks and real estate investment trusts.
FUND PERFORMANCE (October 31, 2014 to October 31, 2024)
The performance line graph below shows the performance of a hypothetical $10,000 initial investment in the Fund over a ten-year period (or for the life of the Fund, if shorter). The subsequent account value as of the end of the Period is listed next to the name of the Fund or index, as applicable. The performance table below shows the average annual total returns of the Fund for the past one-, five-, and ten-year periods, as applicable (or for the life of the Fund, if shorter), as of the end of the Period. Both the line graph and performance table compare the Fund’s performance to an appropriate broad-based index and may compare to additional indices reflecting the market segment(s) in which the Fund invests over the same periods.
INVESTMENT PERFORMANCE OF $10,000
| Average Annual Total Returns (as of October 31, 2024) | 1 Year | 5 Year | 10 Year |
| First Trust Preferred Securities and Income Fund - Class I | 20.92% | 3.22% | 4.91% |
| ICE BofA US Investment Grade Institutional Capital Securities Index | 17.82% | 3.90% | 4.79% |
| Blended Index(1) | 20.56% | 2.84% | 4.76% |
| Bloomberg US Aggregate Bond Index | 10.55% | (0.23)% | 1.49% |
| (1) | The Blended Index consists of a 30/30/30/10 blend of the ICE BofA Core Plus Fixed Rate Preferred Securities Index, the ICE BofA US Investment Grade Institutional Capital Securities Index, the ICE USD Contingent Capital Index and the ICE BofA US High Yield Institutional Capital Securities Index. |
Visit www.ftportfolios.com/MF/FPEIX for more recent performance information.
The Fund’s past performance is not a good predictor of the Fund’s future performance. The graph and table do not reflect the deduction of taxes that a shareholder would pay on Fund distributions or redemption of Fund shares.
KEY FUND STATISTICS (As of October 31, 2024)
| Fund net assets | $234,020,431 |
| Total number of portfolio holdings | 185 |
| Total advisory fee paid | $1,732,894 |
| Portfolio turnover rate | 43% |
WHAT DID THE FUND INVEST IN? (As of October 31, 2024)
The tables below show the investment makeup of the Fund, representing the percentage of total investments of the Fund.
| Bank of America Corp., Series TT | 2.6% |
| Wells Fargo & Co., Series L | 2.1% |
| Barclays PLC | 1.8% |
| JPMorgan Chase & Co., Series NN | 1.8% |
| Energy Transfer, L.P., Series G | 1.7% |
| Intesa Sanpaolo S.p.A. | 1.7% |
| Lloyds Banking Group PLC | 1.5% |
| Toronto-Dominion Bank (The) | 1.5% |
| Bank of Montreal | 1.5% |
| Global Atlantic Fin Co. | 1.4% |
WHERE CAN I FIND ADDITIONAL INFORMATION ABOUT THE FUND?
Visit www.ftportfolios.com/fund-documents/MF/FPEIX to view additional information about the Fund such as the prospectus, financial information, Fund holdings and proxy voting information. You may also request this information by contacting us at 1-800-621-1675 or info@ftportfolios.com.
First Trust Preferred Securities
and Income Fund
FPERX | Class R3
ANNUAL SHAREHOLDER REPORT | OCTOBER 31, 2024
This annual shareholder report contains important information about the First Trust Preferred Securities and Income Fund (the “Fund”) for the year of November 1, 2023 to October 31, 2024 (the “Period”). You can find additional information about the Fund at www.ftportfolios.com/fund-documents/MF/FPERX. You can also request this information by contacting us at 1-800-621-1675 or info@ftportfolios.com.
WHAT WERE THE FUND COSTS FOR THE LAST YEAR?
(Based on a hypothetical $10,000 investment)
| Fund | Costs of a $10,000 investment | Costs paid as a percentage
of a $10,000 investment |
| First Trust Preferred Securities and Income Fund - Class R3 | $183 | 1.66%(1) |
| (1) | The ratio reflects extraordinary legal expenses of 0.01%, which are not included in the expense cap. |
HOW DID THE FUND PERFORM LAST YEAR? WHAT AFFECTED THE FUND’S PERFORMANCE?
The Fund’s Class R3 returned 20.19% for the 12 months ended October 31, 2024. The Fund’s Class R3 underperformed its benchmark, a blended benchmark consisting of a 30/30/30/10 blend of the ICE BofA Core Plus Fixed Rate Preferred Securities Index, the ICE BofA US Investment Grade Institutional Capital Securities Index, the ICE USD Contingent Capital Index and the ICE BofA US High Yield Institutional Capital Securities Index, which returned 20.56% for the same Period.
The performance of the Fund was primarily driven by security selection within variable rate securities during the bullish Period. Many of these securities were trading at deep discounts to par to start the Period but pulled towards par during the Period as resilient economic data and disinflation drove spreads tighter across the market. This was most pronounced within shorter duration securities that are approaching their first call dates. Other factors that contributed to the Fund’s performance were as follows:
Better security selection and overweight allocation to newly issued securities in 2024;
Security selection within global banks including U.S. Global Systematically Important Banks, European banks and high-quality Emerging Market Banks;
Security selection in insurance, utilities and energy pipelines.
There were a few factors that detracted from relative performance compared to the benchmark. This included the Fund’s underweight to longer duration (10+ year) securities, including fixed rate coupon security structures. These securities outperformed as rates moved lower during the Period. Other factors that detracted from relative performance were as follows:
Underweight allocation and security selection within regional and super regional banks;
Overweight allocation to Federal Farm Credit Banks;
Underweight allocation to consumer finance.
Despite the economic resilience experienced through the tightening cycle to date, the Fund maintains a conservative stance as it relates to credit. Specifically, this includes underweighting potentially higher beta parts of the market, including consumer finance, regional banks and real estate investment trusts.
FUND PERFORMANCE (October 31, 2014 to October 31, 2024)
The performance line graph below shows the performance of a hypothetical $10,000 initial investment in the Fund over a ten-year period (or for the life of the Fund, if shorter). The subsequent account value as of the end of the Period is listed next to the name of the Fund or index, as applicable. The performance table below shows the average annual total returns of the Fund for the past one-, five-, and ten-year periods, as applicable (or for the life of the Fund, if shorter), as of the end of the Period. Both the line graph and performance table compare the Fund’s performance to an appropriate broad-based index and may compare to additional indices reflecting the market segment(s) in which the Fund invests over the same periods.
INVESTMENT PERFORMANCE OF $10,000
| Average Annual Total Returns (as of October 31, 2024) | 1 Year | 5 Year | 10 Year |
| First Trust Preferred Securities and Income Fund - Class R3 | 20.19% | 2.66% | 4.32% |
| ICE BofA US Investment Grade Institutional Capital Securities Index | 17.82% | 3.90% | 4.79% |
| Blended Index(1) | 20.56% | 2.84% | 4.76% |
| Bloomberg US Aggregate Bond Index | 10.55% | (0.23)% | 1.49% |
| (1) | The Blended Index consists of a 30/30/30/10 blend of the ICE BofA Core Plus Fixed Rate Preferred Securities Index, the ICE BofA US Investment Grade Institutional Capital Securities Index, the ICE USD Contingent Capital Index and the ICE BofA US High Yield Institutional Capital Securities Index. |
Visit www.ftportfolios.com/MF/FPERX for more recent performance information.
The Fund’s past performance is not a good predictor of the Fund’s future performance. The graph and table do not reflect the deduction of taxes that a shareholder would pay on Fund distributions or redemption of Fund shares. The Fund’s total returns would have been lower if certain fees had not been waived and expenses reimbursed by the investment advisor.
KEY FUND STATISTICS (As of October 31, 2024)
| Fund net assets | $234,020,431 |
| Total number of portfolio holdings | 185 |
| Total advisory fee paid | $1,732,894 |
| Portfolio turnover rate | 43% |
WHAT DID THE FUND INVEST IN? (As of October 31, 2024)
The tables below show the investment makeup of the Fund, representing the percentage of total investments of the Fund.
| Bank of America Corp., Series TT | 2.6% |
| Wells Fargo & Co., Series L | 2.1% |
| Barclays PLC | 1.8% |
| JPMorgan Chase & Co., Series NN | 1.8% |
| Energy Transfer, L.P., Series G | 1.7% |
| Intesa Sanpaolo S.p.A. | 1.7% |
| Lloyds Banking Group PLC | 1.5% |
| Toronto-Dominion Bank (The) | 1.5% |
| Bank of Montreal | 1.5% |
| Global Atlantic Fin Co. | 1.4% |
WHERE CAN I FIND ADDITIONAL INFORMATION ABOUT THE FUND?
Visit www.ftportfolios.com/fund-documents/MF/FPERX to view additional information about the Fund such as the prospectus, financial information, Fund holdings and proxy voting information. You may also request this information by contacting us at 1-800-621-1675 or info@ftportfolios.com.
| (b) | Not applicable to the Registrant. |
Item 2. Code of Ethics.
| (a) | The First Trust Series Fund (“Registrant”), as of the end of the period covered by this report, has adopted a code of ethics that applies to the Registrant’s principal executive officer, principal financial officer, principal accounting officer or controller, or persons performing similar functions, regardless of whether these individuals are employed by the Registrant or a third party. |
| (c) | There have been no amendments, during the period covered by this report, to a provision of the code of ethics that applies to the Registrant's principal executive officer, principal financial officer, principal accounting officer or controller, or persons performing similar functions, regardless of whether these individuals are employed by the Registrant or a third party, and that relates to any element of the code of ethics description. |
| (d) | The Registrant, during the period covered by this report, has not granted any waivers, including an implicit waiver, from a provision of the code of ethics that applies to the Registrant’s principal executive officer, principal financial officer, principal accounting officer or controller, or persons performing similar functions, regardless of whether these individuals are employed by the Registrant or a third party, that relates to one or more of the items set forth in paragraph (b) of this item’s instructions. |
| (f) | A copy of the code of ethics that applies to the Registrant’s principal executive officer, principal financial officer, principal accounting officer or controller is filed as an exhibit pursuant to Item 13(a)(1). |
Item 3. Audit Committee Financial Expert.
As of the end of the period covered by the report, the Registrant’s Board of Trustees has determined that Thomas R. Kadlec and Robert F. Keith are qualified to serve as audit committee financial experts serving on its audit committee and that each of them is “independent,” as defined by Item 3 of Form N-CSR.
Item 4. Principal Accountant Fees and Services.
| (a) | Audit Fees (Registrant) -- The aggregate fees billed for professional services rendered by the principal accountant for the audit of the Registrant’s annual financial statements or services that are normally provided by the accountant in connection with statutory and regulatory filings or engagements were $154,000 for the fiscal year ended 2023 and $156,000 for the fiscal year ended 2024. |
| (b) | Audit-Related Fees (Registrant) -- The aggregate fees billed for assurance and related services by the principal accountant that are reasonably related to the performance of the audit of the Registrant’s financial statements and are not reported under paragraph (a) of this Item were $0 for the fiscal year ended 2023 and $0 for the fiscal year ended 2024. |
Audit-Related Fees (Investment Advisor) -- The aggregate fees billed for assurance and related services by the principal accountant that are reasonably related to the performance of the audit of the Registrant’s financial statements and are not reported under paragraph (a) of this Item were $0 for the fiscal year ended 2023 and $0 for the fiscal year ended 2024.
Audit-Related Fees (Distributor) -- The aggregate fees billed for assurance and related services by the principal accountant that are reasonably related to the performance of the audit of the Registrant’s financial statements and are not reported under paragraph (a) of this Item were $0 for the fiscal year ended 2023 and $0 for the fiscal year ended 2024.
| (c) | Tax Fees (Registrant) -- The aggregate fees billed for professional services rendered by the principal accountant were $84,303 for the fiscal year ended 2023 for tax return review and debt instrument tax analysis and reporting; and $56,000 for the fiscal year ended 2024 for tax consultation and/or tax return preparation and professional services rendered for PFIC (Passive Foreign Investment Company) Identification Services. |
Tax Fees (Investment Advisor) -- The aggregate fees billed for professional services rendered by the principal accountant for tax compliance, tax advice, and tax planning to the Registrant’s advisor and distributor were $0 for the fiscal year ended 2023 and $0 for the fiscal year ended 2024.
Tax Fees (Distributor) -- The aggregate fees billed for professional services rendered by the principal accountant for tax compliance, tax advice, and tax planning to the Registrant’s distributor were $0 for the fiscal year ended 2023 and $0 for the fiscal year ended 2024.
| (d) | All Other Fees (Registrant) -- The aggregate fees billed for products and services provided by the principal accountant to the Registrant, other than the services reported in paragraphs (a) through (c) of this Item were $0 for the fiscal year ended 2023 and $0 for the fiscal year ended 2024. |
All Other Fees (Investment Advisor) -- The aggregate fees billed for products and services provided by the principal accountant to the Registrant’s investment advisor, other than the services reported in paragraphs (a) through (c) of this Item were $0 for the fiscal year ended 2023 and $0 for the fiscal year ended 2024.
All Other Fees (Distributor) -- The aggregate fees billed for products and services provided by the principal accountant to the Registrant’s distributor, other than the services reported in paragraphs (a) through (c) of this Item were $0 for the fiscal year ended 2023 and $0 for the fiscal year ended 2024.
(e)(1) Disclose the audit committee’s pre-approval policies and procedures described in paragraph (c) (7) of Rule 2-01 of Regulation S-X.
Pursuant to its charter and its Audit and Non-Audit Services Pre-Approval Policy, the Audit Committee (the “Committee”) is responsible for the pre-approval of all audit services and permitted non-audit services (including the fees and terms thereof) to be performed for the Registrant by its independent auditors. The Chairman of the Committee is authorized to give such pre-approvals on behalf of the Committee up to $25,000 and report any such pre-approval to the full Committee.
The Committee is also responsible for the pre-approval of the independent auditor’s engagements for non-audit services with the Registrant’s advisor (not including a sub-advisor whose role is primarily portfolio management and is sub-contracted or overseen by another investment advisor) and any entity controlling, controlled by or under common control with the investment advisor that provides ongoing services to the Registrant, if the engagement relates directly to the operations and financial reporting of the Registrant, subject to the de minimis exceptions for non-audit services described in Rule 2-01 of Regulation S-X. If the independent auditor has provided non-audit services to the Registrant’s advisor (other than any sub-advisor whose role is primarily portfolio management and is sub-contracted with or overseen by another investment advisor) and any entity controlling, controlled by or under common control with the investment advisor that provides ongoing services to the Registrant that were not pre-approved pursuant to its policies, the Committee will consider whether the provision of such non-audit services is compatible with the auditor’s independence.
(e)(2) The percentage of services described in each of paragraphs (b) through (d) for the Registrant and the Registrant’s investment advisor and distributor of this Item that were approved by the audit committee pursuant to the pre-approval exceptions included in paragraph (c)(7)(i)(C) or paragraph(C)(7)(ii) of Rule 2-01 of Regulation S-X are as follows:
| Registrant: | | Advisor and Distributor: |
| (b) 0% | | (b) 0% |
| (c) 0% | | (c) 0% |
| (d) 0% | | (d) 0% |
| (f) | The percentage of hours expended on the principal accountant’s engagement to audit the Registrant’s financial statements for the most recent fiscal year that were attributed to work performed by persons other than the principal accountant’s full-time, permanent employees was less than fifty percent. |
| (g) | The aggregate non-audit fees billed by the Registrant’s accountant for services rendered to the Registrant, and rendered to the Registrant’s investment advisor (not including any sub-advisor whose role is primarily portfolio management and is subcontracted with or overseen by another investment advisor), and any entity controlling, controlled by, or under common control with the advisor that provides ongoing services to the Registrant for the fiscal year ended 2023 were $84,303 for the Registrant, $44,000 for the Registrant’s investment advisor, $60,500 for the Registrant’s distributor, and $16,000 for Stonebridge Advisors LLC, which is under common control with the registrant’s investment advisor and serves as the registrant’s sub-advisor for the First Trust Preferred Securities and Income Fund (“Stonebridge”); and for the fiscal year ended 2024 were $56,000 for the Registrant, $28,080 for the Registrant’s investment advisor, $32,400 for the Registrant’s distributor, and $8,640 for Stonebridge. |
| (h) | The Registrant’s audit committee of its Board of Trustees has determined that the provision of non-audit services that were rendered to the Registrant’s investment advisor (not including any sub-advisor whose role is primarily portfolio management and is subcontracted with or overseen by another investment advisor), and any entity controlling, controlled by, or under common control with the investment advisor that provides ongoing services to the Registrant that were not pre-approved pursuant to paragraph (c)(7)(ii) of Rule 2-01 of Regulation S-X is compatible with maintaining the principal accountant’s independence. |
(i) Not applicable to the Registrant.
(j) Not applicable to the Registrant.
Item 5. Audit Committee of Listed Registrants.
| (a) | The Registrant has a separately designated standing audit committee established in accordance with Section 3(a)(58)(A) of the Securities Exchange Act of 1934 consisting of all the independent directors of the Registrant. The audit committee of the Registrant is comprised of: Richard E. Erickson, Thomas R. Kadlec, Denise M. Keefe, Robert F. Keith, Niel B. Nielson and Bronwyn Wright. |
| (b) | Not applicable to the Registrant. |
Item 6. Investments.
| (a) | The Schedule of Investments in securities of unaffiliated issuers as of the close of the reporting period is included in the Financial Statements and Other Information filed under Item 7(a) of this Form N-CSR. |
| (b) | Not applicable to the Registrant. |
Item 7. Financial Statements and Financial Highlights for Open-End Management Investment Companies.
(a) Following is a copy of the annual financial statements required, and for the periods specified, by Regulation S-X.
First Trust Preferred Securities and Income Fund
Annual Financial Statements and Other Information
October 31, 2024
First Trust Preferred Securities and Income Fund
Annual Financial Statements and Other Information
October 31, 2024
Performance and Risk Disclosure
There is no assurance that First Trust Preferred Securities and Income Fund (the “Fund”) will achieve its investment objective. The Fund is subject to market risk, which is the possibility that the market values of securities owned by the Fund will decline and that the value of the Fund’s shares may therefore be less than what you paid for them. Accordingly, you can lose money by investing in the Fund.
Performance data quoted represents past performance, which is no guarantee of future results, and current performance may be lower or higher than the figures shown. For the most recent month-end performance figures, please visit www.ftportfolios.com or speak with your financial advisor. Investment returns and net asset value will fluctuate and Fund shares, when sold, may be worth more or less than their original cost.
First Trust Advisors L.P., the Fund’s advisor, may also periodically provide additional information on Fund performance on the Fund’s web page at www.ftportfolios.com.
This report contains information that may help you evaluate your investment in the Fund. It includes details about the Fund and presents data that provides insight into the Fund’s performance and investment approach.
The material risks of investing in the Fund are spelled out in the prospectus, the statement of additional information, and other Fund regulatory filings.
First Trust Preferred Securities and Income FundPortfolio of Investments
October 31, 2024
| | | | |
$25 PAR PREFERRED SECURITIES – 12.8% |
| | | | |
| | | | |
| | | | |
| | |
| | | | |
| Bank of America Corp., Series KK | | | |
| Pinnacle Financial Partners, Inc., Series B | | | |
| | | | |
| | |
| | | | |
| Affiliated Managers Group, Inc. | | | |
| Affiliated Managers Group, Inc. | | | |
| Brookfield Oaktree Holdings, LLC, Series A | | | |
| | | | |
| DigitalBridge Group, Inc., Series I | | | |
| DigitalBridge Group, Inc., Series J | | | |
| KKR Group Finance Co., IX LLC | | | |
| | | | |
| TPG Operating Group II, L.P. | | | |
| | |
| | | | |
| Global Net Lease, Inc., Series A | | | |
| Diversified Telecommunication Services – 0.2% | | | |
| | | | |
| Electric Utilities – 1.4% | | | |
| SCE Trust IV, Series J (b) | | | |
| SCE Trust V, Series K (b) | | | |
| | | | |
| | | | |
| | |
| Financial Services – 0.4% | | | |
| Equitable Holdings, Inc., Series A | | | |
| | | | |
| South Jersey Industries, Inc. | | | |
| Independent Power & Renewable Electricity Producers – 0.5% | | | |
| Brookfield BRP Holdings Canada, Inc. | | | |
| Brookfield Renewable Partners, L.P., Series 17 | | | |
| | |
| | | | |
| | | | |
| American National Group, Inc., Series A (b) | | | |
| American National Group, Inc., Series B (b) | | | |
| AmTrust Financial Services, Inc. | | | |
| AmTrust Financial Services, Inc. | | | |
| Arch Capital Group Ltd., Series G | | | |
| Aspen Insurance Holdings Ltd. | | | |
| Aspen Insurance Holdings Ltd. | | | |
| | | | |
| Athene Holding Ltd., Series A (b) | | | |
See Notes to Financial Statements
First Trust Preferred Securities and Income FundPortfolio of Investments (Continued)
October 31, 2024
| | | | |
$25 PAR PREFERRED SECURITIES (Continued) |
| | | | |
| Athene Holding Ltd., Series E (b) | | | |
| CNO Financial Group, Inc. | | | |
| F&G Annuities & Life, Inc. | | | |
| | | | |
| RenaissanceRe Holdings Ltd., Series G | | | |
| | |
| | | | |
| Algonquin Power & Utilities Corp., Series 19-A, 3 Mo. CME Term SOFR + CSA + 4.01% (c) | | | |
| Brookfield Infrastructure Finance ULC | | | |
| Brookfield Infrastructure Partners, L.P., Series 13 | | | |
| | |
| Real Estate Management & Development – 0.6% | | | |
| Brookfield Property Partners, L.P., Series A | | | |
| Brookfield Property Partners, L.P., Series A2 | | | |
| | |
| | | | |
| National Storage Affiliates Trust, Series A | | | |
| Wireless Telecommunication Services – 1.5% | | | |
| United States Cellular Corp. | | | |
| United States Cellular Corp. | | | |
| United States Cellular Corp. | | | |
| | |
| Total $25 Par Preferred Securities | |
| | | | |
$1,000 PAR PREFERRED SECURITIES – 2.6% |
| | | | |
| Bank of America Corp., Series L | | | |
| Wells Fargo & Co., Series L | | | |
| Total $1,000 Par Preferred Securities | |
| | | | |
| | | | |
CAPITAL PREFERRED SECURITIES – 81.7% |
| | | | |
| Banco Bilbao Vizcaya Argentaria S.A. (b) (d) | | | |
| Banco de Credito e Inversiones S.A. (b) (d) (e) | | | |
| Banco de Credito e Inversiones S.A. (b) (d) (f) | | | |
| Banco Mercantil del Norte S.A. (b) (d) (e) | | | |
| Banco Mercantil del Norte S.A. (b) (d) (e) | | | |
| Banco Mercantil del Norte S.A. (b) (d) (e) | | | |
| Banco Santander S.A. (b) (d) | | | |
| Banco Santander S.A. (b) (d) | | | |
| Banco Santander S.A. (b) (d) | | | |
| Banco Santander S.A. (b) (d) | | | |
| Bank of America Corp., Series RR (b) | | | |
| Bank of America Corp., Series TT (b) | | | |
| | | | |
See Notes to Financial Statements
First Trust Preferred Securities and Income FundPortfolio of Investments (Continued)
October 31, 2024
| | | | |
CAPITAL PREFERRED SECURITIES (Continued) |
| | | | |
| | | | |
| Bank of Nova Scotia (The) (b) | | | |
| Bank of Nova Scotia (The) (b) | | | |
| | | | |
| | | | |
| | | | |
| BBVA Bancomer S.A. (b) (d) (e) | | | |
| BBVA Bancomer S.A. (b) (d) (e) | | | |
| BNP Paribas S.A. (b) (d) (e) | | | |
| BNP Paribas S.A. (b) (d) (e) | | | |
| BNP Paribas S.A. (b) (d) (e) | | | |
| BNP Paribas S.A. (b) (d) (e) | | | |
| BNP Paribas S.A. (b) (d) (e) | | | |
| Citigroup, Inc., Series DD (b) | | | |
| Citigroup, Inc., Series P (b) | | | |
| Citigroup, Inc., Series X (b) | | | |
| Citigroup, Inc., Series Z (b) | | | |
| Citizens Financial Group, Inc., Series F (b) | | | |
| Citizens Financial Group, Inc., Series G (b) | | | |
| | | | |
| | | | |
| | | | |
| Credit Agricole S.A. (b) (d) (e) | | | |
| Farm Credit Bank of Texas (b) | | | |
| Farm Credit Bank of Texas, Series 3 (b) (e) | | | |
| Fifth Third Bancorp, Series L (b) | | | |
| HSBC Holdings PLC (b) (d) | | | |
| HSBC Holdings PLC (b) (d) | | | |
| HSBC Holdings PLC (b) (d) | | | |
| ING Groep N.V. (b) (d) (f) | | | |
| ING Groep N.V. (b) (d) (f) | | | |
| ING Groep N.V. (b) (d) (f) | | | |
| Intesa Sanpaolo S.p.A. (b) (d) (e) | | | |
| JPMorgan Chase & Co., Series NN (b) | | | |
| Lloyds Banking Group PLC (b) (d) | | | |
| NatWest Group PLC (b) (d) | | | |
| NatWest Group PLC (b) (d) | | | |
| NatWest Group PLC (b) (d) | | | |
| PNC Financial Services Group (The), Inc., Series U (b) | | | |
| PNC Financial Services Group (The), Inc., Series V (b) | | | |
| PNC Financial Services Group (The), Inc., Series W (b) | | | |
| | | | |
| | | | |
| Societe Generale S.A. (b) (d) (e) | | | |
| Societe Generale S.A. (b) (d) (e) | | | |
| Sumitomo Mitsui Financial Group, Inc. (b) (d) | | | |
| | | | |
| | | | |
| Toronto-Dominion Bank (The) (b) | | | |
| | | | |
| | | | |
| | |
| | | | |
| Ares Finance Co. III LLC (b) (e) | | | |
See Notes to Financial Statements
First Trust Preferred Securities and Income FundPortfolio of Investments (Continued)
October 31, 2024
| | | | |
CAPITAL PREFERRED SECURITIES (Continued) |
| Capital Markets (Continued) | | | |
| Charles Schwab (The) Corp., Series H (b) | | | |
| Charles Schwab (The) Corp., Series I (b) | | | |
| Charles Schwab (The) Corp., Series K (b) | | | |
| Credit Suisse Group AG, Claim (g) (h) | | | |
| Credit Suisse Group AG, Claim (g) (h) | | | |
| Credit Suisse Group AG, Claim (g) (h) | | | |
| Credit Suisse Group AG, Claim (g) (h) | | | |
| Deutsche Bank AG, Series 2020 (b) (d) | | | |
| Goldman Sachs Group (The), Inc., Series W (b) | | | |
| Goldman Sachs Group (The), Inc., Series X (b) | | | |
| Goldman Sachs Group (The), Inc., Series Y (b) | | | |
| State Street Corp., Series I (b) | | | |
| State Street Corp., Series J (b) | | | |
| | |
| Electric Utilities – 4.1% | | | |
| American Electric Power Co., Inc. (b) | | | |
| American Electric Power Co., Inc. (b) | | | |
| American Electric Power Co., Inc. (b) | | | |
| | | | |
| Emera, Inc., Series 16-A (b) | | | |
| | | | |
| EUSHI Finance, Inc. (b) (e) | | | |
| NextEra Energy Capital Holdings, Inc. (b) | | | |
| | |
| Financial Services – 3.0% | | | |
| American AgCredit Corp. (b) (e) | | | |
| Capital Farm Credit ACA, Series 1 (b) (e) | | | |
| Compeer Financial ACA (b) (e) | | | |
| Corebridge Financial, Inc. (b) | | | |
| Corebridge Financial, Inc. (b) | | | |
| | |
| | | | |
| Dairy Farmers of America, Inc. (i) | | | |
| Land O’Lakes Capital Trust I (i) | | | |
| | | | |
| | | | |
| | | | |
| | |
| | | | |
| | | | |
| Independent Power & Renewable Electricity Producers – 0.6% | | | |
| | | | |
| | | | |
| | | | |
| Assured Guaranty Municipal Holdings, Inc. (b) (e) | | | |
| AXIS Specialty Finance LLC (b) | | | |
| CNP Assurances SACA (b) (d) (f) | | | |
| Fortegra Financial Corp. (b) (i) | | | |
| Global Atlantic Fin Co. (b) (e) | | | |
| Global Atlantic Fin Co. (b) (e) | | | |
See Notes to Financial Statements
First Trust Preferred Securities and Income FundPortfolio of Investments (Continued)
October 31, 2024
| | | | |
CAPITAL PREFERRED SECURITIES (Continued) |
| | | | |
| Hartford Financial Services Group (The), Inc., 3 Mo. CME Term SOFR + CSA + 2.13% (c) (e) | | | |
| Kuvare US Holdings, Inc. (b) (e) | | | |
| | | | |
| Lancashire Holdings Ltd. (b) (f) | | | |
| Liberty Mutual Group, Inc. (b) (e) | | | |
| QBE Insurance Group Ltd. (b) (e) | | | |
| | |
| | | | |
| Algonquin Power & Utilities Corp. (b) | | | |
| CenterPoint Energy, Inc., Series A (b) | | | |
| CenterPoint Energy, Inc., Series B (b) | | | |
| Dominion Energy, Inc., Series A (b) | | | |
| Dominion Energy, Inc., Series B (b) | | | |
| | | | |
| | | | |
| | | | |
| | | | |
| | |
| Oil, Gas & Consumable Fuels – 7.0% | | | |
| | | | |
| | | | |
| | | | |
| Enbridge, Inc., Series 20-A (b) | | | |
| Energy Transfer, L.P., Series B (b) | | | |
| Energy Transfer, L.P., Series F (b) | | | |
| Energy Transfer, L.P., Series G (b) | | | |
| Energy Transfer, L.P., Series H (b) | | | |
| | | | |
| | | | |
| Venture Global LNG, Inc. (b) (e) | | | |
| | |
| | | | |
| Scentre Group Trust 2 (b) (e) | | | |
| Trading Companies & Distributors – 0.2% | | | |
| Air Lease Corp., Series D (b) | | | |
| Total Capital Preferred Securities | |
| | | | |
| | |
EXCHANGE-TRADED FUNDS – 1.5% |
| | |
| iShares Short Treasury Bond ETF | |
See Notes to Financial Statements
First Trust Preferred Securities and Income FundPortfolio of Investments (Continued)
October 31, 2024
| | |
EXCHANGE-TRADED FUNDS (Continued) |
| Capital Markets (Continued) | |
| SPDR Bloomberg 1-3 Month T-Bill ETF | |
| Total Exchange-Traded Funds | |
| | |
| Total Investments – 98.6% | |
| | |
| Net Other Assets and Liabilities – 1.4% | |
| | |
| |
| Fixed-to-floating or fixed-to-variable rate security. The interest rate shown reflects the fixed rate in effect at October 31, 2024. At a predetermined date, the fixed rate will change to a floating rate or a variable rate. |
| Floating or variable rate security. |
| This security is a contingent convertible capital security which may be subject to conversion into common stock of the issuer under certain circumstances. At October 31, 2024, securities noted as such amounted to $60,384,058 or 25.8% of net assets. Of these securities, 9.1% originated in emerging markets, and 90.9% originated in foreign markets. |
| This security, sold within the terms of a private placement memorandum, is exempt from registration upon resale under Rule 144A of the Securities Act of 1933, as amended (the “1933 Act”), and may be resold in transactions exempt from registration, normally to qualified institutional buyers. Pursuant to procedures adopted by the First Trust Series Fund’s (the “Trust”) Board of Trustees, this security has been determined to be liquid by First Trust Advisors L.P., (the “Advisor”). Although market instability can result in periods of increased overall market illiquidity, liquidity for each security is determined based on security specific factors and assumptions, which require subjective judgment. At October 31, 2024, securities noted as such amounted to $49,601,204 or 21.2% of net assets. |
| This security may be resold to qualified foreign investors and foreign institutional buyers under Regulation S of the 1933 Act. |
| Claim pending with the administrative court of Switzerland. |
| Pursuant to procedures adopted by the Trust’s Board of Trustees, this security has been determined to be illiquid by the Advisor. |
| This security, sold within the terms of a private placement memorandum, is exempt from registration upon resale under Rule 144A of the 1933 Act, and may be resold in transactions exempt from registration, normally to qualified institutional buyers (see Note 2C - Restricted Securities in the Notes to Financial Statements). |
Abbreviations throughout the Portfolio of Investments: |
| – Chicago Mercantile Exchange |
| – Credit Spread Adjustment |
| – Real Estate Investment Trusts |
| – Secured Overnight Financing Rate |
Valuation InputsA summary of the inputs used to value the Fund’s investments as of October 31, 2024 is as follows (see Note 2A - Portfolio Valuation in the Notes to Financial Statements):
| | | Level 2 Significant Observable Inputs | Level 3 Significant Unobservable Inputs |
$25 Par Preferred Securities:
| | | | |
| | | | |
| | | | |
Other Industry Categories* | | | | |
$1,000 Par Preferred Securities* | | | | |
Capital Preferred Securities* | | | | |
| | | | |
| | | | |
| See Portfolio of Investments for industry breakout. |
See Notes to Financial Statements
First Trust Preferred Securities and Income FundStatement of Assets and Liabilities
October 31, 2024
| |
| |
| |
| |
| |
| |
| |
Investment securities sold | |
| |
| |
| |
| |
| |
Investment securities purchased | |
| |
| |
| |
| |
12b-1 distribution and service fees | |
| |
Shareholder reporting fees | |
| |
| |
Commitment and administrative agency fees | |
| |
Trustees’ fees and expenses | |
| |
| |
| |
| |
| |
| |
| |
Accumulated distributable earnings (loss) | |
| |
| |
Foreign currency, at cost (proceeds) | |
| |
Net asset value and redemption price per share (Based on net assets of $42,342,070 and 2,135,861 shares of beneficial interest issued and outstanding, unlimited number of shares authorized) | |
Maximum sales charge (4.50% of offering price) | |
Maximum offering price to public | |
| |
Net asset value and redemption price per share (Based on net assets of $23,928,014 and 1,197,057 shares of beneficial interest issued and outstanding, unlimited number of shares authorized) | |
| |
Net asset value and redemption price per share (Based on net assets of $20,848,186 and 1,036,521 shares of beneficial interest issued and outstanding, unlimited number of shares authorized) | |
| |
Net asset value and redemption price per share (Based on net assets of $146,180,786 and 7,303,086 shares of beneficial interest issued and outstanding, unlimited number of shares authorized) | |
| |
Net asset value and redemption price per share (Based on net assets of $721,375 and 36,563 shares of beneficial interest issued and outstanding, unlimited number of shares authorized) | |
See Notes to Financial Statements
First Trust Preferred Securities and Income FundStatement of Operations
For the Year Ended October 31, 2024
| |
| |
| |
| |
| |
| |
| |
12b-1 distribution and/or service fees: | |
| |
| |
| |
| |
| |
| |
| |
| |
Shareholder reporting fees | |
| |
Commitment and administrative agency fees | |
Trustees’ fees and expenses | |
| |
| |
| |
| |
| |
Fees waived and expenses reimbursed by the investment advisor | |
| |
NET INVESTMENT INCOME (LOSS) | |
NET REALIZED AND UNREALIZED GAIN (LOSS): | |
Net realized gain (loss) on: | |
| |
Foreign currency transactions | |
| |
Net change in unrealized appreciation (depreciation) on: | |
| |
Foreign currency translation | |
Net change in unrealized appreciation (depreciation) | |
NET REALIZED AND UNREALIZED GAIN (LOSS) | |
NET INCREASE (DECREASE) IN NET ASSETS RESULTING FROM OPERATIONS | |
See Notes to Financial Statements
First Trust Preferred Securities and Income FundStatements of Changes in Net Assets
| | |
| | |
Net investment income (loss) | | |
| | |
Net change in unrealized appreciation (depreciation) | | |
Net increase (decrease) in net assets resulting from operations | | |
DISTRIBUTIONS TO SHAREHOLDERS FROM INVESTMENT OPERATIONS: | | |
| | |
| | |
| | |
| | |
| | |
Total distributions to shareholders from investment operations | | |
DISTRIBUTIONS TO SHAREHOLDERS FROM RETURN OF CAPITAL: | | |
| | |
| | |
| | |
| | |
| | |
Total distributions to shareholders from return of capital | | |
| | |
Proceeds from shares sold | | |
Proceeds from shares reinvested | | |
| | |
Net increase (decrease) in net assets resulting from capital transactions | | |
Total increase (decrease) in net assets | | |
| | |
| | |
| | |
See Notes to Financial Statements
First Trust Preferred Securities and Income FundFinancial Highlights
For a Share outstanding throughout each period
| |
| | | | | |
Net asset value, beginning of period | | | | | |
Income from investment operations: | | | | | |
Net investment income (loss) (a) | | | | | |
Net realized and unrealized gain (loss) | | | | | |
Total from investment operations | | | | | |
Distributions paid to shareholders from: | | | | | |
| | | | | |
| | | | | |
| | | | | |
Net asset value, end of period | | | | | |
| | | | | |
Ratios to average net assets/supplemental data: | | | | | |
Net assets, end of period (in 000’s) | | | | | |
Ratio of total expenses to average net assets | | | | | |
Ratio of net expenses to average net assets | | | | | |
Ratio of net investment income (loss) to average net assets | | | | | |
| | | | | |
| Based on average shares outstanding. |
| Amount is less than $0.01. |
| Assumes reinvestment of all distributions for the period and does not include payment of the maximum sales charge of 4.50% or contingent deferred sales charge (CDSC). On purchases of $1 million or more, a CDSC of 1% may be imposed on certain redemptions made within twelve months of purchase. If the sales charges were included, total returns would be lower. These returns include Rule 12b-1 service fees of 0.25% and do not reflect the deduction of taxes that a shareholder would pay on Fund distributions or the redemption of Fund shares. The total returns would have been lower if certain fees had not been waived and expenses reimbursed by the investment advisor. Total return is calculated for the time period presented and is not annualized for periods of less than one year. |
| For the years ended October 31, 2024 and 2023, ratios reflect extraordinary legal expenses of 0.01%, which are not included in the expense cap. |
See Notes to Financial Statements
First Trust Preferred Securities and Income FundFinancial Highlights (Continued)
For a Share outstanding throughout each period
| |
| | | | | |
Net asset value, beginning of period | | | | | |
Income from investment operations: | | | | | |
Net investment income (loss) (a) | | | | | |
Net realized and unrealized gain (loss) | | | | | |
Total from investment operations | | | | | |
Distributions paid to shareholders from: | | | | | |
| | | | | |
| | | | | |
| | | | | |
Net asset value, end of period | | | | | |
| | | | | |
Ratios to average net assets/supplemental data: | | | | | |
Net assets, end of period (in 000’s) | | | | | |
Ratio of total expenses to average net assets | | | | | |
Ratio of net expenses to average net assets | | | | | |
Ratio of net investment income (loss) to average net assets | | | | | |
| | | | | |
| Based on average shares outstanding. |
| Amount is less than $0.01. |
| Assumes reinvestment of all distributions for the period and does not include payment of the maximum CDSC of 1%, charged on certain redemptions made within one year of purchase. If the sales charge was included, total returns would be lower. These returns include combined Rule 12b-1 distribution and service fees of 1% and do not reflect the deduction of taxes that a shareholder would pay on Fund distributions or the redemption of Fund shares. Total return is calculated for the time period presented and is not annualized for periods of less than one year. |
| For the years ended October 31, 2024 and 2023, ratios reflect extraordinary legal expenses of 0.01%, which are not included in the expense cap. |
See Notes to Financial Statements
First Trust Preferred Securities and Income FundFinancial Highlights (Continued)
For a Share outstanding throughout each period
| |
| | | | | |
Net asset value, beginning of period | | | | | |
Income from investment operations: | | | | | |
Net investment income (loss) (a) | | | | | |
Net realized and unrealized gain (loss) | | | | | |
Total from investment operations: | | | | | |
Distributions paid to shareholders from: | | | | | |
| | | | | |
| | | | | |
| | | | | |
Net asset value, end of period | | | | | |
| | | | | |
Ratios to average net assets/supplemental data: | | | | | |
Net assets, end of period (in 000’s) | | | | | |
Ratio of total expenses to average net assets | | | | | |
Ratio of net expenses to average net assets | | | | | |
Ratio of net investment income (loss) to average net assets | | | | | |
| | | | | |
| Based on average shares outstanding. |
| Amount is less than $0.01. |
| Assumes reinvestment of all distributions for the period. These returns include Rule 12b-1 service fees of 0.15% and do not reflect the deduction of taxes that a shareholder would pay on Fund distributions or the redemption of Fund shares. The total returns would have been lower if certain fees had not been waived and expenses reimbursed by the investment advisor. Total return is calculated for the time period presented and is not annualized for periods of less than one year. |
| For the years ended October 31, 2024 and 2023, ratios reflect extraordinary legal expenses of 0.01%, which are not included in the expense cap. |
See Notes to Financial Statements
First Trust Preferred Securities and Income FundFinancial Highlights (Continued)
For a Share outstanding throughout each period
| |
| | | | | |
Net asset value, beginning of period | | | | | |
Income from investment operations: | | | | | |
Net investment income (loss) (a) | | | | | |
Net realized and unrealized gain (loss) | | | | | |
Total from investment operations | | | | | |
Distributions paid to shareholders from: | | | | | |
| | | | | |
| | | | | |
| | | | | |
Net asset value, end of period | | | | | |
| | | | | |
Ratios to average net assets/supplemental data: | | | | | |
Net assets, end of period (in 000’s) | | | | | |
Ratio of total expenses to average net assets | | | | | |
Ratio of net expenses to average net assets | | | | | |
Ratio of net investment income (loss) to average net assets | | | | | |
| | | | | |
| Based on average shares outstanding. |
| Assumes reinvestment of all distributions for the period. These returns do not reflect the deduction of taxes that a shareholder would pay on Fund distributions or the redemption of Fund shares. Total return is calculated for the time period presented and is not annualized for periods of less than one year. |
| For the years ended October 31, 2024 and 2023, ratios reflect extraordinary legal expenses of 0.01%, which are not included in the expense cap. |
See Notes to Financial Statements
First Trust Preferred Securities and Income FundFinancial Highlights (Continued)
For a Share outstanding throughout each period
| |
| | | | | |
Net asset value, beginning of period | | | | | |
Income from investment operations: | | | | | |
Net investment income (loss) (a) | | | | | |
Net realized and unrealized gain (loss) | | | | | |
Total from investment operations: | | | | | |
Distributions paid to shareholders from: | | | | | |
| | | | | |
| | | | | |
| | | | | |
Net asset value, end of period | | | | | |
| | | | | |
Ratios to average net assets/supplemental data: | | | | | |
Net assets, end of period (in 000’s) | | | | | |
Ratio of total expenses to average net assets | | | | | |
Ratio of net expenses to average net assets | | | | | |
Ratio of net investment income (loss) to average net assets | | | | | |
| | | | | |
| Based on average shares outstanding. |
| Amount is less than $0.01. |
| Assumes reinvestment of all distributions for the period. These returns include combined Rule 12b-1 distribution and service fees of 0.50%, and do not reflect the deduction of taxes that a shareholder would pay on Fund distributions or the redemption of Fund shares. The total returns would have been lower if certain fees had not been waived and expenses reimbursed by the investment advisor. Total return is calculated for the time period presented and is not annualized for periods of less than one year. |
| For the years ended October 31, 2024 and 2023, ratios reflect extraordinary legal expenses of 0.01%, which are not included in the expense cap. |
See Notes to Financial Statements
Notes to Financial Statements
First Trust Preferred Securities and Income FundOctober 31, 2024
1. Organization
First Trust Preferred Securities and Income Fund (the “Fund”) is a series of the First Trust Series Fund (the “Trust”), a Massachusetts business trust organized on July 9, 2010, and is registered as a diversified open-end management investment company with the Securities and Exchange Commission under the Investment Company Act of 1940, as amended (the “1940 Act”). The Fund offers five classes of shares: Class A, Class C, Class F, Class I and Class R3. Each class represents an interest in the same portfolio of investments but with a different combination of sales charges, distribution and service (12b-1) fees, eligibility requirements and other features.
The Fund’s investment objective seeks to provide current income and total return. The Fund seeks to achieve its objective by investing, under normal market conditions, at least 80% of its net assets (including investment borrowings) in preferred securities and other securities with similar economic characteristics. There can be no assurance that the Fund will achieve its investment objective. The Fund may not be appropriate for all investors.
2. Significant Accounting Policies
The Fund is considered an investment company and follows accounting and reporting guidance under Financial Accounting Standards Board Accounting Standards Codification Topic 946, “Financial Services-Investment Companies.” The following is a summary of significant accounting policies consistently followed by the Fund in the preparation of the financial statements. The preparation of the financial statements in accordance with accounting principles generally accepted in the United States of America (“U.S. GAAP”) requires management to make estimates and assumptions that affect the reported amounts and disclosures in the financial statements. Actual results could differ from those estimates.
The net asset value (“NAV”) of each class of shares of the Fund is determined daily as of the close of regular trading on the New York Stock Exchange (“NYSE”), normally 4:00 p.m. Eastern time, on each day the NYSE is open for trading. If the NYSE closes early on a valuation day, the NAV is determined as of that time. Domestic debt securities and foreign securities are priced using data reflecting the earlier closing at the principal markets for those securities. The NAV for each class is calculated by dividing the value of the Fund’s total assets attributable to such class (including accrued interest and dividends), less all liabilities attributable to such class (including accrued expenses, dividends declared but unpaid and any borrowings of the Fund), by the total number of shares of the class outstanding. Differences in NAV of each class of the Fund’s shares are generally expected to be due to the daily expense accruals of the specified distribution and service (12b-1) fees and transfer agency costs applicable to such class of shares and the resulting differential in the dividends that may be paid on each class of shares.
The Fund’s investments are valued daily at market value or, in the absence of market value with respect to any portfolio securities, at fair value. Market value prices represent readily available market quotations such as last sale or official closing prices from a national or foreign exchange (i.e., a regulated market) and are primarily obtained from third-party pricing services. Fair value prices represent any prices not considered market value prices and are either obtained from a third-party pricing service or are determined by the Pricing Committee of the Trust’s investment advisor, First Trust Advisors L.P. (“First Trust” or the “Advisor”), in accordance with valuation procedures approved by the Trust’s Board of Trustees, and in accordance with provisions of the 1940 Act and rules thereunder. Investments valued by the Advisor’s Pricing Committee, if any, are footnoted as such in the footnotes to the Portfolio of Investments. The Fund’s investments are valued as follows:
Preferred stocks, exchange-traded funds, and other equity securities listed on any national or foreign exchange (excluding Nasdaq, Inc. (“Nasdaq”) and the London Stock Exchange Alternative Investment Market (“AIM”)) are valued at the last sale price on the exchange on which they are principally traded or, for Nasdaq and AIM securities, the official closing price. Securities traded on more than one securities exchange are valued at the last sale price or official closing price, as applicable, at the close of the securities exchange representing the primary exchange for such securities.
Bonds, notes, capital preferred securities, and other debt securities are fair valued on the basis of valuations provided by a third-party pricing service approved by the Advisor’s Pricing Committee, which may use the following valuation inputs when available:
7)
reference data including market research publications.
Notes to Financial Statements (Continued)
First Trust Preferred Securities and Income FundOctober 31, 2024
Equity securities traded in an over-the-counter market are valued at the close price or the last trade price.
Fixed income and other debt securities having a remaining maturity of sixty days or less when purchased are fair valued at cost adjusted for amortization of premiums and accretion of discounts (amortized cost), provided the Advisor’s Pricing Committee has determined that the use of amortized cost is an appropriate reflection of fair value given market and issuer-specific conditions existing at the time of the determination. Factors that may be considered in determining the appropriateness of the use of amortized cost include, but are not limited to, the following:
1)
the credit conditions in the relevant market and changes thereto;
2)
the liquidity conditions in the relevant market and changes thereto;
3)
the interest rate conditions in the relevant market and changes thereto (such as significant changes in interest rates);
4)
issuer-specific conditions (such as significant credit deterioration); and
5)
any other market-based data the Advisor’s Pricing Committee considers relevant. In this regard, the Advisor’s Pricing Committee may use last-obtained market-based data to assist it when valuing portfolio securities using amortized cost.
Certain securities may not be able to be priced by pre-established pricing methods. Such securities may be valued by the Advisor’s Pricing Committee at fair value. These securities generally include, but are not limited to, restricted securities (securities which may not be publicly sold without registration under the Securities Act of 1933, as amended (the “1933 Act”)) for which a third-party pricing service is unable to provide a market price; securities whose trading has been formally suspended; a security whose market or fair value price is not available from a pre-established pricing source; a security with respect to which an event has occurred that is likely to materially affect the value of the security after the market has closed but before the calculation of the Fund’s NAV or make it difficult or impossible to obtain a reliable market quotation; and a security whose price, as provided by the third-party pricing service, does not reflect the security’s fair value. As a general principle, the current fair value of a security would appear to be the amount which the owner might reasonably expect to receive for the security upon its current sale. When fair value prices are used, generally they will differ from market quotations or official closing prices on the applicable exchanges. A variety of factors may be considered in determining the fair value of such securities, including, but not limited to, the following:
1)
the last sale price on the exchange on which they are principally traded or, for Nasdaq and AIM securities, the official closing price;
3)
the size of the holding;
4)
the initial cost of the security;
5)
transactions in comparable securities;
6)
price quotes from dealers and/or third-party pricing services;
7)
relationships among various securities;
8)
information obtained by contacting the issuer, analysts, or the appropriate stock exchange;
9)
an analysis of the issuer’s financial statements;
10)
the existence of merger proposals or tender offers that might affect the value of the security; and
11)
other relevant factors.
If the securities in question are foreign securities, the following additional information may be considered:
1)
the last sale price on the exchange on which they are principally traded;
2)
the value of similar foreign securities traded on other foreign markets;
3)
ADR trading of similar securities;
4)
closed-end fund or exchange-traded fund trading of similar securities;
5)
foreign currency exchange activity;
6)
the trading prices of financial products that are tied to baskets of foreign securities;
7)
factors relating to the event that precipitated the pricing problem;
8)
whether the event is likely to recur;
9)
whether the effects of the event are isolated or whether they affect entire markets, countries or regions; and
10)
other relevant factors.
Notes to Financial Statements (Continued)
First Trust Preferred Securities and Income FundOctober 31, 2024
The Fund is subject to fair value accounting standards that define fair value, establish the framework for measuring fair value and provide a three-level hierarchy for fair valuation based upon the inputs to the valuation as of the measurement date. The three levels of the fair value hierarchy are as follows:
•
Level 1 – Level 1 inputs are quoted prices in active markets for identical investments. An active market is a market in which transactions for the investment occur with sufficient frequency and volume to provide pricing information on an ongoing basis.
•
Level 2 – Level 2 inputs are observable inputs, either directly or indirectly, and include the following:
o
Quoted prices for similar investments in active markets.
o
Quoted prices for identical or similar investments in markets that are non-active. A non-active market is a market where there are few transactions for the investment, the prices are not current, or price quotations vary substantially either over time or among market makers, or in which little information is released publicly.
o
Inputs other than quoted prices that are observable for the investment (for example, interest rates and yield curves observable at commonly quoted intervals, volatilities, prepayment speeds, loss severities, credit risks, and default rates).
o
Inputs that are derived principally from or corroborated by observable market data by correlation or other means.
•
Level 3 – Level 3 inputs are unobservable inputs. Unobservable inputs may reflect the reporting entity’s own assumptions about the assumptions that market participants would use in pricing the investment.
The inputs or methodologies used for valuing investments are not necessarily an indication of the risk associated with investing in those investments. A summary of the inputs used to value the Fund’s investments as of October 31, 2024, is included with the Fund’s Portfolio of Investments.
B. Securities Transactions and Investment Income
Securities transactions are recorded as of the trade date. Realized gains and losses from securities transactions are recorded on the identified cost basis. Dividend income is recorded on the ex-dividend date. Interest income is recorded daily on the accrual basis, including the amortization of premiums and accretion of discounts. Income is allocated on a pro rata basis to each class of shares.
The Fund may hold the securities of real estate investment trusts (“REITs”). Distributions from such investments may include income, capital gains and return of capital. The actual character of amounts received during the year is not known until after the REITs’ fiscal year end. The Fund records the character of distributions received from the REITs during the year based on estimates available. The characterization of distributions received by the Fund may be subsequently revised based on information received from the REITs after their tax reporting periods conclude.
The Fund invests in restricted securities, which are securities that may not be offered for public sale without first being registered under the 1933 Act. Prior to registration, restricted securities may only be resold in transactions exempt from registration under Rule 144A under the 1933 Act, normally to qualified institutional buyers. As of October 31, 2024, the Fund held restricted securities as shown in the following table that the Advisor has deemed illiquid pursuant to procedures adopted by the Trust’s Board of Trustees. Although market instability can result in periods of increased overall market illiquidity, liquidity for each security is determined based on security-specific factors and assumptions, which require subjective judgment. The Fund does not have the right to demand that such securities be registered. These securities are valued according to the valuation procedures as stated in the Portfolio Valuation note (Note 2A) and are not expressed as a discount to the carrying value of a comparable unrestricted security. There are no unrestricted securities with the same maturity dates and yields for these issuers.
| | | | | | |
Dairy Farmers of America, Inc., 7.13% | | | | | | |
Fortegra Financial Corp., 8.50%, 10/15/57 | | | | | | |
Land O’Lakes Capital Trust I, 7.45%, 03/15/28 | | | | | | |
| | | | | | |
Notes to Financial Statements (Continued)
First Trust Preferred Securities and Income FundOctober 31, 2024
D. Dividends and Distributions to Shareholders
The Fund will declare daily and pay monthly distributions of all or a portion of its net income to holders of each class of shares. Distributions of any net capital gains earned by the Fund will be distributed at least annually. Distributions will automatically be reinvested into additional Fund shares unless cash distributions are elected by the shareholder. The Fund may also designate a portion of the amount paid to redeeming shareholders as a distribution for tax purposes.
Distributions from net investment income and realized capital gains are determined in accordance with federal income tax regulations, which may differ from U.S. GAAP. Certain capital accounts in the financial statements are periodically adjusted for permanent differences in order to reflect their tax character. These permanent differences are primarily due to the varying treatment of income and gain/loss on portfolio securities held by the Fund and have no impact on net assets or NAV per share. Temporary differences, which arise from recognizing certain items of income, expense and gain/loss in different periods for financial statement and tax purposes, will reverse at some point in the future. Permanent differences incurred during the fiscal year ended October 31, 2024, resulting in book and tax accounting differences, have been reclassified at year end to reflect a decrease in accumulated net investment income (loss) of $205,526, an increase in accumulated net realized gain (loss) of $205,525, and an increase to paid-in capital of $1. Accumulated distributable earnings (loss) consists of accumulated net investment income (loss), accumulated net realized gain (loss) on investments, and unrealized appreciation (depreciation) on investments. Net assets were not affected by this reclassification.
The tax character of distributions paid by the Fund during the fiscal years ended October 31, 2024 and 2023, was as follows:
As of October 31, 2024, the components of distributable earnings and net assets on a tax basis were as follows:
Undistributed ordinary income | |
Undistributed capital gains | |
Total undistributed earnings | |
Accumulated capital and other losses | |
Net unrealized appreciation (depreciation) | |
Total accumulated earnings (losses) | |
| |
| |
| |
The Fund intends to continue to qualify as a regulated investment company by complying with the requirements under Subchapter M of the Internal Revenue Code of 1986, as amended, which includes distributing substantially all of its net investment income and net realized gains to shareholders. Accordingly, no provision has been made for federal and state income taxes. However, due to the timing and amount of distributions, the Fund may be subject to an excise tax of 4% of the amount by which approximately 98% of the Fund’s taxable income exceeds the distributions from such taxable income for the calendar year.
The Fund intends to utilize provisions of the federal income tax laws, which allow it to carry a realized capital loss forward indefinitely following the year of the loss and offset such loss against any future realized capital gains. The Fund is subject to certain limitations under U.S. tax rules on the use of capital loss carryforwards and net unrealized built-in losses. These limitations apply when there has been a 50% change in ownership. At October 31, 2024, for federal income tax purposes, the Fund had $29,399,641 of non-expiring capital loss carryforwards available, to the extent provided by regulations, to offset future capital gains.
Certain losses realized during the current fiscal year may be deferred and treated as occurring on the first day of the following fiscal year for federal income tax purposes. For the fiscal year ended October 31, 2024, the Fund did not incur any net late year ordinary losses.
The Fund is subject to accounting standards that establish a minimum threshold for recognizing, and a system for measuring, the benefits of a tax position taken or expected to be taken in a tax return. Taxable years ended 2021, 2022, 2023, and 2024 remain open to
Notes to Financial Statements (Continued)
First Trust Preferred Securities and Income FundOctober 31, 2024
federal and state audit. As of October 31, 2024, management has evaluated the application of these standards to the Fund and has determined that no provision for income tax is required in the Fund’s financial statements for uncertain tax positions.
As of October 31, 2024, the aggregate cost, gross unrealized appreciation, gross unrealized depreciation, and net unrealized appreciation/(depreciation) on investments (including short positions and derivatives, if any) for federal income tax purposes were as follows:
| Gross Unrealized Appreciation | Gross Unrealized (Depreciation) | Net Unrealized Appreciation (Depreciation) |
| | | |
The Fund pays all expenses directly related to its operations. Expenses of the Fund are allocated on a pro rata basis to each class of shares, except for distribution and service (12b-1) fees and incremental transfer agency costs which are unique to each class of shares.
3. Investment Advisory Fee, Affiliated Transactions and Other Fee Arrangements
First Trust, the investment advisor to the Fund, is a limited partnership with one limited partner, Grace Partners of DuPage L.P., and one general partner, The Charger Corporation. The Charger Corporation is an Illinois corporation controlled by James A. Bowen, Chief Executive Officer of First Trust. First Trust is responsible for the ongoing monitoring of the Fund’s investment portfolio, managing the Fund’s business affairs and providing certain administrative services necessary for the management of the Fund. For these investment management services, First Trust is entitled to a monthly fee calculated at an annual rate of 0.80% of the Fund’s average daily net assets. First Trust also provides fund reporting services to the Fund for a flat annual fee in the amount of $9,250.
Stonebridge, a majority-owned affiliate of First Trust, serves as the Fund’s sub-advisor and manages the Fund’s portfolio subject to First Trust’s supervision. The Sub-Advisor receives a monthly portfolio management fee calculated at an annual rate of 0.40% of the Fund’s average daily net assets that is paid by First Trust out of its investment advisory fee.
First Trust Capital Partners, LLC, an affiliate of First Trust, owns a 51% ownership interest in Stonebridge.
First Trust and Stonebridge have agreed to waive fees and/or reimburse Fund expenses to the extent necessary to prevent the total annual fund operating expenses (excluding 12b-1 distribution and service fees, interest expenses, taxes, acquired fund fees and expenses, fees incurred in acquiring and disposing of portfolio securities and extraordinary expenses) from exceeding 1.15% of average daily net assets of any class of shares of the Fund (the “Expense Cap”) through February 28, 2026 and then from exceeding 1.50% from March 1, 2026 through February 28, 2035 (the “Expense Cap Termination Date”). Expenses borne and fees waived by First Trust and Stonebridge are subject to recovery on the Fund’s class level, if applicable, by First Trust and Stonebridge for up to three years from the date the fee or expense was incurred, but no reimbursement payment will be made by the Fund at any time if it would result in the Fund’s expenses exceeding (i) the Expense Cap in place for the most recent fiscal year for which such expense limitation was in place; (ii) the Expense Cap in place at the time the fees were waived; or (iii) the current Expense Cap. Expense limitations may be terminated or modified prior to their expiration only with the approval of the Board of Trustees of the Trust. These amounts would be included in “Expenses previously waived or reimbursed” on the Statement of Operations. The advisory fee waiver and expense reimbursement for the fiscal year ended October 31, 2024 and the expenses borne by First Trust and Stonebridge subject to recovery were as follows:
| | Expenses Subject to Recovery | |
| | Year Ended October 31, 2022 | Year Ended October 31, 2023 | Year Ended October 31, 2024 | |
| | | | | |
BNY Mellon Investment Servicing (US) Inc. (“BNY IS”) serves as the Fund’s transfer agent in accordance with certain fee arrangements. As transfer agent, BNY IS is responsible for maintaining shareholder records for the Fund. The Bank of New York Mellon (“BNY”) serves as the Fund’s administrator, fund accountant, and custodian in accordance with certain fee arrangements. As administrator and fund accountant, BNY is responsible for providing certain administrative and accounting services to the Fund, including maintaining the Fund’s books of account, records of the Fund’s securities transactions, and certain other books and records. As custodian, BNY is responsible for custody of the Fund’s assets. BNY IS and BNY are subsidiaries of The Bank of New York Mellon Corporation, a financial holding company.
Notes to Financial Statements (Continued)
First Trust Preferred Securities and Income FundOctober 31, 2024
Each Trustee who is not an officer or employee of First Trust, any sub-advisor or any of their affiliates (“Independent Trustees”) is paid a fixed annual retainer that is allocated equally among each fund in the First Trust Fund Complex. Each Independent Trustee is also paid an annual per fund fee that varies based on whether the fund is a closed-end or other actively managed fund, a target outcome fund or an index fund.
Additionally, the Chairs of the Audit Committee, Nominating and Governance Committee and Valuation Committee, the Vice Chair of the Audit Committee, the Lead Independent Trustee and the Vice Lead Independent Trustee are paid annual fees to serve in such capacities, with such compensation allocated pro rata among each fund in the First Trust Fund Complex based on net assets. Independent Trustees are reimbursed for travel and out-of-pocket expenses in connection with all meetings. The Committee Chairs, the Audit Committee Vice Chair, the Lead Independent Trustee and the Vice Lead Independent Trustee rotate periodically in serving in such capacities. The officers and “Interested” Trustee receive no compensation from the Trust for acting in such capacities.
4. Capital Share Transactions
Capital transactions were as follows:
| Year Ended October 31, 2024 | Year Ended October 31, 2023 |
| | | | |
| | | | |
| | | | |
| | | | |
| | | | |
| | | | |
| | | | |
| | | | |
| | | | |
| | | | |
| | | | |
| | | | |
| | | | |
| | | | |
Total Dividend Reinvestment | | | | |
| | | | |
| | | | |
| | | | |
| | | | |
| | | | |
| | | | |
| | | | |
5. Purchases and Sales of Securities
The cost of purchases and proceeds from sales of securities, excluding short-term investments, for the fiscal year ended October 31, 2024, were $99,643,309 and $92,862,094, respectively.
6. Distribution and Service Plan
The Board of Trustees adopted a Distribution and Service Plan pursuant to Rule 12b-1 under the 1940 Act. In accordance with the Rule 12b-1 plan, the share classes of the Fund are authorized to pay an amount up to 0.25%, 1.00%, 0.15% and 0.50% of their average daily net assets each year for Class A, Class C, Class F and Class R3, respectively, to reimburse First Trust Portfolios L.P. (“FTP”), the distributor of the Fund, for amounts expended to finance activities primarily intended to result in the sale of Fund shares or the provision of investor services. FTP may also use this amount to compensate securities dealers or other persons for providing
Notes to Financial Statements (Continued)
First Trust Preferred Securities and Income FundOctober 31, 2024
distribution assistance, including broker-dealer and shareholder support and educational and promotional services. Class I shares have no 12b-1 fees.
Effective February 28, 2024, the Trust, on behalf of the Fund, along with First Trust Exchange-Traded Fund III, First Trust Exchange-Traded Fund IV and First Trust Variable Insurance Trust, entered into a new Credit Agreement with BNY as administrative agent for a group of lenders. The borrowing rate is the higher of the federal funds effective rate and the adjusted daily simple SOFR rate plus 1.00%. The commitment amount under the credit agreement is $620 million and such commitment amount may be increased up to $700 million with the consent of one or more lenders. BNY charges on behalf of the lenders a commitment fee of 0.20% of the daily amount of the excess of the commitment amount over the outstanding principal balance of the loans, and an agency fee. Prior to February 28, 2024, the Trust, on behalf of the Fund, along with First Trust Exchange-Traded Fund III and First Trust Exchange-Traded Fund IV had a $550 million Credit Agreement with The Bank of Nova Scotia (“Scotia”) as administrative agent for a group of lenders. Scotia charged a commitment fee of 0.25% of the daily amount of the excess of the commitment amount over the outstanding principal balance of the loans, and an agency fee. First Trust allocates the commitment fee and agency fee amongst the funds that have access to the credit line. To the extent that the Fund accesses the credit line, there would also be an interest fee charged. The Fund did not have any borrowings outstanding during the fiscal year ended October 31, 2024.
The Fund has a variety of indemnification obligations under contracts with its service providers. The Fund’s maximum exposure under these arrangements is unknown. However, the Fund has not had prior claims or losses pursuant to these contracts and expects the risk of loss to be remote.
Management has evaluated the impact of all subsequent events on the Fund through the date the financial statements were issued and has determined that there were no subsequent events requiring recognition or disclosure in the financial statements that have not already been disclosed.
Report of Independent Registered Public Accounting Firm
To the Shareholders and the Board of Trustees of First Trust Series Fund:
Opinion on the Financial Statements and Financial Highlights
We have audited the accompanying statement of assets and liabilities, including the portfolio of investments, of First Trust Preferred Securities and Income Fund (the “Fund”), one of the funds constituting the First Trust Series Fund, as of October 31, 2024, the related statement of operations for the year then ended, the statements of changes in net assets for each of the two years in the period then ended, the financial highlights for each of the five years in the period then ended, and the related notes. In our opinion, the financial statements and financial highlights present fairly, in all material respects, the financial position of the Fund as of October 31, 2024, and the results of its operations for the year then ended, the changes in its net assets for each of the two years in the period then ended, and the financial highlights for each of the five years in the period then ended in conformity with accounting principles generally accepted in the United States of America.
These financial statements and financial highlights are the responsibility of the Fund’s management. Our responsibility is to express an opinion on the Fund’s financial statements and financial highlights based on our audits. We are a public accounting firm registered with the Public Company Accounting Oversight Board (United States) (PCAOB) and are required to be independent with respect to the Fund in accordance with the U.S. federal securities laws and the applicable rules and regulations of the Securities and Exchange Commission and the PCAOB.
We conducted our audits in accordance with the standards of the PCAOB. Those standards require that we plan and perform the audit to obtain reasonable assurance about whether the financial statements and financial highlights are free of material misstatement, whether due to error or fraud. The Fund is not required to have, nor were we engaged to perform, an audit of its internal control over financial reporting. As part of our audits, we are required to obtain an understanding of internal control over financial reporting but not for the purpose of expressing an opinion on the effectiveness of the Fund’s internal control over financial reporting. Accordingly, we express no such opinion.
Our audits included performing procedures to assess the risks of material misstatement of the financial statements and financial highlights, whether due to error or fraud, and performing procedures that respond to those risks. Such procedures included examining, on a test basis, evidence regarding the amounts and disclosures in the financial statements and financial highlights. Our audits also included evaluating the accounting principles used and significant estimates made by management, as well as evaluating the overall presentation of the financial statements and financial highlights. Our procedures included confirmation of securities owned as of October 31, 2024, by correspondence with the custodian and brokers; when replies were not received from brokers, we performed other auditing procedures. We believe that our audits provide a reasonable basis for our opinion.
/s/ Deloitte & Touche, LLP
December 23, 2024
We have served as the auditor of one or more First Trust investment companies since 2001.
First Trust Preferred Securities and Income FundOctober 31, 2024 (Unaudited)
Changes in and Disagreements with Accountants (Item 8 of Form N-CSR)
There were no changes in or disagreements with the Fund’s accountants during the fiscal year ended October 31, 2024.
Proxy Disclosures (Item 9 of Form N-CSR)
There were no matters submitted for vote by shareholders of the Fund during the fiscal year ended October 31, 2024.
Remuneration Paid to Directors, Officers, and Others (Item 10 of Form N-CSR)
The applicable aggregate remuneration paid by the Fund during the period covered by the report is included in the Statement of Operations.
Statement Regarding the Basis for the Board’s Approval of Investment Advisory Contract (Item 11 of Form N-CSR)
The Board of Trustees of First Trust Series Fund (the “Trust”), including the Independent Trustees, unanimously approved the continuation of the Investment Management Agreement (the “Advisory Agreement”) between the Trust, on behalf of the First Trust Preferred Securities and Income Fund (the “Fund”), and First Trust Advisors L.P. (the “Advisor”) and the Investment Sub-Advisory Agreement (the “Sub-Advisory Agreement” and together with the Advisory Agreement, the “Agreements”) among the Trust, on behalf of the Fund, the Advisor and Stonebridge Advisors LLC (the “Sub-Advisor”). The Board approved the continuation of the Agreements for a one-year period ending June 30, 2025 at a meeting held on June 2–3, 2024. The Board determined that the continuation of the Agreements is in the best interests of the Fund in light of the nature, extent and quality of the services provided and such other matters as the Board considered to be relevant in the exercise of its business judgment.
To reach this determination, the Board considered its duties under the Investment Company Act of 1940, as amended (the “1940 Act”), as well as under the general principles of state law, in reviewing and approving advisory contracts; the requirements of the 1940 Act in such matters; the fiduciary duty of investment advisors with respect to advisory agreements and compensation; the standards used by courts in determining whether investment company boards have fulfilled their duties; and the factors to be considered by the Board in voting on such agreements. At meetings held on April 16, 2024, April 25, 2024 and June 2–3, 2024, the Board, including the Independent Trustees, reviewed materials provided by the Advisor and the Sub-Advisor responding to requests for information from counsel to the Independent Trustees, submitted on behalf of the Independent Trustees, that, among other things, outlined: the services provided by the Advisor and the Sub-Advisor to the Fund (including the relevant personnel responsible for these services and their experience); the advisory fee rate payable by the Fund and the sub-advisory fee rate as compared to fees charged to a peer group of funds (the “Expense Group”) and a broad peer universe of funds (the “Expense Universe”), each assembled by Broadridge Financial Solutions, Inc. (“Broadridge”), an independent source, and as compared to fees charged to other clients of the Advisor and the Sub-Advisor; the expense ratio of the Fund as compared to expense ratios of the funds in the Fund’s Expense Group and Expense Universe; performance information for the Fund, including comparisons of the Fund’s performance to that of one or more relevant benchmark indexes and to that of a performance group of funds and a broad performance universe of funds (the “Performance Universe”), each assembled by Broadridge; the nature of expenses incurred in providing services to the Fund and the potential for the Advisor and the Sub-Advisor to realize economies of scale, if any; profitability and other financial data for the Advisor; financial data for the Sub-Advisor; any indirect benefits to the Advisor and its affiliates, First Trust Portfolios L.P. (“FTP”) and First Trust Capital Partners, LLC (“FTCP”), and the Sub-Advisor; and information on the Advisor’s and the Sub-Advisor’s compliance programs. The Board reviewed initial materials with the Advisor at the meeting held on April 25, 2024, prior to which the Independent Trustees and their counsel met separately to discuss the information provided by the Advisor and the Sub-Advisor. Following the April 25, 2024 meeting, counsel to the Independent Trustees, on behalf of the Independent Trustees, requested certain clarifications and supplements to the materials provided, and the information provided in response to those requests was considered at an executive session of the Independent Trustees and their counsel held prior to the June 2–3, 2024 meeting, as well as at the June meeting. The Board applied its business judgment to determine whether the arrangements between the Trust and the Advisor and among the Trust, the Advisor and the Sub-Advisor continue to be reasonable business arrangements from the Fund’s perspective. The Board determined that, given the totality of the information provided with respect to the Agreements, the Board had received sufficient information to renew the Agreements. The Board considered that shareholders chose to invest or remain invested in the Fund knowing that the Advisor and the Sub-Advisor manage the Fund and knowing the Fund’s advisory fee.
In reviewing the Agreements, the Board considered the nature, extent and quality of the services provided by the Advisor and the Sub-Advisor under the Agreements. With respect to the Advisory Agreement, the Board considered that the Advisor is responsible for the overall management and administration of the Trust and the Fund and reviewed all of the services provided by the Advisor to the Fund, including the oversight of the Sub-Advisor, as well as the background and experience of the persons responsible for such services. The Board noted that the Advisor oversees the Sub-Advisor’s day-to-day management of the Fund’s investments, including portfolio risk monitoring and performance review. In reviewing the services provided, the Board noted the compliance program that had been developed by the Advisor and considered that it includes a robust program for monitoring the Advisor’s, the Sub-Advisor’s
Other Information (Continued)
First Trust Preferred Securities and Income FundOctober 31, 2024 (Unaudited)
and the Fund’s compliance with the 1940 Act, as well as the Fund’s compliance with its investment objective, policies and restrictions. The Board also considered a report from the Advisor with respect to its risk management functions related to the operation of the Fund. Finally, as part of the Board’s consideration of the Advisor’s services, the Advisor, in its written materials and at the April 25, 2024 meeting, described to the Board the scope of its ongoing investment in additional personnel and infrastructure to maintain and improve the quality of services provided to the Fund and the other funds in the First Trust Fund Complex. With respect to the Sub-Advisory Agreement, the Board reviewed the materials provided by the Sub-Advisor and considered the services that the Sub-Advisor provides to the Fund, including the Sub-Advisor’s day-to-day management of the Fund’s investments. In considering the Sub-Advisor’s management of the Fund, the Board noted the background and experience of the Sub-Advisor’s portfolio management team, including the Board’s prior meetings with members of the portfolio management team. In light of the information presented and the considerations made, the Board concluded that the nature, extent and quality of the services provided to the Trust and the Fund by the Advisor and the Sub-Advisor under the Agreements have been and are expected to remain satisfactory and that the Sub-Advisor, under the oversight of the Advisor, has managed the Fund consistent with its investment objective, policies and restrictions.
The Board considered the advisory and sub-advisory fee rates payable under the Agreements for the services provided. The Board noted that the sub-advisory fee is paid by the Advisor from its advisory fee. The Board considered that the Advisor and the Sub-Advisor agreed to extend the current expense caps for each share class through March 1, 2026 and agreed to keep the long-term expense cap in place from March 1, 2026 through February 28, 2035. The Board noted that fees waived or expenses borne by the Advisor and the Sub-Advisor are subject to reimbursement by the Fund for up to three years from the date the fee was waived or expense was incurred, but no reimbursement payment would be made by the Fund at any time if it would result in the Fund’s expenses exceeding (i) the applicable expense limitation in place for the most recent fiscal year for which such expense limitation was in place, (ii) the applicable expense limitation in place at the time the fees were waived, or (iii) the current expense limitation. The Board received and reviewed information showing the fee rates and expense ratios of the peer funds in the Expense Group, as well as advisory and unitary fee rates charged by the Advisor and the Sub-Advisor to other fund and non-fund clients, as applicable. With respect to the Expense Group, the Board discussed with Broadridge its methodology for assembling peer groups and discussed with the Advisor limitations in creating a relevant peer group for the Fund, including that not all peer funds employ an advisor/sub-advisor management structure. The Board took these limitations into account in considering the peer data. Based on the information provided, the Board noted that the contractual advisory fee rate payable by the Fund was above the median contractual advisory fee of the peer funds in the Expense Group. The Board also noted that the Fund’s total (net) expense ratio (Class A shares) was above the median total (net) expense ratio of the peer funds in the Expense Group. With respect to fees charged to other clients, the Board considered differences between the Fund and other clients that limited their comparability. In considering the advisory fee rate overall, the Board also considered the Advisor’s statement that it seeks to meet investor needs through innovative and value-added investment solutions and the Advisor’s demonstrated long-term commitment to the Fund and the other funds in the First Trust Fund Complex.
The Board considered performance information for the Fund. The Board noted the process it has established for monitoring the Fund’s performance and portfolio risk on an ongoing basis, which includes quarterly performance reporting from the Advisor and the Sub-Advisor for the Fund. The Board determined that this process continues to be effective for reviewing the Fund’s performance. The Board received and reviewed information comparing the Fund’s performance for periods ended December 31, 2023 to the performance of the funds in the Performance Universe and to that of a blended benchmark index. Based on the information provided, the Board noted that the Fund (Class A shares) underperformed the Performance Universe median for the one- and three-year periods ended December 31, 2023, outperformed the Performance Universe median for the five- and ten-year periods ended December 31, 2023, underperformed the blended benchmark index for the one-, five- and ten-year periods ended December 31, 2023 and outperformed the blended benchmark index for the three-year period ended December 31, 2023.
On the basis of all the information provided on the fees, expenses and performance of the Fund and the ongoing oversight by the Board, the Board concluded that the advisory and sub-advisory fees for the Fund continue to be reasonable and appropriate in light of the nature, extent and quality of the services provided by the Advisor and the Sub-Advisor to the Fund under the Agreements.
The Board considered information and discussed with the Advisor whether there were any economies of scale in connection with providing advisory services to the Fund at current asset levels and whether the Fund may benefit from any economies of scale. The Board noted the Advisor’s statement that it believes that its expenses relating to providing advisory services to the Fund will increase during the next twelve months as the Advisor continues to build infrastructure and add new staff. The Board concluded that the advisory fee rate for the Fund reflects an appropriate level of sharing of any economies of scale that may be realized in the management of the Fund at current asset levels. The Board considered the revenues and allocated costs (including the allocation methodology) of the Advisor in serving as investment advisor to the Fund for the twelve months ended December 31, 2023 and the estimated profitability level for the Fund calculated by the Advisor based on such data, as well as complex-wide and product-line profitability data, for the same period. The Board noted the inherent limitations in the profitability analysis and concluded that, based on the information provided, the Advisor’s profitability level for the Fund was not unreasonable. In addition, the Board considered indirect benefits described by the Advisor that may be realized from its relationship with the Fund. The Board considered that the
Other Information (Continued)
First Trust Preferred Securities and Income FundOctober 31, 2024 (Unaudited)
Advisor had identified as an indirect benefit to the Advisor and FTP their exposure to investors and brokers who, absent their exposure to the Fund, may have had no dealings with the Advisor or FTP. The Board considered the ownership interest of FTCP in the Sub-Advisor and potential indirect benefits to the Advisor from such ownership interest. The Board noted that in addition to the advisory fees paid by the Fund, FTP is compensated for services provided to the Fund through 12b-1 distribution and service fees and that the Advisor receives compensation from the Fund for providing fund reporting services pursuant to a separate Fund Reporting Services Agreement. The Board concluded that the character and amount of potential indirect benefits to the Advisor were not unreasonable.
The Board considered the Sub-Advisor’s statements that the Sub-Advisor bears a combination of fixed and variable costs related to managing the Fund and that the Sub-Advisor would add resources as needed if it experiences significant asset growth. The Board noted that the Advisor pays the Sub-Advisor from its advisory fee and its understanding that the Fund’s sub-advisory fee rate was the product of an arm’s length negotiation. The Board did not review the profitability of the Sub-Advisor with respect to the Fund. The Board concluded that the profitability analysis for the Advisor was more relevant. The Board considered indirect benefits that may be realized by the Sub-Advisor from its relationship with the Fund, including potential indirect benefits to the Sub-Advisor from the ownership interest of FTCP in the Sub-Advisor. The Board noted the Sub-Advisor’s statements that its relationship with the Advisor has helped it build relationships with Wall Street firms that have preferred and hybrid securities trading desks, which has led to access to each of those firms’ research reports, various analysts and investment bankers on new issues, and that the Sub-Advisor never accepts soft-dollar arrangements. The Board concluded that the character and amount of potential indirect benefits to the Sub-Advisor were not unreasonable.
Based on all of the information considered and the conclusions reached, the Board, including the Independent Trustees, unanimously determined that the terms of the Agreements continue to be fair and reasonable and that the continuation of the Agreements is in the best interests of the Fund. No single factor was determinative in the Board’s analysis.
The Fund hereby designates as qualified dividend income 20.97% of its ordinary income distributions (including short-term capital gains, if applicable) for the year ended October 31, 2024. In addition, 12.45% of the ordinary income distributions (including short-term capital gain, if applicable) made by the Fund during the fiscal year ended October 31, 2024, qualify for corporate dividends received deduction available to corporate shareholders.
A portion of the ordinary dividends (including short-term capital gains) paid to shareholders during the taxable year ended October 31, 2024, may be eligible for the Qualified Business Income (QBI) Deduction under the Internal Revenue Code of 1986, as amended, section 199A for the aggregate dividends the Fund received from the underlying Real Estate Investment Trusts (REITs) it invests in.
First Trust/Confluence
Small Cap Value Fund
Annual Financial Statements and Other Information
October 31, 2024
First Trust/Confluence Small Cap Value Fund
Annual Financial Statements and Other Information
October 31, 2024
Performance and Risk Disclosure
There is no assurance that First Trust/Confluence Small Cap Value Fund (the “Fund”) will achieve its investment objective. The Fund is subject to market risk, which is the possibility that the market values of securities owned by the Fund will decline and that the value of the Fund’s shares may therefore be less than what you paid for them. Accordingly, you can lose money by investing in the Fund.
Performance data quoted represents past performance, which is no guarantee of future results, and current performance may be lower or higher than the figures shown. For the most recent month-end performance figures, please visit www.ftportfolios.com or speak with your financial advisor. Investment returns and net asset value will fluctuate and Fund shares, when sold, may be worth more or less than their original cost.
First Trust Advisors L.P., the Fund’s advisor, may also periodically provide additional information on Fund performance on the Fund’s web page at www.ftportfolios.com.
This report contains information that may help you evaluate your investment in the Fund. It includes details about the Fund and presents data that provides insight into the Fund’s performance and investment approach.
The material risks of investing in the Fund are spelled out in the prospectus, the statement of additional information, and other Fund regulatory filings.
First Trust/Confluence Small Cap Value FundPortfolio of Investments
October 31, 2024
| | |
|
| | |
| Winnebago Industries, Inc. | |
| | |
| | |
| | |
| | |
| Hayward Holdings, Inc. (a) | |
| | |
| | |
| | |
| Energy Equipment & Services – 2.6% | |
| | |
| Financial Services – 5.4% | |
| | |
| I3 Verticals, Inc., Class A (a) | |
| | |
| | |
| | |
| John B. Sanfilippo & Son, Inc. | |
| | |
| Ground Transportation – 2.8% | |
| | |
| Health Care Equipment & Supplies – 9.5% | |
| | |
| | |
| UFP Technologies, Inc. (a) | |
| | |
| Household Durables – 3.4% | |
| Cavco Industries, Inc. (a) | |
| Household Products – 3.1% | |
| Spectrum Brands Holdings, Inc. | |
| | |
| Baldwin Insurance (The) Group, Inc. (a) | |
| | |
| Hagerty, Inc., Class A (a) | |
| Stewart Information Services Corp. | |
| | |
| Interactive Media & Services – 2.6% | |
| | |
| | |
|
| | |
| American Outdoor Brands, Inc. (a) | |
| | |
| Gates Industrial Corp. PLC (a) | |
| John Bean Technologies Corp. | |
| | |
| | |
| Personal Care Products – 3.1% | |
| Edgewell Personal Care Co. | |
| Real Estate Management & Development – 3.0% | |
| | |
| | |
| Sapiens International Corp., N.V. | |
| Textiles, Apparel & Luxury Goods – 2.2% | |
| | |
| | |
| | |
| | |
| | |
MONEY MARKET FUNDS – 2.4% |
| Dreyfus Government Cash Management Fund, Institutional Class - 4.76% (b) | |
| | |
| Total Investments – 100.1% | |
| | |
| Net Other Assets and Liabilities – (0.1)% | |
| | |
| Non-income producing security. |
| Rate shown reflects yield as of October 31, 2024. |
See Notes to Financial Statements
First Trust/Confluence Small Cap Value FundPortfolio of Investments (Continued)
October 31, 2024
Valuation InputsA summary of the inputs used to value the Fund’s investments as of October 31, 2024 is as follows (see Note 2A - Portfolio Valuation in the Notes to Financial Statements):
| | | Level 2 Significant Observable Inputs | Level 3 Significant Unobservable Inputs |
| | | | |
| | | | |
| | | | |
| See Portfolio of Investments for industry breakout. |
See Notes to Financial Statements
First Trust/Confluence Small Cap Value FundStatement of Assets and Liabilities
October 31, 2024
| |
| |
| |
| |
| |
| |
| |
| |
| |
| |
| |
| |
Investment securities purchased | |
| |
| |
| |
Shareholder reporting fees | |
| |
| |
Commitment and administrative agency fees | |
Trustees’ fees and expenses | |
| |
12b-1 distribution and service fees | |
| |
| |
| |
| |
| |
| |
| |
Accumulated distributable earnings (loss) | |
| |
| |
| |
Net asset value and redemption price per share (Based on net assets of $2,075,497 and 70,064 shares of beneficial interest issued and outstanding, unlimited number of shares authorized) | |
Maximum sales charge (5.50% of offering price) | |
Maximum offering price to public | |
| |
Net asset value and redemption price per share (Based on net assets of $221,405 and 9,051 shares of beneficial interest issued and outstanding, unlimited number of shares authorized) | |
| |
Net asset value and redemption price per share (Based on net assets of $19,395,529 and 622,936 shares of beneficial interest issued and outstanding, unlimited number of shares authorized) | |
See Notes to Financial Statements
First Trust/Confluence Small Cap Value FundStatement of Operations
For the Year Ended October 31, 2024
| |
| |
| |
| |
| |
| |
| |
| |
| |
| |
Commitment and administrative agency fees | |
Shareholder reporting fees | |
Trustees’ fees and expenses | |
| |
| |
12b-1 distribution and/or service fees: | |
| |
| |
| |
| |
| |
| |
| |
Fees waived and expenses reimbursed by the investment advisor | |
| |
NET INVESTMENT INCOME (LOSS) | |
NET REALIZED AND UNREALIZED GAIN (LOSS): | |
Net realized gain (loss) on investments | |
Net change in unrealized appreciation (depreciation) on investments | |
NET REALIZED AND UNREALIZED GAIN (LOSS) | |
NET INCREASE (DECREASE) IN NET ASSETS RESULTING FROM OPERATIONS | |
See Notes to Financial Statements
First Trust/Confluence Small Cap Value FundStatements of Changes in Net Assets
| | |
| | |
Net investment income (loss) | | |
| | |
Net change in unrealized appreciation (depreciation) | | |
Net increase (decrease) in net assets resulting from operations | | |
DISTRIBUTIONS TO SHAREHOLDERS FROM INVESTMENT OPERATIONS: | | |
| | |
| | |
| | |
Total distributions to shareholders from investment operations | | |
| | |
Proceeds from shares sold | | |
Proceeds from shares reinvested | | |
| | |
Net increase (decrease) in net assets resulting from capital transactions | | |
Total increase (decrease) in net assets | | |
| | |
| | |
| | |
See Notes to Financial Statements
First Trust/Confluence Small Cap Value FundFinancial Highlights
For a Share outstanding throughout each period
| |
| | | | | |
Net asset value, beginning of period | | | | | |
Income from investment operations: | | | | | |
Net investment income (loss) (a) | | | | | |
Net realized and unrealized gain (loss) | | | | | |
Total from investment operations | | | | | |
Distributions paid to shareholders from: | | | | | |
| | | | | |
Net asset value, end of period | | | | | |
| | | | | |
Ratios to average net assets/supplemental data: | | | | | |
Net assets, end of period (in 000’s) | | | | | |
Ratio of total expenses to average net assets | | | | | |
Ratio of net expenses to average net assets | | | | | |
Ratio of net investment income (loss) to average net assets | | | | | |
| | | | | |
| Based on average shares outstanding. |
| Assumes reinvestment of all distributions for the period and does not include payment of the maximum sales charge of 5.50% or contingent deferred sales charge (CDSC). On purchases of $1 million or more, a CDSC of 1% may be imposed on certain redemptions made within twelve months of purchase. If the sales charges were included, total returns would be lower. These returns include Rule 12b-1 service fees of 0.25% and do not reflect the deduction of taxes that a shareholder would pay on Fund distributions or the redemption of Fund shares. The total returns would have been lower if certain fees had not been waived and expenses reimbursed by the investment advisor. Total return is calculated for the time period presented and is not annualized for periods of less than one year. |
See Notes to Financial Statements
First Trust/Confluence Small Cap Value FundFinancial Highlights (Continued)
For a Share outstanding throughout each period
| |
| | | | | |
Net asset value, beginning of period | | | | | |
Income from investment operations: | | | | | |
Net investment income (loss) (a) | | | | | |
Net realized and unrealized gain (loss) | | | | | |
Total from investment operations | | | | | |
Distributions paid to shareholders from: | | | | | |
| | | | | |
Net asset value, end of period | | | | | |
| | | | | |
Ratios to average net assets/supplemental data: | | | | | |
Net assets, end of period (in 000’s) | | | | | |
Ratio of total expenses to average net assets | | | | | |
Ratio of net expenses to average net assets | | | | | |
Ratio of net investment income (loss) to average net assets | | | | | |
| | | | | |
| Based on average shares outstanding. |
| Assumes reinvestment of all distributions for the period and does not include payment of the maximum CDSC of 1%, charged on certain redemptions made within one year of purchase. If the sales charge was included, total returns would be lower. These returns include combined Rule 12b-1 distribution and service fees of 1% and do not reflect the deduction of taxes that a shareholder would pay on Fund distributions or the redemption of Fund shares. The total returns would have been lower if certain fees had not been waived and expenses reimbursed by the investment advisor. Total return is calculated for the time period presented and is not annualized for periods of less than one year. |
See Notes to Financial Statements
First Trust/Confluence Small Cap Value FundFinancial Highlights (Continued)
For a Share outstanding throughout each period
| |
| | | | | |
Net asset value, beginning of period | | | | | |
Income from investment operations: | | | | | |
Net investment income (loss) (a) | | | | | |
Net realized and unrealized gain (loss) | | | | | |
Total from investment operations | | | | | |
Distributions paid to shareholders from: | | | | | |
| | | | | |
Net asset value, end of period | | | | | |
| | | | | |
Ratios to average net assets/supplemental data: | | | | | |
Net assets, end of period (in 000’s) | | | | | |
Ratio of total expenses to average net assets | | | | | |
Ratio of net expenses to average net assets | | | | | |
Ratio of net investment income (loss) to average net assets | | | | | |
| | | | | |
| Based on average shares outstanding. |
| Assumes reinvestment of all distributions for the period. These returns do not reflect the deduction of taxes that a shareholder would pay on Fund distributions or the redemption of Fund shares. The total returns would have been lower if certain fees had not been waived and expenses reimbursed by the investment advisor. Total return is calculated for the time period presented and is not annualized for periods of less than one year. |
See Notes to Financial Statements
Notes to Financial Statements
First Trust/Confluence Small Cap Value FundOctober 31, 2024
1. Organization
First Trust/Confluence Small Cap Value Fund (the “Fund”) is a series of the First Trust Series Fund (the “Trust”), a Massachusetts business trust organized on July 9, 2010, and is registered as a diversified open-end management investment company with the Securities and Exchange Commission under the Investment Company Act of 1940, as amended (the “1940 Act”). The Fund offers three classes of shares: Class A, Class C and Class I. Each class represents an interest in the same portfolio of investments but with a different combination of sales charges, distribution and service (12b-1) fees, eligibility requirements and other features.
The Fund’s investment objective seeks to provide long-term capital appreciation. The Fund seeks to achieve its investment objective by investing, under normal market conditions, at least 80% of its net assets (including investment borrowings) in equity securities of U.S. listed companies with small market capitalizations (“Small-Cap Companies”) at the time of investment that Confluence Investment Management LLC (“Confluence” or the “Sub-Advisor”) believes have produced solid returns over extended periods of time. There can be no assurance that the Fund will achieve its investment objective. The Fund may not be appropriate for all investors.
2. Significant Accounting Policies
The Fund is considered an investment company and follows accounting and reporting guidance under Financial Accounting Standards Board Accounting Standards Codification Topic 946, “Financial Services-Investment Companies.” The following is a summary of significant accounting policies consistently followed by the Fund in the preparation of the financial statements. The preparation of the financial statements in accordance with accounting principles generally accepted in the United States of America (“U.S. GAAP”) requires management to make estimates and assumptions that affect the reported amounts and disclosures in the financial statements. Actual results could differ from those estimates.
The net asset value (“NAV”) of each class of shares of the Fund is determined daily as of the close of regular trading on the New York Stock Exchange (“NYSE”), normally 4:00 p.m. Eastern time, on each day the NYSE is open for trading. If the NYSE closes early on a valuation day, the NAV is determined as of that time. The NAV for each class is calculated by dividing the value of the Fund’s total assets attributable to such class (including accrued interest and dividends), less all liabilities attributable to such class (including accrued expenses, dividends declared but unpaid and any borrowings of the Fund), by the total number of shares of the class outstanding. Differences in NAV of each class of the Fund’s shares are generally expected to be due to the daily expense accruals of the specified distribution and service (12b-1) fees and transfer agency costs applicable to such class of shares and the resulting differential in the dividends that may be paid on each class of shares.
The Fund’s investments are valued daily at market value or, in the absence of market value with respect to any portfolio securities, at fair value. Market value prices represent readily available market quotations such as last sale or official closing prices from a national or foreign exchange (i.e., a regulated market) and are primarily obtained from third-party pricing services. Fair value prices represent any prices not considered market value prices and are either obtained from a third-party pricing service or are determined by the Pricing Committee of the Fund’s investment advisor, First Trust Advisors L.P. (“First Trust” or the “Advisor”), in accordance with valuation procedures approved by the Trust’s Board of Trustees, and in accordance with provisions of the 1940 Act and rules thereunder. Investments valued by the Advisor’s Pricing Committee, if any, are footnoted as such in the footnotes to the Portfolio of Investments. The Fund’s investments are valued as follows:
Common stocks and other equity securities listed on any national or foreign exchange (excluding Nasdaq, Inc. (“Nasdaq”) and the London Stock Exchange Alternative Investment Market (“AIM”)) are valued at the last sale price on the exchange on which they are principally traded or, for Nasdaq and AIM securities, the official closing price. Securities traded on more than one securities exchange are valued at the last sale price or official closing price, as applicable, at the close of the securities exchange representing the primary exchange for such securities.
Equity securities traded in an over-the-counter market are valued at the close price or the last trade price.
Shares of open-end funds are valued based on NAV per share.
Certain securities may not be able to be priced by pre-established pricing methods. Such securities may be valued by the Advisor’s Pricing Committee at fair value. These securities generally include, but are not limited to, restricted securities (securities which may not be publicly sold without registration under the Securities Act of 1933, as amended) for which a third-party pricing service is unable to provide a market price; securities whose trading has been formally suspended; a security whose market or fair value price is not available from a pre-established pricing source; a security with respect to which an event has occurred that is likely to materially affect the value of the security after the market has closed but before the calculation of the Fund’s NAV or make it difficult or impossible to obtain a reliable market quotation; and a security whose price, as provided by the third-party pricing service, does not reflect the security’s fair value. As a general principle, the current fair value of a security would appear to be the amount which the owner might
Notes to Financial Statements (Continued)
First Trust/Confluence Small Cap Value FundOctober 31, 2024
reasonably expect to receive for the security upon its current sale. When fair value prices are used, generally they will differ from market quotations or official closing prices on the applicable exchanges. A variety of factors may be considered in determining the fair value of such securities, including, but not limited to, the following:
1)
the last sale price on the exchange on which they are principally traded or, for Nasdaq and AIM securities, the official closing price;
3)
the size of the holding;
4)
the initial cost of the security;
5)
transactions in comparable securities;
6)
price quotes from dealers and/or third-party pricing services;
7)
relationships among various securities;
8)
information obtained by contacting the issuer, analysts, or the appropriate stock exchange;
9)
an analysis of the issuer’s financial statements;
10)
the existence of merger proposals or tender offers that might affect the value of the security; and
11)
other relevant factors.
The Fund is subject to fair value accounting standards that define fair value, establish the framework for measuring fair value and provide a three-level hierarchy for fair valuation based upon the inputs to the valuation as of the measurement date. The three levels of the fair value hierarchy are as follows:
•
Level 1 – Level 1 inputs are quoted prices in active markets for identical investments. An active market is a market in which transactions for the investment occur with sufficient frequency and volume to provide pricing information on an ongoing basis.
•
Level 2 – Level 2 inputs are observable inputs, either directly or indirectly, and include the following:
o
Quoted prices for similar investments in active markets.
o
Quoted prices for identical or similar investments in markets that are non-active. A non-active market is a market where there are few transactions for the investment, the prices are not current, or price quotations vary substantially either over time or among market makers, or in which little information is released publicly.
o
Inputs other than quoted prices that are observable for the investment (for example, interest rates and yield curves observable at commonly quoted intervals, volatilities, prepayment speeds, loss severities, credit risks, and default rates).
o
Inputs that are derived principally from or corroborated by observable market data by correlation or other means.
•
Level 3 – Level 3 inputs are unobservable inputs. Unobservable inputs may reflect the reporting entity’s own assumptions about the assumptions that market participants would use in pricing the investment.
The inputs or methodologies used for valuing investments are not necessarily an indication of the risk associated with investing in those investments. A summary of the inputs used to value the Fund’s investments as of October 31, 2024, is included with the Fund’s Portfolio of Investments.
B. Securities Transactions and Investment Income
Securities transactions are recorded as of the trade date. Realized gains and losses from securities transactions are recorded on the identified cost basis. Dividend income is recorded on the ex-dividend date. Interest income, if any, is recorded daily on the accrual basis, including the amortization of premiums and the accretion of discounts. Income is allocated on a pro rata basis to each class of shares.
The Fund may hold real estate investment trusts (“REITs”). Distributions from such investments may be comprised of return of capital, capital gains and income. The actual character of amounts received during the year is not known until after the REITs’ fiscal year end. The Fund records the character of distributions received from REITs during the year based on estimates available. The characterization of distributions received by the Fund may be subsequently revised based on information received from the REITs after their tax reporting periods conclude.
C. Dividends and Distributions to Shareholders
The Fund will distribute to holders of its shares semi-annual dividends of all or a portion of its net income. Distributions of any net capital gains earned by the Fund will be distributed at least annually. Distributions will automatically be reinvested into additional
Notes to Financial Statements (Continued)
First Trust/Confluence Small Cap Value FundOctober 31, 2024
Fund shares unless cash distributions are elected by the shareholder. The Fund may also designate a portion of the amount paid to redeeming shareholders as a distribution for tax purposes.
Distributions from net investment income and realized capital gains are determined in accordance with federal income tax regulations, which may differ from U.S. GAAP. Certain capital accounts in the financial statements are periodically adjusted for permanent differences in order to reflect their tax character. These permanent differences are primarily due to the varying treatment of income and gain/loss on portfolio securities held by the Fund and have no impact on net assets or NAV per share. Temporary differences, which arise from recognizing certain items of income, expense and gain/loss in different periods for financial statement and tax purposes, will reverse at some point in the future. Permanent differences incurred during the fiscal year ended October 31, 2024, resulting in book and tax accounting differences, have been reclassified at year end to reflect an increase in accumulated net investment income (loss) of $109,648, a decrease in accumulated net realized gain (loss) of $104,021, and a decrease to paid-in capital of $5,627. Accumulated distributable earnings (loss) consists of accumulated net investment income (loss), accumulated net realized gain (loss) on investments, and unrealized appreciation (depreciation) on investments. Net assets were not affected by this reclassification.
The tax character of distributions paid by the Fund during the fiscal years ended October 31, 2024 and 2023, was as follows:
As of October 31, 2024, the components of distributable earnings and net assets on a tax basis were as follows:
Undistributed ordinary income | |
Undistributed capital gains | |
Total undistributed earnings | |
Accumulated capital and other losses | |
Net unrealized appreciation (depreciation) | |
Total accumulated earnings (losses) | |
| |
| |
| |
The Fund intends to continue to qualify as a regulated investment company by complying with the requirements under Subchapter M of the Internal Revenue Code of 1986, as amended, which includes distributing substantially all of its net investment income and net realized gains to shareholders. Accordingly, no provision has been made for federal and state income taxes. However, due to the timing and amount of distributions, the Fund may be subject to an excise tax of 4% of the amount by which approximately 98% of the Fund’s taxable income exceeds the distributions from such taxable income for the calendar year.
The Fund intends to utilize provisions of the federal income tax laws, which allow it to carry a realized capital loss forward indefinitely following the year of the loss and offset such loss against any future realized capital gains. The Fund is subject to certain limitations under U.S. tax rules on the use of capital loss carryforwards and net unrealized built-in losses. These limitations apply when there has been a 50% change in ownership. At October 31, 2024, the Fund had no non-expiring net capital loss carryforwards for federal income tax purposes.
Certain losses realized during the current fiscal year may be deferred and treated as occurring on the first day of the following fiscal year for federal income tax purposes. For the fiscal year ended October 31, 2024, the Fund did not incur any net late year ordinary losses.
The Fund is subject to accounting standards that establish a minimum threshold for recognizing, and a system for measuring, the benefits of a tax position taken or expected to be taken in a tax return. Taxable years ended 2021, 2022, 2023, and 2024 remain open to federal and state audit. As of October 31, 2024, management has evaluated the application of these standards to the Fund and has determined that no provision for income tax is required in the Fund’s financial statements for uncertain tax positions.
Notes to Financial Statements (Continued)
First Trust/Confluence Small Cap Value FundOctober 31, 2024
As of October 31, 2024, the aggregate cost, gross unrealized appreciation, gross unrealized depreciation, and net unrealized appreciation/(depreciation) on investments (including short positions and derivatives, if any) for federal income tax purposes were as follows:
| Gross Unrealized Appreciation | Gross Unrealized (Depreciation) | Net Unrealized Appreciation (Depreciation) |
| | | |
The Fund will pay all expenses directly related to its operations. Expenses of the Fund are allocated on a pro rata basis to each class of shares, except for distribution and service (12b-1) fees and incremental transfer agency costs which are unique to each class of shares.
3. Investment Advisory Fee, Affiliated Transactions and Other Fee Arrangements
First Trust, the investment advisor to the Fund, is a limited partnership with one limited partner, Grace Partners of DuPage L.P., and one general partner, The Charger Corporation. The Charger Corporation is an Illinois corporation controlled by James A. Bowen, Chief Executive Officer of First Trust. First Trust is responsible for the ongoing monitoring of the Fund’s investment portfolio, managing the Fund’s business affairs and providing certain administrative services necessary for the management of the Fund. For these services, First Trust is entitled to a monthly fee calculated at an annual rate of 1.00% of the Fund’s average daily net assets. First Trust also provides fund reporting services to the Fund for a flat annual fee in the amount of $9,250.
Confluence serves as the Fund’s sub-advisor and manages the Fund’s portfolio subject to First Trust’s supervision. The Sub-Advisor receives a monthly sub-advisory fee calculated at an annual rate of 0.50% of the Fund’s average daily net assets that is paid by First Trust out of its investment advisory fee.
First Trust and Confluence have agreed to waive fees and/or reimburse Fund expenses to the extent necessary to prevent the total annual fund operating expenses (excluding 12b-1 distribution and service fees, interest expenses, taxes, acquired fund fees and expenses, fees incurred in acquiring and disposing of portfolio securities and extraordinary expenses) from exceeding 1.35% of average daily net assets of any class of shares of the Fund (the “Expense Cap”) through February 28, 2026 and then from exceeding 1.70% from March 1, 2026 through February 28, 2035 (the “Expense Cap Termination Date”). Expenses borne and fees waived by First Trust and Confluence are subject to recovery on the Fund’s class level, if applicable, by First Trust and Confluence for up to three years from the date the fee or expense was incurred, but no reimbursement payment will be made by the Fund at any time if it would result in the Fund’s expenses exceeding (i) the Expense Cap in place for the most recent fiscal year for which such expense limitation was in place; (ii) the Expense Cap in place at the time the fees were waived; or (iii) the current Expense Cap. Expense limitations may be terminated or modified prior to their expiration only with the approval of the Board of Trustees of the Trust. These amounts would be included in “Expenses previously waived or reimbursed” on the Statement of Operations. The advisory fee waiver and expense reimbursement for the fiscal year ended October 31, 2024 and the expenses borne by First Trust and Confluence subject to recovery were as follows:
| | Expenses Subject to Recovery | |
| | Year Ended October 31, 2022 | Year Ended October 31, 2023 | Year Ended October 31, 2024 | |
| | | | | |
BNY Mellon Investment Servicing (US) Inc. (“BNY IS”) serves as the Fund’s transfer agent in accordance with certain fee arrangements. As transfer agent, BNY IS is responsible for maintaining shareholder records for the Fund. The Bank of New York Mellon (“BNY”) serves as the Fund’s administrator, fund accountant, and custodian in accordance with certain fee arrangements. As administrator and fund accountant, BNY is responsible for providing certain administrative and accounting services to the Fund, including maintaining the Fund’s books of account, records of the Fund’s securities transactions, and certain other books and records. As custodian, BNY is responsible for custody of the Fund’s assets. BNY IS and BNY are subsidiaries of The Bank of New York Mellon Corporation, a financial holding company.
Each Trustee who is not an officer or employee of First Trust, any sub-advisor or any of their affiliates (“Independent Trustees”) is paid a fixed annual retainer that is allocated equally among each fund in the First Trust Fund Complex. Each Independent Trustee is also paid an annual per fund fee that varies based on whether the fund is a closed-end or other actively managed fund, a target outcome fund or an index fund.
Notes to Financial Statements (Continued)
First Trust/Confluence Small Cap Value FundOctober 31, 2024
Additionally, the Chairs of the Audit Committee, Nominating and Governance Committee and Valuation Committee, the Vice Chair of the Audit Committee, the Lead Independent Trustee and the Vice Lead Independent Trustee are paid annual fees to serve in such capacities, with such compensation allocated pro rata among each fund in the First Trust Fund Complex based on net assets. Independent Trustees are reimbursed for travel and out-of-pocket expenses in connection with all meetings. The Committee Chairs, the Audit Committee Vice Chair, the Lead Independent Trustee and the Vice Lead Independent Trustee rotate periodically in serving in such capacities. The officers and “Interested” Trustee receive no compensation from the Trust for acting in such capacities.
4. Capital Share Transactions
Capital transactions were as follows:
| Year Ended October 31, 2024 | Year Ended October 31, 2023 |
| | | | |
| | | | |
| | | | |
| | | | |
| | | | |
| | | | |
| | | | |
| | | | |
| | | | |
| | | | |
Total Dividend Reinvestment | | | | |
| | | | |
| | | | |
| | | | |
| | | | |
| | | | |
5. Purchases and Sales of Securities
The cost of purchases and proceeds from sales of securities, excluding short-term investments, for the fiscal year ended October 31, 2024, were $3,935,020 and $7,662,408, respectively.
6. Distribution and Service Plan
The Board of Trustees adopted a Distribution and Service Plan pursuant to Rule 12b-1 under the 1940 Act. In accordance with the Rule 12b-1 plan, the share classes of the Fund are authorized to pay an amount up to 0.25% and 1.00% of their average daily net assets each year for Class A and Class C, respectively, to reimburse First Trust Portfolios L.P. (“FTP”), the distributor of the Fund, for amounts expended to finance activities primarily intended to result in the sale of Fund shares or the provision of investor services. FTP may also use this amount to compensate securities dealers or other persons for providing distribution assistance, including broker-dealer and shareholder support and educational and promotional services. Class I shares have no 12b-1 fees.
Effective February 28, 2024, the Trust, on behalf of the Fund, along with First Trust Exchange-Traded Fund III, First Trust Exchange-Traded Fund IV and First Trust Variable Insurance Trust, entered into a new Credit Agreement with BNY as administrative agent for a group of lenders. The borrowing rate is the higher of the federal funds effective rate and the adjusted daily simple SOFR rate plus 1.00%. The commitment amount under the credit agreement is $620 million and such commitment amount may be increased up to $700 million with the consent of one or more lenders. BNY charges on behalf of the lenders a commitment fee of 0.20% of the daily amount of the excess of the commitment amount over the outstanding principal balance of the loans, and an agency fee. Prior to February 28, 2024, the Trust, on behalf of the Fund, along with First Trust Exchange-Traded Fund III and First Trust Exchange-Traded Fund IV had a $550 million Credit Agreement with The Bank of Nova Scotia (“Scotia”) as administrative agent for a group of lenders. Scotia charged a commitment fee of 0.25% of the daily amount of the excess of the commitment amount over the outstanding principal
Notes to Financial Statements (Continued)
First Trust/Confluence Small Cap Value FundOctober 31, 2024
balance of the loans, and an agency fee. First Trust allocates the commitment fee and agency fee amongst the funds that have access to the credit line. To the extent that the Fund accesses the credit line, there would also be an interest fee charged. The Fund did not have any borrowings outstanding during the fiscal year ended October 31, 2024.
The Fund has a variety of indemnification obligations under contracts with its service providers. The Fund’s maximum exposure under these arrangements is unknown. However, the Fund has not had prior claims or losses pursuant to these contracts and expects the risk of loss to be remote.
Management has evaluated the impact of all subsequent events on the Fund through the date the financial statements were issued and has determined that there were no subsequent events requiring recognition or disclosure in the financial statements that have not already been disclosed.
Report of Independent Registered Public Accounting Firm
To the Shareholders and the Board of Trustees of First Trust Series Fund:
Opinion on the Financial Statements and Financial Highlights
We have audited the accompanying statement of assets and liabilities, including the portfolio of investments, of First Trust/Confluence Small Cap Value Fund (the “Fund”), one of the funds constituting the First Trust Series Fund, as of October 31, 2024, the related statement of operations for the year then ended, the statements of changes in net assets for each of the two years in the period then ended, the financial highlights for each of the five years in the period then ended, and the related notes. In our opinion, the financial statements and financial highlights present fairly, in all material respects, the financial position of the Fund as of October 31, 2024, and the results of its operations for the year then ended, the changes in its net assets for each of the two years in the period then ended, and the financial highlights for each of the five years in the period then ended in conformity with accounting principles generally accepted in the United States of America.
These financial statements and financial highlights are the responsibility of the Fund’s management. Our responsibility is to express an opinion on the Fund’s financial statements and financial highlights based on our audits. We are a public accounting firm registered with the Public Company Accounting Oversight Board (United States) (PCAOB) and are required to be independent with respect to the Fund in accordance with the U.S. federal securities laws and the applicable rules and regulations of the Securities and Exchange Commission and the PCAOB.
We conducted our audits in accordance with the standards of the PCAOB. Those standards require that we plan and perform the audit to obtain reasonable assurance about whether the financial statements and financial highlights are free of material misstatement, whether due to error or fraud. The Fund is not required to have, nor were we engaged to perform, an audit of its internal control over financial reporting. As part of our audits, we are required to obtain an understanding of internal control over financial reporting but not for the purpose of expressing an opinion on the effectiveness of the Fund’s internal control over financial reporting. Accordingly, we express no such opinion.
Our audits included performing procedures to assess the risks of material misstatement of the financial statements and financial highlights, whether due to error or fraud, and performing procedures that respond to those risks. Such procedures included examining, on a test basis, evidence regarding the amounts and disclosures in the financial statements and financial highlights. Our audits also included evaluating the accounting principles used and significant estimates made by management, as well as evaluating the overall presentation of the financial statements and financial highlights. Our procedures included confirmation of securities owned as of October 31, 2024, by correspondence with the custodian and brokers; when replies were not received from brokers, we performed other auditing procedures. We believe that our audits provide a reasonable basis for our opinion.
/s/ Deloitte & Touche, LLP
December 23, 2024
We have served as the auditor of one or more First Trust investment companies since 2001.
First Trust/Confluence Small Cap Value FundOctober 31, 2024 (Unaudited)
Changes in and Disagreements with Accountants (Item 8 of Form N-CSR)
There were no changes in or disagreements with the Fund’s accountants during the fiscal year ended October 31, 2024.
Proxy Disclosures (Item 9 of Form N-CSR)
There were no matters submitted for vote by shareholders of the Fund during the fiscal year ended October 31, 2024.
Remuneration Paid to Directors, Officers, and Others (Item 10 of Form N-CSR)
The applicable aggregate remuneration paid by the Fund during the period covered by the report is included in the Statement of Operations.
Statement Regarding the Basis for the Board’s Approval of Investment Advisory Contract (Item 11 of Form N-CSR)
The Board of Trustees of First Trust Series Fund (the “Trust”), including the Independent Trustees, unanimously approved the continuation of the Investment Management Agreement (the “Advisory Agreement”) between the Trust, on behalf of the First Trust/Confluence Small Cap Value Fund (the “Fund”), and First Trust Advisors L.P. (the “Advisor”) and the Investment Sub-Advisory Agreement (the “Sub-Advisory Agreement” and together with the Advisory Agreement, the “Agreements”) among the Trust, on behalf of the Fund, the Advisor and Confluence Investment Management LLC (the “Sub-Advisor”). The Board approved the continuation of the Agreements for a one-year period ending June 30, 2025 at a meeting held on June 2–3, 2024. The Board determined that the continuation of the Agreements is in the best interests of the Fund in light of the nature, extent and quality of the services provided and such other matters as the Board considered to be relevant in the exercise of its business judgment.
To reach this determination, the Board considered its duties under the Investment Company Act of 1940, as amended (the “1940 Act”), as well as under the general principles of state law, in reviewing and approving advisory contracts; the requirements of the 1940 Act in such matters; the fiduciary duty of investment advisors with respect to advisory agreements and compensation; the standards used by courts in determining whether investment company boards have fulfilled their duties; and the factors to be considered by the Board in voting on such agreements. At meetings held on April 16, 2024, April 25, 2024 and June 2–3, 2024, the Board, including the Independent Trustees, reviewed materials provided by the Advisor and the Sub-Advisor responding to requests for information from counsel to the Independent Trustees, submitted on behalf of the Independent Trustees, that, among other things, outlined: the services provided by the Advisor and the Sub-Advisor to the Fund (including the relevant personnel responsible for these services and their experience); the advisory fee rate payable by the Fund and the sub-advisory fee rate as compared to fees charged to a peer group of funds (the “Expense Group”) and a broad peer universe of funds (the “Expense Universe”), each assembled by Broadridge Financial Solutions, Inc. (“Broadridge”), an independent source, and as compared to fees charged to other clients of the Advisor and the Sub-Advisor; the expense ratio of the Fund as compared to expense ratios of the funds in the Fund’s Expense Group and Expense Universe; performance information for the Fund, including comparisons of the Fund’s performance to that of one or more relevant benchmark indexes and to that of a performance group of funds and a broad performance universe of funds (the “Performance Universe”), each assembled by Broadridge; the nature of expenses incurred in providing services to the Fund and the potential for the Advisor and the Sub-Advisor to realize economies of scale, if any; profitability and other financial data for the Advisor; financial data for the Sub-Advisor; any indirect benefits to the Advisor and its affiliate, First Trust Portfolios L.P. (“FTP”), and the Sub-Advisor; and information on the Advisor’s and the Sub-Advisor’s compliance programs. The Board reviewed initial materials with the Advisor at the meeting held on April 25, 2024, prior to which the Independent Trustees and their counsel met separately to discuss the information provided by the Advisor and the Sub-Advisor. Following the April 25, 2024 meeting, counsel to the Independent Trustees, on behalf of the Independent Trustees, requested certain clarifications and supplements to the materials provided, and the information provided in response to those requests was considered at an executive session of the Independent Trustees and their counsel held prior to the June 2–3, 2024 meeting, as well as at the June meeting. The Board applied its business judgment to determine whether the arrangements between the Trust and the Advisor and among the Trust, the Advisor and the Sub-Advisor continue to be reasonable business arrangements from the Fund’s perspective. The Board determined that, given the totality of the information provided with respect to the Agreements, the Board had received sufficient information to renew the Agreements. The Board considered that shareholders chose to invest or remain invested in the Fund knowing that the Advisor and the Sub-Advisor manage the Fund and knowing the Fund’s advisory fee.
In reviewing the Agreements, the Board considered the nature, extent and quality of the services provided by the Advisor and the Sub-Advisor under the Agreements. With respect to the Advisory Agreement, the Board considered that the Advisor is responsible for the overall management and administration of the Trust and the Fund and reviewed all of the services provided by the Advisor to the Fund, including the oversight of the Sub-Advisor, as well as the background and experience of the persons responsible for such services. The Board noted that the Advisor oversees the Sub-Advisor’s day-to-day management of the Fund’s investments, including portfolio risk monitoring and performance review. In reviewing the services provided, the Board noted the compliance program that had been developed by the Advisor and considered that it includes a robust program for monitoring the Advisor’s, the Sub-Advisor’s
Other Information (Continued)
First Trust/Confluence Small Cap Value FundOctober 31, 2024 (Unaudited)
and the Fund’s compliance with the 1940 Act, as well as the Fund’s compliance with its investment objective, policies and restrictions. The Board also considered a report from the Advisor with respect to its risk management functions related to the operation of the Fund. Finally, as part of the Board’s consideration of the Advisor’s services, the Advisor, in its written materials and at the April 25, 2024 meeting, described to the Board the scope of its ongoing investment in additional personnel and infrastructure to maintain and improve the quality of services provided to the Fund and the other funds in the First Trust Fund Complex. With respect to the Sub-Advisory Agreement, the Board reviewed the materials provided by the Sub-Advisor and considered the services that the Sub-Advisor provides to the Fund, including the Sub-Advisor’s day-to-day management of the Fund’s investments. In considering the Sub-Advisor’s management of the Fund, the Board noted the background and experience of the Sub-Advisor’s portfolio management team, including the Board’s prior meetings with members of the portfolio management team. In light of the information presented and the considerations made, the Board concluded that the nature, extent and quality of the services provided to the Trust and the Fund by the Advisor and the Sub-Advisor under the Agreements have been and are expected to remain satisfactory and that the Sub-Advisor, under the oversight of the Advisor, has managed the Fund consistent with its investment objective, policies and restrictions.
The Board considered the advisory and sub-advisory fee rates payable under the Agreements for the services provided. The Board noted that the sub-advisory fee is paid by the Advisor from its advisory fee. The Board considered that the Advisor and the Sub-Advisor agreed to extend the current expense caps for each share class through March 1, 2026 and agreed to keep the long-term expense cap in place from March 1, 2026 through February 28, 2035. The Board noted that fees waived or expenses borne by the Advisor and the Sub-Advisor are subject to reimbursement by the Fund for up to three years from the date the fee was waived or expense was incurred, but no reimbursement payment would be made by the Fund at any time if it would result in the Fund’s expenses exceeding (i) the applicable expense limitation in place for the most recent fiscal year for which such expense limitation was in place, (ii) the applicable expense limitation in place at the time the fees were waived, or (iii) the current expense limitation. The Board received and reviewed information showing the fee rates and expense ratios of the peer funds in the Expense Group, as well as advisory and unitary fee rates charged by the Advisor and the Sub-Advisor to other fund and non-fund clients, as applicable. With respect to the Expense Group, the Board discussed with Broadridge its methodology for assembling peer groups and discussed with the Advisor limitations in creating a relevant peer group for the Fund, including that not all peer funds employ an advisor/sub-advisor management structure. The Board took these limitations into account in considering the peer data. Based on the information provided, the Board noted that the contractual advisory fee rate payable by the Fund was above the median contractual advisory fee of the peer funds in the Expense Group. The Board also noted that the Fund’s total (net) expense ratio (Class A shares) was above the median total (net) expense ratio of the peer funds in the Expense Group. With respect to fees charged to other clients, the Board considered differences between the Fund and other clients that limited their comparability. In considering the advisory fee rate overall, the Board also considered the Advisor’s statement that it seeks to meet investor needs through innovative and value-added investment solutions and the Advisor’s demonstrated long-term commitment to the Fund and the other funds in the First Trust Fund Complex.
The Board considered performance information for the Fund. The Board noted the process it has established for monitoring the Fund’s performance and portfolio risk on an ongoing basis, which includes quarterly performance reporting from the Advisor and the Sub-Advisor for the Fund. The Board determined that this process continues to be effective for reviewing the Fund’s performance. The Board received and reviewed information comparing the Fund’s performance for periods ended December 31, 2023 to the performance of the funds in the Performance Universe and to that of a benchmark index. Based on the information provided, the Board noted that the Fund (Class A shares) underperformed the Performance Universe median and the benchmark index for the one-, three-, five- and ten-year periods ended December 31, 2023. The Board noted the Advisor’s discussion of the Fund’s performance at the April 25, 2024 meeting.
On the basis of all the information provided on the fees, expenses and performance of the Fund and the ongoing oversight by the Board, the Board concluded that the advisory and sub-advisory fees for the Fund continue to be reasonable and appropriate in light of the nature, extent and quality of the services provided by the Advisor and the Sub-Advisor to the Fund under the Agreements.
The Board considered information and discussed with the Advisor whether there were any economies of scale in connection with providing advisory services to the Fund at current asset levels and whether the Fund may benefit from any economies of scale. The Board noted the Advisor’s statement that it believes that its expenses relating to providing advisory services to the Fund will increase during the next twelve months as the Advisor continues to build infrastructure and add new staff. The Board concluded that the advisory fee rate for the Fund reflects an appropriate level of sharing of any economies of scale that may be realized in the management of the Fund at current asset levels. The Board considered the revenues and allocated costs (including the allocation methodology) of the Advisor in serving as investment advisor to the Fund for the twelve months ended December 31, 2023 and the estimated profitability level for the Fund calculated by the Advisor based on such data, as well as complex-wide and product-line profitability data, for the same period. The Board noted the inherent limitations in the profitability analysis and concluded that, based on the information provided, the Advisor’s profitability level for the Fund was not unreasonable. In addition, the Board considered indirect benefits described by the Advisor that may be realized from its relationship with the Fund. The Board considered that the Advisor had identified as an indirect benefit to the Advisor and FTP their exposure to investors and brokers who, absent their exposure
Other Information (Continued)
First Trust/Confluence Small Cap Value FundOctober 31, 2024 (Unaudited)
to the Fund, may have had no dealings with the Advisor or FTP. The Board noted that in addition to the advisory fees paid by the Fund, FTP is compensated for services provided to the Fund through 12b-1 distribution and service fees and that the Advisor receives compensation from the Fund for providing fund reporting services pursuant to a separate Fund Reporting Services Agreement. The Board concluded that the character and amount of potential indirect benefits to the Advisor were not unreasonable.
The Board considered the Sub-Advisor’s statement that many of its costs are fixed, allowing for economies of scale. The Board noted that the Advisor pays the Sub-Advisor from its advisory fee and its understanding that the Fund’s sub-advisory fee rate was the product of an arm’s length negotiation. The Board did not review the profitability of the Sub-Advisor with respect to the Fund. The Board concluded that the profitability analysis for the Advisor was more relevant. The Board considered indirect benefits that may be realized by the Sub-Advisor and one of its affiliates from the Sub-Advisor’s relationship with the Fund, including that the Sub-Advisor may enter into soft dollar and commission sharing arrangements, and considered a summary of such arrangements. The Board noted certain additional indirect benefits identified by the Sub-Advisor deriving from the exposure provided by its relationship with the Fund and the Advisor. The Board concluded that the character and amount of potential indirect benefits to the Sub-Advisor were not unreasonable.
Based on all of the information considered and the conclusions reached, the Board, including the Independent Trustees, unanimously determined that the terms of the Agreements continue to be fair and reasonable and that the continuation of the Agreements is in the best interests of the Fund. No single factor was determinative in the Board’s analysis.
The Fund hereby designates as qualified dividend income 100% of its ordinary income distributions (including short-term capital gains, if applicable) for the year ended October 31, 2024. In addition, 100% of the ordinary income distributions (including short-term capital gain, if applicable) made by the Fund during the fiscal year ended October 31, 2024, qualify for corporate dividends received deduction available to corporate shareholders.
Long-term capital gain distributions designated by the Fund are taxable at the applicable capital gain tax rates for federal income tax purposes. For the fiscal year ended October 31, 2024, the Fund designated $325,009 of long-term capital gain distributions.
First Trust Short Duration High Income Fund
Annual Financial Statements and Other Information
October 31, 2024
First Trust Short Duration High Income Fund
Annual Financial Statements and Other Information
October 31, 2024
Performance and Risk Disclosure
There is no assurance that First Trust Short Duration High Income Fund (the “Fund”) will achieve its investment objectives. The Fund is subject to market risk, which is the possibility that the market values of securities owned by the Fund will decline and that the value of the Fund’s shares may therefore be less than what you paid for them. Accordingly, you can lose money by investing in the Fund.
Performance data quoted represents past performance, which is no guarantee of future results, and current performance may be lower or higher than the figures shown. For the most recent month-end performance figures, please visit www.ftportfolios.com or speak with your financial advisor. Investment returns and net asset value will fluctuate and Fund shares, when sold, may be worth more or less than their original cost.
First Trust Advisors L.P., the Fund’s advisor, may also periodically provide additional information on Fund performance on the Fund’s web page at www.ftportfolios.com.
This report contains information that may help you evaluate your investment in the Fund. It includes details about the Fund and presents data that provides insight into the Fund’s performance and investment approach.
The material risks of investing in the Fund are spelled out in the prospectus, the statement of additional information, and other Fund regulatory filings.
First Trust Short Duration High Income FundPortfolio of Investments
October 31, 2024
| | | | |
CORPORATE BONDS AND NOTES – 51.9% |
| Aerospace & Defense – 0.9% | | | |
| | | | |
| | | | |
| | | | |
| | | | |
| | |
| Alternative Carriers – 0.8% | | | |
| Level 3 Financing, Inc. (a) | | | |
| Application Software – 2.5% | | | |
| | | | |
| | | | |
| | | | |
| | | | |
| | | | |
| | |
| | | | |
| Mavis Tire Express Services Topco Corp. (a) | | | |
| | | | |
| iHeartCommunications, Inc. | | | |
| iHeartCommunications, Inc. (a) | | | |
| | | | |
| Sinclair Television Group, Inc. (a) | | | |
| Sirius XM Radio, Inc. (a) | | | |
| | | | |
| | |
| | | | |
| Advanced Drainage Systems, Inc. (a) | | | |
| Builders FirstSource, Inc. (a) | | | |
| Standard Building Solutions, Inc. (a) | | | |
| | |
| | | | |
| CCO Holdings LLC / CCO Holdings Capital Corp. (a) | | | |
| | | | |
| | | | |
| | |
| | | | |
| Fertitta Entertainment, LLC / Fertitta Entertainment Finance Co., Inc. (a) | | | |
| Fertitta Entertainment, LLC / Fertitta Entertainment Finance Co., Inc. (a) | | | |
| VICI Properties 1, LLC (a) | | | |
| | | | |
| | |
| Commercial Printing – 1.1% | | | |
| | | | |
| Multi-Color Corp. (LABL, Inc.) (a) | | | |
| | |
See Notes to Financial Statements
First Trust Short Duration High Income FundPortfolio of Investments (Continued)
October 31, 2024
| | | | |
CORPORATE BONDS AND NOTES (Continued) |
| | | | |
| | | | |
| Environmental & Facilities Services – 0.9% | | | |
| Allied Universal Holdco LLC (a) | | | |
| | | | |
| Wrangler Holdco Corp. (a) | | | |
| | |
| | | | |
| | | | |
| | | | |
| | |
| Health Care Facilities – 0.0% | | | |
| Concentra Escrow Issuer Corp. (a) | | | |
| Health Care Services – 0.2% | | | |
| Raven Acquisition Holdings, LLC (a) | | | |
| Service Corp. International | | | |
| | |
| Health Care Supplies – 0.5% | | | |
| Medline Borrower, L.P. (a) | | | |
| Medline Borrower, L.P. / Medline Co-Issuer, Inc. (a) | | | |
| | |
| Hotels, Resorts & Cruise Lines – 0.2% | | | |
| Hilton Domestic Operating Company, Inc. (a) | | | |
| | | | |
| | |
| Household Products – 1.0% | | | |
| Energizer Holdings, Inc. (a) | | | |
| Human Resource & Employment Services – 0.6% | | | |
| | | | |
| | | | |
| | |
| Industrial Conglomerates – 0.2% | | | |
| | | | |
| Industrial Machinery & Supplies & Components – 0.3% | | | |
| EMRLD Borrower, L.P. / Emerald Co-Issuer, Inc. (a) | | | |
| | | | |
| | |
| | | | |
| Alliant Holdings Intermediate LLC / Alliant Holdings Co-Issuer (a) | | | |
| Alliant Holdings Intermediate LLC / Alliant Holdings Co-Issuer (a) | | | |
| Alliant Holdings Intermediate LLC / Alliant Holdings Co-Issuer (a) | | | |
| | | | |
| | | | |
| Arthur J. Gallagher & Co. | | | |
| AssuredPartners, Inc. (a) | | | |
| Baldwin Insurance Group Holdings LLC / Baldwin Insurance Group Holdings Finance (a) | | | |
See Notes to Financial Statements
First Trust Short Duration High Income FundPortfolio of Investments (Continued)
October 31, 2024
| | | | |
CORPORATE BONDS AND NOTES (Continued) |
| Insurance Brokers (Continued) | | | |
| HUB International Ltd. (a) | | | |
| HUB International Ltd. (a) | | | |
| Panther Escrow Issuer LLC (a) | | | |
| Ryan Specialty Group, LLC (a) | | | |
| | |
| Integrated Telecommunication Services – 0.4% | | | |
| Radiate Holdco LLC / Radiate Finance, Inc. (a) | | | |
| Zayo Group Holdings, Inc. (a) | | | |
| | |
| Internet Services & Infrastructure – 2.7% | | | |
| Go Daddy Operating Co. LLC / GD Finance Co., Inc. (a) | | | |
| Go Daddy Operating Co. LLC / GD Finance Co., Inc. (a) | | | |
| | |
| Leisure Facilities – 0.2% | | | |
| Life Time Fitness, Inc. (a) | | | |
| Six Flags Entertainment Corp. / Six Flags Theme Parks, Inc. (a) | | | |
| | |
| | | | |
| | | | |
| Life Sciences Tools & Services – 0.4% | | | |
| | | | |
| | | | |
| | |
| Managed Health Care – 0.5% | | | |
| | | | |
| Molina Healthcare, Inc. (a) | | | |
| | |
| Metal, Glass & Plastic Containers – 3.0% | | | |
| | | | |
| | | | |
| | | | |
| Owens-Brockway Glass Container, Inc. (a) | | | |
| | |
| Office Services & Supplies – 0.4% | | | |
| Shift4 Payments LLC / Shift4 Payments Finance Sub, Inc. (a) | | | |
| Packaged Foods & Meats – 3.6% | | | |
| | | | |
| Fiesta Purchaser, Inc. (a) | | | |
| Fiesta Purchaser, Inc. (a) | | | |
| Lamb Weston Holdings, Inc. (a) | | | |
| Performance Food Group, Inc. (a) | | | |
| | | | |
| | | | |
| | |
| Paper & Plastic Packaging Products & Materials – 2.1% | | | |
| Graham Packaging Co., Inc. (a) | | | |
See Notes to Financial Statements
First Trust Short Duration High Income FundPortfolio of Investments (Continued)
October 31, 2024
| | | | |
CORPORATE BONDS AND NOTES (Continued) |
| Paper & Plastic Packaging Products & Materials (Continued) | | | |
| Graphic Packaging International LLC (a) | | | |
| Graphic Packaging International LLC (a) | | | |
| Pactiv Evergreen Group Issuer, Inc. / Pactiv Evergreen Group Issuer LLC (a) | | | |
| | |
| | | | |
| Charles River Laboratories International, Inc. (a) | | | |
| Rail Transportation – 0.4% | | | |
| Genesee & Wyoming, Inc. (a) | | | |
| Research & Consulting Services – 0.7% | | | |
| Clarivate Science Holdings Corp. (a) | | | |
| Dun & Bradstreet Corp. (The) (a) | | | |
| | |
| | | | |
| Raising Cane’s Restaurants LLC (a) | | | |
| Security & Alarm Services – 0.2% | | | |
| | | | |
| | | | |
| | |
| Specialized Consumer Services – 0.9% | | | |
| | | | |
| | | | |
| CrowdStrike Holdings, Inc. | | | |
| | | | |
| SS&C Technologies, Inc. (a) | | | |
| | |
| Trading Companies & Distributors – 3.0% | | | |
| American Builders & Contractors Supply Co., Inc. (a) | | | |
| | | | |
| United Rentals North America, Inc. (a) | | | |
| | | | |
| | |
| Total Corporate Bonds and Notes | |
| | | | |
| | | | |
SENIOR FLOATING-RATE LOAN INTERESTS – 31.3% |
| Application Software – 8.4% | | | |
| CDK Global, Inc. (Central Parent, Inc.), Term Loan B, 3 Mo. CME Term SOFR + CSA + 3.25%, 0.00% Floor | | | |
| ConnectWise, LLC, Term Loan B, 3 Mo. CME Term SOFR + CSA + 3.50%, 0.50% Floor | | | |
| Darktrace PLC (Leia Finco US LLC), Second Lien Term Loan , 3 Mo. CME Term SOFR + CSA + 5.25%, 0.00% Floor | | | |
| Epicor Software Corp., Term Loan E, 1 Mo. CME Term SOFR + CSA + 3.25%, 0.75% Floor | | | |
See Notes to Financial Statements
First Trust Short Duration High Income FundPortfolio of Investments (Continued)
October 31, 2024
| | | | |
SENIOR FLOATING-RATE LOAN INTERESTS (Continued) |
| Application Software (Continued) | | | |
| Genesys Cloud Services Holding II, LLC, Combined Term Loan B, 1 Mo. CME Term SOFR + CSA + 3.00%, 0.75% Floor | | | |
| Inmar, Inc., Term Loan B, 1 Mo. CME Term SOFR + CSA + 5.00%, 0.50% Floor | | | |
| Inmar, Inc., Term Loan B, 3 Mo. CME Term SOFR + CSA + 5.00%, 0.50% Floor | | | |
| Internet Brands, Inc. (Web MD/MH Sub I. LLC), Second Lien Term Loan, 1 Mo. CME Term SOFR + CSA + 6.25%, 0.00% Floor | | | |
| Ivanti Software, Inc., Term Loan B, 3 Mo. CME Term SOFR + CSA + 4.25%, 0.75% Floor | | | |
| LogMeIn, Inc. (GoTo Group, Inc.), First Lien First Out TL, 1 Mo. CME Term SOFR + CSA + 4.75%, 0.00% Floor | | | |
| LogMeIn, Inc. (GoTo Group, Inc.), First Lien Second Out TL, 1 Mo. CME Term SOFR + CSA + 4.75%, 0.00% Floor | | | |
| McAfee Corp., Term Loan B, 1 Mo. CME Term SOFR + CSA + 3.25%, 0.50% Floor | | | |
| N-Able, Inc., Term Loan B, 3 Mo. CME Term SOFR + CSA + 2.75%, 0.50% Floor | | | |
| Qlik Technologies (Project Alpha Intermediate Holding, Inc.), 2024 Refi Term Loan B, 3 Mo. CME Term SOFR + CSA + 3.75%, 0.50% Floor | | | |
| Ultimate Software Group (UKG, Inc.), Term Loan B, 1 Mo. CME Term SOFR + CSA + 3.00%, 0.00% Floor | | | |
| | |
| Asset Management & Custody Banks – 1.9% | | | |
| Ascensus Holdings, Inc. (Mercury), First Lien Term Loan, 1 Mo. CME Term SOFR + CSA + 3.50%, 0.50% Floor | | | |
| Edelman Financial Engines Center, LLC, Second Lien Term Loan, 1 Mo. CME Term SOFR + CSA + 5.25%, 0.00% Floor | | | |
| Edelman Financial Engines Center, LLC, Term Loan B, 1 Mo. CME Term SOFR + CSA + 3.25%, 0.00% Floor | | | |
| | |
| | | | |
| Mavis Tire Express Services Topco Corp., Term Loan B, 1 Mo. CME Term SOFR + CSA + 3.50%, 0.75% Floor | | | |
| | | | |
| Fertitta Entertainment, LLC / Fertitta Entertainment Finance Co., Inc., Term Loan B, 1 Mo. CME Term SOFR + CSA + 3.50%, 0.50% Floor | | | |
| Commercial Printing – 0.2% | | | |
| Multi-Color Corp. (LABL, Inc.), Initial Dollar Term Loan, 1 Mo. CME Term SOFR + CSA + 5.00%, 0.50% Floor | | | |
| Electronic Equipment & Instruments – 1.0% | | | |
| Chamberlain Group, Inc. (Chariot), Term Loan B, 1 Mo. CME Term SOFR + CSA + 3.25%, 0.50% Floor | | | |
| Verifone Systems, Inc., Term Loan B, 3 Mo. CME Term SOFR + CSA + 4.00%, 0.00% Floor | | | |
| | |
See Notes to Financial Statements
First Trust Short Duration High Income FundPortfolio of Investments (Continued)
October 31, 2024
| | | | |
SENIOR FLOATING-RATE LOAN INTERESTS (Continued) |
| Health Care Facilities – 0.7% | | | |
| Ardent Health Services, Inc. (AHP Health Partners, Inc.), 2024 Refi Term Loan, 1 Mo. CME Term SOFR + CSA + 2.75%, 0.50% Floor | | | |
| IVC Evidensia (VetStrategy Canada/IVC Acquisition Midco Ltd.), Facility B10, 3 Mo. CME Term SOFR + CSA + 4.75%, 0.50% Floor | | | |
| | |
| Health Care Services – 0.7% | | | |
| Ensemble RCM, LLC, 2024 Refi Loan, 3 Mo. CME Term SOFR + CSA + 3.00%, 0.00% Floor | | | |
| ExamWorks Group, Inc. (Electron Bidco), Term Loan B, 1 Mo. CME Term SOFR + CSA + 3.00%, 0.50% Floor | | | |
| | |
| Health Care Technology – 4.8% | | | |
| athenahealth, Inc., Term Loan B, 1 Mo. CME Term SOFR + CSA + 3.25%, 0.50% Floor | | | |
| Cotiviti, Inc. (Verscend Technologies, Inc.), Fixed Rate Term Loan | | | |
| Mediware (Wellsky/Project Ruby Ultimate Parent Corp.), 2024 Incremental Term Loan, 1 Mo. CME Term SOFR + CSA + 3.50%, 0.00% Floor | | | |
| Mediware (Wellsky/Project Ruby Ultimate Parent Corp.), Term Loan B, 1 Mo. CME Term SOFR + CSA + 3.25%, 0.75% Floor | | | |
| Waystar Technologies, Inc., Term Loan B, 1 Mo. CME Term SOFR + CSA + 2.75%, 0.00% Floor | | | |
| | |
| | | | |
| Hunter Douglas, Inc., Term Loan B, 3 Mo. CME Term SOFR + CSA + 3.50%, 0.50% Floor | | | |
| Industrial Machinery & Supplies & Components – 1.1% | | | |
| Filtration Group Corp., 2021 Incremental Term Loan B, 1 Mo. CME Term SOFR + CSA + 3.50%, 0.50% Floor | | | |
| TK Elevator Newco, Inc., 2024 USD Refi Loan, 6 Mo. CME Term SOFR + CSA + 3.50%, 0.50% Floor | | | |
| | |
| | | | |
| Howden Group Holdings , Term Loan B, 1 Mo. CME Term SOFR + CSA + 3.50%, 0.50% Floor | | | |
| OneDigital Borrower, LLC, First Lien Term Loan B, 1 Mo. CME Term SOFR + CSA + 3.25%, 0.50% Floor | | | |
| OneDigital Borrower, LLC, Second Lien Term Loan, 1 Mo. CME Term SOFR + 5.25%, 0.50% Floor | | | |
| Truist Insurance Holdings LLC (McGriff/Panther Escrow), Second Lien Term Loan, 3 Mo. CME Term SOFR + CSA + 4.75%, 0.00% Floor | | | |
| USI, Inc., 2029 Term Loan B, 3 Mo. CME Term SOFR + CSA + 2.75%, 0.00% Floor | | | |
| | |
See Notes to Financial Statements
First Trust Short Duration High Income FundPortfolio of Investments (Continued)
October 31, 2024
| | | | |
SENIOR FLOATING-RATE LOAN INTERESTS (Continued) |
| Integrated Telecommunication Services – 1.9% | | | |
| Numericable (Altice France S.A. or SFR), Term Loan B-12, 1 Mo. Synthetic USD LIBOR + 3.69%, 0.00% Floor | | | |
| Numericable (Altice France SA or SFR), Term Loan B-13, 6 Mo. Synthetic USD LIBOR + 4.00%, 0.00% Floor | | | |
| Radiate Holdco LLC (Astound), Amendment No. 6 Term Loan, 1 Mo. CME Term SOFR + CSA + 3.25%, 0.75% Floor | | | |
| Zayo Group Holdings, Inc., Incremental Term Loan B-2, 1 Mo. CME Term SOFR + CSA + 4.25%, 0.50% Floor | | | |
| | |
| Internet Services & Infrastructure – 1.1% | | | |
| Sedgwick Claims Management Services, Inc., 2024 Term Loan B, 3 Mo. CME Term SOFR + CSA + 3.00%, 0.00% Floor | | | |
| IT Consulting & Other Services – 2.1% | | | |
| Gainwell Acquisition Corp. (f/k/a Milano), Term Loan B, 3 Mo. CME Term SOFR + CSA + 4.00%, 0.75% Floor | | | |
| Life Sciences Tools & Services – 0.6% | | | |
| Parexel International Corp. (Phoenix Newco), 2024 Refi Term Loan, 1 Mo. CME Term SOFR + CSA + 3.00%, 0.50% Floor | | | |
| Metal, Glass & Plastic Containers – 0.3% | | | |
| Iris Holding, Inc. (Intertape Polymer, Inc.), Initial Term Loan, 3 Mo. CME Term SOFR + CSA + 4.75%, 0.50% Floor | | | |
| ProAmpac PG Borrower LLC, 2024 Refi Term Loan B, 3 Mo. CME Term SOFR + CSA + 4.00%, 0.75% Floor | | | |
| | |
| Other Specialty Retail – 0.6% | | | |
| Petco Animal Supplies, Inc., Initial Term Loan B, 3 Mo. CME Term SOFR + CSA + 3.25%, 0.75% Floor | | | |
| | | | |
| IRB Holding Corp. (Arby’s/Inspire Brands), 2024 Replacement Term Loan B, 1 Mo. CME Term SOFR + CSA + 2.75%, 0.75% Floor | | | |
| Security & Alarm Services – 0.7% | | | |
| Garda World Security Corp., Term Loan B, 1 Mo. CME Term SOFR + CSA + 3.50%, 0.00% Floor | | | |
| | | | |
| Idera, Inc. (Flash Charm), Second Lien Term Loan, 3 Mo. CME Term SOFR + CSA + 6.75%, 0.75% Floor | | | |
| SUSE (Marcel Bidco, LLC), Term Loan B, Daily SOFR CME Term SOFR + CSA + 3.50%, 0.50% Floor | | | |
| | |
| Trading Companies & Distributors – 0.2% | | | |
| Veritiv Corp. (Verde Purchaser, LLC), 2024 Refi Term Loan B, 3 Mo. CME Term SOFR + CSA + 4.50%, 0.00% Floor | | | |
| Total Senior Floating-Rate Loan Interests | |
| | | | |
See Notes to Financial Statements
First Trust Short Duration High Income FundPortfolio of Investments (Continued)
October 31, 2024
| | | | |
FOREIGN CORPORATE BONDS AND NOTES – 11.2% |
| Application Software – 2.7% | | | |
| | | | |
| | | | |
| | |
| Automotive Parts & Equipment – 1.6% | | | |
| Clarios Global, L.P. / Clarios US Finance Co. (a) | | | |
| | | | |
| Flutter Treasury Designated Activity Co. (a) | | | |
| Environmental & Facilities Services – 0.5% | | | |
| GFL Environmental, Inc. (a) | | | |
| IT Consulting & Other Services – 0.8% | | | |
| | | | |
| Metal, Glass & Plastic Containers – 1.4% | | | |
| Trivium Packaging Finance BV (a) | | | |
| | | | |
| 1011778 BC ULC / New Red Finance, Inc. (a) | | | |
| 1011778 BC ULC / New Red Finance, Inc. (a) | | | |
| | |
| Security & Alarm Services – 0.9% | | | |
| Garda World Security Corp. (a) | | | |
| Garda World Security Corp. (a) | | | |
| Garda World Security Corp. (a) | | | |
| | |
| Specialized Consumer Services – 0.3% | | | |
| Belron UK Finance LLC (a) | | | |
| Transaction & Payment Processing Services – 0.3% | | | |
| Paysafe Finance PLC / Paysafe Holdings US Corp. (a) | | | |
| Total Foreign Corporate Bonds and Notes | |
| | | | |
| | |
|
| | |
| | |
| | |
|
| Life Sciences Tools & Services – 0.0% | |
| New Millennium Holdco, Inc., Corporate Claim Trust, no expiration date (f) (g) (h) (i) | |
| New Millennium Holdco, Inc., Lender Claim Trust, no expiration date (f) (g) (h) (i) | |
| | |
| | |
See Notes to Financial Statements
First Trust Short Duration High Income FundPortfolio of Investments (Continued)
October 31, 2024
| | |
MONEY MARKET FUNDS – 2.8% |
| Morgan Stanley Institutional Liquidity Funds - Treasury Portfolio - Institutional Class - 4.71% (j) | |
| | |
| Total Investments – 97.2% | |
| | |
| Net Other Assets and Liabilities – 2.8% | |
| | |
| This security, sold within the terms of a private placement memorandum, is exempt from registration upon resale under Rule 144A of the Securities Act of 1933, as amended (the “1933 Act”), and may be resold in transactions exempt from registration, normally to qualified institutional buyers. Pursuant to procedures adopted by the Trust’s Board of Trustees, this security has been determined to be liquid by First Trust Advisors L.P. (the “Advisor”). Although market instability can result in periods of increased overall market illiquidity, liquidity for each security is determined based on security specific factors and assumptions, which require subjective judgment. At October 31, 2024, securities noted as such amounted to $44,344,465 or 60.0% of net assets. |
| Senior Floating-Rate Loan Interests (“Senior Loans”) in which the Fund invests pay interest at rates which are periodically predetermined by reference to a base lending rate plus a premium. These base lending rates are generally (i) the SOFR obtained from the U.S. Department of the Treasury’s Office of Financial Research or another major financial institution, (ii) the lending rate offered by one or more major European banks, such as the synthetic LIBOR, (iii) the prime rate offered by one or more United States banks or (iv) the certificate of deposit rate. Certain Senior Loans are subject to a SOFR or synthetic LIBOR floor that establishes a minimum SOFR or synthetic LIBOR rate. When a range of rates is disclosed, the Fund holds more than one contract within the same tranche with identical SOFR or synthetic LIBOR period, spread and floor, but different SOFR or synthetic LIBOR reset dates. |
| Senior Loans generally are subject to mandatory and/or optional prepayment. As a result, the actual remaining maturity of Senior Loans may be substantially less than the stated maturities shown. |
| This issuer has filed for protection in bankruptcy court. |
| Security received in a transaction exempt from registration under the 1933 Act. The security may be resold pursuant to an exemption from registration under the 1933 Act, typically to qualified institutional buyers (see Note 2D - Restricted Securities in the Notes to Financial Statements). |
| Non-income producing security. |
| This security is fair valued by the Advisor’s Pricing Committee in accordance with procedures approved by the Trust’s Board of Trustees, and in accordance with the provisions of the Investment Company Act of 1940 and rules thereunder, as amended. At October 31, 2024, securities noted as such are valued at $0 or 0.0% of net assets. |
| Pursuant to procedures adopted by the Trust’s Board of Trustees, this security has been determined to be illiquid by the Advisor. |
| This security’s value was determined using significant unobservable inputs. (see Note 2A - Portfolio Valuation in the Notes to Financial Statements). |
| Rate shown reflects yield as of October 31, 2024. |
Abbreviations throughout the Portfolio of Investments: |
| – Chicago Mercantile Exchange |
| – Credit Spread Adjustment |
| – London Interbank Offered Rate |
| – Secured Overnight Financing Rate |
| |
See Notes to Financial Statements
First Trust Short Duration High Income FundPortfolio of Investments (Continued)
October 31, 2024
Valuation InputsA summary of the inputs used to value the Fund’s investments as of October 31, 2024 is as follows (see Note 2A - Portfolio Valuation in the Notes to Financial Statements):
| | | Level 2 Significant Observable Inputs | Level 3 Significant Unobservable Inputs |
Corporate Bonds and Notes* | | | | |
Senior Floating-Rate Loan Interests* | | | | |
Foreign Corporate Bonds and Notes* | | | | |
| | | | |
| | | | |
| | | | |
| | | | |
| See Portfolio of Investments for industry breakout. |
| Investments are valued at $0. |
Level 3 investments are fair valued by the Advisor’s Pricing Committee and are footnoted in the Portfolio of Investments. All Level 3 values are based on unobservable inputs.
See Notes to Financial Statements
First Trust Short Duration High Income FundStatement of Assets and Liabilities
October 31, 2024
| |
| |
| |
| |
Investment securities sold | |
| |
| |
| |
| |
| |
| |
Investment securities purchased | |
| |
| |
| |
| |
| |
12b-1 distribution and service fees | |
Shareholder reporting fees | |
| |
| |
| |
Trustees’ fees and expenses | |
| |
| |
| |
| |
| |
| |
| |
| |
| |
Accumulated distributable earnings (loss) | |
| |
| |
| |
Net asset value and redemption price per share (Based on net assets of $11,959,742 and 663,430 shares of beneficial interest issued and outstanding, unlimited number of shares authorized) | |
Maximum sales charge (3.50% of offering price) | |
Maximum offering price to public | |
| |
Net asset value and redemption price per share (Based on net assets of $10,196,711 and 566,118 shares of beneficial interest issued and outstanding, unlimited number of shares authorized) | |
| |
Net asset value and redemption price per share (Based on net assets of $51,734,492 and 2,869,657 shares of beneficial interest issued and outstanding, unlimited number of shares authorized) | |
See Notes to Financial Statements
First Trust Short Duration High Income FundStatement of Operations
For the Year Ended October 31, 2024
| |
| |
| |
| |
| |
| |
| |
12b-1 distribution and/or service fees: | |
| |
| |
| |
| |
| |
| |
Shareholder reporting fees | |
| |
Trustees’ fees and expenses | |
| |
| |
| |
| |
| |
Fees waived by the investment advisor | |
| |
NET INVESTMENT INCOME (LOSS) | |
NET REALIZED AND UNREALIZED GAIN (LOSS): | |
Net realized gain (loss) on investments | |
Net change in unrealized appreciation (depreciation) on investments | |
NET REALIZED AND UNREALIZED GAIN (LOSS) | |
NET INCREASE (DECREASE) IN NET ASSETS RESULTING FROM OPERATIONS | |
See Notes to Financial Statements
First Trust Short Duration High Income FundStatements of Changes in Net Assets
| | |
| | |
Net investment income (loss) | | |
| | |
Net change in unrealized appreciation (depreciation) | | |
Net increase (decrease) in net assets resulting from operations | | |
DISTRIBUTIONS TO SHAREHOLDERS FROM INVESTMENT OPERATIONS: | | |
| | |
| | |
| | |
Total distributions to shareholders from investment operations | | |
DISTRIBUTIONS TO SHAREHOLDERS FROM RETURN OF CAPITAL: | | |
| | |
| | |
| | |
Total distributions to shareholders from return of capital | | |
| | |
Proceeds from shares sold | | |
Proceeds from shares reinvested | | |
| | |
Net increase (decrease) in net assets resulting from capital transactions | | |
Total increase (decrease) in net assets | | |
| | |
| | |
| | |
See Notes to Financial Statements
First Trust Short Duration High Income FundFinancial Highlights
For a Share outstanding throughout each period
| |
| | | | | |
Net asset value, beginning of period | | | | | |
Income from investment operations: | | | | | |
Net investment income (loss) (a) | | | | | |
Net realized and unrealized gain (loss) | | | | | |
Total from investment operations | | | | | |
Distributions paid to shareholders from: | | | | | |
| | | | | |
| | | | | |
| | | | | |
Net asset value, end of period | | | | | |
| | | | | |
Ratios to average net assets/supplemental data: | | | | | |
Net assets, end of period (in 000’s) | | | | | |
Ratio of total expenses to average net assets | | | | | |
Ratio of net expenses to average net assets | | | | | |
Ratio of net investment income (loss) to average net assets | | | | | |
| | | | | |
| Based on average shares outstanding. |
| Assumes reinvestment of all distributions for the period and does not include payment of the maximum sales charge of 3.50% or contingent deferred sales charge (CDSC). On purchases of $250,000 or more, a CDSC of 1% may be imposed on certain redemptions made within twelve months of purchase. If the sales charges were included, total returns would be lower. These returns include Rule 12b-1 service fees of 0.25% and do not reflect the deduction of taxes that a shareholder would pay on Fund distributions or the redemption of Fund shares. The total returns would have been lower if certain fees had not been waived and expenses reimbursed by the investment advisor. Total return is calculated for the time period presented and is not annualized for periods of less than one year. |
| Includes excise tax. If this excise tax expense was not included, the net expense ratio would have been 1.23%. |
See Notes to Financial Statements
First Trust Short Duration High Income FundFinancial Highlights (Continued)
For a Share outstanding throughout each period
| |
| | | | | |
Net asset value, beginning of period | | | | | |
Income from investment operations: | | | | | |
Net investment income (loss) (a) | | | | | |
Net realized and unrealized gain (loss) | | | | | |
Total from investment operations | | | | | |
Distributions paid to shareholders from: | | | | | |
| | | | | |
| | | | | |
| | | | | |
Net asset value, end of period | | | | | |
| | | | | |
Ratios to average net assets/supplemental data: | | | | | |
Net assets, end of period (in 000’s) | | | | | |
Ratio of total expenses to average net assets | | | | | |
Ratio of net expenses to average net assets | | | | | |
Ratio of net investment income (loss) to average net assets | | | | | |
| | | | | |
| Based on average shares outstanding. |
| Assumes reinvestment of all distributions for the period and does not include payment of the maximum CDSC of 1%, charged on certain redemptions made within one year of purchase. If the sales charge was included, total returns would be lower. These returns include combined Rule 12b-1 distribution and service fees of 1% and do not reflect the deduction of taxes that a shareholder would pay on Fund distributions or the redemption of Fund shares. The total returns would have been lower if certain fees had not been waived and expenses reimbursed by the investment advisor. Total return is calculated for the time period presented and is not annualized for periods of less than one year. |
| Includes excise tax. If this excise tax expense was not included, the net expense ratio would have been 2.02%. |
See Notes to Financial Statements
First Trust Short Duration High Income FundFinancial Highlights (Continued)
For a Share outstanding throughout each period
| |
| | | | | |
Net asset value, beginning of period | | | | | |
Income from investment operations: | | | | | |
Net investment income (loss) (a) | | | | | |
Net realized and unrealized gain (loss) | | | | | |
Total from investment operations | | | | | |
Distributions paid to shareholders from: | | | | | |
| | | | | |
| | | | | |
| | | | | |
Net asset value, end of period | | | | | |
| | | | | |
Ratios to average net assets/supplemental data: | | | | | |
Net assets, end of period (in 000’s) | | | | | |
Ratio of total expenses to average net assets | | | | | |
Ratio of net expenses to average net assets | | | | | |
Ratio of net investment income (loss) to average net assets | | | | | |
| | | | | |
| Based on average shares outstanding. |
| Assumes reinvestment of all distributions for the period. These returns do not reflect the deduction of taxes that a shareholder would pay on Fund distributions or the redemption of Fund shares. The total returns would have been lower if certain fees had not been waived and expenses reimbursed by the investment advisor. Total return is calculated for the time period presented and is not annualized for periods of less than one year. |
| Includes excise tax. If this excise tax expense was not included, the net expense ratio would have been 1.01%. |
See Notes to Financial Statements
Notes to Financial Statements
First Trust Short Duration High Income FundOctober 31, 2024
1. Organization
First Trust Short Duration High Income Fund (the “Fund”) is a series of the First Trust Series Fund (the “Trust”), a Massachusetts business trust organized on July 9, 2010, and is registered as a diversified open-end management investment company with the Securities and Exchange Commission under the Investment Company Act of 1940, as amended (the “1940 Act”). The Fund offers three classes of shares: Class A, Class C and Class I. Each class represents an interest in the same portfolio of investments but with a different combination of sales charges, distribution and service (12b-1) fees, eligibility requirements and other features.
The Fund seeks to provide a high level of current income. As a secondary objective, the Fund seeks capital appreciation. The Fund seeks to achieve its investment objectives by investing, under normal market conditions, at least 80% of its net assets (including investment borrowings) in high yield debt securities and bank loans that are rated below-investment grade or unrated. High yield debt securities are below-investment grade debt securities, commonly known as “junk bonds.” For purposes of determining whether a security is below-investment grade, the lowest available rating is used. There can be no assurance that the Fund will achieve its investment objectives. The Fund may not be appropriate for all investors.
2. Significant Accounting Policies
The Fund is considered an investment company and follows accounting and reporting guidance under Financial Accounting Standards Board Accounting Standards Codification Topic 946, “Financial Services-Investment Companies.” The following is a summary of significant accounting policies consistently followed by the Fund in the preparation of the financial statements. The preparation of the financial statements in accordance with accounting principles generally accepted in the United States of America (“U.S. GAAP”) requires management to make estimates and assumptions that affect the reported amounts and disclosures in the financial statements. Actual results could differ from those estimates.
The net asset value (“NAV”) of each class of shares of the Fund is determined daily as of the close of regular trading on the New York Stock Exchange (“NYSE”), normally 4:00 p.m. Eastern time, on each day the NYSE is open for trading. If the NYSE closes early on a valuation day, the NAV is determined as of that time. The NAV for each class is calculated by dividing the value of the Fund’s total assets attributable to such class (including accrued interest and dividends), less all liabilities attributable to such class (including accrued expenses, dividends declared but unpaid and any borrowings of the Fund), by the total number of shares of the class outstanding. Differences in NAV of each class of the Fund’s shares are generally expected to be due to the daily expense accruals of the specified distribution and service (12b-1) fees and transfer agency costs applicable to such class of shares and the resulting differential in the dividends that may be paid on each class of shares.
The Fund’s investments are valued daily at market value or, in the absence of market value with respect to any portfolio securities, at fair value. Market value prices represent readily available market quotations such as last sale or official closing prices from a national or foreign exchange (i.e., a regulated market) and are primarily obtained from third-party pricing services. Fair value prices represent any prices not considered market value prices and are either obtained from a third-party pricing service or are determined by the Pricing Committee of the Trust’s investment advisor, First Trust Advisors L.P. (“First Trust” or the “Advisor”), in accordance with valuation procedures approved by the Trust’s Board of Trustees, and in accordance with provisions of the 1940 Act and rules thereunder. Investments valued by the Advisor’s Pricing Committee, if any, are footnoted as such in the footnotes to the Portfolio of Investments. The Fund’s investments are valued as follows:
Senior Floating-Rate Loan interests (“Senior Loans”)(1) are not listed on any securities exchange or board of trade. Senior Loans are typically bought and sold by institutional investors in individually negotiated private transactions that function in many respects like an over-the-counter secondary market, although typically no formal market-makers exist. This market, while having grown substantially since its inception, generally has fewer trades and less liquidity than the secondary market for other types of securities. Some Senior Loans have few or no trades, or trade infrequently, and information regarding a specific Senior Loan may not be widely available or may be incomplete. Accordingly, determinations of the market value of Senior Loans may be based on infrequent and dated information. Because there is less reliable, objective data available, elements of judgment may play a greater role in valuation of Senior Loans than for other types of securities. Typically, Senior Loans are fair valued using information provided by a third-party pricing service. The third-party pricing service primarily uses over-the-counter pricing from dealer runs and broker quotes from indicative sheets to value the Senior Loans.
Common stocks and other equity securities listed on any national or foreign exchange (excluding Nasdaq, Inc. and the London Stock Exchange Alternative Investment Market (“AIM”)) are valued at the last sale price on the exchange on which they are principally traded or, for Nasdaq and AIM securities, the official closing price. Securities traded on more than one securities
(1)
The terms “security” and “securities” used throughout the Notes to Financial Statements include Senior Loans.
Notes to Financial Statements (Continued)
First Trust Short Duration High Income FundOctober 31, 2024
exchange are valued at the last sale price or official closing price, as applicable, at the close of the securities exchange representing the primary exchange for such securities.
Shares of open-end funds are valued based on NAV per share.
Fixed income and other debt securities having a remaining maturity of sixty days or less when purchased are fair valued at cost adjusted for amortization of premiums and accretion of discounts (amortized cost), provided the Advisor’s Pricing Committee has determined that the use of amortized cost is an appropriate reflection of fair value given market and issuer-specific conditions existing at the time of the determination. Factors that may be considered in determining the appropriateness of the use of amortized cost include, but are not limited to, the following:
1)
the credit conditions in the relevant market and changes thereto;
2)
the liquidity conditions in the relevant market and changes thereto;
3)
the interest rate conditions in the relevant market and changes thereto (such as significant changes in interest rates);
4)
issuer-specific conditions (such as significant credit deterioration); and
5)
any other market-based data the Advisor’s Pricing Committee considers relevant. In this regard, the Advisor’s Pricing Committee may use last-obtained market-based data to assist it when valuing portfolio securities using amortized cost.
Corporate bonds, corporate notes and other debt securities are fair valued on the basis of valuations provided by a third-party pricing service approved by the Advisor’s Pricing Committee, which may use the following valuation inputs when available:
7)
reference data including market research publications.
Equity securities traded in an over-the-counter market are valued at the close price or the last trade price.
Certain securities may not be able to be priced by pre-established pricing methods. Such securities may be valued by the Advisor’s Pricing Committee at fair value. These securities generally include, but are not limited to, restricted securities (securities which may not be publicly sold without registration under the Securities Act of 1933, as amended) for which a third-party pricing service is unable to provide a market price; securities whose trading has been formally suspended; a security whose market or fair value price is not available from a pre-established pricing source; a security with respect to which an event has occurred that is likely to materially affect the value of the security after the market has closed but before the calculation of the Fund’s NAV or make it difficult or impossible to obtain a reliable market quotation; and a security whose price, as provided by the third-party pricing service, does not reflect the security’s fair value. As a general principle, the current fair value of a security would appear to be the amount which the owner might reasonably expect to receive for the security upon its current sale. When fair value prices are used, generally they will differ from market quotations or official closing prices on the applicable exchanges. A variety of factors may be considered in determining the fair value of such securities, including, but not limited to, the following:
1)
the most recent price provided by a pricing service;
2)
available market prices for the fixed-income security;
3)
the fundamental business data relating to the borrower/issuer;
4)
an evaluation of the forces which influence the market in which these securities are purchased and sold;
5)
the type, size and cost of the security;
6)
the financial statements of the issuer;
7)
the credit quality and cash flow of the issuer;
8)
the information as to any transactions in or offers for the security;
9)
the price and extent of public trading in similar securities (or equity securities) of the issuer, or comparable companies;
11)
the quality, value and salability of collateral, if any, securing the security;
12)
the business prospects of the issuer, including any ability to obtain money or resources from a parent or affiliate and an assessment of the borrower’s/issuer’s management;
Notes to Financial Statements (Continued)
First Trust Short Duration High Income FundOctober 31, 2024
13)
the prospects for the borrower’s/issuer’s industry, and multiples (of earnings and/or cash flows) being paid for similar businesses in that industry;
14)
the borrower’s/issuer’s competitive position within the industry;
15)
the borrower’s/issuer’s ability to access additional liquidity through public and/or private markets; and
16)
other relevant factors.
The Fund is subject to fair value accounting standards that define fair value, establish the framework for measuring fair value and provide a three-level hierarchy for fair valuation based upon the inputs to the valuation as of the measurement date. The three levels of the fair value hierarchy are as follows:
•
Level 1 – Level 1 inputs are quoted prices in active markets for identical investments. An active market is a market in which transactions for the investment occur with sufficient frequency and volume to provide pricing information on an ongoing basis.
•
Level 2 – Level 2 inputs are observable inputs, either directly or indirectly, and include the following:
o
Quoted prices for similar investments in active markets.
o
Quoted prices for identical or similar investments in markets that are non-active. A non-active market is a market where there are few transactions for the investment, the prices are not current, or price quotations vary substantially either over time or among market makers, or in which little information is released publicly.
o
Inputs other than quoted prices that are observable for the investment (for example, interest rates and yield curves observable at commonly quoted intervals, volatilities, prepayment speeds, loss severities, credit risks, and default rates).
o
Inputs that are derived principally from or corroborated by observable market data by correlation or other means.
•
Level 3 – Level 3 inputs are unobservable inputs. Unobservable inputs may reflect the reporting entity’s own assumptions about the assumptions that market participants would use in pricing the investment.
The inputs or methodologies used for valuing investments are not necessarily an indication of the risk associated with investing in those investments. A summary of the inputs used to value the Fund’s investments as of October 31, 2024, is included with the Fund’s Portfolio of Investments.
B. Securities Transactions and Investment Income
Securities transactions are recorded as of the trade date. Realized gains and losses from securities transactions are recorded on the identified cost basis. Dividend income is recorded on the ex-dividend date. Interest income is recorded daily on the accrual basis. Market premiums and discounts are amortized over the expected life of each respective borrowing. Amortization of premiums and accretion of discounts are recorded using the effective interest method.
As of October 1, 2024, the United Kingdom’s Financial Conduct Authority ceased all London Interbank Offered Rate (“LIBOR”) publications. Transitioning to the Secured Overnight Financing Rate (“SOFR”), or any alternative reference rate, may affect the value, liquidity or return on certain investments previously based on LIBOR.
Securities purchased or sold on a when-issued, delayed-delivery or forward purchase commitment basis may have extended settlement periods. The value of the security so purchased is subject to market fluctuations during this period. Due to the nature of the Senior Loan market, the actual settlement date may not be certain at the time of the purchase or sale for some of the Senior Loans. Interest income on such Senior Loans is not accrued until settlement date. The Fund maintains liquid assets with a current value at least equal to the amount of its when-issued, delayed-delivery or forward purchase commitments. At October 31, 2024, the Fund had no when-issued, delayed-delivery or forward purchase commitments.
C. Unfunded Loan Commitments
The Fund may enter into certain credit agreements, all or a portion of which may be unfunded. The Fund is obligated to fund these loan commitments at the borrower’s discretion. The Fund had no unfunded loan commitments as of October 31, 2024.
The Fund invests in restricted securities, which are securities that may not be offered for public sale without first being registered under the 1933 Act. Prior to registration, restricted securities may only be resold in transactions exempt from registration under Rule 144A under the 1933 Act, normally to qualified institutional buyers. As of October 31, 2024, the Fund held restricted securities as shown in the following table that the Advisor has deemed illiquid pursuant to procedures adopted by the Trust’s Board of Trustees. Although market instability can result in periods of increased overall market illiquidity, liquidity for each security is determined based
Notes to Financial Statements (Continued)
First Trust Short Duration High Income FundOctober 31, 2024
on security-specific factors and assumptions, which require subjective judgment. The Fund does not have the right to demand that such securities be registered. These securities are valued according to the valuation procedures as stated in the Portfolio Valuation note (Note 2A) and are not expressed as a discount to the carrying value of a comparable unrestricted security. There are no unrestricted securities with the same maturity dates and yields for these issuers.
| | | | | | |
| | | | | | |
* Amount is less than 0.1%. | | | | | | |
E. Dividends and Distributions to Shareholders
The Fund will declare daily and pay monthly distributions of all or a portion of its net income to holders of each class of shares. Distributions of any net capital gains earned by the Fund will be distributed at least annually. Distributions will automatically be reinvested into additional Fund shares unless cash distributions are elected by the shareholder. The Fund may also designate a portion of the amount paid to redeeming shareholder as a distribution for tax purposes.
Distributions from net investment income and realized capital gains are determined in accordance with federal income tax regulations, which may differ from U.S. GAAP. Certain capital accounts in the financial statements are periodically adjusted for permanent differences in order to reflect their tax character. These permanent differences are primarily due to the varying treatment of income and gain/loss on portfolio securities held by the Fund and have no impact on net assets or NAV per share. Temporary differences, which arise from recognizing certain items of income, expense and gain/loss in different periods for financial statement and tax purposes, will reverse at some point in the future. Permanent differences incurred during the fiscal year ended October 31, 2024, resulting in book and tax accounting differences, have been reclassified at year end to reflect an increase in accumulated net investment income (loss) of $97,472, a decrease in accumulated net realized gain (loss) of $97,819, and an increase to paid-in capital of $347. Accumulated distributable earnings (loss) consists of accumulated net investment income (loss), accumulated net realized gain (loss) on investments, and unrealized appreciation (depreciation) on investments. Net assets were not affected by this reclassification.
The tax character of distributions paid by the Fund during the fiscal years ended October 31, 2024 and 2023, was as follows:
As of October 31, 2024, the distributable earnings and net assets on a tax basis were as follows:
Undistributed ordinary income | |
Undistributed capital gains | |
Total undistributed earnings | |
Accumulated capital and other losses | |
Net unrealized appreciation (depreciation) | |
Total accumulated earnings (losses) | |
| |
| |
| |
The Fund intends to continue to qualify as a regulated investment company by complying with the requirements under Subchapter M of the Internal Revenue Code of 1986, as amended, which includes distributing substantially all of its net investment income and net realized gains to shareholders. Accordingly, no provision has been made for federal and state income taxes. However, due to the timing and amount of distributions, the Fund may be subject to an excise tax of 4% of the amount by which approximately 98% of the Fund’s taxable income exceeds the distributions from such taxable income for the calendar year. For the fiscal year ended October 31, 2024, the Fund incurred $0 of excise tax expense.
Notes to Financial Statements (Continued)
First Trust Short Duration High Income FundOctober 31, 2024
The Fund intends to utilize provisions of the federal income tax laws, which allow it to carry a realized capital loss forward indefinitely following the year of the loss and offset such loss against any future realized capital gains. The Fund is subject to certain limitations under U.S. tax rules on the use of capital loss carryforwards and net unrealized built-in losses. These limitations apply when there has been a 50% change in ownership. At October 31, 2024, the Fund had non-expiring net capital loss carryforwards for federal income tax purposes of $25,214,365.
Certain losses realized during the current fiscal year may be deferred and treated as occurring the first day of the following fiscal year for federal income tax purposes. For the fiscal year ended October 31, 2024, the Fund did not incur any net late year ordinary losses.
The Fund is subject to accounting standards that establish a minimum threshold for recognizing, and a system for measuring, the benefits of a tax position taken or expected to be taken in a tax return. Taxable years ended 2021, 2022, 2023, and 2024 remain open to federal and state audit. As of October 31, 2024, management has evaluated the application of these standards to the Fund and has determined that no provision for income tax is required in the Fund’s financial statements for uncertain tax positions.
As of October 31, 2024, the aggregate cost, gross unrealized appreciation, gross unrealized depreciation, and net unrealized appreciation/(depreciation) on investments (including short positions and derivatives, if any) for federal income tax purposes were as follows:
| Gross Unrealized Appreciation | Gross Unrealized (Depreciation) | Net Unrealized Appreciation (Depreciation) |
| | | |
The Fund will pay all expenses directly related to its operations. Expenses of the Fund are allocated on a pro rata basis to each class of shares, except for distribution and service (12b-1) fees and incremental transfer agency costs which are unique to each class of shares.
3. Investment Advisory Fee, Affiliated Transactions and Other Fee Arrangements
First Trust, the investment advisor to the Fund, is a limited partnership with one limited partner, Grace Partners of DuPage L.P., and one general partner, The Charger Corporation. The Charger Corporation is an Illinois corporation controlled by James A. Bowen, Chief Executive Officer of First Trust. First Trust is responsible for the selection and ongoing monitoring of the Fund’s investment portfolio, managing the Fund’s business affairs and providing certain administrative services necessary for the management of the Fund. For these investment management services, First Trust is entitled to a monthly fee calculated at an annual rate of 0.65% of the Fund’s average daily net assets. First Trust also provides fund reporting services to the Fund for a flat annual fee in the amount of $9,250.
First Trust has agreed to waive fees and/or reimburse Fund expenses to the extent necessary to prevent the total annual fund operating expenses (excluding 12b-1 distribution and service fees, interest expenses, taxes, fees incurred in acquiring and disposing of portfolio securities and extraordinary expenses) from exceeding 1.00% of average daily net assets of any class of shares of the Fund (the “Expense Cap”) through February 28, 2026 and then from exceeding 1.35% from March 1, 2026 through February 28, 2035 (the “Expense Cap Termination Date”). Expenses borne and fees waived by First Trust are subject to recovery on the Fund’s class level, if applicable, by First Trust for up to three years from the date the fee or expense was incurred, but no reimbursement payment will be made by the Fund at any time if it would result in the Fund’s expenses exceeding (i) the Expense Cap in place for the most recent fiscal year for which such expense limitation was in place; (ii) the Expense Cap in place at the time the fees were waived; or (iii) the current Expense Cap. Expense limitations may be terminated or modified prior to their expiration only with the approval of the Board of Trustees of the Trust. These amounts would be included in “Expenses previously waived or reimbursed” on the Statement of Operations. The advisory fee waiver and expense reimbursement for the fiscal year ended October 31, 2024 and the expenses borne by First Trust and subject to recovery were as follows:
| | Expenses Subject to Recovery | |
| | Year Ended October 31, 2022 | Year Ended October 31, 2023 | Year Ended October 31, 2024 | |
| | | | | |
BNY Mellon Investment Servicing (US) Inc. (“BNY IS”) serves as the Fund’s transfer agent in accordance with certain fee arrangements. As transfer agent, BNY IS is responsible for maintaining shareholder records for the Fund. The Bank of New York
Notes to Financial Statements (Continued)
First Trust Short Duration High Income FundOctober 31, 2024
Mellon (“BNY”) serves as the Fund’s administrator, fund accountant, and custodian in accordance with certain fee arrangements. As administrator and fund accountant, BNY is responsible for providing certain administrative and accounting services to the Fund, including maintaining the Fund’s books of account, records of the Fund’s securities transactions, and certain other books and records. As custodian, BNY is responsible for custody of the Fund’s assets. BNY IS and BNY are subsidiaries of The Bank of New York Mellon Corporation, a financial holding company.
Each Trustee who is not an officer or employee of First Trust, any sub-advisor or any of their affiliates (“Independent Trustees”) is paid a fixed annual retainer that is allocated equally among each fund in the First Trust Fund Complex. Each Independent Trustee is also paid an annual per fund fee that varies based on whether the fund is a closed-end or other actively managed fund, a target outcome fund or an index fund.
Additionally, the Chairs of the Audit Committee, Nominating and Governance Committee and Valuation Committee, the Vice Chair of the Audit Committee, the Lead Independent Trustee and the Vice Lead Independent Trustee are paid annual fees to serve in such capacities, with such compensation allocated pro rata among each fund in the First Trust Fund Complex based on net assets. Independent Trustees are reimbursed for travel and out-of-pocket expenses in connection with all meetings. The Committee Chairs, the Audit Committee Vice Chair, the Lead Independent Trustee and the Vice Lead Independent Trustee rotate periodically in serving in such capacities. The officers and “Interested” Trustee receive no compensation from the Trust for acting in such capacities.
4. Capital Share Transactions
Capital transactions were as follows:
| Year Ended October 31, 2024 | Year Ended October 31, 2023 |
| | | | |
| | | | |
| | | | |
| | | | |
| | | | |
| | | | |
| | | | |
| | | | |
| | | | |
| | | | |
Total Dividend Reinvestment | | | | |
| | | | |
| | | | |
| | | | |
| | | | |
| | | | |
5. Purchases and Sales of Securities
The cost of purchases and proceeds from sales of securities, excluding short-term investments, for the fiscal year ended October 31, 2024, were $66,592,634 and $47,544,666, respectively.
6. Distribution and Service Plan
The Board of Trustees adopted a Distribution and Service Plan pursuant to Rule 12b-1 under the 1940 Act. In accordance with the Rule 12b-1 plan, the share classes of the Fund are authorized to pay an amount up to 0.25% and 1.00% of their average daily net assets each year for Class A and Class C, respectively, to reimburse First Trust Portfolios L.P. (“FTP”), the distributor of the Fund, for amounts expended to finance activities primarily intended to result in the sale of Fund shares or the provision of investor services. FTP may also use this amount to compensate securities dealers or other persons for providing distribution assistance, including broker-dealer and shareholder support and educational and promotional services. Class I shares have no 12b-1 fees.
Notes to Financial Statements (Continued)
First Trust Short Duration High Income FundOctober 31, 2024
7. Borrowings
Effective February 28, 2024, the Trust, on behalf of the Fund, along with First Trust Exchange-Traded Fund III, First Trust Exchange-Traded Fund IV and First Trust Variable Insurance Trust, entered into a new Credit Agreement with BNY as administrative agent for a group of lenders. The borrowing rate is the higher of the federal funds effective rate and the adjusted daily simple SOFR rate plus 1.00%.The commitment amount under the credit agreement is $620 million and such commitment amount may be increased up to $700 million with the consent of one or more lenders. BNY charges on behalf of the lenders a commitment fee of 0.20% of the daily amount of the excess of the commitment amount over the outstanding principal balance of the loans, and an agency fee. Prior to February 28, 2024, the Trust, on behalf of the Fund, along with First Trust Variable Insurance Trust and First Trust Exchange-Traded Fund IV had a $200 million Credit Agreement with BNY. BNY charged a commitment fee of 0.25% of the daily amount of the excess of the commitment amount over the outstanding principal balance of the loans. First Trust allocates the commitment fee and agency fee amongst the funds that have access to the credit line. To the extent that the Fund accesses the credit line, there would also be an interest fee charged. The Fund did not have any borrowings outstanding during the fiscal year ended October 31, 2024.
The Fund has a variety of indemnification obligations under contracts with its service providers. The Fund’s maximum exposure under these arrangements is unknown. However, the Fund has not had prior claims or losses pursuant to these contracts and expects the risk of loss to be remote.
Management has evaluated the impact of all subsequent events on the Fund through the date the financial statements were issued and has determined that there were no subsequent events requiring recognition or disclosure in the financial statements that have not already been disclosed.
Report of Independent Registered Public Accounting Firm
To the Shareholders and the Board of Trustees of First Trust Series Fund:
Opinion on the Financial Statements and Financial Highlights
We have audited the accompanying statement of assets and liabilities, including the portfolio of investments, of First Trust Short Duration High Income Fund (the “Fund”), one of the funds constituting the First Trust Series Fund, as of October 31, 2024, the related statement of operations for the year then ended, the statements of changes in net assets for each of the two years in the period then ended, the financial highlights for each of the five years in the period then ended, and the related notes. In our opinion, the financial statements and financial highlights present fairly, in all material respects, the financial position of the Fund as of October 31, 2024, and the results of its operations for the year then ended, the changes in its net assets for each of the two years in the period then ended, and the financial highlights for each of the five years in the period then ended in conformity with accounting principles generally accepted in the United States of America.
These financial statements and financial highlights are the responsibility of the Fund’s management. Our responsibility is to express an opinion on the Fund’s financial statements and financial highlights based on our audits. We are a public accounting firm registered with the Public Company Accounting Oversight Board (United States) (PCAOB) and are required to be independent with respect to the Fund in accordance with the U.S. federal securities laws and the applicable rules and regulations of the Securities and Exchange Commission and the PCAOB.
We conducted our audits in accordance with the standards of the PCAOB. Those standards require that we plan and perform the audit to obtain reasonable assurance about whether the financial statements and financial highlights are free of material misstatement, whether due to error or fraud. The Fund is not required to have, nor were we engaged to perform, an audit of its internal control over financial reporting. As part of our audits, we are required to obtain an understanding of internal control over financial reporting but not for the purpose of expressing an opinion on the effectiveness of the Fund’s internal control over financial reporting. Accordingly, we express no such opinion.
Our audits included performing procedures to assess the risks of material misstatement of the financial statements and financial highlights, whether due to error or fraud, and performing procedures that respond to those risks. Such procedures included examining, on a test basis, evidence regarding the amounts and disclosures in the financial statements and financial highlights. Our audits also included evaluating the accounting principles used and significant estimates made by management, as well as evaluating the overall presentation of the financial statements and financial highlights. Our procedures included confirmation of securities owned as of October 31, 2024, by correspondence with the custodian, agent banks and brokers; when replies were not received from agent banks and brokers, we performed other auditing procedures. We believe that our audits provide a reasonable basis for our opinion.
/s/ Deloitte & Touche, LLP
December 23, 2024
We have served as the auditor of one or more First Trust investment companies since 2001.
First Trust Short Duration High Income FundOctober 31, 2024 (Unaudited)
Tax Information
Distributions paid to foreign shareholders during the Fund’s fiscal year ended October 31, 2024, that were properly designated by the Fund as “interest-related dividends” or “short-term capital gain dividends,” may not be subject to federal income tax provided that the income was earned by such foreign shareholders.
Of the ordinary income (including short-term capital gain, if applicable) distributions made by the Fund during the period ended October 31, 2024, none qualify for the corporate dividends received deduction available to corporate shareholders or as qualified dividend income.
Changes in and Disagreements with Accountants (Item 8 of Form N-CSR)
There were no changes in or disagreements with the Fund’s accountants during the fiscal year ended October 31, 2024.
Proxy Disclosures (Item 9 of Form N-CSR)
There were no matters submitted for vote by shareholders of the Fund during the fiscal year ended October 31, 2024.
Remuneration Paid to Directors, Officers, and Others (Item 10 of Form N-CSR)
The applicable aggregate remuneration paid by the Fund during the period covered by the report is included in the Statement of Operations.
Statement Regarding the Basis for the Board’s Approval of Investment Advisory Contract (Item 11 of Form N-CSR)
The Board of Trustees of First Trust Series Fund (the “Trust”), including the Independent Trustees, unanimously approved the continuation of the Investment Management Agreement (the “Agreement”) between the Trust, on behalf of the First Trust Short Duration High Income Fund (the “Fund”), and First Trust Advisors L.P. (the “Advisor”). The Board approved the continuation of the Agreement for a one-year period ending June 30, 2025 at a meeting held on June 2–3, 2024. The Board determined that the continuation of the Agreement is in the best interests of the Fund in light of the nature, extent and quality of the services provided and such other matters as the Board considered to be relevant in the exercise of its business judgment.
To reach this determination, the Board considered its duties under the Investment Company Act of 1940, as amended (the “1940 Act”), as well as under the general principles of state law, in reviewing and approving advisory contracts; the requirements of the 1940 Act in such matters; the fiduciary duty of investment advisors with respect to advisory agreements and compensation; the standards used by courts in determining whether investment company boards have fulfilled their duties; and the factors to be considered by the Board in voting on such agreements. At meetings held on April 16, 2024, April 25, 2024 and June 2–3, 2024, the Board, including the Independent Trustees, reviewed materials provided by the Advisor responding to requests for information from counsel to the Independent Trustees, submitted on behalf of the Independent Trustees, that, among other things, outlined: the services provided by the Advisor to the Fund (including the relevant personnel responsible for these services and their experience); the advisory fee rate payable by the Fund as compared to fees charged to a peer group of funds (the “Expense Group”) and a broad peer universe of funds (the “Expense Universe”), each assembled by Broadridge Financial Solutions, Inc. (“Broadridge”), an independent source, and as compared to fees charged to other clients of the Advisor; the expense ratio of the Fund as compared to expense ratios of the funds in the Fund’s Expense Group and Expense Universe; performance information for the Fund, including comparisons of the Fund’s performance to that of one or more relevant benchmark indexes and to that of a performance group of funds and a broad performance universe of funds (the “Performance Universe”), each assembled by Broadridge; the nature of expenses incurred in providing services to the Fund and the potential for the Advisor to realize economies of scale, if any; profitability and other financial data for the Advisor; any indirect benefits to the Advisor and its affiliate, First Trust Portfolios L.P. (“FTP”); and information on the Advisor’s compliance program. The Board reviewed initial materials with the Advisor at the meeting held on April 25, 2024, prior to which the Independent Trustees and their counsel met separately to discuss the information provided by the Advisor. Following the April 25, 2024 meeting, counsel to the Independent Trustees, on behalf of the Independent Trustees, requested certain clarifications and supplements to the materials provided, and the information provided in response to those requests was considered at an executive session of the Independent Trustees and their counsel held prior to the June 2–3, 2024 meeting, as well as at the June meeting. The Board applied its business judgment to determine whether the arrangement between the Trust and the Advisor continues to be a reasonable business arrangement from the Fund’s perspective. The Board determined that, given the totality of the information provided with respect to the Agreement, the Board had received sufficient information to renew the Agreement. The Board considered that shareholders chose to invest or remain invested in the Fund knowing that the Advisor manages the Fund and knowing the Fund’s advisory fee.
Other Information (Continued)
First Trust Short Duration High Income FundOctober 31, 2024 (Unaudited)
In reviewing the Agreement, the Board considered the nature, extent and quality of the services provided by the Advisor under the Agreement. The Board considered that the Advisor is responsible for the overall management and administration of the Trust and the Fund and reviewed all of the services provided by the Advisor to the Fund, as well as the background and experience of the persons responsible for such services. The Board noted that the Advisor’s Leveraged Finance Investment Team is responsible for the day-to-day management of the Fund’s investments. The Board considered the background and experience of the members of the Leveraged Finance Investment Team and noted the Board’s prior meetings with members of the Team. The Board considered the Advisor’s statement that it applies the same oversight model internally with its Leveraged Finance Investment Team as it uses for overseeing external sub-advisors, including portfolio risk monitoring and performance review. In reviewing the services provided, the Board noted the compliance program that had been developed by the Advisor and considered that it includes a robust program for monitoring the Advisor’s and the Fund’s compliance with the 1940 Act, as well as the Fund’s compliance with its investment objectives, policies and restrictions. The Board also considered a report from the Advisor with respect to its risk management functions related to the operation of the Fund. Finally, as part of the Board’s consideration of the Advisor’s services, the Advisor, in its written materials and at the April 25, 2024 meeting, described to the Board the scope of its ongoing investment in additional personnel and infrastructure to maintain and improve the quality of services provided to the Fund and the other funds in the First Trust Fund Complex. In light of the information presented and the considerations made, the Board concluded that the nature, extent and quality of the services provided to the Trust and the Fund by the Advisor under the Agreement have been and are expected to remain satisfactory and that the Advisor has managed the Fund consistent with its investment objectives, policies and restrictions.
The Board considered the advisory fee rate payable by the Fund under the Agreement for the services provided. The Board considered that the Advisor agreed to extend the current expense caps for each share class through March 1, 2026 and agreed to keep the long-term expense cap in place from March 1, 2026 through February 28, 2035. The Board noted that fees waived or expenses borne by the Advisor are subject to reimbursement by the Fund for up to three years from the date the fee was waived or expense was incurred, but no reimbursement payment would be made by the Fund at any time if it would result in the Fund’s expenses exceeding (i) the applicable expense limitation in place for the most recent fiscal year for which such expense limitation was in place, (ii) the applicable expense limitation in place at the time the fees were waived, or (iii) the current expense limitation. The Board received and reviewed information showing the fee rates and expense ratios of the peer funds in the Expense Group, as well as advisory and unitary fee rates charged by the Advisor to other fund and non-fund clients, as applicable. With respect to the Expense Group, the Board discussed with Broadridge its methodology for assembling peer groups and discussed with the Advisor limitations in creating a relevant peer group for the Fund. The Board took these limitations into account in considering the peer data. Based on the information provided, the Board noted that the contractual advisory fee rate payable by the Fund was above the median contractual advisory fee of the peer funds in the Expense Group. The Board also noted that the Fund’s total (net) expense ratio (Class A shares) was above the median total (net) expense ratio of the peer funds in the Expense Group. With respect to fees charged to other clients, the Board considered differences between the Fund and other clients that limited their comparability. In considering the advisory fee rate overall, the Board also considered the Advisor’s statement that it seeks to meet investor needs through innovative and value-added investment solutions and the Advisor’s demonstrated long-term commitment to the Fund and the other funds in the First Trust Fund Complex.
The Board considered performance information for the Fund. The Board noted the process it has established for monitoring the Fund’s performance and portfolio risk on an ongoing basis, which includes quarterly performance reporting from the Advisor for the Fund. The Board determined that this process continues to be effective for reviewing the Fund’s performance. The Board received and reviewed information comparing the Fund’s performance for periods ended December 31, 2023 to the performance of the funds in the Performance Universe and to that of a blended benchmark index. Based on the information provided, the Board noted that the Fund (Class A shares) outperformed the Performance Universe median for the one- and ten-year periods ended December 31, 2023 and underperformed the Performance Universe median for the three- and five-year periods ended December 31, 2023. The Board also noted that the Fund underperformed the blended benchmark index for the one-, three-, five- and ten-year periods ended December 31, 2023.
On the basis of all the information provided on the fees, expenses and performance of the Fund and the ongoing oversight by the Board, the Board concluded that the advisory fee for the Fund continues to be reasonable and appropriate in light of the nature, extent and quality of the services provided by the Advisor to the Fund under the Agreement.
The Board considered information and discussed with the Advisor whether there were any economies of scale in connection with providing advisory services to the Fund at current asset levels and whether the Fund may benefit from any economies of scale. The Board noted the Advisor’s statement that it believes that its expenses relating to providing advisory services to the Fund will increase during the next twelve months as the Advisor continues to build infrastructure and add new staff. The Board concluded that the advisory fee rate for the Fund reflects an appropriate level of sharing of any economies of scale that may be realized in the management of the Fund at current asset levels. The Board considered the revenues and allocated costs (including the allocation methodology) of the Advisor in serving as investment advisor to the Fund for the twelve months ended December 31, 2023 and the
Other Information (Continued)
First Trust Short Duration High Income FundOctober 31, 2024 (Unaudited)
estimated profitability level for the Fund calculated by the Advisor based on such data, as well as complex-wide and product-line profitability data, for the same period. The Board noted the inherent limitations in the profitability analysis and concluded that, based on the information provided, the Advisor’s profitability level for the Fund was not unreasonable. In addition, the Board considered indirect benefits described by the Advisor that may be realized from its relationship with the Fund. The Board considered that the Advisor had identified as an indirect benefit to the Advisor and FTP their exposure to investors and brokers who, absent their exposure to the Fund, may have had no dealings with the Advisor or FTP. The Board noted that in addition to the advisory fees paid by the Fund, FTP is compensated for services provided to the Fund through 12b-1 distribution and service fees and that the Advisor receives compensation from the Fund for providing fund reporting services pursuant to a separate Fund Reporting Services Agreement. The Board also noted that the Advisor does not utilize soft dollars in connection with the Fund. The Board concluded that the character and amount of potential indirect benefits to the Advisor were not unreasonable.
Based on all of the information considered and the conclusions reached, the Board, including the Independent Trustees, unanimously determined that the terms of the Agreement continue to be fair and reasonable and that the continuation of the Agreement is in the best interests of the Fund. No single factor was determinative in the Board’s analysis.
First Trust Managed Municipal Fund
Annual Financial Statements and Other Information
October 31, 2024
First Trust Managed Municipal Fund
Annual Financial Statements and Other Information
October 31, 2024
Performance and Risk Disclosure
There is no assurance that First Trust Managed Municipal Fund (the “Fund”) will achieve its investment objectives. The Fund is subject to market risk, which is the possibility that the market values of securities owned by the Fund will decline and that the value of the Fund’s shares may therefore be less than what you paid for them. Accordingly, you can lose money by investing in the Fund.
Performance data quoted represents past performance, which is no guarantee of future results, and current performance may be lower or higher than the figures shown. For the most recent month-end performance figures, please visit www.ftportfolios.com or speak with your financial advisor. Investment returns and net asset value will fluctuate and Fund shares, when sold, may be worth more or less than their original cost.
First Trust Advisors L.P., the Fund’s advisor, may also periodically provide additional information on Fund performance on the Fund’s web page at www.ftportfolios.com.
This report contains information that may help you evaluate your investment in the Fund. It includes details about the Fund and presents data that provides insight into the Fund’s performance and investment approach.
The material risks of investing in the Fund are spelled out in the prospectus, the statement of additional information, and other Fund regulatory filings.
First Trust Managed Municipal FundPortfolio of Investments
October 31, 2024
| | | | |
|
| | | | |
| Black Belt Energy Gas Dist AL Gas Proj Rev, Ser C-1 (Mandatory put 06/01/29) | | | |
| Black Belt Energy Gas Dist AL Gas Proj Rev, Ser F (Mandatory put 12/01/28) | | | |
| Homewood AL Eductnl Bldg Auth Rev Stdt Hsg & Parking Proj, Ser C | | | |
| SE Energy Auth AL Cooperative Dist Cmdy Sply Rev Proj #6, Ser B (Mandatory put 06/01/30) | | | |
| | |
| | | | |
| AZ St Indl Dev Auth Edu Rev Acads of Math & Science Proj (a) | | | |
| Phoenix AZ Indl Dev Auth Stdt Hsg Rev Downtown Phoenix Stdt Hsg II LLC AZ St Univ Proj, Ser A | | | |
| | |
| | | | |
| AR Dev Fin Auth Envrnmntl Rev Sustainable Bond United States Steel Corp Proj, AMT | | | |
| | | | |
| CA Cmnty Choice Fing Auth Clean Energy Proj Rev Sustainable Bond, Ser A-1 (Mandatory put 08/01/28) | | | |
| CA Cmnty Choice Fing Auth Clean Energy Proj Rev Sustainable Bond, Ser B-1 (Mandatory put 08/01/31) | | | |
| CA St Muni Fin Auth Chrt Sch Rev Palmdale Aerospace Acdmy Proj, Ser A (a) | | | |
| CA St Poll Control Fing Auth Wtr Furnishing Rev Plant Bonds, AMT (a) | | | |
| CA St Poll Control Fing Auth Wtr Furnishing Rev Poseidon Res LP Desalination Proj, AMT (a) | | | |
| Kern CA Cmnty Clg Dist, Ser D | | | |
| Los Angeles CA Dept of Arpts Arpt Rev Prerefunded Subord Ref, Ser D, AMT (Pre-refunded maturity 11/15/31) | | | |
| Los Angeles CA Dept of Arpts Arpt Rev Sub Los Angeles Intl Arpt, Ser A, AMT | | | |
| Los Angeles CA Dept of Arpts Arpt Rev Unrefunded Subord Ref, Ser D, AMT | | | |
| River Islands CA Pub Fing Auth Spl Tax Ref Cmnty Facs Dist #2003-1, Ser A-1, AGM | | | |
| San Diego Cnty CA Regl Arpt Auth Arpt Rev Ref Subord Arpt Rev Bonds, Ser B | | | |
| San Francisco CA City & Cnty Arpts Commn Intl Arpt Rev, Ser E, AMT | | | |
| Santa Clara Vly CA Wtr Dist Safe Clean Wtr Rev Sustainable Bond, Ser A | | | |
| | |
| | | | |
| Arista CO Met Dist Ref, Ser A, BAM | | | |
| Denver City & Cnty CO Arpt Rev Ref, Ser D, AMT | | | |
| Mirabelle Met Dist #2 CO Sr, Ser A | | | |
| Thompson Crossing Met Dist #4 CO Ref | | | |
| | |
See Notes to Financial Statements
First Trust Managed Municipal FundPortfolio of Investments (Continued)
October 31, 2024
| | | | |
MUNICIPAL BONDS (Continued) |
| | | | |
| CT St Hlth & Eductnl Facs Auth Rev Covenant Home Inc, Ser B | | | |
| CT St Spl Tax Oblig Rev Transprtn Infra Purp, Ser A | | | |
| | |
| District of Columbia – 0.9% | | | |
| Met WA DC Arpts Auth Arpt Sys Rev Ref, Ser A, AMT | | | |
| | | | |
| Beach Cmnty Dev Dist FL Capital Impt Rev Ref, AGM | | | |
| Berry Bay II CDD FL Spl Assmnt Ser 2024 Proj | | | |
| Black Creek FL CDD Spl Assmnt Expansion Area Proj | | | |
| Broward Cnty FL Arpt Sys Rev, Ser A, AMT | | | |
| Broward Cnty FL Port Facs Rev, AMT | | | |
| Forest Lake Cmnty Dev Dist FL Spl Assmnt Area 1 Proj (a) | | | |
| Jea FL Elec Sys Rev Ref, Ser Three A | | | |
| Lakewood Ranch FL Stewardship Dist Util Rev Sys Acq Proj, AGM | | | |
| Lee Cnty FL Indl Dev Auth Hlthcare Facs Rev Shell Point, Ser C | | | |
| Palm Beach Cnty FL Hlth Facs Auth Acts Retmnt, Ser B | | | |
| Pasco Cnty FL Sch Brd, Ser A, COPS, AGM | | | |
| Putnam Cnty FL Dev Auth Ref Seminole Proj, Ser A | | | |
| Sarasota Natl FL CDD Spl Assmnt Ref | | | |
| SE Overtown Park W Cmnty Redev Agy FL Tax, Ser A-1 (a) | | | |
| Volusia Cnty FL Eductnl Fac Auth Ref Embry Riddle Aeronautical Univ Inc Proj, Ser A | | | |
| Westview S CDD FL Spl Assmnt Area One 2023 Proj Area | | | |
| | |
| | | | |
| Burke Cnty GA Dev Auth Poll Control Rev Var GA Pwr Co Plant Vogtle Proj Remk, 1st Ser (Mandatory Put 03/06/26) | | | |
| Fulton Cnty GA Rsdl Care Facs Elderly Auth Retmnt Fac Rev Ref Lenbrook Sq Fdtn Inc | | | |
| Main Street Nat Gas Inc GA Gas Sply Rev, Ser A | | | |
| Main Street Nat Gas Inc GA Gas Sply Rev, Ser A (Mandatory put 09/01/31) | | | |
| Main Street Nat Gas Inc GA Gas Sply Rev, Ser A (Mandatory put 12/01/29) | | | |
| | |
| | | | |
| HI St Arpts Sys Rev, Ser A, AMT | | | |
| Honolulu City & Cnty HI Brd of Wtr Sply Wtr Sys Rev, Ser A | | | |
| | |
| | | | |
| ID St Hlth Facs Auth Rev Ref St Lukes Hlth Sys Proj, Ser A | | | |
| | | | |
| Chicago IL Chicago Wks, Ser A | | | |
| | | | |
| | | | |
| Madison Bond Etc Cntys IL Cmnty Unit Sch Dist #5, Ser B, AGM | | | |
| | |
See Notes to Financial Statements
First Trust Managed Municipal FundPortfolio of Investments (Continued)
October 31, 2024
| | | | |
MUNICIPAL BONDS (Continued) |
| | | | |
| IN St Fin Auth Envrnmntl Rev Ref Var Duke Energy IN Inc Proj Remk, Ser A-1, AMT (Mandatory put 06/01/32) | | | |
| IN St Fin Auth Hlth Sys Rev IN Univ Hlth, Ser A | | | |
| IN St Fin Auth Stdt Hsg Rev Sr Stdt Hsg Proj, Ser A | | | |
| IN St Hsg & Cmnty Dev Auth Sf Mtge Rev Var Remk, Ser C-3 (b) | | | |
| Valparaiso IN Exempt Facs Rev Ref Pratt Paper LLC Proj, AMT (a) | | | |
| Whiting IN Envrnmntl Facs Rev Ref BP Products N America Inc Proj, Ser A, AMT (Mandatory put 06/05/26) | | | |
| | |
| | | | |
| IA St Fin Auth Midwstrn Disaster Area Rev Ref IA Fertilizer Company Proj (Mandatory put 12/01/42) (Pre-refunded maturity 10/01/32) | | | |
| | | | |
| Shawnee Cnty KS Pub Bldg Commn Rev Corrections and Parks & Rec Projs | | | |
| | | | |
| Boyle Cnty KY Eductnl Facs Rev Ref Centre Clg, Ser A | | | |
| KY St Property & Bldgs Commn Revs Proj No. 128, Ser A | | | |
| Louisville & Jefferson Cnty KY Met Govt Hlth Sys Rev Ref Norton Hlthcare Inc, Ser A | | | |
| | |
| | | | |
| LA St Loc Govt Envrnmntl Facs & Cmnty Dev Auth Rev Ref Westlake Chemical Corp Proj Remk | | | |
| LA St Pub Facs Auth Sol Wst Disp Fac Rev Var Elementus Minerals LLC Proj (Mandatory put 11/01/25) (a) | | | |
| Saint John the Baptist Parish LA Rev Ref Var Marathon Oil Corp Proj Remk, Ser A-1 (Mandatory put 07/01/26) | | | |
| Saint John the Baptist Parish LA Rev Var Ref Marathon Oil Corp Proj Remk, Subser 2017B-2 (Mandatory put 07/01/26) | | | |
| | |
| | | | |
| MD St Econ Dev Corp Var Ref Constellation Energy Grp Proj Remk, Ser B (Mandatory put 04/03/28) | | | |
| | | | |
| MI St Fin Auth Rev Multi Modal Mclaren Hlth Care, Ser A | | | |
| | | | |
| MS St Busn Fin Corp Sol Wst Disp Rev Adj MS Pwr Co Proj Remk, AMT (b) | | | |
| | | | |
| Saint Louis Cnty MO Spl Oblg Convention Ctr, Ser A | | | |
| | | | |
| Carson City NV Hosp Rev Ref Carson Tahoe Regl Med Ctr, Ser A | | | |
| Clark Cnty NV Poll Control Rev Var Ref NV Pwr Co Proj Remk (Mandatory put 03/31/26) | | | |
| | |
See Notes to Financial Statements
First Trust Managed Municipal FundPortfolio of Investments (Continued)
October 31, 2024
| | | | |
MUNICIPAL BONDS (Continued) |
| | | | |
| Natl Fin Auth NH Hlthcare Facs Rev Var Novant Hlth Oblig Grp, Ser B (b) | | | |
| NH St Busn Fin Auth Wtr Fac Rev Pennichuck Wtr Wks Inc Proj, Ser A, AMT | | | |
| | |
| | | | |
| NJ St Hgr Edu Asst Auth Stdt Loan Rev, Ser 1A, AMT | | | |
| NJ St Transprtn Trust Fund Auth Fun Auth Transprtn Prog Bonds, Ser CC | | | |
| NJ St Transprtn Trust Fund Auth Ref Transprtn Sys Bonds, Ser A | | | |
| | |
| | | | |
| Farmington NM Poll Control Rev Var Ref Pub Svc Co NM San Juan Proj Remk, Ser D (Mandatory put 06/01/28) | | | |
| Winrock Town Ctr NM Tax Incr Dev Dist #1 Ref Sr Lien (a) | | | |
| | |
| | | | |
| Build NYC Res Corp NY Rev Sustainable Bond Kipp NYC Pub Sch Facs Canal W Proj | | | |
| Long Beach NY, Ser B, BAM | | | |
| New York City NY Muni Wtr Fin Auth Wtr & Swr Sys Rev 2nd Gen Resolution, Ser BB-1 | | | |
| New York City NY Transitional Fin Auth Rev Future Tax Sec Sub, Subser D-1 | | | |
| | | | |
| NY St Urban Dev Corp Rev Personal Income Tax, Ser A | | | |
| Suffolk Regl Off Track Betting Corp NY Rev | | | |
| Westchester NY Tobacco Asset Securitization Ref Sr, Ser B | | | |
| | | | |
| | |
| | | | |
| NC St Med Care Commn Retmnt Facs Rev The United Methodist Retmnt Homes Proj, Ser A | | | |
| | | | |
| Montgomery Cnty OH Hlth Care Facs Rev Ref Solvita Proj | | | |
| OH St Air Quality Dev Auth Exempt Facs Rev AMG Vanadium Proj, AMT (a) | | | |
| OH St Air Quality Dev Auth Ref OH Vly Elec Corp Proj, Ser A | | | |
| | |
| | | | |
| Clackamas Cnty OR Hosp Fac Auth Rev Ref Rose Villa Proj, Ser A | | | |
| OR St Dept of Transprtn Hwy User Tax Rev Subord Lien, Ser A | | | |
| Port of Portland OR Arpt Rev, Ser Twenty Seven A, AMT | | | |
| Union Cnty OR Hosp Fac Auth Grande Ronde Hosp | | | |
| | |
| | | | |
| Lancaster Cnty PA Hosp Auth Penn St Hlth | | | |
See Notes to Financial Statements
First Trust Managed Municipal FundPortfolio of Investments (Continued)
October 31, 2024
| | | | |
MUNICIPAL BONDS (Continued) |
| | | | |
| Maxatawny Twp PA Muni Auth Rev Diakon Lutheran Social Ministries Proj, Ser A | | | |
| Montgomery Cnty PA Indl Dev Auth Ref Acts Retmnt Life Cmntys Inc Oblig Grp | | | |
| PA St Econ Dev Fing Auth T/E Priv Activity Rev The Penndot Major Bridges Package One Proj P3 Proj, AMT | | | |
| PA St Turnpike Commn Oil Franchise Tax Rev Ref, Ser A | | | |
| PA St Turnpike Commn Turnpike Rev Ref, Ser B | | | |
| | | | |
| | | | |
| | |
| | | | |
| Puerto Rico Cmwlth Restructured, Ser A1 | | | |
| Puerto Rico Sales Tax Fing Corp Sales Tax Rev Restructured, Ser A-1 | | | |
| Puerto Rico Sales Tax Fing Corp Sales Tax Rev Restructured, Ser A-2 | | | |
| | |
| | | | |
| SC St Jobs Econ Dev Auth Econ Dev Rev Ref The Woodlands at Furman | | | |
| SC St Jobs Econ Dev Auth Hlth Facs Rev Novant Hlth Oblig Grp, Ser A | | | |
| SC St Jobs Econ Dev Auth Hlthcare Rev Beaufort Memorial Hosp & S of Broad Hlthcare Proj | | | |
| SC St Pub Svc Auth Rev Ref Santee Cooper, Ser C, AGM | | | |
| | |
| | | | |
| Chattanooga TN Hlth Eductnl & Hsg Fac Brd Ref Erlanger Hlth | | | |
| Met Nashville TN Arpt Auth Arpt Rev, Ser B, AMT | | | |
| | |
| | | | |
| Arlington TX Hgr Edu Fin Corp Edu Rev Ref Harmony Pub Schs, Ser A | | | |
| Arlington TX Hgr Edu Fin Corp Edu Rev Trinity Basin Preparatory Inc | | | |
| Austin TX Arpt Sys Rev, Ser B, AMT | | | |
| Centrl TX Regl Mobility Auth Rev Ref Sr Lien, Ser B | | | |
| Centrl TX Regl Mobility Auth Rev, Ser B | | | |
| Corpus Christi TX Util Sys Rev Junior Lien, Ser B | | | |
| Fulshear Muni Util Dist No 3A TX, BAM | | | |
| Lower Colorado River TX Auth Trans Contract Rev Ref LCRA Trans Svcs Corp Proj | | | |
| Mission TX Econ Dev Corp Sol Wst Disp Rev Var Waste Mgmt Inc Proj Remk, Ser A, AMT (Mandatory put 12/02/24) | | | |
| Newark Hgr Edu Fin Corp TX Edu Rev Hughen Ctr Inc Proj, Ser A | | | |
| Princeton TX Spl Assmnt Rev Winchester Pub Impr Dist #2 Proj (a) | | | |
| Tarrant Cnty TX Cultural Edu Facs Fin Corp Hosp Rev Var Baylor Scott and White Hlth Proj, Ser F (Mandatory put 11/15/30) | | | |
See Notes to Financial Statements
First Trust Managed Municipal FundPortfolio of Investments (Continued)
October 31, 2024
| | | | |
MUNICIPAL BONDS (Continued) |
| | | | |
| TX St Muni Gas Acq & Sply Corp IV, Ser B | | | |
| TX St Wtr Dev Brd St Revolving Fund | | | |
| | |
| | | | |
| Downtown E Streetcar Swr Pub Infra Dist Sr Lien, Ser A (a) | | | |
| Fields Estates Pub Infra Dist UT Spl Assmnt Fields Estates Assmnt Area, Ser A-2 (a) | | | |
| Midas Mountain Veterans Prog Pub Infra Dist (a) | | | |
| UT St Telecommunication Open Infra Agy Sales Tax Ref | | | |
| | |
| | | | |
| Isle of Wight Cnty VA Econ Dev Auth Riverside Hlth Sys, AGM | | | |
| VA St Cmwlth Transprtn Brd Transprtn Rev | | | |
| | |
| | | | |
| WV St Econ Dev Auth Sol Wst Disp Facs Var Sr Arch Res Proj, AMT (Mandatory put 07/01/25) | | | |
| | | | |
| WI St Hlth & Eductnl Facs Auth Rev Bellin Memorial Hosp Inc, Ser A | | | |
| | | | |
| Consol Muni Elec Pwr Sys WY Jt Pwrs Brd Sys Jt Pwrs Brd Ref Electrical Sys Proj | | | |
| Total Investments – 98.3% | |
| | |
| Net Other Assets and Liabilities – 1.7% | |
| | |
Futures Contracts (See Note 2C - Futures Contracts in the Notes to Financial Statements):
| | | | | Unrealized Appreciation (Depreciation)/ Value |
Ultra 10-Year U.S. Treasury Notes | | | | | |
| This security, sold within the terms of a private placement memorandum, is exempt from registration upon resale under Rule 144A of the Securities Act of 1933, as amended, and may be resold in transactions exempt from registration, normally to qualified institutional buyers. Pursuant to procedures adopted by the Trust’s Board of Trustees, this security has been determined to be liquid by First Trust Advisors L.P. Although market instability can result in periods of increased overall market illiquidity, liquidity for each security is determined based on security specific factors and assumptions, which require subjective judgment. At October 31, 2024, securities noted as such amounted to $6,093,992 or 8.1% of net assets. |
| Variable Rate Demand bond. Interest rate is reset periodically by the agent based on current market conditions. |
Abbreviations throughout the Portfolio of Investments: |
| – Assured Guaranty Municipal Corp. |
| – Alternative Minimum Tax |
| |
| – Certificates of Participation |
See Notes to Financial Statements
First Trust Managed Municipal FundPortfolio of Investments (Continued)
October 31, 2024
Valuation InputsA summary of the inputs used to value the Fund’s investments as of October 31, 2024 is as follows (see Note 2A - Portfolio Valuation in the Notes to Financial Statements):
| | | Level 2 Significant Observable Inputs | Level 3 Significant Unobservable Inputs |
| | | | |
| | | | |
| | | | |
| See Portfolio of Investments for state and territory breakout. |
| Includes cumulative appreciation/depreciation on futures contracts as reported in the Futures Contracts table. Only the current day’s variation margin is presented on the Statement of Assets and Liabilities. |
See Notes to Financial Statements
First Trust Managed Municipal FundStatement of Assets and Liabilities
October 31, 2024
| |
| |
| |
Cash segregated as collateral | |
| |
| |
| |
Common Shares issued under the Dividend Reinvestment Plan | |
| |
| |
| |
| |
| |
| |
| |
| |
| |
Interest and fees on loan | |
Shareholder reporting fees | |
| |
Trustees’ fees and expenses | |
| |
| |
| |
| |
| |
| |
| |
| |
| |
Accumulated distributable earnings (loss) | |
| |
| |
| |
Net asset value and redemption price per share (Based on net assets of $75,310,420 and 3,681,881 shares of beneficial interest issued and outstanding, unlimited number of shares authorized) | |
See Notes to Financial Statements
First Trust Managed Municipal FundStatement of Operations
For the Year Ended October 31, 2024
| |
| |
| |
| |
| |
| |
| |
| |
Commitment and administrative agency fees | |
| |
| |
Shareholder reporting fees | |
Trustees’ fees and expenses | |
| |
| |
| |
| |
| |
Fees waived by the investment advisor | |
| |
NET INVESTMENT INCOME (LOSS) | |
NET REALIZED AND UNREALIZED GAIN (LOSS): | |
Net realized gain (loss) on: | |
| |
| |
| |
Net change in unrealized appreciation (depreciation) on: | |
| |
| |
Net change in unrealized appreciation (depreciation) | |
NET REALIZED AND UNREALIZED GAIN (LOSS) | |
NET INCREASE (DECREASE) IN NET ASSETS RESULTING FROM OPERATIONS | |
See Notes to Financial Statements
First Trust Managed Municipal FundStatements of Changes in Net Assets
| | |
| | |
Net investment income (loss) | | |
| | |
Net change in unrealized appreciation (depreciation) | | |
Net increase (decrease) in net assets resulting from operations | | |
DISTRIBUTIONS TO SHAREHOLDERS FROM INVESTMENT OPERATIONS: | | |
| | |
Total distributions to shareholders from investment operations | | |
| | |
Proceeds from shares sold | | |
Proceeds from shares reinvested | | |
| | |
Net increase (decrease) in net assets resulting from capital transactions | | |
Total increase (decrease) in net assets | | |
| | |
| | |
| | |
See Notes to Financial Statements
First Trust Managed Municipal FundFinancial Highlights
For a Share outstanding throughout each period
| | For the Period Ended 10/31/2022 (a) |
| | |
Net asset value, beginning of period | | | |
Income from investment operations: | | | |
Net investment income (loss) (b) | | | |
Net realized and unrealized gain (loss) | | | |
Total from investment operations | | | |
Distributions paid to shareholders from: | | | |
| | | |
Net asset value, end of period | | | |
| | | |
Ratios to average net assets/supplemental data: | | | |
Net assets, end of period (in 000’s) | | | |
Ratio of total expenses to average net assets | | | |
Ratio of net expenses to average net assets | | | |
Ratio of net investment income (loss) to average net assets | | | |
| | | |
| Class I Shares were initially seeded and commenced operations on June 15, 2022. |
| Based on average shares outstanding. |
| Assumes reinvestment of all distributions for the period. These returns do not reflect the deduction of taxes that a shareholder would pay on Fund distributions or the redemption of Fund shares. Total return is calculated for the time period presented and is not annualized for periods of less than one year. The Fund’s total returns would have been lower if certain fees had not been waived and expenses reimbursed by the investment advisor. |
| |
See Notes to Financial Statements
Notes to Financial Statements
First Trust Managed Municipal FundOctober 31, 2024
1. Organization
First Trust Managed Municipal Fund (the “Fund”) is a series of the First Trust Series Fund (the “Trust”), a Massachusetts business trust organized on July 9, 2010, and is registered as a non-diversified open-end management investment company with the Securities and Exchange Commission under the Investment Company Act of 1940, as amended (the “1940 Act”). The Fund offers one class of shares: Class I.
The Fund’s primary investment objective is to generate current income that is exempt from federal income taxes and its secondary objective is long term capital appreciation. The Fund seeks to achieve its objectives by investing, under normal market conditions, at least 80% of its net assets (plus any borrowings for investment purposes) in municipal debt securities that pay interest that is exempt from federal income taxes. There can be no assurance that the Fund will achieve its investment objectives. The Fund may not be appropriate for all investors.
2. Significant Accounting Policies
The Fund is considered an investment company and follows accounting and reporting guidance under Financial Accounting Standards Board Accounting Standards Codification Topic 946, “Financial Services-Investment Companies.” The following is a summary of significant accounting policies consistently followed by the Fund in the preparation of the financial statements. The preparation of the financial statements in accordance with accounting principles generally accepted in the United States of America (“U.S. GAAP”) requires management to make estimates and assumptions that affect the reported amounts and disclosures in the financial statements. Actual results could differ from those estimates.
The Fund’s net asset value (“NAV”) is determined daily as of the close of regular trading on the New York Stock Exchange (“NYSE”), normally 4:00 p.m. Eastern time, on each day the NYSE is open for trading. If the NYSE closes early on a valuation day, the NAV is determined as of that time. Domestic debt securities are priced using data reflecting the earlier closing of the principal markets for those securities. The Fund’s NAV is calculated by dividing the value of all assets of the Fund (including accrued interest and dividends), less all liabilities (including accrued expenses and dividends declared but unpaid), by the total number of shares outstanding.
The Fund’s investments are valued daily at market value or, in the absence of market value with respect to any portfolio securities, at fair value. Market value prices represent readily available market quotations such as last sale or official closing prices from a national or foreign exchange (i.e., a regulated market) and are primarily obtained from third-party pricing services. Fair value prices represent any prices not considered market value prices and are either obtained from a third-party pricing service or are determined by the Pricing Committee of the Fund’s investment advisor, First Trust Advisors L.P. (“First Trust” or the “Advisor”), in accordance with valuation procedures approved by the Trust’s Board of Trustees, and in accordance with provisions of the 1940 Act and rules thereunder. Investments valued by the Advisor’s Pricing Committee, if any, are footnoted as such in the footnotes to the Portfolio of Investments. The Fund’s investments are valued as follows:
Municipal securities and other debt securities are fair valued on the basis of valuations provided by a third-party pricing service approved by the Advisor’s Pricing Committee, which may use the following valuation inputs when available:
7)
reference data including market research publications.
Pricing services generally value fixed-income securities assuming orderly transactions of an institutional round lot size, but a Fund may hold or transact in such securities in smaller, odd lot sizes. Odd lots may trade at lower prices than institutional round lots.
Exchange-traded futures contracts are valued at the end of the day settlement price.
Fixed income and other debt securities having a remaining maturity of sixty days or less when purchased are fair valued at cost adjusted for amortization of premiums and accretion of discounts (amortized cost), provided the Advisor’s Pricing Committee has determined that the use of amortized cost is an appropriate reflection of fair value given market and issuer-specific
Notes to Financial Statements (Continued)
First Trust Managed Municipal FundOctober 31, 2024
conditions existing at the time of the determination. Factors that may be considered in determining the appropriateness of the use of amortized cost include, but are not limited to, the following:
1)
the credit conditions in the relevant market and changes thereto;
2)
the liquidity conditions in the relevant market and changes thereto;
3)
the interest rate conditions in the relevant market and changes thereto (such as significant changes in interest rates);
4)
issuer-specific conditions (such as significant credit deterioration); and
5)
any other market-based data the Advisor’s Pricing Committee considers relevant. In this regard, the Advisor’s Pricing Committee may use last-obtained market-based data to assist it when valuing portfolio securities using amortized cost.
Certain securities may not be able to be priced by pre-established pricing methods. Such securities may be valued by the Advisor’s Pricing Committee at fair value. These securities generally include, but are not limited to, restricted securities (securities which may not be publicly sold without registration under the Securities Act of 1933, as amended) for which a third-party pricing service is unable to provide a market price; securities whose trading has been formally suspended; a security whose market or fair value price is not available from a pre-established pricing source; a security with respect to which an event has occurred that is likely to materially affect the value of the security after the market has closed but before the calculation of the Fund’s NAV or make it difficult or impossible to obtain a reliable market quotation; and a security whose price, as provided by the third-party pricing service, does not reflect the security’s fair value. As a general principle, the current fair value of a security would appear to be the amount which the owner might reasonably expect to receive for the security upon its current sale. When fair value prices are used, generally they will differ from market quotations or official closing prices on the applicable exchanges. A variety of factors may be considered in determining the fair value of such securities, including, but not limited to, the following:
1)
the most recent price provided by a pricing service;
2)
available market prices for the fixed-income security;
3)
the fundamental business data relating to the issuer;
4)
an evaluation of the forces which influence the market in which these securities are purchased and sold;
5)
the type, size and cost of the security;
6)
the financial statements of the issuer;
7)
the credit quality and cash flow of the issuer, based on the Advisor’s or external analysis;
8)
the information as to any transactions in or offers for the security;
9)
the price and extent of public trading in similar securities (or equity securities) of the issuer/borrower, or comparable companies;
11)
the quality, value and salability of collateral, if any, securing the security; and
12)
other relevant factors.
The Fund is subject to fair value accounting standards that define fair value, establish the framework for measuring fair value and provide a three-level hierarchy for fair valuation based upon the inputs to the valuation as of the measurement date. The three levels of the fair value hierarchy are as follows:
•
Level 1 – Level 1 inputs are quoted prices in active markets for identical investments. An active market is a market in which transactions for the investment occur with sufficient frequency and volume to provide pricing information on an ongoing basis.
•
Level 2 – Level 2 inputs are observable inputs, either directly or indirectly, and include the following:
o
Quoted prices for similar investments in active markets.
o
Quoted prices for identical or similar investments in markets that are non-active. A non-active market is a market where there are few transactions for the investment, the prices are not current, or price quotations vary substantially either over time or among market makers, or in which little information is released publicly.
o
Inputs other than quoted prices that are observable for the investment (for example, interest rates and yield curves observable at commonly quoted intervals, volatilities, prepayment speeds, loss severities, credit risks, and default rates).
o
Inputs that are derived principally from or corroborated by observable market data by correlation or other means.
•
Level 3 – Level 3 inputs are unobservable inputs. Unobservable inputs may reflect the reporting entity’s own assumptions about the assumptions that market participants would use in pricing the investment.
Notes to Financial Statements (Continued)
First Trust Managed Municipal FundOctober 31, 2024
The inputs or methodologies used for valuing investments are not necessarily an indication of the risk associated with investing in those investments. A summary of the inputs used to value the Fund’s investments as of October 31, 2024, is included with the Fund’s Portfolio of Investments.
B. Securities Transactions and Investment Income
Securities transactions are recorded as of the trade date. Realized gains and losses from securities transactions are recorded on the identified cost basis. Dividend income is recorded on the ex-dividend date. Interest income is recorded daily on the accrual basis. Amortization of premiums and accretion of discounts are recorded using the effective interest method.
Securities purchased or sold on a when-issued, delayed-delivery or forward purchase commitment basis may have extended settlement periods. The value of the security so purchased is subject to market fluctuations during this period. The Fund maintains liquid assets with a current value at least equal to the amount of its when-issued, delayed-delivery or forward purchase commitments until payment is made. At October 31, 2024, the Fund had no when-issued, delayed-delivery or forward purchase commitments.
The Fund may purchase or sell (i.e., is long or short) exchange-listed futures contracts to hedge against changes in interest rates (interest rate risk). Futures contracts are agreements between the Fund and a counterparty to buy or sell a specific quantity of an underlying instrument at a specified price and at a specified date. Depending on the terms of the contract, futures contracts are settled either through physical delivery of the underlying instrument on the settlement date or by payment of a cash settlement amount on the settlement date. Open futures contracts can also be closed out prior to settlement by entering into an offsetting transaction in a matching futures contract. If the Fund is not able to enter into an offsetting transaction, the Fund will continue to be required to maintain margin deposits on the futures contract. When the contract is closed or expires, the Fund records a realized gain or loss equal to the difference between the value of the contract at the time it was opened and the value at the time it was closed or expired. This gain or loss is included in “Net realized gain (loss) on futures contracts” on the Statement of Operations.
Upon entering into a futures contract, the Fund must deposit funds, called margin, with its custodian in the name of the clearing broker equal to a specified percentage of the current value of the contract. Open futures contracts are marked to market daily with the change in value recognized as a component of “Net change in unrealized appreciation (depreciation) on futures contracts” on the Statement of Operations. Pursuant to the contract, the Fund agrees to receive from or pay to the broker an amount of cash equal to the daily fluctuation in value of the contract. Such receipts or payments are known as variation margin and are included in “Variation margin” payable or receivable on the Statement of Assets and Liabilities.
If market conditions change unexpectedly, the Fund may not achieve the anticipated benefits of the futures contract and may realize a loss. The use of futures contracts involves the risk of imperfect correlation in movements in the price of the futures contracts, interest rates and the underlying instruments.
Restricted cash segregated as collateral for futures contracts in the amount of $52,922 is shown as “Cash segregated as collateral” on the Statements of Assets and Liabilities.
D. Dividends and Distributions to Shareholders
The Fund will declare daily and pay monthly distributions of all or a portion of its net income to holders of each class of shares. Distributions of any net capital gains earned by the Fund are distributed at least annually. Distributions will automatically be reinvested into additional Fund shares unless cash distributions are elected by the shareholder. The Fund may also designate a portion of the amount paid to redeeming shareholders as a distribution for tax purposes.
Distributions from net investment income and realized capital gains are determined in accordance with federal income tax regulations, which may differ from U.S. GAAP. Certain capital accounts in the financial statements are periodically adjusted for permanent differences in order to reflect their tax character. These permanent differences are primarily due to the varying treatment of income and gain/loss on portfolio securities held by the Fund and have no impact on net assets or NAV per share. Temporary differences, which arise from recognizing certain items of income, expense and gain/loss in different periods for financial statement and tax purposes, will reverse at some point in the future. Permanent differences incurred during the fiscal year ended October 31, 2024, resulting in book and tax accounting differences, have been reclassified at year end to reflect a decrease in accumulated net investment income (loss) of $3,548 and an increase in accumulated net realized gain (loss) of $3,548. Accumulated distributable earnings (loss) consists of accumulated net investment income (loss), accumulated net realized gain (loss) on investments, and unrealized appreciation (depreciation) on investments. Net assets were not affected by this reclassification.
The tax character of distributions paid by the Fund during the fiscal years ended October 31, 2024 and 2023, was as follows:
Notes to Financial Statements (Continued)
First Trust Managed Municipal FundOctober 31, 2024
As of October 31, 2024, the distributable earnings and net assets on a tax basis were as follows:
Undistributed ordinary income | |
Undistributed capital gains | |
Total undistributed earnings | |
Accumulated capital and other losses | |
Net unrealized appreciation (depreciation) | |
Total accumulated earnings (losses) | |
| |
| |
| |
The Fund intends to continue to qualify as a regulated investment company by complying with the requirements under Subchapter M of the Internal Revenue Code of 1986, as amended, which includes distributing substantially all of its net investment income and net realized gains to shareholders. Accordingly, no provision has been made for federal and state income taxes. However, due to the timing and amount of distributions, the Fund may be subject to an excise tax of 4% of the amount by which approximately 98% of the Fund’s taxable income exceeds the distributions from such taxable income for the calendar year.
In addition, the Fund intends to invest in municipal securities to allow it to pay shareholders “exempt dividends” as defined in the Code.
The Fund intends to utilize provisions of the federal income tax laws, which allow it to carry a realized capital loss forward indefinitely following the year of the loss and offset such loss against any future realized capital gains. The Fund is subject to certain limitations under U.S. tax rules on the use of capital loss carryforwards and net unrealized built-in losses. These limitations apply when there has been a 50% change in ownership. At October 31, 2024, the Fund had non-expiring net capital loss carryforwards for federal income tax purposes of $517,575.
Certain losses realized during the current fiscal year may be deferred and treated as occurring on the first day of the following fiscal year for federal income tax purposes. For the fiscal year ended October 31, 2024, the Fund did not incur any net late year ordinary losses.
The Fund is subject to accounting standards that establish a minimum threshold for recognizing, and a system for measuring, the benefits of a tax position taken or expected to be taken in a tax return. Taxable years ended 2022, 2023, and 2024 remain open to federal and state audit. As of October 31, 2024, management has evaluated the application of these standards to the Fund and has determined that no provision for income tax is required in the Fund’s financial statements for uncertain tax positions.
As of October 31, 2024, the aggregate cost, gross unrealized appreciation, gross unrealized depreciation, and net unrealized appreciation/(depreciation) on investments (including short positions and derivatives, if any) for federal income tax purposes were as follows:
| Gross Unrealized Appreciation | Gross Unrealized (Depreciation) | Net Unrealized Appreciation (Depreciation) |
| | | |
The Fund pays all expenses directly related to its operations.
Notes to Financial Statements (Continued)
First Trust Managed Municipal FundOctober 31, 2024
3. Investment Advisory Fee, Affiliated Transactions and Other Fee Arrangements
First Trust, the investment advisor to the Fund, is a limited partnership with one limited partner, Grace Partners of DuPage L.P., and one general partner, The Charger Corporation. The Charger Corporation is an Illinois corporation controlled by James A. Bowen, Chief Executive Officer of First Trust. First Trust is responsible for the selection and ongoing monitoring of the Fund’s investment portfolio, managing the Fund’s business affairs and providing certain administrative services necessary for the management of the Fund. For these investment management services, First Trust is entitled to a monthly fee calculated at an annual rate of 0.50% of the Fund’s average net assets. First Trust also provides fund reporting services to the Fund for a flat annual fee in the amount of $9,250.
First Trust has agreed to waive fees and/or reimburse expenses to the extent necessary through March 1, 2025, to prevent the Fund’s Total Annual Operating Expenses (excluding interest expenses, taxes, fees incurred in acquiring and disposing of portfolio securities, acquired fund fees and expenses, and extraordinary expenses) from exceeding 0.65% of the average daily net assets of Class I shares of the Fund (the “Expense Cap”). Expenses borne and fees waived by First Trust are subject to reimbursement by the Fund for up to three years from the date the fee or expense was incurred, but no reimbursement payment will be made by the Fund at any time if it would result in the Fund’s expenses exceeding (i) the Expense Cap in place for the most recent fiscal year for which such expense limitation was in place, (ii) the Expense Cap in place at the time the fees were waived, or (iii) the current Expense Cap. The waiver agreement may be terminated by action of the Board of Trustees at any time upon 60 days’ written notice by the Trust, on behalf of the Fund, or by First Trust only after June 14, 2025. These amounts would be included in “Expenses previously waived or reimbursed” on the Statement of Operations. The advisory fee waiver and expense reimbursement for the fiscal year ended October 31, 2024 and the expenses borne by First Trust and subject to recovery were as follows:
| | Expenses Subject to Recovery | |
| | Period Ended October 31, 2022 | Year Ended October 31, 2023 | Year Ended October 31, 2024 | |
| | | | | |
Pursuant to a separate contractual agreement, First Trust agreed to waive management fees of 0.15% of average daily net assets through June 14, 2024, which was not renewed and expired on this date. For the fiscal year ended October 31, 2024, First Trust waived an additional $69,018 of management fees that are not subject to recovery.
BNY Mellon Investment Servicing (US) Inc. (“BNY IS”) serves as the Fund’s transfer agent in accordance with certain fee arrangements. As transfer agent, BNY IS is responsible for maintaining shareholder records for the Fund. The Bank of New York Mellon (“BNY”) serves as the Fund’s administrator, fund accountant, and custodian in accordance with certain fee arrangements. As administrator and fund accountant, BNY is responsible for providing certain administrative and accounting services to the Fund, including maintaining the Fund’s books of account, records of the Fund’s securities transactions, and certain other books and records. As custodian, BNY is responsible for custody of the Fund’s assets. BNY IS and BNY are subsidiaries of The Bank of New York Mellon Corporation, a financial holding company.
Each Trustee who is not an officer or employee of First Trust, any sub-advisor or any of their affiliates (“Independent Trustees”) is paid a fixed annual retainer that is allocated equally among each fund in the First Trust Fund Complex. Each Independent Trustee is also paid an annual per fund fee that varies based on whether the fund is a closed-end or other actively managed fund, a target outcome fund or an index fund.
Additionally, the Chairs of the Audit Committee, Nominating and Governance Committee and Valuation Committee, the Vice Chair of the Audit Committee, the Lead Independent Trustee and the Vice Lead Independent Trustee are paid annual fees to serve in such capacities, with such compensation allocated pro rata among each fund in the First Trust Fund Complex based on net assets. Independent Trustees are reimbursed for travel and out-of-pocket expenses in connection with all meetings. The Committee Chairs, the Audit Committee Vice Chair, the Lead Independent Trustee and the Vice Lead Independent Trustee rotate periodically in serving in such capacities. The officers and “Interested” Trustee receive no compensation from the Trust for acting in such capacities.
Notes to Financial Statements (Continued)
First Trust Managed Municipal FundOctober 31, 2024
4. Capital Share Transactions
Capital transactions were as follows:
| Year Ended October 31, 2024 | Year Ended October 31, 2023 |
| | | | |
| | | | |
| | | | |
| | | | |
| | | | |
| | | | |
Total Dividend Reinvestment | | | | |
| | | | |
| | | | |
| | | | |
5. Purchases and Sales of Securities
The cost of purchases and proceeds from sales of securities, excluding short-term investments, for the fiscal year ended October 31, 2024, were $20,334,780 and $21,942,765, respectively.
6. Derivative Transactions
The following table presents the type of derivatives held by the Fund at October 31, 2024, the primary underlying risk exposure and the location of these instruments as presented on the Statement of Assets and Liabilities.
| | | |
| | Statement of Assets and Liabilities Location | | Statement of Assets and Liabilities Location | |
| | Unrealized appreciation on futures contracts* | | Unrealized depreciation on futures contracts* | |
*Includes cumulative appreciation/depreciation on futures contracts as reported in the Futures Contracts table. Only the current day’s variation margin is presented on the Statement of Assets and Liabilities.
The following table presents the amount of net realized gain (loss) and change in net unrealized appreciation (depreciation) recognized for the fiscal year ended October 31, 2024, on derivative instruments, as well as the primary underlying risk exposure associated with each instrument.
Statement of Operations Location | |
Interest Rate Risk Exposure | |
Net realized gain (loss) on futures contracts | |
Net change in unrealized appreciation (depreciation) on futures contracts | |
The average notional value of futures contracts outstanding during the fiscal year ended October 31, 2024, which is indicative of the volume of this derivative type, was $3,193,613.
The Fund does not have the right to offset financial assets and liabilities related to futures contracts on the Statement of Assets and Liabilities.
Notes to Financial Statements (Continued)
First Trust Managed Municipal FundOctober 31, 2024
7. Borrowings
Effective February 28, 2024, the Trust, on behalf of the Fund, along with First Trust Exchange-Traded Fund III, First Trust Exchange-Traded Fund IV and First Trust Variable Insurance Trust, entered into a new Credit Agreement with BNY as administrative agent for a group of lenders. The borrowing rate is the higher of the federal funds effective rate and the adjusted daily simple SOFR rate plus 1.00%.The commitment amount under the credit agreement is $620 million and such commitment amount may be increased up to $700 million with the consent of one or more lenders. BNY charges on behalf of the lenders a commitment fee of 0.20% of the daily amount of the excess of the commitment amount over the outstanding principal balance of the loans, and an agency fee. Prior to February 28, 2024, the Trust, on behalf of the Fund, along with First Trust Variable Insurance Trust and First Trust Exchange-Traded Fund IV had a $200 million Credit Agreement with BNY. BNY charged a commitment fee of 0.25% of the daily amount of the excess of the commitment amount over the outstanding principal balance of the loans. First Trust allocates the commitment fee and agency fee amongst the funds that have access to the credit line. To the extent that the Fund accesses the credit line, there would also be an interest fee charged. The Fund did not have any borrowings outstanding during the fiscal year ended October 31, 2024.
The Fund has a variety of indemnification obligations under contracts with its service providers. The Fund’s maximum exposure under these arrangements is unknown. However, the Fund has not had prior claims or losses pursuant to these contracts and expects the risk of loss to be remote.
Management has evaluated the impact of all subsequent events on the Fund through the date the financial statements were issued and has determined that there was the following subsequent event:
On November 12, 2024, the Fund filed an initial registration statement for new Class A and Class C shares.
Report of Independent Registered Public Accounting Firm
To the Shareholders and the Board of Trustees of First Trust Series Fund:
Opinion on the Financial Statements and Financial Highlights
We have audited the accompanying statement of assets and liabilities, including the portfolio of investments, of First Trust Managed Municipal Fund (the “Fund”), one of the funds constituting the First Trust Series Fund, as of October 31, 2024, the related statement of operations for the year then ended, the statements of changes in net assets for each of the two years in the period then ended, the financial highlights for each of the two years in the period then ended, and for the period from June 15, 2022 (commencement of investment operations) through October 31, 2022, and the related notes. In our opinion, the financial statements and financial highlights present fairly, in all material respects, the financial position of the Fund as of October 31, 2024, and the results of its operations for the year then ended, the changes in its net assets for each of the two years in the period then ended, and the financial highlights for the each of the two years in the period then ended and for the period from June 15, 2022 (commencement of investment operations) through October 31, 2022, in conformity with accounting principles generally accepted in the United States of America.
These financial statements and financial highlights are the responsibility of the Fund’s management. Our responsibility is to express an opinion on the Fund’s financial statements and financial highlights based on our audits. We are a public accounting firm registered with the Public Company Accounting Oversight Board (United States) (PCAOB) and are required to be independent with respect to the Fund in accordance with the U.S. federal securities laws and the applicable rules and regulations of the Securities and Exchange Commission and the PCAOB.
We conducted our audits in accordance with the standards of the PCAOB. Those standards require that we plan and perform the audit to obtain reasonable assurance about whether the financial statements and financial highlights are free of material misstatement, whether due to error or fraud. The Fund is not required to have, nor were we engaged to perform, an audit of its internal control over financial reporting. As part of our audits, we are required to obtain an understanding of internal control over financial reporting but not for the purpose of expressing an opinion on the effectiveness of the Fund’s internal control over financial reporting. Accordingly, we express no such opinion.
Our audits included performing procedures to assess the risks of material misstatement of the financial statements and financial highlights, whether due to error or fraud, and performing procedures that respond to those risks. Such procedures included examining, on a test basis, evidence regarding the amounts and disclosures in the financial statements and financial highlights. Our audits also included evaluating the accounting principles used and significant estimates made by management, as well as evaluating the overall presentation of the financial statements and financial highlights. Our procedures included confirmation of securities owned as of October 31, 2024, by correspondence with the custodian and brokers; when replies were not received from brokers, we performed other auditing procedures. We believe that our audits provide a reasonable basis for our opinion.
/s/ Deloitte & Touche, LLP
December 23, 2024
We have served as the auditor of one or more First Trust investment companies since 2001.
First Trust Managed Municipal FundOctober 31, 2024 (Unaudited)
Changes in and Disagreements with Accountants (Item 8 of Form N-CSR)
There were no changes in or disagreements with the Fund’s accountants during the fiscal year ended October 31, 2024.
Proxy Disclosures (Item 9 of Form N-CSR)
There were no matters submitted for vote by shareholders of the Fund during the fiscal year ended October 31, 2024.
Remuneration Paid to Directors, Officers, and Others (Item 10 of Form N-CSR)
The applicable aggregate remuneration paid by each Fund during the period covered by the report is included in the Statements of Operations.
Statement Regarding the Basis for the Board’s Approval of Investment Advisory Contract (Item 11 of Form N-CSR)
The Board of Trustees of First Trust Series Fund (the “Trust”), including the Independent Trustees, unanimously approved the continuation of the Investment Management Agreement (the “Agreement”) between the Trust, on behalf of the First Trust Managed Municipal Fund (the “Fund”), and First Trust Advisors L.P. (the “Advisor”). The Board approved the continuation of the Agreement for a one-year period ending June 30, 2025 at a meeting held on June 2–3, 2024. The Board determined that the continuation of the Agreement is in the best interests of the Fund in light of the nature, extent and quality of the services provided and such other matters as the Board considered to be relevant in the exercise of its business judgment.
To reach this determination, the Board considered its duties under the Investment Company Act of 1940, as amended (the “1940 Act”), as well as under the general principles of state law, in reviewing and approving advisory contracts; the requirements of the 1940 Act in such matters; the fiduciary duty of investment advisors with respect to advisory agreements and compensation; the standards used by courts in determining whether investment company boards have fulfilled their duties; and the factors to be considered by the Board in voting on such agreements. At meetings held on April 16, 2024, April 25, 2024 and June 2–3, 2024, the Board, including the Independent Trustees, reviewed materials provided by the Advisor responding to requests for information from counsel to the Independent Trustees, submitted on behalf of the Independent Trustees, that, among other things, outlined: the services provided by the Advisor to the Fund (including the relevant personnel responsible for these services and their experience); the advisory fee rate payable by the Fund as compared to fees charged to a peer group of funds (the “Expense Group”) and a broad peer universe of funds (the “Expense Universe”), each assembled by Broadridge Financial Solutions, Inc. (“Broadridge”), an independent source, and as compared to fees charged to other clients of the Advisor; the expense ratio of the Fund as compared to expense ratios of the funds in the Fund’s Expense Group and Expense Universe; performance information for the Fund, including comparisons of the Fund’s performance to that of one or more relevant benchmark indexes and to that of a performance group of funds and a broad performance universe of funds (the “Performance Universe”), each assembled by Broadridge; the nature of expenses incurred in providing services to the Fund and the potential for the Advisor to realize economies of scale, if any; profitability and other financial data for the Advisor; any indirect benefits to the Advisor and its affiliate, First Trust Portfolios L.P. (“FTP”); and information on the Advisor’s compliance program. The Board reviewed initial materials with the Advisor at the meeting held on April 25, 2024, prior to which the Independent Trustees and their counsel met separately to discuss the information provided by the Advisor. Following the April 25, 2024 meeting, counsel to the Independent Trustees, on behalf of the Independent Trustees, requested certain clarifications and supplements to the materials provided, and the information provided in response to those requests was considered at an executive session of the Independent Trustees and their counsel held prior to the June 2–3, 2024 meeting, as well as at the June meeting. The Board applied its business judgment to determine whether the arrangement between the Trust and the Advisor continues to be a reasonable business arrangement from the Fund’s perspective. The Board determined that, given the totality of the information provided with respect to the Agreement, the Board had received sufficient information to renew the Agreement. The Board considered that shareholders chose to invest or remain invested in the Fund knowing that the Advisor manages the Fund and knowing the Fund’s advisory fee.
In reviewing the Agreement, the Board considered the nature, extent and quality of the services provided by the Advisor under the Agreement. The Board considered that the Advisor is responsible for the overall management and administration of the Trust and the Fund and reviewed all of the services provided by the Advisor to the Fund, as well as the background and experience of the persons responsible for such services. The Board noted that the Advisor’s Municipal Securities Team is responsible for the day-to-day management of the Fund’s investments. The Board considered the background and experience of the members of the Municipal Securities Team and noted the Board’s prior meetings with members of the Team. The Board considered the Advisor’s statement that it applies the same oversight model internally with its Municipal Securities Team as it uses for overseeing external sub-advisors, including portfolio risk monitoring and performance review. In reviewing the services provided, the Board noted the compliance program that had been developed by the Advisor and considered that it includes a robust program for monitoring the Advisor’s and the Fund’s compliance with the 1940 Act, as well as the Fund’s compliance with its investment objectives, policies and restrictions. The Board also considered a report from the Advisor with respect to its risk management functions related to the operation of the Fund.
Other Information (Continued)
First Trust Managed Municipal FundOctober 31, 2024 (Unaudited)
Finally, as part of the Board’s consideration of the Advisor’s services, the Advisor, in its written materials and at the April 25, 2024 meeting, described to the Board the scope of its ongoing investment in additional personnel and infrastructure to maintain and improve the quality of services provided to the Fund and the other funds in the First Trust Fund Complex. In light of the information presented and the considerations made, the Board concluded that the nature, extent and quality of the services provided to the Trust and the Fund by the Advisor under the Agreement have been and are expected to remain satisfactory and that the Advisor has managed the Fund consistent with its investment objectives, policies and restrictions.
The Board considered the advisory fee rate payable by the Fund under the Agreement for the services provided. The Board considered that the Advisor previously agreed to an expense cap for the Fund through March 1, 2026. The Board noted that fees waived or expenses borne by the Advisor pursuant to the expense cap are subject to reimbursement by the Fund for up to three years from the date the fee was waived or expense was incurred, but no reimbursement payment would be made by the Fund at any time if it would result in the Fund’s expenses exceeding (i) the applicable expense limitation in place for the most recent fiscal year for which such expense limitation was in place, (ii) the applicable expense limitation in place at the time the fees were waived, or (iii) the current expense limitation. The Board received and reviewed information showing the fee rates and expense ratios of the peer funds in the Expense Group, as well as advisory and unitary fee rates charged by the Advisor to other fund and non-fund clients, as applicable. With respect to the Expense Group, the Board discussed with Broadridge its methodology for assembling peer groups and discussed with the Advisor limitations in creating a relevant peer group for the Fund. The Board took these limitations into account in considering the peer data. Based on the information provided, the Board noted that the contractual advisory fee rate payable by the Fund was above the median contractual advisory fee of the peer funds in the Expense Group. The Board also noted that the Fund’s total (net) expense ratio (Class I shares) was below the median total (net) expense ratio of the peer funds in the Expense Group. With respect to fees charged to other clients, the Board considered differences between the Fund and other clients that limited their comparability. In considering the advisory fee rate overall, the Board also considered the Advisor’s statement that it seeks to meet investor needs through innovative and value-added investment solutions and the Advisor’s demonstrated long-term commitment to the Fund and the other funds in the First Trust Fund Complex.
The Board considered performance information for the Fund. The Board noted the process it has established for monitoring the Fund’s performance and portfolio risk on an ongoing basis, which includes quarterly performance reporting from the Advisor for the Fund. The Board determined that this process continues to be effective for reviewing the Fund’s performance. The Board received and reviewed information comparing the Fund’s performance for the one-year period ended December 31, 2023 to the performance of the funds in the Performance Universe and to that of a benchmark index. Based on the information provided, the Board noted that the Fund outperformed the Performance Universe median and the benchmark index for the one-year period ended December 31, 2023.
On the basis of all the information provided on the fees, expenses and performance of the Fund and the ongoing oversight by the Board, the Board concluded that the advisory fee for the Fund continues to be reasonable and appropriate in light of the nature, extent and quality of the services provided by the Advisor to the Fund under the Agreement.
The Board considered information and discussed with the Advisor whether there were any economies of scale in connection with providing advisory services to the Fund at current asset levels and whether the Fund may benefit from any economies of scale. The Board noted the Advisor’s statement that it believes that its expenses relating to providing advisory services to the Fund will increase during the next twelve months as the Advisor continues to build infrastructure and add new staff. The Board concluded that the advisory fee rate for the Fund reflects an appropriate level of sharing of any economies of scale that may be realized in the management of the Fund at current asset levels. The Board considered the revenues and allocated costs (including the allocation methodology) of the Advisor in serving as investment advisor to the Fund for the twelve months ended December 31, 2023 and the estimated profitability level for the Fund calculated by the Advisor based on such data, as well as complex-wide and product-line profitability data, for the same period. The Board noted the inherent limitations in the profitability analysis and concluded that, based on the information provided, the Advisor’s profitability level for the Fund was not unreasonable. In addition, the Board considered indirect benefits described by the Advisor that may be realized from its relationship with the Fund. The Board considered that the Advisor had identified as an indirect benefit to the Advisor and FTP their exposure to investors and brokers who, absent their exposure to the Fund, may have had no dealings with the Advisor or FTP. The Board noted that in addition to the advisory fees paid by the Fund, the Advisor receives compensation from the Fund for providing fund reporting services pursuant to a separate Fund Reporting Services Agreement. The Board also noted that the Advisor does not utilize soft dollars in connection with the Fund. The Board concluded that the character and amount of potential indirect benefits to the Advisor were not unreasonable.
Based on all of the information considered and the conclusions reached, the Board, including the Independent Trustees, unanimously determined that the terms of the Agreement continue to be fair and reasonable and that the continuation of the Agreement is in the best interests of the Fund. No single factor was determinative in the Board’s analysis.
Other Information (Continued)
First Trust Managed Municipal FundOctober 31, 2024 (Unaudited)
Federal Tax Information
For the taxable year ended October 31, 2024, the following distribution information is being provided as required by the Internal Revenue Code of 1986, as amended, or to meet a specific state’s requirement. The Fund designates the following percentages or, if subsequently determined to be different, the maximum amount allowable for their fiscal year ended October 31, 2024:
Federal and State Income Tax | |
Tax-Exempt Interest Dividends | |
Alternative Minimum Tax (AMT) | |
(b) The Financial Highlights is included in the Financial Statements and Other Information filed under Item 7(a) of this Form N-CSR.
Item 8. Changes in and Disagreements with Accountants for Open-End Management Investment Companies.
Not applicable to the Registrant.
Item 9. Proxy Disclosures for Open-End Management Investment Companies.
Not applicable to the Registrant.
Item 10. Remuneration Paid to Directors, Officers, and Others of Open-End Management Investment Companies
This information is included in the Financial Statements and Other Information filed under Item 7(a) of this Form N-CSR.
Item 11. Statement Regarding Basis for Approval of Investment Advisory Contract.
This statement is included in the Financial Statements and Other Information filed under Item 7(a) of this Form N-CSR.
Item 12. Disclosure of Proxy Voting Policies and Procedures for Closed-End Management Investment Companies.
Not applicable to the Registrant.
Item 13. Portfolio Managers of Closed-End Management Investment Companies.
Not applicable to the Registrant.
Item 14. Purchases of Equity Securities by Closed-End Management Investment Company and Affiliated Purchasers.
Not applicable to the Registrant.
Item 15. Submission of Matters to a Vote of Security Holders.
There have been no material changes to the procedures by which the shareholders may recommend nominees to the Registrant’s board of directors, where those changes were implemented after the Registrant last provided disclosure in response to the requirements of Item 407(c)(2)(iv) of Regulation S-K (17 CFR 229.407) (as required by Item 22(b)(15) of Schedule 14A (17 CFR 240.14a-101)), or this Item.
Item 16. Controls and Procedures.
| (a) | The Registrant’s principal executive and principal financial officers, or persons performing similar functions, have concluded that the Registrant’s disclosure controls and procedures (as defined in Rule 30a-3(c) under the Investment Company Act of 1940, as amended (the “1940 Act”) (17 CFR 270.30a-3(c))) are effective, as of a date within 90 days of the filing date of the report that includes the disclosure required by this paragraph, based on their evaluation of these controls and procedures required by Rule 30a-3(b) under the 1940 Act (17 CFR 270.30a-3(b)) and Rules 13a-15(b) or 15d-15(b) under the Securities Exchange Act of 1934, as amended (17 CFR 240.13a-15(b) or 240.15d-15(b)). |
| (b) | There were no changes in the Registrant’s internal control over financial reporting (as defined in Rule 30a-3(d) under the 1940 Act (17 CFR 270.30a-3(d)) that occurred during the period covered by this report that has materially affected, or is reasonably likely to materially affect, the Registrant’s internal control over financial reporting. |
Item 17. Disclosure of Securities Lending Activities for Closed-End Management Investment Companies.
| (a) | Not applicable to the Registrant. |
| (b) | Not applicable to the Registrant. |
Item 18. Recovery of Erroneously Awarded Compensation.
| (a) | Not applicable to the Registrant. |
| (b) | Not applicable to the Registrant. |
Item 19. Exhibits.
| (a)(2) | Not applicable to the Registrant. |
| (a)(4) | Not applicable to the Registrant. |
| (a)(5) | Not applicable to the Registrant. |
SIGNATURES
Pursuant to the requirements of the Securities Exchange Act of 1934 and the Investment Company Act of 1940, the registrant has duly caused this report to be signed on its behalf by the undersigned, thereunto duly authorized.
| (Registrant) | | First Trust Series Fund |
| By (Signature and Title)* | | /s/ James M. Dykas |
| | | James M. Dykas, President and Chief Executive Officer
(principal executive officer) |
Pursuant to the requirements of the Securities Exchange Act of 1934 and the Investment Company Act of 1940, this report has been signed below by the following persons on behalf of the registrant and in the capacities and on the dates indicated.
| By (Signature and Title)* | | /s/ James M. Dykas |
| | | James M. Dykas, President and Chief Executive Officer
(principal executive officer) |
| By (Signature and Title)* | | /s/ Derek D. Maltbie |
| | | Derek D. Maltbie, Treasurer, Chief Financial Officer
and Chief Accounting Officer
(principal financial officer) |
* Print the name and title of each signing officer under his or her signature.